towards novel saving and conversion energy systems - Sigarra
279
Functional electroactive materials: towards novel saving and conversion energy systems Marta Susete da Silva Nunes PhD thesis submitted to Faculdade de Ciências da Universidade do Porto, Faculdade de Ciências e Tecnologia da Universidade Nova de Lisboa, Chemistry 2016
-
Upload
khangminh22 -
Category
Documents
-
view
3 -
download
0
Transcript of towards novel saving and conversion energy systems - Sigarra
Functional electroactive materials: towards novel saving and conversion energy systemsMarta Susete da Silva NunesPhD thesis submitted to Faculdade de Ciências da Universidade do Porto, Faculdade de Ciências e Tecnologia da Universidade Nova de Lisboa, Chemistry
2016

Functional electroactive materials: towards novel saving and conversion energy systemsMarta Susete da Silva NunesDoutoramento em Química SustentávelDepartamento de Química e Bioquímica2016
SupervisorAna Cristina Freire, Full Professor,Faculdade de Ciências da Universidade do Porto

Ac
SFRH
Porto
the d
suppo
electr
Mate
Porto
Chim
polyo
Maria
and u
alway
financ
UID/Q
“Poly
cknow
To Fundaç
H/BD/79171/
To Departa
o, for provide
To my supe
edication, kn
ort at the beg
To Doctor
rocatalysis.
To Profess
riais, Depart
o, for providin
To Profess
mie Physique,
oxometalates
To all my c
ana Araújo b
To my frien
To my Mot
understandin
To Pedro,
ys believe in
This work
ced by
QUI/50006/2
yoxometalate
wledge
ção para a C
/2011.
amento de Q
e me the facil
ervisor, Prof
nowledge sh
ginning of th
r Diana Fe
sor Fernando
tamento de
ng me the ac
sor Pedro de
, Université P
s and consta
colleagues o
y shared dis
nds Mariana
ther, my Fat
ng and for su
for being p
me, even w
had the fina
FEDER,
2013 – POC
e Chemistry f
ments
Ciência e a
Química e B
ities for the d
essor Cristin
aring and va
is journey.
rnandes, fo
o Pereira an
Engenharia
ccess to their
Oliveira and
Paris-Sud in
nt availability
of laboratory
cussions abo
Rocha and P
ther and my
pport me in a
present in al
hen I no long
ncial suppor
under the
CI/01/0145/FE
for Molecular
s
Tecnologia
Bioquímica,
development
na Freire, for
aluable sugg
or helping m
nd Doctor In
Química, Fa
r laboratory f
d Doctor Isra
France, for w
y.
y, for the ple
out the elect
Paula Costa
y brother, for
all my decisi
ll moments,
ger believe.
rt from FCT/
e Partners
ERDER/0072
r Nanoscienc
(FCT) for m
Faculdade d
t of my proje
r the opportu
estions; than
me in the
ês Rocha fr
aculdade de
facilities and
ael-Martyr Mb
welcoming m
asant mome
rochromic st
for the friend
r their uncon
ons.
for the mot
/MEC throug
ship Agre
265). Also
ce (PoCheM
my PhD Gra
de Ciências,
ct.
nity to devel
nks for the cr
incursion in
om Laborató
Engenharia
readiness to
bomekalle fro
me so well du
ents spent a
tudies.
dship and co
nditional love
tivation and
gh national fu
ement PT
thanks the
oN)” by the S
iii
ant with refe
, Universida
op this proje
rucial advice
nto the wo
ório de Catá
a, Universida
o help.
om Laborato
uring my wor
nd in particu
onstant suppo
e, encourage
patience an
unds and wa
T2020 (Pr
COST CM
STSM action
erence
de do
ect, for
es and
rld of
álise e
ade do
oire de
rk with
ular to
ort.
ement
nd for
as co-
rojects
M1203
n.

iv
v
Abstract The present thesis is focused on the development of novel efficient systems for
application in energy saving and conversion technologies.
In the framework of saving-energy technologies, novel electrochromic (EC)
materials based in poly[Ni(salen)]-type polymer films were explored. The Ni-salen
metallopolymers, poly[Ni(3-Mesalen)] and poly[Ni(3-MesaltMe)] (poly[1] and poly[2],
respectively) were electropolymerised from the respective [Ni(salen)] complexes and
the influence of the supporting electrolytes – LiClO4/CH3CN and LiClO4/propylene
carbonate (PC) - in their electrochemical, compositional, morphological, electronic and
electrochromic properties were evaluated. Both films exhibited interesting EC
properties, with colour changes between yellow, green and russet, accordingly to the
oxidation state and with superior long-term electrochemical stability in LiClO4/PC; the
most promising results were obtained for poly[1], allowing the assemblage of
electrochromic devices with very good performances.
In order to obtain new materials with improved EC performances, several
nanocomposites were prepared through the electropolymerisation of poly[1] films in the
presence of (i) WO3 and (ii) TiO2 nanoparticles (NPs) and (iii) nitrogen-doped graphene
(N-FLG). All nanocomposites showed a positive effect in some EC properties: the
nanocomposite with WO3 showed faster responses and higher optical contrasts and
colouration efficiencies, while the composite with TiO2 showed an excellent
electrochemical stability; the nanocomposite prepared with N-FLG showed
simultaneous outstanding enhancement of all EC parameters.
In the field of energy-conversion, carbon-based materials were studied as
electrocatalysts for the oxygen reduction reaction (ORR) in alkaline and acidic media.
Two activated carbons prepared from sucrose, SC800 and SH800, were tested as
metal-free ORR electrocatalysts. The SH800 showed the best electrocatalytic
performance, as a consequence of its higher surface area. Moreover, several
nanocomposites prepared through the immobilisation of a polyoxometalate,
tetrabutylammonium salt of vanadium(V)-substituted phosphomolybdate (PMo11V), into
several carbon nanomaterials (carbon black, carbon nanotubes and graphene (GF))
were studied. A strong dependency between the carbon support and the ORR
electrocatalytic activity was found, with PMo11V@GF nanocomposite showing the best
electrocatalytic performance. The prepared nanocomposites also showed
electrocatalytic activity towards H2O2 reduction.

vi
Keywords: Electrochromic materials, Oxygen reduction reaction, Metal-salen polymers,
Metal oxides, Carbon-based materials, Polyoxometalates.
vii
Resumo O trabalho de investigação descrito nesta tese focou-se no desenvolvimento de
novos materiais, para aplicação em tecnologias relacionadas com poupança e
conversão de energia.
No âmbito da temática poupança de energia, foram desenvolvidos novos
materiais electrocrómicos baseados em filmes poliméricos do tipo poli[Ni(salen)]. Os
metalopolímeros, poli[Ni(3-Mesalen)] e poli[Ni(3-MesaltMe)] (poli[1] e poli[2],
respectivamente) foram electropolimerizados a partir dos respectivos complexos
[Ni(salen)], e foi estudada a influência dos electrólitos de suporte - LiClO4/CH3CN e
LiClO4/carbonato de propileno (PC) – nas suas propriedades electroquímicas,
electrónicas e electrocrómicas e na sua composição e morfologia. Ambos os filmes
exibiram propriedades electrocrómicas interessantes, com mudanças de cor entre o
amarelo, verde e castanho-avermelhado de acordo com o estado de oxidação, e com
maior estabilidade electroquímica em LiClO4/PC; os resultados mais promissores
foram obtidos para o poli[1], o que permitiu a construção de dispositivos
electrocrómicos com bom desempenho electrocrómico.
De modo a obter novos materiais com melhor desempenho electrocrómico,
foram preparados vários nanocompósitos através da electropolimerização do poli[1] na
presença de nanopartículas (NPs) de (i) WO3 e (ii) TiO2 e (iii) grafeno dopado com
azoto (N-FLG). Todos os nanocompósitos mostraram um efeito positivo em alguma
das propriedades electrocrómicas: o nanocompósito com NPs de WO3 exibiu
respostas mais rápidas e maior contraste óptico e eficiência de coloração, enquanto o
compósito com NPs de TiO2 mostrou uma excelente estabilidade electroquímica; o
nanocompósito preparado com o N-FLG apresentou um notável melhoramento de
todos os parâmetros electrocrómicos em simultâneo.
No domínio da conversão de energia, foram estudados materiais de carbono
como electrocatalisadores para a reacção de redução do oxigénio (ORR), em meio
alcalino e ácido. Foram testados dois carvões activados preparados a partir da
sacarose, SC800 e SH800, como electrocatalisadores sem metais. O SH800
apresentou o melhor desempenho electrocatalítico, como consequência da sua
elevada área superficial. Foram ainda estudados vários nanocompósitos preparados
através da imobilização de um polioxometalato, sal de tetrabutilamónio de vanado-
fosfomolibdato (PMo11V), em vários materiais de carbono (negro de carbono,
nanotubos de carbono e grafeno (GF)). Observou-se uma forte dependência entre o
suporte de carbono usado e a actividade electrocatalítica para ORR, com o
nanocompósito PMo11V@GF exibindo o melhor desempenho electrocatalítico. Os

viii
nanocompósitos preparados também apresentaram actividade electrocatalítica para a
redução de H2O2.
Palavras-chave: Materiais electrocrómicos, Reacção de redução do oxigénio,
Polímeros metal-salen, Óxidos metálicos, Materiais de carbono, Polioxometalatos.

ix
Contents
List of Figures .............................................................................................................. xv
List of Tables .............................................................................................................. xxv
List of Abbreviations and Symbols ........................................................................ xxvii
Chapter 1 ....................................................................................................................... 1
Introduction ............................................................................................................... 3
1.1 Energy saving ....................................................................................................... 5
1.1.1 Electrochromism ............................................................................................. 5
1.1.2 Electrochromic materials ................................................................................ 6
1.1.3 Conducting polymers ...................................................................................... 7
1.1.4 [M(salen)] complexes ................................................................................... 11
1.1.5 Polymeric nanocomposites .......................................................................... 13
a) Metal oxides .................................................................................................. 13
b) Carbon-based nanomaterials ........................................................................ 14
c) Preparation methods ..................................................................................... 15
1.1.6 Electrochromic properties ............................................................................. 16
1.1.7 Electrochromic devices and applications ..................................................... 17
a) Electrodes and EC layer ............................................................................... 19
b) Electrolyte ..................................................................................................... 20
c) ECD configurations and operation ................................................................ 20
1.2 Energy conversion .............................................................................................. 21
1.2.1 Oxygen Reduction Reaction ......................................................................... 21
1.2.2 Carbon-based ORR electrocatalysts ............................................................ 23
1.2.3 Polyoxometalates ......................................................................................... 24
1.2.4 ORR electrocatalytic activity evaluation ....................................................... 26
1.2.5 ORR-involved electrochemical devices ........................................................ 27
1.3 Objectives ........................................................................................................... 30
References ................................................................................................................ 34
Chapter 2 ..................................................................................................................... 41
High-performance electrochromic devices based on poly[Ni(salen)]-type polymer films ........................................................................................................... 43
Abstract ..................................................................................................................... 43
2.1 Introduction ......................................................................................................... 44
x
2.2 Experimental section ........................................................................................... 45
2.2.1 Materials and solvents .................................................................................. 45
2.2.2 Preparation and characterisation of polymeric films ..................................... 45
2.2.3 Electrochromic properties evaluation ........................................................... 46
2.2.4 Fabrication and characterisation of electrochromic devices ......................... 47
2.3 Results and discussion ....................................................................................... 48
2.3.1 Electrochemical preparation and characterisation of polymeric films ........... 48
2.3.2 Composition and morphology ....................................................................... 50
2.3.3 In situ UV-Vis spectroscopy ......................................................................... 53
2.3.4 Electrochromic properties ............................................................................. 58
2.3.5 ECDs fabrication and characterisation ......................................................... 67
2.4 Conclusions ......................................................................................................... 69
References ................................................................................................................ 71
Chapter 3 ..................................................................................................................... 73
Novel hybrid based in a poly[Ni(salen)] film and WO3 nanoparticles with electrochromic properties ...................................................................................... 75
Abstract ..................................................................................................................... 75
3.1 Introduction ......................................................................................................... 76
3.2 Experimental section ........................................................................................... 77
3.2.1 Materials and solvents .................................................................................. 77
3.2.2 WO3 NPs preparation ................................................................................... 78
3.2.3 Films preparation and electrochemical studies ............................................ 78
3.2.4 Composition and morphology characterisation ............................................ 78
3.2.5 Spectroelectrochemical studies .................................................................... 79
3.2.6 Electrochromic properties evaluation ........................................................... 79
3.3 Results and discussion ....................................................................................... 80
3.3.1 WO3 NPs characterisation ............................................................................ 80
3.3.2 Electrochemical preparation and characterisation of WO3@poly[1] ............. 83
3.3.3 Composition and morphology ....................................................................... 87
3.3.4 In situ UV-Vis spectroscopy ......................................................................... 95
3.3.5 Electrochromic properties ........................................................................... 101
3.4 Conclusions ....................................................................................................... 104
References .............................................................................................................. 106

xi
Chapter 4 ................................................................................................................... 109
Multicolour electrochromic film based in a TiO2@poly[Ni(salen)] nanocomposite with excellent electrochemical stability .................................. 111
Abstract ................................................................................................................... 111
4.1 Introduction ....................................................................................................... 112
4.2 Experimental section ......................................................................................... 113
4.2.1 Materials and solvents ................................................................................ 113
4.2.2 TiO2 NPs preparation and characterisation ................................................ 114
4.2.3 Films preparation and electrochemical studies .......................................... 114
4.2.4 Composition and morphology characterisation .......................................... 115
4.2.5 Spectroelectrochemical studies .................................................................. 115
4.2.6 Electrochromic properties evaluation ......................................................... 115
4.3 Results and discussion ..................................................................................... 116
4.3.1 TiO2 NPs characterisation .......................................................................... 116
4.3.2 Electrochemical preparation and characterisation of TiO2@poly[1] ........... 120
4.3.3 Morphology and composition ..................................................................... 127
4.3.4 In situ UV-Vis spectroscopy ....................................................................... 134
4.3.5 Electrochromic properties ........................................................................... 139
4.4 Conclusions ....................................................................................................... 142
References .............................................................................................................. 144
Chapter 5 ................................................................................................................... 147
N-doped graphene@poly[Ni(salen)] nanocomposite with outstanding electrochromic properties .................................................................................... 149
Abstract ................................................................................................................... 149
5.1 Introduction ....................................................................................................... 150
5.2 Experimental section ......................................................................................... 151
5.2.1 Materials and solvents ................................................................................ 151
5.2.2 N-FLG preparation and characterisation .................................................... 151
5.2.3 Films preparation and electrochemical studies .......................................... 152
5.2.4 Composition and morphology characterisation .......................................... 152
5.2.5 Spectroelectrochemical studies .................................................................. 153
5.2.6 Electrochromic properties evaluation ......................................................... 153
5.3 Results and discussion ..................................................................................... 154
5.3.1 N-FLG characterisation .............................................................................. 154
5.3.2 Electrochemical preparation and characterisation of N-FLG@poly[1] ....... 156
5.3.3 Composition and morphology ..................................................................... 160
xii
5.3.4 In situ UV-Vis spectroscopy ....................................................................... 164
5.3.5 Electrochromic properties ........................................................................... 168
5.4 Conclusions ....................................................................................................... 170
References .............................................................................................................. 172
Chapter 6 ................................................................................................................... 177
Sucrose-derived activated carbons: electron transfer properties and application as oxygen reduction electrocatalysts ............................................. 179
Abstract ................................................................................................................... 179
6.1 Introduction ....................................................................................................... 180
6.2 Experimental section ......................................................................................... 181
6.2.1 Reagents and solvents ............................................................................... 181
6.2.2 Preparation of materials ............................................................................. 181
6.2.3 Evaluation of the ORR electrocatalytic activity ........................................... 182
6.2.4 Electrochemical characterisation of the modified electrodes...................... 183
6.3 Results and discussion ..................................................................................... 184
6.3.1 Activated carbons characterisation ............................................................ 184
6.3.2 Electrocatalytic activity for ORR ................................................................. 187
6.3.3 Electrochemical characterisation of the modified electrodes...................... 197
6.4 Conclusions ....................................................................................................... 203
References .............................................................................................................. 204
Chapter 7 ................................................................................................................... 207
Phosphomolybdate@carbon-based nanocomposites as electrocatalysts for oxygen reduction .................................................................................................. 209
Abstract ................................................................................................................... 209
7.1 Introduction ....................................................................................................... 210
7.2 Experimental section ......................................................................................... 211
7.2.1 Reagents and solvents ............................................................................... 211
7.2.2 Preparation of materials ............................................................................. 211
7.2.3 Electrochemical characterisation ................................................................ 212
7.2.4 Evaluation of the ORR electrocatalytic activity ........................................... 213
7.2.5 Hydrogen peroxide reduction ..................................................................... 214
7.3 Results and discussion ..................................................................................... 214
7.3.1 Compositional characterisation of materials ............................................... 214
7.3.2 Electrochemical characterisation ................................................................ 217
7.3.3 ORR electrocatalytic activity ....................................................................... 222
xiii
7.3.4 Hydrogen peroxide reduction ..................................................................... 228
7.4 Conclusions ....................................................................................................... 229
References .............................................................................................................. 230
Chapter 8 ................................................................................................................... 233
Conclusions and future perspectives ................................................................. 235
8.1 Conclusions ....................................................................................................... 235
8.2 Future perspectives ........................................................................................... 238
Appendices ............................................................................................................... 239
Appendix A ............................................................................................................ 241
Appendix B ............................................................................................................ 243
Appendix C ............................................................................................................ 245

xiv
xv
List of Figures
Figure 1.1 Aromatic molecules structures .......................................................................................... 8
Figure 1.2 Oxidative electropolymerisation process of thiophene. Reproduced from Ref. [33] .......... 8
Figure 1.3 Structure of thiophene trimer in (a) neutral, (b) polaron and (c) bipolaron states. Adapted
from Ref. [16] .................................................................................................................... 9
Figure 1.4 Schematic representation of the electronic structure of a conducting polymer accordingly
to the polaronic model .................................................................................................... 10
Figure 1.5 Structures and photographs of representative EC films studied by Reynolds’s group.
Adapted from Ref. [38] .................................................................................................... 10
Figure 1.6 General molecular structure of the [M(salen)]-type complexes (M = transition metal,
R1–R11 = -H or functional groups) ................................................................................... 11
Figure 1.7 Photographs of several poly[M(salen)]-type films in different oxidation states. Adapted
from Ref. [64] .................................................................................................................. 13
Figure 1.8 Structures of the TiO2 polymorphs: (a) rutile, (b) anatase and (c) brookite; (d) monoclinic
structure of WO3 ............................................................................................................. 14
Figure 1.9 Summary of some routes employed in PNCs preparation .............................................. 15
Figure 1.10 Applications of EC materials: (a) car rear view mirrors with glare elimination (adapted
from Ref. [12]), (b) airplane windows with EC technology (adapted from Ref. [87]), (c) EC
smart window (adapted from Ref. [90]) and (d) EC flexible display ................................ 18
Figure 1.11 Schematic structure of an electrochromic device with (a) vertical and (b) lateral
configurations ................................................................................................................. 19
Figure 1.12 Structures of (a) graphene, (b) graphite, (c) carbon nanotube and (d) fullerene ............. 23
Figure 1.13 Polyhedral representation of Keggin polyoxometalate molecule ..................................... 25
Figure 1.14 Schematic structures of several fuel-cells types ............................................................. 28
Figure 1.15 Schematic structure of a metal-air battery ...................................................................... 29
Figure 1.16 Energy-related materials within the framework of the present thesis: application of EC
materials for energy-saving and of new ORR electrocatalysts for alternative efficient
energy-conversion technologies ..................................................................................... 31
Figure 2.1 CVs of the electrodeposition of (a) [Ni(3-Mesalen)] and (b) [Ni(3-MesaltMe)] complexes,
using 1.0 mmol dm-3 solutions of complexes in LiClO4/CH3CN 0.1 mol dm-3, at
0.020 V s-1 during 10 cycles. Inset: chemical structures of the respective [Ni(salen)]
complex .......................................................................................................................... 48
Figure 2.2 Voltammetric responses of (a and a’) poly[1] (Γ = 0.31 μmol cm-2) and (b and b’) poly[2]
(Γ = 1.13 μmol cm-2) films in LiClO4/CH3CN and LiClO4/PC 0.1 mol dm-3 electrolytes,
acquired at 0.020 V s-1 .................................................................................................... 49
Figure 2.3 High-resolution XPS spectra in O1s region of poly[1] film in (a) reduced and (b) oxidised
states in LiClO4/CH3CN, with respective deconvolutions; — peak assigned to ClO4- ..... 51
Figure 2.4 SEM micrographs and respective EDS spectra at selected zones for poly[1] films in
(a) reduced and (b) oxidised states, with a magnification of 20 000 times ...................... 52
Figure 2.5 Panel A: Absolute UV-Vis spectra of poly[1] (Γ = 0.16 μmol cm-2) acquired during film
oxidation in 0.1 mol dm-3 (a) LiClO4/CH3CN and (b) LiClO4/PC (referenced to the
respective electrolyte spectrum). Panel B: Abs vs. E plots for the electronic bands
xvi
identified in absolute UV-Vis spectra, referenced to the spectra at E = -0.1 V (arrows
indicate scan direction) ................................................................................................... 53
Figure 2.6 Panel A: Absolute UV-Vis spectra of poly[2] (Γ = 0.84 μmol cm-2) acquired during film
oxidation in 0.1 mol dm-3 (a) LiClO4/CH3CN and (b) LiClO4/PC (referenced to the
respective electrolyte spectrum). Panel B: Abs vs. E plots for the electronic bands
identified in absolute UV-Vis spectra, referenced to the spectra at E = -0.1 V (arrows
indicate scan direction) ................................................................................................... 54
Figure 2.7 UV-Vis spectra of poly[1] (Γ = 0.16 μmol cm-2) acquired during film oxidation in
LiClO4/CH3CN (Panel A) and LiClO4/PC (Panel B) from (a) -0.1 to 0.85 V and referenced
to the spectrum of neutral polymer, (b) 0.85 to 1.3 V and referenced to the spectrum of
polymer at E = 0.85 V, (a’) -0.1 to 0.9 V and referenced to the spectrum of neutral
polymer and (b’) 0.9 to 1.3 V and referenced to the spectrum of polymer at E = 0.9 V ... 55
Figure 2.8 UV-Vis spectra of poly[2] (Γ = 0.84 μmol cm-2) acquired during film oxidation in
LiClO4/CH3CN (Panel A) and LiClO4/PC (Panel B) from (a) -0.1 to 0.8 V and referenced
to the spectrum of neutral polymer, (b) 0.8 to 1.3 V and referenced to the spectrum of
polymer at E = 0.8 V, (a’) -0.1 to 0.9 V and referenced to the spectrum of neutral polymer
and (b’) 0.9 to 1.3 V and referenced to the spectrum of polymer at E = 0.9 V ................ 56
Figure 2.9 Plots of the Abs vs. Q for selected electronic bands for poly[1] and poly[2] in (a and
a’) LiClO4/CH3CN and (b and b’) LiClO4/PC; filled forms correspond to the anodic scan
and open forms to the cathodic scan .............................................................................. 58
Figure 2.10 Photographs of (a) poly[1] and (b) poly[2] films in different oxidation states (E = 0.0, 0.7
and 1.3 V vs. Ag/AgCl (NaCl / 1.0 mol.dm-3)) in LiClO4/CH3CN electrolyte .................... 58
Figure 2.11 Chronoabsorptograms of poly[1] films in LiClO4/CH3CN (—) and LiClO4/PC (—), for the
colour transitions (a) yellow ↔ green (λ = 750 nm) and (b) green ↔ russet (λ = 510 nm),
with indication of the estimated switching times .............................................................. 59
Figure 2.12 Chronoabsorptograms of poly[2] films in LiClO4/CH3CN (—) and LiClO4/PC (—), for the
colour transitions (a) yellow ↔ green (λ = 750 nm) and (b) green ↔ russet (λ = 510 nm),
with indication of the estimated switching times .............................................................. 60
Figure 2.13 UV-Vis spectra of poly[1] and poly[2] films in (a and a’) LiClO4/CH3CN and (b and
b’) LiClO4/PC in different oxidation states, corresponding to the colours yellow
(E = 0.0 V,—), green (E = 0.7 V,—) and russet (E = 1.3 V,—). The spectra were acquired
after applying the indicated potential values during 50 s ................................................ 60
Figure 2.14 Chronoabsorptograms and (a) chronoamperograms or (b) chronocoulograms obtained in
simultaneous for poly[1] films in LiClO4/PC, considering the colour transition yellow ↔
green (λ = 750 nm); in chronoamperometric study were applied two potential pulses of
50 s by redox cycle, with potential alternating between 0.0 and 0.7 V ............................ 61
Figure 2.15 Chronoamperograms of poly[1] films in LiClO4/CH3CN (—) and LiClO4/PC (—) for the
colour changes (a) yellow ↔ green and (b) green ↔ russet, applying two potential pulses
of 50 s by redox cycle, with potential alternating between (a) 0.0 - 0.7 V and (b) 0.7 –
1.3 V ............................................................................................................................... 63
Figure 2.16 Chronoamperograms of poly[2] films in LiClO4/CH3CN (—) and LiClO4/PC (—) for the
colour changes (a) yellow ↔ green and (b) green ↔ russet, applying two potential pulses
of 50 s by redox cycle, with potential alternating between (a) 0.0 - 0.7 V and (b) 0.7 –
1.15 V ............................................................................................................................. 64
xvii
Figure 2.17 Voltammetric responses of poly[1] in LiClO4/PC 0.1 mol dm-3, obtained at the scan rate
of 0.020 V s-1, during 200 scans ..................................................................................... 66
Figure 2.18 Pictures (Panel A) and schematic illustrations (Panel B) of the assembled ECDs of (a
and a’) typology 1 and (b and b’) typology 2, showing the colour contrast between the
two electrodes, each one in different oxidation states: electrode 1 in reduced state
(E = -1.0 V and -1.1 V) and electrode 2 in oxidised state (E = 1.0 V and -0.25 V) .......... 67
Figure 2.19 ECD of typology 1: (a) chronoamperograms obtained by the application of two potential
pulses of 200 s by redox cycle, with potential alternating between -1.0 (yellow) and 1.0 V
(green); chronoabsorptograms (at λ = 750 nm) and respective chronoamperograms
obtained during (b) the first 1000 redox cycles and (c) the first three redox cycles, with
indication of the switching times ..................................................................................... 68
Figure 2.20 Chronoamperograms of the ECD of typology 2, applying two potential pulses of 100 s by
redox cycle, with potential alternating between -1.1 (yellow) and -0.25 V (green) .......... 69
Figure 3.1 XRD patterns of WO3 NPs annealed at (a) 450 and 550 ºC and (b) 250 ºC ................... 80
Figure 3.2 (a) SEM and (b) TEM micrographs of WO3 NPs annealed at 550 ºC; particle size
distribution histograms from the analysis of (c) SEM and (d) TEM micrographs (the solid
line represents the log-normal distribution fits) ............................................................... 81
Figure 3.3 FTIR spectra of WO3 NPs annealed at 250, 450 and 550 ºC ......................................... 82
Figure 3.4 High-resolution XPS spectra of WO3 NPs annealed at 550 ºC in the (a) W4f and (b) O1s
regions, with respective deconvolutions ......................................................................... 82
Figure 3.5 CVs obtained during (a) the 1st and 10th scans of electrodeposition, (b) 5th scan of film
redox switching in LiClO4/CH3CN, and (c) 5th scan of film redox switching in LiClO4/PC
for: poly[1] (—, Γ = 0.19 μmol cm-2), WO3@poly[1]_s (—, Γ = 0.22 μmol cm-2) and
WO3@poly[1]_r (—, Γ = 0.27 μmol cm-2); (d) photographs of film in different oxidation
states (E = 0.0, 0.7 and 1.3 V) ........................................................................................ 84
Figure 3.6 CVs of the complete electrodeposition of (a) poly[1], (b) WO3@poly[1]_s and
(c) WO3@poly[1]_r films at 0.020 V s-1, using 1.0 mmol dm-3 monomer solution (with
5 wt.% of WO3 NPs in (b) and (c)) in LiClO4/CH3CN 0.1 mol dm-3 .................................. 85
Figure 3.7 CVs of the redox switching of (a and a’) poly[1], (b and b’) WO3@poly[1]_s and (c and
c’) WO3@poly[1]_r films at 0.010 V s-1, in LiClO4/CH3CN and LiClO4/PC 0.1 mol dm-3 .. 86
Figure 3.8 High-resolution XPS spectra of pristine poly[1] and WO3@poly[1]_r in C1s region, with
the corresponding deconvolutions, (a and a’) before and after redox switching in (b and
b’) LiClO4/CH3CN and (c and c’) LiClO4/PC .................................................................... 88
Figure 3.9 High-resolution XPS spectra of pristine poly[1] and WO3@poly[1]_r in N1s region, with
the corresponding deconvolutions, (a and a’) before and after redox switching in (b and
b’) LiClO4/CH3CN and (c and c’) LiClO4/PC .................................................................... 89
Figure 3.10 High-resolution XPS spectra of pristine poly[1] and WO3@poly[1]_r in O1s region, with
the corresponding deconvolutions, (a and a’) before and after redox switching in (b and
b’) LiClO4/CH3CN and (c and c’) LiClO4/PC .................................................................... 90
Figure 3.11 High-resolution XPS spectra of pristine poly[1] and WO3@poly[1]_r in Cl2p region, with
the corresponding deconvolutions, (a and a’) before and after redox switching in (b and
b’) LiClO4/CH3CN and (c and c’) LiClO4/PC .................................................................... 91
Figure 3.12 High-resolution XPS spectra of pristine poly[1] and WO3@poly[1]_r in Ni2p region, with
the corresponding deconvolutions, (a and a’) before and after redox switching in (b and
b’) LiClO4/CH3CN and (c and c’) LiClO4/PC .................................................................... 92
xviii
Figure 3.13 High-resolution XPS spectra of WO3@poly[1]_r in W4f region, with the corresponding
deconvolutions, (a) before and after redox switching in (b) LiClO4/CH3CN and
(c) LiClO4/PC .................................................................................................................. 93
Figure 3.14 (a) Scanning electron micrograph and (b) respective EDS spectrum of WO3@poly[1]_r
film .................................................................................................................................. 95
Figure 3.15 Panel A: Absolute UV-Vis spectra of (a) poly[1], (b) WO3@poly[1]_s and
(c) WO3@poly[1]_r films acquired during films oxidation in 0.1 mol dm-3 LiClO4/CH3CN
(referenced to the electrolyte spectrum; Γ = 0.06-0.10 μmol cm-2). Panel B: Abs vs. E
plots for the electronic bands identified in absolute UV-Vis spectra, referenced to the
spectra at E = -0.1 V (arrows indicate scan direction) ..................................................... 96
Figure 3.16 Panel A: Absolute UV-Vis spectra of (a) poly[1], (b) WO3@poly[1]_s and
(c) WO3@poly[1]_r films acquired during films oxidation in 0.1 mol dm-3 LiClO4/PC
(referenced to the electrolyte spectrum; Γ = 0.06-0.10 μmol cm-2). Panel B: Abs vs. E
plots for the electronic bands identified in absolute UV-Vis spectra, referenced to the
spectra at E = -0.1 V (arrows indicate scan direction) ..................................................... 97
Figure 3.17 UV-Vis spectra of (a and a’) poly[1], (b and b’) WO3@ poly[1]_s and (c and
c’) WO3@ poly[1]_r acquired during films oxidation in LiClO4/CH3CN from -0.1 to 0.75 V,
referenced to the spectra of neutral films (Panel A) and from 0.75 to 1.3 V, referenced to
the spectra of films at E = 0.75 V (Panel B) .................................................................... 98
Figure 3.18 UV-Vis spectra of (a and a’) poly[1], (b and b’) WO3@ poly[1]_s and (c and
c’) WO3@ poly[1]_r acquired during films oxidation in LiClO4/PC from -0.1 to 0.85 V,
referenced to the spectra of neutral films (Panel A) and from 0.85 to 1.3 V, referenced to
the spectra of films at E = 0.85 V (Panel B) .................................................................... 99
Figure 3.19 Plots of the Abs vs. Q for selected electronic bands of (a and a’) poly[1], (b and
b’) WO3@poly[1]_s and (c and c’) WO3@poly[1]_r in 0.1 mol dm-3 LiClO4/CH3CN and
LiClO4/PC (for anodic scan) .......................................................................................... 101
Figure 3.20 Chronoabsorptograms obtained for pristine (—), WO3@poly[1]_s (—) and
WO3@poly[1]_r (—) films, at the fixed wavelength of λ = 750 nm in (a) LiClO4/CH3CN
and (b) LiClO4/PC 0.1 mol dm-3, indicating the measured switching times; E = 0.0 V
(yellow) or 0.7 V (green), Γ = 0.06-0.10 μmol cm-2 ....................................................... 102
Figure 3.21 Chronoamperograms of poly[1] and WO3@poly[1]_r in 0.1 mol dm-3 LiClO4/PC, applying
two potential pulses of 50 s, with potential alternating between 0.0 and 0.7 V ............. 104
Figure 4.1 XRD patterns of TiO2 NPs annealed at 300, 400 and 500 ºC (A = anatase,
B = brookite) ................................................................................................................. 116
Figure 4.2 (a) TEM micrograph of the TiO2 NPs; (b) particle size distribution histogram from the
analysis of TEM images (the solid line represents the log-normal distribution fit) ......... 117
Figure 4.3 High-resolution XPS spectra of TiO2_300 and TiO2_400 NPs in Ti2p, O1s and N1s
regions, with respective deconvolutions ....................................................................... 118
Figure 4.4 FTIR spectra of TiO2 NPs annealed at different temperatures ...................................... 119
Figure 4.5 (a) UV-Vis absorption spectra for TiO2 NPs annealed at different temperatures;
(αhv)1/2 = f(hv) plots for TiO2 NPs annealed at (b) 300, (c) 400 and (d) 500 ºC ............. 120
Figure 4.6 CVs obtained during the 10th electrodeposition cycles of (a and a’) poly[1],
TiO2@poly[1]_s and TiO2@poly[1]_r (with 5 wt.% of TiO2 loading) and (b and
xix
b’) TiO2@poly[1]_r with 5, 15 and 25 wt.% of TiO2 loading, in LiClO4/CH3CN 0.1 mol dm-3
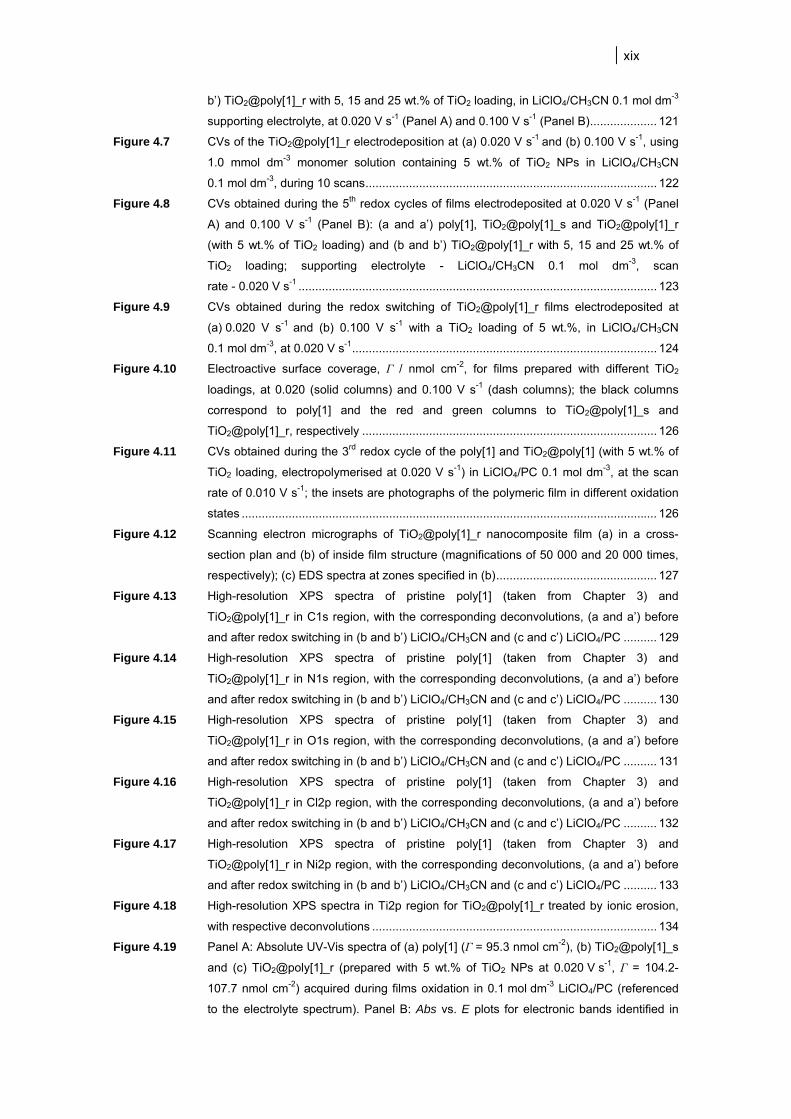
supporting electrolyte, at 0.020 V s-1 (Panel A) and 0.100 V s-1 (Panel B) .................... 121
Figure 4.7 CVs of the TiO2@poly[1]_r electrodeposition at (a) 0.020 V s-1 and (b) 0.100 V s-1, using
1.0 mmol dm-3 monomer solution containing 5 wt.% of TiO2 NPs in LiClO4/CH3CN
0.1 mol dm-3, during 10 scans ....................................................................................... 122
Figure 4.8 CVs obtained during the 5th redox cycles of films electrodeposited at 0.020 V s-1 (Panel
A) and 0.100 V s-1 (Panel B): (a and a’) poly[1], TiO2@poly[1]_s and TiO2@poly[1]_r
(with 5 wt.% of TiO2 loading) and (b and b’) TiO2@poly[1]_r with 5, 15 and 25 wt.% of
TiO2 loading; supporting electrolyte - LiClO4/CH3CN 0.1 mol dm-3, scan
rate - 0.020 V s-1 ........................................................................................................... 123
Figure 4.9 CVs obtained during the redox switching of TiO2@poly[1]_r films electrodeposited at
(a) 0.020 V s-1 and (b) 0.100 V s-1 with a TiO2 loading of 5 wt.%, in LiClO4/CH3CN
0.1 mol dm-3, at 0.020 V s-1 ........................................................................................... 124
Figure 4.10 Electroactive surface coverage, Γ / nmol cm-2, for films prepared with different TiO2
loadings, at 0.020 (solid columns) and 0.100 V s-1 (dash columns); the black columns
correspond to poly[1] and the red and green columns to TiO2@poly[1]_s and
TiO2@poly[1]_r, respectively ........................................................................................ 126
Figure 4.11 CVs obtained during the 3rd redox cycle of the poly[1] and TiO2@poly[1] (with 5 wt.% of
TiO2 loading, electropolymerised at 0.020 V s-1) in LiClO4/PC 0.1 mol dm-3, at the scan
rate of 0.010 V s-1; the insets are photographs of the polymeric film in different oxidation
states ............................................................................................................................ 126
Figure 4.12 Scanning electron micrographs of TiO2@poly[1]_r nanocomposite film (a) in a cross-
section plan and (b) of inside film structure (magnifications of 50 000 and 20 000 times,
respectively); (c) EDS spectra at zones specified in (b) ................................................ 127
Figure 4.13 High-resolution XPS spectra of pristine poly[1] (taken from Chapter 3) and
TiO2@poly[1]_r in C1s region, with the corresponding deconvolutions, (a and a’) before
and after redox switching in (b and b’) LiClO4/CH3CN and (c and c’) LiClO4/PC .......... 129
Figure 4.14 High-resolution XPS spectra of pristine poly[1] (taken from Chapter 3) and
TiO2@poly[1]_r in N1s region, with the corresponding deconvolutions, (a and a’) before
and after redox switching in (b and b’) LiClO4/CH3CN and (c and c’) LiClO4/PC .......... 130
Figure 4.15 High-resolution XPS spectra of pristine poly[1] (taken from Chapter 3) and
TiO2@poly[1]_r in O1s region, with the corresponding deconvolutions, (a and a’) before
and after redox switching in (b and b’) LiClO4/CH3CN and (c and c’) LiClO4/PC .......... 131
Figure 4.16 High-resolution XPS spectra of pristine poly[1] (taken from Chapter 3) and
TiO2@poly[1]_r in Cl2p region, with the corresponding deconvolutions, (a and a’) before
and after redox switching in (b and b’) LiClO4/CH3CN and (c and c’) LiClO4/PC .......... 132
Figure 4.17 High-resolution XPS spectra of pristine poly[1] (taken from Chapter 3) and
TiO2@poly[1]_r in Ni2p region, with the corresponding deconvolutions, (a and a’) before
and after redox switching in (b and b’) LiClO4/CH3CN and (c and c’) LiClO4/PC .......... 133
Figure 4.18 High-resolution XPS spectra in Ti2p region for TiO2@poly[1]_r treated by ionic erosion,
with respective deconvolutions ..................................................................................... 134
Figure 4.19 Panel A: Absolute UV-Vis spectra of (a) poly[1] (Γ = 95.3 nmol cm-2), (b) TiO2@poly[1]_s
and (c) TiO2@poly[1]_r (prepared with 5 wt.% of TiO2 NPs at 0.020 V s-1, Γ = 104.2-
107.7 nmol cm-2) acquired during films oxidation in 0.1 mol dm-3 LiClO4/PC (referenced
to the electrolyte spectrum). Panel B: Abs vs. E plots for electronic bands identified in

xx
absolute UV-Vis spectra, referenced to the spectra at E = -0.1 V (arrows indicate scan
direction) ....................................................................................................................... 135
Figure 4.20 UV-Vis spectra of (a and a’) poly[1], (b and b’) TiO2@poly[1]_s and (c and
c’) TiO2@poly[1]_r acquired during films oxidation in LiClO4/PC from (Panel A) -0.1 to
0.85 V and referenced to the spectra of neutral films and (Panel B) 0.85 to 1.3 V and
referenced to the spectra of films at E = 0.85 V ............................................................ 136
Figure 4.21 Plots of the Abs vs. Q for selected electronic bands of (a) poly[1], (b) TiO2@poly[1]_s
and (c) TiO2@poly[1]_r (c) in 0.1 mol dm-3 LiClO4/PC (for anodic scan) ....................... 138
Figure 4.22 (a) Chronoamperograms of pristine and TiO2@poly[1]_r films in LiClO4/PC 0.1 mol dm-3,
applying two potential pulses of 50 s by redox cycle, with potential alternating between
0.0 V (yellow) and 0.7 V (green); (b) expansion of the chronoamperograms, showing the
measured switching times at the 19th and 3000th cycles;
(c) chronoamperograms/absorptograms obtained for TiO2@poly[1]_r film, at the fixed
wavelength of λ = 750 nm ............................................................................................. 139
Figure 4.23 Graph of the CIELAB colour values (a*, b*) of pristine (symbol ) and nanocomposite
TiO2@poly[1]_r (symbol ) films, at different oxidation states: E = 0.0 V (yellow),
E = 0.7 V (green) and E = 1.3 V (russet) ...................................................................... 142
Figure 5.1 TEM micrographs of (a) purified N-FLG and (b) an enlarged view of the edge of a
flake .............................................................................................................................. 154
Figure 5.2 High-resolution XPS spectra of N-FLG in the C1s, N1s and O1s regions, with the
corresponding deconvolutions ...................................................................................... 154
Figure 5.3 Raman spectra of the undoped and N-doped FLG ....................................................... 155
Figure 5.4 CVs obtained during (a) the 1st, 10th and 30th scans of the electrodeposition and (b) the
3rd scan of the redox switching in LiClO4/PC 0.1 mol dm-3 of N-FLG@poly[1]
(Γ = 296 nmol cm-2) and poly[1] (Γ = 180 nmol cm-2) films; insets in (b) are films
photographs in different oxidation states ...................................................................... 156
Figure 5.5 CVs of the films electrodeposition, using 1.0 mmol dm-3 solution of [Ni(3-Mesalen)]
complex in LiClO4/CH3CN 0.1 mol dm-3, at 0.100 V s-1 during 30 scans: (a) poly[1] and
(b) N-FLG@poly[1] (containing 0.5 wt.% of N-FLG) ..................................................... 157
Figure 5.6 CVs of the redox switching in LiClO4/PC 0.1 mol dm-3, at 0.010 V s-1 during 3 scans:
(a) poly[1] and (b) N-FLG@poly[1] ................................................................................ 158
Figure 5.7 Plot of the electroactive surface coverage, Γ, with the number of electropolymerisation
cycles for N-FLG@poly[1] and pristine films ................................................................. 159
Figure 5.8 High-resolution XPS spectra in C1s, O1s and N1s regions, with the corresponding
deconvolutions: (a) pristine poly[1] and (b) N-FLG@poly[1] films ................................. 161
Figure 5.9 High-resolution XPS spectra in Ni2p and Cl2p regions, with the corresponding
deconvolutions: (a) pristine poly[1] and (b) N-FLG@poly[1] films ................................. 162
Figure 5.10 (a) Scanning electron micrograph and (b) EDS spectrum at a specified zone of
N-FLG@poly[1] film ...................................................................................................... 163
Figure 5.11 UV-Vis spectra of N-FLG@poly[1] acquired during film oxidation in 0.1 mol dm-3
LiClO4/PC: (a) absolute spectra, referenced to the electrolyte spectrum, and differential
spectra (b) from -0.2 to 0.8 V, referenced to the spectrum of neutral films and (c) from
0.8 to 1.3 V, referenced to the spectrum of film at E = 0.8 V; (d) Abs vs. E plots of the
electronic bands identified in absolute UV-Vis spectra, referenced to spectrum at
E = -0.2 V (arrows indicate scan direction) ................................................................... 165

xxi
Figure 5.12 UV-Vis spectra of poly[1] acquired during film oxidation in 0.1 mol dm-3 LiClO4/PC:
(a) absolute spectra, referenced to the electrolyte spectrum, and differential spectra
(b) from -0.2 to 0.75 V, referenced to the spectrum of neutral polymer and (c) from 0.75
to 1.3 V, referenced to the spectrum of polymer at E = 0.75 V; (d) Abs vs. E plots of the
electronic bands identified in absolute UV-Vis spectra, referenced to spectrum at -0.2 V
(arrows indicate scan direction) .................................................................................... 166
Figure 5.13 Plots of the Abs vs. Q for selected electronic bands in 0.1 mol dm-3 LiClO4/PC (for anodic
scan) of: (a) poly[1] and (b) N-FLG@poly[1] ................................................................. 167
Figure 5.14 (a) Chronoamperograms of N-FLG@poly[1] and poly[1] films in LiClO4/PC 0.1 mol dm-3,
applying two potential pulses of 50 s by redox cycle, with potential alternating between
0.0 V (yellow) and 0.6 V (green); (b) expansion of the chronoamperograms, showing the
measured switching times; (c) chronoamperograms/absorptograms obtained for
N-FLG@poly[1] film during 4 redox cycles, at the fixed wavelength of λ = 820 nm ...... 169
Figure 5.15 CVs of the N-FLG@poly[1] redox switching before and after the chronoamperometric
study in LiClO4/PC 0.1 mol dm-3 (E = 0.0 and 0.6 V with pulses of 50 s) ...................... 170
Figure 6.1 (a) N2 adsorption-desorption isotherms at -196 ºC, closed symbols are the desorption
points; (b) micropore size distributions of the activated carbons (adapted from
Ref. [27]) ....................................................................................................................... 184
Figure 6.2 High-resolution XPS spectra for SC800 (left) and SH800 (right) activated carbons:
(a) and (a’) survey spectra and deconvoluted spectra in (b) and (b’) C1s region and
(c) and (c’) O1s region .................................................................................................. 186
Figure 6.3 ORR results in KOH 0.1 mol dm-3: (a) CVs of the as-prepared catalysts in N2- and O2-
saturated solutions at 0.005 V s-1, (b) LSV using RDE in O2-saturated solution at
1600 rpm and 0.005 V s-1 and (c) number of electrons transferred per O2 molecule ( )
at several potential values ............................................................................................ 188
Figure 6.4 ORR polarisation plots of (a) bare GCE, (b) SC800 and (c) SH800 modified electrodes
and (d) 20 wt% Pt/C at several rotation rates and 0.005 V s-1, in 0.1 mol dm-3 KOH
electrolytes .................................................................................................................... 189
Figure 6.5 Koutecky-Levich (K-L) plots of (a) bare GCE, (b) SC800 and (c) SH800 modified
electrodes and (d) 20 wt% Pt/C obtained from data in Figure 6.4 ................................. 190
Figure 6.6 ORR Tafel plots for SC800 and SH800 activated carbons and 20 wt% Pt/C, obtained
from the LSV data in Figure 6.3 (b); current intensities normalised to the mass of each
electrocatalyst deposited on electrode (see experimental section) ............................... 191
Figure 6.7 CVs for ORR in O2-saturated 0.1 mol dm-3 KOH with and without methanol
(1.0 mol dm-3) for (a) SC800, (b) SH800 and (c) 20 wt% Pt/C; (d) relative j-t
chronoamperometric responses of catalyst at E = -0.60 V and 1600 rpm, in O2-saturated
0.1 mol dm-3 KOH solution ............................................................................................ 193
Figure 6.8 ORR results in H2SO4/Na2SO4 (pH 2.5): (a) CVs of the as-prepared catalysts in N2-and
O2-saturated solutions at 0.005 V s-1, (b) LSV using RDE in O2-saturated solution at
1600 rpm and 0.005 V s-1 and (c) number of electrons transferred per O2 molecule ( )
at several potential values ............................................................................................ 194
Figure 6.9 ORR polarisation plots of (a) bare GCE, (b) SC800 and (c) SH800 modified electrodes
and (d) 20 wt% Pt/C at several rotation rates and 0.005 V s-1, in H2SO4/Na2SO4
(pH 2.5) ......................................................................................................................... 195
xxii
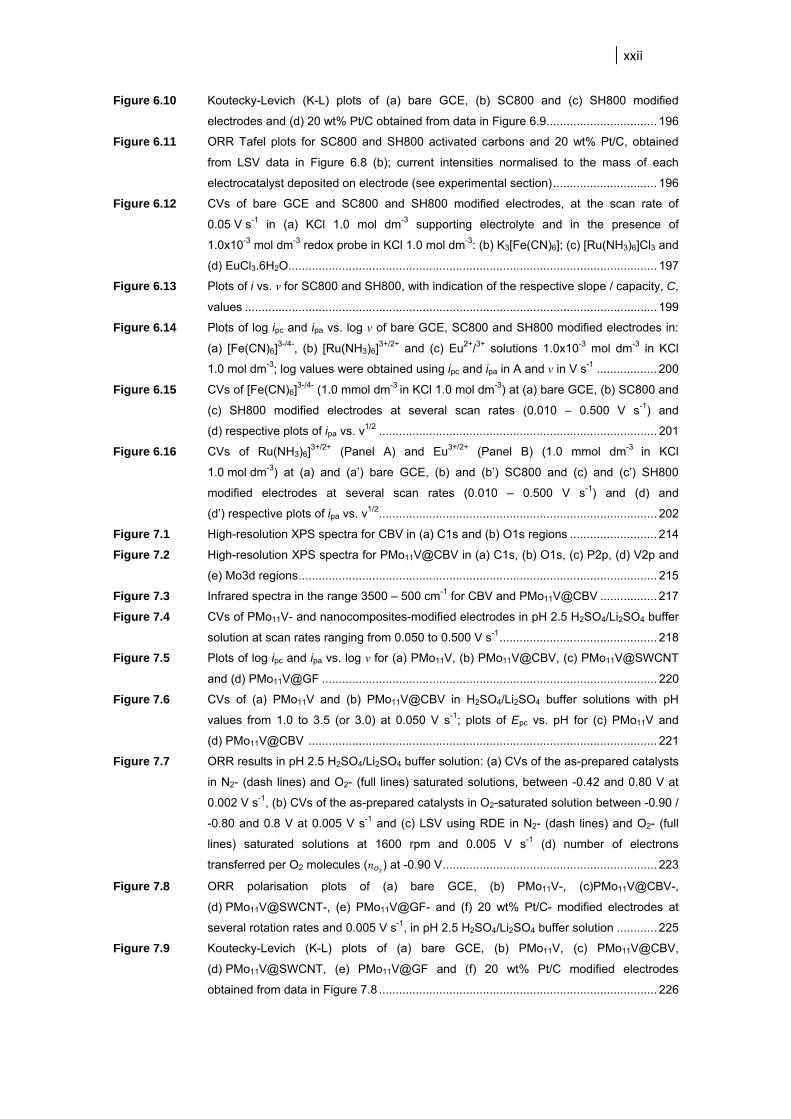
Figure 6.10 Koutecky-Levich (K-L) plots of (a) bare GCE, (b) SC800 and (c) SH800 modified
electrodes and (d) 20 wt% Pt/C obtained from data in Figure 6.9 ................................. 196
Figure 6.11 ORR Tafel plots for SC800 and SH800 activated carbons and 20 wt% Pt/C, obtained
from LSV data in Figure 6.8 (b); current intensities normalised to the mass of each
electrocatalyst deposited on electrode (see experimental section) ............................... 196
Figure 6.12 CVs of bare GCE and SC800 and SH800 modified electrodes, at the scan rate of
0.05 V s-1 in (a) KCl 1.0 mol dm-3 supporting electrolyte and in the presence of
1.0x10⁻³ mol dm-3 redox probe in KCl 1.0 mol dm-3: (b) K3[Fe(CN)6]; (c) [Ru(NH3)6]Cl3 and
(d) EuCl3.6H2O .............................................................................................................. 197
Figure 6.13 Plots of i vs. ν for SC800 and SH800, with indication of the respective slope / capacity, C,
values ........................................................................................................................... 199
Figure 6.14 Plots of log ipc and ipa vs. log ν of bare GCE, SC800 and SH800 modified electrodes in:
(a) [Fe(CN)6]3-/4-, (b) [Ru(NH3)6]
3+/2+ and (c) Eu2+/3+ solutions 1.0x10⁻³ mol dm-3 in KCl
1.0 mol dm-3; log values were obtained using ipc and ipa in A and ν in V s-1 .................. 200
Figure 6.15 CVs of [Fe(CN)6]3-/4- (1.0 mmol dm-3 in KCl 1.0 mol dm-3) at (a) bare GCE, (b) SC800 and
(c) SH800 modified electrodes at several scan rates (0.010 – 0.500 V s-1) and
(d) respective plots of ipa vs. ν1/2 ................................................................................... 201
Figure 6.16 CVs of Ru(NH3)6]3+/2+ (Panel A) and Eu3+/2+ (Panel B) (1.0 mmol dm-3 in KCl
1.0 mol dm-3) at (a) and (a’) bare GCE, (b) and (b’) SC800 and (c) and (c’) SH800
modified electrodes at several scan rates (0.010 – 0.500 V s-1) and (d) and
(d’) respective plots of ipa vs. ν1/2 ................................................................................... 202
Figure 7.1 High-resolution XPS spectra for CBV in (a) C1s and (b) O1s regions .......................... 214
Figure 7.2 High-resolution XPS spectra for PMo11V@CBV in (a) C1s, (b) O1s, (c) P2p, (d) V2p and
(e) Mo3d regions ........................................................................................................... 215
Figure 7.3 Infrared spectra in the range 3500 – 500 cm-1 for CBV and PMo11V@CBV ................. 217
Figure 7.4 CVs of PMo11V- and nanocomposites-modified electrodes in pH 2.5 H2SO4/Li2SO4 buffer
solution at scan rates ranging from 0.050 to 0.500 V s-1 ............................................... 218
Figure 7.5 Plots of log ipc and ipa vs. log v for (a) PMo11V, (b) PMo11V@CBV, (c) PMo11V@SWCNT
and (d) PMo11V@GF .................................................................................................... 220
Figure 7.6 CVs of (a) PMo11V and (b) PMo11V@CBV in H2SO4/Li2SO4 buffer solutions with pH
values from 1.0 to 3.5 (or 3.0) at 0.050 V s-1; plots of Epc vs. pH for (c) PMo11V and
(d) PMo11V@CBV ........................................................................................................ 221
Figure 7.7 ORR results in pH 2.5 H2SO4/Li2SO4 buffer solution: (a) CVs of the as-prepared catalysts
in N2- (dash lines) and O2- (full lines) saturated solutions, between -0.42 and 0.80 V at
0.002 V s-1, (b) CVs of the as-prepared catalysts in O2-saturated solution between -0.90 /
-0.80 and 0.8 V at 0.005 V s-1 and (c) LSV using RDE in N2- (dash lines) and O2- (full
lines) saturated solutions at 1600 rpm and 0.005 V s-1 (d) number of electrons
transferred per O2 molecules ( ) at -0.90 V ................................................................ 223
Figure 7.8 ORR polarisation plots of (a) bare GCE, (b) PMo11V-, (c)PMo11V@CBV-,
(d) PMo11V@SWCNT-, (e) PMo11V@GF- and (f) 20 wt% Pt/C- modified electrodes at
several rotation rates and 0.005 V s-1, in pH 2.5 H2SO4/Li2SO4 buffer solution ............ 225
Figure 7.9 Koutecky-Levich (K-L) plots of (a) bare GCE, (b) PMo11V, (c) PMo11V@CBV,
(d) PMo11V@SWCNT, (e) PMo11V@GF and (f) 20 wt% Pt/C modified electrodes
obtained from data in Figure 7.8 ................................................................................... 226

xxiii
Figure 7.10 ORR Tafel plots for PMo11V, PMo11V@CBV, PMo11V@SWCNT, PMo11V@GF and
20 wt% Pt/C, obtained from LSV data in Figure 7.7 (c); current intensities normalized to
the mass of each electrocatalyst deposited on electrode (see experimental section) ... 227
Figure 7.11 CVs of (a) PMo11V@GF with different concentrations of H2O2 (0, 0.038 and
0.15 mol dm-3) and of (b) free PMo11V- and nanocomposite-modified electrodes with
0.15 mol dm-3 H2O2, in N2-saturated pH 2.5 H2SO4/Li2SO4 buffer solution at
0.050 V s-1 .................................................................................................................... 228

xxiv
xxv
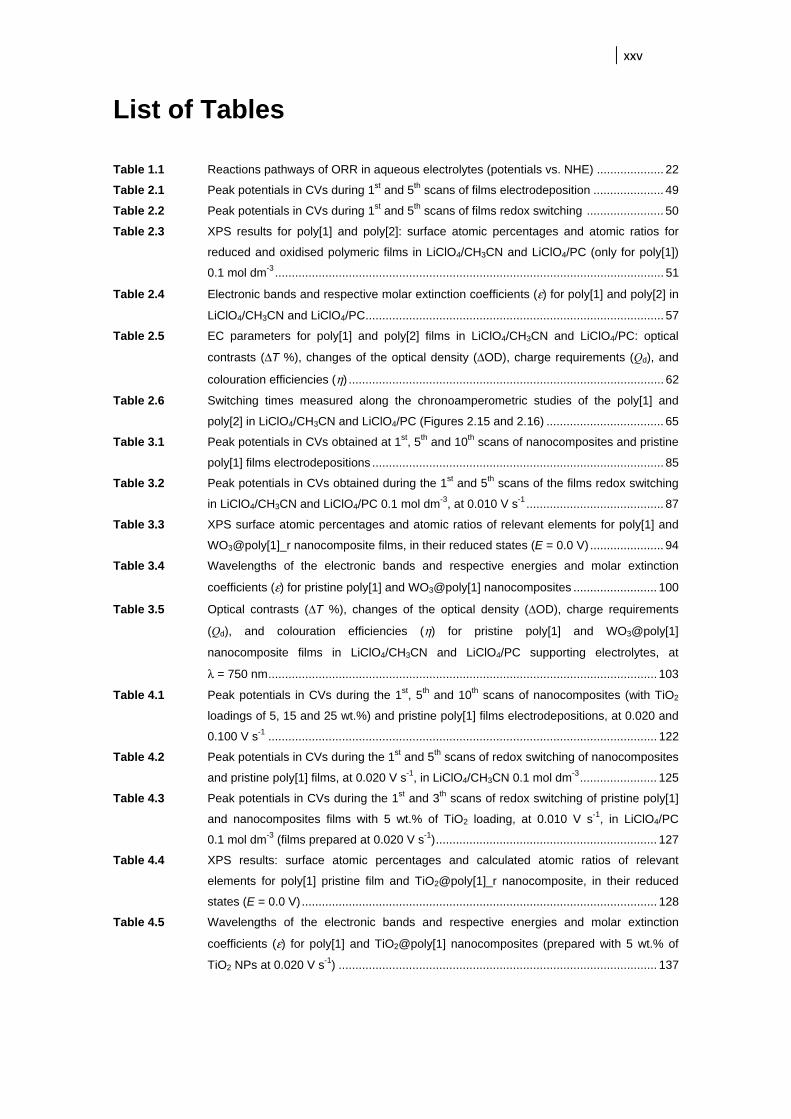
List of Tables
Table 1.1 Reactions pathways of ORR in aqueous electrolytes (potentials vs. NHE) .................... 22
Table 2.1 Peak potentials in CVs during 1st and 5th scans of films electrodeposition ..................... 49
Table 2.2 Peak potentials in CVs during 1st and 5th scans of films redox switching ....................... 50
Table 2.3 XPS results for poly[1] and poly[2]: surface atomic percentages and atomic ratios for
reduced and oxidised polymeric films in LiClO4/CH3CN and LiClO4/PC (only for poly[1])
0.1 mol dm-3 .................................................................................................................... 51
Table 2.4 Electronic bands and respective molar extinction coefficients (ε) for poly[1] and poly[2] in
LiClO4/CH3CN and LiClO4/PC ......................................................................................... 57
Table 2.5 EC parameters for poly[1] and poly[2] films in LiClO4/CH3CN and LiClO4/PC: optical
contrasts (ΔT %), changes of the optical density (ΔOD), charge requirements (Qd), and
colouration efficiencies (η) .............................................................................................. 62
Table 2.6 Switching times measured along the chronoamperometric studies of the poly[1] and
poly[2] in LiClO4/CH3CN and LiClO4/PC (Figures 2.15 and 2.16) ................................... 65
Table 3.1 Peak potentials in CVs obtained at 1st, 5th and 10th scans of nanocomposites and pristine
poly[1] films electrodepositions ....................................................................................... 85
Table 3.2 Peak potentials in CVs obtained during the 1st and 5th scans of the films redox switching
in LiClO4/CH3CN and LiClO4/PC 0.1 mol dm-3, at 0.010 V s-1 ......................................... 87
Table 3.3 XPS surface atomic percentages and atomic ratios of relevant elements for poly[1] and
WO3@poly[1]_r nanocomposite films, in their reduced states (E = 0.0 V) ...................... 94
Table 3.4 Wavelengths of the electronic bands and respective energies and molar extinction
coefficients (ε) for pristine poly[1] and WO3@poly[1] nanocomposites ......................... 100
Table 3.5 Optical contrasts (ΔT %), changes of the optical density (ΔOD), charge requirements
(Qd), and colouration efficiencies (η) for pristine poly[1] and WO3@poly[1]
nanocomposite films in LiClO4/CH3CN and LiClO4/PC supporting electrolytes, at
λ = 750 nm .................................................................................................................... 103
Table 4.1 Peak potentials in CVs during the 1st, 5th and 10th scans of nanocomposites (with TiO2
loadings of 5, 15 and 25 wt.%) and pristine poly[1] films electrodepositions, at 0.020 and
0.100 V s-1 .................................................................................................................... 122
Table 4.2 Peak potentials in CVs during the 1st and 5th scans of redox switching of nanocomposites
and pristine poly[1] films, at 0.020 V s-1, in LiClO4/CH3CN 0.1 mol dm-3 ....................... 125
Table 4.3 Peak potentials in CVs during the 1st and 3th scans of redox switching of pristine poly[1]
and nanocomposites films with 5 wt.% of TiO2 loading, at 0.010 V s-1, in LiClO4/PC
0.1 mol dm-3 (films prepared at 0.020 V s-1) .................................................................. 127
Table 4.4 XPS results: surface atomic percentages and calculated atomic ratios of relevant
elements for poly[1] pristine film and TiO2@poly[1]_r nanocomposite, in their reduced
states (E = 0.0 V) .......................................................................................................... 128
Table 4.5 Wavelengths of the electronic bands and respective energies and molar extinction
coefficients (ε) for poly[1] and TiO2@poly[1] nanocomposites (prepared with 5 wt.% of
TiO2 NPs at 0.020 V s-1) ............................................................................................... 137
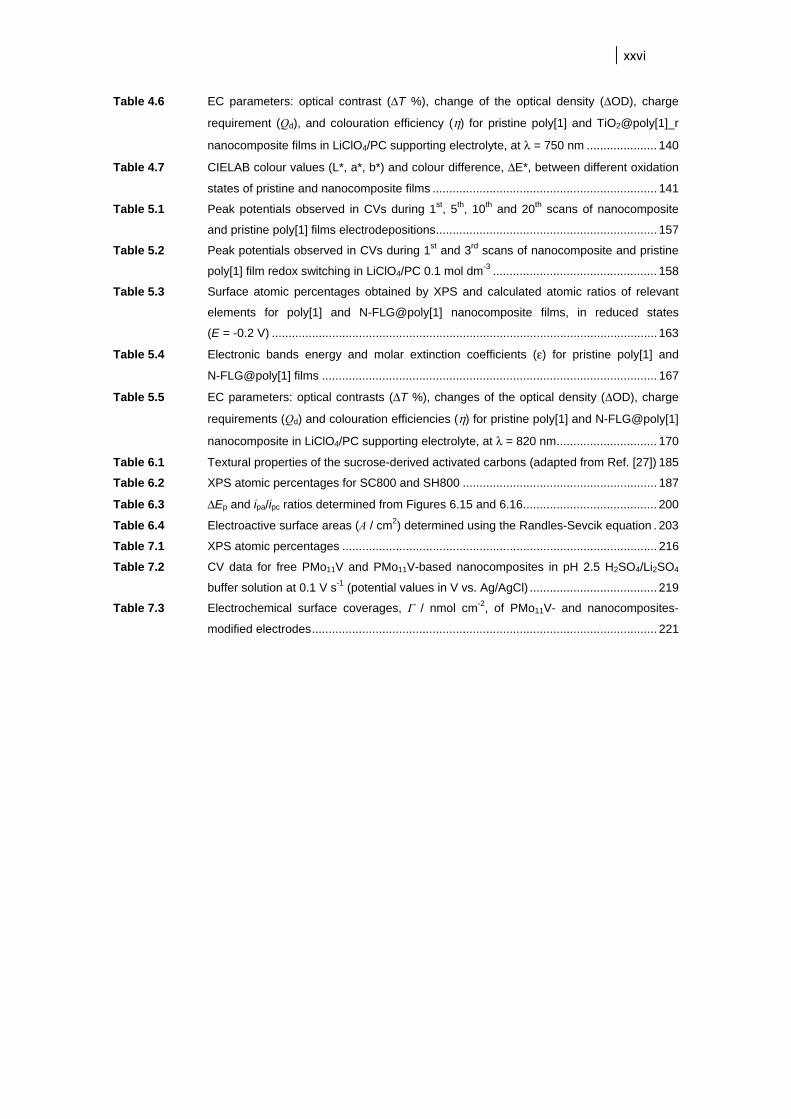
xxvi
Table 4.6 EC parameters: optical contrast (ΔT %), change of the optical density (ΔOD), charge
requirement (Qd), and colouration efficiency (η) for pristine poly[1] and TiO2@poly[1]_r
nanocomposite films in LiClO4/PC supporting electrolyte, at λ = 750 nm ..................... 140
Table 4.7 CIELAB colour values (L*, a*, b*) and colour difference, ΔE*, between different oxidation
states of pristine and nanocomposite films ................................................................... 141
Table 5.1 Peak potentials observed in CVs during 1st, 5th, 10th and 20th scans of nanocomposite
and pristine poly[1] films electrodepositions .................................................................. 157
Table 5.2 Peak potentials observed in CVs during 1st and 3rd scans of nanocomposite and pristine
poly[1] film redox switching in LiClO4/PC 0.1 mol dm-3 ................................................. 158
Table 5.3 Surface atomic percentages obtained by XPS and calculated atomic ratios of relevant
elements for poly[1] and N-FLG@poly[1] nanocomposite films, in reduced states
(E = -0.2 V) ................................................................................................................... 163
Table 5.4 Electronic bands energy and molar extinction coefficients (ε) for pristine poly[1] and
N-FLG@poly[1] films .................................................................................................... 167
Table 5.5 EC parameters: optical contrasts (ΔT %), changes of the optical density (ΔOD), charge
requirements (Qd) and colouration efficiencies (η) for pristine poly[1] and N-FLG@poly[1]
nanocomposite in LiClO4/PC supporting electrolyte, at λ = 820 nm .............................. 170
Table 6.1 Textural properties of the sucrose-derived activated carbons (adapted from Ref. [27]) 185
Table 6.2 XPS atomic percentages for SC800 and SH800 .......................................................... 187
Table 6.3 ΔEp and ipa/ipc ratios determined from Figures 6.15 and 6.16 ........................................ 200
Table 6.4 Electroactive surface areas (A / cm2) determined using the Randles-Sevcik equation . 203
Table 7.1 XPS atomic percentages .............................................................................................. 216
Table 7.2 CV data for free PMo11V and PMo11V-based nanocomposites in pH 2.5 H2SO4/Li2SO4
buffer solution at 0.1 V s-1 (potential values in V vs. Ag/AgCl) ...................................... 219
Table 7.3 Electrochemical surface coverages, Γ / nmol cm-2, of PMo11V- and nanocomposites-
modified electrodes ....................................................................................................... 221
xxvii
List of Abbreviations and Symbols
A Electrode area
a* CIELAB coordinate
ABET Specific surface area
Abs Absorbance
ACs Activated carbons
AFC Alkaline Fuel Cell
a.u. Arbitrary units
b* CIELAB coordinate
CB Carbon black
CBV Carbon black Vulcan CNTs Carbon nanotubes C Concentration of the specie
Bulk concentration of O2
CPs Conducting polymers CT Charge-transfer CV Cyclic voltammetry CVs Cyclic voltammograms CVD Chemical vapour deposition DC Direct current DMF N,N’-dimethylformamide DMFC Direct Methanol Fuel Cell
Diffusion coefficient of O2
Dx Diffusion coefficient of the specie
E Electric potential EC Electrochromic ECD Electrochromic device EDS Energy-dispersive X-ray
Spectroscopy Eg Energy of the band gap Eonset Onset potential Epa Potential of the anodic peak Epc Potential of the cathodic
peak EPR Electron Paramagnetic
Resonance F Faraday’s constant FTIR Fourier Transform Infrared
Spectroscopy FTO Fluorine-doped tin oxide FWHM Full width at half maximum GCE Glassy carbon electrode
GF Graphene HER Hydrogen evolution
reaction HET Heterogeneous electron
transfer HOMO Highest occupied molecular
orbital HOR Hydrogen oxidation
reaction i Peak current intensity ipc Intensity of the cathodic
peak current ipa Intensity of the anodic peak
current ITO Indium tin oxide j Current density j0 Exchange current density jk Kinetic current density jL Diffusion limiting current
density kHET HET rate constant K-L Koutecky-Levich L* CIELAB coordinate LSV Linear sweep voltammetry LUMO Lowest unoccupied
molecular orbital MCFC Molten Carbonate Fuel Cell MWCNTs Multi-walled nanotubes n Doping level N-FLG Nitrogen-doped few layer
graphene Number of electrons
transferred per O2 molecule NPs Nanoparticles OER Oxygen evolution reaction ORR Oxygen reduction reaction PAFC Phosphoric Acid Fuel Cell PANI Polyaniline PB Prussian Blue PC Propylene carbonate PEDOT Poly(3,4-
ethylenedioxythiophene)
xxviii
PEDOT: PSS
Poly(3,4-ethylenedioxythiophene): poly(styrene sulfonic acid)
PEMFC Polymer Electrolyte Membrane Fuel Cell
PET Poly(ethylene terephthalate)
POMs Polyoxometalates PMMA Poly(methyl methacrylate) PNCs Polymeric nanocomposites PPO Poly(propylene glycol) Q Charge Qd Density of charge R Gas constant RDE Rotating disk electrode RHE Reversible hydrogen
electrode salen N,N’-bis(salicylidine)-
ethylenediamine dianion salen N2O2 tetradentate Schiff
base ligands SEM Scanning Electron
Microscopy SOFC Solid Oxide Fuel Cell SWCNTs Single-walled nanotubes T Temperature TEM Transmission Electron
Microscopy Tox Oxidised-state
transmittance value Tred Reduced-state
transmittance value TTIP Titanium (IV) isopropoxide UV-Vis Ultraviolet-Visible v Scan rate Vmeso Mesoporous volume Vtotal Total pore volume Vα super Supermicropore volume Vα total Total volume Vα ultra Ultra volume
W1 Transition from the valence band to the bonding polaron level
W2 Transition from the valence band to the antibonding polaron level
W3 Transition from the bonding to the antibonding polaron level
WI Intervalence band transition XAS X-ray absorption
spectroscopy XPS X-ray photoelectron
spectroscopy XRD X-ray diffraction α Transfer coefficient
Γ Electroactive surface coverage
ΔA Optical absorbance change
ΔE* Total colour difference
ΔEp Peak-to-peak separation
ΔOD Change of the optical density
ΔT Optical contrast
ε Molar extinction coefficient
η Colouration efficiency
θ X-ray diffraction angle
λ Wavelength
τ Response times or switching times
υ Kinematic viscosity of the electrolyte
Ψ Charge transfer parameter ω Angular velocity

Cha
Intro
apter
oducti
r 1
ion


1 Introduction
The world’s population has increased from approximately 2.5 billion in 1950 to
about seven billion in 2014 and it is estimated to keep growing to 10 billion or more in
2100.1 In parallel with the population increase, there has been an improvement in
overall living standards, being desirable that in the next years people in the poorer
countries can enjoy of the same quality of life and amenities existing in the more
prosperous countries. The result of this evolution is that the strains on the global
resources are growing steeply and that there is an unsustainable demand in resources
such as energy, water and minerals.
Currently, energy is mainly derived from the burning of fossil fuels (coal, oil and
gas) with ensuing injection of carbon dioxide, a greenhouse gas, into the air. This
changes the atmosphere and leads to global warming, rising sea level, harsher
weather and shifts in the Earth’s biosphere. The increase in sea levels is well
documented and rises approximately 3.2 mm per year,2 as consequence of the melting
of glaciers and ice caps and thermal expansion of warming water.3 Among the
environmental changes, one main point is the ocean acidification with damage of
calcifying organisms such as corals and foraminifera.4 The effect of global warming due
to greenhouse gases, such as CO2, is yet aggravated by the fact that about half of the
world’s population lives in cities or mega-cities lead to “urban heat islands” with
temperatures several degrees above those of the surrounding countryside, which can
cause cardiovascular, cerebrovascular and respiratory human diseases.5 Furthermore,
it is undoubted that the fossil fuels will be depleted in near future.6
Taking into account the combination of all these factors, the society has been
confronted with two major challenges: (i) to find efficient methods to reduce the
consumption of energy without impairing the actual life standards or (ii) to replace fossil
fuels with sustainable alternative sources of energy.

FCUP Functional electroactive materials: towards novel saving and conversion energy systems
4
The first option has been widely pursued by researchers, in order to find methods
for energy saving. The electrochromic materials and devices have been appointed as a
promising energy-saving and environmental protection technology, due to their low
power requirement and several potential applications such as in electronic paper-like
displays, antiglare rear-view mirrors and energy-saving smart windows. In particular,
the use of smart windows (that allow to control the amount of light that enters in a
building) in the called “green architecture” is a promising application, mainly
considering that approximately 40 % of the total world energy consumption is spent in
buildings for heating, cooling, lighting and ventilation7 and that, in richest countries, we
spend 80 – 90 % of our time indoors and a high level of comfort and convenience is
desirable.
On the other hand, finding environmentally-friendly, secure and sustainable
alternative sources of energy to reduce our dependence on fossil fuels, has become an
important challenge. Over the last few years, several technologies that provide
electrical energy from renewable sources (e.g. solar photovoltaics and wind power
generation) have been increasingly implemented. However, the supply of energy from
such sources is intermittent whereby, to provide an integrated solution, they must be
coupled with advanced energy conversion and storage processes.8 Electrochemical
devices such as fuel cells, water electrolysis, batteries and supercapacitors are
recognised as very feasible and efficient technologies.9 In particular, fuel cells have
attracted a lot of attention due to their ability to efficiently generate electricity from the
energy in chemical bonds of fuels such as hydrogen and simple hydrocarbons.
Hydrogen is the most attractive fuel, as it can be produced through the environmental-
benign electrochemical splitting of water.10
The core of these energy-related technologies is a series of electrochemical
processes, which can include the hydrogen oxidation and evolution reactions (HOR
and HER) and the oxygen reduction and evolution reactions (ORR and OER).11 The
ORR, in particular, is the reaction that occurs at the cathode of fuel cells and metal-air
batteries and strongly influences the devices performance, whereby has been the focus
of an extensive research.
In the next sections of this chapter it is provided an overview on the topics of
electrochromic materials and electrocatalytic oxygen reduction reaction, as solutions
for the saving- and conversion-energy approaches, respectively.
FCUP Functional electroactive materials: towards novel saving and conversion energy systems
5
1.1 Energy saving
As a promising green-technology for the energy-saving, electrochromic (EC)
materials have the ability to adjust their optical properties upon applying external
voltage, which renders important applications in the fields of smart windows, electronic
displays and automotive industry. The pursuit for EC materials is because they are
relatively cheap and require a low power use once, after the optical change has been
effected, the new redox state exists with little or no input of power (memory effect). In
addition, some materials can be switched between several shades or colours,
simplifying devices that might otherwise need to use colour filters.12 In this section, it is
made a foray into the world of electrochromism, highlighting the class of EC conducting
polymers and their nanocomposites, as well as the incorporation of EC materials in
practical devices (electrochromic devices, ECDs).
1.1.1 Electrochromism Chromism is defined as a reversible colour change of a substance, in the most of
cases based in a modification of the electron states of molecules caused by some form
of stimulus, such as temperature, light or solvent effect.13,14 In particular, the
electrochromism phenomenon is characterised by a change, evocation or bleaching of
colour of a material, induced by an electron-transfer (redox) process.15 The observed
colour change can be between a transmissive state and a coloured state or between
multiple coloured states. In the last case the EC materials are referred as
polyelectrochromic materials.16
Even though, although a material to be regarded as electrochromic when
modulate light, by reflectance or absorbance, in the visible region of the
electromagnetic spectrum, recently the definition was also extended to materials with
multispectral energy modulation (in infrared and microwave regions).15
The term “electrochromism” has its origin in Latinized Greek roots elektro- and
khroma, the first root referring to electricity and the second root to colour.17 Although it
was first introduced in 1961 by Platt,18 the colour switching in materials by electron gain
(reduction) or loss (oxidation) has been known since the early 19th century and, so, a
revised of its history can be interesting.
In 1815, Berzelius observed the electrochromic properties of tungsten oxide
(WO3), reporting that pure pale-yellow WO3 changed of colour when reduced under a
flow of hydrogen gas; a similar effect was observed by Wöhler in 1824, through the
chemical reduction of WO3 with sodium metal.19 In 1929, in a London patent, the
chemical oxidation of a dye precursor by molecular iodine was reported, thus forming a
FCUP Functional electroactive materials: towards novel saving and conversion energy systems
6
bright colour.12 The colour change (colourless to blue) of WO3 induced by its
electrochemical reduction was first reported in 1930 by Kobosew and Nekrassow.19 In
the meantime, several other works were developed and, in 1942, Talmey patented a
paper impregnated with particulate MoO3 and/or WO3 (called “electrolytic writing
paper”), whose colour changed when it was in contact with an electrode.19 However,
none of these studies attracted much attention and therefore it is widely accepted that
the first suggestion of an electrochromic device was performed in 1969 by Deb,20 a
researcher at the American Cyanamid Corporation in the U.S.A. In this work, the
electrochromic behaviour was generated by the application of an electrical field across
a thin film of WO3, deposited on quartz. Some authors also cite the Deb’s later paper,21
dated from 1973, as the true birth of the electrochromic technology, once it describes
the first “true” electrochromic device, with a film of WO3 immersed in an ion-containing
electrolyte. Poorly known, or at least rarely cited, are the parallel developments in the
Soviet Union, related to the electrochromism of the niobium oxide and reported in
1974.22 Both these works were motivated by the development of devices for
information displays. Since then, several works were done and, in 1978, Mohapatra of
the Bell Laboratoires in New Jersey, published the first description of the reversible
electro-insertion of lithium for WO3 electrochromism.23 Meanwhile, the electrochromism
of organic materials was also investigated: in 1974 Parker et al.24 studied
methoxybiphenyl species and later Kaufman et al.,25 of IBM in New York, published the
first report of an electrochromic polymer. The first account of an electrochromic
conducting polymer came in 1979, when Diaz et el.,26 of IBM in California, announced
the electrosynthesis of a poly(pyrrole) thin-film. From the 1980s to now, John Reynolds
and his co-workers have been working in the development of conjugated conducting
polymers, through the manipulation of the composition of thiophene-based polymers to
create soluble materials with a whole gamut of possible colours.27,28
1.1.2 Electrochromic materials Nowadays, a great diversity of EC materials is known, from inorganic to the
organic materials. In general, five main classes of EC materials are considered: metal
oxides, viologen derivatives, metal coordination complexes, Prussian Blue (PB) and
conducting polymers.15,19
As EC metal oxides, are considered the thin-films of several (transition) metal
oxides, such as the oxides of tungsten, molybdenum, vanadium, chromium, iridium,
palladium, ruthenium, titanium and nickel.15 These films can be reversibly
electrochemically switched between a near colourless and a highly coloured states
(generally the reduced form),12 being the most prominent example of this class the
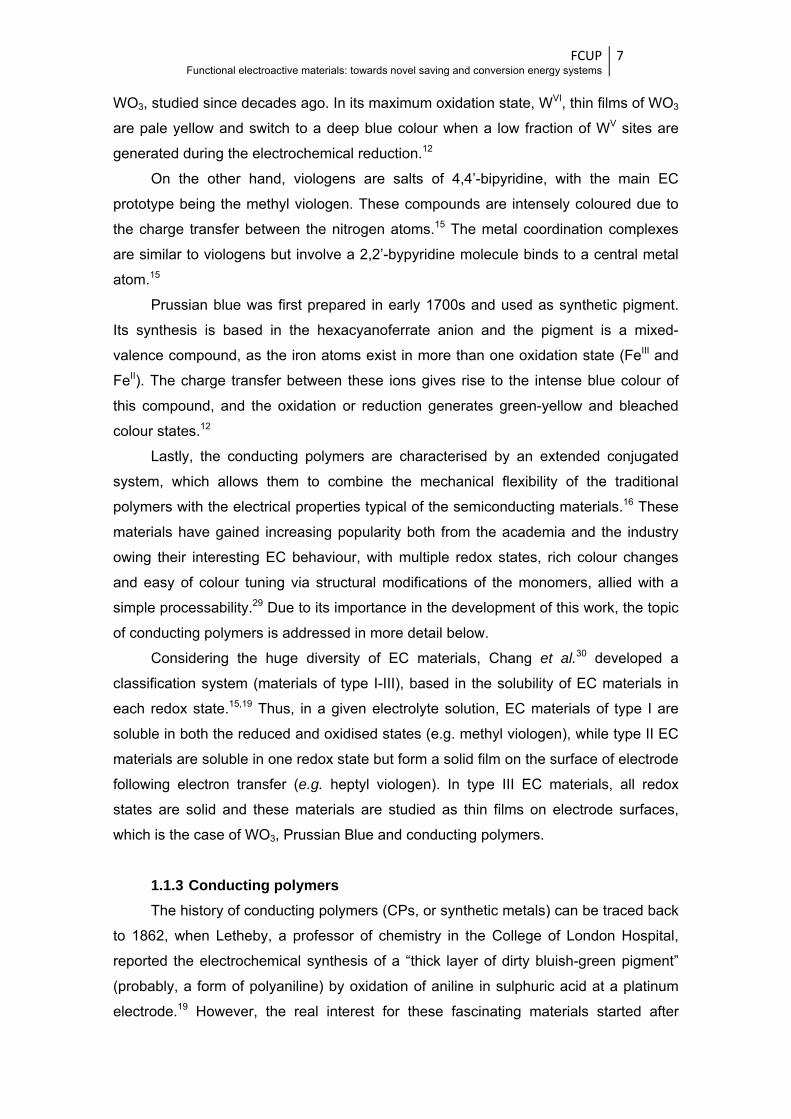
FCUP Functional electroactive materials: towards novel saving and conversion energy systems
7
WO3, studied since decades ago. In its maximum oxidation state, WVI, thin films of WO3
are pale yellow and switch to a deep blue colour when a low fraction of WV sites are
generated during the electrochemical reduction.12
On the other hand, viologens are salts of 4,4’-bipyridine, with the main EC
prototype being the methyl viologen. These compounds are intensely coloured due to
the charge transfer between the nitrogen atoms.15 The metal coordination complexes
are similar to viologens but involve a 2,2’-bypyridine molecule binds to a central metal
atom.15
Prussian blue was first prepared in early 1700s and used as synthetic pigment.
Its synthesis is based in the hexacyanoferrate anion and the pigment is a mixed-
valence compound, as the iron atoms exist in more than one oxidation state (FeIII and
FeII). The charge transfer between these ions gives rise to the intense blue colour of
this compound, and the oxidation or reduction generates green-yellow and bleached
colour states.12
Lastly, the conducting polymers are characterised by an extended conjugated
system, which allows them to combine the mechanical flexibility of the traditional
polymers with the electrical properties typical of the semiconducting materials.16 These
materials have gained increasing popularity both from the academia and the industry
owing their interesting EC behaviour, with multiple redox states, rich colour changes
and easy of colour tuning via structural modifications of the monomers, allied with a
simple processability.29 Due to its importance in the development of this work, the topic
of conducting polymers is addressed in more detail below.
Considering the huge diversity of EC materials, Chang et al.30 developed a
classification system (materials of type I-III), based in the solubility of EC materials in
each redox state.15,19 Thus, in a given electrolyte solution, EC materials of type I are
soluble in both the reduced and oxidised states (e.g. methyl viologen), while type II EC
materials are soluble in one redox state but form a solid film on the surface of electrode
following electron transfer (e.g. heptyl viologen). In type III EC materials, all redox
states are solid and these materials are studied as thin films on electrode surfaces,
which is the case of WO3, Prussian Blue and conducting polymers.
1.1.3 Conducting polymers The history of conducting polymers (CPs, or synthetic metals) can be traced back
to 1862, when Letheby, a professor of chemistry in the College of London Hospital,
reported the electrochemical synthesis of a “thick layer of dirty bluish-green pigment”
(probably, a form of polyaniline) by oxidation of aniline in sulphuric acid at a platinum
electrode.19 However, the real interest for these fascinating materials started after
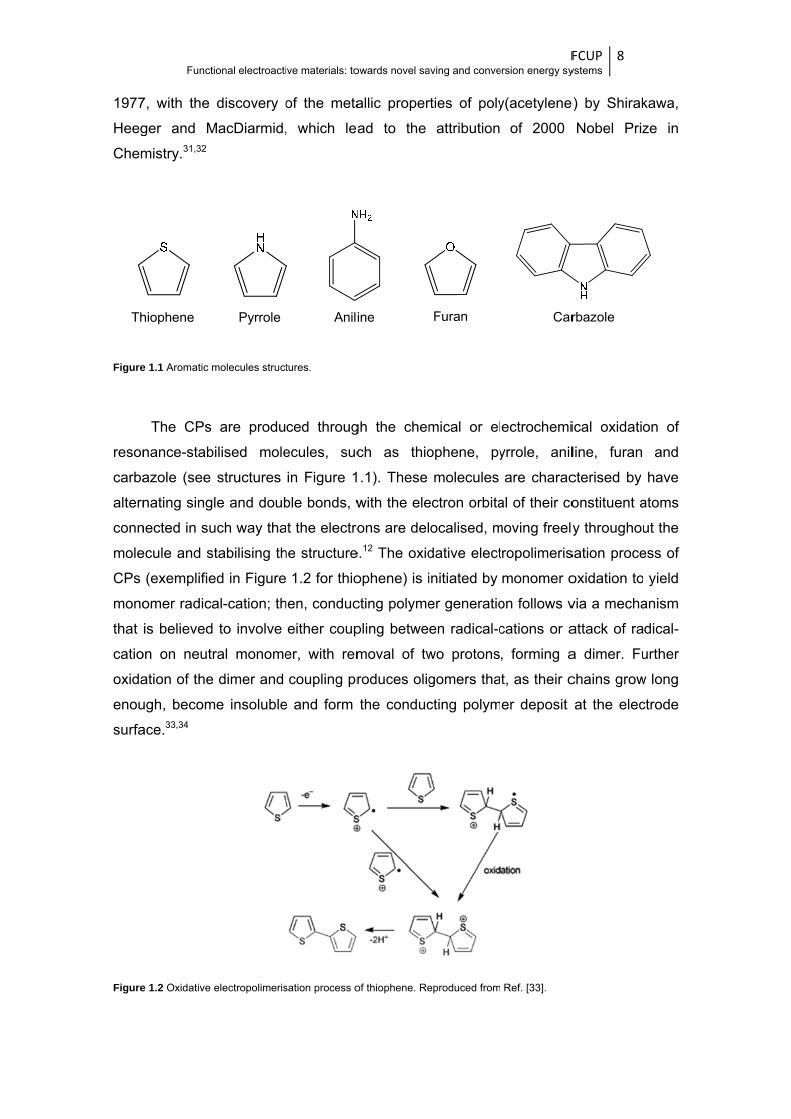
1977
Heeg
Chem
Figure
reson
carba
altern
conn
mole
CPs
mono
that
catio
oxida
enou
surfa
Figure
Th
Functi
7, with the
ger and M
mistry.31,32
e 1.1 Aromatic m
The CPs
nance-stab
azole (see
nating singl
nected in su
ecule and st
(exemplifie
omer radica
is believed
on on neutr
ation of the
ugh, becom
ace.33,34
e 1.2 Oxidative e
hiophene
ional electroacti
discovery o
MacDiarmid,
molecules struct
are produ
ilised mole
structures
le and doub
uch way tha
tabilising th
ed in Figure
al-cation; th
to involve
ral monome
dimer and
me insoluble
electropolimeris
Pyrrole
ive materials: to
of the meta
, which lea
tures.
ced throug
ecules, suc
in Figure 1
ble bonds, w
at the electro
he structure
1.2 for thio
hen, conduc
either coup
er, with rem
coupling pr
e and form
sation process o
Anili
owards novel sa
allic proper
ad to the
gh the chem
ch as thio
.1). These
with the ele
ons are del
e.12 The oxid
ophene) is i
cting polyme
pling betwe
moval of tw
roduces olig
the conduc
of thiophene. Re
ine
aving and conve
rties of poly
attribution
mical or el
ophene, py
molecules
ectron orbita
ocalised, m
dative elect
initiated by
er generatio
en radical-c
wo protons
gomers tha
cting polym
eproduced from
Furan
Fersion energy sy
y(acetylene
of 2000
ectrochemi
yrrole, anil
are charac
al of their co
moving freely
tropolimeris
monomer o
on follows v
cations or a
, forming a
t, as their c
er deposit
Ref. [33].
Car
FCUP ystems
8
e) by Shirak
Nobel Priz
ical oxidatio
line, furan
cterised by
onstituent a
y throughou
sation proce
oxidation to
via a mecha
attack of ra
a dimer. Fu
chains grow
at the elec
rbazole
kawa,
ze in
on of
and
have
atoms
ut the
ess of
yield
anism
dical-
urther
w long
ctrode
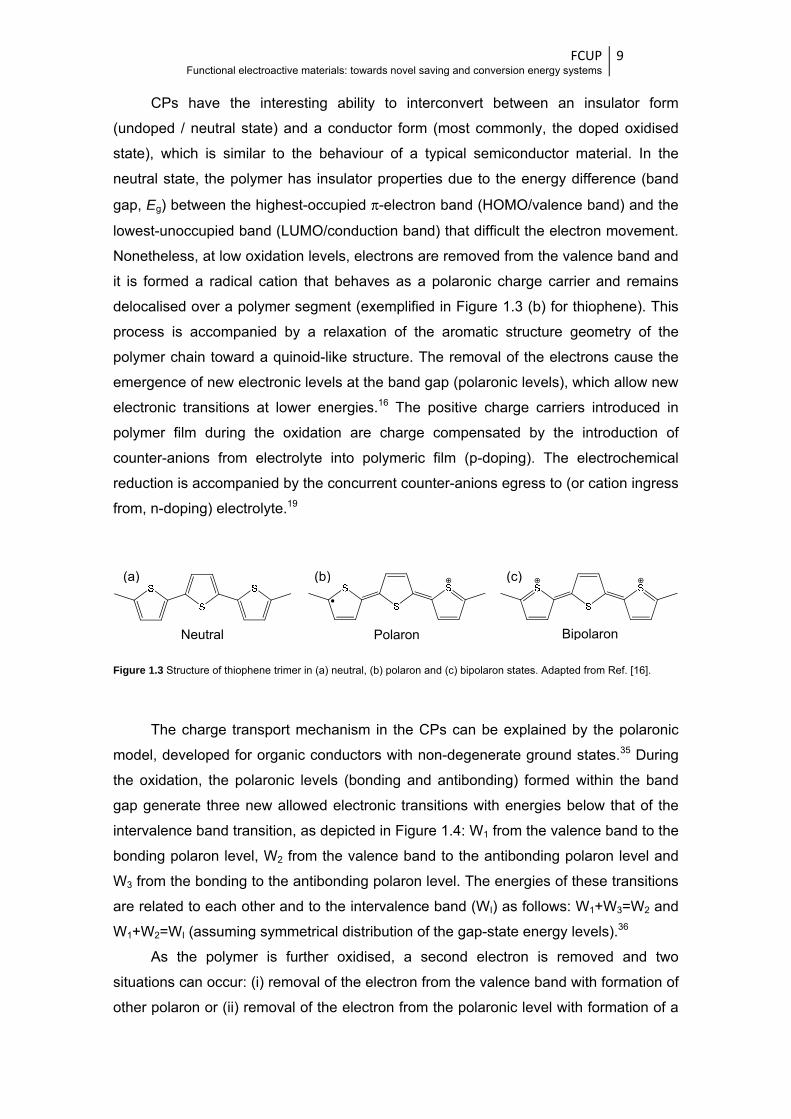
FCUP Functional electroactive materials: towards novel saving and conversion energy systems
9
CPs have the interesting ability to interconvert between an insulator form
(undoped / neutral state) and a conductor form (most commonly, the doped oxidised
state), which is similar to the behaviour of a typical semiconductor material. In the
neutral state, the polymer has insulator properties due to the energy difference (band
gap, Eg) between the highest-occupied π-electron band (HOMO/valence band) and the
lowest-unoccupied band (LUMO/conduction band) that difficult the electron movement.
Nonetheless, at low oxidation levels, electrons are removed from the valence band and
it is formed a radical cation that behaves as a polaronic charge carrier and remains
delocalised over a polymer segment (exemplified in Figure 1.3 (b) for thiophene). This
process is accompanied by a relaxation of the aromatic structure geometry of the
polymer chain toward a quinoid-like structure. The removal of the electrons cause the
emergence of new electronic levels at the band gap (polaronic levels), which allow new
electronic transitions at lower energies.16 The positive charge carriers introduced in
polymer film during the oxidation are charge compensated by the introduction of
counter-anions from electrolyte into polymeric film (p-doping). The electrochemical
reduction is accompanied by the concurrent counter-anions egress to (or cation ingress
from, n-doping) electrolyte.19
Figure 1.3 Structure of thiophene trimer in (a) neutral, (b) polaron and (c) bipolaron states. Adapted from Ref. [16].
The charge transport mechanism in the CPs can be explained by the polaronic
model, developed for organic conductors with non-degenerate ground states.35 During
the oxidation, the polaronic levels (bonding and antibonding) formed within the band
gap generate three new allowed electronic transitions with energies below that of the
intervalence band transition, as depicted in Figure 1.4: W1 from the valence band to the
bonding polaron level, W2 from the valence band to the antibonding polaron level and
W3 from the bonding to the antibonding polaron level. The energies of these transitions
are related to each other and to the intervalence band (WI) as follows: W1+W3=W2 and
W1+W2=WI (assuming symmetrical distribution of the gap-state energy levels).36
As the polymer is further oxidised, a second electron is removed and two
situations can occur: (i) removal of the electron from the valence band with formation of
other polaron or (ii) removal of the electron from the polaronic level with formation of a
Neutral Polaron Bipolaron
(a) (b) (c)
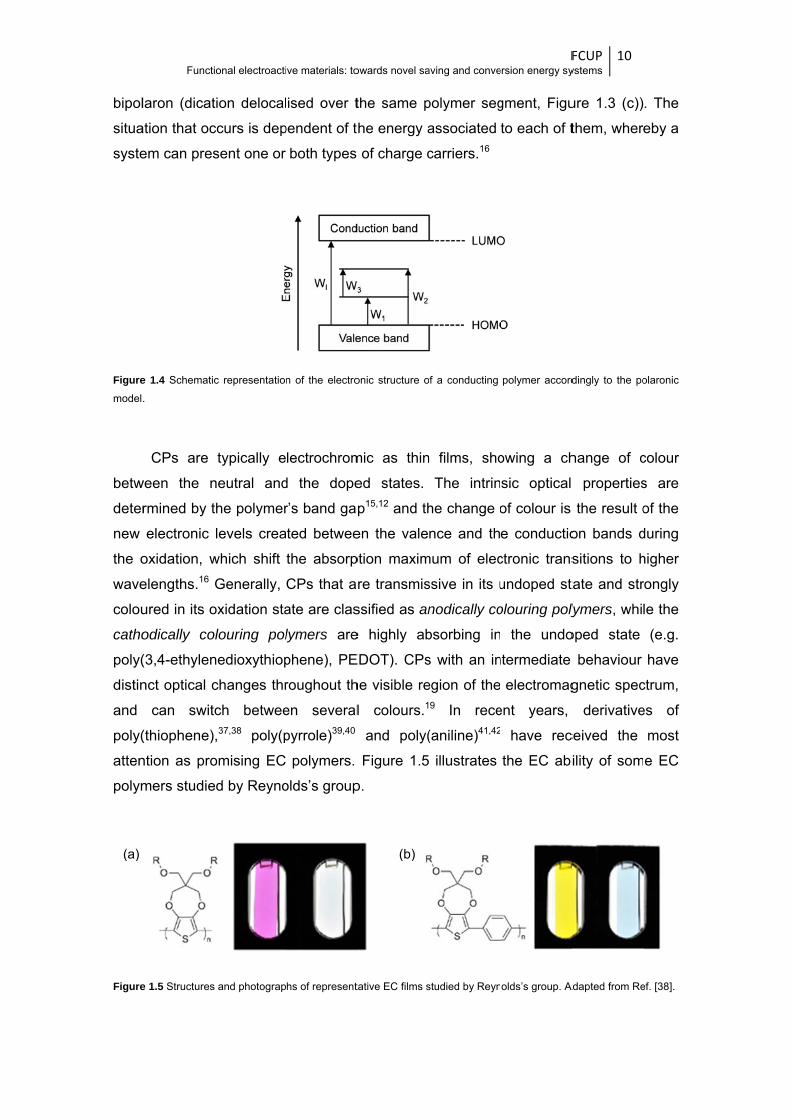
bipol
situa
syste
Figuremodel
betw
deter
new
the o
wave
colou
catho
poly(
distin
and
poly(
atten
polym
Figure
(a)
Functi
laron (dicat
ation that oc
em can pres
e 1.4 Schematic
.
CPs are
ween the n
rmined by t
electronic
oxidation, w
elengths.16
ured in its o
odically co
(3,4-ethylen
nct optical c
can swit
(thiophene)
ntion as pro
mers studie
e 1.5 Structures
ional electroacti
tion delocal
ccurs is dep
sent one or
c representatio
typically e
neutral and
the polymer
levels crea
which shift
Generally,
oxidation sta
olouring pol
nedioxythiop
changes thr
ch betwee
,37,38 poly(p
omising EC
ed by Reyno
and photograp
ive materials: to
ised over t
pendent of t
both types
n of the electro
lectrochrom
d the dope
r’s band gap
ated betwee
the absorp
CPs that a
ate are clas
lymers are
phene), PE
roughout th
en several
pyrrole)39,40
polymers.
olds’s group
hs of represent
owards novel sa
the same p
he energy a
of charge c
onic structure o
mic as thin
ed states.
p15,12 and th
en the vale
ption maxim
re transmis
ssified as an
e highly ab
EDOT). CPs
he visible re
l colours.1
and poly(
Figure 1.5
p.
tative EC films s
(b)
aving and conve
polymer seg
associated
carriers.16
of a conducting
n films, sho
The intrin
he change o
nce and th
mum of elec
ssive in its u
nodically co
bsorbing in
s with an in
egion of the9 In rece
(aniline)41,42
illustrates
studied by Reyn
Fersion energy sy
gment, Figu
to each of t
polymer accord
owing a ch
sic optical
of colour is
e conductio
ctronic trans
undoped st
olouring poly
the undo
ntermediate
electromag
ent years,
have rec
the EC abi
olds’s group. Ad
FCUP ystems
10
ure 1.3 (c))
them, wher
dingly to the po
hange of c
properties
the result o
on bands d
sitions to h
tate and str
lymers, whi
oped state
behaviour
gnetic spec
derivative
ceived the
ility of som
Adapted from Re
. The
eby a
olaronic
colour
s are
of the
during
higher
rongly
le the
(e.g.
have
ctrum,
es of
most
e EC
ef. [38].
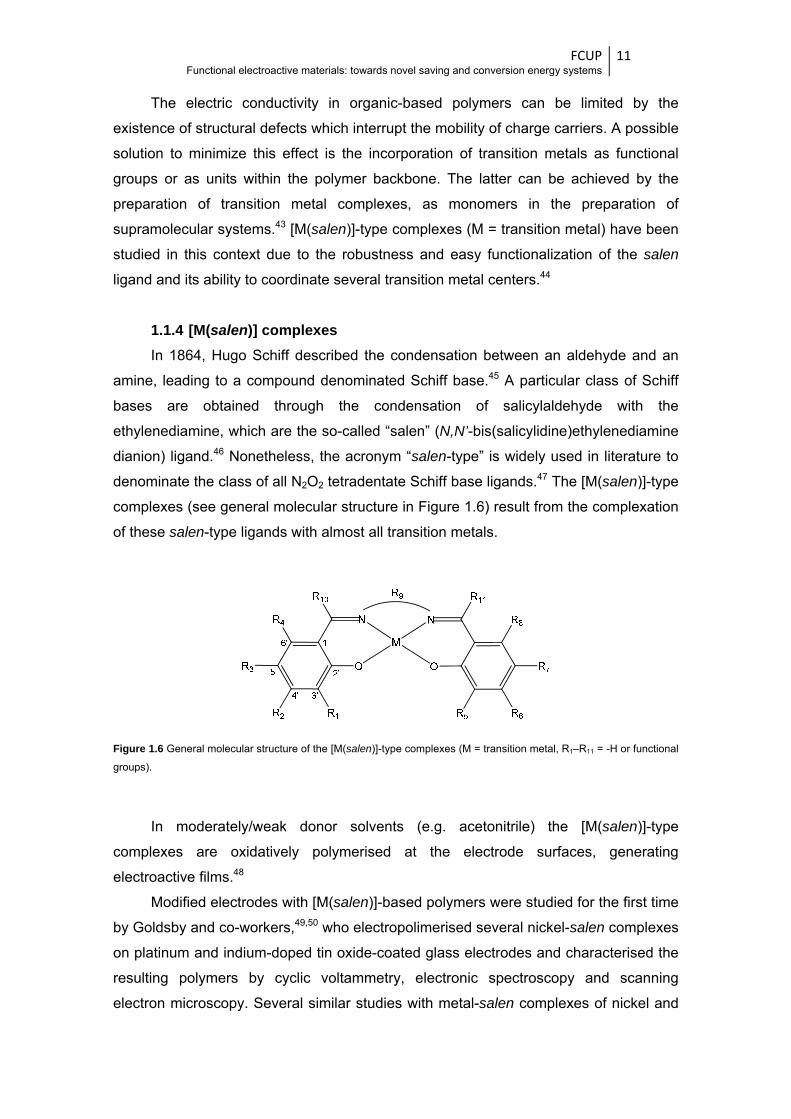
FCUP Functional electroactive materials: towards novel saving and conversion energy systems
11
The electric conductivity in organic-based polymers can be limited by the
existence of structural defects which interrupt the mobility of charge carriers. A possible
solution to minimize this effect is the incorporation of transition metals as functional
groups or as units within the polymer backbone. The latter can be achieved by the
preparation of transition metal complexes, as monomers in the preparation of
supramolecular systems.43 [M(salen)]-type complexes (M = transition metal) have been
studied in this context due to the robustness and easy functionalization of the salen
ligand and its ability to coordinate several transition metal centers.44
1.1.4 [M(salen)] complexes In 1864, Hugo Schiff described the condensation between an aldehyde and an
amine, leading to a compound denominated Schiff base.45 A particular class of Schiff
bases are obtained through the condensation of salicylaldehyde with the
ethylenediamine, which are the so-called “salen” (N,N’-bis(salicylidine)ethylenediamine
dianion) ligand.46 Nonetheless, the acronym “salen-type” is widely used in literature to
denominate the class of all N2O2 tetradentate Schiff base ligands.47 The [M(salen)]-type
complexes (see general molecular structure in Figure 1.6) result from the complexation
of these salen-type ligands with almost all transition metals.
Figure 1.6 General molecular structure of the [M(salen)]-type complexes (M = transition metal, R1–R11 = -H or functional
groups).
In moderately/weak donor solvents (e.g. acetonitrile) the [M(salen)]-type
complexes are oxidatively polymerised at the electrode surfaces, generating
electroactive films.48
Modified electrodes with [M(salen)]-based polymers were studied for the first time
by Goldsby and co-workers,49,50 who electropolimerised several nickel-salen complexes
on platinum and indium-doped tin oxide-coated glass electrodes and characterised the
resulting polymers by cyclic voltammetry, electronic spectroscopy and scanning
electron microscopy. Several similar studies with metal-salen complexes of nickel and

FCUP Functional electroactive materials: towards novel saving and conversion energy systems
12
copper were subsequently performed by Devynck,51 Audebert and collaborators52-55
and Dahm and co-workers,56-58 using electrochemical, spectroscopic and microscopic
techniques. Despite the detailed studies performed, no consensus concerning the
mechanism of electronic conduction and structural information was obtained. Some of
these aspects were clarified later, by some studies performed by Freire’s group.48,59,60
Throughout a combination of electrochemical and spectroscopic (in situ FTIR and
UV-Visible and ex-situ Electron Paramagnetic Resonance (EPR)) techniques, Vilas-
Boas et al.48 revealed that the electropolimerisation of [Ni(salen)] is a ligand-based
process that probably takes place through a mixture of o- and p-linking of the phenyl
ring. Although based in a coordination compound, the study revealed that
poly[Ni(salen)] behaves like a polyphenylene compound, with the electroactivity based
on salen ligand and the metal ion acting as a bridge between the biphenylene moieties.
Analogous to a conducting organic polymer, the polarons were appointed as the main
charge carriers. Later, by X-ray absorption spectroscopy (XAS) measurements, Tedim
et al.59 showed that, in a poly[Ni(salen)]-based film, the nickel atom is covalently
bonded to the nitrogen and oxygen atoms of the salen moiety in a square planar
environment, such as in the monomer; the structure is unaltered by the film redox
switching, which corroborate the assumption of ligand-based film redox process.
During the oxidation, the uptake of counter ions for maintaining the electroneutrality of
the salen film, accompanied by a significant solvent entry (as result of a concentration
gradient or a physical opening of the polymer structure) and consequent polymer
swelling, was described by Vilas-Boas et al.60 The supramolecular structure of the
salen polymers plays a key role in the control of the movement of these mobile species
between the film and the solution during the redox switching, whereby polymers based
in complexes with aliphatic chains in imine bridge tend to facilitate the anion ingress
and solvent swelling, once have a less compact structure.61,62
The potential application of these poly[M(salen)]-type films as EC materials have
also been evaluated by Freire’s group;63,64 the materials have shown promising EC
properties, with several and interesting colour changes (Figure 1.7). The main
achievements about the EC performances of these polymers are given in more detail in
Chapter 2 of this work.
Although the general promising EC properties of CPs, some drawbacks
associated mainly with an insufficient electrochemical stability and larger response
times due to the slow transport of counter anions into the EC layer (see below typical
parameters used for the evaluation of the EC behaviour of a material) limits their
successful commercial application, whereby the improvement of these properties
remain priority demands.65 In order to achieve these goals, the combination of CPs with
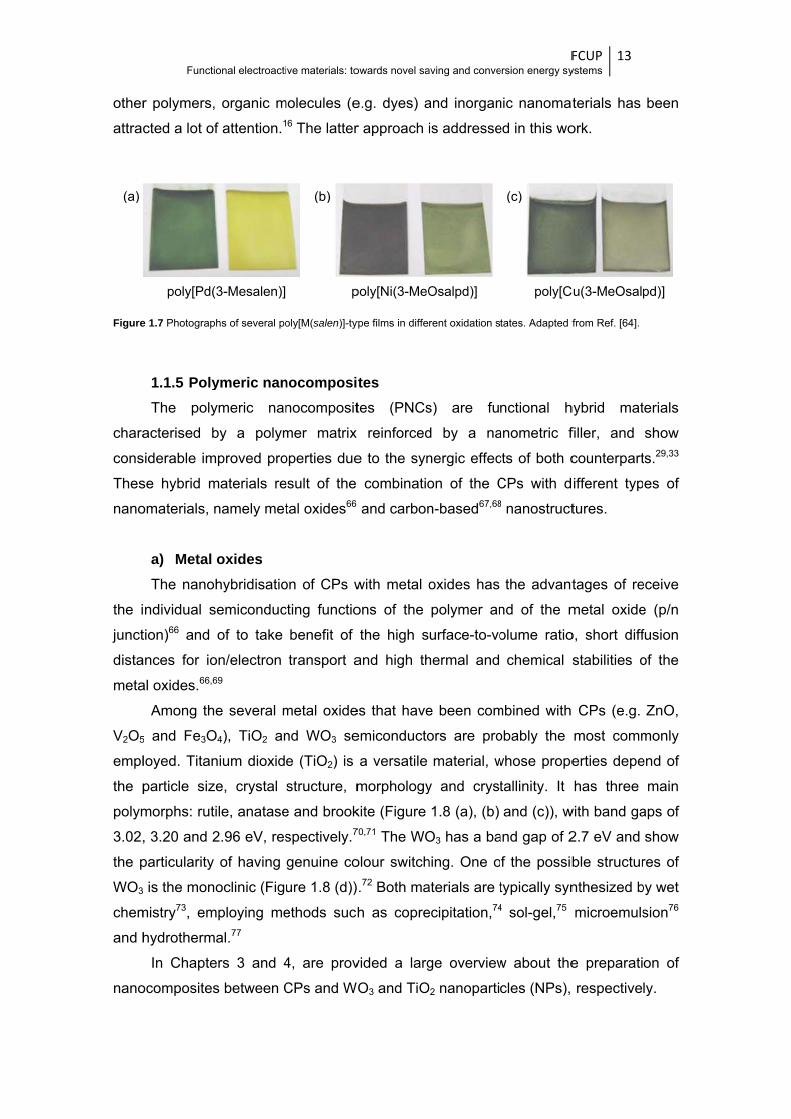
other
attrac
Figure
chara
cons
Thes
nano
the i
junct
dista
meta
V2O5
empl
the p
polym
3.02,
the p
WO3
chem
and h
nano
(a)
Functi
r polymers,
cted a lot of
e 1.7 Photograp
1.1.5 PolyThe poly
acterised b
siderable im
se hybrid m
omaterials, n
a) Metal The nano
individual s
tion)66 and
ances for io
al oxides.66,6
Among th
5 and Fe3O
loyed. Titan
particle siz
morphs: rut
, 3.20 and 2
particularity
3 is the mon
mistry73, em
hydrotherm
In Chapte
ocomposites
poly[Pd(
ional electroacti
, organic m
f attention.1
phs of several po
ymeric nanymeric nan
by a polym
mproved pro
materials re
namely met
oxides hybridisatio
semiconduc
of to take
on/electron 69
e several m
O4), TiO2 an
nium dioxid
ze, crystal
ile, anatase
2.96 eV, res
of having
oclinic (Fig
mploying me
mal.77
ers 3 and 4
s between C
(3-Mesalen)]
ive materials: to
molecules (e6 The latter
oly[M(salen)]-ty
nocomposinocomposit
mer matrix
operties due
esult of the
tal oxides66
on of CPs w
cting functio
benefit of
transport a
metal oxide
nd WO3 se
e (TiO2) is
structure, m
e and brook
spectively.7
genuine co
ure 1.8 (d))
ethods such
4, are prov
CPs and W
(b)
p
owards novel sa
e.g. dyes) a
r approach i
ype films in diffe
tes tes (PNCs
reinforced
e to the syn
combinatio
and carbon
with metal o
ons of the
the high s
and high th
es that have
emiconducto
a versatile
morphology
kite (Figure 70,71 The WO
olour switch
.72 Both ma
h as copre
vided a larg
O3 and TiO
poly[Ni(3-MeO
aving and conve
and inorgan
is addresse
rent oxidation s
s) are fu
d by a na
nergic effec
on of the C
n-based67,68
oxides has
polymer an
urface-to-vo
hermal and
e been com
ors are pro
material, w
y and cryst
1.8 (a), (b)
O3 has a ba
hing. One o
aterials are t
ecipitation,74
ge overview
O2 nanoparti
Osalpd)]
Fersion energy sy
nic nanomat
ed in this wo
tates. Adapted f
nctional h
anometric f
cts of both c
CPs with d8 nanostruct
the advant
nd of the m
olume ratio
chemical s
mbined with
obably the
whose prope
tallinity. It
and (c)), w
and gap of 2
f the possib
typically syn4 sol-gel,75
w about the
cles (NPs),
(c)
poly[C
FCUP ystems
13
terials has
ork.
from Ref. [64].
hybrid mat
filler, and
counterpart
ifferent typ
tures.
tages of re
metal oxide
o, short diff
stabilities o
CPs (e.g.
most comm
erties depe
has three
with band ga
2.7 eV and
ble structur
nthesized b
microemuls
e preparati
respective
Cu(3-MeOsalp
been
terials
show
ts.29,33
es of
eceive
e (p/n
fusion
of the
ZnO,
monly
end of
main
aps of
show
res of
by wet
sion76
on of
ly.
pd)]
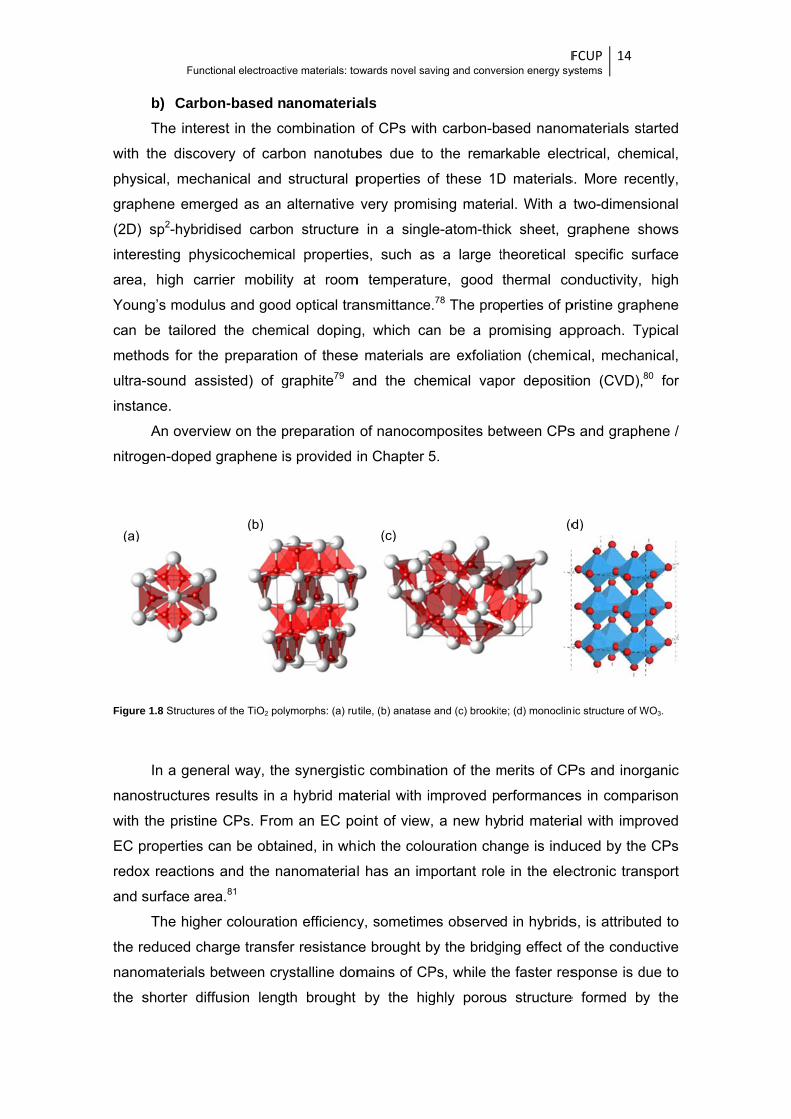
with
phys
grap
(2D)
intere
area
Youn
can
meth
ultra-
insta
nitrog
Figure
nano
with
EC p
redox
and s
the r
nano
the s
(a)
Functi
b) CarboThe intere
the discov
sical, mecha
hene emerg
sp2-hybrid
esting phys
, high car
ng’s modulu
be tailored
hods for the
-sound ass
ance.
An overvie
gen-doped
e 1.8 Structures
In a gene
ostructures
the pristine
properties c
x reactions
surface are
The highe
reduced cha
omaterials b
shorter diff
ional electroacti
on-based nest in the co
very of carb
anical and
ged as an
ised carbo
sicochemica
rier mobilit
us and good
d the chem
e preparatio
sisted) of g
ew on the p
graphene is
of the TiO2 poly
ral way, the
results in a
e CPs. From
can be obta
and the na
a.81
er colouratio
arge transfe
between cry
fusion leng
(b)
ive materials: to
anomateriaombination
bon nanotu
structural p
alternative
n structure
al propertie
ty at room
d optical tra
mical doping
on of these
graphite79 a
preparation
s provided i
ymorphs: (a) rut
e synergistic
a hybrid ma
m an EC po
ined, in wh
anomaterial
on efficiency
er resistanc
ystalline dom
th brought
owards novel sa
als of CPs wit
ubes due to
properties o
very promi
e in a sing
es, such as
m temperatu
ansmittance
g, which ca
e materials
and the ch
of nanocom
in Chapter 5
tile, (b) anatase
c combinat
aterial with i
oint of view
ich the colo
l has an im
y, sometime
ce brought b
mains of CP
by the hig
(c)
aving and conve
h carbon-b
o the rema
of these 1D
ising mater
le-atom-thic
s a large t
ure, good
e.78 The pro
an be a pr
are exfoliat
emical vap
mposites be
5.
e and (c) brookit
ion of the m
improved p
w, a new hy
ouration cha
mportant role
es observe
by the bridg
Ps, while th
ghly porou
Fersion energy sy
ased nanom
rkable elec
D materials
ial. With a
ck sheet, g
theoretical
thermal co
perties of p
romising ap
tion (chemi
por depositi
etween CPs
te; (d) monoclin
merits of CP
erformance
brid materia
ange is indu
e in the ele
d in hybrids
ging effect o
he faster res
s structure
(d
FCUP ystems
14
materials st
ctrical, chem
s. More rec
two-dimens
graphene s
specific su
onductivity,
pristine grap
pproach. Ty
cal, mecha
ion (CVD),
s and graph
ic structure of W
Ps and inor
es in compa
al with impr
uced by the
ectronic tran
s, is attribut
of the condu
sponse is d
e formed by
d)
tarted
mical,
cently,
sional
shows
urface
high
phene
ypical
anical, 80 for
hene /
WO3.
rganic
arison
roved
e CPs
nsport
ted to
uctive
due to
y the

inorg
with
detac
PNC
the p
chem
Figure
sepa
soph
proce
solve
prese
PNC
(typic
(typic
meth
on th
(ii) th
by th
Functi
ganic nanof
the nanom
chment.82
c) PrepaThere is a
Cs, once the
presence o
mical or elec
e 1.9 Summary
In the se
arately and
histicated bl
essability o
ents and dif
ence of the
Cs33. Depen
cal of chem
cal of elec
hod has cle
he electrode
he film thick
he electroc
ional electroacti
fillers.14 The
aterials act
aration meta large poo
e compone
of the othe
ctrochemica
of some routes
equestered
the hybrid
ending of tw
of the CPs (
fficult chem
e nanomate
nding of th
mical polym
ctropolimeri
ear advanta
e surface, fa
kness, poro
chemical pr
ive materials: to
e improved
ting as a sk
hods ol of prepar
nts can be
er counterp
al polymeris
employed in PN
route, the
d is assem
wo compon
(e.g. insolu
ical synthes
rial can be
he polymer
merisation)
sation) are
ges, once (
acilitating th
osity and m
rocedures
owards novel sa
stability can
keleton that
ration meth
e synthesise
art) and th
sation (Figu
NCs preparation
e CP and
bled in a s
nents. Howe
bility of pol
sis). Thus, t
a promisin
risation me
or thin-film
e obtained
(i) the com
he applicati
morphologica
and (iii) th
aving and conve
n be related
t keep the p
ods that ca
ed separate
he polymer
re 1.9).
n.
d the nano
subsequent
ever, these
ly[M(salen)]
the in situ p
ng first appr
ethod empl
s with the
. The one
posite is di
on as a che
al features
he film has
Fersion energy sy
d to the hyb
polymer inta
an be empl
ely prior or
can be o
ocomponen
t step, by
methods a
]-type polym
polymerisati
roach for th
loyed, com
nanomater
e-step elect
rectly forme
emically mo
can be pre
s strong ad
FCUP ystems
15
brid architec
act and avo
oyed to pre
concurrent
obtained thr
nt are prep
simple or
are limited b
mers in com
ion of CPs
he preparati
mposite par
rial incorpo
tropolimeris
ed as a thi
odified elect
ecisely cont
dherence to
cture,
oid its
epare
tly (in
rough
pared
more
by the
mmon
in the
ion of
rticles
orated
sation
n-film
trode,
rolled
o the
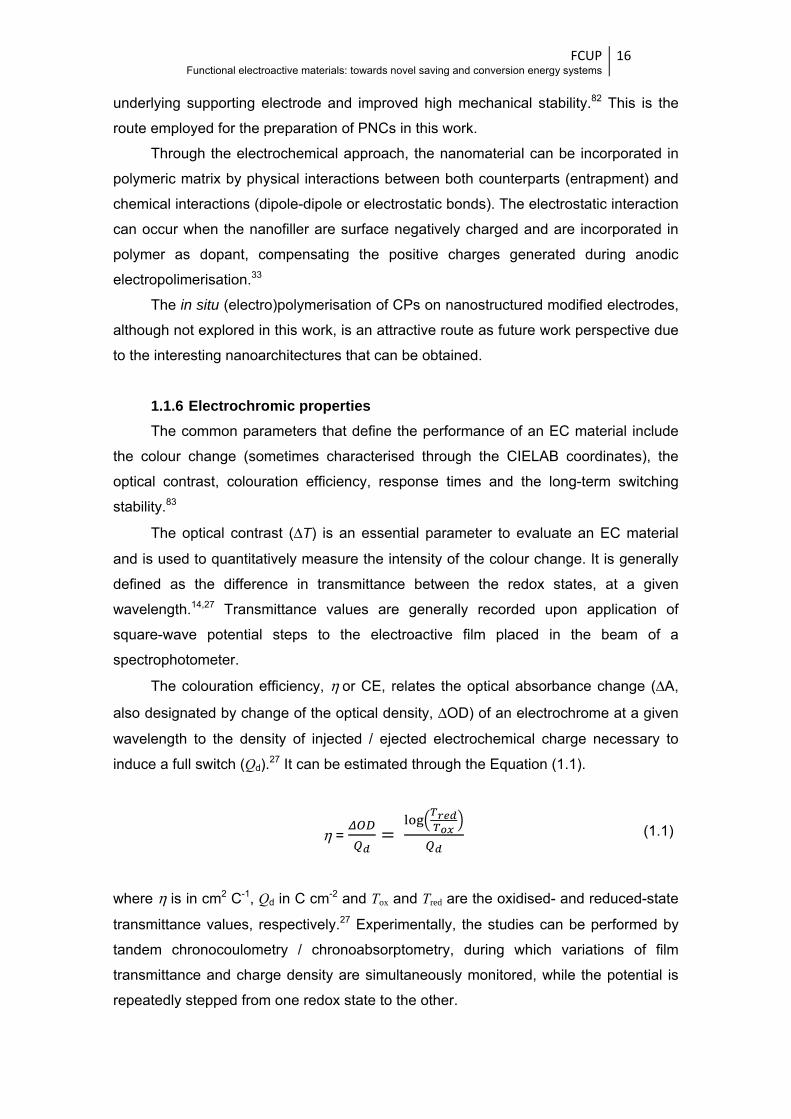
FCUP Functional electroactive materials: towards novel saving and conversion energy systems
16
underlying supporting electrode and improved high mechanical stability.82 This is the
route employed for the preparation of PNCs in this work.
Through the electrochemical approach, the nanomaterial can be incorporated in
polymeric matrix by physical interactions between both counterparts (entrapment) and
chemical interactions (dipole-dipole or electrostatic bonds). The electrostatic interaction
can occur when the nanofiller are surface negatively charged and are incorporated in
polymer as dopant, compensating the positive charges generated during anodic
electropolimerisation.33
The in situ (electro)polymerisation of CPs on nanostructured modified electrodes,
although not explored in this work, is an attractive route as future work perspective due
to the interesting nanoarchitectures that can be obtained.
1.1.6 Electrochromic properties The common parameters that define the performance of an EC material include
the colour change (sometimes characterised through the CIELAB coordinates), the
optical contrast, colouration efficiency, response times and the long-term switching
stability.83
The optical contrast (ΔT) is an essential parameter to evaluate an EC material
and is used to quantitatively measure the intensity of the colour change. It is generally
defined as the difference in transmittance between the redox states, at a given
wavelength.14,27 Transmittance values are generally recorded upon application of
square-wave potential steps to the electroactive film placed in the beam of a
spectrophotometer.
The colouration efficiency, η or CE, relates the optical absorbance change (ΔA,
also designated by change of the optical density, ΔOD) of an electrochrome at a given
wavelength to the density of injected / ejected electrochemical charge necessary to
induce a full switch (Qd).27 It can be estimated through the Equation (1.1).
η = = (1.1)
where η is in cm2 C-1, Qd in C cm-2 and Tox and Tred are the oxidised- and reduced-state
transmittance values, respectively.27 Experimentally, the studies can be performed by
tandem chronocoulometry / chronoabsorptometry, during which variations of film
transmittance and charge density are simultaneously monitored, while the potential is
repeatedly stepped from one redox state to the other.
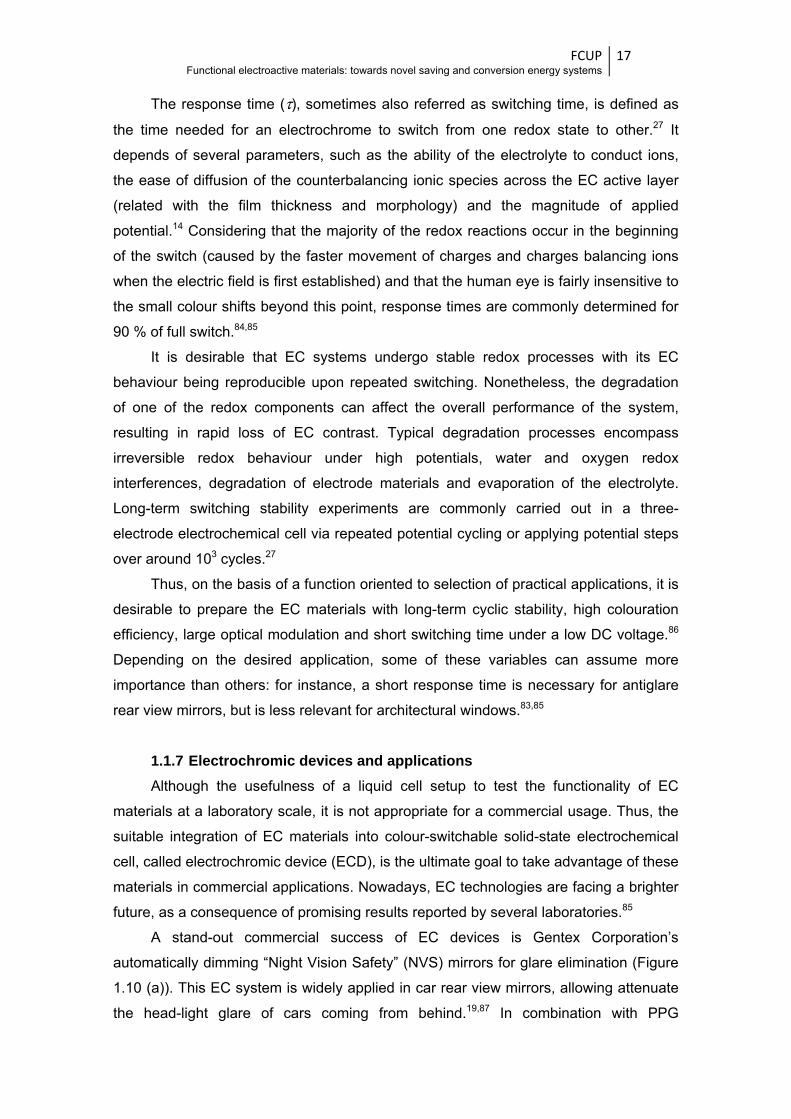
FCUP Functional electroactive materials: towards novel saving and conversion energy systems
17
The response time (τ), sometimes also referred as switching time, is defined as
the time needed for an electrochrome to switch from one redox state to other.27 It
depends of several parameters, such as the ability of the electrolyte to conduct ions,
the ease of diffusion of the counterbalancing ionic species across the EC active layer
(related with the film thickness and morphology) and the magnitude of applied
potential.14 Considering that the majority of the redox reactions occur in the beginning
of the switch (caused by the faster movement of charges and charges balancing ions
when the electric field is first established) and that the human eye is fairly insensitive to
the small colour shifts beyond this point, response times are commonly determined for
90 % of full switch.84,85
It is desirable that EC systems undergo stable redox processes with its EC
behaviour being reproducible upon repeated switching. Nonetheless, the degradation
of one of the redox components can affect the overall performance of the system,
resulting in rapid loss of EC contrast. Typical degradation processes encompass
irreversible redox behaviour under high potentials, water and oxygen redox
interferences, degradation of electrode materials and evaporation of the electrolyte.
Long-term switching stability experiments are commonly carried out in a three-
electrode electrochemical cell via repeated potential cycling or applying potential steps
over around 103 cycles.27
Thus, on the basis of a function oriented to selection of practical applications, it is
desirable to prepare the EC materials with long-term cyclic stability, high colouration
efficiency, large optical modulation and short switching time under a low DC voltage.86
Depending on the desired application, some of these variables can assume more
importance than others: for instance, a short response time is necessary for antiglare
rear view mirrors, but is less relevant for architectural windows.83,85
1.1.7 Electrochromic devices and applications Although the usefulness of a liquid cell setup to test the functionality of EC
materials at a laboratory scale, it is not appropriate for a commercial usage. Thus, the
suitable integration of EC materials into colour-switchable solid-state electrochemical
cell, called electrochromic device (ECD), is the ultimate goal to take advantage of these
materials in commercial applications. Nowadays, EC technologies are facing a brighter
future, as a consequence of promising results reported by several laboratories.85
A stand-out commercial success of EC devices is Gentex Corporation’s
automatically dimming “Night Vision Safety” (NVS) mirrors for glare elimination (Figure
1.10 (a)). This EC system is widely applied in car rear view mirrors, allowing attenuate
the head-light glare of cars coming from behind.19,87 In combination with PPG
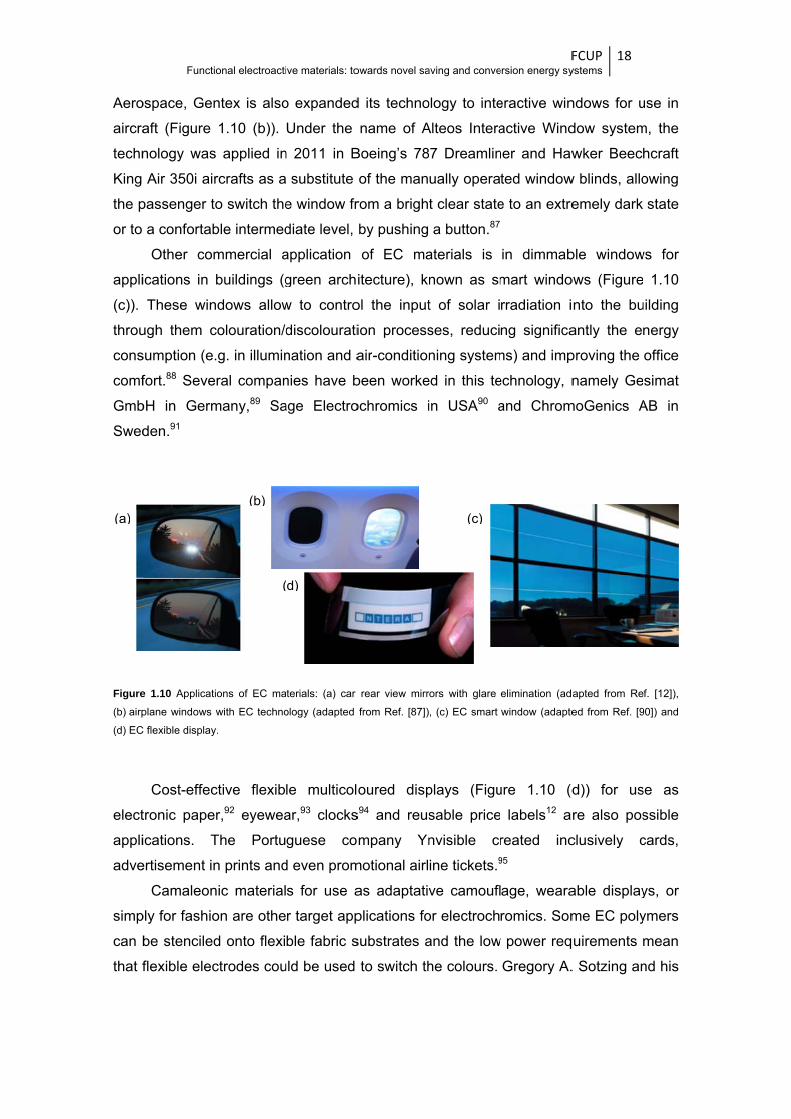
Aero
aircra
techn
King
the p
or to
appli
(c)).
throu
cons
comf
Gmb
Swed
Figure(b) airp
(d) EC
elect
appli
adve
simp
can b
that f
(a)
Functi
ospace, Gen
aft (Figure
nology was
Air 350i air
passenger t
a confortab
Other com
ications in
These win
ugh them c
sumption (e
fort.88 Seve
bH in Germ
den.91
e 1.10 Applicat
plane windows
C flexible display
Cost-effec
tronic pape
ications. T
ertisement in
Camaleon
ply for fashio
be stenciled
flexible elec
ional electroacti
ntex is also
1.10 (b)).
s applied in
rcrafts as a
to switch the
ble intermed
mmercial a
buildings (g
ndows allow
colouration/d
.g. in illumin
eral compan
many,89 Sa
ions of EC ma
with EC techno
y.
ctive flexib
er,92 eyewea
The Portu
n prints and
nic material
on are othe
d onto flexi
ctrodes cou
(b)
(
ive materials: to
o expanded
Under the
n 2011 in B
substitute
e window fr
diate level,
application
green arch
w to contro
discolourati
nation and a
nies have b
age Electro
aterials: (a) car
ology (adapted
le multicol
ar,93 clocks
guese co
d even prom
s for use a
r target app
ble fabric s
uld be used
(d)
owards novel sa
d its techno
name of A
Boeing’s 78
of the man
rom a brigh
by pushing
of EC ma
itecture), k
ol the input
ion process
air-condition
been worke
ochromics i
rear view mirr
from Ref. [87])
oured disp
s94 and reus
mpany Yn
motional airl
as adaptativ
plications fo
substrates a
to switch th
aving and conve
ology to inte
Alteos Intera
87 Dreamlin
ually opera
t clear state
a button.87
aterials is
nown as sm
t of solar i
ses, reduci
ning system
ed in this te
in USA90 a
rors with glare
, (c) EC smart
plays (Figu
sable price
nvisible cr
ine tickets.9
ve camoufl
or electroch
and the low
he colours.
(c)
Fersion energy sy
eractive win
active Wind
ner and Haw
ted window
e to an extre
in dimmab
mart windo
rradiation i
ng significa
ms) and imp
echnology, n
and Chrom
elimination (ad
window (adapte
ure 1.10 (d
labels12 a
reated inc95
age, weara
romics. Som
w power req
Gregory A.
FCUP ystems
18
ndows for u
dow system
wker Beech
w blinds, allo
emely dark
ble window
ows (Figure
nto the bu
antly the e
proving the
namely Ge
moGenics A
apted from Re
ed from Ref. [9
d)) for us
re also pos
clusively c
able display
me EC poly
quirements
. Sotzing an
use in
m, the
hcraft
owing
state
ws for
1.10
uilding
nergy
office
simat
AB in
f. [12]),
90]) and
se as
ssible
cards,
ys, or
ymers
mean
nd his
grou
weav
state
them
an io
Figure
rigid
cond
dope
does
platin
cove
layer
base
but t
one
Exam
to bl
reduc
(colo
case
Functi
p have bee
ving of fabri
ECDs, tha
e electroche
m is optically
on conducto
e 1.11 Schemat
a) ElectrThe trans
– glass –
ducting films
ed tin oxide
s not have t
num electro
As mentio
ered with an
r that can o
ed (i) in the
that genera
EC system
mples of de
ue on oxida
ction),98 PE
ourless to p
es, the ECD
(a)
ional electroacti
en working
ics.96
at serve the
emical cells
y transparen
or electrolyte
ic structure of a
rodes and Esparent elec
– or flexib
s optically t
e (FTO) or
to be transp
ode.
oned, while
n EC mate
or not exhib
same mate
lly exhibit c
m is cathod
eveloped co
ation) as an
EDOT (light
purple on
D is denomi
ive materials: to
on an EC s
e basis for t
, containing
nt and is co
e (Figure 1.
an electrochrom
EC layer ctrodes com
ble – poly(
ransparent
antimony-d
parent, is c
e one of th
erial, the au
bit EC beha
erial of the
complemen
ically colou
omplementa
nodically co
t-blue to de
reduction)10
nated by du
owards novel sa
spandex an
hese applic
g typically tw
oated with a
.11 (a)).15,97
ic device with (a
mprise an e
ethylene te
are, genera
doped tin o
common to
e electrode
uxiliary elec
aviour. In th
main EC s
tary EC be
uring, the o
ary colourin
olouring ma
eep blue on00 as catho
ual electroc
(b)
aving and conve
nd on EC fi
cations, ope
wo electrod
a layer of an
a) vertical and (
electrical co
erephthalat
ally, of indiu
oxide.15 Wh
use as elec
es, the mai
ctrode is co
e former ca
ystem or (i
ehaviour to
other system
g ECDs are
aterial and W
n reduction)
odically col
chromic dev
Fersion energy sy
ibers and th
erate as rec
des, wherein
n EC materi
b) lateral config
onducting f
e), PET -
um tin oxide
hen the au
ctrical cond
n electrode
overed by
ase, the EC
i) in a differ
the main sy
m is anodic
e those with
WO3 (colou
)99 and poly
ouring mat
vice, once is
FCUP ystems
19
hreads for
chargeable
n at least o
ial, separat
gurations.
film coated
substrate.
e (ITO), fluo
uxiliary elec
ductor a silv
e, is neces
an electroa
C system ca
rent EC ma
ystem, i.e.
cally colour
h PB (colou
urless to blu
y(butyl violo
terials. In
s based in
direct
solid-
one of
ed by
on a
The
orine-
ctrode
ver or
ssarily
active
an be
aterial
while
ring.27
urless
ue on
ogen)
those
more
FCUP Functional electroactive materials: towards novel saving and conversion energy systems
20
than one EC material. In comparison with ECDs composed by just one EC material
(single electrochromic device), the dual ECDs offer the advantage of exhibit several
colour changes in a small electrical potential window.14
b) Electrolyte The electrolyte is also an indispensable ECDs component, being responsible for
the ionic conduction between the electrodes.14 The electrolyte has to be an electronic
insulator, transparent in the wavelength range used and has a wide electrochemical
window and low volatility.15 In general, the electrolytes are liquid, gel or solids. The
liquid electrolytes are important when the EC material is dissolved in electrolyte (types I
and II EC materials) and can be aqueous (acids and bases as H2SO4 or KOH) or polar
organic solvents (such as acetonitrile and propylene carbonate (PC)), in which can be
dissolved a salt (e.g. lithium perchlorate, LiClO4).15 The solid electrolytes are used with
type III EC and predominantly are based in solid organic polymers, which can be
subdivided in two categories: polyelectrolytes and polymer electrolytes. The
polyelectrolytes contain ion-labile moieties along the backbone (e.g. Nafion®), while
polymer electrolytes are effectively “solutions” of ionic salts (e.g. LiClO4) with neutral
macromolecules, such as poly(methyl methacrylate) (PMMA) and poly(propylene
glycol) (PPO) as the immobile solvent. The viscosity / rigidity of the electrolyte depend
of the molecular weight of the macromolecules employed.15 In order to increase the
conductivity of the polymer electrolytes,101 an organic solvent is added.
To prevent leakage of electrolyte and to promote easy handling of the device
after the assemblage, the ECDs must be sealed with epoxy or other types of
sealants.14
c) ECD configurations and operation Besides the vertical configuration, outlined in Figure 1.11 (a), the ECDs can also
be assembled in a lateral configuration (Figure 1.11 ( b)) that, although less common,
offers an interesting potential. In this configuration, the working and auxiliary electrodes
are in the same substrate, which decrease the number of layers and simplify the device
assemblage. Nonetheless, as the charge transport between both electrodes occurs
laterally, the response times can be larger than in ECDs with vertical configuration.102
In general, to ensure the working of the device, two redox couples must be
involved between the two electrodes. Applying a voltage difference to the ECD, one
species, for example the EC material in the main electrode, is oxidised (or reduced,
according with the potential applied), while the other one is reduced (or oxidised). In
consequence, the system switches from one coloured state to another.14,97 When the
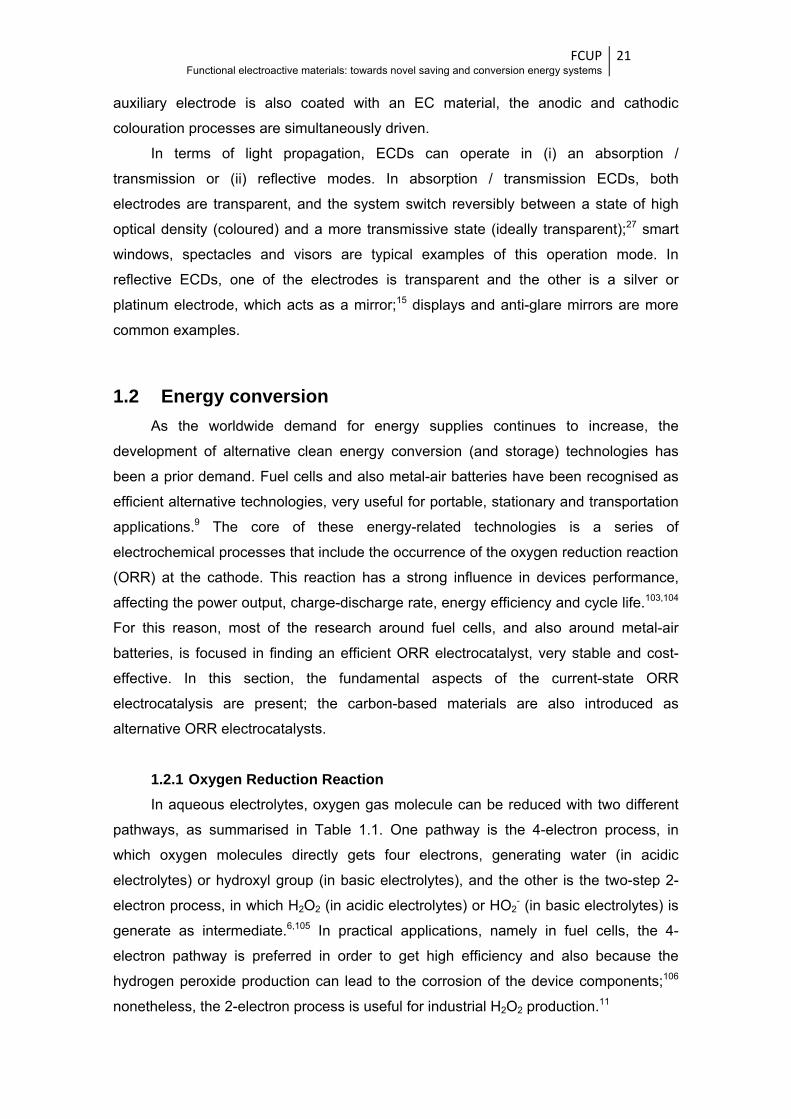
FCUP Functional electroactive materials: towards novel saving and conversion energy systems
21
auxiliary electrode is also coated with an EC material, the anodic and cathodic
colouration processes are simultaneously driven.
In terms of light propagation, ECDs can operate in (i) an absorption /
transmission or (ii) reflective modes. In absorption / transmission ECDs, both
electrodes are transparent, and the system switch reversibly between a state of high
optical density (coloured) and a more transmissive state (ideally transparent);27 smart
windows, spectacles and visors are typical examples of this operation mode. In
reflective ECDs, one of the electrodes is transparent and the other is a silver or
platinum electrode, which acts as a mirror;15 displays and anti-glare mirrors are more
common examples.
1.2 Energy conversion As the worldwide demand for energy supplies continues to increase, the
development of alternative clean energy conversion (and storage) technologies has
been a prior demand. Fuel cells and also metal-air batteries have been recognised as
efficient alternative technologies, very useful for portable, stationary and transportation
applications.9 The core of these energy-related technologies is a series of
electrochemical processes that include the occurrence of the oxygen reduction reaction
(ORR) at the cathode. This reaction has a strong influence in devices performance,
affecting the power output, charge-discharge rate, energy efficiency and cycle life.103,104
For this reason, most of the research around fuel cells, and also around metal-air
batteries, is focused in finding an efficient ORR electrocatalyst, very stable and cost-
effective. In this section, the fundamental aspects of the current-state ORR
electrocatalysis are present; the carbon-based materials are also introduced as
alternative ORR electrocatalysts.
1.2.1 Oxygen Reduction Reaction In aqueous electrolytes, oxygen gas molecule can be reduced with two different
pathways, as summarised in Table 1.1. One pathway is the 4-electron process, in
which oxygen molecules directly gets four electrons, generating water (in acidic
electrolytes) or hydroxyl group (in basic electrolytes), and the other is the two-step 2-
electron process, in which H2O2 (in acidic electrolytes) or HO2- (in basic electrolytes) is
generate as intermediate.6,105 In practical applications, namely in fuel cells, the 4-
electron pathway is preferred in order to get high efficiency and also because the
hydrogen peroxide production can lead to the corrosion of the device components;106
nonetheless, the 2-electron process is useful for industrial H2O2 production.11
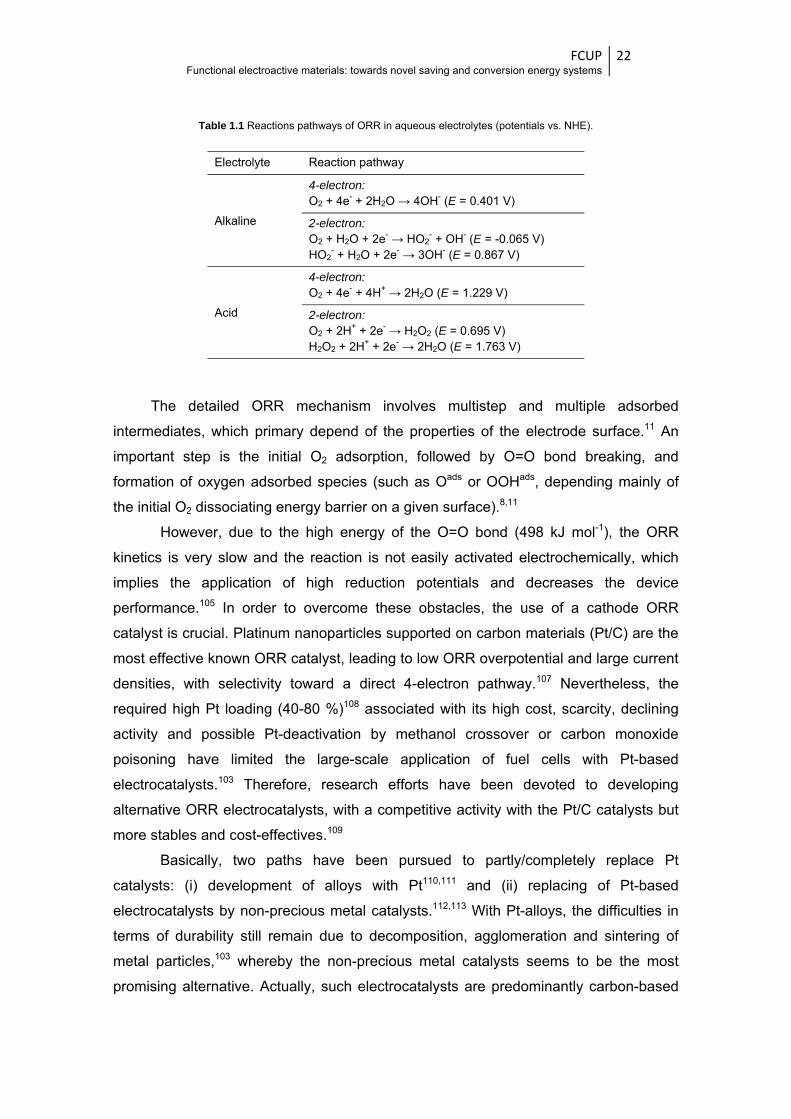
FCUP Functional electroactive materials: towards novel saving and conversion energy systems
22
Table 1.1 Reactions pathways of ORR in aqueous electrolytes (potentials vs. NHE).
Electrolyte Reaction pathway
Alkaline
4-electron: O2 + 4e- + 2H2O → 4OH- (E = 0.401 V)
2-electron: O2 + H2O + 2e- → HO2
- + OH- (E = -0.065 V) HO2
- + H2O + 2e- → 3OH- (E = 0.867 V)
Acid
4-electron: O2 + 4e- + 4H+ → 2H2O (E = 1.229 V)
2-electron: O2 + 2H+ + 2e- → H2O2 (E = 0.695 V) H2O2 + 2H+ + 2e- → 2H2O (E = 1.763 V)
The detailed ORR mechanism involves multistep and multiple adsorbed
intermediates, which primary depend of the properties of the electrode surface.11 An
important step is the initial O2 adsorption, followed by O=O bond breaking, and
formation of oxygen adsorbed species (such as Oads or OOHads, depending mainly of
the initial O2 dissociating energy barrier on a given surface).8,11
However, due to the high energy of the O=O bond (498 kJ mol-1), the ORR
kinetics is very slow and the reaction is not easily activated electrochemically, which
implies the application of high reduction potentials and decreases the device
performance.105 In order to overcome these obstacles, the use of a cathode ORR
catalyst is crucial. Platinum nanoparticles supported on carbon materials (Pt/C) are the
most effective known ORR catalyst, leading to low ORR overpotential and large current
densities, with selectivity toward a direct 4-electron pathway.107 Nevertheless, the
required high Pt loading (40-80 %)108 associated with its high cost, scarcity, declining
activity and possible Pt-deactivation by methanol crossover or carbon monoxide
poisoning have limited the large-scale application of fuel cells with Pt-based
electrocatalysts.103 Therefore, research efforts have been devoted to developing
alternative ORR electrocatalysts, with a competitive activity with the Pt/C catalysts but
more stables and cost-effectives.109
Basically, two paths have been pursued to partly/completely replace Pt
catalysts: (i) development of alloys with Pt110,111 and (ii) replacing of Pt-based
electrocatalysts by non-precious metal catalysts.112,113 With Pt-alloys, the difficulties in
terms of durability still remain due to decomposition, agglomeration and sintering of
metal particles,103 whereby the non-precious metal catalysts seems to be the most
promising alternative. Actually, such electrocatalysts are predominantly carbon-based
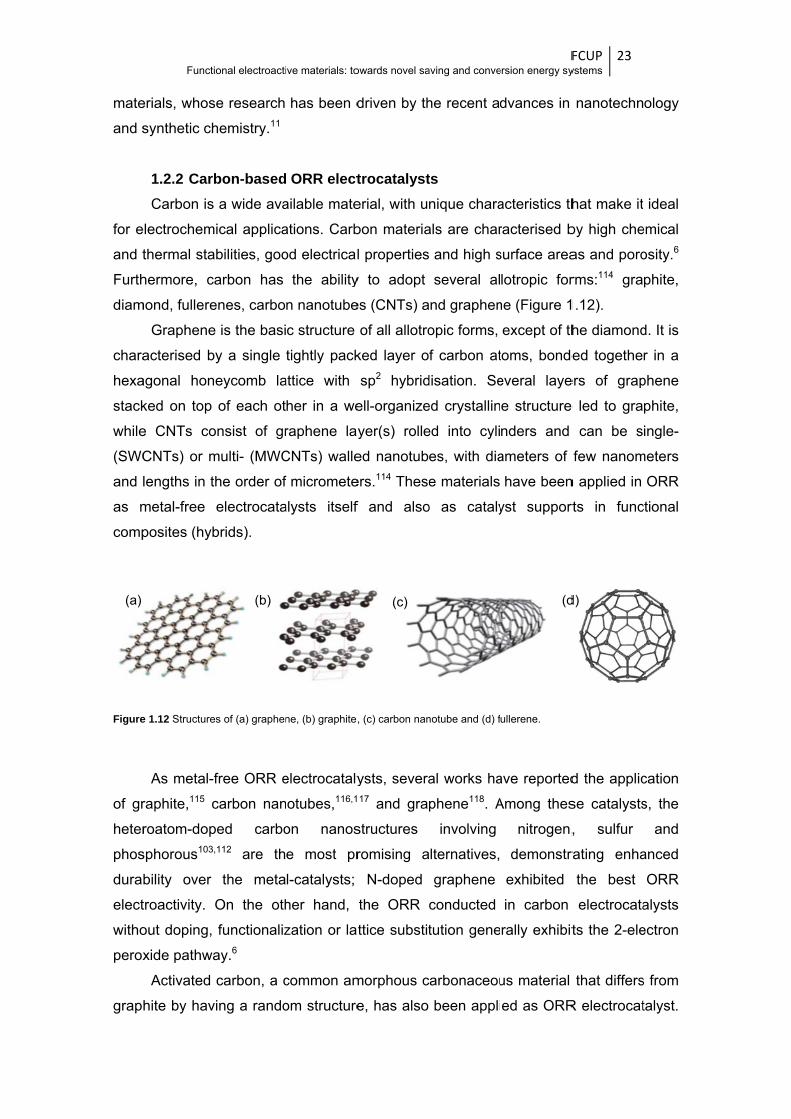
mate
and s
for e
and t
Furth
diam
chara
hexa
stack
while
(SWC
and
as m
comp
Figure
of gr
heter
phos
dura
elect
witho
perox
grap
(a)
Functi
erials, whos
synthetic ch
1.2.2 CarbCarbon is
electrochem
thermal sta
hermore, ca
mond, fullere
Graphene
acterised b
agonal hon
ked on top
e CNTs co
CNTs) or m
lengths in t
metal-free
posites (hyb
e 1.12 Structure
As metal-f
raphite,115 c
roatom-dop
sphorous103,
bility over
troactivity.
out doping,
xide pathwa
Activated
hite by hav
ional electroacti
se research
hemistry.11
bon-baseda wide ava
ical applica
abilities, goo
arbon has
enes, carbo
e is the basi
y a single
eycomb la
of each ot
onsist of gr
multi- (MWC
he order of
electrocata
brids).
es of (a) graphen
free ORR e
carbon nan
ped carbo,112 are th
the meta
On the oth
functionaliz
ay.6
carbon, a c
ving a rando
(b)
ive materials: to
has been d
ORR electailable mate
ations. Carb
od electrical
the ability
n nanotube
c structure
tightly pack
attice with
her in a we
raphene lay
CNTs) walle
f micromete
alysts itself
ne, (b) graphite,
electrocataly
otubes,116,1
on nanos
e most pr
l-catalysts;
her hand,
zation or la
common am
om structure
owards novel sa
driven by th
trocatalysterial, with u
bon materia
l properties
y to adopt
es (CNTs) a
of all allotro
ked layer o
sp2 hybrid
ell-organize
yer(s) rolle
ed nanotub
ers.114 These
f and also
, (c) carbon nan
ysts, severa17 and gra
structures
romising a
N-doped
the ORR
ttice substit
morphous c
e, has also
(c)
aving and conve
he recent ad
ts nique chara
als are char
and high s
several al
nd graphen
opic forms,
f carbon at
disation. Se
ed crystallin
ed into cyli
es, with dia
e materials
o as cataly
notube and (d) f
al works ha
phene118. A
involving
alternatives,
graphene
conducted
tution gene
carbonaceou
been appli
Fersion energy sy
dvances in
acteristics th
racterised b
surface area
lotropic for
ne (Figure 1
except of th
toms, bonde
everal laye
e structure
nders and
ameters of
have been
yst support
ullerene.
ave reported
Among thes
nitrogen,
demonstr
exhibited
in carbon
rally exhibit
us material
ed as ORR
(d
FCUP ystems
23
nanotechn
hat make it
by high che
as and poro
rms:114 gra
1.12).
he diamond
ed togethe
ers of grap
e led to gra
can be s
few nanom
n applied in
rts in func
d the applic
se catalysts
, sulfur
rating enha
the best
electrocata
ts the 2-ele
that differs
R electrocat
d)
ology
ideal
emical
osity.6
phite,
d. It is
r in a
phene
phite,
ingle-
meters
ORR
ctional
cation
s, the
and
anced
ORR
alysts
ectron
s from
talyst.

FCUP Functional electroactive materials: towards novel saving and conversion energy systems
24
This material takes advantage of its high surface area and well developed pore
structure,114 which are favourable conditions for a high ORR electrocatalytic activity,
once increase the number of active sites exposed to the electrolyte.119,120 Furthermore,
superactivated carbons can be obtained from renewable sources, which is an
advantageous green approach.119,121 In the introduction of Chapter 6, it is provided an
overview about the preparation of activated carbons from several biomass sources and
their application as ORR electrocatalysts.
As catalyst support, carbon materials maximize the electroactive surface area,
enhance the conductivities and bring the catalyst particles close to the reactants,
improving the catalytic activity and durability.104 Carbon black (CB), a synthetic carbon
material based on spherical particles (diameter < 50 nm) of graphitic layers that may
form agglomerates with a para-crystallite structure,114 is the most commonly used
support catalyst due to its low cost. Unfortunately, this material is susceptible to
oxidation under fuel cells operating conditions,114 sometimes resulting in active surface
area loss and alteration of the pore surface characteristics. CNTs and graphene
supports, although more expensive than carbon black, normally result in high catalyst
utilization, due to the high crystallinity and surface area of those materials.
Several composites of these materials with conducting polymers,122 non-precious
metals,123,124 metal oxides125 and metallic complexes126 have been applied as ORR
electrocatalysts. Between the metal oxides, polyoxometalates (POMs) can be very
attractive ORR electrocatalysts owing to their ability to mediate electron, proton and
oxygen transfer reactions.127
1.2.3 Polyoxometalates POMs are a class of early transition metal-oxygen clusters, mostly anionic in
nature, based on building blocks with the general formula (MOx)n, where M is generally
molybdenum (MoVI), tungsten (WV) or vanadium (VV) and x = 4-7.128 The metal atoms
(M) are called addenda atoms and are surrounded by bridging or terminal oxygen
atoms. Different combinations and orientations of these building blocks lead to
thousands of possible compounds with the POM denomination, with metal ions from 6
to 368 in a single molecule and monodisperse size from several angstroms up to 10
nm.129
POMs can be broadly classified into three main categories: heteropolyanions,
isopolyanions and molybdenium blue and molybdenium brown reduced POM cluster.130
Heteropolyanions are the most widely studied class and are characterised by
containing, apart from M and O, other type of atoms, X, which are called primary
heteroatoms. The Keggin and Wells-Dawson structures and their derivatives are
amon
[XM1
there
one
oxyg
Figure
aque
Thes
reduc
deco
and,
elect
heter
there
adde
spec
elect
pKa v
simila
atom
anoth
The
MoVI
appli
Functi
ng the mos
2O40]n- (Fig
ein shares t
another by
gens and ha
e 1.13 Polyhedr
The elect
eous mediu
se heterop
ction and
omposition.
in general,
trons is low
ropolymolyb
The pH h
e is a linear
enda atoms
cies.134 The
trons excha
values of th
ar.
The redox
ms. The sub
her addend
POM adde
< VV.135
Sometime
ications is
ional electroacti
st common
gure 1.13),
two edges
y corner s
as a tetrahe
al representatio
rochemical
um by elec
olyanions
further
The electro
, the polyan
wer or equa
bdates.133
has a large
dependenc
s and the
slopes of t
anged in th
he oxidised
x properties
bstitution of
da ion such
nda atoms
es, the uti
hampered
ive materials: to
heteropolya
involves fo
with other
sharing. Th
dral pocket
on of Keggin pol
behaviour
ctrochemica
undergo s
irreversible
ons are acce
nion structu
al to four in
influence o
ce between
pH value,
he plots E v
e redox pro
or reduced
s of POM cl
one or mo
as WVI, Mo
can be orde
ilization of
by their lo
owards novel sa
anion speci
our 3-fold M
MO6 and t
he total as
in its cente
lyoxometalate m
of the Keg
al technique
several rap
multi-elec
epted by th
re is not sig
n Keggin he
on the red
n the redox
as result
vs. pH dep
ocess and
d forms, un
usters can
ore tungsten
oVI and VV g
er by increa
f POMs a
ow specific
aving and conve
ies. In parti
M3O13 grou
he four M3O
ssemblage
er for the he
molecule.
ggin-type a
es, such a
pid one an
ctron redu
e addenda
gnificantly a
eteropolytun
uction of th
potentials a
from the p
end on the
change wh
nless the pK
be tailored
n (WVI) or m
give rise to
asing oxidis
as function
surface ar
Fersion energy sy
cular, the K
ps. Each M
O13 groups
contains 4
eteroatom.
anions has
s cyclic vo
nd two-elec
uctions wi
ions of the
altered whe
ngstates an
hese polyan
attributed to
protonation
number of
hen the pH
Ka values of
by changin
molybdenum
the mixed-a
sing ability a
al materia
rea and so
FCUP ystems
25
Keggin struc
MO6 octahe
are attach
40 close-pa
been studi
oltammetry.
ctron reve
th concom
heteropoly
en the numb
nd six in K
nions; gene
o the reduct
of the red
the protons
approache
of both form
ng their add
m (MoVI) io
addenda an
as follows:
als for pra
lubility in w
cture,
edron
ed to
acked
ed in
.131,132
rsible
mitant
anion
ber of
eggin
erally,
ion of
duced
s and
es the
ms are
denda
ns by
nions.
WVI <
actical
water.
FCUP Functional electroactive materials: towards novel saving and conversion energy systems
26
Thus, their immobilization onto high surface supports, such as carbon materials, is
expected to overcome their difficult processability and leads to significant
improvements in electrochemical properties and electrocatalytic performances.
In Chapter 7 is provided a more detailed overview about the application of POMs
itself and of POM@carbon-based nanocomposites as ORR electrocatalysts.
1.2.4 ORR electrocatalytic activity evaluation Linear sweep voltammetry (LSV) is the most widely used technique to investigate
the performance of potential ORR electrocatalysts. This technique can be
complemented by cyclic voltammetry (CV), which can provide information on the redox
behaviour of the electrocatalysts in the presence of O2 or other molecules, including
potential poisoning species.
The electrochemical parameters that are being used to benchmark the
electrocatalysts with the state-of-the-art Pt/C electrocatalyst are: the onset potential
(Eonset), the diffusion limiting current density (jL) and the number of electrons transferred
per O2 molecule ( ).106 These parameters can be determined from the LSV plots
measured with a rotating disk electrode (RDE). The Eonset is the potential at which the
reaction starts, the limiting current density is the current density reached when the
reaction at the electrode is totally controlled by mass transport (current is determined
by the rate of diffusion of the reactant to the electrode and becomes independent of the
applied potential, whereby a plateau is reached and j = jL); the kinetic current density is
the current in the absence of mass-transfer limitations.
LSV data are analysed through Koutecky-Levich (K-L), Equation (1.2):121,136
1 = 1 + 1 = 1 / + 1 (1.2)
where j is the experimentally measured current density, jk is kinetic current density, and
ω is the angular velocity; B is related to the diffusion limiting density, as expressed by
the Equation (1.3):
B=0.2 ( ) / / (1.3)
where F is the Faraday constant (96 485 C mol-1), is the bulk concentration of O2, υ
is the kinematic viscosity of the electrolyte and is the diffusion coefficient of O2. The
constant 0.2 is adopted when the rotating speed is in rpm. jk and can be
determined from the intercept and the slope of the plot of j-1 vs. ω-1/2, respectively.106
The values of provides information about the selectivity of the electrocatalysts. For
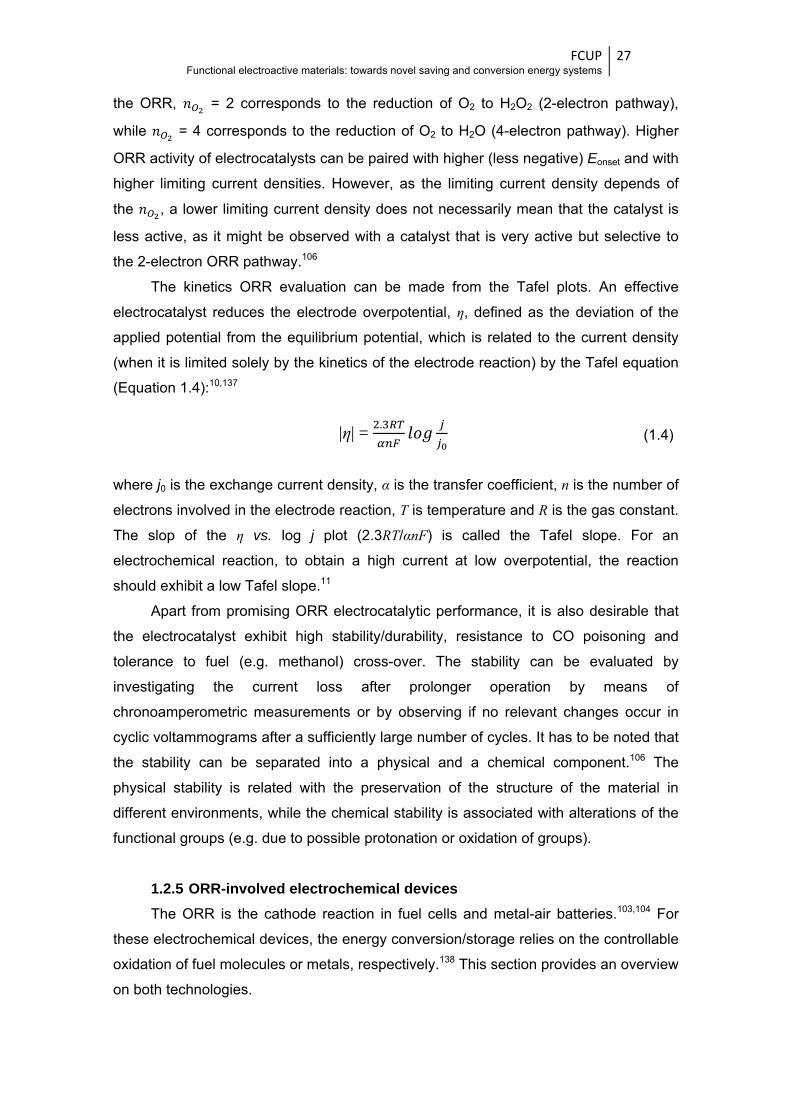
FCUP Functional electroactive materials: towards novel saving and conversion energy systems
27
the ORR, = 2 corresponds to the reduction of O2 to H2O2 (2-electron pathway),
while = 4 corresponds to the reduction of O2 to H2O (4-electron pathway). Higher
ORR activity of electrocatalysts can be paired with higher (less negative) Eonset and with
higher limiting current densities. However, as the limiting current density depends of
the , a lower limiting current density does not necessarily mean that the catalyst is
less active, as it might be observed with a catalyst that is very active but selective to
the 2-electron ORR pathway.106
The kinetics ORR evaluation can be made from the Tafel plots. An effective
electrocatalyst reduces the electrode overpotential, η, defined as the deviation of the
applied potential from the equilibrium potential, which is related to the current density
(when it is limited solely by the kinetics of the electrode reaction) by the Tafel equation
(Equation 1.4):10,137
|η| = .
(1.4)
where j0 is the exchange current density, α is the transfer coefficient, n is the number of
electrons involved in the electrode reaction, T is temperature and R is the gas constant.
The slop of the η vs. log j plot (2.3RT/αnF) is called the Tafel slope. For an
electrochemical reaction, to obtain a high current at low overpotential, the reaction
should exhibit a low Tafel slope.11
Apart from promising ORR electrocatalytic performance, it is also desirable that
the electrocatalyst exhibit high stability/durability, resistance to CO poisoning and
tolerance to fuel (e.g. methanol) cross-over. The stability can be evaluated by
investigating the current loss after prolonger operation by means of
chronoamperometric measurements or by observing if no relevant changes occur in
cyclic voltammograms after a sufficiently large number of cycles. It has to be noted that
the stability can be separated into a physical and a chemical component.106 The
physical stability is related with the preservation of the structure of the material in
different environments, while the chemical stability is associated with alterations of the
functional groups (e.g. due to possible protonation or oxidation of groups).
1.2.5 ORR-involved electrochemical devices The ORR is the cathode reaction in fuel cells and metal-air batteries.103,104 For
these electrochemical devices, the energy conversion/storage relies on the controllable
oxidation of fuel molecules or metals, respectively.138 This section provides an overview
on both technologies.
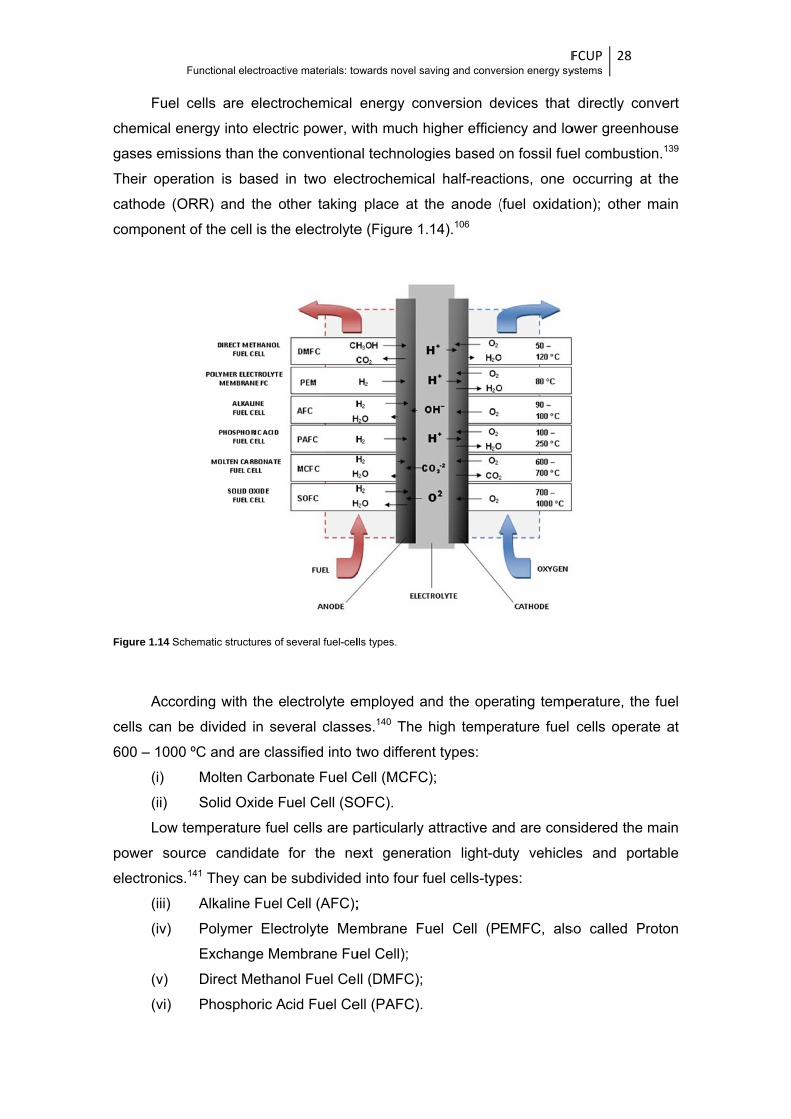
chem
gase
Their
catho
comp
Figure
cells
600 –
powe
elect
Functi
Fuel cells
mical energy
es emission
r operation
ode (ORR)
ponent of th
e 1.14 Schemat
According
can be div
– 1000 ºC a
(i) Mo
(ii) So
Low temp
er source
tronics.141 T
(iii) Alk
(iv) Po
Ex
(v) Dir
(vi) Ph
ional electroacti
s are electr
y into electr
s than the c
is based
and the o
he cell is the
ic structures of
g with the e
vided in sev
and are clas
olten Carbo
olid Oxide F
erature fue
candidate
They can be
kaline Fuel
olymer Elec
xchange Me
rect Methan
hosphoric A
ive materials: to
rochemical
ric power, w
conventiona
in two elec
ther taking
e electrolyte
several fuel-cel
lectrolyte e
veral classe
ssified into t
nate Fuel C
uel Cell (SO
l cells are p
for the ne
e subdivided
Cell (AFC);
ctrolyte Me
embrane Fu
nol Fuel Cel
cid Fuel Ce
owards novel sa
energy con
with much h
al technolog
ctrochemica
place at t
e (Figure 1.
lls types.
employed an
es.140 The
two differen
Cell (MCFC
OFC).
particularly a
ext generat
d into four fu
;
mbrane Fu
uel Cell);
ll (DMFC);
ell (PAFC).
aving and conve
nversion de
higher efficie
gies based o
al half-react
he anode (
14).106
nd the oper
high tempe
nt types:
);
attractive a
tion light-d
uel cells-typ
uel Cell (P
Fersion energy sy
evices that
ency and lo
on fossil fue
tions, one
(fuel oxidat
rating temp
erature fuel
nd are cons
uty vehicle
pes:
EMFC, als
FCUP ystems
28
directly co
ower greenh
el combusti
occurring a
tion); other
perature, the
cells opera
sidered the
es and por
so called P
onvert
house
on.139
at the
main
e fuel
ate at
main
rtable
Proton
the
chara
once
requ
PEM
elect
PAFC
adso
catal
cross
a m
perfo
the a
perfo
the
acco
depe
Figure
effec
hope
batte
Functi
With the e
hydrogen
acterised b
e the ORR k
irement for
MFC is us
trolyte;142 th
C also used
All of thes
orption of th
lyst, blockin
s-over can
mixed poten
ormance.108
The metal
active mate
ormance of
oxygen ev
ompanied b
ending of th
e 1.15 Schemat
The main
ctiveness an
eful for au
eries, Li-air
ional electroacti
exception o
oxidation i
by use an a
kinetics is fa
very pure g
sed a pro
he DMFC is
d an acidic e
se fuel cells
e specie (c
ng the sites
poison the
ntial due 8
l-air battery
erial, oxyge
the battery
volution re
by the form
e electrolyte
ic structure of a
n promise
nd high the
utomotive a
and Zn-air
ive materials: to
f DMFC tha
s the reac
alkaline elec
aster in alk
gases limits
oton-conduc
s a special
electrolyte b
s are sensi
oming as co
available fo
ORR electr
to its oxi
y is compos
n, is acces
y is strongly
action (OE
mation of m
e).144
a metal-air batte
of this tec
oretical ene
applications
r batteries
owards novel sa
at uses me
ction that
ctrolyte (ge
kaline than i
s its large-s
cting poly
form of fue
based in ph
itive to the
ontaminant
or reaction.
rocatalysts,
dation and
sed of a me
ssed from t
y influenced
ER) during
metal oxides
ery.
chnology o
ergy density
s (electrica
have attrac
aving and conve
thanol as fu
occurs in
enerally KO
in acidic ele
cale applica
mer mem
el cell base
hosphoric ac
CO poison
t in fuel stre140 Particula
since meth
d, consequ
etal anode a
the environ
d by the OR
g charge.
s or hydrox
over traditio
y (5200 Wh
al vehicles
cted the m
Fersion energy sy
uel, in all of
the anode
OH), which i
ectrolytes. N
ation. On th
brane (e.g
ed in PEM
cid.
ning that oc
eam) to the
arly in DMF
hanol at the
uently, dec
and an air c
ment (Figu
RR during d
The oxyge
xides (e.g.
onal batter
h kg-1), whic
).145 Amon
ost attentio
FCUP ystems
29
f these fuel
e. The AF
is an adva
Nonetheless
he other ha
g. Nafion®
technology
ccurs due t
active site o
FC, the met
cathode ca
crease the
cathode in w
ure 1.15).143
discharge an
en reductio
Li2O2 or L
ries is its
ch make of
ng all met
on, with the
l cells
FC is
ntage
s, the
nd, in ®) as
y. The
to the
of the
hanol
auses
e cell
which 3 The
nd by
on is
LiOH,
cost-
them
tal-air
e first
FCUP Functional electroactive materials: towards novel saving and conversion energy systems
30
having the potential to deliver the highest energy density.144 Nowadays, the
performance and applicability of these batteries are limited by the sensitivity to
contaminants from air (e.g. CO2) and electrolyte evaporation due to their open cathode
structure.
1.3 Objectives This thesis was devoted to the development of novel efficient systems in the
context of new technologies for energy saving and conversion. In the framework of
saving-energy technologies, the novel EC systems were based in poly[Ni(salen)]-type
polymer films and nanocomposites with inorganic nanomaterials. In the field of energy-
conversion, novel carbon-based materials were developed for the ORR
electrocatalysis.
The main objectives of the work were:
(i) to evaluate the EC behaviour of novel nickel salen-type polymers in order to
find promisor EC materials to assemble a prototype solid-state
electrochromic cell;
(ii) to investigate the effect of the incorporation of (a) metal oxides – WO3 and
TiO2 NPs – and (b) nitrogen-doped graphene in the electronic, optical and
morphological properties of a poly[Ni(salen)]-type polymer film, with the final
purpose to improve the EC properties of the pristine film;
(iii) to explore the potentialities of activated carbons prepared from a renewable
biomass source as novel efficient ORR electrocatalysts;
(iv) to examine the effect of different carbon-based supports on the ORR
electrocatalytic activity of several POM@carbon-based nanocomposites.
The Figure 1.16 illustrates the foray into the world of energy-related materials
within the framework of the present thesis, highlighting the possible applications of
electrochromic materials for energy-saving (Chapters 2 to 5) and the role of the oxygen
reduction reaction in the development of alternative efficient energy-conversion
technologies (Chapters 6 and 7), with practical impact in the human daily life. Several
materials, from the traditional nickel-salen complexes and polyoxometalates (Keggin-
type) to the metal oxides nanostructures and carbon-based materials (including carbon
nanomaterials), were considered as the core for the development of the new energy-
related systems and technologies.
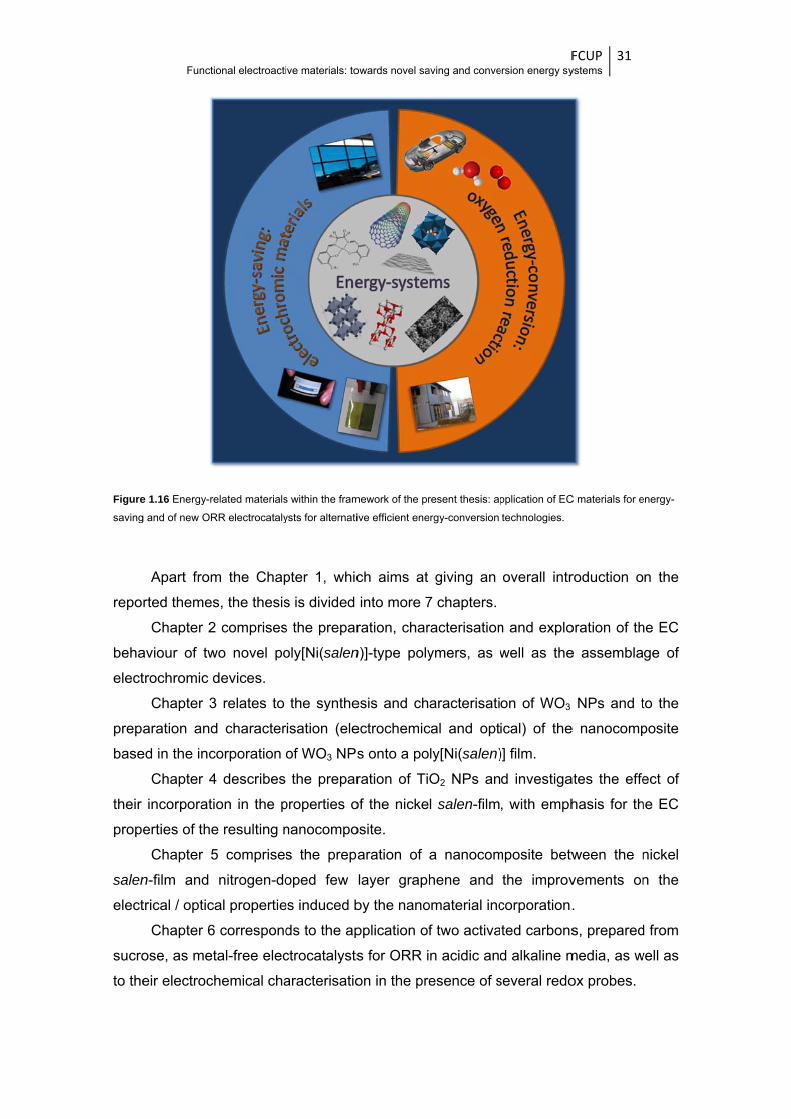
Figuresaving
repo
beha
elect
prepa
base
their
prope
salen
elect
sucro
to the
Functi
e 1.16 Energy-re
g and of new OR
Apart from
rted themes
Chapter 2
aviour of tw
trochromic d
Chapter 3
aration and
ed in the inc
Chapter 4
incorporati
erties of the
Chapter 5
n-film and
trical / optic
Chapter 6
ose, as met
eir electroch
ional electroacti
elated materials
RR electrocataly
m the Chap
s, the thesis
2 comprises
wo novel po
devices.
3 relates to
d character
corporation
4 describes
ion in the p
e resulting n
5 comprises
nitrogen-do
al propertie
6 correspond
tal-free elec
hemical cha
ive materials: to
s within the fram
ysts for alternati
pter 1, whic
s is divided
s the prepar
oly[Ni(salen
the synthe
risation (ele
of WO3 NPs
the prepar
properties o
nanocompo
s the prepa
oped few
es induced b
ds to the ap
ctrocatalysts
aracterisatio
owards novel sa
mework of the pr
ive efficient ene
ch aims at
into more 7
ration, char
n)]-type poly
esis and ch
ectrochemic
s onto a po
ration of Ti
of the nicke
osite.
aration of
layer graph
by the nano
pplication of
s for ORR i
on in the pre
aving and conve
resent thesis: ap
ergy-conversion
giving an
7 chapters.
racterisation
ymers, as w
aracterisati
cal and opt
ly[Ni(salen)
O2 NPs an
l salen-film
a nanocom
hene and
omaterial inc
f two activa
n acidic and
esence of s
Fersion energy sy
pplication of EC
technologies.
overall intr
n and explo
well as the
on of WO3
ical) of the
)] film.
d investiga
, with emph
mposite betw
the improv
corporation.
ted carbons
d alkaline m
several redo
FCUP ystems
31
C materials for e
roduction o
oration of th
e assembla
NPs and t
e nanocomp
ates the effe
hasis for th
ween the n
vements on
.
s, prepared
media, as w
ox probes.
energy-
n the
he EC
ge of
to the
posite
ect of
he EC
nickel
n the
d from
well as

FCUP Functional electroactive materials: towards novel saving and conversion energy systems
32
Chapter 7 describes the electrochemical characterisation of several
POM@carbon-based hybrids, prepared through the incorporation of a polyoxometalate
(PMo11V) on carbon black, CNTs and graphene, and the influence of the carbon
support in the electrocatalytic activity of the hybrids for ORR.
Chapter 8 is devoted to the overall conclusions and future perspectives.
The thesis also includes the Appendices A, B and C, in which the experimental
details on the electrochemical, spectroelectrochemical and other most common
characterisation techniques used are described.
The results described in Chapters 2 to 7 are based on 6 scientific papers, one of
which has been already published in refereed journals and the remaining have been
submitted.
FCUP Functional electroactive materials: towards novel saving and conversion energy systems
33
List of publications
Chapter 2 M. Nunes, M. Araújo, J. Fonseca, C. Moura, A. R. Hillman, C. Freire, “High-
performance electrochromic device based on poly[Ni(salen)]-type polymer films”.
Submitted.
Chapter 3 M. Nunes, C. Moura, A. R. Hillman, C. Freire, “Novel hybrid based in poly[Ni(salen)]
film and WO3 nanoparticles with electrochromic properties”. Submitted.
Chapter 4 M. Nunes, C. Moura, A. R. Hillman, C. Freire, “Multicolour electrochromic film based in
a TiO2@poly[Ni(salen)] nanocomposite with excellent electrochemical stability”.
Submitted.
Chapter 5 M. Nunes, M. Araújo, R. Bacsa, R. V. Ferreira, E. Castillejos, P. Serp, A. R. Hillman,
C. Freire, “N-doped graphene@poly[Ni(salen)] nanocomposite with outstanding
electrochromic properties”. Submitted.
Chapter 6 M. Nunes, I. M. Rocha, D. M. Fernandes, A. S. Mestre, C. N. Moura, A. P. Carvalho, M.
F. R. Pereira, C. Freire, “Sucrose-derived activated carbons: electron transfer
properties and application as oxygen reduction electrocatalysts”, RSC Adv. 2015, 5,
102919-102931. DOI: 10.1039/c5ra20874b.
Chapter 7 M. Nunes, D. Fernandes, I. Rocha, M. F. R. Pereira, I.-M. Mbomekalle, P. de Oliveira,
C. Freire, “Phosphomolybdate@carbon-based nanocomposites as electrocatalysts for
oxygen reduction”. Submitted.
FCUP Functional electroactive materials: towards novel saving and conversion energy systems
34
References
1 World Population Prospects: the 2015 revision; United Nations: New York, USA, http://esa.un.org/unpd/wpp/publications/files/key_findings_wpp_2015.pdf, accessed in January 2016.
2 ocean.nationalgeographic.com/oceancritical-issues-sea-level-rise/, accessed in January 2016. 3 Jacob, T.; Wahr, J.; Pfeffer, W. T.; Swenson, S. Nature 2012, 482, 514. 4 Harrould-Kolieb, E. R.; Herr, D. Clim. Policy 2012, 12, 378. 5 Basu, R.; Samet, J. M. Epidemiol. Rev. 2002, 24, 190. 6 Wang, D. W.; Su, D. S. Energy Environ. Sci. 2014, 7, 576. 7 Shi, L.; Chew, M. Y. L. Renew. Sust. Energ. Rev. 2012, 16, 192. 8 Katsounaros, I.; Cherevko, S.; Zeradjanin, A. R.; Mayrhofer, K. J. J. Angew. Chem.-Int. Edit.
2014, 53, 102. 9 Zhou, X. J.; Qiao, J. L.; Yang, L.; Zhang, J. J. Adv. Energy Mater. 2014, 4, 25. 10 Faber, M. S.; Jin, S. Energy Environ. Sci. 2014, 7, 3519. 11 Jiao, Y.; Zheng, Y.; Jaroniec, M. T.; Qiao, S. Z. Chem. Soc. Rev. 2015, 44, 2060. 12 Mortimer, R. J. Am. Scientist 2013, 101, 38. 13 Caglar, A.; Cengiz, U.; Yildirim, M.; Kaya, I. Appl. Surf. Sci. 2015, 331, 262. 14 Thakur, V. K.; Ding, G. Q.; Ma, J.; Lee, P. S.; Lu, X. H. Adv. Mater. 2012, 24, 4071. 15 Mortimer, R. J. Annu. Rev. Mater. Res. 2011, 41; 241. 16 Skotheim, T. A.; Reynolds, J. R. Conjugated Polymers - Theory, Synthesis, Properties and
Characterization; Third ed.; CRC Press, Taylor & Francis Group: USA, 2007. 17 Fletcher, S. J. Solid State Electrochem. 2015, 19, 3305. 18 Platt, J. R. J. Chem. Phys. 1961, 34, 862. 19 Monk, P. M. S.; Mortimer, R. J.; Rosseinsky, D. R. Electrochromism and Electrochromic Devices;
Cambridge University Press: New York, 2007. 20 Deb, S. K. Appl. Opt. 1969, 8 Suppl 1, 192. 21 Deb, S. K. Philos. Mag. 1973, 27, 801. 22 Granqvist, C. G. Sol. Energy Mater. Sol. Cells 2012, 99, 1. 23 Mohapatra, S. K. J. Electrochem. Soc. 1978, 125, 284. 24 Ronlan, A.; Coleman, J.; Hammeric.O; Parker, V. D. J. Am. Chem. Soc. 1974, 96, 845. 25 Kaufman, F. B.; Schroeder, A. H.; Engler, E. M.; Patel, V. V. Appl. Phys. Lett. 1980, 36, 422. 26 Kanazawa, K. K.; Diaz, A. F.; Geiss, R. H.; Gill, W. D.; Kwak, J. F.; Logan, J. A.; Rabolt, J. F.;
Street, G. B. J. Chem. Soc.-Chem. Commun. 1979, 854. 27 Beaujuge, P. M.; Reynolds, J. R. Chem. Rev. 2010, 110, 268. 28 Beaujuge, P. M.; Vasilyeva, S. V.; Liu, D. Y.; Ellinger, S.; McCarley, T. D.; Reynolds, J. R. Chem.
Mat. 2012, 24, 255. 29 Yang, C.; Wei, H.; Guan, L.; Guo, J.; Wang, Y.; Yan, X.; Zhang, X.; Wei, S.; Guo, Z. J. Mater.
Chem. A 2015, 3, 14929. 30 Chang, I. F.; Gilbert, B. L.; Sun, T. I. J. Electrochem. Soc. 1975, 122, 955. 31 MacDiarmid, A. G. Rev. Mod. Phys. 2001, 73, 701. 32 Hall, N. Chem. Commun. 2003, 1. 33 Li, C.; Bai, H.; Shi, G. Chem. Soc. Rev. 2009, 38, 2397. 34 Zmija, J.; Matachowski, M. J. Journal of Achievements in Materials and Manufacturing
Engineering 2011, 48, 14 35 Bredas, J. L.; Scott, J. C.; Yakushi, K.; Street, G. B. Phys. Rev. B 1984, 30, 1023. 36 Tedim, J.; Patricio, S.; Fonseca, J.; Magalhaes, A. L.; Moura, C.; Hillman, A. R.; Freire, C. Synth.
Met. 2011, 161, 680. 37 Dyer, A. L.; Craig, M. R.; Babiarz, J. E.; Kiyak, K.; Reynolds, J. R. Macromolecules 2010, 43,
4460.
FCUP Functional electroactive materials: towards novel saving and conversion energy systems
35
38 Bulloch, R. H.; Kerszulis, J. A.; Dyer, A. L.; Reynolds, J. R. ACS Appl. Mater. Interfaces 2015, 7,
1406. 39 Kurtay, G.; Ak, M.; Gullu, M.; Toppare, L.; Ak, M. S. Synth. Met. 2014, 194, 19. 40 Chang, K. H.; Wang, H. P.; Wu, T. Y.; Sun, I. W. Electrochim. Acta 2014, 119, 225. 41 Yang, C. H.; Chih, Y. K.; Wu, W. C.; Chen, C. H. Electrochem. Solid State Lett. 2006, 9, C5. 42 Xiong, S. X.; Wei, J.; Jia, P. T.; Yang, L. P.; Ma, J.; Lu, X. H. ACS Appl. Mater. Interfaces 2011, 3,
782. 43 Fonseca, J.; Tedim, J.; Biernacki, K.; Magalhaes, A. L.; Gurman, S. J.; Freire, C.; Hillman, A. R.
Electrochim. Acta 2010, 55, 7726. 44 Holliday, B. J.; Swager, T. M. Chem. Commun. 2005, 23. 45 Schiff, H. Ann. Suppl. 1864, 3, 343. 46 Baleizao, C.; Garcia, H. Chem. Rev. 2006, 106, 3987. 47 Cozzi, P. G. Chem. Soc. Rev. 2004, 33, 410. 48 VilasBoas, M.; Freire, C.; deCastro, B.; Christensen, P. A.; Hillman, A. R. Inorg. Chem. 1997, 36,
4919. 49 Goldsby, K. A. J. Coord. Chem. 1988, 19, 83. 50 Goldsby, K. A.; Blaho, J. K.; Hoferkamp, L. A. Polyhedron 1989, 8, 113. 51 Bedioui, F.; Labbe, E.; Gutierrezgranados, S.; Devynck, J. J. Electroanal. Chem. 1991, 301, 267. 52 Audebert, P.; Capdevielle, P.; Maumy, M. New J. Chem. 1991, 15, 235. 53 Audebert, P.; Capdevielle, P.; Maumy, M. Synth. Met. 1991, 43, 3049. 54 Audebert, P.; Capdevielle, P.; Maumy, M. New J. Chem. 1992, 16, 697. 55 Audebert, P.; Hapiot, P.; Capdevielle, P.; Maumy, M. J. Electroanal. Chem. 1992, 338, 269. 56 Dahm, C. E.; Peters, D. G. Anal. Chem. 1994, 66, 3117. 57 Dahm, C. E.; Peters, D. G. J. Electroanal. Chem. 1996, 406, 119. 58 Dahm, C. E.; Peters, D. G.; Simonet, J. J. Electroanal. Chem. 1996, 410, 163. 59 Tedim, J.; Carneiro, A.; Bessada, R.; Patricio, S.; Magalhaes, A. L.; Freire, C.; Gurman, S. J.;
Hillman, A. R. J. Electroanal. Chem. 2007, 610, 46. 60 Vilas-Boas, M.; Henderson, M. J.; Freire, C.; Hillman, A. R.; Vieil, E. Chem.-Eur. J. 2000, 6, 1160. 61 Vilas-Boas, M.; Freire, C.; de Castro, B.; Christensen, P. A.; Hillman, A. R. Chem.-Eur. J. 2001, 7,
139. 62 Vilas-Boas, M.; Santos, I. C.; Henderson, M. J.; Freire, C.; Hillman, A. R.; Vieil, E. Langmuir 2003,
19, 7460. 63 Pinheiro, C.; Parola, A. J.; Pina, F.; Fonseca, J.; Freire, C. Sol. Energy Mater. Sol. Cells 2008, 92,
980. 64 Branco, A.; Pinheiro, C.; Fonseca, J.; Tedim, J.; Carneiro, A.; Parola, A. J.; Freire, C.; Pina, F.
Electrochem. Solid State Lett. 2010, 13, J114. 65 Reddy, B. N.; Deepa, M.; Joshi, A. G.; Srivastava, A. K. J. Phys. Chem. C 2011, 115, 18354. 66 Janaky, C.; de Tacconi, N. R.; Chanmanee, W.; Rajeshwar, K. J. Phys. Chem. C 2012, 116,
4234. 67 Guo, F. J.; Mi, H. Y.; Zhou, J. P.; Zhao, Z. B.; Qiu, J. S. Carbon 2015, 95, 323. 68 Abdulla, S.; Mathew, T. L.; Pullithadathil, B. Sens. Actuator B-Chem. 2015, 221, 1523. 69 Eren, E.; Celik, G.; Uygun, A.; Tabaciarova, J.; Omastova, M. Synth. Met. 2012, 162, 1451. 70 Choi, M.; Yong, K. Nanoscale 2014, 6, 13900. 71 Silva, E.; La Porta, F. A.; Liu, M. S.; Andres, J.; Varela, J. A.; Longo, E. Dalton Trans. 2015, 44,
3159. 72 Wei, H. G.; Yan, X. R.; Wu, S. J.; Luo, Z. P.; Wei, S. Y.; Guo, Z. H. J. Phys. Chem. C 2012, 116,
25052. 73 Cushing, B. L.; Kolesnichenko, V. L.; O'Connor, C. J. Chem. Rev. 2004, 104, 3893. 74 Pereira, C.; Pereira, A. M.; Fernandes, C.; Rocha, M.; Mendes, R.; Fernandez-Garcia, M. P.;
Guedes, A.; Tavares, P. B.; Greneche, J. M.; Araujo, J. P.; Freire, C. Chem. Mat. 2012, 24, 1496. 75 Kulal, A. B.; Dongare, M. K.; Umbarkar, S. B. Appl. Catal. B-Environ. 2016, 182, 142.
FCUP Functional electroactive materials: towards novel saving and conversion energy systems
36
76 Zhang, W. X.; Wang, H.; Zhang, Y. M.; Yang, Z. H.; Wang, Q.; Xia, J. F.; Yang, X. N. Electrochim.
Acta 2013, 113, 63. 77 Zhang, Z. G.; Huang, Z. F.; Cheng, X. D.; Wang, Q. L.; Chen, Y.; Dong, P. M.; Zhang, X. W. Appl.
Surf. Sci. 2015, 355, 45. 78 Wang, L.; Lu, X. P.; Lei, S. B.; Song, Y. H. J. Mater. Chem. A 2014, 2, 4491. 79 Novoselov, K. S.; Geim, A. K.; Morozov, S. V.; Jiang, D.; Zhang, Y.; Dubonos, S. V.; Grigorieva, I.
V.; Firsov, A. A. Science 2004, 306, 666. 80 Reina, A.; Jia, X. T.; Ho, J.; Nezich, D.; Son, H. B.; Bulovic, V.; Dresselhaus, M. S.; Kong, J. Nano
Lett. 2009, 9, 30. 81 Takagi, S.; Makuta, S.; Veamatahau, A.; Otsuka, Y.; Tachibana, Y. J. Mater. Chem. 2012, 22,
22181. 82 Janaky, C.; Rajeshwar, K. Prog. Polym. Sci. 2015, 43, 96. 83 Padilla, J.; Osterholm, A. M.; Dyer, A. L.; Reynolds, J. R. Sol. Energy Mater. Sol. Cells 2015, 140,
54. 84 Amb, C. M.; Dyer, A. L.; Reynolds, J. R. Chem. Mat. 2011, 23, 397. 85 Jensen, J.; Hosel, M.; Dyer, A. L.; Krebs, F. C. Adv. Funct. Mater. 2015, 25, 2073. 86 Zhang, J. H.; Tu, J. P.; Zhou, D.; Tang, H.; Li, L.; Wang, X. L.; Gu, C. D. J. Mater. Chem. C 2014,
2, 10409. 87 www.gentex.com, accessed in January 2016. 88 Granqvist, C. G. Thin Solid Films 2014, 564, 1. 89 www.gesimat.de, accessed in January 2016. 90 www.sageglass.com/technology/, accessed in January 2016. 91 www.chromogenics.com, accessed in January 2016. 92 Heinkenfeld, J.; Drzaic, P.; Yeo, J.-S.; Koch, T. J. Soc. Inf. Display 2011, 19, 129. 93 Österholm, A. M.; Shen, D. E.; Kerszulis, J. A.; Bullock, R. H.; Kuepfert, M.; Dyer, A. L.; Reynolds,
J. R. ACS Appl. Mater. Interfaces 2015, 7, 1413. 94 Remmele, J.; Shen, D. E.; Mustonen, T.; Fruehauf, N. ACS Appl. Mater. Interfaces 2015, 7,
12001. 95 www.ynvisible.com, accessed in January 2016. 96 Invernale, M. A.; Ding, Y.; Sotzing, G. A. ACS Appl. Mater. Interfaces 2010, 2, 296. 97 Carpi, F.; De Rossi, D. Opt. Laser Technol. 2006, 38, 292. 98 Kraft, A.; Rottmann, M. Sol. Energy Mater. Sol. Cells 2009, 93, 2088. 99 Tung, T. S.; Ho, K. C. Sol. Energy Mater. Sol. Cells 2006, 90, 521. 100 Kuo, T. H.; Hsu, C. Y.; Lee, K. M.; Ho, K. C. Sol. Energy Mater. Sol. Cells 2009, 93, 1755. 101 Agnihotry, S. A.; Pradeep; Sekhon, S. S. Electrochim. Acta 1999, 44, 3121. 102 Tehrani, P.; Isaksson, J.; Mammo, W.; Andersson, M. R.; Robinson, N. D.; Berggren, M. Thin
Solid Films 2006, 515, 2485. 103 Kim, D. W.; Li, O. L.; Saito, N. Phys. Chem. Chem. Phys. 2015, 17, 407. 104 Zhu, C. Z.; Dong, S. J. Nanoscale 2013, 5, 1753. 105 Shi, H.; Shen, Y. F.; He, F.; Li, Y.; Liu, A. R.; Liu, S. Q.; Zhang, Y. J. J. Mater. Chem. A 2014, 2,
15704. 106 Daems, N.; Sheng, X.; Vankelecom, I. F. J.; Pescarmona, P. P. J. Mater. Chem. A 2014, 2, 4085. 107 Panomsuwan, G.; Saito, N.; Ishizaki, T. Phys. Chem. Chem. Phys. 2015, 17, 6227. 108 Tao, G. J.; Zhang, L. X.; Chen, L. S.; Cui, X. Z.; Hua, Z. L.; Wang, M.; Wang, J. C.; Chen, Y.; Shi,
J. L. Carbon 2015, 86, 108. 109 Guo, C. Z.; Liao, W. L.; Li, Z. B.; Chen, C. G. Carbon 2015, 85, 279. 110 Wang, C.; Markovic, N. M.; Stamenkovic, V. R. ACS Catal. 2012, 2, 891. 111 Stephens, I. E. L.; Bondarenko, A. S.; Gronbjerg, U.; Rossmeisl, J.; Chorkendorff, I. Energy
Environ. Sci. 2012, 5, 6744. 112 Qu, L. T.; Liu, Y.; Baek, J. B.; Dai, L. M. ACS Nano 2010, 4, 1321. 113 Chen, S.; Bi, J. Y.; Zhao, Y.; Yang, L. J.; Zhang, C.; Ma, Y. W.; Wu, Q.; Wang, X. Z.; Hu, Z. Adv.
Mater. 2012, 24, 5593.
FCUP Functional electroactive materials: towards novel saving and conversion energy systems
37
114 Trogadas, P.; Fuller, T. F.; Strasser, P. Carbon 2014, 75, 5. 115 Shen, A.; Zou, Y.; Wang, Q.; Dryfe, R. A. W.; Huang, X.; Dou, S.; Dai, L.; Wang, S. Angew.
Chem.-Int. Ed. 2014, 53, 10804. 116 Tuci, G.; Zafferoni, C.; Rossin, A.; Milella, A.; Luconi, L.; Innocenti, M.; Phuoc, L. T.; Cuong, D. V.;
Cuong, P. H.; Giambastian, G. Chem. Mat. 2014, 26, 3460. 117 Vikkisk, M.; Kruusenberg, I.; Ratso, S.; Joost, U.; Shulga, E.; Kink, I.; Rauwel, P.; Tammeveski, K.
RSC Adv. 2015, 5, 59495. 118 Wu, J. J.; Ma, L. L.; Yadav, R. M.; Yang, Y. C.; Zhang, X.; Vajtai, R.; Lou, J.; Ajayan, P. M. ACS
Appl. Mater. Interfaces 2015, 7, 14763. 119 Song, M. Y.; Park, H. Y.; Yang, D. S.; Bhattacharjya, D.; Yu, J. S. ChemSusChem 2014, 7, 1755. 120 Li, J. P.; Wang, S. G.; Ren, Y. Q.; Ren, Z. H.; Qiu, Y. J.; Yu, J. Electrochim. Acta 2014, 149, 56. 121 Chen, P.; Wang, L. K.; Wang, G.; Gao, M. R.; Ge, J.; Yuan, W. J.; Shen, Y. H.; Xie, A. J.; Yu, S.
H. Energy Environ. Sci. 2014, 7, 4095. 122 Yuan, Y.; Zhou, S. G.; Zhuang, L. J. Power Sources 2010, 195, 3490. 123 Charreteur, F.; Jaouen, F.; Ruggeri, S.; Dodelet, J. P. Electrochim. Acta 2008, 53, 2925. 124 Cheng, Y. H.; Li, W. Y.; Fan, X. Z.; Liu, J. G.; Xu, W. G.; Yan, C. W. Electrochim. Acta 2013, 111,
635. 125 Liang, Y. Y.; Li, Y. G.; Wang, H. L.; Zhou, J. G.; Wang, J.; Regier, T.; Dai, H. J. Nat. Mater. 2011,
10, 780. 126 Jiang, Y. Y.; Lu, Y. Z.; Wang, X. D.; Bao, Y.; Chen, W.; Niu, L. Nanoscale 2014, 6, 15066. 127 Fernandes, D. M.; Barbosa, A. D. S.; Pires, J.; Balula, S. S.; Cunha-Silva, L.; Freire, C. ACS Appl.
Mater. Interfaces 2013, 5, 13382. 128 Long, D. L.; Burkholder, E.; Cronin, L. Chem. Soc. Rev. 2007, 36, 105. 129 Liu, S. Q.; Tang, Z. Y. Nano Today 2010, 5, 267. 130 Long, D. L.; Tsunashima, R.; Cronin, L. Angew. Chem.-Int. Edit. 2010, 49, 1736. 131 Fernandes, D. M.; Simoes, S. M. N.; Carapuca, H. M.; Cavaleiro, A. M. V. Electrochim. Acta
2008, 53, 6580. 132 Fernandes, D. M.; Freire, C. ChemElectroChem 2015, 2, 269. 133 Keita, B.; Nadjo, L. In Electrochemistry of Polyoxometalates, in Encyclopedia of Electrochemistry;
Bard, A. J., Stratmann, M., Eds.; Wiley-VCH, 2006. 134 Couto, F.; Cavaleiro, A. M. V.; de Jesus, J. D. P.; Simao, J. E. J. Inorg. Chim. Acta 1998, 281,
225. 135 Sadakane, M.; Steckhan, E. Chem. Rev. 1998, 98, 219. 136 Liu, F. F.; Peng, H. L.; You, C. H.; Fu, Z. Y.; Huang, P. Y.; Song, H. Y.; Liao, S. J. Electrochim.
Acta 2014, 138, 353. 137 Bard, A. J.; Faulkner, L. R. Electrochemical Methods: Fundamentals and Applications; Wiley:
New York, 2001. 138 Yuan, C. Z.; Wu, H. B.; Xie, Y.; Lou, X. W. Angew. Chem.-Int. Edit. 2014, 53, 1488. 139 Zheng, Y.; Jiao, Y.; Jaroniec, M.; Jin, Y. G.; Qiao, S. Z. Small 2012, 8, 3550. 140 Carrette, L.; Friedrich, K. A.; Stimming, U. ChemPhysChem 2000, 1, 162. 141 Wang, Y.; Chen, K. S.; Mishler, J.; Cho, S. C.; Adroher, X. C. Appl. Energy 2011, 88, 981. 142 Debe, M. K. Nature 2012, 486, 43. 143 Laoire, C. O.; Mukerjee, S.; Abraham, K. M.; Plichta, E. J.; Hendrickson, M. A. J. Phys. Chem. C
2009, 113, 20127. 144 Cao, R.; Lee, J. S.; Liu, M. L.; Cho, J. Adv. Energy Mater. 2012, 2, 816. 145 Li, Q.; Mahmood, N.; Zhu, J. H.; Hou, Y. L.; Sun, S. H. Nano Today 2014, 9, 668.

FCUP Functional electroactive materials: towards novel saving and conversion energy systems
38

In
the woorld of energyy-savinng…

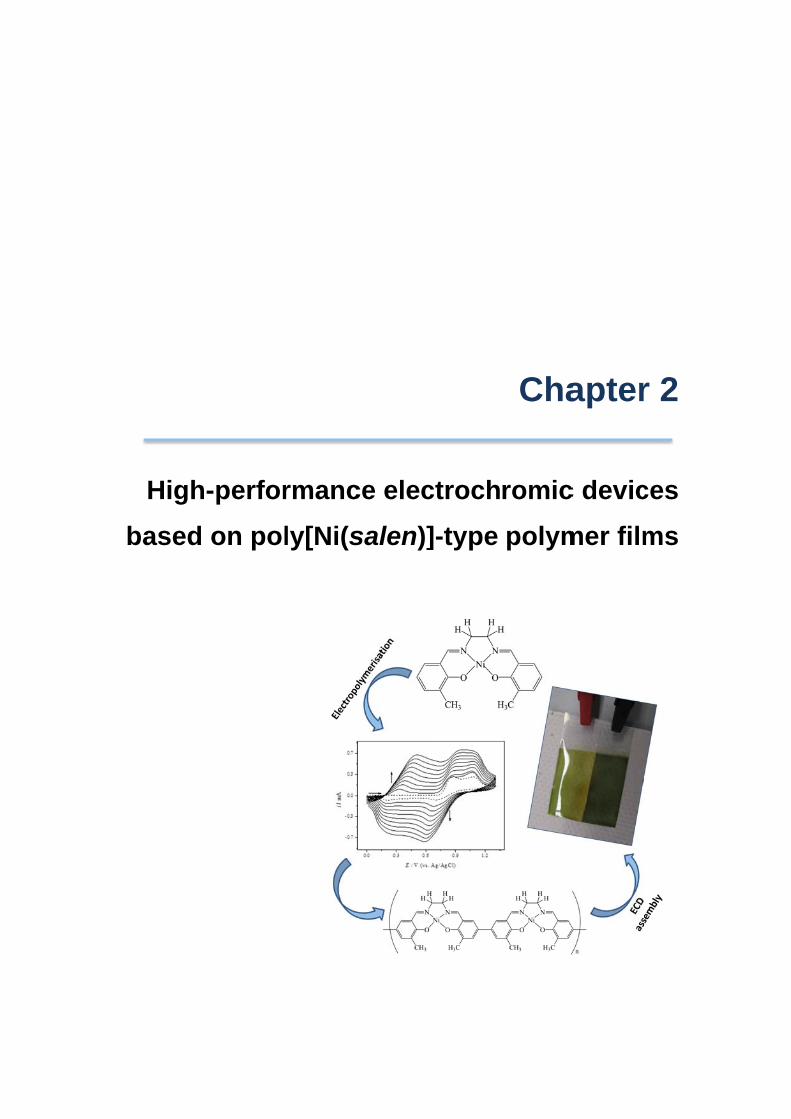
ba
High-ased o
perforon pol
rmancly[Ni(s
ce elecsalen)]
ctroch]-type
Cha
romicpolym
apter
c devicmer film
r 2
ces ms

2 High-performance electrochromic devices
based on poly[Ni(salen)]-type polymer films1,2,3
Abstract
In this chapter it is described the application of two poly[Ni(salen)]-type
electroactive polymer films as new electrochromic materials. The two films, poly[Ni(3-
Mesalen)] (poly[1]) and poly[Ni(3-MesaltMe)] (poly[2]), were successfully
electrodeposited onto ITO/PET flexible substrates and their voltammetric
characterisation revealed that poly[1] showed similar redox profiles in LiClO4/CH3CN
and LiClO4/propylene carbonate (PC), while poly[2] showed solvent dependent
electrochemical responses. Both films showed polyelectrochromic behaviour, exhibiting
yellow, green and russet colours according to their oxidation state, and promising
electrochromic properties with high electrochemical stability in LiClO4/PC supporting
electrolyte. In particular, poly[1] exhibited a very good electrochemical stability
changing colour between yellow and green (λ = 750 nm) during 9000 redox cycles,
with a charge loss of 34.3 %, an optical contrast of ΔT = 26.2 % and an optical density
of ΔOD = 0.49, with a colouration efficiency of η = 75.55 cm2 C-1. On the other hand,
poly[2] showed good optical contrast for the colour change from green to russet (ΔT
= 58.5 %), although with moderate electrochemical stability. Finally, poly[1] was used
to fabricate electrochromic devices using lateral configuration with two figures of merit:
a simple shape (typology 1) and a butterfly shape (typology 2); typology 1 showed the
best performance with optical contrast ΔT = 88.7 % (at λ = 750 nm), colouration
efficiency η = 130.4 cm2 C-1 and charge loss of 37.0 % upon 3000 redox cycles.
1 Adapted from: M. Nunes, M. Araújo, J. Fonseca, C. Moura, A. R. Hillman, C. Freire, High-performance electrochromic
devices based on poly[Ni(salen)]-type polymer films. Submitted. 2 M. Nunes’s contribution to the publication: preparation and characterisation of the poly[Ni(salen)] films, evaluation of
the electrochromic properties, assemble and characterisation of the electrochromic devices and manuscript preparation. 3 The experimental details on the electrochemical/spectroelectrochemical and characterisation techniques are indicated
in Appendices A and C, respectively.

FCUP Functional electroactive materials: towards novel saving and conversion energy systems
44
2.1 Introduction
Among the several known electrochromic materials, conducting polymers have
attracted particular attention due to their multichromism, good EC properties, thin film
mechanical flexibility and cost effectiveness.1-3 In fact, several works have been
reported the EC behaviour of the polypyrrole,4-6 polyaniline (PANI),7 polythiophene8,9
and their derivatives, as well as the fabrication of efficient complementary ECDs
comprising CPs (e.g. polythiophene-derivatives@PANI10,11 and
polypyrrole@polythiophene-derivatives12).
Electroactive poly[M(salen)]-type films (M = transition metal) are a special class
of CPs, formed through the oxidative polymerisation of transition metal complexes with
salen-type ligands onto the electrode surface,13 which exhibit poly(phenylene)-like
properties, with the transition cations acting as a bridge between the phenyl rings.14
Their potential application as EC materials has been explored by Freire’s group.15,16
The colorimetric properties of polymers based on salen-type complexes of Cu(II), Ni(II)
and Pd(II) deposited over transparent flexible electrodes of polyethylene terephthalate
coated with indium tin oxide (ITO/PET) were first studied by Pinheiro et al.,15 using the
CIELAB coordinates and spectroelectrochemical studies. More recently, Branco et al.16
studied other series of [M(salen)]-derived electroactive films and selected materials
were chosen to build homemade ECDs, whose preliminary performance was also
assessed. The reported results addressed some promising EC properties for the
poly[M(salen)] films in terms of colour changes and optical contrasts, but they showed
moderate electrochemical stabilities which is one of the drawbacks for technological
applications. Nevertheless, the results showed that the synthetic versatility of the metal
salen complexes (by the introduction of different substituents into the salen skeleton or
by using different metal centres) allowed fine tuning of the final EC features of the
resulting polymeric systems, providing important guidelines for film molecular design
optimisation.
These observations motivated more detailed studies in order to achieve other
poly[M(salen)]-type films with improved EC performance and electrochemical stability.
Consequently, in this chapter it is described the preparation and study of two novel
electrochromic systems based on the electroactive polymers: poly[Ni(3-Mesalen)],
poly[1] ([Ni(3-Mesalen)] = N,N’-bis(3-methylsalicylideneiminate) nickel(II)), and
poly[Ni(3-MesaltMe)], poly[2] ([Ni(3-MesaltMe)] = N,N’-2,3-dimethylbutane-2,3-dyil-
bis(3-methylsalicylideneiminate) nickel(II)), which differ on the absence/presence of
methyl substituents in the imine bridge, respectively. The influence of two electrolyte
solutions – LiClO4/CH3CN or LiClO4/PC – on the redox and optical properties of the
FCUP Functional electroactive materials: towards novel saving and conversion energy systems
45
films was explored. The EC properties (switching times, optical contrasts and densities,
colouration efficiencies and electrochemical stabilities) of both films were evaluated in
full detail, and used as guidance to choose poly[1] as the polymeric film with the best
EC properties for ECD fabrication with flexible substrates, using a lateral configuration
with two figures of merit: simple lateral assemblage and butterfly shape. The described
work corresponds to a step forward in the design of EC materials and devices
fabrication based in poly[M(salen)] films, since poly[1] surpassed all the previous EC
metallopolymers analogues and are competitive with other EC materials for application
in electronic devices.
2.2 Experimental section 2.2.1 Materials and solvents The complexes N,N’-bis(3-methylsalicylideneiminate) nickel(II), [Ni(3-Mesalen)],
and N,N’-2,3-dimethylbutane-2,3-dyil-bis(3-methylsalicylideneiminate) nickel(II), [Ni(3-
MesaltMe)], and respective salen ligands were prepared by methods described in the
literature.17 Acetonitrile and propylene carbonate (Romil, pro analysis grade), LiClO4
(Aldrich, purity 99 %) and poly(methylmethacrylate) (PMMA, Aldrich) were used as
received.
2.2.2 Preparation and characterisation of polymeric films
The poly[Ni(salen)] films were deposited potentiodynamically from corresponding
monomer solutions (1.0 mmol dm-3 [Ni(salen)] in 0.1 mol dm-3 LiClO4/CH3CN), by
cycling the potential of the working electrode (ITO/PET 3.0 cm2) between 0.0 and 1.3
V, at the scan rate of 0.020 V s-1, during 10 cycles; other conditions are specified in the
corresponding text and figure legends.
After film deposition, the modified electrodes were rinsed with dry CH3CN,
immersed in monomer-free 0.1 mol dm-3 LiClO4/CH3CN or LiClO4/PC solutions and
cycled voltammetrically in the potential ranges 0.0 – 1.3 V or 0.0 – 1.4 V, at 0.020 V s-1.
The electroactive surface coverage, Γ / μmol cm-2, of each film was determined by a
coulometric assay,18,19 using cyclic voltammograms (CVs) obtained in monomer-free
0.1 mol dm-3 LiClO4/CH3CN solution at the scan rate of v = 0.010 V s-1, to ensure
complete film redox conversion. The doping level (n) values used for Γ determination
were calculated from comparison of coulometric data for films deposition and cycling,
as described in literature,18,19 and were found to be n = 0.69 and 0.08 for poly[1] and
poly[2], respectively.
FCUP Functional electroactive materials: towards novel saving and conversion energy systems
46
The monitoring of the redox process by in situ UV-Vis spectroscopy was
performed with films prepared with 5 electrodeposition cycles. The films were
subsequently cycled five times between -0.1 and 1.3 V, at v = 0.020 V s-1, using
monomer-free LiClO4/CH3CN or LiClO4/PC 0.1 mol dm-3 solutions. The UV-Vis spectra
were acquired simultaneously at 0.5 s intervals, in the wavelength range of 315 – 1100
nm. The molar extinction coefficients, ε / cm-1 mol-1 dm3, of all observed electronic
bands were estimated using a combination of the Beer-Lambert and Faraday laws
(Equation 2.1):18-20
Abs(λ) = ε (λ) Q / nFA (2.1)
where Q is the charge (C), n is the doping level, F is the Faraday constant and A the
electrode area (cm2).
Films for SEM/EDS and XPS analysis were prepared with 10 and 15 cycles and
the reduced and oxidised states were achieved by the application of 0.0 or 1.3 V,
during 300 s, in a monomer-free LiClO4/CH3CN 0.1 mol dm-3 solution, after the
electrodeposition. For poly[1] were also studied by XPS reduced and oxidised films in
LiClO4/PC 0.1 mol dm-3.
2.2.3 Electrochromic properties evaluation
The EC properties of the films were explored by a double potential step method
(chronoamperometry) coupled with UV-Vis spectroscopy (chronoabsorptometry). The
studies were performed in 0.1 mol dm-3 LiClO4/CH3CN or LiClO4/PC solutions,
considering two possible colour transitions: yellow ↔ green and green ↔ russet. In the
double potential step experiment, the potential was set at the initial potential value
(E = 0.0 or 0.7 V, according to the colour change) for a period of time of 50 s and was
stepped to a second potential (E = 0.7, 1.3 or 1.15 V) for another period of 50 s, being
after switched back to the initial potential. The simultaneous chronoabsorptometric
measurements were performed at the fixed wavelengths of λ = 510 nm (green ↔
russet) and λ = 750 nm (yellow ↔ green), acquiring the UV-Vis spectra at intervals of
1 s, during 4 redox cycles. The films used in these studies were electrodeposited using
5 potentiodynamic cycles.
Electrochemical stability tests were performed by chronoamperometry, using the
same experimental conditions, but over extended time intervals (400 – 9000 redox
cycles, ca. 11 hours – 11 days). The films used in these studies were prepared with 10
electrodeposition cycles.
FCUP Functional electroactive materials: towards novel saving and conversion energy systems
47
The colouration efficiency, η, and the change of the optical density, ΔOD,
parameters were estimated through Equation 1.1. The switching times were
determined considering 90 % of the full switch.1,21
2.2.4 Fabrication and characterisation of electrochromic devices
ECDs were built using as EC material poly[1] films electrodeposited on flexible
substrates of ITO/PET (4.5 x 3.0 cm2). The devices were assembled in lateral
configuration, with the electrodes side-by-side, in two different typologies: typology 1,
with a simple shape, and typology 2, with a butterfly shape. Both electrodes are based
in the same EC material and, in case of the device of typology 2, one of the electrodes
corresponds to the butterfly inside area, while the other corresponds to the butterfly
outside area.
Following film deposition, the ECDs were assembled by making a cut under the
film and ITO surface, in order to define the limits of each electrode and prevent
electrical contact between each part. The cut is a simple vertical line in case of ECD of
typology 1 and corresponds to the butterfly shape for device of typology 2. Then, a
layer of a PMMA-based electrolyte was put over both electrodes.
The poly[1] films employed were electrodeposited potentiodynamically in the
potential range 0.3 to 1.5 V, at v = 0.020 V s-1, for 10 cycles and with slow stirring, in
the two compartment cell. The electrolyte was a semi-solid polymeric electrolyte based
in PMMA, prepared by a procedure adapted from literature.22 Briefly, a mixture of
PMMA (7 %), LiClO4 (3 %), CH3CN (58 %) and PC (32 %) (% m/m) was stirred during
about 20 hours, at room temperature, to yield a translucent and malleable gel.
The ECD of typology 1 was characterised by chronoamperometry, during 3000
redox cycles, applying potential pulses of 200 s, with potential alternating between -1.0
and 1.0 V (colour transition yellow ↔ green). During the first 1000 redox cycles, the
experiment was monitored by UV-Vis spectroscopy (chronoabsorptometry), at λ = 750
nm. The ECD of typology 2 was also characterised by chronoamperometry, but
applying potential pulses of 100 s, with potential alternating between -1.1 and -0.25 V
(yellow ↔ green). Note that these potential values are, in reality, potential differences
between the two electrodes; since there is no reference electrode, potential values are
not directly placed on an absolute scale.

2.3
[Ni(s
summ
Figuresolutio
respec
and
respe
of ol
scan
peak
corre
seco
the [N
durin
durin
to th
scan
peak
by th
the p
-0.7
-0.3
0.0
0.3
0.7
i / m
A
Functi
Results 2.3.1 ElecThe volta
salen)] com
marised in T
e 2.1 CVs of the
ons of complexe
ctive [Ni(salen)]
In the firs
one peak
ectively, wh
igomers/po
n, two peak
k at Epc = 0
espond to t
ond and sub
Ni(3-Mesale
ng the prev
ng the subs
e oxidation
n it is possib
The growt
ks correspo
he visual ins
process.
0.0 0
7
3
0
3
7
I'
ional electroacti
and discctrochemicmmetric re
plexes are
Table 2.1.
e electrodeposit
es in LiClO4/CH3
complex.
t anodic ha
at Epa = 0.
hich are att
olymer in th
ks are detec
0.64 with a
he reductio
bsequent vo
en)] system
vious cycle(
sequent sca
of monom
ble to disting
th of both po
nding to th
spection of
0.3 0.6
III'
E / V (vs. Ag
I
ive materials: to
cussioncal preparatsponses ob
depicted i
ion of (a) [Ni(3-
3CN 0.1 mol dm
alf-cycle, tw
.99 V for [N
ributed to t
e vicinity o
cted at Epc
slight inflec
on of film de
oltammetric
m. This is as
s).23,24 In th
ans appear
er shows n
guish three
olymers is p
e oxidation
a green film
0.9 1
IVIII
g/AgCl)
owards novel sa
tion and chbtained dur
n Figure 2
Mesalen)] and (
m-3, at 0.020 V s
wo peaks ar
Ni(3-Mesale
the oxidatio
of the worki
= 0.69 an
ction at Epc
eposited in
c cycles, a
ssigned to th
he case of
at Epa = 0.5
now a slight
peaks at Ep
proved by th
and reduc
m deposited
1.2-0.4
-0.2
0.0
0.2
0.4
0.6
i / m
A
(a)
aving and conve
haracterisaring the ele
.1 and the
(b) [Ni(3-Mesalt
s-1 during 10 cy
re observed
en)] and [N
on of monom
ng electrod
d 0.20 V fo
c = 0.50 V f
the preced
new peak a
he oxidation
[Ni(3-Mesa
59 and 0.68
t inflexion a
pc = 0.87, 0
he increasin
ction of film
d on the elec
0.0 0.3
Fersion energy sy
ation of polectropolyme
peak pote
tMe)] complexes
cles. Inset: che
d at Epa = 0
Ni(3-MesaltM
mers, result
de surface.1
or [Ni(3-Me
for [Ni(3-Me
ding anodic
appears at
n of polyme
altMe)], the
8 V and the
at Epa = 1.1
.58 and 0.4
ng of curren
in consecu
ctrode surfa
3 0.6
II'I'
II
I
E / V (vs. Ag/
FCUP ystems
48
lymeric filmerisation of
ential value
s, using 1.0 mm
emical structures
0.87 and 1
Me)] compl
ting in form18 In the re
esalen)] and
esaltMe)], w
scan.23,24 I
Epa ≈ 0.42
er film, depo
two new p
e peak attri
7 V. In cat
45 V.
nt intensity o
utive cycles
ace at the e
0.9 1
III'
I
III
/AgCl)
ms f both
s are
mol dm-3
s of the
.08 V
exes,
mation
verse
d one
which
In the
V for
osited
peaks
buted
thodic
of the
s, and
end of
.2
IV
(b)
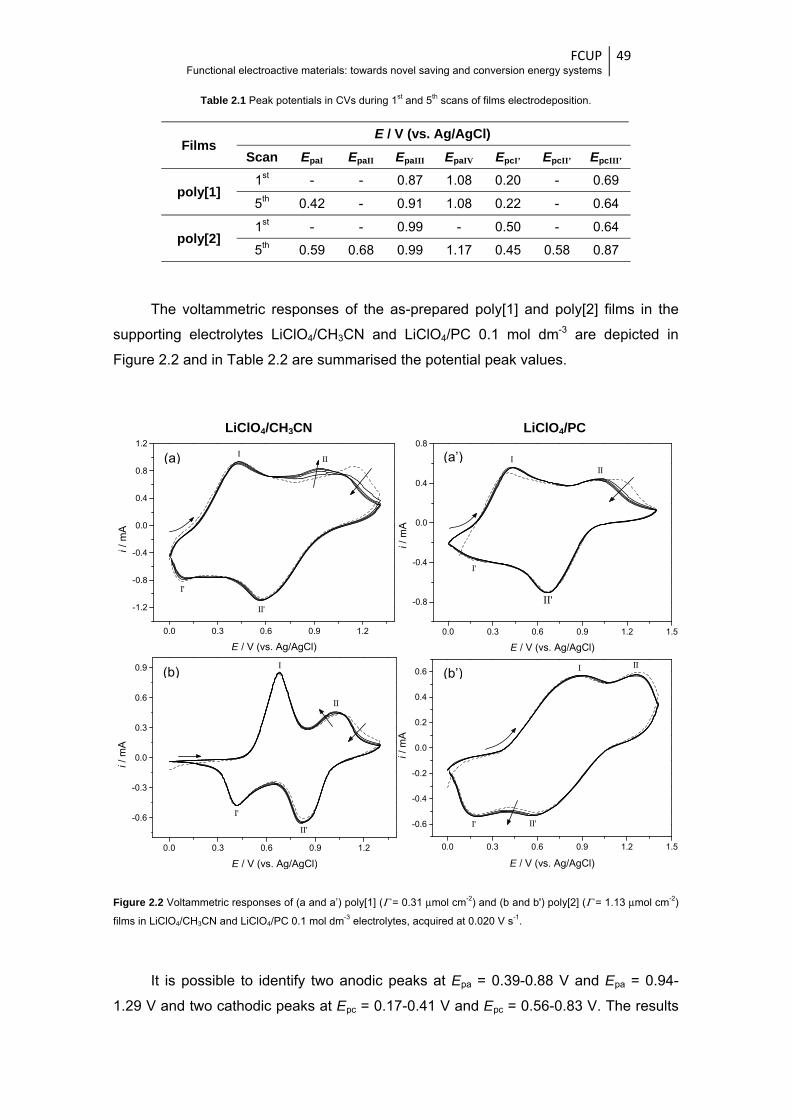
FCUP Functional electroactive materials: towards novel saving and conversion energy systems
49
Table 2.1 Peak potentials in CVs during 1st and 5th scans of films electrodeposition.
Films E / V (vs. Ag/AgCl)
Scan EpaI EpaII EpaIII EpaIV EpcI’ EpcII’ EpcIII’
poly[1] 1st - - 0.87 1.08 0.20 - 0.69
5th 0.42 - 0.91 1.08 0.22 - 0.64
poly[2] 1st - - 0.99 - 0.50 - 0.64
5th 0.59 0.68 0.99 1.17 0.45 0.58 0.87
The voltammetric responses of the as-prepared poly[1] and poly[2] films in the
supporting electrolytes LiClO4/CH3CN and LiClO4/PC 0.1 mol dm-3 are depicted in
Figure 2.2 and in Table 2.2 are summarised the potential peak values.
Figure 2.2 Voltammetric responses of (a and a’) poly[1] (Γ = 0.31 μmol cm-2) and (b and b') poly[2] (Γ = 1.13 μmol cm-2)
films in LiClO4/CH3CN and LiClO4/PC 0.1 mol dm-3 electrolytes, acquired at 0.020 V s-1.
It is possible to identify two anodic peaks at Epa = 0.39-0.88 V and Epa = 0.94-
1.29 V and two cathodic peaks at Epc = 0.17-0.41 V and Epc = 0.56-0.83 V. The results
0.0 0.3 0.6 0.9 1.2
-0.6
-0.3
0.0
0.3
0.6
0.9
II'
I'
II
I
i / m
A
E / V (vs. Ag/AgCl)
(a)
LiClO4/CH3CN LiClO4/PC
(a’)
(b) (b’)
0.0 0.3 0.6 0.9 1.2 1.5
-0.6
-0.4
-0.2
0.0
0.2
0.4
0.6
II'I'
II
i / m
A
E / V (vs. Ag/AgCl)
I
0.0 0.3 0.6 0.9 1.2
-1.2
-0.8
-0.4
0.0
0.4
0.8
1.2
II'
I'
III
i / m
A
E / V (vs. Ag/AgCl)
0.0 0.3 0.6 0.9 1.2 1.5
-0.8
-0.4
0.0
0.4
0.8
II'
I'
III
i / m
A
E / V (vs. Ag/AgCl)
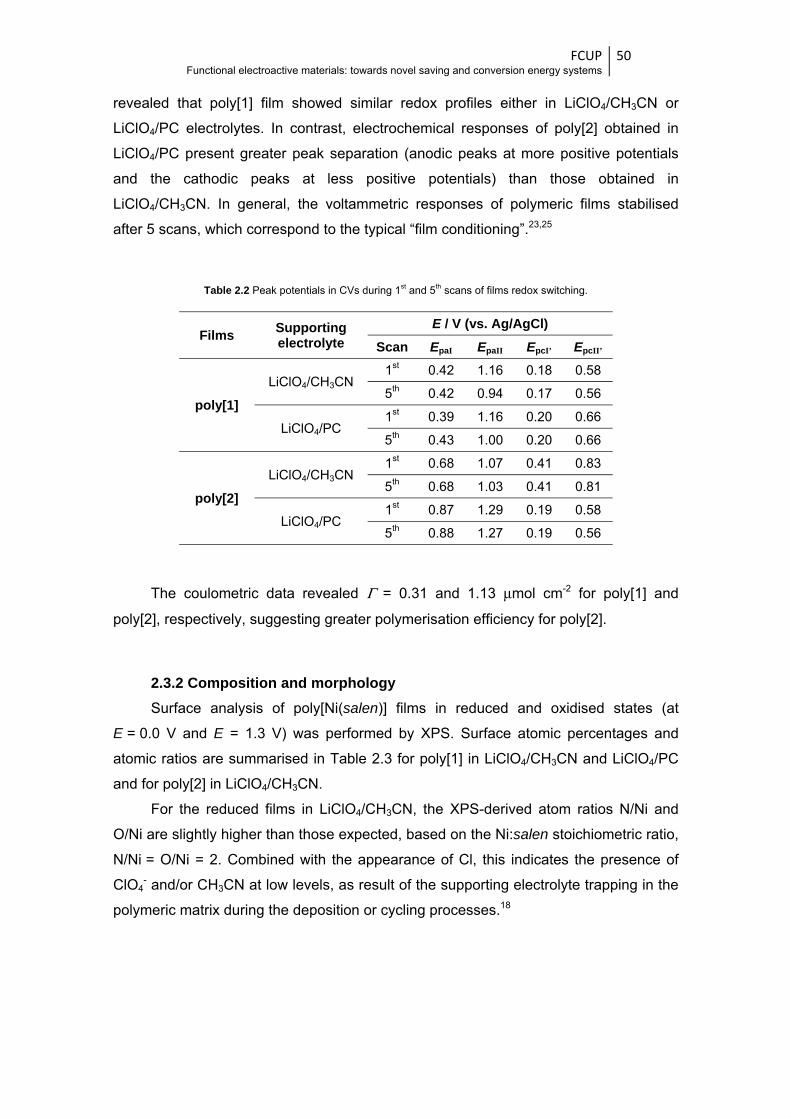
FCUP Functional electroactive materials: towards novel saving and conversion energy systems
50
revealed that poly[1] film showed similar redox profiles either in LiClO4/CH3CN or
LiClO4/PC electrolytes. In contrast, electrochemical responses of poly[2] obtained in
LiClO4/PC present greater peak separation (anodic peaks at more positive potentials
and the cathodic peaks at less positive potentials) than those obtained in
LiClO4/CH3CN. In general, the voltammetric responses of polymeric films stabilised
after 5 scans, which correspond to the typical “film conditioning”.23,25
Table 2.2 Peak potentials in CVs during 1st and 5th scans of films redox switching.
Films Supporting electrolyte
E / V (vs. Ag/AgCl)
Scan EpaI EpaII EpcI’ EpcII’
poly[1]
LiClO4/CH3CN 1st 0.42 1.16 0.18 0.58
5th 0.42 0.94 0.17 0.56
LiClO4/PC 1st 0.39 1.16 0.20 0.66
5th 0.43 1.00 0.20 0.66
poly[2]
LiClO4/CH3CN 1st 0.68 1.07 0.41 0.83
5th 0.68 1.03 0.41 0.81
LiClO4/PC 1st 0.87 1.29 0.19 0.58
5th 0.88 1.27 0.19 0.56
The coulometric data revealed Γ = 0.31 and 1.13 μmol cm-2 for poly[1] and
poly[2], respectively, suggesting greater polymerisation efficiency for poly[2].
2.3.2 Composition and morphology Surface analysis of poly[Ni(salen)] films in reduced and oxidised states (at
E = 0.0 V and E = 1.3 V) was performed by XPS. Surface atomic percentages and
atomic ratios are summarised in Table 2.3 for poly[1] in LiClO4/CH3CN and LiClO4/PC
and for poly[2] in LiClO4/CH3CN.
For the reduced films in LiClO4/CH3CN, the XPS-derived atom ratios N/Ni and
O/Ni are slightly higher than those expected, based on the Ni:salen stoichiometric ratio,
N/Ni = O/Ni = 2. Combined with the appearance of Cl, this indicates the presence of
ClO4- and/or CH3CN at low levels, as result of the supporting electrolyte trapping in the
polymeric matrix during the deposition or cycling processes.18
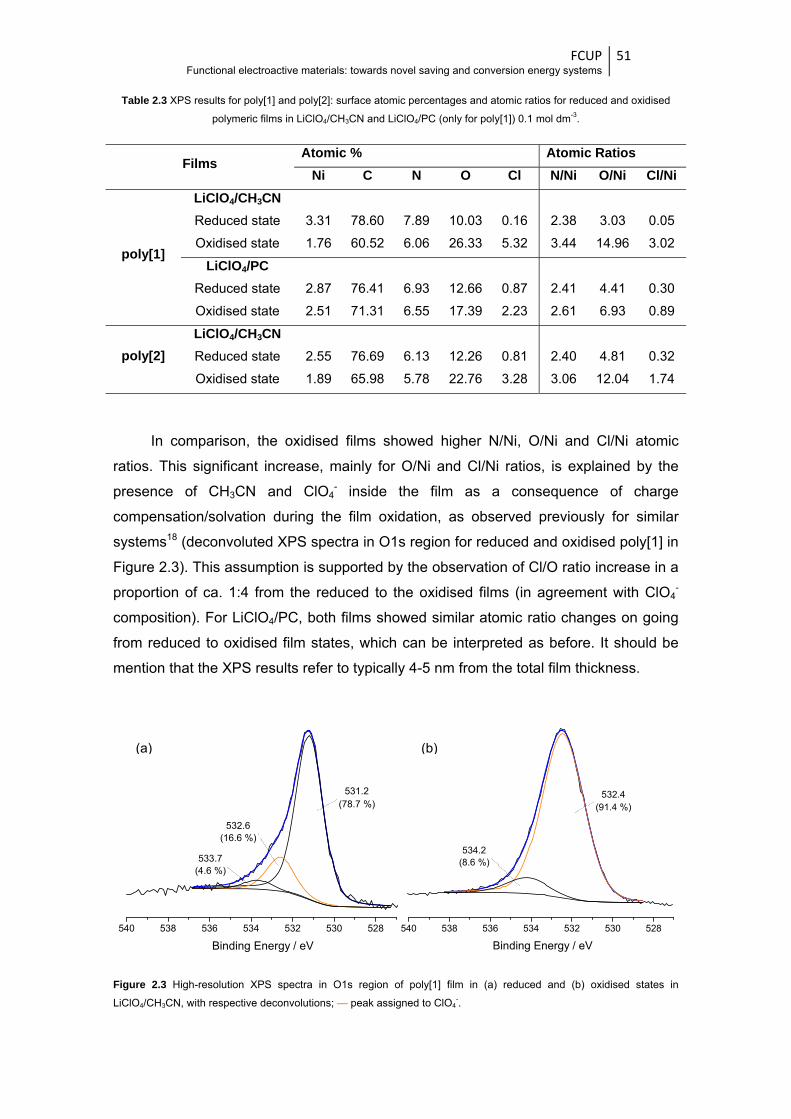
FCUP Functional electroactive materials: towards novel saving and conversion energy systems
51
Table 2.3 XPS results for poly[1] and poly[2]: surface atomic percentages and atomic ratios for reduced and oxidised
polymeric films in LiClO4/CH3CN and LiClO4/PC (only for poly[1]) 0.1 mol dm-3.
Films Atomic % Atomic Ratios
Ni C N O Cl N/Ni O/Ni Cl/Ni
poly[1]
LiClO4/CH3CN
Reduced state 3.31 78.60 7.89 10.03 0.16 2.38 3.03 0.05
Oxidised state 1.76 60.52 6.06 26.33 5.32 3.44 14.96 3.02
LiClO4/PC
Reduced state 2.87 76.41 6.93 12.66 0.87 2.41 4.41 0.30
Oxidised state 2.51 71.31 6.55 17.39 2.23 2.61 6.93 0.89
poly[2] LiClO4/CH3CN
Reduced state 2.55 76.69 6.13 12.26 0.81 2.40 4.81 0.32
Oxidised state 1.89 65.98 5.78 22.76 3.28 3.06 12.04 1.74
In comparison, the oxidised films showed higher N/Ni, O/Ni and Cl/Ni atomic
ratios. This significant increase, mainly for O/Ni and Cl/Ni ratios, is explained by the
presence of CH3CN and ClO4- inside the film as a consequence of charge
compensation/solvation during the film oxidation, as observed previously for similar
systems18 (deconvoluted XPS spectra in O1s region for reduced and oxidised poly[1] in
Figure 2.3). This assumption is supported by the observation of Cl/O ratio increase in a
proportion of ca. 1:4 from the reduced to the oxidised films (in agreement with ClO4-
composition). For LiClO4/PC, both films showed similar atomic ratio changes on going
from reduced to oxidised film states, which can be interpreted as before. It should be
mention that the XPS results refer to typically 4-5 nm from the total film thickness.
Figure 2.3 High-resolution XPS spectra in O1s region of poly[1] film in (a) reduced and (b) oxidised states in
LiClO4/CH3CN, with respective deconvolutions; — peak assigned to ClO4-.
(a) (b)
540 538 536 534 532 530 528
Binding Energy / eV
532.6(16.6 %)
533.7(4.6 %)
531.2(78.7 %)
540 538 536 534 532 530 528
Binding Energy / eV
534.2(8.6 %)
532.4(91.4 %)
reduc
revea
Figureoxidise
fragm
the
subs
Ni. T
spec
resul
ingre
Functi
In Figure
ced and ox
aled a simil
e 2.4 SEM micr
ed states, with a
The films
ments of hig
Ni element
strate), while
These result
ctra reveale
lts) and the
ess of suppo
ional electroacti
2.4 are dep
xidised state
ar morpholo
rographs and r
a magnification
consisted o
gher dimens
t (from po
e, in Z2 reg
ts indicate t
ed yet a hi
e respectiv
orting electr
(a)
(b)
ive materials: to
picted SEM
es; SEM im
ogy.
espective EDS
of 20 000 times
of a continu
sions (Z1).
lymeric film
ions, the In
that the film
igher Cl co
ve microgra
rolyte into th
owards novel sa
micrograph
mages of th
spectra at sele
s.
ous layer (Z
The EDS s
m) is prese
n content inc
m surface an
ontent in o
aph showed
he polymer
aving and conve
hs and EDS
he surface o
ected zones fo
Z2), on top
spectra show
ent in high
creases con
nd thickness
oxidised film
d a bulkier
ic matrix.
Fersion energy sy
S spectra fo
of poly[2] fi
r poly[1] films i
of which th
wed that, in
her quantity
nsiderably i
s are not un
m (in agree
r film, poss
FCUP ystems
52
or poly[1] fil
lms (not sh
in (a) reduced
here are irre
n the Z1 reg
y than In
in comparis
niform. The
ement with
sibly due to
ms in
hown)
and (b)
egular
gions,
(from
son to
e EDS
XPS
o the
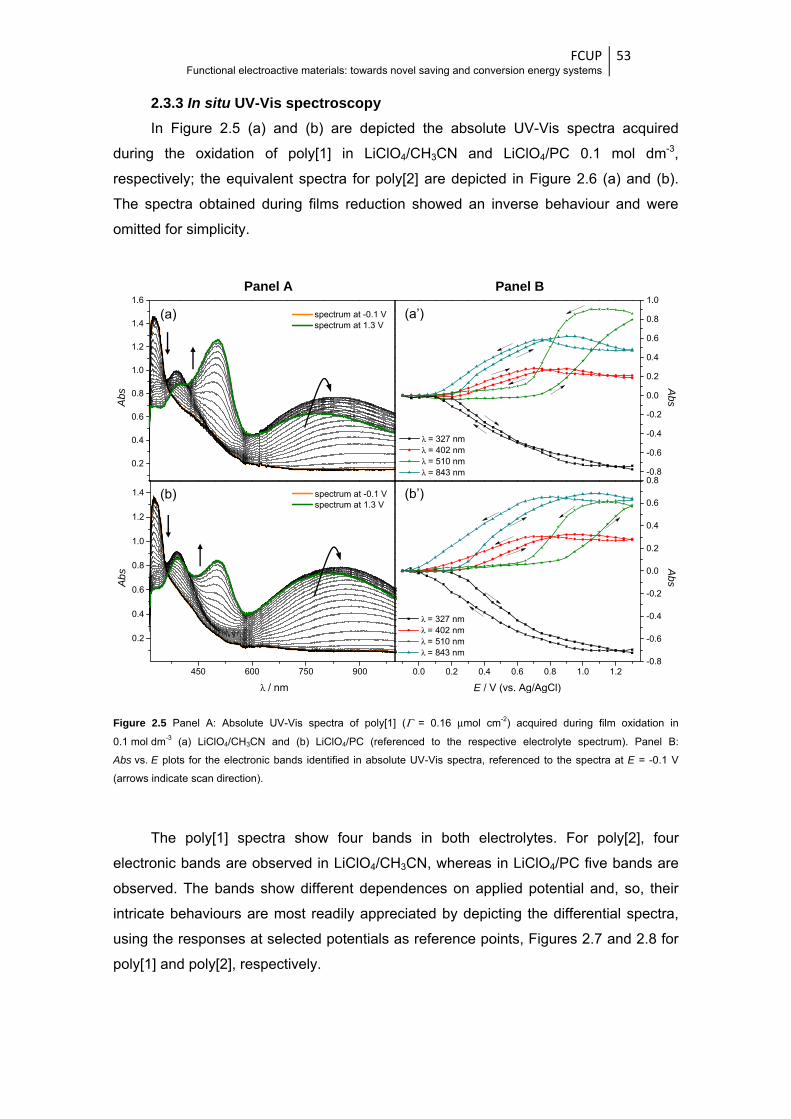
FCUP Functional electroactive materials: towards novel saving and conversion energy systems
53
2.3.3 In situ UV-Vis spectroscopy In Figure 2.5 (a) and (b) are depicted the absolute UV-Vis spectra acquired
during the oxidation of poly[1] in LiClO4/CH3CN and LiClO4/PC 0.1 mol dm-3,
respectively; the equivalent spectra for poly[2] are depicted in Figure 2.6 (a) and (b).
The spectra obtained during films reduction showed an inverse behaviour and were
omitted for simplicity.
Figure 2.5 Panel A: Absolute UV-Vis spectra of poly[1] (Γ = 0.16 μmol cm-2) acquired during film oxidation in
0.1 mol dm-3 (a) LiClO4/CH3CN and (b) LiClO4/PC (referenced to the respective electrolyte spectrum). Panel B:
Abs vs. E plots for the electronic bands identified in absolute UV-Vis spectra, referenced to the spectra at E = -0.1 V
(arrows indicate scan direction).
The poly[1] spectra show four bands in both electrolytes. For poly[2], four
electronic bands are observed in LiClO4/CH3CN, whereas in LiClO4/PC five bands are
observed. The bands show different dependences on applied potential and, so, their
intricate behaviours are most readily appreciated by depicting the differential spectra,
using the responses at selected potentials as reference points, Figures 2.7 and 2.8 for
poly[1] and poly[2], respectively.
0.2
0.4
0.6
0.8
1.0
1.2
1.4
1.6
spectrum at -0.1 V spectrum at 1.3 V
Abs
-0.8
-0.6
-0.4
-0.2
0.0
0.2
0.4
0.6
0.8
1.0
λ = 327 nm λ = 402 nm λ = 510 nm λ = 843 nm
Abs
450 600 750 900
0.2
0.4
0.6
0.8
1.0
1.2
1.4 spectrum at -0.1 V spectrum at 1.3 V
λ / nm
Abs
0.0 0.2 0.4 0.6 0.8 1.0 1.2-0.8
-0.6
-0.4
-0.2
0.0
0.2
0.4
0.6
0.8
E / V (vs. Ag/AgCl)
λ = 327 nm λ = 402 nm λ = 510 nm λ = 843 nm
Abs
(a)
(b)
(a’)
(b’)
Panel A Panel B
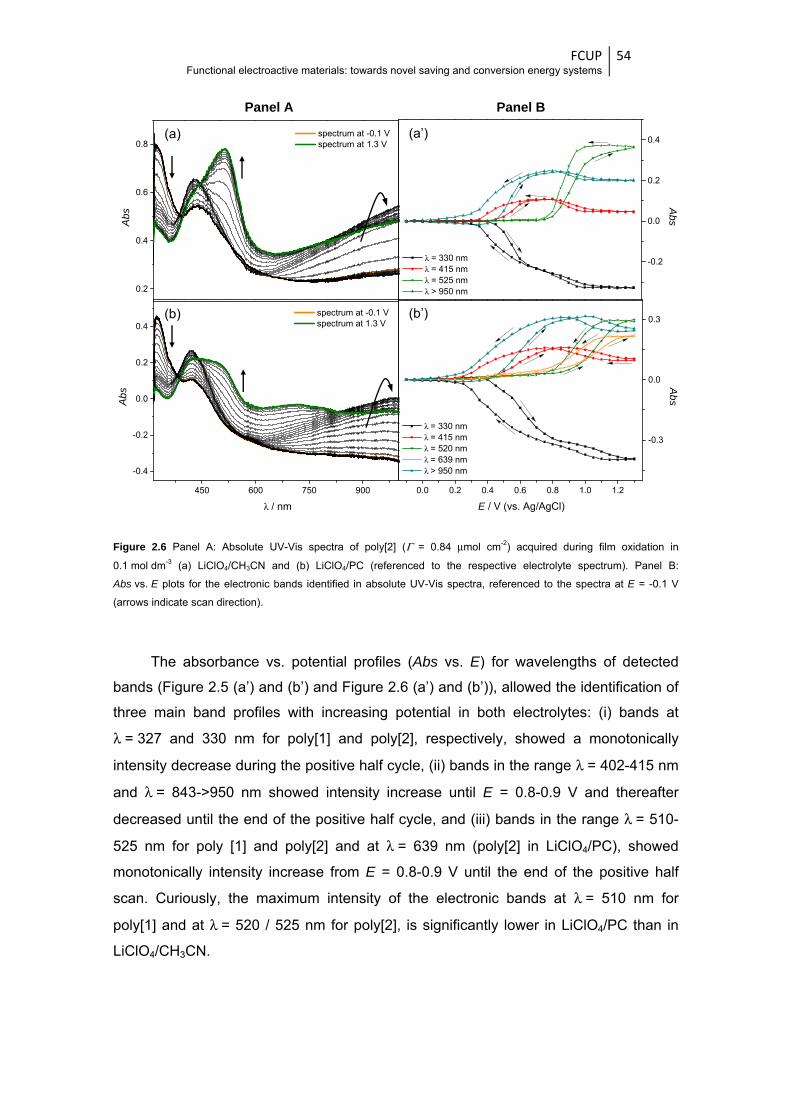
FCUP Functional electroactive materials: towards novel saving and conversion energy systems
54
Figure 2.6 Panel A: Absolute UV-Vis spectra of poly[2] (Γ = 0.84 μmol cm-2) acquired during film oxidation in
0.1 mol dm-3 (a) LiClO4/CH3CN and (b) LiClO4/PC (referenced to the respective electrolyte spectrum). Panel B:
Abs vs. E plots for the electronic bands identified in absolute UV-Vis spectra, referenced to the spectra at E = -0.1 V
(arrows indicate scan direction).
The absorbance vs. potential profiles (Abs vs. E) for wavelengths of detected
bands (Figure 2.5 (a’) and (b’) and Figure 2.6 (a’) and (b’)), allowed the identification of
three main band profiles with increasing potential in both electrolytes: (i) bands at
λ = 327 and 330 nm for poly[1] and poly[2], respectively, showed a monotonically
intensity decrease during the positive half cycle, (ii) bands in the range λ = 402-415 nm
and λ = 843->950 nm showed intensity increase until E = 0.8-0.9 V and thereafter
decreased until the end of the positive half cycle, and (iii) bands in the range λ = 510-
525 nm for poly [1] and poly[2] and at λ = 639 nm (poly[2] in LiClO4/PC), showed
monotonically intensity increase from E = 0.8-0.9 V until the end of the positive half
scan. Curiously, the maximum intensity of the electronic bands at λ = 510 nm for
poly[1] and at λ = 520 / 525 nm for poly[2], is significantly lower in LiClO4/PC than in
LiClO4/CH3CN.
Panel A Panel B
0.2
0.4
0.6
0.8 spectrum at -0.1 V spectrum at 1.3 V
Abs
-0.2
0.0
0.2
0.4
λ = 330 nm λ = 415 nm λ = 525 nm λ > 950 nm
Abs
0.0 0.2 0.4 0.6 0.8 1.0 1.2
-0.3
0.0
0.3
λ = 330 nm λ = 415 nm λ = 520 nm λ = 639 nm λ > 950 nm
E / V (vs. Ag/AgCl)
Abs
450 600 750 900
-0.4
-0.2
0.0
0.2
0.4
spectrum at -0.1 V spectrum at 1.3 V
Abs
λ / nm
(a)
(b)
(a’)
(b’)
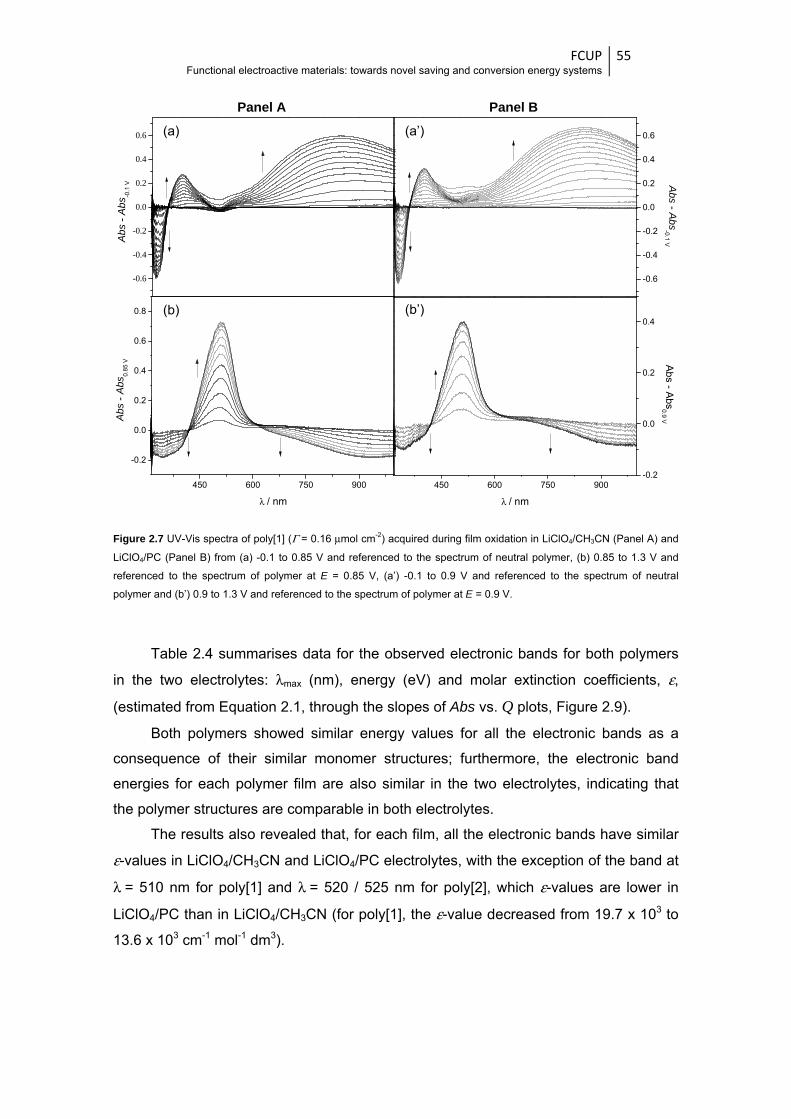
FCUP Functional electroactive materials: towards novel saving and conversion energy systems
55
Figure 2.7 UV-Vis spectra of poly[1] (Γ = 0.16 μmol cm-2) acquired during film oxidation in LiClO4/CH3CN (Panel A) and
LiClO4/PC (Panel B) from (a) -0.1 to 0.85 V and referenced to the spectrum of neutral polymer, (b) 0.85 to 1.3 V and
referenced to the spectrum of polymer at E = 0.85 V, (a’) -0.1 to 0.9 V and referenced to the spectrum of neutral
polymer and (b’) 0.9 to 1.3 V and referenced to the spectrum of polymer at E = 0.9 V.
Table 2.4 summarises data for the observed electronic bands for both polymers
in the two electrolytes: λmax (nm), energy (eV) and molar extinction coefficients, ε,
(estimated from Equation 2.1, through the slopes of Abs vs. Q plots, Figure 2.9).
Both polymers showed similar energy values for all the electronic bands as a
consequence of their similar monomer structures; furthermore, the electronic band
energies for each polymer film are also similar in the two electrolytes, indicating that
the polymer structures are comparable in both electrolytes.
The results also revealed that, for each film, all the electronic bands have similar
ε-values in LiClO4/CH3CN and LiClO4/PC electrolytes, with the exception of the band at
λ = 510 nm for poly[1] and λ = 520 / 525 nm for poly[2], which ε-values are lower in
LiClO4/PC than in LiClO4/CH3CN (for poly[1], the ε-value decreased from 19.7 x 10³ to
13.6 x 103 cm-1 mol-1 dm3).
-0.6
-0.4
-0.2
0.0
0.2
0.4
0.6
Abs
- A
bs-0
.1 V
-0.6
-0.4
-0.2
0.0
0.2
0.4
0.6
Abs - Abs
-0.1 V
450 600 750 900-0.2
0.0
0.2
0.4
Ab
s - Abs
0.9 V
λ / nm
450 600 750 900
-0.2
0.0
0.2
0.4
0.6
0.8
Abs
- A
bs0.
85 V
λ / nm
(a)
(b)
(a’)
(b’)
Panel A Panel B
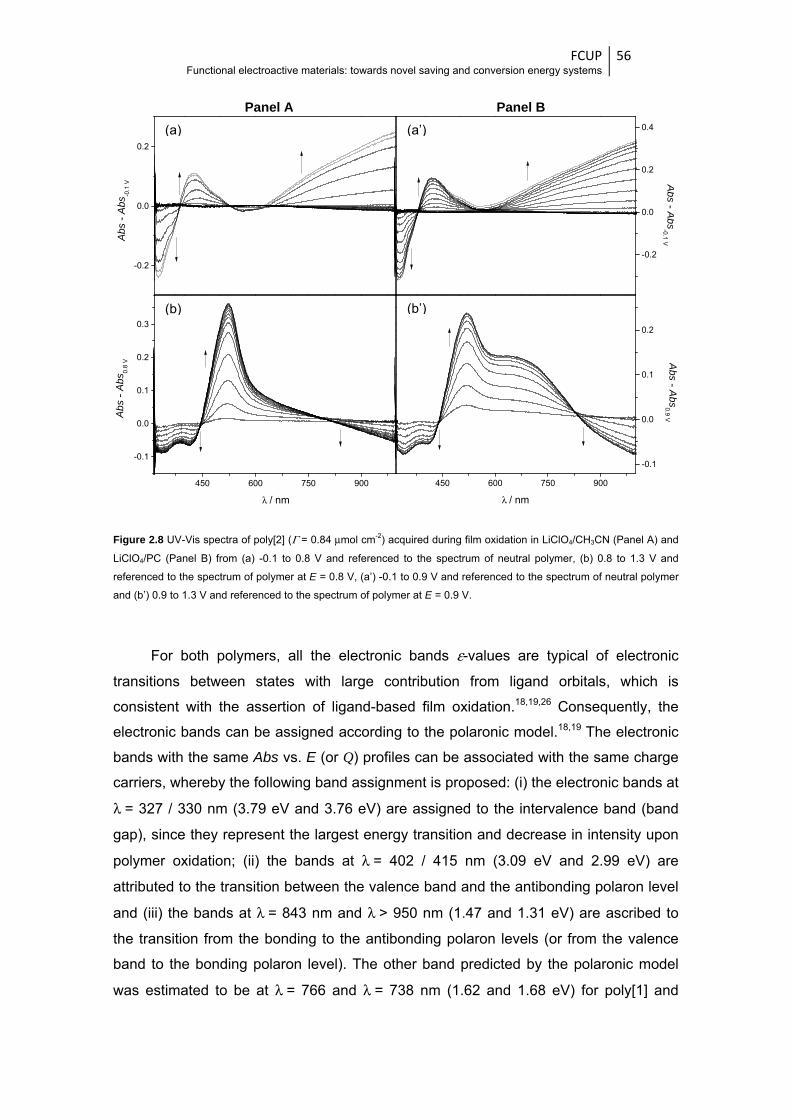
FCUP Functional electroactive materials: towards novel saving and conversion energy systems
56
Figure 2.8 UV-Vis spectra of poly[2] (Γ = 0.84 μmol cm-2) acquired during film oxidation in LiClO4/CH3CN (Panel A) and
LiClO4/PC (Panel B) from (a) -0.1 to 0.8 V and referenced to the spectrum of neutral polymer, (b) 0.8 to 1.3 V and
referenced to the spectrum of polymer at E = 0.8 V, (a’) -0.1 to 0.9 V and referenced to the spectrum of neutral polymer
and (b’) 0.9 to 1.3 V and referenced to the spectrum of polymer at E = 0.9 V.
For both polymers, all the electronic bands ε-values are typical of electronic
transitions between states with large contribution from ligand orbitals, which is
consistent with the assertion of ligand-based film oxidation.18,19,26 Consequently, the
electronic bands can be assigned according to the polaronic model.18,19 The electronic
bands with the same Abs vs. E (or Q) profiles can be associated with the same charge
carriers, whereby the following band assignment is proposed: (i) the electronic bands at
λ = 327 / 330 nm (3.79 eV and 3.76 eV) are assigned to the intervalence band (band
gap), since they represent the largest energy transition and decrease in intensity upon
polymer oxidation; (ii) the bands at λ = 402 / 415 nm (3.09 eV and 2.99 eV) are
attributed to the transition between the valence band and the antibonding polaron level
and (iii) the bands at λ = 843 nm and λ > 950 nm (1.47 and 1.31 eV) are ascribed to
the transition from the bonding to the antibonding polaron levels (or from the valence
band to the bonding polaron level). The other band predicted by the polaronic model
was estimated to be at λ = 766 and λ = 738 nm (1.62 and 1.68 eV) for poly[1] and
-0.2
0.0
0.2
Abs
- A
bs-0
.1 V
450 600 750 900
-0.1
0.0
0.1
0.2
0.3
Abs
- A
bs0.
8 V
λ / nm
-0.2
0.0
0.2
0.4 A
bs - Abs
-0.1 V
450 600 750 900
-0.1
0.0
0.1
0.2
Abs
- Abs
0.9 V
λ / nm
Panel A Panel B(a)
(b)
(a’)
(b’)
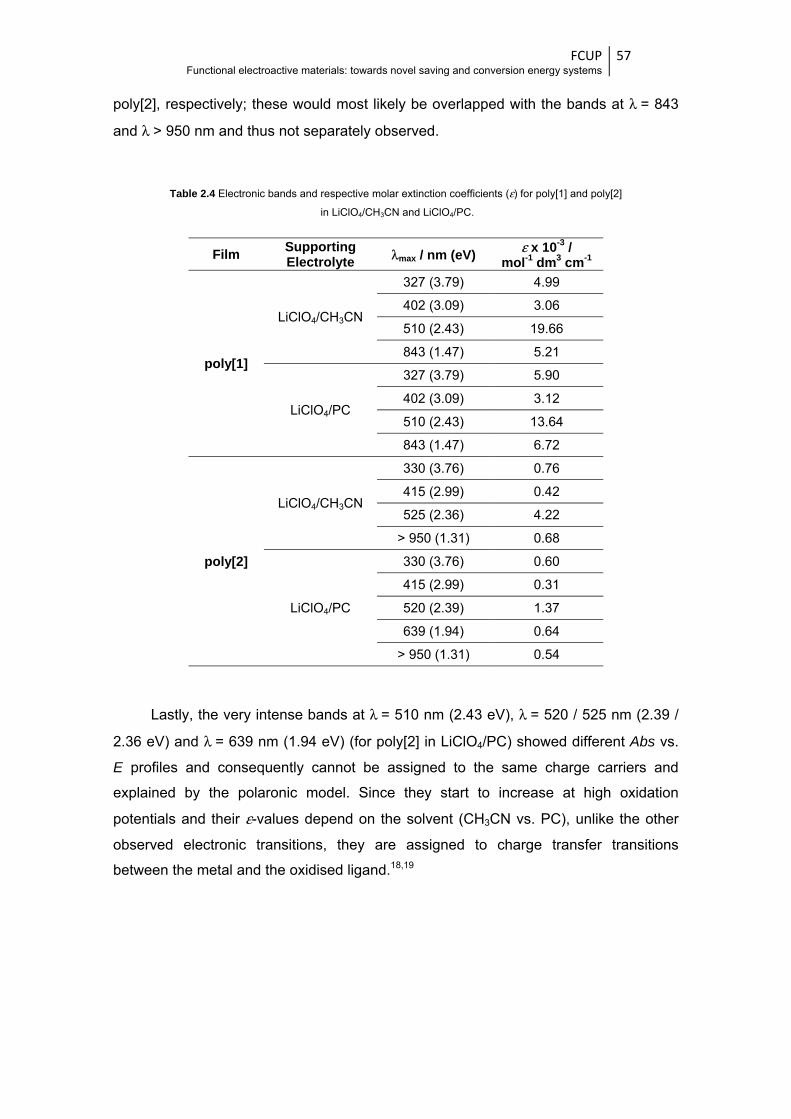
FCUP Functional electroactive materials: towards novel saving and conversion energy systems
57
poly[2], respectively; these would most likely be overlapped with the bands at λ = 843
and λ > 950 nm and thus not separately observed.
Table 2.4 Electronic bands and respective molar extinction coefficients (ε) for poly[1] and poly[2]
in LiClO4/CH3CN and LiClO4/PC.
Film Supporting Electrolyte λmax / nm (eV) ε x 10-3 /
mol-1 dm3 cm-1
poly[1]
LiClO4/CH3CN
327 (3.79) 4.99
402 (3.09) 3.06
510 (2.43) 19.66
843 (1.47) 5.21
LiClO4/PC
327 (3.79) 5.90
402 (3.09) 3.12
510 (2.43) 13.64
843 (1.47) 6.72
poly[2]
LiClO4/CH3CN
330 (3.76) 0.76
415 (2.99) 0.42
525 (2.36) 4.22
> 950 (1.31) 0.68
LiClO4/PC
330 (3.76) 0.60
415 (2.99) 0.31
520 (2.39) 1.37
639 (1.94) 0.64
> 950 (1.31) 0.54
Lastly, the very intense bands at λ = 510 nm (2.43 eV), λ = 520 / 525 nm (2.39 /
2.36 eV) and λ = 639 nm (1.94 eV) (for poly[2] in LiClO4/PC) showed different Abs vs.
E profiles and consequently cannot be assigned to the same charge carriers and
explained by the polaronic model. Since they start to increase at high oxidation
potentials and their ε-values depend on the solvent (CH3CN vs. PC), unlike the other
observed electronic transitions, they are assigned to charge transfer transitions
between the metal and the oxidised ligand.18,19

Figure
and b’)
the o
film d
films
E = 1
FigureAg/AgC
0.2
0.4
0.6
0.8
1.0
1.2
1.4A
bs
0.2
0.4
0.6
0.8
1.0
1.2
1.4
Abs
(a)
Functi
e 2.9 Plots of th
) LiClO4/PC; fille
2.3.4 ElecThe visua
observation
distinct colo
are yellow
1.3 V.
e 2.10 Photogra
Cl (NaCl / 1.0 m
0.0 1.5
ional electroacti
e Abs vs. Q for
ed forms corres
ctrochromial inspection
of their col
ours as a fu
w, switch to
aphs of (a) poly
mol.dm-3)) in LiC
3.0
Q / mC
poly[1]
ive materials: to
r selected electr
pond to the ano
c propertien of both p
our change
unction of th
green at E
y[1] and (b) po
ClO4/CH3CN elec
λ = λ = λ = λ =
4.5 6.0
C
λ = λ = λ = λ =
]
owards novel sa
ronic bands of p
odic scan and o
es poly[Ni(sale
es. Figure 2
he potentia
E = 0.7 V,
oly[2] films in di
ctrolyte.
= 327 nm= 402 nm= 510 nm= 843 nm
7.5
= 327 nm= 402 nm= 510 nm= 843 nm
0.0
(a)
(b)
(b
aving and conve
poly[1] and poly
pen forms to the
n)] films du
2.10 shows
al: in the red
and then to
ifferent oxidatio
1.0 2.0
p
)
Fersion energy sy
y[2] in (a and a’)
e cathodic scan
uring redox
photograph
duced state
o russet (re
n states (E = 0
3.0 4.0
λ = 330 nm λ = 415 nm
Q / mC
poly[2]
FCUP ystems
58
) LiClO4/CH3CN
n.
cycling all
hic images o
e (E = 0.0 V
eddish-brow
0.0, 0.7 and 1.
λ = 330 nm λ = 415 nm λ = 525 nm λ = >950 nm
5.0 6.0
λ = 520 nm λ = 639 nm λ > 950 nm
(a’)
(b’)
N and (b
owed
of the
V) the
wn) at
3 V vs.
0.3
0.4
0.5
0.6
0.7
0.8A
bs
0-0.4
-0.2
0.0
0.2
0.4
Abs

FCUP Functional electroactive materials: towards novel saving and conversion energy systems
59
To explore the potential application of both films as EC materials, a square-wave
potential step method coupled with UV-Vis spectroscopy, was used to evaluate their
EC properties: switching times, optical contrasts, changes of the optical densities and
colouration efficiencies. In Figure 2.11 are depicted the chronoabsorptograms obtained
for poly[1] films (Γ = 0.16 μmol cm-2) in LiClO4/CH3CN and LiClO4/PC, for two colour
changes - yellow ↔ green (λ = 750 nm) and green ↔ russet (λ = 510 nm). The results
obtained for poly[2] (Γ = 0.84 μmol cm-2) in a similar study are depicted in Figure 2.12
and, in Figure 2.13, are depicted the UV-Vis spectra for the two films in each colour
and in both supporting electrolytes, with identification of the considered wavelengths.
Figure 2.11 Chronoabsorptograms of poly[1] films in LiClO4/CH3CN (—) and LiClO4/PC (—), for the colour transitions
(a) yellow ↔ green (λ = 750 nm) and (b) green ↔ russet (λ = 510 nm), with indication of the estimated switching times.
The switching time values obtained in LiClO4/CH3CN are between τ = 9 - 10 s for
the yellow ↔ green transition and τ = 8 - 13 s for the green ↔ russet transition. In
LiClO4/PC, the switching time values ranging between τ = 13 - 15 s for the yellow ↔
green transition and τ = 9 - 24 s for the green ↔ russet, being clearly higher than those
determined in LiClO4/CH3CN. This observation is associated with the solvent PC, and
maybe related with lower degree of PC film solvation that may hamper ClO4- counter-
ions ingress, necessary to the charge balance during redox switching. This assumption
is in agreement with the XPS results (Table 2.3), which revealed a larger increase in
O/Ni (and N/Ni) ratio, from reduced to oxidised state, in LiClO4/CH3CN (increase of
79.7 %) than in LiClO4/PC (increase of 36.4 %). Furthermore, independently of the
supporting electrolyte employed, the colour transition yellow ↔ green is the fastest for
poly[1], while for poly[2] is the green ↔ russet transition.
0 50 100 150 200 250 300 350 400
0.0 0.5 1.0 1.5 2.0 2.5 3.0 3.5 4.0
Number of cycles
Abs
(75
0 nm
) / a.
u.
Time / s
9 s
10 s
0.7 V
0.0 V
13 s
14 s
0 50 100 150 200 250 300 350 400
0.0 0.5 1.0 1.5 2.0 2.5 3.0 3.5 4.0
Number of cycles
Abs
(510
nm
) / a.u
.
Time / s
10 s
13 s
1.3 V
0.7 V
14 s
24 s
(a) (b)
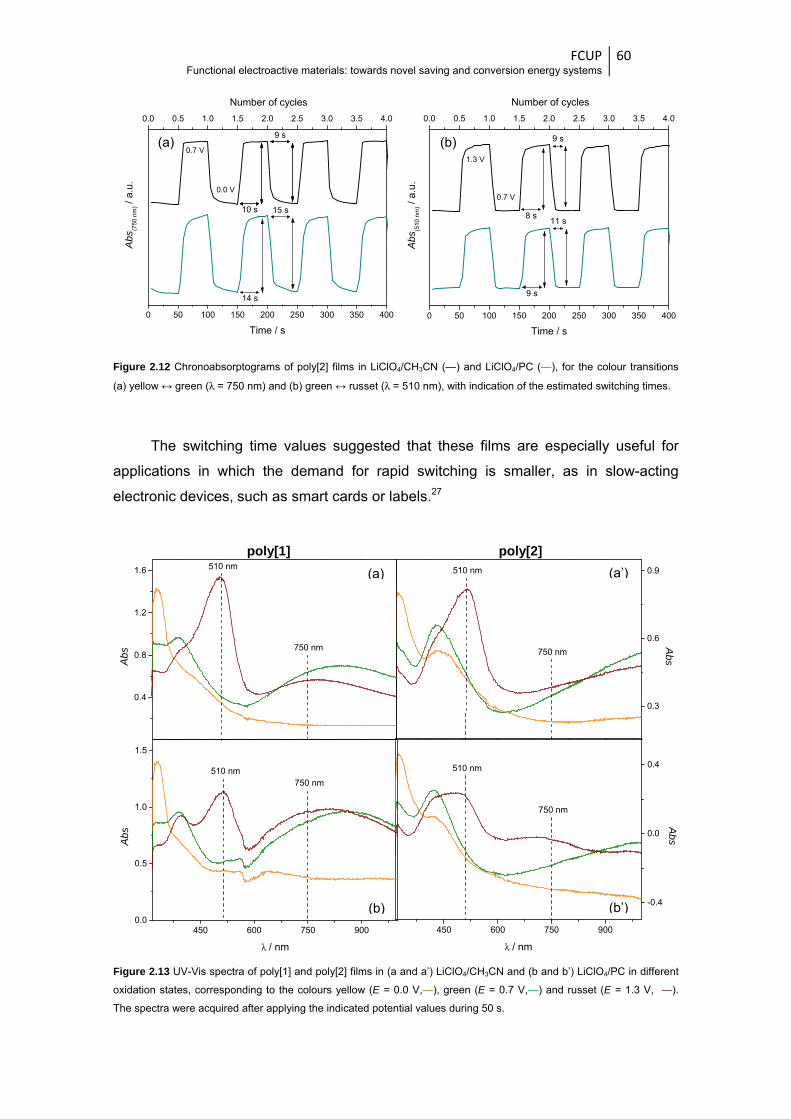
FCUP Functional electroactive materials: towards novel saving and conversion energy systems
60
Figure 2.12 Chronoabsorptograms of poly[2] films in LiClO4/CH3CN (—) and LiClO4/PC (—), for the colour transitions
(a) yellow ↔ green (λ = 750 nm) and (b) green ↔ russet (λ = 510 nm), with indication of the estimated switching times.
The switching time values suggested that these films are especially useful for
applications in which the demand for rapid switching is smaller, as in slow-acting
electronic devices, such as smart cards or labels.27
Figure 2.13 UV-Vis spectra of poly[1] and poly[2] films in (a and a’) LiClO4/CH3CN and (b and b’) LiClO4/PC in different
oxidation states, corresponding to the colours yellow (E = 0.0 V,—), green (E = 0.7 V,—) and russet (E = 1.3 V, —).
The spectra were acquired after applying the indicated potential values during 50 s.
0 50 100 150 200 250 300 350 400
0.0 0.5 1.0 1.5 2.0 2.5 3.0 3.5 4.0
Number of cycles
Abs
(750
nm
) / a
.u.
Time / s
0.7 V
0.0 V
10 s
9 s
14 s
15 s
0 50 100 150 200 250 300 350 400
0.0 0.5 1.0 1.5 2.0 2.5 3.0 3.5 4.0
0.7 V
1.3 V
Number of cycles
Abs
(510
nm
) / a.
u.
Time / s
8 s
9 s
9 s
11 s
(a) (b)
0.3
0.6
0.9
Abs750 nm
510 nm
450 600 750 900
-0.4
0.0
0.4
Abs
750 nm
λ / nm
510 nm
0.4
0.8
1.2
1.6
Abs
510 nm
750 nm
450 600 750 9000.0
0.5
1.0
1.5
Abs
λ / nm
750 nm510 nm
poly[1] poly[2](a)
(b)
(a’)
(b’)
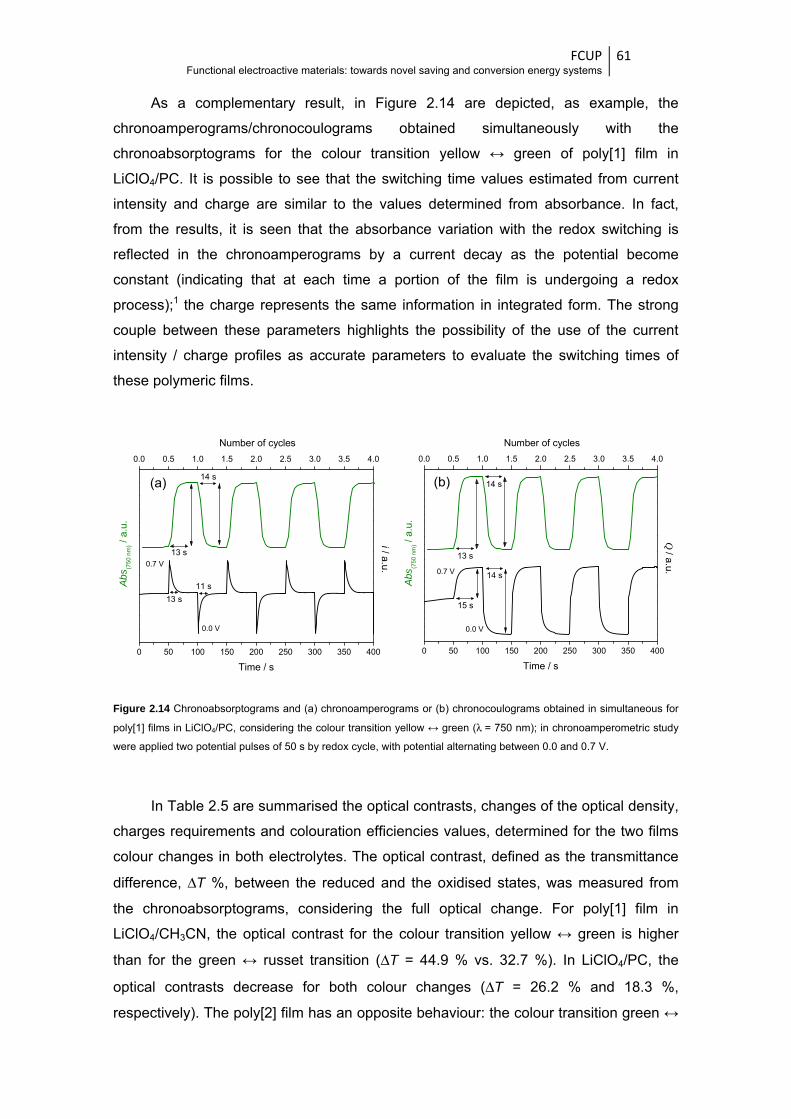
FCUP Functional electroactive materials: towards novel saving and conversion energy systems
61
As a complementary result, in Figure 2.14 are depicted, as example, the
chronoamperograms/chronocoulograms obtained simultaneously with the
chronoabsorptograms for the colour transition yellow ↔ green of poly[1] film in
LiClO4/PC. It is possible to see that the switching time values estimated from current
intensity and charge are similar to the values determined from absorbance. In fact,
from the results, it is seen that the absorbance variation with the redox switching is
reflected in the chronoamperograms by a current decay as the potential become
constant (indicating that at each time a portion of the film is undergoing a redox
process);1 the charge represents the same information in integrated form. The strong
couple between these parameters highlights the possibility of the use of the current
intensity / charge profiles as accurate parameters to evaluate the switching times of
these polymeric films.
Figure 2.14 Chronoabsorptograms and (a) chronoamperograms or (b) chronocoulograms obtained in simultaneous for
poly[1] films in LiClO4/PC, considering the colour transition yellow ↔ green (λ = 750 nm); in chronoamperometric study
were applied two potential pulses of 50 s by redox cycle, with potential alternating between 0.0 and 0.7 V.
In Table 2.5 are summarised the optical contrasts, changes of the optical density,
charges requirements and colouration efficiencies values, determined for the two films
colour changes in both electrolytes. The optical contrast, defined as the transmittance
difference, ΔT %, between the reduced and the oxidised states, was measured from
the chronoabsorptograms, considering the full optical change. For poly[1] film in
LiClO4/CH3CN, the optical contrast for the colour transition yellow ↔ green is higher
than for the green ↔ russet transition (ΔT = 44.9 % vs. 32.7 %). In LiClO4/PC, the
optical contrasts decrease for both colour changes (ΔT = 26.2 % and 18.3 %,
respectively). The poly[2] film has an opposite behaviour: the colour transition green ↔
0 50 100 150 200 250 300 350 400
0.0 0.5 1.0 1.5 2.0 2.5 3.0 3.5 4.0
Number of cycles
Abs
(750
nm
) / a.
u.
Time / s
14 s
i / a.u
.
13 s
11 s
13 s0.7 V
0.0 V
0 50 100 150 200 250 300 350 400
0.0 0.5 1.0 1.5 2.0 2.5 3.0 3.5 4.0
Number of cycles
Abs
(750
nm
) / a.
u.
Time / s
14 s
Q / a.u.
15 s
14 s
13 s
0.7 V
0.0 V
(a) (b)
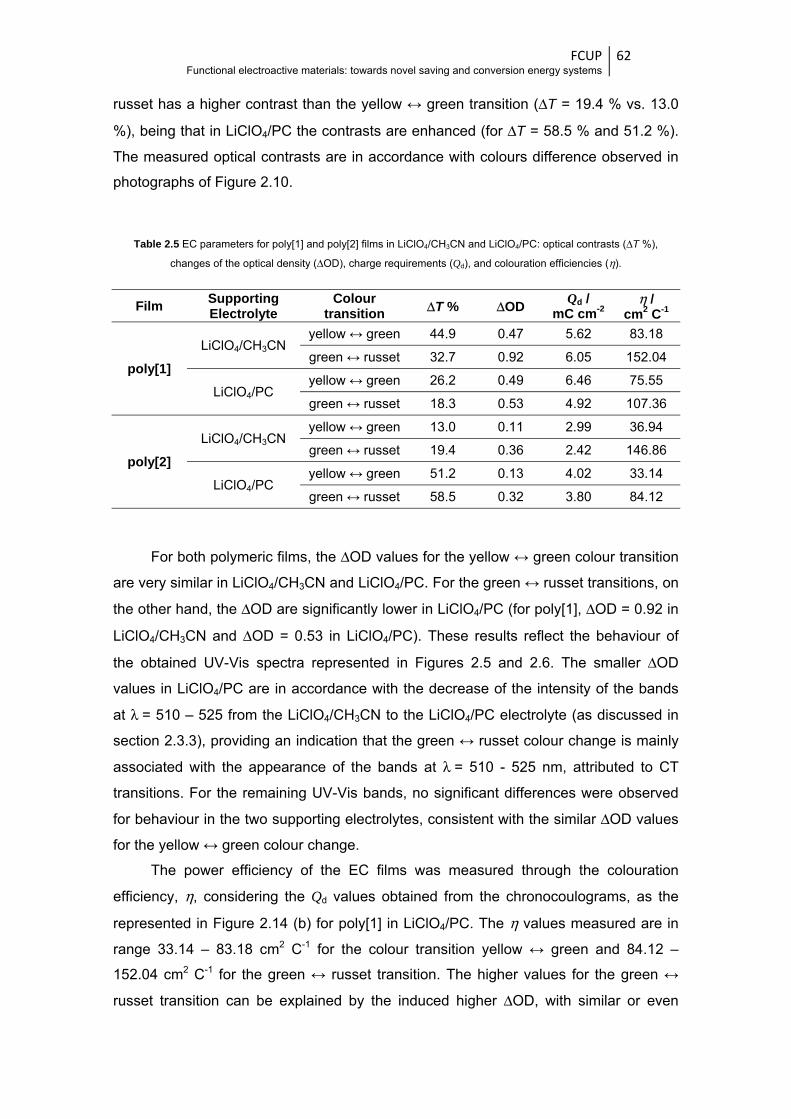
FCUP Functional electroactive materials: towards novel saving and conversion energy systems
62
russet has a higher contrast than the yellow ↔ green transition (ΔT = 19.4 % vs. 13.0
%), being that in LiClO4/PC the contrasts are enhanced (for ΔT = 58.5 % and 51.2 %).
The measured optical contrasts are in accordance with colours difference observed in
photographs of Figure 2.10.
Table 2.5 EC parameters for poly[1] and poly[2] films in LiClO4/CH3CN and LiClO4/PC: optical contrasts (ΔT %),
changes of the optical density (ΔOD), charge requirements (Qd), and colouration efficiencies (η).
Film Supporting Electrolyte
Colour transition ΔT % ΔOD Qd /
mC cm-2 η /
cm2 C-1
poly[1]
LiClO4/CH3CN yellow ↔ green 44.9 0.47 5.62 83.18
green ↔ russet 32.7 0.92 6.05 152.04
LiClO4/PC yellow ↔ green 26.2 0.49 6.46 75.55
green ↔ russet 18.3 0.53 4.92 107.36
poly[2]
LiClO4/CH3CN yellow ↔ green 13.0 0.11 2.99 36.94
green ↔ russet 19.4 0.36 2.42 146.86
LiClO4/PC yellow ↔ green 51.2 0.13 4.02 33.14
green ↔ russet 58.5 0.32 3.80 84.12
For both polymeric films, the ΔOD values for the yellow ↔ green colour transition
are very similar in LiClO4/CH3CN and LiClO4/PC. For the green ↔ russet transitions, on
the other hand, the ΔOD are significantly lower in LiClO4/PC (for poly[1], ΔOD = 0.92 in
LiClO4/CH3CN and ΔOD = 0.53 in LiClO4/PC). These results reflect the behaviour of
the obtained UV-Vis spectra represented in Figures 2.5 and 2.6. The smaller ΔOD
values in LiClO4/PC are in accordance with the decrease of the intensity of the bands
at λ = 510 – 525 from the LiClO4/CH3CN to the LiClO4/PC electrolyte (as discussed in
section 2.3.3), providing an indication that the green ↔ russet colour change is mainly
associated with the appearance of the bands at λ = 510 - 525 nm, attributed to CT
transitions. For the remaining UV-Vis bands, no significant differences were observed
for behaviour in the two supporting electrolytes, consistent with the similar ΔOD values
for the yellow ↔ green colour change.
The power efficiency of the EC films was measured through the colouration
efficiency, η, considering the Qd values obtained from the chronocoulograms, as the
represented in Figure 2.14 (b) for poly[1] in LiClO4/PC. The η values measured are in
range 33.14 – 83.18 cm2 C-1 for the colour transition yellow ↔ green and 84.12 –
152.04 cm2 C-1 for the green ↔ russet transition. The higher values for the green ↔
russet transition can be explained by the induced higher ΔOD, with similar or even
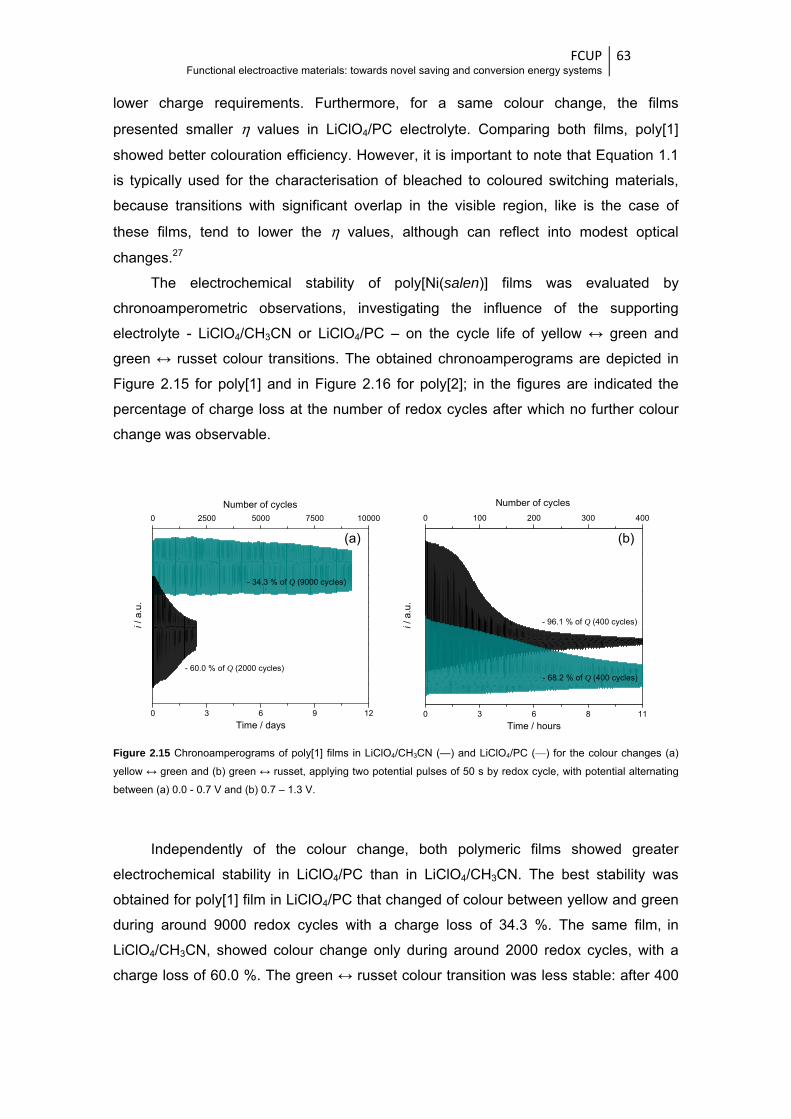
FCUP Functional electroactive materials: towards novel saving and conversion energy systems
63
lower charge requirements. Furthermore, for a same colour change, the films
presented smaller η values in LiClO4/PC electrolyte. Comparing both films, poly[1]
showed better colouration efficiency. However, it is important to note that Equation 1.1
is typically used for the characterisation of bleached to coloured switching materials,
because transitions with significant overlap in the visible region, like is the case of
these films, tend to lower the η values, although can reflect into modest optical
changes.27
The electrochemical stability of poly[Ni(salen)] films was evaluated by
chronoamperometric observations, investigating the influence of the supporting
electrolyte - LiClO4/CH3CN or LiClO4/PC – on the cycle life of yellow ↔ green and
green ↔ russet colour transitions. The obtained chronoamperograms are depicted in
Figure 2.15 for poly[1] and in Figure 2.16 for poly[2]; in the figures are indicated the
percentage of charge loss at the number of redox cycles after which no further colour
change was observable.
Figure 2.15 Chronoamperograms of poly[1] films in LiClO4/CH3CN (—) and LiClO4/PC (—) for the colour changes (a)
yellow ↔ green and (b) green ↔ russet, applying two potential pulses of 50 s by redox cycle, with potential alternating
between (a) 0.0 - 0.7 V and (b) 0.7 – 1.3 V.
Independently of the colour change, both polymeric films showed greater
electrochemical stability in LiClO4/PC than in LiClO4/CH3CN. The best stability was
obtained for poly[1] film in LiClO4/PC that changed of colour between yellow and green
during around 9000 redox cycles with a charge loss of 34.3 %. The same film, in
LiClO4/CH3CN, showed colour change only during around 2000 redox cycles, with a
charge loss of 60.0 %. The green ↔ russet colour transition was less stable: after 400
0 3 6 9 12
0 2500 5000 7500 10000
- 60.0 % of Q (2000 cycles)
Number of cycles
i / a
.u.
Time / days
- 34.3 % of Q (9000 cycles)
0 3 6 8 11
0 100 200 300 400
- 96.1 % of Q (400 cycles)
- 68.2 % of Q (400 cycles)
Number of cycles
i / a
.u.
Time / hours
(a) (b)

FCUP Functional electroactive materials: towards novel saving and conversion energy systems
64
redox cycles poly[1] showed a loss in charge of 96.1 % in LiClO4/CH3CN and 68.2 % in
LiClO4/PC.
Figure 2.16 Chronoamperograms of poly[2] films in LiClO4/CH3CN (—) and LiClO4/PC (—) for the colour changes (a)
yellow-green and (b) green-russet, applying two potential pulses of 50 s by redox cycle, with potential alternating
between (a) 0.0 - 0.7 V and (b) 0.7 – 1.15 V.
Moreover, for the yellow ↔ green change, poly[2] showed charge losses of
10.5 % and 70.9 % in LiClO4/PC and LiClO4/CH3CN, respectively, at around 650 redox
cycles (taking in account that, for this film, the colour contrast between the yellow and
green is low). The green ↔ russet change, although showed the highest contrast for
this film, also revealed to be unstable, with charge losses of 70.2 % in LiClO4/PC and
88.6 % in LiClO4/CH3CN (at 650 cycles). These results showed that poly[2] has an
inferior electrochemical stability than poly[1]. Furthermore, the reasons for the general
better stabilities in LiClO4/PC are not well known, but can be related with the less
volatility of PC compared to CH3CN and with degradation of the substrate (PET) over
time, when immersed in CH3CN.
In Table 2.6 are summarised the switching times determined for both
poly[Ni(salen)] films during the stability studies, along the redox cycles. Note that these
response times are in general higher than those indicated in Figures 2.11 and 2.12,
once the films used here were deposited during 10 scans (Γ ≈ 0.31 and 1.13 μmol cm-2,
for poly[1] and poly[2], respectively), while the films used in chronoabsorptometric
studies were deposited during 5 scans (Γ ≈ 0.16 and 0.84 μmol cm-2, for poly[1] and
poly[2], respectively) and, so, have different thicknesses.
0 3 6 8 11 14 17
0 100 200 300 400 500 600
- 70.2 % of Q (650 cycles)
Number of cycles
i / a
.u.
Time / hours
- 88.6 % of Q (650 cycles)
0 3 6 8 11 14 17
0 100 200 300 400 500 600
- 70.9 % of Q (650 cycles)
- 10.5 % of Q (650 cycles)
Number of cycles
i / a
.u.
Time / hours
(a) (b)

FCUP Functional electroactive materials: towards novel saving and conversion energy systems
65
Tabl
e 2.
6. S
witc
hing
tim
es m
easu
red
alo
ng t
he c
hro
noa
mpe
rom
etric
stu
die
s of
the
po
ly[1
] a
nd p
oly
[2]
in L
iClO
4/C
H3C
N a
nd L
iClO
4/P
C (
Fig
ure
s 2.
15 a
nd 2
.16)
.
Film
s Su
ppor
ting
Elec
trol
yte
Switc
hing
tim
es /
s N
umbe
r of
cyc
les
yello
w -
gree
n gr
een
- ye
llow
N
umbe
r of
cyc
les
gree
n -
russ
et
russ
et -
gree
n
poly
[1]
LiC
lO4/
CH
3CN
0
9.3
8
.4
0
6.9
2
5.0
10
00
11
.3
6.4
1
00
11
.7
24
.2
20
00
24
.0
7.6
2
00
29
.8
17
.8
LiC
lO4/
PC
0
20
.6
15
.4
0
10
.5
36
.02
10
00
16
.5
16
.6
10
0 9
.9
30
.37
20
00
16
.6
17
.2
20
0 1
1.8
2
9.9
30
00
17
.5
16
.7
30
0 1
4.9
3
0.2
60
00
17
.4
13
.2
90
00
17
.9
9.9
poly
[2]
LiC
lO4/
CH
3CN
0
9
.9
3.3
0
2
0.7
8 1
4.3
20
0 1
0.8
3
.7
10
0 -
11
.3
LiC
lO4/
PC
0
38
.8
12
.1
0
23
.9
30
.5
20
0 3
9.1
1
2.2
1
00
17
.2
24
.9
40
0 3
9.5
1
2.0
2
00
19
.9
24
.7
60
0 3
8.8
1
2.0
3
00
20
.0
22
.0
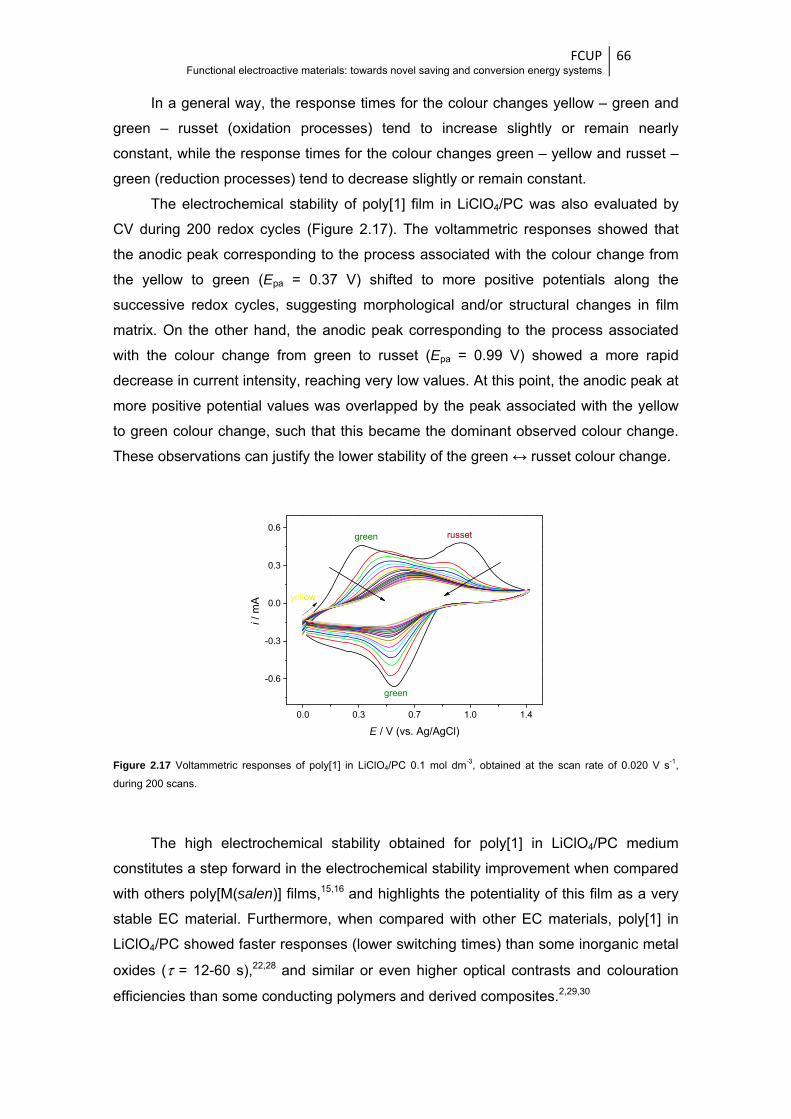
FCUP Functional electroactive materials: towards novel saving and conversion energy systems
66
In a general way, the response times for the colour changes yellow – green and
green – russet (oxidation processes) tend to increase slightly or remain nearly
constant, while the response times for the colour changes green – yellow and russet –
green (reduction processes) tend to decrease slightly or remain constant.
The electrochemical stability of poly[1] film in LiClO4/PC was also evaluated by
CV during 200 redox cycles (Figure 2.17). The voltammetric responses showed that
the anodic peak corresponding to the process associated with the colour change from
the yellow to green (Epa = 0.37 V) shifted to more positive potentials along the
successive redox cycles, suggesting morphological and/or structural changes in film
matrix. On the other hand, the anodic peak corresponding to the process associated
with the colour change from green to russet (Epa = 0.99 V) showed a more rapid
decrease in current intensity, reaching very low values. At this point, the anodic peak at
more positive potential values was overlapped by the peak associated with the yellow
to green colour change, such that this became the dominant observed colour change.
These observations can justify the lower stability of the green ↔ russet colour change.
Figure 2.17 Voltammetric responses of poly[1] in LiClO4/PC 0.1 mol dm-3, obtained at the scan rate of 0.020 V s-1,
during 200 scans.
The high electrochemical stability obtained for poly[1] in LiClO4/PC medium
constitutes a step forward in the electrochemical stability improvement when compared
with others poly[M(salen)] films,15,16 and highlights the potentiality of this film as a very
stable EC material. Furthermore, when compared with other EC materials, poly[1] in
LiClO4/PC showed faster responses (lower switching times) than some inorganic metal
oxides (τ = 12-60 s),22,28 and similar or even higher optical contrasts and colouration
efficiencies than some conducting polymers and derived composites.2,29,30
0.0 0.3 0.7 1.0 1.4
-0.6
-0.3
0.0
0.3
0.6
green
russetgreen
yellow
i / m
A
E / V (vs. Ag/AgCl)
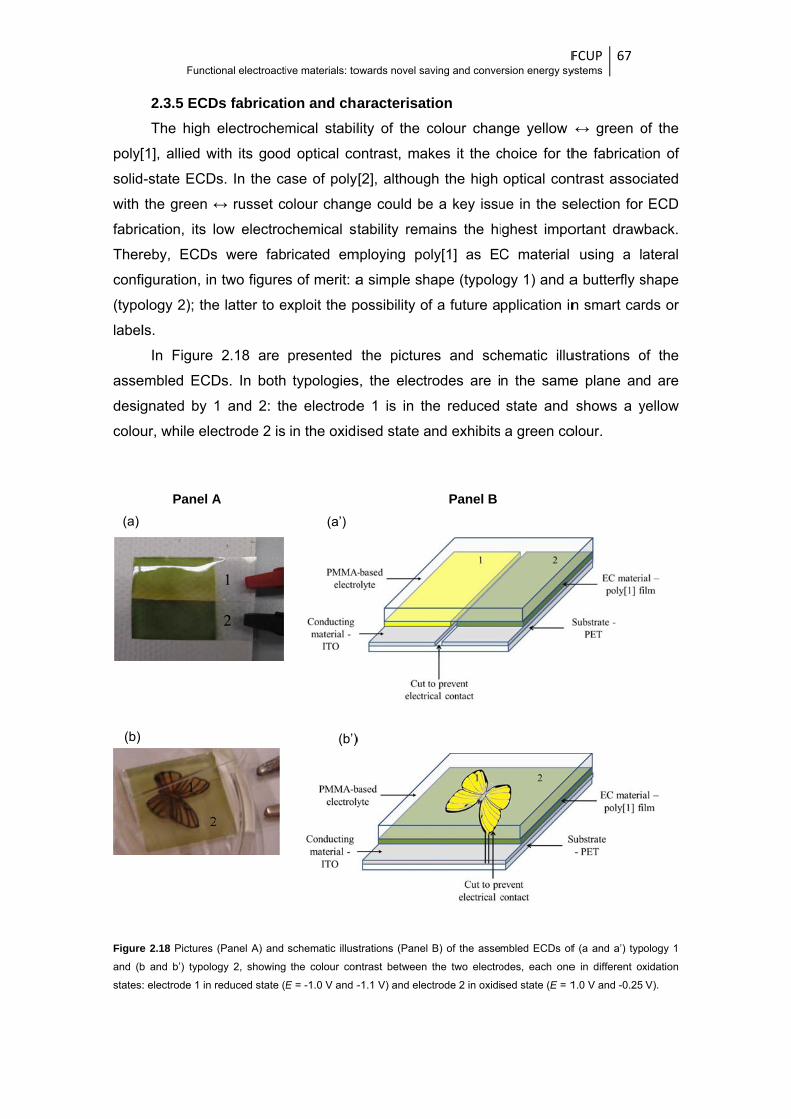
poly[
solid
with
fabric
Ther
confi
(typo
label
asse
desig
colou
Figureand (b
states:
(a)
(b)
Functi
2.3.5 ECDThe high
[1], allied w
-state ECD
the green ↔
cation, its l
reby, ECDs
iguration, in
ology 2); the
ls.
In Figure
embled ECD
gnated by
ur, while ele
e 2.18 Pictures
b and b’) typolo
: electrode 1 in
Panel A
ional electroacti
Ds fabricatielectrochem
with its good
Ds. In the ca
↔ russet c
low electroc
s were fab
n two figures
e latter to e
2.18 are
Ds. In both
1 and 2: th
ectrode 2 is
(Panel A) and
ogy 2, showing
reduced state (E
A
ive materials: to
ion and chamical stabil
d optical co
ase of poly
olour chang
chemical st
ricated em
s of merit: a
exploit the p
presented
typologies
he electrode
in the oxidi
schematic illus
the colour con
E = -1.0 V and -
(a’)
(b’)
owards novel sa
aracterisatlity of the c
ontrast, mak
[2], althoug
ge could be
tability rem
mploying po
a simple sh
possibility of
the picture
s, the electr
e 1 is in th
ised state a
strations (Panel
ntrast between
-1.1 V) and elec
)
aving and conve
tion colour chan
kes it the c
gh the high
e a key issu
mains the hi
oly[1] as EC
hape (typolo
f a future a
es and sch
rodes are i
he reduced
and exhibits
B) of the asse
the two electro
ctrode 2 in oxidi
Panel B
Fersion energy sy
nge yellow
choice for th
optical con
ue in the se
ighest impo
C material
ogy 1) and a
pplication in
hematic illu
n the same
state and
a green co
mbled ECDs of
odes, each one
sed state (E = 1
FCUP ystems
67
↔ green o
he fabricati
ntrast assoc
election for
ortant draw
using a la
a butterfly s
n smart car
ustrations o
e plane an
shows a y
olour.
f (a and a’) typ
e in different ox
1.0 V and -0.25
of the
ion of
ciated
ECD
wback.
ateral
shape
rds or
of the
d are
yellow
ology 1
xidation
V).
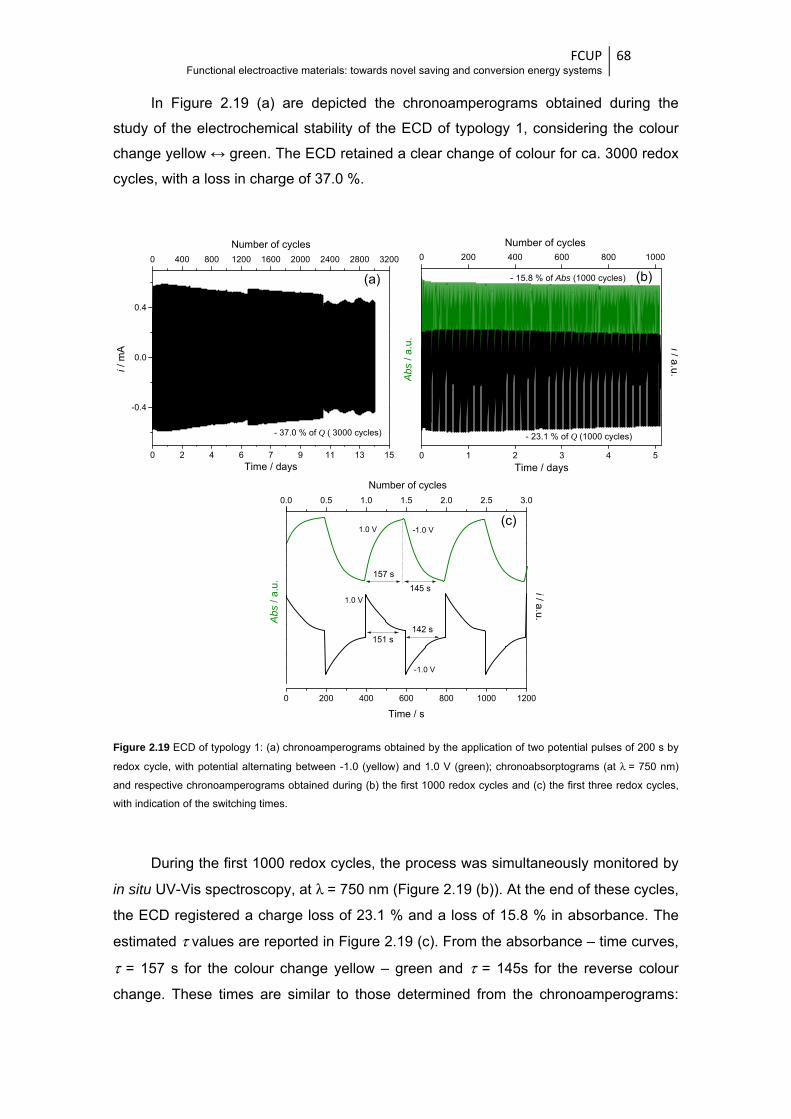
FCUP Functional electroactive materials: towards novel saving and conversion energy systems
68
In Figure 2.19 (a) are depicted the chronoamperograms obtained during the
study of the electrochemical stability of the ECD of typology 1, considering the colour
change yellow ↔ green. The ECD retained a clear change of colour for ca. 3000 redox
cycles, with a loss in charge of 37.0 %.
Figure 2.19 ECD of typology 1: (a) chronoamperograms obtained by the application of two potential pulses of 200 s by
redox cycle, with potential alternating between -1.0 (yellow) and 1.0 V (green); chronoabsorptograms (at λ = 750 nm)
and respective chronoamperograms obtained during (b) the first 1000 redox cycles and (c) the first three redox cycles,
with indication of the switching times.
During the first 1000 redox cycles, the process was simultaneously monitored by
in situ UV-Vis spectroscopy, at λ = 750 nm (Figure 2.19 (b)). At the end of these cycles,
the ECD registered a charge loss of 23.1 % and a loss of 15.8 % in absorbance. The
estimated τ values are reported in Figure 2.19 (c). From the absorbance – time curves,
τ = 157 s for the colour change yellow – green and τ = 145s for the reverse colour
change. These times are similar to those determined from the chronoamperograms:
0 2 4 6 7 9 11 13 15
-0.4
0.0
0.4
0 400 800 1200 1600 2000 2400 2800 3200
Number of cycles
i / m
A
Time / days
- 37.0 % of Q ( 3000 cycles)
0 1 2 3 4 5
0 200 400 600 800 1000
- 23.1 % of Q (1000 cycles)
Number of cycles
i / a.u.
Abs
/ a.
u.
Time / days
- 15.8 % of Abs (1000 cycles)
0 200 400 600 800 1000 1200
0.0 0.5 1.0 1.5 2.0 2.5 3.0
-1.0 V1.0 V
145 s
157 s
142 s
-1.0 V
1.0 V
151 s
i / a.u.
Number of cycles
Time / s
Abs
/ a
.u.
(b) (a)
(c)
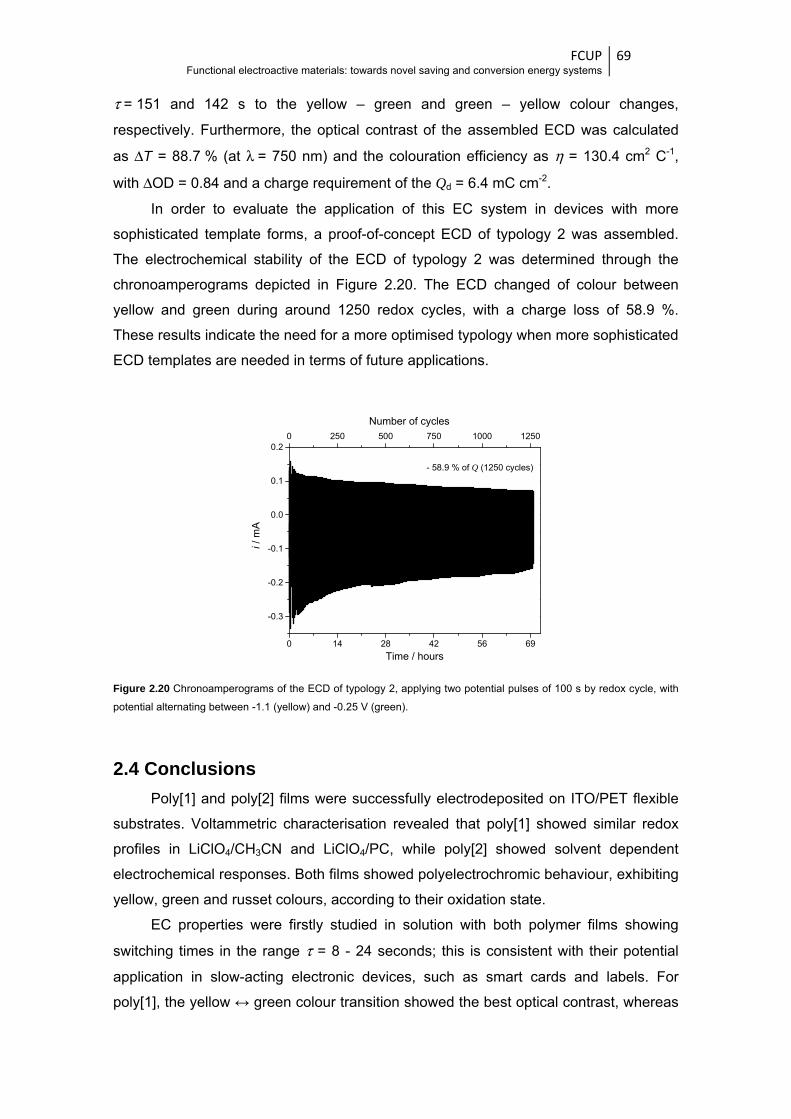
FCUP Functional electroactive materials: towards novel saving and conversion energy systems
69
τ = 151 and 142 s to the yellow – green and green – yellow colour changes,
respectively. Furthermore, the optical contrast of the assembled ECD was calculated
as ΔT = 88.7 % (at λ = 750 nm) and the colouration efficiency as η = 130.4 cm2 C-1,
with ΔOD = 0.84 and a charge requirement of the Qd = 6.4 mC cm-2.
In order to evaluate the application of this EC system in devices with more
sophisticated template forms, a proof-of-concept ECD of typology 2 was assembled.
The electrochemical stability of the ECD of typology 2 was determined through the
chronoamperograms depicted in Figure 2.20. The ECD changed of colour between
yellow and green during around 1250 redox cycles, with a charge loss of 58.9 %.
These results indicate the need for a more optimised typology when more sophisticated
ECD templates are needed in terms of future applications.
Figure 2.20 Chronoamperograms of the ECD of typology 2, applying two potential pulses of 100 s by redox cycle, with
potential alternating between -1.1 (yellow) and -0.25 V (green).
2.4 Conclusions Poly[1] and poly[2] films were successfully electrodeposited on ITO/PET flexible
substrates. Voltammetric characterisation revealed that poly[1] showed similar redox
profiles in LiClO4/CH3CN and LiClO4/PC, while poly[2] showed solvent dependent
electrochemical responses. Both films showed polyelectrochromic behaviour, exhibiting
yellow, green and russet colours, according to their oxidation state.
EC properties were firstly studied in solution with both polymer films showing
switching times in the range τ = 8 - 24 seconds; this is consistent with their potential
application in slow-acting electronic devices, such as smart cards and labels. For
poly[1], the yellow ↔ green colour transition showed the best optical contrast, whereas
0 14 28 42 56 69
-0.3
-0.2
-0.1
0.0
0.1
0.20 250 500 750 1000 1250
Number of cycles
i / m
A
Time / hours
- 58.9 % of Q (1250 cycles)
FCUP Functional electroactive materials: towards novel saving and conversion energy systems
70
for poly[2] it was the green ↔ russet transition. Poly[1] also showed the best
colouration efficiencies, with the highest values being obtained for the green ↔ russet
colour change. Both polymeric films were more electrochemically stable in LiClO4/PC,
although the overall poorer electrochemically stability of poly[2]: the highest
electrochemical stability was obtained for the yellow ↔ green change of poly[1] in
LiClO4/PC, with charge loss of only 34.3 % after 9000 cycles. Consequently, poly[1]
was used to fabricate ECD with two figures of merit (typology 1 and 2), with typology 1
showing the best performance: ΔT = 88.7 % (at λ = 750 nm), η = 130.4 cm2 C-1 and
charge decrease of 37.0 % after 3000 redox cycles.
The results showed that poly[1] has promising EC properties both in a solution
cell and in a solid-state device. Combination of high electrochemical stability,
interesting polyelectrochromism and good optical contrast motivate the application of
poly[1] as EC material in electronic displays. Furthermore, the combination of these EC
properties with a flexible substrate has considerable advantages that may be exploited
in paper-like applications.
FCUP Functional electroactive materials: towards novel saving and conversion energy systems
71
References
1 Amb, C. M.; Dyer, A. L.; Reynolds, J. R. Chem. Mat. 2011, 23, 397. 2 Yu, W. Y.; Chen, J.; Fu, Y. L.; Xu, J. K.; Nie, G. M. J. Electroanal. Chem. 2013, 700, 17. 3 Rende, E.; Kilic, C. E.; Udum, Y. A.; Toffoli, D.; Toppare, L. Electrochim. Acta 2014, 138, 454. 4 Chang, K. H.; Wang, H. P.; Wu, T. Y.; Sun, I. W. Electrochim. Acta 2014, 119, 225. 5 Jarosz, T.; Brzeczek, A.; Walczak, K.; Lapkowski, M.; Domagala, W. Electrochim. Acta 2014, 137,
595. 6 Kurtay, G.; Ak, M.; Gullu, M.; Toppare, L.; Ak, M. S. Synth. Met. 2014, 194, 19. 7 Lu, J. L.; Liu, W. S.; Ling, H.; Kong, J. H.; Ding, G. Q.; Zhou, D.; Lu, X. H. RSC Adv. 2012, 2,
10537. 8 Sydam, R.; Kokal, R. K.; Deepa, M. ChemPhysChem 2015, 16, 1042. 9 Xiong, S. X.; Fu, J. L.; Li, Z. F.; Shi, Y. J.; Wang, X. Q.; Chu, J.; Gong, M.; Wu, B. H. J. Macromol.
Sci. Part B-Phys. 2015, 54, 799. 10 Kang, J. H.; Oh, Y. J.; Paek, S. M.; Hwang, S. J.; Choy, J. H. Sol. Energy Mater. Sol. Cells 2009,
93, 2040. 11 Sydorov, D.; Duboriz, I.; Pud, A. Electrochim. Acta 2013, 106, 114. 12 Kraft, A.; Rottmann, M.; Gilsing, H. D.; Faltz, H. Electrochim. Acta 2007, 52, 5856. 13 Vilas-Boas, M.; Santos, I. C.; Henderson, M. J.; Freire, C.; Hillman, A. R.; Vieil, E. Langmuir 2003,
19, 7460. 14 Martins, M.; Boas, M. V.; de Castro, B.; Hillman, A. R.; Freire, C. Electrochim. Acta 2005, 51, 304. 15 Pinheiro, C.; Parola, A. J.; Pina, F.; Fonseca, J.; Freire, C. Sol. Energy Mater. Sol. Cells 2008, 92,
980. 16 Branco, A.; Pinheiro, C.; Fonseca, J.; Tedim, J.; Carneiro, A.; Parola, A. J.; Freire, C.; Pina, F.
Electrochem. Solid State Lett. 2010, 13, J114. 17 Freire, C.; de Castro, B. J. Chem. Soc.-Dalton Trans. 1998, 1491. 18 Fonseca, J.; Tedim, J.; Biernacki, K.; Magalhaes, A. L.; Gurman, S. J.; Freire, C.; Hillman, A. R.
Electrochim. Acta 2010, 55, 7726. 19 Tedim, J.; Patricio, S.; Fonseca, J.; Magalhaes, A. L.; Moura, C.; Hillman, A. R.; Freire, C. Synth.
Met. 2011, 161, 680. 20 Dale, S. M.; Glidle, A.; Hillman, A. R. J. Mater. Chem. 1992, 2, 99. 21 Wu, T. Y.; Liao, J. W.; Chen, C. Y. Electrochim. Acta 2014, 150, 245. 22 Sapp, S. A.; Sotzing, G. A.; Reynolds, J. R. Chem. Mat. 1998, 10, 2101. 23 Tedim, J.; Carneiro, A.; Bessada, R.; Patricio, S.; Magalhaes, A. L.; Freire, C.; Gurman, S. J.;
Hillman, A. R. J. Electroanal. Chem. 2007, 610, 46. 24 Tedim, J.; Goncalves, F.; Pereira, M. F. R.; Figueiredo, J. L.; Moura, C.; Freire, C.; Hillman, A. R.
Electrochim. Acta 2008, 53, 6722. 25 Dahm, C. E.; Peters, D. G.; Simonet, J. J. Electroanal. Chem. 1996, 410, 163. 26 Vilas-Boas, M.; Freire, C.; de Castro, B.; Christensen, P. A.; Hillman, A. R. Chem.-Eur. J. 2001, 7,
139. 27 Beaujuge, P. M.; Reynolds, J. R. Chem. Rev. 2010, 110, 268. 28 Kalagi, S. S.; Mali, S. S.; Dalavi, D. S.; Inamdar, A. I.; Im, H.; Patil, P. S. Synth. Met. 2011, 161,
1105. 29 Camurlu, P.; Gultekin, C.; Bicil, Z. Electrochim. Acta 2012, 61, 50. 30 Xu, G. Q.; Zhao, J. S.; Cui, C. S.; Hou, Y. F.; Kong, Y. Electrochim. Acta 2013, 112, 95.

FCUP Functional electroactive materials: towards novel saving and conversion energy systems
72
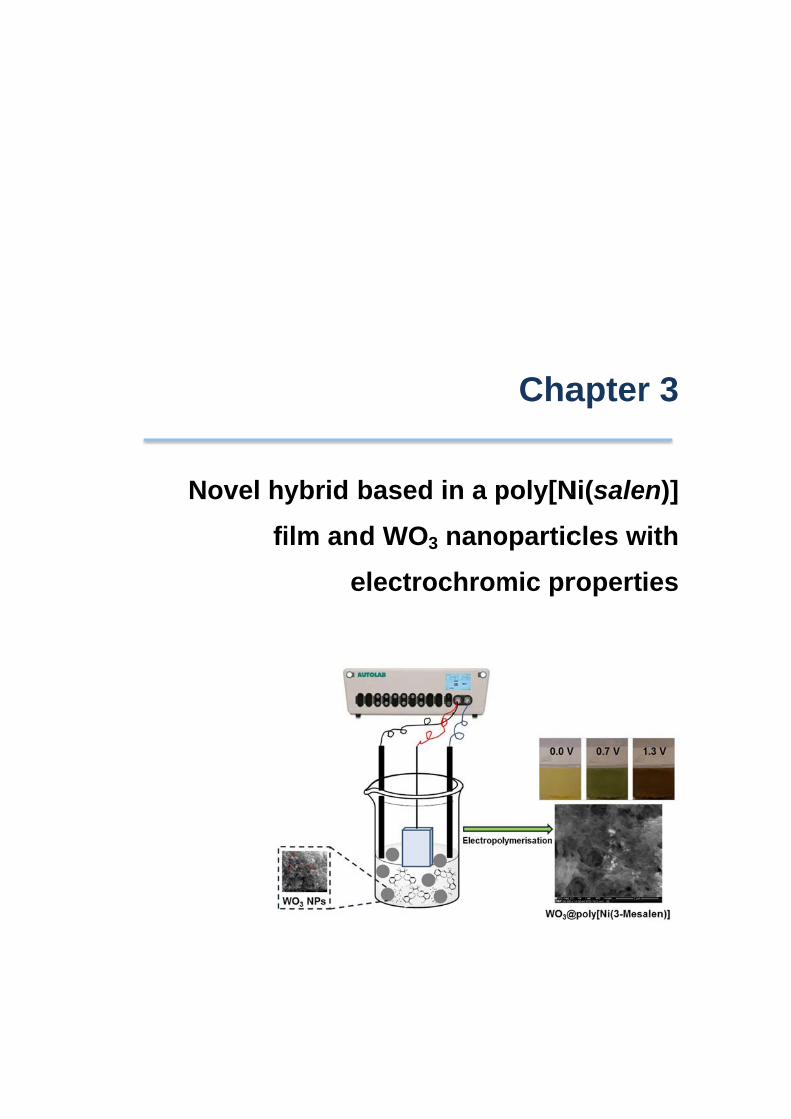
Noovel hyfiybrid ilm an
e
basedd WO
electro
d in a p
3 nanoochrom
Cha
poly[Noparticmic pr
apter
Ni(salecles wropert
r 3
en)] with
ies

3 Novel hybrid based in a poly[Ni(salen)]
film and WO3 nanoparticles with electrochromic properties1,2,3
Abstract
The strategy of combining electroactive polymers and inorganic nanomaterials
has been widely studied in recent years in order to improve some of their properties,
namely electrocatalysis and electrochromism. This chapter focuses on a new
composite prepared through the electropolymerisation of the transition metal complex
[Ni(3-Mesalen)], designated as [1], in the presence of WO3 nanoparticles (NPs) and its
electrochromic performance.
The WO3 NPs were prepared using tungsten metal powder and were
characterised by several techniques, which indicated quasi-spherical morphology, high
crystallinity and sizes of ≈ 34 – 38 nm.
The nanocomposite WO3@poly[1] films displayed similar electrochemical
responses to that of pristine poly[1] film in LiClO4/CH3CN, but higher electroactive
surface coverages, showing the advantage of NPs incorporation in the nanocomposite.
The presence of the WO3 NPs on poly[1] matrix was assessed by X-ray photoelectron
spectroscopy and scanning electron microscopy. The nanocomposite presented similar
electronic spectra to those of poly[1], indicating that the electronic structure of pristine
film is maintained in the nanocomposite, but exhibited lower ε-values for bands
associated with charge transfer transitions for high oxidised states, revealing an
enhanced stability for ligand over-oxidation.
1 Adapted from: M. Nunes, C. Moura, A. R. Hillman, C. Freire, Novel hybrid based in a poly[Ni(salen)] film and WO3
nanoparticles with electrochromic properties. Submitted. 2 M. Nunes’s contribution to the publication: preparation and characterisation of the WO3 nanoparticles and of the
WO3@poly[1] nanocomposite and pristine poly[1] films, evaluation of the electrochromic properties and manuscript
preparation. 3 The experimental details on the electrochemical/spectroelectrochemical and remaining characterisation techniques
are indicated in Appendices A and C, respectively.

FCUP Functional electroactive materials: towards novel saving and conversion energy systems
76
The WO3@poly[1] nanocomposite showed more favourable EC properties in
LiClO4/CH3CN than the pristine film, with lower switching times (τ = 1.3 - 3.6 s), higher
optical contrasts (improvement of ≈ 40 %) and better colouration efficiencies
(improvement of 13.1 - 21.7 %). The results showed unequivocally the advantage of
the entrapment of WO3 NPs on the poly[1] matrix, in the improvement of the EC
properties of the pristine film.
3.1 Introduction In the last years, the continuous research in conducting polymers and the
emergence of the nanotechnology boosted the development of several
organic/inorganic hybrid assemblies based on the combination of CPs with, for
example, metal nanoparticles,1 carbon nanostructures,2,3 and inorganic compounds.4
Among these new composites, combination of CPs with metal oxide semiconductors
constitute, undoubtedly, one of the most promising classes,5,6 once allow to combine
the elasticity and functionality of the CPs with the high thermal and chemical stabilities
of metal oxides;7 some examples of these composites have been reported through the
incorporation of TiO2,8-10 ZnO11 and MnO2
12 nanomaterials on CPs-matrixes. In
particular, tungsten(VI) oxide (WO3), an n-type semiconductor with a band gap of
2.7 eV,13 has been widely employed to assemble WO3/CPs nanocomposites for
applications as sensors14-16 and electrocatalysts,17 mainly due to its ability to intercalate
electrons and protons.18 Furthermore, WO3 is the mostly investigated inorganic
electrochromic material19,20 due to its good chemical stability, strong adherence to
substrate and genuine colour switching (cathodic EC material).21,22 These properties
make it very attractive to be combined with CPs and other electroactive polymers for
EC applications.
In fact, several EC nanocomposites based in the incorporation of WO3
nanostructures in several CPs-matrixes, such as polyaniline21-25 and
poly(3,4-ethylenedioxythiophene)26 has already been reported, taking into account the
complementary EC performances of WO3 and CPs. In a general way, the CPs exhibit
interesting optical properties, with rich colour changes due to its multiple redox states,
but have small colour switching rates due to the slow transport of charge balance
counter ions into the polymer layer; on the other hand, metal oxide nanostructures
have high surface-to-volume ratio and organised structures that allow the ion/electron
intercalation processes and promote an excellent switching reversibility.7,27 Thus, the
resultant nanocomposites can take advantage of the synergic influence of the WO3 on
FCUP Functional electroactive materials: towards novel saving and conversion energy systems
77
the EC properties of conducting polymer and, generally, present improved EC
properties, with more satisfactory switching speeds and colouration efficiencies.21,23,25
The similarity of the poly[M(salen)]-based electroactive metallopolymers with
CPs, namely in the poly(phenylene)-based redox properties and their rich coloured
redox states,28,29 makes them interesting EC polymers. Thus, in this chapter it is
described the preparation and characterisation of a novel composite film based in the
incorporation of WO3 NPs on the matrix of a poly[Ni(salen)]-based film and the
evaluation of its EC properties. The metal salen polymer employed was the
poly[Ni(3-Mesalen)], designated by poly[1]. The EC performance evaluation of the
pristine poly[1] was already described in Chapter 2 and showed promising EC
properties, with a good electrochemical stability - a charge loss of 34.3 % after ≈ 9000
cycles - and interesting colour changes, from yellow in neutral state to green and russet
(reddish-brown) in oxidised states. Nonetheless, in order to potentiate its commercial
application, the EC properties of poly[1] need to be improved, namely in order to
achieve lower response times and increase the colouration efficiency. Thus, we took
the advantages of WO3 NPs properties - nanometric size (high surface-to-volume ratio)
and semiconductor properties - to incorporate them within poly[1] and to evaluate their
influence on the composition, morphology, electrochemical response and
spectroelectrochemical properties, with the ultimate goal to potentiate enhanced EC
properties. The hybrid films were prepared through the in situ electropolymerisation of
the respective Ni-salen complex in the presence of the WO3 NPs; this method has
several advantages, once allow the formation of the metallo-organic/inorganic interface
in one step and because the hybrid film is directly formed on the electrode surface.27,30
To the best of our knowledge, this is the first time that metallopolymer-nanoparticles
hybrid films between this family of M-salen polymers and metal oxides are prepared.
3.2 Experimental section 3.2.1 Materials and solvents Tungsten metal powder (Alfa Aesar, 99.9 %), hydrogen peroxide (Aldrich,
30 wt.% in H2O), glacial acetic acid (Merck, 100 %), acetonitrile and propylene
carbonate (Romil, pro analysis grade) and LiClO4 (Aldrich, 99 %) were used as
received; ultra-pure water (resistivity 18.2 MΩ cm at 25 ºC, Millipore) was used. The
complex N,N’-bis(3-methylsalicylideneiminate) nickel(II), [Ni(3-Mesalen)], and
respective salen ligand were prepared by methods described in literature.31
FCUP Functional electroactive materials: towards novel saving and conversion energy systems
78
3.2.2 WO3 NPs preparation WO3 NPs were prepared by a procedure adapted from literature.32,33 Briefly, 6.5 g
of tungsten metal powder were dissolved in 40 mL of 30 wt.% H2O2 and 4 mL of
millipore water, until a colourless solution was obtained. This solution was filtrated and
refluxed at 55 ºC during 17 hours, after the addition of 40 mL of glacial acetic acid. A
yellow flaky solid was obtained after solvent evaporation, which was heated to 100 ºC
(5 ºC / min) in air, held at this temperature for 1 h, and then brought back to room
temperature. Finally, it was annealed at three different temperatures: 250, 450 or
550 ºC during 2 hours, at the same heating rate.
3.2.3 Films preparation and electrochemical studies The WO3@poly[1] films were prepared by cyclic voltammetry (CV) from solutions
containing 1.0 mmol dm-3 [Ni(3-Mesalen)] (complex [1]) and 5 wt.% (WO3/LiClO4 wt.%)
of WO3 NPs (annealed at 550 ºC) in 0.1 mol dm-3 LiClO4/CH3CN. The potential of the
working electrode (ITO/PET 2.25 cm2) was cycled between 0.0 and 1.3 V at
0.020 V s-1, during 10 scans. Prior to electrodeposition, the starting solutions were (i)
sonicated during 10 minutes or (ii) sonicated during 10 minutes followed by reflux
during 3 hours. According with the method used, the films obtained were named
WO3@poly[1]_s and WO3@poly[1]_r, respectively. The pristine poly[1] film was
prepared using the same experimental conditions, but in the absence of WO3 NPs.
Upon film deposition, the modified electrodes were rinsed with dry CH3CN or PC,
immersed in monomer- and WO3-free 0.1 mol dm-3 LiClO4/CH3CN or LiClO4/PC
solutions and redox cycled in the potential ranges -0.1 to 1.2 V or -0.1 to 1.3 V,
respectively, at 0.010 V s-1, during 5 redox cycles. The electroactive surface coverage,
Γ / μmol cm-2 (cited in terms of monomeric units) of each film was determined by a
coulometric assay,34,35 using CVs obtained in monomer- and WO3-free 0.1 mol dm-3
LiClO4/CH3CN solution at the scan rate of 0.010 V s-1, to ensure complete films redox
conversion. The doping level value used for Γ determination was calculated from
comparison of coulometric data for films deposition and cycling, as described in
literature,34,35 and were found to be n = 0.65.
3.2.4 Composition and morphology characterisation The composition and morphology characterisations of WO3@poly[1]_r
nanocomposite were performed by XPS and SEM/EDS, respectively. All films were
analysed in reduced state. XPS was also used to investigate the influence of the redox
cycling in film chemical composition; films were analysed: (i) upon polymerisation and
before redox cycling, by application of E = 0.0 V during 200 s in 0.1 mol dm-3
FCUP Functional electroactive materials: towards novel saving and conversion energy systems
79
LiClO4/CH3CN, to ensure the reduced state, and after potential cycling in
(ii) LiClO4/CH3CN and (iii) LiClO4/PC 0.1 mol dm-3, in the potential ranges -0.1 to 1.2 V
or -0.1 to 1.3 V, respectively, at 0.020 V s-1, during 5 redox cycles; poly[1] film was
studied in identical conditions for comparison.
3.2.5 Spectroelectrochemical studies Redox process was also study by in situ UV-Vis spectroscopy with films prepared
with 3 electrodeposition cycles, at 0.020 V s-1. The films were cycled in 0.1 mol dm-3
LiClO4/CH3CN and LiClO4/PC supporting electrolytes, in the conditions described in
section 3.2.3. The UV-Vis spectra were acquired simultaneously, at intervals of 0.5 s, in
the range wavelengths of 315 to 1100 nm, during the 4th redox cycle. The molar
extinction coefficients, ε / cm-1 mol-1 dm3, of all observed electronic bands were
estimated using a combination of the Beer-Lambert and Faraday laws (Equation 2.1).
3.2.6 Electrochromic properties evaluation The EC parameters – switching times, optical contrast, change of the optical
density and colouration efficiency - of the nanocomposites films were obtained by a
double potential step method (chronoamperometry) coupled with UV-Vis spectroscopy
(chronoabsorptometry). The studies were performed in 0.1 mol dm-3 LiClO4/CH3CN and
LiClO4/PC solutions, considering the colour transition yellow ↔ green, that proved to be
the most promising for the pristine poly[1] (Chapter 2). In the double potential step
experiment, the potential was set at the initial potential of E = 0.0 V for a period of time
of 50 s and was stepped to a second potential E = 0.7 V for another period of 50 s,
being after switched back to the initial potential. The simultaneous
chronoabsorptometric measurements were performed at the fixed wavelength of
λ = 750 nm, acquiring the UV-Vis spectra with intervals of 1 s, during 4 redox cycles.
The films studied were electrodeposited during 3 cycles, using the typical experimental
conditions. The ΔOD and the colouration efficiency parameters were estimated through
Equation 1.1. The switching times were determined considering 90 % of the full
switch.36,37
The electrochemical stability was evaluated by a chronoamperometric
experiment, using the same experimental conditions, but for a long period of time
(≈ 9500 redox cycles, ≈ 11 days). The films used were prepared with
10 electrodeposition cycles. All EC parameters were also evaluated for pristine poly[1]
film in the same conditions, for comparison.
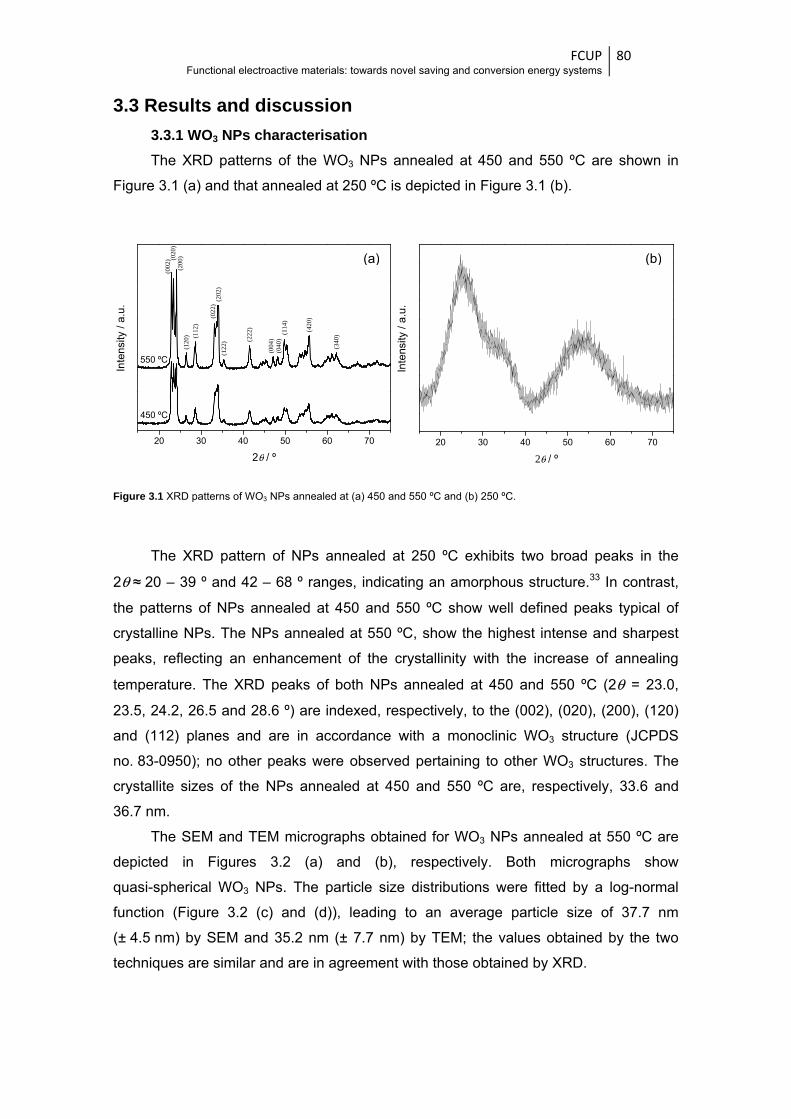
FCUP Functional electroactive materials: towards novel saving and conversion energy systems
80
3.3 Results and discussion
3.3.1 WO3 NPs characterisation The XRD patterns of the WO3 NPs annealed at 450 and 550 ºC are shown in
Figure 3.1 (a) and that annealed at 250 ºC is depicted in Figure 3.1 (b).
Figure 3.1 XRD patterns of WO3 NPs annealed at (a) 450 and 550 ºC and (b) 250 ºC.
The XRD pattern of NPs annealed at 250 ºC exhibits two broad peaks in the
2θ ≈ 20 – 39 º and 42 – 68 º ranges, indicating an amorphous structure.33 In contrast,
the patterns of NPs annealed at 450 and 550 ºC show well defined peaks typical of
crystalline NPs. The NPs annealed at 550 ºC, show the highest intense and sharpest
peaks, reflecting an enhancement of the crystallinity with the increase of annealing
temperature. The XRD peaks of both NPs annealed at 450 and 550 ºC (2θ = 23.0,
23.5, 24.2, 26.5 and 28.6 º) are indexed, respectively, to the (002), (020), (200), (120)
and (112) planes and are in accordance with a monoclinic WO3 structure (JCPDS
no. 83-0950); no other peaks were observed pertaining to other WO3 structures. The
crystallite sizes of the NPs annealed at 450 and 550 ºC are, respectively, 33.6 and
36.7 nm.
The SEM and TEM micrographs obtained for WO3 NPs annealed at 550 ºC are
depicted in Figures 3.2 (a) and (b), respectively. Both micrographs show
quasi-spherical WO3 NPs. The particle size distributions were fitted by a log-normal
function (Figure 3.2 (c) and (d)), leading to an average particle size of 37.7 nm
(± 4.5 nm) by SEM and 35.2 nm (± 7.7 nm) by TEM; the values obtained by the two
techniques are similar and are in agreement with those obtained by XRD.
20 30 40 50 60 70
(340
)
(420
)
(114
)(0
40)
(004
)
450 ºC
Inte
nsity
/ a.
u.
2θ / º
(002
) (020
)(2
00)
(120
) (112
)
(022
)(2
02)
(122
) (222
)
550 ºC
20 30 40 50 60 70
Inte
nsity
/ a
.u.
2θ / º
(a) (b)
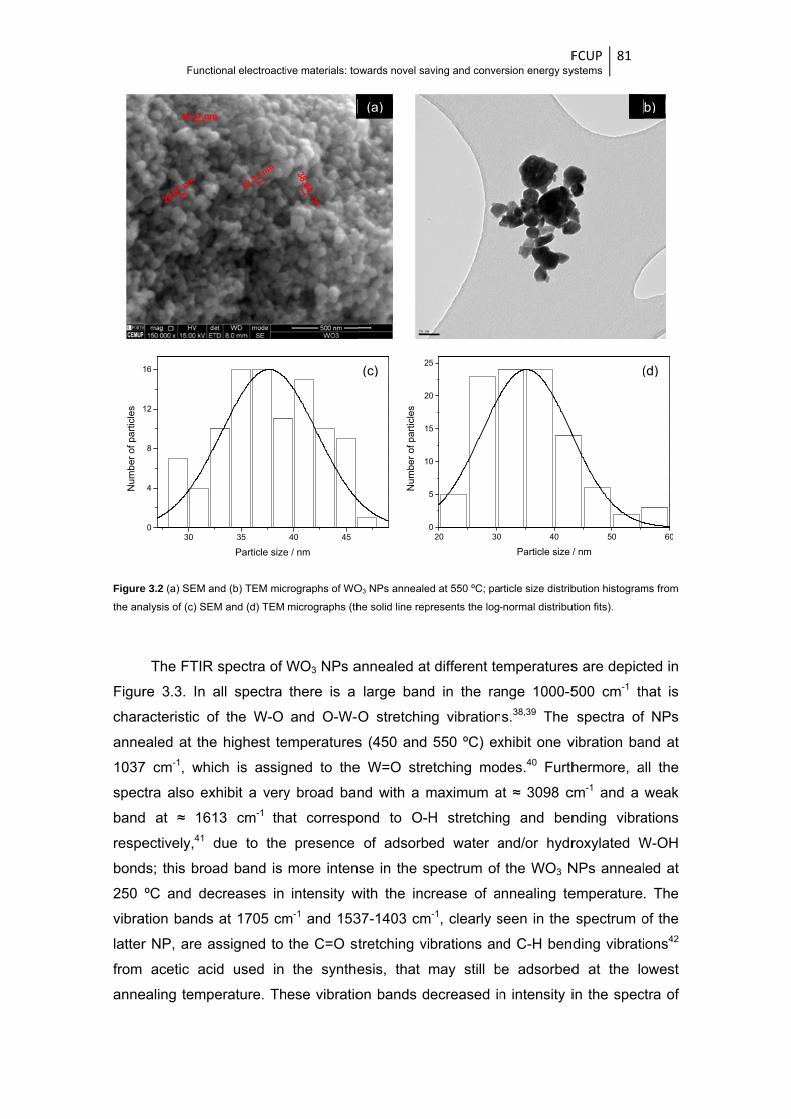
Figurethe ana
Figur
chara
anne
1037
spec
band
respe
bond
250
vibra
latter
from
anne
Num
ber
of p
artic
les
Functi
e 3.2 (a) SEM a
alysis of (c) SEM
The FTIR
re 3.3. In a
acteristic o
ealed at the
7 cm-1, whi
ctra also ex
d at ≈ 161
ectively,41 d
ds; this broa
ºC and de
ation bands
r NP, are a
acetic aci
ealing temp
300
4
8
12
16
ional electroacti
nd (b) TEM mic
M and (d) TEM
spectra of
all spectra
f the W-O
e highest te
ch is assig
xhibit a very
13 cm-1 tha
due to the
ad band is
creases in
at 1705 cm
assigned to
id used in
erature. Th
35
Particle size
ive materials: to
crographs of WO
micrographs (th
WO3 NPs a
there is a
and O-W-
emperatures
gned to the
y broad ban
at correspo
presence
more inten
intensity w
m-1 and 153
the C=O s
the synthe
ese vibratio
40 45
e / nm
owards novel sa
O3 NPs anneale
he solid line rep
annealed at
large band
O stretchin
s (450 and
e W=O stre
nd with a m
ond to O-H
of adsorb
nse in the s
with the inc
37-1403 cm
tretching vi
esis, that
on bands d
1
1
2
2
Nu
mb
er
of p
art
icle
s
(c)
(a)
aving and conve
ed at 550 ºC; pa
presents the log-
t different te
d in the ra
ng vibration
550 ºC) ex
etching mod
maximum a
H stretchin
ed water a
spectrum of
crease of a
m-1, clearly s
brations an
may still b
ecreased in
20 300
5
0
5
0
5
Fersion energy sy
rticle size distrib
-normal distribu
emperatures
nge 1000-5
s.38,39 The
xhibit one v
des.40 Furth
at ≈ 3098 c
ng and ben
and/or hydr
the WO3 N
nnealing te
seen in the
nd C-H ben
be adsorbed
n intensity i
0 40
Particle size
FCUP ystems
81
bution histogram
ution fits).
s are depict
500 cm-1 th
spectra of
vibration ba
hermore, a
cm-1 and a
nding vibra
roxylated W
NPs anneal
emperature
spectrum o
nding vibrati
d at the lo
in the spec
50
/ nm
(
(
ms from
ted in
hat is
f NPs
and at
all the
weak
ations
W-OH
led at
. The
of the
ions42
owest
ctra of
60
(d)
b)
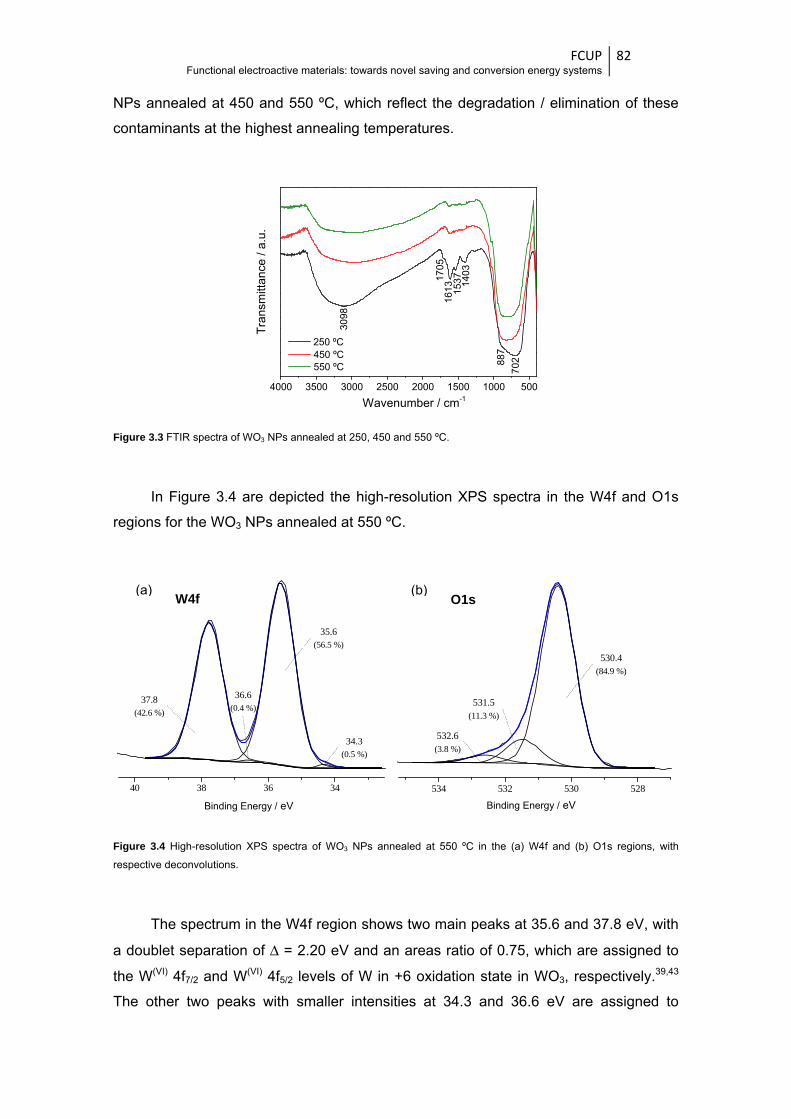
FCUP Functional electroactive materials: towards novel saving and conversion energy systems
82
NPs annealed at 450 and 550 ºC, which reflect the degradation / elimination of these
contaminants at the highest annealing temperatures.
Figure 3.3 FTIR spectra of WO3 NPs annealed at 250, 450 and 550 ºC.
In Figure 3.4 are depicted the high-resolution XPS spectra in the W4f and O1s
regions for the WO3 NPs annealed at 550 ºC.
Figure 3.4 High-resolution XPS spectra of WO3 NPs annealed at 550 ºC in the (a) W4f and (b) O1s regions, with
respective deconvolutions.
The spectrum in the W4f region shows two main peaks at 35.6 and 37.8 eV, with
a doublet separation of Δ = 2.20 eV and an areas ratio of 0.75, which are assigned to
the W(VI) 4f7/2 and W(VI) 4f5/2 levels of W in +6 oxidation state in WO3, respectively.39,43
The other two peaks with smaller intensities at 34.3 and 36.6 eV are assigned to
4000 3500 3000 2500 2000 1500 1000 500
7028
87
1705
250 ºC 450 ºC 550 ºC
Tra
nsm
ittan
ce /
a.u.
Wavenumber / cm-1
3098
161
31
537
140
3
40 38 36 34
36.6(0.4 %)
34.3(0.5 %)
37.8(42.6 %)
35.6(56.5 %)
Binding Energy / eV
534 532 530 528
532.6(3.8 %)
531.5(11.3 %)
Binding Energy / eV
530.4(84.9 %)
W4f O1s(a) (b)
Binding Energy / eV Binding Energy / eV
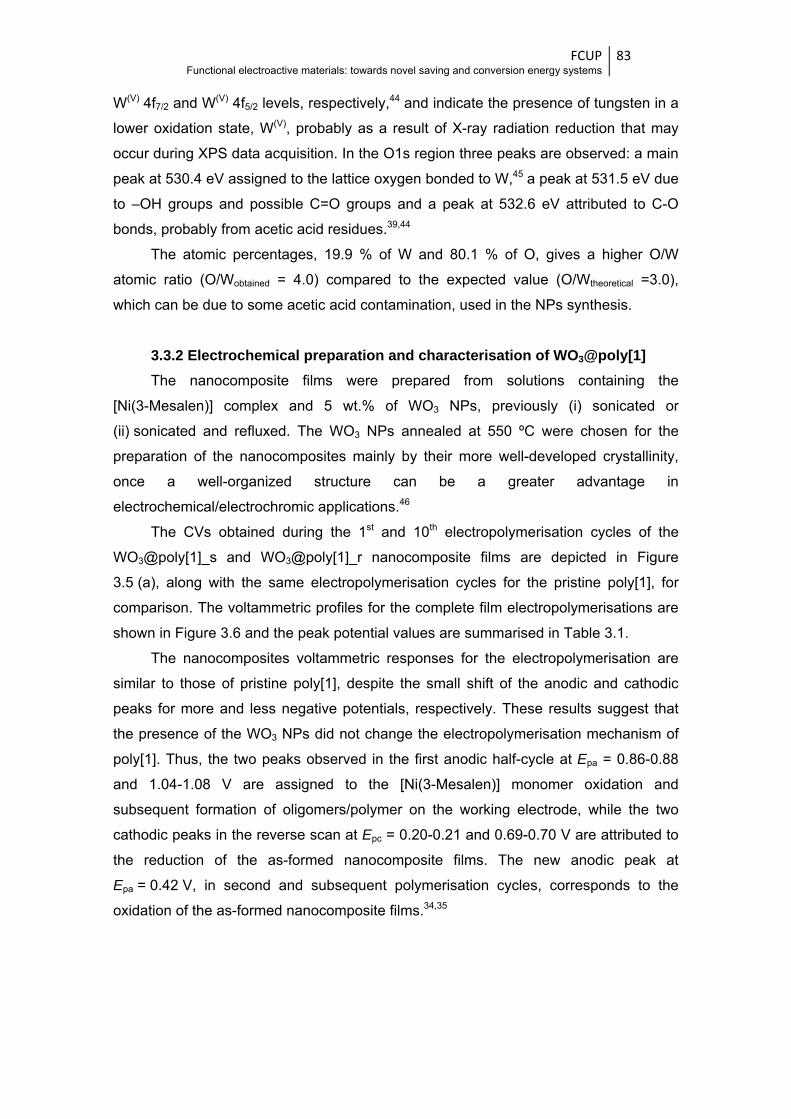
FCUP Functional electroactive materials: towards novel saving and conversion energy systems
83
W(V) 4f7/2 and W(V) 4f5/2 levels, respectively,44 and indicate the presence of tungsten in a
lower oxidation state, W(V), probably as a result of X-ray radiation reduction that may
occur during XPS data acquisition. In the O1s region three peaks are observed: a main
peak at 530.4 eV assigned to the lattice oxygen bonded to W,45 a peak at 531.5 eV due
to –OH groups and possible C=O groups and a peak at 532.6 eV attributed to C-O
bonds, probably from acetic acid residues.39,44
The atomic percentages, 19.9 % of W and 80.1 % of O, gives a higher O/W
atomic ratio (O/Wobtained = 4.0) compared to the expected value (O/Wtheoretical =3.0),
which can be due to some acetic acid contamination, used in the NPs synthesis.
3.3.2 Electrochemical preparation and characterisation of WO3@poly[1] The nanocomposite films were prepared from solutions containing the
[Ni(3-Mesalen)] complex and 5 wt.% of WO3 NPs, previously (i) sonicated or
(ii) sonicated and refluxed. The WO3 NPs annealed at 550 ºC were chosen for the
preparation of the nanocomposites mainly by their more well-developed crystallinity,
once a well-organized structure can be a greater advantage in
electrochemical/electrochromic applications.46
The CVs obtained during the 1st and 10th electropolymerisation cycles of the
WO3@poly[1]_s and WO3@poly[1]_r nanocomposite films are depicted in Figure
3.5 (a), along with the same electropolymerisation cycles for the pristine poly[1], for
comparison. The voltammetric profiles for the complete film electropolymerisations are
shown in Figure 3.6 and the peak potential values are summarised in Table 3.1.
The nanocomposites voltammetric responses for the electropolymerisation are
similar to those of pristine poly[1], despite the small shift of the anodic and cathodic
peaks for more and less negative potentials, respectively. These results suggest that
the presence of the WO3 NPs did not change the electropolymerisation mechanism of
poly[1]. Thus, the two peaks observed in the first anodic half-cycle at Epa = 0.86-0.88
and 1.04-1.08 V are assigned to the [Ni(3-Mesalen)] monomer oxidation and
subsequent formation of oligomers/polymer on the working electrode, while the two
cathodic peaks in the reverse scan at Epc = 0.20-0.21 and 0.69-0.70 V are attributed to
the reduction of the as-formed nanocomposite films. The new anodic peak at
Epa = 0.42 V, in second and subsequent polymerisation cycles, corresponds to the
oxidation of the as-formed nanocomposite films.34,35

Figure
LiClO4
(—, Γ
states
(5th s
and
show
poten
both
than
sligh
attrib
films
agree
poly[
nano
-1.2
-0.8
-0.4
0.0
0.4
0.8
1.2
i / m
A
-0.6
-0.4
-0.2
0.0
0.2
0.4
0.6
0.8
i / m
A
Functi
e 3.5 CVs obtai
4/CH3CN, and (c
Γ = 0.22 μmol c
(E = 0.0, 0.7 an
The nanoc
scan) in LiC
(c), respec
wn in Figur
ntial values
The nanoc
supporting
in LiClO4/C
tly higher c
buted to a
, as result
ement with
[1] and Γ =
ocomposites
0.0 0.22
8
4
0
4
8
2
I'
-0.2 0.0 0.2
6
4
2
0
2
4
6
8
I'
(a)
(c)
ional electroacti
ined during (a)
c) 5th scan of film
cm-2) and WO3@
nd 1.3 V).
composite a
ClO4/CH3CN
ctively; the
re 3.7 and
.
composites
electrolyte
CH3CN. Mo
current inten
larger elec
of the inco
the determ
= 0.22 and
s, respectiv
0.4 0.6
II'
E / V (vs. Ag/
I
2 0.4 0.6
I
I
E / V (vs. Ag/
ive materials: to
the 1st and 10t
m redox switchin
@poly[1]_r (—,
and pristine
N and LiClO
CVs obtai
, in Table
s and pristin
s; in a gene
reover, the
nsities when
ctroactive s
orporation
mined electro
d 0.27 μmo
ely.
0.8 1.0 1.
1st
10
IIIII
/AgCl)
0.8 1.0 1
I'
II
/AgCl)
owards novel sa
th scans of elec
ng in LiClO4/PC
Γ = 0.27 μmol
e film voltam
O4/PC 0.1 m
ined during
3.2, are s
ne films hav
eral way, th
e nanocomp
n compared
surface are
of WO3 NP
oactive surf
ol cm-2 for
.2 1.4
t scan
0th scan -0.8
-0.6
-0.4
-0.2
0.0
0.2
0.4
0.6
0.8
1.0
i / m
A
.2 1.4
aving and conve
ctrodeposition, (
C for: poly[1] (—,
cm-2); (d) pho
mmetric resp
mol dm-3 are
g the comp
summarised
ve similar el
he peaks ar
posites volta
d to those o
a of the a
Ps in the p
face covera
WO3@poly
-0.2 0.0 0.
8
6
4
2
0
2
4
6
8
0
I'
(b)
(d)
Fersion energy sy
(b) 5th scan of f
, Γ = 0.19 μmol
tographs of film
ponses duri
depicted in
plete films c
their corre
ectrochemi
e less defin
ammetric re
of the pristi
s-prepared
polymeric m
ages: Γ = 0.
y[1]_s and
2 0.4 0.6
II
E / V (vs. Ag/
I
FCUP ystems
84
film redox switc
cm-2), WO3@po
m in different ox
ing redox cy
n Figures 3
conditioning
responding
cal respons
ned in LiClO
esponses e
ne film, wh
nanocomp
matrix. This
19 μmol cm
WO3@poly
0.8 1.0
I'
II
/AgCl)
ching in
oly[1]_s
xidation
ycling
.5 (b)
g are
peak
ses in
O4/PC
exhibit
ich is
posite
is in
m-2 for
y[1]_r
1.2
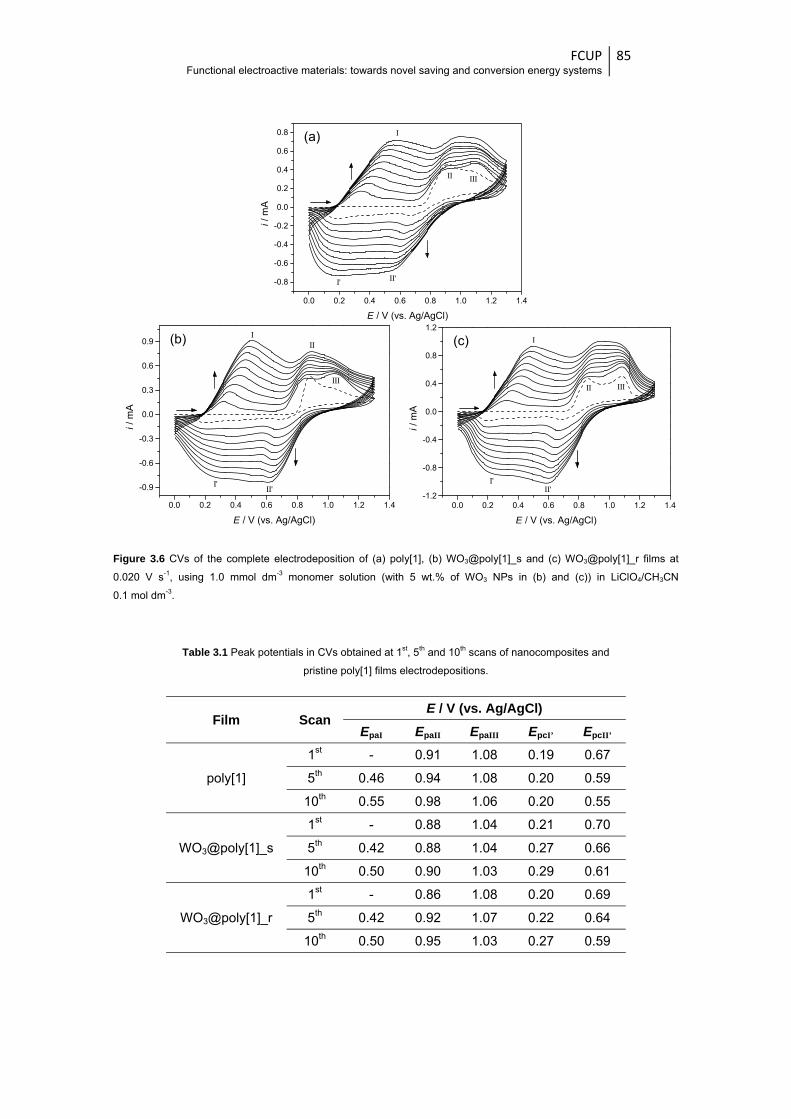
FCUP Functional electroactive materials: towards novel saving and conversion energy systems
85
Figure 3.6 CVs of the complete electrodeposition of (a) poly[1], (b) WO3@poly[1]_s and (c) WO3@poly[1]_r films at
0.020 V s-1, using 1.0 mmol dm-3 monomer solution (with 5 wt.% of WO3 NPs in (b) and (c)) in LiClO4/CH3CN
0.1 mol dm-3.
Table 3.1 Peak potentials in CVs obtained at 1st, 5th and 10th scans of nanocomposites and
pristine poly[1] films electrodepositions.
Film Scan E / V (vs. Ag/AgCl)
EpaI EpaII EpaIII EpcI’ EpcII’
poly[1]
1st - 0.91 1.08 0.19 0.67
5th 0.46 0.94 1.08 0.20 0.59
10th 0.55 0.98 1.06 0.20 0.55
WO3@poly[1]_s
1st - 0.88 1.04 0.21 0.70
5th 0.42 0.88 1.04 0.27 0.66
10th 0.50 0.90 1.03 0.29 0.61
WO3@poly[1]_r
1st - 0.86 1.08 0.20 0.69
5th 0.42 0.92 1.07 0.22 0.64
10th 0.50 0.95 1.03 0.27 0.59
0.0 0.2 0.4 0.6 0.8 1.0 1.2 1.4
-0.8
-0.6
-0.4
-0.2
0.0
0.2
0.4
0.6
0.8
II'I'
IIIII
i / m
A
E / V (vs. Ag/AgCl)
I
0.0 0.2 0.4 0.6 0.8 1.0 1.2 1.4
-0.9
-0.6
-0.3
0.0
0.3
0.6
0.9
II'I'
III
II
i / m
A
E / V (vs. Ag/AgCl)
I
0.0 0.2 0.4 0.6 0.8 1.0 1.2 1.4-1.2
-0.8
-0.4
0.0
0.4
0.8
1.2
II'I'
IIIII
i / m
A
E / V (vs. Ag/AgCl)
I
(a)
(b) (c)
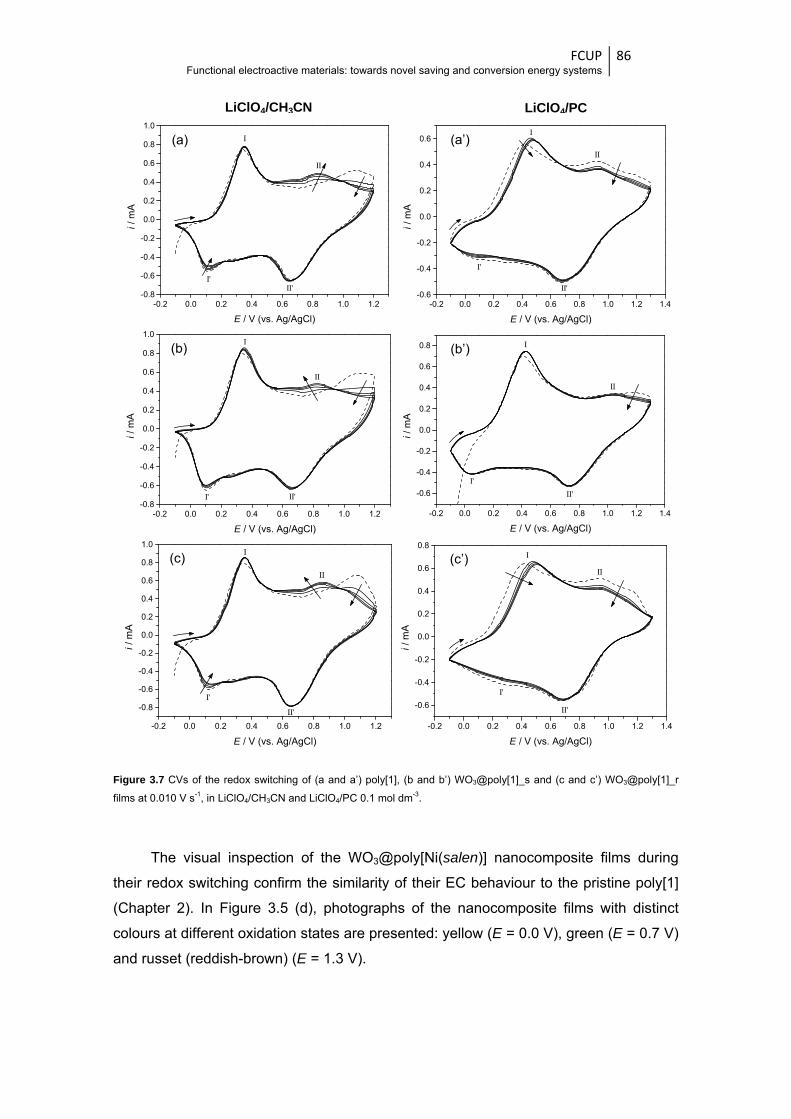
FCUP Functional electroactive materials: towards novel saving and conversion energy systems
86
Figure 3.7 CVs of the redox switching of (a and a’) poly[1], (b and b’) WO3@poly[1]_s and (c and c’) WO3@poly[1]_r
films at 0.010 V s-1, in LiClO4/CH3CN and LiClO4/PC 0.1 mol dm-3.
The visual inspection of the WO3@poly[Ni(salen)] nanocomposite films during
their redox switching confirm the similarity of their EC behaviour to the pristine poly[1]
(Chapter 2). In Figure 3.5 (d), photographs of the nanocomposite films with distinct
colours at different oxidation states are presented: yellow (E = 0.0 V), green (E = 0.7 V)
and russet (reddish-brown) (E = 1.3 V).
-0.2 0.0 0.2 0.4 0.6 0.8 1.0 1.2-0.8
-0.6
-0.4
-0.2
0.0
0.2
0.4
0.6
0.8
1.0
II'I'
II
i / m
A
E / V (vs. Ag/AgCl)
I
-0.2 0.0 0.2 0.4 0.6 0.8 1.0 1.2-0.8
-0.6
-0.4
-0.2
0.0
0.2
0.4
0.6
0.8
1.0
II'I'
II
i / m
A
E / V (vs. Ag/AgCl)
I
-0.2 0.0 0.2 0.4 0.6 0.8 1.0 1.2
-0.8
-0.6
-0.4
-0.2
0.0
0.2
0.4
0.6
0.8
1.0
II'
I'
II
i / m
A
E / V (vs. Ag/AgCl)
I
LiClO4/CH3CN
-0.2 0.0 0.2 0.4 0.6 0.8 1.0 1.2 1.4-0.6
-0.4
-0.2
0.0
0.2
0.4
0.6
II'
I'
II
i / m
A
E / V (vs. Ag/AgCl)
I
LiClO4/PC
-0.2 0.0 0.2 0.4 0.6 0.8 1.0 1.2 1.4
-0.6
-0.4
-0.2
0.0
0.2
0.4
0.6
0.8
II'
I'
II
i / m
A
E / V (vs. Ag/AgCl)
I
-0.2 0.0 0.2 0.4 0.6 0.8 1.0 1.2 1.4
-0.6
-0.4
-0.2
0.0
0.2
0.4
0.6
0.8
II'
I'
II
i / m
A
E / V (vs. Ag/AgCl)
I
(a)
(b)
(c)
(a’)
(b’)
(c’)

FCUP Functional electroactive materials: towards novel saving and conversion energy systems
87
Table 3.2 Peak potentials in CVs obtained during the 1st and 5th scans of the films redox switching in
LiClO4/CH3CN and LiClO4/PC 0.1 mol dm-3, at 0.010 V s-1.
Film Supporting electrolyte Scan
E / V (vs. Ag/AgCl)
EpaI EpaII EpcI’ EpcII’
poly[1]
LiClO4/CH3CN 1st 0.34 1.08 0.11(0.34*) 0.66
5th 0.35 0.84 0.12(0.28*) 0.65
LiClO4/PC 1st 0.42 0.93(1.15*) 0.08(0.30*) 0.67
5th 0.48 0.93 0.12* 0.69
WO3@poly[1]_s
LiClO4/CH3CN 1st 0.33 1.12 0.10(0.32*) 0.66
5th 0.35 0.82 0.11(0.26*) 0.66
LiClO4/PC 1st 0.41 1.17 0.06 0.73
5th 0.42 1.04 0.06 0.73
WO3@poly[1]_r
LiClO4/CH3CN 1st 0.34 1.08 0.12(0.31*) 0.66
5th 0.36 0.85(1.01*) 0.15(0.26*) 0.66
LiClO4/PC 1st 0.42 0.93(1.17*) 0.29 0.67
5th 0.51 0.91 0.69* 0.69
*inflexion
3.3.3 Composition and morphology
The composition and morphology characterisations were performed for
WO3@poly[1]_r nanocomposite, due to the higher electroactive surface coverage
obtained for this nanocomposite film.
The XPS results for WO3@poly[1]_r indicated the presence of Ni, C, N and O
from the pristine film, Cl from the supporting electrolyte (which also contribute to O and
N contents), and W due to the incorporated WO3 NPs (with which also contribute to O).
The deconvoluted high-resolution XPS spectra of nanocomposite in C1s, N1s,
O1s, Cl2p, Ni2p and W4f regions are depicted in Figures from 3.8 to 3.13, respectively,
along with the spectra of poly[1], for comparison (except in W4f region).
In the C1s region, the high-resolution spectra were deconvoluted with four peaks:
a main peak at 284.6 eV attributed to aromatic and aliphatic carbons of the salen
ligand, a peak at 285.8-286.0 eV assigned to carbon bound to oxygen or nitrogen of
the salen moiety, a peak at 286.7-287.0 eV ascribed to C≡N (from CH3CN, Figure 3.8
(a), (a’), (b) and (b’)) or to C=O (from PC, Figure 3.8 (c) and (c’)) entrapped in the film
and a peak at 289.2-290.0 eV assigned to a shake-up satellite associated with π-π*
transitions in the aromatic carbon rings of the ligand.34,47 The spectrum of the
nanocomposite after redox switching in LiClO4/PC (Figure 3.8 (c’)) showed a slight
different profile, which can indicate different interactions provided by the WO3 NPs.
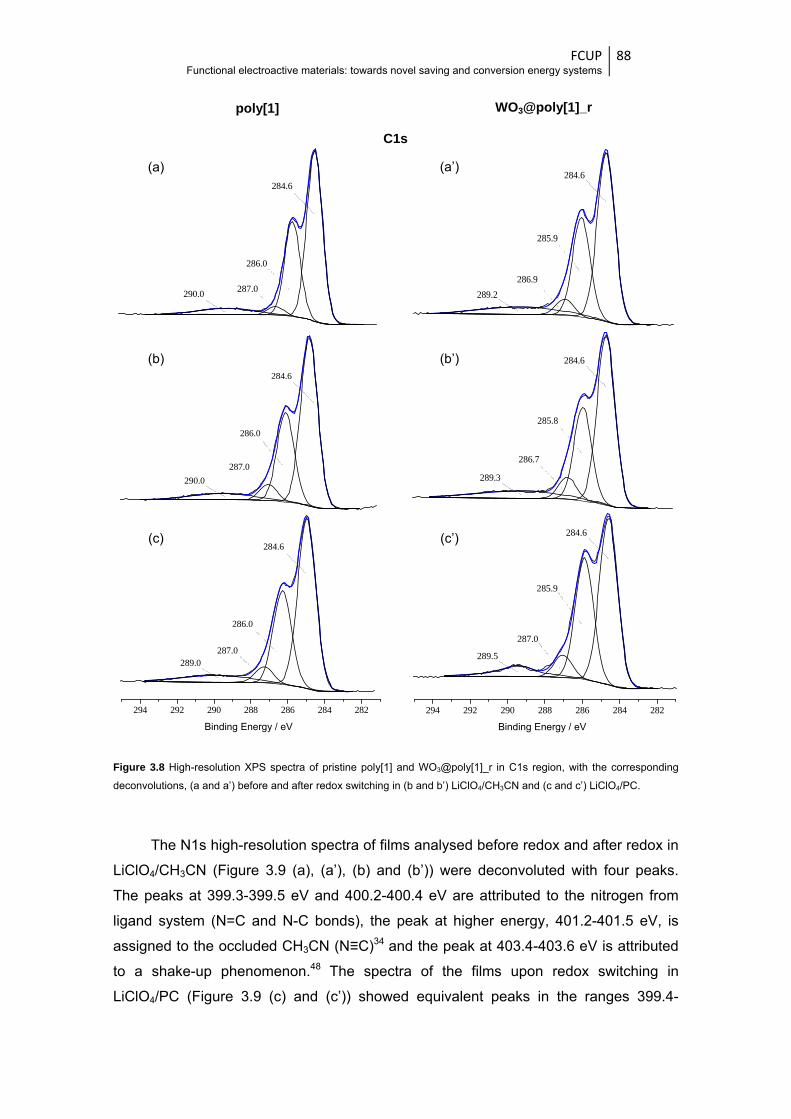
FCUP Functional electroactive materials: towards novel saving and conversion energy systems
88
Figure 3.8 High-resolution XPS spectra of pristine poly[1] and WO3@poly[1]_r in C1s region, with the corresponding
deconvolutions, (a and a’) before and after redox switching in (b and b’) LiClO4/CH3CN and (c and c’) LiClO4/PC.
The N1s high-resolution spectra of films analysed before redox and after redox in
LiClO4/CH3CN (Figure 3.9 (a), (a’), (b) and (b’)) were deconvoluted with four peaks.
The peaks at 399.3-399.5 eV and 400.2-400.4 eV are attributed to the nitrogen from
ligand system (N=C and N-C bonds), the peak at higher energy, 401.2-401.5 eV, is
assigned to the occluded CH3CN (N≡C)34 and the peak at 403.4-403.6 eV is attributed
to a shake-up phenomenon.48 The spectra of the films upon redox switching in
LiClO4/PC (Figure 3.9 (c) and (c’)) showed equivalent peaks in the ranges 399.4-
C 1s
286.0
287.0290.0
284.6
286.0
287.0
290.0
284.6
294 292 290 288 286 284 282
286.0
287.0
Binding Energy / eV
289.0
284.6
285.9
286.9
289.2
284.6
285.8
286.7
289.3
284.6
294 292 290 288 286 284 282
285.9
287.0
Binding Energy / eV
289.5
284.6
poly[1] WO3@poly[1]_r
(a)
(b)
(c)
(a’)
(b’)
(c’)
C1s
Binding Energy / eV Binding Energy / eV

FCUP Functional electroactive materials: towards novel saving and conversion energy systems
89
399.5 eV, 400.7 eV and 403.0-403.2 eV; as the solvent changed to PC, the peak
assigned to CH3CN was not identified.
Figure 3.9 High-resolution XPS spectra of pristine poly[1] and WO3@poly[1]_r in N1s region, with the corresponding
deconvolutions, (a and a’) before and after redox switching in (b and b’) LiClO4/CH3CN and (c and c’) LiClO4/PC.
The O1s spectra of pristine and nanocomposite films before redox switching
(Figure 3.10 (a) and (a’)) were deconvoluted with three peaks: a peak at 531.2 eV
assigned to the oxygen from salen coordination sphere34 and two other peaks at 532.4-
532.6 eV and 533.3-533.4 eV attributed to occluded ClO4- with different
neighbourhoods. In the nanocomposite spectrum, the peak at 531.2 eV also has the
poly[1] WO3@poly[1]_r
(a)
(b)
(c)
(a’)
(b’)
(c’)
N 1s
400.3
401.5403.6
399.4
400.4
401.4403.6
399.5
406 404 402 400 398 396
400.7
403.2
Binding Energy / eV
399.5
400.2
401.2403.4
399.4
400.4
401.3403.4
399.3
406 404 402 400 398 396
400.7403.0
Binding Energy / eV
399.4
N1s
Binding Energy / eV Binding Energy / eV

FCUP Functional electroactive materials: towards novel saving and conversion energy systems
90
contribution of O-W bonds from WO3 and the peaks at higher energy from the –OH
groups, C=O and C-O bonds of WO3 contaminants. The films O 1s spectra after redox
switching in LiClO4/CH3CN (Figure 3.10 (b) and (b’) ) exhibit the same peak at 531.1-
531.6 eV (O from salen coordination sphere)34 and one peak at 532.7-533.1 eV,
assigned to occluded ClO4-, in higher amounts, due to charge compensation processes
during the redox cycles.34
Figure 3.10 High-resolution XPS spectra of pristine poly[1] and WO3@poly[1]_r in O1s region, with the corresponding
deconvolutions, (a and a’) before and after redox switching in (b and b’) LiClO4/CH3CN and (c and c’) LiClO4/PC.
poly[1] WO3@poly[1]_r
(a)
(b)
(c)
(a’)
(b’)
(c’)
O 1s
532.6
533.4
531.2
533.1
531.6
538 536 534 532 530 528
532.8
533.9
Binding Energy / eV
531.3
532.4
533.3
531.2
532.7 531.1
538 536 534 532 530 528
533.4
Binding Energy / eV
531.1532.4
534.4
O1s
Binding Energy / eV Binding Energy / eV
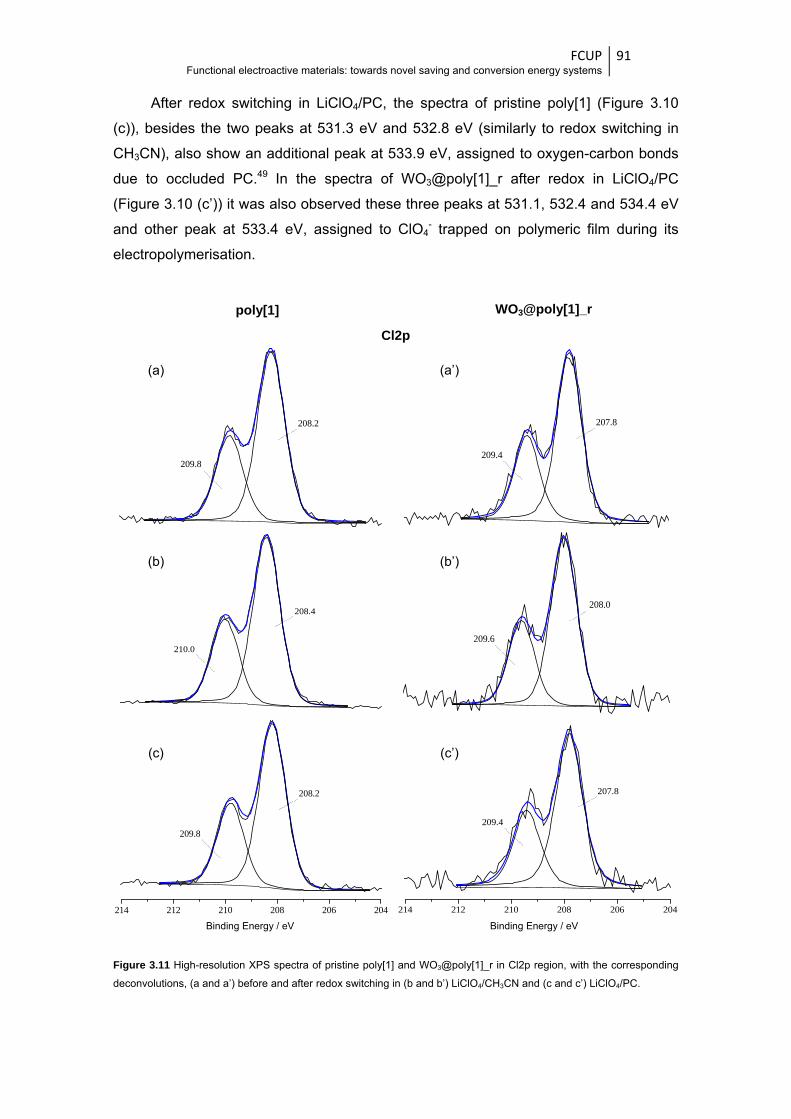
FCUP Functional electroactive materials: towards novel saving and conversion energy systems
91
After redox switching in LiClO4/PC, the spectra of pristine poly[1] (Figure 3.10
(c)), besides the two peaks at 531.3 eV and 532.8 eV (similarly to redox switching in
CH3CN), also show an additional peak at 533.9 eV, assigned to oxygen-carbon bonds
due to occluded PC.49 In the spectra of WO3@poly[1]_r after redox in LiClO4/PC
(Figure 3.10 (c’)) it was also observed these three peaks at 531.1, 532.4 and 534.4 eV
and other peak at 533.4 eV, assigned to ClO4- trapped on polymeric film during its
electropolymerisation.
Figure 3.11 High-resolution XPS spectra of pristine poly[1] and WO3@poly[1]_r in Cl2p region, with the corresponding
deconvolutions, (a and a’) before and after redox switching in (b and b’) LiClO4/CH3CN and (c and c’) LiClO4/PC.
poly[1] WO3@poly[1]_r
(a)
(b)
(c)
(a’)
(b’)
(c’)
Cl 2p
209.8
208.2
210.0
208.4
214 212 210 208 206 204
209.8
Binding Energy / eV
208.2
209.4
207.8
209.6
208.0
214 212 210 208 206 204
209.4
Binding Energy / eV
207.8
Cl2p
Binding Energy / eV Binding Energy / eV
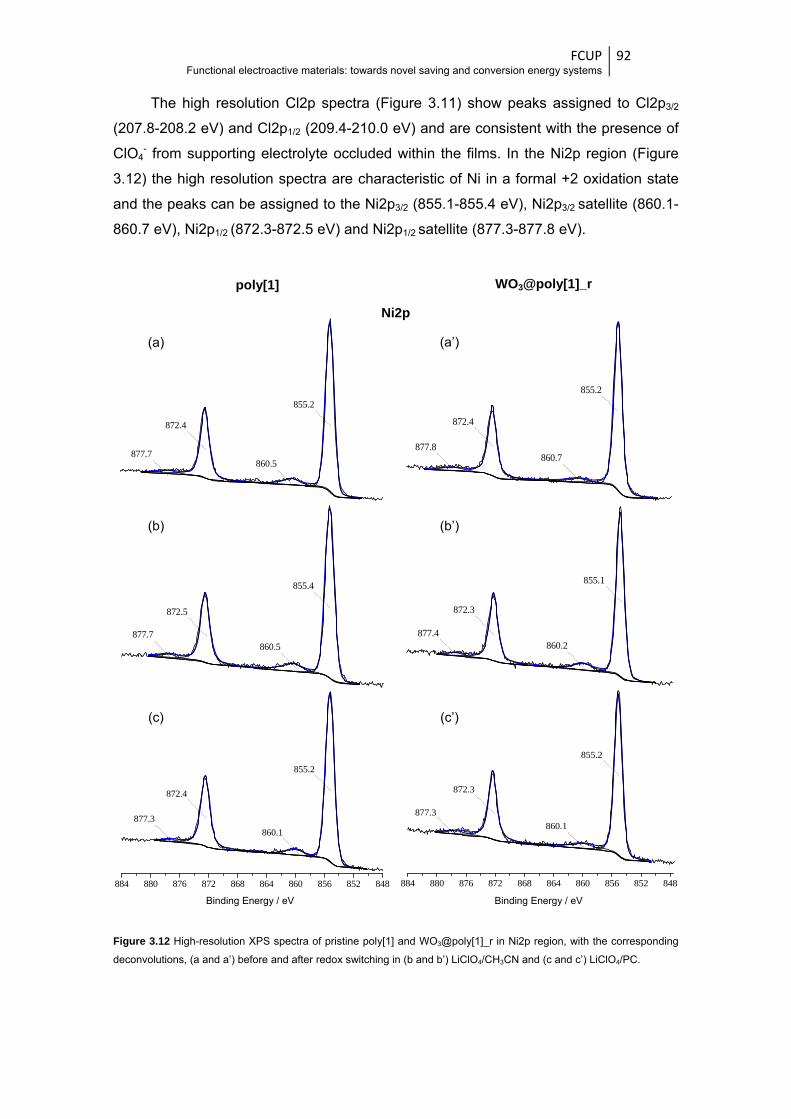
FCUP Functional electroactive materials: towards novel saving and conversion energy systems
92
The high resolution Cl2p spectra (Figure 3.11) show peaks assigned to Cl2p3/2
(207.8-208.2 eV) and Cl2p1/2 (209.4-210.0 eV) and are consistent with the presence of
ClO4- from supporting electrolyte occluded within the films. In the Ni2p region (Figure
3.12) the high resolution spectra are characteristic of Ni in a formal +2 oxidation state
and the peaks can be assigned to the Ni2p3/2 (855.1-855.4 eV), Ni2p3/2 satellite (860.1-
860.7 eV), Ni2p1/2 (872.3-872.5 eV) and Ni2p1/2 satellite (877.3-877.8 eV).
Figure 3.12 High-resolution XPS spectra of pristine poly[1] and WO3@poly[1]_r in Ni2p region, with the corresponding
deconvolutions, (a and a’) before and after redox switching in (b and b’) LiClO4/CH3CN and (c and c’) LiClO4/PC.
poly[1] WO3@poly[1]_r
(a)
(b)
(c)
(a’)
(b’)
(c’)
Ni 2p
872.4
855.2
860.5877.7
872.5
855.4
860.5877.7
884 880 876 872 868 864 860 856 852 848
872.4
Binding Energy / eV
855.2
860.1
877.3
872.4
855.2
860.7877.8
872.3
855.1
860.2877.4
884 880 876 872 868 864 860 856 852 848
872.3
Binding Energy / eV
855.2
860.1
877.3
Ni2p
Binding Energy / eV Binding Energy / eV
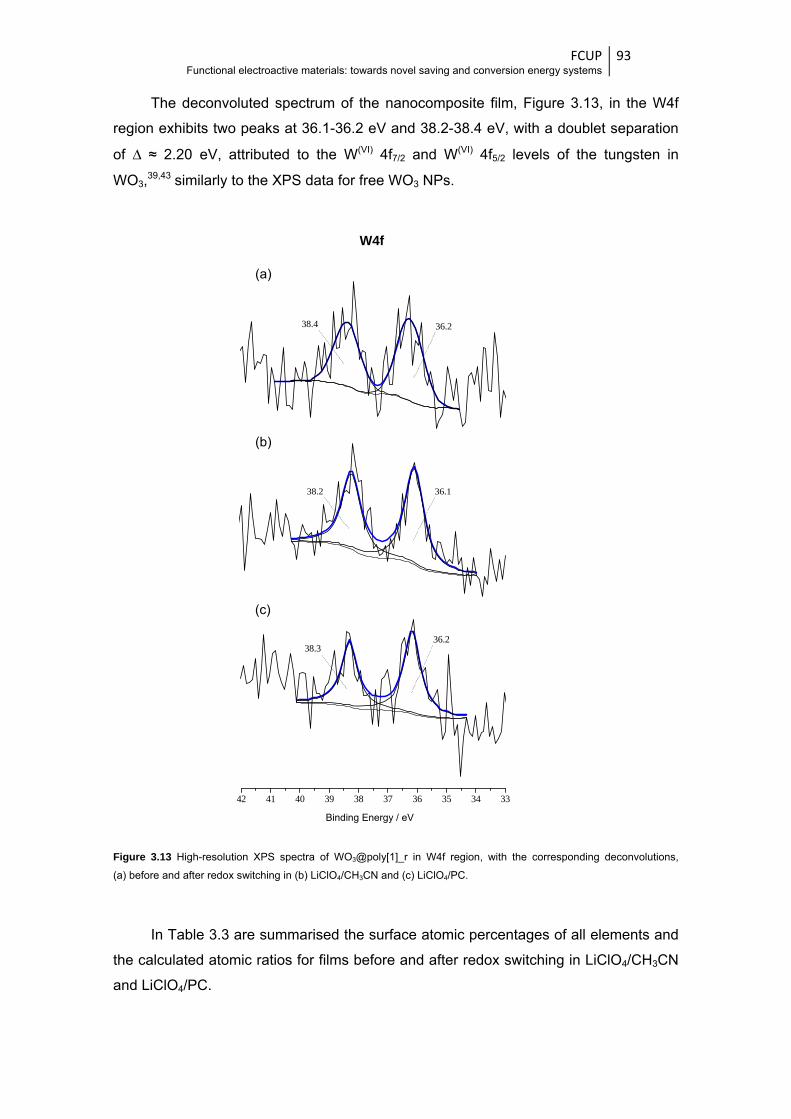
FCUP Functional electroactive materials: towards novel saving and conversion energy systems
93
The deconvoluted spectrum of the nanocomposite film, Figure 3.13, in the W4f
region exhibits two peaks at 36.1-36.2 eV and 38.2-38.4 eV, with a doublet separation
of Δ ≈ 2.20 eV, attributed to the W(VI) 4f7/2 and W(VI) 4f5/2 levels of the tungsten in
WO3,39,43 similarly to the XPS data for free WO3 NPs.
Figure 3.13 High-resolution XPS spectra of WO3@poly[1]_r in W4f region, with the corresponding deconvolutions,
(a) before and after redox switching in (b) LiClO4/CH3CN and (c) LiClO4/PC.
In Table 3.3 are summarised the surface atomic percentages of all elements and
the calculated atomic ratios for films before and after redox switching in LiClO4/CH3CN
and LiClO4/PC.
(a)
(b)
(c)
W 4f
38.4 36.2
38.2 36.1
42 41 40 39 38 37 36 35 34 33
38.3
Binding Energy / eV
36.2
W4f
Binding Energy / eV

FCUP Functional electroactive materials: towards novel saving and conversion energy systems
94
Table 3.3 XPS surface atomic percentages and atomic ratios of relevant elements for poly[1] and
WO3@poly[1]_r nanocomposite films, in their reduced states (E = 0.0 V).
Sample Atomic % Atomic Ratio
Ni C N O Cl W N/Ni O/Ni Cl/Ni poly[1]
Before redox 3.5 75.5 7.6 12.0 1.3 - 2.2 3.4 0.4
After redox in CH3CN 2.5 64.8 6.4 22.4 3.9 - 2.6 9.0 1.6
After redox in PC 2.7 72.8 6.6 15.9 2.1 - 2.4 5.9 0.8
WO3@poly[1]_r
Before redox 3.5 76.9 8.0 10.6 1.0 0.01 2.3 3.0 0.3
After redox in CH3CN 2.9 78.6 7.6 10.3 0.6 0.01 2.6 3.5 0.2
After redox in PC 2.8 76.7 6.4 13.3 0.8 0.03 2.3 4.7 0.3
Before the redox switching, the nanocomposite film shows N/Ni, O/Ni and Cl/Ni
atomic ratios slightly larger than the expected values considering the [Ni(3-Mesalen)]
chemical structure (N/Nitheoretical = O/Nitheoretical = 2.0), due to the presence of WO3 NPs
and trapping of some LiClO4/CH3CN on polymeric matrix during the
electropolymerisation step.
The WO3@poly[1]_r films after redox switching in LiClO4/CH3CN and LiClO4/PC
show only a slightly increase in atomic ratios (most notable for the O/Ni ratio) when
compared with the large increase observed for poly[1] in similar conditions. The
increase in O, Cl and N contents after redox switching is explained by the accumulation
of ClO4- and solvent inside the film, as a consequence of the charge
compensation/solvation processes along the several redox cycles.34 For poly[1]
submitted to redox switching in LiClO4/PC, the increase in O/Ni and Cl/Ni is less
noticeable than in LiClO4/CH3CN, indicating a smaller incorporation of ClO4- with PC,
as already observed in Chapter 2. The lower incorporation of ClO4- in nanocomposite in
comparison to the pristine film can be explained by the presence of the WO3 NPs,
which decrease the polymeric matrix packaging and thus facilitate the ingress /
expulsion of supporting electrolyte.
The presence of W from the WO3 NPs provides an indication of the successful
preparation of the WO3@poly[1]_r nanocomposite. Furthermore, the presence of W in
films after redox switching indicate a stable composition for the nanocomposite as-
prepared, with the WO3 NPs remaining incorporated in the polymeric structure after the
potential cycling.
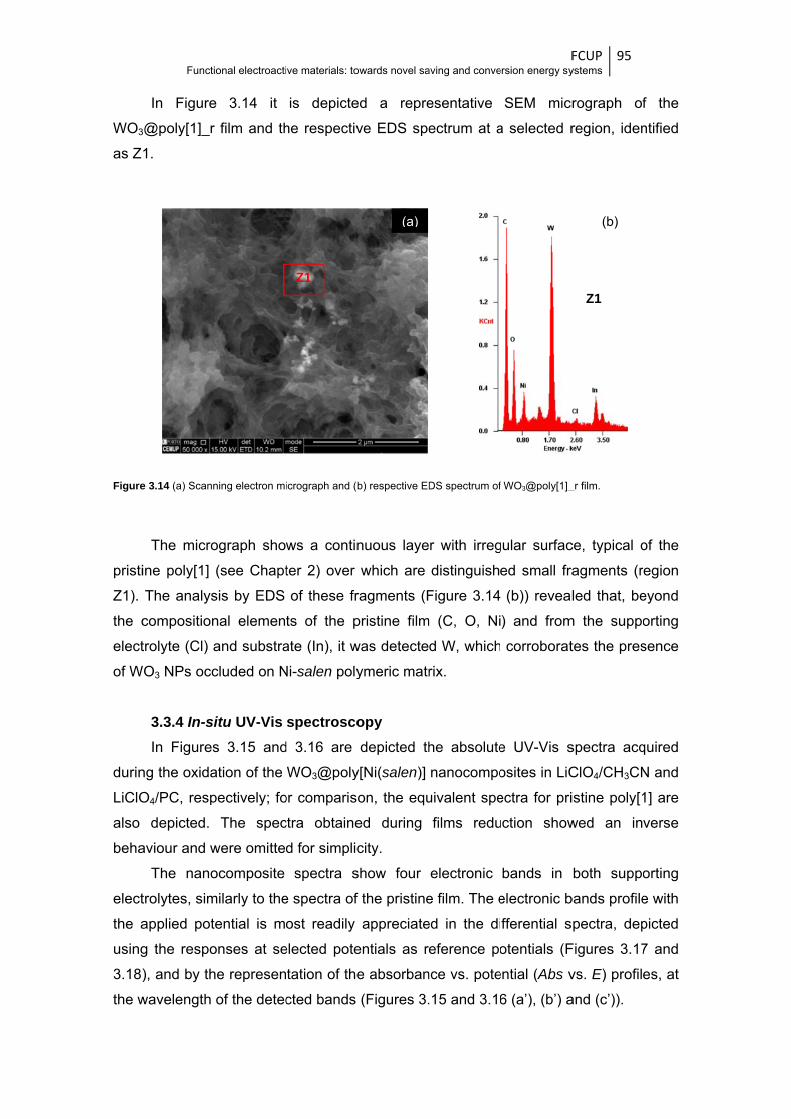
WO3
as Z
Figure
pristi
Z1).
the c
elect
of W
durin
LiClO
also
beha
elect
the a
using
3.18)
the w
Functi
In Figure
3@poly[1]_r
1.
e 3.14 (a) Scann
The micro
ine poly[1]
The analys
composition
trolyte (Cl) a
WO3 NPs occ
3.3.4 In-siIn Figures
ng the oxida
O4/PC, resp
depicted.
aviour and w
The nano
trolytes, sim
applied pot
g the respo
), and by th
wavelength
ional electroacti
e 3.14 it
r film and th
ning electron mi
ograph sho
(see Chapt
sis by EDS
nal elemen
and substra
cluded on N
itu UV-Vis s 3.15 and
ation of the
pectively; fo
The spec
were omitte
ocomposite
milarly to the
ential is m
onses at se
he represen
of the detec
ive materials: to
is depicte
he respectiv
icrograph and (b
ws a contin
ter 2) over
of these fr
ts of the p
ate (In), it w
Ni-salen poly
spectroscod 3.16 are
WO3@poly
or comparis
ctra obtaine
d for simplic
spectra s
e spectra of
ost readily
elected pote
tation of the
cted bands
Z1
owards novel sa
ed a repre
ve EDS spe
b) respective ED
nuous laye
which are
ragments (F
pristine film
was detecte
ymeric matr
opy
depicted th
y[Ni(salen)]
on, the equ
ed during
city.
show four
f the pristine
appreciate
entials as r
e absorban
(Figures 3.
(a)
aving and conve
esentative
ectrum at a
DS spectrum of
r with irreg
distinguish
Figure 3.14
m (C, O, Ni
d W, which
rix.
he absolute
nanocompo
uivalent spe
films redu
electronic
e film. The e
ed in the di
eference po
nce vs. pote
.15 and 3.16
Fersion energy sy
SEM micr
a selected r
f WO3@poly[1]_
gular surfac
ed small fra
(b)) reveal
) and from
corroborat
e UV-Vis s
osites in LiC
ectra for pri
uction show
bands in
electronic b
fferential s
otentials (F
ential (Abs v
6 (a’), (b’) a
FCUP ystems
95
rograph of
region, iden
_r film.
ce, typical o
agments (r
led that, be
m the suppo
tes the pres
spectra acq
ClO4/CH3CN
istine poly[1
wed an in
both suppo
bands profile
pectra, dep
Figures 3.17
vs. E) profile
and (c’)).
Z1
(b)
f the
ntified
of the
egion
eyond
orting
sence
quired
N and
1] are
verse
orting
e with
picted
7 and
es, at

FCUP Functional electroactive materials: towards novel saving and conversion energy systems
96
Figure 3.15 Panel A: Absolute UV-Vis spectra of (a) poly[1], (b) WO3@poly[1]_s and (c) WO3@poly[1]_r films acquired
during films oxidation in 0.1 mol dm-3 LiClO4/CH3CN (referenced to the electrolyte spectrum; Γ = 0.06-0.10 μmol cm-2).
Panel B: Abs vs. E plots for the electronic bands identified in absolute UV-Vis spectra, referenced to the spectra at
E = -0.1 V (arrows indicate scan direction).
These representations revealed that the behaviour of the nanocomposites
electronic bands as a function of the applied potential are similar to those of poly[1],
and show three main band profiles, characteristic of the pristine (as described in
Chapter 2) and other similar poly[M(salen)] films.34,35
0.3
0.6
0.9
1.2
1.5 spectrum at -0.1 V spectrum at 1.3 V
Abs
0.3
0.6
0.9
1.2 spectrum at -0.1 V spectrum at 1.3 V
Abs
-0.4
-0.2
0.0
0.2
0.4
0.6
Abs
λ = 325 nm λ = 396 nm λ = 509 nm λ = 826 nm
-0.4
0.0
0.4
0.8
Abs
λ = 327 nm λ = 402 nm λ = 513 nm λ = 842 nm
450 600 750 900
0.3
0.6
0.9
1.2 spectrum at -0.1 V spectrum at 1.3 V
Abs
λ / nm
0.0 0.4 0.8 1.2
-0.4
-0.2
0.0
0.2
0.4
0.6
E / V (vs. Ag/AgCl)
Abs
λ = 326 nm λ = 399 nm λ = 511 nm λ = 840 nm
Panel A Panel B
(a)
(b)
(c)
(a’)
(b’)
(c’)
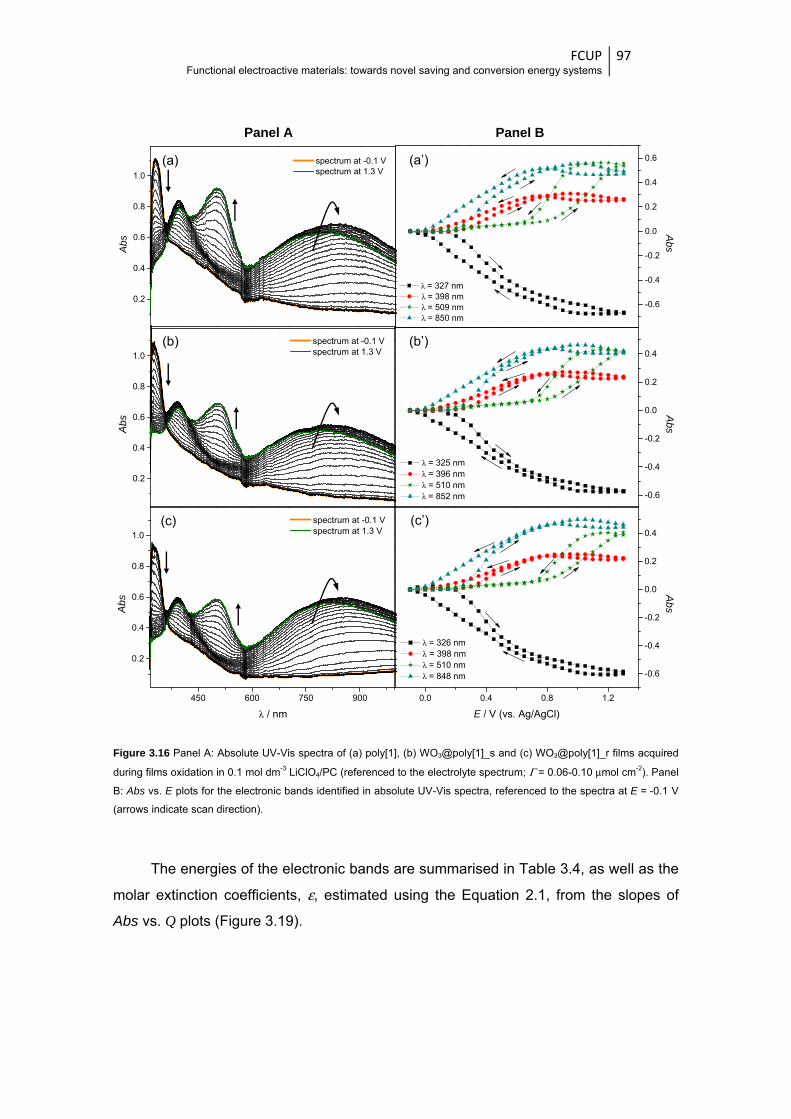
FCUP Functional electroactive materials: towards novel saving and conversion energy systems
97
Figure 3.16 Panel A: Absolute UV-Vis spectra of (a) poly[1], (b) WO3@poly[1]_s and (c) WO3@poly[1]_r films acquired
during films oxidation in 0.1 mol dm-3 LiClO4/PC (referenced to the electrolyte spectrum; Γ = 0.06-0.10 μmol cm-2). Panel
B: Abs vs. E plots for the electronic bands identified in absolute UV-Vis spectra, referenced to the spectra at E = -0.1 V
(arrows indicate scan direction).
The energies of the electronic bands are summarised in Table 3.4, as well as the
molar extinction coefficients, ε, estimated using the Equation 2.1, from the slopes of
Abs vs. Q plots (Figure 3.19).
-0.6
-0.4
-0.2
0.0
0.2
0.4
0.6
Abs
λ = 327 nm λ = 398 nm λ = 509 nm λ = 850 nm
0.2
0.4
0.6
0.8
1.0
spectrum at -0.1 V spectrum at 1.3 V
Abs
-0.6
-0.4
-0.2
0.0
0.2
0.4
Abs
λ = 325 nm λ = 396 nm λ = 510 nm λ = 852 nm
450 600 750 900
0.2
0.4
0.6
0.8
1.0
spectrum at -0.1 V spectrum at 1.3 V
Abs
λ / nm
0.2
0.4
0.6
0.8
1.0
spectrum at -0.1 V spectrum at 1.3 V
Abs
0.0 0.4 0.8 1.2
-0.6
-0.4
-0.2
0.0
0.2
0.4
Abs
E / V (vs. Ag/AgCl)
λ = 326 nm λ = 398 nm λ = 510 nm λ = 848 nm
Panel A Panel B
(a)
(b)
(c)
(a’)
(b’)
(c’)

FCUP Functional electroactive materials: towards novel saving and conversion energy systems
98
Figure 3.17 UV-Vis spectra of (a and a’) poly[1], (b and b’) WO3@ poly[1]_s and (c and c’) WO3@ poly[1]_r acquired
during films oxidation in LiClO4/CH3CN from -0.1 to 0.75 V, referenced to the spectra of neutral films (Panel A) and from
0.75 to 1.3 V, referenced to the spectra of films at E = 0.75 V (Panel B).
Taking into account the rational of ligand-based film oxidation, supported by the
electronic bands ε-values and previously proposed for pristine (Chapter 2) and other
similar poly[M(salen)] films,34,35,50 the following band assignment can be made: (i) the
bands at λ = 325-327 nm are attributed to the intervalence transition (band gap,
Eg = 3.79 eV for pristine film and Eg = 3.81 / 3.82 eV for nanocomposites), (ii) the
bands at λ = 396-402 nm (3.09-3.13 eV) and λ = 826-852 nm (1.46-1.50 eV), that
appears during the film oxidation, are attributed to transitions from the valence band to
the antibonding and bonding polaron levels (or between polaron levels), respectively,
Panel A Panel B
(a)
(b)
(c)
(a’)
(b’)
(c’)
-0.6
-0.4
-0.2
0.0
0.2
0.4
0.6A
bs -
Abs
-0.1
V
-0.2
0.0
0.2
0.4
0.6
Abs - A
bs0.75
V
-0.4
-0.2
0.0
0.2
0.4
Abs
- A
bs-0
.1 V
0.0
0.2
0.4
Abs - A
bs0.7
5 V
450 600 750 900
-0.4
-0.2
0.0
0.2
0.4
Abs
- A
bs-0
.1 V
λ / nm
450 600 750 900
0.0
0.2
0.4
Abs - A
bs0
.75 V
λ / nm
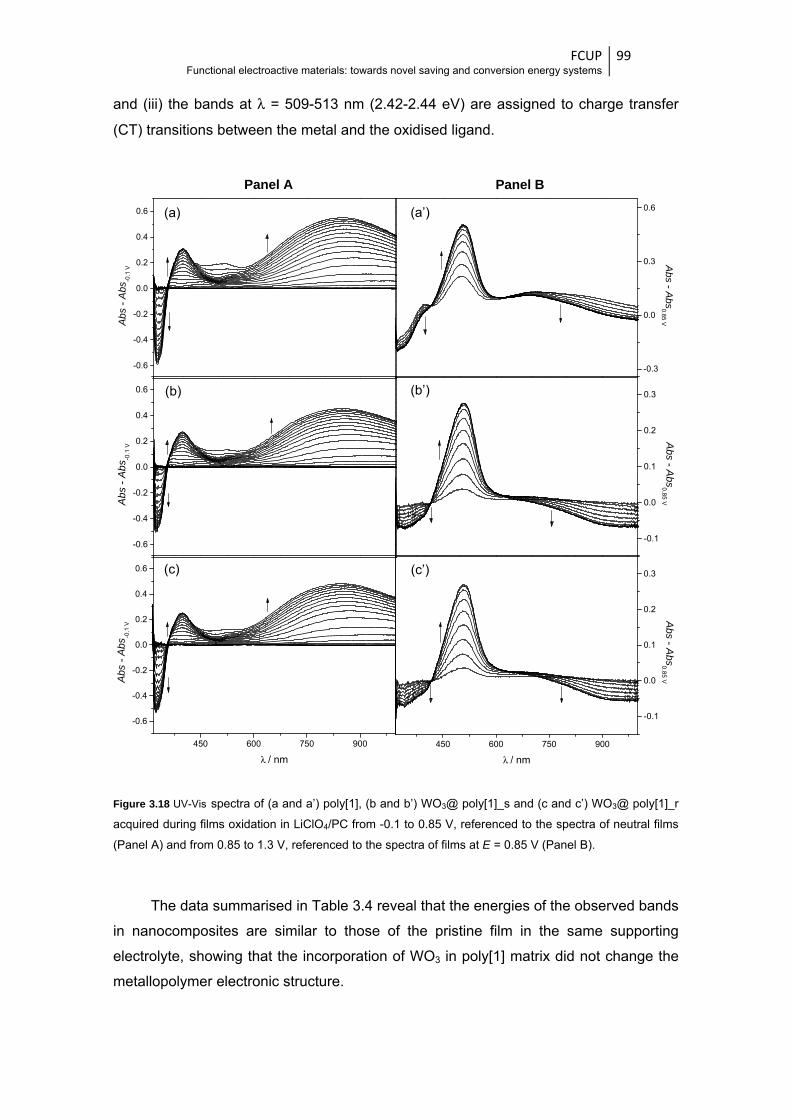
FCUP Functional electroactive materials: towards novel saving and conversion energy systems
99
and (iii) the bands at λ = 509-513 nm (2.42-2.44 eV) are assigned to charge transfer
(CT) transitions between the metal and the oxidised ligand.
Figure 3.18 UV-Vis spectra of (a and a’) poly[1], (b and b’) WO3@ poly[1]_s and (c and c’) WO3@ poly[1]_r
acquired during films oxidation in LiClO4/PC from -0.1 to 0.85 V, referenced to the spectra of neutral films
(Panel A) and from 0.85 to 1.3 V, referenced to the spectra of films at E = 0.85 V (Panel B).
The data summarised in Table 3.4 reveal that the energies of the observed bands
in nanocomposites are similar to those of the pristine film in the same supporting
electrolyte, showing that the incorporation of WO3 in poly[1] matrix did not change the
metallopolymer electronic structure.
Panel A Panel B
(a)
(b)
(c)
(a’)
(b’)
(c’)
-0.6
-0.4
-0.2
0.0
0.2
0.4
0.6
Abs
- A
bs-0
.1 V
-0.3
0.0
0.3
0.6
Abs - A
bs0.85 V
-0.6
-0.4
-0.2
0.0
0.2
0.4
0.6
Abs
- A
bs-0
.1 V
-0.1
0.0
0.1
0.2
0.3
Abs - A
bs0
.85 V
450 600 750 900
-0.6
-0.4
-0.2
0.0
0.2
0.4
0.6
Abs
- A
bs-0
.1 V
λ / nm
450 600 750 900
-0.1
0.0
0.1
0.2
0.3
Abs - A
bs0.85 V
λ / nm

FCUP Functional electroactive materials: towards novel saving and conversion energy systems
100
Table 3.4 Wavelengths of the electronic bands and respective energies and molar extinction coefficients (ε)
for pristine poly[1] and WO3@poly[1] nanocomposites.
Film Supporting Electrolyte λmax / nm (eV) ε x 10-3 /
mol-1 dm3 cm-1
poly[1]
LiClO4/CH3CN
327 (3.79) 7.24
402 (3.09) 3.89
513 (2.42) 17.27 842 (1.47) 6.96
LiClO4/PC
327 (3.79) 7.21
398 (3.12) 4.26
509 (2.44) 11.35 850 (1.46) 6.77
WO3@poly[1]_s
LiClO4/CH3CN
325 (3.82) 6.62
396 (3.13) 3.98
509 (2.44) 15.03 826 (1.50) 6.40
LiClO4/PC
325 (3.82) 7.25
396 (3.13) 4.51
510 (2.43) 9.94 852 (1.46) 6.53
WO3@poly[1]_r
LiClO4/CH3CN
326 (3.81) 6.99
399 (3.11) 3.85
511 (2.43) 15.72 840 (1.48) 6.66
LiClO4/PC
326 (3.81) 7.10
398 (3.12) 4.11
510 (2.43) 9.78 848 (1.46) 6.60
The ε-values for the nanocomposite electronic bands are also similar to those of
pristine film, except for the bands attributed to CT transitions at λ = 509-513 nm (2.42-
2.44 eV) in LiClO4/CH3CN and at λ = 509-510 nm (2.43-2.44 eV) in LiClO4/PC. For the
nanocomposites, the CT band ε-values decrease ≈ 36.0 % from LiClO4/CH3CN to
LiClO4/PC electrolytes (ε ≈ 15.4 vs. 9.86 × 10⁻³ cm-1 mol-1 dm3) similarly to pristine film
and as described in Chapter 2. Beyond that, the main achievement is that the ε-values
of these bands are ≈ 11.0 % (in LiClO4/CH3CN) and ≈ 13.1 % (in LiClO4/PC) lower in
nanocomposites than in pristine film: in LiClO4/CH3CN, for example, ε = 17.27 x 10⁻³
cm-1 mol-1 dm3 for poly[1] and decreased to ε = 15.03 and 15.72 x 10⁻³ cm-1 mol-1 dm3
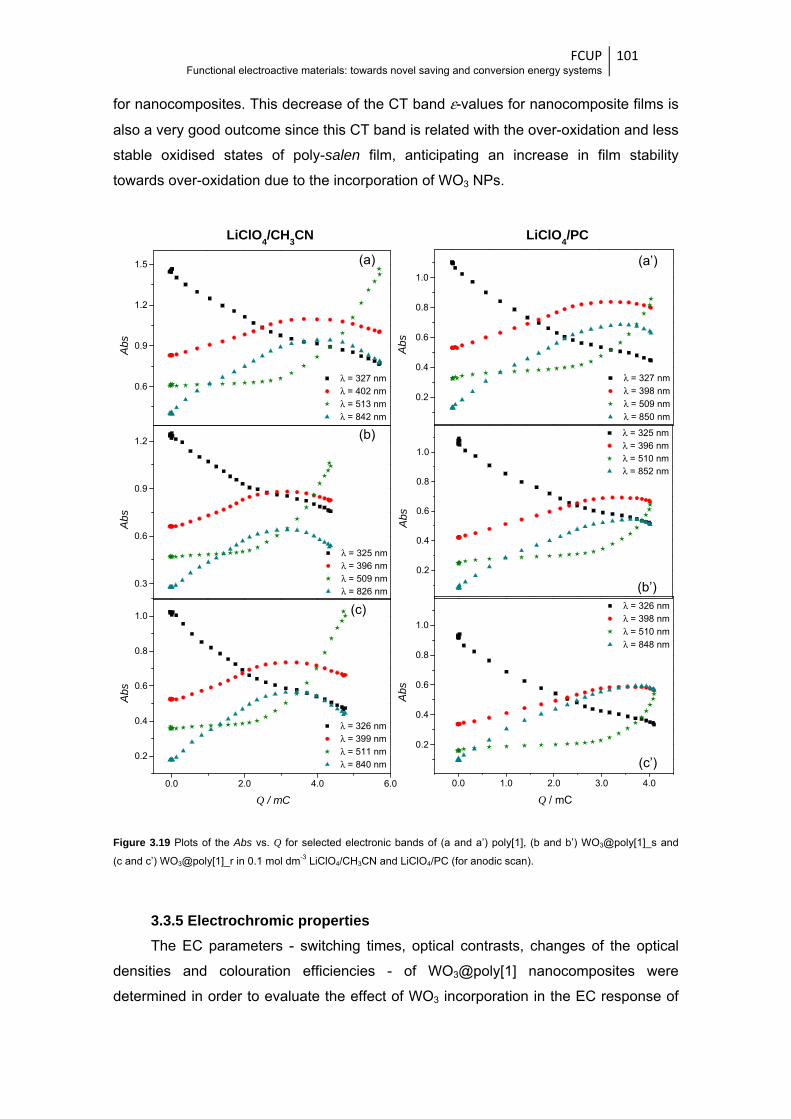
FCUP Functional electroactive materials: towards novel saving and conversion energy systems
101
for nanocomposites. This decrease of the CT band ε-values for nanocomposite films is
also a very good outcome since this CT band is related with the over-oxidation and less
stable oxidised states of poly-salen film, anticipating an increase in film stability
towards over-oxidation due to the incorporation of WO3 NPs.
Figure 3.19 Plots of the Abs vs. Q for selected electronic bands of (a and a’) poly[1], (b and b’) WO3@poly[1]_s and
(c and c’) WO3@poly[1]_r in 0.1 mol dm-3 LiClO4/CH3CN and LiClO4/PC (for anodic scan).
3.3.5 Electrochromic properties
The EC parameters - switching times, optical contrasts, changes of the optical
densities and colouration efficiencies - of WO3@poly[1] nanocomposites were
determined in order to evaluate the effect of WO3 incorporation in the EC response of
(a)
(b)
(c)
(a’)
(b’)
(c’)
LiClO4/CH3CN LiClO4/PC
0.6
0.9
1.2
1.5
Abs
λ = 327 nm λ = 402 nm λ = 513 nm λ = 842 nm
0.3
0.6
0.9
1.2
Abs
λ = 325 nm λ = 396 nm λ = 509 nm λ = 826 nm
0.0 2.0 4.0 6.0
0.2
0.4
0.6
0.8
1.0
Abs
λ = 326 nm λ = 399 nm λ = 511 nm λ = 840 nm
Q / mC
0.2
0.4
0.6
0.8
1.0
λ = 327 nm λ = 398 nm λ = 509 nm λ = 850 nm
Abs
0.2
0.4
0.6
0.8
1.0
λ = 325 nm λ = 396 nm λ = 510 nm λ = 852 nm
Abs
0.0 1.0 2.0 3.0 4.0
0.2
0.4
0.6
0.8
1.0
λ = 326 nm λ = 398 nm λ = 510 nm λ = 848 nm
Q / mC
Abs
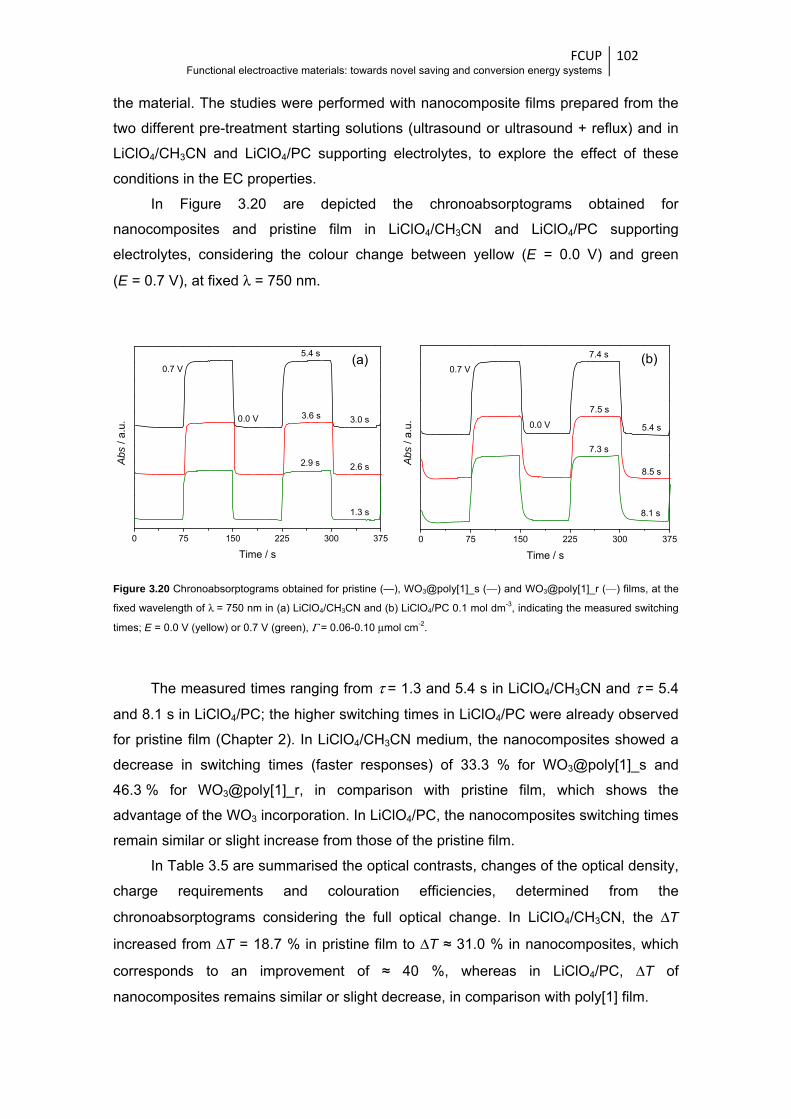
FCUP Functional electroactive materials: towards novel saving and conversion energy systems
102
the material. The studies were performed with nanocomposite films prepared from the
two different pre-treatment starting solutions (ultrasound or ultrasound + reflux) and in
LiClO4/CH3CN and LiClO4/PC supporting electrolytes, to explore the effect of these
conditions in the EC properties.
In Figure 3.20 are depicted the chronoabsorptograms obtained for
nanocomposites and pristine film in LiClO4/CH3CN and LiClO4/PC supporting
electrolytes, considering the colour change between yellow (E = 0.0 V) and green
(E = 0.7 V), at fixed λ = 750 nm.
Figure 3.20 Chronoabsorptograms obtained for pristine (—), WO3@poly[1]_s (—) and WO3@poly[1]_r (—) films, at the
fixed wavelength of λ = 750 nm in (a) LiClO4/CH3CN and (b) LiClO4/PC 0.1 mol dm-3, indicating the measured switching
times; E = 0.0 V (yellow) or 0.7 V (green), Γ = 0.06-0.10 μmol cm-2.
The measured times ranging from τ = 1.3 and 5.4 s in LiClO4/CH3CN and τ = 5.4
and 8.1 s in LiClO4/PC; the higher switching times in LiClO4/PC were already observed
for pristine film (Chapter 2). In LiClO4/CH3CN medium, the nanocomposites showed a
decrease in switching times (faster responses) of 33.3 % for WO3@poly[1]_s and
46.3 % for WO3@poly[1]_r, in comparison with pristine film, which shows the
advantage of the WO3 incorporation. In LiClO4/PC, the nanocomposites switching times
remain similar or slight increase from those of the pristine film.
In Table 3.5 are summarised the optical contrasts, changes of the optical density,
charge requirements and colouration efficiencies, determined from the
chronoabsorptograms considering the full optical change. In LiClO4/CH3CN, the ΔT
increased from ΔT = 18.7 % in pristine film to ΔT ≈ 31.0 % in nanocomposites, which
corresponds to an improvement of ≈ 40 %, whereas in LiClO4/PC, ΔT of
nanocomposites remains similar or slight decrease, in comparison with poly[1] film.
0 75 150 225 300 375
0.0 V 3.0 s
2.6 s
1.3 s
2.9 s
3.6 s
Abs
/ a.
u.
Time / s
5.4 s
0.7 V
0 75 150 225 300 375
0.0 V
0.7 V
5.4 s
8.5 s
8.1 s
7.3 s
7.5 s A
bs /
a.u
.
Time / s
7.4 s(a) (b)
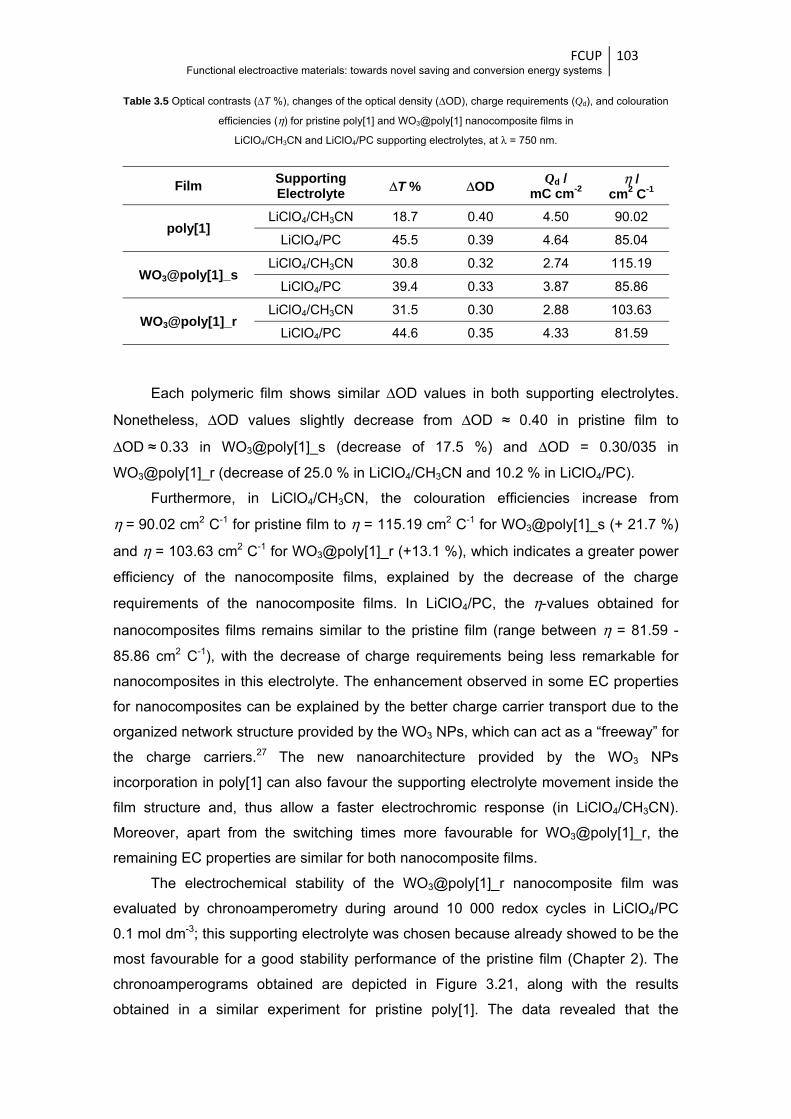
FCUP Functional electroactive materials: towards novel saving and conversion energy systems
103
Table 3.5 Optical contrasts (ΔT %), changes of the optical density (ΔOD), charge requirements (Qd), and colouration
efficiencies (η) for pristine poly[1] and WO3@poly[1] nanocomposite films in
LiClO4/CH3CN and LiClO4/PC supporting electrolytes, at λ = 750 nm.
Film Supporting Electrolyte ΔT % ΔOD Qd /
mC cm-2 η /
cm2 C-1
poly[1] LiClO4/CH3CN 18.7 0.40 4.50 90.02
LiClO4/PC 45.5 0.39 4.64 85.04
WO3@poly[1]_s LiClO4/CH3CN 30.8 0.32 2.74 115.19
LiClO4/PC 39.4 0.33 3.87 85.86
WO3@poly[1]_r LiClO4/CH3CN 31.5 0.30 2.88 103.63
LiClO4/PC 44.6 0.35 4.33 81.59
Each polymeric film shows similar ΔOD values in both supporting electrolytes.
Nonetheless, ΔOD values slightly decrease from ΔOD ≈ 0.40 in pristine film to
ΔOD ≈ 0.33 in WO3@poly[1]_s (decrease of 17.5 %) and ΔOD = 0.30/035 in
WO3@poly[1]_r (decrease of 25.0 % in LiClO4/CH3CN and 10.2 % in LiClO4/PC).
Furthermore, in LiClO4/CH3CN, the colouration efficiencies increase from
η = 90.02 cm2 C-1 for pristine film to η = 115.19 cm2 C-1 for WO3@poly[1]_s (+ 21.7 %)
and η = 103.63 cm2 C-1 for WO3@poly[1]_r (+13.1 %), which indicates a greater power
efficiency of the nanocomposite films, explained by the decrease of the charge
requirements of the nanocomposite films. In LiClO4/PC, the η-values obtained for
nanocomposites films remains similar to the pristine film (range between η = 81.59 -
85.86 cm2 C-1), with the decrease of charge requirements being less remarkable for
nanocomposites in this electrolyte. The enhancement observed in some EC properties
for nanocomposites can be explained by the better charge carrier transport due to the
organized network structure provided by the WO3 NPs, which can act as a “freeway” for
the charge carriers.27 The new nanoarchitecture provided by the WO3 NPs
incorporation in poly[1] can also favour the supporting electrolyte movement inside the
film structure and, thus allow a faster electrochromic response (in LiClO4/CH3CN).
Moreover, apart from the switching times more favourable for WO3@poly[1]_r, the
remaining EC properties are similar for both nanocomposite films.
The electrochemical stability of the WO3@poly[1]_r nanocomposite film was
evaluated by chronoamperometry during around 10 000 redox cycles in LiClO4/PC
0.1 mol dm-3; this supporting electrolyte was chosen because already showed to be the
most favourable for a good stability performance of the pristine film (Chapter 2). The
chronoamperograms obtained are depicted in Figure 3.21, along with the results
obtained in a similar experiment for pristine poly[1]. The data revealed that the

FCUP Functional electroactive materials: towards novel saving and conversion energy systems
104
nanocomposite has a lower electrochemical stability than the pristine film (29.6 % vs.
13.7 % of charge loss).
Figure 3.21 Chronoamperograms of poly[1] and WO3@poly[1]_r in 0.1 mol dm-3 LiClO4/PC, applying two potential
pulses of 50 s, with potential alternating between 0.0 and 0.7 V.
3.4 Conclusions The results showed that poly[1] was successfully electropolymerised in the
presence of WO3 NPs, previously prepared and characterised by XRD, XPS and FTIR.
These techniques confirmed the preparation of quasi-spherical WO3 nanoparticles with
a monoclinic structure, with higher degree of crystallinity and sizes of ≈ 38 or 35 nm
(SEM or TEM, respectively), similar to those estimated by XRD ≈ 37 nm.
The obtained nanocomposite films showed similar electrochemical responses to
the pristine film, but with higher electroactive surface coverages, which appoint the
advantage of the polymeric nanocomposite assemblage. SEM and XPS confirmed the
presence of WO3 NPs on the poly[1] matrix. Furthermore, the XPS analysis revealed
that the redox processes promote the accumulation of large amounts of supporting
electrolyte (due to charge compensation processes) in polymeric matrix, although in a
lesser extent for nanocomposite film. The data obtained by UV-Vis spectroscopy
showed that the electronic bands of nanocomposite films have similar profiles and
energies to those of poly[1], confirming the maintenance of the pristine film electronic
structure. Nevertheless, the lower ε-values of the CT bands for nanocomposites
revealed a higher stability of the composite for over-oxidation processes.
The nanocomposite films showed more favourable EC properties in
LiClO4/CH3CN than the pristine film, with lower switching times (ranging between
0 2 4 6 8 10 12
0 1728 3456 5184 6912 8640 10368
WO3@poly[1]_r
- 29.6 % of Q
Number of cycles
i / a
.u.
Time / days
- 13.7 % of Qpoly[1]

FCUP Functional electroactive materials: towards novel saving and conversion energy systems
105
τ = 1.3 and 3.6 s), higher optical contrasts (ΔT = 30.8 / 31.5 %) and better colouration
efficiencies (η = 103.63 / 115.19 cm2 C-1). These results revealed the advantage of the
preparation of the nanocomposite in the pursue for a solution to improve the EC
properties of the pristine poly[1]. However, in LiClO4/PC there was no significant
enhancement of the nanocomposite EC properties when compared to the pristine film,
what is a drawback for future technological applications.
FCUP Functional electroactive materials: towards novel saving and conversion energy systems
106
References
1 Pascariu, P.; Airinei, A.; Grigoras, M.; Vacareanu, L.; Iacomi, F. Appl. Surf. Sci. 2015, 352, 95. 2 Guo, F. J.; Mi, H. Y.; Zhou, J. P.; Zhao, Z. B.; Qiu, J. S. Carbon 2015, 95, 323. 3 Abdulla, S.; Mathew, T. L.; Pullithadathil, B. Sens. Actuator B-Chem. 2015, 221, 1523. 4 Rafiqi, F. A.; Majid, K. Synth. Met. 2015, 202, 147. 5 Janaky, C.; de Tacconi, N. R.; Chanmanee, W.; Rajeshwar, K. J. Phys. Chem. C 2012, 116,
4234. 6 Zhu, J. H.; Wei, S. Y.; Zhang, L.; Mao, Y. B.; Ryu, J.; Mayinakuli, P.; Karki, A. B.; Young, D. P.;
Guo, Z. H. J. Phys. Chem. C 2010, 114, 16335. 7 Ma, D. Y.; Shi, G. Y.; Wang, H. Z.; Zhang, Q. H.; Li, Y. G. J. Mater. Chem. A 2014, 2, 13541. 8 Moon, S. J.; Baranoff, E.; Zakeeruddin, S. M.; Yeh, C. Y.; Diau, E. W. G.; Gratzel, M.; Sivula, K.
Chem. Commun. 2011, 47, 8244. 9 Heo, J. H.; Im, S. H.; Noh, J. H.; Mandal, T. N.; Lim, C. S.; Chang, J. A.; Lee, Y. H.; Kim, H. J.;
Sarkar, A.; Nazeeruddin, M. K.; Gratzel, M.; Seok, S. I. Nat. Photonics 2013, 7, 487. 10 Hidalgo, D.; Bocchini, S.; Fontana, M.; Saracco, G.; Hernandez, S. RSC Adv. 2015, 5, 49429. 11 Jain, R.; Tiwari, D. C.; Karolia, P. J. Mol. Liq. 2014, 196, 308. 12 Chen, L.; Song, Z. X.; Liu, G. C.; Qiu, J. S.; Yu, C.; Qin, J. W.; Ma, L.; Tian, F. Q.; Liu, W. J. Phys.
Chem. Solids 2013, 74, 360. 13 Tovide, O.; Jaheed, N.; Mohamed, N.; Nxusani, E.; Sunday, C. E.; Tsegaye, A.; Ajayi, R. F.;
Njomo, N.; Makelane, H.; Bilibana, M.; Baker, P. G.; Williams, A.; Vilakazi, S.; Tshikhudo, R.; Iwuoha, E. I. Electrochim. Acta 2014, 128, 138.
14 Hicks, S. M.; Killard, A. J. Sens. Actuator B-Chem. 2014, 194, 283. 15 Su, P. G.; Peng, Y. T. Sens. Actuator B-Chem. 2014, 193, 637. 16 Mane, A. T.; Navale, S. T.; Patil, V. B. Org. Electron. 2015, 19, 15. 17 Zou, B. X.; Liu, X. X.; Diamond, D.; Lau, K. T. Electrochim. Acta 2010, 55, 3915. 18 Zou, B. X.; Liang, Y.; Liu, X. X.; Diamond, D.; Lau, K. T. J. Power Sources 2011, 196, 4842. 19 Yang, P. H.; Sun, P.; Chai, Z. S.; Huang, L. H.; Cai, X.; Tan, S. Z.; Song, J. H.; Mai, W. J. Angew.
Chem.-Int. Edit. 2014, 53, 11935. 20 Sydam, R.; Deepa, M.; Shivaprasad, S. M.; Srivastava, A. K. Sol. Energy Mater. Sol. Cells 2015,
132, 148. 21 Wei, H. G.; Yan, X. R.; Wu, S. J.; Luo, Z. P.; Wei, S. Y.; Guo, Z. H. J. Phys. Chem. C 2012, 116,
25052. 22 Nwanya, A. C.; Jafta, C. J.; Ejikeme, P. M.; Ugwuoke, P. E.; Reddy, M. V.; Osuji, R. U.;
Ozoemena, K. I.; Ezema, F. I. Electrochim. Acta 2014, 128, 218. 23 Cai, G. F.; Tu, J. P.; Zhou, D.; Zhang, J. H.; Wang, X. L.; Gu, C. D. Sol. Energy Mater. Sol. Cells
2014, 122, 51. 24 Zhang, J.; Tu, J. P.; Zhang, D.; Qiao, Y. Q.; Xia, X. H.; Wang, X. L.; Gu, C. D. J. Mater. Chem.
2011, 21, 17316. 25 Zhang, J.; Tu, J. P.; Du, G. H.; Dong, Z. M.; Wu, Y. S.; Chang, L.; Xie, D.; Cai, G. F.; Wang, X. L.
Sol. Energy Mater. Sol. Cells 2013, 114, 31. 26 Dulgerbaki, C.; Oksuz, A. U. Electroanal. 2014, 26, 2501. 27 Janaky, C.; Rajeshwar, K. Prog. Polym. Sci. 2015, 43, 96. 28 Pinheiro, C.; Parola, A. J.; Pina, F.; Fonseca, J.; Freire, C. Sol. Energy Mater. Sol. Cells 2008, 92,
980. 29 Branco, A.; Pinheiro, C.; Fonseca, J.; Tedim, J.; Carneiro, A.; Parola, A. J.; Freire, C.; Pina, F.
Electrochem. Solid State Lett. 2010, 13, J114. 30 Janaky, C.; de Tacconi, N. R.; Chanmanee, W.; Rajeshwar, K. J. Phys. Chem. C 2012, 116,
19145. 31 Freire, C.; de Castro, B. J. Chem. Soc.-Dalton Trans. 1998, 1491. 32 Deepa, M.; Sharma, R.; Basu, A.; Agnihotry, S. A. Electrochim. Acta 2005, 50, 3545. 33 Sun, X. L.; Cao, H. T.; Liu, Z. M.; Li, J. Z. Appl. Surf. Sci. 2009, 255, 8629.

FCUP Functional electroactive materials: towards novel saving and conversion energy systems
107
34 Fonseca, J.; Tedim, J.; Biernacki, K.; Magalhaes, A. L.; Gurman, S. J.; Freire, C.; Hillman, A. R.
Electrochim. Acta 2010, 55, 7726. 35 Tedim, J.; Patricio, S.; Fonseca, J.; Magalhaes, A. L.; Moura, C.; Hillman, A. R.; Freire, C. Synth.
Met. 2011, 161, 680. 36 Amb, C. M.; Dyer, A. L.; Reynolds, J. R. Chem. Mat. 2011, 23, 397. 37 Wu, T. Y.; Liao, J. W.; Chen, C. Y. Electrochim. Acta 2014, 150, 245. 38 Dawson, G.; Zhou, W. Z.; Blackley, R. Phys. Chem. Chem. Phys. 2011, 13, 20923. 39 Bertus, L. M.; Faure, C.; Danine, A.; Labrugere, C.; Campet, G.; Rougier, A.; Duta, A. Mater.
Chem. Phys. 2013, 140, 49. 40 Costa, C.; Pinheiro, C.; Henriques, I.; Laia, C. A. T. ACS Appl. Mater. Interfaces 2012, 4, 1330. 41 Zou, X. X.; Li, G. D.; Wang, P. P.; Su, J.; Zhao, J.; Zhou, L. J.; Wang, Y. N.; Chen, J. S. Dalton
Trans. 2012, 41, 9773. 42 Socrates, G. Infrared and Raman Characteristic Group Frequencies - Tables and Charts; third
ed.; John Wiley & Sons, Ltd.: England, 2004. 43 Meng, Z. C.; Fujii, A.; Hashishin, T.; Wada, N.; Sanada, T.; Tamaki, J.; Kojima, K.; Haneoka, H.;
Suzuki, T. J. Mater. Chem. C 2015, 3, 1134. 44 Cai, Z. X.; Li, H. Y.; Yang, X. N.; Guo, X. Sens. Actuator B-Chem. 2015, 219, 346. 45 Zhu, J.; Li, W. Z.; Li, J.; Li, Y. M.; Hu, H. S.; Yang, Y. H. Electrochim. Acta 2013, 112, 191. 46 Salmaoui, S.; Sediri, F.; Gharbi, N.; Perruchot, C.; Aeiyach, S.; Rutkowska, I. A.; Kulesza, P. J.;
Jouini, M. Appl. Surf. Sci. 2011, 257, 8223. 47 Brown, N. M. D.; Hewitt, J. A.; Meenan, B. J. Surf. Interface Anal. 1992, 18, 187. 48 Goldman, A. I. X-Ray Techniques. Characterization of Materials.; Wiley, 2002. 49 Weng, L. T.; Poleunis, C.; Bertrand, P.; Carlier, V.; Sclavons, M.; Franquinet, P.; Legras, R. J.
Adhes. Sci. Technol. 1995, 9, 859. 50 Vilas-Boas, M.; Freire, C.; de Castro, B.; Christensen, P. A.; Hillman, A. R. Chem.-Eur. J. 2001, 7,
139.

FCUP Functional electroactive materials: towards novel saving and conversion energy systems
108
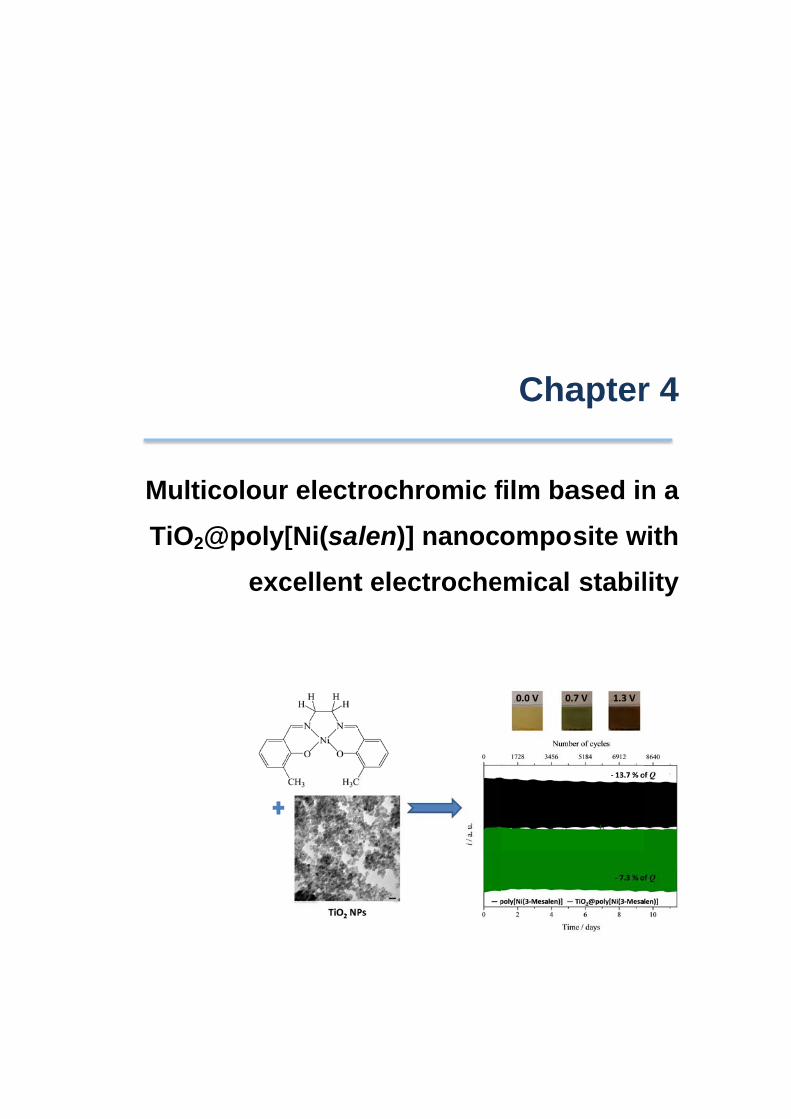
MulticTiO2@
colour@poly[
exc
r elect[Ni(sacellent
rochroalen)] nt elect
omic fnanoctroche
Cha
film baompo
emical
apter
ased insite wstabil
r 4
n a with lity

4 Multicolour electrochromic film based in a TiO2@poly[Ni(salen)] nanocomposite with
excellent electrochemical stability1,2,3 Abstract
This chapter reports the electrochromic properties and performance of a
polymeric nanocomposite prepared through the potentiodynamic deposition of the
transition metal complex [Ni(3-Mesalen)], designated as [1], in the presence of TiO2
nanoparticles. The effects of several TiO2 loadings and of the electropolymerisation
scan rate in the electrochemical properties of nanocomposite films (designated as
TiO2@poly[1]) were also evaluated.
The TiO2 NPs were prepared by sol-gel method and characterised by several
techniques that revealed spherical morphology, crystallite size of 9.7 ± 1.1 nm and a
composition of anatase (65.5 %) and brookite (34.5 %).
The entrapment of TiO2 NPs on the poly[1] matrix was confirmed by XPS and
SEM/EDS. The nanocomposite films TiO2@poly[1] showed similar electrochemical
responses to the pristine poly[1] film, but with higher electroactive areas and
electroactive surface coverages, showing the advantage of nanocomposite
preparation. The increase in Γ-values for nanocomposites prepared with 5 and 15 wt.%
TiO2 loading and further decrease for higher loadings (25 wt.%) indicated that there is
an optimal loading, from which the electropolymerisation of poly[1] is hampered. The
nanocomposite and pristine films showed similar electronic band profiles and energies,
indicating that the electronic structure of poly[1] was retained in nanocomposite;
1 Adapted from: M. Nunes, C. Moura, A. R. Hillman, C. Freire, Multicolour electrochromic film based in a
TiO2@poly[Ni(salen)] nanocomposite with excellent electrochemical stability. Submitted. 2 M. Nunes’s contribution to the publication: preparation and characterisation of the TiO2 nanoparticles, preparation of
the TiO2@poly[1] nanocomposite and pristine poly[1] films, their characterisation, evaluation of the electrochromic
properties and manuscript preparation. 3 The experimental details on the electrochemical/spectroelectrochemical and remaining characterisation techniques
are indicated in Appendices A and C, respectively.
FCUP Functional electroactive materials: towards novel saving and conversion energy systems
112
nonetheless, lower ε-values were obtained for the CT band of the former film, revealing
a superior stability of the nanocomposite for ligand high oxidation states.
The TiO2@poly[1] nanocomposite showed interesting colour changes, from
yellow in reduced state to green and russet in oxidised states, with a superior
electrochemical stability, proved by the charge loss of only 7.3 % upon almost 10 000
redox cycles, which represents an electrochemical stability improvement of 46.7 % in
comparison to pristine poly[1]; an improvement of 16.7 % in the optical modulation
(ΔOD) was also observed for nanocomposite film.
4.1 Introduction In the last years, the continuous development of new technologies demands
novel materials and structures with specific tailored properties.1 In this context,
nanohybridisation of a conducting organic polymer and a metal oxide semiconductor
has been recognised as one of the most attractive combinations of organic/inorganic
composite structures.2 The new nanohybrids have the advantages of receiving
individual semiconducting functions from the polymer and the metal oxide (p/n
junction)3 and are effective candidates for application in solar cells,4 electrochemical
capacitors,5,6 lithium batteries,7 water splitting,8 sensors9 and electrochromic devices.10
Conducting polymers are a widely studied class of electrochromic materials11 that
show interesting optical properties, due to its multiple redox states with rich colour
changes.12-14 The electrochemical stability and the switching reversibility of the CPs can
be enhanced by their combination with organised metal oxide nanostructures, taking
advantage of the high surface-to-volume ratio and short diffusion distances for
ion/electron transport promoted by the nanomaterial.15,16 In fact, the synergetic
combination of the merits of CPs and metal oxides provides an opportunity to develop
new hybrid materials with improved EC properties, in which the colouration change is
induced by the CPs redox reactions and the metal oxide has an important role in
electronic transport through the metal oxide conduction band.2,17
Among the several metal oxides, titanium dioxide (TiO2) is one of the most
investigated wide gap semiconductors, due to its low cost, non-toxicity and good
chemical stability.18,19 The TiO2 ability to act as electron acceptor and, so, to form
electron donor-acceptor pairs when interacting with a p-type CP, raises the possibility
that the changes induced by its incorporation go well beyond simply compositional and
morphological modifications.20 In the last years, some examples of TiO2/CPs hybrids
have been reported as new EC materials through the combination of TiO2 with
polyaniline (PANI),16,20,21 polypyrrole2 and poly(3,4-ethylenedioxythiophene):

FCUP Functional electroactive materials: towards novel saving and conversion energy systems
113
poly(styrene sulfonic acid) (PEDOT:PSS),22 for instance. In general, the
nanocomposites obtained showed faster response times and higher optical contrasts,
colouration efficiencies and electrochemical stability.
In this chapter it is described the preparation and characterisation of a hybrid film
based in the incorporation of TiO2 NPs on the matrix of poly[Ni(3-Mesalen)] film,
designated as poly[1], and the evaluation of its EC properties. The EC properties of the
electroactive metallopolymers poly[M(salen)], M ≡ transition metal, have been studied
and explore to EC device fabrication;23,24 in particular, the EC performance of pristine
poly[1], described in Chapter 2, showed promising results, with an acceptable
electrochemical stability (charge loss of 34.3 % after ≈ 9000 cycles) and interesting
colour changes (from yellow in neutral state to green and russet in oxidised states).
However, to potentiate its commercial application, the EC properties of poly[1] still need
to be improved. Similarly to CPs, this goal can be pursued by the preparation of hybrids
with semiconductors. The nanocomposite of poly[1] with WO3 NPs prepared and
discussed in Chapter 3, showed a slight improvement of the EC properties in
comparison to the pristine film: lower switching times and higher optical contrasts and
colouration efficiencies, but only in LiClO4/CH3CN medium. Thus, in this chapter, it is
explored the effect of the incorporation of TiO2 NPs in the EC properties of the host
polymeric film. TiO2 is a n-type semiconductor, such as WO3, but has a higher band
gap (≈ 3.2 eV),25 similar to that of the pristine film (≈ 3.8 eV). Furthermore, the influence
of different TiO2 NPs loadings in the electrochemical response and in the structural,
morphological and optical properties of the TiO2@poly[1] nanocomposite film was also
evaluated.
4.2 Experimental section 4.2.1 Materials and solvents Titanium (IV) isopropoxide (TTIP, Aldrich, ≥ 97.0 %), LiClO4 (Aldrich, 99 %),
isopropanol (VWR, 99.7 %), ethanol absolute (Fisher Chemical, 99.99 %), nitric acid
(Panreac, 65 %), and acetonitrile and propylene carbonate (Romil, pro analysis grade)
were directly used as received; ultra-pure water (resistivity 18.2 MΩ cm at 25 ºC,
Millipore) was used. The complex N,N’-bis(3-methylsalicylideneiminate) nickel(II),
[Ni(3-Mesalen)], and respective salen ligand were prepared by methods described in
literature.26
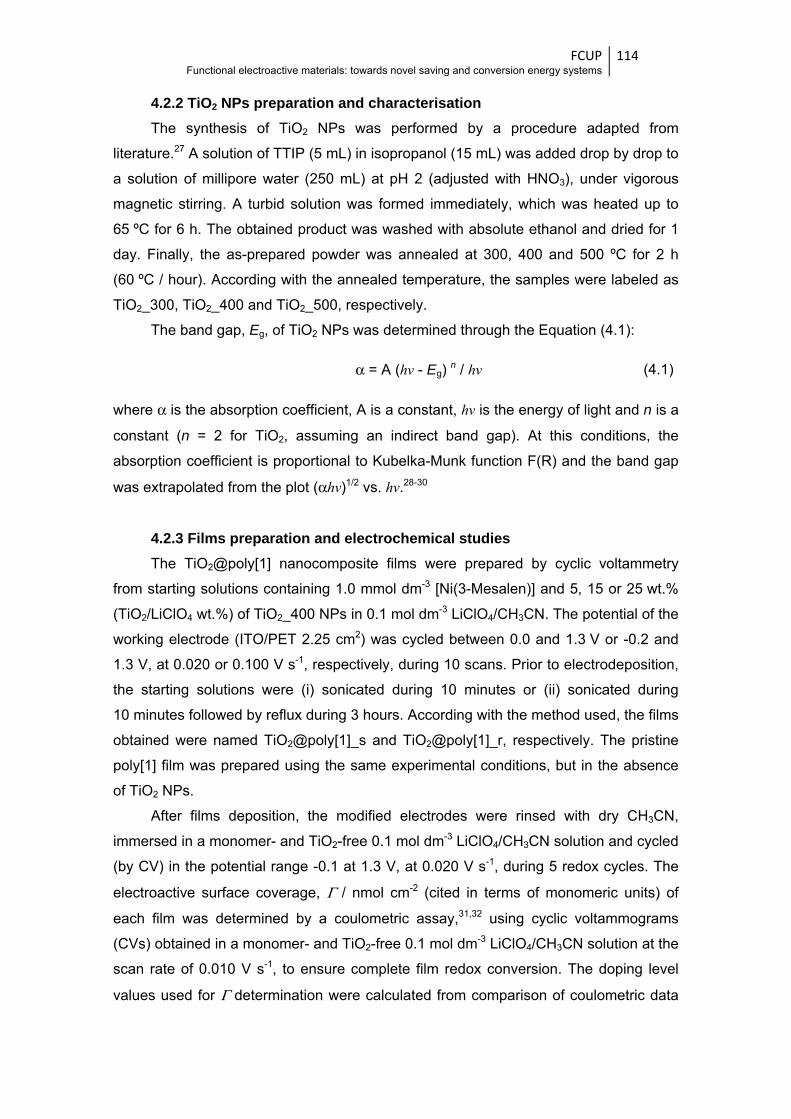
FCUP Functional electroactive materials: towards novel saving and conversion energy systems
114
4.2.2 TiO2 NPs preparation and characterisation The synthesis of TiO2 NPs was performed by a procedure adapted from
literature.27 A solution of TTIP (5 mL) in isopropanol (15 mL) was added drop by drop to
a solution of millipore water (250 mL) at pH 2 (adjusted with HNO3), under vigorous
magnetic stirring. A turbid solution was formed immediately, which was heated up to
65 ºC for 6 h. The obtained product was washed with absolute ethanol and dried for 1
day. Finally, the as-prepared powder was annealed at 300, 400 and 500 ºC for 2 h
(60 ºC / hour). According with the annealed temperature, the samples were labeled as
TiO2_300, TiO2_400 and TiO2_500, respectively.
The band gap, Eg, of TiO2 NPs was determined through the Equation (4.1):
α = A (hv - Eg) n / hv (4.1)
where α is the absorption coefficient, A is a constant, hv is the energy of light and n is a
constant (n = 2 for TiO2, assuming an indirect band gap). At this conditions, the
absorption coefficient is proportional to Kubelka-Munk function F(R) and the band gap
was extrapolated from the plot (αhv)1/2 vs. hv.28-30
4.2.3 Films preparation and electrochemical studies The TiO2@poly[1] nanocomposite films were prepared by cyclic voltammetry
from starting solutions containing 1.0 mmol dm-3 [Ni(3-Mesalen)] and 5, 15 or 25 wt.%
(TiO2/LiClO4 wt.%) of TiO2_400 NPs in 0.1 mol dm-3 LiClO4/CH3CN. The potential of the
working electrode (ITO/PET 2.25 cm2) was cycled between 0.0 and 1.3 V or -0.2 and
1.3 V, at 0.020 or 0.100 V s-1, respectively, during 10 scans. Prior to electrodeposition,
the starting solutions were (i) sonicated during 10 minutes or (ii) sonicated during
10 minutes followed by reflux during 3 hours. According with the method used, the films
obtained were named TiO2@poly[1]_s and TiO2@poly[1]_r, respectively. The pristine
poly[1] film was prepared using the same experimental conditions, but in the absence
of TiO2 NPs.
After films deposition, the modified electrodes were rinsed with dry CH3CN,
immersed in a monomer- and TiO2-free 0.1 mol dm-3 LiClO4/CH3CN solution and cycled
(by CV) in the potential range -0.1 at 1.3 V, at 0.020 V s-1, during 5 redox cycles. The
electroactive surface coverage, Γ / nmol cm-2 (cited in terms of monomeric units) of
each film was determined by a coulometric assay,31,32 using cyclic voltammograms
(CVs) obtained in a monomer- and TiO2-free 0.1 mol dm-3 LiClO4/CH3CN solution at the
scan rate of 0.010 V s-1, to ensure complete film redox conversion. The doping level
values used for Γ determination were calculated from comparison of coulometric data
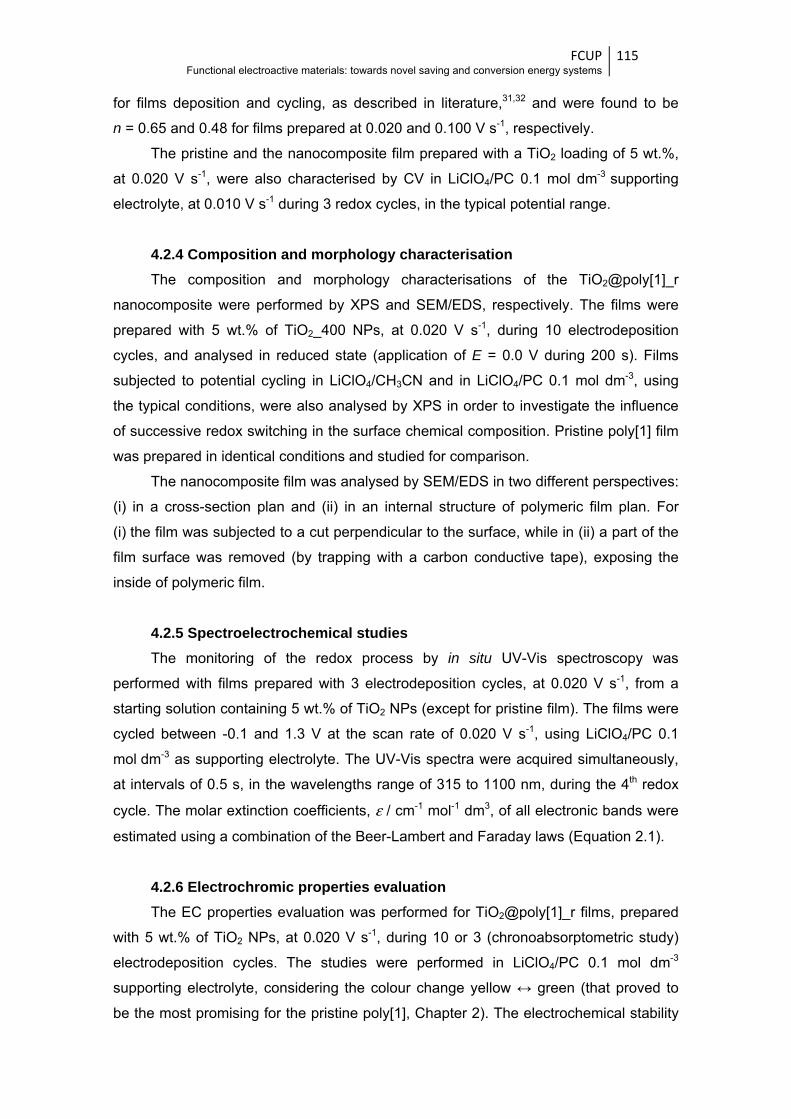
FCUP Functional electroactive materials: towards novel saving and conversion energy systems
115
for films deposition and cycling, as described in literature,31,32 and were found to be
n = 0.65 and 0.48 for films prepared at 0.020 and 0.100 V s-1, respectively.
The pristine and the nanocomposite film prepared with a TiO2 loading of 5 wt.%,
at 0.020 V s-1, were also characterised by CV in LiClO4/PC 0.1 mol dm-3 supporting
electrolyte, at 0.010 V s-1 during 3 redox cycles, in the typical potential range.
4.2.4 Composition and morphology characterisation The composition and morphology characterisations of the TiO2@poly[1]_r
nanocomposite were performed by XPS and SEM/EDS, respectively. The films were
prepared with 5 wt.% of TiO2_400 NPs, at 0.020 V s-1, during 10 electrodeposition
cycles, and analysed in reduced state (application of E = 0.0 V during 200 s). Films
subjected to potential cycling in LiClO4/CH3CN and in LiClO4/PC 0.1 mol dm-3, using
the typical conditions, were also analysed by XPS in order to investigate the influence
of successive redox switching in the surface chemical composition. Pristine poly[1] film
was prepared in identical conditions and studied for comparison.
The nanocomposite film was analysed by SEM/EDS in two different perspectives:
(i) in a cross-section plan and (ii) in an internal structure of polymeric film plan. For
(i) the film was subjected to a cut perpendicular to the surface, while in (ii) a part of the
film surface was removed (by trapping with a carbon conductive tape), exposing the
inside of polymeric film.
4.2.5 Spectroelectrochemical studies The monitoring of the redox process by in situ UV-Vis spectroscopy was
performed with films prepared with 3 electrodeposition cycles, at 0.020 V s-1, from a
starting solution containing 5 wt.% of TiO2 NPs (except for pristine film). The films were
cycled between -0.1 and 1.3 V at the scan rate of 0.020 V s-1, using LiClO4/PC 0.1
mol dm-3 as supporting electrolyte. The UV-Vis spectra were acquired simultaneously,
at intervals of 0.5 s, in the wavelengths range of 315 to 1100 nm, during the 4th redox
cycle. The molar extinction coefficients, ε / cm-1 mol-1 dm3, of all electronic bands were
estimated using a combination of the Beer-Lambert and Faraday laws (Equation 2.1).
4.2.6 Electrochromic properties evaluation The EC properties evaluation was performed for TiO2@poly[1]_r films, prepared
with 5 wt.% of TiO2 NPs, at 0.020 V s-1, during 10 or 3 (chronoabsorptometric study)
electrodeposition cycles. The studies were performed in LiClO4/PC 0.1 mol dm-3
supporting electrolyte, considering the colour change yellow ↔ green (that proved to
be the most promising for the pristine poly[1], Chapter 2). The electrochemical stability
FCUP Functional electroactive materials: towards novel saving and conversion energy systems
116
tests were performed by a double potential step method (chronoamperometry),
applying two potential pulses of 50 s by redox cycle, with potential alternating between
0.0 and 0.7 V, for a long period of time (9500 redox cycles, ≈ 11 days). The switching
times were determined from the obtained chronoamperograms, considering 90 % of
the full switch. The remaining EC parameters were determined through the
chronoabsorptograms obtained during the monitoring of the chronoamperometric
experiment by UV-Vis spectroscopy; the measurements were performed at the fixed
wavelength of λ = 750 nm, acquiring the UV-Vis spectra with intervals of 1 s. The
change of the optical density, ΔOD, and the colouration efficiency parameters were
estimated through Equation 1.1.
The CIELAB values were determined after subject the polymeric films to the
application of a constant potential value - E = 0.0, 0.7 or 1.3 V - during 50 s, in
LiClO4/PC. The CIELAB system provided a psychometric lightness index L*, which is a
chromatic measure in a scale ranging from 0 (black) to 100 (white), and two colour
coordinates a*, a green (negative) - red (positive) continuum, and b*, a blue (negative)
– yellow (positive) values. The total colour difference (ΔE*) between two different
oxidation states of a film was calculated from L*, a* and b* values, using the equation:
ΔE* = ((ΔL*)2+(Δa*)2+(Δb*)2)1/2 (4.2)
where Δx* = x*more oxidised state – x*less oxidised state (x* = L*, a* or b*).
4.3 Results and discussion 4.3.1 TiO2 NPs characterisation Figure 4.1 shows the XRD patterns of TiO2 NPs annealed at different
temperatures.
Figure 4.1 XRD patterns of TiO2 NPs annealed at 300, 400 and 500 ºC (A = anatase, B = brookite).
20 30 40 50 60 70 80
500 ºC
400 ºC
300 ºC
A (1
16) +
B (4
00)
A (2
04) +
B (2
51)
A (1
05) (
211)
+B
(320
) (31
1) (2
41)
A (2
00) +
B (2
31)
A (0
04) +
B (2
01) (
131)
A (1
01) +
B
(120
) (11
1)
B (1
21)
Inte
nsity
/ a.
u
2θ / º

(broo
broo
diffra
plane
A (20
A (20
samp
Rietv
and T
anne
broo
anata
anata
agree
(a)) s
by a
(± 1.
Figure(the so
TiO2_
(
Functi
According
okite, B), th
kite. The o
action peaks
e: A (101) o
00) or B (23
04) or B (2
ples are co
veld refinem
TiO2_400 s
ealed at 500
kite. The s
ase and 9.
ase and 11
ement with
The TEM
show small
log-normal
1 nm), whic
e 4.2 (a) TEM m
olid line represe
XPS chara
_400 samp
(a)
ional electroacti
g to ICSD
e weak diff
other diffrac
s in anatase
or B (120)/(
31) (2θ = 4
51) (2θ = 6
omposed by
ment indicat
samples) are
0 ºC (TiO2_
amples TiO
00 nm for
1.57 nm fo
reported re
micrograph
-size quasi
l function (F
ch is in agre
micrograph of the
nts the log-norm
acterisation
ple, the ca
ive materials: to
CIF no. 2
fraction pea
ction peaks
e (A) and br
(111) (2θ =
47.92 º), A (
62.98 º) and
y two crysta
ed that the
e 65.5 % a
_500 samp
O2_300 and
brookite, b
or brookite,
esults for sim
hs (represe
-spherical T
Figure 4.2 (
eement with
e TiO2 NPs; (b)
mal distribution f
n of TiO2 NP
lculated ato
25 nm
owards novel sa
24276 (ana
ak at 2θ = 3
s, due to t
rookite (B)
25.29 º), A
(105)/(211)
d A (116) o
allographic
TiO2 NPs a
natase and
le) is comp
d TiO2_400
but the crys
for the sa
milar sampl
entative ima
TiO2 NPs. T
(b)), leading
h the XRD re
particle size dis
fit).
Ps indicates
omic perce
m
0
5
10
15
20
25
30
35
40
Nu
mb
er o
f pa
rtic
les
aving and conve
atase, A) a
30.52º is ind
their broad
phases, are
A (004) or B
or B (320)
or B (400) (
structures:
annealed at
d 34.5 % bro
posed by 67
have simila
stallite sizes
ample TiO2_
es.33
age for TiO2
The particle
g to an aver
esults.
stribution histog
s the prese
entages of
7 8 90
5
0
5
0
5
0
5
0
Fersion energy sy
and ICSD
dexed to th
ness and
e ascribed t
B (201)/(131
/(311)/(241
(2θ = 69.36
anatase an
t 300 and 40
ookite, whe
7.0 % anata
ar grain siz
s increase
_500. Thes
2_400 samp
e size distrib
rage particl
gram from the an
nce of Ti, O
Ti and O
9 10 11
Particle size /
FCUP ystems
117
CIF no. 3
he plane (12
proximity to
to more than
1) (2θ = 37.
) (2θ = 54.4
6 º). All the
nd brookite
00 ºC (TiO2
ereas the sa
tase and 33
zes: 9.32 n
to 14.25 n
se results a
ple in Figur
bution was
e size of 9.
nalysis of TEM
O and N. Fo
were 24.7
12 13
/ nm
(b
31122
21) of
o the
n one
74 º),
44 º),
e TiO2
. The
2_300
ample
3.0 %
m for
m for
are in
re 4.2
fitted
.7 nm
images
or the
7 and
14
b)
FCUP Functional electroactive materials: towards novel saving and conversion energy systems
118
74.6 %, respectively, with 0.71 % of nitrogen. The higher value of the obtained O/Ti
atomic ratio (O/Tiobtained = 3.0) compared to the theoretical value (O/Titheoretical =2.0) is
explained by the contribution of the O atoms from surface hydroxyl groups.28 The
obtained atomic percentages for TiO2_300 sample were 28.3, 70.5 and 1.20 % for O, Ti
and N, respectively.
The high-resolution XPS spectra of TiO2_300 and TiO2_400 samples in Ti2p, O1s
and N1s regions are depicted in Figure 4.3.
Figure 4.3 High-resolution XPS spectra of TiO2_300 and TiO2_400 NPs in Ti2p, O1s and N1s regions, with respective
deconvolutions.
470 465 460 455
464.0
Binding Energy / eV
458.3
470 465 460 455
464.1
Binding Energy / eV
458.4
TiO2_300 TiO2_400 Ti2p Ti2p
O1s O1s
N1s N1s
537 534 531 528 525
531.1
532.3
Binding Energy / eV
529.7
405 402 399 396 393
400.9
Binding Energy / eV
398.3
399.7
537 534 531 528 525
531.1
532.3
Binding Energy / eV
529.7
405 402 399 396 393
399.8
Binding Energy / eV
398.0
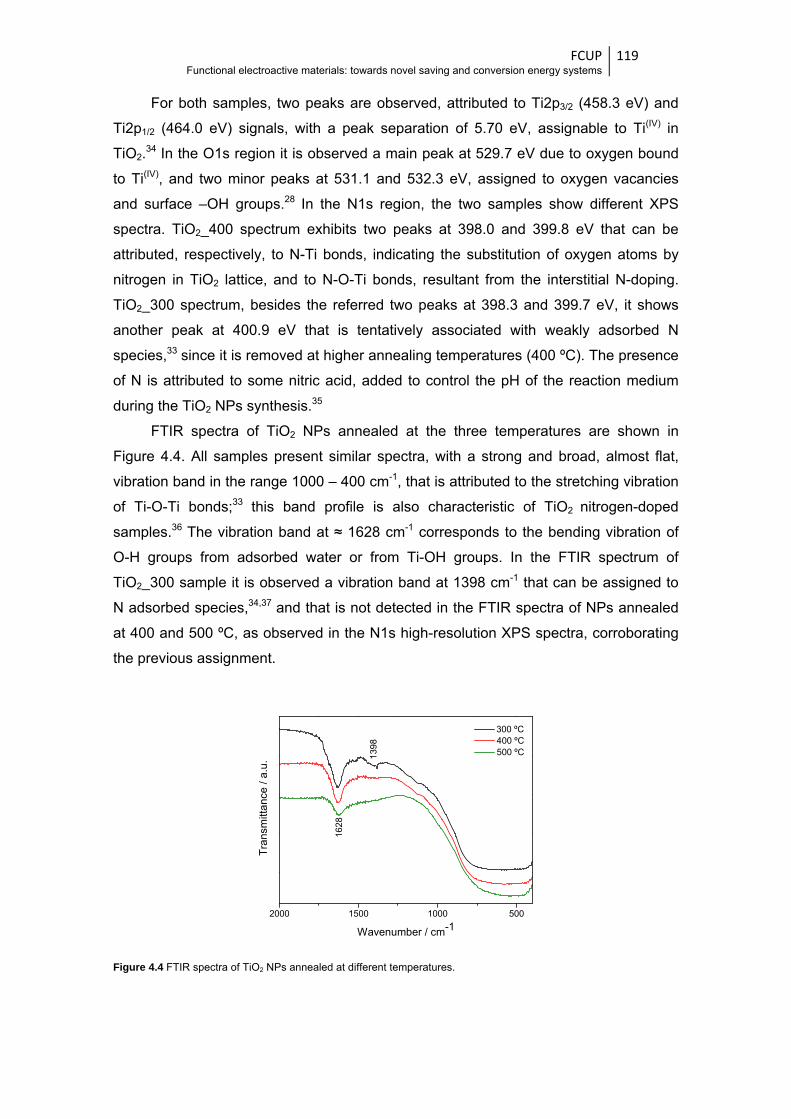
FCUP Functional electroactive materials: towards novel saving and conversion energy systems
119
For both samples, two peaks are observed, attributed to Ti2p3/2 (458.3 eV) and
Ti2p1/2 (464.0 eV) signals, with a peak separation of 5.70 eV, assignable to Ti(IV) in
TiO2.34 In the O1s region it is observed a main peak at 529.7 eV due to oxygen bound
to Ti(IV), and two minor peaks at 531.1 and 532.3 eV, assigned to oxygen vacancies
and surface –OH groups.28 In the N1s region, the two samples show different XPS
spectra. TiO2_400 spectrum exhibits two peaks at 398.0 and 399.8 eV that can be
attributed, respectively, to N-Ti bonds, indicating the substitution of oxygen atoms by
nitrogen in TiO2 lattice, and to N-O-Ti bonds, resultant from the interstitial N-doping.
TiO2_300 spectrum, besides the referred two peaks at 398.3 and 399.7 eV, it shows
another peak at 400.9 eV that is tentatively associated with weakly adsorbed N
species,33 since it is removed at higher annealing temperatures (400 ºC). The presence
of N is attributed to some nitric acid, added to control the pH of the reaction medium
during the TiO2 NPs synthesis.35
FTIR spectra of TiO2 NPs annealed at the three temperatures are shown in
Figure 4.4. All samples present similar spectra, with a strong and broad, almost flat,
vibration band in the range 1000 – 400 cm-1, that is attributed to the stretching vibration
of Ti-O-Ti bonds;33 this band profile is also characteristic of TiO2 nitrogen-doped
samples.36 The vibration band at ≈ 1628 cm-1 corresponds to the bending vibration of
O-H groups from adsorbed water or from Ti-OH groups. In the FTIR spectrum of
TiO2_300 sample it is observed a vibration band at 1398 cm-1 that can be assigned to
N adsorbed species,34,37 and that is not detected in the FTIR spectra of NPs annealed
at 400 and 500 ºC, as observed in the N1s high-resolution XPS spectra, corroborating
the previous assignment.
Figure 4.4 FTIR spectra of TiO2 NPs annealed at different temperatures.
2000 1500 1000 500
300 ºC 400 ºC 500 ºC
Tra
nsm
itta
nce
/ a.u
.
Wavenumber / cm-1
1628
139
8
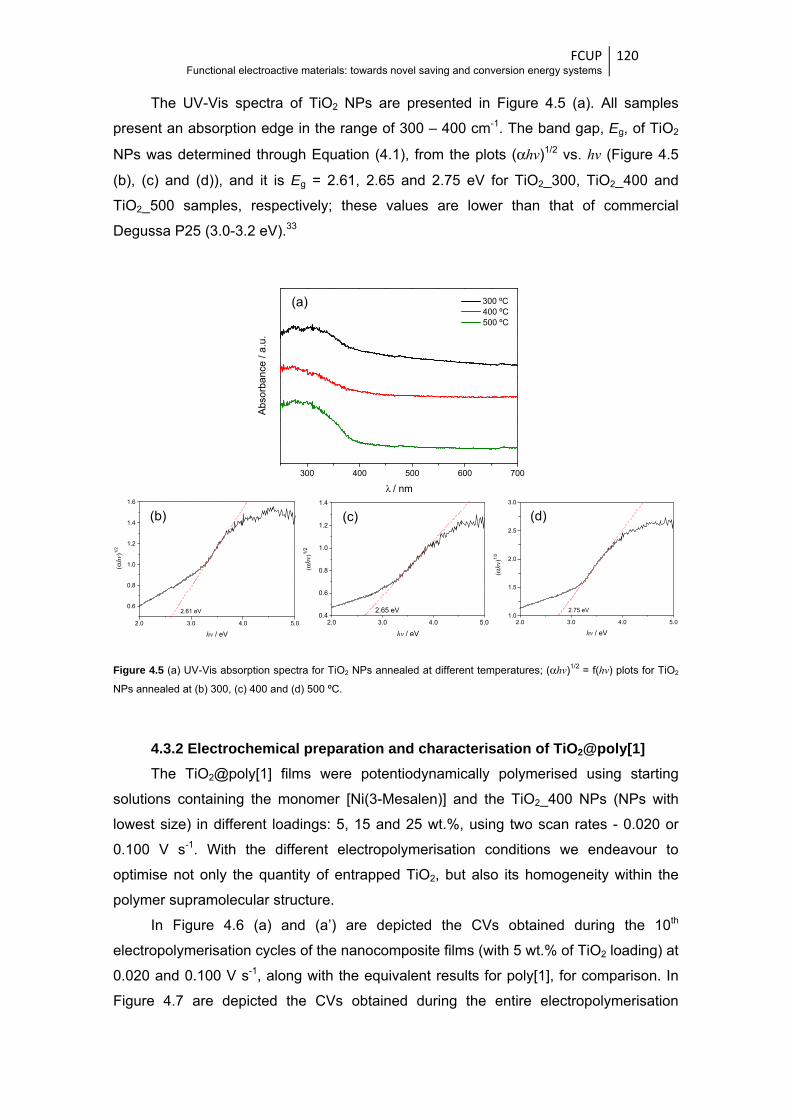
FCUP Functional electroactive materials: towards novel saving and conversion energy systems
120
The UV-Vis spectra of TiO2 NPs are presented in Figure 4.5 (a). All samples
present an absorption edge in the range of 300 – 400 cm-1. The band gap, Eg, of TiO2
NPs was determined through Equation (4.1), from the plots (αhv)1/2 vs. hv (Figure 4.5
(b), (c) and (d)), and it is Eg = 2.61, 2.65 and 2.75 eV for TiO2_300, TiO2_400 and
TiO2_500 samples, respectively; these values are lower than that of commercial
Degussa P25 (3.0-3.2 eV).33
Figure 4.5 (a) UV-Vis absorption spectra for TiO2 NPs annealed at different temperatures; (αhv)1/2 = f(hv) plots for TiO2
NPs annealed at (b) 300, (c) 400 and (d) 500 ºC.
4.3.2 Electrochemical preparation and characterisation of TiO2@poly[1] The TiO2@poly[1] films were potentiodynamically polymerised using starting
solutions containing the monomer [Ni(3-Mesalen)] and the TiO2_400 NPs (NPs with
lowest size) in different loadings: 5, 15 and 25 wt.%, using two scan rates - 0.020 or
0.100 V s-1. With the different electropolymerisation conditions we endeavour to
optimise not only the quantity of entrapped TiO2, but also its homogeneity within the
polymer supramolecular structure.
In Figure 4.6 (a) and (a’) are depicted the CVs obtained during the 10th
electropolymerisation cycles of the nanocomposite films (with 5 wt.% of TiO2 loading) at
0.020 and 0.100 V s-1, along with the equivalent results for poly[1], for comparison. In
Figure 4.7 are depicted the CVs obtained during the entire electropolymerisation
300 400 500 600 700
300 ºC 400 ºC 500 ºC
Abs
orb
an
ce /
a.u
.
λ / nm
(a)
(b) (c) (d)
2.0 3.0 4.0 5.0
0.6
0.8
1.0
1.2
1.4
1.6
(αhv
)1/2
hv / eV
2.61 eV
2.0 3.0 4.0 5.00.4
0.6
0.8
1.0
1.2
1.4
(αhv
)1/2
hv / eV
2.65 eV
2.0 3.0 4.0 5.01.0
1.5
2.0
2.5
3.0(α
hv)1/
2
hv / eV
2.75 eV
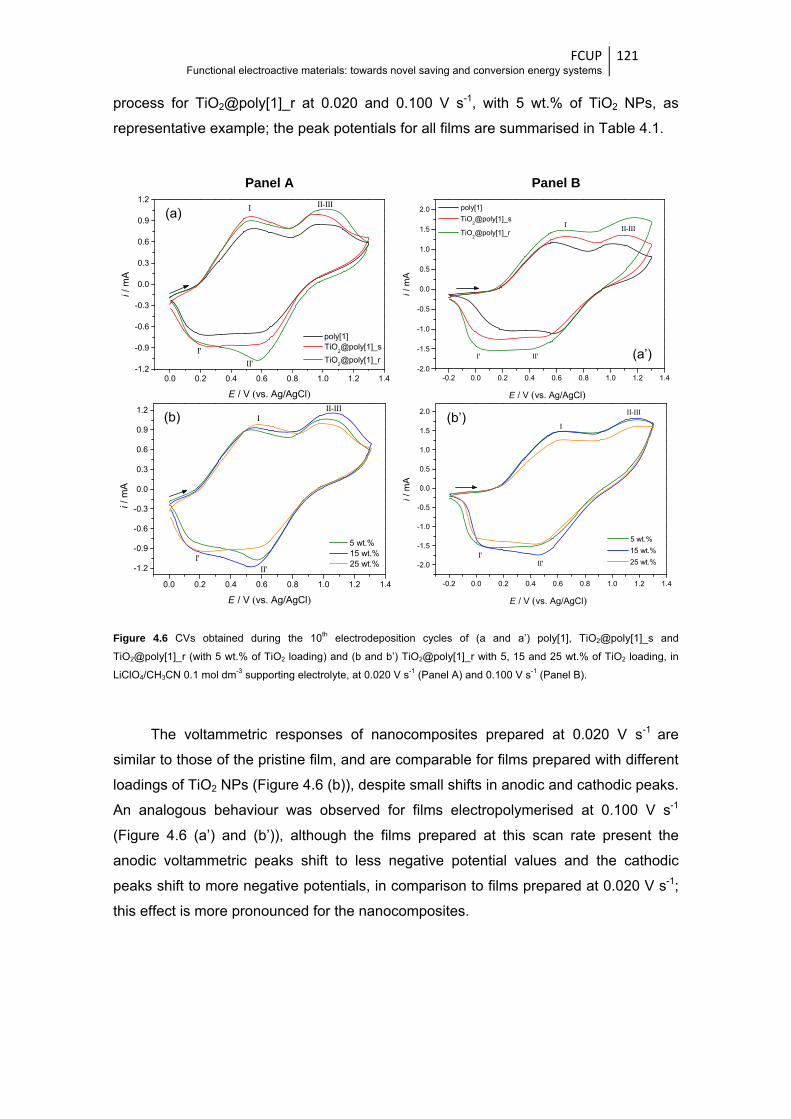
FCUP Functional electroactive materials: towards novel saving and conversion energy systems
121
process for TiO2@poly[1]_r at 0.020 and 0.100 V s-1, with 5 wt.% of TiO2 NPs, as
representative example; the peak potentials for all films are summarised in Table 4.1.
Figure 4.6 CVs obtained during the 10th electrodeposition cycles of (a and a’) poly[1], TiO2@poly[1]_s and
TiO2@poly[1]_r (with 5 wt.% of TiO2 loading) and (b and b’) TiO2@poly[1]_r with 5, 15 and 25 wt.% of TiO2 loading, in
LiClO4/CH3CN 0.1 mol dm-3 supporting electrolyte, at 0.020 V s-1 (Panel A) and 0.100 V s-1 (Panel B).
The voltammetric responses of nanocomposites prepared at 0.020 V s-1 are
similar to those of the pristine film, and are comparable for films prepared with different
loadings of TiO2 NPs (Figure 4.6 (b)), despite small shifts in anodic and cathodic peaks.
An analogous behaviour was observed for films electropolymerised at 0.100 V s-1
(Figure 4.6 (a’) and (b’)), although the films prepared at this scan rate present the
anodic voltammetric peaks shift to less negative potential values and the cathodic
peaks shift to more negative potentials, in comparison to films prepared at 0.020 V s-1;
this effect is more pronounced for the nanocomposites.
0.0 0.2 0.4 0.6 0.8 1.0 1.2 1.4-1.2
-0.9
-0.6
-0.3
0.0
0.3
0.6
0.9
1.2
poly[1] TiO
2@poly[1]_s
TiO2@poly[1]_r
i / m
A
E / V (vs. Ag/AgCl)
I II-III
II'I'
0.0 0.2 0.4 0.6 0.8 1.0 1.2 1.4
-1.2
-0.9
-0.6
-0.3
0.0
0.3
0.6
0.9
1.2
i / m
A
E / V (vs. Ag/AgCl)
5 wt.% 15 wt.% 25 wt.%
III-III
I'II'
(b’)(b)
Panel A Panel B
-0.2 0.0 0.2 0.4 0.6 0.8 1.0 1.2 1.4-2.0
-1.5
-1.0
-0.5
0.0
0.5
1.0
1.5
2.0 poly[1]
TiO2@poly[1]_s
TiO2@poly[1]_r
II'I'
i / m
AE / V (vs. Ag/AgCl)
I II-III
(a’)
-0.2 0.0 0.2 0.4 0.6 0.8 1.0 1.2 1.4
-2.0
-1.5
-1.0
-0.5
0.0
0.5
1.0
1.5
2.0
5 wt.%
15 wt.%
25 wt.%II'I'
i / m
A
E / V (vs. Ag/AgCl)
I
II-III
(a)
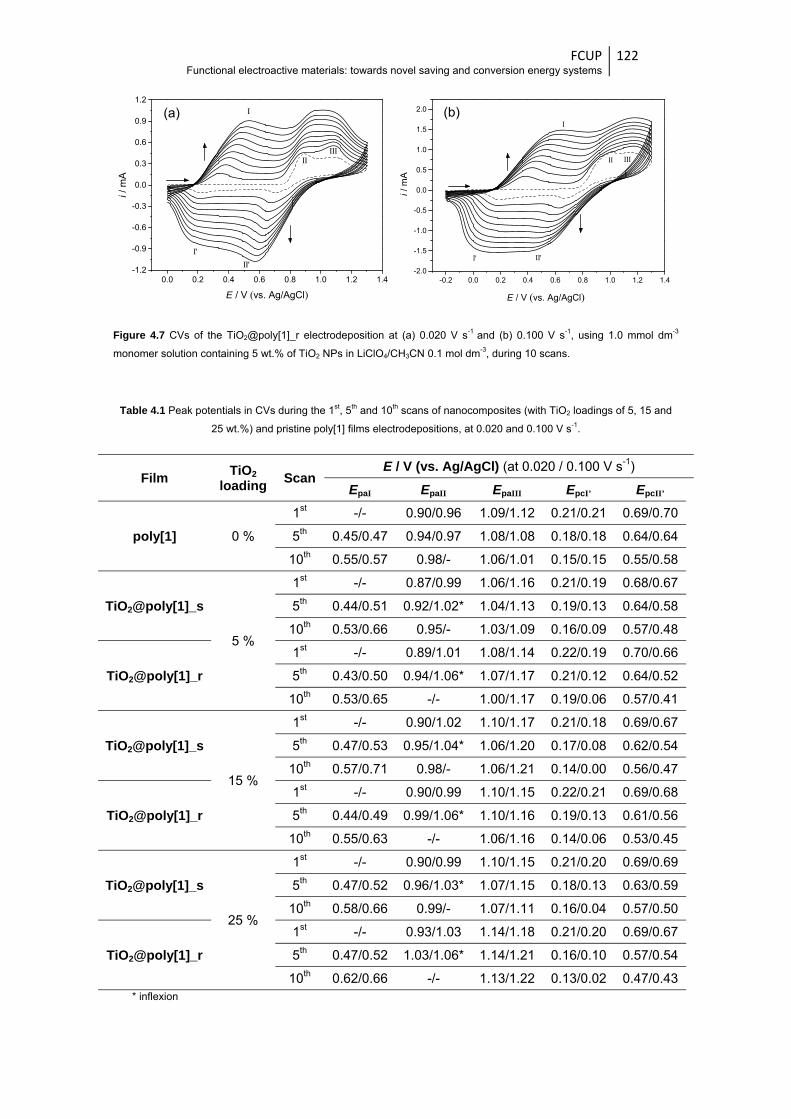
FCUP Functional electroactive materials: towards novel saving and conversion energy systems
122
Figure 4.7 CVs of the TiO2@poly[1]_r electrodeposition at (a) 0.020 V s-1 and (b) 0.100 V s-1, using 1.0 mmol dm-3
monomer solution containing 5 wt.% of TiO2 NPs in LiClO4/CH3CN 0.1 mol dm-3, during 10 scans.
Table 4.1 Peak potentials in CVs during the 1st, 5th and 10th scans of nanocomposites (with TiO2 loadings of 5, 15 and
25 wt.%) and pristine poly[1] films electrodepositions, at 0.020 and 0.100 V s-1.
Film TiO2 loading Scan
E / V (vs. Ag/AgCl) (at 0.020 / 0.100 V s-1)
EpaI EpaII EpaIII EpcI’ EpcII’
poly[1] 0 %
1st -/- 0.90/0.96 1.09/1.12 0.21/0.21 0.69/0.70
5th 0.45/0.47 0.94/0.97 1.08/1.08 0.18/0.18 0.64/0.64
10th 0.55/0.57 0.98/- 1.06/1.01 0.15/0.15 0.55/0.58
TiO2@poly[1]_s
5 %
1st -/- 0.87/0.99 1.06/1.16 0.21/0.19 0.68/0.67
5th 0.44/0.51 0.92/1.02* 1.04/1.13 0.19/0.13 0.64/0.58
10th 0.53/0.66 0.95/- 1.03/1.09 0.16/0.09 0.57/0.48
TiO2@poly[1]_r
1st -/- 0.89/1.01 1.08/1.14 0.22/0.19 0.70/0.66
5th 0.43/0.50 0.94/1.06* 1.07/1.17 0.21/0.12 0.64/0.52
10th 0.53/0.65 -/- 1.00/1.17 0.19/0.06 0.57/0.41
TiO2@poly[1]_s
15 %
1st -/- 0.90/1.02 1.10/1.17 0.21/0.18 0.69/0.67
5th 0.47/0.53 0.95/1.04* 1.06/1.20 0.17/0.08 0.62/0.54
10th 0.57/0.71 0.98/- 1.06/1.21 0.14/0.00 0.56/0.47
TiO2@poly[1]_r
1st -/- 0.90/0.99 1.10/1.15 0.22/0.21 0.69/0.68
5th 0.44/0.49 0.99/1.06* 1.10/1.16 0.19/0.13 0.61/0.56
10th 0.55/0.63 -/- 1.06/1.16 0.14/0.06 0.53/0.45
TiO2@poly[1]_s
25 %
1st -/- 0.90/0.99 1.10/1.15 0.21/0.20 0.69/0.69
5th 0.47/0.52 0.96/1.03* 1.07/1.15 0.18/0.13 0.63/0.59
10th 0.58/0.66 0.99/- 1.07/1.11 0.16/0.04 0.57/0.50
TiO2@poly[1]_r
1st -/- 0.93/1.03 1.14/1.18 0.21/0.20 0.69/0.67
5th 0.47/0.52 1.03/1.06* 1.14/1.21 0.16/0.10 0.57/0.54
10th 0.62/0.66 -/- 1.13/1.22 0.13/0.02 0.47/0.43 * inflexion
0.0 0.2 0.4 0.6 0.8 1.0 1.2 1.4-1.2
-0.9
-0.6
-0.3
0.0
0.3
0.6
0.9
1.2
II'I'
IIIII
i / m
A
E / V (vs. Ag/AgCl)
I
-0.2 0.0 0.2 0.4 0.6 0.8 1.0 1.2 1.4-2.0
-1.5
-1.0
-0.5
0.0
0.5
1.0
1.5
2.0
II'I'
i / m
A
E / V (vs. Ag/AgCl)
I
II III
(a) (b)
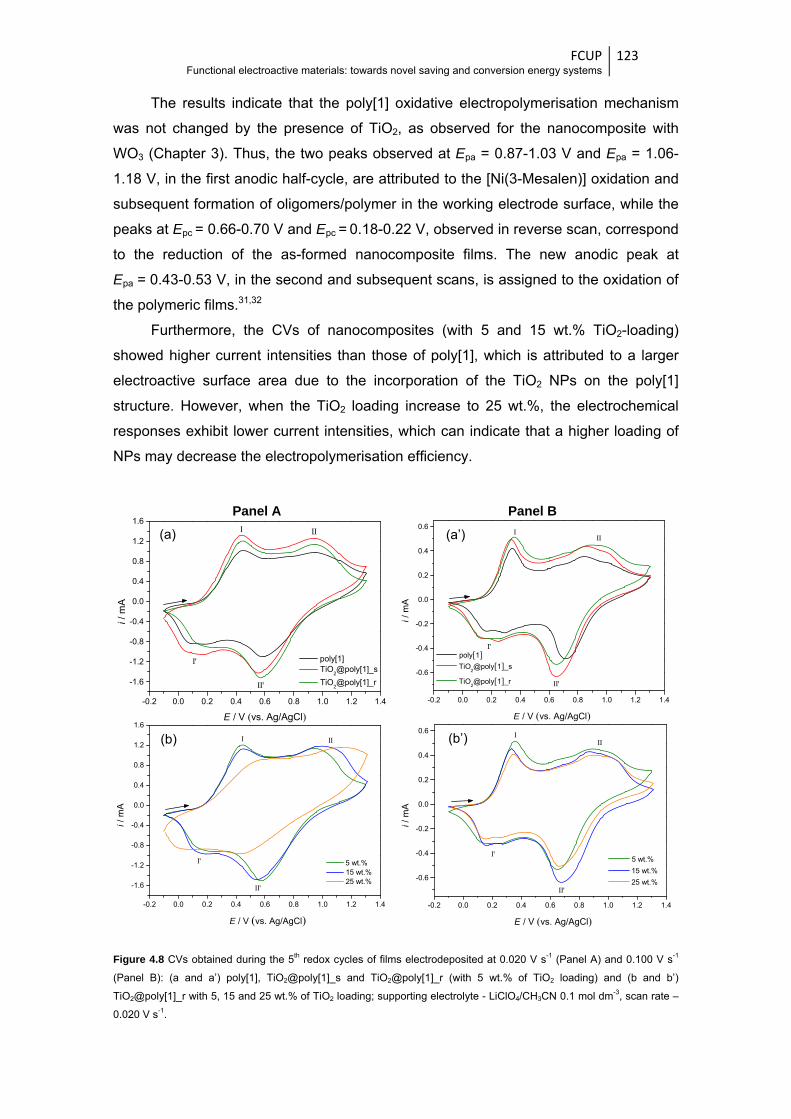
FCUP Functional electroactive materials: towards novel saving and conversion energy systems
123
The results indicate that the poly[1] oxidative electropolymerisation mechanism
was not changed by the presence of TiO2, as observed for the nanocomposite with
WO3 (Chapter 3). Thus, the two peaks observed at Epa = 0.87-1.03 V and Epa = 1.06-
1.18 V, in the first anodic half-cycle, are attributed to the [Ni(3-Mesalen)] oxidation and
subsequent formation of oligomers/polymer in the working electrode surface, while the
peaks at Epc = 0.66-0.70 V and Epc = 0.18-0.22 V, observed in reverse scan, correspond
to the reduction of the as-formed nanocomposite films. The new anodic peak at
Epa = 0.43-0.53 V, in the second and subsequent scans, is assigned to the oxidation of
the polymeric films.31,32
Furthermore, the CVs of nanocomposites (with 5 and 15 wt.% TiO2-loading)
showed higher current intensities than those of poly[1], which is attributed to a larger
electroactive surface area due to the incorporation of the TiO2 NPs on the poly[1]
structure. However, when the TiO2 loading increase to 25 wt.%, the electrochemical
responses exhibit lower current intensities, which can indicate that a higher loading of
NPs may decrease the electropolymerisation efficiency.
Figure 4.8 CVs obtained during the 5th redox cycles of films electrodeposited at 0.020 V s-1 (Panel A) and 0.100 V s-1
(Panel B): (a and a’) poly[1], TiO2@poly[1]_s and TiO2@poly[1]_r (with 5 wt.% of TiO2 loading) and (b and b’)
TiO2@poly[1]_r with 5, 15 and 25 wt.% of TiO2 loading; supporting electrolyte - LiClO4/CH3CN 0.1 mol dm-3, scan rate –
0.020 V s-1.
Panel A Panel B
-0.2 0.0 0.2 0.4 0.6 0.8 1.0 1.2 1.4
-1.6
-1.2
-0.8
-0.4
0.0
0.4
0.8
1.2
1.6
i / m
A
E / V (vs. Ag/AgCl)
poly[1] TiO
2@poly[1]_s
TiO2@poly[1]_r
III
I'
II'
-0.2 0.0 0.2 0.4 0.6 0.8 1.0 1.2 1.4
-1.6
-1.2
-0.8
-0.4
0.0
0.4
0.8
1.2
1.6
5 wt.% 15 wt.% 25 wt.%
i / m
A
E / V (vs. Ag/AgCl)
I II
II'
I'
-0.2 0.0 0.2 0.4 0.6 0.8 1.0 1.2 1.4
-0.6
-0.4
-0.2
0.0
0.2
0.4
0.6
poly[1] TiO
2@poly[1]_s
TiO2@poly[1]_r II'
i / m
A
E / V (vs. Ag/AgCl)
III
I'
-0.2 0.0 0.2 0.4 0.6 0.8 1.0 1.2 1.4
-0.6
-0.4
-0.2
0.0
0.2
0.4
0.6
II'
5 wt.%
15 wt.%
25 wt.%
i / m
A
E / V (vs. Ag/AgCl)
III
I'
(a’)(a)
(b’)(b)
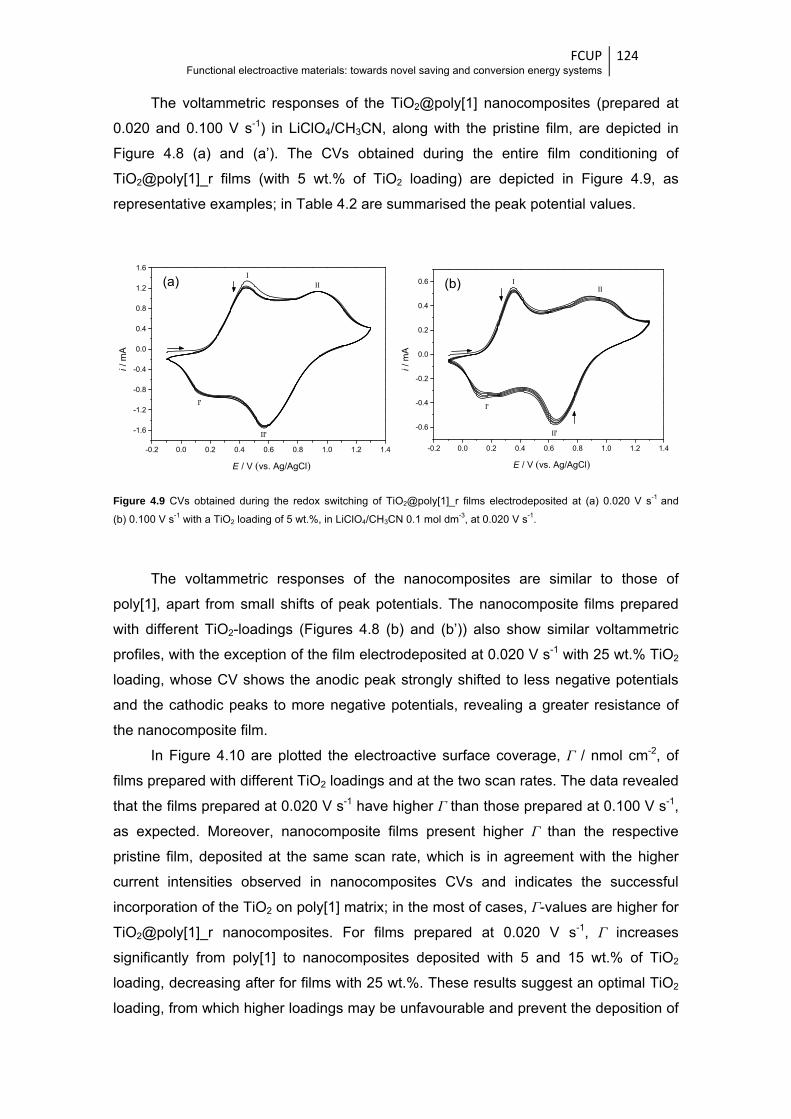
FCUP Functional electroactive materials: towards novel saving and conversion energy systems
124
The voltammetric responses of the TiO2@poly[1] nanocomposites (prepared at
0.020 and 0.100 V s-1) in LiClO4/CH3CN, along with the pristine film, are depicted in
Figure 4.8 (a) and (a’). The CVs obtained during the entire film conditioning of
TiO2@poly[1]_r films (with 5 wt.% of TiO2 loading) are depicted in Figure 4.9, as
representative examples; in Table 4.2 are summarised the peak potential values.
Figure 4.9 CVs obtained during the redox switching of TiO2@poly[1]_r films electrodeposited at (a) 0.020 V s-1 and
(b) 0.100 V s-1 with a TiO2 loading of 5 wt.%, in LiClO4/CH3CN 0.1 mol dm-3, at 0.020 V s-1.
The voltammetric responses of the nanocomposites are similar to those of
poly[1], apart from small shifts of peak potentials. The nanocomposite films prepared
with different TiO2-loadings (Figures 4.8 (b) and (b’)) also show similar voltammetric
profiles, with the exception of the film electrodeposited at 0.020 V s-1 with 25 wt.% TiO2
loading, whose CV shows the anodic peak strongly shifted to less negative potentials
and the cathodic peaks to more negative potentials, revealing a greater resistance of
the nanocomposite film.
In Figure 4.10 are plotted the electroactive surface coverage, Γ / nmol cm-2, of
films prepared with different TiO2 loadings and at the two scan rates. The data revealed
that the films prepared at 0.020 V s-1 have higher Γ than those prepared at 0.100 V s-1,
as expected. Moreover, nanocomposite films present higher Γ than the respective
pristine film, deposited at the same scan rate, which is in agreement with the higher
current intensities observed in nanocomposites CVs and indicates the successful
incorporation of the TiO2 on poly[1] matrix; in the most of cases, Γ-values are higher for
TiO2@poly[1]_r nanocomposites. For films prepared at 0.020 V s-1, Γ increases
significantly from poly[1] to nanocomposites deposited with 5 and 15 wt.% of TiO2
loading, decreasing after for films with 25 wt.%. These results suggest an optimal TiO2
loading, from which higher loadings may be unfavourable and prevent the deposition of
-0.2 0.0 0.2 0.4 0.6 0.8 1.0 1.2 1.4
-1.6
-1.2
-0.8
-0.4
0.0
0.4
0.8
1.2
1.6
i / m
A
E / V (vs. Ag/AgCl)
III
II'
I'
-0.2 0.0 0.2 0.4 0.6 0.8 1.0 1.2 1.4
-0.6
-0.4
-0.2
0.0
0.2
0.4
0.6
II'
i / m
A
E / V (vs. Ag/AgCl)
III
I'
(a) (b)
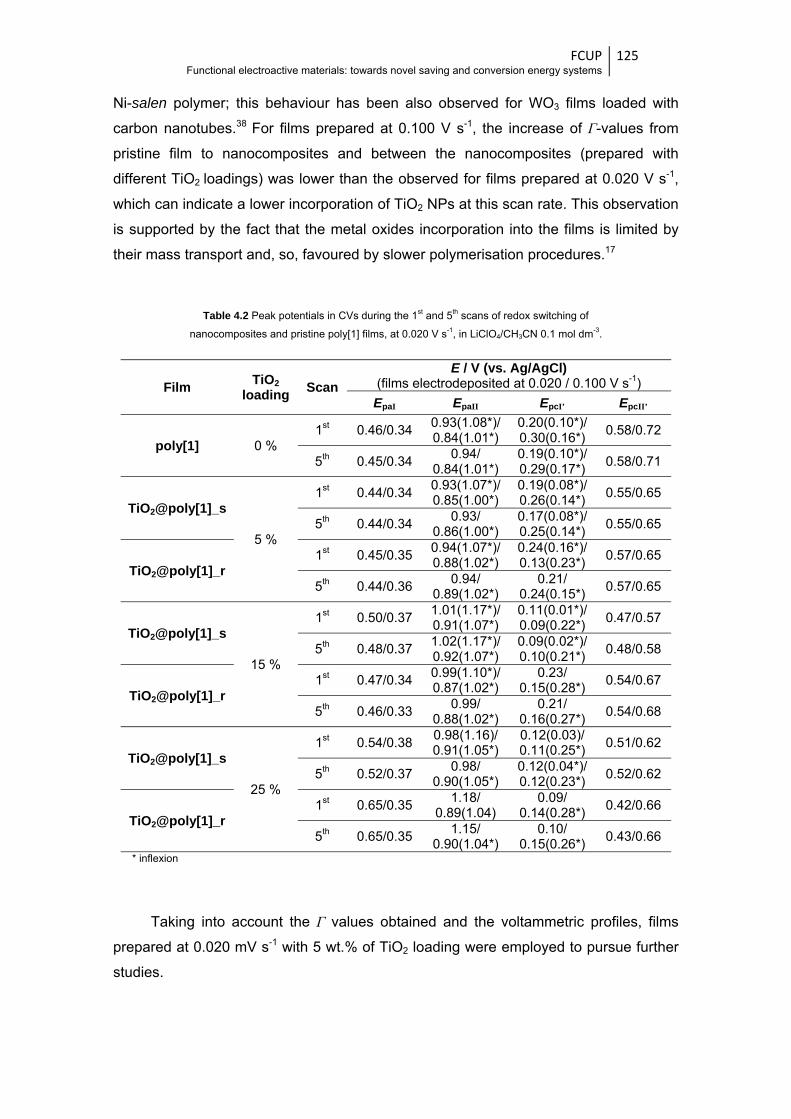
FCUP Functional electroactive materials: towards novel saving and conversion energy systems
125
Ni-salen polymer; this behaviour has been also observed for WO3 films loaded with
carbon nanotubes.38 For films prepared at 0.100 V s-1, the increase of Γ-values from
pristine film to nanocomposites and between the nanocomposites (prepared with
different TiO2 loadings) was lower than the observed for films prepared at 0.020 V s-1,
which can indicate a lower incorporation of TiO2 NPs at this scan rate. This observation
is supported by the fact that the metal oxides incorporation into the films is limited by
their mass transport and, so, favoured by slower polymerisation procedures.17
Table 4.2 Peak potentials in CVs during the 1st and 5th scans of redox switching of
nanocomposites and pristine poly[1] films, at 0.020 V s-1, in LiClO4/CH3CN 0.1 mol dm-3.
Film TiO2 loading Scan
E / V (vs. Ag/AgCl) (films electrodeposited at 0.020 / 0.100 V s-1)
EpaI EpaII EpcI’ EpcII’
poly[1] 0 % 1st 0.46/0.34
0.93(1.08*)/0.84(1.01*)
0.20(0.10*)/0.30(0.16*)
0.58/0.72
5th 0.45/0.34 0.94/
0.84(1.01*) 0.19(0.10*)/0.29(0.17*)
0.58/0.71
TiO2@poly[1]_s
5 %
1st 0.44/0.34 0.93(1.07*)/0.85(1.00*)
0.19(0.08*)/0.26(0.14*)
0.55/0.65
5th 0.44/0.34 0.93/
0.86(1.00*) 0.17(0.08*)/0.25(0.14*)
0.55/0.65
TiO2@poly[1]_r 1st 0.45/0.35
0.94(1.07*)/0.88(1.02*)
0.24(0.16*)/0.13(0.23*)
0.57/0.65
5th 0.44/0.36 0.94/
0.89(1.02*) 0.21/
0.24(0.15*) 0.57/0.65
TiO2@poly[1]_s
15 %
1st 0.50/0.37 1.01(1.17*)/0.91(1.07*)
0.11(0.01*)/0.09(0.22*)
0.47/0.57
5th 0.48/0.37 1.02(1.17*)/0.92(1.07*)
0.09(0.02*)/0.10(0.21*)
0.48/0.58
TiO2@poly[1]_r 1st 0.47/0.34
0.99(1.10*)/0.87(1.02*)
0.23/ 0.15(0.28*)
0.54/0.67
5th 0.46/0.33 0.99/
0.88(1.02*) 0.21/
0.16(0.27*) 0.54/0.68
TiO2@poly[1]_s
25 %
1st 0.54/0.38 0.98(1.16)/ 0.91(1.05*)
0.12(0.03)/ 0.11(0.25*)
0.51/0.62
5th 0.52/0.37 0.98/
0.90(1.05*) 0.12(0.04*)/0.12(0.23*)
0.52/0.62
TiO2@poly[1]_r 1st 0.65/0.35
1.18/ 0.89(1.04)
0.09/ 0.14(0.28*)
0.42/0.66
5th 0.65/0.35 1.15/
0.90(1.04*) 0.10/
0.15(0.26*) 0.43/0.66
* inflexion
Taking into account the Γ values obtained and the voltammetric profiles, films
prepared at 0.020 mV s-1 with 5 wt.% of TiO2 loading were employed to pursue further
studies.
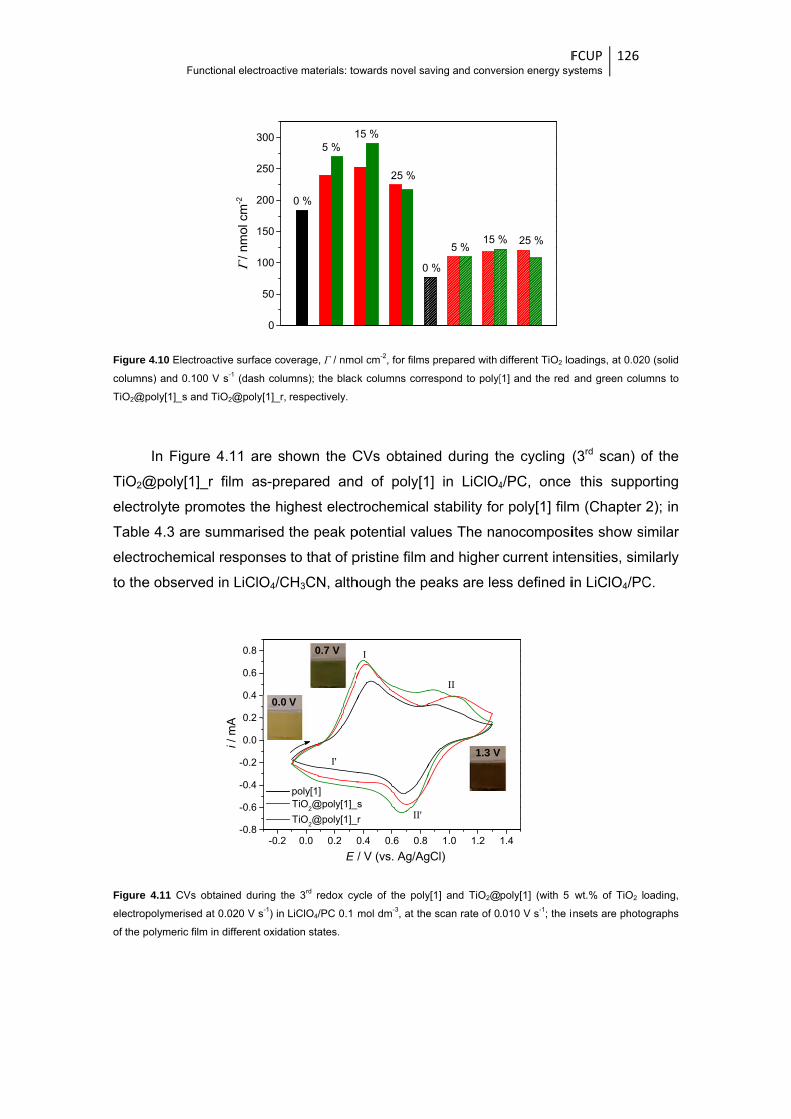
Figure
column
TiO2@
TiO2@
elect
Table
elect
to the
Figureelectro
of the
Functi
e 4.10 Electroac
ns) and 0.100 V
@poly[1]_s and T
In Figure
@poly[1]_r
trolyte prom
e 4.3 are su
trochemical
e observed
e 4.11 CVs obt
opolymerised at
polymeric film in
ional electroacti
ctive surface co
V s-1 (dash colu
TiO2@poly[1]_r,
4.11 are s
film as-pre
motes the hi
ummarised
responses
in LiClO4/C
tained during th
t 0.020 V s-1) in
n different oxida
0
50
100
150
200
250
300
Γ / n
mol
cm
-2
-0.2-0.8
-0.6
-0.4
-0.2
0.0
0.2
0.4
0.6
0.8
i / m
A
0.0
ive materials: to
verage, Γ / nmo
umns); the black
respectively.
hown the C
epared and
ghest elect
the peak p
to that of p
CH3CN, alth
he 3rd redox cy
LiClO4/PC 0.1 m
ation states.
1
0 %
5 %
0.0 0.2 0
I'
poly[1] TiO
2@poly[1]_s
TiO2@poly[1]_
E /
V
0.7 V
owards novel sa
ol cm-2, for films
k columns corre
CVs obtaine
d of poly[1
trochemical
potential val
pristine film
hough the pe
ycle of the poly
mol dm-3, at the
0
25 %
15 %
0.4 0.6 0.8
II'
I
s
r
/ V (vs. Ag/Ag
aving and conve
s prepared with
espond to poly[
ed during th
] in LiClO4
stability for
ues The na
and higher
eaks are les
y[1] and TiO2@
e scan rate of 0
15 %5 %
%
1.0 1.2
II
gCl)
1.3 V
Fersion energy sy
different TiO2 lo
[1] and the red
he cycling (
4/PC, once
r poly[1] film
anocomposi
current inte
ss defined i
poly[1] (with 5
.010 V s-1; the i
25 %%
1.4
FCUP ystems
126
oadings, at 0.02
and green colu
(3rd scan) o
this suppo
m (Chapter
ites show s
ensities, sim
in LiClO4/PC
wt.% of TiO2 l
nsets are photo
20 (solid
umns to
of the
orting
2); in
imilar
milarly
C.
oading,
ographs
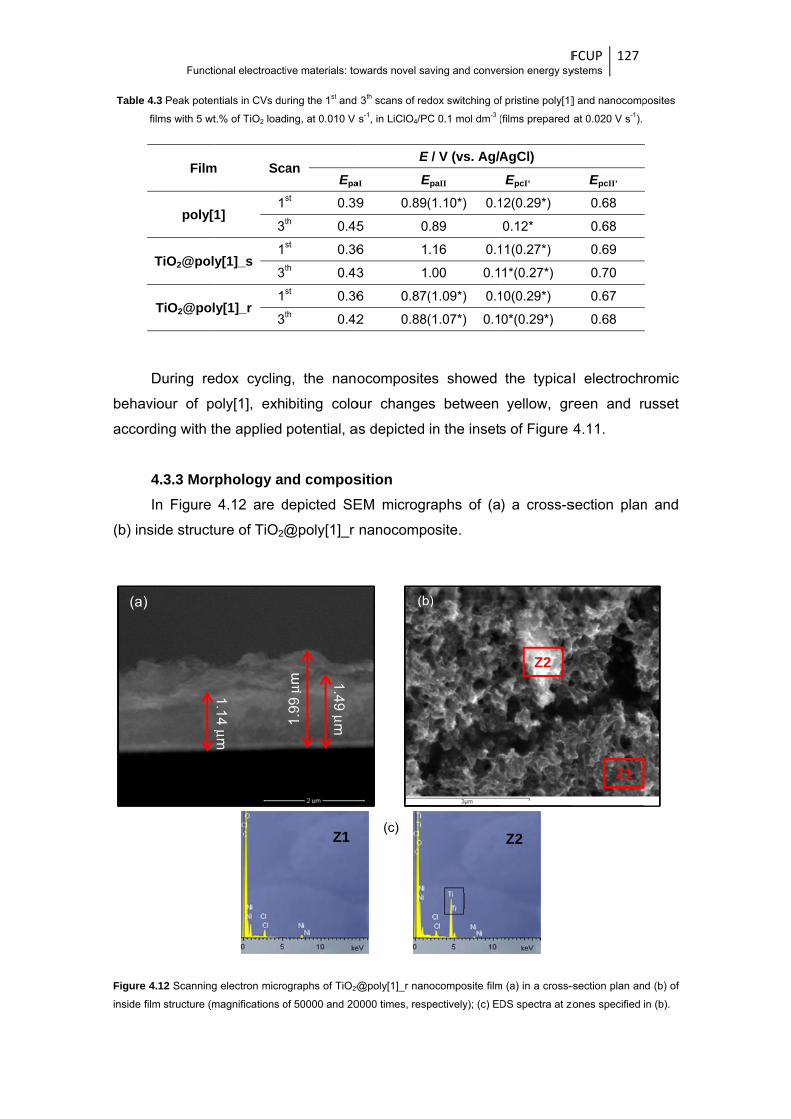
Table
beha
acco
(b) in
Figureinside
(a
Functi
e 4.3 Peak poten
films with 5 wt
Film
poly[
TiO2@pol
TiO2@pol
During re
aviour of p
ording with t
4.3.3 MorIn Figure
nside structu
e 4.12 Scanning
film structure (m
μ
)
ional electroacti
ntials in CVs du
t.% of TiO2 load
m Sca
1] 1s
3t
y[1]_s 1s
3t
ly[1]_r 1s
3t
edox cycling
oly[1], exh
the applied
rphology an4.12 are d
ure of TiO2@
g electron micro
magnifications o
1.14 μm
ive materials: to
uring the 1st and
ing, at 0.010 V
an Epa
st 0.39th 0.45st 0.36th 0.43st 0.36th 0.42
g, the nano
ibiting colo
potential, a
nd composdepicted SE
@poly[1]_r
ographs of TiO2@
of 50000 and 20
1.49 μm
1.99
μm
Z1
owards novel sa
3th scans of red
s-1, in LiClO4/PC
E
aI E9 0.89(
5 0
6 1
3 1
6 0.87(
2 0.88(
ocomposite
our changes
as depicted
sition EM microgr
nanocompo
@poly[1]_r nan
0000 times, resp
(c)
(b
aving and conve
dox switching of
C 0.1 mol dm-3 (
/ V (vs. Ag/A
EpaII (1.10*) 0.1
.89
.16 0.1
.00 0.1
(1.09*) 0.1
(1.07*) 0.1
es showed
s between
in the insets
raphs of (a
osite.
ocomposite film
pectively); (c) ED
)
Fersion energy sy
f pristine poly[1]
(films prepared
AgCl)
EpcI’ 12(0.29*)
0.12*
11(0.27*)
1*(0.27*)
10(0.29*)
0*(0.29*)
the typica
yellow, gr
s of Figure
) a cross-s
m (a) in a cross-
DS spectra at zo
Z2
Z2
FCUP ystems
127
] and nanocomp
at 0.020 V s-1).
EpcII’ 0.68
0.68
0.69
0.70
0.67
0.68
l electroch
reen and r
4.11.
section plan
-section plan an
zones specified
Z1
posites
romic
russet
n and
nd (b) of
in (b).
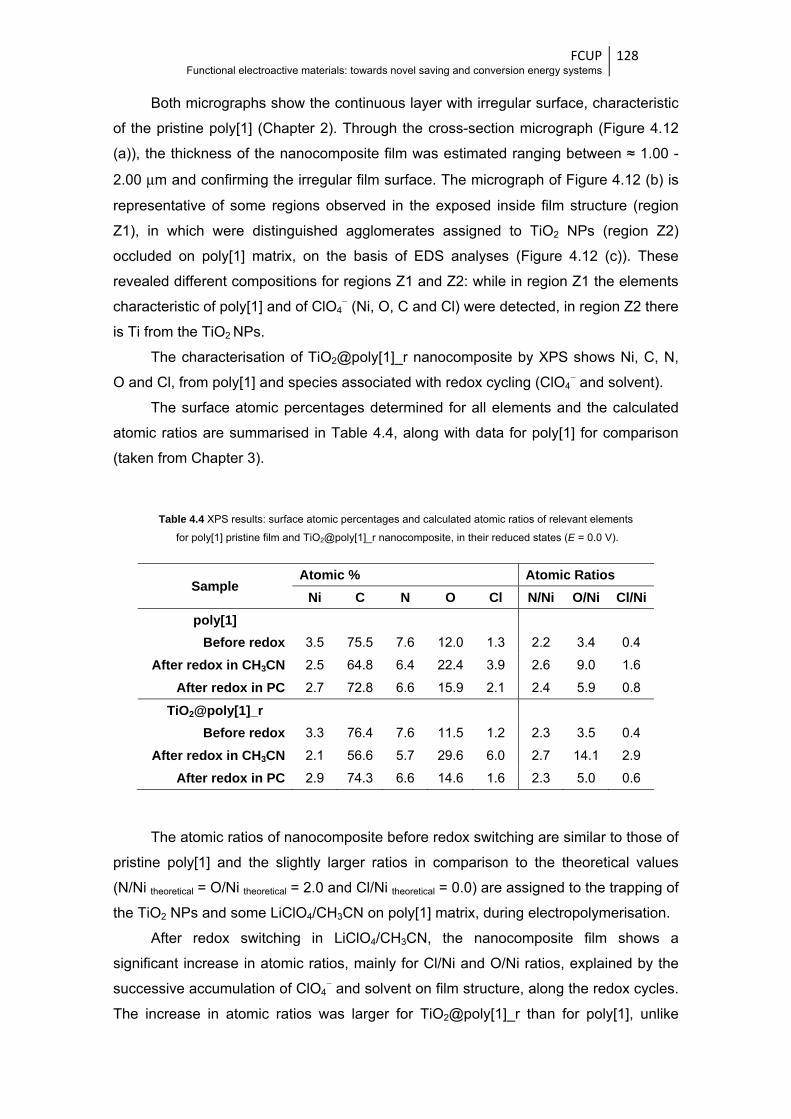
FCUP Functional electroactive materials: towards novel saving and conversion energy systems
128
Both micrographs show the continuous layer with irregular surface, characteristic
of the pristine poly[1] (Chapter 2). Through the cross-section micrograph (Figure 4.12
(a)), the thickness of the nanocomposite film was estimated ranging between ≈ 1.00 -
2.00 μm and confirming the irregular film surface. The micrograph of Figure 4.12 (b) is
representative of some regions observed in the exposed inside film structure (region
Z1), in which were distinguished agglomerates assigned to TiO2 NPs (region Z2)
occluded on poly[1] matrix, on the basis of EDS analyses (Figure 4.12 (c)). These
revealed different compositions for regions Z1 and Z2: while in region Z1 the elements
characteristic of poly[1] and of ClO4− (Ni, O, C and Cl) were detected, in region Z2 there
is Ti from the TiO2 NPs.
The characterisation of TiO2@poly[1]_r nanocomposite by XPS shows Ni, C, N,
O and Cl, from poly[1] and species associated with redox cycling (ClO4− and solvent).
The surface atomic percentages determined for all elements and the calculated
atomic ratios are summarised in Table 4.4, along with data for poly[1] for comparison
(taken from Chapter 3).
Table 4.4 XPS results: surface atomic percentages and calculated atomic ratios of relevant elements
for poly[1] pristine film and TiO2@poly[1]_r nanocomposite, in their reduced states (E = 0.0 V).
Sample Atomic % Atomic Ratios
Ni C N O Cl N/Ni O/Ni Cl/Ni poly[1]
Before redox 3.5 75.5 7.6 12.0 1.3 2.2 3.4 0.4
After redox in CH3CN 2.5 64.8 6.4 22.4 3.9 2.6 9.0 1.6
After redox in PC 2.7 72.8 6.6 15.9 2.1 2.4 5.9 0.8
TiO2@poly[1]_r
Before redox 3.3 76.4 7.6 11.5 1.2 2.3 3.5 0.4
After redox in CH3CN 2.1 56.6 5.7 29.6 6.0 2.7 14.1 2.9
After redox in PC 2.9 74.3 6.6 14.6 1.6 2.3 5.0 0.6
The atomic ratios of nanocomposite before redox switching are similar to those of
pristine poly[1] and the slightly larger ratios in comparison to the theoretical values
(N/Ni theoretical = O/Ni theoretical = 2.0 and Cl/Ni theoretical = 0.0) are assigned to the trapping of
the TiO2 NPs and some LiClO4/CH3CN on poly[1] matrix, during electropolymerisation.
After redox switching in LiClO4/CH3CN, the nanocomposite film shows a
significant increase in atomic ratios, mainly for Cl/Ni and O/Ni ratios, explained by the
successive accumulation of ClO4− and solvent on film structure, along the redox cycles.
The increase in atomic ratios was larger for TiO2@poly[1]_r than for poly[1], unlike

FCUP Functional electroactive materials: towards novel saving and conversion energy systems
129
what was observed for the nanocomposite between poly[1] and WO3 NPs (Chapter 3).
After redox switching in LiClO4/PC it was also observed an increase in atomic ratios,
which was similar for nanocomposite and pristine films.
The high-resolution XPS spectra obtained for both films before and after redox
switching in LiClO4/CH3CN and LiClO4/PC are shown in Figures from 4.13 to 4.17.
Figure 4.13 High-resolution XPS spectra of pristine poly[1] (taken from Chapter 3) and TiO2@poly[1]_r in C1s region,
with the corresponding deconvolutions, (a and a’) before and after redox switching in (b and b’) LiClO4/CH3CN and
(c and c’) LiClO4/PC.
C 1s
286.0
287.0290.0
284.6
286.0
287.0290.0
284.6
294 292 290 288 286 284 282
286.0
287.0
Binding Energy / eV
289.0
284.6
286.9
284.6
285.9
290.0
286.9
284.6
286.0
289.4
294 292 290 288 286 284 282
286.9
Binding Energy / eV
284.6
285.9
289.3
poly[1] TiO2@poly[1]_r
(a)
(b)
(c)
(a’)
(b’)
(c’)
C1s
Binding Energy / eV Binding Energy / eV
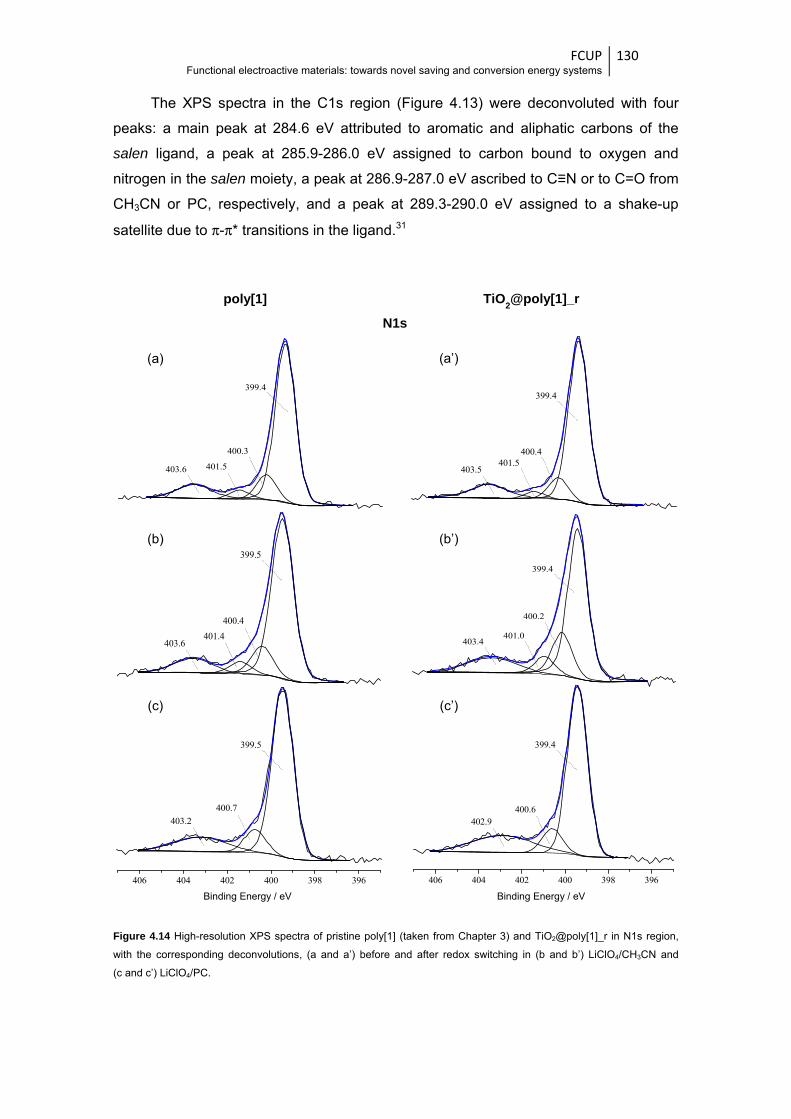
FCUP Functional electroactive materials: towards novel saving and conversion energy systems
130
The XPS spectra in the C1s region (Figure 4.13) were deconvoluted with four
peaks: a main peak at 284.6 eV attributed to aromatic and aliphatic carbons of the
salen ligand, a peak at 285.9-286.0 eV assigned to carbon bound to oxygen and
nitrogen in the salen moiety, a peak at 286.9-287.0 eV ascribed to C≡N or to C=O from
CH3CN or PC, respectively, and a peak at 289.3-290.0 eV assigned to a shake-up
satellite due to π-π* transitions in the ligand.31
Figure 4.14 High-resolution XPS spectra of pristine poly[1] (taken from Chapter 3) and TiO2@poly[1]_r in N1s region,
with the corresponding deconvolutions, (a and a’) before and after redox switching in (b and b’) LiClO4/CH3CN and
(c and c’) LiClO4/PC.
N 1s
400.3
401.5403.6
399.4
400.4401.4
403.6
399.5
406 404 402 400 398 396
400.7403.2
Binding Energy / eV
399.5
401.5400.4
403.5
399.4
401.0
400.2
403.4
399.4
406 404 402 400 398 396
400.6402.9
Binding Energy / eV
399.4
poly[1] TiO2@poly[1]_r
(a)
(b)
(c)
(a’)
(b’)
(c’)
N1s
Binding Energy / eV Binding Energy / eV
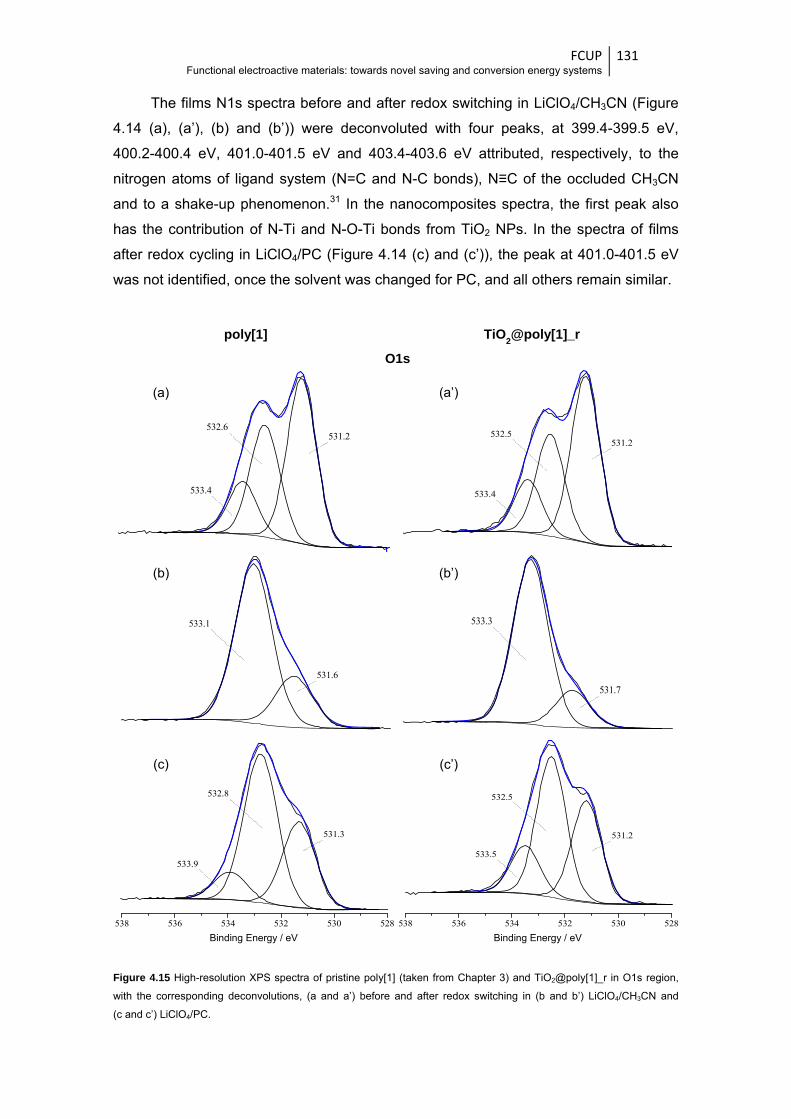
FCUP Functional electroactive materials: towards novel saving and conversion energy systems
131
The films N1s spectra before and after redox switching in LiClO4/CH3CN (Figure
4.14 (a), (a’), (b) and (b’)) were deconvoluted with four peaks, at 399.4-399.5 eV,
400.2-400.4 eV, 401.0-401.5 eV and 403.4-403.6 eV attributed, respectively, to the
nitrogen atoms of ligand system (N=C and N-C bonds), N≡C of the occluded CH3CN
and to a shake-up phenomenon.31 In the nanocomposites spectra, the first peak also
has the contribution of N-Ti and N-O-Ti bonds from TiO2 NPs. In the spectra of films
after redox cycling in LiClO4/PC (Figure 4.14 (c) and (c’)), the peak at 401.0-401.5 eV
was not identified, once the solvent was changed for PC, and all others remain similar.
Figure 4.15 High-resolution XPS spectra of pristine poly[1] (taken from Chapter 3) and TiO2@poly[1]_r in O1s region,
with the corresponding deconvolutions, (a and a’) before and after redox switching in (b and b’) LiClO4/CH3CN and
(c and c’) LiClO4/PC.
O 1s
532.6
533.4
531.2
533.1
531.6
538 536 534 532 530 528
532.8
533.9
Binding Energy / eV
531.3
532.5
533.4
531.2
533.3
531.7
538 536 534 532 530 528
Binding Energy / eV
532.5
533.5
531.2
poly[1] TiO2@poly[1]_r
(a)
(b)
(c)
(a’)
(b’)
(c’)
O1s
Binding Energy / eV Binding Energy / eV
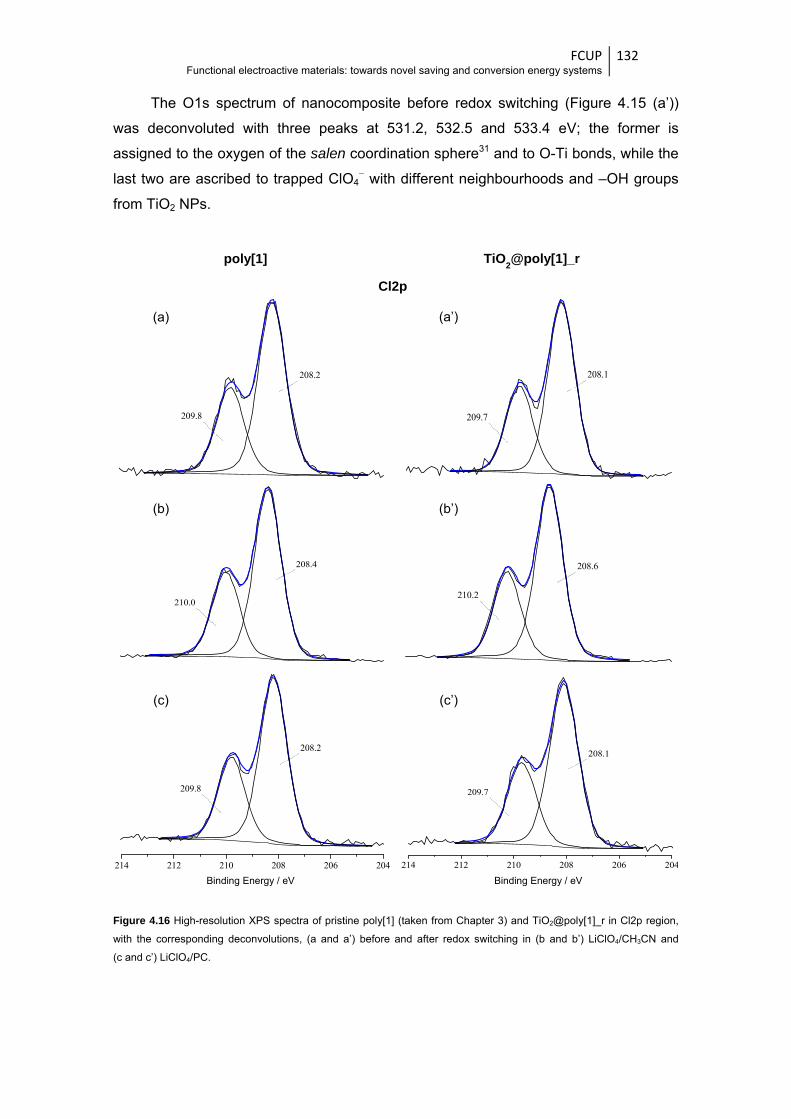
FCUP Functional electroactive materials: towards novel saving and conversion energy systems
132
The O1s spectrum of nanocomposite before redox switching (Figure 4.15 (a’))
was deconvoluted with three peaks at 531.2, 532.5 and 533.4 eV; the former is
assigned to the oxygen of the salen coordination sphere31 and to O-Ti bonds, while the
last two are ascribed to trapped ClO4− with different neighbourhoods and –OH groups
from TiO2 NPs.
Figure 4.16 High-resolution XPS spectra of pristine poly[1] (taken from Chapter 3) and TiO2@poly[1]_r in Cl2p region,
with the corresponding deconvolutions, (a and a’) before and after redox switching in (b and b’) LiClO4/CH3CN and
(c and c’) LiClO4/PC.
Cl 2p
209.8
208.2
210.0
208.4
214 212 210 208 206 204
209.8
Binding Energy / eV
208.2
209.7
208.1
210.2
208.6
214 212 210 208 206 204
209.7
Binding Energy / eV
208.1
poly[1] TiO2@poly[1]_r
(a)
(b)
(c)
(a’)
(b’)
(c’)
Cl2p
Binding Energy / eV Binding Energy / eV

FCUP Functional electroactive materials: towards novel saving and conversion energy systems
133
In the O1s spectrum of nanocomposite after redox switching in LiClO4/CH3CN
(Figure 4.15 (b’)), it is observed a peak at 531.7 eV (O of salen coordination sphere
and O-Ti), along with a large peak at 533.3 eV ascribed to –OH groups from TiO2 and
to higher amounts of ClO4−, trapped in polymeric film as charge compensation anion.
For the nanocomposite after redox cycling in LiClO4/PC (Figure 4.15 (c’)), beyond the
two peaks at 531.2 and 532.5 eV (similarly to the redox in LiClO4/CH3CN), it is
observed an additional peak at 533.5eV, assigned to O-C bonds in occluded PC (as in
Chapter 3).
Figure 4.17 High-resolution XPS spectra of pristine poly[1] (taken from Chapter 3) and TiO2@poly[1]_r in Ni2p region,
with the corresponding deconvolutions, (a and a’) before and after redox switching in (b and b’) LiClO4/CH3CN and
(c and c’) LiClO4/PC.
Ni 2p
872.4
855.2
860.5877.7
872.5
855.4
860.5877.7
884 880 876 872 868 864 860 856 852 848
872.4
Binding Energy / eV
855.2
860.1877.3
872.4
855.2
860.5877.7
872.6
855.4
860.7877.8
884 880 876 872 868 864 860 856 852 848
872.4
Binding Energy / eV
855.2
860.3877.5
poly[1] TiO2@poly[1]_r
(a)
(b)
(c)
(a’)
(b’)
(c’)
Ni2p
Binding Energy / eV Binding Energy / eV
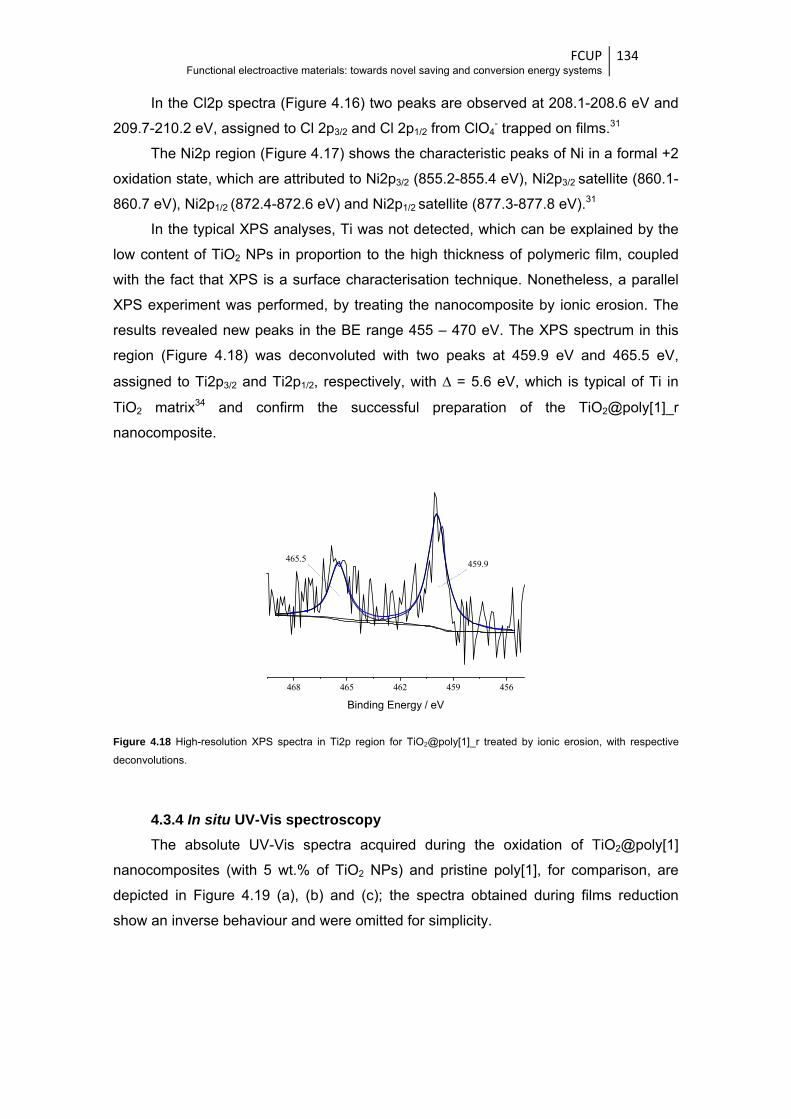
FCUP Functional electroactive materials: towards novel saving and conversion energy systems
134
In the Cl2p spectra (Figure 4.16) two peaks are observed at 208.1-208.6 eV and
209.7-210.2 eV, assigned to Cl 2p3/2 and Cl 2p1/2 from ClO4- trapped on films.31
The Ni2p region (Figure 4.17) shows the characteristic peaks of Ni in a formal +2
oxidation state, which are attributed to Ni2p3/2 (855.2-855.4 eV), Ni2p3/2 satellite (860.1-
860.7 eV), Ni2p1/2 (872.4-872.6 eV) and Ni2p1/2 satellite (877.3-877.8 eV).31
In the typical XPS analyses, Ti was not detected, which can be explained by the
low content of TiO2 NPs in proportion to the high thickness of polymeric film, coupled
with the fact that XPS is a surface characterisation technique. Nonetheless, a parallel
XPS experiment was performed, by treating the nanocomposite by ionic erosion. The
results revealed new peaks in the BE range 455 – 470 eV. The XPS spectrum in this
region (Figure 4.18) was deconvoluted with two peaks at 459.9 eV and 465.5 eV,
assigned to Ti2p3/2 and Ti2p1/2, respectively, with Δ = 5.6 eV, which is typical of Ti in
TiO2 matrix34 and confirm the successful preparation of the TiO2@poly[1]_r
nanocomposite.
Figure 4.18 High-resolution XPS spectra in Ti2p region for TiO2@poly[1]_r treated by ionic erosion, with respective
deconvolutions.
4.3.4 In situ UV-Vis spectroscopy The absolute UV-Vis spectra acquired during the oxidation of TiO2@poly[1]
nanocomposites (with 5 wt.% of TiO2 NPs) and pristine poly[1], for comparison, are
depicted in Figure 4.19 (a), (b) and (c); the spectra obtained during films reduction
show an inverse behaviour and were omitted for simplicity.
468 465 462 459 456
465.5
Binding Energy / eV
459.9

FCUP Functional electroactive materials: towards novel saving and conversion energy systems
135
Figure 4.19 Panel A: Absolute UV-Vis spectra of (a) poly[1] (Γ = 95.3 nmol cm-2), (b) TiO2@poly[1]_s and
(c) TiO2@poly[1]_r (prepared with 5 wt.% of TiO2 NPs at 0.020 V s-1, Γ = 104.2-107.7 nmol cm-2) acquired during films
oxidation in 0.1 mol dm-3 LiClO4/PC (referenced to the electrolyte spectrum). Panel B: Abs vs. E plots for the electronic
bands identified in absolute UV-Vis spectra, referenced to the spectra at E = -0.1 V (arrows indicate scan direction).
Both nanocomposites spectra show four electronic bands, likewise the spectra of
the poly[1] film. In Figure 4.20 are shown the differential spectra, in which responses at
selected potentials were used as reference, allowing an easy view of the electronic
bands dependence with the potential. These spectra, as well as the absorbance vs.
potential (Abs vs. E) profiles at selected wavelengths (Figure 4.19 (a’), (b’) and (c’)),
indicated that the nanocomposites present three main band profiles, such as the
pristine film and similar to other poly[M(salen)] films:31,32 (i) a band at lower
wavelengths (λ = 327 nm) whose intensities decrease monotonically with increasing
0.2
0.4
0.6
0.8
1.0
1.2
spectrum at -0.1 V spectrum at 1.3 V
Abs
-0.6
-0.4
-0.2
0.0
0.2
0.4
0.6A
bs
λ = 327 nm λ = 398 nm λ = 509 nm λ = 850 nm
0.4
0.6
0.8
1.0
1.2 spectrum at -0.1 V spectrum at 1.3 V
Abs
-0.6
-0.4
-0.2
0.0
0.2
0.4
0.6
Abs
λ = 327 nm λ = 396 nm λ = 505 nm λ = 839 nm
450 600 750 900
0.2
0.4
0.6
0.8
1.0
1.2
1.4 spectrum at -0.1 V spectrum at 1.3 V
Abs
λ / nm
0.0 0.3 0.6 0.9 1.2
-0.6
-0.4
-0.2
0.0
0.2
0.4
0.6
E / V (vs. Ag/AgCl)
Abs
λ = 327 nm λ = 397 nm λ = 506 nm λ = 840 nm
Panel A Panel B
(a)
(b)
(c)
(a’)
(b’)
(c’)
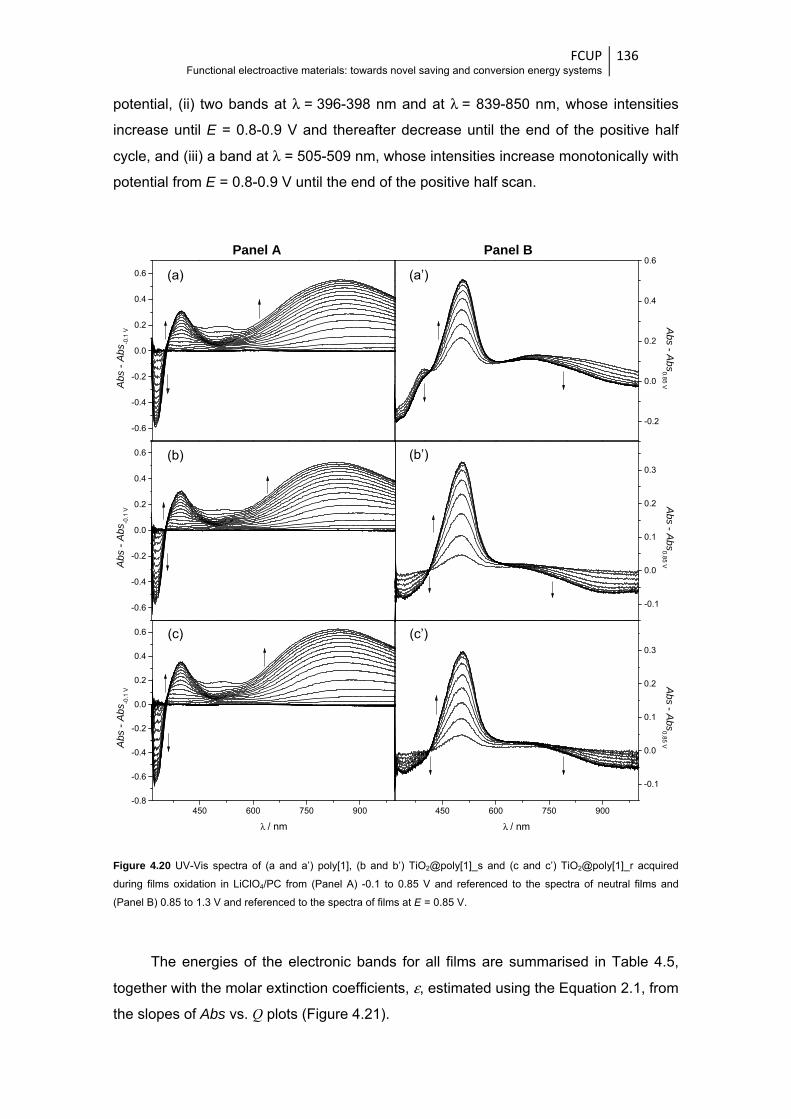
FCUP Functional electroactive materials: towards novel saving and conversion energy systems
136
potential, (ii) two bands at λ = 396-398 nm and at λ = 839-850 nm, whose intensities
increase until E = 0.8-0.9 V and thereafter decrease until the end of the positive half
cycle, and (iii) a band at λ = 505-509 nm, whose intensities increase monotonically with
potential from E = 0.8-0.9 V until the end of the positive half scan.
Figure 4.20 UV-Vis spectra of (a and a’) poly[1], (b and b’) TiO2@poly[1]_s and (c and c’) TiO2@poly[1]_r acquired
during films oxidation in LiClO4/PC from (Panel A) -0.1 to 0.85 V and referenced to the spectra of neutral films and
(Panel B) 0.85 to 1.3 V and referenced to the spectra of films at E = 0.85 V.
The energies of the electronic bands for all films are summarised in Table 4.5,
together with the molar extinction coefficients, ε, estimated using the Equation 2.1, from
the slopes of Abs vs. Q plots (Figure 4.21).
Panel A Panel B
(a)
(b)
(c)
(a’)
(b’)
(c’)
-0.6
-0.4
-0.2
0.0
0.2
0.4
0.6
Abs
- A
bs-0
.1 V
-0.2
0.0
0.2
0.4
0.6
Abs
- Abs
0.85 V
-0.6
-0.4
-0.2
0.0
0.2
0.4
0.6
Abs
- A
bs-0
.1 V
-0.1
0.0
0.1
0.2
0.3
Abs
- Abs
0.85 V
450 600 750 900-0.8
-0.6
-0.4
-0.2
0.0
0.2
0.4
0.6
Abs
- A
bs-0
.1 V
λ / nm
450 600 750 900
-0.1
0.0
0.1
0.2
0.3
Abs - A
bs0
.85 V
λ / nm

FCUP Functional electroactive materials: towards novel saving and conversion energy systems
137
Table 4.5 Wavelengths of the electronic bands and respective energies and molar extinction coefficients (ε)
for poly[1] and TiO2@poly[1] nanocomposites (prepared with 5 wt.% of TiO2 NPs at 0.020 V s-1).
Film λ / nm (eV) ε × 10-3 / mol-1 dm3 cm-1
poly[1]
327 (3.80) 6.80
398 (3.12) 3.78
509 (2.44) 12.19 850 (1.46) 6.44
TiO2@poly[1]_s
327 (3.80) 6.81
396 (3.14) 3.57
505 (2.46) 11.75 839 (1.48) 6.12
TiO2@poly[1]_r
327 (3.80) 7.24
397 (3.13) 3.96
506 (2.45) 10.21 840 (1.48) 6.68
The ε-values obtained for nanocomposites are typical of electronic transitions
between states with large contribution from ligand, which is consistent with the ligand-
based film oxidation, as proposed for poly[1] (Chapter 2) and other similar
poly[Ni(salen)] films.31,32 Using the polaronic model31,32 and considering that electronic
bands with similar Abs vs. E profiles are associated with the same charge carriers, the
follow band assignment can be made: (i) the band at λ = 327 nm is attributed to the
intervalence transition (band gap, Eg = 3.80 eV), (ii) the band at λ = 396-397 nm (3.14-
3.13 eV) is assigned to transitions from the valence band to the antibonding polaron
level and (iii) the band at λ = 839-840 nm (1.48 eV) corresponds to transitions from the
valence band to the bonding polaron level (or between polaron levels). The band at
λ = 505-509 nm (2.44-2.46 eV), with their different Abs vs. E profiles, is attributed to
charge transfer (CT) transitions between the metal and the oxidised ligand.31,32
Furthermore, the bands observed in spectra of nanocomposites and pristine films
have similar energies, which indicate that the electronic structure of poly[1] was not
changed by the incorporation of TiO2 NPs.
The ε-values for the nanocomposites electronic bands are also similar to those of
the pristine film, except for the band assigned to CT transitions at λ = 505-506 nm
(2.44-2.46 eV). For this band, the ε-value decreases significantly from the pristine to
the nanocomposites films. For TiO2@poly[1]_s nanocomposite, the ε-value decreases
3.6 % (ε = 11.75 x 10⁻³ vs. 12.19 x 10⁻³ mol-1 dm3 cm-1), being more significant -
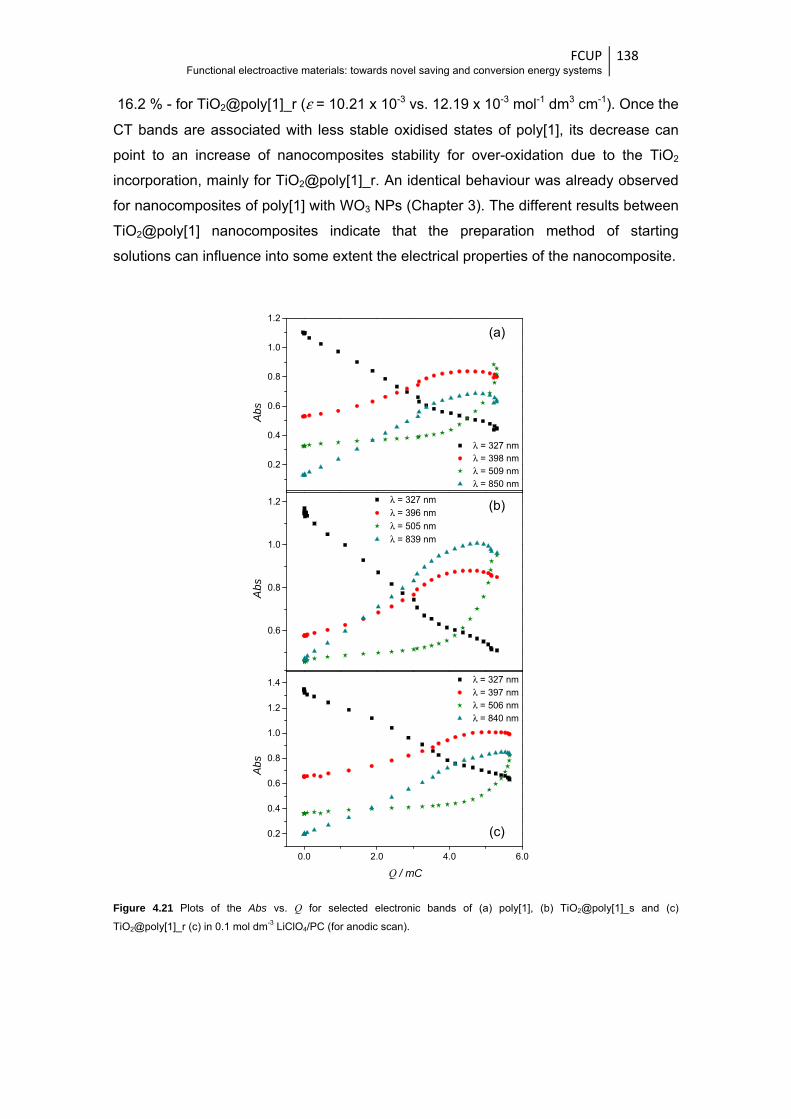
FCUP Functional electroactive materials: towards novel saving and conversion energy systems
138
16.2 % - for TiO2@poly[1]_r (ε = 10.21 x 10⁻³ vs. 12.19 x 10⁻³ mol-1 dm3 cm-1). Once the
CT bands are associated with less stable oxidised states of poly[1], its decrease can
point to an increase of nanocomposites stability for over-oxidation due to the TiO2
incorporation, mainly for TiO2@poly[1]_r. An identical behaviour was already observed
for nanocomposites of poly[1] with WO3 NPs (Chapter 3). The different results between
TiO2@poly[1] nanocomposites indicate that the preparation method of starting
solutions can influence into some extent the electrical properties of the nanocomposite.
Figure 4.21 Plots of the Abs vs. Q for selected electronic bands of (a) poly[1], (b) TiO2@poly[1]_s and (c)
TiO2@poly[1]_r (c) in 0.1 mol dm-3 LiClO4/PC (for anodic scan).
(a)
(b)
(c)
0.2
0.4
0.6
0.8
1.0
1.2
Abs
λ = 327 nm λ = 398 nm λ = 509 nm λ = 850 nm
0.6
0.8
1.0
1.2
Abs
λ = 327 nm λ = 396 nm λ = 505 nm λ = 839 nm
0.0 2.0 4.0 6.0
0.2
0.4
0.6
0.8
1.0
1.2
1.4
Abs
λ = 327 nm λ = 397 nm λ = 506 nm λ = 840 nm
Q / mC
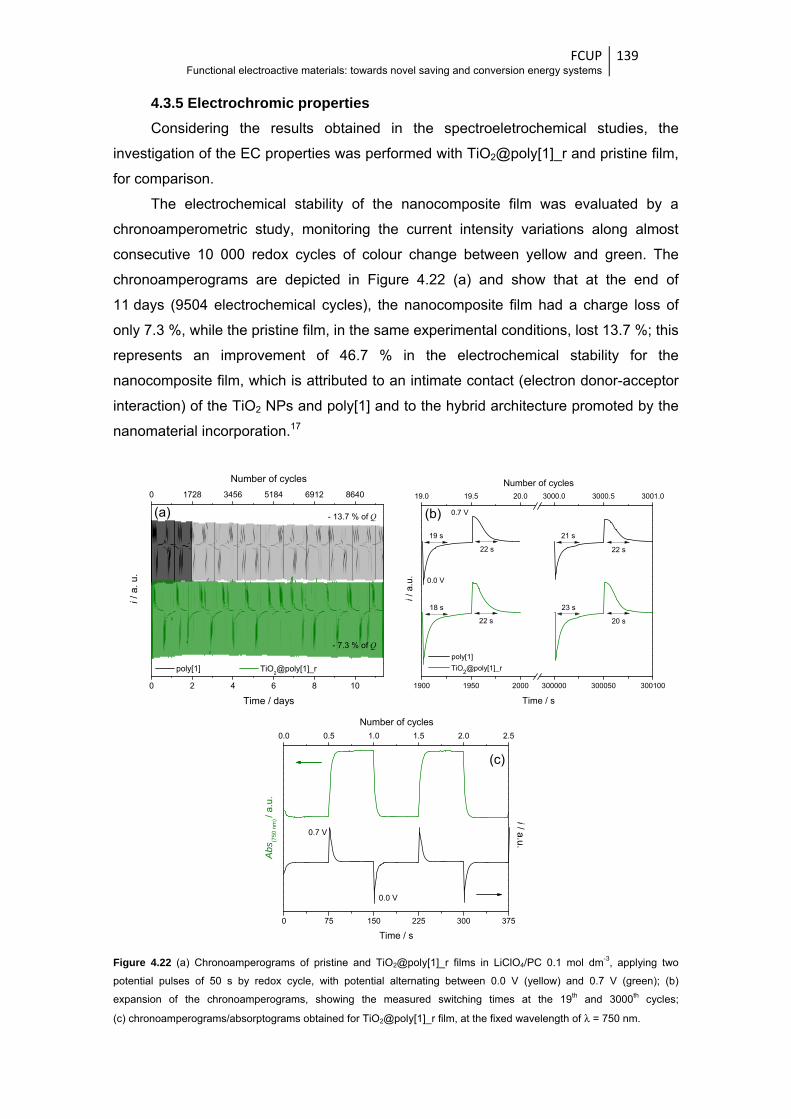
FCUP Functional electroactive materials: towards novel saving and conversion energy systems
139
4.3.5 Electrochromic properties Considering the results obtained in the spectroeletrochemical studies, the
investigation of the EC properties was performed with TiO2@poly[1]_r and pristine film,
for comparison.
The electrochemical stability of the nanocomposite film was evaluated by a
chronoamperometric study, monitoring the current intensity variations along almost
consecutive 10 000 redox cycles of colour change between yellow and green. The
chronoamperograms are depicted in Figure 4.22 (a) and show that at the end of
11 days (9504 electrochemical cycles), the nanocomposite film had a charge loss of
only 7.3 %, while the pristine film, in the same experimental conditions, lost 13.7 %; this
represents an improvement of 46.7 % in the electrochemical stability for the
nanocomposite film, which is attributed to an intimate contact (electron donor-acceptor
interaction) of the TiO2 NPs and poly[1] and to the hybrid architecture promoted by the
nanomaterial incorporation.17
Figure 4.22 (a) Chronoamperograms of pristine and TiO2@poly[1]_r films in LiClO4/PC 0.1 mol dm-3, applying two
potential pulses of 50 s by redox cycle, with potential alternating between 0.0 V (yellow) and 0.7 V (green); (b)
expansion of the chronoamperograms, showing the measured switching times at the 19th and 3000th cycles;
(c) chronoamperograms/absorptograms obtained for TiO2@poly[1]_r film, at the fixed wavelength of λ = 750 nm.
0 2 4 6 8 10
0 1728 3456 5184 6912 8640
TiO2@poly[1]_r poly[1]
Number of cycles
Time / days
i / a
. u.
- 13.7 % of Q
- 7.3 % of Q
1900 1950 2000 300000 300050 300100
19.0 19.5 20.0 3000.0 3000.5 3001.0
0.0 V
21 s
22 s
19 s
22 s
20 s
23 s18 s
Number of cycles
poly[1]
TiO2@poly[1]_r
i /
a.u
.
Time / s
22 s
0.7 V
0 75 150 225 300 375
0.0 0.5 1.0 1.5 2.0 2.5
0.0 V
Abs
(750
nm
) / a
.u.
Number of cycles
Time / s
0.7 V
i/ a.u.
(a) (b)
(c)
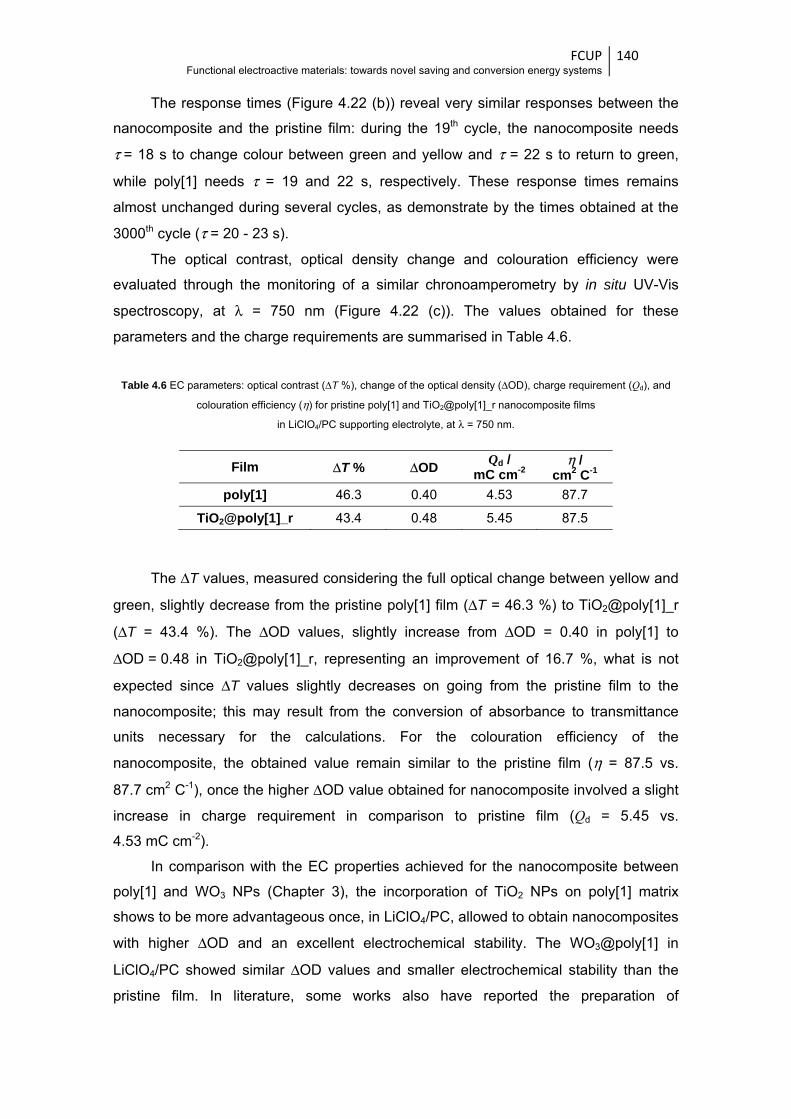
FCUP Functional electroactive materials: towards novel saving and conversion energy systems
140
The response times (Figure 4.22 (b)) reveal very similar responses between the
nanocomposite and the pristine film: during the 19th cycle, the nanocomposite needs
τ = 18 s to change colour between green and yellow and τ = 22 s to return to green,
while poly[1] needs τ = 19 and 22 s, respectively. These response times remains
almost unchanged during several cycles, as demonstrate by the times obtained at the
3000th cycle (τ = 20 - 23 s).
The optical contrast, optical density change and colouration efficiency were
evaluated through the monitoring of a similar chronoamperometry by in situ UV-Vis
spectroscopy, at λ = 750 nm (Figure 4.22 (c)). The values obtained for these
parameters and the charge requirements are summarised in Table 4.6.
Table 4.6 EC parameters: optical contrast (ΔT %), change of the optical density (ΔOD), charge requirement (Qd), and
colouration efficiency (η) for pristine poly[1] and TiO2@poly[1]_r nanocomposite films
in LiClO4/PC supporting electrolyte, at λ = 750 nm.
Film ΔT % ΔOD Qd / mC cm-2
η / cm2 C-1
poly[1] 46.3 0.40 4.53 87.7
TiO2@poly[1]_r 43.4 0.48 5.45 87.5
The ΔT values, measured considering the full optical change between yellow and
green, slightly decrease from the pristine poly[1] film (ΔT = 46.3 %) to TiO2@poly[1]_r
(ΔT = 43.4 %). The ΔOD values, slightly increase from ΔOD = 0.40 in poly[1] to
ΔOD = 0.48 in TiO2@poly[1]_r, representing an improvement of 16.7 %, what is not
expected since ΔT values slightly decreases on going from the pristine film to the
nanocomposite; this may result from the conversion of absorbance to transmittance
units necessary for the calculations. For the colouration efficiency of the
nanocomposite, the obtained value remain similar to the pristine film (η = 87.5 vs.
87.7 cm2 C-1), once the higher ΔOD value obtained for nanocomposite involved a slight
increase in charge requirement in comparison to pristine film (Qd = 5.45 vs.
4.53 mC cm-2).
In comparison with the EC properties achieved for the nanocomposite between
poly[1] and WO3 NPs (Chapter 3), the incorporation of TiO2 NPs on poly[1] matrix
shows to be more advantageous once, in LiClO4/PC, allowed to obtain nanocomposites
with higher ΔOD and an excellent electrochemical stability. The WO3@poly[1] in
LiClO4/PC showed similar ΔOD values and smaller electrochemical stability than the
pristine film. In literature, some works also have reported the preparation of
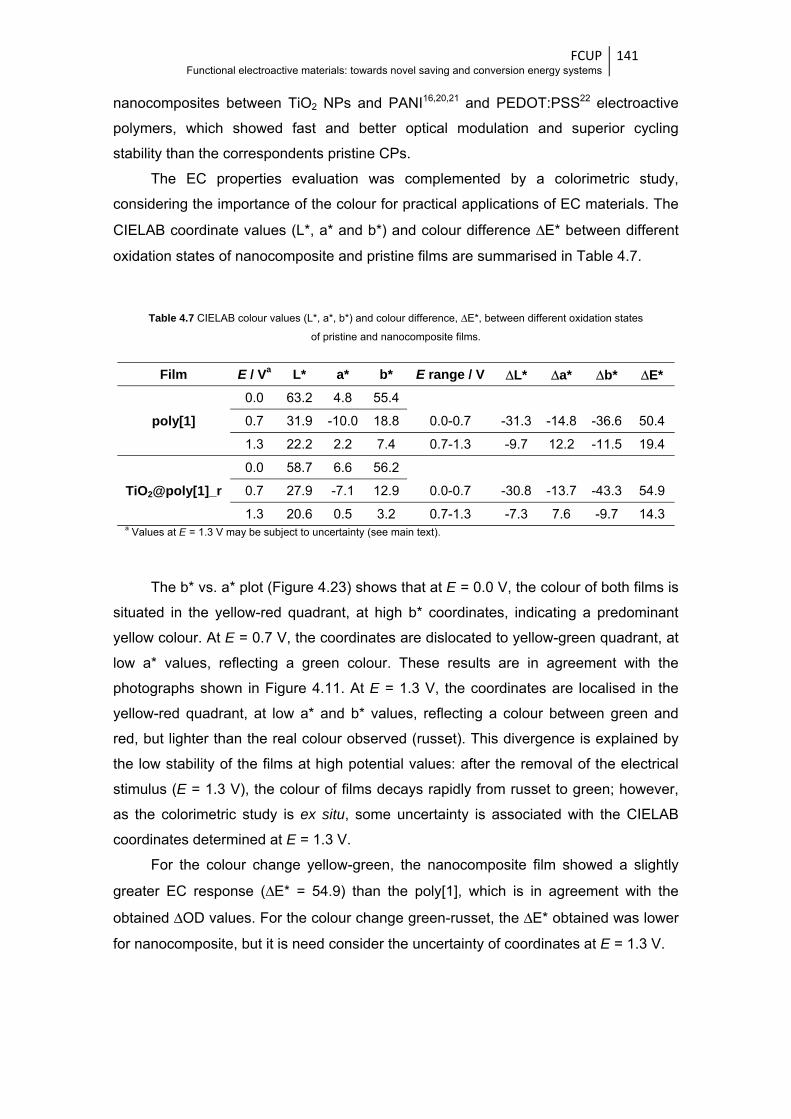
FCUP Functional electroactive materials: towards novel saving and conversion energy systems
141
nanocomposites between TiO2 NPs and PANI16,20,21 and PEDOT:PSS22 electroactive
polymers, which showed fast and better optical modulation and superior cycling
stability than the correspondents pristine CPs.
The EC properties evaluation was complemented by a colorimetric study,
considering the importance of the colour for practical applications of EC materials. The
CIELAB coordinate values (L*, a* and b*) and colour difference ΔE* between different
oxidation states of nanocomposite and pristine films are summarised in Table 4.7.
Table 4.7 CIELAB colour values (L*, a*, b*) and colour difference, ΔE*, between different oxidation states
of pristine and nanocomposite films.
Film E / Va L* a* b* E range / V ΔL* Δa* Δb* ΔE*
poly[1]
0.0 63.2 4.8 55.4
0.7 31.9 -10.0 18.8 0.0-0.7 -31.3 -14.8 -36.6 50.4
1.3 22.2 2.2 7.4 0.7-1.3 -9.7 12.2 -11.5 19.4
TiO2@poly[1]_r
0.0 58.7 6.6 56.2
0.7 27.9 -7.1 12.9 0.0-0.7 -30.8 -13.7 -43.3 54.9
1.3 20.6 0.5 3.2 0.7-1.3 -7.3 7.6 -9.7 14.3 a Values at E = 1.3 V may be subject to uncertainty (see main text).
The b* vs. a* plot (Figure 4.23) shows that at E = 0.0 V, the colour of both films is
situated in the yellow-red quadrant, at high b* coordinates, indicating a predominant
yellow colour. At E = 0.7 V, the coordinates are dislocated to yellow-green quadrant, at
low a* values, reflecting a green colour. These results are in agreement with the
photographs shown in Figure 4.11. At E = 1.3 V, the coordinates are localised in the
yellow-red quadrant, at low a* and b* values, reflecting a colour between green and
red, but lighter than the real colour observed (russet). This divergence is explained by
the low stability of the films at high potential values: after the removal of the electrical
stimulus (E = 1.3 V), the colour of films decays rapidly from russet to green; however,
as the colorimetric study is ex situ, some uncertainty is associated with the CIELAB
coordinates determined at E = 1.3 V.
For the colour change yellow-green, the nanocomposite film showed a slightly
greater EC response (ΔE* = 54.9) than the poly[1], which is in agreement with the
obtained ΔOD values. For the colour change green-russet, the ΔE* obtained was lower
for nanocomposite, but it is need consider the uncertainty of coordinates at E = 1.3 V.

FCUP Functional electroactive materials: towards novel saving and conversion energy systems
142
Figure 4.23 Graph of the CIELAB colour values (a*, b*) of pristine (symbol ) and nanocomposite TiO2@poly[1]_r
(symbol ) films, at different oxidation states: E = 0.0 V (yellow), E = 0.7 V (green) and E = 1.3 V (russet).
4.4 Conclusions The results showed that the poly[1] was successfully electropolymerised in the
presence of TiO2 NPs, previously prepared and characterised by XRD, TEM and XPS.
The NPs have a spherical shape with 9.7 ± 1.1 nm and are composed by anatase and
brookite phases (65.5 vs. 34.5 %).
The CVs of the nanocomposites have similar electrochemical profiles to those of
pristine film, but higher electroactive areas and electroactive surface coverages, which
appoint the advantage of the polymeric nanocomposites assemble. Moreover, the
increase of Γ is most significance for nanocomposite films electropolymerised at
0.020 mV s-1 and rise for TiO2 loadings of 5 and 15 wt.%, decreasing for the loading of
25 wt.%, which indicates an optimal loading from which higher TiO2 contents can
hinder the poly[1] electrodeposition. The incorporation of the TiO2 NPs on poly[1] matrix
was confirmed by SEM and XPS. Furthermore, the XPS data revealed a superior
accumulation of supporting electrolyte along the successive redox cycles for the
nanocomposite film. The UV-Vis spectra show similar electron band profiles and
energies between the pristine and the nanocomposites films, but lower ε-values were
determined for the CT band of nanocomposites, indicating higher stability for ligand
oxidation.
The TiO2@poly[1]_r nanocomposite showed an excellent electrochemical
stability, with a charge loss of 7.3 % after ≈ 10 000 redox cycles, which represents an
improvement of 46.7 % in comparison to pristine film. The ΔOD also showed an
increase of 16.7 % for nanocomposite film. These results clearly show the advantage
-12 -8 -4 0 4 8 12
-60
-40
-20
0
20
40
60
1.3 V0.7 V
+a*(Red)
-a*(Green)
-b*(Blue)
b*
a*
+b*(Yellow) 0.0 V

FCUP Functional electroactive materials: towards novel saving and conversion energy systems
143
of the preparation of the nanocomposite in the pursue for a solution to improve the EC
properties of the pristine poly[1].
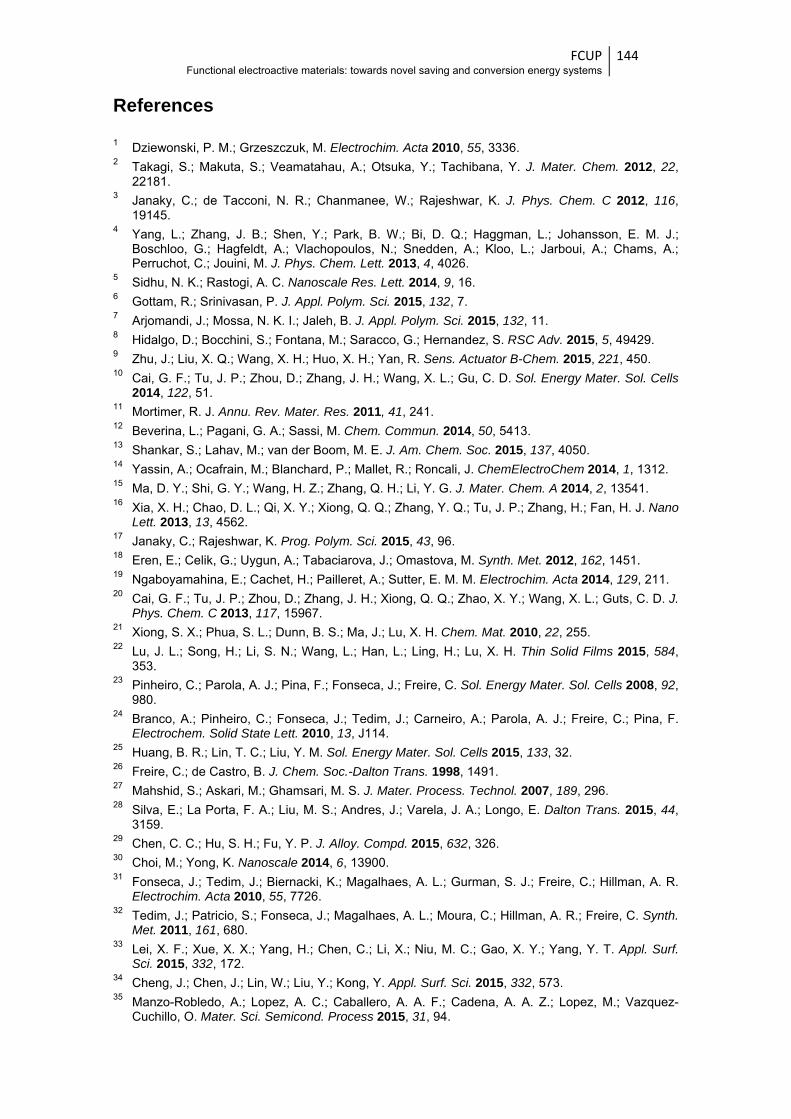
FCUP Functional electroactive materials: towards novel saving and conversion energy systems
144
References
1 Dziewonski, P. M.; Grzeszczuk, M. Electrochim. Acta 2010, 55, 3336. 2 Takagi, S.; Makuta, S.; Veamatahau, A.; Otsuka, Y.; Tachibana, Y. J. Mater. Chem. 2012, 22,
22181. 3 Janaky, C.; de Tacconi, N. R.; Chanmanee, W.; Rajeshwar, K. J. Phys. Chem. C 2012, 116,
19145. 4 Yang, L.; Zhang, J. B.; Shen, Y.; Park, B. W.; Bi, D. Q.; Haggman, L.; Johansson, E. M. J.;
Boschloo, G.; Hagfeldt, A.; Vlachopoulos, N.; Snedden, A.; Kloo, L.; Jarboui, A.; Chams, A.; Perruchot, C.; Jouini, M. J. Phys. Chem. Lett. 2013, 4, 4026.
5 Sidhu, N. K.; Rastogi, A. C. Nanoscale Res. Lett. 2014, 9, 16. 6 Gottam, R.; Srinivasan, P. J. Appl. Polym. Sci. 2015, 132, 7. 7 Arjomandi, J.; Mossa, N. K. I.; Jaleh, B. J. Appl. Polym. Sci. 2015, 132, 11. 8 Hidalgo, D.; Bocchini, S.; Fontana, M.; Saracco, G.; Hernandez, S. RSC Adv. 2015, 5, 49429. 9 Zhu, J.; Liu, X. Q.; Wang, X. H.; Huo, X. H.; Yan, R. Sens. Actuator B-Chem. 2015, 221, 450. 10 Cai, G. F.; Tu, J. P.; Zhou, D.; Zhang, J. H.; Wang, X. L.; Gu, C. D. Sol. Energy Mater. Sol. Cells
2014, 122, 51. 11 Mortimer, R. J. Annu. Rev. Mater. Res. 2011, 41, 241. 12 Beverina, L.; Pagani, G. A.; Sassi, M. Chem. Commun. 2014, 50, 5413. 13 Shankar, S.; Lahav, M.; van der Boom, M. E. J. Am. Chem. Soc. 2015, 137, 4050. 14 Yassin, A.; Ocafrain, M.; Blanchard, P.; Mallet, R.; Roncali, J. ChemElectroChem 2014, 1, 1312. 15 Ma, D. Y.; Shi, G. Y.; Wang, H. Z.; Zhang, Q. H.; Li, Y. G. J. Mater. Chem. A 2014, 2, 13541. 16 Xia, X. H.; Chao, D. L.; Qi, X. Y.; Xiong, Q. Q.; Zhang, Y. Q.; Tu, J. P.; Zhang, H.; Fan, H. J. Nano
Lett. 2013, 13, 4562. 17 Janaky, C.; Rajeshwar, K. Prog. Polym. Sci. 2015, 43, 96. 18 Eren, E.; Celik, G.; Uygun, A.; Tabaciarova, J.; Omastova, M. Synth. Met. 2012, 162, 1451. 19 Ngaboyamahina, E.; Cachet, H.; Pailleret, A.; Sutter, E. M. M. Electrochim. Acta 2014, 129, 211. 20 Cai, G. F.; Tu, J. P.; Zhou, D.; Zhang, J. H.; Xiong, Q. Q.; Zhao, X. Y.; Wang, X. L.; Guts, C. D. J.
Phys. Chem. C 2013, 117, 15967. 21 Xiong, S. X.; Phua, S. L.; Dunn, B. S.; Ma, J.; Lu, X. H. Chem. Mat. 2010, 22, 255. 22 Lu, J. L.; Song, H.; Li, S. N.; Wang, L.; Han, L.; Ling, H.; Lu, X. H. Thin Solid Films 2015, 584,
353. 23 Pinheiro, C.; Parola, A. J.; Pina, F.; Fonseca, J.; Freire, C. Sol. Energy Mater. Sol. Cells 2008, 92,
980. 24 Branco, A.; Pinheiro, C.; Fonseca, J.; Tedim, J.; Carneiro, A.; Parola, A. J.; Freire, C.; Pina, F.
Electrochem. Solid State Lett. 2010, 13, J114. 25 Huang, B. R.; Lin, T. C.; Liu, Y. M. Sol. Energy Mater. Sol. Cells 2015, 133, 32. 26 Freire, C.; de Castro, B. J. Chem. Soc.-Dalton Trans. 1998, 1491. 27 Mahshid, S.; Askari, M.; Ghamsari, M. S. J. Mater. Process. Technol. 2007, 189, 296. 28 Silva, E.; La Porta, F. A.; Liu, M. S.; Andres, J.; Varela, J. A.; Longo, E. Dalton Trans. 2015, 44,
3159. 29 Chen, C. C.; Hu, S. H.; Fu, Y. P. J. Alloy. Compd. 2015, 632, 326. 30 Choi, M.; Yong, K. Nanoscale 2014, 6, 13900. 31 Fonseca, J.; Tedim, J.; Biernacki, K.; Magalhaes, A. L.; Gurman, S. J.; Freire, C.; Hillman, A. R.
Electrochim. Acta 2010, 55, 7726. 32 Tedim, J.; Patricio, S.; Fonseca, J.; Magalhaes, A. L.; Moura, C.; Hillman, A. R.; Freire, C. Synth.
Met. 2011, 161, 680. 33 Lei, X. F.; Xue, X. X.; Yang, H.; Chen, C.; Li, X.; Niu, M. C.; Gao, X. Y.; Yang, Y. T. Appl. Surf.
Sci. 2015, 332, 172. 34 Cheng, J.; Chen, J.; Lin, W.; Liu, Y.; Kong, Y. Appl. Surf. Sci. 2015, 332, 573. 35 Manzo-Robledo, A.; Lopez, A. C.; Caballero, A. A. F.; Cadena, A. A. Z.; Lopez, M.; Vazquez-
Cuchillo, O. Mater. Sci. Semicond. Process 2015, 31, 94.

FCUP Functional electroactive materials: towards novel saving and conversion energy systems
145
36 Jagadale, T. C.; Takale, S. P.; Sonawane, R. S.; Joshi, H. M.; Patil, S. I.; Kale, B. B.; Ogale, S. B.
J. Phys. Chem. C 2008, 112, 14595. 37 Nolan, N. T.; Synnott, D. W.; Seery, M. K.; Hinder, S. J.; Van Wassenhoven, A.; Pillai, S. C. J.
Hazard. Mater. 2012, 211, 88. 38 Lin, C. K.; Tseng, S. C.; Cheng, C. H.; Chen, C. Y.; Chen, C. C. Thin Solid Films 2011, 520, 1375.

FCUP Functional electroactive materials: towards novel saving and conversion energy systems
146

N-dona
oped ganoco
e
graphemposelectro
ene@pite witochrom
Cha
poly[Nth outsmic pr
apter
Ni(salestandiropert
r 5
en)] ing ies

5
N-doped graphene@poly[Ni(salen)] nanocomposite with outstanding
electrochromic properties1,2,3 Abstract
A new nanocomposite was obtained through the incorporation of N-doped few
layer graphene (N-FLG) on poly[Ni(3-Mesalen)] electroactive polymer (poly[1]). The
nanocomposite, N-FLG@poly[1], prepared by in situ electropolymerisation of the metal
complex [Ni(3-Mesalen)] in the presence of N-FLG, showed similar electrochemical
responses to pristine poly[1], but with more well-defined redox peaks and higher
current intensities, in compliance with significantly larger electroactive surface
coverage. N-FLG incorporation did not affect the electronic structure of poly[1], but
caused significant increase (19 - 26 %) in the molar extinction coefficients of electronic
bands assigned to transitions within polymer band gap and a decrease of 12 % in the
molar extinction coefficient of the charge transfer band between metal and oxidised
ligand (λ = 507 nm), which is a promising advantage once this band is related to ligand
over-oxidation.
The N-FLG@poly[1] showed multi-electrochromic behaviour (yellow in reduced
state and green / russet in oxidised states) and revealed an excellent improvement on
electrochromic performance compared to pristine poly[1], showing an increase of 40 %
1 Adapted from: M. Nunes, M. Araújo, R. Bacsa, R. V. Ferreira, E. Castillejos, P. Serp, A.R. Hillman and C. Freire,
N-doped graphene@poly[Ni(salen)] nanocomposite with outstanding electrochromic properties. Submitted. 2 M. Nunes’s contribution to the publication: characterisation of the N-FLG by XPS, preparation and characterisation of
the N-FLG@poly[1] nanocomposite and pristine poly[1] films, evaluation of the electrochromic properties and
manuscript preparation. 3 The experimental details on the electrochemical/spectroelectrochemical and remaining characterisation techniques
are indicated in Appendices A and C, respectively.
FCUP Functional electroactive materials: towards novel saving and conversion energy systems
150
in electrochemical stability, with a loss of only 2.7 % in charge after 10 000 colour
switching cycles. Furthermore, the switching times decreased significantly to τ = 9 and
11 s (71/77 %) and the optical contrast and colouration efficiency have remarkable
improvements, rising to ΔT = 35.9 % (increase of 38 %) and to η = 108.95 cm2 C-1
(increase of 12 %), respectively. The conductive and electrochromic performance
improvements are attributed to the alternative conducting pathways and to the
morphologic modifications induced by the N-FLG incorporation within the electroactive
polymer.
5.1 Introduction Nowadays, the improvement of the electrochemical stability and the
electrochromic contrast and the reduction of the switching times remain priority
demands for successful application of conducting polymers as electrochromic
materials.1 In order to achieve these goals, composites of CPs with nanostructures
have been prepared;2-4 these new materials, generally known as polymeric
nanocomposites (PNCs), are functional hybrid materials that typically comprise a
nanometric filler, and show considerable improved properties due to the synergic
effects of both counterparts.5-7
Due to its conjugated structure, excellent electron-transport properties and
versatile chemistry, graphene (GF) has emerged as one of the most attractive carbon
nanomaterials to be combined with CPs. With a two-dimensional (2D) sp2-hybridised
carbon structure in a single-atom-thick sheet, graphene shows interesting
physicochemical properties, such as a large theoretical specific surface area, high
carrier mobility at room temperature, good thermal conductivity, high Young’s modulus
and good optical transmittance.8-10 Several graphene/PNCs have been prepared to
optimise the properties and performances of polymers for several applications, such as
in supercapacitors,11-13 fuel14,15 and solar16 cells, sensors,17,18 lithium-ion batteries19 and
in anticorrosion coatings.20 For EC applications, some graphene/CPs nanocomposites
with enhanced EC properties have also been reported, combining polyaniline and
pyrrole-derivatives with graphene,21,22 sulfonated-graphene,23 graphene oxide24 or
reduced graphene oxide,1 as counterparts. Ma et al.25 reported the preparation of an
electrochromic polySchiff base functionalised with reduced graphene oxide.
More recently, the chemical doping of graphene with heteroatoms (nitrogen,
boron and sulphur) has emerged as an important approach to tailor the electrical,
morphological and chemical properties of pristine graphene. Nitrogen is the most
commonly used dopant, mainly due to its similar atomic radius to carbon, which
FCUP Functional electroactive materials: towards novel saving and conversion energy systems
151
prevents significant lattice mismatch.26,27 The main differences between nitrogen-doped
graphene (N-GF) and pristine graphene are (i) the spin density and charge distribution
on the carbon atoms (influenced by the neighbour nitrogen dopants) and (ii) the open
band gap, making of N-GF a n-type semiconductor,28 which is very useful for
nanoelectronic applications. In the electrochromism field, the application of N-GF/TiO2
nanocomposite, as an efficient electrode material to improve the EC properties of
polythiophene-derivative EC polymer was reported.29
In this chapter it is described the preparation of a novel PNC made from
poly[Ni(3-Mesalen)] electroactive film, designated hereafter as poly[1], and nitrogen-
doped few layer graphene (N-FLG), and the evaluation of its EC performance. The
pristine poly[Ni(3-Mesalen)], as described in Chapter 2, showed promising EC
properties, with good electrochemical stability and interesting colour changes (yellow,
green and russet). The preparation of a nanocomposite between poly[Ni(3-Mesalen)]
and graphene flakes30 allowed to improve in some extent the EC properties, leading to
more favourable switching times and better optical contrast and colouration efficiencies
relatively to pristine poly[1]. The novel PNC, N-FLG@poly[1], prepared by in situ
electropolymerisation of poly[1] in the presence of N-FLG allowed the resulting
nanocomposite to surpass the conductive and electrochromic properties of both
pristine poly[1] and nanocomposite with graphene flakes, indicating that N-doping of
few layer graphene had a unique beneficial effect. To the best of our knowledge, this is
the first study on PNCs from the group of Metal-salen type electroactive
metallopolymers and nitrogen-doped graphene.
5.2 Experimental section 5.2.1 Materials and solvents The complex N,N’-bis(3-methylsalicylideneiminate) nickel(II), [Ni(3-Mesalen)] and
respective salen ligand were prepared as described in literature.31 Acetonitrile and
propylene carbonate (Romil, pro analysis grade) and LiClO4 (Aldrich, 99 %) were used
as received.
N-FLG was prepared by chemical vapour deposition (CVD) from a mixture of
ethylene and ammonia gases (Air Liquid, France) at 650 ºC in a vertical fluidised bed
reactor using a cobalt ferrite spinel catalyst, the preparation of which is reported
elsewhere.32
5.2.2 N-FLG preparation and characterisation N-FLG were prepared by fluidised bed chemical vapour deposition process, by
the decomposition of a mixture of ethylene and ammonia (90:10) in the presence of a
FCUP Functional electroactive materials: towards novel saving and conversion energy systems
152
ternary oxide powder catalyst at 650°C.32 The N-FLG powder was recovered after
washing with 35 % HCl at 25°C. The nitrogen content was determined by XPS; the
structure of the as-prepared N-FLG was confirmed by TEM and Raman spectroscopy.
5.2.3 Films preparation and electrochemical studies The N-FLG@poly[1] nanocomposite films were prepared by cyclic voltammetry
from the corresponding monomer solution, 1.0 mmol dm-3 [Ni(3-Mesalen)] complex in
0.1 mol dm-3 LiClO4/CH3CN, containing 0.5 wt.% of N-FLG/[Ni(3-Mesalen)]. The
potential of the working electrode (ITO/PET 3.00 cm2) was cycled between -0.2 and 1.3
V, at the scan rate of 0.100 V s-1, during 30 scans; other conditions will be mentioned
on the text. Prior to electrodeposition, the starting solution was refluxed for 3 hours,
followed by sonication for 10 min, to ensure an optimum dispersion of the N-FLG
powder and to promote some type of interaction between the monomer and N-FLG
(e.g. adsorption of monomer on N-FLG). Pristine poly[1] films were prepared using the
same experimental conditions but without N-FLG in the deposition solution.
After film deposition, the modified electrodes were rinsed with dry CH3CN,
immersed in a monomer- and N-FLG-free 0.1 mol dm-3 LiClO4/PC solution and cycled
(by CV) in the potential range of -0.2 to 1.3 V, at 0.010 V s-1.
The electroactive surface coverage, Γ / nmol cm-2 (cited in terms of monomeric
units), of each film was determined by a coulometric assay,33,34 using cyclic
voltammograms obtained in a monomer-free 0.1 mol dm-3 LiClO4/CH3CN solution at the
scan rate of 0.010 V s-1, to ensure complete film redox conversion. The Γ variation with
the number of electrodeposition cycles was studied for films prepared with 1 - 50
cycles. The doping level value used for the determination of Γ was calculated from the
comparison of coulometric data for films deposition and cycling, as described in
literature,33,34 and the value of n = 0.65 was used.
5.2.4 Composition and morphology characterisation The composition and morphology of the nanocomposite films were characterised
by XPS and SEM/EDS, respectively, by the analysis of films in the reduced state
(E = -0.2 V, after cycling the potential between -0.2 and 1.3 V at 0.010 V s-1, during 2
scans, in LiClO4/CH3CN). Exceptionally, in the preparation of nanocomposite for
SEM/EDS analysis, the percentage of N-FLG used in the deposition solution was
increased to 25 wt.%, in order to make the N-FLG flakes easily observable in the
polymeric matrix.
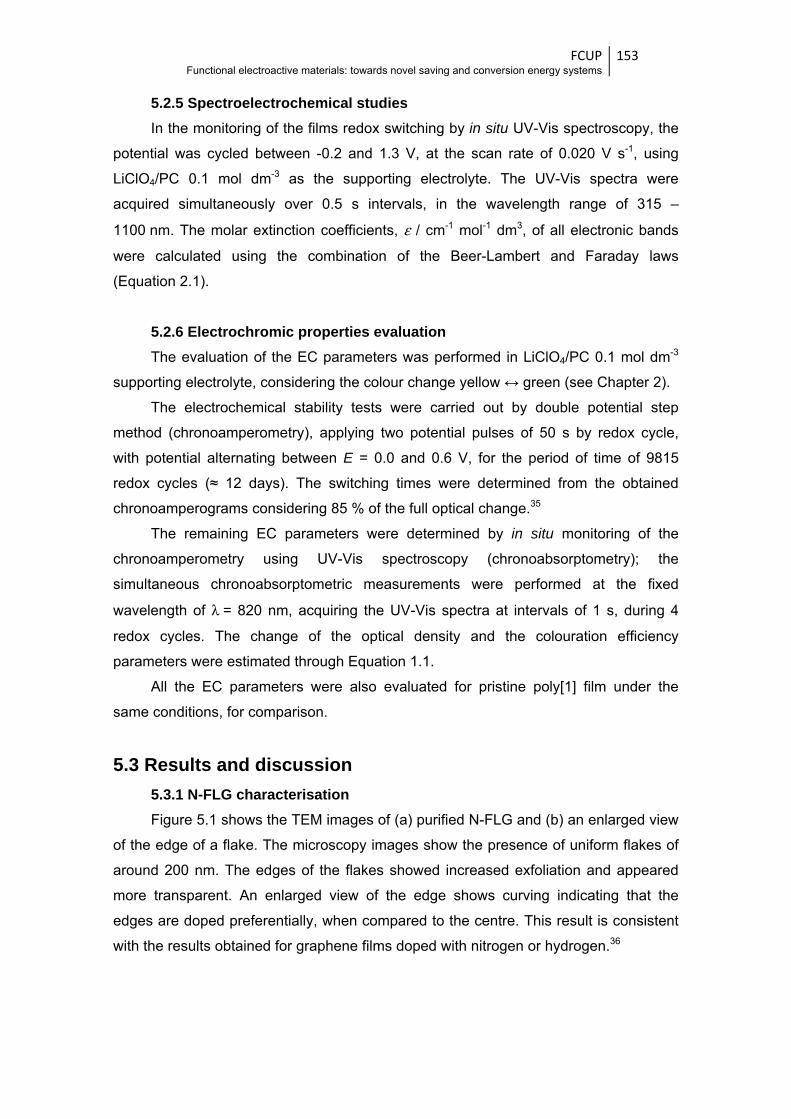
FCUP Functional electroactive materials: towards novel saving and conversion energy systems
153
5.2.5 Spectroelectrochemical studies In the monitoring of the films redox switching by in situ UV-Vis spectroscopy, the
potential was cycled between -0.2 and 1.3 V, at the scan rate of 0.020 V s-1, using
LiClO4/PC 0.1 mol dm-3 as the supporting electrolyte. The UV-Vis spectra were
acquired simultaneously over 0.5 s intervals, in the wavelength range of 315 –
1100 nm. The molar extinction coefficients, ε / cm-1 mol-1 dm3, of all electronic bands
were calculated using the combination of the Beer-Lambert and Faraday laws
(Equation 2.1).
5.2.6 Electrochromic properties evaluation The evaluation of the EC parameters was performed in LiClO4/PC 0.1 mol dm-3
supporting electrolyte, considering the colour change yellow ↔ green (see Chapter 2).
The electrochemical stability tests were carried out by double potential step
method (chronoamperometry), applying two potential pulses of 50 s by redox cycle,
with potential alternating between E = 0.0 and 0.6 V, for the period of time of 9815
redox cycles (≈ 12 days). The switching times were determined from the obtained
chronoamperograms considering 85 % of the full optical change.35
The remaining EC parameters were determined by in situ monitoring of the
chronoamperometry using UV-Vis spectroscopy (chronoabsorptometry); the
simultaneous chronoabsorptometric measurements were performed at the fixed
wavelength of λ = 820 nm, acquiring the UV-Vis spectra at intervals of 1 s, during 4
redox cycles. The change of the optical density and the colouration efficiency
parameters were estimated through Equation 1.1.
All the EC parameters were also evaluated for pristine poly[1] film under the
same conditions, for comparison.
5.3 Results and discussion 5.3.1 N-FLG characterisation Figure 5.1 shows the TEM images of (a) purified N-FLG and (b) an enlarged view
of the edge of a flake. The microscopy images show the presence of uniform flakes of
around 200 nm. The edges of the flakes showed increased exfoliation and appeared
more transparent. An enlarged view of the edge shows curving indicating that the
edges are doped preferentially, when compared to the centre. This result is consistent
with the results obtained for graphene films doped with nitrogen or hydrogen.36
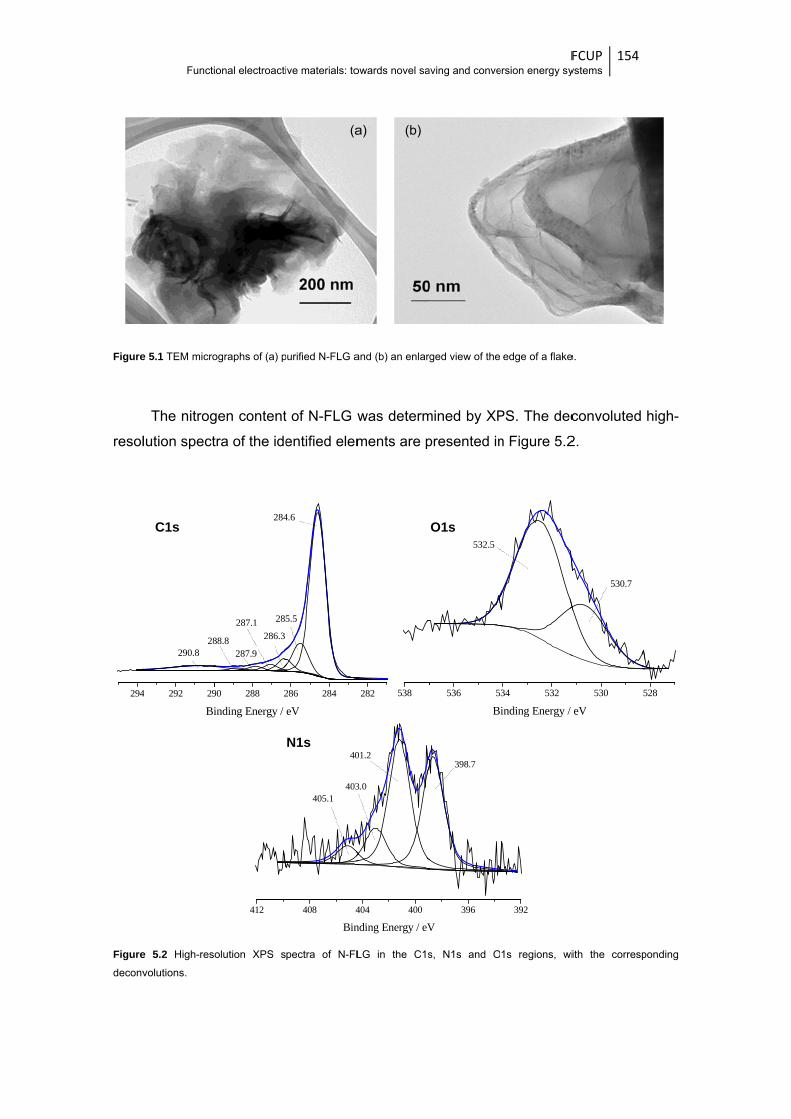
Figure
resol
Figuredeconv
294
Functi
e 5.1 TEM micro
The nitrog
lution spect
e 5.2 High-res
volutions.
4 292 29
290.828
Bi
C1s
ional electroacti
ographs of (a) p
gen content
tra of the ide
olution XPS s
90 288 2
88.8287.9
287.1286.3
285
inding Energy /
284
412
ive materials: to
purified N-FLG a
t of N-FLG w
entified elem
pectra of N-FL
(a
286 284
5.5
eV
4.6
408 4
40
403405.1
Bin
N1s
owards novel sa
and (b) an enlar
was determ
ments are p
LG in the C1s
a) (b)
282 538
404 400
01.2
3.0
nding Energy / eV
aving and conve
rged view of the
mined by XP
presented in
s, N1s and O
536 5
532.5
B
396
398.7
V
O1s
Fersion energy sy
edge of a flake
PS. The dec
n Figure 5.2
1s regions, wi
34 532
inding Energy /
392
FCUP ystems
154
e.
convoluted
2.
ith the corresp
530 5
530.7
eV
high-
ponding
528
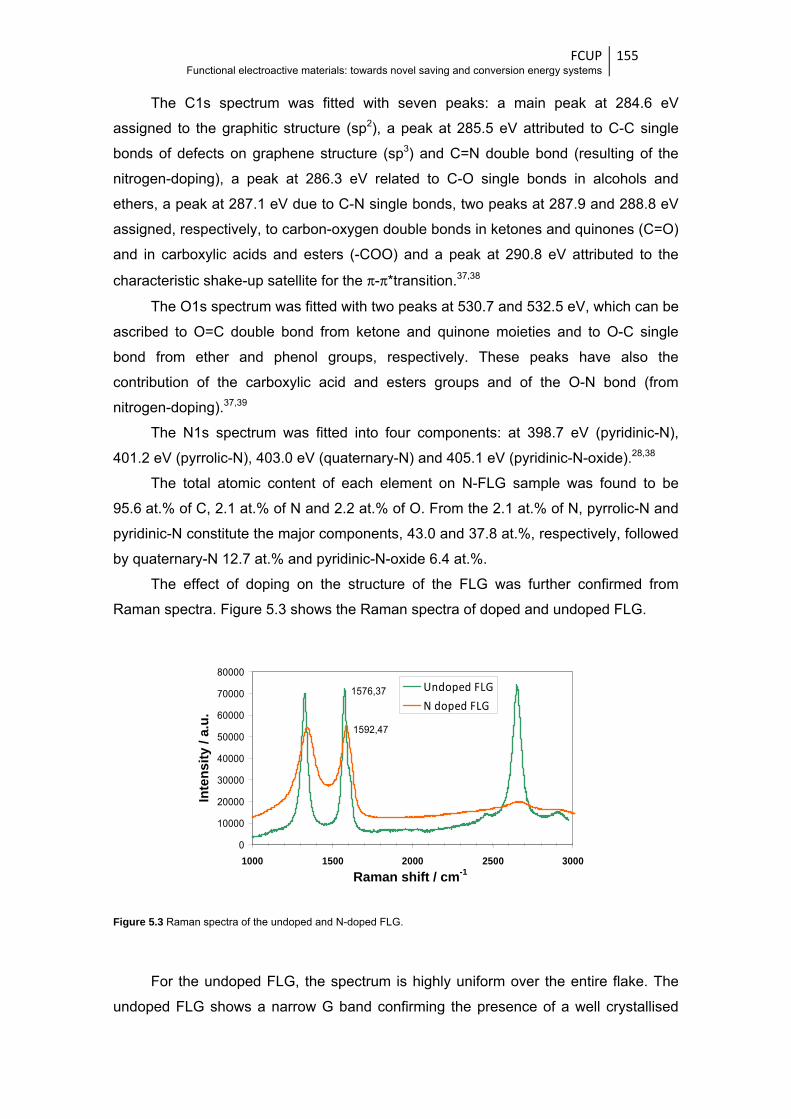
FCUP Functional electroactive materials: towards novel saving and conversion energy systems
155
The C1s spectrum was fitted with seven peaks: a main peak at 284.6 eV
assigned to the graphitic structure (sp2), a peak at 285.5 eV attributed to C-C single
bonds of defects on graphene structure (sp3) and C=N double bond (resulting of the
nitrogen-doping), a peak at 286.3 eV related to C-O single bonds in alcohols and
ethers, a peak at 287.1 eV due to C-N single bonds, two peaks at 287.9 and 288.8 eV
assigned, respectively, to carbon-oxygen double bonds in ketones and quinones (C=O)
and in carboxylic acids and esters (-COO) and a peak at 290.8 eV attributed to the
characteristic shake-up satellite for the π-π*transition.37,38
The O1s spectrum was fitted with two peaks at 530.7 and 532.5 eV, which can be
ascribed to O=C double bond from ketone and quinone moieties and to O-C single
bond from ether and phenol groups, respectively. These peaks have also the
contribution of the carboxylic acid and esters groups and of the O-N bond (from
nitrogen-doping).37,39
The N1s spectrum was fitted into four components: at 398.7 eV (pyridinic-N),
401.2 eV (pyrrolic-N), 403.0 eV (quaternary-N) and 405.1 eV (pyridinic-N-oxide).28,38
The total atomic content of each element on N-FLG sample was found to be
95.6 at.% of C, 2.1 at.% of N and 2.2 at.% of O. From the 2.1 at.% of N, pyrrolic-N and
pyridinic-N constitute the major components, 43.0 and 37.8 at.%, respectively, followed
by quaternary-N 12.7 at.% and pyridinic-N-oxide 6.4 at.%.
The effect of doping on the structure of the FLG was further confirmed from
Raman spectra. Figure 5.3 shows the Raman spectra of doped and undoped FLG.
Figure 5.3 Raman spectra of the undoped and N-doped FLG.
For the undoped FLG, the spectrum is highly uniform over the entire flake. The
undoped FLG shows a narrow G band confirming the presence of a well crystallised
1576,37
1592,47
0
10000
20000
30000
40000
50000
60000
70000
80000
1000 1500 2000 2500 3000
Undoped FLGN doped FLG
Raman shift / cm-1
Inte
nsity
/ a.
u.

sp2 c
defec
of ed
comb
blue
of the
prod
chan
in the
N-FL
elect
comp
value
Figure
switch
in (b) a
profil
less
resul
elect
the fi
-3
-2
-1
0
1
2
3
i / m
A
Functi
carbon netw
cts at edges
dges.32 The
bined effec
shift in the
e graphene
uced by ac
nge in the G
e graphene
5.3.2 ElecThe CVs
LG@poly[1]
trodepositio
plete films
es are summ
e 5.4 CVs obtain
ing in LiClO4/PC
are films photog
The CVs
les to those
negative po
lts indicate
tropolymeris
irst anodic h
-0.4 -0.2 0.0
3.0
2.0
.0
0.0
.0
2.0
3.0 (a)
ional electroacti
work. The D
s of smaller
e Raman
t of both n
G band fre
e lattice.40 H
cid treatmen
G band freq
lattice.
ctrochemicobtained d
film are
on cycles fo
electrodep
marised in T
ned during (a) t
C 0.1 mol dm-3 o
graphs in differe
of the nan
e of the pris
otentials an
e that the
sation mech
half-cycle, a
0.2 0.4 0.6
II'I'
E / V (vs. Ag
I
ive materials: to
D and D0 ba
r flakes, the
spectrum o
itrogen and
equency an
However, sp
nt did not s
uency is a d
cal preparatduring the 1
depicted
or pristine p
ositions are
Table 5.1.
he 1st, 10th and
of N-FLG@poly
nt oxidation sta
nocomposite
stine poly[1]
nd of the ca
e presence
hanism of p
at Epa = 0.9
0.8 1.0 1.2
poly[1] N-FLG@
IIIII
g/AgCl)
owards novel sa
ands are re
e small area
of N-FLG
d oxygen do
nd the atten
pectra of FL
show a G b
direct conse
tion and ch1st, 10th an
in Figure
poly[1], for
e showed
30th scans of th
y[1] (Γ = 296 nm
ates.
e electrode
] film, despi
athodic peak
e of N-FL
poly[1]. Con
96 and 1.13
2 1.4
@poly[1]-0.
-0.
-0.
0.
0.
0.
0.
0.
i / m
A
aving and conve
latively high
a of flakes g
is significa
oping on th
nuation of th
G containin
band shift.
equence of
haracterisad 30th elec
e 5.4 (a)
comparison
in Figure 5
he electrodepos
mol cm-2) and po
eposition ha
te a small s
ks for more
LG did n
nsequently,
V are attrib
-0.4 -0.2 0.06
4
2
0
2
4
6
8 (b)
-0.2 V
0.6
Fersion energy sy
h that could
iving rise to
ntly change
he electroni
he 2D band
ng oxygen fu
Hence, it a
f the substit
ation of N-Fctrodepositio
), along w
n. The CVs
5.5 and the
sition and (b) the
oly[1] (Γ = 180 n
ave similar
shift of the a
negative p
ot change
the two pe
buted to the
0.2 0.4 0.6
E / V (vs. Ag/
I
I'
6 V
FCUP ystems
156
d be the res
o a large nu
ed showing
ic structure
d indicate d
unctional g
appears tha
tution of nitr
FLG@polyon cycles o
with the
s obtained i
e potential
e 3rd scan of th
nmol cm-2) films
electroche
anodic pea
potentials. T
e the oxid
eaks observ
e [Ni(3-Mesa
0.8 1.0 1.2
poly[1]N-FLG@poly[1]
/AgCl)
IIIII
II'
1
sult of
umber
g the
. The
oping
roups
at the
rogen
[1] of the
same
n the
peak
e redox
s; insets
emical
ks for
These
dative
ved in
alen)]
1.4
.3 V

FCUP Functional electroactive materials: towards novel saving and conversion energy systems
157
monomer oxidation and subsequent formation of oligomers/polymer on the working
electrode surface, while in reverse scan, the peaks at Epc =0.68 and 0.18 V correspond
to the reduction of the as-formed nanocomposite film. The anodic peak around
Epa = 0.49 V, which appears in the second and subsequent scans, is attributed to the
oxidation of the as-formed polymeric film.41
Figure 5.5 CVs of the films electrodeposition, using 1.0 mmol dm-3 solution of [Ni(3-Mesalen)] complex in LiClO4/CH3CN
0.1 mol dm-3, at 0.100 V s-1 during 30 scans: (a) poly[1] and (b) N-FLG@poly[1] (containing 0.5 wt.% of N-FLG).
Moreover, the CVs of nanocomposite show higher current intensities when
compared to those of the pristine film, which become more significant with the
increasing number of electrodeposition cycles. This is attributed to the larger
electroactive surface area of the as-prepared nanocomposite film, resulting from the
incorporation of the N-FLG in the polymeric matrix.
Table 5.1 Peak potentials observed in CVs during 1st, 5th, 10th and 20th scans of
nanocomposite and pristine poly[1] films electrodepositions.
Film Scan E / V (vs. Ag/AgCl)
EpaI EpaII EpaIII EpcI’ EpcII’
poly[1]
1st - 0.93 1.10 0.17 0.68
5th 0.45 0.95 1.06 0.16 0.61
10th 0.56 - 0.97 0.16 0.54
20th 0.72 - 1.00 0.09 0.47
N-FLG@poly[1]
1st - 0.96 1.13 0.18 0.68
5th 0.49 0.99 1.10 0.17 0.58
10th 0.62 - 1.05 0.15 0.53
20th 0.84 - 1.08 0.02 0.45
-0.4 -0.2 0.0 0.2 0.4 0.6 0.8 1.0 1.2 1.4-3.0
-2.0
-1.0
0.0
1.0
2.0
3.0
1st scan
2nd - 30th scans
i / m
A
E / V (vs. Ag/AgCl)
I II III
I' II'
-0.4 -0.2 0.0 0.2 0.4 0.6 0.8 1.0 1.2 1.4
-3.0
-2.0
-1.0
0.0
1.0
2.0
3.0
1st scan
2nd - 30th scans
i / m
A
E / V (vs. Ag/AgCl)
I
II III
I' II'
(a) (b)
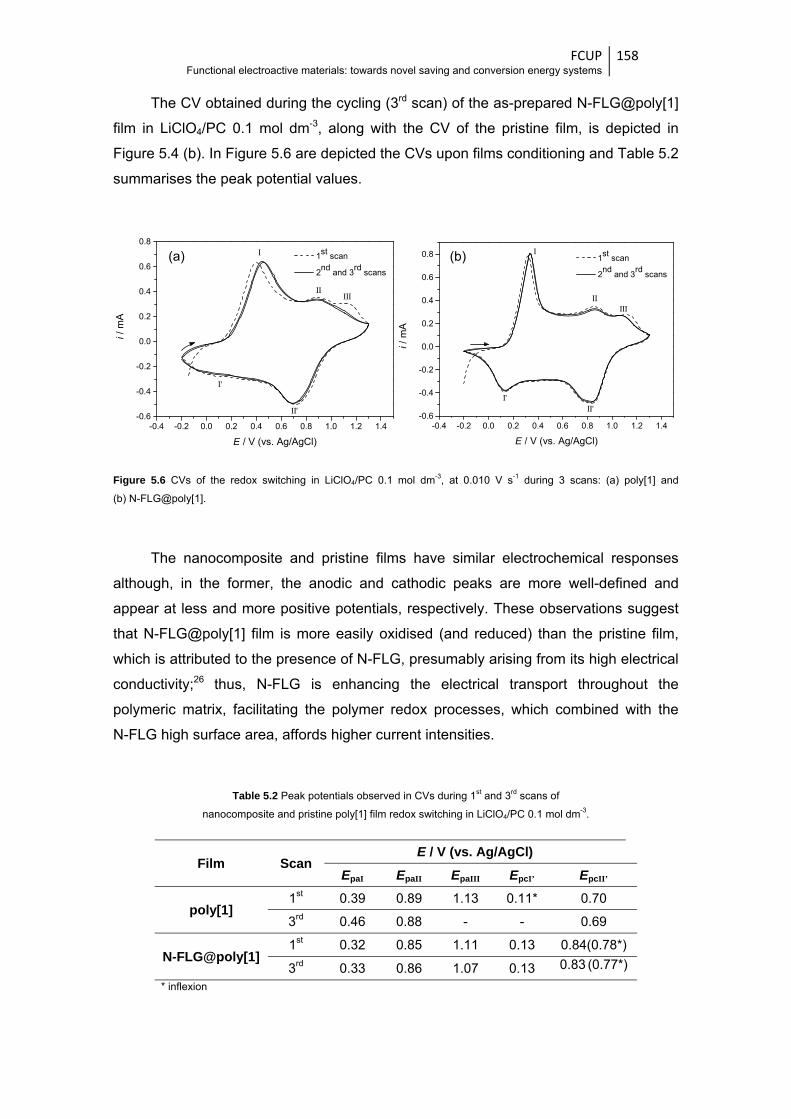
FCUP Functional electroactive materials: towards novel saving and conversion energy systems
158
The CV obtained during the cycling (3rd scan) of the as-prepared N-FLG@poly[1]
film in LiClO4/PC 0.1 mol dm-3, along with the CV of the pristine film, is depicted in
Figure 5.4 (b). In Figure 5.6 are depicted the CVs upon films conditioning and Table 5.2
summarises the peak potential values.
Figure 5.6 CVs of the redox switching in LiClO4/PC 0.1 mol dm-3, at 0.010 V s-1 during 3 scans: (a) poly[1] and
(b) N-FLG@poly[1].
The nanocomposite and pristine films have similar electrochemical responses
although, in the former, the anodic and cathodic peaks are more well-defined and
appear at less and more positive potentials, respectively. These observations suggest
that N-FLG@poly[1] film is more easily oxidised (and reduced) than the pristine film,
which is attributed to the presence of N-FLG, presumably arising from its high electrical
conductivity;26 thus, N-FLG is enhancing the electrical transport throughout the
polymeric matrix, facilitating the polymer redox processes, which combined with the
N-FLG high surface area, affords higher current intensities.
Table 5.2 Peak potentials observed in CVs during 1st and 3rd scans of
nanocomposite and pristine poly[1] film redox switching in LiClO4/PC 0.1 mol dm-3.
Film Scan E / V (vs. Ag/AgCl)
EpaI EpaII EpaIII EpcI’ EpcII’
poly[1] 1st 0.39 0.89 1.13 0.11* 0.70
3rd 0.46 0.88 - - 0.69
N-FLG@poly[1] 1st 0.32 0.85 1.11 0.13 0.84(0.78*)
3rd 0.33 0.86 1.07 0.13 0.83 (0.77*)
* inflexion
-0.4 -0.2 0.0 0.2 0.4 0.6 0.8 1.0 1.2 1.4-0.6
-0.4
-0.2
0.0
0.2
0.4
0.6
0.8
1st scan
2nd
and 3rd
scans
i / m
A
E / V (vs. Ag/AgCl)
I
IIIII
I'
II'
-0.4 -0.2 0.0 0.2 0.4 0.6 0.8 1.0 1.2 1.4-0.6
-0.4
-0.2
0.0
0.2
0.4
0.6
0.8
i / m
A
E / V (vs. Ag/AgCl)
1st scan
2nd
and 3rd
scans
I
IIIII
I'II'
(a) (b)

FCUP Functional electroactive materials: towards novel saving and conversion energy systems
159
In Figure 5.7 are shown the electroactive surface coverage (Γ) profiles for
nanocomposite and pristine films, with increasing number of the electropolymerisation
cycles.
Figure 5.7 Plot of the electroactive surface coverage, Γ, with the number of electropolymerisation cycles for
N-FLG@poly[1] and pristine films.
For thin films (prepared with 1 or 5 electropolymerisation cycles), the
N-FLG@poly[1] and the pristine poly[1] show similar Γ values, with Γ increasing linearly
with the number of deposition cycles. However, as the number of cycles increases
further than ≈ 10 electropolymerisation cycles, N-FLG@poly[1] shows higher Γ values
than the pristine film. This behaviour is similar to that observed for poly[1] doped with
pristine graphene;30 nevertheless, the Γ increase is even more pronounced with
N-FLG. Moreover, these results are in agreement with the higher current intensities
observed for the nanocomposite, as mentioned above, and provide an indirect
indication of the successful incorporation of the N-FLG on poly[1] matrix. For films
prepared in the typical conditions employed in this work (at 0.100 V s-1 during 30
scans), Γ = 180 nmol cm-2 for pristine poly[1] and Γ = 296 nmol cm-2 for
N-FLG@poly[1].
The visual inspection of the N-FLG@poly[1] film during its redox switching
allowed to observe that the nanocomposite has similar EC behaviour as the pristine
poly[1] (Chapter 2). In the inset in Figure 5.4 (b), photographs of the nanocomposite
film in different oxidation states are presented, showing yellow (E = -0.2 V), green
(E = 0.6 V) and russet (reddish-brown) (E = 1.3 V) colours at the different applied
potentials.
0 10 20 30 40 50
0
100
200
300
400
Γ /
nmo
l cm
-2
Number of electropolymerisation cycles
poly[1] N-FLG@poly[1]

FCUP Functional electroactive materials: towards novel saving and conversion energy systems
160
5.3.3 Composition and morphology
The surface composition of N-FLG@poly[1] film in the reduced state (E = -0.2 V)
was obtained by XPS, which revealed the presence of C, Ni, N, O and Cl elements, as
expected. The deconvoluted high-resolution XPS spectra for nanocomposite and
pristine films, for comparison, are shown in Figures 5.8 and 5.9.
Once the two components of the nanocomposite film (N-FLG and poly[1]) are
composed by the same chemical elements, XPS does not provide direct evidences that
could be attributed to each component individually. However, the comparison between
the two deconvoluted XPS spectra and the atomic ratios of the nanocomposite vs. to
those of pristine film provide valuable information.
The C1s spectrum of N-FLG@poly[1] was deconvoluted into four components: a
peak at 284.6 eV attributed to aromatic and aliphatic carbons of the salen moiety and
to the structure of N-FLG, a peak at 285.9 eV associated with the C-O and C-N bonds
of the salen coordination sphere and with the C-O single bonds in N-FLG, a peak with
lower intensity at 286.9 eV assigned to C≡N from CH3CN entrapped on the film and to
C-N bonds of the N-FLG, and a peak at 289.3 eV related to the shake-up satellite of
π-π* transitions due to the aromatic carbons of salen and N-FLG and that also has the
contribution of C=O and –COO bonds of N-FLG.33,38
The N1s spectrum of the nanocomposite was deconvoluted into four peaks at
399.4, 400.4, 401.3 and 403.4 eV. The first peaks are attributed to the nitrogen bonds
of the ligand system and to pyridinic-N of the N-FLG, the peak at 401.3 eV is assigned
to the N≡C bound of occluded CH3CN and to pyrrolic-N of the N-FLG and the peak at
403.4 eV is associated to a shake-up phenomenon due to salen ligand and to
quaternary-N and pyridinic-N-oxide of the N-FLG.28,33,38
The deconvoluted O1s spectrum of the nanocomposite exhibits two peaks: one at
531.5 eV assigned to oxygen belonging to the coordination sphere of salen ligand and
O=C bonds from N-FLG, and other at 533.1 eV attributed to the presence of ClO4-
(from supporting electrolyte) occluded on polymeric films and to O-C bonds from
N-FLG.33
The Ni2p spectrum of the nanocomposite shows the characteristic peaks due to
Ni coordinated to salen ligand in a formal +2 oxidation, which are assigned to: Ni2p3/2
(855.3 eV), Ni2p3/2 satellite (860.6 eV), Ni2p1/2 (872.5 eV) and Ni2p1/2 satellite
(877.8 eV). The presence of peaks in the high resolution Cl2p region at 208.4 eV
(Cl2p3/2) and 210.0 eV (Cl2p1/2) are consistent with the presence of ClO4- from
supporting electrolyte on nanocomposite film.33
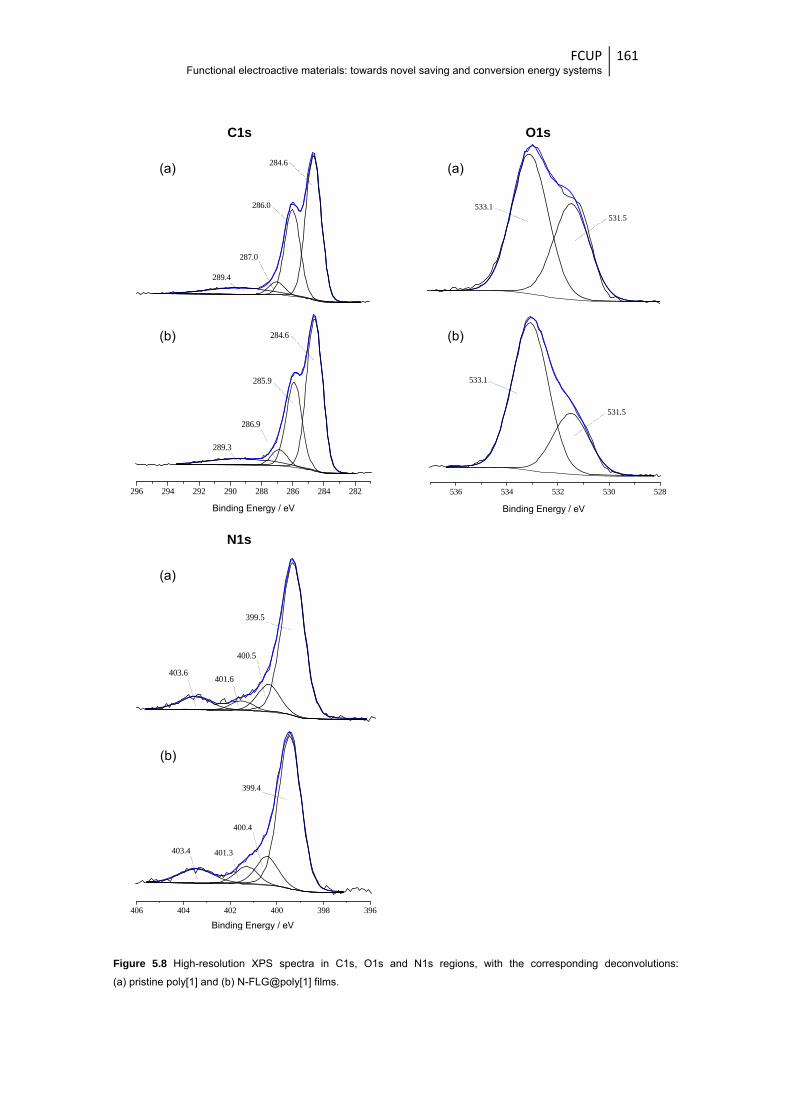
FCUP Functional electroactive materials: towards novel saving and conversion energy systems
161
Figure 5.8 High-resolution XPS spectra in C1s, O1s and N1s regions, with the corresponding deconvolutions:
(a) pristine poly[1] and (b) N-FLG@poly[1] films.
289.4
287.0
286.0
284.6
296 294 292 290 288 286 284 282
Binding Energy / eV
284.6
285.9
286.9
289.3
533.1
531.5
536 534 532 530 528
Binding Energy / eV
533.1
531.5
399.5
400.5
401.6403.6
406 404 402 400 398 396
Binding Energy / eV
399.4
400.4
401.3403.4
C1s O1s
N1s
(a) (a)
(b) (b)
(b)
(a)
Binding Energy / eV Binding Energy / eV
Binding Energy / eV
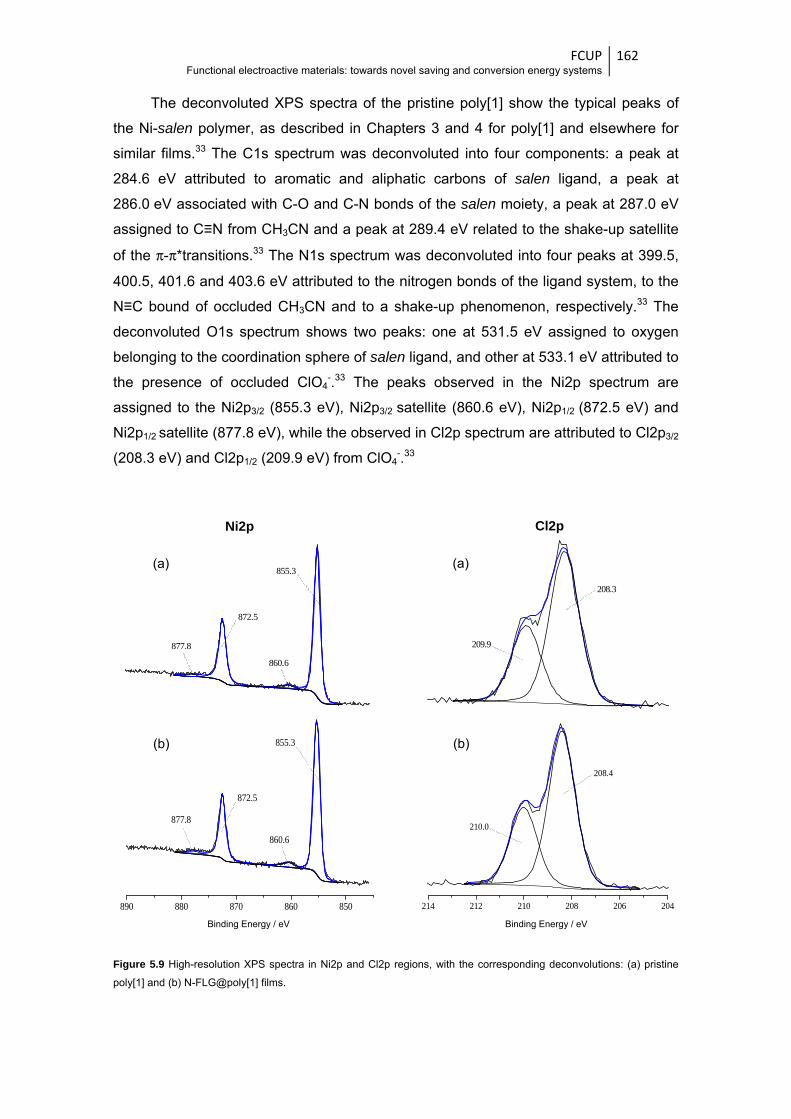
FCUP Functional electroactive materials: towards novel saving and conversion energy systems
162
The deconvoluted XPS spectra of the pristine poly[1] show the typical peaks of
the Ni-salen polymer, as described in Chapters 3 and 4 for poly[1] and elsewhere for
similar films.33 The C1s spectrum was deconvoluted into four components: a peak at
284.6 eV attributed to aromatic and aliphatic carbons of salen ligand, a peak at
286.0 eV associated with C-O and C-N bonds of the salen moiety, a peak at 287.0 eV
assigned to C≡N from CH3CN and a peak at 289.4 eV related to the shake-up satellite
of the π-π*transitions.33 The N1s spectrum was deconvoluted into four peaks at 399.5,
400.5, 401.6 and 403.6 eV attributed to the nitrogen bonds of the ligand system, to the
N≡C bound of occluded CH3CN and to a shake-up phenomenon, respectively.33 The
deconvoluted O1s spectrum shows two peaks: one at 531.5 eV assigned to oxygen
belonging to the coordination sphere of salen ligand, and other at 533.1 eV attributed to
the presence of occluded ClO4-.33 The peaks observed in the Ni2p spectrum are
assigned to the Ni2p3/2 (855.3 eV), Ni2p3/2 satellite (860.6 eV), Ni2p1/2 (872.5 eV) and
Ni2p1/2 satellite (877.8 eV), while the observed in Cl2p spectrum are attributed to Cl2p3/2
(208.3 eV) and Cl2p1/2 (209.9 eV) from ClO4-.33
Figure 5.9 High-resolution XPS spectra in Ni2p and Cl2p regions, with the corresponding deconvolutions: (a) pristine
poly[1] and (b) N-FLG@poly[1] films.
877.8
872.5
860.6
855.3
890 880 870 860 850
Binding Energy / eV
855.3
860.6
872.5
877.8
209.9
208.3
214 212 210 208 206 204
Binding Energy / eV
210.0
208.4
Ni2p Cl2p
(b)
(a)
(b)
(a)
Binding Energy / eV Binding Energy / eV
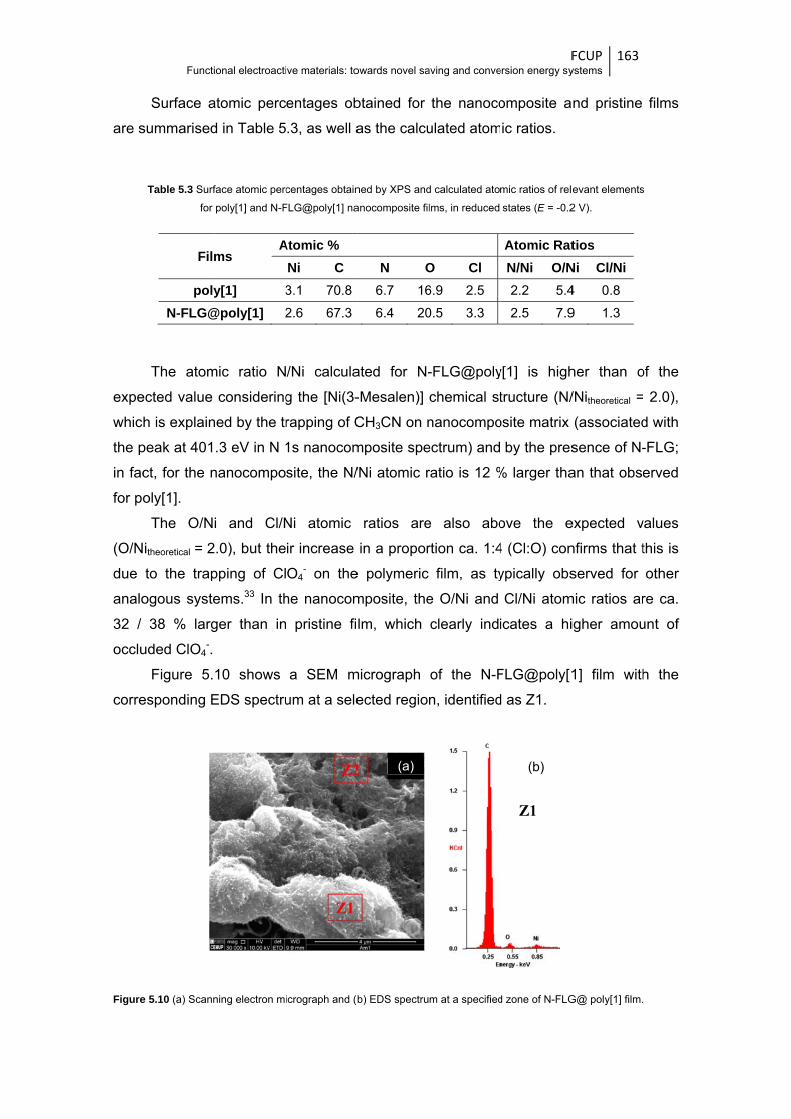
are s
expe
whic
the p
in fac
for po
(O/N
due
analo
32 /
occlu
corre
Figure
Functi
Surface a
summarised
Table 5.3 Surf
for
Film
polyN-FLG@
The atom
ected value
h is explain
peak at 401
ct, for the n
oly[1].
The O/N
itheoretical = 2
to the trap
ogous syste
38 % larg
uded ClO4-.
Figure 5.
esponding E
e 5.10 (a) Scann
ional electroacti
atomic perc
d in Table 5
face atomic perc
poly[1] and N-F
ms A
y[1] 3
@poly[1] 2
mic ratio N
considering
ned by the tr
.3 eV in N 1
nanocompo
i and Cl/N
.0), but the
pping of Cl
ems.33 In th
ger than in
10 shows
EDS spectru
ning electron mi
ive materials: to
entages ob
.3, as well a
centages obtain
FLG@poly[1] na
Atomic % Ni C 3.1 70.8
2.6 67.3
/Ni calcula
g the [Ni(3-
rapping of C
1s nanocom
site, the N/
Ni atomic
ir increase
O4- on the
he nanocom
pristine fi
a SEM m
um at a sele
icrograph and (b
owards novel sa
btained for
as the calcu
ned by XPS and
anocomposite fil
N O6.7 16
6.4 20
ated for N-
-Mesalen)]
CH3CN on n
mposite spe
/Ni atomic r
ratios are
in a propor
e polymeric
mposite, the
lm, which
micrograph
ected regio
b) EDS spectru
(a)
aving and conve
the nanoco
ulated atom
d calculated ato
lms, in reduced
O Cl 6.9 2.5
0.5 3.3
-FLG@poly
chemical st
nanocompo
ectrum) and
ratio is 12 %
e also abo
rtion ca. 1:4
film, as ty
e O/Ni and
clearly ind
of the N-F
n, identified
m at a specified
Fersion energy sy
omposite a
ic ratios.
mic ratios of rele
states (E = -0.2
Atomic RatN/Ni O/N2.2 5.4
2.5 7.9
y[1] is high
tructure (N/
osite matrix
by the pres
% larger tha
ove the e
4 (Cl:O) con
ypically obs
Cl/Ni atom
icates a hi
FLG@poly[1
d as Z1.
d zone of N-FLG
(b)
FCUP ystems
163
nd pristine
evant elements
2 V).
tios
Ni Cl/Ni 4 0.8
9 1.3
her than o
/Nitheoretical =
(associated
sence of N-
an that obse
expected v
nfirms that t
served for
mic ratios ar
igher amou
1] film with
G@ poly[1] film.
films
s
of the
2.0),
d with
-FLG;
erved
values
this is
other
re ca.
unt of
h the
FCUP Functional electroactive materials: towards novel saving and conversion energy systems
164
It is possible identify a continuous layer with an irregular surface (Z2 region)
characteristic of the metal salen-type pristine films (Chapter 2), which is blended with
N-FLG fragments in certain regions (Z1). The micrograph shows that the poly[1] matrix
extents over the N-FLG fragments and, thus, N-FLG is in fact occluded on poly[1] and
not just resting on the surface of the film. The nature of the fragment was confirmed by
EDS analysis in Z1 region (Figure 5.10 (b)). The elements predominantly detected
were carbon and oxygen, which are characteristics of graphene flakes. It was also
detected nickel in a low amount and the absence of other elements typically observed
in poly[1], such as chloride, confirms that the fragment is predominantly a carbon-
based material. These results also demonstrate the successful preparation of the
N-FLG@poly[1] nanocomposite.
5.3.4 In situ UV-Vis spectroscopy
In Figures 5.11 (a) are depicted the absolute UV-Vis spectra acquired during the
oxidation of the N-FLG@poly[1] nanocomposite film; for comparison, the equivalent
spectra for pristine poly[1] are depicted in Figure 5.12 (a). The spectra obtained during
films reduction showed an inverse behaviour and were omitted for simplicity.
The N-FLG@poly[1] spectra are very similar to the spectra of the pristine film and
both show four electronic bands. The electronic bands profile with the applied potential
is most readily appreciated in the differential spectra, depicted using the responses at
selected potentials as reference potentials (Figures 5.11 (b) and (c) for nanocomposite
and Figures 5.12 (b) and (c) for poly[1]) and by the representation of the absorbance
vs. potential (Abs vs. E) profiles, at the wavelength of detected bands (Figures 5.11 (d)
and 5.12 (d)). These representations reveal that the nanocomposite and pristine films
have similar electronic band behaviours, allowing to identify three main band profiles,
characteristics of several metal salen-type films33,34,42 and of the pristine poly[1] film
(Chapter 2).
The energy of the electronic bands for both films are summarised in Table 5.4;
the molar extinction coefficients, ε, were estimated using the Equation 2.1, from the
slopes of Abs vs. Q plots (Figure 5.13).
Taking into account the assertion of ligand-based film oxidation, supported by the
ε-values and proposed for the pristine (Chapter 2) and other similar poly[M(salen)]
films,33,34,42 the polaronic model previously employed in the assignment of the
electronic bands of metal salen-type films,33,34,42 can be used for band assignment:
(i) the band at λ = 332-335 nm is attributed to the intervalence transition and
corresponds to the band gap (Eg = 3.74 and 3.70 eV for pristine and nanocomposite

FCUP Functional electroactive materials: towards novel saving and conversion energy systems
165
films, respectively), (ii) the bands at λ = 401-404 nm (3.09-3.07 eV) and λ = 818-
826 nm (1.52-1.50 eV), that appear during the film oxidation, are attributed to
transitions within the band gap, from the valence band to the antibonding and bonding
polaron levels, respectively, and (iii) the band at λ = 507-509 nm (2.45-2.44 eV) is
assigned to charge transfer (CT) transition between the metal and the oxidised ligand.
Figure 5.11 UV-Vis spectra of N-FLG@poly[1] acquired during film oxidation in 0.1 mol dm-3 LiClO4/PC: (a) absolute
spectra, referenced to the electrolyte spectrum, and differential spectra (b) from -0.2 to 0.8 V, referenced to the
spectrum of neutral film and (c) from 0.8 to 1.3 V, referenced to the spectrum of film at E = 0.8 V; (d) Abs vs. E plots of
the electronic bands identified in absolute UV-Vis spectra, referenced to spectrum at E = -0.2 V (arrows indicate scan
direction).
0.4
0.8
1.2
1.6
2.0
2.4 spectrum at -0.2 V spectrum at 1.3 V
Abs
0.0 0.4 0.8 1.2-0.8
-0.4
0.0
0.4
0.8
1.2
Abs
E / V (vs. Ag/AgCl)
λ = 335 nm λ = 404 nm λ = 507 nm λ = 826 nm
-0.6
0.0
0.6
1.2
Abs
- A
bs-0
.2 V
380 570 760 950
-0.1
0.0
0.1
0.2
0.3
Abs
- A
bs0
.8 V
λ / nm
(a)
(b)
(c)
(d)

FCUP Functional electroactive materials: towards novel saving and conversion energy systems
166
Figure 5.12 UV-Vis spectra of poly[1] acquired during film oxidation in 0.1 mol dm-3 LiClO4/PC: (a) absolute spectra,
referenced to the electrolyte spectrum, and differential spectra (b) from -0.2 to 0.75 V, referenced to the spectrum of
neutral polymer and (c) from 0.75 to 1.3 V, referenced to the spectrum of polymer at E=0.75 V; (d) Abs vs. E plots of the
electronic bands identified in absolute UV-Vis spectra, referenced to spectrum at -0.2 V (arrows indicate scan direction).
The data summarised in Table 5.4 reveal that the energies of the observed bands
in nanocomposite are very similar to those of the pristine film, showing that the
incorporation of the N-FLG in poly[1] matrix did not change the metallopolymer
electronic structure. However, the ε-values for the nanocomposite electronic bands are
different from those of the pristine film. The nanocomposite electronic bands assigned
to transitions within the band gap, at λ = 401-404 nm and λ = 818-826 nm showed,
respectively, 19 % and 26 % increase (from ε = 2.16 x 10³ / 5.26 x 103 cm-1 mol-1 dm3
for pristine to ε = 2.66 x 10³ / 7.11 x 103 cm-1 mol-1 dm3 for nanocomposite films),
whereas, for the CT band at λ = 507-509 nm, the ε−value diminished 12 % (from
0.4
0.8
1.2
1.6
2.0
2.4 spectrum at -0.2 V spectrum at 1.3 V
Abs
0.0 0.4 0.8 1.2
-0.4
0.0
0.4
0.8
1.2
E / V (vs. Ag/AgCl)
Abs
λ = 332 nm λ = 401 nm λ = 509 nm λ = 818 nm
-0.6
0.0
0.6
1.2
Abs
- A
bs-0
.2 V
380 570 760 950
-0.1
0.0
0.1
0.2
0.3
Abs
- A
bs0
.75
V
λ / nm
(a)
(b)
(c)
(d)

FCUP Functional electroactive materials: towards novel saving and conversion energy systems
167
ε = 8.80 x 103 cm-1 mol-1 dm3 in pristine film to ε = 7.11 x 103 cm-1 mol-1 dm3 in
nanocomposite).
Table 5.4 Electronic bands energy and molar extinction coefficients (ε) for
pristine poly[1] and N-FLG@poly[1] films.
Film λ / nm (eV) ε × 10-3 / cm-1 mol-1 dm3
poly[1]
332 (3.74) 3.86
401(3.09) 2.16
509 (2.44) 8.80
818 (1.52) 5.26
N-FLG@poly[1]
335 (3.70) 3.17
404 (3.07) 2.66
507 (2.45) 7.78
826 (1.50) 7.11
Since the electronic bands associated to transitions within the band gap are
associated with charge carriers within the film, the increase in the molar extinction
coefficients is in line with the previous conclusions that the incorporation of N-FLG in
the poly-salen matrix is providing alternative conductive pathways and improved the
overall charge transport.1 On the other hand, the decrease of the CT band ε-value is
also a very good outcome since this CT band is related with the ligand over-oxidation
and less stable oxidised states of poly-salen film, anticipating an increase of the film
stability towards over-oxidation.
Figure 5.13 Plots of the Abs vs. Q for selected electronic bands in 0.1 mol dm-3 LiClO4/PC (for anodic scan) of:
(a) poly[1] and (b) N-FLG@poly[1].
(a) (b)
0.0 2.0 4.0 6.0 8.0 10.0
0.5
1.0
1.5
2.0
λ = 335 nm λ = 404 nm λ = 507 nm λ = 826 nm
Q / mC
Abs
0.0 2.0 4.0 6.0 8.0 10.0
0.5
1.0
1.5
2.0
λ = 332 nm λ = 401 nm λ = 509 nm λ = 818 nm
Q / mC
Abs
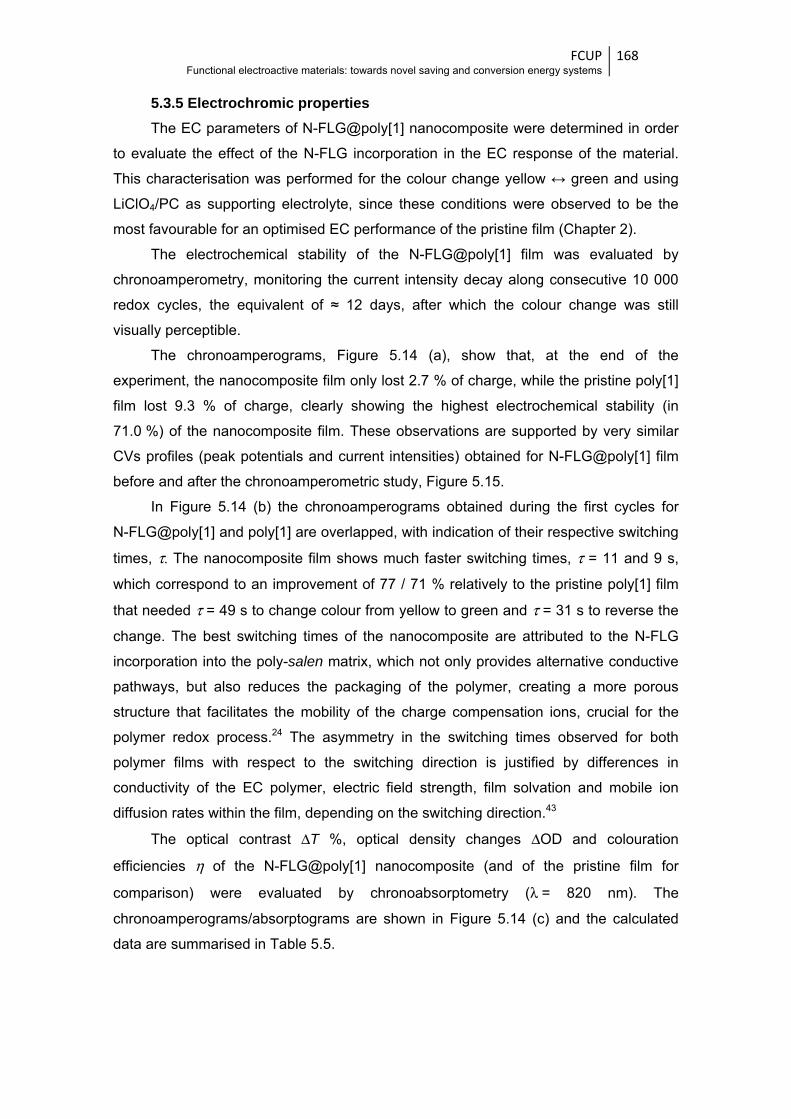
FCUP Functional electroactive materials: towards novel saving and conversion energy systems
168
5.3.5 Electrochromic properties
The EC parameters of N-FLG@poly[1] nanocomposite were determined in order
to evaluate the effect of the N-FLG incorporation in the EC response of the material.
This characterisation was performed for the colour change yellow ↔ green and using
LiClO4/PC as supporting electrolyte, since these conditions were observed to be the
most favourable for an optimised EC performance of the pristine film (Chapter 2).
The electrochemical stability of the N-FLG@poly[1] film was evaluated by
chronoamperometry, monitoring the current intensity decay along consecutive 10 000
redox cycles, the equivalent of ≈ 12 days, after which the colour change was still
visually perceptible.
The chronoamperograms, Figure 5.14 (a), show that, at the end of the
experiment, the nanocomposite film only lost 2.7 % of charge, while the pristine poly[1]
film lost 9.3 % of charge, clearly showing the highest electrochemical stability (in
71.0 %) of the nanocomposite film. These observations are supported by very similar
CVs profiles (peak potentials and current intensities) obtained for N-FLG@poly[1] film
before and after the chronoamperometric study, Figure 5.15.
In Figure 5.14 (b) the chronoamperograms obtained during the first cycles for
N-FLG@poly[1] and poly[1] are overlapped, with indication of their respective switching
times, τ. The nanocomposite film shows much faster switching times, τ = 11 and 9 s,
which correspond to an improvement of 77 / 71 % relatively to the pristine poly[1] film
that needed τ = 49 s to change colour from yellow to green and τ = 31 s to reverse the
change. The best switching times of the nanocomposite are attributed to the N-FLG
incorporation into the poly-salen matrix, which not only provides alternative conductive
pathways, but also reduces the packaging of the polymer, creating a more porous
structure that facilitates the mobility of the charge compensation ions, crucial for the
polymer redox process.24 The asymmetry in the switching times observed for both
polymer films with respect to the switching direction is justified by differences in
conductivity of the EC polymer, electric field strength, film solvation and mobile ion
diffusion rates within the film, depending on the switching direction.43
The optical contrast ΔT %, optical density changes ΔOD and colouration
efficiencies η of the N-FLG@poly[1] nanocomposite (and of the pristine film for
comparison) were evaluated by chronoabsorptometry (λ = 820 nm). The
chronoamperograms/absorptograms are shown in Figure 5.14 (c) and the calculated
data are summarised in Table 5.5.
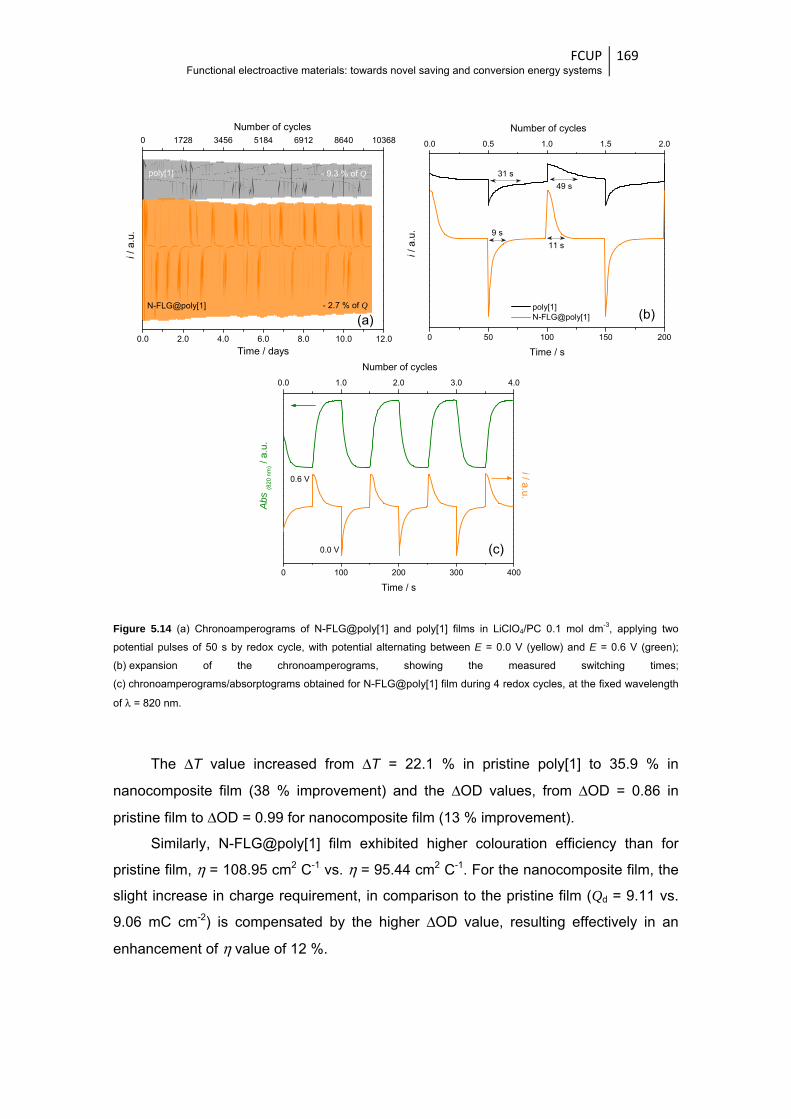
FCUP Functional electroactive materials: towards novel saving and conversion energy systems
169
Figure 5.14 (a) Chronoamperograms of N-FLG@poly[1] and poly[1] films in LiClO4/PC 0.1 mol dm-3, applying two
potential pulses of 50 s by redox cycle, with potential alternating between E = 0.0 V (yellow) and E = 0.6 V (green);
(b) expansion of the chronoamperograms, showing the measured switching times;
(c) chronoamperograms/absorptograms obtained for N-FLG@poly[1] film during 4 redox cycles, at the fixed wavelength
of λ = 820 nm.
The ΔT value increased from ΔT = 22.1 % in pristine poly[1] to 35.9 % in
nanocomposite film (38 % improvement) and the ΔOD values, from ΔOD = 0.86 in
pristine film to ΔOD = 0.99 for nanocomposite film (13 % improvement).
Similarly, N-FLG@poly[1] film exhibited higher colouration efficiency than for
pristine film, η = 108.95 cm2 C-1 vs. η = 95.44 cm2 C-1. For the nanocomposite film, the
slight increase in charge requirement, in comparison to the pristine film (Qd = 9.11 vs.
9.06 mC cm-2) is compensated by the higher ΔOD value, resulting effectively in an
enhancement of η value of 12 %.
0.0 2.0 4.0 6.0 8.0 10.0 12.0
0 1728 3456 5184 6912 8640 10368
N-FLG@poly[1]
poly[1]
- 2.7 % of Q
Number of cycles
i /
a.u.
Time / days
- 9.3 % of Q
0 50 100 150 200
0.0 0.5 1.0 1.5 2.0
poly[1] N-FLG@poly[1]
31 s
49 s
9 s
Number of cycles
i / a
.u.
Time / s
11 s
0 100 200 300 400
0.0 1.0 2.0 3.0 4.0
Number of cycles
Abs
(820
nm
) / a.
u.
Time / s
0.6 V
0.0 V
i / a.u.
(a) (b)
(c)
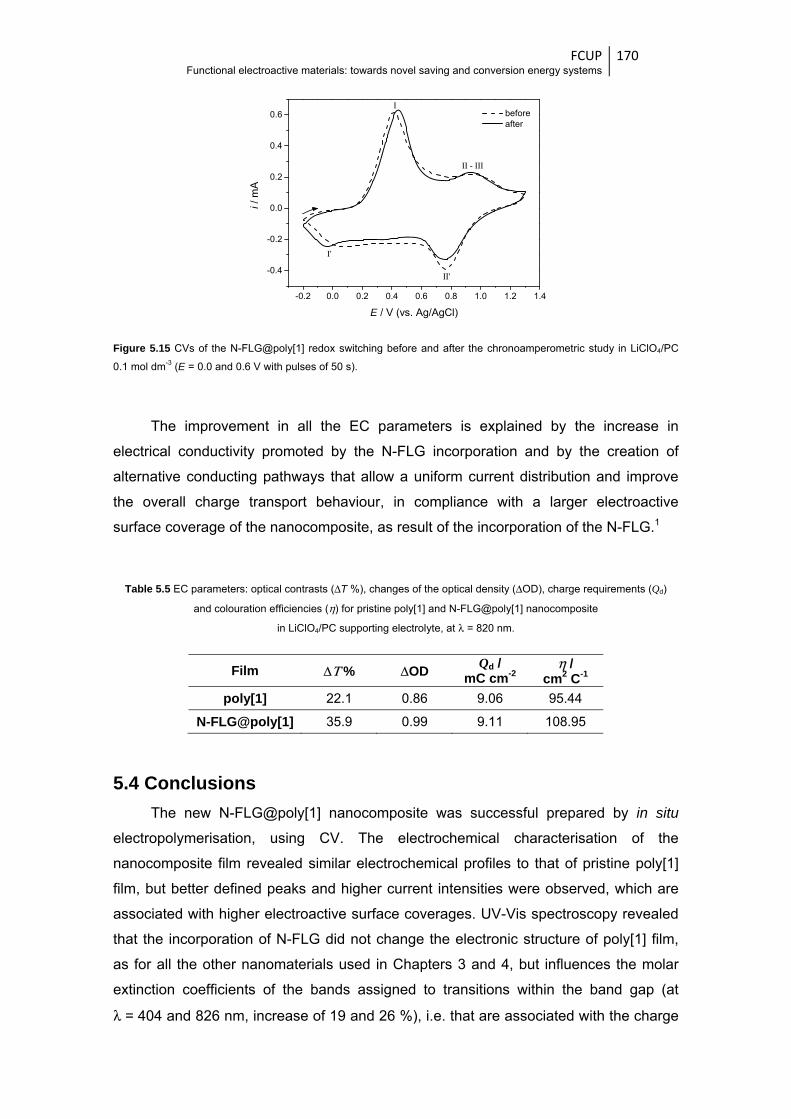
FCUP Functional electroactive materials: towards novel saving and conversion energy systems
170
Figure 5.15 CVs of the N-FLG@poly[1] redox switching before and after the chronoamperometric study in LiClO4/PC
0.1 mol dm-3 (E = 0.0 and 0.6 V with pulses of 50 s).
The improvement in all the EC parameters is explained by the increase in
electrical conductivity promoted by the N-FLG incorporation and by the creation of
alternative conducting pathways that allow a uniform current distribution and improve
the overall charge transport behaviour, in compliance with a larger electroactive
surface coverage of the nanocomposite, as result of the incorporation of the N-FLG.1
Table 5.5 EC parameters: optical contrasts (ΔT %), changes of the optical density (ΔOD), charge requirements (Qd)
and colouration efficiencies (η) for pristine poly[1] and N-FLG@poly[1] nanocomposite
in LiClO4/PC supporting electrolyte, at λ = 820 nm.
Film ΔΤ % ΔOD Qd / mC cm-2
η / cm2 C-1
poly[1] 22.1 0.86 9.06 95.44
N-FLG@poly[1] 35.9 0.99 9.11 108.95
5.4 Conclusions The new N-FLG@poly[1] nanocomposite was successful prepared by in situ
electropolymerisation, using CV. The electrochemical characterisation of the
nanocomposite film revealed similar electrochemical profiles to that of pristine poly[1]
film, but better defined peaks and higher current intensities were observed, which are
associated with higher electroactive surface coverages. UV-Vis spectroscopy revealed
that the incorporation of N-FLG did not change the electronic structure of poly[1] film,
as for all the other nanomaterials used in Chapters 3 and 4, but influences the molar
extinction coefficients of the bands assigned to transitions within the band gap (at
λ = 404 and 826 nm, increase of 19 and 26 %), i.e. that are associated with the charge
-0.2 0.0 0.2 0.4 0.6 0.8 1.0 1.2 1.4
-0.4
-0.2
0.0
0.2
0.4
0.6 before after
II'
I'
II - III
i / m
A
E / V (vs. Ag/AgCl)
I
FCUP Functional electroactive materials: towards novel saving and conversion energy systems
171
carriers, as consequence of the alternative conducting pathways provide by the
nanomaterial. In the nanocomposite the molar extinction coefficients of the CT band
decrease in 12 %, which also is a very good outcome once this band is associated with
over-oxidation processes.
The as-prepared N-FLG@poly[1] nanocomposite showed excellent enhancement
of all EC properties, intrinsic of the pristine electroactive film. The incorporation of the
N-FLG increased the electrochemical stability by 71.0 %, recording only 2.7 % of
charge loss after ≈ 10 000 cycles (≈ 12 days). Simultaneously, the switching times
diminished significantly from τ = 31 / 49 s for the pristine film to τ = 9 / 11 s in the
nanocomposite, which correspond to a decrease of 77 / 71 %. The optical contrast and
colouration efficiency also have an amazing improvement, rising from ΔT = 22.1 to
35.9 % (+ 38 %) and from η = 95.44 to 108.95 cm2 C-1 (+ 12 %), respectively, from the
pristine poly[1] to the nanocomposite film.
Furthermore, the preparation of the nanocomposite using N-doped graphene
allowed to surpass the EC performance of the graphene@poly[1] nanocomposite film,30
as it was the purpose of this report. This is explained by the extraordinary properties
provided by the N-doping of graphene, namely the better conductivity given by the
n-type semiconductor ability of the N-doped graphene.
The obtained results showed undoubtedly the advantage of the N-FLG@poly[1]
nanocomposite preparation and of the N-doping of graphene, as promising approaches
to enhance the EC properties of the pristine Ni-salen film.
FCUP Functional electroactive materials: towards novel saving and conversion energy systems
172
References
1 Reddy, B. N.; Deepa, M.; Joshi, A. G.; Srivastava, A. K. J. Phys. Chem. C 2011, 115, 18354. 2 Wei, H. G.; Zhu, J. H.; Wu, S. J.; Wei, S. Y.; Guo, Z. H. Polymer 2013, 54, 1820. 3 Xiong, S. X.; Wei, J.; Jia, P. T.; Yang, L. P.; Ma, J.; Lu, X. H. ACS Appl. Mater. Interfaces 2011, 3,
782. 4 Wei, H. G.; Yan, X. R.; Wu, S. J.; Luo, Z. P.; Wei, S. Y.; Guo, Z. H. J. Phys. Chem. C 2012, 116,
25052. 5 Kuilla, T.; Bhadra, S.; Yao, D. H.; Kim, N. H.; Bose, S.; Lee, J. H. Prog. Polym. Sci. 2010, 35,
1350. 6 Qi, X. Y.; Tan, C. L.; Wei, J.; Zhang, H. Nanoscale 2013, 5, 1440. 7 Potts, J. R.; Dreyer, D. R.; Bielawski, C. W.; Ruoff, R. S. Polymer 2011, 52, 5. 8 Wang, L.; Lu, X. P.; Lei, S. B.; Song, Y. H. J. Mater. Chem. A 2014, 2, 4491. 9 Lee, T.; Min, S. H.; Gu, M.; Jung, Y. K.; Lee, W.; Lee, J. U.; Seong, D. G.; Kim, B. S. Chem. Mat.
2015, 27, 3785. 10 Wei, D.; Kivioja, J. Nanoscale 2013, 5, 10108. 11 Liu, Y.; Wang, H. H.; Zhou, J.; Bian, L. Y.; Zhu, E. W.; Hai, J. F.; Tang, J.; Tang, W. H.
Electrochim. Acta 2013, 112, 44. 12 Zhou, S. P.; Zhang, H. M.; Zhao, Q.; Wang, X. H.; Li, J.; Wang, F. S. Carbon 2013, 52, 440. 13 Chu, C. Y.; Tsai, J. T.; Sun, C. L. Int. J. Hydrog. Energy 2012, 37, 13880. 14 Zhao, C.; Gai, P. P.; Liu, C. H.; Wang, X.; Xu, H.; Zhang, J. R.; Zhu, J. J. J. Mater. Chem. A 2013,
1, 12587. 15 Hou, J. X.; Liu, Z. L.; Zhang, P. Y. J. Power Sources 2013, 224, 139. 16 Wang, G. Q.; Xing, W.; Zhuo, S. P. Electrochim. Acta 2012, 66, 151. 17 Bo, Y.; Yang, H. Y.; Hu, Y.; Yao, T. M.; Huang, S. S. Electrochim. Acta 2011, 56, 2676. 18 Dong, Y. P.; Zhang, J.; Ding, Y.; Chu, X. F.; Chen, J. Electrochim. Acta 2013, 91, 240. 19 Song, Z. P.; Xu, T.; Gordin, M. L.; Jiang, Y. B.; Bae, I. T.; Xiao, Q. F.; Zhan, H.; Liu, J.; Wang, D.
H. Nano Lett. 2012, 12, 2205. 20 Chang, C. H.; Huang, T. C.; Peng, C. W.; Yeh, T. C.; Lu, H. I.; Hung, W. I.; Weng, C. J.; Yang, T.
I.; Yeh, J. M. Carbon 2012, 50, 5044. 21 Saxena, A. P.; Deepa, M.; Joshi, A. G.; Bhandari, S.; Srivastava, A. K. ACS Appl. Mater.
Interfaces 2011, 3, 1115. 22 Sheng, K. X.; Bai, H.; Sun, Y. Q.; Li, C.; Shi, G. Q. Polymer 2011, 52, 5567. 23 Lu, J. L.; Liu, W. S.; Ling, H.; Kong, J. H.; Ding, G. Q.; Zhou, D.; Lu, X. H. RSC Adv. 2012, 2,
10537. 24 Xiong, S. X.; Li, Z. F.; Gong, M.; Wang, X. Q.; Fu, J. L.; Shi, Y. J.; Wu, B. H.; Chu, J. Electrochim.
Acta 2014, 138, 101. 25 Ma, L. N.; Zhao, P.; Wu, W. J.; Niu, H. J.; Cai, J. W.; Lian, Y. F.; Bai, X. D.; Wang, W. Polym.
Chem. 2013, 4, 4746. 26 Wood, K. N.; O'Hayre, R.; Pylypenko, S. Energy Environ. Sci. 2014, 7, 1212. 27 Wang, H. B.; Xie, M. S.; Thia, L.; Fisher, A.; Wang, X. J. Phys. Chem. Lett. 2014, 5, 119. 28 Wang, H. B.; Maiyalagan, T.; Wang, X. ACS Catal. 2012, 2, 781. 29 Yang, C. H.; Chen, S. M.; Wang, T. L.; Shieh, Y. T. Electrochim. Acta 2014, 123, 268. 30 Araújo, M. unpublished work. 31 Freire, C.; de Castro, B. J. Chem. Soc.-Dalton Trans. 1998, 1491. 32 Bacsa, R. R.; Camean, I.; Ramos, A.; Garcia, A. B.; Tishkova, V.; Bacsa, W. S.; Gallagher, J. R.;
Miller, J. T.; Navas, H.; Jourdain, V.; Girleanu, M.; Ersen, O.; Serp, P. Carbon 2015, 89, 350. 33 Fonseca, J.; Tedim, J.; Biernacki, K.; Magalhaes, A. L.; Gurman, S. J.; Freire, C.; Hillman, A. R.
Electrochim. Acta 2010, 55, 7726. 34 Tedim, J.; Patricio, S.; Fonseca, J.; Magalhaes, A. L.; Moura, C.; Hillman, A. R.; Freire, C. Synth.
Met. 2011, 161, 680. 35 Beaujuge, P. M.; Reynolds, J. R. Chem. Rev. 2010, 110, 268.

FCUP Functional electroactive materials: towards novel saving and conversion energy systems
173
36 Ju, M. J.; Jeon, I. Y.; Kim, J. C.; Lim, K.; Choi, H. J.; Jung, S. M.; Choi, I. T.; Eom, Y. K.; Kwon, Y.
J.; Ko, J.; Lee, J. J.; Kim, H. K.; Baek, J. B. Adv. Mater. 2014, 26, 3055. 37 Fernandes, D. M.; Freire, C. ChemElectroChem 2015, 2, 269. 38 Ratso, S.; Kruusenberg, I.; Vikkisk, M.; Joost, U.; Shulga, E.; Kink, I.; Kallio, T.; Tammeveski, K.
Carbon 2014, 73, 361. 39 Lipinska, M. E.; Rebelo, S. L. H.; Pereira, M. F. R.; Gomes, J.; Freire, C.; Figueiredo, J. L. Carbon
2012, 50, 3280. 40 Beams, R.; Cancado, L. G.; Novotny, L. J. Phys.-Condes. Matter 2015, 27, 26. 41 Tedim, J.; Goncalves, F.; Pereira, M. F. R.; Figueiredo, J. L.; Moura, C.; Freire, C.; Hillman, A. R.
Electrochim. Acta 2008, 53, 6722. 42 Vilas-Boas, M.; Freire, C.; de Castro, B.; Christensen, P. A.; Hillman, A. R. Chem.-Eur. J. 2001, 7,
139. 43 Amb, C. M.; Dyer, A. L.; Reynolds, J. R. Chem. Mat. 2011, 23, 397.

FCUP Functional electroactive materials: towards novel saving and conversion energy systems
174

In
the lannd of eenergy--conveersion……

Su
ucrose
tr
e-deriv
ransfe
oxy
ved ac
er prop
ygen r
ctivate
perties
reduct
ed carb
s and
tion el
Cha
bons:
applic
ectroc
apter
electr
cation
catalys
r 6
ron
as
sts


6 Sucrose-derived activated carbons: electron
transfer properties and application as
oxygen reduction electrocatalysts1,2,3
Abstract
Two sustainable sucrose-based activated carbons (ACs), denominated SC800
and SH800, are applied as ORR electrocatalysts. In alkaline medium the ACs showed
similar onset potentials at Eonset ≈ -0.20 V vs. Ag/AgCl, which are 0.06 V more negative
than that observed for 20 wt% Pt/C used as reference. Higher diffusion-limiting current
densities (jL(-1.0 V, 1600 rpm) = -3.44 mA cm-2) were obtained for SH800 electrocatalyst, in
contrast to SC800 (jL(-1.0 V, 1600 rpm) = -3.04 mA cm-2); these differences can be related
with their different textural properties. Both ACs were neither selective to 2- or 4-
electron ORR processes. SH800 and SC800 showed very similar Tafel plots with two
different slopes, with SH800 showing in both low and high current densities the lowest
values 53 / 171 mV dec-1 vs. 68 / 217 mV dec-1. Furthermore, the ACs presented
excellent tolerance to methanol, with SH800 electrocatalyst also showing greater long-
term electrochemical stability than Pt/C electrocatalyst which are very important
advantages. The ACs-based electrocatalysts also showed ORR catalytic activity in
acidic medium, which makes them promising candidates for applications with acidic
electrolytes (e.g. proton exchange fuel cells). In this case, Eonset = 0.06 V vs. Ag/AgCl
for SC800 and Eonset = -0.01 V vs. Ag/AgCl for SH800, and the diffusion-limiting current
densities are very similar for both ACs (jL = -2.59/-2.76 mA cm-2 at -1.3 V vs. Ag/AgCl,
at 1600 rpm). SH800 and SC800 Tafel plots also showed two different slopes, but with
1 Adapted from: M. Nunes, I. M. Rocha, D. M. Fernandes, A. S. Mestre, C. N. Moura, A. P. Carvalho, M. F. R. Pereira,
C. Freire, Sucrose-derived activated carbons: electron transfer properties and application as oxygen reduction
electrocatalysts, RSC Adv. 2015, 5, 102919. DOI: 10.1039/c5ra20874b. Reproduced by permission of The Royal
Society of Chemistry. 2 M. Nunes’s contribution to the publication: characterisation of activated carbons by XPS, electrochemical
characterisation, evaluation of the ORR electrocatalytic activity and manuscript preparation. 3 The experimental details on the electrochemical / electrocatalytic and remaining characterisation techniques are
indicated in Appendices B and C, respectively.
FCUP Functional electroactive materials: towards novel saving and conversion energy systems
180
higher values in both low and high current density regions, when compared with those
obtained in alkaline medium; still SH800 continues to show the lowest slopes.
6.1 Introduction
Carbon-based materials, with their versatile properties, appeared as ideal metal-
free ORR electrocatalysts and have attracted a great attention.1,2 In particular, the
activated carbons have been applied with this purpose mainly due to their high surface
areas and well developed pore structures,3 which increase the number of active sites
exposed to the electrolyte and promote the ORR electrocatalytic activity.4,5,6
Unfortunately, a great number of commercial carbons are prepared from coal, a non-
renewable raw material.7 In this context, biomass emerged as a class of ideal starting
materials for the green synthesis of carbon materials, once it is earth-abundant, readily
available, cheap and environmental friendly.8,9 The hydrothermal carbonization of
biomass, via dehydration reactions in aqueous medium under mild conditions,10 allows
its conversion into valuable materials with fine tuning chemical structure and
morphology.6 The use of hydrothermal carbonization followed by activation was
recently evaluated,11 allowing to prepare superactivated carbons. The materials
obtained are carbon- and oxygen-rich, due to the nature of biomass precursors,7 which
can constitute an advantage, since the ORR electrocatalytic activity and H2O/H2O2
selectivity, could be influenced by the oxygen-containing groups.12
Numerous studies have been published, reporting the application in ORR of
carbon-based materials (undoped and doped) derived from several biomass sources,
such as carbohydrates / polysaccharides (e.g. glucose10,13-15 and chitin16,17), proteins
from silk,18,19 egg20 and blood,21 animal wastes,22,23 plants,5,6,8,24,25 fungus9 and marine
algae.4,26 Some of these materials showed excellent ORR performance (assigned
though Eonset and jL values), with catalytic activities competitive with the Pt/C
electrocatalyst, but greater stability and tolerance to methanol poisoning is still a prior
demand.4,6,26 Nevertheless, these results constitute a tremendous advantage and
encourage further studies with this type of biomass-derived materials.
In this chapter is described the application of two sustainable activated carbons
prepared from a sucrose-derived hydrochar,11,27 denoted by SC800 and SH800, as
ORR electrocatalysts. Their ORR electrocatalytic activities are explored in alkaline and
acidic media using cyclic and linear sweep voltammetry, and their stabilities and
tolerances to methanol poisoning effects in alkaline medium are also evaluated by
chronoamperometry and cyclic voltammetry, respectively. Complementary
characterisation included ACs surface chemical composition by X-ray photoelectron
FCUP Functional electroactive materials: towards novel saving and conversion energy systems
181
spectroscopy and electron transfer properties of the ACs-based modified electrodes in
the presence of selected redox probes, [Fe(CN)6]3-/4- , [Ru(NH3)6]
3+/2+ and Eu3+/2+.
Dependency between the electron transfer properties and materials C/O ratios with
multiple concurrent effects, has already been observed in studies involving graphite
oxides,28 graphene-type materials29,30 and carbon quantum dots,31 evaluating the
electrochemical response of materials in the presence of selected redox probes.
To the best of our knowledge, this is the first time that it is explored the
application of ACs metal-free ORR electrocatalysts derived from sucrose. Di Noto et.
al32-34 already presented ORR electrocatalysts whose preparation included the use of
sucrose, but the resulting materials included metallic nanoparticles (Pt, Ni and Rh)
deposited in carbon nitrides.
6.2 Experimental section
6.2.1 Reagents and solvents
All reagents used in activated carbons preparation, namely sucrose (Analar
Normapur, > 90 %), potassium carbonate (K2CO3, Aldrich, 99 %) and potassium
hydroxide (KOH, Panreac, 85 %) were used as received. Potassium chloride (KCl,
Merck, ≥ 99.5 %), potassium hexacianoferrate (III) (K3[Fe(CN)6], Merck, ≥ 99 %),
aminoruthenium (III) chloride ([Ru(NH3)6]Cl3, Aldrich, 98.0 %), europium (III) chloride
hexahydrate (EuCl3.6H2O, Aldrich, 99.9 %), potassium hydroxide (KOH, Riedel-de-
Häen), sodium sulfate (Na2SO4, Prolabo, 99.5 %), sulfuric acid (H2SO4, Merck,
95-97 %), Nafion (Aldrich, 5 wt% solution in lower aliphatic alcohols and water), ethanol
(Panreac, 99.8 %) and methanol (Fisher Scientific, > 99.99 %) were used as received.
The 20 wt% Pt/C standard catalyst was prepared by incipient wetness impregnation
method. The active metal precursor, H2PtCl6.6H2O, dissolved in water, was slowly
added to the carbon support, Printex80. During 24 hours, the sample was dried in an
oven at 373 K. The dried sample was annealed at T = 523 K, during 1 h under N2 and
reduced during 3 h under H2.
6.2.2 Preparation of materials
The sucrose-derived activated carbons were prepared by a hydrothermal
carbonization of sucrose solution followed by a chemical activation, as described in
literature.27 Briefly, 15 mL of a 1.5 mol dm-3 sucrose aqueous solution was introduced
in a Teflon-line stainless steel autoclave during 5 h at 190 ºC. The obtained powder
(hydrochar S) was washed with distilled water and acetone and dried (60 ºC). For
chemical activation, 1 g of hydrochar was impregnated under stirring on a solution with
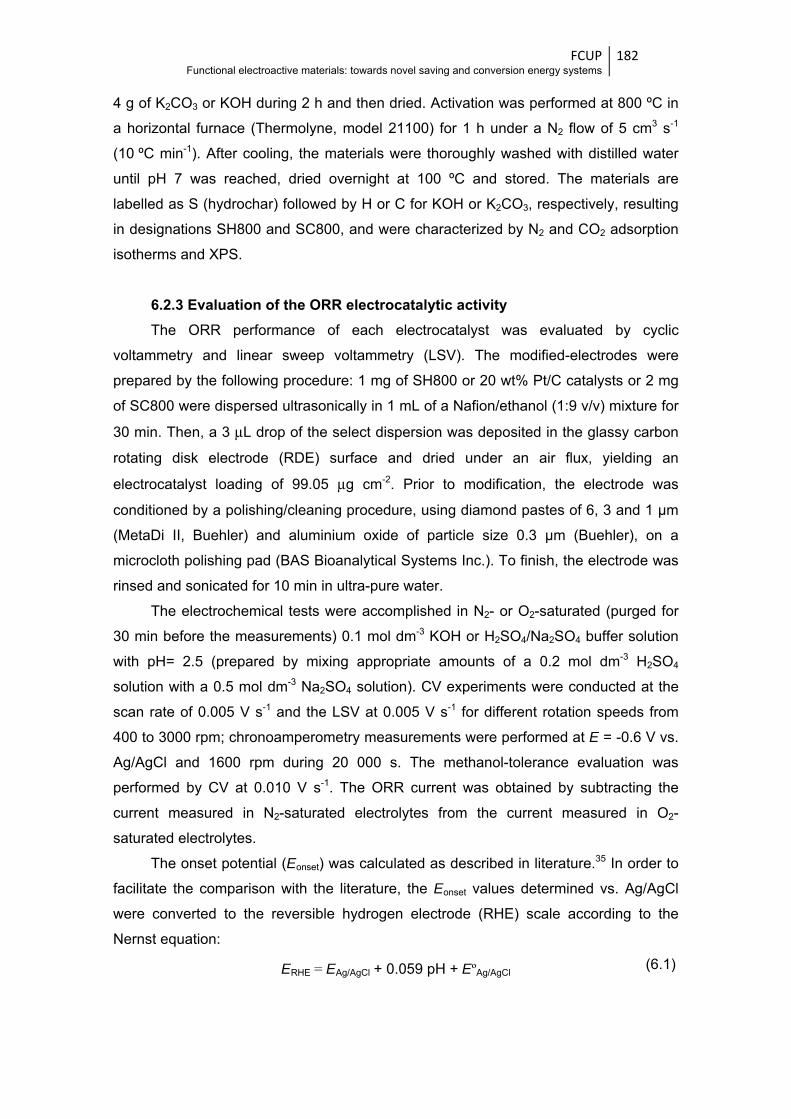
FCUP Functional electroactive materials: towards novel saving and conversion energy systems
182
4 g of K2CO3 or KOH during 2 h and then dried. Activation was performed at 800 ºC in
a horizontal furnace (Thermolyne, model 21100) for 1 h under a N2 flow of 5 cm3 s-1
(10 ºC min-1). After cooling, the materials were thoroughly washed with distilled water
until pH 7 was reached, dried overnight at 100 ºC and stored. The materials are
labelled as S (hydrochar) followed by H or C for KOH or K2CO3, respectively, resulting
in designations SH800 and SC800, and were characterized by N2 and CO2 adsorption
isotherms and XPS.
6.2.3 Evaluation of the ORR electrocatalytic activity
The ORR performance of each electrocatalyst was evaluated by cyclic
voltammetry and linear sweep voltammetry (LSV). The modified-electrodes were
prepared by the following procedure: 1 mg of SH800 or 20 wt% Pt/C catalysts or 2 mg
of SC800 were dispersed ultrasonically in 1 mL of a Nafion/ethanol (1:9 v/v) mixture for
30 min. Then, a 3 μL drop of the select dispersion was deposited in the glassy carbon
rotating disk electrode (RDE) surface and dried under an air flux, yielding an
electrocatalyst loading of 99.05 μg cm-2. Prior to modification, the electrode was
conditioned by a polishing/cleaning procedure, using diamond pastes of 6, 3 and 1 µm
(MetaDi II, Buehler) and aluminium oxide of particle size 0.3 µm (Buehler), on a
microcloth polishing pad (BAS Bioanalytical Systems Inc.). To finish, the electrode was
rinsed and sonicated for 10 min in ultra-pure water.
The electrochemical tests were accomplished in N2- or O2-saturated (purged for
30 min before the measurements) 0.1 mol dm-3 KOH or H2SO4/Na2SO4 buffer solution
with pH= 2.5 (prepared by mixing appropriate amounts of a 0.2 mol dm-3 H2SO4
solution with a 0.5 mol dm-3 Na2SO4 solution). CV experiments were conducted at the
scan rate of 0.005 V s-1 and the LSV at 0.005 V s-1 for different rotation speeds from
400 to 3000 rpm; chronoamperometry measurements were performed at E = -0.6 V vs.
Ag/AgCl and 1600 rpm during 20 000 s. The methanol-tolerance evaluation was
performed by CV at 0.010 V s-1. The ORR current was obtained by subtracting the
current measured in N2-saturated electrolytes from the current measured in O2-
saturated electrolytes.
The onset potential (Eonset) was calculated as described in literature.35 In order to
facilitate the comparison with the literature, the Eonset values determined vs. Ag/AgCl
were converted to the reversible hydrogen electrode (RHE) scale according to the
Nernst equation:
(6.1) ERHE = EAg/AgCl + 0.059 pH + EºAg/AgCl
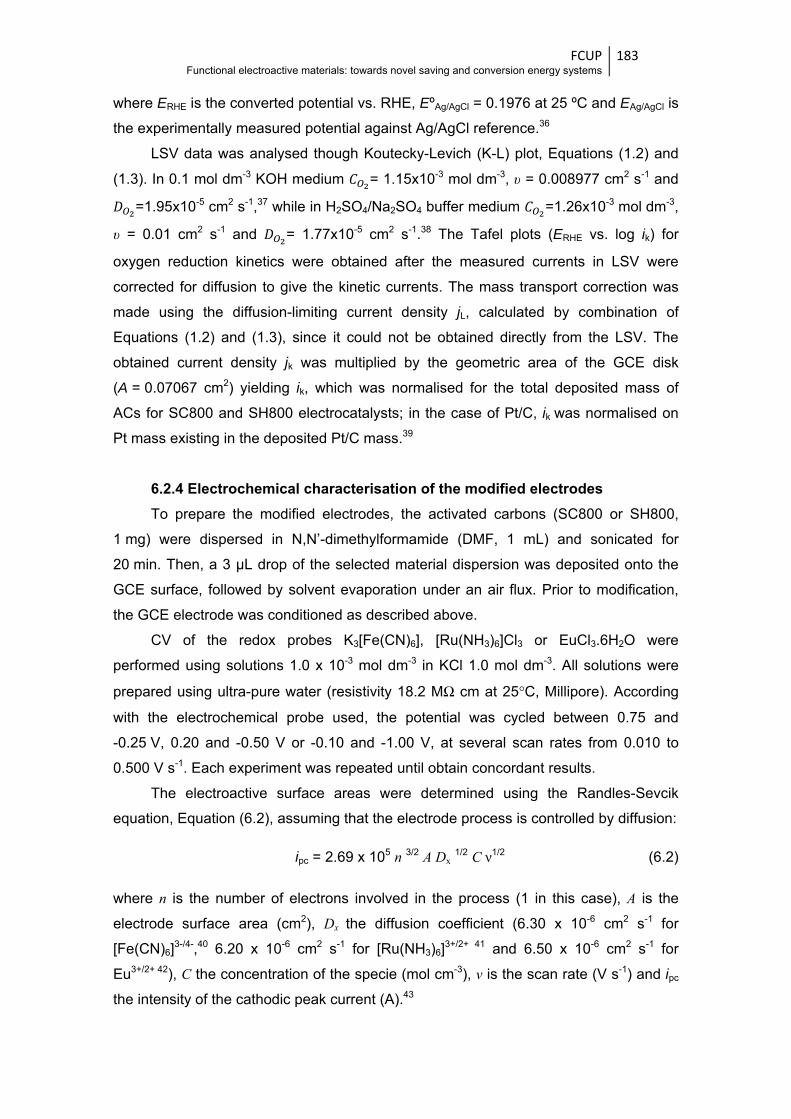
FCUP Functional electroactive materials: towards novel saving and conversion energy systems
183
where ERHE is the converted potential vs. RHE, EºAg/AgCl = 0.1976 at 25 ºC and EAg/AgCl is
the experimentally measured potential against Ag/AgCl reference.36
LSV data was analysed though Koutecky-Levich (K-L) plot, Equations (1.2) and
(1.3). In 0.1 mol dm-3 KOH medium = 1.15x10⁻³ mol dm-3, υ = 0.008977 cm2 s-1 and
=1.95x10⁻⁵ cm2 s-1,37 while in H2SO4/Na2SO4 buffer medium =1.26x10⁻³ mol dm-3,
υ = 0.01 cm2 s-1 and = 1.77x10⁻⁵ cm2 s-1.38 The Tafel plots (ERHE vs. log ik) for
oxygen reduction kinetics were obtained after the measured currents in LSV were
corrected for diffusion to give the kinetic currents. The mass transport correction was
made using the diffusion-limiting current density jL, calculated by combination of
Equations (1.2) and (1.3), since it could not be obtained directly from the LSV. The
obtained current density jk was multiplied by the geometric area of the GCE disk
(A = 0.07067 cm2) yielding ik, which was normalised for the total deposited mass of
ACs for SC800 and SH800 electrocatalysts; in the case of Pt/C, ik was normalised on
Pt mass existing in the deposited Pt/C mass.39
6.2.4 Electrochemical characterisation of the modified electrodes
To prepare the modified electrodes, the activated carbons (SC800 or SH800,
1 mg) were dispersed in N,N’-dimethylformamide (DMF, 1 mL) and sonicated for
20 min. Then, a 3 µL drop of the selected material dispersion was deposited onto the
GCE surface, followed by solvent evaporation under an air flux. Prior to modification,
the GCE electrode was conditioned as described above.
CV of the redox probes K3[Fe(CN)6], [Ru(NH3)6]Cl3 or EuCl3.6H2O were
performed using solutions 1.0 x 10⁻³ mol dm-3 in KCl 1.0 mol dm-3. All solutions were
prepared using ultra-pure water (resistivity 18.2 MΩ cm at 25°C, Millipore). According
with the electrochemical probe used, the potential was cycled between 0.75 and
-0.25 V, 0.20 and -0.50 V or -0.10 and -1.00 V, at several scan rates from 0.010 to
0.500 V s-1. Each experiment was repeated until obtain concordant results.
The electroactive surface areas were determined using the Randles-Sevcik
equation, Equation (6.2), assuming that the electrode process is controlled by diffusion:
ipc = 2.69 x 10⁵ n 3/2 A Dx 1/2 C ν1/2 (6.2)
where n is the number of electrons involved in the process (1 in this case), A is the
electrode surface area (cm2), Dx the diffusion coefficient (6.30 x 10⁻⁶ cm2 s-1 for
[Fe(CN)6]3-/4-,40 6.20 x 10⁻⁶ cm2 s-1 for [Ru(NH3)6]
3+/2+ 41 and 6.50 x 10⁻⁶ cm2 s-1 for
Eu3+/2+ 42), C the concentration of the specie (mol cm-3), v is the scan rate (V s-1) and ipc
the intensity of the cathodic peak current (A).43
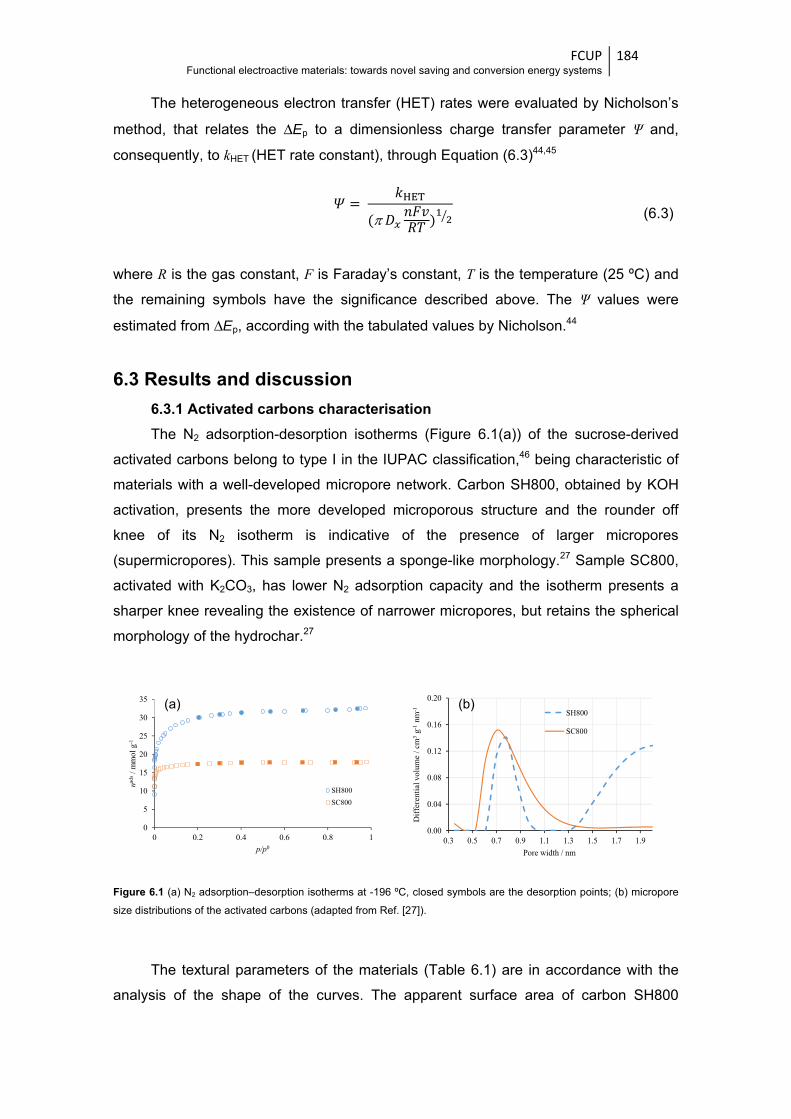
FCUP Functional electroactive materials: towards novel saving and conversion energy systems
184
The heterogeneous electron transfer (HET) rates were evaluated by Nicholson’s
method, that relates the ΔEp to a dimensionless charge transfer parameter Ψ and,
consequently, to kHET (HET rate constant), through Equation (6.3)44,45
= ( ) (6.3)
where R is the gas constant, F is Faraday’s constant, T is the temperature (25 ºC) and
the remaining symbols have the significance described above. The Ψ values were
estimated from ΔEp, according with the tabulated values by Nicholson.44
6.3 Results and discussion
6.3.1 Activated carbons characterisation
The N2 adsorption-desorption isotherms (Figure 6.1(a)) of the sucrose-derived
activated carbons belong to type I in the IUPAC classification,46 being characteristic of
materials with a well-developed micropore network. Carbon SH800, obtained by KOH
activation, presents the more developed microporous structure and the rounder off
knee of its N2 isotherm is indicative of the presence of larger micropores
(supermicropores). This sample presents a sponge-like morphology.27 Sample SC800,
activated with K2CO3, has lower N2 adsorption capacity and the isotherm presents a
sharper knee revealing the existence of narrower micropores, but retains the spherical
morphology of the hydrochar.27
Figure 6.1 (a) N2 adsorption–desorption isotherms at -196 ºC, closed symbols are the desorption points; (b) micropore
size distributions of the activated carbons (adapted from Ref. [27]).
The textural parameters of the materials (Table 6.1) are in accordance with the
analysis of the shape of the curves. The apparent surface area of carbon SH800
0
5
10
15
20
25
30
35
0 0.2 0.4 0.6 0.8 1
nads/ m
mol
g-1
p/p0
SH800SC800
(a)
0.00
0.04
0.08
0.12
0.16
0.20
0.3 0.5 0.7 0.9 1.1 1.3 1.5 1.7 1.9
Diff
eren
tial v
olum
e / c
m3
g-1nm
-1
Pore width / nm
SH800
SC800
(b)
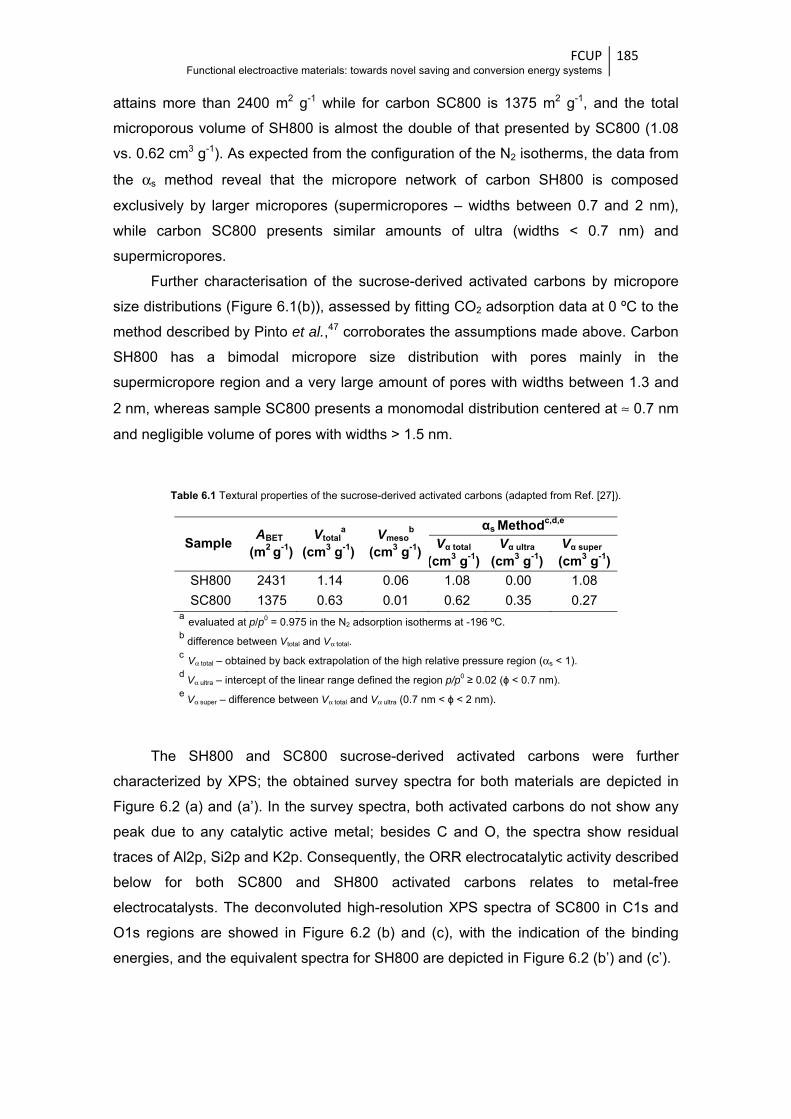
FCUP Functional electroactive materials: towards novel saving and conversion energy systems
185
attains more than 2400 m2 g-1 while for carbon SC800 is 1375 m2 g-1, and the total
microporous volume of SH800 is almost the double of that presented by SC800 (1.08
vs. 0.62 cm3 g-1). As expected from the configuration of the N2 isotherms, the data from
the αs method reveal that the micropore network of carbon SH800 is composed
exclusively by larger micropores (supermicropores – widths between 0.7 and 2 nm),
while carbon SC800 presents similar amounts of ultra (widths < 0.7 nm) and
supermicropores.
Further characterisation of the sucrose-derived activated carbons by micropore
size distributions (Figure 6.1(b)), assessed by fitting CO2 adsorption data at 0 ºC to the
method described by Pinto et al.,47 corroborates the assumptions made above. Carbon
SH800 has a bimodal micropore size distribution with pores mainly in the
supermicropore region and a very large amount of pores with widths between 1.3 and
2 nm, whereas sample SC800 presents a monomodal distribution centered at ≈ 0.7 nm
and negligible volume of pores with widths > 1.5 nm.
Table 6.1 Textural properties of the sucrose-derived activated carbons (adapted from Ref. [27]).
Sample ABET
(m2 g
-1) Vtotal
a
(cm3 g-1) Vmeso
b
(cm3 g-1)
αs Methodc,d,e Vα total
(cm3 g-1)Vα ultra
(cm3 g-1) Vα super
(cm3 g-1) SH800 2431 1.14 0.06 1.08 0.00 1.08
SC800 1375 0.63 0.01 0.62 0.35 0.27 a evaluated at p/p0 = 0.975 in the N2 adsorption isotherms at -196 ºC. b difference between Vtotal and Vα total.
c Vα total – obtained by back extrapolation of the high relative pressure region (αs < 1). d Vα ultra – intercept of the linear range defined the region p/p0 ≥ 0.02 (ϕ < 0.7 nm).
e Vα super – difference between Vα total and Vα ultra (0.7 nm < ϕ < 2 nm).
The SH800 and SC800 sucrose-derived activated carbons were further
characterized by XPS; the obtained survey spectra for both materials are depicted in
Figure 6.2 (a) and (a’). In the survey spectra, both activated carbons do not show any
peak due to any catalytic active metal; besides C and O, the spectra show residual
traces of Al2p, Si2p and K2p. Consequently, the ORR electrocatalytic activity described
below for both SC800 and SH800 activated carbons relates to metal-free
electrocatalysts. The deconvoluted high-resolution XPS spectra of SC800 in C1s and
O1s regions are showed in Figure 6.2 (b) and (c), with the indication of the binding
energies, and the equivalent spectra for SH800 are depicted in Figure 6.2 (b’) and (c’).
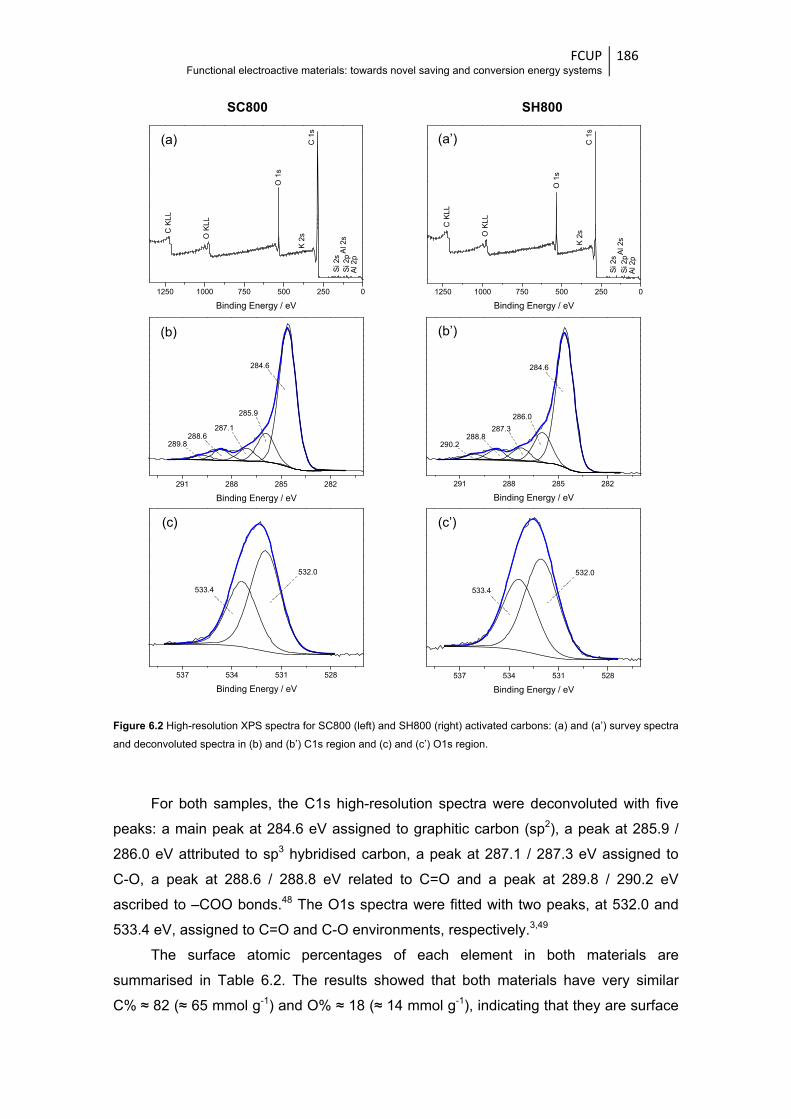
FCUP Functional electroactive materials: towards novel saving and conversion energy systems
186
Figure 6.2 High-resolution XPS spectra for SC800 (left) and SH800 (right) activated carbons: (a) and (a’) survey spectra
and deconvoluted spectra in (b) and (b’) C1s region and (c) and (c’) O1s region.
For both samples, the C1s high-resolution spectra were deconvoluted with five
peaks: a main peak at 284.6 eV assigned to graphitic carbon (sp2), a peak at 285.9 /
286.0 eV attributed to sp3 hybridised carbon, a peak at 287.1 / 287.3 eV assigned to
C-O, a peak at 288.6 / 288.8 eV related to C=O and a peak at 289.8 / 290.2 eV
ascribed to –COO bonds.48 The O1s spectra were fitted with two peaks, at 532.0 and
533.4 eV, assigned to C=O and C-O environments, respectively.3,49
The surface atomic percentages of each element in both materials are
summarised in Table 6.2. The results showed that both materials have very similar
C% ≈ 82 (≈ 65 mmol g-1) and O% ≈ 18 (≈ 14 mmol g-1), indicating that they are surface
SC800 SH800
1250 1000 750 500 250 0
Al 2
p
Al 2
sS
i 2p
Si 2
s
K 2
sC
1s
O 1
s
O K
LL
Binding Energy / eV
C K
LL
1250 1000 750 500 250 0
Binding Energy / eV
C K
LL
O K
LL
O 1
s
K 2
sC
1s
Si 2
sA
l 2s
Si 2
pA
l 2p
291 288 285 282
288.6287.1
285.9
289.8
Binding Energy / eV
284.6
537 534 531 528
533.4
532.0
Binding Energy / eV
291 288 285 282
288.8287.3
286.0
290.2
Binding Energy / eV
284.6
537 534 531 528
533.4
532.0
Binding Energy / eV
(a)
(b)
(c)
(a’)
(b’)
(c’)

FCUP Functional electroactive materials: towards novel saving and conversion energy systems
187
enriched in oxygen-containing groups. For SC800, C% is similar to the compositional
data provided by the elemental analysis previously published (81.2 wt% of C,
67.6 mmol g-1)11 while, for SH800, the C% obtained by XPS is higher than the reported
by elemental analysis (74.5 wt%, 62.0 mmol g-1),11 suggesting for the latter material
inhomogeneity between the carbon and oxygen bulk and surface compositions.
Table 6.2 XPS atomic percentages for SC800 and SH800.
Sample Atomic % (mmol g-1)a
C 1s O 1s
SC800 82.3 (64.8) 17.7 (13.9)
SH800 82.8 (65.2) 17.2 (13.5) a Calculated through: mass C (or O) / mass of sample (calculated from
the XPS data) = at.% C 1s (or O 1s) / [(at.% C 1s x atomic mass C) + (at.% O 1s x atomic mass O)].
6.3.2 Electrocatalytic activity for ORR
LSV measurements with rotating disk electrode (RDE) were performed to
investigate the ORR performances of the prepared activated carbons electrocatalysts.
The ORR activities were tested in alkaline (0.1 mol dm-3 KOH) and acidic
(H2SO4/Na2SO4 buffer solution, pH 2.5) media. For comparison, the standard 20 wt%
Pt/C was also measured in ORR. The results obtained in alkaline medium are depicted
in Figure 6.3.
Figure 6.3 (a) presents the CVs obtained for SC800 and SH800 modified
electrodes in N2- and O2- saturated solutions. In N2-saturated solution no
electrochemical processes are observed, while in O2-saturated solution all materials
exhibited an irreversible electrochemical process indicative of their electrocatalytic
activity for ORR. The SC800 modified electrode showed two cathodic peaks, at
Epc = -0.26 and Epc = -0.44 V vs. Ag/AgCl (0.70 and 0.52 V vs. ERHE, respectively), and
the SH800 showed only one defined cathodic peak, at Epc = -0.28 V vs. Ag/AgCl
(0.68 V vs. ERHE).
Figure 6.3 (b) shows the ORR polarisation plots of the prepared catalysts, the
20 wt% Pt/C and the bare GCE. The RDE voltammograms for the ORR on individual
bare GCE and SC800, SH800 and Pt/C modified electrodes, at rotation rates from 400
to 3000 rpm, are depicted in Figure 6.4. Both activated carbons-based electrocatalysts
showed similar onset potentials (Eonset = -0.19 and -0.20 V vs. Ag/AgCl (0.77 and
0.76 V vs. ERHE) for SC800 and SH800, respectively), but higher diffusion-limiting
current densities (jL(-1.0 V, 1600 rpm) = -3.44 mA cm-2) were obtained for SH800
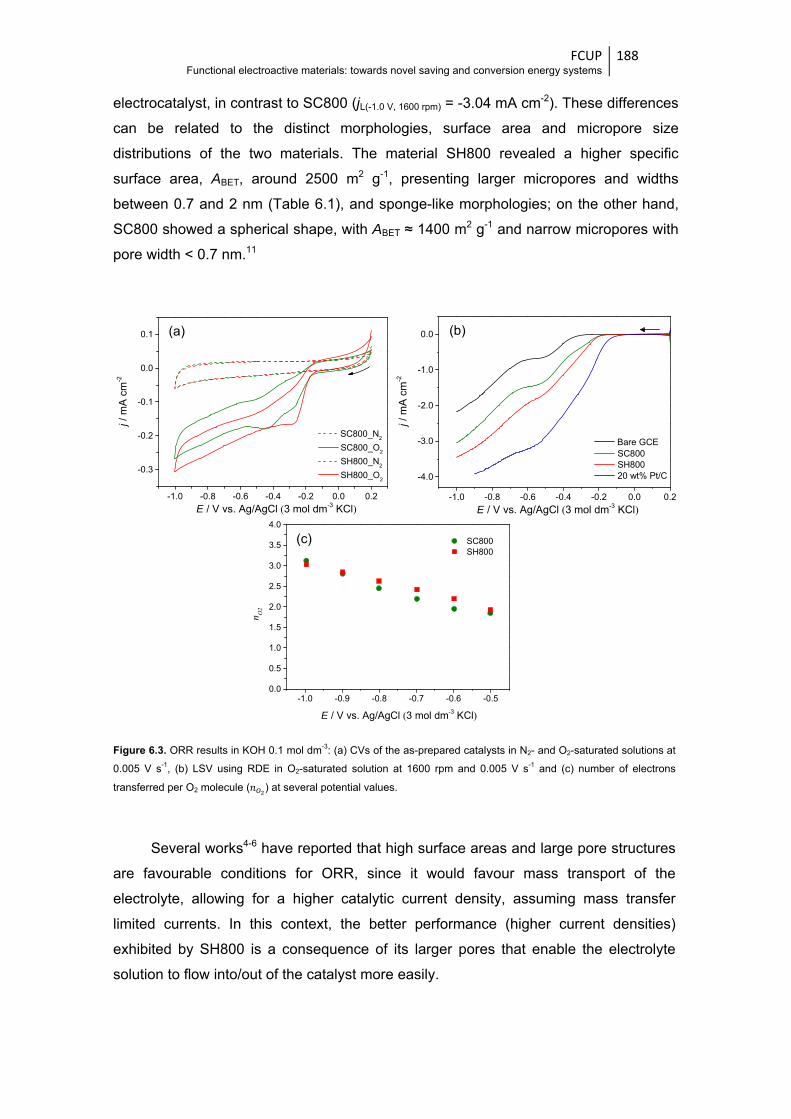
FCUP Functional electroactive materials: towards novel saving and conversion energy systems
188
electrocatalyst, in contrast to SC800 (jL(-1.0 V, 1600 rpm) = -3.04 mA cm-2). These differences
can be related to the distinct morphologies, surface area and micropore size
distributions of the two materials. The material SH800 revealed a higher specific
surface area, ABET, around 2500 m2 g-1, presenting larger micropores and widths
between 0.7 and 2 nm (Table 6.1), and sponge-like morphologies; on the other hand,
SC800 showed a spherical shape, with ABET ≈ 1400 m2 g-1 and narrow micropores with
pore width < 0.7 nm.11
Figure 6.3. ORR results in KOH 0.1 mol dm-3: (a) CVs of the as-prepared catalysts in N2- and O2-saturated solutions at
0.005 V s-1, (b) LSV using RDE in O2-saturated solution at 1600 rpm and 0.005 V s-1 and (c) number of electrons
transferred per O2 molecule ( ) at several potential values.
Several works4-6 have reported that high surface areas and large pore structures
are favourable conditions for ORR, since it would favour mass transport of the
electrolyte, allowing for a higher catalytic current density, assuming mass transfer
limited currents. In this context, the better performance (higher current densities)
exhibited by SH800 is a consequence of its larger pores that enable the electrolyte
solution to flow into/out of the catalyst more easily.
-1.0 -0.8 -0.6 -0.4 -0.2 0.0 0.2
-0.3
-0.2
-0.1
0.0
0.1
SC800_N2
SC800_O2
SH800_N2
SH800_O2
j / m
A c
m-2
E / V vs. Ag/AgCl (3 mol dm-3 KCl)-1.0 -0.8 -0.6 -0.4 -0.2 0.0 0.2
-4.0
-3.0
-2.0
-1.0
0.0
Bare GCE SC800 SH800 20 wt% Pt/C
j /
mA
cm
-2
E / V vs. Ag/AgCl (3 mol dm-3 KCl)
-1.0 -0.9 -0.8 -0.7 -0.6 -0.50.0
0.5
1.0
1.5
2.0
2.5
3.0
3.5
4.0
SC800 SH800
E / V vs. Ag/AgCl (3 mol dm-3 KCl)
n O2
(a) (b)
(c)
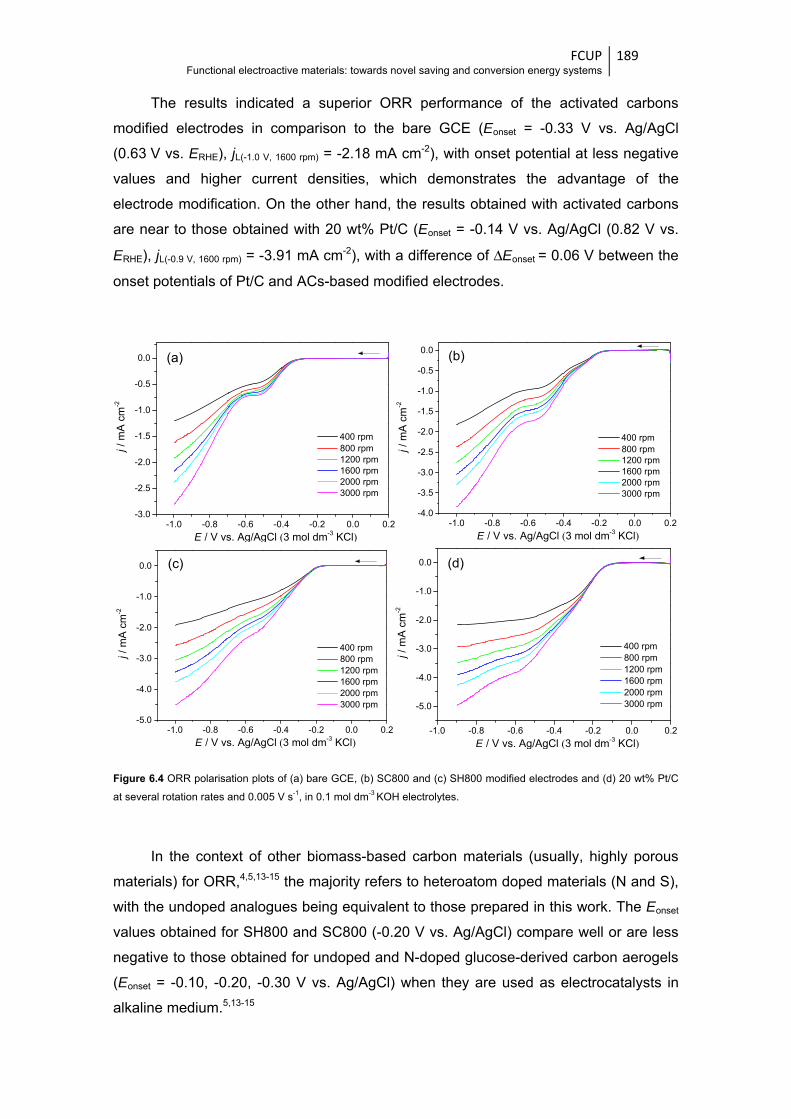
FCUP Functional electroactive materials: towards novel saving and conversion energy systems
189
The results indicated a superior ORR performance of the activated carbons
modified electrodes in comparison to the bare GCE (Eonset = -0.33 V vs. Ag/AgCl
(0.63 V vs. ERHE), jL(-1.0 V, 1600 rpm) = -2.18 mA cm-2), with onset potential at less negative
values and higher current densities, which demonstrates the advantage of the
electrode modification. On the other hand, the results obtained with activated carbons
are near to those obtained with 20 wt% Pt/C (Eonset = -0.14 V vs. Ag/AgCl (0.82 V vs.
ERHE), jL(-0.9 V, 1600 rpm) = -3.91 mA cm-2), with a difference of ΔEonset = 0.06 V between the
onset potentials of Pt/C and ACs-based modified electrodes.
Figure 6.4 ORR polarisation plots of (a) bare GCE, (b) SC800 and (c) SH800 modified electrodes and (d) 20 wt% Pt/C
at several rotation rates and 0.005 V s-1, in 0.1 mol dm-3 KOH electrolytes.
In the context of other biomass-based carbon materials (usually, highly porous
materials) for ORR,4,5,13-15 the majority refers to heteroatom doped materials (N and S),
with the undoped analogues being equivalent to those prepared in this work. The Eonset
values obtained for SH800 and SC800 (-0.20 V vs. Ag/AgCl) compare well or are less
negative to those obtained for undoped and N-doped glucose-derived carbon aerogels
(Eonset = -0.10, -0.20, -0.30 V vs. Ag/AgCl) when they are used as electrocatalysts in
alkaline medium.5,13-15
-1.0 -0.8 -0.6 -0.4 -0.2 0.0 0.2-3.0
-2.5
-2.0
-1.5
-1.0
-0.5
0.0
400 rpm 800 rpm 1200 rpm 1600 rpm 2000 rpm 3000 rpm
j /
mA
cm
-2
E / V vs. Ag/AgCl (3 mol dm-3 KCl)-1.0 -0.8 -0.6 -0.4 -0.2 0.0 0.2
-4.0
-3.5
-3.0
-2.5
-2.0
-1.5
-1.0
-0.5
0.0
400 rpm 800 rpm 1200 rpm 1600 rpm 2000 rpm 3000 rpm
j /
mA
cm
-2
E / V vs. Ag/AgCl (3 mol dm-3 KCl)
-1.0 -0.8 -0.6 -0.4 -0.2 0.0 0.2-5.0
-4.0
-3.0
-2.0
-1.0
0.0
400 rpm 800 rpm 1200 rpm 1600 rpm 2000 rpm 3000 rpm
j / m
A c
m-2
E / V vs. Ag/AgCl (3 mol dm-3 KCl)-1.0 -0.8 -0.6 -0.4 -0.2 0.0 0.2
-5.0
-4.0
-3.0
-2.0
-1.0
0.0
400 rpm 800 rpm 1200 rpm 1600 rpm 2000 rpm 3000 rpm
j /
mA
cm
-2
E / V vs. Ag/AgCl (3 mol dm-3 KCl)
(c) (d)
(a) (b)
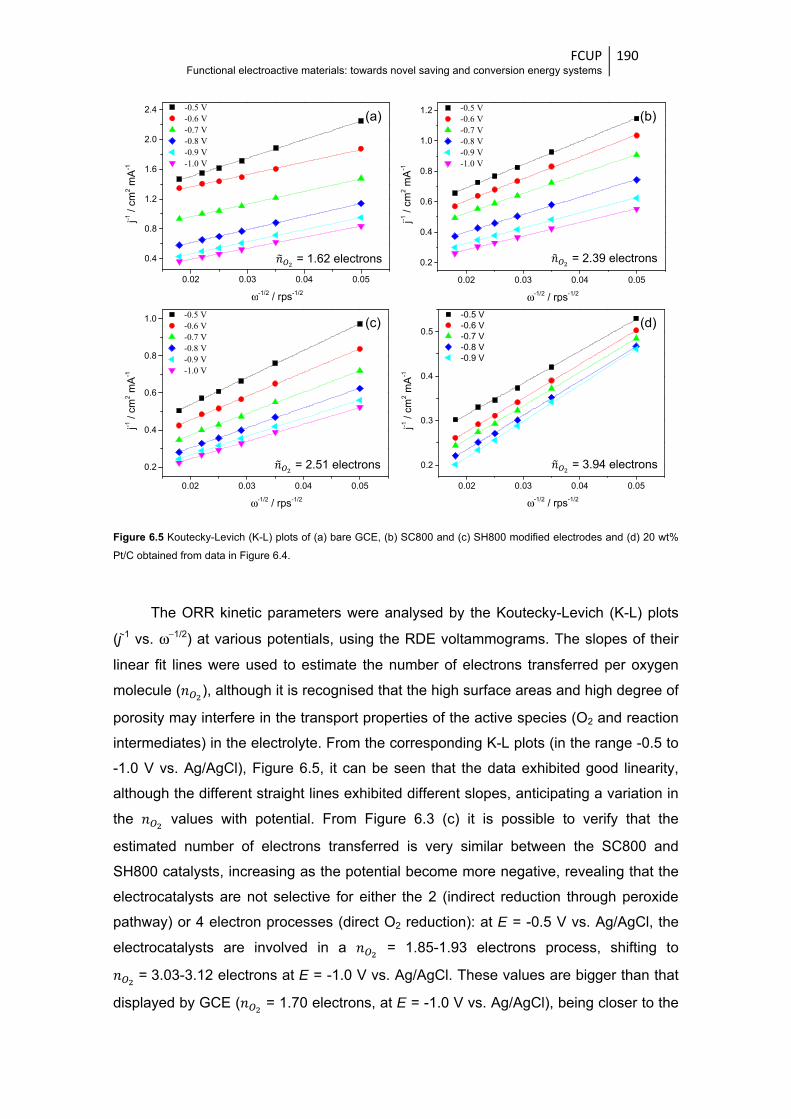
FCUP Functional electroactive materials: towards novel saving and conversion energy systems
190
Figure 6.5 Koutecky-Levich (K-L) plots of (a) bare GCE, (b) SC800 and (c) SH800 modified electrodes and (d) 20 wt%
Pt/C obtained from data in Figure 6.4.
The ORR kinetic parameters were analysed by the Koutecky-Levich (K-L) plots
(j-1 vs. ω−1/2) at various potentials, using the RDE voltammograms. The slopes of their
linear fit lines were used to estimate the number of electrons transferred per oxygen
molecule ( ), although it is recognised that the high surface areas and high degree of
porosity may interfere in the transport properties of the active species (O2 and reaction
intermediates) in the electrolyte. From the corresponding K-L plots (in the range -0.5 to
-1.0 V vs. Ag/AgCl), Figure 6.5, it can be seen that the data exhibited good linearity,
although the different straight lines exhibited different slopes, anticipating a variation in
the values with potential. From Figure 6.3 (c) it is possible to verify that the
estimated number of electrons transferred is very similar between the SC800 and
SH800 catalysts, increasing as the potential become more negative, revealing that the
electrocatalysts are not selective for either the 2 (indirect reduction through peroxide
pathway) or 4 electron processes (direct O2 reduction): at E = -0.5 V vs. Ag/AgCl, the
electrocatalysts are involved in a = 1.85-1.93 electrons process, shifting to
= 3.03-3.12 electrons at E = -1.0 V vs. Ag/AgCl. These values are bigger than that
displayed by GCE ( = 1.70 electrons, at E = -1.0 V vs. Ag/AgCl), being closer to the
0.02 0.03 0.04 0.05
0.4
0.8
1.2
1.6
2.0
2.4 -0.5 V -0.6 V -0.7 V -0.8 V -0.9 V -1.0 V
ω-1/2 / rps-1/2
j-1 /
cm2 m
A-1
0.02 0.03 0.04 0.05
0.2
0.4
0.6
0.8
1.0
1.2 -0.5 V -0.6 V -0.7 V -0.8 V -0.9 V -1.0 V
ω-1/2 / rps-1/2
j-1 /
cm2 m
A-1
0.02 0.03 0.04 0.05
0.2
0.4
0.6
0.8
1.0 -0.5 V -0.6 V -0.7 V -0.8 V -0.9 V -1.0 V
ω-1/2 / rps-1/2
j-1 /
cm2 m
A-1
0.02 0.03 0.04 0.05
0.2
0.3
0.4
0.5
-0.5 V -0.6 V -0.7 V -0.8 V -0.9 V
ω-1/2 / rps-1/2
j-1 /
cm
2 mA
-1
(a) (b)
(c) (d)
= 1.62 electrons = 2.39 electrons
= 2.51 electrons = 3.94 electrons
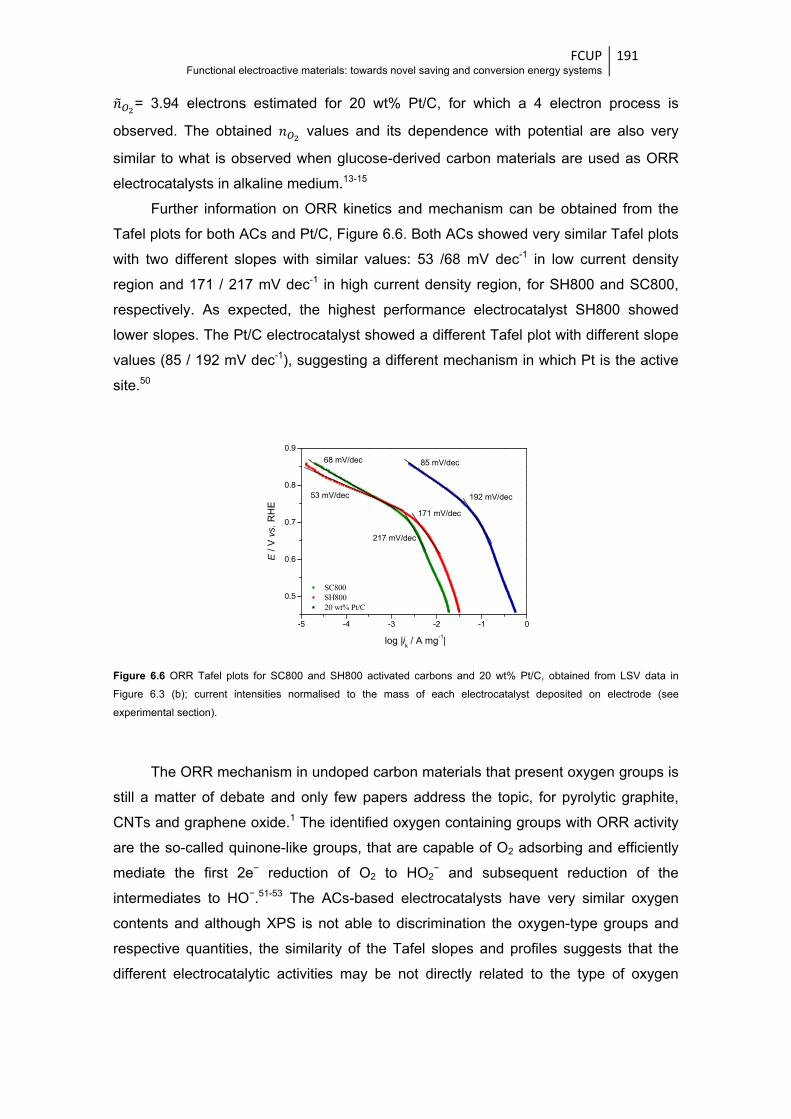
FCUP Functional electroactive materials: towards novel saving and conversion energy systems
191
= 3.94 electrons estimated for 20 wt% Pt/C, for which a 4 electron process is
observed. The obtained values and its dependence with potential are also very
similar to what is observed when glucose-derived carbon materials are used as ORR
electrocatalysts in alkaline medium.13-15
Further information on ORR kinetics and mechanism can be obtained from the
Tafel plots for both ACs and Pt/C, Figure 6.6. Both ACs showed very similar Tafel plots
with two different slopes with similar values: 53 /68 mV dec-1 in low current density
region and 171 / 217 mV dec-1 in high current density region, for SH800 and SC800,
respectively. As expected, the highest performance electrocatalyst SH800 showed
lower slopes. The Pt/C electrocatalyst showed a different Tafel plot with different slope
values (85 / 192 mV dec-1), suggesting a different mechanism in which Pt is the active
site.50
Figure 6.6 ORR Tafel plots for SC800 and SH800 activated carbons and 20 wt% Pt/C, obtained from LSV data in
Figure 6.3 (b); current intensities normalised to the mass of each electrocatalyst deposited on electrode (see
experimental section).
The ORR mechanism in undoped carbon materials that present oxygen groups is
still a matter of debate and only few papers address the topic, for pyrolytic graphite,
CNTs and graphene oxide.1 The identified oxygen containing groups with ORR activity
are the so-called quinone-like groups, that are capable of O2 adsorbing and efficiently
mediate the first 2e− reduction of O2 to HO2− and subsequent reduction of the
intermediates to HO−.51-53 The ACs-based electrocatalysts have very similar oxygen
contents and although XPS is not able to discrimination the oxygen-type groups and
respective quantities, the similarity of the Tafel slopes and profiles suggests that the
different electrocatalytic activities may be not directly related to the type of oxygen
-5 -4 -3 -2 -1 0
0.5
0.6
0.7
0.8
0.9
SC800 SH800 20 wt% Pt/C
217 mV/dec
68 mV/dec
E /
V v
s. R
HE
171 mV/dec
53 mV/dec
log |ik / A mg-1|
85 mV/dec
192 mV/dec
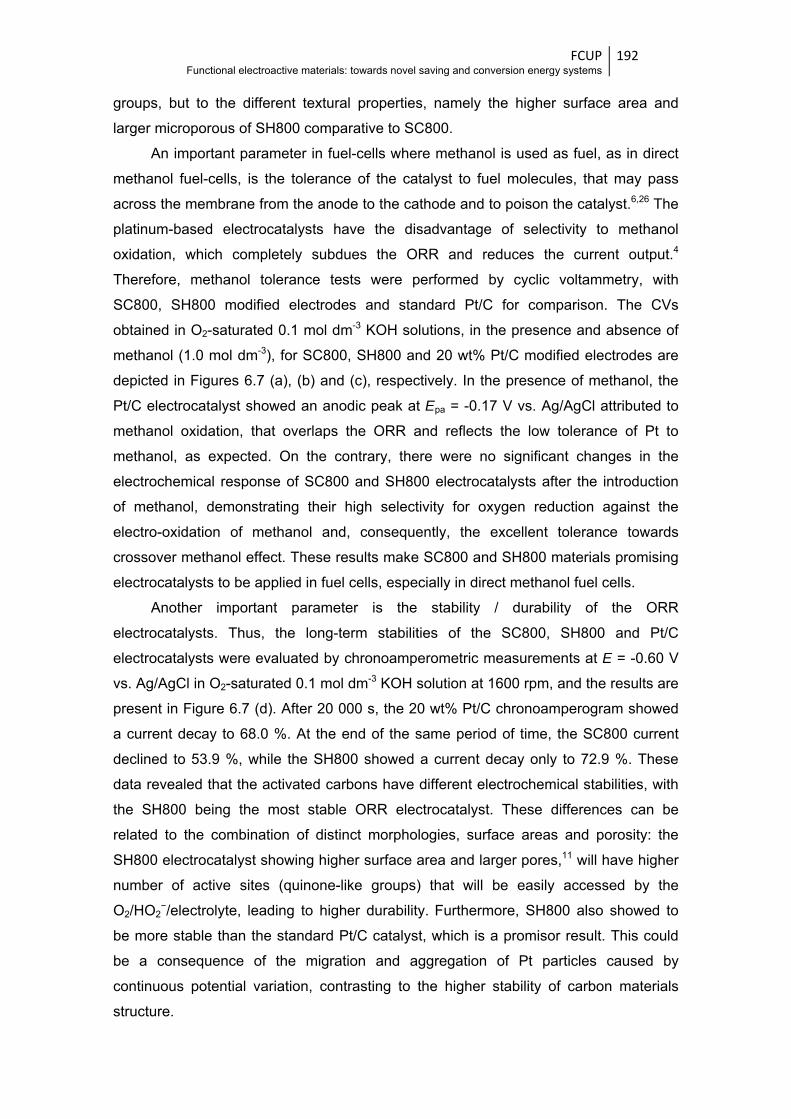
FCUP Functional electroactive materials: towards novel saving and conversion energy systems
192
groups, but to the different textural properties, namely the higher surface area and
larger microporous of SH800 comparative to SC800.
An important parameter in fuel-cells where methanol is used as fuel, as in direct
methanol fuel-cells, is the tolerance of the catalyst to fuel molecules, that may pass
across the membrane from the anode to the cathode and to poison the catalyst.6,26 The
platinum-based electrocatalysts have the disadvantage of selectivity to methanol
oxidation, which completely subdues the ORR and reduces the current output.4
Therefore, methanol tolerance tests were performed by cyclic voltammetry, with
SC800, SH800 modified electrodes and standard Pt/C for comparison. The CVs
obtained in O2-saturated 0.1 mol dm-3 KOH solutions, in the presence and absence of
methanol (1.0 mol dm-3), for SC800, SH800 and 20 wt% Pt/C modified electrodes are
depicted in Figures 6.7 (a), (b) and (c), respectively. In the presence of methanol, the
Pt/C electrocatalyst showed an anodic peak at Epa = -0.17 V vs. Ag/AgCl attributed to
methanol oxidation, that overlaps the ORR and reflects the low tolerance of Pt to
methanol, as expected. On the contrary, there were no significant changes in the
electrochemical response of SC800 and SH800 electrocatalysts after the introduction
of methanol, demonstrating their high selectivity for oxygen reduction against the
electro-oxidation of methanol and, consequently, the excellent tolerance towards
crossover methanol effect. These results make SC800 and SH800 materials promising
electrocatalysts to be applied in fuel cells, especially in direct methanol fuel cells.
Another important parameter is the stability / durability of the ORR
electrocatalysts. Thus, the long-term stabilities of the SC800, SH800 and Pt/C
electrocatalysts were evaluated by chronoamperometric measurements at E = -0.60 V
vs. Ag/AgCl in O2-saturated 0.1 mol dm-3 KOH solution at 1600 rpm, and the results are
present in Figure 6.7 (d). After 20 000 s, the 20 wt% Pt/C chronoamperogram showed
a current decay to 68.0 %. At the end of the same period of time, the SC800 current
declined to 53.9 %, while the SH800 showed a current decay only to 72.9 %. These
data revealed that the activated carbons have different electrochemical stabilities, with
the SH800 being the most stable ORR electrocatalyst. These differences can be
related to the combination of distinct morphologies, surface areas and porosity: the
SH800 electrocatalyst showing higher surface area and larger pores,11 will have higher
number of active sites (quinone-like groups) that will be easily accessed by the
O2/HO2−/electrolyte, leading to higher durability. Furthermore, SH800 also showed to
be more stable than the standard Pt/C catalyst, which is a promisor result. This could
be a consequence of the migration and aggregation of Pt particles caused by
continuous potential variation, contrasting to the higher stability of carbon materials
structure.
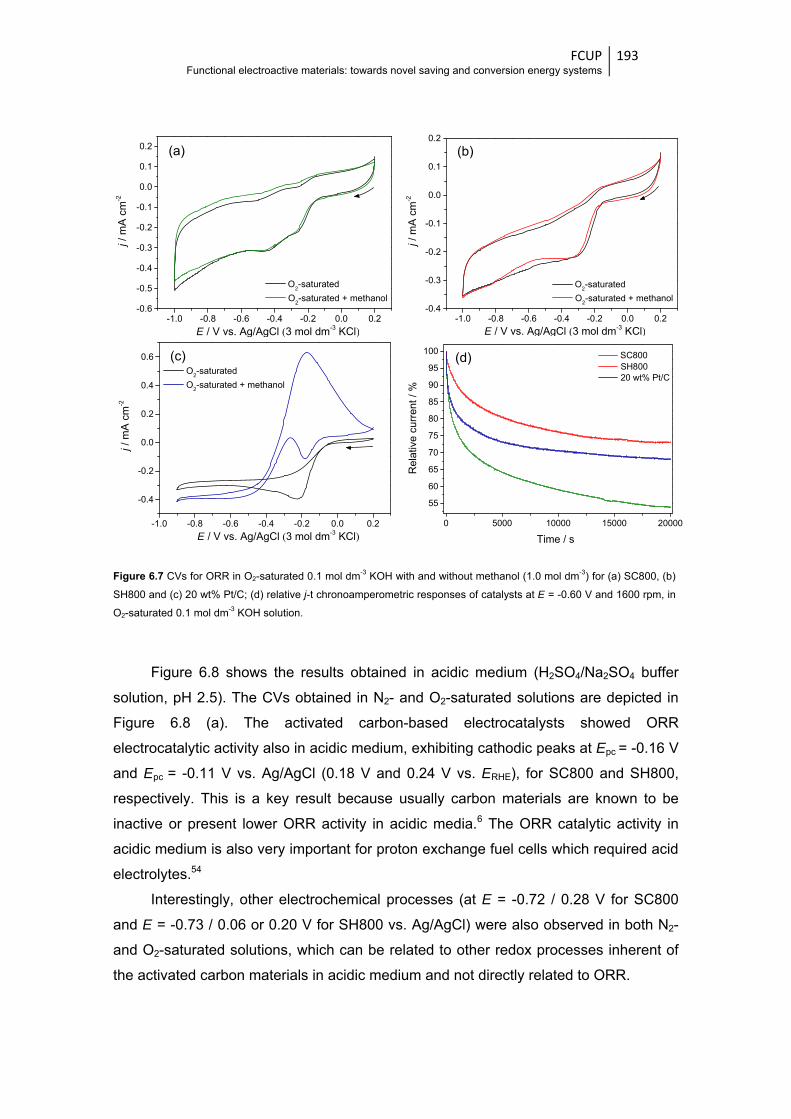
FCUP Functional electroactive materials: towards novel saving and conversion energy systems
193
Figure 6.7 CVs for ORR in O2-saturated 0.1 mol dm-3 KOH with and without methanol (1.0 mol dm-3) for (a) SC800, (b)
SH800 and (c) 20 wt% Pt/C; (d) relative j-t chronoamperometric responses of catalysts at E = -0.60 V and 1600 rpm, in
O2-saturated 0.1 mol dm-3 KOH solution.
Figure 6.8 shows the results obtained in acidic medium (H2SO4/Na2SO4 buffer
solution, pH 2.5). The CVs obtained in N2- and O2-saturated solutions are depicted in
Figure 6.8 (a). The activated carbon-based electrocatalysts showed ORR
electrocatalytic activity also in acidic medium, exhibiting cathodic peaks at Epc = -0.16 V
and Epc = -0.11 V vs. Ag/AgCl (0.18 V and 0.24 V vs. ERHE), for SC800 and SH800,
respectively. This is a key result because usually carbon materials are known to be
inactive or present lower ORR activity in acidic media.6 The ORR catalytic activity in
acidic medium is also very important for proton exchange fuel cells which required acid
electrolytes.54
Interestingly, other electrochemical processes (at E = -0.72 / 0.28 V for SC800
and E = -0.73 / 0.06 or 0.20 V for SH800 vs. Ag/AgCl) were also observed in both N2-
and O2-saturated solutions, which can be related to other redox processes inherent of
the activated carbon materials in acidic medium and not directly related to ORR.
-1.0 -0.8 -0.6 -0.4 -0.2 0.0 0.2-0.6
-0.5
-0.4
-0.3
-0.2
-0.1
0.0
0.1
0.2
O2-saturated
O2-saturated + methanol
j /
mA
cm
-2
E / V vs. Ag/AgCl (3 mol dm-3 KCl)-1.0 -0.8 -0.6 -0.4 -0.2 0.0 0.2
-0.4
-0.3
-0.2
-0.1
0.0
0.1
0.2
O2-saturated
O2-saturated + methanol
j /
mA
cm
-2
E / V vs. Ag/AgCl (3 mol dm-3 KCl)
-1.0 -0.8 -0.6 -0.4 -0.2 0.0 0.2
-0.4
-0.2
0.0
0.2
0.4
0.6
O2-saturated
O2-saturated + methanol
j / m
A c
m-2
E / V vs. Ag/AgCl (3 mol dm-3 KCl)0 5000 10000 15000 20000
55
60
65
70
75
80
85
90
95
100 SC800 SH800 20 wt% Pt/C
Rel
ativ
e cu
rren
t / %
Time / s
(a) (b)
(c) (d)
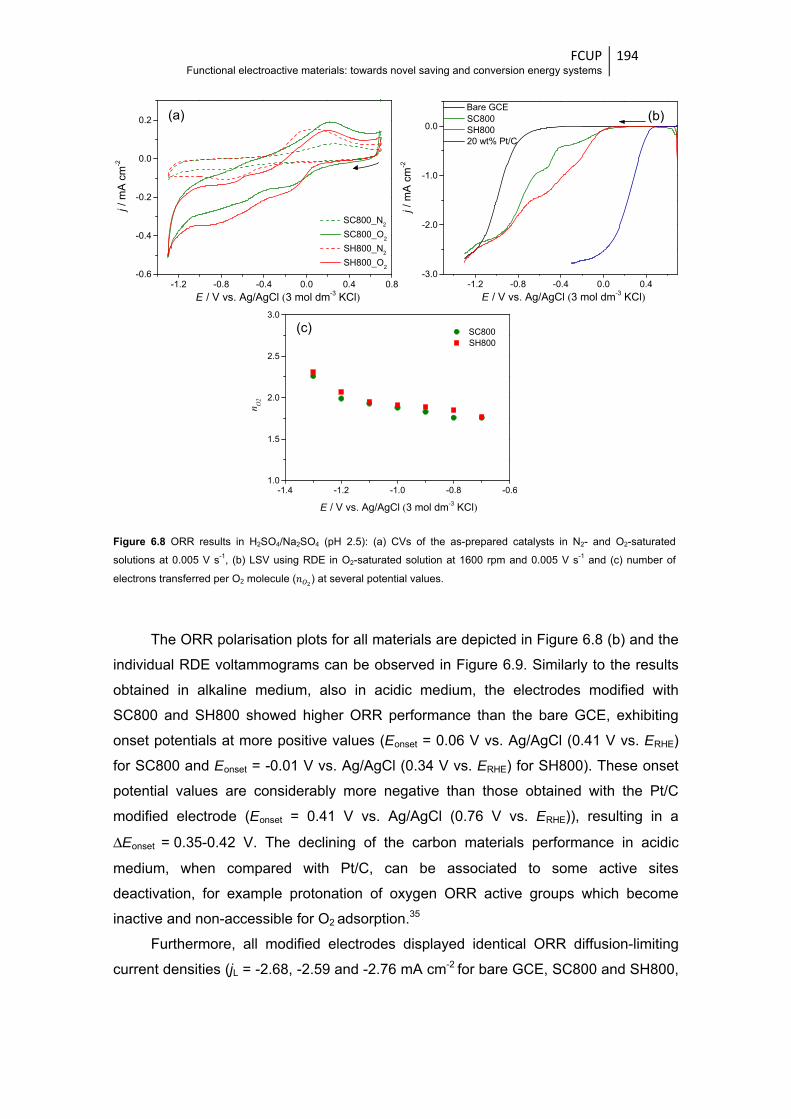
FCUP Functional electroactive materials: towards novel saving and conversion energy systems
194
Figure 6.8 ORR results in H2SO4/Na2SO4 (pH 2.5): (a) CVs of the as-prepared catalysts in N2- and O2-saturated
solutions at 0.005 V s-1, (b) LSV using RDE in O2-saturated solution at 1600 rpm and 0.005 V s-1 and (c) number of
electrons transferred per O2 molecule ( ) at several potential values.
The ORR polarisation plots for all materials are depicted in Figure 6.8 (b) and the
individual RDE voltammograms can be observed in Figure 6.9. Similarly to the results
obtained in alkaline medium, also in acidic medium, the electrodes modified with
SC800 and SH800 showed higher ORR performance than the bare GCE, exhibiting
onset potentials at more positive values (Eonset = 0.06 V vs. Ag/AgCl (0.41 V vs. ERHE)
for SC800 and Eonset = -0.01 V vs. Ag/AgCl (0.34 V vs. ERHE) for SH800). These onset
potential values are considerably more negative than those obtained with the Pt/C
modified electrode (Eonset = 0.41 V vs. Ag/AgCl (0.76 V vs. ERHE)), resulting in a
ΔEonset = 0.35-0.42 V. The declining of the carbon materials performance in acidic
medium, when compared with Pt/C, can be associated to some active sites
deactivation, for example protonation of oxygen ORR active groups which become
inactive and non-accessible for O2 adsorption.35
Furthermore, all modified electrodes displayed identical ORR diffusion-limiting
current densities (jL = -2.68, -2.59 and -2.76 mA cm-2 for bare GCE, SC800 and SH800,
-1.2 -0.8 -0.4 0.0 0.4 0.8-0.6
-0.4
-0.2
0.0
0.2
SC800_N2
SC800_O2
SH800_N2
SH800_O2
j /
mA
cm
-2
E / V vs. Ag/AgCl (3 mol dm-3 KCl)
-1.2 -0.8 -0.4 0.0 0.4-3.0
-2.0
-1.0
0.0
Bare GCE SC800 SH800 20 wt% Pt/C
j /
mA
cm
-2
E / V vs. Ag/AgCl (3 mol dm-3 KCl)
-1.4 -1.2 -1.0 -0.8 -0.61.0
1.5
2.0
2.5
3.0
SC800 SH800
E / V vs. Ag/AgCl (3 mol dm-3 KCl)
n O2
(a) (b)
(c)
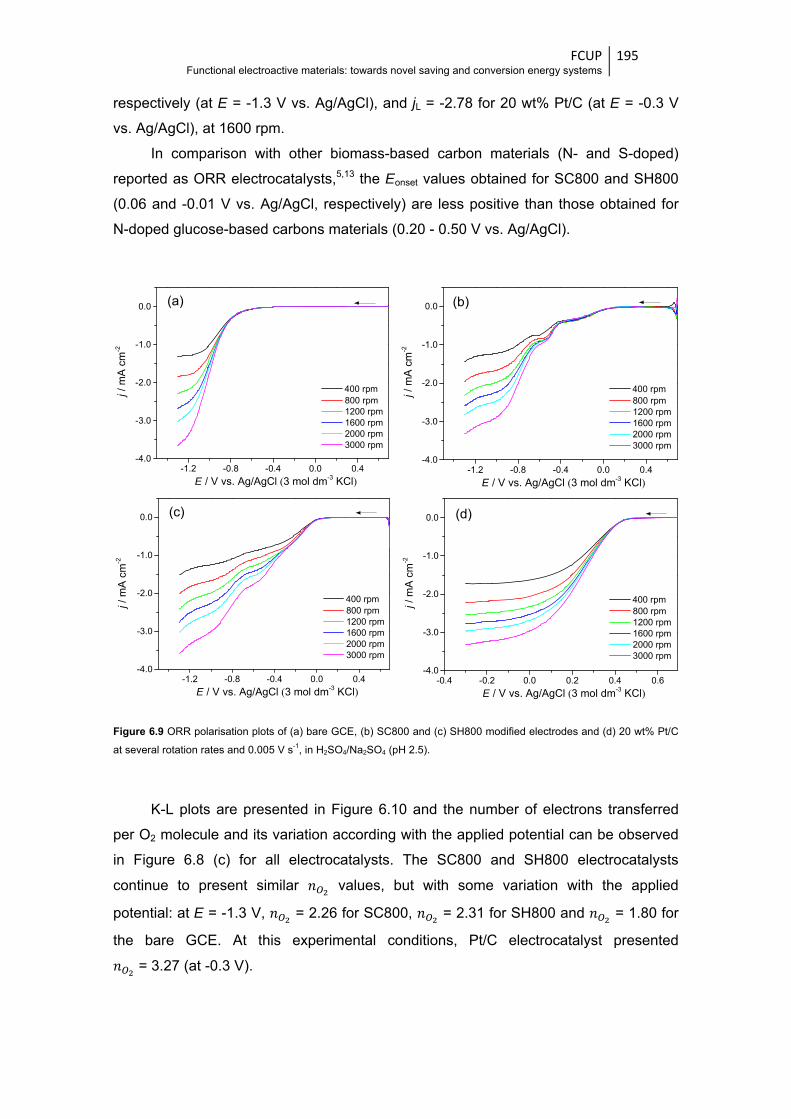
FCUP Functional electroactive materials: towards novel saving and conversion energy systems
195
respectively (at E = -1.3 V vs. Ag/AgCl), and jL = -2.78 for 20 wt% Pt/C (at E = -0.3 V
vs. Ag/AgCl), at 1600 rpm.
In comparison with other biomass-based carbon materials (N- and S-doped)
reported as ORR electrocatalysts,5,13 the Eonset values obtained for SC800 and SH800
(0.06 and -0.01 V vs. Ag/AgCl, respectively) are less positive than those obtained for
N-doped glucose-based carbons materials (0.20 - 0.50 V vs. Ag/AgCl).
Figure 6.9 ORR polarisation plots of (a) bare GCE, (b) SC800 and (c) SH800 modified electrodes and (d) 20 wt% Pt/C
at several rotation rates and 0.005 V s-1, in H2SO4/Na2SO4 (pH 2.5).
K-L plots are presented in Figure 6.10 and the number of electrons transferred
per O2 molecule and its variation according with the applied potential can be observed
in Figure 6.8 (c) for all electrocatalysts. The SC800 and SH800 electrocatalysts
continue to present similar values, but with some variation with the applied
potential: at E = -1.3 V, = 2.26 for SC800, = 2.31 for SH800 and = 1.80 for
the bare GCE. At this experimental conditions, Pt/C electrocatalyst presented
= 3.27 (at -0.3 V).
-1.2 -0.8 -0.4 0.0 0.4-4.0
-3.0
-2.0
-1.0
0.0
400 rpm 800 rpm 1200 rpm 1600 rpm 2000 rpm 3000 rpm
j / m
A c
m-2
E / V vs. Ag/AgCl (3 mol dm-3 KCl)-1.2 -0.8 -0.4 0.0 0.4
-4.0
-3.0
-2.0
-1.0
0.0
400 rpm 800 rpm 1200 rpm 1600 rpm 2000 rpm 3000 rpm
j /
mA
cm
-2
E / V vs. Ag/AgCl (3 mol dm-3 KCl)
-1.2 -0.8 -0.4 0.0 0.4-4.0
-3.0
-2.0
-1.0
0.0
400 rpm 800 rpm 1200 rpm 1600 rpm 2000 rpm 3000 rpm
j / m
A c
m-2
E / V vs. Ag/AgCl (3 mol dm-3 KCl)-0.4 -0.2 0.0 0.2 0.4 0.6
-4.0
-3.0
-2.0
-1.0
0.0
400 rpm 800 rpm 1200 rpm 1600 rpm 2000 rpm 3000 rpm
j / m
A c
m-2
E / V vs. Ag/AgCl (3 mol dm-3 KCl)
(a) (b)
(c) (d)
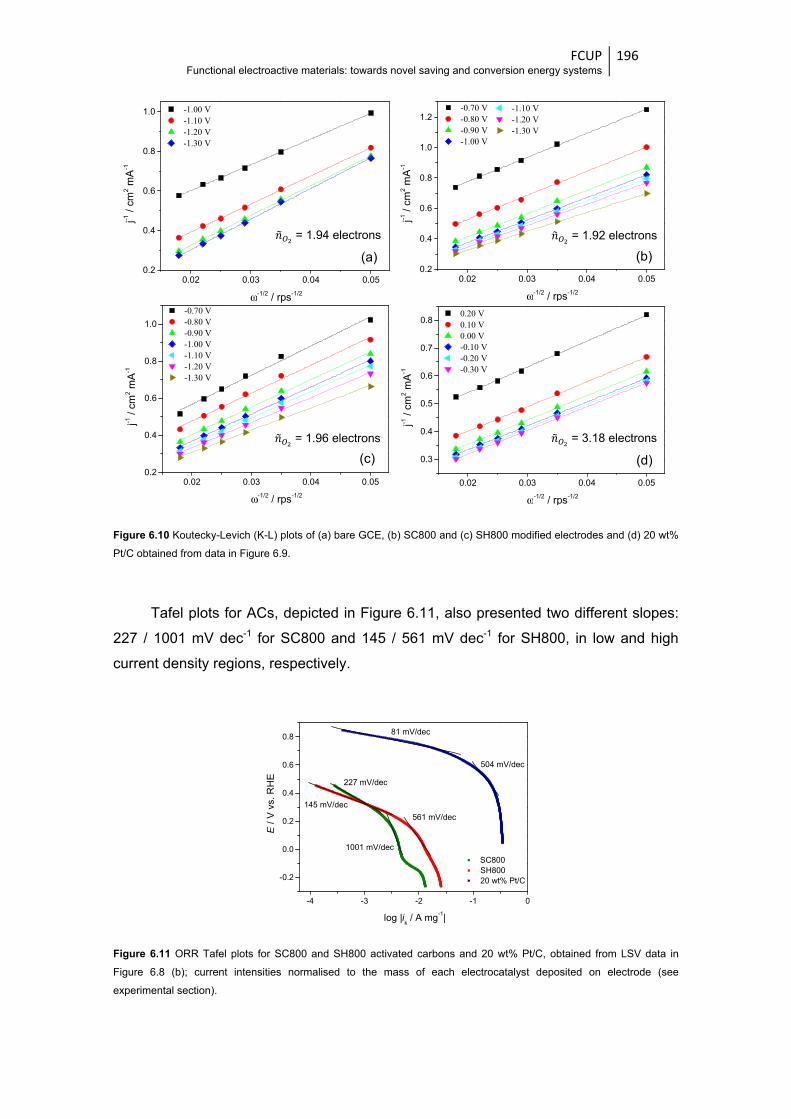
FCUP Functional electroactive materials: towards novel saving and conversion energy systems
196
Figure 6.10 Koutecky-Levich (K-L) plots of (a) bare GCE, (b) SC800 and (c) SH800 modified electrodes and (d) 20 wt%
Pt/C obtained from data in Figure 6.9.
Tafel plots for ACs, depicted in Figure 6.11, also presented two different slopes:
227 / 1001 mV dec-1 for SC800 and 145 / 561 mV dec-1 for SH800, in low and high
current density regions, respectively.
Figure 6.11 ORR Tafel plots for SC800 and SH800 activated carbons and 20 wt% Pt/C, obtained from LSV data in
Figure 6.8 (b); current intensities normalised to the mass of each electrocatalyst deposited on electrode (see
experimental section).
-4 -3 -2 -1 0
-0.2
0.0
0.2
0.4
0.6
0.8
504 mV/dec
1001 mV/dec
561 mV/dec
SC800 SH800 20 wt% Pt/C
E /
V v
s. R
HE
145 mV/dec
227 mV/dec
log |ik / A mg-1|
81 mV/dec
0.02 0.03 0.04 0.050.2
0.4
0.6
0.8
1.0 -1.00 V -1.10 V -1.20 V -1.30 V
ω-1/2 / rps-1/2
j-1 /
cm2 m
A-1
0.02 0.03 0.04 0.050.2
0.4
0.6
0.8
1.0
1.2 -1.10 V -1.20 V -1.30 V
-0.70 V -0.80 V -0.90 V -1.00 V
ω-1/2 / rps-1/2
j-1 /
cm2 m
A-1
0.02 0.03 0.04 0.050.2
0.4
0.6
0.8
1.0
-0.70 V -0.80 V -0.90 V -1.00 V -1.10 V -1.20 V -1.30 V
ω-1/2 / rps-1/2
j-1 /
cm2 m
A-1
0.02 0.03 0.04 0.05
0.3
0.4
0.5
0.6
0.7
0.8 0.20 V 0.10 V 0.00 V -0.10 V -0.20 V -0.30 V
ω-1/2 / rps-1/2
j-1 /
cm2 m
A-1
= 1.94 electrons = 1.92 electrons
(a) (b)
(c) (d)
= 1.96 electrons = 3.18 electrons
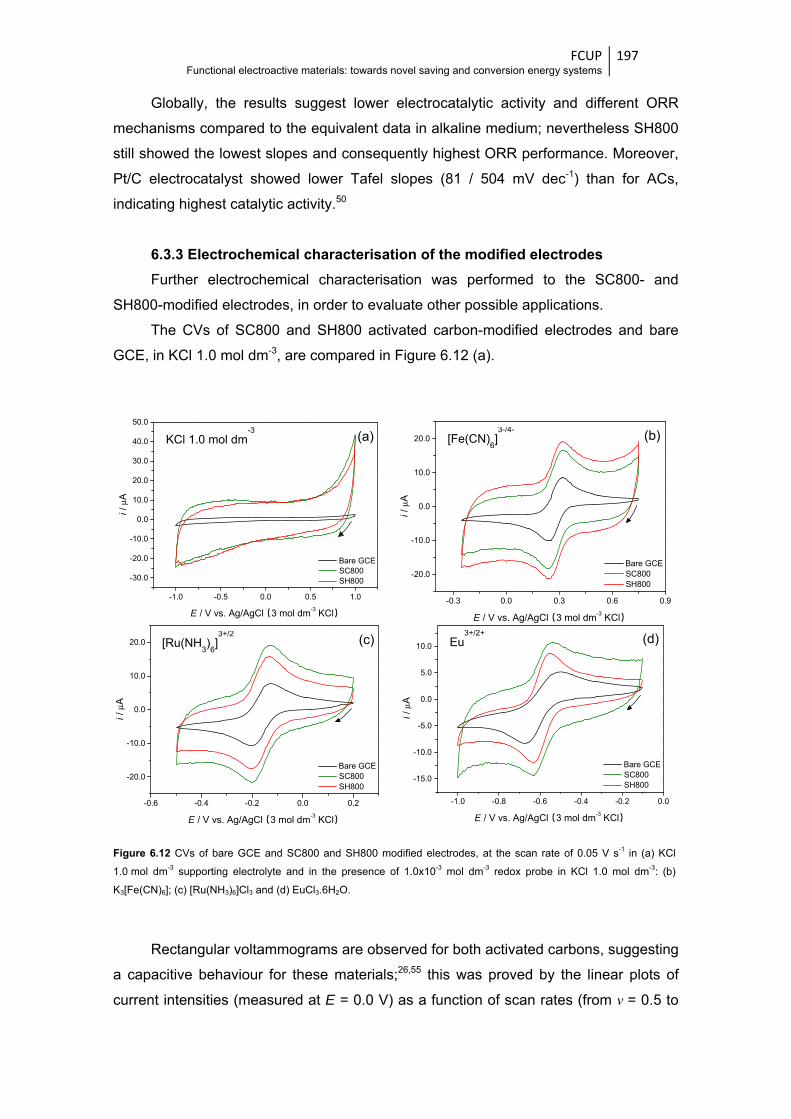
FCUP Functional electroactive materials: towards novel saving and conversion energy systems
197
Globally, the results suggest lower electrocatalytic activity and different ORR
mechanisms compared to the equivalent data in alkaline medium; nevertheless SH800
still showed the lowest slopes and consequently highest ORR performance. Moreover,
Pt/C electrocatalyst showed lower Tafel slopes (81 / 504 mV dec-1) than for ACs,
indicating highest catalytic activity.50
6.3.3 Electrochemical characterisation of the modified electrodes
Further electrochemical characterisation was performed to the SC800- and
SH800-modified electrodes, in order to evaluate other possible applications.
The CVs of SC800 and SH800 activated carbon-modified electrodes and bare
GCE, in KCl 1.0 mol dm-3, are compared in Figure 6.12 (a).
Figure 6.12 CVs of bare GCE and SC800 and SH800 modified electrodes, at the scan rate of 0.05 V s-1 in (a) KCl
1.0 mol dm-3 supporting electrolyte and in the presence of 1.0x10⁻³ mol dm-3 redox probe in KCl 1.0 mol dm-3: (b)
K3[Fe(CN)6]; (c) [Ru(NH3)6]Cl3 and (d) EuCl3.6H2O.
Rectangular voltammograms are observed for both activated carbons, suggesting
a capacitive behaviour for these materials;26,55 this was proved by the linear plots of
current intensities (measured at E = 0.0 V) as a function of scan rates (from v = 0.5 to
-1.0 -0.5 0.0 0.5 1.0
-30.0
-20.0
-10.0
0.0
10.0
20.0
30.0
40.0
50.0
Bare GCE SC800 SH800
i / μ
A
E / V vs. Ag/AgCl (3 mol dm-3 KCl)
-0.3 0.0 0.3 0.6 0.9
-20.0
-10.0
0.0
10.0
20.0
Bare GCE SC800 SH800
i / μ
A
E / V vs. Ag/AgCl (3 mol dm-3 KCl)
-0.6 -0.4 -0.2 0.0 0.2
-20.0
-10.0
0.0
10.0
20.0
Bare GCE SC800 SH800
i / μ
A
E / V vs. Ag/AgCl (3 mol dm-3 KCl)
-1.0 -0.8 -0.6 -0.4 -0.2 0.0
-15.0
-10.0
-5.0
0.0
5.0
10.0
Bare GCE SC800 SH800
i / μ
A
E / V vs. Ag/AgCl (3 mol dm-3 KCl)
(a) (b)
(c) (d)
KCl 1.0 mol dm-3 [Fe(CN)
6]3-/4-
[Ru(NH3)6]3+/2
Eu3+/2+
FCUP Functional electroactive materials: towards novel saving and conversion energy systems
198
0.06 V s-1) (i vs. v) for both materials, as depicted in Figure 6.13. Both ACs show high
capacitive values of similar magnitudes, although SC800 exhibited a higher value,
233.2 μF, compared to 143.3 μF for SH800.
The electrochemical properties of activated carbons were explored in the
presence of the redox probes [Fe(CN)6]3-/4-, [Ru(NH3)6]
3+/2+ and Eu3+/2+, Figures 6.12 (b),
(c) and (d), respectively.
The CVs for [Ru(NH3)6]3+/2+ using the SC800 and SH800 modified electrodes,
Figure 6.12 (c), showed one pair of redox peaks at Epc = -0.20 V / Epa = -0.13 V vs.
Ag/AgCl that are assigned to Ru3+/Ru2+ electronic transfer; furthermore, the CVs
profiles are very similar to that observed when using bare GCE, indicating that the
redox probe does not interact significantly with the modified electrodes. The anodic to
cathodic peak-to-peak separations (ΔEp) obtained for both modified electrodes are very
similar (ΔEp = 0.072 V for SC800 and ΔEp = 0.071 V for SH800 vs. Ag/AgCl), which are
in agreement with the insensitivity of the [Ru(NH3)6]3+/2+ probe to surface defects and
oxygen-containing groups.30
With the [Fe(CN)6]3-/4- redox probe (Figure 6.12 (b)), the CVs profiles for both
SC800 and SH800 modified electrodes are also similar to the bare GCE, with a
cathodic peak at Epc ≈ 0.24 V and an anodic peak at Epa ≈ 0.32 V (Fe3+/Fe2+ electron
transfer), and with ΔEp = 0.083 and 0.080 V vs. Ag/AgCl for SC800 and SH800,
respectively. The similarity between peak potentials and ΔEp values for the modified
and bare electrodes are also indicative of a non-significant interaction between the
redox probe and the modified electrodes surface.
The CV of Eu3+/2+ probe using the bare GCE, Figure 6.12 (d), showed the
electrochemical process associated with Eu3+/Eu2+ electron transfer, with Epc = -0.67 V
and Epa = -0.50 V and ΔEp = 0.172 V vs. Ag/AgCl. In the CVs of activated carbons-
modified electrodes it is also possible to observe the redox processe due to Eu3+/Eu2+,
but the peak potentials are shifted: Epc values are shifted to less negative potentials
whereas the Epa values are shifted to more negative potentials (Epc = -0.64 V /
Epa = -0.54 V for SC800 and Epc = -0.63 V / Epa = -0.55 V for SH800 vs. Ag/AgCl).
These variations are reflected in a decrease in ΔEp values, compared to the GCE:
ΔEp = 0.097 V for SC800 and ΔEp = 0.080 V for SH800 vs. Ag/AgCl. These results
indicate a different interaction of the redox probe with each modified electrode through
the oxygen groups, since the probe can, in this case, bind directly to the carbon-oxygen
groups.30 Thus, in the CV of redox probe using bare GCE the electrochemical process
due to Eu3+/Eu2+ is dominated by the europium species in solution. On the other hand,
in CVs of the redox probe using the activated carbons-modified electrodes, the

FCUP Functional electroactive materials: towards novel saving and conversion energy systems
199
observed electrochemical process due to Eu3+/Eu2+ may also has contributions from the
europium species attached to the oxygen groups in carbon materials. Although the
activated carbons showed similar surface oxygen content (O% from XPS), the material
SH800 has a higher bulk oxygen content associated with a higher surface area and
well developed porosity. In this context, the lower ΔEp value compared to SC800-
modified electrode is compatible with a higher % of adsorbed Eu3+/Eu2+ due to the
highest bulk oxygen content.
Figure 6.13 Plots of i vs. ν for SC800 and SH800, with indication of the respective slope / capacity, C, values.
In the experimental timescale employed (scan rates in the range 0.01 to 0.5 V s-1)
both Epc and Epa varied less than 0.010 V for [Fe(CN)6]3-/4-, 0.010 V (SC800) and
0.005 V (SH800) for [Ru(NH3)6]3+/2+ and 0.030 V (SC800) and 0.009 (SH800) for Eu2+/3+
vs. Ag/AgCl. Figure 6.14 shows the plots of log ip versus log v for bare GCE and SC800
and SH800 modified electrodes. All plots have slopes around 0.50, indicating
predominantly diffusion-controlled processes.43 In addition, the ratios ipa/ipc are close to
one in all cases (see Table 6.3).
The electroactive surface areas of bare GCE and SC800 and SH800 modified
electrodes were determined from CVs of 1 x 10⁻³ mol dm-3 K3[Fe(CN)6], [Ru(NH3)6]Cl3
and EuCl3.6H2O in KCl 1.0 mol dm-3 (Figures 6.15 and 6.16), using the Equation (6.2);
the A values are summarised in Table 6.4.
0.0 0.1 0.2 0.3 0.4 0.5
-120
-100
-80
-60
-40
-20
0
CSH800
= 143.3 μF
SC800 SH800
i / μ
A
v / V s-1
CSC800
= 233.2 μF
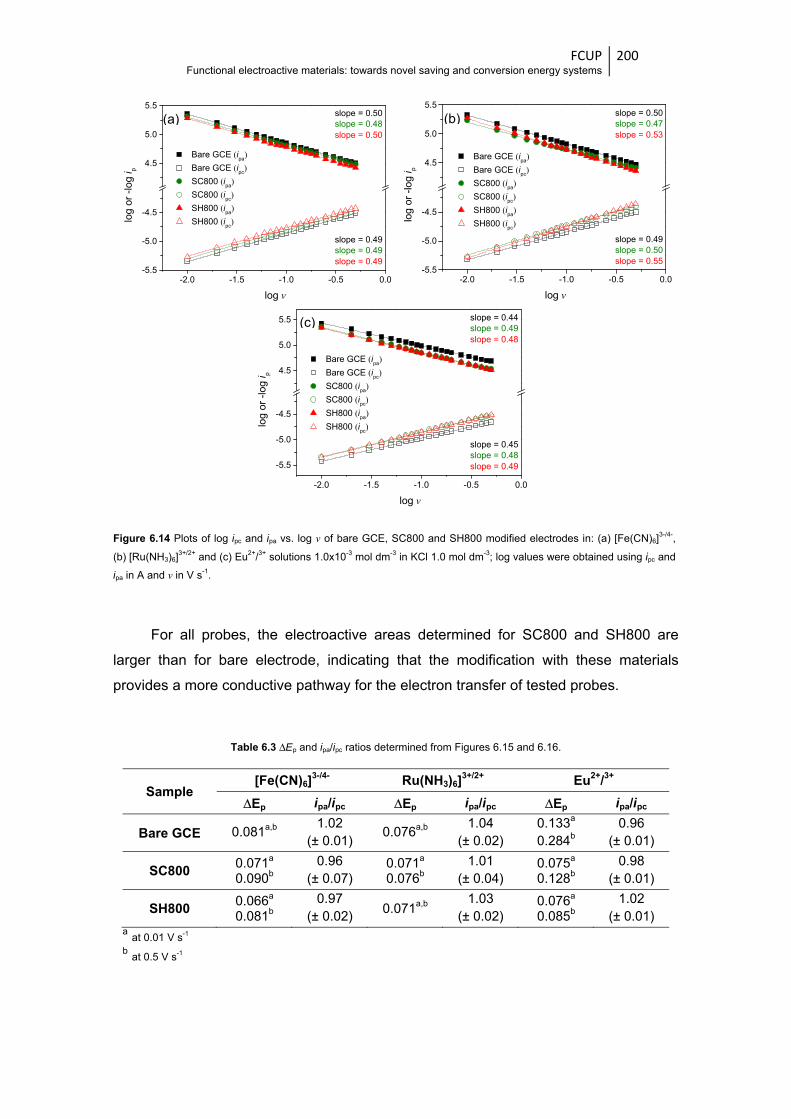
FCUP Functional electroactive materials: towards novel saving and conversion energy systems
200
Figure 6.14 Plots of log ipc and ipa vs. log ν of bare GCE, SC800 and SH800 modified electrodes in: (a) [Fe(CN)6]3-/4-,
(b) [Ru(NH3)6]3+/2+ and (c) Eu2+/3+ solutions 1.0x10⁻³ mol dm-3 in KCl 1.0 mol dm-3; log values were obtained using ipc and
ipa in A and v in V s-1.
For all probes, the electroactive areas determined for SC800 and SH800 are
larger than for bare electrode, indicating that the modification with these materials
provides a more conductive pathway for the electron transfer of tested probes.
Table 6.3 ΔEp and ipa/ipc ratios determined from Figures 6.15 and 6.16.
Sample [Fe(CN)6]
3-/4- Ru(NH3)6]3+/2+ Eu2+/3+
ΔEp ipa/ipc ΔEp ipa/ipc ΔEp ipa/ipc
Bare GCE 0.081a,b 1.02
(± 0.01) 0.076a,b
1.04 (± 0.02)
0.133a
0.284b 0.96
(± 0.01)
SC800 0.071a 0.090b
0.96 (± 0.07)
0.071a 0.076b
1.01 (± 0.04)
0.075a 0.128b
0.98 (± 0.01)
SH800 0.066a 0.081b
0.97 (± 0.02)
0.071a,b 1.03
(± 0.02) 0.076a 0.085b
1.02 (± 0.01)
a at 0.01 V s-1 b at 0.5 V s-1
(a) (b)
(c)
-2.0 -1.5 -1.0 -0.5 0.0-5.5
-5.0
-4.5
4.5
5.0
5.5
Bare GCE (ipa
) Bare GCE (i
pc)
SC800 (ipa
) SC800 (i
pc)
SH800 (ipa
) SH800 (i
pc)
slope = 0.49slope = 0.49slope = 0.49
log v
log
or -
log
i p
slope = 0.50slope = 0.48slope = 0.50
-2.0 -1.5 -1.0 -0.5 0.0-5.5
-5.0
-4.5
4.5
5.0
5.5
Bare GCE (ipa
) Bare GCE (i
pc)
SC800 (ipa
) SC800 (i
pc)
SH800 (ipa
) SH800 (i
pc)
slope = 0.49slope = 0.50slope = 0.55
log v
log
or -
log
i p
slope = 0.50slope = 0.47slope = 0.53
-2.0 -1.5 -1.0 -0.5 0.0
-5.5
-5.0
-4.5
4.5
5.0
5.5
Bare GCE (ipa
) Bare GCE (i
pc)
SC800 (ipa
) SC800 (i
pc)
SH800 (ipa
) SH800 (i
pc)
slope = 0.45slope = 0.48slope = 0.49
log v
log
or -
log
i p
slope = 0.44slope = 0.49slope = 0.48
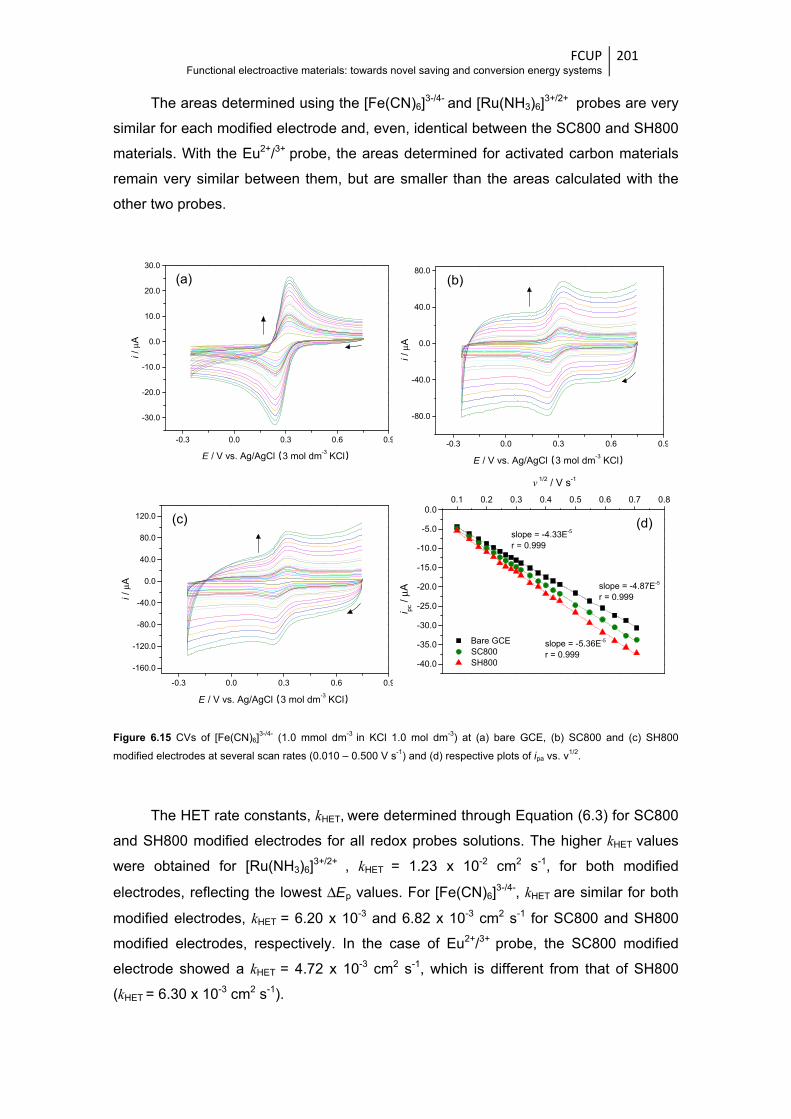
FCUP Functional electroactive materials: towards novel saving and conversion energy systems
201
The areas determined using the [Fe(CN)6]
3-/4- and [Ru(NH3)6]3+/2+ probes are very
similar for each modified electrode and, even, identical between the SC800 and SH800
materials. With the Eu2+/3+ probe, the areas determined for activated carbon materials
remain very similar between them, but are smaller than the areas calculated with the
other two probes.
Figure 6.15 CVs of [Fe(CN)6]3-/4- (1.0 mmol dm-3 in KCl 1.0 mol dm-3) at (a) bare GCE, (b) SC800 and (c) SH800
modified electrodes at several scan rates (0.010 – 0.500 V s-1) and (d) respective plots of ipa vs. ν1/2.
The HET rate constants, kHET, were determined through Equation (6.3) for SC800
and SH800 modified electrodes for all redox probes solutions. The higher kHET values
were obtained for [Ru(NH3)6]3+/2+ , kHET = 1.23 x 10⁻² cm2 s-1, for both modified
electrodes, reflecting the lowest ΔEp values. For [Fe(CN)6]3-/4-, kHET are similar for both
modified electrodes, kHET = 6.20 x 10⁻³ and 6.82 x 10⁻³ cm2 s-1 for SC800 and SH800
modified electrodes, respectively. In the case of Eu2+/3+ probe, the SC800 modified
electrode showed a kHET = 4.72 x 10⁻³ cm2 s-1, which is different from that of SH800
(kHET = 6.30 x 10⁻³ cm2 s-1).
-0.3 0.0 0.3 0.6 0.9
-30.0
-20.0
-10.0
0.0
10.0
20.0
30.0
i / μ
A
E / V vs. Ag/AgCl (3 mol dm-3 KCl)
-0.3 0.0 0.3 0.6 0.9
-80.0
-40.0
0.0
40.0
80.0
i / μ
A
E / V vs. Ag/AgCl (3 mol dm-3 KCl)
-0.3 0.0 0.3 0.6 0.9
-160.0
-120.0
-80.0
-40.0
0.0
40.0
80.0
120.0
i / μ
A
E / V vs. Ag/AgCl (3 mol dm-3 KCl)
-40.0
-35.0
-30.0
-25.0
-20.0
-15.0
-10.0
-5.0
0.00.1 0.2 0.3 0.4 0.5 0.6 0.7 0.8
slope = -4.33E-5
r = 0.999
slope = -4.87E-5
r = 0.999
v 1/2 / V s-1
Bare GCE SC800 SH800
i pc /
μA
slope = -5.36E-5
r = 0.999
(a) (b)
(c) (d)
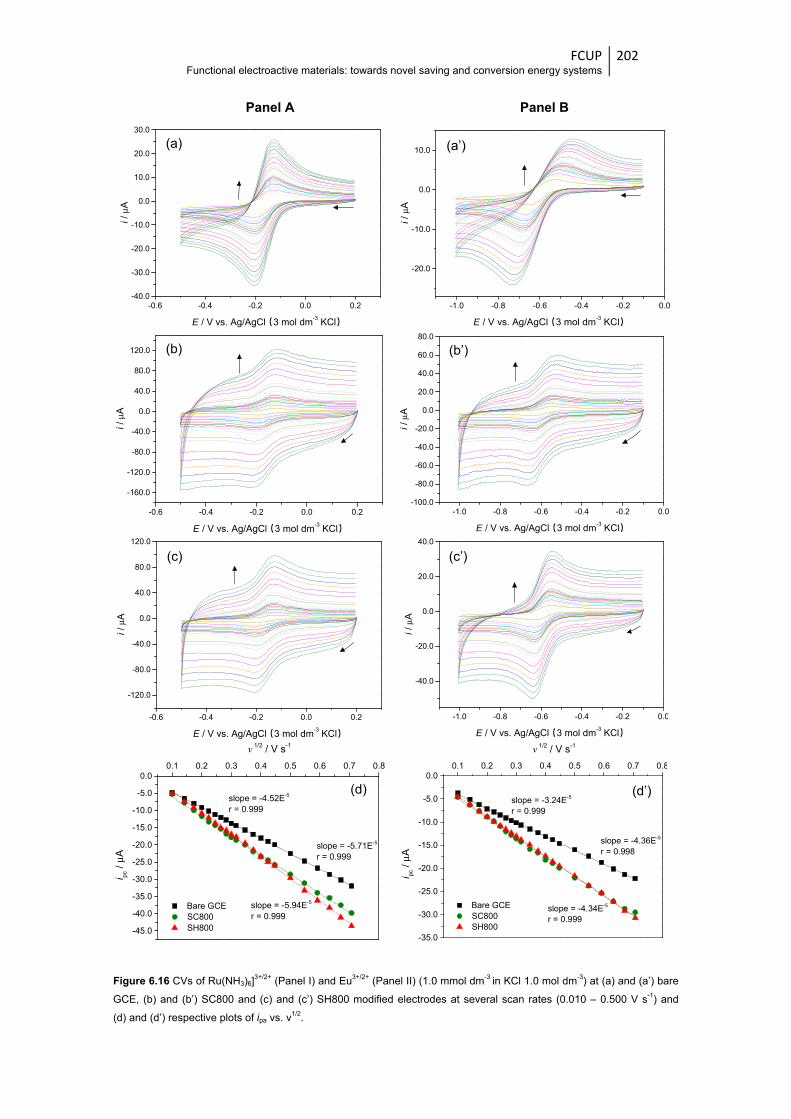
FCUP Functional electroactive materials: towards novel saving and conversion energy systems
202
Figure 6.16 CVs of Ru(NH3)6]3+/2+ (Panel I) and Eu3+/2+ (Panel II) (1.0 mmol dm-3 in KCl 1.0 mol dm-3) at (a) and (a’) bare
GCE, (b) and (b’) SC800 and (c) and (c’) SH800 modified electrodes at several scan rates (0.010 – 0.500 V s-1) and
(d) and (d’) respective plots of ipa vs. ν1/2.
-0.6 -0.4 -0.2 0.0 0.2-40.0
-30.0
-20.0
-10.0
0.0
10.0
20.0
30.0i /
μA
E / V vs. Ag/AgCl (3 mol dm-3 KCl)
-0.6 -0.4 -0.2 0.0 0.2
-160.0
-120.0
-80.0
-40.0
0.0
40.0
80.0
120.0
i / μ
A
E / V vs. Ag/AgCl (3 mol dm-3 KCl)
-0.6 -0.4 -0.2 0.0 0.2
-120.0
-80.0
-40.0
0.0
40.0
80.0
120.0
i / μ
A
E / V vs. Ag/AgCl (3 mol dm-3 KCl)
-45.0
-40.0
-35.0
-30.0
-25.0
-20.0
-15.0
-10.0
-5.0
0.00.1 0.2 0.3 0.4 0.5 0.6 0.7 0.8
slope = -4.52E-5
r = 0.999
slope = -5.71E-5
r = 0.999
v 1/2 / V s-1
Bare GCE SC800 SH800
i pc /
μA
slope = -5.94E-5
r = 0.999
(a) (a’)
(b) (b’)
(c) (c’)
(d) (d’)
-1.0 -0.8 -0.6 -0.4 -0.2 0.0
-20.0
-10.0
0.0
10.0
i / μ
A
E / V vs. Ag/AgCl (3 mol dm-3 KCl)
-1.0 -0.8 -0.6 -0.4 -0.2 0.0-100.0
-80.0
-60.0
-40.0
-20.0
0.0
20.0
40.0
60.0
80.0
i / μ
A
E / V vs. Ag/AgCl (3 mol dm-3 KCl)
-1.0 -0.8 -0.6 -0.4 -0.2 0.0
-40.0
-20.0
0.0
20.0
40.0
i / μ
A
E / V vs. Ag/AgCl (3 mol dm-3 KCl)
-35.0
-30.0
-25.0
-20.0
-15.0
-10.0
-5.0
0.00.1 0.2 0.3 0.4 0.5 0.6 0.7 0.8
slope = -3.24E-5
r = 0.999
slope = -4.36E-5
r = 0.998
v 1/2 / V s-1
Bare GCE SC800 SH800
i pc /
μA
slope = -4.34E-5
r = 0.999
Panel A Panel B
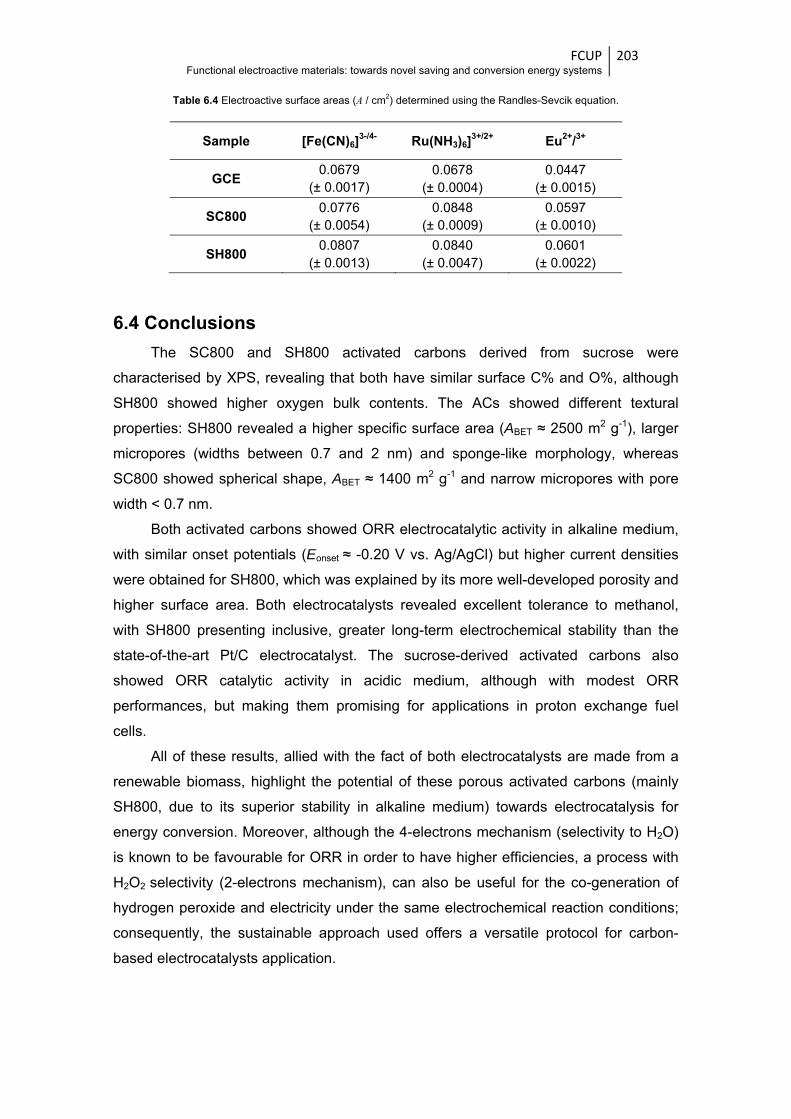
FCUP Functional electroactive materials: towards novel saving and conversion energy systems
203
Table 6.4 Electroactive surface areas (A / cm2) determined using the Randles-Sevcik equation.
Sample [Fe(CN)6]3-/4- Ru(NH3)6]
3+/2+ Eu2+/3+
GCE 0.0679
(± 0.0017) 0.0678
(± 0.0004) 0.0447
(± 0.0015)
SC800 0.0776
(± 0.0054) 0.0848
(± 0.0009) 0.0597
(± 0.0010)
SH800 0.0807
(± 0.0013) 0.0840
(± 0.0047) 0.0601
(± 0.0022)
6.4 Conclusions
The SC800 and SH800 activated carbons derived from sucrose were
characterised by XPS, revealing that both have similar surface C% and O%, although
SH800 showed higher oxygen bulk contents. The ACs showed different textural
properties: SH800 revealed a higher specific surface area (ABET ≈ 2500 m2 g-1), larger
micropores (widths between 0.7 and 2 nm) and sponge-like morphology, whereas
SC800 showed spherical shape, ABET ≈ 1400 m2 g-1 and narrow micropores with pore
width < 0.7 nm.
Both activated carbons showed ORR electrocatalytic activity in alkaline medium,
with similar onset potentials (Eonset ≈ -0.20 V vs. Ag/AgCl) but higher current densities
were obtained for SH800, which was explained by its more well-developed porosity and
higher surface area. Both electrocatalysts revealed excellent tolerance to methanol,
with SH800 presenting inclusive, greater long-term electrochemical stability than the
state-of-the-art Pt/C electrocatalyst. The sucrose-derived activated carbons also
showed ORR catalytic activity in acidic medium, although with modest ORR
performances, but making them promising for applications in proton exchange fuel
cells.
All of these results, allied with the fact of both electrocatalysts are made from a
renewable biomass, highlight the potential of these porous activated carbons (mainly
SH800, due to its superior stability in alkaline medium) towards electrocatalysis for
energy conversion. Moreover, although the 4-electrons mechanism (selectivity to H2O)
is known to be favourable for ORR in order to have higher efficiencies, a process with
H2O2 selectivity (2-electrons mechanism), can also be useful for the co-generation of
hydrogen peroxide and electricity under the same electrochemical reaction conditions;
consequently, the sustainable approach used offers a versatile protocol for carbon-
based electrocatalysts application.

FCUP Functional electroactive materials: towards novel saving and conversion energy systems
204
References
1 Wang, D. W.; Su, D. S. Energy Environ. Sci. 2014, 7, 576. 2 Trogadas, P.; Fuller, T. F.; Strasser, P. Carbon 2014, 75, 5. 3 Chen, Y.; Zhai, S. R.; Liu, N.; Song, Y.; An, Q. D.; Song, X. W. Bioresour. Technol. 2013, 144,
401. 4 Song, M. Y.; Park, H. Y.; Yang, D. S.; Bhattacharjya, D.; Yu, J. S. ChemSusChem 2014, 7, 1755. 5 Li, J. P.; Wang, S. G.; Ren, Y. Q.; Ren, Z. H.; Qiu, Y. J.; Yu, J. Electrochim. Acta 2014, 149, 56. 6 Chen, P.; Wang, L. K.; Wang, G.; Gao, M. R.; Ge, J.; Yuan, W. J.; Shen, Y. H.; Xie, A. J.; Yu, S.
H. Energy Environ. Sci. 2014, 7, 4095. 7 Si, W. J.; Zhou, J.; Zhang, S. M.; Li, S. J.; Xing, W.; Zhuo, S. P. Electrochim. Acta 2013, 107, 397. 8 Zhang, H. M.; Wang, Y.; Wang, D.; Li, Y. B.; Liu, X. L.; Liu, P. R.; Yang, H. G.; An, T. C.; Tang, Z.
Y.; Zhao, H. J. Small 2014, 10, 3371. 9 Gao, S. Y.; Fan, H.; Zhang, S. X. J. Mater. Chem. A 2014, 2, 18263. 10 Jung, A.; Han, S.; Kim, T.; Cho, W. J.; Lee, K. H. Carbon 2013, 60, 307. 11 Mestre, A. S.; Tyszko, E.; Andrade, M. A.; Galhetas, M.; Freire, C.; Carvalho, A. P. RSC Adv.
2015, 5, 19696. 12 Zhang, H. J.; Li, H. L.; Deng, C. C.; Zhao, B.; Yang, J. H. ECS Electrochem. Lett. 2015, 4, 5. 13 Wohlgemuth, S. A.; White, R. J.; Willinger, M. G.; Titirici, M. M.; Antonietti, M. Green Chem. 2012,
14, 1515. 14 Brun, N.; Wohlgemuth, S. A.; Osiceanu, P.; Titirici, M. M. Green Chem. 2013, 15, 2514. 15 Wohlgemuth, S. A.; Fellinger, T. P.; Jaker, P.; Antonietti, M. J. Mater. Chem. A 2013, 1, 4002. 16 Rybarczyk, M. K.; Lieder, M.; Jablonska, M. RSC Adv. 2015, 5, 44969. 17 Yuan, H. R.; Deng, L. F.; Cai, X. X.; Zhou, S. G.; Chen, Y.; Yuan, Y. RSC Adv. 2015, 5, 56121. 18 Iwazaki, T.; Obinata, R.; Sugimoto, W.; Takasu, Y. Electrochem. Commun. 2009, 11, 376. 19 Iwazaki, T.; Yang, H. S.; Obinata, R.; Sugimoto, W.; Takasu, Y. J. Power Sources 2010, 195,
5840. 20 Wang, K. L.; Wang, H.; Ji, S.; Feng, H. Q.; Linkov, V.; Wang, R. F. RSC Adv. 2013, 3, 12039. 21 Guo, C. Z.; Liao, W. L.; Li, Z. B.; Chen, C. G. Carbon 2015, 85, 279. 22 Zhang, J.; Wu, S. Y.; Chen, X.; Cheng, K.; Pan, M.; Mu, S. C. RSC Adv. 2014, 4, 32811. 23 Zhang, Z.; Li, H.; Yang, Y. X.; Key, J. L.; Ji, S.; Ma, Y. Y.; Wang, H.; Wang, R. F. RSC Adv. 2015,
5, 27112. 24 Zhang, H. M.; Chen, J. Y.; Li, Y. B.; Liu, P. R.; Wang, Y.; An, T. C.; Zhao, H. J. Electrochim. Acta
2015, 165, 7. 25 Liu, X. J.; Zhou, Y. C.; Zhou, W. J.; Li, L. G.; Huang, S. B.; Chen, S. W. Nanoscale 2015, 7, 6136. 26 Liu, F. F.; Peng, H. L.; You, C. H.; Fu, Z. Y.; Huang, P. Y.; Song, H. Y.; Liao, S. J. Electrochim.
Acta 2014, 138, 353. 27 Mestre, A. S.; Freire, C.; Pires, J.; Carvalho, A. P.; Pinto, M. L. J. Mater. Chem. A 2014, 2, 15337. 28 Wong, C. H. A.; Sofer, Z.; Pumera, M. Chem.-Eur. J. 2015, 21, 8435. 29 Moo, J. G. S.; Ambrosi, A.; Bonanni, A.; Pumera, M. Chem.-Asian J. 2012, 7, 759. 30 Tan, S. M.; Ambrosi, A.; Chua, C. K.; Pumera, M. J. Mater. Chem. A 2014, 2, 10668. 31 Lim, C. S.; Hola, K.; Ambrosi, A.; Zboril, R.; Pumera, M. Electrochem. Commun. 2015, 52, 75. 32 Di Noto, V.; Negro, E.; Gliubizzi, R.; Gross, S.; Maccato, C.; Pace, G. J. Electrochem. Soc. 2007,
154, B745. 33 Di Noto, V.; Negro, E.; Vezzu, K.; Toniolo, L.; Pace, G. Electrochim. Acta 2011, 57, 257. 34 Di Noto, V.; Negro, E.; Polizzi, S.; Vezzu, K.; Toniolo, L.; Cavinato, G. Int. J. Hydrog. Energy
2014, 39, 2812. 35 Daems, N.; Sheng, X.; Vankelecom, I. F. J.; Pescarmona, P. P. J. Mater. Chem. A 2014, 2, 4085. 36 Hoang, S.; Guo, S. W.; Hahn, N. T.; Bard, A. J.; Mullins, C. B. Nano Lett. 2012, 12, 26. 37 Tuci, G.; Zafferoni, C.; Rossin, A.; Milella, A.; Luconi, L.; Innocenti, M.; Phuoc, L. T.; Cuong, D. V.;
Cuong, P. H.; Giambastian, G. Chem. Mat. 2014, 26, 3460.
FCUP Functional electroactive materials: towards novel saving and conversion energy systems
205
38 Mani, A.; Birss, V. I. J. Electroanal. Chem. 2012, 687, 102. 39 Negro, E.; Vezzu, K.; Bertasi, F.; Schiavuta, P.; Toniolo, L.; Polizzi, S.; Di Noto, V.
ChemElectroChem 2014, 1, 1359. 40 Fernandes, D. M.; Costa, M.; Pereira, C.; Bachiller-Baeza, B.; Rodriguez-Ramos, I.; Guerrero-
Ruiz, A.; Freire, C. J. Colloid Interface Sci. 2014, 432, 207. 41 Keeley, G. P.; O'Neill, A.; McEvoy, N.; Peltekis, N.; Coleman, J. N.; Duesberg, G. S. J. Mater.
Chem. 2010, 20, 7864. 42 Henstridge, M. C.; Laborda, E.; Wang, Y. J.; Suwatchara, D.; Rees, N.; Molina, A.; Martinez-Ortiz,
F.; Compton, R. G. J. Electroanal. Chem. 2012, 672, 45. 43 Bard, A. J.; Faulkner, L. R. Electrochemical Methods, Fundamentals and Applications, 2001. 44 Nicholson, R. S. Anal. Chem. 1965, 37, 1351. 45 Ambrosi, A.; Pumera, M. Chem.-Eur. J. 2013, 19, 4748. 46 Thommes, M.; Kaneko, K.; Neimark, A. V.; Olivier, J. P.; Rodriguez-Reinoso, F.; Roquerol, J.;
Sing, K. S. W. Pure Appl. Chem. 2015, 87, 1051. 47 Pinto, M. L.; Mestre, A. S.; Carvalho, A. P.; Pires, J. Ind. Eng. Chem. Res. 2010, 49, 4726. 48 Wu, X. L.; Chen, L. L.; Xin, S.; Yin, Y. X.; Guo, Y. G.; Kong, Q. S.; Xia, Y. Z. ChemSusChem
2010, 3, 703. 49 Lipinska, M. E.; Rebelo, S. L. H.; Pereira, M. F. R.; Gomes, J.; Freire, C.; Figueiredo, J. L. Carbon
2012, 50, 3280. 50 Zhang, Y. J.; Fugane, K.; Mori, T.; Niu, L.; Ye, J. H. J. Mater. Chem. 2012, 22, 6575. 51 Deng, D. H.; Yu, L.; Pan, X. L.; Wang, S.; Chen, X. Q.; Hu, P.; Sun, L. X.; Bao, X. H. Chem.
Commun. 2011, 47, 10016. 52 Wang, S.; Dong, S. M.; Wang, J.; Zhang, L. X.; Han, P. X.; Zhang, C. J.; Wang, X. G.; Zhang, K.
J.; Lan, Z. G.; Cui, G. L. J. Mater. Chem. 2012, 22, 21051. 53 Zhang, M. N.; Yan, Y. M.; Gong, K. P.; Mao, L. Q.; Guo, Z. X.; Chen, Y. Langmuir 2004, 20, 8781. 54 Lu, G. L.; Yang, H. S.; Zhu, Y. L.; Huggins, T.; Ren, Z. J.; Liu, Z. N.; Zhang, W. J. Mater. Chem. A
2015, 3, 4954. 55 Ambrosi, A.; Poh, H. L.; Wang, L.; Sofer, Z.; Pumera, M. ChemSusChem 2014, 7, 1102.

FCUP Functional electroactive materials: towards novel saving and conversion energy systems
206
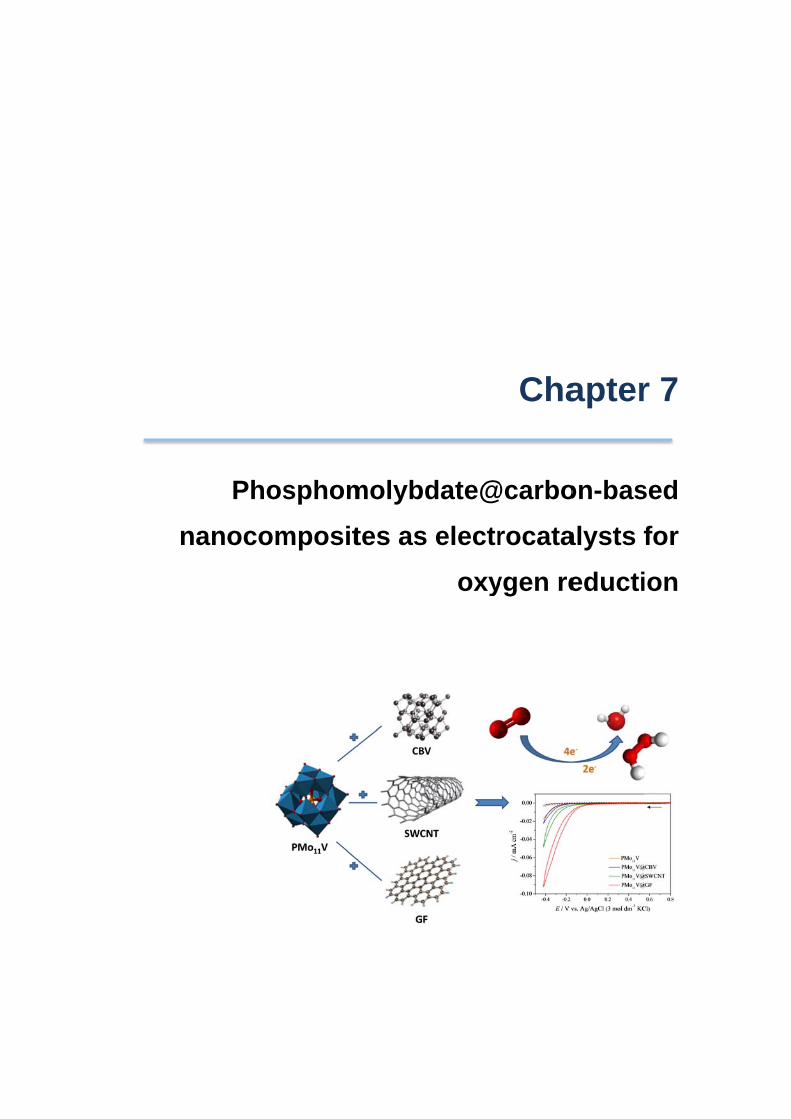
nanPhos
nocomsphom
mpositmolybdtes as
date@electr
oxy
Cha
@carborocata
ygen re
apter
on-basalysts educti
r 7
sed for ion

7 Phosphomolybdate@carbon-based
nanocomposites as electrocatalysts for oxygen reduction1,2,3
Abstract
In this chapter it is described the application of several nanocomposites,
prepared by the incorporation of a vanadium-substituted phosphomolybdate
[PMo11VO40]4- (PMo11V) into the carbon materials carbon black Vulcan (CBV), single-
walled carbon nanotubes (SWCNT) and graphene (GF)), as ORR electrocatalysts. The
nanocomposites, denominated as PMo11V@CBV, PMo11V@SWCNT and
PMo11V@GF, show electrocatalytic activity for the ORR, with a strong dependency
between the electrocatalytic ORR performance and the carbon-based material
employed. Among the materials studied, the PMo11V@GF nanocomposite exhibits the
most promising performance, having the less negative onset potential (Eonset = -0.16 V
vs. Ag/AgCl), which is explained by the excellent electronic properties of GF. An ORR
process based in a 2-electron mechanism is assumed for all modified electrodes.
The PMo11V- and the nanocomposite-modified electrodes also are effective for
the reduction of hydrogen peroxide, with PMo11V@GF displaying the most promising
electrocatalytic performance.
The successful preparation of the nanocomposites is confirmed by X-ray
photoelectron spectroscopy and Fourier transformed infrared spectroscopy techniques.
The electrochemical characterisation of all modified electrodes is also reported.
1 Adapted from: M. Nunes, D. M. Fernandes, I. M. Rocha, M. F. R. Pereira, I.-M. Mbomekalle, P. de Oliveira, C. Freire,
Phosphomolybdate@carbon-based nanocomposites as electrocatalysts for oxygen reduction. Submitted. 2 M. Nunes’s contribution to the publication: preparation and characterisation of the PMo11V@CBV composite,
electrochemical characterisations and evaluation of the ORR electrocatalytic activities of all composites and manuscript
preparation. 3 The experimental details on the electrochemical / electrocatalytic and remaining characterisation techniques are
indicated in Appendices B and C, respectively.
FCUP Functional electroactive materials: towards novel saving and conversion energy systems
210
7.1 Introduction
Carbon-based materials have been applied as ORR electrocatalysts as metal-
free electrocatalysts themselves and also as catalyst supports in functional composites.
As catalyst supports, carbon black (CB) is the most commonly used due to its low cost,
being employed in the preparation of composites with conducting polymers,1,2 Pt-based
alloys3 and non-noble metals.4 CNTs and GF supports, although more expensive than
CB, normally result in an improved catalyst performance. An electrocatalyst with high
ORR activity based on the dispersion of silver nanoparticles on multi-walled carbon
nanotubes (MWCNTs) was reported by Cheng et al.,5 and several GF-based
composites have also been prepared6 through the immobilisation of metals (e.g. Pt),7
metal oxides8 and metallic complexes.9 Normally, GF-based composites have an
enhanced ORR activity in comparison with the other carbon-based allotropes, mainly
due to presence of peculiar graphitic sites that result in a large number of ORR active
sites.10
The ability of POMs to mediate electron, proton and oxygen atom transfer
reactions, makes them particularly interesting as ORR catalysts. In this regard, the
ORR electrocatalytic activity of several POMs has been evaluated both in their pristine
form11,12 and as co-catalysts. Mbomekalle and co-workers published several works
reporting the application of several pristine POMs (Cu(II)-11 and Mn(II)-12 substituted
polyoxoanions) as ORR electrocatalysts and promising results were obtained, with
significant positive shifts in potentials of oxygen reduction. As co-catalysts, the
combination of POMs with a porphyrin13 and Au,14 Pd15 and Pt16,17 nanoparticles (NPs)
was described, resulting in enhanced ORR performances.
Therefore, the incorporation of POMs on carbon materials may be a good
approach to obtain functional composites with an enhanced ORR catalytic activity, as
result of the improvement of the POM redox properties and of the synergetic influence
of the POM and the carbon material on the properties of the nanocomposite. Some
POM/carbon material composites have been prepared for applications as chemical
sensors,18 in lithium batteries,19 as supercapacitors20 and for water oxidation,21 but their
application for the ORR has still been little explored. Nevertheless, recently was
reported the preparation of polyoxotungstates/graphene multilayer films22 and a
polyoxometalate/carbon black nanocomposite23 with good ORR activity, selectivity
towards the 4-electron pathway and better tolerance to methanol crossover and
superior durability than the state-of-the-art 20 wt% Pt/C electrocatalyst. Additionally,
the preparation of several nanocomposites between Ag NPs and CNTs,24 GF25 and
reduced graphene oxide,26 using POMs as reducing agents and bridging molecules
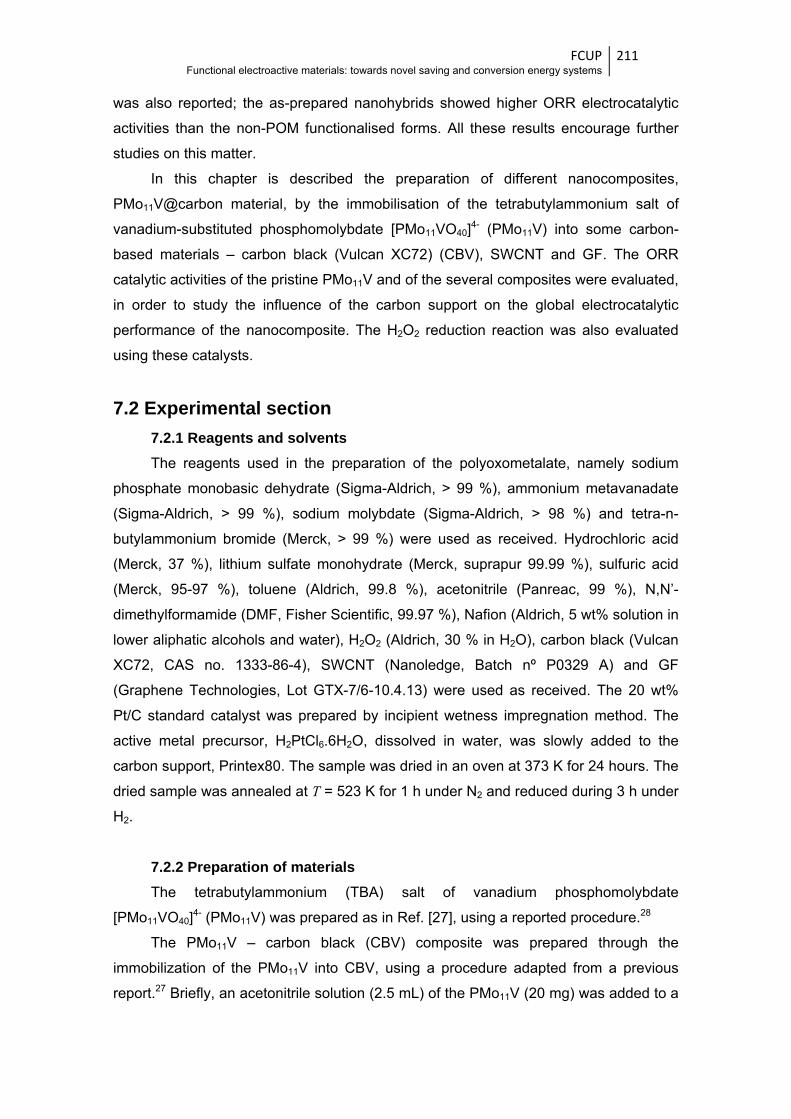
FCUP Functional electroactive materials: towards novel saving and conversion energy systems
211
was also reported; the as-prepared nanohybrids showed higher ORR electrocatalytic
activities than the non-POM functionalised forms. All these results encourage further
studies on this matter.
In this chapter is described the preparation of different nanocomposites,
PMo11V@carbon material, by the immobilisation of the tetrabutylammonium salt of
vanadium-substituted phosphomolybdate [PMo11VO40]4- (PMo11V) into some carbon-
based materials – carbon black (Vulcan XC72) (CBV), SWCNT and GF. The ORR
catalytic activities of the pristine PMo11V and of the several composites were evaluated,
in order to study the influence of the carbon support on the global electrocatalytic
performance of the nanocomposite. The H2O2 reduction reaction was also evaluated
using these catalysts.
7.2 Experimental section 7.2.1 Reagents and solvents The reagents used in the preparation of the polyoxometalate, namely sodium
phosphate monobasic dehydrate (Sigma-Aldrich, > 99 %), ammonium metavanadate
(Sigma-Aldrich, > 99 %), sodium molybdate (Sigma-Aldrich, > 98 %) and tetra-n-
butylammonium bromide (Merck, > 99 %) were used as received. Hydrochloric acid
(Merck, 37 %), lithium sulfate monohydrate (Merck, suprapur 99.99 %), sulfuric acid
(Merck, 95-97 %), toluene (Aldrich, 99.8 %), acetonitrile (Panreac, 99 %), N,N’-
dimethylformamide (DMF, Fisher Scientific, 99.97 %), Nafion (Aldrich, 5 wt% solution in
lower aliphatic alcohols and water), H2O2 (Aldrich, 30 % in H2O), carbon black (Vulcan
XC72, CAS no. 1333-86-4), SWCNT (Nanoledge, Batch nº P0329 A) and GF
(Graphene Technologies, Lot GTX-7/6-10.4.13) were used as received. The 20 wt%
Pt/C standard catalyst was prepared by incipient wetness impregnation method. The
active metal precursor, H2PtCl6.6H2O, dissolved in water, was slowly added to the
carbon support, Printex80. The sample was dried in an oven at 373 K for 24 hours. The
dried sample was annealed at T = 523 K for 1 h under N2 and reduced during 3 h under
H2.
7.2.2 Preparation of materials The tetrabutylammonium (TBA) salt of vanadium phosphomolybdate
[PMo11VO40]4- (PMo11V) was prepared as in Ref. [27], using a reported procedure.28
The PMo11V – carbon black (CBV) composite was prepared through the
immobilization of the PMo11V into CBV, using a procedure adapted from a previous
report.27 Briefly, an acetonitrile solution (2.5 mL) of the PMo11V (20 mg) was added to a

FCUP Functional electroactive materials: towards novel saving and conversion energy systems
212
toluene dispersion (20 mL) of the CBV (20 mg). The resulting yellowish suspension
was vigorously stirred at room temperature for 30 min and then left to rest until it
became colourless and a black precipitate formed (suggesting that all of the POM was
grafted onto the CBV surface). The excess of solvent was removed and the precipitate
was dried in an oven. The nanocomposite obtained was designated as PMo11V@CBV
and was characterised by XPS and FTIR. The other nanocomposites,
PMo11V@SWCNT and PMo11V@GF, had already been prepared and characterised, as
reported in Ref. [27].
7.2.3 Electrochemical characterisation The electrolyte solutions used in the electrochemical characterisation of the
materials were prepared using ultra-pure water (resistivity 18.2 MΩ cm at 25 ºC,
Millipore Integral 5). H2SO4/Li2SO4 buffer solutions with pH values from 1.0 to 3.5 were
prepared by mixing appropriate amounts of 0.5 mol dm-3 H2SO4 and 0.2 mol dm-3
Li2SO4.H2O solutions. The studies at several scan rates (from 0.050 to 0.500 V s-1)
were performed with a H2SO4/Li2SO4 buffer solution with a pH of 2.5 in the potential
range from 0.8 to ≈ -0.51 V (adjusted according with the sample). The electrochemical
potentials were converted from SCE to Ag/AgCl (3 mol dm-3 KCl) using the correction
factor 0.032 V.29
The dispersions used to prepare the modified electrodes were obtained by
dissolving PMo11V (1 mg) in acetonitrile (1 mL) or by dispersing PMo11V@carbon
nanocomposites (1 mg) in DMF (3 mL) with sonication for 10 min.
Prior to modification, the GCE electrode was conditioned by a polishing/cleaning
procedure as described elsewhere,30 which finished with rinsing and sonicating in
ethanol (3 min) and ultra-pure water (3 min). The electrode modification consisted in
depositing a 3 µL drop of the selected material dispersion onto the GCE surface and
the solvent was allowed to evaporate at room temperature.
The electrochemical surface coverages, Γ / nmol cm-2, of the modified electrodes
were calculated by the Equation (7.1):27
Γ = (4ipRT)/(n2F2vA) (7.1)
where ip is the peak current (amperes), R is the gas constant, T is the temperature
(298 K), n is the number of electrons transferred (2 in this case), F is the Faraday’s
constant, v is the scan rate (V s-1) and A is the geometric area of the electrode
(0.07067 cm2).

FCUP Functional electroactive materials: towards novel saving and conversion energy systems
213
7.2.4 Evaluation of the ORR electrocatalytic activity The ORR electrocatalytic capability of the materials was, in a first step, evaluated
by cyclic voltammetry, at the scan rate of 0.002 V s-1.
In a second stage, the ORR performance of each catalyst was systematically
evaluated by CV and linear sweep voltammetry measurements. The electrochemical
tests were accomplished in a N2- or O2-saturated pH 2.5 H2SO4/Li2SO4 buffer solution
(bubbled for 30 min before the measurements). The modified electrodes were prepared
by the deposit of a 3 μL drop of the select dispersion prepared as described above (for
Pt/C, 1 mg of 20 wt% Pt/C was dispersed ultrasonically in 3 mL of DMF) on the glassy
carbon rotating disk electrode (RDE) surface and dried under an air flux. Then, a 3 μL
drop of Nafion (0.5 % in Millipore water) was deposited to protect the sample, which
was also dried under an air flux. The obtained electrocatalyst loadings were 14.15 μg
cm-2 for PMo11V, 28.30 μg cm-2 for PMo11V@CBV, PMo11V@SWCNT and PMo11V@GF
nanocomposites and 70.75 μg cm-2 for 20 wt% Pt/C. Prior to modification, the electrode
was conditioned by a polishing/cleaning procedure, using diamond pastes of 6, 3 and 1
µm (MetaDi II, Buehler) and aluminium oxide of particle size 0.3 µm (Buehler), on a
microcloth polishing pad (BAS Bioanalytical Systems Inc.). Then, the electrode was
rinsed and sonicated for 10 min in ultra-pure water. CV experiments were conducted at
a scan rate of 0.005 V s-1 and LSV experiments at 0.005 V s-1 for rotation speeds
ranging from 400 to 3000 rpm. The ORR current was obtained by subtracting the
current measured in N2-saturated electrolyte from the current measured in O2-saturated
electrolyte.
The onset potential (Eonset) was calculated as described in literature.31 LSV data
was analysed though Koutecky-Levich (K-L) plot, Equations (1.2) and (1.3). Based on
the data applying to H2SO4/Na2SO4 electrolytes,32 it is assumed for H2SO4/Li2SO4
buffer medium that = 1.26x10⁻³ mol dm-3, v = 0.01 cm2 s-1 and
= 1.77x10⁻⁵ cm2 s-1.
The Tafel plots (E vs. log ik) for oxygen reduction kinetics were obtained after the
measured currents in LSV were corrected for diffusion to give the kinetic currents. The
mass transport correction was made using the diffusion-limiting current density jL,
calculated by combination of Equations (1.2) and (1.3), since it could not be obtained
directly from the LSV. The obtained current density jk was multiplied by the geometric
area of the GCE disk (A = 0.07067 cm2) yielding ik, which was normalised for the total
deposited mass of PMo11V and nanocomposites electrocatalysts; in the case of Pt/C, ik
was normalised to the Pt mass existing in the amount of Pt/C deposited.33,34
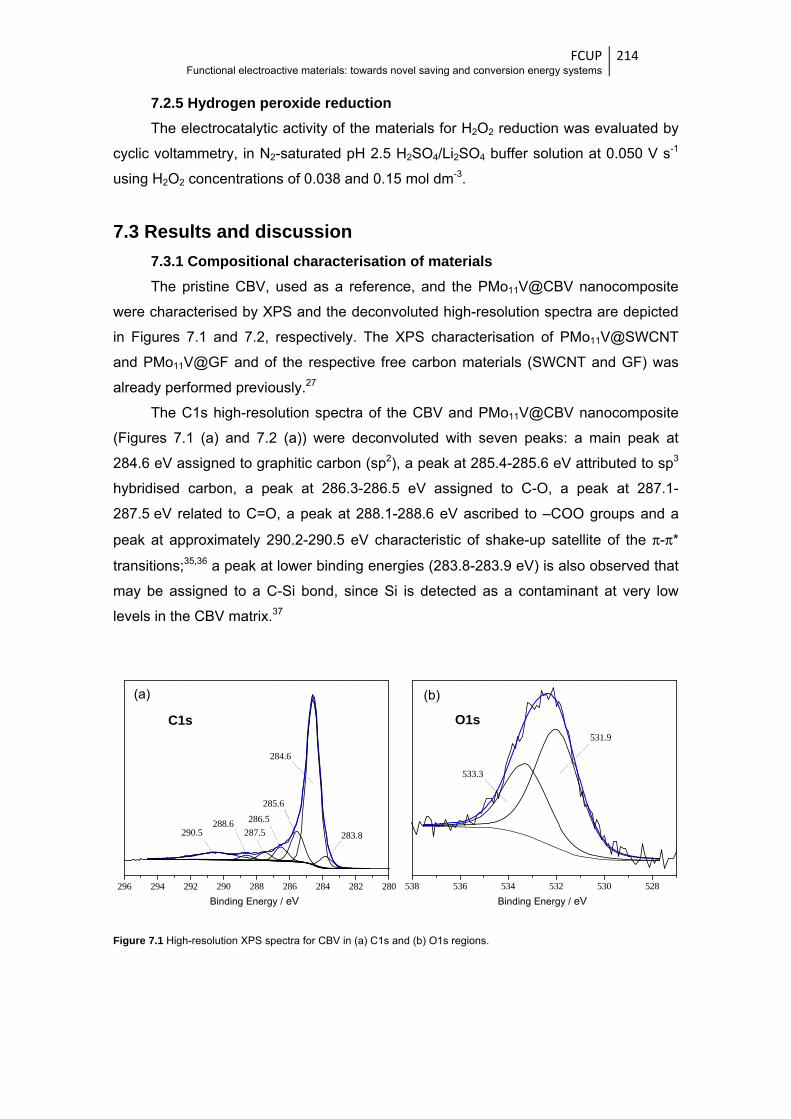
FCUP Functional electroactive materials: towards novel saving and conversion energy systems
214
7.2.5 Hydrogen peroxide reduction The electrocatalytic activity of the materials for H2O2 reduction was evaluated by
cyclic voltammetry, in N2-saturated pH 2.5 H2SO4/Li2SO4 buffer solution at 0.050 V s-1
using H2O2 concentrations of 0.038 and 0.15 mol dm-3.
7.3 Results and discussion 7.3.1 Compositional characterisation of materials The pristine CBV, used as a reference, and the PMo11V@CBV nanocomposite
were characterised by XPS and the deconvoluted high-resolution spectra are depicted
in Figures 7.1 and 7.2, respectively. The XPS characterisation of PMo11V@SWCNT
and PMo11V@GF and of the respective free carbon materials (SWCNT and GF) was
already performed previously.27
The C1s high-resolution spectra of the CBV and PMo11V@CBV nanocomposite
(Figures 7.1 (a) and 7.2 (a)) were deconvoluted with seven peaks: a main peak at
284.6 eV assigned to graphitic carbon (sp2), a peak at 285.4-285.6 eV attributed to sp3
hybridised carbon, a peak at 286.3-286.5 eV assigned to C-O, a peak at 287.1-
287.5 eV related to C=O, a peak at 288.1-288.6 eV ascribed to –COO groups and a
peak at approximately 290.2-290.5 eV characteristic of shake-up satellite of the π-π*
transitions;35,36 a peak at lower binding energies (283.8-283.9 eV) is also observed that
may be assigned to a C-Si bond, since Si is detected as a contaminant at very low
levels in the CBV matrix.37
Figure 7.1 High-resolution XPS spectra for CBV in (a) C1s and (b) O1s regions.
296 294 292 290 288 286 284 282 280
288.6290.5
Binding Energy / eV
284.6
285.6
286.5
287.5 283.8
538 536 534 532 530 528
533.3
Binding Energy / eV
531.9
(a) (b)
C1s O1s
Binding Energy / eV Binding Energy / eV

FCUP Functional electroactive materials: towards novel saving and conversion energy systems
215
Figure 7.2 High-resolution XPS spectra for PMo11V@CBV in (a) C1s, (b) O1s, (c) P2p, (d) V2p and (e) Mo3d regions.
The O1s spectrum of CBV (Figure 7.1 (b)) was fitted with two peaks at 531.9 and
533.3 eV ascribed to O=C (ketone and quinone moieties) and C-O (ether and phenol
groups) bonds; both peaks have the contribution of oxygen atoms from carboxylic and
esters groups.36 On the other hand, the O1s spectrum of PMo11V@CBV
296 294 292 290 288 286 284 282 280
Binding Energy / eV
283.9
284.6
285.4
286.3
287.1288.1
290.2
538 536 534 532 530 528
532.7
533.7
Binding Energy / eV
531.5
530.5
138 136 134 132 130 128
134.5
Binding Energy / eV
133.6
520 518 516 514
400.7
Binding Energy / eV
240 238 236 234 232 230 228
Binding Energy / eV
232.8
235.9
(a)
C1s
(b)
O1s
(c)
P2p
(d)
V2p
(e)
Mo3d
Binding Energy / eV Binding Energy / eV
Binding Energy / eV Binding Energy / eV
Binding Energy / eV
517.1

FCUP Functional electroactive materials: towards novel saving and conversion energy systems
216
nanocomposite (Figure 7.2 (b)) was deconvoluted with four peaks at 530.5, 531.5,
532.7 and 533.7 eV; the last two peaks are assigned to CBV, as described above,
while the first peak can be attributed to the O-Mo bond and the peak at 531.5 eV to the
O-P bond.27
For the remaining elements detected in the nanocomposite, in the P2p region
(Figure 7.2 (c)) two peaks are observed at 133.6 and 134.5 eV, being attributed to
P2p1/2 and P2p3/2, respectively,27 in the V2p region (Figure 7.2 (d)) one peak attributed
to V2p3/2 (517.1 eV) is identified,27 and the Mo3d spectrum (Figure 7.2 (e)) was fitted
with two peaks at 232.8 and 235.9 eV attributed to Mo3d5/2 and Mo3d3/2, respectively,
due to Mo6+ in the POM structure.27
The XPS surface atomic percentages of the elements detected in the
PMo11V@CBV nanocomposite and free CBV are summarised in Table 7.1; in the same
table are also reported the atomic percentages for PMo11V@SWCNT, PMo11V@GF
and free SWCNT and GF, taken from Ref. [27]. As observed for other nanocomposites,
the detection of the elements from each component, CBV (C and O) and PMo11V (O, P,
V, Mo and N), confirms the successful preparation of the PMo11V@CBV
nanocomposite. Furthermore, the surface atomic percentage values suggest a lower
amount of PMo11V immobilised in CBV than in other carbon materials (SWCNT and
GF) (as revealed by the Mo3d atomic %).
Table 7.1 XPS atomic percentages.
Sample Atomic %
C1s O1s P2p V2p Mo3d N1s
CBV 98.8 1.2 - - - -
PMo11V@CBV 93.1 4.7 0.1 0.1 0.8 1.0
SWCNTa 99.3 0.7 - - - -
PMo11V@SWCNTa 95.2 2.2 0.1 0.1 1.8 0.6
GFa 98.8 1.2 - - - -
PMo11V@GFa 96.0 2.3 0.1 0.1 1.2 1.1 a Taken from Ref. [27].
The FTIR spectra of pristine CBV and PMo11V@CBV nanocomposite are
depicted in Figure 7.3. The spectrum of CBV shows very weak and poorly resolved
vibrational bands, with absorptions at 1591 cm-1 due to C=C stretching vibrations, and
at 1251 cm-1, attributed to the stretching of C-O bonds from the oxygen-containing
groups on the carbon surface.38 The FTIR spectrum of PMo11V@CBV, besides the
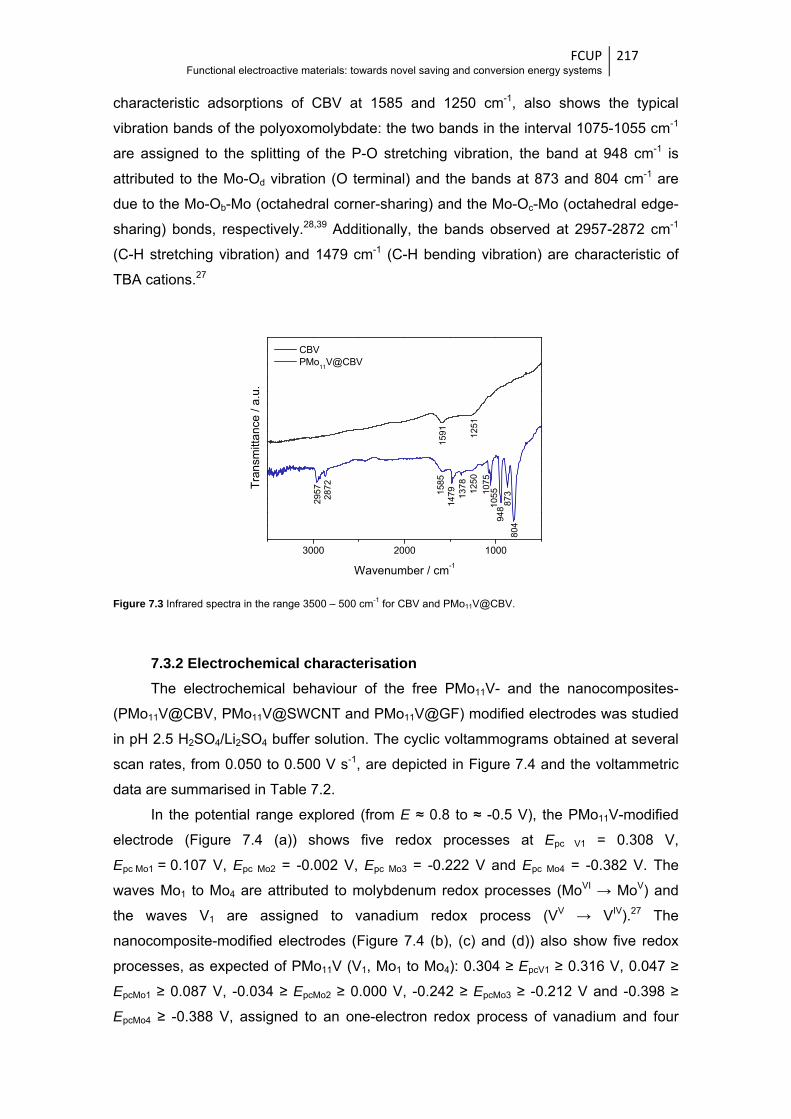
FCUP Functional electroactive materials: towards novel saving and conversion energy systems
217
characteristic adsorptions of CBV at 1585 and 1250 cm-1, also shows the typical
vibration bands of the polyoxomolybdate: the two bands in the interval 1075-1055 cm-1
are assigned to the splitting of the P-O stretching vibration, the band at 948 cm-1 is
attributed to the Mo-Od vibration (O terminal) and the bands at 873 and 804 cm-1 are
due to the Mo-Ob-Mo (octahedral corner-sharing) and the Mo-Oc-Mo (octahedral edge-
sharing) bonds, respectively.28,39 Additionally, the bands observed at 2957-2872 cm-1
(C-H stretching vibration) and 1479 cm-1 (C-H bending vibration) are characteristic of
TBA cations.27
Figure 7.3 Infrared spectra in the range 3500 – 500 cm-1 for CBV and PMo11V@CBV.
7.3.2 Electrochemical characterisation The electrochemical behaviour of the free PMo11V- and the nanocomposites-
(PMo11V@CBV, PMo11V@SWCNT and PMo11V@GF) modified electrodes was studied
in pH 2.5 H2SO4/Li2SO4 buffer solution. The cyclic voltammograms obtained at several
scan rates, from 0.050 to 0.500 V s-1, are depicted in Figure 7.4 and the voltammetric
data are summarised in Table 7.2.
In the potential range explored (from E ≈ 0.8 to ≈ -0.5 V), the PMo11V-modified
electrode (Figure 7.4 (a)) shows five redox processes at Epc V1 = 0.308 V,
Epc Mo1 = 0.107 V, Epc Mo2 = -0.002 V, Epc Mo3 = -0.222 V and Epc Mo4 = -0.382 V. The
waves Mo1 to Mo4 are attributed to molybdenum redox processes (MoVI → MoV) and
the waves V1 are assigned to vanadium redox process (VV → VIV).27 The
nanocomposite-modified electrodes (Figure 7.4 (b), (c) and (d)) also show five redox
processes, as expected of PMo11V (V1, Mo1 to Mo4): 0.304 ≥ EpcV1 ≥ 0.316 V, 0.047 ≥
EpcMo1 ≥ 0.087 V, -0.034 ≥ EpcMo2 ≥ 0.000 V, -0.242 ≥ EpcMo3 ≥ -0.212 V and -0.398 ≥
EpcMo4 ≥ -0.388 V, assigned to an one-electron redox process of vanadium and four
3000 2000 1000
1075Tra
nsm
itta
nce
/ a
.u.
CBV PMo
11V@CBV
Wavenumber / cm-1
1251
1591
295
728
72
1479 13
78
804
873
9481
05515
85
125
0
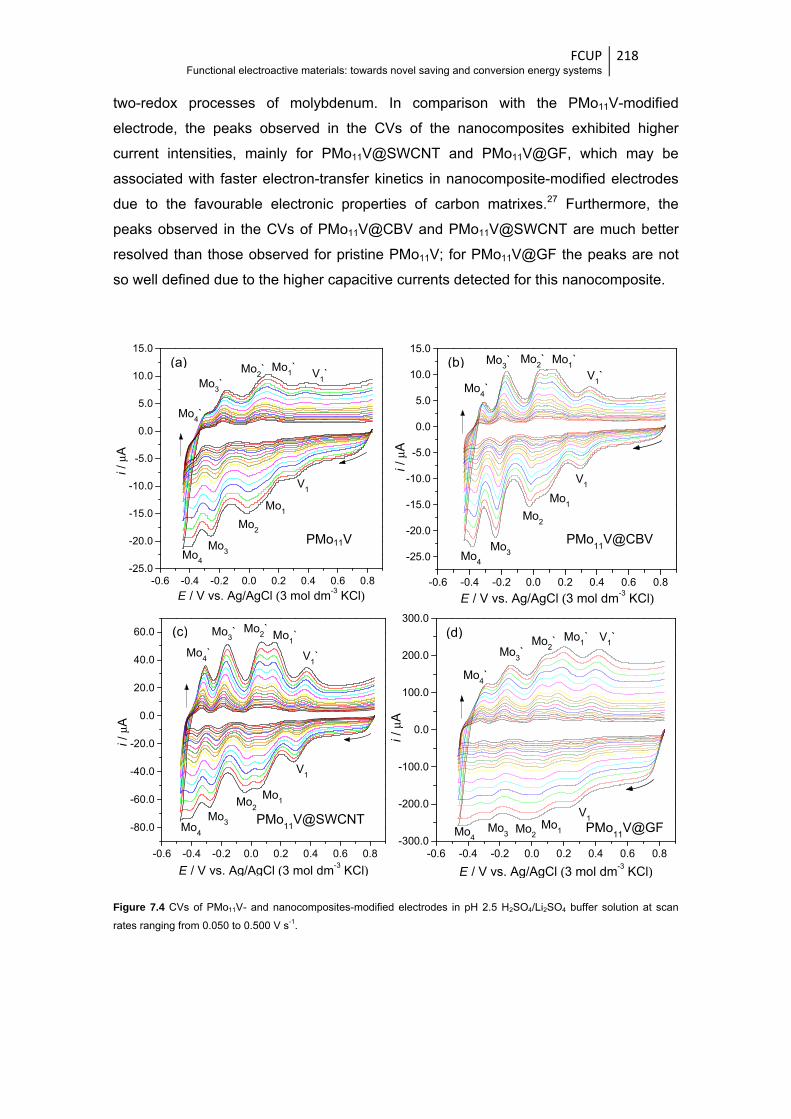
FCUP Functional electroactive materials: towards novel saving and conversion energy systems
218
two-redox processes of molybdenum. In comparison with the PMo11V-modified
electrode, the peaks observed in the CVs of the nanocomposites exhibited higher
current intensities, mainly for PMo11V@SWCNT and PMo11V@GF, which may be
associated with faster electron-transfer kinetics in nanocomposite-modified electrodes
due to the favourable electronic properties of carbon matrixes.27 Furthermore, the
peaks observed in the CVs of PMo11V@CBV and PMo11V@SWCNT are much better
resolved than those observed for pristine PMo11V; for PMo11V@GF the peaks are not
so well defined due to the higher capacitive currents detected for this nanocomposite.
Figure 7.4 CVs of PMo11V- and nanocomposites-modified electrodes in pH 2.5 H2SO4/Li2SO4 buffer solution at scan
rates ranging from 0.050 to 0.500 V s-1.
-0.6 -0.4 -0.2 0.0 0.2 0.4 0.6 0.8-25.0
-20.0
-15.0
-10.0
-5.0
0.0
5.0
10.0
15.0
i / μ
A
E / V vs. Ag/AgCl (3 mol dm-3 KCl)
V1`
Mo1
Mo4`
Mo3`
Mo2`
Mo3Mo
4
Mo2
Mo1`
V1
-0.6 -0.4 -0.2 0.0 0.2 0.4 0.6 0.8
-25.0
-20.0
-15.0
-10.0
-5.0
0.0
5.0
10.0
15.0
i / μ
A
E / V vs. Ag/AgCl (3 mol dm-3 KCl)
V1`
Mo1
Mo4`
Mo3` Mo
2`
Mo3Mo
4
Mo2
Mo1`
V1
-0.6 -0.4 -0.2 0.0 0.2 0.4 0.6 0.8
-80.0
-60.0
-40.0
-20.0
0.0
20.0
40.0
60.0
i / μ
A
E / V vs. Ag/AgCl (3 mol dm-3 KCl)
V1`
Mo1
Mo4`
Mo3` Mo
2`
Mo3Mo
4
Mo2
Mo1`
V1
-0.6 -0.4 -0.2 0.0 0.2 0.4 0.6 0.8-300.0
-200.0
-100.0
0.0
100.0
200.0
300.0
i / μ
A
E / V vs. Ag/AgCl (3 mol dm-3 KCl)
V1`
Mo1
Mo4`
Mo3`
Mo2`
Mo3Mo
4Mo
2
Mo1`
V1
(a)
PMo11V PMo11
V@CBV
PMo11
V@SWCNTPMo
11V@GF
(b)
(c) (d)
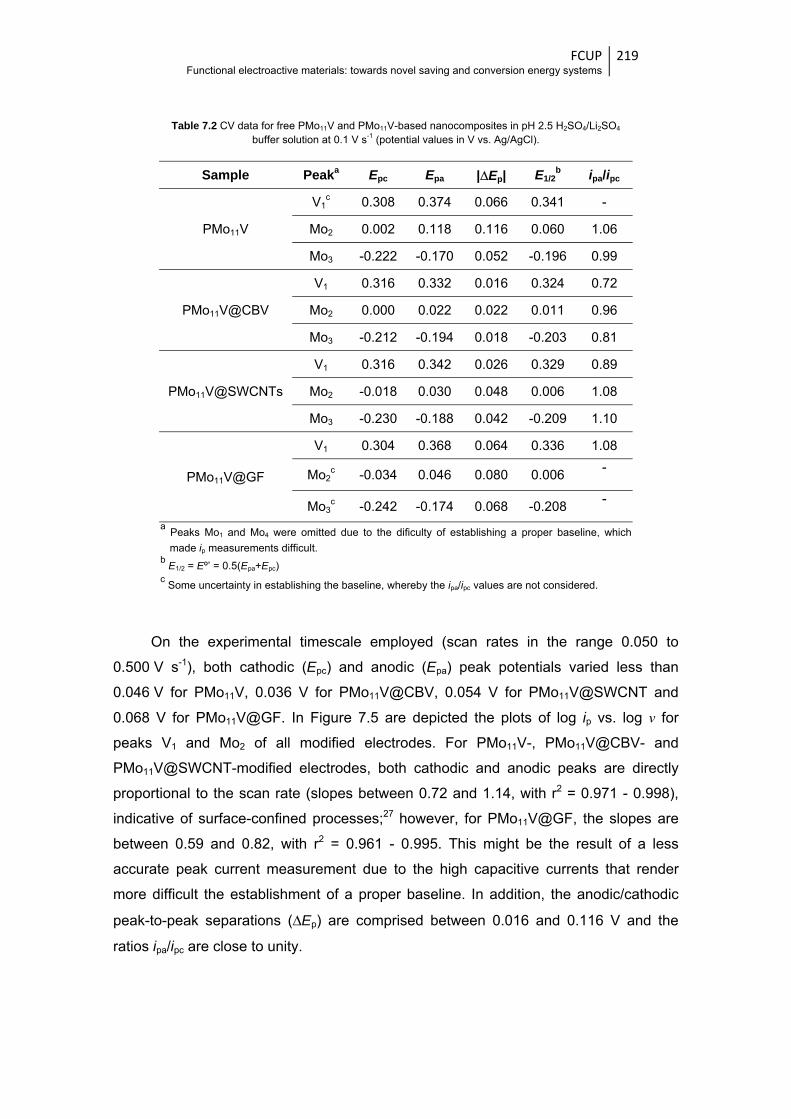
FCUP Functional electroactive materials: towards novel saving and conversion energy systems
219
Table 7.2 CV data for free PMo11V and PMo11V-based nanocomposites in pH 2.5 H2SO4/Li2SO4 buffer solution at 0.1 V s-1 (potential values in V vs. Ag/AgCl).
Sample Peaka Epc Epa |ΔEp| E1/2b ipa/ipc
PMo11V
V1c 0.308 0.374 0.066 0.341 -
Mo2 0.002 0.118 0.116 0.060 1.06
Mo3 -0.222 -0.170 0.052 -0.196 0.99
PMo11V@CBV
V1 0.316 0.332 0.016 0.324 0.72
Mo2 0.000 0.022 0.022 0.011 0.96
Mo3 -0.212 -0.194 0.018 -0.203 0.81
PMo11V@SWCNTs
V1 0.316 0.342 0.026 0.329 0.89
Mo2 -0.018 0.030 0.048 0.006 1.08
Mo3 -0.230 -0.188 0.042 -0.209 1.10
PMo11V@GF
V1 0.304 0.368 0.064 0.336 1.08
Mo2c -0.034 0.046 0.080 0.006
-
Mo3c -0.242 -0.174 0.068 -0.208
-
a Peaks Mo1 and Mo4 were omitted due to the dificulty of establishing a proper baseline, which
made ip measurements difficult. b E1/2 = Eº’ = 0.5(Epa+Epc)
c Some uncertainty in establishing the baseline, whereby the ipa/ipc values are not considered.
On the experimental timescale employed (scan rates in the range 0.050 to
0.500 V s-1), both cathodic (Epc) and anodic (Epa) peak potentials varied less than
0.046 V for PMo11V, 0.036 V for PMo11V@CBV, 0.054 V for PMo11V@SWCNT and
0.068 V for PMo11V@GF. In Figure 7.5 are depicted the plots of log ip vs. log v for
peaks V1 and Mo2 of all modified electrodes. For PMo11V-, PMo11V@CBV- and
PMo11V@SWCNT-modified electrodes, both cathodic and anodic peaks are directly
proportional to the scan rate (slopes between 0.72 and 1.14, with r2 = 0.971 - 0.998),
indicative of surface-confined processes;27 however, for PMo11V@GF, the slopes are
between 0.59 and 0.82, with r2 = 0.961 - 0.995. This might be the result of a less
accurate peak current measurement due to the high capacitive currents that render
more difficult the establishment of a proper baseline. In addition, the anodic/cathodic
peak-to-peak separations (ΔEp) are comprised between 0.016 and 0.116 V and the
ratios ipa/ipc are close to unity.
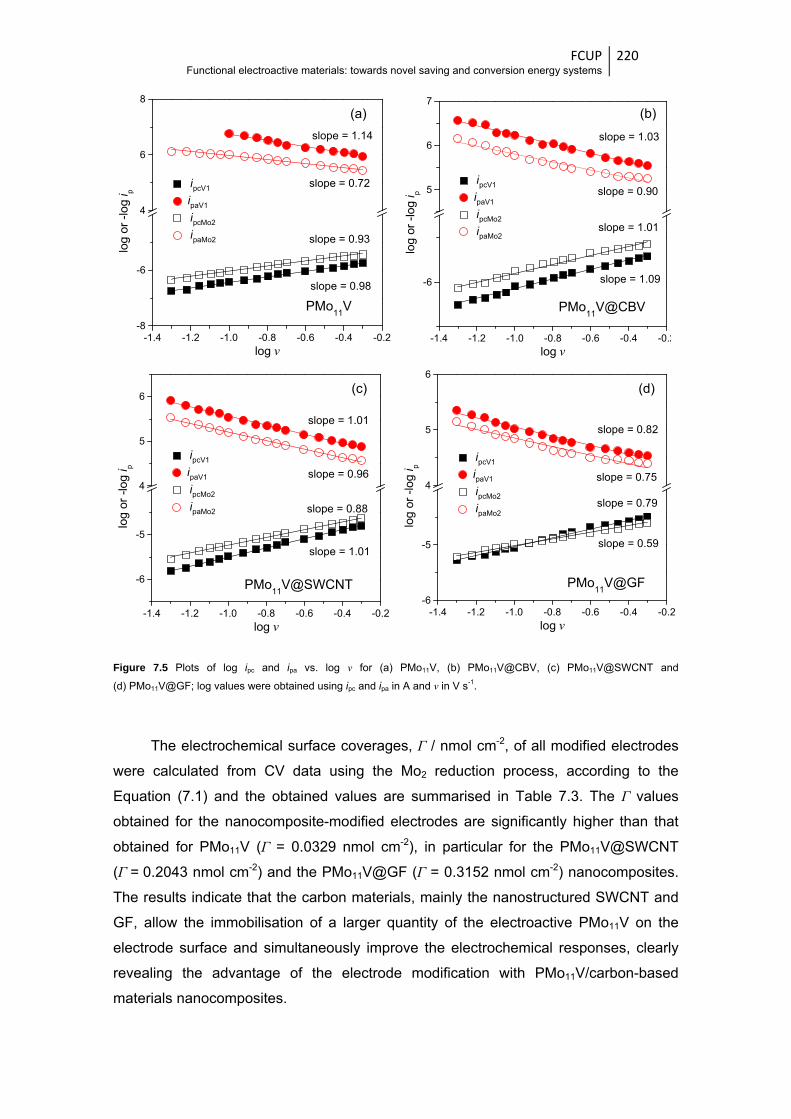
FCUP Functional electroactive materials: towards novel saving and conversion energy systems
220
Figure 7.5 Plots of log ipc and ipa vs. log v for (a) PMo11V, (b) PMo11V@CBV, (c) PMo11V@SWCNT and
(d) PMo11V@GF; log values were obtained using ipc and ipa in A and v in V s-1.
The electrochemical surface coverages, Γ / nmol cm-2, of all modified electrodes
were calculated from CV data using the Mo2 reduction process, according to the
Equation (7.1) and the obtained values are summarised in Table 7.3. The Γ values
obtained for the nanocomposite-modified electrodes are significantly higher than that
obtained for PMo11V (Γ = 0.0329 nmol cm-2), in particular for the PMo11V@SWCNT
(Γ = 0.2043 nmol cm-2) and the PMo11V@GF (Γ = 0.3152 nmol cm-2) nanocomposites.
The results indicate that the carbon materials, mainly the nanostructured SWCNT and
GF, allow the immobilisation of a larger quantity of the electroactive PMo11V on the
electrode surface and simultaneously improve the electrochemical responses, clearly
revealing the advantage of the electrode modification with PMo11V/carbon-based
materials nanocomposites.
(a) (b)
(c) (d)
PMo11
V PMo11
V@CBV
PMo11
V@SWCNT PMo11
V@GF
-1.4 -1.2 -1.0 -0.8 -0.6 -0.4 -0.2-8
-6
4
6
8
slope = 0.93
slope = 0.98
slope = 0.72 ipcV1
ipaV1
ipcMo2
ipaMo2
log
or
-log
i p
log v
slope = 1.14
-1.4 -1.2 -1.0 -0.8 -0.6 -0.4 -0.2
-6
5
6
7
slope = 1.09
slope = 1.01
slope = 0.90 ipcV1
ipaV1
ipcMo2
ipaMo2
log
or -
log
i p
log v
slope = 1.03
-1.4 -1.2 -1.0 -0.8 -0.6 -0.4 -0.2
-6
-5
4
5
6
slope = 1.01
slope = 0.88
slope = 0.96
ipcV1
ipaV1
ipcMo2
ipaMo2
log
or -
log
i p
log v
slope = 1.01
-1.4 -1.2 -1.0 -0.8 -0.6 -0.4 -0.2-6
-5
4
5
6
slope = 0.59
slope = 0.79
slope = 0.75
ipcV1
ipaV1
ipcMo2
ipaMo2
log
or -
log
i p
log v
slope = 0.82
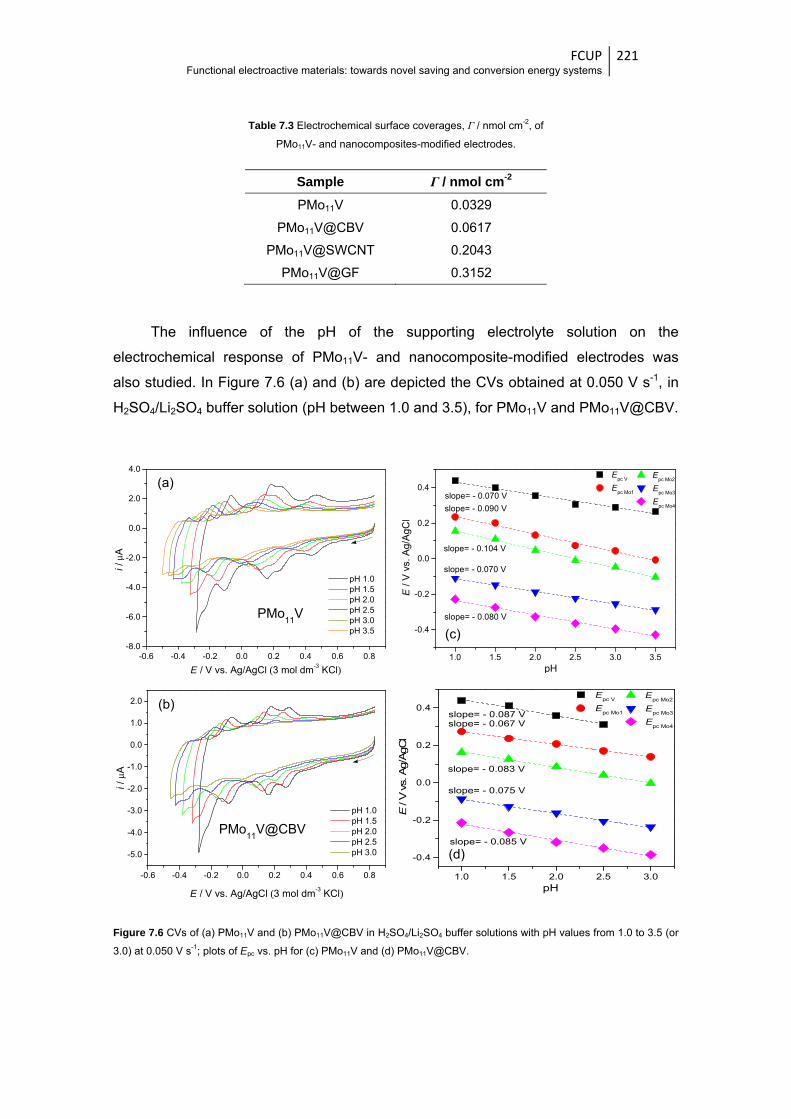
FCUP Functional electroactive materials: towards novel saving and conversion energy systems
221
Table 7.3 Electrochemical surface coverages, Γ / nmol cm-2, of
PMo11V- and nanocomposites-modified electrodes.
Sample Γ / nmol cm-2 PMo11V 0.0329
PMo11V@CBV 0.0617
PMo11V@SWCNT 0.2043
PMo11V@GF 0.3152
The influence of the pH of the supporting electrolyte solution on the
electrochemical response of PMo11V- and nanocomposite-modified electrodes was
also studied. In Figure 7.6 (a) and (b) are depicted the CVs obtained at 0.050 V s-1, in
H2SO4/Li2SO4 buffer solution (pH between 1.0 and 3.5), for PMo11V and PMo11V@CBV.
Figure 7.6 CVs of (a) PMo11V and (b) PMo11V@CBV in H2SO4/Li2SO4 buffer solutions with pH values from 1.0 to 3.5 (or
3.0) at 0.050 V s-1; plots of Epc vs. pH for (c) PMo11V and (d) PMo11V@CBV.
-0.6 -0.4 -0.2 0.0 0.2 0.4 0.6 0.8-8.0
-6.0
-4.0
-2.0
0.0
2.0
4.0
pH 1.0 pH 1.5 pH 2.0 pH 2.5 pH 3.0 pH 3.5
i / μ
A
E / V vs. Ag/AgCl (3 mol dm-3 KCl)
-0.6 -0.4 -0.2 0.0 0.2 0.4 0.6 0.8
-5.0
-4.0
-3.0
-2.0
-1.0
0.0
1.0
2.0
i / μ
A
pH 1.0 pH 1.5 pH 2.0 pH 2.5 pH 3.0
E / V vs. Ag/AgCl (3 mol dm-3 KCl)
(a)
(b)
(c)
(d)
PMo11
V
PMo11
V@CBV
1.0 1.5 2.0 2.5 3.0 3.5
-0.4
-0.2
0.0
0.2
0.4
Epc Mo2
Epc Mo3
Epc Mo4
Epc V
Epc Mo1
slope= - 0.104 V
slope= - 0.090 V
slope= - 0.070 V
slope= - 0.080 V
E /
V v
s. A
g/A
gCl
pH
slope= - 0.070 V
1.0 1.5 2.0 2.5 3.0
-0.4
-0.2
0.0
0.2
0.4
Epc Mo2
Epc Mo3
Epc Mo4
Epc V
Epc Mo1
slope= - 0.083 V
slope= - 0.067 V
slope= - 0.075 V
slope= - 0.085 V
E /
V v
s. A
g/A
gC
l
pH
slope= - 0.087 V
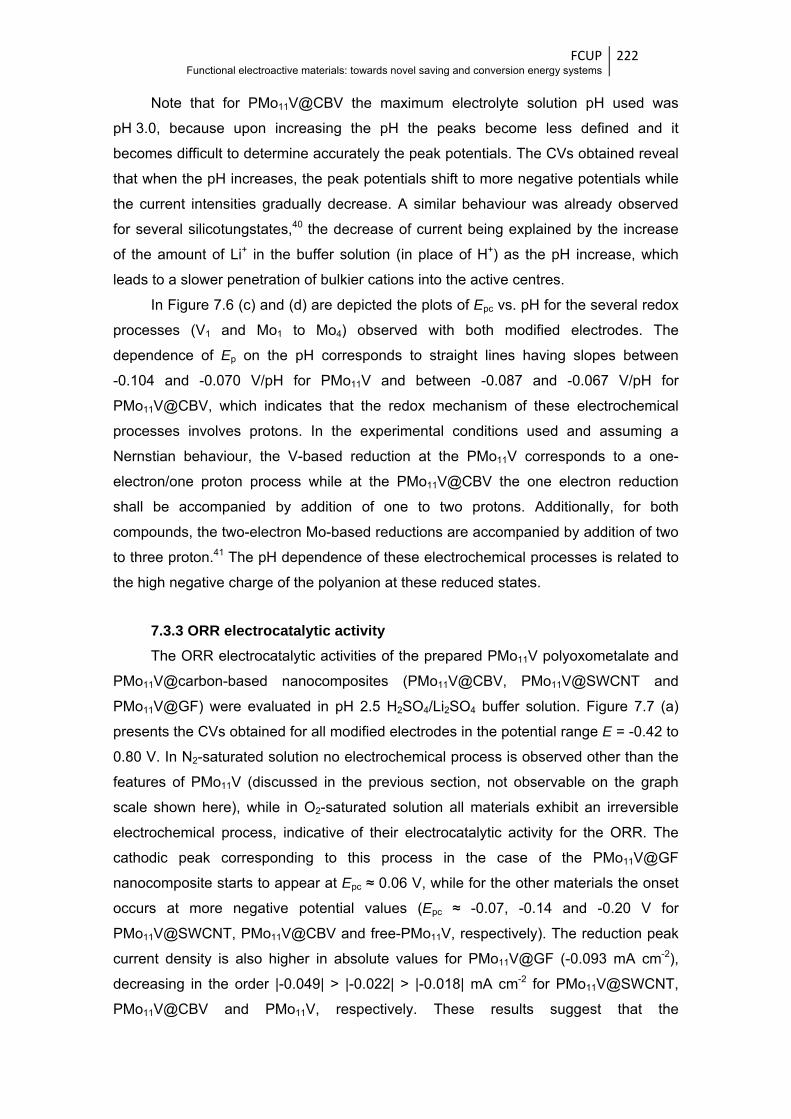
FCUP Functional electroactive materials: towards novel saving and conversion energy systems
222
Note that for PMo11V@CBV the maximum electrolyte solution pH used was
pH 3.0, because upon increasing the pH the peaks become less defined and it
becomes difficult to determine accurately the peak potentials. The CVs obtained reveal
that when the pH increases, the peak potentials shift to more negative potentials while
the current intensities gradually decrease. A similar behaviour was already observed
for several silicotungstates,40 the decrease of current being explained by the increase
of the amount of Li+ in the buffer solution (in place of H+) as the pH increase, which
leads to a slower penetration of bulkier cations into the active centres.
In Figure 7.6 (c) and (d) are depicted the plots of Epc vs. pH for the several redox
processes (V1 and Mo1 to Mo4) observed with both modified electrodes. The
dependence of Ep on the pH corresponds to straight lines having slopes between
-0.104 and -0.070 V/pH for PMo11V and between -0.087 and -0.067 V/pH for
PMo11V@CBV, which indicates that the redox mechanism of these electrochemical
processes involves protons. In the experimental conditions used and assuming a
Nernstian behaviour, the V-based reduction at the PMo11V corresponds to a one-
electron/one proton process while at the PMo11V@CBV the one electron reduction
shall be accompanied by addition of one to two protons. Additionally, for both
compounds, the two-electron Mo-based reductions are accompanied by addition of two
to three proton.41 The pH dependence of these electrochemical processes is related to
the high negative charge of the polyanion at these reduced states.
7.3.3 ORR electrocatalytic activity The ORR electrocatalytic activities of the prepared PMo11V polyoxometalate and
PMo11V@carbon-based nanocomposites (PMo11V@CBV, PMo11V@SWCNT and
PMo11V@GF) were evaluated in pH 2.5 H2SO4/Li2SO4 buffer solution. Figure 7.7 (a)
presents the CVs obtained for all modified electrodes in the potential range E = -0.42 to
0.80 V. In N2-saturated solution no electrochemical process is observed other than the
features of PMo11V (discussed in the previous section, not observable on the graph
scale shown here), while in O2-saturated solution all materials exhibit an irreversible
electrochemical process, indicative of their electrocatalytic activity for the ORR. The
cathodic peak corresponding to this process in the case of the PMo11V@GF
nanocomposite starts to appear at Epc ≈ 0.06 V, while for the other materials the onset
occurs at more negative potential values (Epc ≈ -0.07, -0.14 and -0.20 V for
PMo11V@SWCNT, PMo11V@CBV and free-PMo11V, respectively). The reduction peak
current density is also higher in absolute values for PMo11V@GF (-0.093 mA cm-2),
decreasing in the order |-0.049| > |-0.022| > |-0.018| mA cm-2 for PMo11V@SWCNT,
PMo11V@CBV and PMo11V, respectively. These results suggest that the
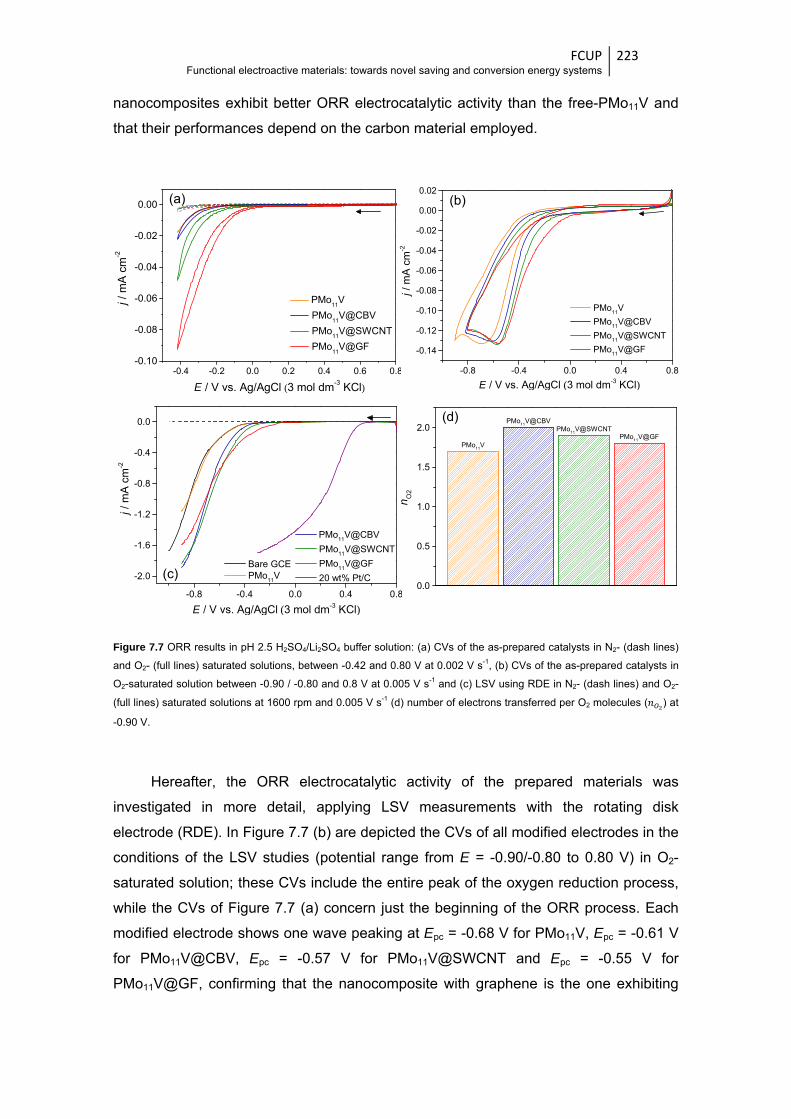
FCUP Functional electroactive materials: towards novel saving and conversion energy systems
223
nanocomposites exhibit better ORR electrocatalytic activity than the free-PMo11V and
that their performances depend on the carbon material employed.
Figure 7.7 ORR results in pH 2.5 H2SO4/Li2SO4 buffer solution: (a) CVs of the as-prepared catalysts in N2- (dash lines)
and O2- (full lines) saturated solutions, between -0.42 and 0.80 V at 0.002 V s-1, (b) CVs of the as-prepared catalysts in
O2-saturated solution between -0.90 / -0.80 and 0.8 V at 0.005 V s-1 and (c) LSV using RDE in N2- (dash lines) and O2-
(full lines) saturated solutions at 1600 rpm and 0.005 V s-1 (d) number of electrons transferred per O2 molecules ( ) at
-0.90 V.
Hereafter, the ORR electrocatalytic activity of the prepared materials was
investigated in more detail, applying LSV measurements with the rotating disk
electrode (RDE). In Figure 7.7 (b) are depicted the CVs of all modified electrodes in the
conditions of the LSV studies (potential range from E = -0.90/-0.80 to 0.80 V) in O2-
saturated solution; these CVs include the entire peak of the oxygen reduction process,
while the CVs of Figure 7.7 (a) concern just the beginning of the ORR process. Each
modified electrode shows one wave peaking at Epc = -0.68 V for PMo11V, Epc = -0.61 V
for PMo11V@CBV, Epc = -0.57 V for PMo11V@SWCNT and Epc = -0.55 V for
PMo11V@GF, confirming that the nanocomposite with graphene is the one exhibiting
-0.4 -0.2 0.0 0.2 0.4 0.6 0.8-0.10
-0.08
-0.06
-0.04
-0.02
0.00
j / m
A c
m-2
E / V vs. Ag/AgCl (3 mol dm-3 KCl)
PMo11
V
PMo11
V@CBV
PMo11
V@SWCNT
PMo11
V@GF
-0.8 -0.4 0.0 0.4 0.8
-0.14
-0.12
-0.10
-0.08
-0.06
-0.04
-0.02
0.00
0.02
PMo11
V
PMo11
V@CBV
PMo11
V@SWCNT
PMo11
V@GF
j /
mA
cm
-2
E / V vs. Ag/AgCl (3 mol dm-3 KCl)
-0.8 -0.4 0.0 0.4 0.8
-2.0
-1.6
-1.2
-0.8
-0.4
0.0
Bare GCE PMo
11V
PMo11
V@CBV
PMo11
V@SWCNT
PMo11
V@GF
20 wt% Pt/C
j / m
A c
m-2
E / V vs. Ag/AgCl (3 mol dm-3 KCl)
0.0
0.5
1.0
1.5
2.0PMo
11V@GF
PMo11
V@SWCNTPMo
11V@CBV
n O2
PMo11
V
(a) (b)
(c)
(d)
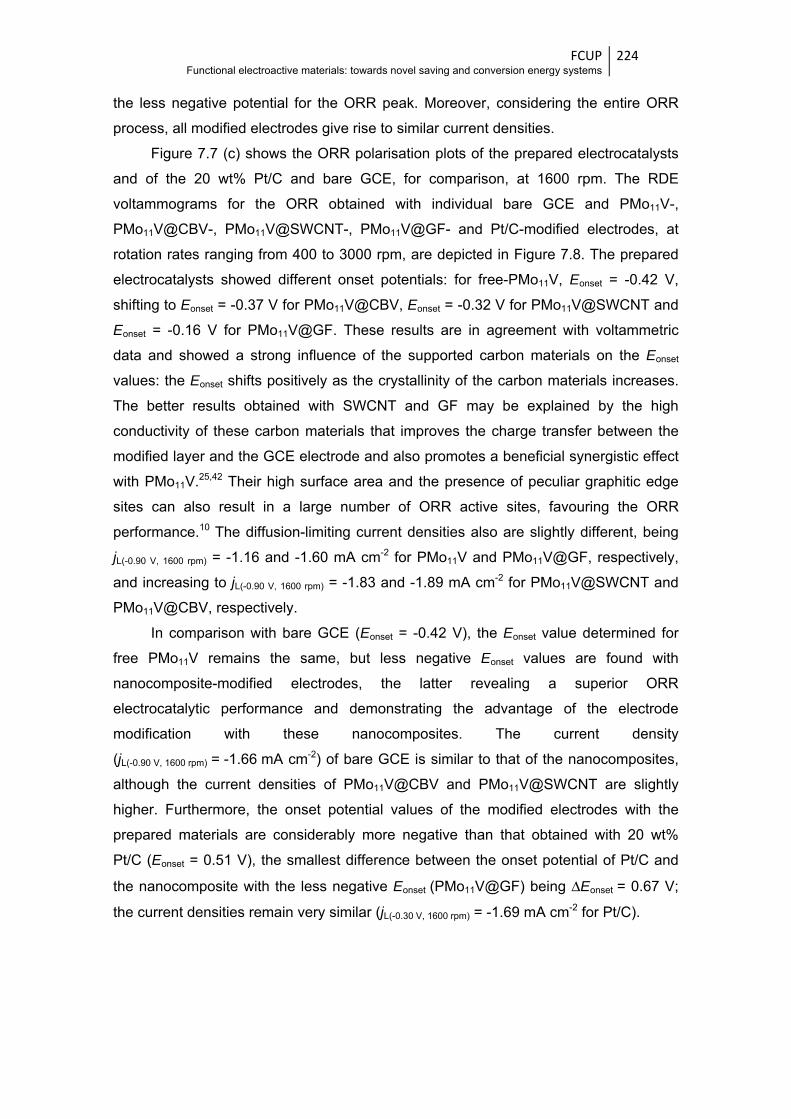
FCUP Functional electroactive materials: towards novel saving and conversion energy systems
224
the less negative potential for the ORR peak. Moreover, considering the entire ORR
process, all modified electrodes give rise to similar current densities.
Figure 7.7 (c) shows the ORR polarisation plots of the prepared electrocatalysts
and of the 20 wt% Pt/C and bare GCE, for comparison, at 1600 rpm. The RDE
voltammograms for the ORR obtained with individual bare GCE and PMo11V-,
PMo11V@CBV-, PMo11V@SWCNT-, PMo11V@GF- and Pt/C-modified electrodes, at
rotation rates ranging from 400 to 3000 rpm, are depicted in Figure 7.8. The prepared
electrocatalysts showed different onset potentials: for free-PMo11V, Eonset = -0.42 V,
shifting to Eonset = -0.37 V for PMo11V@CBV, Eonset = -0.32 V for PMo11V@SWCNT and
Eonset = -0.16 V for PMo11V@GF. These results are in agreement with voltammetric
data and showed a strong influence of the supported carbon materials on the Eonset
values: the Eonset shifts positively as the crystallinity of the carbon materials increases.
The better results obtained with SWCNT and GF may be explained by the high
conductivity of these carbon materials that improves the charge transfer between the
modified layer and the GCE electrode and also promotes a beneficial synergistic effect
with PMo11V.25,42 Their high surface area and the presence of peculiar graphitic edge
sites can also result in a large number of ORR active sites, favouring the ORR
performance.10 The diffusion-limiting current densities also are slightly different, being
jL(-0.90 V, 1600 rpm) = -1.16 and -1.60 mA cm-2 for PMo11V and PMo11V@GF, respectively,
and increasing to jL(-0.90 V, 1600 rpm) = -1.83 and -1.89 mA cm-2 for PMo11V@SWCNT and
PMo11V@CBV, respectively.
In comparison with bare GCE (Eonset = -0.42 V), the Eonset value determined for
free PMo11V remains the same, but less negative Eonset values are found with
nanocomposite-modified electrodes, the latter revealing a superior ORR
electrocatalytic performance and demonstrating the advantage of the electrode
modification with these nanocomposites. The current density
(jL(-0.90 V, 1600 rpm) = -1.66 mA cm-2) of bare GCE is similar to that of the nanocomposites,
although the current densities of PMo11V@CBV and PMo11V@SWCNT are slightly
higher. Furthermore, the onset potential values of the modified electrodes with the
prepared materials are considerably more negative than that obtained with 20 wt%
Pt/C (Eonset = 0.51 V), the smallest difference between the onset potential of Pt/C and
the nanocomposite with the less negative Eonset (PMo11V@GF) being ΔEonset = 0.67 V;
the current densities remain very similar (jL(-0.30 V, 1600 rpm) = -1.69 mA cm-2 for Pt/C).
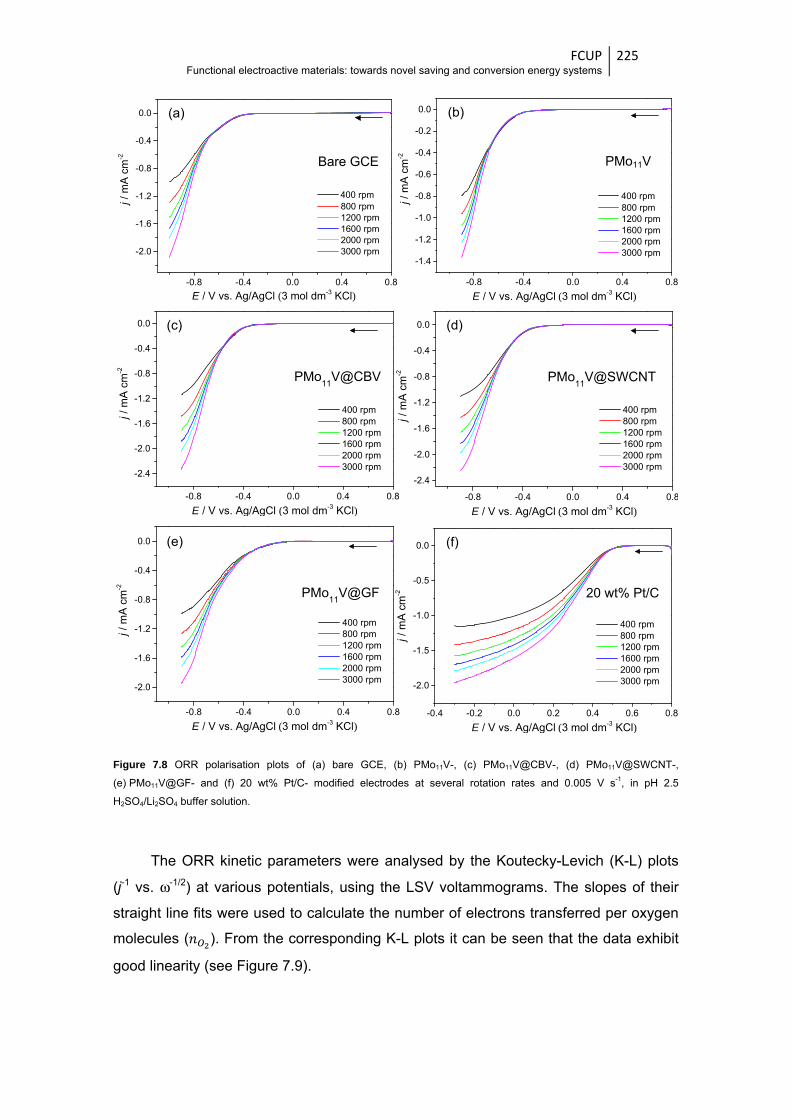
FCUP Functional electroactive materials: towards novel saving and conversion energy systems
225
Figure 7.8 ORR polarisation plots of (a) bare GCE, (b) PMo11V-, (c) PMo11V@CBV-, (d) PMo11V@SWCNT-,
(e) PMo11V@GF- and (f) 20 wt% Pt/C- modified electrodes at several rotation rates and 0.005 V s-1, in pH 2.5
H2SO4/Li2SO4 buffer solution.
The ORR kinetic parameters were analysed by the Koutecky-Levich (K-L) plots
(j-1 vs. ω-1/2) at various potentials, using the LSV voltammograms. The slopes of their
straight line fits were used to calculate the number of electrons transferred per oxygen
molecules ( ). From the corresponding K-L plots it can be seen that the data exhibit
good linearity (see Figure 7.9).
-0.8 -0.4 0.0 0.4 0.8
-2.0
-1.6
-1.2
-0.8
-0.4
0.0
400 rpm 800 rpm 1200 rpm 1600 rpm 2000 rpm 3000 rpm
j / m
A c
m-2
E / V vs. Ag/AgCl (3 mol dm-3 KCl)-0.8 -0.4 0.0 0.4 0.8
-1.4
-1.2
-1.0
-0.8
-0.6
-0.4
-0.2
0.0
400 rpm 800 rpm 1200 rpm 1600 rpm 2000 rpm 3000 rpm
j / m
A c
m-2
E / V vs. Ag/AgCl (3 mol dm-3 KCl)
-0.8 -0.4 0.0 0.4 0.8
-2.4
-2.0
-1.6
-1.2
-0.8
-0.4
0.0
400 rpm 800 rpm 1200 rpm 1600 rpm 2000 rpm 3000 rpm
j / m
A c
m-2
E / V vs. Ag/AgCl (3 mol dm-3 KCl)-0.8 -0.4 0.0 0.4 0.8
-2.4
-2.0
-1.6
-1.2
-0.8
-0.4
0.0
400 rpm 800 rpm 1200 rpm 1600 rpm 2000 rpm 3000 rpm
j / m
A c
m-2
E / V vs. Ag/AgCl (3 mol dm-3 KCl)
-0.8 -0.4 0.0 0.4 0.8
-2.0
-1.6
-1.2
-0.8
-0.4
0.0
400 rpm 800 rpm 1200 rpm 1600 rpm 2000 rpm 3000 rpm
j / m
A c
m-2
E / V vs. Ag/AgCl (3 mol dm-3 KCl) -0.4 -0.2 0.0 0.2 0.4 0.6 0.8
-2.0
-1.5
-1.0
-0.5
0.0
400 rpm 800 rpm 1200 rpm 1600 rpm 2000 rpm 3000 rpm
j /
mA
cm
-2
E / V vs. Ag/AgCl (3 mol dm-3 KCl)
(a) (b)
(c) (d)
(e) (f)
Bare GCE PMo11V
PMo11
V@CBV PMo11
V@SWCNT
PMo11
V@GF 20 wt% Pt/C
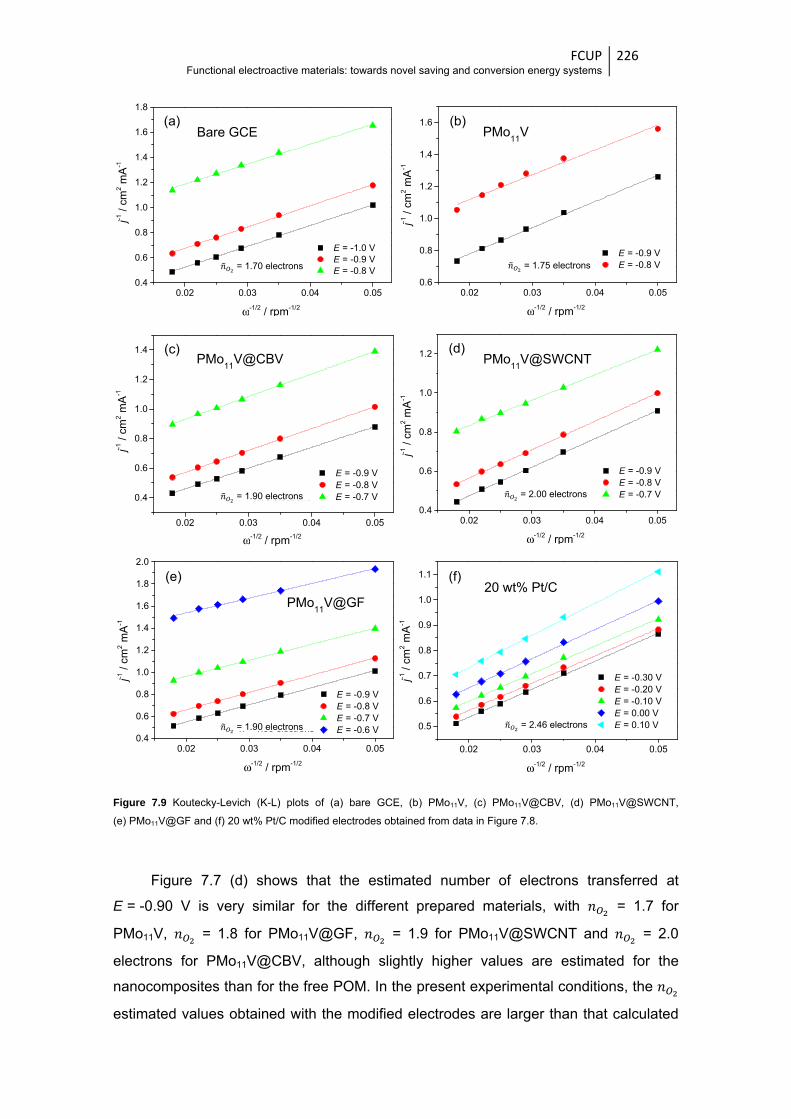
FCUP Functional electroactive materials: towards novel saving and conversion energy systems
226
Figure 7.9 Koutecky-Levich (K-L) plots of (a) bare GCE, (b) PMo11V, (c) PMo11V@CBV, (d) PMo11V@SWCNT,
(e) PMo11V@GF and (f) 20 wt% Pt/C modified electrodes obtained from data in Figure 7.8.
Figure 7.7 (d) shows that the estimated number of electrons transferred at
E = -0.90 V is very similar for the different prepared materials, with = 1.7 for
PMo11V, = 1.8 for PMo11V@GF, = 1.9 for PMo11V@SWCNT and = 2.0
electrons for PMo11V@CBV, although slightly higher values are estimated for the
nanocomposites than for the free POM. In the present experimental conditions, the
estimated values obtained with the modified electrodes are larger than that calculated
0.02 0.03 0.04 0.050.4
0.6
0.8
1.0
1.2
1.4
1.6
1.8
E = -1.0 V E = -0.9 V E = -0.8 V
j-1 /
cm2 m
A-1
ω-1/2 / rpm-1/2
ñ = 1.70 electrons
0.02 0.03 0.04 0.050.6
0.8
1.0
1.2
1.4
1.6
E = -0.9 V E = -0.8 V
j-1 /
cm
2 mA
-1
ω-1/2 / rpm-1/2
ñ = 1.75 electrons
0.02 0.03 0.04 0.05
0.4
0.6
0.8
1.0
1.2
1.4
E = -0.9 V E = -0.8 V E = -0.7 V
j-1 /
cm2 m
A-1
ω-1/2 / rpm-1/2
ñ = 1.90 electrons
0.02 0.03 0.04 0.050.4
0.6
0.8
1.0
1.2
E = -0.9 V E = -0.8 V E = -0.7 V
j-1 /
cm
2 mA
-1
ω-1/2 / rpm-1/2
ñ = 2.00 electrons
0.02 0.03 0.04 0.050.4
0.6
0.8
1.0
1.2
1.4
1.6
1.8
2.0
E = -0.9 V E = -0.8 V E = -0.7 V E = -0.6 V
j-1 /
cm2 m
A-1
ω-1/2 / rpm-1/2
ñ = 1.90 electrons
0.02 0.03 0.04 0.05
0.5
0.6
0.7
0.8
0.9
1.0
1.1
E = -0.30 V E = -0.20 V E = -0.10 V E = 0.00 V E = 0.10 V
j-1 /
cm2 m
A-1
ω-1/2 / rpm-1/2
ñ = 2.46 electrons
(a) (b)
(c) (d)
(e) (f)
Bare GCE PMo11
V
PMo11
V@CBV PMo11
V@SWCNT
PMo11
V@GF20 wt% Pt/C
= 1.70 electrons = 1.75 electrons
= 1.90 electrons = 2.00 electrons
= 1.90 electrons = 2.46 electrons
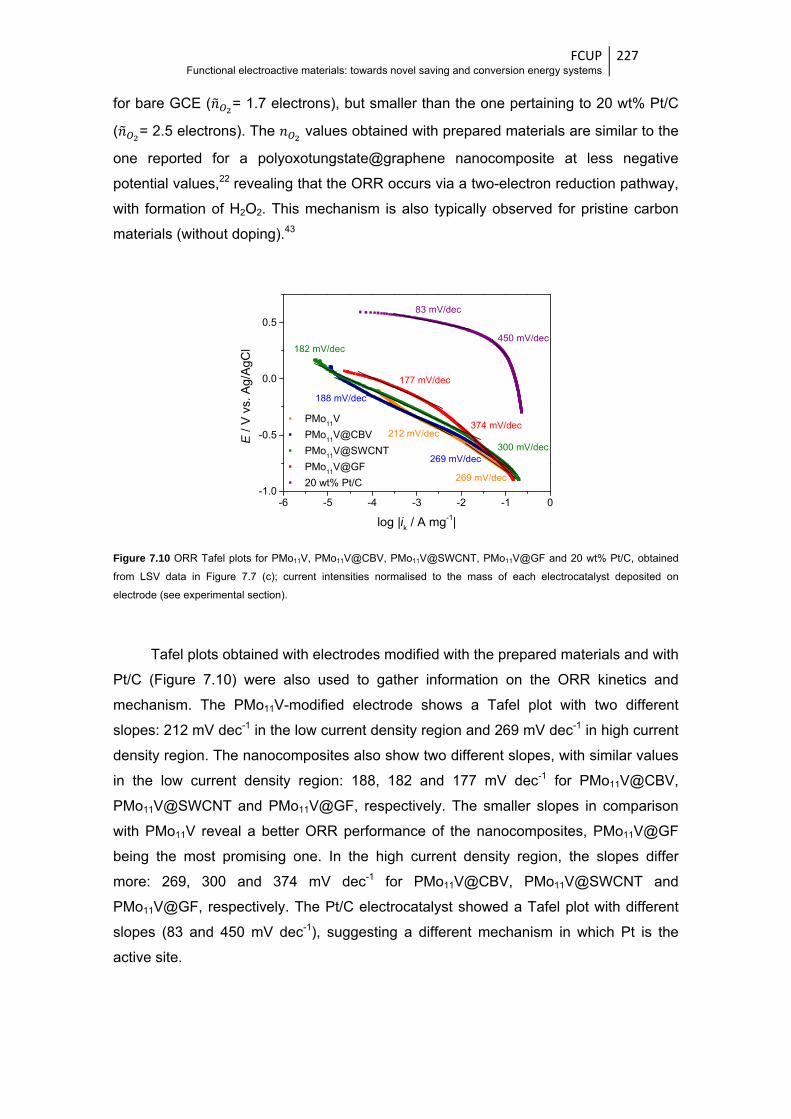
FCUP Functional electroactive materials: towards novel saving and conversion energy systems
227
for bare GCE ( = 1.7 electrons), but smaller than the one pertaining to 20 wt% Pt/C
( = 2.5 electrons). The values obtained with prepared materials are similar to the
one reported for a polyoxotungstate@graphene nanocomposite at less negative
potential values,22 revealing that the ORR occurs via a two-electron reduction pathway,
with formation of H2O2. This mechanism is also typically observed for pristine carbon
materials (without doping).43
Figure 7.10 ORR Tafel plots for PMo11V, PMo11V@CBV, PMo11V@SWCNT, PMo11V@GF and 20 wt% Pt/C, obtained
from LSV data in Figure 7.7 (c); current intensities normalised to the mass of each electrocatalyst deposited on
electrode (see experimental section).
Tafel plots obtained with electrodes modified with the prepared materials and with
Pt/C (Figure 7.10) were also used to gather information on the ORR kinetics and
mechanism. The PMo11V-modified electrode shows a Tafel plot with two different
slopes: 212 mV dec-1 in the low current density region and 269 mV dec-1 in high current
density region. The nanocomposites also show two different slopes, with similar values
in the low current density region: 188, 182 and 177 mV dec-1 for PMo11V@CBV,
PMo11V@SWCNT and PMo11V@GF, respectively. The smaller slopes in comparison
with PMo11V reveal a better ORR performance of the nanocomposites, PMo11V@GF
being the most promising one. In the high current density region, the slopes differ
more: 269, 300 and 374 mV dec-1 for PMo11V@CBV, PMo11V@SWCNT and
PMo11V@GF, respectively. The Pt/C electrocatalyst showed a Tafel plot with different
slopes (83 and 450 mV dec-1), suggesting a different mechanism in which Pt is the
active site.
-6 -5 -4 -3 -2 -1 0-1.0
-0.5
0.0
0.5
PMo11
V
PMo11
V@CBV
PMo11
V@SWCNT
PMo11
V@GF
20 wt% Pt/C
E /
V v
s. A
g/A
gCl
log |ik / A mg-1|
83 mV/dec
450 mV/dec
177 mV/dec
374 mV/dec
182 mV/dec
188 mV/dec
269 mV/dec
212 mV/dec
300 mV/dec269 mV/dec

FCUP Functional electroactive materials: towards novel saving and conversion energy systems
228
7.3.4 Hydrogen peroxide reduction The PMo11V- and nanocomposite-modified electrodes were tested for the
electroreduction of H2O2. In Figure 7.11 (a) are depicted the CVs obtained with a
PMo11V@GF-modified electrode, as an example, in N2-saturated pH 2.5 H2SO4/Li2SO4
buffer solution, without H2O2 and with a H2O2 concentration of 0.038 and 0.15 mol dm-3.
In the CV obtained in the absence of H2O2, no redox peak is observed; however, in the
presence of H2O2 there is a wave peaking at Epc ≈ -0.40 V, whose current intensity
increases with the concentration of H2O2, indicative of the electrocatalytic activity of the
nanocomposite towards the reduction of hydrogen peroxide. A similar behaviour is
observed with the other prepared materials. The CVs obtained for all materials in the
presence of 0.15 mol dm-3 of H2O2 are shown in Figure 7.11 (b) and the results confirm
that the electrocatalytic reduction of H2O2 occurs with all modified electrodes. The
PMo11V@GF nanocomposite exhibits the best performance, with the process starting
at the least negative potential (E ≈ 0.1 V) and giving rise to a greater current intensity
(i = -10 μA) than the remaining tested materials.
Figure 7.11 CVs of (a) PMo11V@GF with different concentrations of H2O2 (0, 0.038 and 0.15 mol dm-3) and of (b) free
PMo11V- and nanocomposite-modified electrodes with 0.15 mol dm-3 H2O2, in N2-saturated pH 2.5 H2SO4/Li2SO4 buffer
solution at 0.050 V s-1.
Hydrogen peroxide is an oxidant widely used in food and pharmaceutical
proceedings as sterilizing agent and released from several industrial processes,
whereby its food content and environmental presence needs to be strictly controlled.44
Thus, the use of these modified electrodes as H2O2 electrochemical sensors may be of
great interest and needs to be investigated in more detail in the near future.
-0.4 -0.2 0.0 0.2 0.4 0.6 0.8
-10.0
-8.0
-6.0
-4.0
-2.0
0.0
2.0
i / μ
A
E / V vs. Ag/AgCl (3 mol dm-3 KCl)
0 mol dm-3
0.038 mol dm-3
0.15 mol dm-3
c(H2O
2):
-0.4 -0.2 0.0 0.2 0.4 0.6 0.8
-10.0
-8.0
-6.0
-4.0
-2.0
0.0
2.0
PMo11
V
PMo11
V@CBV
PMo11
V@SWCNT
PMo11
V@GF
i / μ
A
E / V vs. Ag/AgCl (3 mol dm-3 KCl)
(a) (b)
FCUP Functional electroactive materials: towards novel saving and conversion energy systems
229
7.4 Conclusions
The characterisation of prepared PMo11V@carbon material nanocomposites by
XPS and FTIR confirms the immobilisation of the PMo11V structure on carbon matrixes.
The CVs of PMo11V- and nanocomposite-modified electrodes in pH 2.5 H2SO4/Li2SO4
buffer solution show five pairs of redox waves, attributed to vanadium and molybdenum
redox processes of the POM counterpart. In general, higher current densities and
better peak resolution are achieved in the CVs of the nanocomposites, which are
associated with the favourable electronic properties of carbon-based materials; the
results, in association with the superior electrochemical surface coverages determined
for nanocomposites, show the advantage of the electrode modification with the
prepared nanocomposites.
All the studied materials (free PMo11V and nanocomposites) show electrocatalytic
activity for the ORR, with a strong dependency between the electrocatalytic ORR
performance and the carbon material employed as support. The onset potentials shift
to less negative values in the order PMo11V < PMo11V@CBV < PMo11V@SWCNT <
PMo11V@GF; for PMo11V@GF, the most promising material, it was measured an
Eonset = -0.16 V vs. Ag/AgCl. The diffusion-limiting current densities obtained are similar
for all studied materials and the analysis of Koutecky-Levich plots reveals that the ORR
process occurs through a two-electron process for all modified electrodes.
The materials also have an electrocatalytic activity towards the reduction of H2O2,
particularly PMo11V@GF whose behaviour reveals its potentiality to be explored for
H2O2 sensing.
FCUP Functional electroactive materials: towards novel saving and conversion energy systems
230
References
1 Wu, G.; Li, L.; Li, J. H.; Xu, B. Q. Carbon 2005, 43, 2579. 2 Yuan, Y.; Zhou, S. G.; Zhuang, L. J. Power Sources 2010, 195, 3490. 3 Kadirgan, F.; Kannan, A. M.; Atilan, T.; Beyhan, S.; Ozenler, S. S.; Suzer, S.; Yorur, A. Int. J.
Hydrog. Energy 2009, 34, 9450. 4 Charreteur, F.; Jaouen, F.; Ruggeri, S.; Dodelet, J. P. Electrochim. Acta 2008, 53, 2925. 5 Cheng, Y. H.; Li, W. Y.; Fan, X. Z.; Liu, J. G.; Xu, W. G.; Yan, C. W. Electrochim. Acta 2013, 111,
635. 6 Zhu, C. Z.; Dong, S. J. Nanoscale 2013, 5, 1753. 7 Jafri, R. I.; Rajalakshmi, N.; Ramaprabhu, S. J. Mater. Chem. 2010, 20, 7114. 8 Liang, Y. Y.; Li, Y. G.; Wang, H. L.; Zhou, J. G.; Wang, J.; Regier, T.; Dai, H. J. Nat. Mater. 2011,
10, 780. 9 Jiang, Y. Y.; Lu, Y. Z.; Wang, X. D.; Bao, Y.; Chen, W.; Niu, L. Nanoscale 2014, 6, 15066. 10 Zheng, Y.; Jiao, Y.; Jaroniec, M.; Jin, Y. G.; Qiao, S. Z. Small 2012, 8, 3550. 11 Mbomekalle, I. M.; Bian, F.; Tebba, H.; Muller, A.; Weinstock, I. A. J. Clust. Sci. 2006, 17, 333. 12 Ammam, M.; Keita, B.; Nadjo, L.; Mbomekalle, I. M.; Ritorto, M. D.; Anderson, T. M.; Neiwert, W.
A.; Hill, C. L.; Fransaer, J. Electroanal. 2011, 23, 1427. 13 Nagai, M.; Sanpei, H.; Shirakura, M. J. Mater. Chem. 2012, 22, 9222. 14 Xin, J. H.; Lindenmuth, T.; Shannon, C. Electrochim. Acta 2011, 56, 8884. 15 Sankarraj, A. V.; Ramakrishnan, S.; Shannon, C. Langmuir 2008, 24, 632. 16 Chojak, M.; Kolary-Zurowska, A.; Wlodarczyk, R.; Miecznikowski, K.; Karnicka, K.; Palys, B.;
Marassi, R.; Kulesza, P. J. Electrochim. Acta 2007, 52, 5574. 17 Hsu-Yao, T.; Browne, K. P.; Honesty, N.; Tong, Y. J. Phys. Chem. Chem. Phys. 2011, 13, 7433. 18 Zhang, H.; Xie, A. J.; Shen, Y. H.; Qiu, L. G.; Tian, X. Y. Phys. Chem. Chem. Phys. 2012, 14,
12757. 19 Chen, W.; Huang, L. J.; Hu, J.; Li, T. F.; Jia, F. F.; Song, Y. F. Phys. Chem. Chem. Phys. 2014,
16, 19668. 20 Yang, M.; Choi, B. G.; Jung, S. C.; Han, Y. K.; Huh, Y. S.; Lee, S. B. Adv. Funct. Mater. 2014, 24,
7301. 21 Guo, S. X.; Liu, Y. P.; Lee, C. Y.; Bond, A. M.; Zhang, J.; Geletiib, Y. V.; Hill, C. L. Energy
Environ. Sci. 2013, 6, 2654. 22 Jiang, M.; Zhu, D. D.; Cai, J. J.; Zhang, H. Y.; Zhao, X. B. J. Phys. Chem. C 2014, 118, 14371. 23 Rousseau, G.; Zhang, S. S.; Oms, O.; Dolbecq, A.; Marrot, J.; Liu, R. J.; Shang, X. K.; Zhang, G.
J.; Keita, B.; Mialane, P. Chem.-Eur. J. 2015, 21, 12153. 24 Liu, R. J.; Li, S. W.; Yu, X. L.; Zhang, G. J.; Ma, Y.; Yao, J. N. J. Mater. Chem. 2011, 21, 14917. 25 Liu, R. J.; Yu, X. L.; Zhang, G. J.; Zhang, S. J.; Cao, H. B.; Dolbecq, A.; Mialane, P.; Keita, B.;
Zhi, L. J. J. Mater. Chem. A 2013, 1, 11961. 26 Liu, R. J.; Xian, Z. W.; Zhang, S. S.; Chen, C. H.; Yang, Z. H.; Li, H.; Zheng, W. Q.; Zhang, G. J.;
Cao, H. B. RSC Adv. 2015, 5, 74447. 27 Fernandes, D. M.; Freire, C. ChemElectroChem 2015, 2, 269. 28 Himeno, S.; Ishio, N. J. Electroanal. Chem. 1998, 451, 203. 29 Friis, E. P.; Andersen, J. E. T.; Madsen, L. L.; Bonander, N.; Moller, P.; Ulstrup, J. Electrochim.
Acta 1997, 42, 2889. 30 Vila, N.; Aparicio, P. A.; Secheresse, F.; Poblet, J. M.; Lopez, X.; Mbomekalle, I. M. Inorg. Chem.
2012, 51, 6129. 31 Daems, N.; Sheng, X.; Vankelecom, I. F. J.; Pescarmona, P. P. J. Mater. Chem. A 2014, 2, 4085. 32 Mani, A.; Birss, V. I. J. Electroanal. Chem. 2012, 687, 102. 33 Nunes, M.; Rocha, I. M.; Fernandes, D. M.; Mestre, A. S.; Moura, C. N.; Carvalho, A. P.; Pereira,
M. F. R.; Freire, C. RSC Adv. 2015, 5, 102919. 34 Negro, E.; Vezzu, K.; Bertasi, F.; Schiavuta, P.; Toniolo, L.; Polizzi, S.; Di Noto, V.
ChemElectroChem 2014, 1, 1359.

FCUP Functional electroactive materials: towards novel saving and conversion energy systems
231
35 Assumpcao, M.; De Souza, R. F. B.; Rascio, D. C.; Silva, J. C. M.; Calegaro, M. L.; Gaubeur, I.;
Paixao, T.; Hammer, P.; Lanza, M. R. V.; Santos, M. C. Carbon 2011, 49, 2842. 36 Lipinska, M. E.; Rebelo, S. L. H.; Pereira, M. F. R.; Gomes, J.; Freire, C.; Figueiredo, J. L. Carbon
2012, 50, 3280. 37 Contarini, S.; Howlett, S. P.; Rizzo, C.; Deangelis, B. A. Appl. Surf. Sci. 1991, 51, 177. 38 Yang, F. F.; Ma, L.; Gan, M. Y.; Zhang, J.; Yan, J.; Huang, H.; Yu, L.; Li, Y. J.; Ge, C. Q.; Hu, H.
F. Synth. Met. 2015, 205, 23. 39 Gaunt, A. J.; May, I.; Sarsfield, M. J.; Collison, D.; Helliwell, M.; Denniss, I. S. Dalton Trans. 2003,
2767. 40 Fernandes, D. M.; Brett, C. M. A.; Cavaleiro, A. M. V. J. Electroanal. Chem. 2011, 660, 50. 41 Fernandes, D. M.; Simoes, S. M. N.; Carapuca, H. M.; Cavaleiro, A. M. V. Electrochim. Acta
2008, 53, 6580. 42 Trogadas, P.; Fuller, T. F.; Strasser, P. Carbon 2014, 75, 5. 43 Wang, D. W.; Su, D. S. Energy Environ. Sci. 2014, 7, 576. 44 Ji, Y. C.; Huang, L. J.; Hu, J.; Streb, C.; Song, Y. F. Energy Environ. Sci. 2015, 8, 776.

FCUP Functional electroactive materials: towards novel saving and conversion energy systems
232

CConclusionss and future
Cha
e pers
apter
pectiv
r 8
ves

8 Conclusions and future perspectives
The final chapter of the thesis provides a general overview of the main
conclusions and summarises the most important achievements. Moreover, new
perspectives for future work are proposed.
8.1 Conclusions The work described in the thesis focused on the development of novel efficient
systems for application in energy saving and conversion technologies.
From the point of view of energy saving, the results obtained in Chapter 2,
showed the successful electropolymerisation of poly[1] and poly[2] metallo-polymers on
flexible substrates of ITO/PET. Poly[1] exhibited similar electrochemical responses in
LiClO4/CH3CN and LiClO4/PC electrolytes. The XPS characterisation revealed a larger
incorporation of ClO4- and solvent on oxidised films, although in a lesser extent in
LiClO4/PC. The electronic spectra of both films showed a strong dependency of band
profiles with the applied potential, which is similar in both supporting electrolytes; the
observed electronic bands were attributed, according to the polaronic model, to
transitions between new electronic states created within the band gap of the polymer
and to charge transfer (CT) transitions between the metal and the oxidised ligand. The
electronic bands ε-values also remain similar in both supporting electrolytes, except for
the ε-value of the bands assigned to charge transfer transition that decreases from
LiClO4/CH3CN to LiClO4/PC.
Both poly[Ni(salen)] films showed interesting polyelectrochromic behaviour,
exhibiting a yellow colour in reduced state that changes to green and russet in oxidised
states. For poly[1], the colour change from yellow to green had the highest optical
contrast, while for poly[2] it was the green ↔ russet change. In both cases, the
FCUP Functional electroactive materials: towards novel saving and conversion energy systems
236
response times are in order of seconds (8-24 s), revealing the potentiality of these films
for application in slow-acting electronic devices. Both films showed superior long-term
stability in LiClO4/PC; in this medium, the highest stability was achieved for the
yellow ↔ green colour change of poly[1], with a charge loss of 34.3 % after 9000
cycles. The promising EC performance of poly[1] was demonstrated by the
assemblage of two electrochromic devices with distinct typologies. The device with the
best EC performance showed an optical contrast of ΔT = 88.7 % and a charge loss of
37.0 % upon 3000 redox cycles.
In order to improve the EC properties of the poly[Ni(salen)] film with the best
performance, poly[1], several nanocomposites were prepared through the
electropolymerisation of poly[1] in the presence of (i) WO3 and (ii) TiO2 nanoparticles
and (iii) nitrogen-doped graphene. The characterisation of the WO3 and TiO2 NPs,
previously synthesised, confirmed the achievement of crystalline nanomaterials (WO3:
34-38 nm and TiO2: 9.7 nm) with quasi-spherical morphologies.
The SEM and XPS results confirmed the presence of the nanomaterials within
poly[1] matrix. All nanocomposite films showed similar electrochemical responses to
those of pristine film, but higher electroactive surface coverages, which showed the
advantage of the incorporation of nanomaterials in poly[1]. The electronic spectra of the
nanocomposites and pristine poly[1] also showed similar band profiles and energies,
revealing that the electronic structure of poly[1] remains unchanged with the
incorporation of nanomaterials. However, according with the nanomaterial employed,
differences in the electronic bands ε-values were observed. For WO3@poly[1] and
TiO2@poly[1] nanocomposites, the differences observed were in the ε-values of bands
assigned to charge transitions between the metal and oxidised ligand, that decreased
from pristine to nanocomposites (9.0-12.0 % with WO3 and 3.6-16.2 % with TiO2),
revealing a superior stability of the nanocomposites for over-oxidation processes. For
N-FLG@poly[1] nanocomposite, in addition to the decrease of ε-values for CT band
(12 %) it was also observed an increase in the ε-values of the bands associated with
transitions within band gap (in 19 and 26 %), indicating that this nanomaterial has the
additional ability of provide alternative conducting pathways and facilitate the electronic
transitions, which are associated with the charge carriers. Furthermore, the
nanocomposites prepared with TiO2 NPs and N-FLG showed an increase in the
amount of ClO4- incorporated along the redox cycles, in comparison with the pristine
film, while for WO3@poly[1] nanocomposites the ClO4- entrapment was less favoured.
FCUP Functional electroactive materials: towards novel saving and conversion energy systems
237
Moreover, additional studies performed with TiO2@poly[1] nanocomposites
revealed that high loadings of NPs (above ≈ 15 wt.%) hampered the poly[1]
electrodeposition.
The incorporation of nanomaterials in poly[1] resulted in nanocomposites with
improvement into some EC properties. The WO3@poly[1] nanocomposite allowed
faster response times, higher optical contrast (≈ + 40 %) and greater colouration
efficiency (improvement of 13.1-21.7 %) than the pristine film, but only in
LiClO4/CH3CN. On the other hand, the incorporation of TiO2 NPs resulted in
nanocomposite films with an improvement of 16.7 % of ΔOD and an excellent
electrochemical stability, with a charge loss of 7.3 % upon ≈ 10 000 cycles, which
corresponds to an increase of 46.7 % in electrochemical stability. Finally, the
preparation of N-FLG@poly[1] showed to be the most advantageous, since resulted in
the enhancement of all EC properties: the electrochemical stability increased in 71 %
(2.7 % of charge loss after ≈ 10 000 cycles), the switching times diminished 71-77 %
(τ = 9 / 11 s), the optical contrast increase 38 % (ΔT = 35.9 %) and the colouration
efficiency raised 12 % (η = 108.95 cm2 C-1).
In the context of energy-conversion, activated carbons prepared from sucrose,
SC800 and SH800, showed to be efficient metal-free ORR electrocatalysts either in
alkaline and acidic media, although the results appeared more favourable in alkaline
medium. The electrocatalytic performance was influenced by the textural properties
(specific surface areas, porosity and morphology) of the materials. The SH800, which
exhibited the highest specific surface area and largest micropores, showed the better
ORR electrocatalytic performance, with higher limiting-current density. The materials
showed good tolerance to methanol and the SH800 electrocatalyst showed greater
long-term stability than the state-of-the-art Pt/C electrocatalyst; however, both ACs
were neither selective to 2- or 4-electron ORR processes.
The evaluation of the ORR electrocatalytic activity of the PMo11V- and
PMo11V@carbon-based nanocomposites-modified electrodes revealed a superior
performance of the nanocomposites than of the pristine polyoxometalate, which
demonstrates the advantage of the immobilisation of the PMo11V onto carbon
nanomaterials. Furthermore, the carbon support showed a strong influence on the
ORR electroactivity of the nanocomposites, which was clearly demonstrated by the
variation of the onset potentials (Eonset): PMo11V < PMo11V@CBV < PMo11V@SWCNT
< PMo11V@GF. The better performances exhibited by the PMo11V@SWCNT and
PMo11V@GF nanocomposites were explained by the high conductivity of the SWCNT

FCUP Functional electroactive materials: towards novel saving and conversion energy systems
238
and GF that improved the charge transport between the modified layer and the GCE
electrode and promoted a beneficial synergistic effect with the PMo11V.
The modified electrodes also showed activity for the electrocatalytic reduction of
hydrogen peroxide, with the PMo11V@GF showing the best performance. Thus,
modified electrodes with this nanocomposite can be a valuable approach for H2O2
sensing.
8.2 Future perspectives The results described in the thesis provide new insights in the electrochromic
behaviour of poly[Ni(salen)]-type films and their nanocomposites with metal oxides and
nitrogen-doped graphene. The results are encouraging to pursue in the design and
preparation of new materials with improved EC properties. Taking into account this
goal, the preparation of nanocomposites through the electropolymerisation of poly[1]
directly in nanostructured modified electrodes can be a useful tool, once allows to take
more advantage of the nanostructures to fine control the morphology of the obtained
composite polymer films and to improve the contact between all film components and
the electrode and, ultimately, to control the EC properties.
In order to take advantage of the enhancement in EC properties achieved mainly
with N-FLG@poly[1] in practical / commercial applications, its employment in the
assemblage of electrochromic devices needs to be more explored; other typologies
(vertical configuration) and isolation techniques need to be optimised.
With respect to the ORR electrocatalysts, the preparation of activated carbons
from natural sources with nitrogen and sulphur elements seems to be adequate to
obtained renewable doped carbon-based materials and to study the effect of these
dopants in the electrocatalytic mechanism of the ORR. In general, the results reported
in literature tend to highlight the advantage of doped materials.
Considering the evident advantage of carbon supports in ORR, other carbon-
based nanocomposites can be explored, through the immobilisation of different
polyoxometalates or other compounds such as non-noble metal oxides (e.g. iron
oxides).

Appendices


FCUP Functional electroactive materials: towards novel saving and conversion energy systems
241
Appendix A Chapters relatively to Functional electroactive materials: energy
saving (Chapters 2 to 5)
Electrochemical and spectroelectrochemical studies
A1: Electrochemical techniques The studies were performed using an Autolab PGSTAT 30
potentiostat/galvanostat (EcoChimie B.V.), controlled by a GPES software.
Studies in solution were performed on a three-electrode and single and/or
separate compartment cells, enclosed in a grounded Faraday cage, using an Ag/AgCl
electrode (NaCl / 1.0 mol dm-3, Metrohm ref. 6.0724.140) as the reference electrode, a
Pt wire or a Pt grid (Chapter 2) / foil (Chapters 3-5, for separate compartment cell) as
the counter electrode and poly(ethylene terephthalate) coated with indium tin oxide as
the working electrode (ITO/PET, Aldrich, resistivity of 60 Ω sq-1).
Coulometric studies used a Pt disk working electrode (area 0.0314 cm2, BAS),
which was previously polished with aluminum oxide of particle size 0.3 µm (Buehler) on
a micro-cloth polishing pad (Buehler), then washed with ultra-pure water (resistivity
18.2 MΩ cm at 25°C, Millipore) and CH3CN.
Chapter 2: All studies were performed on the single compartment electrochemical cell,
except the electrodeposition of the films for ECDs assemblage, in which was used the
separate compartment cell.
Chapters 3 and 4: All studies were performed on the single compartment
electrochemical cell, except the chronoamperometric measurements, in which was
used the separate compartment cell.
Chapter 5: All studies were performed on the separate compartment electrochemical
cell.
A2: Spectroelectrochemical techniques Chapters 2-5: The studies were performed in situ using an Agilent 8453
spectrophotometer (with diode array detection) coupled to the potentiostat/galvanostat.
The experimental apparatus comprised a teflon cell with an Ag/AgCl (NaCl /

FCUP Functional electroactive materials: towards novel saving and conversion energy systems
242
3.0 mol dm-3) (Bio-Logic) reference electrode, a Pt grid counter electrode and ITO/PET
(typical area 0.785 cm2) as working electrode.
Particularly in Chapter 2: for ECD monitoring was used a Perkin Elmer Lambda 35
UV/Vis spectrometer, coupled to an Autolab PGSTAT 302N potentiostat/galvanostat
(EcoChimie B.V.).
FCUP Functional electroactive materials: towards novel saving and conversion energy systems
243
Appendix B Chapters relatively to Functional electroactive materials: energy
conversion (Chapters 6 and 7)
Electrochemical characterisation and electrocatalytic studies
B1: Electrochemical characterisation Chapter 6: Cyclic voltammetry measurements were carried out using an Autolab
PGSTAT 30 potentiostat/galvanostat (EcoChimie B.V.), controlled by a GPES software.
The studies were performed on a conventional three-electrode compartment cell, using
a glassy carbon electrode, GCE, (3 mm of diameter, BAS, MF-2012) as working
electrode, a platinum wire (7.5 cm, BAS, MW-1032) as auxiliary electrode and the
Ag/AgCl (sat. KCl) (BAS, MF-2052) as reference electrode. The cell was enclosed in a
grounded Faraday cage and all studies were carried out at room temperature in
deaerated solutions.
Chapter 7: Cyclic voltammetry measurements were carried out using an
electrochemical set-up EG & G 273 A, driven by a PC with the M270 software. The
studies were performed on a conventional three-electrode compartment cell, using a
glassy carbon electrode (GCE, 3 mm diameter, Mersen) as working electrode, a
platinum gauze with a large surface area as auxiliary electrode and the saturated
calomel electrode (SCE) as reference electrode. All studies were carried out at room
temperature and the solutions were previously deaerated for at least 30 min, with pure
argon, and kept under a positive pressure of this gas during the experiments.
B2: Electrocatalytic studies Chapter 6: The cyclic voltammetry and linear sweep voltammetry measurements were
carried out using an Autolab PGSTAT 302N potentiostat/galvanostat (EcoChimie B.V.),
controlled by NOVA v1.10 software. The studies were performed at room temperature
in a three electrode compartment cell, using a rotating disk electrode (RDE) of glassy
carbon (3 mm of diameter, Metrohm) as working electrode, an Ag/AgCl (3 mol dm-3
KCl, Metrohm) as reference electrode and a glassy carbon rod (2 mm of diameter,
Metrohm) as auxiliary electrode.
Chapter 7: In a first step, the ORR performance of materials was evaluated by cyclic
voltammetry measurements, carried out using an electrochemical set-up EG & G

FCUP Functional electroactive materials: towards novel saving and conversion energy systems
244
273 A, driven by a PC with the M270 software. The studies were performed at room
temperature on a conventional three-electrode compartment cell, using a glassy carbon
electrode (GCE, 3 mm diameter, BAS, MF-2012) as working electrode, a platinum
gauze with a large surface area as auxiliary electrode and the saturated calomel
electrode (SCE) as reference electrode. This experimental apparatus was also
employed in the studies of the hydrogen peroxide reduction.
In the second stage of the ORR electrocatalytic evaluation, the cyclic
voltammetry and the linear sweep voltammetry measurements were carried out using
an Autolab PGSTAT 302N potentiostat/galvanostat (EcoChimie B.V.), controlled by the
NOVA v1.10 software. A rotating disk electrode (RDE) of glassy carbon (3 mm
diameter, Metrohm) was used as working electrode, an Ag/AgCl (3 mol dm-3 KCl,
Metrohm) as reference electrode and a glassy carbon rod (2 mm of diameter,
Metrohm) as auxiliary electrode.
FCUP Functional electroactive materials: towards novel saving and conversion energy systems
245
Appendix C: Other characterisation techniques
C1: X-ray photoelectron spectroscopy (XPS) The analyses were performed at Centro de Materiais da Universidade do Porto
(CEMUP, Porto, Portugal). The XPS spectra were deconvoluted with the XPSPEAK 4.1
software, using non-linear least squares fitting routine after a Shirley-type background
subtraction. To correct possible deviations caused by electric charge of the samples,
the C1s band at 284.6 eV was taken as the internal standard. The surface atomic
percentages were calculated from the corresponding peak areas, using the sensitivity
factors provided by the manufacturer.
Chapter 2: The measurements were carried out in a VG Scientific ESCALAB 200A
spectrometer with non-monochromatised Al Kα radiation (1486.6 eV), using the
polymeric films.
Chapters 3, 4 and 5: The measurements were carried out in a Kratos AXIS Ultra HSA
spectrometer with a monochromatic Al Kα radiation (1486.7 eV), using the polymeric
films or pellets of the nanomaterials (WO3 and TiO2 NPs and N-FLG).
Chapters 6 and 7: The measurements were carried out in a Kratos AXIS Ultra HSA
spectrometer with a monochromatic Al Kα radiation (1486.7 eV), using pellets of the
materials.
C2: Scanning Electron Microscopy / Energy-dispersive X-ray Spectroscopy (SEM/EDS) Chapters 2, 3 and 5: The analyses were performed at CEMUP (Porto, Portugal) in a
high resolution (Schottky) environmental scanning electron microscope FEI Quanta
400 FEG ESEM, attached to an EDAX Genesis X4M X-ray spectrometer.
Chapter 4: The analyses were performed at CEMUP (Porto, Portugal) in a high
resolution scanning electron microscope with X-Ray microanalysis and electron
backscattered diffraction analysis (JEOL JSM 6301F/ Oxford INCA Energy 350).
C3: Transmission Electron Microscopy (TEM) Chapter 3: The analyses were performed at HEMS/IBMC – Histology and Electron
Microscopy Service – Institute for Molecular and Cell Biology (IBMC) of the
Universidade do Porto. The sections were examined under a JEOL JEM 1400 TEM
FCUP Functional electroactive materials: towards novel saving and conversion energy systems
246
(Tokyo, Japan) equipped with an EDX Microanalysis System (Oxford Instruments,
Abingdon, UK); the images were digitally recorded using a Gatan SC 1000 ORIUS
CCD camera (Warrendale, PA, USA). To prepare the sample, a small amount of NPs
was dispersed in ethanol under sonication. Afterwards, a carbon-coated 400 mesh
copper grid was immersed in the resulting solution, followed by air-drying. After the
evaluation of the TEM images, the diameter of 100 particles was measured to generate
a histogram and calculate the average particle size distribution.
Chapter 4: The analyses were performed at Departamento de Química, CQ-VR,
Universidade de Trás-os-Montes e Alto Douro (Vila Real, Portugal), with a LEO 906E
microscope at 120 kV. To prepare the sample, a small amount of NPs was dispersed in
ultra-pure water under sonication. Afterwards, a carbon-coated 400 mesh copper grid
was immersed in the resulting solution, followed by air-drying. After the evaluation of
the TEM images, the diameter of 100 particles was measured to generate a histogram
and calculate the average particle size distribution.
C4: Powder X-ray diffraction (XRD) Chapters 3 and 4: The measurements were performed at Departamento de Química,
CQ-VR, Universidade de Trás-os-Montes e Alto Douro (Vila Real, Portugal), at room
temperature using a PW 3040/60 X'Pert Pro Röntgen diffractometer with Cu Kα
radiation (λ = 1.5418 Å) and θ/2θ Bragg-Brentano configuration, over the 2θ range of
15–80º. The system includes the ultrafast PW3015/20 X'Celerator detector and a
secondary monochromator. The diffractograms were treated with the Rietveld
refinement.
C5: Fourier transformed infrared spectroscopy (FTIR) Chapters 3, 4 and 7: The spectra were obtained on a Jasco FT/IR Plus
Spectrophotometer in the 4000 – 400 cm-1 (Chapter 3), 2000 – 400 cm-1 (Chapter 4) or
3500 – 500 cm-1 (Chapter 7) region, with a resolution of 4 cm-1 and 32 scans. The
samples were diluted with KBr (99 %, spectroscopic grade, Sigma-Aldrich) and studied
as pellets containing 1.4 wt. % (Chapter 3), 1.2 wt. % (Chapter 4) or 0.2 wt.% (Chapter
7) of sample.
C6: Ultraviolet-visible spectroscopy (UV-Vis) Chapter 4: The spectra were recorded on a Shimadzu UV-3600 spectrophotometer in
the 250 -700 nm range, using quartz cells with a path length of 10 mm.

FCUP Functional electroactive materials: towards novel saving and conversion energy systems
247
C7: Raman spectroscopy
Chapter 5: The analyses were performed with powder samples in a HR 800 Jobin
Yvon Horiba micro spectrometer, using the red line of an argon laser, k = 639 nm, as
an excitation source.
C8: CIELAB coordinates
Chapter 4: The CIELAB coordinates were acquired on a reflectance
spectrophotometer Konica Minolta Sensing CM-2600d, in the range 350-750 nm. The
spectrophotometer performed five sequential measurements, considering an area of
8 mm diameter. The calibration of the spectrophotometer was performed with white
and black reference standards.
C9: Adsorption isotherms Chapter 6: The textural characterisation was made by N2 and CO2 adsorption
isotherms at -196 ºC and 0 ºC, respectively. The N2 isotherms were performed in an
automatic equipment (Micromeritics ASAP 2010) while the CO2 adsorption isotherms
were obtained on a conventional volumetric apparatus equipped with a MKS-Baratron
(310BHS-1000) pressure transducer (0–133 kPa). Before the isotherm acquisition the
samples (≈ 50 mg) were outgassed overnight at 120 ºC under a vacuum (pressure
< 10-2 Pa). From N2 adsorption data, the apparent surface area, ABET, and microporosity
were evaluated through, respectively, the BET equation (0.05 < p/p0 < 0.15)1 and αS
method, taking as reference the isotherm reported by Rodríguez-Reinoso et al..2 The
micropore size distributions were obtained from the CO2 adsorption isotherms,
according to the method described by Pinto et al..3
References
1 Gregg, S. J.; Sing, K. S. W. Adsorption, Surface Area and Porosity; Academic Press Inc.: London, 1982.
2 Rodriguez-Reinoso, F.; Martin-Martinez, J. M.; Prado-Burguete, C.; McEnaney, B. J. Phys. Chem. 1987, 91, 515.
3 Pinto, M. L.; Mestre, A. S.; Carvalho, A. P.; Pires, J. Ind. Eng. Chem. Res. 2010, 49, 4726.