Towards an automatic construction of Contextual Attribute-Value Taxonomies
TOWARDS AN AUTOMATIC DATA MART DESIGN
Ahlem Nabli, Ahlem Soussi, Jamel Feki, Hanêne Ben Abdallah Faculté des Sciences Economiques et de Gestion de Sfax, Sfax, Tunisie
Email: {ahlem.nabli, jamel.feki,hanene.benabdallah}@fsegs.rnu.tn,[email protected]
Faïez Gargouri Institut Supérieur d’Informatique et du Multimédia de Sfax, Sfax, Tunisie
Email: [email protected]
Keywords: OLAP requirements, Data marts generation, data warehouse generation, design methodology.
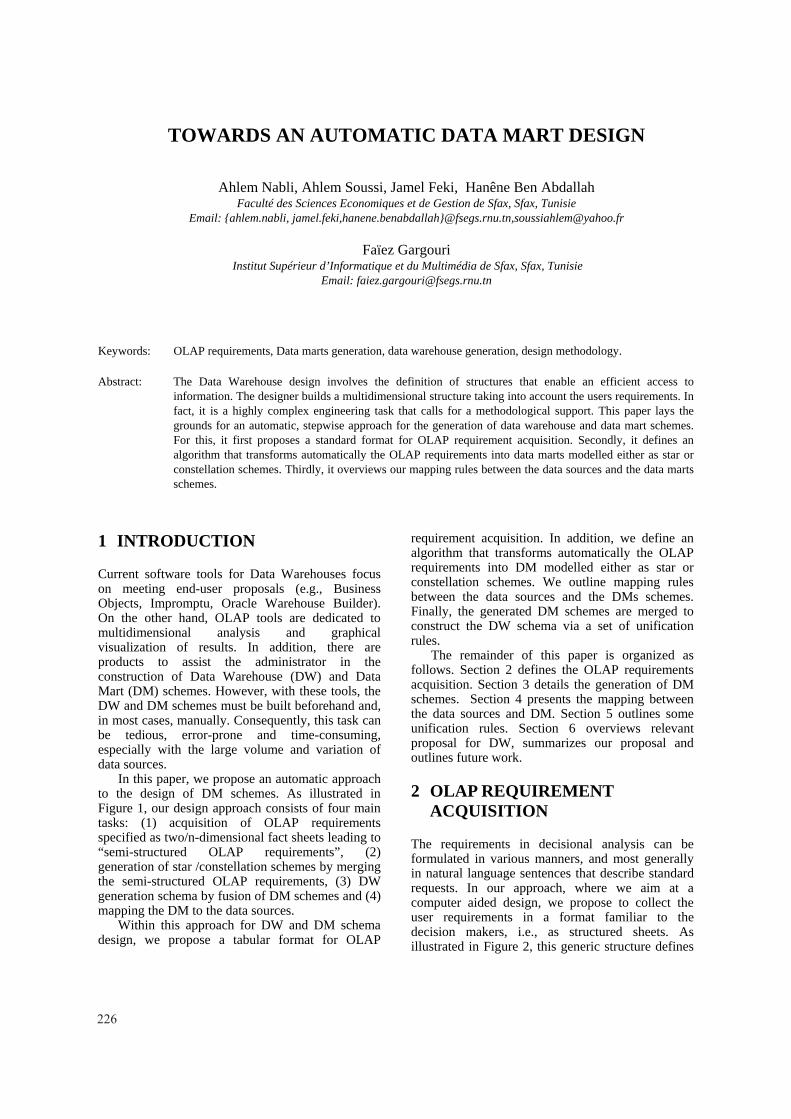
Abstract: The Data Warehouse design involves the definition of structures that enable an efficient access to information. The designer builds a multidimensional structure taking into account the users requirements. In fact, it is a highly complex engineering task that calls for a methodological support. This paper lays the grounds for an automatic, stepwise approach for the generation of data warehouse and data mart schemes. For this, it first proposes a standard format for OLAP requirement acquisition. Secondly, it defines an algorithm that transforms automatically the OLAP requirements into data marts modelled either as star or constellation schemes. Thirdly, it overviews our mapping rules between the data sources and the data marts schemes.
1 INTRODUCTION
Current software tools for Data Warehouses focus on meeting end-user proposals (e.g., Business Objects, Impromptu, Oracle Warehouse Builder). On the other hand, OLAP tools are dedicated to multidimensional analysis and graphical visualization of results. In addition, there are products to assist the administrator in the construction of Data Warehouse (DW) and Data Mart (DM) schemes. However, with these tools, the DW and DM schemes must be built beforehand and, in most cases, manually. Consequently, this task can be tedious, error-prone and time-consuming, especially with the large volume and variation of data sources.
In this paper, we propose an automatic approach to the design of DM schemes. As illustrated in Figure 1, our design approach consists of four main tasks: (1) acquisition of OLAP requirements specified as two/n-dimensional fact sheets leading to “semi-structured OLAP requirements”, (2) generation of star /constellation schemes by merging the semi-structured OLAP requirements, (3) DW generation schema by fusion of DM schemes and (4) mapping the DM to the data sources.
Within this approach for DW and DM schema design, we propose a tabular format for OLAP
requirement acquisition. In addition, we define an algorithm that transforms automatically the OLAP requirements into DM modelled either as star or constellation schemes. We outline mapping rules between the data sources and the DMs schemes. Finally, the generated DM schemes are merged to construct the DW schema via a set of unification rules.
The remainder of this paper is organized as follows. Section 2 defines the OLAP requirements acquisition. Section 3 details the generation of DM schemes. Section 4 presents the mapping between the data sources and DM. Section 5 outlines some unification rules. Section 6 overviews relevant proposal for DW, summarizes our proposal and outlines future work.
2 OLAP REQUIREMENT ACQUISITION
The requirements in decisional analysis can be formulated in various manners, and most generally in natural language sentences that describe standard requests. In our approach, where we aim at a computer aided design, we propose to collect the user requirements in a format familiar to the decision makers, i.e., as structured sheets. As illustrated in Figure 2, this generic structure defines
226
OLAP requirements
AcquisitionDM
generation
Semi-structured
OLAP requirements
DWOntology
Graphic acquisition ofOLAP requirements
DM schemes+mapped elements
DWgeneration
DW schema
Data sources
Data source Mapping
Figure 1: DW design starting from OLAP requirements
Data sources
OLAP requirements
AcquisitionDM
generation
Semi-structured
OLAP requirements
DWOntology
Graphic acquisition ofOLAP requirements
DM schemes+mapped elements
DWgeneration
DW schema
Data sources
Data source Mapping
Figure 1: DW design starting from OLAP requirements
Data sources
Figure 1: DW design starting from OLAP requirements
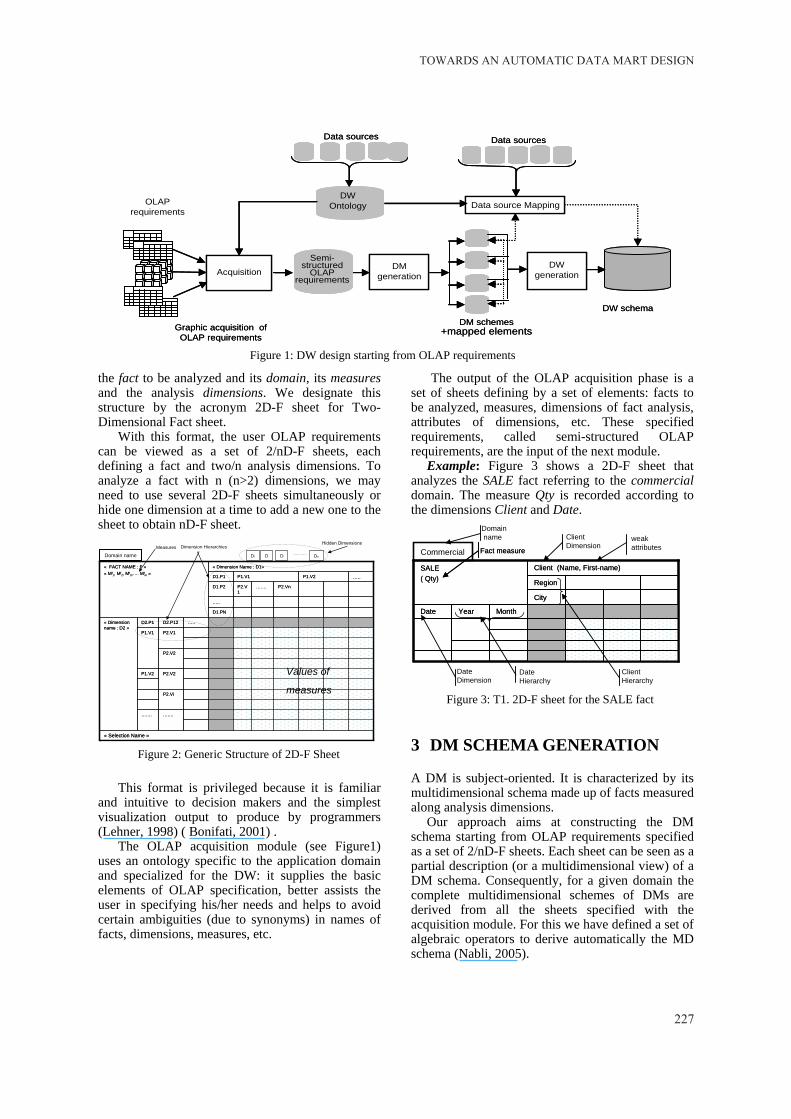
the fact to be analyzed and its domain, its measures and the analysis dimensions. We designate this structure by the acronym 2D-F sheet for Two-Dimensional Fact sheet.
With this format, the user OLAP requirements can be viewed as a set of 2/nD-F sheets, each defining a fact and two/n analysis dimensions. To analyze a fact with n (n>2) dimensions, we may need to use several 2D-F sheets simultaneously or hide one dimension at a time to add a new one to the sheet to obtain nD-F sheet.
This format is privileged because it is familiar
and intuitive to decision makers and the simplest visualization output to produce by programmers (Lehner, 1998) ( Bonifati, 2001) .
The OLAP acquisition module (see Figure1) uses an ontology specific to the application domain and specialized for the DW: it supplies the basic elements of OLAP specification, better assists the user in specifying his/her needs and helps to avoid certain ambiguities (due to synonyms) in names of facts, dimensions, measures, etc.
The output of the OLAP acquisition phase is a set of sheets defining by a set of elements: facts to be analyzed, measures, dimensions of fact analysis, attributes of dimensions, etc. These specified requirements, called semi-structured OLAP requirements, are the input of the next module.
Example: Figure 3 shows a 2D-F sheet that analyzes the SALE fact referring to the commercial domain. The measure Qty is recorded according to the dimensions Client and Date.
MonthYearDate
City
Region
Client (Name, First-name)SALE( Qty)
MonthYearDate
City
Region
Client (Name, First-name)SALE( Qty)
Date Hierarchy
Date Dimension
Fact measureFact measure
ClientDimension
Client Hierarchy
Commercial
Domainname weak
attributes
3 DM SCHEMA GENERATION
A DM is subject-oriented. It is characterized by its multidimensional schema made up of facts measured along analysis dimensions.
Our approach aims at constructing the DM schema starting from OLAP requirements specified as a set of 2/nD-F sheets. Each sheet can be seen as a partial description (or a multidimensional view) of a DM schema. Consequently, for a given domain the complete multidimensional schemes of DMs are derived from all the sheets specified with the acquisition module. For this we have defined a set of algebraic operators to derive automatically the MD schema (Nabli, 2005).
« Selection Name »
…….…….
P2.Vi
P2.V2P1.V2
P2.V2
P2.V1P1.V1
…..D2.P12D2.P1 « Dimension
D1.PN
…..
P2.Vn…….P2.V1
D1.P2
…..P1.V2P1.V1D1.P1
« Dimension Name : D1»« FACT NAME : F »« Mf
1, Mf2, Mf
3,…. Mfm »
name : D2 »…..D2.P12D2.P1 « Dimension
D1.PN
…..
P2.Vn…….P2.V1
D1.P2
…..P1.V2P1.V1D1.P1
« Dimension Name : D1»« FACT NAME : F »« Mf
1, Mf2, Mf
3,…. Mfm »
« Selection Name »
…….…….
P2.Vi
P2.V2P1.V2
P2.V2
P2.V1P1.V1name : D2 »
Dimension HierarchiesMeasures
Domain name
Values of
measures
Figure 2: Generic structure of 2D-F sheet
Di D D Dn
Hidden Dimensions
Figure 3: T1. 2D-F sheet for the SALE fact.Figure 3: T1. 2D-F sheet for the SALE fact
Figure 2: Generic Structure of 2D-F Sheet
TOWARDS AN AUTOMATIC DATA MART DESIGN
227

This derivation is done in two complementary phases according to whether we want to obtain star or constellation schemes: 1- Generation of star schemes which groups sheets referring to the same application domain and describing the same fact. It then merges all the sheets identified within a group to build a star. 2- Generation of constellation schemes which integrates the star schemes (issued from the previous phase) relevant to the same application domain and which may have common dimensions. Two star schemes with common dimensions could be integrated to build a constellation. In the remainder of this paper, we use the following notation: - Dim(s): the set of dimensions in an nD-F sheet s - Hier(d): the hierarchy of a dimension d, - Meas(s): the set of measures in an nD-F sheet s.
3.1 Star Schema Generation
To generate the star schemes, we use the following algorithm: Begin 1. Given t nD-F sheets analyzing f facts belonging to m analysis domains (m<=t). 2. Partition the t sheets into the m domains, to obtain Gdom1, Gdom2,….., Gdomm
sets of sheets. 3. For each Gdomi (i=1..m)
Begin 3.1. Partition the sheets in Gdomi by
facts into GF1domi,…… , GFkdomi (k<=f)
3.2. For each GFjdomi (j=1..k) Begin 3.2.1. For each sheet s ∈ GFjdomi
For each dimension d ∈ dim(s) Begin - Complete the hierarchy of d to obtain a maximal hierarchy. - Add an identifier Idd as an attribute. End
3.2.2. Collect measures M
3.2.3. Create the structure of a fact
F for Fj with MesFj. 3.2.4. Collect dimensions D3.2.5. For each d ∈ DimFj
Begin - Determine hierarchies U UFj dhierhier = )( Fj
domiGs sdd
∈ ∈ )dim(
- Create the structure of a dimension D for d with hierFjd. - Associate D with F. End End
End. In this algorithm, the t nD-F sheets are first
partioned into domains. This first step ensures that each star schema is generated in one domain. In turn, this will reduces the number of comparisons used in the constellation schema generation phase (see section 3.2). A star schema is constructed for each fact (Fj) in steps 3.2.2. to 3.2.5.
A hierarchy is called maximal if it cannot be extended upwards or downwards by including another attribute (Moody, 2000).
Example. Let us extend the previous SALE example with two additional fact sheets in Figure 4.
The star schema resulting from applying our algorithm is shown in Figure 5.
Note that IdDate, IdClient and IdProd were added as
UFjdomiGs
Fj smeases∈
= )(
im∈
= )dim(Ufj
domiGs
Fj s
MonthQuarter YearDate
category
Product (unit price, prod-name)SALE( Qty, Amount)
MonthQuarter YearDate
category
Product (unit price, prod-name)SALE( Qty, Amount)
Commercial
Semester MonthYearDate
Slice
Age
Client (Name, First-name)SALE( Qty, Revenue)
Semester MonthYearDate
Slice
Age
Client (Name, First-name)SALE( Qty, Revenue)
Commercial
Figure 4: T2 and T3 two sheets for the SALE fact.Figure 4: T2 and T3 two sheets for the SALE fact
SALEqty
revenuamount
IdClient
Client
DepartmentCity
Age
Idprod
ProductSub-Category
SALE
IdClient
Client
City
Region Slice
Age
Product-Name
IdProd
ProductCategory
QtyRevenueAmount
First-NameName
Unit-Price
DateDay
DateQuarter
Month IdDateSemerter
Year
SALEqty
IdClient
DepartmentCity
SHIPMENT
IdSupplier
Supplier
City
Region
QtyAmount
Social-Reason
SALEqty
revenuamount
IdClient
Client
DepartmentCity
Age
Idprod
ProductSub-Category
SALE
IdClient
Client
City
Region Slice
Age
Product-Name
IdProd
ProductCategory
QtyRevenueAmount
First-NameName
Unit-Price
DateDay
DateQuarter
Month IdDateSemerter
YearDate
DayDate
Quarter
Month IdDateSemerter
Year
SALEqty
IdClient
DepartmentCity
SHIPMENT
IdSupplier
Supplier
City
Region
QtyAmount
Social-Reason
SALEqty
IdClient
DepartmentCity
SHIPMENT
IdSupplier
Supplier
City
Region
QtyAmount
Social-Reason
SALEqty
revenuamount
IdClient
Client
DepartmentCity
Age
Idprod
ProductCategory
Sub-Category
DateDay SALE
IdClient
Client
City
Region Slice
Age
Product-Name
IdProd
ProductCategory
Date QtyRevenueAmount
Quarter
Month IdDate
First-NameName
Unit-PriceSemerter
Year SALEqty
revenuamount
IdClient
Client
DepartmentCity
Age
Idprod
ProductCategory
Sub-Category
DateDay SALE
IdClient
Client
City
Region Slice
Age
Product-Name
IdProd
ProductCategory
Date QtyRevenueAmount
Quarter
Month IdDate
First-NameName
Unit-PriceSemerter
Year SALEqty
revenuamount
IdClient
Client
DepartmentCity
Age
Idprod
ProductCategory
Sub-Category
DateDay SALE
IdClient
Client
City
Region Slice
Age
Product-Name
IdProd
ProductCategory
Date QtyRevenueAmount
Quarter
Month IdDate
First-NameName
Unit-PriceSemerter
Year
SALEqty
IdClient
DepartmentCity
SHIPMENT
IdSupplier
Supplier
City
Region
QtyAmount
Social-Reason
DateDay
DateQuarter
Month IdDateSemerter
Year SALEqty
IdClient
DepartmentCity
SHIPMENT
IdSupplier
Supplier
City
Region
QtyAmount
Social-Reason
DateDay
DateQuarter
Month IdDateSemerter
YearDate
DayDate
Quarter
Month IdDateSemerter
Year
ICEIS 2005 - DATABASES AND INFORMATION SYSTEMS INTEGRATION
228
Figure 5: Star schema built from the T1 , T2Figure 5: Star schema built from the T1 , T2 Figure 6: S2 Star schema. Figure 7. Constellation schema built from the starsFigure 7. Constellation schema built from the starsFigure 5: Star schema built from the Figure 6: S2 Star schema Figure 7: Constellation schema built
and T3 sheets.and T3 sheets. in Figure 5 and 6.in Figure 5 and 6.T1, T2 and T3 sheets from the stars in Figure 5 and 6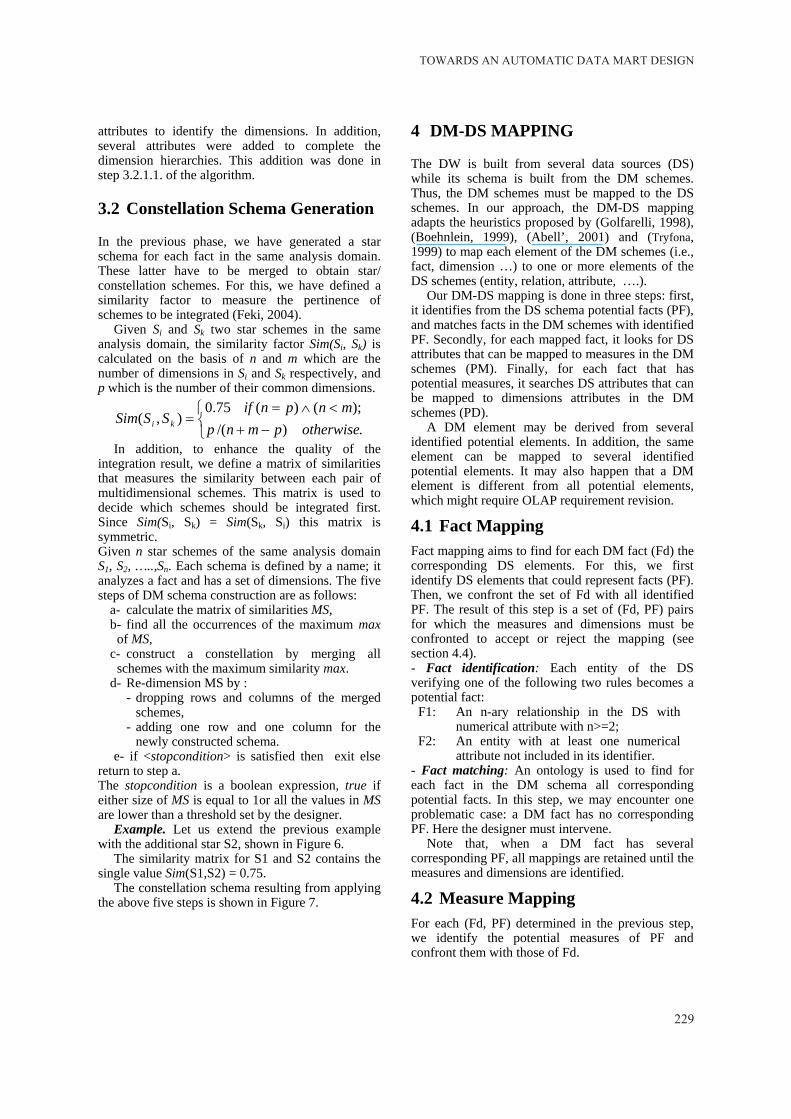
attributes to identify the dimensions. In addition, several attributes were added to complete the dimension hierarchies. This addition was done in step 3.2.1.1. of the algorithm.
3.2 Constellation Schema Generation
In the previous phase, we have generated a star schema for each fact in the same analysis domain. These latter have to be merged to obtain star/ constellation schemes. For this, we have defined a similarity factor to measure the pertinence of schemes to be integrated (Feki, 2004).
Given Si and Sk two star schemes in the same analysis domain, the similarity factor Sim(Si, Sk) is calculated on the basis of n and m which are the number of dimensions in Si and Sk respectively, and p which is the number of their common dimensions.
In addition, to enhance the quality of the integration result, we define a matrix of similarities that measures the similarity between each pair of multidimensional schemes. This matrix is used to decide which schemes should be integrated first. Since Sim(Si, Sk) = Sim(Sk, Si) this matrix is symmetric. Given n star schemes of the same analysis domain S1, S2, …..,Sn. Each schema is defined by a name; it analyzes a fact and has a set of dimensions. The five steps of DM schema construction are as follows:
a- calculate the matrix of similarities MS, b- find all the occurrences of the maximum max
of MS, c- construct a constellation by merging all
schemes with the maximum similarity max. d- Re-dimension MS by :
- dropping rows and columns of the merged schemes,
- adding one row and one column for the newly constructed schema.
e- if <stopcondition> is satisfied then exit else return to step a. The stopcondition is a boolean expression, true if either size of MS is equal to 1or all the values in MS are lower than a threshold set by the designer.
Example. Let us extend the previous example with the additional star S2, shown in Figure 6.
The similarity matrix for S1 and S2 contains the single value Sim(S1,S2) = 0.75.
The constellation schema resulting from applying the above five steps is shown in Figure 7.
4 DM-DS MAPPING
The DW is built from several data sources (DS) while its schema is built from the DM schemes. Thus, the DM schemes must be mapped to the DS schemes. In our approach, the DM-DS mapping adapts the heuristics proposed by (Golfarelli, 1998), (Boehnlein, 1999), (Abell’, 2001) and (Tryfona, 1999) to map each element of the DM schemes (i.e., fact, dimension …) to one or more elements of the DS schemes (entity, relation, attribute, ….).
Our DM-DS mapping is done in three steps: first, it identifies from the DS schema potential facts (PF), and matches facts in the DM schemes with identified PF. Secondly, for each mapped fact, it looks for DS attributes that can be mapped to measures in the DM schemes (PM). Finally, for each fact that has potential measures, it searches DS attributes that can be mapped to dimensions attributes in the DM schemes (PD).
A DM element may be derived from several identified potential elements. In addition, the same element can be mapped to several identified potential elements. It may also happen that a DM element is different from all potential elements, which might require OLAP requirement revision.
4.1 Fact Mapping Fact mapping aims to find for each DM fact (Fd) the corresponding DS elements. For this, we first identify DS elements that could represent facts (PF). Then, we confront the set of Fd with all identified PF. The result of this step is a set of (Fd, PF) pairs for which the measures and dimensions must be confronted to accept or reject the mapping (see section 4.4). - Fact identification: Each entity of the DS verifying one of the following two rules becomes a potential fact:
⎩⎨⎧
−+<∧=
=.)/(
);()(75.0),(
otherwisepmnpmnpnif
SSSim ki
F1: An n-ary relationship in the DS with numerical attribute with n>=2;
F2: An entity with at least one numerical attribute not included in its identifier.
- Fact matching: An ontology is used to find for each fact in the DM schema all corresponding potential facts. In this step, we may encounter one problematic case: a DM fact has no corresponding PF. Here the designer must intervene.
Note that, when a DM fact has several corresponding PF, all mappings are retained until the measures and dimensions are identified.
4.2 Measure Mapping For each (Fd, PF) determined in the previous step, we identify the potential measures of PF and confront them with those of Fd.
TOWARDS AN AUTOMATIC DATA MART DESIGN
229
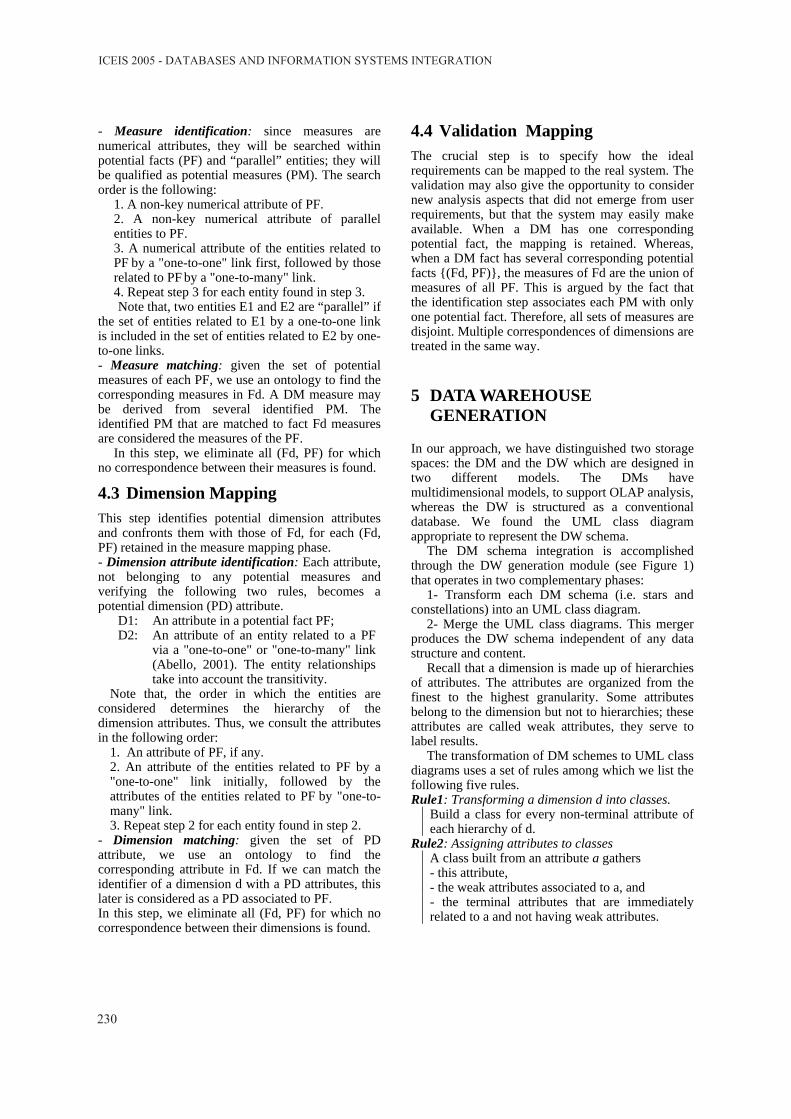
- Measure identification: since measures are numerical attributes, they will be searched within potential facts (PF) and “parallel” entities; they will be qualified as potential measures (PM). The search order is the following:
1. A non-key numerical attribute of PF. 2. A non-key numerical attribute of parallel entities to PF. 3. A numerical attribute of the entities related to PF by a "one-to-one" link first, followed by those related to PF by a "one-to-many" link. 4. Repeat step 3 for each entity found in step 3. Note that, two entities E1 and E2 are “parallel” if
the set of entities related to E1 by a one-to-one link is included in the set of entities related to E2 by one-to-one links. - Measure matching: given the set of potential measures of each PF, we use an ontology to find the corresponding measures in Fd. A DM measure may be derived from several identified PM. The identified PM that are matched to fact Fd measures are considered the measures of the PF.
In this step, we eliminate all (Fd, PF) for which no correspondence between their measures is found.
4.3 Dimension Mapping This step identifies potential dimension attributes and confronts them with those of Fd, for each (Fd, PF) retained in the measure mapping phase. - Dimension attribute identification: Each attribute, not belonging to any potential measures and verifying the following two rules, becomes a potential dimension (PD) attribute.
D1: An attribute in a potential fact PF; D2: An attribute of an entity related to a PF
via a "one-to-one" or "one-to-many" link (Abello, 2001). The entity relationships take into account the transitivity.
Note that, the order in which the entities are considered determines the hierarchy of the dimension attributes. Thus, we consult the attributes in the following order:
1. An attribute of PF, if any. 2. An attribute of the entities related to PF by a "one-to-one" link initially, followed by the attributes of the entities related to PF by "one-to-many" link. 3. Repeat step 2 for each entity found in step 2.
- Dimension matching: given the set of PD attribute, we use an ontology to find the corresponding attribute in Fd. If we can match the identifier of a dimension d with a PD attributes, this later is considered as a PD associated to PF. In this step, we eliminate all (Fd, PF) for which no correspondence between their dimensions is found.
4.4 Validation Mapping The crucial step is to specify how the ideal requirements can be mapped to the real system. The validation may also give the opportunity to consider new analysis aspects that did not emerge from user requirements, but that the system may easily make available. When a DM has one corresponding potential fact, the mapping is retained. Whereas, when a DM fact has several corresponding potential facts {(Fd, PF)}, the measures of Fd are the union of measures of all PF. This is argued by the fact that the identification step associates each PM with only one potential fact. Therefore, all sets of measures are disjoint. Multiple correspondences of dimensions are treated in the same way.
5 DATA WAREHOUSE GENERATION
In our approach, we have distinguished two storage spaces: the DM and the DW which are designed in two different models. The DMs have multidimensional models, to support OLAP analysis, whereas the DW is structured as a conventional database. We found the UML class diagram appropriate to represent the DW schema.
The DM schema integration is accomplished through the DW generation module (see Figure 1) that operates in two complementary phases:
1- Transform each DM schema (i.e. stars and constellations) into an UML class diagram.
2- Merge the UML class diagrams. This merger produces the DW schema independent of any data structure and content.
Recall that a dimension is made up of hierarchies of attributes. The attributes are organized from the finest to the highest granularity. Some attributes belong to the dimension but not to hierarchies; these attributes are called weak attributes, they serve to label results.
The transformation of DM schemes to UML class diagrams uses a set of rules among which we list the following five rules. Rule1: Transforming a dimension d into classes.
Build a class for every non-terminal attribute of each hierarchy of d.
Rule2: Assigning attributes to classes A class built from an attribute a gathers - this attribute, - the weak attributes associated to a, and - the terminal attributes that are immediately related to a and not having weak attributes.
ICEIS 2005 - DATABASES AND INFORMATION SYSTEMS INTEGRATION
230

Rule 3: Linking classes Each class Ci built from attribute at level i of a hierarchy h, is connected via a composition link to the class Ci-1, of the same hierarchy, if any.
Rule 4: Transforming facts into associations A fact table is transformed into an association linking the finest level classes derived from its dimensions. Measures of the fact become attributes of the association. Note that all of the above four rules apply only to
non-date dimension. Rule 5 deals with date dimension. Rule 5: Transforming date dimension
A date dimension is integrated into each of its related fact classes as a full-date, i.e., detailed date.
6 RELATED WORK AND CONCLUSION
There are several proposals to automate certain tasks of DW design, c.f., (Cabibbo, 1998), (Golfarelli, 1998), (Hahn, 2000), (Peralta, 2003), (Sergio, 2003) (Moody, 2000), (Marotta, 2002) and (Hahn, 2000). Other works pertinent to automated DW design mainly focus on the conceptual design, c.f., (Hüsemann, 2000) and (Phipps, 2002) which generate the conceptual schema from an E/R schema of the source database. However, these works do not focus on a conceptual design methodology based on users’ requirements and are, in addition, limited to the sources described as E/R.
The work presented in this paper is a step towards the automatic construction of DW schemes. More precisely, it defined an approach that generates automatically the DM schemes from precisely specified OLAP requirements. Then, it showed how the DW schema can be generated systematically. We are currently optimizing the generation of DM schemes from OLAP requirements. In addition, we are verifying the completeness of the DM to DW schema transformation rules. We are also working on how to identify specific ontology for DM/DW design.
REFERENCES
Abell’ A., Samios J., Saltor F., 2001. Understandding Analysis Dimensions in a Multidimensional Object-Oriented Model. DMDW 01, Interlaken, Switzerland, June 4.
Boehnlein, M., Ulbrich-vom Ende, A., 1999. Deriving the Initial Data Warehouse Structures from the
Conceptual Data Models of the Underlying Operational Information System. DOLAP’99, USA.
Bonifati A., Cattaneo F., Ceri S., Fuggetta A., Paraboschi S., 2001. Designing Data Marts for Data Warehouses. ACM Transactions on Software Engineering Methodology.
Cabibbo, LTorlone, R., 1998. A logical Approch to Multidimensional Databases. EDBT’98, Spain.
Feki J., 2004. Vers une conception automatisée des entrepôts de données : Modélisation des besoins OLAP et génération de schémas multidimensionnels. 8th MCSEAI, 9-12 Mai, Souse-Tunisie.
Golfarelli M., Rizzi S., 1999. Designing the Data Warehouse : Key Steps and Crucial Issues. Journal of Computer Science and Information Manegement, vol. 2, n°3, p. 1-14.
Golfarelli, M., Maio, D., Rizzi, S.,1998. Conceptual Design of Data Warehouses from E/R Schemes. HICSS’98, IEEE, Hawaii.
Hahn K., Sapia C., Blaschka M., 2000. Automatically Generating OLAP Schemes from Conceptual Graphical Models. DOLAP’00, USA.
Hüsemann B., Lechtenbörger J., Vossen G., 2000. Conceptual Data Warehouse Design. DMDW’00, Sweden.
Kimball, R., 1996. The Datawarehouse Toolkit. John Wiley & Son, Inc.
Lehner W., 1998. Modeling Large Scale OLAP Scenarios. 6th International Conference on Extending Database Technology (EDBT'98), Valence (Espagne), 23-27 Mars.
Marotta A., Ruggia R., 2002. Data Warehouse Design: A schema-transformation approach. SCCC’2002. Chile.
Moody D., Kortnik M., 2000. From Enterprise Models to Dimensionals Models: A Methodology for Data Warehouse and Data Mart Design. DMDW’00, Sweden.
Nabli A., Feki J., Gargouri F., 2005. Automatic Construction of Multidimensional Schema from OLAP Requirements. AICCSA’05, 3-6 January, Cairo, Egypt.
Peralta V., Marotta A., Ruggia R., 2003. Towards the Automation of Data Warehouse Design. Technical Report. Universidad de la República, Uruguay.
Phipps C., Davis K., 2002. Automating data warehouse conceptual schema design and evaluation. DMDW'02, Canada,
Tryfona N., Busborg F., and Christiansen J. G. B., 1999. StarER: A Conceptual Model for Data Warehouse Design. Proceedings of the ACM DOLAP99 Workshop, Missouri, November 2-6.
TOWARDS AN AUTOMATIC DATA MART DESIGN
231
Copyright © 2022 FDOKUMEN