Good Practice in Indigenous Family Violence Prevention: Designing and Evaluating Successful Programs
Upload
khangminh22Category
view
3download
0
Page 1
Violence Research Centre Institute of Criminology University of Cambridge
Towards a more effective violence prevention policy in Uruguay
Nico Trajtenberg & Manuel Eisner

Page 2
Contents 1. Introduction
1.1. Relevance, Geographical Definition and Goals 1.2. Conceptual and Methodological Bases 1.3. Focus and Structure of the Report
2. Methodology 2.1. Target Population and Sampling Strategy 2.2. Ethics 2.3. Data Collection and Participation Rates 2.4. Representativeness of the sample 2.5. Questionnaire Translation and Adaptation 2.6. Demographic, Socio-‐Economic and Family Background of Participants 2.7. Data Analysis 2.8. Limitations
3. Violencia juvenil en Montevideo, Uruguay 3.1. La situación social de los adolescentes 3.2. Fuentes de información y caracterización de la violencia y el delito
juvenil 3.3. Estudios recientes sobre delito y violencia juvenil en Uruguay 3.4. Sistema de justicia y políticas recientes en materia de violencia y delito
juvenil 3.5. Síntesis
4. Violent Victimization 4.1. Serious Violent Victimization 4.2. Corporal Punishment 4.3. Bullying Victimization 4.4. Conclusions 5. Self reported violence 5.1. The Extent of Violent Behavior 5.2. Socio-‐Demographic Differences 5.3. Association with other Deviant Behaviors 5.4. Personality Characteristics 5.5. Morality and Police Legitimacy 5.6. Parenting and Parental Conflict 5.7. Group Membership, Leisure Activities and Financial Resources 5.8. Media Consumption 5.9. School Environment and School-‐related Individual Factors 5.10. Conclusions

Page 3
6. Bullying at School 6.1. Incidence of Bullying 6.2. Bullying and Related Factors 6.3. Conclusions 7. A Cross-‐Cultural Comparison: Montevideo and Zurich 7.1. Levels of Youth Violence in Zurich and Montevideo 7.2. Correlates of Violence in Zurich and Montevideo 7.3. Exposure to Risk Factors 7.4. Conclusion 8. Conclusions and recomendations 8.1. The Main Findings 8.2. Four core principles of youth violence prevention 8.3. Specific Recommendations 9. References
10. Appendix: Scales

Page 4
1 Introduction
While Latin American countries have experienced economic growth, financial
stability, decrease in poverty and inequality, and consolidation of its democratic
institutions in the last decades, they have also experienced an increase and dissemination
of different forms of crime, including lethal and non lethal forms of violence and
insecurity (UN, 2013). At present, Latin America is considered one of the most violent
regions in the planet in terms of the high incidence of crime, the variety of forms of
violence, and its persistence (Briceño-León, Villaveces, & Concha-Eastman, 2008;
Imbusch, Misse, & Carrión, 2011; Unodc, 2011). In fact, violence in Latin America is
considered an ‘epidemic problem’ according to World Health Organization standards.
Particularly, youths have become a major issue in the social and political agenda of the
region due to their central role, not only as perpetrators but also as victims (Imbusch et
al., 2011; E. G. Krug, Dahlberg, Mercy, Zwi, & Lozano, 2002; Waiselfisz, 2008). Two
additional problems aggravate this complex scenario: the scarcity of strong and reliable
systems of information and the relatively lack of primary criminological data sets
(Dammert, Salazar, Montt, & Gonzalez, 2010); and the underdeveloped and uneven state
of research in academic institutions (Imbusch et al., 2011).
Although Uruguay is, together with Argentina and Chile, among the countries of
Latin America where violence rates are relatively low (Imbusch et al., 2011; Lagos &
Dammert, 2012), and despite the improvement in several socio economic indicators
observed in the last years (CEPAL, 2013) Uruguay has experienced an increase in a
variety of crimes and manifestations of interpersonal and every day violence (Ministerio
del Interior, 2009; Munyo, 2014; OPP/MIDES, 2013; Paternain & Sanseviero, 2008). As
well as in the rest of Latin America, youth violence is a pressing problem in Uruguay. In
the last years there has been an increasing attention from the politicians, the media, the
criminal justice system and academia. However, the incidence of youth in the recent
increase of crime and violence as well as what type of prevention policies should be
implemented constitute a disputed issue. While some studies based on police statistics
argue that youth crime has tripled in the last ten years and has become a serious issue
(Munyo, 2014) others have challenged the validity of this type of data due to its multiple
biases and hence, question the relevance of youngsters in the overall levels of crime and
violence in Uruguay (Arroyo, De Armas, Retamoso, & Vernazza, 2012; Bayce, 2011). In
fact, official statistics from the youth criminal justice system shows that although it is
true that youngsters’ participation in crime has increased steadily in the last years, their

Page 5
relative participation has remained constant and below 10% (Chouhy, Vigna, &
Trajtenberg, 2010; Lopez & Palummo, 2013). Additionally, Uruguay also suffers the
aforementioned problems of crime data, namely, a lack of adequate information data sets
and scarce academic research in the topic (for more details, refer to chapter 3 of this
report). Not only the scarce available data on youth violence and crime has weak validity
but also there is scarcity of relevant information about key dimensions such as
personality traits, social bonds, perception of authorities, moral beliefs, etc., to formulate
scientific explanations and policy interventions. The application of large self-report
school-based surveys constitutes a cost efficient way to obtain this type of information
and has been successfully applied in many developed and developing societies including
some Latin American countries such as Bolivia, Mexico, Venezuela, Surinam, Antillas,
Aruba, Brazil and Guatemala (Enzmann et al., 2010; Junger-Tas, 1994). Uruguay has
neither been part of these large international surveys nor conducted ad hoc school-based
self-report studies on its own.1 Hence, at present the information available and state of
research existent in Uruguay is clearly insufficient. Specifically, there is lack of knowledge
about the extent of youth involvement in crime and violence, and which are the most
relevant risk and protective factors associated with perpetration and victimization.
This report aims to fill this gap. It presents results of the Montevideo Project on
the Social Development of Children and Youths (henceforth m–proso) study, a large
representative school-based survey of young people on deviance and violence conducted
in Montevideo. The study was funded by the UBS Optimus Foundation and the data was
collected by the University of Cambridge and Universidad de la Republica del Uruguay in
coordination with the directorial council of the Uruguayan Ministry of Education
(ANEP).
1.1 Relevance, Geographical Definition and Goals
This report provides, for the first time, high quality epidemiological data on
violence amongst adolescents in Uruguay, relevant for suggesting preventive feasible
policies that have shown success in other settings (Sherman et al., 1998; Welsh &
Farrington, 2006). It will help authorities, policy makers and practitioners, to develop a
1 There have been self-report school based studies on the use of legal and illegal drugs in the years 2003, 2006, 2007, 2009 and 2011 (Junta Nacional de Drogas, 2011; Junta Nacional de Drogas, 2011b; see http://www.infodrogas.gub.uy) and in sexual abuse and victimization in the years 2006 and 2012 (Ministerio de Salud Publica, 2012). Additionally, in 2010 a self report study on crime was conducted but it was a not a large sample (n = 427); it was not school based; it did not incorporate measures of violence in school, and although included some scales related with personality and socio economic dimensions, it lacked several risk and protective factors tested by the z-proso questionnaire decisive for policy intervention.

Page 6
coherent evidence-based preventive strategy that optimize the use of the scarce resources
to effectively reduce violence. One of the major issues for designing and applying
preventive policies is to have in place adequate evaluation. This study provides reliable
and valid epidemiological estimates of youth victimization and perpetration which will
serve as a benchmark to evaluate the success of future policies. Finally, this study allows
improving a cross-cultural comparative perspective. Most of the empirical research in
criminology has been conducted in the United States and Europe. Therefore, there is
little evidence of the empirical validity of risk and protective factors of victimization and
perpetration of crime and violence in non developed societies (Akers, 2010; Karstedt,
2001). Accordingly, the design of the questionnaire, the sampling, the training of
personnel, and the collection of the information in m–proso were conducted following
the experience of the z–proso study in Zurich, Switzerland, to obtain the greatest
possible standardization.
The decision to geographically limit the study to the capital city Montevideo was
grounded on three reasons. First, the aforementioned importance of generating
comparable estimates with z-proso study (and other similar international studies based
on cities) required conducting the survey at the city level. Second, running a survey with a
representative sample at the national level was unfeasible in terms of resources and
would have meant a much more extended period of time. What is more, Montevideo is
the main political, administrative and business hub, and the largest city of Uruguay with
about 40% of the population (2012 Population Census, National Institute of Statistics).
Additionally, most of the crimes are concentrated in Montevideo, particularly youth
crime (refer to chapter 3 for more details). Therefore, the proposed study seemed the
most cost effective strategy to provide the authorities with evidence-based
recommendations for a violence and crime reduction strategy.
The main long-term goal of this study is to provide the government of Uruguay
with the foundations to develop a policy framework to effectively address the different
forms of youth violence. The recommendations that result from this report entail ideas
for institutional change that will enhance the capacity of the education, public health and
criminal justice agencies to develop a violence reduction strategy and specific
interventions to tackle more effectively violence by and against young people. Therefore,
this report involves three specific goals:
• An outline of epidemiological data on the prevalence and incidence of crime and
violence amongst adolescents
• An overview of the main risk factors associated with victimization and perpetration in
the domains of parenting, personality, moral development, peer association, school
dynamics, use of legal and illegal substances, life-style, socio-economic background

Page 7
• A set of comprehensive set of recommendations on an evidence – based prevention
strategy based on the findings that is linked with guidelines developed by the World
Health Organization but conveniently adapted to Uruguay
1.2 Conceptual and Methodological Bases
The z-proso project is based on a conceptual model of crime and violent behavior
guided by the idea that explaining social phenomena involves more than merely
associating or correlating variables. Rather, explanation entails opening black boxes to
identify those theoretical unobservable causal processes which link observable events,
variables and outcomes (Elster, 2007; Hedstrom & Swedberg, 1998; Hedstrom, 2005; in
criminology see Wikström, 2007, 2011). Following this model there is a distinction of
three different interconnected levels of influence of causal processes (see Figure 1
above). In the first level we find the proximal mechanisms that follow Wikström and
colleagues insight (Wikström et. al. 2012) that crime and violence events a compound
product of individual and situational/contextual causal processes. Among the individual
processes, five specific mental mechanisms are distinguished: i) personality differences in
terms of risk aversion, shortsightedness, impulsivity (self control); ii) cognitive strategies
that neutralize and legitimize crime or violent behaviors (moral disengagement); iii) emotions
such as guilt, shame, trust, empathy, etc. (moral emotions); iv) personal abilities to cope with
conflicts and problems (problem solving skills); v) beliefs about advantages/benefits and
disadvantages/costs (judgment and decision making). There are situational features that
interact with these individual characteristics, namely: provocations, incentives and
opportunities. There is a second intermediate level comprised by the causes of causes
(Wikström, 2011) and involves those processes that are only causally relevant when they
affect either individual features or the structure of the situation. This level includes: life
events; family context and parenting style; relationship with peers; media consumption;
school dynamics; and life style and routine activity patterns. Finally, the wider social context
is the third and most distal level and refers to the family’s socio economic status and
neighborhood characteristics. These components directly influence the causes of causes.
Their causal connection with crime and violence is very loose and mediated through the
first two levels of causal processes.

Page 8
Figure 1 Conceptual Model of Explanation in Z-proso
The m-proso study is based on a validated methodology that involves large scale
representative school based survey and thoroughly tested psychometric instruments
along 6 waves and more than 10 years of the largest longitudinal study on youth violence
in Europe. The instrument includes measures of crime, violence, victimization and
bullying in schools as well scales for a range of validated predictors of victimization and
perpetration. The m–proso survey was designed in parallel to the 6th wave of the z-
proso survey which included a sample of 1300 15 year old adolescents. Conducting a
study with equivalent target population and with identical instruments in Montevideo
allows a comparative assessment of levels of violence and the most salient risk factors,
and hence, targeted recommendations for designing a prevention strategy.
1.3 Focus and Structure of the Report
This report aims to provide an overview of the key aspects of youth violence and
crime in the city of Montevideo, Uruguay. Although this study does not seek to test
empirically theoretical models of perpetration or victimization, the selection of items and
scales is not fortuitous. It aims at providing a comprehensive description which allows to
both evaluate the magnitude and extent of different variants of the youth crime and
violence, and provide an international context to compare Montevideo’s results.

Page 9
The remainder of the report is structured as follows. The first chapter discusses the
methodology of the study and targets several issues: target population and sampling strategy;
ethical issues; data collection and participation rates; representativeness of the sample;
the process of adaptation and development of the questionnaire and a description of its
main thematic domains and scales; demographic and socio economic background
characterization of participants; description of data analysis; and an account of the
limitations of the m-proso study.
The second chapter will introduce a contextualization of crime and violence in Uruguay.
We will focus in three main topics: a description of crime and violence trends in Uruguay
according to existent bases of information and an evaluation of its limitations; a review
of the scarce academic research on the youth violence/crime and bullying; and finally, an
overview of the Juvenile Criminal Justice System in Uruguay and on going prevention
policies on youth violence/crime and bullying.
The third chapter will focus on victimization. We first provide a description of
experiences in youth violent victimization that touches on: last year victimization; multi
victimization; some situational characteristics of victimization; victims’ report to police;
socio demographic characteristics of victims; the role of disabilities in victimization; and
lifestyle risk factors. Then we provide an overview of a second domain of victimization,
namely, experiences of physical punishment by parents. We describe four main issues:
the prevalence rates of corporal punishment; victims’ socio demographic characteristics;
the association between corporal punishment and parental conflict; and the presence of
depressive symptoms among victims. In the final section we explore bullying
victimization as the third domain of youth victimization. Here we review the prevalence
estimates of bullying victimization and its association with depressive symptoms and
physical disabilities.
The fourth chapter provides a description of youth self reported deviance and violence
behaviour. First, we provide results of general figures of violent behavior, its prevalence by
gender, its concentration among a small group of the population, and some situational
characteristics of violent events. Second, we examine the role of socio demographic
characteristics in youth violence. Then, we explore the relationship between violence and
other deviant behaviors. In the following sections we present findings related to different
types of theoretically relevant risk factors of violence such as: personality characteristics;
morality and police legitimacy; family and parenting; group membership; leisure activities;
financial resources; media consumption; and school associated factors.
The fifth chapter is focused on bullying. First, we start with a overview of
conceptual and methodological considerations relevant to research on bullying. Second,
we provide an overview of the incidence of bullying perpetration and victimization

Page 10
among youths in Montevideo. In the third and fourth sections we describe differences in
bullying behaviour across gender and type of educative centre. We then analyse the
association between bullying and more general forms of violence. Afterward we show
associations between bullying behaviours and different factors from the family, school,
peers and the individual.
The sixth chaper provides a cross cultura comparison between Montevideo and
Zurich in terms of its violent behavior rates (both in victimization and perpetration),
other deviant behaviors, and its correlates at different levels (individual, family, school,
structural variables).
The final chapter integrates and relates the findings from all the previous chapters
in order to produce starting points for feasible and effective policies to be developed in
Uruguay.

Page 11
2 Methodology
In this chapter we give an overview of the design, planning and implementation of
the m–proso study. We focus on seven issues: the target population and the sampling
procedure, ethical and data protection issues, the organization of the field work, the
translation and development of the questionnaire, the demographic and socio-economic
profile of the sample, the approach to data analysis and presentation, and a description of
the limitations of the study .
2.1 Target Population and Sampling Strategy
The target population of the study were all adolescents in the 9th grade of public
and private high schools in 2013 in Montevideo, Uruguay. Self-report studies of
delinquency often choose pupils in the 9th grade as the target population, partly because
serious delinquency and violence tend to peak at ages 14-18, partly for the pragmatic
reason that in many societies grade nine is the final year of compulsory schooling.
We aimed to obtain a realized sample of approximately 2000 adolescents randomly
selected from the target population using a cluster-randomized approach with classes as
the randomization units. Randomization was conducted within three strata, which reflect
the main school types in Montevideo. Stratification by school types was chosen primarily
because class sizes differ between school types and because the socio-economic
background of the pupils in each school type differs considerable. The three strata were:
i) private high schools licensed by the State; ii) public high schools; iii) and technological
schools that include a basic education cycle (Escuelas Técnicas del Consejo de Educacion
Tecnico Profesional - C.E.T.P.). The sampling fraction of for each stratum was
proportional to the number of students in the respective school type in the total
population (proportional allocation).
The sampling frame were all classes in Montevideo, sorted by school, within each
respective type of schools. A systematic sampling procedure was followed in each
stratum. First, a sampling fraction was defined, which represented the proportion of
classes needed to achive the targeted number of students within the stratum. The
sampling fraction determines the sampling interval k, which defines the number of steps
down the list until the next unit is selected for the sample. Next, a random number was
chosen between 1 and the sampling interval k. Starting with this number for the first

Page 12
class every kth class was selected classes across the ordered list of schools and classes
until the targeted ‘n’ of classes was obtained in each stratum.
Table 1 shows the number of schools and students, as well as the estimated target
sample size in the three types of schools in Montevideo for the year 2011.2 The goal was
to achieve an effective sample of approximately 2000 students, equal to about one out of
every eight students in Montevideo. In order to take into account various forms of
attrition (school rejections, parent rejection, youth rejection, absence to class due to
truancy or sickness, etc.) we aimed at a raw target sample of approximately 2500
students. The estimated sample size by school type corresponds to the proportion of
pupils.
Table 1 Sampling Frame and scenarios for the definition of the simple size
Stratum Schools (I) Total 9th grade students (II)
Percentage of students (III)
Estimated total target sample by stratum (IV)
Private high schools 99 5,225 32.7% 816
Public high schools 53 10,117 63.2% 1580
CETP 7 658 4.1% 102 Total 159 16,000 100% 2,500
Source: ANEP statistics.
According to ANEP statistics a total of 5225 students in 99 schools and 211 9th
grade classes attended private high schools in 2013. To achieve a sample of private
school students that represents 32% of the total sample we therefore have to select 816
students. Given that there are on average approximately 25 students per class a sample of
32 classes was required. To select the sample of classes the following procedure was
conducted: First, we built a dataset of private schools where every row represented a 9th
grade class so that every school has as many rows as 9th grade classes are included. Then
we created a variable that numbered all class consecutively. In order to achieve the
desired number of classes, using the sampling fraction, we selected one class every 6
rows generating a selection of 33 classes from 32 different schools.
The total of public high school students was 10,117. They attend 324 9th grade classes
in 53 schools. To obtain a sample of public schools’ students that represents 63% of the
total sample we therefore need to select 1580 students. Since on average there are
approximately 31 students by class we needed a sample of 50 classes. The selection of
2 The sampling frame used is based in ANEP’s most recent records and the National Institute of Statistics’ ‘Encuesta Continua de Hogares’.

Page 13
the sample followed the same procedure described for private high schools leading to
generate a selection of 50 classes from 46 different public schools.
Finally, the total of CETP’s students, schools, and 9th grade groups are respectively
658, 7 and 22. To obtain a sample of CEPT’s students that represents a 4% of the total
sample we need to select 102 students. As on average there are approximately 30
students by class a total of seven 9th classes need to be chosen.3 Again, the selection of
the sample followed the same procedure described for private and public high schools
leading to generate a selection of 7 classes from 7 different schools.
2.2 Ethics
In Uruguay studies of populations under full age (less than 18 years old) conducted
in high schools require the approval of the authorities of the National Administration of
Public Education (ANEP) and youth’s informed consent. Both aspects were fully
respected in this study. Additionally, we obtained approval from the authorities of
AUDEC (Association of Private Catholic High Schools) and from AIDEC (Association
of Private Secular High Schools).4 Furthermore, parental passive consent was obtained.
A letter to parents was delivered to students some weeks before the survey. The letter
informed parents about the nature of the study and asked for their permission for
conducting the survey. Finally, we obtained ethical approval by the Ethics Committee of
the Institute of Criminology, University of Cambridge.
Data protection guidance was followed by ensuring the anonymity of
questionnaires completed by students. We eliminated any trace of individual
identification in the questionnaires, which can only be identified at the class level. To
ensure confidentiality the survey was arranged as an exam situation not allowing students
to talk to each other or to see other’s responses. Teachers and other authorities of the
school were not given access to the completed questionnaires. The results are presented
so that no conclusions can be drawn about specific classes or schools, let alone individual
students.
Data protection laws in Uruguay cover this research study.5 Therefore, all the
information provided by students and teachers is included under these laws. All the
people involved in the study (researchers, survey field manager, surveyors, data entry
3 According to a qualified informant from ANEP lists of students in CETP are always oversized due to economic incentives. Therefore we were recommended to increase the number of groups to 7 in order to achieve the sample target (102 students). 4 This was the protocol followed by the Program for International Student Assessment (PISA) in previous waves in Uruguay (2003, 2006, 2009, 2012) and will be also used in the next wave in 2014. 5 Specifically there are two laws: Law 16.616 of statistic secrecy (‘Ley de secreto estadístico’) and Law 18.331 of protection of personal information (‘Ley de resguardo de información personal’).

Page 14
type setters, etc.) signed a privacy agreement where they expressed their compliance with
the requirements of the data protection laws.
2.3 Data Collection and Participation Rates
We adopted a three-step approach to contact the schools. First, we sent a letter on
behalf of ANEP and the University of Cambridge to every selected school. Afterwards,
we made a telephone contact to introduce the project. Finally, a personal meeting with
the director of the educative center and the teacher responsible of the group was
arranged, where the goals of the survey and the study protocol were explained and a date
for the fieldwork was arranged.
A field leader and fourteen undergraduate students from the School of Social
Sciences were hired to help with the fieldwork. Prior to the field work they were trained
in a two day seminar were they were prepared to implement the survey and were given a
detailed protocol document which included: general information about the study; a
description of the questionnaire; privacy policy issues; rules for telephone and personal
interviews with directors; rules for explaining the survey to sudents; rules to follow
during the application of the survey; a set of templates letters; and finally the
confidentiality agreement to be signed by surveyors. Weekly meetings with the
interviewers assured that there was a constant feedback on the collection of data and any
emerging problems.
The survey was carried out in the classroom and always involved the presence of
two fieldworkers per class. Teachers were not present in the classroom during the
implementation of the survey. Filedworkers first introduced the project and explained
the questionnaire. Special attention was given to more difficult sections in order to
minimize error. The voluntary character of participation was emphasized. Additionally
students were explicitly told they must not leave any personal trace in the questionnaire.
They were also informed that all the information they were providing was anonymous
and was not going to be communicated to anyone, particularly their parents and teachers.
Finally, students were advised that they could at any time refuse to respond to a question
if they felt it touched on issues that they did not feel comfortable with. After the
introduction the field workers distributed the questionnaire, being available for help in
case there were questions during the completion. Once the students completed their
survey questionnaire, the field workers checked that there were no personal traces (as
well as no noticeable missing data in any section) before the student placed it in the
‘survey ballot box’.

Page 15
Three issues related to the fieldwork are worth mentioning. First, school
authorities demanded that students should not leave the class until the whole group had
finished the survey. Therefore, field workers had to manage students that had finished
earlier. Yet, no serious discipline problems were reported along the fieldwork. Second, in
low socio-economic background schools some students experienced comprehension
difficulties with some items. In such cases the field workers were available to help by
clarifying item wordings. Finally, the initial plan was to conduct the survey between 15th
July and 22nd August of 2013. However, an extended teacher strike in public schools
during parts of the period meant that several scheduled visits had to be re-scheduled. As
a result, the data collection took approximately 8 weeks from 15th July until 17th
September 2013.
The total target sample was 90 classes in 85 schools. Three private schools refused
to participate (4%). The survey was hence administered in 87 classrooms in 82 schools.
According to the school records 2690 individuals were registered in these classrooms.
No parents expressed that they did not want their sons/daughters to be part of the
survey and there was no refusal by adolescents to take part in the survey. Questionnaires
were obtained from 2204 students in 90 classes. Quality checks after the data entry
revealed that 20 questionnaires (1%) had 20% or more missing values and had to be
considered as problematic in terms of data quality. These questionnaires were not
included in the final analysis. The final total sample therefore was 2184 students, equal to
82.6% of the targeted sample. After the survey was completed, four field-workers were
hired to code the questionnaires and enter the data.
A comparison between the schools’ pupil lists and the pupils present at the day of
the survey revealed that 486 pupils (17.4% of the target sample) did not attend class on
the day of the survey. The school non-attendance rate was lower in private schools
(12.1%) than in public high schools (19.2%) and UTUs (24.0%). Unfortunately we have
no data on the reasons for the absence, in particular whether the absence was authorized
(e.g. for medical reasons) or unauthorized. The rate of pupils not in school on a given
day is higher than that typically found in similar surveys in Europe or the United States.
It may be that classroom lists were not always up-to-date and that some fraction
of the absent students had effectively ended regular schooling or had moved elsewhere.
However, the rate of about 17% of students not being in school is similar to findings
from other studies in Uruguay, which have estimated school drop-out amongst 15 year
old youths to be around 25% in 2003 (Ravela, 2004), 20% in 2006 (Ferna ndez, 2007) and
19.1% in 2009 (ANEP, 2010). This is relevant because adolescents who play truant on a
specific day or who permantly don’t attend school are likely to differ systematically from
those who attend school regularly. In particular, they probably are less motivated to

Page 16
attend school, have had more problems at school, are academically weaker than others,
come from disadvantaged social backgrounds and more difficult family situations, and
have more behavior difficulties. All these characteristics are associated with an increased
risk for delinquency and violence. It is hence important to note that the present study
could not include a substantial minority of adolescents, amongst whom there is likely to
be a over-proportionate number of young people with high levels of antisocial and
criminal behavior.
2.4 Representativeness of the sample
The realized sample slightly over-represents public high schools and CETP, and
slighlty underrepresents private schools. The distribution across school types in the target
population population was 32.7% in private schools, 63.2% in public high schools and
4.1% in CETP’s. The corresponding figures in the sample were 34.3%, 58.4% and 7.2%.
When it comes to sex distribution by type of school our sample slighlty over-estimated
the proportion of males in public high schools (49.9%) and underestimated the
proportion of males in CETP’s (57.4%) in comparison to the population proportions
(43% and 62.2% respectively).
In response to the slight deviations of the sample from the underlying population
we considered the creation of weights to re-balance the data by sex and school type.
However, given the small size of deviations it was decided to conduct all analyses
reported here without applying post-hoc weightings.6
Table 2 Distribution across School Types in Target Population and Sample (in Brackets)
Males Females Total Private high
schools 46.2% (46.3% ) 53.8% (53.7%) 32.6% (34.4%)
Public high schools
43% (49.9% ) 57% (50.1% ) 63.2% (58.4% )
CETP 62.2% (57.4%) 37.8% (42.6%) 4.1% (7.2%)
6 Nevertheless we constructed weight factors by type of school and gender that control these distortions and did some occasional checks in specific cases, particularly, when checking the association between type of educative center and victimization, bullying behavior or perpetration of violence.

Page 17
2.5 Questionnaire Translation and Adaptation
This survey is based on the questionnaire used in wave 6 of the z–proso study in
2013, a questionnaire designed to measure violent perpetration and victimization
amongst adolescents as well as core risk factors associated with violent behavior. The
German original was sent to a qualified native Spanish-speaking translator who had
experience in translations for social science projects. Before the translation began, the
translator was introduced to the main goals that informed the scales of the questionnaire.
In situations where the German questionnaire relied on scales that had originally been
developed in English, the English version was also consulted to maintain equivalence to
the original instruments. Furthermore, the final draft of the translated questionnaire was
sent to another translator for consistency checks. Comments by the second translator
were sent back to the initial translator for validation. Finally, two native German-
speaking members of the z-proso research team examined the Spanish version against
the German original.
We took additional measures to assure that the questionnaire was understandable
for speakers of Uruguayan Spanish and to estimate the time needed to complete the
questionnaire. First, a preliminary version of the questionnaire was discussed with three
qualified informants (two directors and one teacher from schools of Montevideo). Also,
the first draft and the final version of the questionnaire were sent for critical review to
two sociologists in Uruguay who had experience in youth crime research and design of
surveys. Two small initial pre-tests (with 3 and 8 adolescents) were primarly conducted to
estimate the time needed to complete the questionnaire and to identify possible problems
with the overall design. The final draft was tested in a larger pre-test conducted in a
school setting with 121 boys and girls (58 belonging to two 9th groups of a private school
and 63 belonging to two groups of a public school).
The pre-test suggested that the length of the survey should not be more than 80 -
90 minutes for the slowest adolescents. Some scales of the z–proso questionnaire were
therefore removed completely or shortened. Also, a limited number of new items or
scales were introduced. For example, the morality scale in the m–proso questionnaire
includes 14 items rather than the five items used in Zurich. Also, the Montevideo survey
included a new scale designed to measure school legitimacy. Overall, however, the
majority of instruments administered in Montevideo is identical to instruments used in
Zurich, allowing a range of cross-cultural comparisons.
The final version of the questionnaire had approximately 380 items. The main domains
covered by the questionnaire are shown in Table 3.

Page 18
Table 3 Main Thematic Domains Covered by the m-proso Questionnaire
Thematic Domain
1. Demographic and Socio-economic Characteristics: Age, number of siblings, adults living in
household of target person, occupation of father/mother, employment situation of
father/mother.
2. Parenting and Family Dynamics: Parental involvement, supervision, authoritarianism,
inconsequential parenting and physical punishment; conflict between parents.
3. Morality: Moral beliefs about wrongfulness of delinquent acts; moral neutralization of
violence.
4. Bullying: Bullying victimization; bullying perpetration.
5. Violent victimization: Victimization last year; number of victimizations reported to the
police; situational characteristics of last victimization.
6. Substance Use: Alcohol, cannabis, tobacco, and 6 other substances; frequency of
consumption last year.
7. Legitimacy of State Institutions: Legitimacy of the police; Legal cynicism.
8. Self Control: Impulsivity, risk seeking, volatile temper, temper, egocentrism.
9. Internalizing Problems
10. School Relationship: Relationship with students and teachers; school commitment;
perception of school legitimacy.
11. Leisure Time Activities: Media Consuption; indoor/outdoors activities; pocket money.
12. Delinquent Peers: Membership in delinquent gang/peer group; delinquency of best friends.
13. Self Reported Delinquency: Last year prevalence and incidence of 20 different behaviors;
contact with the police; situational characteristics of last assault.
14. Aggressive Descision Making: Two scenarios with a situational trigger; measurement of
perceived advantages/disadvantages of aggressive action, salience of aggressive ideations,
and anticipated reactions by others.
2.6 Demographic, Socio-‐Economic and Family Background of Participants
Throughout the report we will use a number of indicators of the demographic,
socio-economic and family background of the study participants. This section briefly
describes these indicators. The information is summarized in Table 4.
The mean age of students is 15.15 (s.d. = .91). In terms of sex the sample includes
49.2% males and 51.8% females. Almost 60% of the students lived in a family with their
two biological parents, 37.3% lived with one single biological parent only, either because
the parents had separated or because the mother had never lived with the father of the
child. 4.5% of the adolescents lived in arrangements without a biological parent.

Page 19
8.6% of the students in Montevideo had three or more siblings (i.e. a total of four
children). The relatively small proportion of adolecents living in ‘large’ families reflects
the comparatively low overall birth rate in Uruguay, which had already fallen
considerably in the first half of the 20th century. About 9% of the respondents reported
that their mother was teenager when they were born.
The indicator for the education background of the adolescents’ family was
constructed by combining the information from both parents. The data suggest that
slightly more than 31% of adolescents in Montevideo live in households where at least
one parent has a university degree. On the other hand, around 10.5% of students live in
households where neither of the parents have more than a completed primary school as
the highest education level.
The SES was measured using the fourfold EGP4 (Erikson – Goldthorpe –
Portocarero) class categorization scheme (Goldthorpe, 1997) based on youths’ answers
about their parents occupation and job tasks. This class categorization distinguishes the
service class (e.g. professional, managers), the intermediate class (e.g. service and sales
workers, administration, etc.), the skilled workers class (e.g. carpenters, bakers), and the
working class (e.g. mining and construction labourers , manufacturing labourers). As we
can see in Error! Reference source not found. 16.6% of the students came from a
higher social class background, 35.6% belonged to the intermediate class, 21.3% to the
skilled worker class and 26.5% to the working class.
We also included a variable that measured neighborhood disadvantage. Participants
were asked to indicate in which of the 62 neighbourhoods (barrios) of Montevideo they
lived. To classify neighbourhoods we relied on a classification system developed by the
United Nations Development Programme, which classifies neighborhoods in four
groups according to their levels of Human Development Index (A. Rodriguez, 2014). Finally, we included two variables associated with the schools: ‘type of educative
institution’ and ‘school retention. Almost 60% of the sample are students in public high
schools, followed by 34.3% students in private schools and 7.1% students of CTPS.
School retention was defined as any student in the 9th grade who was born before before
the 1 May 1997, and hence older than expected on the basis of the regular of entry into
primary school. Almost 40% of the sample of students were coded as ‘retained’.

Page 20
Table 4 Distribution of Social Background Variables
Criterion Value Distribution %
Gender Male 49.2%
Female 50.8%
Age
14 years 22%
15 years 52.3%
16 years 16.1%
17 years 7.6%
18 years 1.9%
Biological parents
None 4.5%
One biological parent 37.3%
Both biological parents 58.1%
Large families (> 3 silbings) No 86.7%
Yes 8.6%
Teenage mother No 91% Yes 9%
Parents’ maxim level of education
Primary studies 10.5%
Secondary studies 58.0%
Universitary studies 31.4%
EGP4
Service (i/ii) 16.6%
Intermediate (iii/iv) 35.6%
Skilled workers (v/vi) 21.3%
Working class (vii) 26.5%
Neighborhood Human
development index (PNUD)
Highest 11.5%
2 9.2%
3 32.8%
Lowest 46.5%
School Type
Public 58.6%
CTPS 7.1%
Private 34.3%
School retention Normative 60.9%
Retained 39.1%

Page 21
2.7 Data Analysis
The primary goal of the present study was to describe levels of violent perpatration
and victimization in Montevideo, and to show basic associations with selected socio-
demographic, individual, family, school, and neighbourhood characteristics. We aimed to
present the data in a way that doesn’t require expert knowledge and is accessible to a
wider public.
For all indicators of violent victimization and perpetration we present the one-year
prevalence rates for all adolescents as well as for male and female respondents separately.
One year prevalence rates are a widely used measure in epidemiological research. They
represent the proportion of respondents that indicated that they had experienced a given
event within the 12 months preceding the survey. Where meaningful, we also provide
further information about how often an event occurred, for example how many
adolescents were victimized only once and how many experienced several victimizations.
Throughout the book we adopted a standard approach to display findings about
associations between violence and relevant risk factors. For each risk factor we first
created distinct subgroups such as ‘no’, ‘low’, and ‘high’ parental corporal punishment.
For each subgroup we then calculated the mean level of, for example, physical
aggression. The findings are generally presented in tables or visualized with bar charts. In
order to understand whether these differences are practically relevant and statistically
robust we conducted either chi-square tests or F-tests. Both approaches provide
information about how unlikely it is that the differences across levels of a risk factor are
due to chance. This is conventionally expressed by a p-value. Lower p-values mean a
higher significance, indicating that the differences are likely to be found in the general
population of young people in Montevideo. We use the conventional cut-off of p < .05
(two sided) as the threshold for reporting and interpreting differences as significant.
Differences with p < .01 are considered to be highly significant.
Often the ‘risk factors’ measured in the study are continuous variables based on
several individual variables. In these cases we created distinct subgroups by creating so-
called ‘quartiles’. This means that the cases are split into four groups of equal size, with
the first group comprising those 25% of respondents with the lowest scores on the
variable, the next group comprising those with the next highest scores, and so on. We
then present mean prevalence rates of, for example, bullying across each of the quartiles
and report the associated test statistics to determine whether they should be considered
significant.

Page 22
2.8 Limitations
In interpreting the findings of the present study it is important to understand a
number of limitations. First, the present study is based on self-repost by the participants
of their victimization experiences and their own violent and aggressive behaviors. Self-
report victimisation and delinquency surveys have long been a standard instrument in the
social sciences. However, it is important to notice that incomplete recall of events and
response tendencies such as social desirability (the tendency to choose responses that are
believed to be favourable and more positive) can influence the data. Second, the present
study was a cross-sectional study with all information collected at one point in time. It is
therefore generally impossible to make any firm assumptions about cause and effect,
since we don’t usualy know whether a presumed risk factor preceded the outcome in
time. Also, the descriptive goals in the present study mean that we did not conduct
multivariate analyses, which take into consideration several risk factors at the same time.
Finally, we wish to draw attention to the observation that 17% of the adolescents listed
in the school records were not present in the classroom at the time of the study. While
we don’t have information about the reasons for the absence, we hypothesize that these
absentees are more likely to show elevated levels of problems across a range of
behaviors. To the extent that this assumption is correct the prevalence rates presented in
this study may somewhat underestimate the true rates in the population.

Page 23
3 Youth violence in Montevideo, Uruguay
This chapter offers an overview of youth violence in Montevideo, Uruguay. After
putting forward some demographic and educational indicators for the youth population,
we focus on three key issues. First, we examine the sources of data and the existing crime
and violence indicators available in Uruguay and the existing estimates on youth crime
and violence. We also refer to the few sources of data on school violence, bullying and
the use of psycho-active substances. Second, we mention the most important academic
studies on youth violence and bullying in Uruguay. Finally, we describe the legal and
institutional system for juvenile justice and the most recent political initiatives on school
violence and youth crime.
3.1 The social situation of adolescents
Uruguay is administratively divided into 19 provinces, with Montevideo as the
capital. From a demographic point of view, the country's main features are its small size
(3,286,314 people), its advanced demographic transition,7 a high level of urbanization and
the concentration of the population on a coastal strip (OPP/MIDES, 2013).
According to the data of the Encuesta Continua de Hogares (ECH) of 2013, the
country's age structure says that elderly adults (aged over 65) are 13% of the population,
people aged 30-64 make up 42%, young people aged 15-29 are 22% and people below
the age of 15 are 23% of the total population. When we consider gender, we see that
52% of the population are women, although the masculinity rate varies by age group: up
to age 21 there are more men than women, and then the proportion is reversed. In terms
of racial make-up, 94% say that their predominant race is white, 4% say black, 1%
identify themselves as indigenous and the remaining 1% belong to other races.
Montevideo holds 40% of the country's inhabitants, almost exclusively
concentrated in urban areas (99%). Compared to the rest of Uruguay, the capital's
population is older (14% above the age of 65), more female (53%) and less white (93%).
Adolescents aged 13-17, in particular, represent just under 7% of the population of
Montevideo, with a gender split of about half. Ethnic diversity in this group is bigger
than elsewhere, with 91% whites, 7.5% blacks and 1.5% people of a different race. In
7 That means that the gross birth and death rates have stabilised at low values which provide for small demographic growth.

Page 24
terms of welfare, poverty8 is overrepresented in this age group (29.2%), compared with
totals for Montevideo (15.7%) and Uruguay (11.5%).
In terms of education, 79% of individuals aged 13-17 in Montevideo are in
secondary school, 4% are in primary school, 3.5% are in UTU schools and almost 0.5%
are in higher education. Among secondary school students, 68% are in state schools and
32% in private schools. Some 13% do not attend an educational institution at all, which
is more often the case for males (14.2%) than for women (11.4%). Finally, approximately
11% of adolescents said they neither studied nor worked when they took part in the
survey (ECH, 2013).
3.2 Data sources and characterization of violence and youth crime
Crime data for Uruguay basically come from two sources : reports filed before
police, as recorded by the Interior Ministry, and prosecutions by the judiciary. There are
no annual self-reported victimization surveys, although isolated studies were carried out
in the years 1999, 2000, 2001, 2006 and 2011.9 Other available sources of information are
the Public Health Ministry, with data referring to externally induced deaths (suicides,
homicides and accidents), and the Fundapro Observatory10, which uses media reports,
crime victims' reports and specific data on indicators of victimization and insecurity put
together by consultancy firms. In Uruguay, there is more than just a deficit in data
volume and quality with relation to crime: the data available are not published
periodically, systematically and in formats apt to be re-used.
The evolution of reports f i l ed be fore pol i c e shows an increase in completed
crimes in recent years: in 2000-2013, the homicide rate per 100,000 went from 6.5 to 7.7;
the rate of injury went from 275.4 to 272.5, the shoplifting rate went from 1836 to 2873,
and the robbery rate went from 205 to 492.3. Further, in 2005-13, the rate of domestic
violence grew from 205.8 to 769, and rapes from 7.1 to 8.5. Finally, in terms of crime
distribution, in 2013 Montevideo had 81% of all the robbery incidents (with a rate of
1019) and 63% of all homicides (with a rate of 12.2) in the country.
The results of a vic t imizat ion survey that was carried out in Uruguay in 2011 show
that 31% of respondents had been victims of some crime during the last year, with
apparent differences between Montevideo (38%) and the rest of the country (22%).
8 Poverty measured using the income or indirect method. ECH data, 2013. 9 Some of these studies refer just to Montevideo and its metropolitan area. Micro-data are not generally available to the public. 10 For more details, visit http://seguridad.observatoriofundapro.com/.

Page 25
Further, the proportion of victims decreases with age.11 It goes from 36% in the youngest
age group (under 29 years of age) to 23% among people aged 60 and older. Gender
differences are smaller: 33% of women and 28% of men said they had been victims of a
crime over the last year (Interior Ministry-EQUIPOS/MORI, 2011). Other studies based
on court statistics indicated that young males were more vulnerable to violent
victimization in Uruguay, except in the case of rape, which mostly affected women
(Paternain, 2008).
The overall percentage of unreported crimes in the year 2011 was 47%, although it
varied by type of crime. The percentage o f unreported cr imes 12 is relatively high for
attempted burglary (65%) and for injury and threats (61%); it amounts to about half the
cases of non-violent robbery (56%), violent robbery (53%), bicycle theft (53%) and theft
of objects inside a car (45%); and it is relatively low in cases of burglary (40%) and
vehicle theft (3%) (OPP-MIDES, 2013).
The prof i l e o f cr ime perpetrators is mostly male for all types of crime. Court
statistics from 2012 show that the likelihood of being charged with a crime is 7.5 times
higher for men than it is for women. Further, in terms of age group, the population with
the greatest propensity to commit crimes is aged 18-25. This age group in itself
contributes 43% of the total number of criminally charged adults for 2012. The
relationship between age and crime perpetration is inverse, although in this case too
there are variations by type of crime (INE, 2013). 13
It is hard to tell the exact percentage of crimes that are committed by people under
the age of 18. 'Public data on the phenomenon of youth cr ime are marked [more than
general crime data] by isolation, lack of publicity, access problems, the impossibility of
making comparisons and an absence of critical assessments. The latter in many cases also
affects the very agencies in charge of detentions involving adolescents' (Lopez y
Palummo, 2013: 10). Beyond specific studies that may be carried out on the issue, the
official and continuous sources of data on crimes committed by children and adolescents
are i) police detention figures published by the Interior Ministry, ii) cases opened and
11 The National Youth Survey (Encuesta Nacional de Juventud, ENAJ) of 2008 provides data on the victimization of people between the ages of 12 and 29. With the exception of rape, the victimization percentage is higher in Montevideo than in the provinces for all crimes. Among young people aged 15-19, 9.4% say they have experienced robbery or theft at home in the last 12 months; 8.4% have experienced violent robbery; 14.8% have experienced non-violent robbery; 6.7% suffered injury; and 0.1% suffered rape (ENAJ, 2008). 12 The percentage of unreported crime depends on aspects like confidence in police, the cost of reporting the crime (time, travel, etc.), among others. Its effect not only distorts the total number of known crimes but also affects crime structure, victim profile, etc. 13 While crimes like theft and robbery have huge participation by people in the 18-25 age group, with 56% and 66%, respectively, crimes like rape and fraud have a relative participation rate close to 18% and 19%, respectively.

Page 26
legal proceedings launched by the judiciary, and iii) admissions into the juvenile detention
system registered by SERPAJ-INAU.
Figure 2 Outline of Juvenile Criminal Proceedings
Source: (Arroyo, De Armas, Retamoso, & Vernazza, 2012: 92)
The lack of access to the data and the problem with unreported crimes affecting
pol i ce data are joined by an added difficulty, which is that figures on police detentions
affecting children and adolescents refer to individuals instead of crimes, and it is not
possible to separate police data simply by age group. There is thus a problem with the
overestimation of the number of perpetrators, since it includes children under the age of
13 who are criminally not responsible (Arroyo et al., 2012).
In Uruguay, police detentions affecting children and adolescents show evidence of
a persistent, substantial 25% reduction 2008-2012. Property crimes lead to a majority of
detentions affecting minors in every year under consideration, which to a great extent
explains the overall reduction and represents approximately 78% of the total figure for
2012.

Page 27
Figure 3 Children and adolescents aged 11-17 detained by police, by type of crime Uruguay, 2008-2012.
Source: (Vernazza, 2013) Based on data from the Interior Ministry's National Observatory on Violence and Crime.
The quotient of adolescents detained by police over the total number of
complaints is a methodologically weak indicator14 of the weight of juvenile crime on total
crime. Data for 2005-2011 show that this indicator is never above 8.4 detained
adolescents per one hundred complaints, with its minimum in 2011 on 6.4 (Arroyo et al.,
2012: 91). On the other hand, according to the Interior Ministry's National Observatory
on Violence and Crime, participation by minors as homicide perpetrators increased from
9% to 17% of the total of solved cases 2006-2013.
An alternative to police data are those issued by the cr iminal just i c e sys tem . A
better indicator of offences committed by adolescents and the proportion of total crime
that these amount to is found by comparing criminal cases opened against adults and
against adolescents.15
Figure 4 shows that, in cases involving adolescents in conflict with criminal law in
2008-2012, there is a 41% increase in Montevideo, while in the provinces there is a 14% 14 This indicator is problematic since it links crimes (events) committed by people above the age of 13 (police complaints) and people aged 11-17 detained by police. Beyond the different units of analysis in the numerator and the denominator, a crime does not necessarily correspond to a single person, just like a police detention does not necessarily correspond to a crime. 15 Cases opened correspond to the investigation stage, in which the judge brings together sufficient evidence to launch criminal proceedings. Cases opened do not necessarily lead to orders of committal to trial, and they can be closed for lack of probable cause. The indicator helps establish the volume of issues that reached the courts and for how many of those the judge thought it appropriate to launch proceedings (Arroyo et al., 2012: 92). This kind of comparison highlights the problem of looking exclusively at the cases that the criminal justice system takes on, and particularly the fact that the reasons why an individual is tried are different for adults and adolescents (Vernazza, 2013).
2008 2009 2010 2011 2012 Infractores contra la persona 3159 2730 2188 2257 2120 Infractores contra la
propiedad 10126 10245 9535 8345 7834
Infractores sexuales 115 113 159 126 98 Total 13400 13088 11882 10728 10052
0
2000
4000
6000
8000
10000
12000
14000
16000

Page 28
decrease. The comparison changes when we switch from absolute figures to rates, since
the number of cases opened per 1,000 residents aged 13-17 in Montevideo (10.4) was
higher than that in the provinces (10.2) in 2012 (Figure 5).
Figure 4 Developments in cases launched against adolescents in conflict with criminal law Uruguay, 2008-2012
Source: Drafted by ourselves based on data from (Judiciary, 2013b). Note: We must bear in mind that the drop in this indicator for 2012 may have been caused by a change in criteria, with isolated actions not counted as opened cases (Judiciary, 2013b).
Figure 5 Rate of cases opened that involved adolescents per 1,000 residents aged 13-17 Uruguay, 2008-2012
Source: Drafted by ourselves based on data from the Statistical Annual Directories of the (Judiciary, 2013a).
When comparing adolescent figures with those relative to adults, the percentage of
cases opened against adolescents was marginal, below 8%, for every year we took into
consideration (Figure 6).16
16 The number of cases opened against adolescents and adults fell in 2012, so the increase in the relative participation of the former was due to the fact that cases opened against adolescents fell less than those involving adults, not due to an increase in adolescent criminal cases in absolute terms. Finally, it is
670 781 855 1022 944
2072 2167 1843
2257 1787
2742 2948 2698
3279 2731
0 500 1000 1500 2000 2500 3000 3500
2008 2009 2010 2011 2012
Montevideo Interior Total
6.9 8.1 8.8 10.6
10.4 12.6 13.2
11.1 13.8
10.2
0
5
10
15
2008 2009 2010 2011 2012
Montevideo Interior

Page 29
Figure 6 Criminal cases opened against adults and adolescents (left axis) and percentage of adolescent criminal cases (right axis) Uruguay, 2009-2012
Source: Drafted by ourselves based on data from the Statistical Annual Directories of the (Judiciary, 2013a). Note: Cases opened in 2010 and 2011 involving minor offences in the Uruguayan capital are included in the Federal Criminal Courts. From 2012, isolated actions in criminal cases opened against adolescents are not taken into account.
Reinforcing what we saw regarding police detentions, Figure 7 shows how most of
the closed cases involving adolescents corresponded to property crimes. We found
differences between Montevideo and the provinces with relation to the most frequent
type of crime, with robbery the most common in the capital and theft the most common
in the rest of the country. Montevideo shows more violent property crimes as well as
more homicides than the provinces. Finally, the number of adolescents charged with
crimes involving narcotics has almost doubled in Montevideo and more than doubled in
the provinces 2009-2012.
important to note that the interpretation of data for 2012 is affected by a change in the criteria followed by the judiciary.
2008 2009 2010 2011 2012 Penal adultos 49480 47150 45425 47506 32692 Penal adolescentes 2742 2948 2677 3280 2731 Total asuntos penales 52222 50098 48102 50786 35423 % de asuntos penales
adolescentes sobre el total 5.3 5.9 5.6 6.5 7.7
0.0 1.0 2.0 3.0 4.0 5.0 6.0 7.0 8.0 9.0
0 10000 20000 30000 40000 50000 60000

Page 30
Figure 7 Structure of crimes in cases involving adolescents that were closed during the year Uruguay, 2009-2012
Source: Drafted by ourselves based on data from the Statistical Annual Directories of the (Judiciary, 2013a). Note: Injury includes personal, intentional, serious and very serious injury.
A third source of data on youth crime are the adolescents detained in homes
managed by SIRPA-INAU . As we see in Figure 8, we find strong growth in 2010-2013
in the number of detainees, which went from 319 to 591. In the brief period in question,
the number of people held at SIRPA rose by 85%.17
Figure 8 Adolescents detained in SIRPA homes Uruguay, 2009-2014
Source: Drafted by ourselves based on data from INAU's Information System for Children (AGEV - OPP, 2014). Note: Annual average of young people detained in SIRPA homes, based on data for the 30th day of each month. This includes adults who were punished when they were minors and are still serving their time at SIRPA.
17 For reference, Uruguay's population of adult detainees stood at 9,829 in February 2013, according to Interior Ministry figures that were published by the International Centre for Prison Studies.
2009 2010 2011 2012 2009 2010 2011 2012 Montevideo Interior
Otros 26 29 51 94 129 90 149 122 Lesiones 37 34 50 24 59 28 47 59 Estupefacientes 12 8 12 23 12 9 15 31 Homicidio 33 33 42 47 20 18 13 14 Hurto 78 65 119 248 425 404 604 518 Rapiña 595 576 642 445 133 151 203 205
0 200 400 600 800 1000 1200
319
401427
591
0
100
200
300
400
500
600
700
2010 2011 2012 2013

Page 31
Data from 2010 on the adolescents who were admitted into the juvenile detention
system in Montevideo point to the following social profile: 92.7% males (vs. 7.3%
females), 64.1% aged 16-17 (vs. 32.7% aged 14-15 and 3.2% aged 13), 68.9% had primary
school, complete or incomplete, as their highest educational achievement; 65.3% were
adolescents who neither studied nor worked (vs. 20.2% who were students, 12.7% who
worked and 1.7% who both worked and studied), and 76.9% of adolescents who had
been retained at school (vs. 23.1% without retention). Additionally, for Montevideo in
2010, the files on youth offenders mentioned drug addiction,18 with freebase present in
67.7% of all cases and marijuana present in 17.7%. Theft and robbery are the crimes that
are most frequently punished by the juvenile criminal justice system, with 11.5% and
75.5% of all cases, respectively. The trend in Montevideo in recent years points to a
reduction in theft that comes with an increase in robbery (Lopez & Palummo, 2013).
Although all sources of information point to a marginal participation of
adolescents in the total volume of crime, the National Victimization Survey of 2011
shows that many people think that most crimes are committed by minors (57%); one
third of respondents think crimes are committed by adults and minors in equal measure;
and barely 8% attribute most crimes to adults. In this context, 85% of the population
agrees that the courts should be granted access to the criminal records of offending
minors once they turn 18, while 69% support lowering the age for adult criminal
responsibility19 (Interior Ministry-EQUIPOS/MORI, 2011).
There are no official, continuous records on school-re lated v io lence or bul ly ing .
Despite the growing interest that the phenomenon is prompting, there is no information
system on violence in school environments in Uruguay. The data are partial, scarce and
show no continuity, and most of the knowledge on the issue is qualitative in nature.
The National Census on Learning that was carried out in 1999 among students in
the third year of secondary school offered for the first time a national overview on this
phenomenon. Among its results, the most noteworthy is that perception of school-
related violence is greater in Montevideo than in the provinces and that it is mainly
associated with educational institutions with a medium socio-cultural level that are large
and public. With relation to several variables, perception of violence appears to be
greater among men, among people who are not happy with the educational institution,
and to a lesser extent among people with lower grades in their learning tests. On the
other hand, expectations about continued studies do not appear to be associated with a
violent atmosphere in schools (Viscardi, 2003). 18 That figure is below the figure for 2005-2006, with 43% of all cases, and for 2007-2008, with 33.5% (Lopez & Palummo, 2013). 19 In fact, 40% would agree to lower the age of criminal responsibility to 14, with 29% who favour lowering it to 16.

Page 32
The first National Survey on Coexistence in Educational Institutions was carried
out by ANEP in 2010 to find out the impressions of headmasters, teachers and students
of every subsystem within public education (primary, secondary and UTU institutions).20
Data based on the opinion of secondary and UTU students shows that coexistence
problems are more frequent among students, and not among students and teachers or
school officials. Among secondary school students, 56% believe there are always or
almost always verbal attacks between students, 33% report plundering of educational
institutions and 30% report physical assault. Percentages corresponding to UTU students
are a bit lower: 43% report that verbal attacks between students are very common, 31%
report plundering of facilities and 17% report physical assault. Additionally, secondary
school students perceive that conflict between peers is mostly due to issues related to
looks, consumption, sexuality, school grades and social origin, while looks, sexuality and
racial origin are the main causes at UTU (ANEP-OPP-UnaONU, 2010).
The most recent data hail from the Global School-Based Student Health Survey
(GSHS)21 that was carried out during 2012 in Uruguay. The survey was administered to
secondary school students, but it has limitations in that it does not specify where the
violence takes place (whether it is within the family, within certain institutions, etc.).
Based on the results of this survey, we may note that 16.3% of students report having
been victims of physical assault22 at least once during the last 12 months. Victims of
assault are mainly men (18.6%, vs. 14.4% women). About 2.3% of students report having
been forced to have sexual encounters, 23 with no statistically significant gender
differences. Incidence is higher (6.8%) when we take into account instances of sexual
abuse,24 a crime in which more women are victimized (8.6%) than men (4.8%). Finally,
27% of respondents took part in a fight or quarrel with peers during the last year, a figure
that combines 38% of men and 17% of women. Further, 5.9% of adolescents report
belonging to a group that regularly engages in violent activities (GSHS, 2012).
20 In 2012, ANEP also carried out the first Census on Coexistence and Participation, but its results are yet to be published. 21 The GSHS collected the opinions of adolescents in school in the second, third and fourth years of secondary school in public and private educational institutions, in towns and cities around the country with a population of over 5,000. With a combined two-stage sample and using self-administered surveys, 50 educational institutions were surveyed, which amounted to 155 classes and 3,524 students, in June-July 2012. 22 We understand by physical assault "when one person or several people beat up someone, or when one person or several people injure someone else with a weapon (like a stick, a knife or a firearm)." 23 We understand by sexual abuse the abusive exercise of power for the sexual satisfaction of the person exercising that power, to the detriment of and ignoring the other person's will. Abuse can consist in flashing one's genitals or groping and go as far as rape. 24 In this case, adolescents were asked: "Has anyone kissed or touched any part of your body and forced you to do sexual things you did not want to do? (excluding forced sexual relations in which sex is consummated)."

Page 33
With relation to drug use among adolescents, the GSHS showed a life prevalence
of 29.7% in smoking and of 70.5% in alcohol consumption, while prevalence over the
last month stood at 13.1% for smoking and 48.6% for alcohol. Among adolescents who
did not drink alcohol over the last month, only 17.6% reported they had been involved
in a fight or quarrel during the last year, while the percentage rose to 32.8% among
adolescents who had drunk alcohol and to 46.8% among adolescents who had abused
alcohol.25 It is also worth noting that students who drank alcohol reported that they
belonged to a violent group to a greater extent (8.5%) than those who did not drink
alcohol (3.6%). On the other hand, the survey showed a life prevalence of 13.3% in
marijuana use (16.8% in Montevideo), 2.7% in cocaine use and 2.1% in the use of
substances like freebase and ecstasy (GSHS, 2012).
The Fifth National Survey on Drug Use, which was administered in 2011 to
secondary school students, is a further source of information.26 According to this source,
"almost 3 out of 4 students used a legal or illegal drug during the last 12 months, be they
experimental, occasional or regular users. When we separate by substance, we observe
that 70% of students used alcohol, 20% smoked and 12% used marijuana during the last
year. Tranquilizers and sedatives (with and without medical prescription) come fourth,
with a prevalence of 7.7% during the last year. In turn, 1.4% of students reported use of
cocaine and inhalants during the last 12 months, with marginal use of freebase (0.4%)
and ecstasy (0.3%) in this population." (National Board on Drugs, 2011b: 16) Data for
Montevideo are similar to those for the rest of the country, although prevalence in
marijuana use during the last year is practically double among adolescents in the capital.
Distribution by gender shows that men use all drugs in greater proportions than women,
with the exception of smoking and tranquilizers (National Board on Drugs, 2011b).
3.3 Recent studies on juvenile crime and violence in Uruguay
Segmentation and quality problems affecting official data are a hurdle when
assessing juvenile crime in Uruguay. Further, the country lacks systematic surveys on the
issue, and there are few studies that have generated alternative databases. In this context,
the contribution of projects like m-proso takes on particular value and relevance.
25 The threshold for abuse in alcohol consumption was set at 80 millimetres or more of pure alcohol on one single occasion. The survey uses a proxy indicator based on the number of alcoholic drinks students drank when they went out during the last 30 days. 26 In 2011, the Uruguayan Observatory on Drugs (OUD) carried out the Fifth National Survey on Drug Use, which involved young people aged 13-17 who are in all three stages of secondary school (Ciclo Básico, Bachillerato and UTU). The sample included 5,834 surveys administered in 320 classes and 105 educational institutions in cities with more than 10,000 people across the country.

Page 34
A substantial portion of the national l i t erature on youth vio lence and cr ime
consists in legal or social papers that do not make direct and specific use of the empirical
evidence. Those kinds of studies hold theoretical or normative debates on specific
bibliography and other types of academic or journalistic documents. Regarding academic
data based on empirical investigation, we note that it is mostly descriptive, dominated by
qualitative work, with a few quantitative studies and others that handle data of both
sorts. The shortage of quantitative studies that aim to explain juvenile crime is linked not
just to the aforementioned problem with scarce data but also to some writers explicitly
giving up on the task of drawing up causal links on this issue (e.g. Cohen & Silva Balerio,
2003; Iglesias, 2000; Palummo, 2006; Pedernera & Silva Balerio, 2004; Uriarte, 1999).
In terms of content, a majority of empirical research reports tend to focus on
defining the functioning of the adolescent criminal justice system (Aloisio, Chouhy,
Trajtenberg, & Vigna, 2009; Arroyo et al., 2012; J. Cohen & Silva Balerio, 2003; De
Martino & Gabin, 1998; Deus Viana & Gonzalez Perret, 2004; Dominguez & Silva
Balerio, 2014; Fraiman & Rossal, 2011; Gonzalez & Leopold, 2013; Gonzalez, 2011; A.
Lopez & Palummo, 2013; Lopez Gallego & Padilla, 2013; Martinez & Moyano, 2013;
Martinis & Flous, 2013; Palummo, 2006, 2008, 2009, 2010; Trajtenberg, 2004; Vernazza,
2013; Viscardi & Barbero, 2010; Viscardi, 2006, 2011; VVAA, 2008), while approaches
that seek to describe the historical development of the juvenile criminal justice system
(Arbesun, 2010; De Martino & Gabin, 1998; Fessler, 2013; Gonzalez & Leopold, 2013;
Moras, 1992; Tenenbaum, 2011) and that descriptively link the phenomenon of juvenile
crime to social dimensions and variables are less frequent (Aloisio et al., 2009; Anfitti,
Rios, & Menese, 2013; Arroyo et al., 2012; Cano, 2014; Castillo, 2013; Chouhy,
Trajtenberg, & Vigna, 2010; Fraiman & Rossal, 2009; Kaztman, 1996; A. Lopez &
Palummo, 2013; J. Palummo, 2008, 2010; UNODC, 2010; Viscardi, 2006, 2007, 2012).
Beyond isolated differences, there is consensus in the literature around a few
issues: i) most adolescents who have been committed to institutions for offences are
male, older than 14, with weak educational and employment ties, who come from low
socio-economic strata and conflict-ridden unstructured families; ii) most offences that
are found out refer to property crimes (theft and robbery); iii) police detains these
adolescents in selective procedures with weak legal underpinnings; iv) the judiciary
operates based on punitive principles, casting aside the principle of proportionality and
with procedural shortcomings; and v) institutions charged with executing socio-
educational measures (currently SIRPA) have found deficiencies in its functioning that
sometimes lead to degrading treatment and human rights violations against children and
adolescents.

Page 35
The only quantitative study with explanatory/predictive ambitions is (Munyo, 2014),
which analyses from an economic perspective which is the role of incentives in
adolescent offences. A dynamic economic model is put forward that considers making
present decisions a condition for future decisions. The model suggests that four factors
can account for 85% of the variance observed in juvenile crime 1997-2010: i) the drop in
the financial yield of wages (an aspect associated with the educational failure of
vulnerable sub-populations) with relation to the gains from crime explains 35% of the
variance; ii) approval of the Code on Childhood and Adolescence (CNA) in 2004, which
reduced sentences and the probability that adolescents are tried at all, explains 30% of
the variance; iii) the increase in the number of escapes from correctional facilities
explains 10% of the variance; and iv) the cocaine freebase epidemic, which reduces the
time horizon of decisions and increases propensity to adopt risky behaviour, explains
10% of the observed variance. In a nutshell, the study concludes that juvenile crime has
increased not just because crime-associated gains grew more than the yield of legal
activity, but also because the cost associated with criminal activities has dropped
substantially.
If we turn to the study of vio lence in the school context , the first work that was
carried out in Uruguay emerged in the 1990s, based on ANEP technical reports
(Viscardi, 2003). Public visibility of the problem and academic production have grown
since then, although it remains a budding research field. As was the case before, the
availability and the quality of official data limit knowledge on the issue. Empirical
research, be it qualitative or quantitative, corresponds to isolated case studies and does
not allow for a generalization of results. It is to be expected, however, that projects like
m-proso and the first Census on Coexistence and Participation that was carried out by
ANEP in 2012 allow for the emergence of future provincial and national projects.
Qualitative studies have contributed most to reflecting on school sociability and
coexistence (Barcelo, 2005; Baridon, 2010; Giorgi, Kaplun, & Moras, 2012; Rodriguez,
2002, 2014; Viscardi & Alonso, 2013; Viscardi, 2003, 2008a, 2008b). Some studies have
addressed the role of key actors in the phenomenon of bullying, eg. the primary care
doctor (Lozano, 2010). Finally, some studies combine qualitative analysis with the
descriptive presentation of data on violence, drug use and the coexistence environment
in educational institutions (Viscardi & Alonso, 2013; Viscardi, 2003, 2008b).
In recent years, a few quantitative studies have been done on the phenomenon of
bullying and school-related violence. Perez Algorta (2004) has examined the link between
bullying and several psychological alterations at an educational institution. To do that, 67
people aged 15-19 with some involvement in bullying dynamics (perpetrator, victim,
perpetrator-victim) were selected out of a population of 630 adolescents. From a

Page 36
methodological point of view, we implemented the Spanish version of Youth Self-
Report (YSR), by Achenbach and Edelbrock. Statistical processing was carried out
through a comparison of means, hypothesis testing and factor analysis. The results we
obtained are consistent with reference studies, since adolescents who took part in
bullying dynamics (particularly 'perpetrators-victims') showed a higher level of
psychopathology than 'neutral' adolescents.
The work of Cajigas et al. (Cajigas de Segredo et al., 2006; Cajigas de Segredo,
Khan, Luzardo, Najson, & Zamalvide, 2004) is relevant for its empirical results and its
methodological contribution. The goal of that study was to adapt the Aggression Among
Peers Scale and to validate it for a sample of 607 students at a secondary school in
Montevideo. The scale, based on Boswell's self-reported questionnaire on Bullying,
Fighting and Victimization (Espelage and Simon), is made up of four sub-scales: i)
external influences, ii) personal attitude to violence, iii) prosocial behaviour, and iv)
aggressive behaviour. The scales' psychometric properties were satisfactory, and the data
that were obtained were processed through hypothesis testing and factor analysis. The
results show a greater tendency to aggressive behaviour and lower impulse control
among men than among women, which is consistent with the literature. Further, several
dimensions associated with violence appear to increase with age within the age group
that was being studied. In a more recent book, Cajigas, Luzardo, Mungay, & Kahan
(2013) revisit this and other research findings and offer a psycho-epidemiological
overview of youth in public secondary education in Montevideo.
Mazur (2010) addresses the relationship between bullying and academic
performance based on a sample of 308 adolescents aged 11-17 in the Ciclo Básico at a
public secondary school in the Colonia Province. Two self-reported questionnaires were
administered to assess behaviours associated with bullying. The first was an adaptation of
the Aggression Among Peers Scale for adolescents done by Cajigas de Segredo et al.,
(2006) y (2004), and the second was a measure of aggressiveness among school students
(Cerezo's Test Bull-s). The data were processed with hypothesis testing and ANOVA
variance analysis. Results showed that 3.6% of respondents played the role of 'victim,'
4.2% played the role of 'perpetrator,' and 0.6% were 'victims-perpetrators.' Further, all
participants in bullying dynamics showed school performances below the level of youths
not involved with bullying, with 'perpetrators' and 'victims-perpetrators' in a significantly
worse position.
Lozano et al. (Lozano et al., 2010) studied youths (aged 11-20) in the Casavalle
neighbourhood of Montevideo, analysing individual, family, community and social
factors related to violence and other risk behaviours. A total of 943 cases were surveyed,
from 3 public and 1 private institutions. Of these adolescent respondents, 44% reported

Page 37
having suffered physical assault, 4% reported having suffered sexual violence, 59%
reported psychological violence and 6% reported violence through technological media.
Regarding perpetrating violence, 47.6% reported having perpetrated physical violence,
1.8% reported having perpetrated sexual violence, 50.5% reported psychological violence
and 6% reported violence through technological media. Further, a few key variables were
selected, such as gender, age, cohabitation with parents, wealth, school retention and
unhappiness, to build regression models that explain suffered and perpetrated violence of
the four kinds that were listed earlier.
Finally, a study by Roman & Murillo (2011) on violence and academic performance
systematizes some data from the Second Regional Comparative and Explanatory Study
(SERCE), carried out by UNESCO 2005-2009 in 16 Latin American countries.27 This
work shows that violence among students in the sixth grade of primary school is a
regional problem and negatively affects school performances. However, Uruguay appears
to be at a relative advantage for Latin America, particularly with reference to the
prevalence of serious mistreatment, like 'theft' and 'physical mistreatment.'
3.4 Justice system and recent policy regarding youth violence and crime
For Uruguay, the Convention on the Rights of the Child (CRC) in 1990 meant
going from a notion based on disability to another that regards children and adolescents
as subjects with rights. In the field of cr iminal just i c e , the CRC implied acknowledging
special responsibilities from a certain age and drawing a set of guarantees that guide the
state's actions regarding juvenile crime 28 (Arroyo et al., 2012; Vernazza, 2013). In
Uruguay, children below 13 years of age have no criminal responsibility, while youth aged
13-17 have a specific juvenile criminal responsibility system.29 The Code on Childhood
and Adolescence (CNA)30 made progress towards adapting national norms to the CRC,
27 The data for Uruguay can be found in ANEP - CODICEN (2009). 28 According to the CRC, the principles that must guide the juvenile criminal justice system are legality, prison exceptionality and brevity, specialization within the youth criminal justice system, protection and guarantees for the adolescent's development, and non-regressive internal rules relative to the international treaty. 29 In Latin America, the juvenile criminal justice system refers to people aged 12-18 in Bolivia, Brazil, Costa Rica, Ecuador, El Salvador, Honduras, Mexico, Panama, Peru and Venezuela; 13-18 in Guatemala, Nicaragua, the Dominican Republic and Uruguay; 14-18 in Chile, Colombia and Paraguay; 16-20 in Cuba, while there is no criminal responsibility system in Argentina until the age of 16 (Arroyo et al., 2012; Vernazza, 2013). 30 Law 17,823 of 2004, which establishes obligations, rights and guarantees for individuals under 18 years of age and revokes the Law 9,342 of 1934 (Children's Code). The INAU was created in 2005 in order to abide by the law, to replace the prior National Institute for Minors (INAME). To find out more on the issue, visit: http://www.parlamento.gub.uy/htmlstat/pl/codigos/codigonino/2004/cod_nino.htm. However, rights-based progress was weakened by later changes on criminal proceedings. Law 18,777 of 2012 created criminal records for adolescents who committed serious crimes, it postponed the deadline to issue a ruling in some situations, it created the legal entity of attempted theft and it increased (from 60 to

Page 38
and it designated the Institute for Children and Adolescents in Uruguay (INAU) as the
leading institution on this issue. Further, regarding violence, the Law on the Prohibition
of Physical Punishment and Respect for the Personal Integrity of Children and
Adolescents was passed in 2007.
The inst i tut ional f ramework to deal with adolescents who are in conflict with
criminal law has undergone changes in recent years. The Technical Institute for Youth
Rehabilitation (INTERJ) was created in 1995, and it was succeeded in 2009 by the
System for the Implementation of Measures on Juvenile Offenders (SEMEJI) and then,
in 2011, by the current System of Adolescent Criminal Responsibility (SIRPA)31. Law
18,771 created SIRPA as a specific, decentralized body to manage measures regarding
adolescents who are in conflict with the law, in the sphere of influence of INAU.
Beyond successive rounds of institutional reform, pol i c i es for the prevent ion o f
youth vio lence show heterogeneity both in their theoretical scope (regarding risk factors,
citizen security, conflict management, rights, etc.) and in the institutional framework
from which they operate. On the other hand, weaknesses in information systems and
study features in terms of content make it difficult to design policies based on empirical
evidence and its subsequent evaluation. A usual way to classify initiatives refers to the
type of population they seek to address. In this sense, primary prevention refers to the
population in general, secondary prevention refers to particularly vulnerable groups, and
tertiary prevention refers to individuals and groups who have ties to violence, be it as
victims or as actual perpetrators. While primary and secondary prevention programmes
seek to reduce initial involvement in criminal behaviour, tertiary prevention seeks to
prevent recidivism.
Among programmes for pr imary and secondary prevent ion of youth violence, we
can mention:32
-‐ 'Ni ahí con la violencia' (Definitely Not Through Violence), which was launched in
2011 by the city government of Canelones to raise awareness through various forms
of expression (posters, videos, songs) and serve as an incentive for young people
90 days) the temporal margin for the application of precautionary measures in cases of detention pending trial. 31 To find out more on the issue, visit: http://www.inau.gub.uy/index.php?option=com_content&view=article&id=59&Itemid=66: 32 The list of programmes was drawn up using information published by the MIDES Social Observatory, the website Hecho para jóvenes, and various reports published by institutions that are active in this field. Beyond initiatives that seek to prevent youth violence, there are others that might contribute indirectly to such ends by promoting the exercise of rights, catering to situations of social vulnerability, re-inserting adolescents in the workplace and the classroom, etc. In this sense, the National Institute for Youth recently launched the Plan of Action for Youth 2015-2025, which formulates public policy on various relevant issues.

Page 39
aged 12-17 who attend secondary education to get information on domestic violence
and think about it.
-‐ 'Pelota al medio a la esperanza' (Relaunch Hope), which was launched in 2010 by the
Interior Ministry to raise awareness, decrease secondary school drop-out rates and
prevent violence in sport, promoting the values of healthy competition, respect and
friendship through sporting events and talks from well-known sportspeople,
targeting a population of youths aged 12-18 with a vulnerable socio-economic
background and who attend the second stage in secondary school education.
-‐ ‘Knock Out a las Drogas’ (Knock Out Drugs) and ‘Revés a las Drogas’ (Give Drugs
a Backhand) were respectively launched in 2005 and 2011 by the Ministry for
Tourism and Sports to promote sports (boxing and tennis) as a tool to develop
healthy lifestyles that push young people aged 10-20 in deprived areas away from
drug use and risky behaviour.
-‐ ‘Plan 7 zonas’ (7-Area Plan). 'Programa de territorialización de la estrategia por la
vida y la convivencia' (Programme for the Territorialization of the Strategy to
Promote Life and Coexistence) was launched by the Social Development Ministry,
the Interior Ministry and other public bodies in 2012 to deal with the situation in
seven high-vulnerability neighbourhoods in Montevideo and Canelones, which
combines community policing with social projects like articulating existing
programmes aimed at youths; training and development in work-related skills for
youths and women, coupled with a childcare system for them; measures to improve
housing; promotion of a safe, democratic use of public spaces; investment in
infrastructure and equipment for public spaces.
With reference to t er t iary prevent ion , we can highlight the following programmes:
-‐ 'Estudio, Ingreso y Derivación' (Study, Admissions and Referrals), which was
launched in 2012 by SIRPA-INAU to organize the initial diagnosis of all
adolescents entering the system in a precautionary situation and establish referrals
to the institution's various existing programmes and projects.
-‐ 'Medidas Socioeducativas de Base Comunitaria' (Community-Based Socio-
Educational Measures), which was launched in 2002 by INAU (and is currently
managed by SIRPA) to promote adolescent responsibility and reinforce
adolescents' respect for human rights and the rights of others. It is guided by the
integral protection principle and is a way to control adolescents with a definitive
sentence issued by a court. Through professional help and by offering

Page 40
materials/contributions in kind, the goal is to promote family involvement to
reduce risk behaviour by adolescents.
-‐ 'Medidas Privativas de Libertad y de Semi-libertad' (Detention and Partial
Freedom Measures), which was launched in 1994 by INAU (currently managed
by SIRPA) to implement and manage the enforcement of detention,
precautionary, socio-educational and curative measures established by the
relevant courts for youths who violate criminal law. The goal is to prepare
adolescents for their release by training them in trades, study and documentation.
-‐ 'Medidas Curativas' (Curative Measures), which was launched in 2012 by SIRPA-
INAU to contribute, through actions in the fields of health (prevention, medical,
odontological, nutritional, mental assistance, prevention and treatment for
psycho-active substance abuse, etc.), to the development and improvement of the
biopsychosocial abilities of adolescents treated by SIRPA.
-‐ 'Inserción Social y Comunitaria' (Social and Community Integration), which was
launched by SIRPA-INAU in 2011 and which seeks the social re-integration of
adolescents in conflict with criminal law (in terms of training, work experience
and access to housing) through professional help, internships and other
assistance.
-‐ 'Proyectos culturales y tutorías para jóvenes privados de libertad' (Cultural
Projects and Tutoring for Detained Youths), which was launched in 2000 by
INAU to contribute to granting socio-educational proposals within detention
centres managed by SIRPA and entails artistic, sporting and cultural activities.
-‐ 'Medidas alternativas a la privación de libertad' (Alternatives to Detention), which
was launched by INAU in 1998 to give adolescents under the supervision of the
juvenile criminal justice system tools that contribute to their social integration
and prevent recidivism in crime by applying the socio-educational measures that
were prescribed by the judge rather than detention (ej. unpaid tasks in public
services, mediation/reparations for the victim, etc.).
-‐ 'Sistema Integral de Protección a la Infancia y a la Adolescencia contra la
Violencia' (Integral System for the Protection of Children and Adolescents from
Violence), which was launched by INAU in 2007 to build a national system to
deal, using an inter-agency approach, with the problem of violence and abuse of
children and adolescents (0-18 years of age).

Page 41
-‐ 'Centro de atención a niños y niñas víctimas de maltrato, violencia infantil y
abuso sexual' (Support Centre for Child Victims of Abuse, Violence and Sexual
Abuse), which was launched by INAU in 2005 to improve the quality of life of
children and adolescents and their families who are victims of domestic violence,
abuse or sexual abuse and provides specialized care with an integral scope.
-‐ 'Centro de Asistencia a Víctimas del Delito y la Violencia' (Support Centre for
Victims of Crime and Violence), which was launched by the Interior Ministry in
2005 to provide advice for people (of every age) who are victims of crime and
violence and provides: coordination and referrals to a psycho-social support and
treatment network to reduce the effects of primary and secondary victimization;
awareness-raising campaigns on the consequences of violence and crime
-‐ 'Programa de albergues para niños, niñas y sus referentes adultos víctimas de
violencia' (Shelter Programme for Children and their Adult Caretakers who are
Victims of Violence), which was launched by the Social Development Ministry
and the Ministry for Transport and the Environment in 2007 to provide a
fostering space (accommodation, food, clothing, health, education, safety and
recreation) for mothers and/or female caretakers above the age of 18 and their
children who are involved in a crisis involving domestic violence.
-‐ Several support programmes for victims of domestic violence which are run by
town authorities, such as those in Salto, Canelones, Durazno, Tacuarembó and
Montevideo, which involve shelter, support, technical advice and referrals.
Currently, a const i tut ional re form proposal is being debated in Uruguay to lower
the age for adult criminal responsibility from 18 to 16 years of age. The initiative, which
entails replacing Article 43 and temporary special regulation B in the country's
constitution, is set to be the object of a referendum in October 2014.33 The United
Nations' Sub-Committee on the Prevention of Torture and Other Cruel, Inhuman or
Degrading Treatment or Punishment recently asked Uruguay to ensure that the age
threshold for criminal responsibility remains in line with international regulations. The
33 The proposed text says: "People above the age of sixteen and below eighteen will be held responsible according to criminal law and will be punished in accordance with the dispositions of the Criminal Code (Law 9,155 of 4 December, 1933 and its amendments) for the intentional perpetration of the crimes homicide, aggravated homicide, seriously aggravated homicide, serious bodily harm, very serious bodily harm, robbery, robbery with unlawful detention, extortion, kidnapping and rape, as well as any other crimes stipulated by the law."

Page 42
Sub-Committee also expressed serious concerns with relation to the situation of SIRPA
and abuse against detained adolescents.34
Regarding the rules that regulate coexistence in the context o f secondary
educat ion , the Student's Statute went into force in 2005, to replace the prior Rules on
Student Behaviour. The change meant switching from a punitive approach to an
approach that focuses more on the student's rights and responsibilities. Specifically on
regulating the student's behaviour, the Statute draws up responsibilities (regarding peers,
teachers, school authorities, public property and symbols, etc.), it describes disciplinary
proceedings and lists punishments that are to be prescribed in case of violations (ANEP
- CODICEN, 2005).
With relation to policies for the prevention of violence in an educational context,
Uruguay developed experiences like 'Convivencia Saludable' (Healthy Coexistence), '+
Centro' (+ Centre) and other isolated initiatives to promote inclusion and coexistence in
schools.35 'Healthy Coexistence' (ANEP), which was launched in 2010 to strengthen
social integration in educational institutions and within the community, replacing an
approach that focused on violence with another that focused on processes based on
participation and on building democratic coexistence. On the other hand, the 'Programa
+ Centro: Centros Educativos Abiertos' (+ Centre Programme: Open Educational
Institutions, launched by MIDES, ANEP, MEC, UNICEF) started out in 2011 to
promote environments that boost education, improve coexistence and strengthen the ties
between the student body, the educational institution and the community. We can also
highlight projects such as 'Campamentos Educativos' (Educational Camps, by the
Ministry for Education and Culture) and 'Escuelas Disfrutables' (Enjoyable Schools, by
ANEP), which intervene in urban schools across the country to tackle factors that
generate institutional uneasiness and violent situations (UNICEF, 2013).
3.5 Summary
The goal of this chapter was to provide an overview of statistics on youth violence
and crime in Uruguay, the studies that are available on the issue and the policies that
have been implemented in recent years. One of the keys to be able to put into practice a
more appropriate strategy to prevent youth violence is to have a set of reliable, valid
indicators. 34 For more information on the comments and recommendations of the United Nations, please visit: http://bit.ly/1iQza85. The National Institute for Human Rights and social organizations like the Committee on the Rights of the Child Uruguay and the Institute of Legal and Social Studies in Uruguay generally agree with the aforementioned criticism. 35 For more information on policies that were implemented in Uruguay in the late 1990s and early 2000s, see Viscardi (2003).

Page 43
In Uruguay, the data on crime come from reports to police as recorded by the
Interior Ministry and prosecutions by the judiciary. There are no continuous
victimization and self-reporting surveys. Although great efforts have been made in recent
years to improve information systems, there continue to be problems with some of the
indicators that are relevant for diagnosis and decision-making regarding violence and
juvenile crime: many of the data lack quality, they are not consistent with each other and
they are not reported in a systematic way and in appropriate formats.
These information problems complicate the task of estimating the incidence of
juvenile crime relative to the total volume of crime. Although a majority of public
opinion believes that young people are the main actors responsible for crime, the data
suggest that for every year 2008-2012 they never amounted to more than 9% of the total
number of cases opened. In absolute terms, police figures show a sustained reduction in
juvenile crime, court figures show that the annual total number of criminal cases opened
against adolescents is stable and the number of detained adolescents shows substantial
growth. Adolescent crimes in Uruguay are mainly property crimes and show greater
levels of violence in Montevideo, compared to the rest of the country. Adolescents
detained by the juvenile responsibility system have profiles with ties to vulnerable
conditions: they are mostly males who have only reached a low educational level, have
problems with educational and work-related inclusion, and are mainly aged 16-17.
Data on school violence in Uruguay are limited, insofar as there is no official and
continuous information system and records. In recent years, a few concrete studies have
been carried out that generated the first estimates on victimization, perpetration and
associated factors. Overall, school violence appears to be associated with large, public
institutions with a medium socio-cultural level, and with male students who are
unsatisfied with their secondary school and get low grades. Recent studies such as the
present one and the first Census on Coexistence and Participation that was carried out by
ANEP in 2012 set out to provide detailed, good-quality information on the issue.
The lack of valid, reliable and systematic data is a hurdle for the development of
sophisticated quantitative research on crime and youth violence. Almost all studies are
qualitative or are quantitative with a descriptive nature. As regards bullying and school
violence, we have seen in recent years a development in quantitative studies which assess,
based on international scales adapted to Uruguay, young people's involvement in bullying
dynamics, be it as victims, perpetrators or both.
In terms of publ i c pol i cy , Uruguay has a specific criminal responsibility system for
individuals aged 13-17, based on a conception of adolescents as subjects with rights. The
institutional prison framework is SIRPA (INAU), a specific, decentralized body to

Page 44
manage socio-educational measures regarding adolescents who are in conflict with the
law.
In Uruguay, several policies are in place to prevent youth violence in primary,
secondary and tertiary schools. Initiatives show heterogeneity both in terms of their
programmes and their institutional grounding. Regarding school violence, Uruguay has
switched from a punitive system to one that focuses more on the student's rights and
responsibilities. Ongoing programmes seek to strengthen social integration, participation
and coexistence among the various actors in the school environment. Overall,
weaknesses in information systems and the features of studies on the issue make it
difficult to design policies based on empirical evidence and its subsequent evaluation.

Page 45
4 Violent Victimization
Violence inflicts harm on the victims – and it is their suffering that contributes
most to the moral wrongfulness of acts of violence against other humans. Our analysis of
violence therefore begins with the victims: their demographic characteristics, the
circumstances in which they become victimized, and the consequences of their
experiences. This is particularly important because young people at ages 15-24 are more
likely than any other age group to be victims of serious violence such as homicide,
robbery, assault, and rape (Hindelang et al, 1978). Moreover, violent victimisation has
widespread consequences and social costs beyond the immediate physical harm. They
include, for example, a reduction in mental well-being, increased fear, lower educational
achievements, and a desire for revenge, which may trigger retaliatory violence (Finkelhor,
Ormrod, Turner, & Hamby, 2005; Turner, Finkelhor, & Ormrod, 2010; Turner, 2012).
But an understanding of victimization patterns is also important for prevention
policy: Good knowledge about which subgroups are victimized in which situations can
help to provide victim support where it is needed most. Similarly, if we know where, in
what circumstances and when violence occurs we are in a better position to direct the
preventive efforts of schools, the police, community leaders, and parents to those
situations where the greatest effects can be achieved.
We will focus on three domains of victimization: The first relates to experiences of
serious violent crime (assault, robbery and sexual assault); the second covers experiences
of exposure to parental use of force; and the third domain addresses experiences linked
to bullying victimization - the exposure to repeated use of physical and psychological
strategies aimed at dominating and socially excluding others, usually in the context of
schools.
4.1 Serious Violent Victimization
A first domain of victimization measured in the m-proso study relates to serious
violent victimization. The wording of the questions is shown in Table 5. Similar items
have been used in various previous surveys in Germany and Switzerland (Ribeaud &
Eisner, 2009; Wetzels, Enzmann, & Pfeiffer, 1998). They are worded so that they
correspond to the criminal offenses of robbery, physical assault and sexual assault.

Page 46
Youths were informed that these questions did not refer to consensual fights for fun.
Also, in order to make the questions unambiguous the item wordings did not include
attempts. However, one may note that the instrument used here is much shorter than
specialized surveys of violent or sexual victimization, which often comprise large
numbers of specific questions, meaning that they yield a more comprehensive picture
than what can be presented here.
Table 5 Questionnaire Wording and Type of Offenses
Item Wording Offense Alguien te quitó algo, por ejemplo, un bolso, tu bicicleta o dinero, con violencia o amenazándote con usar la violencia Robbery
Alguien te golpeó tan fuerte que te causó lesiones (ej. heridas sangrantes o un ojo morado). Assault
Alguien te obligó con violencia o con una amenaza de utilizar la violencia a realizar actos sexuales o soportar actos sexuales que vos no querías. Sexual violence
For each type of victimization the respondents were asked to indicate whether and
how often they had experienced this kind of violence at any time of their life and in the
past 12 months. They were also asked about whether they had reported the events to the
police. Finally, for the last event they were asked about further characteristics including
where it had happened, whether the perpetrator had been alone or in a group, and what
the sex of the main perpetrator had been.
Last Year Victimization Prevalence
We first describe the extent of victimization in terms of the proportion of students
that were victims in the last year before the survey (‘last year prevalence’). Table 6 shows the
respective prevalence rates for the three aforementioned offenses. It also shows the total
violent victimization rate i.e. the proportion of youths that were victims of at least one of
the three offenses. The findings suggest that almost one fourth of the surveyed youths
(24.6%) had been victims of one of the three types of violence in the 12 months before
the survey. The most common offense is robbery (17.9%) followed by assault (11.0%)
and violent sexual assault with 1.4%. Boys were considerably more likely to be victims of
robbery and assault than girls. For example, 13.3% of boys and 8.6% of girls reported to
have experienced an assault that led to physical injuries. This is in line with many other
studies on youth victimization internationally which find that young men are more likely
to be victims of physical violence than girls (e.g., Snyder & Sickmund, 1999). The most
widely accepted explanation is that young men more often engage in behaviours such as
being gang-members, hanging out late at night, and engaging in delinquent and violent
activities, which put them at greater risk of violent victimization (e.g., Maxfield, 1987).

Page 47
No sex difference was found for serious sexual assault, where 1.5% of boys and
1.4% of girls reported to have been coerced by the use or threat of violence to endure a
sexual act at least once in the past 12 months. This contradicts findings in Europe and
the United States, which generally show that females are at a higher risk of sexual
victimization than males (Finkelhor, 2013; M. Gottfredson, 1986; Zaykowski & Gunter,
2013). However, studies on sexual victimisation in some Asian societies similarly found
no differences in the victimization risk between male and female adolescents (e.g. Ji,
Finkelhor & Dunne, 2013). In the case of the present study only one item of the serious
violence victimization questionnaire related to sexual violence, and a more definitive
assessment would require a more detailed measurement with multiple items. However,
one may note that the result reported here is corroborated by a similar finding, reported
below, on sexual harassment as an aspect of bullying victimization (see Table 13, page
59). There, too, no sex difference in victimization risk was found.
Table 6 Last Year Violent Victimization Rates by Sex
Past 12 Months
Victimization Male Female Total
Robbery 22.4% 13.4% 17.9%
Assault 13.3% 8.6% 11.0%
Sexual assault 1.5% 1.4% 1.4%
Any serious violence 30.3% 19.2% 24.6%
Multiple Victimization
Prevalence rates do not take into consideration differences in how often a person
was victimized (known as incidence rates). Individuals who repeatedly experience the same
kind of victimization (i.e. “repeat victims“) and individuals who experience different kinds
of victimizations within a given time-period (i.e. “poly victims“) differ qualitatively from
those who are victimized only once (Holt, Finkelhor, & Kantor, 2007; Turner et al.,
2010). In particular, multiple victimization increases the likelihood that individuals
change their lifestyle as a response to victimization, and they tend to experience greater
levels of maladjustments, difficulties, and social and psychological problems (Finkelhor,
Ormrod, & Turner, 2007; Averdijk, Muller-Johnson, & Eisner, 2012; Tseloni & Pease,
2003). Multiple victims are therefore often in particular need of victim support services. Table 7 shows the distribution of multiple victimizations. The analysis is based on
all three types of victimization, and is therefore a combined measure of poly-
victimization and repeated victimization.

Page 48
The analysis shows that about half of all victims had experienced only one incident
during the past twelve months (11.7% of all adolescents versus 12.2% who were multiple
victims). Every second victim had experienced at least two incidents and about 3 % of all
adolescents in Montevideo reported that they had been victims of serious violence at
least five times over the past 12 months. Considerably more boys than girls reported
chronic repeat victimization, namely 4.0 % of boys and 2.1% of girls. This may result
from the greater involvement of young males in high-risk delinquent lifestyles, which
specifically expose them to an increased risk of repeated robbery and assault. Overall, far
more adolescents experience repeat victimizations than one would expect if violent
victimization occurred at random, meaning that after each victimization the risk of a next
victimisation increases. This may be because victims have a life-style or friendships that
expose them to increased risk, because offenders may find it easier to target the same
victim again if they have been successful once, or because they have individual
characteristics that may make them easier targets (Farrell & Pease, 2001).
Table 7 Frequency of Violent Victimization, past 12 Months
Male Female Total
Never 72.1% 81.9% 77.1%
Once 14.7% 8.9% 11.7%
2-4 times 9.1% 7.1% 8.1%
5+ times 4.0% 2.1% 3.1%
Situational Characteristics of Last Victimization
Victim surveys can provide useful information about the circumstances in which
violent events happen. This includes, for example, the location where the event
happened, the relationship between perpetrator and victim, and whether the perpetrator
was alone or in a group. In the present study the victims of serious violence were asked
about some main characteristics of their last victimization. Table 8 presents an overview
of the results for assault and robbery. Data on serious sexual assault are not reported
because the number of events (n = 15 for boys and girls, separately) is too small to draw
solid conclusions.
Robberies are most likely to happen in schools or in public space. In most cases
the adolescent or adult perpetrator who is not personally known to the victim (86% of
cases for male victims, 81% of cases for female victims). About half of the cases involve
situations where the perpetrator acted in a group, suggesting that robbery is often
committed by gangs of delinquent youth, who may use their advantage over a single

Page 49
individual to extort money or valuables. Also, male perpetrators, irrespective of whether
the victim was male or female, committed most robberies.
While the situational structure of robberies is highly similar, we find more
systematic differences between male and female victims for assault. If male adolescents
become victims of an assault the event is more likely to happen in public space, to
involve adolescents who are unknown to the victim, and to involve several perpetrators:
Fights triggered by a hot-tempered reaction to quick words on a weekend night in a park,
at the corner of the street or outside a bar are probably what we should imagine.
Furthermore, the perpetrators are almost exclusively also male.
For female victims, in contrast, assaults are somewhat more likely to happen at
home (25.5% versus 10.1%) and to involve either parents or adolescent known to the
victim. Also, 64% of assaults against girls were committed by girls, suggesting that assault
often occurs within same-sex interactions.
Table 8 Situational Characteristics of Robbery and Assault, Last Victimization
Robbery Assault
M F M F
A) Location of Victimization
At home 8.1% 11.0% 10.1% 25.5%
Home of a friend 1.7% 2.1% 5.0% 3.2%
At school 20.3% 24.7% 23.7% 29.8%
Public space 66.1% 56.1% 49.6% 30.9%
other 3.8% 6.2% 11.5% 10.6%
B) Relationship to Perpetrator
Parents/adult family member 4.3% 2.1% 5.0% 17.9%
Other known adult 2.6% 6.3% 5.0% 3.2%
Unknown adult 26.8% 22.9% 2.9% 3.2%
School colleague 10.6% 12.5% 19.3% 17.9%
Other known adolescent 9.8% 14.6% 31.4% 37.9%
Unknown adolescent 43.4% 41.0% 31.4% 17.9%
C) Group Membership of Perpetrator
Perpetrator in a group 53.4% 47.6% 33.8% 17.1%
D) Sex of Perpetrator
Male perpetrator 97.9% 83.3% 95.7% 35.9%

Page 50
N 236 146 139 94
Reporting to the Police
As part of the questions on serious victimization the respondents were also asked
to estimate how many events they had reported to the police. Dividing the number of
incidents reported to the police by the total number of incidents remembered by the
respondents yields an estimate of the reporting-to-the-police rate in Montevideo. Figure
9 shows the results. The data suggest that fewer than 10% of all experiences of serious
violent victimization amongst young people in Montevideo are reported to the police.
There are also differences among types of offenses: while 16% of the sexual
victimization events are reported to police, 11% of the robbery events, and 7% of
physical aggressions are reported. In respect of sexual victimization the small number of
cases probably precludes any firm conclusions for this type of victimization.
It is widely known that only a small fraction of all victimisations are reported to the
police across the world (e.g. Mayhew and van Dijk, 1997). Reasons for not reporting an
incident to the police include, for example, that the event was not perceived as serious
enough, that the police would not be able to do anything about it, or that the victim felt
partly responsible for the incident.
In respect of policy implications it would be useful to know whether the reporting
rates found in Montevideo differ from those in other places. Unfortunately, it is difficult
to compare data on reporting rates across victimization surveys, because methodologies
and target groups vary widely. However, a similar methodology was used in a large cross-
sectional youth survey in the canton of Zurich in Switzerland in 2007 (Ribeaud and
Eisner, 2009). For a similar range of victimizations and using a comparable methodology
that study found that about 17% of all serious violent victimizations had been reported
to the police. This would suggest that the likelihood that adolescent victims in
Montevideo contact the police less often than in a highly affluent European society.

Page 51
Figure 9 Proportion of Victimization Events Reported to the Police
Victimization Risk by Socio-Demographic Characteristics
In a next step we explored the extent to which the risk of victimization differed by
socio-demographic background. We examined all socio-demographic characteristics
described in chapter 2.
The analyses first suggest that family background characteristics such as a young
mother, a large family, or living in a single parent household were not associated with
differences in the victimization risk. Overall, this suggests that the family background
does not significantly influence the risk of serious violent victimisation.
We also examined whether adolescents’ victimization risk is associated with their
social class background. The findings of the study suggest that there was a tendency for
the overall victimization risk to be somewhat lower for high social class backgrounds, but
the differences were very small. Support for the notion that there is some tendency
towards a slightly higher victimization rate amongst less privileged groups also comes
from findings related to victimization rates by school type. For example, violence
victimization rates in schools for professional education are somewhat higher (30%) than
those in public high schools (26%) and in private high schools (21%).
The only factor amongst the structural variables that was associated with a
substantial difference in victimization risk is school retention. We defined school
retention as those who were in 9th grade and were 16 years old or older. By this definition
39% of students have been retained in the present sample. Youths who were retained at
some stage of the educational career tend to have complications in school, i.e., bad
grades, problematic relationship with classmates and teachers, early drop out from
school, etc. (see in Uruguay Cardozo, 2010; Fernandez, Cardozo, & Pereda, 2010). The
analyses suggest that youths who were retained are substantially more likely to be
10.9 6.8 15.9 9.7
0
10
20
30
40
50
60
robbery physical aggression
sexual abuse total
% Reported to Police

Page 52
victimized than other students (31.1% vs. 20.5%, χ2 (1) = 30.79, p <.01). This pattern is
also found for specific offenses: Retained students show significantly higher levels of
victimization in robbery (21.5% vs. average students’ 15.5%, χ2 (1) = 15.25, p <.01) and
physical aggression (16.2% vs. average students’ 7.4%, χ2 (1) = 43.76, p <.01). For sexual
victimization (1.8% vs. average students’ 1.2%, n.s.) the difference proved to be
statistically non significant.
Disabilities and Victimisation Risk
Emerging research suggests that young people with physical or mental disabilities
are more likely to be victimized than their peers without disabilities (Fekkes, Pijpers,
Fredriks, Vogels, & Verloove-Vanhorick, 2006, Mueller-Johnson, Eisner and Obsuth,
2014). The causal mechanisms are poorly understood. One hypothesis assumes that
young people with disabilities are more often victimized because they are more likely to
be excluded and less able to defend themselves, which makes them easier targets than
non-disabled children. A different possibility is that especially children with cognitive
impairments are less able to assess risks and to communicate effectively, meaning that
they are more likely to be in situations with an increased risk of violence.
In the m-proso survey a short screen for disabilities was used. Youths were asked
in a dichotomous item (yes/no) if they regularly suffered from health problems that
impeded him/her do what other teenagers of his/her age do. Examples were poor
eyesight, hearing difficulties, walking, learning, memory, and concentration problems.
15.4% of adolescents in Montevideo indicated that they suffered from a health condition
that impedes them from doing what other teenagers do. This prevalence estimate is
broadly in line with estimates found in other studies (Mikton, Maguire and Shakespeare,
2014).
We examined whether boys and girls with disabilities differ in their victimization
risk during the past year. The results are shown in Figure 10. The findings show that
31.9% of adolescents with a disability experienced one or more violent victimizations last
year. This is significantly higher than the victimization rate for non-disabled peers, which
was 23.2%. Examining male and female adolescents separately we found that the
difference is only statistically significant for female victims, where the risk of
victimisation is about 70% higher amongst disabled girls (29% victims) than for non-
disabled girls (17% victims). Disabled boys are also slightly more at risk of victimisation
than non-disabled boys, but the difference is not statistically significant.

Page 53
Figure 10 Last Year Victimization by Disability
Note: All respondents: χ2 (1) = 11.78, p < .001; Females: χ2 (1) = 15.20, p < .001.
Generally, these findings suggest that in Montevideo especially girls with
disabilities are at an elevated risk for violent victimization. They correspond with findings
from other studies internationally suggesting that disabled children and adolescents are at
a greater risk of child abuse, bullying, and general violent victimization including sexual
victimization (e.g. Mueller-Johnson et al. 2014, Hershkowitz, et al., 2007). They underline
the importance of protecting particularly vulnerable groups of adolescents from attacks
by others.
Lifestyle Risk Factors for Violent Victimization
The way young people use their leisure time is a key indicator used by life style
theories of criminal victimization. These theories expect that spending more time in
outside activities in bars, clubs, the street, parks, parties, etc., involves more exposure to
potential victimization due to the lack of controls/guardianship and the presence of
offenders in these contexts. Especially outside activities during the night increase the
opportunity of frictions and conflicts with other youths that might end up as
victimization episodes (Lauritsen et al., 1991; Jensen & Brownfield, 1986).
We asked youths a series of questions related to their life-style and use of leisure
time outside home, namely, how frequently do they: go out in the night/afternoon to
hang out with friends; go in a date; go to parties late at night; go with friends to
pubs/discos; go with friends to do something forbidden/rob something, among other
activities.
29.4%
17.0%
23.2%
35.9%
29.0% 31.9%
0%
5%
10%
15%
20%
25%
30%
35%
40%
Male Female Total
% Victim of Violence
not disabled
diabled

Page 54
To examine the link between lifestyle and victimisation risk we present findings for
five selected lifestyle indicators, namely ‘going out’, ‘consuming marihuana’, ‘consuming
alcohol’, ‘being a member of a delinquent group of young people’, and ‘committing
delinquent acts oneself’. The variable ‘going out’ was formed on the basis of 12 items
that included questions about the frequency of going out in the night to hang out with
friends, going on a date, going to parties late at night, and going with friends to
pubs/discos. A sum scale was constructed and then dichotomized into ‘low’ and ‘high’
frequency of going out. The variable ‘own delinquency’ was formed using an index of 28
different self-reported delinquent acts, which was dichotomized at the median to form
groups of ‘low’ and ‘high’ own delinquency. All indicators of lifestyle risk are correlated
with each other, suggesting that they represent different aspects of a more extrovert, risk-
seeking and gregarious life-style.
Table 9 displays the differences in victimization risk by five lifestyle indicators. The
findings show the following: Young people are at a higher risk of violent victimization if
they go out frequently, consume substances such as alcohol or marihuana, spend a lot of
time with friends who commit delinquent acts and if they are themselves involved in
committing delinquent acts. These results support the findings from international
research that the risk of violent victimization among young people is strongly associated
with lifestyle characteristics. Furthermore, the results also suggest that the association
between lifestyle and victimization risk holds similarly for male and female victims.

Page 55
Table 9 Victimisation Risk by Lifestyle Risk Factors, Percentages
% Victimized
Lifestyle Characteristic Male Female Total
Going Out Frequently Low 25.3% 14.8% 19.2% χ2Total = 36.56, p< .001
χ2Male = 10.37, p< 0.01
χ2Female= 18.46, p< 0.001 High 34.5% 25.1% 30.4%
Marihuana Use No 27.6% 16.7% 21.9% χ2Total = 53.09, p< .001
χ2Male = 20.15, p< .001
χ2Female= 29.99, p< .001 Yes 44.6% 36.6% 41.6%
Alcohol Monthly or more No 27.8% 18.1% 22.7% χ2Total = 25.04, p< .001
χ2Male = 14.84, p< .001
χ2Female= 7.44, p< .01
Yes 41.0% 26.6% 34.4%
In Delinquent Gang No 26.2% 17.6% 21.7% χ2Total = 80.19, p< .001
χ2Male = 49.15, p< .001
χ2Female= 16.84, p< .001 Yes 53.2% 35.6% 47.3%
Own Serious Delinquency Low 23.7% 14.2% 18.3% χ2Total = 65.21, p < .001
χ2Male = 24.0, p < .001
χ2Female= 32.7, p < .001
High 37.5% 28.3% 33.5%
Several causal mechanisms may account for this association. First, young people
who go out often are more likely to be in situations where there are many motivated
offenders, where opportunities for frictions that may lead to open aggressive conflict,
and where a lack of social control provides opportunities for violent or property crimes.
An outgoing lifestyle may hence increase the victimization risk because adolescents
spend more time in situational environments such as Friday or Saturday nights in
entertainment areas where violence is more likely. Second, some lifestyle components
may directly increase the vulnerability to victimization. Consider the strong association
between substance use and victimization risk: For example, 41.6% of the young people
who consume marihuana had been victims of serious violence in the preceding year as
compared to 21.9% amongst those who don’t consume marihuana. A similar association
can be found for alcohol use. A part of this association may be due to the fact that
psychoactive substances increase levels of vulnerability because intoxication reduces self-
control and the ability to recognize and avoid situational risks. Intoxicated adolescents
may therefore be particularly attractive targets for acts such as robbery or sexual assault.
Third, some lifestyle aspects may actively trigger the risk of victimization. For example,
people under the influence of alcohol or drugs may be more likely to initiate escalations

Page 56
of conflicts by harassing others or uttering insults, which eventually lead to a
victimisation event. Similarly, adolescents who are themselves involved in delinquent acts
such as drug dealing, theft or vandalism increase the chances that those who are directly
affected by their behaviour react aggressively (Jensen & Brownfield, 1986; Lauritsen &
Laub, 2007; Lauritsen et al., 1991; Sampson & Lauritsen, 1990; Woodward & Fergusson,
2000), Finally, own delinquency and victimization are probably strongly correlated
because some underlying personality traits such as risk-seeking or impulsivity are
associated with antisocial behaviour tendencies as well as with behaviours that result in
increased exposure to victimization risk (Stewart, Elifson, & Sterk, 2004).
4.2 Corporal Punishment
A second domain of victimization experiences measured in the m-proso study
relates to experiences of physical punishment by parents. Such experiences can range
from a single slap to repeated and severe hitting with objects such as a belt or a stick.
Corporal punishment and physical abuse are important here because they are associated
with a range of short and long-term negative consequences for child development,
especially if harsh and abusive discipline is combined with emotional and physical
neglect. Such consequences include a higher risk of addictive behaviours such as
substance abuse or obesity, mental health problems, unstable relationships, a higher risk
of exposure to violent victimisation as an adult, and a shorter life expectancy (e.g. Felitti
et al, 1998). Also, corporal punishment in the home is illegal in Uruguay since 2007,
meaning that the state recognizes the problem of parental use of force and its harmful
effects on the young person (Proyecto de Ley Sustitutivo – Prohibición del Castigo
Físico”, Law 18.214).
In the present study participants were asked three questions that relate to corporal
punishment. The items were translated to be identical to those used in the Swiss version
of the questionnaire. The items are part of a longer instrument that taps on various sub
dimensions of parenting and that is modelled on the Alabama Parenting Questionnaire
(Frick, 1991). Respondents were asked to indicate for each behaviour whether the
behaviour occurs ‘never’, ‘rarely’, ‘sometimes’ or ‘often’.

Page 57
Table 10 Item Wordings for Exposure to Parental Use of Force
Spanish English
Tus padres te golpean con un cinturon u otro
objeto
Your parents hit you with a belt or another
object
Tus padres te tiran de las orejas o del pelo Your parents pull your ears or hair
Tus padres te dan una cachetada Your parents slap you
The Prevalence of Corporal Punishment
Table 10 shows the prevalence rates of corporal punishment amongst all
adolescents and for boys and girls separately. Findings show that slapping is the most
widespread form of physical punishment, experienced by about 21% of adolescents in
Montevideo. 17% of adolescents have their hair or ears pulled by their parents. And the
proportion of adolescents whose parents hit them with an object such as a belt or a stick
is 7.3% - meaning that about one out of fifteen adolescents is exposed to a severe form
of corporal punishment that involves an increased risk of severe physical harm. Only this
form of parental use of force differs between boys and girls: Boys are more likely to be
hit with an object than girls are. Finally, considering all forms of corporal punishment the
findings suggest that about 28% of young people in Montevideo experience some kind
of disciplinary measure that entails physical force. Boys and girls are similarly affected,
with rates slightly higher for boys.
Table 11 Prevalence of Corporal Punishment by Gender
Item
Male
Female
Total
Sig. Diff.
(Male-Female)
Slapping 21.1% 20.4% 20.8% n.s.
Pulling ear/hair 16.9% 17.0% 17.0% n.s.
Hit with object 9.4% 5.2% 7.3% p < 0.01
Any 29.7% 26.4% 28.0% p < .05
We also examined the frequency of exposure to corporal punishment, combining
all three items and using the highest reported incidence as an indicator. The findings
show that for most concerned adolescents corporal punishment is a rare experience.
Thus, 68% of those who experienced any type of corporal punishment said that it
happened ‘rarely’ (i.e. 19.1% of total sample). 24.3% said that it happened ‘sometimes’

Page 58
(6.8% of total sample), and 7.7% said that it happened ‘often’ or ‘very often’ (2.2% of
total sample).
Overall, the data provide an estimate of the proportion of adolescents in
Montevideo who not only to experience an occasional slap, but who are exposed to
parental abuse in the sense of frequent or severe parental use of violence. Depending on
what criteria are used they suggest that repeated and severe physical punishment is
experienced by between 2% (any parental violence ‘often’) and 7% (having been hit with
an object at least ‘rarely’) of adolescents.
Socio-demographic Characteristics
Studies tend to find that corporal punishment and especially the experience of
serious physical abuse by parents varies between socio-demographic groups. In
particular, various studies conducted in the United States and in Europe find that
children in families with low education and poor socio-economic background are more
likely to be exposed to corporal punishment than children in middle-class and educated
families (e.g., Straus and Steward, 1999). Also, longitudinal studies in the United States
found that being born to a young mother, living in a disadvantaged neighbourhood, and
instable family arrangements (e.g. new partners) were associated with a higher risk of
child maltreatment (Thornbery et al, 2014).
In the context of Montevideo we found few systematic differences in the
likelihood of corporal punishment between socio-demographic groups. In particular,
growing up in a large family, having been born to a teenage mother, living with a single
parent, or school type were not statistically associated with differences in the likelihood
of experiencing corporal punishment at home. Also, contrary to findings in the US-
American literature, corporal punishment in Montevideo was not systematically related
to social class background, parental education, or neighbourhood disadvantage (e.g.,
Straus and Steward, 1999). This may suggest that in the context of Uruguay corporal
punishment is more widely culturally accepted. In particular, corporal punishment does
not seem to be associated with the difference between a middle class culture where
corporal punishment is widely seen as inadequate and the culture of more disadvantaged
groups, where corporal punishment is more widely accepted.
Parenting and Parental Conflict
The risk of exposure to parental corporal punishment in the Montevideo sample is
associated with other aspects of parenting practices. Generally, corporal punishment is
more likely to be used by harsh and authoritarian parents who show little affection to
their children and rarely praise them if they do something well. This finding confirms

Page 59
results from other studies that corporal punishment tends to be a component of wider
parenting deficits which include general harsh and abusive discipline, lacking emotional
warmth and attachment between parents and their children, and little support and
parental involvement in positive activities (Loeber & Stouthamer-Loeber, 1986).
Also, the likelihood of corporal punishment was found to be associated with
conflict amongst the parents. Based on the adolescents’ reports the relationship between
the parents was classified into four groups from ‘no parental conflict’ to ‘very high’
parental conflict, meaning that parents often fight or shout at each other.
Results show that adolescents who grow up in families with a high level of parental
conflict are significantly more likely to experience corporal punishment than others (see
Figure 11). This is especially the case for repeated and more severe corporal punishment.
In families where parents get along well with each other about 3% of adolescents
experience repeated corporal punishment. In families with frequent conflict between the
parents the proportion of young people exposed to repeat corporal punishment rises
almost 5-fold, to about 14%. Overall, this suggests that abuse parenting practices are
strongly associated with a wider syndrome of family malfunctioning, which includes
violence and abuse amongst the parents.
Figure 11 Percent Experiencing Corporal Punishment by Level of Parental Conflict
Note: ‘High corporal punishment’ was defined as any type of corporal punishment at least happening ‘sometimes’ or more often. χ2 (6) = 75.04, p < .001.
16% 18% 26% 23%
3% 6%
7% 14%
0%
5%
10%
15%
20%
25%
30%
35%
40%
Q1 (Lowest)
Q2 (Low) Q3 (High) Q4(Highest)
Corporal Punishment
Parental Conflict
High Corporal Punishment
Low Corporal Punishment

Page 60
Depressive Symptoms
Especially repeated and serious experiences of physical abuse over many years and
starting early in life have been found to be associated with an increased risk for a range
of mental health problems. The present study is limited in the extent to which
consequences of corporal punishment can be identified. However, it is possible to
examine the association between experiences of corporal punishment and the intensity of
depressive symptoms. Depressive symptoms were measured with a 4-item scale that
comprised questions on how often the respondent ‘had to cry’ or ‘felt unhappy’, ‘felt
lonely’ or ‘were worried’ (Cronbach’s α = .832). Findings suggest that both male and
female adolescents who experience corporal punishment at home are more likely to
suffer from depressive symptoms such as feeling lonely, sad and anxious than this who
don’t. Furthermore, for girls we find a dose-response relationship: the more frequent
corporal punishment occurs at home, the more likely they are to have a poor emotional
wellbeing.
Figure 12 Level of Depressive Symptoms by Exposure to Parental Corporal Punishment
Note: ‘High corporal punishment’ was defined as any type of corporal punishment at least happening ‘sometimes’ or more often. All respondents: F (1) =44.1, p < .001; Males: F (1) = 14.5, p < .001; Females: F (1) = 47.9, p < .001.
4.3 Bullying Victimization
The third domain measured in the m-proso survey relates to experiences of
bullying victimization. A broader range of aspects related to bullying perpetration and
0.0
0.5
1.0
1.5
2.0
2.5
3.0
Boys Girls Total
Depression Score
No Corporal Punishment
Low Corporal Punishment
High Corporal Punishment

Page 61
victimization will be discussed in more detail in Chapter 6. Here we only present basic
descriptive findings on the prevalence of bullying victimization and their association with
two selected issues, namely whether victims of bullying are more likely to have depressive
symptoms and whether young people with disabilities are more likely to become bullying
victims.
Table 12 Item Wording to Measure Bullying Victimisation
Spanish English
Te ignoraron o te excluyeron a propósito? Intentionally ignored or excluded you.
Se rieron de vos, te insultaron o se burlaron de vos?
Laughed at you, insulted you or ridiculed you
Te golpearon, mordieron, patearon o tiraron del pelo?
Hit, bit, kicked, or pulled your hair
Te quitaron, rompieron o escondieron cosas a propósito?
Intentionally took away, damaged or hid your belongings
Te acosaron sexualmente (ej. piropos sexuales ofensivos, te manosearon)?
Sexually harassed you (e.g. verbally molested you, fondled you)
Bullying victimization was measured with five items modelled on the Olweus
Bullying Questionnaire (Olweus, 1993). The question wordings are shown in Table 12.
For each item the adolescents were asked to indicate the frequency of their experiences
in the past year. Responses were given on a 6-point Likert Scale that ranged from ‘never’
and ‘1 or 2 times’ to ‘more than once a week’ and ‘almost daily’. For the following
overview we limit to an analysis of the proportion of adolescents who experienced
bullying ‘at least monthly’, which is the most commonly used cut-off for bullying used in
the research literature.
Table 13 shows the prevalence of at least monthly bullying victimization amongst
15-year olds in Montevideo. The data suggest that between 3.4% (being physically
attacked) and 12.9% (being ridiculed) of adolescents report that they experience at least
one type of bullying monthly or more often. Overall, about one out five adolescents
report experiences of some kind of bullying. Being physically attacked and having ones’
belongings stolen or damaged is experienced more often by boys than by girls. In
contrast, the frequency of experiences of sexual harassment, social exclusion, and verbal
bullying did not differ between male and female respondents.
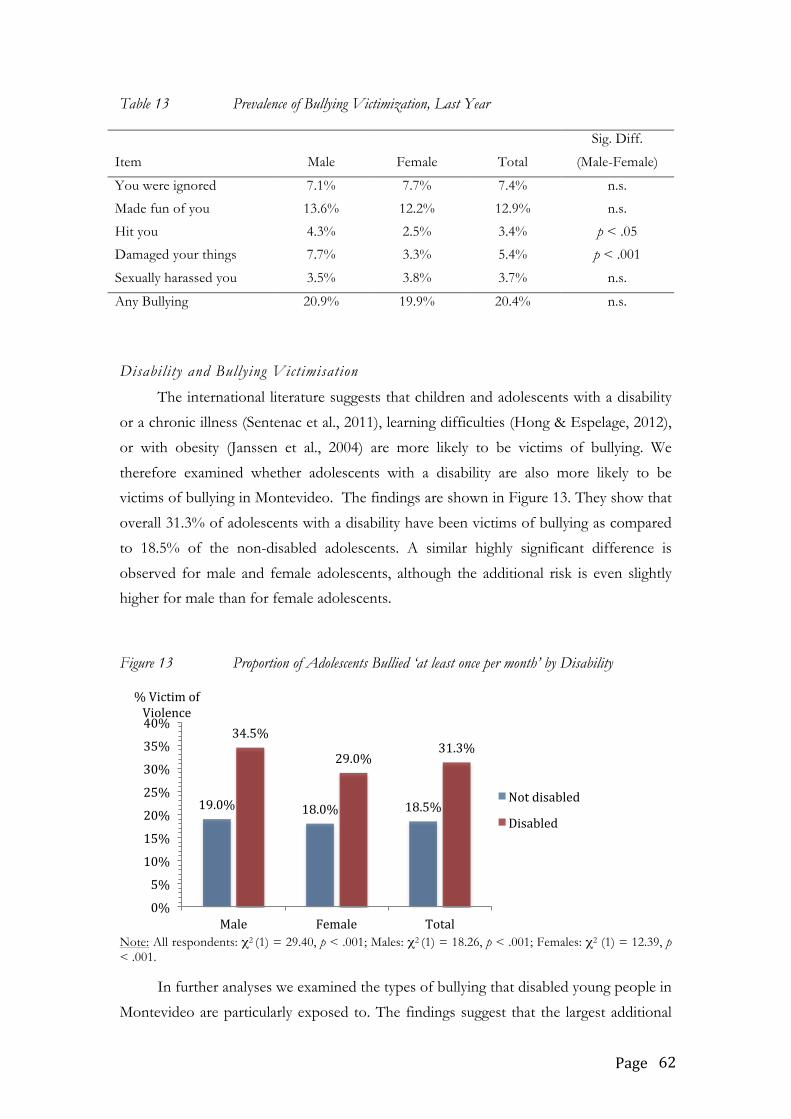
Page 62
Table 13 Prevalence of Bullying Victimization, Last Year
Disability and Bullying Victimisation
The international literature suggests that children and adolescents with a disability
or a chronic illness (Sentenac et al., 2011), learning difficulties (Hong & Espelage, 2012),
or with obesity (Janssen et al., 2004) are more likely to be victims of bullying. We
therefore examined whether adolescents with a disability are also more likely to be
victims of bullying in Montevideo. The findings are shown in Figure 13. They show that
overall 31.3% of adolescents with a disability have been victims of bullying as compared
to 18.5% of the non-disabled adolescents. A similar highly significant difference is
observed for male and female adolescents, although the additional risk is even slightly
higher for male than for female adolescents.
Figure 13 Proportion of Adolescents Bullied ‘at least once per month’ by Disability
Note: All respondents: χ2 (1) = 29.40, p < .001; Males: χ2 (1) = 18.26, p < .001; Females: χ2 (1) = 12.39, p < .001.
In further analyses we examined the types of bullying that disabled young people in
Montevideo are particularly exposed to. The findings suggest that the largest additional
19.0% 18.0% 18.5%
34.5%
29.0% 31.3%
0%
5%
10%
15%
20%
25%
30%
35%
40%
Male Female Total
% Victim of Violence
Not disabled
Disabled
Item
Male
Female
Total
Sig. Diff.
(Male-Female)
You were ignored 7.1% 7.7% 7.4% n.s.
Made fun of you 13.6% 12.2% 12.9% n.s.
Hit you 4.3% 2.5% 3.4% p < .05
Damaged your things 7.7% 3.3% 5.4% p < .001
Sexually harassed you 3.5% 3.8% 3.7% n.s.
Any Bullying 20.9% 19.9% 20.4% n.s.

Page 63
victimisation risk of disabled adolescents can be found for being teased and ridiculed by
others as well as for being excluded by other young people in the school, although
disabled adolescents are somewhat more likely to be bullied in all subcategories with the
exception of sexual harassment.
Consequences of Bullying Victimization
Bullying victimisation has been linked to a range of negative outcomes for the
victims. One negative effect that has been documented particularly well relates to
depressive symptoms such as withdrawal, anxiety and hopelessness (Ttofi, Farrington &
Losel, 2012). We therefore explored the extent to which experiences of bullying among
adolescents in Montevideo are associated with depressive symptoms. More specifically,
we examined overall mean levels of depressive symptoms comparing those who had
experienced at least one form of bullying to those who had not been victims of bullying.
The analyses were conducted separately for boys and girls. Findings are shown in Figure
14. They show that bullying victimization is strongly associated with the likelihood of
depressive symptoms. Boys and girls in Montevideo who have been victims of bullying
have significantly higher levels of feeling sad, lonely and sorrowed than those who had
not been bullied.
Figure 14 Level of Depressive Symptoms by Bullying Victimisation
Note: Total: F (1) = 123.4, p < .001; Males: F (1) = 47.62, p < .001; Females: F (1) = 85.28, p < .001.
0.0
0.5
1.0
1.5
2.0
2.5
3.0
Boys Girls Total
Depression Score
Not Bullied
Bullied

Page 64
Since the present data are cross-sectional it is impossible to say whether bullying
victimization was the cause of emotional problems, or whether adolescents with
emotional problems are more likely to be targeted by school bullies. However,
longitudinal data strongly suggest that at least part of the association is due to a causal
effect of experiences of being excluded, teased, harassed and physically assaulted in the
school context (e.g. Averdijk et al, 2011).
4.4 Conclusions
Across all stages of the life-course from infancy to old age the experience of
exposure to violence and neglect in any form is now recognized as a major source of
suffering for the victims: For example, young children who experience parental
maltreatment have a much greater risk of later mental health problems; adolescents
bullied at school lose confidence in their academic abilities and become socially isolated;
and victims of domestic abuse are more likely to develop depressive disorders and drug
dependencies. Reducing the risk of violent victimization therefore is a major public
health goal.
In line with findings from international research we have demonstrated in this
chapter that adolescents in Montevideo who are exposed to various kinds of violence are
significantly more likely to experience anxiety and depression. Furthermore, we showed
that adolescents with disabilities are at a significantly increased risk of violent
victimization. This was especially the case for the risk of being bullied, where more
dominant adolescents may specifically target those with mental or physical weaknesses.
This suggests that vulnerable children and adolescents should be particularly considered
in measures that aim to improve support for victims.
The findings presented in this chapter show that a substantial proportion of
adolescents in Montevideo experiences harm related to victimization in the forms of
parental use of force, being bullied at school, or serious assault, robbery or sexual assault
as part of daily life. Victimization in one domain tends to be associated with a higher risk
of victimization in other domains. For example, victims of parental abuse also have a
higher risk of being bullied at school or experiencing assaults in public space.
Contrary to expectations the findings also suggest that socio-demographic
background plays no or a very small role in explaining differences in the victimization
risk. In particular, the findings presented here do not suggest that violent victimization of
adolescents is particularly concentrated among adolescents from disadvantaged family or
neighbourhood contexts.

Page 65
Victimization due to assault, robbery and sexual assault was found to be strongly
associated with lifestyle characteristics such as spending much time in unsupervised
public space, going out often, consuming alcohol and marihuana, and spending time with
delinquent peers. For prevention strategies these findings suggest that approaches likely
to be effective should focus on reducing the exposure of young people to these
situations and alerting them to the risks associated with such activities.
A substantial proportion of young people was exposed to corporal punishment by
their parents. The likelihood of experiencing parental use of force at home was
associated with a range of other parenting practices such as generally harsh and
authoritarian discipline as well as a lack of warm and involved parenting. Furthermore,
adolescents were more likely to be exposed to corporal punishment in families where
there was serious conflict amongst the adult partners in the household. These findings
suggest that strategies to reduce violence against adolescents and strategies to reduce
domestic violence should be seen as partly overlapping prevention approaches.
Furthermore, we found that bullying victimization in the sense of repeated
exposure to exclusion, teasing, sexual harassment, physical violence, and damage to
personal belongings is a substantial problem in schools in Montevideo. This suggests that
initiatives aimed at reducing school bullying should be an important part of a violence
prevention strategy.

Page 66
5 Self-reported Violence
In the present study we distinguish two main groups of aggressive behaviors that
young people commit. The first relates to serious violence irrespective of the context or
setting. The second relates to dominant aggressive and harmful behavior against peers in
the school context (e.g. insulting, breaking/stealing others’ belongings, sexual
harassment, etc.), a phenomenon also known as school bullying. In this chapter we will
focus on serious violence only. School bullying will be discussed in the next chapter.
In this chapter we address the following issues. First, we explore the main patterns
of youth violent behavior and some situational features of violent episodes experienced
by youths. Second, we analyze socio-economic characteristics of youths involved in
violence. Then, we explore the connections between violence and other deviant
behaviors such as use of legal and illegal drugs, truancy, vandalism, and different forms
of theft, among others. The rest of the chapter focuses on evaluating the association
between youth violence and different relevant risk factors that include personality traits,
beliefs about moral values and police legitimacy, family and parenting dynamics, peer
group membership, use of leisure time, media consumption and the school-related
variables.
5.1 The Extent of Violent Behavior
In the self-report section of the questionnaire students were asked to respond to
questions regarding 20 different delinquent and deviant behaviors. For each behavior
youths were asked whether they have ever done this in the last 12 months; how often it
had occurred; and whether they had had problems with the police due to the behavior.
Four behaviors relate to physical violence: carrying a weapon, threat/extortion, robbery
and assault. The other items relate to non-violent types of norm-breaking and delinquent
behavior such as truancy, cheating at school, fare dodging, stealing at home, and vehicle
theft. Table 14 shows the wording of the violence items and the proportions of youths
that had committed at least one of the four forms of physical violence by gender.

Page 67
Table 14 Last-year Prevalence of Violence, by Gender
Since July 2012, have you ever…
Crime
Last 12 months prevalence
Total Males Females …carried a weapon or dangerous object to protect yourself or to threaten or attack others?
Carrying a weapon
8.9 % 14.3 % 3.8 %
…threatened to use violence to obtain his/her money or belongings
Threat / extortion
1.2 % 2.1 % 0.4 %
…taken someone's money or belongings using violence
Robbery 1.5 % 2.5 % 0.5 %
…purposely kicked, hit, or cut someone causing him/her injuries
Assault 9.5 % 12.9 % 6.2 %
Total 16.5 % 23.6 % 9.7 %
The data show that 16.5% of youths remembered at least one violent act during
the past 12 months. Carrying a weapon and assaulting another person are most frequent,
with 8.9% and 9.5% of the respondents saying that they have done those behaviors at
least once. The other two behaviors are less frequent: 1.5% of the respondents admitted
a robbery and 1.2% admitted having been involved in threat/extortion.
In line with studies across the world the results show that physical violence is more
prevalent among males than females. The sex ratio for the prevalence rate is close to 3:1
(23.6% for male vs. 9.7% for female adolescents). But it is even larger if we also consider
the number of violent acts: The 360 perpetrators admitted to 7267 acts of violence, equal
to about 20 events per person. 84.1% of these were perpetrated by males and only 15.9%
by females, meaning that the sex ratio for this indicator is about 5:1. Thus, males are not
only more likely to perpetrate violence than girls, but if they do, they are also involved in
a larger number of violent acts than females.
We also draw attention to the extent to which repeated and serious violence is
concentrated among a small fraction of the adolescent population. As we could see from
Table 14 above, more than 83% of adolescents at age 15 do not perpetrate serious
violence. Most of the other young people may have had one or two serious fights, but
the behavior is not regular part of a violent life-style. However, this is not true for a small
minority of adolescents. More specifically, a mere 2% of all adolescents in Montevideo
are responsible for some 70% of violent acts. The finding of a high concentration of
repeated and serious violence amongst a small minority is similar to findings reported by
other studies (e.g. Averdijk et al. 2014). It sends out a strong signal to prevention policy
as it implies that most resources should be targeted to reach this group of most
problematic young people.

Page 68
Situational Characteristics of Assault
We asked those respondents who had committed at least one assault in the past
year to provide more information about the last incident. Adolescents were asked about
the sex and age of the victim, where the incidence had occurred, and whether the
perpetrator or the victim had been in a group. Results are shown in Table 15. They
suggest that male and female adolescents commit assaults in somewhat different
situations: Young men were more likely to pick a fight on sports grounds, while young
women were more likely to be involved in an assault at home. Also, males were more
likely to physically attack a person when the perpetrator or the victim are in a group, and
almost all cases were committed against another male of roughly the same age. Girls
were less likely to use physical aggression in a group context. Also, most assaults by girls,
namely 60%, were committed against another girl that was usually of a similar age as the
perpetrator. It is noteworthy that the findings shown here from the perpetrator
perspective almost perfectly match the findings on situational characteristics of assaults
from the victim perspective that we reported above in section 4.1.
Table 15 Situational Characteristics of Last Assault (location, presence of group, sex of victim, age of victim)
Male Female
Characteristic (N = 120) (N= 61) a) Location At home 7.5% 27.9% At school 18.3% 23.0% Sports ground 25.8% 8.2% Street, square 25.8% 23.0%
b) Group Membership Perpetrator in group 18.7% 4.9% Victim in group 49.6% 30.6%
c) Sex of Victim Victim male 95.9% 40.4%
d) Age of Victim Victim age 13-17 74.8% 75.4%

Page 69
5.2 Socio-‐Demographic Differences
We first examine the extent to which aggressive behaviors are concentrated
amongst adolescents with certain socio-demographic backgrounds. In particular, we look
at the association with the educational and occupational situation of the parents, aspects
of the family structure (single parent, large family, teenage mother), the school situation
of the adolescent, and the neighborhood characteristics. The selected indicators reflect
main structural characteristics examined in other studies of serious youth delinquency
and violence (e.g. Loeber & Farrington, 2001). The results are shown in Table 16.
Table 16 Self-Reported Violence by Socio-Demographic Background
Criterion
Value
% self report
violence
Significant Differences
Parental Class
(EGP4)
Service (i/ii) 11.5% χ2total = n.s.
χ2male = 8.86, p < .05
χ2female = n.s.
Intermediate (iii/iv) 16.6%
Skilled workers (v/vi) 15.7%
Working class (vii) 18.2%
Parental education Primary studies 15.5% χ2total = n.s.
χ2male = n.s.
χ2female = n.s.
Secondary studies 18.0%
University studies 14.1%
Biological Parents None 26.3% χ2total = 8.97, p < .05
χ2male = n.s.
χ2female = 7.70, p < .05
One biologial parent 17.3%
Both biological parents 15.1%
Large Families
(> 3 silblings)
No 15.7% χ2total = n.s.
χ2male = n.s.
χ2female = n.s. Yes 20.7%
Teenage Mother No 15.8% χ2total = n.s.
χ2male = n.s.
χ2female = n.s.
Yes 19.7%
School Type CETP 25.2% χ2total = 14.96, p < .01
χ2male = n.s.
χ2female = 11.34, p < .01
Public 17.4%
Private 13.2%
School Retention Normative 13.6% χ2total = 19.56, p < .01

Page 70
Lagged 20.9% χ2male = 14.20, p < .01
χ2female = n.s.
Neighborhood
Human Development
Index (PNUD)
Highest 13.1% χ2total = n.s.
χ2male = n.s.
χ2female = n.s.
2 16.4%
3 16.3%
Lowest 17.4%
The results regarding the link between parental social class and adolescent
aggression reveal that differences are small and statistically non significant. The socio-
economic situation of the parents does not correlate with the risk of serious youth
violence. However, we find a statistically significant difference for male adolescents in
that only 14.5% of the male adolescents from service class backgrounds were involved in
violent behavior, a smaller proportion than for intermediate class youths (26.3%),
working class youths (22.1%), and the skilled workers class (24.1%). The general finding
on class background is corroborated by the association between parental education and
youth violence. Here, too, we find no statistically significant differences, although we
note a tendency for violence rates to be slightly smaller if adolescents have a parent with
a university degree.
Three variables relate to characteristics of the family structure, namely the number
of biological parents that live with the young person, the family size, and whether the
adolescent had been born to a teenage (i.e. below age 18) mother. Findings first suggest
that 15.1% of the adolescents who live with both biological parents had committed at
least one act of violence in the past year. This is slightly lower than the rate for young
people growing up with only one biological parent (17.3%). However, the highest rates
are found amongst the small group of adolescents (4.5% of the sample) who live without
either parent, where 26.1% admitted to at least one violent act.
Being born to a teenage mother or living in a family with 4 or more siblings was
not associated with significant differences in violent behavior. This is noteworthy
because Farrington & Loeber (1999) had found that both variables are significant risk
factors for serious delinquency in London and in Pittsburgh.
We also examined whether school retention and school type were associated with
the probability of perpetrating violence. We find that pupils who had been retained at
school had a significantly higher level of violence than pupils who were in their regular
school year. It is possible that school retention itself is a negative experience that
increases the probability of aggressive behavior. However, it is more likely that school
retention is a marker for a range of academic problems. They include serious difficulties

Page 71
at school, low academic motivation, and frequent truancy – all of which have been
shown to be associated more antisocial behavior.
Findings also suggest that school types differ in levels of violence. The proportion
of violent adolescents is lowest in private schools (13.2%), close to the overall average in
regular state secondary schools (17.4%), and highest in professional training schools
(25.2%). In interpreting these findings one needs to bear in mind that pupils in the three
types of schools differ significantly in their personal and socio-economic backgrounds.
For example, 56% of adolescents attending a private school have a parent with a
university degree, as compared to 14% in secondary schools and 6% in professional
training schools. Also, a far lower proportion of adolescents in private schools have
repeated class due to academic problems. Pupils in private schools are hence socio-
economically more privileged and less likely to have school difficulties than pupils in
state schools. This may account for their lower lever of aggressive problem behaviors.
Many people believe that violent behavior is strongly concentrated among young
people from disadvantaged backgrounds. Overall, our findings contradict this notion.
Surely there is a tendency: Young people in privileged neighbourhoods who have parents
with an academic background and in advantaged socio-economic positions are somewhat
less likely than others to carry weapons, commit robberies, or get involved in fights. But
differences are small. And more specifically, they cannot justify a violence prevention
policy that mainly focusses on social disadvantage and poverty as main risk factors.
5.3 Association with other Deviant Behaviors
Is violent behavior highly specific or is it part of a more general syndrome? Are
violent teenagers just violent, or are they also involved in the use of substances and non-
violent delinquent behaviors? The question is relevant for two reasons: First, the answer
has an influence on whether explanations should be developed for violence specifically,
or whether they should account for a broad syndrome of antisocial behaviors. Second,
the answer has implications on whether prevention policies should mainly target violence
and aggression, or whether they should more broadly aim to promote a healthy
development of children and adolescents.
Over the past 30 years research in criminology has shown convincingly that youth
violence tends to come together with other forms of deviant behaviors, including
substance use, non-violent delinquency, risky sexual behaviors, and dangerous driving
(Farrington, 1994; Huizinga & Jakob-Chien, 1998; Eisner & Malti, 2014). This overlap
probably results from two different processes: On the one hand, a range of different
antisocial and deviant behaviors are similarly associated with general personality

Page 72
characteristics and social influences such as impulsivity, risk-seeking, or exposure to
parental maltreatment and neglect. This means that different behaviors are correlated
because they have the same underlying causes. On the other hand, some behaviors are
partly a consequence of other behaviors. For example, alcohol use can lead to situations
where conflict and an escalation to violence are more likely or membership in a
delinquent gang can lead to group pressure to consume illicit drugs.
The strong association between violence and other problematic behaviors, found
in previous studies in the United States and Europe, is clearly confirmed in the m-proso
survey. We divided respondents into two groups: those that committed at least one
violent behavior in the last twelve months (16.5%) and those that didn’t (83.5%).
Subsequently we examined the involvement of these two groups in substance use, minor
devant acts, and different deviant and antisocial behaviors in the last 12 months. Figure
15 reveals that violent youths have on average used more alcohol than non-violent
youths (46.6% vs. 15.9%), more marijuana (34.1% vs. 10.5%) and more hard drugs (33%
vs. 18.4%). The strongest statistical association was found between violence and alcohol
consumption.
Figure 15 Self-Reported Violence by Substance Use
Note: Alcohol: χ2 (1) = 161.18, p < .001; Marijuana: χ2 (1) = 132.91, p < .001; Hard drugs: χ2 (1) = 37.38, p <.001. For marijuana and hard drugs we used last 12 months prevalence measure. For alcohol we used a prevalence measure that included all youths who had consumed alcohol at least 6 to 12 times in the last year.
Additionally, Figure 16 and Figure 17 show that violent youths are signifcantly
more likely to engage in all non-violent antisocial and deviant behaviors. For example,
they skip class more often than their non-violent peers (59.9% vs. 38.2%), drive without
having a license (62.1% vs. 34.2%), commit acts of vandalism (30.1% vs. 5.0%) or run
away from home (21.5% vs. 5.9%). The findings in Figure 17 also show that violent
youths are much more involved in criminal activities than non-violent youth: This
includes, for example, minor shoplifting (19.8% vs. 5.5%), burglary of a car or house
15.9 10.5
18.4
46.6
34.1 33.0
0.0
10.0
20.0
30.0
40.0
50.0
60.0
alcohol marijuana hard drugs
no yes

Page 73
(3.4% vs. 0.8%) or drug dealing (9.9% vs. 1.3%). Overall, the overrepresentation of
violent youths is the greatest for the most serious non-violent delinquent behaviors such
as burglary, vehicle theft, drug dealing and sexual abuse.
Figure 16 Minor Delinquency and Deviance amongst Violent and Non-Violent Youths
Figure 17 Serious Delinquency amongst Violent and Non-Violent Youths
Overall, the data suggest that young people who engage in violence usually also
show a pattern of related problematic behaviors. This includes a higher likelihood of
consuming alcohol, cannabis, and hard drugs; a higher likelihood of behaviors that
indicate conflict with authorities such as running away from home or playing truant at
school; a higher likelihood of delinquent acts such as not paying fares on public transport
or cheating at school; and a much increased probability of being engaged in serious acts
of crime such as drug dealing, burglary, or vehicle theft. This finding suggests that
serious violence is primarily one manifestation of a general tendency towards serious
criminal behavior. Any policy against violence should therefore be strongly embedded in
38.2
68.76
34.2
46.7
19.7 23.2
5.0 5.9
59.9
80.45
62.1 57.6
42.9 49.9
30.1 21.5
-‐5
5
15
25
35
45
55
65
75
85
truancy cheating in school
driving w/o licence
illegal downl.
fare dodging grafitti vandalism run away from home
no yes
4.0 2.4
5.5
0.7 0.7 0.8 1.3 0.3
12.3
7.3
19.8
5.1 5.9
3.4
9.9
2.8
0.0 2.0 4.0 6.0 8.0 10.0 12.0 14.0 16.0 18.0 20.0
stealing at school
steal at home
shoplifting less than 800
shoplifting more than
800
vehicle theft
car/house burglary
drug dealing
sexual abuse
no yes

Page 74
a wider policy that aims to reduce adolescents’ consumption of alcohol and illegal drugs
and to control a range of problematic behaviors that range from school truancy and fare
dodging to serious criminal acts such as burglary and drug dealing.
5.4 Personality Characteristics
Psychological research shows conclusively that several individual characteristics are
associated with the likelihood of violent beahvior. This includes traits like being more
risk-seeking and impulsive, psychological disorders such as attention-deficit and
hyperactivity, and cognitive processes such as a tendency to perceive others’ behaviors as
threatening or to access aggressive cognitive scripts more easily (Eisner & Malti, 2014).
In this section we examine two individual characteristics, namely low self-control as a
broadband personality trait linked to a variety of delinquent behaviors, and high
perceived fighting abilities as a specific cognition that may increase the likelihood of
engaging in violence.
Self Control
During the last 20 years the concept of self-control has emerged as one of the
most relevant theoretical constructs for explaining crime, with a lack of self-control seen
as the main driving force behind crime and a range of analogous behaviors (Gottfredson
& Hirschi, 1990). Self control is composed of several sub-dimensions: Low self control
youths tend to be ‘impulsive’ and ‘short-sighted’, they lack ‘diligence’ and ‘tenacity’ in
working towards goals and prefer simple tasks to complex ones, they are more
‘adventuresome’, ‘active’, and ‘risk taking’, more ‘self-centred’ and ‘insensitive’ to others’
problems, and they have a more volatile temperament and little tolerance for frustration
(Gottfredson & Hirschi, 1990; Grasmick, Tittle, Bursik, & Arneklev, 1993). In general,
the empirical support for the connection between self control and crime is strong (Pratt
& Cullen, 2000). However, there is no agreement about the origins of differences in self-
control: Some researchers assume that low self-control originates in exposure to
inadequate parenting in the early years, while others assume that genetic and neurological
differences play an important role (Eisner & Malti, 2014).
To examine the link between self-control and violence in the m-proso survey we
included a validated instrument that comprises 24 items which assess different aspects of
self-control (Grasmick et al., 1993; Longshore, Turner, & Stein, 1996). Although several
sub-dimensions can be distinguished (Delisi, Hochstetler, & Murphy, 2003; Vazsonyi,
Wittekind, Belliston, & Loh, 2004) we used an overall measure based on all 24 items
(Cronbach's α = .87). The mean score for each respondent was first calculated and then

Page 75
four equally sized groups (quartiles) were formed. Interestingly, and in contrast to
findings with the same instrument in other societies, overall levels of self-control hardly
differed between male and female respondents in Montevideo (Mmales = 2.51, Mfemales =
2.40, F (1,2173) = 5.12, p = .024).
Figure 18 shows highly significant differences in violence across the levels of self
control. Youths with the lowest level of self control were four times more likely to
perpetrate acts of violence than individuals in the highest self control category. It is also
clear that the relationship is valid for both males and females: while almost 42.6% of low
self control males have been involved in a violent behavior, less than 13.1% of high self
control males have been so; among females, 21.8% of the low self control group have
been involved in violence compared to only 4.0% of the high self control group. Note
that at every level of self control females report less violence than males. This findings
suggests that differences in self-control cannot account for the observed sex differences
in violence, since females are significantly less likely to engage in physical aggression even
if they are comparable on levels of self-control.
Overall, the present findings show that low self-control is a personality
characteristic which is stongly implicated in differences of aggressive behaviors, but also
a broad range of non-aggressive problem behaviors. It has therefore been argued that
one core goal of prevention policies should be the promotion of self-control throughout
the development of children and adolescents (Moffitt et al. 2011).
Figure 18 Self-reported Violence by Levels of Self Control
Note: All respondents: χ2 (3) = 131.49, p <.01; Males: χ2 (3) = 73.89, p <.01); Females: χ2 (3) = 54.41, p <.01.
13.1 16.9
22.2
42.6
4.0 6.7 8.5
21.8
8.2 11.5
15.5
32.7
0.0
5.0
10.0
15.0
20.0
25.0
30.0
35.0
40.0
45.0
very high high low very low
males females total

Page 76
Perceived Fighting Ability
Physical violence often takes the form of fights that result from conflicts over
atractive goods, reputation, or power (Eisner, 2009). Similarly, robbery can be seen as the
strategic use of superior physical force to steal valuables from another individual. Such
behaviors are not an attractive option for individual who think they are feeble and
unskilled fighters who would be unlikely to win against an opponent. In contrast, we may
expect that individuals who perveive a high fighting ability are more likely to engage in
physical violence (Sell, Cosmides, Tooby, Sznycer, von Rueden & Gurven, 2009).
In the m-proso study we assessed this idea by measuring adolescents’ perception of
their fighting ability. We asked them to estimate their fighting ability on a scale from 0 to
100: A score of zero meant that out of one hundred males they would beat no one in a
fight; if they chose a score of 100 they indicated that they expected to beat all of them.
Female respondents were asked the same question for female opponents. Responses
were divided into four equally sized groups (quartiles) from very low (lowest 25%) to
very high (highest 25%). Then the proportion of adolescents engaged in physical
violence in each group was assessed.
Figure 19 shows that youth that thought they would win a fight against most other
students were four times more likely to have committed violent acts. We observe a
similar pattern for male and female adolescents, although differences are larger in males
than in females. Overall, these findings suggest that young men and women are more
likely to use violence if they believe to have a high fighting ability, i.e. to be likely to win
if they engage in a physical confrontation with a same-sex opponent.
Figure 19 Self-reported Violence by Levels of Perceived Fighting Abilities
Note: All respondents: χ2(3) = 90.01, p <.001; Males: χ2(3) = 32.42, p <.001; Females: χ2(3) = 24.34, p <.001).
5.5 Morality and Police Legitimacy
How wrong is it to lie? How wrong is it to ride on a bus without paying the fare?
How important is it to comply with the law and the police? Does the law and police only
13.7
20.7 21.5
34.1
4.7
11.5 12.0 17.5
7.5
16.1 17.8
29.0
0.0
20.0
40.0
very low low high very high
males females

Page 77
help the powerful while the poor must help themselves? Questions such as these relate
to the moral bases of social order, the beliefs that make it meaningful for people to
cooperate within a social institution such as a school or a state rather than to steal and
fight. Such moral beliefs are to some extent related to personality characteristics such as
impulsivity and self-centredness, but they also reflect the way in which a person relates to
the normative order of a society. Neglected as a research topic for many decades, the
question of how morality influences delinquent and violent behavior has come to the
centre of criminological thinking over the past 10 years or so. In this section we examine
two aspects: the moral beliefs that a person has and the extent to which a person believes
that the state is legitimate and that laws should be obeyed.
Morality
In recent years morality or moral beliefs have been increasingly integrated in
criminological explanations of crime and violence (Wikström, 2007). The central idea is
that individuals comply with the law not just because they fear the negative consequences
of breaking it, but because they believe that crimes are morally ‘wrong’ and that breaking
the law contradicts who they want to be. Recent research has shown that individuals with
strong moral beliefs are less likely to get involved in deviant and violent behaviour, and
that they are less responsive to instrumental considerations or costs of punishment since
these incentives are only relevant for those with weak moral commitment (Bachman,
Paternoster, & Ward, 1992; Paternoster & Simpson, 2009; Tittle, Antonaccio,
Botchkovar, & Kranidioti, 2010; Wikstrom, Tseloni, & Karlis, 2011).
Fourteen items in the questionnaire asked youths about their opinion regarding the
wrongfulness of deviant and delinquent behaviors (e.g. how wrong do you think it is to
‘lie to adults’, ‘come back to home latter than it was agreed’, ‘steal money’, ‘assault another person’,
etc.).36 Young people who believe that all or most things are morally ‘wrong’ or ‘very
wrong’ can be said to have a high morality. Young people who believe that breaking a
rule is right are assumed to have a low morality. The items were combined into an overall
scale (Cronbach's α = .89) and then the scores were split into four groups (quartiles)
from very low to very high morality. Figure 20 shows large and statistically significant
differences in violent behaviour between young people with different levels of morality:
31.2% of the youths that have weaker moral beliefs have been involved in at least one
violent behaviour last year. In contrast, only 7.5% of youths with strong moral values
were involved in violent behaviour. We can see a similar pattern for male and female
respondents: 42.3% of males with weak moral beliefs were involved in violence 36 This instrument is based on an adaptation of Rolf Loeber’s construct from the Pittsburgh Youth Study by Wikström’s and colleagues (Wikström et al., 2012).

Page 78
compared with 12% of males with strong moral beliefs; similarly, 18% of females with
weak moral beliefs were involved in violence compared with only a 4.2% of those
females with strong moral beliefs.37
Figure 20 Self-reported Violence by Levels of Morality
Note: All respondents: χ2(3) = 136.12, p <.01; Males: χ2(3) = 91.64, p <.01; Females: χ2(3) = 91.64, p <.01.
Police Legitimacy
The perceived legitimacy of institutions is another causal mechanism that has been
recently used to explain crime and violence. The assumption is that individuals comply
with the law not because they fear punishment or expect some reward, but rather
because it is ‘what should be done’ or ‘the right thing to do’: they perceive the law and
the ruling authorities as legitimate and therefore, entitled to be accepted and obeyed
(Tyler 1990; Tyler & Fagan, 2006; Tyler, 2008). In situations where the authorities lack
legitimacy, individuals become cynical about complying with the law as they assume that
deviance and violence are inevitable owing to the weakness and irrelevance of
conventional values, social control agencies and more generally institutions (Sampson &
Bartusch, 1998). In the present study we included twelve items to measure police
legitimacy. Youths were asked how much they agree with statements such as ‘Police treats
people respectfully’, ‘One can trust in police work’, ‘police applies law equally’, etc. For the analyses
a mean score of the twelve items was first computed (Cronbach's α = .82), and then the
scale was subdivided into quartiles of respondents with similar levels of police legitimacy.
Figure 21 shows that differences in perception of police legitimacy are strongly
associated with variation in levels of self-reported violence. Youths with very low police
37 Additionally, the survey also included fourteen measures of moral justification and neutralization of violence. This global index of moral justifications showed also strong and statistically significant differences in terms of violence in total population of youths and across sexes (results not shown).
42.3
21.9
12.7 12.0
18.0
10.9 6.6
4.2
31.2
16.6
9.4 7.5
0.0
5.0
10.0
15.0
20.0
25.0
30.0
35.0
40.0
45.0
very low low high very high
males females total

Page 79
legitimacy are more than three times more likely to be involved in violent behavior than
youths with very high perception of police legitimacy. Similar differences can be
observed for male and female adolescents. Males with very low perception of police
legitimacy are almost three times more likely to be involved in violent behavior as
compared to males with very low police legitimacy; amongst female youths the pattern is
slightly stronger. Those with the lowest levels in police legtimacy are almost four times
more likely to be involved in violent behavior in relation to those with higher levels of
police legitimacy.
Figure 21 Self-reported Violence by Levels of Police Legitimacy
Note: All respondents: χ2(3) = 64.62, p <.001; Males: χ2(3) = 39.59, p <.001; Females: χ2(3) = 24.16, p <.001.
5.6 Parenting and Parental Conflict
Parenting is probably the most researched aspect of family functioning associated
with the development of antisocial tendencies. A recent review of the literature suggests
that poor parental monitoring, harsh/hostile parenting, parental neglect, lack of
emotional support, chaotic discipline, and excessive emphasis on harsh discipline are
among the parenting behaviors that are most consistently associated with child and
adolescent aggressive behavior (Eisner & Malti, 2014).
In the m-proso study we included 16 questions referring to parenting styles. They
measure five sub-dimensions: Positive parenting (e.g. “your parents give you rewards when you
do something well”) (Cronbach's α = .66), parental involvement (e.g. “when you are sad your
parents hug you and make you feel better”) (Cronbach's α = .75), authoritarianism (“your parents
are very strict when you do not do exactly what they say”) (Cronbach's α = .63), poor supervision
(“when you go out you got to tell your parents at what time you will be back”) (Cronbach's α = .67),
and erratic parenting (“you persuade your parents not to punish you”) (Cronbach's α = .62).
35.1
24.2 19.7
12.6 16.4
7.8 9.8
4.3
26.0
15.8 14.6
8.1
0.0
10.0
20.0
30.0
40.0
very low low high very high
males females total

Page 80
Table 17 summarizes the results. It shows that except for authoritarian parenting
all parenting sub-dimensions are associated with differences in violent behavior. High
positive parenting and parental involvement are associated with less violence, but the
association is weak and differences are statistically non significant for youth males. Erratic
parenting is associated with more violent behavior, but differences are statistically non
significant among youth females. The only parenting variable that was significantly
associated with violent offending for both male and female respondents was lacking
parental supervision. Amongst adolescents whose parents score very high in monitoring
the behavior of their children only 9.9% had committed at least one violent act in the
past year. Amongst those that were poorly supervised the rate was 22.3%.
Overall, the results confirm that both positive aspects of parenting such as
involvement or warmth and negative ones such as harsh parenting or parents’ violent
behavior are associated with youth violence. However, the findings also suggest that at
the age of 15 years the association between parenting and aggressive behavior is relatively
small (Eisner & Malti, 2014; Farrington, 1998). Moreover, one needs to bear in mind that
various aspects of parenting such as joint activities of the child and the parent or parents
not knowing what their child is doing are influenced by children's own behavior. One
should therefore be cautious about drawing conclusions about causal effects of parenting
on child behavior from the findings presented here.

Page 81
Table 17 Self-Reported Violence by Levels of Parenting Practices
Criterion Value % self report
violence Significant Differences
Positive Parenting Lowest 21.9% χ2Total = 17.83, p < .001
χ2 Males = n.s.
χ2 Females = 12.17, p < .05
2 14.9%
3 13.3%
Highest 15.7%
Parental Involvement Lowest 22.7% χ2Total = 33.92, p < .001
χ2 Males = n.s.
χ2 Females = 18.10, p < .001
2 17.0%
3 12.7%
Highest 9.9%
Authoritanism Lowest 17.1% χ2Total = n.s.
χ2 Males = n.s.
χ2 Females = n.s.
2 15.1%
3 16.8%
Highest 17.0%
Supervision Lowest 22.3% χ2Total = 37.25, p < .001
χ2 Males = 7.99, p < .05
χ2 Females = 13.99, p < .05
2 16.7%
3 13.1%
Highest 9.9%
χ2Total = 9.96, p < .05
χ2 Males = 8.85, p < .05
n.s.
Erratic Parenting Lowest 12.0%
2 14.3%
3 17.0%
Highest 18.8%
Corporal Punishment
In the previous chapter we saw that about 28% of adolescents experienced
corporal punishment such as being slapped, having hair pulled, or being hit with an
object. Corporal punishment, and especially serious parental physical abuse, has variously
been found to be associated with higher levels of aggressive and antisocial behavior. We
therefore extend the previous analyses and examine whether exposure to corporal
punishment is related to youth violence in Montevideo. To examine this link we
subdivided adolescents into three groups, namely no (72% of adolescents), low (20%)
and high (8%) exposure to parental physical punishment.

Page 82
Figure 22 Self-reported Violence by Levels of Corporal Punishment, by Gender
Note: All respondents: χ2(2) = 12.89, p <.001; Females: χ2(2) = 19.50, p <.001.
For all respondents combined the results suggest a consistent and linear
relationship between exposure to corporal punishment and own violent behavior.
Differences emerge when the analyses are conducted separately for boys and girls. For
boys, there is no statistically significant association between corporal punishment and
own violence, while the data suggest a highly significant association for girls. Only 8% of
girls who are never physically punished report own involvement in physical aggression.
In contrast, among those who experience severe physical punishment, 23% were
involved in aggressive acts. In conjunction with the findings shown above this may
suggest that girls’ aggressive behavior is more strongly correlated with a range of
parenting characteristics than boys’ behavior.
Parental Conflict
Three items measured the extent to which parents had conflicts among each other
(insult each other, don’t talk to each other, have fights). There exist big differences in the
extent to which young people in Montevideo experience parental conflict. The majority
perceive that their parents live in a harmonious relationship. However, 8% said that their
parents ‘often or always’ insult each other; similarly, 12% of adolescents said that their
parents often have fights and 11% said that their parents often or always no longer speak
to each other. All three items are strongly correlated. We therefore constructed an overall
measure of parental conflict, which was subdivided into four equally sized groups
(quartiles).
Figure 23 shows the percentage of adolescents involved in serious violence by
levels of parental conflict. It suggests that for male and female young people in
Montevideo the probability of violence is the greater, the more the family environment is
characterized by frequent conflict amongst their parents.
22.2
8.1
15.0
27.4
10.0
19.2
25.9 23.2 24.5
0.0
5.0
10.0
15.0
20.0
25.0
30.0
35.0
40.0
males females total
no low high

Page 83
Figure 23 Self-Reported Violence by Level of Parental Conflict
Note: All respondents: χ2 (3) = 28.29, p < .001; Males: χ2 (3) = 20.75, p < .001; Females: χ2 (3) = 23.05, p < .001.
5.7 Group Membership, Leisure Activities and Financial Resources
Research in the United States and Europe shows that involvement in youth
violence is related to differences in daily routine activities. More specifically, young
people who have an outgoing life-style, spend a lot of time in bars or on the streets, have
friends who engage in substance use or delinquency, or who are members of a delinquent
gang, have been found to be more likely to engage in violence than others. In this section
we analyze three pertinent topics: First we analyze how membership in a delinquent
group is associated with youths’ own violence. Second we examine whether youths’
leisure activities play a role in the occurrence of violent behavior among teenagers.
Finally, we study if the amount of pocket money that a young person has for leisure-time
activities is related to the likelihood of violence.
Group Membership
Adolescent delinquency and violence are mainly group phenomena. Thus, we
expect that being a member of a delinquent group reinforces antisocial tendencies and
makes it more likely that a young person becomes involved in fights or robberies. Of
course, not all young people are equally likely to join a deviant peer group. Rather, young
people with prior antisocial tendencies and risk factors will be much more attracted by
groups who have similar interests and personality characteristics, and with whom they
may engage in substance use, vandalism, or violence (Dishion & Piehler, 2009; Hirschi,
1969).
13% 14% 16%
24%
19% 21%
23%
35%
5% 7% 9%
16%
0% 5% 10% 15% 20% 25% 30% 35% 40%
Q1 (very low) Q2 (low) Q3 (high) Q4 (very high)
% Violent
Level of Parental Con2lict
Total
Males
Females

Page 84
In two sections of the questionnaire adolescents were asked not about their own
perpetration of violent acts, but about the extent to which they were part of a group of
people that committed violent acts. This is important information because throughout
adolescence a very large proportion of youth violence happens within group contexts,
such as fights between groups of young men, robbery attacks by a group of young men
on a single individual, or a member of a group threatening an isolated individual,
benefiting from the added superiority of having friends with a high fighting ability in
their support. Deviant peer groups are also the place where youths learn delinquent
norms, find deviant role models suitable for imitation, and experience admiration for
breaking the moral norms of adults (Akers, 2009; Akers & Warr, 2003; Eisner & Malti,
2014; Pratt et al., 2010).
Table 18 shows the proportion of male and female respondents who reported that
they participated in groups of adolescents who perpetrated violent activities. Criteria
measured in the survey include whether the respondent meets with friends to fight
against other adolescents, and whether he/she is a member of a group that threats and
assaults other people, robs other people, extorts protection money, or carries weapons.
The findings suggest that a considerable minority of adolescents, namely 18.8%, is
involved in youth group activities that include violent acts. Boys (26.1%) are much more
likely to take part in such groups than girls (11.7%). These sex differences of
involvement in group violence are particularly high for extortion (male 4.2% versus
female 0.6%) and meeting friends to fight against other adolescents (male 18.8% versus
female 4.9%).
Table 18 Prevalence of Participation in Group Violence, by Gender
Activity
M-F Difference
Total Males Females sig Meet with friends to fight against other adolescents
11.6% 18.8% 4.9% p < .001
Be a member of a group, which
… threatens and assaults other people 8.7% 11.9% 5.7% p < .001 … robs other people 3.4% 5.0% 1.8% p < .001 … extorts protection money 2.4% 4.2% 0.6% p < .001 … carries weapons 6.2% 9.1% 3.5% p < .001 Any group violence 18.8% 26.1% 11.7% p < .001
Figure 24 shows that involvement in violence differs greatly between adolescents
who belong to to a violent gang and those who don’t. We examined the level of reported

Page 85
violent acts during the past 12 months comparing those who were in a group that
perpetrates violence and those that were in no such group. Findings show that the
probability of own involvement in violence is much higher amongst those who are part
of a violent group. For example, amongst male non-members of violent groups the
likelihood of own violence was 17%, while is was 55% amongst those associated with a
violent gang. There is another way of looking at the problem: Those 18.8% of
adolescents who spend their time in a group of peers whose activities include violence
were responsible for fully two thirds of all serious violent acts reported in the study.
We find a similar association between gang membership and violence amongst
male and female respondents, although statistical tests show that the association is
stronger amongst males han amongst females. This finding confirms results reported in
section 5.1, namely that adolescent male violence is more strongly a group phenomenon
than female violence.
Figure 24 Self-reported Violence by Membership in a Delinquent Group
Note: All respondents: χ2(2) = 229.86, p <.001; Males: χ2(2) = 141.15, p <.001; Females: χ2(2) = 37.84, p <.001.
These results are relevant in terms of intervention and prevention measures. If
serious violence has a an important group dimension, measures that focus excessively on
the individual and neglects this collective dimension run the risk of falling short and
lacking efficacy.
13%
48%
17%
55%
10%
30%
0%
10%
20%
30%
40%
50%
60%
No Yes
% Own Violence
In a Group with Violent Activities
Total
Males
Females

Page 86
Leisure Activities
Activities during leisure time are another dimension to understand how violent
behavior is embedded in youth lifestyle. Undoubtedly personality characteristics such as
extroversion and sociability influence the leisure activities that young people prefer. But
leisure activities are also linked to the situational component of violence: the kinds of
situations and activities where violence is most likely to erupt. Generally, the hypothesis
is that young people who go out often and expose themselves to environments that are
crime-prone, will be more likely to be involved in violence.
To analyze the relationship between leisure activities and violence we used the
same series of fourteen questions used in the victimization chapter but instead of making
a global index we took each item separately and analyzed the differences in violent
behavior between two groups: youths that never did that specific leisure activity and
those that did it at least once last year. In Figure 25 we show all the leisure activities that
revealed statistical significant differences in youths violent behavior last year. The leisure
activities items that showed no significant differences were those that were done either in
the afternoon or involved less harmful places such as gathering with friends in
restaurants or McDonalds. Additionally, those leisure activities that involved deviant or
delinquent behavior showed the largest differences: for example, youths that ‘meet with
friends to smoke tobacco/marijuana or drink alcohol’, that ‘gather to do forbidden things for fun’, or
‘encounter to steal something from a store’, are three times more likely to be involved in violent
behavior than those youths that have not been involved in those activities. Although
other leisure activities not so directly associated to deviance (e.g. ‘go in the night to a party or
a pub with friends’, or ‘go on a date’) show relevant violence differences between youths, they
nevertheless tend to be smaller.
These results confirm the notion that routines and events that involve the presence
of youths in risky environments increase their chances of being involved in violent
incidents. Additionally, and in more indirect way, the connection between violence and
risky leisure activities might be associated both with: a) the presence of non conformist
peer groups were some of these activities are more appreciated and valued, and even
define membership and identity; b) the lack of adequate family attachment and
supervision which allow or do not hinder the development of this risky pattern of youths
routines.

Page 87
Figure 25 Self-reported Violence by Selected Leisure Time Activities
Financial Resources
Because members of lower social classes are overrepresented in prisons and
juvenile centers, there is a widespread belief that youth violence is associated with
material deprivation, poverty and frustrated aspirations. In the present study we directly
assessed this strain hypothesis (Agnew, 1992): We asked the participants to indicate how
much money they have available each month that they don’t use to pay for food, books,
or other school costs. The idea was that a lack of personal financial resources indicates
deprivation and a lack of access to activities and goods that are valued highly among
adolescents. We included two items, namely i) what monthly allowance they received
from parents; ii) how much money they obtained from other sources. The information
was used to construct a global measure of financial resources, which formed the basis to
divide respondents in quartiles of youths with similar levels of ‘pocket money’.
Figure 26 shows the relationship between involvement in violence and disposable
money. The findings contradict the deprivation hypothesis: Youths with the least
financial resources have not the highest, but the lowest involvement in violent acts. In
contrast, youths that have most pocket money (i.e. 1000 pesos or more) are two times
more likely to be involved in violent behavior than youths that have the lowest level of
pocket money. These differences are statistically robust for the whole sample, but also
for girls and boys separately.
12.1 13.3 9.8 10.0 11.9 10.2 12.0 10.0
14.5 17.6 17.6 17.6
20.4 22.0 20.5
31.5 30.5
39.1
0.0 5.0 10.0 15.0 20.0 25.0 30.0 35.0 40.0 45.0 no yes

Page 88
Figure 26 Self-reported Violence by Available Financial Resources
Note: All respondents: χ2(3) = 32.84, p <.001; Males: χ2(3) = 16.32, p <.001; Females: χ2(3) = 9.18, p <.05.
Similar results have been obtained in other studies (Eisner, Manzoni, & Ribeaud,
2000). They make it unlikely that absolute or relative material deprivation plays an
important role in explanations of violence. Rather, previous studies have interpreted the
association between financial resources and violence in two ways: a situational argument
holds that adolescents with more money find it easier to go to risky environments, buy
alcohol and drugs, and spend time without parental supervision, all of which increase the
chances of being involved in violent incidents; a complementary family bond argument
holds that parents with a weak emotional attachment to their children may be more likely
to give them more pocket money rather than investing time and emotions in joint family
activities (Eisner, Manzoni, & Ribeaud, 2000).
5.8 Media Consumption
In the last decades there has been a strong increase in youths’ exposure to violence
through movies, video games, and internet. Yet, despite an extensive body of empirical
studies there is an ongoing debate about the nature of the relationship between media
and youth violence.
Many studies argue that the consumption of aggressive media contents has causal
effects on later aggressive behavior (Anderson, Gentile, & Buckley, 2007; Funk, Baldacci,
Pasold, & Baumgardner, 2004; Hopf, Huber, & Weib, 2008; Huesmann & Taylor, 2006).
Theoretically, these studies are commonly based on a social learning model, which assumes
that children and adolescents who are exposed to violent media contents internalize
violent scripts and models which increase the likelihood of desensitization, imitation and
violent reaction in real life scenarios (Ferguson, 2007). In contrast, other scholars have
questioned the social learning model and doubt whether there is a causal relationship
18.4 20.2 21.2
31.8
6.8 7.3 10.4
14.1 12.3 13.3
15.2
24.3
0.0
5.0
10.0
15.0
20.0
25.0
30.0
35.0
40.0
very low (0 pesos)
low (1 -‐ 400 pesos)
high (401 -‐ 1000 pesos)
very high (1000 pesos or more)
males females total

Page 89
between exposure to violent media contents and violence, claiming that results are weak
or inconsistent, that measures lack validity, and that most studies lack adequate controls
of cofounders of violence and media such as personality traits, family bonds, etc.
(Ferguson & Kilburn, 2009; Savage, 2004). On the other hand, there is the catharsis model
which argues for an inverse relationship between both phenomena. The basic idea is that
violence has other causal origins (mainly biological ones) and exposure to violent media
help to release or discharge violent motivations, and ultimately to behave less violently
(Ferguson, 2007). Complementarily, is also at play the time displacement hypothesis, that is,
time spent with violent media is not spent in interactions with other youths that might
lead to violent conflicts (Espinosa & Clemente, 2013; Mössle, Kleimann & Rehbein,
2007). These alternative models have also been criticized, particularly the catharsis model
which not only has weak empirical support but also there are contradictory results from
several media studies (Gentile, 2013). Finally, other studies have argued that the
connection between both phenomena is spurious and is due to a third factor, namely
personality traits, sex, socio economic status, peer group pressure, etc. (Christakis,
Zimmerman, DiGiuseppe, & McCarty, 2004; Ferguson, 2011).
As part of the present survey youths in Montevideo were asked, for the first time
in Uruguay, about their habits of consuming violent and pornographic media contents.
For eight different types of media consumption, including movies, web/internet, cellular
phones and video games, they were asked how often they engage in these behaviors.
Table 19 shows the percentage of young people who consume either violent or
pornographic contents ‘at least several times a month’.
Table 19 Consumption of Violent and Pornographic Media Contents, at Least Monthly
Type of Media Consumption Total Male Female a) Violent contents Seek violent contents in the internet 45.6% 58.2% 33.7% Play violent (above age 18) computer games 44.1% 68.5% 20.8% Watch horror movies for adults 43.9% 52.6% 35.6% Watch/share violent contents on mobile telephones 6.7% 11.3% 2.3% Record violent scenes with your mobile telephone 3.8% 6.2% 1.5% b) Pornographic and other ‘adult’ contents Watch porno movies 13.2% 24.6% 2.5% Seek pornographic contents on the internet 13.6% 25.0% 2.7% Watch other movies for adults 12.5% 20.6% 4.6%

Page 90
The results show that about 45% of 15-year olds youths in Montevideo seek
violent contents on the internet, play violent computer games such as ‘Mortal Combat’
or ‘Call of Duty’, or watch horror movies that are restricted to viewers above age 18. A
smaller proportion of 6.7% of adolescents shares violent contents at least monthly on
their mobile telephones, and almost 4% admit to having taken video-clips with their
mobile telephone of somebody being beaten up. All behaviors are much more frequent
among male respondents than among females. For example, 69% of male but only 21%
of female adolescents play realistic violent computer games which are restricted to adults
above age 18.
Overall, lower proportions of adolescents admit to consuming pornographic
material. About 13% of adolescents admit to watching pornographic movies or
downloading pornographic material from the web at least a few times per month.
However, the breakdown by gender suggest very large sex differences. Young males are
about 10 times more likely to consume adult pornographic material than females.
In a next step we constructed a general measure of exposure to violent media
content with the five items that involved violent contents in movies, internet, cell phones
and video games (Cronbach's α = .81). We then divided respondents into four equally
sized groups with similar levels of problematic media consumption. Figure 27 shows a
strong association between exposure to aggressive media contents and the perpetration
of violent acts. Youths in the highest group are five times more likely to have acted
violently last year than youths that have the lowest levels of consumption of violent
contents. These statistical significant differences are also present for both sexes.
Figure 27 Self-reported Violence by Levels of Exposure to Violent Media Contents
Note: All respondents: χ2(3) = 148.02, p <.001; Males: χ2(3) = 56.57, p <.001; Females: χ2(3) = 41.70, p <.001.
10.5
16.2 19.3
36.4
4.8 7.7
18.5 18.4
6.1
11.0
19.0
32.2
0.0
5.0
10.0
15.0
20.0
25.0
30.0
35.0
40.0
lowest 2 3 highest
males females total

Page 91
These results confirm what has been observed in many similar surveys across the
world, namely that the consumption of adult, especially violent media contents is
strongly associated with own violence behavior even when a range of personality
characteristics such as self control are taken into account (Anderson, 2004). They add to
the evidence which suggests that it is important to better understand the nature of this
statistical association, which would require longitudinal data on the dynamic relationship
between the consumption of adult media contents and antisocial behavior.
5.9 School Environment and School-‐related Individual Factors
The school context plays an important role in explanations of youth delinquent
and violent behavior. Some authors have argued that negative experiences and feelings of
rejection in the school can lead to frustration, stress, distancing with teachers and other
students, and finally to violent and delinquent behaviors (Agnew, 1992; Cohen, 1955).
Social control theory, in contrast, claims that weak social bonds, particularly with the
school are important to understand delinquency and deviance (Hirschi, 1969). One of the
key dimensions is attachment or emotional connection with other students, teachers and
the institution, which is reflected in youths’ positive attitude and interest for others
opinions, his/her acceptance of school authority, and also in his/her academic
performance. Another dimension is commitment or youths’ valuation or assessment of
educative conventional goals which in turn is reflected in youths beliefs about how useful
school is going to be for his/her future or if they like going to school or doing
homework. Some studies have found a significant relationship between crime and violent
behavior and student’s academic achievement, school attachment and school
commitment (Brookmeyer, Fanti, & Henrich, 2006; R. Felson & Staff, 2006; Hoffmann,
Erickson, & Spence, 2013; Junger-Tas, 1992; Resnick, Ireland, & Borowsky, 2004;
Ribeaud & Eisner, 2010; Rosenbaum & Lasley, 1990).
However the influence of the school on crime and violence has been interpreted in
different ways (Eisner & Ribeaud, 2003; Ribeaud & Eisner, 2008). One possibility is that
problems at school have a causal influence on crime and violence. A second possibility is
that both problems at school and delinquency result from a common third factor. This
could be personality traits, family problems, or being a member of a criminal gang, etc.
Finally, there may also exist bidirectional causal relationships between both phenomena
whereby school problems and delinquency mutually reinforce each other. Some studies
that have investigated such bi-directional relationships found more support for the idea
that school problems lead to deviance than the other way round (Hoffmann et al., 2013;
Shoemaker, 2009).

Page 92
We included 24 questions that touched upon many of these dimensions and built
several indexes that included both individual and school/climate related aspects
(Gottfredson, 2001) which focused on six dimensions: school commitment (e.g. ‘I like to
go to school’) (Cronbach's α = .45); relationship to teachers (e.g. ‘I have a good relationship with
my teacher’) (Cronbach's α = .65); relationship to peers (e.g. ‘Other students are nice with me’)
(Cronbach's α = .72); academic difficulty (e.g. ‘I have bad grades in school’) (Cronbach's α =
.64); future benefits of learning (e.g. ‘It is important for me that I do well in school’)
(Cronbach's α = .69); and perception of legitimacy of the school (e.g. ‘In my school or
students are treated in a fair way’) (Cronbach's α = .75).
Table 20 shows the results. It confirms findings from other studies, namely that
various school-related characteristics are related to youths involvement in violent
behavior. We can see that all the indexes reveal statistically significant differences in
youth’s violent behavior both at a general level and in many cases also across genders.
Yet, some dimensions such as relationship to teachers, relationship to peers as well as future
benefits of learning show a weaker link to violence since they have less clear patterns, show
smaller differences, and reveal statistically non-significant differences among female
students.
It is worth noticing that together with traditional social bonding measures we also
included a measure of school legitimacy. School legitimacy was assessed with a measure
developed for this study that includes 10 items (e.g. ‘In my school students are treated
fairly’, ‘teachers and school authorities should be obeyed even if one disagrees’, ‘In my
school punishments are delivered in a fair way’) (Cronbach's α = .75). The findings
confirms that youth’s crime and violence is associated with their perception of
institutions and how they exert authority, and the importance including measures of
legitimacy of institutions different from the traditional and most used ones such focused
on the police.

Page 93
Table 20 Violence Rates by School Related Variables
5.10 Conclusions
First, we find that amongst young people in Montevideo the active perpetration of
violence is highly concentrated. The vast majority of young people, namely 84%, did not
commit any acts of violence in the past year. 16% had committed at least one act of
violence. However, for most of these young people this was a single event. However, a
Criterion Value % self report
violence
Significant Differences
School
Committment
Lowest 22.3% χ2Total = 41.15, p < .001
χ2Male = 20.58, p < .001
χ2Female = 16.21, p < .001
2 15.4%
3 12.5%
Highest 8.9%
Relationship to
Teachers
Lowest 21.0% χ2Total = 24.80, p < .001
χ2Male = 25.59, p < .001
χ2Female = n.s.
2 12.5%
Highest 13.8%
Relationship to
Peers
Lowest 20.9% χ2Total = 13.47, p < .001
χ2Male = 9.86, p < .05
χ2Female = n.s.
2 14.2%
3 14.1%
Highest 15.6%
Academic
Difficulties
Lowest 12.4% χ2Total = 30.51, p < .001
χ2Male = 23.39, p < .001
χ2Female = 10.92, p < .05
2 16.3%
3 18.7%
Highest 24.5%
Future Benefits of
Learning
Lowest 19.6% χ2Total = 18.04, p < .001
χ2Male = 13.48, p < .001
χ2Female = n.s.
3 12.8%
Highest 12.6%
School Legitimacy Lowest 25.3% χ2Total = 49.59, p < .001
χ2Male = 22.69, p < .001
χ2Female = 27.91, p < .001
2 16.6%
3 11%
Highest 11.5%

Page 94
small minority of adolescents was responsible for the vast majority of violent acts. More
specifically, the self-report data suggest that just 2% of all young people who participated
in the survey were responsible for about 60% of all violent incidents. This finding has
important implications for prevention policy. In particular, it suggests that for this age
group a significant of violence reduction efforts should specifically target those with the
highest risk of aggressive problem behavior.
Second, we found that violent behavior amongst young people is strongly
associated with a range of non-violent problem behaviors. These behaviors include non-
delinquent manifestations of authority conflicts such as running away from home and
playing truant, minor property offenses such as shoplifting, fare dodging, of theft at
home and at school, serious property offenses such as vehicle theft and burglary, damage
of property such as spraying graffiti and vandalism, and drug-related offenses including
drug dealing. Moreover, violent youth are significantly more likely to consume
substances at the age of 15. Notably, both cannabis consumption and alcohol
consumption were strongly associated with levels of violence. Taken together these
findings imply that violence is best seen as part of a broader syndrome of antisocial and
delinquent behavior. One implication of this finding for prevention strategies is that they
should focus on the full range of problem behaviours.
Third, we found little evidence in support of the idea that violence and aggression
is concentrated amongst adolescents from disadvantaged backgrounds. More specifically,
we found no evidence in the survey data that young people whose parents are less
educated or young people who grow up in less prosperous neighbourhoods are generally
more violent. We believe that this adds to the international evidence that social class is
generally a poor predictor of antisocial behavior during childhood and adolescence, and
that prevention and intervention activities should focus on those individual, family,
school and life-style variables that are strongly associated with the risk of violent
behavior. It important to add here that adolescents with high levels of problem behavior
are much more likely to fail in school, to have low academic marks, to be unemployed
and to work in unqualified and insecure positions. But we believe that these outcomes
are at least as much consequences of poor behavior regulation as they are predictors of
antisocial behavior.
Fourth, and consistent with international findings, the results suggest that a range
of individual characteristics are strongly associated with the probability of involvement in
violence. Three of the most important correlates were a lack of self-control, a lack of
constructive and prosocial problem-solving abilities, and a low morality in the sense of
endorsing delinquent norms, and cynical attitude towards the law. This has important
implications for prevention strategies. More specifically, they suggest that prevention

Page 95
strategies are more likely to be successful if they try to promote self-control, social
adequate and cooperative problem solving, and moral beliefs that support respect for
others physical integrity and property.
Fifth, the findings for parenting-related covariates suggest that young people who
are involved in violence tend to experience less parental involvement and less parental
monitoring of their behavior. They also experience more corporal punishment and
parental conflict at home. Overall, this suggests that the provision of parenting skills
training and support for families with domestic violence should be an important element
of effective strategies who reduce youth violence.
Sixth, youth violence is strongly associated with a pattern of lifestyle characteristics.
Young people involved in delinquency and violence are more likely to hang out together
with other delinquent youth, they tend so spend a lot more time hanging out in public
places where they consume alcohol or drugs. For prevention policy these findings
suggest that interventions targeting high-risk adolescents in public spaces are a promising
strategy to reduce violence. This may include policing strategies aimed at crime hot spots.
Seventh, youth violence is strongly associated with the consumption of violent and
pornographic media contents. While the nature of this association remains debated in the
international literature, the findings of this study suggest that strategies aimed at
controlling access to violent media should be considered a meaningful option for
prevention strategies.
Finally, the results confirm that young people with aggressive tendencies differ
systematically from others as regards school-related characteristics. In particular, they are
more likely not to attend school, they have more difficulties at school, are less committed
to engage in school, have a poor relationship with teachers, and feel treated unfairly by
their teacher and school authorities. These findings are partly indicative of individual
characteristics of young people. However, they also suggest that preventive strategies that
promote a coherent classroom and school management are an important pillar of
successful prevention strategies.

Page 96
6 Bullying at School
While bullying at schools had long been considered a normal feature of school-
related behaviors, research conducted over the past three decades has increasingly
highlighted the ways in which bullying can seriously harm children and adolescents in
their psycho-social development. There is some disagreement about the exact definition
of bullying (Swearer, Espelage, Vaillancourt, & Hymel, 2010). However, it is usually
meant to describe a form of behavior that has three characteristics: repeated negative
behavior with the intention to harm and with power asymmetry, either physical or
psychological, between perpetrator and victim (Olweus, 1993; Olweus & Limber, 2010).
Bullying includes not only manifest and physical forms of aggression like hitting or
sexually harassing but also more subtle forms such as insulting, name-calling or ignoring
and excluding (Demaray, Malecki, Jenkins, & Westermann, 2012). At the same time,
bullying can be directly accomplished by the perpetrator when he/she hits or insults the
victim, but also indirectly or covertly by spreading rumors or ostracism (Olweus, 1993;
Rigby, 2012).
Bullying can have a serious negative impact on youths life. Victims of bullying are
more likely to experience health problems such as headache, stomach pains, sleeping
problems, bad temper, depression, low self-esteem, nervousness, tension, poor appetite
(Due et al., 2005; Ttofi & Farrington, 2008). There is also evidence that victims are more
likely to experience problems in school such as low academic achievement, absenteeism,
truancy, dropping out, etc. (Buhs, Ladd, & Herald, 2006; Olweus, 1993; Smith, Talamelli,
Cowie, Naylor, & Chauhan, 2004). Harmful outcomes are not limited to victims. Bullies
also are more likely to experience problems in school (Ma, Phelps, Lerner, & Lerner,
2009) and commit deviant and violent behaviors (Baldry & Farrington, 2000; Tonja R
Nansel, Overpeck, Haynie, Ruan, & Scheidt, 2003; Ttofi, Farrington, & Losel, 2012).
Given the complexity of the concept it is difficult to measure bullying in a reliable
way. There is the risk of underestimation if we only take into consideration direct and
physical forms of behaviors. But we can also overestimate the phenomenon if we don’t
distinguish playful conducts or aggressive behaviors that do not take place recurrently,
with intention to harm and as a result of power imbalance (Cornell & Cole, 2012).
However, power imbalance is usually not included in bullying measures due to the
difficulty of identifying clearly who is the more powerful party. Power differences might
be subtle and more a matter of popularity, self-confidence, verbal abilities, rather than
physical size/strength (Cornell & Cole, 2012; Rigby, 2012). Another problem is the

Page 97
different understanding that youths might have of a global term such as bullying and
how it can affect the prevalence rates, and particularly how it can undermine cross-
cultural comparisons where there are no clear equivalent terms (Ttofi, Farrington, &
Baldry, 2008). In order to cope with this variability, most studies have avoided general
terms and used self-report questionnaires focused on specific types of behaviors such
insulting, destroying properties, etc. (Benbenishty & Astor, 2012).
Following the z-proso study, the m-proso questionnaire included a modified
version of the Olweus Scale, which has been validated in several studies in Europe. In
short, students were presented with five types of of behaviors: to ignore and exclude
another adolescent, to insult or ridicule somebody, to hit, bite, or kick somebody, to steal
or damage another pupil’s belongings, and sexually harassing another pupil. Questions
relating to these experiences were asked twice, first whether the respondent had suffered
such experiences as a victim, and then whether the respondent had committed such acts.
Response options were presented on a six point scale that went from ‘never’ to ‘(almost)
daily’.
This chapter has two main parts. First we will describe the incidence of bullying
among youths in Montevideo, its sex differences, the overlap between victimization and
perpetration, and its relationship with the type of school, and with other problematic
behaviours. In the remain of the chapter we will focus on analysing the association
between bullying perpetration and victimization and risk factors referred to the family, to
the school, and to individual related variables such as personality traits, moral beliefs,
perception of legitimacy of the school institution, etc.
6.1 The Incidence of Bullying
We start the analysis by showing the percentage of youths in m-proso that were
involved in bullying as victims or perpetrators in the last 12 months. Results are shown
in Table 21. Most youths in the survey have not been victims of serious forms of bullying.
78% of youths reported they have never been physically attacked and 87.5% reported
they have never been sexually harassed. However, 38.1% of the students experienced
robbery or destruction of properties. What is more, when it comes to less serious types
of bullying, almost half of the students (46.3%) were ignored or excluded at least once in
the last year, and 61.9% were insulted. If we focus on youths that suffered bullying at
least once a month we see again that the most prevalent bullying victimization episodes
are ‘being ignored’ (12.9%), ‘being insulted’ (7.4%), and ‘having your properties stolen or
vandalized’ (5.4%). However, the less prevalent type of bullying is no longer sexual
harassment (3.6%) but physical attack (3.4%). Additionally, when it comes to generalized

Page 98
forms of school violence (at least once a week) except for insults, all other types of
bullying victimization affect less than 5% of youths surveyed. Table 21 also shows that
there is a fairly good convergence in the prevalence rates of bullying events in victims
and in perpetrators for the first three categories (being ignored, insulted and being
physically attacked). However, there are noteworthy differences in terms of
robbery/destruction of properties and sexual harassment. These differences might be
due to the fact that few students perpetrate most of robberies and sexual harassments;
that a significant number of perpetrators are from outside the school; or that either
perpetrators or victims have not responded honestly (Eisner et al., 2000). Finally we note
that all forms of bullying perpetration and victimization are strongly correlated amongst
each other. For example, adolescents who are being excluded and ignored are also much
more likely to experience verbal and physical aggression.
Table 21 Incidence of Bullying Victimization and Perpetration
Bullying victimization
Never 1-2 Times
3-10 Times
Once a Month
Once a Week
Almost Every Day
Ignored 53.7% 31.2% 7.7 3.3 1.7 2.4 Insulted 38.1% 37.8% 11.2 4.9 4.1 3.9 Physical attack 78.0% 15.8% 2.8 1.4 1.0 1.0 Steal/damage property 62.0% 26.1% 6.5 2.6 1.3 1.5 Sexual harassment 87.5% 6.5% 2.4 1.2 0.9 1.5
Bullying Perpetration
Never 1-2 Times
3-10 Times
Once a Month
Once a Week
Almost Every Day
Ignored 57.7% 31.2% 6.9 2.4 0.8 1.0 Insulted 40.3% 39.5% 12.1 3.6 2.5 1.9 Physical attack 76.8% 14.7% 4.8 1.8 1.2 0.8 Steal/damage property 76.3% 15.7% 4.3 1.8 0.8 1.0 Sexual harassment 95.8% 2.0% 0.5 0.6 0.5 0.7
In the following analyses we use an indicator of chronic bullying victimization and
perpetration that combines the five types of bullying into one dichotomous indicator. In
line with the research literature we operationalize chronic bullying as behavior or
victimizations that occur at least once a month for any subcategory (Furlong, Sharkey,
Felix, Tanigawa, & Greif-Green, 2010). Using this definition we find that almost 20% of
students were victims of regular bullying, and that 13% of adolescents admit to regularly

Page 99
bullying others (see Table 22). Like for violence in general these results suggest that
especially bullying perpetration is highly concentrated amongst a small minority of young
people, who are responsible for the vast majority of acts of bullying.
Table 22 Frequency of bullying victimization and perpetration with and without including categories ‘ignored’ and ‘insulted’
Victimization Perpetration
With ‘ignored’ and ‘insulted’
Without ‘ignored’ and ‘insulted’
With ‘ignored’ and ‘insulted’
Without ‘ignored’ and ‘insulted’
No 79.6% 90.1% 87% 93% Yes 20.4% 9.9% 13% 7%
Total 100 % 100 % 100 % 100 %
Sex Differences
Previous research suggests that males are more likely to be involved in bullying
both as perpetrators and victims than females (Baldry & Farrington, 2000; Frisén,
Jonsson, & Persson, 2007). However, differences are less clear when it comes to more
indirect and psychological types of bullying victimization (Nansel et al., 2001; Tapper &
Boulton, 2004), and some studies have found no gender differences in bullying
victimization more generally (Owusu, Hoag, Weatherby, & Kang, 2012).
The analysis of m-proso survey reveals few gender differences in bullying
victimization. Among students that suffered at least once one of the five types of
bullying victimization there are no statistical significant differences between male (20.9%)
and female students (19.9%). However, boys are more likely to experience physical
attacks (4.3% vs. 2.6%, (χ2 (1) = 4.81, p <.05) as well as theft and damage to their
property (7.7% vs. 3.3%, (c2 (1) = 20.07, p <.01).
In contrast, boys are much more likely than girls to be perpetrators of bullying
(17.8% vs. 8.3%, χ2 (1) = 43.39, p <.01). The overrepresentation of boys can be found
for all subtypes of bullying, including physical attack (5.6% vs. 2.1%, (χ2 (1) = 17.92, p
<.01), theft and damage of property (6% vs. 1.4%, (χ2 (1) = 31.88, p <.01), sexual
harassment (3.1% vs. 0.4%, (χ2 (1) = 24.20, p <.01), ignoring (5.3% vs. 3.3%, (χ2 (1) =
5.35, p <.05) or insulting (11.6% vs. 4.7%, (χ2 (1) = 34.56, p <.01).
The Overlap between Perpetration and Victimization
Bullying researchers have long noted that there is a considerable overlap between
bullying perpetration and victimization, meaning that bullying perpetrators are much
more likely to also become victims of bullying and vice versa. This pattern is also evident

Page 100
in Montevideo. Almost half of the chronic bullying perpetrators (48.2%) reported that
they were also victims of chronic bullying. In contrast, only 16.2% of the non-bullies
were victims. This means that the likelihood of victimization amongst bullies was almost
5 times higher than amongst non-bullies (OR = 4.8, p < .001). Different explanations
may account for this overlap. For one, frequent bullies are likely to interact more
frequently in networks with more problematic classmates, amongst whom aggressive
behavior is more frequent. More specifically, there is empirical evidence of within group
similarity and it has been found that bullying perpetration is associated with belonging to
a bullying group of peers (Espelage, Holt, & Henkel, 2003; Faris & Ennett, 2012) and
more generally to have friends that have been involved in deviated activities (Espelage,
Bosworth, & Simon, 2000a). The group nature of bullying and the influence of peers is
repeatedly mentioned in the literature (Salmivalli, 2010; Swearer et al., 2012a) and it has
been shown that bullying might be considered by many adolescents as a strategic way of
obtaining social status, respect and popularity among peers (Pellegrini & Long, 2004;
Sijtsema, Veenstra, Lindenberg, & Salmivalli, 2009). Second, victims of bullying may feel
resentment against their attackers and retaliate when they have been insulted or when
their property has been intentionally damaged. Finally, perpetrators and victims may
share some individual characteristics such as low self-control, which is associated both
with a higher risk of aggressive behavior and of victimization.
Bullying by Type of School
We also examined whether levels of bullying vary between school types. However,
we found little association between the type of school and the prevalence of bullying.
Overall levels of bullying victimization were 23.8% in private schools, 22.2% in CETP’s
students and 18.2% in public schools (χ2 (2) = 9.71, p <.01). In respect to bullying
perpetration there is also a small but statistical significant difference. In this case CETP
students show a greater proportion of bullies (17.5%) in relation to private school
students (14.5%) and public school students (11.5%) (χ2 (2) = 6.65, p <.05). However,
the higher rate in CETP’s partly reflects the fact that a larger proportion of males attends
these professional training schools.
Bullying and Other Problem Behaviors
Although bullying mostly happens in and around schools, youths involved in
bullying perpetration are generally also involved in a range of problem behaviors that are
unrelated to the situation at school. To illustrate this pattern Table 23 shows the
prevalence of selected problem behaviors amongst adolescents who were chronic bullies

Page 101
and those who were not. The findings show that chronic school bullies are more likely to
run away from home, to play truant o to steal at school, and to carry a weapon with
them. Also, they are significantly more likely to consume licit and illicit drugs including
alcohol, cannabis, and cocaine – and they are more likely to be involved in drug dealing
and to belong to a gang whose members are involved in violence. This finding confirms
and extends findings from previous studies (Shetgiri, Lin, & Flores, 2012; Swearer et al.,
2012). In the context of Montevideo all these associations are characteristic for bullying
perpetration, but not for victimization, which is not or only very marginally associated
with problem behaviors.
Table 23 Prevalence of Selected Problem Behaviors amongst Bullies and non-Bullies
Non-Bullies Bullies sig
Run away from home 5.7% 14.7% OR = 2.1, p < .001
Steal something at school 4.3% 12.9% OR = 3.3, p < .001
Play truant 39.8% 54.5% OR = 1.8, p < .001
Carrying a weapon 7.1% 21.2% OR = 3.5, p < .001
Smoke Cigarettes 23.0% 37.0% OR = 2.0, p < .001
Consume Cocaine 1.4% 5.0% OR = 3.8, p < .001
Consume Alcohol 18.8% 35.4% OR = 2.4, p < .001
Consume Marijuana 12.7%]= 26.1% OR = 2.4, p < .001
Sell Drugs 1.9% 8.3% OR = 4.8, p < .001
Member of a violent gang 16.0% 36.7% OR = 3.0, p < .001
Note: Alcohol consumption measured ‘at least monthly’. All other substance use variables at least once last year.
These results suggest that bullying and aggression in school should not be seen in
isolation. Rather, it is part of a wider behaviour syndrome that includes substance use,
property offenses, as well as violence outside the school context. This also means that
measures that are effective in reducing bullying at school and improving the quality of
behavior in the classroom and on the schoolyard may also have positive effects on
behavior outside school.
6.2 Bullying and Related Factors
In this section we use the dichotomous measure of chronic bullying victimization
and perpetration to explore the associations with three groups of variables. First, we will
consider selected school variables such as the relationship with teacher and classmates, and

Page 102
school commitment. Then we consider aspects of family dynamics, particularly aspects of
parenting such as supervision, commitment, conflict among parents, and harsh parental
discipline. Finally, we examine associations with four individual chracteristics, namely
conflict resolution skills, morality, legal cynicism, and lacking self-control.
Bullying and the School
In line with social control theory (Hirschi, 1969, 2004) studies have found that
feelings of alienation and unfairness with school norms are associated with victimization
in schools (Schreck, Miller, & Gibson, 2003) and with bullying perpetration (Welsh,
2001).
Results from Montevideo survey show that some dimensions of schools dynamics
are relevant to understand bullying, altough associations are stronger for perpetration
than victimization.
Table 24 shows that bullying victimization is not related to levels of commitment with
the school, perception of school legitimacy, and school retention. However, students’ relationship to
peers proves to be significantly associated with their victimization rates: students with
weaker ties with their class mates are two times more likely to suffer bullying in relation
to those that have stronger ties. This finding is in line with the evidence suggesting that
bullying victims are often more marginalized and have poorer peer networks. Also,
academic difficulties are significantly associated with bullying victimisation: Adolescents who
struggle academically at school are more likely to be bullied than others. A similar pattern
is observed in the Future benefits of learning index: 25% of students that think school lacks
relevance for their future have been bullied last year in relation to 19% of those who
think school will be useful. Both findings may reflect some of the negative consequences
of repeat bullying victimization, which can undermine school engagement and academic
achievement (Ma et al., 2009; Skues, Cunningham, & Pokharel, 2005).
Bullying perpetration is associated with most school dimensions except for
relationship to peers, academic difficulties (except for females), and school retention. Table 25
shows that students less committed with school were almost two times more likely to have
bullied other students than more committed students. Survey respondents that perceive
that school and its authorities have little legitimacy are also two times more likely to be
bullies than peers that perceive educative institutions as legitimate. Finally, having a poor
relationship to teachers and the perception that school has little use for youths’ future are also
significantly associated with bullying behavior. These findings are in line with studies
internationally, which show that bullies perceive less support from teachers than non-
bullying students and that they have a less positive relationship with teachers, quite
possibly as a result of disruptive and antogonistic behavior in the classroom (Barboza et

Page 103
al., 2009; Hanish, Kochenderfer-Ladd, Fabes, Martin, & Denning, 2004; You et al.,
2008).
Table 24 Bullying Victimization Rates by School Related Variables
Criterion Value % self report
violence Significant Differences
School
Committment
Lowest 21.2% χ2total = n.s.
χ2male = n.s.
χ2female = n.s.
2 17.9%
3 20.2%
Highest 24.0%
Relationship to
Teachers
Lowest 22.8% χ2total = 13.37, p < .01
χ2male = 16.09, p < .01
χ2female = n.s.
2 16.4%
Highest 23.4%
Relationship to
peers
Lowest 29.3% χ2total = 46.63, p < .01
χ2male = 26.06, p < .01
χ2female = 20.78, p < .01
2 16.0%
3 18.1%
Highest 15.7%
Academic
Difficulties
Lowest 18.3% χ2total = 12.2, p < .01
χ2male = 9.73, p < .05
χ2female = 13.81, p < .01
2 19.3%
3 21.0%
Highest 26.7%
Future
Benefits of
Learning
Lowest 18.9% χ2total = 6.42, p < .05
χ2male = n.s.
χ2female = 12.16, p < .01
3 20.2%
Highest 24.9%
School
Legitimacy
Lowest 22.2% χ2total = n.s.
χ2male = n.s.
χ2female = n.s.
2 20.5%
3 19.5%
Highest 18.1%
School
Retention
Normative 20.9% χ2total = n.s.
χ2male = n.s.
χ2female = n.s. Lagged 19.2%

Page 104
Table 25 Bullying Perpetration Rates by School Related Variables
Criterion Value % self report
violence Significant Differences
School
Committment
Lowest 16.5% χ2total = 17.58, p < .01
χ2male = 9.44, p < .05
χ2female = n.s.
2 11.9%
3 10.4%
Highest 9%
Relationship to
Teachers
Lowest 16.9% χ2total = 23.35, p < .01
χ2male = 14.35, p < .01
χ2female = n.s.
2 9.4%
Highest 10.7%
Relationship to
Classmates
Lowest 15.7% χ2total = n.s.
χ2male = n.s.
χ2female = n.s.
2 12.0%
3 12.6%
Highest 11.3%
Academic
Difficulties
Lowest 12.5% χ2total = n.s.
χ2male = n.s.
χ2female = 8.16, p < .01
2 11.5%
3 12.0%
Highest 14.9%
Future benefits
of Learning
Lowest 15.2% χ2total = 13.97, p < .01
χ2male = n.s.
χ2female = 5.94, p < .05
3 9.1%
Highest 11.3%
School
Legitimacy
Lowest 18.7% χ2total = 23.08, p < .01
χ2male = 10.68, p < .05
χ2female = 13.92, p < .01
2 11.5%
3 11.6%
Highest 9.3%
School Retention Normative 12.3%
χ2total = n.s.
χ2male = n.s.
χ2female = n.s. Lagged 15.2%
Bullying and Family Characteristics
Research in bullying has also shown consistent associations between bullying and
family structure and dynamics.
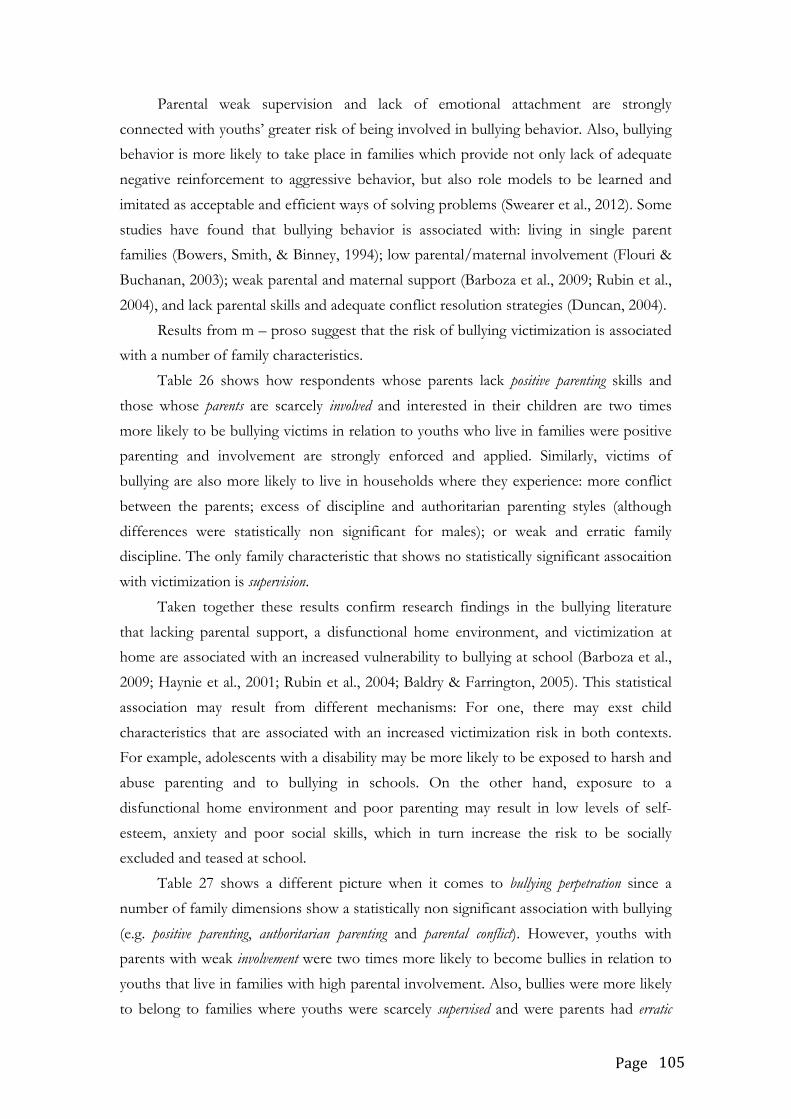
Page 105
Parental weak supervision and lack of emotional attachment are strongly
connected with youths’ greater risk of being involved in bullying behavior. Also, bullying
behavior is more likely to take place in families which provide not only lack of adequate
negative reinforcement to aggressive behavior, but also role models to be learned and
imitated as acceptable and efficient ways of solving problems (Swearer et al., 2012). Some
studies have found that bullying behavior is associated with: living in single parent
families (Bowers, Smith, & Binney, 1994); low parental/maternal involvement (Flouri &
Buchanan, 2003); weak parental and maternal support (Barboza et al., 2009; Rubin et al.,
2004), and lack parental skills and adequate conflict resolution strategies (Duncan, 2004).
Results from m – proso suggest that the risk of bullying victimization is associated
with a number of family characteristics.
Table 26 shows how respondents whose parents lack positive parenting skills and
those whose parents are scarcely involved and interested in their children are two times
more likely to be bullying victims in relation to youths who live in families were positive
parenting and involvement are strongly enforced and applied. Similarly, victims of
bullying are also more likely to live in households where they experience: more conflict
between the parents; excess of discipline and authoritarian parenting styles (although
differences were statistically non significant for males); or weak and erratic family
discipline. The only family characteristic that shows no statistically significant assocaition
with victimization is supervision.
Taken together these results confirm research findings in the bullying literature
that lacking parental support, a disfunctional home environment, and victimization at
home are associated with an increased vulnerability to bullying at school (Barboza et al.,
2009; Haynie et al., 2001; Rubin et al., 2004; Baldry & Farrington, 2005). This statistical
association may result from different mechanisms: For one, there may exst child
characteristics that are associated with an increased victimization risk in both contexts.
For example, adolescents with a disability may be more likely to be exposed to harsh and
abuse parenting and to bullying in schools. On the other hand, exposure to a
disfunctional home environment and poor parenting may result in low levels of self-
esteem, anxiety and poor social skills, which in turn increase the risk to be socially
excluded and teased at school.
Table 27 shows a different picture when it comes to bullying perpetration since a
number of family dimensions show a statistically non significant association with bullying
(e.g. positive parenting, authoritarian parenting and parental conflict). However, youths with
parents with weak involvement were two times more likely to become bullies in relation to
youths that live in families with high parental involvement. Also, bullies were more likely
to belong to families where youths were scarcely supervised and were parents had erratic

Page 106
parenting (except for males where differences were statistically non significant). These
findings are in line with international studies that have shown that bullies are more likely
to live in families characterized by low attachment, weak monitoring, and erratic
parenting practices (Bowers et al., 1994).
Table 26 Bullying Victimization by Family Variables
Criterion Value % self report violence Significant Differences
Positive Parenting Lowest 26.3% χ2total = 19.9, p < .01
χ2male = 10.37, p < .05
χ2female = 10.39, p < .05
2 18.6%
3 18.7%
Highest 12.8%
Parental
Involvement
Lowest 26.3% χ2total = 27.18, p < .01
χ2male = 13.72, p < .01
χ2female = 16.29, p < .01
2 20.6%
3 17.3%
Highest 12.6%
Authoritarian
Parenting
Lowest 17.3% χ2total = 22.99, p < .01
χ2male = n.s.
χ2female = 24.74, p < .01
2 17.9%
3 18.8%
Highest 27.5%
Supervision Lowest 19.7% χ2total = n.s.
χ2male = n.s.
χ2female = n.s.
2 19.4%
3 21.4%
Highest 22.2%
Parental Conflict Lowest 16% χ2total = 22.94, p < .01
χ2male = 15.71, p < .01
χ2female = 9.48, p < .05
2 20.3%
3 21%
Highest 27%
Erratic Parenting Lowest 16.8% χ2total = 32.63, p < .01
χ2male = 21.26, p < .01
χ2female = 13.87, p < .01
2 17.3%
3 21%
Highest 28.9%

Page 107
Table 27 Bullying Perpetration by Family Variables
Criterion Value % self report
violence Significant Differences
Positive Parenting
Lowest 14.5% χ2total = n.s.
χ2male = n.s.
χ2female = n.s.
2 12.7%
3 10.9%
Highest 13.4%
Parental Involvement
Lowest 17.5% χ2total = 19.44, p < .01
χ2male = 8.24, p < .05
χ2female = 10.71, p < .05
2 12.2%
3 10.5%
Highest 9%
Authoritarian Parenting
Lowest 12% χ2total = n.s.
χ2male = n.s.
χ2female = n.s.
2 13.6%
3 11.7%
Highest 14.7%
Poor Supervision
Lowest 15.5% χ2total = 8.67, p < .05
χ2male = n.s.
χ2female = n.s.
2 12.1%
3 12.5%
Highest 10.1%
Parental Conflict
Lowest 12.1% χ2total = n.s.
χ2male = n.s.
χ2female = n.s.
2 14.9%
3 13.8%
Highest 12.8%
Erratic Parenting
Lowest 11.7% χ2total = 14.34, p < .01
χ2male = n.s.
χ2female = 9.22, p < .05
2 10.2%
3 12%
Highest 17.6%
Corporal Punishment
In previous chapters we saw how corporal punishment was associated with higher levels
of victimization and with violent behavior. Here we extend the analysis and consider if
youths exposed to corporal punishment in their homes have also more chances of being
involved in aggressive behavior in schools. We subdivided adolescents in the same three

Page 108
groups (no, low, high) to analyze the link with bullying victimization and perpetration.
Error! Reference source not found. show that there is a statistically significant
association between corporal punishment and bullying victimization. Youths that suffer
corporal punishment are aproximately twice times more likely to be bullied in school last
year than youths that do not suffer corporal punishment. Figure 29 shows that we
obtained similar results with bullying perpetration. 32.1 % of respondents that suffered
corporal punishment at home reported bullying other students last year. In contrast,
among those youths who did not suffer corporal punishment only 15.6% bullied other
adolescents. These statistical significant differences in bullying victimization and
perpetration are present for both sexes. These findings are consistent with other
international studies that show that youths that have suffered maltreatment are more
likely to become involved in bullying behaviors both as perpetrators or victims (Bowes et
al., 2009). Additionally, these findings reinforece the idea that policies to reduce violence
in different domains such as the family or the school should be framed as part of a more
general prevention strategy.
Figure 28 Bullying Victimization by Corporal Punishment, by Gender
Note: All respondents: χ2(2) = 29.16, p <.001; Males: χ2(2) = 16.29, p <.001; Females: χ2(2) = 14.67, p <.001.
17.7% 17.6% 17.6%
28.3%
23.4% 26.0%
29.6%
34.2% 31.9%
0.0%
5.0%
10.0%
15.0%
20.0%
25.0%
30.0%
35.0%
40.0%
Males Females Total
No Low High

Page 109
Figure 29 Bullying Perpetration by Corporal Punishment, by Gender
Note: All respondents: χ2(2) = 22.88, p <.001; Males: χ2(2) = 14.42, p <.001; Females: χ2(2) = 7.80, p <.05.
Bullying and Individual Characteristics
Involvement in bullying has also been associated with a number of individual
factors in the literature. Here we consider four aspects, namely conflict resultion skills,
moral beliefs, legal cynicism, and low self-control.
Low self-control is a personal trait that has been associated with bullying behavior.
Given the large bulk of empirical evidence of this personal trait as a risk factor of
deviance and violence it is expected that studies find that bullying behavior is associated
with low self control (Haynie et al., 2001; Unnever & Cornell, 2003) or more generally
with impulsiveness (Farrington & Baldry, 2010). How youths cope with conflicts is another
individual trait that has been associated with bullying behavior. Studies have shown that
there is an association between solving conflicts constructively and cooperatively without
using anger or retaliation and not getting involved in bullying victimization and
perpetration (Baldry & Farrington, 2005; Bryant, 1992; LaRusso & Selman, 2011). There
is also evidence that bullies tend to have weak moral beliefs/sensibility. Some studies have
shown that while youth’s attitudes towards bullying are generally of rejection, bullies do
not perceive bullying as something wrong, do not empathize with victims’ emotional
feelings and do not think they should intervene in a bullying episode (Fonzi et al., 1999;
Ortega & Merchan, 1999). Additionally, some studies have shown how bullying behavior
and pro bully behavior (passive and reinforcer bystanders) are positively associated with a
weak moral sensitivity and moral disengagement which helps them to perceive it as
acceptable (Pozzoli, Gini, & Vieno, 2012; Thornberg & Jungert, 2013).
Individual dimensions turned out to be of little relevance to understand bullying
victimization in the m – proso survey. Table 28 shows that little association was found
15.6%
7.2%
11.2%
19.7%
9.1%
14.7%
32.1%
15.9%
23.9%
0.0%
5.0%
10.0%
15.0%
20.0%
25.0%
30.0%
35.0%
Males Females Total
No Low High

Page 110
between being bullied and perception of ability to fight,38 dealing with conflict strategies, moral
beliefs, and police legitimacy. However, we observed that victims of bullies were more likely
to have lower self-control than students that have not been bullied last year (24.9% vs.
17.6% respectively).
School bullies differ in various ways from the individual characteristics of their
peers: Table 29 shows that personality traits plays a relevant role: youths with lowest
levels of self control are four times more likely to have been involved in perpetration of
bullying in comparison with youths that have high self control. Additionally, 24.8% of
youths that have lowest scores in non violent strategies to deal with conflicts index were
involved in bullying behavior last year. In contrast, only 5.8% youths with highest scores
in non violent strategies to deal with conflict bullied other students. Very similar patterns
are observed in youths beliefs about the wrongfulness of norm-breaking behavior.
Finally, young people that perceive police as ilegitimate and unfair are two times more
likely to bully other youths in comparison with other youths that perceive police as a
legitimate institution.
Overall, bullies are low on self-control, have poor conflict resolution skills, reject
conventional norms and don’t believe in legitimacy of police. These results are in line
with findings form aforementioned international studies. What is more, these
characteristics are very similar to the characteristics of violent adolescents more generally.
38 Although perception of strength showed statistically significant differences in terms of bullying victimization among youths (χ2(3)= 10.8512, p < .05), differences were very small.

Page 111
Table 28 Bullying Victimization by Individual Variables
Criterion Value % self report violence Significant Differences
Conflict Resolution
Skills
Lowest 20.9% χ2total = n.s.
χ2male = n.s.
χ2female = n.s.
2 17.6%
3 21.1%
Highest 22.8%
Morality Lowest 23.1% χ2total = n.s.
χ2male = n.s.
χ2female = n.s.
2 19.9%
3 18.0%
Highest 20.9%
Police Legitimacy Lowest 23.8% χ2total = 8.38, p < .05
χ2male = n.s.
χ2female = n.s.
2 18.4%
3 21.2%
Highest 17.3%
Self-control Highest 17.6% χ2total = 9.0, p < .05
χ2male = n.s.
χ2female = n.s.
2 20.4%
3 19.7%
Lowest 24.9%

Page 112
Table 29 Bullying Perpetration by Individual Variables
Criterion Value % self report violence Significant Differences
Conflict Resolution
Skills
Lowest 5.8% χ2total = 82.64, p < .01
χ2male = 38.02, p < .01
χ2female = 33.84, p < .01
2 10.6%
3 15.4%
Highest 24.8%
Morality Lowest 20.9% χ2total = 61.93, p < .01
χ2male = 44.65, p < .01
χ2female = 13.29, p < .01
2 14.1%
3 11.1%
Highest 4.9%
Police Legitimacy Lowest 17.2% χ2total = 17.57, p < .01
χ2male = 8.01, p < .05
χ2female = 9.33, p < .05
2 13.2%
3 11.9%
Highest 8.8%
Self-control Lowest 6.0% χ2total = 87.53, p < .01
χ2male = 56.69, p < .01
χ2female = 28.19, p < .01
2 10.9%
3 11.5%
Highest 24.6%
6.3 Conclusions
Over the past two decades bullying has increasingly become seen as a serious
manifestation of dominant harmful and aggressive behavior that can cause a lot of
suffering to children and adolescents at all ages. Bullying and its consequences have been
described at kindergarten, in primary school, and in secondary schools. At all ages
measures that reduce bullying perpetration and victimization have been found to increase
the psychological well-being of children and to positively affect their ability to
concentrate on academic progress.
In the present study we found that almost 20% of students in Montevideo report
having been the victims of any form of chronic bullying last year. A similar picture is
observed in perpetration. Although serious forms of bullying are unusual, 13% of
students admitted having perpetrated at least one type of any type of bullying behavior.
Second, we found there are significant gender differences in bullying perpetration
across al bullying categories. Bullying victimization, instead, shows weaker gender

Page 113
differences (only physical attacks and damage/robbery of property show statistically
significant differences between males and females).
Third, there is a clear overlapp between bullying perpetration and victimization
among youths in Montevideo. Bullies were almost five times more likely to be victims of
bullying than non bullies.
Fourth, we found little evidence that bullying behavior is associated with the type of
school. Bullying victimization and perpetration reveals small significant differences across
public schools, private schools and CETPs.
Fifth, we also found that bullying perpetration does not seem to be an isolated
behavior. Youths that are cronic bullies are also more likely to be involved in problem
behaviors such as truancy, steal at the school, use and sell drugs, be part of a violent
gang, etc. These findings reinforce the idea that bullying should be seen as part of a wider
syndrome of antisocial and violent behavior., and that prevention strategies should focus
on these broader set of problem behaviors.
Sixth, school-related characteristics are strongly associated with bullying behavior,
particularly with perpetration. Findings suggests that youths victims of bullying tend to
have a weaker relationship with their classmates. Additionally, they perceive school as
more difficult and scarcely relevant for their future goals. Bullying perpetrators also
perceive that school has little relevance for their future goals. Bullies are also more likely
to: have a worse relationship with teachers; perceive the school as an unfair and
illegitimate; and to feel less commitment with the school. Overall, this suggests that an
effective strategy of reduction of violence in Montevideo should include school based
prevention policies that aims at school management, and particulary, the improvement of
bonds between students, and between students and teachers. Additionally, these policies
should also provide programs that change youths’ negative perception about educative
institutions’ legitimacy and their relevance for their life.
Seventh, family characteristics and parenting dynamics are associated with youth bullying
in Montevideo, particularly with victimization. Bullying victimization is correlated with all
family characteristics except for supervision. Particularly, the stronger correlates are low
parental involvement, erratic parenting styles, parental conflictive relations, and corporal
punishment. Bullying perpetration is less associated with family characteristics. Yet, the
few characteristics relevant for perpetration are also those strongly associated with
victimization. Bullies are more likely to experience more weak parental involvement,
parental conflict and corporal punishment. These findings reinforce the importance of
parenting skills and support for families that aim at both promoting a stronger parent
involvement with their childrens’ activities, and helping parents to have more fair and
consistent system of punishments and rewards with their children.

Page 114
Finally, we found that a group of individual characteristics were strongly associated
with bullying behavior. Particularly, bullying perpetration and victimization were
associated with: lack of self-control; weak moral beliefs; perception that institutions and
norms are unfair and illegitimate, and poor abilities to solve conflicts in non – violent
and less emotional ways. Overall, these findings tell us that succesful prevention policies
should focus on promoting self control, problems solving skills, beliefs about moral
values and legitimacy of social institutions.

Page 115
7 A Cross-Cultural Comparison: Montevideo and Zurich
Sometimes policy-makers ask questions such as: Is youth violence in our country
worse than elsewhere? What kinds of violence are higher? And what should we do to
change the situation: Should we focus on improving parenting skills? Is there a problem
in school discipline that needs to be addressed? Or should the police change its tactics?
Answers to such questions can benefit from a comparative perspective where one tries to
better understand one’s own situation by examining how it differs from that in another
society. In what follows we propose such a comparison. It’s not with a neighbouring city
in Latin America. It is with a sample of 1400 adolescents who live over 10,000 kilometres
away in Zurich, the largest city of Switzerland.
At first sight such a comparison may look odd, possibly even unfair: What should
one learn from comparing young people in Montevideo with young people who grow up
in Switzerland, one of the wealthiest countries in the world, a place that has long had a
reputation for being a low-crime society and that continues to be seen by many as a
haven of stability, cleanliness, and social cohesion. As we will show, the similarities are
bigger than one might expect. And we find differences that some may find surprising.
The Data
As mentioned in the introduction, the Montevideo study was modelled on the
latest wave of the Zurich Project on the Social Development of Children, z-proso, a
longitudinal study of 1621 children who entered primary school in 2005. The most recent
data collection took place in 2012 when the participants were in the last year of
compulsory school and on average 15.4 years of age. 1447 adolescents participated,
corresponding to 86.4% of all individuals selected for participation in the study in 2005.
In the Montevideo study much of the questionnaire used in Zurich in 2012 was
translated, so that a comparative analysis would be possible. In both cities the studies
were administered as paper-and-pencil questionnaires in a classroom setting, with trained
support staff present to help with the data collection. However, one should note that the
Zurich target sample was defined as all children who had entered year one of primary
school in 2005. They are therefore within a narrow age range, but not necessarily in the
same school year by the age of 15. In Montevideo, in contrast, the target sample were all
adolescents who were in a year nine class in 2013 in one of 85 schools. They were in the
same school year, but their biological age varies more. Also, the data collection in Zurich

Page 116
was conducted outside regular school hours, while in Montevideo the data were collected
during regular school hours.
Structural Background
The two cities have both similarities and differences. They are of a comparable
size: The city of Zurich was a population of 366,000 inhabitants, while Greater Zurich
has a population of 1.19 Million. Montevideo has a population of about 1.3 Million. Both
cities are important national and international economic centres and the largest cities of
their countries. Their economic structure is dominated by the service sector, and in both
cities the banking sector plays an important role. Unemployment rates are also low in
both cities. In Montevideo, unemployment has decreased over the past 10 years and is
estimated to be around 5.5% in 2013. In Zurich, the unemployment rate in 2012 was
3.5%. However, the two cities differ significantly in average levels of wealth. National
data of per capita GDP at purchasing power parity (i.e. taking into account different
price levels) collected by the World Bank show that GDP per capita in 2012 was USD
53,000 in Switzerland and USD 18,000 in Uruguay.
One important difference between the two places is immigration: Zurich is a city
with a large and varied immigrant population. Amongst the participants in the z-proso
study, 60% had at least one parent who was not born in Switzerland. Important countries
of origin include Turkey, Portugal, Kosovo, Serbia, Sri Lanka, Spain, Macedonia, Bosnia-
Hercegovina, and Italy. As a result, too, young people in Zurich come from a variety of
religious, linguistic and cultural backgrounds. For example, similar proportions of
adolescents are Protestant (20.2%), Roman-catholic (25.5%), and Muslim (20.6%), while
smaller groups have no religious denomination (18.1%), are Hindu (4.8%) or Christian
Orthodox (8.6%). Montevideo, in contrast, has experienced very little immigration over
the past 30 years and its population is culturally and linguistically much more
homogenous. It is noteworthy, however, that 59% of adolescents in Montevideo say that
they have no religious orientation. 21% describe themselves as Christian Evangelical and
only 14% describe themselves as Roman Catholic.
The mean age of respondents in Zurich in wave 6 was 15.4 years, while the mean
age in Montevideo was 15.1 years. In Zurich, 70.4% of all adolescents lived together with
both parents. In Montevideo 58.8% of adolescents lived with both parents, meaning that
a larger proportion had experienced a parental separation. The number of siblings also
differed somewhat between the two cities. In Zurich, an adolescent had an average of
1.32 siblings living in the same household. Adolescents in Montevideo had on average
1.67 siblings.

Page 117
Police-Recorded Rates of Violent Crime
In Table 30Error! Reference source not found. we show comparative data on
police-recorded violent crime in Montevideo and Zurich for four major categories,
namely completed homicide, assault, robbery and bag snatching, and rape. Police statistics can be
biased as measures of real levels of crime: They are influenced by factors such as whether
the public reports incidents to the police and whether the police record all reported
incidents in their information systems. Also, comparisons are often difficult because the
definitions of certain types of crime may vary between jurisdictions. However, police
data still provide valuable information about approximate levels of visible crime and can
serve as a starting point for further investigation.
The respective crime rates reveal, first, that homicide rates are considerably higher
in Montevideo (12.5 per 100,000 versus 0.8 per 100,000). This is in line with the robust
finding that homicide is much higher across most of Latin America than in Europe
(Nivette & Eisner, 2012). But although homicide is higher, the rates of police recorded
assault and rape are effectively lower in Montevideo than in Zurich. Different levels of
reporting by the victims and recording by the police may influence these figures
somewhat. But they certainly contradict the notion of a generally higher level of violence
in Montevideo than in Zurich. Finally, we find that street robbery and bag-snatchings are
much more frequently reported in Montevideo than in Zurich. In fact, rates of street
robbery in Montevideo are at least five times higher (1044 per 100,000) than those in
Zurich (192 per 100,000).
Table 30 Police Recorded Violent Crime in Montevideo and Zurich, 2013
Zurich
Montevideo
Number Rate
Number Rate
Homicide (completed) 3 0.8
163 12.5
Assault 2007 542.4
3783 291.0
Robbery & bag snatching 711 192.2
13572 1044.0
Rape 65 17.6
102 7.9
Note: Zürich: (Kantonspolizei Zürich (ed.) (2014). Montevideo: (Ministerio del Interior (2014). The figure for assault in Zurich combines ‘assault with bodily harm’ (“Körperverletzung”) and assault without serious harm (“Tätlichkeit”).

Page 118
7.1 Levels of Youth Violence in Zurich and Montevideo
The police data show city-wide levels of recorded violent crime. But how about the
experiences with aggression and violence amongst 15-year old adolescents according to
the surveys? Do the survey data also reveal differences in violent perpetration or
victimization between the two cities? Are there any differences in experiences with
corporal punishment by parents or bullying victimzation? And if there are differences,
what factors might explain them?
Violent Victimization Rates
Table 31 shows the victimization rates in Montevideo and in Zurich for all eleven
types of harm where a comparison can be made. Considering serious criminal violence first
the findings show that the proportion of male and female adolescents that experienced a
serious assault was almost identical in both cities. The data also suggest that the rate of
victimizations due to robbery is 3-5 times higher in Montevideo than in Zurich. For
serious sexual assault no difference in victimization could be found amongst females. Yet
more males in Montevideo than in Zurich reported an incident where they had been
coerced to a sexual act. However, absolute numbers are quite small for this type of
victimization.
In the domain of corporal punishment we found no differences between adolescents
in the two cities in respect of being slapped by a parent, and as regards being hit with a
belt or a stick by the father or the mother. However, almost twice as many adolescents in
Montevideo experienced having ears or hair pulled by one of their parents.
For bullying victimization the findings suggest higher levels in Montevideo than in
Zurich. This is especially true for male respondents. Thus, larger proportions of male
adolescents in Montevideo report chronic victimization in every category of bullying,
including being ‘ignored or excluded’, ‘physically attacked’, or that their property was
destroyed or taken away than adolescents in Zurich. In interpreting these findings it is
worth noting that Switzerland does not have particularly low levels of bullying. For
example, the 2009/10 Health Behaviour of School-Aged Children (HSBC) study
included questions on bullying victimization in 43 countries of Europe and Northern
America. Swiss children at ages 11,13 and 15 reported levels of victimization that were
above the average of all participating countries (Candace et al., 2012).
Also, the data on sexual bullying show a similar picture as the finding for serious
sexual assault mentioned above: Girls in Montevideo experience sexual harassment less
often than girls in Zurich, while the opposite is true for boys, who report such
experiences more often in Montevideo than in Zurich.

Page 119
Table 31 Violent Victimization Rates in Montevideo and Zurich, past 12 months
Montevideo Zurich Male Female Male Female a) Serious Violence Robbery 22.4% 13.4% 6.2% 2.6% Assault 13.3% 8.6% 11.7% 9.3% Sexual Assault 1.5% 1.4% 0.1% 1.7% b) Corporal Punishment Slapping 21.1% 20.4% 20.0% 17.6% Pull ears or hair 16.9% 17.0% 9.2% 10.0% Hit with an object 9.4% 5.2% 8.9% 7.8% c) Bullying Victimization (at least monthly) Ignored or excluded 7.2% 7.7% 4.5% 7.3% Insulted or taunted 13.7% 12.1% 10.1% 8.6% Physically attacked 4.3% 2.5% 2.8% 1.3% Took or destroyed things 7.6% 3.3% 4.7% 3.2% Sexually harassed 3.6% 3.8% 2.3% 6.2% Any victimization 60.1% 50.4% 43.1% 39.5%
Mean Variety1 1.32 1.01 0.80 0.76 N 1060 1101 750 697 Note: Significantly higher rates in Montevideo printed in bold, significantly lower rates in Montevideo printed in italic. 1 Average number of different victimizations.
Overall, the findings can be summarized in three main points: First, all in all the
exposure of young people to different types of violence is surprisingly similar in the two
societies. Thus, overall levels of experiencing abusive parental punishment at home,
being assaulted and injured by peers, or being chronically bullied are quite comparable.
Second, there is a tendency in some indicators towards somewhat higher levels of
victimization in Montevideo, primarily for young men. We especially note somewhat
higher levels of bullying victimization for boys and a higher rate of exposure to one of
the three corporal punishment items for both sexes. Third, we note one area of
victimization with a very large difference, namely robbery, where the rate of victimization
in Montevideo is about four times higher than in Zurich (17.9% v 4.4%). This difference
according to the victimization data is mirrored in the police data on street robberies. It is
this single type of violence that distinguishes violent victimization experiences of young
people in the two cities most.

Page 120
Violent Perpetration Rates
Bullying victimization, especially amongst men, is somewhat higher and robbery
victimization is several times higher in Montevideo than in Zurich. One would hence
expect a similar pattern of self-reported perpetration, with more adolescents in
Montevideo admitting to bullying behavior and robberies. However, this is not the case.
Table 32 shows the prevalence rates for all 14 items that measure adolescents’ active
involvement in violent and aggressive behaviour in Montevideo and Zurich.
The first group of items refers to serious violence. Here no significant differences
were found for either girls or boys between the two cities. In fact, it is remarkable how
similar the prevalence rates of self-reported violence are in both cities, given that they are
11,000 kilometres apart, have different economic, social and political structures, and a
very different ethnic and cultural mix of their young populations.
The second group refers to items that measure chronic (i.e. at least once a month)
bullying perpetration. Here we find some significant differences for ignoring and excluding
and well as for insulting and taunting, but they go in the opposite direction than
victimization: It is the adolescents in Zurich who admit these behaviors significantly
more often than their peers in Montevideo. This is especially true for males, whose
perpetration rates in Zurich are almost twice as high as those in Montevideo. The
finding is in startling contrast to the victimization data, where male Uruguayans reported
substantially more bullying victimization than male Swiss. We don’t currently have a
good explanation for this inconsistency.
The third group of violence indicators measures the membership in groups that
engage in serious violence. Here indicators suggest somewhat higher prevalence rates in
Montevideo, mainly for men. This is particularly true for being in a group that ‘threatens
and assaults people’ (8.8% in Montevideo vs. 5.6% in Zurich), ‘robs other people’ (3.4%
vs. 1.9%) or that ‘extorts protection money or goods’ (2.4% vs. 1.1%) from other young
people, all of which are substantially more frequent in Montevideo than in Zurich. These
findings suggest that somewhat more young people in Montevideo take part in group
activities that entail the use of violence. However, in both cities the overwhelming
majority of adolescents is not involved in any violent group activities.

Page 121
Table 32 Violent Perpetration Rates in Montevideo and Zurich, past 12 months
Montevideo Zurich Male Female Male Female a) Serious Violence Assault 12.9% 6.2% 13.5% 6.2% Robbery 2.5% 0.5% 3.0% 0.0% Threat 2.1% 0.4% 2.9% 0.4% Carrying Weapons 14.3% 3.8% 14.6% 3.3% b) Bullying Perpetration (at least monthly) Ignored or excluded 5.2% 3.2% 11.5% 4.9% Insulted or taunted 11.5% 4.7% 20.2% 6.9% Physically attacked 5.5% 2.1% 5.5% 2.0% Took or destroyed things 6.0% 1.4% 5.8% 1.4% Sexually harassed 3.1% 0.4% 1.5% 0.4% c) Membership in Violent Group Meet with friends to fight against other adolescents
18.8% 4.9% 16.4% 3.0%
In a group that … … Threatens and assaults people
11.9% 5.7% 8.3% 2.9%
… robs other people 5.0% 1.8% 3.2% 0.7% … extorts protection money
4.2% 0.6% 1.6% 0.6%
… carries weapons 9.1% 3.5% 9.9% 1.6% Note: Italic figures: Significantly higher levels in Zurich than in Montevideo. Bold figures: Significantly higher values in Montevideo than in Zurich.
Overall, three main conclusions emerge from the comparison of self-reported
violent perpetration rates. First, like for victimization rates the prevailing impression is
one of broad similarities in the levels and the distribution of violent behavior in both
societies. For example, we noted earlier that a good approximation of the distribution of
violent perpetrators amongst adolescents in Montevideo is the 70-25-5 rule: 70% are not
involved in serious violence and account for about 2% of all violent acts, 25% of
adolescents are occasionally involved in violence and account for about a fourth of all
violent acts. 5% of adolescents are regularly involved in violence and account for about
70% of all violent acts. This distribution is identical to the distribution found in Zurich
and in many other societies. Importantly, nothing in the data suggests that the far higher
homicide rates in Montevideo as compared to Zurich have their roots in a more general
increased propensity towards violent behavior amongst young people in Montevideo.

Page 122
Second, we find some evidence for higher levels of group activities related to
violence in Montevideo, where a higher proportion of adolescents admit to being in a
group that threatens, robs, or extorts protection money. These data are consistent with
the higher prevalence of robbery victimisation in Montevideo and the higher rates of
police-recorded robbery in Montevideo, but we note that we don’t find the same pattern
in the responses that asked the adolescents whether they themselves had committed a
robbery or a threat.
Third, we note some inconsistencies between the data from the victim and the
perpetrator perspective, especially for bullying. It is not clear where the partial mismatch
comes from. One possibility is that an important subgroup of the perpetrators was not
present in the classrooms at the time of the data collection, either because they belong to
an older age group or because they never or rarely attend school.
7.2 Correlates of Violence in Zurich and Montevideo
Throughout this study we have argued that factors strongly correlated with
violence constitute the most promising targets for an effective prevention strategy. But
are the risk factors found in Montevideo specific to that city or do they reflect more
universal mechanisms that are associated with youth violence in many human societies?
We examine this question by comparing the risk factors for youth violence in
Montevideo with those found in Zurich. To do this we constructed an overall index of
youth violence that is based on the same 14 questions in both cities. It combines all
variables of self-reported violence presented in Table 32 above by creating a so-called
violence variety index, a measure of how many different types of violence an adolescent was
involved in.
We use Pearson correlation coefficients as standardized measures of association.
Larger coefficients mean a stronger association between a risk factor and youth violence.
In delinquency research correlations larger than +/- .3 are usually considered quite large
associations; correlations of between .1 and .3 are often called ‘small’ effects. One should
note that bivariate correlations only indicate an association, but not necessarily causation.
For each risk factor we then tested whether the size of the association differed
between the two cities or whether it can be assumed to be the same in both contexts
(Preacher, 2002). Statistical associations that are the same in both societies can be seen as
an indication the mechanisms associated with violence are more likely to be similar in the
two cultural contexts.

Page 123
Table 33 Correlation between ‘Risk Factors’ and Overall Violence Score in Montevideo and Zurich
Montevideo Zurich Significant Difference1 Gender -.248 -.273 = Single Parent .034 .086 = Large Family .087 .037 = Low Parental Education -.030 =
A) Individual Characteristics Morality -.320 -.362 = Lacking self control .345 .381 = Legal cynicism .294 .346 = Conflict coping abilities .327 .314 = Police legitimacy -.162 -.291 MV < ZH
B) School-Related Characteristics Commitment to school -.230 -.272 =
Relationship to teacher -.205 -.188 = Relationship to peers -.096 -.086 = Academic difficulties .117 .131 = Future benefits of learning -.215 -.193 = Truancy .208 .167 =
C) Parenting and Family Characteristics
Parental involvement -.146 -.167 = Positive parenting -.125 -.086 = Poor supervision -.193 -.191 = Harsh discipline .119 .162 = Erratic parenting .097 .062 = Parental conflict .056 .104 =
D) Routine Activities Violent media exposure .395 .497 MV < ZH
Unsupervised night-time with peers .312 .319 = Time with delinquent peers .538 .532 =
E) Non-Violent Problem Behaviors Alcohol consumption .337 .264 MV > ZH Cannabis consumption .365 .201 MV > ZH Theft .363 .327 = Vandalism and graffiti .378 .382 = Note: 1 Result of a two-sided test that the correlation coefficients obtained from two independent samples are equal, p < .05.
Table 33 presents 25 correlates of self-reported violence, ordered in five major
groups. These results lead to three main conclusions relevant for prevention policy: First,

Page 124
Zurich and Montevideo may differ economically, socially and culturally. But most risk
factors associated with youth violence are the same in both cities. In fact, for 21 of the
25 risk factors the size of the statistical association is undistinguishable in both contexts.
Those that are highly associated with youth violence in one context are also highly
correlated in the other.
In the domain of individual characteristics lacking self-control, a rejection of conventional
rules and norms, being cynical about the law and low conflict resolution abilities are similarly
associated with high violence in Zurich and in Montevideo. In both cities similar school-
related variables are associated with violence: A low commitment to school has the highest
correlation with youth violence in both cities, followed a poor relationship to teachers, a low
perceived future benefit of learning and a high truancy rate. In the domain of parenting all
associations in both cities are below r < .2, suggesting that at this age parenting may no
longer have such an important influence on a young person’s behaviour. The strongest
associations with violence in both cities are poor parental supervision and a lack of parental
involvement in shared activities.
Very high associations can be seen between violent behaviour and routine
activities. In both cities adolescents who spend much time with delinquent peers, who engage
a lot with violent media contents, and who spend a lot of unstructured time at night with peers
are much more likely to aggress against others. Finally, in both cities we find that
violence is strongly associated non-violent kinds of problem behavior including theft,
vandalism, alcohol consumption and drug consumption.
Third, we find cultural differences for four variables --- although they are
differences in degree rather complete reversals of the patterns: Lacking police legitimacy
is more strongly associated with violence in Zurich than in Montevideo, the
consumption of violent media contents is more strongly associated with violence in
Zurich than in Montevideo; and both the consumption of cannabis and of alcohol is
more strongly associated with violence in Montevideo than in Zurich.
We don’t know the reasons for these differences, but the findings on the
association between substance use and violence are worth a comment: What they suggest
is this: In Montevideo adolescents who consume alcohol or cannabis are much more
likely to also be involved in violent acts than is the case with their peers in Zurich. The
tendency is particularly strong for Cannabis, where the association is almost twice as
strong in Montevideo as in Zurich. One can interpret this finding as a measure of the
overlap between two subcultures: In Montevideo the subculture of marihuana smokers
seems to overlap quite strongly with a subculture of violent youth. In Zurich this overlap
seems to be much weaker, meaning that youths may see the hedonistic subculture of
cannabis smokers and the more violent subculture somewhat more as opposites.

Page 125
7.3 Exposure to Risk Factors
A third question that is relevant for prevention and intervention policy refers to
the ‘salience’ of risk factors. The notion of ‘salience’ relates to the issue of how
widespread a risk factor is in a given context. For example, very few adolescents in a
traditional Muslim society may even consider drinking alcohol, while getting drunk in the
company of other adolescents is a very common experience amongst adolescents in the
Western World.
Knowing about salience is important for good prevention: Policy makers want to
focus scarce resources on those causes that are the most urgent and important, because
targeting those risk factors promises the biggest effects.
To explore this issue we compared the mean levels of 25 risk factors in
Montevideo and Zurich and calculated whether they were higher or lower in either city.
This approach yields answers to questions such as: Do young people in Montevideo
believe less strongly in the moral norms of conventional society than adolescents in
Zurich, meaning that their morality should be improved as a strategy to reduce violence?
Are larger proportions of young people in Montevideo exposed to parental abuse,
meaning that parenting interventions should be a priority in a prevention policy?
In computing these differences we calculated so-called standardized scores. This is
a statistical trick that allows us to compare the size of the difference across the risk
factors, and to get a sense of how big the difference is.39 For example, if differences are
smaller than +/- 0.2 we can say that Montevideo and Zurich have equal exposure to the
risk factor. If they are between about +/- 0.2 and 0.5 the difference may be called ‘small’;
between +/- 0.5 and 0.8 it is usually called ‘medium’, and for standardized differences
larger than 0.8 the convention is to call them ‘large’.
Based on these criteria we made a decision to classify all risk factors into three
groups: Those that are equally present in both cities, those that are ‘worse’ or more
salient in Zurich and those that are more salient in Montevideo. Table 34 reveals some
important findings:
39 More technically we computed z-standardized difference scores between Montevideo and Zurich where the difference between the two cities is divided by the pooled standard deviation of the variable.

Page 126
Table 34 Salience of Risk Factors in Zurich and Montevideo
These Risk Factors are more common in …
Zurich Montevideo
• Acceptability of norm-breaking behavior
(Morality) (0.60)
• Cannabis Consumption (0.81)
• Non-violent delinquency (theft) ()
• Spending time with delinquent friends
(0.30)
• Lacking police legitimacy (-1.07)
• Erratic parental discipline (-0.56), parental
conflict (-0.24)
• Poor teacher-child relationship (-0.43), poor
relationship amongst classmates (-0.49),
academic difficulties (-0.54)
• Self control (-0.31), conflict resolution skills
(-0.32).
• Violent media exposure (-0.33)
Note: Values in brackets are standardized differences in mean scores between the two cities, equivalent to Cohen’s d effect sizes.
Which Risk Factors are More Salient in Zurich?
We identified four risk factors associated with the likelihood of violence that are
more common in Zurich than in Montevideo: The first relates to the following question:
In which society do more adolescents believe that it is acceptable to steal something, to
lie to adults, to play truant or to hit somebody who has insulted you? The answer from
the two surveys is clear: Adolescents in Montevideo morally reject norm-breaking
behavior much more strongly than young people in Zurich. For example, 36% of
Uruguayan respondents thought that lying to adults was rather or very seriously wrong,
while in Zurich only 25% held this view. From this we conclude that the belief in moral
norms is stronger in Montevideo than in Zurich.
Second adolescents in Montevideo have considerably lower scores on almost
every non-violent problem behavior than adolescents in Zurich. For example, they are
significantly less likely to steal in shops (7.9% in Montevideo vs. 12% in Zurich, p < .001),
at home (3.2% vs. 8.8%, p < .001), at school (5.4% vs. 13.7%, p < .001) or to steal a vehicle
(1.6% vs. 6.9%, p < .001). Moreover, they are less likely to consume cannabis (14.4% vs.
33.8, p < .001), to be involved in drug dealing (2.7% vs. 8.0%, p < .001), or to use public
transport without paying (23.6% vs. 70.6%, p < .001). In fact, the only three behaviors where
Montevideo is higher than Zurich on non-violent behaviors are illegal downloading,
driving without a licence, and spraying graffiti.
For some of these differences there are plausible situational explanations: The
system of public transport is very highly developed in Zurich and the temptation to ride
a bus or tram without a ticket is high as the risk of getting caught and paying a fine is
relatively small. Also, Zurich has many more bicycles and a higher density of

Page 127
supermarkets than Montevideo, where smaller grocery shops are still more common. It is
therefore likely that Zurich provides more opportunities for theft.
Finally, adolescents in Montevideo are somewhat less exposed to life-style and
routine activity risks. For example, they are somewhat less likely to spend time at night
unsupervised by their parents and somewhat less likely to spend time with delinquent
friends. To some extent this may reflect the somewhat lower levels of affluence: Over
the past 20 years the possibilities in Zurich for night-time entertainment have greatly
expanded
Which risk factors are more salient in Montevideo
Several other risk factors and correlates of violence are more common among
adolescents in Montevideo. They can be clustered into four groups:
A first group relates to interpersonal skills. Here we find that on average young
people in Montevideo report somewhat lower levels of self-control and conflict-
resolution skills than youngsters in Zurich. For example, respondents were asked how
often they try to control their anger when provoked. In Zurich 66% of adolescents said
they used this strategy as compared to 45% in Montevideo.
Second, we find that three variables associated with the school-related risks have
higher means in Montevideo than in Zurich, namely the relationship to the teacher, the
relationship between pupils and the sense to be struggling academically. For example, pupils in
both cities were asked whether they feel that their teachers treat them fairly. This is an
important question because a sense that the school is a legitimate, supportive and just
institution is widely considered to be an important requirement for cooperative behavior
in schools. In Zurich 79.8% of pupils reported that they are being treated fairly by their
teachers, while the same was true for only 65.7% of pupils in Montevideo.
A third area reinforces the impression that adolescents in Montevideo distrust the
adult institutions that are designed to enforce rules of cooperation. Adolescents were
asked how much they trust the police, feel that the police treats people with dignity, or
feel that the police treats people fairly and equally. On all three questions adolescents in
Montevideo are far more distrustful of the police than in Zurich. In Montevideo, only
small minorities of between 20 and 30% of adolescents indicate that the police can be
trusted, while in Zurich the police is trusted by clear majorities of adolescents overall. In
fact, trust in the police is far higher amongst delinquent and violent adolescents in Zurich
than amongst law-abiding adolescents in Montevideo.

Page 128
Table 35 Levels of Police Legitimacy in Zurich and Montevideo, Non-Violent and Violent Adolescents
Finally, it is worth pointing out that within the domain of routine activities outside
school adolescents in Montevideo are more likely than their peers in Zurich to spend a
lot of time playing violent computer games. For example, adolescents were asked about
how often they played violent ego-shooter games that are recommended for ages 18 and
above on their computers or game consoles. In Zurich, 8% of adolescents said that they
played ego-shooter games on a daily basis. In Montevideo the proportion was three times
higher, namely 24%. We note here that the bi-variate association between own violence
and the consumption of violent media contents is strong in both countries, but that the
question of causal effects remains controversial.
7.4 Conclusion
The comparative perspective adopted in this chapter adds important aspects to our
understanding of youth violence in Montevideo. It helps to better see the specific
strengths and challenges in Montevideo, although the comparison with just one urban
context in a very wealthy European society limites the extent to which conclusions can
be drawn. A comparison with a different place would put different findings into relief.
Overall, however, the findings show that experiences of adolescents with violence are
not dramatically different in Montevideo than in Zurich: Levels of bullying victimization
were somewhat higher, especially for men, but the only area where we noted a much
21%
13%
63%
48%
28%
19%
66%
46%
25%
15%
74%
53%
0%
10%
20%
30%
40%
50%
60%
70%
80%
Non-‐Violent Violent Non-‐violent Violent
Montevideo Zurich
% Agree/strongly Agree
Police treats people equally
Police treats people with respect and dignity
One can trust in the police work

Page 129
higher risk in Montevideo was related to robbery, a finding that is also supprted by
official data in the two cities.
Secondly we examined a range of individual, family, school, routine activities and
problem behavior correlates and risk factors both in Montevideo and in Zurich. The
purpose was to examine whether adolescent violent behavior in a city in South America
is associated with similar patterns of characteristics as it is in a highly affluent city in
Western Europe. This is important for prevention policy because prevention
programmes aim to target well-known risk factors, most of which have been identified in
high income societies. Insufficient knowledge currently exists on whether these risk
factors also generalize to other contexts where less research has been conducted (Murray
et al 2014). The present findings suggest that almost all risk factors are similarly
associated with violent behavior in both cities. We note, however, that in Montevideo the
link between alcohol and violence as well as the link between cannabis consumption and
violence is somewhat stronger than in Zurich. The available data do not permit any
conclusions about whether this link reflects a causal relationship. It may simply indicate
that in Montevideo there is a stronger overlap between a hedonistic culture of substance
use and involvment in violent group activities.
Finally, we showed that the profile of salient risk factors in Montevideo differs
from those in Zurich. Overall, adolescents in Montevideo show more beliefs in
conventional norms, spend less time unsupervised by adults, spend less time with other
deliquent kids, and are less likely to consume cannabis. On the other hand, adolescents in
Montevideo are more likely than their peers in Zurich to distrust the police, to have poor
conflict resulution skills and lose self-control. They are also more exposed to a number
of school-related risk factors, including a difficult relationship to teachers and peers.
Futhermore, they consume significantly more violent computer games, they experience
more parental conflict, and they are more often involved in vandalism and praying
graffiti.

Page 130
8 Conclusions and recommendations
The present report is rooted in the public health framework of violence prevention
that the World Health Organization has laid out in the ‘World Report on Violence and
Health’ (Krug, Mercy, Dahlberg, & Zwi, 2002) and the ‘Plan of Action for the Global
Campaign for Violence Prevention for the period 2012-2020’, and which also guides the
framework of the United Nations “World Report on Violence Against Children”
(Pinheiro, 2006). Amongst others, these documents outline principles that can help
national and local governments to develop a more effective and coherent policy for
addressing interpersonal violence. Core principles of this approach include …
• Giving priority to evidence-based approaches, where preventive effects have been
demonstrated in high-quality outcome evaluations of prevention programmes;
• a prevention approach that includes different layers of intensity and that targets both
high-risk groups and the population at large;
• an orientation towards protecting human rights, in particular those of children, women,
vulnerable groups such as individuals with disabilities, and victims in general;
• a life-course perspective that recognizes the need for prevention and intervention at all
stages of development
• a prevention approach that recognizes the need for intersectoral collaboration including the
public health, child protection, education, policing and criminal justice sectors.
Within this framework the present report hopes to contribute to the resources that
can support an effective violence reduction policy by providing information about the
epidemiology of different types of violence amongst adolescents in Uruguay, as well as
information regarding core risk-factors that may be considered for prevention strategies.
In this final chapter we first summarize the main findings and then outline
recommendations, based on the study results.
8.1 The Main Findings
The main empirical goal of this study was to describe levels of violent victimization
and violent behavior among adolescents in Montevideo. It also aimed to identify major
individual, family, school and life-style risk factors associated with victimization and
perpetration that can inform the development of a national policy for the prevention of
youth violence. To achieve this goal a large representative survey of over 2000

Page 131
adolescents in grade 9 (i.e. approximately age 15) was conducted. The following main
results were found:
Victimization
Three areas of victimization were examined in this study, namely experiences of
criminal physical threat and violence, experiences of corporal punishment by parents, and
experiences of bullying victimization at school.
• In respect of criminal physical threat and violence the study suggests that about 25%
of adolescents in Montevideo have been victims of one of the three types of violence in the past year. Robbery victimizations are most frequent, followed by assault and sexual assault. Most victimizations occur in public space or at school, and are committed by peers roughly of the same age. This holds for boys and girls, although the proportion of victimizations at home and by family members is higher for girls. Only about one out of ten incidents are reported to the police.
• The risk of victimization was found to be associated with a number of lifestyle
characteristics. Adolescents who go out frequently, consume legal or illegal psychoactive substances, and who engage in delinquent activities are at a greater risk of violent victimization. Also, adolescents with a disability were at a higher risk of victimization, while socio-demographic characteristics such as social class background and family structure were not found to be predictive of victimization.
• About 28% of adolescents reported experiences of corporal punishment by their
parents. Socio-demographic characteristics were not found to predict the likelihood of corporal punishment. However, the likelihood of corporal punishment was more likely if there was more parental conflict in the child’s family. The experience of corporal punishment was associated with more depressive symptoms, underlining the range of negative psychological consequences of child maltreatment.
• About 20% of male and female adolescents experienced chronic bullying
victimization, meaning that they experience bullying at least once per month. Bullying victims differed from non-victims in several ways: they were more likely to have a poor relationship with classmates and more likely to have academic difficulties. At home they were more likely to experience erratic discipline and parental conflict. Also, adolescents with a disability were found to be more likely to be victimized.
• The results of the present study supported findings from international research that
different types of victimization tend to be correlated. For example, victims of corporal punishment by their parents were significantly ore likely to also experience bullying and violent victimization.

Page 132
• Overall, a substantial minority of adolescents in Montevideo is exposed to some manifestation of violence and aggression. Extensive research has documented the negative short and long-term effects of victimization experiences. They include poor
mental health including depression, lower self-confidence, stress-related symptoms, poor academic functioning, social isolation, fear, and externalizing behaviors. We therefore believe that it a better protection of victims of violence is an important public health goal that requires the collaboration of social services, schools, social workers, medical services, and the police.
Perpetration
The survey included questions on three domains of violent and coercive behavior
by adolescents, namely self-reported violent acts, the membership in youth groups that commit violent
and coercive acts, and bullying in the sense of insulting, harassing, socially ostracizing, or
hitting peers, usually in the school context.
• Results show that 17% of adolescents admitted to having committed at least one act
of violence in the past year. 19% of adolescents reported to be involved in a group
that threatens, robs or assaults other people. And 13 % of adolescents reported that
they chronically (i.e. at least once per month) bullied other adolescents.
• Different types of violence are strongly correlated in that, for examples, adolescents who verbally bully others also tend to be involved in physical fights or robberies committed within a group of other adolescents. Male adolescents are overrepresented for all types of direct aggression, but their predominance is larger for aggression that
entails physical force, is more serious, and committed in groups.
• Involvement in violence is part of a wider syndrome of adolescent problem behaviors: Violent adolescents are much more likely to also be involvement in non-violent delinquent acts including theft in school, at home or in shops, vandalism and burglary, or drug dealing. They are also more likely to run away from home and to play truant at school. Finally, adolescents involved in violence are much more likely
to use psychoactive substances. This includes the regular consumption of alcohol and cannabis as well as the consumption of hard drugs.
• We identified a number of correlates of youth violence and bullying. In respect of socio-demographic background we found very limited evidence that low social class of the parents predicts a higher probability of youth violence.
• Adolescents with a higher involvement in violent acts differed in their personality
characteristics from other youth. They were more risk-seeking, impulsive, self-centred and short-sighted than non-violent youth; they were more likely to internalize delinquent norms and to reject conventional moral principles; they had lower conflict resolution skills in that they were more likely to react with anger and less likely to

Page 133
understand different sides of an argument; and they tend to believe that they are stronger and better fighters than others.
• We found adolescents involved in physical violence and bullying also to differ on
school-related characteristics: They were significantly more likely to have been retained at school, to play truant, to have a poor relationship to the teacher and to have a low commitment to do well at school. They were also less likely to believe that the school and its representatives were ‘legitimate’, meaning that they less likely to accept the authority of teachers and directors to enforce school rules.
• In respect of experiences at home we found a tendency that parents of aggressive adolescents were less likely to be involved in joint activities with the young person,
that they were less able to effectively supervise the activities of their child, and that they were more likely to use physical punishment as a disciplining strategy.
• Furthermore, the current study confirmed findings from other studies that the daily routine activities of violent adolescents differ systematically from those of non-violent youth. They spend a lot more time playing violent computer games, they are out on the streets more often during night-time and weekends, and they spend this
unsupervised time more often in the company of peers who are themselves involved in delinquent behavior.
8.2 Four core principles of youth violence prevention
When considering the implications of the present study for an evidence-based
violence prevention it is important to interpret them in a broader context of general
principles that can guide an evidence-informed violence prevention policy. Four such
principles are particularly important.
Prevention across all phases of the life-course
Longitudinal studies on the development of aggression and non-aggressive
antisocial behavior suggest that youth violence very rarely emerges spontaneously during
adolescence. Individual aggressive tendencies are highly stable over the life-course and
symptoms of increased aggressive behavior can often already be identified in early
childhood. Also, developmental studies show that physical aggression is not limited to
adolescence. Thus, while the growth of body strength during puberty proliferates the
danger of serious consequences, physical aggression such as hitting, biting and kicking is
most widespread in early childhood and decreases as children grow older. Under most
conditions children increasingly learn to control aggressive tendencies as they acquire
social and emotional skills in interactions with parents and other adults, peers and
siblings. Only a small fraction of any cohort shows continued aggression into

Page 134
adolescence, but this group is much more likely to persist with behavior problems into
adulthood. Also, adolescents with serious and persistent violence have usually been
exposed to a multiplicity of risk factors during different phases of their life-course at the
biological, individual, family, school and neighbourhood levels.
These findings mean that violence prevention policy needs to address all stages of
the life course. Measures aimed at reducing violence need to be adapted to different
stages of the life course, support the successful solution of developmental tasks, and
strengthen resilience and protective factors.
Integration into a Public Health Policy Agenda
One of the most robust results of developmental violence research is that at every
stage of human development aggression is part of a wider behavior syndrome. Behaviors
associated with violence during adolescence include property crimes, vandalism, truancy,
promiscuity, and alcohol- and substance abuse. Phenomena associated with aggression or
bullying during primary school years include attention problems, impulsivity,
oppositional behavior, and temper tantrums. At all ages aggressive individuals also seem
to have an increased tendency of suffering from internalizing problems and other
symptoms of poor mental health. Furtermore, there is good evidence that many
environmental risk factors for poor behavioral, mental and academic outcomes are
shared. For example, child abuse has been found to have detrimental effects on a wide
range of outcomes rather than one specific area.
For these reasons we believe that violence prevention should be seen as part of a
wider public health policy that aims to broadly support the psycho-social well-being of
young people and to reduce a range of manifestations of behavior problems.
Address Multiple Risk Factors
The results of over 70 years of empirical research into the causes of aggression and
violence suggest that no single cause of youth violence exists. Rather it seems to result
from the confluence and interplay of different risk factors, developmental processes, and
short-term decision-making dynamics.
In fact, research has identified a large number of risk factors for violence at the
levels of individual, family, peer, school, leisure time, neighbourhood and wider social
context, which seem to independently and interactively contribute to the risk of violence.
We therefore believe that a knowledge-based violence prevention policy should attempt
to focus on the most important, empirically validated risk factors. Moreover, it should
aim to address multiple risk factors.

Page 135
Across the report we showed that virtually all risk factors for youth violence found
in Montevideo are factors that have also been identified in the international literature.
Moreover, a more formal test examining 31 risk factors in Zurich and Montevideo
revealed that all major risk factors were similarly associated with violence in both cities,
that for 27 risk factors not differences in the size of the association could be found, and
that only for four risk factors we found evidence for some difference in the size of the
risk factor.
The following table shows a possible general strategic direction of violence
prevention policies based on the finings of risk factors in the present study:
Table 36 Selected Goals for a Comprehensive Prevention Policy
Layer Strategic Orientation
Individual ü Strengthen impulse and anger control
ü Support social, emotional and cognitive skills
ü Promote norms of cooperative and non-violent behavior
ü Address early manifestations of problem behavior
Family ü Strengthen parenting skills
ü Reduce child maltreatment and neglect
ü Address partnership violence
ü Support families with concentrated adversity
School ü Develop coherent school management strategy
ü Support effective classroom management
ü Address bullying and low-level disruptive behaviors
ü Promote learning motivation and positive school climate
ü Reduce truancy
Peers/neighbourhood ü Reduce early onset alcohol and substance abuse
ü Control access to weapons, especially firearms
ü Prevent formation of youth groups with delinquent norms
ü Strengthen control and surveillance mechanisms in crime and
violence hotspots
Social Institutions ü Strengthen legitimacy of the school
ü Strengthen legitimacy of the police
Coordinate Universal, Selective and Indicated Prevention: The 70-25-5 rule
In all societies public expenditure on prevention, public health and safety competes
with other, equally important goals of public policy. It is therefore important that

Page 136
resources and time are spent in such a way that they optimally achieve their goals. Here
the distinction between universal, selective and indicated prevention is important.
Universal prevention targets all individuals in a society. It is broad and comprehensive,
but also unspecific and less intensive. Selective prevention aims to reduce the risk of
future problems amongst subgroups of individuals that are exposed to one or several risk
factors, but do not necessariy show serious behavior problems. Indicated prevention,
finally, targets adolescents who already show serious and repeated aggressive behavior
and aims to reduce the likelihood that these behaviors persist in the future. It is intensive
and often needs to be adapted to the varying needs of each individual.
One way to think about the relationship between universal, selective and indicated
prevention in connection with youth violence is the the 70-25-5 rule. This is a rule that
seems to apply in all societies. It holds that 70% of adolescents are only marginally
involved in serious rulebreaking problem behaviors. These 70% of adolescents typically
contribute less than 5% to the total of serious crimes. The next 25% of adolescents
commit a range of minor offenses and show considerable levels of norm-breaking
behavior. They are typically responsible for about 20-25% of all serious and violent
crimes. Finally, the 5% most ‘productive’ adolescents commit a very large number of
offenses that also includes serious and violent acts. Across the world this small group
typically accounts for 70-80% of all serious delinquent and violent acts.
Table 37 The 70-25-5 Rule: the Relationship between Universal, Selective and Indicated Violence Prevention.
% of
Adolescents
% of
Violent Acts
Risk Factors
Type of
Prevention
70% 5% Few developmental and situational risk factors
present, high resilience and protective factors, low
probability of future offending
Universal
25% 25% Presence of some family, school and personality
risk factors, exposure to situational risks, medium
resilience and protective factors, elevated risk of
future problem behaviours including violence
Selective
5% 70% High on multiple family, school and individual risk
factors, exposure to risk factors during childhood,
often combination of different behaviour
problems,
Indicated

Page 137
These figures have important implications for prevention policy and the balance
between universal, selective and indicated prevention. They highlight that prevention
must focus most resources on those 5% of the youths who cause the most significant
problems.
The findings of this report confirm evidence from many other studies that
aggressive behavior is faily highly concentrated among a minority of young people, and
that serious and repeated violence is very highly concentrated among a very small
minority of adolescents who are generally exposed to a multitude of risk factors and
adversities.
8.3 Specific Recommendations
The World Health Organization recommends that countries develop
comprehensive national action plans that bring together different agencies with the goal
of addressing violence in its various manifestations. We believe that the development of
an action plan to address youth violence might be a useful tool for developing a long-
term strategy in Uruguay. However, we believe that this will require a more extensive
review of current resources and strategies, a careful examination of current international
knowledge on evidence-based violence prevention, and a consideration of measures that
can be introduced in the current system. Such a task is outside the scope of the present
report and the empirical results presented here. However, based on the findings we
believe it may be useful to point out four issues that may deserve particular attention.
Enhance Parent ing Support
The analyses of the risk factors for youth violence support the notion that
adolescents with behavior problems grow up in families where the parents are less
involved in their activities, where parents monitor the behavior of children less, and
where there is more conflict between the parents. The results also show that a substantial
proportion of about 20% of adolescents still experience corporal punishment, and that a
smaller group of 2-5% of adolescents experiences repeated and serious abusive
parenting.
Access to evidence-informed parenting support for high-risk parents is one of the
cornerstones of the WHO violence reduction strategy. The idea is that helping parents of
children with behavior difficulties or parents in difficult psycho-social circumstances to
better interact with their children can help revent the long-term development of serious
behavior problems. These strategies mainly target parents of toddlers and children up to

Page 138
age 12. The present study with its focus on adolescents at age 15 can only shed limited
light on the question of how meaningful efforts in this domain would be. However, we
believe that better support for parents who struggle in effectively supporting their
adolescent children could be an important component of a strategy to reduce youth
violence. However, within a comprehensive violence prevention strategy it would also be
important to better understand levels of child maltreatment and abuse amongst younger
children, as abusive parenting tends to be more widespread against children during the
first decade of their lives.
Improve School Climate and Behavior Management in Schools
Several results from the present study suggest that additional preventive measures
may be desirable at the school level. The findings of this study are suggestive of
problems at three levels: First, our findings suggest that a considerable proportion of
adolescents are victims of bullying. These findings are in line with a comparative study
which suggests that levels of bullying victimization in Uruguay are close to the average of
Latin American countries (Roman & Murillo, 2011). Bullying victimisation is a known
risk factor for a number of adverse outcomes including poor school motivation and
depressive symptoms. Second, high proportions of adolescents in Montevideo feel
treated unfairly by their teachers and by their school, perceive a negative relationship
with their classmates, and feel that they struggle with the academic tasks in their school.
For example, 41% of adolescents in the survey felt that disciplinary measures in their
school are unfair, and 61% of students felt that some pupils are treated better than
others. These indicators suggest that in some schools there may be scope for improving
aspects of school climate and school management. Finally, a comparison of study
participants with classroom lists suggests that 17% of adolescents were not in school on
the day of the survey although they are listed in the school records. This is a high rate of
school drop-out, a problem that has been recognized in various studies on the education
system in Uruguay (Cardozo, 2010; Fernandez et al., 2010). School drop-out has
consistently been found to be a significant risk factor for negative outcomes including
crime, substance abuse, prostitution, and homelessness. Also, 42% of the adolescents
who were present during the survey admitted to playing truant at least once in the past
year. This is higher than truancy rates commonly reported in the United States or
Europe, which typically range between 20 and 30 percent.
International research has identified a number of evidence-based school-based
strategies that can help to reduce school-related problem behavior. Four universal
strategies include school management programs, classroom management programs, anti-bullying
programs and social skills training programs. School-management programs are probably the

Page 139
broadest approach that comprises all aspects of school life and embodies elements of
universal and selective prevention. School management programs initiate and coordinate
a planned process of change aimed to improve the general functioning of the school and
create a safe and supportive environment for the academic and social development of
children. This can include modifying the decision-making processes, improving the
interactions amongst staff, pupils and parents, changing the curriculum, promoting
teacher development, or implementing monitoring mechanisms. School management
programs that are mainly aimed at improving school discipline may specifically focus on
school ethos and school-wide rules, health policies, classroom management, and
disciplinary procedures. Classroom management programs provide teachers with
preventive strategies and techniques that help to maintain classroom discipline, create a
supportive educational environment, and enhance students’ positive behavior. Current
evidence suggests that improvements in classroom management can reduce disruptive,
antisocial and aggressive behavior in the classroom considerably. Anti-bullying programs
aim to change the processes that enable bullying. To this end, they attempt to stop the
implicit support for bullies by promoting children’s awareness of bullying and its
consequences. In addition, they enhance children’s skills to respond effectively to
bullying. Finally, they sensitize teachers and parents to the problem and provide them
with clear rules about how to intervene. School-based social skills training programmes
are based on social learning and problem solving theories. Their goal is to enhance
individuals’ socio-cognitive, socio-emotional, and behavioral skills in order to regulate
maladaptive behaviors.
Research suggests that evidence-based school-based programmes can contribute to
reducing adolescent problem behavior. The introduction of such approaches in the
context of Uruguayan schools would require careful consideration and should be
accompanied by high-quality evaluation.
Improve the Legitimacy of the Police
A specific area of concern that emerged in the present study was the extent to
which adolescents in Montevideo distrust the major institution in modern society
responsible for controlling violence and crime, namely the police. The vast majority of
adolescents in Montevideo, namely 77% of the respondents, do not trust the police.
Similar proportions of adolescents believe that the police do not apply the law equally to
everybody, that the police is dishonest, and that they treat people without respect. These
figures show a widespread lack of police legitimacy amongst young people in
Montevideo.

Page 140
As we have shown in this report, a widespread lack of trust into the work of the
police likely contributes to problems with violence and crime in Montevideo. For one,
lacking confidence in the police may result in fewer victims reporting crimes to the police
or other authorities, which reduces the chances that victims can be helped and the
perpetrators can be taken to justice. Also, in any society where the police authorities are
not seen to work for the rule of law and to help the delivery of justice there is a danger
that citizens will resort to self-justice, and that young people feel less obliged to comply
with the law.
We therefore believe that strategies to improve the perception of the police should
be considered as an important component of an overall approach to reducing youth
violence. Such strategies probably require a combination of different measures aimed at
improving the reputation of the police in the general public, but also to make the daily
work of the police more efficient and trustworthy, and more responsive to community
needs. A recent meta-analysis has shown that strategies of legitimacy policing can help to
increase compliance, satisfaction with the police and self-reported victimization
(Mazerolle, Bennett, & Davis, 2013).
Reduce Early Access to Psychoactive Substances and Weapons
Reducing access to firearms, alcohol, and drugs is one of the main cornerstones of
the violence reduction strategies recommended by the World Health Organization
(Violence Prevention Alliance, 2012). The data presented in this report suggest that by
far the most important psychoactive substance consumed by young people in
Montevideo is alcohol. A majority of 15-year olds has consumed alcoholic beverages at
least once during the past 12 months, and a substantial minority of approximately 5%
consumes alcohol beverages at least once a week. In line with other studies conducted in
Uruguay (HBSC study) and international findings frequent consumption of alcohol at age
15 is strongly associated both with the risk of violent victimization and violent behavior.
The current drinking age in Uruguay is age 18. We therefore recommend
considering measures that reduce the availability of alcohol beverages to young people,
based on a more consistent enforcement of the existing legal framework. Such measure
may include tighter controls over age in supermarkets and stores, higher penalties for
bars and restaurants that sell alcohol to persons under age 18, and criminal sanctions for
parents who allow their children to drink alcohol.
Illegal drugs are much less common amongst adolescents in Montevideo than
alcohol. However, the present study find that substantial minorities of adolescents at age
15 have consumed cannabis and amphetamines, and a small minority has consumed hard

Page 141
drugs. The findings in this study suggest that consumption of drugs at age 15 is
correlated with an increased probability of involvement in crime and violent behavior.
The pioneering legal framework of Uruguay has made cannabis consumption legal
from age 18 onwards. From the perspective of the prevention of youth violence we
believe it is desirable to monitor closely how the legalisation affects the consumption of
psychoactive substances at younger ages. We also believe that the present evidence
strongly suggests that early onset of any kind of chronic substance use – whether legal or
illegal - is a risk factor for academic failure and behavior difficulties.
Reducing Street Violence and Robbery
A range of data suggests that adolescents in Montevideo experience relatively
elevated levels of group violence and violence with instrumental goals such as robbery
and extortion. This includes findings on the high prevalence of robbery victimisation and
results about the proportion of adolescents in Montevideo who are members of gangs
that commit robberies, extort protection money or carry weapons. Members of gangs are
far over-proportionally involved in violence and in cities where pertinent research has
been conducted a small number of core members have regularly been found to be
responsible for the overwhelming part of the most serious youth violence.
We therefore recommend that the authorities in Montevideo consider specific
strategies aimed at reducing youth violence in public places. Some of these strategies
entail targeted police interventions and research-based problem-oriented policing
initiative that entailed the formation of an interagency working group, the utilization of
the best available research techniques, and continuous adaptation of the intervention
based on observations of success.

Page 142
References
AGEV - OPP. (2014). Rendicion de cuentas y balance presupuestal. Parte I. Contexto y Resultados en Areas Programaticas. Montevideo.
Agnew, R. (1992). FOUNDATION FOR A GENERAL STRAIN THEORY OF CRIME AND DELINQUENCY * ASSOCIATION / SOCIAL LEARNING. Criminology, 30, 47–88. doi:10.1111/j.1745-9125.1992.tb01093.x
Akers, R. (2010). The Challenge of Cross-Cultural Testing of Theory in Criminology. In N. 18. http://my. ilstu. edu/~dkwak/KSCA/annualmeeting. htm. 4th KSCA Annual Meeting, San Francisco (Ed.), .
Akers, R. A. (2009). Social learning and social structure: a general theory of crime and deviance (N.J: Trans.). New Brunswick.
Akers, R. L., & Warr, M. (2003). Companions in Crime: The Social Aspects of Criminal Conduct. Contemporary Sociology. doi:10.2307/3089208
Aloisio, C., Chouhy, C., Trajtenberg, N., & Vigna, A. (2009). Jóvenes en conflicto con la ley: una mirada a las instituciones de rehabilitación desde la perspectiva de género. In Infancia, adolescencia y políticas sociales (Estudios d.). Montevideo.
Anderson, C. A. (2004). An update on the effects of playing violent video games. Journal of Adolescence. doi:10.1016/j.adolescence.2003.10.009
Anderson, C. A., Gentile, D. A., & Buckley, K. E. (2007). Violent video game effects on children and adolescents: Theory, research, and public policy. Violent video game effects on children and adolescents: Theory, research, and public policy. Retrieved from http://ovidsp.ovid.com/ovidweb.cgi?T=JS&PAGE=reference&D=psyc5&NEWS=N&AN=2006-23323-000
ANEP. (2010). Primer Informe Uruguay en Pisa 2009 (pp. 1 – 247). Montevideo.
ANEP - CODICEN. Estatuto del Estudiante de Educación Media. Acta No 47 del CODICEN. Normativa Vigente, 8 de julio de 2005 (2005). Accesible en: http://www.utu.edu.uy/Normativa%20Vigente/ESTATUTO%20DEL%20ESTUDIANTE%20DE%20EDUCACION%20MEDIA.pdf.
ANEP - CODICEN. (2009). Uruguay en el Segundo Estudio Regional Comparativo y Explicativo (SERCE). Informe nacional. Montevideo.
ANEP-OPP-UnaONU. (2010). Encuesta nacional de convivencia en los centros educativos. Documento de difusión. Uruguay.
Anfitti, V., Rios, A., & Menese, P. (2013). Desprotección Social en la juventud y delito. ¿De qué manera el riesgo educativo impacta en el comienzo de trayectorias delictivas? In INJU-MIDES. Jóvenes, instituciones y delito. Número 3 (INJU-MIDES.). Montevideo.

Page 143
Arbesun, R. (2010). Detenciones policiales e intervenciones policiales en adolescentes y jóvenes: serie histórica 1980-2004. Espacio Abierto, Revista Del CIEJ-AFJU, Número 12,, 70–80.
Arroyo, A., De Armas, G., Retamoso, G., & Vernazza, L. (2012). Observatorio de los derechos de la infancia y la adolescencia en Uruguay. Montevideo.
Averdijk, M., Mu ller-Johnson, K., & Eisner, M. (2012). Sexual victimization of children and adolescents in Switzerland. Zurich.
Bachman, R., Paternoster, R., & Ward, S. (1992). The rationality of sexual offending: Testing a deterrence/rational choice conception of sexual assault. Law and Society Review, 26, 343–372. doi:10.2307/3053901
Baldry, A. C., & Farrington, D. P. (2000). Bullies and Delinquents : Personal Characteristics and Parental Styles. Journal of Community & Applied Social Psychology, 10, 17–31. doi:10.1002/(SICI)1099-1298(200001/02)10:1<17::AID-CASP526>3.0.CO;2-M
Baldry, A., & Farrington, D. P. (2005). Protective factors as moderators of risk factors in adolescence bullying. Social Psychology of Education, 8, 263 – 284.
Barboza, G. E., Schiamberg, L. B., Oehmke, J., Korzeniewski, S. J., Post, L. A., & Heraux, C. G. (2009). Individual characteristics and the multiple contexts of adolescent bullying: An ecological perspective. Journal of Youth and Adolescence, 38, 101–121. doi:10.1007/s10964-008-9271-1
Barcelo, L. (2005). ¿De qué hablamos cuando hablamos de escuela?: representaciones sociales y prácticas educativas en un contexto de exclusión. Estudio de caso. Universidad Udelar.
Baridon, D. (2010). Estudio de la violencia escolar en los centros de educación media de Juan Lacaze. Universidad de Alcalá. Alcalá de Henares.
Bayce, R. (2011). Menores estigmatizados y difamados. Revista de La Asociacion de Educadores Sociales Del Uruguay.
Benbenishty, R., & Astor, R. A. (2012). Making the Case for an International Perspective on School Violence: Implications for Theory, Research, Policy and Assessment. In Shane R. Jimerson, Amanda B. Nickerson, Matthew J. Mayer and Michael J. Furlong (ed.) Handbook of School violence and school safety (Routledge., pp. 15 – 26).
Bowers, L., Smith, P. K., & Binney, V. (1994). Perceived Family Relationships of Bullies, Victims and Bully/Victims in Middle Childhood. Journal of Social and Personal Relationships. doi:10.1177/0265407594112004
Bowes, L., Arseneault, L., Maughan, B., Taylor, A., Caspi, A., & Moffitt, T. E. (2009). School, neighborhood, and family factors are associated with children’s bullying involvement: a nationally representative longitudinal study. Journal of the American Academy of Child and Adolescent Psychiatry, 48, 545–553. doi:10.1097/CHI.0b013e31819cb017

Page 144
Briceño-León, R., Villaveces, A., & Concha-Eastman, A. (2008). Understanding the uneven distribution of the incidence of homicide in Latin America. International Journal of Epidemiology, 37, 751–757. doi:10.1093/ije/dyn153
Brookmeyer, K. A., Fanti, K. A., & Henrich, C. C. (2006). Schools, parents, and youth violence: a multilevel, ecological analysis. Journal of Clinical Child and Adolescent Psychology : The Official Journal for the Society of Clinical Child and Adolescent Psychology, American Psychological Association, Division 53, 35, 504–514. doi:10.1207/s15374424jccp3504_2
Bryant, B. K. (1992). Conflict resolution strategies in relation to children’s peer relations. Journal of Applied Developmental Psychology. doi:10.1016/0193-3973(92)90004-2
Buhs, E. S., Ladd, G. W., & Herald, S. L. (2006). Peer exclusion and victimization: Processes that mediate the relation between peer group rejection and children’s classroom engagement and achievement? Journal of Educational Psychology. doi:10.1037/0022-0663.98.1.1
Cajigas de Segredo, N., Kahan, E., Luzardo, M., Najson, S., Ugo, C., & Zamalvide, G. (2006). Agresión entre pares (bullying) en un centro educativo de Montevideo: Estudio de las frecuencias de los estudiantes de mayor riesgo. Revista Médica Del Uruguay, Montevideo, 22, 143–151.
Cajigas de Segredo, N., Khan, E., Luzardo, M., Najson, S., & Zamalvide, G. (2004). Escala de agresión entre pares para adolescentes y principales resultados. Acción Psicológica, Facultad de Psicologia, 3(3), 173–186.
Cajigas, N., Luzardo, M., Mungay, M., & Kahan, E. (2013). Una mirada psicológica de la violencia en los centros educativos: prevalencia de afectos, actitudes y conductas negativas de adolescentes del secundario público de Montevideo, Uruguay (Editorial .). Montevideo.
Candace, C., \, Zanotti, C., Morgan, A., Currie, D., Looze, M. de, … Barnekow, V. (2012). Social determinants of health and well-being among young people Health Behaviour in School-aged Children (HBSC) study: international report from the 2009/2010 survey. Copenhagen.
Cano, A. (2014). Pobres peligrosos. Análisis del proceso de criminalización de la pobreza y la juventud en uruguay y de los desafíos que representa para la psicología comunitaria. Athenea Digital, 14(1), 91 – 109.
Cardozo, S. (2010). El comienzo del fin: las decisiones de abandono durante la Educación Media y su incidencia en las trayectorias. In Fernandez, Tabare (ed) La desafiliación en la Educación Media y Superior de Uruguay: conceptos, estudios y políticas. Central de Impresiones S.A.
Castillo, F. (2013). Una aproximación etnográfica a las representaciones de la legalidad y la ilegalidad en el asentamiento Chacarita. In INJU-MIDES. Jóvenes, instituciones y delito. Número 3. Montevideo.
CEPAL. (2013). Panorama Social de America Latina.

Page 145
Chouhy, C., Trajtenberg, N., & Vigna, A. (2010). Algunos mitos sobre los jo venes en conflicto con la ley: ¿precoces, violentos, armados, drogados y reincidentes? In SERPAJ, No 3, (SERPAJ.). Montevideo.
Chouhy, C., Vigna, A., & Trajtenberg, N. (2010). Algunos mitos sobre los jo venes en conflicto con la ley: ¿precoces, violentos, armados, drogados y reincidentes? doi:in SERPAJ, No 3, Montevideo, Uruguay
Christakis, D. A., Zimmerman, F. J., DiGiuseppe, D. L., & McCarty, C. A. (2004). Early television exposure and subsequent attentional problems in children. Pediatrics, 113, 708–713. doi:10.1542/peds.113.4.917-a
Cohen, A. (1955). Delinquent boys: The culture of the gang (New York: .). New York.
Cohen, J., & Silva Balerio, D. (2003). Investigación sobre las infracciones juveniles y las sanciones judiciales aplicadas a adolescentes en Montevideo. Montevideo.
Cornell, D., & Cole, J. C. M. (2012). Assesment of bullying. In Shane R. Jimerson, Amanda B. Nickerson, Matthew J. Mayer and Michael J. Furlong (ed.) Handbook of School violence and school safety (Routledge,., pp. 289 – 304).
Dammert, L., Salazar, F., Montt, C., & Gonzalez, P. (2010). Crimen e Inseguridad: indicadores para las Americas.
De Martino, M., & Gabin, B. (1998). Hacia un Enfoque Integral de la Minoridad Infractora (Carlos Alv.). Montevideo.
Delisi, M., Hochstetler, A., & Murphy, D. S. (2003). Self-control behind bars: A validation study of the Grasmick et al. scale. Justice Quarterly. doi:10.1080/07418820300095521
Demaray, M. K., Malecki, C. K., Jenkins, L. N., & Westermann, L. D. (2012). Social Support in the Lives of Students Involved in Aggressive and Bullying Behaviors. In HANDBOOK OF SCHOOL VIOLENCE AND SCHOOL SAFETY: INTERNATIONAL RESEARCH AND PRACTICE, 2ND EDITION (pp. 57–67).
Deus Viana, A., & Gonzalez Perret, D. (coord. . (2004). Juicios y Silencios. Los Derechos Humanos de los Niños y Adolescentes en el Proceso de Infracción a la Ley Penal en Uruguay (Konrad Ade.). Montevideo.
Dishion, T. J., & Piehler, T. F. (2009). Deviant by design: Peer contagion in development, interventions, and schools. In Handbook of peer interactions, relationships, and groups. (pp. 589–602). Retrieved from http://libproxy.tulane.edu:2048/login?url=http://search.ebscohost.com/login.aspx?direct=true&db=psyh&AN=2008-19117-032&site=ehost-live&scope=site
Dominguez, P., & Silva Balerio, D. (2014). Autonomía anticipada. Tramas y trampas de los adolescentes institucionalizados por protección (Unicef y L.). Montevideo.

Page 146
Due, P., Holstein, B. E., Lynch, J., Diderichsen, F., Gabhain, S. N., Scheidt, P., & Currie, C. (2005). Bullying and symptoms among school-aged children: International comparative cross sectional study in 28 countries. European Journal of Public Health. doi:10.1093/eurpub/cki105
Duncan, R. D. (2004). The impact of family relationships on school bullies and their victim. In In D. L. Espelage & S. M. Swearer (Eds.), Bullying in American schools: A social ecological perspective on prevention and intervention (Mahwah, NJ., pp. 227 – 244). London.
Eisner, M., & Malti, T. (2014). The Development of Aggressive Behavior and Violence. In Michael E. Lamb and Cynthia Garcia Coll (Eds.) Handbook of Child Psychology and Developmental Science (7th editio.).
Eisner, M., Manzoni, P., & Ribeaud, D. (2000). Gewalterfahrungen von Jugend- lichen. Opfererfahrungen und selbst berichtete Gewalt bei Schu lerinnen und Schu lern im Kanton Zu rich (Aarau: Sau.). Zurich.
Eisner, M., & Ribeaud, D. (2003). Erklärung von Jugendgewalt - eine Übersicht über zentrale Forschungsbefunde. In Raithel, J. & Mansel, J. (Hg.), Kriminalität und Gewalt im Jugendalter. Hell- und Dunkelfeldbefunde im Vergleich. (Weinheim &., pp. 182–206). Weinheim & München: Juventa.
Elster, J. (2007). Explaining Social Behaviour: More Nuts and Bolts for The Social Sciences. More Nuts and Bolts for The Social Sciences. Retrieved from Elster 2007 - Explaining social behaviour.pdf TS - WorldCat
Enzmann, D., Marshall, I. H., Killias, M., Junger-Tas, J., Steketee, M., & Gruszczynska, B. (2010). Self-reported youth delinquency in Europe and beyond: First results of the Second International Self-Report Delinquency Study in the context of police and victimization data. European Journal of Criminology. doi:10.1177/1477370809358018
Espelage, D. L., Bosworth, K., & Simon, T. R. (2000). Examining the social context of bullying behaviors in early adolescence. Journal of Counseling and Development, 78, 326–333. doi:10.1002/j.1556-6676.2000.tb01914.x
Espelage, D. L., Holt, M. K., & Henkel, R. R. (2003). Examination of Peer-Group Contextual Effects on Aggression During Early Adolescence. Child Development, 74(1), 205 – 220.
Espinosa, P., & Clemente, M. (2013). Self-transcendence and Self-oriented Perspective as Mediators between Video game Playing and Aggressive Behaviour in Teenagers. Journal of Community & Applied Social Psychology, 23, 68–80. doi:10.1002/casp.2138
Faris, R., & Ennett, S. (2012). Adolescent aggression: The role of peer group status motives, peer aggression, and group characteristics. Social Networks, 34, 371–378. doi:10.1016/j.socnet.2010.06.003
Farrington, D. P. (1998). Predictors, Causes, and Correlates of Male Youth Violence. Crime and Justice. doi:10.1086/449284

Page 147
Farrington, D. P., & Baldry, A. C. (2010). Individual risk factors for school bullying. Journal of Aggression, Conflict and Peace Research. Retrieved from http://ovidsp.ovid.com/ovidweb.cgi?T=JS&PAGE=reference&D=psyc6&NEWS=N&AN=2011-02862-002
Fekkes, M., Pijpers, F. I. M., Fredriks, A. M., Vogels, T., & Verloove-Vanhorick, S. P. (2006). Do bullied children get ill, or do ill children get bullied? A prospective cohort study on the relationship between bullying and health-related symptoms. Pediatrics, 117, 1568–1574. doi:10.1542/peds.2005-0187
Felson, R., & Staff, J. (2006). Explaining the academic performance-delinquency relationship. Criminology, 44, 299–319. doi:10.1111/j.1745-9125.2006.00050.x
Ferguson, C. J. (2007). Media Violence Effects and Violent Crime: Good Science or Moral Panic? In Chapter 3 (pp. 37–56).
Ferguson, C. J. (2011). The influence of television and video game use on attention and school problems: A multivariate analysis with other risk factors controlled. Journal of Psychiatric Research, 45, 808–813. doi:10.1016/j.jpsychires.2010.11.010
Ferguson, C. J., & Kilburn, J. (2009). The public health risks of media violence: a meta-analytic review. The Journal of Pediatrics, 154, 759–763. doi:10.1016/j.jpeds.2008.11.033
Fernandez, T. (2007). Uruguay en PISA 2006. Montevideo.
Fernandez, T., Cardozo, S., & Pereda, C. (2010). Desafiliación y desprotección social. In Fernandez, Tabare (ed) La desafiliación en la Educación Media y Superior de Uruguay: conceptos, estudios y políticas. Montevideo: Central de Impresiones S.A.
Fessler, D. (2013). En busca del pasado ideal. Delitos, delincuentes y “menores.” In González, C; Leopold, S; López, L y Martinis, P. (coords.). Los sentidos del castigo. El debate uruguayo sobre la responsabilidad en la infracción adolescente (Trilce- CS.). Montevideo.
Finkelhor, D. (2013). Developmental Victimology. The comprehensive study of childhood victimization. In Robert C. Davis, Arthur J. Lurgio and Susan Herman (eds) Victims of Crime (SAGE Publi., pp. 75 – 106). California.
Finkelhor, D., Ormrod, R. K., & Turner, H. A. (2007). Polyvictimization and trauma in a national longitudinal cohort. Development and Psychopathology, 19, 149–166. doi:10.1017/S0954579407070083
Finkelhor, D., Ormrod, R., Turner, H., & Hamby, S. L. (2005). The victimization of children and youth: a comprehensive, national survey. Child Maltreatment, 10, 5–25. doi:10.1177/1077559504271287
Flouri, E., & Buchanan, A. (2003). The Role of Mother Involvement and Father Involvement in Adolescent Bullying Behavior. Journal of Interpersonal Violence. doi:10.1177/0886260503251129

Page 148
Fonzi, A., Genta, M. L., Menesini, E., Bacchini, D., Bonino, S., & Costabile, A. (1999). Italy. In Smith, P. K, Morita, Y., Junger-Tas, J., Olweus, D., Catalano, R. & Slee, P. (eds.) The Nature of School Bullying: A Cross-National Perspective (Routledge., pp. 140 – 156). USA and Canada.
Fraiman, R., & Rossal, M. (2009). Si tocás pito te dan cumbia. Esbozo antropológico de la violência en Montevideo (Ministerio.). Montevideo.
Fraiman, R., & Rossal, M. (2011). De calles, trancas y botones (Ministerio.). Montevideo.
Frisén, A., Jonsson, A.-K., & Persson, C. (2007). Adolescents’ perception of bullying: who is the victim? Who is the bully? What can be done to stop bullying? Adolescence, 42, 749–761.
Funk, J. B., Baldacci, H. B., Pasold, T., & Baumgardner, J. (2004). Violence exposure in real-life, video games, television, movies, and the internet: Is there desensitization? Journal of Adolescence. doi:10.1016/j.adolescence.2003.10.005
Furlong, M. J., Sharkey, J. D., Felix, E., Tanigawa, D., & Greif-Green, J. (2010). Bullying assessment: A call for increased precision of self-reporting procedures. In In S. R. Jimerson, S. M. Swearer, & D. L. Espelage (Eds.), The international handbook of school bullying (Routledge., pp. pp. 329–346). New York:Routledge.
Gentile, D. (2013). Catharsis and Media Violence: A Conceptual Analysis. Societies, 3, 491–510. doi:10.3390/soc3040491
Giorgi, V., Kaplun, G., & Moras, L. (2012). La violencia está en los otros: la palabra de los actores educativos (UR. Comisi.). Montevideo.
Goldthorpe, J. H. (1997). The “Goldthorpe” class schema: Some observations on conceptual and operational issues in relation to the ESRC review of governmental social classifications. In Rose, D. and K. O’Reilly (eds) Constructing classes: Towards a new social classification for the UK (pp. 40–48). UK, London: Office for National Statistics.
Gonzalez, C. (2011). El Tratamiento Socio jurídico de las Infracciones Adolescentes en Uruguay,. Revista de Trabajo Social, 11(1), 1 – 9.
Gonzalez, C., & Leopold, S. (2013). De crisis y reformas: el actual funcionamiento del sistema penal juvenil en Uruguay desde la perspectiva de sus actores y expertos. In González, C; Leopold, S; López, L y Martinis, P. (coords.). Los sentidos del castigo. El debate uruguayo sobre la responsabilidad en la infracción adolescente (Trilce- CS.). Montevideo.
Gottfredson, D. (2001). Schools and Delinquency (Cambridge .). Cambridge.
Gottfredson, M. (1986). Substantive Contributions of Victimization Surveys. In in: Tonry, M. und N. Morris (eds.), Crime and Justice. An Annual Review of Research, Vol. 7,. Chicago: Chicago University Press.
Gottfredson, M., & Hirschi, T. (1990). A general theory of crime. Stanford, CA: Stanford University Press.

Page 149
Grasmick, H. G., Tittle, C. R., Bursik, R. J., & Arneklev, B. J. (1993). Testing the Core Empirical Implications of Gottfredson and Hirschi’s General Theory of Crime. Journal of Research in Crime and Delinquency. doi:10.1177/0022427893030001002
GSHS. (2012). II Encuesta Mundial de Salud Adolescente (p. 146). Montevideo.
Hanish, L. D., Kochenderfer-Ladd, B., Fabes, R. A., Martin, C. L., & Denning, D. (2004). Bullying Among Young Children: The influence of Peers and Teachers. In Swearer, S. M., & Espelage, D. L. (2004). Introduction: A Social-Ecological Framework of Bullying Among Youth. Bullying in American Schools: A Social-Ecological Perspective on Prevention and Intervention (Lawrence E., pp. 141 – 160). London.
Haynie, D. L., Nansel, T., Eitel, P., Crump, A. D., Saylor, K., Yu, K., & Simons-Morton, B. (2001). Bullies, Victims, and Bully/Victims:: Distinct Groups of At-Risk Youth. The Journal of Early Adolescence. doi:10.1177/0272431601021001002
Hedstrom, P. (2005). Dissecting the Social. On the principles of analytical sociology. Cambridge: Cambridge University press.
Hedstrom, P., & Swedberg, R. (1998). Social Mechanisms: An Introductory Essay. In Social Mechanisms An Analytical Approach to Social Theory (pp. 1–31). doi:10.1017/CBO9780511663901.001
Hirschi, T. (1969). A Control Theory of Delinquency. Causes of Delinquency, 16–26.
Hirschi, T. (2004). Self-control and crime. In Handbook of self-regulation: Research, theory, and applications (pp. 537–552).
Hoffmann, J. P., Erickson, L. D., & Spence, K. R. (2013). Modeling the Association Between Academic Achievement and Delinquency: an Application of Interactional Theory. Criminology, 51, 629–660. doi:10.1111/1745-9125.12014
Hopf, W. H., Huber, G. L., & Weib, R. H. (2008). Media violence and youth violence: A 2-year longitudinal study. Journal of Media Psychology: Theories, Methods, and Applications, 20(3), 79 – 96.
Huesmann, L. R., & Taylor, L. D. (2006). The role of media violence in violent behavior. Annual Review of Public Health, 27, 393–415. doi:10.1146/annurev.publhealth.26.021304.144640
Iglesias, S. (2000). El Abandono Existe y se Crea. In C. de F. y E. del INAME (Ed.), El Abandono y su Construcción Punitiva. Serie Material de Apoyo (pp. 2 – 16). Montevideo.
Imbusch, P., Misse, M., & Carrión, F. (2011). Violence research in Latin America and the Caribbean: A literature review. International Journal of Conflict and Violence, 5, 87–154. Retrieved from http://works.bepress.com/fernando_carrion/483/
INE. (2013). Anuario estadístico del Instituto Nacional de Estadística. Montevideo.
Jensen, G. F., & Brownfield, D. (1986). Gender, lifestyles, and victimization: beyond routine activity. Violence and Victims, 1, 85–99.

Page 150
Junger-Tas, J. (1992). An empirical test of social control theory. Journal of Quantitative Criminology, 8, 9–28.
Junger-Tas, J. (1994). Delinquency in thirteen countries: some preeliminary conclusions, in Delinquent Behaviour Among young people in the western world. First results of the International Self report delinquency study, edited by Josine Junger Tas, Gert-Jan Terlow and Malcom W. Amsterdam.
Junta Nacional de Drogas. (2011a). 5ta Encuesta Nacional sobre Consumo de Drogas en Estudiantes de Enseñanza Media 2011. Entre placer y displacer: los adolescentes en su laberinto. Comportamiento de riesgo y uso de drogas en adolescentes escolarizados (p. 62). Montevideo.
Junta Nacional de Drogas. (2011b). Sobre ruido y nueces. Consumo de drogas legales e ilegales en la adolescencia. Montevideo.
Kantonspolizei Zürich. (2014). PKS-Polizeiliche Kriminalstatistik, Jahresbericht 2013. http://www.kapo.zh.ch/internet/sicherheitsdirektio.
Karstedt, S. (2001). Comparing cultures, comparing crime: Challenges, prospects and problems for a global criminology. Crime Law and Social Change, 36, 285–308. doi:10.1023/a:1012223323445
Kaztman, R. (1996). Marginalidad e Integración Social en Uruguay. Montevideo.
Kessler, G. (2004). Sociologia del delito amateur. Buenos Aires: Ediciones Paidos Iberica.
Krug, E. G., Dahlberg, L. L., Mercy, J. A., Zwi, A. B., & Lozano, R. (2002). World Report on Violence and Health. Le Journal médical libanais. The Lebanese medical journal (Vol. 51, p. 346). Retrieved from http://www.ncbi.nlm.nih.gov/pubmed/15298158
Krug, E., Mercy, J., Dahlberg, L., & Zwi, A. (2002). The world report on violence and health. The Lancet, 360, 1083–8. doi:10.1016/S0140-6736(02)11133-0
Lagos, M., & Dammert, L. (2012). La Seguridad Ciudadana. El problema principal de América Latina.
LaRusso, M., & Selman, R. (2011). Early adolescent health risk behaviors, conflict resolution strategies, and school climate. Journal of Applied Developmental Psychology, 32, 354–362. doi:10.1016/j.appdev.2011.05.003
Lauritsen, J. L., & Laub, J. H. (2007). Understanding the link between victimization and offending: New reflections on an old idea. In Surveying the 21st century (pp. 55–75).
Lauritsen, J. L., Sampson, R. J., & Laub, J. H. (1991). The link between offending and victimization among adolescents. Criminology, 29, 265–292. doi:10.1111/j.1745-9125.1991.tb01067.x
Longshore, D., Turner, S., & Stein, J. A. (1996). Self-control in a criminal sample: An examination of construct validity. Criminology, 34, 209–228. doi:10.1111/j.1745-9125.1996.tb01203.x

Page 151
Lopez, A., & Palummo, J. (2013). Delincuencia Juvenil en la ciudad de Montevideo. (Adriana Cardoso ABC/D, Ed.). Montevideo.
Lopez, A., & Palummo, J. (2013). Delincuencia Juvenil en la ciudad de Montevideo (Adriana Ca.). Montevideo.
Lopez Gallego, L., & Padilla, A. (2013). Responsabilidad adolescente y prácticas «psi». Relaciones «peligrosas». In González, C; Leopold, S; López, L y Martinis, P. (coords.). Los sentidos del castigo. El debate uruguayo sobre la responsabilidad en la infracción adolescente (Trilce- CS.). Montevideo.
Lozano, F. (2010). Un caso grave de bullying. Rol del médico en atención primaria. Rev. Médica Uruguaya, 26, 168–171.
Lozano, F., Gimenez, A., Cabrera, J. M., Fernandez, A., Lewy, E., Salas, F., … Olivera, V. (2010). Violencia: Caracterización de la población adolescente de instituciones educativas de la región oeste de Montevideo-Uruguay en relación a la situación de violencia en que viven (Premio Nac.). Montevideo.
Ma, L., Phelps, E., Lerner, J. V., & Lerner, R. M. (2009). Academic Competence for Adolescents Who Bully and Who Are Bullied: Findings from the 4-H Study of Positive Youth Development. Journal of Early Adolescence, 29(6), 862 – 897.
Mahoney, J. (2001). Beyond Correlational Analysis Recent Innovations in Theory and Method. Sociological Forum, 16, 575. doi:10.1023/A:1011912816997
Martinez, F., & Moyano, L. (2013). Los nenes con los nenes. Las nenas con las nenas. Análisis de las lógicas institucionales de los centros de privación de libertad para adolescentes en Uruguay desde la perspectiva de género. In INJU-MIDES. Jóvenes, instituciones y delito. Número 3 (INJU - MID.). Montevideo.
Martinis, P., & Flous, C. (2013). Una mirada pedagógica sobre algunas discusiones en torno a la responsabilidad penal adolescente. In González, C; Leopold, S; López, L y Martinis, P. (coords.). Los sentidos del castigo. El debate uruguayo sobre la responsabilidad en la infracción adolescente (Trilce- CS.). Montevideo.
Mazerolle, L., Bennett, S., & Davis, J. (2013). Legitimacy in policing: a systematic review. … systematic reviews (pp. 1–147). doi:10.4073/csr.2013.1
Mazur, M. (2010). Dinámica Bullying y Rendimiento académico en adolescentes. Tesis de grado de la Licenciatura en Psicología de la Universidad Católica del Uruguay.
Ministerio de Salud Publica. (2012). Presentacion de resultados de la II Encuesta Nacional de Salud Adolescente. Montevideo.
Ministerio del Interior. (2009). Panorama de la Violencia, la Criminalidad y la inseguridad en Uruguay. Montevideo: Ed. Trilce.
Ministerio del Interior. (2014). Observatorio Nacional sobre Violencia y Criminalidad. https://www.minterior.gub.uy/observatorio/.

Page 152
Ministerio del Interior-EQUIPOS/MORI. (2011). Encuesta de opinión pública sobre niveles de victimización, percepciones de inseguridad y grados de confianza institucional en el Uruguay. Montevideo.
Moras, L. E. (1992). Los Hijos del Estado. Fundación y crisis del modelo del modelo de protección – control de menores en Uruguay (Depto. de .). Montevideo.
Mössle, T., Kleimann, M. & Rehbein, F. (2007). Bildschirmmedien im Alltag von Kindern und Jugendlichen. Problematische Mediennutzungsmuster und ihr Zusammenhang mit Schulleistung und Aggressivität (Baden- Bad.).
Munyo, I. (2014a). The Juvenile Crime Dilemma. Review of Economic Dynamics.
Munyo, I. (2014b). The Juvenile Dilemma. Review of Economic Dynamics.
Nansel, T. R., Overpeck, M. D., Haynie, D. L., Ruan, W. J., & Scheidt, P. C. (2003). Relationships between bullying and violence among US youth. Archives of Pediatrics & Adolescent Medicine, 157, 348–353. doi:10.1097/00004703-200308000-00019
Nansel, T. R., Overpeck, M., Pilla, R. S., Ruan, W. J., Simons-Morton, B., & Scheidt, P. (2001). Bullying behaviors among US youth: prevalence and association with psychosocial adjustment. JAMA : The Journal of the American Medical Association, 285, 2094–2100. doi:10.1001/jama.285.16.2094
Nivette, A. E., & Eisner, M. (2012). Do legitimate polities have fewer homicides? A cross-national analysis. Homicide Studies. doi:10.1177/1088767912452131
Olweus, D. (1993). Bullying at school: What we know and what we can do (Cambridge,.). Cambridge.
Olweus, D., & Limber, S. P. (2010). Bullying in school: Evaluation and dissemination of the olweus bullying prevention program. American Journal of Orthopsychiatry, 80, 124–134. doi:10.1111/j.1939-0025.2010.01015.x
OPP-MIDES. (2013). Reporte Social 2013. Montevideo.
OPP/MIDES. (2013). Reporte Social 2013.
Ortega, R., & Merchan, J. A. M.-. (1999). Spain. In Smith, P. K, Morita, Y., Junger-Tas, J., Olweus, D., Catalano, R. & Slee, P. (eds ) The Nature of School Bullying: A Cross-National Perspective (Routledge., pp. 157 – 173). Canada and USA.
Owusu, A., Hoag, A., Weatherby, N. L., & Kang, M. (2012). The Association of Perceived Parental Understanding with Bullying Among Adolescents in Ghana, West-Africa. In Shane R. Jimerson, Amanda B. Nickerson, Matthew J. Mayer and Michael J. Furlong (ed.) Handbook of School violence and school safety (Routledge., pp. 175 – 189).
Palummo, J. (2008). Privados de Libertad: La Voz de los Adolescentes (Unicef – M.). Montevideo.

Page 153
Palummo, J. (2010). Justicia Penal Juvenil. Realidad, perspectivas y cambios en el marco de la aplicación del Código de la Niñez y la Adolescencia en Maldonado, Montevideo, Paysandú y Salto (UNICEF - F.). Montevideo.
Palummo, J. (coord. . (2006). Privados de libertad: la voz de los adolescentes (UNICEF - M.). Montevideo.
Palummo, J. (coord. . (2009). Discurso y Realidad. Segundo Informe de Aplicación del Código de la Niñez y la Adolescencia en Maldonado, Montevideo y Salto (UNICEF - M.). Montevideo.
Paternain, R. (coord. . (2008). Panorama de la violencia, la criminalidad y la inseguridad en el Uruguay. Montevideo.
Paternain, R., & Sanseviero, R. (2008). Violencia, inseguridad y miedos en Uruguay. ¿Qué tienen para decir las ciencias sociales? The Journal of Modern African Studies (Vol. 2, p. 213).
Paternoster, R., & Simpson, S. (2009). Sanction Threats and Appeals to Morality: Testing a Rational Choice Model of Corporate Crime. Journal of Law and Society Association, 30, 549–583. doi:10.2307/3054128
Pedernera, L., & Silva Balerio, D. (2004). La Construcción del Enemigo. Apuntes Para un Ensayo Sobre Adolescentes, Exclusiones e Infracciones. Revista Nosotros, 13 -14, 41 – 46.
Pellegrini, A. D., & Long, J. D. (2004). Part of the solution and part of the problem: The role of Peers in Bullying, Dominance, and Victimization During the Transition From Primary School Through Secondary School. In Swearer, S. M., & Espelage, D. L. (2004). Introduction: A Social-Ecological Framework of Bullying Among Youth. Bullying in American Schools: A Social-Ecological Perspective on Prevention and Intervention (Lawrence E., pp. 107 – 118). London.
Perez Algorta, G. (2004). Dinámica Bullying y Psicopatología en Adolescentes. Revista de La Sociedad de Psiquiatría Biológica Del Uruguay, 3, 15 – 25.
Pinheiro, P. S. (2006). World Report on Violence against Children: Secretary-General’s study on violence against children. New York.
Poder Judicial. (2013a). Anuarios Estadísticos 2012 y anteriores.
Poder Judicial. (2013b). Procedimientos infraccionales de adolescentes: indicadores sobre procesos concluidos en el año 2012. Montevideo.
Pozzoli, T., Gini, G., & Vieno, A. (2012). The Role of Individual Correlates and Class Norms in Defending and Passive Bystanding Behavior in Bullying: A Multilevel Analysis. Child Development, 83, 1917–1931. doi:10.1111/j.1467-8624.2012.01831.x
Pratt, T. C., & Cullen, F. T. (2000). The empirical status of Gottfredson and Girschi’s general theory of crime: A meta-analysis. Criminology, 38, 931–964. doi:10.1111/j.1745-9125.2000.tb00911.x

Page 154
Pratt, T. C., Cullen, F. T., Sellers, C. S., Thomas Winfree, L., Madensen, T. D., Daigle, L. E., … Gau, J. M. (2010). The Empirical Status of Social Learning Theory: A Meta-‐‑Analysis. Justice Quarterly. doi:10.1080/07418820903379610
Preacher, K. J. (2002). Calculation for the test of the difference between two independent correlation coefficients [Computer software]. Available from Http://quantpsy.org.
Ravela, P. (2004). Primer informe nacional PISA 2003. Montevideo.
Resnick, M. D., Ireland, M., & Borowsky, I. (2004). Youth violence perpetration: what protects? What predicts? Findings from the National Longitudinal Study of Adolescent Health. The Journal of Adolescent Health : Official Publication of the Society for Adolescent Medicine, 35, 424.e1–e10. doi:10.1016/j.jadohealth.2004.01.011
Ribeaud, D., & Eisner, M. (2008). Entwicklung von Gewalterfahrungen Jugendlicher im Kanton Zu rich. Schlussbericht zuhanden der Bildungsdirektion des Kantons Zu rich (Universita.). Zurich.
Ribeaud, D., & Eisner, M. (2009). Entwicklung von Gewalterfahrungen Jugendlicher im Kanton Zürich (Sauerlände.).
Ribeaud, D., & Eisner, M. (2010). Risk factors for aggression in pre-adolescence: Risk domains, cumulative risk and gender differences - Results from a prospective longitudinal study in a multi-ethnic urban sample. European Journal of Criminology. doi:10.1177/1477370810378116
Rigby, K. (2012). What Schools May Do to Reduce Bullying. In Shane R. Jimerson, Amanda B. Nickerson, Matthew J. Mayer and Michael J. Furlong (ed.) Handbook of School violence and school safety (Routledge., pp. 397 – 408).
Rodriguez, A. (2014). Desarrollo Economico y Disparidades Territoriales en Uruguay. Montevideo.
Rodriguez, E. (2002). Cultura juvenil y cultura escolar en la enseñanza media del Uruguay de hoy: un vínculo a construir. Revista Última Década, 16, 53 – 94.
Rodriguez, E. (2014). Convivencia en Centros educativos medios: situación, desafíos y propuestas. In INJU-MIDES. Plan de Acción de Juventudes 2015-2025. Estudios (INJU - MID.). Montevideo.
Roman, M., & Murillo, F. J. (2011). América Latina: violencia entre estudiantes y desempeño escolar. Revista CEPAL, 104(agosto), 37 – 54.
Rosenbaum, J. L., & Lasley, J. R. (1990). School, community context, and delinquency: Rethinking the gender gap. Justice Quarterly. doi:10.1080/07418829000090701
Rubin, K. H., Dwyer, K. M., Kim, A. H., Burgess, K. B., Booth-LaForce, C., & Rose-Krasnor, L. (2004). Attachment, Friendship, and Psychosocial Functioning in Early Adolescence. The Journal of Early Adolescence. doi:10.1177/0272431604268530

Page 155
Salmivalli, C. (2010). Bullying and the peer group: A review. Aggression and Violent Behavior. doi:10.1016/j.avb.2009.08.007
Sampson, R. J., & Bartusch, D. J. (1998). Legal Cynicism and (Subcultural?) Tolerance of Deviance: The Neighborhood Context of Racial Differences,. Law & Society Review,, Vol. 32,(No. 4,), pp. 777–804.
Sampson, R. J., & Lauritsen, J. L. (1990). Deviant Lifestyles, Proximity to Crime, and the Offender-Victim Link in Personal Violence. Journal of Research in Crime and Delinquency. doi:10.1177/0022427890027002002
Savage, J. (2004). Does viewing violent media really cause criminal violence? A methodological review. Aggression and Violent Behavior. doi:10.1016/j.avb.2003.10.001
Schreck, C. J., Miller, J. M., & Gibson, C. L. (2003). Trouble in the School Yard: a Study of the Risk Factors of Victimization at School. Crime & Delinquency. doi:10.1177/0011128703049003006
Sherman, L., Gottfredson, D., MacKenzie, D., Eck, J., Reuter, P., & Bushway, S. (1998). Preventing Crime: What Works, What Doesn’t, What’s Promising (pp. 1 – 19).
Shetgiri, R., Lin, H., & Flores, G. (2012). Identifying children at risk for being bullies in the United States. Academic Pediatrics, 12, 509–522. doi:10.1016/j.acap.2012.06.013
Shoemaker, D. J. (2009). Juvenile Delinquency (ROWMAN & L.).
Sijtsema, J. J., Veenstra, R., Lindenberg, S., & Salmivalli, C. (2009). Empirical test of bullies’ status goals: Assessing direct goals, aggression, and prestige. Aggressive Behavior, 35, 57–67. doi:10.1002/ab.20282
Skues, J. L., Cunningham, E. G., & Pokharel, T. (2005). The Influence of Bullying Behaviours on Sense of School Connectedness, Motivation and Self-Esteem. [References] 2209. Australian Journal of Guidance and Counselling. doi:10.1375/ajgc.15.1.17
Smith, P. K., Talamelli, L., Cowie, H., Naylor, P., & Chauhan, P. (2004). Profiles of non-victims, escaped victims, continuing victims and new victims of school bullying. The British Journal of Educational Psychology, 74, 565–581. doi:10.1348/0007099042376427
Stewart, E. A., Elifson, K. W., & Sterk, C. E. (2004). Integrating the general theory of crime into an explanation of violent victimization among female offenders. Justice Quarterly. doi:10.1080/07418820400095771
Swearer, S. M., Espelage, D. L., Koenig, B., Berry, B., Collins, A., & Lembeck, P. (2012a). A socio-ecological model for bullying prevention and intervention in early adolescence. Handbook of School Violence and School Safety: International Research and Practice (2nd Ed.). Retri
Swearer, S. M., Espelage, D. L., Koenig, B., Berry, B., Collins, A., & Lembeck, P. (2012b). A socio-ecological model for bullying prevention and intervention in early

Page 156
adolescence. Handbook of School Violence and School Safety: International Research and Practice (2nd Ed.).
Swearer, S. M., Espelage, D. L., Vaillancourt, T., & Hymel, S. (2010). What Can Be Done About School Bullying?: Linking Research to Educational Practice. Educational Researcher. doi:10.3102/0013189X09357622
Tapper, K., & Boulton, M. J. (2004). Sex differences in levels of physical, verbal, and indirect aggression amongst primary school children and their associations with beliefs about aggression. Aggressive Behavior, 30, 123–145. doi:10.1002/ab.20010
Tenenbaum, G. (2011). La discusión legislativa de la edad de imputabilidad en los anales de la recuperación democrática. Cualquier semejanza con la actualidad NO es pura coincidencia. Revista de Ciencias Sociales, 24(28), 127 – 147.
Thornberg, R., & Jungert, T. (2013). Bystander behavior in bullying situations: Basic moral sensitivity, moral disengagement and defender self-efficacy. Journal of Adolescence, 36, 475–483. doi:10.1016/j.adolescence.2013.02.003
Tittle, C. R., Antonaccio, O., Botchkovar, E., & Kranidioti, M. (2010). Expected utility, self-control, morality, and criminal probability. Social Science Research, 39, 1029–1046. doi:10.1016/j.ssresearch.2010.08.007
Trajtenberg, N. (2004). Uvas amargas. La situación de los adolescentes privados de libertad en el Uruguay (Fundación .). Montevideo.
Tseloni, A., & Pease, K. (2003). Repeat Personal Victimization: “Boosts”� or “Flags”? British Journal of Criminology, 43, 196–212.
Ttofi, M. M., & Farrington, D. P. (2008). Bullying: Short-term and long-term effects, ant he importance of Defiance Theory in explanation and prevention. Victims and Offenders, 3, 289 – 312.
Ttofi, M. M., Farrington, D. P., & Baldry, A. C. (2008). Effectiveness of Programmes to reduce School Bullying (p. 92). Stockholm.
Ttofi, M. M., Farrington, D. P., & Losel, F. (2012). School bullying as a predictor of violence later in life: A systematic review and meta-analysis of prospective longitudinal studies. Aggression and Violent Behavior. doi:10.1016/j.avb.2012.05.002
Turner, H. A. (2012). Recent Victimization Exposure and Suicidal Ideation in Adolescents<alt-title>Victimization Exposure and Suicidal Ideation</alt-title>. Archives of Pediatrics & Adolescent Medicine. doi:10.1001/archpediatrics.2012.1549
Turner, H. A., Finkelhor, D., & Ormrod, R. (2010). Poly-Victimization in a National Sample of Children and Youth. American Journal of Preventive Medicine, 38, 323–330. doi:10.1016/j.amepre.2009.11.012
Tyler, T., & Fagan, J. (2006). Legitimacy and Cooperation: Why Do People Help the Police Fight Crime in Their Communities? SSRN Electronic Journal, 231–275. doi:10.2139/ssrn.887737

Page 157
Tyler, T. R. (2008). Psychology and institutional design. Review of Law and Economics (symposium Issue on Law and Social Norms), 4(3), 801–887.
UN. (2013). Human development report 2013. UN Development Programme. doi:ISBN: 978-92-1-126340-4
UNICEF. (2013). Construcción de una caja de herramientas y análisis de legislacion y políticas públicas Para la protección de los niños, niñas y adolescentes contra todo tipo de violencias en las escuelas (p. 108). Panama.
Unnever, J. D., & Cornell, D. G. (2003). Bullying, Self-Control, and Adhd. Journal of Interpersonal Violence. doi:10.1177/0886260502238731
UNODC. (2010). La relación delito y droga en adolescentes infractores de la ley. Quinto informe Conjunto. Sistema Subregional de Información e Investigación sobre Drogas en Argentina, Bolivia, Chile, Colombia, Ecuador, Peru y Uruguay. disponible en http://www.unodc.org/documents/peruandecuador/Publicaciones/La_Relacion_Droga.pdf.
Unodc. (2011). Global Study on Homicide. UNODOC (pp. 1–125). doi:10.1016/j.jcv.2011.08.025
Uriarte, C. (1999). Control Institucional de la Niñez Adolescencia en Infracción. Un Programa Mínimo de Contención y Límites Jurídicos al Sistema Penal Juvenil (Las Penas de los Jóvenes) (Carlos Alv.). Montevideo.
Vazsonyi, A., Wittekind, J., Belliston, L., & Loh, T. (2004). Extending the general theory of crime to “The East”: Low self-control in Japanese late adolescents. Journal of Quantitative Criminology, 20, 189–216. doi:10.1023/B:JOQC.0000037731.28786.e3
Vernazza, L. (2013). Adolescencia y delito: seis contra argumentos al aumento del castigo. Espacio Abierto, Centro de Investigación de Estudios Judiciales (CIEJ-AFJU), 19(noviembre).
Violence Prevention Alliance. (2012). GLOBAL CAMPAIGN FOR VIOLENCE PREVENTION: PLAN OF ACTION FOR 2012-2020. Geneva.
Viscardi, N. (2003). Enfrentando la violencia en las escuelas: Un Informe de Uruguay. In Violência na Escola: América Latina e Caribe (UNESCO.). Brasilia.
Viscardi, N. (2006). Delitos, trayectorias de vida y procesos socializadores de jóvenes vinculados a Programas de Rehabilitación. Puertas cerradas, vida hacia adentro. Revista de Ciencias Sociales, Año XIX(No 23), 45 – 62.
Viscardi, N. (2007). Trayectorias delictivas y rehabilitación: caminos laberínticos de la configuración de futuro en jóvenes infractores. In Mazzei, E. (Org.). El Uruguay desde la Sociología IV (DS-FCS-UDE.). Montevideo.
Viscardi, N. (2008a). Violencia en las aulas: práctica educativa, conflicto escolar y exclusión social. In Paternain, R. & Sanseviero, R. (comp.): Violencia, inseguridad y miedos

Page 158
en Uruguay: ¿qué tienen para decir las ciencias sociales? (FESUR., pp. 145 – 160). Montevideo.
Viscardi, N. (2008b). Violencia y educación en Uruguay: ni tan nueva, ni tan violenta. In Paternain, R (coord.) Panorama de la violencia, la criminalidad y la inseguridad en el Uruguay (PNUD-Minis.). Montevideo.
Viscardi, N. (2011). Juventud, violencia y ciudadanía en el Uruguay del siglo XXI. Medios, justicia y educación. Análisis y propuestas (Friedrich-.). Montevideo.
Viscardi, N. (2012). Adolescentes infractoras. El lado femenino de la exclusión. In E. Trilce (Ed.), Paternain, R. & Rico, A. (coord.) “Uruguay. Inseguridad, Delito y Estado.” Montevideo.
Viscardi, N., & Alonso, N. (2013). Gramática(s) de la convivencia: un examen a la cotidianidad escolar y la cultura política en la Educación Primaria y Media en Uruguay. Montevideo.
Viscardi, N., & Barbero, M. (2010). Políticas para menores infractores en Uruguay: tendencias sociales e institucionales en base al papel desempeñado por el Poder Judicial, la Policía y la prensa. O Público E O Privado, 15(Janeiro/Junho).
VVAA. (2008). Límite al Poder Punitivo. Análisis de la Aplicación del Principio de Proporcionalidad en el Sistema Penal Juvenil Montevideano (UNICEF.). Montevideo.
Waiselfisz, J. J. (2008). Mapa da violencia: Os jovens da America Latina. Brasilia.
Welsh, B. C., & Farrington, D. P. (2006). Preventing Crime: What works for children, offenders, victims and places. Vasa. Retrieved from http://medcontent.metapress.com/index/A65RM03P4874243N.pdf
Welsh, W. N. (2001). Effects of student and school factors on five measures of school disorder. Justice Quarterly. doi:10.1080/07418820100095131
Wetzels, P., Enzmann, D., & Pfeiffer, C. (1998). Gewalterfahrungen und Kriminalitätsfurcht von Jugendlichen in Hamburg. Erster Zwischenbericht über eine repräsentative Befragung von Schülerinnen und Schülern der 9. Jahrgangsstufe. Hannover: Kriminologisches Forschungsinstitut Niedersachsen.
Wikström, P. O., Oberwittler, D., Treiber, K., Hardie, B., Zaykowski, H., & Gunter, W. D. (2012). Breaking Rules. The social and situational dynamics of young people’s urban crime. Violence and Victims, 28, 341–356.
Wikström, P.-O. (2007). Individuals, settings and acts of crime: situational mechanisms and the explanation of crime. In Wikstrom, P.O. & Sampson, R. (eds.) The Explanation of Crime. Context, Mechanisms and Development.
Wikström, P.-O. (2011). Does Everything Matter? Addressing the Problem of Causation and Explanation in the Study of Crime . In (Eds) McGloin J M, Sullivan C. J & Kennedy L. W. (Eds): When Crime Appears: The Role of Emergence (London. Ro.). London.

Page 159
Wikstrom, P.-O. H., Tseloni, A., & Karlis, D. (2011). Do people comply with the law because they fear getting caught? European Journal of Criminology. doi:10.1177/1477370811416415
Wikström, P.-O., Oberwittler, D., Treiber, K., & Hardie, B. (2012). 1 Situational Action Theory. In Breaking rules. The social and situational dynamics of young people’s urban crime (pp. 3–41).
Woodward, L. J., & Fergusson, D. M. (2000). Childhood and adolescent predictors of physical assault: a prospective longitudinal study. Criminology, 38, 233–262. doi:10.1111/j.1745-9125.2000.tb00889.x
You, S., Furlong, M. J., Felix, E., Sharkey, J. D., Tanigawa, D., & Green, J. G. (2008). Relations among school connectedness, hope, life satisfaction, and bully victimization. Psychology in the Schools, 45, 446–460. doi:10.1002/pits.20308
Zaykowski, H., & Gunter, W. D. (2013). Gender Differences in Victimization Risk: Exploring the Role of Deviant Lifestyles. Violence and Victims, 28, 341–356.

Page 160
APPENDIX: SCALES A) Individual Characteristics Conflict Coping Abilities Definition: This scale measures respondent’s non-‐violent skills to react and deal with conflictive situations. This scale includes two sub dimensions:
• Social Competent Strategies • Aggressive Strategies
Number of items: 6. Examples are ‘I go mad and yell’, ‘I listen very carefully, to avoid misunderstandings’ Reliability: Cronbach’s α = .59 Morality Definition: This scale measures the extent to which the respondent endorses moral beliefs about how wrong is to commit acts that break moral norms and the law. Number of items: 14. Examples are ‘how wrong do you think is to lie to your parents, teachers or other adults’, ‘how wrong do you think is to steal something that is worth 1000 pesos’ Reliability: Cronbach’s α = .89 Moral Neutralization of Aggression Definition: This scale measures the extent which respondent uses a number of justifications and excuses for intentionally harming others. This scale includes three sub dimensions:
• Cognitive Restructuring: • Disregarding / Distorting negative impact • Blaming / Dehumanizing the victim
Number of items: 14. Examples are ‘Violence solves a lot of problems’, ‘It is normal to beat up a person, who does not respect your friends’ Reliability: Cronbach’s α = .87 Police Legitimacy Definition: This scale measures the extent to which the respondent believe that police is a legitimate institution. Police as a legitimate institution is expected to treat fairly and respectfully all individuals, to comply with the law, and to be efficient in maintaining social order. This scale includes three sub dimensions
• Procedural and distributive fairness • Lawfulness • Effectiveness
Number of items: 14. Examples are ‘police treats people respectfully’, ‘police applies law equally’, Reliability: Cronbach’s α = .82 Legal cynicism Definition: This scale measures the extent to which the respondent consider that laws and social norms irrelevant, weak, and not binding.

Page 161
Number of items: 6. Examples are ‘laws are made to be broken’, ‘there are no right or wrong ways to make money, only difficult or easy ones’ Reliability: Cronbach’s α = .63 Self-‐control Definition: This scale measures respondent personality in terms of its ability to resist temptations and to anticipate negative consequences from certain behaviors. Low self-‐control youths are more impulsive, self-‐centered, risk seeking, myopic, prefers physical and simple activities to mental and complex ones, with more volatile temper and less tolerance to frustration. This scale includes six sub dimensions:
• Impulsivity • Egocentrism • Risk – seeking • Preference for physical activities • Temper • Preference for simple activities
Number of items: 24. Examples are ‘I easily loose control’, ‘I like to take risks, just because it is a lot of fun’ Reliability: Cronbach’s α = . 87 B) School-‐Related Characteristics Academic Difficulties Definition: This scale measures the extent to which the respondent considers difficult school tasks. Number of items: 3. Examples are ‘I frequently have bad grades’, ‘I usually find difficult to follow the lesson’ Reliability: Cronbach’s α = .64 Future Benefits of Learning Definition: This scale measures the extent to which the respondent believes how useful school is for obtaining conventional goals in the future (e.g. getting a job). Number of items: 3. Examples are ‘It is important for me that I do well in school’, ‘I work hard in school in order to get a good job in the future’ Reliability: Cronbach’s α = .69 Relationship to Teacher Definition: This scale measures the extent to which the respondent has a good relationship with his/her teacher. Number of items: 3. Examples are ‘I have a good relationship with my teacher’, ‘My teacher treats me in a fair way’ Reliability: Cronbach’s α = .65 Relationship to Peers Definition: This scale measures the extent to which the respondent believes has a good relationship with peers/students.

Page 162
Number of items: 3. Examples are ‘Other students are nice with me’, ‘I get along with my class mates’ Reliability: Cronbach’s α = .72 School Commitment Definition: This scale measures the extent to which the respondent likes going to the school and believes it is useful. Number of items: 3. Examples are ‘I like going to the school’, ‘I find school useless’ Reliability: Cronbach’s α = .45 School Legitimacy Definition: This scale measures the extent to which the respondent perceives the school as a legitimate institution. School is a legitimate institution if all students are treated in a fair and respectful way, and if teachers and authorities are trustworthy and good at their job. This scale includes three sub dimensions:
• Procedural and distributive fairness • Lawfulness • Effectiveness
Number of items: 10. Examples are ‘In my school all students are treated in a fair way’, ‘In my school punishment is administered in a fair way’ Reliability: Cronbach’s α = .75 C) Parenting and Family Characteristics Authoritarianism Definition: This scale measures how strict and harsh is the parenting style in the respondent’s family. Number of items: 3. Examples are ‘Your parents are very strict when you do not do exactly what they say’, ‘Your parents show you who rules’ Reliability: Cronbach’s α = .63 Corporal Punishment Definition: This scale measures the extent to which the respondents suffer physical punishment from their parents. Number of items: 3. Examples are ‘your parents slap you’, ‘your parents hit you with an object or belt’ Reliability: Cronbach’s α = .71 Erratic Parenting Definition: This scale measures the inconsistency of parent’s discipline, that is, how erratic, unfounded, and unpredictable is parent’s punishment over their children. Number of items: 3. Examples are ‘you persuade your parents not to punish you’, ‘your parents threaten you to punish you but ultimately the don’t punish you’ Reliability: Cronbach’s α = .62 Parental Conflict Definition: This scale measures the extent of disagreement, conflict and lack of

Page 163
adequate communication between parents. Number of items: 3. Examples are ‘your parents are angry with each other’, ‘your parents spent a lot of time without talking to each after a fight’ Reliability: Cronbach’s α = .78 Parental Involvement Definition: This scale measures the extent to which parents commit time and energy to their children, and share activities with them. Number of items: 4. Examples are ‘Your parents play or do activities with you’, ‘when you are sad your parents hug you and make you feel better’ Reliability: Cronbach’s α = .75 Positive Parenting Definition: This scale measures the extent to which parents offer ‘positive reinforcements (praises, compliments, rewards) to their children. Number of items: 3. Examples are ‘your parents give you rewards when you do something well, ‘your parents praise you when you do very well in the school, in sports or in hobbies’ Reliability: Cronbach’s α = .66 Supervision Definition: This scale measures the extent to which parents monitor and are after their children. Number of items: 4. Examples are ‘when you go out you got to tell your parents at what time you will be back’, ‘you come home at night later than you agreed with your parents‘ Reliability: Cronbach’s α = .67 D) Routine Activities Consumption of Violent Media Definition: This scale measures respondent’s time spent with violent adult content media (TV, movies, Internet, and cellphones). Number of items: 6. Examples are ‘I watch horror movies for above 18 years old’, ‘I tape violent scenes in my cellphone’ Reliability: Cronbach’s α = .81
Copyright © 2022 FDOKUMEN