
Integration of Planar Antennas Considering Electromagnetic ...

Proceedings of the ASME 2012 International Design Engineering Technical Conferences &Computers and Information in Engineering Conference
IDETC/CIE 2012August 12-15, 2012, Chicago, IL, USA
DETC2012/DTM-70399
TOWARD CONSIDERING RISK ATTITUDES IN ENGINEERING ORGANIZATIONSUSING UTILITY THEORY
Douglas Van Bossuyt∗
Complex Engineered Systems
Design Laboratory
School of Mechanical, Industrial,
and Manufacturing Engineering
Oregon State University
Corvallis, OR 97331
Email: [email protected]
Chris Hoyle
Complex Engineered Systems
Design Laboratory
School of Mechanical, Industrial,
and Manufacturing Engineering
Oregon State University
Corvallis, OR 97331
Irem Y. TumerComplex Engineered Systems
Design Laboratory
School of Mechanical, Industrial,
and Manufacturing Engineering
Oregon State University
Corvallis, OR 97331
Andy DongDesign Lab
Faculty of Architecture,
Design, and Planning
University of Sydney
Sydney, NSW, 2006, Australia
Toni DoolenSchool of Mechanical, Industrial,
and Manufacturing Engineering
Oregon State University
Corvallis, OR 97331
Richard Malak
Design Systems Laboratory
Department of Mechanical Engineering
Texas A&M University
College Station, Texas 77843
ABSTRACT
Design projects within large engineering organizations in-
volve numerous uncertainties that can lead to unacceptably high
levels of risk. Practicing designers recognize the existence of risk
and commonly are aware of events that raise risk levels. How-
ever, a disconnect exists between past project performance and
current project execution that limits decision-making. This dis-
connect is primarily due to a lack of quantitative models that
can be used for rational decision-making. Methods and tools
used to make decisions in risk-informed design generally use an
expected value approach. Research in the psychology domain
has shown that decision-makers and stakeholders have domain-
specific risk attitudes that often have variations between individ-
uals and between companies. Risk methods used in engineer-
ing such as Failure Modes and Effects Analysis (FMEA), Fault
∗Address all correspondence to this author.
Tree Analysis (FTA), and others are often ill-equipped to help
stakeholders make decisions based upon risk-tolerant or risk-
averse decision-making conditions. This paper focuses on the
specific issue of helping stakeholders make decisions under risk-
tolerant or risk-averse decision-making conditions and presents
a novel method of translating engineering risk data from the do-
main of expected value into a domain corrected for risk attitude.
This is done by using risk utility functions derived from the
Engineering-Domain-Specific Risk-Taking (E-DOSPERT) test.
This method allows decisions to be made based upon data that is
risk attitude corrected. Further, the method uses an aspirational
measure of risk attitude as opposed to existing lottery methods
of generating utility functions that are based upon past perfor-
mance. An illustrative test case using a simplified space mis-
sion designed in a collaborative design center environment is in-
cluded. The method is shown to change risk-informed decisions
1 Copyright © 2012 by ASME

in certain situations where a risk-tolerant or risk-averse decision-
maker would likely choose differently than the dictates of the
expected value approach.
INTRODUCTION
Risk is found throughout the complex system design pro-
cess, and recognizing and reacting to design project risk is a
key challenge within large engineering organizations. Practic-
ing designers recognize the existence of risk and commonly are
aware of events that raise risk levels. However, a disconnect ex-
ists between past project performance and current project execu-
tion that limits decision-making. Although designers may recall
a few cases from personal experience and be aware of anecdo-
tal evidence, rarely do they have access to a quantitative and
empirically-based model of how risk-mitigating actions impact
project outcomes. Further, when designing novel or innovative
products, the designer often aspires to create something that has
not been done before. The ability to quantitatively take aspi-
rational risk attitude into consideration in decision-making does
not exist. However, dealing with design risk in industrial orga-
nizations is a largely qualitative and informal endeavor. This
assessment was confirmed in interviews with leaders, project
managers, and designers in engineering organizations. Although
project leaders tend to have a qualitative understanding of the
events that lead to design risk and of the mitigating actions they
can take, they lack an empirically-based and quantitative ap-
proach to making informed design project decisions. Project
leaders might make decisions based on past experiences or anec-
dotal evidence provided by others, but the exchange of such in-
formation remains ad-hoc and rarely, if ever, is quantitative.
Engineering methods such as FTA, FMEA, and others are
commonly used to identify risks and aid in the risk-informed
decision-making process. In addition, there are many methods
that have been proposed in the engineering design research com-
munity to account for risk during the early stages of conceptual
design. Some pertinent examples are Functional Failure Identifi-
cation Propagation (FFIP) [1], Risk in Early Design (RED) [2],
Function Failure Design Method (FFDM) [3], and FMEA [4]
among others. Such methods are designed to guide decision-
makers away from more risky options and toward the least risky
options which results in the mitigation of large risks and the
creation of risk-averse or fault-tolerant designs. This approach
works well for industries, such as nuclear power and aerospace,
that are traditionally risk-averse. However, some industries and
companies thrive on risk taking. For instance, many of the most
successful Internet companies such as Google and Facebook, and
design innovation companies such as IDEO have become so suc-
cessful because they have sought out risks that traditional risk-
averse companies have not been willing to take. There is no cor-
rect level of risk that can be applied to all industries and compa-
nies.
This paper focuses on this aspect of quantifying risk in en-
gineering organizations. However, none of available risk assess-
ment methods have the ability to account for risk attitudes of
individual decision-makers or enterprises. The methods such
as FTA and FMEA, and tools such as trade studies commonly
deployed in industrial settings, view risk as an expected value
choice. For example, if an engineer must make a decision be-
tween one risk that has a 1% chance of occurrence and has a
consequential cost of $10,000 and another risk that has a chance
of 0.1% of occurrence and a consequential cost of $100,000, en-
gineering risk methods would indicate that both risks are equal
with regards to expected value. Therefore, either can be cho-
sen with the same expected value outcome. However, this ig-
nores individual and company risk preferences. Research over
the past two decades has produced the well-respected Domain-
Specific Risk-Taking (DOSPERT) test which enables the deter-
mination of risk attitude in several different content domains of
daily life [5]. Recent advances in the psychology of engineering
risk attitude have created the E-DOSPERT test that attempts to
categorize and determine engineering-specific risk domains [6].
This research seeks to create a link between the E-DOSPERT’s
engineering risk attitude information and traditional widely used
engineering risk methods to allow for individual and enterprise
risk attitudes to be expressed during the risk decision-making
process.
CONTRIBUTIONS
This paper specifically presents a novel method of account-
ing for aspirational risk attitude in risk-informed design. A single
criterion decision based design approach is adapted from risk at-
titude utility functions to bring engineering risk data from the
expected value domain into a risk attitude corrected domain that
is created to be appropriate to the individual stakeholder or en-
terprise. Rather than traditional lottery methods found in risk
utility function generation, the risk attitude utility functions are
developed via E-DOSPERT test results. Using risk attitude as
a lens stakeholders and decision-makers can make quantitative
risk decisions that would have been traditionally justified by “gut
feeling.” This paper draws an important distinction between ap-
propriate uses of E-DOSPERT-derived risk utility functions and
lottery-derived risk utility functions. While lottery methods are
suitable for later stages of the complex conceptual system design
process and beyond into physical design, the authors advocate
for using E-DOSPERT-derived risk utility functions in the early
phases of complex conceptual system design where aspiring to
create a new design can take precedence over developing a de-
sign based upon past performance.
This method will be useful for risk-averse enterprises and
decision-makers by highlighting higher certainty risks. A risk-
averse stakeholder generally favors high over low certainty op-
tions. Similarly, decision-makers who are and decision-makers
in industries where the corporate culture is risk-tolerant will find
2 Copyright © 2012 by ASME

that this method identifies large risks that can drive potential in-
novation and profit. For these reason, this paper develops a novel
way to account for risk attitude in risk-informed design. As such,
the method introduced in this paper will get us one step closer to
handling risk in large engineering organizations.
BACKGROUND
Assessing and Judging Risk
Risk plays an integral role in engineering organizations, yet
is handled differently depending on the type of business. For ex-
ample, highly innovative design firms embrace risk as an essen-
tial ingredient in their success. On the other hand, some entire
industries such as aerospace and nuclear power, are very risk-
averse. Research in risk trading in engineering design shows that
different engineers have different opinions of what makes an ac-
ceptable risk [7], and indicates that there is no single correct level
of acceptable risk for all situations or all people.
In psychology, risk is classically defined as the parameter
that differentiates between different individuals’ utility functions
[8]. The utility function of individuals is often expressed as a
quadratic, logarithmic, or exponential function [9]. This classic
Expected Utility (EU) approach to risk theorizes that an individ-
ual can be modeled choosing between risky options as the func-
tion of the return of the options, the probability of the options oc-
curring, and the risk aversion of the individual [10]. Within the
EU framework and other related methods [11], the shape of an
individual’s utility function denotes the individual’s risk attitude
as either risk-averse (i.e., someone who does not like to take risks
and desires certainty of outcome), risk neutral (i.e., someone who
takes necessary short-term risks to deliver long-term outcomes),
or risk-tolerant (i.e., someone who is comfortable with handling
larger risks, as defined by probability of the risk being realized,
if necessary and accepts more uncertainty in outcomes) behav-
ior [12, 13].
The theory of risk attitudes in the context of EU has encoun-
tered issues of inconsistent risk profiles across risk domains and
cross-method utility instability [14–17]. Different risk-averse or
risk-tolerant classifications often result when different methods
are used to measure people’s utility [14]. Further, individuals
are not consistent across different risk domains. While a person
might be risk-averse making financial decisions, they could be
risk-seeking in social situations [17].
Other methods have been developed within psychology to
make up for the shortcomings of the EU framework. For in-
stance, the risk-return framework of risky choice models people’s
preference for risky options based upon a trade-off between the
Expected Value (EV) and the riskiness of the choice [18]. This
is analogous to the way most engineering risk methods differen-
tiate between risk choices. Psychology extends this to treat per-
ceived risk as a variable that differentiates individuals based upon
content and context interpretations. The framework allows peo-
ple to have different risk preferences in different pre-determined
domains [5] and accounts for desiring risk in some areas while
preferring caution in others by the concept of perceived risk at-
titude. Variances in perceived risk attitude are viewed to be the
result of differences in perception of risks and benefits between
a decision-maker and an outside observer. For instance, in the
management field, managers have less optimistic perceptions of
risk than entrepreneurs [19]. The risk-return framework shows
that a person’s perception of risk affects the choices that person
will make.
In order to assess risk perceptions and attitudes within dif-
ferent domains, the DOSPERT test and related scale were cre-
ated [5]. Six independent domains were identified including the
ethical, investment, gambling, health/safety, recreational, and so-
cial domains within which the majority of day-to-day activities
can be categorized. The DOSPERT test is seeing widespread
adoption in psychology. Recently, the E-DOSPERT test [6] was
proposed as a method to determine engineering-specific risk at-
titudes as defined by four engineering risk domains including
risk identification, analysis, evaluation, and treatment [20]. The
E-DOSPERT scale has been shown to reliably measure general
engineering risk aversion and risk seeking attitudes. It can also
measure risk seeking and risk aversion attitudes in the risk iden-
tification and risk treatment domains. The 25 question version
of the E-DOSPERT test takes approximately 10 minutes to com-
plete.
Trading During Design
Trade studies are often used in creating conceptual com-
plex system designs. Trade studies can be used to create many
potential designs quickly through automated software packages
such as ModelCenter (http://www.phoenix-int.com) or Advanced
Trade Space Visualization (ATSV) [21] as part of ModelCenter.
Trade studies are also used by teams of people to conduct man-
ual trade study sessions [22]. Automated trade studies can also
be performed by computers using conditions and bounds set by
users. Many thousands of conceptual designs can be quickly cre-
ated with an automated trade study. Manual trade studies are con-
ducted by groups of system experts where only one or a handful
of conceptual designs will result.
The primary goal in a design trade study is to maximize
system-level utility. In order to achieve maximum utility, trade-
offs are made between system design variables [23]. This can be
represented as max f (Ð⇀U ) where
Ð⇀U represents relevant system
utility metrics. Design stakeholders choose system utility met-
rics. In the case of trade studies with multiple stakeholders, the
most preferred design of one stakeholder will not be the same as
that of another. Little direction is given in the literature on how
to create appropriate utility functions and selection criteria for
different design situations.
Collaborative Design Centers (CDCs) often will perform
manual trade studies as part of the design process. The most
cited example of a CDC is Team X which is housed in the Project
3 Copyright © 2012 by ASME

Design Center (PDC) at Jet Propulsion Laboratory (JPL) and de-
velops conceptual spacecraft mission designs [22]. In such man-
ually conducted trade studies, subsystem experts often disagree
over which tradeable parameters are the most important [24–26].
A variety of methods are available to resolve design decision
conflicts in both automated and manual trade studies [27, 28].
However, these methods do not take into account individual or
enterprise-level risk attitudes.
Decision Making
Finally, the Decision-Based Design (DBD) framework was
developed in the research community to address the growing
recognition [29–32] that decision-making is a fundamental part
of the design process. A decision-theoretic methodology is uti-
lized to select preferred product design alternatives and set target
product performance levels. A single selection criterion, V, in
the DBD implementation represents economic benefit to the en-
terprise [32]. This approach avoids the difficulties of weighting
factors and multi-objective optimization. A utility function, U,
which expresses the value of a designed artifact to the enterprise
when considering the decision-maker’s risk attitude, is created as
a function of the selection criterion, V. A preferred concept and
attribute targets are selected through the maximization of enter-
prise utility.
In order to effectively use the single criterion approach to
DBD, the selected criterion must be able to capture all of the is-
sues involved in the engineering design such as system features,
costs, risks, physical restrictions, and regulatory requirements.
The single criterion should allow both the interests of the users
and producers of the system to be considered. In most industrial
cases, the most universal unit of exchange is money. Material,
energy, information, faults and time can all be assigned a mon-
etary value. This can be seen in many design decision-making
processes and is practiced widely in industry.
One use of single criterion DBD developed by Hoyle et al.
[33] employs profit as the criterion in a method to determine op-
timum system configuration for Integrated Systems Health Man-
agement (ISHM). The determination of system profit is made
from the product of system availability and revenue, minus the
summation of cost of system risks, and the cost of fault detection.
This method can determine optimal ISHM while also determin-
ing the optimum detection/false alarm threshold and inspection
interval. Using the method has been found to increase profit by
11%, decrease cost by a factor of 2.4, and increase inspection
intervals by a factor of 1.5 [33].
Utility Theory
One approach to analyzing choice outcomes from a non-
neutral expected value perspective is to use risk-based utility
theory [11]. The utility of a range of probabilistic outcomes
can be determined in order to aid decision-makers. This is
done by translating monetary outcomes to utilities. A risk-
tolerant decision-maker’s higher intrinsic value for riskier de-
cisions skews the utility of those decisions higher than a risk-
neutral or risk-averse decision maker’s utility of the same deci-
sions. Figure 1 shows that for a Normal distribution of outcomes,
a risk-tolerant person’s utility distribution will shift to be more
heavily skewed toward higher value outcomes. Utility distribu-
tions for risk-averse individuals will skew more heavily toward
lower value outcomes, as can be seen in Figure 2. The risk neu-
tral state, shown in Figure 3, does not weight outcomes in ei-
ther direction along the utility axis. As can be seen in Figures
1 through 3, different utilities are found based upon a decision-
maker’s risk attitude.
FIGURE 1.
Risk-Tolerant
Utility Function.
FIGURE 2.
Risk-Averse
Utility Function.
FIGURE 3.
Risk Neutral
Utility Function.
Currently accepted methods of developing utility risk func-
tions, such as those in Figures 1 through 3, often require a series
of lotteries to be conducted [11]. Several sets of paired choices
are presented sequentially to an individual. These are often pre-
sented as lotteries where a participant selects amongst paired
probabilistic alternatives. A utility function is then fitted to the
lottery results. In currently accepted methods of utility function
generation, the form utility function is found that is consistent
the decision maker’s lottery results. The scale of the value axis
of the utility function is set to the minimum and maximum limits
of the values used to conduct the lotteries.
Developing and conducting lotteries can be time-consuming
and not intuitive to end-users [34]. Also, the utility functions de-
rived from lotteries are only valid for the range of values used in
the lottery. Therefore, while useful in many areas, lottery-based
methods of utility risk function generation are not always useful.
Pennings and Smidts [34] investigated using psychometric risk
attitude test results to create risk functions for Dutch hog farm-
ers to predict individual farmer behavior in hog futures markets.
The results of the research found lotteries to be the most accurate
method of predicting behavior in the context of the hog futures
market. However, the hog farmers’ self-reported behavior pre-
dictions were most closely correlated with the psychometric risk
attitude test results. The farmers also indicated that the psycho-
4 Copyright © 2012 by ASME

metric risk attitude test was more understandable than the lottery
method.
In this paper, the authors postulate that, while lottery meth-
ods of utility risk function generation are satisfactory for many
DBD situations, they are not as useful for early-phase conceptual
design. Lottery-based risk functions are only valid over the range
of values used in the initial lotteries. In the case of early-phase
conceptual design, the range of values might not be fully known
or could change during the design process. Re-running lotteries
to create expanded risk functions thus would become burden-
some to the practitioner. Further, in cases where utility functions
are developed based upon client or customer risk attitudes, con-
ducting multiple lottery sessions is impractical. Finally, as hinted
at in Pennings and Smidts’ research [34], lotteries do not closely
match what individuals believe they will do. However, actions of
individuals more closely align to the predictions of lottery meth-
ods than to self-reported methods. This can be interpreted as a
disconnect between what individuals aspire to do and what they
actually do. Utility functions generated by alternative methods
could potentially provide new insights for practitioners that will
allow decisions to be made based upon aspirations rather than
upon past performance, as is the case with lotteries.
METHODOLOGY
The long-term goal of this research is to develop a quanti-
tative model derived from empirical project data to make design
project decisions. To achieve this, project decision preferences
must be determined and formalized in terms of a utility function.
For example, preferences associated with commercial products
may be to maximize profitability under a particular risk attitude.
Given this utility function, project leaders must observe the state
of their project as it unfolds, determine the most preferred risk-
mitigating action, and execute the chosen course of action. Be-
fore this goal can be achieved, however, the ability of the various
stakeholders in assessing and judging risk must be addressed.
Risk-informed design methods are used to make decisions
about risk in system design, with tools such as FMEA and FTA
commonly used to evaluate system safety and reduce the likeli-
hood of failure. Such methods take an expected value approach
toward all engineering risk domains. However, design stakehold-
ers often have domain-specific risk attitudes that are not risk neu-
tral. This paper proposes a novel method to determine the true
value of risk decisions using utility theory and the E-DOSPERT
risk attitude research in an aspirational context. The method pre-
sented in this paper translates data from engineering risk methods
such as FMEA or FTA into utility functions
The Risk Attitude Premise
Using the proposed approach, risk-informed design deci-
sions can be made under risk tolerant or risk averse risk attitudes
rather than the expected value approach. For example, the mutu-
ally exclusive, distinct risks in Equations 1 and 2 are equal in the
context of risk-informed design. The risks are defined as such
due to the negative expected value outcome and would be de-
fined as benefits if the expected value were positive. In Equation
1, a 1% chance exists that a risk costing $10,000 to return the
system to a nominal operating state will occur while in Equation
2, there is a 0.1% chance of realizing a risk that costs $100,000
in order to return the system to a nominal state. Equation 2 rep-
resents a case in which additional system complexity has been
added to the base design of Equation 1, which has lowered the
probability of losing system functionality but has increased the
repair cost in the event of a fault. Both risks have an expected
value of -$100. Therefore, a decision-maker using risk-informed
design would have no guidance if choosing between the two de-
signs. The designs are of equal value using the expected value
approach within risk-informed design.
R1 = 0.99(0)+0.01(−$10,000) = −$100 (1)
R2 = 0.999(0)+0.001(−$100,000) = −$100 (2)
Equations 1 and 2 are of the form Rn = B+Am+Am+1+ . . .+Am+x where B = probability of benefit × outcome of benefit and
Am+x = probability of riskm+x× outcome of riskm+x. The bene-
fit and risk probabilities all sum to 100%. This research is only
interested in risks and their costs. Therefore all benefits are con-
sidered to be identical between risk choices, i.e., the full system
benefit is realized when the system is not in a fault state and is
equal among all design variants. For the purposes of this paper,
the outcome of the benefit is taken to always be zero.
Risk-informed design instructs decision-makers that the
choice between the risk in Equation 1 and the risk in Equation 2
does not matter because both outcomes have the same expected
value. However, a risk-averse decision-maker will choose the de-
sign in Equation 2 in order to have more certainty about the like-
lihood of occurrence of the risk. A risk-tolerant decision-maker
is not as concerned with certainty and will choose the design in
Equation 1 due to the lower financial consequence. The example
in Equations 1 and 2 has a clear choice outcome for risk-averse
and risk-tolerant decision-makers. The design choice presented
in Equations 3 and 4 is less clear for decision-makers that are not
risk neutral. One cannot rationalize the choice of a design charac-
terized by Equation 3 using risk-informed design. However, the
risk-tolerant decision-maker might still choose the design with
a larger negative expected value because she is more concerned
with the lower financial consequence than the certainty of the
outcome.
R1 = 0.99(0)+0.01(−$15,000) = −$150 (3)
R2 = 0.999(0)+0.001(−$100,000) = −$100 (4)
5 Copyright © 2012 by ASME

The risk-tolerant decision-maker’s higher intrinsic value for
the riskier decision in this example can be examined through the
lens of utility theory. Figures 1, 2, and 3 demonstrate how risk at-
titude can affect the utility of a value distribution. Figure 1 shows
that for a Normal distribution of outcomes, a risk-tolerant per-
son’s utility distribution will shift to be more heavily skewed to-
ward higher value outcomes. Utility distributions for risk-averse
individuals will skew more heavily toward lower value outcomes,
as can be seen in Figure 2. The risk neutral state, shown in Figure
3, does not weight outcomes in either direction along the utility
axis.
Utility Risk Functions Derived from Risk Attitude Data
Utility functions derived from discrete outcome distributions
can also be affected by risk attitudes. The utility for a system
feature with two potential discrete outcomes takes the form of
Equation 5 where u(s) represents the system utility, p0 is the
probability of the first outcome, u(xH) is the utility of the first
outcome, (1− p0) is the probability of the second outcome, and
u(xL) is the utility of the second outcome.
u(s) = p0×u(xH)+(1− p0)×u(xL) (5)
A generic utility problem where risk is represented as a dol-
lar figure is shown in Equation 6.
u(s) = 0.4×u($900)+0.6×u($400) (6)
Figure 4, developed via a series of lotteries, where the min-
imum value is $250 and maximum is $1,050, provides a risk-
averse quadratic utility function. Determining the utility of each
potential outcome is demonstrated in Equation 7 where the utility
of $900 is found to be 0.91 via inspection of the utility function,
as shown in Figure 4, and the utility of $400 is found to be 0.35
from the risk utility function as demonstrated in Figure 4.
u(s) = 0.4×(0.91)+0.6×(0.35) = 0.57 (7)
These utilities are then multiplied by their respective prob-
abilities and summed together to find the overall system util-
ity, u(s) = 0.57, for this risk-averse decision-maker. Reversing
the procedure, a utility of 0.57 produces a risk-adjusted value
of u−1 = $540 while a neutral utility function results in a risk-
adjusted value of u−1 = $600. This clearly shows that using risk
attitude in a utility function results in a different valuation of the
system than would be found without using a risk attitude func-
tion.
As previously discussed, while risk utility functions gen-
erated using lottery methods are useful in many situations,
early-phase conceptual design can benefit from an alternative
method. The authors propose using risk functions generated
from E-DOSPERT test results. Based upon the findings of
FIGURE 4. Risk-Averse Quadratic Utility Function Developed Using
the Lottery Method. The value of the potential outcomes is translated
via the risk averse utility function to the utility domain. The two utilities
are then combined using Equation 5, and translated back through the
risk averse utility function to find the risk-adjusted value of $540. Using
the risk neutral utility function, a value of $600 is found.
Van Bossuyt et. al. [6], the 25 question E-DOSPERT test pro-
vides sufficient statistical reliability to determine general engi-
neering risk tolerance or risk aversion. The authors propose the
mean of one’s responses to the 25 question E-DOSPERT test is
an appropriate metric for use with utility function assessment.
E-DOSPERT makes use of a 1-5 Likert Scale with 1 correspond-
ing to “Very Unlikely” and 5 corresponding to “Very Likely.” A
score of 3 corresponds to the neutral answer of “Not Sure.” Us-
ing the 25 risk tolerant questions in the E-DOSPERT test, a mean
score of 3 indicates a neutral risk attitude, a mean score of 5 in-
dicates extreme risk tolerance, and a mean score of 1 indicates
an extremely averse risk attitude.
In this research, the authors suggest that an exponential
function is an appropriate utility function to use with psychomet-
ric risk scale test results. The function may be either of the mono-
tonically increasing or decreasing exponential type [35]. An ex-
ponential function was chosen over other potential functions be-
cause it is believed that practitioners will be either constantly
risk averse or constantly risk tolerant during the early phases of
conceptual system design. In one study where a risk survey was
compared to the lottery method, it was found that risk functions
generated by the lottery method were exponential in nature [34].
Further, there was reasonable correlation between the risk sur-
vey results and lottery method results. Risk survey results were
also found to more closely align with self-predicted future per-
formance than lottery methods that were found to more closely
align with past performance [34]. Research is ongoing in this
area to verify that this holds true for the E-DOSPERT.
The choice of an exponential function also allows the direct
use of E-DOSPERT test results in the creation of a risk func-
6 Copyright © 2012 by ASME

tion [9]. The monotonically decreasing exponential utility func-
tion presented by Kirkwood [35] and developed by Pfanzagl [36]
shown in Equation 8 is used throughout the rest of this paper.
U(V) represents utility of the potential value(s) of interest. VMax
is the maximum possible value. It should be noted that VMax
need not be the maximum value of the range of potential val-
ues of interest but can be a larger number than the maximum
potential value of interest. This property is useful in situations
where a larger maximum value is possible than the set of poten-
tial values currently being investigated or when multiple sets of
potential values, representing multiple sets of outcomes of a de-
cision choice, span different numerical ranges. Similarly, VMin
is the minimum possible value which need only be smaller than
or equal to the smallest potential value of interest. Note that
VMin can either be a positive or negative number. R is the risk
tolerance/aversion coefficient of the utility function. In order to
convert an E-DOSPERT mean score (EDSMean) to an R value,
Equation 9 was developed by the authors based upon the work
of Kirkwood [35], Howard [37], and McNamee and Celona [38].
In Equation 9, RSF is a scaling factor. Several different rules
of thumb based upon financial measures are available to deter-
mine RSF such as finding a sufficient RSF that R will be roughly
6% of net sales, a 100-150% of net income, and about 16
of eq-
uity [37]. These rules of thumb have been found useful in the oil
and chemical industries [37]. Additional suggestions are given
by Kirkwood [35] and McNamee and Celona [38]. It is impor-
tant that the practitioner select an RSF that is appropriate to their
industry, company, and the specific analysis being performed. It
is beyond the scope of this paper to provide strict guidance on do-
main and situation-appropriate RSF values. It is also beyond the
scope of this paper to judge if practitioner level of expertise can
influence the selection of appropriate rules of thumb. For the ex-
amples and illustrations presented in this paper, RSF = 60 will be
used to clearly demonstrate the novel method to determine true
value of risk decisions using utility theory and the E-DOSPERT
test.
U(V) =e−
VMax−V
R −1
e−VMax−VMin
R −1(8)
R =VMax−VMin
1000∗
RSF
EDSMean−3(9)
The inverse of Equation 8, shown in Equation 10, is used
to calculate the certainty equivalent. CE(V) represents the
risk-adjusted value of the potential values of interest, otherwise
known as the certainty equivalent. In the method presented in this
paper, CE(V) is presented as a cost. In the special case of an E-
DOSPERT test result where the test-taker is found to have a per-
fectly risk neutral risk attitude, Equations 11 and 12 are used to
generate the risk utility function and find the risk-adjusted value
FIGURE 5. Monotonically Decreasing Exponential Risk Util-
ity Functions Developed Using Equation 8 where EDSMean =
2.8,2.9,3.0,3.1,3.2, RSF = 60, VMax = 1000, and VMin = 0.
of the potential values. Examples of monotonically increasing
exponential utility functions can be found in Kirkwood [35].
Other risk utility functions of potential interest to the practi-
tioner are available in Keeney and Raiffa [9]. A series of risk
utility functions generated in MATLAB using Equation 8 from
E-DOSPERT mean scores of EDSMean = 2.8,2.9,3.0,3.1,3.2,
VMax = 1000, VMin = 0, and RSF = 60 is shown in Figure 5.
CE(V) = R∗ log(−U(V)∗(eVMax
R −eVMin
R )−eVMax
R ) (10)
U(V) =VMax−V
VMax−VMin
(11)
CE(V) =U(V)∗(VMin−VMax)+VMax (12)
Risk Metrics Generated by Risk Methods
In order for engineering risk methods to make use of risk
attitude utility functions, risk metrics generated by the various
engineering risk methods must be translated into an easily com-
parable unit of measure. The authors advocate using consequen-
tial cost as it is a convenient and easily understood unit of mea-
sure. Consequential cost in the context of this research can be
defined as either the cost associated with the realization of a risk,
for instance replacement of a failed part, or as the price to mit-
igate the risk to an acceptable level. The case study in this pa-
per uses the latter definition of consequential cost. Therefore,
in order to use this risk attitude utility method, both consequen-
tial cost and probability must be determinable for the risks iden-
tified by engineering risk methods. Standard engineering tools
used in the design process often contain the necessary risk infor-
mation, but require translation into the appropriate probability
and cost metrics. For example, translating risk information from
an FMEA into probability and consequential cost is relatively
straightforward. Probability can be derived from the occurrence
metric. The occurrence metric is a measure of the probability
of an averse event occurring. In the case of a purely linear oc-
currence metric scale, the percent chance of failure can be found
7 Copyright © 2012 by ASME

by multiplying occurrence, Occ, by an appropriate factor, Oc f .
When the occurrence scale is not linear, an appropriate function
can be used to translate the occurrence metric into a probability
value. In the case of a linear occurrence metric scale, Oc f should
be determined by dividing 100 by the result of subtracting the
low (OccMin) end of the occurrence metric scale from the high
(OccMax) of the scale, as shown in Equation 13. Probability, P0,
can then be determined by Equation 14 where P1→n represents
the complete set of probabilities under consideration.
Oc f =100
OccMax−OccMin
(13)
P0 = 1−
Occ∗Oc f
100
∑P1→n
(14)
Consequential cost, representing value, can be determined
in a variety of manners. The authors suggest that consequential
cost should be determined by the cost to return the system to a
nominal state if the risk occurs. In the event that consequential
cost cannot be directly determined, a summation of the severity
and detection metrics can be used as an analogue metric to con-
sequential cost.
Table 1 provides a simplified FMEA for a complex sys-
tem design with three identified risks and the consequential cost
of each risk. Decision-Maker A has been tasked with decid-
ing which risk is the most important to fix. Decision-Maker A
has a risk-averse attitude where EDSMean = 2.88. The general-
ized form of Equation 5 is used in this example by setting p0
equal to Equation 14 where OccMax = 10, OccMin = 0, Oc f = 0.1,
VMin = $250, VMax = $1,050, and RSF = 20. Using a risk-averse
utility function generated from Equation 8 and Equation 5 ,the
risk-averse Decision-Maker A discovers that the most desirable
certainty equivalent choice to mitigate is CE(R3) = $2.9184,
while CE(R1) = $0.8909 and CE(R2) = $1.1292. Therefore, the
risk-averse decision is to mitigate the R3 risk as it has the high-
est certainty equivalent value. Certainty equivalents with higher
value are more desirable to mitigate than certainty equivalents
with lower values [39].
TABLE 1. Simplified FMEA Example for Decision-Maker A.
Risk Func. Sev. Occ. Det. RPN Cons. Cost
R1 Funct 1 7 3 4 84 $450
R2 Funct 2 4 5 8 160 $300
R3 Funct 3 2 8 3 48 $650
This method can also be used to compare between differ-
ent designs. For instance, using Table 1 as Design 1 and Ta-
ble 2 as Design 2, a risk-tolerant person, Decision-Maker B,
with an E-DOSPERT mean score of EDSMean = 3.15 can de-
termine which design is more preferred. Using the monoton-
ically decreasing exponential risk function of Equation 8 with
VMax = $1,000, VMin = $0, OccMax = 10, OccMin = 0, Oc f = 0.1,
RSF = 60, XH = 0, and XL =V(Rn) the utilities of risks, probabili-
ties, system utilities, and risk-adjusted values are found as shown
in Table 3. Equation 15 is then used to find the overall certainty
equivalents (CE) of the two designs where CEn(Rn) is the risk-
adjusted value of the individual identified risk, Rn. Equation 15
is valid when the identified risks are independent from one an-
other. Equation 15 is used rather than Equation 10 because each
of the risks identified in the FMEA presented in Tables 1 and
2 is an independent risk. Applying Equations 8 and 15 shows
that the risk-tolerant Decision-Maker B with an EDSMean = 3.15
would choose Design 1 as it has the smallest certainty equiva-
lent. Decision-Maker C who has an expected value risk neutral
decision making criteria would find Design 1 to have CE = $8.05
and Design 2 to have CE = $5.50, and thus would choose Design
2 as it has a lower certainty equivalent than Design 1. The lower
certainty equivalent is chosen when comparing between designs
due to certainty equivalent representing the risk-adjusted cost of
mitigating the identified risks within the designs.
CE(RTotal) =CE1(R1)+ . . .+CEn(Rn) (15)
TABLE 2. Simplified FMEA for Design 2 for Decision-Maker B.
Risk Func. Sev. Occ. Det. RPN Cons. Cost
R1 Funct 1 5 4 4 80 $400
R2 Funct 2 6 5 7 210 $700
R3 Funct 3 3 2 3 18 $200
CASE STUDYTo implement and test the proposed approach, NASA was
selected as the engineering organization in this paper. Specifi-
cally, the SuperNova/Acceleration Probe (SNAP) mission trade
study [40] performed by Team X provides the bulk of the back-
ground information necessary for this case study. Additional ma-
terial comes from the Space Mission Analysis and Design book
by Wertz and Larson [41]. Costing and risk data are simulated
for illustrative purposes only and should not be used beyond this
case study.
The SNAP mission was intended to investigate the nature
and origin of “Dark Energy” acceleration and expansion of the
universe. The experiment was designed to precisely measure the
history of the universe’s expansion from the present day back
to approximately 10 billion years in the past. Plans called for a
8 Copyright © 2012 by ASME

TABLE 3. Utility of Risk, Probability, and Risk-Adjusted Value Data
for Design 1 and Design 2 Risks for Decision-Maker B.
Design 1
Risk u(XL) 1-P0 U(s) CE(Rn)
R110.0024 0.0030 0.9994 $2.49
R210.0045 0.0050 0.9995 $2.23
R310.0051 0.0080 0.9971 $12.84
Risk-Adjusted Value (CE(Rtotal)) Total: $17.56
Design 2
Risk u(XL) 1-P0 U(s) CE(Rn)
R110.0034 0.0040 0.9994 $2.74
R210.0029 0.0050 0.9979 $9.40
R310.0020 0.0019 0.9999 $0.52
Risk-Adjusted Value (CE(Rtotal)) Total: $12.66
satellite in a high earth orbit on a four year mission to study the
brightness of la type supernovae and the redshift of la type su-
pernova host galaxies [40]. A la type supernova is a subcategory
of supernova that is the result of a white dwarf star exploding.
Several risks were identified in the SNAP mission report.
This paper makes use of and expands upon potential risks in the
power and attitude control subsystems. Table 4 details several
risks that will be used in the remainder of this paper. The con-
sequential cost dollar amounts in this case study are the cost of
mitigating the risk to an acceptable level. However, consequen-
tial cost may also be defined as the cost of outcome of a risk if it
is realized.
During the course of the CDC trade study session, the risks
outlined in Table 4 were identified. Risks R1 and R2 are potential
threats to mission success. Risks R31−2and R4 are threats to the
level of science data that can be returned from the spacecraft but
will not end the mission completely. The R31and R32
risks iden-
tify the same risk and propose two different solutions. R32also
utilizes the same solution as R4.
In order for the SNAP mission proposal to be considered for
further development funding, it must meet a specific cost cap.
In this fictitious example, the mission proposal is $40M away
from reaching the cost cap. Not all of the identified risks can be
mitigated under this cost cap. Based upon the Risk Priority Num-
bers (RPNs) of the four identified risks, R2 should be addressed
first. This however would not leave enough funds to address R1,
the next largest risk. Additionally, the customer believes that
severity of R1 is overstated and wants to take a more risk-tolerant
stance on R1 while addressing some of the science data concerns
of R3 and R4 within the limited resources available.
To help make risk mitigation decisions, the customer was
given the E-DOSPERT test. The result, EDSMean = 3.17, was
used with the monotonically decreasing exponential risk utility
function in Equation 8 where VMax = $120M, VMin = $0, XH = 0,
XL =V(Rn), OccMax = 10, OccMin = 0, Oc f = 0.1, and RSF = 60.
The consequential cost was used as potential outcome values
while the occurrence values were used to determine probabil-
ity of occurrence. Table 5 shows the resulting probability, and
utility data. From this data, decision-makers can see that risks
R1 and R31are the most preferred risks to mitigate under a risk-
tolerant decision process based upon desiring to mitigate risks
with the highest CE(Rn), and will cost in total less than $40M
in consequential cost to mitigate. A risk-neutral approach would
have chosen to mitigate risks R1 and R2. The two most preferred
risks to mitigate also satisfy some of the questions surrounding
mission success and science data return.
TABLE 5. Probability and Risk Utility Data for Identified Risks in
the SNAP Mission. The Certainty Equivalent is Derived Using the Cus-
tomer’s EDSMean.
Risk u(XL) 1-P0 U(s) CE(Rn)
R1 0.0006 0.0001 1.0378 $0.1681M
R2 0.0018 0.0020 1.0379 $0.1182M
R310.0048 0.0050 1.0378 $0.1641M
R320.0042 0.0050 1.0372 $0.4040M
R4 0.0032 0.0040 1.0373 $0.3991M
After a mission has been conceptually developed within
Team X, it is often placed into competition with other competing
conceptual spacecraft mission designs for further funding. In this
case study, the SNAP mission was put into competition against
two other missions for funding after mitigating the risks iden-
tified above. Table 6 summarizes the relevant SNAP risk data
and risk data for the other competing mission concepts. It is as-
sumed that each mission has already mitigated as many risks as
was possible under the budget cap.
The decision-maker has decided to use a monotonically de-
creasing exponential risk utility function as shown in Equation 8
based upon the information presented in Section of this paper.
Other utility functions are available [9] if the practitioner wishes
to use a different function. The following parameters have
been set by the decision maker to be VMax = $60M, VMin = $0,
OccMax = 10, OccMin = 0, Oc f = 10, and RSF = 20. The decision-
maker’s E-DOSPERT test result is EDS = 3.10, making her risk-
tolerant. Equation 10 is used to determine the certainty equiva-
9 Copyright © 2012 by ASME
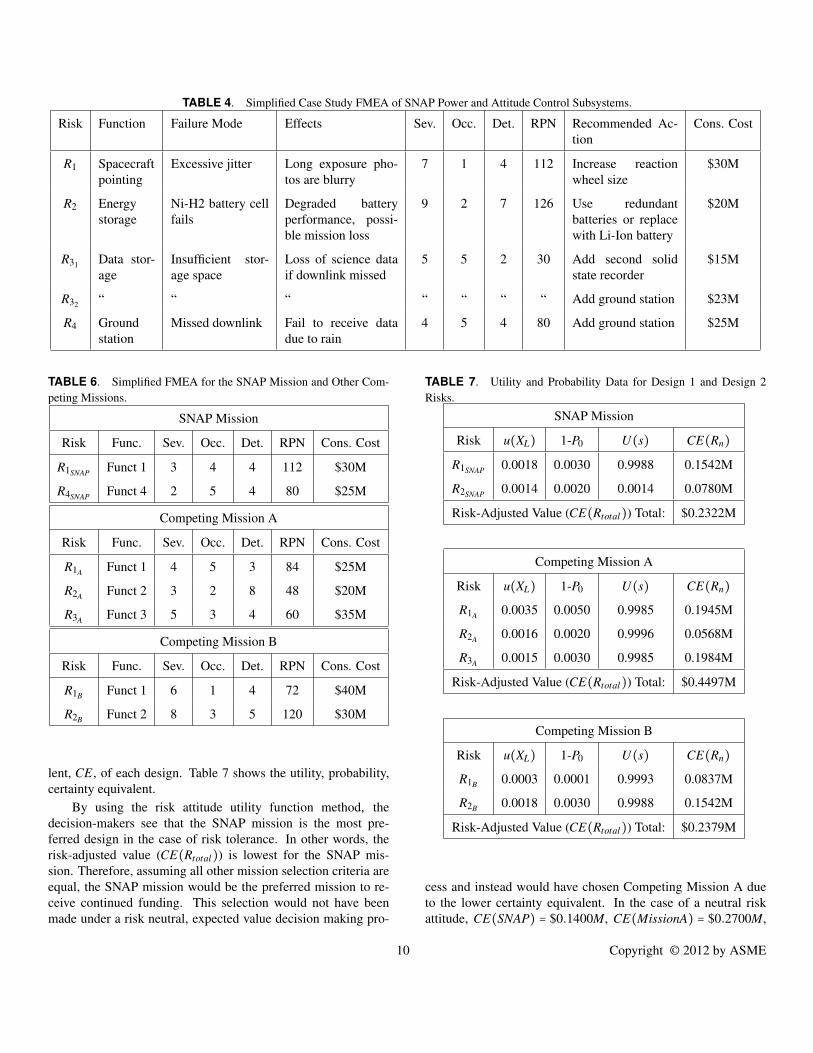
TABLE 4. Simplified Case Study FMEA of SNAP Power and Attitude Control Subsystems.
Risk Function Failure Mode Effects Sev. Occ. Det. RPN Recommended Ac-
tion
Cons. Cost
R1 Spacecraft
pointing
Excessive jitter Long exposure pho-
tos are blurry
7 1 4 112 Increase reaction
wheel size
$30M
R2 Energy
storage
Ni-H2 battery cell
fails
Degraded battery
performance, possi-
ble mission loss
9 2 7 126 Use redundant
batteries or replace
with Li-Ion battery
$20M
R31Data stor-
age
Insufficient stor-
age space
Loss of science data
if downlink missed
5 5 2 30 Add second solid
state recorder
$15M
R32“ “ “ “ “ “ “ Add ground station $23M
R4 Ground
station
Missed downlink Fail to receive data
due to rain
4 5 4 80 Add ground station $25M
TABLE 6. Simplified FMEA for the SNAP Mission and Other Com-
peting Missions.
SNAP Mission
Risk Func. Sev. Occ. Det. RPN Cons. Cost
R1SNAPFunct 1 3 4 4 112 $30M
R4SNAPFunct 4 2 5 4 80 $25M
Competing Mission A
Risk Func. Sev. Occ. Det. RPN Cons. Cost
R1AFunct 1 4 5 3 84 $25M
R2AFunct 2 3 2 8 48 $20M
R3AFunct 3 5 3 4 60 $35M
Competing Mission B
Risk Func. Sev. Occ. Det. RPN Cons. Cost
R1BFunct 1 6 1 4 72 $40M
R2BFunct 2 8 3 5 120 $30M
lent, CE, of each design. Table 7 shows the utility, probability,
certainty equivalent.
By using the risk attitude utility function method, the
decision-makers see that the SNAP mission is the most pre-
ferred design in the case of risk tolerance. In other words, the
risk-adjusted value (CE(Rtotal)) is lowest for the SNAP mis-
sion. Therefore, assuming all other mission selection criteria are
equal, the SNAP mission would be the preferred mission to re-
ceive continued funding. This selection would not have been
made under a risk neutral, expected value decision making pro-
TABLE 7. Utility and Probability Data for Design 1 and Design 2
Risks.
SNAP Mission
Risk u(XL) 1-P0 U(s) CE(Rn)
R1SNAP0.0018 0.0030 0.9988 0.1542M
R2SNAP0.0014 0.0020 0.0014 0.0780M
Risk-Adjusted Value (CE(Rtotal)) Total: $0.2322M
Competing Mission A
Risk u(XL) 1-P0 U(s) CE(Rn)
R1A0.0035 0.0050 0.9985 0.1945M
R2A0.0016 0.0020 0.9996 0.0568M
R3A0.0015 0.0030 0.9985 0.1984M
Risk-Adjusted Value (CE(Rtotal)) Total: $0.4497M
Competing Mission B
Risk u(XL) 1-P0 U(s) CE(Rn)
R1B0.0003 0.0001 0.9993 0.0837M
R2B0.0018 0.0030 0.9988 0.1542M
Risk-Adjusted Value (CE(Rtotal)) Total: $0.2379M
cess and instead would have chosen Competing Mission A due
to the lower certainty equivalent. In the case of a neutral risk
attitude, CE(SNAP) = $0.1400M, CE(MissionA) = $0.2700M,
10 Copyright © 2012 by ASME

and CE(MissionB) = $0.1300M. A similar process to this would
then be repeated at the next level of mission selection after fur-
ther mission concept development.
CONCLUSION AND FUTURE WORK
The longterm goal of this research is to gain new knowledge
that enables mathematically sound and empirically grounded de-
cision making about project risk in large engineering organiza-
tions. A new methodology was introduced in this paper for
utility-based decision making using empirically-derived risk data
based on stakeholders’ risk attitude. Stakeholders’ risk attitude
is determined from the E-DOSPERT test that provides an aspi-
rational assessment of risk attitude in the context of utility the-
ory. As seen in the case study, the risk attitude utility function
method allows engineering risk methods that are in the expected
value domain to be translated into an appropriate risk attitude do-
main for a specific enterprise or decision-maker. Viewing the risk
information through the lens of risk attitude provides a decision-
maker with a new, numerically based approach to select and jus-
tify selection of the most important risks to address under con-
strained resources. Rather than using “gut feeling” to try and
explain risk decisions, this method gives stakeholders a way to
rationalize their risk-informed decisions.
Further expansion of this methodology will examine the
benefit side of Equation 5, which can add an expected benefit
if the risk outcome is not realized. This area of research could
be especially fruitful for comparing multiple risks against one
another for risk-tolerant enterprises. Large risks can have asso-
ciated large benefits. This method does not currently account for
the potential large return for taking a large risk.
Testing of this method should be conducted to determine
user satisfaction levels between utility risk functions generated
with lottery methods and with E-DOSPERT test results. Choice
determinations made with the help of risk functions generated
from the E-DOSPERT test could be compared against choices
made by individual respondents on risk decisions where a risk-
averse person would decide differently than a risk-tolerant per-
son. This would verify that risk atitude affects engineering risk
decisions. The same population of respondents would also be
provided data from the risk attitude utility function method using
risk utility functions generated with lotteries to make risk deci-
sions. In future work, this method will be tested and verified at at
a major aerospace corporation with production-level design en-
gineers who work in or with a Team X-like setting. This will in-
clude further testing and exploration of the creation of the scaling
factor, RSF with the intent of developing rules of thumb specific
to the aerospace industry.
The method has been shown to change risk-informed de-
cisions in certain situations where a risk-averse or risk-tolerant
decision-maker would likely choose differently than the expected
value approach suggests. As the E-DOSPERT test is further re-
fined, the risk attitude utility function method will become more
and more useful. Extension of the method to look at the ben-
efit side of the risk utility equation will provide further benefit
to the practitioner. The risk attitude utility function method is a
promising area of further research and practical application.
ACKNOWLEDGMENT
This research was funded in part by the National Science
Foundation (project number CMMI 1030060). The opinions,
findings, conclusions, and recommendations expressed are those
of the authors and do not necessarily reflect the views of the
sponsors. Special thanks go to Jacob Postman and Zach Bailey
for their MATLAB assistance.
REFERENCES
[1] Kurtoglu, T., and Tumer, I. Y., 2008. “A graph-based fault
identification and propagation framework for functional de-
sign of complex systems”. Journal of Mechanical Design,
30(5).
[2] Grantham-Lough, K., Stone, R., and Tumer, I. Y., 2007.
“The risk in early design method”. Journal of Engineering
Design, 20, Apr., pp. 155–173.
[3] Stone, R. B., Tumer, I. Y., and Wie, M. V., 2005. “The
function-failure design method”. Journal of Mechanical
Design, 127(3), May, pp. 397–407.
[4] Stamanis, D. H., 2003. Failure Modes and Effects Analysis:
FMEA from Theory to Execution, 2nd ed. ASQ Quality
Press, Milwaukee, WI.
[5] Weber, E. U., Blais, A.-R., and Betz, N. E., 2002. “A
domain-specific risk-attitude scale: Measuring risk percep-
tions and risk behaviors”. Journal of Behavioral Decision
Making, 15(4), pp. 263–290.
[6] Van Bossuyt, D. L., Carvalho, L., Dong, A., and Tumer,
I. Y., 2011. “On measuring engineering risk attitudes”. In
Proceedings of the ASME 2011 International Design Engi-
neering Technology Conferences and Computers in Infor-
mation and Engineering Conference (IDETC/CIE2011).
[7] Van Bossuyt, D. L., Wall, S., and Tumer, I., 2010. “To-
wards risk as a tradeable parameters in complex systems
design trades”. In Proceedings of the ASME 2010 In-
ternational Design Engineering Technology Conferences
and Computers in Information and Engineering Confer-
ence (IDETC/CIE2010), ASME, ASME, pp. DETC2010–
29016.
[8] Pratt, J. W., 1964. “Risk aversion in the small and in the
large”. Econometrica, 32, pp. 122–136.
[9] Keeney, R. L., and Raiffa, H., 1993. Decisions with Mul-
tiple Objectives: Preferences and Value Tradeoffs. Cam-
bridge University Press.
11 Copyright © 2012 by ASME

[10] Bernoulli, D., 1954. “Exposition of a new theory on the
measurement of risk”. Econometrica, 22(1), pp. 23–36.
[11] Kahneman, D., and Tversky, A., 1979. “Prospect theory:
An analysis of decision under risk”. Econometrica, 47(2),
Mar., pp. 263–291.
[12] Hillson, D., and Murray-Webster, R., 2007. Understanding
and managing risk attitude. Aldershot, Gower.
[13] von Winterfeldt, D., and Edwards, W., 1986. Decision
Analysis and Behavioral Research. Cambridge University
Press, Cambridge.
[14] Slovic, P., 1964. “Assessment of risk taking behavior”. Psy-
chological Bulletin, 61, pp. 330–333.
[15] MacCrimmon, K. R., and Wehrung, D. A., 1986. Taking
Risks: The Management of Uncertainty. Free Press, New
York.
[16] MacCrimmon, K., and Wehrung, D. A., 1990. “Character-
istics of risk taking executives”. Management Science, 36,
pp. 422–435.
[17] Schoemaker, P. J. H., 1990. “Are risk-preferences related
across payoff domains and response modes?”. Management
Science, 36, pp. 1451–1463.
[18] Sarin, R. K., and Weber, M., 1993. “Risk-value models”.
European Journal of Operations Research, 70, pp. 135–
149.
[19] Cooper, A. C., Woo, C. Y., and Dunkelberg, W. C., 1988.
“Entrepreneurs’ perceived chances for success”. Journal of
Business Venturing, 3, pp. 97–108.
[20] Standards Australia, and Standards New Zealand, 2009.
As/nzs iso 31000:2009 risk management - principles and
guidelines.
[21] Stump, G. M., Lego, S., Yukish, M., Simpson, T. W., and
Donndelinger, J. A., 2009. “Visual steering commands for
trade space exploration: User-guided sampling with exam-
ple”. Journal of Computing and Information Science in En-
gineering, 9(4), pp. 044501:1–10.
[22] Oberto, R. E., Nilsen, E., Cohen, R., Wheeler, R., DeFlo-
rio, P., and Borden, C., 2005. “The NASA exploration de-
sign team: Blueprint for a new design paradigm”. In Pro-
ceedings of the 2005 Aerospace Conference, no. 8957662
in IEEE Conferences, IEEE, pp. 4398–4405.
[23] Papalambros, P. Y., and Wilde, D. J., 2000. Principles of
Optimal Design: Modeling and Computation. Cambridge
University Press.
[24] NASA, 1995. NASA Systems Engineering Handbook.
NASA.
[25] FAA, 2006. National Airspace System System Engineer-
ing Manual, 3.1 ed. Federal Aviation Administration ATO
Operations Planning.
[26] Ross, A. M., Hastings, D. E., Warmkessel, J. M., and Diller,
N. P., 2004. “Multi-attribute tradespace exploration as front
end for effective space system design”. Journal of Space-
craft and Rockets, 41(1), pp. 20–29.
[27] Russell, J. S., and Skibniewski, M. J., 1988. “Decision cri-
teria in contractor prequalification”. Journal of Manage-
ment in Engineering, 4(2), pp. 148–164.
[28] Ji, H., Yang, M. C., and Honda, T., 2007. “A probabal-
istic approach for extracting design preferences from de-
sign team discussion”. In Proceedings of the ASME 2007
International Design Engineering Technology Conferences
and Computers in Information and Engineering Conference
(IDETC/CIE2007), IDETC/CIE.
[29] Lewis, K., Chen, W., and Schmidt, L, E., 2006. Decision
Making in Engineering Design. ASME Press, New York.
[30] Shah, J. J., and Wright, P. K., 2000. “Developing theoretical
foundations of dfm”. In Proceedings of the ASME 2000
International Design Engineering Technology Conferences
and Computers in Information and Engineering Conference
(IDETC/CIE2000), Baltimore, MD, September.
[31] Dong, H., and Wood, W., 2004. “Integrating computational
synthesis and decision-based conceptual design”. In Pro-
ceedings of the ASME 2004 International Design Engineer-
ing Technology Conferences and Computers in Information
and Engineering Conference (IDETC/CIE2004), Salt Lake
City, UT, September.
[32] Wassenaar, H. J., and Chen, W., 2003. “An approach to
decision-based design with discrete choice analysis for de-
mand modeling”. Transactions of the ASME: Journal of
Mechanical Design, 125(3), pp. 490–497.
[33] Hoyle, C., Tumer, I. Y., Mehr, A. F., and Chen, W., 2009.
“Health management allocation for conceptual system de-
sign”. ASME Journal of Computing & Information Sci-
ences in Engineering, 9.
[34] Pennings, J. M. E., and Smidts, A., 2000. “Assessing the
construct validity of risk attitude”. Management Science,
46(10), October, pp. 1337–1348.
[35] Kirkwood, C. W., 1997. Notes on attitude toward risk tak-
ing and the exponential utility function. Department of
Management, Arizona State University, January.
[36] Pfanzagl, J., 1959. “A general theory of measurment appli-
cations to utility”. Naval Research Logistics Quarterly, 6,
pp. 283–294.
[37] Howard, R. A., 1988. “Decision analysis: Practice and
promise”. Management Science, 34, pp. 679–695.
[38] McNamee, P., and Celona, J., 1990. Decision Analysis with
Supertree, 2nd edition ed. Scientific Press, South San Fran-
cisco, CA.
[39] Besanko, D., Dranove, D., Shanley, M., and Schaefer, S.,
2003. Economics of Strategy. Wiley.
[40] Gerber, A., 2002. Super nova-acc probe (snap). Tech. rep.,
NASA JPL / Team-X.
[41] Wertz, J. R., and Larson, W. J., 1999. Space Mission Anal-
ysis and Design. Springer.
12 Copyright © 2012 by ASME
Copyright © 2022 FDOKUMEN