Toward Automating Oral Presentation Scoring During ...
16
Toward Automating Oral Presentation Scoring During Principal Certification Program Using Audio-Video Low-Level Behavior Profiles Shan-Wen Hsiao, Student Member, IEEE, Hung-Ching Sun, Student Member, IEEE, Ming-Chuan Hsieh, Ming-Hsueh Tsai, Yu Tsao , Member, IEEE, and Chi-Chun Lee , Member, IEEE Abstract—Effective leadership bears strong relationship to attributes of emotion contagion, positive mood, and social intelligence. In fact, leadership quality has been shown to be manifested in the exhibited communicative behaviors, especially in settings of public speaking. While studies on the theories of leadership has received much attention, little has progressed in terms of the computational development in its measurements. In this work, we present a behavioral signal processing (BSP) research to assess the qualities of oral presentations in the domain of education, in specific, we propose a multimodal framework toward automating the scoring process of pre-service school principals’ oral presentations given at the yearly certification program. We utilize a dense unit-level audio-video feature extraction approach with session-level behavior profile representation techniques based on bag-of-word and Fisher-vector encoding. Furthermore, we design a scoring framework, inspired by the psychological evidences of human’s decision-making mechanism, to use confidence measures outputted from support vector machine classifier trained on the distinctive set of data samples as the regressed scores. Our proposed approach achieves an absolute improvement of 0.049 (9.8 percent relative) on average over support vector regression. We further demonstrate that the framework is reliable and consistent compared to human experts. Index Terms—Behavioral signal processing (BSP), oral presentation, multimodal signal processing, educational research Ç 1 INTRODUCTION C HARISMATIC and effective leadership has been shown to be related to the phenomenon of emotion conta- gion [1], [2], positive mood [3], and attribute of social intelligence [4]. A recent meta study summarizing twenty years of research in studying the relationship between leadership, affect, and emotions in social science shows that there exists a wealth of literature in formulating these theoretical concepts; in fact, the conceptualization in the complex interplay between these constructs have been quite established. However, the methodologies in deriv- ing valid measurements of these attributes, i.e., largely based on different forms of self reports or human observ- ers perception, have progressed very little over the years [5]. This continues to be a critical hurdle needed to be overcome computationally in further substantiating the concept of leadership in the perception of charisma and moving the theories forward [5], [6]. Furthermore, researchers have also pointed out eviden- ces that this affect-based perception of charisma/leadership is, in fact, reflected in an individual’s public speaking skill [7] or broadly in his/her communicative styles and strate- gies [8]. Studies have revealed that more than the word usage, the communicative strategy and expressivity (i.e., verbal characteristics and non-verbal behaviors) play defin- ing roles in the perception of leadership and charisma [9]-it is, in fact, a result from intertwining effect between content and delivery when giving a speech [10], [11], [12]. Various domain experts have been striving not only to advance the theoretical underpinning of these fundamental attributes of an effective leader but also to derive appropriate methods in quantitatively assessing the quality of these attributes as manifested in these individuals. This is particularly relevant in fields such as political science [13], [14], business (organi- zational) management [15], and also education. While there is abundant research in understanding the content, the research into studying the delivery is much more limited, potentially due to a lack of adequate methodology. In this work, we present a multimodal behavior profiles frame- work to quantify communicative behaviors for tasks of assessing public speaking in the domain of education. In fact, the notion that human internal states are mani- fested in different communicative channels has already sparked a tremendous computational effort. Engineers have developed algorithms in order to recognize humans socio- and emotional-attributes from observable behavioral cues through the use of signal processing algorithms and machine learning techniques. These effort have led to the emergence of S.-W. Hsiao, H.-C. Sun, and C.-C. Lee are with Department of Electrical Engineering, National Tsing Hua University, Hsinchu 30013, Taiwan, China. E-mail: [email protected], [email protected], cclee@ee. nthu.edu.tw. M.-C. Hsieh and M.-C. Tsai are with National Academy for Educational Research, New Taipei City 23703, Taiwan, China. E-mail: {mhsieh, mhtsai}@mail.naer.edu.tw. Y. Tsao is with Research Center for Information Technology, Academia Sinica, Taipei, Taiwan 11529, China. E-mail: [email protected]. Manuscript received 25 Nov. 2016; revised 9 Aug. 2017; accepted 24 Aug. 2017. Date of publication 7 Sept. 2017; date of current version 25 Nov. 2019. (Corresponding author: Chi-Chun Lee.) Recommended for acceptance by S. Scherer. Digital Object Identifier no. 10.1109/TAFFC.2017.2749569 552 IEEE TRANSACTIONS ON AFFECTIVE COMPUTING, VOL. 10, NO. 4, OCTOBER-DECEMBER 2019 1949-3045 ß 2017 IEEE. Personal use is permitted, but republication/redistribution requires IEEE permission. See ht_tp://www.ieee.org/publications_standards/publications/rights/index.html for more information.
-
Upload
khangminh22 -
Category
Documents
-
view
8 -
download
0
Transcript of Toward Automating Oral Presentation Scoring During ...

Toward Automating Oral Presentation ScoringDuring Principal Certification Program UsingAudio-Video Low-Level Behavior Profiles
Shan-Wen Hsiao, Student Member, IEEE, Hung-Ching Sun, Student Member, IEEE,
Ming-Chuan Hsieh, Ming-Hsueh Tsai, Yu Tsao ,Member, IEEE, and Chi-Chun Lee ,Member, IEEE
Abstract—Effective leadership bears strong relationship to attributes of emotion contagion, positive mood, and social intelligence. In
fact, leadership quality has been shown to be manifested in the exhibited communicative behaviors, especially in settings of public
speaking. While studies on the theories of leadership has received much attention, little has progressed in terms of the computational
development in its measurements. In this work, we present a behavioral signal processing (BSP) research to assess the qualities of
oral presentations in the domain of education, in specific, we propose a multimodal framework toward automating the scoring process
of pre-service school principals’ oral presentations given at the yearly certification program. We utilize a dense unit-level audio-video
feature extraction approach with session-level behavior profile representation techniques based on bag-of-word and Fisher-vector
encoding. Furthermore, we design a scoring framework, inspired by the psychological evidences of human’s decision-making
mechanism, to use confidence measures outputted from support vector machine classifier trained on the distinctive set of data samples
as the regressed scores. Our proposed approach achieves an absolute improvement of 0.049 (9.8 percent relative) on average over
support vector regression. We further demonstrate that the framework is reliable and consistent compared to human experts.
Index Terms—Behavioral signal processing (BSP), oral presentation, multimodal signal processing, educational research
Ç
1 INTRODUCTION
CHARISMATIC and effective leadership has been shownto be related to the phenomenon of emotion conta-
gion [1], [2], positive mood [3], and attribute of socialintelligence [4]. A recent meta study summarizing twentyyears of research in studying the relationship betweenleadership, affect, and emotions in social science showsthat there exists a wealth of literature in formulating thesetheoretical concepts; in fact, the conceptualization in thecomplex interplay between these constructs have beenquite established. However, the methodologies in deriv-ing valid measurements of these attributes, i.e., largelybased on different forms of self reports or human observ-ers perception, have progressed very little over the years[5]. This continues to be a critical hurdle needed to beovercome computationally in further substantiating theconcept of leadership in the perception of charisma andmoving the theories forward [5], [6].
Furthermore, researchers have also pointed out eviden-ces that this affect-based perception of charisma/leadershipis, in fact, reflected in an individual’s public speaking skill[7] or broadly in his/her communicative styles and strate-gies [8]. Studies have revealed that more than the wordusage, the communicative strategy and expressivity (i.e.,verbal characteristics and non-verbal behaviors) play defin-ing roles in the perception of leadership and charisma [9]-itis, in fact, a result from intertwining effect between contentand delivery when giving a speech [10], [11], [12]. Variousdomain experts have been striving not only to advance thetheoretical underpinning of these fundamental attributes ofan effective leader but also to derive appropriate methodsin quantitatively assessing the quality of these attributes asmanifested in these individuals. This is particularly relevantin fields such as political science [13], [14], business (organi-zational) management [15], and also education. While thereis abundant research in understanding the content, theresearch into studying the delivery is much more limited,potentially due to a lack of adequate methodology. In thiswork, we present a multimodal behavior profiles frame-work to quantify communicative behaviors for tasks ofassessing public speaking in the domain of education.
In fact, the notion that human internal states are mani-fested in different communicative channels has alreadysparked a tremendous computational effort. Engineers havedeveloped algorithms in order to recognize humans socio-and emotional-attributes from observable behavioral cuesthrough the use of signal processing algorithms and machinelearning techniques. These effort have led to the emergence of
� S.-W. Hsiao, H.-C. Sun, and C.-C. Lee are with Department of ElectricalEngineering, National Tsing Hua University, Hsinchu 30013, Taiwan,China. E-mail: [email protected], [email protected], [email protected].
� M.-C. Hsieh and M.-C. Tsai are with National Academy for EducationalResearch, New Taipei City 23703, Taiwan, China.E-mail: {mhsieh, mhtsai}@mail.naer.edu.tw.
� Y. Tsao is with Research Center for Information Technology, AcademiaSinica, Taipei, Taiwan 11529, China. E-mail: [email protected].
Manuscript received 25 Nov. 2016; revised 9 Aug. 2017; accepted 24 Aug.2017. Date of publication 7 Sept. 2017; date of current version 25 Nov. 2019.(Corresponding author: Chi-Chun Lee.)Recommended for acceptance by S. Scherer.Digital Object Identifier no. 10.1109/TAFFC.2017.2749569
552 IEEE TRANSACTIONS ON AFFECTIVE COMPUTING, VOL. 10, NO. 4, OCTOBER-DECEMBER 2019
1949-3045� 2017 IEEE. Personal use is permitted, but republication/redistribution requires IEEE permission.See ht _tp://www.ieee.org/publications_standards/publications/rights/index.html for more information.

several cross-cutting interdisciplinary fields, e.g., affectivecomputing [16], social signal processing [17], and behavioralsignal processing [18]. For example, progresses in affectivecomputing have resulted in a large body of works on algorith-mic designs for automatic emotion recognition. Researchershave utilized a wide range of behavioral descriptors acrossdifferent modalities, such as speech [19], [20], body gestures[21], [22], facial expressions [23], and evenmultimodal behav-iors [24], [25], to obtain robust recognition of human’s emo-tional states. Aside from emotions, other subjective attributes,such as paralinguistic and social aspects of human behaviors,have also received much attention recently in the develop-ment toward automatic recognition [26]; some notable exam-ples includes intoxication detection [27], dialog backchannelrecognition [28], interest level recognition [29], etc.
While the general human behaviormodeling tasks has pro-gressed significantly, an interdisciplinary field, behavioralsignal processing (BSP), emerges by building upon thiswealth of research and focusing on modeling human behav-iors in a tightly-integrative and contextualized manner.Instead of working on the general problem domain of humanbehaviors, it stresses close integration with the domainexperts to enhace the scientific-rigor in the research, i.e., frommultimodal data acquisition in ecologically-valid real setting,domain-sensitive algorithmic development, to proper experi-mental validation, in order provide meaningful analytics toenhance the experts decision-making process. Exemplary BSPresearch already exists in tasks of recognizing high-level andsubjective attributes for domains ofmental health, e.g., coupletherapy [30], [31], drug addiction therapy [32], [33], andautism spectrum disorder [34], [35], of professional acting[36], and of education, e.g., second language literacy assess-ment [37]. Each of these BSP effort have demonstrated that itwould result not only in novel signal processing algorithmsthat can measure domain-relevant constructs in real worldproblems, but also in promises of advancing the current scien-tific understanding of human.
In this work, we present a thorough BSP research towardquantitative modeling of leaders’ communicative abilities inthe domain of education. In specifics, we collaborate witheducational researchers to contextualize such an analyticaldevelopment in assessing the school candidate principals’impromptu presentation at an yearly certification program-an extension from our previous published work [38].
1.1 Background
In the current climate of society’s high expectation for bettereducation, irresistible school changes and constant rapid edu-cational reforms have made the educational environmentbecome increasingly more complex. Designing effective pre-employment certification and continuing training program toassess and improve desired leadership qualities has become aprevalent research topic in the field of education (e.g., [39],[40], [41]). In fact, the National Academy for EducationalResearch (NAER) has been entrusted by the Ministry of Edu-cation (MOE) in Taiwan with the design and implementationof pre-service school principal certification program. Everyyear, each candidate principals has to attend a 2-month pro-gram to become a certified principal-to-be.
The aim of the program is to rigorously evaluate multipleaspects of each candidate on their potential in being a school
leader. Similar to leadership research in other fields, a keyanticipated ability to be assessed is their communicativeskill, which is important not only to resolve complex prob-lems but also to steer and lead the direction of the schooldevelopment [42]. Each candidate is required to perform a 3-minute long impromptu speech as part of their final exami-nation to demonstrate their immediate speech planning andcommunicative strategy as a leader. Throughout the years,the scores have been graded by two senior coaching princi-pals, which count 5 percent toward the final grade that eachparticipant receives at the end of the program. Due to thenature of subjectivity in the oral presentation assessment,grading impromptu speech is not only time-consuming butalso error-prone. Further, this program repeats every yearwith fresh candidates; however, access to experiencedand eligible coaching principals is becoming more difficultevery year. The NAER has, hence, launched a collaborativeresearch effort into automating this subjective oral presenta-tion scoring in order tomitigate these perennial issues
1.2 Related Works
1.2.1 Educational Research
In the field of education, there exists many different types ofcommonly-used automated systems for various perfor-mance ratings, including passage summary (written or spo-ken presentation and response), written product (essay,email, response to problem-solving scenario), spoken form(read aloud, retell or reconstruct sentences or phrases), shortanswer questions (written or spoken presentation andresponse), and oral reading fluency (accuracy and expres-sion) [43]. In fact, commercial companies have developedautomatic scoring systems for constructed language inassessment tasks, and these systems have been appliedwidely in large scale assessment [44]. For example Streeteret al. reports that Pearson’s Knowledge Technology hasapplied automatic system to score more than 20 million spo-ken and written responses for different kinds of language-related assessments [43]. Aside from commercial applica-tions, Balogh et al. evaluates spoken English tests for adultsand achieves a machine-human correlation of 0.95 [45]; sim-ilarly, Berstein et al. evaluates a spoken Arabic test andobtains a score correlation of 0.97 [46]. Validity of these testscores can be further strengthened by comparing withscores obtained from other concurrent administrations ofexisting tests. For example, Bernstein et al. analyzes thevalidity of test scores from oral exams of four types of lan-guages to quantify a person’s effectiveness in spoken com-munication [47]. Their study shows that scores from theautomated tests are strongly correlated (r=0.77 to 0.92) withthe scores from oral proficiency interviews; similar conclu-sions are obtained by Bernstein & Cheng [48].
While there is a wealth of research works on automatedscoring systems in the field of education, most of these sys-tems rely on well-controlled tasks that are operational oftenin limited contexts, e.g., a pre-defined set of short utterancesor spoken words or short written lexical contents. Theassessment is also carried out only based on single surfaceform of human communication, e.g., written texts or spokenwords. However, since the impromptu speech in this con-text reflects a higher-level attributes of a candidate princi-pal, not only is the talk much less-constrained but also the
HSIAO ET AL.: TOWARD AUTOMATING ORAL PRESENTATION SCORING DURING PRINCIPAL CERTIFICATION PROGRAM USING... 553

assessment is, at the same time, much subjective in nature.This is an important gap needed to be filled with computa-tional methods in the field of education assessment.
1.2.2 Engineering Research
Recently, there are also several related research works in theengineering domain targeted for automatic assessment usingmultimodal behavior cues in education setting [49]. Forexample, Ochoa et al. provide a nice summary showing thefeasibility and the recent trends in developing educationallearning analytics by using multimodal sensor recordingsand automated computational methods in assessingstudent’s learning performances in classes [50], [51]. Further-more, Haider et al. show promising accuracies in ratingstudents’ presentation skill while giving powerpoint-aidedpresentations with a suite of multimodal cues on a largeSpanish corpus [52]. In the area of developing algorithms inautomatic assessment of public speaking, i.e., the closestapplication domain to this work, Batrinca et al. presents aplatform of using virtual agents as audiences and develops amultimodal automatic system for assessing public speakingability [53], and later a similar setup is carried out in a workdone byW€ortwein et al. [54]. Chen et al. and Ramanarayananet al. also present automatic frameworks of using a rich set ofmultimodal behavior features (i.e., data collected from audioand kinect sensors) on ratings of oral presentations [55], [56],[57]. While this body of works only recently emerge, thiseffort of learning analytics development already pointstoward the promises of utilizing automatic method in assess-ing various types of oral presentation skills in less con-strained scenarios.
1.3 Our Contributions
The major theme of the work is on quantitative modeling ofcandidate principals’ multimodal behavior profiles towardautomated assessment of their communicative skills. Wepresent a novel BSP human behavior research integratingthe following three major contributions:
1) Research Settings: conducting the research in a realand contextualized examination scenarios
2) Behavior Representations: using data-driven holisticlow-level multimodal behavior profiles to obtainboth a reliable and a consistent assessment
3) Automatic Scoring: handling challenges in modelinghigh-level attributes by using confidence score frombinary classifier (instead of conventional regression)
First, our work represents a collaborative BSP research.The spontaneous audio-video data is collected directly dur-ing the real candidate principals examinations; the behaviorsthat they exhibit are naturally ecologically-valid. Further,many past works show the efficacy in utilizing advancedsensor technologies, e.g., Kinect senors or depth camera, in ahighly-instrumented recording space. In our context, inorder to avoid unnecessary alteration to the existing imple-mentation of the impromptu speech examination and to fur-ther ensure the algorithm’s wide-applicability in the real-world NAER certification programs, we maintain the exist-ing data recording setup using high-definition video cam-corder that can also be easily scaled up. Also, the gradingsheet that the algorithm is built for is the one that is currently
in use by the educational experts. The outcome of the auto-mated analytics can be easily integrated into the decision-making pipeline of the experts. This realistic nature of ourwork ensures the potential of our framework to achieve themost direct impact and provides ecologically-valid samplesfor human behavior studies at the same time.
Second, we derive low-level behavior profiles as generalfeature representations for the assessment algorithm. Theidea emerges as the goal of the research is to optimize accu-racies for automatic scoring instead to seek manually pre-defined discrete behaviors (e.g., looking at the audiences,proper eye contacts, adequate forearm gestures, etc) that isoften useful in context of educational training. The holisticprofile based approach could potentially include these dis-crete behaviors (in)-directly and possibly beyond. In fact,many past works have demonstrated that due to the com-plex characteristics of human behaviors, many state-of-artrecognition framework benefit from a holistic representationof low-level descriptors (LLDs) describing a multitudeaspects of speech and video signal’s spectral-temporal char-acteristics directly. Various examples can be found acrossfields, e.g., event recognitions [58], action recognitions [59],[60], emotion recognitions [61], and detection of high-levelcouples’ behaviors during therapy [30]. In this work, wepropose to derive behavior profiles from both video andaudio LLDs to assess the quality of impromptu speech.
Lastly, the subjectivity in the annotated labels often cre-ates an issue in the algorithmic developmental process. Han-dling of such subjectivity in the past is largely carried outconventionally at the label preprocessing stage, e.g., averag-ing the raters to generate ground truth. In this work, wedraw our inspiration from literature in psychology statingthat if the underlying true decision-to-make (e.g., in thiscase: assessment of a candidate principal speech) is a (series)of binary choice(s) by nature rather than a continuous scale, byimposing human to make a continuous judgment wouldresult in a loss-of-information [62], [63]. Hence, aside from pre-processing labels, we also propose an technical approach toextend the binary classification framework to directly regressa real-valued score using ‘sample-to-boundary’ distance asthe final assessment score. It is an appealing methodology,especially in highly-professional domain, where expert rat-ings are often limited in number and simply out-sourcingthe annotation can raise concern on the validity. In fact, theeffect of subjectivity handling in our technical framework isdemonstrated not only in the improved recognition accu-racy, but also could be more consistent and less susceptibleto unwanted variation compared to human experts shown inour consistency analysis.
To the best of our knowledge, there is few works thathave systematically, i.e., from research setting, computa-tional handling of subjectivity, to analyses, modeled humanbehaviors computationally in this context; the analytic gen-erated provides a necessary methodological building blockto further advancing the research in understanding leader-ship in education setting. Additionally, the algorithmicapproaches and the recognition rates achieved can also bepresented as benchmark results on the database, where theeffort is undergoing to be released to the community. Therest of the paper is organized as follows: Section 2 describesabout our multimodal database, collection methodology,
554 IEEE TRANSACTIONS ON AFFECTIVE COMPUTING, VOL. 10, NO. 4, OCTOBER-DECEMBER 2019
and annotation labels of interest. Section 3 describes aboutresearch methodology, including multimodal behavior rep-resentations, and our proposed automatic scoring method.Section 4 shows experimental setups, results, analyses, anddiscussions. Finally, Section 5 concludes with future works.
2 DATABASE
2.1 The NAER Principals’ Oral PresentationDatabase
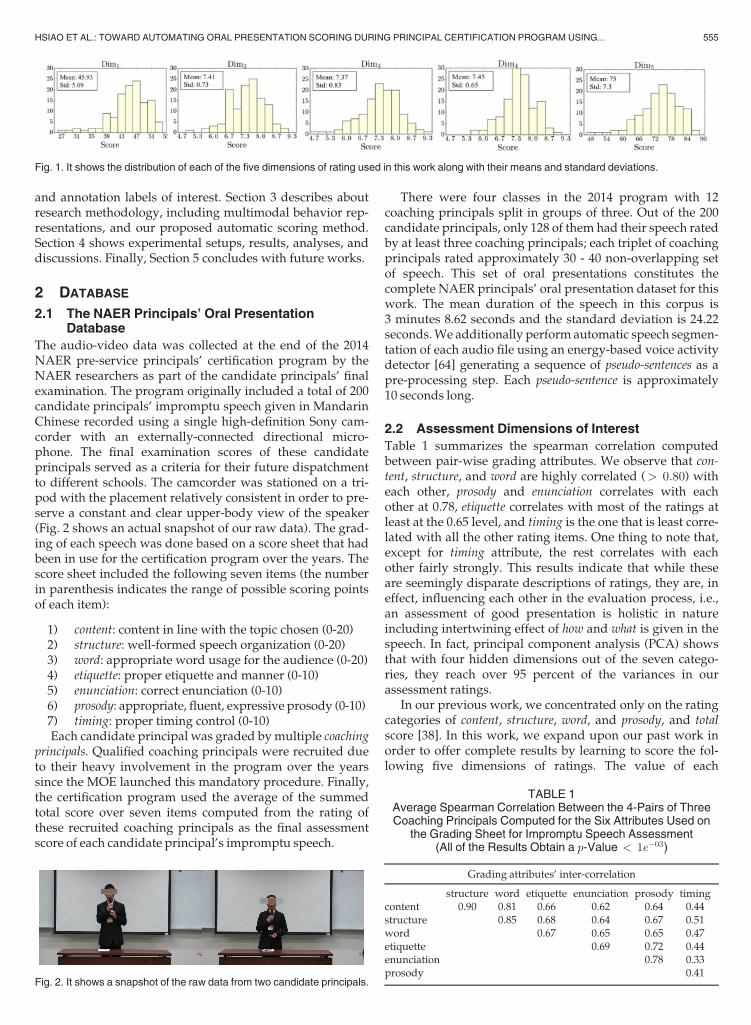
The audio-video data was collected at the end of the 2014NAER pre-service principals’ certification program by theNAER researchers as part of the candidate principals’ finalexamination. The program originally included a total of 200candidate principals’ impromptu speech given in MandarinChinese recorded using a single high-definition Sony cam-corder with an externally-connected directional micro-phone. The final examination scores of these candidateprincipals served as a criteria for their future dispatchmentto different schools. The camcorder was stationed on a tri-pod with the placement relatively consistent in order to pre-serve a constant and clear upper-body view of the speaker(Fig. 2 shows an actual snapshot of our raw data). The grad-ing of each speech was done based on a score sheet that hadbeen in use for the certification program over the years. Thescore sheet included the following seven items (the numberin parenthesis indicates the range of possible scoring pointsof each item):
1) content: content in line with the topic chosen (0-20)2) structure: well-formed speech organization (0-20)3) word: appropriate word usage for the audience (0-20)4) etiquette: proper etiquette and manner (0-10)5) enunciation: correct enunciation (0-10)6) prosody: appropriate, fluent, expressive prosody (0-10)7) timing: proper timing control (0-10)Each candidate principal was graded bymultiple coaching
principals. Qualified coaching principals were recruited dueto their heavy involvement in the program over the yearssince the MOE launched this mandatory procedure. Finally,the certification program used the average of the summedtotal score over seven items computed from the rating ofthese recruited coaching principals as the final assessmentscore of each candidate principal’s impromptu speech.
There were four classes in the 2014 program with 12coaching principals split in groups of three. Out of the 200candidate principals, only 128 of them had their speech ratedby at least three coaching principals; each triplet of coachingprincipals rated approximately 30 - 40 non-overlapping setof speech. This set of oral presentations constitutes thecomplete NAER principals’ oral presentation dataset for thiswork. The mean duration of the speech in this corpus is3 minutes 8.62 seconds and the standard deviation is 24.22seconds.We additionally perform automatic speech segmen-tation of each audio file using an energy-based voice activitydetector [64] generating a sequence of pseudo-sentences as apre-processing step. Each pseudo-sentence is approximately10 seconds long.
2.2 Assessment Dimensions of Interest
Table 1 summarizes the spearman correlation computedbetween pair-wise grading attributes. We observe that con-tent, structure, and word are highly correlated (> 0:80) witheach other, prosody and enunciation correlates with eachother at 0.78, etiquette correlates with most of the ratings atleast at the 0.65 level, and timing is the one that is least corre-lated with all the other rating items. One thing to note that,except for timing attribute, the rest correlates with eachother fairly strongly. This results indicate that while theseare seemingly disparate descriptions of ratings, they are, ineffect, influencing each other in the evaluation process, i.e.,an assessment of good presentation is holistic in natureincluding intertwining effect of how and what is given in thespeech. In fact, principal component analysis (PCA) showsthat with four hidden dimensions out of the seven catego-ries, they reach over 95 percent of the variances in ourassessment ratings.
In our previous work, we concentrated only on the ratingcategories of content, structure, word, and prosody, and totalscore [38]. In this work, we expand upon our past work inorder to offer complete results by learning to score the fol-lowing five dimensions of ratings. The value of each
Fig. 2. It shows a snapshot of the raw data from two candidate principals.
Fig. 1. It shows the distribution of each of the five dimensions of rating used in this work along with their means and standard deviations.
TABLE 1Average Spearman Correlation Between the 4-Pairs of ThreeCoaching Principals Computed for the Six Attributes Used on
the Grading Sheet for Impromptu Speech Assessment(All of the Results Obtain a p-Value < 1e�03)
Grading attributes’ inter-correlation
structure word etiquette enunciation prosody timingcontent 0.90 0.81 0.66 0.62 0.64 0.44structure 0.85 0.68 0.64 0.67 0.51word 0.67 0.65 0.65 0.47etiquette 0.69 0.72 0.44enunciation 0.78 0.33prosody 0.41
HSIAO ET AL.: TOWARD AUTOMATING ORAL PRESENTATION SCORING DURING PRINCIPAL CERTIFICATION PROGRAM USING... 555

category is computed by averaging the ratings given by thethree coaching principals:
� Dim1 ¼ contentþ structureþword� Dim2 ¼ prosody� Dim3 ¼ etiquette� Dim4 ¼ enunciation� Dim5 ¼ total final score (summation of all 7
categories)Through our PCA analysis, the first principal axis (i.e.,
accounts for 81.6 percent of the total variances) weightsare ½�0:54;�0:56;�0:53;�0:18;�0:13;�0:15;�0:20� for theattributes of content, structure, word, etiquette, enunciation,prosody, and timing respectively; this further demonstratesthe correlative structure between these attributes. Hence,we decide to combine the three ratings, i.e., content, struc-ture, and word, into a single dimension. Further note thattiming is not included in this work as it is merely a trackingon how long does each speaker speaks. Fig. 1 shows the dis-tribution, means, and standard deviations for each of thefive dimensions of ratings used in this work.
2.2.1 Pre-Processing Assessment Dimensions
Furthermore, in order to mitigate the issue that each indi-vidual coaching principal may score a speech with differentdynamic ranges, a common practice is to perform label nor-malization. In this work, we use rank label normalizationtechnique [65] to achieve dynamic range normalization. Themethod transforms the original scores of each individualevaluator of each category into a rank order, and we thennormalize this rank by dividing with the total number ofsamples for this evaluator (creating a number boundedbetween zero and one). Fig. 3 demonstrates an example thattwo different coaching principals (Expert 1 and Expert 2)having distinct scoring ranges although they both rated thesame set of candidate principals’ oral presentations. In thiswork, we finally include the following ten labels to train ourassessment system and present all of their complete resultsin Section 4.2.
� Original:Dim1o;Dim2o;Dim3o,Dim4o,Dim5o
� Rank-normalized: Dim1r;Dim2r;Dim3r;Dim4r;Dim5r
A summary of the inter-evaluator agreement for the tendimensions-of-interest (five original, five ranked) is listed inTable 2. We quantify inter-evaluator agreement by averag-ing the Cronbach’s alpha computed between coachingprincipals’ scores. It is interesting to see that these expertcoaching principals achieve the highest inter-evaluatoragreement in Dim5 (the total score). This seems to implicatethat experts judgment tend to agree more on higher-levelrating (e.g., Dim5 can be thought as the final evaluation of
how good is a talk overall) more than the seemingly lower-level rating (e.g., Dim2 is a rating on how well is the prosodymanifested). This corroborates past research showing thatthe quality of the speech is often holistically integrativebetween content and delivery - resulting in an overall felt-sense. In fact, it also justifies the NAER researchers’ use ofDim5 as the assessment score marked on the final gradesheet of these candidates for the certification program.Moreover, we also see that by rank-normalizing labels, itimproves the inter-evaluator agreement for all dimensionsexcept Dim2. One observation that we see with Dim2 is notonly that the range of scoring is small but also coachingprincipals tend to give a same score to multiple presenta-tions, which may lead to a negative effect when performingrank-normalization.
2.3 Comparison to Similar Databases
The public speaking presentation databases collected forsimilar automated assessment task used in the past engi-neering works were often simulated-in lab, i.e., throughrecruiting volunteers to perform presentations in a well-instrumented lab space. For example, the setting used inwork [54] was done in lab with availability of a platform ofdisplaying virtual audiences. Their database included 2recordings each for 45 participants using head mountedmicrophone, web camera, and a Microsoft Kinect as the par-ticipants engaged in interactive scene with virtual humans.Since their goal was mainly on training the subjects toimprove their presentation behaviors not for large-scaleassessment, the rating was designed by the authors includ-ing a pre-set list of discrete behaviors. The database used inworks [55], [56], [57] included 56 presentations from 14recruited speakers total. The multimodal behavior data wascollected in lab using Kinect sensors with audio recordings.This database was collected with a similar goal as ours, i.e.,to perform automatic assessment; hence, the assessment rat-ing was done using a psychometric instrument called PublicSpeaking Competence Rubric (PSCR) on 10 dimensions.Each sample was annotated by two experts only, and thethird expert was brought in only on the samples when there
Fig. 3. (Left) it shows an example of the original scores’, Dim5, distribution that is graded by two different coaching principals, Expert 1 and Expert 2,on the same set of data; the dynamic ranges are clearly different. (Right) It shows an example of the label distribution after the rank normalization isdone on each coaching principal.
TABLE 2The Table Summarizes the Average Inter-Evaluator Agreement,i.e., Cronbach Alpha, Computed Between Coaching Principals
on the Ten Dimensions of Labels Used in This Work
Dim1o Dim2o Dim3o Dim4o Dim5o
Database 0.51 0.48 0.40 0.53 0.58
Dim1r Dim2r Dim3r Dim4r Dim5r
Database 0.55 0.40 0.43 0.58 0.63
556 IEEE TRANSACTIONS ON AFFECTIVE COMPUTING, VOL. 10, NO. 4, OCTOBER-DECEMBER 2019

was a disparate scoring between the original two experts.The inter-evaluator agreement on the 10 dimensions rangedfrom 0.15 to 0.88, where the overall holistic assessmentachieved a modest agreement at 0.39.
While our setting is not directly comparable, we seethat our research setting is more contextualized-in the wild,i.e., the NAER database utilized in this work constitutesreal subjects in examination, larger sample size (128 pre-sentations from 128 subjects), and established expert rat-ings (one that has already been used in the program overthe years). Our data collection protocol is easily scalableto large-scale assessment task, especially important indomain of education.
3 RESEARCH METHODOLOGY
Our complete system is shown in Fig. 4. It consists of threemajor components: 1) audio-video low-level descriptors, 2)session-level behavior profiles, and 3) scoring using the sup-port vector machine (SVM) classifier. Instead of first gener-ating a list of manually pre-defined behaviors to look for,then to assess the overall quality of the presentation, wepropose to compute holistic behavior profiles directly frommultimodal low-level behavior descriptors; in fact, similarlow-level encoding based approach has recently shown tobe effective in complex tasks such as emotion and paralin-guistic recognition (e.g., [66], [67]). The combination of mul-timodal behavior profiles with the scoring regressionsystem using binary SVM classifier achieve desired recogni-tion performances in this work.
In the following section, we describe the details about themultimodal dense unit-level audio-video feature extractions,the two different session-level feature encodings, i.e., k-meansbased bag-of-word model and Fisher-vector encoding togenerate behavior profiles, and lastly, our proposed scoringregression system using binary SVM classifier trained ondistinctive groups of samples.
3.1 Dense Unit-Level Acoustic Feature Extraction
We adopt the use of high-dimensional feature extractionapproach in the acoustic modality as many past workshave demonstrated this comprehensive data analysisapproach is capable of modeling human acoustic in com-plex recognition tasks. We generate high-dimensionalacoustic features at a granular-level using a sliding windowapproach, i.e., a window of 200 ms (roughly correspond toa syllable duration) with 50 percent overlap. This slidingwindow approach attempts to capture more detaileddynamics while maintaining adequate window length toproperly maintaining the temporal characteristics of acous-tic LLDs. We term each of this window as an unit at whichwe compute a high-dimensional acoustic feature vectorusing exhaustive functions. The exact extraction approachis carried out by first calculating various acoustic LLDs andthen applying statistical functions on these LLDs. A com-plete list of acoustic LLDs and the statistical functions usedis listed in Table 3.
The total number of acoustic features computed per unitis 9,063 (57 LLDs� 53 functions� 3 D&DD). We further per-form z-score normalization on these features per speakerand discard features with zero variance; this results in afinal dimension of 8,861 per unit - characterizing extensiveaspects of acoustic-related properties within a unit window.In summary, this acoustic feature extraction approachworks as follows: 1) applying VAD to automatically seg-ment an oral presentation into N utterances, 2) generating asequence of 8,861-dimensional feature vector per utteranceusing the sliding unit approach, and 3) depending on thenumber of units per utterance and the total number of Nutterances, putting these features together to form a varyingnumber of sequences of 8,861-dimensional acoustic featuresper speech, which is then be further converted to a fixed-length acoustic behavior profile using methods described inSection 3.3. The term dense essentially refers to both a moregranular temporal scale and an extensive use of low-level
Fig. 4. It shows a complete diagram of our computational framework and experimentation in this work: dense unit-level audio-video feature extrac-tions is performed on the raw audio-video recordings, and the k-means bag-of-word (BOW) and Fisher-vector (FV) encoding methods map the vary-ing-length sequences of audio-video feature vectors to a single-fixed length vector as the behavior profile at the speech-level. Then, we carry outautomatic scoring of the 10 ratings, i.e., 2 (original & rank-normalized) � 5 dimensions of interest.
HSIAO ET AL.: TOWARD AUTOMATING ORAL PRESENTATION SCORING DURING PRINCIPAL CERTIFICATION PROGRAM USING... 557

descriptors. The approach mentioned above is carried outcompletely using opensmile toolbox [68].
3.2 Dense Unit-Level Video Feature Extraction
We use dense trajectory-based method to compute videofeatures. The raw video resolution is 1920x1020 with a fram-erate of 30 Hz; we downsample the resolution to 640x480with a framerate of 15 Hz before carrying out video descrip-tor extraction. The unit here simply refers to a video frame(15 Hz � 66 ms). The framework is originally proposed byWang et al. [59] and is effective in tasks of humans’ actionrecognition (e.g., [58], [60]). A version of this approach hasalso recently been utilized in emotion recognition withbody expressions [69]. In the following, we will brieflydescribe this video feature extraction approach. The coreidea is to densely sample each video frame instead of tryingto find key feature points. In essence, the algorithm firstdensely samples points within each frame, and then thealgorithm prunes out unnecessary points that are either ‘non-trackable’ over time based on method of autocorrelation(e.g., those could be related to absence of any movement)or ‘too much displacement’ (most likely due to error in
point-tracking). The methodology captures the movementdynamics of these densely-sampled points using an opticalflow and a median filtering technique over time. Afterpruning, it would form a varying number of trajectoriesper frame; the tracking and sampling are reinitialized forevery 15 frames.
Hence, with these densely-sampled points’ trajectories,i.e., so called dense trajectories, we then derive the followingdescriptors in their respected spatio-temporal grid.
� MBHx: motion boundary histogram in the x direc-tion (the relative motion in the x direction)
� MBHy: motion boundary histogram in the y direc-tion (the relative motion in the y direction)
� TRAJ: dense trajectories’ ðx; yÞ normalized positiondisplacement information
A description of the two derived video features is below:TRAJ descriptors: Assume Pt ¼ ðxt; ytÞ is a feature point at
time t, we can track this point using the equation,
Ptþ1 ¼ ðxtþ1; ytþ1Þ ¼ ðxt; ytÞ þ ðM � vÞjxt;yt ; (1)
Where M is the median filter kernel, v is the dense opticalflow field, and xt; yt is the rounded position of ðxt; ytÞ. Now,we can form a trajectory of a feature point as ðPt; Ptþ1;Ptþ2; . . .Þ, and we constrain the length of each trajectory tobe 15 to mitigate issues of drifting. Now, with the trajectoryof a feature point, we can further form another sequence:S ¼ ðDPt; . . . ;DPtþL�1Þ, where DPt ¼ ðxtþ1 � xt; ytþ1 � ytÞ.Now, we can normalize S to obtain S0, i.e., the TRAJ descrip-tors
S0 ¼ ðDPt; . . . ;DPtþL�1ÞPtþL�1j¼t jjDPjjj
: (2)
MBH descriptors: The algorithm would first define a space-time volume for each trajectory. This volume is further splitinto cell-sized spatio-temporal grid, where the parameter ofthe grid size is ðns ; ns; ntÞ ¼ ð2; 2; 3Þ. The descriptors arethen computed on this cell-sized grid. Motion boundary his-togram descriptors are based on derivatives of optical flow,Iv, in order to quantify relative pixel-wise motions; themethod is more robust to movement associated with cameramotion. The optical flow field is first separated into eachdirection (Ix; Iy), where we compute spatial derivative ineach direction of x; y in this cell, and the orientation infor-mation is quantized into histograms (8 bins) and then finallynormalized by L2-norm to generate the two descriptorsMBHx and MBHy. In this work, we further adopt theimproved estimation of camera motion, i.e., based on speedup robust (SURF) features and random sample consensus(RANSAC) method. The process further removes trajecto-ries that are caused by camera motions before the comput-ing the descriptors [70].
In summary, the dense unit-level video feature extractionsconsists of two types of features: TRAJ (30 dimensions, i.e., 15frame of a trajectory’s x; y’s normalized displacement infor-mation),MBHx andMBHy (each 96 dimensions, i.e., cell size2� 2� 3� 8 bins of histogram, describing the relativemotionof a trajectory in the x and ydirection, respectively). Video fea-tures are dense in terms of both in their spatial sampling andin their temporal granularity (single frame shift). The list of
TABLE 3The Table Provides a List of Statistics Applied to Various
Acoustic LLDs to Form a High-Dimensional DenseUnit-Level Acoustic Feature Vector
Acoustic LLDs
Low-level Descriptors (LLDs) Type
zero-crossing rate, log energy, probability ofvoicing, F0
prosodic
Mel-frequency CepstralCoefficients (MFCCs) 0-12, spectral flux,spectralcentroid, max, min, spectral bands 0-4(0-9KHz), spectral roll-off (0.25, 0.5, 0.75, 0.9)
spectral
Functions applied to LLDs/DLLDs/DDLLDs
position of min/max, range,max � arithmetic mean,arithmetic mean �min
extremes
linear regression slope, offset, error, centroid,quadratic error, quadratic regression a; boffset, linear error, quadratic error(contour & quadratic regression)
regression
percentile range (25%, 50%, 75%),3 inter-quartile ranges (25% - 50%,50%-75%,25%-75%)
percentiles
mean value of peaks, distance betweenpeaks, mean value of peaks � arithmeticmean
peaks
arithmetic means, absolute value ofarithmetic mean (original, non-zero values),quadratic mean (original, non-zero values),geometric mean (absolute values ofnon-zero values), number of non-zero values
means
relative duration LLD above 25%, 50%, 75%,95% range, relative duration LLD isrising/falling, relative duration LLD hasleft/right curvature
temporal
558 IEEE TRANSACTIONS ON AFFECTIVE COMPUTING, VOL. 10, NO. 4, OCTOBER-DECEMBER 2019

parameters choice is fairly standard and has been utilized inmany past computer visionworks (e.g., [59], [71], [72]), exceptthat the pixel-window width is set to eight when looking forpoints-to-sample as compared to three to reduce the data size.This approach measures candidate principals bodily move-ment characteristics during impromptu speech and representthem as a high-dimensional (207 dimensions) feature vectorper frame.
3.3 Behavior Profile: Session-Level Encoding
The dense unit-level audio-video feature extraction gener-ates a p-length acoustic feature for 200 ms unit window at100 ms step (p ¼ 8861), and l-length video features atevery 66 ms (l ¼ 207). The labels of interest occur at thespeech session-level (� 3-minute long). Depending on theactual length of each speech, this would result in a vary-ing numbers of feature sequences per presentation. In thiswork, we employ two different methods to encode theseunit-level acoustic-video descriptors to generate session-level vector representation as behavior profiles: k-meansbag-of-word encoding and Fisher-vector encoding. Theseencoding methodologies have been quite useful in proc-essing video information in recognition tasks involvingspatio-temporal movement of humans through videosequences [73]. In this work, we utilize this holistic behav-ior profile representations as inputs to the machine learn-ing algorithm.
3.3.1 k-Means Bag-of-Word Encoding
The first encoding approach is based on k-means clustering,a.k.a., bag-of-word model. The idea is to first randomlysample feature vector sequences from the entire database totrain a ‘codebook’ using k-means clustering approach. Oncea codebook is trained, we assign each unit frame of the fea-ture vectors to the closest ‘code’ using Euclidean distance tothe mean of each cluster. Then, for a particular oral presen-tation, we can form a histogram of k bins with counts fromthe cluster assignments for that speech. After performingz-normalization on the histogram, we obtain the finalsession-level behavior profile, i.e., a single vector of lengthk, from the original sequences of unit-level acoustic-videofeatures. This approach is different from the vector oflocally aggregated descriptors (VLAD) encoding [74].VLAD uses the summation of weighted overall distance ofeach unit frame to the cluster centroid to achieve session-level encoding, while BOW encoding is a counts on thenumber of each cluster occurrence within a session toachieve encoding.
3.3.2 Fisher-Vector Encoding
The use of Fisher-vector encoding has been shown to obtainrecognition results surpassing the use of BOW in a severalcomputer vision tasks [75]. Hence, we further employ thisencoding approach on video descriptors. We brieflydescribe FV encoding below.
FV encoding can be derived as a special case of Fisherkernel (FK). Fisher kernel, i.e., KðX;YÞ, is used to measurethe similarity between the two sets of data samples ðX;YÞ,
ðX ¼ �xt; t ¼ 1T1;Y ¼ �yt; t ¼ 1T2Þ;
where T1; T2 can be different. We define a scoring function,
GX� ¼ r�logu�ðXÞ; (3)
where u�ðXÞ denotes the likelihood of X given the probabil-ity distribution function (PDF), u�. Here the choice of PDFis Gaussian Mixture Model (GMM), and � represents theparameters of GMM, i.e., ð �w; �m;SÞ.GX
� is the direction where� has to move to provide a better fit between u� and X. Withthe use of Equation 3, we have effectively changed a varyinglength X into a fixed-length vector, i.e., a dimension equalsto the total number of parameters in �.
Since u�ðxÞ is GMMwithK mixtures expressed as,
u�ðxÞ ¼XKk¼1
wkukðxÞ;
with � ¼ fwk;mk;Sk; k ¼ 1; . . . ; Kg correspond to mixtureweight, mean, and covariance matrix for each mixture ofGaussian. These parameters are of the following form
XKk¼1
wk ¼ 1
ukðxÞ ¼ 1
ð2pÞD=2jSkj1=2e �1
2ðx�mkÞ0S�1k ðx�mkÞð Þ;
covariance matrices are set to be diagonal.We first define a probability gtðkÞ as
gtðkÞ ¼wkukðxtÞPKj¼1 wjujðxtÞ
;
From this, the gradient with respect to mk; sk of a data pointxt can be derived,
rmklogu�ðxtÞ ¼ gtðkÞ
xt � mk
s2k
� �
rsk logu�ðxtÞ ¼ gtðkÞðxt � mkÞ2
s3k
� 1
sk
!:
Then, by Fisher Information Matrix approximation, we canderive the Fisher encoding for the first and second order sta-tistics below,
gXmk¼ 1
Tffiffiffiffiffiffiwk
pXTt¼1
gtðkÞxt � mk
sk
� �(4)
gXsk ¼ 1
Tffiffiffiffiffiffiffiffi2wk
pXTt¼1
gtðkÞðxt � mkÞ2
s2k
� 1
!: (5)
This results in a fixed dimension vector at the session-levelby concatenating the output from Equation 4 & 5, i.e.,
FV ¼ gXm1; gXs1 ; . . . ; g
Xmk; gXsk ; . . . ; g
XmK
; gXsK
h i: (6)
In this work, we only compute the gradient with respect tomean and standard deviation because empirically weightpossess little useful information [76] and the inclusion ofweight parameter would make the dimension of FV becometoo large. We perform random sampling of unit-level featurevectors to train the GMM, and carry outL2 normalization.
HSIAO ET AL.: TOWARD AUTOMATING ORAL PRESENTATION SCORING DURING PRINCIPAL CERTIFICATION PROGRAM USING... 559

In summary, for audio modality profile, the encoding iscarried out on just the speaking portions within the presenta-tion using BOW; FV is not carried out for the audio modal-ity due to the large acoustic LLD dimension (less suitablefor GMM training). For video modality profile, both kindsof encodings are carried out on the entire presentation.
3.4 Regression Using SVM Binary Classifier
To further handle the subjectivity in developing automatedassessment system for high-level attributes, we employ anovel idea to assign a regressed score to each oral presen-tation. The idea is inspired from the past psychological evi-dence and our hypothesis that when experts assess theseoral presentations, they may internally have templates ofgood and bad presentations and by judging each sample’scloseness to each set of the templates, they then assign ascore respectively. With this idea in mind, we assess eachoral presentation by utilizing sample-to-decision boundarydistance outputted using a SVM binary classifier trained forthe purpose of recognizing good versus bad performingspeech along each rating dimensions of interest. Our ideaintuitively corresponds to the underlying mechanism ofSVM for classification. We can imagine the distance todecision boundary encodes information about how far orclose is a particular speech to the support vectors, i.e., therepresentative set of good and bad examples that maximizethe between-class margin, and we can treat this closenessessentially as a proxy to the subjective process of generat-ing assessment score. The boundary of choosing good andbad speech, i.e., top and bottom rated speech, for SVMtraining is termed as the distinctive cut-off boundary. A simi-lar concept has also been explored in utterance-level emo-tion classification by Mower et al. [77] and facial actionunit categorization [78] though the use in regression tasksremains to be limited.
Hence, for the regression experiment, we first train aseparate acoustic-only and video-only SVM classifier onthe distinctive classes of data using its respective behav-ior profile. For each data, z, we then compute the dis-tance to the decision hyperplane using the trained SVMas follows:
dist ¼Xni¼1
yiaixTi zþ r; (7)
where yi 2 f1;�1g corresponds to the class label of eachsupport vector, ai is the weight parameter for each supportvector xi, and r is the bias term. After generating dist foreach modality (distA; distV ), we normalize the score by line-arly transforming each of them to a range of ½1; 10� such thatboth modalities scores are comparable. Finally, we assign afinal score to each of the rating dimensions mentioned inSection 2.2 by summation of these two distance-based meas-ures. Fig. 5 shows our proposed framework.
4 IMPROMPTU SPEECH SCORING EXPERIMENT
In this section, we present our experimental results on auto-matically scoring the ten dimensions-of-interest using theproposed method mentioned in Section 3.4. The evaluationis done via leave-one-speaker-out cross validation, and theevaluation metric is spearman correlation.
4.1 Experimental Setup
Our proposed method, i.e., utilizing distance-to-decisionhyperplane outputted from binary SVM classifier trainedon the distinctive set of samples as the final score, is denotedas BinarySVM. We compare our method to two other baselinescoring frameworks. One of them is the support vectorregression SVR (denoted as BaselineSVR). Another one isalso based on the same idea as our proposed method, butinstead of training a SVM classifier, we directly use SVRregression (denoted as BinarySVR) to regress the score. TheSVR model for both baseline models is trained using � ¼ 0:2.
Moreover, the parameter K determines the dimensionsof profile using BOW, and M indicates the number of mix-tures used in the GMM for FV encoding. These two parame-ters (K, M) dictate the dimensionality of the final featureinputed to the classifiers. For BOW encoding, we havetested K 2 f1000; 2000; 3000g; for FV encoding, we havetested M 2 f128; 256; 512g. We present the results ofK ¼ 2000 for BOW and M ¼ 256 for FV encodings respec-tively in this work.
4.2 Experimental Results and Analyses
Table 4 summarizes our experimental results using differentfeature sets. The following is the description for each featureset, A� and V� used:
A1: the same feature set used in our previous paper [38], i.e.,computing four statistical functions (mean, variance, kur-tosis, and skewness) over utterance-level functional fea-tures to form a speech-level feature vector; the utterance-level features are derived from the opensmile 2010configuration
A2: BOW encoding on the dense unit-level acoustic low-leveldescriptors (Section 3.1)
V3: BOW encoding onmotion boundary descriptors (MBHxy)V4: BOW encoding on the two descriptors (Traj andMBHxy)V6: FV encoding on motion boundary descriptors (MBHxy)V7: FV encoding on the two descriptors (Traj andMBHxy)
4.2.1 Accuracy Validation of Automatic Scoring
First thing to note that, in general, our proposedmethod, i.e.,BNSVM� , achieve the best average spearman correlation com-puted across all ten dimensions of interest. In specifics, com-paring to the best baseline SVR model, our best model,
Fig. 5. It shows a schematic of our proposed regression using SVMbinaryclassifier. At training, only the distinctive top-bottom scored presentationsare used to train a SVM binary classifier (i.e., samples marked in red andblue), and at testing, a speech is scored by computing the distance to thelearned decision hyperplane. Themultimodal fusion is a simple averagingbetween the two distances to generate a final score.
560 IEEE TRANSACTIONS ON AFFECTIVE COMPUTING, VOL. 10, NO. 4, OCTOBER-DECEMBER 2019

BNSVM7, improves the average correlation by 0.049 abso-lute (9.8 percent relative). The result shows that bothBinarySVR and espcially BinarySVM outperform straightfor-ward BaselineSVR demonstrating that by learning from less-ambiguous data could provide a boost in performance.Additionally, we see that methods based on BinarySVMachieve a better overall accuracy as compared to methodsbased on BinarySVR. Since BinarySVM is essentially a classifi-cation approach without optimizing directly to regress onthe values of the scores, it is quite interesting to observe thatsimply by utilizing distance value as the predicted scoreswould achieve a better regression performance (number inbold). This may reinforces our hypothesis (Section 3.4) aboutthe possiblemechanism in the expert’s subjective assessmentin this context, i.e., not as a process of assigning a real-valuescore, instead, comparing to good/bad templates.
Moreover, the improvement in using dense unit-level pro-files on low-level acoustic descriptors is evident by comparingaccuracies obtained using A2 versus A1 feature sets. The dif-ferences in the use of BOW versus FV encodings on videodescriptors, however, are less significant in this context. Thereason we believe could have been that both profile encodingmethodologies are equally powerful to in capturing discrimi-native characteristics of the speaker’s bodily movementduring impromptu speech. Further, the multimodal fusion of
audio and video information improves the recognition for allten dimensions. In specific, the multimodal BNSVM6 improvesthe correlation of 0.123 absolute (28.8 percent relative) and0.105 (23.6 percent relative) over audio-only BNSVM2 andvideo-only BNSVM4.
Lastly, we observe a very interesting and importantresult. The rating that, for most part, achieves the best accu-racies is the Dim5� (the total score), i.e., 0.62 and 0.66 fororiginal and rank-normalized total scores, respectively. Firstof all, within the application context of automatic oral pre-sentation assessment for the candidate principals certifica-tion program, this result is quite promising and in factuseful. Dim5 is the final score entered into the grading sys-tem for educational decision-maker in order to assess thequalification of these candidate principals. Furthermore,this result underscores the holistic modeling nature of ourproposed multimodal low-level behavior profile frame-work; Dim5 is a higher-level rating compared to all otherdimensions of ratings, which are focused more on a specificaspect, used in this assessment. Further, while the items onthe scoring sheet seem to be disjoint with each focusing ondisparate dimensions from their written descriptions, inSection 2.2, we see that the correlation among dimensionsare actually quite strong implicating that the assessmentof individual rating are strongly affected by each other.
TABLE 4Exp Results: The Metric Is Spearman Correlation
Dim1o Dim2o Dim3o Dim4o Dim5o Dim1r Dim2r Dim3r Dim4r Dim5r AVG
BaselineSVR
BLSVR0 : A1 0.13 0.02 0.03 0.27 0.11 0.01 0.13 0.15 0.18 0.05 0.11BLSVR1 : A2 0.36 0.27 0.31 0.52 0.39 0.37 0.25 0.35 0.48 0.52 0.38BLSVR2 : V3 0.44 0.47 0.43 0.49 0.49 0.40 0.32 0.30 0.40 0.45 0.42BLSVR3 : V4 0.42 0.42 0.42 0.49 0.48 0.39 0.31 0.34 0.40 0.44 0.41BLSVR4 : V6 0.41 0.44 0.47 0.48 0.39 0.42 0.35 0.35 0.44 0.47 0.42BLSVR5 : V7 0.50 0.43 0.47 0.48 0.52 0.38 0.31 0.34 0.42 0.45 0.43BLSVR6 : A2þ V3 0.48 0.50 0.47 0.59 0.54 0.46 0.36 0.41 0.54 0.59 0.49BLSVR7 : A2þ V4 0.49 0.45 0.47 0.60 0.55 0.46 0.34 0.44 0.54 0.59 0.49BLSVR8 : A2þ V6 0.46 0.46 0.51 0.57 0.48 0.48 0.36 0.45 0.54 0.60 0.49BLSVR9 : A2þ V7 0.53 0.45 0.51 0.59 0.57 0.46 0.32 0.44 0.54 0.61 0.50
BinarySVR
BNSVR0 : A1 0.19 0.07 0.19 0.31 0.24 0.01 0.15 0.16 0.18 0.18 0.17BNSVR1 : A2 0.46 0.31 0.31 0.52 0.44 0.40 0.25 0.36 0.48 0.54 0.41BNSVR2 : V3 0.45 0.47 0.43 0.49 0.53 0.41 0.32 0.33 0.40 0.48 0.43BNSVR3 : V4 0.45 0.44 0.44 0.49 0.53 0.38 0.31 0.39 0.40 0.44 0.43BNSVR4 : V6 0.36 0.43 0.47 0.48 0.39 0.40 0.35 0.35 0.44 0.47 0.41BNSVR5 : V7 0.48 0.41 0.47 0.48 0.49 0.37 0.30 0.35 0.42 0.43 0.42BNSVR6 : A2þ V3 0.55 0.50 0.47 0.59 0.59 0.48 0.36 0.45 0.54 0.62 0.51BNSVR7 : A2þ V4 0.54 0.45 0.48 0.60 0.59 0.49 0.34 0.48 0.54 0.61 0.51BNSVR8 : A2þ V6 0.49 0.47 0.51 0.57 0.48 0.48 0.36 0.46 0.54 0.60 0.50BNSVR9 : A2þ V7 0.57 0.46 0.51 0.59 0.57 0.48 0.33 0.46 0.54 0.61 0.51
BinarySVM
BNSVM0 : A1 0.20 0.19 0.21 0.27 0.26 0.07 0.14 0.23 0.23 0.16 0.19BNSVM1 : A2 0.39 0.29 0.33 0.50 0.42 0.47 0.33 0.39 0.56 0.60 0.43BNSVM2 : V3 0.51 0.46 0.40 0.43 0.53 0.40 0.38 0.43 0.38 0.44 0.44BNSVM3 : V4 0.54 0.43 0.45 0.46 0.56 0.38 0.37 0.46 0.38 0.44 0.45BNSVM4 : V6 0.44 0.42 0.42 0.45 0.46 0.39 0.40 0.43 0.45 0.46 0.43BNSVM5 : V7 0.48 0.41 0.45 0.46 0.52 0.39 0.36 0.41 0.39 0.41 0.43BNSVM6 : A2þ V3 0.58 0.47 0.44 0.56 0.59 0.57 0.47 0.50 0.57 0.65 0.54BNSVM7 : A2þ V4 0.61 0.46 0.48 0.58 0.62 0.58 0.46 0.52 0.56 0.66 0.55BNSVM8 : A2þ V6 0.53 0.44 0.47 0.54 0.54 0.55 0.46 0.51 0.58 0.65 0.53BNSVM9 : A2þ V7 0.56 0.46 0.48 0.57 0.60 0.56 0.46 0.51 0.57 0.65 0.54
A1 denotes the baselinemethod, i.e., functionals of functionals. A2 denotes dense unit-level acoustic feature with BOWencoding, V3;4 denote BOWencoding onMBHxy
and All descriptors respectively, and V6;7 denote FV encoding onMBHxy and All descriptors respectively. BinarySVR indicates the method using SVR on best-distinc-tive set of samples, and BinarySVM is our proposedmethod that uses sample-to-hyperplane distance. The best accuracy obtained of each framework on each rating dimen-sion is in bold, and the final best accuracy achieved across frameworks is additionally marked with underline (all of the results obtain a p-value < 1e�03).
HSIAO ET AL.: TOWARD AUTOMATING ORAL PRESENTATION SCORING DURING PRINCIPAL CERTIFICATION PROGRAM USING... 561

Our computational framework can be thought as a quantita-tive holistic modeling on the multimodal delivery form ofthe presentation, which is integrative and influential in theoverall experts judgment’s of how well a candidate principalhas carried out the speech.
4.2.2 Analysis of Best-Distinctive Cut-Off Boundary
Choosing the best distinctive boundary, i.e., top X% andbottom Y% rated speech, to train the binary SVM classifieris a major component of our proposed algorithm. Table 5depicts the final total usage of top and bottom percentage ofscoring samples used for each dimension in our frameworkwith their associated inter-evaluator agreement computedfor those particular samples. The percentage presented ischosen based on a greedy search.
The thing to note is that the best cut-off boundary seemsto come at a trade-off between the amount of data used andthe amount of ambiguity to be included. The more datasamples included in the training of SVM classifier does notnecessary correspond to an increase in the accuracy as theinter-evaluator agreement also tends to decrease; at thesame time, too few data samples included cause the modelto be not well-trained. Depending on the dimension of inter-est, the best total percentage of data used ranges fromapproximately 40 to 85 percent. We observe that the best-distinctive set of data samples used for predicting rank-normalized dimensions tend to be less when compared tothe amount of data required to achieve the best accuracy fororiginal labels. This phenomenon also reflects in the agree-ment level as the portion of data used for rank-normalizeddimensions tend to have a higher inter-evaluator agreement(m ¼ 0:61) when compared to the portion of data used fororiginal labels (m ¼ 0:56).
4.2.3 Comparison with Other Techniques
Aside from using support vector machine as the binary clas-sifier in order to derive confidence score for the regressiontasks, we further compare it with three other classifierapproaches, i.e., logistic regression (BNLogistics), random for-est (BNRandForest, and gradient boosted decision tree(BNGBDT), using the best combination of audio and video
descriptors from Table 4. The confidence score for each of thethree classifiers are derived as probabilities, and further, thebest boundary chosen in Section 4.2.2 is also used for theseclassifiers. Our comparison results are summarized inTable 6. Our results show that using SVM works better thanthe other three methods, most likely, is due to the fact of itsmaximum-margin learning in discriminating between thegood versus bad samples. In this work, we do not explicitlycompare to time series model. On one hand, the usage ofstatic classifier with high-dimensional encoding of low-leveldescriptors have obtained state-of-art recognition of eventswith temporal structure in many audio and video recogni-tion tasks; at the same time, most conventional time-seriesmodels, e.g., HiddenMarkovModel and its variants, are alsoless suitable to handle modeling tasks with high-dimen-sional input feature space.
4.2.4 Consistency Validation of Automatic Scoring
Lastly, we carry out a novel validation analysis in this work.Aside from comparing correlation to the ground truth, i.e., theaverage of the coaching principals’ ratings, as conventionallydone to evaluate the accuracy numbers (e.g., Section 4.2.1),we perform additional validity analysis. We reach out to apair of coaching principals, who were the coaching princi-pals during the 2014 certification program, to rate 10 oral pre-sentations post-hoc again without letting them know thatthey have already seen/graded those speech back during the2014 certification program. We then compute pair-wisespearman correlations between ‘original scores: Ori.’ (theoriginal scores collected at the certification program),‘predicted scores: Pred.’ (scores derived from BNSVM7), and‘new scores: New’ (the re-graded scores) across the tendimensions-of-interest.
Table 7 summarizes the analysis results, and the numberwith a star indicates that particular correlation is significant(a ¼ 0:05). In general, we observe that while these are thesame two coaching principals rating the same ten oral pre-sentations just at two different points in time, both their rat-ings (i.e., original and new) on average correlate with theautomatically-derived scores from audio-video more thanamong themselves. This result is quite intriguing. Humanexpert can potentially suffer variabilities from undesirableidiosyncratic factors and environment contexts naturally,
TABLE 5Summary Information About the Best-Distinctive Split of DataSamples for the Ten Dimensions: Agreementbb Is the CoachingPrincipals’ Agreement Level Computed for This Set of Samples,Agreementori Is the Coaching Principals’ Agreement Level for
the Entire Database, and Usage of Data Indicates thePercentage of Samples Included in the Training of the BinarySVM
Agreementbb Agreementori Usage of Data (%)
Dim1o 0.53. 0.51 85.4Dim2o 0.61 0.48 61.8Dim3o 0.51 0.40 65.0Dim4o 0.53 0.53 100.0Dim5o 0.62 0.58 81.3
Dim1r 0.68 0.55 73.2Dim2r 0.46 0.40 82.9Dim3r 0.72 0.43 38.2Dim4r 0.43 0.58 64.2Dim5r 0.75 0.63 56.9
AVG 0.59 0.41 66.0
TABLE 6Comparison with Three Other Classification Methodologies:
BNLogistics, BNRandForest and BNGBDT Indicate the Use ofLogistic Regression, Random Forest, and Gradient Boosted
Decision Tree, Respectively
BNSVM BNLogistics BNRandForest BNGBDT
Dim1o 0.61 0.54 0.32 0.23Dim2o 0.46 0.39 0.27 0.36Dim3o 0.48 0.42 0.22 0.25Dim4o 0.58 0.57 0.39 0.36Dim5o 0.62 0.58 0.34 0.26
Dim1r 0.58 0.54 0.31 0.28Dim2r 0.46 0.42 0.26 0.34Dim3r 0.52 0.46 0.28 0.23Dim4r 0.56 0.54 0.41 0.52Dim5r 0.66 0.58 0.31 0.29AVG 0.55 0.51 0.31 0.31
562 IEEE TRANSACTIONS ON AFFECTIVE COMPUTING, VOL. 10, NO. 4, OCTOBER-DECEMBER 2019

e.g., grading after watching video tapes versus on-site grad-ing, number of grading needed to be done for a given time,or simply due to changes in one’s grading standard overtime, etc. Our signal-based assessment score never learnsfrom the re-graded labels but remains robust and reliableacross time; for example, the correlation obtained whencomparing to experts rating at two different time points forDim5r remains fairly consistent at 0.65 and 0.61, where thetwo experts only correlate with each other at 0.53. Our pro-posed automatic framework can be more reliable and con-sistent in modeling the quality of an impromptu speechthan human experts.
Furthermore, we also observe the best result still comesfrom Dim5� , which reiterates the holistic modeling nature ofour profile-based recognition framework. While we onlyanalyze 10 samples, to the best of our knowledge, this is oneof the first works that have analyzed the consistency acrosstime in the process of developing recognition frameworkfor subjective human attributes. From Tables 4 and 7, ouranalyses indicate both the reliability and consistency, i.e.,two major metrics in testing the validity of meaningful psy-chological construct, of our computational framework inassessing candidate principals’ oral presentation skills.
4.3 Discussions
In Section 4.2, we present various results in assessing and ana-lyzing our proposed multimodal computational frameworktoward developing a novel automated impromptu speech rat-ing system using fusion of audio-visual information designedfor theNAER’s yearly pre-service principals’ certification pro-gram. A summary of novel results is listed below:
� Accuracy: using sample-to-decision boundary dis-tance obtained from the SVM binary classifier bytraining on distinctive subset of the database achieveimproved scoring correlations compared to regres-sion approaches
� Accuracy: fusing multimodal behavior profiles out-perform single-modality modeling in this context
� Accuracy: Dim5 (the final total score) is the dimensionthat achieves the best results (0.62 & 0.66). It is usefulconsidering the context of the application and reinforc-ing the holisticmodeling nature of our framework
� Consistency: our automatic scoring system is shown tobe possibly more consistent than human experts bydemonstrating that the ratings from the same twoexperts are correlatedmore to our proposed automaticscoring system than among themselves across two dif-ferent time points. The most consistent rating that ourframework obtains is still Dim5 (the total score)
� Analysis: the best distinctive subset of training sam-ples often correspond to the samples with less ambi-guity (higher inter-evaluator agreement).
4.3.1 Comparison to Existing Works
There are a couple points to make when comparingapproaches of existing works. First, while we do not explic-itly compare accuracy to the approach of pre-defining a setof discrete interpretable behaviors to be used in the overallassessment, we can compare with those works that are inthe similar context. We observe that authors of existingworks (i.e., [55], [56]) engineered multimodal features thatare more interpretable, e.g., speaking rate and syntacticstructure derived from manual transcript, hand and bodymovement extracted from Kinect, and head orientation, andthey, however, obtained an correlation using their auto-matic holistic assessment to the experts rating approxi-mately in the range of 0.44. Actually, a most recent workdone on that particular dataset [57] demonstrated a signifi-cant improvement can be obtained by using encoding-basedapproach on low-level descriptors computed from thespeaker’s face, which is an approach that is closer in conceptto our profile-based approach presented in this work.
Second, authors of work [54] first pre-defined and manu-ally annotated a finite set of desirable behaviors of a speakerduring public speaking that could be automatically extractedusing ensemble trees. The method is quite promising andindeed correlates highly with the overall judgment on thequality of the oral presentation in their corpus. Their purposewas to train an individual’s to be good at certain behaviorsduring public speaking; however it may be difficult to scaleup to large-scale assessment when the possible number ofdiscrete behavior types and descriptions can be vast and var-iable, and further simply having these behaviors annotatedfirst by humans are not feasible.
Although our setups and aims are not directly compara-ble, we see that our proposed profile-based representation,i.e., directly compute behavior representation from LLDs,possess promising modeling power of a speaker’s commu-nicative behavior and classifier-as-regression approach, i.e.,handling the ambiguity in the data and subjectivity in theexpert labeling, together can achieve reliable and consistentassessment accuracy of oral presentations. Nonetheless,having interpretable high-level behaviors can still be benefi-cial when moving from assessment to training. In Fig. 6, weplot a truncated (only 150 clusters) summative acousticbehavior profiles (generated with BOW encoding) from topfive-rated impromptu speech in the NAER database. Whilethe interpretability of each acoustic individual behaviorcluster can be hard to assess immediately, the plot showsthat, indeed, certain behavior clusters in the speech modal-ity occur a lot more times than the other clusters in thesetop-rated speech. Instead of pre-designing a set of behaviorsto look for, these data-driven behavior clusters may also
TABLE 7Summary Results in Section 4.2.4
Ori. versus New Pred. versus Ori. Pred. versus New
Dim1o 0.09 0.57 0.69*Dim2o 0.46 0.70* 0.74*Dim3o 0.54 0.37 0.50Dim4o 0.34 0.03 0.16Dim5o 0.29 0.64* 0.76*Dim1r 0.08 0.41 0.56Dim2r 0.47 0.52 0.74*Dim3r 0.55 0.21 0.25Dim4r 0.26 0.48 0.53Dim5r 0.53 0.65* 0.61*AVG 0.40 0.50 0.55
‘Ori.’ indicates the original scores, ‘New’ indicates the same samples gradedagain by the same raters, and ‘Pred.’ denotes the predicted scores. The pair-wise correlation is computed using spearman correlation. The number with a *indicates significance level at 0.05
HSIAO ET AL.: TOWARD AUTOMATING ORAL PRESENTATION SCORING DURING PRINCIPAL CERTIFICATION PROGRAM USING... 563

help in identifying meaningful high-level behaviors thatwould occur in the well-orchestrated presentation whilemaintaining robust recognition rates. Future analyses onwhat those clusters in both audio and video modalities maymean perceptually is beyond the scope of this work, but it isdefinitely an important direction to explore.
5 CONCLUSIONS
Effective leadership bears strong relationship to fundamen-tal attributes, such as emotion contagion, positive mood,and social intelligence. These attributes are also reflected inan individual’s communicative behaviors, especially in set-tings of public speaking. While theoretical conceptualiza-tion of leadership has received much attention, little hasprogressed in terms of quantitative measurement andmodeling of these behaviors. In this work, we present athorough BSP research in the development toward auto-matic assessment on the qualities of oral presentation in thedomain of education, specifically in the real context ofimpromptu speech assessment during pre-service candidateprincipals certification program. We propose the use anddemonstrate the effectiveness of our holistic low-level multi-modal behavior profile techniques in automatically scoringthese oral presentations. Also, handling the subjectivity inthese ratings computationally by utilizing sample-to-decision boundary distance trained on the distinctive subsetas the regressed scores further obtains improved and com-petitive correlations to the expert coaching principals’ rat-ings. The validity is further strengthened by demonstratingthe framework’s ability to maintain its reliabilitymore consis-tently across time as compared to human experts. Theunqiue contextualized and in-the-wild corpus collected in thiswork will be presented publicly to the community afterproper IRB approval; the current work will also help in pro-viding a set of benchmark recognition accuracies obtainedon this corpus. There are multiple directions of future worksalong technical, educational, and scientific directions.
On the technical side, we will continuously worktoward improving the overall system’s accuracy. There areseveral directions. One of the immediate direction is theinclusion of additional modality, i.e., the lexical content.The presented multimodal behavior profile can be thoughtas a quantitative model more on the delivery of the speech,where the inclusion of word usage (lexical) informationwill then be more on the aspect of content. Past literatureshave indicated that an charismatic leader is in fact profi-cient in integrating both attributes in order to achieve moti-vating and emotionally-contagious speech. Further, as wecollect more behavior data, e.g., there is an additional 200
impromptu speech recorded in 2015 pre-service principals’certification program, we imagine the state-of-art featureencoding, i.e., generation of behavior profiles, approachesbased on deep learning, and/or the time series-basedmodeling, e.g., long-short term memory neural network,could then have the potential to further improve therobustness of algorithms. Lastly, we will also continue tounderstand the possible meaning of these data-drivenbehavior profiles in details and cross-referencing to theknown manually pre-defined discrete behaviors. At thesame time, it would be interesting to observe what addi-tional behaviors may have been captured in this holisticrepresentations that are absent before.
Aside from the technical directions, since it is a collabora-tive research effort with the NAER researchers with targetedapplication in real life, another line of immediate futureworks is to realize this engineering system in the context ofeducation. The current status quo in the grading of candidateprincipals (not limited to oral presentations but also otheraspects within the certification program) is completely basedon a limited number of expert coaching principals. We willfirst start exploring the possibility of using this system as anadditional scores to supplement the current grading struc-ture. At the same time, we will investigate other outcomevariables, e.g., other instrumented written-tests assessmentof these principals within this certification program, tounderstand quantitatively the validity and the relationshipbetween each principal’s communicative behaviors andthese other assessment scores. With a focused emphasis onunderstanding expressive behaviors in this context quanti-tatively, we may be able to design a better-suited certifica-tion training program not only for the candidate principalsbut also for other educational professionals at scale in thefuture, e.g., 20,000 per-service teachers going throughassessment program in Taiwan every year.
Lastly, many of the low-level multimodal behaviordescriptors used in this work have also been shown to beeffective in tasks of affective computing-indicating thatthese behavior representations encompass a wide range ofinformation about various internal states of minds inhumans. The automatic framework that we propose in thiswork can serve as an initial computational building blockfor further scientific study. One of the directions is to teaseapart the aspect of an individual’s communicative behav-iors that are either emotionally-expressive or emotionally-contagious when giving a public speech. Instead of justannotating emotional states and/or effects of theseimpromptu speech for further studies, since these are realschool principals that are already in office for some time, weplan to investigate their actual leadership effectivenessesand charismatic impressions (i.e., related to emotion conta-gion) in steering their schools in real life in relation to thecommunicative behaviors exhibited during public speakingin a longitudinal time span (i.e., from the pre-service certifi-cation program, on-boarding speech, to regular publicaddresses). With the availability of computational methodsand the tight integrative collaboration with relevant domainexperts, we hope to continue this BSP research to bring inadditional scientific understanding to substantiate leader-ship theories and affect-perception of charisma with quanti-tative methods that model real-world behaviors.
Fig. 6. It shows a summation of truncated (only 150 clusters) of speechbehavior profiles generated from the top 5 rated candidate principals.
564 IEEE TRANSACTIONS ON AFFECTIVE COMPUTING, VOL. 10, NO. 4, OCTOBER-DECEMBER 2019

ACKNOWLEDGMENTS
Thanks to Ministry of Science and Technology, NationalAcademy for Educational Research, and Novatek Fellow-ship for funding.
REFERENCES
[1] S. G. Barsade, “The ripple effect: Emotional contagion and itsinfluence on group behavior,” Administ. Sci. Quart., vol. 47, no. 4,pp. 644–675, 2002.
[2] A. Erez, V. F. Misangyi, D. E. Johnson, M. A. LePine, and K. C.Halverson, “Stirring the hearts of followers: Charismatic leader-ship as the transferal of affect,” J. Appl. Psychology, vol. 93, no. 3,2008, Art. no. 602.
[3] J. E. Bono and R. Ilies, “Charisma, positive emotions and moodcontagion,” Leadership Quart., vol. 17, no. 4, pp. 317–334, 2006.
[4] C. M. Brotheridge, R. T. Lee, R. E. Riggio, and R. J. Reichard, “Theemotional and social intelligences of effective leadership: An emo-tional and social skill approach,” J. Managerial Psychology, vol. 23,no. 2, pp. 169–185, 2008.
[5] J. Gooty, S. Connelly, J. Griffith, and A. Gupta, “Leadership, affectand emotions: A state of the science review,” Leadership Quart.,vol. 21, no. 6, pp. 979–1004, 2010.
[6] K. J. Levine, R. A. Muenchen, and A. M. Brooks, “Measuring trans-formational and charismatic leadership: Why isn’t charisma meas-ured?”Commun.Monographs, vol. 77, no. 4, pp. 576–591, 2010.
[7] C. Baccarani and A. Bonfanti, “Effective public speaking: A con-ceptual framework in the corporate-communication field,” Corpo-rate Commun.: Int. J., vol. 20, no. 3, pp. 375–390, 2015.
[8] R. E. De Vries, A. Bakker-Pieper, and W. Oostenveld, “Leadership=communication? the relations of leaders communication styles withleadership styles, knowledge sharing and leadership outcomes,” J.Bus. Psychology, vol. 25, no. 3, pp. 367–380, 2010.
[9] S. J. Holladay andW. T. Coombs, “Speaking of visions and visionsbeing spoken an exploration of the effects of content and deliveryon perceptions of leader charisma,” Manage. Commun. Quart.,vol. 8, no. 2, pp. 165–189, 1994.
[10] S. A. Kirkpatrick and E. A. Locke, “Direct and indirect effects ofthree core charismatic leadership components on performanceand attitudes,” J. Appl. Psychology, vol. 81, no. 1, 1996, Art. no. 36.
[11] R. Awamleh and W. L. Gardner, “Perceptions of leader charismaand effectiveness: The effects of vision content, delivery, and orga-nizational performance,” Leadership Quart., vol. 10, no. 3, pp. 345–373, 1999.
[12] K. S. Groves, “Leader emotional expressivity, visionary leader-ship, and organizational change,” Leadership Org. Develop. J.,vol. 27, no. 7, pp. 566–583, 2006.
[13] M. C. Bligh, J. C. Kohles, and J. R. Meindl, “Charisma under crisis:Presidential leadership, rhetoric, and media responses before andafter the September 11th terrorist attacks,” Leadership Quart.,vol. 15, no. 2, pp. 211–239, 2004.
[14] M. Koppensteiner, P. Stephan, and J. P. M. J€aschke, “Morethan words: Judgments of politicians and the role of differentcommunication channels,” J. Res. Personality, vol. 58, pp. 21–30,2015.
[15] D. J. Barrett, “Strong communication skills a must for today’sleaders,”Handbook Bus. Strategy, vol. 7, no. 1, pp. 385–390, 2006.
[16] R. W. Picard and R. Picard, Affective Computing. Cambridge, MA,USA: MIT press Cambridge, 1997, vol. 252.
[17] A. Vinciarelli, et al., “Bridging the gap between social animal andunsocial machine: A survey of social signal processing,” IEEETrans. Affective Comput., vol. 3, no. 1, pp. 69–87, Jan.–Mar. 2012.
[18] S. Narayanan and P. G. Georgiou, “Behavioral signal processing:Deriving human behavioral informatics from speech andlanguage,” Proc. IEEE, vol. 101, no. 5, pp. 1203–1233, May. 2013.
[19] C. M. Lee and S. S. Narayanan, “Toward detecting emotions inspoken dialogs,” IEEE Trans. Speech Audio Process., vol. 13, no. 2,pp. 293–303, Mar. 2005.
[20] M. El Ayadi, M. S. Kamel, and F. Karray, “Survey on speech emo-tion recognition: Features, classification schemes, and databases,”Pattern Recog., vol. 44, no. 3, pp. 572–587, 2011.
[21] M. Karg, A.-A. Samadani, R. Gorbet, K. Kuhnlenz, J. Hoey, andD. Kulic, “Body movements for affective expression: A survey ofautomatic recognition and generation,” IEEE Trans. Affective Com-put., vol. 4, no. 4, pp. 341–359, Oct.–Dec. 2013.
[22] E. Crane and M. Gross, “Motion capture and emotion: Affectdetection in whole body movement,” in Affective Computing andIntelligent Interaction. Berlin, Germany: Springer, 2007, pp. 95–101.
[23] E. Sariyanidi, H. Gunes, and A. Cavallaro, “Automatic analysis offacial affect: A survey of registration, representation, and recog-nition,” IEEE Trans. Pattern Anal. Mach. Intell., vol. 37, no. 6,pp. 1113–1133, Jun. 2015.
[24] C. Busso, et al., “Analysis of emotion recognition using facialexpressions, speech and multimodal information,” in Proc. 6th Int.Conf. Multimodal Interfaces, 2004, pp. 205–211.
[25] H. Gunes, M. Piccardi, and M. Pantic, From the Lab to the RealWorld, Affect Recognition Using Multiple Cues and Modalities. Rijeka,Croatia: InTech Education and Publishing, 2008.
[26] B. Schuller, et al., “Paralinguistics in speech and languagestate-of-the-art and the challenge,” Comput. Speech Language, vol. 27, no. 1,pp. 4–39, 2013.
[27] D. Bone, M. Li, M. P. Black, and S. S. Narayanan, “Intoxicatedspeech detection: A fusion framework with speaker-normalizedhierarchical functionals and GMM supervectors,” Comput. SpeechLanguage, vol. 28, no. 2, pp. 375–391, 2014.
[28] L.-P. Morency, I. de Kok, and J. Gratch, “A probabilistic multi-modal approach for predicting listener backchannels,” Auton.Agents Multi-Agent Syst., vol. 20, no. 1, pp. 70–84, 2010.
[29] J. H. Jeon, R. Xia, and Y. Liu, “Level of interest sensing in spokendialog using decision-level fusion of acoustic and lexical evidence,”Comput. Speech Language, vol. 28, no. 2, pp. 420–433, 2014.
[30] M. P. Black, et al., “Toward automating a human behavioral cod-ing system for married couples interactions using speech acousticfeatures,” Speech Commun., vol. 55, no. 1, pp. 1–21, 2013.
[31] C.-C. Lee, et al., “Computing vocal entrainment: A signal-derivedPCA-based quantification scheme with application to affect analy-sis in married couple interactions,” Comput. Speech Language,vol. 28, no. 2, pp. 518–539, 2014.
[32] B. Xiao, et al., “Modeling therapist empathy through prosody indrug addiction counseling,” in Proc. 15th Annu. Conf. Int. SpeechCommun. Assoc., 2014, pp. 213–217.
[33] Z. E. Imel, et al., “The association of therapist empathy andsynchrony in vocally encoded arousal,” J. Counseling Psychology,vol. 61, no. 1, pp. 146–153, 2014.
[34] D. Bone, et al., “The psychologist as an interlocutor in autismspectrum disorder assessment: Insights from a study of spontane-ous prosody,” J. Speech Language Hearing Res., vol. 57, no. 4,pp. 1162–1177, 2014.
[35] A. Metallinou, R. B. Grossman, and S. Narayanan, “Quantifyingatypicality in affective facial expressions of children with autismspectrum disorders,” in Proc. IEEE Int. Conf. Multimedia Expo,2013, pp. 1–6.
[36] Z. Yang, A. Metallinou, and S. Narayanan, “Analysis and predic-tive modeling of body language behavior in dyadic interactionsfrom multimodal interlocutor cues,” IEEE Multimedia, vol. 16,no. 6, pp. 1766–1778, Oct. 2014.
[37] M. P. Black, J. Tepperman, and S. S. Narayanan, “Automatic pre-diction of children’s reading ability for high-level literacy asses-sment,” IEEE Trans. Audio Speech Language Process., vol. 19, no. 4,pp. 1015–1028, May. 2011.
[38] S.-W. Hsiao, H.-C. Sun, M.-C. Hsieh, M.-H. Tsai, H.-C. Lin, andC.-C. Lee, “A multimodal approach for automatic assessment ofschool prinicipals’ oral presentation during pre-service trainingprogram,” in Proc. Int. Speech Commun. Assoc., 2015, pp. 2529–2533.
[39] P. S. Keung, “Continuing professional development of principalsin hong kong,” Frontiers Edu. China, vol. 2, no. 4, pp. 605–619, 2007.
[40] P. S. Salazar, “The professional development needs of rural highschool principals: A seven-state study,” Rural Educator, vol. 28,no. 3, pp. 20–27, 2007.
[41] D. L. Keith, “Principal desirabilitiy for professional devel-opment,” Academy Educational Leadership J., vol. 15, no. 2, 2011,Art. no. 95.
[42] N. A. of Secondary School Principals, “Selecting and developingthe 21st century school principal.” 2014. [Online]. Available:http://www.nassp.org/tabid/3788/default.aspx?topic=26775
[43] L. Streeter, J. Bernstein, P. Foltz, and D. DeLand, “Pearsons auto-mated scoring of writing, speaking, and mathematics,” vol. 25,p. 2013, 2011.
[44] B. Topol, J. Olson, and E. Roeber, “The cost of new higher qualityassessments: A comprehensive analysis of the potential costs forfuture state assessments,” Stanford, CA: Stanford Center Opportu-nity Policy Edu. Retrieved Aug., vol. 2, 2010, Art. no. 2010.
HSIAO ET AL.: TOWARD AUTOMATING ORAL PRESENTATION SCORING DURING PRINCIPAL CERTIFICATION PROGRAM USING... 565

[45] J. Balogh, J. Bernstein, J. Cheng, and B. Townshend, “Automaticevaluation of reading accuracy: Assessing machine scores,” inProc. ISCA Tutorial Res. Workshop Speech Language Technol. Edu.,2007, pp. 112–115.
[46] J. Bernstein, M. Suzuki, J. Cheng, and U. Pado, “Evaluating diglos-sic aspects of an automated test of spoken modern standard ara-bic,” in Proc. ISCA Tutorial Res. Workshop Speech Language Technol.Edu., 2009, pp. 17–20.
[47] J. Bernstein, A. Van Moere, and J. Cheng, “Validating automatedspeaking tests,” Language Testing, vol. 27, no. 3, pp. 355–377, 2010.
[48] J. Bernstein and J. Cheng, “Logic and validation of fully automaticspoken english test,” The path of speech technologies in computerassisted language learning: From research toward practice,pp. 174–194, 2007.
[49] M. Worsley, “Multimodal learning analytics: Enabling the futureof learning through multimodal data analysis and interfaces,” inProc. 14th ACM Int. Conf. Multimodal Interaction, 2012, pp. 353–356.
[50] X. Ochoa, M. Worsley, K. Chiluiza, and S. Luz, “MLA’14: Thirdmultimodal learning analytics workshop and grand challenges,”in Proc. 16th Int. Conf. Multimodal Interaction, 2014, pp. 531–532.
[51] X. Ochoa, M. Worsley, N. Weibel, and S. Oviatt, “Multimodallearning analytics data challenges,” in Proc. 6th Int. Conf. Learn.Analytics Knowl., 2016, pp. 498–499.
[52] F. Haider, L. Cerrato, N. Campbell, and S. Luz, “Presentationquality assessment using acoustic information and hand move-ments,” in Proc. IEEE Int. Conf. Acoustics Speech Signal Process.,2016, pp. 2812–2816.
[53] L. Batrinca, G. Stratou, A. Shapiro, L.-P. Morency, and S. Scherer,“Cicero-towards a multimodal virtual audience platform for pub-lic speaking training,” in Proc. Int. Workshop Intell. Virtual Agents,2013, pp. 116–128.
[54] T. W€ortwein, M. Chollet, B. Schauerte, L.-P. Morency, R. Stiefelha-gen, and S. Scherer, “Multimodal public speaking performanceassessment,” in Proc. ACM Int. Conf. Multimodal Interaction, 2015,pp. 43–50.
[55] L. Chen, G. Feng, J. Joe, C. W. Leong, C. Kitchen, and C. M. Lee,“Towards automated assessment of public speaking skills usingmultimodal cues,” in Proc. 16th Int. Conf. Multimodal Interaction,2014, pp. 200–203.
[56] L. Chen, C. W. Leong, G. Feng, C. M. Lee, and S. Somasundaran,“Utilizing multimodal cues to automatically evaluate publicspeaking performance,” in Proc. Int. Conf. Affective Comput. Intell.Interaction, 2015, pp. 394–400.
[57] V. Ramanarayanan, L. Chen, C. W. Leong, G. Feng, and D.Suendermann-Oeft , “An analysis of time-aggregated and time-series features for scoring different aspects of multimodal presen-tation data,” in Proc. 16th Annu. Conf. Int. Speech Commun. Assoc.,2015, pp. 1373–1377.
[58] A. Tamrakar, et al., “Evaluation of low-level features and their com-binations for complex event detection in open source videos,” inProc. IEEEConf. Comput. Vis. Pattern Recognit., 2012, pp. 3681–3688.
[59] H. Wang, A. Kl€aser, C. Schmid, and C.-L. Liu, “Action recognitionby dense trajectories,” in Proc. IEEE Conf. Comput. Vis. PatternRecognit., 2011, pp. 3169–3176.
[60] L. Baraldi, F. Paci, G. Serra, L. Benini, and R. Cucchiara, “Gesturerecognition in ego-centric videos using dense trajectories andhand segmentation,” in Proc. IEEE Conf. Comput. Vis. PatternRecognit. Workshops, 2014, pp. 702–707.
[61] C.-C. Lee, E. Mower, C. Busso, S. Lee, and S. Narayanan,“Emotion recognition using a hierarchical binary decision treeapproach,” Speech Commun., vol. 53, no. 9, pp. 1162–1171, 2011.
[62] R. Hertwig and P. M. Todd, “More is not always better: The bene-fits of cognitive limits,” Thinking: Psychological Perspectives Reason-ing Judgment Decision Making, pp. 213–231, 2003.
[63] R. M. Hogarth and N. Karelaia, “Ignoring information in binarychoice with continuous variables: When is less more?” J. Math.Psychology, vol. 49, no. 2, pp. 115–124, 2005.
[64] D. Zhu, B. Ma, and H. Li, “Joint map adaptation of feature trans-formation and gaussian mixture model for speaker recognition,”in Proc. IEEE Int. Conf. Acoustics Speech Signal Process., 2009,pp. 4045–4048.
[65] H. D. Kim, C. Zhai, and J. Han, “Aggregation of multiple judg-ments for evaluating ordered lists,” in Advances in InformationRetrieval. Berlin, Germany: Springer, 2010, pp. 166–178.
[66] H. Kaya, A. Karpov, and A. A. Salah, “Fisher vectors with cas-caded normalization for paralinguistic analysis,” in Proc. Int.Speech Commun. Assoc., 2015, pp. 909–913.
[67] M. Schmitt, F. Ringeval, and B. Schuller, “At the border of acous-tics and linguistics: Bag-of-audio-words for the recognition ofemotions in speech,” in Proc. Int. Speech Commun. Assoc, 2016,pp. 495–499.
[68] F. Eyben, M. W€ollmer, and B. Schuller, “Opensmile: The Munichversatile and fast open-source audio feature extractor,” in Proc.Int. Conf. Multimedia, 2010, pp. 1459–1462.
[69] P. M. M€uller, S. Amin, P. Verma, M. Andriluka, and A. Bulling,“Emotion recognition from embedded bodily expressions andspeech during dyadic interactions,” in Proc. Int. Conf. AffectiveComput. Intell. Interaction, 2015, pp. 663–669.
[70] H. Wang and C. Schmid, “Action recognition with improvedtrajectories,” in Proc. IEEE Int. Conf. Comput. Vis., 2013, pp. 3551–3558.
[71] D. Oneata, J. Verbeek, and C. Schmid, “Action and event recogni-tion with fisher vectors on a compact feature set,” in Proc. IEEEInt. Conf. Comput. Vis., 2013, pp. 1817–1824.
[72] V. Kantorov and I. Laptev, “Efficient feature extraction, encodingand classification for action recognition,” in Proc. IEEE Conf.Comput. Vis. Pattern Recognit., 2014, pp. 2593–2600.
[73] X. Peng, L. Wang, X. Wang, and Y. Qiao, “Bag of visual wordsand fusion methods for action recognition: Comprehensive studyand good practice,” Comput. Vis. Image Understanding, vol. 150,pp. 109–125, 2016.
[74] H. J�egou, M. Douze, C. Schmid, and P. P�erez, “Aggregating localdescriptors into a compact image representation,” in Proc. IEEEConf. Comput. Vis. Pattern Recognit., 2010, pp. 3304–3311.
[75] K. Chatfield, V. S. Lempitsky, A. Vedaldi, and A. Zisserman, “Thedevil is in the details: An evaluation of recent feature encodingmethods,” in Proc. British Mach. Vis. Conf., 2011, vol. 2, no. 4,pp. 8–19.
[76] F. Perronnin, J. S�anchez, and T. Mensink, “Improving the Fisherkernel for large-scale image classification,” in Proc. Eur. Conf. Com-put. Vis., 2010, pp. 143–156.
[77] E. Mower, M. J. Mataric, and S. Narayanan, “A framework forautomatic human emotion classification using emotion profiles,”IEEE Trans. Audio Speech Language Process., vol. 19, no. 5, pp. 1057–1070, Jul. 2011.
[78] P. Lucey, J. F. Cohn, T. Kanade, J. Saragih, Z. Ambadar, andI. Matthews, “The extended Cohn-Kanade dataset (ck+): A com-plete dataset for action unit and emotion-specified expression,” inProc. IEEE Comput. Soc. Conf. Comput. Vis. Pattern Recognit. Work-shops, 2010, pp. 94–101.
Shan-Wen Hsiao (S’15) received the BS degreein electrical engineering from the National CentralUniversity (NCU), Taiwan, in 2014. He is workingtoward the MS degree in the Electrical Engineer-ing Department, the National Tsing HuaUniversity(NTHU), Taiwan. He had Presidential Award: Top5 percent GPA of the class in 2014. His researchinterests include human-centered behavioral sig-nal processing (BSP), machine learning, and mul-timodal signal processing. He was awarded withthe NOVATEK Fellowship (2015-2016). He is astudent member of the IEEE.
Hung-Chin Sun (S’15) received the BS degreein electrical engineering from the National ChungCheng University (NCCU), Taiwan, in 2014. He isworking toward the MS degree in the ElectricalEngineering Department, the National Tsing HuaUniversity (NTHU), Taiwan. His research inter-ests include human-centered behavioral signalprocessing (BSP), machine learning, and multi-modal signal processing. He is a student memberof the IEEE.
566 IEEE TRANSACTIONS ON AFFECTIVE COMPUTING, VOL. 10, NO. 4, OCTOBER-DECEMBER 2019

Ming-Chuan Hsieh received the PhD degree inmeasurement and statistics from the Universityof Iowa, Iowa city, in 2007. She is an associateresearch fellow at National Academy for Educa-tional Research, Taiwan. Her research exploresthe uses and interpretations of educationalassessment, with an emphasis on evaluating theaccountability using modern test theory. Herwork has investigated a variety of technical andpolicy issues in the uses of test data, includingperformance assessment designs and the influ-ence of tests on policy making.
Ming-HsuehTsai received the PhD degree in edu-cation policy and management from the Universityof Taipei University of Education, in 2008. He is anassociate research fellow at National Academyfor Educational Research, Taiwan. His researchexplores of education administrative staff profes-sional development and school quality of the rela-tionship. His work has investigated a variety ofeducation administrative staff professional devel-opment and performance assessments.
Yu Tsao (M’09) received the BS and MS degreesin electrical engineering from National TaiwanUniversity, in 1999 and 2001, respectively, andthe PhD degree in electrical and computer engi-neering from the Georgia Institute of Technology,in 2008. From 2009 to 2011, he was a researcherin the National Institute of Information and Com-munications Technology (NICT), Japan, wherehe engaged in research and product develop-ment in automatic speech recognition for multilin-gual speech-to-speech translation. Currently, he
is an associate research fellow of the Research Center for InformationTechnology Innovation (CITI), Academia Sinica, Taiwan. His researchinterests include speech and speaker recognition, acoustic and lan-guage modeling, multimedia signal and information processing, patternrecognition, and machine learning. He is a member of the IEEE.
Chi-Chun Lee (M’13) received the PhD degree inelectrical engineering from USC, in 2012. He is anassistant professor in the Electrical EngineeringDepartment, the National Tsing Hua University(NTHU), Taiwan. He was a data scientist at id:alab at ID Analytics, Inc. from Feb. 2013-Dec. 2013.His research interests include interdisciplinaryhuman-centered behavioral signal processing. Hewas awarded with the USC Annenberg Fellowship(2007-2009). He led a team to participate and winthe Emotion Challenge Classifier Sub-Challenge
in Interspeech 2009. He is a coauthor on the best paper award in Inter-Speech 2010. He is a member of Tau Beta Pi, Phi Kappa Phi and EtaKappa Nu. He is also amember of ISCA. He has been a reviewer for multi-ple internationally-renowned journals and technical conferences. He is amember of the IEEE.
" For more information on this or any other computing topic,please visit our Digital Library at www.computer.org/publications/dlib.
HSIAO ET AL.: TOWARD AUTOMATING ORAL PRESENTATION SCORING DURING PRINCIPAL CERTIFICATION PROGRAM USING... 567