
Toward a Wider Analysis of Market Definition: Theory and Evidence from the Turkish...
21
Tamer Çetin is a visiting lecturer at the Northeastern University, Boston. He is grateful to Christopher Brown and two anonymous referees for their valuable comments. This research was supported in the scope of Project No. 2016-02-01- KAP01 by the Division of Research of Yildiz Technical University (Turkey), when Çetin was an associate professor at that university. The earlier versions of this article were presented at the XVII April International Academic Conference on Economic and Social Development, held at the Higher School of Economics in Moscow (Russia) in 2016 and at the Fourth European Academic Research Conference on Global Business, Economics, Finance and Banking (EAR16 Swiss Conference) in Zurich (Switzerland) the same year. The author is grateful to the participants for their valuable comments. The responsibility for any errors remains with the author. 1137 ©2017, Journal of Economic Issues / Association for Evolutionary Economics JOURNAL OF ECONOMIC ISSUES Vol. LI No. 4 December 2017 DOI 10.1080/00213624.2017.1391597 Toward a Wider Analysis of Market Definition: Theory and Evidence from the Turkish Telecommunications Industry Tamer Çetin Abstract: This article develops a novel approach to the analysis of market definition. The article empirically investigates the main components of market definition, such as market power, substitution, and the simultaneous interaction between the demand and its determinants for the fixed and mobile voice services. To this end, I employ the multivariate Johansen cointegration methodology and analyze the Turkish voice telecommunications industry. While the VECM analysis confirms the presence of a simultaneous long-term causality relationship among the variables, the Johansen normalization results reveal demand elasticities that enable the analysis of market power and fixed-to-mobile substitution. My findings suggest that the fixed and mobile voice services, which are traditionally viewed as separate markets, can be defined as products that compete in the single market. Keywords: cointegration methodology, (de)regulation, fixed-mobile substitution, market definition, market power JEL Classification Codes: C32, L43, L51, L96, K21 Market definition has long been a very controversial field in antitrust cases (Baker 2007; Kaplow 2014; Massey 2000; Tardiff and Weisman 2009; Werden 2014). Even though different approaches to market definition have been presented so far, consensus has not been achieved on which approach is the best to define a market. The aim of market definition is to understand market power and its anticompetitive effects. Thus, the Lerner index, the market shares of firms, and market concentration have been used as traditional tools to measure market power. However, these approaches suffer from some shortcomings when used to analyze market definition
-
Upload
uni-hamburg -
Category
Documents
-
view
0 -
download
0
Transcript of Toward a Wider Analysis of Market Definition: Theory and Evidence from the Turkish...

Tamer Çetin is a visiting lecturer at the Northeastern University, Boston. He is grateful to Christopher Brown and two
anonymous referees for their valuable comments. This research was supported in the scope of Project No. 2016-02-01-
KAP01 by the Division of Research of Yildiz Technical University (Turkey), when Çetin was an associate professor at
that university. The earlier versions of this article were presented at the XVII April International Academic Conference
on Economic and Social Development, held at the Higher School of Economics in Moscow (Russia) in 2016 and at the
Fourth European Academic Research Conference on Global Business, Economics, Finance and Banking (EAR16 Swiss
Conference) in Zurich (Switzerland) the same year. The author is grateful to the participants for their valuable
comments. The responsibility for any errors remains with the author.
1137
©2017, Journal of Economic Issues / Association for Evolutionary Economics
JOURNAL OF ECONOMIC ISSUES Vol. LI No. 4 December 2017 DOI 10.1080/00213624.2017.1391597
Toward a Wider Analysis of Market Definition: Theory and Evidence from the Turkish Telecommunications Industry
Tamer Çetin
Abstract: This article develops a novel approach to the analysis of market definition. The article empirically investigates the main components of market definition, such as market power, substitution, and the simultaneous interaction between the demand and its determinants for the fixed and mobile voice services. To this end, I employ the multivariate Johansen cointegration methodology and analyze the Turkish voice telecommunications industry. While the VECM analysis confirms the presence of a simultaneous long-term causality relationship among the variables, the Johansen normalization results reveal demand elasticities that enable the analysis of market power and fixed-to-mobile substitution. My findings suggest that the fixed and mobile voice services, which are traditionally viewed as separate markets, can be defined as products that compete in the single market.
Keywords: cointegration methodology, (de)regulation, fixed-mobile substitution, market definition, market power
JEL Classification Codes: C32, L43, L51, L96, K21
Market definition has long been a very controversial field in antitrust cases (Baker
2007; Kaplow 2014; Massey 2000; Tardiff and Weisman 2009; Werden 2014). Even
though different approaches to market definition have been presented so far,
consensus has not been achieved on which approach is the best to define a market.
The aim of market definition is to understand market power and its anticompetitive
effects. Thus, the Lerner index, the market shares of firms, and market concentration
have been used as traditional tools to measure market power. However, these
approaches suffer from some shortcomings when used to analyze market definition

1138
Tamer Çetin
(Carlton 2007). Instead, the own-price elasticity of demand is employed in
determining market power. But, the demand elasticity is also not sufficient to define
the relevant market. In particular, in the industries in which firms have high market
shares, even if the own-price elasticity of demand is high, one has to find a good
substitute for the analyzed product/service to define market. To do this, one has to
estimate the cross-price elasticity of demand. Although the cross-price elasticity of
demand is rather useful in market definition, it is also not sufficient to define the
relevant market (Kaplow 2014). When the cross-elasticity of demand fails to address
the question, some researchers use the income elasticity of demand (Vogelsang 2010;
Ward and Woroch 2010). Consequently, researchers and regulators have used new
and different approaches to define markets.
My purpose in this article is to bring together these approaches and to introduce
a wider analysis of market definition. I empirically investigate the Turkish fixed and
mobile voice markets. The aim is to show how to define a market through the
approach I introduce here. In that sense, my argument differs from the previous
literature in three ways. First, following a simultaneous cointegration methodology
developed by Søren Johansen (1992, 1995), my approach enables defining a market
by simultaneously and empirically investigating both the main components of market
definition, such as market power and substitution, and the long-term relationship
between the demand for fixed voice service and market developments driven by
technological change, such as the changes in the own price of fixed voice services, the
price of substitute services, and the effect of income. This is particularly important in
telecommunications. Because technology in the telecommunications industry has
dramatically changed over time, market structures, prices, and the dynamics of
demand also (and simultaneously) have adjusted to this technological change (Miller
1996, 2001; Spulber and Yoo 2009). As Ingo Vogelsang (2010) points out, in order to
better understand these dynamics and to reach a more realistic and plausible analysis
of market definition, regulators have to simultaneously assess those dynamic
developments in the fixed and mobile markets. I argue that the estimation of price
and income elasticities is necessary for market definition, but not sufficient. For a more
realistic and reliable market definition, one should estimate the long-term causality
relationship between the demand for fixed telephony service and market
developments driven by technological change and the main components of market
definition, such as market power and fixed-to-mobile substitution (FMS). In this
sense, my methodology, which includes a novel empirical perspective to the previous
literature, introduces a more contemporary and wider approach to the analysis of
market definition.
Second, I focus on the voice market of Turkey as an emerging market. The
Turkish experience presents a unique case for the analysis of market definition
because the incumbent fixed operator in the Turkish voice market was privatized in
2005, and thus the transition to competition has been performed relatively recently.
Taking into account only the market share of fixed operator in market definition,
regulators have not defined the fixed and mobile voice markets as the single market,
even though market developments suggest a clear substitution relationship between
fixed and mobile voice services (Oguz and Benli 2015). Because such developments in

Toward a Wider Analysis of Market Definition
1139
the telecommunications industries have recently occurred, regulators have been
having difficulties in understanding the meaning of these developments in terms of
market definition. In that sense, the case of Turkey presents a unique opportunity to
understand the dynamic processes of market definition and to introduce new
evidence from an emerging industry into the literature.
Third, I estimate two different models — including two different data — in order
to reach more realistic and reliable results. While the first model includes the analysis
of market definition through data for the traffic volume and call price per minute, the
second one analyzes market definition by data for the number of subscriptions and
average revenue per user (ARPU). Because the results of the two models are similar,
my findings suggest strong, fresh evidence concerning market power, substitution, and
the long-term relationship of technological development to the telecommunications
industry. Also, I analyze the effect of these findings on the regulatory process, and
thus make an important contribution to the literature of market definition.
Accordingly, I organize the article as follows. In section two, I include a general
statement of the fixed and mobile voice markets within the Turkish
telecommunications industry. In section three, I introduce a detailed discussion of
market definition. In section four, I empirically analyze market definition in the
Turkish voice market and discuss the findings in terms of the regulatory process.
A General Overview of the Turkish Voice Telecommunications Industry
In Turkey, the mobile voice market was opened to competition with the entrance of
mobile telephony operators, Turkcell and Telsim (currently Vodafone), into the
industry in 1994. In the same year, Turk Telecom (TT) was established as a state-
owned fixed telephony operator. Although the government tried to privatize TT
throughout the 1990s, some legal problems and judicial resistance in the process of
privatization impeded the privatization of TT.1 While the block sale of 55 percent of
TT was carried out in 2005, 15 percent of its remaining share was privatized through
offering to the public in 20082 (Bagdadioglu and Cetinkaya 2010). Currently, 30
percent of the shares of TT are under state ownership and TT as a private monopoly
dominates the fixed-line telephony market (Çetin 2014).
In the process of regulatory reform in the Turkish telecommunications industry,
the institutional structure of industry also has changed extensively. The
Telecommunications Authority (ICTA n.d.) as an independent regulator was
established in 2000. Law No. 5369, enacted in 2005, redefined the universal services
in telecommunications in parallel with the EU Directive of 2002 (Directive 2002/22/
EC) (Oguz 2013). The Electronic Communications Law (ECL), Law No. 5809,
enacted in 2008, restricted the regulatory power of the Ministry of Transport in the
1 See Tamer Çetin (2010, 2014) for more detailed discussion about the institutional problems of privatization in Turkey in the 1990s.
2 Following privatizations in 2005 and 2008 by a Cabinet Decision in January 2013, the government vowed to privatize 6.68 percent of the remaining share of TT through offerings to public by the end of 2013. This privatization, however, has not yet materialized.
1140
Tamer Çetin
industry and gave all the regulatory discretion to the ICTA in order to protect
competition, to undertake market analyses for market definition, to determine
operators with significant monopoly power (SMP), to regulate operators with the
SMP, and to approve tariffs and prices if necessary (Atiyas 2011).
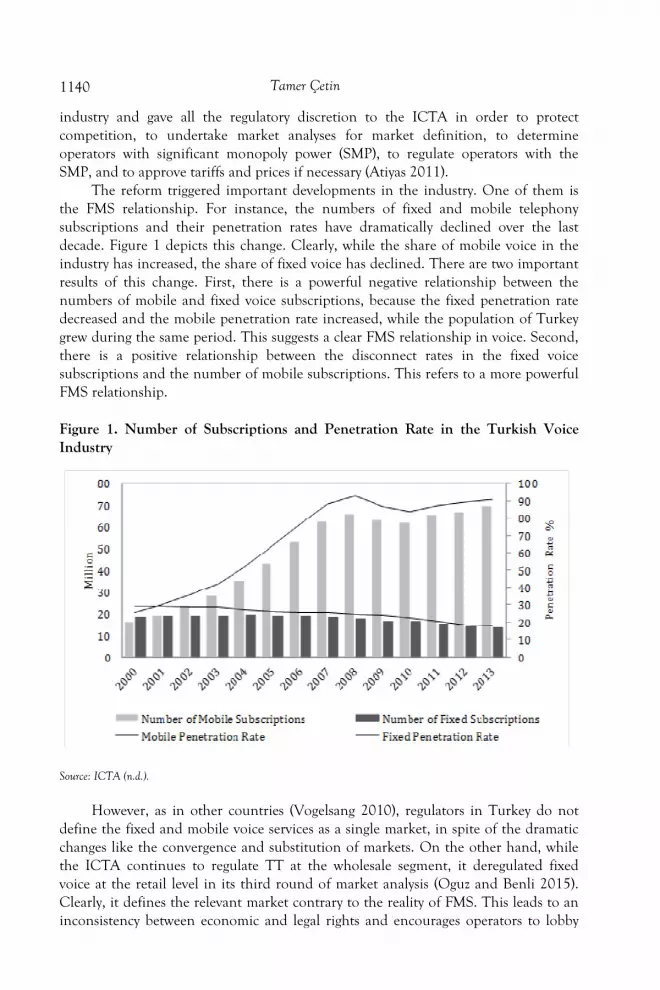
The reform triggered important developments in the industry. One of them is
the FMS relationship. For instance, the numbers of fixed and mobile telephony
subscriptions and their penetration rates have dramatically declined over the last
decade. Figure 1 depicts this change. Clearly, while the share of mobile voice in the
industry has increased, the share of fixed voice has declined. There are two important
results of this change. First, there is a powerful negative relationship between the
numbers of mobile and fixed voice subscriptions, because the fixed penetration rate
decreased and the mobile penetration rate increased, while the population of Turkey
grew during the same period. This suggests a clear FMS relationship in voice. Second,
there is a positive relationship between the disconnect rates in the fixed voice
subscriptions and the number of mobile subscriptions. This refers to a more powerful
FMS relationship.
Figure 1. Number of Subscriptions and Penetration Rate in the Turkish Voice
Industry
Source: ICTA (n.d.).
However, as in other countries (Vogelsang 2010), regulators in Turkey do not
define the fixed and mobile voice services as a single market, in spite of the dramatic
changes like the convergence and substitution of markets. On the other hand, while
the ICTA continues to regulate TT at the wholesale segment, it deregulated fixed
voice at the retail level in its third round of market analysis (Oguz and Benli 2015).
Clearly, it defines the relevant market contrary to the reality of FMS. This leads to an
inconsistency between economic and legal rights and encourages operators to lobby

Toward a Wider Analysis of Market Definition
1141
for wealth transfers. Unfortunately, this approach is common throughout the world.
Because this analysis of market definition neglects the most important components of
market definition and the regulatory decisions are not consistent with market
developments, the current approach to market definition in Turkey (and many other
countries) is not sufficient to define markets in parallel with market developments. I
argue that the analysis of market definition would extensively change and the
individual fixed operator would be deregulated if regulators define the candidate
market as per the methodology I analyze in the next section.
An Analysis of Market Definition
The main rationale of defining a market is to ensure a basis for inferring market
power.3 The aim is to understand anticompetitive components in the analyzed market
and thus to take measures to preclude the negative effects of those components on
competition, if necessary4 (Baker 2007; Kaplow 2010). That is, the process of market
definition consists of two important parts: (i) the analysis of market definition and (ii)
the effect of this analysis on regulation. Taking into consideration these feature of
market definition,5 I accept that the analysis of market definition has three main
components: (i) the long-term dynamic interaction between the demand for fixed
voice services and its determinants driven by technological change, (ii) the
hypothetical monopolist test (HMT), and (iii) the FMS relationship. However, the
previous literature on market definition has only focused on the last two of these
components and neglected the first one (Baker 2007; Barth and Heimeshoff 2014;
Briglauer, Schwarz and Zulehner 2011; Cardona et al. 2009; Karacuka, Haucap and
Heimeshoff 2011; Rhee and Park 2011; Sidak, Crandall and Singer 2002; Vogelsang
2010). In fact, the first component is more important than the others, because the
3 In particular, antitrust cases in the US have turned to the question of market definition after the
DuPont Cellophane Case in 1956 (United States v. E.I. du Pont de Nemours & Co., 353 US 586). Even though
the U.S. Supreme Court first accepted cross-price elasticities of demand to define a market in Times-Picayune
in 1952 (Times-Picayune Publishing Co. v. United States, 345 US 594), this approach was only confirmed with
the DuPont case in terms of revealing market power and defining the relevant market (Massey 2000). 4 Of course, market definition is also important in order to understand the anticompetitive effects of
mergers. However, in this article, (following Barth and Heimeshoff 2014; Briglauer, Schwarz and Zulehner 2011; Cardona et al. 2009; Rhee and Park 2011; Vogelsang 2010), I focus on market definition in terms of market power and fixed to mobile substitution, but not mergers because the point of the market definition process is market power (Kaplow 2010).
5 The definition of a relevant market consists of the definition of relevant product and geographic markets. For that reason, regulators apply the process of market definition twice. They first analyze market definition for a product market and then they define the candidate market geographically (Coate and Fischer 2008). However, I only focus on a demand-based market definition for the product market because my aim is to introduce a wider approach to the analysis of market definition by bringing together the most important components of market delineation, as mentioned in this article’s introduction above. By using these components, I only include the analysis of product market and ignore the definition of geographic market. Of course, this approach can also be used to define a relevant geographic market if data is available. As a matter of fact, “geographic markets are defined using the same process as that used to define product markets,” as clearly stated in the Competition Law Guideline of the Office of Fair Trading of the UK and the Market Analysis Guideline of Information and Communication Technologies Authority in Turkey.

1142
Tamer Çetin
main motivation in the analysis of market definition in the telecommunications
industry is to understand the effect of technological and dynamic change on demand
relationships. When technological developments in the mobile markets drive down
the price of mobile products, and thus the mobile services become more accessible for
all users, consumers in the fixed voice market simultaneously prefer the mobile voice
products to the traditional fixed telephone services (Miller 1996, 2001; Spulber and
Yoo 2009; Vogelsang 2010). For that reason, I have to include the effect of these
dynamic and simultaneous developments on the components of market definition
into the analysis of market definition.
Conversely, in the traditional analysis of market definition, regulators and
researchers have generally relied on the observation of changes in prices, penetration
rates, the number of subscription, the revenue of firms, market shares, and market
concentration. In other words, they have neglected the dynamic and simultaneous
effect of technological change on market developments, market definition, and
regulation. According to the traditional approach, the FMS is based on the
observation that the number of fixed subscriptions decreases, while the number of
mobile subscriptions increases in parallel with developments in mobile technologies.
It is accepted that such interaction between the mobile and fixed use rates is a clear
indicator of the FMS (Vogelsang 2010). This approach is flawed because it does not
include the analysis of simultaneous interaction between demand and market
developments that are critical for market definition. Instead of the separate
observation of each indicator, it is necessary to simultaneously analyze the dynamic
interaction among those variables to better understand the real effect of market
developments on market definition and regulation. It has to be clear whether there is
a simultaneous long-term relationship between the demand for fixed telephony and
its determinants because the interaction among these variables is a dynamic
relationship, which also occurs in the long term.
An important component of market definition has become the measure of
market power since the DuPont Cellophane Case of 1956. In contrast to the
traditional approaches, such as the Lerner index6 and market share,7 the best
6 In the traditional microeconomics literature, market power is usually measured by the Lerner
index. The Lerner index is measured by L=(P-MC)/P. In this equation, P is price and MC is marginal cost. If
P=MC, then L=0 and there is no market power. If P >MC, then L>0 and this means market power. This approach is not available to directly define the relevant market through market power because it only
reflects P and MC. In the analysis of market definition, measuring MC is rather difficult, even though prices are straightforward.
7 In particular, in the cases where there is a strong substitution relationship, even if the market share of an incumbent operator is 100 percent, market share cannot be meaningful in terms of market definition (Baker 2007; Kaplow 2010). For example, in the telecommunications industries in which competition is fierce, even if an operator in the traditional fixed-voice market has 100 percent market share, the pressure of competition stemming from substitute products/services can force the fixed operator to hold prices close to marginal cost in its own market. The presence of a substitute product can impede the profitability of a price increase for the incumbent operator in the traditional telecommunications services. That is, because high market share does not necessary mean more market power, market share is not strongly the probative of market power or anticompetitive effect. If market share is not evidence for market power, then market definition is least useful (Baker 2007). For that reason, market share alone is also not the available tool to define a relevant market.

Toward a Wider Analysis of Market Definition
1143
approach used to measure market power is the HMT. The HMT has been intensively
employed in the analysis of market definition in telecommunications by regulators,
courts, and international competition regimes over the last three decades (Baker
2007; Coate and Fischer 2008). The HMT presents an analytical approach to estimate
the profitability of a hypothetical increase in price, and thus to define the relevant
market. A hypothetical price increase refers to a small, but significant, non-transitory
price increase (SSNIP).8 Accordingly, if a 5.0 percent price increase by the
hypothetical monopolist in the relevant market is profitable, it is accepted that this
firm has the market power to raise price. Or, if the price increase leads to a loss in
sales of the hypothetical monopolist and thus it is not profitable, best substitutes are
included in the analysis of market definition and the process is repeated in certain
intervals (Coate and Fischer 2008).
In order to determine market power, one has to measure the own-price elasticity
of demand for fixed voice services. The own-price elasticity will reveal what would
happen when the hypothetical monopolist imposes a SSNIP on the current price of
relevant product (Coate and Fischer 2008). If the price increase is unprofitable, then
the second step is to define the substitute product. If there is a good substitute of the
hypothetical product, then the own-price elasticity will be high. Conversely, if there is
no substitute, then the own-price elasticity will be close to zero. In that case, whereas
the high own-price elasticity refers to a low market power, market power will be higher
when the own-price elasticity of demand is low. In short, instead of the traditional
approaches, the own-price elasticity of demand is the best tool to measure market
power and to define a market through this market power (Kaplow 2010).
The last important component of market definition is the analysis of the FMS
relationship. The cross elasticity of demand is the best tool to measure the FMS.
While the own-price elasticity explains the market power of fixed operator as the
hypothetical monopolist, the cross-elasticity of demand reveals the best substitute for
the traditional fixed products. Such analysis determines the scope of the relevant
market. For instance, if consumers use substitute products or services, these products
can compete within the same market, and thus the markets including those products
can be defined as a single market. Products or services that are traditionally in
different markets can be classified as products that compete in the same market
(Coate and Fischer 2008). For these reasons, in order to define a market, it is
necessary to use an empirical methodology that allows for investigating the
simultaneous long-term relationship among the related variables at issue, the HMT,
and the FMS relationship.
Empirical Methodology
In this section, I construct some hypotheses to clarify my approach and then specify
equation(s) to empirically test these hypotheses. Accordingly, my first hypothesis is:
8 For that reason, the HTP and the SSNIP can be used in the same meaning.
1144
Tamer Çetin
H1: There is a simultaneous long-term relationship running from the prices of mobile and
fixed telephony services and national income to the demand for fixed voice.
While technological development drives down the price of mobile products, and
thus facilitates access to mobile services, the demand for fixed telephony service
simultaneously declines even if the income of consumers increases. This means that
there is a long-term causality relationship among the price of mobile voice service,
income, the price of fixed telephony, and the demand for fixed telephony service. My
goal is to simultaneously investigate this long-term relationship among the variables
instead of the separate observation of each variable as in the previous literature on
market definition. Thus, I include the effect driven by technological development into
the analysis of market definition and introduce a more contemporary approach to
defining a market in the telecommunications industries. My next three hypotheses
are:
H2: The own-price elasticity of demand for fixed telephony should be higher than 1 or
close to 1 because the price increase has not to be profitable in the HMT.
H3: The cross-elasticity of demand should be positive to show the presence of the FMS.
H4: I expect a positive relationship between the demand for fixed voice and income.
In order to empirically test these hypotheses, I employ the Johansen
cointegration methodology because it allows for simultaneously testing the long-term
relationships among the aforementioned variables (Bremnes, Gjerde and Sattem
2001; Johansen 1992, 1995). Also, this methodology allows for estimating the own-
price, cross-price, and income elasticities of demand for fixed services using the
variables under the assumptions of my model. Accordingly, I analyze the long-term
relationship among the variables, the HMT, and the FMS under the four hypotheses
above. While the own-price elasticity enables the analysis of the market power of fixed
operator, the cross-elasticity of demand reveals the FMS relationship. Lastly, if there is
a cointegration relationship among the variables, one can infer that there is a long-
term causality relationship running from the prices of fixed and mobile voice services
and income as independent variables to the demand for fixed telephony as the
dependent variable.
Model Specification
My model specifies the log of the demand for fixed voice services as a function of
the log of the own price of fixed voice, the price of mobile voice as the best substitute,
and income. Thus, I estimate:
lnDFixt = β0 + β1lnPfix + β2lnPmobile + β3lnYt + εt (1)
In equation (1), DFixt is the demand for fixed voice services in the country in period t,
Pfix is the price of fixed voice in period t, Yt is income in the country in period t, and εt

Toward a Wider Analysis of Market Definition
1145
is the error term. In this equation, parameters β0, β1, β2, and β3 are estimated as long-
term elasticities because the variables are used in logarithmic form.
Because my goals is to estimate the long-term relationships among those
variables through two different data, I rewrite equation (1) as follows:
Dqtfixcall = ft (pt
fixppm, ptmobppm, yt
tipi) (2)
Dqtfixsubnum = ft (pt
ARPUfix, ptARPUmob, yt
tipi) (3)
The variables in equations (2) and (3) are as follows:
Dqtfixcall: the log of fixed calls (minutes)
Dqtfixsubnum: the log of fixed subscription numbers
ptfixppm: the log of the price per minute for fixed calls,
ptmobppm: the log of the price per minute for mobile calls
ptARPUfix: the log of ARPU for fixed voice
ptARPUmob: the log of ARPU for mobile voice
yttipi: the log of the adjusted and seasonal total production index (TIPI)
I estimate two different models. In these equations, the demand for fixed voice
is proxied by calls from the fixed operator and the number of fixed subscriptions,
respectively. Accordingly, while Dqtfixcall is the function of pt
fixppm, ptmobppm, and yt
tipi,
Dqtfixsubnum is the function of pt
ARPUfix, ptARPUmob, and yt
tipi. By empirically investigating these
equations, I aim to:
• reveal whether there is a long-term causality relationship among the variables in
order to test H1;
• estimate the own-price elasticity of demand through the relationship between
Dqtfixcall and pt
fixppm or Dqtfixsubnum and pt
ARPUfix. Thus, I will figure out whether the
fixed operator as a hypothetical monopolist has monopoly or market power
through the HMT in H2;
• estimate the cross-elasticity of demand through the relationship between Dqtfixcall
and ptmobppm or Dqt
fixsubnum and ptARPUmob. Thus, I will reveal the presence of the FMS
in H3;
• understand the relationship in H4 through the income elasticity of demand.
The relationship between Dqtfixcall or Dqt
fixsubnum and yttipi will determine income
elasticity.
In the context of this background, I can derive equations to estimate the
following:
lnDqtfixcall = β0 + β1lnpt
fixppm + β2lnptmobppm + β3lnyt
tipi + εt (4)

1146
Tamer Çetin
In equation (4), Dqtfixcall is the total call quantity (million minutes) from fixed operator
in the country in year t, ptmobppm is the price of fixed call per minute in year t, pt
mobppm is
the price of mobile call per minute, yttipi is the seasonally adjusted total production
index, and εt is the error term. In the same equation, the demand for fixed voice is
proxied by the log of the quantity of total fixed calls, and thus the log of fixed calls is
specified as a function of the log of fixed and mobile-call prices per minute and TIPI
that proxies income:
lnDqtfixsubnum = β0 + β1lnpt
ARPUfix + β2lnptARPUmob + β3lnyt
tipi + εt (5)
In equation (5), Dqtfixsubnum is the number of subscriptions for fixed voice in the country
in year t, ptARPUfix is ARPU for fixed voice in year t, pt
ARPUmob is ARPU for mobile voice,
yttipi is the seasonally adjusted total production index, and εt is the error term. In the
same equation, the number of fixed subscriptions represents the demand for fixed
voice and the log of the number of subscriptions is specified as a function of the log
of ARPU for fixed and mobile voice and TIPI. Accordingly, equations (4) and (5)
enable the definition of the Turkish voice market by the estimation of the long-term
relationships among the variables.
Data
Because my empirical analysis includes the estimation of aggregate demand
functions in the Turkish voice market, I use the national-level quarterly-data, but not
the firm-level data. Data cover the period between 2003Q1 and 2015Q3 for all the
variables in both subscription and call analysis.9 The variables for the call analysis in
Model 1 are fixed calls (minutes), the price per minute for fixed calls, and the price
per minute for mobile calls. Also, I use the adjusted and seasonal total production
index (TIPI), which is highly correlated with GDP to control for changes in income.
These variables represent fixcall, fixcallprice, mobcallprice, and income in Model 1.
9 Undoubtedly, the Johansen’s methodology I use here is the best if the sample size is about 100 observations or more, as C.P. Hargreaves (1994) expresses. However, this is not necessary for the Johansen cointegration approach because the residuals are not autocorrelated for only the sample sizes with 100 observations in Hargreaves’s own study. In this article, the residuals are not highly autocorrelated for both models, as I express below. Also, there is no consensus about the number of observations in the cointegration analysis. Some studies clearly suggest that the power of the cointegration analysis depends on the frequency of the data rather than the number of observations (Perron 1989; Shiller and Perron 1985;). As G.S. Maddala and In-Moo Kim (2004) discuss in detail, unit root test based on quarterly data are more powerful than those based on the corresponding yearly data. As a matter of fact, Johansen himself run his own cointegration analyses with 55, 61, and 67 observations by using quarterly data (Johansen and Juselius 1990, 1992). Also, it is possible to find some other studies using the cointegration methodology with 55 observations (Godbout and van Norden 1997; Kama 1992). On the other hand, my goal here is to introduce a new approach to market definition rather than estimating demand through the most suitable econometric technique, and there is no larger data in Turkey. Most importantly, because the residuals are not highly autocorrelated in this article, the models are valid and the results are reliable. For these reasons, I employ the Johansen cointegration technique with 51 observations for Models 1 and 2, even though these observation numbers are relatively less than an ideal dataset.

Toward a Wider Analysis of Market Definition
1147
The variables for the subscription analysis in Model 2 are the number of fixed
subscriptions, ARPU for fixed voice, ARPU for mobile voice, and TIPI. These
variables represent fixsubnum, ARPUfix, ARPUmob, and income in Model 2.
Accordingly, as the quantity of demand in the models, I use the number of fixed
subscriptions in the subscription analysis and traffic volume in the call analysis. As
prices, I use ARPU and price per minute for mobile and fixed calls. For real prices, all
price data are deflated by the communication price index (CPI) in Turkey.
Data for the period between 2008Q1 and 2015Q3 for the number of fixed
subscriptions and ARPU in the subscription analysis are obtained from the market
analysis data of the ICTA.10 I use annual data for the remaining period of
subscription data and interpolate annual data to the quarterly data through Michael
Baxter’s (1998) 11 method. Data for the fixed and mobile call price are from TUIK.
The call traffic data as quantity in the call analysis for the period between 2003Q1
and 2011Q3 are from the Telecom Market Matrix Data of Analysis Mason and UDH
(2011). The call traffic data for the period between 2011Q4 and 2015Q3 are from the
ICTA. In order to control for changes in income, I use seasonally and calendar
adjusted TIPI that is highly correlated with GDP. Data for TIPI and CPI are from the
Turkish Statistical Institute (TUIK).
Cointegration Analysis and Estimation Results
I employ the Johansen cointegration methodology with a conditional vector
error correction model (VECM), including k lags in the estimation of the models.
First of all, in the analysis of time series, I cannot empirically investigate the presence
of long-term causalities among the variables through the OLS regression methodology.
For instance, if one time series is cointegrated with the other, the familiar regression
approaches cannot estimate this relationship. Also, if some variables are not
stationary, the analysis of those variables through the OLS regression methodology
can produce spurious results. It is possible to estimate demand elasticities to
understand the presence of market power and substitution relationship through the
OLS regressions, but not the long-term equilibrium relationships among the variables.
Clearly, the OLS regression analysis is not sufficient for a wider analysis of market
definition. Conversely, cointegration methodology allows for investigating both the
presence of long-term relationships among the variables and the sensitiveness of these
relationships through the estimation of elasticities simultaneously. That is, by using
the cointegration approach, I can provide a concurrent statistical evidence for both
the estimation of long-term relationship among the variables and the analysis of
demand elasticities. In other words, using the Johansen cointegration methodology, I
10 For the market analysis data of ICTA, see www.btk.gov.tr/tr-TR/Sayfalar/Pazar-Verileri. 11 The Baxter model is commonly used to quadratically interpolate annual data to quarterly data
because of the problem of missing data. For instance, the UK’s Office for National Statistics officially employs the Baxter model to interpolate missing data. In general, existing academic studies linearly interpolate missing data. However, series do not show a linear trend over time. In this sense, quadratic interpolation ensures the obtaining of more accurate results by converting annual data to quarterly values.

1148
Tamer Çetin
can test the hypotheses H1, H2, H3, and H4 and thus reveal the long-term
relationships that are crucial for the analysis of market definition. Under this
framework, I estimate the existence of long-term relationships by the results of VECM
analysis reported in Table 3 and Table 7 and elasticities through the Johansen
normalization results reported in Table 4 and Table 8. It is clear that the estimation
methodology I present here is more suitable than the previous approaches used in the
analysis of market definition. Accordingly, the VECM model, which was proposed by
Johansen (1995), can be written as:
λt =∑ki=1Θiλt–i + ψλt–k + χϕt + εt (6)
In equation (6), λt is the vector of endogenous variables, ϕt is the vector of
exogenous variables, and Θi and χ are the coefficient matrices of endogenous and
exogenous variables, respectively. Θi and ψ represent the short and long-run
relationships, while k is the lag length. The term εt refers to the independent residuals.
The (5×5) matrix ψ can be converted to αβ. In that case, α represents the coefficients
defining the speed of adjustment of λt toward the long-run equilibrium, while β is the
cointegrating vector and represents the long-term relationship among the variables.
The Johansen (1995) procedure tests the rank r≤5 of matrix ψ. If r=0, there is no
cointegration. Also, a reduced rank r means that there are r possible stationary linear
combinations. Using this estimation methodology, I test the long-term relationships
in equation (4) and equation (5). The VECM and the Johansen normalization results
will allow for interpreting the findings in the context of the analysis of market
definition.
Before the cointegration analysis, I perform pre-estimation tests to determine the
appropriate lag length of the system, to understand the autocorrelation structure of
residuals, and to reveal whether variables are stationary (Bremnes, Gjerde and Sattem
2001). In the Johansen cointegration test, variables must be non-stationary at level.
Accordingly, if variables are non-stationary at level, when all variables are converted
into the first difference, they will be stationary — meaning, they are integrated of the
same order. In order to test whether time series for variables are stationary or not, I
employ the augmented Dickey-Fuller (ADF) test.12 Accordingly, because the t statistics
absolute values are less than 5.0 percent critical values for both Model 1 and Model 2,
the null hypothesis is accepted and the alternative is rejected. All variables have unit
root and are non-stationary at level. Coefficient values for variables are negative and
there is no autocorrelation problem. Because tests are valid, I accept the models and
run the Johansen cointegration analysis.
12 In the VECM analysis, the estimate of structural or policy changes is best for testing the (non)stationary properties of the series in the presence of possible structural breaks. For that reason, I tested the effect of any structural or policy changes, such as the privatization and liberalization of THY in 2005 as exogenous and endogenous structural breaks through Lee-Strazicich LM unit root tests in my preliminary VECM analysis, although the model did not estimate these changes in 2005 as structural breaks. The variables do not include structural breaks, even though they are non-stationary in their levels. For that reason, I used the ADF test in the current version of the article for unit root tests.

Toward a Wider Analysis of Market Definition
1149
Model 1: The Call Analysis
First, I estimate equation (4) as Model 1 through the call data. Table 1 reports
the summary statistics of the variables included in Model 1. I follow Akaiki-
information-criteria (AIC) procedure as the lag selection criteria for Model 1.
According to the results of lag selection criteria, I use two lags for the lag selection in
the Johansen cointegration test and the VECM, because the AIC procedure suggests
that the optimal lag length is two. In other words, I select two lags in all the system-
equation models for Model 1. In order to test the null hypothesis that there are no
cointegrating vectors (r=0) against the alternative that there is at least one
cointegrating vector (r≤1), I employ the Johansen cointegration procedure (Johansen
1995). The Johansen test estimates the number of cointegrating vectors by performing
a sequence of trace tests at a given significance level. If there are no cointegrating
vectors, I will reject the null hypothesis (r=0) and accept the alternative (r≤1), meaning
that there is at least one cointegrating vector. Also, following Johansen (1992), I apply
Sastry Pantula’s (1989) principle13 in the selection of trends, including a comparison
of the maximal Eigenvalue test statistics to its critical value. My results confirm that
constant tests in the selection of trend are more available for both Model 1 and
Model 2.
Table 1. Summary Statistics for Model 1
Note: All variables in natural logarithms.
Table 2 reports the rank analysis of multivariate cointegration system for Model
1, including the results from both trace statistics (λtrace) and maximal Eigenvalue statistics
(λmax). I reject the null hypothesis for r=0 in all the models because trace and max
statistics values for r=0 (75.26) and r=0 (53.54) are higher than the critical values
(47.21) and (27.07) at 5.0-percent significance level. On the other hand, I accept the
null hypothesis for r=1 in trace statistics and r≤1 in maximal Eigenvalue statistics
because trace and max statistics values for r=1 (21.71) and r≤1 (13.19) are less than
critical values (29.68) and (20.97) at 5.0-percent significance level. The results confirm
the presence of one cointegrating vector in Model 1. It means that there is a long-term
relationship among the variables in Model 1. I can run the VECM test.
13 I use the Pantula principle for simplicity to simultaneously determine the cointegration rank and the deterministic components of a cointegration model. However, other procedures can be used to test the same process.
Variables Obs. Mean Std. dev. Min. Max.
Fixcall 51 22.67146 0.5564991 21.67878 23.66481 Fixcallprice 51 1.374712 1.685378 –0.2005515 4.801853
Mobcallprice 51 1.610119 1.260683 –1.243349 3.186996
Income 51 4.973313 0.1393245 4.68481 5.188655

1150
Tamer Çetin
Table 2. Johansen Tests for Co-Integration for Model 1
Note: *Indicates level of statistical significance.
Table 3 reports the results of the VECM test for Model 1. The results show the
short and long-term causality relationships among the variables.14 The model is valid
because the value of the error-correction term for Fixcall is negative (–0.25). Also, this
finding is significant at 1.0-percent significance level because the value of p>|z| is
(0.00). The results are statistically and economically significant and affirm the
presence of cointegration among the variables. Accordingly, the VECM analysis
suggests that there is a long-term causality relationship running from the determinants
of demand, such as the prices of fixed and mobile voice services and the income of
consumers to the demand for fixed telephony service. This result empirically confirms
H1 because the long-term relationship among the variables as per the results of the
VECM is as expected. Note that this finding reveals the presence of this simultaneous
long-term relationship without the need for the separate observation of those market
indicators.
Table 3. Summary Results from the VECM Estimations for Model 1
Notes: Standard errors in parentheses *** p<0.01, ** p<0.05, * p<0.1.
Null hypothesis Alternative hypothesis 95% critical values
λtrace rank tests Eigenvalue λtrace rank values
H0 : r = 0 H1 : r = 1 75.2670 47.21 H0 : r = 1 H1 : r = 2 0.69577 21.7189* 29.68
H0 : r = 2 H1 : r = 3 0.25418 8.5218 15.41
H0 : r = 3 H1 : r = 4 0.16804 0.2430 3.76
λmax rank tests Eigenvalue λmax rank value
H0 : r = 0 H1 : r > 0 53.5481 27.07 H0 : r ≤ 1 H1 : r > 1 0.69577 13.1970* 20.97
H0 : r ≤ 2 H1 : r > 2 0.25418 8.2788 14.07
H0 : r ≤ 3 H1 : r > 3 0.16804 0.2430 3.76
Coef. z P >|z| 95% conf. Interval R2 Constant
Fixcall –0.252*** –4.16 0.000 –0.371 –0.133 0.869 –0.092
(0.060)
Fixcallprice –1.449 –0.66 0.509 –5.753 2.855 0.345 0.086 (2.196)
Mobcallprice –0.302 –0.24 0.808 –2.739 2.135 0.619 0.336 (1.245)
Income 0.012 0.21 0.836 –0.103 0.128 0.418 –0.017
(0.059)
14 Because I focus on the long-term relationship in this article, I do not analyze the results showing the short-term causality relationships among the variables.

Toward a Wider Analysis of Market Definition
1151
I estimate the demand elasticities for fixed voice services by means of the
Johansen normalization test results. Table 4 reports these results for Model 1. The
results regarding the own-price, cross-price, and income elasticities are statistically
significant at 10, 5.0, and 1.0-percent significance levels. Also, the signs are as
expected economically. While the own-price elasticity (–0.60) suggests that the fixed
operator has market power in the fixed telephony industry, the cross-price elasticity
(1.87) confirms the presence of a strong FMS relationship. Lastly, the income
elasticity of demand (1.99) suggests that the demand for fixed voice services in Turkey
is strongly sensitive to income. The results from the call analysis are compatible with
my hypotheses H1, H2, H3, and H4.15 The results from the call analysis suggest that
the fixed and mobile voice markets in Turkey can be defined as a single market
because the findings confirm the presence of cointegration among the variables and a
strong FMS relationship.
Table 4. Johansen Normalization Test Results for Model 1
Notes: Standard errors in parentheses *** p<0.01, ** p<0.05, * p<0.1.
Model 2: The Subscription Analysis
In this analysis, I estimate equation (5) as Model 2 through subscription data.
Table 5 reports the summary statistics of the variables in equation (5) for Model 2. I
follow the AIC procedure as the lag selection criteria for Model 2. The results suggest
that the optimal lag length is one. Accordingly, I use one lag in the lag selection for all
the system-equation models for Model 2. I run the Johansen test of cointegration and
the VECM analysis. I also use the Johansen procedure for cointegration tests. Table 6
reports the results of trace and max statistics for Model 2. While the null hypothesis
15 I checked whether the model has autocorrelation by diagnostic checking. According to the Lagrange-multiplier test, there is no autocorrelation problem in the model. Because the probability values (0.91 and 0.32) are bigger than 5.0 percent, the null hypothesis is accepted. There is no autocorrelation at lag order. Also, I tested whether the residuals are normally distributed or not. According to the Jarque-Bera statistics, because the probability values for all variables are bigger than 10 percent, the residuals are normally distributed. The Jarque-Bera statistics suggests the evidence of normality for all variables. The model is acceptable.
Beta Coef. z P > |z| 95% conf. Interval
Fixcall 1
Fixcallprice –0.60** –2.20 0.028 –0.114 –0.006
(0.027)
Mobcallprice 1.871*** 4.77 0.000 0.631 0.125
(0.018)
Income 1.996*** 22.84 0.000 3.653 4.339
(0.174)
Cons. –42.316

1152
Tamer Çetin
for r=0 is rejected as per both the trace and the max statistics values, r=1 for λtrace and
r≤1 for λmax is accepted. As Table 6 shows, the values of both trace (63.65) and max
(39.62) test statistics for r=0 are larger than critical values (47.21) and (27.07) at 5.0-
percent significance level. On the other hand, the values of trace (27.86) and max
(15.25) statistics are less than the critical values (24.03) and (13.60) at 5.0-percent
significance level. Accordingly, the trace and max tests both confirm the presence of
one cointegrating vector in the system. Clearly, there is also a long-term relationship
among the variables in Model 2. I can run the VECM test.
Table 5. Summary Statistics for Model 2
Notes: All variables in natural logarithms.
Table 6. Johansen Tests for Co-Integration for Model 2
Note: *Indicates level of statistical significance.
Table 7 reports the VECM results for Model 2. The value of error correction
term for fixsubnum (–0.01) affirms the existence of a long-term causality from the
independent variables to the dependent variable. Because the probability value of
p>|z| is 0.06, the result is statistically significant. As in the VECM analysis for Model
1, the VECM results from Model 2 also confirm the presence of a long-term causality
relationship among the variables in this model. Clearly, by using this estimation
methodology, I can analyze the relationship in H1 without the need for separate
observation of those market indicators as in the previous literature.
Table 8, which includes the Johansen normalization restriction results, reports
coefficients representing the sensitivity of long-term relationships among the variables
Variables Obs. Mean Std. dev. Min. Max.
Fixsubnum 51 16.60823 0.1536067 16.2751 16.76652 ARPUfix 51 3.03325 0.1162185 2. 87983 3.268846
ARPUmob 51 2.772509 0.1020877 2.603709 2.970811
Income 51 4.973313 0.1393245 4.68481 5.188655
Null hypothesis Alternative hypothesis 95% critical values
λtrace rank tests Eigenvalue λtrace rank values
H0 : r = 0 H1 : r = 1 63.6582 47.21
H0 : r = 1 H1 : r = 2 0.57745 24.0312* 29.68
H0 : r = 2 H1 : r = 3 0.25600 10.4282 15.41
H0 : r = 3 H1 : r = 4 0.15553 2.6521 3.76
λmax rank tests Eigenvalue λmax rank value
H0 : r = 0 H1 : r > 0 39.6270 27.07
H0 : r ≤ 1 H1 : r > 1 0.57745 13.6029* 20.97
H0 : r ≤ 2 H1 : r > 2 0. 25600 7.7762 14.07
H0 : r ≤ 3 H1 : r > 3 0.15553 2.6521 3.76

Toward a Wider Analysis of Market Definition
1153
in the subscription analysis.16 Coefficients are significant at 1.0-percent significance
level for the cross-price and income elasticities and at 10-percent significance level for
the own-price elasticity. The own-price, cross-price, and income elasticities of demand
are –0.85, 1.64, and 1.85 for the subscription analysis, respectively. These findings are
more compatible with hypotheses H1, H2, H3, and H4. The own-price elasticity
suggests that the fixed operator does not have a significant market power because it is
close to one, meaning that a 5.0-percent price increase cannot be profitable. More
importantly, the cross-prices elasticity corroborates this inference since it confirms the
presence of a strong FMS relationship. Overall, the findings suggest that the users of
fixed voice services prefer the mobile voice services, when the fixed operator as the
hypothetical monopolist increases its-own price for fixed services.
Table 7. Summary Results from the VECM Test for Model 2
Notes: Standard errors in parentheses *** p<0.01, ** p<0.05, * p<0.1.
Table 8. Johansen Normalization Test Results for Model 2
Notes: Standard errors in parentheses *** p<0.01, ** p<0.05, * p<0.1.
16 I tested whether the model has autocorrelation by diagnostic checking. According to the results of the Lagrange multiplier test, there is no autocorrelation problem in the model. Because the probability values (0.69 and 0.63) are bigger than 5.0 percent, the null hypothesis is accepted — meaning that there is no autocorrelation at lag order and the alternative is rejected. Similarly, I tested to see if residuals are normally distributed through the Jarque-Bera statistics. The results suggest that the residuals for all variables are normally distributed. The model is plausible.
Coef. z P > |z| 95% conf. Interval R2 Constant
Fixsubnum –0.013* –1.88 0.059 –0.028 –0.0005 0.894 –0.006
(0.007)
ARPUfix 0.007* 0.22 0.825 –0.062 0.078 0.432 –0.005 (0.035)
ARPUmob 0.099*** –2.67 0.008 –0.171 –0.026 0.079 –0.007 (0.037)
Income –0.125*** –3.01 0.003 –0.207 –0.043 0.523 0.006
(0.041)
Beta Coef. z P > |z| 95% conf. Interval
Fixsubnum 1
ARPUfix –0.848* –1.83 0.067 –1.755 .059
(0.463)
ARPUmob 1.635*** 4.47 0.000 0.918 2.353
(0.366)
Income 1.845*** 4.28 0.000 1.000 2.691
(0.431) Cons. –27.21

1154
Tamer Çetin
Discussion of the Findings and Policy Suggestions
In this section, I discuss the findings in terms of policy suggestions for market
definition. The results from both models include important findings regarding the
effect of market developments driven by technological change on the demand for
fixed voice services, the HMT, and the FMS. The own-price elasticities in both call
and subscription analyses affirm the presence of a negative relationship between
demand and price in the fixed voice market, as expected. However, the own-price
elasticities suggest that the hypothetical monopolist in the fixed telephony market can
have market power because coefficients are less than one in both models.
Nonetheless, note that the own-price elasticity in Model 2 is close to one. Accordingly,
if one only takes into account the own-price elasticity to define market, then one can
infer that the hypothetical monopolist has monopoly power, and thus the analyzed
industry should be defined as the relevant market. However, it is rather controversial
to define the incumbent firm as monopolist in the voice market by only taking into
account the own-price elasticity if the other findings suggest the reverse. Moreover, as
T.J. Tardiff and D.L. Weisman (2009) claim, whether the magnitude of own-price
elasticity is sufficient to discipline market power would depend on some other
considerations. When prices are high relative to marginal cost (e.g., because of the
need to recover fixed costs) and/or there are high-margin complementary products
that would exacerbate the loss of profits as subscription fell, inelastic demand
elasticity could suggest market power. This means that inelastic demand elasticity
could stem from some other factors, but not only from market power. For that
reason, I have to take into consideration the other findings in the analysis of market
definition as well. When I evaluate all the findings together, I will reach more reliable
and realistic inferences in the analysis of market definition and policy suggestions for
the regulatory process.
Accordingly, in order to understand whether the price increase is profitable and
the incumbent firm has market power, I have to analyze the FMS relationship. In
both models, the cross-price elasticities confirm the presence of a strong FMS
relationship. That is, these two findings together suggest that consumers would
decrease their demands for fixed voice and most probably prefer the alternative
products or services, such as mobile voice to fixed products, when the hypothetical
monopolist increases the price. I can infer that the fixed operator as the hypothetical
monopolist in the Turkish fixed voice market does not have monopoly power, even if
it has a 100 percent market share. Additionally, the fixed and mobile telephony
services in the Turkish telecommunications industry are strongly substitutable. This
suggests that regulators in Turkey should define the fixed and mobile voice markets as
a single market because the fixed and mobile products compete within the same
market. However, this inference is valid for the retail segment of fixed telephony
services because the findings here only confirm that there is sufficient competitive
pressure from mobile to discipline the market power of incumbent fixed operator in
the retail market. Income elasticities also corroborate these market developments.
Because the sensitivity of demand for fixed voice services to income is considerably
high in both models, the high-income elasticities suggest that the high-level income

Toward a Wider Analysis of Market Definition
1155
groups use the fixed voice services in Turkey. This is compatible with market
developments. Even though the technological development makes the mobile
telephony services cheaper, the high-level income groups continue to use the fixed
voice products. Conversely, when the income of traditional fixed phone users
decreases, they prefer to use the mobile voice services which are increasingly becoming
cheaper with technological development.
More importantly, the results from the cointegration analysis corroborate all
these market developments because the Johansen normalization results in both
models are compatible with the presence of cointegration in the VECM analysis.
Clearly, there is a long-term causality relationship running from the independent
variables to the dependent variables. In other words, the findings confirm that the
demand for fixed telephony service simultaneously declines even if the income of
consumers increases, while technological development drives down the price of
mobile products and thus facilitates the access to mobile services. Because this
relationship is driven by the technological development (as I clarified), I can infer that
technological development affects the preferences of fixed users and makes the fixed
and mobile voice services substitutable in the Turkish telecommunications industry.
As a matter of fact, demand elasticities confirm this inference. Clearly, the fixed and
mobile voice services belong to the same market. Regulator can (or should) define the
fixed and mobile voice markets as a single market and deregulate the fixed voice
market.
Conclusion
In this article, I introduced a novel approach to the analysis of market definition in
telecommunications. I employed the multivariate Johansen cointegration
methodology to investigate the long-term relationships among the variables used in
the analysis of the Turkish fixed and mobile voice industries. Because the variables are
simultaneously cointegrated in both models, there is an equilibrium long-term
causality relationship among those variables. This result empirically affirms the
observation that the demand for fixed voice services decreases, whereas the demand
for mobile voice services increases. This means that the approach I developed in this
article enables the simultaneous investigation of this long-term relationship among
the variables instead of the separate observation of each variable as in the previous
literature on market definition. Moreover, using this approach, I can analyze the
HMT and the FMS relationship through the estimation of demand elasticities.
Elasticities confirm that there is a clear and strong long-term substitution relationship
between the fixed and mobile telephony services. Because this analysis was carried out
by a simultaneous empirical methodology instead of the traditional approaches, I
argued that it introduces a more reliable and realistic approach to the analysis of
market definition. Thus, my approach constitutes a wider approach to the analysis of
market definition in telecommunications.
In terms of the regulatory process, I can infer that the results support a
deregulation of the fixed voice market. The presence of both the FMS and the long-
term causality relationship confirm that the fixed and mobile operators compete with
1156
Tamer Çetin
each other in the same market. Accordingly, regulators should define the fixed and
mobile markets, which are traditionally separate, as a single market because the fixed
and mobile services or products in these markets belong to the same market. Lastly, in
the analysis of market definition, regulators should use the empirical methodology I
presented in this article instead of the traditional tools as employed in the previous
literature. By allowing a simultaneous analysis of the long-term relationships so crucial
to market definition, my approach generates more reliable and realistic findings
regarding the regulatory process in the analysis of market definition.
References
Atiyas, Izak. “Regulation and Competition in the Turkish Telecommunications Industry.” In The Political
Economy of Regulation in Turkey, edited by Tamer Çetin and Fuat Oguz, pp. 177-191. New York, NY: Springer, 2011.
Bagdadioglu, Necmiddin and Murat Cetinkaya. “Sequencing in Telecommunications Reform: A Review of
the Turkish Case.” Telecommunications Policy 34, 11 (2010): 726-735.
Baker, Jonathan. “Market Definition: An Analytical Overview.” Antitrust Law Journal 74 (2007): 129-173. Barth, Anne-Kathrin and Ulrich Heimeshoff. “What Is the Magnitude of Fixed-Mobile Call Substitution?
Empirical Evidence from 16 European Countries.” Telecommunications Policy 38, 8-9 (2014): 771-782.
Baxter, Michael. Interpolating Annual Data into Monthly or Quarterly Data. Methodological Series No. 6. London, UK: Government Statistical Service, 1998.
Bremnes, Helge, Oystein Gjerde and Frode Sattem. “Linkages Among Interest Rates in the United States,
Germany and Norway.” Scandinavian Journal of Economics 103, 1 (2011): 122-145. Briglauer, Wolfgang, Anton Schwarz and Christine Zulehner. “Is Fixed-Mobile Substitution Strong Enough
to Deregulate Fixed Voice Telephony? Evidence from the Austrian Markets.” Journal of Regulatory
Economics 39, 1 (2011): 50-67. Cardona, Melisande, Anton Schwarz, B. Burcin Yurtoglu and Christine Zulehner. “Demand Estimation
and Market Definition for Broadband Internet Services.” Journal of Regulatory Economics 35, 1 (2009): 70-95.
Carlton, Dennis. “Market Definition: Use and Abuse.” Competition Policy International 3, 1 (2007): 2-27. Coate, Malcolm and Jeffrey Fischer. “Practical Guide to the Hypothetical Monopolist Test for Market
Definition.” Journal of Competition Law & Economics 4, 4 (2008): 1031-1106.
Çetin, Tamer. “The Role of Institutions Over Economic Change in Turkey.” In Understanding the Process of
Economic Change in Turkey: An Institutional Approach, edited by Tamer Çetin and Feridun Yılmaz, pp. 21-40. New York, NY: NOVA Science Publishers, 2010.
———. “Structural and Regulatory Reform in Turkey: Lessons from Public Utilities.” Utilities Policy 31 (December 2014): 94-106.
Hargreaves, C.P. “A Review of Methods of Estimating Cointegrating Relationships.” In Nonstationary Time
Series Analysis and Cointegration, edited by C.P. Hargreaves, pp. 87-131. Oxford, UK: Oxford University Press, 1994.
Johansen, Søren. “Determination of Cointegration Rank in the Presence of a Linear Trend.” Oxford Bulletin
of Economics and Statistics 54, 3 (1992): 383-397.
———. Likelihood-Based Inference in Cointegrated Vector Autoregressive Models. Oxford, UK: Oxford University Press, 1995.
Johansen, Søren and Katarina Juselius. “Maximum Likelihood Estimation and Inference on Cointegration
— with Applications to the Demand for Money.” Oxford Bulletin of Economics and Statistics 52, 2 (1990): 69-210.
———. “Testing Structural Hypotheses in a Multivariate Cointegration Analysis of the PPP and UIP for UK.”
Journal of Econometrics 53, 1-3 (1992): 211-244.
Kaplow, Louis. “Why (Ever) Define Markets? Harvard Law Review 124, 437 (2010): 437-517.
———. “Market Definition.” In The Oxford Handbook of International Antitrust Economics, vol. 1, edited by R.D. Blair and D.D. Sokol, pp. 345-363. Oxford, UK: Oxford University Press, 2014.

Toward a Wider Analysis of Market Definition
1157
Karacuka, Mehmet, Justus Haucap and Ulrich Heimeshoff. “Competition in Turkish Mobile
Telecommunications Markets: Price Elasticities and Network Substitution.” Telecommunications Policy
35, 2 (2011): 202-210.
Maddala, G.S. and In-Moo Kim. Unit Roots, Cointegration, and Structural Change. Cambridge, UK: Cambridge University Press, 2004.
Massey, Patrick. “Market Definition and Market Power in Competition Analysis: Some Practical Issues.”
Economic and Social Review 31, 4 (2000): 309-328. Miller, Edythe S. “Economic Regulation and New Technology in the Telecommunications Industry.”
Journal of Economic Issues 30, 3 (1996): 719-735. ———. “The Impact of Technological Change on Market Power and Market Failure in
Telecommunications.” Journal of Economic Issues 35, 2 (2001): 385-393.
Ministry of Transportation, Maritime, and Communications (UDH) of Turkey. Statistics for Transportation,
Maritime and Communication in Turkey: 2003–2011. (In Turkish). Turkey’s Ministry of Transportation, Maritime and Communications, 2011.
Oguz, Fuat. “Universal Service in Turkey: Recent Developments and a Critical Assessment.”
Telecommunications Policy 37, 1 (2013): 13-23. Oguz, Fuat and Eerman Benli. “Fixed-Mobile Substitution in the Turkish Telecommunications Market.”
Network Industries Quarterly 13-3 (2015): 19-22.
Pantula, Sastry. “Testing for Unit Roots in Time Series Data.” Econometric Theory 5, 2 (1989): 256-271. Perron, Pierre. “Testing for a Random Walk: A Simulation Experiment of Power When the Sampling
Interval Is Varied.” In Advances in Econometrics and modeling, edited by Baldev Raj, pp. 47-68. New York, NY: Springer, 1989.
Rhee, Hongjai and Minsoo Park. “Fixed-to-Mobile Call Substitution and Telephony Market Definition in
Korea.” Journal of Regulatory Economics 40, 2 (2011): 198-218. Shiller, Robert and Pierre Perron. “Testing the Random Walk Hypothesis: Power versus Frequency of
Observation.” Economics Letters 18 (April 1985): 381-386. Sidak, J. Gregory, Robert Crandall and Hal J. Singer. “The Empirical Case Against Asymmetric Regulation
of Broadband Internet Access.” Berkeley Technology Law Journal 17, 3 (2002): 953-987.
Spulber, Daniel and Christopher Yoo. Networks in Telecommunications: Economics and Law. Cambridge, UK: Cambridge University Press, 2009.
Tardiff, Timothy J. and Dennis L. Weisman “The Dominant Firm Revised.” Journal of Competition Law and
Economics 5, 3 (2009): 517-536.
The Telecommunications Authority (ICTA). Market Analyses. ICTA, n.d. Available at www.btk.gov.tr/kutuphane_ve_veribankasi/pazar_verileri/pazar_verileri.php. Accessed August 21, 2017.
Vogelsang, Ingo. “The Relationship Between Mobile and Fixed Line Communications: A Survey.”
Information, Economics and Policy 22, 1 (2010): 4-17. Ward, Michael and Glenn Woroch. “The Effect of Prices on Fixed and Mobile Telephony Penetration:
Using Price Subsidies as Natural Experiments.” Information, Economics and Policy 22, 1 (2010): 18-32.
Werden, Gregory J. “The Relevant Market: Possible and Productive.” Antitrust Law Journal (April 2014): 1-7.