Development of pelleted feed containing probiotic ... - sar.rmutt
Upload
khangminh22Category
view
2download
0
Toward a New Theory of Feed Intake Regulation in Ruminants
CENTRALE LAND BOUWCATALOGUS
0000 0425 7834

Promotoren: dr. P. W. M. van Adrichem, emeritus hoogleraar in de algemene-en landbouwhuisdierfysiologie
dr. ir. M. W. A. Verstegen, buitengewoon hoogleraar op het vakgebied van de veevoeding in het bijzonder de voeding van de eenmagigen
dr. D. Zwart, buitengewoon hoogleraar in de tropische veehouderij

MWö^ZOl / ^
J. J. M. H. Ketelaars B. J. Tolkamp
Toward a New Theory of Feed Intake Regulation in Ruminants
Proefschrift ter verkrijging van de graad van
doctor in de landbouw- en milieuwetenschappen,
op gezag van de rector magnificus,
dr. H. C. van der Plas,
in het openbaar te verdedigen
op vrijdag 8 februari 1991
des namiddags om half drie in de Aula
van de Landbouwuniversiteit te Wageningen.
/£7/ 2 2&3Z3^

BIBLIOTHEEK: lANDBOUWUNIVEESrtEOr
iEAGEJVINGEN

To make a prairie it takes a clover and one bee, One clover, and a bee, And revery. The revery alone will do, If bees are few.
Emily Dickinson, The Complete Poems

Abstract
Ketelaars, J.J.M.H. and B.J. Tolkamp, 1991. Toward a new theory of feed intake regulation in ruminants. Doctoral thesis, Agricultural University Wageningen, Wageningen, The Netherlands, 254 pp.
Part I of this thesis contains a critical appraisal of the commonly accepted theory with regard to feed intake regulation in ruminants and the presentation of a new theory. This new theory assumes that feed consumption creates both benefits to the animal (in a non-reproducing animal the intake of net energy for maintenance and gain) and costs (the total oxygen consumption of the animal). It is hypothesized that, for the animal, the intake level where the ratio between benefits and costs becomes maximal, is optimal. Predictions of this optimum level for a wide range of feeds are shown to agree closely with observed voluntary feed intake in non-reproducing ruminants. Physiological processes related to the concept of an optimum feed intake are discussed. Maintenance of intracellular pH and associated energy costs may appear to be key factors in view of increases of the metabolic acid load consequent upon changes in intake. It is concluded that the concepts developed here may reflect a more universal principle governing the intensity of different forms of behaviour in ruminants as well as in monogastric animals.
Part II reports results of a long-term feeding experiment with small West African Dwarf goats and a larger sheep breed given pelleted roughage. Between species, intake of digestible organic matter and fasting heat production appeared to vary as a function of metabolic weight.
The effect of nutrient supplements on intake of low to medium quality roughages was investigated in supplementation and infusion experiments with the same species. Nutritive substances tested were by-pass protein, rumen microbial material, grass juice, intestinally digestible carbohydrates, and volatile fatty acid mixtures. Nutrient supplements usually depressed roughage intake but increased estimated intake of metabolizable energy (ME). From the theory presented in Part I it is inferred that such changes of intake are the result of changes of the efficiency of ME utilization.

tfiJonoi, f £ ^
1. De introductie van dit proefschrift kan dienen als illustratie van Kuhn's paradigmatheorie. Herman Koningsveld, 1976. Het verschijnsel wetenschap. Boom, Meppel, 221 pp.
2. De flexibiliteit waarmee herkauwers de vullingsgraad van het maagdarmkanaal en de digesta-passagesnelheid aanpassen aan veranderende interne of externe omstandigheden is niet in overeenstemming met de idee van fysische beperkingen aan het voederopnameproces.
3. Respiratie-onderzoek kan een grote bijdrage leveren aan verdieping van het inzicht in de oorzaken van variatie in voederopname.
4. Maximalisering van efficiëntie speelt een veel grotere rol in 'foraging behaviour' dan veelal (bijvoorbeeld door Stephens en Krebs, 1986) wordt aangenomen.
David W. Stephens en John R. Krebs, 1986. Foraging theory. Princeton University Press, 247 pp.
5. Met de thans in gebruik zijnde mathematische modellen voor de beschrijving van 'normale' groeicurves (als besproken door Parks, 1982, p. 5-15) kan voor herkauwers slechts een zeer onnatuurlijk gewichtsverloop beschreven worden.
John R. Parks, 1982. A theory of feeding and growth of animals. Springer, Berlijn, 322 pp.
6. Kanis' (1988) observatie dat selectieprogramma's waarin eenzijdig de nadruk wordt gelegd op voederconversie en vleespercentage van mestvarkens kunnen resulteren in varkens met een verlaagd voederopnamevermogen, kan goed in verband worden gebracht met de in dit proefschrift ontwikkelde theorie.
Egbert Kanis, 1988. Food intake capacity in relation to breeding and feeding of growing pigs. Proefschrift Landbouwuniversiteit Wageningen, 129 pp.
7. In publikaties over voederopnameregulering bij landbouwhuisdieren worden 'hoe' vragen meer gesteld dan beantwoord terwijl voor 'waarom' vragen het omgekeerde geldt.
8. De door Oldenbroek (1988) vermelde verschillen in de verhouding lichaamslengte/gewicht en schofthoogte/gewicht tussen kleine en grote melkveerassen suggereren geen verschil maar juist een grote mate van overeenkomst in lichaamsbouw.
J.K. Oldenbroek, 1988. Feed intake and energy utilization in dairy cows of different breeds. Proefschrift Landbouwuniversiteit Wageningen, 155 pp.
9. Het valt te betreuren dat veeteeltwetenschappelijke literatuur zo zelden literaire waarde heeft.
Ilse N. Bulhof, 1988. Darwins Origin of Species: betoverende wetenschap. Een onderzoek naar de relatie tussen literatuur en wetenschap. Ambo, Baam, 166 pp.
10. Over de rol van smaak valt uitstekend te twisten.
Stellingen van Bert Tolkamp behorende bij het proefschrift: 'Toward a new theory of feed intake regulation in ruminants'. Wageningen, 8 februari 1991.

1. Kenmerkend voor de aanpassing van herkauwers aan natuurlijke voedingsomstandigheden zijn een bescheiden consumptie van slecht verteerbare voeders en een hoge consumptie van goed verteerbare voeders.
2. De samenstelling van de extracellulaire vloeistof is van grote invloed op de efficiëntie waarmee cellen energie benutten.
3. Gezien de rol van vluchtige vetzuren in de regulering van de voederopname van herkauwers verdienen deze stoffen meer aandacht bij pogingen de effecten van voedingsvezel op de voedselopname van eenmagigen te verklaren.
4. De techniek van intragaslrische voeding van herkauwers is onvoldoende getest om de ermee verkregen resultaten toe te kunnen passen op de stofwisseling van het zelfstandig etend dier.
0rskov, E.R., D.A. Grubb, G. Wenham en W. Corrigall, 1979. The sustenance of growing and fattening ruminants by intragastric infusion of volatile fatty acid and protein. British Journal of Nutrition 41: 553-558.
5. De benutting van stikstof in de melkveehouderij in ons land is nog gunstig vergeleken bij de benutting van koolstof.
6. Voor het bepalen van de optimale stikstofgift op grasland dienen toenemende marginale kosten en een afnemende marginale opbrengst uitgangspunt te zijn.
7. Het verdient aanbeveling in onderzoek naar landbouwsystemen het begrip 'duurzaamheid' te vervangen door begrippen als 'levensduur' of 'gebruiksduur'.
8. Voor de overleving als soort is een efficiënte exploitatie van de omgeving met als resultaat een talrijk, vruchtbaar nakomelingschap zowel een voorwaarde als een bedreiging.
9. De verwachting dat voortgezet veevoedkundig onderzoek voor de veehouderij steeds meer toepasbare kennis op zal leveren staat op gespannen voet met een streven naar behoud van het zelf-regulerend vermogen van landbouwhuisdieren.
10. De plaats en afleesbaarheid van meters voor het huishoudelijk verbruik van elektriciteit, gas en water, alsmede de gangbare betalingswijze voor deze goederen dragen niet bij aan een doelmatige terugkoppeling gericht op een beheerst gebruik van schaarse grondstoffen.
Stellingen van Jan Ketelaars behorende bij het proefschrift 'Toward a new theory of feed intake regulation in ruminants'. Wageningen, 8 februari 1991.
Voorwoord
De start van ons onderzoek was mogelijk dankzij het in ons gestelde vertrouwen van prof.dr. P.W.M, van Adrichem, emeritus hoogleraar in de algemene fysiologie van mens en dier, dr. ir. H. Bakker, voormalig hoogleraar in de tropische veehouderij, en dr. ir. P. Gaastra, voormalig directeur van het Centrum voor Agrobiologisch Onderzoek (CABO). Naast dezen hebben ook dr. ir. G. Zemmelink, prof. dr. ir. M.W.A. Verstegen, prof. dr. D. Zwart en dr. ir. J.H.J. Spiertz in verschillende fasen van het onderzoek een stimulerende rol gespeeld. Wij menen dat vooral de grote mate van vrijheid die ons in ons onderzoek gegund werd, een positief effect heeft gehad op het uiteindelijke resultaat. Daarvoor onze hartelijke dank.
Aan het in dit proefschrift beschreven experimentele werk hebben velen een bijdrage geleverd. De proeven met dieren werden uitgevoerd in de proefaccommodaties van de Landbouwuniversiteit, t.w. 'de Haar', 'de Ossekampen' en 'het Fisteloo', met medewerking van Proefboerderij Droevendaal van het CABO. Wij danken bedrijfsleiding, in het bijzonder H. van Dijk, J. Hagens en J.W. van Westeneng, en personeel voor hun inzet en adviezen. De infuusproeven waren slechts mogelijk dankzij de deskundig uitgevoerde operaties van schapen en geiten door prof. dr. P.W.M, van Adrichem en dr. ir. J. van Brachem. Waardering gaat ook uit naar de medewerkers in verschillende laboratoria van CABO, Zodiac, Dierfysiologie, Veevoeding en IVVO voor de vele analyses, en naar de medewerkers van Zodiac die geholpen hebben bij de respiratiemetingen. Dr. Th. Wensing willen we bedanken voor de analyses van bloedmonsters. Ir. C. A. J. van Vught, directeur van het slachthuis Nijmegen, en zijn personeel stelden ons in staat materiaal te verzamelen voor één van de infuusproeven, waarvoor hartelijk dank. Verder waren bij de uitvoering en uitwerking van verschillende proeven studenten van LUW en HAS betrokken. Wij danken hen voor de inzet en stimulerende discussies. Een aantal mensen die geholpen hebben bij de uitvoering en interpretatie van het experimentele werk willen we met name noemen: ing. P. Hofs, G.A. Bangma, ing. B.O. Brouwer, ing. W. van der Hel, ing. A. Waanders, J.H. Geurink, G.J. Smeitink, en G. Mekking. Hun praktische ervaring gecombineerd met inzicht in de experimentele vraagstelling is voor ons onderzoek van groot nut geweest. Ing. P.W.J. Uithol en M. Smits-Ketelaars waren behulpzaam bij de afronding van ons proefschrift. Wij danken jullie allen hartelijk. Vele anderen hebben voorafgaand aan en gedurende ons onderzoek door middel van discussies een bijdrage geleverd aan de vorming van onze ideeën. We denken dan aan dr. ir. J. van Bruchem, dr. ir. G. Hof, prof. dr. ir. S. Tamminga, ir. H. G. van der Meer, dr. H. Breman, prof. dr. ir. H. van Keulen, drs. N. Vertregt, dr. S.C. van de Geijn en alle anderen met wie we de voortgang van ons onderzoek bespraken. De reacties van prof. dr. R. A. Prins en prof. dr. W.A. de Voogd van der Straaten op een eerdere versie van onze theorie waren stimulerend.
Tenslotte willen we Willie, Jos, Tim en Mieke bedanken voor hun betrokkenheid bij het tot stand komen van dit proefschrift.

Contents
GENERAL INTRODUCTION l
PARTI: TOWARD A NEW THEORY OF
FEED INTAKE REGULATION IN RUMINANTS
1 CAUSES OF DIFFERENCES IN INTAKE BETWEEN FEEDS :
CRITIQUE OF CURRENT VIEWS Abstract 11
1.1 Introduction H 1.2 Causes of differences in intake between feeds 12 1.3 Relationships between feed characteristics and feed intake 14 1.4 Effects of feed consumption on the animal 23 1.5 Simulation models of feed intake 25 1.6 A crucial assumption on feed intake behaviour 26 1.7 Conclusions 28
References 28
2 FEED INTAKE CAPACITY OF RUMINANTS: FLEXIBLE OR CONSTRAINED? Abstract 33
2.1 Introduction 33 2.2 Opposing views 34 2.3 Effects of genotype 35 2.4 Effects of physiological state 40 2.5 Effects of external conditions 43 2.6 Feed intake, basal metabolism and efficiency of energy utilization 45 2.7 Conclusions 46
References 47
3 COSTS AND BENEFITS OF FEED CONSUMPTION:
AN OPTIMIZATION APPROACH Abstract 49
3.1 Introduction 49 3.2 Oxygen as a toxin 50 3.3 Oxygen consumption and life span 51 3.4 Maximization of the efficiency of oxygen utilization 54 3.5 Feed intake and the efficiency of oxygen utilization 55 3.6 Efficiency of oxygen utilization and differences in intake between animals 60 3.7 Maximization of the efficiency of oxygen utilization: a universal principle? 63 3.8 Conclusions 66
References 67
4 OPTIMUM FEED INTAKE:
IN SEARCH OF A PHYSIOLOGICAL BACKGROUND Abstract 69
4.1 Introduction 69 4.2 The decreasing partial efficiency of energy utilization 70 4.3 The response of fat cells to changes in extracellular nutrient concentrations 70 4.4 Effects of weak organic acids on cell respiration 74 4.5 The metabolic acid load as a cause of decreasing partial efficiency of energy utilization 79 4.6 Effects of feed and animal characteristics on the efficiency of energy utilization 80

4.7 Feed intake regulation: regulation of optimum nutrient concentrations 82 4.8 Intracellular pH: measure for the optimum metabolic intensity? 87 4.9 Future research 88 4.10 Conclusions 89
References 90
PART II: EXPERIMENTAL RESULTS
5 VOLUNTARY INTAKE OF DIGESTIBLE ORGANIC MATTER AND FASTING
HEAT PRODUCTION IN DWARF GOATS AND SHEEP:
A SPECIES COMPARISON Abstract 95
5.1 Introduction 95 5.2 Materials and methods 96 5.3 Results 100 5.4 Discussion 106 5.5 Conclusions 109
References 109
6 EFFECTS OF INCREASED PROTEIN SUPPLY ON ROUGHAGE INTAKE
IN DWARF GOATS Abstract 111
6.1 Introduction 111 6.2 Effects of formaldehyde treatment on formaldehyde binding, rumen degradability and
in vitro and in vivo digestibility of Na-caseinate 119 6.3 Effects of supplementation with formaldehyde treated caseinate on intake of
grass straw diets and nitrogen balance in dwarf goats 127 6.4 Effects of abomasal caseinate infusion on hay intake and nitrogen balance in dwarf goats 147 6.5 Effects of ruminai infusion of potassium citrate with or without abomasal infusion of
caseinate or with ruminai infusion of urea on grass straw intake 155 6.6 General discussion and conclusions 165
References 167
7 EFFECTS OF RUMINAL AND ABOMASAL NUTRIENT INFUSION ON
ROUGHAGE INTAKE IN SHEEP Abstract 171
7.1 Introduction 172 7.2 Materials and methods 177 7.3 Effects of abomasal infusion of rumen microbial material or caseinate
with or without additional glucose 181 7.4 Effects of ruminai infusion of potassium citrate with or without abomasal infusion of
microbial material and effects of ruminai infusion of grass juice 199 7.5 Effects of abomasal infusion of glucose, fructose, maltose, starch and caseinate 217 7.6 Effects of ruminai infusion of a mixture of volatile fatty acids and
abomasal infusion of caseinate 227 7.7 General discussion and conclusions 239
References 244
SAMENVATTING 247
CURRICULA VITAE 253

General introduction
Questions
The causes of variation in voluntary feed intake in ruminants have been a fascinating research topic for many ruminant nutritionists during the last decades. Why does, for instance, a mature ewe when offered straw, consume less than 1 kg dry matter per day, an amount insufficient to maintain body weight, while the same animal given access to young grass will consume more than 2 kg of dry matter and will deposit a substantial amount of body energy? What causes the intake of both feeds to increase when days lengthen and to decrease again when days shorten? Why does the same animal consume substantially more, from straw as well as from grass, when she is lactating instead of dry? Finally, why do sheep, when lactating, consume dry matter equivalent to up to 4% of body weight, smaller-sized dwarf goats up to 6%, but much larger cattle usually not more than 3.5%?
A common answer
In an attempt to explain the differences in voluntary intake between feeds a strong emphasis has been laid on the negative effects of gut fill on intake (Van Soest, 1982; Forbes, 1986; NRC, 1987). Likewise, differences in voluntary feed intake between animals are generally thought to represent different equilibria between nutrient requirements on the one hand and the tolerance for a certain gut fill on the other (Weston, 1982; Weston and Poppi, 1987). This important role attributed to gut fill as a cause of variable feed intake has led to the development of a particular field of digestive physiology dealing in an increasingly detailed way with feed degradation and digesta transactions in various parts of the gastrointestinal tract. A gradual segregation between feed intake research in ruminants and feed intake research in monogastric animals has taken place as a result of the more important role attributed to gut fill in the regulation of intake in ruminants as compared to monogastrics.
A crucial assumption
The explanations mentioned above are firmly rooted in the general belief that, in essence, it would be beneficial to the animal to consume more of a given feed as long as a genetically determined maximum nutrient intake level has not been reached. This belief and the observation that ruminants consume less nutrients than the maximum level from all but the best quality feeds, has led to the obvious conclusion that, apparently, ruminants are physically unable to consume, from many feeds, the amount of nutrients that would be most beneficial to them.

Doubts
We started our research by questioning the strong emphasis on physical limits to feed consumption. Many observations on feed intake and feeding behaviour do not justify this emphasis and we have summarized our criticism in Chapters 1 and 2 of this thesis. We were, however, no exception with regard to the general belief noted above: we also supposed that the animal would benefit from consuming more nutrients from medium or poor quality feeds. Initially, we did not even recognize this idea as axiomatic, let alone that we questioned the validity of it. In fact, in most publications on ruminant feed intake regulation this belief remains an implicit assumption. Probably, the agricultural setting of most research on ruminant feed intake regulation has contributed to this state of affairs, because such research has often been preoccupied with identifying and removing constraints limiting short-term productivity. During our research, we have gradually come to realize that this axiom with regard to feeding behaviour prevents a better understanding of the causes of differences in voluntary feed intake. Contrary to this axiom, it may not be beneficial to the animal to consume more energy from a medium or poor quality feed even if the animal is loosing weight.
Tracing back what caused us to change our mind appears to be difficult now: several factors seem to have contributed. Our dissatisfaction with the lack of predictive power of currently available models of intake regulation, in combination with a certain belief that it should be possible to develop alternative concepts, was one of them. The outcome of own experiments which did not seem to agree with the concept of a constrained intake, was certainly another. Also our fascination for evolutionary processes and the idea that ruminants must be well adapted to the range of feed qualities characteristic of their natural habitats, must have played a role. Ultimately, it was the relationship between the intake of metabolizable energy and net energy that helped us to formulate a new theory of feed intake regulation in ruminants.
A new concept
Intake of metabolizable energy is a measure of the energy absorbed from feed, whereas the intake of net energy is that part of metabolizable energy intake that is not released in the form of increased heat production as the result of feed consumption. Both parameters are related to each other according to the law of diminishing returns: each additional increase in metabolizable energy intake results in a progressively smaller extra gain in net energy intake. This law is well known in agriculture as it applies to many input-output relationships, for instance to the response of grass growth to fertilizer application. In combination with the price tags attached to in- and outputs, the relationship is used to determine the optimum level of fertilizer input, i.e. the optimum combination of costs and benefits. In a similar way we have used the relationship between intake of net and metabolizable energy to estimate the optimum energy intake level, i.e. the most favourable combination of costs and benefits of feed consumption for the animal. Benefits for the animal as a result of feed consumption are more or less self-evident, but it is quite unusual, at least in ruminant nutrition, to ascribe to feed consumption costs for the animal. However, it has been known since the beginning of this century that under laboratory conditions with high quality diets, life span in rodents can be

substantially increased by a restriction of feed consumption (Masoro, 1988). A decrease in wear and tear of tissues as a result of a limited energy intake is generally considered responsible for this phenomenon. The oxygen free radical theory of ageing appears to offer a physiological explanation for this process of wear and tear (Harman, 1986). According to this theory, it is the oxidation of substrate that causes damage to cell structures, loss of vitality, ageing and a limited life span. This means that any activity which increases oxygen consumption, including feed intake, though useful and necessary, has also negative aspects for the organism. We therefore consider metabolic activity, quantitatively measured by oxygen consumption, as inevitable physiological costs which increase upon feed consumption. A reinterpretation of data available in the literature shows that for widely different feeds, voluntary feed consumption corresponds with the intake level at which the net energy intake per litre oxygen consumed is expected to be maximal. For this reason, we have concluded that voluntary feed intake is the optimum intake from the point of view of oxygen utilization. With a seasonally fluctuating feed quality, characteristic of the natural habitats of ruminants, the optimum intake will be periodically below and above the maintenance requirements of the animal. Chapter 3 constitutes a discussion of this new theory of feed intake regulation.
A physiological background
The fact that efficiency of oxygen utilization for net energy intake reaches a maximum value with increasing intake of any feed has two causes: the existence of a basal oxygen consumption, and a decreasing partial efficiency of metabolizable energy utilization. For a physiological interpretation of the concept of optimum feed intake it is important to know why this partial efficiency decreases at higher intake levels. Why is a progressively greater part of each increment in metabolizable energy intake respired in the body so as to leave a smaller part as gain in net energy? No definite answers to that question have been given in the literature (Blaxter, 1989). At first, we thought that perhaps higher absorption costs in order to obtain more energy from a feed might be responsible. Measurements of oxygen use in different organs have shown that oxygen consumption by the gut is a considerable fraction of total consumption and increases exponentially with intake (Webster et al., 1975). After studying effects of volatile fatty acids - the main substrate in ruminant metabolism - on cellular metabolism, we have concluded that increased costs to maintain cellular homoeostasis, in particular intracellular pH, are a more likely cause. Such increased costs are due to the fact that the metabolic acid load upon cells increases as a function of feed intake and metabolic activity. These increased costs to maintain cellular homoeostasis are therefore shared by the cells of all body tissues, which would mean that all organs probably function less efficiently whenever feed intake is raised. Chapter 4 contains our reasoning in this respect.
Perspectives
We consider the theory of feed intake regulation developed in Part I of this thesis (Chapters 1-4) interesting for a number of reasons. First of all, it shows how well ruminants have become

adapted to the fluctuating nutritional conditions of the habitats they evolved in. This sharply contrasts with the more common view that the low nutrient intake from low quality roughages is the result of physical limitations to roughage intake, implying a lack of anatomical adaptation. Secondly, it suggests that the same principle may control feed intake in ruminants and monogastric animals. Finally, it suggests that the principle controlling the intensity of feeding behaviour may be a more universal one governing also the intensity of other forms of behaviour, in ruminants as well as in monogastric animals.
Experiments
Part II of this thesis (Chapters 5-7) describes results from experiments carried out within the framework of this thesis. These experiments included a long-term feeding trial and several short-term supplementation and infusion trials with two different ruminant species: West African Dwarf goats and sheep of mixed breeds (Swifter and Flevolander). West African Dwarf goats were studied because of the special interest of the Department of Tropical Animal Production of the Agricultural University, Wageningen, in the nutrition of this species. Sheep were chosen as experimental animals because of the large body of data relating to feed intake, already available and-also for practical reasons.
Dwarf goats are an interesting ruminant species because of their small size (adult doe size about 30 kg) which might pose problems in dealing with low quality feeds if intake is indeed physically constrained. So it was decided to study the effects of age and live weight on voluntary feed intake of diets of different quality and compare the intake levels measured with dwarf goats with the intake of a much larger sheep breed (Swifter). To allow a meaningful comparison of feed intake levels, regular measurements of fasting heat production were included in this long-term experiment. Results are described in Chapter 5. They show that on the diets of pelleted roughage tested, dwarf goats, despite their small body size, attain a similar level of energy intake relative to fasting heat production compared to sheep.
Results of supplementation and infusion trials are reported in Chapter 6 and 7. The trials were designed to test a number of ideas with regard to the role of nutrients and nutrient ratios in explaining differences in intake between feeds. Results helped to formulate the theory discussed in Chapters 3 and 4. Part II of this thesis, therefore, reflects subsequent stages in our thinking about feed intake regulation in ruminants.
Before planning our experimental work we had concluded, independently (even unaware of each others activities), that the concept of physical limits to roughage intake was inadequate to explain the observed variation in intake, between feeds as well as between animals. A publication of one of us (Ketelaars, 1984) brought us together and we found that, although part of our reasoning coincided, each of us had his specific arguments for rejecting the idea of physical limitations.
In our search for an alternative concept we were first attracted by the concept of nutrient imbalances as a possible cause of low energy intake from roughages. According to some researchers, intake and productivity of ruminants on roughage diets is mainly determined by nutrient ratios, especially the protein/energy ratio (e.g. Preston and Leng, 1987). Hence we thought it worthwhile to test whether roughage intake could be improved by increasing intestinal protein supply of the animal. This led to a series of supplementation and infusion trials with dwarf goats reported in Chapter 6. Initial results indicated positive effects of by-

pass protein but these could not be confirmed in more extensive experiments. Reasons for these negative results are discussed. We concluded that the protein/energy ratio may positively affect the intake of some, but certainly not all roughages.
In an attempt to reconcile the failure to increase roughage intake by a more ample intestinal protein supply, with the positive correlation between nitrogen content of roughages and intake, we thought that perhaps nutrients associated with protein might be responsible for this correlation. Since duodenal protein in ruminants mainly consists of microbial protein originating from feed degradation in the forestomachs, protein supply is closely correlated with the availability of other compounds (carbohydrates, lipids, nucleic acids) present in microbial cells. To test whether effects of microbial material differ from an equivalent amount of protein alone, microbial material was harvested from ruminai contents of slaughterhouse cows and infused in the abomasum of lambs. However, neither microbial material nor caseinate affected roughage intake.
Protein in plant material (vegetative parts as well as seeds) is also correlated with potassium. Hence, this element could also be implicated in the positive effects of increased feed protein contents on roughage intake. Another reason to assume an effect of potassium on intake was evidence that the absorption rate of volatile fatty acids from the forestomachs might be an important limit to roughage intake and that this rate might be affected by ruminai potassium concentrations. This evidence is discussed in Chapter 6 and 7. It led to similar experiments in dwarf goats and sheep in which we looked at specific effects of an increased potassium supply with or without extra protein on intake. No specific effects were found.
All experiments up to this stage were essentially aimed at identification of the factor that was limiting the intake of roughage in the animals in our experiments. None of the experiments, however, suggested the existence of any such limiting factor. At the same time we had realized that, one way or another, feed intake was linked to the efficiency of energy utilization. As explained above, this relationship became the basis for the concept of an optimum feed intake.
Crucial for a physiological interpretation of this concept is an understanding of the causes of variation in efficiency of energy utilization. From available literature we derived that energy costs for the resorption of nutrients may significantly contribute to differences in energy utilization between feeds. This hypothesis could not be tested in one study. We, therefore, investigated to what extent differences in absorption costs between nutrients of similar nutritive value may induce different intake responses. For this purpose we chose intestinally digestible carbohydrates as a model system. Subsequent infusion trials showed differential intake responses depending on type and amount of carbohydrate infused. Interpretation was, however, complicated by the occurrence of diarrhoea and we concluded that abomasal infusion of these substances is not a suitable method to study effects of differences in absorption costs.
Finally, Chapter 7 contains the results of an experiment which was set up to examine the contribution of rumen degradable and by-pass protein to the favourable intake response to increased protein contents of roughages. Results of this experiment suggest that both fractions of plant protein may contribute to an increased energy intake from protein-rich roughages. As both protein fractions provide the animal with nutrients of completely different nature - volatile fatty acids versus intestinally digestible protein - the experiment also demonstrated that to obtain an increase in energy intake the type of nutrients can be of secondary importance.

Synthesis
When we started our experimental work we assumed that the role of nutrients in roughage intake regulation may be described in terms of a hierarchical system, each nutrient limiting intake at a particular level of energy intake. Although the literature provides examples supporting the idea of limiting nutrients, this concept is clearly inadequate to explain the responses observed in many other trials, including our own experiments. The theory discussed in Chapters 3 and 4 offers a satisfactory - though still crude - explanation of these seemingly conflicting results. Generalizing, this theory states that the effect of specific nutrients (protein, carbohydrate, lipids, vitamins, minerals) on feed intake will depend on their effect on efficiency of energy utilization. Such effects may vary from highly positive to extremely negative, depending among others on the type of basal diet, the type of nutrient and the way and site of administration. Consequently, responses of roughage intake following administration of specific nutrients will also range from positive to nil or negative. To be able to predict which response can be expected with a particular combination of feed and nutrient supplement further research is required.
The theory of intake regulation discussed in this thesis has been developed in close cooperation and the origin of most ideas cannot be traced back to either one of us. They are therefore presented as a joint thesis. Jan Ketelaars is, however, first responsible for the contents of Chapters 1, 4 and 7 and Bert Tolkamp for the contents of Chapters 2, 3, 5 and 6.

References
Blaxter, K.L., 1989. Energy metabolism in animals and man. Cambridge University Press, Cambridge, 336 pp. Forbes, J.M., 1986. The voluntary food intake of farm animals. Butterworths, London, 206 pp. Harman, D., 1986. Free radical theory of aging: role of free radicals in the origination and evolution of life,
aging, and disease process. In: J.E. Johnson, R. Walford, D. Harman and J. Miquel (Eds.), Free radicals, aging, and degenerative diseases, Alan R. Liss, Inc., New York, pp. 3-49.
Ketelaars, J J.M.H., 1984. Evaluating rangeland as feed resource for livestock production. In: W. Siderius (Ed.), Proceedings ILCA Workshop Land Evaluation for Extensive Grazing, Addis Ababa, October 31th -November 4th, 1983. ILRI Publication 36, pp. 165-181.
Masoro, EJ., 1988. Food restriction in rodents: an evaluation of its role in the study of aging. Journal of Gerontology: Biological Sciences, 43: B59-B64.
NRC (National Research Council), 1987. Predicting feed intake of food-producing animals. National Academy Press, Washington D.C., 85 pp.
Preston, T.R. and R.A. Leng, 1987. Matching ruminant production systems with available resources in the tropics and sub-tropics. Penambul Books, Armidale, and CTA, Wageningen, pp. 245.
Van Soest, PJ., 1982. Nutritional ecology of the ruminant. O & B Books, Inc., Corvallis, Oregon, 374 pp. Webster, AJ.F., P.O. Osuji, F. White and J.F. Ingram, 1975. The influence of food intake on portal blood flow
and heat production in the digestive tract. British Journal of Nutrition, 34: 125-139. Weston, R.H., 1982. Animal factors affecting feed intake. In: J.B. Hacker (Ed.), Nutritional limits to animal
production from pastures, Commonwealth Agricultural Bureaux, Farnham Royal, pp. 183-198. Weston, R.H. and D.P. Poppi, 1987. Comparative aspects of food intake. In: J.B. Hacker and J.H. Temouth
(Eds.), The nutrition of herbivores, Second International Symposium on the Nutrition of Herbivores, Academic Press, London, pp. 133-161.

Parti
Toward a new theory of
feed intake regulation
in ruminants

1 Causes of differences in intake between feeds: critique of current views
Abstract
This first chapter critically examines current ideas about the nature of differences in intake between feeds. Explanations for such differences have usually been based upon the explicit or implicit assumption that an animal seeks to obtain a genetically determined maximum growth and production rate and a therefore required maximum nutrient intake, but that a submaximum nutrient intake often occurs as the consequence of restrictions to the intake process. A physical restriction, i.e. rumen fill, is primarily held responsible for the large differences in roughage intake. Experimental data that ought to support this conceptual framework are evaluated. It is concluded that the framework offers an incomplete and unsatisfactory explanation for the observed variation in intake. For instance, correlations between feed characteristics and intake do not point exclusively to a relationship between rumen fill and intake; they also suggest a relationship between the efficiency of utilization of metabolizable energy and intake. In addition, relations between intake, rumen fill and digesta passage rates as such do not prove the existence of a physical restriction of intake. Furthermore, intake responses to ruminai infusion of the normal endproducts of digestion, i.e. volatile fatty acids, also do not support a prime role of rumen fill in intake regulation. Detailed studies of feed degradation in the rumen show that ruminants can greatly increase roughage intake by speeding up passage of digesta. It is not known why the animal uses this extra capacity for intake only in certain situations and to a certain extent. Finally, doubt exists with regard to the basic assumption that feeding behaviour aims at achieving a maximum nutrient intake.
1.1 Introduction
The consumption of feed is the first step in the process which converts feed into valuable products like milk and meat for human consumption. The amount of feed ruminants voluntarily consume profoundly influences the efficiency of this conversion process. Voluntary feed intake of ruminants varies as a function of characteristics of the feed, the animal and its environment.
In the scientific literature of the past decades, general agreement has grown about the way differences in feed intake can be understood. However, this consensus amongst researchers has led neither to basically new ways of improving feed intake, nor to the successful construction of explanatory models to predict feed intake.
The causes of this lack of progress are not obvious. Is it due to the complicated nature of feed intake behaviour and insufficient knowledge of the many interactions between the animal, the feed and the environment, or to inappropriate assumptions in the study of feed intake regulation?
In an analysis of these questions, this first chapter takes current ideas about the causes of differences in intake between feeds as a starting point for discussion.
11
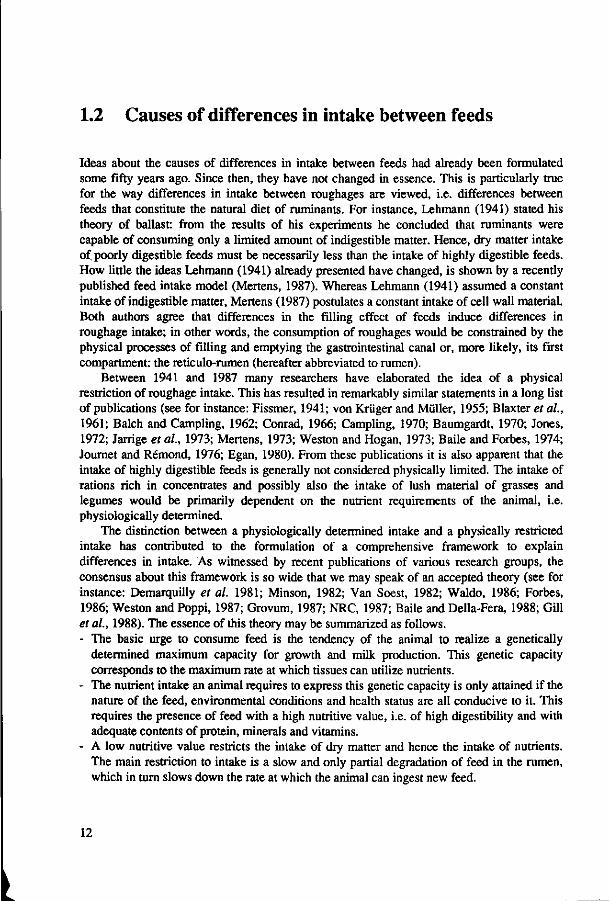
1.2 Causes of differences in intake between feeds
Ideas about the causes of differences in intake between feeds had already been formulated some fifty years ago. Since then, they have not changed in essence. This is particularly true for the way differences in intake between roughages are viewed, i.e. differences between feeds that constitute the natural diet of ruminants. For instance, Lehmann (1941) stated his theory of ballast: from the results of his experiments he concluded that ruminants were capable of consuming only a limited amount of indigestible matter. Hence, dry matter intake of. poorly digestible feeds must be necessarily less than the intake of highly digestible feeds. How little the ideas Lehmann (1941) already presented have changed, is shown by a recently published feed intake model (Mertens, 1987). Whereas Lehmann (1941) assumed a constant intake of indigestible matter, Mertens (1987) postulates a constant intake of cell wall material. Both authors agree that differences in the filling effect of feeds induce differences in roughage intake; in other words, the consumption of roughages would be constrained by the physical processes of filling and emptying the gastrointestinal canal or, more likely, its first compartment: the reticulo-rumen (hereafter abbreviated to rumen).
Between 1941 and 1987 many researchers have elaborated the idea of a physical restriction of roughage intake. This has resulted in remarkably similar statements in a long list of publications (see for instance: Fissmer, 1941; von Krüger and Müller, 1955; Blaxter et al., 1961; Balch and Campling, 1962; Conrad, 1966; Campling, 1970; Baumgardt, 1970; Jones, 1972; Jarrige et al., 1973; Mertens, 1973; Weston and Hogan, 1973; Baile and Forbes, 1974; Journet and Rémond, 1976; Egan, 1980). From these publications it is also apparent that the intake of highly digestible feeds is generally not considered physically limited. The intake of rations rich in concentrates and possibly also the intake of lush material of grasses and legumes would be primarily dependent on the nutrient requirements of the animal, i.e. physiologically determined.
The distinction between a physiologically determined intake and a physically restricted intake has contributed to the formulation of a comprehensive framework to explain differences in intake. As witnessed by recent publications of various research groups, the consensus about this framework is so wide that we may speak of an accepted theory (see for instance: Demarquilly et al. 1981; Minson, 1982; Van Soest, 1982; Waldo, 1986; Forbes, 1986; Weston and Poppi, 1987; Grovum, 1987; NRC, 1987; Baile and Della-Fera, 1988; Gill et al, 1988). The essence of this theory may be summarized as follows. - The basic urge to consume feed is the tendency of the animal to realize a genetically
determined maximum capacity for growth and milk production. This genetic capacity corresponds to the maximum rate at which tissues can utilize nutrients.
- The nutrient intake an animal requires to express this genetic capacity is only attained if the nature of the feed, environmental conditions and health status are all conducive to it. This requires the presence of feed with a high nutritive value, i.e. of high digestibility and with adequate contents of protein, minerals and vitamins.
- A low nutritive value restricts the intake of dry matter and hence the intake of nutrients. The main restriction to intake is a slow and only partial degradation of feed in the rumen, which in turn slows down the rate at which the animal can ingest new feed.
12

- Actual feed intake does not depend only on the filling effect of a feed but also on the tolerance of the animal for a certain rumen fill. This tolerance generally increases with an increase in nutrient requirements of the animal.
- Notwithstanding the dominant role of rumen fill, many other factors may increase or decrease feed intake: this is true for feed characteristics (differences in palatability, differences in fermentation products), environmental conditions (temperature, daylength), and for animal factors (health status, presence of members of the same species). All positive and negative factors are integrated by the animal into a final 'decision' about the actual level of intake.
For ease of discussion the above points will be called the accepted framework of feed intake regulation. The distinction between a physical and physiological type of regulation is here denoted as the two-component model. A graphical representation of it as found in many publications is shown in Fig. 1.1.
Intake
OMD (%)
Fig. 1.1. Graphical representation of a two-component model of intake regulation with organic matter intake (OMI) and digestible organic matter intake (DOMI) as a function of organic matter digestibility (OMD) of the feed. The breaking point is usually assumed to occur between 65 and 70% OMD.
As this Figure illustrates, organic matter intake is considered to increase with digestibility as long as intake is physically limited and to decrease with digestibility when intake is no longer restricted by rumen fill. Digestible organic matter intake is considered to increase with digestibility up to a satiation level corresponding to the maximum nutrient intake. In the following analysis we will examine to what extent the evidence available supports the accepted framework. For this purpose we will consider: 1. relationships between feed characteristics and intake, 2. effects of feed consumption on the animal, 3. simulation models of feed intake in ruminants, and 4. a crucial assumption with regard to the aim of feeding behaviour.
13

1.3 Relationships between feed characteristics and feed
intake
The systematic analysis of relationships between feed characteristics and intake still remains a major source of ideas about the causes of differences in intake. Here some examples of such relationships for two different types of rations, roughages and roughage-concentrate mixtures will be discussed. The data mainly come from experiments with sheep, probably the ruminant species best studied for intake, but are completed with data from other species.
Roughages
From 831 types of roughage information was collected on composition and intake by mature male castrated sheep. These data were published by Milford (1960), Heaney et al. (1963), Minson et al. (1964), Demarquilly and Journet (1967), Milford (1967), Minson (1967), Minson and Milford (1967), Milford and Minson (1968a,b), Minson and Milford (1968), Demarquilly and Weiss (1970), Mertens (1973), Minson (1973), INRA (1978), Vona et al. (1984) and Armstrong et al. (1986). The feeds tested by these researchers cover the whole range of roughage quality, with organic matter digestibility (OMD) varying from 30 to 84% and with content of nitrogen in the organic matter (N) from 0.3 to 5.6%. Grasses and legumes from temperate and tropical regions are included. Feeds were fed either fresh or dried, in the long form or coarsely chopped. Only those trials were considered in which, apart from intake, at least N and in vivo digestibility were measured. If dry matter digestibility (DMD, %) was reported instead of OMD the latter was estimated with the help of a regression function derived from 166 data pairs: OMD = 1.01 * DMD + 1.69 (r2 = 0.98, rsd = 1.06). All figures relating to intake of organic matter (OMI), digestible organic matter (DOMI), and indigestible organic matter (IOMI) have been expressed in grams per kg metabolic weight (MW = W0-75) per day.
The data obtained from this collection of intake trials have been analysed in different ways. - First, a graphical presentation has been made of the relationships between OMD and OMI,
DOMI and IOMI. Results for the entire data set are shown in Fig. 1.2a-c. - Secondly, the relationship between feed characteristics (OMD, N) and OMI has been
analysed in more detail using linear regression. As systematic differences in intake level between locations were present, probably as a result of differences in the type of animals used, external conditions or experimental design, and the distribution of data from different locations was not homogeneous over feed quality classes, location has been included as an additional explanatory factor in all the analyses. Effects of OMD and N were investigated by stepwise regression, including linear effects, interactions and quadratic effects. The results of five different statistical models are presented in Table 1.1. In addition, Figure 1.3 shows the average relationship between OMI and N at a OMD of respectively 55, 60, 65, 70,75 and 80% according to the model which gave the best fit (model 5, Table 1.1).
14

OMI (g/kgMW/d)
100
40
20
.25
DOMI (g/kgMW/d)
80
60 -
35
40 -
20
25 35
IOM
35 -
30 -
25
20
15
10
5 •
0 -
(g/kg MW/d)
- -
25 35
45 65 75 85
45 55 75
45 55
OMD (%)
65 75 85
Fig. 1.2. Intake of organic matter (OMI) (a), digestible organic matter (DOMI) (b), and indigestible organic matter (IOMI) (c), expressed in g per kg metabolic weight (MW) per day, as a function of organic matter digestibility (OMD, %): published data of 831 roughages fed ad libitum to mature wether sheep. See text for literature sources.
15

Table 1.1. Regression analyses of the results of feeding trials with 831 different roughages with organic matter intake (OMI, g.kg W""-75.d~l) as dependent variable and nitrogen content of organic matter (N, % ) , organic matter digestibility (OMD, X) and metabolizability (q, metabolizable energy as fraction of gross energy) as the independent variables. In all models the location of the experiments has been included as explanatory factor.
Model
1. OMI-2. 0MI= 3. OMI-
4. 0MI=
5. 0MI=
6. OMI=
a a a
a
a
a
+ + + + + + + + + + +
+ +
b.OMD b.N bi-OMD b2.N bL.OMD b2.N b3.OMD.N bi.OMD b2.OMD.OMD b3.N.N b4.N.0MD
bl-l/q b2.N/q
Parameter a
-5.6 33.6 2.8
-13.2
-42.8
73.5
values b
0.9349 8.1959 0.6157 5.0158 0.8504
13.9636 -0.1285 2.3039
-0.0175 -1.8872 0.2242
-16.2550 2.9829
r2
0.59 0.58
0.64
0.64
0.65
0.63
rsd*
9.6 9.8
9.1
9.0
8.9
9.1
* residual standard deviation
- Thirdly, the outcome of this statistical analysis has been compared with information on differences between feeds in the efficiency of utilization of metabolizable energy (ME). This latter parameter together with voluntary intake level and feed digestibility are main determinants of the nutritive value of any feed. Between feeds especially the efficiency of ME utilization for gain (kg) shows a wide variation that has been linked to differences in feed metabolizability (q, metabolizable energy as a fraction of gross energy) and N (Blaxter, 1989). As q is almost proportional to digestibility these are the same feed parameters which have been used to predict voluntary intake. The relationship between q and N and kg has been drawn in Fig. 1.4 using information from Blaxter (1989). According to this author kg can be estimated from q and N as kg = 0.951 + 0.023 * (N/q) - 0.336 * (1/q). To see how well the same statistical model would explain the observed variation in intake between roughages in our sample, Table 1.1 also includes the results of a linear regression with the variables 1/q and N/q (model 6). For this purpose q has been estimated from OMD using data from INRA (1978) as q = 0.0091 * OMD - 0.086 (r2 = 0.995, rsd = 0.004).
Results of the different elements of this analysis are now discussed. As Figures 1.2a and b illustrate, differences in OMI and DOMI between feeds of different digestibility are very large: DOMI ranges from less than 0.5 to 3 times maintenance requirements. Fig. 1.2b also shows that DOMI does not reach a satiation level with increasing digestibility. Hence, the two-component model shown in Fig. 1.1 does not apply to this
16

compilation of intake data despite the fact that many feeds had an OMD well over the value of 65-70% at which DOMI is usually considered to level off.
The large variation in intake apparent from Fig. 1.2 has prompted studies of the processes underlying such differences in intake. Attention has mostly been focused on the magnitude and behaviour of the less digestible and indigestible fractions of the feed. The presence of these fractions causes a variable degree of filling of the gastrointestinal canal and this effect has been supposed to explain the variation in intake. However, the intake of indigestible matter is not constant but relatively low at both low and high digestibility of the feed (Fig. 1.2c). If cell wall content is used as a measure of the filling properties of roughage the same phenomenon is seen: the intake of cell wall material appears low at both low and high cell wall contents (Mertens, 1973). Especially remarkable is the low intake of filling material when feed quality (digestibility) is relatively high, i.e. over 70%. In fact, rumen fill with these feeds also appears to be relatively low (Weston, 1985). Apparently, rumen fill does not limit intake of highly digestible roughages, whereas within this group of feeds an increase of digestibility still positively affects OMI and DOMI. From these observations one may doubt whether the true advantage of a higher feed digestibility must be attributed to a lower degree of rumen fill or to other factors.
OMI (g/kgMW/d)
75
70
55
50
45
40 --
35
0% OMD
H h -+- H h
0.5 1 1.5 2 2.5 3 3.5 4
N (%0f0M)
4.5
Fig. 1.3. The statistical relation between the nitrogen content (N) of feed organic matter and the intake of organic matter (OMI, g per kg metabolic weight (MW) per day) at an organic matter digestibility (OMD) of 55, 60,65, 70, 75, and 80%, corresponding to a metabolizability (q, metabolizable energy as fraction of gross energy) of 0.42,0.46,0.51,0.55,0.60, and 0.64, respectively. This Figure shows intake as predicted by regression model 5 from Table 1.1.
17

Efficiency for gain
0.6 y
0.5 --
0.4
0.3
0.2
0.1 --
0 -I 1 1 1 1 1 1 1 1
0.5 1 1.5 2 2.5 3 3.5 4 4.5
N (%ofOM)
Fig. 1.4. The relation between the nitrogen content of feed organic matter (N) and the efficiency of utilization of metabolizable energy for gain (kg) at a metabolizability (q, metabolizable energy as fraction of gross energy) of 0.40,0.45,0.50,0.55,0.60 and 0.65, according to data from Blaxter (1989).
Uncertain is also the correct interpretation of the effect of nitrogen on intake. As shown by the results in Table 1.1 (model 1 and 2) both OMD and N appear to be positively correlated with OMI. Effects of OMD and N are partly independent: within each digestibility class higher nitrogen contents stimulate intake over a wide range of nitrogen contents (model 3, 4 and 5, Fig. 1.3). With location, OMD and N 64% of the variation in OMI could be explained. Figure 1.3 shows that the range of nitrogen contents over which a positive effect is seen far exceeds values that might limit microbial fermentation in the rumen. So, an indirect effect of nitrogen on the rate of rumen emptying through an increased rate of fermentation does not appear sufficient to explain its favourable effect on intake. There are three reasons to think of an effect of nitrogen - or more appropriately protein - on intake not related to any change in rumen fill: 1. the positive effect occurs not only when grasses are compared with legumes, which usually have higher crude protein contents, but also in a comparison of grasses with different crude protein contents (results not shown), 2. the same positive effect of protein is found in trials with synthetic diets in which the digestible and indigestible fractions have been varied independently (Dinius and Baumgardt, 1970, see below), and 3. protein-rich supplements generally have a lower substitution value than protein-poor supplements, both in sheep (Crabtree and Williams, 1971a,b) and in cows (Oldham, 1984; Thomas and Rae, 1988). This does not yet explain the effect of nitrogen. Effects of dietary protein in ruminants may be
18

due either to changes in fermentation products in the rumen or to a more liberal supply of undegraded protein in the small intestine.
A further suggestion that a correct interpretation of the role of feed digestibility and nitrogen content in intake regulation may involve entirely different factors than rumen fill comes from the third element of our analysis. Looking at the variation in voluntary intake and in efficiency of energy utilization for gain (k„) between feeds it was found that the same feed characteristics (digestibility or metabolizability and N) are positively correlated with intake and kg. This parallel follows from a comparison of Fig. 1.3 and 1.4. Furthermore, the statistical model used by Blaxter (1989) for his analysis of differences in kg appeared to explain almost as much of the observed variation in voluntary intake as the model depicted in Fig. 1.3: 63% as compared to 65% (see model 6 and 5 in Table 1.1). Apparently, feed characteristics commonly associated with the filling effect of a feed, also profoundly affect the metabolism of the host animal. The possible significance of this latter association has not received sufficient attention in feed intake studies and will be considered in Chapter 3.
Roughage-concentrate mixtures
The analysis of feeding trials with roughages is inconclusive for the existence of a physiologically determined upper limit to intake: DOMI does not attain a satiation level with increasing OMD as the two-component model presupposes (Fig. 1.1). The absence of such a level, of course, explains the continuous search for still more digestible roughages. That an upper limit to DOMI exists has to be proved by trials with rations higher in digestible energy content or intake, i.e. those composed of roughage and concentrates often fed as pelleted diets. The experiments of Dinius and Baumgardt (1970) and Conrad et al. (1964) deserve special attention in this respect as these experiments have contributed greatly to the belief in a two-component model of intake regulation. Re-appraisal of their publications causes us to doubt the validity of the interpretation and conclusions and we want to summarize briefly our comments.
The experiments of Dinius and Baumgardt (1970), partly also presented by Baumgardt (1970), were carried out with pelleted rations composed of mixtures of concentrates and different diluents: sawdust, sawdust with 3% kaolin clay, or verxite. Maize and soya were used as concentrate ingredients. The rations with sawdust were tested at two different protein contents: a constant content and a variable content depending on the degree of dilution with sawdust. The constant protein content was achieved by varying the proportions of maize and soya in the concentrate part. All rations were fed to wether sheep.
The data on intake of both sawdust series show a similar relation with DMD and seem to obey the two-component model of Fig. 1.1. The data of the verxite series deviate from this model and were discarded by the authors arguing that apparently 'the feed containing verxite was unpalatable' or 'the chelating nature of the verxite interfered with normal metabolism'. The original data do not justify such a manipulation. To show this, the original data have been plotted in Fig. 1.5a and b together with a set of intake data of pelleted feeds as published by Heaney et al. (1963), Demarquilly and Journet (1967), Minson (1967), Minson and Milford (1968), Tetlow and Wilkins (1974) and Clancy et al. (1976). This set of data shows similar variation to the compilation of data of pelleted feeds by ARC (1980).
19

DMI (g/kgMW/d) DDMI (g/kgMW/d)
120 -
100 -
80 -
60 -
41) -
20 -
0 -
o « o
o o o v
0 o o
o o
1
A
% o
O o °
• — •
• — • sawdust series
i — A verxite series
o. o other data
—1 1 1 1
30
70 -i
60 -
50 -
40 -
30 -
20 •
10 -
0 -
(3- 3 / g
o o
^ o oo o o og© o o
°o> O o o °°o
,k^^
oo y ^ ^ v o v ^ o
/ / o
- o ° o o o o
0
1 1 1 1 1 —
40 50 60
DMD (%)
70 80 30 40 50 60
DMD (%)
70
Fig. 1.5. Dry matter intake (DM) (a) and digestible dry matter intake (DDMI) (b), both in g per kg metabolic weight (MW) per day, as a function of dry matter digestibility (DMD, %): a comparison of data on intake from the sawdust and verxite rations in the dilution experiments of Dinius and Baumgardt (1970) with other data from pelleted feeds. See text for literature sources.
Figures 1.5a and b lead to the following comments. - At high digestibility values the data of both series from Dinius and Baumgardt's (1970)
trials deviate from the normal pattern of intake for pelleted feeds, the verxite data being certainly not more anomalous than the sawdust data.
- The maximum intake of digestible matter measured by Dinius and Baumgardt (1970) is considerably lower than the level usually attained with sheep of similar body weight (37 kg at the start and 50 kg at the end of the trials).
- If the sheep for whatever reason had disliked the verxite rations one would have expected the largest discrepancies in intake between the two series at the highest degree of dilution; quite contrary to this, the sheep consumed on average more dry matter of the rations with 40-50% verxite than of the rations with similar amounts of sawdust.
Comparison of the sawdust series at different protein content leads to another remarkable conclusion. As Figure 1.6 shows, intake of the low protein ration was lower than of the high protein ration at all but the lowest two levels of sawdust where differences in protein content were small or absent. Despite these positive effects of protein, the authors concluded that protein had no effect on intake. They did so because they could not show a statistically significant difference in intake at the highest degree of dilution where the largest difference in protein content occurred. They probably would have found such a significant difference if the protein effect had been analysed at all levels.
20

DMI (g/kg
90 -
85 -
80 -
75 -
70 -
65 -
60 -
55 •
50 -
..30%
/ , . 40%
/ ' ' ' ' 45%
./- ^ - ' ^ 5 0 %
.--" * , ' ' ' , ' ' ,• 20%
*-' ,'' / / 25%
/ _ _ • 15%
. — . 10%
* 5%
1 1 1 1
1.5 2 2.5
N (%0fDM)
Fig. 1.6. The effect of feed nitrogen content (N, % of dry matter) on intake of dry matter (DMI) in g per kg metabolic weight (MW) per day at a percentage sawdust varying from 5 to 50% of feed dry matter. Results of the dilution experiments of Dinius and Baumgardt (1970). To facilitate comparison, data pairs with equal percentage sawdust in the feed have been interconnected.
Direction and magnitude of the effect of protein on intake in the dilution experiments are similar to those found with roughages. Clearly different is the fact that in the dilution experiments the composition of digestible and indigestible fractions has been varied independently whereas with roughages changes of both will be confounded. Therefore, the results of Dinius and Baumgardt (1970) suggest that the presence of protein per se provokes a higher feed intake. Summarizing, we conclude that the results of Dinius and Baumgardt (1970) are not convincing evidence for the existence of a two-component model of intake regulation.
In fact, the same conclusion applies to the frequently quoted experiments of Conrad et al. (1964). The choice of an inappropriate statistical model by these authors has already been criticized by others (Mertens, 1973; Grovum, 1987). As important perhaps is the bias of experimental data that does not permit a thorough analysis of the effect of feed characteristics on intake as explained hereafter.
The data used by Conrad et al. (1964) came from 134 feeding trials with lactating dairy cows of the Holstein and Jersey breed. Rations were roughages and roughage-concentrate mixtures varying in DMD from 52 to 80%. The basic data of DMI showed a positive linear relationship with DMD, though with much scatter. After statistical analysis with correction of intake for differences between animals in body weight, faecal dry matter output and output of productive energy in milk and body protein gain, the corrected DMI was found to increase
21

with DMD between 52 and 66% DMD and to decrease for DMD values over 66%. However, it is doubtful whether this is a true effect of digestibility. - From the original data (given by the authors as average values per type of ration) it can be
inferred that the distribution of experimental animals over rations with varying DMD must have been severely biased. As Figure 1.7 shows, mean body weights for the rations with lowest and highest average DMD were 332 and 521 kg, respectively. This difference of nearly 200 kg suggests that on average the Jersey cows were fed the least digestible rations, the Holstein cows the best digestible rations.
- If DMI per type of ration is expressed as a function of mean metabolic weight of the cows, DMI increases between 55 and 70% DMD (Fig. 1.7). This range includes 122 out of the total of 134 trials. The remaining 12 with an average ration DMD of 76% show a lower DMI per kg MW than expected from the trend between 55 and 70% DMD. These 12 experiments were carried out with cows which on average weighed 119 kg more and which, moreover, received a different type of ration. Furthermore, Figure 1.7 shows average intake of digestible dry matter (DDMI) per kg MW to increase over the whole range of DMD values contrary to the prediction of the two-component model.
Intake (g/kgMW/d)
140]
120
100
80
60
40
DMI DDMI
50 55 60 65 70
DMD (%)
50 55 60 65 70
DMD (%)
75
Liveweight (kg)
550
500
450
400 350 300
•
[6]
[36] • •
[14]
[12] 12°] • B
• [34]
B
•
[12]
Fig. 1.7. Mean intake of dry matter (DMI) and digestible dry matter (DDMI) (a), both in g per kg metabolic weight (MW) per day, and mean liveweights of cows in kg (b) for seven groups of experiments differing in average ration dry matter digestibility (DMD, %): results of the experiments analysed by Conrad et al. (1964). Experiments (numbers shown in parentheses) were grouped according to type of ration.
Neither the trials of Dinius and Baumgardt (1970) nor of Conrad et al. (1964) can thus be considered unequivocal illustrations of the two-component model of intake regulation. When mixtures of roughage and concentrates are fed, deviations from this model are frequently found. A compilation of feeding trials with sheep and cattle by Grovum (1987) shows that
22

often DDMI is lower when almost pure concentrates are fed than at less extreme levels of concentrate feeding. This suggests a quadratic type of relationship between DDMI or DOMI and feed digestibility. Whatever the exact relation may be, correlations between intake and feed characteristics do not imply any particular causal relationship.
1.4 Effects of feed consumption on the animal
The idea that rumen fill is an important cause of low feed intake must be an hypothesis which should be tested in more detailed studies of effects of feed consumption on the animal. Such an hypothesis should also be confronted with others. Alternative hypotheses which have been tested in order to explain feed differences in intake concern the role of taste and the role of variable ratios of absorbed nutrients. Although some weight is given to both, most authors agree that none of these can fully explain the huge differences in intake between lowly and highly digestible feeds. How detailed knowledge of effects of feed consumption has contributed to the acceptance of a physical model of intake regulation is now discussed.
Oral effects
The first sensations an animal obtains from a feed is by the senses of sight, smell, touch and taste. Their importance in the recognition and selection of feeds has been shown in the work of Arnold (1981). Opinions differ on their relevance for the decision of the animal how much to eat from a given feed. This has much to do with imprecise use of terminology. Palatability -the hedonic response to differences in taste - is often mentioned as a cause of differences in intake. On reflection, this means nothing more than that feeds have been observed to differ in the amount animals voluntarily consume, as we cannot truly measure whether an animal finds one feed more palatable than another. The question we can try to answer is whether differences in taste contribute significantly to the variation in intake seen in Fig. 1.2a. In our opinion the answer is negative. Experiments in which the effects of taste have been eliminated by introducing feed directly into the rumen do not show abnormal intake responses (Weston, 1966; Egan, 1972), unless access to feed is restricted to only a few hours per day (Greenhalgh and Reid, 1967). Another, more practical, argument is the fact that up to now it has not been possible to remove the large differences in intake by adding certain flavours to poorly digestible feeds. Even if it is found that taste affects intake under certain circumstances, an important question from an evolutionary point of view remains what selective advantage animals may have gained by the ability to vary feed consumption according to differences in taste.
Gastrointestinal effects
The inflow of feed into the gastrointestinal canal has many different but confounded effects. Feed and digesta occupy space, induce secretory activity resulting in a drain of substances
23

from the internal environment into the gut, provoke motorial activity to comminute, mix and propel digesta, induce the release of useful and harmful products of digestion and stimulate their absorption, utilization and excretion. To disentangle the feedback of all these processes is difficult if not impossible. Attempts have focused on the first and last mentioned aspects.
The feedback of rumen fill to the feed consumption process has been investigated in various ways and with variable success. An approach used repeatedly is a correlative analysis of measurements of rumen fill and digesta flow and measurements of feeding intensity. Examples are studies of rumen fill in relation to the initiation and cessation of meals or to the magnitude of daily intake (Campling et ai, 1961; Ulyatt et al., 1967; Egan, 1970), and studies of digesta retention time in relation to feed intake (Thornton and Minson, 1973). Such correlative studies do not allow any conclusion as to cause and effect: is a higher intake cause of a shorter retention time or the consequence of it? Even in situations where at the same intake level differences in retention time have been found (for instance between leaf and stem fractions), it is difficult to prove that such differences per se are the cause of a variation in intake. Recent studies show retention time of solid and fluid phases not to be constant for a given feed but highly variable depending on the physiological state of the experimental animal (Weston, 1988).
The weaknesses of a correlative approach called for a more independent way to manipulate rumen fill. This has been found in artificial changes of rumen contents itself or rumen space. Part of the results has already been mentioned: addition of feed to the rumen through a fistula is usually followed by oral compensation of intake. This was not found when a relatively inert material like polyvinyl chloride powder was introduced into the rumen: intake remained almost unaffected despite a large increase in consumption of indigestible matter (Weston, 1966). A similar phenomenon seemed to occur with removal of digesta from the rumen: when digesta were removed soon after a meal compensation of intake was more complete than some hours later when, in fact, digesta must have consisted for a larger part of truly indigestible matter (Campling and Balch, 1961). Both observations do not support the idea that rumen fill per se determines intake. They seem to indicate that methods to change rumen fill affect simultaneously other processes in the animal.
A logical but extreme conclusion of the latter is to manipulate rumen volume itself in order to be able to study the role of fill. Then it appears that for instance by introducing water filled bladders in the rumen the intake of roughage can be reduced (Egan, 1972). Yet, the artificial nature of such a procedure creates some doubts as to the relevance of the results to normal feeding conditions. Reduction of stomach volume also reduces intake of monogastric animals (Geliebter et al., 1987), although feed intake of monogastrics is generally not considered physically restricted.
In ruminants, changes in digestibility and nitrogen content of the feed are paralleled by changes in the ratio of absorbed nutrients, higher ratios of protein to volatile fatty acids (VFA) being characteristic for better quality feeds (Weston and Hogan, 1973). The effect of changes in nutrient ratios per se has been studied with the help of infusion experiments. The results of extensive experiments with different kinds of roughage have shown that extra protein may enhance the intake of low quality roughages (Egan, 1965, 1977; Egan and Moir, 1965). With better quality roughages extra protein has no or sometimes a negative effect. This means that the intake of digestible matter is not merely a function of the ratio of digestible protein and energy.
24

However, results of experiments with VFA infusions suggest an important role for fermentation products in the regulation of intake. In many experiments animals have responded with a decrease in roughage intake even to small additions of VFA (Egan, 1966; Weston, 1966). With mature sheep such negative intake effects were found at infusions of less than 0.5 Mole VFA whereas these animals absorb from 3-4 Moles VFA at maintenance level and up to 10 Moles with ad libitum feeding of high quality roughages. These effects occur regardless the way of administration (as VFA- salts or acids) and the protein content of the feed. Infusion of acetic acid usually appears more harmful than a mixture of acetic, propionic and butyric acids. The negative effects of acetate could be partially compensated by high doses of protein infused into the duodenum (Egan, 1977).
Infusion experiments with the normal products of digestion thus demonstrate effects of nutrients on intake but not in a form corresponding to a simple model of one or a few nutrients (like protein or glucogenic precursors) limiting roughage intake. They also seem to disprove the idea of a purely physically constrained roughage intake.
1.5 Simulation models of feed intake
Simulation models have been used to integrate knowledge of processes of ruminai degradation, digestion and passage of feed to enable prediction of digesta flow from the rumen and thus feed intake (Mertens, 1973; Mertens and Ely, 1979; Forbes, 1980; Black et al., 1982; Bywater, 1984; Fisher et al., 1987). Actually, attempts to develop truly explanatory models have failed. Causes are not a lack of quantitative data as argued by some researchers (Black et al., 1982), but a poor understanding of the flexibility of feed intake behaviour. We will illustrate this statement using a feed intake model presented by Mertens (1973).
Mertens (1973) compared feed intake with the filling of a vessel (the rumen) from which material flows continuously in two different ways. One flow represents the disappearance of digesta as a consequence of passage to the abomasum and small intestine, the other the disappearance of feed due to absorption of fermentation products. Obviously, in the long term the rate of filling (or rate of feed intake) should be balanced with the rate of emptying (or rate of disappearance of digesta). So if we can calculate the rate of disappearance of digesta, we are also able to predict the possible rate of feed intake. This reasoning seems attractive. But as soon as we realize that digesta do not disappear passively but are actively removed from the rumen, the idea loses much of its attractiveness. For if we introduce in the analogy of the vessel a pump which pumps material through it, it is clear that the capacity of this pump will determine the magnitude of throughput; in other words, it depends on the efforts of the animal how much feed can be processed at a given rumen size. In fact, the influence an animal may exert on the disappearance of digesta is large. This is because much of the digesta present at any moment is in small particle form which can be passed easily. What is required is a sufficiently large flow of electrolyte fluid (saliva) to wash out these small particles from the rumen. Why the animal exploits this opportunity only to a limited extent is not clear. Up to now, rates of passage of solid and fluid phases cannot be predicted from feed or animal characteristics without prior knowledge of intake itself. This means that with currendy available simulation models fractional passage rates and rumen volumes must be known
25

before intake can be estimated. In that case we can no longer speak of a true intake prediction; what is left is a verification whether measurements or estimates of the rate of processing of feed fit the observed rate of intake.
This does not mean that the construction of simulation models has been a useless exercise. Models are helpful in testing the validity of hypotheses, for instance with regard to the important role often attributed to particle breakdown. Several simulation studies have shown that variations in the rate of particle comminution has little effect on the rate of disappearance of digesta (see for an elegant example the study of Poppi et al., 1981). Unfortunately, considerable efforts are still devoted to studies of the physical breakdown of feeds. Admittedly, grinding and pelleting often enhances intake. But simulation models show that for an explanation we should not consider so much the comminutive effect itself but more likely side-effects of such a treatment.
1.6 A crucial assumption on feed intake behaviour
In the foregoing sections a number of critical comments have been made as to the conceptual framework of feed intake regulation. These especially apply to the dominant role rumen fill is thought to play. Furthermore, we had to conclude that the literature does not provide a true alternative framework. Current acceptance of a physical type of intake regulation must certainly be attributed in part to the absence of such an alternative.
The common answer to the question what causes differences in intake between feeds is essentially dual. First the existence of constraints to feed consumption is stated and secondly the nature of these constraints in any particular situation is indicated. A discussion about the validity of this answer should deal with both parts. In fact, intake research has concentrated completely on the second part, trying to identify the nature of the constraints to the intake process. In performing even more detailed analyses of feed degradation one hopes to find the basic factors limiting roughage intake.
This state of affairs has much to do with a common view on the aim of feed intake behaviour: feed intake is considered part of a system which tries to maximize nutrient intake and hence growth and production rates. As long as this assumption is not falsified, it is logical to think in terms of constraints. Besides, efforts to identify and remove constraints on intake are reinforced by the agricultural interest in means or methods to improve intake. If the assumption proves to be incorrect, however, the concept of a constrained intake may well appear inappropriate. Unfortunately, the hypothesis that animals always try to obtain a maximum nutrient intake has mostly been taken for granted instead of rigidly tested.
Yet there are good reasons to search for new explanations with regard to the causes of differences in intake. The idea itself of a limited or constrained intake is difficult to reconcile with the flexibility animals show when they change intake of the same feed in response to changing nutrient needs, for instance during cold stress or lactation. This flexibility is often explained with reference to the idea of a balance between nutrient requirements on the one hand and the discomfort intake of bulky feeds, like roughages, may cause on the other hand. How attractive such an idea intuitively might appear, it is completely obscure how an animal should weigh the benefits of feed consumption against the discomfort caused by feed
26

consumption. The question also arises why ruminants do not always use an apparent extra capacity for feed consumption. If feed intake behaviour is indeed aimed at realizing a genetic capacity for growth, why then do animals often accept a slower growth rate than to which they are physically capable?
Doubt exists if animals ever try to grow as fast as they can (Sibly and Calow, 1986). First of all, doubt arises from the observation of compensatory growth: the phenomenon that after periods of growth inhibition or retardation the growth rate exceeds the 'normal' rate for the age/weight class. This suggests that the 'normal' growth rate is not truly maximal. A second reason for doubt is the fact that forced feeding or hormonal treatments can increase normal growth and production rates. Especially the effects of hormone administration suggest that under normal conditions the endocrine system controls growth and production rates below the physiological capacity of the animal.
We may wonder why animals apparently accept a submaximum growth rate. Evolutionary biologists have suggested that for the animal an increased growth rate may have both advantages, for instance earlier sexual maturity and breeding, and disadvantages, for instance a higher risk of mortality (Sibly and Calow, 1986). For herbivores in a natural environment, higher mortality risks can be imagined to result from longer grazing times with greater risks of prédation. However, physiological processes may also contribute to higher mortality if, for instance, higher growth rates are linked to lower investments in maintenance and repair processes. A higher growth rate, i.e. a higher energy intake, may also contribute more directly to a decrease in vitality and lifespan. Evidence for such a relationship has been found and will be discussed in Chapter 3.
If we abandon the idea that feed intake behaviour is aimed at maximizing nutrient intake, new questions for research will come up. This can be illustrated with the help of information developed from Fig. 1.2. Here we brought together data about the intake of roughages varying widely in nutritive value as measured by differences in organic matter digestibility. In a natural environment, this variation in digestibility reflects the seasonal fluctuation in feed quality characteristic for the ecosystems where ruminants have evolved: seasons with young and highly digestible plant material alternate with seasons when drought or cold stop plant growth and the feed on offer consists of old and poorly digestible material. Ruminants respond to this with a high intake in periods with high quality feed and a low intake in periods with low quality feed. This pattern of intake is often accentuated once more by the impact of daylength on intake (see Chapter 2). The fluctuation in intake reflects itself in adult animals -as mostly used in comparative feeding trials like those of Fig. 1.2 - in alternating periods of weight gain (mainly fat) and weight loss. Averaged from year to year, body weight is more or less constant. This is an important finding: it shows that animals are able to maintain themselves in an environment which seems to restrict feed consumption periodically. At least for adult animals, maintenance of weight will be the aim of feeding behaviour rather than an unlimited deposition of body fat. The latter happens if the normal seasonal fluctuation is removed and high quality feed is continuously available. Then body weight and body composition of sheep attain abnormal values with clearly harmful effects on health: long term feeding experiments show fat percentages of 50% of empty body weight (Searle et al., 1972; Doize et al, 1979; Blaxter et al., 1982). Under natural conditions, high quality feeds are only available seasonally. The variation in intake between feeds may thus be considered the expression of a kind of storage economy in which periodically excess feed is stored as body energy to be used in times when feed quality makes it unattractive to consume much of it.
27

This type of feed intake behaviour appears relatively successful given the long term survival of ruminant species in periodically harsh environments. The question is why ruminants have developed this particular strategy and no other. The usual answer of feed intake research is that ruminants are not physically able to increase the intake of poorly digestible roughages up to a maintenance level. That a different answer is possible will appear as soon as the physiological costs and benefits of different strategies are considered.
1.7 Conclusions
1. The accepted model of feed intake regulation assumes that an animal seeks to obtain a maximum growth and production rate and a therefore required maximum nutrient intake, but that a submaximum nutrient intake often occurs as a consequence of restrictions to the intake process. Physical restrictions, i.e. rumen fill, are primarily held responsible for the large differences in roughage intake.
2. This conceptual framework provides an incomplete and unsatisfactory explanation for differences in intake between feeds for several reasons. a. Differences between feeds which suggest a relationship between the filling effect of a
feed and intake also point to a relationship between the efficiency of ME utilization and intake. Research has almost exclusively focused on the possibly causal nature of the relation between rumen fill and intake.
b. Relations between intake, rumen fill and digesta passage rates as such do not prove the existence of a physical restriction of intake.
c. Attempts to isolate the role of fill from confounding factors have been only partly successful.
d. Intake responses to ruminai infusion of the normal end products of fermentation (VFA, i.e. the main substrate in ruminant metabolism) do not support a prime role for rumen fill in intake regulation.
e. Detailed studies of ruminai degradation, digestion and passage of feed demonstrate that in principle ruminants can greatly increase roughage intake by speeding up passage of digesta. It is not known why the animal uses this apparent extra capacity for intake only in certain situations and to a certain extent.
f. The basic assumption that animals try to obtain a maximum growth and production rate conflicts with actual observations on the regulation of growth and production.
3. To find new answers to the question what causes differences in intake we need to rethink the aims of feed intake behaviour and pay more attention to possible physiological costs and benefits associated with changes in intake.
References
ARC (Agricultural Research Council), 1980. The nutrient requirements of ruminant livestock. Commonwealth Agricultural Bureaux, Famham Royal, 351 pp.
Armstrong, R.H., T.G. Common and H.K. Smith, 1986. The voluntary intake and in vivo digestibility of herbage harvested from indigenous hill plant communities. Grass and Forage Science, 41: 53-60.
28

Arnold, G.W., 1981. Grazing behaviour. In: F.H.W. Morley (Ed.), Grazing animals, Amsterdam, pp. 79-104. Baile, C.A. and J.M. Forbes, 1974. Control of feed intake and regulation of energy balance in ruminants.
Physiological Reviews, 54: 160-214. Baile, C.A. and M.A. Della-Fera, 1988. Physiology of control of food intake and regulation of energy balance in
dairy cows. In: P.C. Garnsworthy (Ed.), Nutrition and lactation in the dairy cow, Butterworth, London, pp. 251-261.
Balch, C.C. and R.C. Campling, 1962. Regulation of voluntary food intake in ruminants. Nutrition Abstracts and Reviews, 32: 669-686.
Baumgardt, B.R., 1970. Control of feed intake in the regulation of energy balance. In: A.T. Phillipson (Ed.), Physiology of digestion and metabolism in the ruminant, Proceedings of the Third International Symposium, Cambridge, Oriel Press Ltd., New Castle upon Tyne, pp. 235-253.
Black, J.L., G.J. Faichney and R.E. Sinclair, 1982. Role of computer simulation in overcoming limitations to animal production from pastures. In: J.B. Hacker (Ed.), Nutritional limits to animal production from pastures, Commonwealth Agricultural Bureaux, Farnham Royal, pp. 473-493.
Blaxter, K.L., 1989. Energy metabolism in animals and man. Cambridge University Press, Cambridge, 336 pp. Blaxter, K.L., F.W. Wainman and R.S. Wilson, 1961. The regulation of food intake by sheep. Animal
Production, 3: 51-61. Blaxter, K.L., V.R. Fowler and J.C. Gill, 1982. A study of the growth of sheep to maturity. Journal of
Agricultural Science, Cambridge, 98:405-420. Bywater, A.C., 1984. A generalised model of feed intake and digestion in lactating cows. Agricultural Systems,
13: 167-186. Campling, R.C, 1970. Physical regulation of voluntary intake. In: A.T. Phillipson (Ed.), Physiology of digestion
and metabolism in the ruminant, Proceedings of the Third International Symposium, Cambridge, Oriel Press Ltd., New Casüe upon Tyne, pp. 226-234.
Campling, R.C. and C.C. Balch, 1961. Factors affecting the voluntary intake of food by cows. 1. Preliminary observations on the effect, on the voluntary intake of hay, of changes in the amount of the reticulo-ruminal contents. British Journal of Nutrition, 15: 523-530.
Campling, R.C, M. Freer and C.C. Balch, 1961. Factors affecting the voluntary intake of food by cows. 2. The relationship between the voluntary intake of roughages, the amount of digesta in the reticulo-rumen and the rate of disappearance of digesta from the alimentary tract. British Journal of Nutrition, 15: 531-540.
Clancy, M., L.S. Bull, P J. Wangsness and B.R. Baumgardt, 1976. Digestible energy intake of complete diets by wethers and lactating ewes. Journal of Animal Science, 42: 960-969.
Conrad, H.R., 1966. Symposium on factors influencing the voluntary intake of herbage by ruminants: physiological and physical factors limiting feed intake. Journal of Animal Science, 25: 227-235.
Conrad, H.R., A.D. Pratt and J.W. Hibbs, 1964. Regulation of feed intake in dairy cows. I. Change in importance of physical and physiological factors with increasing digestibility. Journal of Dairy Science, 47: 54-62.
Crabtree, J.R. and G.L. Williams, 1971a. The voluntary intake and utilization of roughage-concentrate diets by sheep. 1. Concentrate supplements for hay and straw. Animal Production, 13: 71-82.
Crabtree, J.R. and G.L. Williams, 1971b. The voluntary intake and utilization of roughage-concentrate diets by sheep. 2. Barley and soya bean meal supplementation of hay diets. Animal Production, 13: 83-92.
Dcmarquilly, C and M. Joumet, 1967. Valeur alimentaire des foins condensés. 1. Influence de la nature du foin et de la finesse de broyage sur la digestibilité et la quantité ingérées. Annales de Zootechnie, 16: 123-150.
Demarquilly, C. and Ph. Weiss, 1970. Tableaux de la valeur alimentaire des fourrages. Etude no. 42, S.EX, Versailles, 65 pp.
Demarquilly, C , J. Andrieu and Ph. Weiss, 1981. L'ingestibilité des fourrages verts et des foins et sa prévision. In: J. Andrieu, C. Demarquilly and W. Wegat-Litre (Eds.), Prévision de la valeur nutritive des aliments des ruminants, INRA Publ., Route de St. Cyr, 78000 Versailles, pp. 155-167.
Dinius, D.A. and B.R. Baumgardt, 1970. Regulation of food intake in ruminants. 6. Influence of caloric density of pelleted rations. Journal of Dairy Science, 53: 311-316.
Doize, F., R. de Wilde and R. Paquay, 1979. Estimation de la composition chimique du mouton adulte. Annales de Zootechnie, 28: 393-406.
Egan, A.R., 1965. Nutritional status and intake regulation in sheep. II. The influence of sustained duodenal infusions of casein or urea upon voluntary intake of low-protein roughages by sheep. Australian Journal of Agricultural Research, 16:451-462.
29

Egan, A.R., 1966. Nutritional status and intake regulation in sheep. V. Effects of intraluminal infusions of volatile fatty acids upon voluntary intake of roughage by sheep. Australian Journal of Agricultural Research, 17: 741-755.
Egan, AS.., 1970. Nutritional status and intake regulation in sheep. VI. Evidence for variation in setting of an intake regulatory mechanism relating to the digesta content of the reticulorumen. Australian Journal of Agricultural Research, 21: 735-746.
Egan, A.R., 1972. Nutritional status and intake regulation in sheep. VII. Control of voluntary intake of three diets and the responses to intraluminal feeding. Australian Journal of Agricultural Research, 23: 347-361.
Egan, A.R., 1977. Nutritional status and intake regulation in sheep. VUL Relationships between the voluntary intake of herbage by sheep and the protein/energy ratio in the digestion products. Australian Journal of Agricultural Research, 28:907-915.
Egan, A.R., 1980. Host animal - rumen relationships. Proceedings of the Nutrition Society, 39: 79-87. Egan, A.R. and R.J. Moir, 1965. Nutritional status and intake regulation in sheep. I. Effects of duodenally
infused single doses of casein, urea, and propionate upon voluntary intake of a low-protein roughage by sheep. Australian Journal of Agricultural Research, 16:437-449.
Fisher, D.S., J.C. Burns and K.R. Pond, 1987. Modelling ad libitum dry matter intake by ruminants as regulated by distension and chemostatic feedbacks. Journal of Theoretical Biology, 126:407-418.
Fissmer, FB., 1941. Beitrage zur Frage der Sättigung bei der Milchkuh. Zeitschrift für Tierernährung und Futtermittelkunde, 5: 1-108.
Forbes, J.M., 1980. A model of the short-term control of feeding in the ruminant: effects of changing animal or feed characteristics. Appetite, 1: 21-41.
Forbes, J.M., 1986. The voluntary food intake of farm animals. Butterworths, London, 206 pp. Geliebter, A., S. Westreich, D. Gage, R.S. McCray and S.A. Hashim, 1987. Effects of an intragastric balloon on
body weight, food intake, gastric emptying rate. In: R J . Wurtman and J.J. Wurtman (Eds.), Human obesity, Annals of the New York Academy of Sciences, 499: 318-320.
Gill, M., A.J. Rook and L.R.S. Thiago, 1988. Factors affecting the voluntary intake of roughages by the dairy cow. In: P.C. Garnsworthy (Ed.), Nutrition and lactation in the dairy cow, Butterworth, London, pp. 262-279.
Greenhalgh, J.F.D. and G.W. Reid, 1967. Separating the effects of digestibility and palatability on food intake in ruminant animals. Nature, 214: 744.
Grovum, WL., 1987. A new look at what is controlling food intake. In: F.N. Owens (Ed.), Feed intake by beef cattle, Proceedings Symposium: Feed intake by beef cattle, Nov.20-22 1986, Animal Science Department, Agricultural Experimental Station Division of Agriculture, Oklahoma State Univerity, pp. 1-39.
Heany, D.P., WJ . Pigden, DJ. Minson and G.I. Pritchard, 1963. Effect of pelleting on energy intake of sheep from forages cut at three stages of maturity. Journal of Animal Science, 22: 752-757.
INRA, 1978. Alimentation des ruminants. INRA Publications (Ed.), route de Saint-Cyr, 78000 Versailles, 597 pp.
Jarrige, R., C. Demarquilly and J.P. Dulphy, 1973. The voluntary intake of forages. Växtodling, 28:98-106. Jones, G.M., 1972. Chemical factors and their relation to feed intake regulation in ruminants: a review. Canadian
Journal of Animal Science, 52: 207-239. Journet, M. and B. Rémond, 1976. Physiological factors affecting the voluntary intake of feed by cows: a
review. Livestock Production Science, 3: 129-146. Krüger, L. von and W. Müller, 1955. Über Futteraufnahme und Verzehrleistungen bei Milchkühen.
Züchtungskunde, 27: 17-37. Lehmann, F., 1941. Die Lehre vom Ballast Zeitschrift für Tierernährung und Futtermittelkunde, 5: 155-173. Mertens, D.R., 1973. Application of theoretical mathematical models to cell wall digestion and forage intake in
ruminants. Ph.D. thesis, Cornell University, Ithaca, New York, 217 pp. Mertens, D.R., 1987. Predicting intake and digestibility using mathematical models of ruminai function. Journal
of Animal Science, 64: 1548-1558. Mertens, D.R. and L.O. Ely, 1979. A dynamic model of fiber digestion and passage in the ruminant for
evaluating forage quality. Journal of Animal Science, 49: 1085-1095. Milford, R., 1960. Nutritional values for 17 sub-tropical grasses. Australian Journal of Agricultural Research,
11: 138-148. Milford, R., 1967. Nutritive values and chemical composition of seven tropical legumes and lucerne grown in
subtropical south-eastern Queensland. Australian Journal of Experimental Agriculture and Animal Husbandry, 7: 540-545.
30

Milford, R. and DJ. Minson, 1968a. The digestibility and intake of six varieties of rhodes grass (Chloris gayana). Australian Journal of Experimental Agriculture and Animal Husbandry, 8:413-418.
Milford, R. and DJ. Minson, 1968b. The effect of age and the method of haymaking on the digestibility and voluntary intake of the forage legumes Dolichos lablab and Vigna sinensis. Australian Journal of Experimental Agriculture and Animal Husbandry, 8:409-412.
Minson, DJ., 1967. The voluntary intake and digestibility, in sheep, of chopped and pelleted Digitaria decumbens (pangola grass) following a late application of fertilizer nitrogen. British Journal of Nutrition, 21: 587-597.
Minson, D.J., 1973. Effect of fertilizer nitrogen on digestibility and voluntary intake of Chloris gayana, Digitaria decumbens and Pennisetum clandestinum. Australian Journal of Experimental Agriculture and Animal Husbandry, 13: 153-157.
Minson, D.J., 1982. Effects of chemical and physical composition of herbage eaten upon intake. In: J.B. Hacker (Ed.), Nutritional limits to animal production from pastures, Commonwealth Agricultural Bureaux, Farnham Royal, pp. 167-182.
Minson, DJ. and R. Milford, 1967. The voluntary intake and digestibility of diets containing different proportions of legume and mature pangola grass (Digitaria decumbens). Australian Journal of Experimental Agriculture and Animal Husbandry, 7: 545-551.
Minson, DJ. and R. Milford, 1968. The nutritional value of four tropical grasses when fed as chaff and pellets to sheep. Australian Journal of Experimental Agriculture and Animal Husbandry, 8: 270-276.
Minson, DJ., CE. Harris, W.F. Raymond and R. Milford, 1964. The digestibility and voluntary intake of S22 and HI ryegrass, S170 tall fescue, S48 timothy, S215 meadow fescue and germinal cockfoot. Journal of the British Grassland Society, 19: 298-305.
NRC (National Research Council), 1987. Predicting feed intake of food-producing animals. National Academy Press, Washington D.C., 85 pp.
Oldham, J.D., 1984. Protein-energy interrelationships in dairy cows. Journal of Dairy Science, 67: 1090-1114. Poppi, D.P., DJ. Minson and J.H. Ternouth, 1981. Studies of cattle and sheep eating leaf and stem fractions of
grasses. III. The retention time in the rumen of large feed particles. Australian Journal of Agricultural Research, 32: 123-137.
Searle, T.W., N.McC. Graham and M. O'Callaghan, 1972. Growth in sheep. I. The chemical composition of the body. Journal of Agricultural Science, Cambridge, 79: 371-382.
Sibly, R.M. and P. Calow, 1986. Physiological ecology of animals. An evolutionary approach. Blackwell Scientific Publications, Oxford, 179 pp.
Tetlow, R.M. and RJ . Wilkins, 1974. The effects of method of processing on the intake and digestibility by lambs of dried perennial rye-grass and tall fescue. Animal Production, 19: 193-200.
Thomas, C. and R.C. Rae, 1988. Concentrate supplementation of silage for dairy cows. In: P.C. Gamsworthy (Ed.), Nutrition and lactation in the dairy cow, Butterworth, London, pp. 327-354.
Thornton, R.F. and D.J. Minson, 1973. The relationship between apparent retention time in the rumen, voluntary intake, and apparent digestibility of legume and grass diets in sheep. Australian Journal of Agricultural Research, 24: 889-898.
Ulyatt, M J., K.L. Blaxter and I. McDonald, 1967. The relations between the apparent digestibility of roughages in the rumen and lower gut of sheep, the volume of fluid in the rumen and voluntary feed intake. Animal Production, 9: 463-470.
Van Soest, PJ., 1982. Nutritional ecology of the ruminant. O & B Books, Inc., Corvallis, Oregon, 374 pp. Vona, L.C., G.A. Jung, R.L. Reid and W.C. Sharp, 1984. Nutritive value of warm-season grass hays for beef
cattle and sheep; digestibility, intake and mineral utilization. Journal of Animal Science, 59: 1582-1593. Waldo, D.R., 1986. Effect of forage quality on intake and forage-concentrate interactions. Journal of Dairy
Science, 69: 617-631. Weston, R.H., 1966. Factors limiting the intake of feed by sheep. I. The significance of palatability, the capacity
of the alimentary tract to handle digesta, and the supply of glucogenic substrate. Australian Journal of Agricultural Research, 17: 939-954.
Weston, R.H., 1985. Quoted by Weston and Poppi (1987). Weston, R.H., 1988. Factors limiting the intake of feed by sheep. XI. The effect of pregnancy and early lactation
on the digestion of a medium-quality roughage. Australian Journal of Agricultural Research, 39: 659-669.
31

Weston, R.H. and J.P. Hogan, 1973. Nutrition of herbage-fed ruminants. In: G. Alexander and O.B. Williams, The pastoral industries of Australia. Practice and technology of sheep and cattle production, Sydney University Press, pp. 233-268.
Weston, R.H. and D.P. Poppi, 1987. Comparative aspects of food intake. In: J.B. Hacker and J.H. Temouth (Eds.), The nutrition of herbivores, Second International Symposium on the Nutrition of Herbivores, Academic Press, London, pp. 133-161.
32

2 Feed intake capacity of ruminants: flexible or constrained?
Abstract
Using published data about feed intake, basal metabolism and gut fill of domestic ruminants, different opinions are tested with regard to animal differences in intake capacity. Special attention is given to the idea that constraints imposed by gut size and digesta retention time cause feed intake to vary between animals. Between genotypes (species, breeds or individuals) intake is generally proportional to basal metabolism. Per kilogram liveweight, small genotypes have a considerably higher intake capacity than large genotypes, and corresponding larger gut contents and/or a shorter digesta retention time. Differences of the latter parameters are more likely the consequence of a difference in intake than its cause. Within genotypes, parallel changes in intake, gut contents and digesta retention time following changes in weight or physiological state (pregnancy or lactation), do not necessarily imply a causal relationship between gut fill and intake. Simultaneously, drastic changes in animal metabolism occur as reflected, for instance, in differences in the efficiency of metabolizable energy utilization for production. Effects of temperature and daylength demonstrate that the same animal can modify its intake of both high and low quality feeds to a considerable extent. Why ruminants use this capacity to raise energy intake only under certain conditions, may be related to necessary changes in metabolic activity which are not beneficial in all situations.
2.1 Introduction
The level of voluntary feed intake relative to maintenance requirements greatly influences productivity of ruminants. Depending on the quality of roughages, ad libitum intake of digestible organic matter by mature sheep appears to vary from less than 0.5 to 3 times maintenance requirements as shown in Chapter 1. Apart from differences in feed composition, differences in animal genotype, physiological state and environmental conditions influence the level of voluntary feed consumption. A greater understanding of the latter variation in intake is not only of scientific interest, but may also serve practical purposes as for example in the development of breeding strategies, the choice of genotypes for particular nutritional environments and the choice of optimum growth trajectories.
In Chapter 1, concepts currently used to explain differences in voluntary intake between feeds were discussed. The essence of these concepts can be summarized as follows. - Animals seek to obtain a genetically determined maximum growth and milk production rate
and a therefore required maximum nutrient intake. - This inborn tendency can be inhibited by both endogenous and exogenous factors like a
limited physical capacity to ingest feed (a too small rumen size in conjunction with a high fibre content of feeds), low palatability of feeds, unfavourable climatic conditions and disease.
33

- Actual intake depends upon the balance between intake stimulating effects, in particular the demand for nutrients, and intake limiting effects. In case of roughage consumption, the rumen filling effect of feed is considered the main constraint on intake.
From an analysis of relevant literature we concluded in Chapter 1 that these ideas are inadequate to explain the variation in voluntary intake caused by differences in feed composition. The same concepts are also found in studies and reviews of the effects of animal differences on intake. However, also essentially different opinions have been expressed. Therefore, this second paper starts with a brief outline of opinions on differences in intake capacity between herbivores. Their applicability to domestic ruminant species will be subsequently tested with the help of published data on the variation in intake due to differences in genotype, physiological state and environmental conditions. Finally, we will discuss which aspects of feed intake behaviour need to be studied in greater detail in order to improve our understanding of the causes of animal variation in intake.
2.2 Opposing opinions
From comparative studies of herbivorous species, quite different opinions emerge with regard to the capacity of herbivores to consume roughages, i.e. feeds which constitute their natural diet. These differences become especially apparent when considering the putative effects of energy requirements for maintenance and production, and gut size on feed intake capacity. This can be illustrated best with a comparison of large and small-sized species. It is well known that energy requirements of species roughly increase as a function of metabolic weight (MW = W0-75). This means that small species have higher requirements relative to their body weight than large species. Comparing a small species with a large one on the same diet, we may expect to find one of three possible relationships. 1. Feed intake capacity of different species is proportional to their maintenance energy
requirements. As a consequence, the small species will consume more feed relative to its body weight. This requires a larger gut size, a shorter digesta retention time or a combination of the two.
2. Feed intake capacity of different species is proportional to their body weight. In that case the small species will consume less feed relative to its energy requirements. In a natural environment it will probably select better quality feeds.
3. An intermediate relationship: the feed intake capacity of the small species is somewhat larger relative to its body weight but not enough to compensate for the higher energy requirements. The first relationship reflects the opinion of for instance Kleiber (1961). Illustrating the
statement that feed conversion is not affected by the size of the species, Kleiber (1961) claimed that a 2000 lbs batch of hay will give the same weight gain (some 240 lbs), irrespective whether we feed it to 300 rabbits of 4V3 lbs each or to a steer of 1300 lbs. The rabbits will have finished the hay in 30 days, the steer only in 120 days. This is because the maintenance energy requirement per kg weight of the rabbits is four times that of the steer, and because feed intake is supposed to differ accordingly.
34
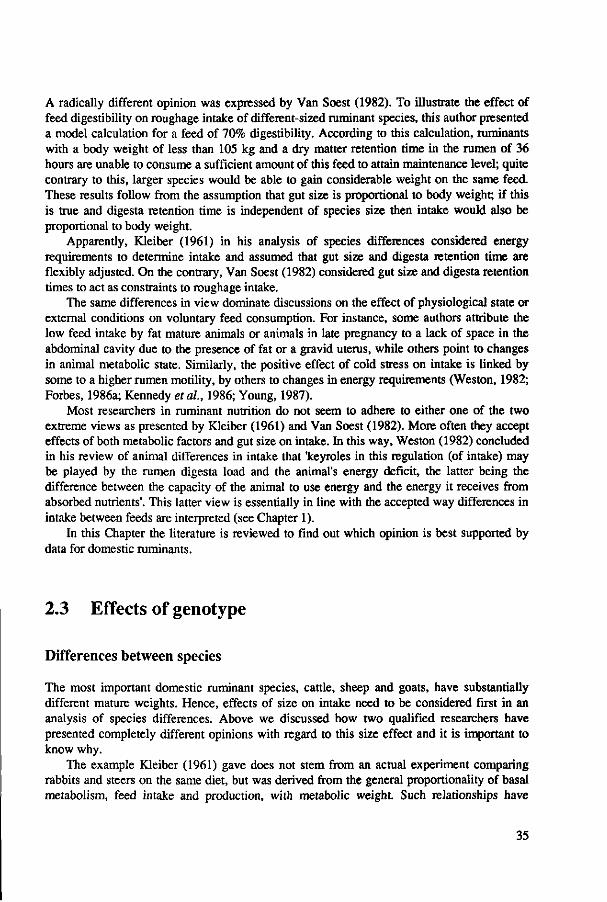
A radically different opinion was expressed by Van Soest (1982). To illustrate the effect of feed digestibility on roughage intake of different-sized ruminant species, this author presented a model calculation for a feed of 70% digestibility. According to this calculation, ruminants with a body weight of less than 105 kg and a dry matter retention time in the rumen of 36 hours are unable to consume a sufficient amount of this feed to attain maintenance level; quite contrary to this, larger species would be able to gain considerable weight on the same feed. These results follow from the assumption that gut size is proportional to body weight; if this is true and digesta retention time is independent of species size then intake would also be proportional to body weight.
Apparently, Kleiber (1961) in his analysis of species differences considered energy requirements to determine intake and assumed that gut size and digesta retention time are flexibly adjusted. On the contrary, Van Soest (1982) considered gut size and digesta retention times to act as constraints to roughage intake.
The same differences in view dominate discussions on the effect of physiological state or external conditions on voluntary feed consumption. For instance, some authors attribute the low feed intake by fat mature animals or animals in late pregnancy to a lack of space in the abdominal cavity due to the presence of fat or a gravid uterus, while others point to changes in animal metabolic state. Similarly, the positive effect of cold stress on intake is linked by some to a higher rumen motility, by others to changes in energy requirements (Weston, 1982; Forbes, 1986a; Kennedy et al, 1986; Young, 1987).
Most researchers in ruminant nutrition do not seem to adhere to either one of the two extreme views as presented by Kleiber (1961) and Van Soest (1982). More often they accept effects of both metabolic factors and gut size on intake. In this way, Weston (1982) concluded in his review of animal differences in intake that 'keyroles in this regulation (of intake) may be played by the rumen digesta load and the animal's energy deficit, the latter being the difference between the capacity of the animal to use energy and the energy it receives from absorbed nutrients'. This latter view is essentially in line with the accepted way differences in intake between feeds are interpreted (see Chapter 1).
In this Chapter the literature is reviewed to find out which opinion is best supported by data for domestic ruminants.
2.3 Effects of genotype
Differences between species
The most important domestic ruminant species, cattle, sheep and goats, have substantially different mature weights. Hence, effects of size on intake need to be considered first in an analysis of species differences. Above we discussed how two qualified researchers have presented completely different opinions with regard to this size effect and it is important to know why.
The example Kleiber (1961) gave does not stem from an actual experiment comparing rabbits and steers on the same diet, but was derived from the general proportionality of basal metabolism, feed intake and production, with metabolic weight. Such relationships have
35

usually been derived from comparisons of species as different as rats and cattle which must have received different diets. So this relationship does not necessarily apply to species on the same diet.
Also the model calculations of Van Soest (1982) were not based on data of comparative feeding trials with different herbivorous species. Instead, they were based on a proportionality of gut contents and liveweight observed in herbivorous species and on estimated maintenance energy requirements as a function of W0-75. Data on gut contents were obtained from captured wild animals belonging to a range of species with body weights of less than 0.1 kg to more than 1000 kg. This means that the observed proportionality between gut contents and body weight did not stem from animals on the same diet; probably the smaller species, by nature concentrate selectors, will have consumed a more digestible diet than the larger species. Such data may not show the potential gut size unless we assume that gut size is not influenced by type of diet which is unlikely (ARC, 1980; Weston and Poppi, 1987). It is also worth noting that gut contents appear to vary between 7 to 20% of body weight for species weighing less than 20 kg as well as for species weighing more (Demment and Van Soest, 1983).
It is evident, however, that over the total range of body weights studied, gut size cannot be related to W0-7^. This is not compatible with real anatomic proportions as the following example shows. Based on normal gut contents of 75 kg for cattle of 500 kg (ARC, 1980; Van Soest, 1982), or 0.7 kg per kg W0-75, a proportionality of gut contents with W0-75 would imply actual gut contents of 372, 105, 59, 33, 19 and 10% of body weight for animals weighing respectively 0.02, 0.2, 2, 20, 200 and 2000 kg. Obviously, very small herbivores will be forced to shorten digesta retention time and/or select a more digestible diet in order to satisfy their energy requirements. However, for herbivores with a body weight above 10 kg, a gut size and intake proportional to W0-75 does not seem impossible. All domestic ruminant species belong to this upper weight range, varying from dwarf goats to cattle with female mature weights of about 30 and 600 kg, respectively.
Much of the confusion with regard to species differences can be removed by looking at actual data of gut contents, retention times and feed intake of domestic ruminants on the same or similar diets. For instance, ARC (1980) derived relations between live weight (LW) and empty body weight (EBW) from almost 100 data sets for both cattle and sheep. For long dried roughages the equation is: LW = 1.09 * (EBW + a), with a=25 for cattle and a=5 for sheep. To compare species at similar maturity we have scaled this relation to the mature weight of reproductive females. For sheep we assumed a weight of 75 kg, for cattle 600 kg. Figure 2.1a shows that at equal maturity gut contents per kg EBW are much higher for sheep than for cattle. The same Figure also includes some observations of gut contents of three groups of dwarf goats (means of 8-12 animals per group). These animals were fed on grass hay for at least a month and then slaughtered early in the morning just before they usually took their largest meal (Zemmelink and Tolkamp, unpublished data). This smallest species clearly has the largest relative gut contents. So the proportionality of gut contents with bodyweight found by Van Soest (1982) in wild herbivores is absent from this comparison of three domestic ruminant species fed similar diets. Instead, gut contents appear roughly proportional to basal metabolism as Figure 2.1b illustrates. In this Fig. gut contents have been scaled to fasting heat production (FHP) as a measure of basal metabolism. FHP of cattle and sheep were estimated according to ARC (1980). Dwarf goats have a similar FHP relative to W0-75 as sheep (see Chapter 5).
36

Gut fill/EBW (kg/kg)
0.5
0.4
0.3
0.2
0.1
n
sheep
cattle
i
0.2 0.4 0.6 0.8
Maturity
Gut fill/FHP
3.0
2.0
1.0
0.0
0.2 0.4 0.6 0.8
Maturity
Fig. 2.1. The ratio of gut fill (kg) to empty body weight (EBW, kg) (a) and to fasting heat production (FHP, MJ.d1) (b) as a function of maturity, i.e. body weight as a fraction of mature weight. See text for data sources.
The average trend in Fig. 2.1a is based upon a large number of observations and indicates relatively high gut contents in sheep and dwarf goats as compared to cattle. Exceptions to this general trend do occur, however. For instance, Poppi et al. (1980) and Hendricksen et al. (1981) found rumen contents between sheep and cattle to vary almost proportional to body weight in trials with 10 different roughages with a dry matter digestibility varying between 46 and 58%. Despite this, the average digestible dry matter intake relative to estimated maintenance requirements was not lower in sheep than in cattle. This was associated with a significantly shorter retention time of dry matter in the rumen (-30.4%, s.e.: 4.5) and a slightly lower digestibility in sheep compared to cattle. Also some other studies show longer digesta retention times in large ruminants compared to smaller-sized species (Engelhardt et al, 1985; Blaxter, 1989).
Direct comparisons of feed intake and FHP of different ruminant species at a similar physiological state are scarce. The available data generally show differences in feed intake and basal metabolism to be proportional. For instance, Blaxter et al. (1966b) confirmed this relationship in experiments with sheep and cattle given oat straw, hay, dried grass and mixtures of these feeds. Diets covered a range of energy digestibility coefficients of less than 50% to over 70% and a digestible energy intake of approximately maintenance level to three times this level. Dry matter intake relative to maintenance requirements of sheep was somewhat higher than that of cattle, especially on the lower quality feeds; but the potential positive effect of this difference on digestible energy intake was offset by a small reduction of digestibility in sheep.
37

From Australian experiments, Weston (1982) also concludes that the differences in intake between sheep and cattle are paralleled by similar differences in maintenance requirements. The same conclusion was drawn from a comparison of cattle, buffalo and banteng (Frisch and Vercoe, 1977; Vercoe and Frisch, 1980) and in own experiments with dwarf goats and much heavier Swifter sheep. The latter experiments involved measurements of feed intake and FHP over a period of 1.5 year on three different rations of long or pelleted roughage (see Chapter 5). FHP was measured 6 times during this period. When the digestible organic matter intake in the month preceding the measurement of FHP was expressed per MJ FHP no significant differences (P>0.20) were detected between sheep and dwarf goats (Fig. 2.2a,b).
DOMI/FHP + se (g/MJ)
200
38 50 65 83 101
Average age (weeks)
118
Average
100
80
60
40
20
0
3
•
0 40 5
•
à
i
0
dwarf goats À sheep
* *
• •
60 70 80 90
Average age (weeks)
1C
A
u
0
B
A
•
110 120
Fig. 2.2. The ratio of voluntary intake of digestible organic matter (DOM, g.d"1) to fasting heat production (FHP, MJ.d"1) (a) and liveweights (kg) of dwarf goats and sheep at six different ages (b) (see Chapter 5). Diets fed in the 2 months preceding each FHP measurement were chopped grass hay (at age 38 weeks), pelleted grass straw (50, 65 and 83 weeks) or pelleted lucerne (101 and 118 weeks). Bars horizontally shaded refer to data of dwarf goats, bars vertically shaded to data of sheep.
The data discussed so far apply to growing animals. Direct comparisons of feed intake and basal metabolism of lactating sheep and cattle have not been traced. However, ARC (1980) gives separate estimates of FHP and feed intake during lactation based upon an extensive literature survey. ARC (1980) estimates FHP per kg W0-75 of lactating sheep at 75% of that of lactating cattle. For rations with a metabolizability of 0.55, ad libitum intake for sheep and cattle is estimated at 105 and 135 g.kg-°-75.d_1, for rations with metabolizability 0.50 the
38

figures are 84 and 115 g.kg-0-75^"1. In the first case, intake relative to W0-75 of sheep is 78% of intake of cattle, in the second case this percentage is 73%. Therefore, also in this comparison differences in intake appear approximately proportional to differences in basal metabolism.
In lactating primiparous dwarf goats (body weight around 20 kg) fed pelleted roughage with dry matter digestibility of about 55%, we measured a dry matter intake of over 6% of body weight (Adenuga et al., 1990). The digestible organic matter intake of these dwarf goats amounted to some three times maintenance requirements, quite similar to the estimates of ARC (1980) for lactating cattle and sheep. Apparently, this small ruminant species shows a similar capacity for feed intake to that of much larger ruminant species if scaled to basal metabolism.
Summarizing, we conclude that between domestic ruminant species of widely differing size, feed intake varies proportional to maintenance requirements as Kleiber (1961) expected. This is accompanied by large differences in gut contents per kg body weight and/or in digesta retention times. Between species, therefore, gut size does not seem to act as a constraint to intake capacity.
Differences within species
The proportionality between feed intake and maintenance requirements observed in between-species comparisons is also found within species: between breeds as well as between individuals within breeds. Although direct evidence is scarce, clear examples are provided by the experiments of Vercoe and Frisch (1982) with Bos taurus and Bos indicus breeds and crosses, and the experiments of Blaxter et al. (1966a, 1966b) with sheep. Unfortunately, in many other comparative studies only feed intake or FHP has been measured.
Indirect evidence is more amply available. For example studies of Ferell and Jenkins (1984) confirmed earlier publications that basal metabolism per kg W0-75 (measured with non-lactating animals) is positively correlated with the milk production capacity of the breed. Geay and Robelin (1979) and Béranger and Micol (1980) concluded that the same positive correlation applies to feed intake (measured in bulls) and milk production capacity of the breeds concerned.
Several factors may disturb the correlation between basal metabolism and feed intake. First of all, maturity changes the relationship between intake and basal metabolism in non-reproducing animals. As discussed below, feed intake decreases relative to maintenance requirements with an advance of maturity. Therefore, comparing breeds of different mature size at equal weights instead of equal maturity may create differences in intake relative to maintenance requirements.
Yet even at equal maturity some variation still remains, part of which appears to be related to breed differences in the composition of weight gain i.e. the proportion of body fat and body protein. This conclusion mainly comes from comparisons of the Limousin, Charolais and Holstein breeds (Geay and Robelin, 1979; Béranger and Micol, 1980). It leads to an interesting parallel with a conclusion drawn in Chapter 1. There we saw that differences in intake between feeds are positively correlated with differences in efficiency of metabolizable energy (ME) utilization for gain. Here a similar phenomenon occurs for animal differences in intake, as it is well documented that the efficiency of ME utilization for body
39

protein gain is lower than for body fat gain (Pullar and Webster, 1977; ARC, 1980). Armstrong (1982) also pointed to a direct relation between the ratio of protein and fat in weight gain of cattle and sheep and the efficiency of ME utilization for gain. This parallel needs further confirmation by direct comparisons of feed intake, composition of weight gain and efficiency of ME utilization in different breeds.
Finally, within-species differences in intake and basal metabolism may be related to the sex of the animal. Most studies show a 10 to 15% higher basal metabolism in intact males compared to females and castrated animals (ARC, 1980), some do not (for instance Blaxter et al, 1982). Although intact males sometimes show a substantially higher intake (see for instance Gettys et al, 1989), more often intake differences between sexes are small or even absent (ARC, 1980; Béranger and Micol, 1980; Blaxter et al, 1982). Possibly, differences in composition of weight gain and efficiency of energy utilization between sexes are also involved here (Armstrong, 1982).
We conclude that, between and within species, differences in intake largely disappear when corrected for differences in basal metabolism and maturity. The remaining variation appears to be linked at least partly to differences in composition of weight gain and sex, both factors of metabolic origin. No evidence was found for effects of anatomical size per se on intake. For instance, the proportionality between roughage intake and body weight in lactating animals often quoted from the work of Conrad et al. (1964) is an artefact due to the use of an inappropriate statistical model (Grovum, 1987). Also the opinion of Oldenbroek (1988) that differences in intake of lactating cows of different breeds may be due to differences in body conformation appears to be based on an incorrect interpretation of breed differences in the ratios of body length and body height to body weight.
2.4 Effects of physiological state
Growth and development
Daily feed intake in absolute terms generally increases with increasing age to a maximum level which is then maintained for months or even years and sometimes decreases again at a later stage. Published data do not provide a uniform picture of the feed intake curve as a function of age or weight. Sometimes the maximum level of intake is reached at about one third of mature weight (i.e. around puberty), sometimes after this (ARC, 1980; Béranger and Micol, 1980; Blaxter et al, 1982; NRC, 1987). Some evidence exists that the form of the intake curve is influenced by differences in diet quality: maximum intake would be attained at lower weights when diet quality is higher (Taylor, 1985). Many different mathematical models have been used to describe the intake curve (ARC, 1980; Parks, 1982; NRC, 1987; Illius, 1989). The same is true for curves relating basal metabolism or maintenance requirements to weight. For the latter relation the allometric model, sometimes extended with an effect of age, seems to be preferred (ARC, 1980). Whatever the exact nature of mathematical relations may be, most publications assume a decrease of voluntary intake relative to basal metabolism for the final two-third or half of the full weight range. An exception are the models ARC (1980) presented to estimate intake and basal metabolism of
40

cattle. Those models suggest a continuous increase of intake relative to basal metabolism which cannot be realistic: as mature weight is approached growth rates decline and intake level must tend towards maintenance requirements. Hence, the proportionality between intake and basal metabolism observed between genotypes does not exist within a genotype.
In an attempt to explain the changes of intake with age or weight, early publications have stressed the reduction of gut capacity due to the presence of large amounts of fat. This view is not generally accepted any more (Blaxter et al., 1982; Weston, 1982; Forbes, 1986a). Recent publications more often refer to a genetically determined growth curve ('the genetic programme for growth', Weston and Poppi, 1987) and changing energy requirements as a consequence of this. As the growth rate decreases when mature weight is approached, energy requirements and thus feed intake relative to maintenance requirements will also decline. This is correct in itself but explains little as long as the requirements for energy cannot be measured truly independently from the consumption of feed. The question always remains whether a lower relative intake is cause or effect of a reduced growth rate.
In Chapter 1 we argued that, if indeed something like a genetic programme for growth exists, this is certainly not fixed as for instance the phenomenon of compensatory growth shows. In addition, one may wonder what the real significance is of growth curves measured in ruminants fed high quality feeds ad libitum for years. Several experiments demonstrate that such conditions induce considerable fattening (Searle et al., 1972; Blaxter et ah, 1982). Fattening starts at about one third of final body weight under such conditions. This means that ultimately two third of body weight consists of body reserves with a fat percentage of about 70%. Fattening - and its counterpart periodic mobilization of body reserves- may be considered a useful strategy of ruminants as long as they are kept in their natural environment, normally characterized by large seasonal fluctuations in feed quality and feed availability. The enormous fat deposition as actually measured in long-term feeding trials may have little to do with a genetic programme for growth but more with the failing response of a system facing abnormal nutritional conditions.
Pregnancy and lactation
Intake usually changes during pregnancy but not always in a predictable way. A pattern regularly observed is a slight increase during mid-pregnancy followed by a slight decrease towards the end of pregnancy. Just before birth a sharp decrease of intake often occurs. The decrease of intake during the last trimester of pregnancy is independent of type of ration and ration quality. Digesta retention time appears to shorten in the course of pregnancy (Weston, 1982; Forbes, 1986a,b).
This intake pattern does not seem to match the increasing energy needs of the pregnant animal which implies that energy requirements and intake do not always change in parallel. Why this happens is not clear. Here again competition for space between the gut and the gravid uterus has been mentioned as a possible cause (Forbes, 1986a). But, as Weston (1988) commented, changes in rumen volume are not consistent with changes in the size of the gravid uterus: 1. rumen volume starts to decrease before uterus size has changed significantly and 2. the change of rumen volume is similar whether one or two foetuses are present in the uterus. These observations, together with the finding that intake also decreases on concentrate rich rations, do not support a causal relation between gut size and intake.
41

In an attempt to explain this paradox, Weston (1988) points to the altered endocrine status during pregnancy which may influence the capacity to handle digesta and, by this, intake. However, changes in hormonal concentrations can show at best the way a change in intake is realized, they do not constitute a functional explanation in themselves. Such an explanation may be found in the metabolic processes which accompany pregnancy and lactation. Studies of Metz and Van den Bergh (1977) have shown that the increased mobilization of body fat results from an increase in lipolytic and a decrease of lipogenic activity in body adipose tissues. Such changes become detectable some time before parturition. Simultaneously, blood concentrations of free fatty acids begin to rise. This probably means a reduction of the capacity to use feed energy for fat synthesis. All these metabolic changes may be considered a useful preparation of the pregnant animal for the onset of lactation. By actively reducing body fat synthesis, the animal prepares for the major channelling of feed energy into milk after parturition. Preparatory metabolic changes probably need some time and this would explain the decrease of intake before parturition.
Lactating animals consume more of the same feed, irrespective of its quality, than non-lactating animals of similar weight, age and nutritional history. Usually, the difference in intake amounts to some tens of percentage units, sometimes considerably more, up to 100 percent in cattle and sheep as well as in dwarf goats (ARC, 1980; Adenuga et al., 1990). The increase in intake is positively influenced by milk yield, number of suckling young and body leanness of the mother animal. The higher intake during lactation is accompanied by an increase in gut contents and a decrease in digesta retention times and sometimes an increase in the average size of faecal particles is observed (ARC, 1980; Van Soest, 1982; Weston, 1982, Forbes, 1986b). A reduction of digestibility (ARC, 1980) also indicates a more rapid digesta turnover.
During lactation there is no strict link between observed changes in intake and changes in milk energy output. During the first part of lactation animals generally have an energy deficit; later on this changes into a positive energy balance if diet quality is sufficiently high.
The changes of feed intake during lactation are often considered a clear illustration of the idea that intake follows from a balance between the demand for nutrients and the constraints imposed by gut size. Higher requirements would induce the animal to accept a higher rumen fill or a more rapid digesta turnover and this would allow a larger intake (Forbes, 1986b; Weston, 1988). Here again, cause and effect are difficult to distinguish. In addition, any change in intake due to whatever cause will show itself in changes of gut fill or digesta retention time.
Changes in intake may be equally well related to changes in metabolic processes. These concern of course the nature of animal products but perhaps more important is the efficiency with which these are formed from metabolizable energy. It is worth noting that both the efficiency of ME utilization and intake are higher in lactating animals compared to non-lactating animals (ARC, 1980). On the other hand, efficiency of ME utilization for pregnancy is remarkably low and this is frequently combined with a decrease in intake despite the fact that energy requirements can be expected to rise as pregnancy advances (ARC, 1980).
42

2.5 Effects of external conditions
Amongst the external conditions affecting intake in ruminants, especially the effects of temperature and daylength may throw some more light on causes of differences in intake.
Temperature
Variation in temperature over a relatively wide range has little effect on intake by ruminants. A decrease of temperature to below the lower critical level or an increase of this latter value (for instance following shearing) raises intake of both growing and pregnant animals (Weston, 1982; Forbes, 1986a; Young, 1986, 1987). The magnitude of the increase depends on the severity of cold stress: values of up to 60% have been recorded, usually in association with increased rumen volumes or a shorter digesta retention time (Weston, 1982; Forbes, 1986a; Kennedy et al., 1986; Young, 1987). Sudden and severe cold stress may actually depress intake: in such cases animals often show hypothermia and sheltering behaviour.
In his extensive studies of effects of cold on intake, Young (1986, 1987) assumed that generally roughage intake is physically limited; in his opinion increased rumen motility, shorter ruminai retention times and consequently a more ample supply of protein to the small intestine are the causative factors explaining a higher intake during cold stress. If so, the question arises why ruminants do not exploit the same mechanism in the thermoneutral zone.
An intriguing observation is the fact that the increase in intake in cold stress does not occur immediately but only after a period of adaptation lasting at least a week (Forbes, 1986a; Sasaki and Weekes, 1986). During that time, animals show shivering behaviour. Once animals have become adapted, shivering is no longer apparent, pituitary activity is raised and basal metabolism increased up to 30-40% for both sheep and cattle. This rise of basal metabolism also occurs in animals fed restricted allowances. If cold adapted animals are transferred to a warmer environment it takes again some time before basal metabolism reestablishes itself on a lower level (Young, 1986,1987).
Unlike cold stress, sudden heat stress changes feed intake immediately, the depression of intake being dependent on the severity of stress. Usually, intake is more depressed during a period of adaptation than afterwards. After adaptation, heat and cold stress have opposite effects on digesta retention time, digestibility, pituitary activity and basal metabolism. (Weston, 1982; Forbes, 1986a; Kennedy etal., 1986; Young, 1987).
The sequence of events during the adaptation to changes in temperature seems to indicate a causal relationship between intake and basal metabolism. For instance, during heat stress feed intake decreases suddenly followed later by an adaptation of basal metabolism but recovery of intake once the heat stress is removed takes again some time. During cold stress, feed intake increases not before metabolic changes have taken place. This suggests that a ruminant with a given basal metabolism is not capable of a sudden increase in intake even if the need for extra energy is acutely increased or the risk of hyperthermia is suddenly removed.
43

Daylength
Effects of daylength on feed intake have been found in wild herbivores as well as in domestic ruminants, in both intact and castrated animals. These are independent of the presence of seasonal fluctuations in feed quality as experiments have shown. Under natural conditions, the cycle of daylength variations lasts a year. The effect on intake is a sinusoid fluctuation of feed intake as a function of time. As an example, Figure 2.3 shows the course of daily feed intake of dwarf goats fed ad libitum pelleted lucerne for a period of two years. Peaks and troughs usually coincide with the extreme daylengths as in the example of Fig. 2.3, but sometimes a slight shift is seen. With artificial variations in daylength it has been possible to induce two cycles of feed intake per year (Blaxter and Boyne, 1982; Weston, 1982; Forbes, i986a; Young, 1986,1987; Gettys et al, 1989).
DOMI (g/animalA FHP
bUO -
500 -
400 -
300 i
200 -
100 -
0 -
. • * . • .
•
•
DOMI. > * V * V .
• * * •
* • * . . • • •
; • • • • •
• • FHP
•
•
^ 1 1 1 -
• •
• • •
-
1
(MJ/d)
- 6
20 40 60
Week
100 120
Fig. 2.3. The development of digestible organic matter intake (DOMI, g.d"1) and fasting heat production (FHP, MJ.d"1) over a period of two years of dwarf goats fed pelleted luceme (Tolkamp and Hofs, unpublished data). Liveweights increased from about 12 to 40 kg in this period. Animals were kept under a natural daylength cycle with the shortest days falling in week number 1, 53 and 105. Minimum temperature in winter was maintained at 17 °C.
The variation in intake due to daylength differences appears to be linked to a similar variation in basal metabolism as was found in the studies with dwarf goats (Fig. 2.3). Blaxter and
44

Boyne (1982) have shown that these changes in basal metabolism also occur in animals fed at maintenance level throughout the year: thus they are not the consequence of an altered intake.
2.6 Feed intake, basal metabolism and efficiency of
energy utilization
In the previous sections we have mentioned the correlation between feed intake and basal metabolism, apparent between animals of different genotype and within animals when environmental conditions change. To some degree, the existence of parallel changes in intake and basal metabolism may be considered self-evident: a genotype with a high basal metabolism also needs a high intake in order to be able to survive and be competitive with other genotypes. The exact nature of the relationship between intake and basal metabolism is difficult to establish. From the effects of temperature and daylength we can at least conclude that an increase in basal metabolism is not the consequence of a higher intake. It is tempting to assume a reverse relationship: an increase in basal metabolic activity being required for the animal to raise its intake.
From this assumption the question arises why animals do not show a permanently high level of metabolic activity and feed intake both in short and long days and in thermoneutral as well as cold conditions. What might be possible disadvantages of such a strategy? For adult animals for which weight gain mainly consists of body reserves at least a partial answer can be given. An increase of basal metabolism seems a disadvantage in either of the following situations. 1. A situation when the quality of feed on offer is good, yet its availability prevents animals
to reach the level of ad libitum intake. Without the latter restrictions, animals with a high basal metabolism would gain more weight than animals with a low basal metabolism. On a restricted amount of feed, however, the animal with the lowest basal metabolism will have the highest gain in body reserves.
2. A situation when feed availability is not limiting but quality is so low that even ad libitum intake is insufficient for maintenance. If also in this case feed intake remains proportional to basal metabolism, animals with a low basal metabolism will have to mobilize less body reserves than animals with a high basal metabolism. Both situations occur seasonally in many natural environments when, due to cold or
drought, all feed and especially young and well digestible plant material is scarce. In temperate climates this is the season with short days. Apparently, ruminants have 'learned', during their evolution, to use the daylength signal to adapt to such fluctuating nutritional conditions. In this way, they are able to reduce their energy needs at times when feed energy is not readily available or feed quality too low to attain maintenance level. On the other hand, an above average basal metabolism during long days would allow animals to profit extra from high quality feeds.
The above illustrates how in the case of good quality feeds, animals may benefit from an increase of basal metabolism if only this way an increase of intake is made possible. Yet it does not explain why animals do not use the same mechanism to consume a constant amount
45

of metabolizable or net energy from feeds of moderate to high quality. Common explanations assume that animals are not physically capable of doing this. However, we find it difficult to imagine why cattle should only consume two to three percent of body weight whereas dwarf goats may consume four to six percent of bodyweight from the same feed. Likewise, we feel it hard to believe that a gut fill of 30 or 40% of empty body weight per se may be well tolerated by a dwarf goat, whereas for cattle the same would be impossible or unacceptable. Doubt as to the validity of such an explanation is reinforced by the observed flexibility with which the same animal appears to change gut fill and digesta retention time in response to changing internal and external conditions.
Apart from the correlation between basal metabolism and intake we have pointed to the correlation between intake and the efficiency of utilization of metabolizable energy. The latter correlation was found when considering the intake of different feeds (Chapter 1) and it reappeared here when considering the intake of animals of different genotype and physiological state. How both correlations have helped to formulate a new theory on feed intake regulation will be the subject of Chapter 3.
2.7 Conclusions
1. In domestic ruminants, voluntary feed intake of genotypes of different mature size is positively correlated with basal metabolism or maintenance energy requirements: small and large genotypes have a similar capacity to fulfil their energy needs when offered the same feed.
2. Small genotypes have a substantially higher intake capacity per kilogram body weight than large genotypes. This is linked to relatively larger gut contents and/or a shorter digesta retention time. Differences of the latter parameters are more likely the effect of a difference in intake than its cause.
3. Differences in intake between genotypes of similar mature size are also correlated with differences in basal metabolism and in addition with differences in the composition of weight gain i.e. the proportion of protein and fat.
4. The variation in intake within animals due to changes in weight or physiological state (pregnancy or lactation) is often explained by a variation in the physical capacity to process feed and the tolerance for gut fill. In fact, such an explanation merely shows the way a change in intake is accommodated, not its cause.
5. Effects of temperature and daylength demonstrate that the same animal can modify its intake of both high and low quality feeds to a considerable extent. Why ruminants use this capacity to raise their energy intake only under certain conditions may be related to necessary changes in metabolic activity which are not beneficial in all situations.
6. In order to improve the understanding of the animal variation in intake, the possible significance of differences in basal metabolism and efficiency of energy utilization for the animal needs to be studied.
46
References
Adenuga, K., B.J. Tolkamp, A.A. Ademosun, G. Montsma and B.O. Brouwer, 1990. Effect of pregnancy and lactation on liveweight, feed intake and eating and rumination in West African Dwarf goats. Accepted for publication in Small Ruminant Research.
ARC (Agricultural Research Council), 1980. The nutrient requirements of ruminant livestock. Commonwealth Agricultural Bureaux, Farnham Royal, 351 pp.
Armstrong, D.G., 1982. Digestion and utilization of energy. In: J.B. Hacker (Ed.), Nutritional limits to animal production from pastures, Commonwealth Agricultural Bureaux, Farnham Royal, pp. 225-244.
Béranger, C. and D. Micol, 1980. Intake in relation to the animal. In: C. Béranger (Ed.), Energy and protein feeding standards applied to the rearing and finishing of beef cattle, Annales de Zootechnie, n' hors série, INRA, Paris, pp. 209-226.
Blaxter, K.L., 1989. Energy metabolism in animals and man. Cambridge University Press, Cambridge, 336 pp. Blaxter, K.L. and A.W. Boyne, 1982. Fasting and maintenance metabolism of sheep. Journal of Agricultural
Science, Cambridge, 99: 611-620. Blaxter, K.L., J.L. Clapperton and F.W. Wainman, 1966a. The extent of differences between six British breeds
of sheep in their metabolism, feed intake and utilization, and resistance to stress. British Journal of Nutrition, 20: 283-294.
Blaxter, K.L., V.R. Fowler and J.C. Gill, 1982. A study of the growth of sheep to maturity. Journal of Agricultural Science, Cambridge, 98:405-420.
Blaxter, K.L., F.W. Wainman and J.L. Davidson, 1966b. The voluntary intake of food by sheep and cattle in relation to their energy requirements for maintenance. Animal Production, 8: 75-83.
Conrad, H.R., A.D. Pratt and J.W. Hibbs, 1964. Regulation of feed intake in dairy cows. I. Change in importance of physical and physiological factors with increasing digestibility. Journal of Dairy Science, 47: 54-62.
Demment, M.W. and P.J. Van Soest, 1983. Body size, digestive capacity, and feeding strategies of herbivores. Winrock International, Morrilton, 66 pp.
Engelhardt, W. von, D.W. Dellow and H. Hoeller, 1985. The potential of ruminants for the utilization of fibrous low-quality diets. Proceedings of the Nutrition Society, 44: 37-43.
Ferrell, C.L. and T.G. Jenkins, 1984. Energy utilization by mature, nonpregnant, nonlactating cows of different types. Journal of Animal Science, 58: 234-243.
Forbes, J.M., 1986a. The voluntary food intake of farm animals. Butterworths, London, 206 pp. Forbes, J.M., 1986b. The effects of sex hormones, pregnancy and lactation on digestion, metabolism, and
voluntary food intake. In: L.P. Milligan, W.L. Grovum and A. Dobson (Eds.), Control of digestion and metabolism in ruminants, Proceedings of the Sixth International Symposium on Ruminant Physiology, Banff, Canada, 1984, pp. 420-435.
Frisch, J.E. and J.E. Vercoe, 1977. Food intake, eating rate, weight gains, metabolic rate and efficiency of feed utilization in Bos taurus and Bos indicus crossbred cattle. Animal Production, 25: 343-358.
Geay, Y. and J. Robelin, 1979. Variation of meat production capacity in cattle due to genotype and level of feeding: genotype-nutrition interaction. Livestock Production Science, 6: 263-276.
Gettys, T.W., B.D. Schanbacher and I.L. Taylor, 1989. An assessment of the interaction between photoperiod and sex phenotype in relation to appetite development in sheep. Livestock Production Science, 22: 283-293.
Grovum, W.L., 1987. A new look at what is controlling food intake. In: F.N. Owens (Ed.), Feed intake by beef cattle, Proceedings Symposium: Feed intake by beef cattle, Nov. 20-22,1986, Animal Science Department, Agricultural Experimental Station Division of Agriculture, Oklahoma Sate University, pp. 1-39.
Hendricksen, R.E., D.P. Poppi and DJ. Minson, 1981. The voluntary intake, digestibility and retention time by cattle and sheep of stem and leaf fractions of a tropical legume (Lablab purpweus). Australian Journal of Agricultural Research, 32: 389-398.
Illius, A.W., 1989. Allometry of food intake and grazing behaviour with body size in cattle. Journal of Agricultural Science, Cambridge, 113: 259-266.
Kennedy, P.M., R.J. Christopherson and L.P. Milligan, 1986. Digestive responses to cold. In: L.P. Milligan, W.L. Grovum and A. Dobson (Eds.), Control of digestion and metabolism in ruminants, Proceedings of the Sixth International Symposium on Ruminant Physiology, Banff, Canada, 1984, pp. 285-306.
Kleiber, M., 1961. The fire of life. An introduction to animal energetics. John Wiley and Sons, Inc., New York, 454 pp.
47

Metz, S.H.M, and S.G. Van den Bergh, 1977. Regulation of fat mobilization in adipose tissue of dairy cows in the period around parturition. Netherlands Journal of Agricultural Science, 25: 198-211.
NRC (National Research Council), 1987. Predicting feed intake of food-producing animals. National Academy press, Washington D.C., 85 pp.
Oldenbroek, J.K., 1988. Feed intake and energy utilization in dairy cows of different breeds. PhD thesis, Agricultural University Wageningen, The Netherlands, 155 pp.
Parks, J JR., 1982. A theory of feeding and growth of animals. Springer-Verlag, Berlin, 322 pp. Poppi, D.P., DJ . Minson and J.H. Ternouth, 1980. Studies of cattle and sheep eating leaf and stem fractions of
grasses. I. The voluntary intake, digestibility and retention time in the reticulo-rumen. Australian Journal of Agricultural Research, 32: 99-108.
Pullar, J.D. and A.J.F. Webster, 1977. The energy cost of fat and protein deposition in the rat. British Journal of Nutrition, 37: 335-363.
Sasaki, Y. and T.E.C. Weekes, 1986. Metabolic responses to cold. In: L.P. Milligan, W.L. Grovum and A. Dobson (Eds.), Control of digestion and metabolism in ruminants, Proceedings of the Sixth International Symposium on Ruminant Physiology, Banff, Canada, 1984, pp. 326-343.
Searle, T.W., N.Mc. Graham and M. O'Callaghan, 1972. Growth in sheep. I. The chemical composition of the body. Journal of Agricultural Science, Cambridge, 79: 371-382.
Taylor, St.C.S., 1985. Use of genetic size-scaling in evaluation of animal growth. Journal of Animal Science, 61, Suppl.2: 118-143.
Van Soest, P J., 1982. Nutritional ecology of the ruminant. O&B Books, Inc., Corvallis, 374 pp. Vercoe, JJE. and J.E. Frisch, 1980. Breeding and genetics for beef cattle in the tropics. In: Proceedings of 2nd
Ruminant Seminar, Ciawi-Bogor, Indonesia, May 1980, pp. 14-27. Vercoe, J.E. and J.E. Frisch, 1982. Animal breeding for improved productivity. In: J.B. Hacker (Ed.), Nutritional
limits to animal production from pastures, Commonwealth Agricultural Bureaux, Famham Royal, pp. 327-342.
Weston, R.H., 1982. Animal factors affecting feed intake. In: J.B. Hacker (Ed.), Nutritional limits to animal production from pastures, Commonwealth Agricultural Bureaux, Farnham Royal, pp. 183-198.
Weston, R.H., 1988. Factors limiting the intake of feed by sheep. XII. Digesta load and chewing activities in relation to lactation and its attendant increase in voluntary roughage consumption. Australian Journal of Agricultural Research, 39:671-677.
Weston, R.H. and D.P. Poppi, 1987. Comparative aspects of food intake. In: J.B. Hacker and J.H. Ternouth (Eds.), The nutrition of herbivores, Second International Symposium on the Nutrition of Herbivores, Academic Press, London, pp. 133-161.
Young, B.A., 1986. Food intake of cattle in cold climates. In: F.N. Owens (Ed.), Feed intake by beef cattle, Proceedings Symposium: Feed intake by beef cattle, Nov. 20-22, 1986, Animal Science Department, Agricultural Experimental Station Division of Agriculture, Oklahoma State University, pp. 328-340.
Young, B.A., 1987. The effects of climate upon intake. In: J.B. Hacker and J.H. Ternouth (Eds.), The nutrition of herbivores, Second International Symposium on the Nutrition of Herbivores, Academic Press, London, pp. 163-190.
48

3 Costs and benefits of feed consumption: an optimization approach
Abstract
In this chapter a new concept of feed intake regulation in ruminants is developed starting from the idea that feed consumption presents both costs and benefits to the animal. For a non-reproducing animal we consider the intake of net energy for maintenance and gain to be the benefits of feed consumption, the concomitant consumption of oxygen the costs, since the use of oxygen by tissues indirectly causes an accumulation of damage to cell structures, a loss of vitality, ageing and a limited life span. This leads to the hypothesis that feed intake behaviour will be aimed at maximizing the efficiency of oxygen utilization: from each feed an animal will consume such an amount that the intake of net energy per litre oxygen consumed will be maximal. Testing this hypothesis extensively with data from non-reproducing ruminants shows a good quantitative agreement between predicted and observed ad libitum intake of feeds widely differing in metabolizability, nitrogen content and physical form. Changes in intake parallel to changes of basal metabolism also agree with our hypothesis. Effects on intake of changes in maturity and physiological state are more difficult to test due to insufficient information about the effects of maturity on efficiency of metabolizable energy utilization and uncertainty about the exact nature of costs and benefits of feed consumption in pregnant and lactating animals. Maximization of the efficiency of oxygen utilization may reflect a more universal principle governing the intensity of different forms of behaviour, in ruminants as well as in monogastric animals.
3.1 Introduction
Common ideas about feed intake regulation in ruminants attribute an important role to constraints to feed consumption: feed and animal factors which would counteract the inborn tendency of an animal to achieve a maximal nutrient intake. In the case of roughage diets, it is thought that especially a limited gut size in combination with bulkiness and fibrosity of the feed prevents the animal to consume a large amount of digestible energy. In Chapters 1 and 2 we argued that such a concept of intake regulation is inadequate to explain the observed variation in feed consumption. As an alternative, an approach was suggested that takes into account possible biological advantages and disadvantages of changes in feed intake. We supposed that in the natural environment where ruminants have evolved, a variable energy intake may augment the chances of survival and reproductive success more than a constant intake independent from changes in feed quality, physiological state or external conditions. In Chapters 1 and 2 we also concluded that differences in voluntary intake between genotypes or subsequent to changes in external conditions are correlated with differences in basal metabolism. In addition, part of the variation in intake due to differences in feed and animal factors appeared to be correlated with the efficiency of utilization of metabolizable energy (ME). Both correlations could be keys to a greater understanding of intake regulation.
Generally, basal metabolism is estimated from the heat production of a fasting animal. The efficiency of ME utilization of a feed is calculated from the extra heat an animal produces for each increase in ME intake. In both instances, heat production is derived from
49

measurements of oxygen consumption and carbon dioxide production by the animal. This means that changes in basal metabolism as well as in efficiency of ME utilization have a common denominator in changes of oxygen consumption.
Oxygen consumption appears to have a dual meaning for the animal. On the one hand consumption of oxygen is a necessity for aerobic organisms for the supply of energy required for maintenance and reproduction of life. On the other hand, consumption of oxygen has damaging effects on living organisms which are supposed to accumulate in the course of life and to result in loss of vitality, ageing and finally death (Harman, 1986). The adverse effects linked with the consumption of oxygen appear crucial for a better understanding of feed intake behaviour and perhaps, more in general, of behaviour the intensity of which causes oxygen consumption to rise progressively.
This third chapter starts with a brief review of harmful effects of oxygen use and the correlation between oxygen consumption and life span. From this we infer that, in the course of evolution, animals will have developed mechanisms aimed at maximization of the efficiency of oxygen utilization. We will test this hypothesis by means of model calculations using published data on voluntary feed intake and efficiency of ME utilization in ruminants.
3.2 Oxygen as a toxin
In aerobic organisms like mammals, oxygen is hydrogenated to water in the process of oxidative phosphorylation to provide the energy for the synthesis of energy-rich compounds which are essential for maintenance of life. Inevitable by-products of this process are oxygen free radicals: a family of oxygen-containing molecules with one or more unpaired electrons (de Jong, 1981; Miquel and Fleming, 1986; Oberley and Oberley, 1986; van Ginkel, 1988). These free radicals are highly reactive substances which can oxidize many different cell compounds. The living cell has a number of defence mechanisms to reduce the potential damage caused by oxygen radicals. First, a number of smaller molecules like ascorbic acid (vitamin C), uric acid and glucose readily react with different oxygen radicals. In addition, the cell has a more specific defence system in the form of antioxidants like catalases, peroxydases, and superoxidedismutases which eliminate part of the radicals before they reach vital cell compounds. Finally, the cell membrane contains substances like a-tocopherol (vitamin E) which can stop certain chain reactions in the membrane initiated by the action of oxygen radicals (Koster, 1986; van Ginkel, 1988; Oberley and Oberley, 1986).
The protective action of forementioned mechanisms is not complete: part of the free radicals oxidizes essential cell compounds like the membranes of the cell or cell organells and DNA of cell nucleus and mitochondria. For instance, Brouwer et al. (1986) estimate the number of DNA damages in man as some thousands per cell per day. Organisms would soon lose their vitality if cells were not capable of repairing such damages. Modern ageing theories assume, however, that not all damage is repaired or that errors are made in the repair process. Especially the mitochondrial capacity to recover from 'oxidative injury' would be limited. This means that during cell life there is an accumulation of damage which is not or only partly repaired. Such an accumulation results either in loss of function and death of cells or in uncontrolled division of cells and tumour development. Both will have negative repercussions
50

for tissue and organ functioning. Finally, loss of organ function will accelerate itself and eventually cause the death of the organism as a whole (Ordy, 1984; Brouwer et al., 1986; Harman, 1986; Katz and Robinson, 1986; Koster, 1986; Miquel and Fleming, 1986; Vijg, 1987; Yu et ai, 1990).
The hypothesis that ageing is intimately linked to oxygen consumption was already formulated in the 1950's by Harman and is supported by a growing number of publications (see for instance the recent reviews in Johnson et al., 1986; Brouwer et al., 1986; Koster, 1986). Although the scientific discipline of gerontology seems remote from the agricultural sciences, we think and hope to demonstrate that it can help to understand feeding behaviour of ruminants.
3.3 Oxygen consumption and life span
If the release of free radicals during oxygen use in tissues is the basic cause of loss of vitality, one may expect more rapid ageing to occur whenever daily oxygen consumption is relatively high. This is confirmed by correlations between cumulative oxygen consumption and life span observed both between and within species.
For instance, it is well documented that for mammals in the mouse to elephant weight range both basal metabolism and average metabolic activity increase proportionally to metabolic weight (MW = W0-75). As metabolic activity is almost synonymous with oxygen consumption, average daily oxygen consumption is also proportional to W0-75. Hence, average oxygen consumption per gram of cells per day will be proportional to W°-75/W or W~0-25. As the average cell size does not appear to vary systematically with the size of animal species, also the average consumption of oxygen by individual cells will increase with W" -̂2 .̂ This general rule agrees with observations of single cell types as for example cells of heart muscle and respiratory muscles (Peters, 1983; Calder, 1984; Schmidt-Nielsen, 1984).
It is also well known that between species many time-related parameters systematically vary as a function of body weight. For instance, the time between two heart beats is roughly proportional to W0-25, indicating a contraction frequency in, for instance, mice and elephants of about 600 and 30 beats per minute, respectively. The general proportionality of time-related parameters to W0-25 is found for parameters as diverse as time between gut contractions, pregnancy and lactation period, time to reach mature weight and potential life span. This proportionality of life span with W0-25 means that elephants may live 20 times as long as mice. It also shows that the hearts of mice and elephants which reach their potential life span, will have beaten approximately the same number of times (about a milliard): yet, mice will have reached this number in less than 5% of the time elephants take (Peters, 1983; Calder, 1984; Schmidt-Nielsen, 1984).
Combining information about size effects on daily oxygen consumption and life span we may infer that a similar conclusion as to the number of heart beats also applies to the cumulative amount of oxygen consumed per gram of heart cells. As average daily oxygen consumption per gram of cells is proportional to W"0-25 and potential life span proportional to W0-2^, cumulative amount of oxygen consumed per gram of cells in a lifetime is not systematically influenced by species size, so constant for both mice and elephants. In other
51

words, roughly speaking, heart cells appear to die after they have consumed a definite quantity of oxygen and this quantity is the same regardless of the species to which the cells belong. This suggests that damage to a given cell type as a result of oxygen consumption is directly proportional to the quantity of oxygen consumed.
Survival rate (%)
100
0 200 400 600
Age (days)
1000 1200
Fig. 3.1. Survival curve of two groups of female Sprague-Dawley rats fed ad libitum or at a level of 54% of ad libitum: data from Berg and Simms (1961).
Relations between cumulative oxygen consumption and potential life span are not absolute: a notable exception is man who lives relatively long taking into account his average metabolic rate. Yet, also within species evidence exists for more rapid ageing whenever the rate of oxygen consumption is increased. This evidence comes from both in vitro and in vivo experiments. For instance, liver cells which were induced in vitro to consume more oxygen showed signs of early ageing like the accumulation of the ageing pigment fuscin (Koster, 1986). In vivo evidence has been mainly obtained with insects and rodents. In Drosophila melanogaster, life span is inversely proportional to metabolic rate regardless whether variation in metabolic rate is the result of differences in genotype, temperature or activity allowed. In this species, slow rates of development caused by low temperatures or high larval density are associated with long life spans (Lamb, 1977; Miquel and Fleming, 1986). Also in other poikilotherms, low temperatures or limited access to food, resulting in a decreased oxygen consumption rate, increase life span (Lamb, 1977). Most research with mammals has been carried out with rats and mice. In these experiments, oxygen consumption has been changed by chronic dietary restriction comparing the effect of restricted and ad libitum feeding on life span and development of tumours and lesions. Without exceptions it was
52

found that at an age at which ad libitum fed animals had died, many of the restrictedly fed animals were still alive. These beneficial effects of dietary restriction mainly depend on the restricted calorie intake and are little influenced by the source of calories: fat, carbohydrates or protein. As an illustration Figure 3.1 has been drawn.
Table 3 . 1 . Percentage of i nd iv idua l s showing d i f f e r en t d i sease condi t ions amongst female Sprague-Dawley r a t s fed ad libitum or 54X of ad libitum; data a re given for two ages (from Berg and Simms, 1961).
feeding ad l i b r e s t r i c t e d ad l i b r e s t r i c t e d age (days) 795 821 1063 1150
l e s i on s* 60 0 89 24 muscle degenerat ion 2 0 88 41 tumours 41 12 83 53
*: examined for g lomeru lonephr i t i s , p e r i a r t e r i t i s and degenerat ion of myocardium
From Table 3.1 it also appears that certain disease conditions were more rare in restrictedly fed animals compared to ad libitum fed animals at the same age. Some observations suggest that the cumulative oxygen consumption of ad libitum and restrictedly fed animals are little different (Berg and Simms, 1960, 1961; Ross, 1961; Ross and Bras, 1975; Weindruch and Walford, 1982; Kubo et al., 1984; Masoro, 1988, 1990; Engelman et al., 1990; Johnson and Good, 1990; Yu étal., 1990).
Although studies of effects of daily oxygen consumption on potential life span are still relatively scarce, the available observations are consistent with a causal relationship between oxygen consumption and vitality or life span as suggested by between species comparisons.
Oxygen consumption and life span of ruminants
Productive life span of ruminants is an important parameter in some branches of livestock production, for instance dairy husbandry. However, for intensive livestock production it often appears more profitable to design systems which maximize short term productivity without overconcern about longevity. Obviously, the majority of our domestic animals is slaughtered at an age which is only a fraction of potential life span.
In a natural environment or under extensive livestock production conditions, longevity is of much greater importance as many individuals in a population die at an early age and reproductive parameters are generally much less favourable. Population models for cattle show that under extensive livestock conditions the decrease or increase in number is highly sensitive to changes in the average reproductive success of female animals (Dahl and Hjort,
53
1976). This means that the survival of the population is dependent on the reproductive success of a small group of females reaching a longer life span.
Therefore, life span must have played an important role in evolutionary processes. If we consider evolution by natural selection as an optimization process (Alexander, 1982), we may expect to find an optimum combination of rate of oxygen consumption and life span in currently existing species. This is even more likely if an increase in oxygen consumption rate, as a consequence of an intensification of certain behaviour, is not followed by a proportional increase in 'fitness'. As we will show below, this seems to be true for feed intake behaviour.
3.4 Maximization of the efficiency of oxygen utilization
In this paragraph we will briefly discuss the criteria for an optimization approach of feed intake behaviour. In his book 'Optima for animals' Alexander (1982) defined optimization of animal behaviour as '...the process of minimizing costs or maximizing benefits, or obtaining the best possible compromise between the two'. In general terms, Alexander (1982) considered costs and benefits of animal behaviour as 'mortality or energy losses' and 'fecundity or energy gain', respectively.
Before defining likely costs and benefits of feed intake behaviour more explicitly, we want to stress that the use of such terminology does not imply that the animal intentionally tries to achieve a certain goal, nor that it is conscious of costs and benefits of its behaviour. Yet, we think that a theory of feeding behaviour is not complete without answering the question as to its aim (Raven, 1968): what is the aim of feeding behaviour? Since Darwin we know how a teleological - or 'teleonomic' in the definition of Mayr (1988) - explanation of animal behaviour can in principle be reduced to a causal explanation (Ruse, 1988). The usual answer of animal nutritionists to this question is that animals try to maximize energy intake and thus growth and milk production rate. In the first two chapters we rejected this hypothesis for a number of reasons. From an evolutionary point of view, emphasis on the contribution of feeding behaviour to survival and reproductive success would appear more logical. If feeding behaviour has opposite effects on the latter parameters, an optimum intake may exist resulting from the balance between positive and negative effects, that is to say: costs and benefits, of feed consumption.
What can be regarded as costs and benefits of feed consumption? To answer this question we may think of two animals, for example mature non-reproducing, non-lactating sheep, one of which eats a substantial amount of a good feed, while the other animal is fasting. The first animal will be able to build up body reserves as fat and protein whereas the other will be forced to mobilize its reserves. We can bring the formation of body reserves and its use to a common denominator by expressing both in terms of energy, i.e. the combustion value of body reserves. In animal husbandry it is common practice to speak of net energy (NE) for gain (NEg) and NE for maintenance (NEm). An objective measure of the beneficial effects of feeding is the difference in body reserves between the two sheep: the sum of NEm and NEg or the total NE intake (NEI) of the feeding animal. Hence, in our optimization approach we consider NEI the quantitatively measurable 'benefits' of feed consumption. As a sheep consumes more of the same feed, NEI will increase. Simultaneously, the consumption of
54

oxygen increases. The total consumption of oxygen, including its basal level, is considered here to be the costs of feed consumption for the reasons discussed earlier. As the total amount of oxygen an animal can consume during its potential life span is thought to be fixed, it seems logical to assume that animals will try to maximize the efficiency of oxygen utilization. This means that, in our hypothesis, the optimum feed intake is the level of feed consumption at which the benefits (kJ of NEI) obtained per unit of costs (one litre of Oj) becomes maximal.
A test of this hypothesis proved to be quite feasible with available information about the relationships between NEI and the intake of metabolizable energy (MEI). The most complete analyses of such relationships is given by ARC (1980).
3.5 Feed intake and the efficiency of oxygen utilization
The data presented by ARC (1980) on the efficiency of ME utilization mainly come from experiments with adult sheep. For this category of animals, ARC (1980) also provides separate estimates of roughage intake as related to differences in metabolizability (q, metabolizable energy as fraction of gross energy) of the feed. Both data sets will be used for a first test of our hypothesis.
Figure 3.2a shows the relation between NEI and MEI for an animal fed an average quality roughage with a q-value of 0.55. NEI and MEI have been scaled to basal metabolism (NEm). The model used for this purpose is: NEI = B * (1 -e"P* MEi). The values for B and p can be derived from the efficiency of ME utilization for maintenance (km) and gain (kg) according to B = km/(km - kg) and p = km * ^(kjj/kg). Km and kg can be estimated from the q-value of the roughage as km = 0.56 + 0.207 * q and kg = 1.32 * q - 0.318. Derivation of the formulae for B and p, and km- and kg-values are given by ARC (1980). Figure 3.2a shows that, initially, NEI rises rapidly as a function of MEI but that partial efficiency of ME utilization gradually falls. Clearly, benefits (NEI) per unit MEI decrease as MEI increases. Figure 3.2a also shows the observed voluntary MEI and corresponding NEI, according to ARC (1980) (see also below). For our model calculations the relationship between MEI and NEI had to be extrapolated beyond this level.
Figure 3.2b shows how heat production, again scaled to NEm, varies with MEI. Heat production has been calculated as MEI-NEI+1. The oxygen consumption is roughly proportional to heat production (see however the remarks below). Figure 3.2b shows that the additional oxygen consumption per extra unit of ME consumed becomes higher as MEI increases.
From Fig. 3.2a and b it is evident that with an increase of MEI, marginal benefits become progressively smaller and marginal costs progressively higher. But in our optimization approach MEI is only of secondary importance unlike NEI and oxygen consumption, here represented by heat production. Hence heat production is plotted against NEI in Fig. 3.2c. According to our hypothesis, the optimum feed intake level is achieved when the ratio of benefits to costs attains its highest value. In Fig. 3.2c this is the level of NEI at which the tangent of the curve passes through the origin. All other levels of NEI will result in a lower ratio of benefits to costs.
55

NEI/NEm
1
NEI/NEm NEI/NEm
Fig. 3.2. NEI as a function of MEI (a); heat production (HP) as a function of MEI (b); heat production as a function of NEI (c) and the efficiency of oxygen utilization (NEI/02-consumption) as a function of NEI (d). NEI, MEI, HP and 02-consumption have been scaled to net energy for maintenance (NE,,,). All data apply to roughages of metabolizability 0.55. Individual points on curves depict values corresponding with the average observed voluntary intake of such feeds in sheep. All according to ARC (1980).
56

The ratio of NEI to total oxygen consumption is shown in Fig. 3.2d as a function of NEI. Oxygen consumption has been calculated from heat production as the latter is usually derived from measured oxygen consumption rates, taking into account CO2 and methane production and urinary nitrogen excretion. According to Blaxter (1989), heat production can be calculated from oxygen consumption using a figure of 19.7 kJ per litre 0 2 for a fasting animal which mobilizes mainly fat and a figure of 21.5 kJ per litre 0 2 for an animal which deposits large amounts of body fat. These figures have been used for conversion of heat production into oxygen consumption assuming that oxygen consumption per MJ heat produced decreases linearly from 50.76 to 46.51 litre when NEI relative to NEm increases from 0 to 2.0. In our example (Fig. 3.2d), the maximal efficiency of oxygen utilization is reached at NEI/NEm = 1.35 and a NEI per litre oxygen consumed equalling 14.84 kJ.l"1.
NEI/02-consumption
20
q=0.65
q=0.60
NEI/NEm
Fig. 3.3. The efficiency of oxygen utilization (NEI/02-consumption) as a function of NEI for roughages of metabolizability q = 0.45, 0.50, 0.55, 0.60 and 0.65. Individual points on curves depict values corresponding with the average observed voluntary intake of such feeds in sheep. All according to ARC (1980).
Using data of voluntary feed consumption collected from the literature, ARC (1980) calculated a regression line relating voluntary dry matter intake (DMI) of roughages to q for sheep with an average weight of 60 kg. Estimated DMI for a roughage of q = 0.55 amounts to 61.0 g.kg W-O-Ad"1. This value can be converted to MEI with MEI = DMI * 18.4 * q which gives a value of 617 kJ.kg W"0-75^"1 in our example. The NEm for our reference animal can
57

be estimated according to ARC (1980) as: Z = 0.251 * (W/1.08)0-75 + 0.0106 * W = 5.74 MJ.d"1 or 266 kJ.kg W"0-75^"1. Scaling MEI to NEm we find a figure of 2.32. Inserting this value in the formula mentioned above with the appropriate values for B and p results in an average NEI/NEm of 1.38. We can further calculate a NEI per litre oxygen consumed of 14.83 kJ.H. This estimate of NEI based upon observations of ad libitum fed animals differs only 2% from the NEI for which the ratio between NEI and total oxygen consumption was estimated to be maximal.
Figure 3.3 shows the relation between the efficiency of oxygen utilization and NEI for a number of roughages with q-values ranging from 0.45 to 0.65. These curves were calculated in the same way as explained above. The maximum value to which the efficiency of oxygen utilization can rise for any particular feed appears to increase with the metabolizability of the feed. The level of NEI at which the maximum efficiency is attained also rises with q. For a q-value of 0.45 the maximum efficiency is found at an intake level close to maintenance, for a q-value of 0.65 at an intake level of about twice maintenance.
Figure 3.3 also includes estimates of the average ad libitum intake for the various roughage qualities according to the regression model of ARC (1980). For each roughage quality, the observed NEI/NEm is almost identical to the value of NEI/NEm at which the ratio of NEI to oxygen consumption is maximal. This means that our hypothesis, when applied to results from respiration measurements of restrictedly fed animals, appears to predict observed ad libitum intake accurately.
Effects of ration type
The ARC (1980) estimates of intake and efficiency of ME utilization for roughages are based upon regression analyses of a large number of individual observations with the q-value as a measure of ration quality. Hence, the ARC (1980) models probably represent the average relations fairly well. However, intake of roughages with a given q-value shows a substantial variation. Similarly, variation in intake is found between rations of equal q but of different type, for instance between fine diets (pelleted roughages and concentrates) and long roughages or between roughages and roughage-concentrate mixtures (ARC, 1980). The same remarks apply to estimates of km and kg as a function of q. From our hypothesis we expected that at least part of the variation in intake for feeds of a given q-value is explained by differences in km and kg.
Unfortunately, data sets with regard to intake and efficiency of ME utilization differ in some respects. The 'pelleted diets' which ARC used for estimates of km and kg mainly comprised pelleted roughages (Blaxter and Boyne, 1978), whereas the 'fine diets' for which intake data are available contained on average 48% concentrates. Especially for rations of higher q-value, concentrates were the major ingredient. Hence, a test of the effect of ration type is restricted to pelleted rations of low metabolizability. Thus for a q-value of 0.45 the intake level was calculated at which the efficiency of oxygen utilization becomes maximal, using km and kg values for pelleted diets. The optimum intake (NEI/NEm = 1.67) is now much higher than the optimum intake for long roughages of equal q (NEI/NEm = 1.05). This is mainly caused by a higher efficiency with which ME from pelleted feeds is utilized for gain. The average observed intake of 'fine diets' with q=0.45 appears to be 1.64 (NEI/NEm)
58

and the average observed intake of long roughages of similar q-value 1.02. Again, observed and predicted intake are almost identical.
The estimates of km and kg for 'mixed diets' (consisting of roughage and concentrates) given by ARC (1980) are, at least for the lower range of q-values, higher than for roughages of equal q. From our hypothesis, mixed diets are thus expected to show higher intake than roughages of similar q, which is indeed confirmed by the ARC (1980) regression analysis of data for cattle: intake is higher as the proportion of concentrates in a diet of a given q-value is higher. In the regression analysis of sheep data, the effect of concentrate portion on intake was not significant, perhaps because concentrates on average made up only 5% of the diet. Unfortunately, a lack of data prevents further quantification of concentrate effects on NEI and oxygen consumption.
Effects of nitrogen content of diets
The ARC (1980) regression models relating efficiency of ME utilization to q were based upon a set of almost 1000 respiration data collected by Blaxter and Boyne (1974). In a later publication (Blaxter and Boyne, 1978), these authors have shown that apart from differences in q also differences in the nitrogen content of the feed significantly contribute to the variation in km and kg. In Chapter 1 we have quantified the effects of q and nitrogen content on roughage intake using a set of 831 roughage feeding trials reported in the literature. Combining detailed information on intake and efficiency of ME utilization as affected by q and nitrogen content of roughages allowed a further test of our hypothesis.
Calculations of optimum intake were again made for a sheep of 60 kg in the way explained above, except that km and k„ were now estimated from the analysis by Blaxter and Boyne (1978). Recently, Blaxter (1989) has summarized the results of this analysis presenting two equations: km = 0.947 - 0.00010 * (P/q) - 0.128/q kg = 0.951 + 0.00037 * (P/q) - 0.336/q, with P as the protein content of the organic matter in g.kg"1.
In the 831 roughage intake trials analysed in Chapter 1 voluntary digestible organic matter intake (DOMI, g.kg W"°-75.d_1) appeared to be related to q and the protein content of the feed organic matter according to: DOMI = -19.50 + 92.46 * q + 0.060 * P (r = 0.89, rsd = 6.0) In the regression analysis, the interaction between q and P was not significant. DOMI was converted to MEI (kJ.kg W0-75^"1) as MEI = 15.8 * DOMI (NRC, 1981). Calculation of NEI/NEm and the efficiency of oxygen utilization was done as before.
For a number of feeds with combinations of q and nitrogen content, covered by both data sets, Figure 3.4 shows the average observed ad libitum NEI as compared to the predicted NEI at which the efficiency of oxygen utilization attains its maximal value. Again, agreement between predicted and average observed intake is remarkable. Noteworthy are the data for roughages of a q-value of 0.40: both observed intake and intake for which efficiency of oxygen utilization is predicted to be maximal lie below maintenance level. Highest quality roughages have a predicted and observed NEI of about twice NEm. The nitrogen content of the feed has a positive effect on predicted and observed NEI/NEm in all quality classes. On average, observed intake is 1% lower than predicted.
59

Observed average intake (NEI/NEm)
2.25 y
1.75
1.25
0.75
• • QD • •
0 0 A A
AA
q=0.40 q=0.45 q=0.50
q=0.55 q=0.60 q=0.65
0.75 1.25 1.75
Predicted average intake (NEI/NEm)
2.25
Fig. 3.4. A comparison of observed and predicted NEI (see text) scaled to NE for maintenance ( N E ^ for roughages differing in metabolizability (q) and protein content of organic matter. Protein contents were 6, 9 and 12% for q=0.40; 6, 9, 12 and 15% for q=0.45; 6, 9, 12, 15 and 18% for q=0.50; 9, 12, 15, 18 and 21% for q=0.55; 9,12,15,18,21 and 24% for q=0.60; 12,15,18,21 and 24% for q=0.65.
So far only information on q and the nitrogen content of roughages has been used to estimate km and kg because more detailed information is lacking. Apart from these parameters other feed characteristics probably also affect the efficiency of ME utilization. Clearly, feed intake research would benefit from a more comprehensive knowledge of factors influencing the efficiency of ME utilization.
3.6 Efficiency of oxygen utilization and differences in
intake between animals
In Chapter 2 the most important sources of animal variation in intake were discussed. In the next paragraphs we will briefly analyse to which extent predictions of our hypothesis agree with this variation in intake.
60

Genotype
In the model calculations shown above NEI has always been scaled to NEm. This means that NEI of ad libitum fed animals is expected to vary proportional to NEm if the efficiency of ME utilization for maintenance and gain remains constant. No evidence exists for systematic differences in km and kg between ruminant species, at least not between sheep and cattle (ARC, 1980; Blaxter, 1989). Hence, the observation of a proportionality between voluntary feed intake and basal metabolism in different genotypes is in agreement with our hypothesis.
Table 3.2. The efficiency of ME u t i l i za t ion for gain (kg) and the contribution of protein energy to to ta l body energy gain in different ca t t l e breeds (Armstrong, 1982).
genotype
bulls steers heifers
Angus
0.414 0.483 0.653
kg
Holstein
0.379 0.407 0.450
prote fraction of
Angus
0.27 0.20 0.13
Ln energy as total energy gain
Holstein
0.45 0.40 0.28
In Chapter 2 we also found evidence for a correlation between voluntary feed intake of different genotypes and the proportion of fat and protein in weight gain, with lowest feed consumption being characteristic for the most lean breeds. Table 3.2 shows values for kg of breeds which differ in the composition of weight gain. The highest value for kg is recorded for the breed with the lowest proportion of protein in body energy gain. Such a breed would be expected to show the highest voluntary intake if a positive difference of kg is not counteracted by an opposite change in km which seems unlikely.
Maturity
The level of voluntary feed intake relative to maintenance requirements decreases with increasing weight of the animal until finally both become equal in terms of net energy and an equilibrium weight is achieved. This finding deviates from the general rule observed between genotypes that intake of a given feed is proportional to maintenance requirements. According to our hypothesis a decrease of optimum NEVNEm with increasing weight of the animal must be attributed to a lower efficiency of ME utilization. At first glance, such a conclusion seems contradictory to available literature data.
61

However, only in a few studies have the possible effects of age or weight on the efficiency of ME utilization been examined. Part of these experiments has dealt with weight ranges still far from mature weights (Blaxter et al., 1966; Van Es et al., 1969). In some experiments which did include heavier animals it was found that heavy and light animals did not differ in the efficiency of ME utilization; yet, in those cases intake level relative to maintenance requirements was neither significantly different between the two types of animal (Bouvier and Vermorel, 1975; Graham, 1980). It is also worth noting that in several experiments no effect of weight on k„ was found although the ratio of protein energy to fat energy in body energy gain changed with weight, sometimes considerably, for instance from 0.67 to 0.33 in the experiments of Van Es et al. (1969). Contrary to this, Graham (1980) observed a lower kg
value in conjunction with a lower voluntary feed intake in young lambs, depositing mainly protein, compared to older and heavier sheep, depositing mainly fat.
In an earlier experiment, Graham (1969) had studied the effect of weight on the efficiency of ME utilization by sheep of the same age. He concluded that the efficiency was not different between lean and fat animals of 35 and 60 kg fleece-free fasted body weight and with 5 and 20 kg body fat, respectively. Measurements of efficiency were carried out after the lean animals had been fed below maintenance for a long time.
Blaxter et al. (1982) concluded from a long term feeding experiment that km for sheep having reached their equilibrium weight of 130 kg was similar to the estimate of km for much lighter animals. This conclusion is correct if the calculation of km is based on the estimate of NEm obtained in this study for sheep ranging in body weight from 40 to 130 kg (316 kJ.kg W-0-75^"1). However, such a value is extremely high when compared with other estimates (see for instance the data compiled by ARC, 1980). NEm may have been overestimated due to a rather unusual procedure (extrapolation from gaseous exchange of animals which still received a kilogram of feed per day), or due to the fact that measurements were made in July, i.e at long daylength. If we apply a more normal estimate of NEm to these results, km for the fat animals must have been much lower than km for the lighter animals.
As far as we know, no experiments have been reported in which the efficiency of ME utilization has been measured repeatedly in a group of animals with voluntary intakes gradually approaching maintenance level. As the results mentioned above are inconclusive on the matter, such experiments are needed to test our prediction that the decrease of relative feeding level in fat animals is associated with a decrease of efficiency of ME utilization.
Lactation and pregnancy
A lactating animal usually eats more of the same feed than a non-lactating animal and ME is used more efficiently for milk secretion than for body gain (ARC, 1980). In view of the hypothesis developed here, a relationship between both observations seems obvious. In reality, no simple link can be established. For the mature sheep which we used as a reference animal in our calculations so far, the total NEI (NEm + NEg) can be considered the benefits of feed consumption. In this type of animal, NEI refers to changes in body reserves only. For a lactating animal, NEI has several components. To some extent, NEI corresponds with changes in body reserves, and to some extent with changes in fat, protein and lactose secreted in milk. Although both components are commonly expressed as NE, it is questionable whether they have the same meaning for the animal. The fact that lactating animals show a different
62

partitioning of NE (between maintenance of body reserves, gain and milk secretion) depending on genotype, stage of lactation, and feed composition suggest a negative answer to this question. Without knowledge of how the different components should be weighted, costs and benefits of feed consumption in lactating animals cannot be evaluated.
Another problem, of quite different nature, concerns the commonly made assumption that the efficiency of ME utilization for milk production (kj) is independent of the level of MEI. Blaxter (1989) points to the problems involved in estimating the efficiency of ME utilization in lactating animals. A reduction of MEI to below its ad libitum level causes not only a decrease of NE secretion in milk but generally also a change in energy retention. A review by ARC (1980) shows that research groups have different ways of correcting for such changes; yet, all methods reported assume a linear relation between ME used for lactation and NE secreted in milk. Whatever the exact relation may be, it will be difficult to detect a statistically significant departure from linearity in view of the complications mentioned above.
Similar complications occur with regard to effects of pregnancy. Although nutrient needs may be expected to rise in the course of pregnancy, usually intake does not increase concurrently. Often, feed consumption even decreases in the final trimester of pregnancy. It is tempting to relate this to the very low efficiency of ME utilization for energy retention in uterus, placenta and foetus (about 0.13 according to ARC, 1980). Yet, as in lactating animals, NEI is also of quite complex nature in a pregnant animal. In addition, part of the total oxygen consumption by the pregnant animal takes place in the growing foetus. So both costs and benefits of feed consumption in pregnant animals are not easy to evaluate.
Daylength and cold stress
Long days and cold stress increase both voluntary feed intake and basal metabolism. As a result, efficiency of oxygen utilization is probably maintained at its original level. In a sense, such parallel changes may be considered an advantage to the animal as an increase in intake independent from an increase in basal metabolism would lead to a lower efficiency of oxygen utilization.
3.7 Maximization of the efficiency of oxygen utilization:
a universal principle?
The harmful effects of oxygen consumption on vitality and potential life span of aerobic organisms made us suppose that the intensity of animal behaviour will be controlled in such a way as to result in a maximal efficiency of oxygen utilization. Feed intake regulation in ruminants appears to obey such a regulating principle. It is logical to assume that feed intake behaviour of other classes of animals will be controlled in a similar way. A test of this assumption is outside the scope of this paper. Yet, we can not refrain from quoting a striking
63

analogy we found between feed intake behaviour of ruminants and foraging behaviour of a completely different species: the honeybee. Schmid-Hempel et al. (1985) studied this foraging behaviour and published their findings in a paper with the provoking title 'Honeybees maximize their efficiency by not filling their crop'. The authors test two different hypotheses. The first hypothesis states that the foraging bee tries to maximize the amount of nectar energy which it can deliver to the hive per unit of time. This hypothesis predicts that the bee on each foraging trip will generally continue to collect nectar until its crop (which has a limited capacity) will be filled. The second hypothesis states that the bee tries to maximize its energetic efficiency, i.e. the amount of nectar energy delivered to the hive per unit of energy spent in the foraging process. Careful observations of foraging bees and calculations of. metabolic costs of transport of nectar show that foraging behaviour is best predicted by the second hypothesis. The authors conclude that energetic efficiency causes bees to return to the hive often with their crop only partially filled. As an explanation they suggest the limited amount of flight performance worker bees appear to have. As this budget is used up the flight metabolism degenerates and the workers become unable to forage. Therefore, accumulation of nectar in the hive will be maximal if each worker uses its foraging capacity energetically most efficiently.
Despite this striking analogy, optimization criteria in many other studies of optimal foraging have been different from energetic efficiency (Alexander, 1982; Stephens and Krebs, 1986). A thorough evaluation in the light of the evidence presented here is clearly required.
Apart from feed intake behaviour, also other types of behaviour may well be controlled by the principle of maximizing efficiency of oxygen utilization. Evidence may be found in studies of the regulation of locomotory behaviour. For feed intake behaviour we expressed intensity as the intake of net energy per unit of time and the efficiency of oxygen utilization as the intake of net energy per litre oxygen consumed. Likewise, intensity of locomotory behaviour is measured as distance moved per unit of time and the efficiency of oxygen utilization as distance moved per litre oxygen consumed. The relationship between both parameters has been studied among others for swimming of fish and walking of man (Peters, 1983; Blaxter, 1989). For both species, optimum speed, i.e. the speed at which oxygen costs per metre moved are lowest, appears to agree with the preferred speed of swimming and walking in these species.
Yet, probably the most elegant example of research into the regulation of locomotion is the study of gait control in horses by Hoyt and Taylor (1981). Their results have been replotted in Fig. 3.5. Oxygen consumption was measured in horses which were trained on a treadmill belt to move slower or faster than the preferred speed without changing gait. This was done for each of three different gaits: walking, trotting and galloping. At least for walking and trotting, preferred speed was close to the optimum speed in terms of efficiency of oxygen utilization. For galloping this could not be confirmed with certainty due to technical problems.
It is important to note a difference in interpretation of results. Although Hoyt and Taylor (1981) actually measured oxygen consumption, they considered their findings evidence for maximization of energy utilization by horses. We have presented their results as an illustration of our hypothesis that animals behave so as to maximize the efficiency of oxygen utilization. From data on locomotion, a definite choice of either of the two interpretations is not indicated.
64

With regard to feeding behaviour, Schmid-Hempel et al. (1985) concluded that honeybees maximize the efficiency of energy utilization where we would see evidence for the maximization of oxygen utilization. Also in this case, consumption of oxygen and energy vary in a parallel way and therefore the data do not exclude either one of the interpretations.
Distance/02-consumption
• 3$c
* ^ • <£@0
1 ** • /
—i—i i i i • i
Sf>M >
Z%* '
• — • 0—O • — •
walk trot gallop
2 3 4 5
Running speed (m/s)
Number of observations
12 1
n
2 3 4 5
Running speed (m/s)
Fig. 3.5. The efficiency of oxygen utilization for locomotion (distance moved/ oxygen consumed) in horses as a function of running speed and type of gait (a); lines were fitted by eye. Fig. 3.5b shows a frequency distribution of gaits in relation to speed of horses which were not constrained to a particular gait (both Figs, redrawn from Hoyt and Taylor (1981).
However, maximizing energetic efficiency instead of net energy gain, only makes sense if resources are allocated from a fixed budget (Stephens and Krebs, 1986). Indeed, Schmid-Hempel et al. (1985) drew attention to the fact that honeybees have a limited total 'flight budget', i.e. they can only oxidize a given amount of substrate and then the ability to forage is lost. The oxygen-free-radical theory of ageing offers an explanation for this limitation: it is not the consumption of energy per se that causes flight metabolism to degenerate but the concomitant release of free radicals due to oxygen consumption. In a parallel way, feed intake behaviour of ruminants can be considered to maximize efficiency of either energy or oxygen utilization. Again, maximization of efficiency of energy utilization only makes sense if every MJ of energy lost by oxidation can not completely be compensated for by a comparable
65

energy gain through feed consumption, but represents an irreversible loss of vitality and lifetime. In our opinion, therefore, the optimization process studied here and in the work of Hoyt and Taylor (1981) and Schmid-Hempel et al. (1985) should be interpreted in terms of maximization of the efficiency of oxygen rather than energy utilization.
The idea of a universal principle underlying the control of widely differing behaviour opens perspectives for new research. One of the intriguing questions is how animals succeed in optimizing the intensity of any single behavioural activity. Still more intriguing is, if and how they succeed in optimizing the intensity of composite behaviour, like for instance locomotion and feeding in grazing herbivores. As any type of behaviour is composed of a mixture of different physiological activities, all contributing to changes in oxygen consumption, body energy content and functional output, it may be that similar processes are involved in the control of very different types of behaviour. A search for such a physiological background will be the subject of Chapter 4.
3.8 Conclusions
1. Consumption of feed presents both benefits and costs to the animal. For a non-reproducing animal we consider the intake of net energy for maintenance and gain benefits, and the concomitant total consumption of oxygen, costs.
2. As oxygen use by tissues causes an accumulation of damage to cell structures, a loss of vitality, ageing and a limited life span, the amount of oxygen an animal can consume in a lifetime is restricted.
3. Therefore, feed intake behaviour will be aimed at maximizing the efficiency of oxygen utilization: from each feed an animal will consume such an amount that the intake of net energy per litre oxygen consumed will be maximal. This level of net energy intake is lower than the maximum that theoretically can be attained.
4. Testing this hypothesis with data of non-reproducing ruminants shows a good quantitative agreement between predicted and observed ad libitum intake of roughages differing in metabolizability and nitrogen content. Also differences in intake between long and pelleted roughages, between roughages and mixed rations and the effects of basal metabolism on intake appear to correspond well with our hypothesis.
5. Effects on intake of changes in maturity and physiological state are more difficult to test due to insufficient information about the effects of maturity on efficiency of metabolizable energy utilization and uncertainty about the exact nature of costs and benefits of feed consumption in pregnant and lactating animals.
6. Maximization of the efficiency of oxygen utilization may reflect a more universal principle governing the intensity of both feeding and non-feeding behaviour, in ruminants as well as in monogastric animals.
66

References
Alexander, R.M., 1982. Optima for animals. Edward Arnold (Publishers), Ltd. London, 112 pp. Armstrong, D.G., 1982. Digestion and utilization of energy. In: J.B. Hacker (Ed.), Nutritional limits to animal
production from pastures, Commonwealth Agricultural Bureaux, Farnham Royal, pp. 225-244. ARC (Agricultura Research Council), 1980. The nutrient requirements of ruminant livestock. Commonwealth
Agricultural Bureaux, Farnham Royal, 351 pp. Berg, B.N. and H.S. Simms, 1960. Nutrition and longevity in the rat. II. Longevity and onset of disease with
different levels of food intake. Journal of Nutrition, 71: 255-263. Berg, B.N. and H.S. Simms, 1961. Nutrition and longevity in the rat. III. Food restriction beyond 800 days.
Journal of Nutrition, 74: 23-32. Blaxter, K i . , 1989. Energy metabolism in animals and man. Cambridge University Press, Cambridge, 336 pp. Blaxter, K.L. and A.W. Boyne, 1974. Quoted in ARC (1980). Blaxter, K.L. and A.W. Boyne, 1978. The estimation of the nutritive value of feeds as energy sources for
ruminants and the derivation of feeding systems. Journal of Agricultural Science, Cambridge, 90:47-68. Blaxter, K.L., J.L. Clapperton and F.W. Wainman, 1966. Utilization of the energy and protein of the same diet
by cattle of different ages. Journal of Agricultural Science, Cambridge, 67: 67-75. Blaxter, K.L., V.R. Fowler and J.C. Gill, 1982. A study of the growth of sheep to maturity. Journal of
Agricultural Science, Cambridge, 98:405-420. Bouvier, J.-C. and M. Vermorel, 1975. Utilisation énergétique et azotée d'une même ration par le mouton adulte
à l'engraissement et l'agneau en croissance. Annales de Zootechnie, 24: 697-710. Brouwer, A., J. Vijg and D.L. Knook, 1986. Medisch-biologisch onderzoek van het verouderingsproces. Cahiers
Bio-wetenschappen en maatschappij, 11: 9-15. Calder, W.A., 1984. Size, function, and life history. Harvard University Press, Cambridge, USA, 431 pp. Dahl, G. and A. Hjort, 1976. Having herds. Pastoral herd growth and household economy. Stockholm studies in
Social Antropology, Stockholm, 335 pp. Engelman, R.W., N.K. Day, R.-F. Chen, Y. Tomita, I. Bauer-Sardina, MX. Dao and R.A. Good, 1990. Calorie
consumption level influences development of C3H/Ou breast adenocarcinoma with indifference to calorie source. Proceedings of the Society for Experimental Biology and Medicine, 193: 23-30.
Ginkel, G. van, 1988. Zuurstof als gifstof. Natuur en Techniek, 56:497-507. Graham, N.McC, 1969. The influence of body weight (fatness) on the energetic efficiency of adult sheep.
Australian Journal of Agricultural Research, 20: 375-385. Graham, N.McC, 1980. Variation in energy and nitrogen utilization by sheep between weaning and maturity.
Australian Journal of Agricultural Research, 31: 335-345. Harman, D., 1986. Free radical theory of aging: role of free radicals in the origination and evolution of life,
aging, and disease process. In: J.E. Johnson, R. Walford, D. Harman and J. Miquel (Eds.), Free radicals, aging, and degenerative diseases, Alan R. Liss, Inc., New York, pp. 3-49.
Hoyt, D.F. and CR. Taylor, 1981. Gait and the energetics of locomotion in horses. Science, 292: 239-240. Johnson, B.C. and R.A. Good, 1990. Chronic dietary restriction and longevity. Proceedings of the Society for
Experimental Biology and Medicine, 193:4-5. Johnson, J.E., R. Walford, D. Harman and J. Miquel (Eds.), 1986. Free radicals, aging, and degenerative
diseases. Alan R. Liss, Inc., New York, 558 pp. Jong, P. de, 1981. Hoe radicaal zijn zuurstofradicalen? Chemisch Magazine, februari 1981: 71-74. Katz, M.L. and W.G. Robinson, 1986. Nutritional influences on autoxidation, lipofuscin accumulation, and
aging. In: J.E. Johnson, R. Walford, D. Harman and J. Miquel (Eds.), Free radicals, aging, and degenerative diseases, Alan R, Liss, Inc., New York, pp. 221-259.
Koster, J.F., 1986. Biologische basis van veroudering. De vrije radicaal-theorie. Tijdschrift voor Gerontologie en Geriatrie, 17: 99-103.
Kubo, C , B.C. Johnson, N.K. Day and R.A. Good, 1984. Calorie source, calorie restriction, immunity and aging of (NZB/NZWF)F1 mice. Journal of Nutrition, 114: 1884-1899.
Lamb, M J., 1977. Biology of ageing. Blackie, Glasgow and London, 184 pp. Masoro, EJ., 1988. Food restriction in rodents: an evaluation of its role in the study of aging. Journal of
Gerontology: Biological Sciences, 43: B59-B64. Masoro, E J., 1990. Assessment of nutritional components in prolongation of life and health by diet Proceedings
of the Society for Experimental Biology and Medicine, 193: 31-34.
67

Mayr, E., 1988. Toward a new philosophy of biology. Observations of an evolutionist The Belknap Press of Harvard University Press, Cambridge, Massachusetts, 564 pp.
Miquel, J. and J. Fleming, 1986. Theoretical and experimental support for an "oxygen radical-mitochondrial injury" hypothesis of cell aging. In: J.E. Johnson, R. Walford, D. Harman and J. Miquel (Eds.), Free radicals, aging, and degenerative diseases, Alan R. Liss, Inc., New York, pp. 51-74.
NRC, 1981. Nutrient requirements of goats. National Academy Press, Washington D.C., 91 pp. Oberley, L.W. and T.D. Oberley, 1986. Free radicals, cancer, and aging. J.E. Johnson, R. Walford, D. Harman
and J. Miquel (Eds.), Free radicals, aging, and degenerative diseases, Alan R. Liss, Inc., New York, pp. 325-371.
Ordy, J.M., 1984. Nutrition as modulator of rate of aging, disease, and longevity. In: J.M. Ordy, D. Harman and R. Alfin-Slater (Eds.), Nutrition in gerontology, Raven Press, New York, pp. 1-17.
Peters, R.H., 1983. The ecological implications of body size. Cambridge University Press, Cambridge, 329 pp. Raven, C.P., 1968. Ontwikkeling als informatieverwerking. Een theoretisch-biologische studie. Wijsgerige
Verkenningen, Meulenhoff, Amsterdam, 159 pp. Ross, M.H., 1961. Length of life and nutrition in the rat. Journal of Nutrition, 75: 197-210. Ross, M.H. and G. Bras, 1975. Food preference and length of life. Science, 190: 165-167. Ruse, M., 1988. Philosophy of biology today. State University of New York Press, Albany, 155 pp. Schmid-Hempel, P., A. Kacelnik and A.I. Houston, 1985. Honeybees maximize efficiency by not filling their
crop. Behavioral Ecology and Sociobiology, 17: 61-66. Schmidt-Nielsen, K., 1984. Why is an animal size so important? Cambridge University Press, Cambridge, 241
pp. Stephens, D.W. and J.R. Krebs, 1986. Foraging theory. Princeton University Press, Princeton, 247 pp. Van Es, AJ.H., H.J. Nijkamp, E.J. van Weerden and K.K. van Hellemond, 1969. Energy, carbon and nitrogen
balance experiments with veal calves. In: K.L. Blaxter, J. Kielanowski and G. Thorbek (Eds.), Energy metabolism of farm animals. Proceedings of the Fourth Symposium, Warsaw, Poland, 1967. EAAP Publication no. 12, pp. 197-201.
Vijg, J., 1987. DNA repair and aging process. PhD thesis, University of Leiden, Leiden, 147 pp. Weindruch, R. and R.L. Walford, 1982. Dietary restriction in mice beginning at 1 year of age: effect on life-span
and spontaneous cancer incidence. Science, 215: 1415-1418. Yu, B.P., D.W. Lee, CG. Marler and J.-H. Choi, 1990. Mechanism of food restriction: protection of cellular
homeostasis. Proceedings of the Society for Experimental Biology and Medicine, 193: 31-34.
68

4 Optimum feed intake: in search of a physiological background
Abstract
In Chapter 3 we concluded that in mature non-reproducing ruminants the efficiency of oxygen utilization for intake of net energy attains a maximum value close to the level of voluntary feed intake. This level was therefore considered the optimum intake for any feed. The occurrence of a maximum value is due to the existence of a basal oxygen consumption and a decreasing partial efficiency of metabolizable energy (ME) utilization when ME intake increases. In this chapter possible causes of a decreasing partial efficiency of ME utilization are discussed from knowledge about the effects of volatile fatty acids (VFA), the main substrate in ruminant metabolism, on cellular metabolism. Increasing extracellular VFA concentrations appear to have opposite and partly independent effects on living cells: they stimulate both the use of substrate for synthesis of cell compounds, and its use for maintenance processes mainly because of an increased proton leakage of membranes. From this observation we develop the hypothesis that a higher metabolic acid load is responsible for a decreasing partial efficiency of ME utilization when ME intake is increased. The intake level at which a maximum efficiency of oxygen utilization is achieved must then be linked to the presence of a certain 'optimum' acid load and thus to certain optimum VFA concentrations. Feed intake regulation will aim at maintaining such concentrations in all body compartments. The fact that optimum VFA concentrations in blood and gut differ according to the quality of the feed may be due to differences in the conditions for absorption and utilization of VFA between feeds. These conditions probably vary as a function of differences in the internal recirculation of electrolytes, in the ratio of nutrients absorbed from the gut, and in differences in endogenous acid production. The value of feed digestibility and protein content as indicators of roughage intake potential are discussed in relation to these conditions. Intracellular pH may be an important parameter used by the animal in assessing the optimum intensity of not only feeding behaviour but also of other behavioural activities of both ruminants and monogastrics.
4.1 Introduction
The process of feed consumption in non-reproducing ruminants obeys the law of diminishing
returns: as the intake of metabolizable energy (MEI) from a feed increases, increments of net
energy intake (NEI) become gradually smaller. The level of voluntary feed intake appears to
be lower than the level at which increments in NEI, in theory, become zero. From this we
inferred in Chapter 3 that a ruminant does not try to obtain a maximum NEI from any feed.
Further analysis showed that the ad libitum feed intake corresponds to the intake level at
which the ratio between NEI and the total oxygen consumption is estimated to be maximal.
We interpreted this result of feeding behaviour as evidence that the animal optimizes its level
of feed consumption. For a mature animal we considered the increase in NEI as benefits from
feed consumption, and the concomitant oxygen consumption as costs. The ratio between
benefits and costs was called the efficiency of oxygen utilization for NEI. The optimum feed
intake is the level at which the efficiency of oxygen utilization, NEI per litre C*2 consumed,
69

becomes maximal. In Chapter 3 we also discussed why it is thought useful for the animal to maximize this efficiency.
The efficiency of oxygen utilization is primarily a function of the level of feed intake. In addition, feed and animal characteristics influence the efficiency of oxygen utilization and change the optimum intake level for that reason. An important question is, which metabolic processes underlie differences in efficiency of oxygen utilization and thus optimum feed intake. This question forms the central theme of the present chapter.
4.2 The decreasing partial efficiency of energy utilization
For a given feed, the efficiency of oxygen utilization increases with increasing MEI to attain an estimated maximum value close to the ad libitum intake level of ME. The existence of a maximum value is due to: 1. the fact that a fasting animal consumes a certain amount of oxygen and 2. the fact that both below and above maintenance the partial efficiency of ME utilization is not constant but decreases gradually with increasing intake. A basal level of oxygen consumption is inherent to life itself. A decreasing partial efficiency seems intuitively self-evident, but is physiologically not well explained despite extensive studies of animal energy metabolism (Webster, 1980; Macrae and Lobley, 1982; Blaxter, 1989). The problem is: why is a progressively increasing part of the extra absorbed energy apparently respired in body tissues?
On biochemical grounds the efficiency of ME utilization for maintenance is expected to be higher than for gain. Yet, this does not necessarily imply a continuously declining partial efficiency: it is not evident why, for instance for a good quality roughage, the partial efficiency for body gain is 0.6 just above maintenance level and only 0.4 close to the ad libitum intake level.
From roughages ruminants appear to absorb from 60 to 85% of ME as volatile fatty acid (VFA) energy (see below). When studying effects of VFA on cellular metabolism, we found a possible explanation for a decreasing partial efficiency of ME utilization. An elegant example of such VFA effects - as far as ruminant metabolism is concerned - is offered by experimental results published by Yang and Baldwin (1973). As they also helped to clarify the concept of an optimum intake, a more detailed discussion of these results is presented.
4.3 The response of fat cells to changes in extracellular
nutrient concentrations
Yang and Baldwin (1973) developed a technique to isolate cells of bovine adipose tissue in order to study in vitro metabolism of glucose and acetate and acute effects of insulin. Isolated cells were incubated in a medium containing glucose, acetate or both, in different concentrations and with or without addition of insulin. Using labelled substrate, oxidation of
70

both nutrients to C0 2 and conversion to lipid were measured. All conversions were expressed per mg cell protein. The data shown here in Fig. 4.1a and b are the results of incubations with acetate and glucose at the highest glucose concentration tested, 2.5 mM.H. For the conversion of acetate to lipid a curvilinear relation was fitted by eye.
As Fig. 4.1a shows, conversion of acetate to lipid increased sharply when acetate concentration was raised from 0.5 to 1.0 mM.l'1, but much less at higher concentrations. Insulin influenced the rate of lipid synthesis from acetate at all but the lowest concentrations of acetate. The oxidation of acetate shows a linear increase over the whole range of acetate concentrations tested. Acetate oxidation was not appreciably affected by the presence of insulin, neither by the level of lipid synthesis.
Acetate converted
700 (muM/h/mg cell protein) uu -
8U -
fin -
40 -
20 •
n -
(muM/h/mg cell protein)
o
1 1
à
° * lipid A A C02
+ insulin
- insulin
1 1 1
0.5 1 1.5 2
Acetate (mM/l)
2.5 0 0.5 1 1.5 2
Acetate (mM/l)
2.5
Fig. 4.1. The conversion of acetate (a) and glucose (b) to lipid and C02 by isolated bovine fat cells as a function of acetate concentration, with and without addition of insulin (redrawn from Yang and Baldwin, 1973). Glucose concentration was 2.5 mM.l"1 in all incubations.
The simultaneous use of glucose for oxidation and lipid synthesis shows a completely different pattern: acetate concentration did not affect either process appreciably, but the presence of insulin increased both at all levels of acetate.
71

The strongly diverging responses of lipid synthesis and acetate oxidation to changes in acetate concentration have important consequences for the utilization of increments in acetate uptake by these cells. These are apparent from Table 4.1. This Table gives the fractional utilization of increments in acetate uptake (on a molar basis) for lipid synthesis as a function of changes in extracellular acetate concentration. Increments in acetate uptake were calculated as the sum of acetate used for lipid synthesis and oxidation. The fractional utilization falls sharply with increasing concentration but both glucose concentration and the presence of insulin have a positive effect on it, at low and high acetate concentrations. Notably, insulin and glucose do not seem to eliminate an inefficient utilization but rather improve acetate utilization by channelling relatively more acetate into lipid synthesis. Calculations of fractional utilization of glucose in the way we did for acetate showed no consistent changes as a result of differences of acetate concentration and insulin level.
Table 4 . 1 . The fract ional u t i l i z a t i o n of Increments of acetate uptake for l i p id synthesis by bovine fat c e l l s as a function of change In medium concentration of acetate , concentration of g lucose, and presence of Insul in; f igures In parentheses refer to Incubations with Insul in. Data were calculated on a molar basis from resu l t s of in vitro experiments of Yang and Baldwin (1973).
Glucose concentration Change in acetate concentration (mM.l-1) (mM.l-1)
(from 0.5 to 1.0) (from 1.0 to 2 .5)
0.625 0.59 (0.66) 0.05 (0.07) 1.25 0.61 (0.66) 0.04 (0.19) 2.5 0.67 (0.74) 0.14 (0 .25)
The response of these fat cells to increases in extracellular acetate concentration reflects the general rule we observed at the level of the whole organism when MEI increases: at both levels an increased uptake of substrate runs parallel with a decrease in partial efficiency of substrate use. This analogy has a number of interesting consequences.
These consequences become apparent when we apply the optimization principle derived for the whole organism to a part of it: acetate metabolism in adipose tissue. This principle assumes that regulation of animal metabolism aims at achieving the most favourable ratio between energy retention and oxygen consumption i.e. substrate oxidation. Applied to acetate metabolism in adipose tissue it means a maximum ratio between acetate used for lipid synthesis and acetate used for oxidative purposes. This ratio can be calculated from the data of Yang and Baldwin (1973) by taking into account the endogenous loss of acetate energy due to oxidation when no acetate was added to the medium. We have assumed that this loss can be found by extrapolation of acetate oxidation to a zero acetate concentration. Figure 4.2 shows how the ratio of acetate used for lipid synthesis and oxidation initially increases with
72

increasing concentration, reaches a maximum value and decreases at still higher concentrations. This is a similar pattern as we derived for the efficiency of oxygen utilization as a function of NEI for the animal as a whole. A notable difference is the fact that, in the in vitro experiment, cell metabolism could be manipulated beyond the conditions required for maximum oxygen utilization efficiency; in vivo, the existence of a maximum value for the efficiency of oxygen utilization could only be shown by extrapolation beyond the level of voluntary feed consumption (Chapter 3).
It is also important to note that the pattern observed in Fig. 4.2 was not apparent for glucose utilization in the experiments in which fat cells were incubated with variable concentrations of glucose. We will return to this difference later.
0.5 1 1.5 2
Acetate (mM/l)
2.5
Fig. 4.2. The ratio between acetate converted into lipid and into CO2 by isolated bovine fat cells as a function of medium acetate concentration and insulin presence; curves were calculated from data in Fig. 4.1.
Summarizing the information in Figs. 4.1 and 4.2 the following can be concluded. - Changes in acetate concentration have both positive and negative effects on cellular
metabolism. An increased availability of substrate for lipid synthesis may be considered a positive effect, an increased oxidative loss, which is at least partly independent of lipid synthesis rate and which causes differences in acetate utilization, a negative effect.
73
- A maximum lipid synthesis rate requires an extracellular acetate concentration exceeding 1 mM.1-1.
- Apart from a maximum lipid synthesis rate we can define an optimum rate at which the ratio of acetate conversion into lipid and acetate oxidation attains a maximum value. This optimum rate requires a lower acetate concentration, between 0.8 and 1.0 mM.1"1, depending on glucose concentration and insulin level. The optimum synthesis rate is consequently submaximal.
- Fat cells have no direct influence on the extracellular conditions affecting synthesis and oxidation.
- An organism that aims at maximization of the efficiency of oxygen utilization will have to optimize the rate of lipid synthesis in fat cells. This must involve the regulation of extracellular concentrations of acetate or some derived parameter. Acetate concentrations in venous blood of ad libitum fed ruminants vary with the quality
of the feed but are often close to 1 mM.1"1 (Baldwin and Smith, 1983), i.e. not very different from the value we would expect from these in vitro experiments and the concept of an optimized lipid synthesis rate.
In order to be able to extend the above discussed findings to the level of the whole organism it is clearly of great importance to know more exactly how acetate affects cellular metabolism.
4.4 Effects of weak organic acids on cell respiration
Non-epithelial cells
An important attribute of weak organic acids (and bases) is the existence of an ionic and non-ionic (protonated) form in solutions containing the acid. The protonated form is peculiar due to its relatively high solubility in lipid substances, like biological membranes, which allows weak acids to penetrate cells much more easily than strong acids. This property, together with a certain permeability of membranes for the ionic form has important consequences for the intracellular environment and cell metabolism.
Characteristic for the intracellular environment is an acidity which is controlled mostly within a narrow range to offer optimum conditions for enzymatic processes. Deviations of the average acidity are generally due to changing external conditions. Additionally, the organism appears to actively exploit the variation in intracellular pH to control metabolic processes. The intracellular pH has thus been candidated as an 'overall governor of metabolic activity' (Busa, 1986). Changes in intracellular pH are an effective means to modulate processes because of a great pH-sensitivity of many enzymes. Intracellular pH of mammalian cells is usually higher than expected from the electrochemical proton gradient: only by a continuous extrusion of protons, cells are able to maintain intracellular pH on this higher level (Thomas, 1984; Boron, 1985; Madshus, 1988).
In a medium with weak organic acids, cells are rapidly penetrated by the protonated form resulting in acidification of the cells' interior. Examples of internal acidification of animal cells by fatty acids are given for instance by De Hemptinne et al. (1983) for Purkinje strands
74

of sheep heart and by Thomas (1984) for snail neurons. Figure 4.3 shows an example from the first mentioned authors. The difference in response between propionate and pyruvate may indicate that the first penetrates the cell passively, the latter through facilitated diffusion.
- dpH/dt
1.5
1 - -
0.5 --
propionate
-+- -+- -+-10 20 30
Concentration (mMol/l)
40
Fig. 4.3. Maximum rate of intracellular acidification, expressed as pH change within 10 minutes, after superfusion of Purkinje strands of sheep heart with propioniate and pyruvate at a pH 6.8 of the medium (redrawn from De Hemptinne et al., 1983).
The cell reacts to this internal acidification with an enhanced proton extrusion in an attempt to correct the decrease of pH. If the cell membrane would be permeable only to the protonated form, a new equilibrium would rapidly establish itself, the concentration of the protonated form at both sides of the membrane being the same and the concentration of the ionic form being higher intracellularly. As, however, the ionic form passively leaks from the cell, a new high intracellular pH can only be maintained by a permanently increased extrusion of protons. Ionic and non-ionic form function together as a 'shuttle' carrying protons into the cell (Boron, 1983). This means that a cell needs more energy for maintenance of the proton gradient in a medium containing weak organic acids than in a medium without these. This phenomenon can be observed in cells of widely differing origin.
Positive effects of low concentrations and negative effects of high concentrations of weak organic acids on growth and activity of cells are mainly known from microbiological investigations (see for instance Maesen and Lako, 1952; Samson et al., 1955; Pöhland et al.,
75

1966; Abbott, 1973; Ko and Edwards, 1975; Men-Chung Tseng and Wayman, 1975; Tuttle and Dugan, 1976). The concentration at which negative effects become apparent depends, among others, on extracellular pH and chain length of the acid.
An elegant example of the way acetate influences cell respiration of microbes is shown by experiments of Hueting and Tempest (1977) with the yeast Candida utilis. These researchers cultured the yeast at different medium acidities and acetate concentrations. In the absence of measurable concentrations of acetate, the yeast was able to survive over a pH range of 2.5-6.9. Moreover, this variation of pH had no appreciable effect on oxygen consumption, contrary to the situation in the presence of acetate. A gradual lowering of medium pH in the presence of acetate caused oxygen use to increase until a pH of 4.8 was reached. At that moment, the culture disappeared from the continuous-flow fermentor. The authors concluded that the negative effect of acetate must be attributed to its protonated form, the concentration of which increases with decreasing pH. A low pH per se is not harmful because of a low permeability of yeast cells for protons, but weak acids act as protonophores. The cell is to some extent able to compensate an increased proton inflow by active proton extrusion. When this capacity is exceeded the cell dies. The authors also concluded that the energetic efficiency with which acetate is utilized for growth will be lower than that of substrates which do not cause proton leakage. Such a conclusion also appears applicable to the observations of acetate metabolism in bovine fat cells.
Hueting and Tempest (1977) suggested that the increase of oxygen consumption may also be due to uncoupling of mitochondrial respiration. Uncoupling is caused by the action of weak organic acids as protonophores over the inner mitochondrial membrane. It is, however, not clear whether this phenomenon is of importance in ruminants in view of the low concentration of acetate in blood and the relatively high pH. Data of Cunarro and Weiner (1975) show that mitochondrial uncoupling by acetate can occur at a concentration of about 100 mM.l"1 and a pH of 7.4. Therefore, uncoupling may be relevant for epithelial cells which, in the case of rumen and large intestine, experience extracellular concentrations between 50 and 200 mM.l-1.
Weak organic acids may affect energetic efficiency of cell metabolism in still other ways, for instance by a reduced energy transfer per molecule ATP hydrolysed when intracellular pH is lower. Such a mechanism has been mentioned as a possible cause of a diminishing contraction force of muscle fibres when severe muscle strain induces intracellular acidification (Curtin et ai, 1988). All the effects mentioned so far find their origin in internal acidification following enhanced proton leakage of membranes of cells or cell compartments. In addition to this mechanism, other ways of interference of fatty acids with cell metabolism may exist, for instance by binding to enzymes and other proteins as suggested by Samson et al. (1955).
Clear evidence that the effects of acetate on cell respiration also occur in vivo is provided by experimental results of Armstrong and Blaxter (1957). These workers examined the energetic efficiency of utilization of different substrates by infusing them, separately and in combinations, in fasting sheep. When isocaloric amounts of acetate, propionate and butyrate were infused separately, the heat increment was found to be 41, 14 and 16%, respectively, of the energy administered. Such differences are hardly surprising in view of the VFA concentration measured in peripheral blood: peak concentrations were 10, 0.1 and 0.5 mM.l-1
for acetate, propionate and butyrate, respectively. The efficiency of utilization of acetate was much higher and its concentration much lower when a mixture of the three acids was infused.
76

Such differences in utilization have also been found by other researchers (ARC, 1980). Generally, differences in acetate utilization are explained by pointing to differences in glucose availability. Such an explanation, however, can only be partly correct. As emphasized above in the discussion of experiments of Yang and Baldwin (1973), the effect of a higher glucose availability is indirect: it enhances the conversion of acetate into lipid without changing the negative effect of acetate on cell respiration.
At this point it is also worth looking again at effects of insulin. As the results of Yang and Baldwin (1973) showed, insulin increases the affinity of lipid synthesis for acetate both at low and high concentrations. This may be due to a higher intracellular glucose availability. Yet, it may also be caused by a positive effect of insulin on intracellular pH (Fig. 4.4) and thus on the activity of enzymes involved in lipid synthesis. Such an action of insulin has been proposed by Mukherjee and Mukherjee (1981) in a study of lipid metabolism in rat adipose cells and agrees with the way insulin is thought to influence glycolysis in muscle cells (Fidelman et al., 1982). If this latter explanation proves to be correct, it seems plausible to link the sharp decline of the affinity of lipid synthesis for acetate, at a concentration of about 1 mM.l"1, to a change of intracellular pH. This is an attractive idea as the intracellular pH in this way becomes a suitable parameter to gauge the optimum extracellular acetate concentration for lipid synthesis, as developed below.
0.3-rdPH
• • + insulin
o o - insulin
H 1 1 1 h
1 2 3 4 5 6 7
Minutes of incubation
Fig. 4.4. Intracellular pH change of rat fat cells incubated with or without insulin at pH 7.05 of the medium (redrawn from Mukherjee and Mukherjee, 1981).
77

Epithelial cells
Epithelial cells differ from non-epithelial cells in two important aspects: 1. the extracellular environment on one side of the cell often has considerably higher concentrations of weak organic acids than present in peripheral blood, and 2. transport of weak acids across the cell is an important cell function. Within the framework of this study, it would be interesting to know how oxygen consumption of these cells varies depending on differences in VFA concentration, VFA transport and transport of other substances. However, such data have not been traced in the literature.
The potentially harmful effect of weak organic acids on the intracellular environment suggests that epithelial cells of forestomachs and large intestine may be equipped with powerful mechanisms to prevent uncontrolled intracellular acidification. In addition, the negative effects of relatively low concentrations of weak organic acids on peripheral tissues do not support the notion of a passive, uncontrollable, mode of transport. Opinions in the literature on the way transport of VFA takes place appear to differ, ranging from a carrier-mediated transport to passive diffusion (Powell, 1987). Different mechanisms presumably coexist, involving both ionic and non-ionic transport, the relative importance of which is probably different between organs. For instance, a typical attribute of the reticulo-rumen seems to be a capacity to absorb large amounts in the form of free acids i.e. without a concomitant absorption of similar amounts of mineral cations like sodium (see Table 4.2). Contrary to this situation, the large intestine usually shows a closer relation between acetate and sodium transport according to data quoted by Argenzio (1988).
In vivo transport of acetate is downward along a concentration gradient and could indeed be entirely passive. From in vitro experiments, however, we know that weak organic acids can be transported against a gradient. Noteworthy is the fact that rumen epithelium incubated in vitro with the same VFA solution on both sides appears to transport VFA against the normal direction, i.e. from serosal to mucosal side (Stevens et al., 1969). This reinforces the idea that the function of rumen epithelium is primarily the prevention of uncontrolled transport and not its facilitation.
In an attempt to explain transport of VFA against a concentration gradient, many publications assign an important role to an intermediate zone in epithelial tissue having a different pH and confined at both sides by membranes or zones with a different permeability for the ionic and non-ionic form of the acid (Stevens et al., 1969; Jackson, 1981; Powell, 1987). In its simplest form, this concept is embodied by an epithelial cell which, by active extrusion of protons on one side of the cell, accomplishes transcellular acid transport. This would mean that epithelial cells are essentially 'normal' cells, yet with a capacity to extrude protons restricted to one side of the cell. In this way transport of weak acids is considered a by-product of intracellular pH regulation (Boron, 1986). A controlled variation of intracellular pH in epithelial cells may then be an important tool to regulate the entry of weak organic acids into the blood and for instance insulin may be involved in its central control. This suggestion does not seem to be seriously studied until now, notwithstanding a plea of Ash and Dobson (1963) for more research into changes of VFA absorption rates. Proof of the urgency of such research may be found in the absorption rates measured under experimental conditions which are often much lower than may be deduced for the free-feeding animal at similar intraruminal VFA concentration and pH. This is not only true for the results of in vitro
78

experiments (Stevens and Stettler, 1966), but also for measurements of absorption rates in in vivo experiments with a temporarily isolated rumen (Ash and Dobson, 1963; Hogan, 1961). For instance, in the latter experiments an absorption rate of acetate was measured in sheep which, when expressed per day, amounted to only 1-1.5 Moles at pH=6.5 and 2.5 Moles at pH=4.5 and acetate concentration of 100 mMi"1 (Hogan, 1961). These amounts are only a quarter of the amounts a free-feeding animal absorbs at similar concentration and equal or higher pH. In the experiments of Hogan (1961), absorption of NH3 also appeared to be much lower than expected.
Maintenance of a proton gradient requires energy and in this way transport of weak acids from the gut can be considered an active process. How these energy costs relate to differences in concentration and amounts transported is not known. Neither do we know how other factors (extracellular pH, CO2 partial pressure, concentrations of strong electrolytes) and cellular functions influence such costs. Amongst the latter, differences in electrolyte transport are particularly relevant. Ruminants daily recycle an amount of sodium between gut and blood which may be twice as large as the amount actually present in blood and interstitial fluid. Obviously, for ruminant life the importance of sodium resorption as an epithelial function is equal to or even greater than the importance of VFA absorption.
Evidence that epithelial cells, like non-epithelial cells, experience negative effects of higher VFA concentrations are for example a saturation of VFA transport at concentrations which differ per segment of the gut, as appears from in vivo studies of human jejunum, ileum and colon (Schmitt et al., 1976, 1977; Ruppin et al, 1980). Both human jejunum and ileum are not well prepared for acid transport and it is likely that VFA concentrations which exceed the saturating concentration will lead to internal acidification and cell damage. The inhibition of fluid, and probably sodium, transport found in in vitro experiments with epithelium of the small intestine, at concentrations which become lower with increasing chain length of the acid, also points to negative effects due to intracellular acidification (Barry and Smyth, 1960).
4.5 The metabolic acid load as a cause of a decreasing
partial efficiency of energy utilization
The mechanisms we identified as likely causes of an increased respiration by the presence of acetate have a common origin: an increased metabolic acid load for cells. This means that, 1. the effects of acetate are shared by all weak acids which can pass membranes in protonated and non-protonated form, 2. all cells suffer from the consequences of such acids, and 3. the final response of cell respiration will depend on the total metabolic acid load. The latter equals the net passive influx of protons into cells and is a function of many different parameters like extracellular concentrations of individual acids, their pK, extracellular and intracellular pH, and membrane permeability for protonated and non-protonated form.
Acids which contribute to the total metabolic acid load partly arise from the microbial fermentation of feed, partly arise from host animal metabolism. In ruminants, VFA from the gut play a dominant role. In monogastrics the dietary contribution is generally much smaller. Man on a Western diet absorbs only 0.2 to 0.6 Moles VFA per day from the large intestine
79

(Cummings, 1981), but pigs on roughage rations probably up to 5 Moles per day (Herschel et al, 1981).
The contribution of host animal metabolism is more difficult to estimate. Quantitatively the most important weak acid is CO2, in addition acids like lactate, acetate and pyruvate play a role. From in vitro studies it is known that increasing O02 concentration leads to a similar chain of events as discussed for VFA. Therefore, we may expect that an increase in CO2 concentration will effectively raise the metabolic acid load of cells and will provoke an enhanced proton extrusion (Boron, 1985).
A crucial question is to what extent this mechanism stimulates cell respiration also in vivo when metabolic activity and C0 2 production are increased. The fact that C0 2 can rapidly be removed by pulmonary excretion would seem to deny this. Yet, the C0 2 concentration of the extracellular environment is not constant. For instance, during physical exercise C0 2 partial pressure of venous blood is increased and blood pH decreased despite a lower C0 2 pressure of arterial blood. Both imply an increased metabolic acid load and this has been proposed as an explanation for a decreasing energetic efficiency of muscular work (Curtin et al, 1988).
A significant contribution of host animal metabolism to the total metabolic acid load is crucial for two reasons. First it implies that metabolic activity, i.e. oxygen consumption itself, indirectly increases the metabolic acid load and causes efficiency of energy utilization to decline. Secondly, it means that both in ruminants and in monogastrics, essentially the same mechanism may be responsible for the decrease of energetic efficiency whenever metabolic activity is raised due to either increased feed consumption or physical exercise.
The effective acid load resulting from the production of metabolic acid in body tissues will of course depend on blood flow, i.e rate of acid clearance. This would explain why in the in vitro experiments of Yang and Baldwin (1973), incubation of cells with glucose alone did not result in an abnormally raised cell respiration. Such experimental conditions do probably not allow a substantial accumulation of acid (mainly CO2) from cell metabolism in the extracellular medium.
Observations from the experiments of Armstrong and Blaxter (1957) already quoted confirm the importance of the metabolic acid load for cell respiration and efficiency of ME utilization. Analysis of the heat increment after both VFA and glucose infusions showed that the heat increment increased linearly with a decrease of plasma C0 2 combining capacity over the range of 63 to 12%. Obviously, such low values grossly outrange normal values of plasma C02 combining capacity. Despite this, the relationship found probably represents a causal one.
4.6 Effects of feed and animal characteristics on the
efficiency of energy utilization
Effects of feed and animal characteristics on the efficiency of ME utilization fall into two categories: effects which arise from metabolic changes in all tissues, and effects which arise from changes in the activity of specific tissues. Examples of the first category can in theory be derived from the model system of fat cells incubated with different nutrient concentrations.
80
Differences in efficiency with which a definite amount of ME is utilized can be visualized to follow from a different partitioning of substrate between processes of synthesis and oxidation. This partitioning is highly variable as the example of fat cells shows: only its upper boundary is fixed by the theoretical efficiency of synthesis processes which can be calculated from knowledge of biochemical conversions. Each increase in affinity of synthesis processes for a particular substrate will have a positive effect on partial efficiency whereas each increase of substrate use for maintenance of the intracellular homoeostasis will tend to reduce partial efficiency. Such shifts in substrate use may follow changes in substrate type, but also changes in enzyme activity as influenced by hormones. The latter may explain why the same amount of ME is used with different efficiency depending on the physiological state of the animal. The effect of an increase in basal metabolism may be considered a change of the intracellular environment - for instance a higher pH which often accompanies an increase in metabolic activity (Busa, 1986) - with favourable effects on the affinity of synthesis processes for the same substrate concentration. In this respect we can compare the basal metabolism with the fixed costs of a production process, the magnitude of which also influences the efficiency with which a production factor (in the animal: MEI above maintenance) is utilized. To what extent an increase of basal metabolism is judged 'attractive' by the animal probably depends on the gains in terms of increased efficiency above maintenance and the possible benefits of an additional heat production, and the costs in terms of extra oxygen consumption.
Differences in efficiency of ME utilization between feeds may be the consequence of differences in substrate partitioning within cells in all tissues and differences in substrate partitioning between tissues. The latter are only partly quantified due to the complexity of measuring substrate use and oxygen consumption in different organs. Many activities related to feed consumption cause changes in substrate partitioning between tissues, for instance due to differences in the amount of energy needed for chewing of feed and mixing and propelling of digesta. Such energy requirements are, however, relatively small when compared to the variation in efficiency of ME utilization between feeds (Webster, 1980; Blaxter, 1989). That the direct contribution of such processes to differences in ME utilization is small, may also be inferred from the fact that differences in ME utilization between feeds are small below maintenance intake. These differences become larger as MEI increases. This may not arise from additional processes requiring energy in the case of lower quality feeds. It is more likely that the efficiency with which all organs function starts to diminish, yet at a variable rate, as the environment which surrounds cells assumes a higher metabolic acid load. Such a variable rate may result from differences between feeds in total metabolic acid load at similar MEI, for instance due to a different contribution of acid from the gut or from host animal metabolism itself. A decrease of the efficiency of individual organ functioning is indicated by measurements of oxygen consumption by the gut: the latter increases exponentially with increasing MEI just like O2 consumption of the whole animal (Webster et al, 1975). The study of Webster et al. (1975) also revealed differences in oxygen consumption of the gut between feeds at a similar MEL How these differences are related to characteristics of the feed cannot be postulated on the basis of current knowledge. The same is true for differences in energy utilization by organs others than the gut.
81

4.7 Feed intake regulation: regulation of optimum
nutrient concentrations
Usually, feed intake regulation is considered the control of a process by which the animal transfers definite amounts of matter in the form of meals from the outside environment to the internal environment. Such a concept loses much of its significance as soon as we focuss on the regulation of uptake and use of nutrients by organs, tissues or cells: their activity responds to changes in concentrations, not to changes in amounts of nutrients in their environment. Obviously, large differences exist in the composition of the extracellular environment, the largest difference being present between blood and interstitial fluid on the one hand, and the gut lumen on the other hand. Within these two again, quite different micro-environments can be distinguished. This variety of environments is reflected by a variation in nutrient concentrations. Amongst these, VFA appear to play an unique role as they contribute to the metabolic acid load. As shown above this means that their presence, in physiological concentrations, has both positive and negative effects. Such dual effects may not be restricted to nutrients like VFA but we shall limit our discussion to this major class of nutrients in ruminant metabolism. Both types of effects resulted, in our model system of fat cells, in the definition of an optimum concentration at which increased substrate availability and metabolic acid load showed the best possible compromise to maximize the efficiency of oxygen utilization. The nature of both types of effects is such that they occur in all tissues to which VFA have access, i.e. in all body cells. Hence, all tissues share the positive and negative effects, yet not all to the same degree. For instance, a medium containing acetate and glucose in the right concentration will allow fat cells to synthesize large amounts of lipid and achieve a high efficiency of oxygen utilization. Yet, the same medium would be unsuitable for protein synthesis in muscle cells, so it would result in a low efficiency there. For this reason, the optimum concentration of VFA will be different for fat and muscle cells depending on the presence of amino acids. In vivo, however, both types of cells bathe in the same medium and rely upon it for their nutrition. Hence, an organism which tries to maximize the overall efficiency of oxygen utilization has to find the optimum VFA concentrations (as part of the optimum metabolic acid load) taking into account the balance of positive and negative effects in all tissues which share the same extracellular environment. This must apply to both the blood and interstitial fluid and the gut contents as extracellular compartment of the gut lining tissues. Therefore, in the ad libitum fed animal we may expect to find VFA concentrations in different body compartments which are actively regulated in order to achieve a maximum efficiency of oxygen utilization for the whole organism. This conclusion is contrary to the common belief that such concentrations merely reflect differences in microbial fermentation rate and VFA production and absorption rates. In the next section we will discuss observations on VFA concentrations in forestomachs and blood supporting our opinion.
82

Optimum VFA concentrations in the forestomachs
VFA concentrations in rumen fluid of roughage-fed animals increase almost linearly with digestibility of the feed as do the amounts of VFA absorbed by ad libitum fed animals. Higher concentrations of VFA in digesta flowing from the reticulo-rumen also result in a general increase of concentrations in omasum, abomasum and duodenum as illustrated by Table 4.2 which was composed from literature data of different sources. The low concentrations typical for poorly digestible feeds are not the consequence of a low acid production per se, but follow from the balance between production, absorption and outflow of acid. All these processes are, to a variable extent, controlled by the animal by actively changing the rates of eating, chewing, absorption and passage. Not surprisingly, concentrations may rise rapidly when one or more processes are deliberately disturbed. An interesting example is the acute increase of VFA concentration when saliva flow is interrupted (McManus, 1959). In addition, it appears that concentrations for the same feed and feed intake are not constant but to some degree influenced by the physiological state of the animal (Weston, 1988).
If the observed VFA concentration reflects an optimum state belonging to a particular feed and animal, we may expect that artificial concentration changes per se will provoke adaptive changes in feed consumption. Such changes of intake will proceed until the animal has achieved a new equilibrium. If the animal does not succeed in establishing this, intake of feed may even fall to zero. In this way the results of VFA infusion experiments which, at first glance, look bizarre and anomalous (Egan, 1966; Weston, 1966) may be explained. A typical response to such infusions is a decrease of energy intake which sometimes is in proportion to the amount administered, sometimes absolutely not. The concentration of infused VFA solutions is usually many times higher than the concentration present in rumen fluid. However, the key factor must be the concentration of undissociated acid - as a function of VFA concentration and pH - which is established in rumen fluid. The role of undissociated acid appears to be well demonstrated by, for instance, results of Papas and Hatfield (1977): in lambs on a concentrate ration, intake decreased on average by 35% when abomasally infused with 0.5 Mole of either acetic, or propionic, or butyric, or hydrochloric acid, whereas comparable amounts of Na-acetate or propionate had little or no effect on intake. Evidence for the importance of the undissociated form may also be seen in the decision of Egan (1966) to use neutralized acids instead of free acids because of rapidly occurring ruminai acidosis when the latter were infused.
Lower concentrations of undissociated acid and greater VFA acceptance by the animal may be expected when VFA become available in less concentrated form either from more diluted infusions or from fermentation of slowly degradable carbohydrates. Rapidly fermenting concentrates usually show a higher substitution value than more slowly fermenting concentrates. Likewise, combination of rapidly fermenting compounds with buffers may act positively in order to control deviations from optimum free acid concentrations for a given feed. Thus, the substitution value of ruminai glucose infusions is high but much smaller when combined with bicarbonate (Weston, 1978).
The above does not answer the question why ruminai VFA concentrations would show different optima depending on the digestibility of the feed. The concept of an optimum concentration has been based upon a changing ratio between the positive and negative effects of VFA on organ functioning when concentrations increase. The main function of the rumen epithelium is the absorption of nutrients, perhaps more appropriately: the protection against
83

Table 4.2. A summary of different parameters relating to feed intake, digestion, and nutrient absorption by sheep given roughages varying in organic matter digestibility (OMD) from 40 to 80%. Parameters were estimated from information given by Egan (1965), Weston and Hogan (1968a,b), Hogan and Weston (1969), Hogan et al.(1969), Weston and Hogan (1971), Ulyatt et al. (1975), Ulyatt and Egan (1979), Doyle et al. (1982), Grace et al. (1985) and Blaxter (1989).
40 50 OMD (X)
60 70 80
Ad libitum intake ÖÏE (g.kg W"0-75^"1) OMI (g.d-1) DOMI (g.d"1) Digestion OM digested in rumen (g.d"*-) OM leaving rumen (g.d'l) % OM in digesta leaving rumen digesta flow from rumen (l.d'l) digesta flow from abomasum VFA flows (mol.d"1) produced in rumen absorbed from rumen leaving rumen concentration in rumen *) absorbed from omasum+abomasum leaving abomasum concentration in abomasum *) produced in caecum produced in rumen+caecum Saliva flows total flow (l.d"1) concentration of Na *) Sodium flows (mol.d'l) ruminai input from saliva absorbed from rumen ruminai outflow concentration in rumen *) **) Molar ratios VFA/Na produced in rumen VFA/Na absorbed from rumen Energy flows (MJ.d"1) consumed digested methane fermentation heat absorbed
as VFA-energy (X) as non-VFA-energy (%)
25 470 188
111 359 3.3
10.9 10.9
1.77 1.22 0.55
50 0.48 0.07
6 0.32 2.09
12.9 140
1.81 0.50 1.31 120
1.0 2.4
9.07 3.63 0.56 0.34 2.73
86 14
39 733 367
220 513 3.6
14.3 16.3
3.38 2.39 0.99
69 0.85 0.14
9 0.55 3.93
16.9 140
2.37 0.65 1.72 120
1.4 3.7
14.42 7.21 0.98 0.59 5.64
80 20
53 996 598
365 631 3.9
16.2 21.1
5.32 3.88 1.44
89 1.17 0.27
13 0.78 6.10
19.7 140
2.76 0.82 1.94 120
1.9 4.7
19.93 11.96 1.35 0.81 9.80
73 27
66 1241 869
530 711 4.3
16.5 23.9
7.47 5.68 1.79 108
1.42 0.37
16 0.96 8.43
19.1 140
2.67 0.69 1.98 120
2.8 8.2
25.11 17.58 1.48 0.89
15.21 66 34
80 1504 1203
734 770 4.6
16.7 26.7
9.98 7.78 2.20 132
1.60 0.60
22 0.96
10.94
16.5 140
2.31 0.31 2.00 120
4.3 25.1
30.61 24.49 1.60 0.96
21.93 61 39
w ) **
Concentrations in mM.l" ) Effects of variable K-concentrations of the feed were not taken into
account.
84

uncontrolled resorption. Absorbed nutrients include exogenous substances - mainly VFA arising from the feed - and endogenous substances - mainly sodium arising from saliva secretion. Hence, it would appear logical to search for an explanation, as to why optimum concentrations differ between feeds, in changes in these two major absorptive processes. However, as noted earlier, our knowledge of the physiological processes involved is insufficient to show that energetic efficient transport of VFA and sodium are only to a certain extent compatible. Some evidence was quoted which indicates that high concentrations of VFA favour the absorption of VFA, yet counteract the absorption of sodium. Indirect evidence that the relationship between the two is important for intake regulation is more amply available and is now summarized.
Any attempt to explain differences in roughage intake which does not rely on an important role of rumen fill should offer an alternative explanation for the correlation between intake and feed characteristics which measure the ease of physical and microbial breakdown like digestibility, cell wall content, and chewing efficiency (Dulphy et al., 1980). Only part of the favourable effect of a higher digestibility can be attributed to changes in nutrient ratios (a smaller proportion of VFA-energy in ME which probably allows a more efficient utilization of ME, see Table 4.2) and lower costs for physical processing of feed (chewing, ruminating, digesta propelling etc.). These can, however, not fully explain the higher intake of highly digestible feeds: even after grinding and pelleting and supplementation with minerals, vitamins and protein, poorly digestible feeds do not show a digestible energy intake equal to highly digestible feeds. So clearly other processes must be involved. These may be secretory and absorptive processes varying in parallel with differences in the filling capacity or degradability of feeds. For instance, for roughages secretion of saliva is highly correlated with digestibility, but even more highly with parameters which measure the amount of chewing needed per kilogram of feed; an example is the chewing index of Troelsen and Bigsby (1964) which in turn appears a better predictor of intake than digestibility itself. Likewise, grinding and pelleting decreases saliva production but increases intake.
The importance of saliva secretion is also supported by the results of simulation models of feed processing in the rumen: ruminants may increase their intake of a roughage by enhancing digesta passage which requires a larger flow of electrolyte fluid i.e. a larger saliva production. The fact that the animal uses this mechanism only under some circumstances may indicate that such an increase presents both benefits and costs.
Addition of electrolytes like NaCl and KCl to the rumen acutely decreases saliva production (Wilson, 1963), at higher doses also feed intake (Wilson, 1966). This points to a fine control of the flow of electrolytes into the rumen in relation to the needs for processes of resorption and passage: small disturbances may be compensated by changes in saliva flow without similar changes in intake, larger disturbances may not. Also, effects of different kinds of manipulations of rumen contents (like addition or removal of materials) may have little to do with changes in rumen fill per se but more with changes in the conditions affecting nutrient absorption.
The extent to which differences in digestibility are paralleled by changes in ruminai absorption processes is illustrated by calculations of VFA and sodium flows across the rumen. These are shown in Table 4.2. The ratio between Na, available from saliva, and VFA from feed appears to vary on a molar basis from 1:1 for very low, to 1:4 for very high quality roughages. The ratio between Na and VFA absorbed from the rumen shows a much wider
85

variation i.e. from 1:2 to 1:25. This means that as digestibility of the feed increases, total absorbed amounts of VFA - in the case of ad libitum feeding - increase and in addition a growing proportion is absorbed as free acid i.e. without a mineral cation. Direct evidence that such ratios are important for the control of absorption and thus intake would seem to come from experiences with intragastric feeding (0rskov et al., 1979). With this technique it has proved possible to sustain ruminants completely on infusions of VFA, protein, vitamins and minerals. Important for its successful application appeared to be the ratio between amounts of buffer and VFA infused into the rumen. With a molar ratio of buffer (Na-bicarbonate) and acid of 1:1 only a small amount could be infused, with a ratio of 1:4 a level of at least 2 times maintenance could be achieved in sheep. It is important to note that higher doses led to accumulation of acid and ruminai acidosis. Although these ratios in combination with feasible energy infusion levels show a parallel with the free-fed animal (see Table 4.2), a clear difference exists between intragastric feeding and free-feeding: external addition of buffer to the rumen is not identical to internal recycling of buffer between blood and gut.
In conclusion, it is emphasized once more that fill characteristics of a feed - often linked to its intake potential - also have a large impact on conditions for resorption of nutrients and electrolyte recycling. Yet, the importance of the latter has largely been ignored in the search for an explanation of causes of differences in intake.
Optimum VFA concentrations in the blood
Although comprehensive data are lacking, VFA concentrations in venous blood of ad libitum fed animals appear to be higher when feed quality or intake are higher. In order to reduce the acid load of VFA, it would appear beneficial for the animal to keep VFA concentrations as low as possible. This requires a high affinity of for instance lipid synthesis for acetate, so high blood concentrations of glucose and insulin. However, manipulation of both parameters does not only affect adipose tissue but the majority of body tissues. Therefore, the optimum VFA concentrations in blood must be dependent on the composite effects of VFA, glucose, amino acids and insulin on all cells. Obviously, it will not be easy to predict them for any particular feed.
The amount of glucose ruminants absorb from roughage rations is small. That is why the provision of sufficient propionate and amino acids as glucogenic precursors could be an important feed parameter affecting efficiency of utilization of ME and intake. The positive effects of protein content on intake, however, may have different causes depending on its magnitude. At low protein contents ME is utilized probably inefficiently both by adipose tissue due to a lack of glucose and by other tissues due to a relative excess of acetate compared to amino acids. Correcting a true deficiency of glucogenic precursors or amino acids under such conditions may explain the spectacular intake increase of low quality roughages sometimes found. At higher protein contents in the feed, extra protein will largely be used for fat synthesis in mature animals. Due to the absence of the protonophoral properties of VFA, protein may be a relatively 'cheap' substrate for fat synthesis. The theoretical efficiency of fat synthesis from protein amounts to 0.66 according to Blaxter (1989) which is higher than the partial efficiency of ME utilization at the level of voluntary MEI. Under such circumstances protein is better considered a preferred, instead of a limiting
86

nutrient: mature sheep may respond positively to a higher protein content of the feed without really having high amino acid requirements.
Apart from the effects mentioned above, feed protein may have another effect irrespective whether the protein content is low or high. Protein in roughages usually has a high degradability and protein breakdown produces a VFA mixture quite different from carbohydrate breakdown: in vitro fermentation of casein gave a mixture with, on a molar basis, 40% acetate, 28% propionate, 12% butyrate and 20% valerate and isovalerate (Demeyer and Nevel, 1979). Such a mixture has an energy content of 1.6 MJ.Mol"1 which is higher than the 1.2 MJ.Mol1 for an average mixture from carbohydrate fermentation. Infusing this mixture in mature sheep was relatively well tolerated when compared to the intake responses often reported when VFA mixtures richer in acetate have been infused (Chapter 7). More experiments are needed to confirm potentially positive effects of degradable protein.
4.8 Intracellular pH: measure for the optimum
metabolic intensity?
In Chapter 3 we presented feed intake regulation as the optimization of costs and benefits of feed consumption. We considered benefits the intake of NE and costs the total concomitant oxygen consumption. Both parameters appear to represent well the gains and losses associated with feed consumption. However, it seemed unlikely that these are also the parameters the organism records to adjust the intensity of feeding. A mechanism to measure oxygen consumption quantitatively is not known. Neither is it apparent how animals could directly sense changes in energy retention. Another basic problem is the fact that both parameters are cumulative quantities calculated on a daily basis, as usual. On a time scale of less than a day both oxygen consumption and NEI would have shown a large and partly independent variation. So if the animal would really measure both parameters it would also need to have some kind of memory to integrate and store the relevant information.
The objections against the choice of these parameters largely disappear if the principle of optimization of feed intake can be reduced to the maintenance of an optimum composition of the extracellular environment in different body compartments. Control of the metabolic acid load appears to be a crucial element in this process. In view of the effects of the metabolic acid load on intracellular pH, the latter appears a good candidate to sense and control the intensity of feeding behaviour. It is worth noting that sensors which react to changes in concentration of the protonated form of VFA - therefore probably to changes of intracellular pH - have been found in the rumen wall (Leek, 1986).
Intracellular pH may not only control the intensity of feeding behaviour but also of other behavioural activities. The tendency towards maximization of efficiency of oxygen utilization not only determines the preferred intensity of feeding behaviour in ruminants but also the preferred intensity of locomotory behaviour in man, horse and fish (Chapter 3). From the harmful effects of oxygen consumption on vitality and life span we supposed that an efficient use of oxygen may be a general principle underlying the control of metabolic intensity in
87
aerobic organisms. Probably characteristic for any increase in metabolic intensity are changes of the concentrations of substrate, metabolites and waste products in the environment surrounding cells. Such changes appear to increase the energy requirements for maintenance of intracellular homoeostasis. Hence, the control of metabolic intensity must involve the assessment of the acceptable costs of maintaining intracellular homoeostasis. In this assessment the organism appears to use the efficiency of oxygen utilization as a guiding principle. As each increase of metabolic intensity tends to acidify the intracellular environment and this in turn affects many different intracellular processes, the assessment of the acceptable excursion of intracellular pH must be part of the control of any behavioural activity. Intracellular pH may thus act as both an overall sensor and governor of metabolic activity (Busa, 1986).
Control of intracellular pH is of vital importance for each cell and feedback information with regard to this parameter is thus required from all body compartments to adjust feeding intensity. For that reason a unique role for a single organ in the regulation of intake, as sometimes suggested for the liver, seems unlikely.
4.9 Future research
The strength of any theory on feed intake regulation depends to a large extent on the successful integration of observations made at different hierarchical levels, ranging from the level of the whole organism to the cellular level. We belief our approach in this respect favourably competes with commonly held opinions on intake regulation. Yet, we are fully aware of the many gaps in our knowledge and future research must prove the firmness of the theory presented. Further research is indicated at all the levels we tried to span.
At the cellular level, we need to know more exactly how VFA affect cell respiration of mammalian cells as most of the information, surprisingly, stems from other scientific fields than ruminant physiology. At the tissue and organ level, information is desired as to the different and probably conflicting requirements of organs for optimum functioning. At the level of the organism as a whole, clearly, a great challenge is to find out how the animal succeeds in integrating information as to the metabolic intensity in different tissues and how it uses this information to adjust nutrient flows between different body compartments, like the gut and blood compartment, and ultimately feed consumption. This question is, of course, not restricted to the stall-fed animal but also extends to the free-ranging animal performing many different behavioural activities, often simultaneously.
We would like to end with some remarks as to the relevance of research into the regulation of feed intake and energy utilization in ruminants. In the idea developed here, we consider the decrease of the efficiency of ME utilization with increasing intake as an inevitable consequence of a higher metabolic acid load threatening the intracellular environment. The organism has to defend itself against this threat and thus incurs certain energy costs. These extra costs in turn appear to be decisive for the optimum level of feed intake, growth and production. To perceive that the costs involved in preserving the internal environment are so crucial causes concern. It does not seem merely coincident that such perception occurs at a moment when we begin to realize that 1. an increased pollution of our

human environment is concurrent with a sharply increased nutrient and energy use in, amongst others, agricultural systems, and 2. such polluting effects have to be taken into account in assessing the optimum production intensity of those systems. Hence, research into the animal metabolism as a model of an optimized production system may well serve a broader interest than the more narrow one of livestock production.
4.10 Conclusions
1. The efficiency of oxygen utilization for NEI attains a maximum value close to the level of voluntary MEL This is caused by: 1. the existence of a basal oxygen consumption in the absence of feed consumption and 2. a decreasing partial efficiency of metabolizable energy (ME) utilization when ME intake increases.
2. The decrease of partial efficiency may be due to the fact that all tissues develop progressively higher maintenance requirements as a result of changes in the extracellular environment. An important change is a higher metabolic acid load caused by higher concentrations of acids from microbial fermentation of feed and host animal metabolism. Differences between feeds in the rate of decline of partial efficiency with MEI may arise from systematic differences in substrate partitioning both within all body cells and between cells of different organs.
3. The level of voluntary feed intake - the optimum level from a point of efficiency of oxygen utilization - is probably linked to the presence of a certain 'optimum' acid load and thus to certain optimum VFA concentrations. Feed intake regulation will aim at maintaining such concentrations in all body compartments. The fact that optimum VFA concentrations in blood and gut differ according to the quality of the feed may be due to feed differences in the conditions for efficient absorption and utilization of VFA. These conditions probably vary as a function of differences in the internal recirculation of electrolytes, in the ratio of nutrients absorbed from the gut, and in differences in endogenous acid production.
4. The value of feed digestibility as a general indicator of roughage intake potential must be attributed to the information this parameter holds with regard to the energetic efficiency of several processes; these probably concern the complete chain of feed processing, from chewing and ruminating to the absorption of nutrients and its subsequent utilization in body tissues.
5. The positive effect of a higher feed protein content on intake may be partly attributable to an increased availability of amino acids to the host animal, partly to an increased proportion of non-VFA-energy in ME, and perhaps also partly to an altered composition of VFA-energy as a result of ruminai protein degradation.
6. Intracellular pH may appear to be an important parameter used by the animal in assessing the optimum intensity of not only feeding behaviour but also of other behavioural activities of both ruminants and monogastrics.
89

References
Abbott, B J., 1973. Ethanol inhibition of a bacterium (Acinetobacter calcoaceticus) in chemostat culture. Journal of General Microbiology, 75: 383-389.
ARC (Agricultural Research Council), 1980. The nutrient requirements of ruminant livestock. Commonwealth Agricultural Bureaux, Farnham Royal, 351 pp.
Argenzio, R.A., 1988. Fluid and ion transport in the large intestine. In: A.Dobson and M.J. Dobson (Eds.), Aspects of digestive physiology in ruminants, Comstock Publishing Associates, Cornell University Press, Ithaca and London, pp. 140-155.
Armstrong, D.G. and K.L. Blaxter, 1957. The heat increment of steam-volatile fatty acids in fasting sheep. British Journal of Nutrition, 11: 247-273.
Ash, R.W. and A. Dobson, 1963. The effect of absorption on the acidity of rumen contents. Journal of Physiology, 169: 39-61.
Baldwin, RX. and N.E. Smith, 1983. Adaptation of metabolism to various conditions: milk production. In: P.M. Riis, Dynamic biochemistry of animal production, Elsevier, Amsterdam, pp. 359-388.
Barry, R J.C. and D.H. Smyth, 1960. Transfer of short-chain fatty acids by the intestine. Journal of Physiology, 152:48-66.
Blaxter, K.L., 1989. Energy metabolism in animals and man. Cambridge University Press, Cambridge, 336 pp. Boron, W.F., 1983. Transport of H+ and of ionic weak acids and bases. Journal of Membrane Biology, 72 :1-16. Boron, W.F., 1985. Control of intracellular pH. In: D.W. Seldin and G. Giebisch (Eds.), The kidney: physiology
and pathophysiology, Raven Press, New York, pp. 1417-1439. Boron, W.F., 1986. Intracellular pH regulation in epithelial cells. Annual Review of Physiology, 48 : 377-388. Busa, W.B., 1986. The proton as an integrating effector in metabolic activation. In: P.S. Aronson and WJ7.
Boron (Eds.), Na+ - H+ exchange, intracellular pH, and cell function, Orlando, FL: Academic Press, Inc., Current Topics in Membranes and Transport, 26: 291-305.
Cummings, J.H., 1981. Short chain fatty acids in the human colon. Gut, 22: 763-779. Cunarro, J. and M.W. Weiner, 1975. Mechanism of action of agents which uncouple oxidative phosphorylation:
direct correlation between proton-carrying and respiratory-releasing properties using rat liver mitochondria. Biochimica et Biophysica Acta, 387: 234-240.
Curtin, N.A., K. Kometani and R.C. Woledge, 1988. Effect of intracellular pH on force and heat production in isometric contraction of frog muscle fibres. Journal of Physiology, 396: 93-104.
Demeyer, D. and C. van Nevel, 1979. Protein fermentation and growth by rumen microbes. Annales de Recherches Vétérinaires, 10: 277-279.
Doyle, P.T., J.K. Egan and A.J. Thalen, 1982. Parotid saliva of sheep. I. Effects of level of intake and type of roughage. Australian Journal of Agricultural Research, 33: 573-584.
Dulphy, J.P., B. Remond and M. Theriez, 1980. Ingestive behaviour and related activities in ruminants. In: Y. Ruckebusch and P.Thivend (Eds.), Digestive physiology and metabolism in ruminants, Proceedings of the 5th International Symposium on Ruminant Physiology, Clermont-Ferrand, 1979, MTP Press Ltd, Lancaster, pp. 103-122.
Egan, A.R., 1965. Nutritional status and intake regulation in sheep. III. The relationship between improvement of nitrogen status and increase in voluntary intake of low-protein roughages by sheep. Australian Journal of Agricultural Research, 16: 463-472.
Egan, A.R., 1966. Nutritional status and intake regulation in sheep. V. Effects of intraluminal infusions of volatile fatty acids upon voluntary intake of roughage by sheep. Australian Journal of Agricultural Research, 17: 741-755.
Fidelman, MX., S.H. Seeholzer, K.B. Walsh and R.D. Moore, 1982. Quoted by Busa, W.B., 1986. Mechanisms and consequences of pH-mediated cell regulation. Annual Review of Physiology, 48: 389-402.
Grace, N.D., D.H. Carr and C.S.W. Reid, 1985. Secretion of sodium, potassium, phosphorus, calcium, and magnesium via the parotid and mandibular saliva in sheep offered chaffed luceme hay or fresh 'Grasslands Ruanui' perennial ryegrass. New Zealand Journal of Agricultural Research, 28:449-455.
Hemptinne, A. de, R. Marrannes and B. Vanheel, 1983. Influence of organic acids on intracellular pH. American Journal of Physiology, 245: C178-C183.
Herschel, D.A., R.A. Argenzio, M. Southworth and Ch. E. Stevens, 1981. Absorption of volatile fatty acid, Na, and H2O by the colon of the dog. American Journal of Veterinary Research, 42:1118-1124.
90

Hogan,, 1961. The absorption of ammonia through the rumen of the sheep. Australian Journal of Biological Sciences, 14:448-460.
Hogan, J.P. and R.H. Weston, 1969. The digestion of pasture plants by sheep. III. The digestion of forage oats varying in maturity and in the content of protein and soluble carbohydrate. Australian Journal of Agricultural Research, 20: 347-363.
Hogan, J.P., R.H. Weston and J.R. Lindsay, 1969. The digestion of pasture plants by sheep. IV. The digestion of Phalaris tuberosa at different stages of maturity. Australian Journal of Agricultural Research, 20: 925-940.
Hueting, S. and D.W. Tempest, 1977. Influence of acetate on the growth of Candida utilis in continuous culture. Archives of Microbiology, 115: 73-78.
Jackson, M.J., 1981. Absorption and secretion of weak electrolytes in the gastrointestinal tract. In: L.R. Johnson, (Ed.), Physiology of the gastrointestinal tract, Volume 2, Raven Press, New York, pp. 1243-1269.
Ko, R.Y.C, and V.H. Edwards, 1975. Transient kinetics of yeast growth in batch and continuous culture with an inhibiting carbon and energy source. Biotechnology and Bioengineering, 17: 965-983.
Leek, B.F., 1986. Sensory receptors in the ruminant alimentary tract. In: L.P. Milligan, W.L. Grovum and A. Dobson (Eds.), Control of digestion and metabolism in ruminants, Proceedings of the Sixth International Symposium on Ruminant Physiology, Banff, Canada, 1984, pp. 3-17.
MacRae, J.C. and G.E. Lobley, 1982. Some factors which influence thermal energy losses during the metabolism of ruminants. Livestock Production Science, 9:447-456.
Madshus, I.H., 1988. Regulation of intracellular pH in eukaryotic cells. Biochemical Journal, 250: 1-8. Maesen, Th J.M. and E. Lako, 1952. The influence of acetate on the fermentation of bakers' yeast. Biochimica et
Biophysica Acta, 9: 106-107. McManus, W.R., 1959. Relationship between pH and volatile fatty acid and diversion of saliva from the actively
fermenting rumen of sheep. Nature, 184: 1572-1573. Men-Chung Tseng, M. and M. Wayman, 1975. Kinetics of yeast growth: inhibition-threshold substrate
concentrations. Canadian Journal of Microbiology, 21: 994-1003. Mukherjee, S.P. and C. Mukherjee, 1981. Metabolic activation of adipocytes by insulin accompanied by an early
increase in intracellular pH. Annals New York Academy of Sciences, 372: 347-351. 0rskov, E.R., D.A. Grubb, G. Wenham and W. Corrigall, 1979. The sustenance of growing and fattening
ruminants by intragastric infusion of volatile fatty acid and protein. British Journal of Nutrition, 41: 553-558. Papas, A. and E.E. Hatfield., 1977. Factors affecting voluntary feed intake of growing ruminants fed high
concentrate diets. Feedstuffs, 2: 22-23. Pöhland, D., M. Ringpfeil and U. Behrens, 1966. Die Assimilation von Glucose, Xylose und Essigsäure durch
Candida utilis. Zeitschrift für Allgemeine Mikrobiologie, 6: 387-395. Powell, D.W., 1987. Intestinal water and electrolyte transport. In: L.R. Johnson (Ed.), Physiology of the
gastrointestinal tract, Volume 2, Raven Press, New York, pp. 1267-1305. Ruppin, H., S. Bar-Meir, K.H. Soergel, CM. Wood and M.G. Schmitt, 1980. Absorption of short-chain fatty
acids by the colon. Gastroenterology, 78: 1500-1507. Samson, F.E., A.M. Katz and D.L. Harris, 1955. Effects of acetate and other short-chain fatty acids on yeast
metabolism. Archives of Biochemistry and Biophysics, 54:406-423. Schmitt, M.G., K.H. Soergel and CM. Wood, 1976. Absorption of short chain fatty acids from the human
jejunum. Gastroenterology, 70: 211-215. Schmitt, M.G., K.H. Soergel, CM. Wood and J J . Steff, 1977. Absorption of short-chain fatty acids from the
human ileum. Digestive Diseases, 22: 340-347. Stevens, CE . and B.K. Stettler, 1966. Transport of fatty acid mixtures across rumen epithelium. American
Journal of Physiology, 211: 264-271. Stevens, CE., A. Dobson and J.H. Mammano, 1969. A transepithelial pump for weak electrolytes. American
Journal of Physiology, 216:983-987. Thomas, R.C, 1984. Experimental displacement of intracellular pH and the mechanism of its subsequent
recovery. Journal of Physiology, 354: 3P-22P. Troelsen, J.E. and Bigsby, 1964. Artificial mastication - a new approach for predicting voluntary forage
consumption by ruminants. Journal of Animal Science, 23: 1139-1142. Tuttle, J.H. and P.R. Dugan, 1976. Inhibition of growth, iron, and sulfur oxidation in Thiobacillus ferrooxidans
by simple organic compounds. Canadian Journal of Microbiology, 22: 719-730. Ulyatt, M.J. and A.R. Egan, 1979. Quantitative digestion of fresh herbage by sheep. V. The digestion of four
herbages and prediction of sites of digestion. Journal of Agricultural Science, Cambridge, 92: 605-616.
91
Ulyatt, MJ., D.W. Dellow, C.S.W. Reid and T. Bauchop, 1975. Structure and function of the large intestine of ruminants. In: I.W. McDonald and A.C.I. Warner (Eds.), Digestion and metabolism in the ruminant, Proceedings of the IVth International Symposium on Ruminant Physiology, Sydney, Australia, August 1974, The University of New England Publishing Unit, Armidale, NSW Australia, pp. 119-133.
Webster, AJ.F., 1980. Energy costs of digestion and metabolism in the gut In: Y. Ruckebusch and P.Thivend (Eds.), Digestive physiology and metabolism in ruminants, Proceedings of the 5th International Symposium on Ruminant Physiology, Clermont-Ferrand, 1979, MTP Press Ltd, Lancaster, pp. 469-484.
Webster, A J J \ , P.O. Osuji, F. White and J.F. Ingram, 1975. The influence of food intake on portal blood flow and heat production in the digestive tract. British Journal of Nutrition, 34: 125-139.
Weston, R.H., 1966. Factors limiting the intake of feed by sheep. I. The significance of palatibility, the capacity of the alimentary tract to handle digesta, and the supply of glucogenic substrate. Australian Journal of Agricultural Research, 17: 939-954.
Weston, R.H., 1978. The voluntary consumption of roughages by sheep receiving supplements. Proceedings of the Australian Society of Animal Production, 12: 130.
Weston, R.H., 1988. Factors limiting the intake of feed by sheep. XI. The effect of pregnancy and early lactation on the digestion of a medium-quality roughage. Australian Journal of Agricultural Research, 39: 659-669.
Weston, R.H. and J.P. Hogan, 1968a. The digestion of pasture plants by sheep. I. Ruminai production of volatile fatty acids by sheep offered diets of ryegrass and forage oats. Australian Journal of Agricultural Research, 19:419^32.
Weston, R.H. and J.P. Hogan, 1968b. The digestion of pasture plants by sheep. II. The digestion of ryegrass at different stages of maturity. Australian Journal of Agricultural Research, 19: 963-979.
Weston, R.H. and J.P. Hogan, 1971. The digestion of pasture plants by sheep. V. Studies with subterranean and berseem clovers. Australian Journal of Agricultural Research, 22: 139-157.
Wilson, A.D., 1963. The effect of diet on the secretion of parotid saliva by sheep. II. Variations in the rate of saliva secretion. Australian Journal of Agricultural Research, 14: 680-689.
Wilson, A.D., 1966. The tolerance of sheep to sodium chloride in food or drinking water. Australian Journal of Agricultural Research, 17: 503-514.
Yang, Y.T. and R.L.Baldwin, 1973. Preparation and metabolism of isolated cells from bovine adipose tissue. Journal of Dairy Science, 56: 351-365.
92
Part II
Experimental results

5 Voluntary intake of digestible organic matter and fasting heat production in dwarf goats and sheep: a species comparison
Abstract
Individual voluntary intake of digestible organic matter (DOMI) and liveweight (W) were recorded weekly in a group of 6 West African Dwarf goats and 6 Swifter sheep, all wethers, for a period of 106 weeks. Initial age was 29 weeks for goats and 35 weeks for sheep. During the first year of the experiment, animals received a diet of pelleted grass straw, during the second a diet of pelleted lucerne. Fasting heat production (FHP) of each animal was measured following ad libitum feeding in seven periods with intervals of about four months. Group mean liveweights increased from 12 to 38 kg in goats and 50 to 110 kg in sheep during the experimental period. Comparing data of both species within weeks, both FHP and DOMI were allometrically related with W, with the estimated exponent of W not significantly different from the overall inter-species mean (0.75). As a result, the two species consumed the same amounts of digestible energy relative to basal metabolic rate (here measured as the ratio DOMI/FHP). An exception were data for a 12 week period toward the end of the experiment when sheep presumably suffered from copper poisoning and showed lower DOMI relative to metabolic size than goats.
5.1 Introduction
The level of voluntary feed intake relative to maintenance requirements is one of the most important parameters determining ruminant productivity, in the tropics as well as in temperate regions. In most studies on the effect of diet quality, physiological state or environmental conditions on voluntary feed intake, the commercially most important species (cattle and sheep) are used as experimental animals while data obtained with goats, especially dwarf goats, are scarce.
The Department of Tropical Animal Production, Agricultural University Wageningen, is involved in a project studying the productivity of West African Dwarf (WAD) goats (Montsma, 1986; Zemmelink et a/., 1985, 1991; Smith and Bosman, 1988) and is therefore especially interested in the feed intake capacity relative to maintenance requirements of this small (adult doe size about 30 kg) ruminant species. In modern nutrient requirement systems for ruminants, in the USA (NRC, 1984, 1985) as well as in Europe (e.g.: ARC, 1980; van Es, 1978), the net energy (NE) required for maintenance, essentially the fasting heat production (FHP), is a basic parameter. Many estimates of FHP have been recorded for sheep and cattle. FHP data obtained with goats are more scarce and highly variable (Mohammed, 1982). To our knowledge, no FHP estimates of WAD goats have been published.
Therefore, a long-term (two years) experiment was designed to study the effects of age and liveweight (W) on voluntary feed consumption of diets of different quality and on the
95

level of FHP in WAD goats. With the aim of comparing the levels of feed intake and FHP of WAD goats with a better studied ruminant species, also one group of Swifter sheep, of an age and with a nutritional history comparable to the goats, was included in the experiment. In view of the importance of roughage as the main feed source in WAD goat production systems, the diets were originally planned to consist of chopped roughage only. After some initial observations it was decided, however, to use pelleted roughages instead, to facilitate data collection and reduce the amount of labour required for a long-term experiment. Twelve goats were fed ad libitum pelleted lucerne for two years and 12 goats and 6 sheep were fed pelleted grass straw during the first year and pelleted lucerne during the second. Individual weekly intake of digestible organic matter (DOMI) was measured for all animals during the two years. FHP was measured at regular intervals in the 6 sheep and in 6 goats of each dietary treatment.
In our attempts to manipulate roughage intake in ruminants, experimental animals were WAD goats (reported in Chapter 6) or sheep from mixed (Swifter or Flevolander ) breeds (reported in Chapter 7). To facilitate the interpretation of data in these chapters, especially with regard to the less well known WAD goats, the results obtained with the 6 sheep and the 6 goats receiving identical treatment will be presented and discussed in this chapter. Within-species effects on DOMI and FHP will be reported elsewhere.
5.2 Materials and methods
Experimental design
An outline of the experimental design is depicted in Fig. 5.2.1. The experiment consisted of a long-term feeding trial with FHP measurements at regular intervals, and of separate digestibility trials. Goats and sheep entered the experimental unit in week -14 for a period of adaptation to the stable, the diet of chopped hay (CH) and the feeding system up to week -8. Individual feed intake was recorded for 6 d in week -7. During weeks -6 until -1 the FHP of all animals was measured in respiration chambers. Immediately after leaving the respiration chamber animals were fed a diet of grass straw pellets (GP). In some cases animals were given limited quantities of hay for some days to stimulate intake after fasting. The individual weekly intake was recorded from week 1 (December 24 until 31, 1984) up to week 106. Animals were fed ad libitum GP up to week 57 and lucerne pellets from week 58 up to week 106. Individual FHP was measured another six times at intervals of about four months during this period. During the experimental period the digestibility of the diets was measured with additional castrated WAD goats and entire male Swifter sheep at regular intervals.
Animals and housing
The 6 goats were selected at random from the university flock of WAD goats described by Montsma (1986) out of a group born in March-April 1984, castrated at 6 and weaned at 12 weeks of age. Before weaning, kids received ad libitum hay and concentrates. After weaning
96

they received initially a diet of hay and limited quantities of concentrates, were then gradually put on a hay diet and remained on this diet until the beginning of the experiment. The 6 sheep were selected at random from a group of male Swifters, a synthetic breed developed from the Texel and Flemish milk breed (Bekedam, 1986). The lambs were all born from university flock dams in February 1984, kept on pasture until weaning at 12 weeks of age after which they were put on a hay diet until the experiment started. Sheep were castrated at approximately 14 weeks of age.
Dig. exp.
Resp. periods | X X X X X X X
Intake recorded | X XXXXXXXXXXXXXXXXXXXXXXXXXXXXXXXXXXXXXXXXXXX|
Diets fed |CH |GP GP GP GP LP LP LP T
Exp. week .15 0 15 30 45 60 75 90 1 05 120
Fig. 5.2.1. Experimental design. Indicated are diets fed (CH: chopped hay; GP: grass straw pellets; LP: lucerne pellets), recording of intake, respiration periods for fasting heat production measurement and digestibility experiments.
An additional group of six goat wethers of the same breeding group were maintained as reserve animals on the same diet as the experimental animals during the initial phase of the experiment. Animals were housed in an experimental unit equipped with windows (i.e.: animals were exposed to natural rhythm of day length) and a heating system that from autumn till spring prevented the temperature to drop below 17 °C. Sheep were housed individually in 3.5 m2 pens separated with wire mesh, on concrete floors with sawdust bedding. Each pen was provided with a feeding trough, water nipple and sheep salt lick (>99% NaCl, guaranteed copper-free). The goats were housed in groups of four animals, in 7 m2 pens separated with wire mesh, on concrete floors and sawdust bedding. Each pen was provided with a water nipple, a regular cattle salt lick (>99% NaCl) and four Calan-doors (Calan Electronics Ltd, Crossroads, East Lothian, Scotland) adapted for dwarf goats. Each goat was provided with a responder attached around the neck that opened one door only, thus allowing individual recording of feed intake. Liveweight was recorded weekly with an accuracy of 0.02 kg for goats and 0.5 kg for sheep. Sheep were shorn in May 1985, May 1986 and in January 1987 and fleece weights were recorded. All sheep weights used in the analyses were fleece-free weights, estimated from W and fleece weight, assuming linear wool growth.
97

Feeds and feeding
The proximate composition (according to AOAC, 1975) and the in vitro (according to Tilley and Terry, 1963) organic matter digestibility (OMD,%) of the diets is in Table 5.2.1.
Table 5.2.1. Proximate composition and in vitro organic matter digestibil ity (OMD) of the chopped hay (CH), grass straw pellet (GP) and lucerne pellet (LP) diets.
Diet DM determined in the dry matter (X) in vitro
(X) OM CP CF EE OMD ( X )
CH 8 4 . 3 9 2 . 0 1 3 . 8 nd nd nd GP 9 0 . 3 9 3 . 0 1 0 . 2 3 3 . 0 1 .8 6 0 . 2 LP 9 0 . 0 9 0 . 4 1 6 . 1 31 .7 2 . 9 6 1 . 1
nd: n o t determined
The chopped (chopping length about 5 cm) meadow hay consisted mainly of Lolium perenne and was offered in amounts allowing for refusals of approximately 25% of the amount offered. About two-third of this amount was offered around 0900 h and the remainder was added around 1700 h. Refusals were removed and (during the measurement period) weighed and sampled just before the morning feeding. The grass straw pellets (GP) were made of threshed Lolium perenne grass straw. The straw was ground through a 16 mm screen and pelleted through a 12 mm screen, adding 2.5% molasses and 0.9% urea. The batch was pelleted at a commercial enterprise without drying facilities and showed a high moisture content after pelleting. To avoid moulding during storage, the batch was mixed, ground and pelleted again (using the same screens) to bring down moisture content. The lucerne pellets were from a commercially available batch, pelleted through a 10 mm screen after artificial drying and grinding. The pellets were stored in gunny (GP) or paper (LP) bags in a mice-free room. The feeding routine of the two pelleted roughages was identical. Once a week, after weighing the animals, feed residues were weighed. If feed dust had accumulated it was sieved out of the residues. Residues consisting of good pellets were offered again to the animals. A weekly amount was weighed for each animal and fresh pellets were added to the feeding trough daily, guaranteeing the constant availability of pellets to the animals.
Measurement of fasting heat production
Before each 48 hours' respiration period, two animals (two series of two goats were alternated with one series of two sheep) were moved at approximately 0900 h from the main
98

experimental unit to the unit containing the two respiration chambers. After arrival, animals were housed individually in an imitation of the respiration chambers (dummy) for a short adaptation period. After entering the dummy, animals received ad libitum their experimental diet for 24 h. Animals started fasting at 0900 h of the second day in the dummy. At approximately 1600 h of the second day the animals entered the respiration chambers. In the dummies as well as in the respiration chambers there was a 12/12 h light/dark period and animals received ad libitum water. Measurement of gaseous exchange started between 0800 and 0900 h of the third day and continued for 48 h. Temperature in the respiration chambers was maintained at 20+1 °C and relative humidity at 70±5%. Oxygen consumption and carbondioxide production was recorded every 18 minutes' period. The respiration chambers (numbers 3 and 4) and the procedures for the measurement of heat production are described in detail by Verstegen et al. (1987). The heat production during the last 12 h dark period (i.e. the last 12 h of a 72 h fasting period) was multiplied by two to give an estimate of the 24 h fasting heat production.
Digestibility trial procedures
During digestibility trials, animals were housed in metabolism cages suitable for the separate collection of faeces and urine. Each observation was based on total collection of faeces and feed residues during a 7 d period following a 14 d adaptation period. Feed offered, feed residues, if any, and faeces were analyzed for dry matter (DM, %) and ash (%) according to AOAC (1975) procedures. To estimate the effect of intake level and species on OMD, a number of trials included apart from ad libitum feeding level a restricted level (approximately maintenance), and apart from WAD goats a group of Swifter sheep.
Statistical analyses
Analyses of variance were used to estimate the effect of species, experimental week, organic matter intake (OMI) relative to metabolic size and interactions between these variables on OMD measured in the digestibility trials.
In the main experiment, daily OMI per animal was calculated from the weekly recorded amounts of feed offered and feed residues and the average of the recorded contents of DM and ash in samples of feed offered and feed residues. W as used in all calculations with regard to OMD and DOMI is the mean of the weight recorded at the beginning and the end of a measurement week. For the relation between W and FHP, however, W was calculated as the mean of the two weekly recordings immediately preceding the FHP measurement.
For the pelleted diets, the regression formulae derived from the digestibility experiments were used to calculate DOMI from OMI and OMD. For the hay diet, sheep were assumed to digest organic matter with the OMD recorded in goats.
Allometric models were used to relate DOMI and FHP to W. Non-linear models were fitted through an iterative procedure, using the Gauss-Newton method. If necessary to obtain normally distributed residuals after fitting, data were analyzed as linear models after log-transformation (natural logarithm). All statistical programmes used were available from SAS (1985).
99

5.3 Results
Digestibility trials
A total of 76 individual estimates of organic matter intake relative to metabolic size (OMI, g.kg-0-75^"1) and organic matter digestibility of the three diets were obtained, 32 with sheep and 44 with goats (group means in Table 5.3.1).
Table 5 . 3 . 1 . Mean organic mat ter Intake (OMI, g.W~°- " . d~^-) and organic mat ter d i g e s t i b i l i t y (OMD, %) recorded in the d i g e s t i b i l i t y t r i a l s (averages of 4 or 6 animals per group)
Weeks
of
trial
0 0 23
52/55 68/71 120/123
Diet
CH GP GP GP LP LP
maint
OMI
-69.0 60.8 49.0 50.5
Goat
enance
OMD
-43.2 43.6 54.8 54.0
s
ad 11
OMI
59.7 89.0 85.8 70.3 71.0 95.8
bitum
OMD
55.9 42.6 41.7 40.3 51.0 53.4
Sheep
maintenance
OMI
--
61.8 47.3 48.3
OMD
--
41.8 52.5 50.0
ad li
OMI
-90.5 81.3
120.2 114.0
bitum
0MD
-38.8 38.6 46.7 49.1
The digestibility of the hay offered at the beginning of the experimental period was estimated with four ad libitum fed goats only. OMD averaged (±s.d.) 55.9+1.7% and was not significantly affected by intake level. The OMD of the grass straw pellets (GP) was significantly affected by intake level and decreased systematically with the advance of the experimental period. Effects of species and interactions were not significant. The following regression line was derived from the 32 data sets (coefficients ± s.e.): OMD=60.5(±2.9) - 0.10(±0.02) * Week - 0.20(±0.03) * OMI (rsd=l .89)
Apart from intake level, also the species effect explained a significant part of the variation in OMD for the lucerne pellets (LP). The average equation was (n=40): OMD=55.4(±1.14) - 0.054(±0.015) * OMI (rsd=2.75) OMD for goats and sheep on this diet was 1.35(±0.46)% units higher and lower, respectively, than the average for the two species at all intake levels. Effects of experimental week and interactions were not significant.
100

Animal numbers, liveweight and intake in the two species
One goat suffered from serious pneumonia from week 20 onwards and did not respond to treatment; the animal was replaced in week 23 with one of the spare animals. This group remained intact until the end of the experiment. Weekly W and intake data for goats are therefore based on 5 observations from week 20 to 23 and on 6 observations in the rest of the experimental period.
Weekly W and intake data for 6 sheep were obtained from the beginning of the experiment until week 97. In week 98 two sheep died, one and two days after leaving the respiration chamber, respectively. Autopsy showed high copper levels in the liver and in the kidneys (1592 and 573 ppm in the dry matter respectively) and cause of death was diagnosed as copper poisoning. Group averages for sheep from week 98 until week 106 are therefore based on four instead of six observations. The surviving four sheep were slaughtered in week 107. Samples taken from their livers also showed high copper concentrations (from 1039 up to 2340 ppm in the dry matter). These levels are comparable to concentrations measured after experimentally induced copper poisoning in sheep (van Adrichem, 1965; Zervas et al,, 1990). After the diagnosis was made, feed samples were analyzed for copper content but these did not contain very high levels (7.6 ppm in the dry matter).
W of goats and sheep in week -7 averaged (±s.d.) 12.5(±2.0) and 51.0(±2.3) kg and DOMI from chopped hay averaged 209(±43) and 623(±105) g.animaH.d-1 for the two species respectively. Hay residues as a percentage of hay offered averaged 25.0(±7.8)% in goats and 23.5(±7.7)% in sheep.
Group mean W and DOMI from pelleted diets are plotted against week 1 to 106 in Figs. 5.3.1 and 5.3.2. Only complete individual weekly records were used to calculate group means. The latter are therefore based on the number of observations mentioned above except during FHP measurement periods when animals were removed from the stable to be fasted and group means ranged from 3 to 5 animals.
The effect of W on intake over species was analyzed with the allometric model DOMI = a, * Wb, with DOMI in g.animaH.d"1, W in kg, b as a common regression coefficient and aj estimated per week. As initial analyses showed residuals to increase approximately in proportion to the estimate for DOMI, data were analyzed as linear models after log-transformation. The results of the analyses for the different periods are presented in Table 5.3.2.
On the chopped hay (week -7) and grass pellet (week 1 to 57) diets, intake of digestible organic matter was approximately proportional to the metabolic size of the species. For these diets, the estimates of b did not differ significantly from the inter-species mean of 0.75. On the lucerne pellet diet (week 58 to 106), however, goats had a higher intake relative to their metabolic size, resulting in an exponent of 0.686±0.012, significantly (P<0.001) different from 0.75. Additional analyses showed that also on the lucerne pellet diet, intake was approximately proportional to metabolic size except for the three months (weeks 85 till 97) preceding the cases of copper poisoning in the sheep when sheep had relatively low intakes compared to goats, resulting in the very low estimate for b of 0.515±0.027. If these weeks were excluded from the analyses, the effect of diet on the estimate for b was not significant any more and none of the estimates for b differed significantly from the inter-species mean of 0.75. The proportionality of DOMI with metabolic size over species for the major part of the experimental period is illustrated in Fig. 5.3.3.
101

Liveweight
120
100
80
40
V1 A » »àT
A A sheep
o • goats
-+- -+-20 40 80 100
Week
Fig. 5.3.1. Group mean liveweight of WAD goats and Swifter sheep during the experimental period. Open symbols are data from animals on the grass straw pellet diet, closed symbols from animals on the lucerne pellet diet
Table 5.3.2. Effect of liveweight (W, kg) on digestible organic matter intake (DOMI, g.animal"̂ -.d"̂ -) over species analyzed with the model DOMI=ai*wb (after ln-transformation) for the different periods with b as a common regression coefficient and a^ estimated per week
Period (weeks)
-7 1 to 57
58 to 106 1 to 106
85 to 97 58 to 84 and 98 to 106 1 to 84 and
98 to 106
Diet
CH GP LP
GP/LP LP LP
GP/LP
b-value (± s.e.)
0.786±0.053 0.74410.007 0.68610.012 0.72310.006 0.51510.027 0.74010.011
0.74310.006
range of a^ (min. - max.)
28.3 27.2 - 41.0 38.3 - 70.5 29.1 - 63.6 68.3 -103.7 31.1 - 59.5
27.3 - 58.9
n
12 649 534
1183 147 387
1036
RSD
0.131 0.122 0.159 0.141 0.180 0.133
0.126
102

DOMI (g/d)
1800
1500
1200 -
900 --
600 -£
300
i 4 . V
-+-
A A sheep
o • goats
H 1-
40 60
Week
100
Fig. 5.3.2. Group mean intake of digestible organic matter (DOMI) of WAD goats and Swifter sheep during the experimental period. Open symbols are data from animals on the grass straw pellet diet, closed symbols from animals on the lucerne pellet diet.
Fasting heat production in the two species
Due to equipment failure or diseased animals, 4 observations are missing in goats and 3 in sheep, resulting in 38 observations for goats and 39 for sheep.
A typical example of the change in heat production and Respiratory Quotient (RQ) during the course of a 48 h observation period is presented in Table 5.3.3. The RQ declines from a value just below 0.80 at the beginning of the measurement period (i.e. 25 to 36 h after fasting started) and stabilizes during the second day of the measurement period (i.e. from 48 h after the start of fasting) at a value around 0.73. Heat production also declines in the course of the measurement period but is higher, as is activity level, in light compared to dark periods. On several occasions samples of outgoing air taken during the second day of the observation period were analyzed for methane content; in all cases methane production was negligible.
During several measurement periods or part of measurement periods, the equipment analyzing the oxygen content of ingoing and outgoing air did not respond properly to changes in atmospheric pressure which frequently resulted in erroneous estimates of oxygen-consumption and unrealistic RQ values. Apart from the routine 18 minutes' measurements of gaseous exchange, samples of ingoing and outgoing air were collected during the last 24 h and analyzed separately for content of Oj and CO2 according to the procedures described by Verstegen et al. (1987). RQ values calculated from these samples were generally close to 0.73
103

and not systematically affected by species. It was therefore decided to estimate the heat production from carbondioxide production alone in all cases, assuming the RQ value to be 0.73. According to Blaxter (1989), the heat equivalent to 1 1 of 0 2 consumed by a fasting animal is 19.7 kJ. From this the heat equivalent per litre of C0 2 produced was calculated as 19.7/0.73 = 27 kJ.
DOMI (g/kgMW/d)
60 T
50 --
40
30 -&
20
7<y A '&H*
<A
'A •
*** \
•
A
A * «A A ' • * >*. * • >
A A * » * A \ A •
'•K
A A sheep
o • goats
-+- -+-20 40 100
Week
Fig. 5.3.3. Group mean intake of digestible organic matter intake (DOMI) relative to metabolic weight (MW) of WAD goats and Swifter sheep during the experimental period. Open symbols are data from animals on the grass straw pellet diet, closed symbols from animals on the lucerne pellet diet.
The 77 estimates of FHP are plotted against W in Fig. 5.3.4. Regression of FHP (kJ.d-1) on W according to the allometric model, including all data and using the non-linear method gave the following equation (see also Table 5.3.4): FHP = 285.0(±39.2) * w°-752(±0.033)
Analysis showed residuals to increase with W and approximately in proportion with the estimated value of FHP. Therefore, additional analyses were all done with linear models after logtransformation of the data. After fitting model 2 (Table 5.3.4) residuals were distributed normally but the method of analyses had virtually no effect on the estimated value for the exponent b in the allometric model. In neither case was the value significantly different from the inter-species mean of 0.75.
104

Table 5.3.3. Typical example of the change In temperature (Temp., ^C), relative humidity (RH, X), O2 consumption (1. d~l), CO2 production (l.d'l), RQ, activity (Act., 12 h activity as a fraction of 48 h activity) and calculated fasting heat production (FHP, kJ.kg"°-75.d"l) during a 48 h respiration period following a 24 h fast.
F a s t i n g (h)
25 -36 37-48 49 -60 61 -72
L ight
on o f f on o f f
Temp.
2 0 . 1 2 0 . 1 2 0 . 1 2 0 . 1
RH
71 . 3 7 0 . 4 7 3 . 1 71 .7
0 2
con s .
332 304 296 295
C02
prod.
255 231 222 217
RQ
0 . 77 0 . 76 0 . 75 0 . 7 4
Ac t .
0 . 35 0 . 22 0 . 25 0 . 18
FHP
305 .6 279 .6 2 7 1 . 4 2 6 9 . 1
FHP (MJ/d)
0
8 -
6 -
4 -
2 -
0 -
if />'
- J* A*
/ •
1 1
/ à
- f
É ,
A
AA
» À
A
\
* sheep
• goats
H 1
20 40 60 80 100
Liveweight (kg)
Figure 5.3.4. Observed fasting heat production (FHP) of WAD goats and Swifter sheep against liveweight and the regression line according to the model FHP = 0.285 * W0-752.
105

The inclusion of a period effect on a (model 3, Table 5.3.4) was highly significant (P<0.001) and reduced residuals substantially. The estimate from this model for the exponent b was, however, much the same and again not significantly different from the inter-species mean of 0.75. The variation in FHP due to the period effect could largely be explained by highly significant effects of daylength (not reported here; see, however, Chapter 2, Fig. 2.3) and compensatory intake following diet changes (not reported here) on FHP. After correcting for these effects, the level of FHP over species relative to metabolic size (W0-75) was estimated at 275.113.4 kJ.d'1.
Table 5 .3 .4 . Results of various models for the analyses of the e f f ec t of l i v e weight (W, kg) on fast ing heat production (FHP, MJ.d'l) over spec ies .
Model used
1: FHP = a*Wb
2: FHP = a*Wb
3: FHP - Pi*Wb
Method
nlin
logtr
logtr
Res. df
75
75
69
RSD
0.732
0.133
0.085
r2
0.92
0.94
0.98
estimate for parameter b
0.752±0.033
0.764±0.022
0.73710.015
p^: period e f fec t ( i from 1 to 7)
All analyses show that, over species, FHP of WAD goats and Swifter sheep is approximately proportional to metabolic size. With exception of the period preceding the death of two sheep, diagnosed as caused by copper poisoning, also DOMI measured in the same experimental week was approximately proportional to metabolic size (Table 5.3.2). This suggests that over these species DOMI is proportional to FHP. Figure 2.2 (Chapter 2) shows the ratio of mean DOMI (g.animaH.d"1) during the four weeks preceding the FHP measurement and FHP (MJ.d-1) for the first six periods. This ratio was indeed not significantly affected by species.
5.4 Discussion
In the literature, conflicting opinions can be found with regard to the effect of herbivore size on feed intake capacity relative to basal metabolic rate or maintenance requirements (see Chapter 2). The results reported here are in line with one of these views: intake of a given feed over genotypes in a similar physiological stage is roughly proportional to maintenance requirements. The data conflict with the opinion that, over herbivore species, intake of a given feed is proportional to body size because of physical limitations to feed intake (see Chapter 2).
106

It is well established that in mammalian species ranging in size from mice to elephants, both basal metabolic rate and metabolizable energy intake vary approximately proportional to metabolic size, i.e. with W0-75 (Peters, 1983; Schmidt-Nielsen, 1984; Calder, 1984). Individual species or breeds within species may, however, deviate from this general mammalian line. Systematic differences in fasting heat production scaled to metabolic size do for example exist between cattle and sheep (ARC, 1980; Blaxter, 1989), between breeds of cattle (Vercoe and Frisch, 1982) and between breeds of sheep (Blaxter et al., 1966) (see also Chapter 2). In a review of maintenance requirements of goats compared to sheep, Mohammed (1982) found as the average of published estimates of adult goat FHP a value of 305 U W"0-75.d"1 (n=9, range 212 - 403, s.d. =71), almost identical to the mean value for adult sheep: 302 kJ.W"0-75^"1 (n=7, range 230 - 378, s.d. =57). However, in a direct comparison of the FHP of goats and sheep (Roy-Smith, 1980) - the only direct comparison available to our knowledge - goats showed a significantly higher FHP relative to metabolic size than sheep (331 versus 272 kJ.W"0-75^-1). The work reported by Roy-Smith (1980) probably involved goats of a dairy breed (British Saanen) and non dairy sheep (Dr. Smith, University of Edinburgh, pers. comm., 1989). Also Mohammed (1982) measured higher maintenance requirements of British Saanen goats compared with crossbred Scottish sheep. Since also within species, e.g. cattle, FHP is reported to be positively correlated with dairy merit of the genotypes (see Chapter 2), the relatively high FHP and maintenance requirements for goats observed by these authors may well have been the result of the choice of a typical dairy breed for the goat species. In our study, goats were represented by a typical meat breed and sheep by a mixed, but certainly not typical dairy, breed and no significant differences between species were observed in level of FHP scaled to metabolic size.
Apart from the effect of breed choice, a species comparison of FHP scaled to metabolic size may also be affected by differences between animals in nutritional history and age or maturity (ARC, 1980). In our experiment, animals of both species had very much the same nutritional history (especially during the latter part of the experimental period) but sheep were about six weeks older than goats. According to Taylor's time-scaling rules (Taylor and Murray, 1987), animals of species with different mature weight (A) should be compared at the same metabolic age which is proportional to the age from conception minus 3.5 d (AFC) multiplied by A-0-27. If it is assumed that A of Swifter sheep is 2.5 times A of WAD goats, these species should be compared at a sheep AFC that is 1.28 times the goat AFC. The actual AFC of sheep in the experiment ranged from 1.07 (period 7) to 1.20 (period 1) times goat AFC, indicating that sheep were slightly too young for a valid comparison with WAD goats. On the other hand, Taylor and Murray (1987) have pointed out that what appears valid for a comparison between species, does not necessarily apply to a comparison of breeds within species. For example, a time parameter like gestation length is approximately proportional to A0-27 from mouse to elephant but within species the effect of A on gestation time of different breeds is almost negligible. This shows that within species metabolic time is not always affected by A to the same extent as between species. As goats and sheep are species of similar average size, it is therefore not evident which is the most appropriate size-scaling rule for time variables in our experiment. Whichever of the assumptions may prove to be the more valid, differences between species in both metabolic and real age were small in this experiment and it seems unlikely that these differences could have masked real differences between the two genotypes in FHP relative to metabolic size.
107

The FHP estimate for sheep and goats in our experiment was 275 * W0-75 kJ.d1. This value is lower than the average of the FHP data for goats and sheep reviewed by Mohammed (1982) but higher than the estimates used by ARC (1980) to calculate energy requirements of sheep. It is important to note that the precise conditions of the FHP estimate may not be of consequence in comparative studies within a laboratory but can affect comparison of data between laboratories (Blaxter, 1989). We decided to fast the animals, directly following ad libitum feeding, for 72 h only and multiply the heat production during the last 12 h (observation at night) by 2 to estimate FHP. Although different procedures are followed (Peters, 1983; Blaxter, 1989), a more usual practice is to feed ruminants a maintenance diet for several weeks and then to measure FHP during a 24 h period following a fasting period of at least 72 h, as ruminants are reported to be in a post-absorptive state only after 3 to 5 days (Blaxter, 1989). Since we were not only interested in comparing FHP but also voluntary feed consumption of WAD goats with sheep, we decided not to restrict feed intake before FHP measurement. In addition, recorded FHP would have been affected by our choice of feeding level prior to FHP measurement. The fasting period was restricted to 72 h to minimize the effect of fasting on the normal feed intake and growth curves. Initial observations had shown that WAD goats needed considerable time to regain normal appetite after fasting for longer periods (i.e. 5 days). Total weight gain during the 106 week experimental period of the group of WAD goats in the experiment reported here did not differ significantly from the total weight gain of an additional group of WAD goats (results not reported here) receiving identical treatment except for the FHP measurement. This suggests that fasting goats for 72 h every 4 months did not fundamentally disrupt long-term growth of animals on these diets. The effect of the relatively short fasting period on the estimate of FHP in our experiment was (partly) counterbalanced by the fact that FHP was calculated from respiration data obtained during the last 12 h dark period of the fast. Generally, level of activity is lower at night (e.g. Table 5.3.2) and in addition sleep is reported to have a negative effect on FHP (Blaxter, 1989).
OMD was significantly affected by experimental week for the GP diet. The regression formula shows that, for a given OMI, OMD decreased with 5 percentage units in the course of the year during which this diet was fed. As the ad libitum OMI tended to decrease during this year, in the main experiment as well as in the digestibility trials, OMD estimates for animals in the main experiment were less affected than the 5 percentage units would suggest. Nevertheless, there is a tendency that also in ad libitum fed animals OMD decreased during the experiment (see Table 5.3.1). The cause of this decrease is not clear.
DOMI scaled to metabolic size was lower in sheep compared to goats in a period preceding the death of two sheep caused by copper poisoning. A differential effect of high copper intake on voluntary feed consumption and liveweight change in sheep (depressed and weight loss) and goats (not depressed and weight gain) has been reported (Zervas et al, 1990). The source of excess copper intake in our experiment could not be established but only water and feed seemed likely as sheep received copper-free salt licks. Water supply to the pens was partly through copper tubes but as feed intake of surviving sheep, after being depressed for about three months, recovered towards the end of the experimental period (Fig. 5.3.2), this does not seem a likely source. Although analysis for copper content of the feed offered after the diagnosis of copper poisoning was made, did not show high values, contamination with
108

copper of part of the batch of lucerne pellets is the most likely cause of poisoning. This should explain the low levels of intake and the weight loss observed in sheep in the period preceding week 98. The data collected do not allow an exact estimate of the length of the period(s) of poisoning. As the depressed intake of sheep was most evident in the 12 week period preceding week 98, this period was analyzed separately. For the remaining periods, DOMI was proportional to metabolic size over species and average DOMI during the four weeks preceding FHP measurement was proportional to FHP. Considering the number of observations, this was particularly evident for the pelleted diets. The single observation with chopped hay is, however, consistent with this observation.
5.5 Conclusions
It is concluded that, when castrated WAD goats and Swifter sheep are compared at a similar age and with a comparable nutritional history, for a considerable part of the growth curve: - the FHP of the two species is approximately proportional to metabolic size (WO-7^); - DOMI from pelleted grass straw or from pelleted lucerne is approximately proportional to
metabolic size ; - as a result, the two species consumed the same amounts of digestible energy relative to
basal metabolic rate (here estimated as the ratio DOMI/FHP).
References
Adrichem, P.W.M van, 1965. Wijzigingen in de activiteit van serumenzymen en in het LDH iso-enzympatroon bij chronische koperintoxicatie van schapen (Changes in the activity of serum-enzymes and in the LDH isoenzymes pattern in chronic copper intoxication in sheep). Tijdschrift voor Diergeneeskunde, 90: 1371-1381.
AOAC, 1975. Official methods of analyses, 12th ed. Association of Official Analytical Chemists, Washington D.C.
ARC, 1980. The nutrient requirements of ruminant livestock. Commonwealth Agricultural Bureaux, Farnham Royal, 351 pp.
Bekedam, M., 1986. Experiences with the development and use of a new breed for fat lamb production in commercial flocks. In: Proceedings 37th Annual Meeting of the E.A.A.P, Budapest, 1-4 September 1986, p. 89.
Blaxter, K.L., J.L. Clapperton and F.W. Wainman, 1966. The extent of differences between six British sheep breeds in their metabolism, feed intake and utilization and resistance to stress. British Journal of Nutrition, 20: 283-294.
Blaxter, K., 1989. Energy metabolism in animals and man. Cambridge University Press, Cambridge, 336 pp. Calder, W.A., 1984. Size, function and life history. Harvard University Press, Cambridge, Massachusetts, 431
pp. Es, A.J.H. van, 1978. Feed evaluation for ruminants. I. The systems in use from May 1977 onwards in the
Netherlands. Livestock Production Science, 5: 331-345. Mohammed, H.H., 1982. Energy requirements for maintenance and growth: comparison of goats and sheep. PhD
thesis, University of Reading. Montsma, G., 1986. Meat production in West African Dwarf goats. Netherlands Journal of Agricultural Science,
34: 413-420. NRC, 1984. Nutrient Requirements of Beef Cattle, 6th Revised Edition, National Academy Press, Washington,
D.C.
109
NRC, 1985. Nutrient Requirements of Sheep, 6th Revised Edition, National Academy Press, Washington., D.C. Peters, H., 1983. The ecological implications of body size. Cambridge University Press, Cambridge, 329 pp. Roy-Smith, F., 1980. The fasting metabolism and relative energy intake of goats compared with sheep. Animal
Production 30:491. SAS, 1985. Users Guide: Statistics, Version 5 Edition. SAS Institute Inc., Cary, N.C., 956 pp. Schmidt-Nielsen, K., 1984. Scaling: Why is animal size so important? Cambridge University Press, Cambridge,
241pp. Smith, O.B. and H.G. Bosman (Eds), 1988. Goat production in the humid tropics. Proceedings of a workshop at
the University of Ife, Ile-Ife, Nigeria, 20-24 July 1987. Pudoc, Wageningen, 187 pp. Taylor, St CS . and J.I. Murray, 1987. Genetic aspects of mammalian survival and growth in relation to body
size. In J.B. Hacker and J.H. Ternouth (Eds.), The nutrition of herbivores, Academic Press, Sydney, pp. 487-533.
Tilley, J.M.A. and R.A. Terry, 1963. A two-stage technique for the in-vitro digestion of forage crops. Journal of British Grassland Society, 18:104-111.
Vercoe, J.E. and J.E. Frisch, 1982. Animal breeding for improved productivity. In J.B. Hacker (Ed.), Nutritional limits to animal production from pastures, Commonwealth Agricultural Bureaux, Farnham Royal, pp. 183-198.
Verstegen, M.W.A., W. van der Hel, H.A. Brandsma, A.M. Henken and A.M. Bransen, 1987. The Wageningen respiration unit for animal production research: a description of the equipment and its possibilities. In: M.W.A. Verstegen and A.M. Henken (Eds.), Energy metabolism in farm animals, Martinus Nijhoff Publishers, Dordrecht, the Netherlands, pp. 21-48.
Zemmelink, G., B. Tolkamp and J. Meinderts, 1985. Feed intake and weight gain of West African Dwarf goats. In J.E. Sumberg and K. Cassaday (Eds.), Sheep and goats in humid West Africa, Proceedings of the workshop on small ruminant production systems in the humid zone of West Africa, ILCA, Ibadan, January 1984.
Zemmelink, G., B J . Tolkamp and N.W.M. Ogink, 1991. Energy requirements for maintenance and gain of West African Dwarf goats! Small Ruminant Research, in press.
Zervas, G., E. Nikolaou and A. Mantzios, 1990. Comparative study of chronic copper poisoning in lambs and young goats. Animal Production, 50:497-506.
110

6 Effects of increased protein supply on roughage intake in dwarf goats
Abstract
The hypothesis that voluntary feed intake of dwarf goats is affected by the ratio of absorbed amino acids relative to energy consumed was experimentally tested. All experiments consisted of short-term feeding trials with West African Dwarf goats on a basal diet of low to medium digestibility. The nitrogen content of the diets was considered sufficient for unlimited microbial digestion in the forestomachs. Two different techniques were used to achieve an increased availability of amino acids at the level of the small intestine: oral supplementation with by-pass protein and abomasal infusion of caseinate. The by-pass protein (caseinate) was prepared with a formaldehyde treatment technique. Extensive tests of the treated caseinate showed the product to be well protected against ruminai degradation and well digestible in the remainder of the digestive tract. Initial observations with chopped and pelleted grass straw diets had suggested a positive response of feed intake following oral supplementation with by-pass protein. This suggestion could not be confirmed in a series of supplementation experiments. Also caseinate infusion in the abomasum did not lead to an increase in roughage intake. Total intake of digestible organic matter either remained constant or increased as a result of by-pass protein supplementation or caseinate infusion. In a number of experiments, the nitrogen balance did not change more following the additional supply of amino acids than could be expected from the change in digestible organic matter intake. Due to uncertainty about the accuracy of some N-balance measurements, this could not be confirmed for all experiments. Results of the experiment with pelleted roughage as the basal diet suggest that pelleting conditions have a considerable effect on subsequent pellet intake by dwarf goats. Feed components or characteristics associated with the variation in intake could not be found. An additional experiment was carried out to test the hypothesis that ruminai potassium (K) availability interacts with nitrogen supply in its effect on feed intake. The effects on intake and a number of rumen parameters of ruminai K plus abomasal caseinate infusion was compared with the effects of ruminai K infusion only. Also the effects on these parameters of ruminai infusion with K plus urea was compared with effects of ruminai infusion of urea only. Infusion resulted in considerable changes of a number of rumen parameters without, however, significantly affecting organic matter intake of the grass straw basal diet. The results of the experiments did not support the original hypothesis that roughage intake can be increased by increasing intestinal protein supply. Possibly, the variation in roughage intake response to increased protein supply is related to the effects of this supply on the efficiency of utilization of metabolizable energy. If so, then the new theory presented in Chapters 3 and 4 provides a framework for a better understanding of this variation.
6.1 Introduction
The accepted conceptual framework used to explain the variation in feed intake in ruminants, places a great emphasis on constraints to the intake process. For lower quality feeds, the most important constraint is considered to be a limited gut size in combination with the filling effects of ingested feed: physical regulation. It is only for the best quality feeds that the animal is assumed to be able to consume nutrients according to its requirements. Under such conditions it is assumed that feed intake is limited by the capacity of tissues to utilize nutrients: metabolic regulation (see Chapters 1 and 2).
I l l

As a result of the involvement in analyses of a number of experiments with ad libitum fed dwarf goats (see e.g. Zemmelink et ai, 1985, 1991), I became sceptic about the validity of this accepted framework. One of the reasons for scepsis was the high ratio of gutfill to liveweight observed in dwarf goats compared with published data for other domestic ruminants (see Chapter 2, Fig. 2.1, for a comparison with sheep and cattle data). These observations demonstrated that at least between species large differences can exist in the physical capacity of animals to consume and process feed. More important, however, were model calculations regarding the overall efficiency of metabolizable energy (ME) utilization in ad libitum fed ruminants. These calculations showed that, despite considerable differences in efficiency of ME utilization between feeds, for maintenance and especially gain, the overall efficiency of ME utilization for maintenance and gain (kmg) was remarkably constant in ruminants fed diets of widely differing quality ad libitum (Tolkamp, 1983). This suggested that the factors determining the efficiency of ME utilization might be the same factors which determine the level of voluntary feed consumption of high as well as low quality feeds. Since efficiency of ME utilization is determined at the level of the animals' metabolism in tissues, it would mean, amongst others, that metabolic events rather than gutfill are the cause of a submaximum energy intake from roughages. Such a reasoning, of course, does not accord with the generally accepted theory of roughage intake regulation. Hence it prompted to a critical analysis of frequently cited literature data on the mechanisms of feed intake regulation in ruminants. From this analysis it was concluded that the basis of the generally accepted framework was weak and that many observations on feeding behaviour do not support an important role for physical constraints to roughage intake (see Chapters 1 and 2 for a more recent appraisal).
At the same time, Ketelaars (1984a) had drawn a similar conclusion. In addition, Ketelaars' analyses showed that nitrogen (N) content of roughage had a positive effect on feed intake on the whole range of roughage digestibility values (see also Chapter 1). This suggested that the availability of amino acids in relation to digestible energy from the feed might be, at least partially, responsible for this effect (Ketelaars, 1984b). For a student of tropical animal production, this was an appealing idea, especially since the dramatic positive effects of N supplementation on the intake of poor quality roughage was known from the literature as well as from own experience (Zemmelink and Tolkamp, 1975). The idea was also very attractive because it agreed with the suggestion that feed intake regulation was, somehow, linked with efficiency of ME utilization. This link was provided by the reported positive effects of an increased protein intake on the efficiency of ME utilization (Blaxter and Boyne, 1978; MacRae and Lobley, 1982; see also Chapters 1 and 3). In addition, in the literature regarding tropical animal production, the positive effect of 'by-pass protein' on feed intake and N-balance in ruminants received and continues to receive much attention (e.g. Preston and Leng, 1987). Opinions differ, however, as to the range of conditions and the type of animals in which positive effects can be expected (Kellaway and Leibholtz, 1983).
It was therefore decided to test the hypothesis that an increase in the ratio of amino acids absorbed in the small intestine relative to intake of digestible energy would result in an increased roughage intake. As our department is especially interested in the nutrition of the West African Dwarf (WAD) goat, it was further decided to use experimental animals of this ruminant species to measure the roughage intake response and the change in N-balance following an increased intestinal amino acid supply.
112

Such an increased amino acid supply can be achieved by a by-pass protein supplement given per os or through infusion of protein directly into the abomasum or duodenum. The latter method would seem preferable as it allows a precise dosing. It also avoids the problems of incomplete ruminai protection or low intestinal digestibility which can be associated with the use of by-pass protein. The method requires, however, the use of fistulated animals. This is a disadvantage as it limits the number of experimental animals compared to a conventional feeding trial. In addition, it may pose health problems due to surgery, especially since we had no previous experience with fistulated dwarf goats. Therefore, it was decided first to test the effect of an increased intestinal protein supply on roughage intake in supplementation experiments using by-pass protein and to try and find out later, through more detailed observations in a limited number of fistulated animals, how this effect was brought about.
For a successful completion of supplementation experiments several questions had to be addressed: questions with regard to the selection of a suitable basal diet, suitable supplements and adequate supplementation methods. It was decided to carry out some preliminary investigations in an attempt to answer these questions and to obtain routine skills in intake, digestibility and N-balance studies.
As to the basal diet we aimed at finding a roughage of such a quality as to satisfy the maintenance requirements of dwarf goats when fed ad libitum. This was based on the considerations that most of tropical animal production systems make use of rather low quality roughages and that an effect of by-pass protein on intake could probably be detected easier on poor quality feed. On the other hand, the feed should not be so poor, especially with regard to N content, that a supplement with rumen degradable protein (RDP) or non-protein nitrogen (NPN) like urea would cause intake to increase. Beneficial effects of these types of supplement on intake of poor quality roughages are well documented and are generally attributed to improved microbial digestion and the resulting more rapid disappearance of feed residues from the forestomachs (e.g. van Soest, 1982; Preston and Leng, 1987). A positive effect of by-pass protein on the intake of such a poor quality roughage could be interpreted in this light (e.g. as a result of N recycling). Such roughages are, therefore, unsuitable to test our hypothesis. As dwarf goats consume more than their maintenance energy requirements on diets of medium quality grass hay (Zemmelink et al., 1985), initial observations were carried out with a batch of grass straw: mature grass cut and sun-cured after the seed has been harvested. These observations showed that dwarf goats consumed insufficient amounts from this diet to cover their estimated maintenance requirements and it was therefore decided to start with a mixture of grass straw and grass hay as the basal diet.
As to the supplements to be used, we wanted to measure the effects of a by-pass protein on roughage intake and compare these, for the reasons mentioned above, with the effects of equivalent amounts, on nitrogen basis, of NPN and RDP. Our choices for the sources of NPN, RDP and by-pass protein were urea, casein and formaldehyde treated casein. This choice was based on the well known characteristics and ready availability of urea and casein and the fact that they are commonly used in supplementation experiments.
As to the supplementation method, we aimed at adding the supplements directly to the basal roughage in order to avoid ruminai ammonia peaks, associated with dose administration of NPN or RDP, and to simulate as closely as possible an increased N content of the forage. This proved to be difficult for the casein and formaldehyde casein supplements: the supplement sticked to slightly wetted forage but most of it fell off after drying and/or when animals started to rummage about the forage offered. This problem was partially solved (see
113
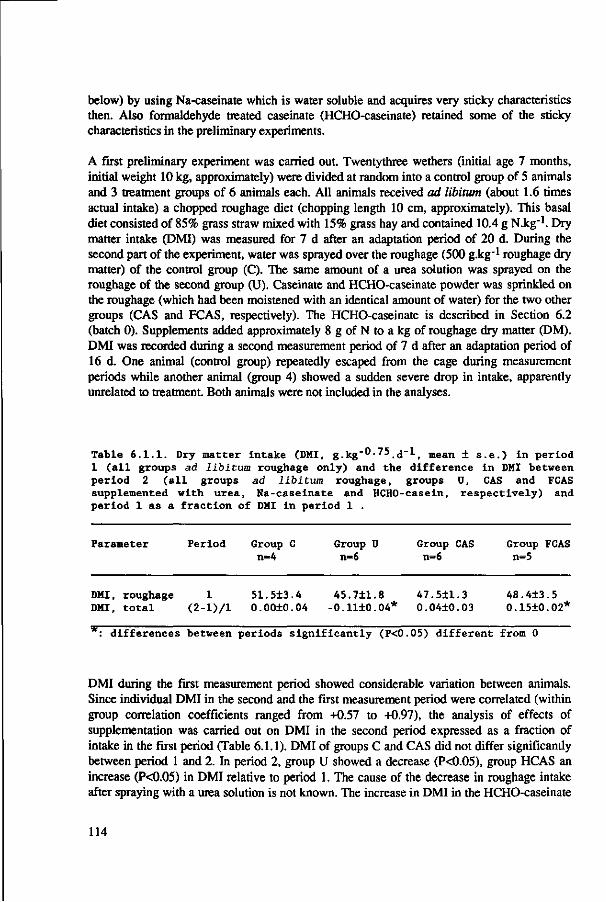
below) by using Na-caseinate which is water soluble and acquires very sticky characteristics then. Also formaldehyde treated caseinate (HCHO-caseinate) retained some of the sticky characteristics in the preliminary experiments.
A first preliminary experiment was carried out. Twentythree wethers (initial age 7 months, initial weight 10 kg, approximately) were divided at random into a control group of 5 animals and 3 treatment groups of 6 animals each. All animals received ad libitum (about 1.6 times actual intake) a chopped roughage diet (chopping length 10 cm, approximately). This basal diet consisted of 85% grass straw mixed with 15% grass hay and contained 10.4 g N.kg"1. Dry matter intake (DMI) was measured for 7 d after an adaptation period of 20 d. During the second part of the experiment, water was sprayed over the roughage (500 g.kg-1 roughage dry matter) of the control group (C). The same amount of a urea solution was sprayed on the roughage of the second group (U). Caseinate and HCHO-caseinate powder was sprinkled on the roughage (which had been moistened with an identical amount of water) for the two other groups (CAS and FCAS, respectively). The HCHO-caseinate is described in Section 6.2 (batch 0). Supplements added approximately 8 g of N to a kg of roughage dry matter (DM). DMI was recorded during a second measurement period of 7 d after an adaptation period of 16 d. One animal (control group) repeatedly escaped from the cage during measurement periods while another animal (group 4) showed a sudden severe drop in intake, apparently unrelated to treatment. Both animals were not included in the analyses.
Table 6 . 1 . 1 . Dry mat ter Intake (DMI, g . kg~° - 7 5 . d~ l , mean ± s . e . ) in per iod 1 ( a l l groups ad libitum roughage only) and the d i f fe rence In DHI between per iod 2 ( a l l groups ad libitum roughage, groups U, CAS and FCAS supplemented with u rea , Na-caseinate and HCHO-caseln, r e spec t i v e l y ) and per iod 1 as a f r a c t i on of DMI in per iod 1 .
Parameter Period Group C n=4
Group U n=6
Group CAS n=6
Group FCAS n=5
DMI, roughage 1 51.5±3.4 45.711.8 47.5±1.3 48.413.5 DMI, t o t a l ( 2 - l ) / l 0.0010.04 -0.1110.04* 0.0410.03 0.1510.02*
: d i f fe rences between per iods s i g n i f i c an t l y (P<0.05) d i f f e r en t from 0
DMI during the first measurement period showed considerable variation between animals. Since individual DMI in the second and the first measurement period were correlated (within group correlation coefficients ranged from +0.57 to +0.97), the analysis of effects of supplementation was carried out on DMI in the second period expressed as a fraction of intake in the first period (Table 6.1.1). DMI of groups C and CAS did not differ significantly between period 1 and 2. In period 2, group U showed a decrease (P<0.05), group HCAS an increase (P<0.05) in DMI relative to period 1. The cause of the decrease in roughage intake after spraying with a urea solution is not known. The increase in DMI in the HCHO-caseinate
114

supplemented group was remarkable considering the low amount of formaldehyde bound to protein in this batch (see Section 6.2) and the presumably low consumption of HCHO-caseinate since part of it was found as white powder at the bottom of the feed container. Nevertheless, the DMI data suggested that the provision of N as by-pass protein may indeed positively affect roughage DMI as hypothesized.
In this first try-out experiment, the basal ration consisted of a mixture of 85% grass straw and 15% grass hay in an attempt to give animals a basal roughage diet that would roughly satisfy their maintenance requirements. During the experiment, it became apparent that the goats selected considerably in the roughage offered as is also recorded for other ruminant species (Zemmelink, 1980). A large sample of feed offered and of the joint feed residues of all animals was separated in stems and leaf sheaths (here called stems) and leaf blades (here called leaves) and N content in all fractions was analyzed. The results (Table 6.1.2) illustrate that animals preferred leaves over stems and selected for high N content in both fractions. Visual observations suggested that this selection coincided with selection for grass hay and against grass straw. This raised the question what the most suitable basal diet in the main supplementation experiments would be. A mixture of two roughages would probably increase selection opportunities because of increased heterogeneity. In a supplementation experiment with expected positive effects of supplementation on roughage intake, a high degree of selection is not very desirable. It means that the extra feed intake in supplemented animals will have to come from poorer roughage than the basal intake and this might mask supplementation effects. It was therefore decided to offer a single chopped roughage only, in sufficient amounts to allow for large feed residues (feed offered twice the estimated unsupplemented intake, approximately).
Table 6 . 1 . 2 . Morphological composition (%) and N con ten t , in g.kg"^- dry mat ter (DM), of feed offered and refused.
In feed DM offered In feed DM refused
Stems Leaves Total Stems Leaves Tota l
Propor t ion 72 28 100 91 9 100 N content 8.6 15.0 10.4 7.0 13.9 7.7
In a second preliminary experiment, intake, digestibility and N-balance of dwarf goats on a batch of grass straw (6.7 g N.kg-1) or grass hay (22.1 g N.kg-1), both chopped, were measured for 7 d after an adaptation period of 28 d with 4 WAD wethers (initial age 8 months, initial W 11.2, s.d. 1.4, kg) per treatment. The results are in Table 6.1.3. On the grass straw and the grass hay diet, DOMI was approximately 30% lower and 20% higher, respectively, than the estimated maintenance energy requirements for dwarf goats (Zemmelink et al., 1985). This
115

suggested that for maintenance intake, a roughage with OMD and N content intermediate between the values measured in this experiment would be required. The general rule of thumb for sheep and cattle is that, to obtain maintenance intake from roughage diets, N content should be around 11 g.kg"1 DM and DM digestibility around 50%. The observations suggested that this rule also applies to dwarf goats. In order to locate a roughage with the desired characteristics, a number of samples were taken from grass straw batches stored in producers' barns and analyzed for N content. The sample with the highest N content contained 11.0 g N.kg-1 and this batch was bought and used in the main supplementation experiments carried out later.
Table 6 .1 .3 . Means and s . e . ' s for liveweight (W, kg), organic matter d igest ibi l i ty (OMD, X) and ad libitum intake of organic matter (OMI) and digestible organic matter (DOMI) and N-balance (a l l in g.kg""-75.d"l) in WAD wethers on a grass straw or a hay diet
Grass straw Grass hay
W 9.8±0.8 11.611.9 OMD 4 2 . 7 1 2 . 5 5 5 . 9 1 1 . 7 OMI 3 8 . 5 1 2 . 4 5 6 . 3 1 3 . 6 DOMI 16.611.9 31.412.1 N-balance -0.2010.02 0.0710.03
As no clear description of the method for correct treatment of caseinate with formaldehyde was available at the start of the first preliminary experiment, the method used was based on a few brief contacts with informants. However, the amount of formaldehyde bound to protein in HCHO-caseinate in the first preliminary experiment was found to be 1.3 g.kg"1 only. A limited literature survey showed that this amount was too low to guarantee a considerable degree of protection from rumen degradation. It was concluded that the effects of HCHO treatment of protein had to be assessed more carefully before using this technique. Therefore, a number of experiments were carried out to test the effect of treatment method on formaldehyde binding to protein and a treatment method was chosen. Then nylon bag rumen degradability and intestinal digestibility and in vitro digestibility of HCHO-caseinate prepared according to this method was determined. The results of these experiments as well as estimates of in vivo HCHO-caseinate digestibility are reported in Section 6.2.
Section 6.3 describes and discusses the four main supplementation experiments carried out to test our hypothesis. The first experiment was intended to confirm the results of the preliminary observations. To that end, a basal diet of chopped grass straw was supplemented with either urea, caseinate or a mixture of caseinate and HCHO-caseinate and the effect of supplementation on intake and N-balance in WAD goats was measured. Also in this experiment, supplementing NPN or RDP did not result in increased roughage intake. Contrary
116

to the preliminary findings, however, roughage intake was also not significantly increased when part of the supplemented N consisted of by-pass protein. Again, there was doubt about the actual amount of HCHO-caseinate consumed by the animals. Using a different supplementation method we ascertained that animals actually consumed the intended amount of supplement and the effects of HCHO-supplementation on roughage intake and N-balance were measured during two experiments subsequently reported in Section 6.3. This section also reports a fourth experiment in which the effect of HCHO-caseinate addition to a basal diet of pelleted instead of chopped grass straw was tested. The motive for this experiment was the much lower intake than expected in the test of a new batch of grass straw pellets planned to be used in the experiments described in Chapter 5. This batch had been prepared from grass straw with the addition of some urea to top up the N content and some molasses. To test whether the low intake was caused by a low level of amino acid availability in the small intestine (e.g. as a result of reactions between N and carbohydrates during the pelleting process), the effect of HCHO-supplementation on pellet intake was measured in a few animals. To this end, a small batch was repelleted with the addition of 4% HCHO-caseinate and intake was measured. These preliminary observations (see Fig. 6.1.1) suggested an important effect, indeed. Experiment 4 in Section 6.3 is a more detailed test of the effects of HCHO-caseinate supplementation on grass straw pellet intake.
Pellet intake (g/kgMW/d)
1 0 0 T basal diet basal diet + 4 % HCHOcas basal diet
Days
Figure 6.1.1. Group mean (n=4) intake of fresh grass straw pellets without or with the addition of 40 g.kg_1
formaldehyde treated caseinate (HCHOcas).
117

Contrary to the suggestions from the preliminary experiments discussed in this introduction, the results of experiments reported in Section 6.3 did not support the idea that intake of grass straw diets could be increased by supplementing animals with by-pass protein in the form of HCHO-caseinate. For a final test of the hypothesis that roughage intake by ruminants could be increased by increasing the amount of absorbable amino acids available at the small intestinal level, a better quality grass hay was used as the basal diet. To be absolutely sure that the provision of by-pass protein resulted in increased availability of amino acids for absorption in the small intestine, caseinate was supplied by infusion directly into the abomasum of dwarf goats equipped with rumen fistulas and abomasal infusion tubes. First, the capacity of the recently operated animals to ingest and digest grass hay was compared with non-operated animals and then the effect of abomasal caseinate infusion on hay intake and N-balance was compared with the effect of physiological salt infusion as a control. The experiment could not be completed because intake of 4 recently operated animals suddenly dropped to very low levels. The experiment was repeated a few months later when the operated animals had recovered. The results of the experiments, presented and discussed in Section 6.4, showed no increase in hay intake as a result of abomasal caseinate infusion.
The results reported in Sections 6.3 and 6.4 did not support the hypothesis that, in general, roughage intake of dwarf goats could be increased by increasing the intestinal amino acid supply. In the mean time, similar results had been obtained by Ketelaars in sheep on a hay diet and abomasally infused with either caseinate or bacterial mass (see Chapter 7). This caused both of us to reconsider the generally accepted hypothesis as well as the hypothesis tested here with regard to roughage intake regulation and stimulated attempts to identify possible alternatives. One of the early suggestions was that the positive correlation between N content of roughages and feed intake might not or (not alone) be caused by an increase in intestinally available amino acids but (also) by other feed components associated with N content. At the time, potassium seemed to be one of the possible components involved because of the correlation between N and K content generally observed in roughages and because of the effect of K-content on ruminai cation-composition and possibly VFA absorption (see Section 6.5).
To test the hypothesis that increased K supply, alone or in combination with increased ruminai N or abomasal amino acid supply would increase voluntary roughage consumption, two experiments involving the ruminai infusion of K-citrate, with or without RDN or by-pass protein, were designed. Effects of infusion on intake, N-balance and a number of rumen parameters were measured. The results of the experiments with dwarf goats are reported in Section 6.5 (see Section 7.4 for results of the sheep experiment). Section 6.6 consists of the final discussion and conclusions of experiments reported in Chapter 6.
118
6.2 Effect of formaldehyde treatment on formaldehyde
binding, rumen degradability and in vitro and in vivo
digestibility of Na-caseinate
Introduction
Treatment of casein with formaldehyde to protect protein from ruminai degradation can be used to study the effect of by-pass protein on ruminant performance. The reactions between protein and formaldehyde causing protection from ruminai degradation have been summarized by Barry (1976). Several methods of formaldehyde treatment of casein have been described by Ferguson et al. (1967), Dinius et al. (1974), Thomas et al. (1979), Redman et al. (1980), Ashes et al. (1984) and West et al. (1984). The different methods do not give uniform results: it is obvious from a number of research reports that formaldehyde treated protein is sometimes still extensively degraded in the rumen or is sometimes over-protected, resulting in a low intestinal digestibility (Barry, 1976; Beever and Thompson, 1977; Thomas et al., 1979; Redman et al., 1980; Kaufmann and Lüpping, 1982; Sriskandarajah et al., 1982; Ashes et al., 1984; West étal., 1984).
Before initiating supplementation trials involving formaldehyde treated Na-caseinate (HCHO-caseinate), a number of experiments were designed to determine the effects of method of formaldehyde treatment and of storage time and storing temperature on formaldehyde binding to protein, and to estimate the effects of treatment on nylon bag rumen degradability and in vitro digestibility. In addition, in vivo N-digestibility of HCHO-caseinate was estimated from the data of two supplementation trials with West African Dwarf (WAD) goats. It is the aim of this section to report and discuss the results.
Materials and methods
Formaldehyde binding to protein in HCHO-caseinate Na-caseinate (EM-6, supplied and analyzed by DMV-Campina, Veghel: 89.5% CP, 5% moisture, 4.5% ash, 0.8% fat and 0.2% lactose in the product) was treated with formaldehyde using a dry method. Formalin containing 37.1% formaldehyde was sprayed on silica as carrier substance with a syringe for small batches or a plant spray for the larger batches during continuous mixing in a container. The silica consisted of either oven dried silica gel pellets, commonly used in exsiccators, or very fine silica powder (Sipernat 22 S, Bayern). After mixing of silica and formalin, Na-caseinate was gradually added. After thorough mixing, the container was closed and placed in a 30 °C oven for two days, its contents were mixed again without opening the container and the container was replaced in the oven for another day treatment. Analyses in duplicate of the amount of formaldehyde bound to protein were done according to Bremanis (1949) within one week after treatment. If silica pellets had been used, these were sieved out prior to analyses. Some HCHO-caseinate samples were stored at either -4 or 20 °C for up to 4 weeks before being analyzed.
119

Disappearance ofHCHO-caseinatefrom nylon bags Approximately 7 g samples of three batches of HCHO-caseinate were weighed into nylon bags (pore size 41 micron). After washing by hand for 5 minutes in lukewarm water, bags were incubated for 6, 12, 24 or 48 h in the rumen of a cow fed ad libitum hay and 2 kg of concentrates daily or in a shaker water bath at 38 °C in our laboratory (DTAP). In addition, samples in nylon bags (pore size 41 micron) of one of these batches were incubated after washing in a washing machine (wool program) for 0, 6 or 18 h in a cows rumen at the Institute for Livestock Feeding and Nutrition Research (IVVO), Lelystad. After rumen incubation, two bags per treatment were analyzed for DM residue and N-content. Three to seven additional nylon bags plus residue per treatment were, after rumen incubation, introduced through a fistula in a cows duodenum and collected from the faeces again after intestinal passage. After incubation and/or intestinal passage, the nylon bags plus residues were thoroughly washed by hand (DTAP) or machine (IVVO) and dried. N-content of HCHO-caseinate and residues after incubation was determined according to AOAC (1975) procedures.
In vitro and in vivo digestibility of HCHO-caseinate In vitro organic matter digestibility (OMD) was determined according to the two stage technique of Tilley and Terry (1963). In vivo N-digestibility of HCHO-caseinate was estimated in two experiments with 18 female and 21 castrated male West African Dwarf goats, 14 and 16 months of age, weighing 14.7 (s.d.: 2.5) and 16.4 (s.d.: 2.2) kg, respectively. Animals were divided in 6 groups of 3 animals and 3 groups of 7 animals, respectively. All animals were fed ad libitum (DM offered was about twice DM intake) Loliwn perenne grass straw (1.1% N and 66.7% NDF in the DM, mean in vivo OMD 46.6%). In the first experiment, groups 2 to 6 received in addition to grass straw HCHO-caseinate supplying approximately 0.1, 0.2, 0.4, 0.6, and 1.0 gkg -°-75d ̂ of N, respectively. In the second experiment groups 2 and 3 received in addition to grass straw HCHO-caseinate supplying approximately 0.5 and 0.8 gkg-0-75 d -l0f N , respectively. The HCHO-caseinate, suspended in water, was administered orally twice daily with a drench pistol. Animals were housed in metabolism cages suitable for the separate collection of faeces and urine. After an adaptation period of 5 weeks to cages and 5 (Exp. 1) or 2 (Exp. 2) weeks to the basal ration and 2 weeks to supplementation, orts and faeces were collected during seven days. Samples of straw offered, orts, supplement and faeces were analyzed for DM, ash and N according to AOAC (1975) procedures. Digestibility of HCHO-caseinate N was estimated from the intake of dry matter (DMI), straw-N (NIstraw), supplement-N (NIsuppi) and apparently digested N (DNI) by multiple regression analysis using a SAS-program (SAS, 1985).
Results and discussion
Formaldehyde binding to protein in HCHO-caseinate The effect of treatment method on percentage of formaldehyde bound to protein is shown in Table 6.2.1. Results of Dinius et al. ( 1974) and Ashes et al.(\984) suggest that HCHO-casein should contain at least 6 g bound formaldehyde per kg protein to result in sufficient protection
120

from rumen degradation. The batches treated with the use of silica gel pellets contained less than this amount while procedures using silica powder (except batch 0) contained more. The use of pellets has the advantage over using powder that pellets can be sieved out of the HCHO-caseinate before feeding, thus avoiding administration of silica powder to animals. Higher formaldehyde to protein ratios might have resulted in better formaldehyde binding. Since, however, the initial experiments with silica powder resulted in an adequate binding of formaldehyde to protein and amounts of silica powder added with HCHO-caseinate supplementation are small, it was decided to continue the experiments using powder as the only silica source.
Table 6 . 2 . 1 . Effect of s evera l methods of formaldehyde (HCHO) t rea tment of Na-caselnate on amount of HCHO bound t o p r o t e i n .
Batch nr
0 1 2 3 4 5 6 7 8 9
Batch weight
(g)
2000 30 30 30 30 30 30
1700 1000 4000
Silica type
powder pellet pellet pellet powder powder powder powder powder powder
HCHO/sllica ratio
Cg.kg"1)
550 10 20 40
200 90
200 550 550 550
HCHO added
(g-kg-1
of protein)
5 10 20 50 20 20 50 20 20 20
HCHO bound
(g.kg"1
of protein)
1 1 2 5 9 9
16 10 10 9
The data in Table 6.2.1 show that adding 20 g-kg _1of formaldehyde to protein consistently resulted in an amount of formaldehyde bound to protein of about 9 gkg ~\ The amount bound does not seem to be much affected by the formaldehyde/silica ratio. Using a method similar to ours, West et al. (1984) found 10 g-kg "'bound formaldehyde to casein after treatment with 25 gkg_1. Attempts to increase the formaldehyde/silica powder ratio to beyond 0.55 resulted in clotting. To avoid over-protection it seems unwise to aim at formaldehyde binding to protein of more than 10 g-kg_1 (Ashes et ai, 1984). All batches used in the following experiments were therefore prepared with a formaldehyde/silica powder ratio of 0.55 and with the addition of 20 g of formaldehyde per kg of protein.
Changes in amount of formaldehyde bound to protein after long storage periods (2 years) have been reported (Ashes et al., 1984). The results in Table 6.2.2 show that storage time up to 4 weeks and storing temperature hardly affect the amount of formaldehyde bound to protein. Single batches of HCHO-caseinate for supplementation periods up to 4 weeks, as
121

planned for our experiments, can thus be prepared and kept at room temperature without danger of important changes in formaldehyde binding during the experiment.
Table 6 . 2 . 2 . Effects of time s ince formaldehyde t reatment of Na-caseinate and s t o r i ng temperature on amount of formaldehyde bound t o p r o t e i n (g.kg"*-, nd: not determined) .
Batch
nr
5 7 7
Temperature
(°C)
20 20 -4
0
9 10 10
Time
1
9 9 8
since treatment
2
8 nd nd
(weeks)
3
nd 9 9
4
9 nd nd
Table 6 . 2 . 3 . Effects of nylon bag incubat ion in a cows rumen or in a shaker water bath on HCHO-caseinate r e s i dua l dry mat ter (DM) (means in X 1 s . d . , de terminat ions in t r i p l i c a t e , one missing value for ba tch 10, 6 h rumen incubat ion) and n i t rogen (N) content of r e s i dua l dry ma t t e r .
Incubation time
00
0 0.1 6
12 24
Residual X of
batch 10 rumen bath
100 84.810.2
86.9/87.0 83.410.3 84.910.2 83.310.6 84.510.5 82.910.4
dry matter original
batch rumen
100 84
86.210.4 85.010.5 84.610.4
14 bath
310.2 82.510 82.810 82.810
6 6 4
N in DM (g-kg-1)
batch 14 rumen bath
142.9 153.1
149.3 152.5 149.4 153.0 149.6 153.0
Disappearance of HCHO-caseinate from nylon bags Table 6.2.3 shows the DM residues of two batches of HCHO-caseinate after incubation up to 24 h in a cows rumen or in a water bath and the N content in one of the batches. An average of 15.5% of initial dry matter had disappeared after washing in lukewarm water. A fine white dust could be seen at the bottom of the wash-basin. Part of the very fine silica powder and/or
122

part of the non-protein content of the Na-caseinate was probably washed out as indicated by the increase in N content of the HCHO-caseinate residue DM after washing. Nevertheless, approximately 10% of the N originally present in the nylon bags was lost by initial washing. This loss may have consisted of fine particles with bound formaldehyde or (in part) of soluble, unprotected Na-caseinate. Addition of trichloroacetic acid to washing water did not show the presence of any soluble protein. Also Dinius et al. (1974) found protein solubility in 0.1 N NaOH of HCHO-treated casein with amounts of bound formaldehyde comparable to ours to be strongly reduced (with 97 to 98% compared to untreated casein). This suggests that the protein loss through washing consisted mainly of very fine HCHO-caseinate particles and not of soluble protein. According to producers information, particle size distribution in EM6 (Na-caseinate) determined with a dry sieving technique varies from batch to batch but typical analyses show that 20 to 25% of DM passes a 45 micron sieve (B. Bekkers, DMV-Campina, personal communication). Although particle size might change as a result of hydration and formaldehyde treatment, these data show that the original material contains a fair proportion of particles smaller than nylon bag pore size. The DM loss during the water bath treatment, especially during the first 6 h, can probably be attributed to a further loss of fine particles from the nylon bags.
HCHO-caseinate residues were generally slightly higher after rumen incubation than after water incubation. This might be the result of uptake of exogenous (rumen) DM in the bags. This would be consistent with the lower N content of the rumen incubated DM residue. In view of the fact that the N content of the rumen incubated material nevertheless remained high, it is highly unlikely that a considerable part of the HCHO-caseinate was degraded and replaced with fine rumen material. On basis of the data of batch 14 in Table 6.2.3 and the assumptions that DM loss from the bags in the rumen contained 152.8 g-kg_1 N and exogenous DM consisted entirely of bacteria with an estimated N-content of 100 g-kg _1DM (van Soest, 1982; see also Section 7.3), it can be calculated that during rumen incubation 3.5% more original DM was lost than in the water bath. As it is unlikely that all exogenous material was of bacterial origin, loss of original material will have been less than 3.5%. It is therefore concluded that, of the protein present in the nylon bags after initial washing, at least 96% did not disappear during rumen incubation for periods up to 24 h.
A third batch was likewise incubated up to 48 h in a cows rumen or a water bath at our laboratory (Table 6.2.4). Residues of this batch are slightly lower compared to batches 10 and 14, but differences between bath and rumen and trend in time remains the same. Residues were also lower at the IVVO than in our laboratory, possibly due to differences in washing procedure or degree of wear of the nylon bag material between laboratories. Despite this, IVVO results confirm the undegradability in the rumen of at least the major part of the HCHO-caseinate. Sriskandarajah et al. (1982) incubated HCHO-casein (protein treated with 15 g-kg_1 formaldehyde) for 48 and 96 h in cattle rumen and found degradabilities of 6 and 65%, respectively. In our experiments, rumen degradability was not measured for incubation periods longer than 48 h as it seems highly unlikely that rumen retention time of HCHO-caseinate will exceed 48 h.
The results of the nylon bag intestinal passage study (Table 6.2.4) show an effect of rumen incubation time on intestinal digestion. About 94% of DM residue present after 18 h of rumen incubation disappeared during intestinal passage compared with only 74% or 67% after 6 or 0 h of rumen incubation, respectively. The causes of this effect are not known.
123

Table 6.2.4. Effects of nylon bag incubation in a cows rumen and nylon bag passage through a cows intestines on residual HCHO caseinate dry matter (DM) or N as a percentage (mean ± s.d. or duple values) of original sample DM or N weight determined in two laboratories (batch 16).
Incubation
Residue after rumen/bath incubation or intestinal passage
time DTAP laboratory I W O laboratory
(h)
0.1 6
12 18 24 48
rumen (DM)
78. 78.2±0.4 77.0±0.7
nd 78.2+0.5 75.110.4
water bath (DM)
710.9 76.8+0.6 76.310.4
nd 76.110.8 75.4+0.7
rumen incubation (DM)
70.0/70.1 70.1/72.2
nd 72.5/73.2
nd nd
(N)
72.6/73.2 71.5/74.3
nd 70.5/74.3
nd nd
rumen + intest.pas. (DM)
24.411.4 19.0+2.4
nd 4.310.8
nd nd
(N)
22.512.5 17.512.7
nd 3 .810. 7
nd nd
In vitro and in vivo digestibility of HCHO-caseinate
The results of the in vitro OMD of HCHO-caseinate (batch 16) and casein are in Table 6.2.5.
HCHO-caseinate digestibility was compared to casein digestibility since both are, in contrast
to Na-caseinate, insoluble in water and therefore suitable for in vitro digestibility estimates.
OMD was lower for HCHO-caseinate compared to casein, the difference being largest after
samples had been frozen for one week. The values are much higher than the 36.2% in vitro
(after pepsin digestion only) CP digestibility reported by West et al. (1984) for HCHO-casein
prepared in a similar way and containing 10 gkg _1of formaldehyde bound to protein.
Table 6 . 2 .5 . In vitro o rganic mat ter d i g e s t i b i l i t y (OMD, mean 1 s . d . ) of case in and HCHO-caseinate of two batches s tored a t two d i f f e r en t temperatures for one week.
Sample Batch Temperature (°C) In v i t r o OMD (X I s . d . )
Casein HCHO-caseinate HCHO-caseinate HCHO-caseinate HCHO-caseinate
7 7 8 8
room -4 20 -4 20
98.310.6 83.312.1 88.7+1.5 83.014.0 86.712.1
124

Contrary to this, the in vivo digestibility estimate of HCHO-casein in rabbits (allowed coprophagy) exceeded 80%. Possibly, incubation in the lower digestive tract followed by coprophagy increased digestibility in rabbits in a way similar to ruminai incubation in this study.
Table 6 . 2 . 6 . Means 1 s .d . for in take of t o t a l N ( N I t o t ) , d i g e s t i b l e N (DNI) and dry mat ter (DMI), NI from supplement ( N I s u p p i ) as a f r a c t i on of N I t o t
and the es t imated r eg ress ion coe f f i c i en t s (1 s . e . ) and RSD from the model DNI= bj/rNIst-i-a,, + b 2 * N I s u p p l + b3*DMI ( a l l v a r i ab l e s in g . k g " 0 - 7 5 ^ " 1 ) in Exp. 1 and 2.
Experiment
Supplementation level
NItot DNI DMI NIsuppl/NItot
bl <NIstraw) b2 <NIsuppl) b3 (DMI) RSD
zero
0.5110.05 0.1310.02 47.314.17
0
0.6410 0.8410
-0.004410 0.049
L
highest
1.5910.25 1.0110.18 55.817.43 0.6610.03
28 04 0032
2
zero
0.39+0.09 0.09+0.07 39.916.41
0
0.7010 0.8410
-0.004510 0.031
highest
1.1610.04 0.73+0.02 45.214.38 0.7010.03
20 03 0020
The in vivo digestibility of HCHO-caseinate was estimated from batches 16 (Exp. 1) and 17 (Exp. 2). Table 6.2.6 shows ranges of parameter values relevant to N-digestibility in the two experiments as well as the results of the regression analyses with DNI as the dependent and Nlstraw NIsuppi and DMI as independent variables for the two experiments. Regression of DNI on NI and DMI is commonly used to estimate true digestibility of N from the NI coefficient and the amount of metabolic faecal N (MFN) from the DMI coefficient (Boekholt, 1976). In view of the limited variation in NIstraw and DMI, the resulting high s.e.'s of the two corresponding regression coefficients are not surprising. Nevertheless, the estimates of the amount of MFN (4.4 and 4.5 g-kg _1DM, respectively) are well within the range of values reported for sheep and cattle and only slightly lower than the average (4.9 g-kg _1DM) in the data reviewed by Boekholt (1976). Estimates of true digestibility of straw N are, not significantly, lower than the values often recorded for roughage diets: around 0.9 (Boekholt, 1976; Van Soest, 1982). Compared to these two variables, the variation in NIsuppi is very much larger and the s.e. attached to the coefficient in the regression model is relatively much smaller. The estimate of the true digestibility of HCHO-caseinate (0.84) is lower than the expected value for untreated Na-caseinate, indicating a depression of N-digestibility as a result of formaldehyde treatment. The depression is small, however, and is comparable with depressions found in a number of experiments with HCHO-casein fed to ruminants (Redman
125

et al., 1980) or rabbits (West et al., 1984). Larger depressions are reported by Kaufmann and Lüpping (1982). For the HCHO-caseinate, the in vivo N-digestibility estimates agree well with the in vitro OMD estimates and with the DMD and N digestibility estimates expected from nylon bag intestinal passage after a rumen incubation time between 6 and 18 h. The apparent digestibility of around 84% found in the in vivo digestibility experiments and comparable values suggested by nylon bag intestinal passage studies do not necessarily mean that the protein is digested and absorbed in the small intestine. Part of it might have been fermented in the large intestine and, as a result, availability of amino acids might have been lower than suggested by the digestibility estimates. In the in vitro experiments, however, when pepsin/HCl digestion is not followed by fermentation, digestibility estimates were also around 85%. This suggests that at least the major part of apparently digested HCHO-caseinate is digested in the small intestine.
Conclusions
The results of the experiments show that the addition of a formaldehyde/silica powder mixture (550 gkg-} to Na-caseinate (formaldehyde/protein ratio of 20 gkg ")• followed by treatment at 30 °C for three days, consistently results in a formaldehyde binding to protein of about 9 gkg_1.
HCHO-caseinate prepared this way appears to be almost completely resistant to rumen degradation as measured by in vivo nylon bag incubation for up to 48 h. The estimates of HCHO-caseinate digestibility from in vivo and in vitro experiments and from nylon bag intestinal passage suggest that approximately 85% of the protein from HCHO-caseinate is digested in the intestines if preceded by a rumen retention time of more than 6 h.
It is concluded that the formaldehyde treatment method described results in a protein that is adequately protected from degradation in the rumen while the depressing effect of treatment on intestinal protein digestibility remains limited as desired.
126

6.3 Effects of supplementation with formaldehyde
treated caseinate on intake of grass straw diets and
nitrogen balance in dwarf goats
Introduction
The positive effect of supplementation with non-protein nitrogen (NPN) or rumen degradable protein (RDP) on intake (and generally also digestibility) of poor quality roughages as found in many tropical areas is well documented. An increase in nitrogen (N) availability for rumen microbes and, consequently, an increase in extent and rate of feed degradation in the forestomachs is generally held responsible for this effect (van Soest, 1982; Siebert and Hunter, 1982; Preston and Leng, 1987).
Although N content of forages within digestibility classes is positively correlated with intake over a broad range of N contents (see Chapter 1), supplementation with NPN or RDP in amounts exceeding the N requirements of rumen microbes for optimum growth, generally does not result in increased roughage intake. For these roughages it has been suggested that rumen non-degradable protein (also called by-pass protein) might have a positive effect on intake. For instance in Australia, a positive effect of by-pass protein on feed intake has been demonstrated repeatedly (Egan and Moir, 1965; Egan, 1965, 1977) and also in more recent literature the beneficial effects of by-pass protein on feed intake have been stressed (Preston and Leng, 1987). On the other hand, several experiments did not show a significant effect of by-pass protein on feed intake as concluded by Kellaway and Leibholtz (1983). The causes of these differences in response are not known but could be related to inadequate protection of the protein supplement from rumen degradation. For example, in the experiments of Sriskandarajah et al. (1982) discussed by Kellaway and Leibholtz (1983), supplementation with urea and formaldehyde treated casein (HCHO-casein) resulted in a non significant 17% increase of organic matter intake (OMI) over controls (receiving urea only) and a liveweight (W) change of +42 g.d"1 instead of -189 g.d"1 in control yearling steers; moreover, it was concluded that extensive degradation of HCHO-casein in the rumen (at least 60%) had occurred. Especially the last observation leaves scope for a real and significant effect of supplementation with by-pass protein on roughage intake.
A number of experiments were therefore designed to test the hypothesis that increased availability of amino acids as a result of by-pass protein supplementation would lead to increased intake of poor quality roughage in dwarf goats.
In a preliminary experiment, the effect on intake of supplementation of dwarf goats on a 85/15 grass straw/hay diet containing 10.5 g.kg"1 N in the dry matter (DM) with urea, Na-caseinate and HCHO-caseinate supplying 8 g.kg"1 N in the DM was tested (see Section 6.1). Supplementation with N as urea or Na-caseinate did not significantly increase DM intake (DMI) but supplementation with HCHO-caseinate did. Also in this experiment, there was doubt about the effectiveness of HCHO treatment to protect Na-caseinate against rumen degradation. Therefore, first a suitable method of treatment was developed, yielding HCHO-
127

caseinate that is virtually undegradable in the ramen but reasonably digestible in the total digestive tract (see Section 6.2).
In a first experiment, the effects of supplementation of dwarf goats on a chopped grass straw diet with urea, Na-caseinate and HCHO-caseinate on intake and N-balance were tested. The effects of graded levels of HCHO-caseinate supplementation on feed intake and Imbalance were estimated in a second experiment which was repeated with fewer treatments and more animals per treatment in a third. Finally, the effects of supplementation with HCHO-caseinate and/or starch on feed intake and N-balance of dwarf goats on a pelleted grass straw diet was measured in a fourth experiment. It is the aim of this section to describe these experiments and discuss the results.
Materials and methods
Experimental animals in the 4 experiments were West African Dwarf goats from the Wageningen University flock described by Montsma (1986). All experiments were planned to be carried out with castrated males (wethers). During the adaptation period of Exp. 1 a disease hit the flock and resulted in several deaths, leaving an insufficient number of wethers to complete the experiment. Therefore, females were used in Exp. 1 and 2, wethers in Exp. 3 and 4 (aged 12,15,12 and 18 months, respectively).
In all experiments, animals were housed in metabolism cages and were offered their basal diet ad libitum at about twice intake for chopped roughage (grass straw and grass hay) and 1.3 times intake for pelleted grass straw. In all experiments, animals had continuous access to fresh water, salt lick and (except in Exp. 4) a small container with a mineral/vitamin mix (with Ca, Na, P, Mg, Cu, Mn, Zn, Co, J and Se in minimum amounts of 115, 100, 118, 32, 1.25, 1.0, 1.0,0.03,0.05 and 0.006 g.kg"1 and vitamins A and D3 as 468,750 and 93,7501.U. kg"1, respectively).
Measurement periods lasted 7 d after adaptation periods to cages and diet of 13 to 25 d. During measurement periods, feed offered, orts and faeces and urine produced were weighed and sampled for later analyses. Analyses for content of DM, ash and N were carried out according to AOAC (1975). N was analyzed in air dry feed and orts but in fresh faeces and urine.
The composition of diets and supplements used in the experiments is in Table 6.3.1. In all experiments, grass straw was Lolium perenne and the grass hay in Exp. 3 also consisted mainly of Lolium perenne. The grass straw fed in Exp. 1, 2 and 3 was from a single batch containing a mean of 66.7% NDF in the DM (determined according to Goering and van Soest, 1970). The formaldehyde treatment of Na-caseinate and rumen degradability and digestibility of the treated caseinate (HCHO-caseinate) are described in Section 6.2. Particle size distribution of various batches of pelleted grass straw was determined with a wet sieving technique using a Fritsch Analysette 3 (Fritsch GMBH, Idar-Oberstein, FRG).
In all experiments, liveweight (W) was measured weekly. Since there was considerable variation in W within groups, intake and N-balance data were all scaled for size. A preliminary analysis showed that for the experiments reported here, regression of intake on W with the allometric model resulted in exponents between 0.7 and 0.95 and not significantly different from 0.75. To facilitate comparisons with other data sets and in view of the effects
128

of W on feed intake in a long-term experiment comparing WAD goats with sheep (see Chapter 5), metabolic size (i.e. W0-75) was used for scaling in all experiments.
Table 6 . 3 . 1 . Composition of d i e t s and supplements in Exp. 1 t o 4 (nd: not de termined) .
Exp.
1 1 1 2 2 2 3 3 3 4 4 4 4 4 4 4 4 4
Diet
Grass straw Na-caseinate HCHO-caseinate Grass straw Na-caseinate HCHO-caseinate Hay Grass straw HCHO-caseinate Grass straw pellet Grass straw pellet Grass straw pellet Grass straw pellet Grass straw pellet Grass straw pellet Grass straw pellet Grass straw pellet Grass straw pellet
0 OR CI C2 P3 P6 S5 P3S5 P6S5
DM (g.kg"1)
836 948 913 855 940 950 832 822 910 919 912 903 904 912 904 907 905 910
Ash in DM (g.kg-1)
79 55 82 83 nd 83 72 81 82 74 77 96 90 93 86 93 88 88
N in DM (gkg-1)
11.0 145.6 140.5 11.0
147.0 142.0 16.9 10.3
141.2 19.0 18.8 19.6 19.2 22.9 25.2 19.0 22.3 26.1
Also within groups, variation in intake relative to metabolic size can still be considerable. Literature shows that substantial differences in group mean roughage intake between control and HCHO-casein supplemented groups (e.g. the 17% difference reported by Sriskandarajah et ai, 1982) may not be significant because of large within-group variation. Within-group variation can be diminished considerably by expressing the individual intake relative to the intake of a standard feed (Van Soest, 1982). This procedure has been followed and therefore all experiments had a similar design. After adaptation a first measurement period followed during which all animals received the same diet. Animals were then ranked according to initial W and/or intake relative to metabolic size in the first measurement period. A number of animals (equal to the number of treatments) with the lowest rankings, was then allocated at random, one to each treatment. This was repeated with the remaining animals until all had been allocated. After a second adaptation period during which the different groups received their specific treatment (including a control group) followed a second measurement period. Since the time interval between measurement periods within experiments was short and changes in W were small, the average of W recorded during both measurement periods was taken for the calculation of intake relative to metabolic size.
129

To correct for individual differences in intake during the first measurement period, the difference in intake between the second and the first measurement period was used to statistically analyze effects of treatment on intake and N-balance. The significance of differences between measurement periods and between groups were analyzed with t-tests. Linear regression models were used to analyze data in Exp. 2 and the relation between intake and N-balance. All statistics were calculated with SAS (1985) programs.
Experiment 1 Twenty goats were divided into 4 groups of 5 animals each. During the first measurement period, all animals received grass straw only. Organic matter intake (OMI), digestible organic matter intake (DOMI) and N-balance were recorded after an adaptation period of 13 d. During the second part of the experiment, a N-supplement (urea, Na-caseinate and a mixture of 1/3 Na-caseinate and 2/3 HCHO-caseinate) was added to the basal diet of groups U, CAS and FCAS, respectively, in amounts to increase the N content of the OM with 10 g.kg"1, approximately. The urea and Na-caseinate supplements were dissolved in water and sprayed over the feed the afternoon of the day before feeding and diets were left drying overnight. The HCHO-caseinate powder (batch 9 described in Section 6.2) was sprinkled over the feed after spraying Na-caseinate which served to glue the HCHO-caseinate to the roughage. The grass straw of group C (controls) was sprayed with water (50% of roughage dry matter offered) only. Orts were weighed, sampled and analyzed after separation in a fine (dust and fine particles accumulated at the bottom of the feed container) and a coarse fraction (the rest of the feed residue). OMI, DOMI and N-balance were recorded after an adaptation period of 25 d.
Experiment 2 Eighteen goats were divided into 6 groups of 3 animals each. During the first part of the experiment animals received grass straw and OMI and NI was recorded after an adaptation period of 21 d to feed and 14 d to cages. During the second part, groups FC1, FC2, FC3, FC4 and FC5 received HCHO-caseinate (batch 16 described in Section 6.2) supplying N at a rate of approximately 0.1, 0.2, 0.4, 0.6, and 1.0 g.kg-0-75^"1, respectively. HCHO-caseinate was administered twice daily as a suspension in water (ratio 1 to 5) with a drench pistol. Water only was administered to group C (controls). OMI, DOMI and N-balance were recorded after an adaptation period of 21 d.
Experiment 3 A group of 21 wethers was divided into 3 groups of 7 animals each. During the first part of the experiment animals received hay ad libitum and OMI, DOMI and N-balance were recorded after an adaptation period of 21 d to feed and 14 days to metabolism cages. During the second measurement period all animals received grass straw ad libitum. Groups FC1 and FC2 received HCHO-caseinate supplying N at a rate of approximately 0.5 and 0.8 g.kg"0-75.d_1, respectively. These rates were based on the results of Exp. 2 which showed a tendency of increased straw intake at the higher supplementation levels. Supplements were administered twice daily as a suspension in water with a drench pistol. Water only was administered to group C (controls). OMI, DOMI and N-balance were recorded after an adaptation period of 14 d.
130

Experiment 4 The basic material for the preparation of experimental diets in this experiment consisted of a batch of pelleted grass straw to which molasses (40 g.kg"1 DM) and urea (14 g.kg"1 DM) had been added (batch O). The intake of this batch was much lower than expected from intake recorded earlier for a batch of pelleted grass straw (described in Chapter 5). Repelleting of a small part of batch O with the addition of some water only (batch OR) had not resulted in a significantly higher intake level (OMI for batch O and OR around 50 g.kg"0-75^"1; Tolkamp, unpublished results). A preliminary trial had shown positive effects of repelleting this material with the addition of 40 g HCHO-caseinate per kg DM on intake (see Section 6.1). Therefore, two batches were prepared from batch O with the addition of 3 or 6% HCHO-caseinate (batches P3 and P6). To test whether a possible effect of HCHO-caseinate on intake was the result of increased availability of amino-acids rather than energy, also one batch was prepared from batch O with the addition of 5% maize starch (S5) and interactions were tested with two batches containing apart from 5% maize starch also 3 or 6% HCHO-caseinate (batches P3S5 and P6S5, respectively). In monogastrics it has been found that positive effects of casein supplementation in comparison with amino acid mixtures was related to the supply of a micro-element (Zn) associated with casein supplementation (Ebihara et al., 1979). To avoid this type of confounding effects, a mineral mixture was added to all newly prepared batches for this experiment (10 g.kg"1 DM). Pellets of batch O were broken in a hammer mill and all experimental diets consisted of re-pelleted material with the addition of minerals, the appropriate supplement and, occasionally, some water to facilitate pelleting. During preparation of the control batch (batch CI), the pelleting machine broke down. After repair, the preparation of the control batch (batch C2) was finished and the batches for the experimental treatments were made.
Twentyfour animals, divided in 6 groups of 4 animals each, received a control diet (CI) in the first part of the experiment and OMI, DOMI and N-balance were measured after an adaptation period to feed and metabolism cages of 19 d. During the second part, the six groups received experimental diets C2, P3, P6, S5, P3S5 and P6S5, respectively. OMI, DOMI and N-balance were measured after a 14 d adaptation period.
Results
Experiment 1 The results of the first experiment are summarized in Table 6.3.2 and 6.3.3. Differences between groups in OMI, NI and N-balance were not significant during the first period but DOMI was higher (P<0.05) in group CAS than in group U. Mean DOMI (18.3, s.e. 0.9 g.kg_0-75.d_1) is lower than the most recent estimate of DOM requirements for maintenance of WAD goats housed in metabolism cages (23.6 g.kg"0-75^"1, Zemmelink et al., 1991).
The increase in OMI in the second period compared to the first did not differ significantly between groups but the increase was only significantly different from 0 (P<0.01) for groups CAS and FCAS. Approximately 60 g of OM was added with the protein supplements to 1 kg of offered straw OM in groups CAS and FCAS in the second period. Therefore, an extra 2.4 g OMI relative to C, very close to the difference observed, can be expected in these groups if protein supplementation would not affect OMI from straw and if animals would consume straw and supplement in the proportion offered. From a comparison of the NI over OMI ratios
131

of the four groups in the second period, it can be concluded that indeed animals in group CAS consumed straw and supplement in approximately the proportions offered while group U consumed slightly more and group FCAS slighdy less N over OM than would be expected from the proportions offered.
Table 6 . 3 . 2 . Exp. 1 : group means and pooled s . e. for W (kg) and OMI and DOMI ( g .kg 'O'^ .d"! ) In period 1 ( a l l groups ad libitum unsupplemented grass straw) and In period 2 ( a l l groups ad libitum grass straw, groups C, Ü, CAS and FCAS supplemented with water, urea, Na-caseinate and 2/3 HCHO-caseinate plus 1/3 Na-caselnate, respect ive ly) and the difference between periods.
Parameter
W
OMI OMI OMI
DOMI DOMI DOMI
Period
1,2
1 2
2-1
1 2
2-1
Group and
control C
13.6
39.3 41.8a b
2.5
18.5ab
19.4a
0.9a
source of N-supplement in
urea Na-cas. U CAS
13.8 14.0
36.7 41.2 39.2a 46.2b
2.5 5.0*
16.8a 20.0b
19.1ab 23.Ie
2.3ab* 3.lab*
period 2
HCHO-cas FCAS
13.9
38.0 43.2ab
5.2*
17.9ab
21.7a b c
3.8b*
s.e.
1.09
1.74 1.78 1.29
0.85 0.91 0.86
: differences between periods s i gn i f i cant ly (P<0.05) d i f ferent from 0 a b c : values of groups not sharing the same superscript d i f f er s i gn i f i cant ly (P<0.05)
The relatively high NI of group U in period 2 is probably due to overestimating NI. The N content in orts DM was lower than could be expected from the amount of N added in the form of urea. It was evident from a slight ammonia odour in the feed orts of this group that part of the N supplied as urea, although recorded as NI, was lost due to NH3 volatilization. Therefore no significance can be attached to the NI, DNI and N-balance values recorded in this experiment for group U during the second period. Group FCAS consumed slightly less N supplement with the straw than the proportion offered and probably less than two-third of the supplement consumed consisted of HCHO-caseinate. A sticky Na-caseinate solution was used in this group to glue the HCHO-caseinate to the straw but observations of white powder at the bottom of the feeding trough suggested that part of the HCHO-caseinate had still dropped off the roughage. The observations were confirmed by the high amount of N in the fine fraction of orts DM (36±3.8 g.kg"1) in this group.
132

Compared to controls, the increase in DOMI from period 1 to period 2 was higher (P<0.05) in the FCAS group and tended (P<0.10) to be higher in the CAS group. Again, consumption of the highly digestible protein alone can explain the major part of these differences if supplementation would not affect OMI from straw.
Table 6 . 3 . 3 . Exp. 1: group means and pooled s . e . for Intake of N (NI), d iges t ib l e N (DNI) and N-balance (g.kg • .d~l) in period 1 ( a l l groups ad libitum unsupplemented grass straw) and in period 2 ( a l l groups ad libitum grass straw, groups C, U, CAS and FCAS supplemented with water, urea, Na-caseinate and 2/3 HCHO-caseinate plus 1/3 Na-caseinate, respect ive ly) and the difference between periods.
Parameter
NI NI NI
DNI DNI DNI
N-balance N-balance N-balance
Period
1 2
2-1
1 2
2-1
1 2
2-1
Group and
control C
0.52 0.59» 0.06»
0.19 0.23» 0.04»
-0.09 -0.01» 0.08»*
source of N-
urea Ü
0.47 1.09b
0.62b*
0.13 0.71b
0.58b*
-0.11 0.24b
0.35b*
supplement in
Na-cas. CAS
0.53 1.14b
0.61b*
0.18 0.68b
0.50b*
-0.11 0.07» 0.18c*
period 2
HCHO-cas FCAS
0.50 0.99c
0.50c*
0.16 0.53c
0.36c*
-0.08 0.04» 0.12»c*
s.e.
0.031 0.040 0.033
0.023 0.035 0.036
0.025 0.034 0.025
: d i fferences between periods s i gn i f i cant ly (P<0.05) d i f ferent from 0 » b c : values of groups not sharing the same superscript d i f f er s i gn i f i cant ly (P<0.05)
N-supplementation resulted in a significantly lower increase (P<0.05) in NI and DNI in the FCAS group compared to the CAS group as a result of a similar increase in OMI but a lower amount of supplement consumed. In the second period compared to the first, N-balance was significantly (P<0.01) increased in all groups and more so (P<0.01) in the CAS group than in controls.
The results of the experiment show that supplementation of this poor quality roughage with N in the form of urea did not result in a significant increase of OMI from straw compared to controls. Although there is some doubt about the actual amount of urea consumed, the N content of straw orts and the increase in urinary N-output following urea supplementation show that the N content of the straw consumed was clearly increased. Supplementation with Na-caseinate tended to increase total OMI compared to controls but the major part, if not all, of this increase is the result of consumption of the supplement itself.
133

Therefore, we conclude that straw intake did also not increase as a result of supplementation with a RDP source. This agrees with the preliminary observations reported in Section 6.1. Contrary to the preliminary observations is the non-significance of the increase in OMI in the HCHO-caseinate supplemented group compared to controls recorded in this experiment. There is, however, some doubt about the actual amount of HCHO-caseinate consumed. In this first experiment, attempts were made to add the N-source directly to the roughage to simulate the effect of an increased N-content of the forage and to avoid peak levels of ruminai ammonia associated with separate supplementation of the soluble N-sources. The attempt was reasonably successful for the urea and caseinate supplemented groups but it was not for the HCHO-caseinate supplemented group, resulting in a lower level of supplementation with protected protein than intended.
From this experiment we concluded that grass straw intake was not affected by supplements of NPN or RDP but that for a proper estimate of the effect of by-pass protein other ways of supplementation should be employed to ensure that animals receive the planned amount of HCHO-caseinate.
Experiment 2 The supplementation method (administration of a suspension of HCHO-caseinate in water with a drench pistol, approximately 15 g of suspension per shot) ensured that animals received the planned amount of protected protein. During the first few days animals had to be restrained with force because they resisted this type of administration. Gradually, however, animals got used to it, especially goats receiving the higher amounts of supplement (up to 28 shots per day). Before the measurement period started, all animals were accustomed to this form of administration. Some animals still had to be restrained slightly by holding the neck rope, others did not resist at all when the drench pistol was introduced in their mouths. Quite a few animals started begging to be supplemented and suckled the mouth piece of the drench pistol when it was inserted through the wire mesh at the side of the cages. It is therefore unlikely that the method of supplementation stressed the supplemented animals and affected straw intake during the second measurement period.
Tables 6.3.4 and 6.3.5 show the results of this experiment. OMI from straw in the first measurement period is at approximately the same level as recorded in Exp. 1. The OMI from straw was significantly (P<0.05) increased in the second compared to the first period for groups FC1, FC4 and FC5 but differences between groups were not significant. Also regression of OMI from straw in the second minus the first period on the amount of N received with the supplement (up to 3rd degree polynomials) showed that the tendency of increasing OMI from straw with increasing levels of supplementation with HCHO-caseinate was not significant.
Total OMI in the second compared to the first period increased with supplementation level, differences between the control group and groups FC4 and FC5 being significant (P<0.05). Also DOMI in the second period increased systematically with increased supplementation level and was significantly higher in groups FC3, FC4 and FC5 than in the control group. These differences were mainly the result of consumption of the highly digestible supplement and only partly related to the non-significant differences in OMI from straw. However, considering the tendency for straw OMI to increase especially at the higher supplementation levels, it was nevertheless decided to repeat the experiment with fewer treatments and more animals per treatment.
134

Table 6.3.4. Exp. 2: group means and pooled s.e. of W (kg) and OMI and DOMI in period 1 (all groups grass straw only) and period 2 (grass straw plus HCHO-caseinate supplement) for experimental groups C, FC1, FC2, FC3, FC4, FC5 (all data in g-kg-O^.d"1) .
Parameter
W
0MIstraw 0MIstraw OMIstraw
0MItotal 0MItotal
D O M I t o t a l
Period
1,2
1 2
2-1
2 2-1
2
Group
C 0
13.7
39.2 43.1
3.9
43. la
3.9a
20. la
and HCHO-
FC1 0.1
14.5
39.7 45.3
5.6*
45.8a b
6.1a*
21.4a b
caseinat
FC2 0.2
15.1
40.5 45.1
4.5
46.5a b
5.9a*
22.2a b
e N leve
FC3 0.4
15.7
42.8 47.4
4.6
50.lab
7.3a*
23.6b
1 in period 2
FC4 0.6
14.7
39.2 46.2
6.9*
50.1a b
10.9b*
24. 9b
FC 5 1.0
14.3
36.8 44.1
7.3*
51.2b
14.4b*
26.0b
s.e.
1.68
2.36 2.10 2.13
2.30 2.03
1.13
: differences between periods significantly (P<0.05) different from 0 a b c: values of groups not sharing the same superscript differ significantly (P-cO.05)
Table 6.3.5. Exp. 2: group means and pooled s.e. of intake of N (NI) in period 1 (all groups grass straw only) and period 2 (grass straw plus HCHO-caseinate supplement) and digestible N (DNI) and N-balance in period 2 for experimental groups C, FC1, FC2, FC3, FC4 and FC5 (all data in g.kg-0-75.d"
Parameter
"̂ •straw "Istraw
NItotal DNI
N-balance
Period
1 2
2 2
2
Group and HCHO-caseinate
C 0
0.45 0.51
0.51a
0.13a
-0.05a
FC1 0.1
0.51 0.58
0.66a
0.24ab
0.06ab
FC2 0.2
0.47 0.54
0.75a
0.32b
0.04ab
N level
FC3 0.4
0.55 0.61
1.00b
0.43bc
0.09ab
in period 2
FC4 0.6
0.48 0.55
1.13b
0.55c
0.17bc
FC5 1.0
0.46 0.54
1.59c
1.01d
0.23c
s.e.
0.04 0.04
0.08 0.05
0.05
at>cd: values of groups not sharing the same superscript differ significantly (P<0.05)
135

Supplementation apparently resulted in positive N-balances while N-balance was negative in the control group. The effect of supplementation on N-balance in relation with DOMI will be discussed in more detail below.
Experiment 3 Tables 6.3.6 and 6.3.7 show the results of Exp. 3. During the first measurement period, OMI from hay in group FC1 was lower (P<0.05) than in controls. The same tendency can be observed for the OMI from straw in the second period. The difference in OMI from roughage between the two periods is not significantly affected by group and there is also no tendency as recorded in Exp. 2. This shows that supplementing wethers with protected protein in considerable amounts had no effect on grass straw intake at all. The decrease in DOMI in period 2 relative to period 1 was larger (P<0.05) in the control group than in the two supplemented groups and also the decrease in N-balance was more pronounced (P<0.001) in this group. The effect of supplementation on N-balance in relation with DOMI will be discussed in more detail below.
Table 6 .3 .6 . Exp. 3: group means and pooled s . e . of W (In kg) , OMI and DOMI in period 1 ( a l l groups on a hay d iet only) and period 2 (grass straw plus HCHO-caselnate supplement) and the difference between periods in experimental groups C, FC1 and FC3 ( a l l data in g. k g " 0 - 7 5 ^ " 1 ) .
Parameter
W
OMIhay 0MIstraw 0MIforage
DOMI DOMI DOMI
Period
1,2
1 2
2-1
1 2
2-1
Group and HCHO-caseinate N
C FC1 0.0 0.5
15.9 16.5
51.9a 47.6b
36.7 33.8 -15.3* -13.8*
29. 9a 27. 6b
17.5 19.2 -12.4a* -8.4b*
level in period 2
FC2 0.8
16.8
50.4ab
35.2 -15.2*
29.1ab
20.1 -8.9b*
s.e.
0.87
1.45 1.88 1.87
0.72 0.98 0.88
*: differences between periods s i gn i f i cant ly (P<0.05) d i f ferent from 0 a b : values of groups not sharing the same superscript d i f f er s i gn i f i cant ly (P<0.05)
Experiment 4 The results of this Exp. are in Tables 6.3.8 and 6.3.9. Treatment had no significant effect on the increase in OMI between the second and the first measurement period but the increase in
136
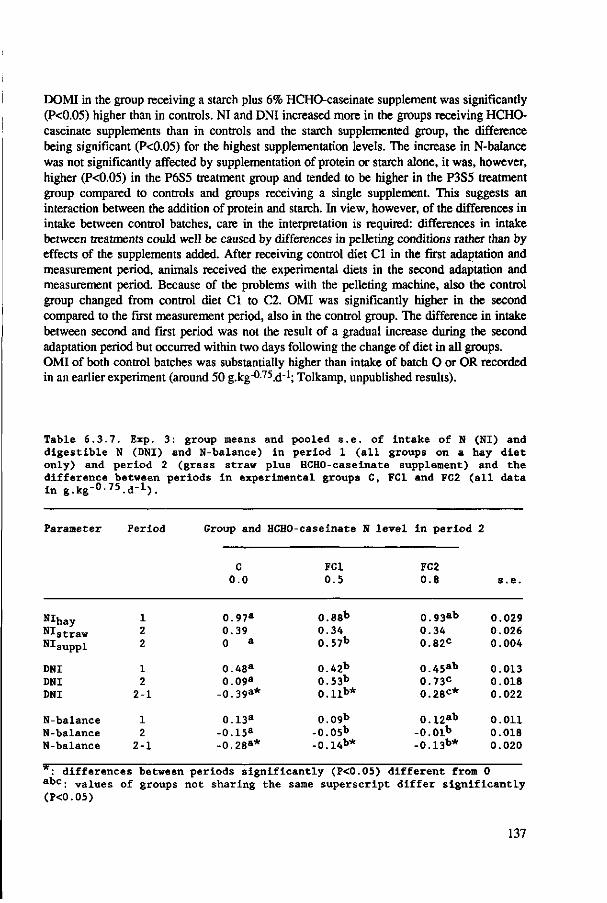
DOMI in the group receiving a starch plus 6% HCHO-caseinate supplement was significantly (P<0.05) higher than in controls. NI and DNI increased more in the groups receiving HCHO-caseinate supplements than in controls and the starch supplemented group, the difference being significant (P<0.05) for the highest supplementation levels. The increase in N-balance was not significantly affected by supplementation of protein or starch alone, it was, however, higher (P<0.05) in the P6S5 treatment group and tended to be higher in the P3S5 treatment group compared to controls and groups receiving a single supplement. This suggests an interaction between the addition of protein and starch. In view, however, of the differences in intake between control batches, care in the interpretation is required: differences in intake between treatments could well be caused by differences in pelleting conditions rather than by effects of the supplements added. After receiving control diet CI in the first adaptation and measurement period, animals received the experimental diets in the second adaptation and measurement period. Because of the problems with the pelleting machine, also the control group changed from control diet CI to C2. OMI was significantly higher in the second compared to the first measurement period, also in the control group. The difference in intake between second and first period was not the result of a gradual increase during the second adaptation period but occurred within two days following the change of diet in all groups. OMI of both control batches was substantially higher than intake of batch O or OR recorded in an earlier experiment (around 50 g.kg_0-75.d_1; Tolkamp, unpublished results).
Table 6 .3 .7 . Exp. 3: group means and pooled s . e . of Intake of N (NI) and d iges t ib l e N (DNI) and N-balance) in period 1 ( a l l groups on a hay d iet only) and period 2 (grass straw plus HCHO-caseinate supplement) and the difference between periods in experimental groups C, FC1 and FC2 ( a l l data in g . k g - 0 - 7 5 ^ - 1 ) .
Parameter
NIhay "•'•straw NISUppl
DNI DNI DNI
N-balance N-balance N-balance
Period
1 2 2
1 2
2-1
1 2
2-1
Group and HCHO-
C 0.0
0.97a
0.39 0 a
0.48a
0.09a
-0.39a*
0.13a
-0.15a
-0.28a*
caseinate N level
FC1 0.5
0.88b
0.34 0.57b
0.42b
0.53b
0.11b*
0.09b
-0.05b
-0.14b*
in period
FC2 0.8
0.93ab
0.34 0.82c
0.45ab
0.73c
0.28c*
0.12ab
-0.01b
-0.13b*
2
s.e.
0.029 0.026 0.004
0.013 0.018 0.022
0.011 0.018 0.020
: d ifferences between periods s i gn i f i cant ly (P<0.05) d i f ferent from 0 a b c : values of groups not sharing the same superscript d i f fer s i gn i f i cant ly (P<0.05)
137

Table 6.3.8. Exp. 4: group means and pooled s.e. for W (kg). Intake of OM (OMI) and digestible OM (DOMI) in g.kg"0-75.d"1) and OMD (X) in period 1 (all groups on control diet CI), in period 2 (groups C2, P3, P6, S5, P3S5 and P6S5 receiving control diet with added: nothing, 3X protein, 6% protein, 5X starch, 3X protein + 5X starch and 6% protein + 5X starch, respectively) and for intakes the difference between periods.
Parameter
W
OMI OMI OMI
DOMI DOMI DOMI
OMD OMD
Period
1.2
1 2
2-1
1 2
2-1
1 2
Group C
18.8
72.1 86.8 14.7*
27.1 33.5
6.5ab
37.6 39.0a b
Group P3
18.8
66.7 77.6 10.9*
25.7 29.7
4.0a
38.5 38. 3a
Group P6
19.1
69.4 80.3 10.9*
26.2 33.4
7.2ac
37.8 41. 6b
Group S5
18.1
68.6 82.6 14.0*
25.6 31.9
6.3ab
37.4 38.6a
Group P3S5
19.3
65.8 83.9 18.1*
24.5 34.0
9 5bc
37.2 40.6a b
Group P6S5
17.1
68.0 90.0 22.0*
25.2 37.0 11.8C
37.0 41.0a b
s.e.
1.26
5.07 5.01 3.76
1.89 1.93 1.64
0.79 0.91
: differences between periods significantly (P<0.05) different from 0 a b c : values of groups not sharing the same superscript differ significantly (P<0.05)
Table 6.3.9. Exp. 4: group means and pooled s.e. for intake of N (NI), digestible N (DNI) and N-balance (all in g.kg"°'75.d'l) period 1 (all groups on diet CI), in period 2 (groups C2, P3, P6, S5, P3S5 and P6S5 receiving in addition to control diet: nothing, 3X protein, 6% protein, 5X starch, 3% protein + 5% starch and 6X protein + 5X starch, respectively) and the differences between periods.
Parameter
NI NI NI
DNI DNI DNI
N-balance N-balance N-balance
Period
1 2
2-1
1 2
2-1
1 2
2-1
Group C
1.57 1.83a
0.27a*
0.47ab
0.56a
0.09ab
0.04 0.07ab
0.03a
Group P3
1.45 1.95ab
0.50ab*
0.58a
0.78bc
0.20a*
0.02 0.05a
0.03a
Group P6
1.51 2.21bc
0.70b*
0.40bc
0.82b
0.42c*
0.02 0.05a
0.03a
Group S5
1.49 1.75a
0.26a*
0.47ab
0.49a
0.02b
0.04 0.08ab
0.05a
Group P3S5
1.43 2.04ab
0.62b*
0.37b
0.61ac
0.25a*
0.03 0.18bc
0.15ab*
Group P6S5
1.47 2.56c
1.09c*
0.53ac
1.02d
0.50c*
0.03 0.25e
0.22b*
s.e.
0.110 0.123 0.091
0.050 0.061 0.055
0.025 0.039 0.041
differences between periods significantly (P<0.05) different from 0 abed. values of groups significantly (P<0.05)
not sharing the same superscript differ
138

In an attempt to find the cause of this difference, some additional experiments were done. To test whether the higher intake was the result of mineral supplementation, three groups of four animals each were formed immediately after measurement period 2 and fed ad libitum either batch CI, batch O or batch O supplemented with minerals. The minerals, 10 g.animaH.d"1, corresponding approximately to the daily intake of the same mineral mixture with the supplemented pellets, were administered in water once daily with a drench pistol. After an adaptation period of 10 days, fresh pellet intake was measured for 5 days. Intake of fresh pellets did not differ between groups receiving batch O or batch O plus mineral mixture but was substantially higher in the group receiving batch CI (66.7, s.e. 4.9, 60.7, s.e. 5.5 and 99.4, s.e. 4.4 g.kg"0-75.d_1, respectively). Therefore, it seems unlikely that the higher intake of batch CI is the result of mineral addition. Since intake of batch O in this experiment was comparable to the intake of fresh pellets recorded before (around 60 g.kg"0-75^"1; Tolkamp, unpublished results), also differences between experiments in procedures and animals used, or time related changes in pellet characteristics are not likely to be responsible for the differences in intake recorded between batches. Differences between batches in content of NDF, ADF and CF (Table 6.3.10) and in in vitro OMD, measured according to the method of Tilley and Terry (1963) but with different incubation times, (Table 6.3.11) were small compared to the large differences in intake.
Table 6 .3 .10 . NDF, ADF straw (X of dry matter).
and CF content of four batches of pe l l e ted grass
NDF ADF CF
Batch 0 Batch OR Batch CI Batch C2
76.2 77.8 75.7 77.3
46.4 46.6 45.0 46.6
40.9 41.4 39.9 41.4
Table 6.3.11. Organic matter residues (OMR) of three batches of pelleted grass straw after different hours in vitro incubation time (X, mean of duple or, for 48 h incubation time, triple, ± s.d., observations).
Hours of incubation in vitro
12 24 36 48
Batch 0 Batch OR Batch CI
82.8 81.4 81.5
76.0 76.1 72.3
61.9 64.1 59.5
56.0 58.6 54.8
52.6±0.3 54.9±0.9 51.210.2
139

Finally, particle size distribution in the relevant batches was determined. The results in Table 6.3.12 do not suggest that differences in intake are associated with differences in pellet particle size.
Table 6 .3 .12 . Cumulative dry mat ter (DM) as a percentage of t o t a l amount of sample DM not passing s ieves with d i f f e r en t pore s i z e s (mean of duple d e t e rmina t ions ) .
Batch 0 Batch OR Batch CI
2.500
0 0 0
1.250
2.8 3.3 2.3
Pore size of
0.630
25.0 23.5 23.1
s ieve s in
0.315
50.0 51.4 46.1
mm
0.160
63.2 68.0 62.9
0.071
72.0 74.1 71.0
In Chapter 1 we have suggested that the effect of pelleting of roughages on intake might well be related to changes in the feed other than the diminution of feed particles. The more than 50% higher intake of batch CI compared with batches O and OR without significant differences between batches in particle size recorded in this experiment supports such a suggestion. Probably, differences in the pelleting process (e.g. temperature, pressure) affecting feed characteristics that are not measured by the parameters investigated are responsible for the large differences in intake between batches made from the same basic material. If pelleting conditions can have such a large effect on intake (e.g. comparing batch CI with C2), differences in intake between the treatments in period 2 may well have been (partly) caused or masked by pelleting conditions. The effects of additional by-pass protein and/or starch on N-balance in relation with DOMI will be discussed below.
Discussion
The results of Exp. 1 showed that supplementation of dwarf goats on a grass straw diet with urea or Na-caseinate did not result in a significant increase in OMI from straw. This means that an increased N-availability in the forestomachs had no effect on intake, making it highly unlikely that an eventual positive effect of by-pass protein on OMI from straw would be the result of an increase in ruminai N-availability through recycling of N. However, supplementation of goats fed chopped grass straw with HCHO-caseinate neither led to an increase in OMI from straw significantly larger than found in the control group in Exp. 1, nor in Exp. 2 and 3. Also, Exp. 4 did not show a significant positive effect of HCHO-caseinate addition to a pelleted grass straw diet on OMI compared to controls or starch supplemented
140

animals. Therefore, the results from these experiments do not support the hypothesis that, in general, roughage intake is primarily governed by the ratio of amino acids to energy available for the animal. HCHO-caseinate supplementation must have resulted in an increase of the ratio glucogenic/non-glucogenic nutrients absorbed. This ratio has also been suggested as one of the major factors limiting roughage intake from poor feeds (Preston and Leng, 1987). The lack of intake response to HCHO-caseinate supplementation in our experiments shows that also this ratio does not seem to play an important role in regulating the grass straw intake of growing goats.
HCHO-caseinate supplementation generally resulted in an increased DOMI compared to controls in the first three experiments where animals received chopped grass straw as the basal diet. In Exp. 4 (pelleted diets), DOMI was increased only if starch as well as HCHO-caseinate was added to the basal diet. The relatively high DOMI in supplemented groups can largely, if not entirely, be explained by the extra intake of the, relatively well digestible, supplements.
Likewise, HCHO-caseinate supplementation generally resulted in an increased N-balance compared to controls in the first three experiments and in Exp. 4 only in the groups receiving starch in addition to protein. The increased N status as a result of HCHO-caseinate supplementation in these experiments could be correlated with the increased DOMI since N-balance and energy intake are in general positively related (e.g. Elliott and Topps, 1964; Grenet and Demarquilly, 1977). It could, however, also be a more direct effect of the increased amounts of amino acids available to the animal. To our knowledge, no general estimate of the relation between DOMI and N-balance is available for WAD goats. Therefore, results from 7 experiments involving 25 groups of 4 to 6 dwarf goat wethers not supplemented or infused with protein were used to regress N-balance on DOMI. These experiments were carried out during the research reported in Chapters 5 and Sections 6.1, 6.4 and 6.5. The data were collected with wethers fed diets of chopped dried roughage (7 and 2 groups for hay and grass straw, respectively) or pelleted roughage (1,6 and 9 groups for grass hay, grass straw and lucerne pellets, respectively). Most groups (19) were fed ad libitum, the others received a maintenance or just above maintenance amount of feed.
Initial analysis showed that one group of 5 wethers fed pelleted lucerne ad libitum had anomalous N-retention data. The 'Jackknife' residual of this observation classified it as an outlier (Kleinbaum et al, 1988) and the rest of the analysis was performed without this observation. The means of the remaining 24 groups are plotted in Fig. 6.3.1. Regression of N-balance on DOMI (group means) resulted in the equation: N-balance = -378(±45) + 14.4(±1.4) * DOMI, n=24, R=0.91, RSD=68 (1) with DOMI in g.kg"0-75.d_1 and N-balance in mg.kg"°-75.d_1 and s.e. between brackets in this and following equations. There was no significant quadratic effect and also effects of experiment number, diet or restricted/unlimited feed access were not significant. The regression equation predicts a zero N-balance for DOMI=26.4 which is about 10% higher than the most recent estimate of maintenance requirements for West African Dwarf goats on metabolism cages (Zemmelink et al., 1991).
Although the regression equation shows a considerable RSD, the regression coefficient is remarkably close to the response of N-balance to energy intake in sheep that may be calculated from observations of Elliott and Topps (1964). These authors measured intake of TDN and N-balance in Blackhead Persian wethers ad libitum fed 16 different diets divided
141

over four diet types with four different CP levels in each. Assuming that 1 g of TDN corresponds to 0.95 g of DOM (NRC, 1981), regression analysis shows that in this experiment N-balance increases with 14.6 mg for each additional g of DOMI (R=0.98). Larger effects of DOMI on N-balance (18.8 up to 20.9 mg.g-1) are reported by Grenet and Demarquilly (1977) for 36 groups of Texel wethers on fresh herbage diets without or with barley supplements. Egan (1965) regressed digestible energy intake (DEI) on N-balance for groups of Merino sheep fed ad libitum dried roughage but receiving additional N (as urea or casein) per duodenum or with supplements. From bx y * by x = r2 and the assumption that 1 g DOM corresponds with 4.5 kcal DE, the reverse regression line may be calculated. It shows that Egan's animals responded with an increase in N-balance of 15.3 and 21.0 mg per additional g of DOMI for animals that did not and did receive N-supplements per duodenum, respectively. The first value is again close to the regression coefficient calculated from the data of Elliott and Topps (1964) and to the value we found for unsupplemented dwarf goats on chopped or pelleted roughage diets. The latter value is not easily interpreted since Egan included duodenal urea infusions in his analyses but nevertheless suggests that supplementation with by-pass protein may have an additional effect on N-balance apart from an effect via an increase in DOMI.
N-balance (mg/kgMW/d)
500
20 30 40 50
DOMI (g/kgMW/d)
Fig. 6.3.1. Plotted values of group mean N-balance against digestible organic matter intake (DOMI) obtained in seven experiments with dwarf goat wethers receiving chopped or pelleted roughage without supplemental N (n=24) and the regression line based upon these observations. Also plotted are the group mean values of goats not receiving N-supplements in Exp. 1 to 4 discussed here.
142

N-balance
500 -
400 -
300 -
200 -
100 -
o -
100 •
200 -
ouu
0
(mg/kg M\
I 10
A//d)
o
o
o 0 •>
A;'""y A /
I 20
DOMI
A
1 I
30
A /
A
•
0
A
A
' 40
(g/kg MW/d)
Expected relation
Exp. 1
Exp. 2
Exp. 3
Exp. 4
1 1 I ~\
50 60
Fig. 6.3.2. Plotted values of group mean N-balance against digestible organic matter intake (DOMI) obtained with groups of goats receiving HCHO-caseinate supplements in Exp. 1 to 4. Also the expected relation according to equation 1 (see text) is drawn.
Group mean observations of DOMI and N-balance of the first measurement period in Exp. 1, 3 and 4 and of animals not supplemented with N in the second measurement period of Exp. 1 to 4 have been plotted in Fig. 6.3.1. These values, which were all obtained with animals not supplemented with N, do not seem to deviate more from the regression line than could be expected from the scatter observed in the other experiments. Regression through these observations yields the equation: N-balance=-313(±65) + 12.7(±2.7) * DOMI, n=8, r=0.89, RSD=46 (2) Intercept nor regression coefficient differ significantly from the values found in equation (1) as expected.
Group means of DOMI and N-balance of animals receiving HCHO-caseinate supplementation in Exp. 1 to 4 have been plotted in Fig. 6.3.2 together with regression line (1). The observations of Exp. 4 do not deviate more from the regression line than could be expected from the scatter in the unsupplemented groups in Fig. 6.3.1 and there is no apparent relation between the deviation from the regression line and level of HCHO-caseinate supplementation. Although also the deviations from the regression line of the observations in Exp. 3 are not extreme, these data fit perfectly the pattern suggested by the observations in Exp. 1 and 2. There is a strong relation between DOMI and N-balance for the observations of these first three experiments which can be described by the following equation: N-balance = -793(±72) + 38.6(±3.3) * DOMI, n=8, r=0.98, RSD=20.6 (3)
143
Intercept and regression coefficient differ significantly from the values found in equation (1). At first sight, this suggests a different response in N-balance to increasing DOMI in
HCHO-caseinate supplemented animals depending on whether the basal diet consists of chopped or pelleted grass straw. Although the relationship between DOMI and N-balance is strong in the groups receiving chopped grass straw and a considerable response in N-balance to supplementation of ruminants on straw diets with feeds providing by-pass protein (fishmeal) has been recorded before (e.g. Fattet et al., 1984), these results should be treated with caution. Regression equation (1) is based on observations collected with groups of castrated goats (wethers) as are the recorded values in Exp. 3 and 4. Contrary to our initial plan, however, Exp. 1 and 2 were carried out with female goats. The metabolism cages used, especially the construction collecting urine, was designed for and previously tested with wethers only. During Exp. 1 and 2 it could be observed that urine voided by female goats sometimes arrived in the collection pot only after flowing alongside the wooden sideboards of the cages and occasionally some urine was spilled on the floor. Due to the difference in urinating behaviour this was never observed in experiments with wethers. This probably resulted in underestimates of the amount of N excreted in the urine and therefore overestimates of N-balance in experiments involving females. If in females the loss of urinary N relative to total urinary N excretion would have been independent of supplementation level, overestimating of N-balance will have been more serious as animals received more HCHO-caseinate supplement and excreted more urinary N. The suggestion that the relatively high N-balance observed in groups receiving HCHO-caseinate in the first two experiments is not (completely) the result of by-pass protein supplementation but (partly) the effect of underestimating urinary N excretion is consistent with the high N-balance of the group receiving Na-caseinate, a rumen degradable protein, in Exp. 1 (Tables 6.3.2 and 6.3.3). It may be calculated that approximately one fourth of the urinary N excreted in Exp. 1 and 2 should have been lost for the deviations from regression line (1) to become normal considering the scatter in unsupplemented groups (Fig. 6.3.1). Although such losses appear very high, they can not be excluded with certainty. It must therefore be concluded that the data of Exp. 1 and 2 do not allow conclusions as to a possibly direct effect of HCHO-caseinate supplementation on N-balance while the data of Exp. 3 and especially Exp. 4 show that there is either no such direct effect or that the effect is much smaller than suggested by equation (3).
Conclusions
1. The results of Exp. 1, 2 and 3 show that OMI from grass straw by dwarf goats is not affected by supplements of either NPN, or RDP or by-pass protein. The hypothesis that an increase in the ratio of amino acids relative to energy available to ruminants leads to an increase in roughage intake is therefore not supported by these data.
2. Although the results of Exp. 4 also show no effect of supplementation with by-pass protein alone on OMI of pelleted grass straw, these results must be interpreted with caution because of the apparent effect of pelleting conditions on intake. Considerable differences in intake between batches of pelleted grass straw prepared from the same raw material and with similar particle size and in vitro OMD support the suggestion that the positive effect of grinding and pelleting of poor quality roughages on intake, might well be due, at least partly, to factors other than the diminution of particle size. Research aimed
144

at clarifying the effect of pelleting conditions on feed intake seems promising for those who are interested in the mechanisms of feed intake regulation in ruminants.
3. Dwarf goat wethers on chopped or pelleted roughage diets respond with an increase in Imbalance of 14.4 mg per g DOMI, a response comparable with reported values for sheep in the tropics.
4. In dwarf goats on a pelleted grass straw diet, N-balance relative to DOMI is not significantly affected by HCHO-caseinate supplements. Whether N-balance is affected by by-pass protein supplements in goats on a chopped grass straw diet cannot be concluded with certainty from these experiments.

6.4 Effects of abomasal caseinate infusion on hay intake
and nitrogen balance in dwarf goats
Introduction
The hypothesis that ruminants will increase roughage intake following an increase in the ratio amino acids/energy available to the animal was not confirmed in a number of experiments with dwarf goats on grass straw diets supplemented with formaldehyde treated caseinate (Section 6.3). The absence of response in intake to by-pass protein supplementation in these experiments could have been due to some unknown factor limiting intake specific for the diet used. We therefore decided to carry out an additional protein supplementation experiment with dwarf goats fed a different quality roughage. The chopped grass straw used in the earlier experiments was of a low quality and ad libitum digestible organic matter intake (DOMI) was below estimated requirements for maintenance (Section 6.3 and Zemmelink et al., 1991). Earlier experiments had shown that in goats fed medium quality hay, intake levels exceeded requirements for maintenance but remained considerably below the level of DOMI recorded in animals supplemented with concentrates (Zemmelink et al., 1991). A basal diet of medium quality hay thus leaves scope for increased roughage intake as a result of by-pass protein supplementation and was therefore chosen for the present experiment.
Orally administered formaldehyde treated caseinate (HCHO-caseinate) was the protein supplement used in the grass straw experiments reported in Section 6.3. Tests had shown that this product was virtually undegradable in the rumen and that apparent intestinal protein digestion was probably depressed only to a very limited extent (Section 6.2). In fact, digestion of the protein supplement in the small intestine was not truly measured. Although we concluded from the in vivo and in vitro estimates and the results from intestinal passage of HCHO-caseinate in nylon bags that it is not very likely that (a substantial part of) the apparently digested HCHO-caseinate was actually fermented in the large intestine and therefore not available as amino acids in the small intestine, this possibility cannot be completely excluded. In addition, some data suggest a specific effect of formaldehyde treatment on digestibility of a number of essential amino acids, especially the sulphur-containing amino acids and lysine and threonine (Barry, 1976; Faichney and White, 1979). If indeed formaldehyde treatment would result in (relative) unavailability of some amino acids, amino acid imbalance could prevent a positive intake response to an increase in total protein availability at the small intestinal level. Since direct infusion of a well digestible protein with a well balanced amino acid composition (caseinate) into the abomasum takes away the doubts associated with the use of HCHO-caseinate supplements, it was decided to use the infusion technique in this experiment. Six goats were equipped with abomasal infusion tubes (and rumen fistulas) to this end. To assess the effects of operation on feed intake and digestive capacity, these parameters were measured and compared to values obtained in intact animals prior to the actual infusion experiment. Because, in contrast to usual procedures when animals could move around freely in the metabolism cage, during infusion experiments animals had to be prevented from turning around, also the effect of tying on intake was estimated. Since the experiment could not be completed because of illness of some experimental animals, the
147

infusion experiment was repeated after recovery of experimental animals. In this section the results of these two experiments are reported and discussed.
Materials and methods
Six castrated West African Dwarf goats initially aged 17 (Exp. 1) and 21 (Exp. 2) months were individually housed in metabolism cages suitable for the separate collection of faeces and urine. Animals had been equipped with rumen fistulas (20 mm i.d.) and permanent silastic infusion tubes (3 mm i.d.) into the abomasal fundus at an age of 17 months. In the first experiment, also 6 non-operated animals of the same age were included. All animals received chopped (approximate length 5 cm) meadow hay at a rate of twice the expected intake (2/3 offered in the morning, 1/3 late afternoon). The batch of hay used in the two experiments consisted mainly of Lolium perenne and contained 73 g.kg"1 ash and 20.3 g.kg"1 nitrogen (N) on dry matter (DM) basis. Fresh water, salt lick and a mineral/vitamin mixture were available ad libitum. The Na-caseinate (EM6, DMV-Campina, Veghel, the Netherlands) used during infusion periods contained 52.6 g.kg"1 ash and 142.8 g.kg"1 N in the DM. During infusion periods, pumps were running continuously except for a daily 30 to 45 min period during which containers were changed and tubes were cleaned. All measurement periods lasted 7 days after adaptation periods to feed and cages of at least 14 days. During measurement periods, roughage offered, orts, solution infused, faeces and urine produced were weighed, sampled and stored at ambient temperature (feed and orts) or frozen (faeces, urine and infused solution) to be analyzed later. DM, ash and N content of feed, orts and faeces and N content of urine was determined according to AOAC (1975). N was analyzed in air dry matter for feed and orts but in fresh material for faeces, urine and solution infused. Liveweights were recorded weekly and all intake and N-balance data were scaled for metabolic size (W0-75). Within experiments, W showed little change in time and mean W was used to calculate metabolic size for all measurement periods within experiments. The experiments were carried out in a blinded stable with a 12 h light, 12 h dark lighting regime.
Experiment 1 In the first measurement period, the intake of organic matter (OMI), digestible organic matter (DOMI) and N-balance was measured after an adaptation period of 4 weeks to feed and cages for the recently operated animals and of 4 weeks to feed and 2 weeks to cages for 6 non-operated animals of equal age. Animals were allowed to move about freely in the metabolism cages in this period.
For the second period, half of the non-operated animals were closely tied by the neck to prevent the animals from turning around in the cages, the other half could move around freely and served as a control group. The operated animals were all tied by the neck. Half of them were abomasally infused with 0.8 kg of a Na-caseinate in water solution (containing 30 g of protein per kg of solution) to supply N at a rate of 0.4 g.kg"0-75^"1, approximately, the other half received an equal amount of a NaCl solution (9 g.kg'1) and served as a control group. OMI, DOMI and N-balance were measured after an adaptation period of 20 days. A third period was planned, identical to the second, with reversed treatments between subgroups within groups but could not be completed because of illness of the animals.
148

Effects of treatment on, and differences between groups in, intake, digestibility coefficients and N-balance were statistically analyzed using normal analyses of variance procedures and t-tests, respectively, available in SAS (1985).
Experiment 2 In the first measurement period, OMI, DOMI and N-balance were recorded in 6 wethers equipped with rumen fistulas and abomasal infusion tubes after an adaptation period of 28 d to feed and 14 d to metabolism cages to assess whether animals had completely recovered and showed normal intakes. For the actual infusion experiment, animals were then divided at random in two groups, A and B, one receiving approximately 0.5 kg of a Na-caseinate solution (50 g Na-caseinate per kg of solution), to supply N at a rate of about 0.4 g.kg"0-75^"1, the other approximately 0.5 kg of physiological salt solution (9 g of NaCl per kg of solution). OMI, DOMI and N-balance were recorded in a second measurement period after an adaptation period of 14 d. Thereafter the treatments were reversed and OMI, DOMI and N-balance were recorded during a third measurement period after an adaptation period of 14 d.
Group effects during the first measurement period were analyzed with analyses of variance. Observations of the second and third measurement period were analyzed with the model Yjjk= a + Aj + T; + Pk + e ^ with Yjjk = parameter tested, Aj=animal effect, Tj=treatment effect and Pk=period effect. All statistical programmes were from SAS (1985).
Results
Experiment 1 The results of the first measurement period are in Table 6.4.1. Fistulated animals weighed significantly (P<0.01) less than the control group during the experiment. As mean W of the group to be operated and the control group during the month preceding operation did not differ significantly (18.6 versus 19.2, s.e. 0.59 kg), this indicates weight loss as a result of the operation stress. OMD and DOMI tended (P<0.10) to be lower in the recently operated group and CPD and N-balance tended (P<0.10) to be higher in the recently operated group but none of the differences reached the P=0.05 level.
The results of the second measurement period are in Table 6.4.2. Animals infused with Na-caseinate received 2.7 (s.d. 0.1) g.kg"°-75.d_1 of OM with the protein supplement. Differences between treatments within the infusion or the control group were not significant except that CPD in the animals receiving Na-caseinate infusion was significantly (P<0.05) higher than in the NaCl infused group. Differences between infusion and control group for OMIh and DOMI, absolute values as well as when expressed relative to the intake in the first measurement period, were significant (P<0.05). These parameters were significantly lower in the second compared to the first measurement period in the infusion group. Also the change in N-balance between the second and first measurement period differed significantly (P<0.05) between infusion and control group. The low hay intake level observed in the infusion group was the result of a sudden decrease in intake in four animals (two in each subgroup) at the beginning of the measurement period. Intake was partly recovered at the end of this period.
149

Table 6.4.1. Llvewelght (W, kg), organic matter Intake (OMI), digestible OMI ( D O M ) , N-balance (all in g.kg~°•75.d"1), organic matter digestibility (OMD, X) and crude protein digestibility (CPD, X) of the recently operated and the control group on a hay diet.
Parameter Period Operated group
Control group
Pooled s .e.
1,2 17. la 20. lb 0.57
OMI OMD DOMI
CPD N-balance
1 1 1
1 1
44.6 59.9 26.7
60.5 0.06
47.9 62.1 29.7
57.4 0.02
1.94 0.86 0.97
1.08 0.016
a b :values of groups not sharing the samesuperscript differ significantly (P<0.05)
Table 6.4.2. Organic matter intake (OMI), digestible OMI (DOMI), N-balance (all g.kg -0.75 d'L), organic matter digestibility (OMD, X) and crude protein digestibility (CPD, X) of the recently operated infusion group and the control group on a hay diet.
Parameter
OMIhay OMItot OMD DOMI CPD N-balance
OMIhay OMD CPD DOMI N-balance
Period
2 2 2 2 2 2
2-1 2-1 2-1 2-1 2-1
Infusion eroun Na-cas
35.0 37.7 60.7 23.0 68.1A
-0.05
-8.9* -0.9 7.5*
-4.1 -0.10
NaCl
38.2 38.2 58.2 22.2 59.9B
-0.06
-7.1* 0.1
-0.4 -4.1 -0.14*
Mean
36.6a
38.0a
59.5 22.6a
64.0 -0.06
-8.0a* -0.4 3.5
-4.1a* -0.12a*
s Control erouo
Tied
50.6 50.6 62.1 31.3 61.8
0.07
1.9 0.3 4.8 1.4 0.05
Free
47.5 47.5 62.1 29.5 56.2 -0.00
0.4 -0.4 -1.5 0.1
-0.02
Mean
49. lb
49. lb
62.1 30.4b
59.0 0.03
1.2b
-0.1 1.6 0.7b
0.01b
.e. of group means
2.03 1.99 0.97 1.18 2.05 0.033
1.98 0.84 2.60 1.27 0.034
A B : v a l u e s o f t r e a t m e n t s w i t h i n g r o u p s n o t s h a r i n g t h e s a m e s u p e r s c r i p t differ significantly (P<0.05) a b : values of group means not sharing the same superscript differ significantly (P<0.05)
: difference between periods significantly (P<0.05) different from 0
150

Since, apart from poor appetite, the animals involved showed a sick appearance and had lost considerable weight already, continuation of the experiment was not considered meaningful. Animals were removed from the cages and put in pens on a hay plus concentrate diet to recover.
Experiment 2 The results of the experiment are in Table 6.4.3.
Table 6 . 4 . 3 . Effects of t reatment and per iod on in take of o rganic mat ter (OM) from hay (OMIha„), t o t a l OM ( O M I t o t a l ) , d i g e s t i b l e OM (DOMI), N (NI) and d i g e s t i b l e N (DNI) and N-balance ( a l l va lues in g .kg~0-75.d~l , S - e . 0 f group means).
Period Group Sol. infused
OMIhay 0MItotal DOMI
NI DNI N-balance
A none
52.6 52.6 32.7
1.27 0.81 0.16
1 B
none
53.4 53.4 32.9
1.23 0.77 0.14
s
2 2 1
0 0 0
e.
10 10 40
05 03 04
A Na-cas
49.3 51.9 32.7
1.49 0.99 0.07
2 B
NaCl
54.1 54.1 32.5
1.13 0.66 0.06
s
1 1 0
0 0 0
e.
25 27 67
03 02 03
A NaCl
53.8 53.8 32.0
1.25 0.78 0.07
3 B
Na-cas
49.9 52.3 31.2
1.52 1.05 0.12
s
2 2 1
0 0 0
e.
51 50 44
05 03 02
Table 6 . 4 .4 . Effects of t reatment on in take of organic mat ter (OM) from hay (0MI h a y ) , t o t a l OM ( 0 M I t o t a l ) , d i g e s t i b l e 0M (DOMI), N (NI) and d i g e s t i b l e N (DNI) and N-balance ( a l l va lues in g . k g " 0 - 7 5 ^ " 1 ) .
So lu t ion infused Na-caseinate NaCl
OMIhay 49.6a 54.0b
OMItotal 52-1 54-° DOMI 32.0 32.3
NI* 1.51a 1.19b
DNI* 1.02a 0.72b
N-balance 0.10 0.07
.corrected for period effect ab: values of treatments not sharing the same superscript differ significantly (P<0.05)
151

Groups A and B did not differ in any parameter during the first measurement period when all animals received ad libitum hay only. During infusion, period nor treatment effect were significant for OMItota] and DOMI. OMIhay was not affected by period but was significantly (P<0.01) lower during Na-caseinate infusion compared to control infusion (Table 6.4.4). NI and DNI were slightly lower (P<0.05) in period 2 compared to period 3 and considerably higher (P<0.001) during Na-caseinate infusion compared to controls. N-balance was neither affected by period nor by treatment, despite the increase in DNI as a result of Na-caseinate infusion.
Discussion
The first measurement period of Exp. 1 was included to assess whether the animals equipped with a rumen fistula and an abomasal infusion tube four weeks earlier had recovered sufficiently and showed feed intake and digestive capacity levels comparable to controls. The operation had been very successful and all animals were free of fever, and wounds had healed well at the start of the first measurement period. Before dry matter content of feed and orts were known, it was concluded from the consumption of fresh hay that mean intake of the operated group was close to and not significantly different from intake of controls and the experiment was continued. Statistical analyses of the data in Table 6.4.1 show, however, that there is a strong tendency of lower OMI and DOMI in operated animals compared to controls. Also in view of the observed decrease in W following operation and the intakes recorded in the same animals on the same diet a few months later (Exp. 2), suggest that recovery may not have been complete. This may have contributed to the sudden decrease in intake in four out of six operated animals during the second measurement period. Since these four animals were equally divided over the two treatment groups and the depression in intake occurred only 20 days after the start of infusion procedures, it is very unlikely that the decreased intake was a result of the treatments imposed. Because the sudden drop in intake occurred immediately after all metabolism cages were moved for about 2 meters within the stable to accommodate another experiment, draught was suspected to be the cause. At a later stage stable air flow was made visible with smoke trails and this showed that indeed a cold air current swept the spot where the experimental animals had been located. Therefore, the intake depression may well have been the effect of draught combined with incomplete recovery from the operation.
As a result of the intake depression and the discontinuation of the experiment, the data recorded in the second measurement period of Exp. 1 have limited value. The difference in CPD, NI and DNI between groups infused with caseinate and NaCl was expected. The absence of significant differences between these groups for OMIhay and DOMI may well be accidental because of the unstable intake pattern. The two infusion groups with similar DOMI also show similar and not significantly different N-balances despite a significantly higher NI and DNI in the caseinate infused group. The data in Table 6.4.2 show that in Exp.l the major part, if not all, of the additional protein intake associated with caseinate infusion was deaminated.
As a result of discontinuation of the experiment, the number of observations to assess the effect of movement restriction on intake is limited. None of the parameters differed significantly between tied and free moving controls and this suggests no large effect of movement restriction on intake. This is supported by the hay intake levels recorded in the first
152

measurement period of Exp. 2 (all animals tied) which are comparable with hay intakes recorded in earlier experiments (Zemmelink et al, 1991). Intake in this measurement period reflected the good health of experimental animals and showed that animals had recovered. No disruptions of feed intake were recorded in Exp. 2. During the actual infusion periods of this experiment (second and third measurement period), OMIhay was significantly affected by treatment. Contrary to expectations, however, infusion with protein resulted in an 8% lower OMI from hay compared to controls instead of a higher one while DOMI was not affected by treatment. This shows that animals receiving digestible organic matter (DOM) with caseinate infusions compensated this with a decrease in DOMI from hay of equal magnitude. The ME equivalent of DOM from caseinate is somewhat higher than of DOM from hay. As a result of the relatively low amount of protein infused, however, it can be calculated that, also in terms of ME, energy intake was about the same for both treatments. These results certainly conflict with the hypothesis tested. However, the observation is also not readily understood from the idea that intake of roughage of the quality used in this experiment is limited by the physical capacity of the animal to handle feed. This limitation is thought to operate at the level of the forestomachs because it has been shown that considerable amounts of inert material can be added to the gastrointestinal tract of ruminants from the abomasum onwards without affecting intake (e.g. Grovum, 1987). The significant decrease in OMI from hay as a result of infusion of a relatively small amount of protein into the abomasum therefore casts doubt on the important role attributed to physical control of roughage intake. Barry and Manley (1985) drew similar conclusions from experiments measuring effects of abomasally infused casein on herbage intake of lambs or triplet-bearing ewes in late pregnancy. Also in these experiments, ME intake from roughage decreased approximately in proportion to the amount of ME from casein infused. The basal diet in these experiments, however, consisted of high quality herbage (OMD higher than 80%). Also in the more generally accepted hypothesis, it is assumed that physiological intake control mechanisms may operate to regulate intake of herbage of such a high quality. The roughage used in our experiments (OMD around 60%) is certainly in the quality range where physical limitations are thought to control feed intake (see Chapter 1). The observations reported here do not support such a view but suggest that physiological rather than physical mechanisms operate to regulate intake of medium quality hay.
Despite the significantly higher NI and DNI in animals receiving caseinate infusion, treatment did not significantly affect N-balance. According to the regression line describing N-balance as a function of DOMI in unsupplemented dwarf goat wethers (Section 6.3), a N-balance of about 0.085 g.kg"0-75^"1 may be expected from the DOMI levels recorded in the infusion groups. Actually recorded values are very close to this estimate, suggesting no effect of protein infusion on N-balance. Even if the non-signifie ant difference in N-balance between the two treatments (0.03 g.kg"0-75^"1 higher in caseinate infused animals) is interpreted as the result of caseinate infusion, it may be calculated that the efficiency of N-utilization of the infused protein must have been extremely low (less than 10%) compared to values recorded in lactating or non lactating ruminants infused with casein under N-limiting conditions (generally 60 to 70%; Lobley, 1985; Fraser et ai, 1990). This suggests that amino acid availability from the basal diet was not limiting N-retention in this experiment.
153

Conclusions
1. The significant decrease in OMI from hay by dwarf goats as a result of abomasally infused caseinate is not consistent with the hypothesis that roughage intake is positively correlated with the ratio of amino acids to energy available to the animal.
2. This negative roughage intake response can neither be well understood from the idea that physical factors limit roughage intake in ruminants. Physiological control of feed intake seems more likely in dwarf goats fed the medium quality roughage used as a basal diet in these experiments.
3. The significant increase in NI and DNI in animals abomasally infused with caseinate compared to controls was not associated with a significantly increased N-balance, suggesting that N-retention was not limited by the availability of amino acids for animals on the basal diet.
154

6.5 Effect of ruminai infusion of potassium citrate with
or without abomasal infusion of caseinate or with
ruminai infusion of urea on grass straw intake
Introduction
Voluntary roughage intake in sheep is, within digestibility classes, positively correlated with nitrogen content of the feed (Chapter 1). This finding, together with other data from the literature, had suggested that supply of by-pass protein would have a beneficial effect on roughage intake of ruminants. A number of experiments with West African Dwarf (WAD) goats on grass straw and hay diets, receiving by-pass protein in the form of formaldehyde treated caseinate or abomasally infused caseinate had shown, however, that by-pass protein alone had either no or even a negative effect on roughage intake (Sections 6.3 and 6.4). In addition, an experiment with sheep had shown that supply of by-pass protein in the form of bacterial material (see Section 7.3) also did not result in an increased roughage intake.
Therefore, an attempt was made to identify other mechanisms responsible for differences in intake between feeds. We thought that intake could be affected by feed components correlated with nitrogen (N) content rather than by N content itself or by a combination of N content and some other component. Potassium could be such a component because its content in herbage is generally well correlated with the N content (Blevins, 1985).
Another reason to think of potassium was based on model calculations with regard to the efficiency of metabolizable energy (ME) utilization in ad libitum fed growing ruminants (Tolkamp, 1983). These calculations had suggested that, somehow, differences in intake level between roughages were linked with differences in ME utilization between feeds. It is well documented that efficiency of ME utilization in ruminants is positively correlated with roughage quality and that it decreases when ME intake of a given roughage increases (ARC, 1980; see also Chapter 3). Although knowledge of the factors affecting efficiency of ME utilization is steadily growing, the causes of the differences between feeds as well as of the declining efficiency at increasing intake are still not well understood (e.g. Webster, 1980; Blaxter, 1989; see, however, Chapter 4). At the time, we considered variation in the energy costs associated with nutrient absorption and metabolism in the gut wall likely to be part of the explanation (as suggested by e.g. Armstrong, 1982).
Volatile fatty acids (VFA) are quantitatively the most important nutrient source for ruminants. Several absorption mechanisms have been suggested to operate in the various compartments of the digestive tract (Stevens, 1970; Dobson and Phillipson, 1969; Argenzio et al, 1975, 1977; Argenzio and Whipp, 1979; Schmitt et al, 1976; Leng, 1978; Umesaki et al, 1979; Crump et al, 1980; Hildman et al, 1980; Rübsamen and Engelhardt, 1981; Watson et al, 1985). These mechanisms include diffusion of undissociated acid, anion exchange (VFA against bicarbonate) and ATP consuming active transport involving Na-H pumps. Very little quantitative information is available on the relative importance of each of these mechanisms in ruminants fed different diets at different feeding levels. One estimate suggests that about
155

half of the VFA absorbed from the sheep rumen is associated with energy consuming Natransport (Dobson and Phillipson, 1969).
There is, however, ample evidence that the ionic composition, especially the Na concentration, of the solution from which the VFA are absorbed, has an important effect on absorption rate (e.g. Argenzio et al., 1975). In ad libitum fed ruminants, there is a positive correlation between the ratio of VFA to Na coming available in the rumen and the voluntary energy intake level (see Chapter 4, Table 4.2). This ratio is low (around 1) in animals consuming less than maintenance from poor quality feeds, it is high (around 4 or higher) in animals consuming twice maintenance or more from good quality feeds. The experiments performed at the Rowett Research Institute (Aberdeen) provide a striking parallel. In experiments with complete intragastric feeding, an energy intake level of about twice maintenance can be achieved when VFA mixtures and buffer solution (mainly NaHCC^) are infused at a VFA/Na ratio of about 4 (0rskov et al., 1979). At a VFA/Na ratio of about 1, only limited amounts of VFA energy could be infused (less than maintenance). Attempts to increase amounts infused above this level resulted in extreme rumen fluid composition (high acidity and osmolarity) and resulted in death of the animal if infusion level was not decreased in time (0rskov and McLeod, pers. comm.). The external application of buffer in these experiments cannot be directly compared with Na recirculation in the free-feeding animal. The data, however, do suggest an important negative effect of the amount of Na that has to be absorbed with a Mole of VFA on total VFA absorption rate. We hypothesized that this mechanism could also play a role in roughage intake regulation.
Ruminants on poor quality feeds produce relative to organic matter intake large amounts of saliva, probably to supply fluid with an appropriate osmotic pressure to wash undigested residues from the forestomachs. As relatively low amounts of VFA are produced per kg organic matter consumed from these feeds, this results in low VFA/Na ratios. These low ratios could be the cause of a limited VFA absorption rate. In this view, low intake of poor quality feed would be the result rather than the cause of the low amounts of VFA absorbed daily. This was supported by additional observations from Rowett. If completely intragastrically fed sheep were stressed (from disease, change of stable or animal caretaker), rumen fluid composition had to be monitored very carefully. Frequently, infusion levels had to be decreased in such cases to avoid rumen acidification and increase in rumen osmolarity (DeHovell, pers. comm.). These observations suggested that in ad libitum fed ruminants, the decrease in intake often observed after stress might be the result of reduced VFA absorption.
In ruminants, the two main cations in the liquid phase of the gut are Na and K. The predominant source of Na is saliva, the predominant source of K is the feed. A stimulating effect of the K concentration on Na absorption has been reported (Scott, 1975). As contents of N and K in herbage are generally well correlated, an increase in N content of feed is associated with increased ruminai availability of K. This suggested that the positive effect of N content on feed intake referred to above could be mediated through K availability, possibly in combination with increased availability of amino acids in the small intestines or ammonia in the rumen. This hypothesis was tested in experiments with goats (reported in this section) and sheep (reported in Section 7.3).
156

Materials and methods
Experimental design Six dwarf goat wethers were housed in metabolism cages for 12 weeks, divided in 4 periods of three weeks. The first two weeks of each period were an adaptation period, the last week the measurement period. Throughout the experiments, animals received a basal diet of grass straw. Periods 1 and 3 served as control periods and grass straw was the only source of nutrients. During period 2, half of the animals were ruminally infused with potassium citrate (treatment K) and half of the animals received the same infusate but in addition an abomasal infusion with caseinate (treatment K+C). During period 4 half of the animals were ruminally infused with urea (treatment U) and half of the animals were ruminally infused with urea plus potassium citrate (treatment U+K). Immediately before each measurement period the volume of the rumen fluid phase was estimated and samples of rumen fluid were taken to be analyzed for its composition. During measurement periods intake of organic matter (OMI) from straw and infusion fluids and total digestible organic matter intake (DOMI) were measured.
Animals, housing and feeding Six WAD goat wethers, aged 3 years with initial liveweight (W) varying from 21 to 27 kg, equipped with rumen fistula and abomasal infusion tubes as described in Section 6.4, were used in this experiment. Animals were housed individually in metabolism cages, suitable for the separate collection of faeces and urine, in a blinded stable with a 12/12 h light/dark regime. The basal grass straw diet was chopped (chopping length about 5 cm) and contained 87% dry matter (DM) and in the DM: 7% ash, 1.0% nitrogen and 67% NDF. Straw was offered at a level of 100 g DM.kg"0-75^"1, approximately, 2/3 offered in the morning, 1/3 added in the afternoon. Animals were offered fresh water three times daily. Orts were removed just before the morning feeding, weighed and, during measurement periods, stored for later sampling and analyses. During the four measurement periods, all lasting 7 d, faeces and urine were collected, sampled and stored in a freezer for later analyses. Content of DM and ash in feed offered, orts and faeces was determined according to AOAC (1975).
Rumen fluid sampling and analyses Two days before the start of each measurement period, 30 ml of a Cr-EDTA solution (containing 4.3 g Cr.l"1) was added to the rumen of each animal at 0700 h after taking a sample of 40 ml rumen fluid. Further rumen fluid samples were taken 3, 6, 9, 24, 27, 30, and 33 h following Cr-EDTA administration. Immediately following sampling, pH of the rumen fluid was measured. A 5 ml sample of rumen fluid was acidified with 5 ml 0.1 N HCl and stored cool until analysis for ammonia content with a Cenco UNMF Auto Analyser. The rest of the sample was transported on ice and immediately ultracentrifuged at 20,000 G for 20 minutes and all other analyses were done in the supernatant. An amount of 0.25 ml 85% phosphoric acid was added to 5 ml centrifuged rumen fluid and stored cool for later analyses of VFA concentration by HPLC. An additional 5 ml sample was taken and stored cool for later analyses of chloride, phosphate and sulphate by HPLC and a further 10 ml for later analyses of Na, K, Ca, Mg and Cr content by atomic absorption spectrophotometry. During the last day of the fourth measurement period a 10 ml blood sample was taken from the jugular vein and stored frozen for later analysis of blood urea concentration.
157

Infusion procedures Immediately after the first measurement period, animals were divided at random into two groups of 3 animals and received, in addition to their basal diet, nutrient infusion. Animals of treatment K+C received approximately 1.5 kg of a solution, prepared by adding 227 g K citrate to 10 kg of water, by ruminai infusion and in addition approximately 0.8 kg of a solution prepared by adding 500 g Na-caseinate to 10 kg of water. Animals of treatment K received the same amount of K citrate by ruminai infusion.
Immediately after the third measurement period animals from both groups received, by ruminai infusion, approximately 1.5 kg of a solution prepared by adding 70 g of urea to 10 kg of water (treatment U) or 70 g of urea plus 227 g of K citrate to 10 kg of water (treatment U+K).
K citrate was chosen as the potassium source because the occurrence of K in plant material is associated with organic acids like citrate (Dijkshoorn, 1973). The K infusion level was chosen with the aim of modifying rumen K concentration significantly without adding unphysiological amounts of this cation.
In both infusion periods, animals were infused with only half the amount of solution during the first two days to facilitate adaptation. Animals were infused continuously with peristaltic pumps except for a period of about 30 min daily when solutions were changed and tubes were cleaned. Infusion fluid containing caseinate or urea were sampled and analyzed for N content. OM content was calculated from the amounts used to prepare the solutions.
Statistical analyses Volume and outflow rate of the reticulo-rumen liquid phase was calculated from the decrease in Cr concentration assuming first order kinetics. For statistical analyses of data with regard to rumen anion and cation concentrations, the mean of the 8 observations per animal per period were used. Effects of treatment on OMI, DOMI, N-balance and rumen parameters were calculated from the difference between observed values during the infusion period and the control period immediately preceding the infusion period. The data were, therefore, analyzed as two separate experiments. Significance of differences between periods were analyzed with t-tests and significance of differences between treatments within periods with analyses of variance, using SAS (1985) programs.
Results
Experiment 1 The ruminai parameters measured in period 2 and the difference with values recorded in period 1 are presented in Table 6.5.1. None of the parameters differed significantly between groups in the first measurement period. The sum of cations in rumen fluid did not differ between the two periods but significant changes in Na concentration (decrease) and K concentration (increase) occurred when K citrate was infused in the rumen. Significant changes also occurred in anion concentration: phosphate decreased, acetate and total VFA increased in both treatments while the response did not differ between treatments. The increases in rumen fluid volume and outflow rate (%.h_1) were not significant but the
158

resulting estimate of outflow in l.d"1 was significantly higher in period 2 in both treatment groups.
The estimated OMI and DOMI in the two measurement periods immediately following the measurement of rumen parameters is presented in Table 6.5.2. In period 2, total OMI and DOMI was significantly increased in the K+C treatment group but not in the K group. This difference was only partly the result of the OM received with the supplements but mainly the effect of a (non-significant) increase in roughage intake in group K+C. This suggested that the intake response to infusion with K citrate, resulting in a dramatic change in Na/K ratio in rumen fluid in both groups, was affected by the N-metabolism of the animal. Infusion of K citrate tended to reduce rumen ammonia levels, whereas the intake response in period 2 tended (P<0.06) to increase with increasing original rumen ammonia concentration and tended (P<0.07) to be larger in animals receiving additional protein.
Table 6 .5 .1 . Effect of ruminai Infusion with K c i t ra te (K) or ruminai infusion with K c i t ra te and abomasal infusion with caseinate (K+C) on a number of rumen parameters in period 2 and the difference between these values and the values observed in the preceding control period. All values in mMol.l"! rumen fluid unless indicated otherwise ( s . e . : pooled s . e . ) .
Treatment
Cations: K Na Mg Ca NH4
Sum
Anions : P04
CI
Acetate Propionate Butyrate
Sum VFA
pH
group
Fluid volume Outflow (% Outflow (1
h" d"
(1) X) X)
K
72 80
1.1 1.4 3.7a
159
18 17
72 15 5a
92
6.8 4.2 6.7 6.6
Period 2
K+C
71 77
1.3 1.3 1.3b
151
18 19
64 15
4b
83
6.8 3.8 6.7 5.6
s.e.
7.6 5.9 0.1 0.1 0.6 5.6
0.2 0.5
5.7 1.1 0.2
6.3
0.1 0.8 1.2 0.9
Period
K
26* -21*
0.1 0.3
-0.3 4
-13* -2
22* 1 l*a
24*
0.2 0.6 1.7 2.4*
2 - Period 1
K+C s.e.
19 7.1 -22* 3.1
0.0 0.1 0.1 0.1
-3.0 1.1 -5 8.2
-16* 2.5 -4 2.6
14* 4.4 1 0.9 0b 0.0
15* 5.0
0.2 0.1 1.0 0.5 0.6 0.6 1.6* 0.6
. d i f f e r e n c ew i t h i n g r oupbe tweenpe r i od s i gn i f i c a n t l y d i f f e r e n t f r om0 (P<0.05) a b : difference between groups within periods is significant (P<0.05)
159

Table 6.5.2. Effect of ruminai infusion with K citrate (K) or ruminai infusion with K citrate and abomasal infusion with caseinate (K+C) on intake of organic matter (OMI) and digestible organic matter (DOMI) in period 2 and the differences between these values and the values observed in the preceding control period (all values in g.kg""-'5.d~ , s.e.: pooled s.e. )
Treatment group
OMIstraw 0MItotal DOMI
K+C
39.0 44.2 22. 9a
Period 2
K
35.1 37.0 17.5b
s.e.
3.6 3.6 1.15
Period
K+C
12.2 17.3* 10.5*a
2 -
K
2.9 4.8 3.5b
Period 1
s.e.
4.5 4.6 1.8
: difference within group between period significantly different from 0 (P<0.05) a . difference between groups within periods is significant (P<0.05)
Experiment 2 Table 6.5.3 presents data for the ruminai parameters observed immediately before the third and fourth measurement periods. Chloride was the only parameter significantly (P<0.05) different between groups in period 3 (data not shown in Table 6.5.3). Treatment U resulted in a significant increase in ammonia concentration and a significant decrease in Na concentration without affecting the sum of cations. Treatment U+K resulted in a significant decrease in Na concentration and significant increases of K, ammonia and total cation concentrations. The changes differed significantly between treatments for the latter three parameters. Both treatments resulted in a significant decrease of P0 4 concentration and an increase in acetate concentration significant for treatment U+K only. Treatment U+K also resulted in a significant increase in rumen fluid volume and outflow (l.d-1) Observed OMI and DOMI in measurement periods 3 and 4 are in Table 6.5.4. Differences between groups within periods or between periods within groups were not significant.
Plasma urea concentration determined in samples taken immediately after period 4 ranged from 371 to 636 mg.H. These concentrations were correlated with the observed ruminai ammonia levels in the corresponding animals (R=+0.88).
Discussion
K citrate was infused in order to increase K and decrease Na concentration of rumen fluid and to test the effect on OMI and DOMI. The results show that treatments K, K+C (and also K+U) did indeed result in increased levels of K and decreased levels of Na in rumen fluid. In Exp. 1, an additional number of rumen parameters changed, apparently as a result of the infusions.
160

Table 6.5.3. Effect of ruminai Infusion with urea (U) or ruminai infusion with urea plus K c i t ra te (U+K) on a number of rumen parameters in period 4 and the difference between these values and the values observed in the preceding control period. All values indicated otherwise ( s . e . : pooled s . e . ) .
in mMol.l"! rumen fluid unless
Group
Cations : K Na Mg Ca NHA
Sum cations
Anions : P04
CI
Acetate Propionate Butyrate
Sum VFA
pH Fluid vo Outflow Outflow
lume (X.h-(l.d-
,(1)
-1) X)
U
32 86
1.3 1.8
22.2a
143a
14 20
69 14 4
87
6.7 4.5 5.6 5.7
Period 4
U+K
78 78 1.6 1.7
13. 3b
173b
15 20
82 16 5
102
6.8 4.4 6.2 6.3
s.e.
4.0 3.3 0.2 0.2 1.6 3.0
0.8 2.7
9.1 1.4 0.6
10.7
0.1 0.7 1.0 0.2
Period
Ü
-5a
-15* 0.1 0.3
16.8*a
-2a
-11* -3
11 -2 -0
9
0.1 0.6
-0.0 0.5
4 - Period
U+K
36*b
-22* 0.3 0.5* 8.1*b
24*b
-10* 1
27* 1 1
28
0.1 1.1* 1.0 2.3*
3
s.e.
2.1 2.9 0.1 0.2 2.1 2.4
2.2 2.6
9.1 0.9 0.7
10.7
0.1 0.3 0.4 0.6
: difference within group between period significantly different from 0 (P<0.05) a b : difference between groups within periods is significant (P<0.05)
Most remarkable were the almost 50% increase in rumen fluid outflow (l.d"1) and the considerable increase in total VFA concentration, mainly due to acetate. Although not significant, these changes tended to be higher for treatment K+C. The differences between the second and the first period for this treatment group were also significant for the parameters total OMI and DOMI and tended (P<0.06) to be significant for OMI from straw. At the time, this suggested that K citrate infusion affected intake, but only if additional N (here in the form of abomasally infused caseinate) was provided. This was supported by the changes in rumen ammonia concentration. In the first period this concentration was just over 4 mMol.r1
corresponding to almost 60 mg NH4-N.I"1, which is higher than the level generally recommended for optimum microbial activity (50 mg.l"1; see e.g. Preston and Leng, 1987). This level did not change as a result of treatment K+C. As a result of small group size and
161

large within-group variation in period 1, the decrease in ammonia concentration to very low levels as a result of treatment K was not significant. This was caused by the high variation of this parameter in the first period (from 2.3 to 7.6 mMol.l"1) while concentrations were uniformly low in the second period in this treatment group (from 0.8 to 1.9 compared with 2.3 to 4.9 in treatment K+C). It nevertheless suggested an interaction of the infused K citrate with ruminai N transactions. Possibly, in treatment K+C the negative effect of K citrate on rumen ammonia levels was mitigated by the abomasal supply of caseinate (e.g. through increased N recycling). In addition, the difference in response in terms of OMI from straw between animals in treatment K seemed to be correlated with the rumen ammonia concentration in period 1. The animal with the highest rumen ammonia concentration in period 1 responded to treatment K with an increase in OMI from straw, comparable to animals in treatment K+C, and the animal with the lowest rumen ammonia concentration responded to treatment K with a decrease in OMI from straw. The results after Exp. 1 suggested that the positive correlation of N content of roughage with ad libitum feed intake level within digestibility classes (Chapter 1) could be the result of the combined effects of increased K and N availability at the rumen level.
Table 6.5.4. Effect of ruminai infusion with urea (U) or ruminai infusion with urea plus K c i t ra te (U+K) on intake of organic matter (OMI) and digestible organic matter (DOMI) in period 4 and the differences between these values and the values observed in the preceding control period ( a l l values in g.kg""-'^.d"^; s . e . : pooled s .e . )
Group
0MIstraw 0MItotal DOMI
U
35.8 36.9a
19.4a
Period
U+K
41.9 44. 9b
22.8b
4
s.e.
1.59 1.60 0.51
Period
Ü
-3.6 -2.6 0.1
4 - Period 3
U+K
2.6 5.6 3.6
s.e.
4.08 4.09 1.42
^ difference within group between period significantly different from 0 (P<0.05) ab: difference between groups within periods is significant (P<0.05)
It was therefore decided to test the effect on intake of a combined urea plus K citrate (U+K) infusion. As the first experiment had not shown an effect of K citrate infusion alone on straw intake, infusion with urea alone (U) was chosen as the second treatment in Exp. 2.
In Exp. 2, treatment U+K resulted in changes in concentration of K, Na, P04 , acetate, total VFA, rumen fluid volume and fluid outflow rate comparable to treatments K and K+C in Exp. 1. Treatments U and U+K differed significantly with regard to their effects on ruminai concentrations of ammonia. This showed that the depressing effect of K citrate infusion on ruminai ammonia concentration observed in Exp. 1 also occurred at high rumen ammonia
162

levels. Nevertheless, rumen ammonia as well as K levels increased significantly as a result of the U+K treatment, as intended. These changes, however, were not accompanied by a significant increase in OMI from straw.
In addition, the results of Exp. 2 affect the interpretation of Exp. 1. A comparison of the OMI from straw of the 4 measurement periods shows virtually no difference between periods 2, 3 and 4. In fact, the lowest as well as the highest mean OMI from straw were recorded in periods 1 and 3 (the control periods), respectively. Possibly, the adaptation period preceding the first measurement period was too short for the animals to attain a stable intake level on this poor quality feed. If so, then only the observations of the last three periods should be considered. Treatments K, K+C, U, U+K in the periods 2 and 4 and the control treatment in period 3 resulted in considerable differences in a number of rumen parameters without any significant effect on OMI from straw. Apart from significant differences in rumen fluid volume, outflow rate and concentration of P04, acetate and total VFA these included changes in ruminai K, Na and ammonia concentrations. The results, therefore, do not support the idea tested that the positive correlation between N content of forages and voluntary forage intake level are the result of increased availability of K in the rumen with or without increased ruminai availability of N or increased duodenal amino acid supply. The results of a parallel experiment with sheep led to similar conclusions (see Section 7.4).
The present experiment does not allow conclusions as to the cause of the depressing effect of K citrate infusion on rumen ammonia concentration. The correlation of rumen ammonia concentration with blood urea level suggests that the effect of K citrate may be related with urea clearance from the blood by the kidneys. Possibly, increased K output in the urine during K citrate infusion caused blood urea level to stabilize at a lower level. Whether the low rumen ammonia concentration is a result of the lower blood urea level (e.g. through decreased N recycling) or a more direct effect of ruminai K concentration on ammonia disappearance from the rumen is not clear.
Conclusions
It is concluded that ruminai K citrate infusion led to considerable changes in the values for a number of rumen parameters. Most notably were changes in the concentration of K, Na and acetate and in daily liquid outflow. These changes, however, did not significantly affect OMI from roughage. Therefore, the results do not support the hypothesis that ruminai availability of K is (partly) responsible for the positive correlation between forage N content and voluntary feed consumption.
163

6.6 General discussion and conclusions
In the accepted conceptual framework used to explain variation in feed intake in ruminants great emphasis is placed on physical constraints to the intake process. From dissatisfaction with this concept, a number of attempts were made to find an alternative theory of feed intake regulation in ruminants. The experiments reported in this chapter were designed at a time when we considered differences in nutrient ratios absorbed from the feed as a likely explanation for the variation in voluntary feed intake. Most experiments discussed here tested the presumed positive effect of an increase in the intestinal availability of amino acids on feed intake. Organic matter intake (OMI) from grass straw diets did, however, not increase significantly following supplementation with by-pass protein (HCHO-caseinate) in any of the experiments described in Sections 6.3. A number of trials had shown that the formaldehyde treatment had been effective, measured by degree of protection against rumen degradation and intestinal digestibility (Section 6.2). Despite the negative outcome of the supplementation experiments it was decided to test the hypothesis once more, using the infusion technique to avoid possible complications associated with the use of HCHO-caseinate. In addition, a better quality basal diet (hay) was fed. The results showed a significant decrease instead of the expected increase in OMI from hay (Section 6.4). Therefore, at least for the type of animals and the type of diets used in these experiments, the hypothesis that the protein/energy ratio controls intake had to be rejected.
Some of the published experiments investigating the same question lead to a similar conclusion while others show results supporting this hypothesis (see e.g. Egan, 1977; Kellaway and Leibholtz, 1983; Preston and Leng, 1987). The variable intake response of animals to an additional protein supply - resulting in an increase in the ratio of amino acids absorbed relative to energy consumed - shows that this ratio is not the general principle governing roughage intake in ruminants. Also a possible interaction of this ratio with ruminai availability of K did not appear to affect OMI from roughage (Section 6.5).
One of the major reasons for the attractiveness of the now rejected hypothesis was its apparent link with the variation in efficiency of ME utilization. Both voluntary feed intake and efficiency of ME utilization are positively correlated with N content of different feeds with the same digestibility. At the time we thought that possibly the ratio of absorbed amino acids relative to energy consumption was at the basis of both relations. In the theory developed since, the relationship between feed intake regulation and efficiency of ME utilization is a more direct one (Chapters 3 and 4). The variable feed intake responses of animals receiving protein supplements can probably be better understood in the light of this new theory. According to this theory, the effect of a supplement on total ME intake will depend on its effect on the efficiency of ME utilization. A number of studies (e.g. ARC, 1980) have shown that the apparent efficiency with which the ME of acetate is utilized, varies with the quality of the basal diet. According to our theory, this will also result in variable intake responses. Considerable effects of very limited amounts of additional amino acids on the efficiency of ME utilization for gain have been recorded and also here the effect is considered to depend on the quality of the basal diet (MacRae et ai, 1985). Very limited information on the interaction between basal diet type and supplement type on efficiency of ME utilization is currently available. Therefore, no explanation can be given for the variation
165

in the DOMI response observed here with West African Dwarf goats receiving low quality feeds and supplemental protein. The existence of such a variation is, however, consistent with our new hypothesis.
Remarkable, though unintended, was the observed variation in intake between batches of grass straw pellets (Section 6.3) which was probably the result of differences in pelleting conditions. The beneficial effects of pelleting on feed intake are generally attributed to a reduction of feed particle size which would allow a more rapid clearance of digesta from the forestomachs and hence, a higher intake (Van Soest, 1982). In our experiment, however, the variation in intake between different batches of pellets was not clearly related to feed particle size. This is consistent with the suggestion contained in Chapter 1 that other characteristics of the pelleted feed probably cause the positive effect of pelleting on roughage intake. These characteristics were not identified in the experiment reported here. Fruitful results can be expected from experiments studying the effect of pelleting conditions on pellet characteristics on the one hand, and voluntary intake and efficiency of ME utilization of pelleted diets on the other. Such experiments may contribute to a better understanding of the processes which cause ruminants to vary their voluntary feed intake level depending on the quality of the feed.
166

References
AOAC, 1975. Official methods of analyses, 12th ed. Association of Official Analytical Chemists, Washington, D.C.
ARC, (Agricultural Research Council), 1980. The nutrient requirements of ruminant livestock. Commonwealth Agricultural Bureaux, Famham Royal, 351 pp.
Argenzio, R.A., N. Miller and W. von Engelhardt, 1975. Effect of volatile fatty acids on water and ion absorption from the goat colon. American Journal of Physiology, 229: 997-1002.
Argenzio, R.A., M. Southworth, J.E. Lowe and CE. Stevens, 1977. Interrelationship of Na, HCO3, and volatile fatty acid transport by equine large intestine. American Journal of Physiology, 233: E469-E478.
Argenzio, R.A. and S.C. Whipp, 1979. Inter-relationship of sodium, chloride, bicarbonate and acetate transport by the colon of the pig. Journal of Physiology, 295: 365-381.
Armstrong, D.G., 1982. Digestion and utilization of energy. In: J.B. Hacker (Ed.), Nutritional limits to animal production from pastures. Commonwealth Agricultural Bureaux, Farnham Royal, pp. 225-244.
Ashes, J.R., J.L. Mangan and G.S. Sidhu, 1984. Nutritional availability of amino acids from protein cross-linked to protect against degradation in the rumen. British Journal of Nutrition, 52: 239-247.
Barry, T.N., 1976. The effectiveness of formaldehyde treatment in protecting dietary protein from rumen microbial degradation. Proceedings of the Nutrition Society, 35: 221-229.
Barry, T.N. and T.R. Manley, 1985. Glucose and protein metabolism during late pregnancy in triplet-bearing ewes given fresh forages ad lib. 1. Voluntary intake and birth weight. British Journal of Nutrition, 54: 521-533.
Beever, D.E. and DJ. Thompson, 1977. The potential of protected proteins in ruminant nutrition. In: W. Haresign and D. Lewis (Eds.), Recent advances in animal nutrition. Butterworths, London, pp. 66-82.
Blaxter, K.L., 1989. Energy metabolism in animals and man. Cambridge University Press, Cambridge, 336 pp. Blaxter, K.L. and A.W. Boyne, 1978. The estimation of the nutritive value of feeds as energy sources for
ruminants and the derivation of feeding systems. Journal of Agricultural Science, Cambridge, 90:47-68. Blevins, D.G., 1985. Role of potassium in protein metabolism in plants. In: R.D. Munson (Ed.), Potassium in
agriculture, Proceedings of an International Symposium, Atlanta, 1985. American Society of Agronomy, Madisson, pp. 413-424.
Boekholt, H.A., 1976. De stikstofhuishouding van het melkrund en de betekenis van de gluconeogenese uit aminozuren (Nitrogen metabolism of the lactating cow and the role of gluconeogenesis from amino acids). Mededelingen Landbouwhogeschool Wageningen, The Netherlands, 76-10,206 pp.
Bremanis, E., 1949. Die photometrische Bestimmung des Formaldehyds mit Chromotropsäure. Zeitschrift für Analytische Chemie, 130:44-47.
Crump, M.H., R.A. Argenzio and S.C. Whipp, 1980. Effects of acetate on absorption of solute and water from the pig colon. American Journal of Veterinary Research, 41:1565-1568.
Dinius, D.A., C.K. Lyon and H.G. Walker, 1974. In vitro evaluations of protein and protein-safflower oil complexes treated with formaldehyde. Journal of Animal Science, 38:467-474.
Dijkshoorn, W., 1973. Organic acids and their role in ion uptake. In: G.W. Butler and R.W. Bailey (Eds.), Chemistry and biochemistry of herbage, Vol. 2. Academic Press, London, pp. 163-188.
Dobson, A. and A.T. Phillipson, 1969. Absorption from the ruminant forestomach. In: CF . Code (Ed.), Handbook of Physiology, Section 6, Alimentary canal, Volume V, Bile; Digestion; Ruminai Physiology, American Physiological Society, Washington D.C, pp. 2761-2774.
Ebihara, K., Y. Imamura and S. Kiriyama, 1979. Effect of dietary mineral composition on nutritional equivalence of amino acid mixtures and casein in rats. Journal of Nutrition, 109: 2106-2116.
Egan, A.R., 1965. Nutritional status and intake regulation in sheep. III. The relationship between improvement of nitrogen status and increase in voluntary intake of low-protein roughages by sheep. Australian Journal of Agricultural Research, 16:463-472.
Egan, A.R., 1977. Nutritional status and intake regulation in sheep. VIII. Relationships between the voluntary intake of herbage by sheep and the protein/energy ratio in the digestion products. Australian Journal of Agricultural Research, 28: 907-915.
Egan, A.R. and R.J. Moir, 1965. Nutritional status and intake regulation in sheep, I. Effects of duodenally infused single doses of casein, urea, and propionate upon voluntary intake of low-protein roughage by sheep. Australian Journal of Agricultural Research, 16:437-449.
167

Elliott, R.C. and J.H. Topps, 1964. Effects of various low protein diets on the distribution of ruminai nitrogen and on the nitrogen required for maintenance of African sheep. Animal Production, 6: 345-355.
Faichney, G J . and G.A. White, 1979. Formaldehyde treatment of concentrate diets for sheep. III. Absorption of amino acids from the small intestine. Australian Journal of Agricultural Research, 30: 1163-1175.
Fattet.1., RD.DeB. Hovell, E.R. Prskov, DJ. Kyle, K. Pennie and R.I. Smart, 1984. Undernutrition in sheep. The effect of supplementation with protein on protein accretion. British Journal of Nutrition, 52: 561-574.
Ferguson, K.A., J.A. Hemsley and PJ. Reis, 1967. Nutrition and woolgrowth; the effect of protecting dietary protein from microbial degradation in the rumen. Australian Jounal of Biological Sciences, 30: 215-217.
Fraser, D.L., E.R. 0rskov, F.G. Whitelaw and N.A. MacLeod, 1990. The efficiency of casein N utilization in dairy cows. Livestock Production Science, 25: 67-78.
Goering, H.K. and P.J. van Soest, 1970. Forage fiber analysis. Agricultural Handbook no. 373, ARC, USDA, Washington, pp. 1-12.
Grenet, E. and C. Demarquilly, 1977. Utilisation de l'azote des fourrages verts par le mouton en croissance: influence du stade de végétation, de l'espèce fourragère, de la fertilisation azotée et de l'addition d'orge. Annales de Zootechnie, 26:481-501.
Grovum, WL., 1987. A new look at what is controlling food intake. In: F.N. Owens (Ed.), Feed intake by beef cattle, Proceedings Symposium: Feed intake by beef cattle, Nov. 20-22 1986, Animal Science Department, Agricultural Experimental Station division of Agriculture, Oklahoma State University, pp. 1-39.
Hildmann, B., C. Storelli, W. Haase, M. Barac-Nieto and H. Murer, 1980. Sodium ion/L-lactate co-transport in rabbit small-intestinal brush-border-menbrane vesicles. Biochemical Journal, 186: 169-176.
Kaufmann, W. and W. Liipping, 1982. Protected proteins and protected amino acids for ruminants. In: E.L. Miller, I.H. Pike and AJ.H. van Es (Eds.), Protein contribution of feedstuffs for ruminants: Application to feed formulation. Butterworths, London, pp. 36-75.
Kellaway, R.C. and J. Leibholtz, 1983. Effects of nitrogen supplements on intake and utilization of low-quality forages. World Animal Review, 48, pp. 33-37.
Ketelaars, J.J.M.H., 1984a. Evaluating rangeland as feed resource for livestock production. In: W. Siderius (Ed.), Proceedings ILCA Workshop Land Evaluation for Extensive Grazing, Addis Ababa, October 31th -November 4th, 1983. ILRI Publication 36, pp. 165-181.
Ketelaars, J J.M.H., 1984b. Patterns of nitrogen and energy intake and their relation to the control of voluntary feed consumption in ruminants and monogastric animals. Internal Report, Centre for Agrobiological Research, Wageningen, The Netherlands, 176 pp.
Kleinbaum, D.G., L.L. Kupper and K.E. Muller, 1988. Applied regression analyses and other multivariable methods. PWS-KENT Publ. Comp., Boston, 718 pp.
Leng, E., 1978. Absorption of inorganic ions and volatile fatty acids in the rabbit caecum. British Journal of Nutrition, 40: 509-519.
Lobley, G.E., 1985. The physiological bases of nutrient responses; growth and fattening. Proceedings of the Nutrition Society, 45: 203-214.
MacRae, J.C. and G.E. Lobley, 1982. Some factors which influence thermal energy losses during the metabolism of ruminants. Livestock Production Science, 11:447-456.
MacRae, J.C, J.S. Smith, P.J.S. Dewey, A.C. Brewer, D.S. Brown and A. Walker, 1985. The efficiency of utilization of metabolizable energy and apparent absorption of amino acids in sheep given spring- and autumn-harvested dry grass. British Journal of Nutrition, 54: 197-209.
Montsma, G., 1986. Meat production in West African Dwarf goats. Netherlands Journal of Agricultural Science, 34:413420.
NRC (National Research Council), 1981. Nutrient requirements of domestic animals No. 15. Nutrient requirements of goats: Angora, dairy, and meat goats in temperate and tropical countries. National Academy Press, Washington, D.C., 1981.
0rskov, E.R., D.A. Grubb, G. Wenham and W. Corrigal, 1979. The sustenance of growing and fattening ruminants by intragastric infusion of volatile fatty acid and protein. British Journal of Nutrition, 41: 553-558.
Preston, T.R. and R.A. Leng, 1987. Matching ruminant production systems with available resources in the tropics and sub-tropics. CTA, Wageningen, the Netherlands, 245 pp.
Redman, R.G., R.C. Kellaway and J. Leibholtz, 1980. Utilization of low quality roughages: effects of urea and protein supplements of differing solubility on digesta flows, intake and growth rate of cattle eating oaten chaff. British Journal of Nutrition, 44: 343-354.
168

Rübsamen, K. and W. v. Engelhardt, 1981. Absorption of Na, H ions and short chain fatty acids from the sheep colon. Pflügers Archiv, 391: 141-146.
SAS, 1985. Users Guide: Statistics, Version 5 Edition. SAS Institute Inc., Cary, N.C., 956 pp. Schmitt, M.G., K.H. Soergel and CM. Wood, 1976. Absorption of short chain fatty acids from the human
jejunum. Gastroenterology, 70: 211-215. Scott, D., 1975. Changes in mineral, water and acid-base balance associated with feeding and diet In: J.W.
McDonald and A.C.I. Warner (Eds.), Digestion and metabolism in the ruminant, Proceedings of the IVth International Symposium on Ruminant Physiology, Sydney, Australia, August 1974, The University of New England Publishing Unit, Armidale, NSW Australia, pp. 205-215.
Sieben, B.D. and R.A. Hunter, 1982. Supplementary feeding of grazing animals. In: J.B. Hacker (Ed.), Nutritional limits to animal production from pastures, CAB, Farnham Royal, UK, pp. 409-426.
Sriskandarajah, N., R.C. Kellaway and J. Leibholtz, 1982. Utilization of low-quality roughages; effects of supplementing with casein treated or untreated with formaldehyde on digesta flows, intake and growth rate of cattle eating wheat straw. British Journal of Nutrition, 47: 553-563.
Stevens, CE., 1970. Fatty acid transport through the rumen epithelium. In: A.T. Phillipson (Ed.), Physiology of digestion and metabolism in the ruminant, Proceedings of the Third International Symposium, Cambridge, Oriel Press Ltd., New Castle upon Tyne, pp. 101-112.
Thomas, E., A. Trenkle and W. Burroughs, 1979. Evaluation of protective agents applied to soybean meal and fed to cattle. I. Laboratory measurements. Journal of Animal Science, 49:1337-1345.
Tilley, J.M.A. and R.A. Terry, 1963. A two-stage technique for the in-vitro digestion of forage crops. Journal of the British Grassland Society, 18:104-111.
Tolkamp, B J., 1983. When the cow stops eating. The use of k-factors for the calculation of energy requirements in ruminants. Internal report, Department of Tropical Animal Production, Wageningen Agricultural University, 19 pp.
Umesaki, Y., T. Yajima, T. Yokokura and M. Mutai, 1979. Effect of organic acid absorption on bicarbonate transport in rat colon. Pflügers Archiv, 379:43-47.
Van Soest, P J., 1982. Nutritional ecology of the ruminant. O&B Books, Corvallis, 374 pp. Watson, AJ.M., M.J. Kelly, M. Wilks, MJ.G. Farthing and P.D. Fairclough, 1985. Mechanisms of acetate
absorption in normal rat jejunum. Gut, 26: A1109. Webster, AJ.F., 1980. Energy costs of digestion and metabolism in the gut. In: Y. Ruckebusch and P.Thivend
(Eds.), Digestive physiology and metabolism in ruminants, Proceedings of the 5th International Symposium on Ruminant Physiology, Clermont-Ferrand, 1979, MTP Press Ltd, Lancaster, pp. 469-484.
West, CE., A.C. Beynen, K.E. Scholtz, A.H.M. Terpstra, J.B. Schutte, K. Deuring and L.G.M. van Gils, 1984. Treatment of dietary casein with formaldehyde reduces its hypercholesterolemic effect in rabbits. Journal of Nutrition, 114:17-25.
Zemmelink, G., 1980. Effect of selective feed consumption on voluntary intake and digestibility of tropical forages. Agricultural Research Report no. 896, Pudoc, Wageningen, 100 pp.
Zemmelink, G. and B.J. Tolkamp, 1975. Supplementacion de ovinos en los Llanos Orientales Colombianos (Supplementation of sheep in the Columbian Llanos Orientales). Proceedings of the Vth Meeting of ALPA (Latin-american Association of Animal Production), Maracay, Venezuela, 1975.
Zemmelink, G., B J . Tolkamp and J.H. Meinderts, 1985. Feed intake and weight gain of West African Dwarf goats. In: J.E. Sumberg and K. Cassady (Eds.), Sheep and Goats in Humid West Africa. Proc. Workshop on Small Ruminant Production Systems in the Humid Zone of West Africa, JJXA, Ibadan, Nigeria, September 1984.
Zemmelink, G., B J . Tolkamp and N.W.M. Ogink, 1991. Energy requirements for maintenance and gain of West African Dwarf goats. Small Ruminant Research, in press.
169

7 Effects of ruminai and abomasal nutrient infusion on roughage intake in sheep
Abstract
Feeding experiments were carried out to test the response of voluntary roughage intake of sheep to changes in the supply of nutrients by ruminai or abomasal nutrient infusions. As roughages grass hays were used of medium quality with organic matter digestibility ranging between 589 and 658 g.kg-1 of organic matter (OM) and nitrogen contents between 15.3 and 18.3 g.kg1 of dry matter (DM). Experimental animals were wethers with mean initial and final live weights of 24 and 27 kg in Exp. 1,52 and 55 kg in Exp. 2,37 and 47 kg in Exp. 3, and 45 and 50 kg in Exp. 4. Control treatments consisted of hay feeding with ruminai and/or abomasal infusions of tap water. Nutrient infusâtes were administered continuously for periods lasting from 7 to 21 days. Apart from information on changes of hay dry matter intake (DMT) and estimated total metabolizable energy intake (MEI), experimental results include measurements of nitrogen and mineral balance, and ruminai and blood parameters. Mean DMI during control periods of all experiments varied between 54 and 63 g.kg"0-75^"1, in good agreement with the intake expected given the quality of the hays used. In Exp. 1 it was tested whether an enhanced abomasal supply of rumen microbial material (RM), protein (Pro) or a combination with glucose, (RM+Glu) and (Pro+Glu), would increase hay intake over intake during control periods. As protein source Na-caseinate was used. Rumen microbial material, isolated from whole ruminai contents of slaughtered cattle by a combination of filtration and centrifugation, had a high ash content (199 g.kg1 DM) due to contamination by minerals in rumen fluid. Nitrogen contents in OM (97.4 g.kg"1), amino acid nitrogen content (822 g N.kg"1 N) and amino acid composition were similar to published values. Rumen microbial material and protein were given in isonitrogenous amounts equivalent to 0.6 g N.kg"°-75.d'. Glucose was infused at a rate of 5 g.kg-0-75.d"'. Neither (RM) nor (Pro) affected hay intake. With (RM+Glu) and (Pro+Glu) hay intake decreased. All treatments increased MEI. Only (Pro+Glu) had a significant positive effect on nitrogen balance. In Exp. 2 effects on intake were studied of increases in the supply of protein and potassium in view of the positive correlation usually present in feeds between contents of both components. Extra potassium (0.5 mol.d1) was administered as a ruminai infusion of a K-citrate solution, alone (K) or in combination with abomasally infused microbial protein (K+RM), equivalent to 0.6 g N.kg"a75.d_1. In addition, the effect was tested of ruminally infused grass juice known to contain substantial amounts of protein and potassium. The juice had 39 g DM.kg1, 172 g ash.kg'1 DM and 38.1 g N.kg1 , and was given at a low dose (4 l.d"1) (LJui) and a high dose (8 l.d"1) (HJui). Infusion of K-citrate caused substantial changes in K and Na concentrations of rumen fluid, but neither (K) nor (K+RM) changed hay intake. Grass juice infusion tended to decrease hay intake. MEI was higher with (K+RM), (LJui) and (HJui) as compared to control treatments. Juice administration induced a large number of changes in ruminai fluid parameters, probably partly as a result of the high water content and partly as a result of the high K content. In the third series of experiments it was tested whether abomasally infused carbohydrates (glucose, maltose, fructose and starch), known to differ in resorption mechanism and costs, would cause differential intake responses. Exp. 3a involved a comparison of glucose and maltose at a low (5 g.kg"°-75.d_1) and high (10 g.kg-°-75.d_1) level, and fructose only at the low level as this was already found to cause diarrhoea. In Exp. 3b low doses of glucose or gelled maize starch, both dissolved in water or saline, were compared. In Exp. 3c abomasal infusions of low amounts of glucose, starch or protein were tested. In Exp. 3a all carbohydrates depressed intake, fructose significantly more than the low level of the two other carbohydrates. In Exp. 3b and c glucose and starch tended to decrease hay intake without a significant difference due to type of carbohydrate or type of solvent. With the same roughage, MEI could be increased by either glucose, maltose, starch or protein. Responses to carbohydrate are discussed in the light of conflicting ideas about the role of glucogenic energy in ruminant nutrition. Extent of intestinal absorption and site of administration (abomasally or intravenously) may
171

be more important parameters influencing the intake response to carbohydrate administration than mode of absorption. Exp. 4 was set up to test to what extent positive effects of protein in roughages may be attributed to the rumen degradable or non-degradable part. To that end sheep received one of the following treatments: a ruminai infusion of a non-neutralized volatile fatty acid mixture (1.7 mol VFA.d1) or the same mixture partly neutralized with ammonia (0.4 mol.d"1), the forementioned treatments in combination with abomasal caseinate infusion (6 g N.d"1), and abomasal infusion of caseinate alone (6 or 12 g N.d"1). The composition of the VFA mixture (40% acetic, 28% propionic, 12% butyric, 7% valeric and 13% isovaleric acid on a molar basis) was chosen so as to reflect the fermentation products of casein. Roughage intake tended to be depressed by all treatments except from caseinate infusion. Estimated metabolizable energy intake was increased by all treatments having VFA infusions with no significant differences between treatments. Addition of ammonia had no effect on the response to VFA infusions. The results suggest that both rumen degradable and rumen by-pass protein may contribute to the higher energy intake from protein rich roughages. This needs to be confirmed by direct comparisons of infusions with different VFA mixtures, with and without complete neutralization by ammonia. Intake responses to nutrient infusions are discussed in relation to the theory of intake regulation developed in Chapters 3 and 4. Effects on voluntary roughage intake of administration of nutrients either by infusion or by dietary supplementation (concentrate feeding) appear to vary from positive to nil or negative. Differences in response can be understood from differential effects of nutrient supplements on efficiency of metabolizable energy (ME) utilization. As the level of voluntary feed intake has been shown to depend on the rate at which efficiency of ME utilization declines with increasing intake, a higher roughage consumption may be expected whenever nutrient supplements improve the efficiency of ME utilization of the basal feed. A lower roughage consumption is assumed to occur if additional nutrients decrease this efficiency. Lack of knowledge of the physiological processes and interactions between feeds and supplements which determine efficiency of energy utilization, as yet prevents prediction of effects on intake of nutrient supplements. Future infusion experiments in combination with measurements of substrate and oxygen consumption in different body compartments and in the animal as a whole may help to fill this gap in our knowledge.
7.1 Introduction
The voluntary intake of roughages by ruminants is often too low to achieve a high production
level. As roughages are generally cheaper than concentrates, many attempts have been made
to increase roughage intake (Forbes, 1986; Grovum, 1987). Different techniques have been
explored varying from physical and chemical treatment of the feed (Wilkins, 1982), to the
provision of catalytic amounts of concentrates (Preston and Leng, 1987). Animal responses to
such dietary changes have been quite variable and often unpredictable. This state of affairs
has been attributed to a poor understanding of the factors controlling roughage intake in
ruminants (Chapter 1).
The large variation in the nature of dietary changes which may either promote or inhibit
roughage consumption, suggests that no single mechanism of intake control is operative. For
instance, intake of poorly digestible roughages often but not always increases upon grinding
of the feed (Minson and Milford, 1968), sometimes but not always increases after spraying
the feed with non-protein nitrogen, and sometimes increases but in other instances decreases
with abomasal protein infusion (Egan, 1965, 1977; Egan and Moir, 1965). The effects of
grinding and non-protein nitrogen supplementation on intake seem to follow from changes of
the rumen microbial system. The effects of protein supplementation are ascribed to changes
of host animal metabolism. In the first case animals are thought to respond to changes in
172

rumen fill, which would mean that roughage intake is controlled primarily by physical restrictions. The responses to protein supplementation suggest that animals react to metabolic changes (for instance an increased rate of acetate utilization), which would mean that roughage consumption is under metabolic control. If these interpretations of intake responses are correct, completely different mechanisms of intake regulation must exist.
However, from an extensive literature analysis preceding our experimental work (Ketelaars, 1984) we concluded that the evidence for a physically constrained intake of roughages is weak (see Chapter 1). This also meant that the usual interpretation of relations between roughage intake and composition from a physical model of intake regulation might be incorrect. We concluded, therefore, that other hypotheses had to be developed concerning the nature of relationships between roughage intake and roughage composition. The experiments to be reported here were meant to test a number of alternative hypotheses. These were developed over a period of four years, i.e. from 1986 to 1989, and reflect a gradually changing opinion on feed intake regulation. They had all in common a firm belief that the positive correlations between physical parameters measuring the degradability of a feed and intake do not necessarily imply a causal relationship between rumen fill and intake. Instead, we started from the assumption that factors different from rumen fill but usually confounded with the filling effect of feeds must underly this correlation. Which factors were involved was not evident at the start of our experiments.
The first hypothesis to be tested assumed that the intake of roughages is strongly affected by the ratio of microbial nutrients being absorbed from the small intestine, to volatile fatty acids being absorbed from the forestomachs. In the case of roughages, this ratio represents the most important nutrient ratio for ruminants. Roughages are generally extensively degraded by microbial fermentation in the reticulo-rumen. This means that the end products of digestion mainly consist of volatile fatty acids (VFA) absorbed from the reticulo-rumen and omasum and a mixture of microbial constituents digested in and absorbed from the small intestine. Microbial constituents consist mainly of microbial protein but in addition also of lipids, carbohydrates, minerals and nucleic acids. Hence, the ratio of microbial nutrients to VFA is more than a simple protein-energy ratio. The latter has been found to affect roughage intake of some but not all roughages, as discussed in Chapter 6. The lack of positive effects of extra protein on intake of some feeds might be related to a deficiency of other nutrients, normally present in microbial cells. As far as we knew, specific effects of the microbial package of nutrients on voluntary feed intake had not been examined. Though speculative, it could not be excluded that intake responses to microbial material differ from responses observed with a protein source like casein, often used in abomasal or duodenal infusion studies. So it was thought worthwhile to test the intake response to an artificially enhanced supply of microbial material to the abomasum. In essence, this means simulation of a more efficient rumen microbial protein synthesis. Reasons to expect a positive intake response were the following. - Roughage intake is positively correlated with nitrogen content and digestibility of the feed
(Chapter 1). As both parameters increase, a larger proportion of metabolizable energy (ME) appears to be absorbed from the small intestine and a smaller proportion from the forestomachs (see Chapter 4). This shift of digestion toward the small intestine is at least partly caused by a more efficient microbial protein synthesis in the forestomachs (Hagemeister et al., 1981). So the latter could be a factor explaining the higher intake of immature roughages.
173

- Intake of low-nitrogen roughages often increases upon non-protein nitrogen supplementation. This could also be interpreted as a result of a more efficient microbial protein synthesis, so a more ample supply of microbial nutrients to the small intestine.
- Roughage intake sometimes responds positively to an increased protein supply either from abomasal infusion or from dietary supplementation. The absence of positive effects in other instances may be due to other nutrients being limiting. Such nutrients might occur in microbial matter or in plant material in association with proteins. To test this first hypothesis, microbial material was harvested from stomach contents of
slaughtered cattle and abomasally infused in roughage-fed lambs. Young sheep were chosen for this experiment because of the laborious work to collect sufficient microbial material for an infusion period lasting at least two weeks. Control animals were infused with casein. In the same experiment we also looked at the effect of additional, abomasally infused, glucose.
As this test did not reveal any positive effect on intake, neither of extra microbial material, nor of extra protein, we searched for a different explanation of the positive effect of higher crude protein contents of roughages on intake. Plant protein is generally positively correlated with a large range of organic and inorganic compounds, most of them being present as cell contents. Effects of protein per se are thus confounded with effects of such substances. Among the latter, potassium could be of special importance for intake regulation for the following reasons.
A positive correlation between protein and potassium contents is not only present in roughages (vegetative material) but also in seeds (Blevins, 1985). The latter, like for instance cotton seed and soybeans, are often used as protein sources for protein supplementation. Hence, beneficial effects of protein-rich supplements on roughage intake might at least partially be due to non-protein constituents, like potassium. More important, however, seemed to us experiences with the technique of intragastric feeding (0rskov et ai, 1979). Developing this technique these authors have found that conditions in the rumen largely determine which level of VFA infusion is tolerated by the animal. An important parameter appeared to be the ratio between buffer solution and VFA solution infused. Paradoxically, low acceptance of VFA accompanied by ruminai acidosis was found when relatively large amounts of buffer were infused. Translating these findings to the free-feeding animal this would mean that voluntary feed intake may be controlled by the rate of VFA absorption from the reticulo-rumen. This rate in turn will be affected by the composition of ruminai fluid. The latter is a dynamic parameter depending on a number of processes: feed consumption, feed digestion, saliva secretion and nutrient resorption. Despite this, effects of feed composition on ruminai fluid parameters are clearly recognizable, especially with regard to concentrations of K, Na and NH4 and VFA. At low K contents of the feed, the dominant cation in ruminai fluid is sodium, at high K contents potassium. In addition, experimental studies with a temporarily isolated rumen have shown that sodium resorption is stimulated by the presence of potassium (Scott, 1967). This in turn might affect VFA resorption, VFA tolerance and feed intake in view of the relationships often observed between Na and VFA absorption. So we decided to examine as a second hypothesis presumed positive effects on roughage intake of an increased supply of K, alone or in combination with extra abomasally administered protein.
To test this second hypothesis an experiment was set up in which sheep received one of the following treatments: potassium citrate infused into the rumen, or a combination of this with abomasaly infused protein, or grass juice infused into the rumen at a low or high dose. Potassium citrate was chosen to represent the extra potassium found in herbage when K
174

contents are increased (Dijkshoorn, 1973). Grass juice was chosen because we hoped to imitate in this way the joint effects of increased protein contents in roughage, as grass juice mainly consists of cell contents.
A test of this second hypothesis did not show positive effects of potassium alone or in combination with protein on roughage intake. Grass juice had a negative effect on intake perhaps due to an excessive amount of water administered with the juice.
So far, our thinking about intake regulation had been based upon the general belief that the existence of constraints to feed consumption - though different from rumen fill - causes roughage intake to be relatively low. However, attempts to identify alternative constraints were unsuccessful. Clearly, a different look at intake regulation was required. A scrutiny of relationships between voluntary feed intake and efficiency of ME utilization appeared to offer such a new look. As we explained in Chapter 3, feed consumption by the animal may be conceived of a process of weighing costs against benefits of feed intake. In non-reproducing animals the intake of net energy appears to be a useful measure of benefits whereas costs can be equated with the total oxygen consumption of the feeding animal. The formulation of that idea was rewarding as it enabled us to predict ad libitum feed intake from measurements of restrictedly fed animals. Besides, both the effects of digestibility and nitrogen content on intake could be accounted for in terms of differences in the efficiency with which ME is utilized by the animal. So, we realized that it was important to find out which processes cause differences in ME utilization between feeds as the same factors must be responsible for differences in intake. Despite a large amount of research that question is not easily answered. Only after the completion of our experimental work we developed the ideas oudined in Chapter 4. From literature data (Webster, 1980; Blaxter, 1989) it appeared quite certain that the work involved in mechanical processing of the feed does not cause the large differences in the efficiency for gain (kg) between feeds. Other processes must be involved. We hypothesized that the work required for absorption of nutrients might be an important one. It is well known that the gut is a metabolically very active organ using up a quarter or more of the total oxygen consumed in the fed state (Webster, 1980). It has also been found that between feeds differences in oxygen consumption by the gut exist. For instance, Huntington et al. (1988) have found that per MJ ME consumed, oxygen consumption of portal drained viscera was higher when orchard grass silage of lower metabolizability was compared with lucerne silage of higher metabolizability. Causes of this difference have not been established but it seemed logical to think of absorption costs as a possible cause of differences. A comprehensive test of this hypothesis appeared to be difficult and outside the scope of this study as the absorption of nutrients from different feeds cannot be easily changed without changing many other processes in parallel. As a more modest goal we tried to find out to what extent differences in absorption costs may induce different intake responses to nutrient infusions. To that end we looked for a class of nutrients with a similar nutritive value but mutually differing in absorption costs. We then considered VFA unsuitable as exact knowledge about their absorption mechanism was lacking, and still is. Moreover, VFA markedly differ with regard to their metabolic fate. Contrary to VFA, intestinally digested and absorbed carbohydrates like glucose, fructose, maltose and starch seemed to fulfil our requirements: they are all glucogenic substances but differ as to the way they are absorbed from the gut. According to Eckert and Randall (1983), glucose is actively transported from the gut lumen by cotransport with sodium. The energy for this transport is provided by the sodium gradient. So the active step is actually the removal of sodium from epithelial cells at
175

the basolateral membrane. Contrary to glucose, fructose is transported by facilitated diffusion. This process is also linked to certain membrane carriers but requires no energy other than the energy provided by the diffusion gradient of fructose from the gut lumen to the cell interior. Maltose is transported in still another way i.e. by hydrolase transport which neither requires energy. This mode of transport involves translocation of disaccharides which are transported and cleaved by the same enzyme located in the brush border. Starch is hydrolysed in the gut lumen by amylases to be absorbed by maltase. Our interest in carbohydrates was further stimulated by the negative effects of small amounts of glucose on intake as was observed in the first experiment. This was remarkable as extra glucogenic energy, for instance in the form of dietary by-pass starch, is often considered beneficial for intake and productivity of ruminants.
The hypothesis that absorption costs may contribute significantly to differences in ME utilization led to a third series of experiments in which we looked at presumed differential responses to abomasal carbohydrate infusion. Results of these experiments demonstrated the existence of a differential response depending on type and amount of carbohydrate infused. However, the occurrence of diarrhoea complicates the interpretation of such responses: incomplete absorption from the small intestine is probably a more important parameter than any difference in absorption costs per se. We concluded that the abomasal infusion of carbohydrates is not a suitable method to study effects on intake of differences in absorption costs.
Nutrients may affect roughage intake in many different and sometimes unexpected ways. To think of one overriding effect for each specific nutrient is probably much too simple. From our concept of feed consumption as an optimization process it may be inferred that, ultimately, the importance of specific nutrients will depend on the extent to which they change the overall efficiency of ME utilization. Considering the end products of digestion as a mixture of nutrients some mixtures may be utilized more efficiently than others. From the first the animal is expected to consume a larger amount than from the latter. Extending this reasoning to effects of dietary protein a higher intake of protein-rich feeds may represent a response to a preferred mixture of substrates more than to a limiting nutrient. In the case of protein it is, however, not evident which change of substrate is actually preferred by the animal. Dietary protein is usually partly fermented in the forestomachs and partly digested in the small intestine. Protein fermentation gives rise to VFA and NH3 production and absorption, protein digestion in the small intestine results in amino acid absorption.
The hypothesis that both rumen-degradable and by-pass protein may contribute to the increased energy intake from protein-rich feeds led to a fourth experiment. Herein we compared the following treatments: ruminai infusion of a VFA mixture resembling the endproducts of protein fermentation, the same treatment in combination with ammonia, and both treatments in combination with abomasally infused protein. This experiment again showed that energy intake can be increased by administration of completely different nutrients and, in addition, suggests that both the ruminally degradable and undegradable part of protein may contribute to a higher intake of ME. Whether the favourable response to the VFA infusion is indeed specific for the mixture resulting from protein degradation has to be confirmed by future experiments. As later became apparent when preparing Chapter 4, such experiments should form part of a more extensive study of effects of VFA on energy metabolism at different levels within the animal.
176

7.2 Materials and methods
Animals and housing
Sheep were used as the experimental animals throughout this study. Animals were whethers from mixed breeds: the Flevolander (Exp. 1 and 2) and Swifter breed (Exp. 3 and 4). For the first experiment lambs were used of 4 months old. For Exp. 2 the same animals were used about a year later. Exp. 3 and 4 were conducted with a new group of sheep of 10 months old at the start of Exp. 3, and 15 months old at the start of Exp. 4. Information on body weights is given in the description of each experiment. Before and between the experiments animals were housed indoors in pens and were provided hay of the same quality as used for the experiments. Depending on the aim of the experiments, animals were surgically prepared with rumen fistulas, abomasal infusion tubes or ileum fistulas. To speed up recovery from surgery small amounts of concentrates were given temporarily. Before the start of each experiment animals were treated against coccidiosis and gastrointestinal helminths. Vitamins were given regularly either orally or by intramuscular administration.
During the experiments animals were kept in metabolism cages in a stable which was continuously illuminated. Room temperature could not be strictly controlled but usually varied between 16 and 23 °C. Occasionally higher temperatures occurred. This happened especially at the end of Exp. 2, when animals showed diminished feed intake. As they probably suffered from heat stress due to the combination of a high temperature and a high air humidity, data of this period were excluded from the analysis.
Feeds and feeding regime
As experimental feeds grass hays of medium quality were chosen with an expected intake clearly below the maximum energy intake for the category of animals used. In this way positive intake responses may be more easily detected than with higher quality roughages. In addition, hays were chosen so as to have sufficient nitrogen to prevent a nitrogen deficiency for the rumen microbial system. Any response to abomasally administered protein would than probably be due to an effect of protein on the host animal. For each experiment a homogeneous batch of hay was used. The hay was coarsely chopped, mixed and weighed in daily portions.
Feeding was aimed at ad libitum intake accepting feed refusals from 40-50% of feed on offer. Animals were allowed access to feed for approximately 23 hr each day. Feed was given in two portions: in the morning and early in the evening. Residues were collected once daily before the evening feeding (Exp. 1) or before the morning feeding (other experiments). Drinking water was available to the animals at all times.
177

Experimental design
Before the start of each experiment animals were grouped by body weight, the number of groups equalling the number of treatments to be imposed simultaneously. All experiments were started with a period of hay feeding and abomasal or ruminai infusions with tap water as a control treatment. This control period was both meant to stabilize feed intake and to provide an intake figure which could serve as a reference to compare within-animals effects of subsequent treatments. Duration of this period was variable but only data of the last two or three weeks were averaged to obtain the intake for the control treatment. After this period, groups of animals received different experimental treatments consisting of hay feeding in combination with abomasal or ruminai infusion of different substances. Duration of these experimental periods also varied and will be given with the description of each experiment. If possible, experimental treatments were followed by a second control period. In such cases within-animal differences between treatment periods and the average of both control periods served as a measure of the effect of treatments. In other instances differences between treatment period and preceding control period were used.
The small number of animals which can be used in this type of infusion experiments imposes restrictions on experimental design. We preferred to maximize the number of animals per experimental treatment which excluded the use of a control group simultaneously. In this way effects of experimental treatments (estimated as the difference between treatment and control period) are confounded with period effects, if present. Such period effects might change the overall level of intake. For a comparison of differences between experimental treatments this is not a serious disadvantage. Yet differences between treatment period and control period may overestimate or underestimate the true effect of treatments. To minimize these objections we included a second control period whenever possible. In addition, condition of animals and housing climate were carefully monitored throughout the experiments. In case of anomalous animal behaviour measurements were discarded.
Infusion procedure
In all experiments nutrient solutions were infused by means of peristaltic pumps through the abomasal tube or ruminai fistula. Infusâtes were dosed at a constant rate throughout the day apart from brief periods needed for changing solutions and cleaning infusion tubes. If needed substances to be infused were dissolved or diluted with tap water. Tap water infusion also served as a control in all experiments. Tap water was chosen after saline solution (9 g NaCl.l"1) had been tried at the start of the first experiment. As animals showed diminished intake and soft faeces after one week, saline infusion was stopped. Blood profile showed several anomalies: hematocrit (0.30-0.40 l.l"1), hemoglobin (7-10 mmol.H) and serum potassium (5.5-7.5 mmol.l"1) were elevated, serum Na (140-148 mmol.l"1) was somewhat depressed, compared to values obtained in the course of Exp. 1 (see Section 7.3, Table 7.3.11 and 7.3.12). Blood glucose, urea and protein levels appeared normal. Although we did not find out whether these health problems were in some way related to the infusion of saline, we decided to try tap water infusion. After this change blood profile became normal and no difficulties were encountered any more. The choice of saline as a physiological control seemed logical. However, it may have provided the young animals (bodyweight 19-25 kg) in
178

this experiment with rather unusual amounts of salt: about 10-15 g.d"1. In a later experiment (Exp. 3b), with older and heavier animals, a comparison of effects of abomasal infusion of carbohydrate dissolved in either saline or tap water did not show any difference between the two ways of administration.
Measurements and sampling
To correct for differences in dry matter content and chemical composition between feed and feed residues the latter were bulked and sampled for periods of seven days, usually the same period as used for measurement of digestibility. Values for dry matter content of feed residues so obtained were applied to hay intake throughout the whole period.
For measurement of digestibility and nitrogen and mineral balance, faeces and urine were collected for periods of seven days, usually the last seven days of a control or experimental period. In Exp. 1 urine was collected using harnasses and in Exp. 4 with the help of trays. Faeces were collected twice daily from trays below the cage floors. Faeces and urine were bulked for the whole period of seven days. Faeces was treated with formaldehyde as a preservative, urine acidified with HCl to pH 2.
For determination of reticulo-ruminal liquor volume and outflow a single dose of either Cr-EDTA (Exp. 1 and 2) (40 ml with 4.3 g Cr.H) or Co-EDTA (Exp. 4) (60 ml with 3.4 g Co.l"1) was administered. In Exp. 1 samples of ruminai fluid were withdrawn at 2, 3, 4, 5, 6, 7, 8, 9, and 10 hours thereafter. As this was found to lead to highly variable figures for passage rates, in the other experiments samples were taken over two subsequent days at 3, 6, 9,24, 27, 30 and 33 hours after marker administration.
In Exp. 1 and 2 blood samples were collected from jugular blood directly into evacuated tubes, two hours after the morning feeding. Tubes were kept cool on melting ice during transfer for analysis on the same day. Samples were collected on two consecutive days for Exp. 1 and on single days in Exp. 2.
Chemical analyses
Dry matter contents of feeds, feed residues and faeces were determined by oven-drying samples to constant weight at 105 °C. Samples of microbial material and grass juice were first dried at 55 °C in a vacuum oven and then at 105 °C. Ash contents were measured by combustion of dry matter residues at 550 °C. Total nitrogen was measured by the Kjeldahl method. For nitrogen analyses of faeces fresh samples were used. Nitrogen in microbial material was determined in frozen samples. The mineral cations Na, K, Ca, Mg and Co were measured by atomic absorption spectrofotometry. For samples of feed, feed residues, and faeces ash residues were dissolved with HCl (37%). For urine and rumen fluid samples were also acidified with HCl. To eliminate interference of sulphate and phosphate BaCl2 and S1CI2 were added to the mineral solution. P was analysed by colorimetry.
Amino acids in rumen microbial mass (freeze dried samples), fresh grass, juice and press cake (frozen samples) and caseinate (dried samples) were determined by HPLC. Samples were hydrolysed with HCl 6 mol.l"1 at 110 °C for 24 hr. The sulphur-containing amino acids
179

cystine and methionine were determined after formic acid oxidation as methionine sulphone and cysteic acid. Tryptophan was not determined.
Ruminai fluid pH was measured immediately after withdrawal of the sample. Buffering capacity was determined by titration of fresh samples of ruminai fluid with 0.1 N HCl to pH 4.0. Buffering capacity was calculated as the amount of H+ needed per 1 rumen fluid to change pH with 0.25 unit. Osmolality was measured with an osmometer after samples had been centrifuged at 70000 g for 30 minutes. For rumen ammonia determinations samples were acidified with 0.1 N HCl and stored cool until analysis. Ammonia was measured with a Cenco UNMF Auto Analyser.
For determination of VFA samples were conserved with concentrated phosphoric acid. VFA were measured in centrifuged fluid by gas liquid chromatography (Exp. 1) or HPLC (Exp. 2 and 4). CI and PO4 were also measured by HPLC. For analysis of anorganic ions rumen fluid was centrifuged at 20000 g for 20 minutes in Exp. 2 and at 2000 g in the other experiments.
Blood was analysed for hematocrit with a Clay Adams centrifuge, hemoglobin concentration with a hemocyanin-method, and protein concentration according to the method of Lowry. Proteins were separated by electroforesis on cellulose-acetate. Protein fractions were coloured with Ponceau red agent and scanned in a densitometer. Blood glucose and urea concentrations were measured by an enzymatic method (Boehringer test kits). Serum Na and K concentrations were determined by flame-photometry.
Statistical analysis
Changes of intake, nitrogen and mineral balance, ruminai and blood parameters, obtained in the way explained above were subjected to analysis of variance with treatments as independent factors. Statistical significance was tested with the F-test. A probability level of 0.05 was used throughout to detect significant effects. Results are presented as absolute values (with standard errors) during control periods and as differences (with standard errors) between experimental and control periods.
180
7.3 Effects of abomasal infusion of rumen microbial
material or caseinate with or without additional
glucose (Exp. 1)
Aim
The aim of this experiment was threefold: l.to test whether an enhanced abomasal supply of rumen microbial material increases the
roughage intake of young sheep, 2. to test whether the effect of microbial material differs from the effect of a similar amount of
nitrogen supplied as caseinate, 3. to test whether an additional small amount of glucose infused into the abomasum changes
the effect of rumen microbial material or caseinate.
To facilitate interpretation of changes in intake, data on nitrogen and mineral balance and rumen fluid and blood parameters were collected.
Experimental details
Isolation of rumen microbial material Large scale isolation of rumen microbial material was initially attempted by way of tangential microfiltration of prefiltered (pore size 44 mu) ruminai fluid. This proved to be unsuccessful due the fact that microfilters (pore size 0.45 mu) got rapidly and irreversibly clogged up.
More satisfactory appeared the method developed by Storm and 0rskov (1983) with centrifugation as the final step to harvest microbial material from prefiltered ruminai fluid. Whole rumen contents were collected in plastic containers from a nearby slaughterhouse. After transfer to our experimental farm ruminai fluid was extracted by slightly pressing the material on a 1 mm sieve. Thereafter the fluid was filtered over a 44 mu filter using tangential flow to prevent stoppage of the filter. The organic matter in the filtrate so obtained was considered to hold mainly microbial cells. Concentration of microbial material was achieved by centrifugation (Alfa-Laval bactofuge). This separated rumen fluid in three fractions: a solid fraction which accumulated against the inner wall of the centrifuge, a fluid fraction enriched with microbial material, and a fluid fraction low in microbial material. As the first two fractions had almost the same nitrogen content in the organic matter they were mixed to yield a suspension varying in dry matter content from 5.5 to 11%. The variation in dry matter content was due to a variable degree of separation between fluid and solid phases as the nozzle diameter of the bactofuge gradually increased due to wear and tear by mineral particles in rumen fluid. The mixed suspension was sealed in small polyethylene bags of 200 g net weight to be frozen and stored at -20 °C. Unlike the procedure followed by Storm and 0rskov (1983) no freeze-
181

drying was carried out. In order to get homogeneous samples for the infusion trial, bags were randomly selected, and their contents were thawed and mixed before use.
Harvesting took place during wintertime from animals which had mainly received maize or grass silage as the basic feed. Filtration was done in the open air at temperatures below 10 °C so that rapid cooling of rumen fluid was achieved.
The objective was to collect 40 kg rumen microbial dry matter. For this we needed about 60 tons of whole ruminai contents. Obviously, efficiency of the harvesting process was low. Most of the microbial cells in rumen contents are firmly attached to feed particles (Cheng and Costerton, 1980) and probably only free floating cells have been collected by our procedure. The total amount of 60 tons of rumen contents was processed in 20 batches on an equal number of days. To process an average batch of ruminai contents took 5 to 10 hours depending on the viscosity of the fluid which led to remarkable differences in filtration rate.
Rumen microbial material was analysed for contents of DM, ash, Na, K, Ca, Mg, P, total N, ammonia-N, and amino acids and compared with values for sodium caseinate (DMV, Veghel) the protein source used for comparison.
Feeding experiment For the feeding experiment 8 lambs were used. Animals were equipped with ruminai fistulas and abomasal infusion tubes. They were divided into two groups of 4 animals each. The whole experiment lasted 11 weeks (excluding a two-weeks adaptation period) and consisted of 4 periods. The first three periods had 3 weeks, the fourth only two weeks. The first and third period served as a control period during which all animals received an infusion with tap water (1-2 l.d"1) into the abomasum. In the second period one group of animals received an infusion with microbial material, the other an infusion with caseinate solution. In the fourth period groups received the same experimental treatments but in addition an amount of glucose was infused into the abomasum.
For the infusions a nitrogen dose of 0.6 g.kg^-^.d"1 was chosen. This corresponded with 67 g microbial organic matter and 42 g organic matter from caseinate in an animal weighing 24 kg at the start of the experiment. Infusion rates were adjusted to increasing body weight throughout the experiment
Glucose administered at a level of 5 g.kg"°-75.d_1 was dissolved in water (147 g.kg"1) and pumped into the abomasum either mixed with the caseinate solution or as a separate solution if rumen microbial material was infused.
Between periods 1, 2 and 3 amounts of fluid infused were kept equal to the amount administered with the rumen microbial material. In period 4 a small additional amount of fluid (±0.5 l.d"1) was infused with the glucose solution. Fresh solutions of mixed rumen microbial material were prepared twice daily. To prevent deterioration during the infusion, vessels with microbial material were kept cool on melting ice. Preliminary tests had shown that under such conditions no measurable ammonia formation occurred. Infusâtes were stirred continuously during infusion.
The roughage used was a mixed grass hay with composition as shown in Table 7.3.1. As phosphorus and calcium contents of the feed were judged to be rather low for growing lambs, the young animals in this experiment received per ruminai fistula a daily supplement of 10 g monocalciumphosphate equivalent to 2.0 g P and 1.6 g Ca. Animals were weighed weekly. Jugular blood samples were withdrawn on two consecutive days giving a total number of samples per animal of 2, 6, 6 and 4 for period 1, 2, 3 and 4
182

respectively. The number for the first control period was only half that originally planned as the samples taken first had to be discarded due to illness of the animals. Blood samples were analysed for hemoglobin, hematocrit, total protein, protein spectrum, glucose, urea, serum Na and K. Ruminai fluid samples were collected at the end of each period, a total of 10 samples per animal. This happened after Cr-Edta had been administered as explained in Section 7.2. Samples were analysed for pH, buffering capacity, osmolality, and concentration of NH4-N, Na, acetic, propionic, and butyric acid. Ruminai fluid volume and outflow were calculated from Cr concentrations. Nitrogen and mineral balance were measured in period 1, 2 and 4. Values of period 1 served as a control for treatments in period 2 and 4.
Table 7.3.1. Chemical composition and digestibility of hay (Exp. 1)
Dry matter content DM (g.kg"1) 879
Composition of dry matter (g.kg"1- DM) Ash 82 Nitrogen 17.3 Crude fiber 320
Mineral composition (g.kg"1 DM) Sodium 2.7 Potassium 11.4 Calcium 5.1 Magnesium 2.0 Phosphor 2.7 Sulphur 2.8
Digestibility (g.kg"1) OM 589
The organic matter digestibility of the hay when offered ad libitum appeared to be 589 g.kg"1
OM. Assuming an energy value of 20 MJ per kg digestible organic matter and a metabolizability of 0.8 the ME content amounts to 16 MJ per kg digestible organic matter. This figure has been used to estimate the changes in ME intake upon infusion. Similarly, ME content of caseinate was estimated as 23 MJ per kg protein assuming complete metabolizability. ME content of microbial material was estimated as 15.4 MJ per kg organic matter assuming a digestibility of approximately 720 g.kg-1 (Storm et al., 1983) and a gross energy value of 22 MJ. kg"1 OM. The latter figure is based on the crude chemical composition as given by Storm and 0rskov (1983) (see Table 7.3.2). ME content of glucose was taken as its combustion value 15.6 MJ.kg"1. Admittedly, all forementioned ME values can be no more than crude estimates in the absence of true measurements. Yet in order to assess changes in energy intake upon infusion differences in energy content have to be taken into account in some way.
183

Results
Composition of rumen microbial material and caseinate The composition of the rumen microbial material and caseinate are given in Table 7.3.2. Values obtained in this study are compared with values obtained by 0rskov and Storm (1983). Also included are mean data of pure cultures of rumen bacteria collected from the literature by the same authors.
The procedure applied by us to collect rumen microbial material yielded a suspension of rumen microbial cells in rumen fluid. Dehydration of this product was not considered useful, simply because infusion would have required re-addition of water. The suspension could be pumped without causing troubles. However, the admixture of large amounts of rumen fluid caused ash contents of the microbial material to be rather high, on average almost 20% of DM. The variation in dry matter content between individual batches enabled us to make an estimate of ash and minerals associated with the solid and liquid phase. This was done by regressing ash and mineral contents of fresh material on dry matter content of the suspensions. In this way it was estimated that on average 23% of ash, almost 100% of Na, 62% of K, 14% of Mg, an insignificant amount of Ca and 27% of P was actually dissolved in the fluid phase and therefore of non-microbial origin. Likewise ash, Na, K, Mg, Ca and P contents of the solid phase were estimated as 150, 0, 5, 2, 17 and 11 g.kg"1 DM, respectively. As the solid phase will have also included some mineral material of non-microbial origin, the latter figures must still overestimate true contents of microbial cells, though the value of 15% ash is slightly lower than the mean value found for pure cultures in Table 7.3.2.
Nitrogen content of microbial organic matter was lower than found in the experimental work of Storm and 0rskov (1983), but slightly higher than the mean for pure cultures quoted by the same authors. As Storm and 0rskov (1983) already point out, most of the variation in nitrogen content is due to variable contents of reserve carbohydrates. These have not been measured in the present study. But it may be relevant that Storm and 0rskov (1983) used ruminai contents of animals which had been fasted for 12-16 h. In our case most animals were slaughtered immediately after arrival at the abattoir. Consequently, rumen contents had often substantial amounts of freshly ingested feed in combination with low amounts of free liquid. Hence, energy must have been abundantly available to microbial cells probably resulting in higher contents of reserve compounds.
Ammonia-N amounted to less than 5% of nitrogen or 293 mg.kg"1 of fresh rumen microbial material. Such a value is to be expected as it is within the range of values measured in rumen fluid itself for cattle on winter diets.
Amino acid-N and composition are remarkably similar to the values obtained by Storm and 0rskov (1983) and the values found for pure cultures. These authors emphasize the lack of any significant variation in amino acid profile between individual estimates of mixed populations of rumen bacteria. Concentrations of diaminopimelic acid (5-10 mmoLmol"1
amino acids) were in a range as expected from the data of Storm and 0rskov (1983) but could not be accurately assessed from the chromatograms.
The organic part of the caseinate contained minute amounts of lipid and carbohydrate. Amino acid contents agreed with the values provided by the manufacturer, apart from a lower value for cystine (probably due to losses during acid hydrolysis) and a higher value for proline. Differences in amino acid profile between microbial material and caseinate mainly concern the non-essential amino acids and in addition cystine.
184

Table 7.3.2. Chemical composition of rumen microbial mass and caseinate; data of rumen microbial mass are compared with those found by Storm and Orskov (1983).
Source :
Dry matter content DM (g.kg"1)
Composition of dry matter (g.kg~* Ash Nitrogen Lipid Carbohydrate
Composition of org. matter (g.kg'l Nitrogen
Mineral composition (g.kg'l DM) Sodium Potassium Calcium Magnesium Phosphor
Composition of nitrogen (g.kg'l N) Ammonia-N Amino acid (AA)-N
AA composition (mmol.mol"1 AA) Arginine Histidine Isoleucine Leucine Lys ine Methionine Cystine Phenylalanine Tyrosine Threonine Valine
Total (semi)essential AA Alanine Aspartic acid Glutamic acid Glycine Proline Serine
Total non-essential AA
1
78 DM)
198 78
OM) 97
34 13 16 2
15
47 822
35 17 61 80 79 25 10 41 29 53 62
492 95
106 119 90 47 50
507
microbial
6
9 9
4
1 6 3 3 5
2
104. 102.
92. 93.
114.
809
37 14 54 74 72 21 11 43 33 57 59
475 102 117 118 90 44 54
525
3 4 1 2
3
mass 3
168.5 77.7
101.0 155.2
93.4
825
39 17 56 75 76 21 13 38 31 58 66
490 104 109 111 96 39 50
509
case 1
943.
50. 147.
154.
17. <0.
0. <0.
7.
25 24 48 89 73
(24) (0) 36 37 45 70
471 43 66
198 32
123 68
530
0
4 0
8
8 1 5 1 6
inate 4
9.0 2.0
16.0 0.1 0.5
<0.1 7.3
>990
26 24 50 91 67 25 4
38 39 47 73
484 42 68
195 31
104 74
514
1: Present study; 2: mean composition of rumen micro-organisms obtained by large-scale isolation (Storm & Orskov, 1983); 3: mean composition of twenty-nine estimates of pure cultures of rumen bacteria as calculated by Storm & Orskov (1983) from different literature sources; 4: data supplied by factory (DMV, Veghel). ( ) Unlike cystine and methionine in microbial mass these amino acids have not been analysed separately after oxidation to cysteic acid and methionine-sulphone.
185
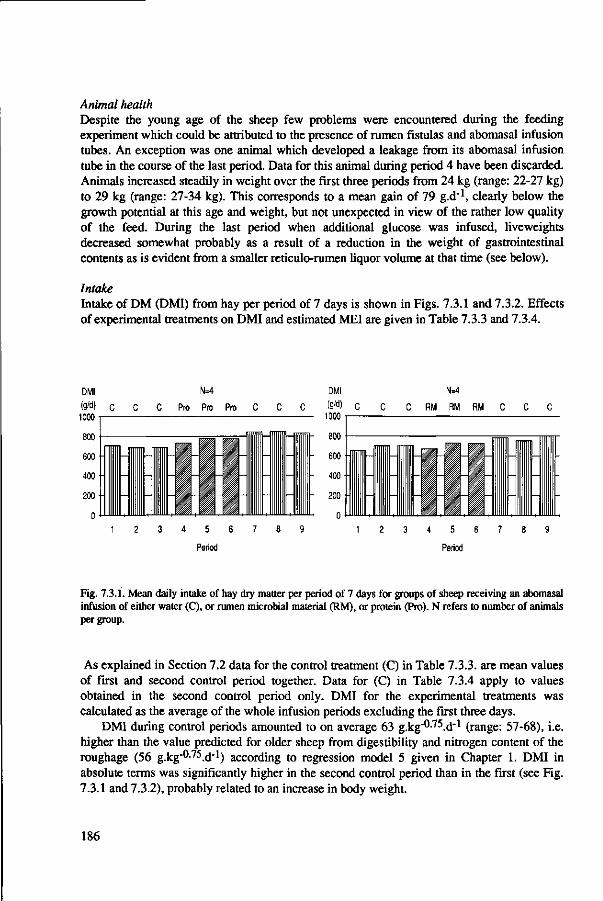
Animal health Despite the young age of the sheep few problems were encountered during the feeding experiment which could be attributed to the presence of rumen fistulas and abomasal infusion tubes. An exception was one animal which developed a leakage from its abomasal infusion tube in the course of the last period. Data for this animal during period 4 have been discarded. Animals increased steadily in weight over the first three periods from 24 kg (range: 22-27 kg) to 29 kg (range: 27-34 kg). This corresponds to a mean gain of 79 g.d"1, clearly below the growth potential at this age and weight, but not unexpected in view of the rather low quality of the feed. During the last period when additional glucose was infused, liveweights decreased somewhat probably as a result of a reduction in the weight of gastrointestinal contents as is evident from a smaller reticulo-rumen liquor volume at that time (see below).
Intake Intake of DM (DMI) from hay per period of 7 days is shown in Figs. 7.3.1 and 7.3.2. Effects of experimental treatments on DMI and estimated MEI are given in Table 7.3.3 and 7.3.4.
Fig. 7.3.1. Mean daily intake of hay dry matter per period of 7 days for groups of sheep receiving an abomasal infusion of either water (C), or rumen microbial material (RM), or protein (Pro). N refers to number of animals per group.
As explained in Section 7.2 data for the control treatment (C) in Table 7.3.3. are mean values of first and second control period together. Data for (C) in Table 7.3.4 apply to values obtained in the second control period only. DMI for the experimental treatments was calculated as the average of the whole infusion periods excluding the first three days.
DMI during control periods amounted to on average 63 g.kg"°-75.d-1 (range: 57-68), i.e. higher than the value predicted for older sheep from digestibility and nitrogen content of the roughage (56 g.kg"0-75.d_1) according to regression model 5 given in Chapter 1. DMI in absolute terms was significantly higher in the second control period than in the first (see Fig. 7.3.1 and 7.3.2), probably related to an increase in body weight.
186

Table 7.3.3. Effects of abomasal infusion of either protein (Pro) or rumen microbial mass (RM) on dry matter intake and estimated metabolisable energy intake of roughage-fed sheep receiving an abomasal infusion of water during control periods (C). Data with standard errors refer to mean intakes during control periods and to mean differences in intake between treatments.
treatment
number of observations n-4
DMI (g.d"1) MEI from feed (MJ.d"1)
767 6.7
734 6.5
39 0.3
treatment difference Pro-C RM-C
DMI (g.d"1) MEI from feed (MJ.d-1) MEI from Infusate (MJ.d-1) MEI total (MJ.d"1)
-7 - 0 . 1 +1 .0
-26 - 0 . 3 + 1 . 1
+1.0* +0.9*
26 0.2 0.03 0.2
significantly different from zero
Table 7.3.4. Effects of abomasal infusion of either protein and glucose (Pro+Glu) or rumen microbial mass and glucose (RM+Glu) on dry matter intake and estimated metabolisable energy intake of roughage-fed sheep receiving an abomasal infusion of water during control periods (C). Data with standard errors refer to mean intakes during control periods and to mean differences in intake between treatments.
treatment
number of observations n=4 n=3
DMI (g.d"1) MEI from feed (MJ.d"1)
841 7.4
780 6.8
56 64 0.5 0.6
treatment difference (Pro+Glu)-C (RM+Glu)-C
DMI (g.d"1) MEI from feed (MJ.d"1) MEI from infusate (MJ.d"1) MEI total (MJ.d"1)
87* - 0 . 8 * +2 .2 + 1 . 5 *
- 1 49* - 1 . 3 * +2 .2 + 0 . 9 *
25 0 . 2 0 . 1 0 . 2
29 0 . 3 0 . 1 0 . 3
significantly different from zero
187

When compared to the average of both control periods DMI was not significantly different during the second period neither with abomasal infusion of rumen microbial material nor with abomasal infusion of caseinate. Both treatments significantly increased estimated MEI to a similar degree, i.e. about 15%.
DMI
m 1000
N=4
C Pro Pro
800 j -
6 0 0 -
400 -r-
200
0
DMI
m 1000
N=3
C RM RM
+Glu +Glu
600
400
200
0
+Glu +Glu
3
Period
3
Period
Fig. 7.3.2. Mean daily intake of hay dry matter per period of 7 days for groups of sheep receiving an abomasal infusion of either water (Q, or rumen microbial material and glucose (RM+Glu), or protein and glucose (Pro+Glu). N refers to number of animals per group.
When additional glucose was infused (treatments RM+Glu and Pro+Glu) DMI from hay decreased significantly, with 19% and 10% for (RM+Glu) and (Pro+Glu) respectively. Nevertheless, estimated MEI was still significantly higher with additional glucose than without, i.e. 13% (RM+Glu) and 20% (Pro+Glu).
Nitrogen retention Data relating to nitrogen balance have been summarized in Table 7.3.5 and 7.3.6. With (C) animals had a positive nitrogen retention of on average 2.2 g.d"1. Infusion of rumen microbial material and caseinate increased total nitrogen intake substantially (by about 50%), yet without any positive effect on nitrogen retention. Most of the extra infused nitrogen was recovered in urine. With additional glucose nitrogen retention increased but only significantly for (Pro+Glu). Even for this treatment utilization of extra infused nitrogen for net protein synthesis remained low: probably some 34%, as can be calculated from the data in Table 7.3.6.
With the control treatment nitrogen retention of individual animals was linearly related to estimated MEI as shown by Fig. 7.3.3. When data for experimental treatments were plotted in the same graph scatter was greatly increased without definite trends being recognizable.
188

Table 7.3.5. Effects of abomasal infusion of either protein (Pro) or rumen microbial mass (RM) on nitrogen balance of roughage-fed sheep receiving an abomasal infusion of water during control periods (C). Data with standard errors refer to mean values during control periods and to mean differences between treatments. All data are expressed in g.d"̂ -.
treatment
number of observations
N-intake from hay N-excretion in faeces N-excretion in urine N-retention
treatment difference
N-intake from hay N-intake from Infusate N-intake hay + Infusate N-excretion in faeces N-excretion in urine N-retention
C
4
13.2 6.0 5.2 2.0
Pro-C
+0.6 +6.8 +7.4* +1.3* +5.8*a
+0.3
C
4
13.8 6.3 5.0 2.4
RM-C
-1.1 +6.9 +5.9* +2.3* +3.7*b
-0.1
se
n=4
0.7 0.4 0.2 0.4
se
1.0 0.2 1.1 0.5 0.5 0.4
: significantly different from zero a": values in a row with different superscripts are significantly different from each others (p<0.05).
Mineral retention Data on mineral retention are given in Table 7.3.7 and 7.3.8. Measurements of mineral retention showed a large variation between animals as is apparent from the high standard errors in both tables. Apart from true differences between animals, low accuracy of the measurements may also partly explain the high variability. For K, Ca, Mg and P retention varied between less than 1 and 7% of intake on treatment (C). A higher figure (24%) applied to Na. Taking into account a high level of excess feeding further reduces the accuracy to be expected for estimates of mineral retention.
Only Na retention was significantly changed, i.e. reduced, by infusion of rumen microbial material or caseinate alone. In combination with glucose the same was found. In addition Ca retention appeared to be lower for (RM+Glu) as compared to (C).
Ruminai parameters Table 7.3.9 and 7.3.10 give values for a number of ruminai parameters. Values for pH and VFA are in a range to be expected for a roughage of medium digestibility and nitrogen content.
189

Table 7.3.6. Effects of abomasal infusion of either protein and glucose (Pro+Glu) or rumen microbial mass and glucose (RM+Glu) on nitrogen balance of roughage-fed sheep receiving an abomasal infusion of water during control periods (C). Data with standard errors refer to mean values during control periods and to mean differences between treatments. All data are expressed in g.d"^.
treatment
number of observations
N-intake from hay N-excretion in faeces N-excretion in urine N-retention
treatment difference
N-intake from hay N-intake from infusate N-intake hay + infusate N-excretion in faeces N-excretion in urine N-retention
C
4
13.2 6.0 5.2 2.0
(Pro+Glu)-C
+0.9 +7.4 +8.2* +0.9 +4.8* +2.5*
C
3
13.6 6.3 5.0 2.3
(RM+Glu)-C
-2.5 +7.5 +5.0* +1.5 +3.2* +0.3
n=4
0.8 0.5 0.2 0.4
1.4 0.3 1.5 0.9 0.6 0.6
se
n=3
0.9 0.5 0.2 0.5
se
1.6 0.3 1.8 1.0 0.7 0.7
significantly different from zero
NH4-N concentration exceeded the level of 50 mg.H that is often considered critical for optimal microbial growth i.e not constrained by a nitrogen deficiency. Ruminai fluid volume was relatively large when related to body weight: taking into account intestinal contents total gut fill must have amounted to more than 30% of liveweight. With (Pro) and (RM) only Na concentration of ruminai fluid was significantly changed (increased); the same was observed with (RM+Glu). With (Pro+Glu) a significant increase was found for ruminai osmolality and a significant decrease of pH. The meaning of these changes is not apparent. Ruminai fluid volume decreased upon addition of glucose to the abomasal infusate, probably as a consequence of a lower DMI with these treatments.
Blood parameters Information on blood parameters is summarized in Table 7.3.11 and 7.3.12. Some parameters showed changes with time as indicated by significant differences between first and second control period. Significant decreases were noted for hemoglobin concentration and hematocrit, a significant increase for serum Na concentration. The fact that these changes were non-linear with time may be the cause that hemoglobin concentration in the second period was found to be significantly lower than the average of first and second control period.
190

Both protein infusion and infusion with rumen microbial material significantly increased glucose and urea concentration. These changes were also present when additional glucose was infused. Besides plasma protein was lower with (Pro+Glu) and (RM+Glu).
Nitrogen retention
0.5 T (g/kg MW/d)
0.4
0.3 ••
0.2
0
•
• •
• O •
A A
O
•
• c
o Pro
A RM
• Pro+Glu
* RM+Glu
0.4 0.5 0.6 0.7
MEI (MJ/kgMW/d)
Fig. 7.3.3. The relation between estimated metabolizable energy intake (MEI) and nitrogen retention for sheep receiving hay with an abomasal infusion of either water (C), or protein (Pro) or rumen microbial material (RM) or protein and glucose (Pro+Glu) or rumen microbial material and glucose (RM+Glu). Data are from individual sheep.
Discussion
Unlike our hypothesis, extra rumen microbial material infused into the abomasum did not increase the intake of roughage and neither did extra protein. Intake changes were absent despite the fact that at least the intake of total nitrogen was substantially increased. In addition, the extra protein supplied was utilized inefficiently as became apparent from nitrogen balance measurements. Higher blood urea concentrations with both (RM) and (Pro) also point to an increased breakdown of protein by the host animal. The absence of a significant positive effect of glucose addition on nitrogen balance with (RM+Glu) will have had different causes. A decrease of nitrogen intake from hay, a lower proportion of protein nitrogen in the infusate of (RM+Glu) compared to (Pro+Glu), and a lower digestibility of microbial protein compared to caseinate will have all contributed to it.
191

Table 7.3.7. Effects of abomasal infusion of either protein (Pro) or rumen microbial mass (RM) on mineral retention of roughage-fed sheep receiving an abomasal infusion of water during control periods (C). Data with standard errors refer to mean values during control periods and to mean differences between treatments.
treatment
number of observations 4 4 n=4
retention of P Na K Ca Mg
treatment difference Pro-C RM-C
0 .27 0 . 5 4 0 .45 0 . 2 1 0 . 01
0 .28 0 . 5 4 0 .98 0 .26 0 . 03
0 . 0 4 0 . 1 1 0 . 27 0 . 08 0 . 02
retention of P Na K Ca Mg
significantly different from zero
+0 .04 - 0 . 3 8 * - 0 . 1 8 - 0 . 0 1 +0 . 02
- 0 . 0 5 - 0 . 3 8 * - 1 . 1 5 - 0 . 1 0 - 0 . 0 2
0 . 1 4 0 . 1 1 0 . 65 0 . 18 0 . 06
From these results it must be inferred that either our hypothesis has been incorrect or that our test has failed. A failure to test correctly the effect of an increased availability of microbial nutrients might be due to the use of a non-representative microbial preparation. Despite the similarities in composition of the microbial organic material between our study and literature reports some caution is needed.
For instance, the composition of rumen microbial material may have not been representative for the total microbial population normally leaving the rumen with digesta. The suspension that we used will have mainly consisted of bacteria associated with the liquid phase and hardly of bacteria attached to digesta particles. The latter usually form the majority of bacteria which arrive at the duodenum (Faichney, 1980). Comparisons of the composition of solid and liquid-associated bacteria have shown that the former had significantly less ash, total N, RNA and diaminopimelic acid and significantly more lipid than the latter (Merry and McAllan, 1983). Especially remarkable was a lipid content of 268 g.kg"1 OM in solid-associated bacteria compared to only 147 g.kg"1 OM in liquid-associated bacteria. Carbohydrate contents of bacterial preparations also are not constant but vary depending among others on nutritional conditions. The impact of such variations on the host animal have not been examined and are therefore difficult to judge.
192

Table 7.3.8. Effects of abomasal infusion of either protein and glucose (Pro+Glu) or rumen microbial mass and glucose (RM+Glu) on mineral retention of roughage-fed sheep receiving an abomasal infusion of water during control periods (C). Data with standard errors refer to mean values during control periods and to mean differences between treatments.
treatment
0 .27 0 . 5 4 0 .45 0 . 2 1 0 . 0 1
0 . 2 4 0 . 50 1 .00 0 . 29 0 . 02
0 . 0 4 0 . 1 1 0 .29 0 .09 0 . 02
0 . 0 4 0 . 1 3 0 . 3 4 0 . 10 0 . 03
number of observations 4 3 n=4 n=3
retention of P Na K Ca Mg
treatment difference (Pro+Glu)-C (RM+Glu)-C
retention of P Na K Ca Mg
- 0 . 0 6 - 0 . 7 0 * +0 .48 - 0 . 0 6 - 0 . 0 3
- 0 . 3 2 - 1 . 0 1 * - 1 . 0 0 - 0 . 6 0 * +0 . 08
0 . 15 0 . 20 0 . 86 0 . 16 0 . 07
0 .17 0 . 23 1 .00 0 . 19 0 . 08
significantly different from zero
From the observed effects of additional glucose one can hardly expect that the presence of larger amounts of bacterial carbohydrate would have positively influenced the intake response to an increased availability of microbial material. The nutritional role of bacterial lipids is less certain. Abomasal infusion of corn oil at a level of 14 g.d"1 did not affect intake of lambs of 25-30 kg body weight (Papas et al., 1974). When the amount of oil was doubled, intake was severely depressed. The amount of microbial lipids administered in our experiment must have been lower, probably not more than 10 g.d"1. It is, however, uncertain whether the results of Papas et al. (1974) also apply to lipids of microbial origin.
Contamination of the microbial suspension with large amounts of rumen fluid may have also obscured the true response to a more ample supply of microbial nutrients. Contamination first concerned minerals dissolved or suspended in rumen fluid, though a large effect of these substances seems unlikely. Apart from minerals the suspension will have been contaminated by VFA. In planning the experiments their potential role has been overlooked and concentrations have not been measured. Assuming a concentration somewhere between 100 and 200 mmol.l"1, infusâtes will have supplied animals an additional 0.1-0.4 mol VFA per day.
193

Table 7.3.9. Effects of abomasal Infusion of either protein (Pro) or rumen microbial mass (RM) on ruminai parameters of roughage-fed sheep receiving an abomasal infusion of water during control periods (C). Data with standard errors refer to mean values during control periods and to mean differences between treatments.
treatment
number of observations 4 4 n=4
0.03 5 1.3 3 4 3 0.5 0.5
PH NH4-N (mg.l-1) buff, capacity (mmol.l"1)** Na (mmoLl"1) osmolarity (mosmol.l"1) VFA (mmol.l-1) fluid volume (1) fluid outflow (X.h"1)
6.76 87 30.5
110 251 61 7.0 6.6
6.8 84 31.2
113 258
64 7.0 7.2
-0.01 +5 -2.3 +6* +7 +6 +0.0 +0.5
-0.01 +1 -1.5 +6* -2 +2 -0.3 +0.8
0.03 9 1.4 1 3 3 0.4 0.9
treatment difference Pro-C RM-C
PH NH4-N (mg.l"1) buff, capacity (mmol.1"1)** Na (mmol.l-1) osmolarity (mosmol.l-1) VFA (mmol.l-1) fluid volume (1) fluid outflow (X.h"1)
* :significantly different from zero ** buffering capacity in mmol H + .l _ 1 to change pH 0.25 unit at pH=6.5
This amount is small relative to the total amounts absorbed from the basal feed (probably some 4 mold"1 as calculated on the basis of data in Table 4.2, Chapter 4). Compared to the amounts absorbed from omasum and abomasum (about 0.8 mold"1 in this case) it is an appreciable quantity. Therefore a significant disturbance of VFA concentration in abomasum and duodenum may well have occurred.
In view of the above remarks some caution must be taken in extrapolating the findings reported here to an increased availability of microbial material under normal feeding conditions. Yet a dominant effect of the ratio between VFA produced in the rumen and microbial nutrients digested in the small intestine on intake as hypothesized before seems unlikely. Additional glucose was given to see wether this would improve the response of intake and protein utilization.
194

Table 7 .3 .10 . Effects of abomasal infusion of e i ther protein and glucose (Pro+Glu) or rumen microbial mass and glucose (RM+Glu) on ruminai parameters of roughage-fed sheep receiving an abomasal infusion of water during control periods (G). Data with standard errors refer to mean values during control periods and to mean differences between treatments.
treatment
number of observations
PH NH4-N (mg.l-1) buff, capacity (mmoLl-1)** Na (mmoLl"1) osmolarity (mosmol.l-1) VFA (mmol.l'1) fluid volume (1) fluid outflow (X.h"1)
treatment difference
PH NH4-N (mg.l"1) buff, capacity (mmol.l"1)** Na (mmol.l-1) osmolarity (mosmol.l-1) VFA (mmol.l-1) fluid volume (1) fluid outflow (Ä.h"1)
C
4
6.81 95 31.3
110 256
62 7.3 6.5
(Pro+Glu)-C
-0.12* +1 -2.5 +5 +9*a
+6 -1.0* +0.6
C
3
6.85 85 32.6
112 260
64 7.6 7.4
(RM+Glu)-C
-0.05 -6 -1.3 +7* +1* -0 -1.7* +0.7
n=4
0.03 8 1.1 3 4 2 0.7 0.4
0.02 9 1.9 2 1 3 0.4 0.5
se
n-3
0.03 9 1.3 3 5 2 0.8 0.5
se
0.03 11 2.2 3 2 3 0.4 0.5
: s i gn i f i can t ly d i f ferent from zero &": values in a row with d i f ferent superscripts are s i gn i f i cant ly d i f ferent from each others (p<0.05). ** buffering capacity in mmol H+.l"1 to change pH 0.25 unit at pH=6.5
Unexpectedly, roughage intake decreased and nitrogen utilization remained low. The amount of glucose administered (5 g.kg"°-75.d_1) does not seem to be excessive. It equals the rate of glucose synthesis estimated in lambs at maintenance level. In fast growing lambs glucose synthesis may amount to 18 g.kg-0-75.d_1 (Kempton et al., 1977). Qualitative tests on the presence of glucose in urine when glucose was infused in our lambs, were negative.
Probably most of the glucose infused will have been absorbed from the small intestine as glucose absorption capacity in young steers has been found to exceed 25 g.kg"0-75^"1
(McAllan and Lewis, 1985) and intestinal starch digestion capacity for mature sheep is estimated at 10-15 g.kg-°-75.d_1 by 0rskov (1986). Local changes in the osmolarity of intestinal contents will have occurred but must have been small.
195

Table 7.3.11. Effects of abomasal infusion of either protein (Pro) or rumen microbial mass (RM) on blood parameters of roughage-fed sheep receiving an abomasal infusion of water during control periods (C). Data with standard errors refer to mean values during control periods and to mean differences between treatments.
treatment
6 .9 0 . 3 1
70 52 . 8 14 . l a
7 .5 2 5 . 7
3 . 2 4 . 0
148 4 . 8
6 .5 0 . 29
69 5 6 . 3 13 . l b
7 .2 2 3 . 6
3 . 2 4 . 2
147 4 . 9
0 . 2 0 . 0 1 2 2 . 6 0 . 2 1 .0 1 .8 0 . 1 0 . 4 0 . 4 0 . 0 4
number of observations 4 4 n=4
hemoglobin (mmol.l"*-) hematocrit (l.l"1) plasma protein (g.l"*
albumin (X) alphaglobulin (%) betaglobulin (%) gammaglobulin (X)
glucose (mmol.l"*-) urea (mmol.l"*-) serum Na (mmol.l"*-) serum K (mmol.l"*-)
treatment difference Pro-C RM-C
hemoglobin (mmol.l"*-) hematocrit (l.l"1) plasma protein (g.l"*-)
albumin (X) alphaglobulin (X) betaglobulin (X) gammaglobulin (X)
glucose (mmol.l"*-) urea (mmol.l"*-) serum Na (mmol.l"*-) serum K (mmol.l"*-)
ju
: significantly different from zero * . values in a row with different superscripts are significantly different from each others (p<0.05).
Abomasal digesta flow can be estimated from ruminai liquor outflow multiplied by a factor of 1.3 for a roughage of some 60% digestibility (see Table 4.2, Chapter 4). This would yield a abomasal digesta flow of some 13 l.d"1. Assuming an osmolality of 300 mosmol.l"1 for abomasal digesta, the infusate of glucose will have caused a local increase in osmolality of less than 10%.
196
- 0 . 3 * - 0 . 0 2 * - 0 . 5 +0 . 2 - 0 . 6 - 0 . 7 + 1 . 1 + 0 . 3 * + 2 . 1 * +0 .5 + 0 . 1
- 0 . 3 * - 0 . 0 1 - 1 . 0 - 1 . 3 - 0 . 3 +0 . 4 + 1 . 1 + 0 . 2 * + 1 . 6 * +0 . 3 - 0 . 1
0 .08 0 . 0 1 0 .7 1 .2 0 . 3 0 . 4 0 . 7 0 . 05 0 . 2 1 .0 0 . 1

Table 7 .3 .12 . Effects of abomasal infusion of e i ther protein and glucose (Pro+Glu) or rumen microbial mass and glucose (RM+Glu) on blood parameters of roughage-fed sheep receiving an abomasal infusion of water during control periods (C). Data with standard errors refer to mean values during control periods and to mean differences between treatments.
treatment
number of observations
hemoglobin (mmol.l"1) hematocrit (l.l"1) plasma protein (g.!"-*-)
albumin (X) alphaglobulin (X) betaglobulin (X) gammaglobulin (X)
glucose (mmol.l"1) urea (mmol.l"-'-) serum Na (mmol.l"1) serum K (mmol.l"1)
treatment difference
hemoglobin (mmol.l"'-) hematocrit (l.l"1) plasma protein (g.l"1)
albumin (X) alphaglobulin (X) betaglobulin (X) gammaglobulin (X)
glucose (mmol.l"-'-) urea (mmol.l"1) serum Na (mmol.l"1) serum K (mmol.l"1)
C
4
6.4 0.29
70 54.7 14.6a
6.4 24.4 3.2 4.2
149 4.8
(Pro+Glu)-C
+0.1 +0.00 -2* -0.7 -0.5 +1.5 -0.3 +0.4* +1.8*a
-0 -0.0
C
3
6.3 0.28
72 56.5 13.2b
7.2 23.2
3.3 4.5
148 5.0
(RM+Glu)-C
+0.4 +0.01 -4* +1.6 -0.0 -0.3 -1.3 +0.3 +0.7*b
+0 -0.1
n=4
0.1 0.01 2.0 2.7 0.2 0.8 1.8 0.1 0.3 0.6 0.1
0.1 0.01 0.5 1.4 0.5 0.9 1.1 0.1 0.2 1.0 0.1
se
n=3
0.2 0.01 2.3 3.1 0.3 1.0 2.1 0.1 0.4 0.7 0.1
se
0.1 0.01 0.6 1.6 0.5 1.0 1.4 0.1 0.2 1.2 0.1
: s i gn i f i can t ly d i f ferent from zero a b : values in a row with d i f ferent superscripts are s i gn i f i can t ly d i f ferent from each others (p<0.05).
With starch as the carbohydrate source, the disturbance of osmolality would have been still much lower. Yet later experiments (Exp. 3b and c) did not show any difference in intake response to equicaloric amounts of glucose or starch.
A relatively larger change might have occurred in the metabolism of gut tissue which in turn may have resulted in a change of subststrate partitioning between gut and other tissues. On biochemical grounds it is often thought that additional glucogenic energy will improve the
197

capacity to convert acetate into lipid and thus roughage intake capacity. If, however, extra abomasally infused glucose is preferentially used by gut tissues, a higher acetate load upon other body tissues may be the unintended consequence of such infusions. In fact, positive effects of abomasally administered glucose on roughage intake appear to be lacking in the literature. Data of Leng (1982) from an experiment with lambs on a semi-purified diet show a negative effect of abomasally infused glucose. Also Barry and Manley (1985) found intake of fresh rye-grass to be depressed in pregnant ewes when glucose was infused into the duodenum. A negative effect was also reported in a short term study with cattle by Gill et al. (quoted in Gill, 1988). Finally, with cattle grazing barley stubble and mature pasture and given no supplement or a supplement of fishmeal or fishmeal plus abomasal glucose, Hynd (1989) did not find a change of herbage intake upon glucose infusion. Clearly, more research is needed to clarify the role of glucose in ruminant nutrition.
198

7.4 Effects of ruminai infusion of potassium citrate with
or without abomasal infusion of microbial material
and effects of ruminai infusion of grass juice (Exp. 2)
Aim
The aim of this experiment was twofold: l.to test whether an increased concentration of potassium in rumen fluid, alone or in
combination with extra abomasal protein (microbial material) increases the roughage intake of sheep,
2. to test whether ruminai administration of grass juice increases the roughage intake of sheep.
Experimental details
Extraction of grass juice Grass juice was extracted from a single batch of fresh spring grass using a screw press (Wieringa et al., 1980). A total amount of 1000 1 juice was collected from about 2 tons of fresh grass. Care was taken to prevent separation of solid and liquid components in the juice before transferring the juice into polyethylene bags of one kg each. The juice was then put into a container at -25 °C. Due the large quantity it took several days before the juice became completely frozen.
Feeding experiment For the feeding trial 8 mature wether sheep fitted with rumen fistulas and abomasal infusion tubes were divided in two groups of 4. Following an adaptation period of 1 week, the experiment had 4 subsequent periods each lasting 3 weeks. The first and third periods served as control periods during which all animals were given hay in combination with a ruminai and abomasal infusion of water. In the second period one group of animals received a ruminai infusion with K-citrate (Merck), equivalent to 0.5 mold"1 of K, dissolved in water (2.4 1) so as to be isotonic with ruminai fluid (280 mosmol.l"1). The other group received the same treatment but in addition an abomasal infusion of rumen microbial material, equivalent to 0.6 g microbial N.kg"°-75.d_1. Microbial material came from the same source as used in Exp. 1. In the fourth period grass juice was infused into the rumen. As we then had lost one animal, 3 animals received a low dose, corresponding to 4 kg.d"1 of fresh juice, the other 4 a high dose equivalent to 8 kg.d"1 of fresh juice. The high dose was chosen so as to obtain a K dose comparable to the amount administered with K-citrate.
Throughout periods 1, 2 and 3 amounts of fluid infused were kept constant at ±2.4 l.d"1
for ruminai infusions and ±1.9 l.d"1 for abomasal infusions. As a consequence amounts of fluid infused were substantially higher in period 4 compared to its control: period 3. This should be kept in mind for the interpretation of effects of grass juice administration.
199

Fresh solutions of microbial material and grass juice were prepared twice daily. Infusion vessels were kept cool on melting ice to prevent deterioration. The rumen microbial suspension and grass juice were stirred continuously to prevent unmixing.
Roughage intake was measured daily. Animals were weighed weekly. The last 7 days of each period were used to collect faeces. At the end of the second week of each period two blood samples per animal were collected on subsequent days. Samples were analysed for hemoglobin, hematocrit, total protein, protein spectrum, glucose, urea, serum Na and K. On the same days samples of rumen fluid were withdrawn after animals had been dosed with Cr-EDTA intraruminally. Measurements included ruminai pH, concentrations of NH4-N, VFA, Na, K, Ca, Mg, Cl, PO4. In addition rumen volume and rumen fluid outflow were calculated from Cr concentrations.
As roughage a mixed grass hay was used with a composition as shown in Table 7.4.1. Organic matter digestibility of the hay as measured during control periods appeared to be 634 g.kg"1 OM. ME content of the hay was calculated assuming an ME content of digestible organic matter equal to 16 MJ per kg digestible organic matter. ME contents of rumen microbial material and K-citrate were estimated as respectively 15.4 MJ.kg"1 OM (see Exp. 1) and 10.3 MJ.kg"1 OM. Grass juice was assumed to be completely digestible, having an ME content of 16 MJ.kg"1 OM.
Table 7.4.1. Chemical composition and digestibility of hay (Exp. 2)
Dry matter content DM (g.kg"1)
Composition of dry matter (g.kg"1- DM) Ash Nitrogen Crude fiber
Mineral composition (g.kg"1- DM) Sodium Potassium Calcium Magnesium Phosphor Sulphur
Digestibility (g.kg"1) OM
883
88 15.3
290
2.8 13.6 5.0 2.2 2.6 2.2
634
Results
Composition of grass juice The composition of fresh grass, extracted juice and pressed grass are given in Table 7.4.2. Conditions for efficient extraction of dry matter present in cell contents were unfavourable as a result of a low dry matter content of the fresh grass (132 g.kg"1).
200

Table 7.4.2. Chemical composition of fresh grass, pressed grass and juice.
Dry matter content DM (g.kg-1)
Composition of dry matter Ash Nitrogen Crude fiber
Mineral composition (g.kg-
Sodium Potassium Calcium Magnesium Phosphor Sulphur
Composition of N (g.kg N) Ammonia-N Nitrate-N Amino acid (AA)-N
AA composition (mmol.moi-' Arginine Histidine Isoleucine Leucine Lysine Methionine Cystine Phenylalanine Tyrosine Threonine Valine
Total (semi)essential AA Alanine Aspartic acid Glutamic acid Glycine Proline Serine
Total non-essential AA
(g.kg"1
1 DM)
AA)
fresh grass
132 DM)
144 29.1
179
2.5 31.0 4.3 1.7 3.1 3.4
68 697
44 19 45 86 66 13 3
45 24 55 66
466 128 92 99
102 58 55
534
pressed grass
223
130 26.
217
2. 25. 3. 1. 2. 2.
43 770
45 18 47 91 59 14 2
49 25 54 66
472 120 93
100 104 56 56
529
9
0 3 4 4 8 6
juice
39
172 38.1 0
6.6 72.9 10.6 3.6 6.4 7.9
9.8 13
744
42 18 47 89 70 14 2
50 25 53 66
476 111 99 99
103 56 57
524
This was caused by rainy weather prior to harvesting. Extraction ratios - defined as the ratio between yield of component in juice and amount of component present in fresh grass - were estimated to be about 0.5 for water, 0.15 for dry matter and 0.19 for crude protein (N * 6.25). These values are similar to results obtained in previous experiments with the same press for early season grass of low dry matter contents (Wieringa et al., 1980). As a result of the high extraction ratio for water as compared to the low ratio for dry matter, juice dry matter content was very low, amounting to only 39 g.kg"1. Nitrogen content of the juice dry matter was 31%
201

higher than in the original material but it still did not reach 4%. Subtracting amounts of crude protein and ash from total dry matter in juice it can be estimated that approximately 60% of the juice dry matter must have been composed of carbon components. These have not been analysed, but they probably consisted mainly of soluble reserve carbohydrates (fructans) with some additional lipid material and organic acids. These are all highly digestible substances. It is important to note the magnitude of this fraction as it probably influenced protein transactions in the rumen and the overall response of the experimental animals to juice administration.
As expected, large amounts of minerals from the fresh grass accumulated in the juice: contents of Na, K, Ca, Mg, P and S were 2.1 to 2.6 times higher in juice dry matter than in the original grass dry matter.
Of the total nitrogen in juice 70 to 77% was recovered as amino-acid nitrogen. Differences between the three fractions probably do not reflect true differences in the contribution of amino acids to total nitrogen, as it is difficult to explain the finding of a lower value in the fresh grass than in the constituting fractions of juice and pressed grass. Values for amino-acid nitrogen found here are lower than the values of over 80% calculated from different sources quoted by Lyttleton (1973). Lower values may be due to the presence of a larger fraction of non-amino acid nitrogen or to losses of amino acids during analysis.
Differences in amino acid composition of fresh grass, pressed grass and juice were small. Large differences were not expected in view of the low extraction ratio for protein. In addition, different protein extracts from leaf tissue usually show very similar amino acid composition according to data shown by Lyttleton (1973). Contents of most amino acids fall within the range of values quoted by the same author except for lysine and alanine which are somewhat higher and the value for cystine which is lower. The latter is certainly due to losses during analysis as cystine was not measured separately as cysteic acid. Comparisons of amino acid contents with published data are probably obscured by the method of sample preparation or analysis. Differences between herbage proteins of different species and plant ages appear to be small when only analyses of the same laboratory are considered (Lyttleton, 1973; Demarquilly et al., 1981). Much larger differences - up to twofold for individual amino acids - are found when values are compared for the same type of herbage protein (lucerne protein for instance) but analysed in different laboratories (Lyttleton, 1973).
When the amino acid composition of grass juice is compared with the composition of rumen microbial material (see Table 6.3.2) both appear to be strikingly similar. Differences mainly concern the sulphur containing amino acids and these probably arise from analytical differences as noted above. For this reason, any scope for changes in amino acid composition of duodenal contents upon juice administration will have been small. In agreement with this conclusion is the observation that duodenal amino acid composition of sheep fed herbage of different protein content was almost constant (Hogan et al., 1969).
Animal health One animal showed a gradually diminishing intake during period 2 and was removed from the experiment. No recovery was observed over the following weeks and the animal was killed. Post-mortem examination revealed signs of pericarditis. Another animal developed a skin lesion over its ankle joint but responded quickly to treatment.
202

As already mentioned in Section 7.2, data of the last week of period 4 had to be discarded. As a result no information was obtained on digestion of the hay diet in combination with grass juice infusion. Animals weighed on average 52 kg (range: 47-58 kg) at the start of the experiment and 55 kg (range: 48-61 kg) at the end, 11 weeks later.
DMI
(g/d)
1200 i
N=4
K
5 6
Period
Fig. 7.4.1. Mean daily intake of hay dry matter per period of 7 days for groups of sheep receiving either ruminai and abomasal infusions of water (C), or a ruminai infusion of a K-citrate solution (K), or the same in combination with an abomasal infusion of rumen microbial material (K+RM). N refers to number of animals per group.
DMI
(g/d)
1200
1000
800
600
400
200
N=3
C LJui Uui
II II L
3
Period
DMI
(g/d)
1200
1000 -
800 -
600 -
400 • -
200 -
oL-
N=3
C C HJui HJui
h 3
Period
Fig. 7.4.2. Mean daily intake of hay dry matter per period of 7 days for groups of sheep receiving either a ruminai infusion of water (C) or a ruminai infusion of grass juice at a low level (LJui) or a high level (HJui). N refers to number of animals per group.
203

Intake DMI from hay per period of 7 days is shown in Figs. 7.4.1 and 7.4.2. Mean DMI for the first control period was calculated from daily intake during the first three weeks. Mean DMI for both treatments with K-citrate infusion and for the second control period was calculated as the average of the last 18 days of the 3 weeks period. Mean DMI with grass juice infusion was taken as the average daily intake during the second week as intake had not stabilized before and data for the third week had to be discarded due to unusual climatic conditions. Effects of experimental treatments on DMI and estimated MEI are given in Table 7.4.3 and 7.4.4. As explained in Section 7.2, data for the control treatment (C) in Table 7.4.3 are mean values of first and second control period together. Data for (C) in Table 7.4.4 apply to values obtained in the second control period only.
Table 7.A.3. Effects of e i ther a ruminai infusion of a K-citrate solution (K) alone or the same in combination with an abomasal infusion of rumen microbial mass (K+RM) on dry matter intake and estimated metabolisable energy intake of roughage-fed sheep receiving ruminai and abomasal infusions of water during control periods (C). Data with standard errors refer to mean intakes during control periods and to mean differences in intake between treatments.
treatment
number of observations n=4 n=3
DMI (g.d"1) MEI from feed (MJ.d"1)
1120 10.3
1093 10.1
46 53 0.4 0.5
treatment difference K-C (K+RM)-C
DMI (g.d"-1-) MEI from feed (MJ.d"1) MEI from Infusate (MJ.d"1) MEI total (MJ.d"1)
+20 +0.2 +0.3a
+0.5
-78 -0.7 +2.2b
+1.4*
32 37 0.3 0.3 0.02 0.02 0.3 0.3
significantly different from zero values in a row with different superscripts are significantly different
from each others (p<0.05).
ab
Mean DMI per animal during both control periods amounted to 57 g.kg"0-75^"1 (range: 52-60), similar to the amount predicted from digestibility and nitrogen content of the roughage (56 g.kg"°-75.d_1) according to regression model 5 given in Chapter 1. Between both control periods DMI was not significantly different.
204
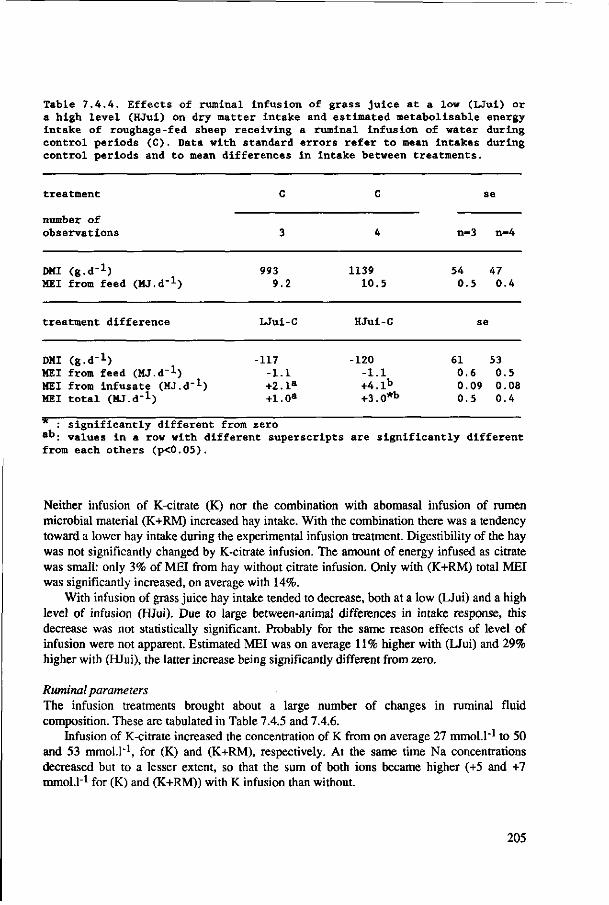
Table 7.4.4. Effects of ruminai Infusion of grass juice at a low (LJul) or a high level (HJui) on dry matter Intake and estimated metabollsable energy intake of roughage-fed sheep receiving a ruminai infusion of water during control periods (C). Data with standard errors refer to mean intakes during control periods and to mean differences in intake between treatments.
treatment
number of observations
DMI (g.d"1) MEI from feed (MJ.d'1)
treatment difference
DMI (g.d"1) MEI from feed (MJ.d"1) MEI from Infusate (MJ.d-1) MEI total (MJ.d"1)
C
3
993 9.2
LJui-C
-117 -1.1 +2.1a
+1.0a
C
4
1139 10.5
HJui-C
-120 -1.1 +4.1b
+3.0*b
se
n=3 n=4
54 47 0.5 0.4
se
61 53 0.6 0.5 0.09 0.08 0.5 0.4
: s ignificantly different from zero a b : values in a row with different superscripts are s ignificantly different from each others (p<0.05).
Neither infusion of K-citrate (K) nor the combination with abomasal infusion of rumen microbial material (K+RM) increased hay intake. With the combination there was a tendency toward a lower hay intake during the experimental infusion treatment. Digestibility of the hay was not significantly changed by K-citrate infusion. The amount of energy infused as citrate was small: only 3% of MEI from hay without citrate infusion. Only with (K+RM) total MEI was significantly increased, on average with 14%.
With infusion of grass juice hay intake tended to decrease, both at a low (LJui) and a high level of infusion (HJui). Due to large between-animal differences in intake response, this decrease was not statistically significant. Probably for the same reason effects of level of infusion were not apparent. Estimated MEI was on average 11% higher with (LJui) and 29% higher with (HJui), the latter increase being significantly different from zero.
Ruminai parameters The infusion treatments brought about a large number of changes in ruminai fluid composition. These are tabulated in Table 7.4.5 and 7.4.6.
Infusion of K-citrate increased the concentration of K from on average 27 mmol.l"1 to 50 and 53 mmol.l'1, for (K) and (K+RM), respectively. At the same time Na concentrations decreased but to a lesser extent, so that the sum of both ions became higher (+5 and +7 mmol.l"1 for (K) and (K+RM)) with K infusion than without.
205

Table 7.4.5. Effects of either a ruminai infusion of a K-citrate solution (K) alone or the same in combination with an abomasal infusion of rumen microbial mass (K+RM) on ruminai parameters of roughage-fed sheep receiving ruminai and abomasal infusion of water during control periods (C). Data with standard errors refer to mean values during control periods and to mean differences between treatments.
treatment
number of observations
K (mmol.l"1) Na (mmol.l"1) Mg (mmol.l-1) Ca (mmol.l - 1 ) NH4 (mmol.l-1) sum of cations (mmol.l"1) PO4 (mmol.l-1) CI (mmol.l-1) Ac (mmol.l-1) Prop (mmol.l"1) But (mmol.l"1) sum of VFA (mmol.l"1) pH fluid volume (1) fluid outflow (%-h"1) fluid outflow (l.d-1)
treatment difference
K (mmol.l"1) Na (mmol.l"1) Mg (mmol.l-1) Ca (mmol.l"1) NH4 (mmol.l-1) sum of cations (mmol.l"1) PO4 (mmol.l-1) CI (mmol.l"1) Ac (mmol.1"1) Prop (mmol.l"1) But (mmol.l"1) sum of VFA (mmol.l"1) pH fluid volume (1) fluid outflow (X.h"1) fluid outflow (l.d-1)
C
4
26 107
1.6 2.0 5.9
143 16.6 10.4 62 19
7 87
6.77 8.5 7.7
15.5
K-C
+24* -19*
+0.7* +0.0 -0.4 +6* - 5 . 1 * a
-0.2 + 4 * a
+3 +0 +7 +0.05 -0.7 + 0 . 7 * a
+0.0
C
3
27 103
1.9 2.2 6.4
141 15.4
9.5 65 20
8 93
6.68 7.9 7.9
14.8
(K+RM)-C
+26* -19*
+0.5 -0.3 -0.1 +7* -0.7 b
-0.5 -lt> -5 -1 -6 +0.06 -0.1 - 0 . 2 b
-0.6
se
n=4
0.9 2.4 0.2 0.06 0.5 2.0 1.0 0.6 3.1 1.1 0.5 3.8 0.04 0.6 0.2 1.2
n=3
1.0 2.8 0.2 0.07 0.6 2.4 1.2 0.7 3.6 1.3 0.6 4.4 0.04 0.7 0.2 1.4
se
2.7 2.8 0.2 0.10 0.4 1.0 0.9 0.5 1.2 2.6 0.4 3.9 0.02 0.6 0.2 1.0
3.1 3.2 0.2 0.12 0.4 1.2 1.0 0.5 1.3 3.0 0.4 4.5 0.02 0.7 0.2 1.2
: significantly different from zero *": values in a row with different superscripts are significantly different from each others (p<0.05).
206

Table 7.4.6. Effects of a ruminai infusion of grass juice at a low (Uui) or a high level (HJui) on ruminai parameters of roughage-fed sheep receiving a ruminai infusion of water during control periods (C). Data with standard errors refer to mean values during control periods and to mean differences between treatments.
treatment
number of observations
K (mmol.l-1) Na (mmol.l"1) Mg (mmol.l'1) Ca (mmol.l"1) NH4 (mmol.1"1) sum of cations (mmol.l"1) PO4 (mmol.l-1) CI (mmol.l-1) Ac (mmol.l-1) Prop (mmol.l-1) But (mmol.l"1) sum of VFA (mmol.l"1) pH fluid volume (1) fluid outflow (X.h"1) fluid outflow (l.d-1)
treatment difference
K (mmol.l"1) Na (mmol.l"1) Mg (mmol.l"1) Ca (mmol.l"1) NH4 (mmol.l"1) sum of cations (mmol.l"1) PO4 (mmol.l-1) CI (mmol.l-1) Ac (mmol.1"1) Prop (mmol.l"1) But (mmol.l"1) sum of VFA (mmol.l"1) pH fluid volume (1) fluid outflow (X.h"1) fluid outflow (l.d-1)
C
3
29 104
2.0 2.0 6.8
145 14.5 10.1 66 20
7 92 6.66 7.1 7.4
12.5
LJui-C
+12* -18* +1.3* +0.6* +0.3 -4 +2.1 +3.0 -9* -1 -2
-11* -0.07 -0.0 +0.0a
+0.0
C
4
27 104
1.4 2.0 6.3
141 13.3 10.3 62 17 7
85 6.77 8.9 7.8
16.7
HJui-C
+12* -25* +1.5* +0.8* -0.7
-12* +2.3 +2.9*
-12* -1 -2
-14* -0.07 -1.2 +2.2*b
+1.7*
se
n=3
1.3 3.0 0.3 0.07 0.7 2.3 2.1 0.8 4.1 2.6 1.0 5.4 0.04 0.9 0.4 1.5
n=4
1.1 2.6 0.3 0.06 0.6 2.0 1.8 0.7 3.5 2.3 0.9 4.6 0.04 0.8 0.3 1.3
se
3.2 5.2 0.3 0.23 0.3 3.1 2.5 1.2 3.0 2.6 0.9 4.1 0.04 0.7 0.5 0.7
2.7 4.5 0.3 0.20 0.3 2.7 2.2 1.1 2.6 2.2 0.8 3.6 0.04 0.6 0.4 0.6
: significantly different from zero a": values in a row with different superscripts are significantly different from each others (p<0.05).
207

As the latter increase was not compensated by a change in the concentrations of other cations the sum of all major cations was also elevated by K-citrate infusion.
Remarkable were the increases of ruminai Mg concentration (p<0.05 for (K); p=0.06 for (K+RM)), probably as a consequence of a reduced Mg absorption in the presence of low Na:K ratios in rumen fluid. The negative effect of such low ratios on ruminai Mg absorption has been experimentally verified by Martens and Rayssiguier (1980) and contributes to the lower Mg availability on potassium-rich grass (Kemp, 1983).
Ruminai pH increased slightly (+0.06 unit) with K-citrate infusion (p=0.06 for (K); p=0.07 for (K+RM)). Changes in other ruminai parameters (P04 and Ac concentration) and in rumen fluid dynamics were not consistent between (K) and (K+RM), and (C).
With grass juice infusion partly similar and partly different changes of rumen fluid composition were noted. K concentrations were increased (+12 mmol.H for both treatments) and Na concentrations decreased (-18 and -25 mmol.l"1 for (LJui) and (HJui)). In this case the sum of cations also decreased, though only significantly with (HJui). Both (LJui) and (HJui) resulted in higher concentrations of Mg and Ca. With (HJui) also CI concentration increased. No change in rumen NH4 concentrations occurred, whereas total VFA concentration became significantly lower as a result of grass juice addition. Despite the reduction of VFA concentration, rumen pH tended to be lower (p=0.16 for (LJui); p=0.10 for (HJui)). With (HJui) rumen fluid outflow was increased, both relatively (as %.h"1) and absolutely (as l.d'1).
Comparing the effects of K-citrate infusion and grass juice administration on rumen K concentration some differences are seen. For instance, total intake of K was 0.88 mold"1 for (HJui) and 0.86 mol.d"1 for K-citrate infusion, i.e nearly identical. Yet the increase of K-concentration with K-citrate infusion was twice as large as with (HJui). Clearly, other factors than K intake must affect rumen concentration of this ion. Hereto belong changes in rumen fluid dynamics as is demonstrated by Fig. 7.4.3. In this Fig. ruminai K and Na concentrations have been plotted against the outflow of rumen fluid per unit of K intake (K consumed plus infused). K intake represents by far the largest influx of K into the rumen as the endogenous flux from saliva is usually small. Therefore, a larger outflow of rumen fluid per unit of K taken in results in a more rapid clearance of K from the rumen, a lower concentration of K and a higher concentration of Na. From the available data it can also be inferred that indeed most of the infused K was removed by passage from the rumen instead of absorption. This is illustrated by Fig. 7.4.4 which shows the outflow of K as a function of K intake. K outflow was calculated as the product of ruminai K concentration and fluid outflow. More than 70% of the extra consumed K disappeared by passage from the rumen to omasum and abomasum.
As noted above, infusion treatments had also effects on the concentrations of Mg and Ca. The variation in concentration of these ions is more difficult to explain and probably depends upon several factors: differences in concentrations in feed, differences in ruminai environment and in absorption and passage rates. No simple relationships were found between their concentrations and ruminai characteristics. Some indications exist that upper limits to the concentrations of Ca and Mg may be set by ruminai pH or more specifically the solubility product of phosphates, as shown by Figs. 7.4.5. and 7.4.6. These Figures show relations between rumen pH and HPO4 concentration, and Ca and Mg concentrations. HPO4 concentrations have been calculated from pH and total PO4 concentration. The Figures also show an effect of Na:K ratios in rumen fluid on Mg concentrations.
208

K concentration (mmol/1)
8 0 T
Na concentration (mmol/1)
40
20
• o
•
TAI -
100 -
80 -
60 -
40 •
20 •
(1 •
• o
D
D
O
1 1 1 \-
: • • • • • •
— i — i — i — i
•
D
•
0
À
c
K
K+RM
LJui
HJui
10 20 30 40 50
Outflow of rumen fluid (l/mol K consumed + infused)
10 15 20 25 30 35 40 45 50
Outflow of rumen fluid (l/mol K consumed + infused)
Fig. 7.4.3. The relation between the outflow of rumen fluid expressed in liter per mol K consumed plus infused and the concentration of K (a) and Na (b) in rumen fluid. Data for K and Na concentrations are means of 8 samples per animal obtained within 36 h during which outflow was measured. Animals received hay with either ruminai and abomasal infusions of water (C), or a ruminai infusion of a K-citrate solution (K), or the same in combination with an abomasal infusion of rumen microbial material (K+RM), or a ruminai infusion of grass juice at a low level (LJui) or a high level (HJui).
Rumen fluid dynamics were probably also responsible for changes in pH and VFA concentration upon grass juice addition. From the presence of large amounts of easily fermentable compounds in juice we had expected to find an increase in VFA in combination with a decrease of pH. Yet the large amount of water administered with the juice must have been a disturbing factor. From the composition of juice given in Table 7.4.2. it can be calculated that juice contained 72 and 11 mmol.kg"1 of K and Na, respectively. So, the sum of concentrations of these major cations is substantially less than found in rumen fluid. As a result rumen fluid became diluted as demonstrated by lower total cation concentrations upon juice addition. Dilution must have also caused a reduction of buffering capacity. The latter becomes apparent when we look at the relation between VFA concentration and pH. As Fig. 7.4.7a shows, data for (HJui) follow a relationship distinct from the one observed with (C) and characterized by lower values of pH at similar VFA concentrations. Such a discrepancy is not apparent any more when the sum of bicarbonate and phosphate concentrations are related to pH (Fig. 7.4.7b). This sum was estimated from the cation-anion balance in rumen fluid by subtracting concentrations of CI and VFA anions from total cation concentration.
209

At a ruminai pH above 6.5 bicarbonate and phosphate mainly contribute to the buffering capacity of rumen fluid. Hence, any relation between VFA and pH depends on the quantitative presence of these buffers.
Outflow of K (mol/d)
1.0 •
0.8 -•
0.6
0.4-•
0.2
D i D
• jP
A
• C
a K
• K+RM
0 LJui
* HJui
0.2 0.4 0.6 0.8 1.0
K consumed + infused (mol/d)
Fig. 7.4.4. Ruminai outflow of K as a function of the amount of K consumed plus infused. Data refer to individual animals. Regression line: y = 0.125 + 0.71x (r^M). See for legend Fig. 7.4.3.
Blood parameters Data on blood parameters are given in Table 7.4.7 and 7.4.8. As was observed in Exp. 1, significant lower values for hemoglobin (-0.6±0.16 mmol.l"1) and hematocrit (-0.03±0.007 l.l"1) were measured in the second control period than in the first. Hence, the changes of both parameters noted in Table 7.4.7 and 7.4.8 were probably not an effect of infusion treatments but of time. In addition, blood glucose concentration was found to be lower (-0.310.07 mmol.l"1) in the second control period when compared to the first control period. Infusion treatments caused slight but significant decreases of serum Na (all infusion treatments) and increases of serum K (only with K-citrate infusion).
With (K) and (HJui) blood urea concentrations decreased whereas with (K+RM) and (LJui) urea tended to be higher. Opposing processes may explain these changes. Increased protein resorption and subsequent breakdown (with (K+RM) and juice administration) probably tend to increase urea concentrations. A more rapid clearance of urea from the blood following consumption of a soluble salt like K-citrate may cause the reverse to happen. Changes in plasma protein concentration, protein spectrum and blood glucose concentration were small and mostly not significant.
210

Ca concentration (mmol/1)
5 T
3 - -
2 - -
Mg concentration (mmol/1)
6 -
5 -
• • . • * • » * > • » • • * • • •*«• • *
. • • * • * • •<*>. »t • •
• • » $ * v v 2-
1 ••
AA i±
A^ V T » A Na/K>3
* Na/K<3
Q A A ^ A
6.10 6.30 6.50 6.70 6.90 7.10 6.10 3.30
pH
6.50 6.70
pH
6.90 7.10
Fig. 7.4.5. The concentration of Ca (a) and Mg (b) in rumen fluid as a function of ruminai fluid pH. Data are from individual samples of sheep receiving hay in combination with different treatments according to Exp. 2. Na/K indicates the ratio of concentrations of Na and K in the sample.
Ca concentration (mmol/l)
5
3 - -
Mg concentration (mmol/l)
6 -
« .• •
\<> v.
-+- -+- -+-4 6 8 10
HP04 concentration (mmol/l)
- t -
12
* A *. .4» .
^ l ^ * * AA
V ^ Ä A A
A Na/K>3
* Na/K<3
2 4 6 8 10 12
HP04 concentration (mmol/l)
Fig. 7.4.6. The concentration of Ca (a) and Mg (b) in rumen fluid as a function of the concentration of HPC42" in rumen fluid. Data are from individual samples of sheep receiving hay in combination with different treatments according to Exp. 2. Na/K indicates the ratio of concentrations of Na and K in the sample.
211

Values of blood parameters measured in this experiment showed a similar range as values obtained with the same animals one year earlier (see Exp. 1). Noteworthy is the large variation in hemoglobin concentration (5.2-8.7 mmol.H) and hematocrit (0.24-0.40 l.l"1) between individual samples of apparently healthy sheep.
pH
7.20 T
7.00
6.60
6.40
5.20
A* 4 A A ^
O 0 < V A A ' A "/A *
° A ^ <X*>
pH
7.20
7.00
6.80 --
6.60 --
6.40
6.20
A
1 4 »
A
n o ' <& o A à
V» A Ä A 4 *P O
» c o HJ
A Î
50 70 90 110
VFA concentration (mmol/l)
20 30 40 50 60 70
Concentration ot (cat • CI • VFA) (mmol/l)
Fig. 7.4.7. Rumen fluid pH as a function of either the concentration of VFA (a) or the concentration of cations minus cloride and VFA ions (b). Data refer to individual samples of sheep receiving hay with a ruminai infusion of either water (C) or grass juice at a high level (HJ).
Discussion
Positive effects of increased protein contents in herbage on intake may have different causes. Positive effects may be related to the presence of protein itself, to the presence of other components known to vary in association with protein or to a combination of both. The present experiment was designed to examine the role of cell contents and especially potassium. The results of the infusion trial with K-citrate do not support a role of potassium in the interpretation of protein effects on intake as was also concluded from experiments with dwarf goats (Section 6.5). Neither potassium alone nor the combination of potassium with extra abomasal protein increased intake. Effects were absent despite the fact that infusions with K-citrate increased K content of the total diet from 13.6 g.kg"1 DM to 31.1 and 33.3 g.kg"1 DM for (K) and (K+RM) respectively.
212

Table 7.4.7. Effects of either a ruminai infusion of a K-citrate solution (K) alone or the same in combination with an abomasal infusion of rumen microbial mass (K+RM) on blood parameters of roughage-fed sheep receiving ruminai and abomasal infusion of water during control periods (C). Data with standard errors refer to mean values during control periods and to mean differences between treatments.
treatment
number of observations n=4 n=3
-!<, hemoglobin (mmol.1 hematocrit (l.l"1) plasma protein (g.l"
albumin (X) alphaglobulin (X) betaglobulin (X) gammaglobulin (%)
glucose (mmol.l"l) urea (mmol.l"l) serum Na (mmol.l"^) serum K (mmol.l'*-)
7 .2 0 . 3 4
73 5 5 . 0 13 . 8
6 .8 2 4 . 3
3 . 6 4 . 3
148 4 . 3 a
7 .7 0 . 36
70 5 8 . 0 1 4 . 4
6 . 6 2 1 . 0
3 . 4 3 . 7
147 4 . 6 b
0 . 3 0 . 0 1 1 . 3 1 .9 0 . 5 0 . 5 1 .5 0 . 08 0 . 2 0 . 3 0 . 06
0 . 4 0 . 02 1 .5 2 . 2 0 . 5 0 . 5 1 .7 0 . 09 0 . 3 0 . 3 0 .07
treatment difference K-C (K+RM)-C
hemoglobin (mmol.l~l) hematocrit (l.l"1) plasma protein (g.l~*-)
albumin (X) alphaglobulin (X) betaglobulin (%) gammaglobulin (X)
glucose (mmol. I"-*-) urea (mmol.l"^) serum Na (rnmol.l"̂ -) serum K (mmol.l"^)
- 0 . - 0 . - 1 - 1 . +0. - 0 . +1 . - 0 .
02*
6 2 3 7 1
- 1 . 1 * *
+0.2*
- 0 . 5 " - 0 . 0 2 * -0 - 2 . 2 +0 .7 - 0 . 3 +1 . 8 - 0 . 0 + 0 . 6 b
- 2 * + 0 . 1 *
0 . 1 0 . 00 1 . 1 1 .4 0 . 4 0 . 3 1 . 0 0 . 0 4 0 . 4 0 . 3 0 . 02
0 . 1 0 . 0 1 1 .3 1 .6 0 . 4 0 . 4 1 . 2 0 . 0 4 0 . 4 0 . 3 0 . 03
: s i g n i f i c a n t l y d i f f e r e n t from zero a . values in a row with different superscripts are s i gn i f i cant ly d i f ferent from each others (p<0.05).
As a consequence, K concentrations of rumen fluid were also substantially increased. Apparently, cationic composition of rumen fluid may change drastically without a concomitant change in feed intake. Infusion of grass juice also did not elicit a positive intake response. Instead, hay intake tended to decrease though estimated total MEI was higher with juice addition than without.
213

Table 7.4.8. Effects of either a ruminai infusion of a K-citrate solution (K) alone or the same in combination with an abomasal infusion of rumen microbial mass (K+RM), or a ruminai infusion of grass juice at a low (LJui) or a high level (HJui) on blood parameters of roughage-fed sheep receiving ruminai and abomasal infusion of water during control periods (C). Data with standard errors refer to mean values during control periods and to mean differences between treatments.
treatment
number of observations
hemoglobin (mmol.l"^) hematocrit (l.l"1) plasma protein (g.1'1)
albumin (X) alphaglobulin (%) betaglobulin (X) gammaglobulin (X)
glucose (mmol.l"l) urea (mmol.l'l) serum Na (mmol.l"^) serum K (mmol.l'l)
treatment difference
hemoglobin (mmol.l"^) hematocrit (l.l"1) plasma protein (g.1'1)
albumin (X) alphaglobulin (X) betaglobulin (X) gammaglobulin (X)
glucose (mmol.l"l) urea (mmol.l'l) serum Na (mmol.l'l) serum K (mmol.l"^-)
C
3
7.3 0.35
72 56.5 14.4 7.0
22.2 3.3 3.9
148 4.5
LJul-C
-0.8* -0.05* +1 -0.2 -0.4 +1.0*a
-0.4 +0.3* +0.1a
-2* -0.0
c
4
7.0 0.32
72 55.0 14.0 6.3
24.6 3.5 4.6
148 4.4
HJui-C
-0.3 -0.Q3* -0 +0.3 -0.2 +0.0b
-0.2 +0.1 -1.0*b
-3* +0.3
se
n=3
0.3 0.02 1.6 2.1 0.9 0.4 1.6 0.08 0.4 0.3 0.14
n=4
0.3 0.01 1.4 1.8 0.8 0.3 1.4 0.07 0.3 0.3 0.12
se
0.2 0.01 1.4 0.5 0.5 0.2 0.7 0.08 0.3 0.6 0.15
0.2 0.01 1.3 0.4 0.5 0.2 0.6 0.07 0.2 0.5 0.13
: significantly different from zero a-°: values in a row with different superscripts are significantly different from each others (p<0.05).
In fact animals responded as if a more digestible roughage was offered: intake of digestible matter increased whereas intake of indigestible matter decreased (see Fig. 1.2b and c, Chapter 1). Addition of grass juice was chosen in an attempt to simulate the combined effects of higher contents of protein and associated cell components in roughage. It is, however, doubtful
214

whether this attempt has been successful. Several anomalies were noted with respect to ramen fluid composition: a decrease of total cation and VFA concentration, a lower buffering capacity and the absence of an increase of NH4 concentration. The role of the low dry matter content of grass juice in explaining the first three aspects has already been discussed. The absence of an increase in NH4 concentration may have had different causes. First, it may be the result of an efficient utilization of nitrogenous compounds in juice for microbial protein synthesis as the juice also contained an appreciable amount of fermentable carbon components. However, assuming complete digestibility of juice organic matter, juice had 46 g N.kg"1 digestible organic matter (DOM), whereas the basal feed had only 26 g N.kg"1 DOM. So compared to the basal feed, juice was relatively richer in nitrogenous components. A relatively low degradability of the juice protein may have also contributed to the absence of an increase of rumen NH4 concentration. This may seem unlikely in view of the high degradability usually reported for leaf protein. However, properties of the leaf protein may have been changed during extraction and storage. After thawing brown colouring and precipitation of juice components were noted. Finally, the simultaneous addition of potassium may have increased clearance of urea from the blood thereby reducing recycling of urea from blood to rumen. With (HJui) blood urea concentrations were depressed. Such findings call for careful interpretation of rumen ammonia levels as a measure of nitrogen transactions between mouth and duodenum. Usually low levels of ammonia are taken as an indicator that no net loss of protein has occurred between mouth and duodenum. However, if rate of urea recycling or rate of NH4 absorption would appear to vary depending on, for instance, K contents of the feed, such an indicator may be unreliable.
In retrospect, it may be concluded that extraction of grass juice and its use in infusion trials is not a method to be preferred in order to analyse relations between herbage composition and intake. The low dry matter content of the juice as well as the large range of ruminai parameters changed simultaneously, do not allow an easy interpretation of the intake responses obtained. Experiments with pure nutrients or simple mixtures of these certainly suffer less from this disadvantage.
215

7.5 Effects of abomasal infusion of glucose, fructose,
maltose, starch and caseinate (Exp. 3a, b, and c).
Aim
The aim of these experiments was: l.to test whether abomasal infusion of intestinally digestible carbohydrates (glucose,
fructose, maltose, starch), known to differ in absorption mechanism and costs, would induce different intake responses,
2. to test whether effects of carbohydrates are influenced by the way of administration, either dissolved in drinking water or in saline.
3. to compare the effects on intake of abomasal carbohydrate and protein infusion, 4. to measure the extent of resorption (disappearance) of different carbohydrates from the
small intestine.
Experimental details
In total three infusion experiments were performed, for which 13 animals were used, all carrying abomasal infusion tubes and 6 in addition ileal fistulas. In the first experiment (Exp. 3a) effects of isocaloric amounts of glucose, maltose and fructose were compared. After an adaptation period the experiment consisted of 3 subsequent periods, each lasting 2 weeks. The first and third period served as control periods during which all animals received hay with an abomasal infusion of water. In the second period 5 animals received an infusion with a glucose solution, another 5 animals were infused with a maltose solution, and the remaining 3 received an infusion with a fructose solution. It was planned to infuse all three carbohydrates at two different levels, a low level (5 g hexose.kg"°-75.d_1) during the first week of the infusion period, and a high level (10 g hexose.kg-0-75^"1) during the second week of the infusion period. As animals already developed diarrhoea at the low infusion level of fructose, the high level was only tested with glucose and maltose. With fructose the dose remained unchanged throughout the two-weeks infusion period.
In the second experiment (Exp. 3b) effects of isocaloric amounts of glucose and gelled maize starch were compared, either dissolved in water or saline. This experiment was carried out immediately following the first, with 12 animals. So the third period of Exp. 3a served as the control for the 4 infusion treatments with 3 animals per treatment. Carbohydrate infusion was carried out for 10 days. This experiment had no second control period. The carbohydrate level amounted to 5 g hexose .kg"0-75.d_1.
In the third experiment (Exp. 3c) abomasal infusions with isocaloric amounts of glucose, gelled maize starch or protein were tested. As protein source Na-caseinate was chosen. This experiment consisted of 3 periods. The first and third, each lasting 2 weeks served as control periods. During the second period, lasting 10 days, 4 animals received glucose, another 4 starch and 5 animals protein. As no differences were found between tap water or saline solution in Exp. 3b, water was used as solvent. The level of infusion was planned to
217

approximate the low level of Exp. 3a, but due to differences in pumping speed, animals received significantly more energy with protein than with carbohydrate infusion (see Table 7.5.4).
Attempts were made to measure the intestinal disappearance of carbohydrates by simultaneously infusing Cr-NDF and Co-EDTA as markers for respectively solid and liquid phase and by sampling ileal digesta. In order to prevent sedimentation of Cr-NDF particles in the infusion vessel, carboxymethylcellulose had to be added to the infusâtes. Despite this, it did not appear possible to prevent unmixing of marker and infusate. Moreover, we found that as a result of administration of carboxymethylcellulose, faeces became very sticky and lost its normal appearance of pellets. Since this may have also indicated disturbance of normal absorption of carbohydrate, attempts to measure intestinal disappearance were discontinued.
Amounts of infusion fluid in all three experiments varied between animals from 1.3-1.9 kg.d"1 for both low (50 g DM.kg"1) and high (100 g DM.kg-1) infusion levels. The starch was gelled by heating the water or saline to 80 °C. All carbohydrates were obtained from Jansen Chimica, the caseinate was the same as used in Exp. 1.
As the basal feed for all 3 experiments a single batch of ryegrass hay was used with a chemical composition as given in Table 7.5.1. Organic matter digestibility was measured with 6 animals during the first control period of Exp. 3c. and appeared to be 622 g.kg"1 OM. MEI was estimated assuming a ME content of 16 MJ kg-1 digestible organic matter for the hay , and a ME content of carbohydrates and caseinate of 2.8 MJ.mol"1 hexose and 23 MJ.kg-1
OM, respectively.
Table 7.5.1. Chemical composition and digestibility of hay (Exp. 3a,b,c)
Dry matter content DM (g.kg"1)
Composition of dry matter (g.kg-1
Ash Nitrogen
Mineral composition (g.kg"1 DM) Sodium Potassium Calcium Magnesium Phosphor
Digestibility (g.kg-1) OM
DM) 832
88 18.3
0.7 40.1 4.3 1.7 3.5
622
Results
Animal health Prior to Exp. 3a the sheep suffered from an unknown infection, exhibiting loss of appetite, mild diarrhoea and body temperatures up to 41.8 °C. Animals did not respond to treatment
218
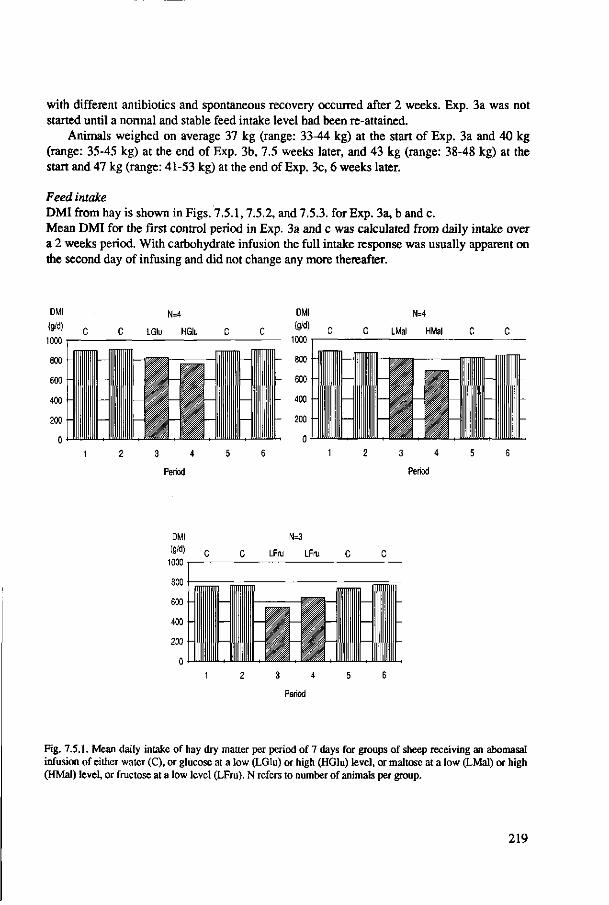
with different antibiotics and spontaneous recovery occurred after 2 weeks. Exp. 3a was not started until a normal and stable feed intake level had been re-attained.
Animals weighed on average 37 kg (range: 33-44 kg) at the start of Exp. 3a and 40 kg (range: 35-45 kg) at the end of Exp. 3b, 7.5 weeks later, and 43 kg (range: 38-48 kg) at the start and 47 kg (range: 41-53 kg) at the end of Exp. 3c, 6 weeks later.
Feed intake DMI from hay is shown in Figs. 7.5.1, 7.5.2, and 7.5.3. for Exp. 3a, b and c. Mean DMI for the first control period in Exp. 3a and c was calculated from daily intake over a 2 weeks period. With carbohydrate infusion the full intake response was usually apparent on the second day of infusing and did not change any more thereafter.
c c
1 1 2
N=4
LGIu HGIu
3 4
Period
C C
5 6
DMI
« M C C
- 800 -
- 600 -
- 400 -
- 200 - —
1 2
N=4
LMal HMal C
——r ... I
V^ i
L
I 3 4 5
Period
c
-
6
Fig. 7.5.1. Mean daily intake of hay dry matter per period of 7 days for groups of sheep receiving an abomasal infusion of either water (C), or glucose at a low (LGIu) or high (HGIu) level, or maltose at a low (LMal) or high (HMal) level, or fructose at a low level (LFru). N refers to number of animals per group.
219

DMI (g/d)
1000
800
600
400
200
0
N=3
C C Glu Glu
111 I- b i7_r _
DMI
m 1000
800
600
400
200 H
N=3
Glu+S Glu+S
2 3
Period
2 3
Period
DMI
(g/d)
1000
N=3
C Sta Sta
800 f -
600
400
200 \-
0
r
2 3
Period
Fig. 7.5.2. Mean daily intake of hay dry matter per period for groups of sheep receiving an abomasal infusion of either water (C), or glucose dissolved in water (Glu) or saline (Glu+S), or starch gelled with water (Sta) or saline (Sta+S). N refers to number of animals per group. Period 1 lasted 6 , the other 5 days.
Hence, intake on the first day was not taken into account for calculating mean DMI during experimental treatments. An exception, however, was fructose which, already at a low level, caused intake to fall sharply on the second day to only 55% of the previous control period. This was accompanied by diarrhoea. During the following days animals regained appetite, diarrhoea gradually subsided but faeces remained soft till the end of the two-weeks infusion period. For a comparison of all three carbohydrates as given in Table 7.5.2 it was therefore decided to calculate mean intake for the fructose treatment over the second infusion week. For calculating mean DMI during the second control period in Exp. 3a and c data on intake of the first 3 days were deleted.
Effects of experimental treatments on DMI and estimated MEI are given in Tables 7.5.2, 7.5.3, and 7.5.4. As explained in Section 7.2. data for the control treatment (C) in Table 7.5.2, and 7.5.4 are mean values for first and second control period together.
220

DMI
(g/d)
1200
1000
800
600
400
200
0
N=4
Glu Glu
I I r r l f 3 4
Period
N=4
Pro Pro
3 4
Period
Fig. 7.5.3. Mean daily intake of hay dry matter per period for groups of sheep receiving an abomasal infusion of either water (C), or glucose (Glu), or starch (Sta) or protein (Pro). N refers to number of animals per group. Period 1,2,5 and 6 lasted 7 days, period 3 and 4 lasted 5 days.
Mean DMI per animal during control periods amounted to 55 (range: 45-65), 54 (range: 44-64) and 59 (range: 53-73) g.kg"0-75^"1 for Exp. 3a, b and c, respectively. Although these values are at a level to be expected from organic matter digestibility and nitrogen content of the hay (predicted DMI: 59 g.kg"0-75^"1 according to model 5 given in Chapter 1) between-animal variation was large. In Exp. 3a there was no significant difference in DMI between both control periods, in Exp. 3c DMI was significantly higher (on average 112 g.d"1) during the second control period as compared to the first.
Infusing glucose, maltose and fructose (Exp. 3a) at a low level caused roughage intake to decrease, the decrease being significantly larger with fructose than with the other carbohydrates. Maltose had the smallest negative effect on hay intake. The difference between maltose and glucose had a random probability of 0.05. At the high level of infusion, intake decreased further with both glucose and maltose infusions. Now, however the reduction tended to be higher with maltose instead of glucose.
221
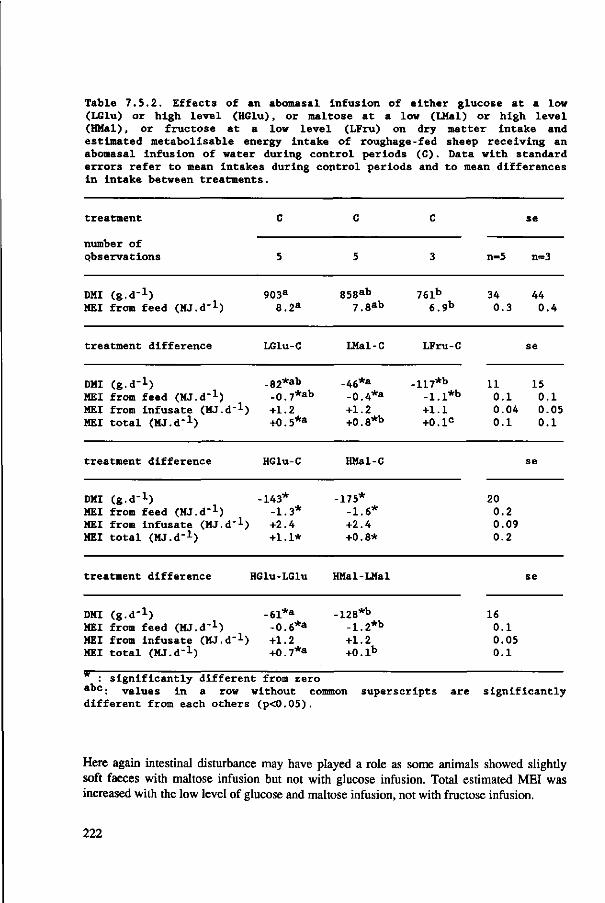
Table 7.5.2. Effects of an abomasal infusion of either glucose at a low (LGlu) or high level (HGlu), or maltose at a low (LMal) or high level (HMal), or fructose at a low level (LFru) on dry matter Intake and estimated metabolisable energy Intake of roughage-fed sheep receiving an abomasal infusion of water during control periods (C). Data with standard errors refer to mean intakes during control periods and to mean differences in intake between treatments.
treatment
number of observations
D M (g.d-1) MEI from feed (MJ.d"1)
treatment difference
DMI (g.d"1) MEI from feed (MJ.d-1) MEI from Infusate (MJ.d" MEI total (MJ.d"1)
treatment difference
DMI (g.d-1) MEI from feed (MJ.d"1) MEI from Infusate (MJ.d" MEI total (MJ.d-1)
treatment difference
DMI (g.d"1) MEI from feed (MJ.d"1) MEI from Infusate (MJ.d" MEI total (MJ.d"1)
h
h
C
5
903a
8.2a
LGlu-C
_32*ab -0.7*ab
+1.2 +0.5*a
HGlu-C
-143* -1.3* +2.4 +1.1*
HGlu-LGlu
h
-61*a
-0.6*a
+1.2 +0.7*a
C
5
858a b
7.8ab
LMal-C
-46*a
-0.4*a
+1.2 +0.8*b
HMal-C
-175* -1.6* +2.4 +0.8*
HMal-LMal
-128*b
-1.2*b
+1.2 +0.1b
C
3
761b
6.9b
LFru-C
-117*b
-l.l*b
+1.1 +0.1c
* : significantly different from zero a b c : values in a row without common superscripts are
n=5
34 0.3
11 0.1 0.04 0.1
20 0.2 0.09 0.2
16 0.1 0.05 0.1
se
n=3
44 0.4
se
15 0.1 0.05 0.1
se
se
significantly different from each others (p<0.05).
Here again intestinal disturbance may have played a role as some animals showed slightly soft faeces with maltose infusion but not with glucose infusion. Total estimated MEI was increased with the low level of glucose and maltose infusion, not with fructose infusion.
222

Table 7.S.3. Effects of an abomasal Infusion of either glucose dissolved In water (Glu) or in saline (Glu+S), or starch dissolved in water (Sta) or saline (Sta+S), on dry matter intake and estimated metabolisable energy intake of roughage-fed sheep receiving an abomasal infusion of water during control periods (C). Data with standard errors refer to mean intakes during control periods and to mean differences in intake between treatments.
treatment
number of observations
D M (g.d"1) MEI from feed (MJ.d"1)
treatment difference
D M (g.d"1) MEI from feed (MJ.d'1) MEI from Infusate (MJ.d-1) MEI total (MJ.d"1)
C
3
821 7.4
Glu-C
-22 -0.2 +1.2 +1.0*
C
3
869 7.9
(Glu+S)-C
-23 -0.2 +1.1 +0.9*
C
3
895 8.1
Sta
-36 -0.3 +1.2 +0.8*
C
3
809 7.3
(Sta+S)-C
-12 -0.1 +1.1 +1.0*
se
n=3
73 0.7
se
25 0.2 0.05 0.2
: significantly different from zero
With the high level of glucose a further increase of MEI was obtained. With maltose MEI remained unchanged between low and high level. Total MEI may be overestimated for the fructose treatment and the high level of maltose infusion as it was assumed that all carbohydrate was absorbed and treatments did not affect digestibility of the basal ration.
Infusion of glucose and starch (Exp. 3b) at a dose similar to the low level in Exp. 3a did not reveal any difference in intake response. Irrespective of the way of administration, hay intake decreased slightly and non-significantly. With all infusions estimated MEI was increased to a similar degree (10-14%).
In Exp. 3c glucose and starch again tended to decrease hay intake without any notable difference between both carbohydrates. With protein, hay intake tended to increase so that the difference in response between protein and carbohydrate became statistically significant. Estimated MEI was raised with all three infusions. Perhaps due to the larger energy dose, the increase of estimated MEI was higher with protein than with glucose or starch.
Discussion
In planning the present experiments we hoped to find differences in intake response to substances having intrinsically a similar nutritive value but differing in the energy costs associated with their absorption from the gut.
223
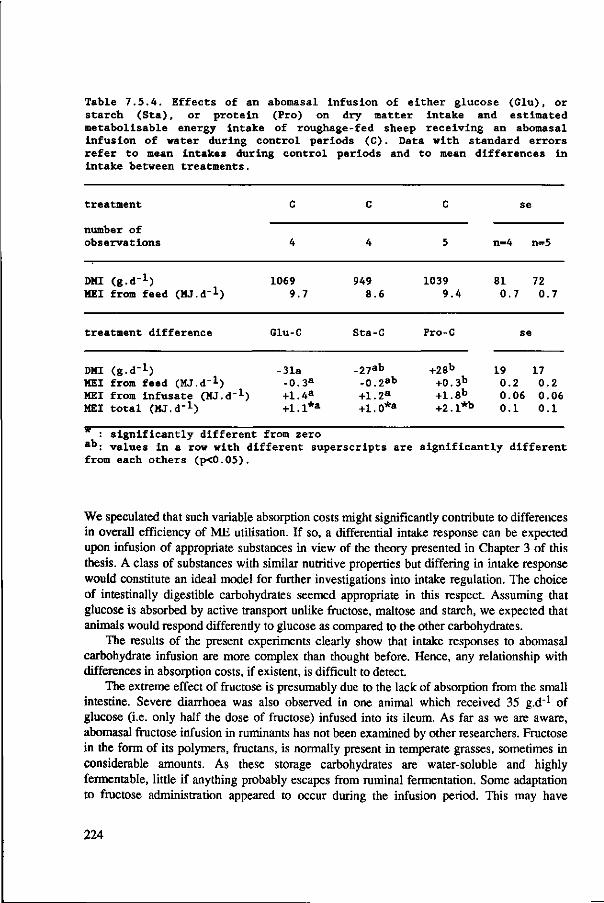
Table 7 . 5 . 4 . Effects of an abomasal Infusion of e i t h e r g lucose (Glu) , or s t a r ch ( S t a ) , or p r o t e i n (Pro) on dry mat ter in take and es t imated metabol isable energy in take of roughage-fed sheep r ece iv ing an abomasal infusion of water during con t ro l per iods (C). Data with s tandard e r r o r s r e f e r t o mean in takes during con t ro l per iods and t o mean d i f fe rences in in take between t r ea tmen t s .
t rea tment
number of observa t ions 4 4 5 n=4 n=5
DMI ( g . d ' 1 ) 1069 MEI from feed (MJ.d"1) 9.7
949 8.6
1039 9.4
81 0.7
72 0.7
t rea tment d i f fe rence Glu-C Sta-C Pro-C
DMI (g.d"1) MEI from feed (MJ.d"1) MEI from Infusate (MJ.d"1) MEI total (MJ.d"1)
-31a -0.3a
+1.4a
+1.l*a
-27ab
-0.2ab
+1.2a
+1.0*a
+28b
+0.3b
+1.8b
+2. l*b
19 17 0.2 0.2 0.06 0.06 0.1 0.1
: s i g n i f i c a n t l y d i f f e r en t from zero a b : va lues in a row with d i f f e r en t s upe r sc r i p t s a re s i g n i f i c a n t l y d i f f e r en t from each o the rs (p<0.05) .
We speculated that such variable absorption costs might significantly contribute to differences in overall efficiency of ME utilisation. If so, a differential intake response can be expected upon infusion of appropriate substances in view of the theory presented in Chapter 3 of this thesis. A class of substances with similar nutritive properties but differing in intake response would constitute an ideal model for further investigations into intake regulation. The choice of intestinally digestible carbohydrates seemed appropriate in this respect. Assuming that glucose is absorbed by active transport unlike fructose, maltose and starch, we expected that animals would respond differently to glucose as compared to the other carbohydrates.
The results of the present experiments clearly show that intake responses to abomasal carbohydrate infusion are more complex than thought before. Hence, any relationship with differences in absorption costs, if existent, is difficult to detect.
The extreme effect of fructose is presumably due to the lack of absorption from the small intestine. Severe diarrhoea was also observed in one animal which received 35 g.d"1 of glucose (i.e. only half the dose of fructose) infused into its ileum. As far as we are aware, abomasal fructose infusion in ruminants has not been examined by other researchers. Fructose in the form of its polymers, fructans, is normally present in temperate grasses, sometimes in considerable amounts. As these storage carbohydrates are water-soluble and highly fermentable, little if anything probably escapes from ruminai fermentation. Some adaptation to fructose administration appeared to occur during the infusion period. This may have
224

involved changes in absorption processes in both small and large intestines. As faeces remained soft even after 2 weeks of infusion it may be concluded that under our conditions sheep had only a limited capacity to handle post-ruminally applied fructose. The dose applied by us equalled 80 g.d"1 for a sheep of 40 kg body weight.
The reaction to the low infusion level of glucose and maltose seemed to point to a more favourable effect of maltose infusion. Yet the difference in intake response was small, i.e. too small to be attractive for further, more detailed studies with a limited number of animals. Moreover, at the high level differences between glucose and maltose became reversed.
If the effects of Exp. 3a might have indicated a difference between glucose and maltose (as we expected there to be), no such difference was apparent between starch and glucose in Exp. 3b and c. This finding adds further doubt to the idea that differences in absorption costs between carbohydrates are sufficiently large to influence the response to carbohydrate infusion.
Exp. 3c suggested a more favourable effect of extra abomasal protein as compared to carbohydrate. Notwithstanding this difference, the experiment also showed that to obtain an increase in MEI the nature of the nutrients infused was of secondary importance, like it was in Exp. 1 and 2.
From published infusion trials it appears that a variety of aqueous solutions (tap water, saline, phosphate buffer) has been used as a carrier for substances to be infused. The impact of such differences on intake responses does not seem to have been examined systematically. In our Exp. 3b the choice of water or saline did not affect the outcome as far as hay intake was concerned. With other types of infusâtes, for instance VFA infusâtes, the way of administration may be more important.
The intake responses obtained in the present experiments do not support the idea that differences in absorption costs between carbohydrates appreciably affect intake. Probably differences in energy costs are too small to change intake differentially and measurably. Based on a Na/sugar coupling ratio of 2:1 for intestinal glucose transport (Armstrong, 1987), energy costs of active transport would probably be only 1 Mol ATP per Mol of hexose, i.e. a small amount compared to the ATP yield of complete glucose oxidation.
More important for the response to carbohydrate infusion seems the extent to which carbohydrate is absorbed. Although carbohydrate disappearance could not be measured reliably, data of 0rskov (1986) suggest that at the low level of infusion almost all of glucose, maltose and starch will have been absorbed; but occurrence of diarrhoea at the same infusion level indicated malabsorption in the case of fructose. The absence of significant differences in effect on intake between glucose, maltose and starch does not necessarily mean that they are all alike, nutritionally. In rats for instance, it has been found that dietary disaccharides and their equivalent monosaccharides have different effects on activity of enzymes of liver and adipose tissue (Michaelis et ai, 1978). In addition, food efficiency (g weight gain per g food consumed) under some feeding conditions appeared to be higher with disaccharides (maltose, sucrose) than with monosaccharides (glucose, invert sugar).
Why infusion of glucogenic nutrients into the abomasum consistently depressed roughage intake remains unexplained and intriguing. As already concluded in Exp. 1 it is unlikely that the explanation should be sought in changes of luminal osmolality: they will have been relatively small and, moreover, one would expect to find differences between starch and glucose if osmolar changes were an important causative factor. A more likely cause could be a shift in substrate use between different tissues of the body. In agreement with this idea is the
225

absence of effects of intravenous glucose administration as reported in several studies (Manning et al., 1959; Vallance and McClymont, 1959; Dowden and Jacobson, 1960; Holder, 1963; Ulyatt, 1965). This lack of effects made Baile and Forbes (1974) conclude in their review of intake regulation: There is little evidence therefore that glucose levels or utilization rate have a significant role in controlling feeding in ruminants; in fact there is much evidence to the contrary'. No effects of intravenous glucose infusion on intake have been found despite the fact that sometimes very high doses have been given. For instance, Manning et al. (1959) infused adult ewes (bodyweight: 58-60 kg) with 1.67 to 8.3 g.kg"1 of body weight over a two-hour period and did not observe a significant change of intake of a pelleted feed during that period. Blood glucose levels were greatly increased from 2-3 mmol.r1 up to 82 mmol.H in one ewe receiving the highest dose. Most studies on intravenous glucose have been relatively short-term, infusion time being limited to a few hours or at best 2 days (Vallance and McClymont, 1959). A direct comparison between the effects of intestinal and intravenous administration has not been found in the literature, at least not for ruminants. In rabbits, Novin et al. (1974) have observed that indeed effects on intake differ depending on whether glucose is infused intravenously or intraduodenally. In free-feeding rabbits intravenous glucose did not change intake, whereas intraduodenal glucose depressed intake. Following a 22-hr total food-deprivation period the effects were reversed.
Our own findings and the results of infusion studies quoted above sharply contrast with the strongly positive role that some authors (see for instance Preston and Leng, 1987) have claimed with regard to the supply of glucogenic energy in the regulation of roughage intake. According to these authors evidence for such a role comes from feeding trials in which low quality roughage diets have been supplemented by concentrates containing, among others, bypass starch. This, of course, is no direct proof as with dietary supplementation many factors are confounded and beneficial effects may be caused by quite a number of factors operating separately or in conjunction. Evidence should come from trials with direct administration of glucose but no such evidence is quoted by Preston and Leng (1987). On biochemical grounds we may expect an extreme lack of glucogenic precursors to limit conversion of acetate into lipid and hence to inhibit acetate uptake and feed consumption. But this does not answer the question how common such a deficiency is with the feeding of roughage diets, and whether such a deficiency can indeed be corrected by an increased intestinal supply of digestible carbohydrate.
226

7.6 Effects of ruminai infusion of a mixture of volatile
fatty acids and abomasal infusion of caseinate
(Exp. 4)
Aim
The aim of the experiment was to test the effects on intake and nitrogen retention of the following treatments: - ruminai infusion of a mixture of volatile fatty acids (VFA) alone or neutralized with
ammonia (NH4VFAX - ruminai infusion of the same mixtures of volatile fatty acids but in combination with
abomasal infusion of protein: (VFA+P) and (NH4VFA+P), - abomasal infusion of protein at a low (LPro) or high dose (HPro).
Experimental details Prior to the main experiment two adult sheep were used to test the intake response to different levels and ways of VFA administration. For all VFA infusions the same mixture was used, the composition of which corresponded to the fermentation products of casein as measured in vitro by Demeyer and Van Nevel (1979). This mixture contained on a molar basis 40% acetic, 28% propionic, 12% butyric, 7% valeric and 13% isovaleric acid.
As a preliminary test one animal received increasing amounts of this VFA mixture neutralized with ammonia in a molar ratio of 1:1. Infusion started at a rate of 0.5 mol VFA.d"1
during the first two days and was subsequently increased up to 1.5 mol.d"1 on the sixth day. This level was then maintained for another two days. Intake was hardly changed over this period but on the eighth day the animal exhibited some loss of coordination and tremors. As we then interpreted these signs as the onset of ammonia intoxication the infusion was stopped immediately. Ammonia intoxication was, however, improbable as rumen ammonia levels appeared to be only 21 mmol.l"1 and ruminai pH varied between 6.3 and 6.6. Moreover, the same symptoms reappeared a few days later after the infusion had been stopped. Because we were still afraid to lose animals we decided to use further only partially neutralized VFA.
The other animal of the preliminary test first received increasing amounts of the non-neutralized mixture of VFA. This animal appeared to tolerate quite well infusion of 1.5 mol VFA.d"1. Only a modest decrease of rumen pH was measured, i.e. from around 6.6 to 6.4. Subsequent addition of ammonia to the infusate in molar ratios of 1:4 to 1:2. had no clear effect on intake. From these limited observations it was decided to test VFA infusion at a high level (1.7 mol.d-1) and the addition of ammonia at a low level (0.43 mol NH3.d"1 or 6 g N.
The main experiment was carried out with 12 sheep and consisted of 3 periods after the animals had become adapted to feed and metabolism cages. This adaptation time lasted 1 week. During the first period of 2 weeks all animals received hay with ruminai and abomasal infusions of water. During the second period (lasting 17 days) 8 sheep were used to test the 4 different treatments having VFA infusions. Groups of 2 animals received one of the following
227

treatments: an intraluminal infusion of VFA with or without an abomasal infusion of protein equivalent to 6 g N.cH, or the same treatments with addition of ammonia to the VFA mixture. In the third period (also lasting 17 days) treatments were changed so that animals which had received infusâtes without ammonia now received the same treatment with ammonia.
VFA to be infused were diluted with water up to a concentration of 920 mmol.kg"1. Hence, infusate volumes were on average 1.9 l.d'1. As protein, caseinate was used dissolved in water (1.4 l.d"1). VFA infusions started with 0.7 mol.d"1 and were increased to 1.2 and 1.7 mol.d1 on the second and third day respectively.
In addition to this group of 8 animals, 4 sheep were given an abomasal infusion of caseinate at a low level (6 g N.d"1) during the second period. The same animals were planned to receive a double dose of caseinate during the third period. But two of these animals developed sore ankle joints and had to be removed from the metabolism cages. They were replaced by 2 other animals and these received only the low level of protein. Hence, data for the high protein level are restricted to 2 animals. These data will be discussed in the text, but have not been included in the statistical analysis.
Roughage intake was measured daily. Faeces and urine were collected from all animals for 7 days during the second half of each period. In addition, samples of rumen fluid were taken from animals receiving VFA infusions. This was done on the last 2 days of each period after animals had been dosed with Co-EDTA. Samples were analysed for concentrations of NH4-N, VFA, Na, K and Cr. Rumen fluid pH was monitored at each change of VFA-infusates in order to detect undesirably low pH values at an early stage.
As roughage a single batch of rye-grass hay was used with a composition as shown in Table 7.6.1. Organic matter digestibility of the hay measured during the control period amounted to 658 g.kg-1 OM. ME content of the hay was calculated assuming an ME content of digestible organic matter equal to 16 MJ per kg digestible organic matter. The ME content of the VFA mixture was taken as 1.6 MJ.mol"1 and of caseinate as 23 MJ.kg"1 protein.
Table 7.6.1. Chemical composition and digestibility of hay (Exp. A)
Dry matter content DM (g.kg"1)
Composition of dry matter (g.kg"1 DM) Ash Nitrogen
Mineral composition (g.kg-1 DM) Sodium Potassium Calcium Magnesium Phosphor
Digestibility (g.kg-1) OM
905
86 17.6
0.7 37.5 4.2 1.7 3.5
658
228

Results
Animal health Apart from the health problems mentioned with regard to the protein infused animals, health status of most animals remained good during the experiment. Data on nitrogen retention of 2 animals were abnormal probably due to a relatively low intake on some days of the measurement period. These data were deleted from the analysis.
Animals weighed on average 45 kg (range: 39-52 kg) at the start of the experiment, and 50 kg (range: 42-57 kg) at the end, 7 weeks later.
Feed intake DMI from hay is shown in Fig. 7.6.1. Data for VFA treatments in this Fig. refer to the period over which the full dose was applied. Mean intake for the control period given in Table 7.6.2. was calculated over a 2 weeks period. With the experimental treatments average intake data in Table 7.6.2. also refer to periods of 2 weeks as the first 3 days of each infusion period were deleted. Mean DMI during the control period amounted to 63 (range: 50-72) g.kg'O-Ad"1, almost equal to the value predicted for this feed according to model 5 given in Chapter 1: 61 g-kg-O-75.^1.
Treatments having VFA infusions all tended to depress hay intake. The reduction of hay intake was more pronounced during the second period (for all VFA treatments on average 92 g.d"1) as compared to the third (on average 20 g.d"1). As the difference between periods was not significant, data per treatment have been combined to estimate the effects of infusion treatments (Table 7.6.2). VFA infusions also tended to depress organic matter digestibility of the hay. Depressions were on average 10, 25,12, and 6 g.kg"1 OM (se: 13 g.kg"1) for (VFA), (NH4VFA), (VFA+P) and (NH4VFA+P) respectively. Estimated total MEI was increased by all VFA infusions with no significant differences between treatments with or without additional protein. Increases of MEI varied from 15-16% for treatments without extra protein to 25-30% for treatments with additional protein. The addition of ammonia had no effect on the response of DMI or MEL
The low level of protein infusion alone did not change hay intake. The 2 animals receiving the high level of protein increased their hay intake with on average 114 g.d"1 so that total MEI was 3.4 MJ.d"1 higher than MEI during the control period. Probably partly because of the low amount of protein-energy infused, the increase of total MEI did not reach statistical significance at the low level of protein infusion. Interaction effects on DMI and total MEI of the low level of protein infusion and VFA infusion were not significant.
Nitrogen balance Results on nitrogen balance during control periods and changes as a result of experimental treatments are shown in Table 7.6.3. Infusion of VFA without extra protein (treatments (VFA) and (NH4VFA)), had no significant effect on nitrogen retention. Protein alone or in combination with VFA (treatments (LPro), (VFA+P) and (NH4VFA+P)), increased nitrogen retention. With (HPro) a further increase in nitrogen retention was noted: 2.6 g.d"1 over the value measured with the same 2 animals on (LPro).
229

DMI
m 1500
1200
900 f
600
300 f
0
N=2 DMI
N=2
C C VFA VFA NH4VFA NH4VFA C C NH4VFA NH4VFA VFA VFA 1500 •
r
2 3 4
Period
1 1 2 3 4
Period
N=2
NH4VFA NH4VFA VFA VFA
+p +p +p +P
f 1 n 3 4
Period
DMI
(g/d)
1500
1200
900
600
300
0
N=2
3 4
Period
c c LPro LPro HPro HPra
1 Fig. 7.6.1. Mean daily intake of hay dry matter per period of 7 days for groups of sheep receiving ruminai and abomasal infusions of water (C) during control periods and one of the following infusions as experimental treatments: a ruminai infusion with a VFA mixture (VFA), or the same mixture partly neutralized with ammonia (NH4VFA), or one of both forementioned treatments in combination with an abomasal infusion of protein (VFA+P) and (NH4VFA+P), or an abomasal infusion of protein alone at a low (LPro) or high level (HPro). N refers to number of animals per group.
230

Table 7.6.2. Effects on dry matter Intake and estimated metabollsable energy intake of roughage-fed sheep of one of the following treatments: abomasal and ruminai infusions of water as a control treatment (C), a ruminai infusion of either a mixture of volatile acids alone (VFA) or in combination with ammonia (NH4VFA), or both latter treatments in combination with an abomasal infusion of protein (VFA+Pro and NltyVFA+Pro), or an abomasal infusion with protein (Pro). Data with standard errors refer to mean intakes during control periods and to mean differences in intake between treatments.
treatment
number of observations
DMI (g.d"1) MEI from feed (MJ d"
treatment difference
h
C
4
1177 11.2
VFA-C
C
4
1142 11.1
(VFA+Pro)-C
C
4
996 9.6
Pro-C
se
n=4
67 0.7
se
DMI (g.d"1) MEI from feed (MJ.d"1) MEI from Infusate (MJ.d-1
MEI total (MJ.d"1) )
88 -1.0 +2.7a
+1.7*
-31 -0.7 +3.6b
+2.8*
+8 +0.3 +0.8C
+1.1
58 0.7 0.05 0.7
treatment difference NH4VFA-C (NH4VFA+Pro)-C
DMI (g.d"1) MEI from feed (MJ.d"1-) MEI from Infusate (MJ.d-1) MEI total (MJ.d"1)
81 -0.9 +2.7a
-20 -0.3 +3.6b
+1.8* +3.3*
47 0.5 0.02 0.5
: s ignificantly different from zero abc. values in a row with different different from each others (p<0.05).
superscripts are s ignificantly
Ruminai parameters Information on ruminai parameters is shown in Table 7.6.4. On average, VFA infusions caused K concentrations in rumen fluid to fall and Na concentrations to rise. Closer examination of the data showed that increases in the rate of clearance of potassium from the rumen, similar to those noted in Exp. 2, were probably responsible for these changes. As Fig. 7.6.2. shows, lower K concentrations were observed when per gram feed (or potassium) consumed, outflow of rumen fluid was increased. Infusion of partially neutralized VFA increased NH4 concentrations from about 7 mmol.l"1 to 12 mmol.l-1.
231

Table 7.6.3. Effects on nitrogen balance of roughage-fed sheep of one of the following treatments: abomasal and ruminai infusions of water as a control treatment (C), a ruminai infusion of either a mixture of volatile acids alone (VFA) or in combination with ammonia (NH4VFA), or both latter treatments in combination with an abomasal infusion of protein (VFA+Pro and NH4 VFA+Pro), or an abomasal infusion with protein. Data with standard errors, both in g.d~l, refer to mean values during control periods and to mean differences between treatments.
treatment
number of observations n=4
N-intake from hay N-excretion in faeces N-excretion in urine N-retention
treatment difference number of observations
N-intake from hay N-intake from Infusate N-intake total N-excretion in faeces N-excretion in urine N-retention
treatment difference number of observations
21.2 8.5 9.9a
2.7
VFA-C
3
-1.8 (Pro)
-1.8a
-0.4 -2.5*a
+1.1
NH4VFA-C
3
21.0 8.2 9.5a
3.2
(VFA+Pro)-C
4
-0.5 +5.8 +5.3*b
+0.7 +1.0b
+3.6*
(NH4VFA+Pro)-C
4
18.2 7.5 7.2b
3.5
Pro-C
4
+0.5 +5.9 +6.4*b
+0.2 +3.3*c
+2.9*
n=3
1.5
1.5 0.4 0.5 1.0
n=3
1.3 0.6 0.6 0.6
se
n=4
1.3 0.1 1.3 0.4 0.5 0.8
se
n=4
N-intake from hay N-intake from Infusate (NH4) N-intake from Infusate (Pro) N-intake total N-excretion in faeces N-excretion in urine N-retention
-0.1 +5.9
+5.8*a
+0.2 +2.9*a
+2.8
-0.4 +6.0 +5.8
+11.4*b
-0.1 +6.7*b
+4.8*
1.3 0.04
1.3 0.8 0.5 1.2
1 04 04 1 7 5 0
: significantly different from zero abc: values in a row with different different from each others (p<0.05).
superscripts are significantly
232

The latter value remains well below the values obtained with protein rich roughages. Grenet and Demarquilly (1977), for instance, measured levels of up to 24 mmol.H with fresh pasture legumes fed to sheep.
VFA infusions on average depressed rumen fluid pH but only to a small extent (0.1 unit approximately). Rumen fluid pH never reached a dangerous level: lowest pH value recorded during VFA infusions was 6.1.
Concentrations of individual VFA tended to rise but increases were often too small and variable to reach statistical significance. The same holds true for the sum of VFA which increased on average from 86 mmol.l"1 to 99 rnmol.l"1.
From the available measurements of VFA concentrations and fluid outflow it is also possible to make an estimate of the fate of extra infused VFA. Assuming a ruminai production of VFA from the basal feed equal to 0.87 mol VFA per 100 g digestible organic matter (in agreement with the data in Table 4.2, Chapter 4), total availability of VFA can be calculated as the sum of VFA produced and infused. Having measured VFA outflow, VFA absorption was found as the difference between total availability and outflow. As Fig. 7.6.3 shows, absorption and outflow appear to be constant fractions (0.80 and 0.20 respectively) of total availability for both control and infusion treatments. Estimated absorption was somewhat higher than the value of 75% given in Table 4.2 for a roughage of 65% organic matter digestibility.
Discussion
As became apparent from the analysis of roughage intake trials in Chapter 1, increased nitrogen contents of roughages stimulate feed consumption by mature sheep over a wide range of nitrogen contents. The exact causes of this positive effect of nitrogen are still obscure despite a considerable amount of research over the past decades. The results of the present experiment suggest that the favourable effect of nitrogen may have different causes. Nitrogen in roughages is mainly present as protein and this plant protein is usually to a large extent degraded in the rumen. Microbial protein degradation yields a mixture of VFA, NH3 and microbial protein. Only a limited part of plant protein escapes rumen fermentation and becomes available for intestinal digestion and absorption as amino acids. The present experiment tried to imitate the outcome of both processes by administering animals intraruminally the fermentation products of protein breakdown either alone or in combination with extra abomasally infused protein. All treatments tested appeared to increase total MEI, the largest increase being obtained with the combined treatments of VFA and protein infusion. This suggests that both rumen degradable and rumen by-pass protein may contribute to the higher energy intake from protein rich roughages.
Quite unexpected was the favourable response to VFA infusions as infusing VFA in smaller amounts have often provoked sharp decreases of roughage intake (Egan, 1966; Weston, 1966). For instance, Weston (1966) noted a reduction of MEI from lucerne hay of 1.5 MJ.d"1 when 1.2 MJ VFA energy was infused as a mixture of free acids. When 1.9 MJ.d"1
was infused of the same mixture but partially neutralized with a mixture of calcium, potassium and sodium hydroxide, the decrease of MEI from hay amounted to 1.7 MJ.d"1.
233

Table 7.6.4. Effects on ruminai parameters of roughage-fed sheep of one of the following treatments: abomasal and ruminai infusions of water as a control treatment (C), a ruminai infusion of either a mixture of volatile acids alone (VFA) or in combination with ammonia (NH4VFA), or both latter treatments in combination with an abomasal infusion of protein (VFA+Pro and NH4VFA+Pro). Data with standard errors refer to mean values during control periods and to mean differences between treatments.
treatment
number of observations n=4
L.l-l)
jl.l"1)
K (mmol.l" Na (mmol. NH4 (mmol Ac (mmol.l"1) Prop (mmol.l"-'-) But (mmol.l"1) Val (mmol.l"1) IsoVal (mmol.l"1) VFA (mmol.l"1) pH fluid volume (1) fluid outflow (%) fluid outflow (l.d"
62 92 6.7
62 16 5 0.3 0.1
83 6.61 7.0 7.8
13.2
61 93 7.1
66 16 6 0.7 0.2
88 6.62 7.6 8.2
14.7
1.9 2.1 0.6 4.1 0.9 0.6 0.2 0.1 5.2 0.07 0.4 0.7 1.2
treatment difference VFA-C (VFA+Pro)-C
K (mmol.l"1) Na (mmol.l"1) NH4 (mmol.l"1) Ac (mmol.l"1) Prop (mmol.l"1) But (mmol.l"1) Val (mmol.l"1) IsoVal (mmol.l"1) VFA (mmol.l"1) pH fluid volume (1) fluid outflow (%) fluid outflow (l.d"
-15* +10
-0.3 +3 +4* -0 +0.4 +0.6 +8 -0.08 -0.0 +1.0 +1.5
-14* +8 +1.3 +7* +5* +1 +0.2 +0.2
+12* -0.12* +0.4 +0.2 +1.0
2.8 6.5 0.6 2.4 1.3 1.4 0.3 0.4 4.5 0.04 0.6 0.8 1.2
234

continued
treatment difference NH4VFA-C (NH4VFA+Pro)-C
K (mmol.l-1) Na (mmol.l"̂ -) NH4 (mmol.!"*-) Ac (mmol.l"^) Prop But Val
(mmol.I"1) (mmol.I"1) (mmol.I"1)
IsoVal (mmol.l"1) VFA ( pH fluid fluid fluid
mmol.l"1)
volume (1) outflow (%) outflow (l.d
-12* +2 +4.6* +5 +6* +1 +1.6* +0.8
+15* -0.07 +0.1 +0.8 +0.8
-10 +6 +5.4* +6 +7* +1 +1.1* +0.8
+17* -0.12* +0.2 -0.0 +0.2
3.9 6.4 0.8 4.1 0.9 1.0 0.3 0.5 5.6 0.04 0.7 0.5 1.4
significantly different from zero
Ruminai concentration
160 -
120 -
80 -
40 -
n -
(mmol/l)
- A A
A A
A
O
• •
•
• • •
1
A
A » 'i
A *
•
^_2—*—-
— 1
A.x»
A
• •
OO 0
•
D D
• •
Na + K
A
A »
Na •
•
K
"•"•—-—-.
1
— 1 —
11 13 15
Outflow of rumen fluid (ml/g DM!)
Fig. 7.6.2. The relation between the outflow of rumen fluid expressed in ml per g DMI and the concentration of K, Na and Na+K in rumen fluid. Data for K and Na concentrations are means of 8 samples per animal obtained within 36 h during which outflow was measured. Regression lines: K, y = 91.0 - 2.8x ( r ^ . ó l ) ; Na, y = 56.6 + 3.0x (r^O.37); Na+K, y = 147.6 + 0.2x (r^O.002). Open symbols refer to data obtained during control periods, closed symbols to data obtained with one of the following experimental treatments: (VFA), (NH4VFA), (VFA+P), (NH4 VFA+P). See caption of Fig. 7.6.1. for an explanation of codes.
235
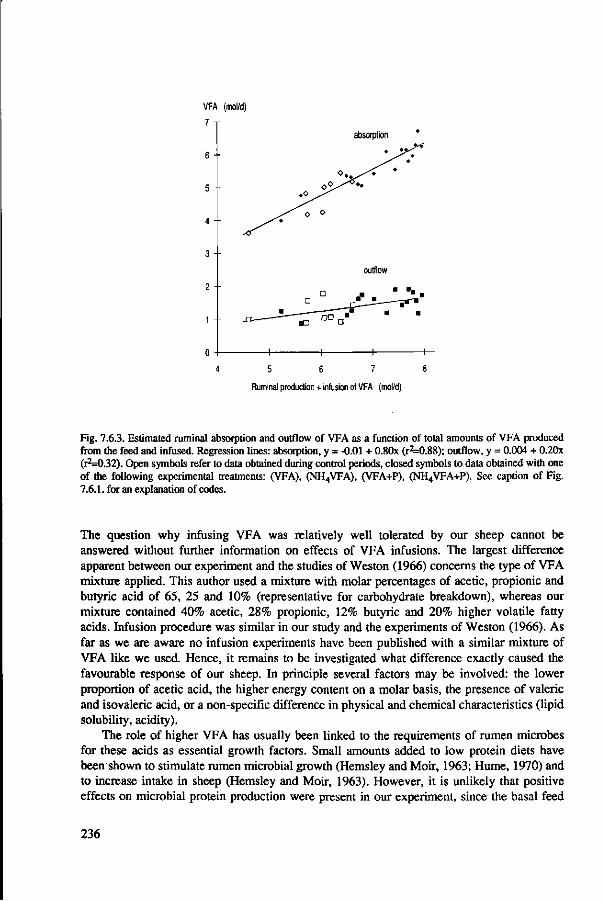
VFA (mol/d)
7
6 - -
4 - -
3 - -
2 --
absorption
outflow
1 — 1 1
5 6 7
Ruminai production + infusion of VFA (mol/d)
Fig. 7.6.3. Estimated ruminai absorption and outflow of VFA as a function of total amounts of VFA produced from the feed and infused. Regression lines: absorption, y = -0.01 + 0.80x (r^0.88); outflow, y = 0.004 + 0.20x (r2=0.32). Open symbols refer to data obtained during control periods, closed symbols to data obtained with one of the following experimental treatments: (VFA), (NH4VFA), (VFA+P), (NH4VFA+P). See caption of Fig. 7.6.1. for an explanation of codes.
The question why infusing VFA was relatively well tolerated by our sheep cannot be answered without further information on effects of VFA infusions. The largest difference apparent between our experiment and the studies of Weston (1966) concerns the type of VFA mixture applied. This author used a mixture with molar percentages of acetic, propionic and butyric acid of 65, 25 and 10% (representative for carbohydrate breakdown), whereas our mixture contained 40% acetic, 28% propionic, 12% butyric and 20% higher volatile fatty acids. Infusion procedure was similar in our study and the experiments of Weston (1966). As far as we are aware no infusion experiments have been published with a similar mixture of VFA like we used. Hence, it remains to be investigated what difference exactly caused the favourable response of our sheep. In principle several factors may be involved: the lower proportion of acetic acid, the higher energy content on a molar basis, the presence of valeric and isovaleric acid, or a non-specific difference in physical and chemical characteristics (lipid solubility, acidity).
The role of higher VFA has usually been linked to the requirements of rumen microbes for these acids as essential growth factors. Small amounts added to low protein diets have been shown to stimulate rumen microbial growth (Hemsley and Moir, 1963; Hume, 1970) and to increase intake in sheep (Hemsley and Moir, 1963). However, it is unlikely that positive effects on microbial protein production were present in our experiment, since the basal feed
236

by itself had a fairly high nitrogen content and organic matter digestibility tended to be depressed instead of increased as a result of the VFA infusions.
When compared with the data obtained by Weston (1966) the results of the present experiment suggest a possible benefit of ruminai protein degradation as compared to ruminai carbohydrate degradation, as far as intake is concerned. The changes brought about by the VFA infusions reflect to some extent those observed between roughages of different nitrogen content.
Minor VFA
3 --
(molar %)
-+- -+-3 4
N (%o(OM)
Fig. 7.6.4. The contribution of minor VFA to total VFA concentrations in rumen fluid of lactating dairy cows given fresh immature ryegrass with different nitrogen concentrations: data from Vérité et al. (1984).
As an example Fig. 7.6.4 shows data from Vérité et al. (1984) concerning ruminai VFA composition of lactating dairy cows fed fresh grass. The contribution of minor VFA to total VFA concentrations, although small, increases linearly with increasing nitrogen contents of the roughage, indicating extensive breakdown of protein. However, before firm conclusions can be drawn with regard to a positive effect of ruminai protein degradation more information is needed with regard to the effects of infusion of different VFA mixtures, with or without complete neutralization of VFA by ammonia.
237

7.7 General discussion and conclusions
The experiments discussed in the previous paragraphs were meant to test different hypotheses concerning the nature of relationships between roughage composition and roughage intake. The experiments all involved the infusion of nutrients: substances that serve as sources of metabolic energy and raw material for growth or repair of tissues and general maintenance of body functions, according to the definition of Eckert and Rendall (1983). The intake responses to the nutrient infusions obtained in this study have been summarized in Table 7.7.1 and Fig. 7.7.1. Taking ME content as a common scalar infusâtes supplied the sheep with an amount of ME varying from only a small quantity in the case of K-citrate (approximately 3% of estimated MEI without infusion) to much larger amounts: i.e over 30% with mixtures of protein and glucose in Exp. 1 and mixtures of protein and VFA in Exp. 4.
Despite a widely differing composition of infusâtes, intake responses by the sheep in our experiments bear several characteristics in common, as illustrated by Fig. 7.7.1. This Figure summarizes the changes of estimated MEI from hay as a function of MEI from infusâtes tested in Exp. 1-4. First of all, infusions depressed MEI from roughage more often than not: only with 3 out of a total of 25 different infusâtes a small, not-significant increase was found. Secondly, estimated total MEI increased nearly always as a result of the extra energy infused. Thirdly, increases in estimated MEI were obtained with different types of nutrients and nutrient mixtures: infusions with protein as well as different carbohydrates and VFA all appeared to increase total MEI, though type of nutrient influenced the magnitude of the increase. The latter phenomenon shows that there is scope for optimizing the composition of the nutrient infusion mixture to obtain the largest possible increase of MEL
The intake responses obtained clearly differ from those expected to find at the start of our experiments. We thought that animals on roughage diets may lack specific nutrients, like protein, glucose, or lipids, to express their maximum energy intake. If so, addition of specific nutrients or mixtures should create systematic increases in roughage intake. Such increases have not been found.
The three response characteristics mentioned above closely resemble those commonly obtained with the feeding of concentrates, i.e the supplementation with dietary nutrients. Concentrates are used to raise total MEI but they usually depress MEI from the basal feed, though to a variable degree. Degree of substitution of the basal feed by concentrates depends among others on the type of concentrates: it is generally less with protein-rich concentrates than with cereal grains (Oldham, 1984; Weston, 1988). A completely different effect has sometimes been observed when concentrates were fed in combination with low quality roughages or agricultural byproducts, for instance those coming from the sugar cane industry in tropical regions. In those situations feeding supplements with by-pass characteristics has sometimes led to substantial increases of basal feed intake (Preston and Leng, 1987). Such increases may be due to the correction of a nutrient imbalance. At least as far as protein is concerned, infusion trials have provided evidence that intake of certain feeds is depressed by a protein deficiency of the host animal (Egan, 1965, 1977; Egan and Moir, 1965). These findings suggested that nutrient imbalances might be a more common cause of low feed intake. The present experiments, and the experiments reported in Chapter 6, do not confirm the idea that roughage intake is primarily controlled by the availability of specific nutrients:
239

neither by-pass protein, carbohydrate or a mixture of both, nor extra rumen microbial material containing a mixture of nutrients in addition to protein, nor a special VFA mixture alone or in combination with by-pass protein increased intake of the basal feed. Instead roughage intake almost always declined as a result of additional nutrients.
Table 7 . 7 . 1 . Effects of ruminai and abomasal n u t r i e n t infusions on es t imated ME in take (MEI, MJ.d"1) in sheep. Resul ts of Exp. 1-4 d iscussed in Chapter 7.
Exp.
1.
2.
3a.
3b.
3c.
4.
Infusate ME intake
from hay from without infusion
microbial material (RM) protein RM + glucose protein + glucose
K-citrate K-citrate + RM grass juice low level grass juice high level
glucose low level glucose high level maltose low level maltose high level fructose low level
glucose glucose + saline starch starch + saline
glucose starch protein
VFA VFA + NH3
VFA + protein VFA + NH3 + protein protein
6.5 6.7 6.8 7.4
10.3 10.1 9.2
10.5
8.2 8.2 7.8 7.8 6.9
7.4 7.9 8.1 7.3
9.7 8.6 9.4
11.2 11.2 11.1 11.1 9.6
Infusate
1.1 1.0 2.2 2.2
0.3 2.2 2.1 4.1
1.2 2.4 1.2 2.4 1.1
1.2 1.1 1.2 1.1
1.4 1.2 1.8
2.7 2.7 3.6 3.6 0.8
Chanee of
from hay
-0.3 -0.1 -1.3 -0.8
+0.2 -0.7 -1.1 -1.1
-0.7 -1.3 -0.4 -1.6 -1.1
-0.2 -0.2 -0.3 -0.1
-0.3 -0.2 +0.3
-1.0 -0.9 -0.7 -0.3 +0.3
MEI
total
+0.9 +1.0 +0.9 +1.5
+0.5 +1.4 +1.0 +3.0
+0.5 +1.1 +0.8 +0.8 +0.1
+1.0 +0.9 +0.8 +1.0
+1.1 +1.0 +2.1
+1.7 +1.8 +2.8 +3.3 +1.1
240

Change in MEI from feed (MJ/d)
1 T
• 2
-3 --
•4 x
y=-x
MEI from infusate (MJ/d)
Fig. 7.7.1. Changes in estimated MEI from feed upon administration of extra ME with different infusâtes: a compilation of results obtained in Exp. 1-4 of this Chapter. Data situated above x-axis indicate an increase of hay intake upon infusion, data between x-axis and the une y = -x indicate partial substitution of hay by infusâtes, data on the line y = -x indicate complete substitution.
The finding of both negative and positive effects of nutrients - either supplied by infusion or as a dietary supplement - on roughage intake raises the question as to the exact role of nutrients in roughage intake regulation. Is it possible to reconcile both negative and positive effects on roughage intake with a single concept of intake regulation? The new theory of intake regulation developed in Chapters 3 and 4 in principle offers an explanation for such opposite effects of supplemental nutrients. In addition, this theory points a way to future research into effects of supplemental nutrients.
From the ideas advanced in Chapters 3 and 4 we infer that, ultimately, the effects of specific nutrients will depend on extent and direction to which they change the efficiency of ME utilization. The level of voluntary intake of any feed (the optimum feed intake) appears to be determined by the rate at which the efficiency of ME utilization declines with increasing consumption level. When the animal receives a fixed amount of supplemental nutrients, intake of the basal feed will change to a new optimum depending on the joint efficiency of ME utilization of basal feed and supplement. The problem is that, from present knowledge, we cannot predict this new efficiency, yet. The complexity of energy utilization makes it unlikely that this new efficiency will be simply the sum of the efficiencies of ME utilization from basal feed and supplemental nutrients. Interactions between utilization of energy from feed and supplement probably often occur creating both positive and negative effects on efficiency of energy utilization. Such different effects should then explain why roughage
241
intake sometimes increases and in other instances remains unchanged or even decreases following nutrient administration. For example, if animals are extremely deficient in glucogenic precursors, a relative excess of acetic acid may give rise to a low efficiency of ME utilization (see Chapter 4). Correcting such a deficiency may improve the efficiency of energy utilization from the basal feed and, hence, it may raise roughage intake. The same could apply to deficiencies of amino acids, vitamins or minerals. Such severe deficiencies will be more common in situations where feed quality is often low. Hence, they will be more frequent in tropical than in temperate regions. In less extreme situations, for instance with the medium quality roughages used by us, apparently, no such beneficial effect of glucogenic supplements occurs. But in that case, there may still be an increase in total MEI due to the fact that additional nutrients may be used relatively efficiently. One might expect that nutrient infusâtes would be always used more efficiently than nutrients which must first be liberated from a feed. Infusing pure nutrients certainly relieves the animal from the energy costs normally associated with the physical processing of feed (eating, ruminating, digesta transport etc.). However, other costs might well undo this possible advantage. For instance, infusing VFA into the rumen often causes relatively large decreases of roughage intake (Egan, 1966; Weston, 1966). These may be related to a higher metabolic acid load imposed on the animal as a result of increased concentrations of VFA (see Chapter 4). As suggested in Section 7.5 an increase of metabolic acid load might also result from a shift in substrate use between tissues when one organ (the small intestine) receives an abundant supply of carbohydrate. In that case the effect of extra glucogenic energy on intake of the basal feed may even become negative.
Lack of knowledge with regard to the overall effect of supplements on efficiency of ME utilization as yet precludes a prediction of the impact of nutrient supplements on roughage intake in any particular situation. To arrive at such a prediction from knowledge of physiological processes must be extremely difficult. First of all, a multitude of physiological processes changes as a result of supplementation and secondly, it is only the integrated effect of all these changes which really appears to determine the animal's decision how much to eat. At some stage of our research we thought that differences in the amount of energy invested in resorption of nutrients from the gut might be an important cause of differences in ME utilization and intake between feeds. This led to a comparison of abomasal infusions with a number of carbohydrates known to differ in mode of resorption. Results of these experiments did not confirm our hypothesis for this particular case. This does not exclude, however, that between feeds of different nature, energy costs related to the transport of endogenous and exogenous nutrients from the gut may contribute significantly to differences in ME utilization. Indirect evidence for an important role of secretion and absorption processes was discussed in Chapter 4.
So, although a physiological interpretation is still far from complete, our theory of intake regulation appears to predict roughage intake accurately (see Chapter 3). In addition, this theory provides a framework capable of accommodating different responses to supplementation of roughages. It has also strong implications for future research. Current research into the physiological basis of effects of concentrates on roughage intake, heavily focuses on changes in the rate of digesta clearance as a result of supplementation (see for instance Weston, 1988). This interest in the physical processing of feed by the animal stems from the idea that reticulo-rumen fill is an important determinant of roughage intake. In our theory digesta clearance per se does not play any role. As far as this process is of real importance for intake regulation, it is so through: 1. the associated energy costs imposed on
242

the animal, and 2. an effect on the type of nutrients becoming available for absorption. This means that many of the variables often measured in intake studies (rumen digesta load, digesta particle size distribution, rate of digesta particle comminution and passage) are of little help for a better understanding of intake regulation: ruminants, in our view, do not respond to changes in the ease with which digesta are removed from the gut, but to the joint effects of feed consumption on energy metabolism and oxygen use. Our theory further implies that a search for physiological upper limits to rates of eating, ruminating, digesta clearance, nutrient absorption and nutrient utilization is futile: animals appear to prefer an optimum intensity of physiological processes and the available evidence indicates that this is usually a submaximum intensity. Therefore, future studies should concentrate on the energetic efficiency of various processes linked to feed consumption, rather than search for limitations to such processes.
Nutrient infusion experiments will probably form part of such future research as they are the only means to change nutrient fluxes through various compartments of the body in a predetermined way. They should, however, be combined with measurements of oxygen consumption and substrate use in different body compartments and in the animal as a whole. Despite the apparent advantage of infusion experiments as a tool in nutrition research some cautionary remarks still have to be made. Since nutrient infusions are in a way a form of forced feeding there is always a risk of creating artefacts: results which bear no relationship with normal feeding conditions. Several aspects of nutrient infusions may give rise to the creation of artefacts. For instance, under normal conditions of feeding many internal state parameters are under the control of the animal and can be adjusted by the animal through changes in feeding intensity. With nutrient infusions deliberate attempts of the animal to change internal conditions (nutrient concentrations for instance) are partially rendered ineffective and this may upset the animal: the most powerful means an animal has learned to use in order to avoid harmful effects of feeding is to stop eating and this does not work any more with forced feeding. Artefacts may also arise from the common practice to administer infusâtes continuously instead of intermittently. Although the nutrient supply from fermentation and digestion is also continuous in the free-feeding animal, fluctuations occur in rate of supply within a day. In fact, the existence of meals and meal pauses are an important characteristic of feed consumption in both ruminants and monogastrics. In rats, feeding patterns appear to differ between diets of different protein content and in this way to affect the efficiency of energy utilization (McCracken, 1975). Finally, artefacts may arise from conditioning, a phenomenon known from experiments in which a nutritious feed was given in combination with intraluminal administration of a harmful substance, for example larkspur extract in the experiments of Olsen and Ralphs (1986). Animals which were offered lucerne and which, at the same time, were repeatedly dosed with larkspur extract, refused the feed also when no extract was given any more. In our experiments however, decreases of intake as a result of nutrient infusions usually disappeared soon after the infusion of the nutrient was discontinued. This suggests that in our experiments conditioning did not occur. Thus, although the complexity of the ruminant digestive tract may make the use of fistulated animals and nutrient infusions a logical choice, translating the results of infusion studies to the intact animal should be done with care.
243

References
Armstrong, W.M., 1987. Cellular mechanisms of ion transport in the small intestine. In: LJR. Johnson (Ed.), Physiology of the gastrointestinal tract. Second edition. Raven Press, New York, 1251-1265.
Baile, C.A. and LM.Forbes, 1974. Control of feed intake and regulation of energy balance in ruminants. Physiological Reviews, 54: 160-214.
Barry, T.N. and T.R. Manley, 1985. Glucose and protein metabolism during late pregnancy in triplet-bearing ewes given fresh forage ad lib. 1. Voluntary intake and birth weight. British Journal of Nutrition, 54, 521-533.
Blaxter, K.L., 1989. Energy metabolism in animals and man. Cambridge University Press, Cambridge, 336 pp. Blevins, D.G., 1985. Role of potassium in protein metabolism in plants. In: R.D. Munson (Ed.), Potassium in
agriculture, Proceedings of an International Symposium, Atlanta, 1985. American Society of Agronomy, Madison, pp. 413-424.
Cheng, K.-J. and J.W. Costerton, (1980). Adherent rumen bacteria - their role in the digestion of plant material, urea and epithelial cells. In: Y. Ruckebusch and P. Thivend (Eds.), Digestive physiology and metabolism in ruminants, Proceedings of the 5th International Symposium on Ruminant Physiology, Clermont-Ferrand, 1979. MTP Press Ltd, Lancaster, pp. 227-250.
Demarquilly, C , E. Grenet and J. Andrieu, 1981. Les constituants azotés des fourrages et la prévision de la valeur azotée des fourrages. In: J. Andrieu, C. Demarquilly and W. Wegat-Litre (Eds.), Prévision de la valeur nutritive des aliments des ruminants. INRA Publications, Versailles, pp. 129-154.
Demeyer, D. and C. Van Nevel, 1979. Protein fermentation and growth by rumen microbes. Annales des Recherches Vétérinaires, 10: 277-279.
Dijkshoorn, W., 1973. Organic acids, and their role in ion uptake. In: G.W. Butler and R.W. Bailey (Eds.), Chemistry and biochemistry of herbage. Volume 2, Chapter 2, p.163-188. Academic Press, London.
Dowden, D.R. and D.R. Jacobson, 1960. Inhibition of appetite in dairy cattle by certain intermediate metabolites. Nature, 188: 148-149.
Eckert, R. and D. Randall, 1983. Animal physiology. Mechanisms and adaptations. Second edition. Freeman and Company, New York, 830 pp.
Egan, A.R., 1965. Nutritional status and intake regulation in sheep. II. The influence of sustained duodenal infusions of casein or urea upon voluntary intake of low-protein roughages by sheep. Australian Journal of Agricultural Research, 16:451-462.
Egan, A.R., 1966. Nutritional status and intake regulation in sheep. V. Effects of intraluminal infusions of volatile fatty acids upon voluntary intake of roughage by sheep. Australian Journal of Agricultural Research, 17: 741-755.
Egan, A.R., 1977. Nutritional status and intake regulation in sheep. VII. Relationships between the voluntary intake of herbage by sheep and the protein/energy ratio in the digestion products. Australian Journal of Agricultural Research, 28: 907-915.
Egan, A.R. and RJ.Moir, 1965. Nutritional status and intake regulation in sheep. I. Effects of duodenally infused single doses of casein, urea and propionate upon voluntary intake of a low-protein roughage by sheep. Australian Journal of Agricultural Research, 16:437-449.
Faichney, G.J., 1980. Measurement in sheep of the quantity and composition of rumen digesta and of the fractional outflow rates of digesta constituents. Australian Journal of Agricultural Research, 31: 1129-1137.
Forbes, J.M., 1986. The voluntary food intake of farm animals. Butterworths, London, 206 pp. Gill, M., A.J. Rook and L.R.S. Thiago, 1988. Factors affecting the voluntary intake of roughage by the dairy
cow. In: P.C. Garnsworthy (Ed.), Nutrition and lactation of the dairy cow. Butterworths, London, pp. 262-279.
Grenet, E. and C. Demarquilly, 1977. Utilisation de l'azote des fourrages verts par le mouton en croissance: influence de stade de végétation, de l'espèce fourragère, de la fertilisation azotée et de l'addition d'orge. Annales de Zootechnie, 26:481-501.
Grovum, W.L., 1987. A new look at what is controlling food intake. In: F.N. Owens (Ed.), Feed intake by beef cattle, Proceedings Symposium: Feed intake by beef cattle, Nov.20-22 1986, Animal Science Department, Agricultural Experimental Station Division of Agriculture, Oklahoma State Univerity, pp. 1-39.
Hagemeister, H., W. Lüpping and W. Kaufmann, 1981. Microbial protein synthesis and digestion in the high-yielding dairy cow. In: W. Haresign and D.J.A. Cole (Eds.), Recent developments in ruminant nutrition. Butterworths, London, pp. 31-48.
244

Hemsley, J.A. and R.J. Moir, 1963. The influence of higher volatile fatty acids on the intake of urea-supplemented low quality cereal hay by sheep. Australian Journal of Agricultural Research, 14: 509-517.
Hogan, J.P., R.H. Weston and J.R. Lindsay, 1969. The digestion of pasture plants by sheep. IV. The digestion of Phalaris tuberosa at different stages of maturity. Australian Journal of Agricultural Research, 20: 925-940.
Holder, J.M., 1963. Chemostatic regulation of appetite in sheep. Nature, 200: 1074-1075. Hume, I.D., 1970. Synthesis of microbial protein in the rumen. II. A response to higher volatile fatty acids.
Australian Journal of Agricultural Research, 21: 297-304. Huntington, G.B., G.A. Varga, B.P. Glenn and D.R. Waldo, 1988. Net absorption and oxygen consumption by
Holstein steers fed alfalfa or orchardgrass silage at two equalized intakes. Journal of Animal Science, 66: 1292-1302.
Hynd, P.I., 1989. The effects of fishmeal and postruminal glucose on the intake and digestion of low-quality herbages by grazing cattle in southern Australia. Australian Journal of Agricultural Research, 40: 925-932.
Kemp, A., 1983. The effect of fertilizer treatment of grassland on the biological availability of magnesium to ruminants. In: J.P. Fontenot et al. (Eds.), Role of magnesium in animal nutrition. Virginia Polytechnic Institute and State University Blacksburg, Virginia, pp. 143-157.
Kempten, TJ„ J.V. Nolan and R.A. Leng, 1977. Principles of the use of non-protein nitrogen and by-pass proteins in diets of ruminants. World Animal Review, 22: 2-10.
Ketelaars, J.J.M.H., 1984. Patterns of nitrogen and energy intake and their relation to the control of voluntary feed consumption in ruminants and monogastric animals. CABO, Wageningen, 176 pp.
Leng, R.A., 1982. Modification of rumen fermentation. In: J.B. Hacker (Ed.), Nutritional limits to animal production from pastures. Commonwealth Agricultural Bureaux, Farnham Royal, pp. 427-453.
Lyttleton, J.W., 1973. Proteins and nucleic acids. In: G.W. Butler and R.W. Bailey (eds.) Chemistry and biochemistry of herbage. Volume 1, Chapter 2, p.63-103. Academic Press, London.
Manning, R., G.I. Alexander, H.M. Krueger and R. Bogart, 1959. The effect of intravenous glucose injections on appetite in adult ewes. American Journal of Veterinary Research, 20: 242-246.
Martens H. and Y. Rayssiguier, 1980. Magnesium metabolism and hypomagnesaemia. In: Y. Ruckebusch and P. Thivend (Eds.), Digestive physiology and metabolism in ruminants, Proceedings of the 5th International Symposium on Ruminant Physiology, Clermont-Ferrand, 1979. MTP Press Ltd, Lancaster, pp. 447-466.
McAUan, A.B. and P.E. Lewis, 1985. The removal of glucose, maltose and different starches from the small intestines of steers. Archiv für Tierernährung, 35:495-505.
McCracken, K.J., 1975. Effect of feeding pattern on the energy metabolism of rats given low-protein diets. British Journal of Nutrition, 33: 277-289.
Merry, RJ. and A.B. McAUan, 1983. A comparison of the chemical composition of mixed bacteria harvested from the liquid and solid fractions of rumen digesta. British Journal of Nutrition, 50: 701-709.
Michaelis, O.E., D.J. Scholfield, CS . Nace and S. Reiser, 1978. Demonstration of the disaccharide effect in nutritionally stressed rats. Journal of Nutrition, 108: 919-925.
Minson, D.J. and R. Milford, 1968. The nutritional value of four tropical grasses when fed as chaff and pellets to sheep. Australian Journal of Experimental Agriculture and Animal Husbandry, 8: 270-276.
Novin, D., J.D. Sanderson and D.A. Vanderweele, 1974. The effect of isotonic glucose on eating as a function of feeding condition and infusion site. Physiology and Behavior, 13: 3-7.
Oldham, J.D., 1984. Protein-energy interrelationships in dairy cows. Journal of Dairy Science, 67: 1090-1114. Olsen, J.D. and M.H. Ralphs, 1986. Feed aversion induced by intraluminal infusion with larkspur extract in
catde. American Journal of Veterinary Research, 47: 1829-1833. 0rskov, E.R., 1986. Starch digestion and utilization in ruminants. Journal of Animal Science, 63: 1624-1633. 0rskov, E.R., D.A. Grubb, G. Wenham and W. Corrigall, 1979. The sustenance of growing and fattening
ruminants by intragastric infusion of volatile fatty acid and protein. British Journal of Nutrition, 41: 553-558. Papas, A., E.E. Hatfield and F.N. Owens, 1974. Responses of growing lambs to abomasal infusion of corn oil,
starch, casein and amino acid mixtures. Journal of Nutrition, 104: 1543-1553. Preston, T.R. and R.A. Leng, 1987. Matching ruminant production systems with vailable resources in the tropics
and sub-tropics. Penambul Books, Armidale, and CTA, Wageningen, pp. 245. Scott, D., 1967. The effects of potassium supplements upon the absorption of potassium and sodium from the
sheep rumen. Quarterly Journal of Experimental Physiology, 52: 382-391. Storm, E. and E.R. 0rskov, 1983. The nutritive value of rumen micro-organisms in ruminants. 1. Large-scale
isolation and chemical composition of rumen micro-organisms. British Journal of Nutrition, 50:463-470.
245

Storm, E., E.R. 0rskov and R.Smart, 1983. The nutritive value of rumen micro-organisms in ruminants. 2. The apparent digestibility and net utilization of microbial N for growing lambs. British Journal of Nutrition, 50: 47M78.
Ulyatt, M.J., 1965. The effects of intra-ruminal infusions of volatile fatty acids on food intake of sheep. New Zealand Journal of Agricultural Research, 8: 397-408.
Vallance, W.S. and G.L. McClymont, 1959. Depression in percentage of milk fat by parenteral glucose infusion and glycerol feeding. Nature, 183:466-467
Vérité, R., B. Rémond and M. Joumet, 1984. Sites of organic matter and protein digestion in lactating cows fed fresh grass from spring to autumn. Canadian Journal of Animal Science, 64 (Suppl.): 328-329.
Webster, AJ.F., 1980. Energy costs of digestion and metabolism in the gut. In: Y. Ruckebush and P. Thivend (Eds.), Digestive physiology and metabolism in ruminants, Proceedings of the 5th International Symposium on Ruminant Physiology, Clermont-Ferrand, 1979, MTP Press Ltd, Lancaster, pp. 469-484.
Wçston, R.H., 1966. Factors limiting the intake of feed by sheep. I. The significance of palatability, the capacity of the alimentary tract to handle digesta, and the supply of glucogenic substrate. Australian Journal of Agricultural Research, 17: 939-954.
Weston, R.H., 1988. Factors limiting the intake of feed by sheep. X. The effects of concentrate supplements on the voluntary consumption and digestion of a medium quality roughage. Australian Journal of Agricultural Research, 39: 255-271.
Wieringa, G.W., H.G. van der Meer and J.H. Geurink, 1980. Production and utilization of energy and protein in grass in relation to nitrogen rate, green crop fractionation and dairy feeding systems. Proceedings of the International Symposium of the European Grassland Federation on The role of nitrogen in intensive grassland production, Pudoc, Wageningen, 1980, pp. 103-111.
Wilkins, R.J., 1982. Improving forage quality by processing. In: J.B. Hacker (Ed.), Nutritional limits to animal production from pastures. Commonwealth Agricultural Bureaux, Farnham Royal, pp. 389-408.
246

Samenvatting
Dit proefschrift getiteld 'Naar een nieuwe theorie over voederopnameregulering bij herkauwers' beschrijft de resultaten van een gezamenlijk onderzoek naar de oorzaken van verschillen in voederopname bij herkauwers. Dergelijke verschillen treden op wanneer we voer in onbeperkte hoeveelheid (ad libitum) aan dieren verstrekken. Ze hangen samen met verschillen in voedereigenschappen, diereigenschappen of omgevingsfaktoren. Elk van deze bronnen van variatie in opname is voor de veehouderij van groot belang aangezien het niveau van voederopname voor een belangrijk deel de produktiviteit van dieren bepaalt.
Het proefschrift bestaat uit twee delen voorafgegaan door een algemene inleiding. In de algemene inleiding wordt in grote lijnen de aanzet tot het onderzoek, het verloop en enkele belangrijke resultaten geschetst.
Deel I omvat de Hoofdstukken 1, 2, 3 en 4. De eerste twee hoofdstukken zijn een kritische beschouwing van gangbare ideeën ten aanzien van voederopnameregulering bij herkauwers. In Hoofdstuk 3 en 4 ontwikkelen we een nieuwe theorie ter verklaring van verschillen in voederopname.
Deel II omvat de Hoofdstukken 5, 6 en 7. Hierin worden de resultaten van eigen experimenten beschreven. Deze experimenten betroffen voederproeven met dwerggeiten en schapen en hadden tot doel verschillende hypothesen m.b.t. voederopnameregulering te toetsen. Resultaten hiervan hebben mede bijgedragen tot de formulering van de theorie beschreven in Hoofdstuk 3 en 4.
Zoals uit Hoofdstuk 1 blijkt, bestaat er in de recente literatuur een grote mate van eenstemmigheid over de oorzaken van verschillen in opname tussen voeders. De gangbare vooronderstelling is, dat herkauwers in principe streven naar een maximale groei- en produktiesnelheid en een daarbij behorende maximale energie-opname. Een hoge energieopname bereiken herkauwers echter alleen op rantsoenen met een hoge verteerbaarheid en energiedichtheid, i.e. rantsoenen met veel krachtvoer welke van nature niet vóórkomen in het menu van herkauwers. Bij rantsoenen bestaande uit uitsluitend ruwvoer ligt de energieopname meestal lager, soms veel lager. Dit zou vooral veroorzaakt worden doordat de omvang van het maagdarmkanaal in combinatie met het grote vullende vermogen van ruwvoeders, de voederopname beperken. Hoewel dus vulling van het maagdarmkanaal als een belangrijke faktor wordt beschouwd voor de opname van ruwvoeders, neemt men in de regel aan dat allerlei andere endogene en exogene faktoren de opname positief dan wel negatief kunnen beïnvloeden. De feitelijke opname van elk voer zou afhankelijk zijn van de totale balans van deze invloeden.
Een kritische analyse van dit concept van opnameregulering toont aan dat hiermee de variatie in voederopname van herkauwers slechts ten dele en vaak onbevredigend te verklaren is. Zo wijzen relaties tussen voederkenmerken en opname niet uitsluitend op een verband tussen maagvulling en opname, maar ook op een verband tussen de efficiëntie waarmee metaboliseerbare energie benut wordt en de ad libitum opname. Verder blijken relaties tussen opname, maagvulling en passagesnelheid als zodanig geen bewijs te leveren voor een fysische beperking van de opname. Opnameveranderingen na toediening van de normale
247

verteringsprodukten in infuusproeven ondersteunen evenmin een belangrijke rol voor maagvulling. Uit gedetailleerd onderzoek naar de voedselafbraak in de voormagen blijkt bovendien dat herkauwers in principe de opname van eenzelfde voer in hoge mate zelf kunnen beïnvloeden door de passagesnelheid van digesta aan te passen. Tenslotte bestaat er twijfel aan de vooronderstelling dat voederopnamegedrag gericht zou zijn op het bereiken van een maximale energie-opname.
In Hoofdstuk 2 komt de vraag aan de orde wat mogelijke oorzaken zijn van verschillen in voederopname tussen herkauwers, zowel op het niveau van soorten als dat van rassen en individuen. De meningen in de literatuur blijken hierover uiteen te lopen. Sommige auteurs gaan ervan uit dat de voederopname van dieren proportioneel is met hun voederbehoefte, anderen veronderstellen dat de opname bepaald en beperkt wordt door de omvang van het maagdarmkanaal. De meeste auteurs nemen aan dat zowel voederbehoefte als omvang van het maagdarmkanaal van betekenis zijn voor verschillen in opname tussen dieren. Doel van Hoofdstuk 2 is na te gaan met welke visie gegevens van gedomesticeerde herkauwers het best overeenstemmen. Daartoe worden literatuurgegevens met betrekking tot voederopname, basaal metabolisme en omvang van de maagdarminhoud vergeleken.
Tussen genotypes (soorten, rassen en individuen) blijkt de voederopname in het algemeen te variëren proportioneel met het basaal metabolisme. Per kilogram lichaamsgewicht hebben kleine genotypes in vergelijking met grote genotypes een aanzienlijk grotere opnamecapaciteit, en een grotere maagdarminhoud of kortere verblijftijd van digesta in het maagdarmkanaal. Veranderingen in opname, maagdarminhoud en digesta-verblijftijd parallel aan veranderingen in fysiologisch stadium en lichaamsomvang wijzen niet noodzakelijkerwijs op een causaal verband tussen maagvulling en opname: tegelijkertijd treden immers ook grote veranderingen op in het metabolisme van het dier zoals o.a. blijkt uit verschillen in efficiëntie van benutting van metaboliseerbare energie. Effecten van temperatuur en daglengte bevestigen dat een dier het niveau van opname van eenzelfde voer kan variëren. Waarom herkauwers alleen onder bepaalde omstandigheden deze capaciteit gebruiken om meer voer op te nemen, houdt mogelijk verband met noodzakelijke veranderingen in het metabolisme die niet altijd gunstig hoeven te zijn voor het dier.
In Hoofdstuk 3 ontwikkelen we een nieuwe theorie ter verklaring van verschillen in voederopname. Kernidee is de veronderstelling dat voederopname voor het dier zowel positieve als negatieve aspekten vertegenwoordigt, door ons respectievelijk als baten en kosten betiteld. Voor een niet-reproducerend dier beschouwen we als baten de opname van netto energie voor onderhoud en gewichtstoename, als kosten de totale zuurstofconsumptie van het dier. Dit laatste is gebaseerd op bevindingen uit onderzoek naar veroudering, die tonen dat het gebruik van zuurstof door lichaamsweefsels oorzaak is van schade aan celstructuren, van verlies aan vitaliteit en van een beperkte levensduur. Onze hypothese luidt dan ook dat voederopnamegedrag gericht zal zijn op het maximaliseren van de efficiëntie van zuurstofbenutting: van elk voer zal het dier zoveel consumeren dat de opname van netto energie per liter zuurstof maximaal is. De ad libitum opname van een voer is bijgevolg de optimale opname uit een oogpunt van efficiëntie van zuurstofbenutting. Een uitvoerige test van deze hypothese aan de hand van gepubliceerde gegevens van niet-reproducerende herkauwers laat zien dat voorspelde en waargenomen ad libitum opname goed overeenstemmen. Dit geldt voor voeders die sterk verschillen in metaboliseerbaarheid, stikstofgehalte en fysische hoedanigheid. Veranderingen in opname parallel aan veranderingen in basaal metabolisme zijn eveneens in overeenstemming met onze hypothese.
248

Effekten van veranderingen in fysiologische ontwikkeling op de voederopname zijn moeilijker te voorspellen. Dit is deels het gevolg van gebrek aan informatie over parallelle veranderingen in efficiëntie van ME benutting, deels het gevolg van onzekerheid met betrekking tot de aard van kosten en baten van voederconsumptie in drachtige en lacterende dieren. Tenslotte concluderen we in Hoofdstuk 3 dat het maximaliseren van de efficiëntie van zuurstofbenutting een principe kan zijn van algemenere toepassing op de regulering van gedrag van aëroob levende organismen.
In Hoofdstuk 4 trachten we een aantal fysiologische processen te identificeren die een rol spelen bij het optreden van verschillen in efficiëntie van zuurstofbenutting als funktie van voederopnameniveau en voedersamenstelling. Het feit dat de efficiëntie van zuurstofbenutting een maximale waarde bereikt bij toenemend opnameniveau, is het gevolg van het bestaan van een basale zuurstofconsumptie en van een afnemende partiële efficiëntie waarmee ME bij stijgende opname benut wordt. Mogelijke oorzaken voor een afnemende efficiëntie worden besproken aan de hand van bekende effecten van vluchtige vetzuren, het belangrijkste eindprodukt van de vertering bij herkauwers, op het celmetabolisme. Toenemende concentraties van vluchtige vetzuren blijken verschillende, deels onafhankelijke effecten te hebben op levende cellen: ze stimuleren zowel het gebruik van substraat voor de synthese van celbestanddelen, als het gebruik voor onderhoudsprocessen, dit laatste hoofdzakelijk vanwege een verhoogde protonenlekkage van membranen. Hieruit ontwikkelen we de hypothese dat een verhoogde extracellulaire zuurlast verantwoordelijk is voor een afnemende partiële efficiëntie van benutting van metaboliseerbare energie. Het opnameniveau waarbij een maximale efficiëntie van zuurstofbenutting wordt bereikt is vermoedelijk gekoppeld aan het voorkomen van een bepaalde 'optimale' zuurlast en bijgevolg aan optimale concentraties van vluchtige vetzuren. Voederopnameregulering moet dan gericht zijn op het handhaven van dergelijke concentraties in alle compartimenten van het lichaam. Het feit dat optimale vluchtige-vetzuurconcentraties verschillen naar gelang de kwaliteit van het voer, zou het gevolg kunnen zijn van verschillen tussen voeders in omstandigheden voor absorptie en benutting van vluchtige vetzuren. Deze omstandigheden variëren vermoedelijk onder invloed van verschillen in interne recirculatie van elektrolyten, in de verhouding van geabsorbeerde nutriënten en in endogene zuurproduktie. De waarde van de verteerbaarheid en het stikstofgehalte van voeders als maat voor de te verwachten opname wordt in verband gebracht met verschillen in deze omstandigheden. Tot slot concluderen we dat de intracellulaire pH voor het dier een belangrijke parameter zou kunnen zijn voor het vaststellen van de optimale intensiteit van voederopnamegedrag maar ook van andere vormen van gedrag. Dit zou zowel voor herkauwers als voor eenmagigen kunnen gelden.
In Deel II, Hoofdstuk 5 worden de resultaten besproken van een twee jaar durend experiment dat tot doel had de voederopname en vastende warmte produktie van West-Afrikaanse dwerggeiten als funktie van gewicht en leeftijd te onderzoeken en te vergelijken met schapen van een gemengd ras, de Swifter. Aanleiding tot dit experiment vormden de speciale belangstelling voor deze diersoort vanuit de Vakgroep Tropische Veehouderij aan de Landbouwuniversiteit en de verhoudingsgewijs geringe hoeveelheid kennis die beschikbaar is over de voederopname en voederbehoefte van deze kleine herkauwerssoort. Bovendien werden beide diersoorten gebruikt voor de voedingsproeven beschreven in Hoofdstuk 6 en 7. Gedurende het eerste jaar van de proef werden de dieren ad libitum gevoerd met gepelleteerd graszaadstro, gedurende het tweede jaar met gepelleteerde lucerne. In de loop van het
249

experiment namen de dwerggeiten toe in gewicht van 12 tot 38 kg, de schapen van 50 tot 110 kg. Een vergelijking van de voederopname van beide soorten op gelijke tijdstippen toonde aan dat de verteerbare organische-stofopname proportioneel was met het metabolisch gewicht. Dezelfde wetmatigheid bleek te gelden voor de vastende warmte produktie. Dit betekent dat beide diersoorten op eenzelfde leeftijd ten opzichte van hun vastende warmte produktie eenzelfde voederopnameniveau bereikten. Deze constatering is in lijn met de algemene conclusies uit Hoofdstuk 2.
Hoofdstuk 6 beschrijft een aantal kortdurende voedingsexperimenten met dwerggeiten. Deze hadden tot doel de hypothese te testen dat de opname van ruwvoeders in belangrijke mate beïnvloed wordt door de verhouding waarin eiwit en energie uit voer opgenomen worden. Deze hypothese werd op twee manieren getest. In een aantal proeven werd extra eiwit oraal bijgevoerd, in andere experimenten werd extra eiwit per infuus in de lebmaag toegediend. Alle proeven werden uitgevoerd met voeders van relatief lage verteerbaarheid maar met voldoende stikstof voor een onbeperkte microbiële vertering in de voormagen. Om zeker te zijn dat oraal toegediend eiwit in de dunne darm belandt, werd een techniek van formaldehyde behandeling gebruikt om eiwit te beschermen tegen microbiële afbraak in de pens. Verschillende testen toonden dat de beschreven techniek eiwit oplevert met een geringe microbiële afbreekbaarheid maar met een hoge verteerbaarheid in de dunne darm. Supplementatieproeven leidden aanvankelijk tot aanwijzingen voor een positief effekt van extra eiwit op de voederopname van lang en gepelleteerd ruwvoer. Dit positieve effekt kon echter niet bevestigd worden in uitgebreidere experimenten en evenmin in infuusproeven. De positieve effekten die aanvankelijk met een gepelleteerd ruwvoer werden gevonden, bleken bij nader onderzoek terug te voeren op effekten van verschillen in pelleteergang. Welke veranderingen in pellet-eigenschappen precies verantwoordelijk zijn voor verschillen in opname kon niet worden vastgesteld.
Hoofdstuk 7 beschrijft een aantal infuusproeven met schapen. Deze hadden tot doel de effekten op de voederopname te onderzoeken van veranderingen in beschikbaarheid van nutriënten middels infusen in pens en lebmaag. Om praktische redenen werden hiervoor schapen als modelherkauwer gekozen. Het basis-rantsoen in alle experimenten bestond uit hooi van matige verteerbaarheid en een matig hoog stikstofgehalte. In het eerste experiment werd de hypothese getoetst dat de nutriënten die als onderdeel van microbiële cellen de voormagen verlaten en in de dunne darm beschikbaar komen (waaronder eiwitten, koolhydraten en lipiden) een belangrijk positief effekt zouden kunnen hebben op de ruwvoederopname. Om deze hypothese te toetsen werd microbiële massa uit pensinhoud van slachthuis-koeien geïsoleerd en vervolgens geïnfundeerd in de lebmaag van lammeren. Ter vergelijking ontving een andere groep een equivalente hoeveelheid stikstof in de vorm van melkeiwit. Geen van beide infusen bleek de ruwvoederopname te beïnvloeden. Toen additioneel een hoeveelheid glucose in de lebmaag geïnfundeerd werd, bleek de ruwvoederopname significant te dalen. Met en zonder glucose bleek evenwel de geschatte totale opname van metaboliseerbare energie middels infusen verhoogd te kunnen worden. In een tweede experiment werd onderzocht of de positieve correlatie tussen opname en stikstofgehalte van ruwvoer mogelijk het gevolg is van een verstrengeling van stikstof met andere componenten in ruwvoer, waaronder kalium. Daartoe werd een infuusproef uitgevoerd waarin het effekt onderzocht werd van extra kalium toegediend in de pens al dan niet in combinatie met eiwit toegediend in de lebmaag. Daarnaast werd geprobeerd het effekt van een hoger stikstofgehalte in ruwvoer te imiteren door eiwitrijk sap uit gras te winnen en
250

dit per infuus toe te dienen aan de pens van proefdieren. Geen van de onderzochte behandelingen resulteerde in een verhoging van de ruwvoederopname. Wel bleek ook hier de geschatte totale opname aan metaboliseerbare energie met infusen van eiwit en grassap toe te nemen. In een derde reeks infuusproeven werd het effekt onderzocht van lebmaaginfusen met glucose, maltose, fructose, zetmeel en eiwit. Genoemde koolhydraten verschillen in de wijze van absorptie uit de dunne darm en de daarmee gepaard gaande energiekosten. Fructose toediening bleek al bij lage doses diarree te veroorzaken en een sterk verlaagde voederopname. Tussen de andere koolhydraten werd geen verschil in opnamerespons gevonden. Zowel toediening van koolhydraten als van eiwit bleek de geschatte totale opname aan metaboliseerbare energie te verhogen. In een vierde experiment werd onderzocht in welke mate de microbieel afbreekbare en bestendige fraktie van voedereiwit bijdragen tot de hogere voederopname van eiwitrijke ruwvoeders. Effekten van afbreekbaar eiwit werden onderzocht door de afbraakprodukten van eiwit (een specifiek mengsel van vluchtige vetzuren) al dan niet in combinatie met ammoniak in de pens te infunderen. De uitkomsten van dit experiment suggereren dat beide eiwitfrakties een positief effekt hebben op de energie-opname.
Bij elkaar genomen geven de resultaten van de verschillende experimenten geen aanleiding te veronderstellen dat de verhoudingen waarin nutriënten uit voer geabsorbeerd worden een beslissende rol spelen voor het ad libitum opnameniveau van ruwvoeders van gemiddelde kwaliteit. Wel blijken ze dit niveau in meer of minder grote mate te kunnen beïnvloeden. De theorie beschreven in Hoofdstuk 3 en 4 geeft een aanzet tot een verklaring van deze effekten. Volgens deze theorie zijn veranderingen in ruwvoederopname als reaktie op de verstrekking van extra nutriënten hetzij via voedersupplementen (krachtvoer) hetzij via infusen het gevolg van veranderingen in de efficiëntie waarmee de opgenomen metaboliseerbare energie benut wordt. Afhankelijk van het effekt van additionele nutriënten op de benutting van metaboliseerbare energie uit het basis-rantsoen zal de opname hiervan toenemen, gelijk blijven of afnemen. Onder welke omstandigheden een positief dan wel negatief effekt optreedt, lijkt op basis van de huidige kennis niet goed te voorspellen.
251
Curricula vitae
Jan Ketelaars werd geboren op 20 juli 1952 te Roermond, waar hij in 1970 aan het Bisschoppelijk College het Gymnasium-ß diploma behaalde. Van 1970 tot 1976 studeerde hij aan de Landbouwhogeschool te Wageningen Tropische Plantenteelt met als specialisatie Graslandkunde, en als bijvakken Tropische Bodemkunde en Vegetatiekunde. Zijn praktijktijd bracht hij door aan het Centrum voor Landbouwkundig Onderzoek in Suriname, aldaar. Van 1976 tot 1978 was hij achtereenvolgens werkzaam als studentassistent bij de vakgroep Landbouwplantenteelt en Graslandcultuur, en als wetenschappelijk assistent bij de vakgroep Theoretische Teeltkunde van de Landbouwhogeschool. Van 1978 tot 1982 studeerde hij fysiotherapie aan de 'Jan van Essen' Academie te Amsterdam. In 1982 trad hij als wetenschappelijk ambtenaar in dienst van het Centrum voor Agrobiologisch Onderzoek te Wageningen waarvoor hij aanvankelijk een studie verrichtte naar de mogelijkheden voor dierlijke produktie op Sahel-graslanden. Vanaf 1986 is hij belast met onderzoek naar de voederkwaliteit van ruwvoeders. Resultaten van dit onderzoek vormden mede de basis voor dit proefschrift.
Bert Tolkamp werd op 22 juni 1951 in Aalten geboren, waar hij in 1969 aan de Christelijke HBS het HBS-b diploma behaalde. Van 1969 tot 1977 studeerde hij aan de Landbouwhogeschool te Wageningen Tropische Veehouderij met als bijvakken Sociologie van niet-westerse gebieden, Graslandkunde, en Veehouderij. Zijn praktijktijd bracht hij in 1974 door aan het CIAT in Colombia. Hij was in 1977 en 1978, en van 1981 tot 1984 als wetenschappelijk ambtenaar met verschillende taakopdrachten verbonden aan de Vakgroep Tropische Veehouderij en de gezamenlijke Zoötechnische Vakgroepen van de Landbouwhogeschool te Wageningen. Als assistent-deskundige voor de FAO werkte hij van 1979 tot 1981 op een melkvee-trainingscentrum in Namaacha, Mozambique. Gedurende zijn aanstelling als promotie-assistent bij de Vakgroep Tropische Veehouderij van 1984 tot 1988 werd het onderzoek met dwerggeiten, beschreven in dit proefschrift, uitgevoerd. Sinds 1988 is hij als toegevoegd docent verbonden aan de sectie Tropische Veehouderij, Vakgroep Veehouderij, van de Landbouwuniversiteit Wageningen.
253
Copyright © 2022 FDOKUMEN