Tourism Network Attention Variation of Chinese Cities under ...
15
Citation: Hou, X. Tourism Network Attention Variation of Chinese Cities under the COVID-19 Pandemic. Sustainability 2022, 14, 5131. https:// doi.org/10.3390/su14095131 Academic Editor: Ender Demir Received: 17 March 2022 Accepted: 22 April 2022 Published: 24 April 2022 Publisher’s Note: MDPI stays neutral with regard to jurisdictional claims in published maps and institutional affil- iations. Copyright: © 2022 by the author. Licensee MDPI, Basel, Switzerland. This article is an open access article distributed under the terms and conditions of the Creative Commons Attribution (CC BY) license (https:// creativecommons.org/licenses/by/ 4.0/). sustainability Article Tourism Network Attention Variation of Chinese Cities under the COVID-19 Pandemic Xinshuo Hou Business School, Xiangtan University, Xiangtan 411105, China; [email protected] Abstract: At the end of 2019, the COVID-19 pandemic broke out globally and had a tremendous impact on tourism development in countries around the world. The rapid shift of tourism from “over-tourism” to “under-tourism”, threatening the future of the global economy and society, has generated considerable interest from academia and the policy community, but the impact of COVID- 19 on tourism variation remains untested by empirical evidence. Based on the daily Baidu Index of 247 prefecture-level cities in China from 2018 to 2021, this study assessed the treatment effect of COVID-19 on tourism and analyzed its dynamic characteristics using the regression-discontinuity- design (RDD) method combined with tourism network attention (TNA) data. The results show that after the outbreak of the COVID-19 pandemic, the level value of TNA dropped significantly by 2.12 (p < 0.10), and the difference value of TNA (TNA_diff ) dropped significantly by 10.77 (p < 0.01), indicating that COVID-19 has a negative causal effect on tourism development, and its impact is more pronounced in major tourist source cities, with a coefficient of -14.91 (p < 0.01) corresponding to -4.57 (p < 0.01) for non-major tourist source cities when the dependent variable TNA_diff. The identification of dynamic effects further confirms that the negative impact of the pandemic on tourism network attention is fluctuating and persistent during the study period, with the two major “golden weeks” and peak season being the most severe. Compared to 2020, the TNA has generally shown an upward trend since 2021, indicating signs of a rebound in the vitality of resident tourism, which is conducive to the healthy development of the tourism market. Keywords: COVID-19 pandemic; tourism development; the Baidu index; RDD; dynamic effects 1. Introduction The emergence of the new coronavirus pneumonia pandemic (COVID-19) has had a huge impact on tourism development in countries around the world [1,2]. For example, from 23 to 26 January 2020, the hotel occupancy rate in China fell by nearly 70% from a year earlier [3]. At the same time, according to the calculation of the tourism network attention index later in this study, the average value in 2019 was 40.92, and it dropped to 31.90 in 2020 due to the impact of the pandemic. The impact of the pandemic is intuitively reflected. As a fast-growing industry, fluctuations in tourism will also be rapidly transmitted to the economic, cultural, and social development sectors [4]. In mid-2019, the mass media was still debating over-tourism, with concerns that the concentration of over-tourism could lead to conflicts and complaints between tourists and residents [5]. But now, in an instant, everything had changed. Global concerns about tourism have shifted from over-tourism to under-tourism, threatening the future of the global economy and society. However, the impact is not limited to China. The observed spread of COVID-19 around the world has led to strict domestic and international travel restrictions. Most countries around the world have restricted or completely suspended international travel. Of course, it should also be noted that China has stricter rules than countries in Europe and America, which means that the case of China can hardly be referred to other countries without restrictions. However, as a new way of monitoring tourism development, by Sustainability 2022, 14, 5131. https://doi.org/10.3390/su14095131 https://www.mdpi.com/journal/sustainability
-
Upload
khangminh22 -
Category
Documents
-
view
1 -
download
0
Transcript of Tourism Network Attention Variation of Chinese Cities under ...
Citation: Hou, X. Tourism Network
Attention Variation of Chinese Cities
under the COVID-19 Pandemic.
Sustainability 2022, 14, 5131. https://
doi.org/10.3390/su14095131
Academic Editor: Ender Demir
Received: 17 March 2022
Accepted: 22 April 2022
Published: 24 April 2022
Publisher’s Note: MDPI stays neutral
with regard to jurisdictional claims in
published maps and institutional affil-
iations.
Copyright: © 2022 by the author.
Licensee MDPI, Basel, Switzerland.
This article is an open access article
distributed under the terms and
conditions of the Creative Commons
Attribution (CC BY) license (https://
creativecommons.org/licenses/by/
4.0/).
sustainability
Article
Tourism Network Attention Variation of Chinese Cities underthe COVID-19 PandemicXinshuo Hou
Business School, Xiangtan University, Xiangtan 411105, China; [email protected]
Abstract: At the end of 2019, the COVID-19 pandemic broke out globally and had a tremendousimpact on tourism development in countries around the world. The rapid shift of tourism from“over-tourism” to “under-tourism”, threatening the future of the global economy and society, hasgenerated considerable interest from academia and the policy community, but the impact of COVID-19 on tourism variation remains untested by empirical evidence. Based on the daily Baidu Indexof 247 prefecture-level cities in China from 2018 to 2021, this study assessed the treatment effect ofCOVID-19 on tourism and analyzed its dynamic characteristics using the regression-discontinuity-design (RDD) method combined with tourism network attention (TNA) data. The results show thatafter the outbreak of the COVID-19 pandemic, the level value of TNA dropped significantly by 2.12(p < 0.10), and the difference value of TNA (TNA_diff ) dropped significantly by 10.77 (p < 0.01),indicating that COVID-19 has a negative causal effect on tourism development, and its impact ismore pronounced in major tourist source cities, with a coefficient of −14.91 (p < 0.01) correspondingto −4.57 (p < 0.01) for non-major tourist source cities when the dependent variable TNA_diff. Theidentification of dynamic effects further confirms that the negative impact of the pandemic on tourismnetwork attention is fluctuating and persistent during the study period, with the two major “goldenweeks” and peak season being the most severe. Compared to 2020, the TNA has generally shown anupward trend since 2021, indicating signs of a rebound in the vitality of resident tourism, which isconducive to the healthy development of the tourism market.
Keywords: COVID-19 pandemic; tourism development; the Baidu index; RDD; dynamic effects
1. Introduction
The emergence of the new coronavirus pneumonia pandemic (COVID-19) has had ahuge impact on tourism development in countries around the world [1,2]. For example,from 23 to 26 January 2020, the hotel occupancy rate in China fell by nearly 70% from a yearearlier [3]. At the same time, according to the calculation of the tourism network attentionindex later in this study, the average value in 2019 was 40.92, and it dropped to 31.90 in2020 due to the impact of the pandemic. The impact of the pandemic is intuitively reflected.As a fast-growing industry, fluctuations in tourism will also be rapidly transmitted to theeconomic, cultural, and social development sectors [4]. In mid-2019, the mass media wasstill debating over-tourism, with concerns that the concentration of over-tourism couldlead to conflicts and complaints between tourists and residents [5]. But now, in an instant,everything had changed. Global concerns about tourism have shifted from over-tourism tounder-tourism, threatening the future of the global economy and society.
However, the impact is not limited to China. The observed spread of COVID-19around the world has led to strict domestic and international travel restrictions. Mostcountries around the world have restricted or completely suspended international travel.Of course, it should also be noted that China has stricter rules than countries in Europeand America, which means that the case of China can hardly be referred to other countrieswithout restrictions. However, as a new way of monitoring tourism development, by
Sustainability 2022, 14, 5131. https://doi.org/10.3390/su14095131 https://www.mdpi.com/journal/sustainability

Sustainability 2022, 14, 5131 2 of 15
expanding the scope of research on the tourism network attention of Chinese cities, someobservable cases could also be made available to other countries.
For the tourism industry, the duration of the impact of COVID-19 is very differentfrom other crises. The impact of COVID-19 was once considered temporary, as with otheremergencies, but the global pandemic situation and COVID-19 mutations have led to thespreading and frequent recurrence of pandemics. This causes the impact of COVID-19to linger for a long time, greatly affecting the recovery process of tourism development.Considering the damage to the real economy caused by the pandemic, households willlose sustainable income and employment opportunities. This will indirectly affect thedevelopment of tourism. How to assess the impact of the crisis as soon as possible isthe focus of many scholars [2]. In previous studies, scholars have assessed the impact ofSARS on subsequent tourism development [6,7]. These analyses are usually conductedtwo to five years after the SARS event, but there is a lack of timely empirical analysis. Inparticular, a large number of literary works have a great influence on the development ofthe tourism industry, such as the number of tourists, tourism revenue, industry prospects,etc. [8–12]. In recent years, COVID-19 has attracted widespread attention from scholarsand the mass media at home and abroad. However, there is still little literature on thissubject. They argued, inter alia, that the crisis will bring a decline in the economy andtourism over a period of time through normative rather than empirical analysis [13–15].Or some research notes, such as Yang et. al. [2], use the DSGE method to expand thediscussion of models. The importance of tourism in economic activity has led to increasinginterest in this issue. The recession caused by the COVID-19 pandemic will eventuallyeliminate 50 million tourism jobs globally [1], and the impact looks likely to be felt acrosscountries. More importantly, tourism is closely linked to other important industries suchas air transportation, oil production, hotels, and retail, so the chain reaction will spreadaround the world. Scholars, as well as government planners and implementers, musttherefore better understand the impact of the pandemic, particularly on tourism.
When assessing the impact of COVID-19, Chinese cities provide a good sample forempirical studies. In China, due to measures such as “city lockdown”, “isolation” and banson crowd gatherings [2], many Chinese residents have canceled their original travel plansand reduced their willingness to travel in the future, which can be considered a certainty atthis stage. In theory, the emergence of crisis events can have a significant impact on tourismand other activities. However, how to quantify the therapeutic effects from the perspectiveof the tourism economy in such a short period of time remains an open question to befurther explored, and one that is rarely addressed in the existing literature. According tosome scholars, based on the experience of SARS, Influenza A H1N1, etc. [16,17], tourismactivities may exacerbate the spread of the pandemic, but it will also deal a heavy blowto the tourism industry due to the emergence of the pandemic. Thus, there is a viscoustwo-way cause-and-effect relationship between the two, which is inherently difficult forus to determine clean treatment effects [18]. But in China’s case, the decisive decisionsand enforcement of lockdowns and quarantines, not by a few but almost all of the Chinesepeople behavior choice, provide us with effective tools to address the endogenous biasesbetween the pandemic and tourism development, allowing this study to more accuratelyidentify the treatment effect of COVID-19. Meanwhile, it can also be found that manyvariables such as the reduction of residents’ willingness to travel and when they will be ableto recover in the future lead to more uncertainty about the future of tourism developmentthan ever before. To sum up, the previous literature mainly (a) analyzes the impact ofcrisis using post-event annual statistical indicators’ values and trends, and (b) relevantdiscussions mainly focus on qualitative documents, while empirical research methodsare seldom applied, and mostly reflect statistical correlation. It is believed that the maindrawback of these studies is that results can be skewed by the lack of real-time index datarelated to tourism and the neglect of possible endogenous problems. So, that’s exactly whatthis study is trying to fill in the blanks and provide a comprehensive study of the linksbetween COVID-19 and tourism.

Sustainability 2022, 14, 5131 3 of 15
The main contribution of this study is twofold. First, this study crawled the dailyBaidu Index of tourism-related keywords by 247 Chinese prefecture-level cities from thewebsite http://index.baidu.com/v2/index.html#/ (accessed on 29 April 2021), and thenconstructed the “tourism network attention” indicator (TNA) to measure the overall statetourism development in the COVID-19 era in real-time. The use of these data can increasethe generalizability of empirical research evidence, as most existing research focuses onthe use of annual data or statistical indicators. Secondly, compared with previous research,the empirical analysis has certain advantages in methodology and identification strategy.This study used the regression-discontinuity-design (RDD) method to understand theimpact of COVID-19 on tourism. Designed by time cutoff, the study represents pioneeringresearch in pandemic impact assessment. Specifically, the RDD method will be appliedto capture the causal link between COVID-19 and the degrowth in tourism. Angrist andPischke [19] believe that in a highly rules-based world, the “arbitrariness” of some contin-gencies provides us with good experiments (or quasi-experiments). The RDD, an empiricalmethod second only to randomized trials, effectively uses real-world constraints to analyzecausality between variables, avoiding the inherent bias in parameter estimations. Therefore,it can truly reflect the causal relationship between variables [20,21]. In addition, this studyalso retrieved the Baidu index of some daily life keywords as control variables, and test thecontinuity of the cutoff position to improve the robustness of the RDD analysis. Principlesof relevant methodologies can be found in relevant studies [18,20,22]. What is special andperfect in the methodology is the construction of a differenced RDD regression to furthervalidate the accuracy of identification and obtain a clearer treatment result by subtractingthe value of the corresponding day with a one-year lag from the explanatory variable.
The rest of this article is arranged as follows. Firstly, this study introduces the dataand identification strategies, briefly introduces the statistical method of the key explanatoryvariable TNA, and explains the basic details of the RDD model. Then the results arepresented and robustness analysis is performed. Finally, the main findings are summarizedin the conclusion.
2. Materials and Methods
The basic period covers from 1 July 2019 to 25 April 2020, and to have more reliableresults, samples from 1 July 2018 to 25 April 2019, and 1 July 2020 to 25 April 2021 havealso been collected, which will be explained later. And the data contains 247 Chineseprefecture-level cities, which covers almost all prefecture-level cities, taking into accountthe availability of the data. The dependent variable of this study is tourism development.Several annual data indicators from statistical yearbooks are usually used for measurement,such as the number of tourists received, tourism income, etc. [23]. This study focuses on thereal-time development of the tourism industry, the annual data is insufficient. Therefore,this study turns to the daily information of TNA, which can be calculated by Function (1)following typical pieces of literature [24,25].
TNAc,t =m
∑k=1
BIk,c,t × wk (1)
where TNAc,t is the comprehensive tourism index of city c on day t, which is constructedbased on the Baidu index of tourism-related keywords; BIk,c,t represents the Baidu index ofthe k-th keyword for cities, wk is the corresponding weight which determined under theentropy weight method. Specifically, this study mainly selects six keywords, as “tourism”,“travel agency”, “self-driving tour”, “Ctrip”, “Qunar”, “fun place” in Chinese, to get the BIk,c,t.The Baidu index provides a weighted sum of the search frequency of certain keywordsby network users in all prefecture-level cities of China. It reflects the distribution ofinformation flow of residents searching the relevant keywords on the network, and hasthe advantage of reflecting the development of tourism in real-time from the demand side,covering a wide range of cities.
Sustainability 2022, 14, 5131 4 of 15
In addition, this study tries to add some control variables to the basis of empiricalanalysis based on existing literature. Unlike the use of annual data, the daily data inthe present paper will face the unavailability of global economic and macro indicators.Given this shortcoming, this study makes improvements in the following three aspects.First, the RDD method itself focuses more on information near the cutoff point of theforcing variable. Following that research strategy, this study analyzed the time cutoffof COVID-19 and used local estimations to largely eliminate the interference of macro-environmental changes. Second, using a web-based data crawl on the post-weather reportwebsite http://www.tianqihoubao.com/lishi/ (accessed on 29 April 2021), this studycollated the weather data of 247 Chinese prefecture-level cities and introduced the dailymaximum temperature, minimum temperature, sunny conditions, and wind grade ascontrol variables. Third, a living-related keyword retrieval ratio is constructed based onthe Baidu Index, denoted by Live. Theoretically, the outbreak would not affect the searchbehavior of these keywords, but the focus on these aspects of life could be a factor affectingtourism demand, and therefore be exogenous. In this way, through local restrictions andappropriate direct time effect control, the estimated result is the causal relationship betweenCOVID-19 and tourism that this study is concerned with.
According to the evaluation of tourism development and the related classical literatureof the RDD method, the regression model is set up as Function (2).
TNAc,t = µ + α × Dc,t +g∑
i=1βi × f (t)+Dc,t ×
g∑
i=1γi × f (t)+δ × Xc,t
+DQc,s + TCc + uc,t
(2)
Dc,t is the treatment variable in the RDD model depending on the outbreak date of theCOVID-19 event; the identifiable start date is determined according to the process of theCOVID-19 crisis in China and the time node that received national attention. Accordingly, itis found that Zhong Nanshan, leader of the high-level expert group of the National Healthand Health Commission, academician of the Chinese Academy of Engineering, and expertin respiratory medicine, accepted the CCTV “News 1+1” interview and argued it clearlythat the new crown virus is of human-to-human transmission, and that day became thelandmark time of COVID-19 and its control, which is the cutoff point of this study. It was20 January 2020. Therefore, this study set D = 0 before that date and D = 1 after. t is theforcing variable of the RDD, to measure the time distance from the cutoff point, on thecutoff day t = 0. f (t) is a polynomial function of the forcing variable, and RDD will selectthe optimal order of the polynomial when estimating.
X is the vector of the control variables, including daily maximum temperature, mini-mum temperature, sunny condition, wind grade, and Live mentioned above. Here, the basickeywords of the variable Live mainly include “food”, “oil price”, “reading” and “cold”. TheirBaidu Indexes were crawled and then synthesized into a composite index by the entropyweight method. In addition, the model also controls the regional fixed effect and the fixedeffect of the city as the major source of tourists, donated as DQc,s, and TCc respectively; u isthe random disturbance item. Descriptive statistics of variables are shown in Table 1.
Further, this study provided a differenced RDD shown as Function (3). TNA_diffrefers to the arithmetic difference between the current period value and the one-year lagperiod value of TNA. The current period in this study is ranged from 1 July 2019 to 25 April2020, and the one-year lag period is 1 July 2018 to 25 April 2019, correspondingly, duringwhich time there was no pandemic. And X_diff is the differenced control variables vectorconstructed in the same way. Function (3) is particularly useful in assessing the impact ofCOVID-19 on tourism as there is no pandemic in the same period of 2018–2019.
TNA_di f fc,t = µ + α × Dc,t +g∑
i=1βi × f (t)+Dc,t ×
g∑
i=1γi × f (t)+δ × X_di f fc,t
+ DQc,s + TCc + uc,t
(3)

Sustainability 2022, 14, 5131 5 of 15
It focuses primarily on the coefficient α̂, which is the estimator of the local averagetreatment effect (LATE) at t = 0. A significant negative result of α̂ would indicate that COVID-19 significantly reduces TNA or TNA_diff, and harms tourism. Besides, by eliminating thesamples after the cutoff day by day and carrying out RDD regression one by one, thisstudy can further explore the dynamic nature of the impact of the pandemic. The relativedescription will take place in Section 3.
Table 1. Variable settings and descriptive statistics.
Variables Setting Obs Mean Min Median Max
Panel ATNA Tourism network attention 82,434 58.38 0 39 1297.47
QWmax Maximum daily temperature 82,434 15.82 −26 17 41QWmin Minimum daily temperature 82,434 5.97 −37 7 28
Qing Whether sunny day 82,434 0.42 0 0 1Feng Wind scale 82,434 2.80 1 2 8Live Living focus ratio 82,434 42.02 0 30 223.61
Panel BTNA_diff Differenced Tourism network attention 81,740 −12.62 −735.23 −8.9 709.42
QWmax_diff Differenced Maximum daily temperature 81,740 0.68 −28 1 22QWmin_diff Differenced Minimum daily temperature 81,740 0.49 −19 1 24
Qing_diff Differenced Whether sunny day 81,740 0.05 −1 0 1Feng_diff Differenced Wind scale 81,740 0.10 −7 0 6Live_diff Differenced Living focus ratio 81,740 −19.56 −163.91 −15 58.05
Panel A is the corresponding variables obtained from 1 July 2019 to 25 April 2020; PanelB is the differenced result with the one-year lagged period (that is, the same time intervalfrom 1 July 2018 to 25 April 2019), which largely eliminate the impact of unobservablefactors. Here this study adds the suffix “_diff ” to distinguish them from the basic form.It is especially helpful to evaluate the impact of the pandemic since there is no pandemicin the same period from 2018 to 2019. Therefore, the Panel B data enables this study toapply the differenced model and provide more convincing empirical evidence. At the sametime, to further study the recent recovery of China’s tourism market, this study also usesdata from 1 July 2020 to 25 April 2021, compared to the same period in 2018–2019 and thesame period in 2019–2020 to explore the recovery of China tourism market in the context ofeffective pandemic prevention and control using quantitative information.
3. Results
In this section, according to Function (2), the results are estimated by applying theshape RDD regression. In particular, to further ensure the accuracy of the results, thisstudy provides three estimators: the conventional RDD estimates, the bias-corrected RDDestimates, and robust bias-corrected RD estimates [18,22]. Then, the robustness of theestimation is tested to observe the validity of the empirical analysis. All estimations arecarried out with Stata 16.0.
3.1. Basic Results
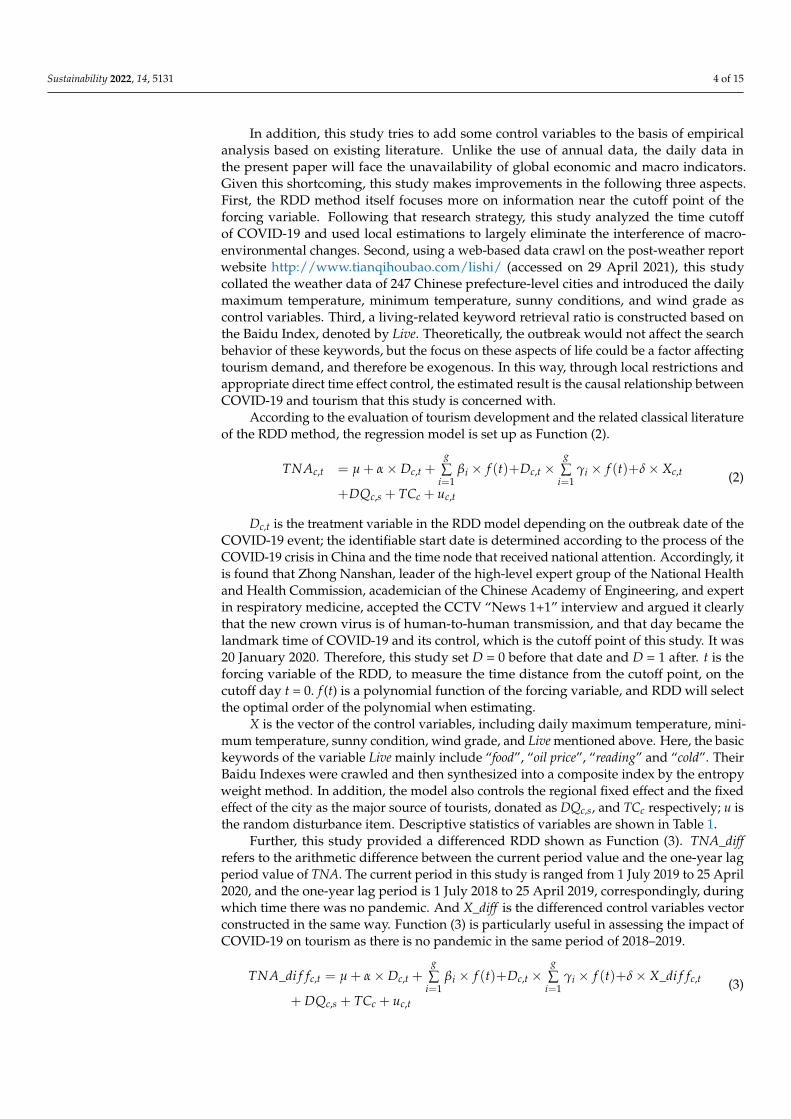
The daily distance from 20 January 2020 is taken as the forcing variable to investigatewhether the core dependent variables TNA (and TNA_diff ) jump or not at the cutoffpoint. The program written by Cattaneo et al. [26] helps to show the effect of COVID-19on tourism from data-driven respect, see Figure 1. It shows the results of dependentvariables using TNA and TNA_diff under the first-order polynomial and the fourth-orderpolynomial, corresponding to the upper part and the lower part, respectively. Intuitively,the dependent variables have an obvious jump before and after the cutoff point, and bothV and TNA_diff decrease significantly. This conclusion is valid under both first-order andfourth-order polynomials. Therefore, it is clear that the outcome variable in this study has
Sustainability 2022, 14, 5131 6 of 15
a jump phenomenon at the cutoff point, that is, there is a discontinuity effect, and the jumpdirection also reflects the adverse impact of the pandemic on tourism development.
Sustainability 2022, 14, x FOR PEER REVIEW 6 of 16
The daily distance from 20 January 2020 is taken as the forcing variable to investigate
whether the core dependent variables TNA (and TNA_diff) jump or not at the cutoff point.
The program written by Cattaneo et al. [26] helps to show the effect of COVID-19 on tour-
ism from data-driven respect, see Figure 1. It shows the results of dependent variables
using TNA and TNA_diff under the first-order polynomial and the fourth-order polyno-
mial, corresponding to the upper part and the lower part, respectively. Intuitively, the
dependent variables have an obvious jump before and after the cutoff point, and both V
and TNA_diff decrease significantly. This conclusion is valid under both first-order and
fourth-order polynomials. Therefore, it is clear that the outcome variable in this study has
a jump phenomenon at the cutoff point, that is, there is a discontinuity effect, and the jump
direction also reflects the adverse impact of the pandemic on tourism development.
Figure 1. Effect of COVID-19 on tourism network attention.
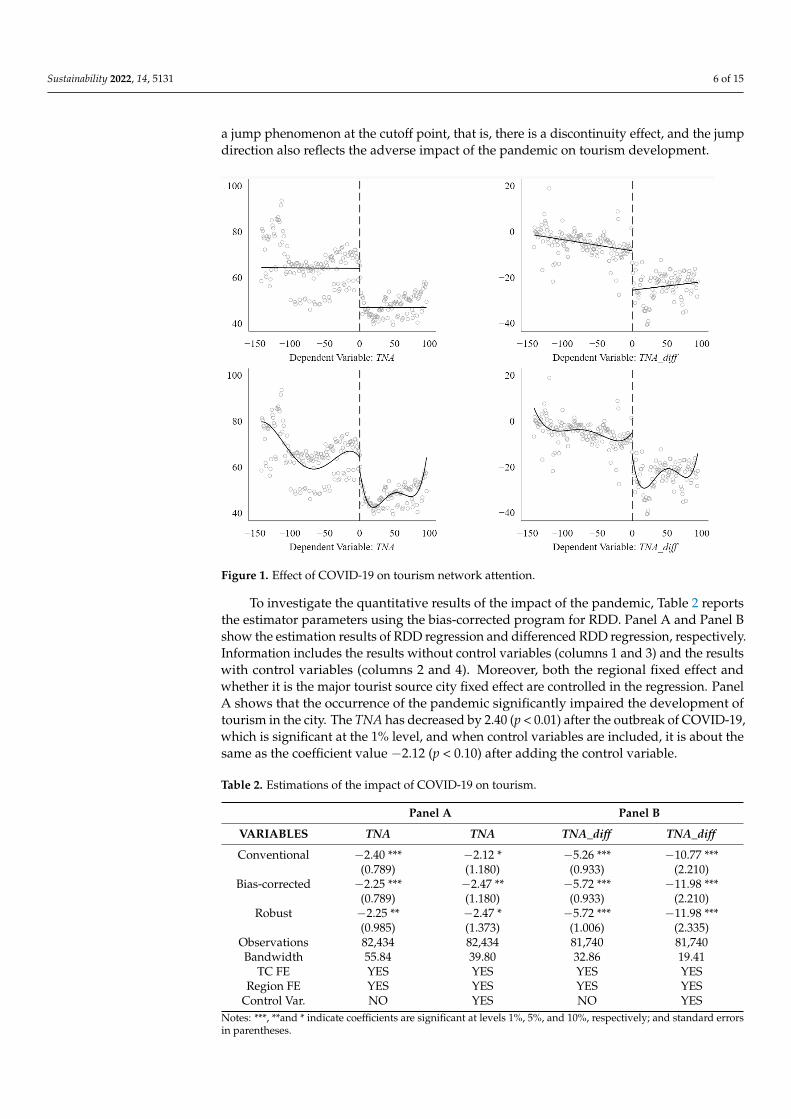
To investigate the quantitative results of the impact of the pandemic, Table 2 reports
the estimator parameters using the bias-corrected program for RDD. Panel A and Panel B
show the estimation results of RDD regression and differenced RDD regression, respec-
tively. Information includes the results without control variables (columns 1 and 3) and
the results with control variables (columns 2 and 4). Moreover, both the regional fixed
effect and whether it is the major tourist source city fixed effect are controlled in the re-
gression. Panel A shows that the occurrence of the pandemic significantly impaired the
development of tourism in the city. The TNA has decreased by 2.40 (p < 0.01) after the
outbreak of COVID-19, which is significant at the 1% level, and when control variables
are included, it is about the same as the coefficient value −2.12 (p < 0.10) after adding the
control variable.
Figure 1. Effect of COVID-19 on tourism network attention.
To investigate the quantitative results of the impact of the pandemic, Table 2 reportsthe estimator parameters using the bias-corrected program for RDD. Panel A and Panel Bshow the estimation results of RDD regression and differenced RDD regression, respectively.Information includes the results without control variables (columns 1 and 3) and the resultswith control variables (columns 2 and 4). Moreover, both the regional fixed effect andwhether it is the major tourist source city fixed effect are controlled in the regression. PanelA shows that the occurrence of the pandemic significantly impaired the development oftourism in the city. The TNA has decreased by 2.40 (p < 0.01) after the outbreak of COVID-19,which is significant at the 1% level, and when control variables are included, it is about thesame as the coefficient value −2.12 (p < 0.10) after adding the control variable.
Table 2. Estimations of the impact of COVID-19 on tourism.
Panel A Panel B
VARIABLES TNA TNA TNA_diff TNA_diff
Conventional −2.40 *** −2.12 * −5.26 *** −10.77 ***(0.789) (1.180) (0.933) (2.210)
Bias-corrected −2.25 *** −2.47 ** −5.72 *** −11.98 ***(0.789) (1.180) (0.933) (2.210)
Robust −2.25 ** −2.47 * −5.72 *** −11.98 ***(0.985) (1.373) (1.006) (2.335)
Observations 82,434 82,434 81,740 81,740Bandwidth 55.84 39.80 32.86 19.41
TC FE YES YES YES YESRegion FE YES YES YES YES
Control Var. NO YES NO YESNotes: ***, **and * indicate coefficients are significant at levels 1%, 5%, and 10%, respectively; and standard errorsin parentheses.

Sustainability 2022, 14, 5131 7 of 15
To avoid the bias caused by potential unobservable factors, Panel B reports the resultsof the differenced RDD regression. Through the first-order difference with the previousyear, the model largely eliminates the influence of potential factors, and using the sameperiod can effectively eliminate the interference of seasonal trends. The results indicatethat when differenced data is used in the RDD model, the significant impact of the pan-demic was further highlighted. The coefficients are −5.26 and −10.77 without and withcontrols, and both are significant at the 1% level. What’s more, both bias-corrected and therobust coefficients exhibit consistent parameter results, which means the treatment effect ofCOVID-19 is robust. Therefore, it can be considered that the tourism industry has suffereda significant impact during the pandemic stage, showing that each coefficient is negativeand significant.
3.2. Heterogeneity
However, due to the pandemic, the decline in tourism demand in major tourist sourcecities or regions is likely to be more pronounced, leading to differences between cities. Totest this hypothesis, this study uses the sample grouping of whether it is the major sourceof tourists and then performs the RDD regression analysis grouped. The results are shownin Figure 2 and Table 3. The upper and lower parts of Figure 2 correspond to the non-majortourist source cities and the major tourist source cities respectively. The scatter and curvepositions show that the samples of the two types of cities have a jump in the trend of thedependent variables at the cutoff point, but relatively speaking, the downward jump of themajor tourist source cities is larger and more obvious both for TNA and TNA_diff. So, it isnecessary to identify the heterogeneity by city grouping regression.
Sustainability 2022, 14, x FOR PEER REVIEW 8 of 16
Figure 2. The heterogeneity effect of cities.
Table 3 shows the heterogeneity of the impact of the pandemic on different types of
cities with a subset of samples. For non-major tourist source cities, the coefficient is about
−2.15 to −4.57, while the impact coefficient of the major tourist source cities is −14.20
to−14.91, significant at the 1% level, indicating that the sudden outbreak of the pandemic
has a greater impact on the major tourist source cities.
Table 3. The impact of COVID-19 on tourism with city heterogeneity.
Non-Major Tourist Source Cities Major Tourist Source Cities
VARIABLES TNA TNA_diff TNA TNA_diff
Conventional −2.15 *** −4.57 *** −14.20 ** −14.91 ***
(0.746) (1.112) (5.683) (4.382)
Bias-corrected −2.50 *** −5.28 *** −15.81 *** −17.79 ***
(0.746) (1.112) (5.683) (4.382)
Robust −2.50 *** −5.28 *** −15.81 ** −17.79 ***
(0.808) (1.183) (7.010) (5.319)
Observations 70,772 70,176 11,662 11,564
BWselect mserd mserd mserd mserd
Bandwidth 29.91 20.66 43.99 32.36
Kernel Triangular Triangular Triangular Triangular
Region FE YES YES YES YES
Control Var. YES YES YES YES
Notes: ***, ** and indicate coefficients are significant at levels 1%, 5%, and 10%, respectively; and
standard errors in parentheses.
3.3. Dynamic Analysis
Over time, the impact of COVID-19 on tourism will change dynamically. To identify
this dynamic, this study set the following strategy: sequentially remove samples from t =
Figure 2. The heterogeneity effect of cities.
Table 3 shows the heterogeneity of the impact of the pandemic on different types ofcities with a subset of samples. For non-major tourist source cities, the coefficient is about−2.15 to −4.57, while the impact coefficient of the major tourist source cities is −14.20to−14.91, significant at the 1% level, indicating that the sudden outbreak of the pandemichas a greater impact on the major tourist source cities.

Sustainability 2022, 14, 5131 8 of 15
Table 3. The impact of COVID-19 on tourism with city heterogeneity.
Non-Major Tourist Source Cities Major Tourist Source Cities
VARIABLES TNA TNA_diff TNA TNA_diff
Conventional −2.15 *** −4.57 *** −14.20 ** −14.91 ***(0.746) (1.112) (5.683) (4.382)
Bias-corrected −2.50 *** −5.28 *** −15.81 *** −17.79 ***(0.746) (1.112) (5.683) (4.382)
Robust −2.50 *** −5.28 *** −15.81 ** −17.79 ***(0.808) (1.183) (7.010) (5.319)
Observations 70,772 70,176 11,662 11,564BWselect mserd mserd mserd mserd
Bandwidth 29.91 20.66 43.99 32.36Kernel Triangular Triangular Triangular Triangular
Region FE YES YES YES YESControl Var. YES YES YES YES
Notes: ***, ** and indicate coefficients are significant at levels 1%, 5%, and 10%, respectively; and standard errorsin parentheses.
3.3. Dynamic Analysis
Over time, the impact of COVID-19 on tourism will change dynamically. To identifythis dynamic, this study set the following strategy: sequentially remove samples from t = 1to t = k (with k = 1,2,3 . . . ), reset the driver variables in the new sample range, and conductRDD analysis, in that way a series of RDD coefficients are estimated, and the trend changewill reflect the dynamic impact of COVID-19. In this study, the basic database is updatedto the day of 25 April 2021, and the maximum k is set to 365, which means that to seethe dynamic effects for one whole year from 20 January 2020. The results are shown inFigure 3, and it shows that effects have a brief recovery period after the cutoff point, then adownward jump, and then show average treatment effects below zero, meaning COVID-19does harm tourism overall.
Sustainability 2022, 14, x FOR PEER REVIEW 9 of 16
1 to t = k (with k = 1,2,3…), reset the driver variables in the new sample range, and conduct
RDD analysis, in that way a series of RDD coefficients are estimated, and the trend change
will reflect the dynamic impact of COVID-19. In this study, the basic database is updated
to the day of 25 April 2021, and the maximum k is set to 365, which means that to see the
dynamic effects for one whole year from 20 January 2020. The results are shown in Figure
3, and it shows that effects have a brief recovery period after the cutoff point, then a down-
ward jump, and then show average treatment effects below zero, meaning COVID-19 does
harm tourism overall.
Figure 3 intuitively and significantly shows the dynamic nature of the daily moving
RDD regression coefficient results, which are characterized by changes over time, reflect-
ing the seasonality of TNA corresponding to the seasonal tourism activities. It is confirmed
that the negative effect of COVID is more significant in the tourist season. At the same
time, to more clearly express the important holiday effects that scholars are concerned
about, this study selects the time interval of two major Chinese holiday weeks in the fig-
ure, namely the May Day holiday (International Labor Day) and the October holiday in
China (China’s National Day), the two major “golden weeks” of China, here two places
showed a significant decrease in TNA.
Figure 3. The dynamic of treatment effects of COVID-19 on TNA.
3.4. Comparison of the TNA States Before and After the Pandemic
In this section, this study has collected and calculated the TNA information of each
city in China from 1 July 2018 to 25 April 2019, 1 July 2019 to 25 April 2020, and 1 July 2020
to April 2021. The scatter plot and the mean line chart of cities are used for visual presen-
tation of the difference in the trend of TNA at different stages. Here, the 2019–2020 period
(pandemic period) is used as the basic period to be compared, and then, the comparison
relationships between the 2018–2019 period (the period before the outbreak) and the basic
period, and the 2020–2021 period (the period after the outbreak) and the basic period are
shown respectively, showing their differences in TNA trends.
To make comparisons more convenient, this study conducted the demeaning pro-
cessing of individual fixed effects on the TNA data each year. That is, this study can check
Figure 3. The dynamic of treatment effects of COVID-19 on TNA.
Figure 3 intuitively and significantly shows the dynamic nature of the daily movingRDD regression coefficient results, which are characterized by changes over time, reflectingthe seasonality of TNA corresponding to the seasonal tourism activities. It is confirmedthat the negative effect of COVID is more significant in the tourist season. At the sametime, to more clearly express the important holiday effects that scholars are concerned

Sustainability 2022, 14, 5131 9 of 15
about, this study selects the time interval of two major Chinese holiday weeks in the figure,namely the May Day holiday (International Labor Day) and the October holiday in China(China’s National Day), the two major “golden weeks” of China, here two places showed asignificant decrease in TNA.
3.4. Comparison of the TNA States before and after the Pandemic
In this section, this study has collected and calculated the TNA information of each cityin China from 1 July 2018 to 25 April 2019, 1 July 2019 to 25 April 2020, and 1 July 2020 toApril 2021. The scatter plot and the mean line chart of cities are used for visual presentationof the difference in the trend of TNA at different stages. Here, the 2019–2020 period(pandemic period) is used as the basic period to be compared, and then, the comparisonrelationships between the 2018–2019 period (the period before the outbreak) and the basicperiod, and the 2020–2021 period (the period after the outbreak) and the basic period areshown respectively, showing their differences in TNA trends.
To make comparisons more convenient, this study conducted the demeaning process-ing of individual fixed effects on the TNA data each year. That is, this study can checkthe changing trend of tourism attention each year under the condition of excluding indi-vidual effect differences, see Figure 4. The results show that compared with 2018–2019and 2019–2020, the 2020–2021 period has shown a more obvious positive upward trendsince 2021 when the individual effects of cities are excluded. This result reflects China’stourism attention and tourism fever has a slight sign of recovery, with strong measures forpandemic prevention and control.
Sustainability 2022, 14, x FOR PEER REVIEW 10 of 16
the changing trend of tourism attention each year under the condition of excluding indi-
vidual effect differences, see Figure 4. The results show that compared with 2018–2019
and 2019–2020, the 2020–2021 period has shown a more obvious positive upward trend
since 2021 when the individual effects of cities are excluded. This result reflects China’s
tourism attention and tourism fever has a slight sign of recovery, with strong measures
for pandemic prevention and control.
Figure 4. Comparison of the TNA states before and after the pandemic.
4. Validity and Robustness
4.1. The Validity Test
To ensure validity, the following methods are used. First, check whether the control
variable meets the smoothness assumption, that there should be no obvious jump at the
breakpoint. Second, check whether there is a jump in the dependent variable at other
breakpoints. Third, it is also one of the characteristics of this article. Use TNA18 (the TNA
from 1 July 2018 to 25 April 2019) to replace the dependent variable to identify whether
there is also an obvious jump. If there is a jump, the treatment effects that have been iden-
tified may not be reliable.
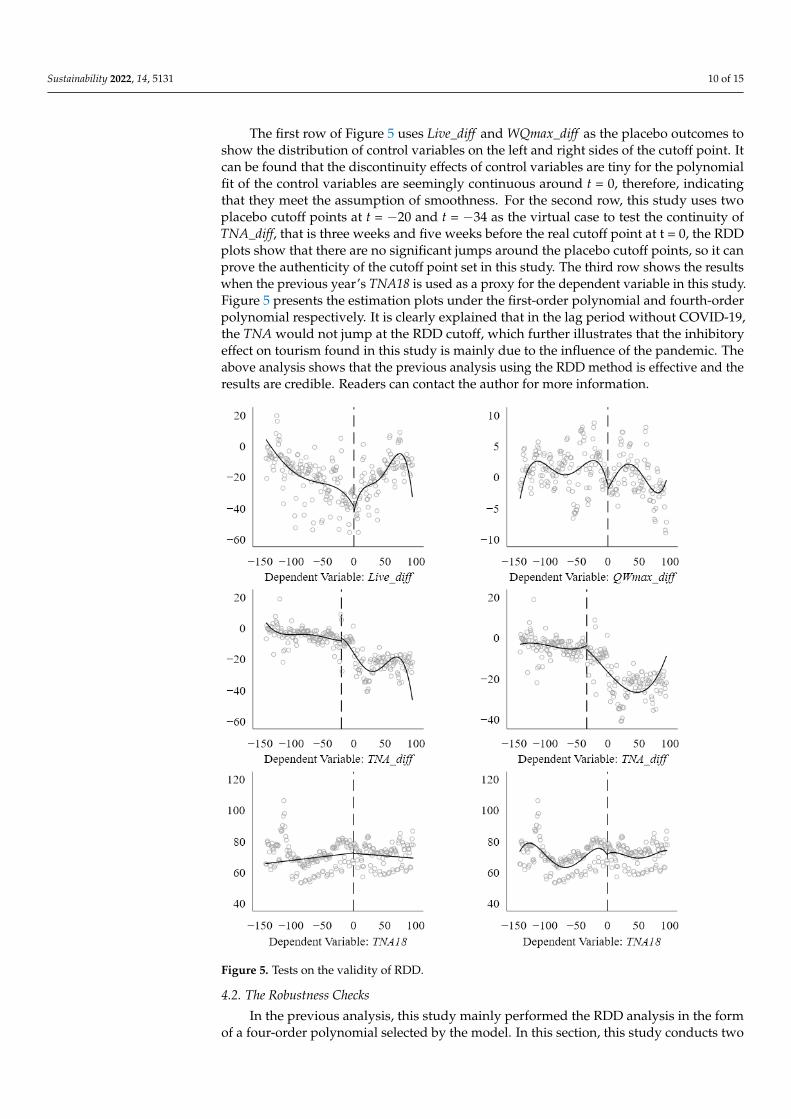
The first row of Figure 5 uses Live_diff and WQmax_diff as the placebo outcomes to
show the distribution of control variables on the left and right sides of the cutoff point. It
can be found that the discontinuity effects of control variables are tiny for the polynomial
fit of the control variables are seemingly continuous around t = 0, therefore, indicating
that they meet the assumption of smoothness. For the second row, this study uses two
placebo cutoff points at t = −20 and t = −34 as the virtual case to test the continuity of
TNA_diff, that is three weeks and five weeks before the real cutoff point at t = 0, the RDD
plots show that there are no significant jumps around the placebo cutoff points, so it can
prove the authenticity of the cutoff point set in this study. The third row shows the results
when the previous year’s TNA18 is used as a proxy for the dependent variable in this
study. Figure 5 presents the estimation plots under the first-order polynomial and fourth-
order polynomial respectively. It is clearly explained that in the lag period without
COVID-19, the TNA would not jump at the RDD cutoff, which further illustrates that the
Figure 4. Comparison of the TNA states before and after the pandemic.
4. Validity and Robustness4.1. The Validity Test
To ensure validity, the following methods are used. First, check whether the controlvariable meets the smoothness assumption, that there should be no obvious jump at thebreakpoint. Second, check whether there is a jump in the dependent variable at otherbreakpoints. Third, it is also one of the characteristics of this article. Use TNA18 (the TNAfrom 1 July 2018 to 25 April 2019) to replace the dependent variable to identify whetherthere is also an obvious jump. If there is a jump, the treatment effects that have beenidentified may not be reliable.
Sustainability 2022, 14, 5131 10 of 15
The first row of Figure 5 uses Live_diff and WQmax_diff as the placebo outcomes toshow the distribution of control variables on the left and right sides of the cutoff point. Itcan be found that the discontinuity effects of control variables are tiny for the polynomialfit of the control variables are seemingly continuous around t = 0, therefore, indicatingthat they meet the assumption of smoothness. For the second row, this study uses twoplacebo cutoff points at t = −20 and t = −34 as the virtual case to test the continuity ofTNA_diff, that is three weeks and five weeks before the real cutoff point at t = 0, the RDDplots show that there are no significant jumps around the placebo cutoff points, so it canprove the authenticity of the cutoff point set in this study. The third row shows the resultswhen the previous year’s TNA18 is used as a proxy for the dependent variable in this study.Figure 5 presents the estimation plots under the first-order polynomial and fourth-orderpolynomial respectively. It is clearly explained that in the lag period without COVID-19,the TNA would not jump at the RDD cutoff, which further illustrates that the inhibitoryeffect on tourism found in this study is mainly due to the influence of the pandemic. Theabove analysis shows that the previous analysis using the RDD method is effective and theresults are credible. Readers can contact the author for more information.
Sustainability 2022, 14, x FOR PEER REVIEW 11 of 16
inhibitory effect on tourism found in this study is mainly due to the influence of the pan-
demic. The above analysis shows that the previous analysis using the RDD method is ef-
fective and the results are credible. Readers can contact the author for more information.
Figure 5. Tests on the validity of RDD.
4.2. The Robustness Checks
In the previous analysis, this study mainly performed the RDD analysis in the form
of a four-order polynomial selected by the model. In this section, this study conducts two
ways to check the robustness of the pandemic’s impact on tourism. First, this study tested
the robustness of the regression results in different polynomial forms. Figure 6 shows the
sensitivity of the coefficient ̂ obtained by Function (3) from order 1 to order 6 polyno-
mials. The results show that all of the conventional, bias-corrected, and robust coefficients
indicate that COVID-19 harms tourism and they are statistically significant, at least at the
5% level.
Second, the bandwidth length can significantly affect the regression results, and a
robust result requires that the bandwidth length be less sensitive. Therefore, this study
Figure 5. Tests on the validity of RDD.
4.2. The Robustness Checks
In the previous analysis, this study mainly performed the RDD analysis in the formof a four-order polynomial selected by the model. In this section, this study conducts two

Sustainability 2022, 14, 5131 11 of 15
ways to check the robustness of the pandemic’s impact on tourism. First, this study testedthe robustness of the regression results in different polynomial forms. Figure 6 shows thesensitivity of the coefficient α̂ obtained by Function (3) from order 1 to order 6 polynomials.The results show that all of the conventional, bias-corrected, and robust coefficients indicatethat COVID-19 harms tourism and they are statistically significant, at least at the 5% level.
Sustainability 2022, 14, x FOR PEER REVIEW 12 of 16
further manually sets the bandwidth to be 50–200% of the optimal bandwidth, and views
the performance of the coefficients, as shown in Figure 7. It can be seen that within the
range of 50% to 200% of the optimal bandwidth, the results of the three groups of coeffi-
cients remain significantly negative, and maintain the creative significance to a certain
extent. This shows that the conclusion is more reliable.
Figure 6. Robustness checks on aspects of polynomial orders.
Figure 7. Robustness checks for bandwidth selections.
Figure 6. Robustness checks on aspects of polynomial orders.
Second, the bandwidth length can significantly affect the regression results, and arobust result requires that the bandwidth length be less sensitive. Therefore, this studyfurther manually sets the bandwidth to be 50–200% of the optimal bandwidth, and viewsthe performance of the coefficients, as shown in Figure 7. It can be seen that within the rangeof 50% to 200% of the optimal bandwidth, the results of the three groups of coefficientsremain significantly negative, and maintain the creative significance to a certain extent.This shows that the conclusion is more reliable.
Sustainability 2022, 14, x FOR PEER REVIEW 12 of 16
further manually sets the bandwidth to be 50–200% of the optimal bandwidth, and views
the performance of the coefficients, as shown in Figure 7. It can be seen that within the
range of 50% to 200% of the optimal bandwidth, the results of the three groups of coeffi-
cients remain significantly negative, and maintain the creative significance to a certain
extent. This shows that the conclusion is more reliable.
Figure 6. Robustness checks on aspects of polynomial orders.
Figure 7. Robustness checks for bandwidth selections. Figure 7. Robustness checks for bandwidth selections.

Sustainability 2022, 14, 5131 12 of 15
5. Discussion and Implication5.1. Discussion
In the basic results section, the coefficients indicating the impact of COVID-19 on TNAor TNA_diff have significantly negative values in many different models, which verifiesthe adverse impact of the COVID-19 pandemic on the tourism network attention. Thisis an intuitive description of the effects, and it also shows that, to a large extent, TNA isdirectly related to travel behavior, since when stricter control measures take place, peoplewill spend more time at home. If the focus on tourism network attention were only onentertainment, the index would there have dropped significantly, but it is not.
Heterogeneity analysis shows that cities with different characteristics are affected bythe pandemic to different degrees. This is due to the fact that the pandemic has mainlycurbed the occurrence of tourism demand, especially in the major tourist source cities,while regions with lower demand tend to remain less willing to travel and are thereforeless impacted. The emergence of heterogeneity allows the studies to further identifythe potential impact of the pandemic on urban, regional, or other tourism disparitiesin future studies, and to focus more on the changing and nurturing demands of keysource populations.
In the dynamics of the pandemic impacting tourism development, the short-termrecovery near t = 0 has greater relevance to the traditional Chinese Spring Festival, but withthe development and popularity of the pandemic across regions of China, the damagingeffect on tourism development has become more obvious. The overall volatility is relativelyhigh, and significant negative coefficients indicate that in recent months, due to COVID-19and regional pandemic prevention and control measures, the tourism network attention inChina has not shown any obvious signs of recovery. According to the trend of TNA, thisstudy believes that the tourism recovery trend to May Day holiday expected by the mediaand experts has not come, at least, there is no clear evidence in 2020.
To obtain intuitive discussions on tourism development issues in the context of keyholiday effects such as the May Day Holiday and the November Holiday in China, whichtwo are the most important tourist weeks in China in the first half and second half ofthe year. Figure 3 uses the boxes to highlight the changing trend of the pandemic impacteffect based on the differenced RD regressions during a total of three weeks before andafter the two holidays. It can be seen that the pandemic does have a significant negativeimpact on the TNA of cities, implicating that the TNA has a sharp drop before and duringthe holiday weeks compared to that of the previous year. While June to August is thepeak season for China’s tourism market, compared to the same period the previous year,cities have shown a significant decline in the attention paid to tourism online search in thebackground of the pandemic. The results of the dynamic analysis can intuitively reflectthe negative impact of the pandemic on the tourism industry, although China has madesufficient results in the prevention and control of the pandemic. At the same time, morenegative and significant coefficients of the impact of the pandemic on tourism are foundduring important holidays and the tourist peak season. It shows that the impact of thepandemic on tourism is substantial. As the global pandemic continues to spread andcontinue, the impact of the pandemic on tourism development is not optimistic.
In addition, a slight sign of recovery has been observed in the trend, but it still needsto be understood that the recurrence of the pandemic is one of the determinants of tourism.As the current pandemic situation can be observed, when the pandemic situation becomesserious, the control in local areas will also spread to the tourism development in otherareas, which will be reflected first in the changes in the level of TNA. TNA is a reflection ofpotential tourism demand. Whether the potential demand can be transformed into a realdemand also depends on various supports from the external environment. Therefore, it ispossible to remain strategically optimistic about the post-pandemic recovery of the tourismmarket, but it should also be tactically cautious. Grasp the timing of policy support fortourism recovery. Concerning the support and intervention policies for the tourism and

Sustainability 2022, 14, 5131 13 of 15
residence industry, countries have to find a balance between them to balance the recoveryand development of the tourism and residence industry and other aspects of the country.
5.2. Implication
Overall, the severe downturn tourism industry amid the pandemic can be understoodon two levels. First, increased economic uncertainty has reduced tourism demand, whichis linked to risk aversion in the face of uncertainty. Second, administrative restrictionsintroduced during the COVID-19 pandemic have the potential to significantly reduce thesupply of tourism services, including restricting population mobility. While the pandemichas sparked a tourism crisis in several countries, including China, the tourism industryis likely to be a key sector for the global economic recovery after the pandemic, so it isimportant to focus on tourism during the pandemic.
This study is of some theoretical and policy implications. Theoretically, strong evidencesupporting the damage caused by COVID-19 to tourism development is provided. Thisstudy clarifies the dynamics of the pandemic’s treatment effects over time, and there isno obvious recovery process in the overall trend in 2020. By looking at those dynamicimpacts, the study sought to capture the likely timing of tourism recovery from recessionamid the pandemic. In terms of policy implications, the emergence of the pandemicposes significant economic and political challenges for national and local governments.This study illustrates from the tourism demand side that COVID-19 has greatly impactedresidents’ tourism willingness in the short term. As the pandemic is gradually broughtunder control or recurs, its impact is constantly changing. Therefore, while helping thelarge-scale development of the tourism industry, the government should make efforts tocultivate and guide tourism demand.
In the post-pandemic era, for the marketing of Chinese tourist cities, suggestionsand inspirations are that, on the one hand, the recovery of the tourism market should beidentified in time, and tourism demand should be guided and cultivated promptly, so thatenterprises and self-employed individuals with the ability to organize tourism demand canquickly operate and demand can converge, and the market can recover. On the other hand,it is necessary to accurately monitor the development of the supply side of the tourismmarket. COVID-19 has forced many relatively weak tourism businesses to terminate orwithdraw, which means that when the tourism market fully recovers, there may be a gapin the provision of tourism services, which should be paid attention to and deployedin advance. As for how to further increase the TNA of Chinese tourist cities, this studyfinds that tourism consumers have an obvious tendency to “internet celebrity cities” whensearching for keywords about tourism. Then take advantage of the current change in theway of information exchange in China’s short video and digital economy era, actively digout the city’s tourism resources or travel personality, consciously build an Internet celebritycity, increase Internet exposure and media voice, then the city will receive attention.
Given the current global pandemic of COVID-19, China’s timeliness and advancementin responding to the pandemic means that China will enter the post-pandemic era fasterand earlier than other countries in the world. Although European and American countrieshave different measures to combat the pandemic than China, observing the performanceand trends of China’s tourism development under COVID-19 can also help provide somepotential guidance for other countries, and can also serve as a signal for the recovery of theglobal tourism industry.
6. Conclusions
COVID-19 has forced countries to take various measures to restrict the movementand gatherings of people. While the pandemic has had a positive impact on slowingthe spread of the pandemic, it has also had a huge impact on the economy and society,attracting considerable interest from scholars and policymakers. This study attempts toinvestigate the treatment effect of COVID-19 on tourism network attention in 247 Chineseprefecture-level cities from 2018 to 2021, to explore the adverse effects and the developing

Sustainability 2022, 14, 5131 14 of 15
trends of the pandemic on tourism. To this end, this study adopted a very effective RDDmethod and analyzed it in the form of an intelligent setting. The basic regression resultsused TNA and TNA_diff as the explained variables, respectively, and the RDD analysis wascarried out. The estimated treatment effect coefficient values were −2.12 (p < 0.10) and−10.77 (p < 0.01), which were statistically significant, demonstrating the causal relationshipbetween the pandemic and tourism development in quantitative and empirical terms.And the effects vary with whether it is a major tourist source city or not. Specifically,the estimated coefficient for major tourist source cities is −14.91 (p < 0.01), while thatfor non-major ones is −4.57 (p < 0.01), that is the impact of the pandemic on tourism isgreater in the major tourism source cities. Further identifying the dynamics over time, theimpact of the pandemic fluctuates negatively, and this adverse impact is more pronouncedduring the two major Chinese holiday and tourist seasons. This study further comparesthe trend changes of TNA in the pre-pandemic period and the pandemic period, and in thepost-pandemic period and the pandemic period. The results show that, after excluding theindividual effects, the TNA of Chinese cities shows an upward trend in 2021 relative to theyear 2020. This is good news for tourism development, but the global spread, mutation,and recurrence of the pandemic remains a key variable to focus on.
Although this study is new to existing literature, it still has its limitations. First,Chinese cities have different economic and tourism characteristics and are at different stagesof development. Their heterogeneity made it difficult to make a single recommendation.Spatial and cultural differences must be taken into account. Second, researchers mustalso pay attention to clarifying and considering theoretical mechanisms for COVID-19 andother contingencies affecting regional tourism development. Third, regarding the rulesfor dealing with COVID-19, China has stricter rules than others, making the case of Chinaatypical and hard to be referred to other countries directly. Only when these factors aretaken into account will the study be able to fully assess the impact of COVID-19.
Funding: This research was funded by Hunan Provincial Philosophy and Social Science Fund, grantnumber 18YBA393, Outstanding Youth Project of Hunan Education Department, grant number20B549, and Hunan Graduate Education Reform Project, grant number 2020JGYB093.
Institutional Review Board Statement: Not applicable.
Informed Consent Statement: Not applicable.
Data Availability Statement: Not applicable.
Conflicts of Interest: The authors declare no conflict of interest.
References1. Fletcher, R.; Murray, I.; Blazquez Salom, M.; Blanco, A. Tourism, Degrowth, and the COVID-19 Crisis. 2020. Available online:
https://politicalecologynetwork.org/2020/03/24/tourism-degrowth-and-the-covid-19-crisis/ (accessed on 17 March 2022).2. Yang, Y.; Zhang, H.; Chen, X. Coronavirus pandemic and tourism: Dynamic stochastic general equilibrium modeling of infectious
disease outbreak. Ann. Tour. Res. 2020, 83, 102913. [CrossRef] [PubMed]3. Baker, T. Chinese Hotels Seeing Steep Declines from Coronavirus. 2020. Available online: http://hotelnewsnow.com/Articles/30
0132/Chinese-hotels-seeing-steepdeclines-from-coronavirus (accessed on 17 March 2022).4. Inchausti-Sintes, F. Tourism: Economic growth, employment and Dutch Disease. Ann. Tour. Res. 2015, 54, 172–189. [CrossRef]5. Seraphin, H.; Zaman, M.; Olver, S.; Bourliataux-Lajoinie, S.; Dosquet, F. Destination branding and overtourism. J. Hosp. Tour.
Manag. 2019, 38, 1–4. [CrossRef]6. Kuo, H.-I.; Chen, C.-C.; Tseng, W.-C.; Ju, L.-F.; Huang, B.-W. Assessing impacts of SARS and Avian Flu on international tourism
demand to Asia. Tour. Manag. 2008, 29, 917–928. [CrossRef]7. Henderson, J. Corporate social responsibility and tourism: Hotel companies in Phuket, Thailand, after the Indian Ocean tsunami.
Int. J. Hosp. Manag. 2007, 26, 228–239. [CrossRef]8. Lian, W. Research on Risk Governance Order of Spring Festival Tourism Emergency—Based on Mass Passenger Stranding
Incident in Haikou Port. Open J. Soc. Sci. 2020, 8, 119–127. [CrossRef]9. Hillingdon, A.Y.; Page, S.; Fletcher, J. Emergency Management and Tourism Stakeholder Responses to Crises: A Global Survey. J.
Travel Res. 2016, 56, 299–316. [CrossRef]10. Kim, H.; Hall, K.; Genco, E.; Van Dyke, M.; Barker, E.; Monte, A. Marijuana Tourism and Emergency Department Visits in
Colorado. N. Engl. J. Med. 2016, 374, 797–798. [CrossRef]

Sustainability 2022, 14, 5131 15 of 15
11. Becken, S.; Hughey, K. Linking tourism into emergency management structures to enhance disaster risk reduction. Tour. Manag.2013, 36, 77–85. [CrossRef]
12. Beirman, D. The integration of emergency management and tourism. Aust. J. Emerg. Manag. 2011, 26, 30–34.13. Nicola, M.; Alsafi, Z.; Sohrabi, C.; Kerwan, A.; Al-Jabir, A.; Iosifidis, C.; Agha, M.; Agha, R. The Socio-Economic Implications of
the Coronavirus and COVID-19 Pandemic: A Review. Int. J. Surg. 2020, 8, 8–17. [CrossRef] [PubMed]14. Jhaveri, R. Echoes of 2009 H1N1 Influenza Pandemic in the COVID Pandemic. Clin. Ther. 2020, 42, 736–740. [CrossRef] [PubMed]15. Nabil, A.; Eldesoky, N.; Khalifa, H.; Rashed, S. Online faculty development using Cognitive apprenticeship in response to
COVID-19. Med. Educ. 2020, 54, 665–666. [CrossRef]16. Indranil Chakraborty, P.M. COVID-19 outbreak: Migration, effects on society, global environment and prevention. Sci. Total
Environ. 2020, 728, 138882. [CrossRef] [PubMed]17. Zeng, B.; Carter, R.W.; De Lacy, T. Short-term Perturbations and Tourism Effects: The Case of SARS in China. Curr. Issues Tour.
2005, 8, 306–322. [CrossRef]18. Calonico, S.; Cattaneo, M.D.; Farrell, M.H.; Titiunik, R. Regression Discontinuity Designs Using Covariates. Rev. Econ. Stat. 2019,
101, 442–451. [CrossRef]19. Angrist, J.D.; Pischke, J.-S. Mastering ’Metrics: The Path from Cause to Effect; Princeton University Press: Princeton, NJ, USA, 2014.20. Lee, D.; Lemieux, T. Regression Discontinuity Designs in Economics. J. Econ. Lit. 2010, 48, 281–355. [CrossRef]21. Imbens, G.; Kalyanaraman, K. Optimal Bandwidth Choice for the Regression Discontinuity Estimator. Rev. Econ. Stud. 2012, 79,
933–959. [CrossRef]22. Calonico, S.; Cattaneo, M.; Titiunik, R. Robust Nonparametric Confidence Intervals for Regression-Discontinuity Designs.
Econometrica 2014, 82, 2295–2326. [CrossRef]23. Hou, X. High-Speed Railway and City Tourism in China: A Quasi-Experimental Study on HSR Operation. Sustainability 2019,
11, 1512. [CrossRef]24. Zaman, K.; Shahbaz, M.; Loganathan, N.; Raza, S.A. Tourism development, energy consumption and Environmental Kuznets
Curve: Trivariate analysis in the panel of developed and developing countries. Tour. Manag. 2016, 54, 275–283. [CrossRef]25. Wang, D.; Niu, Y.; Qian, J. Evolution and optimization of China’s urban tourism spatial structure: A high speed rail perspective.
Tour. Manag. 2018, 64, 218–232. [CrossRef]26. Cattaneo, M.D.; Frandsen, B.R.; Titiunik, R. Randomization Inference in the Regression Discontinuity Design: An Application to
Party Advantages in the U.S. Senate. J. Causal Inference 2015, 3, 1–24. [CrossRef]