Today's adult generations are less healthy than their predecessors: generation shifts in metabolic...
11
EURO PEAN SOCI ETY OF CARDIOLOGY ® Original scientific paper Today’s adult generations are less healthy than their predecessors: generation shifts in metabolic risk factors: the Doetinchem Cohort Study Gerben Hulsegge 1,2 , H Susan J Picavet 1 , Anneke Blokstra 1 , Astrid CJ Nooyens 1 , Annemieke MW Spijkerman 1 , Yvonne T van der Schouw 2 , Henrie ¨tte A Smit 2 and WM Monique Verschuren 1,2 Abstract Background: The health of the elderly of the future is partly determined by their exposure to metabolic risk factors during their life course. Our aim is to study generation shifts in metabolic risk factors. Design: Cohort study. Methods: We used data of the Doetinchem Cohort Study, that started in 1987–1991 and had follow-up examinations after 6, 11, and 16 years (n ¼ 6377). The analyses were stratified by sex and generation, i.e. 10-year age groups (20–29, 30–39, 40–49, and 50–59 years) at baseline. Whether a generation had, at a similar age, a different risk profile compared to a generation born 10 years earlier (i.e. generation shift) was tested by means of generalized estimation equations. Results: The prevalence of overweight, obesity, and hypertension increased with age within all generations, but in general more recently born generations had, at a similar age, a higher prevalence of these risk factors than generations born 10 years earlier (p < 0.05). Unfavourable generation shifts were most pronounced for overweight/obesity, present in men between every generation while in women especially present between the most recently born generations. We observed unfavourable generation shifts in diabetes among men but not among women. No generation shifts for hypercholesterolaemia were observed and favourable generation shifts for low high-density lipoprotein cholesterol between the oldest two generations only. In general, the pattern of generation shifts did not differ according to socio- economic status. Conclusions: The lifelong exposure to especially obesity will increase. As a consequence, more elderly of the future will develop overweight-related diseases such as diabetes and cardiovascular disease. Keywords Cardiovascular disease, cohort study, life course, generation shift, metabolic risk factors, trends Received 7 September 2012; accepted 12 March 2013 Introduction It is estimated that in the year 2040, more than one in every four Europeans and more than one in every five North Americans will be 65 years or older. 1 Whether the health of the elderly of the future differs from today’s elderly depends among others on differences in exposure to metabolic risk factors during the life course of the current adult generations. Metabolic risk factors including obesity, hypertension, and dysli- pidaemia substantially increase the risk of chronic and 1 National Institute for Public Health and the Environment, Bilthoven, The Netherlands 2 University Medical Center Utrecht, Utrecht, The Netherlands Corresponding author: Gerben Hulsegge, Centre for Prevention and Health Services Research, National Institute for Public Health and the Environment, Antonie van Leeuwenhoeklaan 9, 3720 BA Bilthoven, The Netherlands. Email: [email protected] European Journal of Preventive Cardiology 2014, Vol. 21(9) 1134–1144 ! The European Society of Cardiology 2013 Reprints and permissions: sagepub.co.uk/journalsPermissions.nav DOI: 10.1177/2047487313485512 ejpc.sagepub.com at University Library Utrecht on December 23, 2014 cpr.sagepub.com Downloaded from
-
Upload
umcutrecht -
Category
Documents
-
view
1 -
download
0
Transcript of Today's adult generations are less healthy than their predecessors: generation shifts in metabolic...

EU RO PEANSOCIETY O FCARDIOLOGY ®Original scientific paper
Today’s adult generations are less healthythan their predecessors: generation shiftsin metabolic risk factors: the DoetinchemCohort Study
Gerben Hulsegge1,2, H Susan J Picavet1, Anneke Blokstra1,Astrid CJ Nooyens1, Annemieke MW Spijkerman1,Yvonne T van der Schouw2, Henriette A Smit2 andWM Monique Verschuren1,2
Abstract
Background: The health of the elderly of the future is partly determined by their exposure to metabolic risk factors
during their life course. Our aim is to study generation shifts in metabolic risk factors.
Design: Cohort study.
Methods: We used data of the Doetinchem Cohort Study, that started in 1987–1991 and had follow-up examinations
after 6, 11, and 16 years (n¼ 6377). The analyses were stratified by sex and generation, i.e. 10-year age groups (20–29,
30–39, 40–49, and 50–59 years) at baseline. Whether a generation had, at a similar age, a different risk profile compared
to a generation born 10 years earlier (i.e. generation shift) was tested by means of generalized estimation equations.
Results: The prevalence of overweight, obesity, and hypertension increased with age within all generations, but in
general more recently born generations had, at a similar age, a higher prevalence of these risk factors than generations
born 10 years earlier (p< 0.05). Unfavourable generation shifts were most pronounced for overweight/obesity, present
in men between every generation while in women especially present between the most recently born generations. We
observed unfavourable generation shifts in diabetes among men but not among women. No generation shifts for
hypercholesterolaemia were observed and favourable generation shifts for low high-density lipoprotein cholesterol
between the oldest two generations only. In general, the pattern of generation shifts did not differ according to socio-
economic status.
Conclusions: The lifelong exposure to especially obesity will increase. As a consequence, more elderly of the future will
develop overweight-related diseases such as diabetes and cardiovascular disease.
Keywords
Cardiovascular disease, cohort study, life course, generation shift, metabolic risk factors, trends
Received 7 September 2012; accepted 12 March 2013
Introduction
It is estimated that in the year 2040, more than one inevery four Europeans and more than one in every fiveNorth Americans will be 65 years or older.1 Whetherthe health of the elderly of the future differs fromtoday’s elderly depends among others on differencesin exposure to metabolic risk factors during the lifecourse of the current adult generations. Metabolicrisk factors including obesity, hypertension, and dysli-pidaemia substantially increase the risk of chronic and
1National Institute for Public Health and the Environment, Bilthoven,
The Netherlands2University Medical Center Utrecht, Utrecht, The Netherlands
Corresponding author:
Gerben Hulsegge, Centre for Prevention and Health Services Research,
National Institute for Public Health and the Environment, Antonie van
Leeuwenhoeklaan 9, 3720 BA Bilthoven, The Netherlands.
Email: [email protected]
European Journal of Preventive
Cardiology
2014, Vol. 21(9) 1134–1144
! The European Society of
Cardiology 2013
Reprints and permissions:
sagepub.co.uk/journalsPermissions.nav
DOI: 10.1177/2047487313485512
ejpc.sagepub.com
at University Library Utrecht on December 23, 2014cpr.sagepub.comDownloaded from

in particular cardiovascular disease (CVD),2–6 which isthe main cause of disability and death in most high-income countries.3,7
Data on time trends in cardiovascular risk factorsamong the adult population of high-income countrieshave shown increases in the prevalences of overweight,obesity, and diabetes in the last two decades.8–14 Forthe prevalence of hypertension and hypercholesterol-aemia, most studies showed a decline over time,though stable and increasing prevalences were alsoobserved.8,9,12,15–19 Although some information aboutthe development of metabolic risk factors is availablefor adult populations, little attention has been paid towhether or not there are differences in these time trendsand levels between the younger and older adult gener-ations. Data from the USA showed that more recentlyborn generations were doing worse, e.g. the prevalenceof obesity among 20–39-year-old men was 15% in1988–1994 and 24% in 1999–2000.10 The prevalenceof hypertension among 18–29-year-old men was 4%in 1988–1994 and 6% in 1999–2004,17 findings thatwere based on repeated cross-sectional data. A longitu-dinal study from Austria showed in general a highermean body mass index (BMI) but lower mean totalcholesterol and mean blood pressure at a similar ageamong more recently born generations compared togenerations born 10 years earlier.20
Knowledge about risk profiles of today’s generationsis essential since it determines the disease burden laterin life. Over time, generations (i.e. 10-year age groups)will reach a similar age as their preceding generation.Therefore, generation shifts can be determined by com-paring the prevalence of risk factors, at a similar age,across consecutive generations. We were able to analysethis in a large-scale longitudinal study that started in1987–1991 among Dutch adults between 20 and 59years of age. Our aim is to study generation shifts inmetabolic risk factor prevalences and means, bydescribing changes within four 10-year generations ofDutch adults during 16 years of follow-up.
Methods
Population
Participants were randomly selected based on an age-and sex-stratified sample from the civil registries ofDoetinchem, a small town in the Netherlands (46,967inhabitants in 2000). At baseline (1987–1991: wave 1),20,155 people aged 20–59 years were invited to visit themunicipal health centre to participate in the ‘MonitoringProject on Cardiovascular Disease Risk Factors’. Fromthe participants in wave 1 (n¼ 12,405, participation rate62%), a random sample of 7768 was invited for a secondexamination (1993–1997: wave 2). The total random
sample was invited again in 1998–2002 (wave 3,n¼ 6579) and 2003–2007 (wave 4, n¼ 5783), except forthose who did not give permission to retrieve their infor-mation from the municipal administration, missed twoexaminations in a row, emigrated, actively withdrewfrom the study, or died. The response rates for allfollow-up measurements varied between 75% and80%, resulting in 6113, 4916, and 4520 participants forwaves 2, 3, and 4, respectively. The study design of theDoetinchem Cohort study is extensively described else-where.21 For the present analyses, we excluded pregnantwomen only for that specific wave (n¼ 140) andincluded all participants who took part in at least twowaves. Most of these participants completed all fourwaves (61.1%), three examinations were completed by19.4%, and two by 19.5% of the participants. Thisresulted in a total of 6308, 6070, 4898, and 4517 partici-pants in waves 1, 2, 3, and 4, respectively. In total, 21,786examinations from 6377 participants were included forthe present study. All participants gave written informedconsent and the study was approved according to theguidelines of the Helsinki Declaration by the externalMedical Ethics Committee of the NetherlandsOrganization for Applied Scientific Research.
Measures
Trained staff completed standardized measurements ofcardiovascular risk factors (i.e. overweight, obesity,hypertension, hypercholesterolaemia, and low high-density lipoprotein (HDL) cholesterol) during a visitto the municipal health service. These includedanthropometric measurements, blood pressure meas-urement, and blood sampling. Demographic character-istics, medical history of chronic diseases, use ofmedication, and lifestyle factors were collected usingstandardized questionnaires. Body weight and heightwere measured with participants wearing light indoorclothing with emptied pockets and without shoes. Bodyweight was measured to the nearest 0.1 kg on calibratedscales and height to the nearest 0.5 cm. BMI was calcu-lated as weight minus 1 kg to adjust for clothing,divided by height squared (kg/m2). Anyone with aBMI �25 kg/m2 was classified as overweight, andthose with a BMI �30 kg/m2 as obese. Systolic anddiastolic blood pressure were measured with arandom zero sphygmomanometer (Hawksley andSons, Lancing, UK) in waves 1 to 3. Participantswere measured twice in each wave in sitting positionafter 2 minutes of rest. Systolic blood pressure was rec-orded at the appearance of sounds (first-phaseKorotkoff) and diastolic blood pressure was recordedat the disappearance of sounds (fifth-phase Korotkoff).The mean value of two measurements was used in theanalyses. Hypertension was defined as a systolic blood
Hulsegge et al. 1135
at University Library Utrecht on December 23, 2014cpr.sagepub.comDownloaded from

pressure �140mmHg, and/or diastolic blood pressure�90mmHg, and/or use of antihypertensive medication(according to World Health Organization definition).22
In wave 4, blood pressure was measured with a differentmeasuring device (Speidel Keller) and participants satin a slightly different position during the measurement.Blood pressure measurements are sensitive to smallchanges in the methodology and results were not asexpected. Therefore, we only included data on bloodpressure of the first three waves. Total and HDL chol-esterol were measured until 1998 in non-fasting EDTA-plasma and from 1998 onwards in serum at the lipidreference laboratory (LRL), using standardized enzym-atic methods. Hypercholesterolaemia was defined astotal cholesterol �6.5mmol/l and/or use of choles-terol-lowering medication and low HDL cholesterolas HDL cholesterol <0.9mmol/l. Type 2 diabetescases were defined on basis of self-report. Most self-reported diabetes cases were verified with informationfrom the general practitioner or pharmacist (86%). Ofthe identified cases, 20 were type 1 diabetes and eightunknown/other diabetes type and were excluded for theanalysis on diabetes. The highest level of completededucation during follow-up was used as a proxy forsocioeconomic status (SES) and classified into threecategories: low (intermediate secondary education orless), intermediate (intermediate vocational or highersecondary education), and high (higher vocational edu-cation or university).
Statistical analyses
The developments in the prevalence of metabolic riskfactors over time in four 10-year generations aredescribed. The generations are defined on the baselineage of the participants: 20–29, 30–39, 40–49, and 50–59years, further referred to as those who were in their 20 s,30 s, 40 s, and 50 s, respectively.
In Figure 1, the prevalence of metabolic risk factorsis plotted against the mean age of these generations atthe time of measurement, for men and women. At base-line, those who were in their 20 s were on average 25years, 31 years in wave 2, 36 years in wave 3, and 41years in wave 4. Means and standard deviations werecalculated for all continuous outcome variables (i.e.BMI, systolic blood pressure, diastolic blood pressure,total cholesterol, and HDL cholesterol) at each wavefor every generation and both sexes.
A generation shift refers to a difference in the preva-lence or mean of a metabolic risk factor between gen-erations when they have attained a similar age. Fromthe figure, this can be derived by determining whetherthe lines of consecutive generations overlap or not.Overlap of the lines implies no generation shift. Anunfavourable generation shift is present if the line of
the more recently born generation is above that of ageneration born 10 years earlier, a favourable gener-ation shift if the line is below that of a generationborn 10 years earlier. To test whether the generationshifts were statistically significant, logistic regressionfor dichotomous outcomes and linear regression forcontinuous outcomes were used. To take the correl-ations amongst repeated observations on the same par-ticipants into account, generalized estimating equations(GEE) with auto-regressive structure were performed.At waves 3 and 4, the average age of a generation wasapproximately the same as the average age of a gener-ation born 10 years earlier at waves 1 and 2, respect-ively. Therefore, the prevalence or mean of a metabolicrisk factor (dependent variable) at waves 3 and 4 of ageneration (independent variable) was compared to theprevalence or mean of a generation born 10 years ear-lier at waves 1 and 2, respectively. GEE was not usedfor hypertension and mean blood pressure, since onlywave 1 was compared to wave 3. The analyses wereadjusted for age and a p-value <0.05 was consideredstatistically significant. To determine whether gener-ation shifts were present among different socioeco-nomic classes, the plots were also stratified by SES. Inaddition, to statistically test whether the generationshifts differed by SES, we entered SES and an inter-action term of generation and SES into all regressionmodels. All analyses were performed in SAS version 9.2(SAS Institute, Cary, NC, USA).
Results
At baseline, the age range was 20–59 years and 47.5%were men (Table 1). Slightly more than half of thepopulation (51.5%) had a low educational level. Atbaseline, participants belonging to older generationswere more often low educated, smokers, and hadunfavourable levels of the risk factors studied.
The prevalence of metabolic risk factors increasedover the 16-year follow-up period within all gener-ations, except for low HDL cholesterol (Table 2 andFigure 1). In general, more recently born generationshad, when reaching a similar age as the generation born10 years earlier, a statistically significant higher preva-lence of overweight, obesity, and hypertension. Amongmen, such unfavourable generation shifts in the preva-lence of obesity were present between all generations.For example, 40% of the males who were in their 30 s atbaseline (average age 35 years) were overweight. At 11-year follow-up, the prevalence was 52% among menwho were then in their 30 s (those who were in their20 s at baseline) (p< 0.01). Unfavourable generationshifts of overweight and obesity among women wereonly evident between the most recently born gener-ations. Although the prevalence of obesity increased
1136 European Journal of Preventive Cardiology 21(9)
at University Library Utrecht on December 23, 2014cpr.sagepub.comDownloaded from

during follow-up within all generations, the prevalenceamong those who were in their 20 s at baseline wasalmost twice as high, when they reached a similar ageas those who were in their 30 s at baseline (p< 0.01). Atthe average age of 41 years, 15% of those who were intheir 20 s at baseline and 8% of those who were in their30 s at baseline had obesity. Unfavourable statisticallysignificant generation shifts in hypertension were
observed in both sexes between every consecutive gen-eration, except for the two most recently born gener-ations of men. Generation shifts were not present forthe prevalence of hypercholesterolaemia. For low HDLcholesterol, statistically significant favourable gener-ation shifts were present between those who were intheir 40 s and those who were in their 50 s at baselineonly. The prevalence of type 2 diabetes was low during
(a)
0
10
20
30
40
50
60
70
80
Mean age generation (years)
Per
cent
age
over
wei
ght
(b)
0
10
20
30
40
50
60
70
80
Mean age generation (years)
Per
cent
age
over
wei
ght
(c)
0
5
10
15
20
25
30
Mean age generation (years)
Per
cent
age
obes
ity
(d)
0
5
10
15
20
25
30
20 25 30 35 40 45 50 55 60 65 70 75 20 25 30 35 40 45 50 55 60 65 70 75
20 25 30 35 40 45 50 55 60 65 70 75 20 25 30 35 40 45 50 55 60 65 70 75
20 25 30 35 40 45 50 55 60 65 70 75 20 25 30 35 40 45 50 55 60 65 70 75
Mean age generation (years)
Per
cent
age
obes
ity
(e)
0
10
20
30
40
50
60
Mean age generation (years)
Per
cent
age
hype
rten
sion
(f)
0
10
20
30
40
50
60
Mean age generation (years)
Per
cent
age
hype
rten
sion
Figure 1. Age-specific prevalence of risk factors over 16 years follow-up (4 waves) in those who were in their 20 s (-¨-), 30 s (-*-),
40 s (-N-), and 50 s (-«-) at baseline, stratified by gender: for overweight (BMI �25 kg/m2) (a,b), obesity (BMI �30 kg/m2) (c, d),
hypertension (systolic blood pressure �140 mmHg, and/or diastolic blood pressure �90 mmHg, and/or on antihypertensive medi-
cation) (e, f), hypercholesterolemia (total cholesterol �6,5 mmol/l and/or on cholesterol lowering medication) (g, h), low HDL-
cholesterol (HDL-cholesterol <0.9 mmol/l) (i, j), and type 2 diabetes (k,l).
Hulsegge et al. 1137
at University Library Utrecht on December 23, 2014cpr.sagepub.comDownloaded from

the complete follow-up period, especially among thosewho were in their 20 s and 30 s at baseline.Unfavourable generation shifts were observed betweenthe two most recently born generations of men andbetween the two oldest generations of men (p< 0.05).No generation shifts in diabetes were present amongwomen.
The observed generation shifts in obesity, hyperten-sion, and low HDL cholesterol were also reflected in thechanges for mean BMI, blood pressure (diastolic andsystolic), and HDL cholesterol, respectively (Table 2).Statistically significant favourable generation shifts formean total cholesterol were observed between thosewho were in their 40 s compared to those who were in
their 50 s at baseline, among men and women.Generation shifts for the use of blood pressure andcholesterol-lowering medication were present i.e. theuse of medication was, at a similar age, higher amongmore recently born generations compared to gener-ations born 10 years earlier.
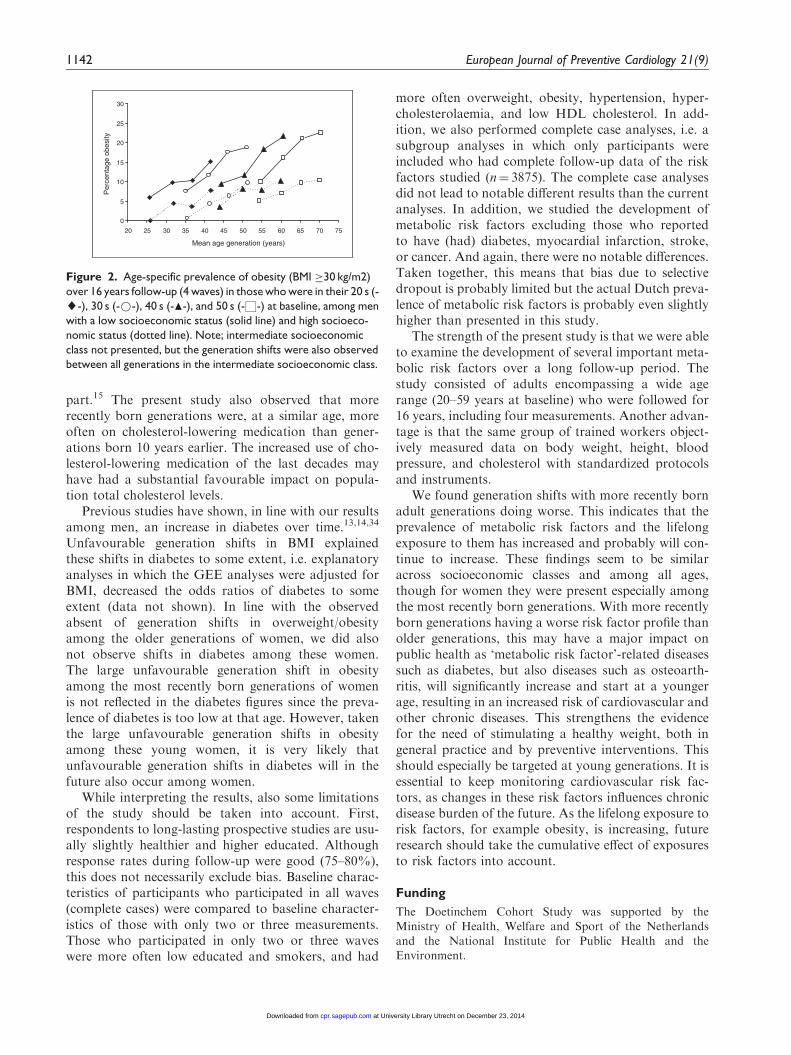
A SES gradient was observed for every risk factor:participants with a low SES had higher prevalences ofmetabolic risk factors compared to those with inter-mediate or high SES. However, in general the patternof generation shifts was similar for different socioeco-nomic classes (p> 0.05). As an example, this is illu-strated for the prevalence of obesity among men(Figure 2).
Figure 1. Continued.
1138 European Journal of Preventive Cardiology 21(9)
at University Library Utrecht on December 23, 2014cpr.sagepub.comDownloaded from

Discussion
Our results suggest a clear generation shift in the preva-lence of overweight, obesity, and hypertension, withmore recently born adult generations doing worsethan their predecessors. Generation shifts were notfound for hypercholesterolaemia and low HDL choles-terol, except a favourable generation shift in HDL chol-esterol between the two oldest generations. Theprevalence of type 2 diabetes was low in the presentstudy and unfavourable generation shifts were observedamong men but not among women. The unfavourablegeneration shifts observed in the total population wereconsistent across different SES strata and do not lead toincreasing or decreasing socioeconomic differences.
The unfavourable generation shifts in metabolic riskfactors observed in our study are partly in line withprevious studies. For BMI an increase in high-incomecountries over the past two decades is well known, asindicated by repeated cross-sectional studies.9,10,12,23–25
These studies did however not separate the analyses byage group at all9,12,23,24 or only by two age groups ofadults.10,25 Therefore, these studies were unable toshow which age groups specifically had higher BMI
levels over time. In the present study, unfavourablegeneration shifts were present in men between everygeneration and in women especially present betweenthe most recently born 10-year generations. For exam-ple, in 10 years the prevalence of obesity doubledamong young women (mean baseline age was 25years). This seems to be in line with results from theNutrition Examination Survey (NHANES) in the USAthat found an increase of 9% and 10% in the preva-lence of obesity between 1988–1994 and 1999–2000among 20–39-year-old men and women, respectively.10
The observed unfavourable generation shifts for over-weight and obesity are, in theory, a result of anunfavourable imbalance between energy intake andenergy expenditure. Trends in energy intake and phys-ical activity in the Netherlands during this period areunclear. Evidence indicates that physical inactivityincreased over time and energy intake slightly decreasedwith the note that underreporting of energy intakeprobably also increased.26
For blood pressure, most previous studies showeddecreasing levels over the last decades,9,12,20,23,27,28
which is in contrast to our findings. However, theNHANES showed also an increase in the prevalence
Table 1. General baseline (1987–1991) characteristics of the Doetinchem Cohort Study (n¼ 6308)
20–29 years 30–39 years 40–49 years 50–59 years
Men
(n¼ 467)
Women
(n¼ 588)
Men
(n¼ 940)
Women
(n¼ 1038)
Men
(n¼ 928)
Women
(n¼ 955)
Men
(n¼ 659)
Women
(n¼ 733)
Age (years) 25.4� 2.9 25.3� 2.9 35.1� 2.9 35.0� 2.7 44.3� 2.6 44.2� 2.8 54.5� 2.8 54.5� 2.9
Level of educationa
Low 32.6 38.8 37.8 52.5 47.6 64.5 53.7 78.9
Intermediate 46.9 44.9 33.2 25.3 28.6 18.6 22.7 12.0
High 20.6 16.3 29.0 22.2 23.8 17.0 23.6 9.9
Smokers 39.2 39.8 36.9 38.1 33.8 33.5 30.7 24.5
BMI (kg/m2) 23.4� 2.9 22.6� 3.4 24.5� 2.9 23.5� 3.5 25.6� 3.0 24.6� 3.7 26.0� 2.9 26.3� 4.0
BMI classes
Normal (BMI <25 kg/m2) 73.1 83.9 59.7 73.4 44.4 61.6 39.5 41.6
Overweight (25–30 kg/m2) 24.1 13.0 36.2 21.9 48.0 30.2 52.4 43.5
Obese (BMI �30 kg/m2) 2.8 3.1 4.1 4.7 7.5 8.2 8.1 14.9
SBP (mmHg) 125� 12 114� 11 124� 12 113� 12 124� 14 118� 15 130� 15 127� 16
DBP (mmHg) 75� 9 72� 9 78� 10 73� 9 81� 10 77� 10 82� 11 81� 11
Hypertensionb 14.1 4.6 17.9 6.3 23.7 16.1 35.3 32.4
Total cholesterol (mmol/l) 4.8� 0.9 5.0� 0.9 5.4� 1.1 5.0� 0.9 5.8� 1.1 5.4� 0.9 6.0� 1.0 6.2� 1.0
Hypercholesterolaemiac 3.6 4.6 15.0 6.9 23.8 13.3 29.3 33.9
HDL cholesterol (mmol/l) 1.13� 0.24 1.36� 0.29 1.12� 0.26 1.35� 0.30 1.12� 0.27 1.40� 0.32 1.09� 0.26 1.35� 0.32
Low HDL cholesterold 14.8 2.7 17.6 4.6 18.2 3.6 22.9 4.7
Type 2 diabetes 0.2 0.2 0.0 0.1 0.7 0.5 1.1 1.6
Values are mean� SD or %; aHighest attained level during follow-up.; bSystolic blood pressure �140 mmHg, and/or diastolic blood pressure
�90 mmHg, and/or on antihypertensive medication; cTotal cholesterol �6.5 mmol/l and/or on cholesterol-lowering medication; dHDL cholesterol
<0.9 mmol/l; BMI, body mass index; DBP, diastolic blood pressure; HDL, high-density lipoprotein; SBP, systolic blood pressure.
Hulsegge et al. 1139
at University Library Utrecht on December 23, 2014cpr.sagepub.comDownloaded from

Table 2. Metabolic risk factors at four waves of those who were in their 20 s, 30 s, 40 s, and 50 s at baseline, stratified by gender
nemoWneM
1987–1991 1993–1997 1998–2002 2003–2007
p-value
1987–1991 1993–1997 1998–2002 2003–2007
p-valueWave 1 Wave 2 Wave 3 Wave 4 Wave 1 Wave 2 Wave 3 Wave 4
b
a
thgiewrevO
5.161.259.830.72s02 < 0.01 16.2 28.1 39.1 45.8 < 0.01
07.05.943.642.734.6250.02.863.363.252.04s03
5.277.176.363.55s04 < 0.01 38.6 51.6 57.4 59.6 0.11
–6.866.866.665.85–8.277.969.768.06s05
Obesity
7.015.86.68.2s02 < 0.05 3.1 7.6 10.3 15.3 < 0.01
41.06.514.113.86.420.09.314.111.80.4s03
9.717.312.015.7s04 < 0.01 8.1 13.2 17.1 19.4 0.33
–8.723.522.026.41–3.811.617.217.8s05
BMI (kg/m2)
4.32s02 2.9 24.6 3.1 25.5 3.2 26.2 3.6 < 0.01 22.6 3.4 23.8 4.0 24.9 4.2 25.5 4.7 < 0.01
5.42s03 2.9 25.4 3.1 26.2 3.2 26.7 3.3 0.03 23.5 3.5 24.6 3.9 25.3 4.1 25.9 4.2 0.04
6.52s04 3.0 26.3 3.1 26.8 3.4 27.1 3.6 < 0.01 24.6 3.7 25.7 4.2 26.4 4.4 26.5 4.5 0.03
0.62s05 2.9 26.5 3.1 26.7 3.2 27.1 3.3 – 26.3 4.0 27.0 4.3 27.2 4.4 27.6 4.9 –
Hypertensionc
–9.114.76.484.0–1.020.511.41s02 < 0.01
–3.331.329.71s03 < 0.01 6.4 13.4 23.8 – 0.04
–8.249.438.32s04 < 0.01 16.1 28.0 38.1 – 0.65
––6.454.448.13––2.950.154.53s05
SBP (mmHg)c
521s02 12 124 12 125 13 – 0.13 114 11 114 12 115 14 – 0.05
421s03 12 125 13 128 14 – < 0.01 113 12 118 14 122 16 – < 0.01
521s04 14 129 16 133 18 – < 0.01 118 15 125 17 130 18 – < 0.01
031s05 15 137 18 141 20 – – 127 16 133 19 138 19 – –
DBP (mmHg)c
57s02 9 78 9 80 10 – 0.02 72 9 75 9 75 10 – 0.02
87s03 10 81 10 83 11 – < 0.01 73 9 77 10 80 10 – < 0.01
18s04 10 83 10 85 11 – < 0.01 77 10 81 11 82 11 – 0.03
28s05 11 84 10 84 11 – – 81 11 81 11 82 10 – –
Hypercholesterolaemia
19.00.80.73.36.443.09.319.418.66.3s02
14.03.125.314.70.752.09.521.423.619.41s03
27.07.633.435.714.3142.09.826.920.227.32s04
–0.749.644.838.43–0.233.132.524.92s05
Total cholesterol (mmol/l)
8.4s02 0.9 5.0 1.0 5.4 1.0 5.5 0.9 0.86 5.0 0.9 4.9 0.8 5.1 0.9 5.1 0.9 0.40
4.5s03 1.1 5.5 1.0 5.7 1.0 5.6 1.0 0.15 5.0 0.9 5.1 0.9 5.4 0.9 5.6 1.0 0.19
8.5s04 1.1 5.7 1.0 5.8 1.0 5.5 1.0 < 0.01 5.4 0.9 5.7 1.0 6.1 1.0 6.0 1.0 < 0.01
0.6s05 1.0 5.8 0.9 5.8 0.9 5.4 1.0 – 6.2 1.0 6.2 1.0 6.2 1.1 5.9 1.1 –
Low HDL cholesterol
35.01.29.24.27.292.06.313.412.318.41s02
37.08.17.29.15.444.01.216.511.516.71s03
8.118.315.313.81s04 < 0.01 3.6 1.7 2.9 2.2 0.05
–5.41.57.38.4–3.217.510.419.22s05
(Continued)
1140 European Journal of Preventive Cardiology 21(9)
at University Library Utrecht on December 23, 2014cpr.sagepub.comDownloaded from
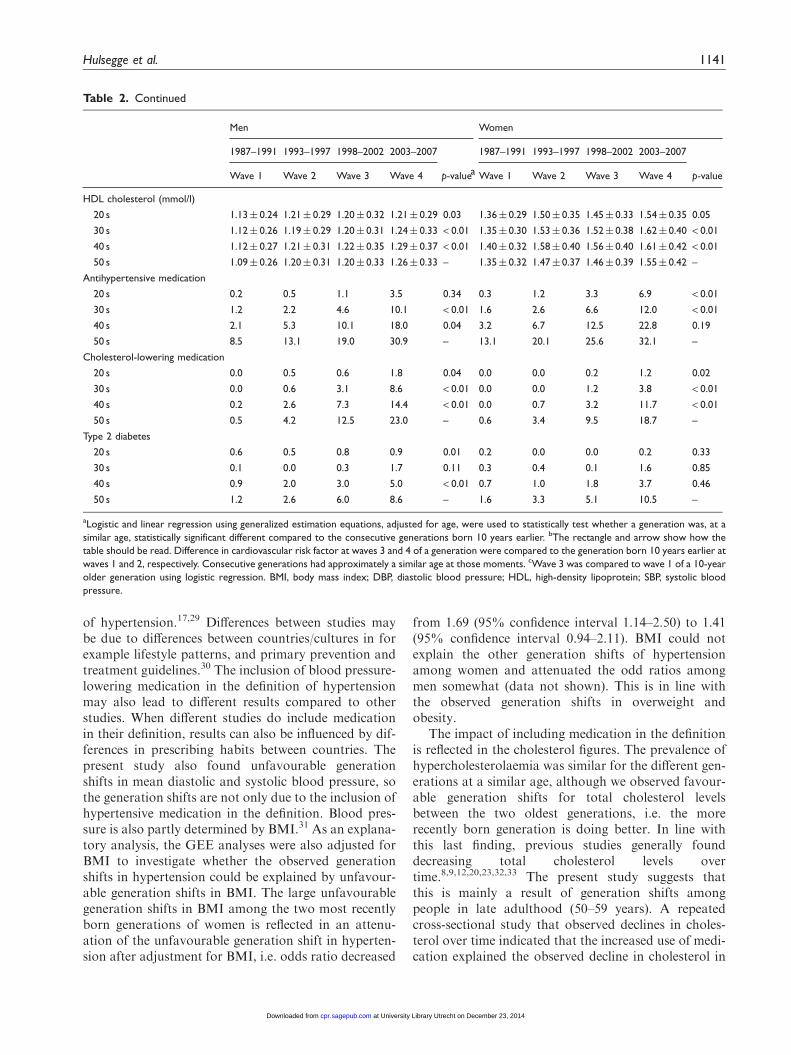
of hypertension.17,29 Differences between studies maybe due to differences between countries/cultures in forexample lifestyle patterns, and primary prevention andtreatment guidelines.30 The inclusion of blood pressure-lowering medication in the definition of hypertensionmay also lead to different results compared to otherstudies. When different studies do include medicationin their definition, results can also be influenced by dif-ferences in prescribing habits between countries. Thepresent study also found unfavourable generationshifts in mean diastolic and systolic blood pressure, sothe generation shifts are not only due to the inclusion ofhypertensive medication in the definition. Blood pres-sure is also partly determined by BMI.31 As an explana-tory analysis, the GEE analyses were also adjusted forBMI to investigate whether the observed generationshifts in hypertension could be explained by unfavour-able generation shifts in BMI. The large unfavourablegeneration shifts in BMI among the two most recentlyborn generations of women is reflected in an attenu-ation of the unfavourable generation shift in hyperten-sion after adjustment for BMI, i.e. odds ratio decreased
from 1.69 (95% confidence interval 1.14–2.50) to 1.41(95% confidence interval 0.94–2.11). BMI could notexplain the other generation shifts of hypertensionamong women and attenuated the odd ratios amongmen somewhat (data not shown). This is in line withthe observed generation shifts in overweight andobesity.
The impact of including medication in the definitionis reflected in the cholesterol figures. The prevalence ofhypercholesterolaemia was similar for the different gen-erations at a similar age, although we observed favour-able generation shifts for total cholesterol levelsbetween the two oldest generations, i.e. the morerecently born generation is doing better. In line withthis last finding, previous studies generally founddecreasing total cholesterol levels overtime.8,9,12,20,23,32,33 The present study suggests thatthis is mainly a result of generation shifts amongpeople in late adulthood (50–59 years). A repeatedcross-sectional study that observed declines in choles-terol over time indicated that the increased use of medi-cation explained the observed decline in cholesterol in
Table 2. Continued
nemoWneM
1987–1991 1993–1997 1998–2002 2003–2007
p-value
1987–1991 1993–1997 1998–2002 2003–2007
p-valueWave 1 Wave 2 Wave 3 Wave 4 Wave 1 Wave 2 Wave 3 Wave 4
HDL cholesterol (mmol/l)
31.1s02 0.24 1.21 0.29 1.20 0.32 1.21 0.29 0.03 1.36 0.29 1.50 0.35 1.45 0.33 1.54 0.35 0.05
21.1s03 0.26 1.19 0.29 1.20 0.31 1.24 0.33 < 0.01 1.35 0.30 1.53 0.36 1.52 0.38 1.62 0.40 < 0.01
21.1s04 0.27 1.21 0.31 1.22 0.35 1.29 0.37 < 0.01 1.40 0.32 1.58 0.40 1.56 0.40 1.61 0.42 < 0.01
90.1s05 0.26 1.20 0.31 1.20 0.33 1.26 0.33 – 1.35 0.32 1.47 0.37 1.46 0.39 1.55 0.42 –
Antihypertensive medication
9.63.32.13.043.05.31.15.02.0s02 < 0.01
1.016.42.22.1s03 < 0.01 1.6 2.6 6.6 12.0 < 0.01
91.08.225.217.62.340.00.811.013.51.2s04
–1.236.521.021.31–9.030.911.315.8s05
Cholesterol-lowering medication
20.02.12.00.00.040.08.16.05.00.0s02
6.81.36.00.0s03 < 0.01 0.0 0.0 1.2 3.8 < 0.01
4.413.76.22.0s04 < 0.01 0.0 0.7 3.2 11.7 < 0.01
–7.815.94.36.0–0.325.212.45.0s05
Type 2 diabetes
33.02.00.00.02.010.09.08.05.06.0s02
58.06.11.04.03.011.07.13.00.01.0s03
0.50.30.29.0s04 < 0.01 0.7 1.0 1.8 3.7 0.46
–5.011.53.36.1–6.80.66.22.1s05
a
aLogistic and linear regression using generalized estimation equations, adjusted for age, were used to statistically test whether a generation was, at a
similar age, statistically significant different compared to the consecutive generations born 10 years earlier. bThe rectangle and arrow show how the
table should be read. Difference in cardiovascular risk factor at waves 3 and 4 of a generation were compared to the generation born 10 years earlier at
waves 1 and 2, respectively. Consecutive generations had approximately a similar age at those moments. cWave 3 was compared to wave 1 of a 10-year
older generation using logistic regression. BMI, body mass index; DBP, diastolic blood pressure; HDL, high-density lipoprotein; SBP, systolic blood
pressure.
Hulsegge et al. 1141
at University Library Utrecht on December 23, 2014cpr.sagepub.comDownloaded from
part.15 The present study also observed that morerecently born generations were, at a similar age, moreoften on cholesterol-lowering medication than gener-ations born 10 years earlier. The increased use of cho-lesterol-lowering medication of the last decades mayhave had a substantial favourable impact on popula-tion total cholesterol levels.
Previous studies have shown, in line with our resultsamong men, an increase in diabetes over time.13,14,34
Unfavourable generation shifts in BMI explainedthese shifts in diabetes to some extent, i.e. explanatoryanalyses in which the GEE analyses were adjusted forBMI, decreased the odds ratios of diabetes to someextent (data not shown). In line with the observedabsent of generation shifts in overweight/obesityamong the older generations of women, we did alsonot observe shifts in diabetes among these women.The large unfavourable generation shift in obesityamong the most recently born generations of womenis not reflected in the diabetes figures since the preva-lence of diabetes is too low at that age. However, takenthe large unfavourable generation shifts in obesityamong these young women, it is very likely thatunfavourable generation shifts in diabetes will in thefuture also occur among women.
While interpreting the results, also some limitationsof the study should be taken into account. First,respondents to long-lasting prospective studies are usu-ally slightly healthier and higher educated. Althoughresponse rates during follow-up were good (75–80%),this does not necessarily exclude bias. Baseline charac-teristics of participants who participated in all waves(complete cases) were compared to baseline character-istics of those with only two or three measurements.Those who participated in only two or three waveswere more often low educated and smokers, and had
more often overweight, obesity, hypertension, hyper-cholesterolaemia, and low HDL cholesterol. In add-ition, we also performed complete case analyses, i.e. asubgroup analyses in which only participants wereincluded who had complete follow-up data of the riskfactors studied (n¼ 3875). The complete case analysesdid not lead to notable different results than the currentanalyses. In addition, we studied the development ofmetabolic risk factors excluding those who reportedto have (had) diabetes, myocardial infarction, stroke,or cancer. And again, there were no notable differences.Taken together, this means that bias due to selectivedropout is probably limited but the actual Dutch preva-lence of metabolic risk factors is probably even slightlyhigher than presented in this study.
The strength of the present study is that we were ableto examine the development of several important meta-bolic risk factors over a long follow-up period. Thestudy consisted of adults encompassing a wide agerange (20–59 years at baseline) who were followed for16 years, including four measurements. Another advan-tage is that the same group of trained workers object-ively measured data on body weight, height, bloodpressure, and cholesterol with standardized protocolsand instruments.
We found generation shifts with more recently bornadult generations doing worse. This indicates that theprevalence of metabolic risk factors and the lifelongexposure to them has increased and probably will con-tinue to increase. These findings seem to be similaracross socioeconomic classes and among all ages,though for women they were present especially amongthe most recently born generations. With more recentlyborn generations having a worse risk factor profile thanolder generations, this may have a major impact onpublic health as ‘metabolic risk factor’-related diseasessuch as diabetes, but also diseases such as osteoarth-ritis, will significantly increase and start at a youngerage, resulting in an increased risk of cardiovascular andother chronic diseases. This strengthens the evidencefor the need of stimulating a healthy weight, both ingeneral practice and by preventive interventions. Thisshould especially be targeted at young generations. It isessential to keep monitoring cardiovascular risk fac-tors, as changes in these risk factors influences chronicdisease burden of the future. As the lifelong exposure torisk factors, for example obesity, is increasing, futureresearch should take the cumulative effect of exposuresto risk factors into account.
Funding
The Doetinchem Cohort Study was supported by theMinistry of Health, Welfare and Sport of the Netherlands
and the National Institute for Public Health and theEnvironment.
0
5
10
15
20
25
30
20 25 30 35 40 45 50 55 60 65 70 75
Mean age generation (years)
Per
cent
age
obes
ity
Figure 2. Age-specific prevalence of obesity (BMI �30 kg/m2)
over 16 years follow-up (4 waves) in those who were in their 20 s (-
¨-), 30 s (-*-), 40 s (-N-), and 50 s (-«-) at baseline, among men
with a low socioeconomic status (solid line) and high socioeco-
nomic status (dotted line). Note; intermediate socioeconomic
class not presented, but the generation shifts were also observed
between all generations in the intermediate socioeconomic class.
1142 European Journal of Preventive Cardiology 21(9)
at University Library Utrecht on December 23, 2014cpr.sagepub.comDownloaded from
Conflict of interest
None declared.
Presentations
This work was presented at the annual conference of TheNetherlands Epidemiology Society (WEON) 2012, Healthand disease during the life course.
Acknowledgements
The authors would like to thank the field workers of theMunicipal Health Services in Doetinchem (C te Boekhorst,I Hengeveld, L de Klerk, I Thus, and ir. C de Rover) for their
contribution to the data collection for the present study.Project director is dr. ir. WMM Verschuren. Logistic man-agement was provided by J Steenbrink and P Vissink, and the
secretarial support by EP van der Wolf. The data manage-ment was provided by ir. A Blokstra, drs. AWD van Kesseland ir. PE Steinberger. For statistical advice, Dr. CMASchipper (Expertise Centre for Methodology and
Information Services, National Institute for Public Healthand the Environment Bilthoven, The Netherlands) is grate-fully acknowledged.
References
1. Kinsella K and He W. An aging world: 2008 international
population reports, P95/09-1. Washington, DC: U.S.
Government Printing Office, 2009.2. Mannino DM and Buist AS. Global burden of COPD: risk
factors, prevalence, and future trends. Lancet 2007; 370:
765–773.3. Lopez AD, Mathers CD, Ezzati M, et al. Global and
regional burden of disease and risk factors, 2001: system-
atic analysis of population health data. Lancet 2006; 367:
1747–1757.
4. Berry JD, Dyer A, Cai X, et al. Lifetime risks of cardio-
vascular disease. N Engl J Med 2012; 366: 321–329.5. Dudina A, Cooney MT, Bacquer DD, et al. Relationships
between body mass index, cardiovascular mortality, and
risk factors: a report from the SCORE investigators. Eur J
Cardiovasc Prev Rehabil 2011; 18: 731–742.
6. Kondo T, Osugi S, Shimokata K, et al. Metabolic syn-
drome and all-cause mortality, cardiac events, and cardio-
vascular events: a follow-up study in 25,471 young- and
middle-aged Japanese men. Eur J Cardiovasc Prev Rehabil
2011; 18: 574–580.7. Rayner M, Allender S and Scarborough P. Cardiovascular
disease in Europe. Eur J Cardiovasc Prev Rehabil 2009;
16(Suppl 2): S43–S47.8. Berg CM, Lissner L, Aires N, et al. Trends in blood lipid
levels, blood pressure, alcohol and smoking habits from
1985 to 2002: results from INTERGENE and GOT-
MONICA. Eur J Cardiovasc Prev Rehabil 2005; 12:
115–125.9. Eriksson M, Holmgren L, Janlert U, et al. Large improve-
ments in major cardiovascular risk factors in the popula-
tion of northern Sweden: the MONICA study 1986–2009.
J Intern Med 2011; 269: 219–231.
10. Flegal KM, Carroll MD, Ogden CL, et al. Prevalence and
trends in obesity among US adults, 1999–2000. JAMA
2002; 288: 1723–1727.11. Parikh NI, Pencina MJ, Wang TJ, et al. Increasing trends
in incidence of overweight and obesity over 5 decades.
Am J Med 2007; 120: 242–250.12. Vartiainen E, Laatikainen T, Peltonen M, et al. Thirty-
five-year trends in cardiovascular risk factors in Finland.
Int J Epidemiol 2010; 39: 504–518.
13. Lipscombe LL and Hux JE. Trends in diabetes preva-
lence, incidence, and mortality in Ontario, Canada
1995–2005: a population-based study. Lancet 2007; 369:
750–756.14. Mokdad AH, Ford ES, Bowman BA, et al. Diabetes
trends in the U.S.: 1990–1998. Diabetes Care 2000; 23:
1278–1283.15. Arnett DK, Jacobs Jr DR, Luepker RV, et al. Twenty-
year trends in serum cholesterol, hypercholesterolemia,
and cholesterol medication use: the Minnesota Heart
Survey, 1980–1982 to 2000–2002. Circulation 2005; 112:
3884–3891.16. Cohen JD, Cziraky MJ, Cai Q, et al. 30-year trends in
serum lipids among United States adults: results from the
National Health and Nutrition Examination Surveys II,
III, and 1999–2006. Am J Cardiol 2010; 106: 969–975.17. Cutler JA, Sorlie PD, Wolz M, et al. Trends in hyperten-
sion prevalence, awareness, treatment, and control rates
in United States adults between 1988–1994 and 1999–
2004. Hypertension 2008; 52: 818–827.
18. Ford ES, Li C, Pearson WS, et al. Trends in hyperchol-
esterolemia, treatment and control among United States
adults. Int J Cardiol 2010; 140: 226–235.19. Hajjar I and Kotchen TA. Trends in prevalence, aware-
ness, treatment, and control of hypertension in the
United States, 1988–2000. JAMA 2003; 290: 199–206.20. Ulmer H, Kelleher CC, Fitz-Simon N, et al. Secular
trends in cardiovascular risk factors: an age-period
cohort analysis of 698,954 health examinations in
181,350 Austrian men and women. J Intern Med 2007;
261: 566–576.21. Verschuren WM, Blokstra A, Picavet HS, et al. Cohort
profile: the Doetinchem Cohort Study. Int J Epidemiol
2008; 37: 1236–1241.22. Chalmers J, MacMahon S, Mancia G, et al. 1999 World
Health Organization-International Society of
Hypertension Guidelines for the management of hyper-
tension. Guidelines sub-committee of the World Health
Organization. Clin Exp Hypertens 1999; 21: 1009–1060.23. Evans A, Tolonen H, Hense HW, et al. Trends in coron-
ary risk factors in the WHO MONICA project. Int J
Epidemiol 2001; 30(Suppl 1): S35–S40.24. Finucane MM, Stevens GA, Cowan MJ, et al. National,
regional, and global trends in body-mass index since
1980: systematic analysis of health examination surveys
and epidemiological studies with 960 country-years and
9.1 million participants. Lancet 2011; 377: 557–567.25. Flegal KM, Carroll MD, Ogden CL, et al. Prevalence and
trends in obesity among US adults, 1999–2008. JAMA
2010; 303: 235–241.
Hulsegge et al. 1143
at University Library Utrecht on December 23, 2014cpr.sagepub.comDownloaded from
26. Health Council of the Netherlands. Overweight and obes-ity. The Hague: Health Council of the Netherlands, 2003.
27. Danaei G, Finucane MM, Lin JK, et al. National, regio-
nal, and global trends in systolic blood pressure since1980: systematic analysis of health examination surveysand epidemiological studies with 786 country-years and5.4 million participants. Lancet 2011; 377: 568–577.
28. Bjorkelund C, Andersson-Hange D, Andersson K, et al.Secular trends in cardiovascular risk factors with a 36-year perspective: observations from 38- and 50-year-olds
in the Population Study of Women in Gothenburg. ScandJ Prim Health Care 2008; 26: 140–146.
29. Egan BM, Zhao Y and Axon RN. US trends in preva-
lence, awareness, treatment, and control of hypertension,1988–2008. JAMA 2010; 303: 2043–2050.
30. Wolf-Maier K, Cooper RS, Banegas JR, et al.
Hypertension prevalence and blood pressure levels in 6European countries, Canada, and the United States.JAMA 2003; 289: 2363–2369.
31. Brown CD, Higgins M, Donato KA, et al. Body mass
index and the prevalence of hypertension and dyslipide-
mia. Obes Res 2000; 8: 605–619.32. Farzadfar F, Finucane MM, Danaei G, et al. National,
regional, and global trends in serum total cholesterol
since 1980: systematic analysis of health examination sur-
veys and epidemiological studies with 321 country-years
and 3.0 million participants. Lancet 2011; 377: 578–586.33. Hyre AD, Muntner P, Menke A, et al. Trends in ATP-
III-defined high blood cholesterol prevalence, awareness,
treatment and control among U.S. adults. Ann Epidemiol
2007; 17: 548–555.34. Estoppey D, Paccaud F, Vollenweider P, et al. Trends in
self-reported prevalence and management of hyperten-
sion, hypercholesterolemia and diabetes in Swiss adults,
1997–2007. BMC Public Health 2011; 11: 114.
1144 European Journal of Preventive Cardiology 21(9)
at University Library Utrecht on December 23, 2014cpr.sagepub.comDownloaded from