TOC - i - San Juan Water District
147
SJWD– Wholesale Master Plan Phase II B&V Project 139074.0200 Table of Content B&V File G.2 February 21, 2007 FINAL TOC - i TABLE OF CONTENT EXECUTIVE SUMMARY .................................................................................................... ES-1 Purpose ..................................................................................................................................... ES-1 Project Overview ..................................................................................................................... ES-1 Historical and Projected Demand: Level of Service (TM1) .................................................... ES-2 Water Storage and Transmission System Analysis (TM2) ...................................................... ES-7 Water Storage and Transmission System Analysis Cost Update (TM3) ............................... ES-10 Plan for Meeting Reduced Surface Water Delivery (TM4) ................................................... ES-11 Opinions of Cost and Implementation Schedule for Recommended Improvements (TM5) ...................................................................... ES-16 1.0 TECHNICAL MEMORANDUM NO. 1 SUPPLEMENT ................................................................................ TM1 Supplement-1 1.0 TECHNICAL MEMORANDUM NO. 1 HISTORICAL AND PROJECTED DEMAND ................................................. TM1-1 Purpose .................................................................................................................................. TM1-1 Historical and Projected Demand Evaluation ....................................................................... TM1-3 Levels of Service ................................................................................................................... TM1-9 Preliminary Conclusions ..................................................................................................... TM1-10 Appendix ................................................................................................................. TM1-Appendix 2.0 TECHNICAL MEMORANDUM NO. 2 WATER STORAGE AND TRANSMISSION SYSTEM ANALYSIS ............. TM2-1 Summary and Purpose .......................................................................................................... TM2-1 Transmission System Evaluation .......................................................................................... TM2-1 Storage Analysis ................................................................................................................. TM2-11 Preliminary Conclusions ..................................................................................................... TM2-16 Appendix ................................................................................................................. TM2-Appendix 3.0 TECHNICAL MEMORANDUM NO. 3 WATER STORAGE AND TRANSMISSION SYSTEM ANALYSIS COST UPDATE .................................................................................................... TM3-1 Purpose and Summary .......................................................................................................... TM3-1 Background ........................................................................................................................... TM3-2 Estimated Costs in 1998 Report ............................................................................................ TM3-4 Updated Costs ....................................................................................................................... TM3-5
-
Upload
khangminh22 -
Category
Documents
-
view
1 -
download
0
Transcript of TOC - i - San Juan Water District
SJWD– Wholesale Master Plan Phase II B&V Project 139074.0200 Table of Content B&V File G.2 February 21, 2007 FINAL
TOC - i
TABLE OF CONTENT
EXECUTIVE SUMMARY .................................................................................................... ES-1
Purpose ..................................................................................................................................... ES-1 Project Overview ..................................................................................................................... ES-1 Historical and Projected Demand: Level of Service (TM1) .................................................... ES-2 Water Storage and Transmission System Analysis (TM2) ...................................................... ES-7 Water Storage and Transmission System Analysis Cost Update (TM3) ............................... ES-10 Plan for Meeting Reduced Surface Water Delivery (TM4) ................................................... ES-11 Opinions of Cost and Implementation Schedule
for Recommended Improvements (TM5) ...................................................................... ES-16
1.0 TECHNICAL MEMORANDUM NO. 1
SUPPLEMENT ................................................................................ TM1 Supplement-1
1.0 TECHNICAL MEMORANDUM NO. 1
HISTORICAL AND PROJECTED DEMAND ................................................. TM1-1
Purpose .................................................................................................................................. TM1-1 Historical and Projected Demand Evaluation ....................................................................... TM1-3 Levels of Service ................................................................................................................... TM1-9 Preliminary Conclusions ..................................................................................................... TM1-10 Appendix ................................................................................................................. TM1-Appendix
2.0 TECHNICAL MEMORANDUM NO. 2
WATER STORAGE AND TRANSMISSION SYSTEM ANALYSIS ............. TM2-1
Summary and Purpose .......................................................................................................... TM2-1 Transmission System Evaluation .......................................................................................... TM2-1 Storage Analysis ................................................................................................................. TM2-11 Preliminary Conclusions ..................................................................................................... TM2-16 Appendix ................................................................................................................. TM2-Appendix
3.0 TECHNICAL MEMORANDUM NO. 3
WATER STORAGE AND TRANSMISSION SYSTEM ANALYSIS
COST UPDATE .................................................................................................... TM3-1
Purpose and Summary .......................................................................................................... TM3-1 Background ........................................................................................................................... TM3-2 Estimated Costs in 1998 Report ............................................................................................ TM3-4 Updated Costs ....................................................................................................................... TM3-5

SJWD– Wholesale Master Plan Phase II B&V Project 139074.0200 Table of Content B&V File G.2 February 21, 2007 FINAL
TOC - ii
4.0 TECHNICAL MEMORANDUM NO. 4
PLAN FOR MEETING REDUCED SURFACE WATER
DELIVERY ........................................................................................................... TM4-1
Executive Summary .............................................................................................................. TM4-1 Introduction ........................................................................................................................... TM4-5 Demands to be Met ............................................................................................................... TM4-9 Reliability Goals ................................................................................................................. TM4-11 Currently Available Surface Water Entitlements and Groundwater Supplies .................... TM4-12 Shortage Scenarios .............................................................................................................. TM4-17 Available Strategies to Address Shortages ......................................................................... TM4-23 Conclusions and Recommendations ................................................................................... TM4-32 Appendix ............................................................................................................................ TM4-A1
5.0 TECHNICAL MEMORANDUM NO. 5
OPINION OF COST AND IMPLEMENTATION SCHEDULE
FOR RECOMMENDED IMPROVEMENTS .................................................... TM5-1
Executive Summary .............................................................................................................. TM5-1 Introduction ........................................................................................................................... TM5-4 Implementation of Recommended Improvements ................................................................ TM5-7 Opinions of Probable Project Costs .................................................................................... TM5-10 Implementation Schedule .................................................................................................... TM5-11 Cost Allocation Considerations .......................................................................................... TM5-13 Conclusions and Recommendations ................................................................................... TM5-14 Appendix ............................................................................................................................ TM5-A1

SJWD– Wholesale Master Plan Phase II B&V Project 139074.0200 Table of Content B&V File G.2 February 21, 2007 FINAL
TOC - iii
LIST OF FIGURES
EXECUTIVE SUMMARY
Figure ES-1 Total Demand Projections for SJWD Family Agencies .................................. ES-3 Figure ES-2 Distribution System Analysis .......................................................................... ES-8 Figure ES-3 HGL Comparisons .......................................................................................... ES-9 Figure ES-4 Hinkle Reservoir Storage Issues ................................................................... ES-10 Figure ES-5 Emergency Outrage Scenarios ...................................................................... ES-14
TECHNICAL MEMORANDUM NO. 1 SUPPLEMENTAL
Figure 1-1: Total Demand Projections for SJWD Family Agencies ............ TM1 Supplement-2
TECHNICAL MEMORANDUM NO. 1
Figure 1-1: San Juan Water District Service Area ............................................................ TM1-2 Figure 1-2: Total Demand Projections for SJWD Family Agencies ................................ TM1-6 Figure 1A-1 Citrus Heights - Historical Per Capita Analysis ........................................ TM1A-1 Figure 1A-2 Citrus Heights - Historical and Projection Comparisons .......................... TM1A-2 Figure 1A-3 Citrus Heights - Demand Projections ........................................................ TM1A-3 Figure 1A-4 Fair Oaks - Historical Per Capita Analysis ............................................... TM1A-4 Figure 1A-5 Fair Oaks - Historical and Projections Comparisons ................................ TM1A-5 Figure 1A-6 Fair Oaks - Demand Projections ............................................................... TM1A-6 Figure 1A-7 Folsom - Ashland Service Area - Historical Per Capita Analysis ............. TM1A-7 Figure 1A-8 Folsom - Ashland Service Area -
Historical and Projections Comparisons ............................................................... TM1A-8 Figure 1A-9 Folsom - Ashland Service Area - Demand Projections ............................ TM1A-9 Figure 1A-10 Orange Vale - Historical Per Capita Analysis ....................................... TM1A-10 Figure 1A-11 Orange Vale - Historical and Projections Comparisons ........................ TM1A-11 Figure 1A-12 Orange Vale - Demand Projections ...................................................... TM1A-12 Figure 1A-13 SJWD Retail - Historical Per Capita Analysis ...................................... TM1A-13 Figure 1A-14 SJWD Retail - Historical and Projections Comparisons ....................... TM1A-14 Figure 1A-15 SJWD Retail - Demand Projections ...................................................... TM1A-15 Figure 1A-16 Population and Water Demand Projections .......................................... TM1A-16 Figure 1A-17 SJWD Family Agencies Total Demand Projections ............................. TM1A-17 Figure 1A-18 Populations and Water Demand Projections -
Dry and Driest Year Scenarios ........................................................................... TM1A-18 Figure 1A-19 SJWD Family Agencies Surface and Groundwater Projections ........... TM1A-19 Figure 1A-20 Peaking Values ...................................................................................... TM1A-20 Figure 1A-21 2005 Population Comparison ................................................................ TM1A-21
TECHNICAL MEMORANDUM NO. 2
Figure 2-1 SJWD Wholesale Service Area ...................................................................... TM2-2

SJWD– Wholesale Master Plan Phase II B&V Project 139074.0200 Table of Content B&V File G.2 February 21, 2007 FINAL
TOC - iv
Figure 2-2 SJWD Transmission System ........................................................................... TM2-6 Figure 2-3 HGL Comparisons .......................................................................................... TM2-8 Figure 2-4 SJWD Wholesale Service Area - Maximum Day Flows (180 mgd Total) ..... TM2-9 Figure 2-5 SJWD Wholesale Service Area - Peak Hour Flows (247.5 mgd Total) ....... TM2-10 Figure 2-6 Hinkle Reservoir ........................................................................................... TM2-11 Figure 2A-1 Diurnal Flow Curve - Taken from June 14, 2004,
measured flows at Oak Ave. and Filbert Ave ....................................................... TM2-A1 Figure 2A-2 Demand Curve - 180 mgd Analysis .......................................................... TM2-A2 Figure 2A-3 Mass Curve - 180 mgd Analysis ............................................................... TM2-A3 Figure 2A-4 180 mgd Storage Analysis ........................................................................ TM2-A4 Figure 2A-5 140 mgd Storage Analysis ........................................................................ TM2-A5 Figure 2A-6 120 mgd Storage Analysis ........................................................................ TM2-A6 Figure 2A-7 Modeling Output for Maximum Day Flows ............................................. TM2-A7 Figure 2A-8 Model Output for Peak Hour Flows .......................................................... TM2-A8 Figure 2A-9 Model Output for CTP Agreement Flows ................................................. TM2-A9 Figure 2A-10 Wholesale Transmission Pipeline with Interconnections ...................... TM2-A10 Figure 2A-11 Interconnections and meter Locations of the CTP and FO40 ............... TM2-A11
TECHNICAL MEMORANDUM NO. 3
Figure 3-1: Fair Oaks 40 Pipeline ..................................................................................... TM3-3
TECHNICAL MEMORANDUM NO. 4
Figure 4-1: District Wholesale Service Area ................................................................... TM4-6 Figure 4-2: District Wholesale Service Area .................................................................. TM4-10 Figure 4-3: District Entitlements from Folsom Lake ...................................................... TM4-14 Figure 4-4: Existing and Planned Well Locations .......................................................... TM4-15 Figure 4-5: Drier and Driest Year Definitions ................................................................ TM4-18 Figure 4-6: Characterizations of Emergency Conditions ............................................... TM4-18 Figure 4-7: Outrage Scenarios ........................................................................................ TM4-20 Figure 4-8: District's 5-Stage pricing .............................................................................. TM4-25 Figure 4-9: Hinkle Reservoir Storage Issue .................................................................... TM4-26 Figure 4-10: Reliability Enhancements .......................................................................... TM4-29 Figure 4-11: Inter-ties with Neighboring Agencies ........................................................ TM4-31
TECHNICAL MEMORANDUM NO. 5
Figure 1-1: District Wholesale Service Area .................................................................... TM5-5 Figure 2-1: General Location of Tanks ............................................................................ TM5-8 Figure 4-1: 12-Hour Emergency Required and Recommended Storage ........................ TM5-11 Figure 4-2: Extended Emergency Recommended Improvements .................................. TM5-12

SJWD– Wholesale Master Plan Phase II B&V Project 139074.0200 Table of Content B&V File G.2 February 21, 2007 FINAL
TOC - v
LIST OF TABLES
EXECUTIVE SUMMARY
Table ES-1 Project Tasks .................................................................................................... ES-2 Table ES-2 Summary of Projected Average Demand ......................................................... ES-4 Table ES-3 Summary of Projected Flows (mgd) ................................................................. ES-4 Table ES-4 2030 Driest Year Analysis ................................................................................ ES-5 Table ES-5 Groundwater Wells ........................................................................................... ES-6 Table ES-6 Comparison of Updated Costs to Rehabilitate FO40 ..................................... ES-10 Table ES-7 Normal, Drier, and Driest Year Definitions ................................................... ES-11 Table ES-8 Groundwater Availability ............................................................................... ES-12 Table ES-9 Year 2030 Average Demands and Currently Available Supplies ................... ES-13 Table ES-10 Available Water during Various Emergency Outage Scenarios ................... ES-15 Table ES-11 Summary of Conceptual Level Facilities ..................................................... ES-16 Table ES-12 Summary of Opinion of Probable Project Cost ............................................ ES-17 Table ES-13 Schedule of Recommended Improvements .................................................. ES-17
TECHNICAL MEMORANDUM NO. 1 SUPPLEMENTAL
Table 1-1: Summary of Projected Average Demand (acre-ft/year) .............. TM1 Supplement-1 Table 1-2: 2030 Driest Year Analysis .......................................................... TM1 Supplement-1 Table 1-3: Groundwater Wells ..................................................................... TM1 Supplement-3
TECHNICAL MEMORANDUM NO. 1
Table 1-1: Summary of Historical and Projected Demand Evaluation ............................. TM1-3 Table 1-2: Population Projections .................................................................................... TM1-4 Table 1-3: Per Capita Demand for Family Agencies (gpcd) ............................................ TM1-4 Table 1-4: Summary of Projected Average Demand (acre-ft/year) .................................. TM1-5 Table 1-5: Peaking Factors and Associated 2030 Flows (mgd) ....................................... TM1-5 Table 1-6: 2030 Driest Year Analysis .............................................................................. TM1-8 Table 1-7: Groundwater Wells ......................................................................................... TM1-9 Table 1-8: Percent of Annual Average Demand Met Through Surface Water ............... TM1-10
TECHNICAL MEMORANDUM NO. 2
Table 2-1 Projected Flow for Family of Agencies ........................................................... TM2-3 Table 2-2 Projected Flow for Family of Agencies and SSWD ......................................... TM2-4 Table 2-3 Projected Flow Comparison ............................................................................. TM2-5 Table 2-4 CTP Agreement Required Hydraulic Grade Line ............................................ TM2-5 Table 2-5 Hydraulic Grade Line Comparison .................................................................. TM2-7 Table 2-6 Storage Analysis Results ................................................................................ TM2-12 Table 2-7 Emergency Storage Requirements ................................................................. TM2-14

SJWD– Wholesale Master Plan Phase II B&V Project 139074.0200 Table of Content B&V File G.2 February 21, 2007 FINAL
TOC - vi
Table 2-8 Emergency Storage Requirements without SSWD ........................................ TM2-15 Table 2-9 Emergency Storage Requirements without SSWD
and Using Groundwater ......................................................................................... TM2-15
TECHNICAL MEMORANDUM NO. 3
Table 3-1: Cost Allocation by Fair Oaks 40 Section (1998 Report) ................................ TM3-4 Table 3-2: Fair Oaks 40 Cost Allocation Summary (as % of total cost)(1998 Report) .... TM3-4 Table 3-3: Fair Oaks 40 Cost Allocation Summary (in $) (1998 Report) ........................ TM3-5 Table 3-4: Estimated Cost of Pipeline Rehabilitation ...................................................... TM3-6 Table 3-5: Comparison of Updated Costs ........................................................................ TM3-6 Table 3-6: Cost Allocation by Fair Oaks 40 Section - 2005 Update ................................ TM3-7 Table 3-7: Fair Oaks 40 cost Allocation Summary (as % of total cost) - 2005 Update ... TM3-7 Table 3-8: Fair Oaks 40 Cost Allocation Summary (in $) - 2005 Update ........................ TM3-7
TECHNICAL MEMORANDUM NO. 4
Table ES-1: Current Water Availability ........................................................................... TM4-3 Table 4-1: Documents Review for WWMP2 .................................................................. TM4-7 Table 4-2: Summary of Projected Average Demand in Acre-feet per Year (AFY) ......... TM4-9 Table 4-3: Associated 2030 Flows ................................................................................. TM4-10 Table 4-4: Groundwater Availability .............................................................................. TM4-16 Table 4-5: Year 2030 Average Demands and Currently Available Supplies ................. TM4-21 Table 4-6: Available Water during Various Emergency Outage Scenarios ................... TM4-22 Table 4-7: Applicability of Surface Water Shortage Strategies ..................................... TM4-23 Table 4-8: Summary of District's 5-Stage Water Conservation Program ....................... TM4-24 Table 4-9: Additional Groundwater Required to Meet Emergency Outage Scenarios .. TM4-28 Table 4-10: Potential Water Available from Interties .................................................... TM4-30
TECHNICAL MEMORANDUM NO. 5
Table ES-1 Summary of Opinions of Probable Project Cost ........................................... TM5-2 Table ES-2 Schedule of Recommended Improvements ................................................... TM5-3 Table 3-3: Summary of Opinions of Probable Project Cost ........................................... TM5-10 Table 4-1: Schedule of Improvements ............................................................................ TM5-12 Table 6-1: Summary of Opinions of Probable Project Cost ........................................... TM5-15 Table 6-2: Schedule of Recommended Improvements ................................................... TM5-15
BLACK & VEATCH EXECUTIVE SUMMARY
ES-1
SJWD–Wholesale Master Plan Phase 2 B&V Project 139074.0200 Executive Summary B&V File G.2 February 21, 2007
FINAL
PURPOSE
San Juan Water District (SJWD or District) is developing the Wholesale Master Plan Phase 2 (WMPP2) as a follow up to the Water Forum and Regional Water Master Plan. Overall goals for WMPP2 are to assess the District’s storage and transmission as related to the Family of Agencies (Citrus Heights Water District, Fair Oaks, the Ashland area of the City of Folsom, Orange Vale Water Company, and SJWD Retail) and to develop a water supply plan for the Family of Agencies within the context of regional planning efforts. The major objectives of WMPP2 are to: (1) determine demands/level of service, (2) plan for normal operations, (3) plan for reduced surface water operations, and (4) determine cost for any additional required facilities. Project deliverables include a series of technical memoranda (TMs) and a Final Report.
Project concepts are described in five technical memoranda (TMs) developed in concert with the District and the Family of Agencies through meetings and workshops. This Executive Summary presents a Project Overview and highlights the five TMs constituting the main body of this report.
PROJECT OVERVIEW
The District provides wholesale treated water supplies to Fair Oaks and Citrus Heights Water Districts (Fair Oaks, Citrus Heights), Orange Vale Water Company (Orange Vale), the City of Folsom (Folsom) north of the American River (the Ashland area), and the SJWD Retail Service Area. The District also supplies water, when water treatment plant capacity is available, to Sacramento Suburban Water District (SSWD). At peak water demands, the wholesale service provides up to approximately 115 million gallons per day (mgd), 128,800 acre-feet per year (AFY), within the wholesale service area.
The District is signatory to the Water Forum Agreement (WFA) and is one of the American River Basin Cooperating Agencies (ARBCA). The concepts presented in this report are compatible with WFA and ARBCA goals and objectives.
The District contracted with Black & Veatch (B&V) to develop WMPP2. Project tasks and associated deliverables are summarized in Table ES-1.

SJWD– Wholesale Master Plan Phase 2 B&V Project 139074.0200 Executive Summary B&V File G.2 February 21, 2007 FINAL
ES-2
Table ES-1 Project Tasks
Task Deliverable(s) Comments
Develop Demand Projections
TM1 – Historical and Projected Demand: Level of Service Workshop No. 1
Analysis of Family of Agencies data.
Analyze Water Storage and Transmission System
TM2 – Water Storage and Transmission System Analysis Workshop No. 2 TM3 – Water Storage and Transmission System Analysis Cost Update
Evaluation of the adequacy of the existing system to meet operational and emergency requirements.
Develop Strategies for Meeting Reduced Surface Water Delivery
TM4 – Plan for Meeting Reduced Surface Water Delivery Workshop No. 3
Development of strategies to address reduced inflows to Folsom Lake as well as emergencies.
Recommend System Improvements
TM5 – Opinion of Cost and Implementation Schedule for Recommended Improvements Workshop No. 4 Workshop No. 5
Conceptual design and schedule for facilities identified in TM 4.
As the project developed, reliability goals for the facilities were established by the General Managers of the Family of Agencies:
1. Water supply equal to 100 percent of annual average demand during Drier and Driest years defined in the WFA.
2. Water treatment capacity equal to at least 110 percent of maximum day demand.
3. Emergency supply equal to 100 percent maximum day demand for 12 hours with largest source out of service.
4. Emergency supply equal to 50 percent of average day demand for extended outage of largest source.
HISTORICAL AND PROJECTED DEMAND: LEVEL OF SERVICE (TM1)
At the outset of the project (April 2005), B&V developed an evaluation of historical and projected demand. Historical per capita demand, historical and projected population and total annual demands, and historical and various annual demand projections were reviewed for the Family of Agencies and SJWD Retail. The historical and projected demand are presented graphically on Figure ES-1 and summarized in Table ES-2. Other evaluation components included an approach to surface water and groundwater use in dry years, historical groundwater/surface water use and a projection for normal/average year use, factors used by each agency to estimate maximum day and peak hour demands, and a comparison of previous 2005 population projections and current estimated population for each agency. Discussions were also conducted with each agency to determine the desired level of service from the District.

SJWD– Wholesale Master Plan Phase 2 B&V Project 139074.0200 Executive Summary B&V File G.2 February 21, 2007 FINAL
ES-3
Figure ES-1: Total Demand Projections for SJWD Family Agencies

SJWD– Wholesale Master Plan Phase 2 B&V Project 139074.0200 Executive Summary B&V File G.2 February 21, 2007 FINAL
ES-4
Table ES–2
Summary of Projected Average Demand (acre-ft / year)
Year Citrus Heights
Fair Oaks Folsom Orange
Vale SJWD Retail
Total Demand
2005 20,036 14,611 1,382 4,982 18,691 59,702
2010 23,108 15,525 1,413 5,205 19,196 64,447
2015 23,258 16,438 1,413 5,381 19,700 66,190
2020 23,527 16,438 1,413 5,511 20,204 67,093
2025 23,577 16,438 1,413 5,592 20,708 67,728
2030 23,577 16,438 1,413 5,624 21,970 69,022
TM1 determined that the Family of Agencies would require approximately 121.3 mgd in 2030 as a maximum day flow. The associated peak hour flow was calculated to be 188.5 mgd. The projected average day, max day, and peak hour flows are summarized in Table ES-3.
Table ES–3
Summary of Projected Flows (mgd)
Family Agency
Max Day Factor
Peak Hour Factor
Average Demand
Max Day Flow
Peak Hour Flow
Citrus Heights 2.1 2.9 21.0 44.0 61.1
Fair Oaks 2.0 3.0 14.7 29.4 44.0
Folsom 2.0 3.6 1.3 2.5 4.5
Orange Vale 2.0 3.6 5.0 10.1 18.1
SJWD Retail 1.8 3.1 19.6 35.3 60.8
Total Flow 61.6 121.3 188.5
To determine groundwater availability, the installed well capacity was derated to 80 percent to account for mechanical outages and under-performing wells. In addition, increased groundwater production would only occur for 9 months, since a “Dry Year” would not be declared until March, and production on an annual basis would be only 75 percent of the derated capacity. Table ES-4 summarized the analysis of a driest year in terms of supply and demand in 2030.

SJWD– Wholesale Master Plan Phase 2 B&V Project 139074.0200 Executive Summary B&V File G.2 February 21, 2007 FINAL
ES-5
Table ES–4
2030 Driest Year Analysis
Family Agency Demand (afa)
Surface Water (afa)
Supplemental Need (afa)
Groundwater Available
(afa)
SJWD Retail 21,970 13,525 7,183 0
Citrus Heights 23,577 18,332 5,245 5,807
Fair Oaks 16,438 13,781 2,657 6,766
Folsom 1,413 1,063 350 0
Orange Vale 5,624 4,150 1,474 2,942
TOTAL 69,022 50,851 16,909 15,515
Existing and proposed groundwater wells within the family agencies’ service areas are summarized in Table ES-5.

SJWD– Wholesale Master Plan Phase 2 B&V Project 139074.0200 Executive Summary B&V File G.2 February 21, 2007 FINAL
ES-6
Table ES-5
Groundwater Wells
Family Agency Well Name Energy
Source Existing or Proposed
Year Built
Well Capacity (gpm)
Citrus Heights Sunrise (10) SMUD Existing 1991 900
Palm Ave (1A) SMUD Existing 1991 1,400
Sylvan (8) SMUD, diesel Existing 1991 1,600
Mitchell Farms (12) SMUD Proposed 2006 900
Skycrest School SMUD Proposed 2007 1,200
Subtotal 6,000
Fair Oaks Chicago SMUD Existing 1947 581
New York SMUD Existing 1972 830
Casabella SMUD Existing 1953 850
Park SMUD Existing 1990 1,090
Northridge SMUD Existing 1992 940
Town SMUD Proposed 2006 1,500
Heather SMUD Proposed 2007 1,200
Subtotal 6,991
Orange Vale Well #1 Diesel Existing 1977 1,200
Well #2 Electric Existing 1991 996
Well #3 Proposed 1,040
Subtotal 3,040
TOTAL 16,031
The following preliminary conclusions were made:
• The area has reached a high level (90 percent +/-) of full development, and future increase in demand is estimated at approximately 10 percent.
• Water use on a per capita basis has declined over the long term from 450-500 gallons per capita per day (gpcd) in the 1960s to 300 +/- gpcd.
• Demand projections are mostly consistent with similar projections developed in the Regional Master Plan and through the Water Forum process.

SJWD– Wholesale Master Plan Phase 2 B&V Project 139074.0200 Executive Summary B&V File G.2 February 21, 2007 FINAL
ES-7
• Recent historical use of groundwater has been minimal, consistent with regional policies to maximize surface water use during normal and wet years and reserve groundwater supplies for use during dry years.
• Citrus Heights, Folsom, Orange Vale, and SJWD Retail will continue to service their demand primarily through surface water, and Fair Oaks will meet approximately 70 percent of its demand with surface water, using groundwater to satisfy the remaining demand.
The information developed in TM1 was used in subsequent analyses developed for TMs 2, 3, and 4.
WATER STORAGE AND TRANSMISSION SYSTEM ANALYSIS (TM2)
The water storage and transmission system analysis was undertaken to determine the adequacy of existing facilities.
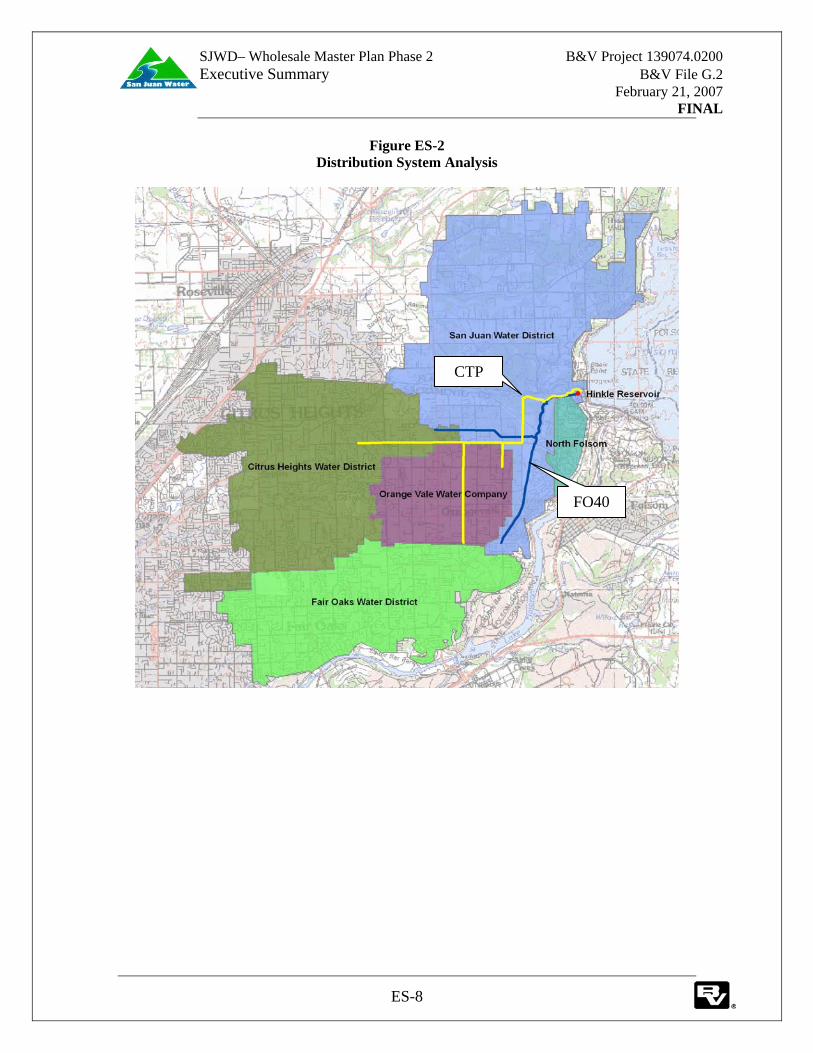
Distribution System Analysis. The objective of the distribution system analysis was to assess the ability of the system to meet flow and pressure requirements. Using projected flows for 2030, the Cooperative Transmission Pipeline (CTP) and the Fair Oaks 40 (FO40) Pipeline were assessed using the projected maximum day and peak hour flows developed in TM1 (121.3 and 188.5 mgd, respectively). The system is shown on Figure ES-2. Projected pressures were found to be consistent with requirements of the CTP agreement as shown on Figure ES-3.
SJWD– Wholesale Master Plan Phase 2 B&V Project 139074.0200 Executive Summary B&V File G.2 February 21, 2007 FINAL
ES-8
Figure ES-2 Distribution System Analysis
CTP
FO40

SJWD– Wholesale Master Plan Phase 2 B&V Project 139074.0200 Executive Summary B&V File G.2 February 21, 2007 FINAL
ES-9
Figure ES-3 HGL Comparisons
Storage Analysis. The objective of the storage analysis was to determine the adequacy of existing storage to meet operational and emergency requirements. Currently, storage for the majority of the wholesale system is only available at Hinkle Reservoir, although individual agencies are examining the potential for future storage in their respective service areas. Hinkle Reservoir has a nominal volume of 60 million gallons (MG), which occurs at a water depth of 20 feet. Depth is the reservoir must be maintained above 7 feet to avoid operational problems associated with the floating cover. The water volume at 7 feet is approximately 19.7 MG. Thus, approximately 42.3 MG is available as usable storage.
The usable storage must meet the needs of both normal operations and emergencies. Under normal operations a minimum of approximately 8% of the maximum day is required to balance demands and plant production. However, it is recommended that 15% of the available storage be used for this purpose, resulting in an operational need of 16.5 MG
Therefore, the Hinkle Reservoir can meet operational storage requirements through 2030. However, emergency storage within the reservoir will only supply maximum day demand for a
Note: Assume all demand met from surface water
340
345
350
355
360
365
370
375
380
385
18 20 21 23 27
Projected Max Day flowProjected Peak Hour flowCTP Agreement flowRequired HGL
Node Number
Maximum Difference of 5.5 feet which is approximately 2.4 psi
Hyd
raul
ic G
rade
Lin
e (f
t)

SJWD– Wholesale Master Plan Phase 2 B&V Project 139074.0200 Executive Summary B&V File G.2 February 21, 2007 FINAL
ES-10
limited duration. (See Figure ES-4.) Emergency storage available in Hinkle Reservoir is only 19.8 MG; however, 60.7 MG of storage (or 63.5 MG if SSWD is supplied water for only 2 hours after the start of the emergency) is required to meet the 12 hour emergency demand if no other strategy is employed.
Figure ES-4 Hinkle Reservoir Storage Issues
WATER STORAGE AND TRANSMISSION SYSTEM ANALYSIS COST UPDATE (TM3)
As part of the System Analysis, costs previously developed for the District for the rehabilitation of the Fair Oaks 40 Pipeline were updated. Table ES-6 presents the comparison of updated cost.
Table ES – 6
Comparison of Updated Costs to Rehabilitate FO40
ENR Construction Cost Index
B&V Cost Database
Section 1998
Report Updated
Cost Percent Increase
Updated Cost
Percent Increase
Phase 1 $72,200 $87,900 122% $87,900 122%
Phase 2-Section 1 $300,000 $365,300 122% $718,500 240%
Phase 2-Section 2 $100,000 $121,800 122% $239,500 240%
Total $472,200 $575,000 122% $1,045,900 221%
Citrus Heights – 22.0 Fair Oaks – 14.7 Folsom – 1.3
Orange Vale – 5.0 SJWD Retail – 17.7
Total Storage required to meet 12 hour emergency at Max Day rate is 60.7 MG
NOTE: Assumes SSWD drops off line after two hours
Emergency Storage in
Hinkle Res.25.8 MG
34.9 MG (Shortfall)
SJWD– Wholesale Master Plan Phase 2 B&V Project 139074.0200 Executive Summary B&V File G.2 February 21, 2007 FINAL
ES-11
PLAN FOR MEETING REDUCED SURFACE WATER DELIVERY (TM4)
A plan was developed for meeting reduced surface water delivery. Information used included results of the water demand analysis (TM1) and the water storage and transmission analyses (TMs 2 and 3), review of past reports, and new information provided by the Family of Agencies in workshops and interviews. TM 4 outlines reliability goals and currently available surface water entitlements and groundwater supplies. Also described are potential shortage scenarios and available strategies to address them. Preliminary conclusions and recommendations are then presented.
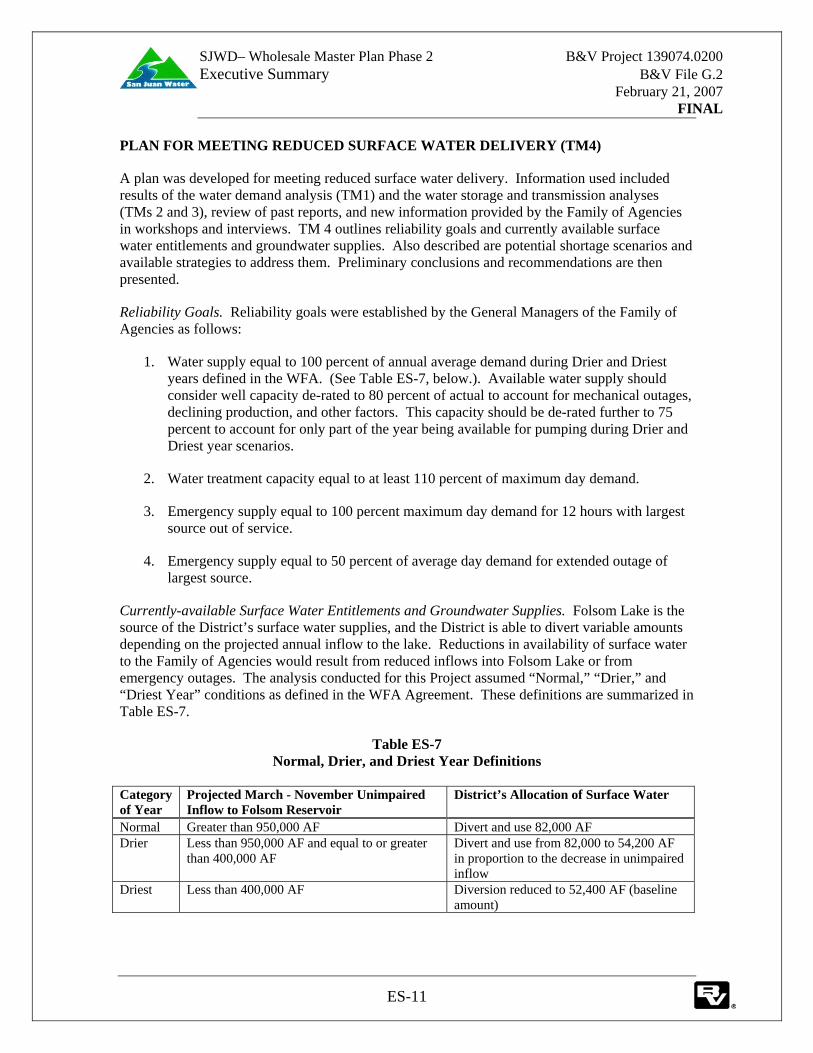
Reliability Goals. Reliability goals were established by the General Managers of the Family of Agencies as follows:
1. Water supply equal to 100 percent of annual average demand during Drier and Driest years defined in the WFA. (See Table ES-7, below.). Available water supply should consider well capacity de-rated to 80 percent of actual to account for mechanical outages, declining production, and other factors. This capacity should be de-rated further to 75 percent to account for only part of the year being available for pumping during Drier and Driest year scenarios.
2. Water treatment capacity equal to at least 110 percent of maximum day demand.
3. Emergency supply equal to 100 percent maximum day demand for 12 hours with largest source out of service.
4. Emergency supply equal to 50 percent of average day demand for extended outage of largest source.
Currently-available Surface Water Entitlements and Groundwater Supplies. Folsom Lake is the source of the District’s surface water supplies, and the District is able to divert variable amounts depending on the projected annual inflow to the lake. Reductions in availability of surface water to the Family of Agencies would result from reduced inflows into Folsom Lake or from emergency outages. The analysis conducted for this Project assumed “Normal,” “Drier,” and “Driest Year” conditions as defined in the WFA Agreement. These definitions are summarized in Table ES-7.
Table ES-7 Normal, Drier, and Driest Year Definitions
Category of Year
Projected March - November Unimpaired Inflow to Folsom Reservoir
District’s Allocation of Surface Water
Normal Greater than 950,000 AF Divert and use 82,000 AF Drier Less than 950,000 AF and equal to or greater
than 400,000 AF Divert and use from 82,000 to 54,200 AF in proportion to the decrease in unimpaired inflow
Driest Less than 400,000 AF Diversion reduced to 52,400 AF (baseline amount)
SJWD– Wholesale Master Plan Phase 2 B&V Project 139074.0200 Executive Summary B&V File G.2 February 21, 2007 FINAL
ES-12
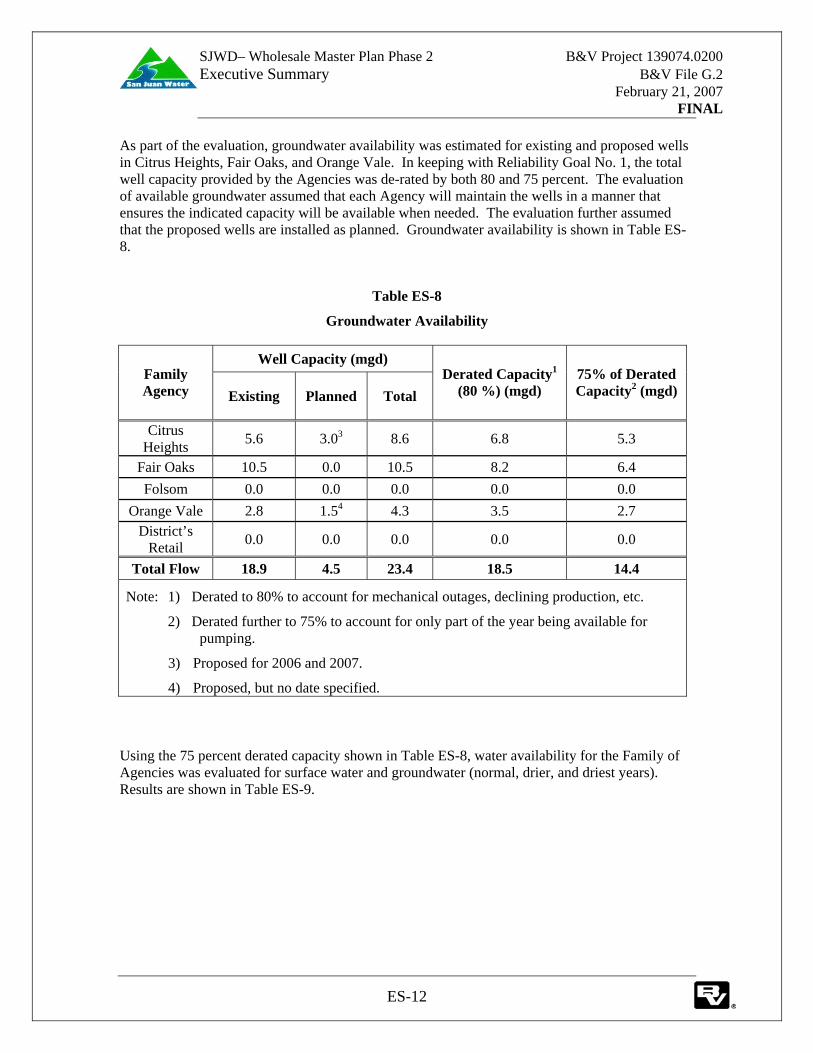
As part of the evaluation, groundwater availability was estimated for existing and proposed wells in Citrus Heights, Fair Oaks, and Orange Vale. In keeping with Reliability Goal No. 1, the total well capacity provided by the Agencies was de-rated by both 80 and 75 percent. The evaluation of available groundwater assumed that each Agency will maintain the wells in a manner that ensures the indicated capacity will be available when needed. The evaluation further assumed that the proposed wells are installed as planned. Groundwater availability is shown in Table ES-8.
Table ES-8
Groundwater Availability
Well Capacity (mgd) Family Agency Existing Planned Total
Derated Capacity1
(80 %) (mgd) 75% of Derated Capacity2 (mgd)
Citrus Heights 5.6 3.03 8.6 6.8 5.3
Fair Oaks 10.5 0.0 10.5 8.2 6.4 Folsom 0.0 0.0 0.0 0.0 0.0
Orange Vale 2.8 1.54 4.3 3.5 2.7 District’s
Retail 0.0 0.0 0.0 0.0 0.0
Total Flow 18.9 4.5 23.4 18.5 14.4
Note: 1) Derated to 80% to account for mechanical outages, declining production, etc.
2) Derated further to 75% to account for only part of the year being available for pumping.
3) Proposed for 2006 and 2007.
4) Proposed, but no date specified.
Using the 75 percent derated capacity shown in Table ES-8, water availability for the Family of Agencies was evaluated for surface water and groundwater (normal, drier, and driest years). Results are shown in Table ES-9.

SJWD– Wholesale Master Plan Phase 2 B&V Project 139074.0200 Executive Summary B&V File G.2 February 21, 2007 FINAL
ES-13
Table ES-9 Year 2030 Average Demands and Currently Available Supplies
Surface Water Groundwater
Family Agency
Year 2030
AverageDemand (mgd) (1)
Normal Year (mgd)
Drier Year (mgd)
Driest Year (mgd)
(2)
Normal, Drier & Driest Year (mgd)
Emergency Outage (mgd)
Citrus Heights 21.0 21.0 21.0 – 16.4 16.4 5.3 6.8
Fair Oaks 14.7 14.7 14.7 – 12.3 12.3 6.4 8.2 Folsom 1.3 1.3 1.3 – 0.9 0.9 0.0 0.0
Orange Vale 5.0 5.0 5.0 – 3.7 3.7 2.7 3.5 District’s
Retail 19.6 19.6 19.6 – 12.1 12.1 0.0 0.0
Water for Conjunctive
Use 12.9 12.9 12.9 – 1.5 1.5 0.0 0.0
Total Flow 74.5 74.5 74.5 – 46.9 46.9 14.4 18.5
1. Year 2030 Average demand from Table 4 – 2.
2. Surface Water allocated to each member to meet Driest Year Demand in excess of available groundwater.
Emergency Conditions The evaluation also considered emergency conditions, defined as any unanticipated, partial or complete, interruption in service from the system. Examples include mechanical, structural, electrical, or control failures at USBR or District facilities, whether caused by natural disasters, terrorist actions, or other factors. Other anticipated conditions include a break in one of the transmission pipelines. The District currently maintains 163 miles of pipeline, which transports water to wholesale and retail customers. Nine specific emergency outage scenarios were considered. These are shown on Figure ES-5.

SJWD– Wholesale Master Plan Phase 2 B&V Project 139074.0200 Executive Summary B&V File G.2 February 21, 2007 FINAL
ES-14
A
D
BC
E
F
G H
I
CTP
FO40
Figure ES-5 Emergency Outrage Scenarios
A. Water Treatment Plant or Intake
B. Hinkle Reservoir C. CTP pipe leaving
Hinkle Reservoir D. FO40 pipe leaving
Hinkle Reservoir E. FO40 pipe to Fair
Oaks Water District (FOWD)
F. FO40 pipe to SJWD, OVWC, and CHWD
G. CTP pipe to OVWC
H. CTP pipe to OVWC and FOWD
I. CTP pipe to CHWD and SSWD
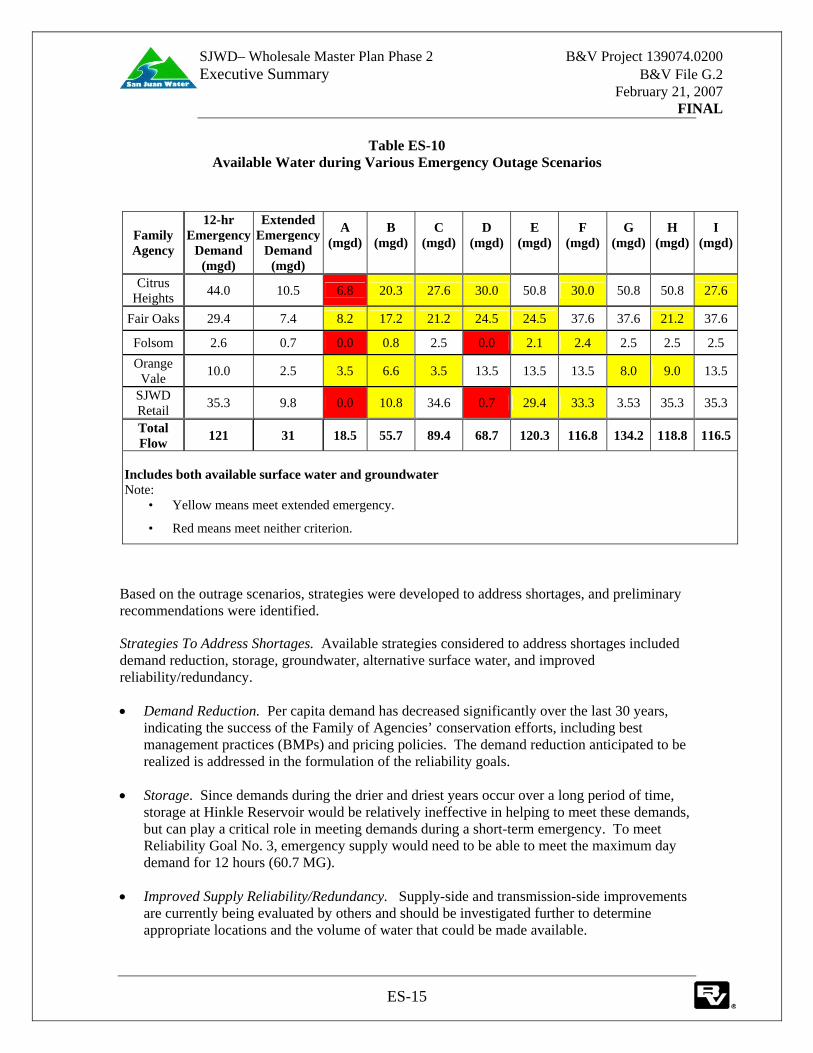
As shown in Table ES-10, water available varies by outage scenario.
SJWD– Wholesale Master Plan Phase 2 B&V Project 139074.0200 Executive Summary B&V File G.2 February 21, 2007 FINAL
ES-15
Table ES-10 Available Water during Various Emergency Outage Scenarios
Family Agency
12-hr Emergency
Demand (mgd)
Extended Emergency
Demand (mgd)
A (mgd)
B (mgd)
C (mgd)
D (mgd)
E (mgd)
F (mgd)
G (mgd)
H (mgd)
I (mgd)
Citrus Heights 44.0 10.5 6.8 20.3 27.6 30.0 50.8 30.0 50.8 50.8 27.6
Fair Oaks 29.4 7.4 8.2 17.2 21.2 24.5 24.5 37.6 37.6 21.2 37.6
Folsom 2.6 0.7 0.0 0.8 2.5 0.0 2.1 2.4 2.5 2.5 2.5 Orange
Vale 10.0 2.5 3.5 6.6 3.5 13.5 13.5 13.5 8.0 9.0 13.5
SJWD Retail 35.3 9.8 0.0 10.8 34.6 0.7 29.4 33.3 3.53 35.3 35.3
Total Flow 121 31 18.5 55.7 89.4 68.7 120.3 116.8 134.2 118.8 116.5
Includes both available surface water and groundwater Note:
• Yellow means meet extended emergency.
• Red means meet neither criterion.
Based on the outrage scenarios, strategies were developed to address shortages, and preliminary recommendations were identified.
Strategies To Address Shortages. Available strategies considered to address shortages included demand reduction, storage, groundwater, alternative surface water, and improved reliability/redundancy.
• Demand Reduction. Per capita demand has decreased significantly over the last 30 years, indicating the success of the Family of Agencies’ conservation efforts, including best management practices (BMPs) and pricing policies. The demand reduction anticipated to be realized is addressed in the formulation of the reliability goals.
• Storage. Since demands during the drier and driest years occur over a long period of time, storage at Hinkle Reservoir would be relatively ineffective in helping to meet these demands, but can play a critical role in meeting demands during a short-term emergency. To meet Reliability Goal No. 3, emergency supply would need to be able to meet the maximum day demand for 12 hours (60.7 MG).
• Improved Supply Reliability/Redundancy. Supply-side and transmission-side improvements are currently being evaluated by others and should be investigated further to determine appropriate locations and the volume of water that could be made available.

SJWD– Wholesale Master Plan Phase 2 B&V Project 139074.0200 Executive Summary B&V File G.2 February 21, 2007 FINAL
ES-16
Preliminary Recommendations. Based on the reliability goals established by the General Managers of the Family of Agencies, the following conclusions and recommendations were developed in TM4:
• Drier and Driest Years. No additional groundwater or storage is required to meet demands during Drier and Driest years.
• 12-HourEmergency. To meet the goal of providing water sufficient to supply the max day demand for 12 hours, 38 MG of storage or 103 mgd of groundwater is required. However, the storage is only usable if the location is downstream of the outage point. The additional groundwater is only usable with pump back provisions if the outages are upstream of the connection.
• Extended Emergency. Additional storage would be ineffective in meeting an extended emergency outage. To meet extended emergency demands, 12 mgd of additional groundwater would be required. However, as in the case with the 12-hour emergency storage, the groundwater is only usable with some pump back provisions and if the outages are upstream of the connection.
• Additional Activities. Several other actions would help enhance the system: (1) maintain current groundwater supplies by periodically testing the wells to confirm capacity, routine maintenance, and well redevelopment, if necessary, (2) install wells currently proposed by Family Members, and (3) investigate the potential for additional inter-ties with surrounding utilities and between the Family of Agencies.
• Recommendations. It is recommended that a minimum of 12 mgd of additional groundwater and 32 MG of storage be added to the system (3 tanks at 11 MG each) and 3 pumping stations (one pump station for each tank).
OPINIONS OF COST AND IMPLEMENTATION SCHEDULE FOR RECOMMENDED IMPROVEMENTS (TM5)
TM 5 developed conceptual-level storage, pumping, and well facilities required to fulfill the demand reduction strategies in TM4 and provided a preliminary opinion of probable cost and improvements schedule. Tables ES-11, ES-12 and ES-13 present, respectively, a summary of proposed facilities, preliminary costs, and preliminary schedule.
Table ES-11
Summary of Conceptual Level Facilities
Facilities Description Comments Storage (Total 33 MG)
3 tanks @ 11 MG Three tanks provide increased reliability/redundancy, compatibility with developed areas, and greater choice of tank type.
Pumping (Total 66 mgd)
3 @ 22 mgd Pumping stations will meet emergency requirements for customers at higher elevations and will allow for turnover of tank volume to optimize water quality.
Groundwater Wells (Total 12 mgd)
12 @ 1 mgd The wells would be tied to existing mains to allow water to be available throughout the regional system.

SJWD– Wholesale Master Plan Phase 2 B&V Project 139074.0200 Executive Summary B&V File G.2 February 21, 2007 FINAL
ES-17
Table ES-12 Summary of Opinion of Probable Project Cost
Facilities Unit Cost Rounded Cost Tanks (3 @ 11 MG) $ 9,600,000 $ 28,800,000 Pumping (3 @ 22 mgd) $ 6,000,000 $ 18,000,000 Groundwater Wells (12 @ 1 mgd) $ 2,000,000 $ 24,000,000 Property Acquisitions (12 Acres) $ 300,000 $ 3,600,000 Subtotal Net Construction $ 74,400,000 Engineering Contingency 30% $ 22,300,000 Engineering, Legal, and Administration 25% $ 24,200,000 Total Project Cost $ 120,900,000
Table ES-13 Schedule of Recommended Improvements
Facilities Current Need 2013 2021 Total Storage
3 @ 11 MG
----- ----- 33 MG
Pumping
3 @ 22 mgd ----- ----- 66 mgd
Groundwater Wells
10 @ 1 mgd 1 @ 1 mgd 1 @ 1 mgd 12 mgd

BLACK & VEATCH TECHNICAL MEMORANDUM NO. 1 SUPPLEMENT
TM1 Supplement - 1
SJWD–Wholesale Master Plan Phase II B&V Project 139074.0200 Historical and Projected Demand B&V File G.2 Level of Service December 15, 2006
FINAL
Technical Memorandum (TM) No. 1 was finalized on April 29, 2005. During the preparation of TM No. 4, the Family of Agencies provided additional data. The following tables and figures from TM No. 1 were updated based on this additional data provided by the Family of Agencies as of September 21, 2006. Changes are highlighted in the tables.
Table 1 - 1: Summary of Projected Average Demand (acre-ft / year)
Year Citrus Heights
Fair Oaks Folsom Orange
Vale SJWD Retail
Total Demand
2005 20,036 14,611 1,382 4,982 18,691 59,702
2010 23,108 15,525 1,413 5,205 19,196 64,447
2015 23,258 16,438 1,413 5,381 19,700 66,190
2020 23,527 16,438 1,413 5,511 20,204 67,093
2025 23,577 16,438 1,413 5,592 20,708 67,728
2030 23,577 16,438 1,413 5,624 21,970 69,022
Table 1 - 2: 2030 Driest Year Analysis
Family Agency Demand (afa)
Surface Water (afa)
Supplemental Need (afa)
Groundwater Available
(afa)
SJWD Retail 21,970 13,525 7,183 0
Citrus Heights 23,577 18,332 5,245 5,807
Fair Oaks 16,438 13,781 2,657 6,766
Folsom 1,413 1,063 350 0
Orange Vale 5,624 4,150 1,474 2,942
TOTAL 69,022 50,851 16,909 15,515

SJWD– Wholesale Master Plan Phase II B&V Project 139074.0200 Historical and Projected Demand B&V File G.2 Level of Service December 15, 2006
FINAL
TM1 Supplement - 2
Figure 1 - 1: Total Demand Projections for SJWD Family Agencies

SJWD– Wholesale Master Plan Phase II B&V Project 139074.0200 Historical and Projected Demand B&V File G.2 Level of Service December 15, 2006
FINAL
TM1 Supplement - 3
Table 1 - 3: Groundwater Wells
Family Agency Well Name Energy
Source Existing or Proposed
Year Built
Well Capacity (gpm)
Citrus Heights Sunrise (10) SMUD Existing 1991 900
Palm Ave (1A) SMUD Existing 1991 1,400
Sylvan (8) SMUD, diesel Existing 1991 1,600
Mitchell Farms (12) SMUD Proposed 2006 900
Skycrest School SMUD Proposed 2007 1,200
Subtotal 6,000
Fair Oaks Chicago SMUD Existing 1947 581
New York SMUD Existing 1972 830
Casabella SMUD Existing 1953 850
Park SMUD Existing 1990 1,090
Northridge SMUD Existing 1992 940
Town SMUD Proposed 2006 1,500
Heather SMUD Proposed 2007 1,200
Subtotal 6,991
Orange Vale Well #1 Diesel Existing 1977 1,200
Well #2 Electric Existing 1991 996
Well #3 Proposed 1,040
Subtotal 3,040
TOTAL 16,031
TM1-1
BLACK & VEATCH TECHNICAL MEMORANDUM NO. 1
SJWD–Wholesale Master Plan Phase II B&V Project 139074.0200 Historical and Projected Demand B&V File G.2 Level of Service April 29, 2005
Final
To: Keith Durkin
Prepared By: Jay Hesby Willard Pack Christina Hartinger Melissa Blanton Reviewed By: Jim English PURPOSE
San Juan Water District (SJWD or District) is developing the Wholesale Master Plan Phase 2 (WMPP2) as a follow-on to the Water Forum and Regional Water Master Plan, to assess the District’s storage and transmission as related to the Family of Agencies (Citrus Heights Water District, Fair Oaks, the Ashland area of the City of Folsom, Orange Vale Water Company, and San Juan Water District Retail)and to develop a water supply plan for the Family of Agencies within the context of the regional planning efforts. Figure 1-1 presents the District’s service area.
The four project objectives of WMPP2 are as follows:
Determine demands/level of service
Plan for normal operations
Plan for reduced water operations
Allocate costs
This technical memorandum (TM) presents historical and projected demands and levels of service for the four Family Agencies. The information will be used in determining system treatment, storage, and delivery requirements.

SJWD– Wholesale Master Plan Phase II B&V Project 139074.0200 Historical and Projected Demand B&V File G.2 Level of Service April 29, 2005 Final
TM1-2
Figure 1 - 1: San Juan Water District Service Area

SJWD– Wholesale Master Plan Phase II B&V Project 139074.0200 Historical and Projected Demand B&V File G.2 Level of Service April 29, 2005 Final
TM1-3
HISTORICAL AND PROJECTED DEMAND EVALUATION
The historical and projected demand evaluations for the Family Agencies are presented in the tables and figures attached as an appendix to this TM. The information is summarized in Table 1 - 1 below and discussed in more detail in the paragraphs that follow.
Table 1 - 1: Summary of Historical and Projected Demand Evaluation
Appellation Title(s) Description For Each Agency Per Capita Projections Graph
(One set of information for SJWD Retail and one for each of the four Family Agencies.) Analysis of historical per capita demand Historical and projected population and total annual demands Historical and various annual demand projections
Population-Demand Population and demand data for all agencies, including SJWD Retail demand (developed by others)
Wholesale Demand Chart Historical and projected demands for each agency, including SJWD Retail demand, and the total of all demands
Dry Years An approach to surface water and groundwater use for driest years
Demand Type Historical groundwater/surface water use and a projection for normal/average year use
Peak Values Factors used by each agency to estimate maximum day and peak hour demands
2005 Comparison Comparison of previous 2005 population projections and current estimated population in each agency
Demand Projections
Demand projections, through the Plan Year of 2030, were based on population projections and estimated per capita use (gallons per capita per day). In general, population projections were obtained from each agency and verified against Sacramento Area Council of Governments (SACOG) projections where possible. Population projections are presented in Table 1 - 2.
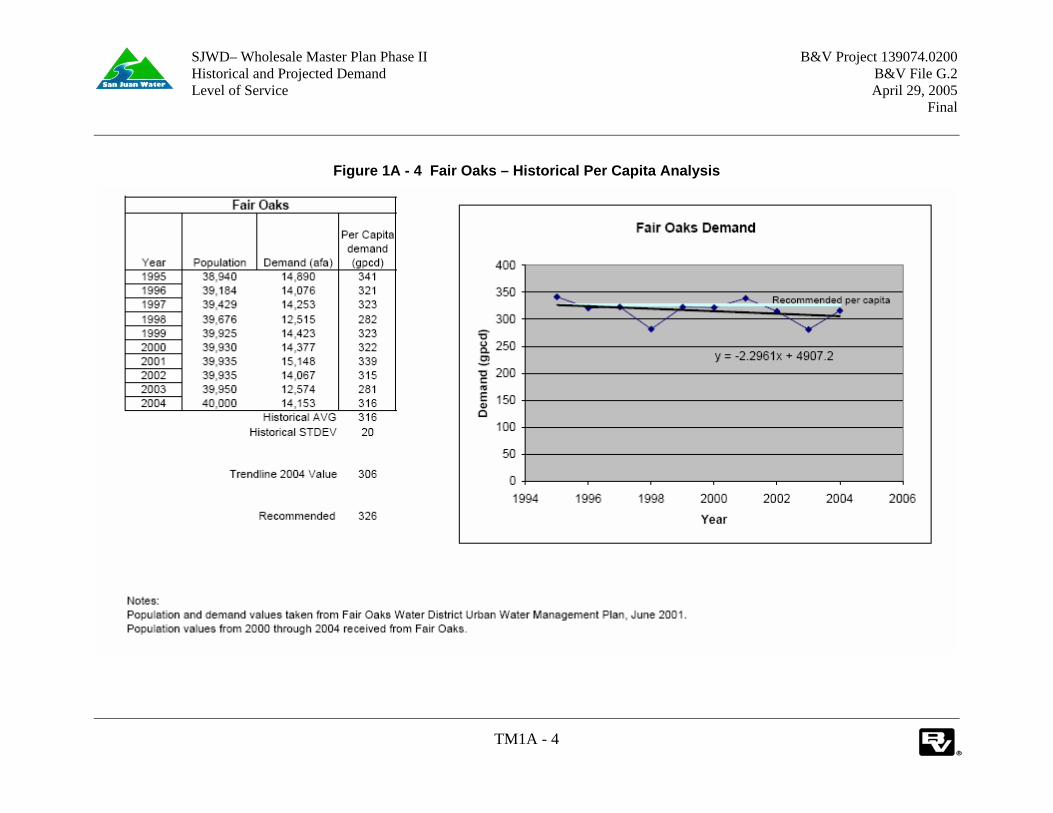
Per capita demand has decreased significantly over the last thirty years due to conservation efforts including routine use of low water-use fixtures and increased consumer awareness. As shown in the Per Capita analysis, historical total demand (surface water plus groundwater) and population figures were used to determine historical per capita use. Future per capita demand was determined by projecting the historical trend line to 2005 and adding one standard deviation. This approach provides a reasonable projection of water demand, i.e. a projection that captures many of the higher demand years without being overly conservative. In addition, historical per capita use, the trend line, and the recommended per capita use are developed and included in the

SJWD– Wholesale Master Plan Phase II B&V Project 139074.0200 Historical and Projected Demand B&V File G.2 Level of Service April 29, 2005 Final
TM1-4
appendix. A summary of the per capita demand for each of the member agencies is presented in Table 1 - 3.
Table 1 - 2: Population Projections
Year Citrus Heights Fair Oaks Folsom Orange
Vale SJWD Retail
Total Population
2005 66,943 40,000 5,516 17,738 29,007 159,204
2010 68,753 42,500 5,638 18,531 29,790 165,212 2015 69,200 45,000 5,638 19,161 30,572 169,571
2020 70,000 45,000 5,638 19,623 31,355 171,616
2025 70,148 45,000 5,638 19,911 32,137 172,834
2030 70,148 45,000 5,638 20,023 32,137 172,946
Table 1 - 3: Per Capita Demand for Family Agencies (gpcd)
Family Agency Per Capita Demand Citrus Heights 300
Fair Oaks 326
Folsom 224 Orange Vale 251
SJWD Retail 575
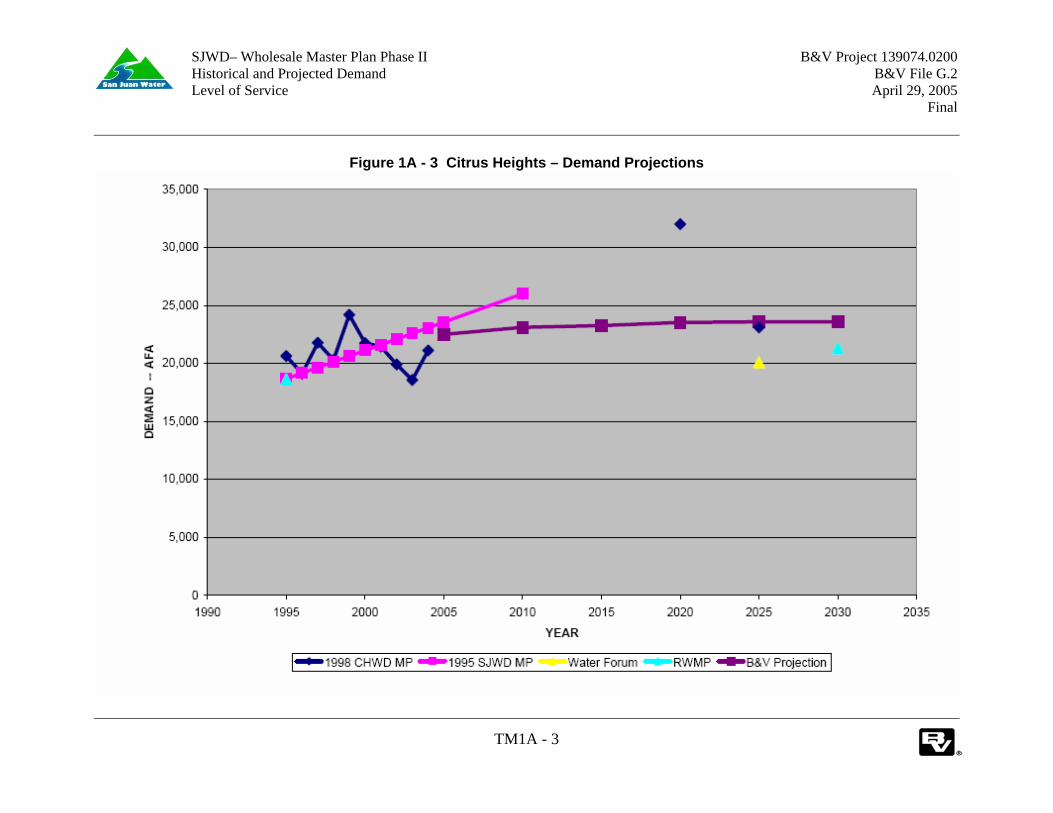
TOTAL 1,676 For each agency’s projection analysis, the historical demand, previous demand projections, and the demand projections determined from the approach described above are presented in the appendix. Previous demand projections include those contained in the agency previous master plans, or similar documents, projections from the 2005 SJWD Retail Water Master Plan Update, the 2000 Water Forum, and the 2003 Regional Water Master Plan. The service areas are all approaching a level of full development so it is expected that population growth will be at a moderate pace and that demand will grow at a moderate rate due to conservation measures and implementation of best management practices (BMPs). Projected average demand for each of the member agencies through the planning period is summarized in Table 1 - 4.

SJWD– Wholesale Master Plan Phase II B&V Project 139074.0200 Historical and Projected Demand B&V File G.2 Level of Service April 29, 2005 Final
TM1-5
Table 1 - 4: Summary of Projected Average Demand (acre-ft / year)
Year Citrus Heights
Fair Oaks Folsom Orange
Vale SJWD Retail
Total Demand
2005 22,500 14,611 1,382 4,982 18,691 62,166
2010 23,108 15,525 1,413 5,205 19,196 64,447
2015 23,258 16,438 1,413 5,381 19,700 66,190 2020 23,527 16,438 1,413 5,511 20,204 67,093
2025 23,577 16,438 1,413 5,592 20,708 67,728
2030 23,577 16,438 1,413 5,624 20,708 67,760 The historical and projected demands are presented graphically on Figure 1 - 2. The moderate projected growth in demand is readily apparent on the figure.
Peaking factors applied to the average flows yield maximum day and peak hour flows were then used to analyze the system for its ability to transmit the necessary flows. The peaking factors used in our analysis and the associated 2030 flows are presented in Table 1 - 5. The maximum day peaking factors are close to 2.0, and the peak hour factors range from 2.9 to 3.6.
Table 1 - 5: Peaking Factors and Associated 2030 Flows (mgd)
Family Agency Max Day Factor
Peak Hour Factor
Max Day Flow
Peak Hour Flow
Citrus Heights 2.1 2.9 44.0 61.1
Fair Oaks 2.0 3.0 29.4 44.0
Folsom 2.0 3.6 2.5 4.5 Orange Vale 2.0 3.6 10.1 18.1
SJWD Retail 1.8 3.1 35.3 60.8
Total Flow 121.3 188.5

SJWD– Wholesale Master Plan Phase II B&V Project 139074.0200 Historical and Projected Demand B&V File G.2 Level of Service April 29, 2005 Final
TM1-6
Figure 1 - 2: Total Demand Projections for SJWD Family Agencies

SJWD– Wholesale Master Plan Phase II B&V Project 139074.0200 Historical and Projected Demand B&V File G.2 Level of Service April 29, 2005 Final
TM1-7
Demand Type Breakdown
For each agency’s demand type analysis, demand information from the agencies and from the District for surface water as well as groundwater is included in the appendix. Generally, for surface water, the District numbers were used to verify the agency data.
Orange Vale’s surface water demand values were used since they were close to the District values, as were the values from Fair Oaks. Folsom surface water demand data was not available except from the District so the values used come from District meter readings. For Citrus Heights, the two data sets were less consistent, and the District data for surface water was used since it showed generally higher demand and would provide for a more conservative projection.
The City of Folsom does not use groundwater wells in the Ashland area, which is served by the District’s wholesale system. Orange Vale only uses groundwater for emergencies, reducing its groundwater demand essentially to zero. It is understood that Orange Vale does not have the ability to chlorinate its groundwater supply. Citrus Heights uses groundwater only occasionally to meet peaking demands. Fair Oaks uses some groundwater on a regular basis -- mostly to meet peak demands.
Dry Year Use
Dry year use is important to the WMPP2 effort because, under the Water Forum Agreement, surface water diversion during dry years will be reduced. There is a “ramp down” function from normal years when surface water diversions up to the District’s allocation will be allowed, to the driest years, when diversions must be ramped down to not exceed the 1995 baseline.
For the Dry Year analysis, an analysis of the driest year is included in the appendix. In this analysis, it was assumed that total system demand for each agency would remain the same as for normal years, which is consistent with the Regional Water Master Plan. As mentioned above, the surface water supplied would equal that received by each agency in 1995. Using the projected demand and the 1995 surface water demand, the demand on supplemental supply, namely groundwater, was estimated. This demand was then be compared to the groundwater availability for each agency.
The groundwater availability was estimated from installed well capacity, which was derated to 80 percent to account for mechanical outages and under-performing wells. In addition, because a “Dry Year” would not be declared until March, increased groundwater production would only occur for 9 months, and production on an annual basis would be only 75 percent of the derated capacity. Table 1 - 6 presents the analysis of a driest year in terms of supply and demand in 2030.
Some of the groundwater wells listed as being in service have never been fully tested to understand their ability to withstand the demand of a driest year period. One of the wells in

SJWD– Wholesale Master Plan Phase II B&V Project 139074.0200 Historical and Projected Demand B&V File G.2 Level of Service April 29, 2005 Final
TM1-8
Orange Vale runs on diesel fuel, which may be a limiting factor in the event of an extended dry period, possibly reducing its available groundwater supply.
Table 1 - 6: 2030 Driest Year Analysis
Family Agency Demand (afa)
Surface Water (afa)
Supplemental Need (afa)
Groundwater Available
(afa) SJWD Retail 20,708 13,525 7,183 0
Citrus Heights 23,577 18,332 5,245 3,774
Fair Oaks 16,438 13,781 2,657 8,807
Folsom 1,413 1,063 350 0 Orange Vale 5,624 4,150 1,474 3,383
TOTAL 67,760 50,851 16,909 15,964
Presented in Table 1 - 7 are the various existing and proposed groundwater wells within the family agencies’ service areas. Included in the table are the well name, capacity, energy source, and year constructed.

SJWD– Wholesale Master Plan Phase II B&V Project 139074.0200 Historical and Projected Demand B&V File G.2 Level of Service April 29, 2005 Final
TM1-9
Table 1 - 7: Groundwater Wells
Family Agency Well Name Energy Source
Existing or Proposed
Year Built
Well Capacity (gpm)
Citrus Heights Sunrise SMUD Existing 1991 900
Palm Ave (1A) SMUD Existing 1991 1,500
Sylvan (8) SMUD, diesel Existing 1991 1,500 Metro Farms (12) SMUD Proposed 2005 900
Subtotal 4,800 Fair Oaks Town Existing 1,500
Chicago Existing 1,000
Heather Existing 1,500
New York Existing 1,500 Casabella Existing 1,500
Park Existing 1,500
Well 7 Existing 1,500
Well 9 Proposed 1,500 Subtotal 13,000
Orange Vale Well #1 Diesel Existing 1977 2,500
Well #2 electric Existing 1991 996 Subtotal 3,496
TOTAL 21,296
LEVELS OF SERVICE
Discussions were conducted with each of the member agencies to determine the desired level of service from the District. Citrus Heights, Folsom, and Orange Vale all desire to have their water demands met by surface water in the future. Citrus Heights and Orange Vale will use groundwater to supplement the surface water in drier years and during peak flow conditions. Folsom and SJWD Retail do not have groundwater available and so will rely on surface water to meet all needs.
Fair Oaks has expressed a desire to have approximately seventy percent of its demand met by surface water and will meet the remaining demand with groundwater. This represents a shift in water management for the service area from a strong reliance on surface water to an increase in reliance on groundwater. This shift will reduce the demand load on the surface water system,

SJWD– Wholesale Master Plan Phase II B&V Project 139074.0200 Historical and Projected Demand B&V File G.2 Level of Service April 29, 2005 Final
TM1-10
making more water available to the other members of the Family of Agencies. Table 1 - 8 summarizes the level of service desired by the Family Agencies.
Table 1 - 8: Percent of Annual Average Demand Met Through Surface Water
Family Agency Percent of Annual Average Demand Met Through Surface Water (1)
Citrus Heights 95
Fair Oaks 70 Folsom 100
Orange Vale 100
SJWD Retail 100
Note: 1. Percent of maximum day and peak hour demands met through surface water is presented and discussed
in TM 2. PRELIMINARY CONCLUSIONS
From the information developed during the historical and projected demands evaluation, the following preliminary conclusions can be drawn:
The area has reached a high level (90 percent +/-) of full development, and future increase in water demand is estimated at approximately 10 percent.
Water use on a per capita basis has declined over the long term, from 450-500 gallons per capita per day in the 1960’s to 300 +/- gpcd.
These demand projections are mostly consistent with similar projections developed in the Regional Master Plan and through the Water Forum process.
Recent historical use of groundwater has been minimal. This would be consistent with policies developed through the Regional Master Plan and Water Forum Process to maximize surface water use under normal and wet years and reserve groundwater supplies for use during dry years.
Citrus Heights, Folsom, Orange Vale, and SJWD Retail will continue to service their demand primarily through surface water and Fair Oaks will meet approximately 70 percent of their demand with surface water, using groundwater to satisfy the remaining demand.

SJWD– Wholesale Master Plan Phase II B&V Project 139074.0200 Historical and Projected Demand B&V File G.2 Level of Service April 29, 2005 Final
TM1-Appendix
APPENDIX
HISTORICAL AND PROJECTED DEMAND ANALYSIS
The analysis is presented in the following figures:
Figure 1A - 1 Citrus Heights – Historical Per Capita Analysis ..................................................... 1
Figure 1A - 2 Citrus Heights – Historical and Projection Comparisons........................................ 2
Figure 1A - 3 Citrus Heights – Demand Projections ..................................................................... 3
Figure 1A - 4 Fair Oaks – Historical Per Capita Analysis............................................................. 4
Figure 1A - 5 Fair Oaks – Historical and Projection Comparisons ............................................... 5
Figure 1A - 6 Fair Oaks – Demand Projections............................................................................. 6
Figure 1A - 7 Folsom – Ashland Service Area – Historical Per Capita Analysis ......................... 7
Figure 1A - 8 Folsom – Ashland Service Area – Historical and Projection Comparisons............ 8
Figure 1A - 9 Folsom – Ashland Service Area – Demand Projections ......................................... 9
Figure 1A - 10 Orange Vale – Historical Per Capita Analysis .................................................... 10
Figure 1A - 11 Orange Vale – Historical and Projection Comparisons ...................................... 11
Figure 1A - 12 Orange Vale – Demand Projections .................................................................... 12
Figure 1A - 13 SJWD Retail – Historical Per Capita Analysis ................................................... 13
Figure 1A - 14 SJWD Retail – Historical and Projection Comparisons...................................... 14
Figure 1A - 15 SJWD Retail – Demand Projections ................................................................... 15
Figure 1A - 16 Population and Water Demand Projections ........................................................ 16
Figure 1A - 17 SJWD Family Agencies Total Demand Projections ........................................... 17
Figure 1A - 18 Populations and Water Demand Projections – Dry and Driest Year Scenarios.. 18
Figure 1A - 19 SJWD Family Agencies Surface and Groundwater Projections ......................... 19
Figure 1A - 20 Peaking Values.................................................................................................... 20
Figure 1A - 21 2005 Population Comparison .............................................................................. 21

SJWD– Wholesale Master Plan Phase II B&V Project 139074.0200 Historical and Projected Demand B&V File G.2 Level of Service April 29, 2005 Final
TM1A - 1
Figure 1A - 1 Citrus Heights – Historical Per Capita Analysis

SJWD– Wholesale Master Plan Phase II B&V Project 139074.0200 Historical and Projected Demand B&V File G.2 Level of Service April 29, 2005 Final
TM1A - 2
Figure 1A - 2 Citrus Heights – Historical and Projection Comparisons
SJWD– Wholesale Master Plan Phase II B&V Project 139074.0200 Historical and Projected Demand B&V File G.2 Level of Service April 29, 2005 Final
TM1A - 3
Figure 1A - 3 Citrus Heights – Demand Projections
SJWD– Wholesale Master Plan Phase II B&V Project 139074.0200 Historical and Projected Demand B&V File G.2 Level of Service April 29, 2005 Final
TM1A - 4
Figure 1A - 4 Fair Oaks – Historical Per Capita Analysis

SJWD– Wholesale Master Plan Phase II B&V Project 139074.0200 Historical and Projected Demand B&V File G.2 Level of Service April 29, 2005 Final
TM1A - 5
Figure 1A - 5 Fair Oaks – Historical and Projection Comparisons

SJWD– Wholesale Master Plan Phase II B&V Project 139074.0200 Historical and Projected Demand B&V File G.2 Level of Service April 29, 2005 Final
TM1A - 6
Figure 1A - 6 Fair Oaks – Demand Projections

SJWD– Wholesale Master Plan Phase II B&V Project 139074.0200 Historical and Projected Demand B&V File G.2 Level of Service April 29, 2005 Final
TM1A - 7
Figure 1A - 7 Folsom – Ashland Service Area – Historical Per Capita Analysis

SJWD– Wholesale Master Plan Phase II B&V Project 139074.0200 Historical and Projected Demand B&V File G.2 Level of Service April 29, 2005 Final
TM1A - 8
Figure 1A - 8 Folsom – Ashland Service Area – Historical and Projection Comparisons

SJWD– Wholesale Master Plan Phase II B&V Project 139074.0200 Historical and Projected Demand B&V File G.2 Level of Service April 29, 2005 Final
TM1A - 9
Figure 1A - 9 Folsom – Ashland Service Area – Demand Projections

SJWD– Wholesale Master Plan Phase II B&V Project 139074.0200 Historical and Projected Demand B&V File G.2 Level of Service April 29, 2005 Final
TM1A - 10
Figure 1A - 10 Orange Vale – Historical Per Capita Analysis
SJWD– Wholesale Master Plan Phase II B&V Project 139074.0200 Historical and Projected Demand B&V File G.2 Level of Service April 29, 2005 Final
TM1A - 11
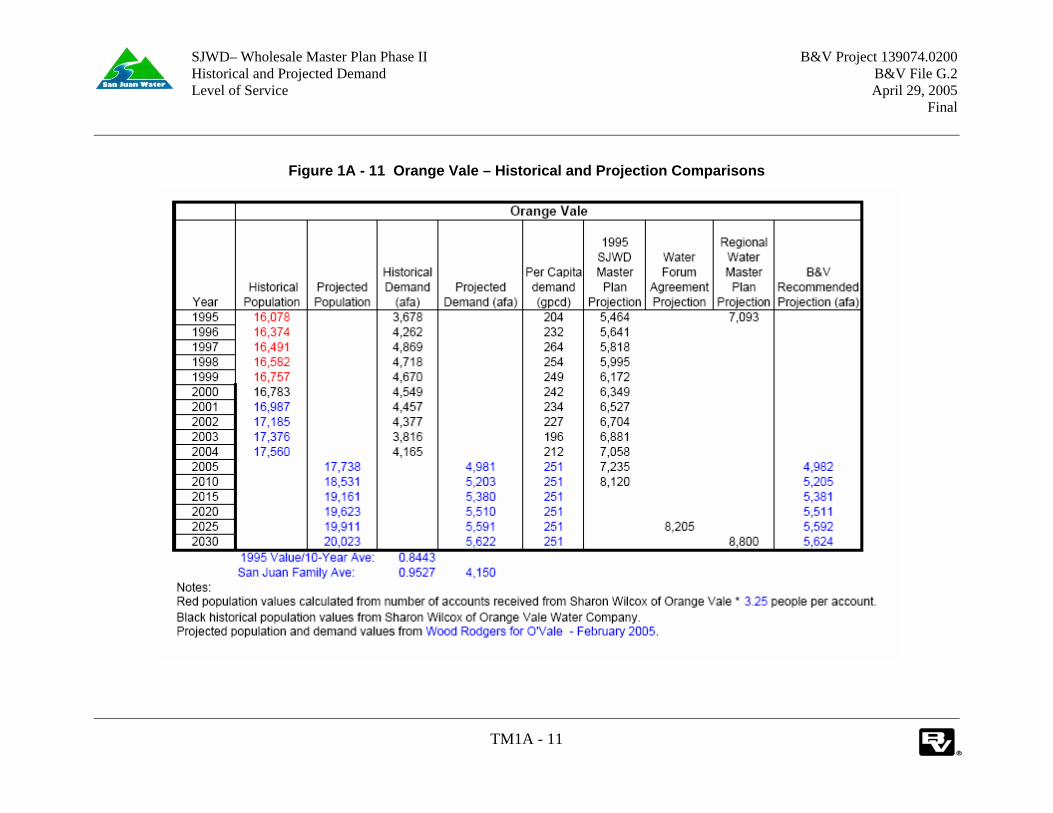
Figure 1A - 11 Orange Vale – Historical and Projection Comparisons

SJWD– Wholesale Master Plan Phase II B&V Project 139074.0200 Historical and Projected Demand B&V File G.2 Level of Service April 29, 2005 Final
TM1A - 12
Figure 1A - 12 Orange Vale – Demand Projections
SJWD– Wholesale Master Plan Phase II B&V Project 139074.0200 Historical and Projected Demand B&V File G.2 Level of Service April 29, 2005 Final
TM1A - 13
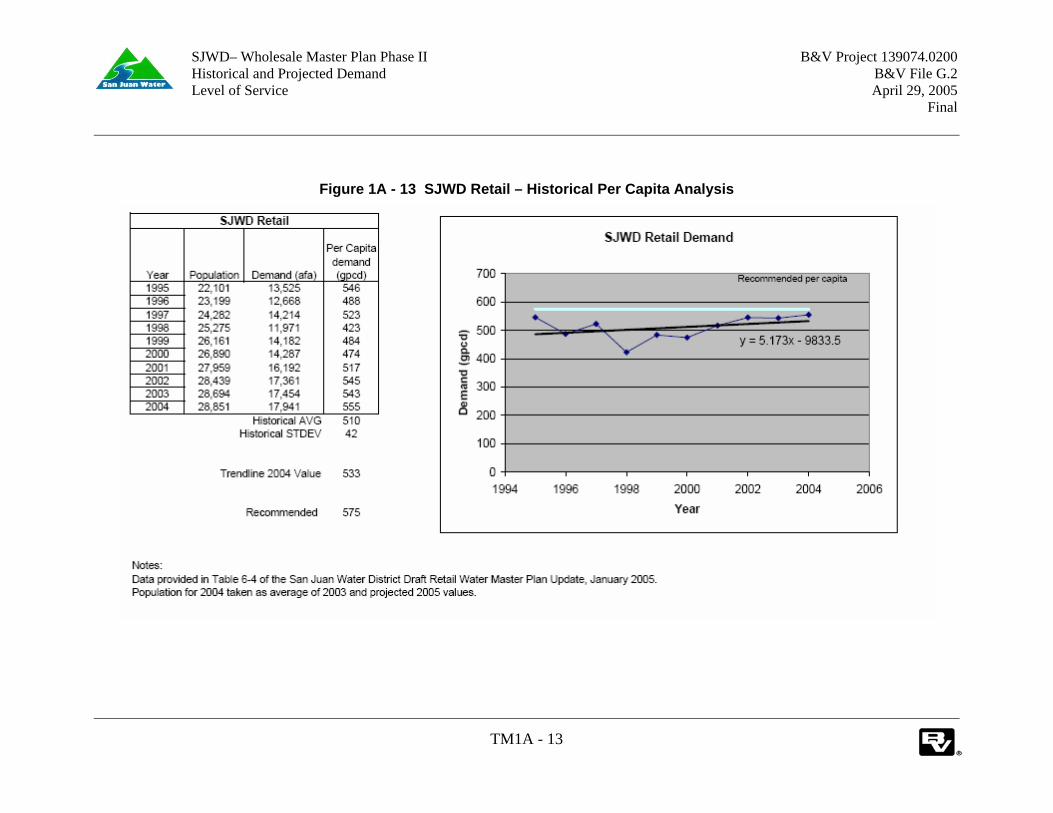
Figure 1A - 13 SJWD Retail – Historical Per Capita Analysis

SJWD– Wholesale Master Plan Phase II B&V Project 139074.0200 Historical and Projected Demand B&V File G.2 Level of Service April 29, 2005 Final
TM1A - 14
Figure 1A - 14 SJWD Retail – Historical and Projection Comparisons
SJWD– Wholesale Master Plan Phase II B&V Project 139074.0200 Historical and Projected Demand B&V File G.2 Level of Service April 29, 2005 Final
TM1A - 15
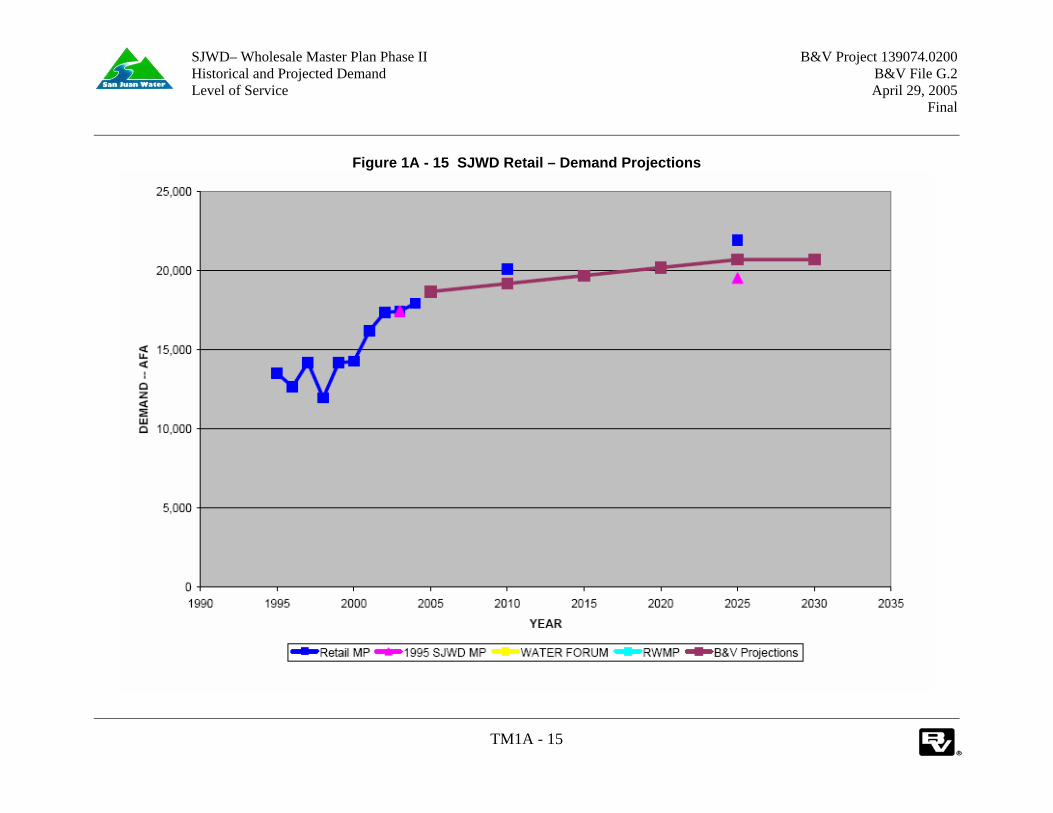
Figure 1A - 15 SJWD Retail – Demand Projections

SJWD– Wholesale Master Plan Phase II B&V Project 139074.0200 Historical and Projected Demand B&V File G.2 Level of Service April 29, 2005 Final
TM1A - 16
Figure 1A - 16 Population and Water Demand Projections

SJWD– Wholesale Master Plan Phase II B&V Project 139074.0200 Historical and Projected Demand B&V File G.2 Level of Service April 29, 2005 Final
TM1A - 17
Figure 1A - 17 SJWD Family Agencies Total Demand Projections

SJWD– Wholesale Master Plan Phase II B&V Project 139074.0200 Historical and Projected Demand B&V File G.2 Level of Service April 29, 2005 Final
TM1A - 18
Figure 1A - 18 Populations and Water Demand Projections – Dry and Driest Year Scenarios

SJWD– Wholesale Master Plan Phase II B&V Project 139074.0200 Historical and Projected Demand B&V File G.2 Level of Service April 29, 2005 Final
TM1A - 19
Figure 1A - 19 SJWD Family Agencies Surface and Groundwater Projections

SJWD– Wholesale Master Plan Phase II B&V Project 139074.0200 Historical and Projected Demand B&V File G.2 Level of Service April 29, 2005 Final
TM1A - 20
Figure 1A - 20 Peaking Values

SJWD– Wholesale Master Plan Phase II B&V Project 139074.0200 Historical and Projected Demand B&V File G.2 Level of Service April 29, 2005 Final
TM1A - 21
Figure 1A - 21 2005 Population Comparison
BLACK & VEATCH TECHNICAL MEMORANDUM NO. 2
TM2-1
SJWD–Wholesale Master Plan Phase II B&V Project 139074.0200 Water Storage and Transmission System Analysis B&V File G.2 September 8, 2005
FINAL
To: Keith Durkin
Prepared By: Jay Hesby Willard Pack Christina Hartinger Melissa Blanton Reviewed By: Jim English SUMMARY AND PURPOSE
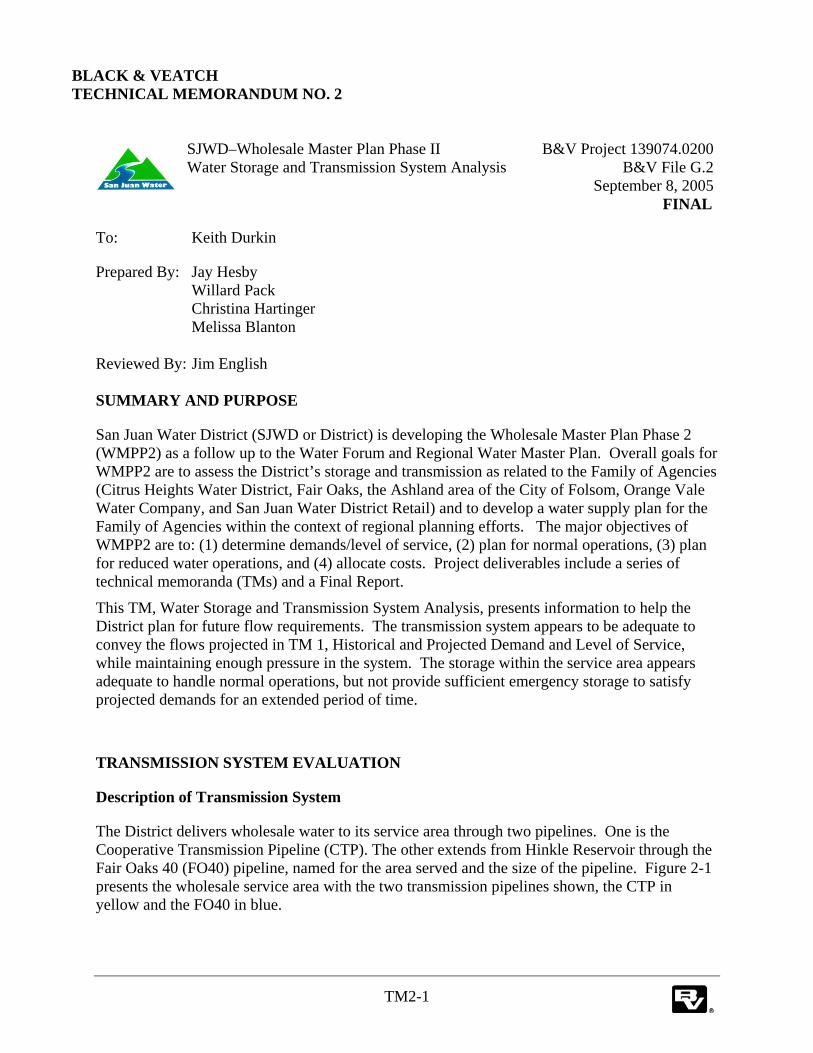
San Juan Water District (SJWD or District) is developing the Wholesale Master Plan Phase 2 (WMPP2) as a follow up to the Water Forum and Regional Water Master Plan. Overall goals for WMPP2 are to assess the District’s storage and transmission as related to the Family of Agencies (Citrus Heights Water District, Fair Oaks, the Ashland area of the City of Folsom, Orange Vale Water Company, and San Juan Water District Retail) and to develop a water supply plan for the Family of Agencies within the context of regional planning efforts. The major objectives of WMPP2 are to: (1) determine demands/level of service, (2) plan for normal operations, (3) plan for reduced water operations, and (4) allocate costs. Project deliverables include a series of technical memoranda (TMs) and a Final Report.
This TM, Water Storage and Transmission System Analysis, presents information to help the District plan for future flow requirements. The transmission system appears to be adequate to convey the flows projected in TM 1, Historical and Projected Demand and Level of Service, while maintaining enough pressure in the system. The storage within the service area appears adequate to handle normal operations, but not provide sufficient emergency storage to satisfy projected demands for an extended period of time.
TRANSMISSION SYSTEM EVALUATION
Description of Transmission System
The District delivers wholesale water to its service area through two pipelines. One is the Cooperative Transmission Pipeline (CTP). The other extends from Hinkle Reservoir through the Fair Oaks 40 (FO40) pipeline, named for the area served and the size of the pipeline. Figure 2-1 presents the wholesale service area with the two transmission pipelines shown, the CTP in yellow and the FO40 in blue.

SJWD– Wholesale Master Plan Phase II B&V Project 139074.0200 Water Storage and Transmission System Analysis B&V File G.2 September 8, 2005
FINAL
TM2-2
Figure 2 - 1 SJWD Wholesale Service Area
CTP
FO40
CTP
FO40

SJWD– Wholesale Master Plan Phase II B&V Project 139074.0200 Water Storage and Transmission System Analysis B&V File G.2 September 8, 2005
FINAL
TM2-3
The CTP is a distribution pipeline ranging from 78 inches to 39 inches in diameter. It extends approximately seven miles from Hinkle Reservoir to the points of connection with Orange Vale, Fair Oaks, Citrus Heights, and Sacramento Suburban Water District (SSWD). A figure and accompanying table showing interconnection and meter locations may be found in the Appendix: Figure 2A – 10 and Figure 2A - 11.
The CTP Agreement was entered into by the Family of Agencies to formulate a regional solution to their needs for surface water. The CTP itself is a direct result of the Agreement. The members of the Family of Agencies and the District helped fund the project. The members each purchased capacity within the pipeline by segment. When it was determined that the pipeline would handle extra capacity beyond that required by the member agencies, SSWD contributed to the cost of the project with the understanding that they would be able to use some of that extra capacity.
The operation of the system is such that the District does not have the ability to limit the amount of water to individual members of the Family of Agencies and SSWD. Flow meters with alarms are in place to monitor the flows to the members and to alert the District if a member agency withdraws more than contracted amounts from the system.
Projected Flows Used in the Evaluation
In TM No. 1, the historical and projected demands for the area serviced by the District were analyzed. It was determined that the Family of Agencies served by the District would require approximately 121.3 million gallons per day (mgd) in 2030 as a maximum day flow. The associated peak hour flow was calculated to be 188.5 mgd. Table 2 - 1 lists the projected max day and peak hour flows as well as the projected peak flows from Exhibit A of the CTP Agreement. The ratio of peak hour flow to maximum day flow was then calculated to be 1.55.
Exhibit A of the CTP Agreement lists flow for both the CTP as well as the other wholesale distribution piping. The flow listed in Table 2-1 represents the entire wholesale distribution system as shown in that exhibit.
Table 2 - 1 Projected Flow for Family of Agencies
Family Agency
Master Plan Projected Max Day Flows (mgd)
Master Plan Projected Peak hour Flows (mgd)
CTP Agreement Peak Flows (mgd)
Citrus Heights 44.0 61.1 52.9 Fair Oaks 29.4 44.0 36.1 Folsom 2.5 4.5 N/A
Orange Vale 10.1 18.1 21.7 SJWD Retail 35.3 60.8 52.2
Total 121.3 188.5 162.9

SJWD– Wholesale Master Plan Phase II B&V Project 139074.0200 Water Storage and Transmission System Analysis B&V File G.2 September 8, 2005
FINAL
TM2-4
It was originally assumed that SSWD would require approximately 59 mgd through the CTP, as was suggested they were entitled in the CTP Agreement. Adding that flow to the aforementioned max day and peak hour flows yields a maximum day flow of approximately 180 mgd and a peak hour flow of 247.5 mgd. However, it has been seen that the flow to SSWD has regular fluctuation and that a peaking factor would need to be applied to their projected flow as well. Applying the same peaking factor obtained from the projected 2030 flows for the Family of Agencies, namely 1.55, to a maximum day flow of 180 mgd, yields a peak hour flow of 279.7 mgd. Similarly, reducing the peak hour flow of 247.5 mgd by the same peaking factor yields a maximum day flow of 159.3 mgd. These flows are presented in Table 2 - 2.
Table 2 - 2 Projected Flow for Family of Agencies and SSWD
Family Agency
Projected Max Day without peaking SSWD (mgd)
Projected Peak Hour
without peaking SSWD (mgd)
Projected Max Day
with SSWD max day
at 59 (mgd)
Projected Peak Hour
with SSWD max day
at 59 (mgd)
Projected Max Day
with SSWD peak hour
at 59 (mgd)
Projected Peak Hour
with SSWD peak hour
at 59 (mgd)
Citrus Heights 44.0 61.1 44.0 61.1 44.0 61.1 Fair Oaks 29.4 44.0 29.4 44.0 29.4 44.0 Folsom 2.5 4.5 2.5 4.5 2.5 4.5
Orange Vale 10.1 18.1 10.1 18.1 10.1 18.1 SJWD Retail 35.3 60.8 35.3 60.8 35.3 60.8
SSWD 59.0 59.0 59.0 91.2 38.0 59.0 Total 180.3 247.5 180.3 279.7 159.3 247.5
Table 2 - 3 presents a comparison of the flows listed as entitlements to each member of the Family of Agencies in the CTP Agreement as well as the projected peak hour flows from the projections summarized in TM No.1. The master plan projected peak hour flows are generally more than the CTP Agreement flows. The differences range from -3.6 mgd to 8.6 mgd and -17 percent to 22 percent. The total flow difference amounts to 25.6 mgd or 12 percent. The master plan projected maximum day and peak hour flows as well as the CTP agreement flows were used in the evaluation of the transmission system.
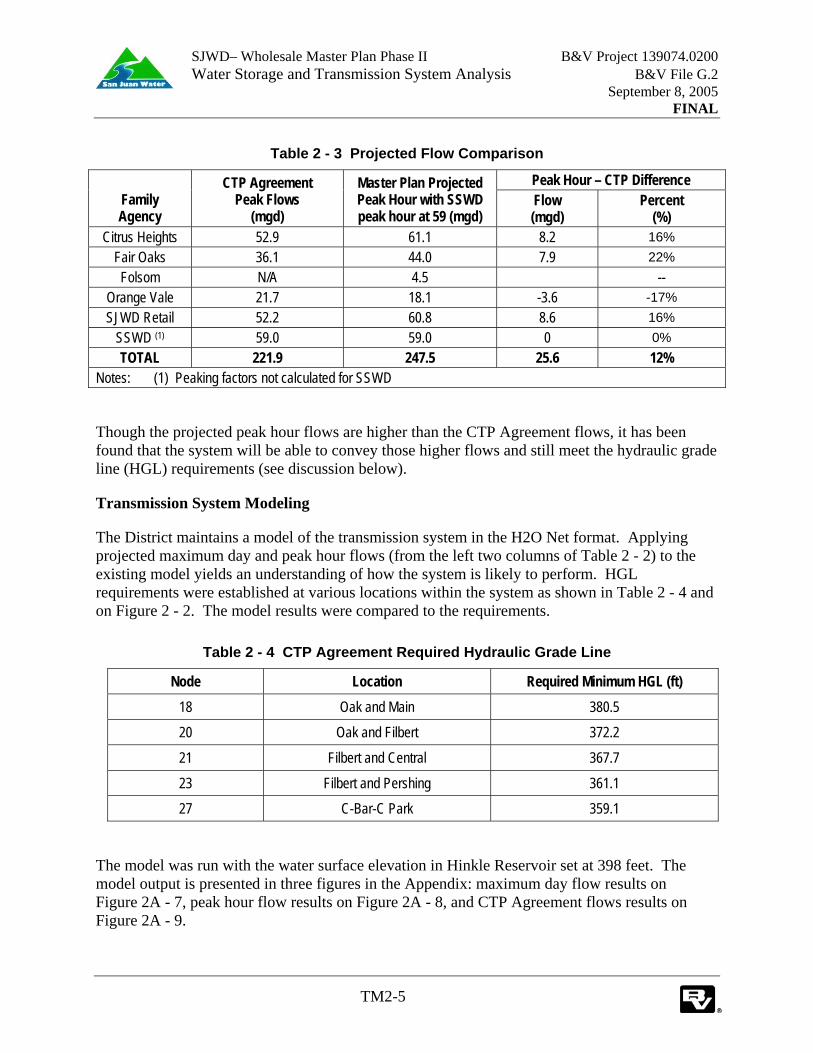
SJWD– Wholesale Master Plan Phase II B&V Project 139074.0200 Water Storage and Transmission System Analysis B&V File G.2 September 8, 2005
FINAL
TM2-5
Table 2 - 3 Projected Flow Comparison
Peak Hour – CTP Difference Family Agency
CTP Agreement Peak Flows
(mgd)
Master Plan Projected Peak Hour with SSWD peak hour at 59 (mgd)
Flow (mgd)
Percent (%)
Citrus Heights 52.9 61.1 8.2 16% Fair Oaks 36.1 44.0 7.9 22% Folsom N/A 4.5 --
Orange Vale 21.7 18.1 -3.6 -17% SJWD Retail 52.2 60.8 8.6 16%
SSWD (1) 59.0 59.0 0 0% TOTAL 221.9 247.5 25.6 12%
Notes: (1) Peaking factors not calculated for SSWD
Though the projected peak hour flows are higher than the CTP Agreement flows, it has been found that the system will be able to convey those higher flows and still meet the hydraulic grade line (HGL) requirements (see discussion below).
Transmission System Modeling
The District maintains a model of the transmission system in the H2O Net format. Applying projected maximum day and peak hour flows (from the left two columns of Table 2 - 2) to the existing model yields an understanding of how the system is likely to perform. HGL requirements were established at various locations within the system as shown in Table 2 - 4 and on Figure 2 - 2. The model results were compared to the requirements.
Table 2 - 4 CTP Agreement Required Hydraulic Grade Line
Node Location Required Minimum HGL (ft) 18 Oak and Main 380.5 20 Oak and Filbert 372.2
21 Filbert and Central 367.7
23 Filbert and Pershing 361.1 27 C-Bar-C Park 359.1
The model was run with the water surface elevation in Hinkle Reservoir set at 398 feet. The model output is presented in three figures in the Appendix: maximum day flow results on Figure 2A - 7, peak hour flow results on Figure 2A - 8, and CTP Agreement flows results on Figure 2A - 9.

SJWD– Wholesale Master Plan Phase II B&V Project 139074.0200 Water Storage and Transmission System Analysis B&V File G.2 September 8, 2005
FINAL
TM2-6
Figure 2 - 2 SJWD Transmission System
359.1 ft
367.7 ft
361.1 ft
372.2 ft 380.5 ft
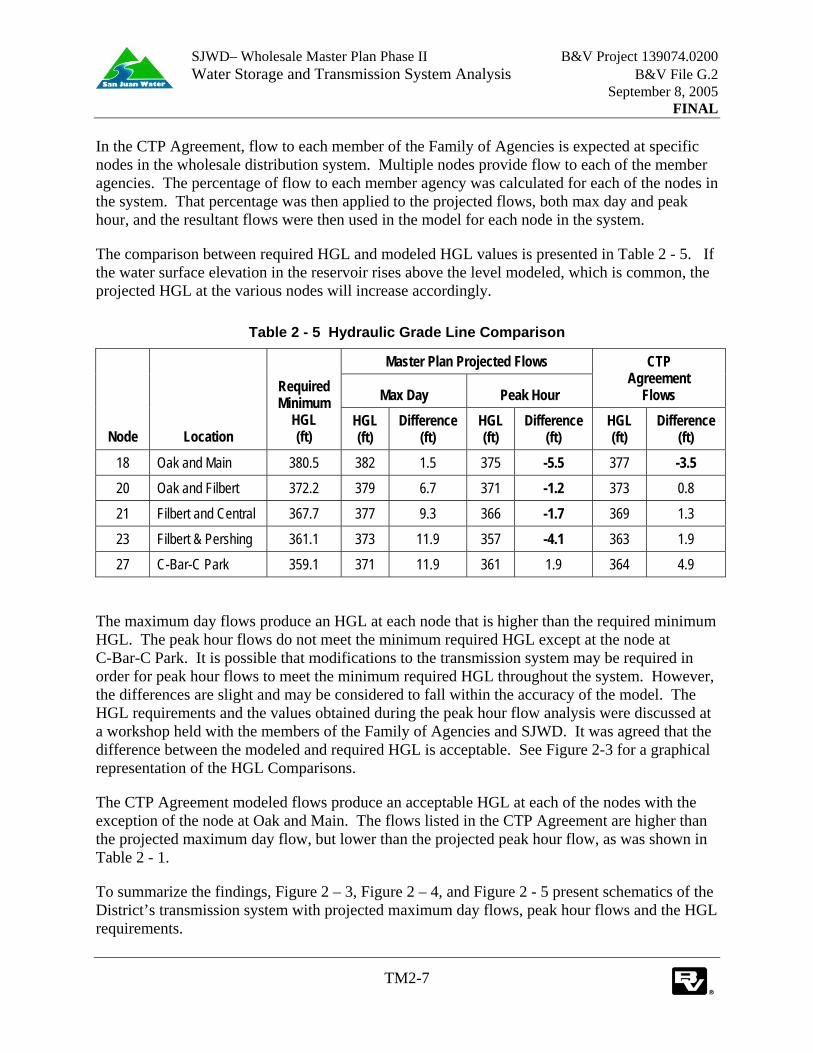
SJWD– Wholesale Master Plan Phase II B&V Project 139074.0200 Water Storage and Transmission System Analysis B&V File G.2 September 8, 2005
FINAL
TM2-7
In the CTP Agreement, flow to each member of the Family of Agencies is expected at specific nodes in the wholesale distribution system. Multiple nodes provide flow to each of the member agencies. The percentage of flow to each member agency was calculated for each of the nodes in the system. That percentage was then applied to the projected flows, both max day and peak hour, and the resultant flows were then used in the model for each node in the system.
The comparison between required HGL and modeled HGL values is presented in Table 2 - 5. If the water surface elevation in the reservoir rises above the level modeled, which is common, the projected HGL at the various nodes will increase accordingly.
Table 2 - 5 Hydraulic Grade Line Comparison
Master Plan Projected Flows
Max Day Peak Hour
CTP Agreement
Flows
Node Location
Required Minimum
HGL (ft)
HGL (ft)
Difference (ft)
HGL (ft)
Difference (ft)
HGL (ft)
Difference (ft)
18 Oak and Main 380.5 382 1.5 375 -5.5 377 -3.5 20 Oak and Filbert 372.2 379 6.7 371 -1.2 373 0.8
21 Filbert and Central 367.7 377 9.3 366 -1.7 369 1.3
23 Filbert & Pershing 361.1 373 11.9 357 -4.1 363 1.9 27 C-Bar-C Park 359.1 371 11.9 361 1.9 364 4.9
The maximum day flows produce an HGL at each node that is higher than the required minimum HGL. The peak hour flows do not meet the minimum required HGL except at the node at C-Bar-C Park. It is possible that modifications to the transmission system may be required in order for peak hour flows to meet the minimum required HGL throughout the system. However, the differences are slight and may be considered to fall within the accuracy of the model. The HGL requirements and the values obtained during the peak hour flow analysis were discussed at a workshop held with the members of the Family of Agencies and SJWD. It was agreed that the difference between the modeled and required HGL is acceptable. See Figure 2-3 for a graphical representation of the HGL Comparisons.
The CTP Agreement modeled flows produce an acceptable HGL at each of the nodes with the exception of the node at Oak and Main. The flows listed in the CTP Agreement are higher than the projected maximum day flow, but lower than the projected peak hour flow, as was shown in Table 2 - 1.
To summarize the findings, Figure 2 – 3, Figure 2 – 4, and Figure 2 - 5 present schematics of the District’s transmission system with projected maximum day flows, peak hour flows and the HGL requirements.

SJWD– Wholesale Master Plan Phase II B&V Project 139074.0200 Water Storage and Transmission System Analysis B&V File G.2 September 8, 2005
FINAL
TM2-8
Figure 2 - 3 HGL Comparisons
Note: Assume all demand met from surface water
0
50
100
150
200
250
300
350
400
450
18 20 21 23 27
Projected Max Day flowProjected Peak Hour flowCTP Agreement flowRequired HGL
Maximum Difference of 5.5 feet which is approximately 2.4 psi
Hyd
raul
ic G
rade
Lin
e (f
t)
Node Number

SJWD– Wholesale Master Plan Phase II B&V Project 139074.0200 Water Storage and Transmission System Analysis B&V File G.2 September 8, 2005
FINAL
TM2-9
Figure 2 - 4 SJWD Wholesale Service Area – Maximum Day Flows (180 mgd Total)
180 mgd Max Day
Flow fromHinkle
Reservoir
NNot to Scale
109.36
22.18
103.09
66.67
4.2024.36
4.53
1.22
0.6213.01
5.524.52
16.34
0.021.9659.04
21.21
20.80
1.38
80.25108.61
42.3
119
.38
5.52
20.8
616
.34
0.75
0.75
82.23
Node with minimum HGL Requirement
380.5382375
372.2379371
367.7377366
361.1373357
359.1371361
380.5382375
HGL RequirementMax Day HGLPeak Hour HGL
109.36 Flow (mgd)
Sacramento Suburban
SJWD and FolsomFair OaksOrange Vale
Citrus HeightsCTP
Fair
Oak
s 40

SJWD– Wholesale Master Plan Phase II B&V Project 139074.0200 Water Storage and Transmission System Analysis B&V File G.2 September 8, 2005
FINAL
TM2-10
FIGURE 2 - 5 SJWD WHOLESALE SERVICE AREA – PEAK HOUR FLOWS (247.5 MGD TOTAL)
247.5 mgdPeak Hour Flow from
HinkleReservoir
NNot to Scale
Sacramento SuburbanCitrus Heights
SJWD and FolsomFair OaksOrange Vale
135.14
31.28
123.90
105.15
7.2542.07
7.83
2.10
1.0819.50
9.958.15
24.50
0.032.7259.04
29.45
28.89
2.39
88.49 133.85
63.0
830
.51
9.95
32.6
524
.50
1.29
1.29
91.25
Node with minimum HGL Requirement
380.5382375
372.2379371
367.7377366
361.1373357
359.1371361
380.5382375
HGL RequirementMax Day HGLPeak Hour HGL
115.15 Flow (mgd)

SJWD– Wholesale Master Plan Phase II B&V Project 139074.0200 Water Storage and Transmission System Analysis B&V File G.2 September 8, 2005
FINAL
TM2-11
STORAGE ANALYSIS
Currently, storage for the majority of the wholesale system is only available at Hinkle Reservoir, though individual agencies are examining the potential for future storage in their respective service areas. Fair Oaks has an existing storage tank with a volume of 3 million gallons. Orange Vale is considering opportunities for a reservoir as a joint venture or regional solution within their service area. If additional storage in the wholesale system is recommended in this wholesale master transmission facility plan, then joint venturing with planned facilities may be a viable alternative.
Hinkle Reservoir has a nominal volume of 62 million gallons (MG), which occurs at a water depth of 20 feet. When the water depth in the reservoir drops below 7 feet, the floating cover drops to a level at which it may become entangled within the trash racks over the outlet. If the cover becomes entangled, it could damage the cover and the outlet. The volume of water in the reservoir when the water depth is 7 feet is approximately 19.7 MG. Approximately 42.3 MG is thus available as usable storage within the reservoir. This storage is used to accommodate the diurnal flow variations under normal operations (i.e. operational storage) as well as emergency raw water supply and/or plant outages (i.e. emergency storage).
The current water treatment plant capacity is approximately 120 mgd. With planned hydraulic and process improvements, the plant is expected to be able to treat approximately 140 mgd of surface water. The plant may be expanded to a maximum of 180 mgd in the future (which is the total projected maximum day flow in year 2030). In order to provide a comprehensive evaluation, storage requirements for the three plant capacities were analyzed.
Diurnal Flow Variation
To understand how the treatment plant will serve the system at the three capacities of 120, 140, and 180 mgd, a diurnal curve was developed with each of those values as the maximum day flow.
Existing flow data were obtained from the District for the past 15 months. The flow was reported in 5-minute intervals. The meter at the intersection of Oak Avenue and Filbert Avenue
Figure 2-6. Hinkle Reservoir

SJWD– Wholesale Master Plan Phase II B&V Project 139074.0200 Water Storage and Transmission System Analysis B&V File G.2 September 8, 2005
FINAL
TM2-12
was selected to represent the system for analysis of the diurnal curve. The flows measured at that location indicate that approximately 40% of the total flow passes through that meter. The other meters represented in the data set represent smaller portions of the total flow or are located in areas that are upstream of smaller portions of the distribution system. Thus, use of the meter at Oak and Filbert provides the most complete set of information for flow analysis.
While analyzing the data, it became apparent that the peak flow of 55.2 mgd occurred at the meter located at Oak and Filbert on June 14, 2004. Analyses were made on the data to determine the method that best fit the diurnal flow variations in such a way that the resulting diurnal flow curve could be adequately extrapolated to show projected peak hour and maximum day flows. This diurnal curve was then scaled to obtain the diurnal curves for 120 mgd, 140 mgd, and 180 mgd from the treatment plant.
Required Operation Storage
Using these three diurnal curves and assumed constant rates of treated water supply (180, 140, and 120 mgd), the net input or takeout volumes from Hinkle Reservoir were calculated in hourly increments. It was then determined what minimum storage in the reservoir would be required at the start of the day to handle the daily needs of the area. The required volume of equalization storage would then be equal to the maximum required operational storage volume for any 24-hour cycle.
Using this approach, it was determined that the required storage volumes for the system operating at the 120, 140, and 180 mgd scenarios were 10 MG, 11 MG, and 15 MG, respectively, which is approximately 8% of the maximum day flow. These values are the absolute minimum values required of operational storage for flow equalization under the given assumptions. It is the recommendation of Black & Veatch that the District plan for more operating storage, specifically 150% of those storage volumes listed previously, namely 15, 16.5, and 22.5 MG. The storage analysis results are summarized in Table 2 - 6.
Table 2 - 6 Storage Analysis Results
Scenario Minimum Required Storage
(MG)
Recommended Storage for
Normal Operations (MG)
Available Emergency
Storage (MG)
Emergency Storage
Time of Service (hr)
120 mgd 10 15 27.3 5.5 140-mgd 11 16.5 25.8 4.4
180-mgd 15 22.5 19.8 2.6
SJWD– Wholesale Master Plan Phase II B&V Project 139074.0200 Water Storage and Transmission System Analysis B&V File G.2 September 8, 2005
FINAL
TM2-13
Emergency Storage
In order to provide time, in the event of an emergency, for the members of the Family of Agencies to begin their emergency procedures, it is desirable that the District have 12 to 24 hours of emergency storage to meet maximum day flows.
The storage in Hinkle Reservoir above the amount required for operational storage is considered emergency storage. The emergency storage available is 27.3, 25.8, and 19.8 MG for each of the scenarios, 120, 140, and 180 mgd. The emergency storage available when the demand on the system is at 120 mgd would allow for service to the wholesale customers for 5.5 hours. At 140 mgd, the available storage of 25.8 MG would provide service for 4.4 hours. At a demand of 180 mgd, the available storage in Hinkle Reservoir would provide service for approximately 2.6 hours.
As shown in Table 2 - 6, the amount of emergency storage available in Hinkle Reservoir can be determined by subtracting the amount recommended for normal operations from the total available storage of 42.3 mg. Thus, the amount of emergency storage available will only provide water to the wholesale service area for approximately 5.5 hours, operating at 120 mgd. This is less than the amount of emergency storage recommended to allow sufficient time for response to unforeseen supply interruptions or treatment plant outages. As the demand on the system increases to 140 and 180 mgd, it appears that Hinkle Reservoir ultimately would be able to provide only 2.6 hours of service.
Table 2 - 7 summarizes the needs of the individual agencies to meet their emergency storage requirements for 12 and 24 hours based on projected year 2030 maximum day demands. Emergency storage requirements for SSWD were not considered in this evaluation. The storage requirements to meet the 12- and 24-hr demands are listed for each of the agencies, assuming Hinkle Reservoir is used to meet 2.6 hours of emergency service and that SSWD still removes just over 59 mgd from the system, or 6.4 million gallons.

SJWD– Wholesale Master Plan Phase II B&V Project 139074.0200 Water Storage and Transmission System Analysis B&V File G.2 September 8, 2005
FINAL
TM2-14
Table 2 - 7 Emergency Storage Requirements
Family Agency
Emergency Storage
Available from Hinkle
Reservoir (million gallons)
2030 Max Day
12-hr Demand (million gallons)
2030 Max Day
24-hr Demand (million gallons)
Additional Storage
Requirement to meet 12-hr Demand
(million gallons)
Additional Storage
Requirement to meet 24-hr
Demand (million gallons)
Citrus Heights 4.9 22.0 44.0 17.1 39.1
Fair Oaks 3.2 14.7 29.4 11.5 26.2
Folsom 0.3 1.2 2.5 0.9 2.2 Orange Vale 1.1 5.1 10.1 4.0 9.0
SJWD Retail 3.9 17.7 35.3 13.8 31.4
SSWD 6.4 Not Considered TOTAL 19.8 60.7 121.3 47.3 107.9
The values listed in allow for water flowing to SSWD through the CTP. Since SSWD is not a member of the Family of Agencies for the District and contracts allow its use to be diminished in times of need, it would be possible to eliminate flow to that agency and thus increase the storage available to the Family of Agencies. Table 2 - 8 summarizes the storage requirements for each Agency if SSWD refrains from withdrawing water from the CTP, leaving the water in the system for the Family Agencies.

SJWD– Wholesale Master Plan Phase II B&V Project 139074.0200 Water Storage and Transmission System Analysis B&V File G.2 September 8, 2005
FINAL
TM2-15
Table 2 - 8 Emergency Storage Requirements without SSWD
Family Agency
Emergency Storage
Available from Hinkle
Reservoir (million gallons)
2030 Max Day
12-hr Demand (million gallons)
2030 Max Day
24-hr Demand (million gallons)
Additional Storage
Requirement to meet 12-hr Demand
(million gallons)
Additional Storage
Requirement to meet 24-hr Demand
(million gallons) Citrus Heights 7.2 22.0 44.0 14.8 36.8
Fair Oaks 4.7 14.7 29.4 10.0 24.7
Folsom 0.5 1.2 2.5 0.7 2.1
Orange Vale 1.6 5.1 10.1 3.5 8.5
SJWD Retail 5.8 17.7 35.3 11.9 29.5 TOTAL 19.8 60.7 121.3 40.9 101.5
Table 2 - 8 did not include the availability of groundwater within Citrus Heights, Fair Oaks, and Orange Vale. Discussion will be held between the members of the Family of Agencies to determine the amount of time required to begin groundwater production in the event of an emergency. If the agencies were to start well use at the time of the emergency and the wells were producing the supply listed in TM No. 1, then the required storage will be reduced to the values listed in Table 2 - 9.
Table 2 - 9 Emergency Storage Requirements without SSWD and Using Groundwater
Family Agency
2030 Max Day
12-hr Demand
(MG)
2030 Max Day
24-hr Demand
(MG)
Emergency Supply
available from Hinkle Reservoir
(MG)
Groundwater Provided by
Agency wells (mgd)
Additional Storage
Requirement to meet 12-hr Demand (MG)
Additional Storage
Requirement to meet 24-hr Demand (MG)
Citrus Heights 22.0 44.0 7.2 6.9 11.4 29.9
Fair Oaks 14.7 29.4 4.7 10.4 4.8 14.3
Folsom 1.2 2.5 0.5 0.0 0.7 2.0
Orange Vale 5.1 10.1 1.6 5.5 0.8 3.0 SJWD Retail 17.7 35.3 5.8 0.0 11.9 29.5
TOTAL 60.7 121.3 19.8 22.8 29.5 78.7

SJWD– Wholesale Master Plan Phase II B&V Project 139074.0200 Water Storage and Transmission System Analysis B&V File G.2 September 8, 2005
FINAL
TM2-16
During the draft process of this TM, a workshop was held during which the storage requirements of the Family of Agencies were addressed. It was discussed that storage may be a viable alternative to ease emergency situations. Enhancing the groundwater availability within the service areas was discussed more favorably as a method of providing an alternative source for water for emergency and drought situations, which is discussed in TM 4. Further analyses will be done to determine the feasibility of creating more wells and pumping the required water from the ground as well as exploring alternatives for supplemental storage within the system.
PRELIMINARY CONCLUSIONS
Based on the transmission and storage evaluation, the following preliminary conclusions were developed:
The transmission system is adequate for transmission of the projected average flows of 180 mgd along with peak hour flows of 247.5 mgd without losing required pressure in the system which meets the projected 2030 demands of the Family of Agencies with a constant flow of 59 mgd to SSWD.
The projected peak hour flows in the wholesale system are more than those planned for in the CTP Agreement and the projected maximum day flows are less than those planned for in the CTP Agreement.
Under normal operations of Hinkle Reservoir, 15 MG of storage would be required when the system is providing the maximum day flow of 120 mgd to the service area and 22.5 MG would be required when the system is providing 180 mgd.
27.3 MG of emergency storage is available when the system is operating at 120 mgd, providing for approximately 5.5 hours of service. The situation worsens to 19.8 MG of emergency storage when operated at 180 mgd, allowing approximately 2.6 hours of operation.
Further analysis in a later technical memorandum will be done to determine the feasibility of increased groundwater pumping and supplemental storage to meet emergency storage needs beyond 2.6 hours.

SJWD– Wholesale Master Plan Phase II B&V Project 139074.0200 Water Storage and Transmission System Analysis B&V File G.2 September 8, 2005
FINAL
TM2-Appendix
APPENDIX
TRANSMISSION AND STORAGE ANALYSIS
The analysis is presented as follows:
Figure 2A - 1 Diurnal Flow Curve – Taken from June 14, 2004, measured flows at Oak Ave. and Filbert Ave
Figure 2A - 2 Demand Curve – 180 mgd Analysis
Figure 2A - 3 Mass Curve – 180 mgd Analysis
Figure 2A - 4 180 mgd Storage Analysis
Figure 2A - 5 140 mgd Storage Analysis
Figure 2A - 6 120 mgd Storage Analysis
Figure 2A - 7 Modeling Output for Maximum Day Flows
Figure 2A - 8 Model Output for Peak Hour Flows
Figure 2A - 9 Model Output for CTP Agreement Flows
Figure 2A - 10 Wholesale Transmission Pipeline with Interconnections
Figure 2A - 11 Interconnections and Meter Locations of the CTP and FO40

SJWD– Wholesale Master Plan Phase II B&V Project 139074.0200 Water Storage and Transmission System Analysis B&V File G.2 September 8, 2005
FINAL
TM2-A1
Figure 2A - 1 Diurnal Flow Curve – Taken from June 14, 2004, measured flows at Oak Ave. and Filbert Ave
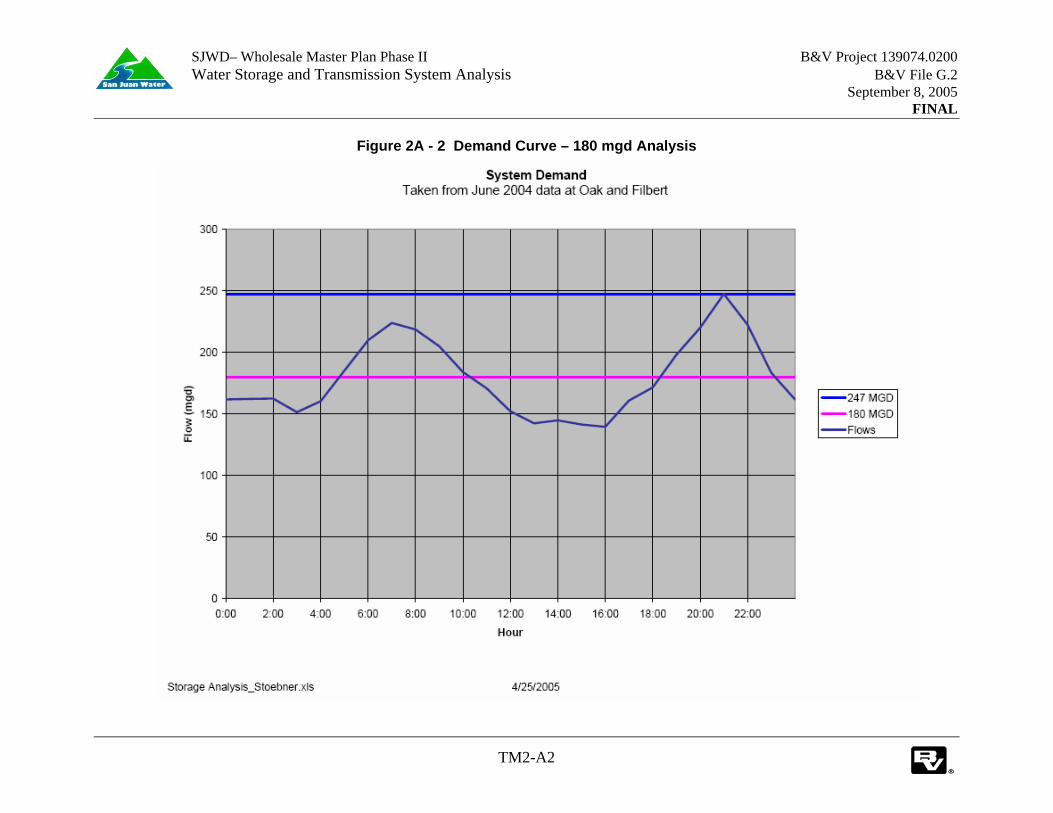
SJWD– Wholesale Master Plan Phase II B&V Project 139074.0200 Water Storage and Transmission System Analysis B&V File G.2 September 8, 2005
FINAL
TM2-A2
Figure 2A - 2 Demand Curve – 180 mgd Analysis

SJWD– Wholesale Master Plan Phase II B&V Project 139074.0200 Water Storage and Transmission System Analysis B&V File G.2 September 8, 2005
FINAL
TM2-A3
Figure 2A - 3 Mass Curve – 180 mgd Analysis

SJWD– Wholesale Master Plan Phase II B&V Project 139074.0200 Water Storage and Transmission System Analysis B&V File G.2 September 8, 2005
FINAL
TM2-A4
Figure 2A - 4 180 mgd Storage Analysis

SJWD– Wholesale Master Plan Phase II B&V Project 139074.0200 Water Storage and Transmission System Analysis B&V File G.2 September 8, 2005
FINAL
TM2-A5
Figure 2A - 5 140 mgd Storage Analysis

SJWD– Wholesale Master Plan Phase II B&V Project 139074.0200 Water Storage and Transmission System Analysis B&V File G.2 September 8, 2005
FINAL
TM2-A6
Figure 2A - 6 120 mgd Storage Analysis

SJWD– Wholesale Master Plan Phase II B&V Project 139074.0200 Water Storage and Transmission System Analysis B&V File G.2 September 8, 2005
FINAL
TM2-A7
Figure 2A - 7 Modeling Output for Maximum Day Flows

SJWD– Wholesale Master Plan Phase II B&V Project 139074.0200 Water Storage and Transmission System Analysis B&V File G.2 September 8, 2005
FINAL
TM2-A8
Figure 2A - 8 Model Output for Peak Hour Flows

SJWD– Wholesale Master Plan Phase II B&V Project 139074.0200 Water Storage and Transmission System Analysis B&V File G.2 September 8, 2005
FINAL
TM2-A9
Figure 2A - 9 Model Output for CTP Agreement Flows

SJWD– Wholesale Master Plan Phase II B&V Project 139074.0200 Water Storage and Transmission System Analysis B&V File G.2 September 8, 2005
FINAL
TM2-A10
Figure 2A - 10 Wholesale Transmission Pipeline with Interconnections

SJWD– Wholesale Master Plan Phase II B&V Project 139074.0200 Water Storage and Transmission System Analysis B&V File G.2 September 8, 2005
FINAL
TM2-A11
Figure 2A - 11 Interconnections and Meter Locations of the CTP and FO40
Point Item Elevation Comment 1 Hinkle Reservoir 381.5 Storage for the system 2 78" x 42" Tee 373 Connection for SJWD - nearby probe meter access manway 3 72" x 72" Wye 294.5 Blind connection to north 4 72" x 42" Tee 295.5 Connection for CHWD 5 72" x 18" Tee 295 Connection for SJWD 6 72" x 72" Tee 283.5 Connection to FO40 - Valve shut 7 78" x 30" Tee 251 Connection to 30" line in Main Ave 8 30" to 24" reducer 255 Connection to existing 24" water line for OVWC 9 78" x 48" Tee 199.5 Connection to 48" line in Filbert Ave
10 Water Meter 201.5 Probe meter 11 72" x 8" Tee 205.5 Connection to CHWD 12 48" x 24" Tee 255.9 Connection to OVWC - downstream probe meter access manway 13 39" x 16" Tee 237.5 Connection to OVWC at Greenback - unused 14 39" x 30" Wye 216 Connection to existing 27" water line for FOWD probe meter and 30" saddle type propeller meter downstream
15 72" x 18" Tee 200 Connection to CHWD 16 72" x 48" Tee 182.5 Blind connection for future CHWD 17 72" x 24" Cross 190 Connection for CHWD probe meter and 48" saddle type propeller meter in connection
18 189 Connection to SSWD 19 Water Meter 20 42" x 12" Tee 381 Connection to SJWD - usually turned off 21 375 Connection to SJWD and OVWC with Eden Oaks meter 22 374 Connection to CHWD 23 Water Meter Meter for FOWD at Main Ave 24 Connection to FOWD 25 72” x 36” Tee 320 Future connection to Roseville

BLACK & VEATCH TECHNICAL MEMORANDUM NO. 3
TM3 - 1
SJWD–Wholesale Master Plan Phase 2 B&V Project 139074.0200 Water Storage and Transmission System Analysis B&V File G.2 Cost Update November 9, 2005
FINAL
To: Keith Durkin
Prepared By: Willard Pack Christina Hartinger Jay Hesby Melissa Blanton Reviewed By: Jim English PURPOSE AND SUMMARY
San Juan Water District (SJWD or District) is developing the Wholesale Master Plan Phase 2 (WMPP2) as a follow-on to the Water Forum and Regional Water Master Plan, to assess the District’s storage and transmission as related to the Family of Agencies (Citrus Heights Water District, Fair Oaks Water District, the Ashland area of the City of Folsom, Orange Vale Water Company, and San Juan Water District Retail), and to develop a water supply plan for the Family of Agencies within the context of the regional planning efforts. Key project objectives are to: (1) determine demands/level of service, (2) plan for normal operations, (3) plan for reduced water operations, and (4) allocate costs
This technical memorandum (TM) presents an update of cost estimates for the rehabilitation of the Fair Oaks 40 Pipeline. Previous estimates were presented in the report Conceptual Design Memorandum: Rehabilitation of the American River Canyon Crossing of the Fair Oaks 40-inch Pipeline and Rehabilitation of the Fair Oaks 40 Pipeline, prepared by Bookman-Edmonston Engineering, Inc. in October 1998. The total project cost identified in the 1998 report was $472,200.
Costs were updated by two methods. The first method, using the 20-City Average Engineering News Record (ENR) Building Cost Index (BCI), developed an updated total project cost of $575,000. The second method utilized a combination of the BCI and the Black & Veatch cost database. This method developed an updated total project cost of $1,045,900. The latter estimate was determined to more accurately reflect cost conditions in the project area.
Cost allocations were then developed for the three Family of Agencies members that would contribute to the rehabilitation project: Fair Oaks, San Juan, and Orange Vale. It is recommended that the updated numbers be incorporated in the Fair Oaks 40 Pipeline Rehabilitation portion of the District’s capital improvements plan.

SJWD– Wholesale Master Plan Phase 2 B&V Project 139074.0200 Water Storage and Transmission System Analysis B&V File G.2 November 9, 2005
FINAL
TM3-2
BACKGROUND
The Fair Oaks 40 Pipeline is a 40-inch, 11,000-foot (or 2-mile) long potable water pipeline delivering water from Hinkle Reservoir to the Fair Oaks Water District, Orange Vale Water Company, and several retail customers of the San Juan Water District.
As shown on Figure 3 - 1, the pipeline is divided into three sections for the purposes of this work. Phase 1 consists of the 60-foot pipeline section at the American River Canyon Crossing; Phase 2-Section 1 consists of the 1.5-mile pipeline section from approximately Oak Avenue to Greenback Lane; and Phase 2-Section 2 consists of the 0.5-mile pipeline section south of Greenback Lane. These designations are adopted from the Bookman Edmonston Report.
The pipeline section at the American River Canyon Crossing in Phase 1 was supported by a timber trestle. Over time, the timbers have deteriorated to the point that the pipeline is experiencing stresses beyond those recommended by the AWWA for pipe on above-ground supports. The report by Bookman-Edmonston was commissioned to analyze various means of improving the crossing’s reliability. Options examined included replacing the existing crossing with a buried pipeline; adding a reinforced concrete central pier to the existing span; and, adding steel plate reinforcement and concrete supports to the existing span near the canyon walls to reduce and redistribute the stresses in the pipe. It was determined that the pipeline was in good condition, but that new supports were required to relieve the increased stresses in the pipe walls. Since the option of adding steel plate reinforcement and concrete supports was the least expensive and would adequately satisfy the needs of the crossing, it was the preferred alternative.
Phase 2 was to provide repairs along the buried sections of the pipeline. The pipeline is a mortar-lined, asphalt-coated steel pipe. The joints are swaged bell-and-spigot type with lead packing. The cement mortar lining is cracked at the joints and leaks have occurred at joints throughout the life of the project. In the past, it was feasible to excavate the ground around the leaks and weld a steel band around the leaking joints to seal the leaks. However, with growth in the area, it is becoming increasingly more difficult to continue this practice of leak repair without disrupting the desired standard of life for the community. The rehabilitation project was requested to seal the pipe against consistent leakage without the need for regular maintenance and repair as was traditionally done. The recommended repair was to install an internal joint seal at each pipe joint. Based on a typical joint spacing of 40 feet, the 2-mile long pipeline would require installation of 275 joint seals. It is expected that a seal similar to a Weko Seal or a Creamer In-Weg Seal would be applied to the interior of each of the joints. The joint is covered by a rubber seal that is held in place with two stainless steel rings, which are forced to expand against the inside of the host pipe and locked in place. Each joint seal is then tested with compressed air for tightness after installation.

SJWD– Wholesale Master Plan Phase 2 B&V Project 139074.0200 Water Storage and Transmission System Analysis B&V File G.2 November 9, 2005
FINAL
TM3-3
Figure 3 - 1: Fair Oaks 40 Pipeline
Phase 1 - America River Canyon Crossing
Phas
e 2
–Se
ctio
n 1
Phas
e 2 –
Sect
ion
2
Phase 1 - America River Canyon Crossing
Phas
e 2
–Se
ctio
n 1
Phas
e 2 –
Sect
ion
2

SJWD– Wholesale Master Plan Phase 2 B&V Project 139074.0200 Water Storage and Transmission System Analysis B&V File G.2 November 9, 2005
FINAL
TM3-4
ESTIMATED COSTS IN 1998 REPORT
In the Bookman-Edmonston Report, several tables were presented showing cost estimates for the project to rehabilitate the Fair Oaks 40 Pipeline. Not only was the cost of each pipeline segment presented, but cost allocations were presented in tables showing the cost to each of the agencies receiving water through the pipeline. Table 3 - 1, Table 3 - 2, and Table 3 - 3 present the information as it appeared in Section 5 of the report. Table 3 - 1 shows the cost allocation by Fair Oaks 40 section. The estimated total project cost of $472,200 includes construction cost as well as allowance for engineering, administration, and legal services.
Three agencies use water in the Fair Oaks 40 Pipeline: Fair Oaks, San Juan, and Orange Vale. The turnout for Orange Vale is located at Greenback Lane. Therefore, all three agencies use water that flows through Phase 1 and Phase 2 - Section 1. Only Fair Oaks and San Juan use the water that flows through Phase 2 - Section 2. It was decided that the cost allocation should follow the water allocation within the pipeline. Table 3 - 2 and Table 3 - 3 present, respectively, the cost allocation summary as a percent of total cost and the cost allocation summary in dollars.
Table 3 - 1: Cost Allocation by Fair Oaks 40 Section (1998 Report)
Section Pipeline Length
Percent of Total Length
Total Cost of Phase
Cost of Section
Phase 1 American River Canyon Crossing
60 feet (1) 100.00% $72,200 $72,200
Phase 2 - Section 1 Pipeline from Oak Avenue to Greenback Lane
1.5 miles 75.00% $400,000 $300,000
Phase 2 - Section 2 Pipeline section south of Greenback Lane
0.5 miles 25.00% $400,000 $100,000
Total Cost of Fair Oaks 40 Rehabilitation $472,200
Note: (1) Number not included in Table 1 of Bookman-Edmonston Report. Information obtained from report text.
Table 3 - 2: Fair Oaks 40 Cost Allocation Summary (as % of total cost) (1998 Report)
District Method Fair Oaks San Juan Orange Vale Total
Base - Extra Capacity (3-year average) 92.44% 4.97% 2.59% 100.00% Base - Extra Capacity (1994) 92.59% 4.76% 2.65% 100.00% Percent Annual Consumption (3-year average) 92.36% 5.03% 2.60% 100.00% Percent Annual Consumption (1994) 92.77% 4.69% 2.54% 100.00%

SJWD– Wholesale Master Plan Phase 2 B&V Project 139074.0200 Water Storage and Transmission System Analysis B&V File G.2 November 9, 2005
FINAL
TM3-5
Table 3 - 3: Fair Oaks 40 Cost Allocation Summary (in $) (1998 Report)
District Method Fair Oaks San Juan Orange Vale Total
Base-Extra Capacity (3-year average) $436,503 $23,448 $12,249 $472,200 Base-Extra Capacity (1994) $437,196 $22,479 $12,525 $472,200 Percent Annual Consumption (3-year avg.) $436,142 $23,775 $12,283 $472,200 Percent Annual Consumption (1994) $438,071 $22,128 $12,000 $472,200
UPDATED COSTS
A simple approach to update the previous cost estimates is to use the 20-City Average ENR BCI. The cost index for October 1998, the date on the Bookman-Edmonston Report, was 3423. April 2005 has a cost index of 4168. Applying the factor of 1.218 (i.e. ratio of 4168 to 3423), the total project cost of $472,200 may be updated to $575,000. The respective costs of Phase 1, Phase 2 – Section 1 and Phase 2 – Section 2 are $87,900, $365,300, and $121,800.
While cost index provides trending of construction costs, B&V experience indicates it may not accurately reflect the local pricing of specialty construction such as pipeline rehabilitation. Therefore, an independent cost estimate of the pipeline rehabilitation in Phase 2 (i.e. install 275 joint seals along 2-mile long pipeline) was performed using B&V cost database. As presented in Table 3 - 4, the estimated cost of Phase 2 pipeline rehabilitation is $958,000. This cost includes 25 percent estimating contingency and 35 percent allowance for engineering, administration, and legal services.
Presented in Table 3 - 5 is a comparison of the updated costs using the ENR BCI and those from the independent analysis. The ENR BCI updated cost for the entire project is $575,000, i.e. approximately 122 percent of that presented in the original report. Using a combination of B&V cost database for Phase 2, the rehabilitation of the pipeline, and ENR BCI for Phase 1, the American River Crossing, the updated cost is $1,045,900, i.e. approximately 221 percent of the cost presented in the original report. It is recommended that the District use the updated cost of $1,045,900 in the planned capital improvements program.

SJWD– Wholesale Master Plan Phase 2 B&V Project 139074.0200 Water Storage and Transmission System Analysis B&V File G.2 November 9, 2005
FINAL
TM3-6
Table 3 - 4: Estimated Cost of Pipeline Rehabilitation
Cost Estimated Construction Cost per Pipe Joint
General requirements $185 Surface preparation of existing pipe and removal of existing grout = 5 hours at $84 per hour $420 Install joint seals including materials, labor, general contractor markup of 10% $1,100 Testing = 2 hours at x $84 per hour $160 Confined space entry and access points $200
Subtotal $2,065 Estimating Contingency @ 25% $515
Estimated Construction Cost per Pipe Joint $2,580 Estimated Construction Cost of 275 Joints $709,500
Allowance for Engineering, Administration and Legal Services @ 35% $248,500 Estimated Project Cost of Phase 2 Pipeline Rehabilitation $958,000
Table 3 - 5: Comparison of Updated Costs
ENR Construction Cost Index
B&V Cost Database
Section 1998
Report Updated
Cost Percent Increase
Updated Cost
Percent Increase
Phase 1 $72,200 $87,900 122% $87,900 122% Phase 2-Section 1 $300,000 $365,300 122% $718,500 240% Phase 2-Section 2 $100,000 $121,800 122% $239,500 240% Total $472,200 $575,000 122% $1,045,900 221%
Table 3 - 6, Table 3 - 7, and Table 3 - 8 present the updated costs in the same format as the information appeared in Section 5 of the Bookman-Edmonston Report. Table 3 - 6 presents the cost allocation of the Fair Oaks 40 Pipeline by pipeline section. Phase 2 has been divided into two sections, Section 1 encompassing approximately 75 percent of the phase and Section 2 encompassing the remaining 25 percent of the phase. Table 3 - 7 summarizes the percentage of

SJWD– Wholesale Master Plan Phase 2 B&V Project 139074.0200 Water Storage and Transmission System Analysis B&V File G.2 November 9, 2005
FINAL
TM3-7
flow for each of the three agencies in each of the three phase sections described above. Table 3 - 8 allocates the cost of each section by the percentage of flow used by each agency in each section. The variation of cost allocation among the methods is minimal. The Bookman-Edmonston Report indicates that the base-extra capacity method of cost allocation is preferred.
Table 3 - 6: Cost Allocation by Fair Oaks 40 Section – 2005 Update
Section Pipeline Length Percent of Total
Length Total Cost of
Phase Cost of Section Phase 1 60 ft 100.00% $87,900 $87,900 Phase 2-Section 1 1.5 miles 75.00% $958,000 $718,500 Phase 2-Section 2 0.5 miles 25.00% $958,000 $239,500 Total Cost of Fair Oaks 40 Rehabilitation/Replacement $1,045,900
Table 3 - 7: Fair Oaks 40 Cost Allocation Summary (as % of total cost) – 2005 Update
District Method Fair Oaks San Juan Orange Vale Total
Base-Extra Capacity (3-year average) 92.44% 4.97% 2.59% 100.00% Base-Extra Capacity (1994) 92.59% 4.76% 2.65% 100.00% Percent Annual Consumption (3-year avg.) 92.36% 5.03% 2.60% 100.00% Percent Annual Consumption (1994) 92.77% 4.69% 2.54% 100.00%
Table 3 - 8: Fair Oaks 40 Cost Allocation Summary (in $) – 2005 Update
District Method Fair Oaks San Juan Orange Vale Total
Base-Extra Capacity (3-year average) $966,830 $51,981 $27,089 $1,045,900 Base-Extra Capacity (1994) $968,399 $49,785 $27,716 $1,045,900 Percent Annual Consumption (3-year avg.) $966,096 $52,610 $27,194 $1,045,900 Percent Annual Consumption (1994) $970,281 $49,053 $26,566 $1,045,900

BLACK & VEATCH TECHNICAL MEMORANDUM NO. 4
TM4-1
SJWD–Wholesale Master Plan Phase 2 B&V Project 139074.0200 Plan for Meeting Reduced Surface Water Delivery B&V File G.2 December 18, 2006
FINAL
To: Keith Durkin
Prepared By: Jay Hesby David Carlson Nhicolas Ly Reviewed By: Jim English
Melissa Blanton EXECUTIVE SUMMARY
Purpose
San Juan Water District (District) is developing the Wholesale Master Plan Phase 2 (WMPP2) as a follow up to the Water Forum and Regional Water Master Plan. Overall goals for WMPP2 are to assess the District’s storage and transmission as related to the Family of Agencies (Citrus Heights Water District, Fair Oaks Water District, the Ashland area of the City of Folsom, Orange Vale Water Company, and San Juan Water District Retail) and to develop a water supply plan for the Family of Agencies within the context of regional planning efforts. The major objectives of WMPP2 are to: (1) determine demands/level of service, (2) plan for normal operations, (3) plan for reduced water operations, and (4) allocate costs of any additional required facilities. Project deliverables include a series of technical memoranda (TMs) and a Final Report. This TM, Plan for Meeting Reduced Surface Water Delivery, presents information on options to meet demands when the supply of surface water is reduced. Scope
Delivery of surface water from Folsom Reservoir to the Family of Agencies will be reduced to levels less than the projected demands under scenarios of Emergency, “Drier Years,” and “Driest Years” (Conference Years, when the unimpaired inflow is less than 400,000 AF). Several strategies were evaluated for meeting the demand under these scenarios. Demand reduction (conservation) and establishment of Best Management Practices (BMPs) have been aggressively pursued by the District and the Family of Agencies. In addition to documenting existing demand reduction policies, the evaluation considered increased groundwater pumping, additional storage, and improved reliability of surface water. An assessment of these strategies and a preliminary recommendation is presented.

SJWD– Wholesale Master Plan Phase 2 B&V Project 139074.0200 Plan for Meeting Reduced Surface Water Delivery B&V File G.2 December 18, 2006
FINAL
TM4-2
The General Managers of the Family of Agencies established reliability goals that the system must meet.
These goals entail:
• Water supply equal to 100 percent of annual average demand during drier and driest years. Available water supply should consider well capacity de-rated to 80 percent of actual to account for mechanical outages, declining production, etc. This capacity should be de-rated further to 75 percent to account for only part of the year being available for pumping during Drier and Driest Years scenarios.
• Water treatment capacity equal to at least 110 percent of maximum day demand.
• Emergency supply equal to 100 percent of maximum day demand for 12 hours with largest source out of service.
• Emergency supply equal to 50 percent of average day demand for extended outage of largest source.
These goals must be met under conditions of reduced surface water supply that could occur during emergencies, “Drier” years, and “Driest” (Conference) years. Emergency conditions were defined as any unanticipated, partial or complete, interruption in service from the system. Examples include mechanical, structural, electrical, or control failures at U.S. Bureau of Reclamation (USBR) or District facilities, whether caused by natural disasters, terrorist actions or other factors. Consistent with the Water Forum Agreement (WFA), “Drier Years” were defined as years when the projected inflow to Folsom Reservoir is less than 950,000 acre-feet (AF) and equal to or greater than 400,000 AF. Also consistent with the WFA, “Driest Years” (Conference Years) were defined as levels at Folsom Reservoir below 400,000 AF of inflow.
Key Findings
Table ES - 1 indicates the water available with the current surface and ground water supplies. Values are presented in units of million gallons per day (mgd).

SJWD– Wholesale Master Plan Phase 2 B&V Project 139074.0200 Plan for Meeting Reduced Surface Water Delivery B&V File G.2 December 18, 2006
FINAL
TM4-3
Table ES - 1: Current Water Availability
Surface Water Groundwater (mgd)
Family Agency Normal Year (mgd)
Drier Year (mgd)
Driest Year (mgd)
(1)
Normal, Drier & Driest Year (mgd)
Emergency Outage (mgd)
Citrus Heights 21.0 21.0 – 16.4 16.4 5.3 6.8 Fair Oaks 14.7 14.7-12.3 12.3 6.4 8.2 Folsom 1.3 1.3 – 0.9 0.9 0.0 0.0
Orange Vale 5.0 5.0 – 3.7 3.7 2.7 3.5 District’s Retail 19.6 19.6-12.1 12.1 0.0 0.0
Water for Conjunctive Use 12.9 12.9 - 1.5 1.5 0.0 0.0
Total Flow 74.5 74.5-46.9 46.9 14.4 18.5 1. Surface Water allocated to each member to meet Driest Year Demand in excess of
available groundwater.
The evaluation of the ability of these supplies to meet the reliability goals found:
Drier and Driest Years. No additional groundwater or storage is required to meet demands during Drier and Driest Years.
12-Hour Emergency. To meet the goal of providing water sufficient to supply the maximum day (max-day) demand for 12 hours, 38.0 million gallons (MG) of storage or 103.0 mgd of groundwater is required. However, the storage is only usable if the location is downstream of the outage point. The additional groundwater is only usable with pump back provisions and if the outages are upstream of the connection.
Extended Emergency. Additional storage would be ineffective in meeting an extended emergency outage. To meet extended emergency demands, 12.0 mgd of additional groundwater would be required. However, the groundwater is only usable with some pump back provisions (such as portable pumps) and if the outages are upstream of the connection.
Conclusions and Recommendations
Extended emergency needs can only be met with groundwater if the emergency entails a loss of the surface water supply. The minimum additional groundwater, could be in the form of underground storage, required would be 11.6 mgd. This capacity of additional groundwater is equivalent to 6.0 mgd over the 12 hour emergency outage. As a result, the storage required under this outage scenario could be reduced to 32 MG (6.0 MG subtracted from the max-day storage assumed for the 12-hour emergency).

SJWD– Wholesale Master Plan Phase 2 B&V Project 139074.0200 Plan for Meeting Reduced Surface Water Delivery B&V File G.2 December 18, 2006
FINAL
TM4-4
It is recommended that a minimum of 12 mgd of additional well capacity and 32 MG of storage be added to the system. An evaluation of interconnects and pump back provisions should be conducted to evaluate the optimal methods to fully utilize this additional capacity.
The following additional activities should also be undertaken to fully realize the benefit of the recommended improvements:
1. The amount of groundwater currently available should be maintained by periodically testing the wells to confirm capacity, routine maintenance, and well redevelopment, if necessary.
2. The Family Members should install the proposed wells at the indicated capacity.
3. The number, size, and location of additional storage facilities should be evaluated further.
4. The improvements at the WTP being evaluated by others should be implemented.
5. The potential for additional interties with all surrounding utilities and between the Family of Agencies should be investigated further.

SJWD– Wholesale Master Plan Phase 2 B&V Project 139074.0200 Plan for Meeting Reduced Surface Water Delivery B&V File G.2 December 18, 2006
FINAL
TM4-5
1.0. INTRODUCTION
1.1. Overview
This section discusses the framework of existing agreements within which the proposed plan for meeting reduced surface water delivery requirements will be implemented. Documents reviewed in developing the plan are identified. In addition, a brief description is provided of the organization of this TM, as well as a list of abbreviations and acronyms used herein.
1.2. Background
The District provides wholesale treated water supplies to Fair Oaks Water District (Fair Oaks), Citrus Heights Water District (Citrus Heights), Orange Vale Water Company (Orange Vale), the City of Folsom (Folsom) north of the American River (the Ashland area), and the San Juan Water District retail service area. Collectively, these entities are referred to as the Family of Agencies. The District’s wholesale service area is shown on Figure 4 - 1. This figure also shows the Cooperative Transmission Pipeline (CTP) and the Fair Oaks 40 (FO40) Pipeline. The District also treats and conveys surface water, when capacity is available, to Sacramento Suburban Water District (SSWD).
The District is signatory to the WFA, an agreement among a diverse group of business and agricultural leaders, environmentalists, citizen groups, water managers, and local governments in Sacramento, Placer, and El Dorado counties. The WFA has two co-equal objectives: (1) provide a reliable and safe water supply for the region’s economic health and planned development through to the year 2030 and (2) preserve the fishery, wildlife, recreational, and aesthetic values of the Lower American River. In addition, the District is one of the American River Basin Cooperating Agencies (ARBCA), who developed a Regional Water Master Plan to ensure a reliable, high-quality water supply for the next 30 years and beyond. The plan encourages resource conservation, regional planning, and increased water efficiency and productivity. As part of this plan, the District agreed to a regional conjunctive use program to optimize the use of surface water during wet years and save groundwater for drier years.
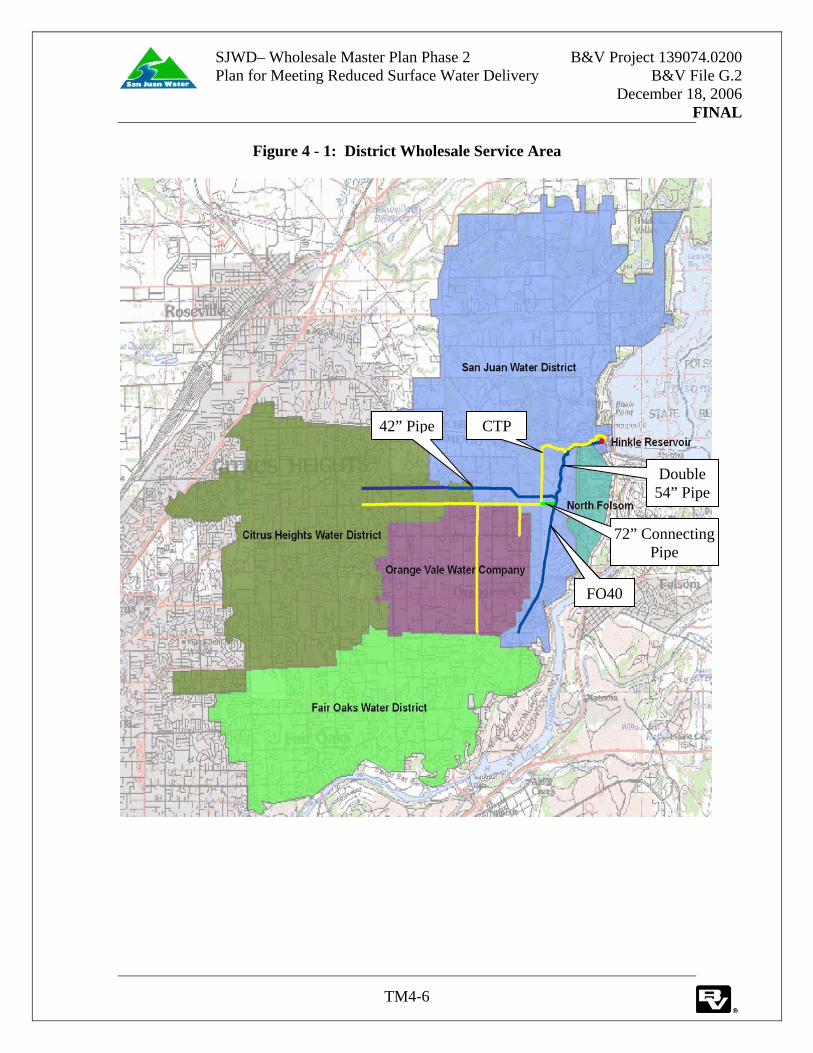
SJWD– Wholesale Master Plan Phase 2 B&V Project 139074.0200 Plan for Meeting Reduced Surface Water Delivery B&V File G.2 December 18, 2006
FINAL
TM4-6
Figure 4 - 1: District Wholesale Service Area
CTP
FO40 FO40
Double 54” Pipe
42” Pipe
72” Connecting Pipe

SJWD– Wholesale Master Plan Phase 2 B&V Project 139074.0200 Plan for Meeting Reduced Surface Water Delivery B&V File G.2 December 18, 2006
FINAL
TM4-7
1.3. Project Description
The overall goals of WMPP2 are to assess the District’s storage and transmission as related to the Family of Agencies and to develop a water supply plan within the context of the regional planning efforts described above. The major objectives of WMPP2 are to:
Determine demands/level of service
Plan for normal operations
Plan for reduced water operations
Allocate costs
These objectives are being explored through development of a series of evaluations to be presented in TMs and incorporated into a Final Report. Workshops and reviews of Administrative and Final Drafts of the Final Report will enable extensive review and input by the Family of Agencies.
1.4. Related Documents
Several reports, information files, and other documents were reviewed in development of WMPP2. These are listed in Table 4 - 1.
Table 4 - 1: Documents Review for WWMP2
Type Document Regional Reports and Agreements
American River Cooperating Agencies Regional Water Master Plan Final Report, Fall 2003
SJWD Water Forum Purveyor Specific Agreement SJWD Wholesale Master Plan Water Supply and Treatment, September 2001 Agreement for Ownership, Utilization, Operation and Maintenance of the
Cooperative Transmission Pipeline Project, July 1, 1997, as amended December 3, 2001
Water Forum Agreement (January 2000) Agency-Specific Documents
Citrus Heights Water System Master Plan, April 1998 Orange Vale Engineer’s Report, November 2000 Fair Oaks Water System Master Plan Final Draft Report (June 1998) and
Urban Water Management Plan (June 2001) Folsom Water Treatment Plant (WTP) and Master Plan Update (September
2003) Water Demand TM for San Juan Water District Retail Service Area, July 19,
2005 Other Existing System Maps
Groundwater Well Data
SJWD– Wholesale Master Plan Phase 2 B&V Project 139074.0200 Plan for Meeting Reduced Surface Water Delivery B&V File G.2 December 18, 2006
FINAL
TM4-8
1.5. Organization of This TM
This introductory section (Section 1) provides background information and presents the rationale for WMPP2. Section 2 presents the demands for the Family of Agencies, and Section 3 presents reliability goals that must be met. Section 4 describes the currently available surface water entitlements and groundwater supplies available to meet the reliability goals. Sections 5 and 6 provide the scenarios under which the supply of surface water might be reduced and strategies available to meet demand under these scenarios. Finally, Section 7 presents conclusions and recommendations.
1.6. Abbreviations and Acronyms
A list of abbreviations used in this TM is presented below.
AF acre-feet afa acre-feet annually AFY acre-feet per year ARBCA American River Basin Cooperating Agencies BMPs Best Management Practices Citrus Heights Citrus Heights Water District CTP Cooperative Transmission Pipeline CVP Central Valley Project DHS California Department of Health Services District San Juan Water District EID El Dorado Irrigation District Fair Oaks Fair Oaks Water District FO40 Fair Oaks 40 Pipeline Folsom City of Folsom max-day maximum day mgd million gallons per day MG million gallons Orange Vale Orange Vale Water Company PCWA Placer County Water Agency SJWD San Juan Water District SSWD Sacramento Suburban Water District TMs technical memoranda USBR United States Bureau of Reclamation VA Vulnerability Assessment Water Forum Sacramento Area Water Forum WFA Water Forum Agreement WMPP2 Wholesale Master Plan Phase 2 WTP water treatment plant

SJWD– Wholesale Master Plan Phase 2 B&V Project 139074.0200 Plan for Meeting Reduced Surface Water Delivery B&V File G.2 December 18, 2006
FINAL
TM4-9
2.0. DEMANDS TO BE MET
2.1. Overview
This section summarizes the results of TM No. 1 which established the annual demands that will need to be met through Year 2030. These demands are converted to daily flow rates to allow evaluation of reduced surface water delivery scenarios.
2.2. Projections
As discussed in Section 1, the District provides wholesale treated surface water supplies to five entities collectively known as the Family of Agencies. The District’s wholesale service area is shown on Figure 4 - 1 and Figure 4 - 2. The District also conveys water, when capacity is available, to SSWD.
Demand projections, through the Year 2030, are based on population projections and estimated per capita use, as developed in TM No. 1. The annual average projected demand was summarized in Table 1 - 4 of TM No. 1 and is presented again in Table 4 - 2. Table 4 - 3 presents the associated 2030 flows.
The total projected average demand does not include the volume of water used for conjunctive use and groundwater stabilization programs in accordance with the agreements discussed in Section 4.
Table 4 - 2: Summary of Projected Average Demand in Acre-feet per Year (AFY)
Year Citrus Heights
Fair Oaks Folsom Orange
Vale SJWD Retail
Total Projected Average Demand (1) (2)(3)
2005 20,036 14,611 1,382 4,982 18,691 59,702
2010 23,108 15,525 1,413 5,205 19,196 64,447
2015 23,258 16,438 1,413 5,381 19,700 66,190
2020 23,527 16,438 1,413 5,511 20,204 67,093
2025 23,577 16,438 1,413 5,592 20,708 67,728
2030 23,577 16,438 1,413 5,624 21,970 69,022
1. Does not account for water required for conjunctive use and groundwater stabilization programs.
2. Does not indicate entitlements necessary to meet firm supply for peak year demands. 3. Projected demand is base on the population projections and estimated per capita use as
developed in TM – 1.

SJWD– Wholesale Master Plan Phase 2 B&V Project 139074.0200 Plan for Meeting Reduced Surface Water Delivery B&V File G.2 December 18, 2006
FINAL
TM4-10
CTP
FO40
Table 4 - 3: Associated 2030 Flows Family Agency Average Day Flow (mgd) Max Day Flow (mgd) Peak Hour Flow (mgd)
Citrus Heights 21.0 44.0 61.1
Fair Oaks 14.7 29.4 44.0
Folsom 1.3 2.5 4.5
Orange Vale 5.0 10.1 18.1
District Retail 19.6 35.3 60.8
SSWD 59.0 59.0 59.0 Total Flow w/
SSWD 121 180 248
Total Flow w/o SSWD 61.6 121 189
Note: Average Day demands = AFY from Table 4 - 2 X (8.927 x 10-4)
Figure 4 - 2: District Wholesale Service Area

SJWD– Wholesale Master Plan Phase 2 B&V Project 139074.0200 Plan for Meeting Reduced Surface Water Delivery B&V File G.2 December 18, 2006
FINAL
TM4-11
3.0. RELIABILITY GOALS
3.1. Overview
This section documents the reliability goals established by the General Managers of the Family of Agencies.
3.2. Goals
The General Managers of the Family of Agencies established the following reliability goals:
1) Water supply equal to 100 percent of annual average demand during drier and driest years. Available water supply should consider well capacity de-rated to 80 percent of actual to account for mechanical outages, declining production, etc. This capacity should be de-rated further to 75 percent to account for only part of the year being available for pumping during Drier and Driest Years scenarios.
2) Water treatment capacity equal to at least 110 percent of maximum day demand.
3) Emergency supply equal to 100 percent of maximum day demand for 12 hours with largest source out of service.
4) Emergency supply equal to 50 percent of average day demand for extended outage of largest source.
This District is currently in compliance with the first goal and will be in compliance with the second goal following completion of planned improvements at the water treatment plant. Additional supply will be necessary to meet the third and fourth goals. The remainder of this TM outlines the evaluation of the goals and the ability of the District to meet them.

SJWD– Wholesale Master Plan Phase 2 B&V Project 139074.0200 Plan for Meeting Reduced Surface Water Delivery B&V File G.2 December 18, 2006
FINAL
TM4-12
4.0. CURRENTLY AVAILABLE SURFACE WATER ENTITLEMENTS AND GROUNDWATER SUPPLIES
4.1. Overview
This section presents the District’s approach to conjunctive use and describes entitlements to surface water, including constraints and reductions to the entitlements due to agreements with Placer County Water Agency (PCWA), the USBR, and the Sacramento Area Water Forum (Water Forum). Information is also presented on the groundwater availability for each Family Member Agency. Together these two supply sources represent the amount of water currently available to meet demand under a variety of conditions.
4.2. Conjunctive Use
The District, through its involvement in the Water Forum and the Regional Water Master Plan, has made conjunctive use a part of its sustainable supply strategy. The District has taken a position to use more surface water during wet years, and to rely more on groundwater during driest years. Since the District does not have access to groundwater it relies on family members to make up the difference of surface versus groundwater during the driest years.
Working in cooperation with the family of agencies, the District has participated in two joint effort pilot programs to demonstrate the ability of the family to do conjunctive use programs. The first was with the Sacramento Area Flood Control Agency and the second with the Environmental Water Account.
Future conjunctive use programs may include the use of Aquifer Recovery Systems to further benefit the sustainability and stability of the groundwater resource.
4.3. Surface Water Entitlements
The District acquired its first and oldest water rights entitlements through the acquisition of the North Fork Ditch Company during the District’s formation in 1954. The 33,000 AFY of Pre-1914 entitlements is the oldest adjudicated water rights on the American River. The water may be used anywhere within the District’s boundaries, and beyond if desired; it comes without any cost, and it is not constrained except that the diversion rate may not exceed a daily average of 75 cubic feet per second.
Following the construction of Folsom Dam in 1955 as part of the Central Valley Project (CVP), the District entered into negotiations with the USBR to acquire its second supply entitlement to meet the future demands within the boundaries of its service area. In the early 1960s, the District successfully completed an agreement for up to 40,000 AFY of additional supplies. The entitlement amount was determined through an agreed upon

SJWD– Wholesale Master Plan Phase 2 B&V Project 139074.0200 Plan for Meeting Reduced Surface Water Delivery B&V File G.2 December 18, 2006
FINAL
TM4-13
formula that would allow for the reduction of the entitlement if the demand was not necessary.
In 1967, the USBR exercised its right to reduce the contract amount, and lowered the CVP water entitlement from 40,000 AFY to 11,200 AFY. While the District provided the USBR with additional studies to support the need for full entitlement and continued to challenge the decision, no increases were allowed.
In the mid-1970s, PCWA offered a temporary supply agreement (if needed by the District), while negotiations with the USBR continued. By the early 1980s, after exhausting its efforts to increase the CVP water entitlement, the District entered into a contract with PCWA for its third entitlement, a diversion of up to 25,000 AFY of American River Middle Fork Project water to be diverted at Folsom Dam. The water entitlement was stipulated for use in Placer County only and could not be used in the Sacramento County portion of the District’s service area.
In 1992, federal legislation was passed to add the District’s fourth and final entitlement, 13,000 AFY of CVP water under a separate USBR agreement.
With the exception of the District’s Pre-1914 entitlement, each entitlement has constraints and conditions which have a direct impact on the amount of actual water supply available under certain conditions.
In addition to meeting entitlement agreement requirements, the District is bound by agreements as a signatory to the WFA.
The District diverts its surface water entitlements from Folsom Lake and can divert variable amounts depending on the projected annual inflow to the Lake. These diversions are shown on Figure 4 - 3.
The District’s treatment capacity is approximately 120 mgd. In accordance with previous studies, the plant capacity can be increased to 140 mgd with structural and hydraulic improvements and acceptance by the California Department of Health Services (DHS) of increased filter rates. Maximum capacity which could be achieved at this site with current technology is approximately 180 mgd.

SJWD– Wholesale Master Plan Phase 2 B&V Project 139074.0200 Plan for Meeting Reduced Surface Water Delivery B&V File G.2 December 18, 2006
FINAL
TM4-14
Figure 4 - 3: District Entitlements from Folsom Lake
4.4. Groundwater
Citrus Heights, Fair Oaks, and Orange Vale all operate and maintain groundwater wells within their service areas. Figure 4 - 4 shows the location of these wells. Table 4 - 4 lists the availability of groundwater (from existing and proposed wells) for each Agency. The well capacity information provided by each Agency is in Appendix A.
The groundwater total well capacity provided by the agencies was derated to 80 percent to account for mechanical outages and underperforming wells. In addition, because a “Dry Year” would not be declared until March, increased groundwater production would only occur for 9 months and, on an annual basis, would be only 75 percent of the derated capacity.
Inflow to Folsom Reservoir (acre-ft/year)
From the Water Forum Agreement, January 2000, Purveyor Specific Agreements, Page 292
950,000 400,000
54,200
82,200
Allo
wab
le D
iver
sion
s (a
cre-
ft/ye
ar)

SJWD– Wholesale Master Plan Phase 2 B&V Project 139074.0200 Plan for Meeting Reduced Surface Water Delivery B&V File G.2 December 18, 2006
FINAL
TM4-15
Figure 4 - 4: Existing and Planned Well Locations
W
FO40
CTP
W
W
W
P
W W
W W
W
W
P
W
W
W Existing Wells P Proposed Wells (2005)
* Tentative location for Orange Vale
P

SJWD– Wholesale Master Plan Phase 2 B&V Project 139074.0200 Plan for Meeting Reduced Surface Water Delivery B&V File G.2 December 18, 2006
FINAL
TM4-16
Table 4 - 4: Groundwater Availability
Well Capacity (mgd) Agency Existing Planned Total
Derated Capacity1
(80 %) (mgd) 75% of Derated Capacity2 (mgd)
Citrus Heights 5.6 3.03 8.6 6.8 5.3
Fair Oaks 10.5 0.0 10.5 8.2 6.4
Folsom 0.0 0.0 0.0 0.0 0.0
Orange Vale 2.8 1.5 4.3 3.5 2.7
District’s Retail 0.0 0.0 0.0 0.0 0.0
TOTAL 18.9 4.5 23.4 18.5 14.4
Note: 1) Derated to 80% to account for mechanical outages, declining production, etc.
2) Derated further to 75% to account for only part of the year being available for pumping.
3) Proposed for 2006 and 2007. 4) Proposed, but no date specified.
The evaluation of the available groundwater assumes that each Agency will maintain the wells in a manner that ensures the indicated capacity will be available when needed. This maintenance should include periodic testing of the wells to confirm the capacity as well as routine maintenance of the equipment and well redevelopment if necessary. It further assumes that the proposed wells are installed as planned.
In the evaluation of reduced surface water deliveries, the 75% of Derated Capacity (last column in Table 4 - 4) would be available to meet the demands during Drier Years, and Driest Year. However, the Derated Capacity (third column in Table 4 - 4) would be available to meet both 12 hour Emergency and Extended Emergency outage scenarios due to the ability to operate the wells when necessary as opposed for waiting for a declaration of Drier or Driest Year.

SJWD– Wholesale Master Plan Phase 2 B&V Project 139074.0200 Plan for Meeting Reduced Surface Water Delivery B&V File G.2 December 18, 2006
FINAL
TM4-17
5.0. SHORTAGE SCENARIOS
5.1. Overview
This section describes the conditions that could result in a reduced volume of surface water being available to the Agencies. These reductions would result from reduced inflows into Folsom Lake or from emergency outages. The paragraphs below describe the amount of water available pursuant to the WFA and USBR agreements during reduced inflows to Folsom Lake, the location of outages representing the emergency scenarios, and the resulting impact to available supplies.
5.2. Normal
The normal condition (Most Years) is defined in the WFA as years when the projected March through November unimpaired inflow to Folsom Reservoir is greater than 950,000 AF. In these years, the District may divert and use up to 82,200 AF.
5.3. Drier Year
Consistent with the WFA, “Drier Years” are defined as years when the projected March through November unimpaired inflow to Folsom Reservoir is less than 950,000 AF and equal to or greater than 400,000 AF. In these years, the District will divert and use a decreasing amount of surface water from 82,200 AF to 54,200 AF in proportion to the decrease in the unimpaired inflow to Folsom Reservoir. The USBR could invoke a 25% reduction even in years not requiring a WFA reduction.
5.4. Driest Year
Also consistent with the WFA, “Driest Years” are defined as years when the projected March through November unimpaired inflow is less than 400,000 AF. In these years, the District will reduce its diversion to 54,200 AF, equivalent to its baseline amount. The water supply agreement also acknowledges that, in years when inflow is less than 400,000 AF, insufficient water may be available to provide the purveyors with the driest year’s quantities specified in their agreements and provide the expected driest year’s flows to the mouth of the American River. In such years, the District would participate in a conference with other stakeholders on how the available water should be managed (thus, this scenario is known as a Conference Year).
Figure 4 - 5 shows drier and driest year definitions which are linked to inflow to Folsom Reservoir.

SJWD– Wholesale Master Plan Phase 2 B&V Project 139074.0200 Plan for Meeting Reduced Surface Water Delivery B&V File G.2 December 18, 2006
FINAL
TM4-18
Figure 4 - 5: Drier and Driest Year Definitions
5.5. Emergency
Emergency conditions are defined as any unanticipated, partial or complete, interruption in service from the system. Examples include mechanical, structural, electrical, or control failures at USBR or District facilities, whether caused by natural disasters, terrorist actions, or other factors. Figure 4 - 6 shows emergency conditions characterized by severity and duration.
Figure 4 - 6: Characterizations of Emergency Conditions
Inflow to Folsom Reservoir (acre-ft/year)
950,000 400,000
54,200
82,200
Allo
wab
le D
iver
sion
s (a
cre-
ft/ye
ar)
Driest Years
Drier Years
Most Years
Duration
Ava
ilabl
e Su
rfac
e W
ater
as %
of S
uppl
y
0 2 hr 12 hr 24 hr 48+ hr
0
25
50
75
100
Warning
Shortage
Crisis
Emergency
Normal
SJWD– Wholesale Master Plan Phase 2 B&V Project 139074.0200 Plan for Meeting Reduced Surface Water Delivery B&V File G.2 December 18, 2006
FINAL
TM4-19
Emergencies could include supply interruptions, Hinkle Reservoir storage issues, natural disaster, deliberate acts to disrupt service and other unanticipated conditions.
5.5.1. Raw Water Supply and WTP Interruptions
The USBR owns and operates Folsom Dam, which is fed from the North and South Forks of the American River. Surface water from Folsom Lake is currently the District’s sole source of water supply. Water is moved either by gravity or by pumping from the USBR’s pumping station located at the base of Folsom Dam. An 84-inch pipe from the USBR’s facilities splits into a 72-inch and then into a 54-inch diameter pipe that conveys water to the District’s WTP. The current design capacity is 120 mgd with planned expansions to 140 mgd. Issues that could affect the surface water supply range from USBR service interruptions to fire to chemical spills to disruption of the treatment process.
5.5.2. Hinkle Reservoir Storage Issues
Treated water flows to the 62 MG Hinkle Reservoir, the final component of the District’s water supply and treatment system. The lined and covered earthen reservoir acts as the clearwell for treated water for the WTP as well as a facility for system storage. Water stored in the reservoir flows by gravity to the District’s wholesale customers and a portion of its retail service area. Additional water is pumped to the remainder of the retail service area and to the Ashland area of Folsom. As developed in TM 2 of the WWMP2, storage at the reservoir is currently insufficient for emergency conditions.
5.5.3. Natural Disasters
The most probable natural disasters affecting surface water supplies in the area would be an extreme earthquake or long-term drought. The service area is located in Seismic Area Zone 3 and, historically, has experienced severe droughts.
5.5.4. Terrorist Actions
The Public Health Security and Bioterrorism Preparedness and Response Act of 2002 required public water supply systems to prepare a Vulnerability Assessment (VA) to identify system vulnerabilities to acts or events which may substantially disrupt the system’s ability to provide a safe and reliable supply of drinking water. The District has undertaken this evaluation and is developing a security program including emergency response plans. Nonetheless, it is possible that a terrorist attack could impact surface water supply facilities. In addition, actions of disgruntled employees or acts of vandalism could cause failures in the system.

SJWD– Wholesale Master Plan Phase 2 B&V Project 139074.0200 Plan for Meeting Reduced Surface Water Delivery B&V File G.2 December 18, 2006
FINAL
TM4-20
5.5.5. Other Unanticipated Conditions
Other unanticipated conditions that could affect the water supply include a break in one of the transmission pipelines. The District currently maintains 163 miles of pipeline, which transports water to wholesale and retail customers.
5.5.6. Outage Scenarios
Several potential outage scenarios were considered for this analysis. The locations of the outages are presented on Figure 4 - 7 and are listed below.
A. Raw Water Supply or WTP B. Hinkle Reservoir C. CTP pipe leaving Hinkle Reservoir D. FO40 pipe leaving Hinkle Reservoir E. FO40 pipe to Fair Oaks F. FO40 pipe to the District, Orange Vale, and Citrus Heights G. CTP pipe to Orange Vale H. CTP pipe to Orange Vale and Fair Oaks I. CTP pipe to Citrus Heights and SSWD
Figure 4 - 7: Outage Scenarios
A
D
B C
E
F
GH
I
CTP
FO40

SJWD– Wholesale Master Plan Phase 2 B&V Project 139074.0200 Plan for Meeting Reduced Surface Water Delivery B&V File G.2 December 18, 2006
FINAL
TM4-21
5.6. Summary of Water Available During Shortage Scenarios
Table 4 - 5 presents the Year 2030 demand average and the currently available surface and groundwater supplies.
Table 4 - 5: Year 2030 Average Demands and Currently Available Supplies Surface Water Groundwater (mgd)
Family Agency
Year 2030
Average Demand
(mgd) (1)
Normal Year (mgd)
Drier Year (mgd)
Driest Year (mgd)
(2)
Normal, Drier & Driest Year (mgd)
Emergency Outage (mgd)
Citrus Heights 21.0 21.0 21.0 – 16.4 16.4 5.3 6.8
Fair Oaks 14.7 14.7 14.7 – 12.3 12.3 6.4 8.2
Folsom 1.3 1.3 1.3 – 0.9 0.9 0.0 0.0
Orange Vale 5.0 5.0 5.0 – 3.7 3.7 2.7 3.5 District’s
Retail 19.6 19.6 19.6 – 12.1 12.1 0.0 0.0
Water for Conjunctive
Use 12.9 12.9 12.9 – 1.5 1.5 0.0 0.0
Total Flow 74.5 74.5 74.5 – 46.9 46.9 14.4 18.5 1. Year 2030 Average demand from Table 4 – 2. 2. Surface Water allocated to each member to meet Driest Year Demand in excess of
available groundwater.
As indicated in Table 4 - 5, sufficient surface water and groundwater is available in both Drier and Driest Years while maintaining the available conjunctive use water. This analysis assumes that even in the Driest Year (Conference Years) sufficient water exists to meet the District’s entitlement.
Table 4 - 6 presents the water available to each of the Agencies under different emergency outage scenarios. Each agency could receive at least the indicated flow; however, most agencies, except Folsom and SSWD, would be able to supplement this water by requesting an increase in the flow in the other transmission pipeline (either the FO40 or CTP, whichever is not out of service) and transferring the water through their distribution systems. These values were determined by the max-day capacity of the transmission system, plus the groundwater available within that Agency. Values

SJWD– Wholesale Master Plan Phase 2 B&V Project 139074.0200 Plan for Meeting Reduced Surface Water Delivery B&V File G.2 December 18, 2006
FINAL
TM4-22
highlighted in yellow meet the extended emergency requirement but not the 12 hour emergency requirement. Values highlighted in red meet neither criterion.
Table 4 - 6: Available Water during Various Emergency Outage Scenarios
Family Agency
12-hr Emergency
Demand (mgd)
Extended Emergency
Demand (mgd)
A (mgd)
B (mgd)
C (mgd)
D (mgd)
E (mgd)
F (mgd)
G (mgd)
H (mgd)
I (mgd)
Citrus Heights 44.1 10.5 6.8 20.3 27.6 30.0 50.8 30.0 50.8 50.8 27.6
Fair Oaks 29.4 7.4 8.2 17.2 21.2 24.5 24.5 37.6 37.6 21.2 37.6 Folsom 2.6 0.7 0.0 0.8 2.5 0.1 2.2 2.4 2.6 2.6 2.6 Orange
Vale 10.0 2.5 3.5 6.6 3.5 13.5 13.5 13.5 8.0 9.0 13.5 SJWD Retail 35.3 9.8 0.0 10.7 34.5 0.7 29.3 33.2 35.2 35.2 35.2
Total Flow 121 31 18.5 55.6 89.3 68.8 120.3 116.8 134.2 118.8 116.5
Includes both available surface water and groundwater
Note: A Raw Water Supply or WTP B Hinkle Reservoir C CTP leaving Hinkle Reservoir D FO40 leaving Hinkle Reservoir E FO40 to Fair Oaks F FO40 to District, Orange Vale, and Citrus Heights G CTP to Orange Vale H CTP to Orange Vale and Fair Oaks I CTP to Citrus Heights and SSWD

SJWD– Wholesale Master Plan Phase 2 B&V Project 139074.0200 Plan for Meeting Reduced Surface Water Delivery B&V File G.2 December 18, 2006
FINAL
TM4-23
6.0. AVAILABLE STRATEGIES TO ADDRESS SHORTAGES
6.1. Overview
This section presents strategies available to meet the reduced surface water delivery shortages identified in Section 4. Strategies discussed include demand reduction, storage, groundwater alternative, surface water, improved reliability, and interties. These strategies and their applicability to each scenario are summarized in Table 4 - 7.
Table 4 - 7: Applicability of Surface Water Shortage Strategies
6.2. Demand Reduction
Water conservation is an important part of demand reduction strategies being implemented in the District’s service area. The Family of Agencies has aggressively implemented water conservation BMPs and has achieved substantial savings. In addition, the District has developed a 5-Stage Water Conservation program for its retail customers that include a “staircase” of exceedingly stringent water conservation measures for implementation during drought and emergencies. The intent of the program is to
Strategy Drier Years Scenarios
Driest Years Scenarios
Emergency Scenarios
Demand Reduction
BMPs
5-Stage Water Conservation
Water Pricing Measures
Storage
Groundwater Surface
Alternative Surface Water
Improved Reliability
Interties
Essential Strategy Potentially Helpful Strategy Not Applicable

SJWD– Wholesale Master Plan Phase 2 B&V Project 139074.0200 Plan for Meeting Reduced Surface Water Delivery B&V File G.2 December 18, 2006
FINAL
TM4-24
provide a coordinated basis for requesting water use cutbacks by the District’s retail customers. The program, which is summarized in Table 4 - 8, defines five water supply stages:
Stage One, Normal Water Supply. The District’s supply or distribution system is able to meet all water demands of its customers in the immediate future.
Stage Two, Water Warning. There is a probability that the District’s supply or distribution system will not be able to meet all the water demands of its customers. All customers will be required to reduce consumption by 5 to 10 percent.
Stage Three, Water Shortage. The District’s supply or distribution system will not be able to meet all the water demands of its customers. All customers will be required to reduce consumption by 11 to 25 percent.
Stage Four, Water Crisis. The District’s supply or distribution system is not able to meet all the water demands of its customers under Stage 3 Water Shortage requirements. All customers will be required to reduce consumption by 26 to 50 percent.
Stage Five, Water Emergency. The District is experiencing a major failure of a water supply, shortage, or distribution facility. All customers will be required to restrict consumption to 50 percent or less.
Table 4 - 8: Summary of District’s 5-Stage Water Conservation Program
Stage Description Water Consumption Reduction
Landscape Irrigation
Other Actions
No: 1: Normal Water Supply
7-step program of actions to achieve water-use efficiencies.
---------- ---------- ----------
No: 2: Water Warning
Stage 1 actions plus additional measures.
5 – 10% Between midnight and 10 a.m.
----------
No. 3: Water Shortage
Stage 1 and Stage 2 actions plus additional measures.
11 – 25% Two days per week
----------
No. 4: Water Crisis
Stage 1, 2, and 3 actions plus additional measures.
26 – 50% One day per week
No potable water to refill pools or water features. Recycled water for car washing and other uses.
No. 5: Water Emergency
Stages 1 through 4 plus additional measures.
At least 50%
Prohibited No potable water for construction purposes. No new connections to District system.
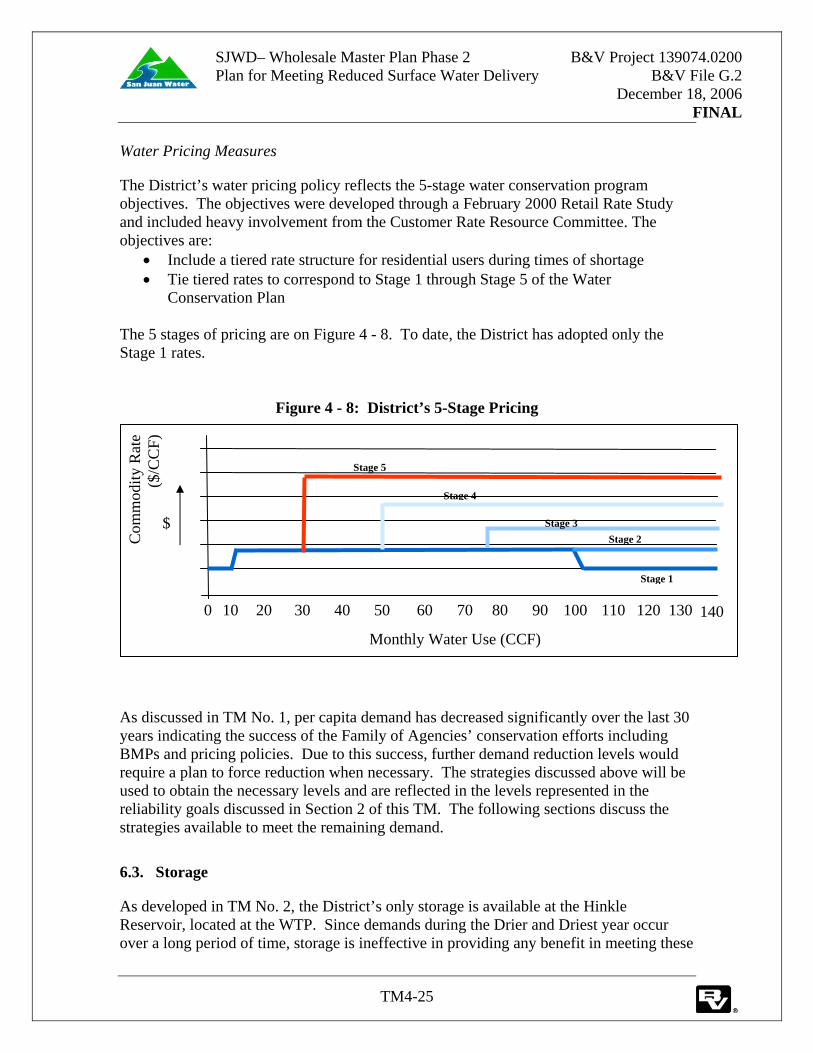
SJWD– Wholesale Master Plan Phase 2 B&V Project 139074.0200 Plan for Meeting Reduced Surface Water Delivery B&V File G.2 December 18, 2006
FINAL
TM4-25
Water Pricing Measures
The District’s water pricing policy reflects the 5-stage water conservation program objectives. The objectives were developed through a February 2000 Retail Rate Study and included heavy involvement from the Customer Rate Resource Committee. The objectives are:
• Include a tiered rate structure for residential users during times of shortage • Tie tiered rates to correspond to Stage 1 through Stage 5 of the Water
Conservation Plan The 5 stages of pricing are on Figure 4 - 8. To date, the District has adopted only the Stage 1 rates.
Figure 4 - 8: District’s 5-Stage Pricing
As discussed in TM No. 1, per capita demand has decreased significantly over the last 30 years indicating the success of the Family of Agencies’ conservation efforts including BMPs and pricing policies. Due to this success, further demand reduction levels would require a plan to force reduction when necessary. The strategies discussed above will be used to obtain the necessary levels and are reflected in the levels represented in the reliability goals discussed in Section 2 of this TM. The following sections discuss the strategies available to meet the remaining demand.
6.3. Storage
As developed in TM No. 2, the District’s only storage is available at the Hinkle Reservoir, located at the WTP. Since demands during the Drier and Driest year occur over a long period of time, storage is ineffective in providing any benefit in meeting these
Monthly Water Use (CCF)
140
$
0 30 20 40 60 50 70 80 100 90 110 120 10 130
Stage 5
Stage 4
Stage 2
Stage 1
Stage 3
Com
mod
ity R
ate
($/C
CF)

SJWD– Wholesale Master Plan Phase 2 B&V Project 139074.0200 Plan for Meeting Reduced Surface Water Delivery B&V File G.2 December 18, 2006
FINAL
TM4-26
demands. However, storage can play a critical role in meeting demands during a short term emergency. As indicated in Section 2 of this TM, the emergency supply would need to be able to meet the maximum day demand for 12 hours (60.7 MG).
6.3.1. Hinkle Reservoir
Hinkle Reservoir is a 62 MG, lined and covered earthen and concrete structure, which acts as the clearwell for treated water for the WTP as well as a facility for system storage. Water stored in the reservoir flows by gravity to the District’s wholesale customers and a portion of its retail service area. Additional water is pumped to the remainder of the retail service area and to the Ashland area of Folsom. As developed in TM 2, the reservoir has approximately 42.3 MG as available usable storage.
Also as developed in TM 2, storage at the reservoir is currently insufficient for emergency conditions. Emergency storage available is only 25.8 MG when the WTP is operating at 140 mgd, the anticipated plant capacity after improvements are completed. However, 60.7 MG of storage (or 63.5 MG if SSWD is supplied water for 2 hours after the start of the emergency) is required to meet the 12 hour emergency demand if no other strategy is employed.
Figure 4 - 9 shows the storage issues at Hinkle Reservoir.
Figure 4 - 9: Hinkle Reservoir Storage Issue
Citrus Heights – 22.0 Fair Oaks – 14.7 Folsom – 1.3
Orange Vale – 5.0 SJWD Retail – 17.7

SJWD– Wholesale Master Plan Phase 2 B&V Project 139074.0200 Plan for Meeting Reduced Surface Water Delivery B&V File G.2 December 18, 2006
FINAL
TM4-27
6.3.2. New Storage
An additional 38MG will be required to meet 12-hr emergency demand for all agencies. This storage could be provided in a single location or in multiple locations. Multiple locations would provide additional redundancy; however, it would likely increase the costs and may increase the difficulty of project implementation due to the need to obtain multiple properties.
Further evaluation of the optimal method to provide the required storage is recommended. This evaluation should include a public outreach component.
6.4. Groundwater
No additional groundwater is necessary to meet demands during the drier and driest years assuming that the groundwater availability as reported by the Agencies is maintained. However, insufficient water is available to meet emergency conditions. Table 4 - 9 indicates the amount of additional groundwater that would be required, assuming no contribution from storage.
Positive values represent the additional amount of water required. Negative values represent the excess amount of water available with existing groundwater and surface water supplies.
As shown in Table 4 - 9, there are scenarios where some agencies have more groundwater available than required to meet their demands. Therefore, in order to fully utilize the available groundwater during shortages, groundwater will need to able to be distributed to areas other than those from which it is pumped. This will require a pumping system, perhaps using temporary portable pumps with hook-ups to the existing pipelines.

SJWD– Wholesale Master Plan Phase 2 B&V Project 139074.0200 Plan for Meeting Reduced Surface Water Delivery B&V File G.2 December 18, 2006
FINAL
TM4-28
Table 4 - 9: Additional Groundwater Required to Meet Emergency Outage Scenarios Family Agency A (mgd) B (mgd) C (mgd) D (mgd) E (mgd) F (mgd) G (mgd) H (mgd) I (mgd)
Citrus Heights
37.3 3.7
23.8 -9.8
16.5 -17.1
14.1 -19.5
-6.7 -40.3
14.1 -19.5
-6.7 -40.3
-6.7 -40.3
16.5 -17.1
Fair Oaks
21.2 -0.8
12.2 -9.8
8.2 -13.8
4.9 -17.1
4.9 -17.1
-8.2 -30.2
-8.2 -30.2
8.2 -13.8
-8.2 -30.2
Folsom 2.6 0.7
1.8 -0.1
0.1 -1.8
2.5 0.6
0.4 -1.5
0.2 -1.7
0.0 -1.9
0.0 -1.9
0.0 -1.9
Orange Vale
6.5 -1.0
3.4 -4.1
6.5 -1.0
-3.5 -11.0
-3.5 -11.0
-3.5 -11.0
2.0 -5.5
1.0 -6.5
-3.5 -11.0
SJWD Retail
35.3 9.8
24.6 -0.9
0.8 -24.7
34.6 9.1
6.0 -19.5
2.1 -23.4
0.1 -25.4
0.1 -25.4
0.1 -25.4
Total Flow
103 12
66 -25
32 -58
53 -38
1.1 -89
4.6 -86
-13 -103
2.6 -88
4.9 -86
Note: Values above are as follows:
12-hr Emergency
Extended Emergency
Positive values represent the additional amount of water required. Negative values represent the
excess amount of water available with existing groundwater and surface water supplies. Note:
A Raw Water Supply or WTP B Hinkle Reservoir C CTP leaving Hinkle Reservoir D FO40 leaving Hinkle Reservoir E FO40 to Fair Oaks F FO40 to District, Orange Vale, and Citrus Heights G CTP to Orange Vale H CTP to Orange Vale and Fair Oaks I CTP to Citrus Heights and SSWD
6.5. Alternative Surface Water
Alternative surface water has the potential to help meet drier, driest, and emergency demands. However, new surface water supplies are difficult to develop and take long periods of time to implement. The Sacramento River diversion should be considered as a potential supply in the future.

SJWD– Wholesale Master Plan Phase 2 B&V Project 139074.0200 Plan for Meeting Reduced Surface Water Delivery B&V File G.2 December 18, 2006
FINAL
TM4-29
6.6. Improved Reliability/Redundancy
Section 5.5 outlines several potential emergency conditions. Key to addressing these emergency conditions is improving reliability and redundancy. Improvements should be considered on the supply side (intake and WTP) and on the transmission side (pipelines).
6.6.1. Supply Side Improvements
Improvements that are being evaluated by others at the WTP include a second intake, a parallel raw water pipeline, and bifurcation of the Hinkle Reservoir. Figure 4 - 10 presents the enhancements that are being considered.
The second intake could be located in the vicinity of the existing intake. However, alternative locations should also be investigated. One approach to an alternative location would be co-use of a site with another utility. The El Dorado Irrigation District has proposed the construction of a new intake in Folsom Lake. This new intake could present co-use opportunities that should be investigated further.
Figure 4 - 10: Reliability Enhancements
New Intake Parallel Pipeline
Bifurcation of Hinkle

SJWD– Wholesale Master Plan Phase 2 B&V Project 139074.0200 Plan for Meeting Reduced Surface Water Delivery B&V File G.2 December 18, 2006
FINAL
TM4-30
6.6.2. Transmission System Improvements
The reliability of the transmission system can be improved through piping improvements and interties with other utilities. Piping improvements may entail selective repair or replacement and is being evaluated separately.
Interties with neighboring utilities will also improve reliability. Proposed and potential intertie locations are presented in Figure 4 - 11.
Table 4 - 10 presents the potential water available from the interties.
Table 4 - 10: Potential Water Available from Interties
Neighboring Utilities Water Available (mgd) Roseville 2.4 PCWA 2.5
Total Flow 4.9
Additional interties should be investigated to determine appropriate locations and the volume of water that could be made available. The potential for additional interties with all surrounding utilities and between the Family of Agencies should be investigated further.

SJWD– Wholesale Master Plan Phase 2 B&V Project 139074.0200 Plan for Meeting Reduced Surface Water Delivery B&V File G.2 December 18, 2006
FINAL
TM4-31
Figure 4 - 11: Inter-ties with Neighboring Agencies
10” Intertie with Roseville
2 12” Intertie with PCWA
12” Intertie with Roseville
Hinkle Reservoir
FO40
CTP
SJWD– Wholesale Master Plan Phase 2 B&V Project 139074.0200 Plan for Meeting Reduced Surface Water Delivery B&V File G.2 December 18, 2006
FINAL
TM4-32
7.0. CONCLUSIONS AND RECOMMENDATIONS
7.1. Overview
This section presents conclusions and recommendations linked to the reliability goals established by the General Managers of the Family of Agencies. (See Executive Summary and Section 2 for a listing of the reliability goals.)
7.2. Conclusions
7.2.1. Drier and Driest Years
No additional groundwater or storage is required to meet demands during Drier and Driest Years.
7.2.2. 12-Hour Emergency
To meet the goal of providing water sufficient to supply the max day demand for 12 hours, 38 million gallons of storage or 103 mgd of groundwater is required. However, the storage is only usable if the location is downstream of the outage point. The additional groundwater is only usable with pump back provisions and if the outages are upstream of the connection.
7.2.3. Extended Emergency
Additional storage would be ineffective in meeting an extended emergency outage. To meet extended emergency demands, 12 mgd of additional groundwater would be required. However, the groundwater is only usable with some pump back provisions and if the outages are upstream of the connection.
7.2.4. Additional Activities
In addition to the conclusions associated with meeting demands under each scenario, this study identified the following activities that are required to realize the benefits provided by the recommended improvements or that will result in enhancements to the system.
1. The amount of groundwater currently available should be maintained by periodically testing the wells to confirm capacity, routine maintenance, and well redevelopment, if necessary.
2. The Family Members should install the proposed wells at the indicated capacity.
3. The number, size, and location of additional storage facilities should be evaluated further.

SJWD– Wholesale Master Plan Phase 2 B&V Project 139074.0200 Plan for Meeting Reduced Surface Water Delivery B&V File G.2 December 18, 2006
FINAL
TM4-33
4. The improvements at the WTP being evaluated by others should be implemented.
5. The potential for additional interties with all surrounding utilities and between the Family of Agencies should be investigated further.
7.3. Recommendations
Extended emergency needs can only be met with groundwater if the emergency entails a loss of the surface water supply. The minimum additional groundwater required would be 12 mgd. This capacity of additional groundwater is equivalent to 6.0 mgd over the 12 hour emergency outage. As a result the storage required under this outage scenario could be reduced to 32 MG (38 - 6.0).
It is recommended that a minimum of 12 mgd of additional groundwater and 32 MG of storage be added to the system. An evaluation of interconnects and pump back provisions should be conducted to evaluate the optimal methods to fully utilize this additional capacity.
The additional activities listed in the conclusions should be implemented.

SJWD– Wholesale Master Plan Phase 2 B&V Project 139074.0200 Plan for Meeting Reduced Surface Water Delivery B&V File G.2 December 18, 2006
FINAL
TM4-A1
APPENDIX
A1. Orange Vale Wells A2. Citrus Heights Wells A3. Fair Oaks Wells
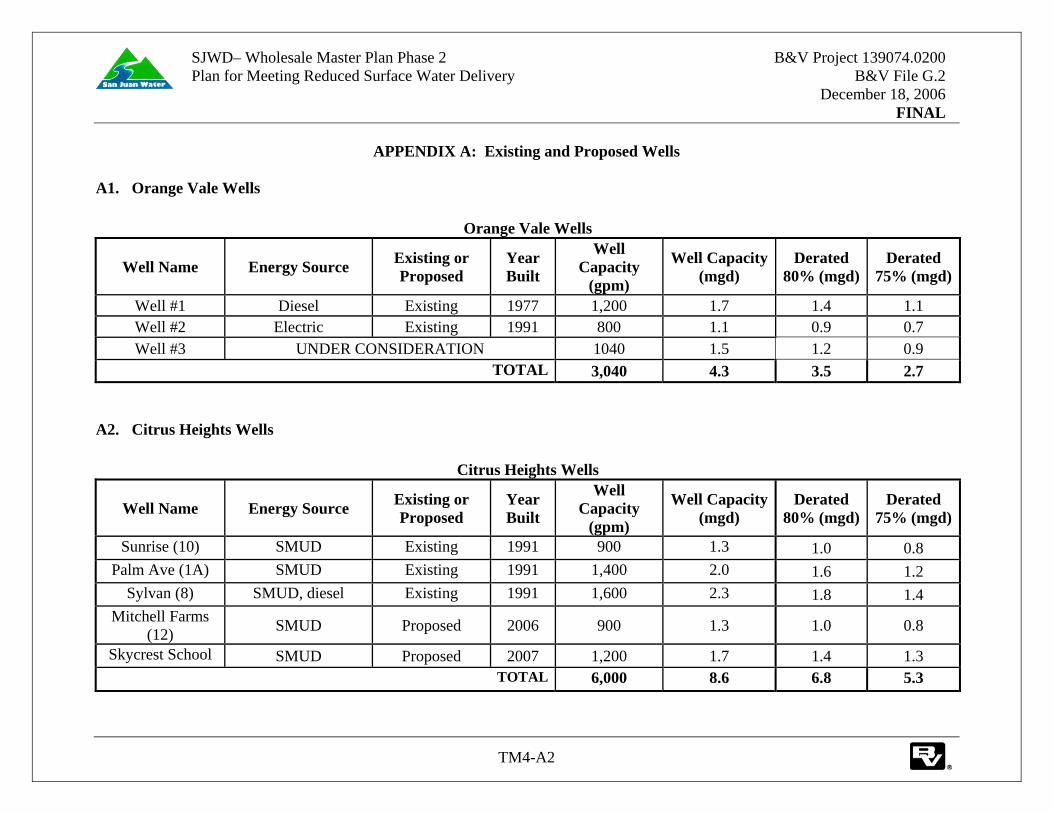
SJWD– Wholesale Master Plan Phase 2 B&V Project 139074.0200 Plan for Meeting Reduced Surface Water Delivery B&V File G.2 December 18, 2006
FINAL
TM4-A2
APPENDIX A: Existing and Proposed Wells A1. Orange Vale Wells
Orange Vale Wells
Well Name Energy Source Existing or Proposed
Year Built
Well Capacity
(gpm)
Well Capacity (mgd)
Derated 80% (mgd)
Derated 75% (mgd)
Well #1 Diesel Existing 1977 1,200 1.7 1.4 1.1 Well #2 Electric Existing 1991 800 1.1 0.9 0.7 Well #3 UNDER CONSIDERATION 1040 1.5 1.2 0.9
TOTAL 3,040 4.3 3.5 2.7 A2. Citrus Heights Wells
Citrus Heights Wells
Well Name Energy Source Existing or Proposed
Year Built
Well Capacity
(gpm)
Well Capacity (mgd)
Derated 80% (mgd)
Derated 75% (mgd)
Sunrise (10) SMUD Existing 1991 900 1.3 1.0 0.8 Palm Ave (1A) SMUD Existing 1991 1,400 2.0 1.6 1.2
Sylvan (8) SMUD, diesel Existing 1991 1,600 2.3 1.8 1.4 Mitchell Farms
(12) SMUD Proposed 2006 900 1.3 1.0 0.8
Skycrest School SMUD Proposed 2007 1,200 1.7 1.4 1.3 TOTAL 6,000 8.6 6.8 5.3

SJWD– Wholesale Master Plan Phase 2 B&V Project 139074.0200 Plan for Meeting Reduced Surface Water Delivery B&V File G.2 December 18, 2006
FINAL
TM4-A3
A3. Fair Oaks Wells
Fair Oaks Wells
Well Name Energy Source Existing or Proposed
Year Built
Well Capacity
(gpm)
Well Capacity (mgd)
Derated 80% (mgd)
Derated 75% (mgd)
Chicago SMUD Existing 1947 581 0.8 0.6 0.5 New York SMUD Existing 1972 830 1.2 1.0 0.8 Casabella SMUD Existing 1953 850 1.2 1.0 0.8
Park SMUD Existing 1990 1,090 1.6 1.3 1.0 Northridge SMUD Existing 1992 940 1.4 1.1 0.8
Town SMUD Proposed 2006 1,500 2.2 1.8 1.4 Heather SMUD Proposed 2006 1,200 1.7 1.4 1.1
TOTAL 6,991 10.1 8.2 6.4

BLACK & VEATCH TECHNICAL MEMORANDUM NO. 5
TM5-1
SJWD–Wholesale Master Plan Phase 2 B&V Project 139074.0200 Opinion of Cost and Implementation Schedule B&V File G.2 For Recommended Improvements December 18, 2006
FINAL
To: Keith Durkin
Prepared By: David Carlson Nhicolas Ly Reviewed By: Jim English
Melissa Blanton EXECUTIVE SUMMARY
Purpose
San Juan Water District (District, SJWD) is developing the Wholesale Master Plan Phase 2 (WMPP2) as a follow up to the Water Forum and Regional Water Master Plan. Overall goals for WMPP2 are to assess the District’s storage and transmission as related to the Family of Agencies (Citrus Heights Water District, Fair Oaks Water District, the Ashland area of the City of Folsom, Orange Vale Water Company, and SJWD Retail) and to develop a water supply plan for the Family of Agencies within the context of regional planning efforts. The major objectives of WMPP2 are to: (1) determine demands/level of service, (2) plan for normal operations, (3) plan for reduced water operations, and (4) determine costs for any additional required facilities. Project deliverables include a series of technical memoranda (TMs) and a Final Report. This TM, Opinion of Cost and Implementation Schedule for Recommended Improvements, develops facilities to implement the improvements identified in TM No. 4 – Plan for Meeting Reduced Surface Water Delivery. An opinion of probable project cost and information on cost allocations are also presented. Scope
TM No. 4, Plan for Meeting Reduced Surface Water Delivery, evaluated improvements required to meet projected demands under both normal and emergency operation. The evaluation concluded that the system is adequate to meet demands during normal conditions, but may be unable to meet demands under emergency conditions. As a result, it was recommended that 12 million gallons per day (mgd) of well capacity and 32 million gallon (MG) of storage should be added. In this TM, an analysis was performed to determine the number of storage tanks and wells that would be required to meet these requirements. The need for pumping of the storage volume was also assessed. After determining the required facilities, opinions of probable project cost were developed for the facilities. Factors to consider in the allocation of the costs among the Family of Agencies were also developed.
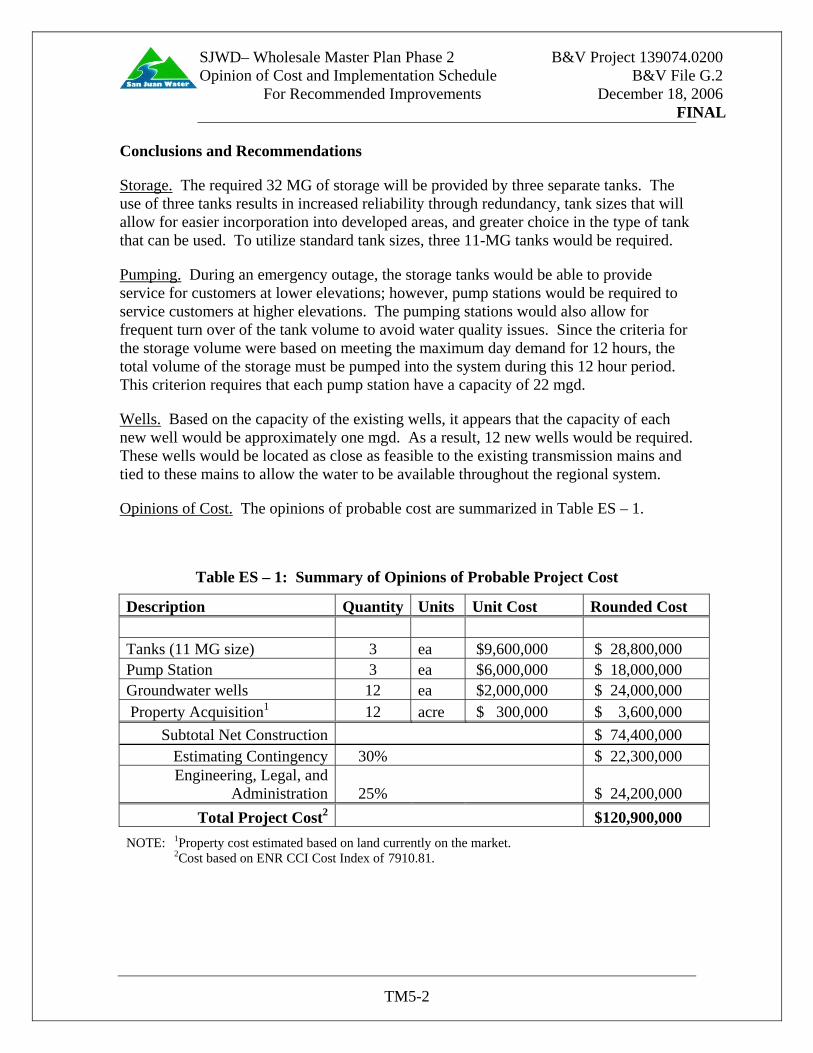
SJWD– Wholesale Master Plan Phase 2 B&V Project 139074.0200 Opinion of Cost and Implementation Schedule B&V File G.2 For Recommended Improvements December 18, 2006 FINAL
TM5-2
Conclusions and Recommendations
Storage. The required 32 MG of storage will be provided by three separate tanks. The use of three tanks results in increased reliability through redundancy, tank sizes that will allow for easier incorporation into developed areas, and greater choice in the type of tank that can be used. To utilize standard tank sizes, three 11-MG tanks would be required.
Pumping. During an emergency outage, the storage tanks would be able to provide service for customers at lower elevations; however, pump stations would be required to service customers at higher elevations. The pumping stations would also allow for frequent turn over of the tank volume to avoid water quality issues. Since the criteria for the storage volume were based on meeting the maximum day demand for 12 hours, the total volume of the storage must be pumped into the system during this 12 hour period. This criterion requires that each pump station have a capacity of 22 mgd.
Wells. Based on the capacity of the existing wells, it appears that the capacity of each new well would be approximately one mgd. As a result, 12 new wells would be required. These wells would be located as close as feasible to the existing transmission mains and tied to these mains to allow the water to be available throughout the regional system.
Opinions of Cost. The opinions of probable cost are summarized in Table ES – 1.
Table ES – 1: Summary of Opinions of Probable Project Cost
Description Quantity Units Unit Cost Rounded Cost Tanks (11 MG size) 3 ea $9,600,000 $ 28,800,000 Pump Station 3 ea $6,000,000 $ 18,000,000 Groundwater wells 12 ea $2,000,000 $ 24,000,000 Property Acquisition1 12 acre $ 300,000 $ 3,600,000
Subtotal Net Construction $ 74,400,000 Estimating Contingency 30% $ 22,300,000 Engineering, Legal, and
Administration 25% $ 24,200,000 Total Project Cost2 $120,900,000
NOTE: 1Property cost estimated based on land currently on the market. 2Cost based on ENR CCI Cost Index of 7910.81.

SJWD– Wholesale Master Plan Phase 2 B&V Project 139074.0200 Opinion of Cost and Implementation Schedule B&V File G.2 For Recommended Improvements December 18, 2006 FINAL
TM5-3
Cost Allocation Considerations. The Family of Agencies is presently holding discussions on cost allocation policies. Considerations may include allocations based on demand under the emergency outages and each Agency’s current supply.
Schedule. Table ES – 2 presents the implementation schedule necessary to meet the emergency criteria that has been established.
Table ES – 2: Schedule of Recommended Improvements
Tanks Pump Stations Wells Year Number Capacity Number Capacity Number Capacity Current Need 3 33 MG 3 66 mgd 10 10 mgd
2013 1 1 mgd 2021 1 1 mgd Total 3 33 MG 3 66 mgd 12 12 mgd

SJWD– Wholesale Master Plan Phase 2 B&V Project 139074.0200 Opinion of Cost and Implementation Schedule B&V File G.2 For Recommended Improvements December 18, 2006 FINAL
TM5-4
1.0. INTRODUCTION
1.1. Overview
This section presents the project background and description. Also provided are a brief narrative on the organization of this TM and a list of abbreviations and acronyms used herein.
1.2. Background
The District provides wholesale treated water supplies to Fair Oaks Water District (Fair Oaks), Citrus Heights Water District (Citrus Heights), Orange Vale Water Company (Orange Vale), the City of Folsom (Folsom) north of the American River (the Ashland area), and the SJWD retail service area. Collectively, these entities are referred to as the Family of Agencies. The District’s wholesale service area and its transmission pipelines, the Cooperative Transmission Pipeline (CTP) and the Fair Oaks 40 (FO40), are shown on Figure 1 - 1. The District also treats and conveys surface water, when capacity is available, to Sacramento Suburban Water District (SSWD).
The District is signatory to the Sacramento Area Water Forum Agreement (WFA), an agreement among a diverse group of business and agricultural leaders, environmentalists, citizen groups, water managers, and local governments in Sacramento, Placer, and El Dorado counties. The WFA has two co-equal objectives: (1) provide a reliable and safe water supply for the region’s economic health and planned development through to the year 2030 and (2) preserve the fishery, wildlife, recreational, and aesthetic values of the Lower American River.
1.3. Project Description
The overall goals of WMPP2 are to assess the District’s storage and transmission as related to the Family of Agencies and to develop a water supply plan within the context of the regional planning efforts described above. The major objectives of WMPP2 are to:
Determine demands/level of service
Plan for normal operations
Plan for reduced water operations
Determine opinions of probable project cost
These objectives are being explored through development of a series of evaluations to be presented in TMs and incorporated into a Final Report. Workshops and reviews will enable extensive review and input by the Family of Agencies.
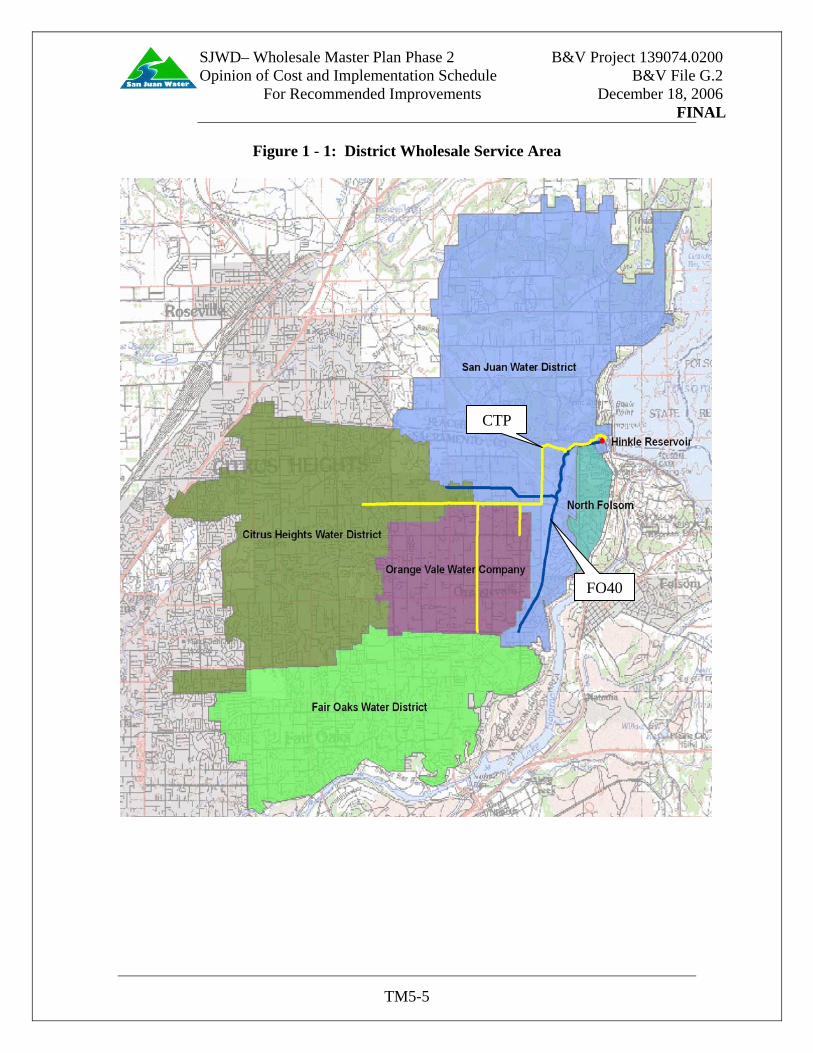
SJWD– Wholesale Master Plan Phase 2 B&V Project 139074.0200 Opinion of Cost and Implementation Schedule B&V File G.2 For Recommended Improvements December 18, 2006 FINAL
TM5-5
Figure 1 - 1: District Wholesale Service Area
CTP
FO40

SJWD– Wholesale Master Plan Phase 2 B&V Project 139074.0200 Opinion of Cost and Implementation Schedule B&V File G.2 For Recommended Improvements December 18, 2006 FINAL
TM5-6
1.4. Organization of This TM
This introductory section (Section 1) provides background information and presents the rationale for WMPP2. Section 2 presents the definition of the recommended improvements, and Section 3 presents the opinions of probable project costs. Section 4 presents an implementation schedule for the new facilities and Section 5 provides considerations for the cost allocation among the Family of Agencies. Finally, Section 6 presents conclusions and recommendations.
1.5. Abbreviations and Acronyms
A list of abbreviations used in this TM is presented below.
Citrus Heights Citrus Heights Water District CTP Cooperative Transmission Pipeline District San Juan Water District Fair Oaks Fair Oaks Water District FO40 Fair Oaks 40 Pipeline Folsom City of Folsom mgd million gallons per day MG millions gallons O&M operations and maintenance Orange Vale Orange Vale Water Company SJWD San Juan Water District SSWD Sacramento Suburban Water District TMs technical memoranda WFA Sacramento Area Water Forum Agreement WMPP2 Wholesale Master Plan Phase 2

SJWD– Wholesale Master Plan Phase 2 B&V Project 139074.0200 Opinion of Cost and Implementation Schedule B&V File G.2 For Recommended Improvements December 18, 2006 FINAL
TM5-7
2.0. IMPLEMENTATION OF RECOMMENDED IMPROVEMENTS
2.1. Overview
This section summarizes the results of TM No. 4, which established the additional capacity necessary to meet demand through Year 2030, and translates this additional capacity into the required facility improvements. TM No. 4 found that the existing facilities could meet the capacity requirements under normal demands; however, additional facilities would be required to meet both the 12-hour and extended emergency outages. These additional facilities fall into three categories: storage, pumping stations, and wells. The facilities are summarized in Table 2 – 1 and described briefly below.
2.2. Storage
TM No. 4 identified the need for 32 MG of storage to meet the 12 hour emergency demand criteria. To develop costs for these improvements, the number of tanks, the tank dimensions, and the tank type need to be evaluated. The number of tanks was selected to balance the redundancy provided by multiple tanks, and the subsequent increased reliability, with the increased costs associated with multiple tank sites. Consideration of these factors resulted in the selection of three tanks to provide the total needed volume of 32 MG. To keep all tanks the same size and utilize standard tank dimensions, three 11 MG tanks were assumed.
The three tanks would be distributed along the transmission pipelines to improve reliability by limiting the area out of service due to a single pipeline failure. However, locating the tanks in these developed areas requires that consideration be given to tank dimensions that would be acceptable to the community. For the purposes of this evaluation, the tanks were limited to a height of 25 feet resulting in a tank diameter of 314 feet. Figure 2 – 1 shows a general concept for the distribution of the tanks. The conceptual locations were chosen based on cursory review of open lots and proximity to the transmission pipelines. Further study is needed to select specific sites.
The final criterion considered was the type of tank construction. Water storage tanks for this service are typically either steel, prestressed concrete, or cast-in-place concrete. While cast-in-place offers the greatest flexibility in terms of tank configuration, it is also the most costly type. Steel tanks can frequently provide the lowest initial cost, but have higher operation & maintenance (O&M) costs. Prestressed concrete tanks have relatively low initial cost and O & M costs. These tanks also provide greater flexibility in terms of site utilization such as partial burial to minimize the visual impact. Due to these factors, prestressed tanks were selected for the basis of the cost opinion.

SJWD– Wholesale Master Plan Phase 2 B&V Project 139074.0200 Opinion of Cost and Implementation Schedule B&V File G.2 For Recommended Improvements December 18, 2006 FINAL
TM5-8
Figure 2 - 1: General Location of Tanks
CTP
FO40

SJWD– Wholesale Master Plan Phase 2 B&V Project 139074.0200 Opinion of Cost and Implementation Schedule B&V File G.2 For Recommended Improvements December 18, 2006 FINAL
TM5-9
2.3. Pump Stations
The water stored in the proposed tanks must be available to all of the Family of Agencies in the emergency scenario. Due to the elevations within the Agencies’ distribution systems and the potential elevations of the tanks, a portion of the demand may be met by releasing water by gravity from the tanks. However, the remaining volume would need to be pumped to supply adequate pressure. A pumping system is also necessary to provide continual turn over of the tank volume to avoid water quality problems. To address these issues, three pump stations, one for each tank, would be required. The maximum capacity of each pump station would be 22 mgd to allow pumping of the entire volume to the Family of Agencies in 12 hours as required by the emergency criteria which was established by the Family of Agencies.
Each pump station would be located adjacent to one of the storage tanks. Multiple pumps would be provided to meet the variations in flow. The pumps would be housed in block structures compatible with the surrounding development.
2.4. Wells
Storage will meet short term outages, but well capacity is necessary to meet extended emergency demands. As determined in TM No. 4, 12 mgd of well capacity would need to be added to the system.
Based on the data for the existing wells, it was assumed that the new wells would yield 1 mgd and would be 16 inches in diameter with a depth of 450 feet. As a result, a total of 12 wells would be required.
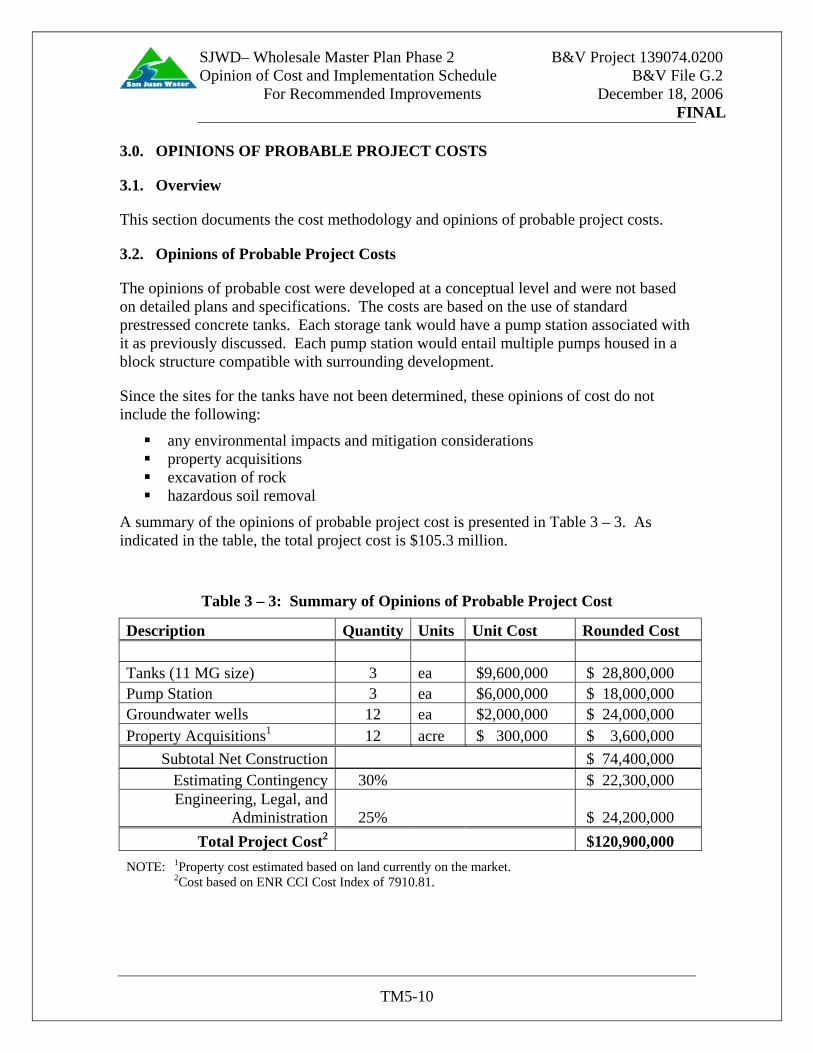
SJWD– Wholesale Master Plan Phase 2 B&V Project 139074.0200 Opinion of Cost and Implementation Schedule B&V File G.2 For Recommended Improvements December 18, 2006 FINAL
TM5-10
3.0. OPINIONS OF PROBABLE PROJECT COSTS
3.1. Overview
This section documents the cost methodology and opinions of probable project costs.
3.2. Opinions of Probable Project Costs
The opinions of probable cost were developed at a conceptual level and were not based on detailed plans and specifications. The costs are based on the use of standard prestressed concrete tanks. Each storage tank would have a pump station associated with it as previously discussed. Each pump station would entail multiple pumps housed in a block structure compatible with surrounding development.
Since the sites for the tanks have not been determined, these opinions of cost do not include the following:
any environmental impacts and mitigation considerations property acquisitions excavation of rock hazardous soil removal
A summary of the opinions of probable project cost is presented in Table 3 – 3. As indicated in the table, the total project cost is $105.3 million.
Table 3 – 3: Summary of Opinions of Probable Project Cost
Description Quantity Units Unit Cost Rounded Cost Tanks (11 MG size) 3 ea $9,600,000 $ 28,800,000 Pump Station 3 ea $6,000,000 $ 18,000,000 Groundwater wells 12 ea $2,000,000 $ 24,000,000 Property Acquisitions1 12 acre $ 300,000 $ 3,600,000
Subtotal Net Construction $ 74,400,000 Estimating Contingency 30% $ 22,300,000 Engineering, Legal, and
Administration 25% $ 24,200,000 Total Project Cost2 $120,900,000
NOTE: 1Property cost estimated based on land currently on the market. 2Cost based on ENR CCI Cost Index of 7910.81.

SJWD– Wholesale Master Plan Phase 2 B&V Project 139074.0200 Opinion of Cost and Implementation Schedule B&V File G.2 For Recommended Improvements December 18, 2006 FINAL
TM5-11
4.0. IMPLEMENTATION SCHEDULE
Figure 4 – 1 presents the storage required to meet the criteria established for the 12 hour emergency as detailed in TM No. 4. Also shown is the existing storage of 25.8 MG.
Figure 4 - 1: 12-Hour Emergency Required and Recommended Storage
Emergency Storage
25
30
35
40
45
50
55
60
65
2005 2010 2015 2020 2025 2030Year
Stor
age
(MG
)
Emergency StorageRequiredRecommended Storage
Emergency Storage Required
3 Tanks and 3 Pump Stations
Reduction in Storage due to Additional Well Capacity
As indicated in this figure, all three storage tanks and associated pumping stations would be required to meet the current 12 hour emergency criteria.
Figure 4 – 2 presents the well capacity required to meet the criteria established for the extended emergency as detailed in TM No. 4. Also shown is the current well capacity of 18.8 mgd.

SJWD– Wholesale Master Plan Phase 2 B&V Project 139074.0200 Opinion of Cost and Implementation Schedule B&V File G.2 For Recommended Improvements December 18, 2006 FINAL
TM5-12
Figure 4 - 2: Extended Emergency Recommended Improvements
Extended Emergency
18
20
22
24
26
28
30
32
2005 2010 2015 2020 2025 2030Year
Dem
and
(mgd
)
Demand to be Met DuringExtended EmergencyGroundwater Recommended
Demand to be Met During Extended Emergency
10 Wells
1 Well
Demand to be Met During Extended Emergency
1 Well
As indicated on the figure, 10 additional wells are required to meet the current extended emergency criteria. Two more wells would be needed to meet ultimate requirements. This schedule assumes adding one well in 2013 and the other well in 2021.
Table 4 – 1 presents a summary of the implementation of facilities required to meet the emergency criteria that have been established.
Table 4 - 1: Schedule of Improvements
Tanks Pump Stations Wells Year Number Capacity Number Capacity Number Capacity Current Need 3 33 MG 3 66 mgd 10 10 mgd
2013 1 1 mgd 2021 1 1 mgd Total 3 33 MG 3 66 mgd 12 12 mgd

SJWD– Wholesale Master Plan Phase 2 B&V Project 139074.0200 Opinion of Cost and Implementation Schedule B&V File G.2 For Recommended Improvements December 18, 2006 FINAL
TM5-13
5.0. COST ALLOCATION CONSIDERATIONS
5.1. Overview
This section presents cost allocation considerations for the recommended improvements.
5.2. Cost Allocation Considerations
The Family of Agencies is currently considering cost allocation policies. A preferred policy has not been established at the time of this TM.
As the policy is developed, the following factors may be considered:
Percentage of the demand associated with each Agency during the emergency condition
o Maximum day during the 12 hour emergency o 50 percent of average day during the extended emergency
Need during the emergency equal to the projected demand minus the Agency owned supply

SJWD– Wholesale Master Plan Phase 2 B&V Project 139074.0200 Opinion of Cost and Implementation Schedule B&V File G.2 For Recommended Improvements December 18, 2006 FINAL
TM5-14
6.0. CONCLUSIONS AND RECOMMENDATIONS
6.1. Overview
This section presents conclusions and recommendations associated with the recommended improvements.
6.2. Conclusions
6.2.1. Storage
To provide the required 32 MG of storage, this volume was divided among three separate tanks. The use of three tanks would result in increased reliability through redundancy, tank sizes that will allow for community acceptance in developed areas, and greater flexibility in selecting the type of tank that can be used. To utilize standard tank sizes, three 11-MG tanks would be required.
6.2.2. Pumping
During an emergency outage, the storage tanks would be able to provide service for customers at lower elevations; however, pump stations would be required to service customers at higher elevations. The pumping stations would also allow for frequent turn over of the tank volume to avoid water quality issues. Since the criteria for the storage volume were based on meeting the maximum day demand for 12 hours, the total volume of the storage must be pumped into the system during this 12 hour period. This criterion requires each pump station have a capacity of 22 mgd.
6.2.3. Wells
Based on the capacity of the existing wells, it appears that the capacity of each new well would be approximately 1 mgd. As a result, 12 new wells would be required. These wells would be located as close as feasible to the existing transmission mains and tied to these mains to allow the water to be available throughout the regional system.
6.2.4. Opinion of Cost
The opinions of probable cost are summarized in Table 6 – 1.

SJWD– Wholesale Master Plan Phase 2 B&V Project 139074.0200 Opinion of Cost and Implementation Schedule B&V File G.2 For Recommended Improvements December 18, 2006 FINAL
TM5-15
Table 6 – 1: Summary of Opinions of Probable Project Cost
Description Quantity Units Unit Cost Rounded Cost Tanks (11 MG size) 3 ea $9,600,000 $ 28,800,000 Pump Station 3 ea $6,000,000 $ 18,000,000 Groundwater wells 12 ea $2,000,000 $ 24,000,000 Property Acquisition1 12 acre $ 300,000 $ 3,600,000
Subtotal Net Construction $ 74,400,000 Estimating Contingency 30% $ 22,300,000 Engineering, Legal, and
Administration 25% $ 24,200,000 Total Project Cost2 $120,900,000
NOTE: 1Property cost estimated based on land currently on the market. 2Cost based on ENR CCI Cost Index of 7910.81.
6.2.5. Cost Allocation Considerations
The Family of Agencies is presently holding discussions on cost allocation policies. Considerations may include allocations based on demand under the emergency outages and each Agency’s current supply.
6.3. Recommendations
Table 6 – 2 presents the implementation schedule recommended to meet the emergency criteria that have been established.
Table 6 – 2: Schedule of Recommended Improvements
Tanks Pump Stations Wells Year Number Capacity Number Capacity Number Capacity 2007 3 33 MG 3 66 mgd 10 10 mgd 2013 1 1 mgd 2021 1 1 mgd Total 3 33 MG 3 66 mgd 12 12 mgd

SJWD– Wholesale Master Plan Phase 2 B&V Project 139074.0200 Opinion of Cost and Implementation Schedule B&V File G.2 For Recommended Improvements December 18, 2006 FINAL
TM5-A1
Appendix A: Opinions of Probable Cost for Storage Tank
Description Quantity Unit Cost Unit Cost Prestressed Concrete Tanks (11 MG)
General Requirements 14% $ 1,183,000Contractors OH&P 18% $ 1,289,000Site Work
Clear & Grub 2.2 $ 3,400 Acre $ 7,000Site Grading 2.2 $ 5,000 Acre $ 11,000Revegetation & Landscape 0.5 $ 8,500 Acre $ 4,000Access Road/ Parking 2000 $ 18 S.Y. $ 36,000Electric Service 1 $ 306,750 Lot $ 307,000
Foundations Excavation 30000 $ 12 C.Y. $ 345,000Excavation Disposal 0 $ 1 C.Y. $ 0Reinforced Concrete 0 $ 0 $ 0
Overflow Basin 0 $ 0 $ 0Tank (314' Dia x 22' High) 1 $6,135,000 EA $ 6,135,000Instrumentation & Controls 1 $ 50,000 Lot $ 50,000
Conduit & Wiring 1 $ 10,000 Lot $ 10,000Piping Site & Tanks 1 $ 150,000 Lot $ 150,000Painting & Coating $ 0 $ 0Const. Access/Temp Esmt. 1 $ 0 Lot $ 0Site Fencing & Gates 2000 $ 50 Ft $ 100,000Traffic Control 1 $ 5,000 Lot $ 5,000
Subtotal Net Construction $ 9,632,000
Subtotal Net Construction (Rounded) $ 9,600,000Estimating Contingency 30% % $ 2,900,000
Engineering and Administration 25% % $ 3,100,000TOTAL PROJECT COST $ 15,600,000

SJWD– Wholesale Master Plan Phase 2 B&V Project 139074.0200 Opinion of Cost and Implementation Schedule B&V File G.2 For Recommended Improvements December 18, 2006 FINAL
TM5-A2
Appendix B: Opinions of Probable Cost for Pump Station Description Quantity Unit Cost Unit Cost Pump Station
General Requirements 14% % $ 741,000Contractors OH&P 18% $ 807,000Site Work
Clear & Grub 0.5 $ 3,400 Acre $ 2,000 Site Grading 1 $ 5,000 Acre $ 5,000 Revegetation & Landscape 0.5 $ 8,500 Acre $ 4,000 Access Road/Parking 1000 $ 18 SY $ 18,000Transformer Yard 102 $ 18 SY $ 2,000 Storm Drain 1 $ 5,000 Lot $ 5,000 Electric Service 1 $ 139,150 Lot $ 139,000
Foundations Excavation 3000 $ 100 CY $ 300,000 Excavation Disposal 2400 $ 1 CY $ 2,400 Reinforced Concrete 1000 $ 580 CY $ 580,000
Building Masonry 40' x 50' 2000 $ 220 SF $ 440,000 Acoustical Panels 2400 $ 5 SF $ 13,000
Equipment Pumps (Vertical Turbine) 5 $ 128,625 EA $ 643,000 Diesel Generator 1 $ 190,000 EA $ 190,000 Surge Tank 1 $ 55,000 EA $ 55,000 Piping & Tie ins 1 $ 105,000 Lot $ 105,000 Valves 1 $ 32,000 Lot $ 32,000 Meters 1 $ 18,000 EA $ 18,000
Electrical VFD for Pumps 5 $ 125,000 EA $ 625,000 Electrical Lines and Poles 3000 $ 100 FT $ 300,000 Transformers & MCC 1 $ 375,000 Lot $ 375,000 Conduit & Wiring 3000 $ 100 FT $ 300,000 Outdoor Lighting 1 $ 4,500 Lot $ 5,000
Instrumentation & Controls 1 $ 100,000 Lot $ 100,000 Plumbing & HVAC 1 $ 20,000 Lot $ 20,000 Const. Access/Temp Esmt. 1 $ 200,000 Lot $ 200,000 Traffic Control 1 $ 5,000 Lot $ 5,000
Subtotal Net Construction $ 6,031,000Subtotal Net Construction (Rounded) $ 6,000,000
Estimating Contingency 30% % $ 1,800,000 Engineering, Legal, and Administration 25% % $ 2,000,000
TOTAL PROJECT COST $ 9,800,000

SJWD– Wholesale Master Plan Phase 2 B&V Project 139074.0200 Opinion of Cost and Implementation Schedule B&V File G.2 For Recommended Improvements December 18, 2006 FINAL
TM5-A3
Appendix C: Opinions of Probable Cost for Wells
Description Anticipated Cost Wells General Requirements $ 96,000 Contractors OH&P 18% $ 272,000 Sitework $ 96,000 Well Drilling $ 350,000 Well Enclosure Building $ 80,000 Electrical Generator & Building $ 328,000 Mechanical $ 224,000 Onsite Hypochlorite Disinfection System $ 112,000 Electrical and I&C $ 224,000 Piping and Tie ins including valves $ 200,000
Subtotal $ 1,982,000 Subtotal Net Construction (Rounded) $ 2,000,000
Estimating Contingency 30% $ 600,000 Engineering, Legal, and Administration 25% $ 700,000
Total Cost $ 3,300,000