TITLE AND PREFACE CONTENTS - ...
323
Proceedings of the IPI-OUAT-IPNI International Symposium Bhubaneswar, Orissa, India 5-7 November 2009 Volume I: Invited Papers Potassium Role and Benefits in Improving Nutrient Management for Food Production, Quality and Reduced Environmental Damages Edited by MS Brar SS Mukhopadhyay IPI 2010 Potassium Role and Benefits in Improving Nutrient Management for Food Production, Quality and Reduced Environmental Damages, Vol. I
-
Upload
khangminh22 -
Category
Documents
-
view
0 -
download
0
Transcript of TITLE AND PREFACE CONTENTS - ...

Proceedings of theIPI-OUAT-IPNI International SymposiumBhubaneswar, Orissa, India5-7 November 2009
Volume I: Invited Papers
Potassium Role and Benefits in Improving
Nutrient Management for Food Production,
Quality and Reduced Environmental Damages
Edited by
MS Brar
SS Mukhopadhyay
IPI
2010
Po
tassiu
mR
ole
an
dB
en
efits
inIm
pro
vin
gN
utrie
nt
Man
ag
em
en
tfo
r
Fo
od
Pro
du
ctio
n, Q
uality
an
d R
ed
uced
En
viro
nm
en
tal D
am
ag
es, V
ol. I

j
Potassium Role and Benefits inImproving Nutrient Management for
Food Production, Quality and ReducedEnvironmental Damages
Volume I: Invited Papers
ISBN 978-3-905887-05-1DOI 10.3235/978-3-905887-05-1

j
Proceedings of the International Symposium
IPI-OUAT-IPNIInternational Symposium on
Potassium Role and Benefits in Improving NutrientManagement for Food Production, Quality and
Reduced Environmental Damages
Bhubaneswar, 5-7 November 2009
Edited by: MS Brar130-B, Rajguru NagarLudhiana - 141012Indiae-mail : [email protected]
SS MukhopadhyayElectron Microscopy & Nanoscience LabPunjab Agricultural UniversityLudhiana - 141004Indiae-mail : [email protected]
Volume I: Invited Papers

Published by IPI, Horgen/Switzerland and IPNI, Norcross/USA.Copyright 2010, IPI and IPNI.All rights reserved.ISBN 978-3-905887-05-1DOI 10.3235/978-3-905887-05-1
Organized by:International Potash Institute (IPI), International Plant Nutrition Institute
(IPNI), and Orissa University of Agriculture & Technology (OUAT)
Co-sponsored by:Bangladesh Fertilizer Association (BFA), Fertilizer Association of India (FAI),
Indian Council of Agricultural Research (ICAR), and Pakistan AgriculturalResearch Council (PARC)
Printer : Swami Printers,Ludhiana, India.
has published nine papers thatare included in this volume with their permission.
Plant and Soil (Vol. 335; 2010) journal
5
Baumgärtlistrasse 17P.O. Box 569CH-8810 Horgen, SwitzerlandTel.: +41 43 810 49 22Fax: +41 43 810 49 [email protected]
U
U
INTERNATIONAL POTASH INSTITUTE
3500 Parkway Lane, Suite 550Norcross, GA 30092USATel.: +1 770 447 0335Fax: +1 770 448 [email protected]
Foreword
Worldwide, improving crop production is of increasing importance. With arising population and steadily increasing demand of food per capita, India faces aparticular challenge in meeting these needs and in improving its crop production.Moreover, increasing crop productivity is not just about the science of newtechnologies or management of crops as environmental sustainability is of vitalimportance. The complexity of the issues now faced make improving cropproductivity a more challenging task. Managing inputs is a crucial issue. Water,fertilizers, crop protection inputs, and professional advice all need to be managedin the most effective way, not only because of their high costs, but also due todiminishing availability and increasing competition over use. Optimal use ofresources, including land availability, is becoming more complicated as the rate ofproduction increases, and requires enhanced science and improved application byfarmers.
Food security is measured mainly by the production of cereals. However, asthe income of the urban population increases, the demand for meat, vegetables,fruits and oil increase at a much faster rate than the production of cereals; the foodof the poor - causing policymakers much concern. In recent years, as in otherregions, growth rates of cereal production in India have decreased; a trend thatmust be reversed if food security is to prevail.
Balanced fertilization is an important tool in achieving improved cropproduction. The relatively low levels of potash fertilizer application in Indianagriculture leads to mining of potassium (K) from the soil, which results in amultitude of negative impacts, including preventing full utilization of appliednitrogen and phosphorus fertilizers that limit yields, decrease farmers' income,and hence jeopardize the future food security of the country. Indian farmers andtheir advisors need to adopt advanced tools for potash fertilizer applications, andstate research institutes need to update K recommendations according to the latestscientific findings. We are encouraged that a number of papers included in theseproceedings discuss the issue of efficient and balanced use of nutrients; otherspresent latest findings on improving productivity in common cropping systems ofthe region. Several papers are focused on the quality aspects of agriculturalproduce, while others discuss issues of fertilization and environmentalstewardship.
This publication, which is a result of the IPI-OUAT-IPNI InternationalSymposium on “Potassium Role and Benefits in Improving Nutrient Managementfor Food Production, Quality and Reduced Environmental Damages”, which tookplace on 5-7 November, 2009 in Bhubaneswar, Orissa, India, contains allvoluntary papers that were presented in the Poster Sessions at the event. The

journal; Plant and Soil accepted nine invited papers from the Oral Presentationsessions at the symposium for publication and, with the journal's permission, theseare included here. The proceedings are intended to provide the reader with up-to-date knowledge of aspects related to nutrient management in Indian and SouthAsian agriculture, as well as their application for wider audiences, with aparticular emphasis on potassium.
We thank Dr. MS Brar and Dr. SS Mukhopadhyay for editing this volume.
Director, IPI Vice President, IPNIHillel Magen Adrian Johnston
6 7
Foreword
India has achieved foodgrain production of 234 million tons (the highestquantity achieved so far), but set a target of 276 million tons within the next 10years, which has to be doubled to 450 million tons by 2050 to feed her burgeoningpopulation. The situation is same for allAsian countries, which are home for morethan four billion people. Apart from foodgrain production, agriculture is stressedto produce more fruit, more fibre, more bio-fuel, and more amount of industrialraw materials. This stress, if seen at the backdrop of declining per capitaavailability of cultivable land and renewable fresh water resources and a ever-increasing threat of global warming and increasing uncertainty of climate is trulyworrisome. In the past decade, there was a strong demand of food and bio-fuel,which would likely to rise further as nations come out of recession. Together, theywill put more pressure on scarce natural resources, and threaten to furtheraccelerate in the extent and severity of the human-induced soil degradation (1.94billion ha globally and increasing at the rate of 5–10 million ha annually).
Editors of Nature in 2009 identified seven parameters: climate change, ozonedepletion, ocean acidification, biodiversity, freshwater use, the global nitrogenand phosphorus cycles, and change in land use for the biophysical processes thatdetermine the Earth's capacity for self-regulation. They warned that we must staywithin the boundaries in order to avoid catastrophic environmental change. Eachone of these global issues are rooted in agriculture, which highlights the urgentneed of reorienting our agricultural research to focus on fundamental issues ofimproving quality of ecosystems services and the environment. This is not an easytask, seeing that large number of our researchers, especially in developingcountries, engaged themselves into nutrient management research in its mostprimitive form. At the same time our farm service providers lack skills and powerto communicate the farmers need of balanced use of nutrients in environmentallysustainable manner, and for choice of right crop, and right nutrients and rightmanagement practices for a profitable farming.Yes, farming in these countries canbe profitable, if these issues are taken care of. It is important to remember thatfertilizer subsidy can’t continue for long and rising food prices can become thesingle most threat to peace. Therefore, we need to be innovative in our approach inunderstanding agricultural production system alongside socio-economiccompulsions to overcome current crisis in agriculture. Our new tools like newermodels, breakthroughs in genomes, advancements in understanding in rootsystem in crops to name a few, and a synergy between nanotechnology,biotechnology and information technology must be strategically incorporated intoour nutrient management research to address these issues. It is also important forthe nutrient-management researchers to use concepts like Fuzzy logic and remotesensing techniques to transfer experimental field results to the farmers’ fields.

Preface
The International Symposium entitled, “Potassium Role and Benefits inImproving Nutrient Management for Food Production, Quality andEnvironmental Damages” was held at the Orissa University of Agriculture andTechnology, Bhubaneswar-751003, India from 5-7 November 2009. During thesymposium, 34 invited speakers presented papers covering different aspects ofbalanced fertilization. Present volume consists of 30 papers including 9 paperspublished earlier in the Plant and Soil (Vol. 335; 2010) journal. The 'ExtendedAbstracts' of papers that were presented by the volunteered participants during thesymposium were already published in the companion Volume II.
The symposium treated role of potassium nutrition to plants holistically –from fundamental aspects (Romheld; Kirkby; Lambers) to outreach activities(Raviprasad and Adhikari), and from pedosphere to human health (Stein;Bhaskarachary). It covered importance of soil fertility mapping through GIS (Heet al.), role K plays in alleviating water stress (Srinivasarao et al.; Rengel), saltstress (Singh et al.), acid or iron stress (Panda; Mitra et al.), and climate change(Clair and Lynch; Snyder and Johnston). Potassium's contribution to quality of theproduces (Lester et al.; Mitra and Dhaliwal; Ebert) was given due emphasis.Potassium does not work in isolation, but improves use efficiency of many othernutrients both for production of crops and environmental safety (Zhang et al.).Ecosystems apart from field crops and horticulture also get benefitted from Kapplications. Two papers – one on forest ecosystem (Smethurst), and other ongrass rotation (Oborn et al.)-dealt with that. Three papers wrapt issues ofdemarking of the K deficient sites in some areas that were earlier thought well-supplied with available K (Buresh et al.; Sanyal et al.; Benbi and Brar). These sitescould be chosen for laying K-response demonstrations for farmers. This volumeincludes seven papers that analyzes situation of K-centric balanced fertilization insoils with focus on the geographic regions within South Asia (Timsina et al.),especially India (Samra and Sharma; Subba-rao and Reddy; Satyanarayana andTewatia; Singh and Bansal), Pakistan (Ahmed and Mian), and Bangladesh(Islam).
Editorial Board places on record deep sense of gratitude to the InternationalPotash Institute, the International Plant Nutrition Institute and the OrissaUniversity of Agriculture and Technology for organizing and bearing financialliability of the august event. We are also indebted to the Indian Council ofAgricultural Research, Fertilizer Association of India, Bangladesh FertilizerAssociation and PakistanAgricultural Research Council for their sponsorship. Wethank NBARD for partly financing publications of the proceedings. We aregrateful to His Excellency Shri MC Bhandare, Honorable Governor of Orissa for
8 9
Similarly, response of nutrient application is never linear, and there is a need tointerpret it by applying concepts of the non-linear dynamical system, so thatproper crop-specific protocol is developed in the interest of farmers, and climaterelated constraints and stress can be addressed to facilitate profitable farming.I will also strongly advocate the use of precision farming in nutrient managementresearch so that farmers can use inputs judiciously for most economical andprofitable farming while protecting the environment and scarce natural resources.
I congratulate IPI and IPNI for holding this important global event in Indiaand highlighting the plight of nutrient management, especially for populouscountries like China, India, Bangladesh, Pakistan, and Sri Lanka. I am sure, IPIand IPNI will steer farming into new millennium's challenges for the future aswell.
CEO, National Rainfed Area AuthorityNASC Complex
New Delhi
(JS Samra)

gracing the Inaugural Function. We acknowledge with thanks for the kind supportextended by Dr. N Panda, Chairman, WODC and Prof. DP Ray, Vice-Chancellor,OUAT. We admire Dr. D Jena for untiring work as Organizing Secretary, and forproviding leadership. We are obliged to the chairpersons of the sessions formaking our work plausible. We are indebted to the authors for copy right transferand for allowing us to publish their papers.
Editors
ContentsPage
Foreword 5
Preface 9
Food security - Indian scenario 15
Global impacts of human mineral malnutrition 45
The opening of Pandora's Box: Climate change impacts on soil 83fertility and crop nutrition in developing countries
Implications of soil fertility to meet future demand: 109The Indian scenario
Particular issues in plant production under acid soils: 137The Orissa scenario
Potassium nutrition of crops under varied regimes 147of nitrogen supply
Mineral nutrition under salt stress 173
Role of potassium in water stress management 199in dry land agriculture
Characterization of iron toxic soils of Orissa and ameliorating 215effects of potassium on iron toxicity
Role of nutrient management in reduction of greenhouse gases 231
Forest fertilization: Trends in knowledge and practice 259compared to agriculture
JS Samra PD Sharma
AJ Stein
SB St. Clair J Lynch
A Subba-Rao KS Reddy
N Panda
F Zhang J Niu W Zhang X Chen C Li L Yuan J Xie
AK Singh A Qadar NPS Yaduvanshi
Ch Srinivasarao KPR Vittal B Venkateswarlu
GN Mitra SK Sahu RK Nayak
CS Snyder AM Johnston
PJ Smethurst
l
l
l
l l l l l l
l l
l l
l l
l
10 11

Role of nutrients in human health: New insights 291
Impact of potassium nutrition on postharvest fruit quality: Melon 303( L) case study
Effect of potassium on fruit quality and their storage life 327
Field-specific potassium and phosphorus balances and fertilizer 343requirements for irrigated rice-based cropping systems
Site specific potassium management in rice based 389cropping systems in India
GIS based soil fertility mapping for SSNM at village level 407in China: A case study in Shanxi province
Potassium management for crops in soils of Orissa 417
Quantifying uptake rate of potassium from soil in a long-term 437grass rotation experiment
State-wise approach to crop nutrient balances in India 467
Analysis of crop productivity, partial factor productivity, and 487soil fertility in relation to nutrient management in theIndo-Gangetic plains
Evaluation of soil fertility and nutrient balances under intensive 499agriculture
Challenges for nutrient management in Bangladesh 519
K Bhaskarachary
GE Lester JL Jifon DJ Makus
SK Mitra SS Dhaliwal
RJ Buresh MF Pampolino C Witt
SK Sanyal MS Gill K Majumdar
P He H Wang Jiyun Jin
D Jena AK Pal KK Rout
I Öborn AC Edwards S Hillier
T Satyanarayana RK Tewatia
H Singh SK Bansal
DK Benbi MS Brar
MS Islam
Cucumis melol l
l
l l
l l
l l
l l
l l
l
l
l
Increasing crop productivity through judicious use of 537potash in Pakistan
Rice-maize systems of South Asia: Current status, future 545prospects and research priorities for nutrient management
Role of industry initiatives in extension activities in India 575
Research on potassium in agriculture: Needs and prospects 583
Crop mineral nutrition under drought conditions 627
Phosphorus acquisition efficiency: Root morphology and physiology 633
Potassium nutrition and its effect on quality and post harvest 637properties of potato
Z Ahmad SM Mian
J Timsina ML Jat K Majumdar
G Raviprasad M Adhikari
V Römheld EA Kirkby
Z Rengel
H Lambers
G Ebert
l
l l
l
l
12 13

JS Samra
CEO, NRAA, NASC Complex, Pusa, New Delhi-110 012, India
e-mail : [email protected]
PD Sharma
ADG (Soils), ICAR, KAB-II, Pusa, New Delhi-110 012, India
Proceedings IPI-OUAT-IPNI International Symposium (2009)
Food security - Indian scenario
JS Samra PD Sharmal
Abstract India is continually faced with the problem of increasing food
production to feed its teeming millions. Achieving targets is a formidable
challenge in the backdrop of declining factor productivity in agriculture since 90s.
The National Agricultural Policy recognizes efficient conservation and
management of natural resources as one of the essentials for higher productivity
and agricultural growth. Along with food security, nutritional security is to be
provided to about one-fifth of Indian population suffering from malnutrition
problems.
The declining fertilizer response for the last thirty years (from 13.4 kg grain
kg nutrient in 1970 to 3.7 kg grain kg nutrient in 2005 in irrigated areas)
necessitates change in the fertilizer-use pattern. We need to adopt balanced
(including micro and secondary nutrients) and integrated nutrient management for
higher productivity and profitability. The supplies of organic manures,
biofertilizers, micro and secondary nutrients and soil amendments have to be
augmented to have integrated nutrient management on a sound footing. To have
sustained and adequate supplies of fertilizers, appropriate policy initiatives are
required to restore the health of the fertilizer industry and make it a vibrant sector.
The indigenous sources of nutrients like rock phosphate (P), phosphogypsum (S)
and waste mica (K) need to be exploited to reduce dependence on imports for
fertilizers.
The availability of adequate irrigation water is going to be uncertain in
foreseeable future due to growing competition from other sectors and slow pace of
development of irrigation potential. The focus, therefore, requires to be given on
enhancing surface and ground water-use efficiencies and use of waste waters. The
rainfed areas covering two-third of cultivated area and contributing 40 percent of
food merit special attention. The interventions required for higher productivity in
the areas are, rainwater harvesting, micro-irrigation, integrated nutrient and pest
management, and choice of suitable crops (especially hybrids of maize, pulses and
oilseeds). The amelioration of about 2-3 m ha of salt affected lands and 10 m ha of
acidic lands should be taken on priority to increase food grain production by about
-1 -1
14 15

25 million tonnes per annum. Appropriate soil and crop management practices
need to be evolved to face the challenge of climate change.
Climate change fertilizer response integrated nutrient management
land degradation water management
India has achieved remarkable growth in agriculture, raising food grain
production from 83 mt in 1960-61 to 231 mt in 2007-08. The achievement made
country self-reliant in food grains by mid 80s and surplus for exports by 90s.
However, the country is continually faced with the challenge of keeping pace with
the demands for food of ever-growing population. The population is growing,
presently, at the rate of 1.7 percent adding 20 million people per annum. The
demand for cereals, pulses, oilseeds and sugarcane has been estimated to be about
262, 19, 54 and 345 million tonnes, respectively by 2020 compared to 193, 14, 35
and 262 million tonnes for the base year 2004-05 in the country (Table 1).
Demand projections for various food products in India (mt)
The projected demands for other food items are also high. Achieving desired
food targets is a challenging task, seeing the trend of stagnation or deceleration in
the growth of Total Factor Productivity in agriculture since 90s, especially in the
Indo-Gangetic Plains (Murgai 2000; Singh 2003; Kumar et al. 2004). The required
growth rates per annum for cereals and pulses (2%), oilseeds (6%) and sugarcane
(0.6%) to meet the projected demands are much higher than the realized growth
rates for the last ten years (Chand 2007). There was depression in rates of
production and productivity of major crops including pulses and oilseeds
Keywords
Introduction
Table 1
l l
l l
(Anonymous 2004a). The slowdown in growth of food grains production notably
after mid-nineties posed a virtual threat to food security in the country. The
stagnating productivity got reflected in falling agricultural growth rate, reaching
about 2 percent during Tenth Plan period (2002-07). The National Agricultural
Policy identifies food security as one of the major challenges and aims to attain
annual growth rates in excess of 4 percent over the next decades.As high growth of
non-agricultural sector has not brought about any significant improvement in the
socio-economic conditions of rural people, an inclusive higher growth in
agricultural sector is the hallmark of agricultural policy of the Indian government.
It envisages conservation and efficient management of natural resources amongst
development of horticulture, livestock, fisheries, food processing and marketing
infrastructure etc in rural areas. The Government of India has recently launched
several initiatives including National Rainfed Area Authority (2006), Centrally
Sponsored Scheme of Micro-irrigation (2006), National Agricultural
Development Scheme (2007), the National Food Security Mission (2007) and
(RKVY) to have an increased and equitable
agricultural growth. The primary objective of National Food Security Mission is
to increase production and productivity of wheat, rice and pulses by focusing on
districts having high potential for productivity gains. A number of technologies
have been identified to minimize the yield gaps of 40-100 percent between
experimental farms and farmers' fields (ICAR 2007). The new initiatives will also
go a long way in fulfilling the United Nations Millennium Development Goals of
Eradicating Extreme Hunger and Poverty in theAsian region.
Food security implies availability of adequate food to people to meet their
dietary and nutritional needs for a healthy and productive life. More than one-fifth
of Indian population, especially the rural families living below the poverty line, is
still undernourished and suffers from protein-energy-trace elements-malnutrition
syndrome. Although the notable increase in the production of fruits, vegetables,
milk, eggs and fish (Anonymous 2009) may have improved the nutritional profile
of the people to some extent, there is need for bio-enrichment of food grains with
micro-elements through application of fertilizers to address widespread
malnutrition problem.
The impaired soil health is often cited as one of the reasons for stagnation in crop
productivity (Sinha et al. 1998). The inadequate and imbalanced nutrient use
coupled with neglect of organic manures has caused multi-nutrient deficiencies
and organic carbon reduction in Indian soils. The deficiencies are becoming more
critical for sulphur, zinc and boron. In early 1990s, about 130 districts were
deficient in sulphur, the number today is over 240. About 47 million ha of area
representing major cropping systems in the country is deficient in sulphur. Seeing
Rashtriya Krishi Vikas yojana
Managing soil health
Commodity Base year (2004-05) Projection 2020-21
Cereals 192.8 262.0Pulses 14.2 19.1Foodgrains 207.0 281.1Milk and milk products 91.0 141.5Egg (number billion) 44.1 81.4Meat 6.0 10.9Fish 5.9 11.2Edible oilseeds 35.5 53.7Vegetables 90.6 127.2Fresh fruits 52.9 86.2Sugar in terms of cane 262.3 345.3
Source: Chand 2007
16 17

the widespread deficiency, sulphur is being recognized as the fourth major plant
nutrient in the country. The estimated gap between requirement and additions of S
is about I million tonnes presently and is likely to be doubled within few years to
meet targeted levels of production. The zinc deficiency is rampant in alluvial soils
of the Indo-Gangetic plain, black soils of the Deccan Plateau and red and other
associated soils. The boron deficiencies are showing up in red, lateritic and
calcareous soils of Bihar, Orissa and West Bengal. The increased mining of soil
potassium seems to be a cause of more rampant decline in rice yields compared to
wheat in the Indo-Gangetic Plain, as revealed by the analysis of data pertaining to
rice-wheat cropping system from 24 research stations in IGP (NAAS 2006). The
limiting nutrients not allowing the full expression of other nutrients lower the
fertilizer responses and crop productivity.
Declining fertilizer response
A decline in partial factor productivity of fertilizer has been revealed at country
level, having related food grain production and fertilizer consumption for the last
four decades (NAAS 2006). The response ratio was around 6 kg grain kg
nutrient for the last three decades. The picture on fertilizer responses was,
however, made still more clear by relating the food grain production and
fertilizer consumption for irrigated areas only consuming major share of the
fertilizers. It was also appropriate to take out the increase in fertilizer consumption
due to increase in irrigated area per se (increase from 30 m ha in 1970 to 56 m ha in
2005) from the total fertilizer consumption for the irrigated areas during this
period. The more realistic fertilizer response ratios were, therefore, calculated
employing the chain rule of partial differential calculus (Biswas and Sharma
2008a). The overall fertilizer response in irrigated areas of the country has
decreased nearly three times from 13.4 kg grain kg NPK in 1970 to 3.7 kg grain
kg NPK in 2005 (Fig. 1). The Individual nutrient ratios in respect of N, P and K
also followed the same trend (Fig. 2). While only 54 kg NPK ha was required to
produce around 2 t ha in 1970, around 218 kg NPK ha are being used presently to
sustain the same yield (Fig. 3). The declining fertilizer response since 70s is,
therefore, a matter of great concern. The fertilizer input has been the mainstay of
food production in India, contributing about 50 per cent towards crop productivity
over the last 35 years.
-1
-1
-1
-1
-1 -1
Integrated balanced nutrient management
The Integrated nutrient management encompassing conjunctive use of chemical
fertilizers including secondary and micronutrients, organic manures, composts /
vermicomposts, bio fertilizers and green manures is the most ideal system of
nutrient management. The system maintains soil health, enhances nutrient-use
efficiency and yields and reduces cost of cultivation. Its usefulness has very well
been demonstrated by the All India Co-ordinated Research Project on Long Term
Fertilizer Experiments of ICAR running since 1970 (Samra 2006). The
application of nitrogen alone gave very low use efficiency. The response increased
13.4
11
8.2
7
5.84.9
4.1 3.7
0
2
4
6
8
10
12
14
16
1960 1970 1980 1990 2000 2010
Period (year)
Res
pon
sera
tio
(kg
gra
in/k
gn
utr
ien
t)
Fig. 1 Fertiliser response of foodgrain crops in irrigated areas in India
0
2
4
6
8
10
12
14
16
1960 1970 1980 1990 2000 2010
Period (year)
Res
po
nse
rati
o(k
g
gra
in/k
gn
utr
ien
t)
N P K
Fig. 2 NPK responses of foodgrain crops in irrigated areas in India.
(Source: Biswas and Sharma 2008a)
(Source: Biswas and Sharma 2008a)
18 19

in the fertilizer industry. There have been virtually no significant investments in
urea and phosphatic sectors for the last ten and seven years, respectively in the
industry. The continued stagnation in capacity and investment has affected
adversely the production of fertilizers in the country. The country had been
importing increasing quantities of fertilizers to meet the demands, the figures
being 7.0, 3.0 and 4.4 mt of urea, phosphatic and potassic fertilizers, respectively
for 2007-08 (Fertilizer Statistics 2007-08). The import dependence has, thus, risen
significantly with 30 % dependence in nitrogenous sector, 90 % in phosphatic
sector and 100 % in potassic sector. The import of fertilizers is, obviously, causing
burden on the state exchequer.
One of the reasons for the stagnation in fertilizer industry is the pricing
mechanism of the fertilizers under subsidy regime that leaves only thin margins
for the industry. The returns to fertilizer industry are capped and efficiencies are
mopped up to reduce subsidy bill. The delayed disbursement of subsidy further
adds to the woes of the fertilizer industry. The subsidy is provided to farmers by
charging only part of the delivered cost of the fertilizers at farm gate level by
fixing MRPs. The government since 2002-03 to keep the fertilizers at affordable
price to the farmers has not increased the MRPs of urea. The current MRPs are
even less than 16 % of the delivered cost of the fertilizers. As delivered cost of the
fertilizers has been escalating due to sharp increase in international prices of
fertilizer inputs and finished fertilizers, the subsidy bill has been rising
unusually in the recent years. It has swollen from Rs. 11,013 crore in 2002-03 to
more than Rs. 100,000 crore in 2008-09. The Government is finding it difficult to
cope up with the rising subsidy bill. There is need for rationalization of the existing
subsidy regime that protects the interests of fiscal planning, fertilizer industry and
farmers.
The fertilizer industry requires capacity enhancement through revamp,
expansion, new plants and joint ventures abroad. A number of old Naphtha and
fuel oil based plants (present capacity being 26 %) with about 2.5 times more cost
of production compared to gas based plants need to be phased out. These plants
have lot of subsidy burden on the Government. To have committed supplies of
natural gas to the gas based plants, the fertilizer sector should have priority
allocations of the natural gas. Although the supplies are going to improve soon
with the production from the Krishna-Godavari Basin fields, the demand is likely
to outstrip supplies. Given the production constraints in the country, the joint
ventures abroad seem to be a desirable strategy. Such ventures have already been
initiated with Morocco, Jordan, Senegal, Oman and UAE.
To promote balanced fertilization, we need to move to nutrient based pricing
and subsidy and fortification/coating of fertilizers with micro and secondary
nutrients. The move would broaden the basket of fertilizers and enable fertilizer
use as per soil and crop requirements. The fully water soluble/liquid fertilizers
suitable for fertigation of horticulture, plantation, vegetable, floriculture and other
with the application of phosphorus along with nitrogen, but its reduction with time
was again evident in the absence of potassium. The response got stabilized at a
higher level only with the balanced application of NPK. Further improvement in
the response could not be realized merely with the addition of higher amounts of
chemical fertilizers. The addition of organic manure along with chemical
fertilizers was required for obtaining such an effect. The continued additions of
NPK fertilizers at higher rates without organic manure caused deficiencies of
secondary and micronutrients. The deficiencies of S and Zn and consequent drop
in the response level were noticed at some places that omitted S and Zn from the
fertilization schedule. The site-specific nutrient management gave, on an average,
annual grain productivity of 13.3 t ha of rice-wheat at 10 locations across the
Indo-Gangetic Plain (Tiwari et al. 2006). The extra net returns over the farmers'
practice were Rs 20,530 with a benefit:cost ratio of about 5.0.
Ensuring adequate supplies of fertilizers
The availability of fertilizers on a sustained basis is essential for food security and
overall growth in economy. To ensure fertilizers at affordable prices to the farmers,
the subsidy/concession on them is an integral part of Government policy. The
country will require about 45 mt of nutrients to produce 300 mt of food grains for
about 1.4 billion population by 2025. Therefore, the fertilizer industry is required
to augment fertilizer production substantially from the present level of about 23 mt
of nutrients to keep pace with the food demands of the country. This looks to be
unlikely, given the prevalent non-conducive policy environment for investments
-1
Fig. 3
.
Contribution of fertilizer NPK towards food grain production
in irrigated areas in India
0
0.5
1
1.5
2
2.5
1970 1980 1990 2000Period (year)
Gra
inyie
ld( t
ha
-1)
0
50
100
150
200
250
Fer
tilise
rad
ded
( kg
ha
-1)
K response
P response
N response
Control
Fertiliser
added
(Source: Biswas and Sharma 2008a)
20 21
production of cheap and quality composts. Also, appropriate quality standards
should be established for composts to ensure their safe use in agriculture.
Promoting bio-fertilizers
Biofertilizers being cheap and eco-friendly sources of nutrients are important
component of integrated nutrient management system. The production of
biofertilizers is still low, being around 20,000 tonnes per annum against the
installed capacity of 67,162 tonnes per annum of 164 biofertilizer units in the
country (DAC 2009). The production is skewed as well, with 90 % of production
confined to southern and western parts of the country. The low popularity and use
of bio-fertilizers is ascribed to their poor quality linked with inappropriate strains
for a given soil and climatic situation and inefficient production technology (Singh
et al. 1999). A survey by ICRISAT (Singletone et al. 1996) has revealed 90 % of
biofertilizer samples lacking the required Rhizobia count for effective
performance. Greater research and development efforts are required to increase
shelf life of biofertilizers by way of isolating location-specific strains, better
production technology avoiding contamination and better storage and handling.
The liquid cultures containing cell protectants maintain high microbial numbers
and promote the formation of resting cells like cysts and spores having resistance
to abiotic stresses. Even after one year of storage, the liquid media maintained
higher cell count of Rhizobium, Azospirillum and P-solubilising Bacillus
megaterium (Rao 2008) compared to commonly used lignite carrier. The region
and crop specific consortia of biofertilizers (combining Azotobacter,
Azospirillum, Phosphate solubilizing bacteria, Rhizobium and Plant Growth
Promoting Rhizobacteria) should be developed to popularize biofertilizers.
Developing nutrient-use efficient cultivars
The development of crop cultivars having ability to thrive well even under low
fertility situations through biotechnological manipulations is an interesting area of
research. The manipulations could be thought in terms of increased root growth
and its changed architecture, increased secretions of enzymes and organic acids by
root tips and symbiotic relationships with mycorrhizal fungi to have mobilized
more nutrients by roots. The root exudates bring sparingly soluble nutrients into
soil solution and enhance their acquisition by roots. The nutrient use efficient
cultivars would affect considerable savings on costly fertilizers and mitigate
micronutrient/trace element related malnutrition.
Nanotechnology for slow release fertilizer
The nanotechnology promises slow release fertilizers (nanoporous zeolites) and
high value crops need to be evaluated and popularized. These fertilizers hold great
promise in the context of micro-irrigation being expanded to 69 m ha in
subsequent Plan periods. The fertigation results in saving of the fertilizers by about
40 percent. The fertilizers being imported, presently, are costly and require to be
produced by the Indian fertilizer industry. We need to encourage production and
use of SSP to correct widespread sulphur deficiency in soils besides serving as a
source of phosphorus. It is also suitable for making fertilizer mixtures and
customized fertilizers. The regular and higher rate of concession would
incentivise its production and use. Presently, only 16 fertilizers are covered under
subsidy/concession scheme and a large number of other fertilizers including the
products containing secondary and micronutrients are outside the ambit of subsidy
policy. It would be in the interest of the Indian farmer, if these fertilizers were
covered under the concession/subsidy scheme.
We should utilize all indigenously available nutrient sources to reduce
dependence on import of fertilizer raw materials/ intermediates and finished
products. There are good reserves of low grade rock phosphate (160 million
tonnes) and potassium bearing mica in the country. The reserves uneconomic for
exploitation as fertilizers, could be used for production of enriched manures
containing P and K through co-composting. Phosphogypsum, a by-product of
phosphoric acid based fertilizer industry containing 16 % S and 21 % Ca, could
serve as a potential source of sulphur and calcium to crops.About 7 million tonnes
of phosphogypsum are generated per annum by the fertilizer industry. The product
has a potential to supply about 1 million tonnes of sulphur and 1.4 million tonnes
of Ca annually. All the coarse textured, acidic and sodic soils low in S and Ca
would benefit from its supplementation. Its agronomic value has been tested on a
variety of cereal, oilseed and pulse crops under varied agro-climatic situations
(Biswas and Sharma 2008b).
Augmenting supplies of organic manures
To have Integrated Nutrient Management System (IPNS) on a sound footing, we
need to augment the supplies of organic manures. The availability of organic
manures comprising rural and urban composts, farm yard manure, vermicompost
and other materials is around 385 million tonnes per annum (DAC 2009) against
the moderate requirement of about 900 million tonnes per annum (assuming
addition @ 5 tonnes ha on a gross cropped area of 185 m ha) at the country level.
The supplies could be augmented to some extent by composting large amounts of
urban and agro-industrial wastes. About 57 million tonnes of urban solid wastes
generated per annum have a potential to provide 8 million tonnes of good quality
compost in the country. Besides, a variety of agro-industrial wastes like press mud,
spent wash, poultry litter and fruit and vegetable waste could be recycled and
converted into valuable manure. There is need to develop technologies for the
-1
22 23

these soils has increased substantially the wheat yields and Zn content in grains.
The consumption of Zn containing fertilizers has increased from nil in 1994 to
about 400,000 tonnes per annum in Turkey. The economic benefits in terms of crop
productivity and human health enhancement are enormous. The Anatolian
experience, therefore, merits its replication in other Zn-deficient areas to address
public health while improving crop production. Zinc is one of the nutrients
depleted significantly under intensive agriculture, especially in rice-wheat
cropping sequence, in India (Tandon 1995) and requires its replenishment through
fertilizers for food and nutritional security.
The iron malnutrition is a problem in many parts of the world including India
(United Nation 1992), where poor people depend largely for their food on cereals
containing low iron. The iron deficiencies are associated with anemia, fatigue,
nervousness, reduced appetite, lower wait gain, sore tongue and memory loss etc.
The iron deficiencies have been reported in livestock of north-western Rajasthan
and sheep and goats in West Bengal (Sarkar et al. 1992 a, b). The deficiencies of
Cu, especially in sandy soils or soils having large content of organic matter, have
also been reported to affect crop productivity and human health in India. Its
deficiency causes defective melanin synthesis leading to leucoderma (vitilogo),
osteoporosis, arthritis, infertility and cardiovascular disorders etc in humans. Its
deficiency caused depigmentation of hair and skin in buffaloes in India, Pakistan
and Indonesia (Randhawa 1999; Sinha et al. 1976). In South Australia and New
Zealand, the cows grazing on Cu deficient lands suffered from heart failure Falling
Disease.
The irrigation sector is the largest consumer of fresh water (about 83 %) in the
country. Its share, however, is going to decline to 72% and 68% in 2025 and 2050,
respectively (MoWR 1999) in the wake of growing competition from the
industrial and domestic sectors. The per capita water availability in India has
reduced to 1820 m in 2001 compared to 5200 m in 1950. It has now declined to
below 1700 m , the limit considered as cutoff for being water stressed, and would
be less than 1000 m per capita per year for about two-third of population by 2050
(Planning Commission 2002). The per capita water availability in India is very low
compared to 25,708 m in Australia and 10,837 m in USA. The future gains in
agricultural productivity of the country are, therefore, going to be determined by
proper development and utilization of surface and ground water resources.
India could meet its required irrigation potential of about 180 million ha from
major and medium irrigation sources (58.5 million ha), minor irrigation sources
(81.5 million ha; 64.1 million ha as ground water and 17.4 million ha as surface
water) and inter-basin transfer of river waters (35 million ha). The achieved
Augmenting water resource
3 3
3
3
3 3
soil quality and plant health monitoring systems (nanosensors). The new products
and tools would go a long way in managing soil fertility and enhancing crop
productivity.
Ensuring nutritional security
The dietary inadequacies of Zn, Fe, I, Al, Cu, Mn, Co etc. and associated
malnutrition / health disorders in humans and animals are linked with deficiencies
of these elements in soils and foods. Over one billion people in South Asia still
suffer from protein-energy-trace elements-malnutrition syndrome (United
Nations 1992). The problem is more serious in young children, women of child
bearing age and livestock. The trace element deficiencies could be geogenic in
nature depending on mineral and soil composition or induced due to increased
mining of nutrients under intensive agriculture. The Zn deficiency has become a
big public health issue in India and is second in importance to Fe. It is assumed that
around 25 % of Indian population is under risk of Zn deficiency related problems.
The Zn content of crops grown on Zn deficient soils is generally lower than on the
Zn sufficient soils. The analysis of about 250,000 soil and 25,000 plant samples
collected from different states in India has indicated that 48 % soil and 44 % plant
samples were deficient in Zn (Singh 2007). The dietary intake of 0.2- 0.3 mg Zn
day is regarded as deficient. Its deficiency impairs the immune system and
increases the incidence of infectious diseases such as diarrhoea and pneumonia. It
also causes dwarfism, hypogonadism, anemia, geophagia, anorexia, skin lesions,
rough and dry skin and loss of taste etc. A study in Haryana on 283 pregnant
women has showed 65 % of them to be deficient in Zn based on low serum Zn
concentration (Pathak et al. 2008). The Zn deficiency related disorders like
parakeratosis disease, associated with bone and joint disorders and thickening of
skin, has been reported from Panjab and Haryana in animals feeding continuously
on forages deficient in Zn (Vasudevan 1987). Likewise, wool-shedding syndrome
in Corriedale sheep was observed at the Central Sheep Breeding Farm, Hissar due
to Zn deficiency (Mandokhot et al. 1987).
The high incidence of Zn deficiency in Indian population is primarily due to
more consumption of cereal-based foods and less of animal based-foods or pulses.
The rice and wheat, constituting major staple foods in India, contribute about 60-
70 % of daily calorie intake. The cereal grains are not only low in Zn, but also
contain antinutritive compounds like phytates which reduce bio-availability of Zn.
Growing of cereals on Zn deficient soils will further reduce the availability of Zn
in grains. This has been very well demonstrated by a study in Central Anatolia,
Turkey facing problem of Zn-deficiency. The Zn concentration in grains of 54
wheat cultivars grown on a Zn deficient soil averaged 9 mg Zn kg compared to 26
mg Zn kg on normal soils (Cakmak 2008). The application of Zn fertilizers on
-1
-1
-1
24 25

Checking fall in water table
The groundwater is being increasingly depleted in Central Punjab, Haryana,
Western Uttar Pradesh, Rajasthan, Tamilnadu, and West Bengal due to its over
drawl. The increased ground water abstraction (Fig. 4) has been prompted by the
availability of free or subsidized power and pumpsets in the rural areas since
eighties. The decline in ground water used for irrigating over 60 % area poses a
threat to food security besides entailing mounting over head costs to the farmers in
deepening their wells, installing submersible pumps and incurring more power to
lift water from increasing depths. The hard hit is the marginal and small farmers,
whose shallow/dug wells would go dry as the water table goes deeper with over
drawl. For equitable resource use, we should have clearly defined property rights
irrigation potential of about 56 million ha is grossly inadequate covering only
40 % of total arable area. There is continued gap between the assessed irrigation
potential and actual irrigation potential put to use in different states (CWC 2007).
As execution of major irrigation projects takes long time and inter-basin water
transfer remains a debatable subject, the augmentation of water resource in the
short term could be viewed within the perspective of conservation of existing
water resources through better water management (Chowdary et al. 2005). A
number of measures like harvesting of rain water in small storages, controlling
seepage from canals, efficient water distribution systems, additional ground water
development through artificial recharge, conjunctive use of surface and ground
waters, use of poor quality and waste waters and micro-irrigation could augment
water resource to a significant extent.
Rain water harvesting
India receives 400 M ha-m of rainfall per year. Of this, only 69 M ha-m are
available as surface flow and 43 M ha-m as ground water. Therefore, only 29
percent of annual precipitation is used and rest is lost as runoff to sea or as water
vapour to atmosphere. The potential exists for harvesting nearly 24 million ha-m
of rainwater in small-scale water harvesting structures in various rainfall zones
(Table 2).
If stored properly, about 30 percent of it (7million ha-m) could be available as
pre-sowing and protective irrigations for about 95 million ha area under Rabi
crops. The intervention promises additional food grain production of about 60
million tonnes per annum.
Table 2 Estimated rainwater harvesting storage potential in different rainfallzones, India
Rainfallzone (mm) effective surface
storage (%) structure (m ha-m)
110-500500-750750-10001000-2500> 2500
Total 24.0
Source: CSWCRTI 2007
Area (m ha) Rainfall for Harvestable runoffin water harvesting
52.1 5 0.840.3 6 1.565.9 7 4.0
137.2 6 14.632.6 4 3.3
Fig. 4 Growth of Groundwater abstraction (Source: CGWB 2007)
0
5
10
15
20
1982-83 1993-94 2000-01
Year
Nu
mb
er
of
str
uc
ture
s(m
illi
on
)
Dug-wells Shallow tube wells Deep tube wells Total
to surface and ground waters. Presently, a land owner is entitled to draw any
amount of ground water even if no water is left for others in the area. The Central
Ground Water Board has drafted a Model Bill (CGWB 2007) for adoption by the
states to ensure sustainable and equitable development of ground water resources.
The bill entails registration of bore well owners, statutory permission to sink a bore
well, restriction on the depth of bore wells and creation of a ground water
regulation body etc. The recharge of groundwater through appropriate
interventions is also assuming great significance in the country. There have been
spectacular increases in ground water table (0.2-2m) in well-managed watersheds
in different parts of India (Table 3). The conventional methods of augmenting
26 27

based on biological and soil-aquifer treatment approaches are, therefore, being
advocated. The waste waters could also be used safely after their dilution with
fresh water to contain the load of toxins within the permissible limits (Minhas and
Samra 2004). Aquaculture based utilization of sewage water also seems to be an
attractive proposition in high rainfall areas (Minhas and Samra 2004).
Enhancing water-use efficiency
The irrigation efficiency is low for both surface and ground waters. It requires to
be enhanced from 35 percent to 60 percent for surface water and from 65 percent to
75 percent for ground water. Even an increase of 5% in irrigation efficiency could
increase irrigation potential by 10-15 million ha. Losses in water conveyance
system are normally 40-50 % due to leakage, seepage and evaporation. Lining of
canals or distribution system is recommended where the availability of surface
water is much less than the demand and exploitation of ground water is a costly
affair. The adoption of pipe distribution system is recommended to reduce water
loss in the distribution system. The improved on-farm water management through
efficient irrigation scheduling, water application and choice of suitable crops and
cropping systems matching available water supplies could go a long way
enhancing the irrigation water use efficiency (Rao and Sinha 1991). The micro-
irrigation promises further increase in water-use efficiency by 40-50% compared
to surface irrigation.
The mounting anthropogenic pressure on land resources has left 31 percent of
global land resource at the brink of ecological collapse (Eswaran et al. 2006). This
is the land that has diminishing capacity for biomass production. A large
proportion of this land belongs to rainfed regions. Amongst Asian countries, India
and Thailand are the worst affected. Although the land degradation figures for
India furnished by various agencies are at variance (varying from 53 to 188 million
ha) due to differences in approaches, methodologies and criteria for assessment,
the fact remains that large area is under degradation due to different degrading
agents. Recently, the datasets on land degradation/wasteland available with
different agencies have been harmonized in GIS environment for whole country.
As per new estimates, 120.7 million ha constituting 36.5 percent of total
geographical area are degraded in India due to soil erosion, salinity/alkalinity, soil
acidity, Water logging, and some other complex problems (Table 4). The degraded
soils with very low productivity do not contribute much to the national GDP.
Enhancing productivity of these lands is central to the planning for food secure
India, seeing little scope for horizontal expansion in the cultivated area in future.
The arable area may rather diminish with the mounting pressure for good lands
Amelioration of degraded lands
ground water recharge like percolation ponds and check dams have found a major
place in all watershed development programmes. However, the new recharge
techniques like recharge pits and shafts and injection wells etc need to be evaluated
for best results.
Use of waste water
India generates about 18.4 million M of wastewater per day as sewerage and
industrial effluents. The waste waters are, generally, used for irrigation on
agricultural lands for the cultivation of vegetables, fruits and other food crops.
As hardly 20% of waste water is treated in the country (Patnakar 2001), the
effluents are, generally, loaded with prohibitive levels of heavy metals and
toxic compounds (Tiwana et al. 1987; Mitra and Gupta 1999; Brar et al. 2000;
Khurana et al. 2003). The continued use of waste waters on agricultural
lands increases the load of toxic substances, heavy metals and pathogenic
microbes in soils, waters and foods (Brar et al. 2000) endangering human and
animal health.
For safe use of waste waters, there should be strict enforcement of safeguards
on their use as prescribed by the regulatory authorities. The effluents should be
pre-treated to remove/reduce their toxic load. The effluent treatment plant of
leather industries at Jallandhar, Punjab lowered significantly the concentration of
chromium in the effluent from initial 21 ug mL to 0.8 ug mL (Brar et al. 2000).
The pre-treated effluent is being used continuously for more than two decades
without any adverse effects on soils and crops in Tamilnadu (Pushpavalli et al.
1999).
The high establishment and operational costs of waste water treatment plants
are some of the constraints in their large scale use. The cost-effective methods
3
-1 -1
Table 3 Effect of watershed interventions on ground water recharge in different
regions, India
Watershed Surface storage capacityCreated(ha -m) water table(m)
Bazar-Ganiyar (Haryana)Behdala (H.P.)Bunga (Haryana)Chhajawa (Rajasthan)Chinnatekur (A.P.)GR Halli (Karnataka)Joladarasi (Karnataka)Siha (Haryana) 42.2 2.0
Source: CSWCRTI 2007
Observed rise in ground
79.0 2.018.0 1.060.0 1.820.0 2.05.6 0.86.8 1.54.0 0.2
28 29

Himalayan states were worst affected with more than one-third area falling in the
category of severe soil erosion. The earlier studies (Singh et al. 1992) have also
revealed serious problem of soil erosion in the north-western Himalayan regions,
Siwalik Hills, Shifting cultivation regions of NEH, Western Coastal Ghats, ravines
and black cotton belt of Peninsular India. The rates were quite high for Siwalik
Hills (> 80 t ha yr ) and shifting cultivation regions in NEH (>40 t ha yr ). In
quantitative terms, about 5.3 billion tonnes of soil are eroded in India at an average
rate of 16.3 t ha yr (Dhruvanarayana and Ram 1983). While 61 percent simply
moved from one place to another, nearly 29 percent were lost permanently to the
sea. The remaining 10 percent were deposited in reservoirs reducing their holding
capacity by 1 to 2 percent annually. About 8 million tonnes of plant nutrients were
also washed away along with eroded sediments. The increased soil erosion taking
away the fertile topsoil and forcing decline in crop yields (Yadav et al. 1993;
Agnihotri et al. 1994) is, therefore, a biggest threat to food security. The adoption
of appropriate soil and water conservation measures is essential for protecting the
lands from accelerated soil erosion.
Watershed management in rainfed areas
Many model watersheds developed in different parts of the country by research
institutes, government departments and non-governmental organizations have
demonstrated their usefulness in conserving soil and water resources and
ameliorating the socio-economic conditions of rainfed regions (Samra 2002
Some of the successful watersheds are Sukhomajri, Ralegaon Sidhi, Chitradurga,
Fakot, Kothapally, Tejpura and Alwar. The severe drought of 1987 in the country
has demonstrated the potentialities of watershed management as a drought
mitigation strategy (Fig. 5). Accordingly, the programme was scaled up at the
national level with larger public investments in National Watershed Development
Program for Rainfed Areas (NWDPRA), Integrated Wasteland Development
Project (IWDP) and many other initiatives supported by World Bank, DFID,
DANIDA and SIDA etc. Over the last three decades, the Government of India has
-1 -1 -1 -1
-1 -1
).
from industrial and domestic sectors. The Planning Commission, Government of
India, accordingly, envisages rehabilitation of 88 million ha of degraded lands in
the next four plans period. There is need for proper land-use planning consistent
with the prevailing socio-economic-environmental-market imperatives for
sustainable management of land resources. The plans must be wedded to the
strategies of diversification and integrated farming, seeking all round
development of an area.
Eroded land
Soil erosion due to water and wind is the major cause of soil degradation affecting
about 95 million ha area (Table 4). About 39% of total geographical area has soil
erosion beyond the permissible rate of 10 t ha yr (Table 5). The area under severe
soil erosion category of more than 40 t ha yr constituted about 11%. Some of the
-1 -1
-1 -1
S.No. Type of Degradation Arable land(M ha) (<40%
Canopy)(M ha)
1 Water erosion (>10 t/ha/yr) 73.27 9.302. Wind erosion (Aeolian) 12.40 -
Sub total 85.67 9.30
3. Chemical degradationa) Exclusively salt affected soils 5.44 -b) Salt-affected and water eroded soils 1.20 0.10c) Exclusively acidic soils (pH< 5.5) 5.09 -d) Acidic (pH < 5.5) and water eroded soils 5.72 7.13
Sub total 17.45 7.23
4. Physical degradationa) Mining and industrial waste 0.19 -b) Water logging & marshy lands(permanent) (water table within2 mts depth) 0.97 -
Sub total 1.16 -
Total 104.28 16.53
Grand total (Arable land and Open forest) 120.81
Open forest
Source: NBSSLUP 2008
Table 4 Degraded lands in India (M ha) Table 5 Area affected by potential soil erosion in India
Soil erosion (percent of Total Geographical Area)
Moderate(10-15 t/ha/yr) severe
(15-20 t/ha/yr) t/ha/yr) t/ha/yr) (>80t/ha/yr)
11.22 6.46 9.92 7.14 3.99 38.73
Source: NBSS&LUP 2008
Moderate Severe Very severe Extra Total(40-80 (40-80 severe (>10
t/ha/yr)
30 31

The ICRISAT, Hyderabad has been developing community watersheds in
India, to improve land productivity and livelihoods for poor people. The
development of 150 community watersheds gave significant yield gains of 35-270
% in sorghum, 30-174 % in maize, 72-242 % in pearl millet, 28-179 % in
groundnut and 97-204 % in sole pigeonpea (Dar 2007). The ICRISAT has carried
out meta analysis of 311 watersheds in India in terms of efficiency, equity and
sustainability benefits (Joshi et al. 2005). The mean benefit-cost ratio of watershed
program in the country was quite modest at 2.14. The internal rate of return was 22
per cent which compared very well with rural development programs. The
watershed programs generated enormous employment opportunities, augmented
irrigated area and cropping intensity and conserved soil and water resources. The
study concluded that the watershed program is silently rejuvenating and
revolutionizing rainfed areas.
The rainfed areas covering two-third of cultivated area and contributing
40 percent of food merit special attention in terms of bridging the gaps in
production technologies and resource allocations. The areas bypassed by the green
revolution still have poor resource base and marketable surplus. The various
interventions required for achieving higher productivity in the areas are, rainwater
harvesting, micro-irrigation, integrated nutrient and pest management, choice of
suitable crops (especially hybrids of maize, pulses and oilseeds), increased credits
and crop insurance etc. The establishment of National Rainfed Authority in 2006
will go a long way in ushering in the required socio-economic-food security in the
areas.
Bio-industrial watershed management
The economic and social benefits of watershed management could be upscaled
further by bringing industry to the watersheds and transforming them to the
industrial watersheds (Bali 2008). The new system would have the bio-produce
processed and value added at the watershed level, thereby, bringing urban profits
of industry and commerce to the rural poor. The watershed people through
cooperatives or corporates should wholly or substantially own these bio-
industries. Even the landless people of the watersheds would be partners of the
bio-industry. The fresh or processed watershed produce will be sold directly to the
consumers by these cooperatives, doing away with the middlemen. An
industrialist or entrepreneur ready to invest for the bio-industry, should be
acceptable provided the person provides 40 percent of share to the cooperative.
The bio-industry would take upon itself the role of running the affairs of bio-
industrial watersheds. It would arrange for grants from the Government for soil
and water conservation works and build-up of infrastructure and credit from
financial institutions for production purposes. It would develop backward
treated 56.5 million ha of degraded lands at an expenditure of about Rs. 20,000
crores under watershed management programme.
The Fakot watershed in the Garhwal Himalaya has increased the total food
production, cropping intensity and average family income during 20 years of its
operation (Dhyani et al. 1997). The development of Salaiyur watershed in
Coimbatore improved irrigation resource and crop diversification indices (Sikka
et al. 2004). The management of Kokriguda watershed in Orissa reduced soil loss
from 38.2 to 6.6 t ha year and runoff from 37 to12 percent with yield increases of
little millet and upland paddy by 15 and 38 percent, respectively (Patnaik et al.
2004). Similarly, The Rajiv Gandhi Watershed Mission in Madhya Pradesh
brought about increase in irrigated area by 59 % and in agricultural production by
37 % in Kharif and 30 % in Rabi season. The ground water improved in over 3000
villages covered under the project.
-1 -1
Fig. 5 Effect of watershed management on drought moderation in 1987
(Source: Samra 2005)
Fig 5. Effect of watershed management on drought moderation in 1987
(Source: Samra, 2005)2320
50 50
40
20
40
60
80
89
80
71
0
10
20
30
40
50
60
70
80
90
100
Fakot
(Uttaranchal)
Una (H.P.) Palghat (Kerala) Bazar Ganiyar
(Haryana)
Navamota
(Gujarat)
Tejpura (U.P.)
Watershed
%y
ield
red
ucti
on
Treated Watershed Untreated watershed
32 33
component of farming system in rural India, the bio-industry based on milk,
poultry, wool, meat and other animal products could be a great success. The
development of cold storage /cold chain to store and transport perishable produce
to the markets at appropriate time to avoid distress sales should be part of the bio-
industrial development programme.
The programme fits very well in the framework of various rural development
schemes, including National Rural Employment Guarantee Act (NREGA),
launched by the Government of India. The programme also has great promise in
fulfilling the United Nations Millennium Development Goals (MDGs) of
eradicating extreme poverty and hunger, promoting gender equality and
empowerment of women and ensuring environmental sustainability. The greater
institutional support to the programme through Government departments,
financial institutions and Institutions would allow tapping of a
multitude of potential benefits of the bio-industrial watershed management
programme. The National Rainfed Area Authority established recently to bring in
much needed convergence of resources with different Ministries and Departments
could provide fillip to the programme.
We need to strengthen micro-credit system for establishing micro-enterprises
in the watershed areas. The bigger financial institutions would seldom come to the
help of small enterprises with little capacity to pay back the loans at higher interest
rates. The micro finance institutions, to the contrary, would extend small loans at
low interest rates and flexible time limits. The setting up of more Banks
and Cooperative Societies in the rural sector is desired besides strengthening
National Bank forAgriculture and Rural Development (NABARD).
About 8.5 million ha of cultivated soils affected by alkalinity and salinity have
very low productivity due to unfavourable conditions for growing of crops in India
(Anonymous 2004b). The states most affected are Uttar Pradesh, Gujarat,
Rajasthan, West Bengal and Andhra Pradesh. The high pH, exchangeable sodium
and salt contents inhibit transformation and availability of native and applied
nutrients. The soils are, generally, deficient in Ca, N and Zn. The deficiency of Mn
has recently been reported in wheat grown on calcareous and light textured alkali
soils. The technology has been developed to reclaim these soils through addition
of amendments, drainage, growing of salt tolerant varieties, bio-drainage and
proper use of poor quality waters. Over 1 million ha of barren alkali lands have
been reclaimed, realizing productivity of about 8 t ha . The potential exists for
increasing food production by another10-15 million tonnes per annum by
reclaiming more areas under sodic lands.
Besides amelioration of existing salt affected lands, conscious efforts need to
Panchayati Raj
Gramin
Reclamation of salt affected soils
-1
linkages to provide production inputs like seeds, planting materials, fertilizers,
manures, pesticides, drip / fertigation systems and technical know-how etc and
forward linkages in finding markets and remunerative prices for the produce. The
bio-industrial watershed management is different from the contract farming in the
sense that it does not only focus on production and buy back of the produce, but
takes care of natural resource conservation and protection also to have sustainable
production.
It would be prudent to have all the Central and State governments' watershed
management programmes converted into bio-industrial watersheds. There are a
number of watershed level activities related to agriculture, horticulture, agro-
forestry, livestock, fisheries, poultry, sericulture, mushroom farming, honey bee
keeping and vermi-composting etc that could form agri-enterprizes for bio-
industrial watershed development. We need to choose such enterprizes suiting to
varied socio-economic-environmental conditions of different rural areas for
greater livelihood, nutritional and environmental security. The operation of one
thousand per annum capacity vermicompost bioindustry involving one hundred
households of a watershed, could generate net income of about Rs 50 lakhs besides
creating employment to rural households, especially women. There is growing
demand for vermi-composting for high value fruit, plantation, vegetable and
organically grown crops. The country with the existing vegetational wealth is
capable of sustaining 150 million bee colonies, providing 1.5 lakh tonnes of honey.
The value addition to the produce at the watershed level would fetch more income
to the farmers while generating employment for 15 million rural and tribal
families. Likewise, the mushroom farming is big livelihood generator in rural
areas. The horticulture-based food processing industry under bio-industrial
watersheds is going to offer immense economic gains and livelihood opportunities
besides food and nutritional security to rural people. Horticulture is emerging as a
single largest category in world agricultural trade accounting for over 20 percent
of share in recent years. The great demand for fresh fruits and vegetables
worldwide is stimulating international trade in horticulture in India. The
Government has been spearheading horticultural development through National
Horticulture Mission in providing suitable infrastructure in terms of handling,
transportation, storage, markets, processing and value addition. India loses more
than Rs 58,000 crores worth the agricultural produce due to lack of post-harvest
and food processing infrastructure.
The bio-industrial watershed management system could be viewed on the
parlance of Amul cooperatives in Gujarat, Kuppam vegetable farming and
processing cooperative in Andhra Pradesh, Kokam fruit concentrate production
cooperatives in Maharashtra and Goa, sugar mills co-operatives in Maharashtra
and Gujarat, Leh Berry fruit concentrate production cooperative in Leh (J&K) and
many other ventures in different parts of the country. As animals are essential
34 35

Mitigating climate change
The climatic change due to increased green house gases emissions and global
warming is going to have far reaching repercussions on the sustainability of
agriculture and food security in the near future. The change is likely to alter agro-
meteorological parameters, overall crop-water balance, pest and disease incidence
and land use etc. It has been estimated that an increase of 0.5 C in mean
temperature in Punjab, Haryana and Uttar Pradesh would have reduced the
productivity of wheat crop by 10%. The melting and receding of Himalayan
glaciers (Table 7), regulating water and hydro-power supplies to adjoining Indo-
Gangetic plain, puts a big question mark on the sustainability of agriculture in the
northern states of the country.
There is already 16 % loss in glacial area over the past 40 years. The Inter
Governmental Panel on Climate Change in its Fourth Assessment Report (IPCC,
2007) has projected warming of 0.2 C per decade in the next two decades, even if
the concentration of all green house gases and aerosols remains constant at year
2000 level. As glaciers melt, sea levels would also rise and inundate low-lying
resource rich coastal regions and islands. The global warming is also projected to
increase water, shelter and energy requirement of livestock and affect fish
breeding, migration and harvests. The rising temperatures may affect productivity
of temperate fruits like apple. The decline in apple productivity in Simla and Kullu
districts of Himachal Pradesh in recent years is linked to inadequate chilling to
crop due to prevalent warm weather (Bhagat et al. 2007). There is a shift in the
apple belt towards higher reaches in Lahaul & Spiti and Kinnaur districts of
Himachal Pradesh.
0
0
be made in preventing secondary salinization of lands. The excess use of canal
water has led to salinization in major irrigation commands of the country.
The productivity of acidic soils, particularly with pH < 5.5, is low due to
deficiencies as well as toxicities of some nutrients. The soils need liming to
neutralize active and part of exchange acidity and application of fertilizers to
ensure adequate supplies of nutrients to crops. The earlier approach of liming of
soils based on lime requirement (2-4 t ha ) and broadcast method of application
proves uneconomical. The application of lime @ 1/10th of lime requirement in
furrows along with the fertilizers is cost-effective and acceptable to the farmers.
The conjunctive use of lime and fertilizers on 871 farmers' fields under ICAR
Network Project onAcid Soils has increased yields of a variety of crops by 49-189
% over farmer's practice (Sharma and Sarkar 2005). Liming could save half of the
recommended fertilizer, especially for legumes and pulses (Table 6). The adoption
of technology on 10 million ha of these lands would contribute at least 10 million
tonnes of additional food grains to the national food basket per annum.
The cost-effective technology requires to be operationalized by creating
requisite infrastructure for marketing and distribution of liming materials and
creating more awareness on usefulness of the technology among farmers. The
cheap and effective liming materials like basic slag and lime sludges are available
with steel industries and paper mills, respectively.
Amelioration of acid soils
-1
Table 6 Effect of liming on crop yield (q ha ) in acid soils-1
State Crop 100% NPK 50% NPK +Lime
Assam Rapeseed 9.70 10.10Summer green gram 4.42 5.17
Kerala Cowpea 8.57 10.65Black gram 6.38 8.10
Meghalaya Maize 30.50 30.30Groundnut 14.20 21.30
West Bengal Mustard 8.15 8.40Wheat 16.70 17.15
Jharkhand Maize + Pigeon pea(Maize equiv. yield) 69.0 65.0Pea 38.4 50.8
Orissa Groundnut + Pigeon pea 22.5+12.0 23.6 + 12.2HP Maize 34.0 33.1
Wheat 27.9 23.7
Source: Sharma and Sarkar 2005
Table 7 Basin wise loss in glacial area
Basin No. of glaciers Area 1962
( Km ) ( Km ) Area %
Chandra 116 696 554 20Bhaga 111 363 254 30Parbati 90 493 390 20Basapa 19 173 140 19Warwan 253 847 672 21Bhut 189 469 420 10Miyar 166 568 523 08Alaknanda 126 734 638 13Bhagirathi 187 1218 1074 11Gauriganga 60 305 256 16
Total 1317 5866 4921 16
Area 2001/2004 Loss in2 2
Source: Kulkarni et al. 2009
36 37

development planning in India. The country would require about 280 million
tonnes of food grain by 2020, with annual growth rate of 2 percent. With cultivated
area remaining static, the desired growth in production has to come with the
increase in productivity. The growth rates of Total Factor Productivity are,
however, decelerating for quite sometime, endangering food security. The factors
impacting factor productivity have to be identified and addressed to have the
growth of agriculture on a higher trajectory. The declining response of fertilizers,
contributing over 50 percent towards productivity, for the last 30 years or so is a
matter of great concern. The imbalanced fertilizer use in terms of NPK and micro
and secondary nutrients coupled with less use of organic manures has given rise to
this situation. The solution lies in the widespread adoption of integrated nutrient
management, envisaging conjunctive use of inorganic and organic fertilizers. We
need to augment the supplies of organic manures, composts/vermicomposts and
biofertilizers, which are still in short supply. To have adequate and sustained
supplies of fertilizers, the fertilizer industry facing stagnation for almost a decade
requires to be bailed out through appropriate policy initiatives. It is high time, the
fertilizer industry looked forward towards production of soil and crop specific
fortified, coated and customized fertilizers. The completely water soluble
fertilizers, ideal for fertigation systems, need to be produced in the country to
make them cost-effective.
The share of irrigation water is going to drop from 83 percent to 72 percent in
the near future, given the growing competition for fresh water from domestic and
industrial sectors. The problem is likely to be compounded with slow execution of
multi-purpose projects, drying up of ground water resource, complexities in
negotiations on inter-basin river water transfers and crop-water imbalances under
impending climate change. The focus, therefore, requires to be given on improved
water management at basin, command and farm levels. The rainfed areas
occupying 87 million ha and supporting 40 percent of food, determine food
security to a large extent. These areas require special attention to bridge the gaps in
production technologies and allocation of resources. The establishment of
National Rainfed Authority is a right step in this direction. The amelioration of 3
million ha of salt affected and 10 million ha of acidic lands could add about 25
million tonnes of additional grain to the national food basket.
Agnihotri RC, Bhushan LS, Singh SP (1994) Productivity loss due to soil erosion
and its restoration by conservation practices. In: Bhushan et al. (ed) Soil and
water conservation – Challenges and opportunities, Vol. I. 8 ISCO conf New
Delhi. pp. 462Anonymous. (2004a) Report of the Commission forAgricultural Costs and Prices,
References
th
Naturally, we can afford to release only a limited amount of carbon into the
atmosphere to keep the greenhouse warming effect within safer limits. A
temperature increase of 1 C is the maximum that could be allowed. This safe limit
is bound to be reached in just 40 years if we continued with the present state of
affairs.
Developing new genotypes suitable to the changing climatic situations should
be a major priority. The research efforts need to be intensified employing marker
assisted selections and transgenic approaches to evolve cultivars tolerant to
droughts, high temperatures, water logging and new emerging pests and diseases.
The C3 plants could be transformed into C4 plants to lower the elevated carbon
dioxide levels in the atmosphere, while at the same time enhancing photosynthetic
activity and crop productivity. The new land use and management systems
requiring least soil disturbances and minimal soil carbon loss into the atmosphere
need to be devised for different regions. The conservation tillage and aerobic –rice
systems deserve a special mention in this regard. The pests and disease forecasting
systems covering range of climatic parameters need to be developed for
contingency planning and effective pest/disease management. The knowledge
based decision support systems for translating short, medium and long range
weather forecasts into operational management practices should be strengthened
for reducing production risks. The simple manipulations in terms of planting dates
(extending or delaying) to escape aberrant weather changes due to climate need to
be identified. The soil, water and fertilizer management practices that reduce GHG
emissions of methane and nitrous oxide (Aulakh and Adhya 2006) merit their
adoption.
Although India's share in total emissions is relatively less, it should
participate vigorously being a responsible member of international community in
collective global efforts in reducing emissions. The large area under waste lands in
our country could be gainfully employed for sequestration of green house gases by
taking up large scale plantations. The potential for sequestration of organic carbon
through restoration of degraded and desertified soils in India is 10 –14 Tg C yr
(Lal 2004). The Indian farmers would be benefitted greatly by carbon trading
projects both from sale of timber and carbon credits. There is growing interest in
the country to bring about 2.5 million ha of wastelands under bio-fuel plantations
of Jatropha (Jatropha curcas) and Karanja (Pongamia pinnata) to supply 2.6
million tonnes of biodiesel in order to blend 5% petrodiesel with biodiesel.
Besides carbon sequestration, we need to develop speedily non-carbon sources of
energy like hydro-power, nuclear, solar and wind energies and enhance energy use
efficiencies in industry, transport, domestic appliances and agriculture.
Providing food and nutritional security to growing population has been central to
o
-1
Epilogue
38 39

Dhyani BL, Samra JS, Juyal GP, Babu R, Katiyar VS (1997) Socio-economic
analysis of participatory integrated watershed management in Garhwal-
Himalaya-Fokot watershed, Bulletin No.T-35/D-24, CSWCR&TI, DehradunEswaran H. Reich P, Vearsaili T (2006) A global assessment of land quality in the
anthropocene. In: Proc. Int Conf on Soil, Water and Environ Quality, Jan. 28-
Feb. 1, 2005, New Delhi. pp.119-131Fertilizer Statistics (2007-08) FertilizerAssociation of India, New DelhiJoshi PK, Jha AK, Wani SP, Joshi L, Shiyani RI (2005) Meta-analysis to assess
impact of watershed program and people's participation. Comprehensive
Assessment Research Report 8. pp.17ICAR (2007) State-specific technological interventions for higher agricultural
growth. Indian Council ofAgricultural Research, New DelhiIPCC (2007) Climate change: The physical science basis. Summary for policy
makersKhurana MPS, Nayyar VK, Bansal RL, Singh MV (2003) Heavy metal pollution
in soils and plants through untreated sewage water. In: Singh VP, Yadav RN
(eds) Proc Int Conf Water and Env (WE-2003).Allied, New Delhi, pp 487-495Kulkarni AV, Bahuguna IM, Rathore BP (2009) Application of remote sensing to
monitor glaciers. Bull Nat Natural Resources Manage Sys, NNRMS (B)-33,
Department of Space,Antariksh Bhavan, Bangalore. pp 79-82Kumar P, Kumar A, Mittal S (2004) Total factor productivity of crop sector in the
Indo-Gangetic Plain of India: Sustainability issues revisited. Indian Econ
Review 39:169-201Lal R (2004) Soil carbon sequestration impacts on global climate change and food
security. Science 304:1623-1629Mandokhot VM, Vasudevan B, Mandal AB, Yadav IS (1987) Serum and wool
mineral status of wool shedding manifestation in corriedale sheep. In:
Mandokhot VM (ed) Proc Symp Recent Adv Mineral Nutr. CCSHAU, Hisar,
pp 33-37Minhas PS, Samra JS (2004) Wastewater use in peri-urban agriculture: Impacts
and opportunities. Tech. Bull. No. 2/2004, Central Soil Salinity Research
Institute, KarnalMitra A, Gupta SK (1999) Effect of sewage water irrigation on essential plant
nutrient and pollutant element status in vegetable growing area around
Calcutta. J Indian Soc Soil Sci 47:99-105MoWR (1999) Integrated water resource development: a plan for action Report of
the National Commission for Integrated Water Resources Development, 1,
Government of India, pp 515Murgai R (2000) The green revolution and the productivity paradox: evidence
from Indian Punjab.Agri Econ 25(2&3): 199-210NAAS (2006) Low and declining crop response to fertilizers. Policy Paper No. 35,
NationalAcademy ofAgricultural Sciences, New Delhi. pp 8NBSS&LUP (2008) Harmonization of degraded lands/wastelands datasets of
.
Govt. of India, New DelhiAnonymous (2004b) Reclamation and Management of Salt- Affected Soils.
Central Soil Salinity Research Institute, KarnalAnonymous (2009) State of Indian agriculture. National Acad Agril Sci, New
DelhiAulakh MS, Adhya TK (2006) Impact of agricultural activities on emission of
green house gases – Indian perspective. Proc International Conf Soil, Water
and Environmental Quality, ISSS, New Delhi, pp 319-335Bali JS (2008) Bioindustrial watershed management in rainfed areas for rural
employment and prosperity. In: Anand-Swarup et al. (ed) Conservation
Farming: Enhancing Productivity and Profitability of Rainfed Areas Soil
Conservation Soc India, NASC Complex, New Delhi, India, pp 379-398.Bhagat RM, Singh R, Prasad R, Lal H, Kalia V, Sood C (2007) Impact,
vulnerability and adaptation of mountain agriculture to climate change,
Technical Report. pp, 87Biswas PP, Sharma PD (2008a) A new approach for estimating fertiliser response
ratio – the Indian scenario. Indian J Fert 4(7): 59-62Biswas PP, Sharma PD (2008b) Phosphogypsum - a potential source of sulphur
and calcium to crops. Indian J Fert 4(8): 49-52Brar MS, Malhi SS, Singh AP, Arora CL, Gill KS (2000) Sewage water irrigation
effects on some potentially toxic trace elements in soil and potato plants in
northwestern India. Canadian J Soil Sci 80: 465-447Cakmak I (2008) Enrichment of fertilizers with Zn - an excellent investment for
humanity and crop production in India. FAI Annual Seminar 2008, New
Delhi, SII-2: 1-8CGWB (2007) Report of the Expert Group on ground water management and
ownership Central Ground Water Board, Govt of India, New DelhiChand R (2007) Demand for food grains. Economic and Political Weekly 42(52):
10-13Chowdary VM, Rao NH, Samra PBS (2005) GIS-based decision support
framework for assessment of non-point source pollution of groundwater in
large irrigation projects.Agri Water Manage 75:194-225CSWCRTI (2007) Perspective Plan Vision 2025, CSWCR&TI, DehradunCWC (2007) The CWC Handbook. Central Water Commission, Ministry of Water
Resources, Government of India, New DelhiDAC (2009) Personal Communication, Department of Agriculture and
Cooperation, Ministry ofAgriculture, Government of India, New DelhiDar WD (2007) Efficient conservation and utilization of rainwater in drylands for
high productivity. In: Souvenir Ensuring Water and Environment for
Prosperity and Posterity. 10 Inter-Regional Conference on Water and
Environment. Oct 17-20, pp.1-5Dhruvanaryana VV, Babu R (1983) Estimation of soil erosion in India J Irrig
Drain Eng 109: 419-434
,
,
.
th
40 41

Singh G, Babu R, Narain P, Bhushan LS, Abrol IP (1992) Soil erosion rates in
India. J Soil Water Cons 47: 97-99Singh K (2003) Punjab agricultural policy review, Report to the World Bank, New
DelhiSingh MV (2007) Micronutrient deficiencies in crops and soils in India. In:
Alloway BJ (ed) Micronutrient Deficiencies in Global Crop Production.
Springer, pp 93-125SinghT, Ghosh TK, Tyagi MK, Duahn JS (1999) Survival of Rhizobia and level of
contamination in charcoal and lignite.Annal Biol 15:155-158Singletone PW, Boonkerd N, Carr TJ, Thompson JA (1996) Technical and
marketing constraints limiting legume inoculant use in Asia, In: Extending
nitrogen fixation research to farmers' fields. Proc Int Workshop on Managing
Legume Nitrogen Fixation in the Cropping System of Asia, ICRISAT, Asia
Centre, IndiaSinha BP, Jha JG, Sinha BK (1976) Leucoderma in Indian buffaloes (
). J Indian Vet 53:812-815Sinha SK, Singh GB, Rai M (1998) Decline in crop productivity in Haryana and
Punjab: Myth or reality? Indian Council ofAgricultural Research, New DelhiTandon HLS (1995) Major nutritional constraints to crop production and the soil
fertility management strategies in different agro-climatic regions of Asia. In:
Proc Int Potash Inst Colloq Potassium in Asia: Balanced fertilization to
increase and sustain agricultural production. Chiang Mai Thailand, IPI, Basel,
pp 43-72Tiwana NS, Panesar RS and Kansal BD (1987) Characterization of wastewater of
a highly industrialized city of Punjab. In: Proc Nat Sem on Impact of Environ
Protection for Future Development of India, Nainital, 1:119-126Tiwari KN, Sharma SK, Singh VK, Dwivedi BS, Shukla AK (2006) Site-specific
nutrient management for increasing crop productivity in India. Results with
rice-wheat and rice-rice system. PDCSR, Modipuram and PPIC-India
Programme, Gurgaon, pp 112United Nations (1992) ACCSN Second Report on the World Nutrition Situation,
Vol. 1 Global and regional results, Geneva, pp 1-80Vasudevan V (1987) Mineral deficiencies syndrome among dairy cattle, sheep and
goats in India. In: Mandokhot VM (ed) Proc Symp Recent Adv Mineral
Nutrition HisarYadav SC, Sehgal J, Vadivelu S (1993) UNDP Terminal Technical Report on
Study of Factors of Land Evaluation System. National Bureau of Soil Survey
and Land Use Planning, Nagpur. pp 77-100
Bubalus
bubalis
.
India-a GIS based approach, NBSS&LUP, NagpurPatnaik S, Choudhary PR, Sudhishri S, Dass A, Paikaray NK (2004) Participatory
watershed management for sustainable development in Kokriguda watershed,
Koraput, Orissa, CSWCR&TI, Research Centre, Sunabeda, pp 123Patnakar SN (2001) Reuse of treated wastewater and sludge for agriculture in
India-a case study. In: 52 IEC Meeting of the International commission on
irrigation and drainage, International Workshop on Wastewater Reuse and
Management, Seoul, KoreaPlanning Commission (2002) Report of the Steering Committee on irrigation for
the Tenth FiveYear Plan, 2002-07, pp 51Pushpavalli R, Kotteeswaran P, Krishnamurthi M, Parameswaran P (1999) Impact
of application of treated distillery effluents on soil, yield and quality of
sugarcane. 2 Int Conf on Contamination in Soil Environment in theAustralia
– Pacific Region, pp 47-48Rao DLN (2008) Biofertilizer Research Progress (2004-07). All India Network
Project on Biofertilizers, IISS, Bhopal, pp 105Rao NH, Sinha SK (1991) Sustainable development of water resources for
agriculture. In: Srivastava (ed.) Glimpses of Science in India. Malhotra, New
Delhi, pp 173-208Samra JS (2005) Policy and institutional processes of participatory watershed
management in India: Past lessons learnt and future strategies. In: Sharma et
al. (ed) Watershed Management Challenges: Improving Productivity,
Resources and Livelihoods. IWMI, Sri Lanka, pp 336Samra JS (2006) Declining factor productivity and sustainability of crop
production. In: Benbi et al. (ed) Proc International Symposium on Balanced
Fertilization for Sustaining Crop Productivity, Vol I. pp 21-56.Samra JS, Sharda VN, Sikka AK (2002) Water harvesting and recycling – Indian
Experiences. CSWCR&TI, Dehradun, pp 347Sarkar S, Das KC, Chaudhary SP, Bhowmik MK. Mukherjee BN (1992 a) Effect
of certain micromineral status in the soils and forages in alluvian tropics on the
incidence of nutritional anemia in grazing sheep. Indian JAnimal Sci 62: 665-
669Sarkar S, Mishra SK, Bhowmik MK, SamantaAK, Basak DN (1992 b). Anote on
anemia in goats of alluvian belt of west Bengal and its therapy. J Indian
Veterinary 69: 1139-1141Sharma PD, Sarkar AK (2005) Managing Acid Soils for Enhancing Soil
Productivity NRM Division ICAR, KAB – II, Pusa Campus, New Delhi.
Tech. Bulletin, pp 23Sikka AK, Madhu M, Subhash Chand, Selvi V, Singh DV, Sundarambal P,
Jeevarathnam K (2004) Participatory watershed management for sustainable
development in Salaiyur watershed, Coimbatore, CSWCR&TI, Research
Centre, Udhagamandalam
nd
nd
42 43

Global impacts of human mineral malnutrition
Alexander J Stein
Abstract
Keywords
Abbreviations
Introduction
Malnutrition - in the form of insufficient energy intakes - affects millions
of people worldwide and the negative impact of this kind of hunger is well
acknowledged, not least by agronomists trying to increase yields to ensure a
sufficient supply of food. Scope: This review focuses on another, more particular
and "hidden" form of malnutrition, namely mineral malnutrition. It illustrates the
burden of disease that is caused by mineral deficiencies and the social and
economic consequences they bring about. Conclusions: Mineral malnutrition has
a considerable negative impact on individual well-being, social welfare and
economic productivity.Agricultural scientists should keep the nutritional qualities
of food in mind and - next to optimizing the agricultural properties of crops that are
paramount for their adoption by farmers - in particular try to increase the
micronutrient content in major staple crops as one way to address vitamin and
mineral malnutrition in humans; especially plant breeding approaches promise to
be very cost-effective.
Human micronutrient malnutrition mineral deficiencies burden
of disease social and economic costs biofortification
CaD: Calcium deficiency, CGIAR: Consultative Group on
International Agricultural Research, FAO: Food and Agriculture Organization of
the United Nations, FeD: iron deficiency, FeDA: iron deficiency anemia, GDP:
gross domestic product, GM: genetically modified, ID: iodine deficiency, IPR:
intellectual property rights; SeD: selenium deficiency, VAD: vitaminAdeficiency,
VMD: vitamin and mineral deficiency, WFP: World Food Programme, WHO:
World Health Organization, ZnD: zinc deficiency
In humans, malnutrition is mostly understood to mean chronic hunger. According
to estimates of the Food andAgriculture Organization of the United Nations (FAO
l l l
l l
Proceedings IPI-OUAT-IPNI International Symposium (2009)
AJ Stein
Seville, Spain, e-mail: [email protected], URL: www.AJStein.de
Presented at IPI-OUAT-IPNI International Symposium.Published in Plant Soil 2010.335:133-154. Printed here with permission from Plant Soil.
44 45

global level, and in particular in developing countries, it is above all deficiencies in
iron ( ), zinc ( ) and iodine ( ) that are recognized to have a negative impact on
public health (Horton et al. 2008; Ezzati et al. 2004; WHO 2002). Also
deficiencies in calcium ( ) and selenium ( ) are considered to represent public
health problems, albeit less significant ones (Black et al. 2008; Allen et al. 2006;
WHO 2004; Pettifor 2004), and in sub-populations or at regional levels also
deficiencies in magnesium ( ) and copper ( ) may represent more common
health problems (White and Broadley 2009; JN 2009; Biesalski et al. 2003; Black
2001; Bhan et al. 2001). As the focus of this review is on the impact of
human malnutrition with minerals, in the following only the impacts of iron
deficiency (FeD), zinc deficiency (ZnD) and iodine deficiency (ID) will be
discussed in greater detail, but where appropriate and available also information
on calcium deficiency (CaD) and selenium deficiency (SeD) will be included.
Fe Zn I
Ca Se
Mg Cu
global
2
3
Regarding the prevalence of the main mineral deficiencies, the prevalence of
(more severe) FeD is generally approximated by the prevalence of anemia because
it is its primary cause, even if not all FeD manifests in anemia and not all anemias
are due to FeD. (In general 50-60% of anemia can be attributed to FeD, although
this share may be lower in regions where e.g. hookworms or AIDS are prevalent
(Stein et al. 2005)). De Benoist et al. (2008) estimate that 25% of the global
population (1.6 billion people) suffers from anemia, and the World Health
Organization (WHO 2009a) puts the number of anemic people at 2 billion people
(over 30% of the world's population). The WHO also confirms that FeD is the most
common and widespread nutritional disorder in the world, predominantly
affecting children and women in both developing industrialized countries. A
similar share of the world population may be affected by ZnD; the WHO (2002)
estimates that 2 billion people (33%) are not consuming the "US recommended
dietary intake" of and Hotz and Brown (2004) estimate that 1.2 billion (20%)
are at risk of inadequate intakes. For ID de Benoist et al. (2004) estimate that
35% of the general population (2 billion individuals) have insufficient intakes.
While underlining the difficulty to quantify the total number of people suffering
from SeD worldwide, Combs (2001) puts forward an estimate of 0.5-1 billion (i.e.
roughly 10-15%). Similarly, Allen et al. (2006) do not find sufficient data to
quantify a global prevalence of SeD nor of CaD, but for they report severe
deficiency in some regions of various countries and for they confirm that low
intakes are very common. For nutritional rickets in general, which can be a
consequence of CaD or vitamin D deficiency, Bereket (2003) states that it remains
and
Zn
Zn
I
Se
Ca
2009), currently over one billion people worldwide – one out of six – are thus
undernourished. The related negative global impacts of undernutrition on
individual well-being and economic growth are well acknowledged and there is
general agreement that fighting hunger not only represents one of the foremost
challenges for humanity but also offers considerable economic and social returns
(FAO 2008a; Horton et al. 2008; WFP 2007; World Bank 2006; Sanchez et al.
2005; Fogel 2004). In any case, going beyond ethical and economic
considerations, the Economic and Social Council of the United Nations affirmed
the legal obligation by every state "to ensure for everyone under its jurisdiction
access to the minimum essential food which is sufficient, nutritionally adequate
and safe, to ensure their freedom from hunger" (UN 1999).
Yet, apart from this outright hunger – the reasons and consequences of which
are obvious to both the individuals concerned and to their social environment –
over the last two decades the definition of malnutrition increasingly also covers
so-called "hidden hunger" (Allen 2003a; WHO 2004). This form of hunger is
caused by a chronic lack of vitamins and minerals that is called "hidden" because
people who suffer from it do not feel they lack something and its consequences are
often not immediately visible (MI 2009); hence entire populations can be affected
by this kind of malnutrition, even if the food supply is adequate in preventing
"classical" hunger (Kennedy et al. 2003a). The global impacts of human
malnutrition with minerals are the subject of the present review.
There are at least twenty dietary minerals and trace elements that are – or are
plausibly suspected to be – essential for the proper functioning of the human body
(Table 1; for a recent review of the role of minerals in plants and human health also
see Martínez-Ballesta et al. 2009). Consequently, if they are not ingested in
adequate amounts (or are poorly bioavailable), there will be negative impacts on
the health of those who consume too little of these nutrients. Still, many minerals
are needed in such small amounts or are so abundantly available in many
foodstuffs that the occurrence of related deficiencies is rare or even unknown. On a
-1
Impacts of human mineral malnutrition
1The FAO and the WFP differentiate between "malnutrition" (the physical condition resulting from
inadequate or unbalanced nutrient intakes or their poor absorption), "undernutrition" (the physicalmanifestation of prolonged low level food intakes with serious deficiencies in one or a number ofmacronutrients and micronutrients), "undernourishment" (a situation where people's food intakes arecontinuously insufficient to meet their basic requirements), "micronutrient deficiency" (lack ofessential as a result of malnutrition) and, less of relevance in the present context,"overnutrition" (the physical condition resulting from an excess of certain nutrients, which also fallsunder "malnutrition") (FAO 1999; WFP 2007). Yet, as the WFP acknowledges, there is somedisagreement on what these terms mean and how they relate to each other. Nevertheless, despite beingsomewhat artificial, such a categorization may offer a relatively clear and consistent way ofapproaching the issues.
energyvitamins and minerals
2In this context usually also vitamin A deficiency (VAD) is listed, but as the focus of this article is on
minerals, vitamin malnutrition is not further considered here.
Even though potassium is an essential mineral (for which e.g. in the USA health claims on foods arepermitted), potassium deficiency due to insufficient potassium in the diet is rare and not commonlyconsidered a public health problem; deficiency is rather caused by excessive losses or poor retention.
3
46 47

IOM (2001) JN (2009)
Arsenic
( )
Boron
( )
Calcium
( )
Chloride
( )
Chromium
( )
Copper
( )
Fluorine
( )
Iodine
( )
Iron
( )
Magnesium
( )
Manganese
( )
As
B
Ca
Cl
Cr
Cu
F
I
Fe
Mg
Mn
No biological funct ion,
although animal data indicate a
requirement.
No clear biological function,
although animal data indicate a
functional role.
Essential role in blood clotting,
muscle contraction, nerve
transmission, and bone and
tooth formation.
As sodium chloride (salt)
r e q u i r e d t o m a i n t a i n
extracellular volume and
plamsa osmolality (IOM 2004:
269).
Helps to maintain normal blood
glucose levels.
Component of enzymes in iron
metabolism.
As fluoride inhibits the
initiation and progression of
dental caries and stimulates
new bone formation.
Component of the thyroid
hormones; and prevents goiter
and cretinism.
Component of hemoglobin and
numerous enzymes; prevents
anemia.
Cofactor for enzyme systems.
Involved in the formation of
bone and in enzymes in the
metabolism of amino acid,
cholesterol and carbohydrate.
Has been shown to have beneficial actions when
fed in very small amounts to laboratory animals,
but its physiological role has not been clearly
defined.
May be essential for humans based on recent
experimental evidence showing that boron
affects blood biochemical markers of energy and
mineral metabolism.
Structural function (stores in the skeleton),
electrophysiological function (carries charge
during an action potential across membranes),
intracellular regulator, and cofactor for
extracellular enzymes and regulatory proteins.
As sodium chloride (table salt) required for
maintenance of extracellular fluid volume.
Required for normal sugar and fat metabolism,
potentiates the action of insulin.
Part of enzymes that help biochemical reactions
in every cell, involved in the absorption, storage
and metabolism of iron.
As fluoride serves as catalyst for the
mineralization of developing tooth enamel and
for remineralization of surface enamel; reduces
occurrence of dental decay (caries).
Essential component of thyroid hormones,
which regulate cell activity and growth in
virtually all tissues and are essential for normal
embryonic and postnatal development.
Carries oxygen and forms part of hemoglobin in
blood and myoglobin in muscles; component of
various enzymes.
Important role in 300+ fundamental enzymatic
reactions, in the activation of amino acids, the
synthesis and degradation of DNA, in
neurotransmission and immune function.
Part of several enzymes (preventing tissue
damage, breaking down carbohydrates, nitric
oxide synthesis, urea formation); activates
numerous enzymes (cartilage formation).
IOM (2001) JN (2009)
Molybdenum
( )
Silicon
( )
Sodium
( )
Sulfur
( )
Vanadium
( )
Zinc
( )
Mo
Si
Na
S
V
Zn
Nickel
( )
Phosphorus
( )
Potassium
( )
Selenium
( )
Ni
P
K
Se
Cofactor for enzymes involved
in catabolism of sulfur amino
acids, purines and pyridines.
No b io log i ca l func t ion
identified; in animal studies
involved in bone function.
As sodium chloride (salt)
r e q u i r e d t o m a i n t a i n
extracellular volume and
plamsa osmolality (IOM 2004:
269).
As inorganic sulfate required
for the synthesis of PAPS,
which is required for synthesis
of many important sulfur-
containing compounds (IOM
2005: 424).
No b io log i ca l func t ion
identified.
Component of mul t ip le
enzymes and proteins; involved
in the regulation of gene
expression.
No clear biological function
identified; may serve as a
cofactor of metalloenzymes
and facilitate iron absorption or
metabol ism in microor-
ganisms.
Maintenance of pH, storage and
t rans fe r o f ene rgy and
nucleotide synthesis.
Required for cellular function;
deficiency can cause cardiac
arrhythmias, muscle weakness,
glucose intolerance, high blood
pressure, salt sensitivity, risk of
kidney stones, high bone
t u r n o v e r a n d r i s k o f
cardiovascular diseases (IOM
2004: 186).
Defense against oxidative
stress and regulation of thyroid
hormone action.
Component of a number of enzymes
(metabolism of sulfur amino acids, oxidation of
purines and pyrimidines, production of uric acid,
oxidation of aldehydes).
May play a role in structure of glycosamino-
glycans and their protein complexes; no human
data available.
Predominant cation in extracellular fluid; acts in
consort with K, the chief cation of intracellular
fluid, to regulate body water distribution and
blood pressure; important for acid-base balance
and the transmission of nerve impulses.
n/a
No specific biochemical function has been
identified.
Structural, catalytic and regulatory roles; role in
the coding for zinc finger proteins; required by
over 60 enzymes for activity, incl. RNA
polymerases; supports synaptic vesicles.
Cellular effects documented but no deficiency
disease in man; found in highest concentrations
in lung, kidney and some hormone-producing
tissues; can activate or inhibit a number of
enzymes that usually contain other elements.
The metabolism of all major metabolic
substrates depends on its functioning as a
cofactor in a variety of enzymes and as the
principal reservoir for metabolic energy.
The most essential cation of the cells; because of
its association with the metabolizing, oxygen-
consuming portion of the body, a decline in total
body potassium is usually interpreted as a loss of
muscle mass due to a catabolic condition.
Functions as a component of enzymes involved
in antioxidant protection and thyroid hormone
metabolism.
Table 1 Function of minerals and elements in humans (IOM 2001, IOM 2004, JN2009)
48 49

an issue. However, excessive intakes are generally less widespread and are not of
concern in this context.
Burden of disease of human mineral malnutrition
The previous section highlighted the health consequences that can occur with the
most common forms of human mineral malnutrition, ranging from bouts of
diarrhea to premature death. While the magnitude of some of the health
consequences is more intuitive, the dimensions of others are more difficult to
grasp. Hence, given the different health outcomes of the various mineral
deficiencies, their overall health loss cannot simply be aggregated for individual
deficiencies nor can their severity be compared across different deficiencies. To
quantify and compare the burden of disease of each deficiency means that the
health losses due to each adverse health outcome need to be quantified and
expressed in common units of measurement. Addressing the issue of how to
measure "health", the World Bank (1993) introduced "disability-adjusted life
years", or DALYs, a concept that was further popularized through the WHO's
"Global Burden of Disease" project (WHO 2009b) and the seminal book by
Murray and Lopez (1996); for FeD and ZnD the DALYs method has been refined
by Stein et al. (2005; 2009).
In essence, DALYs combine the health loss due to cause-specific morbidity
and mortality in a single index, with one DALY being equal to the loss of one
"healthy" life year. In the case of mortality the loss corresponds to the remaining
standard life expectancy at the age of death, expressed in years; for morbidity the
health loss is calculated from the average duration of the disease (also expressed in
years), which is multiplied by a weighting coefficient to capture the severity of the
disease and the loss of quality of life. (This coefficient can range from 0, i.e. no
health is lost, to 1, i.e. all health is lost.) With this, the "burden" of a health outcome
is calculated across all affected individuals by summing up the "years of life lost"
(YLL) due to cause-specific mortality and the "years lived with disability" (YLD).
More formally this can be represented as:
DALYs =YLL+YLD
Once the DALYs lost due to each adverse health outcome of a deficiency are
determined they can be aggregated to yield the overall burden of the
corresponding deficiency. Using this method in a comprehensive study, the WHO
(2002) described the amount of disease, disability and death in the world due to the
most important health risks; in this context also the global burdens of FeD, ZnD
and ID were calculated. As can we seen in Table 2, these three most important
forms of mineral malnutrition are estimated to have caused the loss of over 65
million DALYs worldwide in the year 2000 – representing almost 5% of the
overall burden of disease caused by the major health risks. Furthermore, in the
lost weighted
prevalent in developing countries all around the world, even if its prevalence is
highly variable between countries and regions. The difficulty of substantiating the
reach of mineral deficiencies is also highlighted by Borwankar et al. (2007) who
find in their analysis of the magnitude of vitamin and mineral deficiencies
(VMDs) that – for other minerals but and – "we do not have data on the
prevalence of other micronutrient deficiencies. Surveys are needed to fill these
gaps. We need to develop, field test, and apply field methods for other
micronutrients."
Health consequences of human mineral malnutrition
Inadequate intake of bioavailable dietary leads to FeD, severe FeD results in
iron deficiency anemia (FeDA), and anemia is subdivided into mild, moderate and
severe anemia. While further adverse health outcomes are suspected to be
attributable to FeDA, it is generally accepted that at least the following three are
caused by FeDA: impaired physical activity, impaired mental development in
children, and maternal mortality (which indirectly leads to further negative
outcomes such as stillbirths and child deaths due to lack of breastfeeding and care)
(Stein et al. 2005). In the case of ZnD the related adverse health outcomes are only
documented for infants and children; these outcomes are stunting, diarrhea and
pneumonia, with the latter two also contributing to overall under-five mortality
(Stein et al. 2005). For ID the health consequences are goiter, irreversible mental
retardation and, at the more extreme end, cretinism (which in severely endemic
areas may reduce the mean IQ in the population by over 10 points) (de Benoist et
al. 2004). CaD is the major cause of rickets inAfrica and parts of tropicalAsia, but
in other parts of the world – including an industrialized country like the USA –
rickets is also recognized as an adverse health outcome of CaD in infants and
children (Thacher et al. 2006; DeLucia et al. 2003). Calcium is also important for
bone and bone tissue health in adults and insufficient supplies can lead to
osteomalacia and osteoporosis (Nieves 2005; Allgrove 2004; Heaney 2003).
Research findings also indicate that CaD may negatively influence a variety of
chronic diseases, including type 2 diabetes (Nicklas 2003; Pittas et al. 2007).
Overt SeD is primarily associated with Keshan disease, a cardiomyopathy that is
frequently fatal and affects mainly children and women of childbearing age;
marginal SeD may increase the mortality and cancer risk, contribute to cognitive
decline and coronary heart disease, and impact on male and female reproduction
(Rayman 2008; Broadley et al. 2006). For all minerals there is also the possibility
of excessive intakes that may have adverse health effects and toxicity can become
I Fe
Fe
4
4Stunting can also be an outcome of undernourishment; in cases where undernourishment and ZnD
occur in parallel, ZnD increases the prevalence or severity of stunting (Stein et al. 2005).
50 51

ranking of the burdens of disease caused by each health risk, FeD represents the 9
and ZnD the 11 biggest health risk worldwide (Fig.1). In this study only FeD,
ZnD and ID were considered; no comparable analysis is available for other
mineral deficiencies. Given that ID, the third mineral deficiency considered by the
WHO, represents a relatively smaller health risk than either FeD or ZnD, it can be
assumed that – at the global level – the other mineral deficiencies, in particular
CaD and SeD, also represent relatively smaller public health problems.
Socio-economic impact of human mineral malnutrition
So far it has been shown that mineral deficiencies affect billions of people, causing
disease and suffering at the level of the individual, and contributing considerably
to the burden of disease that is borne by the societies they are living in. However,
next to this social cost, mineral malnutrition also imposes tangible economic costs
by hampering both individual productivity and overall economic growth, i.e. apart
from the human and moral necessity to help those suffering from hunger,
malnutrition and ill health, there is also a purely economic rationale for controlling
malnutrition. This rationale is based on the notion that it is not the poor who are
hungry but the hungry who are poor – or rather, that there is a vicious circle of
mutually reinforcing hunger and poverty (Fig. 2).
The idea that the income of individuals depends on their productivity and that
their productivity depends on the nutritive value of their food intakes – and not
only the other way round – goes at least back to Leibenstein (1957). He also
already pointed to "evidence relating not only calorie intake, but also other
nutritive elements to output, either directly or indirectly through their effect on
such things as debilitating disease, absenteeism, and lethargy" (Leibenstein 1957:
96, emphasis added) and he linked individual undernutrition and national
underdevelopment. However, Leibenstein and other early researchers did not
th
th
Fig. 1 The 20 leading health risks and their share in the overall burden of disease
(WHO 2002)
0% 1% 2% 3% 4% 5% 6% 7% 8% 9% 10%
Underweight
Unsafe sex
Blood pressure
Tobacco
Alcohol
Unsafe water, sanitation, hygiene
Cholesterol
Indoor smoke from solid fuels
Iron deficiency
Overweight
Zinc deficiency
Low fruit & vegetable intake
Vitamin A deficiency
Physical inactivity
Risk factors for injury
Lead exposure
Illicit drugs
Unsafe health care injections
Lack of contraception
Childhood sexual abuse
Millionlost burden
Most important risks to human health 1,455.0
Considered nutritional risks(underweight, VAD, FeD, ZnD, ID)Considered VMDs (VAD, FeD, ZnD, ID) 92.2 6.3%Considered mineral deficiencies (FeD, ZnD, ID) 65.6 4.5%Iron deficiency (FeD) 35.1 2.4%Zinc deficiency (ZnD) 28.0 1.9%Iodine deficiency (ID) 2.5 0.2%
Share inDALYs overall
230.0 15.8%
Table 2 Global burden of selected nutritional risks in 2000 (WHO 2002)
Poverty
Poor
diets
Malnutrition
Low
productivity
Low
earnings
Fig. 2 The malnutrition-poverty trap (Stein 2006)
52 53
is associated with faster economic growth. However, for developing countries
with severe food shortages they also found a population effect, i.e. for improved
nutrition to contribute to (per capita) economic growth, population growth needs
to be controlled. In a historic analysis, Fogel (2004) found that 30% of the growth
in British per capita income over the last two centuries was due to better overall
nutrition (including vitamins and minerals). Focusing more specifically on
vitamins and minerals, the World Bank (1994: 2) suggested already 15 years ago
that "deficiencies of just vitamin A, iodine, and iron could waste as much as 5% of
gross domestic product, but addressing them comprehensively and sustainably
would cost less than 0.3% of gross domestic product (GDP)." In a more detailed
analysis of the economic impact of FeD through mental impairment and low work
productivity, Horton and Ross (2003) calculated for a sample of ten developing
countries a median loss of GDPof 4%. For "all forms" of VMD (FeD, ID, VAD and
folate deficiency are specifically mentioned), the Micronutrient Initiative and
UNICEF put forward losses of over 2% of GDPfor individual countries (Adamson
2004). These estimates confirm that malnutrition in general and VMDs in
particular have a significant negative impact on economic growth. And even if
only the lower-bound estimates are true, as the current economic crisis shows, 1-
2% difference in economic growth have substantial implications for national
economies and social welfare (e.g. G-20 2009). Moreover, the dynamic aspect of
successive increases in national income becomes evident from the analysis by
Fogel (2004): better nutrition and somewhat higher economic growth today and
tomorrow means a much higher income for future generations.
However, economic growth and a higher GDPare no ends in themselves; they
are means to support human development (longevity, knowledge, decent
standards of living, participation) and happiness (UNDP 2009; Thinley 1998) –
dimensions that are also reflected in the United Nations "Millennium
Development Goals", which cover the reduction of poverty and hunger, the
achievement of universal primary education and gender equality, the reduction of
child mortality and maternal mortality, the reversal of the spread of major diseases,
the guarantee of environmental sustainability, and the creation of a global
partnership for development (UN 2000). In as far as mineral malnutrition
increases mortality, morbidity and susceptibility to infectious diseases, reduces
cognitive abilities, physical performance and earning potential, and
disproportionately affects children and (young and pregnant) women, as has been
shown in the previous sections, it also has a decidedly negative impact on most of
these indicators.
Hunger in general – as a result of food insecurity – has four main causes: (i)
of food, (ii) lack of to food and (iii) its poor (due to
Causes and determinants of malnutrition
unavailability access utilization
analyze low productivity from a nutrition or health point of view; the interest was
rather to explain the functioning of the rural wage and labor system. In this context
poor nutrition was merely seen as a consequence of surplus labor in rural areas:
because of too little available work, workers earn very little, but for the same
reason there is no need for them to be more productive (see Stein 2006).
In subsequent work the interaction between nutrition and work capacity was
analyzed more in view of increasing agricultural productivity. While for instance
Ward and Sanders (1980) have reported that higher incomes can lead to improved
food intakes, others (Strauss 1986; Deolalikar 1988; Haddad and Bouis 1991;
Alderman et al. 1996) have provided empirical support showing that the
mechanism can also work the other way round, i.e. that better nutrition can
increase individual productivity – or that chronic malnutrition can impact
negatively on market wages and farm output. In a review of the literature on the
nutrition-productivity link, Strauss and Thomas (1998) have also concluded that
there is not only a strong effect of income on health, but that – at least in low-
income settings – there exists a causal impact of health on wages and productivity.
While these studies addressed the malnutrition-productivity link more from an
economic point of view and with a focus on insufficient energy intakes, there is
also a wealth of medical and nutrition literature confirming the negative impact of
FeD on productivity (for an overview see e.g. Haas and Brownlie 2001). In an
economic analysis Weinberger (2003) estimated that sufficiency could increase
the wages of agricultural laborers in India on average by 5-17%.And only recently
Jha (2009) re-confirmed the existence of malnutrition-poverty traps, also for
India, explicitly including the impact of VMDs.
Apart from a direct impact on individual productivity and personal earnings,
in the aggregate malnutrition also affects overall economic growth and national
income. This, in turn, keeps labor demand down, suppresses wages and, thus,
aggravates malnutrition: another vicious circle. Low national incomes also limit
public resources that can be used for nutrition and health interventions – when
health care costs (both at the individual level and in the public health system) are
already increased through malnutrition. Finally malnutrition also affects future
productivity and income, e.g. when malnourished mothers have smaller babies
that are more prone to suffer from diseases later on in life, or when malnutrition in
children – in particular with and – leads to reduced cognitive abilities and to
deficits in schooling (Horton et al. 2008; World Bank 2006; FAO 2004; Behrman
et al. 2004; Broca and Stamoulis 2003; WHO 2001). Given this body of evidence,
it is not surprising that in last year's food crisis the need to break the malnutrition-
poverty trap has been highlighted by the FAO (2008b) as well.
Estimating the impact of malnutrition on overall economic growth, Arcand
(2001) found that an inadequate dietary energy supply is responsible for a shortfall
of 0.2-4.7% in the annual growth rate of global per capita income. Extending this
analysis, Wang and Taniguchi (2003) confirmed that better dietary energy supply
Fe
I Fe
54 55

In the context of VMDs, poor utilization of food that is both available and
(theoretically) accessible can also result from food preferences in which
micronutrients are not directly included, i.e. households do not demand
micronutrients per se but select their food according to many other, more highly
valued food attributes (Behrman 1995). Correspondingly, Ward and Sanders
(1980) found for urban migrants in Brazil that they were not able to utilize
increased income to qualitatively improve their diets. Pitt (1983) found for rural
Bangladesh that poor households could improve their nutrition by altering their
food preference patterns, i.e. with better nutrition knowledge they could achieve
better nutrition outcomes for their given (low) level of income. Behrman and
Deolalikar (1987) found for rural south India that income increases are not
primarily used to obtain more nutrients. And Bouis and Novenario-Reese (1997)
found that food preferences have a negative impact on nutrient intakes and that
consumers could satisfy them relatively inexpensively if they were aware of their
micronutrient needs.Arelated issue is the "nutrition transition" occurring in many
parts of the developing world, which is only partially explained by economic
factors alone and which can lead to the coexistence of both overnutrition and
micronutrient malnutrition in the same population (Popkin 2001; Popkin et al.
2001; FAO 2006). However, in cases where highly-valued food (which people
can afford with rising incomes) incidentally also contains higher levels of
micronutrients, fighting poverty can automatically help reducing VMDs. For
instance in one recent study Kwun et al. (2009) found that nutrition in South
Korea improved markedly in the period of rapid economic growth between 1969
and 1998: lower intakes due to decreased cereal consumption were
counterbalanced by marked increases in the consumption of meat and fish as well
as by improved bioavailability due to reduced phytate consumption.
Food choices that disregard micronutrients can also result from poor nutrition
knowledge and low education in general (Horton 2009; FAO 2008a; WFP 2007;
Allen et al. 2006). Consequently, both general schooling and nutrition education –
especially of women and of those with poor educational backgrounds – have been
shown to improve micronutrient status and the overall adequacy of the diets
consumed in the respective households (Chernichovsky and Meesook 1984;
Smith and Haddad 2000; Block 2002; Webb and Block 2003; Abdulai and Aubert
2004; Kandpal and McNamara 2009). Improving women's status more generally
can also contribute to increased female nutrient status through delayed
childbearing and fewer pregnancies (Ramakrishnan and Yip 2002). Poor maternal
nutrition – with ensuing fetal undernutrition – is particularly damaging because
the adverse health effects of a basic lack of protein and energy can be compounded
by VMDs and have negative impacts on the thus born children's growth, their
5
Zn
Zn
Zn
a person's inability to select, take-in and absorb the nutrients in the food).
Moreover, these causes can be affected by the (iv) of an individual
(i.e. by physical, environmental, economic, social and health risks) (WFP 2007).
In particular in the case of VMDs, another cause can be the of nutrients (e.g.
Ramakrishnan and Yip 2002). Finally, changes (reductions) in the micronutrient
of common crops can also contribute to VMDs.
Unavailability of food at the regional level can be a consequence of disasters
– whether man-made or natural – that disrupt the food supply or the access to it;
similarly seasonal variations in local food availability and food shortages may
contribute to VMDs (FAO 2008; WFP2007;Allen et al 2006; WHO 2004).
Regarding the access to food, this is part of the other half of the vicious circle
described in the previous section: poverty can be a major underlying cause of
malnutrition by limiting people's access to food (Horton 2009; FAO 2008a; Black
2008; Allen et al. 2006; Strauss and Thomas 1998). At the household level the
distribution of food within the household can also be a factor limiting individuals'
access to (micronutrient-rich) food. However, at least for India no general,
nationwide and persistent biases in the intra-household distribution of food could
be found (see Mahendra Dev 2003; Stein et al. 2007; 2008a). Other household
characteristics are more relevant in determining the access to food: smaller
households as well as households that engage in agricultural activities seem to be
better able to secure higher food consumption and better micronutrient intakes for
their members (Ward and Sanders 1980; Wolfe and Behrman 1983;
Chernichovsky and Meesook 1984; Block 2002; Stein 2006; Liu and Shankar
2006). At the national level low incomes contribute to malnutrition by setting a
ceiling for public and private investments that could otherwise address underlying
determinants of (child) malnutrition, like care for mothers and children or the
quality of the health environment (Smith and Haddad 2000). However, e.g.
Haddad et al. (2003) found that income growth alone may not be sufficient to
markedly reduce hunger in the foreseeable future, and also the WFP (2007) states
that income growth alone does not lead to sufficient improvements in nutrition and
health, especially if economic progress does not "trickle down" to the poor.
In the case of VMDs poverty also influences people's nutrition in a different
way: poverty – just like the recent food price shocks – forces people to reduce not
only the number of their meals, which reduces their absolute nutrient intakes, but
also the diversity of their diets and hence their food security (FAO 2009; Ruel
2003). When diverse diets are or become unaffordable, switching to relatively
cheaper staple foods can help the poor maintain their energy intakes, thus
preventing outright hunger. Yet, more monotonous diets that are poor in fruit,
vegetables and animal source foods result in low micronutrient intake and poor
bioavailability, especially of minerals (FAO 2008a; WFP 2007; Allen et al. 2006).
Hence monotonous diets can also be responsible for poor utilization of the (little)
food that is accessible to the poor.
vulnerability
loss
content
5Other authors suggest that causal relationships may exist between micronutrient deficiencies and
obesity in different populations (García et al. 2009).
56 57

and 1992 – a time during which grain yield has increased considerably. Similarly,
Cakmak et al. (2000) found higher and concentrations in primitive wheat
cultivars than in modern varieties ( spp).
Another reason for low mineral concentrations in crops can be mineral
deficient soils (e.g. see Bouis 2000, White and Broadley 2009). For instance the
occurrence of ZnD in humans is correlated with areas where soils are deficient in
plant-available , as is the case in many Asian countries (Cakmak 2009a).
Khoshgoftarmanesh et al. (2009) list in more detail mineral deficiencies in soils
around the world; they also point out that micronutrients have been depleted from
soils through higher crop production per unit area (when and where micronutrient
fertilization was disregarded).
Conventional and novel, agricultural approaches
Given the negative impact of mineral malnutrition in humans on their individual
well-being, social welfare and economic productivity, and given the various
causes of mineral malnutrition mentioned in the previous section, various
interventions to control mineral malnutrition have been devised. These
interventions can be divided into three broad groups, namely supplementation,
fortification and dietary diversification, which are complemented by the
promotion of proper infant feeding practices, overarching nutrition education
(especially of women), and supporting interventions in public health (like control
of parasites and infectious diseases), water and sanitation, and more general
poverty reduction Table 3 provides a tentative conceptual framework for
categorizing individual interventions according to these broad groups (although
the boundaries can be somewhat blurred when e.g. a capsule taken with lunch
counts as supplementation but a powder sprinkled over the lunch counts as
fortification).
Table 3 is also indicative of a trade-off between the possible speed and
directness of the impact of the interventions and their long-term sustainability:
interventions at the top can be implemented more quickly and the mineral dose
provided can be adjusted more precisely, whereas towards the bottom more time is
required to implement the intervention successfully (whether it is to breed and
disseminate mineral-rich crops or to educate people and bring about behavior
change). However, once implemented the interventions towards the bottom have a
more enduring impact (mineral-rich seeds are replanted from the previous harvest
and new behavior patterns persist) whereas e.g. the impact of supplementation
ends after the last supplement was taken. Together, these interventions represent
the toolbox for mineral interventions in public health and it becomes clear that
each of them has its particular strengths and weaknesses (regarding time horizon,
Fe Zn
Triticum
Zn
Interventions against mineral malnutrition
development and the nutritional status for the rest of their lives (WHO 2002; Black
et al. 2008; Bhutta and Haider 2009; Dickinson et al. 2009).
Regarding the loss of nutrients as one cause of malnutrition and VMDs, this
can result from disease – which itself is linked to poverty. Similar to the interaction
between hunger and poverty, malnutrition does not only cause some diseases and
is a risk factor for others, disease also adversely affects nutrition: it directly
contributes to malnutrition by reducing appetite, interfering with the absorption of
nutrients, or altering the metabolism and increasing nutrient demand, and it
indirectly aggravates malnutrition by causing the loss of nutrients through
vomiting, diarrhea or bleeding (Horton 2009; Black 2008; WFP 2007; Allen et al.
2006; WHO 2004). In as far as a poor health environment, infestation with
parasites and lack of clean water and sanitation lead to blood loss and diseases like
diarrhea, they also contribute to nutrient deficiencies (Behrman and Deolalikar
1990; Block 2002; Ramakrishnan and Yip 2002; WHO 2004; WFP 2007; Kandpal
and McNamara 2009).
Finally, the past focus of agronomists and policy makers on yields – thereby
neglecting the nutritional quality of the crops – is also seen to be partly responsible
for mineral malnutrition in humans (Welch and Graham 2000; 2002;
Khoshgoftarmanesh et al. 2009). Reviewing a number of recent studies, White et
al. (2009) confirm that increased yields in modern cultivars are often associated
with reduced concentrations of minerals in edible crops, i.e. when grown under
identical conditions, mineral concentrations are lower in genotypes yielding more
grain or shoot biomass than in older, lower-yielding genotypes. One such negative
trend in mineral concentrations is for instance depicted in Fig 3 for a historical set
of wheat cultivars ( spp.) that were released by CIMMYT between 1950Triticum
1950 1955 1960 1965 1970 1975 1980 1985 1990
Year of cultivar release
Co
ncen
trati
on
(pp
m)
45
40
35
30
25 Fe concentration of cultivar
Zn concentration of cultivar
Fig. 3 Fe and Zn concentrations in wheat cultivars (Monasterio and Graham 2000)
58 59

dose adjustment, infrastructure needs, resource use, required intensity of
cooperation of beneficiaries, etc.). Therefore there is no panacea, i.e. no
intervention is "best" in all situations. Rather, policy makers have to decide on the
right mix of interventions in each case.
Most of the interventions against mineral malnutrition lie outside the sphere
of agronomy and are already discussed to various degrees elsewhere (e.g. GAIN
2009; Horton et al. 2008; WFP 2007; Stein 2006; MI/UNICEF 2004;Allen 2003b;
Kennedy et al. 2003a; Kennedy et al. 2003b; WHO 2002; Ruel 2001; FAO 2001;
Underwood and Smitasiri 1999). However, interventions like increasing the
micronutrient content in people's food through breeding crops for higher
micronutrient content or through fertilizing crops with minerals (on mineral-poor
soils), are interventions that fall squarely into the remit of plant and soil scientists.
Moreover, agricultural approaches to increase the micronutrient content of food
crops, in particular the use of genotypic crop variations in the uptake and
accumulation of micronutrients, are also considered to be both (i) useful to
overcome micronutrient deficiency in soils as a limiting factor in crop productivity
and (ii) sustainable and cost-effective methods for alleviating mineral deficiency
in humans (Khoshgoftarmanesh et al. 2009).
The plant breeding approach is called (genetic) "biofortification" and its
major advantage comes from the fact that the diets of the target populations (i.e.
the poor and malnourished, especially in rural areas) are based primarily on a few
staple crops that are eaten regularly in larger amounts by all family members.
Hence biofortification is self-targeting. This is also an important difference to
industrial fortification that may bypass the poor who lack the purchasing power to
buy processed food – as it may bypass households in remote rural areas if they are
self-sufficient or have no direct access to outlets where processed food is sold.
Another major advantage of biofortification is economics. After an initial
investment into the development of the germplasm, recurrent costs are low: the
germplasm can be shared internationally and, once adopted by farmers, the seeds
can be saved and biofortified crops can be cultivated year after year, thus allowing
the realization of economies of scale across space and time that make the
biofortified crop system highly sustainable. Finally, biofortification with minerals
may be synergetic in that it not only improves the nutritional value of the crops but
also – in as far as the mineral is also essential for the plant – the vigor of the seeds
and the plant itself, thus avoiding a yield penalty (for an overview see Nestel et al.
2006; Graham et al. 2001; Welch and Graham 2002).
The challenges plant breeders are confronted with – stability of nutrient
efficiency, reliability of screening techniques, impact on crop yields,
concentration of toxic metals, bioavailability of micronutrients – are reviewed by
Khoshgoftarmanesh et al. (2009) and to some extent Welch and Bouis (2009).
Nevertheless, it has already been established since years that biofortification of
key crops is feasible in principle (Graham et al. 1999; see also White and Broadley
Intervention Description
Supplementation
Fortification
Dietary diversification
Infant feeding
Nutrition education
Public health measures;
water, sanitation &
hygiene; poverty
reduction
Medical
supplementation
Dietary
supplementation
Home fortification
Industrial fortification
Fertilization
Biofortification
Micronutrient-rich
crops
Micronutrient
availability in meals
Supplying micronutrients in addition to people's usual dietary intakes
Increasing micronutrient content and availability in the usual food
people eat
Increasing the micronutrient uptake through different food
Promoting breastfeeding and proper weaning practices to avoid child
malnutrition
Overarching measure to generate the awareness and the knowledge to
demand, put into practice and use the other interventions
Supporting interventions to avoid micronutrient losses (e.g. through
diarrhea or parasitic blood loss) and to generate the purchasing power
to realize the demand for the other interventions
Distribution of micronutrients in pharmaceutical form by medical staff
or on prescription, often during routine health checks (especially iron
pills for pregnant women), during specific supplementation campaigns
or in combination with vaccination days (especially vitaminAdoses for
children)
Selling of micronutrients as over-the-counter drugs, especially for self-
medication in industrialized countries
Addition of (commercial) micronutrient "sprinkles" during food
preparation at home, often containing multiple micronutrients
Mandatory or commercial addition of micronutrients to foodstuffs
during processing or (as premix) along the supply chain, for instance
iodization of salt or enrichment of wheat flour with iron
Addition of minerals in (commercial or subsidized) fertilizers during
crop cultivation to increase the mineral content in the final produce
Breeding crops (conventionally or through genetic engineering) to
accumulate micronutrients in their edible parts (e.g. iron-rich rice or
"golden rice"); also breeding crops for lower presence of micronutrient
inhibitors (like phytate) in their edible parts
Increasing production of micronutrient-rich crops (through agricultural
policies or the promotion of home gardens) or increasing demand for
micronutrient-rich food (through communication for behavior change)
Avoidance of micronutrient losses in food (through new food
conservation and preparation techniques) or improvement of the
bioavailability of the micronutrients that are present in a meal (through
selection of food containing promotors and avoidance of food
containing inhibitors of micronutrient uptake, e.g. including a vitamin
C source or avoiding tea when consuming iron-rich food)
Table 3. Overview of micronutrient interventions
60 61

projects that cover specific micronutrients, crops or regions:
- HarvestPlus, a "Global Challenge Program" of the Consultative Group on
International Agricultural Research (CGIAR), focuses on those staple crops
it has identified as being most important in the diets of the poor and
malnourished in developing countries, namely rice, wheat, maize, cassava,
sweet potatoes and beans. These crops are conventionally bred for higher
levels of Fe, Zn and beta-carotene (HarvestPlus 2009).
- The "Golden Rice Project" focuses on rice only, and in contrast to
HarvestPlus it follows a genetic engineering approach to biofortify rice with
beta-carotene and, more recently under the "Grand Challenges in Global
Health" scheme of the Bill & Melinda Gates Foundation, also with Fe, Zn,
vitamin E and protein (GR 2009).
- Other projects that are also sponsored by the Gates Foundation are the
2005). First intervention studies and feeding trials have already shown that
biofortified crops can indeed improve the micronutrient status of their consumers
(Haas et al. 2005; Low et al. 2007; Rosado et al. 2009; Tang et al. 2009) and a
sensory analysis study has confirmed that mineral biofortification is possible
without significant sensory differences between biofortified crops and controls
(Park et al. 2009).
The fertilizer approach (also called "agronomic" biofortification), while
sharing the advantage of biofortification to be self-targeting if applied to staple
crops, has the drawback that it requires a system for the regular and widespread
distribution of the fertilizer – which may again exclude poor farmers or those
living in remote rural areas. Moreover, the need to apply fertilizer regularly
eliminates the economic advantage of biofortification, i.e. the possibility to
exploit economies of scale over space and time. Similarly, the fertilizer may not be
used by all target farmers if it is not subsidized or otherwise made accessible to
them. However, in places where mineral malnutrition is prevalent and where there
is already an established infrastructure or fertilizer use is widespread, minerals
could be added to conventional fertilizer and thus achieve a quicker impact than
would be possible with biofortification (for further discussions of this approach
see Broadley et al. 2006; Cakmak 2008; White and Broadley 2009; Cakmak
2009a; Cakmak 2009b; Welch and Bouis 2009. Martínez-Ballesta et al. 2009
discuss the fertilizer approach also in the context of environmental stress that
affects plant mineral content. Khoshgoftarmanesh et al. 2009 provide a
comprehensive review of possible agricultural approaches – including soil and
foliar fertilization, crop systems, application of soil amendments and organic
sources, as well as biofortification – to address micronutrients deficiency and to
increase micronutrient density in the edible parts of plants. For a comparison of
biofortification and fertilization see also Zhu et al. 2007).
Currently no in-depth studies on impact and cost-effectiveness of the
fertilizer approach are available (although in a recent review Martínez-Ballesta et
al. (2009) suggest that fertilization is one of the most practical and effective ways
to improve the nutritional value of crops). However, for biofortification of various
staple crops a number of ex-ante analyses have already shown the potential of this
approach to considerably reduce micronutrient malnutrition in a very cost-
effective manner (also compared to other micronutrient interventions), whether
through classical breeding or genetic engineering and whether biofortification is
done with Fe, Zn or beta-carotene (Zimmermann and Qaim 2004; Stein et al. 2006,
2007, 2008a, 2008b; Meenakshi et al. 2009; Table 4). A recent report by the UK's
Royal Society on science and the sustainable intensification of global agriculture
also acknowledges that the introduction of biofortified varieties may offer a
solution to micronutrient malnutrition (Baulcombe et al. 2009).
Most of the biofortified crops are currently being developed in the framework
of a few international programs, but also of more limited or more recent research
Burden of disease ofrespective deficiency (USD)*
highimpact
scenario scenario scenario scenario
Fe Rice Bangladesh -21% -8% 3 10Philippines -11% -4% 49 197India -38% -12% 4 <1
Wheat India -26% -7% 9 <1Beans NE-Brazil -36% -9% 13 56
Honduras -22% -4% 20 114Zn Rice Bangladesh -46% -15% 2 6
Philippines -39% -11% 7 46India -41% -18% 4 <1
Wheat India -12% -2% 40 2Beans NE-Brazil -20% -5% 95 799
Honduras -15% -3% 48 423Fe, Zn Rice, China -57% -18% 4 14
Cost per DALYsaved
Mineral Crop Country low high lowimpact impact impact
wheat
Table 4 Projected impact and cost-effectiveness of mineral biofortification andbenchmarks (Meenakshi et al. 2009; Qaim and Stein 2009; Stein et al.2008a; Ma et al. 2008; Stein et al. 2007; Stein and Qaim 2007)
* AWorld Bank threshold for highly cost-effective interventions is 200 USD/DALY saved,
whereas other standard valuations of one DALY (in cost-benefit analyses in developing
countries) are often based on per capita incomes or approximations thereof (e.g. 1,000
USD). Cost-effectiveness estimates of the WHO for supplementation and fortification with
iron and zinc falls into the range of 2-487 USD/DALYsaved.
62 63

Dickinson et al. 2008; Heyd 2007; Wolson 2007; Pray et al. 2007; Mazuze 2007;
Chong 2003; Hagenimana and Low 2000). These studies indicate that, above all,
biofortified crops have to have agronomic properties of interest to farmers (e.g.
higher yields, drought tolerance, propagation capacities or pest resistance), they
have to be available as locally adapted varieties and access to the planting material
has to be easy and reliable. Biofortified crops also have to be marketable so the
farmers can sell them for income generation if necessary, i.e. there have to be
markets nearby and the crops have to be acceptable to consumers, i.e. they have to
correspond closely to familiar varieties, especially regarding taste and consistency
but also regarding storability. Furthermore, community-based participatory
approaches to research and product development that ensure the identification of
the genotypes that best suit producer-consumer needs, improvement of women's
access to corresponding resources and accompanying nutrition information tend
to speed up adoption and increase consumer acceptance, inducing even a positive
willingness to pay for biofortified crops. If these conditions are or can be fulfilled
it seems possible to ensure sufficiently widespread acceptance also of such
recognizably biofortified crops (Nestel et al. 2006; Qaim et al. 2007; Qaim and
Stein 2009). And indeed, in the CGIAR proposal for its biofortification program
the centers involved clearly highlight the need to avoid bypassing the rural poor,
they stress the need to pay attention to seed multiplication and diffusion, and they
suggest collaborating with national agricultural research extension systems,
commodity-based regional research networks, local and private companies, civil
society groups, farmers organizations, women's cooperatives and specially-
formed seed producer groups, supporting a mix of centralized and decentralized
seed production and diffusion arrangements to ensure a steady supply of the new
germplasm that meets farmer-desired quality standards (CIAT/IFPRI 2002).
In the case of biofortification through genetic engineering additional
problems may prevent the biofortified crops from reaching farmers and
consumers in the first place. For instance (to refer to the most advanced
biofortified GM crop), when Golden Rice was developed, the complexity
resulting from fragmented intellectual property ownership was considered to
represent a potential constraint for its commercial development (Delmer et al.
2003; Kryder et al. 2000). However, as one of its developers highlights, compared
to the hurdles raised by the regulatory requirements for GMOs that Golden Rice
has to comply with, the issue of sorting out the intellectual property rights (IPR)
was only a minor one (Potrykus 2009). According to Potrykus, current GMO
regulation delays the introduction of GM crops by years and imposes a heavy
financial burden on their developers – with the consequence that public
institutions cannot afford to commercialize humanitarian crops (and that only a
few financially potent companies remain that concentrate on the development of a
few profitable crops for selected lucrative markets). Similarly Cohen and
Paarlberg (2002) point out that IPR constraints are real but not a primary reason for
"African Biofortified Sorghum Project" where the goal is to biofortify
sorghum with Fe, Zn, vitamin A and vitamin E (ABS 2009), the "BioCassava
Plus" project that targets Fe, Zn, vitamin A, vitamin E and protein (BCP
2009), and a project for the biofortification of bananas with Fe, provitamin A
and vitamin E (GCGH 2009).
- Smaller research projects, some of which also target micronutrient
malnutrition in industrialized countries, cover for instance the
biofortification of cereals, carrots, lettuce, brassica, tomatoes or potatoes
with Se, Ca, Mg, folate or essential amino acids, or they try to reduce the
accumulation of toxic analogues of the targeted mineral (cadmium (Cd)
instead of Zn) (Broadley et al. 2006; Zhu et al. 2007; Zhu et al. 2009;
Connolly 2008; Ríos et al. 2008; Bekaert et al. 2008; Palmgren et al. 2008;
Stomph et al. 2009; Broadley et al. 2009). Of these projects probably the
BAGELS project at the University of Nottingham, which aims at the
fortification of wheat with Se, is furthest advanced (BAGELS 2009).
- Last year INSTAPA, a project funded by the 7 Framework Programme of the
European Union, started with the aim of identifying novel staple food-based
approaches (incl. biofortification) to address FeD, ZnD and VAD; its target
groups are women and children in sub-Saharan Africa and it focuses on the
improvement of (complementary) foods based on millet, sorghum, maize and
cassava (INSTAPA2009).
- "Harvest Zinc" is another recently initiated project, which focuses on the
fertilizer approach (Cakmak I 2009b); the target crops of this project are
cereals and the goal is to increase their Zn content (Harvest Zinc 2009).
Current developments and constraints
Despite the flurry of research activities, most biofortified crops are still at the stage
of research and development; only orange-fleshed sweet potatoes are already
introduced and promoted in Africa. Hence more general statements on the
determinants of the adoption of mineral biofortified crops by farmers and on their
acceptance by consumers (who can be the same farmers) are difficult to make.
While it is assumed that mineral biofortification does not change visible crop
characteristics (unlike the change in color introduced through beta-carotene
biofortification), if the biofortification is done through genetic engineering and if
food from genetically modified (GM) crops needs to be labeled, mineral
biofortified crops may also become differentiable from conventional crops. In this
case farmers as well as consumers have to decide actively in favor of biofortified
crops for the latter to have an impact on mineral malnutrition.
Various studies on the acceptance and on potential barriers to the adoption of
noticeably biofortified crops have been carried out (Chowdhury et al. 2009;
Stevens and Winter-Nelson 2008; Muzhingi et al. 2008; De Groote et al. 2008;
th
64 65

promises to be a very cost-effective intervention in the fight against micronutrient
deficiencies. Crucially, as long as the other agricultural properties of the plants are
not neglected, the adoption of biofortified crops by farmers is not compromised. In
some cases (e.g. when sensory changes occur or when genetic engineering is used
in the breeding process), particular emphasis on community-based approaches
and the dissemination of nutrition information may become necessary to enhance
the acceptance of biofortified crops by consumers. In the case of genetic
engineering also the international community is called upon to help avoiding that
strict regulations in rich export markets prevent poor countries from using a
promising tool in the fight against micronutrient malnutrition.
The author thank Thomas Fellmann for revising the
manuscript.
Abdulai A, Aubert D (2004) A cross-section analysis of household demand for
food and nutrients in Tanzania. Agr Econ 31: 67-79. Also available via
http://dx.doi.org/10.1111/j.1574-0862.2004.tb00222ABS (2009) The Project.African Biofortified Sorghum Project c/oAfrica Harvest
Biotech Foundation International, Johannesburg. Available via
http://biosorghum.org/project.Accessed 25 June 2009Adamson P (2004) Vitamin & mineral deficiency: a global progress report.
Micronutrient Initiative, Ottawa. Available via http://www.micron-
utrient.org/English/View.asp?x=614.Accessed 4April 2009Alderman H, Behrman JR, Ross DR, Sabot R (1996) The returns to endogenous
human capital in Pakistan's rural wage labour market. Oxford Bull Econ Stat
58: 30-55. Also available via http://EconPapers.repec.org/RePEc:bla:
obuest:v:58:y:1996:i:1:p:29-55Agronomist (2009). I'm an agronomist: what is agronomy? Iowa State University,
Ames, IA. Available via http://www.imanagronomist.net/. Accessed 26 June
2009Allen L, de Benoist B, Dary O, Hurrell R (ed) (2006) Guidelines on food
fortification with micronutrients. World Health Organization, Geneva. Also
available via http://www.who.int/nutrition/publications/micronutrientsAllen LH (2003a) Ending hidden hunger: the history of micronutrient deficiency
control. In: Gillespie S, McLachlan M, Shrimpton R (ed) Combating
malnutrition: time to act. World Bank, Washington, DC, pp 93-101. Also
available via http://go.worldbank.org/VF10E49Q81Allen LH (2003b) Interventions for micronutrient deficiency control in
developing countries: past, present and future. J Nutr 133: 3875S-3878S.
Also available via http://jn.nutrition.org/cgi/content/abstract/133/11/3875S
Acknowledgements
References
the unavailability of GM crops for poor country farmers: on the one hand patents
lack international protection and can only be enforced where they were
granted and developing country governments have other political and legal
means to obtain needed licenses, on the other hand in the past private companies
have shown to be ready to extend their proprietary GM technologies into the
developing world and to waive royalties on the use of their IPR for humanitarian
purposes.
Related to the strict regulation of GMOs, another barrier that may prevent
developing countries from cultivating or even approving GM crops is the fear of
commercial losses in the form of lost export sales to Europe: because of critical
consumers and restrictive import and labeling policies in importing countries,
food exporting countries in the developing world are hesitant to implement
biosafety frameworks and to approve GM crops (Cohen and Paarlberg 2002; Pray
and Huang 2007). Given the possibility of adventitious "cross commingling"
along the supply chain of one type of GM crops with other types of crops (Reuters
2009), fear of commercial losses may even hamper the approval of biofortified
crops that are targeted at local markets – although studies indicate that developing
countries are set to gain more from GM crops than they may loose (Paarlberg
2006, Anderson et al. 2004). Yet, at least for consumers in Asia, genetic
engineering does not seem to be a major issue; they trust the authorities and are
much more concerned about other food-related issues, like zoonoses,
microbiological contamination, pesticide residues or food additives (Cairns
2005).
This review of the impacts of mineral malnutrition in humans clearly shows that
mineral malnutrition negatively affects billions of people and – through the often
severe or even fatal health outcomes it produces – imposes a heavy burden on
humankind and overall development by reducing individual well-being, social
welfare and economic productivity at a large scale. While the underlying causes of
micronutrient malnutrition are complex and sometimes mutually reinforce each
other, one direct and immediate determinant of mineral malnutrition is insufficient
dietary intakes. Consequently most current micronutrient interventions in the field
of public health aim at adding the lacking minerals to people's diets (either by
directly fortifying food or in the form of supplements). However, providing
wholesome food is one of the key tasks for agronomists (Agronomist 2009), and
while the more differentiated nutritional qualities of food may have been
neglected in the past when the main concern were yields, new approaches to
control mineral malnutrition also – and rightly so – rely on agricultural sciences to
increase the micronutrient content in major staple crops. First studies have shown
that breeding plants for higher mineral densities in the edible part of the crops
Conclusions
66 67

Bhan MK, Sommerfelt H, Strand T (2001) Micronutrient deficiency in children.
Brit J Nutr 85: S199-S203. Also available via http://journals.cambridge.org/
action/displayAbstract?aid=891316Bhutta ZA, Haider BA (2009) Prenatal micronutrient supplementation: Are we
there yet? CMAJ 180: 1188-1189. Also available via http://dx.doi.org/
10.1503/cmaj.090652Biesalski HK, Brummer R-J, König J, O'Connell AA, Ovesen L, Rechkemmer G,
Stos K, Thurnham DI (2003) Micronutrient deficiencies: Hohenheim
Consensus Conference. Eur J Nutr 42: 353-363. Also available via
http://dx.doi.org/10.1007/s00394-003-0460-0Black RE (2001) Micronutrients in pregnancy. Brit J Nutr 85: S193-S197. Also
available via http://journals.cambridge.org/action/displayAbstract?
aid=891300Black RE, Allen LA, Bhutta ZA, Caulfield LE, de Onis M, Ezzati M, Mathers C,
Rivera J (2008) Maternal and child undernutrition: global and regional
exposures and health consequences. Lancet 371: 243-260. Also available via
http://dx.doi.org/10.1016/S0140-6736(07)61690-0Block SA (2002) Nutrition knowledge versus schooling in the demand for child
micronutrient status. Working Papers in Food Policy and Applied Nutrition
10, Tufts University, Boston, MA. Also available via http://nutrition.
tufts.edu/1184937206715/Nutrition-Page-nl2w_1184937205502.htmlBorwankar R, Sanghvi T, Houston R (2007) What is the extent of vitamin and
mineral deficiencies? Magnitude of the problem. Food Nutr Bull 28: S174-
S181. Also available via http://foodandnutritionbulletin.org/FNB/
index.php/FNB/issue/view/138Bouis HE (ed) (2000) Special issue on improving human nutrition through
agriculture. Food Nutr Bull 21: 351-567. Also available via
http://www.unu.edu/unupress/food/fnb21-4.pdf (1.6 MB)Bouis HE, Novenario-Reese MJG (1997) The determinants of demand for
micronutrients: an analysis of rural households in Bangladesh. FCND
Discussion Paper 32, International Food Policy Research Institute,
Washington, DC. Also available via http://www.ifpri.org/divs/
FCND/dp/dp32.htmBroadley MR, White PJ, Bryson RJ, Meacham MC, Bowen HC, Johnson SE,
Hawkesford MJ, McGrath SP, Zhao F-J, Breward N, Harriman M, Tucker M
(2006) Biofortification of UK food crops with selenium. Proc Nutr Soc 65:
169-181.Also available via http://dx.doi.org/10.1079/PNS2006490Broadley MR, Hammond JP, King GJ, Bowen HC, Hayden R, Spracklen WP,
Lochlainn SO, White PJ (2009) Biofortifying Brassica with calcium (Ca) and
magnesium (Mg). Proceedings of the International Plant Nutrition
Colloquium XVI, September 15, Paper 1256. Also available via
http://repositories.cdlib.org/ipnc/xvi/1256
Anderson K, Jackson LA, Nielsen C (2004) Genetically modified rice adoption:
Implications for welfare and poverty alleviation. Policy Research Working
Paper 3380. World Bank, Washington, DC. Also available via
http://go.worldbank.org/5Z6GGMKL70Allgrove J (2004) Is nutritional rickets returning? Arch Dis Child 89: 699-701.
Also available via http://adc.bmj.com/cgi/content/extract/89/8/699Arcand J-L(2001) Undernourishment and economic growth: the efficiency cost of
hunger. Economic and Social Development Paper No. 147. Food and
Agriculture Organization of the United Nations, Rome. Also available via
http://www.fao.org/DOCREP/003/X9280E/X9280E00.htmBAGELS (2009) Biofortification through agronomy and genotypes to elevate
levels of Selenium. University of Nottingham, Loughborough. Available via
http://bagels.ukcrop.net/.Accessed 30 September 2009Baulcombe D, Crute I, Davies B, Dunwell J, Gale M, Jones J, Pretty J, Sutherland
W, Toulmin C (2009) Reaping the Benefits: Science and the sustainable
intensification of global agriculture. The Royal Society, London. Also
available via http://royalsociety.org/document.asp?tip=0&id=8825BCP (2009) Mission & Objectives. BioCassava Plus Project c/o The Donald
Danforth Plant Science Center, St. Louis, MO. Available via
http://www.biocassavaplus.org/program_description.htm. Accessed 25 June
2009Behrman JR (1995) Household behaviour and micronutrients: What we know and
what we don't know. Agricultural Strategies for Micronutrients, Working
Paper 2. International Food Policy Research Institute, Washington, DC. Also
available via http://www.ifpri.org/pubs/otherpubs.htm#wpBehrman JR, Alderman H, Hoddinott J (2004) Hunger and malnutrition.
Challenge Paper 2004. Copenhagen Consensus, Frederiksberg.Available via
http://www.copenhagenconsensus.com/Default.aspx?ID=223. Accessed 4
April 2009Behrman JR, Deolalikar AB (1987) Will developing country nutrition improve
with income?Acase study for rural South India. J Pol Econ 95: 492-507.Also
available via http://www.jstor.org/pss/1831975Behrman JR, Deolalikar AB (1990) The intrahousehold demand for nutrients in
rural south India: Individual estimates, fixed effects, and permanent income.
J Human Res 25 (4): 665-696. Abstract also available via
http://www.ssc.wisc.edu/jhr/1990ab/behrman.htmlBekaert S, Storozhenko S, Mehrshahi P, Bennett MJ, Lambert W, Gregory III JF,
Schubert K, Hugenholtz J, Van Der Straeten D, Hanson AD (2008) Folate
biofortification in food plants. Trends Plant Sci 13: 28-35. Also available via
http://dx.doi.org/10.1016/j.tplants.2007.11.001Bereket A (2003) Rickets in developing countries. Endocr Dev 6: 220-232. Also
available via http://dx.doi.org/10.1159/000072778
68 69

Combs GF (2001) Selenium in global food systems. Br J Nutr 85: 517-547. Also
available via http://dx.doi.org/10.1079/BJN2000280Connolly EL (2008) Raising the bar for biofortification: enhanced levels of
bioavailable calcium in carrots. Trends Biotechnol 26: 401-403. Also
available via http://dx.doi.org/10.1016/j.tibtech.2008.04.007De Benoist B, Andersson M, Egli I, Takkouche B, Allen H (eds) (2004) Iodine
status worldwide: WHO global database on iodine deficiency. World Health
Organization, Geneva. Also available via http://www.who.int/vmnis/
iodine/status/De Benoist B, McLean E, Egli I, Cogswell M (2008) Worldwide prevalence of
anaemia 1993-2005: WHO global database on anaemia. World Health
Organization, Geneva. Also available via http://www.who.int/vmnis/
anaemia/prevalence/De Groote H, Chege Kimenju S (2008) Comparing consumer preferences for
color and nutritional quality in maize: application of a semi-double-bound
logistic model on urban consumers in Kenya. Food Policy 33: 362-370. Also
available via http://dx.doi.org/10.1016/j.foodpol.2008.02.005Delmer DP, Nottenburg C, Graff GD, Bennett AB (2003) Intellectual property
resources for international development in agriculture. Plant Physiol 133:
1666-1670. Also available via http://www.plantphysiol.org/cgi/
content/short/133/4/1666DeLucia MC, Mitnick ME, Carpenter TO (2003) Nutritional rickets with normal
circulating 25-hydroxyvitamin D: a call for reexamining the role of dietary
calcium intake in NorthAmerican infants. J Clin Endocrinol Metab 88: 3539-
3545. Also available via http://jcem.endojournals.org/cgi/content/
abstract/88/8/3539Deolalikar AB (1988) Nutrition and labor productivity in agriculture: Estimates
for rural South India. Rev Econ Stat 70: 406-13. Also available via
http://EconPapers.repec.org/RePEc:tpr:restat:v:70:y:1988:i:3:p:406-13Dickinson N, Macpherson G, Hursthouse AS, Atkinson J (2009) Micronutrient
deficiencies in maternity and child health: A review of environmental and
social context and implications for Malawi. Environ Geochem Health 31:
253-272.Also available via http://dx.doi.org/10.1007/s10653-008-9207-4Ezzati M, Lopez AD, Rodgers A, Murray CJL (ed) (2004) Comparative
quantification of health risks: Global and regional burden of diseases
attributable to selected major risk factors. World Health Organization,
Geneva. Also available via http://www.who.int/healthinfo/global_
burden_disease/cra/FAO (1999) The state of food insecurity in the world 1999. Food and Agriculture
Organization of the United Nations, Rome. Also available via
http://www.fao.org/publications/sofi/en/FAO (2001) Targeting for nutrition improvement: Resources for advancing
Broca S, Stamoulis K (2003) Micro- and macroevidence on the impact of
undernourishment. In: Taniguchi K, Wang X (eds) Nutrition intake and
economic growth. Food and Agriculture Organization of the United Nations,
Rome. Also available via http://www.fao.org/docrep/006/y4850e/
y4850e00.htmCairns G (2005) Food biotechnology and consumer perceptions in Asia. Food
Nutr Bull 26: 443-444. Also available via http://www.unu.edu/unupress/
food/unupress.htm#2005, Volume 26, number 4Cakmak I (2008) Enrichment of cereal grains with zinc: agronomic or genetic
biofortification? Plant Soil 302: 1-17. Also available via
http://dx.doi.org/10.1007/s11104-007-9466-3Cakmak I (2009a) Enrichment of fertilizers with zinc:An excellent investment for
humanity and crop production in India. J Trace Elements Med Biol 23: 281-
289.Also available via http://dx.doi.org/10.1016/j.jtemb.2009.05.002Cakmak I (2009b) Agronomic approaches in biofortification of food crops with
micronutrients. Proceedings of the International Plant Nutrition Colloquium
XVI, Paper 1451. Available via http://repositories.cdlib.org/ipnc/xvi/1451.
Accessed 18 September 2009Cakmak I, Ozkan H, Braun HJ, Welch RM, Romheld V (2000) Zinc and iron
concentrations in seeds of wild, primitive, and modern wheats. Food Nutr
Bull 21: 401-403. Also available via http://foodandnutritionbulletin.org/
FNB/index.php/FNB/article/view/276Chernichovsky D, Meesook OA (1984) Patterns of food consumption and
nutrition in Indonesia: an analysis of the national socioeconomic survey,
1978. Staff Working Paper 670, World Bank, Washington, DC.Also available
via http://go.worldbank.org/QNBRY2APZ3Chong M (2003) Acceptance of Golden Rice in the Philippine 'rice bowl'. Nat
Biotechnol 21: 971-972. Also available via http://dx.doi.org/10.1038/
nbt0903-971Chowdhury S, Meenakshi JV, Tomlins K, Owori C (2009) Are consumers willing
to pay more for biofortified foods? Evidence from a field experiment in
Uganda. HarvestPlus Working Paper 3. International Food Policy Research
Institute, Washington. Also available via http://www.harvestplus.org/
content/are-consumers-willing-pay-more-biofortified-foods-evidence-
field-experiment-ugandaCIAT/IFPRI (2002) Biofortified crops for improved human nutrition.AChallenge
Program proposal. Consultative Group on International Agricultural
Research, Washington. http://www.cgiar.org/pdf/biofortification.pdf (767
KB)Cohen JI, Paarlberg R (2002) Explaining restricted approval and availability of
GM crops in developing countries. AgBiotechNet 4: 1-6. Also available via
http://www.joelcohen.org/publications.html#biosafety
70 71

GCGH (2009) Optimisation of bioavailable nutrients in transgenic bananas.
Grand Challenges in Global Health c/o Bill & Melinda Gates Foundation,
Seattle, WA. Available via http://www.gcgh.org/ImproveNutrition/
Challenges/NutrientRichPlants/Pages/Bananas.aspx. Accessed 25 June
2009GR (2009) Grand Challenges in Global Health Project. Golden Rice Project c/o
University of Freiburg, Freiburg. Available via http://www.goldenrice.org/
Content5-GCGH/GCGH1.html.Accessed 25 June 2009Graham R, Senadhira D, Beebe S, Iglesias C, Monasterio I (1999) Breeding for
micronutrient density in edible portions of staple food crops: Conventional
approaches. Field Crops Research 60: 57-80. Also available via
http://dx.doi.org/10.1016/S0378-4290(98)00133-6Graham RD, Welch RM, Bouis HE (2001) Addressing micronutrient malnutrition
through enhancing the nutritional quality of staple foods: Principles,
perspectives and knowledge gaps. Adv Agron 70: 77-142. Also available via
http://www.elsevier.com/wps/find/bookdescription.cws_home/675475/desc
riptionHaas JD, Brownlie T (2001) Iron deficiency and reduced work capacity: a critical
review of the research to determine a causal relationship. J Nutr 131: 676S-
690S. Also available via http://jn.nutrition.org/cgi/content/abstract/
131/2/676SHaas JD, Beard JL, Murray-Kolb LE, del Mundo AM, Felix AR, Gregorio GB
(2005) Iron-biofortified rice improves iron stores in non-anemic Filipino
women. J Nutr 135: 2823-2830. Also available via http://jn.nutrition.org/
cgi/content/abstract/135/12/2823Haddad L, Alderman H, Appleton S, Song L, Yohannes Y (2003) Reducing child
malnutrition: How far does income growth take us? World Bank Econ Rev
17: 107-131. Also available via http://wber.oxfordjournals.org/cgi/
content/abstract/17/1/107Haddad LJ, Bouis HE (1991) The impact of nutritional status on agricultural
productivity: Wage evidence from the Philippines. Oxford Bull Econ Stat 53:
45-68 . Also ava i l ab le v ia h t tp : / /Econ Papers . r epec .o rg /
RePEc:bla:obuest:v:53:y:1991:i:1:p:45-68Hagenimana V, Low J (2000) Potential of orange-fleshed sweet potatoes for
raising vitaminAintake inAfrica. Food Nutr Bull 21: 414-418.Also available
via http://www.unu.edu/unupress/food/unupress. htm#2000, Volume 21,
number 4HarvestPlus (2009) Target Countries and Crops. Web page of HarvestPlus,
International Food Policy Research Institute, Washington, DC. Available via
http://www.harvestplus.org/content/target-countries-and-crops. Accessed
25 June 2009HarvestZinc (2009) HarvestZinc fertilizer project. Web page of HarvestZinc,
nutritional well-being. Chapter 5: types of targeted food and nutrition
programmes. Food and Agriculture Organization of the United Nations,
Rome, pp 63-72. Also available via http://www.fao.org/DOCREP/004/
Y1329E/y1329e00.htmFAO (2002) World agriculture: Towards 2015/2030. Food and Agriculture
Organization of the United Nations, Rome. Also available via
http://www.fao.org/docrep/004/y3557e/y3557e00.htmFAO (2004) The state of food insecurity in the world 2004. Food and Agriculture
Organization of the United Nations, Rome. Also available via
http://www.fao.org/publications/sofi/en/FAO (2006) The double burden of malnutrition: Case studies from six developing
countries. Food and Agriculture Organization of the United Nations, Rome.
Also available via http://www.fao.org/docrep/009/a0442e/a0442e00.htmFAO (2008a) The state of food insecurity in the world 2008. Food and Agriculture
Organization of the United Nations, Rome. Also available via
http://www.fao.org/SOF/sofi/FAO (2008b) Hunger on the rise. News Story, 18 September. Food andAgriculture
Organization of the United Nations, Rome. Available via http://
www.fao.org/newsroom/en/news/2008/1000923/.Accessed 4April 2009FAO (2009) The state of food insecurity in the world 2009. Food and Agriculture
Organization of the United Nations, Rome. Also available via
http://www.fao.org/publications/sofi/en/FDA (2000) Health claim notification for potassium containing foods. Web page
of the Center for Food Safety and Applied Nutrition of the U.S. Food and
Drug Administration, College Park, MD. Available via http://
vm.cfsan.fda.gov/~dms/hclm-k.html.Accessed 20 March 2009Fogel RW (2004) The escape from hunger and premature death, 1700-2100:
Europe, America, and the Third World. Cambridge University Press,
Cambridge, MA.Also available via http://www.cambridge.org/us/catalogue/
catalogue.asp?isbn=9780511206979G-20 (2009) Global plan for recovery and reform. Official communiqué of the
Group of Twenty (G-20) Finance Ministers and Central Bank Governors.
London Summit, London. Available via http://www.londonsummit.gov.uk/
resources/en/news/15766232/communique-020409.Accessed 4April 2009GAIN (2009) Vitamin and mineral deficiencies technical situation analysis: ten
year strategy for the reduction of vitamin and mineral deficiencies. Global
Alliance for Improved Nutrition, Geneva. Also available via
http://www.gainhealth.org/reports/ten-year-strategy-vitamin-and-mineral-
deficiencies-technical-situation-analysisGarcía OP, Long KZ, Rosado JL (2009) Impact of micronutrient deficiencies on
obesity. Nutr Rev 67: 559-572. Also available via http://www3.interscience.
wiley.com/journal/122608371/abstract
72 73

y8346m02.htmKennedy E, Mannar V, Iyengar V (2003b)Alleviating hidden hunger:Approaches
that work. IAEA Bullet in 45: 54-60. Also available via
http://www.iaea.org/Publications/Magazines/Bulletin/Bull451/Khoshgoftarmanesh AH, Schulin R, Chaney RL, Daneshbakhsh B, Afyuni M
(2009) Micronutrient-efficient genotypes for crop yield and nutritional
quality in sustainable agriculture. A review. Agron Sustain Dev, published
online 25 June.Also available via http://dx.doi.org/ 10.1051/agro/2009017Kryder RD, Kowalski SP, Krattiger AF (2000) The intellectual and technical
property components of pro-vitamin A rice (Golden Rice): A preliminary
freedom-to-operate review. ISAAA Brief 20. International Service for the
Acquisition of Agri-biotech Applications, Ithaca, NY. Also available via
http://www.isaaa.org/resources/ publications/briefs/20/Kwun I-S, Do M-S, Chung H-R, Kim Yh, Beattie JH (2009) The impact of rapid
economic growth and globalization on zinc nutrition in South Korea. Public
Health Nutr 12: 1234-1241. Also available via http://dx.doi.org/
10.1017/S1368980008003789Leibenstein H (1957) The theory of underemployment in backward economies. J
Pol Econ 65: 91-103.Also available via http:// dx.doi.org/10.1086/257894Liu Y, Shankar B (2006) A panel data study of the determinants of micronutrient
intake in China. Contributed Paper, 26 Conference of the International
Association ofAgricultural Economists,August 12-18, Broadbeach.AgEcon
Search, St. Paul, MN. http://purl.umn.edu/ 25585Low JW, Arimond M, Osman N, Cunguara B, Zano F, Tschirley D (2007) A food-
based approach introducing orange-fleshed sweet potatoes increased vitamin
A intake and serum retinol concentrations in young children in rural
Mozambique. J Nutr 137: 1320-1327. Also available via
http://jn.nutrition.org/cgi/content/abstract/137/5/1320Ma G, Jin Y, Li Y, Zhai F, Kok FJ, Jacobsen E, Yang X (2008) Iron and zinc
deficiencies in China: What is a feasible and cost-effective strategy? Public
Health Nutr 11: 632-638. Also available via http://dx.doi.org/
10.1017/S1368980007001085Mahendra-Dev S (2003) Right to food in India. Working Paper 50. Centre for
Economic and Social Studies, Hyderabad. Also available via
http://www.cess.ac.in/cesshome/workingpaperoff.htmMartínez-Ballesta MC, Dominguez-Perles R, Moreno DA, Muries B, Alcaraz-
López C, Bastías E, García-Viguera C, Carvajal M (2009) Minerals in plant
food: Effect of agricultural practices and role in human health. A review.
Agron Sustain Dev, online 6 August. Also available via http://dx.doi.org/
10.1051/agro/2009022Mazuze FM (2007) Analysis of adoption of orange-fleshed sweetpotatoes: The
case study of Gaza Province in Mozambique. Research Report 4E. Michigan
th
Sabanci University, Istanbul. Available via http://www.harvestzinc.org/.
Accessed 26 October 2009Heaney RP (2003) Long-latency deficiency disease: Insights from calcium and
vitamin D. Am J Clin Nutr 78: 912-919. Also available via
http://www.ajcn.org/cgi/content/abstract/78/5/912Heyd H (2007) Food consumption, micronutrient malnutrition and the potential of
orange-fleshed sweet potatoes in Uganda. Universität Hohenheim, StuttgartHorton S, Alderman H, Rivera JA (2008) Hunger and malnutrition. Challenge
Paper 2008. Copenhagen Consensus, Frederiksberg. Available via
http://www.copenhagenconsensus.com/Default. aspx?ID=1149. Accessed
28 February 2009Horton S, Ross J (2003) The economics of iron deficiency. Food Pol 28: 51-75.
Also available via http://dx.doi.org/10.1016/S0306-9192(02)00070-2Hotz C, Brown KH (ed) (2004) Assessment of the risk of zinc deficiency in
populations and options for its control. International Zinc Nutrition
Consultative Group Technical Document No. 1, Food Nutr Bull 25: S91-
S204.Also available via http://www.izincg.org/technical.phpINSTAPA (2009) Novel staple food-based strategies to improve micronutrient
status for better health and development in sub-Saharan Africa. Web page of
INSTAPA, Wageningen University, Wageningen. Available via
http://www.instapa.org/.Accessed 27 October 2009IOM (2001) Dietary Reference Intakes: Elements. Overview table of the Institute
of Medicine of the National Academies, Washington, DC. Available via
http://www.iom.edu/CMS/54133/54377/54395.aspx. Accessed 1 March
2009IOM (2004) Dietary Reference Intakes for water, potassium, sodium, chloride,
and sulfate. Institute of Medicine, National Academies Press, Washington,
DC.Also available via http://www.nap.edu/ catalog.php?record_id=10925Jha R, Gaiha R, Sharma A (2009) Calorie and micronutrient deprivation and
poverty nutrition traps in rural India. World Dev 37: 982-991. Also available
via http://dx.doi.org/10.1016/j.worlddev.2008.09.008JN (2009) Nutrient information. Web page of The Journal of Nutrition, American
Society for Nutrition, Bethesda, MD. Available via http://jn.nutrition.org/
nutinfo/.Accessed 1 March 2009Kandpal E, McNamara PE (2009) Determinants of nutritional outcomes of
children in India: A quantile regression approach. Selected Paper, Annual
Meeting of the Agricultural and Applied Economics Association, July 26-28,
Milwaukee, WI. AgEcon Search, St. Paul, MN. Also available via
http://purl.umn.edu/49415Kennedy G, Natel G, Shetty P (2003a) The scourge of 'hidden hunger': Global
dimensions of micronutrient deficiencies. Food, Nutrition and Agriculture
32: 8-16. Also available via http://www.fao.org/ DOCREP/005/Y8346M/
74 75

10.1016/j.tplants.2008.06.005Pettifor JM (2004) Nutritional rickets: Deficiency of vitamin D, calcium, or both?
Am J Cl in Nu t r 80 : 1725S-1729S . Al so ava i l ab l e v i a
http://www.ajcn.org/cgi/content/abstract/80/6/1725SPitt MM (1983) Food preferences and nutrition in rural Bangladesh. Rev Econ Stat
65: 105-114.Also available via http://www.jstor.org/ stable/1924414Pittas AG, Lau J, Hu FB, Dawson-Hughes B (2007) The role of vitamin D and
calcium in type 2 diabetes: A systematic review and meta-analysis. J Clin
Endocrinol Metab 92: 2017-2029. Also available via http://dx.doi.org/
10.1210/jc.2007-0298Popkin BM (2001) The nutrition transition and obesity in the developing world. J
Nutr 131: S871-S873. Also available via http://jn.nutrition.org/cgi/
content/abstract/131/3/871SPopkin BM, Horton S, Kim S, Mahal A, Shuigao J (2001) Trends in diet,
nutritional status, and diet-related noncommunicable diseases in China and
India: The economic costs of the nutrition transition. Nutr Rev 59: 379-390.
Also available via http://www3.interscience. wiley.com/journal/
121482696/abstractPotrykus I (2009) Lessons from Golden Rice on public sector responsibility and
failure. New Biotechnol 25: S321-S322. Also available via http://dx.doi.org/
10.1016/j.nbt.2009.06.542Pray C, Huang J (2007) Biofortification for China: Political responses to food
fortification and GM technology, interest groups, and possible strategies.
AgBioForum 10: 161-169. Also available via http://www.agbioforum.org/
v10n3/v10n3a05-pray.htmPray C, Paarlberg R, Unnevehr L (2007) Patterns of political response to
biofortified varieties of crops produced with different breeding techniques
and agronomic traits. AgBioForum 10: 135-143. Also available via
http://www.agbioforum.org/v10n3/v10n3a02-pray.htmQaim M, SteinAJ, Meenakshi JV (2007) Economics of biofortification.Agr Econ
37: S119-S133. Also available via http://www3. interscience.wiley.com/
journal/117962879/abstractQaim M, Stein AJ (2009) Biofortification of staple crops: How well does it work
and what does it cost? Ernähr Um 56: 274-280. Also available via
http://www.ernaehrungs-umschau.de/archiv/ summaries/ ?id=3858Ramakrishnan U, Yip R (2002) Experiences and challenges in industrialized
countries: Control of iron deficiency in industrialized countries. J Nutr 132:
S 8 2 0 - S 8 2 4 . A l s o a v a i l a b l e v i a h t t p : / / j n . n u t r i t i o n . o r g /
cgi/content/abstract/132/4/820SRayman MP (2008) Food-chain selenium and human health: Emphasis on intake.
Brit J Nutr 100: 254-268. Also available via http://dx.doi.org/
10.1017/S0007114508939830
State University, East Lansing. Also available via http://www.aec.msu.edu/
fs2/mozambique/iiam/rr_4e.pdf (187 KB)Meenakshi JV, Johnson N, Manyong VM, De Groote H, Javelosa J, Yanggen D,
Naher F, Gonzalez C, Garcia J, Meng E (2009) How cost-effective is
biofortification in combating micronutrient malnutrition? An ex-ante
assessment. World Dev, in press. Also available via http://dx.doi.org/
10.1016/j.worlddev.2009.03.014MI (2009) What is hidden hunger? Web page of the Micronutrient Initiative,
Ottawa. Available via http://www.micronutrient.org/ english/View.asp?
x=573.Accessed 28 February 2009MI/UNICEF (2004) Vitamin and mineral deficiency: a global progress report. The
Micronutrient Initiative, Ottawa. Also available via http://
www.micronutrient.org/ English/View.asp?x=614Monasterio I, Graham RD (2000) Breeding for trace minerals in wheat. Food Nutr
B u l l 2 1 : 3 9 2 - 3 9 6 . A l s o a v a i l a b l e v i a h t t p : / / f o o d a n d -
nutritionbulletin.org/FNB/index.php/FNB/article/view/304Murray CJL, Lopez AD (eds) (1996) The Global Burden of Disease. Global
Burden of Disease and Injury Series, Vol. 1. Harvard University, Cambridge,
MA. Also available via http://www.hup. harvard.edu/catalog/
MURGLO.htmlMuzhingi T, Langyintuo AS, Malaba LC, Banziger M (2008) Consumer
acceptability of yellow maize products in Zimbabwe. Food Policy 33: 352-
36.Also available via http://dx.doi.org/10.1016/j.foodpol. 2007.09.003Nestel P, Bouis HE, Meenakshi JV, Pfeiffer W (2006) Biofortification of staple
food crops . J Nutr 136: 1064-1067. Also avai lable via
http://jn.nutrition.org/cgi/content/abstract/136/4/1064Nicklas TA(2003) Calcium intake trends and health consequences from childhood
through adulthood. J Am Coll Nutr 22: 340-356. Also available via
http://www.jacn.org/cgi/content/abstract/22/5/340Nieves JW (2005) Osteoporosis: The role of micronutrients. Am J Clin Nutr 81:
1232S-1239S. Also available via http://www.ajcn.org/ cgi/content/
abstract/81/5/1232SPaarlberg R (2006) Are genetically modified (GM) crops a commercial risk for
Africa? Int J Tech Global 2: 81-92. Also available via
http://www.ingentaconnect.com/content/ind/ijtg/2006/00000002/F0020001
/art00011Park S, Elless MP, Park J, Jenkins A, Lim W, Chambers IV E, Hirschi KD (2009)
Sensory analysis of calcium-biofortified lettuce. Plant Biotech J 7: 106-117.
Also available via http://dx.doi.org/10.1111/j.1467-7652.2008.00379.xPalmgren MB, Clemens S, Williams LE, Krämer U, Borg S, Schjørring JK,
Sanders D (2008) Zinc biofortification of cereals: problems and solutions.
Trends Plant Sci 13: 464-473. Also available via http://dx.doi.org/
76 77

http://dx.doi.org/10.1038/nbt1006-1200bSteinAJ, Nestel P, Meenakshi JV, Qaim M, Sachdev HPS, Bhutta ZA(2007) Plant
breeding to control zinc deficiency in India: How cost-effective is
biofortification? Public Health Nutr 10: 492-501. Also available via
http://dx.doi.org/10.1017/S1368980007223857Stein AJ, Qaim M (2007) The human and economic cost of hidden hunger. Food
Nutr Bull 28: 125-134. Also available via http://foodandnutrition
bulletin.org/FNB/index.php/FNB/article/view/1841Stein AJ, Meenakshi JV, Qaim M, Nestel P, Sachdev HPS, Bhutta ZA (2008a)
Potential impacts of iron biofortification in India. Soc Sci Med 66: 1659-
1870. Also available via http://dx.doi.org/:10.1016/ j.socscimed.
2008.01.006Stein AJ, Sachdev HPS, Qaim M (2008b) Genetic engineering for the poor:
Golden Rice and public health in India. World Dev 36: 144-158. Also
available via http://dx.doi.org/10.1016/j.worlddev.2007.02.013Stein AJ, Qaim M, Nestel P (2009) Zinc deficiency and DALYs in India: Impact
assessment and economic analyses. In: Preedy V, Watson RR (ed) Handbook
of disease burdens and quality of life measures. Springer, Heidelberg. Also
available via http://www.springer.com/ medicine/book/978-0-387-78665-0Stevens R, Winter-Nelson A (2008) Consumer acceptance of provitamin A-
biofortified maize in Maputo, Mozambique. Food Policy 33: 341-351. Also
available via http://dx.doi.org/10.1016/j.foodpol. 2007.12.003Stomph Tj, Jiang W, Struik PC (2009) Zinc biofortification of cereals: Rice differs
from wheat and barley. Trends Plant Sci 14: 123-124. Also available via
http://dx.doi.org/10.1016/j.tplants.2009.01.001Strauss J (1986) Does better nutrition raise farm productivity? J Pol Econ 94: 297-
320.Also available via http://dx.doi.org/10.1086/261375Strauss J, Thomas D (1998) Health, nutrition, and economic development. J Econ
Lit 36: 766-817. Also available via http://www.aeaweb.org/
journal/contents/june1998.htmlTang G, Qin J, Dolnikowski GG, Russell RM, Grusak MA (2009) Golden Rice is
an effective source of vitamin A. Am J Clin Nutr 89: 1776-1783. Also
available via http://dx.doi.org/10.3945/ajcn.2008.27119Thacher TD, Fischer PR, Strand MA, Pettifor JM (2006) Nutritional rickets
around the world: Causes and future directions. Ann Trop Paediatr Int Child
Health 26: 1-16. Also available via http://www.ingentaconnect.com/
content/maney/atp/2006/00000026/00000001/art00001Thinley LJY (1998) Values and development: "Gross National Happiness".
Keynote speech delivered at the Millennium Meeting forAsia and the Pacific,
Seoul. In: Kinga S, Galay K, Rapten P, Pain A (ed) (1999) Gross National
Happiness: A set of discussion papers, Centre for Bhutan Studies, Thimpbu,
pp. 12-23. Available via http://www.bhutanstudies.org.bt/main/
Reuters (2009) EU rejects more U.S. soy with GM corn traces. News article,
September 18. New York: Thomson Reuters. Available via
http://www.reuters.com/article/companyNews/idUKTRE58H4GG2009091
8.Accessed 12 Oct 2009Ríos JJ, Rosales MA, Blasco B, Cervilla LM, Romero L, Ruiz JM (2008)
Biofortification of Se and induction of the antioxidant capacity in lettuce
plants. Sci Hortic-Amsterdam 116: 248-25. Also available via
http://dx.doi.org/doi:10.1016/j.scienta.2008.01.008Rosado JL, Hambidge KM, Miller LV, Garcia OP, Westcott J, Gonzalez K, Conde
J, Hotz C, Pfeiffer W, Ortiz-Monasterio I, Krebs NF (2009) The quantity of
zinc absorbed from wheat in adult women is enhanced by biofortification. J
Nutr 139: 1920-1925. Also available via http://dx.doi.org/10.3945/
jn.109.107755Ruel MT (2001) Can food-based strategies help reduce vitamin A and iron
deficiencies? A review of recent evidence. International Food Policy
Research Institute, Washington, DC. Also available via http://www.ifpri.org/
pubs/fpreview/fpreview05.htmRuel MT (2003) Is dietary diversity an indicator for food security or dietary
quality? A review of measurement issues and research needs. FCND
Discussion Paper 140, International Food Policy Research Institute,
Washington, DC. Also available via http://www.ifpri.org/ publication/
dietary-diversity-indicator-food-security-or-dietary-qualitySanchez PA, Swaminathan MS, Dobie P, Yuksel N (2005) Halving hunger: It can
be done. UN Millennium Project. Earthscan, London. Also available via
http://www.unmillenniumproject.org/reports/ tf_hunger.htmSmith LC, Haddad L (2000) Explaining child malnutrition in developing
countries:Across-country analysis. Research Report 111, International Food
Policy Research Institute, Washington DC. Also available via
http://www.ifpri.org/pubs/abstract/abstr111.htmStein A (2006) Micronutrient malnutrition and the impact of modern plant
breeding on public health in India: How cost-effective is biofortification?
Cuvillier Verlag, Göttingen. Also available via http://nbn-
resolving.de/urn/resolver.pl?urn=urn:nbn:de:bsz:100-opus-1574Stein AJ, Meenakshi JV, Qaim M, Nestel P, Sachdev HPS, Bhutta ZA (2005)
Analyzing the health benefits of biofortified staple crops by means of the
Disability-Adjusted Life Years approach: A handbook focusing on iron, zinc
and vitamin A. HarvestPlus Technical Monograph 4, International Food
Policy Research Institute, Washington DC. Also available via
http://www.harvestplus.org/ content/analyzing-health-benefits-biofortified-
staple-crops-means-disability-adjusted-life-years-appSteinAJ, Sachdev HPS, Qaim M (2006) Potential impact and cost-effectiveness of
Golden Rice. Nat Biotechnol 24: 1200-1201. Also available via
78 79

c o n t e n t . P l a n t S o i l 2 4 5 : 2 0 5 - 2 1 4 . A l s o a v a i l a b l e v i a
http://www.ingentaconnect.com/content/klu/plso/2002/00000245/0000000
1/00312890WFP (2007) Hunger and health. World Hunger Series 2007, World Food
Programme. Earthscan, London. Also available via http://wfp.org/policies/
introduction/other/White PJ, Bradshaw JE, Finlay M, Dale B, Ramsay G, Hammond JP, Broadley
MR (2009) Relationships between yield and mineral concentrations in potato
tubers. Hort Sci 44: 6-11. Also available via http://hortsci.ashspubli
cations.org/cgi/content/abstract/44/1/6White PJ, Broadley MR (2005) Biofortifying crops with essential mineral
elements. Trends Plant Sci 10: 586-593. Also available via
http://dx.doi.org/10.1016/j.tplants.2005.10.001White PJ, Broadley MR (2009) Biofortification of crops with seven mineral
elements often lacking in human diets – Iron, zinc, copper, calcium,
magnesium, selenium and iodine. New Phytol 182: 49-84. Also available via
http://dx.doi.org/10.1111/j.1469-8137.2008. 02738.xWHO (2001) Macroeconomics and health: Investing in health for economic
development. World Health Organization, Geneva. Also available via
http://libdoc.who.int/publications/2001/ 924154550X.pdf (546 KB)WHO (2002) The World Health Report 2002. World Health Organization,
Geneva.Also available via http://www.who.int/whr/2002/WHO (2004) Vitamin and mineral requirements in human nutrition. World Health
Organization, Geneva. Also available via http:// www.who.int/nutrition/
publications/micronutrients/9241546123/WHO (2009a) Micronutrient deficiencies: Iron deficiency anaemia. Web page of
the World Health Organization, Geneva. Available via http://www.who.int/
nutrition/topics/ida/.Accessed 8 March 2009WHO (2009b) Global burden of disease. Web page of the World Health
Organization, Geneva. Available via http://www.who.int/healthinfo/
global_burden_disease/.Accessed 27 March 2009Wolfe BL, Behrman JR (1983) Is income overrated in determining adequate
nutrition? Econ Dev Cult Change 31: 525-549. Also available via
http://dx.doi.org/10.1086/451340Wolson RA(2007)Assessing the prospects for the adoption of biofortified crops in
South Africa. AgBioForum 10: 184-191. Also available via
http://www.agbioforum.org/v10n3/v10n3a08-wolson.htmWorld Bank (1993) World development report 1993. World Bank, Washington,
DC.Also available via http://go.worldbank.org/ 6R5DC7G090World Bank (1994) Enriching lives: Overcoming vitamin and mineral
malnutrition in developing countries. World Bank, Washington, DC. Also
available via http://go.worldbank.org/N8B0YJMVB0
pub_detail.php?pubid=65.Accessed 4April 2009UN (1999) The right to adequate food. E/C.12/1999/5. Committee on Economic,
Social and Cultural Rights, twentieth session. United Nations, Economic and
Social Council, Geneva. Available via http://www.unhchr.ch/tbs/
doc.nsf/0/3d02758c707031d58025677f003b73b9. Accessed 28 February
2009UN (2000) United Nations Millennium Declaration. General Assembly
Resolution 55/2, 8 September. United Nations, New York. Available via
http://www.un.org/millennium/declaration/ares552e.htm. Accessed 4 April
2009Underwood BA, Smitasiri S (1999) Micronutrient malnutrition: Policies and
programs for control and their implications. Annu Rev Nutr 19: 303-324.
Also available via http://dx.doi.org/10.1146/ annurev.nutr.19.1.303UNDP (2009) The human development concept. Web page of the Human
Development Report Office. United Nations Development Programme, New
York. Available via http://hdr.undp.org/en/ humandev/. Accessed 4 April
2009Wang X, Taniguchi K (2003) Does better nutrition enhance economic growth? The
economic cost of hunger. In: Taniguchi K, Wang X (ed) Nutrition intake and
economic growth. Food and Agriculture Organization of the United Nations,
Rome. Also available via http://www.fao.org/docrep/006/y4850e/
y4850e00.htmWard JO, Sanders JH (1980) Nutritional determinants and migration in the
Brazilian northeast: A case study of rural and urban Ceara. Econ Dev Cult
Change 29: 141-163.Also available via http://dx.doi.org/ 10.1086/451235Webb P, Block S (2003) Nutrition knowledge and parental schooling as inputs to
child nutrition in the long and short run. Working Papers in Food Policy and
Applied Nutrition 21, Tufts University, Boston, MA. http:// nutrition.
tufts.edu/1184937206715/Nutrition-Page-nl2w_1184937205502.htmlWeinberger K (2003) The impact of micronutrients on labor productivity:
Evidence from rural India. Contributed Paper, Annual Meeting, August 16-
22, International Association of Agricultural Economists, Durban. Available
via http://purl.umn.edu/25897.Accessed 4April 2009Welch RM, Bouis HE (2009) Biofortification – A sustainable agricultural strategy
for reducing micronutrient malnutrition in the Global South. Science Forum,
16-17 June, Wageningen. Also available via http://www.science
forum2009.nl/Portals/11/2WelchBouisBiofortification.pdf (319 KB)Welch RM, Graham RD (2000)Anew paradigm for world agriculture: productive,
sustainable, nutritious, healthful food systems. Food Nutr Bull 21: 361-366.
Also available via http:// foodandnutritionbulletin.org/FNB/index.php/
FNB/article/view/322Welch RM, Graham RD (2002) Breeding crops for enhanced micronutrient
80 81

World Bank (2006) Repositioning nutrition as central to development: A strategy
for large-scale action. World Bank, Washington, DC. Also available via
http://go.worldbank.org/M63XQNCQ20Zhu C, Naqvi S, Gomez-Galera S, Pelacho AM, Capell T, Christou P (2007)
Transgenic strategies for the nutritional enhancement of plants. Trends Plant
Sci 12: 548-555. Also available via http://dx.doi.org/ 10.1016/j.tplants.
2007.09.007Zhu Y-G, Pilon-Smits EAH, Zhao F-J, Williams PN, MehargAA(2009) Selenium
in higher plants: Understanding mechanisms for biofortification and
phytoremediation. Trends Plant Sci 14: 436-442. Also available via
http://dx.doi.org/10.1016/j.tplants.2009.06.006Zimmermann R, Qaim M (2004). Potential health benefits of Golden Rice: A
Philippine case study. Food Policy 29: 147-168. Also available via
http://dx.doi.org/10.1016/j.foodpol.2004.03.001
The opening of Pandora's Box: Climate change
impacts on soil fertility and crop nutrition in
developing countries
Samuel B St Clair Jonathan Lynchl
l l l l l
l
Abstract
Keywords
Feeding the world's growing population is a serious challenge. Food
insecurity is concentrated in developing nations, where drought and low soil
fertility are primary constraints to food production. Many crops in developing
countries are supported by weathered soils in which nutrient deficiencies and ion
toxicities are common. Many systems have declining soil fertility due to
inadequate use of fertility inputs, ongoing soil degradation, and increasingly
intense resource use by burgeoning populations. Climate models predict that
warmer temperatures and increases in the frequency and duration of drought
during the 21 century will have net negative effects on agricultural productivity.
The potential effects of climate change on soil fertility and the ability of crops to
acquire and utilize soil nutrients is poorly understood, but is essential for
understanding the future of global agriculture. This paper explores how rising
temperature, drought and more intense precipitation events projected in climate
change scenarios for the 21 century might affect soil fertility and the mineral
nutrition of crops in developing countries. The effects of climate change on
erosion rates, soil organic carbon losses, soil moisture, root growth and function,
root-microbe associations and plant phenology as they relate to mineral nutrition
are discussed. Our analysis suggests that the negative impacts of climate change
on soil fertility and mineral nutrition of crops will far exceed beneficial effects,
which would intensify food insecurity, particularly in developing countries.
Drought erosion food security precipitation soil degradation
soil organic carbon temperature
st
st
Proceedings IPI-OUAT-IPNI International Symposium (2009)
Samuel B St. Clair
Department of Plant and Wildlife Sciences, BrighamYoung University, Provo, UT
84602, USA email: [email protected].
Jonathan Lynch
Department of Horticulture, The Pennsylvania State University, University Park,
PA, 16802, USA.
Presented at IPI-OUAT-IPNI International Symposium.Published in Plant Soil 2010.335:101-115. Printed here with permission from Plant Soil.
82 83

Challenges to food security in developing countries in the 21 centuryst
The world in general and developing countries in particular face major challenges
of food security in the 21 century. Current estimates suggest that more than 1.02
billion people on our planet are underfed or malnourished including a 10%
increase over the last 3 years due to rising food costs (FAO 2009). Food insecurity
is increasing and projections are that it will worsen in coming decades. Demand
for food is expected to increase 2-5 fold from 1990 to 2030, while per capita arable
land area dedicated to crop production continues to shrink because of population
growth, urbanization and soil degradation (Daily et al. 1998). Estimates suggest
that food production will have to increase by 60% in the coming decades to meet
world food demands (Wild 2003). The only way to keep pace with the demand will
be to increase crop production by farming marginal lands, or through more
intensive production on lands already under cultivation (Lal 2000). The green
revolution is an excellent example of how agricultural intensification driven by
innovation resulted in exponential increases in crops yields that kept pace with
population growth in the mid 20 century (Borlaug 2007). Once again food
production in developing countries is being outpaced by rapid population growth.
From the supply side, this imbalance is largely driven by edaphic constraints that
result from inherently low soil fertility and/or soil degradation from unsustainable
farming practices (Lal 2007).
The success of the green revolution was mainly driven by dwarf crop varieties
that could respond to fertilizer inputs without lodging. However, yield increases
that kept pace with population growth during the green revolution have slowed
since the 1990's (Fig. 1). The green revolution bypassed sub-Saharan Africa as
crop yields were heavily constrained by nutrient poor soils and most farmers had
little or no access to fertilizers. Africa is the only continent where cereal
production per capita has steadily decreased since the early 1960's (Fig. 1).
Much of the research aimed at understanding best farming practices is
focused on the challenges and crop species that are relevant to developed countries
where the resource base exists for conducting research. Based on these challenges
there has been a call for a second green revolution with a goal of enhancing crop
yields in developing countries by improving soil fertility through better
management practices (Sanchez and Swaminathan 2005) and by breeding crops
with greater tolerance to edaphic stresses (Lynch 2007). There is substantial
opportunity to improve crop yields since current production is only a fraction of
yield potential (Lynch 2007) (Table 1). In addition, significant genetic variation
exists for crop traits associated with tolerance to mineral stress, and
biotechnological advances are accelerating the process of trait identification and
selection (Lahner et al. 2003; Wu et al. 2008).
Nutrient impoverished soils contribute to human malnutrition in two
st
th
Fig. 1 Cereal production per capita from 1960-2008. Source:
(last updated June 23 2009).
Food and
Agriculture Organization of the United Nations (FAO). FAOSTAT 2009
important ways. First, they reduce crop yields, causing food scarcity that results in
protein-energy malnutrition. Second, crops produced on nutrient poor soils
typically have low tissue concentrations of trace elements. Human populations
whose diet primarily consists of staple cereal crops (primarily maize, rice, wheat,
sorghum, and millet) may meet their protein and energy demands but often suffer
micronutrient deficiencies. It is estimated that of the world's human population,
60-80% are Fe deficient, >30% are Zn deficient, 30% are Iodine deficient and
about 15% are Se deficient (White and Broadley 2005). The overwhelming
majority of people that suffer from micronutrient deficiencies live in developing
countries (Kennedy et al. 2003).
If we are somehow able to clear this first hurdle and increase crop yields and
nutrient availability by overcoming soil limitations, global climate change also
looms large in determining food sufficiency and quality in the 21 century
(Rosenzweig and Parry 1994). Evidence suggests that due to high vulnerabilities
and limited resources, developing countries may have limited capacity to
implement adaptation measures to achieve food stability in a warmer climate
(Kates 2000; Mertz et al. 2009). It is well documented that climate warming, and
changes in global precipitation patterns, particularly drought, are already affecting
crop production in developing countries (Pandey et al. 2007; Barrios et al. 2008).
st
84 85
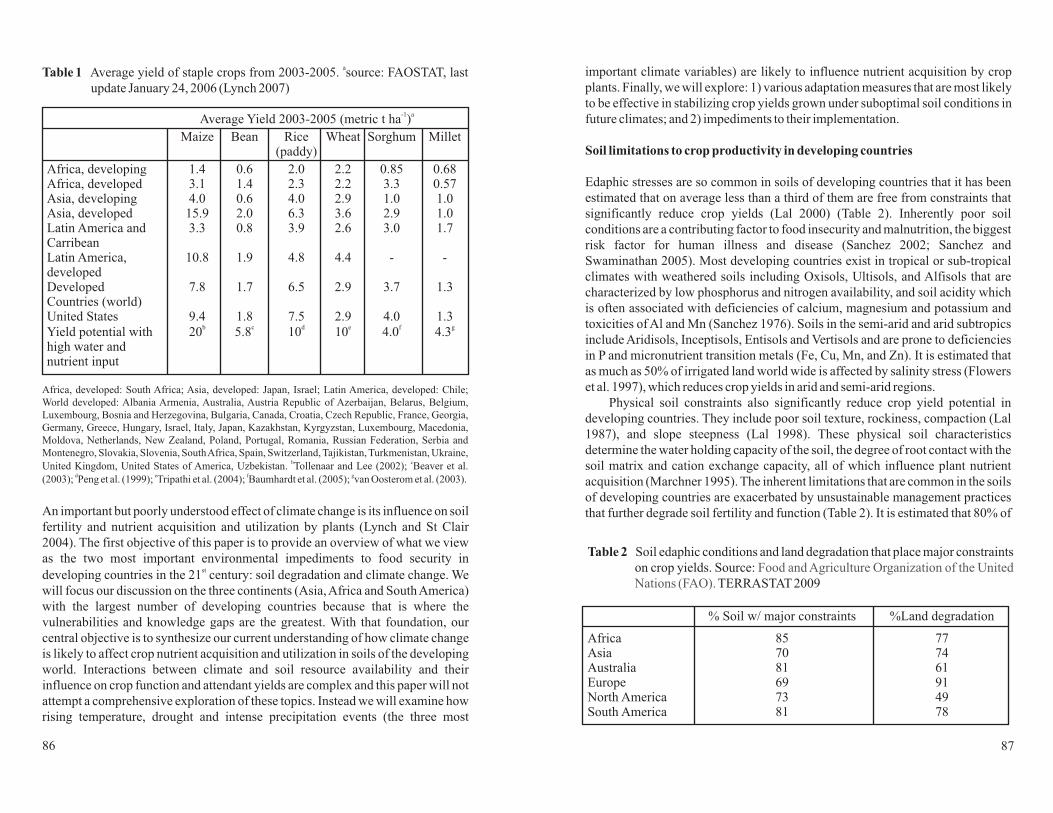
important climate variables) are likely to influence nutrient acquisition by crop
plants. Finally, we will explore: 1) various adaptation measures that are most likely
to be effective in stabilizing crop yields grown under suboptimal soil conditions in
future climates; and 2) impediments to their implementation.
Edaphic stresses are so common in soils of developing countries that it has been
estimated that on average less than a third of them are free from constraints that
significantly reduce crop yields (Lal 2000) (Table 2). Inherently poor soil
conditions are a contributing factor to food insecurity and malnutrition, the biggest
risk factor for human illness and disease (Sanchez 2002; Sanchez and
Swaminathan 2005). Most developing countries exist in tropical or sub-tropical
climates with weathered soils including Oxisols, Ultisols, and Alfisols that are
characterized by low phosphorus and nitrogen availability, and soil acidity which
is often associated with deficiencies of calcium, magnesium and potassium and
toxicities of Al and Mn (Sanchez 1976). Soils in the semi-arid and arid subtropics
include Aridisols, Inceptisols, Entisols and Vertisols and are prone to deficiencies
in P and micronutrient transition metals (Fe, Cu, Mn, and Zn). It is estimated that
as much as 50% of irrigated land world wide is affected by salinity stress (Flowers
et al. 1997), which reduces crop yields in arid and semi-arid regions.
Physical soil constraints also significantly reduce crop yield potential in
developing countries. They include poor soil texture, rockiness, compaction (Lal
1987), and slope steepness (Lal 1998). These physical soil characteristics
determine the water holding capacity of the soil, the degree of root contact with the
soil matrix and cation exchange capacity, all of which influence plant nutrient
acquisition (Marchner 1995). The inherent limitations that are common in the soils
of developing countries are exacerbated by unsustainable management practices
that further degrade soil fertility and function (Table 2). It is estimated that 80% of
Soil limitations to crop productivity in developing countries
An important but poorly understood effect of climate change is its influence on soil
fertility and nutrient acquisition and utilization by plants (Lynch and St Clair
2004). The first objective of this paper is to provide an overview of what we view
as the two most important environmental impediments to food security in
developing countries in the 21 century: soil degradation and climate change. We
will focus our discussion on the three continents (Asia,Africa and SouthAmerica)
with the largest number of developing countries because that is where the
vulnerabilities and knowledge gaps are the greatest. With that foundation, our
central objective is to synthesize our current understanding of how climate change
is likely to affect crop nutrient acquisition and utilization in soils of the developing
world. Interactions between climate and soil resource availability and their
influence on crop function and attendant yields are complex and this paper will not
attempt a comprehensive exploration of these topics. Instead we will examine how
rising temperature, drought and intense precipitation events (the three most
st
Africa, developed: South Africa; Asia, developed: Japan, Israel; Latin America, developed: Chile;
World developed: Albania Armenia, Australia, Austria Republic of Azerbaijan, Belarus, Belgium,
Luxembourg, Bosnia and Herzegovina, Bulgaria, Canada, Croatia, Czech Republic, France, Georgia,
Germany, Greece, Hungary, Israel, Italy, Japan, Kazakhstan, Kyrgyzstan, Luxembourg, Macedonia,
Moldova, Netherlands, New Zealand, Poland, Portugal, Romania, Russian Federation, Serbia and
Montenegro, Slovakia, Slovenia, SouthAfrica, Spain, Switzerland, Tajikistan, Turkmenistan, Ukraine,
United Kingdom, United States of America, Uzbekistan. Tollenaar and Lee (2002); Beaver et al.
(2003); Peng et al. (1999); Tripathi et al. (2004); Baumhardt et al. (2005); van Oosterom et al. (2003).
b c
d e f g
Average Yield 2003-2005 (metric t ha )
Maize Bean Rice Wheat Sorghum Millet
Africa, developing 1.4 0.6 2.0 2.2 0.85 0.68Africa, developed 3.1 1.4 2.3 2.2 3.3 0.57Asia, developing 4.0 0.6 4.0 2.9 1.0 1.0Asia, developed 15.9 2.0 6.3 3.6 2.9 1.0Latin America and 3.3 0.8 3.9 2.6 3.0 1.7
Latin America, 10.8 1.9 4.8 4.4 - -
Developed 7.8 1.7 6.5 2.9 3.7 1.3
United States 9.4 1.8 7.5 2.9 4.0 1.3
Yield potential with 20 5.8 10 10 4.0 4.3
-1 a
b c d e f g
(paddy)
Carribean
developed
Countries (world)
high water andnutrient input
Table 1 Average yield of staple crops from 2003-2005. source: FAOSTAT, last
update January 24, 2006 (Lynch 2007)
a
% Soil w/ major constraints %Land degradation
Africa 85 77Asia 70 74Australia 81 61Europe 69 91North America 73 49South America 81 78
Table 2 Soil edaphic conditions and land degradation that place major constraints
on crop yields. Source:
TERRASTAT 2009
Food and Agriculture Organization of the United
Nations (FAO).
86 87

end of the 21 century, temperature averages on those continents will have
increased by at least another 2-4 °C (Salinger 2005; IPCC 2007a). Subtropical
regions are likely to experience increases in drought which will be driven by
higher vapor pressure deficits and less annual rainfall (Shindell et al. 2006; IPCC
2007a). Variability in precipitation patterns are projected to increase with longer
periods of droughts interspersed with more intense rainfall events (Easterling et al.
2000; Groisman et al. 2005; Sun et al. 2007). These changes in temperature and
precipitation are expected to have net negative effects on global agriculture and in
particular in developing countries (IPCC 2007b). The severe impacts of drought
on crop failure that has led to widespread starvation in sub-Saharan Africa during
the late 20 century is expected to continue and intensify in the 21 century (Broad
andAgrawala 2000; Held et al. 2005). By 2020, yields from rain-fed agriculture in
Africa could be reduced by 50%, largely a result of increases in the intensity and
duration of drought events (IPCC 2007b). Depending on location, increases in the
frequency and magnitude of droughts and floods are expected to have major
impacts on agricultural production in Asia (IPCC 2007b). Recent climate models
suggest that future patterns of drought in Asia are likely to be most problematic in
Asian monsoon regions (AMRs: South Asia and East Asia) and West Asia during
the spring and summer months (Kim and Byun 2009). In South America, shifts in
precipitation patterns and the disappearance of glaciers are expected to
substantially decrease water availability for agriculture. Projected warming and
reductions in precipitation expected to occur by 2030 in developing countries,
suggests that SouthAsia and SouthernAfrica will be the two regions most likely to
suffer negative impacts on several crops important to large food-insecure
populations (Lobell et al. 2008).
Recent analysis suggest that uncertainty in understanding crop responses to
future climate change is greater for temperature than precipitation (Lobell and
Burke 2008). The influence of warmer temperatures on crop yields will somewhat
depend on moisture availability. In areas where precipitation is plentiful or
irrigation is available, warmer temperatures may positively influence yields by: 1)
increasing rates of physiological capacity (Taiz and Zeiger 2006); 2) lengthening
the growing season (Juin et al. 2004); and 3) reducing the incidence of frost
damage to crops in temperate climates (Moonen et al. 2002). In semi-arid and arid
regions, the largest impact of warmer temperatures on agriculture will be
exacerbation of soil moisture deficit (drought) driven by increased rates of
evapotranspiration (Biggs et al. 2008). Interestingly, increases in both daily
maximum and minimum temperatures (which will continue to rise during the 21
century) have been shown to negatively impact crop yields, by altering phenology
(Mitchell et al. 1993; Peng et al. 2004) and through heat stress at more extreme
temperatures (Spiertz et al. 2006).
st
th st
st
soil degradation worldwide occurs in developing countries (Lal 2000). Erosion
driven by tilling practices and cultivation on sloped terrains is the most
ecologically and economically devastating soil degrading process (Ananda and
Herath 2003; Meadows 2003). In developing countries erosion can carry away as
much as 30-40 t/ha/yr of topsoil (Barrow 1991). Lost with erosion are the nutrients
that are abundant in the cation exchange sites and organic fractions of the topsoil.
Since most fertilizers are surface broadcast large proportions of fertilizer inputs
(20-50%) are also lost through erosive processes (Pimentel 1996). Soil erosion
studies in Africa have shown drastic reductions in crop yields (>65%) because the
exposed sub-surface soils have much lower fertility and poorer physical
characteristics than topsoil (Oyedele andAina 2006; Salako et al. 2007).
Estimates are that the world has lost 55-90 Pg of soil organic carbon (SOC)
through land conversion from natural to agricultural ecosystems (Ruddiman
2003). Soil organic carbon (SOC) is positively correlated with crop productivity
(Olson and Janzen 1992). High SOC enhances soil water holding capacity,
increases soil fertility through cation exchange and mineralization processes and
improves soil structure (Lal 2006). Increasing SOC in degraded soils is therefore a
major goal in efforts to renew fertility in degraded soils (Lal 2006). As SOC
accumulates it produces a positive feedback in which better functioning soil
produces more crop biomass that then increases organic matter inputs to the soil
(Lal 2006). Additionally, SOC storage is an important terrestrial sink for CO ,
which mitigates climate change (Post and Kwon 2000; Yu et al. 2009). In contrast,
when SOC is lost through erosion, tillage and other agricultural processes (Lal
2004), soil function and plant productivity that maintains organic matter in the soil
are compromised. Soil conditions, particularly soil moisture content, temperature
and nutrients status have drastic effects on the abundance, infection potential and
efficiency of N-fixing bacteria that are vitally important to increasing N in
cropping systems that lack fertilizer inputs (Dakora and Keya 1997). Alleviation
of soil constraints that are common in Sub-Saharan Africa dramatically increases
nodulation, plant growth and crop yields, indicating that soil conditions represent
a major limitation to biological N fixation (Dakora and Keya 1997).
Climate conditions, particularly drought, have had significant impacts on crop
yield reductions and food insecurity in Africa over the last 50 years (Barrios et al.
2008). Analyses suggest that this trend will intensify in developing countries
during the 21 century (Murdiyarso 2000; IPCC 2007b). During the 20 century
Asia, Africa and South America experienced a 0.7-1.0 °C increase in temperature
(IPCC 2007a). Conservative estimates from climate models suggest that by the
2
Climate change impacts on crop productivity and quality in developing
countries
st th
88 89

productivity but also reduces yields through its influence on the availability and
transport of soil nutrients (Table 3). Drought increases vulnerability to nutrient
losses from the rooting zone through erosion (Gupta 1993). Because nutrients are
carried to the roots by water, soil moisture deficit decreases nutrient diffusion over
short distances and the mass flow of water-soluble nutrients such as nitrate,
sulfate, Ca, Mg, and Si over longer distances (Mackay and Barber 1985; Barber
1995). Roots extend their length, increase their surface area and alter their
architecture in an effort to capture less mobile nutrients such as phosphorus
(Lynch and Brown 2001). Reduction of root growth and impairment of root
function under drought conditions thus reduces the nutrient acquisition capacity of
root systems (Marchner 1995).
Drought also disrupts root-microbe associations that are a principal strategy
for nutrient capture by plants. Reductions in both carbon and oxygen fluxes and
nitrogen accumulation in root nodules under drought conditions inhibit nitrogen
fixation in legume crops (Gonzalez et al. 2001; Ladrera et al. 2007; Athar and
Ashraf 2009). Drought alters the composition and activity of soil microbial
communities which determine the C and N transformations that underlie soil
fertility and nutrient cycling (Schimel et al. 2007). For example, soil moisture
deficit has been shown to reduce the activity of nitrifying bacteria by slowing
diffusion of substrate supply and through cytoplasmic dehydration (Stark and
Firestone 1995). Less is known about how drought influences mineralization and
decomposition in agricultural systems but it likely slows these processes. Studies
suggest that the root-mycorrhizal symbiosis is not overly sensitive to moderate
soil moisture deficits (Entry et al. 2002; Garcia et al. 2008). There is a large
literature documenting the beneficial effects of mycorrhizal fungi in crops plants
experiencing drought conditions (Wu and Chang 2004; Boomsma and Vyn 2008).
Part of the benefit provided by mycorrhizae under drought conditions is associated
with increase in nutrient transfer to the roots (Goicoechea et al. 1997; Al-Karaki
and Clark 1998).
Effects of Intense precipitation on nutrient acquisition
Excessive precipitation can reduce crop yields (Paul and Rasid 1993; Kawano et
al. 2009) (Table 3). Intense rainfall events can be a major cause of erosion in sloped
cropping systems and where soil instability results from farming practices that
have degraded soil structure and integrity (Meadows 2003). Surface erosion
during intense precipitation events is a significant source of soil nutrient loss in
developing countries (Tang et al. 2008; Zougmore et al. 2009). Because of its high
mobility in soil, nitrate leaching following intense rainfall events can also be a
significant source of N loss in agriculture (Sun et al. 2008).
Soil moisture is the master environmental variable because its availability
integrates climate and soil conditions, and because plants and soil microbes are so
responsive to its availability. Drought is an important selection force on biological
organisms (McDowell et al. 2008) and can drastically alter plant community
structure and function (Ciais et al. 2005; Holmgren et al. 2006). One of the
important innovations in human agriculture was irrigation which mitigated the
negative impacts of water deficit on crop growth. However, because of the extent
and magnitude of projected climate change, infrastructure, adaptation to drought
in developing countries appears to be limited in the future (Kates 2000; De
Wrachien and Feddes 2004).
In addition to the effects of climate on crop growth potential and yield,
temperature extremes and water deficit can have varying effects on the nutritional
quality of harvested products. Elevated temperature and drought tend to reduce
grain yield and starch content, while increasing protein content (Gooding et al.
2003, Erekul and Kohn 2006). Temperature is positively correlated with grain
micronutrient concentrations (Karami et al. 2009) and frost damage reduces grain
filling and typically has negative effects on grain quality (Cromey et al. 1998;
Allen et al. 2001). Elevated CO generally increases grain size but reduces protein
and mineral nutrient concentrations (Hogy and Fangmeier 2008), which may
result from tissue dilution and/or reductions in transpiration-driven mass flow of
nutrients (Lynch and St.Clair 2004). Post-harvest fruit and grain losses can be as
high as 20% in developing countries (Aidoo 1993). Fruit and grain spoilage is
particularly problematic in tropical areas where climate conditions are optimal for
microbial growth. The effect of climate change on postharvest storage of crops is
poorly understood but could be substantial in some regions.
Brouder and Volenec (2009) pointed out that: “implicit in discussions of plant
nutrition and climate change is the assumption that we know what to do relative to
nutrient management here and now but that these strategies might not apply in a
changed climate.” In other words, the rate and magnitude of changes in
precipitation and temperature, anticipated in the coming century have the potential
to fundamentally alter our understanding and strategies for the nutrient
management of crops.
Drought effects on nutrient acquisition
Crop yields on soils in developing countries decrease exponentially with
increasing aridity (Lal 2000). Soil moisture deficit directly impacts crop
2
Key climate-nutrient interactions in cropping systems of developing
countries
90 91
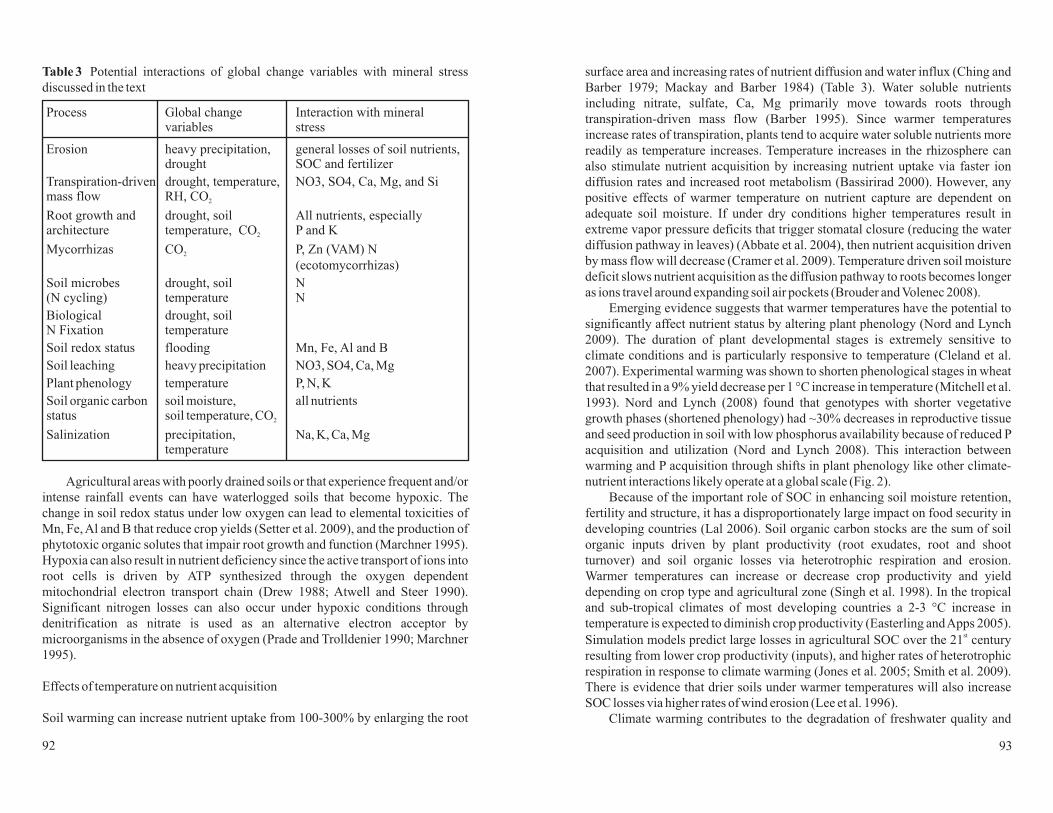
surface area and increasing rates of nutrient diffusion and water influx (Ching and
Barber 1979; Mackay and Barber 1984) (Table 3). Water soluble nutrients
including nitrate, sulfate, Ca, Mg primarily move towards roots through
transpiration-driven mass flow (Barber 1995). Since warmer temperatures
increase rates of transpiration, plants tend to acquire water soluble nutrients more
readily as temperature increases. Temperature increases in the rhizosphere can
also stimulate nutrient acquisition by increasing nutrient uptake via faster ion
diffusion rates and increased root metabolism (Bassirirad 2000). However, any
positive effects of warmer temperature on nutrient capture are dependent on
adequate soil moisture. If under dry conditions higher temperatures result in
extreme vapor pressure deficits that trigger stomatal closure (reducing the water
diffusion pathway in leaves) (Abbate et al. 2004), then nutrient acquisition driven
by mass flow will decrease (Cramer et al. 2009). Temperature driven soil moisture
deficit slows nutrient acquisition as the diffusion pathway to roots becomes longer
as ions travel around expanding soil air pockets (Brouder and Volenec 2008).
Emerging evidence suggests that warmer temperatures have the potential to
significantly affect nutrient status by altering plant phenology (Nord and Lynch
2009). The duration of plant developmental stages is extremely sensitive to
climate conditions and is particularly responsive to temperature (Cleland et al.
2007). Experimental warming was shown to shorten phenological stages in wheat
that resulted in a 9% yield decrease per 1 °C increase in temperature (Mitchell et al.
1993). Nord and Lynch (2008) found that genotypes with shorter vegetative
growth phases (shortened phenology) had ~30% decreases in reproductive tissue
and seed production in soil with low phosphorus availability because of reduced P
acquisition and utilization (Nord and Lynch 2008). This interaction between
warming and P acquisition through shifts in plant phenology like other climate-
nutrient interactions likely operate at a global scale (Fig. 2).
Because of the important role of SOC in enhancing soil moisture retention,
fertility and structure, it has a disproportionately large impact on food security in
developing countries (Lal 2006). Soil organic carbon stocks are the sum of soil
organic inputs driven by plant productivity (root exudates, root and shoot
turnover) and soil organic losses via heterotrophic respiration and erosion.
Warmer temperatures can increase or decrease crop productivity and yield
depending on crop type and agricultural zone (Singh et al. 1998). In the tropical
and sub-tropical climates of most developing countries a 2-3 °C increase in
temperature is expected to diminish crop productivity (Easterling andApps 2005).
Simulation models predict large losses in agricultural SOC over the 21 century
resulting from lower crop productivity (inputs), and higher rates of heterotrophic
respiration in response to climate warming (Jones et al. 2005; Smith et al. 2009).
There is evidence that drier soils under warmer temperatures will also increase
SOC losses via higher rates of wind erosion (Lee et al. 1996).
Climate warming contributes to the degradation of freshwater quality and
st
Table 3 Potential interactions of global change variables with mineral stress
discussed in the text
Agricultural areas with poorly drained soils or that experience frequent and/or
intense rainfall events can have waterlogged soils that become hypoxic. The
change in soil redox status under low oxygen can lead to elemental toxicities of
Mn, Fe, Al and B that reduce crop yields (Setter et al. 2009), and the production of
phytotoxic organic solutes that impair root growth and function (Marchner 1995).
Hypoxia can also result in nutrient deficiency since the active transport of ions into
root cells is driven by ATP synthesized through the oxygen dependent
mitochondrial electron transport chain (Drew 1988; Atwell and Steer 1990).
Significant nitrogen losses can also occur under hypoxic conditions through
denitrification as nitrate is used as an alternative electron acceptor by
microorganisms in the absence of oxygen (Prade and Trolldenier 1990; Marchner
1995).
Effects of temperature on nutrient acquisition
Soil warming can increase nutrient uptake from 100-300% by enlarging the root
Process
Erosion heavy precipitation,
Transpiration-drivenmass flow
Root growth andarchitecture
Mycorrhizas
Soil microbes(N cycling)
BiologicalN Fixation
Soil redox status
Soil leaching
Plant phenology
Soil organic carbonstatus
Salinization
Global change Interaction with mineralvariables stress
general losses of soil nutrients,drought SOC and fertilizer
drought, temperature, NO3, SO4, Ca, Mg, and SiRH, CO
drought, soil All nutrients, especiallytemperature, CO P and K
CO P, Zn (VAM) N
(ecotomycorrhizas)
drought, soil Ntemperature N
drought, soiltemperature
flooding Mn, Fe, Al and B
heavy precipitation NO3, SO4, Ca, Mg
temperature P, N, K
soil moisture, all nutrientssoil temperature, CO
precipitation, Na, K, Ca, Mgtemperature
2
2
2
2
92 93

Adaptation/mitigation strategies and limitations
The trends outlined above describe a dire situation that is likely to worsen in the
short term. To address this challenge it is urgent that the fertility and productivity
of agro-ecosystems in developing regions be maintained and even improved to
keep pace with population growth. The conceptual framework for this effort
should be integrated soil fertility management (ISFM), consisting of three primary
components: 1) judicious use of fertilizers and soil amendments, 2) soil
conservation to reduce erosion, maintain soil organic matter, and enhance water
and nutrient bioavailability, and 3) cultivation of crop species, genotypes and
cropping systems that make optimal use of soil resources for food production
while conserving soil fertility.
Technically, the simplest solution to many of the fertility problems in low
input agro-ecosystems would simply be to use fertilizers particularly in African
nations where soil fertility is low and fertilizer use is minimal (Fig. 3). Indeed, the
first Green Revolution consisted mainly of fertilizers and genotypes that could
respond to them without lodging. Although many tropical soils have chemical
characteristics that make fertilizer use problematic, the basic technologies for
fertilizing tropical soils have been known for decades (Sanchez 1976), and
demonstration plots have shown sustained yield improvements in response to
liming and the application of chemical fertilizers (Sanchez et al. 1983; Fearnside
1987). In recent years private foundations have devoted considerable resources to
availability (IPCC 2007b). A major way in which this happens is through
salinization, an important limitation to agriculture productivity in semi-arid
regions that is expected to intensify through the 21 century (Yeo 1999). Increases
in demand for irrigation in semi-arid regions such as the Indo-Gangetic plain of
northern India and Pakistan and parts of Africa driven by population growth and
climate warming are expected to increase the extent of salinization in agriculture
(Yeo 1999). Climate warming can increase agricultural salinization by increasing
the demand for irrigation and increasing rates of surface water evaporation.
Warmer temperature can also increase salt accumulation in crops via increased
transpiration rates (West 1980). Theoretically there are reasons to believe that
elevated CO may mitigate salt accumulation but empirical evidence does not
support that conclusion (Yeo 1999, Nicolas et al. 1993). In addition, rising sea
levels driven by climate warming is expected to contribute to seawater intrusion of
coastal aquifers (Don et al. 2006;Antonellini et al. 2008).
st
2
Fig. 2 Important climate-nutrient interactions often occur at a global scale. For
example, this diagram illustrates that greater than 50% of the vegetated
land area predicted to have significant increases in warming during the 21
century overlaps with low P soils. Recent studies suggest that climate
warming hastens plant phenology, which is likely to exacerbate P
deficiency in plants. Data from Jaramillo and Lynch, unpublished.
st
Fig. 3 World fertilizer use in 2007. Source: Food andAgriculture Organization of
the United Nations (FAO). FAOSTAT 2009. Map produced by Raul
Jaramillo
94 95
Fertilizer Use in the World

consequences of practices such as deforestation, residue burning, cultivation of
steep slopes without runoff barriers. In some cases this is due to ignorance,
compounded by disruption of traditional cropping practices by war, disease, and
migration. Soil resources may be devalued because of the transitory nature of the
cropping system, such as in the 'slash and burn' agriculture at retreating forest
margins, or because the land is not owned by the farmer. In other cases soil fertility
may be recognized as a resource but valued less than competing imperatives such
as labor requirements for fuel wood collection, or the need to maximize food
production in the short term. Many of the poorest farmers have little access to
technical information or government services, and lack the exogenous incentives
for soil conservation as a public good enjoyed by farmers in rich countries. The
capability of this leg of ISFM to address the soil fertility crisis in the third world is
therefore problematic, because of poor diffusion and adoption.
The third component of ISFM is the cultivation of crop species, genotypes
and cropping systems that make optimal use of soil resources for food production
while conserving soil fertility. Although crop species and cropping systems vary
substantially in their ability to produce food in marginal soils, the adoption of new
crop species and cropping systems is subject to some of the same socio-economic
barriers noted above for soil conservation practices, with the added obstacle of
cultural attachments to specific foods. For subsistence farmers, the crops they
grow and consume are a dominant feature of their daily life. Strong preferences
may exist for specific grain types within a crop species, regardless of yield
advantages to introduced types. The cultivation of more nutrient- efficient crop
species and cropping systems will probably be an important element of the
adaptation of third world agriculture to global climate change, but these changes
will likely be slow and difficult adjustments for traditional agricultural
communities, made as a last resort. The prospect of cultivating new genotypes of
existing crops with greater productivity in infertile soils is considerably more
promising, especially if such genotypes have agronomic and grain characteristics
that are similar to traditional landraces. Substantial genotypic variation exists in
crop species for tolerance to Al toxicity (Kochian et al. 2004), Mn toxicity
(Gonzalez and Lynch 1999) and low P (Lynch and Brown 2001), and this variation
has been deployed through crop breeding programs in Africa, Asia, and Latin
America (Lynch 2007). Selection for root traits that increase the acquisition of
limiting nutrients such as phosphorus in crop plants (Fig. 4) is an increasingly
important objective of breeding programs in developing countries (Yan et al.
1995). Successful genotypes can be adopted and disseminated through informal
seed exchange networks, requiring no new additional information, credit, or social
resources. Indeed, genotypes with greater productivity at suboptimal soil fertility
are 'scale neutral' in that they would benefit producers at all resource levels
improving yield with low inputs and reducing input costs in intensive systems.
There is a significant effort in the scientific community to biofortify crops
the improvement of fertilizer availability and use in sub-Saharan Africa as a key
element of their programs to reduce world hunger.
These efforts notwithstanding, it is not obvious that application of chemical
fertilizers will be sufficient or even successful over the broad spatial scales they
are needed. Low input farmers typically do not have money to buy fertilizers,
which are often considerably more expensive in poor countries than in wealthy
nations because of poor transportation infrastructure and greater distances to the
source of manufacture (Sanchez 2002). Even farmers that can afford fertilizers
typically have poor access to distribution markets and limited information about
how to properly use them. Local markets for goods and services are often
dysfunctional because of corruption and lack of competition. In recent years,
fertilizer costs have increased substantially along with energy costs, since fossil
fuels are needed for fertilizer production and distribution. In the medium to long
term, the cost of concentrated P fertilizer will increase as readily available
phosphate ore deposits are depleted (Herring and Fantel 1993). Given the
magnitude of these challenges, and the current trends in energy prices and
sociopolitical stagnation in the poorest nations, it is doubtful that on a global scale,
resource-poor farmers will be able to fertilize their way to higher yielding, more
sustainable production systems in the next 10 or 20 years, a critical period in terms
of resource degradation and hunger alleviation.
The use of locally available fertility amendments is a more feasible strategy
for many poor farmers. These include minimally processed rock phosphate for
acid soils, locally available liming materials, biological nitrogen fixation (see
below), agroforestry systems, and other nutrient sources with low production and
transportation costs. The use of rock phosphate is especially promising since low P
availability is a primary constraint in weathered soils characteristic of many poor
countries, and sources of rock phosphate are found in many developing nations
(Smyth and Sanchez 1982; Gichuru and Sanchez 1988). These are promising
solutions for farmers with some access to credit, transportation, and markets, as in
many developing regions of Latin America and Asia. In subsistence agriculture
characteristic of the poorest and most food insecure regions of Africa, even these
inputs may be out of reach.A larger problem is that many poor farmers do not own
their land, and therefore lack incentives for investing in soil fertility
improvements.
The second leg of ISFM is soil management to conserve and enhance soil
fertility, including erosion control, maintenance of soil organic matter (Fernandes
et al. 1997), and enhancing nutrient bioavailability by promoting beneficial root
symbionts, most notably via biological nitrogen fixation (Hubbell 1995) and
mycorrhizal associations (Plenchette et al. 2005).Although the critical importance
of these management tools has been known for decades, other than nitrogen fixing
food legumes they are rarely used in the poorest countries. Indeed, many poor
farmers use soil resources abusively, without apparent regard for the longer-term
96 97

low-input systems, increased productivity might permit the farmer to climb out of
the poverty trap of low inputs and low yields, subject to the accessibility of
additional fertility inputs as discussed above. Improved genotypes may represent
the leading edge of technical intervention in low input systems, because of the
relatively few barriers to their adoption, as well as the large impact they can have
on crop yields. Genotypes selected for synergies with other fertility enhancing
technologies, such as legume genotypes with superior utilization of rock P, leading
to greater biological nitrogen fixation, or genotypes with greater soil cover that
reduced soil erosion, may represent the leading edge of technology packages that
could substantially improve and sustain the productivity of marginal lands.
Presently, the poorest nations confront a critical lack of trained people to
implement this vision. Agricultural training has actually been de-emphasized in
recent decades by development agencies and donors, and what training has
occurred has often been directed to trendy fields such as biotechnology that have
limited utility in the poorest countries. There has been inadequate attention to the
complexity of these problems, including agro-ecological as well as socio-cultural
factors, in favor of searches for technical solutions of limited scope, perhaps
informed by the dramatic success and technical simplicity of the first green
revolution. Thus despite the renewed emphasis on global food security by research
donors, especially forAfrica, it is not clear that sufficient progress will be achieved
to avert a human disaster of epic proportions, as food insecure people are further
marginalized by climatic shifts and the social disruptions that are likely to
accompany them.
Although the interactions of global climate change and crop nutrition are not well
understood, it is probable that the net effects of these changes will be negative for
agricultural production in poor nations. Drought induced by higher temperatures
and altered rainfall distribution would reduce nutrient acquisition, biological
nitrogen fixation, and may disrupt nutrient cycling. More intense precipitation
events would reduce crop nutrition by causing short-term root hypoxia, and in the
long term by accelerating soil erosion. Increased temperature will reduce soil
fertility by increasing soil organic matter decomposition, and may have profound
effects on crop nutrition by altering plant phenology. Since soil fertility is already a
primary constraint to food security in many developing regions, and crop
production is already marginal, these stresses may be disastrous for vulnerable
populations. Social adaptation to changing conditions is possible, although most
of the technical options face serious obstacles of diffusion and adoption.An urgent
effort is required to improve crop nutrition and soil fertility management in poor
nations, integrating agro-ecological and socio-cultural aspects of the problem, to
avert worsening of a situation that is already desperate.
Conclusionswith trace elements to alleviate micronutrient malnutrition (Tanumihardjo et al
2008). Promising biofortification solutions include micronutrient enrichment of
fertilizers (Cakmak 2009), intercropping of dicot and gramineous species (Zuo
and Zhang 2009) and using molecular breeding and biotechnology to produce
genotypes with root traits that increase the acquisition of limiting micronutrients
(Zhu et al. 2007; Mayer et al. 2008). Based on known climate impacts on nutrient
acquisition by crops (reviewed in this paper), projected climate changes in the 21
century are very likely to have net negative effects on trace element acquisition of
crops in developing countries. Biofortification is a potentially powerful tool in
offsetting edaphic and climate constraints to trace element acquisition by crops.
However, to be successful, scientists will need to understand how climate
conditions impact biofortification strategies.
Adoption of more nutrient-extractive genotypes without additional
interventions may lead to accelerated nutrient mining in some systems (Henry et
al. 2009). In upland systems where soil erosion causes major losses of soil fertility,
greater crop biomass through increased nutrient extraction may actually enhance
the sustainability of the system by reducing topsoil loss (Lynch 1998). In many
st
Fig. 4 Root traits of importance in adaptation to phosphorus deficiency include
shallower root architecture, aerenchyma formation, longer and denser root
hairs, greater root exudate and phosphatase production and mycorrhizal
associations (Lynch 2007).
98 99

Brouder SM, Volenec JJ (2008) Impact of climate change on crop nutrient and
water use efficiencies. Physiol Plant 133: 705-724Cakmak I (2009) Enrichment of fertilizers with zinc: An excellent investment for
humanity and crop production in India. J Trace Elem Med Bio 23: 281-289.Ching PC, Barber SA (1979) Evaluation of temperature effects on K uptake by
corn.Agron J 71: 1040-1044Ciais P et al. (2005) Europe-wide reduction in primary productivity caused by the
heat and drought in 2003. Nature 437: 529-533Cleland EE, Chuine I, MenzelA, Mooney HA, Schwartz MD (2007) Shifting plant
phenology in response to global change. Trends Ecol Evol 22: 357-365Cramer MD, Hawkins HJ, Verboom GA (2009) The importance of nutritional
regulation of plant water flux. Oecologia 161: 15-24Cromey MG, Wright DSC and Boddington HJ (1998) Effects of frost during grain
filling on wheat yield and grain structure. N ZJ Crop Hort. Sci. 26: 279-290Daily G et al. (1998) Policy forum: Global food supply - Food production,
population growth, and the environment. Science 281: 1291-1292Dakora FD and Keya SO (1997) Contribution of legume nitrogen fixation to
sustainable agriculture in Sub-Saharan Africa. Soil Biol Biochem 29: 809-
817De Wrachien D, Feddes R (2004) Global warming and drainage development:
Perspective and challenges. Irrigation Drainage 53: 215-224Don NC, Hang NTM, Araki H, Yamanishi H, Koga K (2006) Salinization
processes in an alluvial coastal lowland plain and effect of sea water level
rise. Environ Geology 49: 743-751Drew M (1988) Effects of flooding and oxygen deficiency on the plant mineral
nutrition. In: Lauchli A, Tinker PB (ed) Advances in plant nutrition, Vol III.
Praeger, NewYork, pp 115-159Easterling W, Apps M (2005) Assessing the consequences of climate change for
food and forest resources:Aview from the IPCC. Clim Change 70: 165-189Easterling DR, Meehl GA, Parmesan C, Changnon SA, Karl TR, Mearns LO
(2000) Climate extremes: Observations, modeling, and impacts. Science
289: 2068-2074Entry JA, Rygiewicz PT, Watrud LS, Donnelly PK (2002) Influence of adverse
soil conditions on the formation and function of Arbuscular mycorrhizas.
Adv Environ Res 7: 123-138Erekul O and Kohn W (2006) Effect of weather and soil condition on yield
components and bread-making quality of winter wheat
L.) on winter Triticale varieties in north-east Germany.
JAgron Crop Sci. 192: 452-464FAO (2009) The state of food insecurity in the world 2009. The Food and
Agriculture Organisation of the United Nations, RomeFearnside PM (1987) Rethinking continuous cultivation in Amazonia. Bioscience
37: 209-213
(Triticum aestivum
(Triticosecale Wittm.)
References
Abbate PE, Dardanelli JL, Cantarero MG, Maturano M, Melchiori RJM, Suero EE
(2004) Climatic and water availability effects on water-use efficiency in
wheat. Crop Sci 44: 474-483Aidoo KE (1993) Postharvest storage and preservation of tropical crops. Int.
Biodeterior. Biodegrad 32: 161-173Al-Karaki GN, Clark RB (1998) Growth, mineral acquisition, and water use by
mycorrhizal wheat grown under water stress. J Plant Nutr 21: 263-276Allen H M, Pumpa J K and Batten GD (2001) Effect of frost on the quality of
samples of Janz wheat.Aust J ExpAgric 41: 641-647Ananda J, Herath G (2003) Soil erosion in developing countries: A socio-
economic appraisal. J Environ Manag 68: 343-353Antonellini M et al. (2008) Salt water intrusion in the coastal aquifer of the
southern Po Plain, Italy. Hydrogeol J 16: 1541-1556Athar HR, Ashraf M (2009) Strategies for crop improvement against salinity and
drought stress: An Overview. In:Athar HR, Ozturk M (ed) Salinity and water
stress: improving crop efficiency. Springer, NewYork, pp 1-16Atwell BJ, Steer BT (1990) The effect of oxygen deficiency on uptake and
distribution of nutrients in maize plants. Plant Soil 122:1-8Barber SA (1995) Soil nutrient bioavailability: A mechanistic approach, 2nd ed.
John Wiley, NewYorkBarrios S, Ouattara B, Strobl E (2008) The impact of climatic change on
agricultural production: Is it different forAfrica? Food Policy 33: 287-298Barrow CJ (1991) Land degradation. Cambridge University Press, CambridgeBassirirad H (2000) Kinetics of nutrient uptake by roots: Responses to global
change. New Phytol 147: 155-169Baumhardt RL, Tolk JA, Winter SR (2005) Seeding practices and cultivar
maturity effects on simulated dryland grain sorghum yield. Agron J 97: 935-
942Beaver JS, Rosas JC, Myers J, Acosta J J, Kelly JD, Nchimbi-Msolla S, Misangu
R, Bokosi J, Temple S,Arnaud-Santana E, Coyne DP(2003) Contributions of
the Bean / Cowpea CRSPto cultivar and germplasm development in common
bean. Field Crops Res 82: 87-102Biggs TW, Mishra PK, Turral H (2008) Evapotranspiration and regional
probabilities of soil moisture stress in rainfed crops, southern India.Agric For
Meteor148: 1585-1597Boomsma CR, Vyn TJ (2008) Maize drought tolerance: Potential improvements
through arbuscular mycorrhizal symbiosis? Field Crops Res 108: 14-31Borlaug NE (2007) Sixty-two years of fighting hunger: Personal recollections.
Euphytica 157: 287-297Broad K, Agrawala S (2000) Policy forum: Climate - The Ethiopia food crisis -
Uses and limits of climate forecasts. Science 289: 1693-1694
100 101

IPCC (2007a) Working Group 1 Fourth Assessment Report. Cambridge
University Press, CambridgeIPCC (2007b) Working Group II Fourth Assessment Report. Cambridge
University Press, CambridgeJones C et al. (2005) Global climate change and soil carbon stocks: Predictions
from two contrasting models for the turnover of organic carbon in soil. Global
Change Biol 11: 154-166Juin S, Brisson N, Clastre P, Grand P (2004) Impact of global warming on the
growing cycles of three forage systems in upland areas of southeastern
France.Agronomie 24: 327-337Karami M, Afyuni M, Khoshgoftarmanesh AH, Papritz A and Schulin R (2009)
Grain zinc, iron and copper concentrations of wheat grown in central Iran and
their relationships with soil and climate variables J. Agric. Food Chem. 57:
10876-10882Kates RW (2000) Cautionary tales: Adaptation and the global poor. Clim Change
45: 5-17Kawano N, Ito O, Sakagami JI (2009) Morphological and physiological responses
of rice seedlings to complete submergence (flash flooding). Ann Bot 103:
161-169Kennedy G, Nantel G and Shetty P 2003 The scourge of "hidden hunger": Global
dimensions of micronutrient deficiencies. Food, NutrAgric 32: 8-16Kim D-W and Byun H-R (2009) Future pattern of Asian drought under global
warming scenario. Theor Appl Clim 98: 137-150Kochian LV, Hoekenga OA, Pineros MA (2004) How do crop plants tolerate acid
soils? Mechanisms of aluminum tolerance and phosphorus efficiency.
Annual Review of Plant Biology 55: 459-493Ladrera R, Marino D, Larrainzar E, Gonzalez EM, Arrese-Igor C (2007) Reduced
carbon availability to bacteroides and elevated ureides in nodules, but not in
shoots, are involved in the nitrogen fixation response to early drought in
soybean. Plant Physiol 145: 539-546Lahner B et al. (2003) Genomic scale profiling of nutrient and trace elements in
Arabidopsis thaliana. Nat Biotechnol 21: 1215-1221Lal R (2007) Anthropogenic influences on world soils and implications to global
food security.AdvAgron 93: 69-93Lal R (2006) Enhancing crop yields in the developing countries through
restoration of the soil organic carbon pool in agricultural lands. Land Degrad
Develop 17: 197-209Lal R (2004) Soil carbon sequestration impacts on global climate change and food
security. Science 304: 1623-1627Lal R (2000) Soil management in the developing countries. Soil Science 165: 57-
72Lal R (1998) Soil erosion impact on agronomic productivity and environment
quality. Crit Rev Plant Sci 17: 319-464
Fernandes EC et al. (1997) Management control of soil organic matter dynamics in
tropical land-use systems. Geoderma 79: 49-67Flowers TJ, Garcia A, Koyama M, Yeo AR (1997) Breeding for salt tolerance in
crop plants - The role of molecular biology.Acta Physiol Plant 19: 427-433Garcia I, Mendoza R, Pomar MC (2008) Deficit and excess of soil water impact on
plant growth of by affecting nutrient uptake and arbuscular
mycorrhizal symbiosis. Plant Soil 304: 117-131Gichuru MP, Sanchez PA (1988) Phosphate rock fertilization in tilled and no-till
low-input systems in the humid tropics. Agron J 80: 943-947Goicoechea N, Antolin MC, SanchezDiaz M (1997) Influence of arbuscular
mycorrhizae and Rhizobium on nutrient content and water relations in
drought stressed alfalfa. Plant Soil 192: 261-268Gonzalez A, Lynch J (1999) Tolerance of tropical common bean genotypes to
manganese toxicity: Performance under different growing conditions. J Plant
Nutr 22: 511-525Gonzalez EM, Galvez L, Royuela M, Aparicio-Tejo PM, Arrese-Igor C (2001)
Insights into the regulation of nitrogen fixation in pea nodules: Lessons from
drought, abscisic acid and increased photoassimilate availability.Agronomie
21: 607-613Gooding MJ, Ellis RH, Shewry PR and Schofield JD (2003) Effects of restricted
water availability on the grain filling, drying and quality of winter wheat. J.
Cereal Sci. 37: 295-309Groisman PY, Knight RW, Easterling DR, Karl TR, Hegerl GC, Razuvaev VAN
(2005) Trends in intense precipitation in the climate record. J Clim 18: 1326-
1350Gupta JP (1993) Wind erosion of soil in drought-prone areas. In: SenA, KarA(ed)
Desertification and its control in the Thar, Sahara and Sahel regions.
Scientific, Jodhpur, pp 91-105Held IM, Delworth TL, Lu J, Findell KL, Knutson TR (2005) Simulation of Sahel
drought in the 20th and 21st centuries. Proc NatlAcad Sci 102: 17891-17896Henry A, Kleinman PJA, Lynch JP (2009) Phosphorus runoff from a phosphorus
deficient soil under common bean L.) and soybean
( L.) genotypes with contrasting root architecture. Plant Soil
317: 1-16Herring JR, Fantel RJ (1993) Phosphate rock demand in the next century: Impact
on world food supply. Nat Resour Res 2: 226-246Hogy P and Fangmeier A (2008) Effects of elevated atmospheric CO on grain
quality of wheat J. Cereal Sci. 48: 580-591
Holmgren M et al. (2006) Extreme climatic events shape arid and semiarid
ecosystems. Front Ecol Environ 4: 87-95Hubbell DH (1995) Extension of symbiotic biological nitrogen fixation
technology in developing countries. Fertilizer Research 42: 231-239
Lotus tenuis
(Phaseolus vulgaris
Glycine max
2
102 103
Nicolas ME, Munns R, Samarokoon AB and Gifford RM (1993) Elevated CO
improves the growth of wheat under salinity. Aust J Plant Physiol 20: 349-
360.Nord EA, Lynch JP (2009) Plant phenology: A critical controller of soil resource
acquisition. J Exp Bot 60: 1927-1937Nord EA, Lynch JP (2008) Delayed reproduction in Arabidopsis thaliana
improves fitness in soil with suboptimal phosphorus availability. Plant Cell
Environ 31: 1432-1441Olson BM, Janzen HH (1992) Influence of topsoil quality parameter on crop yield.
In: Soils and crops workshop. Management of agricultural soils, Saskatoon,
pp 137-143van Oosterom EJ, Bidinger FR, Weltzien ER. (2003) A yield architecture
framework to explain adaptation of pearl millet to environmental stress. Field
Crops Res 80: 33-56Oyedele DJ, Aina PO (2006) Response of soil properties and maize yield to
simulated erosion by artificial topsoil removal. Plant Soil 284: 375-384Pandey S et al. (2007) Coping with drought in rice farming inAsia: Insights from a
cross-country comparative study.Agric Econ 37: 213-224Paul BK, Rasid H (1993) Flood damage to rice crop in Bangladesh. Geog Rev 83:
150-159Peng SB et al. (2004) Rice yields decline with higher night temperature from
global warming. Proc NatlAcad Sci 101: 9971-9975Peng, S Cassman KG, Virmani SS, Sheehy J, Khush GS (1999) Yield potential
trends of tropical rice since the release of IR8 and the challenge of increasing
rice yield potential. Crop Sci 39: 1552-1559Pimentel D (1996) Green revolution agriculture and chemical hazards. Sci Total
Environ 188:S86-S98Plenchette C, Clermont-Dauphin C, Meynard JM, Fortin JA (2005) Managing
arbuscular mycorrhizal fungi in cropping systems. Can J Plant Sci 85: 31-40Post WM, Kwon KC (2000) Soil carbon sequestration and land-use change:
Processes and potential. Global Change Biol 6: 317-327Prade K, Trolldenier G (1990) Denitrification in the rhizosphere of rice and wheat
seedlings as influenced by plant K status, air-filled porosity and substrate
organic matter. Soil Biol Biochem 22: 769-773Rosenzweig C, Parry ML(1994) Potential impact of climate change on world food
supply. Nature 367: 133-138Ruddiman WF (2003) The anthropogenic greenhouse era began thousands of
years ago. Clim Change 61: 261-293Salako FK et al. (2007) Soil strength and maize yield after topsoil removal and
application of nutrient amendments on a gravelly Alfisol toposequence. Soil
Till Res 94: 21-35Salinger M (2005) Climate variability and change: Past, present and future - An
overview. Clim Change 70: 9-29
2Lal R (1987) Managing the soils of sub-SaharanAfrica. Science 236: 1069-1076Lee JJ, Phillips DL, Dodson RF (1996) Sensitivity of the US corn belt to climate
change and elevated CO : 2. Soil erosion and organic carbon. Agric Syst 52:
503-521Lobell DB and Burke MB (2008) Why are agricultural impacts of climate change
so uncertain? The importance of temperature relative to precipitation.
Environ Res Lett 3: 034007 (8pp) doi:10.1088/1748-9326/3/3/034007Lobell DB, Burke MB, Tebaldi C, Mastrandrea MD, Falcon WP and Naylor RL
(2008) Prioritizing climate change adaptation needs for food security in
2030. Science 319: 607-610Lynch JP(2007) Roots of the second green revolution.Austral J Bot 55: 493-512Lynch JP, St Clair SB (2004) Mineral stress: The missing link in understanding
how global climate change will affect plants in real world soils. Field Crops
Res 90: 101-115Lynch JP, Brown KM (2001) Topsoil foraging - an architectural adaptation of
plants to low phosphorus availability. Plant Soil 237: 225-237Lynch, J (1998) The role of nutrient efficient crops in modern agriculture. Journal
of Crop Production 1: 241-264Mackay AD, Barber SA (1985) Soil moisture effect on potassium uptake by corn.
Agron J 77: 524-527Mackay AD, Barber SA (1984) Soil-temperature effects on root growth and
phosphorus uptake by corn. Soil Sci SocAm J 48: 818-823Marchner H (1995) Mineral nutrition of higher plants.Academic, San DiegoMayer JE, Pfeiffer WH and Beyer P (2008) Biofortified crops to alleviate
micronutrient malnutrition. Curr Opin Plant Biol 11: 166-170McDowell N et al. (2008) Mechanisms of plant survival and mortality during
drought: Why do some plants survive while others succumb to drought? New
Phytol 178: 719-739Meadows ME (2003) Soil erosion in the Swartland, Western Cape Province, South
Africa: Implications of past and present policy and practice. Environ Sci
Policy 6: 17-28Mertz O, Halsnaes K, Olesen JE, Rasmussen K (2009) Adaptation to Climate
Change in Developing Countries. Environ Manag 43: 743-752Mitchell RAC, Mitchell VJ, Driscoll SP, Franklin J, Lawlor DW (1993) Effects of
increased CO concentration and temperature on growth and yield of winter
wheat at two levels of nitrogen application. Plant Cell Environ 16: 521-529Moonen AC, Ercoli L, Mariotti M, Masoni A (2002) Climate change in Italy
indicated by agrometeorological indices over 122 years. Agric For Meteor
111: 13-27Murdiyarso D (2000) Adaptation to climatic variability and change: Asian
perspectives on agriculture and food security. Environ MonitAssess 61: 123-
131
2
2
104 105

Tripathi SC, Sayre KD, Kaul JN, Narang RS (2004) Lodging behavior and yield
potential of spring wheat ( L.): Effects of ethephon and
genotypes. Field Crops Res 87: 207-220West DW and Taylor JA (1980) The effects of temperature on salt uptake by
tomato plants with diurnal and nocturnal waterlogging of salinized
rootzones. Plant Soil 56: 113-121Wild A (2003) Soils, Land and Food: Managing the land during the 21st Century,
NewYorkWhite PJ and Broadley MR (2005) Biofortifying crops with essential mineral
elements. Trends Plant Sci 10: 586-593Wu C-C, Chang DC-N (2004) Mechanism for the drought stress resistance of
arbuscular mycorrhizal plants. J Chin Soc Hort Sci 50: 235-243Wu J et al. (2008) Mapping QTLs for mineral accumulation and shoot dry biomass
under different Zn nutritional conditions in Chinese cabbage (
L. ). Plant Soil 310: 25-40Yan XL, Lynch JP, Beebe SE (1995) Genetic variation for phosphorus efficiency
of bean in contrasting soil types. 1. Vegetative response. Crop Sci 35: 1086-
1093Yeo A (1999) Predicting the interaction between the effects of salinity and climate
change on crop plants. Scientia Hort 78: 159-174Yu YY, Guo ZT, Wu HB, Kahmann JA, Oldfield F (2009) Spatial changes in soil
organic carbon density and storage of cultivated soils in China from 1980 to
2000. Global Biogeochem Cycl 23: GB2021 doi:10.1029/2008GB003428Zhu C, Naqvi S, Gomez-Galera S, Pelacho A M, Capell T and Christou P (2007)
Transgenic strategies for the nutritional enhancement of plants. Trends Plant
Sci 12: 548-555Zougmore R, Mando A, Stroosnijder L (2009) Soil nutrient and sediment loss as
affected by erosion barriers and nutrient source in semi-arid Burkina Faso.
Arid Land Res Manag 23: 85-101Zuo Y and Zhang F (2009) Iron and zinc biofortification strategies in dicot plants
by intercropping with gramineous species. A review. Agron Sust Dev 29: 63-
71
Triticum aestivum
Brassica rapa
ssp pekinensis
Sanchez PA, Swaminathan MS (2005) Hunger in Africa: The link between
unhealthy people and unhealthy soils. Lancet 365: 442-444Sanchez PA (2002) Ecology - Soil fertility and hunger in Africa. Science
295:2019-2020Sanchez PA, Villachica JH, Bandy DE (1983) Soil fertility dynamics after clearing
a tropical rainforest in Peru. Soil Sci SocAm J,. 47: 1171-1178Sanchez PA (1976) Properties and management of soils in the tropics. John Wiley,
NewYorkSchimel J, Balser TC, Wallenstein M (2007) Microbial stress-response physiology
and its implications for ecosystem function. Ecology 88:1386-1394Setter TL et al. (2009) Review of wheat improvement for waterlogging tolerance
in Australia and India: the importance of anaerobiosis and element toxicities
associated with different soils.Ann Bot 103: 221-235Shindell DT, Faluvegi G, Miller RL, Schmidt GA, Hansen JE, Sun S (2006) Solar
and anthropogenic forcing of tropical hydrology. Geophys Res Lett 33Singh B, El Maayar M, Andre P, Bryant CR, Thouez JP (1998) Impacts of a GHG-
induced climate change on crop yields: Effects of acceleration in maturation,
moisture stress and optimal temperature. Clim Change 38: 51-86Smith WN, Grant BB, Desjardins RL, Qian B, Hutchinson J, Gameda S (2009)
Potential impact of climate change on carbon in agricultural soils in Canada
2000-2099. Clim Change 93: 319-333Smyth TJ, Sanchez PA (1982) Phosphate rock dissolution and availability in
cerrado soils as affected by phosphorus sorption capacity. Soil Sci Soc Am J
46: 339-345Spiertz JHJ, Hamer RJ, Xu H, Primo-Martin C, Don C, van der Putten PEL (2006)
Heat stress in wheat ( L.): Effects on grain growth and
quality traits. Euro JAgron 25: 89-95Stark JM, Firestone MK (1995) Mechanisms for soil moisture effects on activity
of nitrifying bacteria.Appl Environ Microbiol 61: 218-221Sun B, Chen DL, Li Y, Wang XX (2008) Nitrogen leaching in an upland cropping
system on an acid soil in subtropical China: Lysimeter measurements and
simulation. Nutri CyclAgroecosyst 81: 291-303Sun Y, Solomon S, Dai AG, Portmann RW (2007) How often will it rain? J Clim
20: 4801-4818Taiz L, Zeiger E (2006) Plant Physiology. Sinauer, SunderlandTang JL, Zhang B, Gao C, Zepp H (2008) Hydrological pathway and source area
of nutrient losses identified by a multi-scale monitoring in an agricultural
catchment. Catena 72: 374-385Tanumihardjo SA, Bouis H, Hotz C, Meenakshi JV and McClafferty B (2008)
Biofortification of staple crops: An emerging strategy to combat hidden
hunger. Compr Rev Food Sci Food Saf 7: 329-334Tollenaar M and Lee EA(2002) Yield potential, yield stability and stress tolerance
in maize. Field Crops Res 75: 161-169
Triticum aestivum
106 107

Proceedings IPI-OUAT-IPNI International Symposium (2009)
Annangi Subba-Rao Kotha Sammi-Reddy
Indian Institute of Soil Science, Nabi Bagh, Berasia Road, Bhopal – 462 038 (M. P.), India;
Annangi Subba-Rao e-mail: [email protected]
l
Implications of soil fertility to meet future demand:
The Indian scenario
Annangi Subba-Rao Kotha Sammi Reddyl
Abstract India would need to produce 350 Mt of food-grains to feed the
population of 1.41 billion by 2025. Contrary to ever increasing demand for food,
the countrywide on-going long-term experiments revealed that the rate of
response to added fertilizers and the factor productivity of major crops are
declining year after year under intensive cropping systems due to various soil
fertility problems such as (i) Wide nutrient gap between nutrient demand by crops
and supply from soil and fertilizer, (ii) High nutrient turn over in soil-plant system
coupled with low and imbalanced fertilizer use, (iii) Emerging deficiencies of
secondary and micronutrients, (iv) Poor nutrient use efficiency, (v) Soil organic
matter depletion and loss of soil fauna and flora, (vi) Insufficient input of organic
sources because of other competitive uses, (vii) Acidification and aluminum
toxicity in acid soils (viii) Soil erosion etc. This highlights the urgency for
developing efficient nutrient management strategies for sustaining higher crop
productivity and meeting future demands. Keeping this in view, lot of research
effort is being made to develop efficient nutrient management strategies for
producing higher yields and sustaining soil fertility. Integrated nutrient
management strategies, balanced fertilization with NPK and other deficient
nutrients in different crops, and soil test based fertilizer recommendations, were
found to be efficient in improving the crop yield and to protect the soil fertility for
future purposes. Involving legumes in cereal based cropping systems and the Real
Time N Management using Leaf Colour Charts (LCC) in rice-wheat based
cropping systems helped in improving the N use efficiency. Phosphorus and
sulphur management strategies should include mobilization and efficient use of
residual (accumulated) Por S in the soils. If the nutrients are applied on the basis of
their availability in the soil, and by considering the cropping system as a whole
rather than a single crop, the costly fertilizers can be saved. Split application of K,
recycling of crop residues, the mobilization of K from different indigenous
minerals such as waste mica, glauconite are emerging strategies of K management
in different cropping systems. Since, different areas differ in their micronutrients
status and extent of deficiency, the appropriate combination of nutrients for
108 109

intensive cropping systems have possibly resulted from deterioration in overall
soil fertility. The emerging issues of soil fertility are; wide nutrient gap between
nutrient demand by crops and supply from soil and fertilizer sources; high nutrient
turn over in soil-plant system coupled with low and imbalanced fertilizer use;
emerging deficiencies of secondary and micronutrients; poor nutrient use
balanced fertilization will depend on the nature of soil and its nutrient status, and
cropping systems followed in a given location. Therefore, it is necessary to
develop situation-specific or area-specific customized fertilizer recommendations
through NPK with required micronutrients.
Partial factor productivity soil fertility issues nutrient management
strategies
The current world population of 6 billion is expected to reach 8 billion by the year
2025. It is expected that most of the increase in population would occur in
developing countries where nearly 1 billion people may suffer from chronic
malnutrition. The Indian population, which increased from 683 million in 1981 to
1100 million in 2006, is estimated to reach 1412 million in 2025. To feed the
projected population of 1.41 billion by 2025 India need to produce 350 million
tonnes of food-grains (Subba-Rao and Sammi-Reddy 2008). The expanding food
needs of future must be met through intensive agriculture without much expansion
in the arable land and limited natural resources. The per capita arable land
decreased from 0.34 ha in 1950-51 to 0.15 ha in 2000-01 and is expected to shrink
to 0.08 ha in 2025. The current food grains production of 231 Mt (2007-08) is
produced from the net arable land of 141 m ha. Contrary to this ever increase
demand for food, the countrywide on-going long-term experiments revealed that
the rate of response of crops to added fertilizers and the factor productivity of
major crops are declining year after year under intensive cropping systems.
The partial factor productivity of fertilizers is declining in intensive cropping
systems (Fig. 1). The incremental fertilizer use efficiency computed from 5-year
average foodgrain production and fertilizer consumption decreased from 14 kg
grain kg NPK in 1974-75 to 6 kg grain kg NPK in 2007-08 (Fig. 2). In urgency
for higher production, no serious attention was given to the long-term soil fertility,
and sustained high productivity. As a consequence, the annual compound growth
rate of major crops has declined from 1980s to 2000s. Such gloomy trend was also
registered in case of pulses and oilseeds, while cotton exhibited even negative
growth rate. Rice productivity increased at an annual compound growth rate of
3.19 in 80s, which fell to 1.34 and 1.27 per cent in 90s and 2001-05, respectively.
Wheat productivity decreased from 3.1 in 80s to 1.83 per cent in 90s (Table 1).
Similar trends were also observed in case of oilseeds and pulses.
The decline in partial factor productivity and the growth rate of productivity
of major crops as well as rate of response of crops to added fertilizer under
Keywords
Introduction
Declining crop response to fertilizer application
l l
-1 -1
Fig. 1
Fig. 2
Partial factor productivity of fertilizer NPK (PFPf) for foodgrain
production in India (Source:Aulakh and Benbi 2008)
Incremental fertilizer use efficiency over a period of time in India (Based
on data from FAI 2008)
0
10
20
30
40
50
60
1970-71 1980-81 1990-91 2000-01 2007-08
kg
foo
dg
rain
/kg
nu
trie
nt
0
2
4
6
8
10
12
14
16
18
1974-
75
1979-
80
1984-
85
1985-
90
1994-
95
1999-
00
2004-
05
2007-
08
IFU
Ef
(kg
gra
in/k
gN
PK
)
110 111

High nutrient turnover in soil-plant system coupled with low and imbalanced
fertilizer use
The fertilizer consumption in India is grossly imbalanced since beginning. It
is tilted more towards N followed by P. The decontrol of the phosphatic and
potassic fertilizers resulted in more than doubling the prices of phosphatic and
potassic fertilizers. Thus, the fertilizer consumption ratio is highly imbalanced
(N:P O :K O, 5.5:2.1:1) during 2007-08 as against favorable ratio of 4:2:1
implying thereby that farmers started adding more nitrogen and proportionately
less phosphatic and potassic fertilizers (FAI 2008).
Emerging deficiencies of secondary and micronutrients in soils
Intensive cropping systems are heavy feeders of nutrients and are bound to extract
heavily the nutrient resources from the soil. Hence nutrient deficiencies are
inevitable unless steps are taken to restore fertility levels through supplementation
from external sources. Deficiencies of essential elements in Indian soils and crops
started emerging since 1950s' and as food production increased with time the
number of elements becoming deficient in soils and crops also increased (Fig. 4).
Micro nutrient deficiencies in soils are also emerging as yield limiting factors.
Analysis of more than 0.25 million soil samples revealed wide spread deficiency
of Zn (49%) followed by S (41%), Fe (12%), Cu (3%), Mn (4%) and B (32%).
Emerging deficiencies of plant nutrients in relation to increased foodgrain
production (Source: Sammi-Reddy et al. 2007).
Poor nutrient use efficiency
The inputs in crop production mainly include nutrient supply (from soil, fertilizer
and manure sources), irrigation, energy, plant protection measures and crop land.
2 5 2
Fig. 4
efficiency; soil organic matter depletion and loss of soil fauna and flora;
insufficient input of organic sources because of other competitive uses;
acidification and aluminum toxicity in acid soils; soil erosion.
Emerging issues of soil fertility
Fig. 3
Wide nutrient gap between nutrient demand and supply
The growth in fertilizer consumption slowed down during 1990's and there was
stagnation like situation for 4-5 years. Recently, there is again spurt in fertilizer
consumption. After achieving a record consumption level of 18.1 Mt of NPK in
1999-00, the total NPK consumption hovered around 16-17 Mt during 2001-04
reaching 21 million tonnes in 2006-07. At present level of crops production, there
exists a negative balance of 10 Mt between the nutrient (NPK) removal by crops
and addition through fertilizers annually (Fig. 3).
Projected food grain production in relation to nutrient (N-P O K O) con-
sumption, removal and gap (Source: Subba-Rao and Sammi-Reddy 2008).2 5 2
-
Table 1 Compound growth rates of productivity of foodgrains
Source: Government of India (GOI)Agricultural Statistics at a Glance (2004-05)
Crop Productivity (% per annum)
1980 - 1990 1991 - 2000 2001 - 2005
Rice 3.19 1.34 1.27Wheat 3.10 1.83 -0.11Pulses 1.61 0.93 2.79Foodgrains 2.74 1.52 1.20All major crops 2.56 1.33 1.96
0
5
10
15
20
25
30
35
40
45
50
2003 2010 2025
Year
Nu
trie
nts
0
50
100
150
200
250
300
350
400
Fo
od
gra
inp
rod
uc
tio
n
Foodgrain production (Mt) NP O K O Demand (Mt)2 5 2
NP O K O2 5 2 Cunsumption (Mt) NP O K O Gap (Mt)2 5 2
1950 1960 1970 1980 1990 2000 2010 2025
0
50
100
150
200
250
300
350
400
Fo
od
gra
inp
rod
uc
tio
n
Elements deficient Foodgrain production (Mt)
N
Fe
N
K
P
Zn
Fe
N
Mn
S
K
P
Zn
Fe
N
B
Mn
S
K
P
Zn
Fe
N
B
Mn
S
K
P
Zn
Fe
N
Mo
B
Mn
S
K
P
Zn
Fe
N
?
Mo
B
Mn
S
K
P
Zn
Fe
N
112 113

production by optimizing the benefits from all possible sources of plant nutrients.
The basic objectives of INM are to reduce the inorganic fertilizer requirement, to
restore organic matter in soil, to enhance nutrient use efficiency and to maintain
soil quality in terms of physical, chemical and biological properties. Bulky organic
manures may not be able to supply adequate amount of nutrients, nevertheless
their role becomes important in meeting the above objectives. Long-term studies
being carried out underAICARP (Hegde and Dwivedi 1992) have indicated that it
is possible to substitute a part of fertilizer N needs of kharif crop by FYM without
any adverse effect on the total productivity of the system in major cereal based
cropping systems such as rice-rice, rice-wheat, maize-wheat sorghum-wheat,
The current status of nutrient use efficiency is quite low in case of P, N, Zn, Fe and
Cu (Table 2). The use efficiency in case of micronutrients is extremely low (1 to 5).
Nutrient use efficiency in India
Declining organic matter status
Soil organic matter plays key role in soil fertility sustenance. In soybean-wheat
system, without balanced input of nutrients, organic matter status of soil declined
over a time in Alfisols of Ranchi. Whereas, balanced fertilization with NPK and
NPK+FYM improved the organic matter status in Vertisols under soybean-wheat
system at Jabalpur (Fig. 5). Thus, assessing soil organic carbon (SOC)
accretions/sequestration under intensive cropping systems with different
management practices plays an important role in long-term maintenance of soil
fertility for meeting future demands.
Acidification and aluminum toxicity in acid soils
Nutrient imbalance is one of the main reasons for low productivity in acid soils.
Solubility of Al, Fe and Mn being high in acid environment, these elements are
available quite in excess at times causing toxicity. Soil acidity causes shortage of
Ca and Mg. Ordinarily, B should be available under acid conditions but porous
nature of topsoil allows the soluble B to leach down in the profile beyond the reach
of the plant roots (Mondal and Khan 1972). In light textured soils, Zn becomes
deficient. At mildly acidic conditions availability of P increases but with further
increase in acidity P reacts with active Fe and Al to form insoluble compounds
(Panda 1998).
Integrated nutrient management strategies
The basic concept underlying the principle of Integrated Nutrient Management
(INM) is to maintain or adjust plant nutrient supply to achieve a given level of crop
Table 2
Emerging soil fertility management strategies for meeting future demands
Nutrient Efficiency (%)
Nitrogen 30-50Phosphorus 15-20Potassium 70-80Zinc 2-5Iron 1-2Copper 1-2
Source: Sammi-Reddy et al. 2007)
RANCHI (ALFISOLS)
0.0
0.1
0.2
0.3
0.4
0.5
1970 1980 1990 2000 2010 2020 2030
Years
OC
(%)
100%NPK 100%NPK+ FYM Control
JABALPUR (VERTISOLS)
0.00
0.20
0.40
0.60
0.80
1.00
1.20
1.40
1970 1980 1990 2000 2010 2020 2030
Years
OC
(%)
100% NPK 100% NPK +FYM
Fig. 5 Long-term trend of soil organic carbon status in Alfisol (Ranchi) and
Vertisol (Jabalpur) under soybean-wheat system
114 115

and manure was observed (Reddy et al. 1999b). Therefore, it is necessary to
popularize the IPNS strategies for different cropping systems for achieving higher
crop yields and fertilizer use efficiency. The INM strategies developed for major
cropping systems all over the country are compiled in the Table 3.
Integrated use of farmyard manure and inorganic fertilizer nitrogen not only
produced higher sustainable yield index SYI of Rice-black-horsegram system
(Table 4) but also maintained the highest soil quality index under dry land
conditions (Sharma et al. 2005).
Potential availability of organic resources
It is estimated that 300, 375 and 16.5 million tonnes of crop residues, livestock
dung and human excreta per annum, respectively are available in the country
(Tandon 1996). Of this, around one third of crop residues and half of the livestock
dung and 80% of human excreta are available for use in agriculture. The greater
use of these materials in agriculture can ensure better soil fertility and sustained
high productivity. The availability of these organic sources is likely to increase in
future. It is estimated that for every million tonne increase in food grain
production, there will be production of 1.2-1.5 million tonnes of crop residue and
every million increase in cattle population will provide additional 1.2 million
tonnes of dry dung per annum. Thus the estimated NPK supply from all the wastes
including crop residues is 5.0, 6.25 and 9.25 million tonnes, respectively during
1991, 2011 and 2025. A greater use of organic input has the potential to decrease
the expected negative balance since greater availability of alternative fuel such as
LPG in rural households in future may make the more organics available for use in
agriculture.
Future prospects of integrated nutrient management in India
pearl millet-wheat, maize-wheat and rice-maize. Organic manures alone cannot
supply sufficient P for optimum crop growth because of limited availability and
low P concentration. The organic manures are known to decrease P
adsorption/fixation and enhance P availability in P-fixing soils (Reddy et al.
1999a). Organic anions formed during the decomposition of organic inputs can
compete with P for the same sorption sites and thereby increase P availability in
soil (Iyamuremye et al. 1996) and improve utilization by crops. Higher apparent P
recovery by soybean-wheat system on Vertisol with a combination of fertilizer P
Cropping system IPNS strategy
Rice - wheat Green manuring of rice with sunnhemp equivalent to 90 kg fertilizer
N along with 40 kg N ha produces yield equivalent to 120 kg N ha .
In an acid Alfisol soil, incorporation of lantana camera 10-15 daysbefore transplanting of rice helps to increase the N use efficiency.
Apply 75% NPK + 25% NPK through green manure or FYM at 6 t
ha to rice and 75% NPK to wheat.
Inoculation of BGA@ 10kg ha provides about 20-30 kg N ha .
Rice - rice Use of organic sources, such as FYM, compost, green manure, azollaetc. meet 25-50% of N needs in kharif rice and can help curtailingNPK fertilizers needs by 25-50%.
Apply 75% NPK + 25% NPK through green manure or FYM at 6 t
ha to kharif rice and 75% NPK to rabi rice.
A successful inoculation of blue green algae @ 10 kg ha provides
about 20-30 kg N ha .
Rice-potato- Use 75% NPK with 10 t FYM ha in rice and potato.
Sugarcane based Combined use of 10 t FYM ha and recommended NPK increases the
cane productivity by 8-12 t ha over chemical fertilizer alone.
Maize basedcropping systems maize and 100% of recommended NPK as fertilizer in wheat.
Soybean -wheat To get 2 t soybean and 3.5 t wheat, apply 8 t FYM ha to soybean and
60 kg N+11 kg P ha to wheat or apply 4 t FYM + 10 kg N+ 11 kg P
ha to soybean and 90 kg N+22 kg Pha to wheat.
Pulses Integrated use of FYM at 2.5 t ha and 50% recommended NPKfertilizers plus rhizobium inoculation helps in saving of 50%chemical fertilizers.
Sorghum based Substitute 60 kg N through FYM or green Leuceana leaucocephalaloppings to get higher yields and FUE.
Cotton 50% of recommended NPK can be replaced by 5 t FYM ha .
Oil seeds (Mustard, Substitute 25-50% of chemical fertilizer through 10 t FYM ha to gethigher yield and FUE.
(Source: Subba-Rao et al. 1995; Mondal and Chettri 1998;Acharya et al. 2003)
-1
-1
-1 -1
-1
-1
-1
-1
-1
-1
-1
-1
-1 -1
-1
-1
-1
-1
groundnut
cropping systems
Apply 50% recommended NPK as fertilizer and 50% of N as FYM in
cropping system
Sunflower etc.)
Table 3 IPNS strategies for major cropping systems.
Treatment SYI* RSQI**
Control 0.13 -RDF (inorganic)(R-60-30-30 & BG - 20-40-40) 0.32 0.7925 kg N (FYM) 0.31 0.5515 kg N FYM + 20 kg N (inorg) 0.45 1.0015 kg N GLM + 20 kg N (inorg) 0.39 0.6615 kg N FYM + 15 kg N GLM 0.27 0.70
*SYI- Sustainable yield index; **RSQI- Relative Soil Quality Index,RDF:Recommended dose of Fertilizer, FYM:Farmyard Manure,GLM:Greenleaf ManureSource: Sharma et al. (2005)
Table 4 Relative soil quality index (RSQI) and SYI under rainfed rice-blackgram-horsegram system after 7 years of cropping at Phulbani, Orissa
116 117

In an era of multiple nutrient deficiencies a single nutrient approach can lower
Fertilizer Use Efficiency. Balanced nutrition implies that there are no deficiencies,
no excesses, no antagonisms and no negative interactions. All deficient nutrients
must be at an optimum rate by themselves and in relation to each other enabling
positive interactions to enhance yields. Field trials conducted in different villages
of Central India on black soils deficient in N, P, S and Zn showed that the balanced
fertilization through application of NPKSZn at recommended rates produced
higher soybean seed yield by 30-35% over farmers' practice (FP) (12 kg N and 13
kg P ha ) (Fig. 6). Skipping of application of P and S had resulted in 15-19% yield
reduction in soybean seed yield as compared to NPKSZn treatment. Similarly the
soybean seed yield was reduced significantly when Zn was not applied.
Application of S (20 kg ha ) and Zn (5 kg ha ) with the farmers' practice
(FP+S+Zn) produced 19% more soybean yield over farmers' practice (Sammi-
Reddy et al. 2007).
Soil test based fertilizer recommendations
General blanket fertilizer recommendations are static and can't commensurate
with variability and changes in soil nutrient status, crop demand and crop
management. The application of fertilizers based on recommendations emanating
-1
-1 -1
If judiciously used, organic manures may help in meeting future food demand
by narrowing down the nutrient gap. Several fertilizer prescription equations
based on Soil Test Crop Response (STCR) have been developed for different crops
grown on contrasting soils across the country for computing fertilizer doses under
INM (Subba-Rao and Srivastava 2001). Nutrient availability coefficients of
manures have been taken into account while developing these fertilizer
prescription equations. The STCR based fertilizer and manure based
recommendations should be popularized in place of general blanket rates of
applications for greater balance in nutrient supply and efficient utilization of
applied nutrients.
Prospects of organic solid waste recycling
Organic solid wastes generated in large quantities by domestic, commercial and
industrial activities are often indiscriminately disposed on the soils. It has been
estimated that a large amount of urban compost is being generated every year from
different cities of India which will reach to around 10.4 million tonnes per year
during 2025 as a result of phenomenal increase in urban population and ever
increasing industrialization (Sammi-Reddy et al. 2007). This could be increased
to 20.8 million tonnes per year by 2025, if entire compostable material (42%)
under goes composting. This, however, is possible by improving the composting
technology of city wastes that is also cost effective. By following the proper
composting techniques, the municipal solid wastes can provide an amount of 2.85
lakhs tonnes of N, P O and K O that could be increased to about 5.4 lakh tonnes
per year by 2025. The currency value of compost is currently 158.3 crores and can
go up to 659.6 crores by the year 2025 through the involvement of improved
technology in compost making.
Balanced fertilization through inorganic fertilizers
Even though sizeable quantity of cattle dung, crop residues, municipal solid
wastes are available in India, they are not sufficient to cover the entire cultivated
area in a particular year with integrated nutrient management.Asurvey conducted
in Central India revealed that due to insufficient availability of manures, farmers
are trying to cover entire land holding in 3-4 years with INM (Sammi-Reddy et al.,
2005). With this approach, it is possible to cover the entire holding in 3-4 years
frequency with the available FYM in case of small and marginal farmers (1-2 ha).
But in case of medium and large farmers (6-10 ha), only 58% of their holding was
covered with INM in 3-4 years. Even after 4 years, 42% of the holding may not
receive organic manure in case of medium and large farms. Therefore, farmers
should go for balanced fertilization with inorganic fertilizers for realizing the full
potential of crop yield on portion of their holding.
2 5 2
Fig 6 Effect of balanced fertilization on soybean seed yield (I indicates the l.s.d.at P= 0.05). (Source: Sammi-Reddy et al. 2007)
2360
1905
2250
1920
2220
1720
2050
0
500
1000
1500
2000
2500
3000
Gra
inyie
ld(k
gh
a)
-1
NPKSZn NKSZn NPSZn NPKZn
NPKS FP FP+S+Zn
118 119

is a linear relationship between grain yield and nutrient uptake by the crop, and for
obtaining a particular yield, a definite amount of nutrients is taken up by the plant.
Once this requirement is known for a given yield level, the fertilizer needed can be
estimated taking into consideration the contribution from soil available nutrients.
The advantage of application of fertilizer nutrients based on the target yield
approach has been demonstrated (Srivastava et al. 2001). The soil test based
fertilizer dose computed from the above equations produced significantly higher
yields over the farmers' practice (FP) at all the sites (Table 5).
Seed yield of soybean under farmers' practice (FP) and Soil test crop
response (STCR) based fertilizer dose.
Under INM, fertilizer and manure prescription equations for different crops
have been developed on the basis of soil test value, nutrient release coefficients of
manures, and yield target. These STCR based prescription equations for
computing fertilizer and manure doses to get a particular target yield of different
crops have been placed on the Indian Institute of Soil Science website
(www.iiss.nic.in). End users/farmers can easily compute manure and NPK rates of
application to a particular crop, if he knows his soil test values and target yield.
Nitrogen management strategies
Soil fertility maps prepared by Motsara (2002) showed that the N is universally
Table 5
Efficient use of applied nutrients in biological systems
from Soil Test Crop Response Correlation (STCR) data may be the alternative
approach. Among the various methods, the one based on yield targeting is unique
in the sense that this method not only indicates soil-test based fertilizer dose but
also gives the level of yield the farmer can hope to achieve if good agronomic
practices are followed in raising the crop. The essential basic data required for
formulating fertilizer recommendations for targeted yield are (i) nutrient
requirement in kg/100 kg of produce (ii) the per cent contribution from the soil
available nutrients, and (iii) the per cent contribution from the applied fertilizer
nutrients (Ramamoorthy et al.1967). These parameters are calculated as follows
(Subba-Rao and Srivastava 2001):
i) Nutrient requirement of N, P and K for grain production (NR)
Ramamoorthy et al. (1967) refined the procedure of fertilizer prescription
initially given by Truog (1960) and later extended to different crops in different
soils (Randhawa and Velayutham 1982). Targeted yield concept strikes a balance
between 'fertilizing the crop' and 'fertilizing the soil'. The procedure provides a
scientific basis for balanced fertilization and balance between applied nutrients
and soil available nutrients. In the targeted yield approach, it is assumed that there
)100(
)()100/(
kgyieldGrain
kgnutrientofuptakeTotalgrainofkgnutrientofkgNR =
ii) Per cent contribution of nutrient from soil (%CS)
100)(
)(% ´=
ha-1
kgplotcontrolinnutrientofvaluetestSoil
ha-1
kgplotcontrolinuptakeTotalCS
iii) Per cent contribution of nutrient from fertilizer (% CF)
( )CSplotstreatedfertilizerinnutrientofvaluestestSoil
nutrientsofuptakeTotalCFplotstreatedinfertilizerfromonContributi
´s
)(
)(
100%
ha-1
kgdoseFertilizer
CFCF
´=
iv) Calculation of fertilizer dose (FD)The above basic data are transformed into workable adjustment equation asfollows:
÷ø
öçè
æ ´-÷ø
öçè
æ ´´= valuetestSoilCF
CST
CF
NRFD
%
%100
%
ha-1
kginvaluetestsoilconsantbTconsantaFD ´-´=
Where T is the yield target (q ha )(i.e. Quintal=100 kg)-1
Site Treatment Fertilizer dose
(kg ha ) (kg ha )
N P O5 K O
Site 1 FP 9 23 0 1080STCR (1680 kg ha )* 0 57 9 1650
Site 2 FP 32 23 0 2030STCR (1680 kg ha ) 44 0 19 2260
Site 3 FP 34 12 0 1760STCR (2000 kg ha ) 42 65 0 2270
Site 4 FP 45 82 12 1770STCR (2000 kg ha ) 17 37 38 2170
Site 5 FP 80 100 36 1550STCR (2400 kg ha ) 1 0 0 2390
Site 6 FP 23 80 29 2100STCR (2400 kg ha ) 34 13 11 2310
*Figures in the parenthesis are target yield of soybean; FP - Farmers' practice;STCR - Soil test crop response based fertilizer dose
Grain yield-1 -1
2 2
-1
-1
-1
-1
-1
-1
120 121
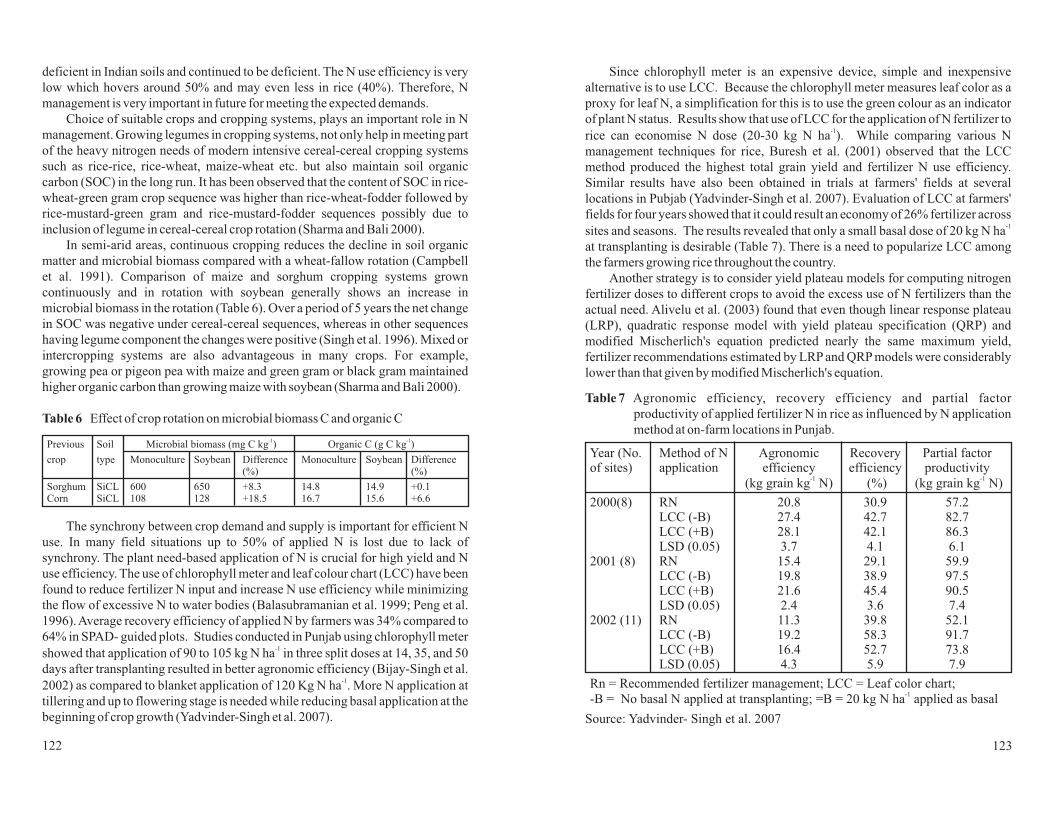
Since chlorophyll meter is an expensive device, simple and inexpensive
alternative is to use LCC. Because the chlorophyll meter measures leaf color as a
proxy for leaf N, a simplification for this is to use the green colour as an indicator
of plant N status. Results show that use of LCC for the application of N fertilizer to
rice can economise N dose (20-30 kg N ha ). While comparing various N
management techniques for rice, Buresh et al. (2001) observed that the LCC
method produced the highest total grain yield and fertilizer N use efficiency.
Similar results have also been obtained in trials at farmers' fields at several
locations in Pubjab (Yadvinder-Singh et al. 2007). Evaluation of LCC at farmers'
fields for four years showed that it could result an economy of 26% fertilizer across
sites and seasons. The results revealed that only a small basal dose of 20 kg N ha
at transplanting is desirable (Table 7). There is a need to popularize LCC among
the farmers growing rice throughout the country.
Another strategy is to consider yield plateau models for computing nitrogen
fertilizer doses to different crops to avoid the excess use of N fertilizers than the
actual need. Alivelu et al. (2003) found that even though linear response plateau
(LRP), quadratic response model with yield plateau specification (QRP) and
modified Mischerlich's equation predicted nearly the same maximum yield,
fertilizer recommendations estimated by LRP and QRP models were considerably
lower than that given by modified Mischerlich's equation.
-1
-1
deficient in Indian soils and continued to be deficient. The N use efficiency is very
low which hovers around 50% and may even less in rice (40%). Therefore, N
management is very important in future for meeting the expected demands.
Choice of suitable crops and cropping systems, plays an important role in N
management. Growing legumes in cropping systems, not only help in meeting part
of the heavy nitrogen needs of modern intensive cereal-cereal cropping systems
such as rice-rice, rice-wheat, maize-wheat etc. but also maintain soil organic
carbon (SOC) in the long run. It has been observed that the content of SOC in rice-
wheat-green gram crop sequence was higher than rice-wheat-fodder followed by
rice-mustard-green gram and rice-mustard-fodder sequences possibly due to
inclusion of legume in cereal-cereal crop rotation (Sharma and Bali 2000).
In semi-arid areas, continuous cropping reduces the decline in soil organic
matter and microbial biomass compared with a wheat-fallow rotation (Campbell
et al. 1991). Comparison of maize and sorghum cropping systems grown
continuously and in rotation with soybean generally shows an increase in
microbial biomass in the rotation (Table 6). Over a period of 5 years the net change
in SOC was negative under cereal-cereal sequences, whereas in other sequences
having legume component the changes were positive (Singh et al. 1996). Mixed or
intercropping systems are also advantageous in many crops. For example,
growing pea or pigeon pea with maize and green gram or black gram maintained
higher organic carbon than growing maize with soybean (Sharma and Bali 2000).
Effect of crop rotation on microbial biomass C and organic C
The synchrony between crop demand and supply is important for efficient N
use. In many field situations up to 50% of applied N is lost due to lack of
synchrony. The plant need-based application of N is crucial for high yield and N
use efficiency. The use of chlorophyll meter and leaf colour chart (LCC) have been
found to reduce fertilizer N input and increase N use efficiency while minimizing
the flow of excessive N to water bodies (Balasubramanian et al. 1999; Peng et al.
1996).Average recovery efficiency of applied N by farmers was 34% compared to
64% in SPAD- guided plots. Studies conducted in Punjab using chlorophyll meter
showed that application of 90 to 105 kg N ha in three split doses at 14, 35, and 50
days after transplanting resulted in better agronomic efficiency (Bijay-Singh et al.
2002) as compared to blanket application of 120 Kg N ha . More N application at
tillering and up to flowering stage is needed while reducing basal application at the
beginning of crop growth (Yadvinder-Singh et al. 2007).
Table 6
-1
-1
Previous
crop type Monoculture Soybean Difference Monoculture Soybean Difference(%)
Sorghum SiCL 600 650 +8.3 14.8 14.9 +0.1Corn SiCL 108 128 +18.5 16.7 15.6 +6.6
Soil Microbial biomass (mg C kg ) Organic C (g C kg )
(%)
-1 -1
Year (No.of sites) application efficiency
(kg grain kg N) (%) (kg grain kg N)
2000(8) RN 20.8 30.9 57.2LCC (-B) 27.4 42.7 82.7LCC (+B) 28.1 42.1 86.3LSD (0.05) 3.7 4.1 6.1
2001 (8) RN 15.4 29.1 59.9LCC (-B) 19.8 38.9 97.5LCC (+B) 21.6 45.4 90.5LSD (0.05) 2.4 3.6 7.4
2002 (11) RN 11.3 39.8 52.1LCC (-B) 19.2 58.3 91.7LCC (+B) 16.4 52.7 73.8LSD (0.05) 4.3 5.9 7.9
Rn = Recommended fertilizer management; LCC = Leaf color chart;
-B = No basal N applied at transplanting; =B = 20 kg N ha applied as basal
Method of N Agronomic Recovery Partial factorefficiency productivity
-1 -1
-1
Table 7 Agronomic efficiency, recovery efficiency and partial factor
productivity of applied fertilizer N in rice as influenced by N application
method at on-farm locations in Punjab.
Source: Yadvinder- Singh et al. 2007
122 123

Phosphorus management strategies
The first systematic soil fertility map of Indian soils published in 1967 by
Ramamoorthy and Bajaj (1969) showed around 4% samples high in available P.
But the recently published soil fertility map (Motsara 2002) indicates around 20%
of soils high in available P. This is probably due to continuous use of phosphatic
fertilizers by the farmers. Therefore, if the farmers apply P as per the soil tests,
there is a chance to save a lot of valuable phosphatic fertilizers. The future strategy
of P management should aim at utilization of build-up P in soils testing high in
available P. Several studies have been conducted to evaluate the response of crops
to residual P (Subba-Rao and Ganeshamurthy 1994). The results revealed that
application of 39 kg P ha to soybean had significant effect on yields of 2
subsequent crops (wheat and soybean) whereas the same amount of P applied to
wheat had significant effect on only one subsequent crop (soybean) in Vertisols
(Subba-Rao et al. 1996).Aresidual P management technology has been developed
in which the application of 39 kg P ha either to soybean or wheat produced the
statistically similar yield as the application of 26 kg Pha to each crop, thus, saving
of about 13 kg Pha year (Sammi-Reddy et al. 2003).
The application of only maintenance dose of P, equivalent to amount of P
removed by the previous crop has been suggested (Souza et al. 1987), under
situations where available P status is higher than 14 mg P kg soil. Similarly, a
maintenance fertilization dose equivalent to P removal by crops, supplied either
through 5 t FYM plus 8 kg fertilizer P ha or 10 t FYM ha to soybean and 10 kg
fertilizer P ha to wheat was good enough to obtain the target of 2 t soybean and 4 t
wheat yields ha and helped to maintain P fertility at near initial level (Reddy et al.
2006) (Table 8).
Management of acid soils should aim at realization of production potential
either by addition of amendments or to manipulate agricultural practices to
enhance fertilizer use efficiency. Application of lime as amendment to neutralize
the exchangeableAl to a certain extent has been found effective. Liming improves
the base status, inactivates Fe, Mn and Al in soil solution and thus reduces P
fixation. But the farmers are reluctant to apply large quantities of liming materials
for reclaimation due to economic reasons. Rattan (2007) suggested ameliorating
the acid soil with minimum quantities of lime with application of all other macro
and micronutrients at recommended rates in a balanced way. Studies conducted in
7 states of India revealed that the application of lime @ 200 to 300 kg ha
improved the crop yields by 16-48%.Application of half of the recommended rate
of NPK with lime was at par or superior to the full dose of NPK without lime
(Sharma and Sarkar 2005). The strategies for enhancing P utilization efficiency in
different cropping systems on acid soils are presented in Table 9.
-1
-1
-1
-1 -1
-1
-1 -1
-1
-1
-1
P supply Soil test maintenance Prequirement (STMPR)
of soybean-wheat
rotation (kg ha yr )Soybean Wheat
PSS-I 36.1 (22.2 + 13.9) 1.91 4.10 25.2 1.4PSS-II 26.3 (16.2 + 10.1) 1.86 4.06 23.4 1.1PSS-III 24.1 (14.8 + 9.3) 1.90 4.01 23.7 1.0
Yield levels of l Total annual STMPR tostrategy rotationa crops at P removal at P removal
(PSS)* STMPR (Mg ha ) STMPR ratio
(kg ha yr )
-1
-1 -1 -1
@
-1
Table 8 Soil test maintenance P requirement and its relationship with crop yield
and Premoval (uptake) under different Psupply strategies.
*
@
PSS-I, PSS-II and PSS-III imply P supply through inorganic (fertilizer), organic (FYM)
and integrated (fertilizer+FYM) sources, respectively to soybean. P supply to wheat was
solely through fertilizer under all strategies.
Figures in parentheses indicate the P rates for component crops of annual soybean-wheat
rotation obtained by splitting STMPR in the same ratio of 1.6:1 as was used in the
treatments for soybean and wheat.
Table 9 Strategies for enhancing P use efficiency in crops in acid soils.
Source: Subba-Rao et al. 2004
Cropping System Agro-climatic zone Strategy
Maize-wheat Western Himalayan Apply 60 kg P205 ha as a mixture ofSSP and rock phosphate in a ratio of 1:2to maize. However, apply SSP tofollowing wheat for higher FUE.
Rice-rice Eastern Himalayan
region (pH<5.1) well as monsoon rice in the form of rockphosphate or a mixture of SSP and RP in1:1 ratio.
Rice-rice Brahmaputra Valley Apply MRP at 40 kg P O ha at 20
day before rice transplanting.
Rice-rice Lower GangeticPlain region basal dressing for higher P use efficiency.
Rice-rice Central Plateau &
Hills region as rock phosphate.
Pulses Southern plateau& Hills region treated with 1.5 kg of finely powdered
lime (300 mesh). Liming rate should bedetermined by soil test method and the rateshould be that it can only upset the Altoxicity and does not impair the K and Cabalance.
Rice-rice East & West Coast
& Hills region
-1
region (pH <6.0)
Apply 30 kg P O ha to summer as
Use SSP and rock phosphate in 1:2 ratio as
Recommended P dose is 60 kg P O ha
Rhizobium inoculated seed should be
Apply 60 kg P O ha as rock
Plains phosphate 3 weeks before transplanting.
2 5
2 5
2 5
-1
-1
-1
-1
2 5
124 125

total quantity mined, about 75% is wasted during dressing of the blocks. Biotite
mica is rarely used for any commercial purpose but very large reserves are
available (Varadachary 1992). Enriched compost using rice-straw, dung, rock-
phosphate and waste mica, increase in the release of water soluble P and K
(Nishanth and Biswas 2008). Vast reserves to the tune of 938 Mt of glauconite
sand stones are available in India. It contains 5.4% K O. Mazumdar et al. (1993)
perfected a technique to increase the water soluble K by partial acidulation of the
concentrated glauconite (with sulphuric acid as medium and fluorite mineral as
additive) to produce acidulated material to be used as mineral fertilizer.
Potassium fertilizers are generally broadcast or spread on the surface and
mixed with surface soil. Only in soils with a low level of available K or with a high
K fixing capacity, band placement is recommended. In some soil-crop situations,
split application is emerging as an alternative to basal application. The situations
are (i) rice grown in light textured soils and acid soils in high rainfall areas in order
to reduce leaching losses; (ii) low tillering and late maturing varieties, where the
natural supply of K from soil plus irrigation which decreases in the later stages of
crop growth (iii) in highly reduced soils where conditions may hinder K uptake;
and (iv) during the monsoon season. Several studies have indicated the beneficial
effect of application of K in 2-3 splits in rice. Split application of both N and K in
rice is recommended in Andhra Pradesh, Kerala, Orissa and Uttar Pradesh. Split
application of K is also recommended in crops like sugarcane, banana, grape-
vines, papaya, pineapple and tea in different states (Tandon and Sekhon 1988).
Most of the red and laterite soils of the country are deficient in available K.
Recently conducted experiments (Wanjari 2009) revealed that split application of
recommended rate of K (50% K at basal and 50% K at 30 days after sowing) with
100% NP produced significantly higher finger millet yield over 100% NP with
recommended rate of K as basal application. Crops like potato, tapioca, tea,
rubber, coconut, tobacco, banana, leafy vegetables like cauliflower and cabbage,
2
Potassium management strategies
At present level of crop production, there exists a negative balance of 10 Mt
between the nutrient (NPK) removal by crops and addition through fertilizers,
annually (Fig. 3). Of the current negative NPK balance of 10 Mt, 6.9 Mt is K, 1.9
Mt N and 1.2 Mt P. Annual fertilizer potassium consumption is only 2.6 Mt
against the crop removal of 9.5 Mt of K from Indian soils. Farmers are not applying
sufficient levels of K as crop yields are not suffering due to the reason that most of
the Indian soils are considered as rich in K. However, If this trend continues for a
longer time, many of the soils may be depleted of K reserves. Continued mining of
K from soil through crop uptake may bring certain changes in the forms and
mineralogy of K in soils. Continuous rice-wheat cropping system for 8 years in
Vertisols, with only N application, resulted in an increase in the negative K balance
from 50 kg ha year in control to 102 kg ha year at 90 kg N ha .
Entire fertilizer K requirement in India is being met through imports,
therefore, K management strategies should be developed to utilize indigenous
sources of K such as crop residues, K rich minerals etc for meeting at least partly
requirement.About 336 million tones of crop residues are produced in a year at the
current level of crop production which can supply 5.04 Mt K (Srinivasa-Rao et al.
1996). But most of the mechanical harvest-borne crop residues are being burnt by
the farmers in rice and wheat growing areas. Burning the residues causes loss of
precious organic matter, plant nutrients and environmental pollution. Several
strategies have been developed to recycle mechanical harvest-borne rice and
wheat straws without adversely affecting crop yields. Recycling of crop residues
with green manures, organic manures, N fertilizers etc were found to be
efficient strategies. Experiments conducted in Punjab have shown that co-
incorporation of green manure and crop residues of wheat and rice helped alleviate
the adverse effects of unburnt crop residues on crop yields Therefore, the
technologies developed for the incorporation of mechanical harvest-borne crop
residues need to be popularized among the farmers in the rice-wheat and rice-rice
growing areas.
A number of recent studies have indicated that incorporation of rice or wheat
residues in rice-wheat cropping system can built up soil fertility and improve soil
physical properties Studies conducted at Bhopal showed that mechanical harvest
borne wheat residue incorporation/surface retention with on-farm FYM resulted
in higher crop yields in soybean-wheat cropping system and led to an
improvement in organic C and nutrient availability of soil under soybean-wheat
system as compared to residue burning (Table 10).
India has the world's largest deposits of micas, which contain about 8-10%
K O readily available as mine wastes as well as poor grade ores which find little
use. Muscovite mica is widely mined and used as an electrical insulator. Of the
-1 -1 -1 -1 -1
.
.
2
N sources Wheat residue management options for soybean
Burning Soil incorporation Surface retention
Control 402 440 459Fertilizer -N 525 608 600FYM 611 696 690PM 588 656 678GLM 505 567 579l.s.d (P=0.05) RMO - 23.3 N source - 27.5 RMOxN source -NS
Table 10 Effect of wheat residue management options and N sources on soybean
seed yield (kg ha )-1
Source: Reddy 2007
126 127

Micronutrient management strategies
Red and black soils of Deccan Plateau, black soils of Central India, Bundelkhand
region and Eastern Ghats, Red loam soils of Tamil Nadu, Alluvial soils of Eastern
India and North-East India are deficient in Zn to the extent of 50-74% (Singh
2009). Deficiency of B is most widespread in course textured sandy soil, red and
laterite soils and acid soils of Deccan Plateau, Eastern Plateau, Assam and Bangal
Plains and Northeastern Hill Region. In alluvial soils of Indo-Gangetic Plains,
iron deficiency is most common in rice and Mn deficiency is most common in
wheat under rice-wheat system. The appropriate combination of nutrients for
balanced fertilization will depend on the nature of soil and its nutrient status, and
cropping systems followed in a given location. Therefore, it is necessary to
develop situation-specific or area-specific customized fertilizer recommendations
through NPK with required micronutrients. Tandon and Narayan (1990) identified
components of balanced fertilization for different situations (Table 12). If the
estimated level of pulse production has to be achieved more phosphate has to be
made available to the pulse growing farmers at an affordable price keeping in view
the fact that the risk factor under dry land conditions is much higher.
Globalization and urbanization has changed the paradigm for agriculture. The age
old paradigm based on massive soil inversion with a plough has changed to a new
paradigm of conservation agriculture (CA) wherein some observed major shifts
includes conventionally tilled wheat to Zero tillage/reduced tilled wheat, puddled
transplanted rice to direct dry seeded rice (zero-till rice), residue burning/residue
Improved agronomic practices
forage crops like alfalfa are the heavy feeders of K. Therefore, it is necessary to
apply higher doses of K in the areas growing these crops as compared to other
crops.
Sulphur management strategy
Several factors lead to decline in S status of soil over a period of time. Plant-
available S is derived primarily from the decomposition of plant residues and soil
organic matter. Sulphur deficiency is most common in soils, which are inherently
low in S, sandy texture, low in organic matter and soils prone to high leaching.
Historically when ordinary superphosphate which contains 12% S was in common
usage, S was inadvertently applied to many soils.
The soils testing below 10 mg S kg soil have been considered to be S
deficient. Fertilizer S application rates to different crops should be based on the
available S status of the soils. Depending upon the soil test value of S, the
optimum rate of application of S to oilseed crops varied from 15 to 60 kg S ha
(Table 11) (Singh 1999). Since the S requirement of crops is more at early growth
stages, its application may preferably be made prior to sowing or bud initiation or
flowering under moist conditions to ensure high availability for better crop yields.
Like P, continuous application of S fertilizers to different crop rotations leads to
build-up of soil S status. Therefore, it is essential to utilize the residual S left over
in the soils during next crop for higher efficiency. Singh and Saha (1997) found
that application of 20 kg S ha to both soybean and wheat or application of 40 kg S
ha to either soybean or wheat was found adequate to sulphur requirement of a
soybean – wheat rotation. Ganeshamurthy and Takkar (1997) found that the S
applied @ 60 kg ha to soybean showed residual effects in two succeeding crops
(wheat and soybean) while the same applied to wheat showed residual effect in
only one succeeding crop (soybean). Sulphur applied to soybean was more
efficiently utilized by succeeding crops as compared to that applied to wheat in the
system.
-1
-1
-1
-1
-1
Available S
(mg kg ) in soil be applied (kg ha )
<5 Very low 606-10 Low 4511-15 Medium 3016-20 High 15>20 Very High 0
S fertility class Amount of S to-1 -1
Table 11 Fertilizer S recommendations based on available S status of soils
Source: Singh 1999
Situation Component of balanced fertilization(Nutrients whose application needed)
Red and lateritic soils N, P, K with limeNewly reclaimed alkali soils N & ZnMany areas in alluvial soils, wheat belt N, P, K, Zn & S / N, P, Zn & S / N,
P & Zn / N, P, K, & ZnMany areas under oil seeds N, P, K, & S / N, P, & S / N, P, Zn &
S / N, P, S & BLegumes in oilseeds N, P, K, Ca & MoMalnad area of Karnataka N, P, K, Mg, S and ZnHigh yielding tea plantation N, P, K, Mg, S & Zn
Source: Tandon and Narayan 1990
Table 12 Components of balanced fertilization under different situations
128 129

be worst in the country as the K consumption is very meager. It remains to be
seen that how long soil K reserves could sustain present level of crop
productivity. Keeping in view the continuous depletion of K reserves by
intensive cropping, a close watch is needed to monitor K deficiency assuming
significance in crop production.
Acharya CL, Subba-Rao A, Biswas AK, Sammi-Reddy K, Yadav RL, Dwivedi
BS, ShuklaAK, Singh VK, Sharma SK (2003) Methodologies and package of
practices on improved fertilizer use efficiency under various agro-climatic
regions for different crops/cropping systems and soil conditions. Indian
Institute of Soil Science, Bhopal, India.Alivelu K, Srivastava S, Subba-RaoA, Singh KN, Selvakumari G, Raju NS (2003)
Comparison of modified Mitcherlich and response plateau models for
calibrating soil test based nitrogen recommendations for rice on Typic
Ustropept. Commun Soil Sci PlantAnal 34:2633-2644Aulakh MS, Benbi DK (2008) Enhancing fertilizer use efficiency. In: Proceedings
of FAI annual seminar on fertilizer security :Apre-requisite for food security.
FertilizerAssociation of India, New Delhi.Balasubramanian V, Morales AC, Curz RT, Abdulrachman S (1999) On-farm
adaptation of knowledge-intensive nitrogen management technologies for
rice-system. Nutr CyclAgroecosyst 53:59-69Bijay-Singh, Yadvinder-Singh, Ladha JK, Bronson KF, Balasubramanian V,
Singh J, Khind CS (2002) Chlorophyll meter- and leaf color chart- based
nitrogen management for rice and wheat in north-western India. Agron J
94:821-829Buresh RJ, Peng S, Witt C, Balasubramanian V, Laureles E (2001) Improving
nitrogen fertilizer use efficiency for rice: How do management options
compare? Poster paper presented at the 2001 ASA-CSSA-SSSA Meeting.
Charlotte, NCCampbell CA, Biederbeck VO, Zentner RP, Lafond GP (1991) Effect of crop
rotations and cultural practices on soil organic matter, microbial biomass and
respiration in a thin black chernogem. Can J Soil Sci 71:363-376FAI (2008) Fertilizer Statistics (2007-08), Fertilizer Association of India, New
Delhi.Ganeshamurthy AN, Takkar PN (1997) Residual management of sulphur applied
to soybean or wheat in soybean-wheat cropping system on Vertisols. Aust J
Soil Res 35:199-208Gupta RK (2006) Resource conservation technologies for management of natural
resources. J Indian Soc Soil Sci 54:430-434Hegde DM, Dwivedi BS (1992) Nutrient management in rice-wheat cropping
References
incorporation to residue retention (mulching), monocultures to diversified
agriculture and sole crops to Intercrops in bed-planting.
The new multi-crop planters enable the farmers to plant the crops timely in
residual soil moisture of preceding crops to save pre-sowing irrigation water,
diesel, and labour. The drill places seed and fertilizers at an appropriate soil depth
in a narrow slit which helps in enhancing the fertilizer use efficiency. By end of
rabi 2006-07 more than 3.13 Mha were planted to zero-till, and reduced till
systems in Indo-Gangetic Plains (Gupta 2006). The CA production technology
package is emerging as a clear winner. Probably it is adaptable, divisible, reliable,
and spreading faster than projected.
After green revolution, food grain production in India increased from 74 Mt in
1966-67 to 231 Mt in 2007-08 with corresponding increase in the fertilizer
consumption from 1.1 Mt to 22 Mt. But growth in fertilizer consumption was
mainly in N and P to very little extent in K. Therefore, the continuous application
of only N and P that too in lower rates than recommended led to emergence of
secondary (S) and micronutrient (Zn, B, Fe, Mn, etc) deficiencies in soils. As a
result, the rate of response of crops to applied fertilizers, factor productivity of
crops, and nutrient use efficiencies declined year after year. Nutrient management
strategies such as Integrated Nutrient Management, Balanced fertilization through
inorganic fertilizers, Soil test based fertilizer recommendations, Recycling of crop
residues, Customized fertilization as per the situation, Efficient management of
residual or accumulated nutrients in soils appear to be viable measures to meet the
food grain demands.
The future research should aim at
Precision agriculture is likely to play a greater role in which site-specific
nutrient management has to be coupled with temporal specific nutrient needs
of crop. Very little work has been done on this aspect.
Nutrient management strategies need to be developed for mobilizing
nutrients from indigenous and cheaper minerals and industrial by-products so
that pressure on costly imported fertilizers can be reduced.
Improved nutrient management technologies should be recommended and
popularized among the farmers along with other pest, weed and water
management options as a package of practices.
Plant analysis, usually used for horticultural and vegetable crops, must be
made more popular.
The K balance of Punjab, Haryana and other Northern Indian states appears to
Conclusions
·
·
·
·
·
130 131

Sammi-Reddy K, Subba-Rao A, Singh S, Damodar Reddy D (2003) Crop
responses to residual phosphorus and economic evaluation in soybean –
wheat system on Vertisols. J MaharashtraAgric U 28:12-16Sammi-Reddy K, Kumar N, Sharma AK, Acharya CL, Dalal RC (2005)
Biophysical and sociological impacts of farmyard manure and its potential
role in meeting crop nutrient needs: A farmers' survey in Madhya Pradesh,
India.Aust J ExpAgric 45:357-367Sammi-Reddy K, Rao DLN, Singh M, Mohanty M, Subba-Rao A, Dixit SK,
Pandey M, Singh G (2007) Enhancing productivity of soybean-wheat system
by balanced and integrated nutrient management on black soils of Madhya
Pradesh. ICAR-ACIAR Project Bulletin No.1, Indian Institute of Soil
Science, Bhopal, pp 1-17Sammi-Reddy K, Srivastava S, SharmaAK (2007) IISS Perspective Plan: Vision-
2025. Indian Institute of Soil Science, Bhopal, India, pp 1-64Sharma KL, Mandal UK, Srinivas K, Vittal KPR, Mandal B, Grace KJ, Ramesh V,
(2005) Long-term soil management effects on crop yields and soil quality in a
drylandAlfisol. Soil Tillage Res 83:246-259Sharma MP, Bali SV (2000) Long-term effect of different cropping systems on
physiochemical properties and soil fertility. J Indian Soc Soil Sci 48: 181-183Sharma PS, Sarkar AK (2005) Managing acid soils for enhancing productivity.
Natural Resource Management Division Technical Bulletin (ICAR), New
Delhi, India, pp 1-23Singh M V, Saha JK (1997) 27th Annual report of All India Coordinated Research
Project of Micro-and Secondary Nutrients and Pollutant Elements in Soils
and Plants for the year 1995-96. Indian Institute of Soil Science, Bhopal,
India.Singh MV (1999) Sulphur management for oilseed and pulse crops. All India
Coordinated Research Project of Micro-and Secondary Nutrients and
Pollutant Elements in Soils and Plants. Indian Institute of Soil Science,
Bhopal, India, pp 1-54Singh MV (2009) Multiple nutrient deficiencies, the strategies and issues and
customized fertilizers for enhancing crop production in India. Training
Manual of Winter School conducted at IISS, Bhopal 3-23 January 2009. pp
291Singh Y, Chaudhary DC, Singh SP, Bharadwaj AK, Singh D (1996) Sustainability
of rice ( ) – wheat ( ) sequential cropping
through introduction of legume crops and green-manure crop in system.
Indian JAgron 41: 510-514Souza DMG, Miranda LN, Lobato E (1987) Interpretacao de analise de terra e
recomendacao de adubos fosfatados para culturas anuais nos cerrados. Com
Tec 51. Planaltina, DF, Brasil, EMBRAPA-CPACSrinivas-Rao Ch, Subba-Rao A, Bansal SK (1996) Potassium supply and
Oryza sativa Triticum aestivum
system in India. Fert News 37(2):27-41Iyamuremye F, Dick RP, Baham J (1996) Organic amendments and phosphorus
dynamics: III Phosphorus speciation. J Soil Sci 161: 444-451Mazumdar AK, Sharma T and Rao TC (1993) Extraction of potassium from
glauconite sandstone. Int J Miner Process 38: 111-123Mondal LN, Khan SK (1972) Release of phosphorus from insoluble phosphatic
materials in acidic lowland rice soils. J Indian Soc Soil Sci 20:19Mondal SS, Chettri M (1998) Integrated nutrient management for sustaining
productivity and fertility under rice based cropping system. Indian JAgric Sci
68:337-340Motsara (2002) Available NPK Status of Indian Soils as depicted by soil fertility
map. Fert News 47 (8): 15-21Nishant D, Biswas DR (2008) Kinetcis of phosphorus and potassium release from
rock phosphate and waste mica enriched compost and their effect on yield and
nutrient uptake by wheat. Bioresource Tech 100:3342-3353Panda N (1998) Problems and prospects of efficient use of fertilizers in acid soils
of India. Fert News 43(5): 39-50Peng S, Garcia FC, Laza RC, Sanico AI, Visperas RM, Cassman KG (1996)
Increased N-use efficiencies using a chlorophyll meter on high yielding
irrigated rice. Field Crops Res 47:243-252Ramamoorthy B, Bajaj JC (1969) Available N, P and K status of Indian soils. Fert
News 14(8): 24-26Ramamoorthy B, Narasimham RL, Dinesh RS (1967) Fertilizer application for
specific yield targets of Sonora 64. Indian Farming 17(5): 43-45Randhwa NS, Velayutham M (1982) Research and development programme for
soil testing in India. Fert News 27(9): 35-36Rattan RK (2007) Proceedings of and recommendations from the symposium on
nutrient management in acid soils. Bulletin of the Indian Society of Soil
Science, No.25, Indian Society of Soil Science, New Delhi, India, pp 1-3Reddy DD (2007) Technology for managing mechanical harvest borne wheat
residue in soybean-wheat system on Vertisols. In: Sammi-Reddy K,
Srivastava S, Sharma AK (ed) IISS Perspective Plan – Vision 2025. India
Institute of Soil Science, Bhopal, India, pp 14Reddy DD, Subba-Rao A, Sammi-Reddy K, Takkar PN (1999) Yield
sustainability and phosphorus utilization in soybean-wheat system on
Vertisols in response to integrated use of manure and fertilizer phosphorus.
Field Crops Res 62: 180-190Reddy DD, Subba-RaoA, Singh M, and Takkar PN (2006) Organic manure based
phosphorus supply strategies for soybean-wheat rotation on Vertisols: Crop
responses and soil test maintenance Prequirement. BiolAgric Hort 24: 21-34Reddy DD, Subba-RaoA, Takkar PN (1999a) Phospate adsorption behaviour of a
Typic Haplustert in relation to long-term use of fertilizer P and manure under
soybean-wheat rotation. J Indian Soc Soil Sci 47:425-430
132 133

Wanjari RH (2009) IISS Annual Report (2009-10), Indian Institute of Soil
Science, Bhopal, pp 40-43Varadachary C (1992) Potash fertilizers from mica wastes. Fert News 37(2): 57-60Yadvinder-Singh, Bijay-Singh, Ladha JK, Bain JS, Gupta RK, Singh J,
Balasubramanian V (2007) On-farm evaluation of leaf color chart for need-
based nitrogen management in irrigated transplanted rice in northwestern
India. Nutr CyclAgroecosyst 78:167-176
management through non-conventional sources for optimizing K nutrition
and crop production. Fert News 41(7): 33-40Srivastava S, Subba-Rao A, Biswas AK (2001) Results of participatory diagnosis
of constraints and opportunities (PDCO) based trials from the state of Uttar
Pradesh. In: Subba-Rao A, Srivastava S (ed) Development of farmers'
resource based integrated plant nutrient supply systems: Experience of FAO-
ICAR-IFFCO Collaborative Project. All India Coordinated Research Project
for Investigations on Soil Test Crop Response Correlation, Indian Institute of
Soil Science, Bhopal, India, pp10-49Subba-RaoA, Sammi-Reddy K, (2008) Soils: Deterioration in Physical, Chemical
and Biological Qualities. The Hindu-Survey of IndianAgriculture 2008, M/s.
Kasturi and Sons. Ltd. Chennai, India, pp105-108Subba-Rao A, Sammi-Reddy K, Singh M (2004) Emerging strategies for
improving fertilizer use efficiency in different crops/cropping systems.
Indian Fertilizer SceneAnnual, 17:3-22Subba-Rao A, Sammi-Reddy K, Takkar PN (1995) Phosphorus management: A
key to boost productivity of soybean-wheat system on swell-shrink soils.
Fert News. 40 (12): 87-95Subba-RaoA, Sammi-Reddy K, Takkar PN (1996) Residual effects of phosphorus
applied to soybean or wheat in soybean-wheat cropping system on a Typic
Haplustert. JAgric Sci (Cambridge) 127:325-330Subba-Rao A, Srivastava S (2001) Soil test based fertilizer recommendation for
targeted yields of crops. Proceedings of the National Seminar on Soil Testing
for Balanced and Integrated Use of Fertilizers and Manures, Indian Institute
of Soil Science, Bhopal, India, pp 326Subba-Rao, A, Ganeshamurthy AN (1994) Soybean response to applied
phosphorus and sulphur on Vertic Ustochrepts in relation to available
phosphorus and sulphur. J Indian Soc Soil Sci 42: 606-610Tandon HLS, Sekhon GS (1988). Potassium research and agricultural production
in India. Fertilizer Development and Consultation Organization. C110
Greater Kailash, New Delhi.Tandon HLS, Narayan, P (1990) Fertilizers in Indian agriculture: Past, present and
future (1950-2000). Fertilizer Development and Consultation Organization,
New Delhi, pp 160Tandon, HLS (1996) Organic resources:An assessment of potential supplies, their
contribution to agricultural productivity, and policy issues for Indian
Agriculture from 2000-2025. In: Kanwar JS, Katyal JC (ed) Proceedings of
Symposium on Plant Nutrient Needs, Supply, Efficiency and Policy Issues:
2000-2025. National Academy of Agriculture Science, New Delhi, India,
pp15-28Truog E (1960) Fifty years of soil testing. Transactions of 7th International
Congress of Soil Science, Volume III, Commission IV, Paper No 7, pp 46-53
134 135

Particular issues in plant production under acid soils:
The Orissa scenario
N Panda
Abstracts
Keywords
Acid soils in Orissa are formed due to weathering caused by hot humid
climate and heavy precipitation. Seventy percent of the cultivated land in the state
is acidic that particularly occurred in the uplands. The common problems with
respect of crop production are low pH, low CEC, nutrient imbalance, low level of
base saturation, high concentrations of Al, Fe and Mn in soils, high P fixation, and
domination of low activity clays. The problems could be managed by the
application of liming. But, liming calculated on the basis of lime requirement (LR)
is not cost effective. However, liming @ 1/10 LR (4-5 q ha ) applied on the rows to
each crop is inexpensive and effective. Apart from calcitic and dolomitic lime
stones, industrial wastes such as lime sludge from paper mills, basic slag from
steel mills, blast furnace slag, press mud, cement, and kiln wastes could be
potential amendments. Another possibility is to grow acid tolerant plant species
and cultivars, which have already been identified. As diabetic in human being is
not curable but one has to live with it through medicines and other health practices
it, so is soil acidity!
Amelioration basic slag liming lime sludge soil acidity
-1
l l l l
Introduction
Orissa is situated between 17 47 to 22 33 N latitudes and 81 21 to 87 30 longitude
covering 1557 million hectares geographical area, of which 8.67 M ha is acidic.
Out of 6.1 M ha cultivated area, about 70 percent area is acidic. Orissa has wide
variations in climate, geology, land forms and vegetation, which give rise to large
variations in soils. Out of 1482 mm annual average rainfall, 85 percent is received
during July through October. In the state, the mean annual temperature is 26.2 C,
mean summer temperature is 30.3 C, and mean winter temperature is 21.3 C.
Based on stratigraphy, tectonic history, relief feature, and erosion process, the
state represents four broad and well-defined physical regions viz. Northern
plateau, Central tableland, Eastern Ghats and Coastal plains. The geological
sequences responsible for the present topography are the Archean to Recent
0 / 0 / 0 / 0 /
0
0 0
Proceedings IPI-OUAT-IPNI International Symposium (2009)
Chairman, Western Orissa Development Council, Orissa, 6 Floor, Rajiv Bhawan,
Bhubaneswar, Orissa. e-mail: [email protected]
th
136 137

through Pleistocene. The Archeans dominate the rock system with other system
like Proterozoic, cretaceous and carboniferous. Integrating the effects of land
form, topography, climate, soil and crop adaptability the state has been divided
into 10 Agro Climatic Zones. The National Bureau of Soil Survey and Land use
Planning (NBSS & LUP) in cooperation with the Soil Conservation (Survey)
Department have categorized the soils of Orissa into 3 Agro-Ecological Regions,
and 6 Agro-Ecological Sub-regions (Sehgal et al. 1993). This is based on the
variability in rainfall, potential evapo-transpiration and actual evapo transpiration.
The soils of Orissa belong to 4 orders as per Soil Taxonomy. Inceptisols (7.49
m ha), Alfisols (5.62 m ha), Entisols (1.53 m ha), and Vertisols (0.93 ma ha)
constitute 48, 36, 10 and 6 percent of geographical area, respectively. Red soils
(Haplustalfs, Rhodustalfs and Ustorthents) have extensive coverage of 7.14 m ha.
The dominant clay minerals are kaolinite and illite in these soils. The soils are
mildly acidic in reaction. Mixed Red and yellow soils (Haplustalfs, Paleaustalfs,
Ustochrepts) constitute 5.5 m ha and are moderately acidic. Laterite soils
(Hapustalfs, Plinthustalfs, Orchaqualfs) constitute 0.70 m ha and are mildly to
strongly acidic. Coastal saline soils (Haplaquepts and Haloquents) constitute 0.25
m ha. Some of these soils are mildly acidic. Brown forest soils (Haplustalfs,
Ustochrepts and Rhodustalfs) constituting 0.17 m ha are acidic. Apart from these
acid soils there are Black soils, Deltaic alluvial soils, mixed red and black soils,
which are mildly acidic to slightly alkaline.
The major degradation problems of soils of Orissa are water erosion due to
undulating terrain and heavy precipitation, and water logging and salinity in the
coastal area. The anthropogenic processes are excessive irrigation, deforestation,
and indiscriminate industrial growth. Exploitation of natural resources with little
consideration for maintenance of the eco-balance has been very harmful. It is
estimated that 6.12 m ha representing 39.3% of the total geographical area in
Orissa are affected by various soil degradation process.
Acid soils occupy about 30 percent of cultivated land in India, whereas 70 percent
of the cultivated land in Orissa is acidic. Acid soils have poor base saturation;
which generally varied from 16 to 17 percent in the pH range of 5.0 to 6.0. The
active species of naturally occurring ions bound to the clay are H andAl . The KCI
extractable Fe has minor role in soil acidity compared to Al. Humic acid,
hymetamalonic acid, fulvic acid and humus contribute to acidity in various ways.
The total acidity of the soil extracted by BaC1 –TEA comprises pH dependent
acidity and exchange acidity. The pH dependent acidity (variable charge)
calculated as the difference between total and exchange acidity increased linearly
with increasing free Fe O +A1 O plus organic carbon in soil (Mishra et al. 1989).
Development of acid soil
+ +
2
2 3 2 3
Since the organic carbon contents were lower (0.29–1.19%) than the sum of free
oxides of Fe+A1 (0.7–11.0%), the pH dependent acidity, constituting more than
81 percent of total acidity in the soil was ascribed mainly to inorganic compounds.
The most common of the problems in acid soils in respect of chemical properties
are low pH, low CEC, nutrient imbalance, low level of base saturation percentage,
high Al, Fe, Mn saturation percentage, high P fixing capacity, and clay fraction
constituting of rather surface inactive minerals. All these problems could be
managed by liming, which improves base status, inactivates Fe,Al, and Mn in soil
solution and reduces P fixation markedly (Panda and Kosy 1982). Improvement of
availability of soil- and fertilizer-P by liming were reported by Panda and Panda
(1969), and Panda and Mishra (1970). Management of acid soils should aim at
realization of production potential either by addition of amendment or
manipulation of agricultural practices.
Soil acidity in the uplands, which is caused mostly by leaching losses of bases
and high percolation of water, create problems of crust formation particularly in
light textured red soils. It adversely affects the seed emergence. Such problem
could be managed by compaction with heavy iron rollers giving 4 to 6 passes.
Straw mulching in the seed lines, particularly in cotton, soybean, cowpea and
fingermillet is helpful. Water retentivity of red and laterite soils could be improved
by addition of tank silt and clay.
The acid soils of Orissa are deficient in available-N, low to medium in available-P
and medium to high in available-K. Barring the soils of Bolangir, Sonepur,
Kalahandi, Nuapara, Balasore and Bhadrak districts all other soils are mildly to
highly acidic. Total N content varied between 260-1180 mg kg in virgin soils and
300-900 mg kg in cultivated soils. Organic carbon varied from 0.62 to 1.10
percent in red soils, and from 0.9 to 1.05 percent in laterite soils (Sahu et al. 1983).
In the laterite soils (Udic Ustochrepts) under the rice-rice cropping system total N
was 1316 kg ha and mineralisable N was 188 kg ha . The hydrolysable ammonia
was 23 kg ha , amio sugar 38 kg ha , amino acid N 281 kg ha , unidentified
hydrolysable fraction 344 kg ha and total hydrolysable N was 866 kg ha . Most of
the Red and laterite soils of Orissa are low in available P (Bray-1P; 1.3 to 5.9 mg
kg ) although total content is adequate (Panda and Mishra 1969). P fractionation
studies conducted under long term experiments in a rice-rice cropping sequence in
laterite soils showed that residual P mostly accumulated as the Fe-P > reductant
soluble P>Al-Pfraction. Results of multiple regression and path analysis indicated
Problems associated with acid soils
Plant nutritional problems associated with soil acidity
-1
-1
-1 -1
-1 -1 -1
-1 -1
-1
138 139

the reductant soluble P and Fe-P directly and Al-P indirectly contributed towards
Olsen's P of the soil. Availability of both native and applied water soluble P is low
in the predominantly acidic soils of Orissa due to their high P fixing capacity. P
fixation capacity increased with free Fe O +A1 O content.
Potassium status of acid soils of Orissa is medium to high. The annual crop
removal of K from soils of Orissa was 282.3 x 10 tonnes and addition through
fertilizer is only 39.5 x 10 tonnes leaving a huge negative balance of 242.9 x 10
tonnes (Mishra and Mitra 2001). This accounted for a negative balance of 29.2 kg
ha . The NH OAc extractable K of surface soils did not reflect the large negative
balance of K because of a substantial contribution from non-exchangeable mineral
fractions. Red soils are adequate and laterites soils are low in K.
Calcium deficiency rarely occurs as a field problem. It is usually the most
dominant cation in the soil even at low pH and also principal cation moving down
through leaching. Calcium deficiency however occurs in acid sandy soil of humid
regions. The calcium deficiency has been observed in light textured sandy soils of
Khurda, Mayurbhanja, Sundargarh, Koraput and Dhenkanal districts. Peanut
yields have been drastically reduced in the acid course textured soils due to Ca
deficiency. Liming @ 1/10 lime requirement work more as Ca source rather than
correcting soil acidity. Limited work has been done on magnesium, as its
deficiency is uncommon. Results of long-term fertilizer (LTF) experiments
showed that available Mg status of the soil decreased from initial value of 142 mg
kg to 106 mg kg after raising 41 crops of rice without addition of any fertilizer.
The total S content of different soil groups was in the range of 25.7 to 925.0
mg kg . The light textured red and lateritic soil with low clay context contained
less total S. Organic S constituted 66.5–98.3 percent of total S. The red and laterite
acid soils had significant positive correlation between clay content and total S
(Mishra et al. 1990).
Increased use of high yielding crop varieties, increase in cropping intensity,
use of high analysis chemical fertilizers without application of organic manure and
unbalanced use of fertilizers have resulted in rapid depletion of micronutrient
reserves of the soils of Orissa. The decreasing trend of yield of many crops in
recent years is partly due to deficiency of specific micronutrient. The soils are
generally deficient in B and Mo and partly in Zn. They are mostly rich or sufficient
in Fe, Mn and Cu (Sahu and Mitra 1992). After raising 41 crops of rice, it was
observed that DTPA-Zn decreased to value below the critical limits (Table 1).
Available Fe, Mn and Cu decreased in control plots. There was decrease in hot
water soluble B in all the treatments (Sahu 1997).All the soils had adequate Fe, Mn
and Cu. Deficiency of B was high (69.6%) in light textured uplands due to leaching
of soluble boron caused by soils acidity. More than 80 percent of acid soils were
deficient in available-Mo, 19 percent were deficient in available-Zn whereas only
less than 2 percent were deficient in available forms of Cu, Fe, and Mn (Sahu and
2 3 2 3
4
3
3 3
-1
-1 -1
-1
Mitra 1992).
Management of acid soils should aim at realization of production potential either
by addition of amendments or by manipulation of agricultural practices to derive
optimum crop yield even in acid conditions. By liming exchange acidity is
deceased but a small amount of lime could neutralize pH dependant acidity.
Liming produced significant effect on wheat, maize, pulses and oilseeds (Panda
and Das 1971; Mathur 1992).Acidic rice lands, where mono cropping is practiced
need not be limed but about 25 percent of the rice soils in India (9.2 M ha), where
multi-cropping with pulses and oilseeds is done require to be limed.
Among the naturally occurring lime sources, calcitic, dolomitic and
stromatolytic limestones are important. But the former two have industrial uses
and hardly have prospects of being economically used as agricultural lime. Lime
stone containing more than 47 percent CaO and above are usually preferred in the
manufacturing of cement. Orissa has a limestone reserve of 1682 M tonnes.
Stromatolytic limestone is a poor grade lime, which contains 28-32 percent CaO,
12 percent MgO and 0.5 percent P. The algal deposits in it contribute to its P
content (Panda and Mishra 1970). High silica content restricts its use in industry
and hence is good for agriculture. Estimated reserve of such material is 40 M
tonnes in Orissa.
Several industrial wastes such as steel mill slag, blast furnace slag, lime sludge
from paper mills, press mud from sugar mills using carbonation process, cement
Liming acid soils: Scopes and limitations
Industrial wastes as amendment for acid soils
Treatment Av.S Ca Mg -zn -Mn -Fe -Cu B
kg ha mg kg
100% NPK 38.3 652 122 0.40 5.3 171 1.8 0.30100% NPK+Zn 40.7 668 151 3.40 6.1 230 2.0 0.32100% NPK+FYM 41.8 848 214 1.20 10.1 254 2.6 0.45100% NPK (-S) 11.6 324 103 0.60 3.6 213 1.8 0.32Lime+LPK 47.7 956 139 0.60 8.4 136 1.9 0.36
Control 19.7 376 106 0.50 6.8 76 1.2 0.28Initial (1972) 34.0 492 142 1.44 7.8 53 1.4 0.50
Source: Sahu D 1997 Appraisal Report QRT (1972-96) Long Term Fertiliser Expts,Bhubaneswar
Av. Av. DTPA DTPA DTPA DTPA Av.
kg ha kg ha mg kg mg kg mg kg mg kg
(Soil Test)
-1 -1 -1 -1 -1 -1 -1 -1
Table 1 Effect of treatments on available secondary and micronutrient status ofsoil (after 41 crops)
140 141

kiln wastes, precipitated CaCO from fertilizer factories have been successfully
and economically used as amendment for acid soils, which are also eco-friendly
(Panda and Das 1971). Lime sludge contains 65-84 percent CaCO , 2 percent R O
and 1.5 percent free alkali. The paper mills located in the acid soil regions of
Assam, Nagaland, West Bengal, Orissa, Chhatishgarh and Andhra Pradesh
produce 182,000 tonnes of sludge annually, which could be utilized taking into
consideration the cost of transport and economics. Basic slag is the double silicate
phosphate of lime. It is estimated that for every ton of hot metal 500 kg of blast
furnace slag is produced whereas 200-250 kg SMS is produced for every tonnes of
steel. The steel mills located at Bhilai, Rourkela, Bokaro, Durgapur, and Burnpur
generate about 100 m tonnes of slag annually of which very small quantity goes to
manufacturing of black cement. Indian slogs contain 24-42 percent CaO and 2-10
percent MgO.
The cost of P fertilization in acid soils can be reduced by direct use of ground rock
phosphate or in combining it with a small proportion of water soluble P from super
phosphate. By such a combination initial P need at the early seedling stage is
satisfied by water soluble P and later rockphospate releases P when enough acidity
is created in the rhizospher (Panda and Panda 1969). Most indigenous rock
phosphates of sedimentary origin are of poor quality for economic processing to
water-soluble form. Partial acidulation of rock has been observed to be possible
means for economic and efficient utilization of indigenous rock Phosphate (Panda
and Mishra 1970). Udaipur rock phosphate containing substantial amount of
dolomite and calcite, served as amendment when applied directly to acid soils.
Highly reactive imported rock phosphate such as North Carolina rock could work
as a starter for crops grown in acid soils mixed with higher proportion of
indigenous rock. In the acid soils the activity of non-symbiotic free-living
bacteria, non-symbolic free-living blue green algae and symbiotic rhizobia could
be improved by application of lime, phosphorus and molybdenum. Liming
reduces the activities of fungi and increases the activity of bacteria and
actinomycetes facilitating nitrification.
Iron toxicity of low lying rice fields in red and laterite soils could be remedied by
providing deep drains around the rice fields and construction of check
embankment across the slope and diverting the ferrous iron through diversion
weirs. Modest application of lime on the soil surface to control acidity temporarily
3
3 2 3
Agro techniques for reducing phosphate fixation and improving fertilizer use
efficiency in acid Soils
Management of acid soils having iron toxicity
is also recommended. Use of Udaipur rock phosphate, which contains good
amount of dolomite and calcite helped in rectifying iron toxicity. Application of
about 60 kg K ha to create an oxidizing zone around the rhizosphere holds good in
checking conversion of Fe to Fe
In view of high lime requirement of acid soils, which is not cost effective,
sustainability of such practice remains questionable. This is more so because
heavy rains of 1500 mm during the three months period either take out lime
through the surface runoff or leaching down. Therefore, its alternative is to grow
acid tolerant plant species and cultivars. Rice has tolerance to soil acidity because
of flooding of rice fields. The rainfall distribution system in the sub humid tropics
compels the farmers to grow rice in medium and low land in kharif (wet) season
because the major portion of the annual precipitation is received through July to
September and fields remain ponded with standing water. In the post rainy season
some pulses, oilseeds and vegetables those have established themselves by the
process of natural selection are grown with the help of residual moisture. Poor
response of crops like minor millets, finger millets to liming indicates their
tolerance to acidity. The crops, which show moderate response to liming, are
Bengal gram, peanut, corn, sorghum and field peas. Crops like soybean, pigeon
pea, cotton responded well to liming indicating high sensitivity to acidity. Rainfall
and moisture storage capacity of soils determine the cropping patterns. Crop
diversification is confined to uplands where rice, corn, finger millet, pearl millet,
sorghum, pigeon pea, mesta and niger are grown as alternative crops and at times
as a mixture.
The basic principle of INMS is the maintenance of soil fertility, sustainable
agriculture productivity and improving profitability through judicious and
efficient use of chemical fertilizers, organic manures, green manures, and bio
fertilizers. Reliance on chemical fertilizers for sustainable agricultural
development would have to continue in spite of the environmental threats, real or
imaginary. Though bio fertilizers can increase yields significantly, its benefit in
the acid soils is restricted. Rhizobia culture is beneficial for pulses like green gram,
black gram, peas and oilseeds like soybean and peanuts. But soil acidity is not
compatible to growth of rhizobia. Low base status and poor availability of P in acid
soils come adversely on the way of efficient rhizobia culture. Blue Green Algae
(BGA) performs poorly when the soil is highly acidic. Frequent BGA application
in rice is necessary since acid soils are incapable of maintaining high BGA
population. Since acid soils have high P fixing capacity, the P requirement of azola
-1
3+ 2+.
Selection of crop species and cropping systems for acid soil region
Scope of integrated nutrient management system (INMS) in acid soils
142 143

ordinarily cannot be met.
Liming on the basis of lime requirement is highly expensive and not cost
effective. Hence such a technique is not acceptable to poor farmers. However, a
cheaper method evolved by the OUAT, Bhubaneswar and BAU, Ranchi, involving
application of 4-5 q ha of Lime (1/10 LR) on rows was acceptable. This technique
was tested on 871 farmers field trials spread over NE States, Assam, West Bengal,
Orissa, Jharkhand, Chhatisgarh, Himachal Pradesh, and Maharastra with
encouraging results. Yields of different crops increase by 14 to 52 percent over
farmers practice (Figs. 1 & 2).
The conjunctive use of lime and NPK through chemical fertilizer raised the
-1
yields by 49 to 189 percent. The mean benefit cost ratio was 2.5, which varied from
1.4 to 4.3 with the conjunctive use. By such a practice the poor farmers of Orissa
who ordinarily own the infertile, low water retentive uplands could be benefitted
immensely (Sharma and Sarkar 2005). Under the climate and field conditions of
Orissa soil acidity cannot be reclaimed but certainly it could be ameliorated for
higher production. Orissa grows 5.8 lakhs ha of leguminous kharif pulses and 3.9
lakhs ha kharif oilseeds with an average productivity of 527 and 661 kg ha
respectively. Though results from the farmer's plots showed 44-45 percent yield
increase by only amending such acid soils with lime, even if a discounted increase
of 20 percent is taken, the increase in kharif production would be of the order of
61000 tonnes in case of pulses and 51000 tonnes oilseeds without any addition of
fertilizer, which should suit to the economically distressed small and marginal
farmers of the State.
Mathur BS (1992) Acid soils and their management. Proc Summer Inst BAU
Ranchi
Mishra UK, Satpathy S, Panda N (1989) Characterization of some acid soils of
Orissa 1- Nature of soil acidity. J Indian Soc Soil Sci 37: 22-28
Mishra UK, Mitra GN (2001) Nutrient mining in Agro-Climatic Zones of Orissa,
Fertiliser News 48(4): 73-79
Mishra UK, Sahu SK, Mitra GN, Das R (1990) Effect of sulphur and lime on yield
and oil content of Kharif groundnut grown in Haplaquept. J Indian Soc Soil
Sci 38: 772-774
Panda N, Mishra UK (1970) Utilization of partially acidulated rock phosphates in
acid laterite soil. Plant Soil 33: 225-234
Panda N, Das JC (1971) Evaluation of lime sludge from paper mills. Proc Int Symp
Fertility Evaluation 27: 82-86
Panda N, Mishra SP (1970) Liming of acid soils. Proc Symp Acid Soil
Management, Bhubaneswar, pp 25-31
Panda N, Kosy M (1982) Review of soil research: Part I. Int Soil Science
Congress. pp 160-168
Panda N, Panda D (1969) Evaluation of Mixture of ground rock phosphate and
super-phosphate in lateritic paddy soil. J Research OUAT 2: 45-51
Panda N, Mishra UK (1969) Evaluation of partially acidulated rock phosphate in
Lateritic soil in India. JAgri Sci 39: 353-361
Sahu D (1997) Appraisal Report QRT (1972-96) All India Coordinated Res Proj
Long-term Fertilizer Expts OUAT, Bhubaneswar. pp 01 -19
Sahu GC, Panda N, Nanda SSK (1983) Genesis and mineralogy of some red and
laterite soils of Orissa. J India Soc Soil Sci 31: 254 259
Sahu SK, Mitra GN (1992) Micronutrient status of soils of Orissa and their
management. Proc Workshop on Micronutrients, India British Education
-1
References
Fig. 1 Response of groundnut to liming and fertilization in acidic soils of Orissa
20
18
16
14
12
10
8
6
4
2
0
Yie
ld (
q h
a)
-1
Treatments
FP FP +lime 100% NPK 100% NPK+lime
Fig. 2 Response of pigeonpea to liming and fertilization in acidic soils of Orissa
25
0
Yie
ld (
q h
a)
-1
Treatments
FP FP +lime 100% NPK 100% NPK+lime
5
10
15
20
144 145

Proj. Calcutta pp 84-92
Sehgel JL, Mandal DK, Mandal C (1993) Agro-ecological soil region (NBSS &
LUP) Pub 35, Nagpur
Sharma PD, Sarkar AK (2005) Managing acid soils for enhancing productivity.
Natural Resource Management Div. ICAR, New Delhi pp 01-23
Proceedings IPI-OUAT-IPNI International Symposium (2009)
Potassium nutrition of crops under varied regimes of
nitrogen supply
Fusuo Zhang Junfang Niu Weifeng Zhang Xinping Chen
Chunjian Li LixingYuan Jianchang Xie
l l l
l l l
Abstract Nitrogen (N) over-application is a serious problem in intensive
agricultural production areas with consequent large N losses and environmental
pollution. In contrast to N, potassium (K) application has been neglected in many
developing countries and this has resulted in soil K depletion in agricultural
ecosystems and prevented increases in crop yields. Nitrogen-potassium
interaction is currently a topic of interest in many studies and the focus of this
review is K nutrition under varied N regimes. Nitrogen form and application rate
and time influence soil K fixation and release, as well as K uptake, transport,
cycling and reutilization within crops. High yielding quality crops can be obtained
by optimal N: K nutritional ratios. High rates of applications of N and K do not
necessarily lead to increased yield increments and may even reduce yield. Yield
response to K uptake depends on N nutritional status and the interaction is usually
positive when NO -N is supplied.Antagonism between NH and K in uptake was
mostly attributed to simple competitive effects in the past while evidence showing
mixed-noncompetitive interactions existed. Two components of membrane
transport systems for K uptake by plants are a high-affinity K transport system
which is inhibited by NH and a low-affinity K transport system which is
relatively NH insensitive. Potassium is highly mobile within plants but its flow
and partitioning can change depending on the forms of N supply. NH nutrition in
comparison to NO supply results in more K translocation to leaves. A better
understanding of the mechanism of N-K interaction can be a useful guide to best
3 4
4
4
4
3
- + +
+
+ +
+
+
–
FS Zhang WF Zhang XPChen CJ Li LXYuan
Department of Plant Nutrition, ChinaAgricultural University, Beijing 100193, China
JF Niu
Center for Agricultural Resources Research, Institute of Genetics & Developmental
Biology, ChineseAcademy of Sciences, Shijiazhuang 050021, China
JC Xie
Institute of Soil Science, ChineseAcademy of Sciences, Nanjing 210008, China
F S Zhang
e-mail: [email protected]
l l l l
Presented at IPI-OUAT-IPNI International Symposium.Published in Plant Soil 2010.335:21-34. Printed here with permission from Plant Soil
146 147

nutrient management in agricultural practice in order to achieve high yields with
high nutrient use efficiency.
Potassium-nitrogen interaction potassium transport and cycling
ammonium nitrate
Potassium is an important essential macronutrient for plants which, with N and P,
plays an important role in plant development. Potassium has a wide range of
functions in plant nutrition, including the maintenance of electrical potential
gradients across cell membranes, the generation of turgor, and the activation of
numerous enzymes. It is also essential for photosynthesis, protein synthesis, and
regulation of stomatal movement, and is the major cation in the maintenance of
anion-cation balances (Marschner 1995). Potassium nutrition in crops is
influenced by cultivation practices, crop species and environmental conditions
such as soil type and climatic conditions. Nitrogen, in terms of its requirement and
management in the field, is the most important nutrient for all crop plants. Over-
application of N is a serious problem in intensive agricultural production areas
because this leads to enrichment of reactive N constituents into the atmosphere,
soil and water with consequent impairment of ecosystem services. Current
fertilizer N application rates of 550-600 kg N per hectare annually in Taihu region
of east China and on the North China Plain could be cut by 30 to 60% while still
maintaining crop yields and N balance in the rotation and substantially reducing N
losses to the environment (Ju et al. 2009). Compared to N, application of K has
been neglected in many developing countries including Asian countries and this
has resulted in the continual depletion of soil K (Regmi et al. 2002; Panaullah et al.
2006; Ladha et al. 2003; Wang et al. 2007b; Lal et al. 2007). Frequent K deficiency
has been observed in crops in these regions (Dobermann et al. 1996; Panaullah et
al. 2006; Mussgnug et al. 2006). Regmi et al. (2002), suggested that because of
inadequate K application soil K imbalance in agricultural ecosystems and
stagnation of yields will become more pronounced with time (Regmi et al. 2002).
In China the increase in K fertilizer consumption has been much lower than that of
N fertilizers although in recent years it has increased rapidly (Fig. 1).
Many long term experiments have shown that high yields can be achieved
from balanced NPK supply (Belay et al. 2002; Cai and Qin 2006; Wang et al.
2007a). To ensure sustained crop production under intensive cropping, application
of recommended doses of NPK plus FYM is required (Rupa et al. 2001). Nitrogen
application rate, timing and N source influence the K nutrition of crops and the
interaction of these factors with K nutrition has been found to be significant in
numerous studies Optimal N and K application is propitious to best nutrient
management in agriculture. A nitrogen-potassium interaction generally exists in
Keywords
Introduction
.
l l
l
agricultural ecosystems (Gething 1993; Johnston and Milford 2009). In this paper
we review K in crops under varied N regimes, including effects of N-K interaction
on crop yields, and processes of N-K interaction such as K uptake, transport,
recycling and reutilization within plants under different levels of N supply. We
also consider N-K interactions in relation to soil-K fixation and release under
varied N regimes as well as their influence on crop yield, quality and stress
tolerance in order to provide a guide to best nutrient management in agriculture.
Soil-K fixation and release under variable N regimes
Soil K status influences K uptake by plant roots. The amount of K removed by
plants depends on the production level, soil type, and the retention or removal of
crop residues (Yadvinder-Singh et al. 2005). Even if the soil is rich in K, it becomes
K deficient under conditions where no K is supplied, because of the continuous K
removal during uptake by crops (Rupa et al. 2001; Cai and Qin 2006). On the other
hand, a small build-up in available K was observed in K amended plots
notwithstanding the negative balance of K, based on the approach of the input-
output relationship (Benbi and Biswas 1999). There was a shift in the equilibrium
from the non-exchangeable to the exchangeable and soluble forms in the soil K
pool. Potassium uptake during plant growth is a dynamic process with periods of
Processes of N-K interaction in the soil-crop system
Fig. 1 Trends in fertilizer consumption in China from 1949 to 2007 (According to
ChinaAgricultureYearbook)
0
5
10
15
20
25
30
35
40
45
1949 1957 1967 1977 1987 1997 2007
N
K2O
Fer
tili
zer
Co
nsu
mp
tio
n(M
illi
on
ton
es n
utr
ient)
148 149

K depletion in the root zone and release of non-exchangeable K to exchange and
solution phases by K bearing soil minerals (Jalali 2006). The process of K release
is initiated by a low K concentration in the soil solution and not by cation
exchange (Jalali 2006).Release and fixation rates of K in soil are highly dependent on the soil K
balance, confirming that these are reversible processes that depend on plant uptake
and fertilizer inputs (Simonsson et al. 2007). Crop K requirement under negative
soil K balance due to imbalanced NPK fertilization in intensive cropping systems
is mainly met through K released from non-exchangeable sources (Rupa et al.
2003; Lal et al. 2007). To meet the crop K requirement, non-exchangeable sources
contributed on an average about 95% in the absence of applied K and 65% with
added K (Lal et al. 2007) The potassium quantity-intensity (Q/I) plot components,
labile K , activity ratio for K at equilibrium (AR ) and linear potential buffering
capacity for K (PBC ) were affected by tillage and N additions (Evangelou and
Blevins 1988). The highest and lowest PBC values were in conventional tillage
with no N at 0–50-mm depth and no-tillage with no N also at the same depth
(Evangelou and Blevins 1988). The values of AR , the activity ratio of K in soil
solution inequilibrium with the soil, non-specific or immediate available K were
observed in the following order:
+ +
+ +
+
+ +
+
.
K
K
K
K
NPK+FYM (Farmyard mature) >NPK>control>
N>NP (Rupa et al. 2003). The scale of Q/I plot indices, which were affected by
tillage and N additions, indicated the potassium nutritional status in the soil and the
ability to supply potassium to crops.
Levels of exchangeable K and both NH and K fixation capacities are
influenced by long-term fertility management (Liu et al. 1997). Fixation
capacities for both NH and K were significantly reduced by sustained high rates
of K fertilization, but not by N fertilization (Liu et al. 1997). Simultaneous
proximal injection of anhydrous ammonia (AA) and KCl solution in a Hoytville
silty clay loam soil, however, has been shown to increase exchangeable and
solution K (Stehouwer and Johnson 1991; Stehouwer 1993). Decreased K
fixation was attributed to preferential NH fixation blocking K fixation.
Increased exchangeable K was attributed to pH-induced increases in cation-
exchange capacity (primarily in the organic fraction), and to decreased K fixation
(Stehouwer and Johnson 1991; Stehouwer 1993).
NH fixation was increased with increased N rates and was reduced with
increased K rates with urea. With NH Cl application, an increase in fixed NH was
noted with increasing K rate (Chen and MacKenzie 1992). By contrast, K fixation
was enhanced consistently with increasing K application rate and decreased with
increasing N application rate (Chen and MacKenzie 1992; Du et al. 2007). But
other research found that the fixation of NH was reduced by K addition before
NH , and the reduction was proportional to the amount of K previously fixed
4
4
4
4
4 4
4
4
+ +
+ +
+ +
+ +
+
+
+
+
+
+
+
(Kenan et al. 1999). In the presence of K, NH -N concentrations increased 4.1 fold
when N fertilizer was applied and 3.5 times in the absence of N application (Tung
et al. 2009). Compared with application of K alone, addition of NH did not show
any effects on diffusion distance of fertilizer K but did increase the concentration
of water extractable K in fertilizer microsites (Du et al. 2007). In the soil close to
the fertilizer placement site the concentration of exchangeable K decreased as a
result of the NH addition, and this was less apparent in Flurvo-aquic soil than in
red soil. The addition of NH reduced K fixation in soil crystal lattices, thereby
increasing the risk of K leaching in the soil (Du et al. 2007).
N sources and the sequence of NH and K application influence K fixation
(Chen et al. 2007). NH application before K fertilization at high rates resulted in
poor rice growth compared to NH application after K fertilization (Fig. 2).
However, when nitrate was used as the N source plant growth was not affected by
the order in which N and K were applied (Chen et al. 2007).
4
4
4
4
4
4
4
+
+ +
+
+
+
+
+
Fig. 2 Effects of N source and the order of N and K application on rice growth
(adapted from Chen et al. 2007) NB: NH-K, K-NH, NO-K, and K-NO
indicate NH -N application before K fertilization, NH application after K
fertilization, NO -N application before K fertilization and NO -N
application after K fertilization, respectively.
4 4
3 3
+ +
- -
0
1
2
3
4
5
6
7
8
9
NH-K K-NH NO-K K-NO
Dry
mat
ter
wei
ght
(gpla
nt
-1)
20d 50d 70d
Low K use efficiency often happens as the result of soil K leaching losses,
even especially in the subtropical regions with sandy soils and heavy rainfall. K
leaching losses are related to soil mineralogy, soil textures, rainfall pattern,
150 151
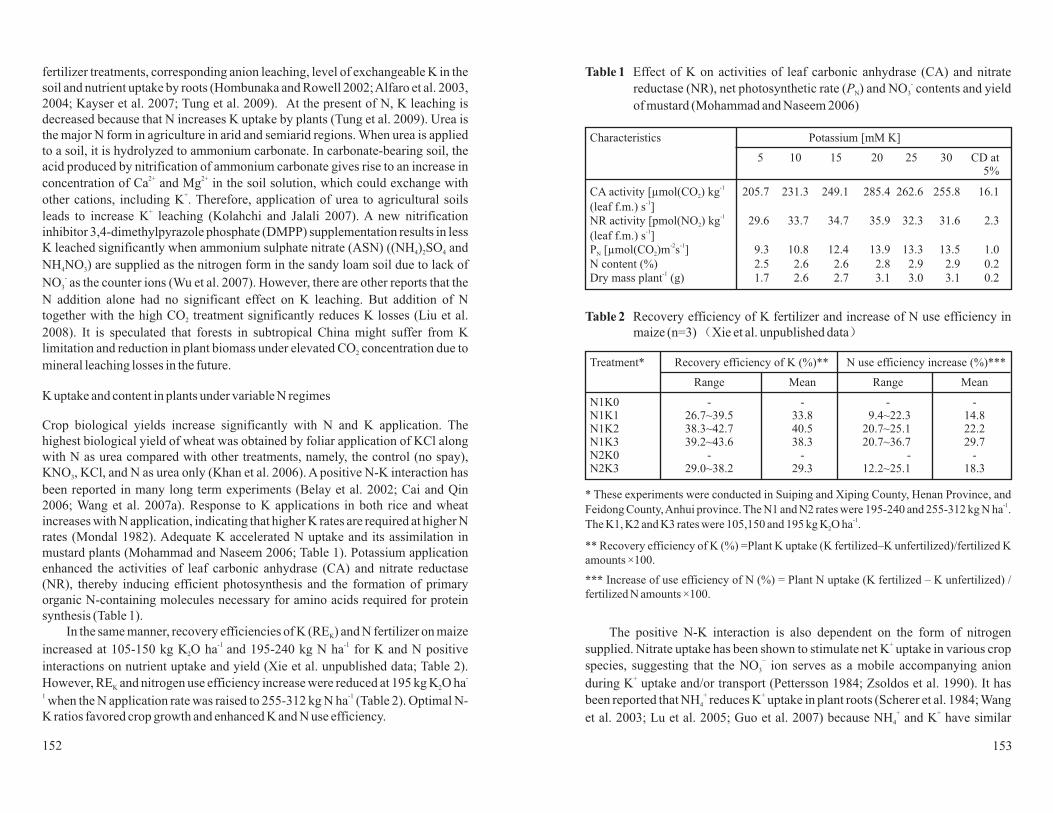
fertilizer treatments, corresponding anion leaching, level of exchangeable K in the
soil and nutrient uptake by roots (Hombunaka and Rowell 2002;Alfaro et al. 2003,
2004; Kayser et al. 2007; Tung et al. 2009). At the present of N, K leaching is
decreased because that N increases K uptake by plants (Tung et al. 2009). Urea is
the major N form in agriculture in arid and semiarid regions. When urea is applied
to a soil, it is hydrolyzed to ammonium carbonate. In carbonate-bearing soil, the
acid produced by nitrification of ammonium carbonate gives rise to an increase in
concentration of Ca and Mg in the soil solution, which could exchange with
other cations, including K . Therefore, application of urea to agricultural soils
leads to increase K leaching (Kolahchi and Jalali 2007). A new nitrification
inhibitor 3,4-dimethylpyrazole phosphate (DMPP) supplementation results in less
K leached significantly when ammonium sulphate nitrate (ASN) ((NH ) SO and
NH NO ) are supplied as the nitrogen form in the sandy loam soil due to lack of
NO as the counter ions (Wu et al. 2007). However, there are other reports that the
N addition alone had no significant effect on K leaching. But addition of N
together with the high CO treatment significantly reduces K losses (Liu et al.
2008). It is speculated that forests in subtropical China might suffer from K
limitation and reduction in plant biomass under elevated CO concentration due to
mineral leaching losses in the future.
K uptake and content in plants under variable N regimes
Crop biological yields increase significantly with N and K application. The
highest biological yield of wheat was obtained by foliar application of KCl along
with N as urea compared with other treatments, namely, the control (no spay),
KNO , KCl, and N as urea only (Khan et al. 2006). A positive N-K interaction has
been reported in many long term experiments (Belay et al. 2002; Cai and Qin
2006; Wang et al. 2007a). Response to K applications in both rice and wheat
increases with N application, indicating that higher K rates are required at higher N
rates (Mondal 1982). Adequate K accelerated N uptake and its assimilation in
mustard plants (Mohammad and Naseem 2006; Table 1). Potassium application
enhanced the activities of leaf carbonic anhydrase (CA) and nitrate reductase
(NR), thereby inducing efficient photosynthesis and the formation of primary
organic N-containing molecules necessary for amino acids required for protein
synthesis (Table 1).
In the same manner, recovery efficiencies of K (RE ) and N fertilizer on maize
increased at 105-150 kg K O ha and 195-240 kg N ha for K and N positive
interactions on nutrient uptake and yield (Xie et al. unpublished data; Table 2).
However, RE and nitrogen use efficiency increase were reduced at 195 kg K O ha
when the N application rate was raised to 255-312 kg N ha (Table 2). Optimal N-
K ratios favored crop growth and enhanced K and N use efficiency.
2+ 2+
+
+
-
-1 -1
-
1 -1
4 2 4
4 3
3
2
2
3
K
2
K 2
The positive N-K interaction is also dependent on the form of nitrogen
supplied. Nitrate uptake has been shown to stimulate net K uptake in various crop
species, suggesting that the NO ion serves as a mobile accompanying anion
during K uptake and/or transport (Pettersson 1984; Zsoldos et al. 1990). It has
been reported that NH reduces K uptake in plant roots (Scherer et al. 1984; Wang
et al. 2003; Lu et al. 2005; Guo et al. 2007) because NH and K have similar
+
−
+
+ +
+ +
3
4
4
Treatment* Recovery efficiency of K (%)** N use efficiency increase (%)***
Range Mean Range Mean
N1K0 - - - -N1K1 26.7~39.5 33.8 9.4~22.3 14.8N1K2 38.3~42.7 40.5 20.7~25.1 22.2N1K3 39.2~43.6 38.3 20.7~36.7 29.7N2K0 - - - -N2K3 29.0~38.2 29.3 12.2~25.1 18.3
Characteristics Potassium [mM K]
5 10 15 20 25 30 CD at5%
CA activity [µmol(CO ) kg
(leaf f.m.) s ]NR activity [pmol(NO ) kg
(leaf f.m.) s ]P [µmol(CO )m s ] 9.3 10.8 12.4 13.9 13.3 13.5 1.0
N content (%) 2.5 2.6 2.6 2.8 2.9 2.9 0.2Dry mass plant (g) 1.7 2.6 2.7 3.1 3.0 3.1 0.2
2
-1205.7 231.3 249.1 285.4 262.6 255.8 16.1
29.6 33.7 34.7 35.9 32.3 31.6 2.3
-1
-1
-1
-2 -1
-1
2
2N
Table 1 Effect of K on activities of leaf carbonic anhydrase (CA) and nitrate
reductase (NR), net photosynthetic rate ( ) and NO contents and yield
of mustard (Mohammad and Naseem 2006)
PN 3
-
Table 2 Recovery efficiency of K fertilizer and increase of N use efficiency in
maize (n=3) Xie et al. unpublished data( )
* These experiments were conducted in Suiping and Xiping County, Henan Province, and
Feidong County,Anhui province. The N1 and N2 rates were 195-240 and 255-312 kg N ha .
The K1, K2 and K3 rates were 105,150 and 195 kg K O ha .
** Recovery efficiency of K (%) =Plant K uptake (K fertilized–K unfertilized)/fertilized K
amounts ×100.
Increase of use efficiency of N (%) = Plant N uptake (K fertilized – K unfertilized) /
fertilized N amounts ×100.
-1
-1
2
***
152 153

charges and hydrated diameters (Wang et al. 1996). K depletion of the nutrient
solution enhances the absorption of NH -N but in contrast suppresses the
absorption, translocation, and assimilation of NO -N, simultaneously lowering
leaf nitrate reductase activity (NR). This behavior suggests that plants require an
adequate supply of K for absorbing NO -N and maintaining high levels of NRAas
compared with the assimilation of NH -N (Ali et al. 1991). Compared with NO
nutrition, supplying both forms of N (NO plus NH ) increased whole plant
and/or shoot accumulation of K (Wang and Below 1998). Potassium activates
plant enzymes functioning in ammonium assimilation and transport of amino
acids (Hagin et al. 1990). Therefore, an adequate supply of K enhances ammonium
utilization and thus improves yield when both N forms are applied together (Hagin
et al. 1990).
There have been numerous studies on NH -K interactions in different crops.
K may alleviate NH toxicity by inhibiting NH uptake and/or by stimulating C
and N assimilation in the roots (Roosta and Schjoerring 2008). The chemical
similarity and identical ionic status of the NH and K ions suggest possible
substrate competition via a transport system (Jarvis 1987; Guo et al. 2007).
However, contradictory observation on the effect of K on NH uptake has been
reported. Scherer et al. (1984) reported that NH inhibits K uptake in plant roots,
but NH uptake rate did not recover when K was removed, suggesting mixed-
noncompetitiveinteractions between K and NH . There are two components of K
uptake by plants which have different sensitivities to NH and will be mentioned
in the next section. An enhanced efflux of K coupled to NH influx via an
antiporter cannot be ruled out, which would contribute to the decrease in net K
uptake (Scherer et al. 1984). The inhibitory effect of ambient NH on net K
uptake resulted from an initial but temporary enhancement of K efflux and a
constant inhibition of K influx (Topa and Jackson 1988). This negative interaction
also depended on ion concentrations. Potassium influx was restricted
progressively as ambient ammonium concentration increased to about 100
micromolar while little inhibition of K influx appeared with ammonium
concentrations up to 500 micromolar (Vale et al. 1987). The optimal range of
NH -N concentration (0.9-1.8 mM) in the nutrient solution led to increases in both
the total fruit yield and the fertilizer K use efficiency in sweet pepper (Xu et al.
2002).
Many studies have reported that K concentration in crops remained
practically unchanged irrespective of N supply. Working with rice and wheat crops
Panaullah et al. (2006) observed that the majority of K taken up was present in
straw and the proportion in grain (11-29%) varied little across the sites. K
concentrations present in ryegrass expressed on both a dry matterand tissue water
4
3
3
4 3
3 4
4
4 4
4
4
4
4
4
4
4
4
4
+
-
-
+ -
- +
+
+ + +
+ +
+ +
+ +
+ +
+ +
+
+ +
+
+ +
+
+
+
basis remained within a narrow range irrespectiveof treatment or time (Jarvis et al.
1990). The rate of N application had little impact on the K concentrations in ripe
grains (Alfoldi et al. 1994). These results show that K concentrations in the grain
are well-buffered against increments in grain yield resulting from the application
of N and are also relatively insensitive to low supplies of K in the soil (Alfoldi et al.
1994). Contrary to these findings Rui et al. (2009) reported that K was
significantly lower in treatments with N fertilizer compared to a control without N
fertilizer and a significant negative correlation (R) was observed between K and N
fertilizer input -0.89.
Long term K stress for a 3 1/2-month reduced the root capacity to absorb
NO of sugarcane as shown by lower initial NO uptake rates and lower Vmax and
increased Km for NO uptake at 0.02 and 0.2 m M K (Subasinghe 2006). Long
term N stress reduced the initial K uptake rates and decreased the affinity of roots
for K , as indicated by increasing Km and decreasing Vmax for K uptake with
decreasing N availability. Furthermore, there were genetic differences in the
response of K uptake to N stress (Subasinghe 2006). A drought and salinity
resistant cultivar showed greater adaptability to a low-nutrient environment due to
its higher root allocation and affinity for NO and K under N and K stress,
suggesting that the resistance of sugarcane to multiple stresses may involve a
general stress-response system (Subasinghe 2006). Potassium deprivation in
general induces changes in the relative growth of roots, nodules, and shoots rather
than changes in N and/or carbon uptake rates per unit mass or area of these organs
(Hogh-Jensen 2003). The mechanism of N-K interaction is complicated and
further study is required.
K transport, cycling and reutilization in plants under varied N regimes
Two distinct membrane transport systems for K uptake by plants have been
described: a high-affinity transport system (HATS) and a low-affinity transport
system (LATS) (Kochian and Lucas 1982; Hirsch et al. 1998). HATS operates
primarily at low external concentrations (<1mM) of K by transporters while
LATS dominates at higher external concentrations (>1mM) mostly via channels
(Maathuis and Sanders 1997; Hirsch et al. 1998; Véry and Sentenac 2002;
Szczerba et al. 2006).Alarge number of genes encoding K transport systems have
been identified, revealing a high level of complexity (see reviews by Véry and
Sentenac 2002; Szczerba et al. 2009).
Different nitrogen forms influence the activity of the two distinct K transport
systems. NH inhibits high-affinity K transport (Scherer et al. 1984; Vale et al.
1988; Hirsch et al. 1998; Spalding et al. 1999; Santa-Maria et al. 2000; Ashley et
al. 2006; Nieves-Cordones et al. 2007; Szczerba et al. 2008), while low-affinity K
transport is relatively NH insensitive and takes effect on the alleviation from
- -
-
+
+ +
+
- +
+
+
+ +
+
+
3 3
3
3
4
4
154 155

NH toxicity at high K concentrations (Santa-Maria et al. 2000; Britto and
Kronzucker 2002; Kronzucker et al. 2003; Szczerba et al. 2006; Szczerba et al.
2008) A distinct variation in cytosolic K concentrations ([K ] ) was observed in
plants supplied with nitrate or ammonium N for both HATS and LATS activity
(Szczerba et al. 2006). The increase in [K ] with improving external potassium
supply and the rapid and futile cycling of potassium at the plasma membrane were
two characteristics in LATS-range cytosolic K pools in contrast to the relative
constancy in the HATS range (Kronzucker et al. 2003).At high external potassium
concentration (and particularly at 40 mM), cytosolic potassium efflux, an energy-
intensive process, was greater with nitrate-grown than ammonium-grown plants
(Szczerba et al. 2006).
Potassium is the most mobile ion within plants since most of K is not
assimilated in organic compounds. Potassium has the property of high phloem
mobility and, as a result, a high degree of reutilization by retranslocation via the
phloem (Marschner 1995; Marschner et al. 1997). Cytosolic K concentrations are
shown to vary between 40 and 200 mM, depending on [K ] , on nitrogen
treatment (NO or NH ), and on the dominant mode of transport (high- or low-
affinity transport), illustrating the dynamic nature of the cytosolic K pool
(Szczerba et al. 2006). K cycling and recycling play an important part in NO
translocation from root to shoot as counterion and assimilate loading in the phloem
(Maathuis 2007). The partitioning and the amount of phloem retranslocation of K
from the shoot and cycling through the root are quite different depending on plant
type and can be changed by stress (Jiang et al. 2001; Lu et al. 2005).
Moreover, the flow and partitioning of K in tobacco plants can be modified
depending on the forms of N supplied and nutrient levels. NH nutrition resulted
in more K translocated to leaves than did NO supply in terms of the amounts of
xylem-transported potassium in plants (Lu et al. 2005; Zou et al. 2005), although
NH -N as the sole N-source caused a decrease in potassium uptake relative to
NO -N supply. When NH -N was supplied as the sole N-source, massive amounts
of K were exported from leaves and cycled in the phloem, especially at low
nutrient levels compared to NO -N or NH NO supply. NH -N as the sole N-
source also caused a reduction in transpiration rate, changes in plant water use
efficiency and a decrease in K uptake (Wang et al. 2003; Lu et al. 2005; Zou et al.
2005). However, there are other reports that roots treated with high levels of NO
absorbed and translocated more K ( Rb) than seedlings treated with low levels of
NO (Pettersson 1984; Zsoldos et al. 2006). Cycling and recycling of K increased
with increasing shoot growth rate, which is in accordance with the suggested role
of K for charge balance of NO in the xylem and organic acids in the phloem
(Engels and Kirkby 2001).
4
cyt
cyt
ext
3 4
3
4
3
4
3 4
3 4 3 4
3
3
3
+ +
+ +
+
+
+
+
- +
+
-
+
+
–
+
- +
- +
−
+ 86
− +
+ -
.
Concentrations of K in the cytoplasm of most cortical cells were generally
greater than in the vacuoles and this difference was greater in low NO -fed plants
than in those supplied with high NO -N (Jarvis et al. 1990). The changes in K
concentration in the cortex were related to the role ofK in the transport of NO in
the xylem and effects on recycling to the roots in the phloem (Jarvis et al. 1990).
Interactions may exist between other factors and N nutrition affecting K
nutrition. The uptake and accumulation of K in shoots decreased more due to
salinity in ammonium-fed plants compared to nitrate-fed plants. By contrast, K
cycling in shoots increased due to salinity, with higher rates in the ammonium-
treated plants (Abdolzadeh et al. 2008)
Potassium is acknowledged as a nutrient element improving crop quality and
protecting plants against abiotic and biotic stress, while excessive N dressings
often cause lower quality and higher susceptibility of crops to disease. An
important aspect of the N-K interaction, therefore, is its relationship with crop
quality and stress tolerance. The highest growth parameters, carbohydrate
contents and juice extract of sweet sorghum were obtained with combination of N
and K ferilizers (Almodares et al. 2008). Application of K favors an increase in
grain protein and amino acid contents (Yang et al. 2004; Venkatesan et al. 2004;
Zou et al. 2006b), but responses vary among cultivars (Zou et al. 2006b).
Compared with Ningmai 9 (a low-protein wheat cultivar), the role of K in
improving the contents of grain protein was greater in Yangmai 10 (a medium-
protein wheat cultivar). Protein content in wheat grain showed a close positive
correlation with N accumulation and translocation (Zou et al. 2006b). However, in
tea crops overall quality was impaired when either N or K was used at high levels
(Venkatesan and Ganapathy 2004). There are other reports that the N-K interaction
was not significant for concentration of oil or protein in grain of canola although it
was always significant for grain production (Brennan and Bolland 2007; 2009).
Nitrate contents in vegetables were raised with increasing N supply but decreased
with potassium application, especially at high N application levels (Sun et al.
2000; Fig. 3).
At N rates of 150 and 250 mg N L in the nutrient solution, fertilization with
K (at 440 and 760 mg K O L ) increased vitamin C (Vc) content in tomato, the
highest Vc content being achieved in the 250 mg N L plus 760 mg K O L
treatment (Fig. 3). However, overall quality of vegetables was impaired when
either N or K or both were used at high levels (350 mg N L and 1080 mg K O L )
(Fig. 3). The same was also true for tea (Venkatesan and Ganapathy 2004).
Adequate K supply and optimum N and K in combination can ensure high quality
and high yield production of vegetables. In China nutrient input is very high for
+
-
- +
+ –
+
+
-1
-1
-1 -1
-1 -1
.
Effects of N-K interaction on quality and stress tolerance of crops
3
3
3
2
2
2
156 157

both nitrogen and potash in greenhouse vegetable production (Chen et al. 2004;
Table 3) and many problems are associated with fertilizer wastage in these fields
and this presents serious questions on nutrient management in China.
The important role of K in alleviating detrimental effects of abiotic stresses
in plants and pest and disease invasions has been reviewed by Cakmak (2005) and
Amtmann et al. (2008). Adequate K supply can relieve the damage caused by
drought, salt, chilling, high light intensity, and heat (Cakmak 2005). Potassium
application increased the grain yield, uptake of K and nitrogen, and water use
efficiency in maize over control (Nakashgir 1992). Application of N along with K
decreased significantly Na uptake in leaves of sugarcane and increase plant salt
tolerance to produce high biomass (Noaman 2004; Ashraf et al. 2008). The
+
beneficial effect of K was most obvious for fungal and bacterial diseases where 70
and 69% of the studies reported a decrease in disease incidence (Amtmann et al.
2008). KNO significantly reduced the severity of Alternaria leaf blight of cotton
(Gossypium hirsutum) at the middle canopy level (Bhuiyan et al. 2007).
Aggregate sheath spot (AgSS) severity of rice decreased with increasing N and K
fertilizer rates and leaf N and K concentrations at particle initiation (Williams and
Smith 2001; Linquist et al. 2008). But it was not recommended to over fertilize
with N in order to reduceAgSS because over fertilization can increase the severity
of other fungal leaf sheath diseases and result in crop lodging and reduced yield.
Rather, N fertilizer should be applied with the goal of achieving optimal yields as
opposed to maximum yields and advisable amounts of K should be supplied to
improve yield and decrease the severity ofAgSS diseases when the soil extractable
K is low (Linquist et al. 2008).
Yield response to K uptake depends to a great extent on the level of N nutrition and
the interaction is normally positive (Macleod 1969; Blevins 1978; Loué 1978;
Guo et al. 2004; Bruns and Ebellhar 2006; Brennan and Bolland 2007, 2009).
When moderate N fertilizer was supplied (wheat 112.5 kg N ha and cabbage 350
kg N ha ), yield increments of wheat and cabbage after K application were higher
than when N or K fertilizer was applied singly (Figs 4 and 5). Response to yield
and the utilization of nitrogen by maize was found to be accentuated when K
application was supplemented with farm yard manure (Nakashgir 1992).
Moreover, Crop yield response to total applied N was influenced by inherent soil P
and K fertility differences (Brye et al. 2007). Increasing the rate of fertigated N
when growth was constrained by K deficiency had no effect on ecnomic yield and
quality of apples (Neilsen et al. 2004) and cotton plants (Pettigrew et al. 2006). At
Rothamsted research station, responses to N application of spring barley were
observed on both high and low K soils (Johnston and Milford 2009). The average
yields showed that the maximum yield was reached by applying 50 kg N ha to a
soil with 55 mg kg exchangeable K, but yield was further increased by an
application of N of up to 96 kg ha when the soils contained adequate amounts of
exchangeable soil K (Johnston and Milford 2009). These results suggest that a
strong interaction between N and K exists in crop growth. However, over-
application of N and K does not lead to further yield increments as shown in Figs 4
and 5. Critical and maximum K concentrations are proportional to critical %N
throughout growth (Greenwood and Stone 1998). Optimum N: K ratios are in
favor of healthy plant growth and development whereas imbalance of N and K
supply results in maladjustment of plant growth (Xie 2000; Wells and Wood
2007).
3
Effects of N-K interactions on crop yields
-1
-1
-1
-1
-1
0
5
10
15
20
25
N1 N2 N3
0
4
8
12
16
20
N1 N2 N3
NO
3- -N
cont
ent
(µg
g-1
) K1 K2 K3 K4
Vc
cont
ent
(mg
g-1
)Fig. 3 Effects of K fertilization on nitrate and Vc content of tomato at different N
levels (adapted from Sun et al. 2000)
a
. The K1, K2, and K3 rates in the solution were 120, 440, 760, 1080 µg
K O g .
NB: The N1, N2, and N3 rates in the solution were 150, 250 nd 350 μg
N g-1
-1
2
Table 3 Average nutrient inputs for selected greenhouse vegetable species inChina in Beijing suburb from 1996-2000 (Chen et al. 2004)
Species Samples N input(kg ha ) K O input(kg ha )
Cabbage 14 440 132Chinese Cabbage 65 624 173Cucumber 94 1012 261Eggplant 19 1070 339Sweet pepper 5 1068 283Tomato 132 787 232
-1
2
-1
158 159

Intra- and inter-specific differences in response to K application exist in
agricultural ecosystems (Rengel and Damon 2008). Moreover, crops show
genotypic interactions with N and K (Gething 1993; Pettigrew et al 1996; Tsai and
Huber 1996). Research on rice-wheat systems has revealed that responses to direct
K application were larger for wheat than for rice (Chen and Zhou 1999; Regmi et
Fig. 4 Effects of K fertilization on wheat yield under variable N regimes (adapted
from Zou et al. 2006a)
Fig. 5 Effects of K fertilization on cabbage yield under variable N regimes
(adapted from Guo et al. 2004)
0
10
20
30
40
50
60
0 100 200 300 400 500
N level (kg ha )-1
Yie
ld(t
ha-1
)
K0
K300
al. 2002). Wheat yield was more sensitive to K deficiency than maize (Cai and Qin
2006). The effects of N-K interaction on crops would be expected to be greater at
higher yield levels, and it is certainly true that the higher yields now commonly
obtained must impose a greater strain on soil reserves of K (Gething 1993).
Applying increasing rates of K increased the rate of N required for 90% of
maximum canola grain yield. Likewise, applying increasing rates of N increased
the rate of K required for 90% of the maximum grain yield (Brennan and Bolland
2009). From 2005 to 2007, multi-site field experiments were conducted in North
and Northeast China to evaluate the response of staple crops including maize,
wheat and soybean to K application in high-yielding cultivation practices, mainly
by ameliorating fertilization such as increasing inorganic N and P fertilizer supply
and split-application of N fertilizer, and increasing the plant population. The
results indicate that the yield responses of maize and soybean to medium K supply
were greater in high-yield cultivation practices (HP) than that in current
cultivation practices (CP) which resemble farming practice on average. Wheat,
however, did not show the same pattern (Table 4).
Wheat yield responses to K application were insensitive at high yield level,
which confirms the general observation of lower response to K fertilization in
wheat fields in north China. The N-K interaction was related to soil nutrient status,
Note: The K1 and K2 rates indicated medium (75-120 kg K O ha ) and overuse K
application (150-240 kg K O ha ) respectively. Specific K levels were decided by executive
partners based on specific target crop and experimental sites conditions.
2
2
-1
-1
Table 4. Crop yield increments (%) by K application on average in high-yieldingcultivation practices (HP) and current cultivation practices (CP)
Crop K level CP HP Trials number
Maize K1 8.5 13.7 14K2 14.0 15.9 14
Soybean K1 13.9 18.2 6K2 14.4 12.5 6
Wheat K1 9.0 7.1 5K2 15.6 13.6 5
cultivation practices, crop species, yield level etc. When the exchangeable K in the
soil is below the critical value, excessive N fertilization becomes much more
critical because the nutrient cannot be used efficiently and the N loss becomes
much greater. These principles can be used in practice as a guide to best nutrient
management in agricultural ecosystems, especially in intensive rotations.
160 161
0
1000
2000
3000
4000
5000
6000
7000
8000
0 112.5 225.0
N level (kg ha-1
)
Gra
iny
ield
(kg
ha-1
)
K
K
K
0
75
150

Conclusions
The issue of sustainable management of soil K has partly been ignored during
recent decades when the potential environmental impact from agricultural use of
nitrogen and phosphorus has been considered to be a more important problem
(Simonsson et al. 2007). The yield response to K uptake depends to a great extent
on the N supply and the interaction is usually positive. Nitrogen application rate,
timing of application and the form of N supplied influence soil K fixation and
release as well as K uptake, transport, cycling and reutilization within crops.
Optimal N and K favors crop yield and quality as well as stress resistance.
Application of N and K in excess of crop demand does not lead to increases in yield
and may even cause a yield reduction.
Nitrogen-potassium interactions depend on the form of N supply (nitrate,
ammonium or both) and the K and N nutritional levels. Antagonism between NH
and K was always attributed to simple competitive effects due to competition for
binding sites of the respective carriers for their similar charges and hydrated
diameters in the past while there was evidence of mixed-noncompetitive
interactions. Two distinct membrane transport systems for K uptake by plants,
HATS and LATS, have been described. NH inhibited HATS which operates
primarily at low external concentrations (<1mM) of K , while LATS, which
dominates at higher external concentration, is relatively NH insensitive. The
flow and partitioning of K occurring within plants at high mobility can be
modified by the form of N supply. NH nutrition results in more K being
translocated to leaves than occurs with NO supply. This result suggests that good
quality of tobacco with high K concentration can be obtained by combined
application of NH -N with other N forms. Nitrogen-potassium interactions have
been significant in numerous studies and are complicated. The N-K interaction has
been related to soil nutrient status, cultivation practices, crop species, yield level
and the forms of N supplied.
In many intensive agricultural production areas, large amounts of N are
supplied in order to achieve higher crop yields and this has led to low N use
efficiency and serious environmental problems. At present, nitrogen use
efficiency on staple crops such as rice, wheat and maize in China in terms of
recovery N efficiency (RE ) is 27.5% on average (Zhang et al. 2007). Balancing
the NPK ratio by increasing the input of K-fertilizers is a practical way to improve
N agronomic efficiency (Zhu and Chen 2002). If optimum N is applied to plants in
the presence of suitable K level, plant productivity increases which could be due to
increase in N use efficiency of the plants.
It appears that K application can alleviate the N pollution problem by
inducing a high uptake rate of N by crops (Ardjasa et al. 2002; Yang et al. 2006).
The positive interaction of N and K may offer the opportunity for considerable
4
4
4
4
3
4
N
+
+
+
+
+
+
–
+
savings in the cost of N fertilizer and food security for the rapidly expanding
human population. Therefore, N and K fertilizers should be applied with optimal
ratios at the right time and right rate according to the nutrient uptake pattern of the
crops, soil nutrient status, soil texture and climate changes, in order to reach the
target yields with good quality and minimize K and N losses to the environment.A
good understanding of the mechanisms of N-K interactions may serve as a guide to
best nutrient management practice in agriculture. Further studies on N-K
interaction on yield responses, stress resistence, gentypic difference of different
crops, and the mechanims on molecular level should be continued as well as the
adverse impacts to environment.
We thank the International Potash Institute (IPI), the Chinese
Ministry of Agriculture (No. 2006-G60 and No. 200803030) and the Innovative
Group Grant from NSFC (30821003) for financial support. We will give special
thanks to Prof. P. Christie in Queen's University Belfast, UK for his linguistic
revisions.
Abdolzadeh A, Shima K, Lambers H, Chiba K (2008) Change in uptake, transport
and accumulation of ions in (Rosebay) as affected by
different nitrogen sources and salinity.Ann Bot 102:735-746
Alfaro MA, Jarvis SC, Gregory PJ (2003) Potassium budgets in grassland systems
as affected by nitrogen and drainage. Soil Use Manage 19, 89–95
Alfaro MA, Jarvis SC, Gregory PJ (2004) Factors affecting potassium leaching in
different soils. Soil Use Manage 20, 182–189
Alfoldi Z, Pinter L, Feil B (1994) Nitrogen, phosphorus and potassium
concentrations in developing maize grains. JAgron Crop Sci 172: 200-206
Ali AA, Ikeda M, Yamada Y (1991) Effects of the supply of K, Ca, and Mg on the
absorption and assimilation of ammonium-nitrogen and nitrate-nitrogen in
tomato plants. Soil Sci Plant Nutr 37: 283-289
Almodares A, Taheri R, Chung IM, Fathi M (2008) The effect of nitrogen and
potassium fertilizers on growth parameters and carbohydrate contents of
sweet sorghum cultivars. J Envirn Biol 29: 849-852
Amtmann A, Troufflard S, Armengaud P (2008) The effect of potassium nutrition
on pest and disease resistance in plants. Physiol Plantarum 133: 682-691
Ardjasa WS, TomonoriA, HoA, Ken-lchi K, Makoto K (2002) Fate of basal N and
growth of crops cultivated under cassava-based intercropping system with
reference to K application rate. Soil Sci Plant Nutr 48: 365-370
Ashley MK, Grant M, GrabovA(2006) Plant responses to potassium deficiencies:
a role for potassium transport proteins. J Exp Bot 57: 425–436
Ashraf MY, Hussain F,Akhter J, GulA, Ross M, Ebert G (2008) Effect of different
Acknowledgements
References
Nerium oleander
162 163
sources and rates of nitrogen and supra optimal level of potassium fertilization
on growth, yield and nutrient uptake by sugarcane. Grown under saline
conditions. Pak J Bot 40(4): 1521-1531
BelayA, ClaassensAS, Wehner FC (2002) Effect of direct nitrogen and potassium
and residual phosphorus fertilizers on soil chemical properties, microbial
components and maize yield under long-term crop rotation. Biol Fert Soils 35:
420-427
Benbi DK, Biswas CR (1999) Nutrient budgeting for phosphorus and potassium in
a long-term fertilizer trial. Nutr CyclAgroecosys 54: 125-132
Bhuiyan SA, Boyd MC, Dougall AJ, Martin C, Hearnden M (2007) Effects of
foliar application of potassium nitrate on suppression of Alternaria leaf blight
of cotton in northern Australia. Aust Plant Pathol 36:
462-465
Blevins DG, Bamett NM, Frost WB (1978) Role of potassium and malate in nitrate
uptake and translocation by wheat seedlings. Plant Physiol 62:784-788
Brennan RF, Bolland MDA (2007) Influence of potassium and nitrogen fertiliser
on yield, oil and protein concentration of canola ( L.) grain
harvested in south- westernAustralia.Aust J ExpAgr 47(8): 976-983
Brennan RF, Bolland MDA (2009) Comparing the Nitrogen and Potassium
Requirements of Canola and Wheat for Yield and Grain Quality. J Plant Nutr
32: 2008-2026
Britto DT, Kronzucker (2002) NH toxicity in higher plants: a critical review. J
Plant Physiol 159: 567-584
Bruns HA, Ebellhar MW (2006) Nutrient uptake of maize affected by nitrogen and
potassium fertility in a humid subtropical environment. Commun Soil Sci
PlantAnal 37:275-293
Brye KR, Longer DE, Cordell ML, Gbur EE, Pirani AL (2007) Wheat response to
nitrogen under low phosphorus and potassium fertility in a wheat-soybean
production system. Commun Soil Sci PlantAnal 38: 389-402
Cai ZC, Qin SW (2006) Dynamics of crop yields and soil organic carbon in a long-
term fertilization experiment in the Huang-Huai-Hai Plain of China.
Geoderma 136: 708-715
Cakmak I (2005) The role of potassium in alleviating detrimental effects of abiotic
stresses in plants. J Plant Nutr Soil Sci 168: 521-530
Chen JS, MacKenzie AF (1992) Fixed ammonium and potassium as affected by
added nitrogen and potassium in three Quebec soils. Commun Soil Sci Plant
Ana1 23: 1145-1159
Chen Q, Zhang XS, Zhang HY, Christie P, Li XL, Horlacher D, Liebig HP (2004)
Evaluation of current fertilizer practice and soil fertility in vegetable
production in the Beijing region. Nutr CyclAgroecosyst 69: 51-58
Chen X, Zhou J (1999) Effect of potash application patterns on crop yields under
(Gossypium hirsutum)
Brassica napus
4
+
different cultivation systems. Pedosphere 9: 219–226
Chen XQ, Zhou JM, Wang HY, Du CW (2007) Effect of N varieties application
and interaction of N and K fertilizers on rice growth and nutrient uptake.
ChineseAgr Sci Bulletin 23: 376-382 (in Chinese)
Dobermann A, Cassman KG, Sta.Cruz PC, Adviento MA, Pampolino MF (1996)
Fertilizer inputs, nutrient balance, and soil nutrient-supplying power in
intensive, irrigated rice systems. I: potassium uptake and K balance. Nutr
CyclAgroecosyst 46: 1-10
Du ZY, Zhou JM, Wang HY, Du CW, Chen XQ (2007) Effect of NH on
movement and transformation of K in fertilizer microsites in soils. Acta
Pedologica Sinica 44: 492-498 (in Chinese)
Engels C, Kirkby EA(2001) Cycling of nitrogen and potassium between shoot and
roots in maize as affected by shoot and root growth. J Plant Nutr Soil Sci 164:
183-191
Evangelou VP, Blevins RL(1988) Effect of long-term tillage systems and nitrogen
addition on potassium quantity-intensity relationships. Soil Sci Soc Am J 52:
1047-1054
Gething PA (1993) Improving returns from nitrogen fertilizer - the potassium-
nitrogen partnership. 2nd Edition, IPI Research Topics, 13 Switzerland
Greenwood DJ, Stone DA(1998) Prediction and measurement of the decline in the
critical-K, the maximum-K and total cation plant concentrations during the
growth of field vegetable crops.Ann Bot 82: 871-881
Guo SW, Shen QR, Brueck H (2007) Effects of local nitrogen supply on water
uptake of bean plants in a split root system. J Integr Plant Biol 49: 472-480
Guo XS, Zhu HB, Wang WJ,Ye SY, Wu J, Wu LS (2004) Effect of different rates of
nitrogen and potash on yield and quality of cabbage. Plant Nutri Fertil Sci
10(2): 161-166 (in Chinese)
Hagin J, Olsen SR, Shaviv A (1990) Review of interaction of ammonium nitrate
and potassium nutrition of crops. J Plant Nutr 13: 1211–1226
Hirsch RE, Lewis BD, Spalding EP, Sussman MR (1998) A role for the AKT1
potassium channel in plant nutrition. Science 280: 918–921
Hogh-Jensen H (2003) The effect of potassium deficiency on growth and N -
fixation in Physiol Plantarum 119: 440-449
Hombunaka P, Rowell DL (2002) Potassium leaching potential and fertilizer
recommendations for smallholder coffee gardens of Papua New Guinea.
Commun Soil Sci PlantAnal 33: 1767 - 1778
Jalali M (2006) Kinetics of non-exchangeable potassium release and availability
in some calcareous soils of western Iran. Geoderma 135:63-71
Jarvis SC (1987) The effect of low regulated supplies of nitrate and ammonium
nitrogen on the growth and composition of perennial rye grass. Plant Soil
100:99–112
4
2
+
+
Trifolium repens.
164 165

Jarvis SC, Macduff JH, Webb J, Mosquera A (1990) Effect of nitrate supply and
deprivation and/or defoliation on potassium absorption and distribution in rye
grass. J Exp Bot 41:1–10
Jiang F, Li CJ, Jeschke WD, Zhang FS (2001) Effect of top excision and
replacement by 1-naphthylacetic acid on partition and flow of potassium in
tobacco plants. J Exp Bot 52: 2143-2150
Johnston AE, Milford GFJ (2009) Nitrogen and potassium interactions in crops.
The Potash DevelopmentAssociation. PO Box 697,YorkYO32 5WP, UK.
Ju XT, Xing GX, Chen XP, Zhang SL, Zhang LJ, Liu XJ, Cui ZL, Yin B, Christie P,
Zhu ZL, Zhang FS (2009) Reducing environmental risk by improving N
management in intensive Chinese agricultural systems. Proc Natl Acad Sci
USA106: 3041-3046
Kayser M, M ller J, Isselstein J (2007) Potassium leaching from cut grassland and
from urine patches. Soil Use Manage 23: 384-392
Kenan K, Derici RM, Saltal K (1999) The ammonium fixation in great soil groups
of Tokat region and some factors affecting the fixation: 1. The affect of
potassium on ammonium fixation. Turk JAgric For 23: 673–678
Khan MZ, Muhammad S, Naeem MA, Akhtar E, Khalid M (2006) Response of
some wheat ( L.) varieties to foliar application of N & K
under rainfed conditions. Pak J Bot 38: 1027-1034
Kochian LV, Lucas WJ (1982) Potassium transport in corn roots. I. Resolution of
kinetics into a saturable and linear component. Plant Physiol 70: 1723–1731
Kolahchi Z, Jalali M (2007) Effect of water quality on the leaching of potassium
from sandy soil. JArid Environ 68: 624-639
Kronzucker HJ, Szczerba MW, Britto DT (2003) Cytosolic potassium
homeostasis revisited: K-tracer analysis in L. reveals set-
point variations in K1. Planta 217: 540–546
Ladha JK, Dawe D, Pathak H, Padre AT, Yadav RL, Bijay-Singh, Yadvinder-
Singh, Singh Y, Singh P, Kundu AL, Sakal R, Ram N, Regmi AP, Gami SK,
Bhandari AL, Amin R, Yadav CR, Bhattarai S, Das S, Aggarwal HP, Gupta
RK, Hobbs PR (2003) How extensive are yield declines in long-term rice-
wheat experiments inAsia? Field Crop Res 81: 159-181
Lal K, SwarupA, Singh KN (2007) Potassium balance and release kinetics of non-
exchangeable K in a typic natrustalf as influenced by long term fertilizer use
in rice-wheat cropping system.Agrochimica 51:95-104
Linquist BA, Byous E, Jones G, Williams JF, Six J, Horwath W, van Kessel C
(2008) Nitrogen and potassium fertility impacts on aggregate sheath spot
disease and yields of rice. Plant Prod Sci 11: 260-267
Liu JX, Zhang DQ, Zhou GY, Faivre-Vuillin B, Deng Q, Wang CL (2008) CO
enrichment increases nutrient leaching from model forest ecosystems in
subtropical China. Biogeosciences 5: 1783-1795
ü
Triticum aestivum
Hordeum vulgare42
2
Liu YJ, Laird DA, Barak P (1997) Release and fixation of ammonium and
potassium under long-term fertility management. Soil Sci Soc Am J 61: 310-
314
LouéA(1978) The interaction of potassium with other growth factors, particularly
with other nutrients. Proceedings of the 11 Congress of the International
Potash Institute: 407-433
Lu YX, Li CJ, Zhang FS (2005) Transpiration, potassium uptake and flow in
tobacco as affected by nitrogen forms and nutrient level.Ann Bot 95: 991-998
Maathuis FJM (2007) Monovalent cation transporters; establishing a link between
bioinformatics and physiology. Plant Soil 301: 1-5
Maathuis FJM, Sanders D (1997) Regulation of K absorption in plant root cells by
external K : interplay of different plasma membrane K transporters. J Exp
Bot 48: 451–458
Macleod LB (1969) Effects of N, P, and K and their interactions on the yield and
kernel weight of barley in Hydroponic culture.Agron J 61: 26-29
Marschner H (1995) Mineral nutrition of higher plants, 2nd edn. Academic Press,
London
Marschner H, Kirkby EA, Engels C (1997) Importance of cycling and recycling of
mineral nutrients within plants for growth and development. Bot Act
110:265–273
Mohammad F, Naseem U (2006) Effect of K application on leaf carbonic
anhydrase and nitrate reductase activities, photosynthetic characteristics,
NPK and NO contents, growth and yield of mustard. Photosynthetica 44:
471-473
Mondal SS (1982) Potassium nutrition at high levels of N fertilization on rice.
Potash Review 3: 1-4
Mussgnug F, Becker M, Son TT, Buresh RJ, Viek PLG (2006) Yield gaps and
nutrient balances in intensive, rice-based cropping systems on degraded soils
in the Red River Delta of Vietnam. Field Crop Res 98: 127-140
Nakashgir GH (1992) Influence of potassium on nitrogen utilization by maize
under dryland conditions as affected by water storage. Adv Plant Sci 5: 134-
142
Neilsen GH, Neilsen D, Herbert LC, Hogue EJ (2004) Response of apple to
fertigation of N and K under conditions susceptible to the development of K
deficiency. JAm Soc Hortic Sci 129: 26-31
Nieves-Cordones M, Martínez-Cordero MA, Martínez V, Rubio F (2007) An
NH -sensitive component dominates high-affinity K uptake in tomato
plants. Plant Sci 172: 273-280
Noaman MN (2004) Effect of potassium and nitrogen fertilizers on the growth and
biomass of some halophytes grown under high levels of salinity. J Agron 3 :
25-30
th
+
+ +
-
+ +
3
4
166 167

Panaullah G.M, Timsina J, Saleque MA, Ishaque M, PathanABMBU, Connor DJ,
Saha PK, Quayyum MA, Humphreys E, Meisner CA (2006) Nutrient uptake
and apparent balances for rice-wheat sequences. III. Potassium. J Plant Nutr
29: 173-187
Pettersson S (1984) Effects of nitrate on influx, efflux and translocation of
potassium in young sunflower plants. Physiol Plantarum 61:663-669
Pettigrew WT, Heitholt JJ, Meredith Jr WR (1996) Genotypic interactions with
potassium and nitrogen in cotton of varied maturity.Agron J 88, 89-93
Regmi AP, Ladha JK, Pasuquin E, Pathak H, Hobbs PR, Shrestha LL, Gharti DB,
Duveiller E (2002) The role of potassium in sustaining yields in a long-term
rice-wheat experiment in the Indo-Gangetic Plains of Nepal. Biol Fert Soils
36: 240-247
Rengel Z, Damon PM (2008) Crop and genotypes differ in efficiency of potassium
uptake and use. Physiol Plantarum 133: 624-636
Roosta HR, Schjoerring JK (2008) Effects of nitrate and potassium on ammonium
toxicity in cucumber plants. J Plant Nutr 31: 1270-1283
Rui YK, Jiang SL, Zhang FS, Shen JB (2009) Effect of nitrogen fertilizer input on
the composition of mineral elements in corn grain.Agrociencia 43: 21-27
Rupa TR, Srivastava S, SwarupA, Sahoo D, Tembhare B R (2003) The availability
of potassium in Aeric Haplaquept and Typic Haplustert as affected by long-
term cropping, fertilization and manuring. Nutr CyclAgroecosys 65: 1-11
Rupa TR, Srivastava S, Swarup A, Singh D (2001) Potassium supplying power of
a Typic Ustochrept profile using quantity/intensity technique in a long-term
fertilized plot. JAgr Sci 137: 195-203
Santa-Maria GE, Danna CH, Czibener C (2000) High-affinity potassium transport
in barley roots. Ammonium-sensitive and -insensitive pathways. Plant
Physiol 123: 297-306
Scherer HW, Mackown CT, Leggett JE (1984) Potassium-ammonium uptake
interactions in tobacco seedlings. J Exp Bot 35:1060-1070
Simonsson M, Andersson S, Andrist-Rangel Y, Hillier S, Mattsson L, Obom I
(2007) Potassium release and fixation as a function of fertilizer application
rate and soil parent material. Geoderma 140:188-198
Spalding EP, Hirsch RE, Lewis DR, Qi Z, Sussman MR, Lewis BD (1999)
Potassium uptake supporting plant growth in the absence of AKT1 channel
activity. J Gen Physiol 113: 909-918
Stehouwer RC (1993) Potassium adsorption and exchange selectivity within an
anhydrous ammonia fertilizer band. Soil Sci SocAm J 57:346-350
Stehouwer RC, Johnson JW (1991) Soil adsorption interactions of band-injected
anhydrous ammonia and potassium chloride fertilizers. Soil Sci Soc Am J
55:1374-1381
Subasinghe R (2006) Effect of nitrogen and potassium stress and cultivar
differences on potassium ions and nitrate uptake in sugarcane. J Plant Nutr 29:
809-825
Sun HM, Li TL, Xu H, Guo Y, Fan WL (2000) Effect of potassium fertilizers on
yield and quality of tomato under different application of nitrogen fertilizers. J
ShenyangAgr University 31(1): 68-71 (in Chinese)
Szczerba MW, Britto DT, Ali SA, Balkos KD, Kronzucker HJ (2008) NH -
stimulated and -inhibited components of K transport in rice ( L.).
J Exp Bot 59: 3415-3423
Szczerba MW, Britto DT, Kronzucker H (2009) K transport in plants: Physiology
and molecular biology. J Plant Physiol 166: 447-466
Szczerba MW, Britto DT, Kronzucker HJ (2006) Rapid, futile K cycling and pool-
size dynamics define low-affinity potassium transport in barley. Plant
Physiol141: 1494-1507
Topa MA, Jackson WA (1988) Influence of ambient ammonium on net potassium
uptake by decapitated maize seedlings. New Phyto 110:135-141
Tsai CY, Huber DM (1996) Genetic variation of maize hybrids in grain yield
response to potassium and inhibiting nitrification. J Sci Food Agr 70: 263-
270.
Tung PGA, Yusoff MK, Majid NM, Joo GK, Huang GH (2009) Effect of N and K
fertilizers on nutrient leaching and groundwater quality under mature oil palm
in Sabah during the monsoon period.Am JAppl Sci 6: 1788-1799
Vale FR, Jackson WA, Volk RJ (1987). Potassium influx into maize root systems-
influence of root potassium concentration and ambient ammonium. Plant
Physiol 84: 1416-1420
Vale FR, Jackson WA, Volk RJ (1988) Nitrogen-stimulated of potassium influx
into maize roots: Differential response of components resistant and sensitive
to ambient ammonium. Plant Cell Environ 11: 493– 500
Venkatesan S, Ganapathy MNK (2004) Impact of nitrogen and potassium fertiliser
application on quality of CTC teas. Food Chem 84: 325-328
Venkatesan S, Murugesan S, Ganapathy MNK, Verma DP (2004) Long-term
impact of nitrogen and potassium fertilizers on yield, soil nutrients and
biochemical parameters of tea. J Sci FoodAgr 84: 1939-1944
Véry AA, Sentenac H (2002) Cation channels in the Arabidopsis plasma
membrane. Trends Plant Sci 7: 168–175
Wang GY, Li CJ, Zhang FS (2003) Effect of different nitrogen forms and
combination with foliar spraying with 6-benzylaminopurine on growth,
transpiration, and water and potassium uptake and flow in tobacoo. Plant Soil
256: 169-178
Wang MY, Siddiqi MY, Glass DM (1996) Interaction between K and NH :
Effects on ion uptake by rice roots. Plant Cell Environ 19: 1037–1046
Wang XB, Cai DX, Hoogmoed WB, Perdok UD, Oenema O (2007a) Crop residue,
manure and fertilizer in dryland maize under reduced tillage in northern
4
4
+
+
+
+
+ +
Oryza sativa
168 169

China: 1: Rain yields and nutrient use efficiencies. Nutr CyclAgroecosyst 79:
1-16
Wang XB, Hoogmoed WB, Cai DX, Perdok UD, Oenema O (2007b) Crop residue,
manure and fertilizer in dryland maize under reduced tillage in northern
China: II nutrient balances and soil fertility. Nutr Cycling in Agroecosys 79:
17-34
Wang XT, Below FE. (1998). Accumulation and partitioning of mineral nutrients
in wheat as influenced by nitrogen form. J Plant Nutr 21: 49-61
Wells ML, Wood BW (2007) Relationships between leaflet nitrogen: potassium
ratio and yield of pecan. Horttechnology 17: 473-479
Williams JF, Smith SG (2001) Correcting potassium deficiency can reduce rice
stem diseases. Better Crops 1: 7-9
Wu SF, Wu LH, Shi QW, Wang ZQ, Chen XY, Li YS (2007) Effects of a new
nitrification inhibitor 3,4-dimethylpyrazole phosphate (DMPP) on nitrate and
potassium leaching in two soils. J Environ Sci-China 19: 841-847
Xie JC, Zhou JM, Härdter R (2000) Potassium in Chinese agriculture. Hohai
University Press, Nanjing, China (in Chinese)
Xu GH, Wolf S, Kafkafi U (2002) Ammonium on potassium interaction in sweet
pepper. J Plant Nutr 25: 719–734
Yadvinder-Singh, Bijay-Singh, Timsina J (2005) Crop residue management for
nutrient cycling and improving soil productivity in rice-based cropping
systems in the tropics.AdvAgron 85: 269-407
Yang SM, Li FM, Malhi SS, Wang P, Suo DR, Wang JG (2004) Long-term
fertilization effects on crop yield and nitrate nitrogen accumulation in soil in
Northwestern China.Agron J 96: 1039-1049
Yang SM, Malhi SS, Song JJ, Xiong YC, Yue WY, Lu LL, Wang JG, Guo TW
(2006) Crop yield, nitrogen uptake and nitrate-nitrogen accumulation in soil
as affected by 23 annual applications of fertilizer and manure in the rainfed
region of Northwestern China. Nutr CyclAgroecosys 76(1): 81-94
Zhang FS, Cui ZL, Wang JQ, Li CJ, Chen XP (2007). Current status of soil and
plant nutrient management in China and improvement strategies. Chin Bull
Bot 24, 687-694 (in Chinese)
Zhu ZL, Chen DL (2002) Nitrogen fertilizer use in China-Contributions to food
production, impacts on the environment and best management strategies.
Nutr CyclAgroecosys 63: 117-127
Zou CQ, Wang XF, Wang ZY, Zhang FS (2005) Potassium and nitrogen
distribution pattern and growth of flue-cured tobacco seedlings influenced by
nitrogen form and calcium carbonate in hydroponic culture. J Plant Nutr 28:
2145-2157
Zou TX, Dai TB, Jiang D, Jing Q, Cao WX (2006a) Effects of nitrogen and
potassium supply on grain yield and quality in weak gluten wheat. J Triticeae
Crops 26(6): 86-90
Zou TX, Dai TB, Jiang D, Jing Q, Cao WX (2006b) Potassium supply affected
plant nitrogen accumulation and translocation and grain protein formation in
winter wheat (in Chinese). ScientiaAgri Sinica 39(4): 686-692
Zsoldos F, Haunold E, Herger P, Vasfaegyi A (2006) Effects of sulfate and nitrate
on K uptake and growth of wheat and cucumber. Physiol Plantarum 80: 425-
430
+
170 171

Mineral nutrition under salt stress
Anil Kumar Singh Ali Qadar NPS Yaduvanshil l
Abstract Salt-affected (salinity as well as sodicity) soils cover an area of about
831 m ha (> 6 percent of the total ice-free land in the world).About 6.74 million ha
area is affected with salinity and sodicity in India. In addition to osmotic stresses,
plants growing in these soils are exposed to a number of unfavourable conditions
like moisture stress, elemental toxicity, poor soil physical conditions, and
imbalance and deficiency of nutrients. Plant responses to these adverse conditions
are complex and their nutrient requirement may not be same as it is under non-
stress conditions. The relation between salt stress and mineral nutrition of plants is
complex as the activity of nutrient elements is altered because of excess of
potentially toxic ions and antagonistic effects on uptake of each other and pH
induced changes in their solubility and availability. Nitrogen is the most limiting
nutrient in these soils because of low inherent fertility and organic matter, poor
symbiotic N fixation and higher volatilization losses leading to low efficiency of
applied fertilizer-N. Evidence exists which supports that nutrient levels
considered optimal in non–salt stress conditions may be inadequate under salt
stress and 25 percent more N should be applied. Olsen's P in these soils particularly
under sodicity is very high, thus P should not be applied in the initial 3-5 years of
reclamation. Salt stress reduces uptake of P and its accumulation mainly by
reducing its absorption especially under saline conditions. The reduction in P
absorption is attributed to antagonistic effects of Cl .Addition of P(within a certain
range) in several studies not only helped plants in terms of growth and yield, but
also improved the tissue tolerance. Excess of Na and Cl in the medium reduces
uptake of K and NO respectively. Na induced K deficiency is reported and under
that situation, addition of K is likely to be beneficial for growth and yield. Those
crops especially the horticultural crops, which are highly sensitive to Cl toxicity,
are likely to be benefitted by adding more N as NO to offset the effects of Cl on its
uptake. In general, SO salinity of the same EC as that of Cl is less toxic compared
to Cl dominated salinity.
Excess of Na not only reduces Ca availability, its transport and mobility to
growing regions of the plants, but also impairs the integrity of cell membrane
-
3,
3
4
Proceedings IPI-OUAT-IPNI International Symposium (2009)
Anil Kumar SinghIndian Council of Agricultural Research, New Delhi 110012, Indiae-mail : [email protected] Qadar NPS YaduvanshiCentral Soil Salinity Research Institute, Karnal, India
l
172 173

Nitrogen
In one or other form, nitrogen (N) accounts for about 80 percent of the total
nutrients absorbed by the plants (Marschner 1995). Salt stress soils are very low in
organic matter and available N throughout the soil profile. Because of this, most
crops suffer from inadequate N supply. Nitrogen transformations are adversely
affected by high pH and sodicity/salinity. High soil pH coupled with poor physical
conditions also adversely affects the transformations and availability of applied
nitrogenous fertilizers. Martin et al. (1942) reported that threshold pH value for
nitrification of ammonia was 7.1±0.1. They observed that nitrification did occur at
higher pH values but was accompanied by considerable accumulation of nitrites.
NH volatilization can be a pathway through which N is lost from soil-plant system
after the application of nitrogen fertilizers. Ammonium fertilizers are particularly
subjected to volatilization losses if they remain on the surface of a damp but drying
calcareous soil and the fertilizer anion forms an insoluble calcium salt.
Increase in volatilization losses of NH was noticed with a decrease in
solubility of reaction products of NH -N sources with Ca compounds. Jewitt
(1942) observed a loss of 87 percent N from ammonium sulphate applied to a
Barber soil (pH 10.5) in northern Sudan. Similarly, Bhardwaj and Abrol (1978)
observed that 32 to 52 percent of the applied nitrogen was lost through
volatilization in alkali soils. Laboratory and field studies have shown lower losses
3
3
4
+
leading to uncontrolled influx and efflux of several elements. Alkali soils contain
low amounts of DTPAextractable Zn. Due to high pH, ESP, calcium carbonate and
low amounts of organic matter, efficiency of applied Zn fertilizer is much less and
the crops, especially rice, suffer from Zn deficiency. Low efficiency of applied
fertilizers in salt affected soils is due to low uptake of the nutrients because of
antagonistic effects on each other and their impaired utilization and higher losses
of nutrients during the leaching of the salts.
Crop management inland salinity salt-affected soils
Salt affected soils are found in more than 100 countries and it is estimated that
approximately 831 million hectares (mha) are affected world wide, which account
for more than 6percent of the world's total area (Martinez-Beltran and Manzur
2005). Out of these, 397 mha are saline and 434 mha are sodic. More areas are
going out of cultivation where irrigation is not applied judiciously, and
specifically when irrigation water is saline. Of the current 275 mha of irrigated
land about 20 percent (55 mha) is salt affected, which might be up to even 50
percent (Pitman and Lauchli 2004; FAO, 2005). Of the 1,500 mha of dryland
agriculture, 32 mha are salt affected to varying degrees (Ghassemi et al. 1995;
FAO 2008). Secondary salinisation of agricultural land is widespread, particularly
in arid and semiarid environments where irrigation is unavoidable to achieve good
production. At the current level of food supply, the food production needs an
increase of 38 percent by 2025 and 57 percent by 2050 to meet the demand of
growing population (Wild 2003). The area affected by salinity and sodicity in
India is about 6.73 mha (2.96 mha saline and 3.77 mha sodic), and distributed in 15
states (Table 1) (NRSA and Associates 1996). Salt affected soils are spread over
the Indo-Gangetic plains, arid regions and coastal areas. With the expansion of
irrigation, vast acreage of non-saline soils in the canal command areas have been
affected by secondary salinity. Salt affected soils affect agricultural production as
virtually all crops are adversely affected. There are considerable variations among
the different crops and their cultivars to tolerate salt stress (Gupta andAbrol 1990;
Francoise and Mass 1994; Qadar 1995).
In addition to its toxicity, Na also interferes with the uptake of other essential
nutrients like K and Ca. Also high concentration of Na reduces the activity of
many nutrients. In contrast to non-saline conditions, salt affected soils have high
concentrations of Na and Cl ions, which may depress nutrient ion activities and
cause extreme ion ratios of Na : Ca , Na : K , Ca : Mg , Cl : NO , Cl : H PO4 .
The extreme ratios are likely to cause nutritional disorders.
Keywords
Introduction
l l
+
+
+ 2+ + + 2+ 2+ - - - -
3 2
Table 1 State wise distribution of salt affected soils in India (ha)
State Saline Soils Sodic Soils Total
Andhra Pradesh 77598 196609 274207Andaman & Nicobar Isalnds 77000 0 77000Bihar 47301 105852 153153Gujarat 1680570 541430 2222000Haryana 49157 183399 232556Karnataka 1893 148136 150029Kerala 20000 0 20000Madhya Pradesh 0 139720 139720Maharashtra 184089 422670 606759Orissa 147138 0 147138Punjab 0 151717 151717Rajasthan 195571 179371 374942Tamil Nadu 13231 354784 368015Uttar Pradesh 21989 1346971 1368960West Bengal 441272 0 441272Total 2956809 3770659 6727468
Source : NRSA and Associates 1996
174 175
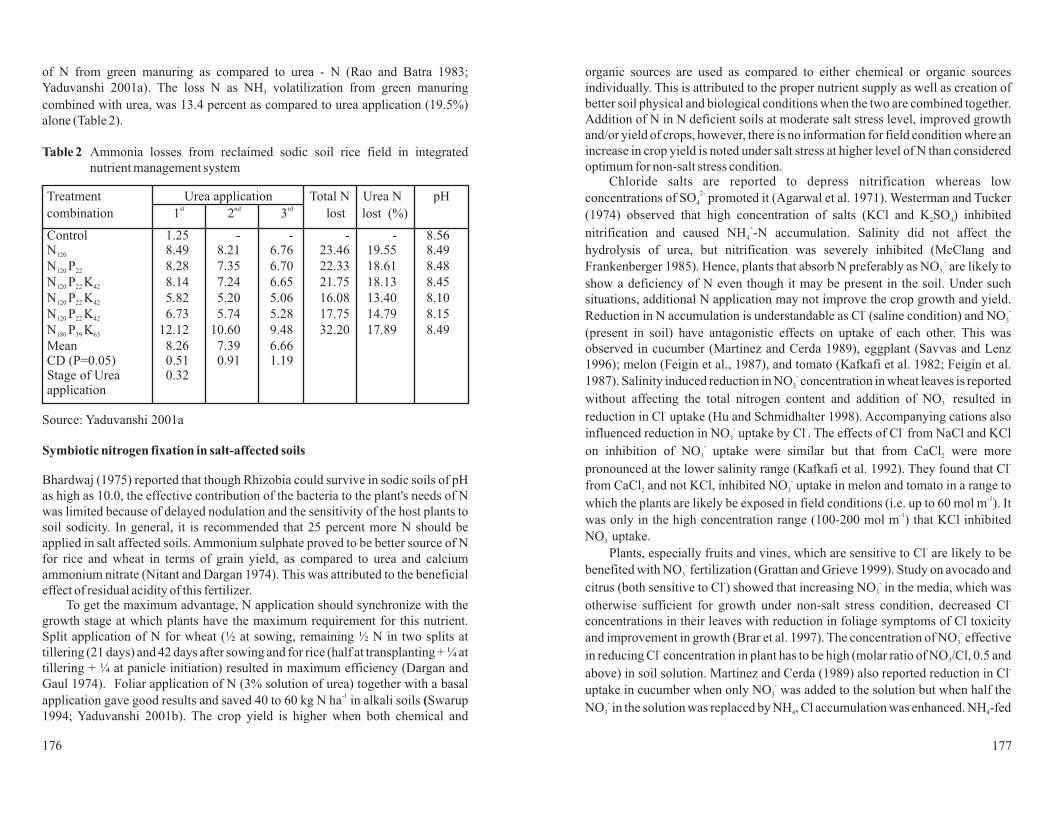
of N from green manuring as compared to urea - N (Rao and Batra 1983;
Yaduvanshi 2001a). The loss N as NH volatilization from green manuring
combined with urea, was 13.4 percent as compared to urea application (19.5%)
alone (Table 2).
Bhardwaj (1975) reported that though Rhizobia could survive in sodic soils of pH
as high as 10.0, the effective contribution of the bacteria to the plant's needs of N
was limited because of delayed nodulation and the sensitivity of the host plants to
soil sodicity. In general, it is recommended that 25 percent more N should be
applied in salt affected soils. Ammonium sulphate proved to be better source of N
for rice and wheat in terms of grain yield, as compared to urea and calcium
ammonium nitrate (Nitant and Dargan 1974). This was attributed to the beneficial
effect of residual acidity of this fertilizer.To get the maximum advantage, N application should synchronize with the
growth stage at which plants have the maximum requirement for this nutrient.
Split application of N for wheat (½ at sowing, remaining ½ N in two splits at
tillering (21 days) and 42 days after sowing and for rice (half at transplanting + ¼ at
tillering + ¼ at panicle initiation) resulted in maximum efficiency (Dargan and
Gaul 1974). Foliar application of N (3% solution of urea) together with a basal
application gave good results and saved 40 to 60 kg N ha in alkali soils Swarup
1994; Yaduvanshi 2001b). The crop yield is higher when both chemical and
3
Table 2 Ammonia losses from reclaimed sodic soil rice field in integrated
nutrient management system
Symbiotic nitrogen fixation in salt-affected soils
(-1
organic sources are used as compared to either chemical or organic sources
individually. This is attributed to the proper nutrient supply as well as creation of
better soil physical and biological conditions when the two are combined together.
Addition of N in N deficient soils at moderate salt stress level, improved growth
and/or yield of crops, however, there is no information for field condition where an
increase in crop yield is noted under salt stress at higher level of N than considered
optimum for non-salt stress condition.Chloride salts are reported to depress nitrification whereas low
concentrations of SO promoted it (Agarwal et al. 1971). Westerman and Tucker
(1974) observed that high concentration of salts (KCl and K SO ) inhibited
nitrification and caused NH -N accumulation. Salinity did not affect the
hydrolysis of urea, but nitrification was severely inhibited (McClang and
Frankenberger 1985). Hence, plants that absorb N preferably as NO are likely to
show a deficiency of N even though it may be present in the soil. Under such
situations, additional N application may not improve the crop growth and yield.
Reduction in N accumulation is understandable as Cl (saline condition) and NO
(present in soil) have antagonistic effects on uptake of each other. This was
observed in cucumber (Martinez and Cerda 1989), eggplant (Savvas and Lenz
1996); melon (Feigin et al., 1987), and tomato (Kafkafi et al. 1982; Feigin et al.
1987). Salinity induced reduction in NO concentration in wheat leaves is reported
without affecting the total nitrogen content and addition of NO resulted in
reduction in Cl uptake (Hu and Schmidhalter 1998). Accompanying cations also
influenced reduction in NO uptake by Cl . The effects of Cl from NaCl and KCl
on inhibition of NO uptake were similar but that from CaCl were more
pronounced at the lower salinity range (Kafkafi et al. 1992). They found that Cl
from CaCl and not KCl, inhibited NO uptake in melon and tomato in a range to
which the plants are likely be exposed in field conditions (i.e. up to 60 mol m ). It
was only in the high concentration range (100-200 mol m ) that KCl inhibited
NO uptake.
Plants, especially fruits and vines, which are sensitive to Cl are likely to be
benefited with NO fertilization (Grattan and Grieve 1999). Study on avocado and
citrus (both sensitive to Cl ) showed that increasing NO in the media, which was
otherwise sufficient for growth under non-salt stress condition, decreased Cl
concentrations in their leaves with reduction in foliage symptoms of Cl toxicity
and improvement in growth (Brar et al. 1997). The concentration of NO effective
in reducing Cl concentration in plant has to be high (molar ratio of NO /Cl, 0.5 and
above) in soil solution. Martinez and Cerda (1989) also reported reduction in Cl
uptake in cucumber when only NO was added to the solution but when half the
NO in the solution was replaced by NH , Cl accumulation was enhanced. NH -fed
4
2 4
4
3,
3
3
3
3
3 2
2 3
3
3
3
3
3
3
3 4 4
2-
+
-
- -
-
-
-
- - -
-
-
-
-1
-
-
-
- -
-
-
-
-
-
-
-1
Treatment Urea application
1 2 3 lost lost (%)
Control 1.25 - - - - 8.56N 8.49 8.21 6.76 23.46 19.55 8.49
N P 8.28 7.35 6.70 22.33 18.61 8.48
N P K 8.14 7.24 6.65 21.75 18.13 8.45
N P K 5.82 5.20 5.06 16.08 13.40 8.10
N P K 6.73 5.74 5.28 17.75 14.79 8.15
N P K 12.12 10.60 9.48 32.20 17.89 8.49
Mean 8.26 7.39 6.66CD (P=0.05)Stage of Ureaapplication
Total N Urea N pH
combination
0.51 0.91 1.190.32
st nd rd
120
120 22
120 22 42
120 22 42
120 22 42
180 39 63
Source: Yaduvanshi 2001a
176 177

maize (Lewis et al. 1989), melon (Feigin 1990) and pea (Speer et al. 1994) plants
showed higher sensitivity to salinity than NO -fed plants when grown in solution
cultures. Specific cations like Ca have also been reported to play a role, e.g.,
addition of Ca to the media improved the growth rate of the plants in the NO
treatment, but not those treated with NH (Lewis et al. 1989). In presence of NO as
the only source of N, K uptake increased in salt-stressed melon and with increase
in NH /NO ratio, the accumulation of Cl increased, but the reverse was true for Ca
and K in the leaves (Adler and Wilcox 1995). Crop responses may not be the same
for the same source of N in different growing conditions. Leidi et al. (1991) and
Silberbush and Lips (1991a, b) reported higher sensitivity of wheat (Triticum
aestivum L.) to salinity as the ratio of NH /NO increased in solution and sand
culture. Contrary to this, wheat grown in soil salinised with NaCl, showed
improved salt tolerance in terms of grain yield under a combination of NH and
NO , than NO alone (Shaviv et al. 1990)
The plant roots largely absorb it as dihydrogen orthophosphate ion (H PO ),
however, under neutral to alkaline environments, it is also taken up as
monohydrogen orthophosphate (HPO ) ion. The high amounts of Na CO and
Na HCO react with native insoluble calcium phosphates to form soluble sodium
phosphate and hence, give a positive correlation between the electrical
conductivity and their soluble P status. Due to high pH and the presence of soluble
carbonates and bicarbonates, water soluble sodium phosphates are formed in these
soils. Sodic soils are reported to contain high amount of soluble phosphorus.
Research conducted at CSSRI revealed lack of response to added phosphorus in
sodic soils during early years after reclamation. However, other studies, indicated
that sodic soils are not always high in available phosphorus and significant
increase in yields of some crops was obtained with application of P fertilizer
When these soils were reclaimed by using amendments and growing rice under
submerged conditions, Olsen's extractable P of surface soil decreased due to its
movement to lower sub-soil layers, uptake by the crop and increased
immobilization (Chhabra et al. 1981; Swarup 1986; 1994). In freshly reclaimed
alkali soils, crops did not respond to application of phosphatic fertilizers in the
initial 3 to 5 years. During this period, continuous cultivation also improved the
soils considerably in the upper 15-cm (pH 8.5-9.0). It was observed that if the
Olsen's P of the surface 15-cm soil falls below 7.5 kg P ha , rice yields may suffer.
Nutrient uptake in rice (a shallow–rooted crop) is dependent on the fertility status
of the surface 30-cm layer, which becomes depleted and start responding to P
fertilization. On the other hand, wheat plants, with a relatively deeper rooting
3
3
4 3
4 3
4 3
4
3 3
2 4
4 2 3
2 3
2
-
-
2-
-1
Phosphorus
.
system, can extract P from the lower layers to meet their needs, therefore, do not
respond to applied P for another 3 to 5 years. Long-term field studies were
conducted on a gypsum amended alkali soil (pH 9.2, ESP 32) with rice wheat and
pearl millet cropping sequence and NPK fertilizer use for 25 years (1974-75 to
1999-2000). Phosphorus application enhanced the grain yield of rice (Yaduvanshi
2003 when Olsen's extractable P in 0-15 cm soil depth had reduced from the initial
level of 33.6 kg ha to 12.7 kg ha , and wheat responded to applied P when
available P came down close to 8.7 kg P ha . Crop responses to applied P were
limited to the application of 11 kg P ha in the initial years of cropping and that too
only to rice crop in a rice-wheat cropping sequence. Subsequently, application of
22 kg P ha significantly improved the rice and wheat yield. Recent studies on
integrated nutrient management showed that continuous use of fertilizer P, green
manuring and FYM to crops significantly enhanced the yield of rice and wheat as
well as improved the available Pstatus of the alkali soils (Yaduvanshi 2000).
The available P status of saline soils is highly variable and does not show any
trend or relation to level of soil salinity. The availability of fertilizer phosphorus in
the soil may be modified by soil salinity due to higher precipitation of added
soluble P (Taylor and Gurney 1965), higher retention of added P by the soil (El
Mahi and Mustafa 1980) and due to antagonistic effect of excess Cl on the P
sorption by the plants (Manchanda and Sharma 1983). Wheat responded
significantly to P application up to 50 kg ha (0, 25, 50 and 75 kg ha ) in terms of
grain yield at the site irrigated with Cl dominated water (EC 15-19 dS m ), but
there was no response to applied P on the SO irrigation water site although the
former (irrigated with Cl dominant water) had more Olsen's P than the latter
(Manchanda et al. (1982). Barley crop irrigated with Cl dominant water also
showed higher requirement of P. It has been generally observed that application of
P fertilizers increased crop yields in saline soils (Singh et al. 1990, 1992). Higher
plant responses to applied phosphorus occurred on moderately saline soils than on
non-saline soils. Manchanda and Singh (1982) and Manchanda and Sharma
(1983) reported that P requirement under SO dominated saline conditions (SO >
70%) was either less or at the most equal to the non-saline soil, whereas in case of
under Cl -dominated salinity (Cl > 70%), it was considerably more than that of the
non-saline soil. Application of P helped rice plants to restrict increase of Na
concentration under salinity (Naheed et al. 2008). Rice genotypes showed higher
requirement of P with increase in sodicity stress (Qadar 1998). Seedlings of
CSR13 and Jaya (moderately tolerant to sodicity) did not show any problem of
survival and growth at pH 8.0, with Olsen's-P 8.5 kg ha but failed to survive at
pH 9.7 and 9.9 where Olsen's-P was 12.5 and 14.8 kg ha , respectively. However,
there was no problem of survival or growth at these sodicity levels when Olsen's-P
was raised to 17.6 and 20.8 kg ha , respectively, and plants attained maturity and
2
4
4 4
2
2
)-1 -1
-1
-1
-1
-1 -1
- -1
—
-
-
-
+
-1
-1
-1
178 179

produced grain (Table 3). CSR10, a sodicity tolerant genotype showed less
response to added P. Plants fertilized with P had less Na , a potentially toxic ion in
the shoot. It is likely that internal plant requirement of P is higher under stress for
restricting uptake of Na at root level and its better regulation at tissues/cellular
+
+
levels (sequestering in the vacuole). This is reflected with higher chlorophyll
contents in the leaves of Pfertilized plants in sodic soil (Table 4) (Qadar andAnsari
2006).Phosphate availability to plants is likely to be reduced in saline soils because
of its reduced activity as a result of increased ionic strength and because phosphate
concentrations in soil solution are tightly controlled by sorption processes and by
the low-solubility of Ca-Pminerals
Most of the plants invariably show a decrease in K concentration under salt stress
and maintenance of adequate levels of K is essential for plant survival in saline
habitats (Marschner 1995). High Na level in the ambient solution surrounding the
roots may disrupt the integrity of root membranes, thus, compromising on their
selectivity. Plants absorb potassium as potassium ions (K ). In general, increasing
soil ESP decreases the K and increases the Na content of the plants. Numerous
studies have shown that K concentration in plant tissues declines with increase in
the levels of salt stress or Na/Ca in the root media leading to high Na/K ratio
(Subbarao et al. 1990; Izzo et al. 1991; Qadar 1991; Perez-Alfocea et al. 1996).
Contrary to these observations, an increase in K levels of the cell sap of bean
leaves were found to be associated with increasing NaCl salinity (Cachorro et al.
1993). Due to high Na and deficiency of Ca, many studies have shown reduced
uptake of K by plants raised in alkali soils (Singh et al. 1981). The antagonistic
effect of Na on uptake of K occurs both under sodicity (CO , HCO
predominant anions) and salinity where Cl and SO are predominant anions
(More and Manchanda 1992; Qadar and Azam 2007). Chickpea and pea shoots
grown in the SO system contained more K than in the Cl system (Manchanda
and Sharma 1989; More and Manchanda 1992). However, absolute K
concentration in the plant tissue is nearly always above the lower critical limit.
Alkali soils in the lndo-Gangetic plains generally contain very high amounts of
available K (Swarup and Chhilla, 1986). Application of K fertilizer to either or
both the crops had no effect on yields of rice and wheat (Swarup and Yaduvanshi
2000). The contribution of the non-exchangeable K towards total potassium
removal was about 94.9 percent in the absence of applied K, which decreased to
69.9 percent with use of K. The decrease was about 50.6 percent with use of K
combined with organic manures (Yaduvanshi 2000). Chhabra (1985) reported that
to correct lower content of K in the plants raised on K rich alkali soils, add
recommended doses of amendments to correct Ca:Na:K balance rather than apply
K fertilizers.
Significant leaching losses of K (3.2 to 8.2 mg K L ) in the drain water
effluents (Swarup 1995), and higher levels of available K into the lower soil depths
Potassium
+
+
+ + 2- -
- 2-
2- -
-1
3 3
4
4
Table 3 Grain yield (g pot ) of three rice genotypes as influenced by fertilization
of sodic soils with Pand alone or in combination
-1
Treatment
kg ha 8.0 9.3 9.7 9.9
K P CSR 10 44.9 28.1 19.7 14.0
CSR 13 59.0 23.7 0.0* 0.0*Jaya 46.7 22.1 0.0* 0.0*
K P CSR 10 44.6 33.3 21.7 15.7
CSR 13 56.6 23.2 0.0* 0.0*Jaya 50.5 22.1 0.0* 0.0*
K P CSR 10 55.9 42.4 34.9 25.0
CSR 13 60.0 50.5 34.5 19.6Jaya 60.2 47.1 38.4 18.5
K P CSR 10 54.7 42.2 33.9 26.3
CSR 13 60.3 46.3 36.1 18.3Jaya 60.9 47.6 37.4 25.4
CD (P=0.01) Fertilizer (F)Sodicity (S)Genotype (G) 1.9 GxS 3.8
Genotype pH
2.2 FxS 4.4 FxGxS 7.62.2 FxG 3.8
2
0
60 0
0 60
60 60
-1
0
* Plants failed to reach maturity, Source: Qadar 1998
Table 4 Total chlorophyll/100 mg kg Na load in top three leaves of rice at pH 9.7
in response to phosphorus and potassium fertilization
-1
2
Leaf Phosphorus fertilization
P P P P P
Flag leaf 2.95 3.80 4.57 4.26 4.71 4.06Next lower leaf 3.12 3.12 4.57 4.22 4.00 3.673rd lower leaf 1.58 1.98 2.81 3.11 3.25 2.55Mean 2.55 2.97 3.87 3.80 3.95
CD (P=0.01) Leaf (L) 0.25, Phosphorus levels (P) 0.32CD (P=0.05) LxP 0.47
Mean
0 20 40 60 80
Source: Qadar and Ansari 2006
180 181

indicated continuous movement of native and applied K from the surface to the
lower layers and even beyond the effective root zone causing deficiency of
available K in surface layer of saline soils under sub surface drainage system.
Sodium toxicity may be more common in saline soils than in alkali soils. Wheat
responded to K up to 90 kg K O ha in saline sodic (ECe 5.31 dS m , pHs 8.56)
under field conditions both in terms of growth and yield, which had 118 mg L
extractable K (Mehdi et al. 2007). Very limited information is available on added
K in alleviating the adverse effects of salt stress on crops under field conditions.
Sulphur is a secondary nutrient, but in most of the studies where response of crops
to SO and Cl dominated salinities were examined, nutritional aspect of sulphur
was often overlooked. Not much attention has been given to the influence of
salinity on the uptake of sulphur and its accumulation in crops. More and
Manchanda (1992) compared the effects of both chloride and sulphate salinity on
pea and reported that chloride-salinity reduced the sulphur content in the straw.
Sulphur accumulation in the roots, however, was enhanced by Cl-salinity. Crops
sensitive to Cl dominated salinity are invariably unable to tolerate high Cl
concentrations at cellular level, and when compared to their response to Cl-
salinity and SO - salinity showed better tolerance to the latter condition. This has
led to the suggestion that for most of the vegetable crops salt-tolerance would be 2
dS m greater in a sulphate system as opposed to chloride system (Bernstein
1962).
Plants absorb calcium as Ca ions. It is most abundant in plant available forms in
the soil. It is important for the growth of meristems and functioning of the root tips.
Besides being structural component of the cell, Ca plays a vital role in regulating
many physiological processes that influence both growth and development and
also responses to abiotic stresses including salt stress. Its importance in
maintaining the structural and functional integrity of cell membrane, stomatal
function, cell division, cell wall synthesis, translocation, direct or signaling roles
in systems involved in plant defense, repair from biotic and abiotic stress and rates
of respiratory metabolism are well known (Marschner 1995; McLaughlin and
Wimmer 1999). Cachorro et al. (1994) reported that addition of calcium to the
saline media increased root membrane integrity of bean and minimized leakage of
NO and H PO . The alkali soils are deficient in both soluble and exchangeable Ca,
and excess of soluble and exchangeable Na further aggravates its availability to
plants. Mehrotra and Das (1973) reported that crops which have a narrower Ca:Na
2
4
4
3 2 4
-1 -1
-1
2- -
- -
-1
2+
Sulphur
Calcium
ratio under normal soil conditions are relatively more tolerant to alkalinity than
those that have a broader ratio. Under high levels of salt stress, Ca uptake and
transport to all organs is significantly reduced. As Na readily displaces Ca from
its extracellular binding sites, Ca could be seriously reduced especially at low
Ca :Na ratio (Cramer et al. 1988). Addition of Ca alleviated the adverse effects
of NaCl stress on bean plants (LaHaye and Epstein 1971). Bean plants subjected to
a NaCl concentration about one tenth that of seawater for one week suffered no
damage if the Ca concentration of the nutrient solution was 1 mmol L or higher.
But at lower calcium concentrations the damagewas severe and apparently due to
a massive breakthrough of Na into the leaves. Low Ca :Na ratio in the media also
causes significant morphological and anatomical changes and Ca deficiency in
general, can impair the selectivity and integrity of cell membrane causing passive
accumulation of Na in plant (Cramer and Nowak 1992). Elevated external Ca
also inhibits Na -induced K efflux through outwardly directed, K -permeable
channels. NaCl-induced K efflux was partially inhibited by 1 mmol Ca and fully
prevented by 10 mmol Ca (Shabala et al. 2006). Calcium was found to be
effective at reducing the transport of both Na and Cl from roots to leaves in citrus
grown under saline conditions, thereby, alleviating foliar injury and/or defoliation
(Banuls et al. 1991; Zekri and Parsons 1992; Zekri 1993; Banuls et al. 1997).
Calcium appeared to offset damage to blueberry shoots salinized with Na SO , but
not with NaCl (Wright et al. 1992; 1993; 1994). Salinity (NaCl) adversely affected
water transport properties of maize primary roots by NaCl-induced morphological
and anatomical changes (Evlagon et al. 1990; Neumann et al. 1994). Added Ca
tended to reverse or prevent these changes and mitigated reductions in root
hydraulic conductivity Azaizeh and Steudle 1991; Azaizeh et al. 1992; Neumann
et al. 1994). Amendments like gypsum, phospho-gypsum and press-mud are most
commonly used. Since all alkali soils are calcareous in nature, use of acids like
H SO4, or acid forming materials like pyrites (FeS ) and elemental S are also
helpful in solublising the native CaCO and thus meet the Ca needs of plant and
soil. The availability of Ca from applied CaSO depends upon the soil ESP, root
CEC, and plant species. Poonia and Bhumbla (1972) using Ca reported that 31
percent of Ca in Sesbania aculeata (high root CEC) was contributed by the added
CaSO while in Zea mays (low root CEC) it was only 17 percent. Addition of
organic matter in the form of FYM, press-mud, poultry manure, paddy and wheat
straw, and green manure through Sesbania all help in solublising native CaCO and
thus improve the soil. Decomposition of organic matter under anaerobic
conditions helps in increasing pCO and production of acids and acidic products,
which increase the solubility of native CaCO . Addition of amendments is a pre-
requisite for getting good stand of the crop, reduce toxicity of Na, and meet Ca
needs of plants.
2+
+ 2+
2+
2+ + 2+
2+ -1
+ 2+ +
2+
+ 2+
+ + +
+ 2+
2+
+ -
2+
45
2 4
2 2
3
4
4,
3
2
3
(
182 183

Sodium
Zinc
Sodium is a predominant cation both in saline and sodic soils. It is considered to be
non-essential in plant system and its excess uptake creates problem of Na toxicity.
One of the best strategies is to restrict its uptake when plants are growing in saline
sodic soils. Its sequestration in the vacuoles not only avoids its interference with
the normal metabolic activity leading to its toxicity but also serves as a beneficial
osmolyte. Nevertheless, sodium is the principal electrolyte in the plant system.
Many halophytic plants can utilize Na under conditions of limited availability for
non-K specific functions ( Subbarao et al. 1999, 2000). Glycophytic plants such as
beets, celery, turnip and spinach, which are natrophilic in nature could be better
suited for cultivation in salt affected soils. Many C plants species like Atriplex
vesicaria, A. tricolour, A. amnicola, Kochia childsii and Panicum miliaceum
require Na for optimum growth (Qadar 1992; Marschner 1995). However, other C
species like sorghum, maize, and sugarcane do not show such a response to Na
(Ohnishi et al. 1990)
Solubility of micronutrients like Zn, Fe, Mn, Cu and Mo in saline and sodic soils is
low and plants often experience deficiencies of these elements (Page et al. 1990).
There is a 100-fold decrease in solubility of Zn per unit increase in pH (Lindsay
1972). The availability of most of the micronutrients to plants depends on pH and
pE (negative logarithm of the activity of electron). Plants absorb zinc as Zn . Most
of the alkali soils contain high amount of total Zn (40 to 100 mg Zn kg soil) and
most of this is in an insoluble form and its solubility is influenced by pH and
presence of CaCO . Generally, sodic soils contain less than 0.6 mg
DTPA–extractable Zn kg soil (Singh et al. 1984). A negative correlation was
observed between extractable Zn and pH as well as CaCO content of the soil
(Mishra and Pandey 1976). The solubility of Zn in alkali soils is dependent by the
solubility of Zn(OH) and ZnCO , which are the immediate reaction products
(Dhillon et al. 1975). The higher Zn extractability at high ESP was attributed to the
formation of sodium zincate, which is soluble. On addition of amendments, the
extractability of added Zn decreased (Singh et al. 1984) due to greater adsorption
of Zn by Ca-than by Na saturated soil, retention of added Zn on the surface of
freshly precipitated CaCO formed as a result of reaction between soluble
carbonates and added gypsum, and enhanced competition of added Ca with Zn for
the DTPA ligands during extraction. Shukla et al. (1980) observed that Zn
adsorption in soils saturated with various cations was of the order of H < Ca < Mg <
K < Na.
Efficiency of applied fertilizer Zn depends upon the degree of amelioration
4
4
3
3
2 3
3
2+
-1
-1
brought about in the alkali soils. When the recommended doses of amendments are
added to the soil, 10 to 20 kg ZnSO ha is enough to get optimum yields of crops.
At low level of gypsum application, the plants suffer more due to excess of Na and
deficiency of Ca and become incapable of utilizing absorbed Zn. As a result, the
crop suffers and results in poor yields (Singh et al. 1987). It has been observed that
on soils containing 1 mg kg of DTPA-extractable Zn, it is enough to apply Zn
only to rice crop in the rice-wheat cropping sequence (Chhabra et al. 1976). Best
results are obtained when ZnSO is added along with other fertilizers as a basal
dose. With the application of FYM and Sesbania green manure, it was possible to
prevent the occurrence of Zn deficiency in rice grown on alkali soils (Sawrup
1991). Organic amendments like pressmud, poultry manure and farmyard manure
could effectively supply zinc from the native and applied sources to rice crop in a
saline sodic soil (Milap Chand et al. 1980). Zinc applications improved growth of
salt-stressed tomato plants (El-Sherif et al. 1990).
Solubility of Fe in saline and sodic soils is low and plants often suffer deficiency of
this element in salt affected soils (Page et al. 1990). The alkali soils are rich in total
Fe but are generally poor in water-soluble plus exchangeable and reducible forms
of Fe (Swarup 1989). There exists a negative relationship between pH and Fe-Mn
availability. Soluble Fe-salts when applied to alkali soils are rendered unavailable
because of rapid oxidation and precipitation, consequently their recovery by soil-
test methods is very low (Swarup 1981). Since iron solubility is conditioned by
pH, CaCO , oxidation status of the soil and the amount of organic matter, it is not
the total-Fe but the available-Fe that is a limiting factor in alkali soils. Correction
of iron deficiency using soluble salts as FeSO is generally not effective unless it is
accompanied by changes in the oxidation status of the soil brought about by
prolonged submergence and addition of easily decomposable organic matter
(Katyal and Sharma 1980). Foliar application of Fe (3% solution of FeSO ) gave a
limited relief to the suffering crop and must be used to supplement the
improvement in reduction status of the soil. Results available on Fe concentration
in plants growing under salt stress are as inconsistent as those for Zn
concentration. The concentration of Fe in the shoots of pea (Dahiya and Singh
1976), tomato, soybean (Glycine max (L.)), squash (Maas et al. 1972) and
lowland-rice (Verma and Neue 1984) increased, but its concentration decreased in
the shoots of barley and corn under salinity (Hassan et al. 1970a; b). Iron nutrition
does not seem to be a problem in paddy in sodic soils as anaerobic conditions
favour reduction of Fe to Fe form. However, considerable variations existed
among the genotypes in their Fe concentrations in the shoot (Qadar 2002).
4
4
3
4
4
-1
-1
3+ 2+
≥
Iron
184 185

Manganese
Boron
The solubility and availability of Mn in soil is also affected by pH and oxidation-
reduction status of the soil. The alkali soils are rich in total Mn but are generally
poor in water-soluble plus exchangeable and reducible forms of Mn (Swarup
1989). Deficiency of Mn is seldom a problem for wetland rice, while it can become
a serious limiting factor for subsequent crops like wheat, because on submergence
Mn gets reduced and is leached to the lower layers (Chhabra 1996).As a result, Mn
deficiency is increasingly being observed in wheat grown in rice-wheat cropping
system on coarse textured alkali soils. Due to oxidation of Mn, it is very difficult to
correct Mn deficiency by soil application of MnSO and repeated spray of MnSO
is needed to make up the deficiency of this element in upland crops. Adoption of
rice-wheat system for more than two decades on gypsum-amended alkali soils
resulted in decline of the DTPA- extractable Mn to a level of 2.7 mg kg and in
those conditions wheat responded to MnSO application at a rate of 50 to 100 kg
ha (Soni et al. 1996). Substantial leaching losses of Mn occurs following gypsum
application in alkali soils (Sharma andYadav 1986). In a study with rice genotypes
for their tolerance to sodicity and Zn deficiency stresses, an increase in Mn
concentration was found under sodic conditions (Qadar 2002).
Salinity-induced Mn deficiency is reported in barley (Hordeum vulgare L.)
shoots and Mn additions to solution cultures increased its salt-tolerance (Cramer
and Nowak 1992). Salinity caused reduction in Mn concentration in shoot tissues
of corn (Izzo et al. 1991; Rahman et al. 1993) and tomato (Alam et al. 1989).
Contrary to these, Mn concentration in sugarbeet shoot increased with salinity
(Khattak and Jarrell 1989) which is probably because of increased plant available
Mn in saturated soil as a result of added salt (NaCl, CaCl ). Manganese and Zn
concentrations also increased in rice (Verma and Neue 1984) under salinity stress,
but decreased in corn (Hassan et al. 1970b).
Boron is considered to be absorbed passively as H BO . Its toxicity rather than
deficiency is expected in sodic soils as its availability increases with increase in
soil pH and ESP. Kanwar and Singh (1961) observed a positive correlation
between water-soluble B and pH as well as EC of soils. Uncultivated alkali soils in
Haryana and Punjab are reported to have hot water extractable B up to 25 mg kg in
0-15 cm (Bhumbla et al. 1980). In addition of leaching, B hazards in alkali soils
can be minimized by addition of gypsum. From a laboratory study, Gupta and
Chandra (1972) reported a marked reduction in water soluble B together with pH
and SAR, on addition of gypsum to a highly alkali soil. At high pH/ESP, boron is
present as highly soluble sodium metaborate, which upon addition of gypsum is
4 4
4
2
3 3
-1
-1
-1
converted into relatively insoluble calcium metaborate. The solubility of calcium
metaborate is very low around 0.4 percent as compared to 26 to 30 percent of
sodium metaborate.
Although high boron and high salinity occur in many parts of the world, very
little research has been done to study their interactions (Ferreyra et al. 1997) and
results are often contradictory. Some research showed increased tolerance of
plants to B with increased salinity (Yadav et al. 1989; Holloway and Aston 1992;
Grattan et al. 1996; Ferguson et al. 2002). However, decreased tolerance to B in the
presence of salinity stress has also been reported (Grieve and Pass 2000;Alpasalan
and Gunes 2001; Wimmer et al. 2003, 2005). The differences in results were
because of plant/crop types or varieties, composition of salts used for salt stress,
environmental conditions and external pH. Mehmood et al. (2009) reported
increased growth and yield of rice in saline sodic conditions with B application up
to 1.5 kg B ha and this beneficial effect was due to reduced concentration of Na
and Cl in the shoot.Application of 6.0 kg B ha had adverse effects on growth and
yield.
Negative responses of many field grown crops to high levels of B in irrigation
water, were reduced when grown under salinity (achieved using mixture of salts)
(Ferreyra et al. 1997). In other studies, using a mixture of chloride and sulphate
salts, El-Motaium et al. (1994) reported salinity induced reduction in B uptake and
accumulation in the stem of several Prunus rootstocks thereby decreasing B
toxicity symptoms. As there was a negative relationship between B and SO
concentration in tissues, it was suggested that SO could be responsible for the
salinity–induced reduction of B in Prunus. However in neither study, the
investigators were able to suggest the actual mechanism that supports this
phenomenon such as direct ion interactions, reduced transpiration in salt-stressed
conditions or both. The absorption of B is reduced from this substrate having high
Ca particularly under calcareous conditions, which can induce B deficiency
(Gupta et al. 1985). Therefore, it is difficult to distinguish the effect of SO and Ca
on uptake of B and its transport to shoot where a mixture of salts having both were
used to achieve the desired salinity levels (Yadav et al. 1989; El-Motaium et al.
1994). Salinity also influenced the sub-cellular distribution of B cations and
proteins in basal and apical sections of wheat. High B supply increased B
concentration in all leaf parts, but was below 25 mg B kg (on dry weight basis) in
basal sections, whereas it exceeded 600 mg B kg (on dry weight basis) in leaf tips.
In basal leaf sections, intercellular soluble B concentration was double than
intracellular concentrations of B (soluble) indicating some retention of excess B in
the apoplast. Combined salinity and B toxicity stresses significantly increased
soluble B concentrations in inter and intracellular compartments of basal leaf
sections in comparison with either of the stresses occurring alone (Wimmer et al.
2003).
-1 +
- -1
2-
2-
-1
-1
4
4
4
186 187
Molybdenum and Copper
Conclusions
Sodic soils contain high amounts of available Mo since its solubility increases
with soil pH. Forage crops grown on these soils were found to contain high Mo
concentrations that could cause toxicity to the animals, referred to as
“Molybdenosis”. Application of gypsum decreased Mo in plants due to the
antagonistic interaction of SO released from the applied gypsum with Mo
absorption. However, application of gypsum also reduces the pH of the soil thus
affecting solubility of Mo. Not much information is available on effect of salt
stress on Mo and Cu concentration in plants. Salinity resulted in increased Mo
concentrations in maize when the crop was grown in soil (Rahman et al. 1993), but
there was no effect of salinity on Mo uptake from solution culture (Izzo et al.
1991). Likewise, the effect of salinity on Cu accumulation was also variable
depending on the crop. Its concentration decreased in the leaf and shoot of maize
grown either in salt-stressed soil (Rahman et al. 1993) or in saline solution cultures
(Izzo et al. 1991) but in tomato, leaf Cu substantially increased in NaCl saline
nutrient solution.
Plants/crops growing in salt affected soils are exposed to a number of unfavorable
conditions like moisture stress, element toxicity, poor soil physical conditions,
nutrients imbalance and their deficiency. Plants responses to these adverse
conditions are complex and their requirement of different nutrients may not be
same under salt stress conditions compared to that of non-stress. The relationships
between salt stress and mineral nutrition of plants are equally complex as activity
of nutrient elements is altered because of excess of potentially toxic ions (Na , Cl ,
SO , CO , and HCO ) present in salt affected soils. These ions cause toxicity in
plants after their uptake, and also have antagonistic effects on uptake of other
nutrient elements like K, N, and P. pH induced changes in the solubility and
availability of nutrients is another important factor. Salt affected soils have
inadequate levels of some of the nutrients like N, whereas, availability of others
such as Zn may be very low. A good number of published results both under
controlled as well as field conditions, have shown that improving the soil
nutritional status helped plants to grow and yield better under salt stress. However,
in some of the reports increased application of nutrients (N, P, and K) did not
produce the desired results, which is likely to be because of differences in growing
conditions, level of salt stress, crops and their varieties used in the study. The
present paper has focused on one of the major reasons for the aggravation of the
adverse effects of salt stress on plant growth and yield because of inadequate
supply of mineral nutrients, namely, nitrogen, phosphorus, potassium, calcium
4
4 3 3
+ -
2– 2- -
and zinc. To get the maximum advantage from the applied mineral nutrients, they
must be given in the right quantity, at the appropriate time and place, from a proper
source and in the right combination. Nutrient application should synchronize with
the growth stage of the plants when the requirement of nutrient is maximum. This
is true for any situation, but more important under stress environment as adequate
level of nutrients may alleviate, to some extent, the adverse effects of salinity and
sodicity. Crops especially the horticultural crops, which are highly sensitive to Cl
toxicity are likely to be benefited by adding more N as NO to offset the adverse
effects of Cl on its uptake. Similarly, Na induced Ca deficiency or K in plants
could be corrected by adding Ca and K as nutrients
The above review has resulted in the identification of several gaps in addition
to the need for systematic studies dealing with physiological aspects and
interactions when multiple nutrient deficiencies occur under field conditions.
Some of the issues need to be focused on are: (a) generating resource inventories
on waterlogged and salt affected soils, and poor quality waters for appropriate land
use planning, (b) improving the nutrient use efficiency, which is low in salt
affected soils, (c) minimising the dependence on inorganic fertilizers, as the raw
materials for their production are not infinite, (d) sustaining the productivity in
post-reclamation phase in relation to soils and water quality vis-à-vis organic
matter dynamics and carbon sequestration, and (e) breeding / developing /
identifying varieties having higher nutrient use efficiency as well as tolerance to
salt with the long term objective of multiple stress tolerance.
Adler PR, Wilcox GE (1995) Ammonium increases the net rate of sodium influx
and partitioning to the leaf of muskmelon. J Plant Nutri 18: 1951-1962
Agarwal AS, Singh BR, Kanehiro Y (1971) Ionic effect of salts on mineral
nitrogen release in anAlophanic soil. Soil Sci SocAm Proc 35: 454-457
Alam SM, Naqvi SSM, Azmi AR (1989) Effect of salt stress on growth of tomato.
Pakistan J Sci Indust Res 32: 110-113
Alpasalan M, GunesA(2001) Interactive effects of boron and salinity stress on the
growth, membrane permeability and mineral composition of tomato and
cucumber plants. Plant Soil 236:123-128
Azaizeh H, Gunse B, Steudle E (1992) Effects of NaCl and CaCl on water
transport across root cells of maize ( L.) seedlings. Plant Physiol 99:
886-894
Azaizeh H, Steudle E (1991) Effects of salinity on water transport of excised
maize ( L.) roots. Plant Physiol 97: 1136-1145
Banuls J, Legaz F, Primo-Millo E (1991) Salinity-calcium interactions on growth
and ionic concentration of citrus plants. Plant Soil 133: 39-46
-
-
3
2
References
Zea mays
Zea mays
188 189

Banuls J, Serna MD, Legaz F, Talon M, Primo-Millo E (1997) Growth and gas
exchange parameters of citrus plants stressed with different salts. J Plant
Physiol 150: 194-199
BarY,ApelbaumA, KafkafiA, Goren R (1997) Relationship between chloride and
nitrate and its effects on growth and mineral composition of avocado and
citrus plants. J Plant Nutri 20: 715-731
Bernstein L (1962) Salt-affected soils and plants. In: Problems of the arid zones.
Proc 18 UNESCO Symposium, Paris, France, pp 139-174
Bhardwaj KKR (1975) Survival and symbiotic characteristics of Rhizobium in
saline- alkali soils. Plant Soil 43: 377-385
Bhardwaj KKR, Abrol IP (1978) Nitrogen management in alkali soils. Proc Natn
Symp on NitrogenAssimilation and Crop Productivity. Hisar, India. pp 83-96
Bhumbla DR, Chhabra R, Abrol IP (1980) Distribution of boron in alkali soils.
Ann Rep. CSSRI, Karnal, India
Cachorro P, Ortiz A, Cerda A (1993) Growth, water relations and solute
composition of L. under saline conditions. Plant Sci 95:
23-29
Cachorro P, Ortiz A, Cerda A (1994) Implications of calcium nutrition on the
response of L. to salinity. Plant Soil 159: 205-212
Chhabra R (1985) Crop responses to phosphorus and potassium fertilization of a
sodic soil.Agron J 77: 699-702
Chhabra R (1996) Soil salinity and water quality. Oxford & IBH, New Delhi
Chhabra R, Abrol IP, Singh MV (1981) Dynamics of phosphorus during
reclamation of sodic soils. Soil Sci 132: 319-324
Chhabra R, RingoetA, Lamberts D (1976) Kinetics and interaction of chloride and
phosphate absorption by intact tomato plants (
Mill) from a dilute nutrient solution. Z Pfianzenphysiol 78: 253-261
Cramer GR, Epstein E, Lauchli A (1988) Kinetics of root elongation of maize in
response to short-term exposure to NaCl and elevated calcium concentration.
J Expt Bot 39: 1513-1522
Cramer GR, Nowak RS (1992) Supplemental manganese improves the relative
growth, net assimilation and photosynthetic rates of salt-stressed barley.
Physiol Plant 84: 600-605
Dahiya SS, Singh M (1976) Effect of salinity alkalinity and iron application on the
availability of iron, manganese, phosphorus and sodium in pea (
L.) crop. Plant Soil 44: 697-702
Dargan KS, Gaul BL (1974) Optimum nitrogen levels for dwarf varieties of paddy
in semi-reclaimed alkali soils. Fertil News 19: 24-25
Dhillon SK, Sinha MK, Randhawa NS (1975) Chemical equilibria and Q/I
relationship of zinc in selected alkali soils of Punjab. J Indian Soc Soil Sci 23:
38-46
El-Mahi YE, Mustafa HA (1980) Effects of electrolyte concentration and sodium
th
Phaseolus vulgaris
Phaseolus vulgaris
Lycopersicom esculentum
Pisum
sativum
adsorption ratio on phosphate retention by soils. Soil Science 130: 321-325
El-Motaium R, Hu H, Brown PH (1994) The relative tolerance of six prunus
rootstocks to boron and salinity. JAm Soc Horticul Sci 119: 1169-1175
El-Sherif AF, Shata SM, Youssef RA (1990) Response of tomato seedlings to zinc
application under different salinity levels I: Dry matter, Ca, Mg, K and Na
content Egyp J Hort 17: 131-142
Evlagon D, Ravina I, Neumann P(1990) Interactive effects of salinity and calcium
on hydraulic conductivity, osmotic adjustment, and growth in primary roots
of maize seedlings. Israel J Bot 39: 239-247
FAO (2005) Global network on integrated soil management for sustainable use of
salt affected soils. Rome, Italy. FAO Land and Plant Nutrition Management
Service. http://www.fao.org./ag/agl/agll/spush/
FAO (2008) GM and Saline Tolerant Crops. http://www.fao.org./ag/agl/agll/spush
Feigin A (1990) Interactive effects of salinity and ammonium/nitrate ratio on
growth and chemical composition of melon pants. J Plant Nutri 13: 1257-
1269
Feigin A, Rylski I, Meiri A, Shalhevet J (1987) Response of melon and tomato
plants to chloride-nitrate ratios in saline nutrient solutions. J Plant Nutri 10:
1787-1794
Ferguson L, Poss JA, Grattan SR, Grieve CM, Wang D, Wilson C, Donovan TJ,
Chao CT (2002) Pistachio rootstocks influence scion growth and ion relations
under salinity and boron stress. JAm Soc Hort Sci 127: 194-199
Ferreyra R,AljaroA, Ruiz R, Rojas L, Oster JD (1997) Behavior of 42 crop species
grown in saline soils with high boron concentrations. Agricul Water Manage
34: 111-124
Francoise LE, Maas EV (1994) Crop response and management on salt affected
soils. In: Pessarakli M (ed) Handbook of plant and crop stress. Marcel
Dekker, NewYork, pp 149–181
Ghassemi F, Jackeman AJ, Nix HA (1995) Salinisation of land and water
resources: Human causes, extent, management and case studies. CABI,
Wallingford, UK
Grattan SR, Grieve CM (1999) Mineral nutrient acquisition and response by pants
grown in saline environments. In: Pessarakli M (ed) Handbook of plant and
crop stress, 2 edn. Marcel Dekker, NewYork, pp 203-229
Grattan SR, Shannon MC, Grieve CM, Poss JA, Suarez DL, Francoise LE (1996)
Interactive effects of salinity and boron on the performance and water use of
eucalyptus.Acta Hort 449: 607-613
Grieve CM, Poss JP (2000) Wheat response to interactive effects of boron and
salinity. J Plant Nutr 23: 1217-1226
Gupta IC, Chandra H (1972) Effect of gypsum in reducing boron hazard of saline
irrigation waters and irrigated soil.AnnArid Zone 11: 228-230
Gupta RK,Abrol IP (1990) Salt affected soils: Their reclamation and management
.
nd
190 191
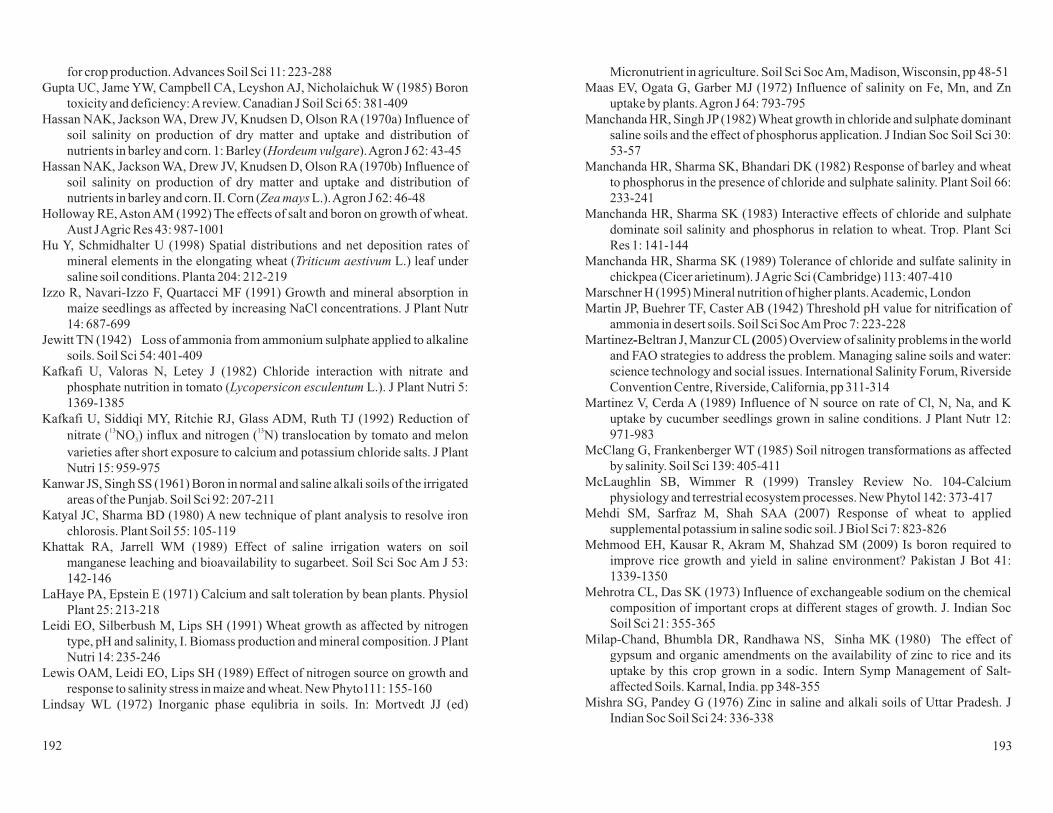
for crop production.Advances Soil Sci 11: 223-288
Gupta UC, Jame YW, Campbell CA, Leyshon AJ, Nicholaichuk W (1985) Boron
toxicity and deficiency:Areview. Canadian J Soil Sci 65: 381-409
Hassan NAK, Jackson WA, Drew JV, Knudsen D, Olson RA (1970a) Influence of
soil salinity on production of dry matter and uptake and distribution of
nutrients in barley and corn. 1: Barley ( ).Agron J 62: 43-45
Hassan NAK, Jackson WA, Drew JV, Knudsen D, Olson RA (1970b) Influence of
soil salinity on production of dry matter and uptake and distribution of
nutrients in barley and corn. II. Corn ( L.).Agron J 62: 46-48
Holloway RE,AstonAM (1992) The effects of salt and boron on growth of wheat.
Aust JAgric Res 43: 987-1001
Hu Y, Schmidhalter U (1998) Spatial distributions and net deposition rates of
mineral elements in the elongating wheat ( L.) leaf under
saline soil conditions. Planta 204: 212-219
Izzo R, Navari-Izzo F, Quartacci MF (1991) Growth and mineral absorption in
maize seedlings as affected by increasing NaCl concentrations. J Plant Nutr
14: 687-699
Jewitt TN (1942) Loss of ammonia from ammonium sulphate applied to alkaline
soils. Soil Sci 54: 401-409
Kafkafi U, Valoras N, Letey J (1982) Chloride interaction with nitrate and
phosphate nutrition in tomato ( L.). J Plant Nutri 5:
1369-1385
Kafkafi U, Siddiqi MY, Ritchie RJ, Glass ADM, Ruth TJ (1992) Reduction of
nitrate ( NO ) influx and nitrogen ( N) translocation by tomato and melon
varieties after short exposure to calcium and potassium chloride salts. J Plant
Nutri 15: 959-975
Kanwar JS, Singh SS (1961) Boron in normal and saline alkali soils of the irrigated
areas of the Punjab. Soil Sci 92: 207-211
Katyal JC, Sharma BD (1980) A new technique of plant analysis to resolve iron
chlorosis. Plant Soil 55: 105-119
Khattak RA, Jarrell WM (1989) Effect of saline irrigation waters on soil
manganese leaching and bioavailability to sugarbeet. Soil Sci Soc Am J 53:
142-146
LaHaye PA, Epstein E (1971) Calcium and salt toleration by bean plants. Physiol
Plant 25: 213-218
Leidi EO, Silberbush M, Lips SH (1991) Wheat growth as affected by nitrogen
type, pH and salinity, I. Biomass production and mineral composition. J Plant
Nutri 14: 235-246
Lewis OAM, Leidi EO, Lips SH (1989) Effect of nitrogen source on growth and
response to salinity stress in maize and wheat. New Phyto111: 155-160
Lindsay WL (1972) Inorganic phase equlibria in soils. In: Mortvedt JJ (ed)
Hordeum vulgare
Zea mays
Triticum aestivum
Lycopersicon esculentum
13 13
3
Micronutrient in agriculture. Soil Sci SocAm, Madison, Wisconsin, pp 48-51
Maas EV, Ogata G, Garber MJ (1972) Influence of salinity on Fe, Mn, and Zn
uptake by plants.Agron J 64: 793-795
Manchanda HR, Singh JP (1982) Wheat growth in chloride and sulphate dominant
saline soils and the effect of phosphorus application. J Indian Soc Soil Sci 30:
53-57
Manchanda HR, Sharma SK, Bhandari DK (1982) Response of barley and wheat
to phosphorus in the presence of chloride and sulphate salinity. Plant Soil 66:
233-241
Manchanda HR, Sharma SK (1983) Interactive effects of chloride and sulphate
dominate soil salinity and phosphorus in relation to wheat. Trop. Plant Sci
Res 1: 141-144
Manchanda HR, Sharma SK (1989) Tolerance of chloride and sulfate salinity in
chickpea (Cicer arietinum). JAgric Sci (Cambridge) 113: 407-410
Marschner H (1995) Mineral nutrition of higher plants.Academic, London
Martin JP, Buehrer TF, Caster AB (1942) Threshold pH value for nitrification of
ammonia in desert soils. Soil Sci SocAm Proc 7: 223-228
Martinez Beltran J, Manzur CL 2005) Overview of salinity problems in the world
and FAO strategies to address the problem. Managing saline soils and water:
science technology and social issues. International Salinity Forum, Riverside
Convention Centre, Riverside, California, pp 311-314
Martinez V, Cerda A (1989) Influence of N source on rate of Cl, N, Na, and K
uptake by cucumber seedlings grown in saline conditions. J Plant Nutr 12:
971-983
McClang G, Frankenberger WT (1985) Soil nitrogen transformations as affected
by salinity. Soil Sci 139: 405-411
McLaughlin SB, Wimmer R (1999) Transley Review No. 104-Calcium
physiology and terrestrial ecosystem processes. New Phytol 142: 373-417
Mehdi SM, Sarfraz M, Shah SAA (2007) Response of wheat to applied
supplemental potassium in saline sodic soil. J Biol Sci 7: 823-826
Mehmood EH, Kausar R, Akram M, Shahzad SM (2009) Is boron required to
improve rice growth and yield in saline environment? Pakistan J Bot 41:
1339-1350
Mehrotra CL, Das SK (1973) Influence of exchangeable sodium on the chemical
composition of important crops at different stages of growth. J. Indian Soc
Soil Sci 21: 355-365
Milap-Chand, Bhumbla DR, Randhawa NS, Sinha MK (1980) The effect of
gypsum and organic amendments on the availability of zinc to rice and its
uptake by this crop grown in a sodic. Intern Symp Management of Salt-
affected Soils. Karnal, India. pp 348-355
Mishra SG, Pandey G (1976) Zinc in saline and alkali soils of Uttar Pradesh. J
Indian Soc Soil Sci 24: 336-338
- (
192 193

More RP, Manchanda HR (1992) Influence of phosphorus on the tolerance of table
pea to chloride and sulfate salinity in a sandy soil.Arid Soil Res Reh 6: 41-52
Naheed G, Shahbaz M, Akram NA (2008) Interactive effect of rooting medium
application of phosphorus and NaCl on plant biomass and mineral nutrients
of rice (Oryza sativa L.) Pakistan J Bot 40: 1601-1608
Neumann PM, Azaizeh H, Leon D (1994) Hardening of root cell walls: A growth
inhibitory response to salinity stress. Plant Cell Environ 17: 303-309
Nitant HC, Dargan KS (1974) Influence of nitrogenous fertilizers on yield and
nitrogen uptake of wheat in a saline-sodic soils. J Indian Soc Soil Sci 22: 121-
124
NRSA and Associates (1996) Mapping of salt affected soils in India, 1:250000
mapsheets, Legend NRSAHyderabad
Ohnishi J, Flugge U, Heldt HW, Kanai R (1990) Involvement of Na in active
uptake of puruvate inmesophyll chloroplasts of some C4 plants. Plant Physiol
94: 950-959
Page AL, Chang AC, Adriano DC (1990) Deficiencies and toxicities of trace
elements, Chapter 7. In:ASCE Manuals and Reports on Eng. Practice No. 71,
Agricultural SalinityAssessment and Management,ASCE, pp 138-160
Pasricha NS, Randhawa NS (1971)Available Mo status of some saline-sodic soils
and its effect on the concentration of Mo, Cu, S and N in berseem grown on
these soils. Proc Int Symp Soil Fert Eval. pp 1017-1025
Perez-Alfocea F, Balibrea ME, Santa Cruz A, Estan MT (1996) Agronomical and
physiological characterization of salinity tolerance in a commercial tomato
hybrid. Plant Soil 180: 251-257
Pitman MG, Lauchli A (2004) Global impact of salinity and agricultural
ecosystem. In: Salinity: Plants-Molecules, Springer, pp 3-20
Poonia SR, Bhumbla DR (1972) Effect of ESP on availability of Ca from soil and
added gypsum to maize (Zea mays) and dhaincha ( ). Pl Soil
36: 671-679
Qadar A (1991) Differential sodium accumulation in shoots of rice genotypes in
relation to their sodicity tolerance. JAgric Sci 61: 40-42
Qadar A (1992) Influence of cations on the growth of Atriplex amnicola. Indian J
Plant Physiol 35: 48-55
QadarA(1995) Requirement of rice crop for phosphorus and potassium at varying
sodicity levels. J Plant Nutr 18: 2291-2303
Qadar A (1998) Alleviation of sodicity stress on rice genotypes by phosphorus
fertilisation. Plant Soil 203: 269-277
Qadar A (2002) Selecting rice genotypes tolerant to zinc deficiency and sodicity
stresses. 1. Differences in zinc, iron, manganese copper, phosphorus
concentrations and phosphorus/zinc ratio in their leaves. J Plant Nutr 25: 457-
473
QadarA,Ansari ZMA(2006) Phosphorus requirements of rice grown in soils with
+
Sesbania aculeata
different sodicity. J Plant Nutr 29: 2105-2117
QadarA,Azam ZM (2007) Selecting rice genotypes tolerant to zinc deficiency and
sodicity. Differences in concentration of major cations and sodium/potassium
ratio in leaves. J. Plant Nutr 30: 2061-2076
Rao DLN, Batra L (1983) Ammonia volatilization from applied nitrogen in alkali
soils. Plant Soil 20: 219-228
Rahman S, Vance GF, Munn LC (1993) Salinity induced effects on the nutrient
status of soil, corn leaves and kernels. Comm Soil Sci Plant Anal 24: 2251-
2269
Savvas D, Lenz F (1996) Influence of NaCl concentration in the nutrient solution
on mineral composition of eggplants grown in sand culture. Angewandte
Botanik 70: 124-127
Shabala S, Demidchik V, Shabala, L, Cuin TA, Smith SJ, Miller AJ, Davies JM,
Newman IA(2006) Extracellular Ca ameliorates NaCl-induced K loss from
Arabidopsis root and leaf cells by controlling plasma membrane K -
permeable channels. Plant Physiol 141: 1653-1665
Sharma BM, Yadav JSP (1986) Leaching losses of iron and manganese during
reclamation of alkali soil. Soil Sci 142: 149-152
Shaviv A, Hazan O, Neumann PM, Hagin J (1990) Increasing salt tolerance of
wheat by mixed ammonium nitrate nutrition. J Plant Nutri 13: 1227-1239
Shukla US, Mittal SB, Gupta RK (1980) Zinc application in some soils as affected
by exchangeable cations. Soil Sci 129: 366-370
Silberbush M, Lips SH (1991a) Potassium, nitrogen, ammonium/nitrate ratio, and
sodium chloride effects on wheat growth. I. Shoot and root growth and
mineral composition. J Plant Nutri 14: 751-764
Silberbush M, Lips SH (1991b) Potassium, nitrogen, ammonium/nitrate ratio, and
sodium chloride effects on wheat growth. II. Tillering and grain yield. J Plant
Nutr 14: 765-773.
Singh KN, Swarup A, Sharma DP, Rao KVGK (1990) Influence of sub surface
drainage and phosphorus application of soil salinity and uptake of
phosphorus by wheat in saline soil. J Indian Soc Soil Sci 38: 511-515
Singh KN, Swarup A, Sharma DP, Rao KVGK (1992) Effect of drain spacing and
phosphorus levels on yield, chemical composition and uptake of nutrient by
Indian mustard ( ). ExptAgric 28: 135-42
Singh MV, Chhabra R, Abrol IP (1984) Factors affecting DTPA extractable Zn in
sodic soils. Soil Sci 136: 359-366
Singh MV, Chhabra R, Abrol IP (1987) Interaction between application of
gypsum and zinc sulphate on the yield and chemical composition of rice
grown in an alkali soil. JAgric Sci (Camb) 108: 275-279
Singh SB, Chhabra R, Abrol IP (1981) Effect of exchangeable sodium on the
yield, chemical composition and oil content of safflower (
2+ +
+
Brassica juncea
Carthamum
194 195

tinctoriuo Linum usitatissimum
Cajanus
cajan
L.) and linseed ( L.). Indian J Agric Sci 52:
881-891
Soni ML, SwarupA, Singh M (1996) Influence of rates and methods of manganese
application on yield and nutrition of wheat in a reclaimed sodic soil. J Agric
Sci (Camb) 127: 433-439
Speer M, BruneA, Kaiser WM (1994) Replacement of nitrate by ammonium as the
nitrogen source increases the salt sensitivity of pea plants I. Ion
concentrations in roots and leaves. Plant Cell Envir 17: 1215-1221
Subbarao GV, Johansen C, Jana MK, Kumar Rao JVDK (1990) Effects of the
sodium/calcium ratio in modifying salinity response of pigeonpea (
). J Plant Physiol 136: 439-443
Subbarao GV, Wheeler RM, Stutte GW, Levine H (1999) How far can sodium
substitute for potassium in redbeet? J Plant Nutr 22: 1745-1761
Subbarao GV, Wheeler RM, Stutte GW (2000) Feasibility of substituting sodium
for potassium in crop plants for advance life support system. Life-Support-
Biosph. Sci 7: 225-232
Swarup A (1981) Effect of iron and manganese application on the availability of
micronutrients to rice in sodic soil. Plant Soil 60: 481-485
Swarup A (1989) Transformation and availability of iron and manganese in
submerged sodic soil in relation to yield and nutrition of rice. Fert News 34:
21-31
Swarup A (1991) Effect of gypsum, green manure, farmyard manure and zinc
fertilization on the zinc, iron and manganese nutrition of wetland rice on a
sodic soil. J Indian Soc Soil Sci 39: 530-536
Swarup A (1994) Chemistry of salt affected soils and fertility management. In:
Rao DLN, Singh NT, Gupta, RK, Tyagi NK (ed) Salinity management for
sustainable agriculture. Central Soil Salinity Research Institute, Karnal. pp
18-40
Swarup A (1995) Nutrient management for sustainable crop production on saline
soils under subsurface drainage system. . In: Rao et al. (ed) Reclamation and
management of waterlogged saline soils. Central Soil Salinity Research
Institute, Karnal. pp 438-448
Swarup A, Chhillar RK (1986) Build up and depletion of soil phosphorus and
potassium and their uptake by rice and wheat in a long term field experiment.
Plant Soil 91: 161-170
Swarup A, Yaduvanshi NPS (2000) Effect of integrated nutrient management on
soil properties and yields of rice and wheat in alkali soils. J Indian Soc Soil Sci
48: 279-282
Taylor AW, Gurney EL (1965) The effect of salts on dissolution of monocalcium
phosphate. Soil Sci SocAm Proc 29: 151 -153
Verma TS, Neue U (1984) Effect of soil salinity level and zinc application on
growth, yield and nutrient composition of rice. Plant Soil 82: 3-14
Wild A (2003) Soils, land, and food: Managing the land during twenty-first
century. Cambridge University Press, Cambridge
Westerman RL, Tucker TC (1974) Effect of salts plus nitrogen labeled ammonium
chloride on mineralization of soil nitrogen, nitrification and immobilization.
Soil Sci SocAm Proc 38: 602-605
Wimmer WA, Bassil ES, Brown PH, Lauchli A (2005) Boron response in wheat is
genotype dependent and related to boron uptake, translocation, allocation,
plant phenological development and growth rate. Func Plant Biol 32:
207–515
Wimmer MA, Muhling KH, Lauchli A, Brown PH, Goldbach HE (2003) The
interaction between salinity and boron toxicity affects the subcellular
distribution of ions and proteins in wheat leaves. Plant Cell Environ 26: 1267
1274
Wright GC, Patten KD, Drew MC (1992) Salinity and supplemental calcium
influence growth of rabbiteye and southern highbush blueberry. J Am Soc
Hort Sci 117: 749-756
Wright GC, Patten KD, Drew MC (1993) Gas exchange and chlorophyll content of
`Tifblue' rabbiteye and `Sharpblue' Southern highbush blueberry exposed to
salinity and supplemental calcium. JAm Soc Hort Sci 118: 456-463
Wright GC, Patten KD, Drew MC (1994) Mineral composition of young rabbiteye
and Southern highbush blueberry exposed to salinity and supplemental
calcium. JAm Soc Hort Sci 119: 229-236
Yadav HD, Yadav OP, Dhankar OP, Oswal CM (1989) Effect of chloride salinity
and boron on germination, growth, and mineral composition of chickpea
( ).AnnArid Zone 28: 63-67
Yaduvanshi NPS (2000) Budgeting of P and K for a rice-wheat cropping sequence
on a sodic soil. TropAgric (Trinidad) 79: 211-216
Yaduvanshi NPS (2001a) Ammonia volatilization losses from integrated nutrient
management in rice fields of alkali soils. J Indian Soc Soil Sci 49: 276-280
Yaduvanshi NPS (2001b) Effect of five years of rice-wheat cropping and NPK
fertilizer use with and without organic and green manures on soil properties
and crop yields in a reclamation sodic soil. Indian Soc Soil Sci 49: 714-719
Yaduvanshi NPS (2003) Substitute of inorganic fertilizers with organic manures
and its effect on soil fertility in rice-wheat rotation on reclaimed sodic soil. J
Agric Sci (Camb) 140:161-169
Zekri M, Parsons LR (1992) Salinity tolerance of citrus rootstocks : Effects of salt
on root and leaf mineral concentrations. Plant Soil 147:171-181
Zekri M (1993) Salinity and calcium effects on emergence, growth and mineral
composition of seedlings of eight citrus rootstocks. J Hort Sci 68: 53-62
Cicer arietinum
196 197

Role of potassium in water stress management in dry
land agriculture
Ch Srinivasarao KPR Vittal B Venkateswarlul l
l l
Abstract
Keywords
Introduction
Potassium (K) deficiency is one of the important soil fertility
constraints in increasing world food production. Rainfed agriculture, which
extends over 85 m ha in India covering wide variety of soils and crops often,
suffers from intermittent drought and water stress. Potassium has special role in
rainfed agriculture as it enhances resistance to adverse environmental conditions
such as drought. Potassium status of Indian soils varies from low to high
depending upon soil type and management practices; however its application in
rainfed crops is meager. Thus, for most of the rainfed crops, soil K reserves are
major sources of crop K nutrition. Optimum K nutrition is known to improve water
relations in crop plants through stomatal closure/opening mechanism. Present
paper reviews the K status of Indian soils in rainfed regions, K removals by
different crops, mechanism of K in water stress tolerance of crop plants and impact
of K addition in water stress management and crop yields.
Potassium nutrition K deficiency water stress
Crop production in the world has made a remarkable step forward since the sixties
enabling to feed its steadily increasing population although the area of arable land
remained almost the same. An analysis of the nutrient balances (Syers et al. 2001)
for the period 1960-1998 for six Asian countries, indicated an overall annual K
deficit of about 11 m t of K, which is 250 per cent more than the current K fertilizer
use. Recent estimate of nutrient balances in world soils indicated the largest
negative K balance inAsia followed byAfrica and positive K balances inAmerica
and Europe (FAO 2003). In India, a considerable progress was made over the
years in increasing the food grain production reaching a record level of 231 mt in
2007-08, yet it will require about 7-9 mt additional food grains each year if the
Proceedings IPI-OUAT-IPNI International Symposium (2009)
Ch Srinivasarao B Venkateswarlu
Central Research Institute for Dryland Agriculture
Santoshnagar, Saidabad P.O., Hyderabad – 500 059, Andhra Pradesh, India
e-mail [email protected]
KPR Vittal
Central Arid Zone Research Institute, Jodhpur, Rajasthan, India
l
198 199

rising population trend continues.
Two-thirds of the cultivated area in India is under rainfed farming. Rainfed
agriculture support 40 percent of India's human population and two-thirds of the
livestock. Ninety percent of the coarse cereals, 90 percent grain legumes, 80
percent oilseeds and 65 percent of cotton are grown in rainfed regions. However,
rainfed areas suffer from a number of crop production constraints. Among them,
low soil organic carbon, poor soil fertility, frequent droughts are important factors,
which determine the productivity levels of dryland soils. As the food production
increased with time, the number of deficient elements in Indian soils and crops
also increased. Among the essential plant nutrients, potassium assumes greater
significance since it is required in relatively larger quantities by plants. Besides
increasing the yield, it improves the quality of the crop produce and improves N
and Puse efficiency. Among soil fertility problems, potassium deficiency is one of
the emerging nutritional constraints for increasing productivity levels of dryland
crops (Srinivasa-Rao and Vittal 2007; Srinivasa-Rao and Venkateswarlu 2009).
Potassium nutrition has special significance in dryland crops as it is associated
with crop tolerance to water stress condition, which is a common feature of
dryland agriculture.
Information on K status in different agro-ecological regions of India is
summarized in Table 1. Different soil types exist in these agro-ecological regions
such as alluvial, medium and deep black soils, red and literitic soils. Potassium
status of these soils varies depending on soil type, parent material, texture and
management practices. In general, black soils with smectite as a dominant clay
mineral, higher clay and CEC showed high levels of exchangeable K and medium
to high non-exchangeable K content (Fig 1). Alluvial soils with higher contents of
K rich mica with light texture showed medium level of exchangeable K and high of
nonexchangeable K content. Red and lateritic soils with kaolinite as a dominant
clay mineral and light texture showed low levels of exchangeable as well as
nonexchangeable K content.
Apparently, rainfed crops in India, under compulsion to meet their K needs
are mining soil K reserves. Under these circumstances, the amount of reserve K in
specific soil and its release would be the most important factors for K nutrition of
the crops (Srinivasarao et al. 1999). Besides, in rainfed crops optimum K nutrition
plays a vital role in inducing resistance to withstand moisture stress and improve
water-use efficiency during drought conditions (Mengel and Kirkby 1987). As
most of the rainfed crops are deep rooted, contribution of sub soil K towards K
nutrition is substantial.
Release studies indicated that despite the larger reserves of K in alluvial soils
of U.P., Bihar and Rajasthan, the rate of K release is much slower as compared to
K status in rainfed agriculture
black soils. Hence under intensive cropping with high-yielding short duration
genotypes, the soil K supply may not match with K demand by crop. Therefore,
application of K to crops particularly in light textured acidic alluvial soils is
essential to sustain higher productivity. Similarly, K application is essential on red
and lateritic soils, as these soils possess low levels of soil K status as well as its
buffering capacity (Sriniviasa-Rao et al. 1998).
In rainfed agro ecosystems, the soils are characterized by low to high
available K status. Surface soils of Agra, S.K.Nagar, Bangalore, Hoshiarpur and
Rakh Dhiansar were low in K, Faizabad, Phulbani, Ranchi, Anantapur, Akola,
Hisar and Arjia were medium and at Rajkot, Indore, Rewa, Kovilpatti, Bellary,
Bijapur and Solapur were high. Potassium deficiency is noticed in coarse textured
alluvial soils, red and lateritic and shallow soils and soils which supported
Agroec- States covered Climate/SoilK
K
Region 2 Gujarat, Rajasthan,Harayana
Region 3 A. P Hot semi arid- red soils L-M L-HRegion 4 U.P., Rajasthan,
Gujarat, M.P.Region 5 Rajasthan, Gujarat, Hot semi-arid medium-
deep blackRegion 6 Maharastra,
A.P. blackRegion 7 A.P. Hot semi-arid Red and black L-H L-MRegion 8 Tamil Nadu,
A.P.Region 9 U.P.,Uttaranchal, Hot sub-humid alluvial M M-H
Region 10 M.P. Hot sub-humid black H M-HRegion 11 M.P. Maharashtra Hot sub-humid Red & yellow H M-HRegion 12 Jarkhand, M.P. Hot sub-humid Red &
Lataritic, blackRegion 13 Orissa, Jarkhand, Hot sub-humid Alluvial M-H L-H
Region 14 H.P, J&K, Punjab Humid -Acidic alluvium L-M L-MRegion 15 West Bengal,
Assam,Arunachal Pradesh
Region 17 Meghalaya Per humid-red and lateritic L-H M-HRegion 18 A.P., T.Nadu, Orissa Hot semi arid -coastal light L-M L-HRegion 19 Kerala Per humid -lateritic L-H LowRegion 20 Andaman-Nicobar Per humid-red loamy M M
L: low; M: Medium; H: HighExchangeable K: Low: <50 mg kg ; Medium: 50-120 mg kg ; High: >120 mg kgNon-exchangeable K: Low: <300 mg kg ; Medium: 300-600 mg kg ; High >600 mg kg
Exchangeable Nonlogical exchangeableregion
Hot arid-black and alluvial L-H L-H
Hot semi-arid a Alluvial M-H H
H M-HM.P.
Hot semi-arid Medium-deep H M-HKarnataka,
Hot semi-arid Red loamy M LKarnataka,
Bihar,
L-M LChattisgadh
Chattisgadh
Hot-Sub humid-Terai L-H L-HSikkim, acid soils
-1 -1 -1
-1 -1 -1
Table 1 Potassium status in different agroecological regions of India (Source:
Subba-Rao and Srinivasa-Rao 1996).
200 201

continuous high yields without K addition (Srinivasarao et al. 2007; Srinivasarao
and Vittal 2007). Vertisols and Vertic intergrades showed relatively high available
K as compared to Inceptisols and Alfisols because of higher clay content and
smectitic clay. Profile mean of available K varied from 138.8 to 195.1 kg ha
under rice based production system, from 129.2 to 188.8 kg ha under groundnut
system, 322.3 to 407.5 kg ha under soybean system, from 76.7 to 272.3 kg ha
under cotton system, from 365.4 to 500.4 kg ha under rabi sorghm system, from
85.1 to 163.1 kg ha under pearlmillet system, 53.0 kg ha under fingermillet and
from 55.6 to 109.4 kg ha under maize based production system.
-1
-1
-1 -1
-1
-1 -1
-1
K requirements of different dry land crops
Table 2
K nutrition and water stress
Intensive cropping invariably results in heavy withdrawal of nutrients from soils
and its sustenance largely depends upon the judicious application of inputs
commensurate with nutrient uptake. Nutrient uptake values generally provide a
reliable estimate of nutrient requirements under varying agro-ecological regions
which would form the basis for the development of a sound fertilizer
recommendation strategy for realizing higher productivity and maintaining soil
fertility. The average uptake of major nutrients by crops at 100 percent NPK
treatments of selected intensive cropping systems indicated that in most of the
cropping systems, K uptake exceeded N, especially when three crops are taken in a
year like maize-wheat-cowpea (f), rice-wheat-jute fibre and sorghum-sunflower
hybrids. Potassium uptake in relation to N and P O is presented in some important
dryland crops in India (Table 2)
Nutrient uptake of some important rainfed crops in India (Source:
Srinivasarao and Venkateswarlu, 2009)
However, in case of potassium, K release rates should be matched with daily
K uptake by different crops (Srinivasarao et al. 1999; 2006). Some of the K loving
crops like cereals, tuber crops, banana, sugarcane, tobacco, tea have higher uptake
rates. For example, rate of K absorption by pigeonpea over a period of time (Fig. 2)
shows maximum K absorption during 80 to 140 days (Narasimhachary 1980).
When soils are low to medium such as light textured alluvial, red and lateritic, crop
needs K fertilization specially to meet the K absorption rates during these critical
stages of crop plants.
The major limiting factor for crop yield in arid and semi-arid regions is the amount
2 5
Fig. 1 Exchangeable and nonexchangeable K status in different soil types in
rainfed regions of India
0
20
40
60
80
100
120
140
Exch
an
geab
leK
(mg
kg
-1)
Inceptisols Vertisols Alfisols
a) Exchangeable K
Surface
Sub-surface
0
200
400
600
800
1000
1200
No
nexch
an
geab
leK
(mg
kg
-1)
Inceptisols Vertisols Alfisols
b) Nonexchagneable K
Surface
Sub-surface
Crop Produce kg nutrient tonne produce
N P O K O
Sorghum Grain 22.4 13.3 34.0Pearl millet Grain 42.3 22.6 90.8Rice Grain 20.1 11.2 30.0Chickpea Grain 46.3 8.4 49.6Groundnut Grain 58.1 19.6 30.1Soybean Grain 66.8 17.7 44.4Sunflower Grain 56.8 25.9 105.0Cotton Seed 44.5 28.3 74.7
-1
2 5 2
202 203
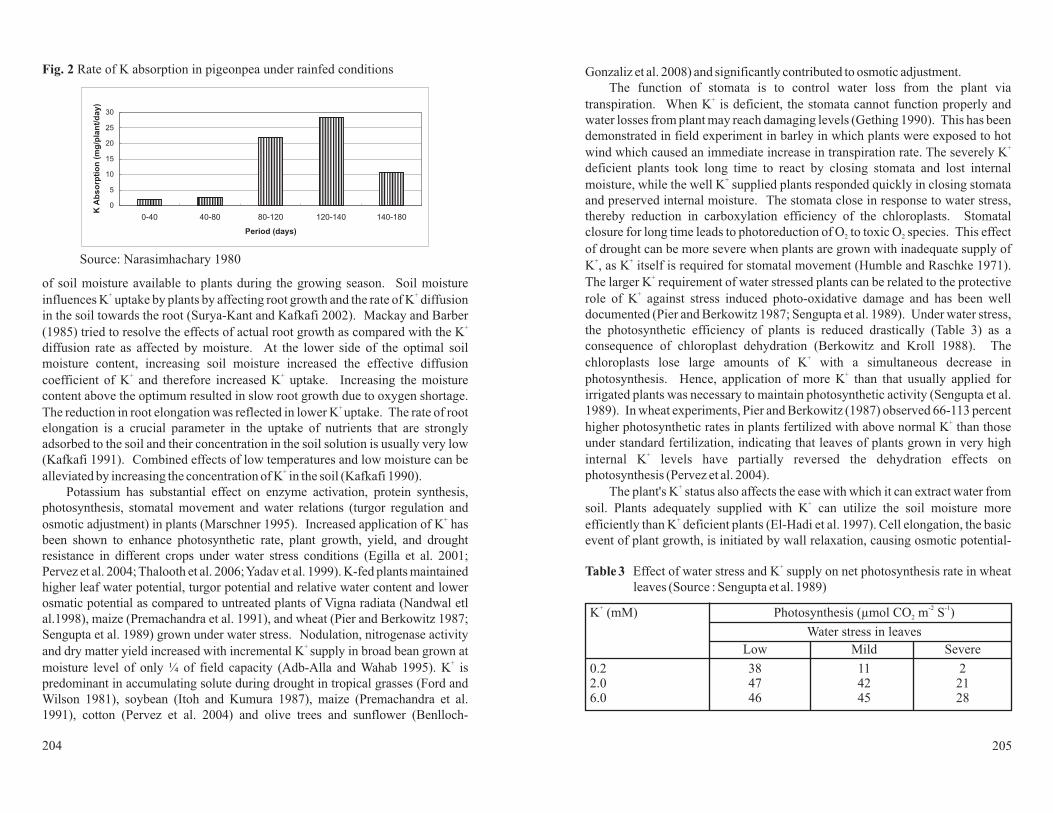
of soil moisture available to plants during the growing season. Soil moisture
influences K uptake by plants by affecting root growth and the rate of K diffusion
in the soil towards the root (Surya-Kant and Kafkafi 2002). Mackay and Barber
(1985) tried to resolve the effects of actual root growth as compared with the K
diffusion rate as affected by moisture. At the lower side of the optimal soil
moisture content, increasing soil moisture increased the effective diffusion
coefficient of K and therefore increased K uptake. Increasing the moisture
content above the optimum resulted in slow root growth due to oxygen shortage.
The reduction in root elongation was reflected in lower K uptake. The rate of root
elongation is a crucial parameter in the uptake of nutrients that are strongly
adsorbed to the soil and their concentration in the soil solution is usually very low
(Kafkafi 1991). Combined effects of low temperatures and low moisture can be
alleviated by increasing the concentration of K in the soil (Kafkafi 1990).
Potassium has substantial effect on enzyme activation, protein synthesis,
photosynthesis, stomatal movement and water relations (turgor regulation and
osmotic adjustment) in plants (Marschner 1995). Increased application of K has
been shown to enhance photosynthetic rate, plant growth, yield, and drought
resistance in different crops under water stress conditions (Egilla et al. 2001;
Pervez et al. 2004; Thalooth et al. 2006;Yadav et al. 1999). K-fed plants maintained
higher leaf water potential, turgor potential and relative water content and lower
osmatic potential as compared to untreated plants of Vigna radiata (Nandwal etl
al.1998), maize (Premachandra et al. 1991), and wheat (Pier and Berkowitz 1987;
Sengupta et al. 1989) grown under water stress. Nodulation, nitrogenase activity
and dry matter yield increased with incremental K supply in broad bean grown at
moisture level of only ¼ of field capacity (Adb-Alla and Wahab 1995). K is
predominant in accumulating solute during drought in tropical grasses (Ford and
Wilson 1981), soybean (Itoh and Kumura 1987), maize (Premachandra et al.
1991), cotton (Pervez et al. 2004) and olive trees and sunflower (Benlloch-
+ +
+
+ +
+
+
+
+
+
Gonzaliz et al. 2008) and significantly contributed to osmotic adjustment.
The function of stomata is to control water loss from the plant via
transpiration. When K is deficient, the stomata cannot function properly and
water losses from plant may reach damaging levels (Gething 1990). This has been
demonstrated in field experiment in barley in which plants were exposed to hot
wind which caused an immediate increase in transpiration rate. The severely K
deficient plants took long time to react by closing stomata and lost internal
moisture, while the well K supplied plants responded quickly in closing stomata
and preserved internal moisture. The stomata close in response to water stress,
thereby reduction in carboxylation efficiency of the chloroplasts. Stomatal
closure for long time leads to photoreduction of O to toxic O species. This effect
of drought can be more severe when plants are grown with inadequate supply of
K , as K itself is required for stomatal movement (Humble and Raschke 1971).
The larger K requirement of water stressed plants can be related to the protective
role of K against stress induced photo-oxidative damage and has been well
documented (Pier and Berkowitz 1987; Sengupta et al. 1989). Under water stress,
the photosynthetic efficiency of plants is reduced drastically (Table 3) as a
consequence of chloroplast dehydration (Berkowitz and Kroll 1988). The
chloroplasts lose large amounts of K with a simultaneous decrease in
photosynthesis. Hence, application of more K than that usually applied for
irrigated plants was necessary to maintain photosynthetic activity (Sengupta et al.
1989). In wheat experiments, Pier and Berkowitz (1987) observed 66-113 percent
higher photosynthetic rates in plants fertilized with above normal K than those
under standard fertilization, indicating that leaves of plants grown in very high
internal K levels have partially reversed the dehydration effects on
photosynthesis (Pervez et al. 2004).
The plant's K status also affects the ease with which it can extract water from
soil. Plants adequately supplied with K can utilize the soil moisture more
efficiently than K deficient plants (El-Hadi et al. 1997). Cell elongation, the basic
event of plant growth, is initiated by wall relaxation, causing osmotic potential-
+
+
+
+ +
+
+
+
+
+
+
+
+
+
2 2
Table 3 Effect of water stress and K supply on net photosynthesis rate in wheat
leaves (Source : Sengupta et al. 1989)
+
K (mM) Photosynthesis (µmol CO m S )
Water stress in leaves
Low Mild Severe
0.2 38 11 22.0 47 42 216.0 46 45 28
+ -2 -1
2
0
5
10
15
20
25
30
0-40 40-80 80-120 120-140 140-180
Period (days)
KA
bs
orp
tio
n(m
g/p
lan
t/d
ay
)
Fig. 2 Rate of K absorption in pigeonpea under rainfed conditions
Source: Narasimhachary 1980
204 205
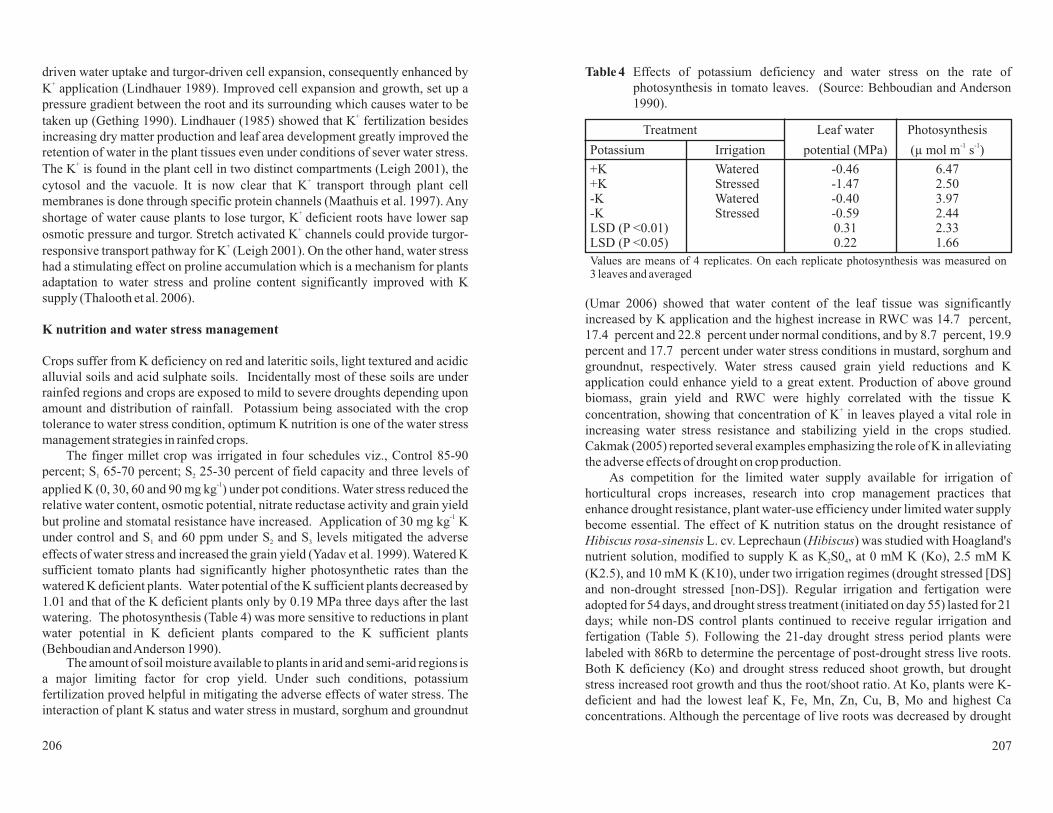
driven water uptake and turgor-driven cell expansion, consequently enhanced by
K application (Lindhauer 1989). Improved cell expansion and growth, set up a
pressure gradient between the root and its surrounding which causes water to be
taken up (Gething 1990). Lindhauer (1985) showed that K fertilization besides
increasing dry matter production and leaf area development greatly improved the
retention of water in the plant tissues even under conditions of sever water stress.
The K is found in the plant cell in two distinct compartments (Leigh 2001), the
cytosol and the vacuole. It is now clear that K transport through plant cell
membranes is done through specific protein channels (Maathuis et al. 1997). Any
shortage of water cause plants to lose turgor, K deficient roots have lower sap
osmotic pressure and turgor. Stretch activated K channels could provide turgor-
responsive transport pathway for K (Leigh 2001). On the other hand, water stress
had a stimulating effect on proline accumulation which is a mechanism for plants
adaptation to water stress and proline content significantly improved with K
supply (Thalooth et al. 2006).
Crops suffer from K deficiency on red and lateritic soils, light textured and acidic
alluvial soils and acid sulphate soils. Incidentally most of these soils are under
rainfed regions and crops are exposed to mild to severe droughts depending upon
amount and distribution of rainfall. Potassium being associated with the crop
tolerance to water stress condition, optimum K nutrition is one of the water stress
management strategies in rainfed crops.
The finger millet crop was irrigated in four schedules viz., Control 85-90
percent; S 65-70 percent; S 25-30 percent of field capacity and three levels of
applied K (0, 30, 60 and 90 mg kg ) under pot conditions. Water stress reduced the
relative water content, osmotic potential, nitrate reductase activity and grain yield
but proline and stomatal resistance have increased. Application of 30 mg kg K
under control and S and 60 ppm under S and S levels mitigated the adverse
effects of water stress and increased the grain yield (Yadav et al. 1999). Watered K
sufficient tomato plants had significantly higher photosynthetic rates than the
watered K deficient plants. Water potential of the K sufficient plants decreased by
1.01 and that of the K deficient plants only by 0.19 MPa three days after the last
watering. The photosynthesis (Table 4) was more sensitive to reductions in plant
water potential in K deficient plants compared to the K sufficient plants
(Behboudian andAnderson 1990).The amount of soil moisture available to plants in arid and semi-arid regions is
a major limiting factor for crop yield. Under such conditions, potassium
fertilization proved helpful in mitigating the adverse effects of water stress. The
interaction of plant K status and water stress in mustard, sorghum and groundnut
+
+
+
+
+
+
+
-1
-1
K nutrition and water stress management
1 2
1 2 3
(Umar 2006) showed that water content of the leaf tissue was significantly
increased by K application and the highest increase in RWC was 14.7 percent,
17.4 percent and 22.8 percent under normal conditions, and by 8.7 percent, 19.9
percent and 17.7 percent under water stress conditions in mustard, sorghum and
groundnut, respectively. Water stress caused grain yield reductions and K
application could enhance yield to a great extent. Production of above ground
biomass, grain yield and RWC were highly correlated with the tissue K
concentration, showing that concentration of K in leaves played a vital role in
increasing water stress resistance and stabilizing yield in the crops studied.
Cakmak (2005) reported several examples emphasizing the role of K in alleviating
the adverse effects of drought on crop production.
As competition for the limited water supply available for irrigation of
horticultural crops increases, research into crop management practices that
enhance drought resistance, plant water-use efficiency under limited water supply
become essential. The effect of K nutrition status on the drought resistance of
L. cv. Leprechaun ( ) was studied with Hoagland's
nutrient solution, modified to supply K as K S0 , at 0 mM K (Ko), 2.5 mM K
(K2.5), and 10 mM K (K10), under two irrigation regimes (drought stressed [DS]
and non-drought stressed [non-DS]). Regular irrigation and fertigation were
adopted for 54 days, and drought stress treatment (initiated on day 55) lasted for 21
days; while non-DS control plants continued to receive regular irrigation and
fertigation (Table 5). Following the 21-day drought stress period plants were
labeled with 86Rb to determine the percentage of post-drought stress live roots.
Both K deficiency (Ko) and drought stress reduced shoot growth, but drought
stress increased root growth and thus the root/shoot ratio. At Ko, plants were K-
deficient and had the lowest leaf K, Fe, Mn, Zn, Cu, B, Mo and highest Ca
concentrations. Although the percentage of live roots was decreased by drought
+
$
Hibiscus rosa-sinensis Hibiscus
2 4
Treatment Leaf water Photosynthesis
(µ mol m s )
+K Watered -0.46 6.47+K Stressed -1.47 2.50-K Watered -0.40 3.97-K Stressed -0.59 2.44LSD (P <0.01) 0.31 2.33LSD (P <0.05) 0.22 1.66
Potassium Irrigation potential (MPa)-1 -1
Values are means of 4 replicates. On each replicate photosynthesis was measured on3 leaves and averaged
Table 4 Effects of potassium deficiency and water stress on the rate of
photosynthesis in tomato leaves. (Source: Behboudian and Anderson
1990).
206 207

stress, K2.5 and K10 plants (with similar percent live roots) had greater root
survival ratio after drought treatment than the K-deficient plants. These
observations indicate that adequate K nutrition can improve drought resistance
and root longevity in Hibiscus rosa-sinensis (Egilla et al. 2001).
Effects of K and drought stress on midday leaf water relations of
Hibiscus rosa-sinensis L. cv. Leprechaun during a 21-d drought stress
period. Means of 2 leaves from 3 plants per K treatment ± S.E., n
= leaf pressure
potential [MPa], P = net photosynthetic rate [µmol m S ], E =
transpiration rate [mmol m S ], g = stomatal conductance [mol m S ].
D = day 0, D = day 21; K =0.0 m M K, K =2.5 m M K, K = 10 m M K
(Source: Egilla et al. 2005).
In an another set of experiments, Egilla et al. (2005) reported that compared to
K deficient plants, adequate K supply improved the leaf water content and leaf
water relations and generally sustained rates of net photosynthesis, transpiration
and stomatal conductance in drought stress and non drought stress
plants.Considerable osmotic adjustment occurred in pearlmillet plants
experiencing water deficit under high K supply (Ashraf et al. 2001). Chlorophyll a
and b contents increased significantly with increase in K supply under well
watered conditions, but under water deficit they increased only in ICMV 94133.
Leaf water potential and osmotic potential of both lines decreased significantly
with the imposition of drought and leaf water potential was increased with
increase in K supply under water stress conditions.
Table 5
= 6, Ψ =
leaf water potential, Ψ = leaf osmotic potential, ΨI
$ P
N
s
1 3 0 2.5 10
-2 -1
-2 -1 -2 -1
Two major crops with greatly differing botanical characteristics, olive tree
and sunflower, were studied whether moderate K starvation inhibits water-stress
induced stomatal closure and if it is a generalized phenomenon (Benlloch-
Gonzalez et al. 2008). The olive is a slow-growing, woody plant displaying
considerable water-use efficiency in drought situations. The sunflower is a fast-
growing, herbaceous plant, whose water and nutrient uptake mechanisms are
highly efficient. The new data obtained here on olive trees and sunflowers showed
that moderate potassium starvation inhibits water-stress-induced stomatal clo-
sure, which suggests that it can be universal in nature. Results for olive trees also
suggest some level of intra specific genetic variability with regard to the effect of
potassium deficiency on shoot growth and stomatal conductance.
Vigna radiata L. plants were grown in greenhouse at moisture content of sand
(SMC) of 12.0±0.5 percent. At flower bud initiation stage i.e. 45-50 days after
sowing, the SMC was decreased to 3.5±0.5 percent, and the effects of applied
potassium (0, 2.56 and 3.84 mmol dm3) were studied (Nandwal et al. 1998).
During water stress, K fed plants maintained higher leaf water potential and
relative water content (RWC) of leaves and nodules and lower osmotic potential as
compared to untreated plants. The proline content was higher in nodules than in
leaves sowing their difference in degree of stress (Table 6). K fed plant showed
higher C and N content in stem, roots and nodules than untreated plants. Dry
masses of different plant parts were also increased in K-fed plants.
Cotton, a major world fibre crop experiences drought during its growth,
which significantly reduce its growth and yield. The effect of potassium nutrition
(0, 6.25, 12.50, 25.00 g (K)m ) of K SO or KCl) on gas exchange characteristics
and water relations in four cultivars (CIM-448, CIM-1100, Karishma, S-12) of
cotton were assessed under an arid environment (Pervez et al. 2004). Net
photosynthetic rate (PN) and trasnpirtation rate (E) increased with increased K
supply. The leaf pressure potential increased significantly by the addition of 25.00
+
-2
2 4
Time [d] K supply /
0 K -0.62±0.08 -1.99±0.04 1.37±0.09 2.50±0.44
K -0.43±0.04 -1.87±0.09 1.44±0.10 3.65±0.63
K -0.48±0.05 -2.18±0.22 I. 70±0.22 3.90±0.74
21 K -1.50±0.04 -2.10±0.14 0.59±0.13 0.40±0.08
K -1.52±0.02 -2.23±0.08 0.71±0.09 0.47±0.06
K -1.61±0.04 -2.37±0.11 0.76±0.13 0.48±0.09
Time [d) Ksupply P E g P /E
0 K 17.95±063 8.32±0.38 0.86±0.07 2.17±0.07
K 22.69±0.47 9.23±0.35 1.17±0.07 2.47±0.05
K 21.21±0.88 9.15±0.39 0.99±0.05 2.34±0.05
21 K 5.39±0.64 2.98±0.41 0.17±0.03 1. 92±0.22
K 8.27±1.28 3.13±0.39 0.18±0.01 2.64±0.23
K 6.04±0.99 1.98±0.23., 0.16±0.03 2.95±0.17
I P P I
0
2.5
10
0
2.5
10
N s N
0
2.5
10
0
2.5
10
Y Y Y Y Y
Table 6 Effect of potassium on proline content [µg g (d.m.)] of leaves and
nodules in Vigna radiata under drought and rehydration (Source:
Nandwal et al. 1998).
-l
Leavescontrol control
K0 129 1989 400 488 6204 1132K1 123 2696 546 455 6013 1022K2 150 2436 565 432 5368 1041
C.D. at 5 % level
K S K x S K S K x S
Leaves 160 160 278 Nodules 295 295 487
Stress Recovery Nodules Stress Recovery
208 209

g(K) m compared to zero K level. The water use efficiency was improved by 24.6
percent under the highest K dose compared to zero K. There were positive
correlations between K doses and Pn, E, and Pn/E.
High potassium supply had a positive effect on nitrogen fixation, on shoot and
root growth and on water potential in both water regimes. With common bean, in
both water treatments (sufficient and water stress), K could increase the water
potential substantially. The values were -0.83, -0.56 and -0.27 MPa for 0.1, 0.8
and 3.0 mM K in the low water treatment and -0.31, -0.15 and -0.07 MPa for the
high water treatment, respectively. These data are consistent indicating that high
K fertilization can at least in part compensate water shortage and K concentration
is an essential factor determining plant resistance to water stress. This would
support the view that K helps maintain the osmatic potential of plant cells, an
increasingly critical problem with increasing water stress. The beneficial effect of
high K supply on growth was generally similar in both water treatments with the
exception that in faba bean the beneficial effect of 0.8 mM K compared to 0.1 mM
was more pronounced in the low water treatment than in the high water treatment.
The beneficial effect of high K under water stress can certainly in part, be
explained by the fact that under conditions of restricted water flow into the roots,
an increase in nutrient concentration will lead to an increased nutrient intake per
unit of water uptake (Sangakkara et al. 1996).
The excess K in the leaf partially protects photosynthesis from the deleterious
effects of water stress. The protective effect appears to be mediated by extrachol-
oroplantic K in the plant cells, possibly acting on chloroplast photosynthesis
through the mechanism of a K /H ant port system. Stomatal closure in water stress
conditions is related with K transport and also associated with high proline
content of the plant parts. Thus potassium is needed at high concentrations inside
the plants from early stages of vegetative growth phase. However, external K
application to different crops should be recommended depending upon soil status
of exchangeable and reserve K and crop K requirements.
-2
+
+
+ +
+
Ψs
Conclusions
References
Abd-Alla MH, Wahab AMA (1995) Response of nitrogen fixation, nodule
activities, and growth to potassium supply in water-stressed broad bean. J
Plant Nutr 18:1391-1402
Ashraf M, Ahmad A, McNeilly T (2001) Growth and photosynthetic
characteristics in pearlmillet under water stress and different potassium
supply. Photosynthetica 39:389-394
Behboudian MH, Anderson DR (1990) Effects of potassium deficiency on water
relations and photosyntehsis of the tomato plant. Plant Soil 127:137-139
Benlloch-Gonzalez M, Arquero O, Fournier JM, Barranco D, Benlloch M (2008)
K starvation inhibits water-stress-induced stomatal closure. J Plant Physiol
165:623-630
Berkowitz GA, Kroll KS (1988)Acclimation of photosynthesis in to low
water potentials involves altered degree of protoplast volume reduction.
Planta 175:374-379
Cakmak I (2005) The role of potassium in alleviating detrimental effects of abiotic
stresses in plants. J Plant Nutr Soil Sci. 168:521-530
Egilla JN, Davies FT Jr, Drew MC (2001) Effect of potassium on drought
resistance of cv. Leprechaun: Plant growth. leaf macro
and micronutrient content and root longevity. Plant Soil 229:213-224.
Egilla JN, Davies FTJr, Boutton TW (2005) Drought stress influences leaf water
content, photosynthesis, and water-use efficiency of at
three potassium concentrations. Photosynthetica 43:135-140.
EI-Hadi AHA, Ismail KM, EI-Akabawy MA (1997) Effect of potassium on the
drought resistance of crops in Egyptian conditions. pp. 328-336. In: Proc. of
Regional Workshop of IPI, held at Bornova, Izmir, Turkey. IPI, Basel.
FAO (2003) Assessment of soil nutrient balance. FAO Fertilizer and Plant
Nutrition Bulletin 14;Approaches and Methodologies, FAO, Rome. p 101.
Ford CW, Wilson JR (1981) Changes in levels of solutes during osmotic
adjustment to water stress in leaves of four tropical pasture species. Aust J
Plant Physiol 8:77-91.
Gething PA(1990). Potassium and water relationships. In: Potash facts. IPl, Bern.
Humble GD, Raschke K (1971) Stomatal opening quantitatively related to
potassium transport. Plant Physiol 48: 447-453.
Itoh R, Kumara A (1987) Acclimation of soybean plants to water deficit. V.
Contribution of potassium and sugar to osmotic concentration in leaves.
Japanese J Crop Sci 56:678-684.
Kafkafi U (1990) The functions of plant K in overcoming environmental stress
situations. In: Proc. 22nd colloquium of IPI held in Soligorsk, USSR, IPI,
Bern, pp. 81-93
Kafkafi U (1991) Root growth under stress. In: Waisel Y, Eshel A, Kafkafi U (ed).
Plant Roots: The Hidden Half. Marcel Dekker, NewYork, pp. 375-391
Leigh RA (2001) Potassium homeostasis and membrane transport. J Plant Nutr
Soil Sci 164:193-198.
Lindhauer MC (1989) The role of K in cell extension, growth and storage of
assimilates. In: Proc 21st colloquium of IPI, Louvain-la-Neuve, Belgium, IPI,
Bern, pp 161-187
Lindhauer MG (1985) Influence of K nutrition and drought on water relations and
growth of sunflower. Z. Pflanzenernahr Bodenk 148: 654-669.
+
+
+
Zea mays
Hibiscus rosa-sinensis
Hibiscus rosa-sinensis
210 211
Maathuis JM, Ichida AM, Sanders D, Schroeder JI (1997) Role of higher plant K
channels. Plant Physiol 114: 1141-1149
MackayAD, Barber SA(1985) Soil moisture effects on potassium uptake by corn.
Agron J 71:524-527
Marschner H (1995) Mineral nutrition of higher plants, 2 Ed. Academic, San
Diego,
Mengel K, Kirkby EA(1987) Potassium in crop production.Adv Soil Sci 2:65-131
NandwalAS, HoodaA, Datta D (1998) Effect of substrate moisture and potassium
on water relations and C, N and K distribution in . Biol Plant
41:149-153
Narasimhachary P (1980) Studies on uptake of major nutrients N, P and K by red
gram variety in relation to yield, grain and protein content. M.Sc. Thesis,
ANGRAgri U, India
Pervez H, Ashram M, Makhdum MI (2004) Influence of potassium nutrition on
gas exchange characteristics and water relations in cotton
. Photosynthetica 42:251-255
Pier PA, Berkowitz GA (1987) Modulation of water stress effects on
photosynthesis by altered leaf K . Plant Physiol 85:655-661
Premachandra GS, Saneoka H, Ogata S (1991) Cell membrane stability and leaf
water relations as affected by potassium nutrition of water-stressed maize. J
Exp Bot 42:739-745
Sangakkara UR, Hartwig UA, Nosberger J (1996) Soil moisture and potassium
affect the performance of symbiotic nitrogen fixation in faba bean and
common bean. Plant Soil 184:123-130
SenguptaA, Berkowitz GA, Pier PA(1989) Maintenance of photosynthesis at low
leaf water potential in wheat. Plant Physiol 89:1358-1365
Srinivasa-Rao Ch, Bansal SK, Subba-Rao A, Takkar PN (1998) Potassium
desorption kinetics of major benchmark soil series of India. J Indian Soc Soil
Sci 46:357-362
Srinivasarao Ch, Swarup A, Subba Rao A, Rajagopal V (1999) Kinetics of non-
exchangeable potassium release from a Tropaquept as influenced by long
term cropping, fertilization and manuring.Aust J Soil Res 37: 317-328
Srinivasarao Ch, Rupa TR, Subba-Rao A, Singh SP, Bansal SK (2006) Kinetics of
non-exchangeable potassium release from important benchmark soils of
India: Effects of mineralogy, soil depth and extraction media. Commun Soil
Sci PlantAnal 36:1-19
Srinivasarao Ch, Venkateswarlu B (2009) Nutrient ratios and crop response to
potassium in relation to soil reserve K in different agro-ecological regions of
India. Proceedings of workshop “Crop response and nutrient ratio” National
Academy ofAgricultural Science, New Delhi, pp 37-52
Srinivasarao Ch, Vittal KPR (2007) Emerging nutrient deficiencies in different
+
nd
+
Vigna radiata
(Gossypium
hirsutum L.)
soil types under rainfed production systems of India. Indian J Ferti 3:37-46
Srinivasarao Ch, Vittal KPR, Tiwari KN, Gajbhiye PN, Kundu S (2007)
Categorization of soils based on potassium reserves and production systems:
Implications in K management.Aust J Soil Res 45:438-447
Subba-Rao A, Srinivasa-Rao Ch (1996) Potassium status and crop response to
potassium on the soils of Agro-Cological Regions of India. IPI Research
Topics No.20, International Potash Institute, Basel, Switzerland. pp 1-57
Surya-Kant, Kafkafi U (2002) Potassium and abiotic stresses in plants.
Proceedings of International Symposium on “Role of potassium in nutrient
management for sustainable crop production in India. International Potash
Institute, Switzerland, pp 233-251
Syers JK, Sheldrick WF, Lingard J (2001) Nutrient depletion inAsia: How serious
is the problem? Proceedings of the 12 World Fertilizer Congress, August,
2001, Beijing, China.
Thalooth AT, Tawfik MM, Mohamed HM (2006) A comparative study on the
effect of foliar application of zinc, potassium and magnesium on growth,
yield and some chemical constituents of mungbean plants grown under water
stress conditions. World JAgric Sci 2:37-46
Umar S (2006) Alleviating adverse effects of water stress on yield of sorghum,
mustard and groundnut by potassium application. Pak J Bot 38:1373-1380
Yadav DS, Goyal AK, Vats BK (1999) Effect of potassium in
(L.) Gaertn. under moisture stress conditions. J Potassium Res 15:131-134
th
Eleusine coracana
212 213

Proceedings IPI-OUAT-IPNI International Symposium (2009)
GN Mitra SK Sahu RK Nayak
Department of Soil Science and Agricultural Chemistry, Orissa University of Agriculture
and Technology, Bhubaneswar-751003, India
GN Mitra (e.mail. [email protected])
l l
Characterization of iron toxic soils of Orissa and
ameliorating effects of potassium on iron toxicity
GN Mitra SK Sahu RK Nayakl l
l l
Abstract
Keywords
Introduction
Iron toxic soils of Orissa are located in red and laterite soil region
especially in low lands adjacent to uplands, which enrich these soils with lateral
flow of soluble iron during rainy season. The dominant iron bearing minerals in
these soils are chlorite, garnet, magnetite and siderite. The soils were classified as
Aquic Haplustepts, Fluventic Haplustepts, Kanhaplic Rhodustalfs and Kandic
Paleustalfs. DTPA-Fe ranged from 105-570 mg kg and pH 4.5-6.8. DTPA-Fe
showed significant correlations with pH, K, Ca, Mg and Mn and all these factors
collectively contributed 85% towards iron toxicity. Significant negative
correlations were found between Leaf-Fe and soil characteristics such as, clay, pH,
K, Ca, Mg, Zn and Mn. Out of 19 long duration (135 days and more) and 20 medium
duration (100 - 125 days) rice varieties, eleven each from long and medium duration
varieties were found to be tolerant to Fe-toxicity. All the tolerant rice varieties gave
yields of 19.1 - 36.3 q ha against the yields of 5.2 - 26.5q ha in susceptible
varieties. The toxic effects of Fe could be alleviated by application of K at 30-90 mg
kg . On an iron toxic soil (DTPA-Fe, 396 mg kg ) application of K at higher doses
could alleviate effects of iron toxicity. Leaf bronzing disappeared and some of the
yield parameters such as thousand grain weight, percent filled grains etc. improved
at higher doses of K application. The grain yield of Fe-susceptible rice variety; Jaya
doubled and of tolerant rice variety; Mahsuri increased by one and half times due to
application of 120-160 kg K O ha . Since soils of Orissa in general are iron rich and
fertilizer consumption is very low (57 kg ha , 2007), there is considerable nutrient
imbalance in the soil. This is conducive to cause iron toxicity in soil even at sub-
toxic levels of Fe. It is suggested that the recommended dose of K for rice be
increased form the current 30 kg ha to 60 kg ha .
Iron toxicity potassium soils of Orissa
Iron toxicity in India is generally associated with iron rich red and lateritic soils.
-1
-1 -1
-1 -1
-1
-1
-1 -1
2
214 215

These soils occur in the southern, eastern and northeastern regions to a large extent
and in the central and western region to a limited extent. They constitute 28 per
cent of the soils of the Country (Sehgal 1993). These soils are excessively to well
drained, acidic, with low CEC and organic matter content, and have mixed or
kaolinitic clay mineralogy enriched with sesquioxides. They suffer from toxicity
of Al, Fe, and Mn, and deficiencies of N, P, K, Ca, and Mg, and also some other
micronutrients. These soil groups come under the taxonomic orders Alfisols,
Ultisols and Oxisols occurring in association with Entisols and Inceptisols. They
have moderate to high productive potential for export-oriented crops, such as tea,
coffee, cocoa, cardamom, cloves etc. However all other major crops such as,
cereals, pulses, oilseeds, fruits and vegetables are grown in these soils with
moderate to low yields.
Soils of Orissa are generally rich in iron with DTPA-Fe ranging from 8.2-356.0 mg
kg (Sahu and Mitra 1992; Mitra et al. 2002). Red and lateritic soils contain 17.8-
356.0 mg kg of DTPA-Fe (Mitra et al. 2006). The Fe content of these soils
increases at lower depths (Mitra et al. 2006, Nayak, 2008, Sahu et al. 1990).
During monsoon rains in the wet season (June to September) soluble Fe iron
from anaerobic lower depths migrates to the surface and increases its iron content
to sub-toxic/ toxic levels. In a rolling topography and with heavy monsoon
downpour (1482 mm) there is considerable lateral flow of Fe-containing water
from the adjacent uplands to mid- and lowlands. This increases their Fe content to
toxic levels. Rice grown under such lowland water logged condition suffers from
iron toxicity. Poorly drained sandy soils in valleys receiving interflow water from
adjacent upland soils with lateritic horizon (Plinthudults) showed iron toxicity in
Sri Lanka, Kerala and Orissa in India and Sierra Leone (van Breemenn and
Moormann 1978).
The alluvial soils of Orissa including deltaic alluvium contain 15.8-153.2
DTPA-Fe. The coastal saline soils contain 1.1.6-107.8 mg kg DTPA-Fe. The
symptoms of leaf bronzing in rice grown in the lateritic soils of Research Farm of
Orissa University of Agriculture & Technology were suggested to be due to Fe
toxicity (Sahu 1968). The problem again appeared in 1972, when a long term
fertiliser experiment with rice-rice cropping sequence was laid out in a low land
about 100m from an upland lateritic soil. The control plot showed symptoms of
iron toxicity, which disappeared in treatments receiving higher doses of
potassium. A deep ditch was dug up to prevent inflow of Fe from the uplands and
drainage helped to control Fe-toxicity in the this experiment. The land adjacent to
the upland with high Fe content was used to further study the problem of Fe-
toxicity.
The total area under iron toxic soils in Orissa is estimated to be 52,000 ha. The
Iron rich soils of Orissa and the problem of iron toxicity
-1
-1
++
-1
mg
kg-1
major crop, which suffers from iron toxicity, is low land rice. Iron toxicity
symptoms as observed are in conformity with the observations of Tanaka and
Yoshida (1970), van Breemann and Moormann (1978). These symptoms manifest
in soil, leaf, root, grain and crop yield. Brick red oily scum floating on surface
water around the corners of field bunds is a common feature of iron toxic soils
(Benckiser et al.1982). Roots become bushy and turn brown to black due to heavy
deposition of oxides of iron and there is near absence of white roots. The seed coats
become tinged with brown spots.
Four pedons of Fe toxic soils were used for classification. The iron bearing
minerals present in the fine sand fraction of these soils (Table 1) showed that the
chlorite was the dominant mineral followed by magnetite, garnet and siderite.
Fe bearing minerals (%) in fine sand fraction of Fe-toxic soils
The profile distribution of different forms of iron
In all the four pedons the quantity of iron was in the order of total-Fe > oxide-Fe >
DTPA-Fe (Table 2). Total Fe and Fe-O increased with depth. Total Fe and Fe-O of
Pedon-1 and 2 were less than Pedon-3 and 4 in corresponding horizons indicating
that with similar source of iron in all the type of iron bearing minerals, quantities of
Fe differed of the (Douli and Mustafi 1997; Khan et al. 1997; Patil and Dasog
1997). DTPA-Fe, which is considered the most appropriate form of available Fe,
decreased with depth indicating the presence of less active forms of Fe (Suresh and
Savitri 2001).
Taking into account all other parameters such as, morphology of pedons (site
characteristic, slope, surface condition, parent material, groundwater table,
natural vegetation, erosion, surface drainage, land use, genetic horizons, their
depth and description, the iron toxic soils were classified according to “Keys to
soil taxonomy' USDA(1998) as given in Table 3.
Classification of iron toxic soil and status of nutrients
Table 1
Sl. Name of thedominantmineral insoils in soils
1. Chlorite Fe (SiO O ) OH 3.0 2.0 4.0 4.0 3.2
2. Garnet Fe Fe (SiO ) 1.0 0.5 1.5 1.0 1.0
3. Magnetite Fe Fe O 2.0 1.5 0.5 3.5 1.9
4. Siderite Fe (CO ) 0.5 0.5 1.0 1.0 0.7
Total 6.5 4.5 7.0 9.5 6.9
Source: Nayak 2008
Formula of Names of locations MeanNo. ironoxide
mineral Bhuba- Chiplima Gajmar Duburineswar
4 10 8
3 2 4 3
2 4
3
216 217

Physical properties and nutrient status
The iron toxic soils of Orissa were sandy loam to clayey in texture and had a pH
range of 4.6-6.8. A total of 62.5% of the soils were strongly acidic (pH 4.5-5.5),
33% moderately acidic (5.6-6.5) and 4.5% slightly acidic (6.6-7.0). Organic C
content of 75% of the samples was low (< 5.0 g kg ) and 25% medium (5.0-7.5 g
kg ). The iron rich soils with relatively high organic matter show iron toxicity
-1
-1
under submergence (Mohanty and Patnaik 1977; Tanaka and Yoshida, 1970).
Available N content of 96.6% of the samples was low (less than 125 mg kg ), 25%
were low in Available P ( 4.5 mg kg ) and 52.3% were low in Available K ( 59 mg
kg ). The percentage of samples medium in N (125-250), P (4.5- 11.0) and K (59-
140 mg kg ) were 3.4, 72.7 and 45.4, respectively. None of the sample was high in
N ( 250 mg kg ), where as 2.3% of samples were high each in P (11 mg kg ) and K
( 140 mg kg ). The values of exchangeable Ca and Mg were low, 1.7-4.8 and 0.8-
2.5 (c mol (p+) kg respectively for all the samples due to low pH of the iron toxic
soils. The lower limit of Fe content to show iron toxicity symptoms in rice has been
reported as 40-100 mg kg (Panabokke 1975), 30 mg kg for soils with low
nutrient content and 300-400 mg kg with fertile soils. On the basis of 100 mg kg
astoxic limit all the soil samples (with 105 to 750 mg kg DTPAFe) were above the
toxic limits. The limits of adequacy of DTPA-Zn, Mn and Cu have been fixed at
1.20, 4.0 and 0.40 mg kg by theAll India coordinated Project on Micronutrients
and Pollutants. On the basis of these limits about 10% of the iron toxic soils of
Orissa have adequate levels of Zn, 94% adequate Mn and 98% adequate Cu.
Benckiser et al. (1982) and Tadano and Yoshida (1978) had reported such nutrient
imbalance in iron toxic soils.
Interaction of DTPA-Fe with other soil nutrients
DTPA-Fe showed non-significant positive correlation with clay and Cu but
negative and significant correlations with pH, K, Ca, Mg and Mn. Zn had a
positive correlation with DTPA-Fe. Sahu et al. (1990) had reported a significant
negative correlation between DTPA-Fe and clay while analyzing 48 soil samples
representing all the soil groups of Orissa. The difference is probably due to
selection of only iron toxic soils from specific locations. Multiple regression
equation was developed considering DTPA-Fe as dependent variable and other
soil properties as independent variables. The equation was as follows:
DTPA-Fe = 99.8 + 128.3 silt + 257.0 clay + 459.4 pH + 199.7 OC – 1.1 N 15.9 P–
2.0 K – 119.8 Ca –69.5 Mg + 196.7 Zn – 1.2 Mn + 13.1 Cu; R = 0.850
All the factors mentioned above collectively contributed 85% towards iron
toxicity. The major contributors for iron toxicity were pH (45.8%), Clay (14.3%),
organic carbon (8.6%) and silt (3.5%). Soil acidity plays a significant role in
solubilising Fe from iron rich lateritic soils of Orissa and causing iron toxicity to
low land rice. Clay and organic carbon have relatively lower contribution, as the
soils are predominantly sandy or sandy loam and organic carbon contents are low.
Fe contents in rice leaf
Iron contents of leaves affected by iron toxicity from 57 locations (Table 4) were in
-1
-1
-1
-1
-1 -1
-1
-1
-1 -1
-1 -1
-1
2
-1
+
Table 2 Profile distribution of different forms of iron
No. and name Depth(cm) (%) oxide (%) (mg kg )
1. Bhubaneswar 0-17 3.8 0.52 42817-33 4.8 0.98 39835-53 6.3 1.23 38453-120 5.8 1.78 372
2. Chplima 0-12 4.0 0.69 27212-39 4.8 1.09 16639-69 6.2 1.21 15169-100 6.6 1,48 148
3. Gajamara 0-15 4.6 0.84 46015-33 5.0 1.23 38033-93 6.4 1.46 21093-157 7.2 1.90 190
4. Duburi 0-15 4.5 0.78 42515-41 5.2 1.12 31841-72 6.6 1.36 18672-110 6.9 1.85 110
Source: Nayak 2008
Total Fe Free iron DTPA-Feof the pedon
-1
Pedon Order Sub-order Great group Sub-group Family Series
1. Inceptisols Ustepts Haplustepts AquicHaplustepts loamy, mixed,
hyperthermic2. Inceptisols Ustepts Haplustepts Fluventic
Haplustepts
3. Alfisols Ustalfs Rhodustalfs KanhaplicRhodustalfs
4. Alfisols Ustalfs Paleustalfs KandicPaleustalfs
Source: Nayak, 2008
No.
Coarse, Bhubaneswar
-do- Chiplima
-do- Gajamara
-do- Duburi
Table 3 Classification of iron toxic soils of Orissa
218 219

the range of 360-915 mg kg . Such variation is expected since a number of
factors such as variety grown and its tolerance to iron toxicity, soil conditions
prevailing at different locations, concentrations of other nutrients in soil and
plants, and environmental factors (e.g., temperature, solar radiation) (van
Breemann and Moormann 1978). Taking 300 mg kg as threshold limit (Tanaka
and Yoshids 1970) all the samples of rice leaves had toxic concentrations of Fe
(360-915 mg kg ).
Nutrient content of rice leaves affected by iron toxicity from different
locations of Orissa
The leaf-Fe was significantly and negatively correlated with soil
characteristics such as clay, pH, K , C, Mg, Zn, and Mn. Significant positive
correlations were observed for Fe (table 5). Leaf-Fe had significant negative
correlations with leaf-P, K, Ca, Mg, Zn and Mn. High content of Fe in leaf led to
deficient contents of other nutrients.
1
1
1
Table 4
Tolerance of iron toxicity by rice varieties
A number of rice varieties of different duration currently grown in Orissa were
tested for their tolerance to iron toxicity (IRRI 1980). Some of the tall traditional
varieties such as, T-90, T-141, T-1242 were found to have greater tolerance to iron
toxicity. Yield levels of tolerant varieties were also considerably higher than
susceptible varieties. The mechanism involved could be their root oxidizing
power. The presence of aerenchyma (tissue containing enlarged gas spaces) in the
roots of rice is considered to contribute to its healthy growth under waterlogged
conditions.Aerenchyma occupies 40-50% of the total cross sectional area of roots
of waterlogged rice whereas under upland conditions it occupies 25-30% (Kimura
1993). These gas spaces provide a pathway for oxygen transport from shoots to
roots. Developmentof gas spaces in many wetland species is constitutive because
this process occurs whether or not plants are growing in aerated or waterlogged
soils (Schussler 1997). No reports are available on space occupied by aerenchyma
in tolerant and susceptible rice varieties. Since this property is constitutive, it
might provide a mechanism through which Fe-tolerant rice varieties could
increase their root oxidizing power and improve their tolerance to Fe-toxicity.
Recent concepts on mechanism of Fe uptake by plants
.
There are two distinct iron uptake mechanisms in plants. Strategy I plants include
all dicots and non-graminaceous monocots. Theseplants respond to Fe-deficiency
by decreasing rhizosphere pHand reducing sparingly soluble ferric iron at the root
surface by membrane-resident ferric chelate reductase (Chaney et al. 1972.
Strategy II plants are limited to graminaceous monocots, which would include
rice. These plants release mugineic acid-family phytosiderophores to the
rhizosphere, where they solubilise sparingly soluble iron by chelation. The
chelated complex is then absorbed into the roots. Genes for the synthesis of
phytosiderophores havebeen isolated from barley (Higuchi et al. 1999; Kobayashi
et al. 2001; Okumura et al. 1994; Takahashi et al. 1999). The gene families for
heavy metal transporters in plants are quite large ( Mäser et al. 2001; Mills et al.
2003; Williams et al. 2000). They have different substrate specificity and are
located in different organs and organelles This diversity is necessary to provide
the highand low affinity systems needed to cope with varying metal availability in
the soil; to provide the specific requirements for transport at the different cellular
and membranes of organells within the plant; and to respond to a variety of stress
conditions (Hall and Williams 2003).
The gene family, Nramps (Natural resistance associated macrophage proteins)
transports Mn , Cu and Fe . ZIP family (ZRT, IRT-like proteins) transports Fe ,
Zn and Mn . ABC (ATP-binding cassette) transporters carry Mn and Fe . Most
transitional metals are potential substrates for at least two gene families (Hall and
2+ 2+ 2+ 2+
2+ 2+ 2+ 2+
District Fe P K Ca Mg Mn Zn(mg kg ) % % % % (mg kg ) (mgkg )
(20)* 0.12 0.62-0.91 0.29-0.48 0.13-0.23 113-170 15-28418-490
Khurda 450-915 0.07-Puri (4) 0.11-0.12 0.88-0.94 0.44-0.49 0.20-0.23 165-176 27-28Nayagarh (5) 420-560 0.09-0.12 0.81-0.95 0.43-0.48 0.20-0.23 158-177 25-29Jajpur (5) 377-485 0.10-0.12 0.92-1.10 0.46-0.50 0.22-0.24 166-182 27-32Dhenkanal (5) 400-415 0.09-0.10 0.98-1.01 0.48-0.49 0.3-0.24 176-181 29-30Keonjhar (5) 375-400 0.10-0.11 1.00-1.12 0.49-0.50 0.22-0.23 179-182 30-32Balasore (4) 360-400 0.10-0.11 1.14-1.21 0.48-0.51 0.22-0.24 182-186 29-31Bargarh (5) 360-451 0.09-0.11 1.05-1.20 0.44-0.48 0.19-0.24 173-184 28-32Sambalpur (4) 422-465 0.09-0.10 1.05-1.12 0.41-0.43 0.19-0.20 176-180 28-30All (57) 360-915 0.07-0.12 0.60-1.21 0.29-0.51 0.13-0.24 113-186 15-32
* Values in parenthesis indicate number of samples
1 1 1
Table 5 Correlations between leaf Fe and soil characteristics and leaf nutrients
Soil Parameters (r) Plant Parameters (r)
Clay -0.282* - -PH (1:2) -0.540** - -OC (g kg ) 0.153 - -P (mg kg ) 0.232 P (%) -0.809**K (mg kg ) -0.734** K (%) -0.912**Ca (cmol (p+) kg -0.518** Ca (%) -0.956**Mg(cmol (p+) kg -0.389** Mg (%) -0.954**Fe (mg kg ) 0.709 Fe (mg kg ) 1.0**Zn (mg kg ) -0.194** Zn (mg kg ) -0.988**Mn (mg kg ) -0.389** Mn (mg kg ) -0.995**Cu (mg kg ) 0.246 Zn (mg kg ) -
-1
-1
-1
-1
-1
-1 -1
-1 -1
-1 -1
-1 -1
220 221

Williams 2003). Thus Fe and Mn are transported by both the Nramps and ZIPs. Mn
is a substrate for both Ca -ATPase and the cation/H antiporters. Zn is a substrate
for both the CDFs (cation diffusion facilitator) and ZIPs. When a transporter
protein is carrier for more than one ion a competition to occupy the substrate sites is
possible. Thus negative interactions between Fe and Zn , Fe and Mn , Mn and
Cu , Mn and Zn are possible. While such genetic regulation mechanisms
operate while nutrient ions are initially taken up by plants they are probably
inactivated when toxic concentrations of ions accumulate within the plant.
Heavy metals cause toxicity in plants due to production ofreactive oxygen species
by auto-oxidation and Fenton reaction (Fe +H O =Fe +OH`+OH );this reaction
is typical for transition metals such as iron or copper (Hall and Williams 2003).
Under conditions of Fe toxicity, Fe iron accumulates in the apoplast of tissues and
it is oxidized to Fe through Fenton reaction. The production of hydroxy radical
causes oxidative injury, which cannot be controlled by antioxidants. According to
Xinxiang and Yamauchi (1995) leaf bronzing is caused by precipitation and
deposition of ferric compounds in the apoplast. Oxidation of Fe to Fe in the
apoplast may result in increased production of free radicals such as O and HO ,
which may damage membrane, nick DNA, inactivate enzymes and proteins, and
break up cellular integrity. There is a significant correlation between bronzing and
ethylene production in leaves. However ethylene production did not increase with
the increase of iron concentration in rice plants with intact roots. In iron toxic soils
due to fast accumulation of Fe the exclusion capacity of apoplast is overcome and
Fe enters the symplast. Then bronzing symptoms, injury to symplast and
ethylene production takes place in parallel though not simultaneously.
There are cellular mechanisms for metal detoxification and tolerance by higher
plants. These are: Restriction of metal movements to roots; binding to cell wall and
root exudates; reduced influx across plasma membrane; active efflux into
apoplast; chelation in cytosol by various ligands; repair and protection of plasma
membrane under stress conditions; transport of phytochelatin-metal complex into
the vacuole and transport and accumulation of metals in the vacuole. Upon
exposure to heavy metals, plants often synthesize a set of diverse metabolites that
accumulate in the mM range, such as amino acids: proline and histidine, peptides:
glutathione and phyto-chelatins (PC), and the amines: spermine, spermidine,
putrescine, nicotianamine, and mugineic acids. These metabolites bear functional
significance in the context of metal stress tolerance. Tseng et al. (1993) showed
2+ +
2+ 2+ 2+ 2+ 2+
2+ 2+ 2+
++ +++ -
++
+++
++ +++
- -
++
++
Effects of iron toxicity on plants
Defense mechanisms by plants for metal detoxification
2 2
2
that, in rice, both heat stress and heavy-metal stress increasedthe levels of mRNAs
for low molecular mass HSPs (Heat shock proteins) of 16–20 kDa. HSPS act as
molecular chaperones in normal protein folding and assembly, but may also
function in the protection and repair of proteins under stressconditions.
Recent concepts on genetic regulation of K uptake
Amelioration of iron toxicity through application of K
+
Genetic regulation of potassium uptake by plants under normal conditions as well
as under conditions of stress has been extensively reviewed (Mitra 2009; Navarro
and Rubio 2006). K-transporters have been recently classified (TC- system) into
two major pathways for K acquisition by plants (Busch and Saier 2002; Mitra,
2008; Mitra, 2009). Class-I: Channels and other low affinity systems (LATS)
effective at K concentrations near 1 mM and above. There are three families,
Shaker type channels, KCO channels and Cyclic-nucleotide-gated channels.
Class-II: High affinity systems (HATS), operative at K concentrations in the
micro molar range. These consist of TrK/HKT transporters, [Na / K symporter],
KUP/HAK/KT transporters, K / H antiporter homologue and Glutamate
receptors. These genes have been identified in many plants including rice and have
different roles in uptake of K from soil solution present at either high or low
concentrations. For example, Plant voltage gated Shaker channels participate at
the cell and whole plant levels, in K uptake from the soil solution, long-distance
K transport in the xylem and phloem and K fluxes in guard cells during stomatal
movement (Chérel 2004). In rice OsHKT1, a high affinity K transporter showed
properties of a Na selective uniporter. A salt tolerant cultivar Pokkali contained
OsHKT2, a K /Na symporter (Golldack et al. 2003). The presence of many of
these genes in plants and the functions of corresponding protein transporters coded
by them are yet to be discovered.
The protective action of potassium on plants under stress at biochemical
level has been well documented. Possible injury to plants under conditions of
stress is counteracted by controlling acivity of super oxide dismutase, mitigating
injury caused by free radicals of active oxygen. It maintains integrity of plasma
membrane and thus protects the symplast from possible injury from Fe
accumulation in the apoplast (Li 2006). Potassium increases proline content of
leaves and suppresses malondialdehyde (MDA) content produced under stress
and strengthens stress resistance crops. It also maintains the balance of internal
hormone level of CTK, ABA and ethylene. Gating properties of K channels and
their expression are probably regulated byABA(Roberts and Snowman 2000).
In a green house experiment the effects of Fe, K and interaction between Fe and K,
+
+
+
+ +
+ +
+
+
+ +
+
+
+ +
+
222 223

were all found to be significant. At 50 mg kg of Fe application dry matter yield
increased with increased levels of K application. As Fe level was increased to 100
mg kg there was decline in dry matter yield at all levels of K. Increased levels of K
applications increased dry matter yield significantly up to 60 mg kg . Beyond 100
mg kg , the yield reductions were drastic due to Fe-toxicity. Application of K
significantly increased dry matter yield up to 200 mg kg Fe application. Above
this level yield differences were not significant (Table 6).
Effects of Fe and K applications were significant on uptake of K (Table 7).
The application of Fe at 100 mg kg or above significantly decreased K uptake by
rice. The application of K at higher doses increased K uptake significantly up to Fe
level of 200 mg kg .Above this level of Fe the effects were not significant.
Potassium and symptoms of iron toxicity, grain yield and quality
The effect of increased K application on leaf bronzing at 40 DAT (days after
transplanting) was more for Jaya (susceptible to Fe toxicity) than for Mahsuri
-1
-1
-1
-1
-1
-1
-1
(tolerant). The decrease of bronzing due to increased application of K was steeper
in Jaya but gradual in Mahsuri (Table 8). The grain yield of the susceptible rice
variety Jaya increased with increase in K application and more than doubled at 120
and 160 kg K O ha . The yields of tolerant variety Mahsuri also increased
substantially with application of 120 and 160 kg K O ha . The beneficial effects of
higher doses of potassium on crop yield manifested, only in the presence of
adequate quantities of other nutrients. Percent filled grains increased significantly
with increased levels of potash for both the varieties. The susceptible variety
(Jaya) benefited more than the tolerant variety (Mahsuri). This is due to alleviation
of Fe toxicity by potassium and its known role in improving translocation of
carbohydrates.
In iron toxic soils apart from leaf bronzing the seed coat (husk) of rough rice
develops brown spots, which fetches less price in the market. Potassium
application significantly reduced percent tinged grains in both the varieties, more
in Jaya than Mahsuri. About that 77% of iron taken up by the whole grain is
retained in the husk and only 23% goes to the grain. This appears to be a natural
mechanism in plants to protect its reproductive part from toxic constituents.
During the process of grain filling most of the iron translocated to grains is filtered,
retained by the husk and only a small portion reaches the kernel.
K, and Fe contents at different stages of growth
The K contents of the plants of both the varieties increased with increased levels of
K. The K contents of Mahsuri (tolerant to Fe-toxicity) were higher than those of
Jaya (suceptible) for all the levels of K at maximum tillering stage.At PI stage, this
trend was reversed and K contents of Jaya were higher than those of Mahsuri. This
2
2
-1
-1
Table 6 Effects of Fe-K interaction on dry matter yields (g pot ) of rice (cv. Daya)-1
Fe levels
(mg kg ) 0 30 60 90
0 7.86 7.05 7.89 7.8850 7.95 8.00 8.16 8.20100 5.75 6.27 6.75 6.79200 1.05 1.54 2.00 2.10300 0.99 1.05 1.07 1.21400 0.80 0.56 0.60 0.61
Fe K Fe x K0.18 0.15 0.36
Source: Sahu and Mitra 1992
Levels of K (mg kg )
CD (0.05)
-1
-1
Table 7 Effects of Fe-K interaction on K uptake (mg pot ) by rice (cv. Daya)-1
Fe levels
K K K K
0 151.3 155.3 156.8 168.650 150.0 153.0 153.0 162.0100 99.8 108.8 120.5 124.5200 15.8 23.5 32.5 35.1300 13.0 15.5 16.0 18.4400 10.4 7.2 8.6 8.7
Fe K FeXK4.96 4.05 N.S
Levels of K (mg kg )
(mg kg )
C.D(0.05)
-1
-1
0 30 60 90
Source: Sahu and Mitra 1992
Table 8 Effects of potash application on iron toxicity score (leaves at 40 DAT),
grain yield and quality parameter of rice grown on an iron toxic soil
Levels ofK O (1-9 scale) (q ha ) (%) (%)
Jaya Mahsuri Jaya Mahsuri Jaya Mahsuri Jaya Mahsuri
0 8.3 2.7 10.3 18.2 62.3 82.9 14.7 7.540 7.0 2.3 13.8 22.1 65.0 84.4 11.1 6.380 5.0 1.7 19.4 22.7 71.6 85.2 10.1 5.3120 5.0 1.0 22.1 26.8 76.8 86.0 9.4 4.7160 3.0 1.0 24.4 28.8 78.7 87.1 8.5 2.7
K V Kx V K V Kx V K V Kx V
C.D (0.05) 3.12 9.43 N.S 8.79 7.47 7.47 2.42 1.56 N.S
Source: Sahoo 1989
Iron toxicity Grain Yield. Filled grains Tinged grainsscore
(kg ha )
2
-1
-1
224 225

reverse trend persisted at the harvest stage as well. The variety Jaya was benefited
more than Mahsuri at higher doses of K (120 and 160 kg ha ) and its yield
increased, more than two times the control yield. Fe-contents of both the rice
varieties decreased significantly with increase in K-levels at all the stages of
growth. Jaya had higher content of Fe than Mahsuri at every stages of growth. The
tolerant variety Mahsuri had probably a constitutive mechanism (higher % of
aerenchyma in the root cortex?) to exclude Fe uptake by increasing oxidizing
power of its roots.
The lateral flow of soluble iron during rainy season enriched the soils to a toxic
level. There is a considerable nutrient imbalance in the soil.
The rice plants
may not show the characteristic visual symptom of bronzing of leaves.
Nevertheless a relatively higher Fe content of soil at sub-toxic level is probably
responsible for low yield of rice and other crops of Orissa. Amendment of such
soils with application of higher doses of K is essential and current recommended
dose of K for rice be revised from 30 kg to 60 K O ha . The ameliorating effect of
applied K at higher doses on iron toxicity has been attributed to its role in
increasing root oxidizing power in rice, which results in oxidation of Fe to Fe
and its exclusion from uptake. This is evident from increase in intensity of iron
oxide coating on rice roots at higher levels of K application. Recent concepts about
genetic control of ion uptake do not indicate any common transporters for K and
Fe. The mechanisms of their uptakes are unique to each of them. At ionic level
there is no possibility for competition of Fe and K for the same site on any
transporter protein. The effects of K on alleviating Fe-toxicity are indirect. K
counteracts the toxic effects of Fe-toxicity by neutralizing them through different
mechanisms and restoring the nutrient balance in the plants.
Benckiser G, Ottow JCG, Santiago S, Watanabe I (1982) Physicochemical
characterization of iron-toxic soils in some Asian countries. IRRI Res paper
No 85 IRRI Manila Philippines
Busch W, Saier MH (2002) The Transporter Classification (TC) System, Critical
Review. Biochem and Molecular Biol 37: 287 – 337
Chaney RL, Brown JC, Tiffin LO (1972) Obligatory reduction of ferric chelates in
iron uptake by soybeans. Plant Physiol 50: 208–213
Chérel I (2004) Regulation of K channel activities in plants: from physiological to
molecular aspects. J Exp Bot 55(396): 337-351
Dolui AK, Mustafi SC (1997) Forms of extractable iron in relation to soil
-1
-1
2+ 3+
+
Conclusions
References
There was a huge
negative balance (-241.87 thousand tons annually) of K in the soil.
2
characteristics of someAlfisols. J Indian Soc Soil Sci 45: 192-194
Golldack D, Quigley F, Michalowski CB, Kamasani UR, Bohnert HJ (2003)
Salinity stress-tolerant and -sensitive rice ( L.) regulate AKT1-
type potassium channel transcripts differently. Plant Mol Biol 51: 71-81
Hall JL, Williams LE (2003) Transition metal transporters in plants. J Exp Bot 54 :
2601-2613
Higuchi K, Suzuki K, Nakanishi H, Yamaguchi H, Nishizawa NK, Mori S (1999)
Cloning of nicotianamine synthase genes, novel genes involved in the
biosynthesis of phyto-siderophores. Plant Physiol 119 471–479
IRRI (1980) Standard evaluation system for rice. International Rice Testing
Programme, International Rice Research Institute, Philippines
Kimura Y (1993) Microbiology of waterlogged rice fields. In:Alvin Paul (ed) Soil
Biochemistry. Marcel Dekker, NewYork
Khan ZH, Mazumdar AR, Hussain MS, Saheed SM (1997) Chemical and
mineralogical properties of some benchmark soils in the flood plains of
Bangladesh. J Indian Soc Soil Sci 45: 362-369
Kobayashi T, Nakanishi H, Takahashi M, Kawasaki S, Nishizawa NK, Mori S
(2001). evidence that Ids3 from Hordeum vulgare encodes a
dioxygenase that converts 2'-deoxymugineic acid to mugineic acid in
transgenic rice. Planta 212: 864–871
Li F (2006) Potassium and water interaction, International workshop on soil water
and K fertiliser management, Agriculture College, Guangxi University,
China
Mäser P, Thomine S, Schroeder JI, et al. (2001) Phylogenetic relationships within
cation transporter families ofArabidopsis. Plant Physiol 126: 1646–1667
Mills RF, Krijger GC, Baccarini PJ, Hall JL, Williams LE (2003) Functional
expression of AtHMA4, a P -type ATPase in the Zn/Co/Cd/Pb subclass.
Plant J 35: 164 175
Mitra GN, Misra UK, Sahu SK (2002) Macro and micronutrient status of soils of
Orissa, IFFCO, Kolkata
Mitra GN, Rout KK, Sahu SK (2006) Nutrient status of soils of Orissa. In: Mitra
GN (ed) Nutrient management of crops in soils of Orissa. Indian Society of
Soil Science, Bhubaneswar Chapter
Mitra GN (2008) Genetic regulation of nutrient uptake, transport and
redistribution in plants, News Letter, Bhubaneswar Chapter, Indian Society
of Soil Science, 1 (1).
Mitra GN (2009) Genetic regulation of potassium uptake by plants under normal
conditions and in response to drought and salinity, Souvenir, IPI-OUAT-IPNI
International symposium on potassium, OUAT, Bhubaneswar, Orissa, India
Mohanty SK, Patnaik S (1977) Effect of submergence on the chemical change in
different rice soils.ActaAgronomica 26: 187-192
:
Oryza sativa
In vivo
1B
226 227

Nayak RK (2008) Studies on iron toxicity in relation to rice nutrition in Orissa. Ph.
D dissertation, Visva Bharati, Sriniketan, West Bengal, India
Navarro AR, Rubio F (2006) High-affinity potassium and sodium transport
systems in plants. J Exp Bot 57(5):1149-1160
Okumura N, Nishizawa NK, Umehara Y, Ohata T, Nakanishi H, Yamaguchi H,
Chino M, Mori S (1994) A dioxygenase gene (Ids2) expressed under iron
deficiency condition in the roots of Hordeum vulgare. Plant Mol Biol 25:
705–719
Panabokke CR (1975) Problem rice soils of Sri Lanka, IRRI Research Conference,
Los Banos, Philippines.
Patil PL, Dasog GS (1997) Low land soils of Western Ghat region –
Characterization, genesis and classification.Agropedol 7: 71-77
Roberts SK, Snowman BN (2000) The effects of ABA on channel mediated K
transport across higher plant roots, J Exp Bot 51 (350): 1585-1594
Sahu BN (1968) Bronzing disease of rice in Orissa as influenced by soil types and
manuring and its control. J Indian Soc Soil Sci 16: 41-54
Sahu SK, Mitra GN, Misra UK (1990) Relationship between available
micronutrient status of soils growing rice and micronutrient contents of rice
plant. J Indian Soc Soil Sci 38: 84-88
Sahu SK, Mitra GN (1992) Micronutrient status of soils of Orissa, Proc Work shop
on micronutrients, Bhubaneswar, Hindustan Fertilizer Corporation
Schussler EE (1997) Aerenchyma development in the freshwater marsh species
L. Ph.D. dissertation Louisiana State U, Baton Rouge
Sehgal J (1993) Red and lateritic soils of India –An Overview. In: Red and lateritic
soils of India, National Bureau of Soil Survey and Land Use Planning,
Nagpur, pp 1-14
Suresh S, Savitri P (2001) Characterization of iron toxic soils in the flooded
valleys of the high rain fall zone of Tamil Nadu. J Indian Soc Soil Sci 49:746-
749
Tadano T, Yoshida S (1978) Chemical changes in submerged soil and their effect
on rice growth. In: Soils and Rice, IRRI, Los Banos, Manila, Philippines
Takahashi M, Yamaguchi H, Nakanishi H, Nishizawa NK, Mori S (1999) Cloning
two genes for nicotianamine aminotransferase, a critical enzyme in iron
acquisition (Strategy II) in graminaceous plants. Plant Physiol 121: 947–956
Tanaka A, Yoshida S (1970) Nutritional disorder of rice plant in Asia. Bull 10, Int.
Rice Res. Institute, Manila, Pholippines.
Tseng TS, Tzeng SS, Yeh CH, Chang FC, Chen YM, Lin CY (1993) The heat-
shock response in rice seedlings—isolation and expression of cDNAs that
encode class-I low-molecular-weight heat-shock proteins. Plant Cell Physiol
34:165–168
Van Breemenn N, Moormann FR (1978) Iron toxic soils, In: Soils and Rice,
International Rice Research Institute, Manila, Philippines, pp 781-800
+
Sagittaria lancifolia
Xinxiang P, Yamauchi, M (1995) Iron toxicity and stress ethylene production in
rice. J Trop Subtrop Bot 4:43-51
Williams LE, Pittman JK, Hall JL (2000) Emerging mechanisms for heavy metal
transport in plants. Biochimica et BiophysicaActa 1465:104–126
228 229

Proceedings IPI-OUAT-IPNI International Symposium (2009)
CS Snyder
Nitrogen Program Director, International Plant Nutrition Institute, P.O. Drawer 2440
Conway, Arkansas, USA 72033
AM Johnston
Vice President, Asia & Oceania Group, International Plant Nutrition Institute, 102 - 411
Downey Road, Saskatoon, SK S7N 4L8
e-mail : [email protected]
Role of nutrient management in reduction of
greenhouse gases
CS Snyder Johnstonl
l l l
l l l l l
l
AM
Abstract
Keywords
Introduction
Food, fiber, and fuel demands of a growing global population are resulting
in increased fertilizer nitrogen (N) use. Farmers are being asked to improve N use
efficiency and effectiveness through better management in their fields, to minimize
greenhouse gas (GHG) emissions that contribute to climate change. Correct
decisions in the management of N, which are based on sound agronomic and
environmental research, can improve crop production and help reduce GHG
emissions. Appropriate nutrient management helps increase biomass production
necessary to help restore and maintain soil organic carbon (SOC) levels, which are
necessary for sustainable production. Residual levels of soil nitrate and emissions of
nitrous oxide (N O) may be minimized when best management practices (BMPs)
for fertilizer N are implemented. Balanced fertilization with other essential nutrients
enhances crop N use efficiency and is considered a BMP. Emissions of N O vary
among fertilizer N sources, depending on site- and weather-specific conditions, and
the cropping system. With intensive crop management, GHG emissions are not
necessarily increased per unit of crop or food production. Such ecological
intensification of crop production can help spare natural areas from conversion to
cropland and allow conversion of selected lands to forests for GHG mitigation. Use
of the right source, at the right rate, right time, and right place – termed 4R Nutrient
Stewardship - is advocated, in combination with appropriate cropping and tillage
practices, to achieve agronomic, economic, and environmental goals.
Best management practice (BMP) carbon dioxide climate change
cropping system fertilizer global warming greenhouse gas (GHG) nitrogen
nitrous oxide methane
Agricultural activities contributed 32 percent (13,360 million tonnes or Tg) of the
2
2
230 231

global 41,382 million tonnes (Tg) of carbon dioxide (CO )-equivalent greenhouse
gas (GHG) emissions in 2000; 63 percent of agriculture's GHGs were non-CO
GHGs (EPA 2006). Baumert et al. (2005) reported that about 15 percent of the
world's GHGs were associated with agricultural activities in 2004, while Smith et
al. (2007) estimated that agriculture contributed 10-12 percent of global
anthropogenic GHG emissions in 2005.Among all economic sectors in developed
countries, agriculture is generally a relatively small contributor to total GHG
emissions, but the percentage contributions may be higher in many developing
countries. The agricultural sector accounted for less than 7 percent (~413 Tg CO -
equivalent) of national GHG emissions in the United States (U.S.) in 2007 (EPA
2009), while the agricultural sector accounted for 24 percent (~ 412 Tg CO -
equivalent) of India's GHG emissions in 2005 (Garg et al. 2006).
Carbon dioxide (CO ) dominates the CO -equivalent global GHG emissions
from all sectors at 77 percent, while CH emissions represent 15 percent and N O
emissions represent 8 percent (EPA2006). Countries with the largest portion of the
global agricultural sector GHG emissions in 2000 were: China-18 percent, India-
11 percent, EU-9 percent, U.S. -9 percent, and Brazil-8 percent (Baumert et al.
2005). Soil management activities were thought to contribute 40 percent of the
global agricultural sector GHGs, with an even division (45-46 percent each)
between nitrous oxide (N O) and methane (CH ) emissions, on a CO -equivalent
basis (Baumert et al. 2005).
Emissions of the three prominent GHGs - CO , CH , and N O – are known to
vary, depending on the land use and management (Bellarby et al. 2008). These
three GHGs also differ in their effectiveness in trapping heat and in their turnover
rates in the atmosphere. For a 100-year timeframe, unit masses of CH and N O
are considered to have 23 and 296 times the global warming potential (GWP),
respectively, as a unit of CO (IPCC 2001). Although older sources (IPCC 1996)
may use the GWP CO equivalent values of 21 for CH and 310 for N O, for the
purposes of this review we will use the more recent values of 23 and 296,
respectively (IPCC 2001).
An estimated 20 percent of GHG emissions are thought to be due to clearing and
burning of forests, largely as a result of development pressures and human demand
for food and fuel (Baumert et al. 2005). Safe-guarding and storing carbon (C) in
agricultural systems is one means of mitigating GHG emissions. Increasing the
agricultural productivity per unit of existing land area can help preserve and
protect natural areas (Cassman 1999) and help minimize anthropogenic CO
emissions. Intensification of agricultural production on existing lands may also
2
2
2
2
2 2
4 2
2 4 2
2 4 2
4 2
2
2 4 2
2
GHG mitigation by agriculture
lower the risk of accelerated N O emissions be preventing heightened
decomposition of soil organic matter and subsequent N mineralization which may
be associated with cultivation of former wetlands, forests, or grasslands (IPCC
2006). There is evidence that net GHG emissions can be kept low in agricultural
cropping systems with optimized management that exploits the realistic,
attainable yield potential (Adviento-Borbe et al. 2007). Intensive crop
management systems may have increased GHG emissions per unit land area, but
they do not necessarily increase GHG emissions per unit of crop or food
production (Snyder et al. 2007; 2009). Using the economic optimum N rate
(EONR) for crop production might increase emissions of CO compared to a no N
or 50 percent of the EONR scenario, but the increased land area that would be
required to compensate for the yield loss under these two lower input scenarios
would result in CO emissions as much as four times greater than those of the
intensive EONR system (Brentrup and Palliere 2008).
Soil organic carbon (SOC) sequestration is believed to be a cost-effective
strategy for mitigating climate change through the first three decades of the 21st
century (Lal 2003). Making agriculture C neutral by 2030 has been proposed as a
challenging, but achievable goal (Trumper et al. 2009). Indeed, agriculture is
increasingly being viewed as a solution rather than a cause of environmental
challenges like global warming and climate change (Lal 2007; 2008).
Carbon loss (i.e. CO emissions) in agricultural systems can be reduced in
many ways, including the use of conservation tillage practices, use of appropriate
cropping systems and rotations, integrated nutrient management, integrated pest
management, and improved grazing land management (Lal 2008). Integrated
nutrient management “conserves carbon while sustaining food production”, “ will
depend on the specific characteristics of the agricultural system in question”, and
“can represent a win-win situation as high levels of soil organic carbon improve
nutrient and water use efficiency, reduce nutrient loss and subsequently increase
crop production” (Trumper et al. 2009).
Agricultural-related GHG emissions are a growing concern because there
is an increasing global demand for food, feed, fiber, and fuel (Bellarby et al.
2008; EPA 2006). Coarse grains - including maize or corn (Zea mays L.), wheat
(Triticum aestivum L.), and rice (Oryza sativa L.) - are the cereal crops with the
largest global production and the greatest global demand (FAO, 2009); they
provide over 60 percent of the world's human calories, either directly as food or
indirectly through livestock products (Cassman et al. 2002). For most upland
crops (e.g. wheat and maize), N O may be considered the principal GHG
(Snyder et al. 2009), while CH may be the GHG emitted in the largest amounts
by flooded rice systems (Anand et al. 2005; Majumdar 2005). Since CH and
N O have GWPs so much higher than CO , agricultural management that
reduces the emissions of these two GHGs is likely to have a large mitigation
2
2
2
2
2
4
4
2 2
232 233

potential.
A number of studies have shown higher denitrification losses of N under
reduced tillage or no-till conservation practices compared to plowed or frequently
tilled soils, which have been attributed to higher available soil C (water soluble
and mineralizable C), increased soil moisture, and higher microbial biomass under
reduced tillage or no-till conditions (Coyne 2008). Efforts to address global
increases in CO emissions and to reduce soil erosion through conservation tillage
practices (esp. no-till) and sequester more C in soil organic matter, must be
considered cautiously and should be thoroughly evaluated because of the potential
for increased risks for NO leaching (Phillips et al. 1980) and elevated N O
emissions. The literature indicates mixed effects of tillage practices on NO
leaching (Power et al. 2001); yet, Randall and Mulla (2001) reported no significant
differences in NO leaching between no-till and tilled systems and Brye et al.
(2001) found only slightly higher NO leaching in no-till compared to chisel-
plowed agroecosystems. There are reports that N O loss under no-till were equal
to or lower than those under intense tillage (Venterea et al. 2005), or were reduced
during the growing season under no-till compared to conventional till (plowed),
when averaged across years and four N rates (Halvorson et al. 2008). In contrast,
Rochette et al. (2008) observed higher N O emissions with no-till compared to
conventional moldboard plowing on a clayey soil (77 percent clay) in eastern
Canada. More research is needed to simultaneously measure N O, CH , and CO
associated with different long-term tillage and nutrient management practices,
under different climatic and cropping conditions.
Methane is emitted through methanogenesis under anaerobic conditions in soils
and manure storage, through enteric fermentation, and during incomplete
combustion while burning organic matter (IPCC 2006). Baumert et al. (2005)
estimated that CH emissions from livestock contributed 27 percent, rice
cultivation contributed 10 percent, and manure management contributed 7 percent
of the total global CO -equivalent GHG emissions from agriculture. Rice
cultivation contributed about 23 percent of all global CH emissions from all
sectors. Yan et al. (2009) estimated that more than half of the global CH emissions
were from rice fields in China and India. According to Garg et al. (2006), the
agricultural sector contributed 83 percent of India's CH emissions; rice
cultivation was estimated to account for about 20 percent of the CH emissions
from the agricultural sector. The IPCC (2006) reported a default emission factor
of 1.30 kg CH ha day for flooded rice culture, with an error range of -0.5 to +0.9
(0.80 - 2.20). Methane emissions from a given area of rice are known to vary
2
3 2
3
3
3
2
2
2 4 2
4
2
4
4
4
4
4
-
-
-
-
-1 -1
Methane emissions and rice paddy management
considerably with the number and duration of crops grown, water regimes before
and during the cultivation period, types and amount of organic and inorganic soil
amendments, as well as soil type, temperature, redox potential, and rice cultivar
(IPCC 2006; Xie et al. 2009).
About 80 percent of the world's harvested rice area is lowland or irrigated
rice, and accounts for about 92 percent of the total rice production (Dobermann
and Fairhurst 2000). Using the IPCC guidelines for 2006, Yan et al. (2009)
estimated that CH emissions could be reduced by 16 percent if all the
continuously-flooded rice fields were drained at least once during the growing
season, or if rice straw applications were made to fields in the off-season. If
implemented together, these two management actions were estimated to reduce
CH emissions from rice fields by 32 percent. If alternate draining and flooding
management does not require intensified N management practices, and it
improves RE without impacting rice yield as was reported by Cabangon et al.
(2004), it may offer practical CH and N O emission reduction benefits. However,
Johnson-Beebout et al. (2008) concluded that simultaneous minimization of both
CH and N O emission in soils growing rice (i.e. maintaining the theoretical
redox potential between -100mV and 200mV) was not practically attainable
because the redox potential changed with depth, but appropriate water and
residue management could help reduce GHG emissions. Continuous flooding
without crop residue incorporation had the lowest combined risk of CH and N O
emissions, but when residue was incorporated, alternate flooding and draining
had similar or lower emission risks.Although draining continuously-flooded rice
fields once per season would increase N O emissions, Yan et al. (2009) estimated
that the increased N O emissions (assuming an average fertilizer N application
rate of 150 kg N ha ) would only be approximately 2.7 percent of the reduced
GWPresulting from the benefits of reduced CH emissions.
Agricultural soils and their management – which includes the application of
fertilizer and manure - are considered the principal global sources of N O
emissions. Yet, N O emissions from agricultural soils represented only 3.5 percent
of the total GHG emissions in North America in 2007, with little percentage
change observed since 1990 (Environment Canada 2009; EPA2009).Agricultural
activities accounted for more than 80 percent of the total direct and indirect
national N O emissions from all economic sectors in India in 2005, including
approximately 60 percent from the use of fertilizer (Garg et al. 2006). Fertilizer N
use and applications in 2007 accounted for 47 percent of the direct N O emissions
associated with agricultural soil management in Canada (Environment Canada
4
4
N
4 2
4 2
4 2
2
2
4
2
2
2
2
-1
Nitrous oxide emissions associated with nitrification and denitrification
234 235

2009), 28 percent in the U.S. (EPA 2009), and 27 percent in Europe's EU-15 (EEA
2009).
The interaction of soil factors that control nitrification and denitrification are
complex and have a strong influence on the N cycle, and pathways that govern the
direct and indirect risks for N O emissions. The amount of N O produced depends
on the range of oxygen (O ) concentrations in the soil, which is influenced by the
moisture content, and temperature determines the rate at which the soil
microorganisms nitrify or denitrify. The rate of N species conversion is slow at
cooler temperatures, but increases to a maximum as temperatures rise. Other
important factors, which affect N O emissions, are soil texture, the amount of
ammonium (NH ) available for nitrification, and the amount of nitrate (NO )
available for denitrification (Firestone 1982; Granli and Bøckman 1994).
Nitrification requires ammonium NH , O , and CO while denitrification is
favored by a supply of NO , organic carbon (C), and reduced or O deficient
conditions (Rochette et al. 2000). Nitrification and denitrification, can occur
simultaneously in soils and both can contribute to production of N O (Bremner
and Blackmer 1978; Hutchinson and Davidson 1993). Denitrification occurs
when NO is transformed to dinitrogen (N ) gas as described in the following
pathway, NO NO NO N O N (Firestone 1982; Firestone and
Davidson1989; Robertson and Groffman 2007). The conversion of NO to N can
be complete, but a small and variable portion of the N is often emitted as N O gas.
Emissions are sporadic, occurring before, during, and after the crop growing
season. Increased levels of inorganic N and available C result in a greater
abundance of denitrifying enzymes and may lead to increased denitrification rates.
In soils with a low available C content, application of manure can result in greater
N O emissions than with mineral fertilizer (Rochette et al. 2000). In well-aerated,
moist soil conditions (>60% water-filled pore space) N O losses can be substantial
(Coyne et al. 2008; Francis et al. 2008).
Modern fertilizers are conservatively estimated to contribute to at least 30 to 50
percent of the world's food supply (Stewart et al. 2005). The Haber-Bosch
synthesis of ammonia for fertilizer N production has made it possible to provide
food for more than 40 percent of the world's population (Lal 2007; Smil 2002).
While manures or organic manures have been a significant source of nutrients
historically, their proportionate use for fertilizing crops is shrinking. In India for
example, “The proportion of cattle manure available for fertilizing purposes
decreased from 70 percent of the total produced in the early 1970s to 30 percent in
the early 1990s” (FAO 2006).
2 2
2
2
4 3
4 2 2
3 2
2
3 2
3 2 2 2
3 2
2
2
2
+ –
+
-
–
– –
–
Increasing fertilizer N consumption and N O emission implications
→ → → →
2
Farmers, input providers, crop advisers, and governments are all seeking
opportunities to improve the efficiency and effectiveness of fertilizer N use to
maximize economic returns, to increase food production, to sustain productivity,
and to minimize environmental consequences - including GHG emissions. Global
fertilizer nitrogen (N) consumption has been increasing; especially in East Asia
and in South Asia (Figure 1) (IFA Statistics 2009), and consumption among these
countries is projected to increase into the near future (Figure 2) (FAO 2009).
Global fertilizer N consumption (IFAStatistics 2009)
Projected world fertilizer N consumption (FAO 2009)
Fig. 1
Fig. 2
0
20
40
60
80
100
120
1970
1972
1974
1976
1978
1980
1982
1984
1986
1988
1990
1992
1994
1996
1998
2000
2002
2004
2006
Oceania
Africa
W. Asia
E. Europe & C. Asia
L. Am. & Caribbean
W. & C. Europe
N. America
S. Asia
E. Asia
Mil
lio
n m
etr
ic t
on
s o
f N
0
20
40
60
80
100
120
2007/08 2008/09 2009/10 2010/11 2011/12
Mil
lio
n m
etr
ic t
on
s o
f N
Oceania
C. Europe
E. Europe & C. Asia
Africa
W. Asia
L. America
W. Europe
N. America
S. Asia
E. Asia
236 237

Increased fertilizer N consumption has raised concerns about increases in
reactive N release to the environment, cascading effects on the N cycle, and the
associated direct and indirect N O emissions from a global perspective (Galloway
et al. 2003, 2004; Sutton et al. 2007) and within an Asian and Indian context
(Galloway et al. 2008). The role of nutrient management in minimizing
environmental losses of reactive N, and the potential to help mitigate GHG
emissions, may be of particular interest in China and India because they may
presently contribute more than two-thirds of Asia's agricultural N O emissions
(Singh and Singh 2008).
One of the key ways to reduce the risk of GHG emissions associated with fertilizer
use and cropping systems is to increase nutrient use efficiency and effectiveness.
Simply stated, good fertilizer stewardship (Roberts 2007) - applying the right
fertilizer source, at the right rate, right time, and right place (i.e. 4R Nutrient
Stewardship) - should lead to improved economic crop production and help
minimize the environmental impacts; including minimization of GHG emissions.
Implementation of fertilizer best management practices (BMPs) (Bruulsema et al.
2008; IFA 2007), adoption of 4R Nutrient Stewardship (Bruulsema et al. 2009)
and Site-Specific Nutrient Management (SSNM) have been advanced as practical
means to help achieve agronomic, economic, and environmental objectives
(Adviento-Borbe et al. 2007; Dobermann and Fairhurst 2000; Dobermann and
Cassman 2002; Fixen et al. 2005; Peng et al. 2003; Snyder 2008; Snyder et al.
2007, 2009; Vetsch et al. 1995).
Nitrogen from soil, fertilizer and manure sources is used relatively
inefficiently by crops, with 50 percent or less N use efficiency (Balasubramanian
et al. 2004), but N use efficiency can be increased to 60 to 70 percent or more with
improved management in many cropping systems (Cassman et al. 2002; Kitchen
and Goulding 2001; Raun and Johnson 1999). Based on available data in the U.S.
and Asia, Dobermann and Cassman (2002) reported that typical on-farm apparent
crop recovery of applied N (RE ) was only 30 percent in rice and 37 percent in
maize, but with good management RE could be 50 to 80 percent. Increasing crop
RE can reduce the potential for losses of N that reduce economic returns to
farmers and which raise the risks of environmental impact. In cereal crop research
trials, total RE from a one-time application of N averages about 50 to 60 percent,
and 40-50 percent under most on-farm conditions (Dobermann 2007). The
remainder of N is subject to loss from the cropping system. Based on 241 site-
years of field experiments in North America and China, Fixen et al. (2005)
reported that first-year crop RE increased from 21 percent in the conventional or
check treatments to 54 percent with site-specific, multi-element balanced
2
2
N
N
N
N
N
Fertilizer management for nutrient use efficiency and effectiveness
nutrition. These results indicate there is a considerable opportunity to recover lost
efficiencies through improved nutrient management, especially by emphasizing
balanced and optimum levels of all nutrients.
It is possible for NO to accumulate in the soil whenever N is not the factor
most limiting crop production. For example, in a long-term study on the North
American Great Plains comparing maize response to N rates with and without P,
adequate fertilization for improved crop nutrition increased yields 42 percent,
improved economic returns, and reduced soil profile NO -N levels by 66 percent
(Schlegel et al. 1996). Proper K nutrition, through adequate rates of fertilizer and
maintenance of soil test K levels in the agronomic optimum range, can improve
RE (Figure 3) and also reduce loss of NO (Johnson et al. 1997). High yield
management research with maize in the state of Kansas in the U.S. (Gordon 2005)
showed that balanced fertilization, using the right rate of other essential nutrients
like sulfur (S) in addition to N, P, and K can significantly increase crop RE (Figure
4).
Aulakh and Malhi (2004) reported additional examples of the impacts of
proper nutrient balance with N, and showed that improvements in RE ranging
from approximately 20 to 50 percent were possible. Balanced fertilization and soil
fertility are important major factors under farmer control, which affect crop yield
and N use efficiency (Balasubramanian et al. 2004; Cassman et al. 2002; Snyder
and Bruulsema 2007; Stewart et al. 2005). These examples of balanced
fertilization underscore the need for farmers to optimize all other agronomic
3
3
N 3
N
N
-
-
Fig. 3 Effects of proper K fertilization on apparent N recovery by maize (Johnson
et al. 1997)
0
10
20
30
40
50
60
70
80
90
100
110
90 180 270 360
Fertilizer N, kg ha-1
139
135
116
100
80
Soil K, mg kg-1
Grain yield at
optimum N
13.1 t grain ha-1-
213 kg N ha-1-
10.5 t grain ha-1
308 kg N ha-1
N r
eco
ve
ry i
n b
iom
ass
, %
238 239

factors, to ensure that N provided to the cropping system is used as efficiently and
effectively as possible; to prevent NO accumulation, leaching and drainage
losses that could pose risks to water resources, and which could potentially result
in increased N O emissions.
Nutrient imbalance and inadequate soil test levels of phosphorus (P) and
potassium (K) are currently limiting crop production in many countries and
regions (Table 1). In NorthAmerica, 41 percent of the soil P tests and 39 percent of
the soil K tests indicated that fertilizer should be applied each year to avoid profit
loss by most major crops. Fifty-six percent of the soil P tests and 52 percent of the
soil K tests indicated a need for fertilization rates of at least crop removal to sustain
crop production, in support of typical “build-maintenance” recommendation
programs (Fixen et al. 2005).
Nutrient management practices that improve RE of applied N are likely to
minimize the risks of N loss via the various loss pathways (immobilization,
ammonia volatilization, runoff, leaching, denitrification) (Chien et al. 2009).
Nutrient managers should consider the risks for reductions in N loss via one
pathway being offset by increased N loss via another pathway (Snyder 2008;
Snyder et al. 2009). For example, reductions in the direct loss of N via ammonia
(NH ) volatilization, could conserve N and increase the inorganic soil N supply
and lead to an increased risk for elevated NO in water resources; which may
elevate the potential for direct and indirect N O emissions (Crutzen et al. 2008; Del
Grosso et al. 2006; Galloway et al. 2003; Sutton et al. 2007). The combination of
3
2
N
3
3
2
-
-
fertilizer source, timing and placement that produces the greatest yield with the
least amount of N is likely to help optimize agronomic goals and minimize
environmental impacts. Continued in-field assessment of new practices for
optimum crop N use efficiency, and measurements to assess progress, are essential
to production and environmental goals (Dobermann 2007; Snyder and Bruulsema
2007).
There is conflicting information in the literature on the effects of fertilizer N
management on CH emissions. The presence of rice plants under flooded culture
and the type of fertilizer N applied were reported to affect the emissions of CH ,
N O, and N (Lindau et al. 1990).Application of ammonium–based fertilizers (e.g.
urea, ammonium sulfate) can increase rice growth and stimulate plant-related CH
emissions, but this enhanced emission may be countered by ammonium effects on
the inhibition of CH oxidation (Xie et al. 2009). Literature reports of inhibitory
and stimulatory effects of ammonium fertilizers on CH emissions were mentioned
in a report of work with maize and soybean ( L.) in the eastern U.S.
cornbelt (Hernandez-Ramirez et al. 2009), which indicated CH was absorbed by
soils receiving fertilizer N application (urea ammonium nitrate or UAN) while
Fertilizer N management for reduced methane emissions
4
4
2 2
4
4
4
4
Glycine max
0
0.1
0.2
0.3
0.4
0.5
0.6
0.7
0.8
0-0-0-0 300-0-0-0 300-100-0-0 300-100-80-0 300-100-80-40
Ap
pa
ren
t N
re
co
ve
ry e
ffic
ien
cy
N-P-K-S, kg ha-1
Arrows are % increase in apparent Nrecovery efficiency over N-P-K-S
treatment shown at immediate left
41 40 14
Fig. 4 Balanced fertilization effects on apparent N recovery by maize using
balanced fertilization (assuming 25 kg of N uptake per ton ofgrain (Gordon
2005).
Table 1 Phosphorus (P) and potassium (K) fertility condition of sampled soils in
the U.S., China, and India and median soil test levels in North America
(adapted from Fixen et al. 2005)
Plant available soil P Plant available soil K
Level U.S. China India U.S. China India
% of soil samples % of soil samples
Low 24 46 46 14 58 13Medium 23 25 49 29 18 53High 53 29 5 57 23 34
North America
Median soil testP (mg kg ) K (mg kg )
2001 27 1542005 31 154
% of soil
in 2005
Data source: PPI/PPIC/FAR 2005.
a
-1 -1
-1 -1
Median soil test
samples with 42 % of soil samples with 53< 25 mg kg soil test P < 160 mg kg soil test Kin 2005a
240 241

manured soils emitted CH . In China, increasing the ammonium N rates from
medium to high levels, within the range of typical N rates in China, did not appear
to modify CH emissions (Nayak et al. 2007). Methane oxidation was stimulated
by fertilizer or compost N, but when applied together CH oxidation was inhibited
(Nayak et al. 2007). Bufogle et al. (1998) cited work in which CH emissions were
less when ammonium sulfate was the fertilizer N source for rice, as opposed to
urea, which is in agreement with a review by Cai et al. (2007).
When flooded soils become more reduced (more negative redox potential),
sulfate–reducing bacteria effectively compete with methanogenic bacteria.
Although NO -based fertilizers can reduce CH emissions (Hou et al. 2000), by
temporarily increasing the redox potential (Jugsujinda et al. 1995), they are rarely
applied and generally not practical for mitigation of CH emissions in rice fields
because of their low N use efficiency and stimulation of N O emissions (Cai et al.
2007). To better evaluate the relationship between N management and CH
emissions, Cai et al. (2007) suggested more research is needed at moderate N
levels (<150 kg ha ) with different types of N fertilizers, different application
times, and different rice cultivars.
Right source
Snyder et al. (2009) reviewed the available data on the effects of N source, rate,
timing, and placement in combination with other cropping and tillage practices, on
GHG emissions. Their review included summaries of information in three reviews
published in 1990, 1994, and 2006, which evaluated the effects of fertilizer N
source on direct soil N O emissions. In numerous studies, which had been
reviewed by Bouwman et al. (2002a; 2002b), N O emissions appeared lower for
NO -based fertilizers compared to NH -based fertilizers, or organic or synthetic-
organic sources. A later report by Stehfest and Bouwman (2006) indicated that
differences among fertilizer types almost disappeared, after balancing for rate of
application, crop type, climate, SOC, soil pH, and length of experiment (Table 2).
Bouwman et al. (2002b) warned against applying any of the estimates from their
summarized data to individual fields because their emission estimates represented
gross relative differences among fertilizer sources/types.
In contrast to the global summaries and modeling approaches mentioned
above, Chen et al. (2008) stated, “Since ammonia or ammonium producing
compounds are the main sources of fertilizer N, maintenance of the applied N in
the ammonical form should result in lowered emissions of nitrous oxide from
soils”. Harrison and Webb (2001) also reported that relative N O emissions from
NO -based sources may be greater than those from NH -based sources and
4
4
4
4
3 4
4
2
4
2
2
3 4
2
3 4
-1
Fertilizer management for reduced nitrous oxide emissions
differences may increase with increasing soil wetness. Higher N O emissions with
NH -based fertilizers may be related to potential NO accumulation or N O
production during nitrification (Venterea and Stenanas 2008). These conflicting
reports and the summary by Snyder et al. (2009) raise questions about the
importance of N source in addressing N O emissions, and they illustrate the need
for continued research.
Intuitively, one might expect a potentially higher N O loss with an abundance
of NO -N in soil systems from NO -based fertilizers compared to other N
fertilizers, since NO and NO are essential for denitrification (Coyne 2008).
However, higher N O emissions with anhydrous NH were found in several studies
which compared it with other N sources (Breitenbeck and Bremner, 1986;
Venterea et al. 2005). In contrast, Burton et al. (2008) found no differences in N O
emissions between anhydrous ammonia and urea in Manitoba, Canada. It is
possible that fertilizer source/type effects on N O emissions may be less important
than the size of the mineral N pool, and the warm, moist soil conditions which are
conducive to rapid nitrification and denitrification. For example, Mosier et al.
(1996) considered soil management and cropping systems as having more impact
on N O emissions than mineral N source.
2
4 2 2
2
2
3 3
3 2
2 3
2
2
2
–
- -
Mean fertilizerinduced emission emission
N source n N O as % of
applied N -N ha
Calcium ammonium nitrate 61 0.7 73 1.56aAmmonium nitrate 59 0.8 131 1.12aAnhydrous ammonia 38 0.9 38 1.04aNitrate-based fertilizers 53 0.9 53 0.80bUrea ammonium nitrate (solutions) 37 1.0 40 0.78bUrea 98 1.1 131 0.96bAmmonium-based fertilizers 59 1.2 74 0.82b
Balanced median
n kg N O
1 2
-1
3
4
5
2 2
IPCC default 1
Table 2 Summary of N O emissions induced by common fertilizer N sources,
based on Bouwman et al. (2002a; 2002b) and Stehfest and Bouwman2
1
2
3
4
5
Bouwman et al. 2002a, 2002b
Stehfest and Bouwman 2006
Values followed by a common letter are not significantly different, based on two-tailed
statistical tests (Stehfest and Bouwman 2006)
Includes potassium nitrate, calcium nitrate, sodium nitrate (Bouwman et al. 2002a; 2002b)
Includes ammonium bicarbonate, ammonium chloride, ammonium sulfate (Bouwman et
al. 2002a; 2002b)
242 243

Right rate
Merely cutting applied N rates to reduce the potential for increases in residual soil
NO -N was not considered an appropriate management action because N rates
below the EONR could result in “mining” of soil organic nitrogen (SON) and
cause a decline in long-term soil productivity (Jaynes and Karlen 2005). Nitrogen
rates considerably above the EONR may raise the risk of NO leaching and
increase the risk of direct N O emissions (Follett 2001), as noted in the review by
Snyder et al. (2009). Fang et al. (2006) reported a significant potential to better
manage N applications to increase N use efficiency and to reduce NO -N leaching
in the North China Plain; especially since the actual N fertilizer application rates of
400–600 kg N ha yr by farmers exceeded the 200-300 kg N ha yr requirements
for the wheat–maize rotation system. Rates of N above the EONR were associated
with increased residual soil NO and greater potential for N loss in winter wheat
production systems in the North China Plain (Cui et al. 2009). Similar results of
elevated soil NO with N rates above the EONR have been reported in the U.S.
(Hong et al. 2007), and the authors suggested that additional environmental
benefits may be possible with use of variable-rate N applications. High residual
soil NO , if not properly considered in nutrient management planning, can result
in reduced RE , increased soil NO accumulation and leaching below the root
zone; especially where precipitation exceeds evapotranspiration (Follett 2001).
When other factors are held constant, increased fertilizer N rates may increase soil
NO accumulation and N O emissions (McSwiney and Robertson 2005).
However, because soil moisture and temperature have such a strong influence on
nitrification and denitrification, and because the level of crop management and
crop yields may also exert an influence on soil N dynamics, N O emissions may
not always exhibit a strong linear correlation with increases in soil NO even at
similar N input rates (Adviento-Borbe et al. 2007). As explained by Adviento-
Borbe et al. (2007), N O emissions may be affected more by the soil N turnover
rather than the mineral N pool size per se, which is in agreement with Mosier et al.
(1996).
It is quite challenging to manage fertilizer N at an appropriate amount
because each agro-ecosystem and specific growing season will differ as to what is
most appropriate. Residual soil N estimation has proven useful in some regions,
but wide ranges in yield response to a given N rate often occur when attempting to
calibrate soil NO tests or mineralizable N tests (Dahnke and Johnson 1990;
Follett 2001; Stanford 1982).Ascatter or “cloud' of data points instead of a distinct
response curve is often observed in research calibration efforts because of the large
spatial and temporal variability in soil NO (Meisinger 1984). Nitrous oxide
emissions began to increase significantly compared to unfertilized check
3
3
2
3
3
3
3
N 3
3 2
2
3 ,
2
3
3
-
-1 -1 -1 -1
-
-
-
-
-
-
-
-
treatments with N rates above 100 kg ha in an irrigated corn study (Grant et al.
2006; Kachanoski et al. 2003). In the less humid areas of the world where upland
crops predominate, farmers may minimize the potential for N O emissions by
following a nutrient management plan (NMP) which includes soil testing to
determine residual NO in the soil; where it is appropriate and has been properly
calibrated by research. By considering the normal N mineralization potential from
SOM for soils in a field and the residual soil NO , the deficit between the sum of
these two N-inputs and the expected N uptake demand for realistically attainable
crop yields can be calculated; which allows estimation of an appropriate amount of
timely and well-placed N fertilizer.
Right time and right place
Shortening the time in which NH -based fertilizers can undergo nitrification or
NO –based fertilizers can be denitrified before plant N uptake, is likely to
decrease N O emissions (Bouwman et al. 2002a). Timing of N applications to
provide just what the plant needs, just when it needs it would be ideal. However,
practical labor, economic, and logistical challenges often prevent such perfect N
timing management in farmer fields. Complexities of weather uncertainty (IPNI
2007) and unpredictable soil N release necessitate some compromise in N
management, and in the past, many farmers have preferred to apply N earlier than
the plant needed it to avoid N deficiencies (Randall and Goss 2001). Some of these
challenges in Asia are being met in rice production with the SSNM approach and
use of leaf color charts, which are calibrated to identify in-season N needs
(Dobermann and Fairhurst 2000; Fairhurst et al. 2007). In addition, technologies
are being calibrated to sense crop N status and to adjust N fertilization on-the-go
(Raun et al. 2002; Scharf and Lory 2009).
Particularly in humid environments, when N is applied on the soil surface and
not incorporated, a substantial proportion can be lost to the air as NH especially
with manure or urea as sources (Follett 2001; Kissel 1988). For example, in drill-
seeded flood-irrigated rice systems in the southern U.S., NH volatilization can
exceed 30 percent of the applied N if flooding is delayed for up to 14 days after
urea is surface broadcast. Most of this NH loss occurs within 7-10 days after N
fertilization if flooding is delayed; immediate flooding after urea fertilization in
dry-seeded flood-irrigated rice systems minimizes loss and optimizes RE (Griggs
et al. 2007). In transplanted rice paddy systems in Asia, NH volatilization losses
have exceeded 50 percent of the applied urea N, in rice less than 3 weeks old after
transplanting; peak losses occurred within 7-10 days after N application.
Ammonia volatilization loss during panicle initiation was much less and ranged
from 10-15 percent of the applied urea N (Buresh and Witt 2008).
-1
–
–
2
3
3
4
3
2
3;
3
3
N
3
244 245

Although it is not a GHG, volatilized NH from fields will be ultimately
deposited back on the soil or water resources elsewhere. Generally, the proportion
of N emitted as N O is assumed to be the same, whether the applied N stays
available in the soil for plant uptake or it goes elsewhere as NH . Therefore, BMPs
that reduce NH volatilization also reduce N O emission in the same proportion as
the amount of N conserved. In lowland irrigated rice systems, NH volatilization is
a significant management issue, since Buresh and De Datta (1990) found that NH
volatilization, and not N O or N emissions, was the dominant loss pathway for N
applied as urea. Buresh and Witt (2008) reviewed many published studies on N
transformations in submerged soils, and reported that soil incorporation of urea
before transplanting, as opposed to broadcasting into the floodwater 10-21 d after
rice transplanting, reduces NH loss.
Urea placed in a band below and to the side of the seed-row resulted in lower
N O emissions compared to urea broadcast on the soil surface, in 2 years of a 3-
year study at two sites in Saskatchewan, Canada (Hultgreen and Leduc 2003). In
many small grain cropping systems in the Great Plains area of North America,
farmers subsurface place N and P fertilizers to enhance crop nutrient recovery and
to increase yields.
According to Wang et al. (2007) the framework of SSNM helps ensure that
essential N, P, and K are applied as needed by the rice crop, it eliminates nutrient
wastage by preventing excessive rates of fertilization and it helps avoid
fertilization when the crop does not need it. Using this same approach in the
Phillipines and Vietnam, in comparison with typical farmer practice, it was shown
that N O emissions (modeled) and CO - equivalent GHG emissions could be
reduced through improved fertilizer use efficiency (Pampolino et al. 2007). In
environments where higher yield could be attained with less fertilizer N, lower
N O emission per unit of grain yield could also be achieved. Farmer profits were
increased with SSNM by 34 U.S. $ ha year in Vietnam, 106 U.S. $ ha year in the
Philippines, and 168 U.S. $ ha year in India (Pampolino et al. 2007). As a
consequence of these intensive cropping system SSNM nutrient efforts in Asia,
rice and wheat crop yields are being increased, RE is improving, use of
indigenous soil N is being improved, and economic returns to farmers are being
raised (Buresh and Witt 2008; Khurana et al. 2008).
Enhanced efficiency of fertilizers
Enhanced-efficiency N fertilizers (slow and controlled release fertilizers and
stabilized N fertilizers) have been defined as products that minimize the potential
of nutrient losses to the environment, as compared to “reference soluble”
fertilizers. Enhanced efficiency fertilizers were divided into two general
3
2
3
3 2
3
3
2 2
3
2
2 2
2
N
-1 -1 -1 -1
-1 -1
categories of; Slow-release and controlled-release, or encapsulated fertilizers and
fertilizers with nitrification and urease inhibitors or stabilized fertilizers (Weiske
2006).
These product technologies may help some farmers reduce risks of N loss
under conditions where management challenges limit RE optimization with the
more “reference soluble” fertilizers, and where N losses pose significant
economic and environmental costs. As Dobermann (2007) has stated, these
technologies have some theoretical advantage over the more “knowledge-
intensive” N management “because the knowledge is 'embedded' in the product to
be applied”, but the relative importance of these technologies may vary among
cropping systems and regions. Such embedded knowledge, as experience has
shown with seeds, can lead to high adoption rates by farmers, provided that the
benefit/cost ratio is high (Dobermann 2007). More details on some of these
enhanced efficiency technologies were provided in the review by Snyder et al.
(2009), so only selected points will be made here regarding these fertilizer
technologies.
Controlled-release technologies, by affecting the timing of N release from
fertilizer (Shaviv 2000), have potential to reduce leaching losses of NO , volatile
losses of N as NH , and N O emissions (Chien et al. 2009). Reductions in these
losses may improve RE and provide greater stability in fertilizer N performance.
Urease inhibitors can help reduce ammonia volatilization and nitrification
inhibitors can help reduce the potential for accumulation of NO and losses via
leaching and denitrification. Use of the nitrification inhibitor dicyandiamide
(DCD) and polyolefin coated urea (POCU/CRF), when used with urea on a barley
(Hordeum vulgare L.) field were capable of reducing N O emissions by 81 percent
and 35 percent (Shoji et al. 2001). Average total N fertilizer losses from the
common pathways (e.g. NH volatilization, NO leaching, NO and N O
emissions) in the study were 15 and 10 percent in the DCD and urea treatments,
respectively, and only 1.9 percent in the POCU/CRF treatment. These results
indicate RE may be improved with POCU/CRF and nitrification inhibitor
technologies, and allow possible reductions in the total fertilizer N rate.
Halvorson et al. (2009a; 2009b) found that N source had little impact on
irrigated maize grain yield, but did impact N O emissions. Inclusion of soybean or
dry bean (Phaseolus vulgaris L.) in a no-till maize rotation increased the level of
N O emissions during the maize year. Controlled release and stabilized N sources
reduced N O emissions by 29-50 percent compared to UAN and urea, under a no-
till continuous maize system. Use of slow or controlled-release fertilizers and the
use of urease and nitrification inhibitors are not new to agriculture. However, there
is renewed interest associated with increased fertilizer costs and a better
understanding of the potential impacts of inefficient fertilizer N management.
Measurement of environmental impact with enhanced efficiency fertilizers is an
N
3
3 2
N
3
2
3 3 2
N
2
2
2
–
-
–
246 247

area of on-going research (Grant and Wu 2008; Halvorson et al. 2008; Motavalli et
al. 2008). More enhanced efficiency fertilizers are becoming available to farmers,
which may increase the ability to match specific fertilizer properties and
characteristics with specific crop and soil system requirements.
Global agricultural growth will be necessary to meet human demands for food,
fiber, and fuel. This growth is expected to depend on concomitant increases in
fertilizer use. Because there are multiple economic, social, and ecological goals
associated with increased crop production and fertilizer use, nutrient management
planning will likely involve broader stakeholder input and more multi-
disciplinary approaches than in the past. Science-based nutrient management
principles should form the foundation of every nutrient input decision and goal: in
developed and developing countries alike. The fertilizer industry is working
globally with university researchers, extension leaders, government agencies,
crop advisers, and leading farmers to implement a strategy of improved nutrient
stewardship. This effort has been termed '4R Nutrient Stewardship' and depends
upon use of the right nutrient source at the right rate, right time, and right place.
Crop nutrient use efficiency can be improved through the '4R' approach to help
raise global RE values for cereal crops from the typical <50 percent range to the
60-70 percent range, or higher. It is critical that efforts to increase nutrient use
efficiency will simultaneously address improved nutrient effectiveness. Policies
and action to reduce the GWP and to counter climate change through reduced
GHG emissions must consider agriculture not only as a source of GHG emissions,
but also as a solution. Land suitable for crop production is becoming more limited
as a result of population-driven urban encroachment, and expanded commitments
to preserve natural areas. The principal way to meet the expanding food, fiber and
fuel production challenges, while addressing GHG emissions, is through
ecological intensification of crop production on existing lands. Site-specific
nutrient management will become increasingly important as a consequence of
these pressures.
Adviento-Borbe MAA, Haddix ML, Binder DL, Walters DT, Dobermann A
(2007) Soil greenhouse gas fluxes and global warming potential in four high-
yielding maize systems. Glob Change Biol 13:1972-1988
Anand S, Dahiyaa RP, Talyana V, Vrat P (2005) Investigations of methane
emissions from rice cultivation in Indian context. Environ Intl 31:469-482
Aulakh MS, Malhi SS (2004) Fertilizer nitrogen use efficiency as influenced by
interactions with other nutrients. In: Mosier AR, Syers JK, Freney JR (ed)
Conclusions
References
N
Agriculture and the nitrogen cycle: Assessing the impacts of fertilizer use on
food production and the environment. Scientific Committee on Problems of
the Environment (SCOPE), of the International Council for Science. Island
Press, Washington, DC, USA, pp 181-193
Balasubramanian V, Alves B, Aulakh M, Bekenda M, Cai Z, Drinkwater L,
Mugendi D, van Kessel C, Oenema O (2004) Crop environmental, and
management factors affecting nitrogen use efficiency. In: Mosier AR, Syers
JK, Freney JR (ed) Agriculture and the nitrogen cycle: Assessing the impacts
of fertilizer use on food production and the environment. Scientific
Committee on Problems of the Environment (SCOPE), of the International
Council for Science. Island Press, Washington, DC, USA, pp 19-43
Baumert KA, Herzog T, Pershing J (2005) Navigating the numbers: Greenhouse
gas data and international climate policy. World Resources Institute.
Washington, DC, pp 122 http://www.wri.org
Bellarby J, Foreid B, Hastings A, Smith P (2008) Cool Farming: Climate impacts
of agriculture and mitigation potential. Greenpeace, Amsterdam, The
Netherlands, 43 pp
BouwmanAF, Boumans LJM, Batjes NH (2002a) Emissions of N O and NO from
fertilized fields: Summary of available measurement data. Global
Biogeochem Cycles 16(4): 6-1 to 6-13
Bouwman AF, Boumans LJM, Batjes NH (2002b) Modeling global annual N O
and NO emissions from fertilized fields. Global Biogeochem Cycles 16:28-1
to 28-8
Bremner JM, Blackmer AM (1978) Nitrous oxide: Emission from soils during
nitrification of fertilizer nitrogen. Science 199:295-296
Breitenbeck GA, Bremner JM (1986) Effects of various nitrogen fertilizers on
emission of nitrous oxide from soils. Biol Fert Soils 2:195–199
Brentrup F, Palliere C (2008) GHG emissions and energy efficiency in European
nitrogen fertilizer production and use. Proc. 639, International Fertiliser
Society,York, UK, pp 28
Bruulsema TW, Witt C, Garcia F, Li S, Rao TN, Chen F, Ivanova S (2008)Aglobal
framework for fertilizer BMPs. Better Crops 92:13-15
Bruulsema T, Lemonyon J, Herz B (2009) Know your fertilizer rights. Crops &
Soils March-April 2009, American Society of Agronomy, Madison, WI, pp
13-18
Brye KR, Norman JM, Bundy LG, Gower ST (2001) Nitrogen and carbon
leaching in agroecosystems and their role in denitrification potential. J
Environ Qual 30:58–70
Bufogle Jr. A, Bollich PK, Kovar JL, Lindau CW, Macchiavellid RE (1998)
Comparison of ammonium sulfate and urea as nitrogen sources in rice
production. J Plant Nutr 21:1601-1614
2
2
248 249

Buresh RJ, De Datta SK (1990) Denitrification losses from puddled rice soils in
the tropics. Biol Fert Soils 9:1-13
Buresh RJ, Witt C (2008) Balancing fertilizer use and profit inAsia's irrigated rice
systems. Better Crops 92:18-22
Burton DL, Li X, Grant CA (2008) Influence of fertilizer nitrogen source and
management practice on N O emissions from two Black Chernozemic soils.
Can J Soil Sci 88: 219-227
Cabangon RJ, Tuong TP, Castillo EG, Bao LX, Lu G, Wang G, Cui Y, Bouman
BAM, Li Y, Chen C, Wang J (2004) Effect of irrigation method and N-
fertilizer management on rice yield, water productivity and nutrient-use
efficiencies in typical lowland rice conditions in China. Paddy Water Environ
2:195–206
Cai Z, Shan Y, Xu H (2007) Mini-review: Effects of nitrogen fertilization on CH
emissions from rice fields. Soil Sci Plant Nutr 53:353-361
Cassman KG (1999) Ecological intensification of cereal production systems:
Yield potential, soil quality, and precision agriculture. Proc NationalAcad Sci
96: 5952-5959
Cassman KG, Dobermann A, Walters DT (2002) Agroecosystems, nitrogen-use
efficiency, and nitrogen management.Ambio 31(2):132-140
Chen D, Freney JR, Rochester I, Constable GA, Mosier AR, Chalk PM (2008)
Evaluation of a polyolefin coated urea (Meister) as a fertilizer for irrigated
cotton. Nutr CyclAgroecosyst 81:245-254
Chien SH, Prochnow LI, Cantarella (2009) Recent developments of fertilizer
production and use to improve nutrient efficiency and minimize
environmental impacts.AdvAgron 102:267-322
Coyne MS (2008) Biological denitrification. In: Schepers JS, Raun WR (ed)
Nitrogen in agricultural systems. American Society of Agronomy, Madison,
#Ch 7, pp 201-254
Crutzen P J, Mosier AR, Smith KA, Winiwarter W (2008) N O release from agro-
biofuel production negates global warming reduction by replacing fossil
fuels.Atmos Chem Phys 8:389-395
Cui Z, Zhang F, Dou Z, Yuxin M, Sun Q, Chen X, Li J, Ye Y, Yang Z, Liu C, Huang
S (2009) Regional evaluation of critical nitrogen concentrations in winter
wheat production of the North China Plain.Agron J 101:159-166
Dahnke WC, Johnson GV (1990) Testing Soils for Available Nitrogen. In:
Westerman, R.L. (ed) Soil testing and plant analysis, 3 ed. Soil Science
Society ofAmerica, Madison, Wisconsin, Ch 6, pp 127-140
Del Grosso SJ, Parton WJ, MosierAR, Walsh MK, Ojima DS, Thornton PE (2006)
DAYCENT National-scale simulations of nitrous oxide emissions from
cropped soils in the United States. J Environ Qual 35:1451-1460
DobermannA(2007) Nutrient use efficiency – measurement and management. In:
2
4
2
rd
Fertilizer best management practices: General principles, strategy for their
adoption and voluntary initiatives vs regulations. 259 pp. Proc. IFA
International Workshop on Fertilizer Best Management Practices. 7-9 March
2007, Brussels, Belgium. International Fertilizer Industry Association, Paris,
France, pp 1-28
Dobermann A, Cassman KG (2002) Plant nutrient management for enhanced
productivity in intensive grain production systems of the United States and
Asia. Plant Soil 247:153–175
Dobermann A, Fairhurst TH (2000) Rice: Nutrient disorders and nutrient
management. Pp 191, International Rice Research Institute and Potash &
Phosphate Institute
EEA (2009) Annual European Community greenhouse gas inventory 1990–2007
and inventory report 2009. Submission to the UNFCCC Secretariat. Version
27 May 2009. European EnvironmentAgency. Technical Report No. 04/2009
Environment Canada (2009) National Inventory Report, Greenhouse Gas Sources
and Sinks in Canada: 1990–2007. Greenhouse Gas Division, Environment
Canada. Submission to the United Nations Framework Convention on
Climate Change
EPA (2006) Global Anthropogenic non-CO greenhouse gas emissions: 1990-
2020. United States Environmental Protection Agency, EPA 430-R-06-003,
June 2006 revised. Washington, DC
EPA (2009) Inventory of U.S. Greenhouse Gas Emissions and sinks: 1990-2007.
U.S. Environmental Protection Agency, 15 April 2009, EPA 430-R-09-004,
Available at http://epa.gov/climatechange/emissions/usinventoryreport.html
Fairhurst TH, Witt C, Buresh RJ, DobermannA(ed) (2007) Rice:Apractical guide
to nutrient management, 2nd edn. International Rice Research Institute
(IRRI), Philippines, International Plant Nutrition Institute (IPNI), and
International Potash Institute (IPI), Singapore, pp 89
http://www.irri.org/publications/catalog/ricepg.asp
Fang Q, Yu Q, Wang E, Chen Y, Zhang G, Wang J, Li L (2006) Soil nitrate
accumulation, leaching and crop nitrogen use as influenced by fertilization
and irrigation in an intensive wheat–maize double cropping system in the
North China Plain. Plant Soil 284:335–350
FAO (2006) Fertilizer use by crop. FAO Fertilizer and Plant Nutrition Bulletin 17,
Food andAgriculture Organization of the United Nations. Rome, Italy
FAO (2008) Current world fertilizer trends and outlook to 2011/12, Food and
Agriculture Organization of the United Nations. Rome, Italy
FAO (2009) Crop prospects and food situation, No. 2, April 2009. Food and
Agriculture Organization of the United Nations. Rome, Italy
Fixen PE, Jijun J, Tiwari KN, Stauffer MD (2005) Capitalizing on multi-element
interactions through balanced nutrition – a pathway to improve nitrogen use
2
250 251

efficiency in China, India and North America. Science in China Ser C Life
Sciences Special Issue 48:780-790
Fixen PE, Bruulsema TW, Johnston AM, Mikkelsen RL, Murrell TS, Snyder CS,
Stewart WM (2006) The fertility of North American soils. Reference #
06078. Available at: http://www.ipni.net/ipniweb/portal.nsf/0/20DEE100
DAA86F668525727300746DF5
Firestone MK (1982) Soil nitrogen budgets. In: Stevenson FJ (ed) Nitrogen in
agricultural soils. Agron Monogr 22, ASA, CSSA, and SSSA, Madison, WI,
pp 289-326
Firestone MK, Davidson EA (1989) Microbiological basis of NO and N O
production and consumption in soil. In:Andreae MD, Schimel DS (ed), Trace
gas exchange between terrestrial ecosystems and the atmosphere, Wiley,
Berlin, pp 7-22
Follett RF (2001) Nitrogen transformation and transport processes. In: Follett RF,
Hatfield JL (ed) Nitrogen in the environment: Sources, problems, and
management. Elsevier,Amsterdam, The Netherlands, Ch 2, pp 17-44
Francis DD, Vigil MF, Mosier AR (2008) Gaseous losses of nitrogen other than
through denitrification. In: Schepers JS, Raun WR (ed) Nitrogen in
agricultural systems. Agronomy Monograph # 49. American Society of
Agronomy, Madison, WI, Ch 8, pp 255-279
Garg A, Shukla PR, Kapshe M (2006) The sectoral trends of multigas emissions
inventory of India.Atmosph Environ 40:4608-4620
Galloway JN, Aber JD, Erisman JW, Seitzinger SP, Howarth RW, Cowling EB,
Cosby BJ (2003) The nitrogen cascade. BioScience 53:341-356
Galloway JN, Denter FJ, Capone DG, Boyer EW, Howarth RW, Seitzinger SP,
Asne, GP, Cleveland CC, Green PA, Holland EA, Karl DM, Michaels AF,
Porter H, Townsend AR, Vorosmarty CJ (2004) Nitrogen cycles: past,
present, and future. Biogeochem 70:153–226
Galloway JN, Raghuram N,AbrolYP(2008)Aperspective on reactive nitrogen in
a global,Asian and Indian context. Curr Sci 94:1375-1381
Gordon B (2005) Maximizing irrigated corn yields in the Great Plains. Better
Crops 89:8-10
Granli T, Bøckman OC (1994) Nitrous oxide from agriculture. Supplement 12.
Norwegian JAgric Sci, pp 128
Grant C, Wu R (2008) Enhanced-efficiency fertilizers for use on the Canadian
prairies. Online, Crop Management doi:10.1094/CM-2008-0730-01-RV
Grant RF, Pattey E, Goddard TW, Kryzanowski LM, Puurveen H (2006) Modeling
the effects of fertilizer application rate on nitrous oxide emissions. Soil Sci
SocAm J 70:235-248
Griggs BR, Norman RJ, Wilson CE Jr., Slaton NA (2007) Ammonia volatilization
and nitrogen uptake for conventional and conservation tilled dry-seeded,
2
delayed-flood rice. Soil Sci SocAm J 71:745–751
Halvorson AD, Del Grosso SJ, Reule CA (2008) Nitrogen, tillage, and crop
rotation effects on nitrous oxide emissions from irrigated cropping systems. J
Environ Qual 37:1337-1344
Halvorson AD, Del Grosso SJ, Alluvione F (2009a) Nitrogen rate and source
effects on nitrous oxide emissions from irrigated cropping systems in
Colorado. Better Crops 93:16-18
HalvorsonAD, Del Grosso SJ,Alluvione F (2009b) Tillage and inorganic nitrogen
source effects on nitrous oxide emissions from irrigated cropping systems.
Soil Sci SocAm J (accepted for publication on 1 June 2009)
Harrison R, Webb J (2001) A review of the effect of N fertilizer type on gaseous
emissions.AdvAgron 73: 65-108
Hernandez-Ramirez G, Brouder SM, Smith DR, Van Scoyoc GE (2009)
Greenhouse gas fluxes in an Eastern Cornbelt soil: Weather, nitrogen source,
and rotation. J Environ Qual 38:841-854
Hong N, Scharf PC, Davis JG, Kitchen NR, Sudduth KA (2007) Economically
optimal nitrogen rate reduces soil residual nitrate. J Environ Qual 36:
354–362
Hou AX, Chen GX, Wang ZP, Van Cleemput O, Patrick Jr. WH (2000) Methane
and nitrous oxide emissions from a rice field in relation to soil redox and
microbiological processes. Soil Sci SocAm J 64:2180-2186
Hultgreen G, Leduc P (2003) The effect of nitrogen fertilizer placement,
formulation, timing, and rate on greenhouse gas emissions and agronomic
performance. Final Report, Project No. 5300G, ADF#19990028,
Saskatchewan Department of Agriculture and Food, Regina, SK.
http://www.agr.gov.sk.ca/apps/adf/adf_admin/reports/19990028.pdf
Hutchinson GL, Davidson EA (1993) Processes for production and consumption
of gaseous nitrogen oxides in soil. In: Harper LA, et al. (ed) Agricultural
ecosystem effects on trace gases and global climate change. Am Soc Agron
Spec Publ 55,American Society ofAgronomy, Madison, WI, pp 79–83
IFA (2007) Fertilizer best management practices: General principles, strategy for
their adoption and voluntary initiatives vs. regulations, Proc IFA
International Workshop on Fertilizer Best Management Practices, 7-9 March
2007, Brussels, Belgium, International Fertilizer Industry Association, Paris,
France, 259 pp
IFA Statistics (2009) http://www.fertilizer.org/ifa/Home-Page/STATISTICS.
International Fertilizer IndustryAssociation, Paris, France
IPCC (2006) IPCC guidelines for national greenhouse gas inventories, Eggleston
HS, Buendia L, Miwa K, Ngara T, Tanabe K (ed) National Greenhouse Gas
Inventories Programme, IGES, Japan.
IPCC (1996) Climate Change 1995: The Science of Climate Change. In:
Houghton JT, Meira Filho LG, Callander BA, Harris N, Kattenberg A,
252 253

Maskell K (ed), Intergovernmental Panel on Climate Change, Cambridge
University Press, Cambridge, UK
IPCC (2001) Climate Change 2001: The Scientific Basis. Contribution of
Working Group I to the Third Assessment Report of the Intergovernmental
Panel on Climate Change. In: Houghton JT, Ding Y, Griggs DJ, Noguer M,
van der Linden PJ, Dai X, Maskell K, Johnson CA (ed), Cambridge
University Press, Cambridge, UK and NewYork, NY, USA, 881pp
IPNI (2007) Managing crop nitrogen for weather. Proc of the Soil Science Society
of America Symposium on Integrating Weather Variability into Nitrogen
Recommendations, 15 November 2006, Indianapolis, IN. International Plant
Nutrition Institute, Norcross, GA30092-2837 USA
Jaynes DB, Karlen DL (2005) Sustaining soil resources while managing
nutrients. In: Proc. of the Upper Mississippi River Sub-Basin Hypoxia
Nutrient Committee Workshop, September 26-28, 2005, Ames, Iowa, pp
141-150 http://www.umrshnc.org/files/Hypwebversion.pdf
Johnson JW, Murrell TS, Reetz HF (1997) Balanced fertility management: A key
to nutrient use efficiency. Better Crops 81:3-5
Johnson-Beebout SE, Angeles OR, Carmelita M, Alberto R, Buresh RJ (2009)
Simultaneous minimization of nitrous oxide and methane emission from rice
paddy soils is improbable due to redox potential changes with depth in a
greenhouse experiment without plants. Geoderma 149:45–53
Jugsujinda A, DeLaune RD, Lindau CW (1995) Influence of nitrate on methane
production and oxidation in flooded soil. Commun Soil Sci Pl Anal
26(15&16): 2449-2459
Kachanoski RG, O'Halloran I, Rochette P (2003) Site-specific application of
fertilizer N for reducing greenhouse gas emissions. Climate change funding
initiative in Agriculture,Canadian Agri-Food Research Council, Ottawa,
Ontario. (http://www.carc-crac.ca/common/CCFIA%20Kachanoski%20
Report.pdf )
Kissel D (1988) Management of urea fertilizers. NCR 326, North Central
Regional Extension Publication, Kansas State University, Manhattan,
Kansas
Kitchen NR, Goulding KWT (2001) On-farm technologies and practices to
improve nitrogen use efficiency. In: Follett RF, Hatfield JL (ed) Nitrogen in
the environment: Sources, problems, and management. Elsevier,
Amsterdam, Ch 13, pp 335-370
Khurna HS, Singh B, Dobermann A, Phillips SB, Sidhu AS, Singh Y (2008) Site-
specific nutrient management performance in a rice-wheat cropping system.
Better Crops 92: 26-28
Lal R (2008) Carbon sequestration. Philosoph Trans. Royal Society B: Biological
Sciences 363: 815-830
Lal R (2007) Soil science and the carbon civilization. Soil Sci Soc Am J 71:1425-
1437
Lal R (2003) Global potential of soil carbon sequestration to mitigate the
greenhouse effect. Crit Rev Pl Sci 22(2): 151-184
Lindau CW, DeLaune RD, Patrick Jr. WH, Bollich PK (1990) Fertilizer effects on
dinitrogen, nitrous oxide, and methane emissions from lowland rice. Soil Sci
SocAm J 54:1789-1794
Majumdar D (2005) Past, present, and future emissions of nitrous oxide emissions
from rice fields: a treatise. In Livingston JV (ed) Trends in air pollution
research, Nova, pp 53-130
McSwiney CP, Robertson GP (2005) Nonlinear response of N O flux to
incremental fertilizer addition in a continuous maize ( L.) cropping
system. Glob Change Biol 11:1712–1719
Meisinger JJ (1984) Evaluating plant-available nitrogen in soil-crop systems. In:
Hauck, R.A. (ed) Nitrogen in crop production. American Society of
Agronomy, Madison, Wisconsin, Ch 26, pp 391-417
Mosier AR, Duxbury JM, Freney JR, Heinemeyer O, Minami K (1996) Nitrous
oxide emissions from agricultural fields: Assessment, measurement and
mitigation. Plant Soil 181:95–108
Motavalli PP, Goyne,KW, Udawatta RP (2008) Environmental impacts of
enhanced-efficiency nitrogen fertilizers. Online, Crop Management
doi:10.1094/CM-2008-0730-02-RV
Nayak DR, Babu YJ, Datta,Adhya TK. 2007. Methane oxidation in an intensively
cropped tropical rice field under long-term application of organic and mineral
fertilizers. J Environ Qual 36: 1577-1584
Pampolino MF, Manguiat IJ, Ramanathan S, Gines HC, Tan PS, Chi TTN,
Rajendran R, Buresh RJ (2007) Environmental impact and economic benefits
of site-specific nutrient management (SSNM) in irrigated rice systems.Agric
Systems 93:1-24
Peng S, Buresh R, Huang J, Yang J, Wang G, Zhong X, Zou Y (2003) Principles
and practices of real-time nitrogen management: A case study on irrigated
rice in China. In: Mew TW, Brar DS, Peng S, Dawe D, Hardy B (ed) Rice
science: Innovations and impact for livelihood, International Rice Research
Institute. pp 433-446
Phillips RE, Blevins RL, Thomas GW, Frye WW, Phillips SH. (1980) N-tillage
agriculture. Science 208:1108-1113
Power JF, Wiese R, Flowerday D (2001) Managing farming systems for nitrate
control: A research review from Management Systems Evaluation Areas. J
Environ Qual 30: 1866-1880
PPI/PPIC/FAR (2005) Soil Test Levels in North America, 2005; Summary
Update, PPI/PPIC/FAR Technical Bulletin 2005-1, Potash & Phosphate
Institute, Potash & Phosphate Institute of Canada, Foundation for
2
Zea mays
254 255
Agronomic Research, Norcross, GA
Randall GW, Goss MJ (2001) Nitrate losses to surface water through subsurface,
tile drainage. In: Follett RF, Hatfield JL (ed) Nitrogen in the environment:
Sources, problems, and management. Elsevier,Amsterdam, Ch 5, pp 95-123
Randall GW, Mulla DJ (2001) Nitrate nitrogen in surface waters as influenced by
climatic conditions and agricultural practices. J Environ Qual 30: 337–344
Raun WR, Johnson GV (1999) Improving nitrogen use efficiency for cereal
production.Agron J 91:357–363
Raun WR, Solie JB, Johnson GV, Stone ML, Mullen RW, Freeman KW,
Thomason WE, Lukina EV (2002) Improving nitrogen use efficiency in
cereal grain production with optical sensing and variable rate application.
Agron J 94:815-820
Roberts TL (2007) Right product, right rate, right time and right place...the
foundation of best management practices for fertilizer. In: Fertilizer best
management practices. General principles, strategy for their adoption, and
voluntary initiatives vs. regulations. Proc. of IFAInternational Workshop, 7-9
March 2007, Brussels, Belgium, International Fertilizer Industry
Association, Paris, France, pp 29-32
Robertson GP, Groffman PM (2007) Nitrogen transformation. In: Paul EA (ed)
Soil microbiology, bio-chemistry, and ecology. Springer, New York, pp 341-
364
Rochette P, Angers DA, Chantigny MH, Bertrand N (2008) Nitrous oxide
emissions respond differently to no-till in a loam and a heavy clay soil. Soil
Sci SocAm J 72:1363-1369
Rochette PE, van Bochove D, Pre´ vost DA, Angers DC, Bertrand N (2000) Soil
carbon and nitrogen dynamics following application of pig slurry for the 19th
consecutive year: II. Nitrous oxide fluxes and mineral nitrogen. Soil Sci Soc
Am J 64:1396–1403
Scharf PC, Lory JA (2009) Calibrating reflectance measurements to predict
optimal sidedress nitrogen rate for corn.Agron J 101:615–625
ShavivA(2000)Advances in controlled release fertilizers.AdvAgron 71:1-49
Shoji S, Delgado J, Mosier A, Miura Y (2001) Use of controlled release fertilizers
and nitrification inhibitors to increase nitrogen use efficiency and to conserve
air and water quality. Commun Soil Sci PlAnal 32(7&8):1051-1070
Singh B, Singh Y (2008) Reactive nitrogen in Indian agriculture: inputs, use
efficiency and leakages. Curr Sci 94:1382-1393
Smil V (2002) Nitrogen and food production: Proteins for human diets. AMBIO J
Human Environ 31:126-131
Smith P, Martino D, Cai Z, Gwary D, Janzen H, Kumar P, McCarl B, Ogle S,
O'Mara F, Rice C, Scholes B, Sirotenko O (2007) Agriculture. In: Metz B,
Davidson OR, Bosch PR, Dave R, Meyer LA (ed) Climate Change 2007:
Mitigation. Contribution of Working Group III to the Fourth Assessment
Report of the Intergovernmental Panel on Climate Change, Cambridge
University Press, Cambridge, UK, NewYork, NY, USA
Snyder CS (2008) Fertilizer nitrogen BMPs to limit losses that contribute to global
warming. Ref # 080507, International Plant Nutrition Institute. Norcross,
GA, USA, 8 pp http://www.ipni.net/ipniweb/portal.nsf/0/9bbc50427c
6469ae852574f200162796/$FILE/Nitrogen%20BMP.pdf
Snyder CS, Bruulsema TW (2007) Nutrient use efficiency and effectiveness in
north america: Indices of agronomic and environmental benefit. International
Plant Nutrition Institute. June 2007, Ref # 07076, 4 pp, International Plant
Nutrition Institute. Norcross, GA, USA
http://www.ipni.net/ipniweb/portal.nsf/0/D58A3C2DECA9D7378525731E
006066D5
Snyder CS, Bruulsema TW, Jensen TL (2007) Greenhouse gas emissions from
cropping systems and the influence of fertilizer management—a literature
review. International Plant Nutrition Institute, Norcross, Georgia, USA
Snyder CS, Bruulsema TL, Jensen TL, Fixen PE (2009) Review of greenhouse gas
emissions from crop production systems and fertilizer management effects.
Agric Ecosyst Environ (in press) doi:10.1016/j.agee.2009.04.021
Stanford G (1982) Assessment of soil nitrogen availability. In: Stevenson FJ (ed)
Nitrogen in agricultural soils, Agron Monogr 22, American Society of
Agronomy, Madison, Wisconsin, Ch 17, pp 651-688
Stehfest E, Bouwman L (2006) N O and NO emission from agricultural fields and
soils under natural vegetation: Summarizing available measurement data and
modeling of global annual emissions. Nutr CyclAgroecosyst 74:207-228
Stewart WM, Dibb DW, Johnston AE, Smyth TJ (2005) The contribution of
commercial fertilizer nutrients to food production.Agron J 97:1-6
Sutton MA, Erisman JW, Oenema O (2007) Strategies for controlling nitrogen
emissions from agriculture: Regulatory, voluntary and economic approaches.
In: Fertilizer Best Management Practices: General Principles, Strategy for
their Adoption and Voluntary Initiatives vs Regulations. Proc IFA
International Workshop on Fertilizer Best Management Practices, 7-9 March
2007, Brussels, Belgium, International Fertilizer Industry Association Paris,
France, pp 245-259
Trumper K, Bertzky M, Dickson B, van der Heijden G, Jenkins M, Manning P
(2009) The Natural Fix? The role of ecosystems in climate mitigation A
UNEP rapid response assessment. United Nations Environment Programme,
UNEPWCMC, Cambridge, UK
Venterea RT, Burger M, Spokas KA(2005) Nitrogen oxide and methane emissions
under varying tillage and fertilizer management. J Environ Qual 34: 1467-
1477
Venterea RT, Stanenas AJ (2008) Profile analysis modeling and modeling of
2
.
256 257

reduced tillage effects on soil nitrous oxide flux. J Environ Qual 37: 1360-
1367
Vetsch JA, Malzer GL, Robert PC, Huggins DR (1995) Nitrogen specific
management by soil condition; managing fertilizer nitrogen in corn. In:
Robert PC, Rust RH and Larson WE (ed) Site-Specific Management for
Agricultural Systems, 2 International Conference, 27-30 March 1994,
Minneapolis, MN, American Society of Agronomy, Crop Science Society of
America, and Soil Science Society of America. Madison, Wisconsin, pp 465-
474
Wang G, Zhang QC, Witt C, Buresh RJ (2007) Opportunities for yield increases
and environmental benefits through site-specific nutrient management in rice
systems of Zhejiang province, China.Agric. Systems 94:801-806
WeiskeA, VabitschA, Olesen JE, Schelde K, Michel J, Friedrich R, Kaltschmitt M
(2006) Mitigation of greenhouse gas emissions in European conventional and
organic dairy farming.Agric Ecosyst Environ 112:221-232
Xie B, Zheng X, Gu J, Zhu B, Chen X, Shi Y, Wang Y, Zhao Z, Liu C, Yao Z, Zhu J
(2009) Effects of nitrogen fertilizer on CH emission from rice fields; multi-
site field observations. Plant Soil DOI 10.1007/s11104-009-0020-3 (on-line
21 May 2009)
Yan X,Akiyama H,Yagi K,Akimoto H (2009) Global estimations of the inventory
and mitigation potential of methane emissions from rice cultivation
conducted using the 2006 Intergovernmental Panel on Climate Change
Guidelines. Global Biogeochem Cycles 23, GB2002, doi:10.1029/2008
GB003299
nd
4
258

Proceedings IPI-OUAT-IPNI International Symposium (2009)
Presented at IPI-OUAT-IPNI International Symposium.Published in Plant Soil 2010.335:83-100. Printed here with permission from Plant Soil
Forest fertilization: Trends in knowledge and practice
compared to agriculture
Philip J Smethurst
Abstract
Keywords
Introduction
Plantation forestry continues to intensify and grow in area, with a
concomitant increase in fertilizer demand. Virtually no fertilizer is used on non-
plantation forest systems. The scale of fertilizer use per ha per year in a small
proportion of plantation systems is now similar to some agricultural production
systems, but the total area of plantation forestry remains only a few percent of that
used for agriculture. Hence, in a global context, forestry is a minor user of
fertilizers. In relation to the knowledge base for fertilizer management, forestry
and agriculture have similar practical questions that drive research, i.e. nutritional
diagnosis and the development of fertilizer prescriptions that optimize production,
environmental and economic goals. Much of this research is soil-climate-species-
management specific. During the past few decades, solution culture methods were
developed that maintain stable internal nutrient concentrations, which were
essential for improving our understanding of nutrient-growth relationships. The
development of plant production models that include the mechanistic simulation
of nutrient supply and uptake are at an early stage of development. Plantation
forestry and agriculture lack a mechanistic basis for evaluating base cation
availability that accounts for Al-pH-root interactions. Further developments in
this field could assist in rationalizing the use of lime. There is a lack of resources
available in plantation forestry, and probably also in agriculture in some countries,
to develop and refine calibrations of traditional types of soil and foliar analyses.
Further testing of soil solution approaches is warranted. Further research on
resource use efficiency, wood quality, rhizosphere relations, and mixed-species
systems in relation to fertilization is also warranted.
N-fixation plantations nutrients soil testing lime rhizosphere
Fertilizer use in forestry is almost entirely restricted to plantations, of which there
l l l l l
Philip J Smethurst
CSIRO Sustainable Ecosystems, Private Bag 12, Hobart TAS 7001, Australia
e-mail: [email protected]
259

were 140 Mha world-wide in 2005 when this land use was increasing by 2.8 Mha
annually (FAO 2006). The plantation area is likely to continue to expand, and
almost all plantations receive fertilizer at some stage of their development. Hence,
an increasing area of plantations leads to an increase in the demand for fertilizers in
forestry. Another factor driving increased fertilizer usage in forestry is the level of
intensification of management, with the objective of increasing the average rate of
wood production per unit of land. Intensification reduces the duration of the crop
cycle and increases the frequency of harvesting, and, because younger trees have
higher concentrations of nutrients, it increases the average rate of nutrient export.
Until about three decades ago forest plantations had a rotation cycle of at least
two decades, which was many times longer than most agricultural crops, but
increasing demand globally has intensified management and led to rotation
lengths of 4- to 7-years in some countries for growing several and
species. Demand for wood for traditional uses (paper, sawn timber,
veneers, charcoal and firewood) drove this intensification, and short-rotation tree
crops are emerging as a possible option for producing bioenergy (Gopalakrishnan
et al. 2009). Most perennial horticultural crops have much longer rotations than
these short-rotation forest plantations. Therefore, in relation to annual fertilizer
application requirements, many forest plantations can be considered broadly
similar to annual or perennial agricultural crops. However, Asia and South
America, where the shortest-rotation forest plantations are grown, together
account for only 24% of industrial roundwood production globally (FAO 2005).
Most roundwood is still produced in much longer rotations in Europe, North
America and Oceania from natural forests and plantations.
Forest nutrition research can be considered to have begun with the first
detailed publications by Ebermayer in 1876 and 1882 in Germany, when it was
noted that the periodic removal of the forest litter layer for use as animal bedding
led to unhealthy forests, and that this effect was nutritionally mediated (cited by
Attiwill and Leeper 1987, Rennie 1955 and Tamm 1995). Since Ebermayer, forest
nutrition research has bolstered general knowledge of soil-plant nutrient relations
in synergy with developments in agriculture and other domains of plant nutrition.
Agricultural research with artificial fertilizers began around 1842 when Lawes
and Gilbert took out a patent on the production of superphosphate, and in the same
year Lawes published the effects on cabbage growth of applying different forms of
inorganic nitrogen fertilizers (Johnston 1994). Only a few years later in 1847,
inorganic fertilizer experiments on forest soils commenced in France (Baule and
Fricker 1970, cited by Pritchett 1979). However, forest fertilization commenced
operationally for many plantation types only in the 1950s, after the development
of reasonably sound scientific principles (Ballard 1984). The use of fertilizer in
forestry increased during the 1960s and 1970s as the economic value of
fertilization became apparent; fertilizing to maximize tree growth rate became a
priority (Cromer et al. 1977; Schönau and Herbert 1989). As the need developed
Eucalyptus
Acacia
to refine the management of forest fertilization, which was mainly in a plantation
context, forestry began to contribute generally to the science of fertilization.
The objective of this review is to provide an overview of fertilizer usage in
forestry internationally and the history of forest nutrition research, and describe
developments in specific aspects of the knowledge base of forest fertilization that
have implications for other cropping systems. I conclude by identifying major
knowledge gaps and likely future trends in the research and practice of forest
fertilization.
In agriculture, fertilizers can be used to increase vegetative growth and total
biomass production, e.g. for root-crops and pastures, but most fertilizers are used
to increase reproductive growth for food production, e.g. cereals, oilseeds, and
horticulture. In addition to maximizing yields, fertilizers are managed in many
instances to optimize product quality, which is achieved by synchronizing the
rates and timing of fertilization with the stage of growth. In contrast, the main goal
of fertilization in forestry is to increase biomass production for wood volume and
weight (which is the main context of other sections of this review) whilst avoiding
serious deteriorations in wood quality. On a small scale, fertilizers are also used in
forestry to manage seed production (Williams et al. 2003).
Where it has been of interest, wood quality in relation to fertilization has
mainly been assessed for pulp and paper purposes. The principle qualities of
interest are wood density, fibre diameter and length, microfibril angle, cell wall
thickness, and contents of lignin, cellulose and extractives. The high cost of
assessing these attributes has hindered progress, but the use of NIR analyses has
recently reduced the cost and increased research in this area. In relation to
eucalypts, fertilizer generally either increases or has no effect on wood quality, but
it increases the nutrient content of wood and hence nutrient export from sites
(Raymond 1998). In conifers, fertilization that increases growth rates also tends to
decrease wood density, but overall there is usually an increase in the total value of
wood for sawn timber or pulpwood (Antony et al. 2009; Cao et al. 2008; Downes et
al. 2002, Nyakuengama et al. 2002; Zobel 1992). Overuse of fertilizers in forestry
can result in trees with multiple or contorted stems that greatly reduces the value of
the tree for either pulpwood or sawn timber purpose (Turnbull et al. 1994).
Forest plantations are widespread around the globe, with large areas in suitable
parts of Asia, the Americas, and Europe, and much smaller areas in Africa and
Oceania (FAO 2006). World-wide, forest plantations grown for wood products
occupy about 3% of the total land area used for food and fibre production. The
Goals of fertilization
Fertilizer use in forestry
260 261

same percentage applies to Australia, where the low percentage of land used for
plantations compared to agriculture, combined with low average annual rates of
fertilizer usage per ha, results in plantations accounting for only 0.12% of N and
0.24% of Pfertilizer usage (May et al. 2009b).
While the proportion of total fertilizer usage in plantations, and the average
rates of application are low, the amounts and types of
fertilizers are broadly similar to those in agriculture (Table 1). There is far less
frequent use of fertilizers in forest plantations, where applications during the first
year are common but later applications range from annually to never. The forms of
fertilizer used in forestry mirror those used in agriculture, but some forestry-
specific blends are available.
Like other cropping systems, the emphasis of most forest fertilization
research has been on diagnosis of nutrient limitations in specific contexts (i.e.
combinations of soils, climate, species and management) using soil and plant
analyses, and the refinement of fertilizer rate, timing, form and placement options
(Fox et al. 2007; Gonçalves and Barros 1999; Smethurst et al. 2004a). Fertilizer
placement in a plantation considers uptake efficiency and the relative value of
placement options. Planting densities are commonly 1000-2000 trees per ha,
which means plants are several meters apart. Young tree seedlings have only small
root systems. Therefore, applications around planting time are usually localized in
concentrated spots or bands 10-50 cm from the planting position on or below the
soil surface, or over small areas close to the plant (Smethurst and Wang 1998). As
the root system develops, the zone of application usually increases in area until
totally broadcasting the fertilizer becomes efficient (Attiwill and Adams 1996;
Smethurst et al. 2004a), which in most countries is the cheapest and preferred way
to apply fertilizer. Modern navigational methods aid the selection and recording of
ground or flight paths for fertilizer application, which in-turn improves the
uniformity of application, and improves the ability of pilots to avoid buffers and
other areas that are not to be fertilized (e.g. McBroom et al. 2008).
Examples of Forest Fertilization
Some plantation conifers in Europe are grown in rotations of
several decades (e.g. 92 years in central Sweden) and fertilized at planting with
multi-nutrient mixes (Evers 1991). Thereafter N fertilizers are applied at various
intensities up to 150 kg N ha every 5 years, but more commonly less frequently or
never (Eriksson et al. 2007). When these plantations are fertilized, it is commonly
by broadcasting calcium ammonium nitrate or NPK mixtures.
Coniferous plantations in Australia and the south-
eastern USA grown in 15- to 30-year rotations are commonly fertilized at
establishment with NPK mixtures applied close to the planting position, and
annual per application
Slow-grown conifers
Medium-growth-rate conifers
-1
Cro
p, C
ountr
yN
itro
gen
Phosp
horu
sA
ges
or
freq
uen
cyap
pli
edre
quir
ed
Aver
age
rate
hig
h r
ate
form
s*ra
teap
pli
ed(k
g h
ayea
r)
yea
r)
Bra
zil
720
U,A
S,
MA
P, D
AP
US
A6
224
U, D
AP
250
DA
P, S
P, P
R0, 2-2
2 y
ears
B, K
, M
gA
ust
rali
a4
208
U,A
S2
112
DA
P0, 1-2
5 y
ears
K,
S, C
u, Z
n, B
Aust
rali
a10
104
AS
, U
454
DA
P0, 1-1
2 y
ears
K, S
, C
u, Z
n
Dai
ry20
200
U25
75
MA
P, D
AP,
1-4
/yea
rK
Sugar
cane
160
300
U20
38
SP,
DA
P1-2
/yea
rK
Hort
icult
ure
100-8
00
8-6
4U
, D
AP,
18-1
00
2-1
0D
AP,
MA
P1-1
2/y
ear
or
K
Cer
eals
, oil
seed
s30
200
U,A
S10
10
SP
1/y
ear
K, S
Oth
er n
utr
ients
com
monly
Com
mon
Com
mon
Aver
age
Com
mon
Com
mon
hig
h r
ate
form
sap
pli
ed(k
g h
a(k
g h
a(y
ears
)ap
pli
cati
on
)(k
g h
aap
pli
cati
on
)
853
PR
, M
AP,
Spli
t 0-2
yea
rsK
, B
DA
P
SP
fert
igat
ion
MA
P, K
Nev
ery 1
-2 d
ays
1
-1-1
-1-1
-1-1
-1-1
Fore
st p
lan
tati
on
s
Agri
cult
ura
l sy
stem
s,A
ust
rali
a
Euca
lyptu
s,
Pin
us,
Pin
us,
Euca
lyptu
s,
Tab
le 1
Sum
mar
y o
f fe
rtil
izer
use
in s
elec
ted p
lanta
tion f
ore
st a
nd a
gri
cult
ura
l sy
stem
s.
Mai
nso
urc
es:
Bar
ros
and
Novai
s(1
996)B
arro
set
al.(
2004),
Gonça
lves
etal
.(2008),
Alb
augh
etal
.(2007),
May
etal
.(2009b)
*U
ure
a,A
Sam
monoiu
msu
lphat
e,M
AP,
mono-a
mm
oniu
mphosp
hat
e,D
AP
di-
amm
oniu
mphosp
hat
e,P
Rphosp
hat
ero
ck,
SP
super
phosp
hat
ein
cludin
gtr
iple
super
phosp
hat
e,K
Npota
ssiu
mnit
rate
262 263

application rates are 10-50 kg ha each of N and P (Fox et al. 2007; May et al.
2009b). Established stands receive nutrients at high rates of 208-324 kg N and 50-
112 kg Pha broadcast every 5-15 years.
Some eucalypt plantations in Brazil are grown on 6-
year rotations that receive 2-3 applications of 20 kg N and 53 kg P ha (mainly as
monoammonium phosphate and diammonium phosphate) during the first 2 years,
plus K and B (Barros et al. 2004; Gonçalves et al. 2008). Eucalypt rotations of
about twice the length are used in Australia, with generally higher N and lower P
rates than those in Brazil.
Liming
The use of lime (including dolomite) has increased in forestry during the past few
decades in response to a perception that soil acidification and concomitant nutrient
deficiencies threaten forest ecosystems. Liming of forests occurs predominantly
in Central and Northern Europe (Kreutzer 1995; Meiwes et al. 2002). In Europe,
soil acidification has accompanied the atmospheric deposition of nitrogen and
sulphur generated from coal-fired power stations and from automobiles, i.e. the
'acid rain' effect. The realization of its potential consequences for forestry
developed in the 1970s and 1980s, with the expectation that as a predisposing
stress it would contribute to an increased incidence of toxicities and nutrient
imbalances that would slow forest growth or in some cases lead to mortality
(Hüttermann 1985; Matzner and Ulrich 1985). The accompanying critical load
concept (Sverdrup and de Vries 1994) influenced many forest managers in Europe
to commence or increase the use of lime (including dolomite). However, data on
forest growth later indicated faster rather than slower growth of forests (Binkley
and Högberg 1997), suggesting that the beneficial N- and S-fertilizer effects of
atmospheric depositions outweighed any negative effects of acidification for
several decades at least.
Liming can also have negative consequences associated with humus decay,
nitrate concentrations in seepage water, mobilization of heavy metals, shallower
root systems, boron deficiency and pathogens (Kreutzer 1995). Further, liming has
had little effect on acidity in soil per se, because it is applied to established forests
with a litter layer, and most of the chemical changes occur only in the litter layer.
Changes in litter chemistry can result in higher rates of nitrification and increased
rates of nitrate leaching at a catchment scale, and other adverse outcomes (Löfgren
et al. 2009). Far more important to countering the effects of acid deposition than
liming are the trends in electricity production during the past few decades that
have reduced S deposition by 90% and N deposition by 50% in southern Sweden,
for example (Löfgren et al. 2009).
-1
-1
-1
High-growth-rate eucalypts
Liming is also used routinely by some plantation forestry companies in Brazil
to counter soil acidity, but its main purpose is to correct Ca and Mg deficiencies.
This practice is not universal amongst plantation companies in that country, and
experimental results indicate that liming to correct acidity is not warranted when
planting with or species, which are tolerant of acid soils
(Gonçalves et al. 1997). What appears to be an unnecessary use of lime in Europe,
and in some cases in Brazil, underscores the risks associated with acting on
expected soil chemistry and plant growth effects without confirmation of the latter
under normal field conditions. While some progress has been made in our
understanding of the effects of forest liming, we particularly need to separate the
effects of liming to alleviate the toxic effects of H and Al from those on nutrient
availability at root membrane to stand scales. There is a larger knowledge base for
some agricultural species, but in that domain too we still lack an adequate
quantitative, mechanistic, understanding of the interactive effects of liming across
a range of spatial and temporal scales.Aschematic of the main pools and processes
involved is presented in Fig. 1. A number of these aspects have been studied in
Eucalyptus Pinus
Fertilizers, lime
Bulk soil solution
Shoot
Vacuolar and
other storesRoot cytoplasm
Apoplastic solution
at plasmalemma
Root surfaceCell walls
Plant processes
Mineralsdissolution and mixing
sorption
exchange
root exudates
movement through
root cortex
movement of water and ions
to root surfaces
Solid phase
preciptation
dissolution
exchange
active and passive uptake
and efflux
translocation
Al-H
-Ca-M
g-K
-Na
inte
ractions
Fig. 1 Schematic diagram of the main soil-plant processes involved in Al-H-base
cation availability responses to liming and fertilization.
264 265

detail for some soil-plant systems, but quantitative links have not been established
for any plant-soil system. Until such understanding and quantification is available,
we will have to rely on calibrated, empirical relations between fertilizer or lime
applications and ecosystem responses.
There is a very wide range of fertilizer practices used in agriculture due to the
variety of natural and socio-economic conditions, crop requirements, nutrient
forms and fertilizer availability. Examples are provided in Table 1 for some
Australian agricultural systems, which show that relatively high annual rates are
used in horticulture and sugarcane, and lower rates in cereals, oilseeds and dairy
systems. These latter systems have rates about twice those in intensively managed
forest plantations. Annual rates of fertilizer usage in Australian agriculture are
within the large range reported for cropping and pastures in the UK (Chalmers
2001), vegetable crops in China (Chen et al. 2004), and also broad-acre and
horticultural crops in various regions of the world (Crews and Peoples 2005).
Nutrient cycling
Although fertilizer management in forest plantations is similar in principle and
practice to many agricultural situations, differences in some aspects of nutrient
cycling need to be considered. Prior to 1960, plant nutrition as a discipline had no
particular emphasis on forests, but in the period 1960-1990 forest nutrition
developed as a discipline of research by focusing on nutrient budgets and nutrient
cycling in a variety of natural and managed forest systems (Smethurst 2004).
Some of these systems had been fertilized, but not all. Comerford (2002) lists 16
key texts on forest soils published between 1983 and 2000 that document an
increasing emphasis on nutritional management. To these can be added Bowen
and Nambiar (1984), Nambiar and Brown (1997), and Gonçalves (2004) that
specifically develop the topic in a plantation context.
As Comerford (2002) highlighted, there are several aspects of forest soils that
are distinct from agricultural systems: time between harvests, nutrient cycling,
erosion, topography, fertilization practices, irrigation, soil temperature, utilized
soil depth, stoniness, remoteness from markets, and surface soil organic horizons.
All of these differences impinge to some degree on fertilizer management, some of
which are further explored here.
In trees, the annual requirement for nutrients for new growth is partially met
by drawing on internal pools in older tissues rather than meeting nutrient demand
entirely by uptake from soil. In this context, internal cycling includes the
Fertilizer use in agriculture
Understanding Forest Nutrition and Growth
withdrawal of nutrients from aging or dying tissues and retranslocation of those
nutrients to younger tissues. The importance of this process had been recognized
by the 1970s (Wells and Jorgensen 1975), and it has been quantified in a number of
forest systems since. In a 13-year-old, N-deficient plantation, N
fertilization led to a 45% increase in wood production and 350% increase in N
retranslocation, showing increased reliance on retranslocation as growth rate
increased (Fife and Nambiar 1997). Internal cycling of nutrients in three
and was studied between 12
and 22 months of age, during which 31-60% of N present in young, green foliage,
54-63% of P and 18-38% of K was retranslocated (Fife et al. 2008). Hence, such
dependence on retranslocation probably exists among all or many forest
plantation species. In contrast, annual agricultural crops depend almost entirely
on uptake, during which sub-annual transfers of carbohydrates and nutrients are
important for grain, fruit or tuber production.
Cycling of nutrients external to the plant is also prevalent in forests that have
commenced above- or below-ground litter production, and it can account for a
significant component of annual nutrient availability to tree roots. For example,
tropical plantations of various species accumulate in litter 80-660 kg N and 4-20
kg P ha , which is more than in many natural tropical forests (O'Connell and
Sankaran 1997) and generally more than the average annual amounts of N and P
accumulated in trees of tropical forest plantations (Gonçalves et al. 1997). Hence,
retention of this material and harvesting residues between rotations is essential to
reduce or alleviate the need for fertilizers during the early phase of the next crop
(Nambiar 2008). Conversely, slow decomposition of litter in some systems,
particularly in cold climates, immobilizes large pools of N and other nutrients
(Tamm 1995). This build-up of nutrients in litter layers limits nutrient losses via
leaching from these ecosystems, but it can also contribute to N deficiency in trees.
Links between nutrient cycling and catchment-scale outcomes were made
early in forestry because some aspects of forestry practices were controversial, i.e.
clearfelling and complete vegetation control using herbicides could lead to high
nitrate concentrations in streams and ground water (Vitousek and Melillo 1979).
Later studies have shown that N and P fertilizer in forestry leads to generally small
and transient increases in N and P concentrations in stream water (Binkley et al.
1999). More recently, practices in agriculture have come under scrutiny in a
nutrient context for potential adverse catchment scale and greenhouse gas
outcomes (McDowell 2008). Agriculture generally, via fertilizer use, has caused a
much larger perturbation of global nutrient cycles than forestry (May et al. 2009b).
For example, by about 1990, global N fertilizer production, which is mainly used
to produce food, and other anthropogenic influences had doubled the rate of N
transfer from atmospheric to terrestrial pools compared to that which would
otherwise have occurred due to natural processes (Vitousek et al. 1997). This
proportion has probably increased substantially during the past decade.
Pinus radiata
Eucalyptus species, Acacia mearnsii Pinus radiata
-1
266 267

Nutrient flux density and uptake kinetics
Developing a mechanistic understanding of nutrient uptake processes has led to
the realization that nutrient uptake at the cell membrane level of roots and
mycorrhizal hyphae was an active process mediated by enzymes. Together with
nutrient supply phenomena in soils, supply and uptake could be mathematically
modeled (Barber 1995; Tinker and Nye 2000). Between 1970 and 1991, the need
to experimentally control plant growth rates and nutrient concentrations led to the
development of hydroponic culture techniques that supplied all nutrients at non-
limiting concentrations, except for one limiting nutrient (Asher and Blamey 1987;
Asher and Cowie 1970; Ingestad 1971). Supply of the limiting nutrient (usually N)
conformed to a schedule that directly led to control of the growth rate of the plant.
Different exponential growth rates resulted in different but stable internal nutrient
concentrations, which greatly assisted in the testing of various hypotheses of
nutrient-growth relations in plants (Ericsson et al. 1995; Ingestad 1982).
However, Ingestad came to the conclusion that concentrations of nutrients in
hydroponic and soil solutions and uptake kinetics of plant roots were unimportant
for controlling plant growth rates (Ingestad 1982). Instead, the rate of nutrient
replenishment was critical, which he and his coauthors termed the nutrient flux
density approach. This method was also applied to several field experiments in
forests around the world (Albaugh et al. 2007; Linder 1995) and was adopted by
scientists working on nutrient-growth relations of other forestry, agricultural, and
aquatic species (e.g. Groot et al. 2002; Hawkins et al. 2005; Macduff et al. 1993;
Pintro et al. 2004; Raven 2001), because of the high level of control it offers over
plant growth rates and internal nutrient concentrations.
The nutrient flux density approach presented a dilemma for some scientists
working in the more common paradigm where concentrations in growth solutions
and uptake kinetics were important (Macduff et al. 1993; Raven 2001). Sands and
Smethurst (1995) subsequently demonstrated that these two approaches were not
necessarily inconsistent by using uptake kinetic principles to model nutrient
uptake and plant growth reported for one of Ingestad's experiments. A solution
concentration of 50 mM inorganic N was required (via periodic or continuous
replenishment) to produce a relative growth rate of 0.25. Building on the earlier
work of Tinker and Nye (2000) and Barber (1995), nutrient supply and uptake
theory has since been used to simulate nutrient uptake and growth of a eucalyptus
plantation over several years with simultaneous potential limitations of N, P, light,
water or temperature (Smethurst et al. 2004b).
CEC and base cations
Forest soils are generally more acidic and organic than soils used for agriculture.
Experience with forest soils has questioned traditional views developed primarily
in an agricultural context that use cation exchange capacity, base cation saturation
and exchangeable cation concentrations as indicators of base cation availability
(Ross et al. 2008). In such forest soils, the source of charge is mainly organic
matter, and cation retention cannot be explained by simple exchange phenomena.
Ross et al. (2008) argue four salient points that apply to acid soils across
agriculture and forestry: (1) new measures of exchangeable Al and H are needed,
(2) base saturation should be abandoned as a measure of base cation availability,
(3) the paradigm that higher pH accompanies higher CEC does not hold, and (4)
CEC should not be used to indirectly infer base cation availability. These
observations will become more pertinent as agricultural and forestry soils acidify,
which is a long-term trend globally, and as society is forced to use more acid soils
to grow food and fibre.
In many parts of the world, salinity or sodicity adversely affects crop growth,
and the problem is expanding. During recent decades, Na has been recognized as a
functional nutrient for many agricultural plant species, and to some extent it can
substitute for the functions of Ca, Mg and K (Subbarao et al. 2003). One
implication is that increasing Na availability and uptake can reduce the need for
these other base cations, and lower critical foliar concentrations can be used as a
guide to fertilizer needs. However, few studies have demonstrated Na substitution
of other bases under field conditions. A recent demonstration of this effect in a
plantation forestry context comes from Brazil, where K depletion after several
decades of eucalypt cropping led to substantial K deficiency (Almeida et al. 2009).
Trees responded substantially to K fertilizer applications, and about 40% of that
response was also achieved by Na fertilization alone.
Productivity modeling that includes nutrients
Agricultural crop productivity modeling that accounts for species-specific
responses to light, water, temperature, and nitrogen was already well developed
more than a decade ago (Hanks and Ritchie 1991; Keating et al. 2003), and has
since expanded in sophistication and application. A similar model has been
developed for forest plantations (Landsberg and Waring 1997), but it considers
nutrients by using only a generic fertility factor, and it cannot account for fertilizer
applications. A more mechanistic model has been developed that considers some
silvicultural operations used in plantation forestry, including N fertilization
(Battaglia et al. 2004), which was used to simulate N and P uptake and estimate
growth limitation due to light, water, N and P(Smethurst et al. 2004b). Other forest
productivity models have been developed that account for one or more nutrients
(usually N), but none combine a high level of silvicultural flexibility with detailed
nutrient dynamics and uptake by trees and weeds (Smethurst 2007). These
process-based plantation forestry models also do not yet have the sophistication to
account for all the options available for managing fertilizers, e.g. fertilizer forms
268 269

and placement, but such developments are possible. Such detailed fertilizer
management options can instead be compared using more empirical models or
decision support systems based on experience and financial information (Fox et al.
2007; May et al. 2009a).
Nutrient use efficiency
Forest researchers have had an interest in nutrient use efficiency (NUE) for several
decades. Based on litterfall as a surrogate for growth and net primary productivity
(NPP), and litter N content as a surrogate for N supply, it was asserted that the more
nutrient that was used the less was its NUE, i.e. biomass produced per unit of
resource supply decreased with an increase in supply (Vitousek 1982). With actual
measures of above-ground NPP (ANPP), Binkley et al. (2004) sought evidence
that this was the case for the resources of light, water and nitrogen, and found that
the few data available supported the opposite hypothesis, i.e. resource use
efficiency increased with increasing resource capture. For example, across 14
stands in Brazil, Stape et al. (2004) found that ANPP per unit of N
uptake, increased about 30% with a 200% increase in N uptake, while litterfall per
unit of N uptake and litterfall proportion of ANPP both decreased by about 50%,
with a 300% increase inANPP.
Akey concept in agriculture is that resource use efficiency is based on product
yield per unit of resource supply (e.g. Passioura 2004 for water). But for nutrients,
the contribution of both fertilizer and soil sources needs to be considered, and
resource capture needs to be separated from resource use within the plant. There
are few data in agriculture or forestry that allow a full analysis of nutrient use
efficiency, but instead product yield can be expressed per unit of external resource
input (e.g. irrigation or fertilizer). This latter index has also been referred to as the
partial factor productivity (PFP) of an applied nutrient (Dobermann 2007).
Nutrient use efficiency can also be expressed as biomass or product yield per unit
of nutrient taken up regardless of the nutrient source, which approximates to the
inverse of the average concentration of a nutrient in a plant. It is important that
such concepts are more fully understood by including below-ground productivity
and measures of resource supply and resource capture, and that the implications
for fertilizer practices are clarified.
Various fuel sources are used or considered for biofuel production, but these
can have a very wide range of PFP values (Table 2). These data indicate that corn,
cereals and pasture have very low PFP values (0.6-144) compared to some
eucalypt plantations that had a low requirement for N fertilizer (2-14 kg), but
similar to pine plantations that had a high N fertilizer requirement. Biofuel
production requiring little or no fertilizer input would have a PFP value
approaching infinity, e.g. in riparian plantings of trees and grasses that utilize
nutrients in wastewater or polluted groundwater (Gopalakrishnan et al. 2009) or in
Eucalyptusparts of Europe and North America with high atmospheric deposition. As biofuel
technologies develop to better cope with woody materials, it is expected that more
of this feedstock will be used and thereby increase the N-use efficiency of biofuel
production (Galloway et al. 2008), but it will be important to consider the N
fertilizer requirement of the particular plantation system under consideration.
Production systems with less fertilizer
There is a concern that the availability of inorganic N and P fertilizers will
diminish as the surplus of supply over demand decreases (FAO 2008, Huang 2009)
and as mineral reserves of P-containing rocks are depleted (Cordell et al. 2009).
However, others argue that world reserves and resources for N and P appear
adequate for at least the next two years (FAO 2008) and the foreseeable future
(Fixen 2009). Under both scenarios, the price of fertilizers could increase relative
to the cost of other farm inputs. Lack of availability, or economic pressures could
therefore reduce the per ha use of these fertilizers and necessitate food and fibre
production using lower nutrient input systems. This trend could in-turn expanded
interest in the use of rhizosphere and mixed-species technologies that potentially
add N and better utilise existing sources of soil N and P otherwise unavailable to
crop plants. These technologies include enhanced P uptake by roots and
mycorrhizae via organic acid and phosphatase production (Jones 1998,
Richardson et al. 2009), symbiotic (Forrester et al. 2006) and non-symbiotic
biological N-fixation, and improved plant root nutrient uptake kinetics (Bassirirad
2000, Raghothama 1999). There is scope for (1) using existing genotypes that can
up-regulate these mechanisms, (2) selecting and breeding for new genotypes of
Crop Fertilizer NUE(kg yield per kg N fertilizer)
Minimum Maximum
Corn 1.2 2.6 Dobermann et al.Cereals 124 488 Dobermann 2007Perennial pastures 32 144 Brouder et al. 2009Pine plantations 16 44 Albaugh et al. 2004Eucalypt plantations 2,222 13,545 Stape et al. 2004
Reference
2002
Table 2 Comparison of fertilizer nitrogen use efficiencies (NUE; PFP as defined
by Dobermann 2007) of typical biomass produced from cereals, corn,
and perennial pasture compared to stem wood from plantations that had
relatively low (eucalypt) or high (pine) N fertilizer requirements. Corn
and cereal biomasses were calculated using a harvest index (grain
biomass to total biomass ratio) of 0.5 and 0.25 respectively (Donald and
Hamblin 1976).
270 271

plants and microbes, and (3) genetic engineering to induce or enhance these
processes in important crop species (Schachtman and Shin 2007, Richardson et al.
2009). There will probably be a greater need for these developments in agriculture
than in forestry, so important opportunities might develop for plantation forestry
by being aware of such trends in agriculture. However, studies of forest and other
non-agricultural crop species have contributed significantly to our current
understanding of these processes, because of their importance in low-fertility,
non-agricultural systems.
Mycorrhizae, fungal symbionts that infect the root system, act as a very fine
extension of the root system with a high surface area to biomass ratio that enhances
under some conditions nutrient and water uptake and the ability of a plant to cope
with biotic and abiotic stresses. In return for these potential benefits, the plant
supplies carbon to the fungus for growth and metabolism. Many of these functions
are genetically mediated (Graham and Miller 2005). In relation to nutrient uptake,
plants benefit most from the mycorrhizal symbiosis in terms of biomass growth
and survival under conditions of low availability of poorly-mobile nutrients, e.g. P
in highly P-limited natural and man-made ecosystems (Chen et al. 2008). In
contrast, under high nutrient availability, infection and growth of mycorrhizae can
be negligible, or the cost in terms of carbon can reduce plant growth where nutrient
uptake is not enhanced by mycorrhizae. These principles have been amply
demonstrated in controlled environment and field conditions using a variety of
plant species (e.g. perennial versus annual, woody versus non-woody,
domesticated versus non-domesticated species) (Graham and Miller 2005).
However, field studies can be difficult due in-part to a limited ability to control and
measure the level of infection by inoculated and endemic species of fungi. Organic
acid and phosphatase enzyme exudates increase the availability of inorganic and
organic soil P, respectively, by converting solid-phase P to liquid-phase phosphate,
which is the main form of P taken up by roots and mycorrhizal hyphae of crops
(Richardson et al. 2009).
Nitrogen-fixing plants have been of interest in plantation forestry for many
years as primary crop species or as nurse/companion crops to other main species
in plantation forests or agro-forestry systems (Forrester et al. 2006). Increased
N availability benefits in such systems have been well-demonstrated (Binkley
and Giardina 1997), but major deterrents to their adoption on a large scale have
been management complexity and economic viability. An overall financial
benefit is not obvious unless fertilizer costs are very high or the wood value
gained is very high (Turvey and Smethurst 1983). These financial benefits will
probably become more obvious if fertilizer and fibre shortages develop. If or
when that situation eventuates, plantation forestry and agriculture will need to
seriously consider mixed-species systems, for which there are many generic
and system-specific research and management questions remaining to be
answered.
Ion Flux and Membrane Transporter Technologies
In recent years, the use of ion flux and membrane transporter technologies have
started to expand our understanding of the nutritional physiology of trees. Wood
formation has a particular dependence on potassium (K), the supply of which to
cambial cells is regulated by K channels (Langer et al. 2002). In
one transporter was continuously present at a low level, suggesting a house-keeper
function, but the levels of two others followed the annual variation in plant growth
(Langer et al. 2002). Functioning of theses transporters (and hence uptake of K
into cambial and expanding xylem cells) depends on the necessary H -gradient
being generated by a H -ATPase in the plasma membrane, and this response can be
initiated within a few hours of the addition of auxin to dormant twigs (Arend et al.
2002). Similar transporter and ion flux studies in tree roots also indicate a key role
for H -pumping to maintain the electrochemical gradient that drives the fluxes of
K and Na (Knowles 2007; Sun et al. 2009). However, when measuring fluxes of
these cations, care needs to be exercised in the use of the non-invasive, ion-
selective flux microelectrode technology, because one needs to correctly account
for the non-ideal, ion-selective behavior of the resins used to make the
microelectrodes (Knowles and Shabala 2004).Using and agricultural species (Escalante-Perez et al.
2009; Knowles 2007; Sun et al. 2009), these technologies are now elucidating the
genetic and physiological basis to salt sensitivity and tolerance. Regulation of the
proton gradient across the plasma membrane reduces Na influx via non-specific
cation channels and simultaneously reduces K efflux through depolarization-
activated channels. The addition of Ca markedly enhances these processes and
thereby assists in maintaining K /Na homeostasis.Ion-flux technologies are also available for nitrogen, but not yet for
phosphorus. Simultaneous measurements of ammonium, nitrate and proton fluxes
around roots of revealed a preference for ammonium, spatial
and temporal variations in fluxes in the 20-60 mm region from the root tip, no
affect of proximity to root hairs or root laterals, and Michaelis-Menten-style
uptake kinetics (Garnett et al. 2001, 2003). Ammonium preference is a more
common observation in forest ecosystems than in agricultural systems
(Kronzucker et al. 1997; Min et al. 2000). Such results encourage the continued
use of ammonium-based fertilizers in forestry. Increased development and use of
ion-flux technologies will be needed as we seek to further expand our
understanding of plant nutritional physiology and improve fertilizer management,
but we need to be cognizant of some current limitations. For example, these
methods are mainly suitable for young plants in controlled environments that
experience very different growing conditions to field-grown plants, and the lower
limits of concentration detection are not as low as the concentrations at which
+
+
+
+
+
+
2+
+ +
Populus tremula,
Populus, Eucalyptus,
Eucalyptus nitens
272 273

uptake occurs in many forestry and agricultural cropping systems.
There is a well-established method of calibrating soil and plant indicators of
potential growth (or yield) response to fertilization (McLaughlin et al. 1999;
Smith and Loneragan 1997). This method requires that many fertilizer
experiments be established in time and space to capture climatic and landscape
variability. Yield of the unfertilized treatment is expressed relative to maximum
growth with fertilizer, and these data plotted as a function of the indicator, e.g. a
soil or leaf analysis. The value of the indicator at the point where relative yield
decreases significantly from below 1.0 (generally taken as 0.90 or 0.95 relative
yield) is referred to as the critical value for that indicator. Instead of relative yield,
other yield response criteria can also be used, e.g. percent increase in growth due to
fertilization.
Fertilizer needs in agriculture commonly take into account soil and plant
analyses that are well calibrated. As plantation forestry intensifies and the relative
cost of fertilizer increases there will be a need to further develop and apply suitable
soil and plant analyses. Appropriate calibrations and their use will not only guide
fertilizer use in low- to medium-input systems, but they can also be useful for
avoiding the over-use of fertilizers and concomitant environmental problems such
as those that occur already in parts of Europe, USA, China and Mexico (Vitousek
et al. 2009). Fertilizer practices in forestry should be developed while avoiding
over-use.
This protocol for calibrating potential indicators of nutrient deficiency is
rarely fully applied in forestry, because resources have often not been available to
cater for the long crop cycles and large plot and plant sizes. Some examples are
available, and critical indicator values are also inferred, but less-reliably so, from
growth and nutrient indicator surveys across operational plantations. Such
inferences have also been developed from growth and nutrient relations within just
one or a few fertilizer experiments. In the following paragraphs, examples of
nutrient limitations in several major plantation regions of the world are described
along with the criteria used to predict fertilizer responses.
plantations, south-eastern USA
A large concentration of forest plantations of and (13 M ha)
are grown in their native range in the south-eastern USA, and fertilization has been
a key component of management intensification during the past five decades (Fox
et al. 2007). Nutritionally, these plantations are severely limited by low P and N
supply if unfertilized. P-fertilizer is needed at planting (Pritchett et al. 1961), and
thereafter a combination of N and P is far better than either nutrient alone (Amateis
Indicators of plantation response to fertilization
Pinus
Pinus elliottii P. taeda
et al. 2000). The concentration of P in an acid extract (Bray2-P) best discriminated
between responsive and non-responsive sites at planting (Ballard and Pritchett
1975). Once established, leaf area index (LAI) is the main diagnostic. A fully
stocked stand with stem cross-sectional areas at 1.3 m height greater than 22.9 m
ha should have an LAI of at least 3.5, unless there are other obvious problems that
have altered LAI, e.g. fire, ice, insects etc. (Fox et al. 2007). It is possible to use
these criteria, because water is generally less limiting than low N and P supply at
this stage of the crop.
and plantations,Australia
Almost 2 M ha of and plantations are grown inAustralia. Where
grown on ex-native forest sites that do not have a history of P-fertilization for
agricultural production, applications of P fertilizer at planting are essential
(Boomsma 1949). Various indices of soil, plant and litter P have been sought for
these plantations (May et al. 2009b). Although a common basis for assessment is
still lacking, some of these indexes have been calibrated for specific soil-climate-
species-management contexts, e.g. CaCl -extractable P for
and in temperate Australia (Mendham et al. 2002) and total P
concentration in litter for in south-east South Australia (May et al.
2009a).As for plantations in the south-eastern USA, LAI has been recognized
as a key determinant of potential growth response to N fertilization in
plantations in south-east South Australia (May et al. 2009a) and in
plantations in Tasmania (Smethurst et al. 2003). Soil and litter N
analyses have also been examined as indicators for these plantations; litter N
concentrations in were significantly correlated with response to N-
plus-P fertilization (May et al. 2009a). The critical concentration of total N in
surface soil was 6 mg g for plantations in Tasmania (Smethurst
et al. 2004a) and 2 mg g for plantations in WesternAustralia (White et
al. 2009), which illustrates the contextualization required for many critical
concentrations based on soil analyses.Deficiencies of K in occur under some circumstances in
Australia, e.g. on ex-farmland where decades of K removals in agricultural
products have not been replaced by fertilization (Smethurst et al. 2007). Although
foliar analysis appears useful as a diagnostic tool in these circumstances, further
refinement of the critical concentrations is warranted to account for soil type,
management and climate (Smethurst et al. 2007).
Eucalyptus and plantations, Brazil
The area of eucalypt and pine plantations in Brazil has increased rapidly during the
2
-1
-1
-1
Pinus Eucalyptus
Pinus Eucalyptus
Eucalyptus globulus
E. nitens
Pinus radiata
Pinus
Pinus
radiata
Eucalyptus nitens
Pinus radiata
Eucalyptus nitens
E. globulus
Pinus radiata
Pinus
2
274 275

past two decades, and now totals 4 Mha for eucalypts and 2 Mha for pines.
Applications of P and K were recognized early as necessary in many regions
(Barros et al. 2004). Little or no N fertilization was needed for the first rotation.
The incidence and severity of N deficiency on these sites is expected to increase
with subsequent rotations, and relative growth of 0.74 to 0.98 has recently been
documented in later rotations by age 2 years at 11 sites in São Paulo State (Pulito
2009).At three of these sites, trees had already reached or were close to harvest age
of 7 years, and in each of these cases relative growth had increased from 0.74-0.83
at 2 years of age to 1.0 at around 7 years, indicating that the earlier response to N
fertilizer had disappeared. The reason for this change was not investigated, and
raises the hypothesis that N or another resource became limiting between 2 and 7
years. Specific for either Eucalyptus or Pinus, critical concentrations of organic
matter had earlier been proposed as an indicator of the need for N fertilization
(Barros et al. 2004), but this criterion was not supported by the Pulito (2009) data.
Resin-P for P fertilization, and exchangeable K for K fertilization are still a current
recommendation and critical concentrations of these indicators depend on clay
content. (Barros et al. 2004).
Soil solutions as indicators of nutrient supply
In agriculture and forestry, the development of soil and foliar analyses as
indicators of nutrient deficiency has largely been the responsibility of public
organizations like universities and state or national departments of research and
extension. However, during the past decade it has become difficult for these
organizations to resource this activity, and in many cases it has been dropped as an
important objective unless the user-pay principle is applied. Meanwhile, crop
genotypes, climate, crop management, and soil conditions have changed. Such
changes would be expected to in-turn change the critical concentrations of soil and
foliar diagnostics. With food and fibre shortages increasing globally, and system
inputs becoming more expensive, including fertilizers, there is a mismatch
between the need to use resources more efficiently, and the knowledge base for
making fertilizer management decisions. Either traditional systems for
developing critical nutrient concentrations need to be re-built, or new technologies
need to be developed that are less expensive. This dilemma developed in
plantation forestry some years ago and led to consideration of nutrient
concentrations in soil solutions as potential indictors that were more generic than
traditional, soil-type-specific measures, which rely on strong acid, alkaline or salt
extracts (Smethurst 2000).
The desire to interpret nutrient availability from nutrient concentrations in
soil solution also motivated others to seek appropriate methods. For example,
Barraclough (1989) demonstrated how critical soil solution concentrations for
agricultural crops in the UK might be used to derive more accurate critical
concentrations of more traditional soil indices by accounting for volumetric
soil water content (θ ).Asoil of θ
, in comparison to a drier soil (θv v
v
2
4 3 4
4 4
3
4 3 4
4 3
= 0.34 was estimated to have a critical Olsen P
value of 7 mg g = 0.30) requiring a higher
critical Olsen P value of 23 mg g . This motivation and operational simplicity
were also behind development of a dilute calcium chloride extract (0.01 M
CaCl ) as an indicator of nutrient availability in European agricultural soils;
this solution mimics the ionic strength and pH of soil solutions (Houba et al.
2000). Such an extract was particularly useful for identifying P deficiency in
pastures (Dear et al. 1992) and temperate eucalypt plantations (Mendham et al.
2002).
In a research context, soil solution technology has proven more useful than
traditional measures of soil fertility where well-established calibrations are
lacking (e.g. Smethurst et al. 2001; 2007). Can this technology be developed also
as an operational method? The principle of using soil solutions for inferring
nutrient deficiencies relies on three main steps. Firstly, the concentration of the
inorganic nutrient needs to be measured in a paste extract. Secondly, this
concentration may need adjusting for potential dilution effects that can occur
during preparation of the paste. The adjusted concentration is an estimate of the
concentration in bulk soil solution. Thirdly, the bulk soil solution concentration is
interpreted on the basis of that which is required at root surfaces to maintain near-
optimum growth.
There is a possibility that the soil solution method could be adapted to low-
cost, portable equipment by using simple centrifugation or suction methods to
extract the paste solution and by analyzing the solution using portable water
analysis equipment (Osborne et al. 2001). The essential aspects of this method
were demonstrated in a survey of forest plantations in four regions of Australia,
where a large part of the variation in soil fertility is attributed to fertilizer history,
in particular whether there had been a pasture phase accompanied by fertilizer
inputs. Paste samples were prepared using de-ionized water, and solution was
extracted using porous ceramic tips (Rhizon solution samplers purchased from
Eijkelkamp) to which a partial vacuum had been applied. Solutions were
analyzed for NH , NO , PO and K on a portable spectrophotometer designed for
water analysis (Spectroquant Nova 60 Photometer purchased from Merck).
Due to buffering by the solid phase, concentrations of NH , PO and K in soil
solution were assumed to be altered little by the addition of water during
preparation of the paste, but NO concentrations were adjusted to account for the
dilution effect.
Frequency distributions of concentrations of NH , NO , and PO indicated that
higher values were more common on ex-pasture sites than on ex-forest sites (Fig.
2). In a separate study, soil solution NH and NO correctly discriminated between
6 responsive and 2 non-responsive plantations when fertilized with N.
-1
-1
©
©
E. nitens
276 277

This level of discrimination was better than that achieved by the commonly used
KCl extract (Smethurst et al. 2004a). Soil solution Pand its surrogate CaCl -Pwere
also good discriminators of P responsive sites (Mendham et al. 2002). Even if the
soil solution approach is adopted, it will not eliminate the need for field
2
Fig. 2 Frequency distribution of surface soil NO (top), NH (middle) and PO
(bottom) concentrations measured in Australian forest plantations grown
on ex-pasture and ex-forest sites. Concentrations were measured using a
low-cost, portable nutrient anlaysis system (Osborne et al. 2001).
3 4 4
0
10
20
30
0
10
20
30
Ex-pasture
Ex-forest
0
10
20
30
0.00
010.
0005
0.0010.
0050.
010.
05 0.1
0.5 1 5 10 50
Mor
e
Concentration (M)
Nu
mb
er
of
Sit
es
Nitrate
Phosphate
Ammonium
experiments; instead, its potential to reduce the need for field experiments and to
provide a more generic approach to soil fertility assessment warrants further
testing.
Conclusions and Knowledge Gaps
This review places several aspects of forest fertilization developments in an
agricultural context, and identifies knowledge gaps:
1. Fertilizer use in intensive plantation forestry does not approach the usage seen
in the most intensive pasture (dairy) or annual cropping systems on a per ha
per year basis.
2. However, intensive plantation forestry systems are similar to some biennial or
perennial agricultural systems in the length of the crop cycle and the rates of
fertilizer applied per application.
3. Less intensive plantations systems have much longer rotations than in
agriculture and much lower rates of fertilizer use, and plantation forestry
overall occupies a small portion of the landscape compared with agriculture.
4. Fertilization strategies in forestry consider internal and external nutrient
cycling and deep rooting.
5. As an option for improving nutrient use efficiency, both forestry and
agriculture will need to further develop rhizosphere and mixed-species
technologies.
6. Forest scientists have contributed significantly to developing methods of
plant culture that maintain stable internal nutrient concentrations. As a
research tool, this development should continue to improve our
understanding of nutrient-growth relationships.
7. The development of plant production models that include the mechanistic
simulation of nutrient supply, uptake and weed competition are at a similar
early stage of development in both agriculture and forestry. Nitrogen
modeling is more advanced than other nutrients.
8. Plantation forestry lacks a mechanistic basis for evaluating base cation
availability that accounts for Al-pH-root interactions, which is also the
situation in agriculture. Further developments in this field could assist in
rationalizing the use of lime.
9. Traditional concepts of nutrient use efficiency in forestry have recently been
challenged and need clarifying in the context of fertilizer management for
food, fiber and biofuel production.
10. There is an on-going need to develop calibrations of traditional types of soil
and foliar analyses, but, in some countries, organizations that have developed
these calibrations in the past are finding it difficult to resource further work.
11. Testing soil solution approaches of assessing soil fertility are warranted,
278 279

because they offer a more generic and affordable approach that might reduce
the need for field experimentation.
Juergen Bauhus, Leonardo Gonçalves, and Tom Fox assisted
in sourcing some of the literature. Comments by Daniel Mendham, Shaun Lisson,
Barrie May, Christiane Smethurst, and Don White on earlier drafts of the
manuscript were much appreciated. The author also appreciates the assistance
provided to him to present this paper to the IPI-OUAT-IPNI International
Symposium 'Potassium Role and Benefits in Improving Nutrient Management for
Food Production and Reduced Environmental Damages', 5–7 November 2009,
Bhubaneswar, Orissa, India.
Albaugh TJ, Allen HL, Dougherty PM, Johnsen KH (2004) Long term growth
responses of loblolly pine to optimal nutrient and water resource availability.
For Ecol Manage 192: 3-19
Albaugh TJ, Allen HL, Fox TR (2007) Historical patterns of forest fertilization in
the southeastern United States from 1969 to 2004. South J Appl For 31: 129-
137
Almeida JCR, Laclau J-P, Gonçalves JLM, Ranger J, Saint-André L (2009) A
positive growth response to NaCl applications in plantations
established on K-deficient soils. For Ecol Manage 259: 1786-1795
Amateis RL, Liu J, Ducey M, Allen HL (2000) Modeling response to midrotation
nitrogen and phosphorus fertilization in loblolly pine plantations. South J
Appl For 24: 207-212
Antony F, Jordan L, Daniels RF, Schimleck LR, ClarkA, Hall DB (2009) Effect of
midrotation fertilization on growth and specific gravity of loblolly pine. Can J
For Res 39: 928–935
Arend M, Weisenseel MH, Brummer M, Osswald W, Fromm JH (2002) Seasonal
changes of plasma membrane H -ATPase and endogenous ion current during
cambial growth in poplar plants. Plant Physiol 129: 1651-1663
Asher CJ, Cowie AM (1970) Programmed nutrient addition - a simple method for
controlling the nutrient status of plants. In: Proceedings of Australian plant
nutrition conference, Sept. 1970, Mt Gambier, SouthAustralia, pp 28-32
Asher CJ, Blamey FP (1987) Experimental control of plant nutrient status using
programmed nutrient addition. J Plant Nutr 10: 1371-1380
Attiwill PM, Adams MA (eds) (1996) Nutrition of eucalypts. CSIRO,
Collingwood,Australia
Attiwill PM, Leeper GW (1987) Forest soils and nutrient cycles. Melbourne
University Press, Melbourne,Australia.
Ballard R, Pritchett WL (1975) Evaluation of soil testing methods for predicting
Acknowledgements
References
Eucalyptus
+
growth and response of to phosphorus fertilization. Soil Sci Soc
Am J 39: 132-136
Ballard R (1984) Fertilization of plantations. In: Bowen GD, Nambiar EKS (eds)
Nutrition of plantation forests.Academic, London, pp 327-360
Barber SA(1995) Soil nutrient bioavailability. Wiley, NewYork, USA
Barraclough PB (1989) Root growth, macro-nutrient uptake dynamics and soil
fertility requirements of a high-yielding winter oilseed rape crop. Plant Soil
119: 59-70
Barros NF, Neves JCL, Novais RF (2004) Mineral fertilizer recommendations for
eucalypt plantations. In: Gonçalves JLM (ed) Forest nutrition and
fertilization. IPEF, Piracicaba, Brazil, pp 269-284
Barros NF, Novais RF (1996) Eucalypt nutrition and fertilizer regimes in Brazil. In
Attiwill PM, Adams MA (eds) Nutrition of eucalypts. CSIRO, Collingwood,
Australia, pp 335-355
Bassirirad H (2000) Kinetics of nutrient uptake by roots: responses to global
change. New Phytol 147: 155-169
Battaglia M, Sands P, White D, Mummery D (2004) CABALA: a linked carbon,
water and nitrogen model for forest growth for silvicultural decision support.
For Ecol Manage 193: 251-282
Baule H, Fricker C (1970) The fertilizer treatments of forest trees. BLV
Verlagsgesellschaft mbH, Munich
Binkley D, Burnham H, Allen HL (1999) Water quality impacts of forest
fertilization with nitrogen and phosphorus. For Ecol Manage 121: 191-213
Binkley D, Giardina C (1997) Nitrogen fixation in tropical forest plantations. In:
In: Nambiar EKS, Brown AG (eds) Management of soil, nutrients and water
in tropical plantation forests.ACIAR Monograph No. 43, pp 297-337
Binkley D, Högberg P (1997) Does atmospheric deposition of nitrogen threaten
Swedish forests? For Ecol Manage 92: 119-152
Binkley D, Stape JL, Ryan MG (2004) Thinking about efficiency of resource use
in forests. For Ecol Manage 193: 5-16.
Boomsma CD (1949) Phosphate for top dressing as a normal plantation operation.
Aust For 13: 108-112
Bowen GD, Nambiar EKS (eds) (1984) Nutrition of plantation forests.Academic,
London
Brouder S, Volenec JJ, Turco R, Smith DR, Gebisa E (2009) Nutrient use
efficiency in bioenergy cropping systems: critical research questions. The
Proceedings of the international plant nutrition colloquium XVI, Paper 1430,
10p. Available via http://repositories.cdlib.org/ipnc/xvi/1430. Accessed
October 2010.
Cao T, Valsta L, Härkönen S, Saranpää P, Mäkelä A (2008) Effects of thinning and
fertilization on wood properties and economic returns for Norway spruce. For
Ecol Manage 256: 1280-1289
Pinus elliottii
280 281

Chalmers AG (2001) A review of fertilizer, lime and organic manure use on farm
crops in Great Britain from 1983 to 1987. Soil Use Manage 17: 254-262
Chen CR, Condron LM, Xu ZH (2008) Impacts of grassland afforestation with
coniferous trees on soil phosphorus dynamics and associated microbial
processes: a review. For Ecol Manage 255: 396-409
Chen Q, Zhang X, Zhang H, Chrisie P, Li X, Horlacher D, Liebig H-P (2004)
Evaluation of current fertilizer practices and soil fertility in vegetable
production in the Beijing region. Nutr CyclAgroecosys 69: 51-58
Comerford NB (2002) Forest soils. In: Lal R (ed) Encyclopedia of soil science,
Marcel Dekker, pp 586-589
Cordell D, Drangert J-O, White S (2009) The story of phosphorus: global food
security and food for thought. Global Environ Change 19: 292-305
Crews TE, Peoples MB (2005) Can the synchrony of nitrogen supply and crop
demand be improved in legume and fertilizer-based agroecosystems? A
review. Nutr CyclAgroecosys 72: 101-120
Cromer RN, Dargavel JB, Henderson VT, Nelson PF (1977) More pulpwood from
less land.APPITA31: 49-54.
Dear BS, Helyar KR, Muller WJ, Loveland B (1992) The P fertilizer requirements
of subterranean clover, and the soil P status, sorption and buffering capacities
from two Panalyses.Aust J Soil Res 30: 27-44
DobermannA,Arkebauer T, Cassman K, Lindquist J, Specht J, Walters D, Yang H
(2002) Understanding and managing corn yield potential. Proceedings of the
fertilizer industry round table, Charleston, South Carolina. The Fertilizer
Industry Round Table, Forest Hill, Maryland, October. Available via
http://www.potafos.org/far/farguide.nsf/926048f0196c9d4285256983005c6
4 d e / 8 a 3 4 4 a 0 a 2 c a 7 d 9 0 f 8 6 2 5 6 e 8 c 0 0 6 a 2 c 8 2 / $ F I L E / N E -
11F%202002%20Annual%20Report.doc.Accessed in 6 Oct 2009
Dobermann A (2007) Nutrient use efficiency – measurement and management.
Paper presented at international fertilizer industry workshop on fertilizer best
management practices 7-9 March 2007, Brussels, Belgium. Available via
http://www.fertilizer.org/ifacontent/download/7334/115716/version/1/file/2
007_IFA_FBMP_part_1_dobermann.pdf Accessed 6 Oct 2009
Donald CM, Hamblin J (1976) The biological yield and harvest index of cereals as
agronomic and plant breeding criteria.Agron 28: 361-405
Downes GM, Nyakuengama JG, Evans R, Northway R, Blakemore P, Dickson
RL, Lausberg M (2002) Relationship between wood density, microfibril
angle and stiffness in thinned and fertilized Pinus radiata. IAWAJ 23: 253-265
Eriksson E, Gillespie AR, Gustavsson L, Langvall O, Olsson M, Sathre R,
Stendahl (2007) Integrated carbon analysis of forest management practices
and wood substitution. Can J For Res 37: 671-681
Ericsson T, Göansson A, van Oene H, Gobran G (1995) Interactions between
aluminium, calcium and magnesium – Impacts on nutrition and growth of
forest trees. Ecol Bulletins (Copenhagen) 44:191-196
Escalante-Pérez M, Lautner S, Nehls U, Selle A, Teuber M, Schnitzler J-P,
Teichmann T, Fayyaz P, Hartung W, Polle A, Fromm J, Hedrich R, Ache P
(2009) Salt stress affects xylem differentiation of grey poplar (
). Planta 229: 299-309
Evers F-H (1991) Forest fertilization – present state and history with special
reference to South German conditions. Fert Res 27: 71-86
FAO (2005) The state of food and agriculture. Available via
http://www.fao.org/docrep/008/a0050e/a0050e09.htm. Accessed 14 Jan
2010
FAO (2006) Global forest resources assessment 2005. FAO Forestry Paper 147.
Available via http://www.fao.org/DOCREP/008/a0400e/a0400e00.htm.
Accessed 18 Jan 2010
FAO (2008) Current world fertilizer trends and outlook to 2011/12. FAO, Rome,
2008. Available via ftp://ftp.fao.org/agl/agll/docs/cwfto11.pdf. Accessed 18
Jan 2010
Fife DN, Nambiar EKS (1997) Changes in the canopy and growth of
in response to nitrogen supply. For Ecol Manage 93: 137-152
Fife DN, Nambiar EKS, Saur E (2008) Retranslocation of foliar nutrients in
evergreen tree species planted in a Mediterranean environment. Tree Physiol
28: 187-196
Fixen PE (2009) World fertilizer nutrient reserves – A view to the future. Better
Crops 93(3): 8-11
Forrester DI, Bauhus J, Cowie AL, Vanclay JK (2006) Mixed-species plantations
of with nitrogen-fixing trees: a review. For Ecol Manage 233:
211-230
Fox TR, Allen HL, Albaugh TJ, Rubilar R, Carlson CA (2007) Tree nutrition and
forest fertilization of pine plantations in the southern United States. South J
Appl For 31: 5-11
Galloway JN, Townsend AR, Erisman JW, Bekunda M, Cai Z, Freney JR,
Martinelli LA, Seitzinger SP, Sutton MA (2008) Transformation of the
nitrogen cycle: Recent trends, questions, and potential solutions. Science
320: 889-892
Garnett TP, Shabala SN, Smethurst PJ, Newman IA (2001) Simultaneous
measurement of ammonium, nitrate and proton fluxes along the length of
eucalypt roots. Plant Soil 236: 55-62
Garnett TP, Shabala SN, Smethurst PJ, Newman IA(2003) Kinetics of ammonium
and nitrate uptake by eucalypt roots and associated proton fluxes measured
using ion selective microelectrodes. Funct Plant Biol 30: 1165-1176
Gopalakrishnan G, Negri MC, Wang M, Wu M, Snyder SW, Lafreniere L (2009)
Biofuels, land, and water: A systems approach to sustainability. Environ Sci
Technol 43: 6094-6100
Populus x
canescens
Pinus radiata
Eucalyptus
282 283

Gonçalves JLM (ed) (2004) Forest nutrition and fertilization. IPEF, Piracicaba,
Brazil
Gonçalves JLM, Barros NF (1999) Improvement of site productivity for short-
rotation plantations in Brazil. Bosque 20: 89-106
Gonçalves JLM, Barros NF, Nambiar EKS, Novais RF (1997) Soil and stand
management for short-rotation plantations. In: Nambiar EKS, Brown AG
(eds) Management of soil, nutrients and water in tropical plantation forests.
ACIAR Monograph No. 43, pp 379-417
Gonçalves JLM, Stape JL, Laclau J-P, Bouillet, Ranger J (2008) Assessing the
effects of early silvicultural management on long-term site productivity of
fast-growing eucalypt plantations: the Brazilian experience. Southern Forests
70: 105-118
Graham JH, Miller RM (2005) Mycorrhizas: Gene to function Plant Soil 274: 79-
100
Groot CC, Marcelis LFM, van den Boogaard R, Lambers H (2002) Interactive
effects of nitrogen and irradiance on growth and partitioning of dry mass and
nitrogen in young tomato plants. Funct Plant Biol 29: 1319-1328
Hanks J, Ritchie JT (eds) (1991) Modeling plant and soil systems. Agronomy 31,
Am SocAgron, Wisconsin, USA, pp 287-321
Hawkins BJ, Burgess D, Mitchell AK (2005) Growth and nutrient dynamics of
western hemlock with conventional or exponential greenhouse fertilization
and planting in different fertility conditions. Can J For Res 35: 1002-1016
Houba VJG, Temminghoff EJM, Gaikhorst GA, van Vark W (2000) Soil analaysis
procedures using 0.01 M calcium chloride as extraction reagent. Commun
Soil Sci PlantAnal 31: 1299-1396
Huang W (2009) Factors contributing to the recent increase in U.S. fertilizer
prices, 2002-08. USDAEconomic Research Service ReportAR-33
HüttermannA(1985) The effects of acid deposition on the physiology of the forest
ecosystem. Experientia 41: 584-590
Ingestad T (1971) A definition of optimum nutrient requirements in birch
seedlings. II. Physol Plant 23: 118-125
Ingestad T (1982) Relative addition rate and external concentration: driving
variables used in plant nutrition research. Plant Cell Environ 5: 443-453
Johnston AE (1994) The Rothamsted classical experiments. In: Leigh RA,
Johnston AE (eds) Long-term experiments in agricultural and ecological
sciences. CAB International, Wallingford, UK, pp 9-37
Jones DL (1998) Organic acids in the rhizosphere - A critical review. Plant Soil
205:25-44
Keating BA, Carberry PS, Hammer GL et al. (2003) An overview of APSIM, a
model designed for farming systems simulation. Eur JAgron 18: 267-288
Knowles AE (2007) Aspects of the nutrition and physiology of
. PhD Thesis, Univ. Tasmania
Eucalyptus
globulus
Knowles A, Shabala S (2004) Overcoming the problem of non-ideal liquid ion
exchanger selectivity in microelectrode ion flux measurements. J Membrane
Biol 202: 51-59
Kreutzer K (1995) Effects of forest liming on soil processes. Plant Soil 168-169:
447-470
Kronzucker HJ, Siddiqi MY, Glass ADM (1997) Conifer root discrimination
against soil nitrate and the ecology of forest succession. Nature 385: 59-61
Landsberg JJ, Waring RH (1997) A generalised model of forest productivity using
simplified concepts of radiation-use efficiency, carbon balance and
partitioning. For Ecol Manage 95: 209-228
Langer K, Ache O, Geiger D, Stinzing A, Arend M, Wind C, Regan S, Fromm J,
Hedrich R (2002) Poplar potassium transporters capable of controlling K
homeostasis and K -dependent xylogenesis. Plant J 32: 997-1009
Linder S (1995) Foliar analysis for detecting and correcting nutrient imbalances in
Norway spruce, Ecol. Bull. (Copenhagen) 44: 178–190.
Löfgren S, Cory N, Zetterberg T, Larsson P-E, Kronnäs V (2009) The long-term
effects of catchment liming and reduced sulphur deposition on forest soils and
runoff chemistry in southwest Sweden. For Ecol Manage 258: 567-578
Macduff JH, Jarvis SC, Larsson C-M, Oscarson P (1993) Plant growth in relation
to the supply and uptake of NO : a comparison between relative addition rate
and external concentration as driving variables. J Exp Bot 44: 1475-1484
Matzner E, Ulrich B (1985) Implications of the chemical soil conditions for forest
decline. Experientia 41: 578-584
May B, Carlyle C, Lowther R, Keeley P, Bernie C, Michael M (2009a) A decision
support system for maximizing profit from nutrient management of mid-
rotation radiata pine. Forests and Wood Products Australia Project PNO:
03.3907. Available via http://www.fwpa.com.au/environment.aspx?s=
2&pn=PN03.3907.Accessed 18 Jan 2010
May B, Smethurst P, Carlyle C, Mendham D, Bruce J, Baillie C (2009b) Review of
Fertiliser Use in Australian Forestry. Forest and Wood Products Australia
Report PRC072-0708. Available via http://www.fwpa.com.au/
latestreports.aspx?s=4&pn=PRC072-0708.Accessed 6 Oct 2009
McBroom MW, Beasley RS, Chango M (2008) Water quality effects of clearcut
harvesting and forest fertilization with best management practices. J Environ
Qual 37: 114–124
McDowell RW (ed) (2008) Environmental impacts of pasture-based farming.
CAB International
McLaughlin MJ, Reuter DJ, Rayment GE (1999) Soil testing – Principles and
concepts. In: Peverill KI, Sparrow LA, Reuter DJ (eds) Soil analysis and
interpretation manual, CSIRO, Collingwood,Australia, pp 1-21
Meiwes KJ, Mindrup M, Khanna PK (2002) Retention of Ca and Mg in the forest
+
+
-
3
284 285

floor of a spruce stand after application of various liming materials. For Ecol
Manage 159: 27-36
Mendham D, Smethurst P, Holz G, Menary R, Grove T, Weston C and Baker T
(2002) Soil analyses as indicators of P status in young and
plantations. Soil Sci SocAm J 66: 959-968
Min XJ, Siddiqi MY, Guy RD, Glass ADM, Kronzucker HJ (2000) A comparative
kinetic analysis of nitrate and ammonium influx in two early-successional
tree species of temperate and boreal forest ecosystems. Plant Cell Environ 23:
321-328
Nambiar EKS (ed) (2008) Site management and productivity in tropical plantation
forests: proceedings of workshops in Piracicaba (Brazil) 22-26 Nov 2004 and
Bogor (Indonesia) 6-9 November 2006. Center for International Forestry
Research (CIFOR). Available via http://www.cifor.cgiar.org/
Knowledge/Publications/Detail?pid=774.Accessed 14 Jan 2010
Nambiar EKS, BrownAG (eds) (1997) Management of soil, nutrients and water in
tropical plantation forests. Australian Centre for International Agricultural
Research Monograph No. 43
Nyakuengama JG, Downes GM, Ng J (2002) Growth and wood density responses
to later-aged fertilizer applications in Pinus radiata. IAWAJ 23: 431-448
O'ConnellAM and Sankaran KV (1997) Organic matter accretion, decomposition
and mineralisation. In: In: Nambiar EKS, Brown AG (eds) Management of
soil, nutrients and water in tropical plantation forests. ACIAR Monograph
No. 43, pp 297-337
Osborne R, Smethurst P and Wilkinson A (2001) Soil fertility assessment: survey
and training using a quick-test meter. Cooperative Research Centre for
Sustainable Production Forestry, Hobart, Tasmania,Australia, Tech Rep 61
Passioura J (2004) Water-use efficiency in farmers' fields. In: Bacon M (ed) Water-
use efficiency in plant biology. Blackwell, Oxford, UK, pp 302–321
Pintro JC, Taylor GJ, Matumoto-Pintro T (2004) Optimizing exponential growth
of by application of the relative addition rate (RAR)
technique utilizing a computer-controlled nutrient delivery system. Braz J
Plant Physiol 16: 163-169
Pritchett WL(1979) Properties and management of forest soils. Wiley, NewYork
Pritchett WL, Llewellyn WR, Swinford KR (1961) Response of slash pine to
colloidal phosphate fertilization. Soil Sci SocAm J 46: 640-644
Pulito AP (2009) Resposta à fertilização nitrogenada e estoque de nitrogênio
biodisponível em solos usados para plantações de [Response to
nitrogen fertilization and stock of available nitrogen in soils used in
eucalyptus crops]. MSc (Forestry) Thesis, University of São Paulo,
Piracicaba
Raghothama KG (1999) Phosphate acquisition. Ann Rev Plant Physiol Plant Mol
Biol 50: 665-693
Eucalyptus nitens
E. globulus
Triticum aestivum
Eucalyptus
Raven JA(2001)An aquatic perspective on the concepts of Ingestad relating plant
nutrition to plant growth. Physiol Plant 113: 301-307
Raymond CA (1998) Wood properties, silviculture and growth: a review of
published literature for eucalypts. Cooperative Research Centre for
Temperature Hardwood Forestry, Hobart,Australia, Tech Rep 6
Rennie PJ (1955) The uptake of nutrients of mature forest growth. Plant Soil 7:49-
95
RichardsonAE, Barea J-M, McNeillAM, Prigent-Combaret C (2009)Acquisition
of phosphorus and nitrogen in the rhizosphere and plant growth promotion by
microorganisms. Plant Soil 321: 305-339
Ross DS, Matschonat G, Skyllberg U (2008) Cation exchange in forest soils: The
need for a new perspective. European J Soil Sci 59: 1141-1159
Schachtman DP, Shin R (2007) Nutrient sensing and signaling: NPKS. Ann Rev
Plant Biol 58: 47-69
Sands PJ, Smethurst PJ (1995) Modelling nitrogen uptake in Ingestad units using
Michaelis-Menten kinetics.Aust J Plant Physiol 22:823-831
Schönau APG, Herbert MA (1989) Fertilizing eucalypts at plantation
establishment. For Ecol Manage 29:221-244
Smethurst PJ (2000) Soil solution and other soil analyses as indicators of nutrient
supply:Areview. For Ecol Manage 138: 397-411
Smethurst P (2004) Nutritional physiology of trees. In: Burley J, Evans J,
Youngquist JA(eds) Encyclopedia of forest sciences, Oxford, pp 1616-1622
Smethurst PJ (2007) Nitrogen cycling in forests with inter-specific competition:
models and knowledge in relation to temperate eucalypt and pine plantations.
Cooperative Research Centre for Forestry Tech Rep 172. Available via
http://www.crcforestry.com.au/publications/technical-reports/index.html.
Accessed 12 Oct 2009.
Smethurst PJ, Baillie C, Cherry M, Holz G (2003) Fertilizer effects on LAI and
growth of four plantations. For Ecol Manage 176: 531-42
Smethurst PJ, Herbert AM, Ballard LM (2001) Fertilization effects on soil
solution chemistry in three plantations. Soil Sci Soc Am J 65: 795-
804
Smethurst P, Holz H, Moroni M and Baillie C (2004a) Nitrogen management in
plantations. For Ecol Manage 193: 63-80
Smethurst PJ, Knowles A, Wilkinson A, Churchill K, Lyons A (2007) Soil and
foliar chemistry associated with potassium deficiency in . Can J
For Res 37: 1093-1105
Smethurst P, Mendham D, Battaglia M, Misra R (2004b) Simultaneous prediction
of nitrogen and phosphorus dynamics in a plantation using
linked CABALAand PCATS models. In: Borralho N et al. (eds) in
a changing world, Proc. IUFRO Conference, Aveiro, Portugal, 11-15 Oct.
2004, pp 565-568
Eucalyptus nitens
eucalypt
Eucalyptus nitens
Pinus radiata
Eucalyptus nitens
Eucalyptus
286 287

Smethurst PJ, Wang BP (1998) Soil solution phosphorus and
roots in NP-treated microsites in highly phosphorus-fixing soil. N Z J
Forestry Sci 28: 140-51
Smith FW, Loneragan JF (1997) Interpretation of plant analysis: Concepts and
principles. In: Reuter DJ, Robinson JB (eds) Plant analysis an interpretation
manual. CSIRO, Collingwood,Australia, pp 3-33
Stape JL, Binkley D, Ryan MG (2004) Eucalyptus production and the supply, use
and efficiency of use of water, light and nitrogen across a geographic gradient
in Brazil. For Ecol Manage 193: 17-31
Subbarao GV, Ito O, Berry WL, Wheeler RM (2003) Sodium - A functional plant
nutrient. Crit Rev Pl Sci 22: 391-416
Sun J, Dai SX, Wang RG, Chen SL, Li NY, Zhou XY, Lu CF, Shen X, Zheng XJ,
Hu ZM, Zhang ZK, Song J, Xu Y (2009) Calcium mediates root K /Na
homeostasis in poplar species differing in salt tolerance. Tree Physiol 29:
1175-1186
Sverdrup H, de Vries W (1994) Calculating critical loads for acidity with the
simple mass balance method. WatAir Soil Poll 72: 143-162
Tamm CO (1995) Towards an understanding of the relations between tree
nutrition, nutrient cycling and environment. Plant Soil 168-169: 21-27
Tinker PB, Nye PH (2000) Solute movement in the rhizosphere. Oxford
University Press, UK
Turnbull CRA, Beadle CL, West PW, Cromer RN (1994) Copper deficiency a
probably cause of stem deformity in fertilized Can J For
Res 24: 1434-1439
Turvey ND, Smethurst PJ (1983) Nitrogen fixing plants in forest plantation
management. In: Gordon JC, Wheeler CT (eds) Biological nitrogen fixation
in forest ecosystems: Foundations and applications. Martinus Nijhof, The
Hague, pp. 233-260
Vitousek PM (1982) Nutrient cycling and nutrient use efficiency. Am Nat
119:553-572
Vitousek PM, Aber JD, Howarth RW, Likens GE, Matson PA, Schindler DW,
Schlesinger WH, Tilman DG (1997) Human alteration of the global nitrogen
cycle: Sources and consequences. EcolAppl 7: 737-750
Vitousek PM, Melillo JM (1979) Nitrate losses from disturbed forests: Patterns
and mechanisms. For Sci 25: 605-619
Vitousek PM, Naylor R, Crews T, David MB, Drinkwater LE, Holland E, Johnes
PJ, Katzenburger J, Martinelli LA, Nziguheba G, Ojima D, palm CA,
Robertson GP, Sanchez PA, Townsend AR, Zhang FS (2009) Nutrient
imbalances in agricultural development. Sci 324: 1519-1520
Wells CG, Jorgensen JR (1975) Nutrient cycling in loblolly pine plantations. In:
Bernier B, Winget CH (eds) Forest soils and forest land management, Les
Presses de l'Université Laval, pp 137-158
Eucalyptus nitens
Eucalyptus nitens.
+ +
White DA, Crombie SD, Kinal J, Battaglia M, McGrath JF, Mendham DS, Walker
SN (2009) Managing productivity and drought risk in
plantations in south-westernAustralia. For Ecol Manage 259: 33-44.
Williams DR, Potts BM, and Smethurst PJ (2003) Promotion of flowering in
by paclobutrazol was enhanced by nitrogen fertilizer. Can J
For Res 33: 74-81
Zobel B (1992) Silvicultural effects on wood properties. IPEF International,
Piracicaba 2: 31-38.
Eucalyptus globulus
Eucalyptus nitens
288 289

Role of nutrients in human health: New insights
K Bhaskarachary
Abstract
Keywords
Introduction
The importance of nutrition as a determinant of health status of the
population has been well recognized. Nutrition is a dynamic science. Our
understanding of functions of known nutrients is still not complete. There is a
wealth of new information emerging from research on hither to unexplored roles
of nutrients and the definition of nutrient itself is under scanner. Among the bio
active phytochemicals, carotenoids other than non vitaminAprecursors like lutein
and zeaxanthin have shown strong evidence in preventing or delaying the age
related muscular degenerative disease and lycopene in prostrate cancer. Curcumin
is another phytochemical, which is a remarkable inhibitor of oral cancer and cell
growth. Tannins and Phytates which were considered as anti nutritional factors
have now been found to help in reducing the risk of cancers and cardiovascular
diseases. Consequent to westernization of Indian diets, the intake of salt is on the
increase and this is not only risk factor for hypertension and also creating
imbalance in the sodium/potassium ratio. Recent study had indicated that
increased potassium intake and reduced sodium intake can reduce the risk of
hypertension. Dietary intake of Potassium among Indians is one tenth of what is
recommended. Until recently, the role of nutrients in preventing chronic diseases
was not systematically considered in defining dietary recommendations.
Therefore there is urgent need to look in to the recommended dietary allowances
for these emerging nutrients for various physiological groups.
Cancer cardiovascular diseases nutrition phytochemicals
vitamins.
Nutrition is a dynamic science. Our understanding of functions of known nutrients
is still not complete. There is a wealth of new information emerging from research
on hither to unexplored roles of nutrients and the definition of nutrient itself is
under scanner. The importance of nutrition as a determinant of health status of the
population has been well recognized. Diet can modify the pathophysiological
processes of various metabolic disorders and can be an effective preventive
strategy for various disease processes most of which are known to involve
l l l l
Proceedings IPI-OUAT-IPNI International Symposium (2009)
K Bhaskarachary
National Institute Of Nutrition, Jamia Osmania, Hyderabad- 500007, India
e-mail [email protected]
290 291

oxidative damage. Both nutrient and non-nutrient components of the diet have
been recognized for their anti-oxidant and other potential benefits. New scientific
evidence gave support to the concept that nutrients were not only essential to the
growth, development, and maintenance of tissues, but were also linked to the
expression of genetic information, the effectiveness of the immune system, the
prevention of cell damage, and in general, to increased resistance to many chronic
diseases and even some infectious diseases. This link to health maintenance and
disease prevention resulted in a renewed interest and excitement in nutrition that
was now expanded beyond the domain of classical nutritional deficiencies. The
realization came about that a diet and its nutritional consequences could have a
profound influence on the control and prevention of many chronic conditions such
as osteoporosis, cardiovascular disease, high blood pressure, and cancer, as well as
play an important role in many oral diseases and pathoses such as dental caries,
periodontal disease, salivary gland dysfunction, and soft tissue lesions. The
present paper is the documentation of beneficial effects of some of the phyto
chemicals and emerging new roles of minerals.
Plant carotenoids are red, orange, and yellow lipid-soluble pigments found
embedded in the membranes of chloroplasts and chromoplasts. Their color is
masked by chlorophyll in photosynthetic tissues, but in late stages of plant
development these pigments contribute to the bright colors of many flowers and
fruits and the carrot root. Carotenoids protect photosynthetic organisms against
potentially harmful photo oxidative processes and are essential structural
components of the photosynthetic antenna and reaction center complexes (Glen
and Scolnik 2009). In plants, some of these compounds are precursors of abscisic
acid (ABA), a phytohormone that modulates developmental and stress processes
(Koornneef, 1986).
Carotenoids with provitamin A activity are essential components of the
human diet, and these are abundantly present in Indian foods (Baskarachary et al.
1995; Bhaskarachary et al. 2008). Early observational studies suggested an
inverse relationship between lung cancer risk and beta-carotene intake, often
assessed by measuring blood levels of beta-carotene (Peto et al. 1981; Ziegler
1989). Dietary intakes of total carotenoids, lycopene, beta-cryptoxanthin, lutein,
and zeaxanthin, but not beta-carotene, were associated with significant reductions
in risk of lung cancer in a 14-year study of more than 27,000 Finnish male smokers
(Holick et al. 2002), while only dietary intakes of beta-cryptoxanthin and lutein
and zeaxanthin were inversely associated with lung cancer risk in a 6-year study of
more than 58,000 Dutch men (Voorrips et al. 2000).
The results of several prospective cohort studies suggest that lycopene-rich
diets are associated with significant reductions in the risk of prostate cancer,
Carotenoids
particularly more aggressive forms (Giovannucci 2000). In a prospective study of
more than 47,000 health professionals followed for eight years, those with the
highest lycopene intake had a risk of prostate cancer that was 21 percent lower than
those with the lowest lycopene intake (Giovannucci et al. 1995). Those with the
highest intakes of tomatoes and tomato products (accounting for 82 percent of
total lycopene intake) had a risk of prostate cancer that was 35 percent lower and a
risk of aggressive prostate cancer that was 53 percent lower than those with the
lowest intakes. Similarly, a prospective study of Seventh Day Adventist men
found those who reported the highest tomato intakes were at significantly lower
risk of prostate cancer (Mills et al. 1989), and a prospective study of U.S.
physicians found those with the highest plasma lycopene levels were at
significantly lower risk of developing aggressive prostate cancer (Gann et al.
1999). Because they are very soluble in fat and very insoluble in water, carotenoids
circulate in lipoproteins along with cholesterol and other fats. Evidence that low-
density lipoprotein oxidation plays a role in the development of atherosclerosis led
scientists to investigate the role of antioxidant compounds like carotenoids in the
prevention of cardiovascular disease (Kritchevsky 1999). The results of several
prospective studies indicate that people with higher intakes of carotenoids-rich
fruits and vegetables are at lower risk of cardiovascular disease (Sahyoun et al.
1996; Rimm et al. 1995; Gaziano et al. 1995; Osganian et al. 2003), it is not yet
clear whether this effect is a result of carotenoids or other factors associated with
diets high in carotenoids-rich fruits and vegetables.
Degeneration of the macula, the center of the eye's retina, is the leading cause
of blindness in older adults. Unlike cataracts, in which the diseased lens can be
replaced, there is no cure for age-related macular degeneration (AMD). Therefore,
efforts are aimed at disease prevention or delaying the progression of AMD. The
only carotenoids found in the retina are lutein and zeaxanthin. Lutein and
zeaxanthin are present in high concentrations in the macula, where they are
efficient absorbers of blue light. By preventing a substantial amount of the blue
light entering the eye from reaching the underlying structures involved in vision,
lutein and zeaxanthin may protect against light-induced oxidative damage, which
is thought to play a role in the pathology of age-related macular degeneration
(Snellen et al. 2002; Krinsky et al. 2003). Epidemiological studies provide some
evidence that higher intakes of lutein and zeaxanthin are associated with lower risk
of AMD (Mares-Perlman et al. 2002). To date, the available scientific evidence
suggests that consuming at least 6 mg/day of dietary lutein and zeaxanthin from
fruits and vegetables may decrease the risk of age-related macular degeneration
(Seddon et al. 1994; Mares-Perlman et al. 2001, 2002). Four large prospective
studies found that men and women with the highest intakes of foods rich in lutein
and zeaxanthin, particularly spinach, kale, and broccoli, were 18-50 percent less
likely to require cataract extraction (Brown et al. 1999; Chasan-Taber et al. 1999)
or develop cataracts (Lyle et al. 1999; Christen et al. 2003; Moeller et al. 2008).
292 293

Phytates
Polyphenols
Until recently, phytates were considered to be antinutrients since they prevented
the absorption of other nutrients. Although they are not toxic and consuming them
does not cause serious changes in our body, they were regarded negatively due to
their ability to bind minerals in the intestine, such that the absorption of certain
minerals, such as iron, calcium and magnesium was reduced throughout the body
and the benefit received from these nutrients, which are fundamental to our health
was less, which in the case of iron, could result in anaemia. Despite having been
questioned, this view has changed and current opinion is that, in the correct
proportions, phytates can play a beneficial role in our health. Once they have been
absorbed, they can exert a biological effect, either inside or outside the intestine. If
the phytic acid binds to lead or other metals, which are harmful to the body such as
cadmium, it helps to detoxify it because it prevents it from assimilating in the
blood and facilitates their elimination in our faeces without passing through the
bloodstream from the intestine. Otherwise, they can cause irreversible damage to
the central nervous system. Phytates' ability to bind themselves to other elements
is highly beneficial for the human body since it helps to prevent the appearance of
conditions such as diabetes, heart disease and kidney stones (Jariwalla 2001).
Inositol hexaphosphate (IP (6)) is a naturally occurring polyphosphorylated
carbohydrate, abundantly present in many plant sources and in certain high-fiber
diets, such as cereals and legumes. In addition to being found in plants, IP(6) is
contained in almost all mammalian cells, although in much smaller amounts,
where it is important in regulating vital cellular functions such as signal
transduction, cell proliferation, and differentiation. For a long time IP (6) has been
recognized as a natural antioxidant. Recently IP (6) has received much attention
for its role in cancer prevention and control of experimental tumor growth,
progression, and metastasis. In addition, IP(6) possesses other significant benefits
for human health, such as the ability to enhance immune system, prevent
pathological calcification and kidney stone formation, lower elevated serum
cholesterol, and reduce pathological platelet activity (Vucenik and Shamsuddin
2003; Vucenik and Shamsuddin 2006). Specifically, the interaction of phytic acid
with certain types of protein in the large intestine can help to reduce the activity of
the bacterial enzymes involved in developing cancer of the colon. Furthermore, it
binds with cholesterol and triglycerides, reducing their absorption and,
consequently, their concentration in the blood, and also helps to control the rhythm
of intestinal evacuation. Likewise, phytates prevent the formation of oxalate salts
in the kidneys, which are responsible for forming kidney stones.
Plant polyphenols, a large group of natural antioxidants, are serious candidates in
explanations of the protective effects of vegetables and fruits against cancer and
cardiovascular diseases. Epidemiologic studies are useful for evaluation of the
human health effects of long-term exposure to physiologic concentrations of
polyphenols, but reliable data on polyphenols contents of foods are still scarce.
Polyphenols occur in all plant foods and contribute to the beneficial health effects
of vegetables and fruit. Their contribution to the antioxidant capacity of the human
diet is much larger than that of vitamins. The total intake of polyphenols in a
person's diet could amount to 1 gram a day, whereas combined intakes of beta-
carotene, vitamin C, and vitamin E from food most often is about 100 mg a day.
Phenolic acids account for about one third of the total intake of polyphenols in our
diet, and flavonoids account for the remaining two thirds. (Williamson and
Manach 2005).
Fruit and beverages such as tea and red wine represent the main sources of
polyphenols. Despite their wide distribution, the healthy effects of dietary
polyphenols have come to the attention of nutritionists only in the last years. The
main factor responsible for the delayed research on polyphenols is the variety and
the complexity of their chemical structure. Emerging findings suggest a large
number of potential mechanisms of action of polyphenols in preventing disease,
which may be independent of their conventional antioxidant activities.
Isoflavones (genistein and daidzein, found in soy) have significant effects on bone
health among postmenopausal women, together with some weak hormonal
effects. Monomeric catechins (found at especially high concentrations in tea) have
effects on plasma antioxidant biomarkers and energy metabolism. Procyanidins
(oligomeric catechins found at high concentrations in red wine, grapes, cocoa,
cranberries, apples, and some supplements such as Pycnogenol) have pronounced
effects on the vascular system, including but not limited to plasma antioxidant
activity. Quercetin (the main representative of the flavonol class, found at high
concentrations in onions, apples, red wine, broccoli, tea, and Ginkgo biloba)
influences some carcinogenesis markers and has small effects on plasma
antioxidant biomarkers in vivo, although some studies failed to find this effect.
Compared with the effects of polyphenols in vitro, the effects in vivo, although
significant, are more limited (Williamson and Manach 2005).
Harper et al. (2009) showed that Genistein, resveratrol, and the high-dose
combination treatments suppressed prostate cancer. Polyphenol treatments
decreased cell proliferation and insulin-like growth factor-1 (IGF-1) protein
expression in the prostate. In addition, genistein as a single agent induced
apoptosis and decreased steroid receptor coactivator-3 in the ventral prostate.
Genistein and resveratrol, alone and in combination, suppress prostate cancer
development in the SV-40 Tag model. Regulation of SRC-3 and growth factor
signaling proteins are consistent with these nutritional polyphenols reducing cell
proliferation and increasing apoptosis in the prostate. The health benefits of
Epigallocatechin-3-gallate, one of the most abundant and widely studied catechin
294 295

found in green tea ( ) catechins are becoming increasingly
recognised. Amongst the proposed benefits are the maintenance of endothelial
function and vascular homeostasis and an associated reduction in atherogenesis
and cardiovascular disease risk (Moore et al. 2009). Atherogenic dyslipidaemia
associated with a pro-inflammatory pro-thrombotic state in metabolic syndrome
and related risk of fatty liver, arthritis, neurodegenerative disorders and certain
types of cancers are ideal therapeutic targets for bioactive phytochemicals,
particularly flavonoids and tanins which can combat oxidative stress induced
damage at a sub-cellular level (Soory 2009).
Currently reliance on natural products is gaining popularity to combat various
physiological threats including oxidative stress, cardiovascular complexities,
cancer insurgence, and immune dysfunction. The use of traditional remedies may
encounter more frequently due to an array of scientific evidence in their favor.
Garlic ( ) holds a unique position in history and was recognized for
its therapeutic potential. Recent advancements in the field of immunonutrition,
physiology, and pharmacology further explored its importance as a functional
food against various pathologies. Extensive research work has been carried out on
the health promoting properties of garlic, often referred to its sulfur containing
metabolites i.e. allicin and its derivatives. Garlic in its preparations are effective
against health risks and even used as dietary supplements such as age garlic extract
(AGE) and garlic oil etc. Its components/formulations can scavenge free radicals
and protect membranes from damage and maintains cell integrity. It also provides
cardiovascular protection mediated by lowering of cholesterol, blood pressure,
anti-platelet activities, and thromboxane formation thus providing protection
against atherosclerosis and associated disorders. Besides this, it possesses
antimutagenic and antiproliferative properties that are interesting in
chemopreventive interventions (Butt et al. 2009).
Non-pharmacological treatment options for hypertension have the potential
to reduce the risk of cardiovascular disease at a population level. Animal studies
have suggested that garlic reduces blood pressure, but primary studies in
humans and non-systematic reviews have reported mixed results. Reid et al.
(2008) meta-analysis revealed that garlic preparations are superior to placebo in
reducing blood pressure in individuals with hypertension. Garlic reduced systolic
blood pressure (SBP) by 16.3 mm Hg (95% CI 6.2 to 26.5) and diastolic blood
pressure (DBP) by 9.3 mm Hg compared with placebo in patients with elevated
SBP. Meta-analysis suggests that garlic is associated with blood pressure
reductions in patients with an elevated SBP although not in those without elevated
SBP(Reinhart et al. 2008).
Garlic has been used for centuries for treating various ailments, and its
Camellia sinensis
Allium sativum
Sulphur compounds
consumption is said to reduce cancer risk and its extracts and components
effectively block experimentally induced tumors (Hirsch et al. 2000; Ried et al.
2008). The study conducted by Oommen et al. (2004) demonstrated allicin-
induced apoptosis of cancer cells are novel since allicin has not been shown to
induce apoptosis previously. This study also provides a mechanistic basis for the
antiproliferative effects of allicin and partly account for the chemopreventive
action of garlic extracts reported by earlier workers.
Glucosinolates (GLSs) are found in vegetables. Examples of these
sources include cabbage, brussels sprouts, broccoli, cauliflower and various root
vegetables (e.g. radish and turnip). A number of epidemiological studies have
identified an inverse association between consumption of these vegetables and the
risk of colon and rectal cancer. Animal studies have shown changes in enzyme
activities and DNA damage resulting from consumption of brassica vegetables or
isothiocyanates, the breakdown products of GLSs in the body (Verkerk et al.
2009). Broccoli consumption mediates a variety of functions including providing
antioxidants, regulating enzymes and controlling apoptosis and cell cycle. The
organosulfur chemicals namely glucosinolates and the S-methyl cysteine
sulphoxide found in broccoli in concert with other constituents such as vitamins E,
C, K and the minerals such as iron, zinc, selenium and the polyphenols namely
kaempferol, quercetin glucosides and isorhamnetin are presumably responsible
for various health benefits of broccoli (Vasanthi et al. 2009).
Potassium intake prevents from ailments like stroke, blood pressure, anxiety and
stress, muscular strength, metabolism, heart and kidney disorders, water balance,
electrolytic functions, nervous system and other general health problems. Until
recently, humans consumed a diet high in potassium. However, with the increasing
consumption of processed food, which has potassium removed, combined with a
reduction in the consumption of fruits and vegetables, there has been a large
decrease in potassium intake which now, in most developed countries, averages
around 70 m mol day , i.e. only one third of our evolutionary intake. Much
evidence shows that increasing potassium intake has beneficial effects on human
health. Epidemiological and clinical studies show that a high-potassium diet
lowers blood pressure in individuals with both raised blood pressure and average
population blood pressure. Prospective cohort studies and outcome trials show
that increasing potassium intake reduces cardiovascular disease mortality. This is
mainly attributable to the blood pressure-lowering effect and may also be partially
because of the direct effects of potassium on the cardiovascular system. A high-
potassium diet may also prevent or at least slow the progression of renal disease.
An increased potassium intake lowers urinary calcium excretion and plays an
important role in the management of hypercalciuria and kidney stones and is likely
Brassica
Potassium
−1
296 297

to decrease the risk of osteoporosis. Low serum potassium is strongly related to
glucose intolerance, and increasing potassium intake may prevent the
development of diabetes that occurs with prolonged treatment with thiazide
diuretics (Feng et al. 2008 Dietary intake of Potassium among Indians is one
tenth of what is recommended. Therefore consuming various varieties of fruit and
vegetables will augment the potassium levels effectively.
Boron, chromium, manganese, nickel, tin, vanadium, molybdenum, arsenic,
lithium, aluminium, strontium, cesium and silicon are regarded as new trace
elements in the sense that they have only recently been considered essential in
human diets. These elements are the subject of exciting research in animals,
particularly ruminants, where they have been shown to be essential in one or more
species. For example, ruminants feeding on grass grown in soil where
molybdenum levels are abnormally high have demonstrated an increased
tendency to exhibit copper deficiency. However, for many of these new trace
elements (e.g., Mn) there is no evidence that abnormally low or high dietary
intakes cause substantial nutritional problems in human populations (Weisell
1991).
Nutrition science and the quest to improve human diet have undergone a quiet but
major transition over the last 50 years. The first half of the 20th century was
centered on the discovery and characterization of essential nutrients, vitamins,
amino acids, and cofactors that were indispensable constituents of a healthy diet.
These discoveries greatly influenced the focus of applied nutrition, which
centered first on defining the minimum needs of essential nutrients in humans, and
second in defining diets that provided those minimum amounts needed to maintain
health. In the second half of the 20th century, environmental factors began to gain
prominence as important determinants of human health. It witnessed the
increasing influence of nutritional epidemiology in discovering these diet–health
associations, and deciphered the mystery by performing some of the unique
experiments on human beings. Some of the phytochemicals such as flavonoids,
phenolic acids, carotenoids, sulphur compounds, minerals, trace elements showed
beneficial biological activity in chronic degenerative diseases. These should be
considered along with the known nutrients for sustaining human health. Until
recently, the role of nutrients in preventing chronic diseases was not
systematically considered in defining dietary recommendations.Therefore, there
is urgent need to look in to the recommended dieatry allownaces for these
emerging nutrients for various physcilogical groups.
).
Other minerals
Conclusions
References
)
:
Bhaskarachary K, Ananthan R, Longvah T (2008) Carotene content of some
common (cereals, pulses, vegetables, spices and condiments) and
unconventional sources of plant origin. Food Chem 106: 85-89
Bhaskarachary K, Sankara-Rao DS, Deosthale YG, Reddy V (1995) Carotene
content of some common and less familiar foods of plant origin. Food Chem
54: 189-193
Brown L, Rimm EB, Seddon JM, et al. (1999) A prospective study of carotenoid
intake and risk of cataract extraction in US men.Am J Clin Nutr 70: 517-524
Butt MS, Sultan MT, Butt MS, Iqbal J (2009) Garlic: Nature's protection against
physiological threats. Crit Rev Food Sci Nutr 49: 538-551
Chasan-Taber L, Willett WC, Seddon JM, et al. (1999) A prospective study of
carotenoid and vitaminAintakes and risk of cataract extraction in US women.
Am J Clin Nutr 70: 509-516
Christen WG, Manson JE, Glynn RJ, et al. (2003) A randomized trial of beta
carotene and age-related cataract in US physicians. Arch Ophthalmol 121:
372-378
Feng JH, Graham AMG (2008) Beneficial effects of potassium on human health.
Physiologia Plantarum 133: 725 – 735
Gann PH, Ma J, Giovannucci E, Willett W, Sacks FM, Hennekens CH (1999
Lower prostate cancer risk in men with elevated plasma lycopene levels
Results of a prospective analysis. Cancer Res 59: 1225–1230
Gaziano JM, Manson JE, Branch LG, Colditz GA, Willett WC, Buring JE (1995)A
prospective study of consumption of carotenoids in fruits and vegetables and
decreased cardiovascular mortality in the elderly.Ann Epidemiol 5: 255-260
Giovannucci E (2000) A review of epidemiologic studies of tomatoes, lycopene,
and prostate cancer. Exp Biol Med (Maywood) 227: 852-859
Giovannucci E, Ascherio A, Rimm EB, Stampfer MJ, Colditz GA, Willett WC
(1995) Intake of carotenoids and retinol in relation to risk of prostate cancer. J
Natl Cancer Inst 87: 1767-1776
Glenn EB, Pablo AS (2009) Plant Carotenoids: Pigments for photoprotection,
visual attraction, and human health. Plant Cell 7: 1027-1038
Harper CE, Cook LM, Patel BB, Wang J, Eltoum IA et al. (2009) Genistein and
resveratrol, alone and in combination, suppress prostate cancer in SV-40 tag
rats. Prostate 69: 1668-1682
Hirsch K, Danilenko M, Giat J, Miron T, et al. (2000) Effect of purified allicin, the
major ingredient of freshly crushed garlic, on cancer cell proliferation. Nutr
Cancer 38: 245-254
Holick CN, Michaud DS, Stolzenberg-Solomon R, et al. (2002) Dietary
carotenoids, serum beta-carotene, and retinol and risk of lung cancer in the
alpha-tocopherol, beta-carotene cohort study.Am J Epidemiol 156: 536-547
298 299

Jariwalla RJ (2001) Rice-bran products: phytonutrients with potential
applications in preventive and clinical medicine. Drugs Exp Clin Res 27: 17-
26
Koorneef M (1986) Genetic aspects absscisic acid. In: Blovsten AD, King PJ (ed)
Genetic approach to plant Biochemsitry. Springer-Verlag, New York, pp 35-
54
Krinsky NI, Landrum JT, Bone RA (2003) Biologic mechanisms of the protective
role of lutein and zeaxanthin in the eye.Annu Rev Nutr 23: 171-201
Kritchevsky SB (1999)
Lyle BJ, Mares-Perlman JA, Klein BE, Klein R, Greger JL (1999) Antioxidant
intake and risk of incident age-related nuclear cataracts in the Beaver Dam
Eye Study.Am J Epidemiol 149: 801-809
Mares-Perlman JA, Fisher AI, Klein R, et al. (2001) Lutein and zeaxanthin in the
diet and serum and their relation to age-related maculopathy in the third
national health and nutrition examination survey. Am J Epidemiol 153: 424-
432
Mares-Perlman JA, Millen AE, Ficek TL, Hankinson SE (2002) The body of
evidence to support a protective role for lutein and zeaxanthin in delaying
chronic disease: Overview. J Nutr 132: 518S-524S
Mills PK, Beeson WL, Phillips RL, Fraser GE (1989) Cohort study of diet,
lifestyle, and prostate cancer inAdventist men. Cancer 64: 598-604
Moeller SM, Voland R, Tinker L, et al. (2008) Associations between age-related
nuclear cataract and lutein and zeaxanthin in the diet and serum in the
Carotenoids in the Age-Related Eye Disease Study, an Ancillary Study of the
Women's Health Initiative.Arch Ophthalmol 126: 354-364
Moore RJ, Jackson KG, Minihane AM (2009) Green tea ( )
catechins and vascular function. Br J Nnutr 102: 1790-1802
Oommen S, Anto RJ, Srinivas G, Karunagaran D (2004) Allicin (from garlic)
induces caspase-mediated apoptosis in cancer cells. Eur J Pharmacol 485: 97-
103
Osganian SK, Stampfer MJ, Rimm E, Spiegelman D, Manson JE, Willett WC
(2003) Dietary carotenoids and risk of coronary artery disease in women.Am
J Clin Nutr 77: 1390-1399.
Peto R, Doll R, Buckley JD, Sporn MB (1981) Can dietary beta-carotene
materially reduce human cancer rates? Nature 290 (5803): 201-208
Reinhart KM, Coleman CI, Teevan C, Vachhani P, White CM (2008) Effects of
garlic on blood pressure in patients with and without systolic hypertension: A
meta-analysis.Ann Pharmacother 42: 1766-1771
Ried K, Frank OR, Stocks NP, Fakler P, Sullivan T (2008) Effect of garlic on blood
pressure: A systematic review and meta-analysis. BMC Cardiovasc Disord
16: 8-13
β-Carotene carotenoids and the prevention of coronary
heart diseases. J Nutr 129: 5-8
Camellia sinensis
Rimm EB, Stampfer MJ, Ascherio A, Giovannucci E, Colditz GA, Willett WC
(1995) Vitamin E consumption and the risk of coronary heart disease in men.
N Engl J Med 328: 1450-1456
Sahyoun NR, Jacques PF, Russell RM (1996) Carotenoids, vitamins C and E, and
mortality in an elderly population.Am J Epidemiol 144: 501-511
Seddon JM,Ajani UA, Sperduto RD, et al. (1994) Dietary carotenoids, vitaminsA,
C, and E, and advanced age-related macular degeneration. Eye Disease Case-
Control Study Group. JAMA272: 1413-1420
Snellen EL, Verbeek AL, Van Den Hoogen GW, Cruysberg JR, Hoyng CB (2002)
Neovascular age-related macular degeneration and its relationship to
antioxidant intake.Acta Ophthalmol Scand 80: 368-371
Soory M (2009) Relevance of nutritional antioxidants in metabolic syndrome,
ageing and cancer: potential for therapeutic targeting. Infect Disord Drug
Targets 9: 400-414
Vasanthi HR, Mukherjee S, Das DK (2009) Potential health benefits of broccoli -
Achemico-biological overview. Mini Rev Med Chem 9: 749-759
Verkerk R, Schreiner M, Krumbein A, Ciska E, et al. (2009) Glucosinolates in
Brassica vegetables: The influence of the food supply chain on intake,
bioavailability and human health. Mol Nutr Food Res 53: S219
Voorrips LE, Goldbohm RA, Brants HA, et al. (2000) A prospective cohort study
on antioxidant and folate intake and male lung cancer risk. Cancer Epidemiol
Biomarkers Prev 9: 357-365
Vucenik I, Shamsuddin AM (2003) Cancer inhibition by inositol hexaphosphate
(IP6) and inositol: from laboratory to clinic. J Nutr 133: 3778S-3784S
Vucenik I, Shamsuddin AM (2006) Protection against cancer by dietary IP6 and
inositol. Nutr Cancer 55: 109-125
Weisell RC (1991) Trace elements in human nutrition. Food Nutr Agril Bulletin.
http://fao.org
Williamson G, Manach C (2005) Bioavailability and bioefficacy of polyphenols in
humans. II. Review of 93 intervention studies.Am J Clin Nutr 81: 243S-255S
Ziegler RG (1989) A review of epidemiologic evidence that carotenoids reduce
the risk of cancer. J Nutr 119: 116-122
300 301
Proceedings IPI-OUAT-IPNI International Symposium (2009)
Impact of potassium nutrition on postharvest fruit
quality: Melon ( L) case studyCucumis melo
Gene E Lester John LJifon Donald J Makusl l
Abstract Among the many plant mineral nutrients, potassium (K) stands out as a
cation having the strongest influence on quality attributes that determine fruit
marketability, consumer preference, and the concentration of critically important
human-health associated phytonutrients. However, many plant, soil, and
environmental factors often limit adequate uptake of K from the soil in sufficient
amounts to satisfy fruit K requirements during development to optimize the
aforementioned quality attributes. The objectives of this review are 1) to
summarize published study abstracts on the effects of soil and/or foliar K
fertilization as well as diverse K forms, on fruit phytonutrient concentrations; and
2) to illustrate the important role of K forms on fruit quality with a case study of
L (muskmelon) fruit produced with optimal soil applied K. The
muskmelon studies will compare commercial sources (forms) of K applied to
examine seasonal effects (spring vs. autumn) and the number of foliar K
applications during fruit development on fruit marketability (maturity, yield,
firmness, soluble solids, sugars, relative sweetness), consumer preference
attributes (sugar content, sweetness, texture), and phytochemical concentrations
(K, ascorbic acid, and b-carotene concentrations). Numerous studies have
consistently demonstrated that specific K fertilizer forms, in combination with
specific application regimes, can improve fruit quality attributes. Potassium
fertilizer forms in order of effectiveness (Glycine (Gly)-complexed K = K SO
KCl > no K > KNO ) when applied wet (foliar or hydroponic) vs. dry (soil) were
generally superior in improving fruit marketability attributes, along with many
human-health nutrients. The muskmelon case study demonstrated that two K
Cucumis melo
2 4
3
>
Gene E Lester Donald J Makus
US Department of Agriculture, Agricultural Research Service, Kika de la Garza
Subtropical Agricultural Research Center, 2413 East Business Highway 83,
Building 200, Weslaco, Texas 78596 USA.
e-mail [email protected]
John LJifon
Texas AgriLife Research, Fruit and Vegetable Improvement Center, Texas A&M
System, 2415 East Business Highway 83, Weslaco, Texas 78596 USA.
l
Presented at IPI-OUAT-IPNI International Symposium.Published in Plant Soil 2010.335:117-131. Printed here with permission from Plant Soil
302 303

forms: Gly-complexed K and K SO , combined with a silicone-based surfactant,
applied weekly, as a foliar spray, during fruit development, from both autumn and
spring-grown plants, had the greatest impact on improving fruit marketability
attributes (maturity, yield, firmness, and sugars), as well as fruit quality attributes
(human-health bioactive compounds K, ascorbic acid, and -carotene). Among
several foliar applied K salts studied under field conditions so far, salts with
relatively low salt indices appeared to have the greatest impacts on fruit quality
when applied during the mid- to late-season fruit development periods.
Fruit foliar application human health marketability potassium
fertilizers sugar vitamins yield
Potassium (K) is an essential plant mineral element (nutrient) having a significant
influence on increasing many human-health related quality compounds in fruits
and vegetables (Usherwood, 1985). Although K is not a constituent of any organic
molecule or plant structure, it is involved in numerous biochemical and
physiological processes vital to plant growth, yield, quality and stress (Marschner,
1995; Cakmak, 2005). In addition to stomatal regulation of transpiration and
photosynthesis, K is also involved in photophosphorylation, transportation of
photoassimilates from source tissues via the phloem to sink tissues, enzyme
activation, turgor maintenance, and stress tolerance (Usherwood, 1985; Doman
and Geiger, 1979; Marschner, 1995; Pettigrew, 2008). Adequate K nutrition has
also been associated with increased yields, fruit size, increased soluble solids and
ascorbic acid concentrations, improved fruit color, increased shelf life, and
shipping quality of many horticultural crops (Geraldson 1985; Lester et al. 2005,
2006; Kanai et al. 2007).
Even though K is abundant in many soils, the bulk of soil K is unavailable to
plants, in part, because the pool of plant-available K is much smaller compared to
the other forms of K in the soil. Potassium exists in several forms in the soil such
as mineral K (90-98% of total), nonexchangable K, exchangeable K, and
dissolved or solution K (K ions), and plants can only directly take up solution K
(Tisdale et al. 1985). Uptake in turn depends on numerous plant and environmental
factors (Tisdale et al. 1985; Marschner, 1995; Brady and Weil 1999). For instance,
adequate soil moisture supply is necessary to facilitate diffusion of K (which
usually accounts for > 75% of K movement) to plant roots for uptake. Mass flow,
which also accounts for some soil K transport, also requires sufficient water in the
soil. Skogley and Haby (1981) found that increasing soil moisture from 10 to 28%
more than doubled total soil K transport. Therefore, soil moisture deficits can
limit soil K transport as well as uptake into the plant, thereby causing K deficiency.
2 4
b
Keywords
Introduction
l l l l
l l l
+
Soil properties also have a strong influence on K availability. For instance,
clay soils typically have high K-fixing capacities and thus often show little
response to soil-applied K fertilizers because much of the available K quickly
binds to clays (Tisdale et al. 1985; Brady and Weil 1999). Such K fixation can help
reduce leaching losses, and be beneficial in the long-term as storage reservoirs of
K for subsequent crops. Sandy soils, on the other hand tend to have a low K
supplying power because of their low cation exchange capacities.
In calcareous soils, Ca ions tend to exist in high concentrations and
dominate clay surfaces, and even though this can limit K sorption and increase
solution K, high concentrations of cationic nutrients (particularly Ca and Mg )
tend to limit K uptake by competing for binding sites on root surfaces.
Consequently, crops grown on highly calcareous soils can show K-deficiency
symptoms even though the soil test may report sufficient K (Havlin et. al. 1999).
Potassium uptake also depends on plant factors, including genetics and
developmental stage (vegetative versus reproductive stages; Rengel et al. 2008).
In many fruiting species, uptake occurs mainly during vegetative stages, when
ample carbohydrate supply is available for root growth and uptake processes.
Competition for photoassimilates between developing fruits and vegetative
organs during reproductive growth stages can limit root growth/activity and K
uptake. Under such conditions, increasing soil K fertilization may not be enough
to alleviate this developmentally-induced deficiency partly because of reduced
root growth/activity during reproductive development and also because of
competition from other cations for binding sites on roots (Marschner 1995).
In the literature, much confusion exists regarding the benefit of K fertilization
due to different K forms utilized, soil vs. foliar applications, the environment
(season), plus frequency of applications during fruit growth and development
stages. This review will (1) summarize some of the published abstracts on K
fertilization of several fruit crops, and (2) illustrate the influence of adequate K
nutrition on fruit quality with a case study of supplemental foliar K fertilization of
L (muskmelon) grown on soil with seemingly adequate K content.
Special attention is given to the effectiveness (comparison) of various K fertilizer
sources, and soil vs. foliar application on fruit quality.
Although many examples have been reported on the positive effects of K
fertilization improving fruit disease control, yield, weight, firmness, sugars,
sensory attributes, shelf-life, and human bioactive compound concentrations, the
scientific literature also contains examples of studies with conflicting results of the
beneficial effects of K fertilization on fruit quality (Table 1). These conflicting
results cannot be resolved, but they can be explained by differences in modes of
2+
2+ 2+
Cucumis melo
Fruit studies comparing K sources
304 305

fertilization [soil applied (dry) vs. foliar, fertigation or hydroponic applied (wet)],
and differences in forms of K fertilizer e.g. Glycine-complexed K, versus K SO ,
KCl, or KNO from K fertilization. A review of published abstracts (Table 1),
spanning the last twenty years, eight particular studies [apple (
Hassanloui, et al. 2004), cucumber (
Umamaheswarappa and Krishnappa 2004), mango (
Rebolledo-Martinez et al. 2008), pear ( Johnson et al. 1998),
bell pepper ( Hochmuth et al. 1994), strawberry (Fragaria X
ananassa; Albregts et al. 1996), and watermelon ( Locascio and
Hochmuth 2002; Perkins-Veazie et al. 2003)] stand out, because of their
conclusions: there is 'little or no change' (i.e. improvement) from K fertilization on
fruit quality. However, except for the apple study, these studies have a common
denominator in that potassium was applied directly to the soil and in many cases
little information was given regarding timing of application with regard to crop
phenology or soil chemical and physical properties such as pH, calcium and
magnesium contents, and textures (sandy vs. clay). These properties are known
to influence soil nutrient availability and plant uptake, and soil fertilizer K
additions under such conditions may have little or no effect on uptake, yield and
fruit quality (Tisdale et al. 1985; Brady and Weil 1999). In a number of studies
involving several fruiting crops (e.g. cucumber, mango, and muskmelon) where
soil-applied fertilizer K was compared to foliar K applications, the latter approach
consistently resulted in improved fruit quality attributes whereas the former
approach generally had little or no effects (Demiral and Koseoglu 2005; Lester et
al. 2005; Lester et al. 2006; Jifon and Lester 2009; Table 1). Furthermore, in
studies where several fertilizer K salts were evaluated, fruit quality improvements
appeared to depend on timing of application as well as fertilizer K formulation.
For instance, when mid- to-late season soil or foliar K applications were made
using KNO there were little or no improvements in fruit marketable or human-
nutritional quality attributes and in some instances, these attributes were actually
inferior compared to fruit from control plots (Jifon and Lester 2009).
As discussed above, plant and soil factors can limit soil-available, as well as plant
uptake of K even though soil tests may report sufficient K. This situation is
particularly acute for crops grown on highly calcareous soils whereby such uptake
limitations can lead to K-deficiency symptoms, reduced yield and poor quality. In
such cases where soil-applied fertilizers would be ineffective, due to high fixation,
the only way to improve plant K uptake has been through foliar application of
water-soluble K fertilizers, such as potassium chloride (KCl) or potassium nitrate
2 4
3
3
Malus X
Domestica; Cucumis sativus;
Mangifera indica;
Prunus communis;
Capsicum annuum;
Citrullus lanatus;
Foliar Fertilization with different K salts: Case studies with muskmelon
( L.)Cucumis melo
Cro
pK
ap
pli
cati
on
Kfo
rmA
ttri
bu
tes
(im
pro
ved
)R
efer
ence
ab
c
Apple
K S
O ;
K S
O
Apple
Foli
arU
nknow
n;
KC
lN
o c
han
ge
(Has
sanlo
ui
2004)
Ban
ana
Soil
Unknow
n;
KC
lS
ize,
sugar
s, a
cid
(Sure
sh &
Has
an 2
002)
Cit
rus
Foli
arK
Cl,
KN
O ;
Yie
ld, qual
ity;
(Q
ual
ity
(Shaw
ky
2000)
Cit
rus
Soil
Unknow
n;
(U
nknow
nQ
ual
ity,
shel
f-li
fe(S
rivas
tava
2001)
Cit
rus
Foli
arK
Cl
>K
NO
Pee
l t
hic
knes
s, q
ual
ity
(Gil
l &
Sin
gh 2
005)
Cucu
mber
Soil
K S
O >
KC
l;(
KC
lN
o c
han
ge
(Um
amah
esw
arap
pa
&K
rish
nap
pa
2004)
Cucu
mber
Foli
arK
Cl
>K
NO
"Qual
ity",
dis
ease
tole
rance
(Mag
en2003)
Gra
pes
Soil
K S
O"Q
ual
ity",
sen
sory
(Sip
iora
2005)
Guav
aS
oil
Unknow
nY
ield
, w
eight,
"qual
ity"
(Ke
&W
ang 1
997)
Guav
aF
oli
arK
SO
>
KC
lA
cidit
y, "
qual
ity"
Dutt
a (2
004)
Kiw
ifru
itS
oil
KS
O >
KC
lF
irm
nes
s, a
cid, gra
de
He
(2002)
Lit
chi
Foli
arK
NO
Wt.
, yie
ld,
(Ash
ok &
Gan
esh 2
004)
Man
go
Soil
KN
ON
o c
han
ge
Sim
oes
(2001)
Soil
KC
l;C
olo
r, f
irm
nes
s, s
ugar
;(N
ava
et a
l. 2
009)
;S
ize,
colo
r, f
irm
nes
s, s
ugar
s;E
l-G
azza
r (2
000);
Wt.
yie
ld, fi
rmnes
s, s
ugar
sA
ttal
a (1
998)
Siz
e, c
olo
r, f
irm
nes
s, s
ugar
s;W
ojc
ik (
2005); et a
l.
Qual
ity;
Nar
esh (
1999);
No c
han
ge;
Hag
gag
(1990);
unknow
n;
Dutt
a et
al.
2003);
KS
Oet
al.
Yie
ld, qual
ity;
Lin
et
al. 2006);
et a
l.
Am
ino a
cids,
qual
ity;
Guo e
t al
. 2004);
et a
l.
et a
l.
(Malu
s X
dom
esti
ca)
(Cucu
mis
sati
vus)
(Act
inid
ia d
elic
iosa
)
4
24
3
24
3
24
3
24
24
24 3
2
(Musa
sp.)
(Cit
rus
sines
is)
(Cit
rus
reti
cula
ta)
(Cit
rus
reti
cula
ta)
(Vit
is v
inif
era)
(Psi
diu
m g
uaja
va)
(Lit
chi
chin
ensi
s)
(Mangif
era i
ndic
a)
3
Tab
le 1
Rev
iew
of
publi
shed
abst
ract
s on t
he
infl
uen
ce o
f pota
ssiu
m (
K):
eff
ects
by c
rop, K
appli
cati
on, an
d K
form
on f
ruit
att
ribute
s
306 307

Cro
pK
ap
pli
cati
on
Kfo
rmA
ttri
bu
tes
(im
pro
ved
)R
efer
ence
ab
c
Man
go
Foli
arK
NO
;N
o e
ffec
t;T
extu
re, fl
avor,
(Reb
oll
edo-M
arti
nez
et
al.
colo
r, s
hel
f-li
fe2008);
Unknow
nS
hin
de
(2006)
Fir
mnes
s, v
itam
ins;
Les
ter
et a
l. 2
006);
Fir
mnes
s, s
ugar
s, v
itam
ins;
Les
ter
(2006);
Jif
on &
Les
ter
(2009)
Fir
mnes
s, v
itam
ins,
sugar
s,
yie
ld, m
arket
able
fru
it
Soil
Unknow
nF
irm
nes
s, s
hel
f-li
fe, re
duce
d(Z
han
g e
t al
. 2008)
crac
kin
g
Lit
tle
chan
ge;
(Hoch
muth
et
al. 1994):
Pungen
cy, "q
ual
ity";
(Anan
thi
et a
l. 2
004);
Pungen
cy, yie
ld, w
t.;
(Golc
z et
al.
2004);
El-
Mas
ry (
2000)
3
24
3
24
24
24
24
24
3
24
3
Musk
mel
on
Soil
Unknow
nY
ield
(Dem
iral
& K
ose
oglu
2005)
Musk
mel
on
Foli
arG
ly-a
min
o-K
;(
Gly
-am
ino-K
> K
Cl;
Gly
-am
ino-K
= K
S
O >
KC
l >
KN
O
Nec
tari
ne
Okra
Foli
arN
aphth
enat
e-K
Chlo
rophyll
, pro
tein
, ca
rote
ne
(Jah
an e
t al
. 199
1)
Pas
sionfr
uit
Hydro
ponic
K S
OY
ield
, s
eed n
um
ber
, "q
ual
ity"
(Cost
a-A
raujo
et
al. 2006)
Pap
aya
Soi
Unknow
nW
eight,
sugar
s, "
qual
ity"
Ghosh
&T
arai
(2007)
Pea
rsS
oi
K S
ON
o c
han
ge
(Johnso
n e
t al
. 1998)
Phal
saF
oli
arK
S
OS
ize,
wt.
, "q
ual
ity"
(Sin
gh e
t al
. 1993)
Pep
per
Soil
KC
l;K
S
O ;
K S
O >
KN
O ;
K S
O"q
ual
ity"
Pep
per
Hydro
ponic
sK
NO
No c
han
ge
(Flo
res
et a
l. 2
004)
(Cucu
mis
mel
o)
(Abel
mosc
hus
escu
lentu
s)
(Pass
iflo
ra e
duli
s)
(Gre
wia
subin
aeq
uali
s)
(Capsi
cum
annuum
)
(Pru
nus
per
sica
)
(Cari
ca p
apaya
)
(Pru
nus
com
munis
)
Cro
pK
ap
pli
cati
on
Kfo
rmA
ttri
bu
tes
(im
pro
ved
)R
efer
ence
ab
c
Pin
eapple
Soil
KC
lV
it. C
, an
d r
educe
d i
nte
rnal
(Her
ath e
t al
. 2000)
bro
wnin
g
Pom
egra
nat
eF
oli
arK
S
O >
KC
lG
row
th, y
ield
, "q
ual
ity"
Muth
um
anic
kam
&
Bal
akri
shnam
oort
hy (
1999)
Soil
;K
Cl;
No c
han
ge;
(Alb
regts
et
al. 1996);
Soil
KC
l;L
yco
pen
e;(T
aber
et
al. 2008);
K S
O ;
"qual
ity";
(Si
et a
l. 2
007);
KC
l >
KN
O ;
Appea
rance
, qual
ity;
Chap
agai
n &
Wis
eman
(2003);
Yie
ld, "q
ual
ity";
Chap
agai
n &
Wis
eman
Car
ote
noid
s, v
it.E
,(2
004);
Anti
oxid
ants
;(F
anas
ca e
t al
. 2006);
Lyco
pen
e;L
i et
al.
2006);
"qual
ity"
( Li
et a
l. 2
008)
Wat
erm
elon
No c
han
ge;
Loca
scio
& H
och
muth
(2002);
(Ananas
com
osu
s)
(Punic
a g
ranatu
m)
(Cit
rull
us
lanatu
s)
24
3
24
24
24
3 3
24
24
Str
awber
ryF
erti
gat
ion
KC
l >
KN
O"q
ual
ity"
(Ibra
him
et
al. 2004)
Str
awber
ryH
ydro
ponic
sK
S
OY
ield
, t
ota
l qual
ity
(Khay
yat
et
al. 2
007)
Tom
ato
K S
O ;
Yie
ld, ea
rlin
ess,
qual
ity
Hew
edy (
2000)
Tom
ato
Fer
tigat
ion/
soil
less
KC
l >
KN
O ;
K S
O ;
Unknow
n;
(U
nknow
nY
ang e
t al
. 2005)
Tom
ato
Foli
arU
nknow
nG
row
th, pro
tein
, vit
. C
,(
sugar
, ac
id
Veg
etab
les
Soil
K S
O >
KC
lD
ry w
t., vit
. C
(Ni
et a
l. 2
001)
Soil
KC
l
KC
lN
o c
han
ge
(Per
kin
s-V
eazi
e e
t al
. 2003)
(Fra
gari
a X
ananass
a)
(Lyc
oper
sico
n
escu
lentu
m)
a
b
c
Form
sfr
om
dif
fere
nts
tudie
sar
ese
par
ated
by
ase
mi-
colo
n;K
form
attr
ibuti
ng
toim
pro
ved
qual
ity
gre
ater
than
anoth
erK
form
isin
dic
ated
by
the
>sy
mbol;
Att
ribute
sfr
om
dif
fere
nt
studie
sar
ese
par
ated
by
ase
mic
olo
n,
the
word
“qual
ity”
indic
ates
the
auth
ors
'lis
ted
no
spec
ific
attr
ibute
s,orth
eat
trib
ute
sw
ere
too
num
erous
toli
st,
Ref
eren
ces
from
dif
fere
nts
tudie
sar
ese
par
ated
by
ase
mi-
colo
n
308 309

(KNO ). Controlled environment studies have indeed shown that supplementing
soil-derived K supply with foliar K applications during the fruit development
period can improve fruit quality and that differences may exist among K
compounds for foliar feeding (Lester et al. 2005; 2006). To further explore the
degree to which differences among some K salts may influence fruit quality, field
studies were conducted near Weslaco, TX using a netted muskmelon (
L.) variety 'Cruiser'. Soils in this important fruit-producing region are
predominantly calcareous with free calcium carbonate (CaCO ), which tends to
buffer soil pH to around 7.5 to 8.5. Base saturation is generally ~100%, and cation
exchange is dominated by calcium.Average pre-plant soil concentrations of major
cations were 7300, 660, 440, and 190 mg kg for Ca, K, Mg and Na respectively.
All studies were conducted during the spring (February-May) growing season
following standard commercial muskmelon production practices for this region
(Dainello 1996). Foliar K treatments (Fig.1) were applied weekly (between 0500
and 0800 a.m.) starting at fruit set, and continued till fruit maturation using K from
various sources namely: potassium chloride (KCl), potassium nitrate (KNO ),
potassium sulfate (K SO ), Gly-complexed K (glycine amino acid complexed K -
Potassium Metalosate™, 20% K; Albion Laboratories, Inc, Clearfield, Utah),
monopotassium phosphate (PeaK™, 24% K, Rotem BKG LLC, Ft Lee, NJ), and
potassium thiosulfate (KTS™, 20% K, Tessenderlo Kerley Inc., Phoenix, AZ).
Treatment solutions were formulated to supply the equivalent of ~4 kg K ha per
week and each solution contained a non-ionic surfactant (Silwet L-77 at 0.3% v/v;
Helena, Collierville, TN).
Leaf K concentrations measured during the fruit maturation period were
significantly lower (~13 g kg ) than the values measured before fruit set (~37 g
kg ). Leaf K concentrations were also lower than the recommended sufficiency
ranges (20-40 g kg ; Hochmuth and Hanlon 1995), even though pre-plant soil
analysis indicated very high soil K concentrations (>600 mg kg ). At fruit
maturity, tissue (leaf, petiole, stem and fruit) K concentrations of foliar K-treated
plants were on average ~19% higher than those of control plants. This observation
suggests that plant K uptake from this calcareous soil was not sufficient to
maintain tissue K concentrations within sufficiency levels, and that the K
supplying power of this soil may be low even though pre-plant soil K content was
high. The low K supplying capacity of this soil is further indicated by the high pH
and high Ca and Mg concentrations since these conditions are known to suppress
soil K availability and plant uptake (Marschner 1995; Brady and Weil 1999). Fruit
quality parameters (soluble solids concentration, total sugars, sweetness, and the
phytochemical compounds - ascorbic acid and beta-carotene) responded
positively to foliar K applications (Fig. 1). However, no clear trends were
apparent with regard to the most suitable salt for all quality parameters except for
KNO whose effects were nearly always statistically similar to those of the control
3
3
3
2 4
3
Cucumis
melo
-1
-1
-1
-1
-1
-1
treatments. The lack of significant differences between controls and KNO -
treated plants was probably related to timing of treatment applications with respect
to crop phenology. Treatments were applied during the reproductive growth
stages (mid- to late-season), and foliar fertilization with KNO significantly
increased leaf N concentrations (~30%) compared to the other K salts; the
resulting stimulation of vegetative growth at the expense of roots and fruits
probably accounted for the marginal effect on fruit quality through competition for
assimilates (Way and While 1968; Davenport 1996; Neuweiler 1997; Keller et al.
1999; Wade et al. 2004). Fruit mesocarp tissue firmness, a good indicator of
shipping quality, texture and shelf life (Harker et. al. 1997), was improved by
foliar K applications. This may be related to increased tissue pressure potential
(Lester et al. 2006). Foliar K-treated plots had slightly higher yields (Fig. 1),
however, this effect was only significant in one of the three years, and with one K
salt (potassium thiosulfate). Additionally, the average number of cull fruit with
defects such as poor external rind (net) development or small size was generally
higher in plots treated with foliar KNO than in plots treated with the other K forms
(Fig. 1).
In addition to plant and environmental factors, critical properties of potential
K salts for foliar nutrition are solubility, salt index (SI) and point of deliquescence
(POD). A suitable balance among these properties is required to maximize
nutrient absorption into plant tissues and to minimize phytotoxicity effects.
Highly soluble salts are preferred since this means faster cuticular penetration and
smaller volumes of solution needed for application. The salt index of a fertilizer
material is defined as the ratio of the increase in solution osmotic pressure
produced by the fertilizer material to that produced by the same mass of NaNO
(Mortvedt, 2001). The SI gives an indication of which fertilizer salts (usually
those with higher SI) are most likely to cause injury and compares one fertilizer
formulation with others regarding the osmotic (salt) effects (Mortvedt, 2001). The
SI of some common K salts are, KCl, 116; KH PO , 8.4; K SO , 43; potassium
thiosulfate, 68 (Mortvedt, 2001).
A common production problem not observed in this study, which is likely
temperature related, is the foliar 'burning' effect, which is frequently observed
when using foliar applied salts such as KCl (Swietlik and Faust, 1984). Burning
of leaves occurs when salts accumulate on the surface and are not absorbed. Rates
of absorption are highest when relative humidity is 80% or higher (Schonherr and
Luber, 2001). In this field study leaf 'burn' symptoms were not observed with any
of the treatments, in part, because all treatments were applied between 0500 and
0800 when high air relative humidities, (>80%), low air temperatures (<25°C) and
low wind speeds (< 0.45 m s ) prevailed.
Point of deliquescence of a foliar fertilizer salt determines the rate at which
the applied salt is absorbed by plant tissues. Point of deliquescence is the humidity
3
3
3
3
2 4 2 4
. -1
310 311

over a saturated salt solution containing solid salt (Schönherr and Luber 2001). If
air humidity is higher than the POD, salts will remain dissolved in solution and
absorption will proceed rapidly. However, when air humidity is below the POD
(i.e. drier air), salts will re-crystallize, resulting in slower uptake and increasing
the potential for salt injury. Reported POD values for some common K salts are
K CO , 44%; KCl, 86%; KNO , 95%; and KH PO , 97% (Schönherr and Luber,
2001). Several studies have shown that phytotoxicity effects are common when
compounds such as KCl, with high salt indices and relatively high point of
deliquescence, are used and this is more pronounced when they are applied under
conditions of high temperature and/or low air humidity (Schönherr and Luber,
2001).
Muskmelon fruit firmness (external - under the epidermis, at the equatorial region;
and internal middle-mesocarp - at the equatorial plane, using a penetrometer) from
autumn and spring fruit-bearing plants, sprayed with K, was higher than that of
fruit from control plants (no foliar K) regardless of season, surfactant use, or K
form (Fig 2). Similar beneficial effects of foliar K, from KH PO , on tomato fruit
( Mill.) firmness has been shown (Chapagain and
Wiesman, 2004), but the mechanisms for improved firmness were not discussed.
Increased melon fruit firmness from exogenously-applied K is not due to
improved membrane integrity or cell wall stability, as is the case with
exogenously-applied calcium (Lester and Grusak 1999), since K does not become
part of any structural component of plant tissues as does Ca (Cooke and Clarkson
1992). The increase in melon fruit firmness resulting from foliar applied K is
increased (more positive) fruit-tissue pressure pot )
(+46% and +150% for Gly amino acid comp
and internal fruit firmness (r = 0.259; P = 0.01). The increa of
K-treated fruit, compared to controls, resulted, at least in part, from greater
accumulation of other osmolytes (e.g. sugars; Fig. 2) in addition to increased K
concentrations in fruit cells (Lester et al., 2006). Since there were no differences
)
) values in K-treated, compared to control fruits (Lester et
al. 2006). Pressure potential was found to be positively correlated with SSC (r =
0.232; P = 0.01), total sugars (r = 0.276), fruit sucrose and glucose concentrations
(P = 0.05) (Lester et al. 2006). Positive correlations among tissue solute
2 3 3 2 4
2 4
p
p
p
p p
w , s
p p w s
K fertilizer application: Seasonal influence and silicone-based surfactant
Lycopersicon esculentum
ential (ψ (Table 2). Mesocarp
tissue ψ was significantly higher in all K-treated, compared to non-treated control
fruits. Addition of surfactant increased the effect of foliar K application on
mesocarp tissue ψ lexed K (Gly-K)
and KCl, respectively), although surfactant use was not always associated with
increased fruit firmness. A significant positive correlation was observed between
fruit-tissue ψ sed ψ
in tissue water potential (ψ a more negative solute potential (ψ ) resulted in
higher ψ (ψ = ψ - ψ
Fig. 1 Effects of various K fertilizer sources (potassium chloride - KCL, potassium nitrate - KNO ,
potassium sulfate - K SO , gylcine amino acid potassium - Gly –K, monopotassium
phosphate - KH PO , and potassium thiosulfate - KTS) foliar applied weekly to field-grown,
fruit-bearing muskmelon plants during fruit development on various marketability andquality attributes of fruit. All plants had sufficient soil fertilization. Relative sweetness = 1.8(mg/ g FWT fructose) + 0.7 (mg/g FWT glucose) + 1.0 (mg/g FWT sucrose). Data are meansSD and are separated by the LSMEANS procedure of SAS (StatisticalAnalysis System, Cary,NC, USA) at 0.05 (Jifon and Lester 2008)
3
2 4
2 4
+
<P
312 313

concentration, turgor and firmness have also been reported for potato (
L.) tubers (Beringer et al. 1983) and apples (Tong et al. 1999).
Fruit sugars as measured by soluble solids concentrations and relative
sweetness were higher in K-treated compared to control fruit in both autumn and
spring grown fruit (Fig. 2). Fruits from plants treated with Gly-K also tended to
have slightly greater soluble solids concentrations and relative sweetness levels
than those treated with KCl regardless of silicone-based surfactant use or season.
Previous studies on supplemental K fertilization have reported a variety of
responses including an increase in fruit sugar levels (e.g. Chapagain and Wiesman
2004; Daugaard and Grauslund 1999; Johnson et al. 1998), no effect on fruit SSC
(Flores et al. 2004; Hartz et al. 2001) and improved yields (Hartz et al. 2005).
Hartz et al. (2001, 2005) also found that K fertigation reduced the incidences of
yellow shoulder and internal white tissue disorders in tomato but did not influence
fruit SSC or juice color. Hartz (2001, 2005) attributed the absence of any response
of fruit SSC to other overriding factors, such as cultivar and irrigation
management, which potentially masked any K effects. Lin et al. (2004) found that
supplemental K fertilization of melon in soil less culture increased fruit sucrose
content but had no effect on fruit fructose and glucose concentrations. However,
in the Lester et al. (2006) study, netted muskmelon fruit sucrose, glucose and
fructose levels were increased by supplemental foliar K fertilization. It is worth
noting that foliar Gly-complexed K treatments without surfactant had higher fruit
fructose concentrations than the Gly-complexed K treatments with a silicone-
based surfactant. A plausible explanation for this observation maybe silicone-
based surfactant interference with the catalytic role of amino acids on invertase
activity. Silicone-based reagents synthesize aminophosphonates (Boduszer and
Soroka 2002) which act as antagonists of amino acids, inhibiting enzyme
Solanum
tuberosum
Table 2
Treatment Fruit Pressure (MPa)
Influence of weekly supplemental foliar K - glycine amino acid-potassium (Gly-K) and potassium chloride (KCl) applied with or withouta surfactant (S), to fruit-bearing plants grown with adequate soil Kconcentrations, on muskmelon fruit tissue pressure potential (Lester et.al. 2006)
Gly-K -0.018bKCl -0.034cGly-K +S 0.003aKCl + S 0.011aControl -0.064d
The more positive the pressure potential the firmer the fruit. Means followedby the same letter are not significantly different by the LSMEANS procedureof SAS (Statistical Analysis System, Cary, NC, USA) at P< 0.05
yp
a
b
ba
Fig. 2 Effect of growing season (autumn or spring) and two sources of K (potassium chloride - KCL,gylcine amino acid potassium –Gly –K) with or without a silicon-based surfactant (S) foliarapplied weekly to glasshouse-grown fruit-bearing muskmelon plants during fruit developmenton various marketability and quality attributes of fruit.All plants had sufficient soil fertilization.Relative sweetness = 1.8 (mg/ g FWT fructose) + 0.7 (mg/g FWT glucose) + 1.0 (mg/g FWTsucrose). Data are means SD and are separated by the LSMEANS procedure of SAS(StatisticalAnalysis System, Cary, NC, USA) at 0.05 ( Lester et al. 2006)
+<P
314 315

metabolism affecting the physiological activity of the cell (Kafarski and Lejcak
1991). Acid invertase (EC 3.2.1.26), found in melon fruits (Lester et al. 2001) is
responsible for sucrose hydrolysis to fructose and glucose. Amino acids are
catalysts in this hydrolysis reaction (Quick and Schaffer, 1996). It is likely the
silicone-based surfactant interfered with the catalytic activity of the amino acid
cofactor, thus down-regulating acid invertase allowing sucrose phosphate
synthase (EC 2.3.1.14), the sucrose-synthesizing enzyme in melons (Lester et al.
2001), to remain active. Sucrose phosphate synthase specifically utilizes K as a
cofactor to synthesize sucrose from glucose and fructose (Lester et al. 2001). The
relative levels of sucrose and fructose in fruit also have important implications for
consumer preference (relative sweetness) since fructose is perceived to be up to
80% sweeter than sucrose.Total ascorbic acid and b-carotene were generally higher in fruits treated with
K than in control fruits (Fig. 2). However, there were no consistent K source
effects on these quality parameters. The beneficial effects of supplemental K
probably resulted from a combination of improved leaf photosynthetic CO
assimilation, assimilate translocation from leaves to fruits, improved leaf and fruit
water relations, increased enzyme activation and substrate availability for
ascorbic acid and b-carotene biosynthesis all associated with adequate K nutrition
(Hopkins 1963; Gross 1991). At present, it is unclear how high K concentrations
in melon fruit increases ascorbic acid and beta-carotene concentrations, but
increased synthesis through enzyme activation is a possible mechanism. In
general, use of a surfactant increased fruit tissue concentrations of ascorbic acid
and b-carotene (Fig. 2). However, the surfactant effect was not always consistent
with both K forms; requiring further investigations into various surfactants
applied with and without K foliarly to fruit-bearing plants. Use of specific foliar
applied K forms, as a means to improve the antioxidant capacity (ascorbic acid and
b-carotene, respectively) of melon fruits is a readily applicable, low-technology
approach to improve the human wellness attributes of current commercially
produced melon cultivars.
The beneficial effects of supplemental foliar K applications to fruit-bearing
plants on melon fruit quality parameters were consistently positive regardless of
growing season – spring or autumn. However, fruit produced in autumn had
higher fruit firmness, ascorbic acid, b-carotene, total sugars and SSC (Fig. 2).
Mechanisms for the improved quality parameters in autumn- compared to spring-
grown fruit are still uncertain since average daily temperatures and cumulative
heat units were slightly higher in autumn (~33°C and 728, respectively) than in
spring (~28°C and 601, respectively). Cumulative photosynthetic photon flux
during fruit development (from pollination to final harvest) was higher in spring
(982 mol·m ) than in autumn (637mol·m ). New findings suggest that weather and
climate play key roles in the human-health bioactive compounds in fruits (Lester
2
-2 -2
2006). These studies highlight how global climate change might affect the
nutritional properties of food crop and how, through the use of foliar applied K,
growers may counteract these effects.
Supplemental foliar K applications resulted in earlier maturity of treated fruit
compared to controls (Fig. 3). While this important marketability trait is not
reported in K-treated fruit and the mechanisms for this effect are unclear, similar
K-induced effects on fruit K concentrations and firmness have been reported
(Chapagain and Wiesman 2004). Earlier maturity is a desirable economic trait in
muskmelon production regions where adequate solar radiation flux can permit
sufficient soluble solids accumulation in fruits before full-slip (abscission). Also,
increased fruit firmness realized with weekly K foliar applications > biweekly
applications > no foliar K application (Fig. 3), results in a melon fruit having an
extended shelf-life which is another important marketability trait.
Fruit K contents resulting from the supplemental foliar application,
increasing with weekly applications > biweekly applications of K compared to
control fruit, was accompanied by increased fruit sugar levels (Fig. 3). Leaf
photosynthesis rates are reported to increase with increased leaf K concentrations
and this could be one mechanism of increased sugar contents in fruit (Terry and
Ulrich 1973; Peoples and Koch 1979; Pettigrew 1999). However, leaf
photosynthesis rates measured during the melon fruit maturation were similar
among control and K-treated fruits (data not shown). Increased phloem loading,
transport rate and/or unloading of sugars could also account for the increased fruit
sugar levels, although it is uncertain whether this is a direct effect (enhanced
phloem unloading in fruits) or an indirect effect (e.g. enhanced sucrose synthesis
in source leaves) (Doman and Geiger 1979; Peel and Rogers 1982). Asche et al.
(2001) provided evidence for faba bean ( L.) indicating that K channels
are involved in sugar unloading. Potassium-induced increases in fruit sugar levels
have also been reported in hydroponically grown muskmelon plants (Lin et al.
2004) however, the mechanism for this effect was also unclear. Although a
threshold tissue K concentration for attaining optimum fruit sugar levels has not
been established, our melon data (Lester et al. 2005 and 2006; Jifon and Lester
2009) provide additional evidence that fruit sugar concentrations can be increased
through supplemental foliar K sprays.
Antioxidants ascorbic acid, derived from glucose (Hopkins 1963), and beta-
carotene significantly increased with weekly K applications > biweekly
applications > no foliar K application (Fig 3). Of the two antioxidants, beta-
carotene dramatically responded to K foliar fertilizations increasing 70% and
100% with biweekly and weekly applications respectively. A benefit to the plant
for having heightened levels of antioxidants is improved plant tolerance to various
Number of foliar K applications
Vicia faba+
316 317

Fig. 3 Effect of number of foliar applications of K (gylcine amino acid potassium) applied toglasshouse-grown, fruit-bearing muskmelon plants during fruit development on variousmarketability and quality attributes of fruit. All plants had sufficient soil fertilization. Data aremeans SD and are separated by the LSMEANS procedure of SAS (Statistical AnalysisSystem, Cary, NC, USA) at 0.05 (Lester et al. 2005)
+<P
environmental stresses such as drought, low temperature, salinity, and sun burning
all of which trigger cellular oxidative stress (Hodges et al. 2001; Cakmak 2005).
The mechanism for K-induced oxidative stress tolerance is through increased
ascorbic acid and beta carotene antioxidant activity. Ascorbic acid acts as an
antioxidant by donating electrons and hydrogen ions thus reducing reactive
oxygen species or free radicals. And beta-carotene is an accessory pigment in
green tissues involved in photon capture protecting chlorophyll molecules from
photo-oxidation due to excessive light thus reducing bleaching and sun burning
and exhibits good radical-trapping antioxidant behavior under low (2%) oxygen
conditions in fruit and root/tuber tissues (Gross 1991).
In melon fruit, the enzyme lipoxygenase (EC 1.13.11.12) has been associated
with cellular membrane breakdown and fruit senescence through enhanced
production of free radicals, however, this effect is minimized in fruit with high
beta-carotene concentrations (Lester 1990). Ascorbic acid and beta-carotene also
play similar important roles as antioxidants in humans when consumed in diets.
Enhancing their accumulation in fruits, through carefully-timed, controlled K
foliar fertilization to fruit-bearing plants will enhance the human wellness
potential of melons (Lester and Eischen 1996; Larson 1997).
Supplementing soil K supply with foliar K applications to fruit-bearing plants
improves fruit quality by increasing firmness, sugar content, ascorbic acid and
beta-carotene levels. Among the K salts, KNO has little or no beneficial effects
on fruit quality when applied during fruit maturation, perhaps due to a dilution
effect resulting from N stimulation of vegetative growth at the expense of roots
and fruits. Perhaps foliar fertilization KNO would be more beneficial during the
vegetative growth stages when N is most needed for development of leaves with
high photosynthetic capacity. The fruit quality improvements summarized in this
review were obtained by implementing a simple low cost management tool that
growers can easily adopt; resulting in nutritionally enrich fruits which, at little or
no extra retail cost, benefits the consumer. Future research is needed to validate
these findings in commercial field trials under different production environments
(temperate vs. tropical) and productions systems (conventional vs. organic), and
evaluate the effect of different K forms (glycine amino acid complexed K versus
potassium chloride and others) on marketable quality and health-bioactive
compound quality attributes of various fruits.
Conclusions
3
3
References
Ache PD, Becker R, Deeken I, Dreyer H, Weber JF, Hedrich R (2001) VFK1, a
Vicia faba K channel involved in phloem unloading. Plant J 27: 571-580+
318 319

Davenport JR (1996) The effect of nitrogen fertilizer rates and timing on cranberry
yield and fruit quality. JAmer Soc Hort Sci 121:1089-1094
Demiral MA, Koseoglu AT (2005) Effect of potassium on yield, fruit quality, and
chemical composition of greenhouse-grown Galia melon. J Plant Nutr 28:
93-100
Doman DC, Geiger DR (1979) Effect of exogenously supplied potassium on
phloem loading in L. Plant Physiol 64: 528-533
Dutta P (2004) Foliar potassium spray in improving the quality of Sardar guava
( L.). Orissa J Hort 32: 103-104
Dutta P, Chakroborty AK, Chakroborty PK (2003) Effect of different levels of
potassium on fruit quality and yield of sweet orange. Ann Agric Res 24:
786-788
El-Gazzar AAM (2000) Effect of fertilization with nitrogen, potassium and
magnesium on Anna apples: 2 - Effect of potassium fertilization. Ann
Agric Sci Cairo 3 (Special): 1153-1160
El-Masry TA (2000) Growth, yield and fruit quality response in sweet pepper to
varying rates of potassium fertilization and different concentrations of
paclobutrazol foliar application. AnnAgric Sci, Moshtohor 38: 1147-1157
Fanasca S, Colla G, Rouphael Y, Saccardo F, Maiani G, Venneria E, Azzini E
(2006) Evolution of nutritional value of two tomato genotypes grown in
soilless culture as affected by macrocation proportions. Hort Science 41:
1584-1588
Flores P, Navarro JM, Garrido C, Rubio JS, Martinez V (2004) Influence of Ca ,
K and NO fertilisation on nutritional quality of pepper. J Sci Food Agric
84: 571-576.
Geraldson CM (1985) Potassium nutrition of vegetable crops. In: Munson RS (ed)
Potassium in agriculture.ASA-CSSA-SSSA, Madison, WI. pp 915- 927
Ghosh SN, Tarai RK (2007) Effect of NPK on yield and quality of papaya in
laterite soils. Indian J Fert 3: 47-49
Gill PS, Singh SN, Dhatt AS (2005) Effect of foliar application of K and N
fertilizers on fruit quality of Kinnow mandarin. Indian J Hort 2005 62: 282-
284
Golcz A, Kujawski P, Politycka B (2004) The influence kind of fertilizer
potassium on yielding hot pepper ( L.). Folia
UniversitatisAgriculturae Stetinensis,Agricultura (95): 109-113
Gross J (1991) Carotenoids. In: Gross J (ed) Pigments in vegetables: Chlorophylls
and carotenoids. Van Nostrand Reinhold, N.Y. pp 75-278
Guo XS, Ye SY, Wang WJ, Zhu HB, Xu J, Wu LS (2004) Effect of different K
sources and rates on the yield and quality of cucumber. Plant Nutr Fert-Sci
10: 292-297
Haggag MN (1990) Effect of spraying different potassium salts on fruit creasing,
Beta vulgaris
Psidium guajava
Capsicum annuum
2+
+ -
3
Albregts EE, Hochmuth GJ, Chandler CK, Cornell J, Harrison J (1996) Potassium
fertigation requirements of drip-irrigated strawberry. J Amer Soc Hort Sci
121: 164-168
Ananthi S, Veeraragavathatham D, Srinivasan K (2004) Influence of sources and
levels of potassium on quality attributes of chili ( L.).
South Indian Hort 52: 152-157
Ashok K, Ganesh K (2004) Effect of foliar applications of water soluble fertilizer
'Multi-K' on yield and quality of litchi ( Sonn.) cv. Rose
Scented.Adv Plant Sci 17: 519-523
Attala ES (1998) Effect of potassium fertilization on Anna apple trees grown in
sandy soils of Egypt. Egyptian JAgric Research 76:709-719
Beringer H, Haeder HE, Lindhauer M (1983) Water relationships and
incorporation of C assimilates in tubers of potato plants differing in
potassium nutrition. Plant Physiol 73: 956-960
Boduser B, Soroka A (2002) Application of silicon-phosphorus based reagents in
synthesis of aminophosphonates. Part 2 Reactions of N-(triphenylmethyl)-
aldiamines with the silylated phosphorus esters. Polish J Chem 76: 1105-
1117
Brady NC, Weil RR (1999) The nature and properties of soils. 9 ed. Macmillan,
NewYork. 750 p
Cakmak I (2005) The role of potassium in alleviating detrimental effects of abiotic
stresses in plants. J Plant Nutr Soil Sci 168:521-530
Chapagain BP, Wiesman Z (2004) Effect of Nutri-Vant-PeaK foliar spray on
plant development, yield, and fruit quality in greenhouse tomatoes. Sci
Hort 102: 177-188
Chapagain BP, Wiesman Z (2003) Effect of potassium magnesium chloride in the
fertigation solution as partial source of potassium on growth, yield and
quality of greenhouse tomato. Sci Hort 99: 279-288
Chapagain BP, Wiesman Z, Zaccai M, Imas P, Magen H (2003) Potassium chloride
enhances fruit appearance and improves quality of fertigated greenhouse
tomato as compared to potassium nitrate. J Plant Nutr 26: 643-658
Cooke DL, Clarkson DT (1992) Transport and receptor proteins of plant
membranes: molecular structure and function. Plenum, N.Y. pp 75-208
Costa-Araujo R, Bruckner CH, Prieto-Martinez HE, Chamhum-Salomao LC,
Alvarez VH, Pereira de-Souza A, Pereira WE, Hizumi S (2006) Quality of
yellow passionfruit ( Sims f. flavicarpa Deg.) as affected
by potassium nutrition. Fruits 61: 109-115
Dainello FJ (1996) Texas commercial vegetable production guide. 2e. Texas
AgriLife Extension. Daugaard H, Grauslund J (1999) Fruit colour and
correlations with orchard factors and post-harvest characteristics in apple
cv. Mutsu. J Hort Sci Biotech 74: 283-287
Capsicum annuum
Litchi chinensis
Passiflora edulis
14
th
320 321

Johnson DS, Samuelson TJ, Pearson K, Taylor J (1998) Effects of soil applications
of potassium sulphate on the mineral composition and eating quality of
stored 'conference' and 'Doyenne du Comice' pears. J Hort Sci Biotechnol
73: 151-157
Kafarski P, Lejcak B (1991) Biological activity of amninophsphonic acids. Phos
Sulfur Silicon Related Elements 63: 193-215
Kanai S, Ohkura k, Adu-Gyamfi JJ, Mohapatra PK, Nguyen NT, Saneoka H,
Fujita K (2007) Depression of sink activity precedes the inhibition of
biomass production in tomato plants subjected to p[potassium deficiency
stress. J Experimental Bot 58: 2917-2928
Ke LS, Wang WD (1997) Effects of nitrogen, phosphorus and potassium fertilizer
levels on yield and quality of guava ( L.). J Agric Assoc
China 179: 15-29
Keller M, Pool RM, Henick-Kling T (1999) Excessive nitrogen supply and shoot
trimming can impair color development in Pinot Noir grapes and wine.Aus
J Grape Wine Res 5: 45–55
Khayyat M, Tafazoli E, Eshghi S, Rahemi M, Rajaee S (2007) Salinity,
supplementary calcium and potassium effects on fruit yield and quality of
strawberry ( Duch.). Amer Eurasian J Agric Environ
Sci 2: 539-544
Larson HR (1997) Vitamin C: Your ultimate health insurance. Int J Alternative
Complementary Med 15: 208-220
Lester GE (1990) Lipoxygenase activity of hypodermal- and middle-mesocarp
tissues from netted muskmelon fruit during maturation and storage. J
Amer Soc Hort Sci 115: 612-615
Lester, GE (2006) Environmental regulation of human health nutrients (ascorbic
acid, beta-carotene, and folic acid) in fruits and vegetables. Hor Sci 41: 59-
64
Lester GE, Eischen F (1996) Beta-carotene content of postharvest orange-flesh
muskmelon fruit: Effect of cultivar, growing location and fruit size. Plant
Foods Hum Nutri 49: 191-197
Lester GE, Grusak MA(1999) Postharvest application of calcium and magnesium
to honeydew and netted muskmelons: Effects on tissue ion concentrations,
quality and senescence. JAmer Soc Hort Sci 124: 545-552
Lester GE, Jifon JL, Makus DJ (2006) Supplemental foliar potassium applications
with or without a surfactant can enhance netted muskmelon quality. Hort
Sci 41: 741-744
Lester GE, Jifon JL, Rogers G (2005) Supplemental foliar potassium applications
during muskmelon fruit development can improve fruit quality, ascorbic
acid, and beta-carotene contents. JAmer Soc Hort Sci 130: 649-653
Lester GE, Saucedo Arias L, Gomez Lim M (2001) Muskmelon fruit soluble acid
invertase and sucrose phosphate synthase activity and polypeptide profiles
Psidium guajava
Fragaria ananassa
quality and leaf mineral composition of Washington Navel orange.
Alexandria JAgril Res 1988. 33: 157-167
Harker FR, Redgwell RJ, Hallett IC, Murray SH, Carter G (1997) Texture of fresh
fruit. Hort Rev 20: 121-224
Hartz TK, Johnstone PR, Francis DM, Miyao EM (2005) Processing tomato yield
and fruit quality improved with potassium fertigation. Hort Sci 1862-1867
Hartz TK, Miyao EM, Mullen RJ, Cahn MD (2001) Potassium fertilization effects
on processing tomato yield and fruit quality.Acta Hort 542: 127-133
Hassanloui MRD, Taheri M, Malakouti MJ (2004) The interactive effects of
potassium and calcium on the K/Ca and quality of apple fruits (in
Naghadeh). JAgric Eng Res 5: 71-84
Havlin JL, Beaton JD, Tisdale SL, Nelson WL (1999) Soil Fertility and Fertilizers.
6th ed Prentice Hall. Upper Saddle River, NJ. 499 p
He ZJ, Zhang GL, Zhang GW, Ma L, TongY(2002) Effect of potash application on
the output and quality of kiwifruit in loess area. J Fruit Sci 19: 163-166
Herath HMI, Bandara DC, Banda DMGA (2000) Effect of calcium and potassium
fertilizer applied at the time of planting on the control of internal browning
under cold storage of Mauritius pineapple. TropAgric Res 12: 352-359
HewedyAM (2000) Effect of methods and sources of potassium application on the
productivity and fruit quality of some new tomato hybrids. Egyptian J
Agric Res 78: 227-244
Hochmuth GJ, Hanlon EA (1995) Commercial vegetable crop nutrient
requirements in Florida. Gainesville (FL): University of Florida
Cooperative Extension Service. Special Publication SP177
Hochmuth G, Shuler K, Hanlon E, Roe N (1994) Pepper response to fertilization
with soluble and controlled-release potassium fertilizers. Proc Florida
State Hort Soc 107: 132-139
Hodges DM, Forney CF, Wismer WV (2001) Antioxidant responses in harvested
leaves of two cultivars of spinach differing in senescence rates. JAmer Soc
Hort Sci 126: 611-617
Hopkins F (1963) Vitamin C. In: Braverman JBS (ed) The biochemistry of foods.
Elsevier, N.Y. pp 205-210
Ibrahim A, Abdel-Latif T, Gawish S, Elnagar A (2004) Response of strawberry
plants to fertigation with different K-KCl/K-KNO combination ratios.
Arab Universities JAgric Sci 12: 469-48
Jifon JL, Lester GE (2009) Foliar potassium fertilization improves fruit quality of
field-grown muskmelon on calcareous soils in south Texas. J Sci Food
Agric 89: 2452-2460
Jahan N, Fattah QA, Salam MA (1991) Changes in yield and biochemical
responses of lady's finger ( (L.) Moench)
following potassium naphthenate treatment. Bangladesh J Bot 20:163-168
3
Abelmoschus esculentus
322 323
Pettigrew WT (2008) Potassium influences on yield and quality production for
maize, wheat, soybean and cotton. Physiol Plant 133: 670-681
Quick WP, Schaffer AA (1999) Sucrose metabolism in sources and sinks. In:
Zamski E, Schaffer AA (ed) Photoassimilate distribution in plants and
crops: Source and sink relationships. Marcel Dekker. pp 115-156
Rebolledo-Martinez A, Lid-del-Angel-Perez A, Rey-Moreno J (2008) Effects of
paclobutrazol and KNO over flowering and fruit quality in two cultivars of
mango Manila. Interciencia 33: 518-522
Rengel Z, Damon, PM, Cakmak, I (2008) Crops and genotypes differ in efficiency
of potassium uptake and use. Physiologia Plantarum 133: 624-636
Schönherr J, Luber M (2001) Cuticular penetration of potassium salts: Effects of
humidity, anions and temperature. Plant Soil 236: 117–122
Shawky I, MontasserA, Nageib M, Haggag L,Abd-El-Migeed M (2000) Effect of
fertilization with potassium and some micronutrients on Navel orange
trees. II - Effect on yield, fruit quality and juice mineral content. In: El-
Sawy M, Francis RR, El-Borollosy MA, Hosni AM (ed) Annals Agric Sci
Cairo 3 (Special): 1215-1226
Shinde AK, Dabke DJ, Jadhav BB, Kandalkar MP, Burondkar MM (2006) Effect
of dose and source of potassium on yield and quality of 'Alphonso' mango
( ). Indian JAgric Sci 76: 213-217
Si SKG, Bellal M, Halladj F (2007) Effect of potassium supply on the behaviour
of two processing tomato cultivars and on the changes of fruit
technological characteristics.Acta Hort (758): 269-274
Simoes Ado-N, Menezes JB, Lima SEVD, Medeiros JF, Silva GF, Freitas DF
(2001) Postharvest quality of mango grown under water stress and
potassium nitrate induction. Caatinga 14: 31-35
Singh HK, Chauhan KS, Singh BP (1993) Effect of urea and potassium sulphate
on size and quality of phalsa ( ) fruits. Haryana J Hort
Sci 22:276-279
Sipiora MJ,Anderson MM, Matthews MA(2005) Composition of L.
cv. Pinot noir fruit and wines from Carneros appellation in response to
potassium fertilization and supplemental irrigation. Proc Soil Environment
Vine Mineral Nutr Symp San Diego, CA, 29-30-June,-2004. pp 185-192
Skogley EO, Haby VA(1981) Predicting crop responses on high potassium soils of
frigid temperature and ustic moisture regimes. Soil Sci SocAmer J 45: 533-
536
Srivastava AK, Huchche AD, Lallan R, Shyam S (2001) Pre- and post-harvest
response of Nagpur mandarin ( ) to K fertilization
in Typic Haplustert. J Potassium Res 17: 93-97
Suresh CP, Hasan MA(2002) Fruit quality of Dwarf Cavendish banana ( )
as influenced by nitrogen and potassium nutrition. Res Crops 3: 398-402
3
Mangifera indica
Grewia subinaequalis
Vitis vinifera
Citrus reticulata Blanco
Musa sp.
during growth and maturation. JAmer Soc Hort Sci 126: 33-36
Li RH, Xu DB, Huang QW (2008) Effect of foliar fertilizer on the growth of
tomato plant. China Vegetables 6: 17-20
Li S, Xu Y, White WS, Rodermel S, Taber H (2006) Lycopene concentration in
tomato fruit is increased by enhanced potassium nutrition. FASEB J 20 (5,
Part 2):A1059
Lin D, Huang D, Wang S (2004) Effects of potassium levels on fruit quality of
muskmelon in soilless medium culture. Sci Hort 102: 53-60
Lin XY, Zhang YS, Cai MZ, Zhang YP, Li G, Yang XE (2006) Effects of
phosphorus and potassium on the yield, quality and storability of citrus
fruits. Plant Nutr Fert Sci 12: 82-88
Locascio SJ, Hochmuth GJ (2002) Watermelon production as influenced by lime,
gypsum, and potassium. Hort. Sci. 37: 322-324
Magen H, Imas P, Ankorion Y, Ronen A (2003) Advanced products for fertigation
and foliar nutrition. Proc Internationall Fertiliser Soc 524:13-24
Marschner H (1995) Functions of mineral nutrients: Macronutirents, p. 299-312.
In: H. Marschner (ed) Mineral nutrition of higher plants, 2 Ed. Academic
Mortvedt JJ (2001) Calculating Salt Index. Fluid J 9: 8-11
Muthumanickam D, Balakrishnamoorthy G (1999) Spraying of potassium
solution on the yield and quality of pomegranate ( L.).
South Indian Hort 47: 152-154
Naresh B (1999) Response of different levels of nitrogen and potassium on
chemical-characteristics of banana ( L.) fruits. Bioved
10: 39-42
Nava G, Roque-Dechen A, Ribeiro-Nachtiga G (2008) Nitrogen and potassium
fertilization affect apple fruit quality in southern Brazil. Comm Soil Sci
PlantAnal 39: 96-107
Neuweiler R (1997) Nitrogen fertilization in integrated outdoor strawberry
production. Acta Hort 439: 747-751
Ni WZ, Liang JS, Hardter R (2001) Yield and quality responses of selected
solanaceous vegetable crops to potassium fertilization. Pedosphere 11:
251-255
Peel AJ, Rogers S (1982) Stimulation of sugar loading into sieve elements of
willow by potassium and sodium salts. Planta 154: 94-96
Peoples TR, Koch DW (1979) Role of potassium in carbon dioxide assimilation in
L. Plant Physiol 63: 878-881
Perkins-Veazie P, Roberts W, Perez K (2003) Watermelon fruit potassium and
lycopene content in response to increased potassium fertility. Hort Sci. 38:
816-817
Pettigrew WT (1999) Potassium deficiency increases specific leaf weights and
leaf glucose levels in field-grown cotton.Agron J 91: 962–968
nd
Punica granatum
Musa paradisiaca
Medicago sativa
324 325

Proceedings IPI-OUAT-IPNI International Symposium (2009)
SK Mitra
Department of Fruits and Orchard Management, Bidhan Chandra Krishi Vishwavidyalya,
Mohanpur, West Bengal, India
SS Dhaliwal
Department of Soil Science, Punjab Agricultural University, Ludhiana, India
e-mail: [email protected]
Effect of potassium on fruit quality and their storage
life
SK Mitra SS Dhaliwall
l l l
Abstract
Keywords
Introduction
Potassium has been described as the quality element and it plays a
pivotal role in ensuring optimum quality of agricultural produce. Potassium has
two main functions in the plant. Firstly it has an irreplaceable role in the activation
of enzymes that are fundamental to metabolic processes especially the production
of proteins and sugars. Only small amounts of K are required for this biochemical
function. Secondly, K maintains the water content and thus helps in maintaining
the turgor of cells as a biophysical role. Turgid cells maintain the leaf's vigour so
that photosynthesis proceeds efficiently. The relationship between water and
nutrient content of the cell controls the movement of both, through the plant and
the transport of sugars produced by photosynthesis to storage organs of fruit.
Potassium is required in much higher quantities for its physiological functions
than for its biochemical role in plants. Fertilization with K is the first step to
achieve the required quality standards. A great deal of research has established the
beneficial effects of balanced nutrient supply, including adequate K, on the quality
of the harvested produce. This is especially true for nutritional properties such as
the protein content, oil, and vitamins and other functional aspects. Crops with an
adequate supply of K have more weight, better appearance, taste and flavor, and
also produce disease and pest free food. Numerous on-farm trials within IPI
projects have proved that balanced fertilization with K helps the farmer to produce
food, which fulfills the different quality criteria. Potassium improves the product's
appearance and reduces the risk of rejection when the produce is offered for sale in
the buyer's market.
Fruit quality processing quality storage life of fruits mineral and
vitamins
Fruits are the health capsules being the main source of vitamins and minerals
Swietlik D, Faust M (1984) Foliar nutrition of fruit crops, In: Janick J (ed) Hort
Reviews, Vol. 6,AVI. Westport, Conn. pp 287-356
Taber H, Perkins-Veazie P, Li SS, White W, Rodermel S, Xu Y (2008)
Enhancement of tomato fruit lycopene by potassium is cultivar dependent.
Hort Sci 43: 159-165
Terry N, Ulrich A (1973) Effects of potassium deficiency on the photosynthesis
and respiration of leaves of sugar beet. Plant Physiol 51: 783-786
Tisdale SL, Nelson WL, Beaton JD (1985) Soil and Fertilizer Potassium. Ch. 7 in
Tisdale SL, Nelson WL, and Beaton JD (ed) Soil Fertility and Fertilizers 4
ed., Macmillan, NewYork. 249-291
Tong C, Krueger D, Vickers Z, Bedford D, Luby J, El-Shiekh A, Shackel K,
Ahmadi H (1999) Comparison of softening-related changes during storage
of 'Honeycrisp' apple, it parents, and 'Delicious'. J Amer Soc Hort Sci 124:
407-415
Umamaheswarappa P, Krishnappa KS (2004) Effect of nitrogen, phosphorus and
potassium on cucumber cv. Poinsette grown in dry region of southern India.
Trop Sci 44: 174-176
Usherwood NR (1985) The role of potassium in crop quality. In: Munson RS (ed)
Potassium in agricultureASA-CSSA-SSSA, Madison, WI. pp 489-513
Wade J, Holzapfel B, Degaris K, Williams D, Keller M (2004) Nitrogen and water
management strategies for wine-grape quality.Acta Hort 640: 61–67
Way W, While GC (1968) The influence of vigour and nitrogen status on the
fruitfulness of Talisman strawberry plants. J Hort Sci 43: 409-419
Wójcik, P (2005) Effect of foliar potassium sprays on apple tree yielding, and fruit
quality under conditions of low soil potassium availability. Proceedings
International Scientific Conference: Environmentally Friendly Fruit
Growing, Polli, Estonia,-7-9-September,-2005. pp 44-50
Yang XY, Bu YS, Duan XZ (2005) Effects of potassium on the yield and quality of
tomato. XinjiangAgric Sci 42: 272-275
Zhang SY, Yang J, Liu GH (2008) Effects of K nutrition levels on fruit quality of
"Yanguang" nectarine. JAnhuiAgric Univ 35: 289-292
th
326 327

beneficial in the long-term as storage reservoirs of K for subsequent crops. Sandy
soils, on the other hand tend to have a low K supplying power because of their low
cation exchange capacities. In calcareous soils, Ca ions tend to exist in high
concentrations and dominate clay surfaces, and limit K sorption. High
concentrations of cationic nutrients (particularly Ca and Mg ) tend to limit K
uptake by competing for binding sites on root surfaces. Consequently, crops
grown on highly calcareous soils can show K-deficiency symptoms even though
the soil test may report sufficient K (Kafkafi et al. 2001).
Potassium uptake also depends on plant factors, including genetics and
developmental stage (vegetative and reproductive stages) (Marschner et al. 1996).
Deficiency symptoms of K have been reported in many fruit crops. Management
of K in light and porous soils with less organic matter is very important. In
such cases application of heavy doses of organic matter will facilitate the
retention of K by soil. Application of organic manures exclusively to meet the
demand of the entire nutrient requirement of the crop or judicious and conjunctive
use of both organic and inorganic is the option available to supply nutrients to fruit
crops.
In many fruiting plant species, uptake of K occurs mainly during vegetative
stages, when ample carbohydrate supply is available for root growth and uptake
processes. Competition for photoassimilates between developing fruits and
vegetative organs during reproductive growth stages can limit root growth and K
uptake. Under such conditions, increasing soil K fertilization may not be enough
to alleviate this developmentally-induced deficiency partly because of reduced
root growth/activity during reproductive development and also because of
competition from other cations for binding sites on roots (Marschner 1995).
Special attention needs to be given to the effectiveness of various K fertilizer
sources and soil and foliar application of K on fruit quality. With the introduction
of high yielding varieties and hybrids of fruits, responses to higher doses of
fertilizer application have increased (Shamshiri and Usha 2004). Plant nutrients
like N, P O and K O available at high concentrations are often lost due to leaching,
erosion, and volatilization due to limited time of absorption at different growth
stages and the capacity of the soil to retain and release the applied nutrients (Tiwari
et al. 1999). Among different nutrient sources in the soil, water-soluble sources of
nutrients are in increased demand for fertigation (Sullivan et al. 1974; Tandon and
Kemmler 1986).
Fruit crops are heavy feeders of potassium (K) and remove K higher than that
of nitrogen (N) and phosphorus (P O ) (Table1). Potassium, along with other
macronutrients like N and P is an essential nutrient which is taken up by the crops
in relatively high amounts compared to other nutrients (Gene et al. 2010; Haldter
and Krauss 1999; Shawky et al. 2004). Potassium increases both yield as well as
quality of fruit crops. Apart from it, potassium enhances the ability of fruit crops
2+
2+ 2+
2 5 2
2 5
besides providing other dietary elements like carbohydrates, proteins, fiber, fats,
vitamins and enzymes. India is endowed with favorable tropical, sub-tropical and
temperate climate which is very conducive for producing high quality fruits round
the year (Perrenoud 1990; Shamshiri and Usha 2004) in which more than 50 kinds
of fruits are grown and important of them being Banana, citrus, grapes, mango,
papaya, pineapple, passion fruits and litchi etc (Tandon and Kemmler 1986).
Although the country has achieved fairly good production level of fruits to the tune
of 43 million tones, but it is hardly sufficient to meet the 92 million tones, the total
requirement of the country (Kumar et al. 2006). This warrants increase in
production and productivity of fruit crops.
Judicious use of nutrients (N, P O and K O) and their management is often
regarded as one of the important aspects to increase the productivity of
horticultural crops particularly fruit crops (Hardter and Krauss 1999; Hochmuth et
al. 1994; Kafkafi et al. 2001). The only way to increase fruit production is to
increase crop efficiency i.e. fruit yield per unit land area and cropping efficiency
i.e. fruit yield and returns per unit of time. Efficient and rationale use of the
fertilizers is imperative not only for obtaining more yields per unit area on a
sustainable basis, but also to conserve the energy. The quantum jump in fruit
production has to come from increase in productivity by intensive cultivation of
fruit crops (Marshner 1995; Marshner et al. 1996).Apart from the fruit production,
fruit quality is another aspect that has gained relative importance in modern day
horticulture.
Even though K is abundant in many soils, the bulk of soil K is unavailable to
plants, because the plant-available K pool is much smaller compared to the other
forms of K in the soil. Potassium exists in several forms in the soil such as mineral
K (90–98% of total), non-exchangeable K, exchangeable K, and dissolved or
solution K (K ions), and plants can only directly take up solution K (Lester et al.
2010). Uptake in turn depends on numerous plant and environmental factors
(Usherwood 1985), which may limit K supply during the development stages,
hence adversely affecting the quality attributes. For instance, adequate soil
moisture supply is necessary to facilitate diffusion of K (which usually accounts
for >75% of K movement) to plant roots for uptake. Mass flow, which also
accounts for some soil K transport, also requires sufficient water in the soil.
Marschner et al. (1996) found that increasing soil moisture from 10 to 28 percent
doubled total soil K transport. Therefore, soil moisture deficits can limit soil K
transport as well as uptake by the plants, thereby causing K deficiency.
The availability of K in the soil is strongly influenced by soil properties like
pH, EC, OC, alkalinity, salinity, texture and CEC. For instance, clay soils typically
have high K-fixing capacities and often show little response to soil-applied K
fertilizers because much of the available K quickly adsorbs to clays (Sullivan et al.
1974). Such K fixation can help in reducing the leaching losses and can be
2 5 2
+
328 329

Potassium and physiological processes in fruit crops
Parameters to define fruit quality
In general, in addition to activation of more than 60 enzyme systems in fruits, K
helps in photosynthesis, favors high energy status, maintains cell turgour,
regulates opening of leaf stomata, promotes water uptake, regulates nutrients
translocation in plant, favors carbohydrate transport, enhances N uptake, helps in
protein synthesis and promotes starch synthesis.
Following are the important quality parameters in fruits which affect the
economics of fruit production and nutrition value of fruits
Appearance quality factors
This parameter is very important from the marketing point of view to fetch higher
price. It includes size, shape, color, gloss, and freedom from defects and decay.
Defects can originate before harvest as a result of damage by insects, diseases,
birds, hail, chemical injuries and various blemishes. Post-harvest defects may be
morphological, physical, physiological, or pathological.
Textural quality factors
These include firmness, crispness, juiciness, mealiness, and toughness, depending
on the commodity. Textural quality of horticultural crops is not only important for
their eating and cooking quality but also for their shipping ability. Soft fruits
cannot be shipped over long distances without substantial losses due to physical
injuries. In many cases, the shipment of soft fruits necessitates that they be
harvested at less than ideal maturity, from the flavor quality standpoint.
Flavour quality factors
These include sweetness, sourness (acidity), astringency, bitterness, aroma, and
off-flavors. Flavor quality involves perception of the tastes and aromas of many
compounds.An objective analytical determination of critical components must be
coupled with subjective evaluations by a taste panel to yield useful and meaningful
information about the flavor quality of fresh fruits and vegetables. This approach
can be used to define a minimum level of acceptability. In order to assess consumer
preference for the flavor of a given commodity, large-scale testing by a
representative sample of consumers is required.
to withstand adverse conditions, helps in the development of a strong and healthy
root system and increases the absorption and utilization of other nutrients
(Sulladmath et al. 1984). To get optimum yield, different fruit plants differ in their
nutrient (N, P O and K O) requirement. For example, the available information on
nutrients requirement of lemon to improve its yield and fruit quality is small as
compared to oranges, however the Study of Koo (1963) showed that
potassium requirement for lemon was much higher than that of orange and
recommended rates of potassium fertilizers were 25 per cent higher than those for
nitrogen, for optimum yield of lemon. The data presented in Table 1 showed that
N, P O and K O requirement of banana fruit was much higher than that of papaya
and passion fruits. Drastically higher consumption of potassium (K O) was
reported in case of banana fruit (1000 kg ha ). Citrus fruits also consume relatively
higher amount of K O than that of grapes, mango and papaya fruits. Interestingly,
citrus and pineapple need same amount of K O fertilizer with a yield difference of
20 t ha .
Fruit quality is the degree of excellence or superiority is a combination of
attributes, properties, or characteristics that give each commodity value in terms of
its intended use (Geraldson 1985; Ramesh Kumar 2004). The relative importance
given to a specific quality attribute varies in accordance with the commodity
concerned and with the individual producer, consumer, and handler or market
concerned with quality assessment. To producers, high yields, good appearance,
ease of harvest, and the ability to withstand long-distance shipping to markets are
important quality attributes (Koch and Mengal 1974; Mengal 1997). Appearance,
firmness, and shelf-life are important from the point of view of wholesale and
retail marketers. Consumers, on the other hand, judge the quality of fresh fruits on
the basis of appearance at the time of initial purchase (Shamshiri and Usha 2004;
Sipiora et al. 2005). Subsequent purchases depend upon the consumer's
satisfaction in terms of flavor and quality of the edible part of fruits.
2 5 2
2 5 2
2
2
2
-
-
1
1
Crop Yield (t ha ) Nutrient removal (kg ha ) by fruit crops
N P O K O
Banana 40 250 60 1000Citrus 30 270 60 350Grapes 20 170 60 220Mango 15 100 25 110Papaya 50 90 25 130Pineapple 50 185 55 350Passion fruit 15 60 15 75
-1 -1
2 5 2
Table 1 Nitrogen, phosphorus and potassium removal by fruit crops
330 331

2004). Fissures, cracks and lesions observed on K deficient fruits and leaves not
only offer easy access to invading pathogens but also are less appealing to
potential consumers at the market.
Contribution of various workers in generation of information on quality
parameters in different fruits is summarized in Table 2. Fruit size and peel colour
are important fruit characteristics for fresh market, while for their processing,
soluble solids, juice, pectin and essential oil content are important parameters
which help during storage.
Nutritional quality factors
Nutritional quality factor includes fat, oil, arytenoids, flavonoids, sterols and
antioxidants. Fresh fruits play a significant role in human nutrition, especially as
sources of vitamins (Vitamin C, Vitamin A, Vitamin B, thiamine, niacin),
minerals, and dietary fibre. Other constituents of fresh fruits that may lower the
risk of cancer and other diseases include carotenoid, flavonoids, isoflavones,
phytosterols, and other phytochemicals (phytonutrients).
The nutritional value of fruits refers to the content of certain constituents such as
protein, oil or fat, starch, mineral components and vitamins. The contents of fiber
as well as the energy content are widely used parameters in assessing the value of
food stuff in the human diet (Tandon and Kemmler 1986). Potassium (K) has a
significant influence on increasing many human-health related quality
compounds in fruits (Usherwood 1985). The content of nutritive elements, like
proteins or oils, is used in many countries as a basis for procurement systems and
thus, is an economic factor. Studies with the N isotope N showed that plants well
supplied with K were able to take up more N, and moreover convert the N more
rapidly into protein. Nitrate in the plant is reduced first to amines and then
incorporated into amino acids to ultimately form proteins. A small K supply
restricts NO transport and inhibits protein formation, leading to an accumulation
of nitrate-N and soluble amino-N in the plant. K influences on quality can also be
indirect as a result of its positive interaction with other nutrients (especially with
nitrogen) and production practices (Usherwood 1985). Potassium also improves
and citric and ascorbic acid (vitamin C) content in juice, while influences other
juice characteristics, like the acid/sugar ratio and soluble solids content (Koo
1985). The effect of K on increasing vitamin C is related with the improved sugar
metabolism in the plant under proper K nutrition (Mengel 1997)
An adequate supply of K promotes the formation of fruits through a more intensive
and longer period of photosynthesis. In citrus, K nutrition positively influences the
size of fruit, thickness of the rind and fruit color (Anonymous 1975; Lester et al.
2010). The improved yield is due, in part, to reduced fruit fall from the tree and
larger fruit size. Physiological disorders of citrus fruits like plugging and creasing,
are associated with high N and low K availability. Potassium deficiency resulting
in small, thin-skinned fruit promotes fruit splitting, even though extra K will not
always correct normal splitting in susceptible cultivars. Plants adequately
supplied with K show fewer incidences of pests and diseases (Shamshiri and Usha
Potassium and nutritional value of crops
Potassium and food appearance
15
3
Table 2 Information available on quality parameters of fruits
Quality Parameter Fruit References
Fruit size Citrus Shamshiri and Usha 2004Grape Wojcik 2005Banana Kumar and Kumar 2007Litchi Mitra 2009Mango Wojcik 2005Guava Zehler et al. 1981
Colour Citrus Shawky et al. 2004Grape Usherwood 1985Apple Tandon and Kemmler 1986Litchi Tandon and Kemmler 1986Banana Kumar and Kumar 2007
Soluble solids Citrus Tiwari et al. 1999Banana Kumar and Kumar 2007Grape Usherwood 1985Guava Mitra 2009Mango Wojcik 2005Papaya Sulladhmath et al. 1984Pineapple Stewart 1956
Acidity Citrus Shawky et al. 2004Grape Usherwood 1985Papaya Sulladhmath et al. 1984Guava Zehler et al. 1981Mango Wojcik 2005Pineapple Stewart 1956Banana Kumar et al. 2006
Soluble solids Citrus Shawky et al. 2004Guava Zehler et al. 1981Aonla Wojcik 2005Banana Kumar and Kumar 2007Pineapple Stewart 1956Papaya Sulladhmath et al. 1984
332 333

The data presented in Table 3 depicted the effect of potassium fertilization
on leaf K content, fruit yield and fruit size of Shamouti a variety of orange over a
period of 4 years beginning from 1984 to 1987. From 1984 till 1987 a significant
and positive increase in % leaf K concentration (on dry wt. basis) was observed
with the application of K as compared to the control whereas fruit yield (t ha ) and
fruit weight (g) showed a positive and significant increase with K application on
alternate years. Potassium application increased the orange yield significantly in
1984 and 1986 as compared to control, whereas fruit weight was significantly
higher in 1985 and 1987.
Fruit weight (kg), TSS (%), acidity (%) and ascorbic acid (mg 100 g pulp)
content increased with an increase in concentration of KCl and highest values for
these were observed at foliar application of 2.0 percent KCl concentration as
compared to control and 1.0 percent KCl concentration (Table 4). Fruit weight
was significantly higher at 2.0 percent KCl concentration by 8.8 kg as compared to
control whereas TSS (%) was significantly lower in control as compared to 1.0
percent and 2.0 percent KCl concentrations by 0.24 and 0.38 percent
respectively. Similarly, acidity (%) was significantly higher in 1.0 percent and 2.0
percent KCl concentrations as compared to control by 0.042 and 0.030 percent
respectively whereas a significant difference of 0.012 percent was also observed
between 1.0 percent and 2.0 percent KCl concentrations.Ascorbic acid content at
2.0 percent KCl concentration was significantly greater than that for control and
1.0 percent KCl concentration by 4.7 and 2.5 mg 100 g pulp respectively.
Application of foliar K markedly improved several cantaloupe fruit quality
parameters, despite sufficient soil test K levels (Koch and Mengal 1974;
Usherwood 1985).
The experiments conducted at Bidhan Chandra Krishi Vishwavidyalya,
Mohanpur, West Bengal indicated that increase in levels of applied K increased the
yield of fruits varying from 13.8 to 35.7 percent in different fruits (Table 5).
Similarly, the total sugar yield increased from 4.2 to 34.1 percent in different fruits.
-1
-1
-1
Effect of foliar application of potassium on yield and quality of fruit crops
There are several potassium chemicals that can be used commercially in fruit
orchards. Potassium nitrate and potassium sulphate can be applied as foliar sprays
to increase the fruit yield and quality. The double salt sulphate of potash magnesia
is widely used in areas where magnesium deficiency occurs. Using ammonium
fertilizers as the nitrogen source can increase the uptake of K.An optimum level of
K is most important in relation to external aspects of fruit quality (Embleton et al.
1973). Excessively high K levels result in large fruits with coarse, thick peel and
poor colour. Moreover, early and intensive regreening will occur in such fruit
plants (orchards). On the other hand too low K levels in fruit plants result in small
fruits, which are rejected by the fresh fruit and export markets, in spite of their thin
rinds and good colour. Potassium decreases the loss of fruit from creasing,
splitting and the addition of auxins can further reduce these peel disorders. In
citrus, K improved both the citric and ascorbic acid content of the juice, as well as
other juice characteristics, like the acid/sugar ratio and soluble solids content.
Vitamin C (commonly referred to as ascorbic acid) is perhaps the most popular
vitamin.
Soil and foliar application of K has been shown to increase the level of
ascorbic acid in banana, guava and papaya. Fruits crops receiving adequate K give
a larger root yield with increased sugar content and consequently much larger
sugar content in the fruits. The lower sugar content in fruits receiving inadequate K
derives from reduced translocation of assimilates from the leaves into the storage
organ due to restricted phloem loading.
Treatment 1984 1985 1986 1987
Leaf K% (D. Wt.)
-K 0.45 0.60 0.44 0.51+K 0.64 0.85 0.67 0.87
Sign. + + + +
Yield (ton ha )
-K 67 57 71 67+K 77 54 86 72
Sign. + - + -
Fruit weight (g)
-K 181 211 187 172+K 193 256 197 222
Sign. - + - +
Source : Dasberg 1988, + Significant, - Not significant
-1
Table 3 Effect of potassium fertilization on leaf K, yield and fruit size of'Shamouti' orange
Treatments Fruit Weight (kg) TSS (%) Acidity (%) Ascorbic Acid
(mg 100 g pulp)
Control 133.0 11.28 0.296 237.71.0% KCl * 136.7 11.52 0.326 239.92.0% KCl 141.8 11.66 0.338 242.4CD (P=0.05) 5.61 0.144 0.009 1.543
Source: Kundu et al. 2007; *Two sprays - May 10th and September 10th.
-1
Table 4 Effect of foliar application of KCl on fruit weight and quality of Sardarguava
334 335

observed in eypoovan banana with an increase in SOP concentration and acidity at
1.0 and 1.5 percent concentrations of SOP was significantly lower than control by
0.17 percent. A rapid increase in sugar to acid ratio (sugar:acid) with increasing
SOP concentration was observed with highest ratio being observed at 1.5 percent
SOP concentration which was significantly higher than control by 46.7 whereas it
was significantly higher at 0.5 and 1.0 percent SOP concentrations by 20.9 and
33.4 respectively as compared to control. Shelf life (days) was similar for 0.5 and
1.0 percent SOP concentrations (7.8 days) but it was significantly higher than for
control by 1.3 days. Similarly, shelf life was more at 1.5 percent SOP
concentration as compared to control by 2.2 days.
In banana, potassium improves fruit weight and number of fruits per bunch,
and increases the content of total soluble solids, sugars and starch (Table 7)
(Bhargava et al. 1993).
The effects of K on shelf life are predominantly favorable, both through slowing
senescence and through a decrease of numerous physiological diseases. Potassium
increases firmness and strengthens the skin of fruits, thus they are not damaged
easily during transport, resist decay for a longer period and stay fresh longer.
Effect of Potassium on storage/shelf life of fruit crops
The maximum increase in fruit weight (35.7 %) was observed in pine apple (Kew
var.) when the rate of K application was increased from 200 to 600 kg ha yr .
Correspondingly, an increase of 18.7 percent in total sugar was also observed for the
same fruit. The highest increase in fruit size of pine apple was followed by Mandarin
orange where an increase of 27.4 percent was observed when the rate of K
application was increased from 200 to 600 g plant yr with a corresponding increase
of 18.1 percent in total sugars. In mango (var. Fazli) when the rate of K application
was increased from 150 to 1000 g plant yr there was a corresponding increase of
25.7 percent and 4.2 percent in fruit weight and total sugars respectively. An
increase of 18.8 and 14.4 percent respectively, was observed for fruit weight and
total sugar in banana (Giant var.) for a 120 g increase in K per plant when the rate of
K application was increased from 120 to 240 g plant yr . Fruit weight in guava
(Sardar var.) increased by 15.8 percent, while a corresponding increase of 14.3
percent was also observed for the total sugar when the rate of K application was
increased from 130 to 260 g plant yr . In Papaya, with an increase of about 400 g K
plant yr there was an increase of 15.3 and 34.1 percent in fruit weight and total
sugar respectively. Lowest increase in fruit weight (13.8%) with a corresponding
increase of 13.7 percent in total sugars was observed in Litchi (Bombai var.)
although the rate of K application was increased from 200 to 600 g plant yr .
The effect of sulphate of potash (SOP) on yield, quality and post-harvest life of
eypoovan banana has been observed (Table 6). Increased concentrations of
potassium sulphate improved the bunch weight, TSS, sugar to acid ratio and self-
life of banana. With an application of 1.5 percent in SOP, bunch weight increased
significantly by 4.47 kg as compared to control treatment. Significant increases of
1.1 and 1.64 kg respectively in bunch weights were observed as the SOP
concentration was gradually increased by 0.5 percent upto 1.5 percent. On the
other hand, TSS (%) at SOP concentrations of 1.0 and 1.5 percent was similar but
significantly higher than control by 4.5 percent. A decrease in acidity (%) was
-1 -1
-1 -1
-1 -1
-1 -1
-1 -1
-1 -1
-1 -1
Fruit Variety Increase inapplied K
(g plant yr ) Weight (g) Sugar (%)
Mango Fazli 150 to 1000 595 -748 25.7 12.0-12.5 4.2Banana Giant 120 to 240 117-139 18.8 14.6-16.7 14.4Pine Apple Kew 200 to 600 ** 1400-1900 35.7 12.8-15.2 18.7Litchi Bombai 200 to 600 18.1-20.6 13.8 13.9-15.8 13.7Guava Sardar 130 to 260 152-176 15.8 7.93-8.72 14.3Papaya Ranchi 200 to 600** 1420-1640 15.3 5.07-6.80 34.1Mandarin - 200 to 600 84-107 27.4 8.30-9.80 18.1
Source: Mitra 2009 ** kg ha
Increase Per cent Increase Per centin fruit Increase in total increase
orange
-1 -1
-1
Table 5 Effect of K application on yield and total sugar in different fruits
Treatments Bunchweight (kg) ratio (Days)
Control 10.80 24.4 0.40 50.9 6.50.5% SOP * 11.53 27.9 0.30 71.8 7.81.0% SOP 12.63 28.9 0.23 84.3 7.81,5% SOP 14.27 28.9 0.23 97.6 8.7CD (P=0.05) 1.02 2.06 0.024 6.72 0.98
Source: Kumar and Kumar 2007; * Sprayed twice, initially after the opening oflast hand (7th month after planting) and 30 days later
TSS (5) Acidity (%) Sugar:Acid Shelf life
Table 6 Sulphate of potash (SOP) foliar spray effects on yield, quality and post-harvest life of eypoovan banana
K O
(g pl ) (kg) (t ha ) (%) (%) (%)
P R P R P R P R P R
0 12.0 12.1 30.0 30.2 11.0 11.9 15.9 16.0 0.59 0.59240 13.4 14.2 33.5 35.5 12.6 12.6 16.5 16.4 0.55 0.55480 15.2 15.3 38.0 38.2 13.1 13.1 17.0 17.0 0.53 0.52
Source: Bhargava et al. 1993. P = Plant, R=Ratoon
2 Bunch weight Yield Total sugar TSS Acidity-1 -1
Table 7 Effect of K levels on yield and quality of bananas
336 337
K SO was used and lowest (14.7) when KCl was used as a source of K. Similar
trends were observed for acidity at harvest as well as at 28 days of storage. At
harvest, maximum acidity (0.55%) was observed with KCl while the minimum
value for acidity (0.50%) was observed when K SO was used as a source of K, at
28 days of harvest, highest (0.67%) and lowest (0.54%) values of acidity were
observed when KCl and K SO were used as sources of K respectively. At harvest,
firmness was maximum (13.9) when a mixture of KCl+ K SO was used and
minimum (11.7) when KCl was used as a source of K while at 28 days of storage
maximum (9.6) firmness was observed while using K SO while minimum (8.0)
was observed using a mixture of KCl+ K SO . Post-harvest characteristics of fruits
were more affected by K rates than by K sources.
The scientific literature also contains examples of studies with conflicting
results of the beneficial effects of K fertilization on fruit quality. These conflicting
results can be explained by taking into consideration the differences in modes of
fertilization i.e. soil applied (dry) vs. foliar application, fertigation or hydroponic
applied, differences in forms of K fertilizer e.g. glycine-complexed K, versus
K SO , KCl, or KNO from K fertilization, timing of application with regard to
crop phenology or soil chemical and physical properties such as pH, calcium and
magnesium contents, and textures (sandy vs. clay). These properties are known to
influence soil nutrient availability and plant uptake, and soil fertilizer K additions
under such conditions may have little effect on uptake, yield and fruit quality
(Mengal 1997). In a number of studies involving several fruiting crops e.g. mango
and citrus where soil-applied fertilizer K was compared to foliar K applications,
the latter approach consistently resulted in improved fruit quality attributes during
processing whereas the former approach generally had little or no effects
(Marshner et al. 1996; Perrenud 1990). Furthermore, in studies where several
fertilizer K salts were evaluated, fruit quality improvements during storage
2 4
2 4
2 4
2 4
2 4
2 4
2 4 3
Increased K application reduces the post harvest moisture loss by increasing the
weight of the harvested organs and maintaining tissue integrity. Potassium also
reduce the incidence of some storage fungal diseases that may cause considerable
losses, because fruits, tubers or roots showing even minor damage must be
discarded before marketing. Storage compounds accumulating in the harvested
organ during growth and maturation are consumed in the course of metabolic
activitites during storage. Respiration includes the oxidative breakdown of sugars,
starch and organic acids into carbon dioxide and water, with the concurrent
production of energy, heat and intermediary compounds to be used in biochemical
reactions. With a shortage of K, the rate of respiration is increased and more energy
is required for this function, thus fruits do not last long in storage.
The direct relationship between K and storage life of fruits has been reported
by various workers (Table 8).
Adequate K nutrition has been associated with increased shelf life, and
shipping quality of many horticultural crops (Kumar et al. 2006). Fruits from trees
sprayed with K were firmer and better quality than the control fruit during the
storage period (Robertson et al. 1990). K application on Kaki fruit increased fruit
firmness (El-Fatah et al. 2008) thus improving storage period. Potassium
enhanced storage and shipping quality of bananas and many other crops, and also
extends their shelf life (Bhargava et al. 1993; Geraldson 1985; Koo 1985; Mengel
1997; Usherwood 1985; Von Uexkll 1985). Quality of citrus fruits during storage
is also influenced by K nutrition of the tree. The incidence of stem-end rot and
green mold is reduced as K fertilization rate is increased, therefore fruit loss during
transport is reduced and shelf life in the supermarket is increased (Koo 1985). A
low potassium nutrition results in thin and fragile bunches with shorter shelf life
(Von Uexkll 1985).
Stewart (1956) studied the post harvest behavior of pineapple as affected by
different sources of potassium (Table 9) at harvest and at 28 days of storage and
observed that at harvest maximum TSS (15.5%) was observed with KCl while the
minimum value for TSS (15.1%) was observed when K SO was used as a source
of K. At 28 days of storage, TSS was highest (15.5%) when a mixture of KCl+2 4
Fruit Effect References
Mango + Wojcik 2005Citrus + Shamshiri and Usha 2004Pineapple + Stewart 1956Grape + Wojcik 2005Banana + Kumar et al. 2007
+ Positive effect
Source of K TSS Brix Acidity (%) Firmness
At Harvest
KCl 15.5 0.55 11.7K SO 15.1 0.50 12.7
KCl+K SO 15.4 0.53 13.9
At 28 days of Storage
KCl 14.7 0.67 8.5K SO 15.4 0.54 9.6
KCl+K SO 15.5 0.59 8.0
Source: Stewart 1956
o
2 4
2 4
2 4
2 4
Table 9 Post-harvest behaviour of pineapple affected by sources of potassium
Table 8 Relation of K and storage life of fruits
338 339

Koo RCJ (1985) Potassium nutrition of citrus. In: Munson RS (ed) Potassium in
agriculture.ASA-CSSA-SSSA, Madison, WI. pp. 1077-1086
Kumar RA (2004) Studies on the efficacy of sulphate of potash (SOP) on growth,
yield and quality of banana. Ph.D. Thesis, Tamil Nadu Agricultural
University, Coimbatore
Kumar N, Kavino M, Rameshkumar M (2006) Balanced fertilization for
sustainable yield and quality in tropical fruits. Proceedings of International
Symposium held at PAU, Ludhiana from November 22-25, 2006
Kumar A, Kumar N (2007) Sulfate of potash foliar spray effects on yield, quality,
and post-harvest life of banana. Better Crops. 91:22-24
Lester GE, Jifon JL, Makus DJ (2010) Impact of potassium nutrition on food
quality of fruits and vegetables: A condensed and concise review of the
literature. Better Crops 94:18-21
Marschner H (1995) Functions of mineral nutrients: Macronutrients. In:
Marschner H (ed) Mineral nutrition of higher plants, 2 ed. Academic, San
Deigo, NY, pp. 299-312
Marschner H, Kirkby EA, Cakmak I (1996) Effect of mineral nutritional status on
shoot-root partitioning of photo-assimilates and cycling of mineral nutrients.
J Exp Bot 47:1255-1263
Mengel K (1997) Impact of potassium on crop yield and quality with regard to
economical and ecological aspects. In: Johnston AE (ed) Food security in the
WANA region, the essential need for balanced fertilization. International
Potash Institute, Basel, Switzerland, pp 157-174
Mitra SK (2009) Effect of potassium on quality and storage life of fruit crops.
Paper presented in International Symposium on potassium conducted by IPI –
OUAT – IPNI at Bhubaneswar, Orissa, India from 5–7 November 2009
Perrenoud S (1990) Potassium and Plant Health, 2 ed. IPI Research Topics # 3
International Potash Institute, Basel, Switzerland
Robertson JA, Meredith FI, Horvat RJ, Senter SD (1990) Effect of cold storage
and maturity on the physical and chemical characteristics and volatile
constituents of peach cv. Cresthaven. JAgric Food Chem 38:620-624
Shamshiri MH, Usha K (2004) Effect of arbuscular mycorrhizal fungus on growth
parameters in kinnow. Improving Productivity, Quality, Post-harvest
Management and Trade in Horticultural Crops. I Indian Hort. Congress, pp
243
Sipiora MJ, Anderson MM, Matthews MA (2005) Proc. Soil Environment Vine
Mineral Nutr. Symp. San Diego, CA, 29-30 June, 2004 pp 185-192
Shawky I, MontasserA, Nageib M, Haggag L,Abd-El-Migeed M (2004) Effect of
fertilization with potassium and some micronutrients on Navel orange trees.
II: Effect on yield, fruit quality and juice mineral content. In: El-Sawy M,
Francis RR, El-Borollosy MA, Hosni AM (ed.) Ann Agric Sci, Cairo. 3
(Special):1215-1226
nd
nd
st
appeared to depend on timing of application as well as fertilizer K formulation. For
instance, when mid- to-late season soil or foliar K applications were made using
KNO there were little or no improvements in fruit quality or human nutritional
quality attributes and in some instances, these attributes were actually inferior
compared to fruit from control plots (Lester et al. 2010).
Potassium is important in optimizing both crop yield and economic quality of fruit
crops. A balanced nutrition allows K to contribute its best towards higher yield,
quality and profitability. Potassium enhances the quality parameters of fruits thus
helping consumers to eat good quality and nutritious fruits and farmers to get more
profit.
Anonymous (1975) Cultivation practices of fruits. Department of Horticulture,
UAS, IIHR, Bangalore, pp 31-34
Bhargava BS, Singh HP, Chadha KL (1993) Role of potassium in development of
fruit quality. In: Chadha KL, Pareek, OP(ed)Advances in Horticulture, Vol. 2
Fruit Crops: Part 2. Malhotra, New Delhi. pp. 947-960
El-Fatah DM, Soad AM, Omayma MI (2008) Effect of biostimulants, ethrel,
boron and potassium nutrient on fruit quality of "costata" persimmon. Aust.
J. Basic &Appl. Sci 2:1432-1437
Embleton TW, Reitz HJ, Jones WW (1973) Citrus fertilization. In: Reuther W (ed)
The citrus industry, Vol. III, Revised edition. University of California.
Berkeley, CA, pp.122- 182.
Geraldson CM (1985) Potassium nutrition of vegetable crops. In: Munson RD (ed)
Potassium in agriculture.ASA-CSSA-SSSA, Madison, WI, pp 915- 927
Hardter R, Krauss A (1999) Balanced fertilization and crop quality. IFA Agric
conference on managing plant nutrition. Barcelona, Spain
Hochmuth G, Shuler K, Hanlon E, Roe N (1994) Proceedings of Florida State Hort
Soc 107: 132-139
Kafkafi U, Xu G, Imas P, Magen H, Tarchitzky J (2001) Potassium and chloride in
crops and soils: The Role of potassium chloride fertilizer in crop nutrition.
IPI-Research Topic 22. International Potash Institute, Basel, Switzerland
Koch K, Mengel K (1974) The influence of the level of potassium supply to young
tobacco L. on short-term uptake and utilization
of nitrate nitrogen ( N). J Sci FoodAgric 25:465-471
Koo RCJ (1963) Nitrogen and potassium study for lemon. Annual Report. Florida
Agricultural Experimental Station, pp 235-236.
3
Conclusions
References
(Nicotiana Tabacum ) plants15
340 341

Stewart PY (1956) Pineapple. In: Recommendation on the nutritional
management of pineapple. Su, NR (ed.) Soils and fertilizers in Taiwan. Soc
Soil Sci Fert Techn. Taiwan
Sulladmath UV, Gowda NTV, Ravi SV (1984) Effect of nitrogen, phosphorus and
potassium on yield and quality of papaya. Proc. of Nat. Seminar on papaya
and papain production, March 26-27, TNAU, Coimbatore, pp 70-71
Sullivan GA, Jones GL, Moore RP (1974) Effects of dolomitic limestone, gypsum
and potassium on yield and seed quality of peanuts. Paper No. 140 of the
Journal Series of the North Carolina State University Agricultural Extension
Service, Raleigh, NC 27607
Tandon HLS, Kemmler C (1986) Potassium sulphate for quality crops in India.
Intern Potash Inst Worblanfen–Berne, Switzerland
Tiwari VS, Raisadhan SR, Jagtap DD, Pujari CV (1999) Effect of organic and
inorganic fertilizer on yield and quality of sweet orange. International
Symposium on Citriculture, Nagpur, Nov.23-27, pp 411
Usherwood NR (1985) The role of potassium in crop quality. In: Munson RD (ed)
Potassium in agriculture.ASA, Madison, WI, pp 489-514
Von Uexkll HR (1985) Potassium nutrition of some tropical plantation crops. In:
Munson RD (ed) Potassium in agriculture.ASA, Madison, WI, pp. 929-954
Wojcik P (2005) Proceedings International Scientific Conference:
Environmentally friendly fruit growing, Polli, Estonia, 7-9 September, 2005.
pp 44-50
Zehler E, Kreipe H, Gething PA (1981) Potassium sulphate and potassium
chloride. IPI-Research Topic 9. International Potash Institute, Basel,
Switzerland
342
Proceedings IPI-OUAT-IPNI International Symposium (2009)
Presented at IPI-OUAT-IPNI International Symposium.Published in Plant Soil 2010.335:35-64. Printed here with permission from Plant Soil
Field-specific potassium and phosphorus balances and
fertilizer requirements for irrigated rice-based
cropping systems
Roland J Buresh Mirasol F Pampolino Christian Wittl l
l l l l
l
Abstract
Keywords
Fertilizer K and P requirements for rice ( L.) can bedetermined with site-specific nutrient management (SSNM) using estimatedtarget yield, nutrient balances, and yield gains from added nutrient. We used theQUEFTS (Quantitative Evaluation of the Fertility of Tropical Soils) model with>8000 plot-level observations to estimate the relationship between grain yieldand nutrient accumulation in above-ground dry matter of irrigated rice withharvest index 0.4. Predicted reciprocal internal efficiencies (RIEs) at 60% to70% of yield potential corresponded to plant accumulation of 14.6 kg N, 2.7 kg P,and 15.9 kg K per tonne of grain yield. These RIEs enable determination of plantrequirements for K and P and net output of K and P in harvested grain andremoved crop residues at a target yield. Yield gains for nutrient applied toirrigated rice averaged 12% for K and 9% for P for 525 to 531 observations. Forfields without certain yield gain, fertilizer K and P requirements can bedetermined by a partial maintenance approach (i.e., fertilizer input < output innutrient balance), which considers nutrient supply mediated through soilprocesses and balances trade-offs between financial loss with full maintenancerates and risk of excessive nutrient depletion without nutrient application. Whenyield gains to an added nutrient are certain, partial maintenance plus yield gaincan be used to determine fertilizer requirements. The SSNM-based approach andalgorithms enable rapid development of field-specific K and P management.
Field-specific nutrient management nutrient balance SSNM ricewheat maize
Oryza sativa
Roland J BureshInternational Rice Research Institute (IRRI), DAPO Box 7777, Metro Manila, Philippines;e-mail: [email protected] F Pampolino Christian WittInternational Plant Nutrition Institute (IPNI), Southeast Asia Program, PO Box 500 GPO,Penang 10670, Malaysia
1
l
343

Abbreviations CRR; crop residue retained: FK; fertilizer K: FM; fraction of full
maintenance: FP; fertilizer P: GY; grain yield: HI; harvest index: IE; internal
efficiency: IGP; Indo-Gangetic Plains: QUEFTS; Quantitative Evaluation of the
Fertility of Tropical Soils: RE; recovery efficiency: RIE; reciprocal internal
efficiency: RTDP; Reversing Trends in Declining Productivity: SSNM; site-
specific nutrient management
Oryza sativa
Triticum aestivum
Zea mays
Introduction
Rice ( L.) is the main staple food crop in Asia, which accounts forabout 90% of global rice production. Irrigated rice covers half the rice-growingarea and accounts for about 75% of total rice production (Maclean et al. 2002).Continuous rice cultivation with two and occasionally three crops per year iscommon in tropical Asia. Rice in rotation with other crops, particularly wheat( L.), is common in subtropical Asia (Ladha et al. 2009), andthe rotation of maize ( L.) with irrigated rice is increasing in importancein Asia (Ali et al. 2008). Fertilizer use has contributed to increasing production ofrice-based systems since the Green Revolution, and the effective use ofsupplemental nutrients remains vital for essential increases in the production ofrice and associated cereal staples to meet rising demand for food security andpolitical stability.
Plots of land for cultivation of rice-based cropping systems in Asia aretypically small and spatially variable in management. Large variations in nutrientbalances and nutrient requirements can exist across small distances within alandscape due to differences in retention of crop residues, historical fertilizer use,input of organic materials, inherent soil fertility, and crop yield attainable withfarmers' management practices. Existing blanket fertilizer recommendations forlarge areas or agro-ecological zones fail to account for these variations in cropneeds for supplemental nutrients among fields within small distances.Approaches and algorithms for tailoring fertilizer requirements to field-specificneeds of crops are necessary to further improve productivity and profitabilityfrom fertilizer use.
Algorithms for determining fertilizer recommendations are often derivedfrom factorial fertilizer trials conducted across multiple locations. Site-specificnutrient management (SSNM) for rice arose in the mid-1990s as an alternativeapproach for dynamic management of nutrients to optimize supply and demandof a nutrient within a specific field in a particular cropping season (Dobermann etal. 2004). The SSNM approach reasoned that fertilizer requirements should bebased on more generic relationships such as internal nutrient efficiency, which isthe amount of grain yield produced per unit of nutrient accumulated in above-ground plant dry matter (Witt et al. 1999). The QUEFTS (QuantitativeEvaluation of the Fertility of Tropical Soils) model developed by Janssen et al.
(1990) was used to provide a generic empirical relationship between grain yieldand nutrient accumulation in rice plants (Witt et al. 1999), which wassubsequently combined with the estimation of attainable yield, nutrient balances,and probable yield gains from added nutrient to determine field-specific fertilizerrequirements for rice (Witt and Dobermann 2004).
The determination of field-specific fertilizer N requirements in the SSNMapproach for rice has subsequently been modified to use a target agronomicefficiency of fertilizer N use, which is the increase in yield per unit of fertilizer Napplied, and an estimated field-specific yield gain to applied N (Buresh and Witt2007; Witt et al. 2007). The determination of fertilizer K and P requirements inthe SSNM approach, on the other hand, has continued to use internal nutrientefficiency combined with estimates of attainable yield, nutrient balances, andprobable yield gains from added nutrient within specific fields (Witt et al. 2007).The SSNM approach has recently been applied to wheat (Khurana et al. 2008)and maize (Witt et al. 2009).
Witt et al. (2007) advocated use of nutrient balances with full maintenance ofsoil fertility, in which the applications of fertilizer K and P are sufficient to matchthe output of the nutrients. Such an approach does not adjust fertilizer K and Prates for enhanced availability of nutrients through soil biological, chemical, andphysical processes. Moreover, the application of fertilizer at full maintenance canresult in financial loss when the crop does not respond to the added nutrient. Anincrease in farm-gate fertilizer prices relative to the farm-gate price of producefurther increases this financial loss. Failure to apply K or P, on the other hand, canresult in nutrient depletion and eventual loss in yield, which could take a numberof seasons before detection (Abdulrachman et al. 2006). The importance of soilbiological, chemical, and physical processes on nutrient availability and thedramatic fluctuations in fertilizer prices highlight the need to re-examine fullmaintenance approaches for determining fertilizer K and P requirements.Algorithms are needed for determining fertilizer K and P rates that effectivelyconsider soil processes and soil characteristics mediating K and P availability andbalance the trade-offs between profitability in the short term and sustainableproductivity in the longer term.
Technological approaches and algorithms for developing fertilizerrequirements tailored to field-specific needs of crops in irrigated rice-basedcropping systems must be based on robust scientific principles applicable acrossthe field-level variability and diversity of crop-growing conditions. At the sametime, approaches must be relatively simple with minimal characterization orinterviewing of farmers for each field in order to ensure rapid, cost-effectivedelivery of field-specific guidelines to millions of small-scale farmers.Technological approaches and algorithms should strive to draw upon existingresearch information in order to avoid delays in reaching farmers with practicalsolutions based on scientific principles.
344 345

Nutrient balances and fertilizer requirements determined with SSNM forirrigated rice rely on reciprocal internal efficiency (RIE), which is the amount ofthe nutrient in above-ground plant dry matter per tonne of grain production.Values currently used with SSNM for irrigated rice were derived with theQUEFTS model by Witt et al. (1999). Given the importance of RIE indetermining fertilizer requirements, there is merit after a decade to re-examinewith a larger data set the robustness of RIEs used for irrigated rice.
The objectives of this study are:1) To determine, using a large data set for irrigated rice from across Asia, the
relationship between rice grain yield and N, P, and K accumulation in totalabove-ground plant dry matter of mature rice, and through this to confirmRIE values for K and P for use in determining fertilizer requirements forsemi-dwarf irrigated rice;
2) To assess at the field level through K and P nutrient balances the factors,uncertainties, and emerging trends affecting the determination of field-specific fertilizer K and P requirements for rice–rice, rice–wheat, andrice–maize cropping systems; and
3) To examine and compare revised approaches for calculating field-specific Kand P fertilizer rates that can consider the net effect of soil processes and soilcharacteristics mediating K and P availability and balance the trade-offsbetween short-term profitability of fertilizer use and longer termsustainability of the productivity of high-yielding rice-based systems.
We provide alternatives to factorial field trials and rigid nutrient balances fordetermining fertilizer K and P requirements. The framework we present does notspecifically consider soil–plant–nutrient interactions and biological processesmediating nutrient availability.
Internal nutrient efficiencies for rice
The QUEFTS model (Janssen et al. 1990) as modified and described by Witt et al.(1999) was used with a large data set to develop relationships between grain yieldand nutrient accumulation in total above-ground plant dry matter of rice atmaturity. The data originated from irrigated rice production areas in sevencountries across tropical and subtropical environments in Asia (Table 1). Data forrice grain yield, harvest index, and plant accumulation of N, P, and K werecompiled from various research projects and then grouped into separate data setsfor N, P, and K. The data set for each nutrient contained results from all plots withmeasurements for both plant accumulation of the nutrient and grain yield(Table 1).
Materials and methods
Table 1 Origin of data used to examine the relationship between rice grain yieldand accumulation of N, P, and K in total above-ground dry matter atmaturity
In each of the seven countries, except Thailand, data originated from bothnutrient omission trials and fertilizer evaluation trials conducted in farmers'fields. Data from Bangladesh originated from research described by Alam et al.(2005). Data from on-farm trials before 2001 in other countries originated fromthe Reversing Trends in Declining Productivity project (Dobermann et al. 2002).On-farm data from 2001 onward originated from the subsequent ReachingToward Optimal Productivity project in which SSNM was further refined intoguidelines for rice fertilization (Witt et al. 2007). Data from on-stationexperiments in the Philippines originated from several long-term experimentsthat included treatments without application of N, P, or K but ample applicationof other nutrients to meet crop needs. All data were for irrigated rice, and waterrarely limited plant growth. In all cases semi-dwarf, modern high-yielding indicacultivars were grown with good agronomic practices. Comparablemethodologies for plant sampling, yield determination, and analysis for plantnutrients were used for collected data across the countries and experiments (Wittet al. 1999).
Internal nutrient efficiency (IE) is defined as the amount of grain yield in kgha (adjusted to 0.14 g water g fresh weight) produced per kg of plant N, P, or Kaccumulation in above-ground plant dry matter expressed on an oven dry basis.Reciprocal internal efficiency (RIE) is the amount of N, P, or K in the above-ground plant dry matter per 1000 kg of grain production. Harvest index is grain
–1 –1
Country Type of experiment Years Number of plot-level observations (n)
HI = 0.4 to 0.63 HI = 0.2 to 0.4
N P K N P K
Bangladesh On-farm nutrient omission trials 2000-2002 153 100 99 29 16 17On-farm fertilizer trials 2000-2002 259 325 325 98 98 98
China On-farm nutrient omission trials 2001-2002 38 38 38On-farm fertilizer trials 1998-2002 415 415 415
India On-farm nutrient omission trials 2001-2004 939 936 939 3 3 3On-farm fertilizer trials 1997-2004 2086 2086 2086
Indonesia On-farm nutrient omission trials 2001-2002 110 72 72On-farm fertilizer trials 1997-2002 602 602 599 10 10 10On-station experiments 2001-2003 144 144 144
Philippines On-farm nutrient omission trials 2001-2002 36 36 36 5 5 5On-farm fertilizer trials 1997-2002 616 616 616 110 110 110On-station experiments 1991-2007 8279 1781 1783 409 163 163
Thailand On-farm fertilizer trials 1997-2000 206 206 206 80 80 80Vietnam On-farm nutrient omission trials 2002-2003 150 150 150 10 10 10
On-farm fertilizer trials 1997-2003 1474 1441 1475 68 62 68Total 15507 8948 8983 822 557 564
HI = harvest index
a
a
346 347

yield expressed as a proportion of total above-ground plant dry matter (kg grainper kg total above-ground dry matter).
Relationships between grain yield and plant nutrient accumulation aspredicted by QUEFTS follow a linear-parabolic-plateau model, which dependson an established maximum yield potential and coefficients of maximum nutrientaccumulation (a) and maximum nutrient dilution (d). The a and d coefficientsused in this paper were the 2.5th and 97.5th percentile of the measured IE (Witt etal. 1999). The predicted model is linear up to about 60% to 70% of the yieldpotential, which is seldom exceeded in farmers' fields. Internal nutrientefficiencies determined from the linear portion of the model represent the amountof nutrient needed to achieve a grain yield for modern high-yielding rice cultivarsacross a wide range of yields attainable in farmers' fields (Witt et al. 1999).
The RIEs obtained for a data set with the QUEFTS model are intended foruse in calculating nutrient balances and fertilizer rates for modern high-yieldingrice cultivars (Witt and Dobermann 2004) grown in farmers' fields with goodagronomic practices and balanced use of N, P, and K fertilizers. We thereforeexcluded from analysis with QUEFTS the data from plots either with suspectedyield loss due to pests and disease or known to have unbalanced application offertilizer.
Harvest index for the entire data set ranged from 0.2 to 0.63. Low harvestindices suggest that disease, weeds, or insect pests resulted in some yield loss.Like Witt et al. (1999) and Haefele et al. (2003), we excluded data with harvestindex <0.4 from the determination of relationships and internal nutrientefficiencies with QUEFTS for semi-dwarf irrigated rice. About 5% of theobservations in the entire data set had harvest index <0.4 (Table 1).
Mean and median RIE for N, P, and K are consistently lower for rice grownwithout addition of the nutrient (nutrient omission plots) than with fullfertilization due to dilution of the nutrient in plants not fertilized with the nutrient(Table 2). We therefore excluded all nutrient omission plot data from the analysiswith QUEFTS. Data from NPK fertilized plots with harvest index from 0.4 to0.63 as summarized in Table 2 were used to develop relationships and determineRIE with QUEFTS.
Determination of K and P balances
Simple nutrient balances for K and P in the absence of fertilizer input weredetermined for a single rice crop, one rice–wheat cropping cycle, and onerice–maize cropping cycle. The balances took into account the fraction ofretained crop residue and the inputs of nutrient from irrigation water and addedorganic materials.K balance for rice = K + K + K – K – (GY x RIE ) [1]W OM CRr L r Kr
K balance for rice–wheat or rice–maize = K + K + K + K– K – (GY x RIE ) – (GY x RIE ) [2]P balance for rice = P + P – (GY x RIE ) [3]P balance for rice–wheat or rice–maize = P + P + P– (GY x RIE ) – (GY x RIE ) [4]
where K and P balances and each input are expressed in kg ha , K is K inputwith irrigation water for an entire cropping cycle, K and P are K and P inputsfrom added organic materials, K and P are K and P inputs with retainedresidues of rice, K and P are K and P inputs with retained residues of
wheat or maize, K is K loss by percolation or leaching in kg ha , GY and GY
are targeted grain yields in t ha for rice and wheat or maize, RIE and RIE arereciprocal internal efficiencies of rice for K and P, and RIE and RIE arereciprocal internal efficiencies of wheat or maize for K and P. Input of P inirrigation water, loss of P by percolation and leaching, and inputs of P and K withrainfall are treated as negligible and not included in the equations (Dobermann etal. 1998).
The P and K balances reported in this study used RIEs for rice determinedfrom the linear portion of the QUEFTS model predicted in this study (Table 3).The RIEs used for wheat (21.6 kg plant K and 3.5 kg plant P per 1000 kg grain)
W OM CRr CRwm
L r Kr wm Kwm
OM CRr r Pr
OM CRr CRwm
r Pr wm Pwm
W
OM OM
CRr CRr
CRwm CRwm
L r wm
Kr Pr
Kwm Pwm
–1
–1
–1
Parameter n RIE (kg nutrient in above-ground dry matterper 1000 kg grain)
Mean SD 25%quartile
Plant NFull fertilized plots 13327 16.4 3.2 14.2 16.2 18.3- N plots 2180 12.8 2.6 11.2 12.6 14.2All data 15507 15.9 3.3 13.5 15.7 17.9
Plant PFull fertilized plots 8404 3.2 0.8 2.7 3.2 3.7- P plots 544 2.6 0.7 2.1 2.6 3.0All data 8948 3.2 0.8 2.7 3.2 3.6
Plant KFull fertilized plots 8521 17.8 4.6 14.2 17.2 20.8- K plots 462 14.8 5.5 11.0 12.4 18.4All data 8983 17.7 4.7 14.0 17.0 20.7
n = number of observations SD = Standard Deviation
a
b
a b
Median 75%quartile
Table 2 Reciprocal internal efficiency (RIE) for N, P, and K at maturity ofirrigated rice as affected by location and treatment. Results are for thedata set with harvest index (HI) = 0.4 to 0.63 as described in Table 1
348 349

were obtained from the linear portion of a predicted QUEFTS model using a dataset with 1102 observations for K and 1119 observations for P compiled fromacross Asia (IPNI, unpublished data). Pathak et al. (2003), using a smaller dataset from India, reported a higher RIE for K (28.5) and a comparable RIE for P(3.5), and Liu et al. (2006), using a data set from China, reported relativelycomparable RIE for K (23.0) and P (3.7).
Constants for internal efficiency (IE) corresponding to maximumaccumulation (a) and maximum dilution (d) and reciprocal internalefficiency (RIE) calculated by QUEFTS for the linear portion of therelationship between rice grain yield and nutrient accumulation in totalabove-ground dry matter of rice at maturity
The RIEs used for maize (17.4 kg plant K and 2.56 kg plant P per 1000 kggrain) were obtained at 80% of yield potential of a QUEFTS model predictedwith yield potential = 14 t ha using a data set with 2361 observations for K and2363 observations for P compiled from Nebraska in the USA, Indonesia, andVietnam (Setiyono et al. 2010). The RIEs were obtained at 80% of yield potentialbecause this yield level is attainable with hybrid maize in farmers' fields inSoutheast Asia. Liu et al. (2006), using a smaller data set from China, reportedhigher RIE for K (23.1) and P (4.3).
The K and P inputs from residues for a crop (K and P ) depend uponamount and nutrient content of the above-ground crop biomass retained in thefield after harvest.K = GY x RIE x (1 – HI ) x CRR [5]P = GY x RIE x (1 – HI ) x CRR [6]
Table 3
Data are from NPK fertilized plots with harvest index (HI) = 0.4 to 0.63 as described inTable 2. The grain yield potential was set to 10 t ha . Constants a and d were calculated byexcluding the upper and lower 2.5 percentiles (2.5th and 97.5th) of all IE data
–1
–1
CR CR
CR K K
CR P P
where HI and HI are K and P harvest indices for a crop expressed as kg nutrientin grain per kg nutrient in total above-ground dry matter, and CRR for a crop isthe fraction of total crop residue retained in the field after harvest.
The K and P nutrient balances reported in this study used K and P harvestindices (HI = 0.15 and HI = 0.7) for rice that were determined from NPKfertilized plots in this study (Table 4). Nutrient balances reported in this studywith wheat and maize used HI = 0.2 for wheat and maize, HI = 0.6 for wheat,and HI = 0.85 for maize because they approximate values obtained fromrelatively large data sets from multiple locations. In a data set for wheat fromBangladesh and India with 305 observations for K and 323 observations for P, themedian HI = 0.22 and the median HI = 0.60 (IPNI, unpublished data). In a dataset for maize from Nebraska, Indonesia, and Vietnam with 2361 observations forK and 2363 observations for P, the median HI = 0.16 and the median HI = 0.86(Setiyono et al. 2010).
Determination of fertilizer K and P rates
The principles of QUEFTS can be used to determine fertilizer P and Krequirements to achieve a targeted yield through approaches based on eitherexpected yield gain from the added nutrient or estimated nutrient balance (Wittand Dobermann 2004). In the yield gain approach, the fertilizer K (FK) orfertilizer P (FP) (in kg ha ) required to achieve a targeted yield (GY, expressed int ha ) is a function of the expected yield gain from the added nutrient, the RIE forthe nutrient, and the use efficiency of the applied nutrient:FK = (GY – GY ) x RIE /RE [7]FP = (GY – GY ) x RIE /RE [8]
where GY and GY are grain yield in t ha in the respective nutrient omissionplot in which the nutrient of interest is not applied, RIE of a nutrient is determined
K P
K P
K P
P
K P
K P
0K K
0P P
0K 0P
–1
–1
–1
Nutrient IE constants (kg grain/kg nutrient inabove-ground dry matter) above-ground dry
matter perMaximum
accumulation (a) dilution (d)
Witt et al.(1999) (1999) (1999)
N 42 43 96 94 14.7 14.6P 206 202 622 595 2.6 2.7K 36 36 115 95 14.5 15.9
RIE (kg nutrient in
Maximum 1000 kg grain)
This study Witt et al. This study Witt et al. This study
Table 4 Nutrient harvest index (HI) for N, P, and K of irrigated rice obtainedfrom NPK fertilized plots with HI = 0.4 to 0.63 as described in Table 2
Nutrient n Nutrient HI (kg nutrient in grain per kg nutrient in totalabove-ground dry matter)
Mean SD 25%quartile quartile
N 13327 0.63 0.07 0.59 0.63 0.67P 8404 0.69 0.10 0.62 0.69 0.77K 8521 0.16 0.06 0.12 0.15 0.19
a
b Median 75%
a
b
n = number of observationsSD = standard deviation
350 351

with QUEFTS (Table 3), and use efficiency is the recovery efficiency of theapplied nutrient (RE or RE ) expressed in kg kg . Because RIE is a constant toonly 60% to 70% of yield potential, the targeted grain yield should not exceedabout 70% of the yield potential when RIE is derived from the linear portion ofthe QUEFTS model. Current yields of irrigated rice in Asia are generally below70% of yield potential (Dobermann et al. 2002).
Witt and Dobermann (2004), using a data set for irrigated rice from acrossAsia, observed RE ranging from 0.35 to 0.66 kg kg and RE ranging from 0.22
to 0.35 kg kg between the median and the 75% quartile. Using these valuestogether with RIE reported in Witt et al. (1999), they estimated as a general rulethat 25 kg K or 9 kg P are required to raise the respective nutrient-limited yield by1 t ha . The data set used by Witt and Dobermann (2004) did not include highlyweathered soils (i.e., Oxisols and Ultisols) and volcanic soils (i.e., Andisols) withhigh capacity to fix P. P-fixing soils would likely have lower RE andcorresponding higher fertilizer P requirements.
Expected yield gains from the addition of a nutrient (GY – GY ) as obtainedwith the nutrient omission plot technique can be used to determine the need of acrop for fertilizer. We used results from 525 K omission plot trials and 531 Pomission plot trials conducted in farmers' fields in Bangladesh, India, Indonesia,and Vietnam (Table 1) to estimate the gain in rice yield from K and P fertilization.The yield gain from application of K or P was determined from the difference ingrain yield between a plot with full fertilization of N, P, and K at sufficiently highrates to avoid limitation of these nutrients and an adjacent plot withoutapplication of K or P (i.e., a nutrient omission plot) but with sufficient amounts ofother nutrients to prevent their limitations on yield. The full-fertilized andnutrient omission plots in a given field were managed identically except for theomission of the nutrient of interest in plots without K or P. The difference in grainyield between the full-fertilized plot and the nutrient omission plot represents theexpected yield gain from addition of the nutrient to overcome the deficit betweenthe crop demand for the nutrient and indigenous supply of the nutrient fromsources other than fertilizer.
Fertilizer K and P requirements to achieve a targeted yield can also beestimated with QUEFTS principles through nutrient input-output balances. Wittand Dobermann (2004) used the following equations based on nutrient balance toestimate fertilizer K (FK) or fertilizer P (FP) requirements (in kg ha ) for a cropwith full maintenance of soil K and P.FK = (GY x RIE ) + ((GY – GY ) x RIE ) – K – K – K + K [9]FP = (GY x RIE ) + ((GY – GY ) x RIE ) – P – P [10]where K and P are K and P inputs with retained residues, and other inputs andlosses are as defined for equations 1 to 4. Inputs and losses are all expressed in kg
K P
K P
P
0
K 0K K CR W OM L
P 0P P CR OM
CR CR
–1
–1
–1
–1
–1
ha . Witt and Dobermann (2004) included the expected yield gain from additionof a nutrient (GY – GY ) in the determination of fertilizer requirements to ensurethat fertilizer K and P rates in the presence of a yield gain were increased by theamount of the nutrient uptake deficit to slowly build up soil nutrient supplies.
In our study we did not include yield gain in the estimation of fertilizer K andP based on a nutrient balance approach. We examined two options using nutrientbalances to calculate fertilizer K and P rates based on partial maintenance withgradual drawdown or depletion of soil K and P rather than full maintenance ofsoil K and P. In one option with partial maintenance, fertilizer K and Prequirements are calculated as a fraction of full maintenance (FM) as shown inequations 11 and 12.FK with fractional K depletion = (GY x RIE – K – K – K + K ) xFM [11]FP with fractional P depletion = (GY x RIE – P – P ) xFM [12]
The other option with partial maintenance allows drawdown of K or P fromsoil reserves up to a threshold limit (K or P in kg ha ), which is treated as aninput in the nutrient balance.FK with limited K depletion = GY x RIE – K – K – K – K + [13]FP with limited P depletion = GY x RIE – P – P –P [14]The FM, K , and P terms can be used to estimate the net effect of soil biological,chemical, and physical processes and soil characteristics on supply of soil K andP. When FM = 1 or when K or P = 0, the calculated fertilizer rates for a nutrientensure full maintenance with no drawdown of the nutrient from soil reserves.
We also combined the partial maintenance and yield gain approaches fordetermining fertilizer K and P when crop response to the nutrient is certain.FK with fractional K depletion = ((GY x RIE – K – K – K + K ) xFM) + ((GY – GY ) x RIE /RE ) [15]FP with fractional P depletion = ((GY x RIE – P – P ) x FM) +((GY – GY ) x RIE /RE ) [16]FK with limited K depletion = (GY x RIE – K – K – K – K + K ) +((GY – GY ) x RIE /RE ) [17]FP with limited P depletion = (GY x RIE – P – P – P ) + ((GY – GY ) xRIE /RE ) [18]Fertilizer K (FK) and P (FP) rates are set to zero whenever the value calculated inequations 11 through 18 is negative.
Internal nutrient efficiencies for rice
Relationships for grain yield with total plant N, P, and K developed with
–1
–1
0
K CR W OM L
P CR OM
S S
K CR W OM S
P CR OM S
S S
S S
K CR W OM L
0K K K
P CR OM
0P P P
K CR W OM S L
0K K K
P CR OM S 0P
P P
Results
352 353
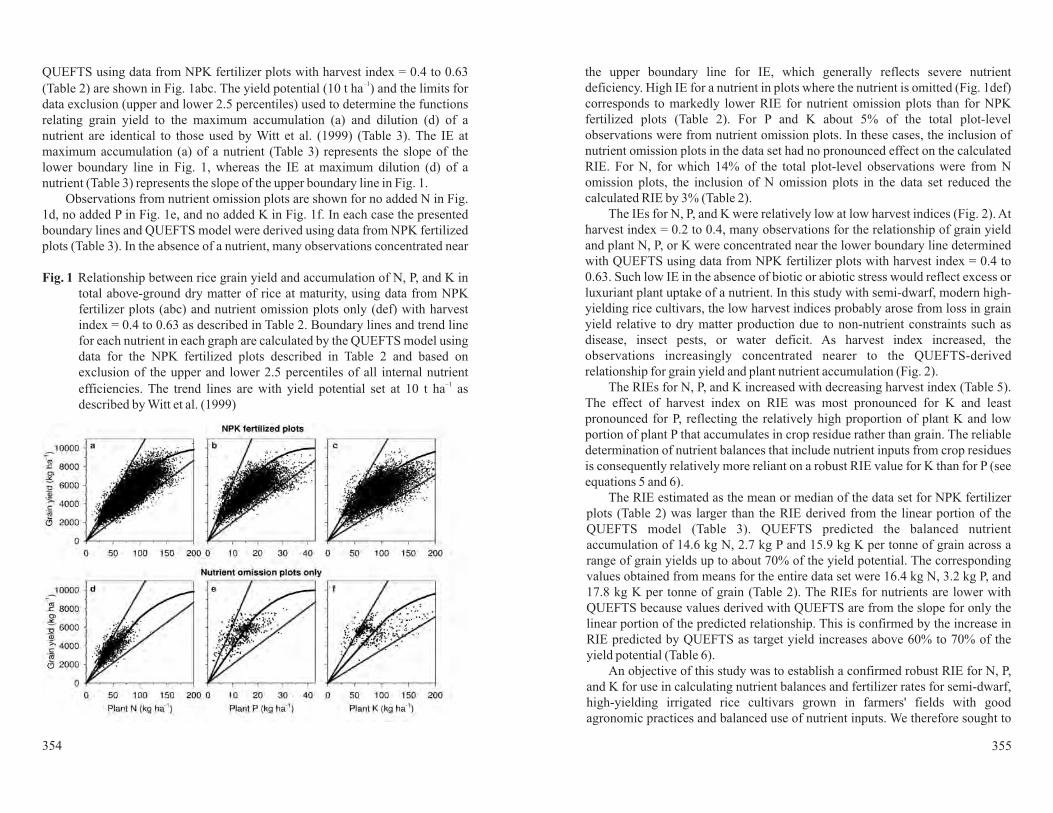
QUEFTS using data from NPK fertilizer plots with harvest index = 0.4 to 0.63(Table 2) are shown in Fig. 1abc. The yield potential (10 t ha ) and the limits fordata exclusion (upper and lower 2.5 percentiles) used to determine the functionsrelating grain yield to the maximum accumulation (a) and dilution (d) of anutrient are identical to those used by Witt et al. (1999) (Table 3). The IE atmaximum accumulation (a) of a nutrient (Table 3) represents the slope of thelower boundary line in Fig. 1, whereas the IE at maximum dilution (d) of anutrient (Table 3) represents the slope of the upper boundary line in Fig. 1.
Observations from nutrient omission plots are shown for no added N in Fig.1d, no added P in Fig. 1e, and no added K in Fig. 1f. In each case the presentedboundary lines and QUEFTS model were derived using data from NPK fertilizedplots (Table 3). In the absence of a nutrient, many observations concentrated near
–1
the upper boundary line for IE, which generally reflects severe nutrientdeficiency. High IE for a nutrient in plots where the nutrient is omitted (Fig. 1def)corresponds to markedly lower RIE for nutrient omission plots than for NPKfertilized plots (Table 2). For P and K about 5% of the total plot-levelobservations were from nutrient omission plots. In these cases, the inclusion ofnutrient omission plots in the data set had no pronounced effect on the calculatedRIE. For N, for which 14% of the total plot-level observations were from Nomission plots, the inclusion of N omission plots in the data set reduced thecalculated RIE by 3% (Table 2).
The IEs for N, P, and K were relatively low at low harvest indices (Fig. 2). Atharvest index = 0.2 to 0.4, many observations for the relationship of grain yieldand plant N, P, or K were concentrated near the lower boundary line determinedwith QUEFTS using data from NPK fertilizer plots with harvest index = 0.4 to0.63. Such low IE in the absence of biotic or abiotic stress would reflect excess orluxuriant plant uptake of a nutrient. In this study with semi-dwarf, modern high-yielding rice cultivars, the low harvest indices probably arose from loss in grainyield relative to dry matter production due to non-nutrient constraints such asdisease, insect pests, or water deficit. As harvest index increased, theobservations increasingly concentrated nearer to the QUEFTS-derivedrelationship for grain yield and plant nutrient accumulation (Fig. 2).
The RIEs for N, P, and K increased with decreasing harvest index (Table 5).The effect of harvest index on RIE was most pronounced for K and leastpronounced for P, reflecting the relatively high proportion of plant K and lowportion of plant P that accumulates in crop residue rather than grain. The reliabledetermination of nutrient balances that include nutrient inputs from crop residuesis consequently relatively more reliant on a robust RIE value for K than for P (seeequations 5 and 6).
The RIE estimated as the mean or median of the data set for NPK fertilizerplots (Table 2) was larger than the RIE derived from the linear portion of theQUEFTS model (Table 3). QUEFTS predicted the balanced nutrientaccumulation of 14.6 kg N, 2.7 kg P and 15.9 kg K per tonne of grain across arange of grain yields up to about 70% of the yield potential. The correspondingvalues obtained from means for the entire data set were 16.4 kg N, 3.2 kg P, and17.8 kg K per tonne of grain (Table 2). The RIEs for nutrients are lower withQUEFTS because values derived with QUEFTS are from the slope for only thelinear portion of the predicted relationship. This is confirmed by the increase inRIE predicted by QUEFTS as target yield increases above 60% to 70% of theyield potential (Table 6).
An objective of this study was to establish a confirmed robust RIE for N, P,and K for use in calculating nutrient balances and fertilizer rates for semi-dwarf,high-yielding irrigated rice cultivars grown in farmers' fields with goodagronomic practices and balanced use of nutrient inputs. We therefore sought to
Fig. 1 Relationship between rice grain yield and accumulation of N, P, and K intotal above-ground dry matter of rice at maturity, using data from NPKfertilizer plots (abc) and nutrient omission plots only (def) with harvestindex = 0.4 to 0.63 as described in Table 2. Boundary lines and trend linefor each nutrient in each graph are calculated by the QUEFTS model usingdata for the NPK fertilized plots described in Table 2 and based onexclusion of the upper and lower 2.5 percentiles of all internal nutrientefficiencies. The trend lines are with yield potential set at 10 t ha asdescribed by Witt et al. (1999)
–1
354 355

yield of semi-dwarf cultivars. The exclusion of data from omission plots slightlyincreased RIE obtained from the linear portion of the QUEFTS prediction. Withthe exclusion of omission plot data, the RIE for nutrients increased from 14.1 to14.6 kg N per tonne of grain, 2.6 to 2.7 kg P per tonne of grain, and 15.6 to 15.9
Fig. 2 Effect of harvest index on relationship between rice grain yield andaccumulation of N, P, and K in total above-ground dry matter of rice atmaturity, using the entire data set reported in Table 1. Boundary lines andtrend line for each nutrient in each graph are calculated by the QUEFTSmodel using data for the NPK fertilized plots with harvest index = 0.4 to0.63 as described in Table 2 and based on exclusion of the upper and lower2.5 percentiles of all internal nutrient efficiencies. The trend lines are withyield potential set at 10 t ha as described by Witt et al. (1999)–1
exclude from analysis with QUEFTS the data from plots where plant growth waslimited by factors other than nutrient supply. The strong influence of harvestindex on RIE, especially for K and N, verifies the merit of excluding data withharvest index <0.4 when factors other than nutrients were likely limiting the
Table 6 Reciprocal internal efficiency (RIE) calculated by QUEFTS to establishtarget grain yields
Data are from NPK fertilized plots with harvest index (HI) = 0.4 to 0.63 asdescribed in Table 2. The grain yield potential was set to 10 t ha-1
Grain yield(kg ha ) dry matter per 1000 kg grain)
N P K
5000 50 14.6 2.7 15.96000 60 14.6 2.7 15.97000 70 14.7 2.7 16.07500 75 15.0 2.7 16.38000 80 15.5 2.8 17.08500 85 16.2 3.0 17.79000 90 17.2 3.1 18.7
Percentage of RIE (kg nutrient in above-groundyield potential (%)-1
Parameter n RIE (kg nutrient in above-ground dry matter per1000 kg grain)
Mean SD 25%quartile quartile
Plant NHI: 0.2-0.4 822 23.0 5.9 19.5 22.2 25.4HI: 0.4-0.5 8156 16.7 3.4 14.3 16.4 18.8HI: 0.5-0.63 7351 14.9 3.0 12.7 15.0 16.9
Plant PHI: 0.2-0.4 557 3.9 1.2 3.0 3.7 4.5HI: 0.4-0.5 4680 3.2 0.8 2.7 3.3 3.7HI: 0.5-0.63 4268 3.1 0.8 2.6 3.1 3.6
Plant KHI: 0.2-0.4 564 27.3 8.1 23.0 27.6 32.3HI: 0.4-0.5 4708 19.1 5.0 15.5 18.7 22.3HI: 0.5-0.63 4275 16.1 3.8 13.2 15.4 18.6
n = number of observationsSD = standard deviation
a
b
a
b
Median 75%
Table 5 Reciprocal internal efficiency (RIE) for N, P, and K at maturity ofirrigated rice as affected by harvest index (HI). Results are for the data setdescribed in Table 1
356 357
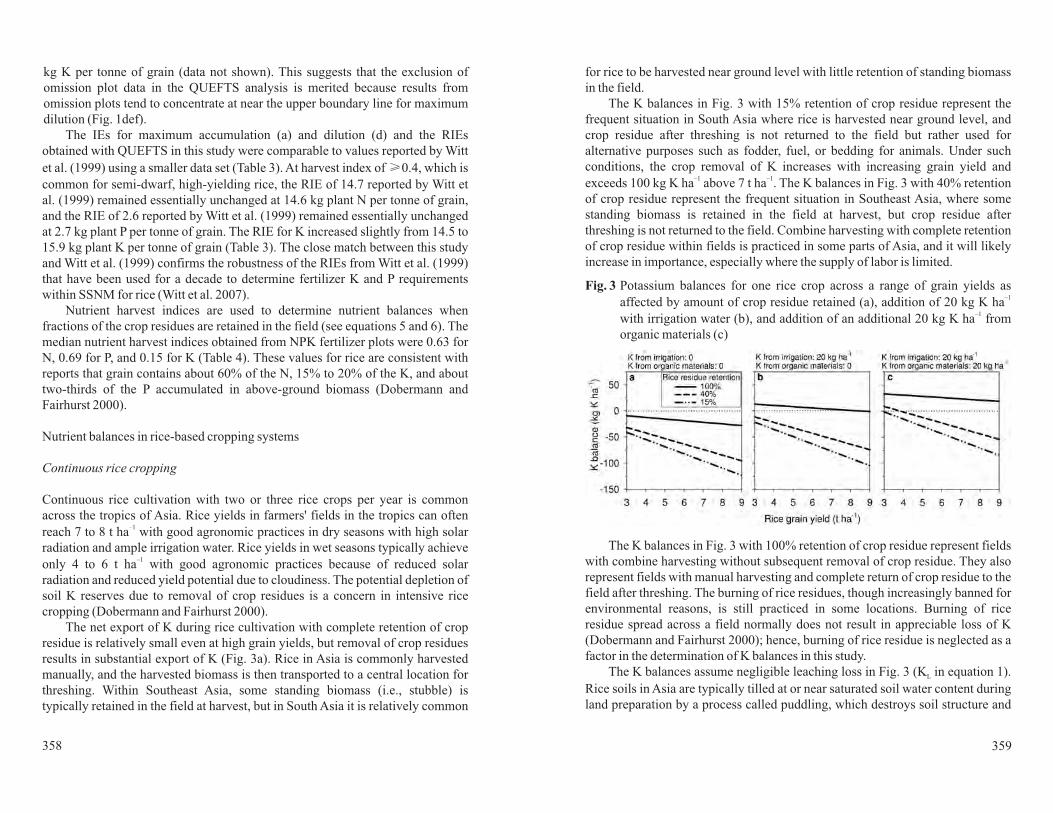
kg K per tonne of grain (data not shown). This suggests that the exclusion ofomission plot data in the QUEFTS analysis is merited because results fromomission plots tend to concentrate at near the upper boundary line for maximumdilution (Fig. 1def).
The IEs for maximum accumulation (a) and dilution (d) and the RIEsobtained with QUEFTS in this study were comparable to values reported by Wittet al. (1999) using a smaller data set (Table 3). At harvest index of 0.4, which iscommon for semi-dwarf, high-yielding rice, the RIE of 14.7 reported by Witt etal. (1999) remained essentially unchanged at 14.6 kg plant N per tonne of grain,and the RIE of 2.6 reported by Witt et al. (1999) remained essentially unchangedat 2.7 kg plant P per tonne of grain. The RIE for K increased slightly from 14.5 to15.9 kg plant K per tonne of grain (Table 3). The close match between this studyand Witt et al. (1999) confirms the robustness of the RIEs from Witt et al. (1999)that have been used for a decade to determine fertilizer K and P requirementswithin SSNM for rice (Witt et al. 2007).
Nutrient harvest indices are used to determine nutrient balances whenfractions of the crop residues are retained in the field (see equations 5 and 6). Themedian nutrient harvest indices obtained from NPK fertilizer plots were 0.63 forN, 0.69 for P, and 0.15 for K (Table 4). These values for rice are consistent withreports that grain contains about 60% of the N, 15% to 20% of the K, and abouttwo-thirds of the P accumulated in above-ground biomass (Dobermann andFairhurst 2000).
Nutrient balances in rice-based cropping systems
Continuous rice cultivation with two or three rice crops per year is commonacross the tropics of Asia. Rice yields in farmers' fields in the tropics can oftenreach 7 to 8 t ha with good agronomic practices in dry seasons with high solarradiation and ample irrigation water. Rice yields in wet seasons typically achieveonly 4 to 6 t ha with good agronomic practices because of reduced solarradiation and reduced yield potential due to cloudiness. The potential depletion ofsoil K reserves due to removal of crop residues is a concern in intensive ricecropping (Dobermann and Fairhurst 2000).
The net export of K during rice cultivation with complete retention of cropresidue is relatively small even at high grain yields, but removal of crop residuesresults in substantial export of K (Fig. 3a). Rice in Asia is commonly harvestedmanually, and the harvested biomass is then transported to a central location forthreshing. Within Southeast Asia, some standing biomass (i.e., stubble) istypically retained in the field at harvest, but in South Asia it is relatively common
Continuous rice cropping
–1
–1
for rice to be harvested near ground level with little retention of standing biomassin the field.
The K balances in Fig. 3 with 15% retention of crop residue represent thefrequent situation in South Asia where rice is harvested near ground level, andcrop residue after threshing is not returned to the field but rather used foralternative purposes such as fodder, fuel, or bedding for animals. Under suchconditions, the crop removal of K increases with increasing grain yield andexceeds 100 kg K ha above 7 t ha . The K balances in Fig. 3 with 40% retentionof crop residue represent the frequent situation in Southeast Asia, where somestanding biomass is retained in the field at harvest, but crop residue afterthreshing is not returned to the field. Combine harvesting with complete retentionof crop residue within fields is practiced in some parts of Asia, and it will likelyincrease in importance, especially where the supply of labor is limited.
The K balances in Fig. 3 with 100% retention of crop residue represent fieldswith combine harvesting without subsequent removal of crop residue. They alsorepresent fields with manual harvesting and complete return of crop residue to thefield after threshing. The burning of rice residues, though increasingly banned forenvironmental reasons, is still practiced in some locations. Burning of riceresidue spread across a field normally does not result in appreciable loss of K(Dobermann and Fairhurst 2000); hence, burning of rice residue is neglected as afactor in the determination of K balances in this study.
The K balances assume negligible leaching loss in Fig. 3 (K in equation 1).Rice soils in Asia are typically tilled at or near saturated soil water content duringland preparation by a process called puddling, which destroys soil structure and
–1 –1
L
Fig. 3 Potassium balances for one rice crop across a range of grain yields asaffected by amount of crop residue retained (a), addition of 20 kg K hawith irrigation water (b), and addition of an additional 20 kg K ha fromorganic materials (c)
–1
–1
358 359

reduces percolation rate and leaching loss of ions, including K (Sharma and DeDatta 1986). My Hoa et al. (2006) reported only 1 to 3 kg K ha loss by leachingduring a growing season on puddled soil in the Mekong Delta of Vietnam. Theinput of K from rainwater by comparison was 6 to 10 kg ha . Witt andDobermann (2004) estimated 11 kg K ha loss by leaching and 5 kg K ha inputfrom rainwater in an approximation of K balances for a typical irrigated rice cropin Asia. Percolation rate and leaching loss are higher on coarse-textured soil withlow cation exchange capacity (Bijay-Singh et al. 2004), but such soils are muchless common for rice–rice cropping systems. We therefore assume that leachingloss of K approximately matched K input from rainwater and could be treated asnegligible.
Phosphorus balances, unlike K balances, in continuous rice cultivation arenot strongly affected by management of rice residue (Fig. 4a). Only about one-third of the total P in a mature rice plant typically remains in the crop residue afterharvest (Dobermann and Fairhurst 2000). The retention of crop residue has only asmall effect on net crop removal of P. All crop residue from rice with 7 t ha grainyield contains only about 5 kg P ha .
Phosphorus balances for one rice crop across a range of grain yields asaffected by crop residue retention (a) and addition of 10 kg P ha fromorganic materials (b)
Irrigation water from both gravity-fed systems and tube wells typicallycontains K, and irrigation can represent an important input of K during riceproduction. The input of K with irrigation water depends on both the Kconcentration in added water and the quantity of water added during the entirecropping cycle in rice production from the onset of land preparation to harvest.The concentration of K in irrigation water, as shown in Table 7, varies within andamong rice-growing areas. The median concentration of K in irrigation watercollected from eight rice-growing areas across six countries across Asia ranged
–1
–1
–1 –1
–1
–1
–1
Fig. 4
from 1.2 to 3.9 mg L . When all 245 observations across the eight rice-growingareas were combined, the median K concentration was 1.8 mg L and the mean Kconcentration was 2.5 mg L (Table 7).
The total water input from rainfall plus irrigation for one rice-growing cyclecan vary from as little as 400 mm for heavy clay soil with shallow groundwatertables that supply water to rice by capillary rise to more than 2000 mm for coarse-textured soil with deep groundwater tables. About 1300 to 1500 mm is a generalvalue for irrigated rice in Asia (Bouman and Tuong 2001; Bouman et al. 2006).Rainfall can differ markedly between growing seasons in Asian rice productionareas with two or three rice crops per year. During monsoonal wet seasons, muchof the required water can be provided through rainfall. Some irrigated rice areasdo not even receive irrigation in the wet season. In the dry season, on the otherhand, much of the water must be supplied through irrigation.
We assume an addition of 1000 mm of irrigation water during one croppingcycle. The addition of 1000 mm of irrigation water with 1.8 mg K L , the medianK concentration in Table 7, would add 18 kg K ha . This input of K wouldincrease with increased use of irrigation water, and it would decrease as rainfallcontributed a greater portion of the total required water.
The variability in K concentration of irrigation water leads to uncertainty inthe input of K for a specific rice field. Results for the two locations in thePhilippines in Table 7 illustrate substantial variation in K concentration amonglocations within a country. The K concentration in irrigation water ranged from
–1
–1
–1
–1
–1
Table 7 Potassium concentration of irrigation water collected from canals ofgravity-fed irrigation systems and from tube wells in rice–rice croppingsystems across Asia
Country Location Source n K concentration (mg L )
Mean SDb 25%quartile quartile
China Zhejiang Canal 65 2.1 2.0 1.1 1.7 2.2India Cauvery Delta Well 24 2.6 2.1 1.3 1.8 3.0Indonesia West Java Canal 22 4.0 5.4 1.7 1.9 3.3Philippines Bohol Canal 13 1.1 0.4 1.2 1.2 1.4
Iloilo Canal 22 3.8 1.1 3.3 3.9 4.2Thailand Central Plain Canal 20 2.0 0.8 1.6 1.8 2.0Vietnam Red River Delta Canal 31 2.7 2.0 1.2 2.0 3.3
Mekong Delta Canal 48 2.0 1.7 1.1 1.8 2.3All data 245 2.5 2.4 1.3 1.8 2.8
n = number of observationsb SD = standard deviationUnpublished data from IRRI Reversing Trends in Declining Productivity project,
1997-2000
a -1
of water Median 75%
c
c
c
c
c
a
b
c
360 361

0.3 to 1.5 mg L for 13 samples from Bohol and from 2.0 to 6.1 mg L for 22samples from Iloilo (data not shown). The K concentration for 50% of thesamples was 1.2 to 1.4 mg L in Bohol and 3.3 to 4.2 mg L in Iloilo. Assumingan addition of 1000 mm of irrigation water, K input for 50% of the rice fieldswould be 12 to 14 kg K ha in the sample area in Bohol and 33 to 42 kg K ha inthe sample area in Iloilo. The K inputs for the remaining 50% of rice fields wouldfall outside these ranges. The deficit in K balances, and consequently the amountof fertilizer K needed to maintain a non-negative K balance, would differ byabout 20 to 30 kg K ha between Bohol and Iloilo at comparable rice yields andfractions of retained rice residue.
Results in Table 7 also illustrate substantial variability in K concentration ofirrigation water within a rice-growing area. In the case of the Cauvery Delta inIndia, the K concentration in irrigation water for 24 samples ranged from 1.0 to9.5 mg L (data not shown), and 50% of the samples fell within 1.3 to 3.0 mg L .Assuming an addition of 1000 mm of irrigation water, K input for rice fieldswould range from 10 to 95 kg ha in the sample area with 50% of the fieldsreceiving 13 to 30 kg ha . This variability within a rice-growing area highlightsthe importance of information on K inputs from irrigation water whendetermining field-specific fertilizer K rates based on K balances.
The K balances in Fig. 3b assume input of 20 kg K ha from irrigation water,which, based on results in Table 7, appears likely for irrigated rice in seasons withlimited rainfall. Complete retention of crop residue with such input of K fromirrigation water results in near neutral K balances even at high rice yields. Thissuggests that K deficiency is unlikely in continuous cultivation of irrigated ricewith continual retention of all rice residue, use of irrigation water containing 2mg K L , and negligible K loss by leaching.
Irrigation water normally contains negligible P. The P concentration inirrigation water samples reported in Table 7 was consistently <0.1 mg L (datanot shown). Irrigation water is consequently not considered a source ofsignificant P in rice–rice cropping systems.
Integrated use of organic materials with manufactured chemical fertilizers isrecommended in some rice-growing areas (Mamaril et al. 2009). Organicmaterials such as composted animal manure and green manures contain K (Wittet al. 2007; Mamaril et al. 2009), which contribute to K balances and the supplyof plant-available K to rice crops. The K balances in Fig. 3c assume input of 20 kgK ha from organic material, corresponding to 2 t ha with 10 g K kg , inaddition to 20 kg K ha from irrigation water. The K deficits and hence likelyneed for fertilizer K are greatest at high rice yields, especially when little or nocrop residue is retained.
Organic materials at common levels of availability and application areunlikely to eliminate deficits in K balances at relatively high rice yields when
–1 –1
–1 –1
–1 –1
–1
–1 –1
–1
–1
–1
–1
–1
–1 –1 –1
–1
crop residue is only partially retained. But, at lower rice yields such as <5 t ha ,which are common for wet seasons, the application of organic materials withpartial retention of crop residues can result in near neutral K balances (Fig. 3c).When all crop residue is retained, the application of organic materials can resultin positive K balances across all rice yields (Fig. 3c).
The P from added organic materials can have a marked effect on P balances.The input of 10 kg P ha from organic material, corresponding to 2 t ha with 5 gP kg , can eliminate deficits in P balances at rice yields of <5 t ha (Fig. 4b).Organic P in added organic materials must be converted to phosphate duringdecomposition of the organic material to become plant available. As a result ofthis delayed release of plant-available P from organic materials, a relativelysmaller fraction of added P from organic material than from manufacturedchemical fertilizer would likely be taken up by rice in the season when P isapplied.
The rice–wheat cropping system is common in the subtropics of South Asia andChina. It is the main cereal system in the Indo-Gangetic Plains (IGP) of SouthAsia, where it is practiced on 13.5 million ha across Bangladesh, India, Nepal,and Pakistan. In the northwestern part of the IGP, the rice–wheat system is highlyintensive with liberal and often excessive use of irrigation water. There areincreasing concerns regarding the sustainability of the system in the northwesternIGP due to low use-efficiency of inputs, including fertilizers, depletion ofirrigation water, and degradation of soil resources (Ladha et al. 2009).
In Northwest India, within the northwestern part of the IGP, the groundwaterused for irrigation of rice–wheat is relatively high in K. Reported Kconcentrations for 242 samples from tube wells in the central plain region of thestate of Punjab in Northwest India ranged from 0.87 to 38.2 mg L with a mean of5.1 mg L (Pasricha et al. 2001). This corresponded to an estimated input ofabout 80 kg K ha from irrigation water for a rice–wheat system. Canal waterfrom gravity-fed irrigation is relatively lower in K content than water from tubewells. Because some farmers use water from both sources during a rice–wheatcropping cycle (Erenstein 2009), the input of K with irrigation water depends onsource as well as the amount of added water.
Soils for rice–wheat cropping in the northwestern IGP are light textured withrapid loss of water by percolation. An abundance of electric and diesel tube wellshas enabled considerable extraction of groundwater for rice–wheat production(Erenstein 2009). A survey of farmers at sites in Haryana, India and Punjab,Pakistan revealed use of about 1600 to 1900 mm irrigation water during one riceproduction cycle (Erenstein 2009). Much less irrigation water, approximating
–1
–1 –1
–1 –1
–1
–1
–1
Rice–wheat system
362 363

200 to 300 mm, is used for wheat production (Khurana et al. 2008; Erenstein2009). Use for one rice–wheat cropping cycle of an estimated 2000 mm irrigationwater originating from a tube-well with 5.1 mg K L would result in input of 102kg K ha from tube well irrigation. This matches with an estimated 100 kg K hayr from irrigation water reported in a long-term rice–wheat experiment atLudhiana, Punjab, by Bijay-Singh et al. (2004) in a review of literature. Afraction of the added K would likely be lost from the crop rooting zone throughleaching. An annual input of 75 kg K ha from irrigation water is therefore usedin Fig. 5 as a plausible net K input for a typical rice–wheat cropping system inNorthwest India.
Soil K in addition to K from irrigation water can be lost by leaching.Leaching loss of soil K can be an important output in K balances on soils withrelatively high release of K from nonexchangeable pools and minerals, leading tohigh concentrations of K in soil solution lost by percolation (Haefele 2001).Bijay-Singh et al. (2004), in a review of literature, estimated an annual Kleaching loss of 19 to 31 kg ha , depending on inputs of K, from a rice–wheatsystem on light-textured soil in Punjab. The estimated annual K input fromrainwater was 5 kg ha . Annual leaching loss of 20 kg K ha is therefore used inFig. 5 to approximate total leaching loss of soil K minus the small input of K fromrainwater.
Potassium balances for one rice–wheat cropping cycle in Northwest Indiaacross a range of rice grain yields as affected by net input of K withirrigation water and amount of crop residue retained. Wheat grain yield is5 t ha in all cases
As reported by Pasricha et al. (2001), K concentrations in tube-well watercan be markedly higher than 5 mg L . Assuming an application of 1800 mm ofwater with 10 mg K L and leaching loss of about 30% of the added K, this wouldresult in a net input of about 125 kg K ha , which is included in Fig. 5 as a
–1
–1 –1
–1
–1
–1
–1 –1
–1
–1
–1
–1
Fig. 5
plausible high net input of K with irrigation water. The low net K input of 25 kgha in Fig. 5 represents the use of water-saving technology leading to substantialsavings in total water use, enabling the use of primarily canal water rather thantube-well water for irrigation.
Wheat residue is often removed from the field for use as fodder in NorthwestIndia, whereas rice residue is less valuable for fodder and is often partially orcompletely retained in the field (Mandal et al. 2004). The K balances in Fig. 5awith 15% retention of both rice and wheat residue represent removal of all above-ground crop biomass except for small standing biomass near ground level. Undersuch conditions, K balances are negative across all rice grain yields even withhigh input of K from irrigation water.
The K balances in Fig. 5b with 15% retention of wheat residue and 100%retention of rice residue represent a relatively common situation with removal ofwheat residue but complete retention of rice residue such as after combineharvesting. Under such conditions, the K balance is near neutral across all ricegrain yields with net input of 125 kg K ha from irrigation water. Annual Kbalances are somewhat negative (–50 to –60 kg K ha ) with a plausible commonnet input of 75 kg K ha from irrigation water. Soils in this region have aninherent capacity to release K (Bijay-Singh et al. 2004). The retention of somecrop residue, use of relatively large amounts of irrigation water from tube wells,and net release of K from soil reserves could contribute to the commonlyobserved absence of crop response to applied K (Khurana et al. 2008). Theburning of rice residue would likely not have much effect on the K balancesbecause residue spread across a field normally does not result in appreciable lossof K (Dobermann and Fairhurst 2000).
The use of water-saving technologies that markedly reduce K inputs fromirrigation (e.g., input = 25 kg K ha in Fig. 5b) would result in more negative Kbalances, suggesting that water-saving technologies could increase the likelihoodof K deficiency even when rice residue is retained. Water-saving technologiescould be combined with retention of wheat residue (Fig. 5c) or use of fertilizer Kto compensate for reduced input of K from irrigation water. The value of wheatresidue for fodder and uses other than a supply of K would need to be assessedrelative to the cost of fertilizer K to determine the potential attractiveness ofwheat residue as a source of K. Our analysis suggests that variation in irrigationand residue management among fields can strongly affect K balances, whichcould have a considerable effect on the estimation of field-specific fertilizer Krates in the rice–wheat system.
The P balances in the rice–wheat system are consistently negative regardlessof the quantity of retained crop residue (Fig. 6). The retention of crop residuehas less effect on P than K balances because a much smaller fraction of the plantP than K remains in crop residue after harvest. The net removal of P in one
–1
–1
–1
–1
–1
364 365

cropping cycle with 5 t ha wheat grain yield and 7 t ha rice grain yield is about30 kg ha . This matches closely with results of on-station research at Ludhiana,Punjab, that led to recommended application of 26 kg P ha to wheat thatresponds to P and no application of P to rice that typically does not respond to P(Gupta et al. 2007).
Phosphorus balances for one rice–wheat cropping cycle in NorthwestIndia across a range of rice grain yields as affected by amount of cropresidue retained. Wheat grain yield is 5 t ha in all cases
The rice–maize cropping system in irrigated lowlands is gaining importanceacross tropical and subtropical Asia in response to increasing demand of maizefor feed and biofuel. Rice is a well-adapted crop in lowlands in the wet season,but maize can replace rice in the drier or cooler season, especially whenmarketing opportunities are attractive for maize or irrigation water is limited forrice production (Ali et al. 2008).
The nutrient balances for one rice–maize cycle in Fig. 7 represent commonmanagement for a rice–maize system with removal of nearly all above-groundbiomass (residue retention = 15%) and retention of some standing rice biomassafter harvest (residue retention = 40%). Maize residue is typically not retainedbecause it is difficult to incorporate during tillage for rice production and theincorporated residue with its high C-to-N ratio can lead to immobilization of Nduring decomposition. The K input from irrigation water is assumed to be only 25kg ha because the rice–maize system, unlike rice–wheat in Northwest India, isnot common in areas with high application to rice of tube-well water high in K.Leaching loss of K is assumed to be negligible.
–1 –1
–1
–1
–1
–1
Fig. 6
Rice–maize system
Fig. 7 Potassium and phosphorus balances for one rice–maize cropping cycleacross a range of rice grain yields as affected by maize yield. In each case40% of rice residue and 15% of maize residue were retained in the field,and K input from irrigation water during the cropping cycle was 25 kg ha
Nutrient balances for the rice–maize system are strongly affected by theyield of maize (Fig. 7). Hybrid maize in a rice–maize system can achieve a yieldup to 12 t ha with good management practices and a sufficient supply ofnutrients in farmers' fields (IPNI, unpublished data), which is markedly higherthan the achievable yield for either rice or wheat in the same season. At 12 t hamaize grain, there is a net export of about 200 kg K ha and 40 kg P ha for onerice–maize cropping cycle with common residue management practices andproduction of 5 t ha rice grain (Fig. 7). The rice–maize system with high maizeyield is more extractive of nutrients than rice–rice and rice–wheat systems.
The retention of maize residues can markedly reduce the net export from arice–maize cropping system of K but not P (Fig. 8). In the rice–maize croppingsystem, rice is typically grown in the wet season when rice yield is often lowerthan in the dry season. The nutrient balances in Fig. 8 consequently assume a riceyield of only 5 t ha in the wet season. Retention of maize residues markedlyreduces but does not eliminate the deficit in K balances when rice residue is notretained (Fig. 8a). Retention of all maize and rice residues is required to achievenear-neutral K balances (Fig. 8b).
Retention of rice residues is feasible through either combine harvesting ormanual harvesting with retention of standing biomass. Retention of maizeresidue is problematic because it increases the energy required for tillage beforerice. Incorporation of maize residue due to its high C-to-N ratio can also haveshort-term negative effects on N availability to rice due to N immobilization(Buresh et al. 2008). Establishment of rice with mulching of the maize residue
–1
–1
–1
–1 –1
–1
–1
366 367

rather than tillage to incorporate maize residue, such as through direct dryseeding, might provide an alternative to facilitate retention of maize residues inthe rice–maize system. In the absence of technologies to facilitate retention ofmaize residue, higher K deficits and hence higher fertilizer K requirements arelikely for the rice–maize system with high-yielding hybrid maize than for therice–rice or rice–wheat system.
The P balances are affected more by maize yield than by management ofmaize and rice residues. The P deficits and hence likely need for fertilizer Pincrease in direct proportion to the yield of maize (Fig. 8cd).
Determination of fertilizer K and P rates
Results from over 500 on-farm nutrient omission trials conducted with irrigatedrice in Bangladesh, India, Indonesia, and Vietnam (Table 1) are presented in Fig.9 to provide an example of yield gains attainable for rice from K and Pfertilization in Asia. Grain yields without K or without P increased in directproportion to yields with full fertilization throughout the range in yields from 3 to9 t ha . Yield gains expressed as a fraction of the yield with full fertilizationaveraged 12% (slope = 0.88) for K and 9% (slope = 0.91) for P.
Relationship between rice grain yields in a plot with full fertilization ofample N, P, and K and an adjacent plot without application of K or P butsufficient amounts of other nutrients to prevent their limitations. Data arefrom trials conducted in farmers' fields in Bangladesh, India, Indonesia,and Vietnam
In the yield gain approach for determining fertilizer K and P requirements,fertilizer K and P are applied only when a crop response to the nutrient is certain.As shown in Fig. 9, the yield gain for irrigated rice from added K or P is oftenrelatively small to moderate, averaging near 10%. We therefore present yield gainsof 5%, 10% and 20% in an illustration of fertilizer K and P rates and balancesacross the feasible range of irrigated rice yields from 3 to 9 t ha (Fig. 10).
Fertilizer K and P rates were determined using equations 7 and 8 in whichyield gain (GY – GY ) at a targeted yield with full fertilization (GY) wasdetermined as the respective fraction (5%, 10%, or 20%) of GY. We used RIEs forK (15.9) and P (2.7) as determined by QUEFTS (Table 3) and recovery efficiencies
Yield gain approach
–1
–1
Fig. 9
0
Fig. 8 Potassium and phosphorus balances for one rice–maize cropping cycleacross a range of maize grain yields as affected by amount of maize andrice residue retained. Rice grain yield was 5 t ha in all cases, and K inputfrom irrigation water during the cropping cycle was 25 kg ha
–1
–1
368 369

of K (RE = 0.64) and P (RE = 0.3) that correspond to about the 70% quartile forvalues obtained by Witt and Dobermann (2004) from a large data set for irrigatedrice in Asia. Fertilizer requirements corresponded to 25 kg K ha and 9 kg P ha toraise the respective nutrient-limited yield by 1 t ha . In the estimation of K and Pbalances in Fig. 10, we assumed 40% retention of rice residue (CRR = 0.4 inequations 5 and 6) and 20 kg K ha net input from irrigation water, whichapproximates a likely median value for dry-season rice among sites shown in Table7. Leaching loss of K is assumed to be negligible.
Fertilizer K and P requirements determined by the yield gain approach(equations 7 and 8) increased with increasing target yield (Fig. 10ac), but the Kand P rates did not increase sufficiently fast to prevent increasing depletion of soil
K P
–1 –1
–1
–1
fertility with increasing yield within the ranges of yield gain common forirrigated rice (Fig. 10bd). The same trends of increasing fertilizer rates anddecreasing nutrient balances with increasing yield occur when lower recoveryefficiencies (RE = 0.35 and RE = 0.22) corresponding to median valuesreported by Witt and Dobermann (2004) were used to determine fertilizerrequirements (data not shown).
A distinctly undesirable feature of fertilizer K and P rates determined by theyield gain approach is higher K and P depletion at high than low target yields.This could accelerate the onset of nutrient limitations and subsequent declines inproductivity in existing high-yielding areas. For both K and P, the slope forestimated nutrient balances with increasing yield became less negative as yieldgain increased from 5% to 20%. Yield gains >20%, which are not common forirrigated rice (Fig. 9), would be required to obtain slope = 0 (Fig. 10), at whichpoint nutrient depletion would be constant across yields.
Although Fig. 10 presents results for rice, the same trends would apply towheat and maize. Cereal-growing areas with high-yielding crops and relativelysmall current yield gain from K and P fertilization — and hence low fertilizer Kand P recommendations based on a yield gain approach — would be particularlyprone to nutrient mining and risk of declining productivity. For K, because of thelarge portion of total plant K in crop residues, the risk would be greater in high-yielding fields with removal than with retention of crop residues. Locations withexisting large yield gains from K and P fertilization would be relatively less atrisk of further K and P mining from fertilizer K and P recommendations basedsolely on a yield gain approach.
The determination of fertilizer K (FK) or fertilizer P (FP) (in kg ha ) requiredto achieve a targeted yield (GY, expressed in t ha ) by the yield gain approach canbe simplified by replacing RIE/RE in equations 7 and 8 with a target agronomicefficiency (AE) for the nutrient:FK = (GY – GY ) x 1000/AE [19]FP = (GY – GY ) x 1000/AE [20]where agronomic efficiency of the applied nutrient (AE or AE ) is expressed askg increase in grain yield per kg applied nutrient. The determination with SSNMof fertilizer N requirements uses a comparable yield gain approach withagronomic efficiency (Witt et al. 2007). The target fertilizer requirements of 25kg K and 9 kg P to raise the respective nutrient-limited yield by 1 t hacorrespond to AE = 40 kg kg and AE = 110 kg kg . This AE is derived from adata set without P-fixing soils, and it would likely be lower for soils with highcapacity to fix P.
The nutrient balance approach based on full or partial maintenance of nutrient
K P
0K K
0P P
K P
K P P
–1
–1
–1
–1 –1
Nutrient maintenance based on nutrient balance approach
Fig. 10 Fertilizer K and P rates for rice determined with a yield gain approachbased on anticipated yield gain from K or P fertilization, expressed as apercentage of the attainable yield with full balanced fertilization. In eachcase 40% of rice residue was retained in the field, and K input fromirrigation water during the cropping cycle was 20 kg ha–1
370 371

input-output balances provides an alternative to the yield gain approach fordetermining fertilizer K and P requirements. With full maintenance (FM = 1 inequations 11 and 12), the fertilizer K or P rates match removal of K or P, ensuringno nutrient depletion (depletion = 0 in Fig. 11). Full maintenance rates of anutrient fail to consider enhanced nutrient availability from soil biological,chemical, and physical processes. They can also result in short-term financial lossfor farmers when the yield gain resulting from application of the nutrient isnegligible or small. But, failure to apply the nutrient leads to nutrient depletion,which might eventually lead to yield loss. Application of fertilizer K and P at lessthan full (i.e., partial) maintenance rates could then provide an opportunity toconsider the supply of nutrient from soil reserves, including contributions frombiological processes, and better handle the tradeoffs between longer-term
sustained productivity and short-term financial benefit.One option for determining fertilizer rates at partial maintenance is to allow a
drawdown or depletion of soil nutrient reserves equivalent to a fraction of thenutrient required for full maintenance of the nutrient input-output balance. Thisoption, which we refer to as fractional depletion, is illustrated in Fig. 11 forfertilizer K and P rates determined at 50% of full maintenance (depletion = 50%;FM = 0.5 in equations 11 and 12). Fertilizer rates increased with increasing targetyield (Fig. 11ac), but the K and P rates did not increase sufficiently fast to preventincreasing depletion of soil K and P with increasing yield (Fig. 11bd). Nutrientdepletion and risk of declining productivity are higher at high than low targetyields with this option of partial maintenance.
Another option for determining fertilizer rates at partial maintenance is toallow depletion of a nutrient up to but not beyond a threshold limit (K and P inequations 13 and 14). In this option, which we refer to as limited depletion, thethreshold limit represents the estimated drawdown of soil nutrient reserves thatcould be sustained without leading to more nutrient limitations on crop yield. Theallowable drawdown of soil nutrient reserves (FM in fractional depletion optionand K and P in limited depletion option) could depend upon soil processes likesoil biological activity as affected by water regime (Turner and Haygarth 2001)and tillage (Lorenz et al. 2009), equilibrium among nutrient pools (Singh at el.2002; Saleque et al. 2009), and soil characteristics like mineralogy (Bijay-Singhet al. 2004). Fig. 11 illustrates conditions in which the limits for drawdown of soilnutrient reserves were 30 kg K ha (K ) and 8 kg P ha (P ). Rice residue
retention was 40%, net K input from irrigation water was 20 kg ha , and leachingloss of K was negligible.
With the limited depletion option, fertilizer rates (Fig. 11ac) are calculatedsuch that nutrient balances (Fig. 11bd) are never more negative than the limit fordrawdown of soil nutrient reserves (K and P ). No fertilizer K or P isrecommended at low yields (Fig. 11bd). Fertilizer K or P is recommended onlyabove the yield at which the net output of the nutrient in the nutrient balanceexceeds K or P (equations 13 and 14). The relatively comparable level ofnutrient depletion across yields and the absence of increasing nutrient depletionat high yields make the limited depletion option for partial maintenance(equations 13 and 14) more attractive than the fractional depletion option(equations 11 and 12) for determining fertilizer K and P across environments withwidely varying yields.
Use of the partial maintenance approach to determine fertilizer requirementsrisks applying insufficient nutrient to meet crop needs when yield gain to the
S S
S S
S S
S S
S S
–1 –1
–1
Partial maintenance plus yield gain approach
Fig. 11 Fertilizer K and P rates for rice determined with a nutrient balanceapproach allowing three contrasting amounts for K and P depletion. Ineach case 40% of rice residue was retained in the field, and K input fromirrigation water during the cropping cycle was 20 kg ha–1
372 373

added nutrient is large, but use of the yield gain approach by itself can result innutrient depletion at high yields (Fig. 10bd). A combination of the twoapproaches was therefore examined for determining fertilizer requirements whenyield gain from added nutrient is certain.
In Fig. 12 the fertilizer K and P rates and balances for a partial maintenanceapproach with limited depletion (K = 30 kg K ha and P = 8 kg P ha ) arecompared alone (equations 13 and 14) and in combination with a yield gainapproach (equations 17 and 18). Yield gain was either set at 20% of attainableyield (GY – GY = 0.2GY) or at a constant 1 t ha (GY – GY = 1). In Fig. 13 the
S S
0 0
–1 –1
–1
fertilizer K and P rates and balances for a partial maintenance approach withfractional depletion (depletion = 50%, FM = 0.5) are compared alone (equations11 and 12) and in combination with a yield gain approach (equations 15 and 16).As in Fig 12, yield gain was either set at 20% of attainable yield or at a constant 1t ha . As in Fig. 10 and Fig. 11, rice residue retention was 40%, net K input fromirrigation water was 20 kg ha , and leaching loss of K was negligible.
Fertilizer rates were lowest when determined with only a partial maintenanceapproach (Fig. 12ac and 13ac). Combining partial maintenance with a yield gainapproach resulted in higher calculated fertilizer rates and more positive K and Pbalances (Fig. 12bd and 13bd). Fertilizer rates with a partial maintenance plusyield gain approach increased faster with increasing yield when yield gain wasexpressed as a fraction of attainable yield (i.e., 20%) rather than as a fixed amount
–1
–1
Fig. 12 Fertilizer K and P rates for rice determined with a partial maintenanceplus yield gain approach in which maximum K and P depletion does notexceed a threshold limit from the soil nutrient reserves. In each case 40%of rice residue was retained in the field, and K input from irrigation waterduring the cropping cycle was 20 kg ha–1
Fig. 13 Fertilizer K and P rates for rice determined with a partial maintenance +yield gain approach in which maintenance rates of K and P are a fractionof the nutrient depletion determined with nutrient balances. In each case40% of rice residue was retained in the field, and K input from irrigationwater during the cropping cycle was 20 kg ha–1
374 375

(i.e., 1 t ha ). The K and P balances as a result were more positive at higher yieldswhen yield gain was expressed as a fraction of attainable yield (i.e., 20%).
Based on results from nutrient omission plot studies (Fig. 9), the yield gain ofrice from K and P fertilization is directly related to the attainable yield with fullfertilization. Yield gain is consequently better represented across a wide range ofyields as a fraction of the attainable yield (i.e., 20% in Fig. 12 and 13) rather thana fixed amount (i.e., 1 t ha ). Based on data in Fig. 9, for example, at 5 t haattainable yield with full fertilization, the mean yield gain was 0.6 t ha for Kapplication and 0.5 t ha for P application; at 8 t ha attainable yield with fullfertilization, the mean yield gain was 1.0 t ha for K application and 0.7 t ha forP application.
The results suggest that at low rice yields when the yield gain from applied Kor P is relatively small such as 0.5 t ha , which often corresponds to yields of<5 t ha (Fig. 9), fertilizer requirements can be determined with only a partialmaintenance approach (Fig. 11). When yield gain is more pronounced, a partialmaintenance plus yield gain approach can be considered for determiningfertilizer requirements (Fig. 12 and 13). Expressing yield gain as a fraction oftargeted yield helps ensure a good fit with measured yield gains (Fig. 9), and ithelps ensure that the input of nutrient at higher yields is relatively higher andsufficient to overcome nutrient deficiencies.
The determination of fertilizer K (FK) or fertilizer P (FP) by a partialmaintenance plus yield gain approach can be simplified by replacing RIE/RE inequations 15 to 18 with a target agronomic efficiency (AE) of the nutrient.Equations 15 and 16 for the fractional depletion option become:FK = ((GY x RIE – K – K – K + K ) x FM) + ((GY – GY ) x 1000/AE ) [21]FP = ((GY x RIE – P – P ) x FM) + ((GY – GY ) x 1000/AE ) [22]Equations 17 and 18 for the limited depletion option become:FK = (GY x RIE – K – K – K – K + K ) + ((GY – GY ) x 1000/AE ) [23]FP = (GY x RIE – P – P – P ) + ((GY – GY ) x 1000/AE ) [24]
The SSNM-based approach and algorithms we present for determining fertilizerK and P requirements provide an alternative to soil-test approaches (Slaton et al.2009) that use algorithms derived from fertilizer response trials conducted acrossmultiple locations. The SSNM-based approach through the use of nutrientbalances enables the determination of fertilizer K and P requirements when theyield gain from the applied nutrient is negligible or uncertain (Witt andDobermann 2004; Witt et al. 2007), which periodically occurs for irrigated riceespecially at lower yields (Fig. 9). In this paper we revise the SSNM-basedapproach to accommodate partial nutrient balances, which consider the net effect
–1
–1 –1
–1
–1 –1
–1 –1
–1
–1
K CR W OM L 0K K
P CR OM 0P P
K CR W OM S L 0K K
P CR OM S 0P P
Discussion
of soil processes and soil characteristics mediating K and P supply when yieldgain from the applied nutrient is uncertain. The use of nutrient balances across afull range of plausible yields enables fertilizer K and P requirements to beadjusted for field-specific yield and management, such as amounts of retainedcrop residue and applied organic materials, which affect inputs and outputs of Kand P.
The SSNM-based approach for determining fertilizer requirements is wellsuited for small, heterogeneous landholdings typical of rice-based croppingsystems in Asia where fertilizer requirements can vary greatly among nearbyfields and the yield gain from applied K or P is often uncertain. Nutrient balancescan provide a pragmatic estimate of nutrient inputs and outputs for a field plot,which can then be used for determining fertilizer K and P requirements for thespecific field. Numerous practices including tillage, management of cropresidues and organic materials, and water management can influence soilbiological activity and nutrient availability. Their net effect on K and P supply canbe considered through K and P in partial nutrient balances (equations 13, 14, 23,and 24). Research is needed to quantify the net effect of soil processes and soilcharacteristics on the sustainable drawdown of soil K and P reserves (K and P )used in the determination of fertilizer K and P requirements.
Whereas nutrient balances are essential for determining SSNM-basedfertilizer K and P requirements, nutrient balances are not used for determiningSSNM-based fertilizer N requirements. With SSNM, fertilizer N requirementsare based on the yield gain from applied N (Witt et al. 2007) because rice andother cereal crops in irrigated environments virtually always respond to fertilizerN. The SSNM-based approach enables yield gain from applied fertilizer N, andhence total fertilizer N requirement, to be adjusted for management practices. Italso provides decision tools such as the leaf color chart for dynamically adjustingthe application of N during the growing season to match crop needs forsupplemental N (Alam et al. 2005), which can be influenced by the effects ofmanagement on availability of soil N.
Internal nutrient efficiencies for rice
Field-specific requirements of a cereal crop for fertilizer K and P can becalculated using RIE to estimate nutrient accumulation by a crop (Witt andDobermann 2004). The RIE values obtained for rice in our study using QUEFTSmatched well with RIE values reported by others (Witt et al. 1999; Haefele et al.2003) for rice with harvest index 0.4, grown with balanced fertilization andgood agronomic management. This consistency in RIE across diverse irrigatedrice-growing environments and cultivars provides confidence that one RIE pernutrient can be used for semi-dwarf irrigated rice in determining fertilizer P and
S S
S S
376 377

K requirements when fertilization is balanced to match crop needs.Deviations in RIE from the estimation with QUEFTS arise from unbalanced
plant nutrition leading to either nutrient accumulation associated with luxuriantuptake of the nutrient or nutrient dilution associated with nutrient deficiency.Deviations in RIE can also arise from biotic or abiotic stresses that adverselyaffect grain production leading to low harvest index. The desired RIE value foruse in determining fertilizer P and K requirements reflects an optimalaccumulation of the nutrients in a mature crop without biotic and abiotic stress.
The RIE increases slightly as targeted yield increases above 60% to 70%yield potential, which is common in farmers' fields, to 80% of yield potential,which represents a likely upper limit to profitable rice production (Table 6). Butthis change in RIE is relatively small ( 7%) compared to other inherentuncertainties associated with the determination of fertilizer rates such asestimation of the attainable yield, yield gain, and some components of thenutrient balance such as K addition from irrigation water. The use of RIE at 60%to 70% of yield potential therefore appears appropriate for determing fertilizerrequirements for irrigated rice.
Semi-dwarf, high-yielding irrigated rice without biotic or abiotic stresses hasharvest index 0.4, which was the lower limit of harvest index used by Witt et al.(1999), Haefele et al. (2003), and our study. We propose that 14.6 kg N, 2.7 kg P,and 15.9 kg K per tonne of grain (Table 3) and nutrient harvest indices of HI =0.15 and HI = 0.7 (Table 4) obtained from a large data set in our study andcomparable to values reported by others (Witt et al. 1999, Haefele et al. 2003) canserve as standards for use in determining nutrient balances and associated P andK fertilizer rates with semi-dwarf, high-yielding irrigated rice grown with goodagronomic practices and sufficient water. Alternative RIE values would berequired for rice cultivars with harvest index <0.4 (Table 5).
Some rice in rainfed areas can have harvest index <0.4 and correspondingincreased accumulation of plant nutrient in above-ground dry matter per tonnegrain yield. Mukhopadhyay et al. (2008), for example, in a fertilizer trial withrainfed rice in West Bengal in eastern India, reported mean harvest index = 0.32and mean accumulation of 33 kg K and 4.3 kg P per tonne of grain. In a multi-location trial in Thailand with 624 observations for traditional tall rice cultivars,Naklang et al. (2006) reported median harvest index = 0.28 and median plantaccumulation of 48 kg K and 4.7 kg P per tonne of grain. In both studies the riceyields were relatively low (<4 t ha ). The higher RIE reported for traditional-typerice by Naklang et al. (2006) than found for semi-dwarf modern rice such as inWitt et al. (1999) and our study resulted from differences in harvest index ratherthan differences in tissue concentration of nutrients between the two types of rice.
The RIE estimated from the mean or median of a data set (Table 2) tends tobe higher than the RIE estimated from the linear portion of the QUEFTS model
K
P
–1
(Table 3), which reflects a more balanced uptake of nutrient by the crop. Wetherefore recommend use of the QUEFTS model with a relatively large data setfrom across rice-growing areas to estimate RIE for rice cultivars with harvestindex <0.4. The estimated RIE for K and P can then be used in calculatingnutrient balances and fertilizer rates for rice cultivars — for a given range inharvest index — grown with balanced use of nutrient inputs and good agronomicpractices. Data from crop-growing situations with either luxuriant uptake ofnutrients, such as arising from excessive fertilization, or nutrient deficiency aretherefore preferably omitted from the data set used with QUEFTS.
Nutrient balances in rice-based cropping systems
Potassium balances in rice-based systems are strongly affected by the attainedcrop yield and fraction of crop residue retained, which can vary from field tofield. An immediate opportunity for improving the profitability and effectivenessof fertilizer K use is consequently to enable field-specific adjustments in fertilizerK rates based on probable yield and fraction of crop residue retained in a specificfield. Fertilizer K rates for a field could then be further adjusted based on the useof externally produced organic materials. Whereas organic materials are oftenpromoted for their N benefit, the K inputs from organic materials can beoverlooked. From the perspective of K balances and maintenance of soil Kfertility, the application of organic materials to rice is more warranted when cropresidues are removed rather than retained. Full retention of rice residue with theapplication of organic materials can potentially result in positive K balances (Fig.3c).
Irrigation water can be an unknown but important input of K in riceproduction because of the large quantity of water applied to rice. Uncertaintiesassociated with K concentration in irrigation water and quantity of addedirrigation water, which can vary from field to field, present a challenge forimproving K management and adjusting fertilizer K rates for field-specificconditions. The K concentration in irrigation water depends on the source of thewater. It is often higher in water from tube wells than from canals in gravity-fedirrigation systems (Pasricha et al. 2001), but it can vary among gravity-fedirrigation systems as illustrated by the contrast between Bohol and Iloilo in thePhilippines (Table 7).
The adjustment of fertilizer K requirements to field-specific yields andresidue retention can be relatively straightforward because farmers know theirfield-specific yields and residue management practices. The K input throughirrigation water, on the other hand, will not be known to farmers. An adjustmentin fertilizer K requirements for inputs from irrigation water would likely need tobe made across a region rather than for a specific field. One option could be toestimate, across an entire gravity-fed irrigation system or across all tube wells in
378 379

a region, a probable net K input based on approximate K concentration of thewater and typical amount of irrigation water used in a cropping season. Thisestimated probable K input could then be used to adjust nutrient balance-based Kfertilizer rates across fields for the irrigation system or region. Although such anadjustment in fertilizer K rates would undoubtedly contain much uncertainty, itwould be superior to the current situation in which net K input from irrigationwater is either ignored or assumed to be constant across a country.
Phosphorus balances in rice and rice-based systems are strongly affected byattained crop yield. Residue retention has relatively little effect on P balances andhence fertilizer P requirements determined through nutrient balances because ofthe relatively low P content of residue compared with grain. An immediateopportunity for improving the profitability and effectiveness of fertilizer P use isconsequently to enable field-specific adjustments in fertilizer P rates based onprobable yields.
Fertilizer P rates at the field level could then be further adjusted based on theuse of organic materials, which, when relatively rich in P, can contribute to Pbalances (Fig. 4). Uncertainty exists regarding P supply from organic materialsbecause organic materials can vary greatly not only in P concentration but also inthe rate of release of plant-available P. The supply of P from organic materials atleast in the short term is probably less than from manufactured chemicalfertilizer, in which case one unit of P from organic materials would substitute forless than a comparable unit of P from manufactured chemical fertilizer. Theeffectiveness in replacing P from manufactured chemical fertilizer mightincrease, however, through longer-term application of organic materials.Appropriate adjustment in fertilizer P rates for P supplied by added organicmaterials is consequently a challenge.
High input of K through irrigation water together with supply of K from soilhas likely contributed to the long-term production of rice–wheat in NorthwestIndia (Fig. 5) with little or no response to fertilizer K (Khurana et al. 2008). Theintroduction of practices that markedly reduce the use of tube-well water, such asresource-conserving technologies (Ladha et al. 2009), could lead to morenegative K balances and increased need for fertilizer K (Fig. 5). The monitoringof changes in K balances and fertilizer K needs arising from the adoption ofwater-saving technologies in areas with high use of tube-well water rich in K ismerited.
Potassium deficiencies in the rice–wheat system are more likely in areas withlittle K input from irrigation water and limited retention of crop residues.Although K is high in irrigation water from tube wells in the northwestern IGP(Pasricha et al. 2001), irrigation water can be lower in K in other rice–wheat areasof the IGP. Analysis of 21 samples of irrigation water from tube wells inrice–wheat areas of Uttaranchal, India, for example, revealed relatively low Kconcentration ranging from 0.8 to 2.8 mg L , with a median of 1.3 mg L–1 –1
(unpublished data, IRRI Reversing Trends in Declining Productivity project,1997–2000). At these K concentrations, the K input from irrigation water for arice–wheat cropping cycle would approximate 25 kg ha , leading to markedlynegative K balances regardless of residue retention (Fig. 5).
The rice–maize cropping system, because of the high yields of hybrid maize,can be a large net exporter of K and P (Fig. 7). The conversion of rice–rice orrice–wheat to rice–maize cropping could lead to a rapid depletion of soil K and Pif K and P fertilizer are not appropriately adjusted to account for the higher cropproduction and plant accumulation of nutrients. Guidelines for determining field-specific K and P requirements that optimally balance the trade-offs betweenshort-term profitability and longer-term sustainable productivity can therefore beespecially important for the emerging high-yielding rice–maize system. Based onK balances, fertilizer K needs could be particularly high when maize residue isnot retained in the field either because of off-field value such as for fodder orbecause it is a nuisance during subsequent tillage and establishment practices forrice (Fig. 8b).
Determination of fertilizer K and P rates
The established RIE for K and P for a crop (i.e., 2.7 kg P and 15.9 kg K per tonneof grain for rice, Table 3) can be used to determine fertilizer P and K requirementsthat are based on a targeted attainable yield, nutrient balances, and anticipatedyield gain from the added nutrient. When yield gain from an added nutrient issmall or negligible, the application of nutrient would not be recommended withsolely a yield gain approach (equations 7 and 8), but the failure to apply anynutrient could result in rapid nutrient depletion, especially at high yields (Fig. 10bd). A nutrient maintenance approach based on nutrient balances, on the otherhand, would recommend application of nutrient even when yield gain is notcertain.
Use of a full maintenance approach (equations 9 and 10) as advocated byWitt and Dobermann (2004) and Witt et al. (2007) for rice can result in relativelylarge applications of the nutrient, which would be unprofitable in the absence of ayield gain from the added nutrient. A partial maintenance approach, rather than afull maintenance approach, for determining fertilizer requirements can include anestimate of nutrient supply as affected by soil processes and soil characteristicsand provide an option to balance the trade-offs between longer-term sustainedproductivity and short-term profitability.
The merit of a partial maintenance approach for determining fertilizer Krequirements can be illustrated with results from a long-term fertilizerexperiment with two rice crops per year in West Java, Indonesia (Abdulrachmanet al. 2006). The yield loss from not applying fertilizer K during the initial fiveyears (10 crops) was not statistically significant or certain to farmers in any
–1
380 381

season. Use of a yield gain approach in such a situation would result in no use offertilizer K. Yet, the cumulative yield loss without fertilizer K for the 10 cropswas 3 t ha or 0.3 t ha crop . Use of a full maintenance approach would result inmean application of about 30 kg K ha for each crop, which could be financiallyunattractive with probable farm-gate prices for fertilizer and produced rice. Useof a lower fertilizer K rate based on an estimated sustainable extraction of K fromsoil reserves (i.e., partial maintenance using K in equation 13) and consideringthe farm-gate price of harvested rice relative to the farm-gate fertilizer pricecould help ensure a balance between short-term profitability and longer-termsustained productivity without a yield loss due to K deficiency.
We consequently recommend use of a partial maintenance approach fordetermining fertilizer K and P requirements when yield gain from an addednutrient is small or negligible. Based on the results of analyses in our study, werecommend a partial maintenance approach in which fertilizer rates arecalculated to ensure that the depletion of the nutrient does not exceed a thresholdlimit (K and P ) regardless of yield (equations 13 and 14). This avoids the risk ofincreasing nutrient depletion with increasing yield.
When a detectable yield gain from an added nutrient is certain, an approachother than solely maintenance or yield gain appears merited. Witt andDobermann (2004) and Witt et al. (2007) combined full maintenance of soilfertility and yield gain approaches to determine fertilizer K and P requirements.They did not sum the fertilizer rates determined from full maintenance and yieldgain approaches. Rather, they separately calculated fertilizer K or P rates with thetwo approaches and then selected the larger of the two calculated values as thefertilizer requirement. In this fashion the nutrient recommendation was never lessthan full maintenance and was potentially higher than full maintenance whenyield gain from the added nutrient was appreciable.
The full maintenance plus yield gain approach of Witt and Dobermann(2004) and Witt et al. (2007) can result in a relatively large application of nutrient,which can potentially be unprofitable when farm-gate fertilizer prices are highrelative to the farm-gate price of produced grain and crop response to the nutrientis modest. Based on the analyses in our study, we consequently recommend apartial maintenance plus yield gain approach to determine fertilizer requirementswhen the crop responds to the added nutrient. The calculated fertilizerrequirement is the sum of the amount determined by partial maintenance andyield gain (equations 15 to 18 and equations 21 to 24). Calculated fertilizerrequirements can result in positive nutrient balances, but the fertilizer rates canalso result in slightly negative nutrient balances (Fig 12 bd and 13 bd) becausemaintenance is only partial. Our analysis highlighted the merit of expressingyield gain as a fraction of targeted yield rather than an absolute amount, becausemeasured yield gains from fertilizer K and P across a wide range of yields
–1 –1 –1
–1
S
S S
approximate a fraction of the yield with full fertilization (Fig. 9).The procedures and algorithms presented for determining fertilizer K and P
requirements for rice can also be used for wheat and maize with appropriate RIEsdetermined by QUEFTS for the crops. The threshold limit for nutrient extractionfrom soil reserves (K and P ) could differ between rice and wheat or maizebecause the release of soil nutrients can differ between saturated anaerobic soilsin rice cultivation and aerobic soils in wheat and maize cultivation. Soilsubmergence in rice cultivation, for example, tends to increase P availability(Turner and Gilliam 1976), which might conceivably affect the limit ofsustainable nutrient extraction from soil reserves as well as the yield gain of acrop from fertilizer P. For rice–wheat and rice–maize systems, this can influencethe optimal distribution of fertilizer P between rice and the non-rice crop in therotation (Gill and Meelu 1983).
Fertilizer K and P requirements for a specific field can be determined with anSSNM-based approach using attainable target yield, nutrient balances, andprobable yield gains from added nutrient. One standardized RIE value pernutrient for a crop facilitates the determination of nutrient balances in thealgorithms. The partial maintenance and partial maintenance plus yield gainapproaches that we have presented can be used in computer-based decision toolssuch as Nutrient Manager for Rice (IRRI 2010), which is designed to quicklyprovide extension workers, crop advisors, and farmers with fertilizer bestmanagement practices for specific rice fields. Each decision tool consists ofquestions readily answered within 15 minutes without the need for soil analysis.The responses to the questions provide sufficient information to develop field-specific fertilizer K and P recommendations using approaches and algorithms wehave described in this paper. The generic SSNM-based principles and algorithmswe presented for K and P are well suited for the rapid development and extensionof field-specific fertilizer recommendations for rice, and they can be readilyadapted for use with wheat and maize.
The Swiss Agency for Development and Cooperation (SDC),the International Fertilizer Industry Association (IFA), the International PlantNutrition Institute (IPNI), and the International Potash Institute (IPI) supportedthe research from which most data in this paper were obtained and through whichthe principles of SSNM that make this paper possible were developed.
We thank Ms. Nadialin Borje for the compilation of the data set and theQUEFTS analysis. We thank the following institutions for collaboration, whichcontributed data used in this paper: Bangladesh Rice Research Institute; Zhejiang
S S
Conclusions
Acknowledgment
382 383

University, China; Tamil Nadu Agricultural University, India; Indonesian Centerfor Rice Research; Philippine Rice Research Institute; West Visayas StateUniversity, Philippines; Bohol Agricultural Promotion Center, Philippines; RiceDepartment, Thailand; Cuu Long Rice Research Institute, Vietnam; Soil andFertilizer Research Institute, Vietnam. Floodwater data from the RTDP projectwere obtained and compiled by Dr. Arlene Adviento-Borbe.
Abdulrachman S, Witt C, Buresh RJ (2006) The need for potassium fertilizationin rice and experiences from a long-term experiment in Indonesia. e-ifc no.10, International Potash Institute. www.ipipotash.org/eifc/2006/10/6.Accessed 25 January 2010
Alam MM, Ladha JK, Khan SR, Foyjunnessa, Rashid H, Khan AH, Buresh RJ(2005) Leaf color chart for managing nitrogen fertilizer in lowland rice inBangladesh. Agron J 97: 949–959
Ali MY, Waddington SR, Hodson D, Timsina J, Dixon J (2008) Maize-ricecropping systems in Bangladesh: Status and research opportunities.International Maize and Wheat Improvement Center (CIMMYT), Mexico,D.F.
Bijay-Singh, Yadvinder-Singh, Imas P, Jing-chang X (2004) Potassium nutritionof the rice–wheat cropping system. Adv Agron 81: 203–259
Bouman BAM, Humphreys E, Tuong TP, Barker R (2006) Rice and water. AdvAgron 92: 187–237
Bouman BAM, Tuong TP (2001) Field water management to save water andincrease productivity in irrigated rice. Agric Water Manage 49: 11–30
Buresh RJ, Reddy KR, van Kessel C (2008) Nitrogen transformations insubmerged soils. In: Schepers JS, Raun WR (ed) Nitrogen in agriculturalsystems. Agronomy Monograph 49. ASA, CSSA, and SSSA, Madison, WI,USA, pp 401–436
Buresh RJ, Witt C (2007) Site specific nutrient management. Proceedings of theIFA international workshop on fertilizer best management practices, 7–9March 2007, Brussels, Belgium. International Fertilizer IndustryAssociation, Paris, pp 47–55.
Dobermann A, Cassman KG, Mamaril CP, Sheehy JE (1998) Management ofphosphorus, potassium, and sulfur in intensive, irrigated lowland rice. FieldCrops Res 56: 113–138
Dobermann A, Fairhurst T (2000) Rice: Nutrient disorders and nutrientmanagement. Potash and Phosphate Institute (PPI) and Potash andPhosphate Institute of Canada (PPIC), Singapore and International RiceResearch Institute (IRRI), Los Baños, Philippines
Dobermann A, Witt C, Dawe D (eds) (2004) Increasing the productivity of
References
intensive rice systems through site-specific nutrient management. SciencePublishers Inc., Enfield, NH, USA and International Rice Research Institute(IRRI), Metro Manila, Philippines
Dobermann A, Witt C, Dawe D, Abdulrachman S, Gines GC, Nagarajan R,Satawathananont S, Son TT, Tan PS, Wang GH, Chien NV, Thoa VTK,Phung CV, Stalin P, Muthukrishnan P, Ravi V, Babu M, Chatuporn S,Sookthongsa J, Sun Q, Fu R, Simbahan GC, Adviento MAA (2002) Site-specific nutrient management for intensive rice cropping systems in Asia.Field Crops Res 74: 37–66
Erenstein O (2009) Comparing water management in rice–wheat productionsystems in Haryana, India and Punjab, Pakistan. Agric Water Manage 96:1799–1806
Gill HS, Meelu OP (1983) Studies on the utilization of phosphorus and causes forits differential response in rice–wheat rotation. Plant Soil 74: 211–222
Gupta RK, Yadvinder-Singh, Ladha JK, Bijay-Singh, Singh J, Singh G, Pathak H(2007) Yield and phosphorus transformations in a rice–wheat system withcrop residue and phosphorus management. Soil Sci Soc Am J 71: 1500–1507
Haefele SM (2001) Improved and sustainable nutrient management for irrigatedrice-based cropping systems in West Africa. PhD dissertation. HamburgUniversity, Germany.
Haefele SM, Wopereis MCS, Ndiaye MK, Barro SE, Ould Isselmou M (2003)Internal nutrient efficiencies, fertilizer recovery rates and indigenousnutrient supply of irrigated lowland rice in Sahelian West Africa. Field CropsRes 80: 19–32
IRRI (International Rice Research Institute) (2010) Nutrient managementdecision tools. www.irri.org/nmrice. Accessed 10 May 2010
Khurana HS, Phillips SB, Bijay-Singh, Alley MM, Dobermann A, Sidhu AS,Yadvinder-Singh, Peng S (2008) Agronomic and economic evaluation ofsite-specific nutrient management for irrigated wheat in northwest India.Nutr Cycl Agroecosyst 82: 15–31
Janssen BH, Guiking FCT, Van der Eijk D, Smaling EMA, Wolf J, van Reuler H(1990) A system for quantitative evaluation of the fertility of tropical soils(QUEFTS). Geoderma 46: 299–318
Ladha JK, Kumar V, Alam MM, Sharma S, Gathala MK, Chandna P, SaharawatYS, Balasubramanian V (2009) Integrating crop and resource managementtechnologies for enhanced productivity, profitability, and sustainability ofthe rice-wheat system in South Asia. In: Ladha JK et al. (eds) Integrated cropand resource management in the rice–wheat system of South Asia.International Rice Research Institute (IRRI), Metro Manila, Philippines
Liu M, Yu Z, Liu Y, Konijn NT (2006) Fertilizer requirements for wheat andmaize in China: the QUEFTS approach. Nutr Cycl Agroecosyst 74: 245–258
Lorenz N, Verdell K, Ramsier C, Dick RP (2009) A rapid assay to estimate soil
384 385

microbial biomass potassium in agricultural soils. Soil Sci Soc Am J 74: 512-516
Maclean JL, Dawe DC, Hardy B, Hettel GP (2002) Rice almanac: Source bookfor the most important activity on earth. Third edition. CABI Publishing,Wallingford, UK and International Rice Research Institute (IRRI), MetroManila, Philippines
Mamaril CP, Castillo MB, Sebastian LS (2009) Facts and myths about organicfertilizers. Philippine Rice Research Institute (PhilRice), Science City ofMuñoz, Nueva Ecija, Philippines
Mandal KG, Misra AK, Hati KM, Bandyopadhyay KK, Ghosh PK, Mohanty M(2004) Rice residue-management options and effects on soil properties andcrop productivity. J Food Agric Environ 2: 224–231
Mukhopadhyay D, Majumdar K, Pati R, Mandal MK (2008) Response of rainfedrice to soil test-based nutrient application in Terai alluvial soils. Better CropsPlant Food 92 (4): 13–15
My Hoa N, Janssen BH, Oenema O, Dobermann A (2006) Comparison of partialand complete soil K budgets under intensive rice cropping in the MekongDelta, Vietnam. Agric Ecosyst Environ 116: 121–131
Naklang K, Harnpichitvitaya D, Amarante ST, Wade LJ, Haefele SM (2006)Internal efficiency, nutrient uptake, and the relation to field water resourcesin rainfed lowland rice of northeast Thailand. Plant Soil 286: 193–208
Pasricha NS, Sharma BD, Arora CL, Sidhu PS (2001) Potassium distribution insoils and ground waters of Punjab. J Potassium Res 17: 1–13
Pathak H, Aggarwal PK, Roetter R, Kalra N, Bandyopadhaya SK, Prasad S, VanKeulen H (2003) Modelling the quantitative evaluation of soil nutrientsupply, nutrient use efficiency, and fertilizer requirements of wheat in India.Nutr Cycl Agroecosyst 65: 105–113
Saleque MA, Anisuzzaman M, Moslehuddin AZM (2009) Quantity-intensityrelationships and potassium buffering capacity of four Ganges Riverfloodplain soils. Comm Soil Sci Plant Anal 40: 1333–1349
Setiyono TD, Walters DT, CassmanKG, Witt C, Dobermann A (2010) Estimatingthe nutrient uptake requirements of maize. Field Crops Res (under review)
Sharma PK, De Datta SK (1986) Puddling influence on soil, rice development,and yield. Soil Sci Soc Am J 49: 1451–1457
Slaton NA, Golden BR, Norman RJ, Wilson CE, DeLong RE (2009) Correlationand calibration of soil potassium availability with rice yield and nutritionalstatus. Soil Sci Soc Am J 73: 1192–1201
Singh M, Singh VP, Reddy DD (2002) Potassium balance and release kineticsunder continuous rice–wheat cropping system in Vertisol. Field Crops Res77: 81–91
Turner BL, Haygarth PM (2001) Phosphorus solubilization in rewetted soils.Nature 411:258
Turner FT, Gilliam JW (1976) Increased P diffusion as an explanation ofincreased P availability in flooded rice soils. Plant Soil 45: 365–377
Witt C, Buresh RJ, Peng S, Balasubramanian V, Dobermann A (2007) Nutrientmanagement. In: Fairhurst et al. (ed) Rice: A practical guide to nutrientmanagement. International Rice Research Institute (IRRI), Los Baños,Philippines and International Plant Nutrition Institute and InternationalPotash Institute, Singapore, pp 1–45
Witt C, Dobermann A (2004) Toward a decision support system for site-specificnutrient management In: Dobermann A, Witt C, Dawe D (ed) Increasingproductivity of intensive rice systems through site-specific nutrientmanagement. Science, Enfield, NH, USA and International Rice ResearchInstitute (IRRI), Metro Manila, Philippines, pp 359–395
Witt C, Dobermann A, Abdulrachman, S, Gines HC, Wang G, Nagarajan R,Satawatananont S, Son TT, Tan PS, Tiem LV, Simbahan GC, Olk DC (1999)Internal nutrient efficiencies of irrigated lowland rice in tropical andsubtropical Asia. Field Crops Res 63: 113–138
Witt C, Pasuquin JMCA, Pampolino MF, Buresh RJ, Dobermann A (2009) Amanual for the development and participatory evaluation of site-specficnutrient management for maize in tropical, favorable environments.International Plant Nutrition Institute, Penang, Malaysia
386 387

Proceedings IPI-OUAT-IPNI International Symposium (2009)
Site specific potassium management in rice based
cropping systems in India
SK Sanyal MS Gill K Majumdarl l
l
l l
Abstract
Keywords
Introduction
Potassium fertility of Indian soils has been on the decline as is evidentfrom comparative soil test results over the years and increasing response topotassium application in different crops and soils. Several experimental evidencesshowed that potassium balances in rice-based cropping systems are essentiallynegative due to deficit application rates of the nutrient compared to its uptake. Thishas lead to considerable K mining from soils that is undesirable for long termsustainability of rice-based systems. Potassium dynamics in soils are governed bythe mineralogy, while the K–supplying capacity of the soils depends on the natureof the K-bearing minerals and the extent of weathering. Variability in type andstate of weathering of the K-bearing minerals as well as difference in managementhistory leads to spatial difference in K fertility of soils. The current practice ofapplying potassium at a blanket dose without taking into account such variabilityis thus limiting crop yield and causing K mining as was evident from long-termexperiments. The concept of site-specific potassium management in rice-basedcropping systems on the other hand provides an approach that takes into accountthe K supplying capacity of soils and K requirement of crops while formulatingpotassium recommendations. Experimental evidences showed that such anapproach can improve yield and economics of production of rice-based croppingsystems and can reverse the current negative yield trends.
potassium imbalance in Indian agriculture soil mineralogy andpotassium availability site specific potassium management rice basedcropping systems
Potassium (K) did not receive much attention in India till the '80s because of thegeneral belief that the Indian soils were well supplied with potassium (Pasricha
SK SanyalBidhan Chandra Krishi Viswavidyalaya, Kalyani- 741 235, Nadia, West Bengal, Indiae-mail : [email protected] GillDirectorate of Extension, PunjabAgricultural University, Ludhiana - 141004, IndiaK MajumdarInternational Plant Nutrition Institute (IPNI), India Programme, 354, Sector 21, HUDA,Gurgaon 122 016, Haryana, India, e-mail: [email protected]
388 389
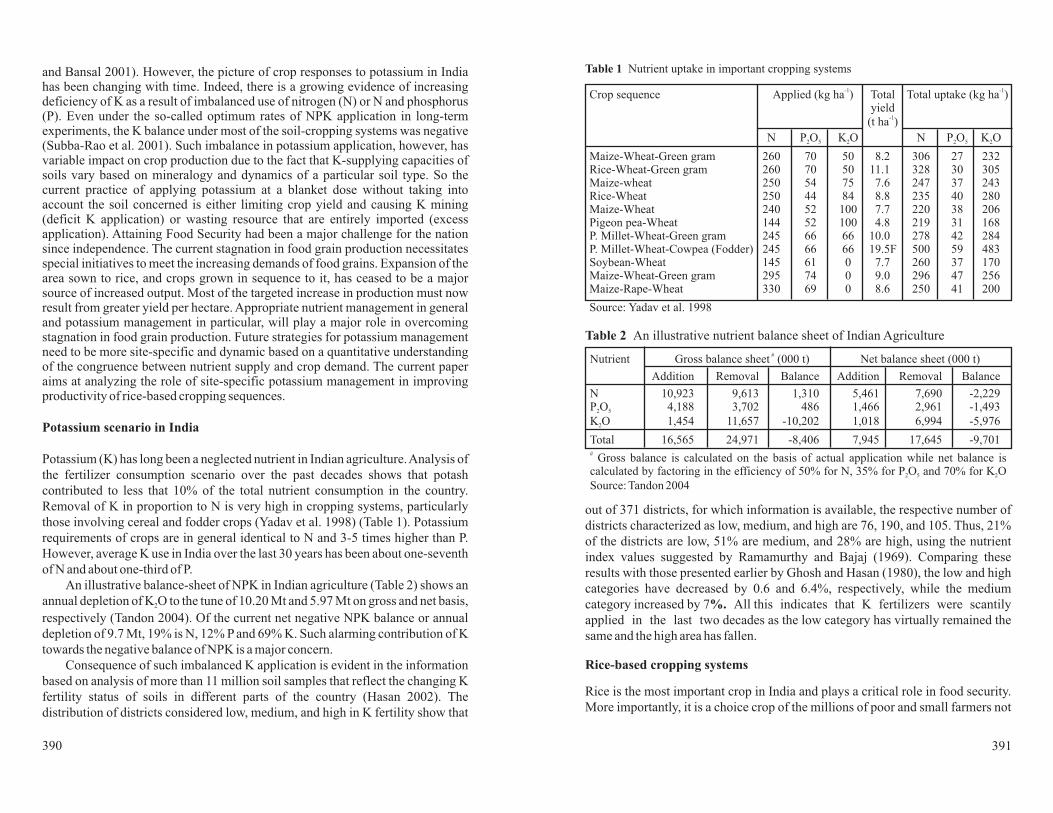
and Bansal 2001). However, the picture of crop responses to potassium in Indiahas been changing with time. Indeed, there is a growing evidence of increasingdeficiency of K as a result of imbalanced use of nitrogen (N) or N and phosphorus(P). Even under the so-called optimum rates of NPK application in long-termexperiments, the K balance under most of the soil-cropping systems was negative(Subba-Rao et al. 2001). Such imbalance in potassium application, however, hasvariable impact on crop production due to the fact that K-supplying capacities ofsoils vary based on mineralogy and dynamics of a particular soil type. So thecurrent practice of applying potassium at a blanket dose without taking intoaccount the soil concerned is either limiting crop yield and causing K mining(deficit K application) or wasting resource that are entirely imported (excessapplication). Attaining Food Security had been a major challenge for the nationsince independence. The current stagnation in food grain production necessitatesspecial initiatives to meet the increasing demands of food grains. Expansion of thearea sown to rice, and crops grown in sequence to it, has ceased to be a majorsource of increased output. Most of the targeted increase in production must nowresult from greater yield per hectare. Appropriate nutrient management in generaland potassium management in particular, will play a major role in overcomingstagnation in food grain production. Future strategies for potassium managementneed to be more site-specific and dynamic based on a quantitative understandingof the congruence between nutrient supply and crop demand. The current paperaims at analyzing the role of site-specific potassium management in improvingproductivity of rice-based cropping sequences.
Potassium (K) has long been a neglected nutrient in Indian agriculture.Analysis ofthe fertilizer consumption scenario over the past decades shows that potashcontributed to less that 10% of the total nutrient consumption in the country.Removal of K in proportion to N is very high in cropping systems, particularlythose involving cereal and fodder crops (Yadav et al. 1998) (Table 1). Potassiumrequirements of crops are in general identical to N and 3-5 times higher than P.However, average K use in India over the last 30 years has been about one-seventhof N and about one-third of P.
An illustrative balance-sheet of NPK in Indian agriculture (Table 2) shows anannual depletion of K O to the tune of 10.20 Mt and 5.97 Mt on gross and net basis,respectively (Tandon 2004). Of the current net negative NPK balance or annualdepletion of 9.7 Mt, 19% is N, 12% P and 69% K. Such alarming contribution of Ktowards the negative balance of NPK is a major concern.
Consequence of such imbalanced K application is evident in the informationbased on analysis of more than 11 million soil samples that reflect the changing Kfertility status of soils in different parts of the country (Hasan 2002). Thedistribution of districts considered low, medium, and high in K fertility show that
Potassium scenario in India
2
out of 371 districts, for which information is available, the respective number ofdistricts characterized as low, medium, and high are 76, 190, and 105. Thus, 21%of the districts are low, 51% are medium, and 28% are high, using the nutrientindex values suggested by Ramamurthy and Bajaj (1969). Comparing theseresults with those presented earlier by Ghosh and Hasan (1980), the low and highcategories have decreased by 0.6 and 6.4%, respectively, while the mediumcategory increased by 7 All this indicates that K fertilizers were scantilyapplied in the last two decades as the low category has virtually remained thesame and the high area has fallen.
Rice is the most important crop in India and plays a critical role in food security.More importantly, it is a choice crop of the millions of poor and small farmers not
%.
Rice-based cropping systems
Crop sequence Appliedyield
(t ha )
N P O K O N P O K O
Maize-Wheat-Green gram 260 70 50 8.2 306 27 232Rice-Wheat-Green gram 260 70 50 11.1 328 30 305Maize-wheat 250 54 75 7.6 247 37 243Rice-Wheat 250 44 84 8.8 235 40 280Maize-Wheat 240 52 100 7.7 220 38 206Pigeon pea-Wheat 144 52 100 4.8 219 31 168P. Millet-Wheat-Green gram 245 66 66 10.0 278 42 284P. Millet-Wheat-Cowpea (Fodder) 245 66 66 19.5F 500 59 483Soybean-Wheat 145 61 0 7.7 260 37 170Maize-Wheat-Green gram 295 74 0 9.0 296 47 256Maize-Rape-Wheat 330 69 0 8.6 250 41 200
Source: Yadav et al. 1998
(kg ha ) Total Total uptake (kg ha )-1 -1
-1
2 5 2 2 5 2
Table 1 Nutrient uptake in important cropping systems
Nutrient Gross balance sheet (000 t) Net balance sheet (000 t)
Addition Removal Balance Addition Removal Balance
N 10,923 9,613 1,310 5,461 7,690 -2,229P O 4,188 3,702 486 1,466 2,961 -1,493K O 1,454 11,657 -10,202 1,018 6,994 -5,976
Total 16,565 24,971 -8,406 7,945 17,645 -9,701
Gross balance is calculated on the basis of actual application while net balance iscalculated by factoring in the efficiency of 50% for N, 35% for P O and 70% for K OSource: Tandon 2004
#
#
2 5
2
2 5 2
Table 2 An illustrative nutrient balance sheet of Indian Agriculture
390 391
only for income but also for household food security. Intensification anddiversification are two main trends of rice-based cropping systems as they haveevolved in different agro-ecological regions in India where wheat, maize or one ofmany other secondary crops are grown during the part of the year when rice wasnot in the field. Diversification and intensification of rice-based systems wasadvocated to make a breakthrough in productivity and profitability, and severaloptions with different levels of productivity and profitability were outlined by(Gill 2006; Gill et al. 2008). The most prevalent cropping systems are rice–rice,rice– rice–rice, rice–rice–pulse, rice–wheat, rice–oilseed crop, and more recentlyrice–maize. The rotation of rice-rice and rice-wheat, for example, are majoragricultural production systems that account for 16 M ha of food grain producingarea in India and are the mainstay of food security in the country.
However, the rice sector has witnessed rapid dynamism in productionprocesses. After a four-fold increase in production during the past four decades,the production curves have started showing downward trend and productivitydecelerating since the later half of the 1990s. The productivity decline isexperienced not only in the core green revolution state of Punjab but also in severalother states such as Tamilandu, Andhra Pradesh and Kerala, etc., including therain-fed areas. There are several reasons for such stagnation, the most conspicuousbeing wide-scale nutrient depletion through crop harvest, on one hand and lowlevel of replenishment through inadequate nutrient supply, on the other.
Tiwari et al. (2006) in their multi-location trial with rice-wheat systemshowed that the average system uptake (rice + wheat) of nutrients over 10 sitesand 2 years was 761 kg of N + P O + K O ha year for an average system yield of
13 t ha . The mean uptake of N: P O :K O was in the proportion of 100:29:129.Similar experiments with rice-rice system across 6 sites and 2 years showedaverage uptake of 782 kg of N +P O + K O for an average system yield of 12 t hawith an average uptake ratio of 100:40:133 for N:P O :K O. The mean K uptakewas 1.74 times the K input in case of rice-wheat system, while mean uptake was62% higher than K input in rice-rice system suggesting net depletion of soil K in allthe sites. The K-omission plots (no external K application) in this study showedthat native potassium supply in rice-wheat system varied from 205 to 354 kg K O
ha year depending on location. In treatments based on K supply exclusivelyfrom native sources (K-omission plots), the yield levels supported by sites differedconsiderably. Thus, Ranchi with a native supply of 205 kg K O ha year produced65% lesser system yield (rice-wheat) than did Ludhiana which provided 354 kgK O ha year in absence of external supply (Tiwari et al., 2006). Similar resultswere obtained in rice-rice cropping system by the authors. This suggests that site-specific potassium application, based on estimation of soil supply and croprequirement, will be required to support equal levels of yields in rice-basedcropping systems in different locations.
2 5 2
2 5 2
2 5 2
2 5 2
2
2
2
-1 -1
-1
-1
-1 -1
-1 -1
-1 -1
Mineralogy and K availability
Potassium availability to plants is regulated in soils by the soluble, exchangeableand non-exchangeable fractions of K that are interrelated by a dynamicequilibrium. The driving force for this equilibrium is largely a function of claycomposition, while the magnitude of the process is a function of clay content ofsoil. As growing season is limited in most cases, a high growth rate for high yieldcan only be maintained with high flux rates of nutrients to the plant roots.Therefore, mineralogy plays a pivotal role in potassium supplying capacity of aparticular soil (Rao and Rao 1996). The mineral sources of K in soils are thedioctahedral micas: muscovite, glauconite, and hydrous mica or illite; thetrioctahedral mica, namely biotite and phlogopite and the feldspar, namelysanidine, orthoclase and microlone (Sarma 1976). Weathering of micas / feldsparsleads to the formation of secondary minerals (such as smectite or vermiculites),intermediates like illites, with simultaneous release of K (Sparks and Huang1985). Results of numerous studies (Sanyal et al. 2009) suggest that for soils oflow intensity of weathering and from trioctahedral mica parent material, K releaseto soil solution is rather high as for the crop need and the replenishment of theexhausted K in soil due to crop removal. For soils of dioctahedral mica parentmaterial, and a moderate state of weathering or both, K release is less, but it is theleast for soils of low mica content or intensive weathering, or both. Indeed, whileformulating a sound K fertilizer recommendation, it is imperative that the abovecharacteristics need to be taken into account.
Plant uptake of K is related to the weathering of feldspars and micas in soilenvironments. Micas are more important than K-feldspars in supplying K to plants(Rich 1972). The native K status depends, not only on the parent material of soil,but also on the subsequent stages of weathering of the parent material. So theweathering history of a mineral phase, rather than its mere presence, may be animportant factor to be reckoned while relating the plant availability of soil K to thesoil mineralogy (Sanyal and Majumdar 2001). An example of such postulate isprovided by a sharp contrast between the Entisol and the Alfisol under rice-basedcropping sequence in West Bengal (Table 3) where despite having almost the sameamount of illite content, there was a wide variation in total K and nonexchangeableK (NEK) contents of these soils (Sanyal et al. 2009). This obviously is linked tothe relative stages of weathering of the illitic mineral phase in the given soils(Sanyal et al. 2009; Ghosh and Sanyal 2006). Such observations have importantbearing to the fertilizer K recommendations to support the different croppingsequences.
Recently, Chatterjee (2008) found wide variability in soil K fractions inselected rice growing soils in the alluvial tract of West Bengal. Descriptivestatistics of K fractions in soils of three adjacent blocks of Nadia district showedwide variability (Table 4). The water soluble and exchangeable form of potassium
via
392 393

varied to a greater extent (33.96 % and 52.87% respectively) than did the non-exchangeable form of potassium (20.12%) (Table 4).
Variability of different forms [cmol (p ) kg ] of potassium in the threestudy areas
Recent studies on potassium variability (IPNI 2006-07) in the alluvial and redand lateritic soil zones of West Bengal and Jharkhand showed that variability ofavailable potassium in soils is quite high among fields within villages (Table 5).Such short-range variability was attributed to several factors includingfertilization and cropping history as well as resource availability to the farmers(Sen and Majumdar 2006; Sen et al. 2008).
These experimental observations suggest that due consideration must begiven to the nature and composition of soil minerals while formulating a Kfertilization strategy in rice based systems and any attempt to develop a “one fitsall” strategy will fail to produce the desired improvement in productivity andprofitability, while it will encourage nutrient depletion.
Depletion of soil K reserves under continuous rice-based system has become a
Table 4
Changes in potassium fertility in rice-based cropping systems
+ -1
matter of concern. Tiwari (1985) observed a decline in available K by 17% and28% after two crop cycles in the middle Indo-Gangetic plains. Sekhon (1999),studying K depletions in the soils of Indo-Gangetic plains (IGP), showed that sixout of eight benchmark soils studied showed considerable decrease in ammoniumacetate and nitric acid soluble K-fractions (denoting the exchangeable and non-exchangeable K fractions, respectively) after 10 years of continuous cultivation(Table 6).
Decrease in available potassium content of soils, even where K was applied inboth rice and wheat, was observed in long-term experiments progressing atdifferent locations in IGP (Yadav et al. 2000a). The long-term experiments alsorevealed that response to applied potassium increased steadily over the last 20years as a result of depletion of soil K (Swarup and Srinivasa Rao 1999). Singh et
Soil properties Kalyani(an Entisol) (an Alfisol)
Illite (%) 38.0 38.8Smectite (%) 28.0 -Kaolinite (%) 11.0 61.2Chlorite (%) 6.0 -Vermiculite (%) 17.0 -Nonexchangeable K (NEK) cmol (p ) kg 6.0 0.6Total K cmol (p ) kg 52.2 29.0
Anandapur
+ -1
+ -1
Source: Sanyal et al. 2009; Ghosh and Sanyal 2006
Statisticalparameters K K K K
Minimum 0.020 0.017 0.093 2.83Maximum 0.066 0.329 0.350 6.07Mean 0.042 0.121 0.163 4.15Standard Deviation 0.014 0.064 0.056 0.83CV (%) 33.96 52.87 34.39 20.12
Source: Chatterjee 2008
Water Exchangeable Available Nonexchangeablesoluble
Location Maximum Minimum Mean StandardDeviation
Ghoragacha, Nadia,West Bengal 640 96 283 109 39Sripurdanga, Murshidabad,West Bengal 448 87 254 93 37Bahadurpur, Birbhum,West Bengal 150 96 110 9 8Meherpur, Birbhum,West Bengal 494 24 168 113 68Barhu Simatoli, Ranchi,Jharkhand 356 61 142 71 50
Source: IPNI 2006-07
CV(%)
Table 3 Distribution of different clays and forms of K in two soils of West Bengal Table 5 Variability of available potassium (kg ha ) among farmers' plots within avillage
-1
Table 6 Changes observed in soil fertility in some soil series supporting rice-based cropping system in the Indo-Gangetic Plains
Soil Series and NH OAc-K (mg kg ) HNO -K (mg kg )
First After 10 First After 10
Nabha, Punjab 104±54 63±41 965±25 875±23Akbarpur, UP 125±41 71±23 1448±20 1231±18Rarha, UP 95±33 79±20 1531±35 1497±18Hanrgram, WB 132±53 93±16 425±16 400±19Kharbona, WB 42±17 29±16 119±34 109±26
Source: Sekhon 1999
4 3
-1 -1
Locationsampling years sampling years
394 395

al. (2002) in a 8 year rice-wheat cropping system experiment observed thatapplication of K at 33 kg ha to both the crops caused a negative potassium balanceof 103 to 156 kg ha year depending on the rate of N application. Such changes inK fertility under intensive cropping, however, can also be quite abrupt,particularly when vegetables are included in the rice-based system. Sen et al.(2008), while assessing changes in nutrient availability through GIS-basedfertility mapping, found that K fertility in an intensively cultivated village in thealluvial zone of West Bengal decreased perceptibly within two years. For availableK O, the range changed from 87-448 kg ha in 2006 to 56-375 kg ha in 2008
and the mean from 166 kg ha in 2006 to 88 kg ha in 2008. Potassium fertility ofthe village was generally low to medium in 2006 but the frequency distributionshifted more towards the low fertility category with a substantial increase insample number in the lowest category (Figure 1). The authors found that lowerapplication of potassium during this period due to unavailability and high uptakeof K by the vegetable crops contributed to this swift decline in K fertility of thesoils.
Consequence of such depletion scenario across the country has led to negativepotassium balance in most cropping systems, including rice-based systems. Ladhaet al. (2003) analyzed yield trends in rice-wheat systems in the IGP, non-IGP areasof India and China and noted that rice and wheat yields stagnated at 72 and 85% oflong-term experiments where recommended rates of NPK were applied. These
-1
-1 -1
-1 -1
-1 -12
authors further reported that fertilizer K rates used were not sufficient to sustain aneutral K input-output balance in 90% of the long-term experiments, while all theexperiments with significant yield decline had large negative K balances. It is clearthat such negative K balances in soils will adversely affect the sustainability ofrice-based systems and a rational approach of K management, keeping in mind thevariable soil supplying power and nutrient requirements of crops/croppingsystems, will be necessary to reverse the trend.
The basic principle of maintaining the fertility status of a soil under high intensitycrop production systems is to annually replenish those nutrients that are removedfrom the field. Site specific nutrient management (SSNM) provides an approachof nutrient management that takes into account 1) nutrient requirement for unityield, 2) nutrient contribution from soils, and 3) nutrient contributions requiredfrom fertilizers to formulate fertilizer recommendation. Nutrient use on theprinciples of SSNM could provide an avenue to reverse the declining productivitytrend and nutrient mining from soils.
Undoubtedly, rice based cereal cropping systems are very exhaustive andrequire high quantum of macro, secondary and micronutrients. They are practicedin a myriad of soil conditions in IGP and non-IGP areas. Variability in nutrientreserves, nutrient supplying capacity of the soils under these vastly different soiland climatic conditions and management strategies require that potassium isapplied in a site-specific manner to improve productivity and maintain soilfertility.
It is well established that crop yields, profit, plant nutrient uptake and nutrientuse efficiencies can be significantly increased by applying fertilizers on a fieldspecific and crop season specific manner (Bijay-Singh et al. 2003). FertilizerK rates predicted by the QUEFTS model (Janssen et al. 1990) to achieve highyield and maintain soil fertility are usually higher than the rates currentlyapplied by farmers. Potassium rates in SSNM plots ranged from 50 to 66 kg hacrop while the average farmer fertilizer K rate was 30 kg ha (Bijay-Singh et al.2003).
The findings from a survey conducted by the Project Directorate for CroppingSystems Research (ICAR), India on the use pattern of nutrients to rice-wheatsystem in various sub-regions of the Indo-Gangetic Plains are presented in Table 7.The economic, social and climatic factors as well as soil and institutional factorswere largely responsible for spatial variation in major nutrients application. Themost conspicuous point to note was the use of potassium in a much imbalancedmanner in both the crops that seems to be the prime factor causing yield stagnationof rice-wheat system in IGP.
Site-specific potassium management
-1
-1 -1
Fig. 1 Comparative maps of available potassium before and after four croppingseasons
396 397
K O Map of Sripurdanga 20062 K O Map of Sripurdanga 20082
87 - 135
135 - 215
215 - 295
295 - 447
56 - 135
135 - 215
215 - 295
295 - 374
K O2 K O2
kg ha-1
kg ha-1
Table 7 Major nutrients use in various sub regions of the Indo-Gangetic Plains
Recent work on site-specific potassium management (SSKM) by Chatterjeeand Sanyal (2007) across three locations and twelve sites in the alluvial soils ofWest Bengal showed significant yield increase in the SSKM plot over the generalrecommendation. The K application rate of the SSKM plots were based onavailable and non-exchangeable K contents in each site as well as the yield target.The SSKM plot registered higher K uptake than that for the generalrecommendation and farmers' practice, the highest mean residual crop availablepotassium in the soil and highest relative agronomic efficiency among thetreatments. Tiwari et al. (2006) working in 17 locations on rice-rice and rice-wheatsystems also showed that economically optimum potassium rates variedaccording to locations (Table 8).
Potassium application in site-specific manner significantly enhanced the rice-wheat system productivity in the above study. The system yield increase was
associated with response rate of 8.9 kg grain kg K O applied with a Benefit: CostRatio (BCR) of 4.3 to 13.5 depending on the location. Pooled data of location andK rates showed that benefit for K application were 5 or more in 81% cases and 10or more in 57% cases. In rice-rice system, the response to K application was 5 kggrain kg K O. Across the sites, the BCR for K application was 5 or higher in 59%cases. The authors concluded that optimum potash application can increase theproductivity of the rice-rice system by 1300-1900 kg ha and the current general Kapplication rates need upward revision to achieve higher target yields. Gill et al.(2009) studied the level of response of NPK in major cropping systems across 32centers located in different agro-climatic zones. The response to potassium in ricebased cropping systems varied from 11.7 to 51.0 kg rice grain equivalent kgnutrient. The oilseeds crops following rice gave response of 17.3 to 24.6 kg ricegrain equivalent kg nutrient, while in rice based cereal cropping systems, thepotassium response was confined to the range of 14.0 to 16.2 kg rice grainequivalent kg ha nutrient (Table 9).
The reasonably high response to potassium of rice based cropping system isthus worth noting and application of K seems a necessity for ensuring high grainyield realization. The highest response to potassium was found in rice-tomatocropping systems where the response was up to 51 kg rice grain equivalent kgpotassium. The economic response to potassium in cereal based cropping systemvaried from Rs. 9.4 to 10.6 Rupee invested. The rice followed by oilseed gaveeconomic response in the range of Rs. 5.0 to 17.6 Rupee invested. While in rice-chickpea, the economic response was Rs. 8.3 Rupee invested. The highesteconomic response was recorded in rice-tomato (Rs. 24.9 Rupee invested),thereby clearly advocating the use of potassium as per the recommended dose(Gill et al. 2009).
Recently Mukhopadhyay et al. (2008), while studying a rice-rice system inthe Terai alluvium, found that omitting potassium from a soil test based
-1
-1
-1
-1
-1
-1
-1
-1
-1
-1
-1
2
2
Sub region of IGP Area
(X 10
ha) Rice Wheat Rice Wheat Rice Wheat
Trans-Gangetic Plains 3809 166.1 154.2 51.3 49.6 0.8 12.3Upper-Gangetic Plains 3160 115.0 109.8 40.7 37.6 5.2 11.4Mid-Gangetic Plains 3133 116.1 100.0 29.1 32.7 4.3 20.5Lower-Gangetic Plains 119 82.6 87.1 16.3 21.4 36.4 44.0
Adapted from Sharma (2003) after modification
Nutrient use (kg ha )
N P K
-1
3
Location Optimum rates Location Optimum rates(kg K O ha )
Rice Wheat System Rice Rice System
Sabour 75 76 153 Maruteru 93 94 188Palampur 76 103 182 Jorhat 89 92 176R. S. Pura 94 104 196 Navsari 72 106 186Ranchi 82 91 179 Karjat 94 95 165Ludhiana 102 84 188 Coimbatore 34 45 72Faizabad 80 60 143 Thanjavur 86 82 178Kanpur 89 66 153Modipuram 87 88 177Varanasi 85 104 171Pantnagar 76 77 148
Source: Tiwari et al. 2006
(kg K O ha )2
-1
2
-1
Table 8 Economically optimum potassium rates in rice-wheat and rice-ricesystems (mean of two years)
Table 9 On-farm response to nutrient in rice based cropping system
Cropping system Response (kg rice grainequivalent kg nutrient) Rs. invested on nutrient)
N P O K O N P O K O
Rice-rice 12.0 14.6 16.2 9.9 5.1 10.6Rice-wheat 10.1 15.9 14.0 8.4 5.7 9.4Rice-groundnut 14.3 22.8 24.6 11.8 8.1 17.6Rice-chickpea 14.0 11.7 11.7 11.4 4.1 8.3Rice-mustard 10.8 19.5 17.3 8.4 6.4 5.0Rice-tomato 19.5 20.2 51.0 10.3 5.1 24.9
Source: Gill et al. 2009
Economic response (Rs.-1 -1
2 5 2 2 5 2
398 399

recommendation caused a yield loss of 20-32%. They found highly positivecorrelation between yield and potassium uptake (Figure 2) that corroborated theimportance of soil test based potassium application in rain-fed rice systems.
Interrelation between grain yield and uptake of potassium in rice (IET1444)
Source: Mukhopadhyay et al. 2008
Potassium based nutrient management tested at cultivators' field under theAllIndia Coordinated Research Project (AICRP) on Cropping System (2006-07) hadhighlighted the response of potassium and sulphur in rice-wheat system. Theaverage nutrient management options under the existing farmers' cropmanagement practice (FCM) gave 4.32 to 6.95 t ha paddy yield, which improvedby 3 to 25% with recommended management practice at different locations.Inclusion of K, S and Zn, along with farmers' management, produced extra yield of0.75 to 1.78 t ha depending on locations. The corresponding response topotassium over N P clearly demonstrated the major role of potassium towardsenhancement in yield (Table 10). Wheat productivity increased from 0.13 to 0.68 tha over farmers' fertilizer management practice (FFP), along with thecorresponding response to potassium application being 0.13 to 0.68 t ha over NP,thereby stressing the fact that yield and response to potassium are variable and Kmust be applied in a site-specific manner to improve productivity of rice basedsystems.
Thus, the question that arises now is where one goes from such concepts liketargeted yield, soil test recommendation, and SSNM for efficient and balanced use
Fig. 2
Spatial variability and GIS mapping:Akey to future
-1
-1
-1
-1
of plant nutrients. The SSNM requires intensive soil sampling and analyses inorder to construct crop- and soil-specific nutrient recommendation. This providesa major challenge considering the fragmented land holdings in the country as wellas the existing soil testing infrastructure. Geo-statistical analysis and GIS-basedmapping effectively counters that challenge by providing an option to create soilfertility maps of large areas through interpolation of soil analysis data from a smallnumber of samples (Sen et al. 2008). Such dynamic maps provide an opportunityto assess variability in distribution of native nutrients across a large area and thusaid in strategizing appropriate management of nutrients leading to better yield andenvironmental protection. Indeed, in India, where each farm family operates oneor several small field plots, farmers' fertilizer decision making process iscommonly limited by inadequate understanding of soil nutrient status or spatialnutrient variability of their plots, with such understanding on spatial variability ofsoil nutrients in fragmented land-holdings being expected to give a strong impacton the sustainable development of agriculture in the country.As mentioned earlier,Sanyal and Chatterjee (2007) revealed that contrast of non-exchangeablepotassium and available potassium status between soils can be effectively utilizedto modify the soil test-based fertilizer recommendation practices for potassium.Sen and Majumdar (2006) and Sen et al. (2008) documented wide spatialvariability in available nutrient contents of soils even in small areas of intensivelycultivated region of West Bengal. Such studies clearly highlighted the necessity tocomprehensively understand the spatial variability of soil nutrients under theprevalent small-scale operation systems in India for developing the guidelines forsoil nutrient management and fertilization for optimum production (Sen et al.2008).
Table 10 Grain yield response (t ha ) to K, S and Zn application over farmers'fertilizer management practice in rice-wheat system
-1
Yie
ld (
kg
ha
-1)
K Uptake (kg ha-1)
Nutrient applied Modi-puram Sahib
Rice (t ha )
K over NP 0.47 0.40 0.76 0.66 0.47 0.79K, S and Zn over NP 0.86 0.75 1.40 1.11 0.98 1.78S and Zn over NP 0.30 0.47 0.57 0.26 0.30 1.01S and Zn over NPK 0.40 0.35 0.63 0.45 0.50 0.99
Wheat
K over NP 0.60 0.18 0.68 0.61 - 0.13K, S and Zn over NP 0.85 0.34 1.20 0.92 - 0.50S and Zn over NP 0.35 0.22 0.30 0.50 - 0.30S and Zn over NPK 0.26 0.16 0.52 0.31 - 0.36
Source: Annual report of AICRP on Cropping Systems 2006-07
Fatehgarh Sabour Pantnagar Varanasi Banda
(t ha )
-1
-1
400 401

Conclusions
References
Larger proportion of mining in respect of potassium as mentioned in previoussections partly result from the average crop removal of 1.5 times more K than thatof N and lower K application than N or P, with the misconception that the soils ofthe country are relatively rich in potash. Apart from this, relatively low cost perunit of nitrogen, its widespread availability, and quick and evident response of theplant has further accentuated such an imbalance. While it will be necessary torationalize the use of N fertilizers, ominous signs are that if strategies and policiesare not developed to boost K supplies, and this essential nutrient continues toremain neglected as in the past, future sustainability of rice-based systems is likelyto be constrained mostly by K. Sustainability of the regions supporting highintensity cropping and fertilizer responsive strains are foreseen to be the earliestvictims of such imbalance. Besides, our current understanding and interest on soilquality requires that enough focus is given towards the mining aspects of nutrientsin general and potash in particular. As much as it may seem economically prudentto apply less potassium from external sources as it is an imported commodity, andrely more on the inherent potash supplying capacity of the soils, in the long-run itmight turn out to be a very short-sighted approach as we lose the quality of a veryvital resource of our country, our SOILS. Rather a balanced approach that takesinto account soil properties, its potassium supplying capacity and potassiumrequirement of crops in the realm of site-specific nutrient management can reversethe declining production trend, improve the soil quality and thus will leave ourenvironment clean for the posterity.
Annual Report (2006-07) All India Coordinated Research Project on CroppingSystem Research. Project Directorate for Cropping Systems Research,Modipuram, Meerut, Uttar Pradesh.
Bijay-Singh, Yadvinder Singh, Vashista M (2003) Potassium nutrition of rice-wheat cropping system in Indo-Gangetic Plains. Yadvinder-Singh, Bijay-Singh, Nayyar VK, Singh J (ed) Nutrient Management for Sustainable Rice-Wheat Cropping System. NATP, ICAR, New Delhi and PAU, Ludhiana,Punjab, pp 412
Chatterjee S (2008) Site specific potassium management with special emphasis onits dynamics for sustainable production in selected rice growing areas of WestBengal, Ph D Thesis, Bidhan Chandra Krishi Viswavidyalaya, Mohanpur,Nadia, West Bengal.
Chatterjee S, Sanyal SK (2007) Site-specific potassium management for ricegrown in selected alluvial soils of West Bengal. Better Crops-India, 1:22-25.
Ghosh AB, Hasan R (1980) Soil fertility map of India, Indian Agricultural
Research Institutes, New Delhi.Ghosh S, Sanyal SK (2006) Final progress report of the Potash and Phosphate
Institute of Canada-India Programme-funded project on phosphate andpotash management to support rice-based cropping sequences in the lateriticand alluvial soils of West Bengal, Bidhan Chandra Krishi Viswavidyalaya,West Bengal
Gill MS (2006) Sustaining high yield of rice-wheat system through site specificnutrient management in Punjab. Indian J. Fertilizers 2:45-50
Gill MS, Gangwar B, Gangwar KS (2008) Site-specific crop managementapproach for high yield realization of cereal-based cropping systems. Indian JFertilizers 4:31-34, 37-40, 43-46
Gill MS, Singh VK, Mahapatra IC (2009) Crop response to applied nutrient underdifferent cropping systems. Paper presented in the brainstorming session oncrop response and nutrient ratio, National Academy of Agricultural Sciences,New Delhi, pp 79-91
Hasan R (2002) Potassium status of soils of India. Better Crops International16:3-5
International Plant Nutrition Institute (IPNI) 2006-07 Unpublished researchreports, IPNI, Gurgaon, Haryana
Janssen BH, Guiking FCT, van der Eijk D, Smaling EMA, Wolf J, Van Reuler H(1990) A system for quantitative evaluation of the fertility of tropical soils(QUEFTS). Geoderma 46:299-318
Ladha JK, Dame D, Pathak H, Padra AT, Yadav RL, Bijay-Singh (2003) Howextensive are yield declines in long term rice-wheat experiments in Asia.Field Crops Res. 81:159-180
Mukhopadhyay D, Majumdar K, Pati R, Mandal MK (2008) Response of rainfedrice to soil test based nutrient application in Terai alluvial soils. Better Cropswith Plant Food 92:13-15
Pasricha NS, Bansal SK (2001) Potassium fertility of Indian bench-mark soils. In:Papers and Presentations Section .
Ramamurthy B, Bajaj JC (1969) Soil fertility map of India, Indian AgriculturalResearch Institute, New Delhi.
Rich CJ (1972) Potassium in soil minerals, Proceedings of 9 Colloquium ofInternational Potash Institute, Switzerland, pp 15-31
Sanyal SK, Majumdar K, Chatterjee S (2009) Influence of mineralogy onpotassium availability in Indian soils and its implication on current nutrientuse ratio. Paper presented in the brainstorming session on crop response andnutrient ratio, NationalAcademy ofAgricultural Sciences, New Delhi, pp 13-36
www.ipipotash.org
Reddy D, Prasad RN (eds) Long-term fertility management through integratedplant nutrient supply. Indian Institute of Soil Science, Bhopal, India, pp. 1-335.
th
402 403

Sanyal SK, Majumdar K (2001) Kinetics of potassium release and fixation in soils.In: Potassium in Indian agriculture Potash Research Institute of India,Gurgaon, India & International Potash Institute, Switzerland, pp. 9-31.
Sanyal SK, Chatterjee S (2007) Efficient use of soil, water and plant nutrients forfood and environmental security. Indian J Fertilizers 3:71-88
Sarma VAK (1976) Mineralogy of soil potassium. Bulletin Indian Soc Soil Sci. 10:66-77
Sekhon GS (1999) Potassium in Indian soils and crops. Proc Indian NationalScienceAcademy. B65: 83-108.
Sen P, Majumdar K (2006) Spatial variability in soil physico-chemical propertiesand nutrient status in an intensively cultivated village of West Bengal. ProcFifth Intern. Conf Asian Federation for Information Tech Agriculture,Bangalore, India. MacmillanAdvanced Research Series, pp 653-660
Sen P, Majumdar K, Sulewski G (2008) Importance of spatial nutrient variabilitymapping to facilitate SSNM in small land holding systems. Indian J.Fertilizers 4: 43-50
Sharma, SK (2003) Characterization and mapping of rice-wheat system: Itschanges and constraints to system sustainability. NATP (PSR 4.1) FinalReport, (2003-04), New Delhi
Singh M, Singh VP, Reddy DD (2002) Potassium balance and release kineticsunder continuous rice-wheat cropping system in Vertisol. Field Crops Res 77:81-91
Sparks DL, Huang PM (1985) Physical chemistry of soil potassium. In: RDMunson (ed.) Potassium in agriculture. Soil Sci Soc America, Madison,Wisconsin, pp 210-276
Subba-Rao A, Rupa TR, Yadav RL (2001) Assessing potassium needs of differentcrops and cropping systems in India. In: Papers and Presentations Section ofwww.ipipotash.org, pp 184-215
Subba-Rao A, Rao S (1996) Potassium status and crop response to K in differentAgro-Ecological Regions in India. IPI Research Topics No. 20, InternationalPotash Institute, Basel, Switzerland, pp 1-57
Swarup A, Rao S (1999) Current status of crop response to nutrients: ExperiencesfromAICRPon LTFE. Fertilizer News 44 (4): 27-40
Tandon HLS (2004) Fertilizers in Indian agriculture – from 20 to 21 Century,FDCO, New Delhi. Pp 240
Tiwari KN (1985) Changes in potassium status of alluvial soils under intensivecropping. Fertilizer News 30:17-24
Tiwari KN, Sharma SK, Singh VK, Dwivedi BS, Shukla AK (2006) Site specificnutrient management for increasing crop productivity in India. Results withrice-wheat and rice-rice systems PDCSR, Modipuram and PPIC IndiaProgramme Gurgaon, pp 92
Yadav RL, Prasad K, Gangwar KS (1998) Prospects of Indian agriculture with
,
th st
special reference to nutrient management under irrigated systems. In: SwarupA, Damodar Reddy D, Prasad RN (ed) Long term fertilizer managementthrough integrated plant nutrient supply. Indian Institute of Soil Science,Bhopal, India, pp 1-325
Yadav RL, Dwivedi BS, Kamta-Prasad, Tomar OK, Shurpali NJ, Pandey PS(2000) Yield trends and changes in soil organic-C and available NPK in along-term rice-wheat system under integrated use of manures and fertilizers.Field Crops Res 68: 219-246
404 405
Proceedings IPI-OUAT-IPNI International Symposium (2009)
Ping He Jiyun JinBeijing Office of the International Plant Nutrition Institute, Beijing 100081 Chinae-mail: [email protected] WangInstitute of Soil and Fertilizer, Shanxi Academy of Agricultural Sciences, Taiyuan030031 China
GIS based soil fertility mapping for SSNM at village
level in China: A case study in Shanxi province
Ping He Hongting Wang Jiyun Jinl l
l l l
Abstract
Keywords
Abbreviations
Introduction
Rapid development of information technology provides an opportunityto improve soil nutrient management by using the advanced technology. In thisstudy, Ershilipu village of Xinzhou city in Shanxi Province, which encompassed245 ha and consisted of 443 farmer's plots, was selected as experimental sites todevelop the approach to meet the needs of site-specific nutrient management forthe small scale operation under family responsibility system in China. Twohundred and eighty plow layer (0-20 cm) soil samples were collected on a 100×100 m grid prior to the plots being sown for maize. Soil pH, organic matter (OM),available P, K, Zn, and other nutrients were measured. The results showed thatOM, P, Zn and Fe were the main limiting factors in the soil. Spatial variability oftested soil properties in the experimental village was observed. Great variationwas observed in soil OM, P, S, Zn and B, and small spatial variation in soil Kresulting from the little fertilizer input. The spatial variability of soil OM and Carelied mainly on regional factors. The variability of soil nutrient was greatlyrelated to fertilization history, fertilizer application level, and soil texture. Site-specific nutrient management (SSNM) based on regionalized balancedfertilization helped to produce higher yield and income due to rational nutrientsupply to crop.
SSNM GIS Soil nutrients Spatial variability
DGPS: differential global positioning system; OM: organicmatter; SSNM: site specific nutrient management
Soil nutrient management with information technology is an important part ofinformation agriculture (Atherton et al. 1999; Borgre and Mallarino 1997; Bouma
406 407

Soil sampling and analysis
Atotal of 280 soil samples from 0-20 cm depth were collected on a 100×100 m gridin the study areas of guided by using differential global positioning system(DGPS) technology with a trimble 132 GPS receiver. All soil samples were air-dried and ground through 2 mm sieve prior to analysis. The soil nutrients weredetermined with procedures applied by the Chinese Academy of AgriculturalSciences (CAAS) and International Plant Nutrition Institute (IPNI) CooperativeSoil and Plant Analysis Laboratory and the National Laboratory of Soil Testingand Fertilizer Recommendation of CAAS as described by Portch and Hunter(2002).Available P, K, Cu, Fe, Mn and Zn of the soil samples were extracted using0.25 M/L NaHCO , 0.01 M/L EDTAand 0.01 M/L NH F. The concentration of P inthe extraction was measured by the molybdenum blue colorimetric method.Concentration of K, Cu, Fe, Mn and Zn were determined using an atomicabsorption spectrophotometer. The organic matter (OM) of the soil samples wasextracted with an extracting solution containing 0.2 M/L NaOH, 0.01 M/L EDTAand 2 percent methyl alcohol, and the concentration of OM in the extract wasdetermined by colormetry method. Soil pH was measured in a 2.5:1 soil-watersuspension using a glass pH electrode. Soil nitrate-N was extracted with a 2 M/LKCl solution, and the concentration of nitrate-N in the extract was analyzed usingan ultraviolet spectrophotometer at 220 and 275 nm (Chen et al. 1995; Wang et al.2004).
Data analysis
Descriptive statistics and geo-statistics were used to analyze the data.ANOVAwascalculated using SPSS 12.0 for Windows. The structure of spatial variation wasanalyzed through semivariograms using GS+ for Windows 3.1. Spatialdistribution was analyzed through kriging interpolation using ArcGIS 8.0software.
A semivariogram from the set of sample data is calculated using thefollowing equation (Chil s and Delfiner 1999):
=[1/2 ] [ ( ) Z( )]
Where
3 4
è
- ( )γ(h) N(h) Z x +h xi i
21
is the semi-variance for separate distance class h, is thenumber of sample pairs at each distance interval , ( ) is the value of the variable
at sampled location and ( ) is the value of the variable at a distanceaway from .
Parameters defining semivariogram models are nugget (variability at asmaller scale than the sampling internal and/or sampling and analytical error), sill
γ(h) N(h)
h Z x
Z x Z x +h Z h
x
i
i i
i
et al. 1999). Compared with developed countries, China is far behind in terms ofinformation technology use in soil nutrient management (Jin and Jiang 2000). Thesmall scale farmer's farmland and variability in their fertilization practices causedthe great variability in soil nutrient status. A fertilizer application surveyinvestigation in Shanxi province indicated that the percentage of time that Napplication rate exceeded 250 kg N ha was 20 percent for wheat and 25 percentfor maize, and the percentage of time that N application rate less than 150 kg N haaccounted for 56 percent for wheat and 53 percent for maize (Yang et al. 2008).Continuous cropping without balanced and efficient use of fertilizers hascontributed to not only losses in yield and profit, but also to environmentalproblems such as groundwater nitrate-N contamination and eutrophication ofrivers. Therefore, how to manage soil nutrient for the small scale operation withinformation technology is of great challenge in managing soil nutrient.
In China, due to the small-scale farm size and the cost of soil testing, it isimpossible to give fertilizer recommend fertilizer based on each farmer. Usually,the same amount of fertilizer is recommended for a 15- to 20 ha field irrespectiveof the soil nutrient variability within the field. Thus, some areas of a field willreceive too much fertilizer, whereas other areas will receive too little. A betterunderstanding of the spatial variability of soil nutrients is required as a basis of soilnutrient management and rational fertilizer application (Hammond 1994; Franzenet al. 1996). Site-specific nutrient management in developed countries is based ona large scale of farm size with a high level of mechanization. With the rapidprogresses of rural development and thereafter movement of farmers working inthe city, and the policy on stimulation of the farm land transition to the larger size,fertilizer precision management based on soil nutrient variability would inevitablymake great progress.
In this study, a systematic analysis of soil nutrient variability in a maizeproduction area associated with the application of corresponding managementapproach was carried out. The objectives were 1) to investigate spatial variation ofsoil nutrient status and its distribution; 2) to develop nutrient management strategybased on nutrient variation; and 3) to evaluate the effect of nutrient managementon yield and profits.
Location of trials
The trials were located at Ershilipu village, Boming town, Xinzhou city, Shanxiprovine. The tested soil was Fluvo-aquic. The site consisted of 443 farmers (244ha), with an east longitude of 112°17' to 112°58' and a north latitude of 38°13' to38°41'. The local climate is semiarid monsoon, with an average annual rainfall of405 mm, average temperature of 8.5 C, and a frost free period about 160 days.
–1
–1
0
Materials and methods
408 409

other nutrient regional factors, such as climate, soil type, fertilization or humanactivities. The proportion of spatial variability for soil pH, P, K, Mg, S, B, Cu, Fe,Mn and Zn were 58 percent, 70 percent, 26 percent, 56 percent, 68 percent, 29percent, 59 percent, 50 percent, 41 percent and 74 percent, respectively, indicatingthat their spatial correlations were moderate (Table 2).
Semivariograms analysis for soil pH, OM and nutrients in the study areaTable 2
and range. The range of the semivariogram is defined as the distance at which thevariogram stabilizes around a limiting value, the sill, which can be approximatelyby the total variance of Z(x ). The sill expresses the distance (range) beyond whichsamples are not correlated.
Kriging of geo-statistics is an optimum interpolation technique for markingunbiased estimates of regionalized variables at unsampled locations in which thestructural properties of the semivariogram and the values of a soil variable at anunsampled point X is estimated by the formula (Chil s and Delfiner 1999):
2
Where X denotes the set of spatial coordinates (X , X ), is the number ofneighboring samples and are the weights associated with the sampling pointsXi. The predicted value Z(X ) is a weighted average of the values atsurrounding points.
Status of soil nutrients
Available nutrient contents of surface soil samples from the experimental villagewere determined using the systematic approaches for soil nutrient evaluation(Portch and Hunter, 2002). Table 1 showed that most of the soils were low in soilOM, and deficient P, Zn and Fe, with the percentage of soil samples below thecritical value being 100, 86, 94 and 77, respectively. About 23percent of the soilswere relatively low in K, whereas soil S, Mn and Cu contents were above mediumevaluation levels, with average values of 44.6 mg l , 6.1 mg l and 1.4 mg l ,respectively. Soil Ca, Mg and B contents were much higher than the critical values.Great variation existed in soil OM, P, S, Zn and B content with C.V. of 47.5percent,46.0percent, 38.5percent, 37.6percent and 42.0percent, respectively (Table 1).
Spatial variation of soil nutrients
Semi-variograms analysis revealed a distinct different degree of spatial variabilityof soil nutrients. Cambardella et al. (1994) reported that spatial variability for aregionalized variable may be divided into three classes: strong, moderate andweak spatial dependence, corresponding to a nugget to still ratio [c / (c +c)] of<25percent, 25-75percent and 75percent, respectively. About 20percent and23percent of the spatial variability for OM and Ca were due to random factorsassociated with human activities (such as fertilization, crop varieties, managementlevels, etc), which demonstrated that spatial variability for soil OM and Ca wasmainly relied on regional factors (e.g. topography, climate and soil matrix). The
i
0
1 2
0
0 0
Z
n
Z n
è
( )
λi
Results
-1 -1 -1
å=
=n
i
ii XZXZ1
0 )()( l
Item Mini-mumvalue Value soil nutrient
fertilityevaluation (%)
pH 7.7 8.2 8 0.1 1.2OM (%) 0.03 0.83 0.22 0.1 47.5 1.5 100P (mg l ) 1 43 8 4 46 12 86K (mg l ) 47 137 88.3 16.6 18.8 78 23Ca (mg l ) 1363 4068 2594 507 19.5 401 0Mg (mg l ) 142 490 274 55.3 20.2 122 0S (mg l ) 8 97 44 17 38 12 3Zn (mg l ) 0.6 4.6 1.2 0.5 37.6 2 94Mn (mg l ) 3.5 14.9 6.1 1.4 23.0 5 18Fe (mg l ) 4.5 17.0 8.4 2.3 27.0 10 77Cu (mg l ) 0.9 4.0 1.4 0.3 24.9 1 4B (mg l ) 0.3 5.0 2.2 0.9 42.0 0.2 0
Maxi- Mean Standard C.V. The critical Percentage ofmum deviation (%) values of soil samples
below thecritical values
-1
-1
-1
-1
-1
-1
-1
-1
-1
-1
Table 1 Soil OM, available nutrient and pH in the maize production area understudy
Item C0Nugget-
to sill
pH 0.69 1.19 0.58 1739 L 0.882OM 0.20 1.01 0.20 328 S 0.686K 0.27 1.02 0.26 405 E 0.614Ca 0.31 1.35 0.23 1949 S 0.999Mg 0.69 1.23 0.56 1739 L 0.877P 0.79 1.13 0.70 1739 L 0.891S 0.78 1.14 0.68 1739 L 0.799B 0.30 1.03 0.29 336 E 0.629Cu 0.70 1.18 0.59 1739 L 0.755Fe 0.58 1.17 0.50 1995 E 0.909Mn 0.42 1.02 0.41 418 S 0.965Zn 0.83 1.12 0.74 1739 L 0.905
C+C0 C0/ Range Model RSill (C+Co) (m)
2
410 411
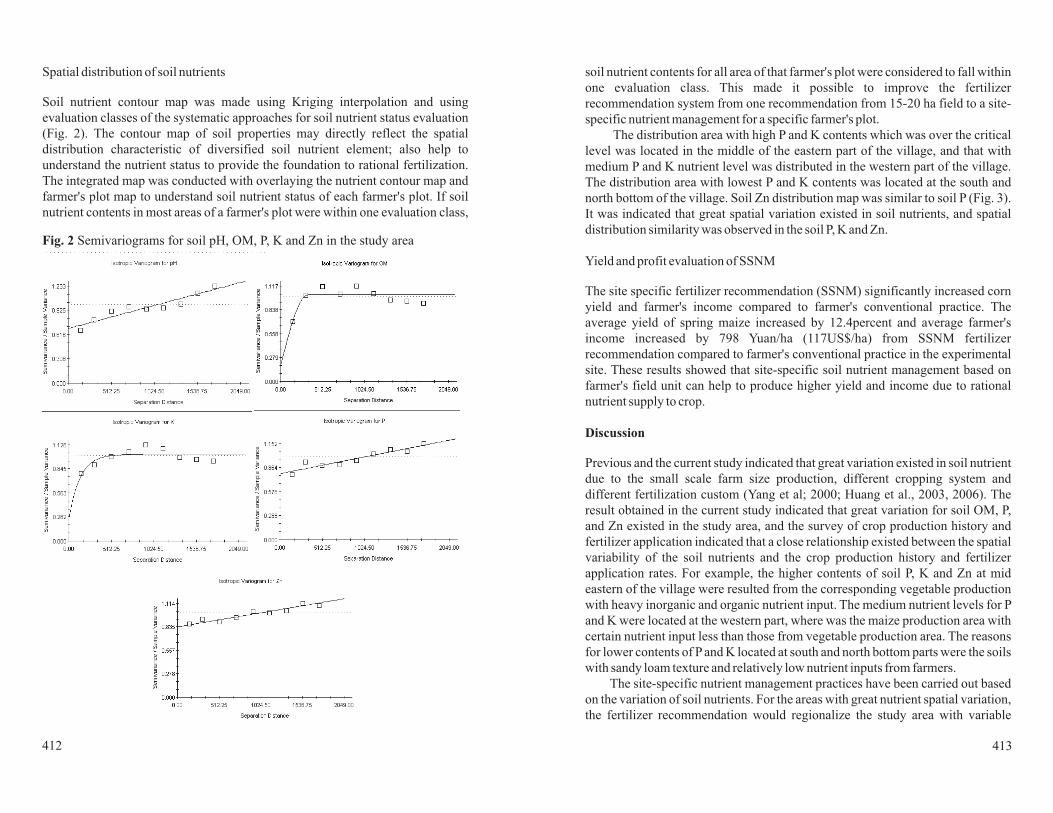
soil nutrient contents for all area of that farmer's plot were considered to fall withinone evaluation class. This made it possible to improve the fertilizerrecommendation system from one recommendation from 15-20 ha field to a site-specific nutrient management for a specific farmer's plot.
The distribution area with high P and K contents which was over the criticallevel was located in the middle of the eastern part of the village, and that withmedium P and K nutrient level was distributed in the western part of the village.The distribution area with lowest P and K contents was located at the south andnorth bottom of the village. Soil Zn distribution map was similar to soil P (Fig. 3).It was indicated that great spatial variation existed in soil nutrients, and spatialdistribution similarity was observed in the soil P, K and Zn.
Yield and profit evaluation of SSNM
The site specific fertilizer recommendation (SSNM) significantly increased cornyield and farmer's income compared to farmer's conventional practice. Theaverage yield of spring maize increased by 12.4percent and average farmer'sincome increased by 798 Yuan/ha (117US$/ha) from SSNM fertilizerrecommendation compared to farmer's conventional practice in the experimentalsite. These results showed that site-specific soil nutrient management based onfarmer's field unit can help to produce higher yield and income due to rationalnutrient supply to crop.
Previous and the current study indicated that great variation existed in soil nutrientdue to the small scale farm size production, different cropping system anddifferent fertilization custom (Yang et al; 2000; Huang et al., 2003, 2006). Theresult obtained in the current study indicated that great variation for soil OM, P,and Zn existed in the study area, and the survey of crop production history andfertilizer application indicated that a close relationship existed between the spatialvariability of the soil nutrients and the crop production history and fertilizerapplication rates. For example, the higher contents of soil P, K and Zn at mideastern of the village were resulted from the corresponding vegetable productionwith heavy inorganic and organic nutrient input. The medium nutrient levels for Pand K were located at the western part, where was the maize production area withcertain nutrient input less than those from vegetable production area. The reasonsfor lower contents of P and K located at south and north bottom parts were the soilswith sandy loam texture and relatively low nutrient inputs from farmers.
The site-specific nutrient management practices have been carried out basedon the variation of soil nutrients. For the areas with great nutrient spatial variation,the fertilizer recommendation would regionalize the study area with variable
Discussion
Spatial distribution of soil nutrients
Soil nutrient contour map was made using Kriging interpolation and usingevaluation classes of the systematic approaches for soil nutrient status evaluation(Fig. 2). The contour map of soil properties may directly reflect the spatialdistribution characteristic of diversified soil nutrient element; also help tounderstand the nutrient status to provide the foundation to rational fertilization.The integrated map was conducted with overlaying the nutrient contour map andfarmer's plot map to understand soil nutrient status of each farmer's plot. If soilnutrient contents in most areas of a farmer's plot were within one evaluation class,
Fig. 2 Semivariograms for soil pH, OM, P, K and Zn in the study area
412 413

fertilizer application rate; while for the areas with small nutrient spatial variation,an uniformed fertilization rate would be recommended.Yang et al. (2000) reportedthat the application of grid sampling and variable rate application technology in a54-ha cotton field increased fertilizer efficiency, with a net profit of 5313 RMBYuan ha (RMB Yuan 8.26 = US$ 1) higher than that obtained with localfertilization practice. Huang et al. (2003) reported that the incorporation ofregionalized balanced fertilization technology into wheat and corn farmingpractices significantly increased income by 590-1350 RMB Yuan ha . The resultsobtained in this study demonstrated that maize yield increased by 12.4percent andprofit increased by RMBYuan 798 ha with the regionalized balanced fertilizationcompared with that by farmer's practice. It was indicated that site specific nutrientmanagement practice based on nutrient spatial variation with regionalizedbalanced fertilization is a promising nutrient management practice in China.
The great variability in farmer's fertilization practices resulted in the great spatialvariation in soil nutrient status in the study area. The soil OM, P, Zn and Fe wasdeficient in high percentage of nutrient values below the critical values. Largevariation in nutrient contents was observed in soil OM, P, S, Zn and B. On thecontrary, soil K had a smaller spatial variability due to little nutrient input asfertilizer. The variability of soil OM and Ca attributed mainly to random factorsand regional factors (e.g. topography, climate and soil matrix), and that for pH andother nutrients related to more closely to random factors related to humanactivities such as fertilization, cropping system, etc. The contour map of soilproperties may directly reflect the spatial distribution characteristic of diversifiedsoil nutrient, and help to understand the nutrient status to provide the foundation torational fertilization; Site-specific nutrient management integrated withregionalized balanced fertilization based on farmer's field plot can help to producehigher yield and income due to rational nutrient supply to crop.
This research was supported by the National Basic ResearchProgram of China (973 Program) (2007CB109306), International PlantNutrition Institute and Shanxi Academy of Agricultural Sciences.
Atherton BC, Morgan MT, Shearere SA, Stombawgh TS, Ward AD (1999) Site-specific farming: A perspective on information needs, benefits, andlimitations. J Soil Water Conserv 54:455–461
Borges R, Mallarino AP (1997) Field-scale variability of phosphorus andpotassium uptake by no-till corn and soybean. Soil Sci SocAm J 61: 846-853
-1
-1
-1
Conclusion
References
Acknowledgement
Fig. 3 Distribution of soil P, K and Zn in the experimental site
414 415

Proceedings IPI-OUAT-IPNI International Symposium (2009)
D Jena AK Pal KK RoutDepartment of Soil Science and Agricultural Chemistry, Orissa University of Agricultureand Technology, Bhubaneswar – 751003, Orissa, IndiaD Jenae-mail: [email protected]
l l
Potassium management for crops in soils of Orissa
D Jena AK Pal KK Rout
Abstract
Keywords
Introduction
l l
l l
l l
The soils of Orissa are broadly classified as Alfisols, Inceptisols,Entisols and Vertisols. Total potassium content in soils varies between 0.3 to 3.0%.Non-exchangeable K constitute 21 to 61% of total K, whereas exchangeable K12.5 to 35.7%. Production and productivity of major crops in the state are lowerthan national average probably due to imbalance and lower fertilizer consumptionrate (62 kg ha ). Potassium application in the state was neglected up to 80's due tolack of response and thereafter crop responses are increasing in time and space.Low application of K leads to depletion of K to the extent of 242.8 thousand tonesper annum. In long-term fertilizer studies with rice-rice and rice-pulse croppingsystems, the sustainability of crop yield was threatened in absence of Kapplication. In many production systems in the state, the non-exchangeable Kmeets the K requirement and sustains the level of production. Higher correlationbetween HNO -K and K balance and yield suggests the inclusion of this method insoil testing programmes in the state. Optimal and super-optimal doses of K couldnot sustain the yield and K depletion. Hence, a need to reschedule the K dose forcrops. An holistic management of K could be possible by applying adequateamount of K on the basis of soil test, recycling of crop residues and addition ofrural and non-toxic urban compost in different cropping systems under varyingagro-ecological regions. A sustainable fertilizer management strategy shouldensure farm productivity, optimum economic return and soil health.
Acid soil integrated potassium management potassium balancepotassium mining step-K
The state of Orissa located in the Coromondal coast of India has a tropicalmonsoon climate characterized by high humidity, high rainfall (1497 mm) andshort and medium winter. It is the 10 largest and 11 populous state accountingabout 5% of the geographical area and 4% of the population of the country. The
-1
th th
3
Bouma J, Stoorvogel J, van Alphen BJ, Booltink HWG (1999) PrecisionAgriculture, and the changing paradigm of agricultural research. Soil SciSocAm J 63:1763-1768
Cambardella CA, Moorman TB, Noval JM, Parkin TB, Karlen DL, Turco RF,Konopka AE (1994) Field scale variability of soil properties in central Iowasoils. Soil Sci SocAm J 58: 1501-1511
Chen MC, Zhang Q, Yang JL (1995) Selection and verification of methods fordetermination of nitrate in soil extracts (in Chinese). J Shanxi Agric Sci23:31-36
Chil s JP and Delfiner P (1999) Geostatistics: Modeling spatial uncertainty. JohnWiley, NewYork
Franzen DW, Hofman VL, Halvorson AD, Cihacek LJ (1996) Sampling for site-specific farming: Topography and nutrient considerations. Better Crop80:14-18
Hammond MW (1994) Comparison of phosphorous and potassium utilizationwith conventitional and variable fertility management. Better Crop 78: 22-23
Huang SW, Jin JY, Yang LP, Bai YL (2006) Spatial variability of soil nutrients andinfluencing factors in a vegetable production area of Hebei Province inChina. Nutr CyclAgroecosyst 75:201-212
Huang SW, Jin JY, Yang LP, Cheng MF (2003) Spatial variability and regionalizedmanagement of soil nutrients in thegrain crop region in Yutian county (inChinese).Acta Pedologia Sinica 40:79-88
Jin J, Jiang C (2000) Spatial variability of soil nutrients and site-specific nutrientmanagement. Proceeding of International Conference on Engineering andTechnological Sciences, New World, Beijing, pp 137-141
Portch S, Hunter A (2002) A systematic approach to soil fertility evaluation andimprovement. Special publication No.5 PPIC China Program, Hong Kong.p 62
Wang SG, Hou YL, Guo W (2004) Study on the effect of different fertilizer-soilratios on NO N concentration (in Chinese). Plant Nutr Fertilizer Sci 10:148-151
Yang B, Chen MC, Yang ZP, Zhang JJ , Zhang Q (2008) Nutrient resourcesmanagement and nutrient balance of wheat and maize in Shanxi (in Chinesewith English abstract). J ShanxiAgri Sci 36:3-7
Yang LP, Jiang C, Jin JY, Zhang FM (2000) Study on site-specific nutrientmanagement in cotton field (in Chinese). SciAgric Sinica 33: 67-72
è
3
416 417

more strongly weathered that Inceptisols. Entisols (10% TGA) represent alluvial,coastal saline and colluvial soil. These soils are recently formed soil with littledevelopment of pedogenic horizons and are seen in flood plains in delta areas.Vertisols (6% TGA) are black or regur and occurs in specific locations of the state.These soils are black or dark coloured, uniform with gilgai micro relief. The claycontent is more than 30% and clay minerals are mostly smectitic. These soils swellon wetting and shrink on drying with cracks of more than 1 cm wide and haveangular blocky structure. About 70-75% of soils of Orissa are acidic and supportimportant production systems including cereals, pulses, oilseeds, horticulturalcrops, plantation crops and forestry. The production and productivity of crops inOrissa are low (Table 1) as compared to all India average due to both deficiencyand toxicity of plant nutrients, low consumption of fertilizer and imbalanced useof fertilizer (Table 2).
Important K bearing minerals in soils of Orissa are muscovite, biotite and feldspar.Release of K to crops depends on the nature of dominating K bearing mineral. On
Mineralogy of soils
geographical area of the state is 15.57 m ha, out of which 6.2 m ha are arable land.Agriculture contributes 28% to net state domestic production and employ 64% ofthe work force.
Rice is the principal food grain of the state and occupies 50% of the totalcultivated area followed by pulses (22%), oilseeds (9%), vegetable (7%) and othercrops like fruits, spices, sugarcane, jute, etc. (12%). The production andproductivity of major crops in the state are below the Indian average. In addition tosoil acidity, low fertilizer consumption (57 kg ha ) and imbalanced use of fertilizerare the reasons for low productivity. Although the state has experienced upwardtrend in fertilizer use from 7.6 kg ha (1980) to 62 kg ha (2008 – 09), the ratio of Nto K fertilizer is still wide, although narrowed down from 5.9 during 1980 to 4.43during 2008– 09.
During 1960 to 1990, India experienced a dramatic change in food grainproduction with introduction of high yielding varieties and improved managementstrategies. Later on, the yield level remains stagnant or declined even with increasein level of input. Evidence of declining partial or total factor productivity isalready available. Depletion of soil K was one of the reason of yield decline in longterm fertilizer experiment (Ladha et al. 2003).
The experience with rice – rice cropping system which started during 1972 –
73 in lateritic (Aric haplaquepts) soil of Bhubaneswar showed lack of response toK till 1983 and thereafter the response increased from 2.90 q ha to 8.95 q ha . Inmost of the cropping systems practiced in India, K balance is negative, howeverthe negative balance is not reflected in available K (Water soluble + ExchangeableK) status over years of cropping. A huge negative balance of 242.8 thousand tonesper year in Orissa (Mishra and Mitra 2001) and proposed deficit of 8.1 milliontones per year by 2020 (Katyal 2001) in Indian agriculture is a matter of concern.We have attempted to discuss K dynamics and management practices for majorcropping systems of Orissa under diverse agro-ecological situations.
The state of Orissa is situated between 17 47 and 22 33 N latitude and between81 21 ' and 87 30 E longitude. Based on physiography and relief, the state isbroadly classified into 4 broad physical divisions, namely Northern plateau,Central tableland, Eastern Ghats and Coastal plains. The soils of Orissa comeunder 4 orders namely Inceptisols (7.49 m ha),Alfisols (5.62 m ha), Entisols (1.53m ha) and Vertisols (0.93 m ha). Inceptisols occupy 48% of total geographical area(TGA), represent older alluvial and mixed red and yellow soils. These soils haveweak profile development and are at the beginning stage of soil formation.Alfisols(36% of TGA) represent red, laterite and lateritic and brown forest soils. Thesesoils are base rich mineral soil and characterized by light coloured surface horizonover a clay enriched argillic subsurface horizon. They are rich in Fe,Al oxides and
-1
-1 -1
-1 -1
0 / 0 /
0 / 0 /
Soils of Orissa
Crops Productivity (q ha )
Orissa All India
Rice 14.5 19.8Wheat 13.3 26.0Maize 13.2 19.0Arhar 6.8 6.6Groundnut 15.1 10.2Sugarcane 686.0 647.5Potato 94.9 179.2
Source: Agricultural Statistics of Orissa 2008
-1
Table 1 Productivity of different crops in Orissa as compared to all India (2004-05)
Table 2 Fertilizer consumption rate and ratio of N and K in Orissa
Year N+P O + K O (kg ha ) N: K O ratio
1980 7.6 5.91990 21.0 5.12000 31.0 6.72005-06 46.0 5.82006-07 52.0 4.92007-08 57.0 4.4
Source: Agricultural Statistics of Orissa 2008
2
-1
5 2 2
418 419

Mineral Species (%) Orders
Inceptisols Alfisols
Quartz 80.5 55.0Orthoclase Feldspar 9.5 31.0Andelusite 0.5 1.0Garnet 0.5 1.0Muscovite - 1.0Biotite 2.0 1.0Zircon - 0.5Chlorite 2.0 2.0Rutile 0.5 -Opaque 3.5 4.5Unidentified mineral 1.0 2.0
Source: Nayak et al. 2001
orthoclase content varies 7 to 42.4 %. Except Shyamakhunta and Motto (salinesoil), mica content varies between 1.0 to 4.8 %. These soils in general are, neutralto slightly alkaline and have high base saturation capacity with Ca and Mgdominating in the exchange complex. These conditions are favorable for theformation of smectites in the clay fractions (Sahu et al. 1983). Alternation of K-feldspar might have led to the formation of illite in clays. The Entisols are found inDelta area of Orissa due to deposition of silt and clay by the action of flood andcontained higher amount of orthoclase (27.1 to 38.6%) and mica (1.7 to 17.4 %).High mica content in the sand fraction indicates lack of weathering and the soilsare rich in K. High base saturation with mild acidic to neutral soil reaction musthave favoured formation of smectites besides illites (Sahu et al. 1990)
The orthoclase and mica in Vertisols of Orissa varies between 12.4 and 26.9 %and between 2.7 and 11.0 %, respectively. Their transformation/alterationaccounts for the occurrence of illite. Abundance of Ca and Mg in an alkalineenvironment favours the formation of montmorilonite in the clay fraction. Nayaket al. (2001) analysed the fine sand fraction (0.1 to 0.25 mm) of Alfisols andInceptisols of university farm (OUAT) at Bhubaneswar and reported that quartzdominated (55.0 - 80.5 % ) the fine sand fraction along with K bearing mineralslike orthoclase feldspar (9.5 -31.0 %), biotite and muscovite mica (0.5 -2%). TheAlfisols contained more K bearing minerals than the Inceptisols (Table 4). In finesand fraction (0.1 -0.25 mm) of soils of Kanchinala micro watershed under coastalplains of Mahanadi delta of Orissa. Mishra (2008) observed a considerableamount of K bearing minerals like orthoclase, muscovite and biotite in upland,medium land and low land soils (Table 5). Higher amount of orthoclase waspresent in low land (20.6%) followed by medium land (19.2%) and upland
2+ 2+
2+ 2+
the basis of K release power, the minerals are arranged in the order of: biotite >muscovite > orthoclase > microcline. The inherent status of K in soils of Orissa ismainly governed by the soil mineralogy. The microcline is the most common K-feldspar in the soils of Orissa (Sahu et al. 1995). InAlfisols, orthoclase constituted9.8 to 41.1% while muscovite mica from nil to 6.1% (Table 3). The presence ofhigh content of light minerals (orthoclase feldspar) in fine sand fractions may beattributed to moderate weathering in the environment. High temperature withalternate wet and dry season in humid sub-tropical climate of Orissa are alsoconducive for development of illite in the clay fractions due to alternation andpartial hydrolysis of feldspar and mica (Sahu et al. 1983). The occurrence ofKaolinite in these soils is also expected due to leaching of bases. In the Inceptisols,
Location Classification Orthoclase(%) Muscovite
abundance
Alfisols
Phulbani Oxic Paleustalfs 24.6 6.1 I,KBhubaneswar Rhodic Paleustalfs 41.1 - I,KKhurda Ferric Plinthustalfs 37.6 - I,KSemiliguda Oxic Paleustalfs 9.8 1.9 K,ISuakati Ultic Paleustalfs 31.0 - K,IMuktapur Lithic Plinthustalfs 15.4 - I,K
Inceptisols
Bhubaneswar Eutrochrepts 16.0 1.0 I,M,KShymakhunta Aeric Ustochrepts 30.5 - K,I,MRanital Typic Haplaquepts 7.0 2.5 M,I,KMotto Vertic Haplaquepts 41.5 - K,I,MKeshpur Typic Haplaquepts 42.5 4.8 M,C,I,K
Entisols
Jasuapur Typic Ustifluvents 27.1 14.8 I,M,KKendrapara Typic Usterthents 33.0 1.1 I,M,KChilika Prammaquents 22.5 3.1 K,I,MAstaranga Typic Haplaquents 38.6 4.3 M,I,K
Vertisols
Bhawanipatwana(Arkabali)Luisinga Ustalfic Pellusterts 26.9 11.0 I,M
I = Illite, K= Kaolinite, M= Montmorillonite,C=ChloriteSource : Sahu et al. 1995
Mica Claymineralogy
(%) in order of
Typic Pellusterts 12.4 2.7 M,I
Table 3 Mineral composition of different soil orders of Orissa
Table 4 Mineralogy of fine sand fraction in the soils of Central Research Station,OUAT, Bhubaneswar
420 421
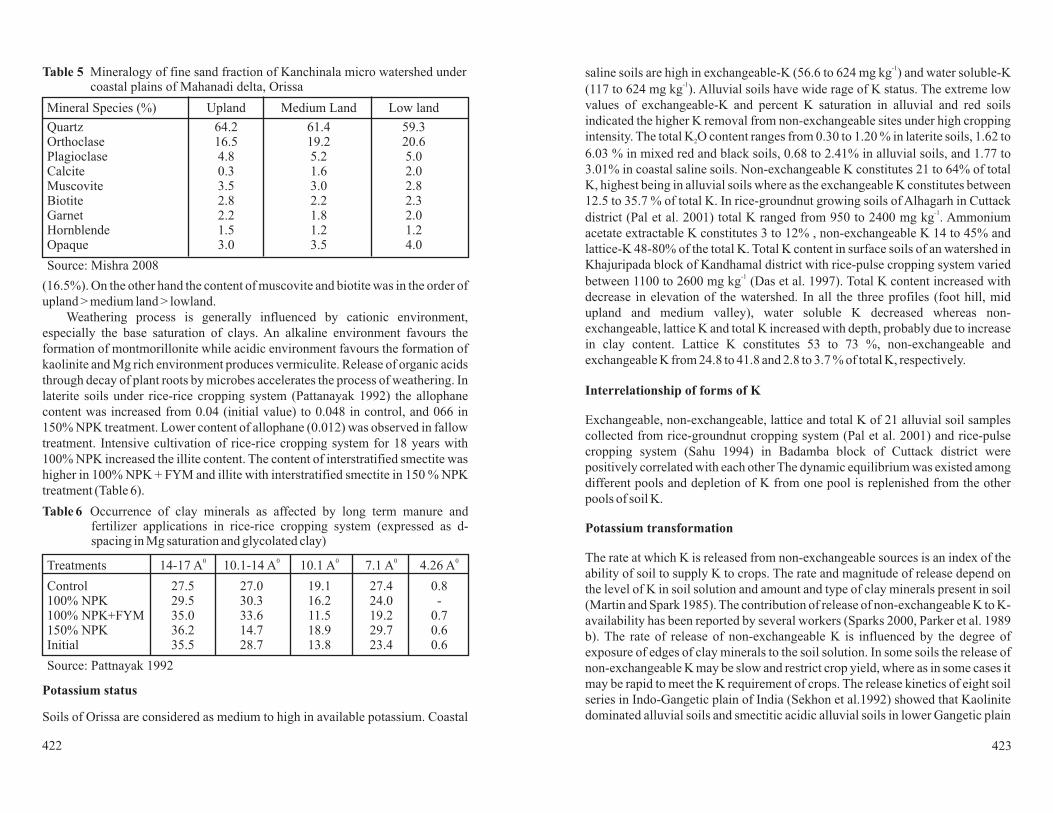
saline soils are high in exchangeable-K (56.6 to 624 mg kg ) and water soluble-K(117 to 624 mg kg ). Alluvial soils have wide rage of K status. The extreme lowvalues of exchangeable-K and percent K saturation in alluvial and red soilsindicated the higher K removal from non-exchangeable sites under high croppingintensity. The total K O content ranges from 0.30 to 1.20 % in laterite soils, 1.62 to6.03 % in mixed red and black soils, 0.68 to 2.41% in alluvial soils, and 1.77 to3.01% in coastal saline soils. Non-exchangeable K constitutes 21 to 64% of totalK, highest being in alluvial soils where as the exchangeable K constitutes between12.5 to 35.7 % of total K. In rice-groundnut growing soils of Alhagarh in Cuttackdistrict (Pal et al. 2001) total K ranged from 950 to 2400 mg kg . Ammoniumacetate extractable K constitutes 3 to 12% , non-exchangeable K 14 to 45% andlattice-K 48-80% of the total K. Total K content in surface soils of an watershed inKhajuripada block of Kandhamal district with rice-pulse cropping system variedbetween 1100 to 2600 mg kg (Das et al. 1997). Total K content increased withdecrease in elevation of the watershed. In all the three profiles (foot hill, midupland and medium valley), water soluble K decreased whereas non-exchangeable, lattice K and total K increased with depth, probably due to increasein clay content. Lattice K constitutes 53 to 73 %, non-exchangeable andexchangeable K from 24.8 to 41.8 and 2.8 to 3.7 % of total K, respectively.
Exchangeable, non-exchangeable, lattice and total K of 21 alluvial soil samplescollected from rice-groundnut cropping system (Pal et al. 2001) and rice-pulsecropping system (Sahu 1994) in Badamba block of Cuttack district werepositively correlated with each other The dynamic equilibrium was existed amongdifferent pools and depletion of K from one pool is replenished from the otherpools of soil K.
The rate at which K is released from non-exchangeable sources is an index of theability of soil to supply K to crops. The rate and magnitude of release depend onthe level of K in soil solution and amount and type of clay minerals present in soil(Martin and Spark 1985). The contribution of release of non-exchangeable K to K-availability has been reported by several workers (Sparks 2000, Parker et al. 1989b). The rate of release of non-exchangeable K is influenced by the degree ofexposure of edges of clay minerals to the soil solution. In some soils the release ofnon-exchangeable K may be slow and restrict crop yield, where as in some cases itmay be rapid to meet the K requirement of crops. The release kinetics of eight soilseries in Indo-Gangetic plain of India (Sekhon et al.1992) showed that Kaolinitedominated alluvial soils and smectitic acidic alluvial soils in lower Gangetic plain
-1
-1
-1
-1
2
Interrelationship of forms of K
Potassium transformation
(16.5%). On the other hand the content of muscovite and biotite was in the order ofupland > medium land > lowland.
Weathering process is generally influenced by cationic environment,especially the base saturation of clays. An alkaline environment favours theformation of montmorillonite while acidic environment favours the formation ofkaolinite and Mg rich environment produces vermiculite. Release of organic acidsthrough decay of plant roots by microbes accelerates the process of weathering. Inlaterite soils under rice-rice cropping system (Pattanayak 1992) the allophanecontent was increased from 0.04 (initial value) to 0.048 in control, and 066 in150% NPK treatment. Lower content of allophane (0.012) was observed in fallowtreatment. Intensive cultivation of rice-rice cropping system for 18 years with100% NPK increased the illite content. The content of interstratified smectite washigher in 100% NPK + FYM and illite with interstratified smectite in 150 % NPKtreatment (Table 6).
Soils of Orissa are considered as medium to high in available potassium. Coastal
Potassium status
Mineral Species (%) Upland Medium Land Low land
Quartz 64.2 61.4 59.3Orthoclase 16.5 19.2 20.6Plagioclase 4.8 5.2 5.0Calcite 0.3 1.6 2.0Muscovite 3.5 3.0 2.8Biotite 2.8 2.2 2.3Garnet 2.2 1.8 2.0Hornblende 1.5 1.2 1.2Opaque 3.0 3.5 4.0
Source: Mishra 2008
Table 5 Mineralogy of fine sand fraction of Kanchinala micro watershed undercoastal plains of Mahanadi delta, Orissa
Treatments 14-17 A 10.1-14 A 10.1 A 7.1 A 4.26 A
Control 27.5 27.0 19.1 27.4 0.8100% NPK 29.5 30.3 16.2 24.0 -100% NPK+FYM 35.0 33.6 11.5 19.2 0.7150% NPK 36.2 14.7 18.9 29.7 0.6Initial 35.5 28.7 13.8 23.4 0.6
Source: Pattnayak 1992
0 0 0 0 0
Table 6 Occurrence of clay minerals as affected by long term manure andfertilizer applications in rice-rice cropping system (expressed as d-spacing in Mg saturation and glycolated clay)
422 423

Fig. 2
Fig. 3
Variation in NH OAC extractable (available) K status of soil under longterm manuring at Keonjhar centre
There was a gradual decrease of HNO –K over the years and after 20 years itreached almost 50% of the initial level particularly in the treatments that receivedK every year (Fig. 3). Maximum decrease was recorded in NP followed byNPK+FYM treatment. The decrease in latter treatment might be due to relativelymuch higher cumulative uptake of K by crops associated with higher biomassyield. The depletion of 1N HNO -K could maintain large amount of potassium insoil solution and exchange sites by reestablishing the equilibrium among differentforms of K. Multiple correlation studies revealed that, both NH OAC and 1NHNO extractable K in soil in various treatments of LTFE trials were significantlycorrelated to the K balance indicating a strong influence of K application anduptake on the extractable K status of surface soil.
Variation in 1N HNO extractable K over the years at Bhubaneswar
4
3
3
4
3
3
showed lower rate of K release from the non-exchangeable fraction than that ofillitic alluvial soils.
In rice-rice cropping system in Inceptisols and soyabean-wheat-cowpea inVertisols (Typic Haplusterts), the total K uptake by crops exceeded the amount ofK applied. The plots which did not receive K fertilizer (control, N and NPtreatment) in soybean-wheat-cowpea system contributed K to the extent of 3129to 9932 kg ha from non-exchangeable source as against 1183 to 1891 kg ha inrice-rice system. The results of LTFE trials clearly showed that mining of Koccurred with N, NPand even with NPK application (Rupa et al. 2003)
Results from two long term fertilizer experiments conducted at Bhubaneswarwith rice-rice cropping system and at Keonjhar with rice-oilseed/pulse croppingsystem representing two different agro-climatic regions of Orissa showed that inrice-rice cropping system there was sharp increase in available K in the first 10years of cropping followed by a rapid fall between 1980-1983 and almostplateauing afterwards in all treatments except NPK+FYM treatment (Fig. 1). Thetreatment that received 100% NP but no K always recorded lowest NH OAC Kfollowed by 50% NPK treatment. On the other hand 150% NPK treatmentrecorded highest value of NH OAC K followed by 100 % NPK treatment. Inmixed red and black soil of Keonjhar with rice-mustard cropping system, theNH OAC K in surface increased rapidly by nearly 100% than the initial (144 kg ha
) probably due to bringing the uncultivated barren land under cultivation andincrease in organic matter content ( 0.23 to 0.55%). Subsequently there was agradual drop of NH OAC K to the extent of 25 to 75 kg ha (Fig. 2)
Variation in NH OAC extractable (available) K status of soil (3 yearsaverage) under long term manuring at Bhubaneswar centre
-1 -1
-
1
-1
4
4
4
4
4Fig. 1
0
10
20
30
40
50
60
70
80
90
100
1972 1972-74 1975-77 1978-80 1981-83 1984-86 1987-89 1990-92
Period
NH
4O
Ac
Extr
acta
ble
K(k
gh
)
50%NPK 150%NPK 100%NPK
a-1
0
10
20
30
40
50
60
70
80
90
100
1972 1972-74 1975-77 1978-80 1981-83 1984-86 1987-89 1990-92
Period
NH
4O
Ac
Extr
acta
ble
K(k
gha
-1)
50%NPK 150%NPK 100%NPK
1NH
NO
3E
xtra
ctab
le K
(kg
ha)
-1
0
50
100
150
200
250
300
1972 1982 1986 1990 1993
Period
50%NPK 150%NPK 100%NPK100%NP 100%NPK+FYM
424 425

counter act to replace structural potassium (Kirk et al. 1993). This was observed inrice- rice system at Bhubaneswar due to decrease in total K in all the three layersover 15 years of cropping.
Step K provides estimation of K availability from the non–exchangeable sourcesand constant rate K (CR-K) is a measure of difficulty available K of mineral latticesource. The K release characteristics of 21 surface soil samples of laterite soilswith rice based cropping system revealed that step K was maximum in the 1extraction and varied from 150 to 700 mg kg and gradually decreased to zero in 6and 7 extraction (Pal et al. 2001). Higher values of step K is associated withgreater release of K from non–exchangeable K under stress condition. The CR- K,total step K and total exchangeable K in soils varies between 12-56, 140-1332 and500-1592 mg kg . The correlation coefficient of K release parameter withdifferent forms of K showed that exchangeable, non–exchangeable, lattice andtotal K were positively correlated with each other suggesting the existence ofdynamic equilibrium among the different pools of K in soil. Highly significant andpositive correlation between step K with HNO K indicates that HNO K couldserve as a good index of plant available non–exchangeable K in soil. In alluvialsoils with rice based cropping system, the step K was maximum in the 1extraction and varied between 104 and 1510 mg kg and gradually decreased withincrease in number of extraction (Sahu 1994). Constant rate K (CR K) valuesvaried from 8 to 44 mg kg , which indicate adequate supply of lattice K to plants.The total extractable K varied from 442 to 1792 mg kg soil. In a long termfertilizer experiment (LTFE) with rice-rice cropping system sequential stepwiseextraction with boiling yielded two categories of K viz. CR K, releasedfrom mineral lattice at a fairly constant rate and step K released from edge andwedge zone of micaceous minerals, the amount of which was negligible after 3extraction (Senapati 1993). There was little difference of CR K in differenttreatments (Table 7).
There was a quite large difference in step-K. The NPK treatments recordedmuch higher step K values compared to NP treatments in all the three layers ofsoil indicating their potentiality to release K for crop uptake. As compared to theinitial level, Step K declined by 55% in NP treatment in 0-15 cm layer. When bothsurface and subsurface layers are taken into account, the decrease in Step K was45% in NP treatment, 4% in 150% NPK and 19% in 100% NPK treatment. Thedecrease in 100% NPK +FYM was slightly more (27%) due to higher crop uptake.
Balanced use of fertilization enhances crop yield, crop quality, farm profit andmaintain soil health and crop productivity of the land. The grain yield of kharif rice
Potassium release characteristics
Crop response to applied potassium
st
-1 th
th
-1
st
-1
-1
-1
rd
3 3
HNO3
Dobermann and Fairhurst (2000) suggested K saturation as a better indicatorfor K supply of soils. He categorized rice soils with less than 1.5% K saturation aslow K, with 1.5–2.5% K saturation as medium K and with more than 2.5% Ksaturation as high K soils. The K saturation of broad soil groups of Orissa were inthe order of: black soils (5.54%) > coastal saline soils (4.32%) > laterite soils(2.7%) > alluvial soils (2.35%). Although K saturation of Orissa soils come underhigh category, still good response to K application was recorded in alluvial andlaterite soils where as there was no response in coastal saline soils. However,optimum dose of K for crops in coastal saline soils is recommended to suppress Nauptake.
Subsurface K contributes significantly to plant nutrition. The difference inmineralogy and K reserve in subsurface horizon influences the subsurface Kavailability. Results of 15 years of rice-rice cropping at Bhubaneswar revealed thatalthough NH OAC –K of the surface layer was higher than the initial value, the subsurface layers showed a lower status as compared to initial value. On the otherhand, there was substantial decrease in 1N HNO -K in all the layers indicating thecontribution of non exchangeable K towards K nutrition of crops. Similar findingswere also observed with respect to NH OAc–K and HNO –K at Keonjhar after 10years of cropping.
These results indicated that at Bhubaneswar NH OAc–K in different layersshowed very poor correlation with K balance. On the contrary significantcorrelation existed between HNO –K of each layer and K balance (r=0.85**,0.72** and 0.74** for 0-0.15, 0.15-0.30 and 0.30-0.45m layer), respectively.Around 68% of the variation of HNO –K of 0-0.15 m layer were accounted for Kbalance. A measure of total K in all the three layers also shows a substantialvariation from the initial value. A drop in total K at the end of 1987-88 was manytimes higher than the decrease in NH OAc–K and HNO –K indicating thatweatherable K bearing minerals in surface and sub surface layers make a majorcontribution to plant uptake K. Singh et al. (2002 b) reported that application oforganic manures along with urea –N increased the cumulative non – exchangeableK release and could maintain large amount of K in soil solution on exchange sitesby reestablishing the equilibrium among different forms of K. In rice-ricecropping system at Bhubaneswar , NPK + FYM treatment encourage release ofmore non – exchangeable K under acidic environment to meet crop requirementof K. Wihandjaka et al. (1999) observed that mobilization of non-exchangeable Kin flooded rice is due to root induced acidification and removal of K from soilsolution by roots. Under flooded rice ecosystem, release of hydronium ion (H O )from roots and decomposition of organic manures and plant residue, actively
Contribution of subsurface K to plant uptake
4
3
4 3
4
3
3
4 3
3
+
426 427

In acidic Inceptisols of Bhubaneswar, complete exclusion of K resulted in 74% loss in yield and highest chaff production of hybrid rice (Table 8). A gradualincrease in K rate increases grain yield, narrowed the grain: straw ratio andsteadily improved the harvest index (Pattanayak et al. 2008).
Benefit of use of Potassium on pulse was observed in the K deficient Balisahiseries of Khurda district of Orissa (Mitra et al. 1993). Application of 40 kg K, 20kg N and 40 kg P ha to summer groundnut in laterite soils of Bhubaneswarsignificantly increased yield from 10.60 to 15.88 q ha . Significantly higher yield(22.7 q ha ) of rabi groundnut over NP control (16.4 q ha ) with the application of60 kg K ha has also been reported. Results of farmer's field trials in alluvial soilsof Siula (Puri district of Orissa) revealed that there was significant increase ingreen gram yield by 67% with application of 20 kg K ha even without applicationof any N fertilizer (Mitra and Sahoo 1998).
Among the fruit crops, banana responded significantly to K application. Atyield level of 58 t ha , banana removes 1180 kg K ha . Experimental results ofOUAT revealed fruit yield, fruit weight, total soluble solids, total sugar andascorbic acid content of banana increased with increasing level of K in alluvialsoils of Puri district (Table 9).
-1
-1
-1 -1
-1
-1
-1 -1
in rice-rice cropping system of LTFE trial in Inceptisols of Bhubaneswar over 22years revealed that continuous cultivation of rice without fertilizer (N P K )
decreased grain yield by 52 % over initial year yield (9.7 q ha ) where as in N andNP treatments the grain yield was declined by 50 and 37%, respectively over theinitial year yield (Fig. 4). With application of balanced NPK, the yield decline wasnarrowed down to 25%. Combined application of NPK+FYM and super optimaldose of NPK (150%) increased the grain yield by 21 and 10%, respectively overthe initial year yield. With passage of time, the yield gap between control (N P K )
and NPK+FYM treatment increased from 9 q ha (initial year) to 25 q ha over 41cropping cycles. The decline trend was more prominent after 1983 onwardsprobably due to K and other micronutrients as limiting factors.
Long term effect of nutrients on Rice yield (Kharif)
0 0 0
0 0 0
-1
-1 -1
Fig. 4
5
10
15
20
25
30
35
40
45
50
55
1973 1977 1978 1983 1988 1993
Year
Yie
ld (
q h
a)
-1
Control 100%N 100%NP
100%NPK 150%NPK 100%NPK+FYM
Treatments Grain Yield( t ha ) (t ha ) ratio Index
Control 8.0 1.00 1:1.44 0.3925% K 9.3 0.90 1:1.29 0.4250% K 10.7 0.80 1:1.15 0.4575% K 11.2 0.70 1:1.15 0.45100% K 13.9 0.48 1:1.01 0.49CD (0.05) 0.5 0.08
Source: Pattanayak et al. 2008
Chaff Grain:straw Harvest-1 -1
Table 8 Effect of K rate on hybrid rice yield (two consecutive season) atBhubaneswar
Table 9 Effect of levels of K on yield and quality of banana in alluvial soil
K (g plant ) Yield(t ha ) weight(g) soluble Solid (%) (mg/100 g pulp)
200 37.0 115.2 18.4 12.6 5.69400 50.7 132.7 19.3 14.2 7.45600 55.9 138.8 20.0 16.7 9.86C.D.(0.05) 0.9 4.4 0.2 0.1 0.50
Source: Senapati and Santra 2009
-1
-1
Fruit Total Total Ascorbic acidSugar
Treatments Step-K (mg kg ) CR-K (mg kg )
0-0.15 0.15-m 0.30 m m m 0.30 m 0.45 m
NP 43 51 74 15 16 22NPK 84 54 108 16 18 24NPK(150%) 98 88 105 17 18 25NPK+FYM 72 54 97 16 17 24Initial 96 97 111 17 20 26
Source: Senapati 1993
-1 -1
0.30-0.45 0-0.15 0.15- 0.30-
Table 7 Cumulative effect of treatments on Step -K and CR-K after 22 years ofrice-rice cropping at Bhubaneswar
428 429

ranges between 90 to 480 kg ha . Tuber crops like potato, cassava, sweet potato,elephant-foot yam remove about 310 to 350 kg K O ha , whereas fruit crops like
banana and pine apple remove 1180 and 530 kg K O ha , respectively. In most ofthe cropping systems being practiced in India, potassium balance is negative(Rupa et al. 2003).Ahuge negative balance of 242.9 thousand tones of K in soils ofOrissa has been reported by Misra and Mitra (2001) who suggested that dose of Kfor rice need to be revised from 30 to 60 kg ha since 62% of K depletion is causedby rice.
Nutrient balance of rice-groundnut cropping system in alluvial soils ofNimapara
Nutrient balance of rice-green gram cropping system in laterite soils ofNayagarh
-1
-1
-1
-1
2
2
Fig. 5
Fig. 6
The response of turmeric and ginger to K application is well documented. Thedata revealed that turmeric responded up to 90 kg K ha and 26 % higher yield overK control (8.14 t ha ) was recorded. Similarly, the yield of ginger at 50 and 100 kgK ha increased by 6 and 12% over control respectively. There was no response tohigher dose of K.
Jena et al. (2006) reported that average response of rice to K application wasof the magnitude of 7.8 kg per kg K O for mixed red and black, 4.8 to 6.4 kg for redand lateritic and 4.4 to 4.8 kg per kg of K O for mixed red and yellow soils whereas there was no response to K application in coastal saline and brown forest soils.The average response of pulses (black gram and green gram) was of the order of2.7 kg for brown forest soil and 4.4 kg for black soil per kg of K O applied. Thevariation in response in different soil groups could be attributed to difference intexture and mineralogy of soils.
-1
-1
-1
2
2
2
Potassium removal and balances in different cropping systems
In rice-rice cropping system over 41 cropping cycles in laterite soil ofBhubaneswar, the K uptake under optimum fertilizer application (100% NPK)was 137 kg ha which was increased to 167 kg ha with integrated use of 100%NPK + FYM. The mean annual K balance was negative in all the treatments (Table10). Green manuring or incorporation of paddy straw reduces K mining in rice-rice cropping system (Pal and Dash 2009). The K removal by rice – groundnutcropping system in alluvial soils was 180 kg ha where as in rice – green gramcropping system in laterite soils it was 170 kg ha (Jena 2008). In general, cereals,pulses and oil seed crops removes 226, 67 and 83 kg K ha , respectively (Panda1995). K removal in vegetables and fruit crops was much higher than cereals,pulses and oilseeds (Senapati and Santra 2009). The K removal by vegetables
-1 -1
-1
-1
-1
Treatments Yield (q ha ) Mean AnnualK Uptake(kg ha ) (kg ha )
Control 15.6 13.1 56.0 -56.0100% N 20.9 20.5 84.0 -84.0100% NP 22.5 28.0 90.0 -90.0100% NPK 29.8 32.1 137.0 -37.0100% NPK + FYM 34.8 37.6 167.0 -47.0150% NPK 30.3 34.0 187.0 -7.0
Source: Sahoo 1994
-1 Mean AnnualK Balance
Kharif Rabi -1 -1
Table 10 Mean annual K uptake and balance in some selected treatments underrice-rice cropping system (41 cropping cycles)
-40
-30
-20
-10
0
10
20
30
40
Nu
trie
nt
Bala
nce (
kg
ha
)-1
100% RDF 100% RDF+Zn 125% RDF 125% RDF+Zn
Treatments
N P K
-60
-40
-20
0
20
40
Nu
trie
nt
Bala
nce
(kg
ha
)-1
100% RDF 100% RDF+Zn 125% RDF 125% RDF+Zn
Treatments
N P K
430 431

P and FYM improve the nutrient use efficiency and yield and hence recommendedfor higher profit.
The mining of K will limit crop yield and it may not be possible to maintain thepresent production. Results of long term fertilizer trials with rice-rice and rice-pulse cropping systems indicated that gradually the magnitude of response toapplied K increased as K becomes limiting factor. Application of FYM, recyclingof crop residues and green manuring can help to improve K balance in differentcropping systems. Significant correlation of HNO -K with K balance and yieldsuggest its inclusion in soil testing laboratories. K balance in different croppingsystems, based on precise data on K removal, K inputs from irrigation water or rainwater, straw recycling besides fertilizers and manures needs to be worked out.Straw management can strongly influence K budget and can help in efficientmanagement of K for a sustainable cropping systems in different regions. Asustainable fertilizer management strategy must ensure the farm productivity,optimum economic return without deterioration of agricultural environment.
Das PK, Sahu GC, Das N (1997) Vertical distribution and release characteristics ofpotassium in some lateritic soils of Orissa. J Potassium Res 13:105-110
Jena D (2008) Effect of optimal and super optimal level of NPK and micronutrientfor enhancing production of rice based cropping system in Orissa. 14 IFFCOchair conference, 18-20 Sept.2008, Bhubaneswar pp.1-29
Katyal JC (2001) Fertilizer use situation in India. J Indian Soc Soil Sci 49:570-592Kirk JGD, Begg CBM, Solivas JL (1993) The chemistry of the lowland rice
rhizosphere. Plant Soil 1556, 83-86Ladha JK, Dawe D, Pathak H, Padre AT, Yadav RL, Bijay-Singh (2003) How
extensive are yield declines in long term rice-wheat experiments in Asia.Field Crops Res 81:159-180
Martin HW, Sparks DL (1985) On the behaviour of non exchangeable potassiumin soils. Commun Soil Sci PlantAnal 16:133-162
Mishra KN (2008) Soil recourses mapping in Kanchinala micro-watershed underthe coastal plain of Mahanadi Delta of Orissa. Ph.D. Thesis, OUAT, pp.1-176
Misra UK, Mitra GN (2001) Nutrient mining in agroclimatic zones of Orissa.Fertilizer News 46(4):73-79
Mitra GN, Sahoo D (1998) Nitrogen –potassium interaction on yield and qualitydevelopment for rice-legume sequence in Orissa. Final Report. IPI-PRIIsponsored research project, OUAT, pp.1-58
Conclusion
References
3
th
The depletion of K to the extent of 51.0 and 37.0 kg ha was recorded in rice –
green gram and rice-groundnut cropping system, respectively at optimum level ofK application (Jena 2008). However, at super-optimal level (150% NPK) the Kdepletion was decreased to 41.0 and 26.0 kg ha in rice – green gram and rice-groundnut cropping system, respectively (Fig. 5, 6).
Soil type, mineralogy, K fixation, amount and leaching loss of K should beconsidered while fixing the dose of K for different crops. Potassium fixationstudies have revealed that soils become more hungry for K fixation with thecontinuation of negative balance. Illite soils fixed 23-29% of applied K, kaoliniteand smectite soils 17-23% and 26-32%, respectively (Srinivas-Rao et al. 2000).Maintenance of shallow surface submergence in rice-rice cropping system in soilscontaining 2:1 clay minerals may increase K fixation and reduce solution K, thusincreasing the rice dependence on non-exchangeable reserve for K uptake.
Leaching losses of K is a major concern under frequent intense rainfallconditions in well drained soils of humid tropics. Leaching tends to be a problemin soils with low CEC. The leaching losses of K in loam and sandy loam profilesunder submerged moisture regime were 22 and 16% of applied K, respectively(Singh et al. 2004). Therefore, either K application level should be increased by25-50% or the rice residues, which contain huge quantity of K (88-92% of totaluptake), be recycled in the soil. Even burning of rice straw in field is a better optionthan its removal (Prasad 2007). Split application of K in the ratio of 1:1 at peaktillering and PI stage is recommended to rice to reduce the chaff percent andincrease test weight.
Generally application of N, P O and K O @ 20:40:40 kg ha is recommended
for groundnut in most of the soils of Orissa. Application of 40 kg K O ha with NPto summer groundnut grown on the lateritic soils of Bhubaneswar significantlyincreased yield from 10.60 q ha to 15.88 q ha . Benefits of use of potassicfertilizers on pulses were also observed in the K deficient Balisahi series. Greengram yield was significantly increases due to application of 30 kg K O ha . Therecommended application (100% NPK) to rice – pulse and rice – oilseedscropping system recorded highest yield and benefit:cost ratio. There wassignificant response to super optimal dose (150%) of NPK in alluvial and lateritesoils having medium to high organic carbon status. Basal application of K @ 40 kgha at sowing is recommended for pulse crops in Orissa. Split application of K inthe ratio of 1:1:1 at planting, 30 and 60 days after planting is recommended forvegetable crops like cabbage, cauliflower, brinjal, tomato and spices like chilli.Basal application of 30 kg K ha for mustard and 60 kg K ha for sunflower isrecommended for higher yield and oil content. Integrated application of K with N,
-1
-1
-1
-1
-1 -1
-1
-1
-1 -1
Management of potassium
2 5 2
2
2
432 433

judicious use of potassium”, 28 May 2009, OUAT, BhubaneswarSingh M, Singh VP, Damodar-Reddy D (2002b) Potassium balance and release
kinetics under continuous rice-wheat cropping system in Vertisols. FieldCrops Res 77:81-91
Singh Y, Singh B, Ladha J K, Khind CS, Gupta RK., Meelu OP, Pasuquin E(2004) Long-term effects of organic inputs on yield and soil fertility in therice-wheat rotation. Soil Sci SocAm J 69:845-853
Spark DL (2000) Bioavailability of soil potassium, D-38-D-52. In Summer ME(ed.) Handbook of soil science. CRC, Boca Raton, Florida
Srinivas-Rao Ch, Rupa TR, Subba-Rao A, Bansal SK (2000) Potassium fixationcharacteristics of major Benchmark soils of India. J Indian Soc Soil Sci48:220-228
WihandjakaAG, Kirk GJD, Mantauk CP (1999) Potassium balance in rainfed lowland rice on a light textured soil. Field Crops Res 64:237-247
Nayak RK, Sahu GC, Nanda SSK (2001) Characterization, survey andclassification of soils of Central Research Station, OUAT, Bhubaneswar.Agropedology 42 :1-8
PalAK, Pattnaik MR, Santra GH, Swain N (2001) Studies on K releasing power oflaterite soils of Cuttack district. J Indian Soc Soil Sci 49:70-74
PalAK, DashAK (2009) Potassium balance and release characteristics under rice-rice cropping system. State level seminar on “Optimising crop productionthrough judicious use of potassium”, 28 May 2009, OUAT, Bhubaneswar
Panda N (1995) Balanced fertilization use for increasing food grain production ineastern states. Proc. of Zonal Symposium held at OUAT, Bhubaneswar PPIC-India Programme, pp 5-21
Parker DR, Hendricks GJ, Sparks DL (1989b) Potassium in Atlantic Coastal plainsoils: II. Crop responses and changes in soil potassium under intensivemanagement. Soil Sci SocAm J 53:397-401
Pattanayak SK (1992) Effect of long term fertilizer and manure application to amedium land acid laterite on nutrient transformation and changes in some soilproperties, Ph.D. Thesis, IARI, New Delhi
Pattanayak SK, Mukhi SK, Majumdar K (2008) Potassium unlocks the potentialfor hybrid rice (India) Better Crops with Plant Food 92(2):8-9
Prasad R (2007) Primary and secondary nutrient uptake pattern by rice as a guideto fertilizer application practices. Indian Farming June-2007:5-8
Rupa TR, Srivastava S, SwarupA, Sahoo D, Tembhare BR (2003) The availabilityof potassium in Aeric Haplaquepts and Typic Haplusterts as affected by longterm cropping, fertilization and manuring. Nutr CyclAgroeco 65:1-11
Sahu GC, Panigrahi SK, Nayak N (1995) Characterization, classification and landuse planning of the soils of a watershed in the Eastern Ghat region of Orissa. JCurrAgril Res 8:21-26
Sahu GC, Panda N, Nanda SSK (1983) Genesis and mineralogy of some red andlaterite soils of Orissa. J Indian Soc Soil Sci 31:254-262
Sahu GC, Patnaik SN, Das PK (1990) Morphology, genesis, mineralogy andclassification of soils of northern plateau zone of Orissa. J Indian Soc Soil Sci38:116-121
Sahu PK (1994) Distribution of different forms of potassium and its release patternin rice growing soils ofAthagarh. M.Sc. (Ag) Thesis, OUAT, pp. 1-93
Sekhon GS, Brar MS, Subba-RaoA(1992) Potassium in some Benchmark soils ofIndia. PRII Spec. Pub.3, Potash Research institute of India, Gurgaon,Haryana, India. p.82
Senapati AK (1993) Long term effect of fertilizer on release pattern of K in alateritic Inceptisol under rice-rice system. M. Sc. (Ag) Thesis, OUAT,Bhubaneswar pp. 1-24
Senapati HK, Santra GH (2009) Potassium management in vegetables, spices andfruit crops, state level seminar on “Optimising crop production through
434 435

Proceedings IPI-OUAT-IPNI International Symposium (2009)
I Öborn AC Edwards S HillierMacaulay Institute, Craigiebuckler,AberdeenAB15 8QH, UKI ÖbornDep. Crop Production Ecology, Swedish University of Agricultural Sciences (SLU), P.O.Box 7043, SE-750 07 Uppsala, Swedene-mail: [email protected] EdwardsNether Backhill,Ardallie (by Peterhead),AberdeenshireAB42 5BQ, UK
l l
Quantifying uptake rate of potassium from soil in a
long-term grass rotation experiment
I Öborn AC Edwards S Hillierl l
l l l
Abstract
Keywords
Soil-plant potassium (K) dynamics were studied using a long-term fieldexperiment in order to evaluate the plant performance and K delivering capacity ofthe soil parent material. Rye grass ( L.) based rotations on a loamysand derived from granitic bedrock were studied over 30 years with two K-fertilisation regimes, nil (K0) and 65 kg K ha yr . Mineralogical and chemicalmethods were combined to identify and quantify soil K resources including thepartitioning of K between minerals. Two or three cuts were taken annually andherbage yield and composition together with exchangeable soil K were analysed.Herbage yield declined with time and significantly reduced when the Kconcentrations approached 1%. The grass K concentration also declined over timeand stabilized at around 0.5-0.7% (dw) in K0 in all cuts. Input-output massbalances showed an accumulated net K off-take (deficit) of 1100 kg ha , i.e. 35 kgha yr . With an exchangeable K pool of 100 kg ha (in the rooting zone 0-40 cm)this indicated a substantial release of K from mineral sources, most probablybiotite and hydrobiotite. Assuming a similar net off-take was continued then thisparticular mineralogical K source would be depleted within two centuries. Thestudy illustrates the strength of combining long-term field experimental data withstate of the art quantitative mineralogical methods in order to assess site-specificresources which can form a basis to evaluate the sustainability of differentmanagement practices.
Depletion perennial ryegrass potassium release soil mineralsweathering
Lolium perenne
-1 -1
-1
-1 -1 -1
Presented at IPI-OUAT-IPNI International Symposium.Published in Plant Soil 2010.335:3-15. Printed here with permission from Plant Soil
436 437

Introduction
Nutrient imbalances are a common feature of many agricultural systems, withboth annual surpluses and deficiencies being reported (e.g. Smaling et al. 1999;Askegaard et al. 2004). While much emphasis has been given to quantifyingnitrogen (N) and phosphorus (P) balances at geographical scales ranging fromfield to nation, similar calculations are not generally reported for potassium (K).One notable exception is Foy et al. (2002). A lack of any obvious environmentalconcerns associated with a K surplus is probably the main factor responsible forthis omission. This general situation is changing due to factors such as theincreased price of agricultural inputs including K fertilisers. Evidence for adecline in soil K status has been provided through the regular monitoring ofagricultural soils in England and Wales (Goulding and Loveland 1986; Skinnerand Todd 1998) where both regional and temporal trends in soil extractable K weredescribed for the previous 25 years. There was some indication for a wider declinein K status, particularly evident for grassland, with 20% of all fields sampled in theNorthern region having a low K status (index 0). Declining rates of K fertilisercoupled with manure applications determined on the basis of their N content hasresulted in a wide ranging annual K balance within cropping systems of NWEurope (e.g. Askegaard and Eriksen 2002; Alfaro et al. 2003; Berry et al. 2003;Kayser and Isselstein 2005; Öborn et al. 2005a, b). Also in other geographicalregions negative K balances in agricultural production systems have been reportedurging for intensified research efforts on K management and dynamics in differentsoil types, climatic regions and cropping systems (e.g. Bedrossian and Singh2004; Bell et al 2009). Greatly increased crop yields and nutrient off-take inharvested products have exacerbated this situation. Losses of K can also beassociated with home produced forage crops and recycling of manure/urine (e.g.Öborn et al. 2005b; Gustafson et al. 2007), and/or where excessive leaching occursfrom coarse textured soils (e.g. Wulff et al. 1998; Askegaard and Eriksen 2008).Within systems managed organically negative K field balances have also beenreported (e.g. Watson et al. 2002; Askegaard et al. 2003; Bengtsson et al. 2003),and there is a growing concern about net off-take of K and how to sustain the soilfertility, harvest level and crop quality (e.g. Fortune et al. 2005). Export ofnutrients accompanies the sale of all agricultural produce and inherent site-specific soil properties such as mineralogy and texture coupled with climaticfactors and farming system determine the likely long-term significance of anypotential K deficiency (e.g. Heming 2004; Andrist-Rangel et al. 2007; Simonssonet al. 2007; Barré et al. 2008; 2009).
The significant contribution that soil minerals can make to plant available Kmeans that this aspect should also be considered in addition to fertiliser andmanure inputs. While lack of total soil K (Tot-K) reserves (organic soils being anexception) is not often an issue, it is possible that short-term deficits of plant
available K, for example, during the later part of the pasture growing season mayoccur (e.g. Brady and Weil 1996). During these times the rates of exchangebetween various soil K sources need to be considered. Various soil K pools havebeen defined as, soil solution K, exchangeable K, fixed or non-exchangeable Kbound in the inter-layer positions, e.g. of weathered micas, vermiculites etc., andfinally structural K particularly associated with micas and K-feldspars (e.g.Sparks and Huang 1985; Sparks 1987; Huang 1989; Robert 1992). The dynamicsituation that exists between the K pools determines the plant available K and isamong other things influenced by plant properties such as root density and rootingdepth (e.g. Haak 1981; Kuhlmann 1990; Witter and Johansson 2001), climaticconditions (soil temperature and moisture) (e.g. Holmqvist et al. 2003), soilattributes (organic acids, pH, particle size distribution etc) as well as type of Kbearing minerals (e.g. Wilson 1992; 2004; Hinsinger and Jaillard 1993; Barré et al.2007; 2008) and management practices (e.g. Singh and Goulding 1997;Simonsson et al. 2007).
This paper describes the long-term soil-plant K dynamics for a grass (L.) based rotation growing on a loamy sand soil derived from granitic
bedrock. Treatments without or with annual fertiliser K additions are comparedover a 30 year period and the system sustainability including the plantperformance and K delivering capacity of the soil parent material are considered.It was hypothesised that K-bearing soil minerals could supply sufficient K tomaintain grass herbage production in low input systems.
The specific objectives were to:i) Assess the annual and within year performance of herbage biomass
production and K concentration of ryegrass herbage;ii) Establish annual and long-term K input-output mass balances in order to
identify major sources and sinks and assess temporal trends;iii) Study trends in plant available (acetic acid extractable) K, andiv) Quantify individual chemical and mineralogical soil K pools in order to
determine their potential contributions to long-term plant available K.
Site and soil description
The experimental site was located on Macaulay Institute grounds atCraigiebuckler (57 8'N, 2 9'W), Aberdeen, NE Scotland. The mean annualaverage temperature and rainfall were 7.9 and 791 mm, respectively (1961-80;Dyce airport 57 12'N, 2 12'W) (Broad and Hough 1993). Precipitation wasmeasured on the experimental site 1968-95 and the monthly averages were usedwhen evaluating the uptake rates. The average growing season (6 C) in the area
Lolium
perenne
Materials and Methods
o o
o o
o
o
C
438 439

was 215 days (s.d. 14 days) lasting from 8 April to 10 November (Broad andHough 1993).
The soil was classified as Dystric Cambisol (FAO) or Typic Fragiorthod (SoilTaxonomy) (Adamo et al. 1998). According to Scottish terminology it is a freelydraining iron humus podsol developed in glacial till derived from granitic bedrockand it belongs to the Countesswells Association and Dess Series (Glentworth andMuir 1963). Soil and profile characteristics of the experimental site are given inTable 1.
Experimental design
The field experiment was established in 1968 and had a randomised block designwith two K treatments, K65 which received 65 kg K ha yr (as KCl) and K0 whichreceived no K, and five replicates. Three experimental phases could be defined; aninitial 12 year period of grass (Grass I, two cuts per year) followed by 6 years withcereals (Cereal), and a final 11 years of grass (Grass II, three cuts per year). Thetiming of the cuts, i.e. the growth stage of the grass, was set to mimic the hay/silagecuts by farmers. During the two grass periods the K65 plots received fertiliserannually during the spring. All plots also received a basal N (50 kg N ha yr )dressing as nitrochalk at the start of the growing season and after each cut, i.e. intotal 100 kg N ha yr for Grass I and 150 kg N ha yr for Grass II. During the six-year cereal period a similar annual basal N, P and K dressing was applied to allplots (75-85 kg N, 19-21 kg P and 63-74 kg K). The cropping sequence thereforeconsisted of perennial ryegrass ( L.) established in 1969 (Grass I)and 1987/88 (Grass II) with the cereal phase consisting of four years of springbarley ( L.), one year of oats ( L.), and one year ofwinter wheat ( L.).
Sampling and sample treatment
Responsibility for sample collection and analysis changed over the 30 yearexperimental period, however, protocols were all well documented and analyticaldata consistently recorded.
Total herbage biomass yield was recorded at each cut, and a sub-sample taken fordry matter determination and chemical analyses. All remaining herbage wasremoved from the field to simulate a hay/silage situation. Prior to digestion andchemical analyses herbage samples were dried at 60 C and milled. For cereals, thegrain weight was recorded and sub-samples taken and prepared for analysis. Both
-1 -1
-1 -1
-1 -1 -1 -1
o
Lolium perenne
Hordeum vulgare, Avena sativa
Triticum aestivum,
Plant sampling and preparation
Hor
i-zo
nD
epth
pH CaC
l%
%%
den-
dist
r.
Ap1
0- 5
4.9
5.4
0.38
0.04
0.71
217
818.
10.
80.
20.
319
5042
Ap2
5-15
5.1
4.3
0.30
0.04
0.65
117
828.
20.
30.
10.
117
5121
Ap3
15-2
55.
24.
10.
280.
020.
802
2276
9.6
0.1
0.1
0.1
1758
21B
s25
-40
5.2
1.5
0.09
0.01
0.68
421
754.
10.
10.
10.
19
4816
BC
40-6
05.
3-
--
0.73
725
685.
20.
10.
10.
110
52~
0
a
2
CN
SB
ulk
Cl
Si
Sa
Ca
Mg
KN
aC
EC
BS
Rel
cm%
root
sity
bb
bd
dd
ee
ee
fg
c
Tab
le1
Cha
ract
eris
atio
nof
the
soil
prof
ile
atth
eex
peri
men
talf
ield
.The
data
are
forc
ompo
site
sam
ples
from
the
10pl
ots.
Bul
kde
nsit
y,g
cm,
was
dete
rmin
edfo
rth
e<
2mm
frac
tion
.E
xcha
ngea
ble
(Ex)
cati
ons
and
CE
C(p
H7)
are
give
nin
cmol
(+)
kgdw
.The
part
icle
size
frac
tion
s(%
)ar
egi
ven
ascl
ay(<
2m),
silt
(2-6
0m)
and
sand
(60m
-2m
m).
Rel
ativ
ero
otdi
stri
buti
on(%
)is
from
Edw
ards
etal
.(19
87).
Soi
lpH
in0.
01M
CaC
l ,s
oil:
solu
tion
rati
o1:
2;T
otal
-C,-
Nan
d-S
(wei
ght%
)–
fine
lygr
ound
soil
was
anal
ysed
ona
Lec
o;
The
soil
isfo
rmed
ingl
acia
ltil
lwhe
regr
avel
san
dst
ones
wer
eab
unda
nt(>
2mm
)an
dth
usth
ebu
lkde
nsit
yfo
rth
e<
2mm
was
low
;P
ipet
tem
etho
d,sa
mpl
esdi
sper
sed
inde
ioni
zed
wat
erw
ith
ultr
ason
icpr
obe;
10g
soil
250
ml1
MN
H A
c(p
H7)
(Row
ell
1994
),E
x-C
a,E
x-M
g,E
x-K
and
Ex-
Na
anal
ysed
byIC
P-A
ES
.C
EC
=su
mof
Ex-
cati
ons
(Ca
,Mg
,K,N
a)
and
acid
ity.
Aci
dity
:m
ix5
gso
ilw
ith
1MB
a-ac
etat
e(p
H7)
and
titr
ate
wit
hB
a(O
H)
topH
7.B
ase
satu
rati
on(B
S)
=(E
x-ca
tion
s/C
EC
)*10
0.
-3c
5
-13
ab
c
de
f2+
2++
+
g
2
4
pH7
2
pH7
440 441

the cereal grain and the straw were removed from the field, and in 1987 straw wassampled and analysed. For budget calculations the straw weight was estimatedusing a grain:straw ratio of 1:1 (Hanson 1990). In two years, 1981 (grass) and 1985(barley), the plots were cut and cleared but no yield recorded, on these occasionsthe average K removal from grass 1978-80, and barley 1982 and 84, were used inbudget calculations as estimates for 1981 (grass) and 1985 (barley), respectively.
Surface soil (0-15 cm) was collected annually in the autumn (after the last herbagecut) 1968 to 1987 when approximately 10 sub-samples were taken from each plotwith a screw auger. InApril 1998 (before the fertilisation), soil samples were takenfrom three surface horizons, 0-5 cm (Ap1), 5-15 (Ap2) and 15-25 cm (Ap3), andone subsurface horizon within the rooting depth (B, 25-40 cm). When possible(only in 5 plots because it was very stony), the BC-horizon (40-60 cm) wassampled. Within each plot 20, 10, 10 and 5 sub-samples were taken from 0-5 cm, 5-15, 15-25 cm, and 25-40 cm depths respectively.Acore sampler was used for the 0-25 cm samples and a screw auger for the 25-60 cm depth. The C-horizon (60-80cm) was also sampled in three soil pits located immediately adjacent to theexperimental plots. In total 0.5-1 kg soil per plot and horizon was taken. The soilwas sieved fresh at 2 mm and air-dried at 30 C prior to the analyses. Themineralogical analyses were carried out on pooled composite samples from thedifferent horizons.
The bulk density for each soil horizon was determined in the three soil pits(0.5*0.5*0.5 m). All soil from each horizon was removed, and the volume of theremoved horizon was carefully measured in the soil pit. The soil was air dried,sieved and the <2mm fraction weighed and its bulk density calculated for eachhorizon. The average values from the three profiles (Table 1) were used in thecalculation and expression of soil K data on an aerial basis.
Plant and soil analyses
The crop samples were wet-digested and K was analysed by flame photometry(1969-88) or ICP-AES (1989-1998). The straw K concentration measured in 1987in the K0 and K65 treatments, respectively, were used as general estimates for thestraw K concentration in the two treatments. The weighted annual average Kconcentrations were calculated for the grass cuts and used in graphs and budget
Soil sampling and sample preparation
Soil bulk density
Plant analyses
o
calculations.
Acetic acid extractable-K (Ac-K) was determined annually on soil collected fromindividual plots between 1969 and 1987, and then in 1990, 1991 and in 1998. Air-dried soil (2.5 g) was extracted by 100 ml 2.5% acetic acid (MISR/SAC 1985) andK was analysed by flame photometry (1969-88) or ICP-AES (1988-1998). Inaddition, a subset of samples (n=10) were extracted with 1 M ammonium acetate(NH Ac pH 7) (Rowell 1994) and analysed by ICP-AES in order to relate theAc-Kextraction to an internationally frequently used extraction for exchangeable K.Acetic acid (2.5%) extracted on average 94% of 1 M NH Ac and Ac-K will in thispaper be used as a proxy for exchangeable K. Aqua-regia K (Aq-K) was extractedby 3:1 50% HCl:conc. HNO (by volume) (McGrath and Cunliffe 1985; McGrath1987) and analysed by ICP-AES. Total-K (Tot-K) was determined by X-rayfluorescence (XRF) using a Philips PW 1404 spectrometer and the methods byNorrish and Hutton (1969) for sample fusion and corrections for interelementeffects.
For determination of the mineralogical composition 3 g soil (<2 mm) wasground in an agate McCrone mill for 12 min with 9 g of liquid (0.5% polyvinylalcohol and 2 drops of octanol) and spray dried as per Hillier (1999). X-ray powderdiffraction (XRPD) pa
articipant 18). Uncertainty at 95% confidence isgiven by X , where X is concentration in weight percent (Hillier 2003).Mineralogical analyses were carried out on composite samples from theexperimental plots. The partitioning of K amongst the identified mineral phaseswas estimated using assumed chemical compositions (Table 2) (Andrist-Rangel etal. 2006;Andrist-Rangel 2008).
Soil analyses
4
4
3
tterns were recorded on a Siemens D5000 instrument from2-75°2θ using Cobalt Kα radiation, in 0.02° steps counting for 2 seconds per step.The resulting XRPD patterns were quantified by full-pattern fitting as described indetail by Omotoso et al. (2006, p
0.35
Table 2 K-bearing mineral phases and their assumed elemental compositionused in the normative calculations
Mineral phase Elemental composition
K-feldspar KAlSi OMuscovite KAl (AlSi O )(OH)
Illite K Al Mg Fe Ca Na Si O (OH)
Biotite KMg Fe AlSi O (OH)
Hydrobiotite K Mg Fe Fe AlSi O (OH)
3 8
2 3 10 2
0.6 2.15 0.3 0.22 0.05 0.03 3.4 10 2
1.5 1.5 3 10 2
0.5 1.5 1.0 0.5 3 10 2
III
II
II III
442 443

K input-output mass balance calculations
Input-output mass balance for K was calculated for the two K treatments(Equation 1). The inputs taken into account were K-fertiliser (Fert ) applicationand atmospheric deposition (Dep ), and the outputs were K removed by harvestproducts (Crop ) and leaching (Leach ). A K-surplus indicates a net accumulationof K in the soil pool (Soil ), whereas a K-deficit means that Soil is decreasing.
Soil = Fert + Dep - Crop - Leach (Eq. 1)
Dep was estimated from an average rain water concentration of 5 g Lmeasured by Reid et al. (1981) and the mean annual precipitation for 1961-80. Therun-off was calculated from mean monthly data on precipitation andevapotranspiration (1961-80). Soil water K concentrations were obtained from anadjacent field experiment, and Leach estimated from mean monthly run-off dataand soil-water K concentrations.
Estimation of K 'uptake rate' and K uptake within the rooting zone
The K 'uptake rate' (kg K ha d ) was roughly estimated by dividing the grass Kremoval by each cut by the days between the cuts. For cut 1, the days from 1 Aprilto the harvest time was used as estimate for the growth period. For cut 2 and cut 3the days elapsed between the grass cuts was used.
The root length density (cm cm ) from an established grass sward on anadjacent field with the same soil type was used to estimate the K uptake fromdifferent soil depths (Edwards et al. 1987). Edwards et al. (1987) determined theroot length density using soil cores subdivided into the depths; 0-5, 5-15, 15-25(/30) cm (subsoil boundary) and subsoil (30-45 cm). The root length densitywas highest in the upper 0-5 cm where it was 25-30 cm cm . The main part of theroots, 42%, were found in the upper 0-5 cm, 21% in each of the 5-15 and 15-25 cmlayers, respectively (Table 1).
Statistical analyses
The statistical analyses were carried out using SYSTAT for Windows 8.0 (Systat1998) and EXCEL (Microsoft Excel 2002). Analysis of variance (ANOVA) wascarried out using the GLM procedure followed by the Tukey test for pair-wisecomparison of means. We considered statistical probabilities of p<0.05 assignificant.
K
K
K K
k K
K K K K K
K
K
D
m -1
-1 -1
-3
-3
Results
Grass biomass production and K concentrations
Highest yields, >10 tonnes dw ha (t ha ) occurred during the first few years ofGrass I, with both treatments displaying a trend of declining production. Yieldsremained comparable between treatments for the first five years afterestablishment. The yield for K0 continued to decline until an apparent plateau atabout 6 t ha was reached, and from the seventh year the K65 plots had asignificantly higher production (Fig. 1a). After the break years with cereals nosignificant differences in biomass harvest for the first two years of Grass II wereapparent, but from the third year until the end of the period the K65 plots showed asignificantly higher yield (Fig. 1a). The accumulated herbage yield over the two
Herbage yield
-1 -1
-1
Fig. 1 Annual (a) biomass yield (tonnes dry weight (dw) ha ), (b) potassium (K)concentration (% dw) in the grass herbage given as weighted mean for thecuts , (c) K removal by crop off-take (kg K ha ), and (d) net off-take of K(Input via K-fertiliser – Output via harvested biomass, kg K ha ), in the K0
( ) and K65 ( ) treatments in the field experiment. Bars represent thestandard error calculated from 5 replicates, with only one side shown forclarity. The dotted vertical lines indicate the three experimental phases;Grass I, Cereals and Grass II.
-1
-1
-1
▲
0
2
4
6
8
10
12
14
16
18
20
0 10 20 30
Years
ton
ne
s (
dw
) h
a-1
Figure 1a
Grass I Cereals Grass II
444 445

grass phases was 140 and 180 t ha for K0 and K65, respectively, or 7 and 9 t ha yrif expressed on average annual bases.
The annually averaged herbage K concentration decreased significantly in K0 andK65 treatments during both Grass I and II periods (Fig. 1b). The K65 herbage had a
-1 -1 -
1
Herbage K concentrations
K concentration of 1.7% initially, and thereafter it steadily declined to 1.1% by theend of Grass I. In K0 the K concentrations were always less than those in thecomparable K65 material, declining rapidly to <1.0% and finally reaching 0.5%for the last 3 years of Grass I. During Grass II, the initial K concentration was 1.5and 0.8% for K65 and K0, respectively, and by the end of this grass period it hadreached 1.3 and 0.6%, respectively. The difference in K concentration between theK65 and K0 treatments was statistically significant during the entire period theplots were under grass.
For the Grass II phase, data for individual cuts on biomass harvests and herbage Kconcentration were further analysed (Table 3). The first cut (cut 1) accounted forthe major biomass yield, being roughly double that of cut 2 and three times largerthan cut 3 (Table 3).
The K65 treatment had overall a higher yield than the K0, the difference beingmost pronounced for cut 1. In the K65 treatment, herbage K concentration washighest (1.5%) in cut 1, decreasing to 1.1 and 1.0 % in cut 2 and 3, respectively(Table 3). Herbage K concentration was low (0.7 %) in K0 and remained similarthroughout the growing season.An estimate of daily K 'uptake rate' was calculatedfor individual cuts and it declined substantially from the first to the third cut in bothK65 and K0 (Table 3). The uptake rate of K was always greater for K65 than K0and the decline was larger in K65 as compared to K0. The K uptake rate was notsignificantly related (with simple linear regression) to the accumulatedprecipitation during the growth period (roughlyApril-May for cut 1, June-July forcut 2 andAugust-September for cut 3) (data not shown).
K dynamics during the growing season
0.0
0.5
1.0
1.5
2.0
2.5
0 10 20 30
Years
%K
(dw
)
Figure 1b
0
50
100
150
200
250
0 10 20 30
Years
kg
Kh
a-1
-200
-150
-100
-50
0
50
100
0 5 10 15 20 25 30
Years
kg
Kh
a-1
Figure 1c Figure 1d
Treatment Cut Biomass harvesttonnes (dw) ha % (dw) kg ha d
K0 1 3.66 (0.38) 0.74 (0.06) 0.40 (0.06)2 1.79 (0.14) 0.71 (0.05) 0.26 (0.04)3 1.24 (0.14) 0.75 (0.05) 0.14 (0.02)
K65 1 5.45 (0.54) 1.48 (0.12) 1.15 (0.10)2 2.54 (0.12) 1.12 (0.04) 0.57 (0.07)3 1.66 (0.20) 1.00 (0.07) 0.24 (0.03)
April 1 was used as an estimate of the start of the growing season for cut 1
K conc in grass K 'uptake' rate-1
a
-1 -1
Table 3 Biomass harvest and K concentration (per unit dry weight, dw) in grassthe three annual cuts from the second grass period (Grass II). The Kremoval by harvest (biomass*K concentration) was recalculated as'uptake' rate based on the days of growth . Means and standard errors(within brackets) are given (n=5)
a
Grass I Grass II
Grass I Grass II Grass I Grass II
Cereals
Cereals Cereals
446 447

Potassium off-take and K input-output mass balances
The total amount of K removed annually in the harvested biomass declined withtime but was always significantly greater for any given year in the K65 treatmentcompared to the K0 treatment (Fig. 1c). The annual net K off-take was calculatedas the fertiliser derived input minus the K removed in harvested biomass (Fig. 1d).During the first two years of Grass I the deficit was large, being more than 100 kgK ha yr (Fig. 1d). Thereafter crop removal exceeded fertiliser application by 55-70 kg K ha yr during a five year period, followed by four years with a smaller netK off-take of around 30 kg ha yr . There was generally no significant differencein net off-take between the K0 and K65 plots during Grass I. Grass II showed asimilar pattern with a net off-take between 90 and 100 kg K ha yr the first year,thereafter 55-85 kg ha yr for two years, and 40 kg ha yr during the final years(Fig. 1d). There was no significant difference in net off-take between K0 and K65for six years of Grass II.
The input-output mass balance calculations for the entire period showed an annualK deficit during the two grass periods (Grass I and Grass II) and a surplus duringthe 6-years of cereals (Table 4). During Grass I, an average of 67 kg K ha yr wasremoved by herbage from the K0 plots whereas 128 kg K ha yr was removedfrom the K65 plots. This resulted in K removal in the herbage greatly exceedingthe amount added as fertiliser and resulted in an annual deficit of about 65 kg K ha, a value that was similar for both treatments. During Grass II the annual Kremoval by herbage averaged 48 and 120 kg K ha for the K0 and K65 treatments,respectively, and the K mass balance calculation showed an average deficit of 47(K0) and 56 (K65) kg K ha yr . The cereal crops all received K fertiliser, onaverage 63 (K0) and 73 (K65) kg K ha yr , and during that period the annual Ksurplus was 15 (K0) and 10 (K65) kg K ha yr (Table 4).
Acetic acid extractable soil K and its turnover rates
At the start of the experiment the K status of the soil was moderate to low and overtime it dropped into very low status (MISR/SAC, 1985). The long-term dynamicsof Ac-K in the surface soil (0-15 cm) showed an annual variation but also a cleardifference between the years with grass compared to those with cereals, the Ac-Kconcentration being lower under grass (Fig. 2). The general trend was similar for
Annual K removal and net off-take by biomass harvest
Input-output K mass balances
Acetic acid extractable soil K
-1 -1
-1 -1
-1 -1
-1 -1
-1 -1 -1 -1
-1 -1
-1 -1
-
1
-1
-1 -1
-1 -1
-1 -1
both treatments, but the K0 plots overall showed a lower Ac-K than the K65 plots.A very dry summer could be a possible explanation for the high Ac-Kconcentrations recorded by the end of the 6 year of Grass I (1976).Ac-K was onlydetermined on three occasions during Grass II, with the final sampling takingplace in spring, and although based on very few observations the concentrationsappeared to be at similar (or lower) levels to those measured during the Grass Iphase.
The replenishment of the Ac-K pool in the topsoil (0-15 cm) was estimated forGrass I where annual data for net off-take (Fig. 1d) and Ac-K (Fig. 2) wereavailable. Replenishment was estimated based on two different assumptions (Fig.3); (1) all K (100%) in herbage was taken up in the top 15 cm, or (2) K was taken upproportional to the root distribution (Table 1), i.e. 63% in top 15 cm. With the firstassumption, after the initial two years, the net K off-take was about double theamount of the Ac-K for the following 5 year period, i.e. the ratio was around 2during this time, indicating that the Ac-K pool was replenished twice a year (Fig.3). The K0 was replenished somewhat quicker than K65, i.e. the ratio was 2.3 (K0)and 1.8 (K65). During the final 4 years, the net K off-take was of a similar quantityas the Ac-K pool, i.e. the ratio was close to 1 (K0 1.1 and K65 0.8), indicating thatthe Ac-K pool was replenished once per year (Fig. 3). For the second assumption
th
Soil K turnover rates
Table 4 Annual K mass balances, kg K ha yr , for the three periods: (i) 11 years ofgrass (Grass I, 1970-80), (ii) 6 years of cereals (Cereals, 1982-87), and(iii) 9 years of grass (Grass II, 1989-97). The years when the rye grass wasestablished were not included (1969, 1988)
-1 -1
Treatment InputsDeposition Leaching Deficit/Surplus
Grass IK0 1.4 0.0 0.8 66.6 -66.0K65 1.4 65.0 2.3 128.4 -64.3
CerealsK0 1.4 62.6 0.8 47.8 +15.4K65 1.4 73.5 2.3 62.9 + 9.7
Grass IIK0 1.4 0.0 0.8 47.7 -47.0K65 1.4 65.0 2.3 119.9 -55.7
During the period with cereals a basal NPK dressing was applied, except for1987 when the 0 and 65 kg K treatments were applied
K-fertiliser Outputs Harvest Inputs-Outputs
a
a
a
448 449

and the same time periods the ratio was lower, 1.4 (K0) and 1.1 (K65) for years 2-7,and 0.7 (K0) and 0.5 (K65) for years 8-11, showing that theAc K pool was initiallyreplenished in less than a year and thereafter took between 1.5 and 2 years toreplenish (Fig. 3).
Soil K resources and their relative contributions to plant available K
The distribution of K within the soil profile (rooting zone) of the K0 and K65 plotswas determined 30 years after the start of the experiment and included themeasurement of three K fractions; Tot-K, Aq-K and Ac-K (Table 5). Potassiumconcentrations were compared within profiles as well as between the K0 and K65treatments. Tot-K concentration was significantly higher in the B and BC horizonsas compared to theAp horizons (Table 5).Asimilar pattern was apparent forAq-K.Ac-K was significantly higher in both Ap1 horizons compared to other soilhorizons, and it was higher in the K65 treatment as compared to the K0 (Table 5).The Aq-K fraction represented 16-20% of Tot-K in the Ap and Bs horizonswhereas it accounted for 30% in the BC horizon.
Potassium in the soil profile (rooting zone)
The quantities of K within the various extractable fractions were calculatedfor the horizons of the K0 and K65 soil profiles. The Aq-K and Tot-K soil pools inthe main rooting zone (0-40 cm) approximated 13 000 and 72 000 kg K ha ,respectively (Table 6). The corresponding Ac-K pool was 98 and 106 kg K ha inthe K0 and K65 treatments, respectively.
The quantitative XRPD analyses showed that about 30% of the soil mineralscontained K, and these minerals were partitioned one third as K-feldspar and twothirds as 2:1 phyllosilicates (Table 7). The dioctahedral micas, muscovite andillite, were the main phyllosilicates (12-15%), but there were also considerableamounts (5-9%) of trioctahedral mica (biotite) and hydrobiotite, a commonweathering product of biotite.
The partitioning of K amongst the identified mineral phases showed that onaverage 55% of the K was allocated in the form of K-feldspar, 32% in dioctahedralphyllosilicates and 12% in trioctahedral biotite and hydrobiotite. The results alsoshow that there was more K held in micas in the Bs- and B/C-horizons as comparedto the surface layers (Ap1-Ap3), and this was especially evident with respect to thetrioctahedral mica minerals biotite and hydrobiotite (Table 8).
-1
-1
Soil mineralogical composition and partitioning of total K in the solid phase
Fig. 2 Acetic acid extractable K (Ac-K, mg K kg soil) in the Ap-horizon (0-15cm) determined annually during the first 18 years (1969-1987) and by the
end of the experimental period (1998) in the K0 ( ) and K65 ( )treatments. The dotted vertical lines indicate the three experimentalphases; Grass I, Cereals and Grass II.
-1
▲
Fig. 3 The replenishment of the Ac-K pool in the 0-15 cm layer during Grass Icalculated as: Replenishments (yr ) = Net K-off take (kg ha yr )/Ac-K
pool (kg ha ) in the K0 ( ) and K65 ( , ) treatments. The filledsymbols are showing the replenishment assuming that 63% of K is taken upfrom the 0-15 cm horizon (related to the relative root distribution) and theopen symbols are based on 100% K uptake from the top 15 cm.
-1 -1 -1
-1▲ , ∆ □
Grass I Grass IICereal
mg K
kg
-1
Years
450 451

Treatment/Horizon cm g kg g kg mg kg Tot-K %
K0Ap1 0- 5 22.9 (0.5) 3.74 53.0 (1.5) 16Ap2 5-15 23.9 (0.6) 3.86 32.7 (5.1) 16Ap3 15-25 24.3 (0.5) 4.35 30.3 (2.4) 18Bs 25-40 27.4 (0.8) 5.39 33.0 (9.6) 20BC 40-60 28.5 6.76 41.9 30C 60-80 nd 5.95 nd nd
K65Ap1 0- 5 22.7 (0.1) 3.71 69.1 (7.0) 16Ap2 5-15 24.0 (0.3) 3.81 37.1 (3.3) 16Ap3 15-25 24.5 (0.4) 4.30 31.2 (2.2) 18Bs 25-40 28.1 (1.0) 5.00 31.3 (9.3) 18BC 40-60 28.5 6.76 41.9 30C 60-80 nd 5.95 nd nd
Aq-K was analysed on composite samples from the 5 plotsThe BC and C horizons were analysed as composite samplesnd=not determined
Depth, Tot-K Aq-K Ac-K Aq-K/a
-1 -1 -1
a b
b c
b c
c c
b
b
a a
b c
b c
c c
b
b
a
b
Table 5 Soil K concentrations in the K0 and K65 treatments 30-years after thestart of the experiment. Total K (Tot-K, < 2 mm), aqua regia extractable K(Aq-K, < 2 mm) and acetic acid extractable K (Ac-K, < 2 mm) weredetermined and the ratio between Aq-K and Tot-K were calculated; (Aq-K/Tot-K)*100. Means of 5 plots and standard deviations (withinbrackets) are given for Tot-K and Ac-K. Values having the same lettersuffix do not differ significantly (p < 0.05)
Altogether the total K based on partitioning of K amongst the K bearingminerals (Table 8) resulted in 100 ±10% of the directly measured Tot-K from theXRF analyses (Table 6), slightly overestimating total K in the Ap1-horizon andslightly underestimating it in the B-horizon, but nonetheless indicating a verygood agreement between the two independent estimates.
Mass balance calculations for the entire experimental period were used to estimatethe total K off-take. The accumulated deficit for the 30-year period was similar forthe K0 and K65 treatments, i.e. about 1150-1200 kg K ha , which can be assumedto have been taken up from the soil pools within the rooting zone (Soil ) (Table 9).
A change in Soil can either be as exchangeable K or in the fixed or mineralbound K pool. The changes in exchangeable K (using Ac-K as an estimate) were
Long-term budget calculations and changes in soil K pools
-1
K
K
calculated for the 30 year period by comparing the Ac-K (0-15 cm) before thetreatments were applied with that measured in the soil samples taken 30-yearslater. The comparison showed that Ac-K decreased by about 50 kg K ha during-1
Table 6 Soil K pools in the soil horizons, kg K ha , in the K0 and K65 treatments30 years after the start of the experiment. Total K (Tot-K), aqua regiaextractable K (Aq-K) and acetic acid extractable K (Ac-K) wereanalysed on the < 2 mm fraction.
-1
Treatment/ Depth,cm kg ha kg ha kg ha
K0Ap1 0- 5 8 130 1 326 19Ap2 5-15 15 535 2 508 21Ap3 15-25 19 440 3 482 24Bs 25-40 27 948 5 494 34BC 40-60 40 470 9 599 59C 60-80 nd 8 449 ndTotal in the rooting zone 0-40 cm 71 053 12 810 98K65Ap1 0- 5 8 059 1 319 25Ap2 5-15 15 600 2 475 24Ap3 15-25 19 600 3 436 25Bs 25-40 28 662 5 102 32BC 40-60 40 470 9 599 59C 60-80 nd 8 449 ndTot in rooting zone 0-40 cm 71 921 12 333 106
Aq-K was analysed on composite samples from the 5 plotsThe BC and C horizons were analysed as composite samples for the fieldnd=not determined
Tot-K, Aq-K , Ac-K,Horizon
a
-1 -1 -1
b
b
b
b
a
b
Horizon Depth cm K-bearing minerals
Kf Mu Illi Bio Hy-bio minerals
Ap1 0- 5 10 8 1 1 4 63Ap2 5-15 10 7 1 1 3 65Ap3 15-25 10 8 1 1 4 65Bs 25-40 10 6 1 1 7 65BC 40-60 10 9 1 2 5 68C 60-80 9 9 1 3 6 67
Kf=K-feldspars, Mu=muscovite, Illi=illite, Bio=biotite, Hy-bio=hydrobiotite
a
a
Other
Table 7 Quantification of soil mineralogy (weight %), K-bearing and otherminerals in the <2mm fraction (XRPD)
452 453

the first few years of the experiment (and then appeared to have stabilized there).This is a minor change in relation to the accumulated net off-take (deficit), leaving1100-1150 kg K ha unaccounted for (Table 9), that presumably has originatedfrom fixed and mineral bound K sources and/or was taken up by roots in deepersoil horizons (below 15 cm). Since the Ac-K pool in the rooting zone (0-40 cm)was estimated at about 100 kg ha by the end of the experimental period (Table 6),the main part of the K 'unaccounted' for can be assumed to have been released fromthe non-exchangeable and structural mineral K pool. This means that in total 1100kg K ha has been released from these fractions over a 30 year period whichcorresponds to about 35 kg K ha yr .
While somewhat extreme, the zero (K0) and low (K65) fertiliser K treatment and
-1
-1
-1
-1 -1
Discussion
exploitative nature associated with regular herbage cuts and removal means thatconsiderable K net off-take occurred over the 30 year experimental period. It isreadily apparent from both herbage yield and K compositional data that especiallythe K0 treatment K became the growth limiting nutrient element. The coarse soiltexture (loamy sand) and granitic parent material also contributed to make thisstudy relevant for large areas of (medium to lower productive) agricultural land.By combining detailed soil profile sampling including both chemical andmineralogical analyses with these accumulated negative K balances (net K off-take) an attempt has been made to quantify the underlying mechanisms controllingK cycling in this soil.
Potassium – the limiting nutrient for plant growth
Herbage K concentrations reached values as low as 0.5-0.7% in the K0 treatment(Fig. 1b), a value below that reported as the 'critical limit' for K in many previousfield studies (Whitehead 2000). First indications of a yield difference betweenK65 and K0 treatments occurred at herbage concentrations of ~ 1%. However, thespecies composition is an important factor to consider when determining thecritical K concentration and may explain some of the differences with publishedfindings. The analysis of herbage taken from individual cuts showed low Kconcentrations (0.7%) all through the season in K0 whereas in K65 there was adecline in K% with cut 3 reaching 1% (Table 3). The similar low herbage Kconcentrations in K0 in all three cuts (Table 3) indicated that K probably was thegrowth limiting factor all through the season and thus 'testing' the systems limits interms of K release capacity.
Øgaard et al. (2002) studied the effects of K-fertiliser application rates ingrass herbage trials (dominated by timothy, L., and meadowfescue, L.), and found that on sandy soils low in K there was apositive yield response on addition of K fertiliser the second and third year wheregrass K concentrations were 1.0-1.4%. Exhaustive cropping with perennialryegrass ( L.) in a pot experiment, demonstrated that atconcentrations of 0.6-0.8% K (Ghorayshi and Lotse 1986) growth essentiallyceased. In long-term fertility trials (40 years) Andersson et al. (2007) found noyield reduction and maintained grass/clover herbage K concentration of ~2% in Knil plots on silty clay and clay soils. However, on sandy loam and loam soilsherbage concentrations were generally less than 2% K, and, although it camedown to 1% in one case, no effects on yield were recorded. The studied plots werefertilised with N but not P or K, and possibly P had become the limiting elementprior to K in these systems, not 'pushing' the K delivering capacity as hard as in theexperiment described herein.
Phleum pratense
Festuca pratensis
Lolium perenne
Horizon Depth, K - Kf K - Mu K - Illi K - Bio K - Tot
Ap1 0- 5 5160 2750 160 220 650 8930Ap2 5-15 9150 4920 310 440 990 15810Ap3 15-25 11580 6370 330 340 1480 20100Bs 25-40 14020 6620 690 800 3060 25180BC 40-60 20870 11980 770 2220 3050 38890C 60-80 18450 12330 710 3180 3610 38270Tot in 0-40 39910 20660 1490 1800 6180 70020
cm Hy-bio Min-K
rooting zone cm
Table 8 Partitioning of K between the different K bearing minerals, K-feldspar(Kf), muscovite (Mu), illite (Illi), biotite (Bio) and hydrobiotite (Hy-bio),given as kg K ha in the mineral phases in the sampled soil horizons. TotMin-K is the sum of K in these minerals
-1
K0 K65
Input +448 +1969Output -1608 -3158Balance (Deficit) -1160 -1189Change (Decrease) in Ac-K (0-15 cm) +52 +31Unaccounted for +1108 +1158
Release of non-exchangeable K and/or uptake from subsurface horizons (>15cm depth)
a
a
Table 9 Accumulated K mass balances for the K0 and K65 treatments for theentire experimental period, kg K ha-1
454 455

Plant available soil K
Exchangeable and soil solution K have often been considered readily available forplants (e.g., Sparks 1987), while fixed and structural K are less available (e.g., Palet al. 1999). The exchangeable K pool, usually extracted by ammonium acetate,ammonium lactate, ammonium nitrate, acetic acid or similar, as used in soil testsfor fertiliser recommendations (e.g., Egnér et al. 1960; Thomas 1982; Rowell1994; MISR/SAC 1985; MAFF, 1986), were replenished about 10 times duringthe 30 year experiment (Tables 6 and 9), suggesting a lack of sensitivity in thismeasurement to reflect actual plant availability of soil K. This indicated thatsubstantial amounts of “non-exchangeable” K had been released during theexperimental period and made available for plant uptake. In fact, severalstudies have shown that release of fixed or structural K can contribute significantlyto plant supply (e.g., Sinclair 1979a; 1979b; Andrist-Rangel et al. 2007;Simonsson et al. 2007) and thus calling for a new approach to 'plant available K'.The demand for sustainable use of natural resources, including K fertiliser rawmaterial (mined KCl and K SO ) that has a rather limited distribution globally(regions such as Africa, Asia and Oceania have to rely on import) and rapidlyincreasing prices of agricultural inputs are also pertinent in this regard (e.g.Manning 2010).
In a K depleted soil the exchangeable K (i.e. Ac-K) concentration by the endof the growing season indicates a soil specific property to bind and release K; andwhereas in certain soil types the release rate of K is slow and will restrict yieldsmarkedly in other parent materials it will meet all crop needs (McLean and Watson1985). After some initial years, Ac-K in Grass I was on average 39 mg kg ,whereas in Grass II it was 28 mg kg (Fig. 2). The lower Ac-K in the autumn inGrass II might be due to the fact that three cuts were taken while in Grass I the grasswas cut only twice a year. This can be compared with the results of a potexperiment with intensive rye grass cropping to reach K exhaustion on soils fromthe same soil association (Sinclair 1979a) where the exchangeable K (average fortwo course textured granitic soils of the CountesswellsAssociation) was 34 mg kgwhen the soil was partly depleted (after 6-8 cuts, low yield level) and 26 mg kg in
the more depleted soil (after 9-12 cuts, growth virtually ceased). The similaritybetween the results from the field experiment and the pot trial indicates that the Krelease rate has been governed by the parent material of the soil and the plant-soilsystem. This includes a combination of soil mineralogy, particle size (or ratherspecific surface area), rooting depth and density, efficiency in K uptake, etc., allfactors determining the soil solution K concentration and thus controlling thediffusion of K e.g. from interlayer positions of micas (e.g. Newman, 1969;Fanning et al 1989).
2 4
-1
-1
-
1 -1
Annual K off-take and soil K pools
In this study, the accumulated total K net-deficit was about 1100 kg K ha , i.e. onaverage 35 kg K ha yr and the question arises as to how this can be related todifferent K sources. The Tot-K soil concentrations were rather high, 23-28 g K kg ,as compared to 5-40 g K kg recorded in a range of Scottish agricultural soils(Andrist-Rangel et al. 2010) and 0.4-30 g K kg reported as a typical range inmineral soils globally (Sparks 1987). Thus the Tot-K pool in the rooting zone wasvery large (72 000 kg K ha ) indicating that the soil was very rich in mineral boundK. The chemically definedAq-K pool (0-40 cm) was 12 000 kg ha , which equatedto 17% of the Tot-K. That can be compared to a study of Scottish grassland soilsshowing an average extractability of 13% (9-17%, n=3) for similar soils(CountesswellsAssociation) (Andrist-Rangel et al. 2010).
However, the type of K bearing minerals influence the potential rate of releasethrough mineral weathering and thus plant supply. Of the K bearing minerals thatwere identified in the soil, biotite is the one most prone to release K followed byhydrobiotite (e.g. Thompson and Ukrainczyk 2002). The estimated K pool interms of these minerals showed that by the end of the 30 year period the rootingzone contained 8 000 kg K ha in the form of biotite and hydrobiotite. Assumingthat the C horizon is representative of the material the soil was derived from therewas originally 13 600 kg ha K in biotite and hydrobiotite (Table 8). Comparingthat to the present situation, the difference is 5600 kg K, which can be seen inrelation to the K off-take of 1100 kg during the last 30 years. A hypotheticcalculation of continued intensive grass production, with no or low K fertiliserapplication and an annual net K off-take of 35 kg, would completely deplete the Kpresent in trioctahedral micas in a bit more than two centuries. Taking the relativeroot distribution into account showing that most roots were in the top 25 cm the(84%, Table 1), where the K pool in biotite and hydrobiotite was 4100 kg K ha(Table 8), and applying the release (net-off take) rate of 35 kg K ha yr the K-biotite and -hydrobiotite pool would last for another 120 or 140 years assuming 84and 100% uptake from this soil layer.
Although these are very rough estimates, the findings can be related tolaboratory studies of release mechanisms of interlayer K in micas. Newman(1969) found that micas release interlayer K by cation exchange and diffusion, aprocess that is governed by low solution concentration of K. The dioctahedralmicas were found to be less reactive than trioctahedral micas and thus required aconsiderable (two orders of magnitude) lower solution concentration of K torelease interlayer K. The study by Newman (1969) also showed that the releaserate of K was largely independent of the proportion of mica K being exchanged.Applying this conceptually to the results of the present study, it seems most likelythat the K delivering capacity in the experimental soil is regulated by grass uptake
-1
-1 -1,
-1
-1
-1
-1
-1
-1
-1
-1
-1 -1
456 457

of K from the soil solution and hence the release rate of interlayer K intrioctahedral (biotite and hydrobiotite) micas, and that the release rate mightremain at a similar level until most biotite and hydrobiotite is K depleted andthereafter change (decrease) drastically when dioctahedral micas (and Kfeldspars) become the main K source for plants.
Estimation of K release from soil resources
Simonsson et al. (2007) found that when receiving no K (or P, but N) for 40 years, aloamy sand soil released 8 ± 10 kg K ha yr , whereas four other soils (sandy loamsto clays) had been releasing 40±8, 45±10, 51±12, and 65±7 kg K ha yr during thesame period of time. This can be compared with the 35 kg K ha yr on averagetaken out from the loamy sand in this study.Asimplified view has been that the soilK release and fixation capacity is mainly related to soil texture, particularly thefine textured material. However, that is not fully supported by this study, or otherrecent field studies (e.g., Andrist-Rangel et al. 2007; Murashkina et al. 2007),which have shown the importance of the mineralogical composition of coarserfractions, in particular the occurrence of biotite and hydrobiotite in the siltfraction. The main difference between the loamy sand in this study as compared tothe one studied by Simonsson et al. (2007) was the mineralogy and in particular thepresence of biotite and hydrobiotite, in total accounting for 4-8% of the minerals inthe former but only 1-2% in the latter (Andrist-Rangel, 2008). Other differenceswere numbers of years with grass or grass/clover herbage in relation to cerealcrops and the climate.
In order to predict the K weathering potential of different soils, soilmineralogy and other soil properties, cropping systems, management practices,climate etc have to be taken into account and a modelling approach would beneeded. Some first attempts to apply the biogeochemical steady-state modelPROFILE on some northern European agricultural soils were carried out byHolmquist et al (2003) who estimated K weathering rates of between 3 and 82 kgha yr . A comparison between K release estimates from net off-take based onmass balance calculations (Table 9) and modelled weathering rates for the studiedCountesswells soil showed, however, a large discrepancy between field basedestimates and model predictions, 35 versus 5 (uncertainty range 2-16) kg K ha yr(Holmquist et al. 2003). This difference is most likely related to a combination offactors that include the small clay content and specific surface area of the soil,parameters that the PROFILE model is very sensitive to (e.g. Hodson et al. 1997).There is also an issue as to how the weathering of micas is represented within themodel in terms of chemical reactions (Warfvinge and Sverdrup 1992; Sverdrupand Warfvinge 1993) because diffusion controlled exchange of interlayer K mightbe expected to be the dominant process in agricultural soils maintained at near
-1 -1
-1 -1
-1 -1
-1 -1
-1 -1
neutral pH values (e.g. Fanning et al. 1989).As mentioned earlier, there are orders of magnitude differences in critical K
solution activity between di- and tri-octahedral micas (Newman, 1969; Fanning etal. 1989), i.e. in soils with tri-octahedral micas (such as biotite) they will becomethe main K source for plant supply in K depleted/low input systems. Wheninterlayer K in biotite has been released and dioctahedral mica (and/or K feldspar)becomes the major K source the release rate will most probably decreaseconsiderably since much lower solution concentrations of K are required fordiffusion. This means that the release of K from soil resources observed in this andother long-term experiments will not be constant over time or related to the total Kpool but very dependent on the types and amount of K bearing minerals, inparticular the presence of tri-octahedral micas.
The long-term field data obtained from this study in combination with thequantitative mineralogical and geochemical characterisation of the soil and datafrom the literature (e.g. controlled laboratory experiments) have demonstrated thepotential and need for further developing an approach linking mechanistic andquantitative assessment of plant K uptake and release from mineral sources inagricultural systems including predictions of K weathering rates. The increasingprices of agricultural inputs such as fertilisers and the increasing awareness oflimited availability and uneven distribution of non-renewable resources(including soils) are reinforcing a better knowledge, use and management of site-specific resources for developing and maintaining sustainable production systemswhich requires cross-disciplinary research linking up basic and applied scienceswithin biogeochemistry and agricultural sciences.
This study has shown that K became the growth limiting nutrient element allthrough the growing season 'pushing' the K release capacity of the soil. The plant(perennial rye grass) K concentration was lower (0.6-0.7%) than reported in mostprevious field studies. The relation between the average annual K net-off take (35kg ha ) and the quantified exchangeable K pool (~ 100 kg ha ), often assumed torepresent 'plant available' K, illustrated that 'non-exchangeable' K had beencontinually released and made available for plant uptake. Hence, the perception of'plant available K' needs to be reassessed taking the dynamics of the soil Kresource(s) into account. The accumulated net K off-take (1 100 kg ha during 30year) was higher than previously reported from coarse texture soils derived fromgranitic parent material. The relatively high concentration of trioctahedral micas,i.e. biotite and hydrobiotite, was most probable the main K source. However,assuming a continued low input management system with similar net K off-takethese easily weatherable minerals would be depleted of K within two centuries,
Conclusions
-1 -1
-1
458 459
something that needs to be considered in land-use and nutrient management.The study illustrates the strength of combining long-term field experimental
data with state of the art quantitative mineralogical methods in order to assess site-specific resources which can form a basis to evaluate the sustainability of differentmanagement practices. It shows how long-term field experimental data can beutilized to obtain quantitative measures on the potential K release in low inputsystems in different soil environments in order to better interpret K input/outputfield mass balances, predict the long-term sustainability of different farmingpractices, and suggest possible land-use and management options. Including anintegrated modelling approach would be an important component to come furtherin research and implementation within this area. The increasing prices ofagricultural inputs such as K fertilisers and the increasing awareness of limitedavailability of non-renewable resources are reinforcing a better knowledge anduse of site-specific resources for developing and maintaining sustainableproduction systems.
JAM Ross, D Nelson and Y Cook for field and laboratoryassistance. The long-term funding from Scottish Government Rural, Environmentand ResearchAnalysis Department (RERAD) is acknowledged.
Adamo P, McHardy WJ, Edwards AC (1998) SEM observations in the back-scattered mode of the soil-root zone of (cv. Rafal) plantsgrown at a range of soil pH values. Geoderma 85: 357-370
Alfaro MA, Jarvis SC, Gregory PJ (2003) Potassium budgets in grassland systemsas affected by nitrogen and drainage. Soil Use Manage 19: 89-95
Andersson S, Simonsson M, Mattsson L, Edwards AC, Öborn I (2007) Responseof soil exchangeable and crop potassium concentrations to variable fertiliserand cropping regimes in long-term field experiments on different soil types.Soil Use Manage 23:10-19
Andrist-RangelY(2008) Quantifying mineral sources of potassium in agriculturalsoils. Doctoral Thesis No 2008: 53, Faculty of Natural Resources andAgricultural Sciences,Acta UniversitatisAgriculturae Sueciae, Uppsala
Andrist-Rangel Y, Simonsson M, Andersson A, Öborn I, Hillier S (2006)Mineralogical budgeting of potassium in soil: A basis for understandingstandard measures of reserve potassium. J Plant Nutr Soil Sci 169: 605-615
Andrist-Rangel Y, Edwards AC, Hillier S, Öborn I (2007) Long-term K dynamicsin organic and conventional mixed cropping systems as related tomanagement and soil properties.Agric Ecosyst Environ 122: 413-426
Andrist-Rangel Y, Hillier S, Öborn I, Lilly A, Towers W, Edwards AC, Paterson E(2010)Assessing potassium reserves in northern temperate grassland soils:A
Acknowledgements
References
Brassica napus
perspective based on quantitative mineralogical analysis and aqua-regiaextractable potassium. Geoderma (accepted)
Askegaard M, Eriksen J (2002) Exchangeable potassium in soil as indicator ofpotassium status in an organic crop rotation on loamy sand. Soil Use Manage18: 84-90
Askegaard M, Eriksen J, Olesen JE (2003) Exchangeable potassium andpotassium balances in organic crop rotations on a coarse sand. Soil UseManage 19: 96-103
Askegaard M, Eriksen J, Johnston AE (2004) Sustainable management ofpotassium. In: Schjønning P, Elmholt S, Christensen BT (ed) Managing soilquality - Challenges in modern agriculture, CAB International, Wallingford,85-102
Askegaard M, Eriksen J (2008) Residual effect and leaching of N and K incropping systems with clover and ryegrass catch crops on a coarse sand.Agric Ecosyst Environ 123: 99-108
Barré P, Velde B, Catel N, Abbadie L (2007) Soil-plant potassium transfer; impactof plant activity on clay minerals as seen from X-ray diffraction. Plant Soil292: 137-146
Barré P, Velde B, Fontaine C, Catel N, Abbadie L (2008) Which 2:1 clay mineralsare involved in the soil potassium reservoir? Insights from potassiumaddition or removal experiments on three temperate grassland soil clayassemblages. Geoderma 146: 216-223
Barré P, Berger G, Velde B (2009) How element translocation by plants maystabilize illitic clays in the surface of temperate soils. Geoderma 151: 22-30
Bedrossian S, Singh B (2004) Potassium adsorption characteristics and potassiumforms in some New South Wales soils in relation to early senescence incotton.Aust J Soil Res 42: 747-753
Bell MJ, Moody PW, Harch GR, Compton B, Want PS (2009) Fate of potassiumfertiliser applied to clay soils under rainfed grain cropping in south-eastQueensland,Australia.Aust J Soil Res 47: 60-73
Bengtsson H, Öborn I, Jonsson S, Nilsson I,AnderssonA(2003) Field balances ofsome mineral nutrients and trace elements in organic and conventional dairyfarming – a case study at Öjebyn, Sweden. Eur JAgron 20: 101-116
Berry PM, Stockdale EA, Sylvester-Bradley R, Philipps L, Smith KA, Lord EI,Watson CA, Fortune S (2003) N, P and K budgets for crop rotations on nineorganic farms in the UK. Soil Use Manage 19: 112-126
Brady NC, Weil RR (1996) The Nature and properties of soils, 11 Ed, Prentice-Hall, Upper Saddle River, New Jersey
Broad HJ, Hough MN (1993) The growing and grazing season in the UnitedKingdom. Grass Forage Sci 48: 26-37
Edwards AC, Mackie-Dawson LA, Millard P, Shepherd H, Reid ME, Webster L,Pratt S, Stott C (1987) Quantify the availability of soil and fertiliser
th
460 461

phosphorous to crops by chemical methods and field trials and assessinteractions with acidity. In: Macaulay Land Use Research Institute, Reportof Work in Progress 1987, Craigiebuckler,Aberdeen, pp 171-173
Egnér H, Riehm H, Domingo WR (1960) Untersuchungen über die ChemischeBodenanalyse als Grundlage für die Beurteilung des Nährstoffzustandes derBöden.Ann RoyAgr Coll Sweden 26: 199–215
Fanning DS, Keramidas VZ, El-Desoky MA (1989) Micas. In: Dixon JB, WeedSB Minerals in Soil Environments, 2 Ed. SSSABook Series No 1, Madison,WI, pp 551-634
Fortune S, Robinson JS, Watson CA, Philipps L, Conway JS, Stockdale EA(2005)Response of organically managed grassland to available phosphorus andpotassium, in the soil and supplementary fertilization: field trials using grass-clover leys cut for silage. Soil Use Manage 21: 370-376
Foy RH, Bailey JS, Lennox SD (2002) Mineral balances for the use of phosphorusand other nutrients by agriculture in Northern Ireland from 1925 to 2000 –
methodology, trends and impacts of losses to water. Irish J Agr Food Res 41:247–263
Ghorayshi M, Lotse E (1986) Quantity Intensity Relationships of Potassium in 3Swedish Soils. Swed JAgr Res 16: 57-65
Glentworth RS, Muir JW (1963) The soils around Aberdeen, Inverurie, andFraserburgh. Soil Survey of Scotland Memoirs. The Macaulay Institute forSoil Research,Aberdeen
Goulding KTW, Loveland PJ (1986) The classification and mapping of potassiumreserves in soils of England and Wales. J Soil Sci 37: 555-565
Gustafson GM, Salomon E, Jonsson S (2007) Barn balance calculations of Ca, Cu,K, Mg, Mn, N, P, S and Zn in a conventional and organic dairy farm inSweden.Agric Ecosyst Environ 119: 160-170
Haak E (1981) Nutrient uptake from subsoil by cereals. In: Agricultural yieldpotentials in continental climates. Proceedings of the 16 Colloquium of theInternational Potash Institute, Basel
Hanson AA (1990) Practical handbook of agricultural science, CRC Press, BocaRaton, Florida
Heming SD (2004) Potassium balances for arable soils in southern England 1986-1999. Soil Use Manage 20: 410-417
Hillier S (1999) Use of an air brush to spray dry samples for X-ray powderdiffraction. Clay Miner 34: 127-135
Hillier S (2003) Quantitative analysis of clay and other minerals in sandstones byX-ray powder diffraction (XRPD). Int Assoc Sedimentol Spec Publ 34:207–245
Hinsinger P, Jaillard B (1993) Root-induced release of interlayer potassium andvermiculitization of phlogopite as related to potassium depletion in the
nd
th
rhizosphere of ryegrass. J Soil Sci 44: 525-534Hodson ME, Langan SJ, Wilson MJ (1997) A critical evaluation of the use of the
PROFILE model in calculating mineral weathering rates. Water Air Soil Poll98: 79-104
Holmqvist J, Falk Øgaard A, Öborn I, Edwards AC, Mattsson L, Sverdrup H(2003) Application of the PROFILE model to estimate potassium releasefrom mineral weathering in Northern European agricultural soils. Eur JAgron 20: 149-163
Huang PM (1989) Feldspars, Olivines, Pyroxenes, and Amphiboles In: Dixon JB,Weed SB Minerals in Soil Environments, 2 Ed. SSSA Book Series No 1,Madison, WI, pp 975-1050
Kayser M, Isselstein J (2005) Potassium cycling and losses in grassland systems:Areview. Grass Forage Sci 60:213-224
Kuhlmann H (1990) Importance of the subsoil for the K-nutrition of crops. PlantSoil 127: 129-136
MAFF (1986) The analysis of agricultural materials, 3 Ed. Reference Book 427.Defra, Information Resource Centre, London
Manning DAC (2010) Mineral sources of potassium for plant nutrition. A review.Agron Sustain Dev 30: 281-294
Mclean EO, Watson ME (1985) Soil measurements of plant-available potassium.In: Munson (ed) Potassium in agriculture, ASA-CSSA-SSSA Madison, WI,277-308
McGrath SP (1987) Computerized quality control, statistics and regional mappingof the concentrations of trace and major elements in the soils of England andWales. Soil Use Manage 3: 31–38
McGrath SP, Cunliffe CH (1985) A simplified method for the extraction of themetals Fe, Zn, Cu, Ni, Cd, Pb, Cr, Co, and Mn from soils and sewage sludges.J Sci FoodAgric 36: 794–798
MISR/SAC (1985) Advisory soil analysis and interpretation. The MacaulayInstitute for Soil Research and ScottishAgricultural Colleges Bulletin 1: 1-13
Murashkina MA, Southard RJ, Pettygrove GS (2007) Silt and fine sand fractionsdominate K fixation in soils derived from granitic alluvium of the SanJoaquin Valley, California. Geoderma 141: 283-293
Newman ACD (1969) Cation exchange properties of micas. I. The relationbetween mica composition and potassium exchange in solutions of differentpH. J Soil Sci 20: 357-373
Norrish K, Hutton JT (1969) An accurate X-ray spectrographic method for theanalysis of a wide range of geological samples. Geochim Cosmochim Acta33: 431-453
Öborn I, Andrist-Rangel Y, Askegaard M, Grant CA, Watson CA, Edwards AC(2005a) Critical aspects of potassium management in agricultural production
nd
rd
462 463

systems. Soil Use Manage 21: 102-112Öborn I, Modin-Edman A-K, Bengtsson H, Gustafson GM, Salomon E, Nilsson
SI, Holmqvist J, Jonsson S, Sverdrup H (2005b)Asystems approach to assessfarm-scale nutrient and trace element dynamics: A case study at the Öjebyndairy farm.Ambio 34: 301-310
Øgaard AF, Krogstad T, Lunnan T (2002) Ability of some Norwegian soils tosupply grass with potassium (K) – soil analyses as predictors of K supplyfrom soil. Soil Use Manage 18: 412-420
Omotoso O, Mccarty DK, Hillier S, Kleeberg R (2006) Some successfulapproaches to quantitative mineral analysis as revealed by the 3rd ReynoldsCup contest. Clay Clay Miner 54: 748-760
Pal Y, Wong MTF, Gilkes RJ (1999) The forms of potassium and potassiumadsorption in some virgin soils from south-western Australia. Aust J Soil Res37: 695-709
Reid JM, MacLeod DA, Cresser MS (1981) Factors affecting the chemistry ofprecipitation and river water in an upland catchment. J Hydrol 50: 129-145
Robert M (1992) K-fluxes in soils in relation to parent material and pedogenesis intropical, temperate and arid climates. Proceedings of the 23 Colloquium ofthe International Potash Institute, Basel, pp 25-44
Rowell DL (1994) Soil science methods and applications. Longman, Singapore,pp 66-67
Simonsson M, Andersson S, Andrist-Rangel Y, Hillier S, Mattsson L, Öborn I(2007) Potassium release and fixation as a function of fertilizer applicationrate and soil parent material. Geoderma 140: 188-198
Sinclair AH (1979a) Availability of potassium to ryegrass from Scottish Soils I.Effects of intensive cropping on potassium parameters. J Soil Sci 30: 757-773
Sinclair AH (1979b) Availability of potassium to ryegrass from Scottish Soils II.Uptake of initially non-exchangeable potassium. J Soil Sci 30: 775-783
Singh B, Goulding KWT (1997) Changes with time in the potassium content andphyllosilicates in the soil of the Broadbalk continous whear experiment atRothamsted. Eur J Soil Sci 48: 651-659
Skinner RJ, Todd AD (1998) Twenty-five years of monitoring pH and nutrientstatus of soils in England and Wales. Soil Use Manage 14: 162-169
Smaling EMA, Oenema O, Fresco LO (eds) (1999) Nutrient disequilibria inagroecosystems. Concepts and case studies. CABI, London
Sparks DL (1987) Potassium dynamics in soils. In: Stewart BA (ed) Advances inSoil Science. Springer-Verlag, NewYork, pp 1-63
Sparks DL, Huang PM (1985) Physical chemistry of soil potassium. In: Munson(ed) Potassium in agriculture,ASA-CSSA-SSSAMadison, WI, 201-276
Sverdrup H, Warfvinge P (1993) Calculating field weathering rates using amechanistic geochemical model PROFILE.Appl Geochem 8: 273-283
Systat (1998) SYSTAT for Windows: Statistics Version 8.0, Evanston IL Systat
rd
Inc 1086 ppThomas GW (1982) Exchangeable cations. In: Page AL, Miller RH, Keeney DR
(ed) Methods of soil analysis, Part 2, Agronomy Monograph no 9 2 Ed, pp159-165
Thompson ML, Ukrainczyk L (2002) Micas. In: Dixon JB, Schulze DG (ed) Soilmineralogy with environmental applications, SSSA Book Series No 7,Madison, WI, pp 431-466
Warfvinge P, Sverdrup H (1992) Calculating critical loads of acid deposition withPROFILE – a steady state soil chemical model. Water Air Soil Poll 63: 119-143
Watson CA, Bengtsson H, Ebbesvik M, Løes A-K, Myrbeck A, Salomon E,Schroeder J, Stockdale EA(2002)Areview of farm-scale nutrient budgets fororganic farms as a tool for management of soil fertility. Soil Use Manage 18:264-273
Whitehead DC (2000) Nutrient elements in grassland. Soil-plant-animalrelationships. CAB International Wallingford UK
Wilson MJ (1992) K-Bearing minerals and their K-release rates in differentclimates. Proceedings of the 23 Colloquium of the International PotashInstitute, Basel, pp 44-57
Wilson MJ (2004) Weathering of the primary rock-forming minerals: Processes,products and rates. Clay Miner 39: 233-266.
Witter E, Johansson G (2001) Potassium uptake from the subsoil by green manurecrops. BiolAgric Hortic 19: 127-141
Wulff F, Schulz V, Jungk A, Claassen N (1998) Potassium fertilization on sandysoils in relation to soil test, crop yield and K-leaching. Z Pflanz Bodenkunde161: 591-599
nd
rd
464 465

Proceedings IPI-OUAT-IPNI International Symposium (2009)
T SatyanarayanaInternational Plant Nutrition Institute (IPNI), South India Programme, Flat No. 401,Tejaswini Arcade, West Maredpally, Secunderabad – 500 003 (Andhra Pradesh) India,e-mail: [email protected],RK TewatiaThe Fertiliser Association of India, FAI House, 10 Shaheed Jit Singh Marg, New Delhi –
110 067 India
State-wise approach to crop nutrient balances in India
T Satyanarayana RK Tewatial
l l l
l
Abstract
Keywords
Introduction
India registered an ever recorded food grain production of 230 mt with aconsumption of 23 mt of NPK's during 2007-08 and it was estimated that about 45mt of nutrients are needed to produce 300 mt of food grains by 2025 to sustain therequirement of growing population. Present intensive production systems in Indiacharacterized by heavy removal and inadequate replenishment of nutrientsresulted in multiple nutrient deficiencies and depletion of soil nutrient reserves.For sustaining the crop productivity and to restore the soil fertility, there is a needto arrest depletion of soil nutrient reserves for which understanding of cropnutrient balances is important. An attempt was made to generate information onnutrient balances in some of the agriculturally important states considering thepresent scenario of nutrient additions and crop removals at current levels of cropproduction. N, P driven agriculture with neglect of K has shown an alarmingsituation of negative K balance in almost all the states with reported deficiencies ofsecondary and micronutrients. The present paper review the status of nutrientbalances in different states and suggests approaches for balancing the existingnutrient gaps.
Apparent nutrient balances crop removal nutrient additions soilhealth yield sustainability
Crop management in India during the past four decades has been driven byincreased use of external inputs. Fertilizer nutrients have played a major role inimproving crop productivity. During the period 1969-2008, food grain productionmore than doubled from about 98 mt to a record 230 mt in 2007-08, while fertilizernutrient use increased by nearly 12 times from 1.95 mt to more than 23 mt in 2007-08 (Rao 2009). Notwithstanding these impressive developments, food grain
466 467

demand is estimated to increase to about 300 mt yr by 2025 for which the countrywould require 45 mt of nutrients (ICAR 2008). With almost no opportunity toincrease the area under cultivation over 142 m ha, much of the desired increase infood grain production has to be attained through yield enhancement in per unitarea productivity. To sustain production demands, the productivity of major cropshas to increase annually by 3.0 to 7.5 percent (NAAS 2006). Much of this has to bemet by increasing genetic potential and improved production efficiency of theresources and inputs like water and nutrients. In addition, the growing concernabout poor soil health and declining factor productivity or nutrient use efficiencyhas raised concern on the productive capacity of agricultural systems in India.Major factors contributing to the low and declining crop responses to fertilizernutrients are (a) continuous nutrient mining due to imbalanced nutrient use, whichis leading to depletion of some of the major, secondary, and micro nutrients like P,K, S, Zn, Mn, Fe and B, and (b) mismanagement of irrigation systems leading toserious soil quality degradation. Furthermore, such low efficiency of resourcesand fertilizer inputs has impacted the production costs with serious environmentalconsequences.
Intensive agriculture is continuously being practiced in most of the states ofIndia and therefore, the problems of soil fertility exhaustion and nutrientimbalances are bound to occur. The ill effects of exhaustive cropping systems arereflected on production of succeeding crops. In order to maintain the optimumlevel of production, it is necessary to know the nutrient requirement of crops,fertility status of the soil and the amount of nutrient removal from the soil by crops.During 1999-2000, the crop removal of nutrients is estimated to be about 28 mtwhile the fertilizer consumption was only 18 mt with an annual nutrient gap of 10mt. Although a part of this nutrient gap is expected to be bridged from non-chemical sources like organic manures and biological processes, still there is adistinct gap in nutrient removal and supply leading to nutrient mining from thenative soil posing a serious threat to long term sustainability of crop production(Hegde and Sudhakarbabu 2001). Furthermore, the country like India can hope toachieve and sustain the desired level of agricultural production in the long run onlyif we can bridge the gap between nutrient removal and addition. Therefore,understanding the present status of plant nutrient use and removal and the resultantnutrient balances in different states of the country with varied agro climaticconditions would enable us for undertaking the corrective measures to bridge thenutrient gap and help to maintain soil health and ensure the food and nutritionalsecurity. Information on nutrient balances would also help in developing anunderstanding about the annual loss of nutrients from the soil and to devisenutrient management strategies for rational use of soil resource in sustainablemanner. It also gives insights into the level of fertilizer use efficiency and theextent to which externally added nutrients have been absorbed by the crop andutilized for yield production. It can also forewarn about nutrient deficiencies,
-1 which may aggravate in the coming years and need attention.In India, state wise approaches to crop nutrient balances have been developed
way back in 2001 considering the nutrient additions and removal data either from1998-99 or 1999-2000. Since then, the information on nutrient balances has notbeen updated. Furthermore, for making future estimations, information on currentnutrient balances is highly essential. Therefore an attempt has been made in thispaper to generate fresh information on nutrient balances in major agriculturallyimportant states of India considering the recent statistics of nutrient additions andremovals as available from FAI (2008). Nutrient balance calculations in most ofthe cases do not give real picture as they consider nutrient removal by crops andaddition through fertilizers neglecting contribution from sources other thanfertilizers such as organic manures, crop residues and stubbles, irrigation wateretc. However, in this paper, the authors have tried to overcome that limitation byconsidering nutrient additions through organic sources wherever possible fromthe information available in the published literature. While calculating nutrientremoval by crops at the present production levels, emphasis has been made toconsider removal of nutrients by fruits and vegetables in all the states; tea, coffee,jute, rubber and other plantation crops in states wherever applicable and the totalproduction values have been multiplied with the nutrient uptake per tonne ofproduce and arrived at removal figures. During the discussions on nutrientbalances in individual states, efforts have been made to compare the currentscenarios with that of either 1998-99 or 1999-2000, the reason being the lastnutrient balance studies were generated from the statistics of those years.Efficiency factors were involved for calculating net nutrient balances.
Assam
Assam has 4 m ha of gross cropped area of which 14.5 percent is irrigated. Majorportion of the soils of the state are Inceptisols (49.3 percent), followed by Entisols(32.3 percent), Alfisols (12.3 percent) and Ultisols (6.1 percent). Amongst severalsoil related constraints, high soil acidity especially in the uplands and transitionalmedium lands limits nutrient availability to the crops. The principal crops grownare rice, jute, potato, pulses, oilseeds, vegetables, sugarcane, fruits, tea etc and thecropping intensity of the state is around 145 percent. The share of area under foodgrains to gross cropped area is 71 percent. A variety of cropping systems are inpractice in the state. The current fertilizer use in the state is 57.3 kg ha consistingof 27.7, 14.6 and 15.0 kg ha N, P O and K O respectively, the N:P O :K O useratio being 1.8:0.9:1.0. The consumption of total fertilizer nutrients (N + P O +K O) during 2007-08 was 214 thousand ton.
Nutrient balance scenario in major states of eastern India
-1
-1
2 5 2 2 5 2
2 5
2
468 469

Nutrient balance scenario (Table 1) for the state of Assam shows that the cropremoval being higher than that added, all the three NPK nutrients have a negativebalance. Nutrient mining is found to be to the tune of 0.113, 0.011 and 0.199 mt ofN, P O and K O, respectively. If the similar trend of mining of nutrient reserves isallowed to continue without replenishment, worsen situations would lead todeterioration of soil health and decline in crop productivity. The soils of Assambeing constrained with soil acidity, high phosphorus fixation, nutrient losses fromsoil along with socio-economic problems, the state needs special attention onadequate application of plant nutrients in order to achieve targeted cropproduction. Integrated nutrient management, organic recycling and
2 5 2
supplementary nutrient addition are the keys to uphold productivity at high andsustained level.
Bihar
Agriculture in Bihar is the only backbone to the overall development of state. It hastotal geographical area of 9.37 m ha. The net cropped area stands at 5.7 m ha, ofwhich 61.1 percent is irrigated. About 89 percent of the total cropped area of thestate is under food grains and the current cropping intensity is 139.4 percent. Theprincipal crops grown are rice, wheat, maize, pulses, oilseeds, vegetables, andsugarcane along with large acreage under fruits. The state is divided into four agro-climatic regions. Three major soil groups are recognized as foothill soils in thenarrow strips of northern boundary, sedentary foot hill and forest soils in thesouthern boundary and remaining soils are dominantly of alluvial origin in theIndo-Gangetic plains. The current fertilizer use in the state is 162.8 kg haconsisting of 125.5, 25.9 and 11.4 kg ha N, P O and K O respectively, theN:P O :K O use ratio being 9.9:2.2:1.0. While most of the nitrogen, phosphorusand potassium are applied through urea, DAP (46 percent P O ) and MOP (60percent K O) respectively, a healthy share of complex fertilizers also contributesto the total NPK consumption in the state.
The total NPK removal by selected crops appears to be 1.30 mt as against thefertilizer nutrient addition of 1.21 mt. Thus, a net NPK depletion of 0.09 mt wasrecorded for the whole state (Table 1). The balance sheet indicates that themaximum removal was recorded with K followed by N and P. Potassium balancein the state is negative and this is very much expected under the situations when thepotash removals by crops is much larger than its addition through fertilizers andother sources. The nutrient use pattern in Bihar is confined to N and P and the Kfertilization is by and large neglected in most of the cases. Due to intensivecultivation, sulphur and micronutrients like Zn and B are also getting severelydepleted from the soil. There is a need to exploit the prevailing practices ofmanuring and residue recycling, which are not satisfactory at the present level ofcultivation. Integrated plant nutrient supply system seems to have a long way to gofor maintaining soil health and sustaining yield in the state.
Jharkhand
Jharkhand has an area of 7.95 m ha and a population of 21.8 million. The state hasabout 2.2 m ha of net sown area, of which only 9 percent is irrigated. The red andlateritic soils forms the major group of soils encountered in the state and aregenerally poor in fertility, coarse textured, with low water and nutrient retentioncapacity. Farmers in the state generally grow direct seeded rice/finger millet or
-1
-1
2 5 2
2 5 2
2 5
2
State Nutrients (000 t) MiningIndex(R/A)
Assam
N 103.4 216.1 -112.8 2.1P O 54.6 65.1 -10.5 1.2K O 56.0 255.8 -199.8 4.6NPK Total 213.9 537.1 -323.1 7.9
Bihar
N 929.6 452.8 476.8 0.5P O 191.6 203.2 -11.6 1.1K O 84.4 646.4 -561.9 7.7NPK Total 1205.6 1302.4 -96.8 9.2
Jharkhand
N 89.4 122.5 -33.1 1.4P O 45.8 59.5 -13.6 1.3K O 9.8 169.6 -159.9 17.4NPK Total 145.0 351.6 -206.6 20.0
Orissa
N 272.1 264.9 7.2 1.0
West Bengal
N 684.5 676.7 7.8 1.0P O 385.8 319.3 66.5 0.8K O 304.4 972.8 -668.4 3.2NPK Total 1374.7 1968.8 -594.1 5.0
Additions Removal Balance(A*) (R*)
P O 116.8 135.3 -18.5 1.2K O 63.0 383.6 -320.6 6.1NPK Total 451.9 783.8 -331.9 8.2
2 5
2
2 5
2
2 5
2
2 5
2
2 5
2
Table 1 Nutrient additions, removal by crops and apparent balance in majorstates of Eastern India
A* - Nutrient additions only throw fertilizers being considered.R* - Nutrient removal calculated as per FAI statistics.
470 471

pulses in uplands and transplanted rice in low lands. Maize, rice, groundnut andoilseed crops cover medium lands. The productivity levels of these crops are verylow owing to low nutrient inputs and poor inherent soil fertility of the region. Theintensity of nutrient (N + P O + K O) use through fertilizers in Jharkhand 68.5 kg
ha consisting of 42.3 kg N, 21.7 kg P O and 4.6 kg K O with N:P O :K O use ratioof 9.2:4.7:1.
Total removal of plant nutrients is around 0.352 mt out of which N, P O andK O accounts for 0.123, 0.06 and 0.17 mt, respectively (Table 1). The total nutrientaddition is only 0.145 mt with N, P O and K O added at 0.089, 0.046 and 0.009 mt,respectively. Thus, there is a negative balance of 0.21 mt of NPK nutrients at thepresent levels of crop production in the state. This is really alarming and with theprojected increase in population and associated food grain requirements forJharkhand, the depletion in plant nutrients is likely to be alarming and requiresserious consideration.
Orissa
The state of Orissa is known for mono-cropping of rice with other crops like pulsesand oilseeds grown on residual moisture after rice. The state has 8.9 m ha of grosscropped area with cropping intensity of 157 percent. Major soils of the state aredeltaic coastal soils, coastal saline soils, red and laterite soils, black soils andbrown forest soils. The share of area under food grains to gross cropped area is 76percent. The crop yields as well as crop removal of nutrients from the soil werevery low and the natural processes of nutrient cycling, biological nitrogen fixation,addition of crop residues and FYM possibly sustained the nutrient balance of soil.The intensity of nutrients (N + P O + K O) use through fertilizers in Orissa is very
low at 51.8 kg ha consisting of 31.2, 13.4 and 7.2 kg ha N, P O and K O,respectively with N:P O :K O use ratio of 4.3:2.2:1. Though the share of Orissa toall India gross cropped area is 5.3 percent but its share to all India consumption ofNPK is only 2 percent . The share of potash to total NPK consumption is 13.9percent .
The state as a whole had a negative nutrient balance of 332 thousand tonnes ofNPK nutrients. The nutrient balance with respect to N was found to be positive by7.2 thousand tonnes where as phosphorus was negatively balanced at 18.5thousand ton. . The total K removal by the crops at current level of productivity is384 thousand ton against total addition of 63 thousand ton resulting in asevere negative K balance of 320 thousand ton. The current fertilizer use inOrissa is extremely low and has resulted in lower yield levels of most of thecrops. Total nutrients added as fertilizers accounts for 58 percent of cropremoval and fertilizer K added is about 16 percent of K removed by the crops.Unless fertilizer consumption is substantially increased, apart from perpetuating
2 5 2
2 5 2 2 5 2
2 5
2
2 5 2
2 5 2
2 5 2
2 5 2
-1
-1 -1
lower yields, there is an immediate danger of a steep decline of existing cropyields.
West Bengal
West Bengal is one of the agriculturally most important states of Eastern Indiahaving 9.6 m ha of gross cropped area of which 35 percent is irrigated. Major soilsof the state are alluvial, red and laterites, coastal saline soils and hill and soils.The principal crops grown are rice, potato, pulses, oilseeds, vegetables, sugarcane,fruits, tea . The share of area under food grains to gross cropped area is 71percent. A variety of cropping systems are in practice in the state. The currentfertilizer use in the state is 144.2 kg ha consisting of 71.8, 40.5 and 31.9 kg ha N,P O and K O, respectively, the N:P O :K O use ratio being 2.4:1.2:1.0. Totalfertilizer nutrient consumption in the state grew by 7.2 percent, from 1.283 mtduring 1999-2000 to 1.375 mt during 2007-08. The consumption of N, P O andK O at 0.697, 0.417 and 0.312 M t during 2007-08, recorded increase of 4.9, 7.8and 14.7 percent, respectively, over 1999-2000.
The total removal of nitrogen during 2007-08 was 0.678 mt, however, theaddition through fertilizers was 0.685 mt (Table 1). Therefore, the N balance in thestate seems to be positive (0.008 mt) at present level of crop production.Phosphorus was positively balanced at 0.067 mt, however, the potassium balancewas extremely negative. The total potassium removal by major crops at currentlevel of productivity is 0.973 mt against total addition of 0.304 mt throughfertilizers showing a negative balance of 0.668 mt. The total negative balance ofNPK in the state is amounting to 0.594 mt.
Haryana
Haryana is an agriculturally important state of Northern India having 6 m ha ofgross cropped area of which 81 percent is irrigated with cropping intensity of 170percent. Major soils of the state are alluvial and saline - sodic with problems ofsalty waters in some parts. The principal crops grown are rice, wheat, pearl millet,cotton, sugarcane, mustard, chickpea, and potato. The share of area under foodgrains to gross cropped area is 71 percent. A five-fold increase in food grainproduction during the last 35 years combined with inadequate and unbalancednutrient supply has led to a large degree of soil nutrient 'mining' of all the essentialplant nutrients. Farmers in Haryana apply generalized quantities of N, P and Znand as a consequence, deficiencies of K and other nutrients are spreading in spaceand time. The intensity of nutrients (N + P O + K O) use through fertilizers in
terai
etc
-1 -1
2 5 2 2 5 2
2 5
2
2 5 2
Nutrient balance scenario in major states of northern India
472 473

Haryana is 187.6 kg ha consisting of 144.4 kg N, 39.6 kg P O and 3.6 kg K O withN: P O :K O use ratio of 59.7:18.6:1. Though the share of Haryana to all Indiagross cropped area is 3.2 percent but its share to all India consumption of NPK is 6percent. The share of potash to total NPK consumption is only 1.93 percent.
The nutrient mining scenario in Haryana reveals that there was a gap of 0.78mt between removal and additions of NPK nutrients through mineral fertilizersand other organic sources in the year 2007-08 (Table 2). Except for N showing apositive balance of 0.031 mt, both Pand K balances were found to be negative. TheN gap in the state has been improved from -22.5 thousand tonnes in 1999-2000 to+30.8 thousand tonnes which was mainly due to increase in fertilizer consumptionfrom 109.13 kg ha in 1999-2000 to 187.6 kg ha in 2007-08. There is a negativebalance of about 155 and 652 thousand tonnes of P and K in the state, whichindicate that the depletion of both Pand K would continue to increase in future, as aresult more and more areas will come under the deficiency of these nutrients.Vinod Kumar et al. (2001) also reported a negative balance of S, Fe, Mn and Cu inthe state though the Zn balance was positive due to application of Zn in rice andwheat crops. It is possible to narrow the gap between removal and additionsthrough continuous recycling of nutrients and through balanced fertilizer use and
-1
-1 -1
2 5 2
2 5 2
encouraging combined use of fertilizers with organic manures, crop residues,green manuring and biofertilisers.
Punjab
Punjab having 8.2 m ha of gross cropped area is one of the most important states ofNorthern India. In Punjab, 95 percent of the gross cropped area is irrigated withcropping intensity of 194 percent. Major soils of the state are alluvial in nature.The principal crops grown are rice, wheat, maize, cotton, sugarcane, mustard,chickpea, and potato. The share of area under food grains to gross cropped area is77 percent. The total nutrient consumption in the state increased by 23.5 percent,from 1.38 mt during 1998-99 to 1.69 mt during 2007-08. The intensity of nutrients(N + P O + K O) use in Punjab is 210 kg ha consisting of 162.7 kg N, 42.5 kg P Oand 4.7 kg K O with N:P O :K O use ratio of 34.3:9.0:1 which evidently is highlyunbalanced.Apparently, the share of potash in total NPK use in the State is only 2.3percent, which is negligible.
Nutrient addition to crops is mainly through mineral fertilizers and thecontribution of organic sources is marginal in the state. It is evident from Table 2that the N balance in the state is positive at 565 thousand tonnes. However, with thecurrent additions of 344 thousand tonnes of P O as against 446 thousand tonnes ofcrop removal, the P balance in the state is negative by 102 thousand tonnes. Theuse of K in Punjab is almost negligible, whereas its removal is 36 and 129 percentgreater than that of N and P. The total K removal by the crops at current level ofproductivity is 1.022 mt against total addition of 0.038 mt with the negative Kbalance of 0.985 mt. (Brar 2004) reported that total K loss from Punjab soilsincreased from 159 thousand tonnes in 1960-61 to 678 thousand tonnes by 2002-03. This wide gap in potash removal and addition has impoverished soil's potashreserves and thus the magnitude and extent of its deficiency and crop responses toits application are on increase in both time and space. Sulphur deficiency ispredominantly seen in the state, limiting the yields of oilseeds, pulses and cereals.Current status of S balance is negative with mining of about 80 thousand tonnesannually in the state (Aulakh and Bahl 2001). Amount of Zn added was severaltimes higher than its removal and as a result substantial amount of Zn was left inthe balance owing to its poor utilization. There is a need to implement the 4 R'sstrategy of nutrient management focusing right quantity of nutrients through rightsource at right time by right methods of application, which would help in bridgingthe nutrient gaps in the state.
Uttar Pradesh
Uttar Pradesh is one of the agriculturally important states of Northern India with
2 5 2 2 5
2 2 5 2
2 5
-1
State Nutrients (000 t) MiningIndex(R/A)
Additions Removal Balance(A) (R)
Uttar Pradesh (a*)
N 3180.7 1488.3 1692.4 0.5P O 1023.6 591.8 431.8 0.6K O 863.1 1842.1 -979.0 2.1NPK Total 5067.4 3922.2 1145.2 3.2
Punjab (b*)
N 1315.5 750.2 565.2 0.6P O 343.9 446.3 -102.4 1.3K O 38.4 1022.8 -984.5 26.7NPK Total 1697.8 2219.3 -521.6 28.5
Haryana (c*)
N 520.6 489.8 30.8 0.9P O 65.1 220.3 -155.2 3.4K O 16.6 669.1 -652.5 40.4NPK Total 602.3 1379.2 -776.9 44.7
2 5
2
2 5
2
2 5
2
Table 2 Nutrient additions, removal by crops and apparent balance in major states ofNorthern India
a* Inputs through fertilizers, irrigation water, crop residues and FYM consideredb* Inputs through fertilizer additions, contribution from other sources considered negligiblec* Additions through fertilizers, 1/3rd contribution of nutrients from cow dung and efficiency factors
of 0.55, 0.25 and 0.66 were considered for NPK
474 475

17.6 m ha of gross cropped area, of which 72 percent is irrigated with croppingintensity of 152 percent. Major soils of the state are alluvial and saline – sodic(with some problems of salty waters) in Gangetic plains and residual soils inBundel Khand . The principal crops grown are rice, wheat, maize, pearl millet,sorghum, mustard, pigeon pea, chickpea, pea, lentil, potato, sugarcane, vegetablesand fruits The area under food grains is 78 percent of net cropped area. The share ofUttar Pradesh to all India gross cropped area is 14 percent but its share to all Indiaconsumption of NPK is 17 percent. Farmers are continuously applyinggeneralized quantities of N, P and to some extent Zn and as a consequence,deficiencies of K and other nutrients are spreading in space and time. The intensityof nutrients (N +P O + K O) use through fertilizers in Uttar Pradesh is 149.6 kg
ha consisting of 109.6 kg N, 32.7 kg P O and 7.3 kg K O with N:P O :K O useratio of 16.0:5.3:1. The share of potash to total NPK consumption is only 5 percent.
In general, N and P additions are greater than their removal by different cropsand as a result the apparent balances of both the nutrients are tending to be positive(Table 2). However, the total K removal by major crops is reported to be 1.842 mtagainst total addition of 863 thousand tonnes through fertilizers and other sourcesand resulted in a negative K balance of 979 thousand tonnes thereby raisingserious concerns of K depletion from the soil. Owing to severe losses of N throughleaching and volatilization in the rhizosphere and also through severedenitrification losses in rice soils, the existing positive N balances in the state maynot be considered as satisfactory input-output relations and therefore it may beinferred that the current practices of cropping and nutrient management areexhaustive in terms of N and K withdrawals, leading to greater depletion of N andK from native soil reserves. Therefore, appropriate N and K management practiceshave to be followed in order to minimize the losses to soil fertility and sustain thecrop productivity in years to come.
Andhra Pradesh
Andhra Pradesh is one of the most progressive states with respect to agriculturaldevelopment, maintaining higher levels of crop production compared to severalother states. It is the second largest fertilizer consuming state in the country, next toUttar Pradesh. During the last decade, the consumption of total fertilizer nutrientsincreased by 25 percent, from a total of 2.131 mt during 1998-99 to 2.667 mtduring 2007-08.All the three nutrients recorded positive growth during the period.The consumption of N, P O and K O at 1.560, 0.695 and 0.412 mt, during 2007-08registered an increase of 18.2, 14.7 and 105 percent, respectively, over 1998-99.However, the contribution of K in total NPK consumption was the lowest (15.4
2 5 2
2 5 2 2 5 2
2 5 2
-1
Nutrient balance scenario in major states of southern India
percent) as compared to N (58.5 percent) and P O (26.1 percent). NPK use ratiochanged significantly from 13 : 6 : 2 during 1998-99 to 4.4 : 2.1 : 1 during 2007-08.Per hectare consumption of total nutrients during 2007-08 was 205.3 kg ascompared to 158 kg ha during 1998-99 and the state of Andhra Pradesh has thehighest per hectare consumption among the major states of southern India. Thedata pertaining to crop nutrient balance in Andhra Pradesh has been shown inTable 3.
For calculating the nutrient balances, information on nutrient additionsthrough fertilizers and crop removal of nutrients has been taken from FAI (2008),whereas, the nutrient additions through organic sources has been adopted fromSingh et al. (2001). The total removal of nitrogen during 2007-08 was 0.506 mt,with the addition of 0.786 mt. Therefore, the N balance in the state was positive(0.281 mt) at the present level of crop production and registered a positive growth
2 5
-1
State Nutrients (000 t) MiningIndex(R/A)
Additions Removal Balance(A) (R)
Andhra Pradesh (a*)
N 786.0 505.5 280.5 0.6P O 187.1 232.8 -45.8 1.2K O 411.3 708.6 -297.3 1.7NPK Total 1384.4 1446.9 -62.6 3.6
Karnataka (b*)
N 790.3 569.2 221.1 0.7P O 386.8 295.8 91.0 0.8K O 330.3 734.4 -404.0 2.2NPK Total 1507.4 1599.4 -91.97 3.7
Tamil Nadu (b*)
N 543.3 494.8 48.6 0.9P O 228.1 230.9 -2.8 1.0K O 304.2 726.1 -421.9 2.4NPK Total 1075.7 1451.7 -376.1 1.3
Kerala (b*)
N 93.3 185.6 -92.3 2.0P O 42.7 76.9 -34.2 1.8K O 72.3 278.6 -206.3 3.9NPK Total 208.3 541.1 -332.8 2.6
2 5
2
2 5
2
2 5
2
2 5
2
Table 3 Nutrient additions, removal by crops and apparent balance in major states ofSouthern India
a* Recent figures of nutrient additions and removals along with efficiency factor and 10% ofavailable potential organic matter considered
b* Nutrient additions through fertilizers only
476 477
of 37.5 percent (0.073 mt) during the last ten years. The total P removal was 0.233mt and the total P additions were 0.187 mt resulting in a net negative balance of0.048 mt. Though there is an improvement in P balance from -0.132 mt during1998-99 to -0.048 mt in 2007-08, there is still a need to review the fertilizerrecommendations and develop effective strategies for P management in order tobring down the negative P balance in the state. K balance was also found to benegative, with a total K removal of 0.709 mt and total K additions of 0.411 mt, andthe resultant K use is in a state of net negative balance of 0.297 mt. Although thenegative balance has come down from 0.431 mt during 1998-99 to 0.297 mt, thereis a need to adopt appropriate K management strategies in order to overcome theexisting negative balances. In addition to the major nutrients, Sulphur deficiencieshave been reported in light textured, low organic matter containing soils, whichare prone to subsequent leaching and among the micronutrients, zinc is the mostdeficient micronutrient in the entire state. The results indicate that the farmers ofthe region need to adopt the balanced fertilization strategies in order to keep thenutrient balances at optimum levels.
Karnataka
Karnataka state is bestowed with a wide range of soil and climatic conditions thatsupport myriad species of crops and farming systems. The state has been in thefore-front in terms of adoption of newer agricultural practices and maintainingfertilizer use (116 kg ha ) at par with the national average of 117 kg ha . The totalnutrient consumption increased from 1.27 mt during 1999-00 to 1.51mt during2007-08 and registered an increase of 19 percent in the consumption of totalnutrients over the last eight years. The state with 6.5 percent of the country's grosscropped area has 6.7 percent of total fertilizer nutrients consumed in the country,which has come down from 1999-2000 levels of 7.6 percent. The consumption ofN and K O at 0.79 and 0.33 mt during 2007-08, registered an increase of 16.2percent and 52.8 percent, respectively, over 1999-2000, and the consumption ofP O at 0.387 mt recorded a slight increase of 1.3 percent during the period. NPKuse ratio changed from 3.2:1.7:1 to 2.4:1.2:1 during the period.
The current nutrient addition through fertilizers was worked out from FAI(2008), which reveals that about 1.51 mt of nutrients were consumed against totalremoval of 1.6 mt of nutrient by different major crops grown in the state resultingin a negative nutrient balance of 0.092 mt of NPK that is not met through fertilizerapplications for the crop year 2007-08 (Table 3). However, considering thenutrient availability of about 0.55 mt (Hegde and Surendrababu 2001) throughdifferent organic sources in the state, the negative balance of 0.92 lakh tonnes ofnutrients could be considered negligible. However, the negative balance of 0.404mt of K is a matter of concern in the state and before depleting the K reserves of the
-1 -1
2
2 5
soils in the state, there is a need to address this issue through appropriate potassiumnutrient management practices.
Kerala
The state of Kerala has net cropped area of only 2.1 m ha and the state producesmore than 48 percent of coconut, 97 percent of black pepper and 60 percent ofnatural rubber in the country. In addition, it has a significant share of India's otherplantation produces such as coffee, tea, betel nut, cocoa and cashew, fruits such asbanana and pineapple and spices like cardamom, ginger, turmeric, nutmeg andclove. The fertilizer nutrient consumption in the state decreased marginally by 5percent from 0.219 mt during 1998-99 to 0.208 mt during 2007-08 and as a result,the agricultural productivity of the state showed a continuous decline in recentyears. While, the consumption of N at 0.093 mt, registered an increase of 7.27percent during 2007-08 over 1998-99, the consumption of P O and K O at 42.7and 72.3 thousand ton, recorded a decline of 3.4 percent and 17.2 percent,respectively, during the period. Present NPK use ratio of the state is 1.3:0.5 :1. Theper hectare consumption of total fertilizer nutrients is 70 kg and is far below thenational average of 117 kg ha .
From the nutrient balance sheet of Kerala (Table 3), it is quite obvious that thefertilizer usage in the state is not adequate to meet the demand for crop removal.Out of the potential demand of 0.541 mt of fertilizer nutrients, only 0.21 mt isadded through fertilizers during 2007-08 and as a result, there is a net negativebalance of 0.332 mt, which is to be supplied through additional nutrient inputs inorder to overcome excess nutrient mining form the soil. The total K removal bymajor crops is reported to be 0.279 mt against total addition of 0.072 mt K throughfertilizers with a negative potassium balance of 0.206 mt and in consequence the Kreserve of the soils of the state has depleted. In addition to this, the micronutrientdeficiencies are also becoming widespread at an alarming rate (John et al. 2001).For attaining a sustainable crop production from the state and cater to the needs ofthe ever growing population, there is a need to create awareness among farmersabout the responsible management of plant nutrients through balanced andintegrated nutrient management strategies.
Tamil Nadu
Tamil Nadu has 3.4 percent of India's gross cropped area with about 4.8 percent ofthe total fertilizer consumption of the country. The total consumption of fertilizernutrients in the state increased from 0.79 mt during 1998-99 to 1.075 mt during2007-08 and has registered an increase of 36 percent over 1998-99 levels. Duringthe last 8-9 years, the consumption of P O and K O is more than doubled at 0.228
2 5 2
2 5 2
-1
478 479
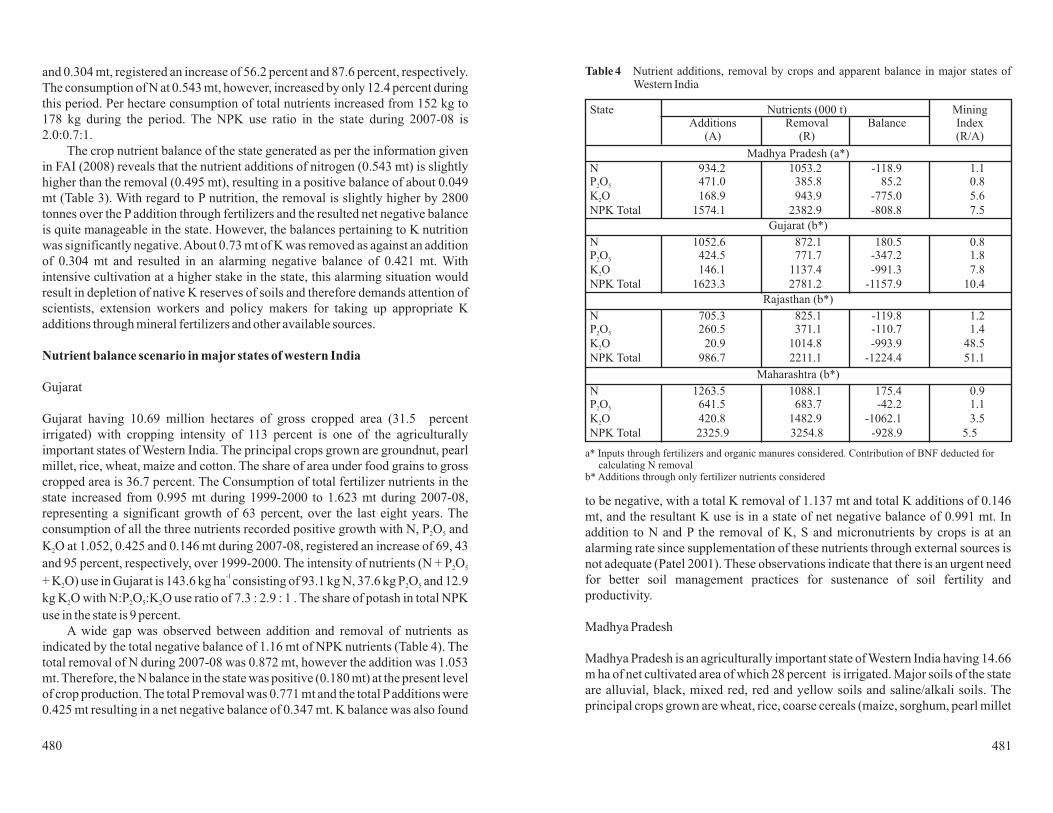
and 0.304 mt, registered an increase of 56.2 percent and 87.6 percent, respectively.The consumption of N at 0.543 mt, however, increased by only 12.4 percent duringthis period. Per hectare consumption of total nutrients increased from 152 kg to178 kg during the period. The NPK use ratio in the state during 2007-08 is2.0:0.7:1.
The crop nutrient balance of the state generated as per the information givenin FAI (2008) reveals that the nutrient additions of nitrogen (0.543 mt) is slightlyhigher than the removal (0.495 mt), resulting in a positive balance of about 0.049mt (Table 3). With regard to P nutrition, the removal is slightly higher by 2800tonnes over the P addition through fertilizers and the resulted net negative balanceis quite manageable in the state. However, the balances pertaining to K nutritionwas significantly negative.About 0.73 mt of K was removed as against an additionof 0.304 mt and resulted in an alarming negative balance of 0.421 mt. Withintensive cultivation at a higher stake in the state, this alarming situation wouldresult in depletion of native K reserves of soils and therefore demands attention ofscientists, extension workers and policy makers for taking up appropriate Kadditions through mineral fertilizers and other available sources.
Gujarat
Gujarat having 10.69 million hectares of gross cropped area (31.5 percentirrigated) with cropping intensity of 113 percent is one of the agriculturallyimportant states of Western India. The principal crops grown are groundnut, pearlmillet, rice, wheat, maize and cotton. The share of area under food grains to grosscropped area is 36.7 percent. The Consumption of total fertilizer nutrients in thestate increased from 0.995 mt during 1999-2000 to 1.623 mt during 2007-08,representing a significant growth of 63 percent, over the last eight years. Theconsumption of all the three nutrients recorded positive growth with N, P O andK O at 1.052, 0.425 and 0.146 mt during 2007-08, registered an increase of 69, 43and 95 percent, respectively, over 1999-2000. The intensity of nutrients (N + P O
+ K O) use in Gujarat is 143.6 kg ha consisting of 93.1 kg N, 37.6 kg P O and 12.9kg K O with N:P O :K O use ratio of 7.3 : 2.9 : 1 . The share of potash in total NPKuse in the state is 9 percent.
A wide gap was observed between addition and removal of nutrients asindicated by the total negative balance of 1.16 mt of NPK nutrients (Table 4). Thetotal removal of N during 2007-08 was 0.872 mt, however the addition was 1.053mt. Therefore, the N balance in the state was positive (0.180 mt) at the present levelof crop production. The total Premoval was 0.771 mt and the total Padditions were0.425 mt resulting in a net negative balance of 0.347 mt. K balance was also found
Nutrient balance scenario in major states of western India
2 5
2
2 5
2 2 5
2
-1
2 5 2
to be negative, with a total K removal of 1.137 mt and total K additions of 0.146mt, and the resultant K use is in a state of net negative balance of 0.991 mt. Inaddition to N and P the removal of K, S and micronutrients by crops is at analarming rate since supplementation of these nutrients through external sources isnot adequate ( These observations indicate that there is an urgent needfor better soil management practices for sustenance of soil fertility andproductivity.
Madhya Pradesh
Madhya Pradesh is an agriculturally important state of Western India having 14.66m ha of net cultivated area of which 28 percent is irrigated. Major soils of the stateare alluvial, black, mixed red, red and yellow soils and saline/alkali soils. Theprincipal crops grown are wheat, rice, coarse cereals (maize, sorghum, pearl millet
Patel 2001).
State Nutrients (000 t) MiningIndex(R/A)
Additions Removal Balance(A) (R)
Madhya Pradesh (a*)N 934.2 1053.2 -118.9 1.1P O 471.0 385.8 85.2 0.8K O 168.9 943.9 -775.0 5.6NPK Total 1574.1 2382.9 -808.8 7.5
Gujarat (b*)
N 1052.6 872.1 180.5 0.8P O 424.5 771.7 -347.2 1.8K O 146.1 1137.4 -991.3 7.8NPK Total 1623.3 2781.2 -1157.9 10.4
Rajasthan (b*)
N 705.3 825.1 -119.8 1.2P O 260.5 371.1 -110.7 1.4K O 20.9 1014.8 -993.9 48.5NPK Total 986.7 2211.1 -1224.4 51.1
Maharashtra (b*)
N 1263.5 1088.1 175.4 0.9P O 641.5 683.7 -42.2 1.1K O 420.8 1482.9 -1062.1 3.5NPK Total 2325.9 3254.8 -928.9 5.5
2 5
2
2 5
2
2 5
2
2 5
2
Table 4 Nutrient additions, removal by crops and apparent balance in major states ofWestern India
a* Inputs through fertilizers and organic manures considered. Contribution of BNF deducted forcalculating N removal
b* Additions through only fertilizer nutrients considered
480 481

and small millets), pulses (pigeon pea, chickpea and lentil) and oilseeds (mustard,soybean). The share of area under food grains to gross cropped area is 60 percent.The consumption of total fertilizer nutrients in the state increased from 0.99 mtduring 1998-99 to 1.3 mt during 2007-08, representing a growth of 31.3 percent,during the last ten years. The consumption of all the three nutrients recordedpositive growth. N, P O and K O at 0.796, 0.43 and 0.076 mt during 2007-08,registered an increase of 38, 12.4 and 183 percent, respectively over 1998-99levels. The current fertilizer use in the state is only 66.4 kg ha consisting of 40.6,21.9 and 3.9 kg ha N, P O and K O respectively, the N:P O :K O use ratio being10.5 : 5.7 : 1.0. The share of potash in total NPK use in the state is 5.8 percent.
The total removal of N during 2007-08 was 1.053 mt, with the additionthrough fertilizers and organic manures of 0.934 mt (Table 4). Therefore, the Nbalance in the state seems to be negative (0.119 mt) at present level of cropproduction. P was positively balanced at 0.085 mt, however, the K balance wasextremely negative. The total K removal by major crops at current level ofproductivity is 0.944 mt against total addition of 0.169 mt through fertilizers andorganic manures showing a negative balance of 0.775 mt. This wide gap in Kremoval and addition has impoverished soil's K reserves and thus the magnitudeand extent of its deficiency and crop responses to its application are on increase inboth time and space. The total negative balance of NPK in the state is amounting to0.808 mt. Apart from considering nutrient contributions from organic manures,there are considerable quantities of crop residues, forest litters, press mud, poultrymanure, biofertilisers etc are also available in the state. Therefore, there is a needfor the development of strategies for recycling of available crop residues in orderto fulfill the existing nutrient gap.
Maharashtra
Maharashtra, the third largest Indian state occupying 1/10 of the area of thecountry enjoys varied agro-climatic situations. Black soils with swell-shrinkcharacteristics dominate the soil type along with lateritic, coastal alluvial, salinealkali, mixed red and black soils. The consumption of total fertilizer nutrientsrecorded an impressive growth of 11.3 percent during 2007-08. Total nutrientconsumption increased from 1.46 mt during 1998-99 to 2.33 mt during 2007-08.All the three nutrients recorded positive growth during the period. Theconsumption of N, P O and K O at 1.264, 0.642 and 0.421 mt, recorded anincrease of 45.3, 62.5 and 113.7 percent, respectively, during 2007-08 over 1998-99. The present NPK use ratio was 3.0:1.5:1 and consumption of total fertilizernutrients in the state during 2007-08 was 103 kg ha .
Removal of N during 2007-08 was 1.088 mt, and addition through fertilizerswas 1.264 mt, therefore the N balance in the soils of Maharashtra was positive by
2 5 2
2 5 2 2 5 2
2 5 2
-1
-1
th
-1
0.175 mt (Table 4). P removal by crops was 0.684 mt and additions throughfertilizers was 0.642 mt showing a negative balance of .042 mt. This shows that theP use in Maharashtra was below the recommended levels of application andtherefore there is a need to increase Papplication. There is a wide gap in addition ofK to soil and their removal by crops. Although about 0.421 mt of K was added, theremoval was very high at 1.483 mt, leaving a negative balance of 1.062 mt of K.Replenishment of S and other micronutrients is almost negligible and widespreadmulti nutrient deficiencies have been reported in the state (Patil et al. 2001).Therefore, there is a need to improve additions of deficient nutrients in the lowconsuming areas along with use of organic manures and encouraging retention ofcrop residues in soil.
Rajasthan
Rajasthan having 19.23 m ha of gross cropped area (31 percent irrigated) is one ofthe agriculturally important states of Western India. The state is endowed with alarge diversity in soils from dune and associated soils to medium black soils. Theprincipal crops grown are pearl millet, maize, coarse millets, pulses, oilseeds,cotton, vegetables . The share of area under food grains to gross cropped area is59 percent. A variety of cropping systems are in practice in the state. The currentfertilizer use in the state is only 45.5 kg ha consisting of 32.5, 12.0 and 1.0 kg haN, P O and K O respectively, the N: P O : K O use ratio being 57.4:16.9:1.0. Theshare of potash to total NPK consumption is only 2.3 percent. The total K removalby major crops is reported to be 1.015 mt against total addition of 0.021 mt Kthrough fertilizers showing negative balance of 0.994 mt and in consequence the Kreserve of the soils of the state is continuously depleting.
Based on the nutrients absorbed by the crops and nutrients added throughfertilizers, the balance sheet shows negative trend for all the three NPK nutrients(Table 4). There is a requirement of about 0.12, 0.11 and 0.99 mt of additional NPKnutrients to bridge the deficit in the state. Gupta (2001) reported that K mining inRajasthan is highest followed by N, S, P and Zn. The negative nutrient balance inthe state could be bridged through adequate use of fertilizers. There is a need todouble the present levels of nutrient consumption through additional fertilizer useand also by supplying nutrients through cattle manure and other organic sources.
From the foregoing discussions, it is conspicuous that the nutrient use pattern inmajority of the agriculturally important states of India is inadequate and mostlydominated by NP fertilization. The negative balance of K is highly predominant inalmost all the states, which imply that the use of K fertilizers is neglected in most
etc
-1 -1
2 5 2 2 5 2
Conclusions
482 483

cases. K additions through the prevailing practices of manuring and residuerecycling, as well as the meager inputs through K fertilizers are not sufficient tomatch the K removal by different crops and therefore, tremendous efforts areneeded to promote K consumption through use of K rich fertilizers. The currenttrends of nutrient balances reveals that the gap between nutrient use and supply infarming areas will continue to grow wide on account of intensive cropping andtherefore, there is a need to ensure proper and timely supply of major as well assecondary and micronutrients. Other than additions through fertilizer nutrients,practices like recycling of crop residues instead of taking back the residues awayfrom the field and use of animal manures through appropriate compostingprocesses should be encouraged than diverting the resources for fuel and othersecondary purposes.
Nutrient balance calculations, sometimes, do not give the real picture as theyconsider nutrient removal by crops and addition through fertilizers neglectingcontribution from sources other than fertilizers such as organic manures, cropresidues and stubbles, irrigation water etc. Therefore, contribution of nutrientsfrom the available sources should be taken into account while making calculationsto the maximum extent possible. Further, if the average use efficiency of fertilizers(N 50-60 percent; P 15-25 percent, K 60-70 percent) is taken into account, thenutrient additions through fertilizers is much more reduced and therefore, theremoval exceeds the consumption and nutrient gap is widened. Nevertheless, thesituation is balanced by addition of the nutrients through biofertilisers, FYM,compost, green manuring or addition of crop residues in the field. Theconsumption data on secondary and micronutrient fertilizers are not available.There is a need to compute nutrient balances with respect to secondary andmicronutrients, giving emphasis primarily to the most limiting nutrients like S, Znand B.
Aulakh MS, Bahl GS (2001) Nutrient mining in agro-climatic zones of Punjab.Fert News 46 (4): 47-61
Brar MS (2004) Potassium mining and agricultural sustainability: PunjabScenario Fert News 49 (7): 51-55
FAI (2008) Fertilizer statistics. FertiliserAssociation of India, New DelhiGupta AK (2001) Nutrient mining in agro-climatic zones of Rajasthan. Fert News
46 (9): 39-46Hegde DM, Sudhakar-Babu SN (2001) Nutrient mining in agro-climatic zones of
Karnataka. Fert News 46 (7): 55-72ICAR (2008) From the DG's desk. News Reporter (April-June 2008), pp 2John PS, George M, Jacob R (2001) Nutrient mining in agro-climatic zones of
Kerala. Fert News 46 (8): 45-57
References
NAAS (2006) Low and declining crop responses to fertilizers. Policy Paper 351-8
Patel KP (2001) Nutrient mining in agro-climatic zones of Gujarat. Fert News 46(5): 41-55
Patil VD, Pholane LP, Adsul PB (2001) Plant nutrient mining in agro-climaticzones of Maharashtra. Fert News 46 (7): 43-54
Rao KV (2009) Site-specific integrated nutrient management – principles andstrategies. In: Proceedings of the Workshop on SSNM in Rice and Rice-basedCropping Systems Hyderabad, pp 22-29
Singh HP, Sharma KL, Ramesh V, Mandal UK (2001) Nutrient mining in agro-climatic zones ofAndhra Pradesh. Fert News 46 (8): 29-42
Vinod K, Antil RS, Narwal RP, Kuhad MS (2001) Nutrient mining in agro-climatic zones of Haryana. Fert News 46 (4): 81-92
:
,
484 485

Proceedings IPI-OUAT-IPNI International Symposium (2009)
H Singh
International Plant Nutrition Institute (IPNI), India West Program, C-2/301, Lunkad Gold
Coast, Viman Nagar, Near Symbiosis College, Pune 411 014, Maharashtra, India
e-mail: [email protected]
SK Bansal
Potash Research Institute of India (PRII), Sector 19, Dundahera, Gurgaon 122 001,
Haryana, India
e-mail: [email protected]
Analysis of crop productivity, partial factor
productivity, and soil fertility in relation to nutrient
management in the Indo-Gangetic plains
H Singh SK Bansall
l l
l l l l
A The Indo-Gangetic Plains (IGP) is among the most extensive fluvial
plains of the world covering several states of the northern, central, and eastern
parts of India. The IGP occupies a total area of approximately 43.7 m ha, which is
nearly 13% of the total geographical area of the country, and represents eight agro-
ecological regions (AER) and 14 agro-ecological sub-regions. Over the last
three–four decades the states of the IGP have been successful in increasing their
food grain production, chiefly rice and wheat, by introducing high-input
technologies to meet the demands of the exponentially growing population. Now
IGP produces about 50% of the total food grains to feed 40% of the population of
the country. The production of grains is, however, not uniform across the IGP
regions because of the spatial variation in land-resource characteristics and socio-
economy in the region. Also, the imbalanced fertilizer application in the IGP has
resulted in stagnating or declining yields, nutrient use efficiencies, and soil health.
The future sustainability of the present cropping system in the IGP demands a
review on the trends in crop productivity vis-à-vis potential yields, partial factor
productivity, and soil fertility. This paper reviews both the trends and the impact of
efficient nutrient management strategies, which can significantly benefit the
agriculture in the region through increasing crop yields, adding to farmer's
income, and improving agricultural sustainability.
Crop productivity Geographic Information System Indo-Gangetic
Plain nutrient use efficiency rice Site-Specific Nutrient Management wheat
bstract
Keywords
Abbreviations: IGP – Indo-Gangetic Plains; m ha – million hectares, SSNM –
Site-Specific Nutrient Management, AER – Agro-Ecological Region
486 487

Introduction
The Indo-Gangetic Plains (IGP) ranks as one of the most extensive fluvial plains
of the world. The deposit of this tract represents the last chapter of earth's history.
The IGP developed mainly by the alluvium of the Indus, Yamuna, Ganga,
Ramganga, Ghagra, Rapti, Gandak, Bhagirathi, Silai, Damodar, Ajay, and Kosi
rivers. The nature and properties of the alluvium vary in texture from sandy to
clayey, calcareous to non-calcareous and acidic to alkaline. Though the overall
topographic situation remains fairly uniform with elevations of 150 m in the
Bengal basin, and 300 m in the Punjab plain, local geomorphic variations are
significant (Shankarnarayana 1982). Geophysical surveys and deep drilling by the
Oil and Natural Gas Commission of India suggest that the IGPis a vast asymmetric
trough with maximum thickness of 10,000 m that thins out to the south (Sastri et al.
1971; Raiverman et al. 1983). During the past five decades several workers have
indicated the various soil-forming processes in soils of the IGP, such as
calcification, leaching, lessivage, salinization and alkalinization, gleization, and
homogenization (Shankarnarayana and Sarma 1982). The temperature regime is
hyperthermic (i.e. mean annual temperature is >22°C and the difference of mean
summer and winter temperature is >6°C), but differences in precipitation have
contributed to the formation of a variety of soils in the plains that represent mainly
three soil orders like Entisols, Inceptisols, and Alfisols. Recent studies indicate
that the IGP is dominated by Entisols, Inceptisols, Alfisols, Mollisols, and
Aridisols (Bhattacharyya 2004).
The IGP covers about 43.7 m ha area, which is approximately 13% of the total
geographical area of India, and produces nearly 50% of the country's foodgrains to
feed 40% of the total population of the country. It represents eight agro-ecological
regions (AERs) and 14 agro-ecological subregions (AESRs; Fig. 1). The Mughal
statistics confirm that much of the land in the IGP was under cultivation. This
involved traditional mixed cropping methods. This land-use pattern continued till
the middle of the 19th century. Over the last three–four decades the states of the
IGP have been successful in increasing their food grain production, chiefly rice
and wheat, by introducing high-input technologies to meet the demands of the
exponentially growing population. The soils under arid climates require addition
of organic matter and phosphorus but not potassium in the initial years of
cultivation (Velayutham et al. 2002). The strategies and measures adopted to
achieve this success included, among others, (i) the spread of high-yielding
varieties, (ii) expansion of irrigated area, (iii) increased use of fertilizers, (iv) plant
protection chemicals, (v) strengthening of marketing infrastructure, and (vi)
introduction of subsidies. The production of grains is, however, not uniform across
the IGP regions because of the spatial variation in land-resource characteristics
and socio-economy in the region. Also, these management interventions for
'money economy' have resulted in (i) widespread degradation, (ii) depletion of
natural resources, (iii) declining water level, (iv) loss in soil fertility, (v) nutrient
imbalance/deficiency, (vi) drainage congestion, and (vii) loss in soil carbon (Abrol
and Gupta 1998; Bhandari et al. 2002).
This paper reviews the trends in crop productivity vis-à-vis potential yields,
partial factor productivity, and soil fertility in the dominant rice-wheat cropping
system of the IGP. The paper also reviews the available information on how
efficient nutrient management strategies can increase crop productivity, add to
farmer's income, and improve overall agricultural sustainability.
Fig. 1 Location map of the Indo-Gangetic plains (IGP), India showing agro-
ecological sub regions
488 489

Rice-wheat yields vis-à-vis potential yields
Fig. 2
In most parts of the Indo-Gangetic plains of India where rice-wheat is currently
produced, climatic factors allow a potential yield between 12.0 and 19.5 t ha
(Aggarwal et al. 2000; Fig. 2).
Potential yields (t ha ) of rice (above) and wheat (below) in the Indo-
Gangetic plains of India.
-1
-1
However, average yields of rice + wheat in the Punjab, Haryana, Uttar
Pradesh, Bihar and West Bengal currently are 7.5, 6.1, 4.5, 3.3 and 4.4 t ha ,
respectively (Ladha et al. 2003; Table 1). Many farmers in north-west India now
harvest almost 16 t ha from the rice-wheat system, which indicates negligible
yield gaps with the current genetic technology. These yields on per day as well as
annual basis are comparable to the best in world considering the level of inputs
used. Research for such farmers or regions must now focus on increasing potential
yield and input use efficiency. Their study also showed that the yield potential is
higher in the northwestern regions compared to the eastern regions and is related to
temperatures and solar radiation during crop season. These results are based on the
mean weather data. Therefore, small deviations in these estimates are possible at
some locations due to climatic variability. These estimates can be used to calculate
the magnitude of current yield gap in different regions and the possibility of
bridging them to increase food production.
The variation in average yields across different states in IGP indicates that at
the regional level there still exist considerable yield gaps in most parts of the plains
(Shukla et al. 2004). In Uttar Pradesh and Bihar, there is a large untapped potential
for rice and wheat production. For example, Aggarwal et al. (2000) showed that
several districts of Uttar Pradesh had potential yields similar to Punjab and
Haryana. Yet in most cases farmers of this region were not able to attain higher
yields because of sub-optimal input use and land degradation status. Greater focus
on nutrient management in these regions in future will help sustain food security of
the country for a long time.
Thus, there is a need to determine optimal food production opportunities
considering the potential yields, land degradation status as well as socio-economic
status of the farmers in a region. The systems approach with its well-developed
-1
-1
Wheat yields Rice yields
(t ha ) % of wheat (t ha ) % of rice
area under area under
State 1990-93 1996-97 Irrigation 1990-93 1996-97 Irrigation
(overall) 1994-95 (overall)
W-R (fav) W-R (unfav) W-R (fav) W-R (unfav)
Punjab 3.69 4.24 96.7 4.84 5.10 99.1
Haryana 3.57 3.88 98.4 4.29 4.45 99.6
Uttar Pradesh 2.28 2.03 2.66 92.2 3.04 2.45 3.18 60.4
Bihar 1.79 1.71 2.17 87.8 2.29 1.58 2.14 39.8
West Bengal 2.00 2.39 72.5 2.68 3.27 24.6
Madhya Pradesh 1.04 1.76 67.3 1.20 1.75 23.1
-1 -1
a b c
d
Table 1 Wheat and rice yields under favourable and less favourable rice-wheat systems in India.
a
b
c
d
Center for Monitoring Indian Economy. India's Agricultural Sector, July, 1996.
Department of Economics and Statistics, Ministry of Agriculture, India. 1998. Agricultural Statistics at a glance.
Huke and Huke (1997) adjusted to an unhusked rice basis.
Fav = favorable, unfav = unfavorable.
490 491

analytical framework, databases and powerful simulation models can greatly
assist us in this endeavour.
Partial Factor Productivity (PFP) is the average productivity, and measured by
grain output divided by quantities of fertilizer. This is relatively easy to measure,
but its interpretation is not clear. Some workers have calculated trends in the
partial factor productivity of fertilizer (PFP-F) over time. Invariably, these
calculations show sharply declining trends, and they are cited as a cause for
concern. Long-term trends in PFP-F are highly misleading as indicators of
sustainability, however, because most of the decline in PFP-F is due to movement
along a fertilizer response function, as opposed to a downward shift of the
response function itself. The former is not a cause for concern, as it is merely a
reflection of the fact that farmers took some time to learn about optimal levels of
fertilizer usage. For example, survey data for a group of farmers in Central Luzon
in the Philippines show that it took 10 to 15 years after the introduction of modern
varieties for average N use in the wet season to increase from 10 to 60 kg ha
(Ladha et al. 2000). And the spread of higher levels of fertilizer use from one area
to another has also taken time, requiring the transmission of knowledge and the
construction of irrigation systems. Thus, as modern varieties spread and farmers
learned about fertilizer, fertilizer use increased sharply. Since nitrogen response
functions are highly concave, this large increase in fertilizer use has led to a sharp
decline in the PFP-F. But this decline in the PFP-F is of no concern and does not
imply a lack of sustainability in the system.
It, therefore, is highly preferable to calculate trends in Total Factor
Productivity (TFP) or use production functions to assess sustainability. The data
with which to measure TFP at the farm level are difficult to collect because they
require a large amount of detail, including the prices and quantities of all inputs
and outputs. Nevertheless, two recent studies by Ali and Byerlee (2000) and
Murgai (2000) have estimated trends in TFP in the rice-wheat systems of
Pakistan and India, respectively. Ali and Byerlee (2000) calculated TFP
growth rates on a cropping systems basis in Pakistan's Punjab from 1966 to
1994. They found positive TFP growth of 1.26% per annum for the entire
period for all systems considered together. Growth was positive in the
wheat-cotton and wheat-mungbean cropping systems, but was negative in the
rice-wheat system, especially in the early years of the Green Revolution (1966-
74). Perhaps surprisingly, TFP growth in the rice-wheat system was increasing
over time, and was +0.88% per year from 1985 to 1994. Relatively rapid TFP
growth in this latter period suggests that there is no imminent crisis of
sustainability.
Trends in Partial Factor Productivity
-1
Using district-level data from the Indian Punjab, Murgai (2000) found a
similar pattern of relatively slow productivity growth in the early years of the
Green Revolution. She argues that this pattern occurs because the technical
change induced by the Green Revolution was not Hicksneutral, that is, it
favored increased use of certain inputs relatively more than others. Under
such conditions, estimates of TFP growth are biased indicators of
technological progress. She found that TFP growth from 1985 to 1993 was
greater than 1.5% per annum in eight of nine districts in Punjab and Haryana.
The only exception was in Ferozepur, where wheat-cotton is the dominant
cropping system. According to Murgai (2000), the evidence in India's Punjab
“suggest(s) that fears about unchecked reductions in productivity growth are
exaggerated.”
It is important to remember that TFP does not directly measure environmental
degradation. In fact, Ali and Byerlee (2000) found substantial deterioration of soil
and water quality in all cropping systems in Pakistan's Punjab, including those
with positive TFP growth. It was most severe in the wheat-rice system, where it
reduced TFP growth by 0.44% per annum during the period 1971-94. If TFP
growth is positive in the presence of environmental degradation, this indicates that
technological progress and improved infrastructure have more than compensated
for the environmental degradation. Even if this has happened in the past, however,
this is no guarantee that it will continue in the future.
Research conducted by the International Plant Nutrition Institute (IPNI) in the IGP
over the last 20 years indicates a gradual but continuous nutrient mining from
soils. Early on in the IPNI program the focus was on the balance between N:P:K,
which was highlighted in a couple of publications focused on P and K in particular
(Tiwari 2001; Hasan 2002). Most obvious in these early years was the widening
ratio of N:P:K in the use of fertilizers, especially after the wide spread nature of P
and K deficiencies had been identified. Work with balancing P and K fertilisers
resulted in significant yield increases in many trials with multiple crops. In
addition, the use of K in many areas of India, increased yield potential and the
deficiency of other secondary and micronutrients in crops. This is a characteristic
response, which we have observed in countries around the world, where N and P
use forms the basis of crop fertilization. Introduction of K results in moderate to
significant yield increases, along with quality improvement in crops. However, it
also results in deficiencies of secondary and micronutrients becoming obvious in
field grown crops. In most of these instances, it is K, which is the most limiting
nutrient, and once corrected, it opens the door to further deficiencies in the
cropping system (Tandon 1997).
Trends in soil fertility
492 493

Efficient nutrient management strategies or approaches, and their impact
on crop productivity and soil fertility
The growing concern about poor soil health and declining factor productivity or
nutrient use efficiency has raised concern on the productive capacity of
agricultural systems in the IGP. Research on farmers' fields has revealed that there
is no compelling evidence of significant increases in fertilizer N efficiency in the
rice-wheat system during the past 30 years (Dobermann and Cassman 2002). The
average plant recovery efficiency of fertilizer N is still only about 30%
(Dobermann 2000). Major factors contributing to the low and declining crop
responses to fertilizer nutrients are (a) continuous nutrient mining due to
imbalanced nutrient use, which is leading to depletion of some of the major,
secondary, and micro nutrients like P, K, S, Zn, Mn, Fe and B and (b)
mismanagement of irrigation systems leading to serious soil quality degradation.
Furthermore, such low efficiency of resources and fertilizer inputs has impacted
the production costs with serious environmental consequences.
Recent research conducted in various countries including India (Dobermann
2002) has demonstrated limitations of the blanket fertilizer
recommendations practiced across Asia. Cassman et al. (1996) observed that
indigenous N supply of soils was variable among fields and seasons, and was not
related to soil organic matter content. On-farm research has clearly demonstrated
the existence of large field variability in terms of soil nutrient supply, nutrient use
efficiency and crop responses. Thus, it was hypothesized that future gains in
productivity and input use efficiency will require soil and crop management
technologies that are knowledge-intensive and are tailored to specific
characteristics of individual farms or fields to manage the variability that exists
between and within them (Tiwari 2007).
Three different nutrient management strategies for efficient nutrient
management are being applied today to mitigate the poor soil health in the IGP.
One is the soil-test based approach, the second is the plant-based approach, and the
third is the satellite imagery technique. In many of the field trials that IPNI has
conducted over the years in IGP, fertilizer rates were established based on the
concept of crop removal, with an adjustment for soil residual nutrients. While this
approach actually fits most production systems in India quite well, given that most
of the crop biomass is removed from harvested fields, the role that residual soil
nutrients play in meeting crop nutrient requirements becomes a challenge. If a soil
tests medium or low in most of the plant nutrients, then application of these
nutrients based on target yield crop removal is going to address these nutrient
demands. However, on soils where the soil nutrient analysis indicates a high level
of nutrient supply the issue of whether to apply the nutrient at removal rates
becomes a challenge to the researcher. The issue is one of balanced nutrition for
the crop. Addition of high rates of N, P, and K as part of the treatment actually
et al.
stimulates a deficiency of a secondary or micro-nutrient, which according to soil
testing was considered adequate. The best example of this is found with K use in
many production systems where soil testing shows that K levels should be more
than adequate to meet crop demand, but at what yield level? Many of the
recommendations, and soil test levels, used for K guidelines are associated with
much lower yields than are currently being targeted by growers. Research
conducted by IPNI in India clearly shows that many of these guidelines are
inadequate for current yield targets, and as a result a soil test K level once
considered adequate turns out to be insufficient to balance the high rates of N and P
being applied (Tiwari 2005). As a result, the best option is to apply all macro and
secondary nutrients, which are required to meet crop yield removal, and those
micronutrients which soil testing show to be marginal or deficient. This then
provides the environment for full yield expression in the absence of any nutrient
deficiency. And once this yield potential of a site has been determined, the next
step is to refine nutrient application rates with further field trials. The impact of
secondary and micronutrients was clearly shown in a report of research series of
experiments conducted by IPNI on site-specific nutrient management (SSNM) in
rice-rice and rice-wheat cropping systems in seven different locations in the IGP.
We identified yield-limiting nutrients at each location, and when these nutrients
were applied, crop productivity and farmers' profits increased when compared
with state-recommended and farmer practices (Table 2).
Effect of site-specific nutrient management (SSNM) on wheat
productivity (t ha ) and economic returns (Rs ha , in parenthesis) at
seven locations in India
The plant-based SSNM approach was evaluated comprehensively for
agronomic, economic, and environmental performance in 56 farmers' fields with
irrigated wheat and transplanted rice in Punjab (Khurana , 2007; Khurana
, 2008). The results of the study clearly brought out the positive impact of
SSNM on grain yields, and agronomic recovery, and physiological efficiencies of
N under rice-wheat cropping system in Punjab vis-à-vis farmer's practice. Also,
Table 2-1 -1
et al. et
al.
Site FP SR SSNM Increase over
SR [% (Rs ha )] FP [% (Rs ha )]
Ranchi 2.56 (1575) 4.15 (25,276) 4.06 (26,854) 10.0 (1,578) 58.5 (25,309)
Modipuram 4.77 (29,292) 4.90 (31,859) 6.43 (58,083) 31.0 (26,224) 46.5 (28,791)
Kanpur 4.72 (7,258) 5.45 (17,644) 6.00 (31,338) 10.1 (13,694) 27.1 (24,080)
Ludhiana 5.45 (27,772) 6.28 (39,105) 6.55 (46,219) 4.3 (7,114) 20.1 (18,447)
Sabour 3.92 (18,306) 4.97 (28,614) 5.82 (45,116) 17.1 (16,502) 48.7 (26,810)
Pantnagar 3.87 (7,828) 5.10 (14,276) 6.39 (19,426) 25.3 (5,150) 66.0 (11,598)
Palampur 2.64 (55,122) 3.76 (54,583) 3.87 (60,905) 3.0 (6,322) 46.5 (5.783)
FP= Farmers' practice
SR= State fertilizer recommendation
a b
a
b
Increase over-1 -1
494 495

the highly negative P and K balances observed in farmers' fields were reduced
using the SSNM approach indicating that SSNM promotes more balanced
fertilization than is followed by farmers.
Very recently, IPNI has successfully tried the Geographical Information
Systems (GIS) mapping approach to measure the spatial variability in nutrient
status (Sen , 2007) and used such maps as a site-specific fertilizer
recommendation tool to positively impact rice yields in farmers' fields (Sen ,
2008). This mapping is based on two factors: (a) nutrient content of agricultural
soils varies spatially due to variation in genesis, topography, cropping history,
fertilization history, and resource availability and (b) soil testing of all holdings to
estimate native fertility levels to ensure appropriate recommendation is a logical
step, but we do not have adequate infrastructure to accomplish this task. The
process of soil fertility mapping involved geo-referenced soil sampling and using
the soil analysis data in a GIS platform to develop surface maps of analyzed soil
parameters across the study area. The spatial variability maps created by
combining the location information of the sampling points (latitude/longitude)
and the analyzed soil parameter are capable of predicting soil parameter values of
un-sampled points. This is possible because the interpolation technique used in the
GIS platform creates a smooth surface map of the study area utilizing point
information (geographic location and corresponding soil parameters), where each
point on the map has a soil parameter value associated with it. The possibility of
using such maps as a fertilizer decision support tool to guide nutrient application in
a site-specific mode is being explored in several studies under IPNI research
initiative. Besides, delineating the fertility management zones within the study
area, these maps can give a clear visual indication of the changing fertility scenario
at a village level with time, which is important for nutrient management
planning (Sen et al., 2008). Besides the logistical and economic advantages
of implementing such a system, once established, the technique can create
an effective extension tool where field agents work more directly with
farmers. Thus, farmers become more aware of how their fields rank within the
landscape in terms of basic soil fertility, which in turn enables a system of more
rational use of fertilizer application. These tools are far from perfect, but they do
help to overcome many of the challenges associated with state wise
recommendations.
Crop productivity, factor productivity, and soil fertility are not uniform across the
IGP regions because of the spatial variation in land-resource characteristics and
socio-economy in the region.Also, the imbalanced fertilizer application in the IGP
has resulted in stagnating or declining yields, nutrient use efficiencies, and soil
health. To improve the situation, new and more efficient, knowledge-intensive,
et al.
et al.
Conclusions
and site-specific strategies of nutrient management need to be adapted and
applied.
Abrol IP, Gupta RK (1998) Indo-Gangetic Plains – Issues of changing land use.
LUCC Newsl No. 3 (March 1998). p. 67
Aggarwal PK, Talukdar KK, Mall RK (2000) Potential yields of rice-wheat
system in the Indo-Gangetic Plains of India. Rice-Wheat Consortium Paper
Series 10. New Delhi, India: Rice-Wheat Consortium for the Indo-Gangetic
Plains. pp 16
Ali M, Byerlee D (2000) Productivity growth and resource degradation in
Pakistan's Punjab. Policy Working Paper. World Bank, Washington, D.C.
BhandariAL, Ladha JK, Pathak H, PadreAT, Dawe D, Gupta RK (2002) Yield and
soil nutrient changes in a long-term rice–wheat rotation in India. Soil Sci Soc
Am J 66: 162– 170
Bhattacharyya T, Pal DK, Chandran P, Mandal C, Ray SK, Gupta RK, Gajbhiye
KS (2004) Managing soil carbon stocks in the Indo-Gangetic Plains, India.
Rice–Wheat Consortium for the Indo-Gangetic Plains, New Delhi, p. 44
Cassman KG, Dobermann A, Sta.Cruz PC, Gines HC, Samson MI, Descalsota JP
et al. (1996) Soil organic matter and the indigenous nitrogen supply of
intensive irrigated rice systems in the tropics. Plant Soil 182: 267-278
Dobermann A, Cassman KG (2002) Plant nutrient management for enhanced
productivity in intensive grain production systems of the United States and
Asia. Plant and Soil 247: 153-175
Dobermann A, Witt C, Dawe D, Abdulrachman S, Gines HC, Nagarajan R et al.
(2002) Site-specific nutrient management for intensive rice cropping systems
inAsia. Field Crops Res 74: 37-66
Hasan R (2002) Potassium status of soils in India. Better Crops 16(2): 3-5
Huke E, Huke R (1997) Rice area by type of culture: South, Southeast, and East
Asia—a revised and updated data base. Manila (Philippines): International
Rice Research Institute (IRRI)
Khurana HS, Phillips SB, Bijay-Singh, Alley MM, Dobermann A, Sidhu AS,
Yadvinder-Singh, Peng S (2008)Agronomic and economic evaluation of site-
specific nutrient management for irrigated wheat in northwest India. Nutr
CyclingAgroecosys 82: 15-31
Khurana HS, Phillips SB, Bijay-Singh, Dobermann A, Sidhu AS, Yadvinder-
Singh, Peng S (2007) Performance of site-specific nutrient management for
irrigated, transplanted rice in northwest India.Agron J 99(6): 1436-1447
Ladha JK, Fischer KS, Hossain M, Hobbs PR, Hardy B (ed) (2000) Improving the
productivity and sustainability of rice-wheat systems of the Indo-Gangetic
Plains: A synthesis of NARS-IRRI partnership research. p. 31. IRRI Disc
References
496 497

Proceedings IPI-OUAT-IPNI International Symposium (2009)
Dinesh K Benbi MS Brar
Department of Soils,
PunjabAgricultural University, Ludhiana 141 004, India.
e-mail: [email protected]; [email protected]
l
Evaluation of soil fertility and nutrient balances under
intensive agriculture
Dinesh K Benbi MS Brarl
l l l
l
Abstract
Keywords
Introduction
The food grain production in India, which was only 82 million tonnes
(mt) during 1960-61 before the green revolution period increased to 230 mt in
2007-08. The large increase in food grain production has resulted from the
increase in productivity with increased use of fertilizer, irrigation water, adoption
of new technology and increased intensity of cropping. The fertilizer consumption
has increased from 70,000 t in 1951-52 to about 23 mt in 2007-08. However, the
partial factor productivity (for fertilizer NPK) for food grain production has
declined from 48 in 1970-71 to 10 in 2007-08.Alarge part of this decrease could be
ascribed to gradual decline in the indigenous supply of soil nutrients leading to
macro- and micronutrient deficiencies due to inappropriate fertilizer application
and little recycling of organic sources. A number of fertilizer recommendation
strategies have been developed, each of which has its own merits and limitations
under different soil, crop and climatic conditions. While there is wide scale
adoption of blanket fertilizer recommendation and to a lesser extent of soil-test
based fertilizer adjustments, there is a need for site-specific nutrient management
for balanced fertilization. There is a need to monitor soil fertility and emerging
nutrient deficiencies and to adopt appropriate practices for alleviation. Soil test
methods for fertility evaluation and for formulating fertilizer recommendations
must be augmented with other chemical and biological fractions to achieve higher
fertilizer use efficiency (FUE).
Soil testing fertilizer use efficiency balanced fertilization nutrient
mining soil test interpretation
In India, the growth in food grain production during the last four decades, which
has been associated with the well known “Green Revolution”, saw the
development and adoption of new high yielding varieties of wheat, rice and other
Paper Ser No. 40, Makati City, Philippines
Ladha JK, Pathak H, Tirol-PadreA, Dawe D, Gupta RK (2003) Productivity trends
in intensive rice-wheat cropping systems in Asia. In: Ladha JK et al. (ed)
Improving the productivity and sustainability of rice-wheat systems: Issues
and Impacts. ASA Spec. Publ. 65. ASA, CSSA, and SSSA, Madison, WI. pp.
45–76
Murgai R (2000) The Green Revolution and the productivity paradox: Evidence
from the Indian Punjab. Working Paper.
Raiverman V, Kunte S, Mukherji A (1983) Basin geometry, Cenzoic
sedimentation and hydrocarbon prospects in northwestern Himalaya and
Indo-Gangetic Plains. Pet.Asia 6:67–97
Sastri VV, Venkatachala BS, Bhandari LL, Raju ATR, Datta AK (1971) Tectonic
framework and subsurface stratigraphy of the Ganga Basin. J Geol Soc India
12: 222–233
Sen P, Majumdar K, Sulewski G (2007) Spatial variability in available nutrient
status in an intensively cultivated village. Better Crops 91(2): 10-11
Sen P, Majumdar K, Sulewski G (2007) Importance of spatial nutrient variability
mapping to facilitate SSNM in small land holding systems. Indian J Fert
4(11): 43-50
Shankarnarayana HS (1982) Morphology, genesis and classification of soils of the
Indo-Gangetic Plains. In: Review of Soil Research in India, Part II, 12th Intl
Cong Soil Sci, New Delhi. pp. 467–473
Shankarnarayana HS, Sarma VAK (1982) Soils of India. In: Murthy RS et al. (ed)
Benchmark Soils of India, NBSS&LUP(ICAR), Nagpur. pp. 41–70
Shukla AK, Singh VK, Dwivedi BS, Sharma SK, Tiwari KN (2004) Site-specific
nutrient management for maximum economic yield of the rice-wheat
cropping system. Better Crops 88(4), 18-21
Tandon HLS (1997) Experiences with balanced fertilization in India. Better Crops
11(1): 20-21
Tiwari KN (2001) Phosphorus needs of Indian soils and crops. Better Crops 15(2):
6-10
Tiwari KN (2005) Diagnosing potassium deficiency and maximizing fruit crop
productivity. Better Crops 89(4): 29-31
Tiwari KN (2007) Breaking yield barriers and stagnation through site-specific
nutrient management. J Indian Soc Soil Sci : 444-454
Velayutham M, Pal DK, Bhattacharyya T, Srivastava P (2002) Soils of the Indo-
Gangetic Plains, India – the historical perspective. In: Abrol Y P, Sangwan S,
Tiwari M (ed) Land Use – Historical Perspectives – Focus on Indo-Gangetic
Plains,Allied, New Delhi. pp. 61–70
498 499
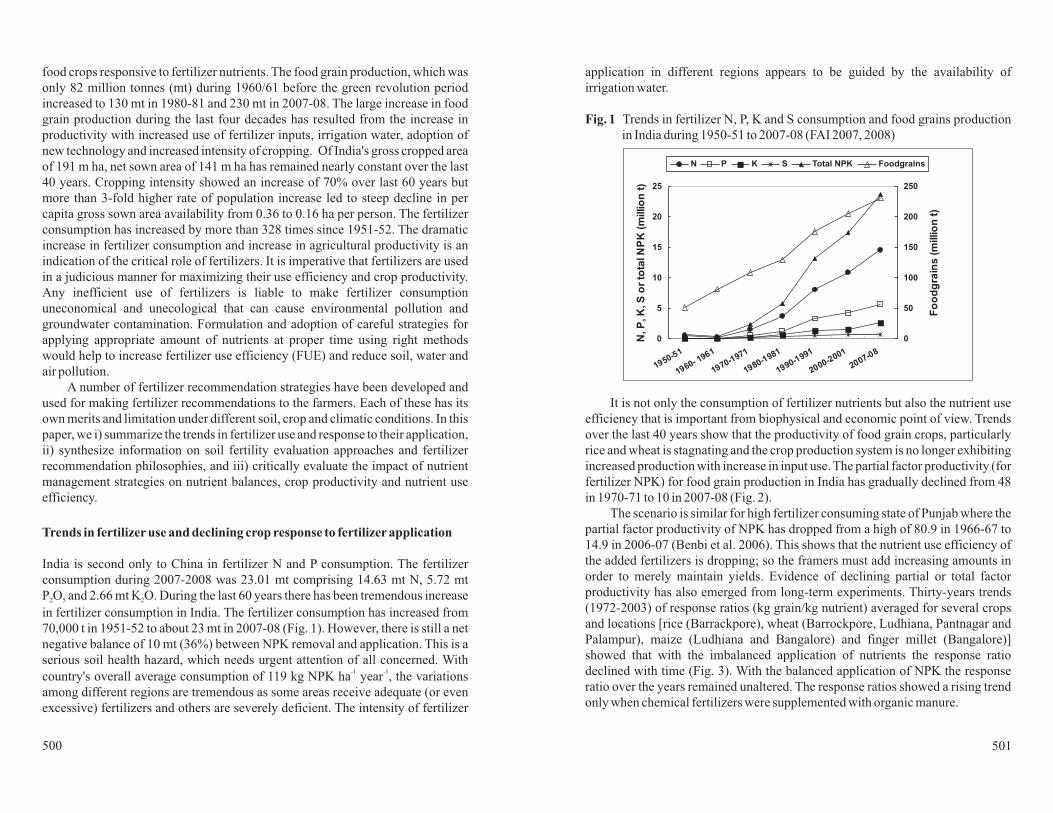
food crops responsive to fertilizer nutrients. The food grain production, which was
only 82 million tonnes (mt) during 1960/61 before the green revolution period
increased to 130 mt in 1980-81 and 230 mt in 2007-08. The large increase in food
grain production during the last four decades has resulted from the increase in
productivity with increased use of fertilizer inputs, irrigation water, adoption of
new technology and increased intensity of cropping. Of India's gross cropped area
of 191 m ha, net sown area of 141 m ha has remained nearly constant over the last
40 years. Cropping intensity showed an increase of 70% over last 60 years but
more than 3-fold higher rate of population increase led to steep decline in per
capita gross sown area availability from 0.36 to 0.16 ha per person. The fertilizer
consumption has increased by more than 328 times since 1951-52. The dramatic
increase in fertilizer consumption and increase in agricultural productivity is an
indication of the critical role of fertilizers. It is imperative that fertilizers are used
in a judicious manner for maximizing their use efficiency and crop productivity.
Any inefficient use of fertilizers is liable to make fertilizer consumption
uneconomical and unecological that can cause environmental pollution and
groundwater contamination. Formulation and adoption of careful strategies for
applying appropriate amount of nutrients at proper time using right methods
would help to increase fertilizer use efficiency (FUE) and reduce soil, water and
air pollution.
A number of fertilizer recommendation strategies have been developed and
used for making fertilizer recommendations to the farmers. Each of these has its
own merits and limitation under different soil, crop and climatic conditions. In this
paper, we i) summarize the trends in fertilizer use and response to their application,
ii) synthesize information on soil fertility evaluation approaches and fertilizer
recommendation philosophies, and iii) critically evaluate the impact of nutrient
management strategies on nutrient balances, crop productivity and nutrient use
efficiency.
India is second only to China in fertilizer N and P consumption. The fertilizer
consumption during 2007-2008 was 23.01 mt comprising 14.63 mt N, 5.72 mt
P O and 2.66 mt K O. During the last 60 years there has been tremendous increase
in fertilizer consumption in India. The fertilizer consumption has increased from
70,000 t in 1951-52 to about 23 mt in 2007-08 (Fig. 1). However, there is still a net
negative balance of 10 mt (36%) between NPK removal and application. This is a
serious soil health hazard, which needs urgent attention of all concerned. With
country's overall average consumption of 119 kg NPK ha year , the variations
among different regions are tremendous as some areas receive adequate (or even
excessive) fertilizers and others are severely deficient. The intensity of fertilizer
Trends in fertilizer use and declining crop response to fertilizer application
2 5 2
-1 -1
application in different regions appears to be guided by the availability of
irrigation water.
Trends in fertilizer N, P, K and S consumption and food grains production
in India during 1950-51 to 2007-08 (FAI 2007, 2008)
It is not only the consumption of fertilizer nutrients but also the nutrient use
efficiency that is important from biophysical and economic point of view. Trends
over the last 40 years show that the productivity of food grain crops, particularly
rice and wheat is stagnating and the crop production system is no longer exhibiting
increased production with increase in input use. The partial factor productivity (for
fertilizer NPK) for food grain production in India has gradually declined from 48
in 1970-71 to 10 in 2007-08 (Fig. 2).
The scenario is similar for high fertilizer consuming state of Punjab where the
partial factor productivity of NPK has dropped from a high of 80.9 in 1966-67 to
14.9 in 2006-07 (Benbi et al. 2006). This shows that the nutrient use efficiency of
the added fertilizers is dropping; so the framers must add increasing amounts in
order to merely maintain yields. Evidence of declining partial or total factor
productivity has also emerged from long-term experiments. Thirty-years trends
(1972-2003) of response ratios (kg grain/kg nutrient) averaged for several crops
and locations [rice (Barrackpore), wheat (Barrockpore, Ludhiana, Pantnagar and
Palampur), maize (Ludhiana and Bangalore) and finger millet (Bangalore)]
showed that with the imbalanced application of nutrients the response ratio
declined with time (Fig. 3). With the balanced application of NPK the response
ratio over the years remained unaltered. The response ratios showed a rising trend
only when chemical fertilizers were supplemented with organic manure.
Fig. 1
0
5
10
15
20
25
1950-51
1960- 1961
1970-1971
1980-1981
1990-1991
2000-2001
2007-08
N,P
,K
,S
or
tota
lN
PK
(millio
nt)
0
50
100
150
200
250
Fo
od
gra
ins
(millio
nt)
N P K S Total NPK Foodgrains
500 501

Fig. 3 Nutrient response ratios (kg grain kg nutrient) in cereals. Drawn from
long-term fertilizer experiments data averaged over 1972-2003 and several
locations of rice, wheat, maize and finger millet (Samra 2006)
There could be many reasons for the decline in the crop responses to applied
fertilizer nutrients. First, it is natural, since the law of diminishing returns will
operate and show its effect with each successive increase in fertilizer nutrient dose.
But a large part of this decrease could also be ascribed to gradual decline in the
indigenous supply of soil nutrients leading to macro- and micronutrient
imbalances due to inappropriate fertilizer application and little recycling of
organic sources. However, results of a recent study showed that with balanced and
adequate application of fertilizer nutrients there is no decline in soil fertility
-1
(Benbi and Brar 2009). The results from long-term fertilizer experiments show
that when S application was omitted from fertilization schedule, the deficiency of
S and the drop in the response ratios became evident in maize and rice at different
sites in India (Fig. 4). Similarly, the omission of Zn from the fertilization schedule
led to lowering of average response ratios of crops at different locations. These
observations emphasize the need to monitor soil fertility status and emerging
nutrient deficiencies and to adopt appropriate management practices for improved
nutrient use efficiency.
Response ratio (kg grain kg nutrient) of sulphur in a) maize at Palampur
and b) Rice at Barrackpore. Data from long-term fertilizer experiments
(Samra 2006)
Fig. 4-1
Fig. 2 Partial factor productivity of fertilizer NPK for food grains production in
India during the years 1960-61 to 2007-08. (FAI 2007, 2008)
0
10
20
30
40
50
1970-71 1980-81 1990-91 1999-2000 2007-08
kg
foo
dg
rain
s/
kg
nu
trie
nts
100% NPK, R2
= 8E-07
100% NP R2
= 0.7109
100% N, R2
= 0.7372
100% NPK+FYM, R2
= 0.1884
150% NPK, R2
= 0.0661
0
4
8
12
16
20
1970 1980 1990 2000 2010
Re
sp
on
se
rati
o
a) Maize at Palampur
NPK-S
NPK
0
4
8
12
16
20
1970 1975 1980 1985 1990 1995 2000 2005
Re
sp
on
se
rati
o
NPK NPK-S
NPK-S
NPK
0
4
8
12
16
20
1970 1975 1980 1985 1990 1995 2000 2005
Resp
on
se
rati
o
NPK NPK-S
b) Rice at Barrackpore
502 503

Soil fertility evaluation
A proper evaluation of the fertility of a soil is the key to achieve efficient fertilizer
use and take appropriate measures to alleviate constraints to productivity. Soil
testing and plant analysis are useful tools for soil fertility evaluation and for
devising nutrient management practices.
Soil testing
The aim of soil testing is to estimate the nutrient–supplying power of a soil. The
methods for evaluating the soil fertility may be biological or chemical. Since the
biological methods are time consuming and do not fit into routine batch process of
the soil testing laboratories, chemical methods are generally followed. The
chemical methods for evaluating the soil fertility involve analyzing a soil sample
for plant available fraction of an essential plant nutrient(s), which is(are) expected
to be in relatively short supply and whose deficiency can be corrected by
appropriate additions of suitable fertilizer. The choice of a chemical method to
estimate nutrient availability in soils is based on the relationship between crop
yield or crop response and the soil test values. There is always some theoretical
basis for the choice of a method. Soil test results are used to classify soils into low,
medium and high categories. Such a classification is based on soil test crop
response relationship studies. Obviously, application of a nutrient in a soil testing
low in that particular nutrient will result in greater increase in crop yield as
compared to a soil testing medium in its nutrient supplying capacity.
Plant analysis for diagnosing nutrient deficiencies
Although plant analysis is not a direct evaluation of soil fertility, yet it is a valuable
supplement to soil testing. Plant analysis is useful in confirming nutrient
deficiencies, toxicities or imbalances, identifying hidden hunger, and determining
the availability of nutrients. Plant analysis can be particularly useful in
determining the bio-availability of nutrients in situations when adequate level of a
nutrient may be present in the soil, but its availability is constrained due to
problems such as soil moisture conditions and inadequate amounts of other
nutrients. Plant analysis includes: (i) Tissue tests made on fresh tissue in the field,
and (ii) the complete chemical analyses conducted in the laboratory. Rapid tests,
generally conducted for N, P and K, on the sap from ruptured cells, are semi-
quantitative and predict nutrient deficiencies on the spot. For most diagnostic
purposes, plant analyses are interpreted on the basis of critical value approach that
uses tissue nutrient concentration calibrated to coincide with 90 or 95% of the
maximum yield; below this value the plants are considered deficient and above
that value sufficient (Munson and Nelson 1990). For example, S content in plant
foliage during active growth is a quite good parameter to ascertain S sufficiency.
Several studies have revealed that the S content below 0.2% in the plant tissue at
the pre-flowering stage of was the threshold level, below which the crop
yield and quality were adversely affected (Aulakh 2003). For most crops, there is a
sufficiency range of nutrient composition over which yield will be maximized
rather than a single value.
The major disadvantage of critical value and sufficiency range approach is
that it does not consider nutrient balances and interactions and require different
critical values for different tissue ages. Nutrient ratios are considered as a better
tool as it takes care of nutrient interrelationships. To further enhance the reliability
of plant analysis, the Diagnosis and Recommendation Integrated System (DRIS),
which considers nutrient concentration ratios, rather than individual elemental
concentration, has been proposed (Walworth and Sumner 1987). The DRIS
approach measures the relative balance between nutrients by means of index
values with negative values indicating insufficiencies and vice versa. The DRIS
approach can also be employed to compute low, sufficient, high, and excessive/
toxic ranges for nutrients (Bhargava 2002). This approach has been used for
diagnosing nutrient requirement of several fruit plants (Hundal and Arora 1995
and 2001; Hundal et al. 2007) in Indian Punjab, but the results have neither been
validated nor used for advisory purposes.
Several approaches have been used to formulate nutrient management practices
for different crops. These include (i) Generalized fertilizer recommendations
(GRD), (ii) Soil test based fertilizer recommendations (STRD), (iii) Critical value
or sufficiency approach, (iv) Build-up and maintenance concept, v) Fertilizer
recommendations for targeted yield of crops or site-specific fertilizer
recommendations (vi) Building and maintenance concept, (vii) basic cation
saturation ratios, and (viii) Response surfaces and mechanistic modelling. Both
the sufficiency range of available nutrients and basic cation saturation concepts
recognise that a fraction of a plant nutrient measured by soil tests is available to
plants and its level may range from low to high. The sufficiency approach is based
on law of diminishing returns where increase in crop yield per unit of available
nutrient decreases as the level of available nutrient approaches sufficiency. The
concept of basic cation ratios is based on the premise that for most crops there is a
best ratio of basic cations on the soil cation exchange capacity. Any given
concept seems to work well under specific conditions. Out of these concepts, the
following approaches for formulating fertilizer recommendations are most
commonly used.
Brassica
Soil test interpretation and fertilizer recommendations
504 505
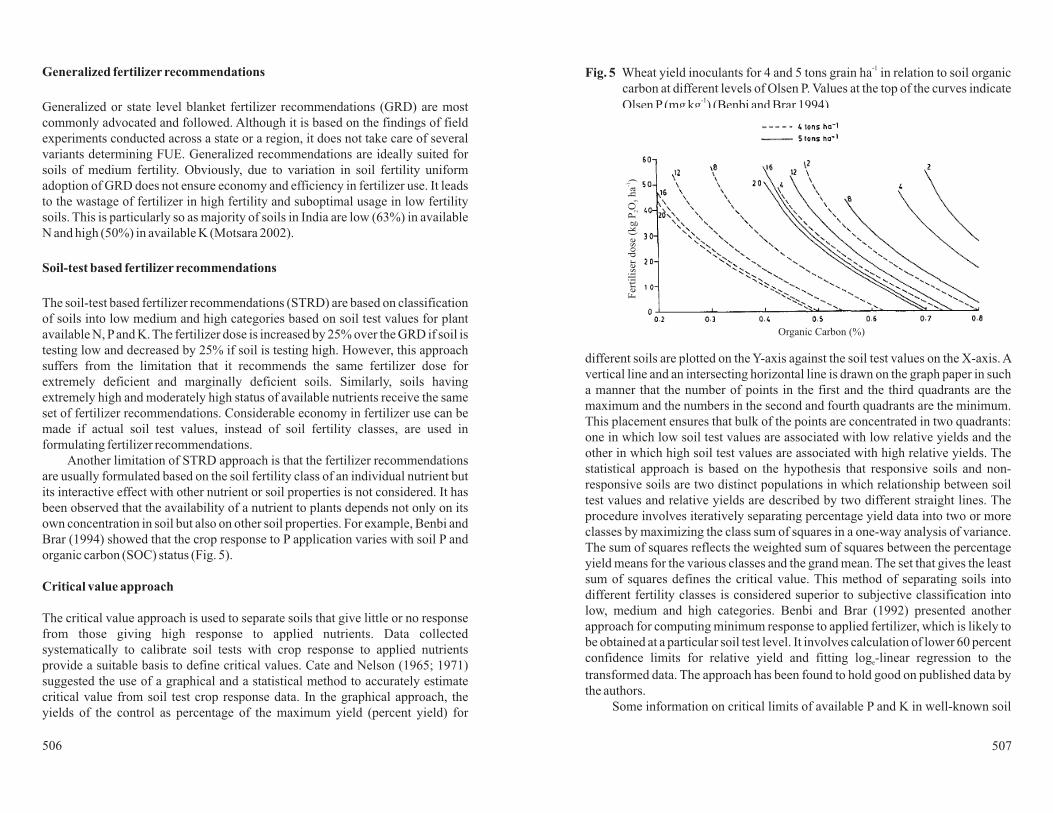
Generalized fertilizer recommendations
Soil-test based fertilizer recommendations
Critical value approach
Generalized or state level blanket fertilizer recommendations (GRD) are most
commonly advocated and followed. Although it is based on the findings of field
experiments conducted across a state or a region, it does not take care of several
variants determining FUE. Generalized recommendations are ideally suited for
soils of medium fertility. Obviously, due to variation in soil fertility uniform
adoption of GRD does not ensure economy and efficiency in fertilizer use. It leads
to the wastage of fertilizer in high fertility and suboptimal usage in low fertility
soils. This is particularly so as majority of soils in India are low (63%) in available
N and high (50%) in available K (Motsara 2002).
The soil-test based fertilizer recommendations (STRD) are based on classification
of soils into low medium and high categories based on soil test values for plant
available N, Pand K. The fertilizer dose is increased by 25% over the GRD if soil is
testing low and decreased by 25% if soil is testing high. However, this approach
suffers from the limitation that it recommends the same fertilizer dose for
extremely deficient and marginally deficient soils. Similarly, soils having
extremely high and moderately high status of available nutrients receive the same
set of fertilizer recommendations. Considerable economy in fertilizer use can be
made if actual soil test values, instead of soil fertility classes, are used in
formulating fertilizer recommendations.
Another limitation of STRD approach is that the fertilizer recommendations
are usually formulated based on the soil fertility class of an individual nutrient but
its interactive effect with other nutrient or soil properties is not considered. It has
been observed that the availability of a nutrient to plants depends not only on its
own concentration in soil but also on other soil properties. For example, Benbi and
Brar (1994) showed that the crop response to P application varies with soil P and
organic carbon (SOC) status (Fig. 5).
The critical value approach is used to separate soils that give little or no response
from those giving high response to applied nutrients. Data collected
systematically to calibrate soil tests with crop response to applied nutrients
provide a suitable basis to define critical values. Cate and Nelson (1965; 1971)
suggested the use of a graphical and a statistical method to accurately estimate
critical value from soil test crop response data. In the graphical approach, the
yields of the control as percentage of the maximum yield (percent yield) for
different soils are plotted on the Y-axis against the soil test values on the X-axis. A
vertical line and an intersecting horizontal line is drawn on the graph paper in such
a manner that the number of points in the first and the third quadrants are the
maximum and the numbers in the second and fourth quadrants are the minimum.
This placement ensures that bulk of the points are concentrated in two quadrants:
one in which low soil test values are associated with low relative yields and the
other in which high soil test values are associated with high relative yields. The
statistical approach is based on the hypothesis that responsive soils and non-
responsive soils are two distinct populations in which relationship between soil
test values and relative yields are described by two different straight lines. The
procedure involves iteratively separating percentage yield data into two or more
classes by maximizing the class sum of squares in a one-way analysis of variance.
The sum of squares reflects the weighted sum of squares between the percentage
yield means for the various classes and the grand mean. The set that gives the least
sum of squares defines the critical value. This method of separating soils into
different fertility classes is considered superior to subjective classification into
low, medium and high categories. Benbi and Brar (1992) presented another
approach for computing minimum response to applied fertilizer, which is likely to
be obtained at a particular soil test level. It involves calculation of lower 60 percent
confidence limits for relative yield and fitting log -linear regression to the
transformed data. The approach has been found to hold good on published data by
the authors.
Some information on critical limits of available P and K in well-known soil
e
Fig. 5 Wheat yield inoculants for 4 and 5 tons grain ha in relation to soil organic
carbon at different levels of Olsen P. Values at the top of the curves indicate
Olsen P(mg kg ) (Benbi and Brar 1994)
-1
-1
Organic Carbon (%)
Fert
ilis
er
dose (
kg P
O ha
)2
5
-1
506 507

types of India for different crops are presented in tables 1 and 2, respectively.As is
apparent from the tables, the critical value of available nutrient in soil varies with
soil type and the crop grown. For example, the critical limit for available
(NaHCO -extractable) P in soil for wheat ranges from 3.3 mg kg in alluvial soils
to 16.3 mg kg in black soils (Table 1).
Critical limits of available P in soils for different crops and soils based on
data from different regions of India (Adapted from Subba-Rao and
Reddy 2006)
Information compiled from different studies shows that the critical value of
available (NH OAc-extractable) potassium ranges from 47 mg K kg soil for
maize in Haplustalfs to 335 mg kg soil for sorghum in Vertisols (Table 2).
Obviously, the potassium availability depends on the amount of exchangeable K
and soil mineralogy. Exchangeable K is generally more in the Vertisols and Vertic
type soils and in the fine-textured alluvial soils than in the red and latertic soils,
acidic alluvial soils with kaolinite as dominant clay mineral, and coarse-textured
alluvial soils. Most alluvial soils have illite as the dominant mineral in their clay
fraction and quartz- feldsapr, quartz-mica or quartz alone as the dominant mineral
in their silt fraction. All black soils have smectite as the dominant clay mineral
while quartz alone is the dominant mineral in the silt fraction in several soils and
feldspar in others. All red, laterite and acid-sulphate soils have kaolinite as the
dominant clay mineral and generally quartz as the dominant mineral in the silt
fraction. Because of appreciable contribution of non-exchangeable K towards soil
3
4
-1
-1
-1
-1
Table 1
K supply it is relatively difficult to establish critical limits for available potassium
in soils. Studies on soil test calibration based on non-exchangeable K are limited.
Categorization of soils based on non-exchangeable K can be used as a measure of
their relative K supplying capacity to soil.
Critical limits of available K (NH OAc extractable) in soils for different
crops based on data from different regions of India (Adapted from
Subba-Rao and Reddy 2006)
Site-specific nutrient management (SSNM) is an approach for feeding crops with
nutrients as and when needed. The application and management of nutrients are
dynamically adjusted to crop needs of the location and season. The SSNM
approach aims to increase farmer's profits through increased yield of crops, site
and season-specific application of nutrients (primarily N, Pand K) and optimal use
of existing indigenous nutrient sources such as crop residues and organic manures.
In the SSNM approach, advocated by International Rice Research Institute
(IRRI), N application to rice is made using leaf colour chart (LCC) or Chlorophyll
meter. Nutrient omission plot technique is used to determine the soil supply of P
and K (Dobermann et al. 2002).
Another approach involving site–specific nutrient management, known as
“target yield concept”, is being advocated in India since late 1960s (Ramamoorthy
et al. 1967). The approach is unique in the sense that it not only prescribes the
Table 2
Site-specific nutrient management
4
Crop Soil type Critical limit
(mg P kg soil)
Rice Alluvial 10.6-11.8
Red 2.9-3.5
Black 5.8-6.5
Laterite 13.6
Wheat Alluvial 3.3-7.9
Black 9.4-16.3
Pearlmillet Alluvial 4.8
Black 7.7
Maize Alluvial 12.3
Groundnut Black 6.5
Alluvial 16.6
Raya Alluvial 5.1-6.5
Cotton Alluvial 11.9
Sugarcane Alluvial 4.8
Potato Alluvial 8.6-11.5
-1
Crop Soil Critical limit
(mg K kg soil)
Rice Medium black 100
Red soils 75
Alluvial 190
Calcareous 58
Laterite 76-87
Wheat Calcareous 60
Alluvial 95-100
Maize Calcareous 81
Haplustalfs 47
Sorghum Typic Chromusterts 335
Pearl Millet Alluvial 160
Medium black 95
Black calcareous 137
Cotton Alluvial 50
Groundnut Black calcareous 65
-1
508 509

optimum dose of nutrient based on soil fertility status but also predicts the level of
yield that a farmer can expect. The targets can be chosen based on farmer's
resources. Considering the crop yield to be a continuous function of plant nutrient
supply in the growth medium, calibrations are obtained for different levels of soil
fertility (created in adjacent field plots with addition of different amounts of
fertilizers to the preceding crop, in the cropping sequence) with a given crop in a
soil. The procedure of creating different levels of fertility artificially in adjacent
plots is adopted to ensure homogeneity in soil management and weather, whose
diversity in experiments performed at different locations and in different seasons
usually leads to poor correlations. From such experiments, fertilizer dose to attain
a specified yield target is obtained [Equation 4] by computing three basic
parameters, namely (i) NR- nutrient requirement per unit of economic yield,
[Equation 1] (ii) CS- contribution from soil available pool [Equation 2] and (iii)
CF- fractional recovery of applied fertilizer nutrient [Equation 3].
NR (kg nutrient /Mg grain) = X / GY (1)
CS = X / STV (2)
CF = (X – (STV x CS))/A (3)
Fertilizer dose (kg ha ) = (4)
CF
Where X and X represent amount (in kg) of nutrient in the grain and straw of
fertilized and unfertilized crop, respectively; GY is the grain yield (in megagram,
Mg), STV represents soil test value (in kg ha ) with subscripts and indicating
soil test value of fertilized and unfertilized plots, respectively; A is the amount of
fertilizer nutrient applied (in kg ha ); T is the target grain yield (in Mg ha ). The
approach has also been applied for integrated nutrient management where
inorganic fertilizers are applied together with organic sources (Benbi et al. 2007).
Under All India Coordinated Research project on soil test crop response
correlation (STCR), fertilizer adjustment equations have been developed for a
number of crops in the country (Subba Rao and Srivastava 2001; Muralidharudu et
al. 2007). Figure 6 shows the typical soil-test based fertilizer recommendations for
targeted yield of rice (7 Mg ha ) and wheat (5.5 Mg ha ) grown in alluvial soils of
Punjab (Benbi et al. 2007). Obviously, considerable adjustment in fertilizer
amount can be made if soil test values are taken into consideration. It results in
higher economic benefit and FUE over GRD.
One of the major difficulties with the approach is the precise estimate of
contribution of nutrient from soil available pool (CS) (Benbi and Chand 2007).
Poor estimate of CS is most often the reason for imprecise calculation of fertilizer
dose for a targeted yield. The percent contribution from the soil is influenced by
soil type, texture, rooting depth and nutrient release characteristics of the soil.
f
0 0
f f f
f 0
f
-1
-1
-1 -1
-1 -1
(NR*T) – (CS x STV)
f 0
Fig. 6 Soil test based fertilizer recommendations for targeted yield of rice (7 t ha )
and wheat (5.5 t ha ) grown in alluvial soils of Punjab (Benbi et al. 2007)
-1
-1
Since the percent nutrient contribution from soil is obtained by dividing the
nutrient uptake in control plots by soil test value (see equation 4), the approach is
heavily biased towards high fertility of native and applied nutrients (Milap-Chand
et al. 2004). Low CS values, especially at high P soil tests, underestimate P supply
and provide exaggerated fertilizer Prequirements.
The approach is a step ahead of STRD and critical value approach as fertilizer
recommendations to crops are made on the basis of the actual amount of nutrients
that are likely to be made available to crops during period of growth. This
approach takes into account the nutrient requirements of the crop, nutrient
supplying power of the soil and the percent recovery of applied fertilizer nutrients.
In essence STCR approach integrates both soil and plant aspects. The approach
has been validated in several follow-up experiments at farmer's fields
(Muralidharudu et al. 2007).
174161
136123
11198
8573
6048
35
0
50
100
150
200
60 80 120 140 160 180 200 220 240 260 280
203188
173158
143128
11398
8368
0
40
80
120
160
200
240
80 120 160 200 240 280 320 360 400 440
91
74
57
41
24
8
0
20
40
60
80
100
4 6 8 10 12 14
115
100
85
70
55
40
25
11
0
20
40
60
80
100
120
140
10 15 20 25 30 35 40 45
54
47
40
33
26
19
12
5
0
10
20
30
40
50
60
100 105 110 115 120 125 130 135
77
63
49
35
21
7
0
10
20
30
40
50
60
70
80
90
10 20 30 40 50 60
Fert
iliz
er
do
se (
kg
N h
a)
-1F
ert
iliz
er
do
se (
kg
PO
ha
)2
5
-1F
ert
iliz
er
do
se (
kg
KO
ha
)2
-1
Fert
iliz
er
do
se (
kg
N h
a)
-1F
ert
iliz
er
do
se (
kg
PO
ha
)2
5
-1F
ert
iliz
er
do
se (
kg
KO
ha
)2
-1
Available N (kg ha )-1
Available N (kg ha )-1
Available P (kg ha )-1
Available P (kg ha )-1
Available K (kg ha )-1
Available K (kg ha )-1
510 511

Fig.7 Annual balance of potassium (kg K ha yr ) in long term rice-wheat
cropping system at Ludhiana (India) during 1988 through 2000
(Yadvinder-Singh et al. 2004)
-1 -1
Imbalanced fertilization and nutrient balances
It has become increasingly clear that crops should receive nutrients in adequate
and balanced amounts for sustainable crop productivity, optimum nutrient-use
efficiencies, and reduced environmental risks. The present NPK use ratio of
6.8:2.8:1 in India is typically unfavourable to K when compared to the generally
proclaimed ideal ratio of 4:2:1. Imbalanced use of NPK, resulting in the mining
(NPK removed by crops- NPK applied as fertilizer or manure) of native soil
nutrients, is considered to be the main cause for declining crop response ratios. In
addition to NPK, soils are also getting depleted of secondary and micronutrients
especially sulphur and zinc; about 46 % of the Indian soils are reported to be
deficient in these two nutrients. This calls for increased focus on application and
management of S and Zn in Indian soils.
Balanced nutrient use does not mean use of N, P and K in a fixed ratio in all
situations. Balanced fertilization means having all plant nutrients available to the
plants in adequate, but not toxic or imbalanced amounts. The ratio of 4:2:1 could
be satisfactory for cereals but for other crops like legumes etc. the ratio could vary
from 1:2:1, 1:1:1 to 2:1:2 (Aulakh and Malhi 2004). Balanced nutrient use
involves both rate and ratio. For example, recommended rates of 120 kg N, 60 kg
P O and 30 kg K O ha for wheat in most of the states in India provide a balanced
ratio of 4:2:1. If a farmer applies 80-40-20, the ratio is still 4:2:1, but rate applied is
less and hence imbalanced application.
As compared to N and P, the use of K in India is very small (see Fig. 1). But the
removal of K by crops is 19 and 150% greater than that of N and P, respectively.
Farmers generally do not apply K to cereals and prefer to apply to cash crops.
Tandon and Sekhon (1988) found negative K balances in wheat and rice
amounting to 61 and 141 kg K O ha , whereas fertilization of potato yielded a
positive balance of 87 kg K O ha . Negative balance indicates that mining of soil K
has progressively increased. Results of K indexing in soils over a period of 10
years (Sekhon 1999) and long-term fertilizer experiments (Brar and Brar 2002)
showed a substantial decline in exchangeable and non-exchangeable K with time.
The north Indian state of Punjab having highest productivity of wheat (4.52 t ha )
and paddy (5.80 t ha ), shows the greatest imbalanced use of NPK (33.7:9.2:1.0)
and substantial mining of K from soils. Data compiled by Brar (2004) show that
the net negative balance of K in Punjab has increased from 0.159 mt in 1960-61 to
0.806 mt in 1994-95. Because of increase in K consumption during late 1990s, the
negative balance slightly declined (0.68 m t) in 2002-03. Data from a long-term
fertilizer experiment on maize-wheat cropping system showed that after 13 cycles
cropping the exchangeable and non-exchangeable forms of K in soil declined in
the fields that did not receive potassium fertilizer. There was substantial release of
K from the non-exchangeable form (Table 3).
2 5 2
2
2
-1
-1
-1
-1
-1
Table 3 Potassium removed by 13 crop cycles (maize-wheat) and its effect on
exchangeable- and non-exchangeable K in soils (1970-71 through 1983-
84) (Adapted from Singh and Brar 1986)
In the absence of K application, there was a net negative balance of 136 kg
K O ha yr indicating substantial contribution from non-exchangeable forms.
Even with the application of 83 kg K O ha yr , the removal of K was 179 kg K O
ha yr and about 100 kg K O ha yr was contributed from the soil-reserve
sources. After considering total removal of K, amount applied and changes in
exchangeable and non-exchangeable forms of K, 149-210 kg K ha was
unaccounted for, which was contributed by the ground water used for irrigation
(Singh and Brar 1986). Similarly, under intensive rice-wheat cropping system
receiving 158 kg K O ha yr (50+100+8 kg K O ha yr from fertilizer, irrigation
water and rain/seed, respectively) , a net negative K balance of 150 kg K O ha yr
has been reported (Fig. 7). Even after considering the contribution of rice and
wheat straw incorporation, (= 60 kg K O ha yr ), the net negative balance is 90 kg
2
2 2
2
2 2
2
2
-1 -1
-1 -1
-1 -1 -1 -1
-1
-1 -1 -1 -1
-1 -1
-1 -1
Treatment Total K
removed
(kg ha ) (kg ha )
(kg ha )
a b c d e = c+d f = a+-c a-e
Control 803 0 -51 -597 -648 752 155
N 1392 0 -72 -1110 -1182 1320 210
N P 1766 0 -78 -1483 -1561 1689 205
N P K 2323 1097 +6 -1101 -1095 1250 149
E K= change in exchangeable K, NE-K= change in non-exchangeable K
Total K E-K NE-K Total E-K Release Unaccounted
applied (kg ha ) (kg ha ) + NE- K from NE K
(kg ha ) - K (kg ha )
D D
D
-1 -1
-1 -1 -1
-1
-1
100
100 22
100 22 41
D
512 513
157
304
-147
219
309
-90
-200
-100
0
100
200
300
400
1 2 3 4 5 6
Without in corporation of straw With in corporation of straw
Kg K
ha
yr
-1-1
Input Output
Balance
Input Output
Balance

K O ha yr (Yadvinder-Singh et al. 2004). At farmers' fields, the negative K
balance could be still higher as the farmers usually do not apply K fertilizers to
wheat and rice. Thus the non-exchangeable K will be depleted at a faster rate and
will ultimately influence the K-mineralogy of soils.
Imbalanced application of nutrients does not result in realizing potential
yields and results in low FUE. This also has environmental implications as low
nutrient use efficiencies may lead to the nutrients' accumulation, loss through
leaching and gases causing environmental pollution (Aulakh and Malhi 2004).
Results of a long-term experiment showed a significant role of balanced
application of P and K along with N in reducing NO -N accumulation in the soil
profile, which would otherwise be prone to losses through leaching and
denitrification (Benbi et al. 1991). Similarly, N removal and apparent N recovery
by both maize and wheat was directly related to the balanced application of N, P
and K fertilizers.Averaged over 22 years of data, application of N alone resulted in
a recovery of 17.1% in maize and 31.7% in wheat. The application of P and K
along with N almost doubled (32.8% in maize and 64.7% in wheat) the apparent N
recovery in the crops (Benbi and Biswas 1997). However, the improvement in
FUE with balanced application of NPK depends on crop, soil type and soil's
inherent capacity to supply nutrients. Twenty-nine years mean data for maize-
wheat and rice-wheat cropping system at different locations showed highest
increase in FUE in maize-wheat sequence in Alfisols at Palampur. Application of
N alone yielded a very low recovery efficiency of 6.4% in maize and 1.9% in
wheat. Balanced application of NPK improved the N recovery efficiency to 52.6
and 50.6% in maize and wheat, respectively (Table 4).
Phosphorus use efficiency can be enhanced only if no other nutrient is
limiting in the soil. Studies have revealed the lowest P use efficiency, when it was
applied without adequate dose of N. As observed by Benbi and Biswas (1999),
2
3
-1 -1
-
application of N and K along with P further enhanced P use efficiency (Table 5).
Similar effects of other deficient elements such as S, Zn, Mn etc. may be expected
on Puse efficiency.
Influence of rates and balanced N, P and K application on apparent
fertilizer P recovery (%) in maize and wheat during 20 years of cropping
(Benbi and Biswas 1999)
The fertilizer consumption in India during the last 40 years has increased
dramatically but the response ratio (kg grain per kg NPK) for food grain
production has declined from 48 in 1970-71 to 10 in 2007-08. The decline in
response ratio could be ascribed to gradual decline in the indigenous supply of soil
nutrients leading to macro- and micronutrient deficiencies due to inappropriate or
imbalanced fertilizer application and little recycling of organic sources. While
there is wide scale adoption of blanket fertilizer recommendation and to a lesser
extent of soil-test based fertilizer adjustments, there is a need for site-specific
nutrient management for balanced fertilization. These observations emphasize the
need to monitor soil fertility and emerging nutrient deficiencies and to adopt
appropriate management practices for improved nutrient use efficiency. Soil test
methods for soil fertility evaluation and for formulating fertilizer
recommendations must be augmented with other chemical and biological
fractions to achieve higher FUE.
Aulakh MS (2003) Crop responses to sulphur nutrition. In:AbrolYPandAhmadA
(ed) Sulphur in plants, Kluwer, Dordrecht, Netherlands, pp 341-358
Table 5
Conclusions
References
Table 4 Influence of balanced fertilization on N and P use efficiency in maize-
wheat and rice-wheat cropping systems in different soil types (29-year
mean). (Singh et al. 2004)
Crop Soil type/Location Apparent N recovery (%) Apparent P
recovery (%)
N NP NPK NP NPK
Maize Inceptisols/
Wheat 32.0 50.6 63.1 20.6 30.7
Maize Alfisols/
Wheat 1.9 35.6 50.6 10.7 15.2
Rice Mollisols/
Wheat 42.4 46.1 48.4 11.2 10.4
Ludhiana16.7 23.5 36.4 10.3 21.4
Palampur 6.4 34.7 52.6 21.8 35.6
Pantnagar 37.5 40.7 44.4 18.2 23.3
Treatment 1971-80 1981-90
Maize
100% NP 15.7 7.3
100% NPK 29.2 12.7
50% NPK 21.2 10.1
150% NPK 19.9 8.2
Wheat
100% NP 18.3 22.5
100% NPK 26.5 33.5
50% NPK 13.1 14.0
150% NPK 17.9 22.4
100% NPK represents recommended dose; 50% and 150% NPK represent ½ and 1.5
times the recommended dose
514 515

Aulakh MS, Malhi SS (2004) Fertilizer nitrogen use efficiency as influenced by
interactions with other nutrients. In: Mosier AR, Syers JK, Freney J R (ed)
Agriculture and the nitrogen cycle: Assessing the impacts of fertilizer use on
food production and the environment. Island, Washington, pp 181-191
Benbi DK, Biswas CR (1997) Nitrogen balance and N recovery after 22 years of
maize-wheat-cowpea cropping in a long-term experiment. Nutr Cycl
Agroecosyst 47: 107-114
Benbi DK, Biswas CR (1999) Nutrient budgeting for phosphorus and potassium in
a long-term fertilizer trial. Nutr CyclAgroecosyst 54: 125-132
Benbi DK, Biswas CR, Kalkat JS (1991) Nitrate distribution and accumulation in
an Ustochrept soil profile in a long-term fertilizer experiment. Fertil Res 28:
173-178
Benbi DK, Brar JS (2009) A 25-year record of carbon sequestration and soil
properties in intensive agriculture.Agron Sustain Dev 29: 257-265
Benbi DK, Brar SPS (1992) The interpretation of Olsen extractable P values in
relation to recommendations for fertilizer requirements of crops. Fertil Res
32: 223-227
Benbi DK, Brar SPS (1994) Influence of soil organic carbon on the interpretation
of soil test Pfor wheat grown on alkaline soils. Fertil Res 37: 35-41
Benbi DK, Chand M (2007) Quantifying the effect of soil organic matter on
indigenous soil N supply and wheat productivity in semiarid sub-tropical
India. Nutr CyclAgroecosyst 79: 103-112
Benbi DK, Chand M, Mavi MS, Kaur M, Muralidharudu Y (2007) STCR- An
approach for fertilizer recommendations based on soil test and targeted yield
of crops. Research Bulletin, Department of Soils, Punjab Agricultural
University, Ludhiana, 34 p
Benbi DK, Haer HS (2007) Boiling KCl-extractable nitrogen as an index of
potentially mineralizable and plant available N in soil. Commun Soil Sci
PlantAnal 38: 871-884
Benbi DK, Nayyar VK, Brar JS (2006) Green revolution in Punjab: The impact on
soil health. Indian J Fertil 2(4): 57-66
Bhargava BS (2002) Leaf analysis for nutrient diagnosis, recommendation and
management in fruit crops. J Indian Soc Soil Sci 50: 352-373
Brar MS (2004) Potassium mining and agricultural sustainability: Punjab
scenario. Fertil News 49: 51-55
Brar MS, Brar BS (2002) Assessment of soil nutrient depletions in Punjab. Fertil
News 47: 33-38
Campbell CA, Jame YW, Akinremi OO, Beckie HJ (1994) Evaluating potential
nitrogen mineralization for predicting fertilizer nitrogen requirements of
long-term field experiments. In: Soil testing: Prospects for improving
nutrient recommendations. Soil Sci SocAmer special publication 40: 81-100
Cate RB, Nelson LA (1965) A rapid method for correlation of soil test analysis
with plant response data. International Soil Testing Programme, Technical
Bulletin No. 1, North Carolina State University, Raleigh, N.C., USA
Cate RB, Nelson LA(1971)Asimple statistical procedure for partitioning soil test
correlation data into two classes. Soil Sci SocAmer Proc 35: 658-660
Dobermann A, Witt C, Dawe D, Abdulrachman S, Gines GC, Nagarajan R,
Satawathananont S, Son TT, Tan CS, Wang GH, Chien NV, Thoa VTK,
Phung CV, Stalin P, Muthukrishnan P, Ravi V, Babu M, Chatuporn S,
Sookthongsa J, Sun Q, Fu R, Simbahan G,Adviento MA(2002) Site-specific
nutrient management for intensive rice cropping systems inAsia. Field Crops
Res 74: 37-66
FAI (2007) Fertiliser statistics (2006-07). Fertiliser Association of India, New
Delhi
FAI (2008) Annual review of fertiliser production and consumption 2007-08.
Indian J Fertil 4(9): 111-155
Hundal HS, Arora CL (2001) Diagnosis and recommendation integrated system
approach for diagnosing nutrient status of kinnow fruit trees. J Indian Soc
Soil Sci 49: 703–709
Hundal HS, Singh D, Singh K (2007) Monitoring nutrient status of Guava fruit
trees in Punjab, northwest India through the Diagnostic and
Recommendation Integrated System approach. Commun Soil Sci Plant Anal
38:2117–2130
Milap-Chand, Benbi DK, Azad AS (2004) Modifying soil test based fertilizer
recommendations for targeted yields of rice on a Typic Haplustalfs. J Indian
Soc Soil Sci 52: 258-261
Motsara MR (2002) Available nitrogen, phosphorus and potassium status of
Indian soils as depicted by soil fertility maps. Fertil News 47(8): 15-21
Munson RD, Nelson WL (1990) Principles and practices in plant analysis In:
Westerman RL (ed) Soil testing and plant analysis, Soil Science Society of
America, Madison, Wisconsin, pp 359-388
Muralidharudu Y, Rathore A, Subba Rao A (2007) 18 Progress Report of the All
India Coordinated Research Project for Investigations on Soil Test Crop
Response Correlation, IISS, Bhopal, 192p
Olsen SR, Cole CV, Watanabe FS, Dean LA (1954) Estimation of available
phosphorus in soils by extraction with sodium bicarbonate, USDA Circ. No.
939
Ramamoorthy B, Narasimham RL, Dinesh RS (1967) Fertilizer application for
specific yield targets of 64. Indian Farming 17(5): 43-45
Samra JS (2006) Declining factor productivity and sustainability of crop
production. In: Benbi DK, Brar MS, Bansal SK (eds.) Balanced fertilization
for sustaining crop productivity Volume 1. International Potash Institute,
Horgen, Switzerland, pp 21-56
Sekhon GS (1999) Potassium in Indian soils and crops. Proc Indian Nat Sci Acad
Sonara
,
th
516 517

Proceedings IPI-OUAT-IPNI International Symposium (2009)
Soil Scientist and Former Director General, Bangladesh Agricultural Research Institute.
Presently Technical Advisor, Bangladesh Fertilizer Association
e-mail : [email protected]
Challenges for nutrient management in Bangladesh
MS Islam
Abstract
Keywords
Introduction
Present and future nutrient management challenges in Bangladesh have
been reviewed. The major challenges include: distribution and marketing of
fertilizers to the farmers in time of needs; soil fertility constraints; soil and crop
needs based recommendation; imbalanced use of fertilizers; insufficient use of
organic manure, biofertilizers and plant growth regulators; strengthening soil
testing services and maintenance of soil health. Marketing and distribution of all
fertilizers except urea in the country are now made by the private sectors under the
supervision and control of the government. Most of the demand of fertilizers is met
up through import. There is intensive cropping to meet growing demand for food
in Bangladesh that led to continuous mining of nutrients from soil. Most of the
soils are depleted and are in urgent need of replenishment with organic manure and
nutrients (fertilizers). Recent high prices of phosphate and potash fertilizers, and
other secondary and micronutrients have forced farmers to cut down their applic-
ations. Only exception is N, because urea continues to be under heavy subsidy
regime. This has caused severe imbalances in nutrients use.Adoption of integrated
nutrient management based on close matching of their addition and removal
would be the best way to maintain optimum soil fertility and crop productivity.
The government should encourage the farmers to use organic manure, and bio-
fertilizers in an effort to reduce the application of chemical fertilizers. Soil testing
services need to be strengthened which can ensure efficient use of liming and
nutrients. Short-term and long-term appropriate actions have been suggested to
face the present and future challenges for nutrient management in the country.
Balanced fertilization bio-fertilizers liming soil testing nutrient
fertilizer soil fertility
Bangladesh is facing many challenges; the most important ones are the food
production and security for her more than 150 million people in an area of 1,
47,624 km where cultivable land is decreasing and population is increasing.
Among the total land resources, 8.29 million ha are used for agriculture and 2.40
l l l l l
l
2
518 519
65: 83-108
Sekhon GS, Brar MS, Subba Rao A (1992) Potassium in some benchmark soils of
India. PRI Special Publication 3, Potash Research Institute of India,
Gurgaon, 82p
Singh B, Brar SPS (1986) Long term effect of NPK and Zn fertilization in maize-
wheat rotation on crop yield and soil characteristics. Research Bulletin No.
12, PunjabAgricultural University, Ludhiana. 52p.
Singh MV, Wanjari RH, Adhikari T (2004) Nutrient dynamics, crop productivity
and sustainability under long-term fertilizer experiments in India. AICRP-
LTFE, Indian Institute of Soil Science, Bhopal, 120p.
Stanford G, Smith SJ (1972) Nitrogen mineralization potentials of soils. Soil Sci
SocAm Proc 36:465–472
Subba-Rao A, Sammi-Reddy K (2006) Analysis of soil for pH, EC and available
major nutrients. In: Tandon HLS (ed) Methods of analysis of soils, plants and
fertilizers, Fertilizer Development and Consultation Organization, New
Delhi, pp 21-59
Subba-Rao A, Srivastava S (ed) (2001) Soil test based fertilizer recommendations
for targeted yield of crops. Proceedings of the National Seminar on Soil
Testing for Balanced and Integrated Use of Fertilizers and Manures, IISS,
Bhopal, 326p
Tandon HLS, Sekhon GS (1988) Potassium research and agricultural production
in India. FDCO, New Delhi.
Yadvinder-Singh, Bijay-Singh., Ladha JK, Khind CS, Gupta RK, et al. (2004)
Long-term effects of organic inputs on yield and soil fertility in the rice-
wheat rotation. Soil Sci SocAm J 69: 845-853
Walworth JL, Sumner ME (1987) The diagnosis and recommendation integrated
system (DRIS).Adv Soil Sci 6: 149-188

million ha are forest (including community forest and village forest). Bangladesh
is also now passing through a phase of ecological deterioration leading to loss of
plant cover thus lowering organic matter content of the soil, reduction in varietal
diversity, lowering water-holding and fertility of the soils, lowering ground water
table, loss of wetlands, and many others (Islam et al. 2008). The process of
ecological deterioration is negatively affecting the already fragile livelihood of the
rural poor and lowering land productivity level. With an ever-increasing
population and limited cultivable land, Bangladesh is forced to maximize crop
yields per unit area through intensive use of land and soil resources. Moreover, in
recent years there has been a shift in the cropping pattern. In many places, because
of high demand for poultry feeds acreage under high nutrient demanding hybrid
maize is expanding. As a result, continuous mining of nutrients from the soil
system is going on. Under such situations, integrated nutrient management is
considered one of the best ways to arrest fertility degradation as well as to maintain
sustainable productivity of soils. This paper describes the challenges of the
nutrient management in Bangladesh agriculture.
The major challenges of nutrient management include timely supply and
availability of fertilizers at the doorstep of the farmers, recommendation based on
soil and crop requirements, use of organic manure, biofertilizers and plant growth
regulators, strengthening soil testing services and maintenance of soil health.
Fertilizer supplies plant nutrient and is considered one of the key inputs for
increasing crop yields and its contribution to crop production is about 50-60%.
The use of chemical fertilizers in subsistence and food deficit East Pakistan (now
Bangladesh), which began in 1951, increased steadily with time after introduction
of modern varieties and reached peak value of about 4.45 million tons in 2008-09
(Table 1). The Department ofAgricultural Extension on the basis of nutrient needs
and crop production projections usually calculates fertilizer demand. There is
huge gap between productions (1.7 million tons) and demands (4.45 million tons).
Timely supply of locally produced and imported fertilizers at the farm gates are
handicapped by various constraints that result in crisis.
Fertilizer distribution system
Marketing, promotion and distribution of almost all fertilizers except urea in the
country are now controlled by private sectors. The transition from government to
private sector passed through various phases of experimentation and took about 40
The challenges
Fertilizer use
years to complete. Presently, all fertilizer requirements of the country such as TSP,
DAP, MOP and urea (about 40-50%), etc. are met through import by the private
companies. Out of total requirement of urea (2.52 million tons during 2007-08)
only 1.45 million tons and small amount of TSP (50,000 tons) as well as SSP (0.10
million ton) were produced within the country from six urea fertilizer factories and
TSP Complex of Bangladesh Chemical Industries Corporation (BCIC). Urea
production and import is always controlled by the government, and is distributed
to the farmers in the country through 4850 BCIC appointed dealers at heavily
subsidized rates. Total production capacity from 6 BCIC's urea fertilizer factories
is 1.70 million tons, although installed capacity is about 2.30 million tons. The
private importers import TSP, DAP and MoP from USA, Tunisia, Australia,
Jordan, Morocco, CIS and China according to the annual needs of the country.
Fertilizer subsidy
The prices of TSP, DAP and MOP increased abruptly in the international market at
the end of 2003 and beginning of 2004. Due to such high price hike, the balanced
use of fertilizer was being seriously affected. The government in consultation with
Bangladesh FertilizerAssociation (BFA) decided to provide 25% subsidy on these
fertilizers. During 2004-05 and 2005-06 the government provided US $ 37.31 and
53.04 millions as subsidy for the phosphate and potash fertilizers, respectively.
The government has been providing heavy subsidy on urea fertilizer, which
provides the key nutrient nitrogen, critically deficient in the country's soils. The
present price of urea per ton at the mill gate is US$ 142.86 and at the buffer gate
US$ 152.86. The dealer can sell urea among the farmers at the cost of US cents
15-17 per kg.
Although Bangladesh is a small country, it has wide variety and complexity of
soils at short distances due to a diverse nature of physiography, parent materials,
land types, and hydrology and drainage conditions. Under intensive cropping,
Present soil fertility status
Year Urea TSP DAP SSP MOP Gypsum Ammoniumsulphate sulphate sulphate
2001-02 2247 425 127 127 222 96 15 10 13 13 32952002-03 2239 405 112 130 250 120 30 10 14 10 33202003-04 2324 361 90 148 240 140 15 10 14 13 33552004-05 2523 420 140 170 260 135 16 10 14 26 37142005-06 2451 436 145 130 290 104 10 10 20 99 36952006-07 2600 340 115 125 122 26 25 12 20 160 35432007-08 2515 325 122 115 230 72 26 15 25 120 35652008-09 2850 500 200 100 400 150 25 20 50 150 4445
Magnesium Zinc NPKS Total
Table 1 Fertilizer use in Bangladesh during the last eight years ('000' Mt)
520 521

continuous changes are taking place in the soil fertility status due to organic matter
depletion, nutrient deficiencies, drainage impedance/water logging followed by
degradation of soil physical and chemical properties as well as soil salinity/acidity.
The fertility status of Soils of Bangladesh is extremely variable. Most of the soils
are depleted and are in urgent need of replenishment with organic manure and
fertilizers if projected crop production target is to be obtained.
Nitrogen
Nitrogen is generally considered as the key nutrient in agriculture in Bangladesh
because soils are low in N. Most of the agricultural soils are critically deficient in
N. The main reasons for N-deficiency are because of intense rate of decomposition
of organic matter, rapid removal of mineralized products under excessive leaching
condition and crop removal. Total-N content in soils of Bangladesh ranges from
0.032% in the Shallow Red-Brown Terrace Soils to 0.20% in Peat Soils. The
approximate values of total-N used to interpret soil test values are; Low: 0.09-0.18
%; Medium: 0.18-0.27%; and Optimum: 0.27-0.36% for upland crops in loamy to
clayey soils. In light textured soils, somewhat lower values are used to interpret the
soil test results for upland crops. For wetland rice, soil test values for N interpreted
as low, medium and optimum are 0.09-0.18, 0.18-0.27 and 0.27-0.36%,
respectively, irrespective of soil texture. The soil-testing laboratories of the NARS
institutes use these critical levels for total-N in soil.
Except few leguminous crops, all other crops respond to applied N
irrespective of soil types, growing seasons and cultivars used. Practically high
yielding varieties of different crops such as wheat, maize, potato, sweet potato,
cabbage, brinjal, tomato, cauliflower and banana are highly responsive and need
ample supply of fertilizer N to attain their yield potentials; while cotton, tobacco,
mustard and sugarcane are substantially responsive. Pulses and other legumes are
less responsive to applied N in soils of Bangladesh. For some leguminous crops a
starter N dose is considered essential for higher nodulation and production.
Responses of applied N to high yielding varieties of rice have been studied
extensively throughout the country by a series of fertility trials. The average yield
increase due to fertilizer N varies from 30 to 75% (BRRI, 2009). In some cases,
without applied N high yielding varieties of rice fail, while application of 100 kg N
ha along with other nutrients resulted in a very successful yield of 6-7 t ha . The
field trial conducted by Parul (2008) showed that with 120 kg N ha , it was
possible to obtain more than 7 t ha grain yield from BRRI dhan29 (Table 2).
Phosphorus
Phosphorus is the second most important nutrient element limiting successful crop
production. It becomes unavailable or fixed in the soils through a variety of ways.
-1 -1
-1
-1
In acidic terrace and brown hill soils, phosphorus is largely fixed by iron and
aluminum oxides at low pH, while in calcareous soils fixation occurs by calcium-
magnesium carbonates. The net result of fixation is a decrease in the immediate
availability of native and applied phosphorus. In medium and heavy textured soils,
the available P contents up to 7.50 mg kg soil is interpreted as low, 15.1-22.5 mg
kg soil as medium and 22.5-30.0 mg kg soil as optimum for upland crops. In light
textured soils, somewhat lower values are considered to interpret soil P as low,
medium and high. For wetland rice, soil P contents of 6.0-12.0 mg kg soil are
considered as low, 12.1-18.0 mg kg soil as medium and 18.0-24.0 mg kg soil as
optimum. The critical level of Pby the Olsen method, which is extensively used for
rice, has been considered as 8.0 mg kg .
Appreciable response of wetland rice to P fertilization is rarely observed in
Bangladesh soils. On the other hand, P is considered as one of the major
constraints to successful production of legumes and upland crops such as wheat,
maize, chickpea, groundnut, cotton, mustard, brinjal, tomato, lady's finger etc.
Significant role of phosphate application in sustaining and building up soil fertility
for various upland crops is well recognized.
Potassium
Potassium is the third major plant nutrient recently identified as deficient in most
Bangladesh soils. The previous idea about the sufficiency of potassium in soils of
Bangladesh might be true for local crop varieties with low yield potentials. Yield
of 1 t ha of wheat and 2 t ha of rice can be obtained without the application of K
fertilizers. The crop intensification with high yielding and hybrid varieties has
shown widespread deficiency of potassium in soils of Bangladesh on potato, sweet
-1
-1 -1
-1
-1 -1
-1
–1 -1
Table 2 Grain and straw yield of BRRI dhan28 and BRRI dhan29 as affected by
different N rates
N rate BRRI dhan28 BRRI dhan29
Grain yield(kg ha ) (kg ha ) (kg ha ) (kg ha )
N0 2160d 2605d 2600f 2858fN40 3640c 3598c 3862e 4053eN80 4710b 5140b 6000c 5620dN100 5600a 5753a 6640b 6465cN120 5712a 6095a 7230a 7468abN140 5642a 6000a 7300a 7648aN160 5340a 6063a 7130ab 7740aN200 4039c 6525ab 5400d 7843bCV% 6.55 7.10 5.88 6.11
Straw yield Grain yield Straw yield-1 -1 -1 -1
522 523

potato and other root crops, sugarcane, fruit, onion, garlic, fiber crops and HYV of
cereals. It has been recorded that a 5 t ha rice crop will remove more than 110 kg K
which is to be made available to plants in less than 3 months time and many of our
old and highly weathered soils may not have potential to supply K at this rate.
Alluvial soils of Bangladesh are comparatively rich in potash bearing
minerals than the terraces that are older and show evidences of extensive
weathering of 2:1 type minerals and potash bearing minerals. These soils may not
release K fast enough to match the crop requirements especially for the modern
varieties to sustain yields. Potassium may also be leached and deficiency of K
may become a production constraint in light sandy soils of recent alluvium
with high percolation rate (72 mm day ). The critical levels of potassium for
soils of Bangladesh have been determined 35.1-70.2 mg kg soil as low,
70.2-105.3 mg kg as medium, 105.3-140.4 mg kg as optimum and above 140.4
mg kg high.
The report of a field trial conducted by BRRI (2009) shows that during the
boro season of 2008, application of K fertilizer significantly increased the grain
yield of all tested genotypes (Table 3).
Effect of K rates on the grain yield of varieties at BRRI farm (BRRI
2009)
Sulphur
Sulphur has been recognized as the fourth major nutrient limiting crop production
as early as 1980. In the past very little attention was paid to this nutrient until 1977
when sulphur deficiency in wetland rice was first detected at the Bangladesh Rice
Research Institute (BRRI) farm and on nearby farmers' fields. Since then sulphur
deficiency in soils of Bangladesh is becoming widespread and acute. Available S
varies widely and ranges from 2 to 75 mg kg . The problem is more severe in
wetland rice than in upland crops as anaerobic condition, under which rice is
grown, reduces sulphate and makes it unavailable to plants. Among the upland
-1
-1
-1
-1 -1
-1
-1
Table 3 boro
crops, oilseeds are most affected by S deficiency problems. Beneficial effects of
sulphur fertilization have been observed on mung bean, black gram and chickpea.
The critical level of sulphur for soils of Bangladesh has been determined as 10 mg
kg soil.
Calcium and magnesium
The pH in the soils of Bangladesh ranges between 5.8 and 7.0 (with exception of
acid hill soils and calcareous soils). Thus, most of the soils have adequate Ca and
Mg saturation on the exchange sites. Recent investigations have reflected that acid
hill soils and Old Himalayan piedmont soils are extremely low in exchangeable Ca
and Mg. The critical levels are 800 and 200 mg kg for Ca, and 480 and 120 mg
kg for Mg. Magnesium deficiency problems have been observed on potato,
cotton, sugarcane and tea grown on these soils and added Mg has brought about an
appreciable increase in yields. Although Ca is also inadequate in these soils,
applications of TSP and gypsum to supply P and S satisfactorily meet Ca demand
of crops, thus correcting Ca deficiency properly.
Zinc
The importance of zinc in crop nutrition has received considerable attention
during eighties in the country. The incidence of zinc deficiency is widespread in
most calcareous and alkaline soils. The problem is more acute in wetland rice
culture. The critical levels of available soil zinc content as established by different
extracting procedures are 1 mg kg for light textured soils and 2 mg kg for heavy
and calcareous soils. The critical level of Zn in rice plant tissue is generally
considered as 20 mg kg . Yield responses of rice to zinc fertilization have been
well documented in different soils of Bangladesh where zinc contents were below
the critical level.
Boron
Although taken up in tiny quantities, boron deficiency may lead to serious
consequences regarding economic yield of various crops. Boron deficiency in
Bangladesh was first observed in reverine soils of Teesta on wheat causing sterility
in grains (Islam 2006). Light textured soils of the country are deficient in available
boron where significant leaching loss of borate ions might have depleted soil
boron level. The available boron content of the major soils of Bangladesh varies
between 0.1 and 1.9 mg kg . But most of the light textured soils of Rangpur,
Dinajpur and terrace soils of Gazipur and hill soils of Srimangal contain low level
of available B (0.1-0.3 mg kg ). The critical level of available soil boron used to
interpret the soil test result is 0.2 mg kg . However, Studies showed that sterility
-1
-1
-1
-1 -1
-1
-1
-1
-1
K rate
(kg ha ) BRRI dhan36 BRRI dhan45 Hybrid-EH Hybrid-EH
0 1.86 2.86 3.64 3.0820 5.01 5.70 6.40 6.4840 5.58 5.04 5.62 6.2260 5.90 5.93 5.92 6.0080 5.87 6.09 6.27 6.46
LSD (0.05) 0.64CV (%) 7.3
Grain yield (t ha )-1
-1
1 2
524 525

Table 4
Present challenges of nutrient management
Domestic Fertilizer Production during last 8 years (BER 2008)
Fertilizer types and grades
The farmers of Bangladesh use mainly single or straight fertilizers as sources of
plant nutrients. Urea, TSP, DAP, SSP and MOP are the widely used straight
fertilizers. Among them, urea shares about 66%, TSP 11%, SSP 4.3%, DAP 4.3%
and MOP 9% of the total fertilizer use. Gypsum, ammonium sulphate, zinc
sulphate, boric acid, magnesium sulphate and potassium sulphate account for the
rest. The government of Bangladesh has recommended 6 crop specific grades of
mixed or blended fertilizers for balanced application of nutrient elements in the
crop fields. These grades are; NPKS (8-20-14-5) for HYV Rice, NPKS (10-24-17-
6) for HYV Rice, NPKS (10-15-10-4) for Sugarcane, NPKS (14-22-15-6) for
Sugarcane, NPKS (12-16-22-6.5) for Wheat and other Rabi crops, NPKS (12-15-
20-6) for wheat and other Rabi crops. Among the six grades, different companies
produce only rice grades.
The food requirement of Bangladesh will be double in the next 25 years while its
natural resource base will shrink. To keep pace with population growth, yields
will have to be increased by 60-70 per cent within that period. Although the
total agricultural production has increased significantly, but recently,
declining or stagnation of yield of major crops has been recorded in the country.
This is due to the cumulative effects of many soil-related constrains. Besides
nutrient mining; depletion of soil organic matter, imbalanced use of fertilizers,
scanty use of bio and organic fertilizers and poor management practices are the
major causes.
According to current statistics, the farmers of Bangladesh use 191 kg
nutrients (N 143 kg, P O 27 kg, K O 17 kg and S +Zn + B + others: 4 kg) ha year
from chemical fertilizers, while the estimated removal is around 250 -350 kg ha .2 5 2
–1 -1
-1
problems in wheat, chickpea and mustard grown on sandy soils of Rangpur were
significantly improved by the application of boron. Wheat yield after boron
treatment was increased by more than 50% and was contributed by increased
number of grain per spike. Thus, it has been reported that boron deficiency might
be a causative factor for sterility problems. Yields of vegetables like cauliflower,
cabbage, broccoli and tomato were found to increase (14-52%) due to B
fertilization.
Other micronutrients
Recently Cu and Mn application in calcareous Soils have appeared to be beneficial
for higher yield in some field trials. Recent studies have also indicated that Mo
deficiency is widespread in cabbage and legumes like groundnut in acid soils.
Appreciable yield increases of these crops in presence of added molybdenum have
also been recorded. Deficiency of Cl has been detected in coconut and betel nut
plants. But proper potassium fertilization with muriate of potash prevents the
occurrence of Cl deficiency problems in most cases. Iron is the only
micronutrient that is abundantly present in available form in the soils of
Bangladesh.
The Ministry of Agriculture, in consultation with the Department of Agricultural
Extension fixes up monthly as well as annual requirement of fertilizers. Besides
demand requirement, the Ministry also makes a total exercise on production,
import and price fixation.
Domestic production
In Bangladesh, urea, TSP and SSP are produced in local industries, which can
partly meet the total demand of the country (Table 4). About 60,000 tons of
phosphorgypsum is produced as a byproduct of TSP factory. All the six fertilizer
factories can produce 1.70 million tons of urea, 12000 tons of ammonium
sulphate, 50,000 tons of TSP, 0.10 million ton of DAP, and 0.10 million tons of
SSP. Additional requirements of urea are met up from import. Additional
requirements of TSP, DAP and gypsum are also met by import. All MOP are
imported. There are more than 50 small zinc sulphate manufacturing factories in
the country which can produce ten thousand tons of granular monohydrate and
crystalline heptahydrate zinc sulphate. Some companies produce small amounts
of boric acid.
-1
-1
Present supply and availability situations
Year Production (000 tons)
Urea TSP SSP DAP
2001-02 1546 68 120 -2002-03 2057 65 136 -2003-04 2164 65 135 -2004-05 2200 65 134 -2005-06 1700 60 100 -2006-07 1700 60 100 1002007-08 1400 50 100 1002008-09 1700 50 100 100
526 527

only provide ideal nutrition for crops (Tables 6 & 7). In Gazipur and Faridpur,
application of along with 75% recommended doses
produced comparable results with 100% recommended doses. However, as
expected poultry bioslurry produced the highest yields (Table 6).
Effect of (organic fertilizer) on the yield of
tomato (Islam et al. 2008)
Data in Table 7 showed that an amount of 75% RD of chemical fertilizer in
combination with 10 t PM ha produced the highest yield of tomato (66.4 t ha )
while 5 t PM ha in addition to 75% RD produced the highest of the second crop-
okra, that was statistically identical to 100% RD. Nutrient residue of the first two
crops along with supplemental N gave statistically identical yield (34.7 t ha ) with
100% RD for the third crop- Indian spinach.
Balanced fertilization
Balanced fertilization is the key to successful crop production and maintenance of
good soil health. Unfortunately, fertilizer use in the country is generally
considered sub-optimal and unbalanced. Looking at the nutrient balanced ratios
for the last few years (N: P: K-8.5:1.4:1.0 for 2007-08) the picture appears bleak
(BER 2008). During 2006-07 the ratio was 16.6:4.1:1.0 for N: P: K.Application of
Grameen Shakti Jaibo sar
grameen shakti jaibo sarTable 6
-1 -1
-1
-1
Treatment Yield (t ha ) % Increase overcontrol
Gazipur Faridpur Gazipur Faridpur
100%RD 64.7ab 73.3ab 183 15375%RD 56.9c 66.5cd 149 13050%RD 46.3d 54.9e 103 8975%RD+CD@5 t ha 63.9ab 71.2a-d 180 14650%RD+CD@10 t ha 58.8c 66.8bcd 157 13175%RD+CD bioslurry@5 t ha * 65.1ab 72.9abc 185 15250%RD+CD bioslurry@10 t ha * 61.8abc 66.6bcd 171 13075%RD+PM@3 t ha 64.6ab 70.4a-d 183 14350%RD+PM@6 t ha 60.4bc 66.9d 164 13175%RD+PL bioslurry@3 t ha * 66.6a 75.0a 192 15950%RD+PL bioslurry@6 t ha * 60.6bc 68.0bcd 165 135Control (native fertility) 22.8e 28.9f - -SE(±) 1.57 2.02CV (%) 4.72 5.38
RD (Recommended dose): N P K S Zn B ; CD: Cow dung; PM: Poultry
manure; *Grameen Shakti Jaibo Sar
-1
-1
-1
-1
-1
-1
-1
-1
-1
150 45 85 20 3 2
From organic and natural sources about 50-70 kg nutrients are added to the soil
system every year. Annual depletion of nutrients (NPKS) in many areas under
intensive cultivation ranges between 150 and 250 kg ha yr . A nutrient balance
study made by DAE-SFFP from a typical -Fallow–T. cropping pattern
(10 t grain yields) shows that negative balance of 78 kg N and 41 kg K in a hectare
of land are occurring every year (Table 5).
It is quite evident from the study that severe mining of N and K are going on in
the soil system. That's why the productivity of the soils is low and decline in crop
yields has been recorded in many areas. Since fertile is the fundamental resource
for high yield, its maintenance is a prerequisite for long-term sustainable crop
production. In view of the deteriorating soil fertility situations in the country, the
major challenge is how to arrest or halt the depletion of nutrients from the soil
system. The adoption of Integrated Nutrient Management System and Balanced
Fertilization Practices are the most important remedial measures that maintain
soils in high fertility state.
Adoption of Integrated Nutrient Management System (IPNS)
The adoption of IPNS that combines the use of organic and chemical fertilizers can
-1 -1
Boro Aman
Nutrient dynamics N (kg ha ) P (kg ha ) K (kg ha )
Nutrient uptake 180 27 180
Soil 1217 - -
Erosion 12 2 12
Organic 24 - -N fertilizer 68 - -
Fertilizer 170 25 75Organic manure (5t ha ) 20 12 24Incorporated crop residue 25 3 25Non symbiotic fixation 10 - -Atmospheric fixation 8 1 2Sedimentation/weathering - 2 10Irrigation water 2 6 21
-78 20 -41
-1
-1
-1 -1
Removal
Leaching losses
Gaseous losses
Addition
Balance
- 6Fertilizer
Total Output 313 29 198
Total Input 235 49 157
Table 5 Nutrient dynamics in -Fallow–T. cropping pattern (DAE-
SFFP2002)
Boro Aman
528 529

potassium is very low indicating its severe mining from the soil system. It is
important to see how close nutrient addition and removal by crops match with each
other. During 2005-06, about 1.65 million tons of nutrients from the chemical
sources were used, whereas the estimated nutrient removal was more than 2.20
million tons indicating depletion of nutrients in the soils.
Extension activities on balanced fertilization have been undertaken by various
research institutes, GO/NGOs and development partners through out the country.
Technologies generated on balanced fertilization practices for different crops and
cropping patterns at the various National Agricultural Research System (NARS)
institutes and also at the Agricultural and General Universities are transferred to
the end users through various mechanisms. One of the main mechanisms is the
Department of Agricultural Extension, which directly takes the technology to the
farmers' fields for demonstration. Besides DAE, different NGOs directly involved
in agricultural development activities also take the fertilizer use technology to the
doorsteps of the farmers. The different National Agricultural Research Systems
(NARS) institutes arrange training programs for extension and NGO personnel
through which they are trained about the beneficial aspects of the technology.
BARC's Technology Transfer and Monitoring Unit (TTMU) also serve as a
vehicle in between research institutes and agricultural development agencies.
TTMU also helps transfer of promising NARS institutes' technology to the
farmers' fields through different projects funded by the government as well as
donors and development partners. International Fertilizer Development Center
Extension activities for promoting balanced fertilization
has been playing a significant role in developing and disseminating fertilizer use
technology in the country since long. Other important donor projects such IFAD
SAIP, ADB NW Crop Diversification and FAO/UNDP project on food security in
DAE are also making significant contribution to agricultural development in the
country.
Fertilizer recommendation for single crops and cropping system are usually made
by following the guidelines clearly stated in “The National Fertilizer
Recommendation Guide” which is revised and published from time to time by the
Bangladesh Agricultural Research Council in consultation with NARS scientists
engaged in soil fertility and fertilizer management research activities. Upazila Soil
Use Guide published and updated by SRDI from time to time is also a useful guide
for site-specific fertilizer recommendation. Each guide has at least 100-150 site-
specific information on soils nutrient status, topography, hydrology, vegetation
and drought. Fertilizer recommendations are usually made on the basis of soil
fertility classes; yield goals and farmers' management ability. For high yield goal
fertilizer recommendation, one should have site-specific information on nutrient
status of soils as well as the crops. If the site-specific information on the soils is not
available, moderate yield target may be fixed and the information available about
agro ecological region in the guide may be used to find out the fertilizer doses.
Fertilizer recommendation
Table 7 Yield of vegetables in Tomato-Okra-Indian spinach cropping pattern as
influenced by integrated use of chemical fertilizers and organic manure
at homestead, Tangail during 2005-06 (Khan et al. 2008)
Treatments Tomato Okra Indian Yield of crops Tomatoquivalent
PM CD PM CD PM CD Tomato Okra Indianspinach
Org. manure (t ha Yield (t ha
100%RD 0 0 0 0 0 0 64.2ab 9.7ab 36.2a 102.775%RD 10 0 5 0 0 0 66.4a 20.8a 34.7ab 104.575%RD 0 10 0 5 0 0 60.2b 18.8abc 32.5abc 95.850%RD 10 0 5 0 0 0 58.7b 17.3bcd 30.8bc 91.850%RD 0 0 0 10 0 0 53.3c 15.4cd 28.4c 73.1CV (%) 6.5 9.8 7.3
RD (recommended dose):N P K S Zn B for tomato; N P K S Zn B for okra and N
for Indian spinach
spinach e
yield(t ha )
) )
-1
-1 -1
150 40 80 20 2 1 120 35 70 15 2 1 120
Fig.1 Grain yield (kg ha ) and Square root (SQRT) of grain yield data of BRRI
dhan29 as affected by different LCC value based N treatments, BRRI,
Gazipur, 2002.
-1
Grain yield BR29
y = -398.56x2 + 2443x + 2894.6
R2 = 0.9296
4000
4500
5000
5500
6000
6500
7000
2.00 3.00 4.00 4.50LCC value
Gra
inyie
ld(k
gh
a-1
)
SQRT of grain yield_BR29
y = -2.079x2 + 12.493x + 56.126
R2 = 0.9995
60
65
70
75
80
85
90
2.00 3.00 4.00 4.50LCC value
SQ
RT
ofg
rain
yie
ldd
ata
y = -2.079x + 12.49x + 56.12R = 0.99
2
2
530 531

Research on site-specific N management using leaf color chart in Bangladesh is in
progress at the Bangladesh Rice Research Institute.
Use of biofertilzer in Bangladesh agriculture could not yet make any significant
contribution. BARI and BINA have been experimenting with different crop
specific biofertilizers since 1980. Some of the biofertilizers proved useful for
chickpea, lentil, mung bean, groundnut and soybean, which is quite evident from
Table 8. Their contribution to yield increases range from 5 to15% where the native
population of the microbes is low.
Effect of rhizobial inoculums and chemical fertilizers on the seed yield of
lentil (BARI 2008)
In addition to Rhizobia, there are free-living microorganisms like Azotobacter,
Clostridium, and Azospirilum in or on soils that can fix atmospheric nitrogen.
There is also a group of organisms known as blue -green algae that fix atmospheric
nitrogen. N fixed by these organisms play a significant role in meeting the nitrogen
requirement of our crop plants.
The farmers of Bangladesh could not harvest additional yield advantage of crops
due to use of plant growth regulators, although the role of growth regulators in
various physiological and biochemical processes is well known. Growth
regulators are reported to influence seed germination, vegetative growth,
nodulation, tuberization, flowering, fruit and seed development, fruit ripening and
yield. The studies of Wahida et al.(2006) have confirmed this (Table 9).
Soil testing service in Bangladesh is weak and not satisfactory up to the standard,
Use of biofertilizers
Table 8
Use of Plant Growth Regulators (PGR)
Soil testing service
as one could have expected after installing all modern equipments and instruments
at all the laboratories. SRDI and the soil laboratories at the NARS institutes
provide soil-testing services to the farmers at limited scale, although SRDI's 15
regional laboratories located at different parts of the country are designed to
analyze at least 75000 samples of the farmers.
The Department of Agricultural Extension with a view to provide soil-testing
service to the farmers has procured 460 soils testing kits and distributed among
428 upa-zilas (sub-districts), 20 nurseries and 12 ATIs. After initial runs with the
supplied chemicals all the kits now become nonfunctional for want of consumable
chemicals and operational funds.
Bangladesh has great diversity of soils. Except calcareous floodplain and coastal
saline soils, all other soils are slightly to strongly acidic. Strongly acid soils are not
productive soils. Very strongly acidic soils have been identified from acid sulphate
and brown hill areas. Red soils of Madhupur and Old Himalayan Piedmont plain
soils in northwestern part of Bangladesh have also been rated as strongly acidic.
Because of the increasing cropping intensity and fertilizer use during the last two
decades, the acidity has gone up unexpectedly. From every harvest, the crops take
up lots of calcium and magnesium. As a result, acidity in these soils is increasing
day by day. For every 100 kg use of urea, 74 kg calcium carbonate is needed to
reduce the acidity. Application of lime to the soils depends on the intensity of
active acidity.Acid Brown Hill soils and Old Himalayan Piedmont Plain soils need
dolomite lime to reduce acidity and correct magnesium deficiency. The liming has
a favourable effect on the yield of maize on these soil (Table 10)
Liming
Treatment Yield (t ha )
2006-07 2007-08
N P K S Zn 1.77c 1.75b
N P K S Zn 1.94b 1.65c
N P K S Zn +Inoculum 2.22a 1.86a
Farmer's practice (N P K ) 1.73c 1.56d
CV (%) 4.5 10
-1
24 22 42 20 5
50 22 42 20 5
22 42 20 5
20 12 17
50
Treatments No. of fruitsplant plant (gm) (%) vigor
Distilled water 71.0 d 146.6 d 65.0 d 275.5 d10ppm Naa 136.3 a 277.8 a 92.0 a 589.1 a50 ppm Naa 91.3 c 176.4 c 82.0 bc 522.5 ab100 ppm Ethophone 107.7 b 221.1 b 67.0 ab 518.8 ab500 ppm Ethophone 112.3 b 206.0 bc 79.0 c 409.5 bc1000 ppm KNap 104.3 b 202.0 bc 78.0 c 254.1 d5000 ppm KNap 103.7 b 189.4 c 79.0 c 358.6 cdLSD (0.05) 10.19 29.65 7.14 129.9CV (%) 5.61 8.35 5.05 13.73
Fruit yield Germination Seedling-1 -1
Table 9 Yield and seed quality of chili ( L.) as affected by
different growth regulators.
Capsicum annum
532 533

Table 10
Future nutrient management challenges
The response of maize to liming in Old Himalayan Piedmont Plain soils
(BARI, 2008)
Liming has many favorable functions in the soils. It increases nitrogen and
phosphorus availability, makes potassium more efficient, furnishes calcium and
magnesium for plant nutrition, encourages activity of beneficial bacteria and
reduces the harmful effects of aluminum. Liming also improves the physical
conditions of the soils by decreasing its bulk density, increasing its infiltration
capacity and increasing its rate of percolation.
An overview of the soil fertility issues described above has shown that there exists
tremendous opportunities to build a poverty and hunger free Bangladesh if the
fertilizer use technology developed by the NARS institutes is disseminated. The
soils of Bangladesh are continuously being depleted because of increasing
cropping intensity. If appropriate measures are not taken to correct the
deficiencies, the soil resources will be degraded. Under such situations,
production program of agricultural crops to a level that will ensure food security
will be jeopardized. Environmental pollution due to fertilizer use would be
minimum if proper methods of soil fertility management were adopted. The
following short-term and log-term actions should be undertaken to maintain soil
health at a productive state.
Short-term actions
Short term actions include the application of balanced fertilizers to crops
/cropping system, site specific fertilizer application through soil testing/leaf color
chart, application of USG and UMG to increase efficiency of nitrogen, sufficient
application of potash fertilizers to arrest it's mining, strengthening activities of soil
fertility and fertilizer management project, production, marketing and distribution
of compost, farmyard manure, vermin-compost, bioslurry etc, increasing uses of
mixed and DAP fertilizers, undertaking action program for quality control of
fertilizers, introduction of pulse crops/sesbania in between two rice crops,
introduction of jute in wheat-fellow-rice pattern.
Long-term actions
Includes strengthening Integrated Soil and Fertilizer Management Program,
strengthening Coordinated Soil Test Response Studies and strengthening IPNS
approach and establishment of IPNS school for the farmers
Timely supply and availability of fertilizers at reasonable prices at the doorsteps of
the hard working farmers in the country can only ensure proper nutrient
management that is very much needed for the depleted soils for optimum supply of
nutrients for successful crop production and maintenance of soil health.At present
more than 4 million tons of chemical fertilizers pricing to over US $ 10,000
millions are being used along with 70 million tons of organic manure. The use
efficiency of the chemical fertilizers is low and unsatisfactory because of
imbalanced or under use/ over use resulting in huge wastage which the country
cannot afford. Therefore, the practice of balanced fertilization should receive top
priority to sustain/increase crop productivity when food security is so crucial for
poverty stricken people, when the country is facing challenges of increasing
population and shrinking natural resources including agricultural land and also
when there exists big gap between research and farmer's yields.
s
BARI (2008) Annual research report, 2007-08. Division of Soil Science,
BangladeshAgricultural Research Institute, Gazipur
BER (2008) Bangladesh economic review, Ministry of Finance, Government of
Bangladesh
BRRI (2009) Annual research review, 2007-08. Bangladesh Rice Research
Institute, Gazipur
DAE-SFFP (2002) Seminar on soil health management: Department of
Agricultural Extension-Soil Fertility and Fertilizer Project Experience
Islam MS (2006) Soil fertility issues in Bangladesh, EU Food Security
Identification and Formulation Mission, Dhaka, Bangladesh
Islam MS, Khan MS, Sen R, Hossain K M, Noor S, Islam, MS (2008) Effect of
Grameen Shakti Jaibo Sar on the yield and yield components of tomato.
Bangladesh JAgric Environ 4(2): 1-9
Khan MS, Shil NC, Noor S (2008) Integrated nutrient management for sustainable
yield of major vegetable crops in Bangladesh. Bangladesh JAgric Environ 4:
Conclusions
Reference
Lime applied (t ha ) Maize grain yield (t ha )
Lalmonirhat location Patgram location
0 6.29b 6.46b-1 - 7.45a2 8.35a 7.92a-3 - 7.52aCV (%) 7.65 10.69
-1 -1
534 535
81-94
Parul SA (2008) Determination of optimum N-dose of BRRI dhan29 using Leaf
Color Chart. PhD Thesis, Department ofAgronomy, BangladeshAgricultural
University, Mymensingh
Wahida S, Fattah QA, Islam MS (2006) Yield and seed quality of chili (
L.) as affected by different growth regulators. Bangladesh J Bot 35:
195-197
Capsicum
annum
Proceedings IPI-OUAT-IPNI International Symposium (2009)
ZAhmad
Engro Chemical Pakistan Limited, e-mail [email protected]
SM Mian
Director Soil Fertility Research Institute, Punjab, Pakistan
e-mail : [email protected]
Increasing crop productivity through judicious use of
potash in Pakistan
ZAhmad SM Mianl
l l
Agricultural lands of Pakistan once considered adequately supplied with
potassium (K) for crop production are fast losing their soil test K levels due to
continuous cultivation of crops without K application. Many crops now respond to
K application while its application rate is negligible compared to nitrogen (N) and
phosphorus (P). It has been estimated that soil test K levels have declined in
various cropping systems ranging from 7 to 49%. Public and private sector
stakeholders have joined hand for promoting K use, while its high price, relatively
low response in majority of crops and lack of quality premium for growers of cash
crops are main constraints in popularity of K application among farmers. On the
other hand, crops varied widely in response to K application, ranging from meager
one percent in case of maize grown in Rainfed Zone to 30% in case of potato sown
in Central and Rice Zones. There is need to intensify extension activities in
creating awareness for K use among farmers while government need to subsidize
potash fertilizers to sustain crop productivity and soil fertility in Pakistan.
Crop productivity potash depletion soil testing
Abstract
Keywords
Introduction
Agriculture provides livelihood to about two-third of country's population while
majority of farming units are of only subsistence size and about 80% of farmers
have less than 5 hectare (Ha) of land. Such distribution of farming land is the main
reason behind overall cropping pattern of the country whereby food crops (wheat,
rice, maize etc.) occupy 54% of total cultivated area while cash crops (cotton,
sugarcane, potato etc) constitute only 20% (Government of Pakistan 2007). In
other words, agriculture is mainly taken as a source to ensure food grain for the
family throughout the year, and enough surplus to use as exchange for menial
services. Lack of progressive approach in agriculture led to unscientific use of land
and other inputs such as fertilizers resulting in average crop yields lower than
536 537

world average by 20-30% and lower by 40 to 50% than their genetic potential as
realized by progressive growers (Malik 2008).
Most of cultivated soils of Pakistan have developed from micaceous alluvium
– a rich source of potassium (K), and are supposed to have sufficient supply of
potassium for optimum plant growth (Bhatti 1978; Mehdi et al. 2001). The need
for K is not as widespread as for nitrogen (N) and phosphorus (P), probably due to
dominance of hydrous mica in the clay fraction (Ranjha et al. 1993). Recent
studies, however, have shown that certain crops grown in wide range of agro-
climatic conditions in Pakistan needed K addition to realize the optimum (95% of
the maximum attainable) and / or maximum (99% of the maximum attainable)
yields (Ahmad et al. 2000). This might have been the result of K mining due to
introduction of high yielding varieties in 1960s coupled with increased use of N
and P in subsequent years, while K use was not popularized due to lack of response
in most crops (Mian and Ahmad 2007). Almost all soils are deficient in N mainly
because of arid to semi arid climate leading to high oxidation rate of organic
matter, about 90% soils are low to medium in Pand around 50-60% are deficient in
potassium (Ahmad 2008). Although the fertilizer use in Pakistan is about 130 kg
per ha per annum, it is lopsided towards N with respect to P and K (Ahmad 2008).
Current N:P:K application ratio (10.0:2.7:1.0) is highly imbalanced with respect
to the desired ratio of 10.0:5.0:1.0. The main reason for this imbalance is price
parity in case of N compared to Pand K. The K lags far behind in this race, which is
expected to have negative impact on crop yields, quality of produce, and
sustainability of soil fertility of agricultural lands. According to an estimate, soils
test K level in Punjab province which is the main agricultural state contributing
about 70% to overall agricultural productivity of the country, have declined at
average annual rate of 3 mg per kg during last 15 years (Mian and Ahmad 2007).
This means a decline of about 60 mg per kg K from Punjab soils during last two
decades, and resultantly, soil test K levels once considered adequate for plant
growth are now nearing the deficiency threshold (Mian et al. 2009).
Public as well as private sector organizations are working hand in hand for
promoting balanced use of fertilizers in the country, especially with respect to K,
to avoid further loss of soil fertility and overall agricultural productivity. During
recent years, extensive research and extension work was carried out to fulfill this
objective.
Changing patterns of soil test K
Soil Fertility Research Institute, Punjab (SFRIP) has the mandate to monitor soil
fertility levels of agricultural lands in the Punjab province, and to conduct
experiments for studying crop responses to applied nutrients. Based on these
Soil testing and crop response calibration studies
studies, fertilizer recommendations for various crops are formulated and
forwarded to growers through extension workers of public and private sectors.
In a bid to assess changing pattern of soil test K levels, data from samples
analyzed for advisory purpose to farmers from two particular years i.e. 1990 and
2005 were used (Table 1). Whole of the province was segregated into four agro-
ecological zones: Rainfed Zone comprises of northern parts of the province where
rainfall is the only source of moisture for crops, and the cropping pattern consists
of wheat during winter and maize during summer. Rice Zone consists of irrigated
north-eastern parts of the province famous for the production of fine rice during
summer while wheat remains the main winter crop. The Central Zone comprises of
central irrigated districts of the province where wheat is the major winter crop
while other crops include maize, sugarcane, potato, pulses and fodders. The
Cotton Zone falls in southern parts of the province where wheat-cotton is the
major crop rotation.
Soil test potassium (mg kg ) in various crop zones of the Punjab through
1990 to 2005.
A consistent decline was evident in soil test K levels in all cropping systems
ranging from 7 to 49% in the order of Central > Rice > Cotton > Rainfed (Table 1).
The fifteen years of continuous cropping caused K levels of Rice and Cotton
Zones to slide down from high K level category to medium category, considering
180 mg per kg as the threshold (Akram et al. 1994). Although soils of Central
Zone are still categorized as high in K levels, a decline of 49% during thirteen
years is alarming, and may cause soils to become deficient in K soon if potashic
fertilizers are not given their due share in farmer input practices. The trends are
explainable in the light of farming practices of the zones. Rainfed zone is
characterized by very low cropping intensity (about 50%) and low crop yields, due
to unavailability of irrigation water – thus resulting in minimum decline of soil test
K levels. Rice and Cotton Zones, on the other hand, are characterized by a
cropping intensity of about 130% while crop yields are also higher than in Rainfed
Zone. Food crops are predominantly grown and farmers have tendency of low P
and no K application because of nutrient price factor. In Central Zone, fertilizer
addition per hectare is higher than other three zones on comparative basis
Table 1-1
Zone 1990 2005 Per cent
No. ofsamples
Rainfed 1500 114 34 1550 106 21 7Rice 1400 176 71 1645 132 90 33Central 2670 295 153 3200 198 83 49Cotton 1658 210 15 2280 165 32 27
Mean SD No. of Mean SD decreasesamples
538 539

(Government of Pakistan 2007). A high cropping intensity coupled with multi
cropping system including exhaustive crops like potato and maize may be the
cause of K-depletion at higher rate in Central Zone.
The high values of standard deviation (SD) of the data is due to extreme low or
high values. These extreme values may impart a dragging effect on mean values,
and thus could paint a different picture of the distribution of K level in test Zones.A
model site, therefore, was selected at Sultanke, Lahore for monitoring changes in
soil test K levels on six monthly intervals for a period of thirteen years starting
from 1990-91 (Fig. 1). During this time period, normal rice-wheat cropping was
practiced by applying only N and P, as per farmers' practice of that area. This site
also depicted a declining trend in soil test K level and since 1998, remained
consistently below 180 mg kg , which is considered as the threshold in
categorizing the soils into responsive and non-responsive and confirmed by
predicting wheat and rice responses to applied K (Akram et al. 1994). It can also
be observed that rate of mining K from soil was rapid once it crossed the critical
limit.
Soil test K at model site (Sultanke, Lahore) during 14 years (1990-2003)
Crop responses to applied K
Yield data of field experiments conducted throughout the Punjab during 2004-
2005 were used to fetch response magnitude of major crops to applied K. These
experiments were conducted under the auspices of SFRIP, laid out according to
randomized complete block design (RCBD) on farmer fields by applying N and P
at rates recommended for these crops byAgriculture Department.
The results of 514 replicated trials envisaged 5-6% response in case of wheat
-1
Fig. 1
to the application of 120 kg K O ha in all four cropping Zones. Consistency of
wheat response to K addition across zones indicates that soil properties like types
and amounts of clay were almost identical in these zones for K release to wheat.
Maximum response of rice to applied K (6%) was observed in Rice Zone, with the
application of 120 kg K O ha . In Central and Cotton Zones, 150 kg K O ha was
required to maximize the response, which indicated that soils and climatic
conditions of these Zones are not to the mark of suitability for rice. In the Punjab,
cotton is grown on diversity of soils with varied levels of soil test K, in Central and
typical Cotton zones. The results of 165 field trials conducted in Cotton Zone and
44 in Central Zone indicated 1.3 times higher seed cotton production in Cotton
Zone than in Central Zone. Response magnitude due to 120 kg K O ha was also
higher (8%) in Cotton Zone than 6% in Central Zone. Maize responded well to K
application at the rate of 150 kg K O ha in Central (8%) and Cotton (12%) zones,
while the magnitude of response was lower (4%) in Rainfed Zone.
The demonstration trials on farmer fields during 2005 to 2008 conducted by Engro
Chemical Pakistan Limited (ECPL) on potato and Sugar industry on sugarcane in
Rice and Central Zones indicated that both these crops respond positively to K
application in terms of yield while quality of sugarcane crop measured in terms of
sucrose contents also improved (Table 2). The economics of K application also
proved beneficial for growers as realized by calculating value:cost ratio, which
ranged 1.5 to 3.3 in case of sugarcane and 2.5 to 7.8 in case of potato in these trials.
Sugarcane and potato response to applied K at farmer fields.
Both public and private sectors are doing extension work for promoting K use on
crops in Pakistan. Fertilizer industry being a major stakeholder in agriculture
sector and few other agro based industries especially sugar industry and fruit
exporters (being direct beneficiaries of improved produce quality) are major
players in private sector promoting balanced fertilizer use including K. Jointly
2
2 2
2
2
-1
-1 -1
-1
-1
Response of potato and sugarcane to applied K
Table 2
Extension services for promoting K usage at farm level
0
50
100
150
200
250
300
1 3 5 7 9 11 13 15 17 19 21 23 25 27
Six monthly intervals
K (
mg
kg
)-1
K Sugarcane Potato
application No. oftrials yield (t ha ) (percent) trials yield (t ha )
0 K 34.60 8.40 13.59
+ K 40.39 8.95 17.66
Average Sucrose No. of Average
15 21
-1 -1
540 541

with Public Sector Extension Departments, these organizations reach farmers
through mass and individual contacts such as farmer gatherings, seminars,
demonstration plots, and group discussions, promotional print materials, print and
electronic media etc. In addition, institutions those purchase farmer produce at
harvest such as sugar and cotton industries and financial institutions like banks
extend credit facilities to growers in their areas for purchase of fertilizers. These
institutions influence farmers' choice of nutrients to be added by offering 'credit in
kind' instead of 'credit in cash'.
There are, nevertheless, many constraints in promoting K application among
farmers in a country like Pakistan where majority of farmers are doing subsistence
agriculture. Unpredictable produce prices in case of rice and wheat, lack of
quality premium for farmers in cash crops like sugarcane, cotton, vegetables and
fruits, and ever increasing prices of P and K fertilizers in international market are
few important factors restricting K use in Pakistan.
Recent focus on promoting balanced use of fertilizers especially K at all levels has
resulted in increased awareness among farmers on its importance. Economical
reasons, nevertheless, often act as the driving force behind decision making by the
farmers on choice of inputs to be applied to a crop. There is a need to enhance the
momentum of K acceptability by common growers so that rate of K mining from
agricultural lands can be checked. In the wake of unprecedented price increase of
K fertilizers during last two years (2008-09), it is imperative to subsidize these
fertilizers as is the case in many developing countries such as India and Iran.
Marketing system of agricultural products need to be tuned on the basis of produce
quality, especially in case of cash crops. There is likewise need to reduce margins
earned by middle men in the markets so that farmers get rightful benefits of their
inputs. Fertilizer recommendations for at least cash crops, which are grown by
progressive growers need to be tuned on soil test basis rather than giving
generalized or Zone based recommendations. A web based system developed by
SFRIP may help achieve this objective while their network of laboratories may
provide testing facilities to interested farmers.Agro based industries such as Sugar
Industry should involve itself more in research and development than just giving
loans to growers. Fertilizer Industry should ensure availability of easy, economical
and viable options such as tailor made blends of nutrients for various soils, crops
and categories of farmers at all times.
Ahmad N (2008) Fertilizer use practices in Pakistan. In: Hamid A, Jalil A (ed)
Balanced Fertilizer Use: Impact on Crop Production. Proc Symp National
The way forward
References
Fertilizer Development Center, Islamabad, Pakistan. pp 65-71
Akhtar ME, Saleem MT, Stauffer MD (2003) Land use and crop production. In:
Potassium in PakistanAgriculture. PakAgri Res Council, pp 8-14
Bhatti HM (1978) Review paper on potash, micronutrients and rhizobium. In:
Tech Bull, PakAgri Res. Council, Islamabad. pp 1-56
Government of Pakistan (2007) Agri statistics of Pakistan, 2006. Ministry of
Food,Agriculture and Livestock, Islamabad
Malik KA (2008) Welcome address and symposium objectives. In: Hamid A, Jalil
A (eds) Balanced Fertilizer Use: Impact on Crop Production. Proc Symp
National Fertilizer Development Center, Islamabad, Pakistan. pp 1-7
Mehdi SM, Ranjha AM, Sarfaraz M, Hassan G (2001) Response of wheat to
potassium application on six soil series of Pakistan. J Biol Sci 1(6): 429-431
Mian SM, Ahmad Z (2007) Potassium scenario in Pakistani Punjab. In: Proc
international symposium on balanced fertilization for sustainable crop
productivity. PunjabAgri Univ Ludhiana, India, Vol II, pp 428-429
Mian SM, Ali I, Shaheen K (2009) Annual progress report, Soil Fertility Research
Institute, Punjab, Lahore Pakistan.
Ranjha AM, Mehdi SM, Qureshi RH (1993) Clay mineralogy of some selected
soils of Indus Plains. Pak J Soil Sci 8: 3-7
542 543

Proceedings IPI-OUAT-IPNI International Symposium (2009)
J Timsina,International Rice Research Institute (IRRI)-International Maize and Wheat Centre(CIMMYT), IRRI-Bangladesh Office, Banani DOHS, Dhaka 1206, Bangladesh;e-mail: [email protected] JatIRRI-CIMMYT, NASC Complex New Delhi-110 012, IndiaK Majumdar,International Plant Nutrition Institute (IPNI), India Programme, 354, Sector-21, Huda,Gurgaon 122016, Haryana, India
Presented at IPI-OUAT-IPNI International Symposium.Published in Plant Soil 2010.335:65-82. Printed here with permission from Plant Soil
Rice-maize systems of South Asia: Current status,
future prospects and research priorities for nutrient
management
J Timsina ML Jat K Majumdar
Abstract
Keywords
l l
l l l l
Rice ( L.) and maize ( ) are grown in 3.5 million
hectares (Mha) inAsia that includes 1.5 Mha in SouthAsia. These crops are grown
in sequence on the same land in the same year either in double- or triple-crop
systems to meet the rice demand of a rapidly expanding human population and
maize demand of livestock and poultry. The objective of this review is to provide a
comprehensive overview of the current state of technical knowledge on
agro-ecosystems and adaptation, area and distribution, yield potential and yield
gaps, and nutrient management for rice-maize (R-M) systems in SouthAsia. Rice-
maize systems are emerging all around SouthAsia but in particular are developing
quite rapidly in Bangladesh and South and North India. Yield potential of rice and
maize, as estimated by ORYZA2000 and Hybrid Maize models, reaches up to 15
and 22 t ha , respectively. However, data from several environments in India
reveal gaps between potential and attainable yields of maize of upto 100%
and between attainable and actual yields of upto 25-50%. Nutrient demand of R-M
system is high due to high nutrient removal by high-yielding maize. Nutrient
balance studies for these highly-productive and nutrient-extractive systems are
scarce in SouthAsia. The review outlines principles of nutrient management for R-
M systems, and identifies development, refinement, and dissemination of the
integrated plant nutrition system technologies based on site-specific nutrient
management principles as priorities for future research to increase yield,
profitability, and sustainability of R-M systems.
Rice-maize yield potential yield gaps SouthAsia integrated plant
Oryza sativa Zey mays
-1
544 545

nutrition system Site-Specific Nutrient Management
Rice, maize, and wheat are major cereals contributing to food security and income
in South Asia. These crops are grown either as a monoculture or in rotations in
tropical and sub-tropical environments of South Asia. In the irrigated and
favorable rainfed lowland areas, rice-rice (R-R), rice-wheat (R-W), and rice-
maize (R-M) are the predominant cropping systems. Rice-rice is common in
tropical climate with distinct dry and wet seasons such as in South India, and in
sub-tropical areas with mild cool winter climate such as in Bangladesh, Eastern
India, and Eastern Nepal. Rice-wheat systems are extensive in the sub-tropical
areas of the Indo-Gangetic Plains (IGP) of Bangladesh, India, Nepal, and Pakistan
(Timsina and Connor 2001) while R-M systems exist in all climate ranging from
tropical to sub tropical to warm temperates (Timsina et al. 2010). Rice-maize
systems, however, are less extensive as compared to R-W or R-R if total area under
these cereal systems is considered. There are mainly three cropping seasons in S.
Asia: summer or or (or called or in Bangladesh)
from June/July to Sept/Oct, or winter from Oct/Nov to Feb/Mar, and spring or
or (or in Bangladesh) from Mar/Apr to
May/June. Rice (called transplanted or T. in Bangladesh) is the main
crop in summer while a wide range of crops, including rice (called in
Bangladesh, eastern India and eastern Nepal), wheat, maize, winter pulses
(chickpea, lentil, field peas), potatoes, and mustard are grown in or winter
season. In the or spring season, short-duration crops such as maize, pulses
(mungbean, cowpea), and rice (called aus in Bangladesh) are grown. All the three
major double-crop systems (R-R, R-W, R-M) often include an additional crop
such as potato, lentil, chickpea, mustard, etc. in and jute, maize, rice,
mungbean, cowpea, etc. during or spring season (Table 1).
Much is known about rice and maize production systems separately in South
Asia. Also, the other two important systems, R-R and R-W, have been researched
and reviewed rigorously (for example, see Timsina and Connor 2001 for a
comprehensive review of R-W system). Research on R-M system, on the other
hand, did not receive any priority until recently. Consequently, there are only a few
published papers in scientific journals, and no critical review papers on any
aspects of the R-M systems.
Rice-rice systems differ completely from R-W or R-M systems because in the
former both crops are grown under flooded conditions, so root development and
water and nutrient dynamics would be similar to both rice crops. In contrast, due to
similar growing conditions and altered soil hydrology from flooded rice to non-
flooded wheat or maize, R-M and R-W systems would face similar soil physical
environment as both wheat and maize roots could break plow pans and roots could
l
Introduction
kharif monsoon kharif-II aman
rabi
pre-kharif pre-monsoon kharif-1
aman aman
Boro
rabi
kharif-1
rabi,
kharif-1
grow deeper in the profile. Hence, the soil physical and structural properties under
R-M system would be fairly similar to that under R-W system. Timsina and
Connor (2001) have critically reviewed the soil physical and chemical properties
and associated management for alternating wetting and drying environments of R-
W system that could be well applied to R-M system as well. However, in contrast
to wheat which is grown only in season, maize is also grown during pre-kharif
or (spring) and (summer) seasons, especially under rainfed
situation. While maize is generally grown in uplands or higher landscape
fields maize is grown in low-lying rice fields. Hydrology and transient
water logging of maize would vary between and the two seasons. In
maize the risk of water logging occurs during emergence and seedling
establishment while during water logging risk due to pre-monsoon
rainfall occurs during reproductive stage. In addition, crops could also be
damaged by heavy storms accompanied by the pre-monsoon rainfall. Transient
water logging due to heavy rainfall and heavy storms could be more damaging
then transient water logging during establishment of maize. Both water
logging events could, however, alter soil hydrology and nutrient dynamics both
during water logging and during drying following water logging. Such altered
hydrology could also bring changes in soil-borne diseases and insects and weed
ecology and weeds abundance. Breeding for tolerance to transient water logging
for maize would be necessary for successful growing of maize in both and
seasons. Conservation agriculture (CA) based agronomic practices such
as raised beds and reduced tillage would be potential options help alleviate the risk
of water logging in both seasons.
One aspect of R-M system that is different from R-W or R-R system is that the
rabi
kharif-1 kharif
kharif
kharif-1
rabi kharif
rabi
kharif-1,
kharif-1
rabi
rabi
kharif-1
Cropping
system Bangladesh India Nepal Pakistan
Rice-rice 4.50 4.70 0.30Rice-rice-rice 0.30 0.04Rice-wheat 0.40 9.20 0.57 2.20Rice-maize 0.35 0.53 0.43 NAMaize-wheat 1.80 0.04 1.00Rice-pulses 3.50Rice-vegetable 1.40Millet-wheat 2.44Rice-potato 0.30 NACotton-wheat NA 3.10
Areas exist but data not available
Area (Mha)
a
a
Table 1 Area (Mha) under major cropping systems in four south Asian countries
(Source: modified and updated from JK Ladha, unpublished data)
546 547

nutrient extraction and nutrient drawdown from R-M system would be much
greater due to higher yield of maize. High-yield maize crops would require higher
amounts of nutrients than that would be required for rice or wheat. Hence, if
fertilizers are not added as per the requirements for high target yield of maize there
is a possibility of nutrient mining. Realistic nutrient drawn (especially P and K)
factors could be derived for each soil and crop growing environments whereby
yield could be optimized and profit could be maximized without substantial
mining of nutrients from the soil (Buresh et al 2010). At present, there are no
literatures on these aspects of R-M systems. Research is required to understand the
various aspects of R-M systems that would improve the productivity, profitability,
and sustainability of these systems in SouthAsia.
The magnitude and intensity of R-M systems in the region depend in part upon
soil and climate but, more importantly, on the socio-economic circumstances of
the farmers, demand of maize by livestock (especially poultry) sector, and
domestic and international markets of maize for food, feed and fuel industries. It
should also be noted that the R-M systems are also prevalent in Indonesia and
common in China and Vietnam but published literatures are lacking. The objective
of this review is to provide the comprehensive overview of the current state of
technical knowledge in relation to agro-ecosystems and adaptation, area and
distribution, yield potential and yield gaps, and nutrient management of R-M
systems in South Asia. The review is based on the existing, limited published and
unpublished literature on R-M systems, focusing on nutrient management. The
review highlights the issues and priorities for future research on R-M systems in
general, and for nutrient management in particular. Separate reviews could be
justified for R-M systems in East and Southeast Asia as well as on the socio-
economic issues and value chain analysis of rice and maize in relation to nutrient
and fertilizer management for these systems.
Rice-maize systems are distributed all over South Asia but more particularly in
Bangladesh, India, Nepal, and Pakistan (Timsina et al. 2010). Dynamics of the
area and productivity of R-M systems in different countries depend on the
dynamics of area and yield per hectare of rice and maize in those countries. FAO
statistics indicate small increases in rice area in the above four south Asian
countries from 1976 to 2006 but the rice production more than doubled due to
increase in average yield over the same period. Maize area increased dramatically
in Bangladesh, Nepal, and Pakistan but slowly in India. However, production in all
countries increased substantially due to increase in area as well as yield per hectare
with the use of maize hybrids (www.faostat.fao.org). FAO statistics for fertilizer
use for the three major cereals (rice, maize, wheat) over the same period reveal that
the trend in consumptions of N fertilizer is highest followed by P and K fertilizers.
Distribution of R-M systems and fertilizer use in SouthAsia
Fertilizer consumption in India and Bangladesh increased steadily since 1961
until recently but that in Nepal and Pakistan was variable (www.fao.org/site/575/
default.aspx). There are common concerns of imbalanced fertilizer use (i.e., very
high use of N, less use of P, and negligible use of K, S, and micronutrients), soil
nutrient mining, and soil organic matter and soil fertility decline (FAO 2006) in all
the four countries.
Yadav and Rao (2001) identified the main maize-based cropping systems in
irrigated and rainfed conditions in different agro-climatic regions of India.
Cropping systems with rice and maize together in the system are presented from
their study in Table 2. The Planning Commission of India has delineated country in
15 broad agro-climatic regions based on physiography and climate, and R-M
systems are prevalent in all agro-climatic regions, especially in the IGP (Pandey et
al. 2008; Gill et al. 2008a,b). Pandey and Sud (2007) and Singh et al. (2008) also
showed prevalence of maize in potato- and rice-based systems in different agro-
ecological regions of India. Likewise, R-M systems have been highly intensified
and diversified all over Bangladesh. Even within a small district of Bogra in
northern Bangladesh, for example, several forms of R-M systems exist with the
Agro-climatic region Cropping system
Irrigated Rainfed
Eastern Himalayan Summer rice-maize- Sesame-rice+maize
Lower-Gangetic Plain Autumn rice-maizeJute-rice-maize
Upper-Gangetic Plain Rice-potato-maizeEastern Plateau & Hills Rice-potato-maizeSouthern plateau &Hills region Rice-maizeEast Coast Plain andHills region Maize-rice
Rice-maizeRice-rice-maize
West Coast Plain andHills regionGujarat plains andhills regionIsland region Rice-maize Maize-rice
Rice-maize + cowpeaRice-maize-urdbeanRice-rice-maize
regionmustard
region Rice-maize
regionregion
Maize-rice
Rice-maize-pearl millet Rice-maize + cowpea
Rice-maize Rice-maize
Rice-maize
Table 2 Main cropping systems involving rice and maize in different ago-
climatic zones of India (Source: modified fromYadav and Rao 2001)
548 549

use of diverse maize hybrids (Ali et al. 2008; 2009).
Timsina et al. (2010) have identified four main R-M agro-ecosystems with four
broad climates inAsia, of which three exist in SouthAsia (Table 3). The first agro-
ecosystem (tropical, warm, semi arid, no winter) includes locations in southern
India with tropical monsoon with a longer dry season. In this agro-ecosystem, both
rice and maize are not limited by low temperature and can be grown all year round.
Here either the fallows after rice are replaced by a maize crop, or the existing areas
under rice-rice-maize and rice-maize-maize systems are increasing in acreage.
The second agro-ecosystem (sub-tropical, sub-humid, warm summer, mild cool
winter) includes locations in Bangladesh, Nepal, and northern India. In this agro-
Rice-maize agro-ecosystems inAsia
ecosystem, winter is mild cool so rice maybe limited by low temperature. Maize,
however, will perform well due to mild cold winter and long grain-filling period
and can replace wheat or Boro rice. The third agro-ecosystem (sub-tropical to
warm temperate, sub-humid, warm summer, mild to severe cold winter) has been
classified into 2 sub-classes, and includes areas in north and northwest India, Terai
and hills of Nepal, and Punjab and Sindh provinces in Pakistan. In this agro-
ecosystem, both rice and maize can be limited by low temperature and hence can
not be grown for sometime in winter. In all the agro-ecosystems, due to decreased
availability of irrigation water, some areas under rice, cotton, and sorghum in
summer are already or will likely be replaced by a summer maize crop.
Excluding China and Pakistan for which exact data for R-M area are not available,
R-M systems currently occupy approx. 3.5 Mha in Asia (Timsina et al. 2010).
Excluding Pakistan, area under R-M systems is 1.31 Mha in SouthAsia (Table 4).
The highest acreage is in India followed by Nepal. The absolute area under R-M
system is less in Bangladesh compared to other south Asian countries but it is
increasing rapidly over the past 5-6 years (Ali et al. 2009). Rice-maize systems are
practiced mostly in the south (Andhra Pradesh, Tamil Nadu, and Karnataka) and in
the northeast (Bihar and West Bengal) parts of India with an acreage of more than
0.5 Mha (Table 5). Andhra Pradesh has the highest acreage under R-M system in
South India where this system is rapidly increasing under resource-conserving
technologies, mostly zero tillage (Jat et al. 2009). Of the four south Asian
countries, R-M systems are rapidly spreading in South India and Bangladesh,
driven by the rising demand for maize, especially by poultry sector, and tightening
world export-import markets. The recent development of short-duration rice
varieties and maize hybrids with improved drought tolerance is also providing
opportunities for the expansion of R-M systems into areas of South Asia with
insufficient irrigation or rain for continuous rice cultivation.
Why R-M systems are important in SouthAsia?
Key features Current systems Emerging Key examples
1. Tropical, warm, semiarid, no winter
Tropical monsoon with longerdry season; both rice and maizenot limited by low temperaturesand can be grown all year round
2. Sub-tropical, subhumid, warm summer, mild cool winter
Sub-tropical monsoon with coolwinter and summer rainfall; ricebut not maize maybe limited bylow temperatures
E
3. Sub-tropical to warm temperate, subhumid, semiarid, warm summer, mild to severe coldwinter
3.1. Sub-tropical monsoon withcold winter and summer rainfall;both rice and maize limited bylow temperatures and can't begrown for some time in winter
3.2. Sub-tropical to warmtemperate, semiarid, with hotsummer and cool to cold winter;very low rainfall; both rice andmaize limited by lowtemperatures and can't be grownfor some time in winter
systems
Rice-rice Rice-maize Cauvery Delta (TamilRice-rice-pulses Nadu), Karnataka and
A.P., India
Rice-wheat Rice-maize Central, western, andRice-rice- NW Bangladesh;
Rice-Boro rice maize Eastern Terai, Nepal;Rice-potato- West Bengal,maize astern UP and Bihar,
India
Rice-wheat Rice-maize North and NW India;Central and westernTerai and mid-hills,Nepal
Rice-wheat Rice-maize Punjab and Sindh,Cotton-wheat Rice-potato- PakistanSorghum-wheat maize
Table 3 Key emerging R-M agro-ecosystems in South Asia (Source: modifiedfrom Timsina et al. 2010)
Country Area (Mha)
Rice Maize R-M
India 43.4 7.80 0.53Bangladesh 10.5 0.38 0.35Nepal 1.6 0.90 0.43
Total 55.5 9.08 1.31(exc. Pakistan)
Table 4 Current areas (Mha) under R-M systems in SouthAsia (Source: modified
from Timsina et al. 2010)
550 551

Drivers of change from other systems to R-M systems
Among the three competitive crops ( rice, maize, wheat) in the season in
Bangladesh, maize has clear superiority over the other two crops. Though hybrid
maize requires high input, especially nutrients, it has a very high output that makes
it over twice more profitable than wheat or rice (Ali et al. 2008; 2009). Maize
also requires far less water than rice and produces consistently much higher
yield than rice and wheat. In particular, wheat is often vulnerable to
temperature fluctuation resulting in shriveled grains and poor yield. Besides,
maize has fewer pest and disease problems than rice and wheat.
Maize needs around 850 l water per kg grain production (with 2-4 irrigations)
compared to 1,000 l kg wheat grain (1-3 irrigations) and over 3,000 l kg rice
grain (with 20-35 irrigations) for rice (Ali et al. 2009). The high financial and
environmental costs of irrigating rice from electric or diesel pumps is an
increasing concern. There are increasing evidences from Bangladesh that arsenic
(As) moves along with irrigation water from soil to the plant and then to the grain.
Thus, there is a greater chance of As accumulating into the soil, its uptake by the
plant, and entering into the food chain through rice cultivation (Duxbury
and Panaullah 2007). Thus, growing maize may be environmentally safer
due to less water requirement and less chance of As accumulation in soils and
plants and its subsequent transport to food chain. Where soils are already
contaminated with As, maize can be grown instead of rice as an As
management option.
Similarly maize is considered to be a better alternative to wheat or or
rice due to several reasons: (i) wheat encounters several biotic stresses, and
most importantly, abiotic stresses due to terminal heat stress in the IGP, (ii)
evidences of declining yield of rice in West Bengal and Orissa, and (iii) water
scarcity in peninsular India affecting yield of rice in Andhra Pradesh and
Tamil Nadu. Peninsular India and Bangladesh are considered to be neutral
Boro rabi
Boro
Boro
Boro
Boro
Boro
Boro
Boro
rabi
Boro
Boro
rabi
Boro
rabi
-1 -1
environments where maize can be cultivated in all seasons and this is emerging as
a potential driving force for diversification from the existing cropping systems to a
R-M system. A recent study by National Centre for Agricultural Economics and
Policy Research (NCAP) in India has also shown an increasing demand for maize
by the industry sector which caters to consumer needs like textiles, paper, glue,
alcohol, confectionery, food processing, and pharmaceutical industry, etc.
(Dass et al. 2008a). Therefore, in the changing farming scenario in South Asia,
maize is emerging as one of the potential crops in rice-based systems that
can favorably address several issues like food and nutritional security, climate
change, water scarcity, farming systems, bio-fuel demand and other industrial
requirements.
Yield potential (Yp) of any crop cultivar/hybrid for a site (called site Yp) and for a
given planting date is the yield achieved when grown in environments to which it
is adapted, with nutrients and water non-limiting and pests and diseases effectively
controlled (Evans and Fischer 1999). Yield potential will be different for different
varieties and for different planting dates. Attainable yield (Yat), generally set at
80-90% of Yp, is average grain yield in farmers' fields with best management
practices and without major limitations of water and nutrients. Attainable yield
can be limited by variety, planting density, water and nutrient management, soil-
related constraints (acidity, alkalinity, salinity, etc.), and climate-related
constraints (flooding, drought, etc.).Actual yield (Yac) is the yield farmers receive
with their average management under all possible constraints. Yield potential of
any crop species or varieties can be estimated by use of crop simulation models. A
detailed study on Yp of rice and maize for R-M systems was done by Timsina et al.
(2010) who used the ORYZA2000 (Bouman et al. 2001) and Hybrid Maize (Yang
et al. 2004) models and long-term NationalAeronautics and SpaceAdministration
(NASA) climate data to estimate Yp for several sites in nine Asian countries,
including the four south Asian countries reviewed here. In that study, four generic
rice varieties differing in maturity (extra short-, short-, and long-duration) were
created by calibrating the DVRJ (development rate during juvenile phase), DVRI
(development rate during photoperiod sensitive phase), DVRP (development rate
during panicle development phase) and DVRR (development rate during
reproductive phase) coefficients used in the model. Coefficients for an
intermediate maturity type as used for IR72 were adapted from Bouman et al.
(2001). The growth durations for extra short-, short-, intermediate-, and long-
duration varieties in the four south Asian countries ranged from 75 to 110 days, 90
to 125 days, 110 to 150 days, and 130 to 180 days, respectively. Mean Yp of extra
short, short, intermediate, and long-duration rice varieties across R-M agro-
Yield potential of rice and maize in R-M systems in South Asia: a modeling
analysis
State Area (ha)
Andhra Pradesh 250,000Tamilnadu 30,000Karnataka 20,000Bihar 120,000West Bengal 60,000Orissa 20,000Other states 25,000
All India 525,000
Table 5 Estimates of acreage (ha) under R-M system in India
Source: ML Jat 2009, unpublished data
552 553

ecosystems, as predicted by ORYZA2000, ranged from 0.6 to 9.0, 0.7 to 10.8, 0.6
to 12.8, and 0.7 to 17.6 t ha , respectively (Table 6). There were large differences in
Yp amongst sites within a country, amongst the countries, as well as amongst
planting dates at each site (Timsina et al. 2010). For each site, Yp was highest for
long and lowest for extra short-duration varieties. The large ranges in Yp for
different varieties were associated with large variations in growth duration, total
intercepted solar radiation, and growing season mean temperature leading to
differences in grain-filling period. In the tropical to sub-tropical climate, Yp was
highest for Dinajpur in Bangladesh and Begusarai in Bihar followed by Bogra in
Bangladesh. In the sub-tropical to warm temperate climate, Yp was highest in
Punjab in India followed by Chitwan in Nepal. Yield potential in Pakistan was
intermediate.
For maize, four hybrids differing in growing degree days (GDD), defined as
cumulative degree days from seeding to physiological maturity, ranging from
1300 to 1800 GDD, were used. Yield potential of the four hybrids ranged from 7.1
to 19.7 t ha in India (with 1400 to 1800 GDD), from 8.7 to 20.4 t ha in
Bangladesh (with 1500 to 1800 GDD), from 5.8 to 22.4 t ha in Pakistan (with
1300 to 1700 GDD), and from 11.1 to 32. 7 t ha (with 1500 to 1800 GDD) in
Nepal (Table 6). Planting during August to November gave exceptionally high
yields due to low temperature during grain filling, long growth duration, and large
receipts of solar radiation (Timsina et al. 2010). Thus for rabi planting of maize
after rice in SouthAsia, October and November would provide high Yp and would
-1
-1 -1
-1
-1
Table 6 Yield potential (Yp, t ha ) of rice varieties and maize hybrids for severallocations in four south Asian countries (Source: Modified from Timsinaet al. 2010)
-1
Country Location Rice Maize
Variety Yp (t ha ) Hybrid Yp (t ha )
Bangladesh Bogra Extra short 4.4-8.1 1500 8.8-12.6Short 5.2-9.6 1600 9.8-16.8Intermediate 6.4-11.0 1700 10.9-18.3Long 7.8-11.5 1800 12.0-19.6
Dinajpur Extra short 4.5-9.0 1500 9.0-16.5Short 5.1-10.2 1600 10.2-18.1Intermediate 6.1-12.3 1700 11.2-19.3Long 6.2-14.5 1800 12.2-20.4
Jessore Extra short 4.3-7.5 1500 8.7-14.2Short 5.5-9.0 1600 9.7-16.0Intermediate 7.0-10.4 1700 10.7-17.7Long 8.2-12.9 1800 11.8-19.0
-1 -1
Country Location Rice Maize
Variety Yp (t ha ) Hybrid Yp (t ha )-1 -1
India Begusarai Extra short 4.6-8.9 1500 8.1-14.9Short 5.5-9.9 1600 9.2-16.9Intermediate 7.4-11.5 1700 10.4-18.5Long 6.2-14.8 1800 11.4-19.7
Aduthurai Extra short 4.0-6.3 1500 9.1-11.2Short 5.4-7.7 1600 10.2-12.5Intermediate 6.5-9.7 1700 11.2-14.0Long 8.4-11.9 1800 12.3-5.0
Thanjavur Extra short 4.1-6.1 1400 9.2-11.1Short 5.1-7.5 1500 10.2-12.4Intermediate 6.9-9.4 1600 11.1-13.6Long 8.7-11.5 1700 12.2-14.7
Bangalore Extra short 6.4-7.7 1400 10.0-13.3Short 7.9-9.2 1500 11.2-14.9Intermediate 10.0-11.5 1600 12.3-16.4Long 12.2-13.8 1700 13.6-17.6
Nalgonda Extra short 4.8-7.0 1400 7.7-12.6Short 5.1-8.3 1500 9.1-14.2Intermediate 6.1-10.6 1600 10.0-15.8Long 8.2-12.6 1700 10.7-17.0
Ludhiana Extra short 3.0-8.8 1500 7.1-16.6Short 2.9-10.8 1600 8.2-20.4Intermediate 3.0-12.8 1700 9.0-23.7Long 2.6-17.6 1800 9.8-26.0
Nepal Chitwan Extra short 1.6-8.7 1500 11.3-27.4Short 1.7-9.3 1600 13.1-29.7Intermediate 1.9-10.9 1700 14.1-31.3Long 2.1-14.4 1800 15.4-32.7
Pakistan Larkana Extra short 2.1-7.0 1400 6.2-17.2Short 2.5-8.0 1500 7.0-19.2Intermediate 2.8-9.5 1600 7.8-20.7Long 3.8-11.5 1700 8.6-21.9
Okara Extra short 0.6-4.7 1300 5.8-17.7Short 0.7-5.6 1400 6.7-18.4Intermediate 0.6-8.0 1500 7.6-18.4Long 0.7-10.0 1600 8.4-22.4
554 555
help in successful intensification and diversification of the rice-based systems.
Likewise, for or pre-monsoon season, late March to early May planting
would result in reasonably high Yp and the maize crop would fit easily into the
rice-based systems. Very long growth duration in warm temperates of Chitwan,
Nepal, and two sites in Pakistan resulted in unrealistically high yields due to larger
receipts of solar radiation. The Hybrid Maize model needs to be further tested and
refined for warm temperate region of SouthAsia.
The difference between attainable yield (Yat) and actual yield (Yac) of crop
species and varieties can be quite large. Attainable yield of maize in farmers'
fields, achieved under optimal conditions, can vary significantly across the
agro-ecologies mainly due to genotype x environment interactions but also due
to confounding influence of biotic and abiotic stresses and agronomic
management.
Dass et al. (2008b) reported Yat and Yac of maize from experiments
conducted in 13 representative locations in various agro-environments for nine
years (1995-2003) under the All India Coordinated Research Project (AICRPM)
on maize. The selected locations were first divided into two categories: locations
having lower productivity than the national average (Banswara, Udaipur, Godhra,
Varanasi, Kanpur and Chhindwara) and locations (Mandya, Arbhavi, Ludhiana,
Dhaulakuan, Bajaura, Dholi and Hyderabad) having greater productivity as
compared to national average. Data indicated that the Yac is always less than Yat
under all the agro-environments due to limited availability of agronomic inputs
and their scheduling. Potential for improving Yat was more at the locations of the
first group as compared to the locations of the second group. Except Banswara,
other locations of the first group showed the potential for achieving Yat of 4-6 t
ha , while Yac at all the locations of this group was less than half (1-2 t ha ) of the
Yat. It has also been reported that present average Yac at farmers' fields is only
about 50% of the Yat, which could be increased through adoption of improved
technology. On the other hand,Yat for most locations was about 4.0 t ha except for
Arbhavi (5.9 t ha ) in the high productivity group, whereas, Yac at most of the
locations of this group was more (1.2–3.4 t ha ) as compared to the low
productivity group (Dass et al. 2008b).
Data from multi-location trials in India in 2007 and 2008 on integrated
nutrient management in hybrid maize (HQPM-1) revealed linear yield increase,
without any yield plateau, upto 150% of recommended N rate (150:60:40 kg N,
P O and K O ha ) together with 6 t ha FYM, which indicates that more N will be
required than the existing rates to achieve higher yield (unpublished data, ML Jat).
Grain yield and grain and straw N uptake data on response of 6 hybrids under three
kharif-1
Attainable and actual yields of maize in India
-1 -1
-1
-1
-1
-1
2 5 2
-1
nutrient levels (100:50:50; 150:65:65; 200:80:80 kg N, P O and K O ha ,
respectively), however, reveal highest yield from 150:65:65 treatment and varying
responses of different hybrids to the three nutrient levels. Hybrids varied
significantly in nutrient uptake indicating their differences in efficiency as well as
nutrient requirements (unpublished data, ML Jat). The data reveal that Yat of
maize can be quite large, and so yield gap between Yp and Yat, between Yat and
Yac, and that betweenYp andYac can be minimized.
Principles of nutrient management
Rice-maize systems extract large amounts of mineral nutrients from the soil due to
large grain and stover yields. Proper nutrient management of exhaustive systems
like R-M should aim to supply fertilizers adequate for the demand of the
component crops and apply in ways that minimize loss and maximize the
efficiency of use. The amount of fertilizer required depends on many factors
including the indigenous supply of each nutrient which can be in appreciable
quantities (Cassman et al. 1998). Phosphorus inputs from irrigation and rain
waters are negligible (Dobermann et al. 1998) but 1000 mm irrigation through
surface water may provide up to 30 kg K ha yr (Dobermann et al. 1996, 1998)
and up to 1100 kg S ha yr (Pasricha 1998). In R-M areas where groundwater is
used, K inputs may be much larger than 30 kg ha . Thus, to achieve and sustain the
high yields currently demanded of R-M systems, emphasis must be upon the
nutrient requirements for target yields and nutrient supply by integrated use of
indigenous sources, soil organic matter (SOM), farm yard manure (FYM),
composts, crop residues, and increasingly, inorganic fertilizers. Fertilizer is the
dominant source of nutrients and is required to increase yield of individual crops in
R-M systems but should be applied in such a quantity that it becomes profitable
and will have least adverse effect on environment. In the exhaustive R-M systems,
it is necessary to attend to the distinct requirements and growing conditions of the
individual crops. The inclusion of legumes or potato in the R-M system further
increases the demand for the macronutrients (N, P, K, Ca, Mg, S) that they require
in larger quantities than cereals.
Inorganic fertilizers
Timsina and Connor (2001) devised principles of fertilizer practice required to
achieve high efficiency of use and high sustainable yield in R-W systems that
could equally apply to R-M systems. Of all the nutrients, nitrogen (N), phosphorus
(P), and potassium (K) remain the major ones for increased and sustained
2 5 2
-1
Nutrient management for R-M systems
-1 -1
-1 -1
-1
556 557

productivity. However, the development of high yielding R-M systems will likely
exacerbate the problem of secondary and micronutrient deficiencies, not only
because larger amounts are removed, but also because the application of large
amounts of N, P, and K to achieve higher yield targets often stimulates the
deficiency of secondary and micronutrients (Johnston et al. 2009).
Nitrogen management requires special attention so that potentially large
losses can be minimized and efficiency can be maximized. During the growing
season of rice, the aim of fertilizer management should be to reduce N loss through
denitrification, volatilization and leaching by either deep placement or split
applications to match crop demand and to increase N-use efficiency. At the end of
the rice season, the return to aerobic conditions sees rapid nitrification of newly
formed and existing ammonium. Once the maize crop is established, split
applications of N fertilizer can supplement mineralization of SOM to meet the N
requirement of the crop without undue loss, even under irrigation. Water
availability during the dry winter period varies among R-M systems and will
determine yield of the maize crop and hence its N requirement. Achievement of
efficient use by the system requires that the maize crop leave little mineral N at the
end of the season because that may either depress N fixation by a legume crop such
as mungbean, or will be rapidly lost during puddling for rice (Buresh and de Datta
1991).
Phosphorus management principles developed for R-W systems by Timsina
and Connor (2001) are applicable to R-M systems as well. Phosphorus tends to
accumulate in the soil due to fixation by Fe and Al, especially in acidic soils. Over
time, large amounts of P can be fixed in that way (Kirk et al. 1990) while
contributing slowly to available P pool of the soil. Phosphorus, however,
solubilizes immediately after flooding, leading to a flush of available P (Kirk et al.
1990) increasing its supply to rice. Subsequent drying, however, reduces its
availability to maize for which strong crop responses to P fertilizer are expected
(Willet and Higgens 1978; Willet 1979; Sah and Mikkelsen 1989; Sah et al.
1989a,b). In systems of low P fertility, the repeated dry-wet transition in
R-M system increases Pextraction, further lowering fertility. Finally, management
of P fertilizer for R-M systems must take account of residue and organic
amendments.
The increased concentrations of Fe(II), Mn(II), and ammonium in flooded
soils during rice cultivation displace K from the exchange complex into the soil
solution (Ponnamperuma 1972). This displacement, however, ceases on return to
aerobic conditions. Despite often having relatively large total K content, the K
nutrition of R-M systems grown on the soils of South Asia is not assured, because
many heavy textured alluvial flood plain Terai soils of Nepal and northern and
eastern India, and soils of Bangladesh contain vermiculite, illite, or other K-fixing
minerals (Dobermann et al. 1996, 1998). Improved K management may have great
potential for improving the overall productivity of R-M systems of SouthAsia, but
will require special consideration on soils containing K-fixing minerals.As with P,
it may seem appropriate to make differential applications of K to component crops
in R-M systems on non-K fixing soils, again with least K applied to rice with the
aim of preventing loss by leaching.
Finally, occurrence of K deficiency and response to applied K depend on yield
level, K buffering capacity of the soil, straw management, and net K inputs from
sources other than fertilizer. Clay mineralogy, texture, and K inputs from irrigation
or rainwater need to considered (Dobermann et al. 1998) along with K inputs from
sediments deposited from flood plains and flood water while formulating a
rational K management strategy for R-M systems.Application of full maintenance
rate of K (input=output) may not be profitable for rice and maize under situations
where crop response to K is poor. In such soils, such as in Bangladesh, some K
mining may be allowed by applying K below maintenance rate (Buresh et al.
2010). However, the extent of mining that could be allowed in a particular soil will
require a complete understanding of the dynamics of K in the soil as well as the K
input-output balance associated with the cropping system practiced.
Soil puddling for rice with continuous soil submergence helps maintain SOM and
sustain a supply of indigenous N originating from BNF and soil (Pampolino et al.
2008). The conversion from continuous rice cultivation with soil puddling and soil
submergence to a R-M rotation with soil drying and tillage of aerated soil during
land preparation for maize, however, can result in loss of SOM and soil fertility
(Pampolino et al. 2010). Retention of crop residues after no or minimum tillage or
on raised beds in R-W systems has increased yield and SOM in many experiments
in South Asia (Humphreys and Roth 2008). In a 4-yrs experiment on a sandy loam
soil in northern Bangladesh, SOM in surface soil layers of the permanent raised
beds (PRB) had increased by 13–41% after 4 years (ie four rice+wheat+maize
crop cycles) with straw retention (SR), with a greater increase with 100%
recommended dose of fertilizers than 50% of the same. Soil organic C in PRB
without SR was similar to the initial organic C prior to bed formation (Talukder et
al 2008) which might be due to lesser biomass formation in absence of appropriate
fertilization. We hypothesize that the establishment of maize after rice with
reduced or no tillage and retention of crop residues could help conserve SOM and
maintain soil fertility provided improved nutrient management is practiced.
Reduced or no-till practices can also facilitate fast turnaround between crops.
Experiments are underway in South Asia, particularly in India and Bangladesh,
comparing maize and rice under conventional, reduced, and zero tillage in R-M
systems to standardize nutrient management practices under differing tillage
practices.
Bijay-Singh et al. (2008) made a simplified decision tree to illustrate
Residue management
558 559

guidelines for managing residues in rice-based cropping systems. They proposed
that for the systems in which residue from rice or a non-flooded crop (such as
maize) is retained or incorporated to ensuing rice, the management of residue
depends upon whether soil during the recipient rice crop has been puddled. For
non-puddled rice production, they recommended a no-till system in which the
residues are left on the surface as mulch. For puddled rice production where crop
residue cannot readily be used as mulch, however, the residue of the preceding
maize crop can typically be safely removed from the field without any loss in
productivity or sustainability of the system. However, an appropriate increase in
fertilizer addition, particularly K, will be required to compensate for nutrient
removal in the residue. The removal of crop residue has the potential to reduce the
detrimental environmental impacts arising with CH emission from incorporating
residue in flooded soils. For non-flooded rice or maize crop in rice-based system
under reduced or no tillage, residue should be retained as mulch. Consistent
residue removal for non-flooded crops with full tillage will result in loss of SOM
and soil nutrient supplying capacity because of enhanced oxidation of SOM
(Bijay-Singh et al. 2008).
Existing fertilizer recommendations for rice and maize often consist of one
predetermined rate of nutrients for vast areas of production. Such
recommendations assume that the need of a crop for nutrients is constant over time
and space. However, the growth and needs for supplemental nutrients of any crop
can vary greatly among fields, seasons, and years as a result of differences in crop-
growing conditions, crop and soil management, and climate. Hence, the
management of nutrients for rice and maize requires an approach that enables
adjustments in applying nutrients to accommodate the field-specific needs of the
crop for supplemental nutrients. Site-specific nutrient management (SSNM), a
plant-based approach, is used to address nutrient differences which exist
within/between fields by making adjustments in nutrient application to match
these location, or soil, differences. This approach for irrigated rice systems for
Asia was developed in the 1990s by IRRI in collaboration with national partners
across Asia (Fairhurst et al., 2007; Witt et al. 1999, 2007) to address serious
limitations arising from blanket fertilizer recommendation for large areas, as
practiced in Asia. It focused on managing field-specific spatial variation in
indigenous N, P, and K supply, temporal variability in plant N status occurring
within a growing season and medium-term changes in soil P and K supply
resulting from actual nutrient balance. The plant-based SSNM strategies for rice is
well advanced but that for maize is under development and evaluation. Here we
present a few examples from Bangladesh and India where experiments on SSNM
in R-M systems have been initiated.
4
Site-specific nutrient management in R-M systems
An omission plot SSNM experiment on R-M system was conducted in
Hyderabad, India, using rice hybrid PA6201 and maize hybrid MQPM1. The
treatments included (1) control with no fertilizer- T1 (2) state recommendation- T2
(3) recommendation based on AICRP results- T3 (4) Full N, P, and K (SSNM)- T4
(5) N omission- T5 (6) P omission- T6 and (7) K omission- T7 (Table 7). The
nutrient levels for T4 to T7 treatments were calculated based on the QUEFTS
model (Jansen et al. 1990) taking into account organic carbon and available P and
K in the soil as well as potential and targeted yields. Results from the experiment
(Table 7) revealed that highest yields for both rice and maize and highest system
productivity were obtained from the SSNM treatment (M. L. Jat, unpublished
data). Omission of N from the optimum treatment reduced yield by about 1 and 3 t
ha in rice and maize, respectively. Yield loss in rice and maize (0.8 and 1.5 t ha ,
respectively) was similar in P and K omission treatments. This suggests that N is
by far the most limiting nutrient and greater response to applied nutrients is
expected in maize than rice possibly due to a combined effect of higher yield
potential in maize and change from puddled submergence condition in rice to a
more aerobic ecology in maize.Table 8 shows data from another set of SSNM experiments, in maize from
India. The trials were conducted in 2 major maize-based cropping systems, i.e.
-1 -1
Table 7 Grain yield (t ha ) of rice and maize, maize equivalent yield of rice, andrice-maize system productivity in an SSNM experiment (Source: ML Jat2009, unpublished data)
-1
a
-1 -1
b
Maize equivalent yield (MEY) of rice = [Grain yield of maize (t/ha)* selling price of maize(Rs/t) + (grain yield of rice (t/ha)* selling price of rice (Rs/t)]/selling price of maize (Rs/t)];price of rice: Rs. 850 t ; price of maize: Rs. 900 t
T1 = control with no fertilizer; T2 = State recommendation; T3 = recommendation basedonAICRPresults; T4 = full N, P, and K; T5 = N omission; T6 = Pomission; T7 = K omission
Treatmenta Rice yield(t ha ) (t ha ) yield (MEY)
of rice (t ha )b of MEY (t ha )
T1 4.11 3.87 3.88 7.76T2 4.98 6.53 4.70 11.23T3 5.01 7.04 4.73 11.77T4 5.76 8.06 5.44 13.50T5 4.88 4.86 4.61 9.47T6 5.01 6.52 4.73 11.25T7 5.00 6.65 4.72 11.37
CD(P=0.05)(kg ha )
Maize yield Maize equivalent R-M systemproductivity in terms
232.1 715.7
-1 -1
-1 -1
-1
560 561

maize-wheat at 8 locations (Delhi, Bajaura, Udhampur, Dholi, Ludhiana,
Pantnagar, Banswara and Ranchi) and rice-maize at 3 locations (Jorhat, Banswara,
Hyderabad) during Kharif 2008. Significantly higher yield of maize was recorded
under SSNM compared to State recommendations at most of the locations.
Omission plot yield data revealed differential indigenous nutrient supplying
capacity of the study sites across locations (agro-ecologies). However, yield loss
due to omission of N was higher as compared to P and K suggesting N as the major
yield-limiting factor under all agro-ecologies. The response to applied nutrients
varied from 1-5 t ha for N to about 0.2-1.5 t ha for P and K across locations. The
results also suggest that response to applied nutrients must be included as a criteria
to develop recommendations where nutrient application rates should be fixed
based on expected response and application of maintenance rate, calculated on the
basis of off-take of the concerned nutrient after a cropping season, might be a more
economical approach under no or limited response scenarios.
Table 9 summarizes grain yield data from SSNM trials on rabi maize under R-
M systems in two districts in NW Bangladesh. The experiment consisted of seven
-1 -1
treatments namely, 1) N omission with ample P and K, 2) P omission with ample N
and K, 3) K omission with ample N and P, 4) low P with ample N and K, 5) low K
with ample N and P, 6) ample N, P, and K, and 7) ample N, P, K, S and Zn. Yields
under all treatments differed in the two sites, with highest yields for ample N, P,
and K and N, P, K, S, and Zn treatments. Yields in the minus nutrient treatments
varied widely across farmers' fields within a district and also differed in the two
districts, indicating large variations in the indigenous nutrient supplying
capacities of the soils. Yields in minus N treatment were quite low but in low P and
low K treatments were quite close to ample N, P, and K treatment indicating high
response to added N but low response to added P and K due to low indigenous N
but high indigenous P and K in the soils (Table 10). Yields in all treatments were
generally higher in Rajshahi than Rangpur due to differences in soil nutrient
levels.
The above results from India and Bangladesh highlight the highly variable
response to applied N, P and K across agro-ecologies suggesting the necessity of
SSNM to improve the productivity of R-M systems. Very high yield losses in
maize in the N omission plots might be associated with the loss of SOM due to dry
tillage in aerated soil after rice cultivation under submergence (Pampolino et al.
2010) and may need serious consideration for reduced or zero-till cultivation of
maize with residue retained from the previous rice crop. However, there is a
distinct knowledge gap in terms of nutrient dynamics and subsequent indigenous
nutrient availability in R-M systems where no- or reduced tillage is practiced with
or without the retention of residues of previous crop. We anticipate that soils under
reduced tillage with retention of residues will differ considerably from the
conventional tillage without retention of residues as far as nutrient dynamics is
concerned and may need separate set of strategies in terms of nutrient application
rate and timing.
Table 8 Effect of nutrient management practices on grain yield of maize (t ha ) atdifferent locations in India (Source: MLJat, unpublished data)
-1
Nutrient Grain yield (t ha )
Delhi Bajaura Udhampur Dholi Ludhiana Pantnagar Banswara Ranchi
State recom-mendationSSNM 7.94 7.21 4.52 4.96 6.98 5.09 6.94 4.46SSNM (-N) 4.46 2.76 2.26 3.21 5.87 3.11 1.72 2.78SSNM (-P) 7.71 5.84 3.41 3.41 6.76 3.78 6.19 4.33SSNM (-K) 7.36 5.87 4.41 3.69 7.33 5.22 6.41 3.89
-1
management
7.78 5.69 4.06 3.65 6.76 4.44 5.93 3.69
Treatments Rangpur Rajshahi
N omission 0.5-5.1 3.4-3.9P omission 3.9-8.3 4.5-8.5K omission 4.1-8.1 5.3-7.9Low P 5.5-8.8 6.2-8.9Low K 5.8-9.8 6.5-8.6NPK 6.0-10.3 6.7-10.3NPKSZn 6.0-10.4 7.2-10.8
Table 9 Grain yield (t ha ) of rabi maize in 10 farmers' fields in an SSNM
experiment at two districts in NW Bangladesh in 2008-2009 (Source: J.
Timsina, 2010, unpublished data)
-1
Parameters Rangpur Rajshahi
pH 4.0-5.7 5.2-6.8Total N (%) 0.02-0.08 0.04-0.075Available P (ppm) 3-56 6-35Available K (meq/100 ml) 0.38-0.64 0.1-0.38Zn (µg ml ) 0.2-1.7 0.2-0.57
-1
Table 10 Soil nutrient levels (ranges) in ten farmers' fields in two districts in NW
Bangladesh (Source: J. Timsina, 2010, unpublished data)
Soil test methods: Total N, Kjeldahl; Avail. P, Bray-1; Avail. K, 1 N NH4-acetate; Zn,
DTPA-extractable
562 563

Estimating fertilizer needs for R-M systems
Continuous production of high yielding maize may lead to the rapid depletion of
mineral nutrients from soil unless appropriate nutrient inputs are supplied and best
management followed. Maize hybrids grown in the rabi season in SouthAsia have
an attainable grain yield of about 10-12 t ha , with similar amount of non-grain
biomass. To obtain such high yields, for example in Bangladesh, maize plants take
up around 200 kg N, 30 kg P, 167 kg K and 42 kg S ha (BARC 2005). Farmers, on
the other hand, apply imbalanced fertilizers, with high amount of N and low
amounts of P, K, S, and micronutrients. In R-M system in Bangladesh, the apparent
nutrient balances have been highly negative for N and K (-120 to -134 and -80 to -
109 kg ha , respectively), while the P balance has been positive (15 to 33 kg ha )
(Ali et al. 2008, 2009). Nutrient depletion-replenishment studies in R-W systems
have also shown negative balances for N and K and positive balance for P
(Panaullah et al. 2006; Saleque et al. 2006; Timsina et al. 2006). Declining soil
organic C, acid leaching of soils through CO -charged rainwater and consequent
base (Ca, Mg) removal, and micronutrient deficiencies (e.g. Zn and B in
calcareous and coarse-textured soils) may be associated with this (Ali et al. 2008,
2009). One recent estimate shows that about 200 kg ha yr N+P+K applied as
fertilizers remain unutilized by the crops in these systems, mainly due to improper
management practices such as imbalanced fertilizer doses, inappropriate time of
fertilizer application, and inappropriate timing and amount of irrigation (BARC
2005).
Fertilizer N, P and K needs by crops, as determined with the SSNM approach,
are directly related to Yat levels. It is thus important to know the Yat targets for
crops when assessing probable opportunities for future crop production and the
associated needs for fertilizers in intensive cropping systems such as emerging R-
M systems. Buresh and Timsina (2008) illustrated how crop simulation models for
rice and maize can be used to estimate attainable yield (Yat) targets with best crop
management practices for Sadar Upazilla of Kushtia District in Bangladesh. In
Sadar Upazilla, R-R and R-W were formerly the main cropping patterns. Starting
in about 1990, maize was introduced during the season to be grown after the
harvest of rice. The area of maize production subsequently expanded rapidly and
replaced rice and wheat. The cultivation of decreased by about 40-50%
and wheat cultivation is now almost non-existent. Rice-rice and R-M are now the
two predominant cropping systems. Based on interviews of farmers in January
2008 by the first author, the average yield of maize in this area is about 8 t ha .
Buresh and Timsina (2008) used ORYZA2000 and Hybrid-Maize to estimate
climatic and genetic yield potential (Yp) of rice and maize using 20 years of
satellite-derived historical weather data from NASA for Sadar Upazilla. Farmers
generally transplant rice from mid-July to mid-August and rice from
-1
-1
-1 -1
-1 -1
-1
2
rabi
Boro Boro
Aman Boro
mid-January to mid-February. The Yp of rice was consequently determined for
intermediate duration rice (about 110 to 130 days from seed to seed) with
transplanting on 1August for and on 1 February for Farmers generally
plant maize from November to mid-January. The Yp for maize was determined for
a hybrid with duration of 1800 GDD and planting on 1 December. Simulation
results showed that Yp for rice was higher for than and Yp for maize
was much higher than for rice (Table 11). Maize captured more solar radiation
during the growing season and also experienced cool environment during the
grain-filling period, resulting in high yield. The Yat for high financial return
through use of best crop and nutrient management practices was set at 80% of the
Yp (Witt et al. 2007). The Yat of maize established through this technique (11.1 t
ha ; Table 11) was markedly higher than the currently reported average farmers'
yield of 6 t ha , indicating opportunities for future increases in maize yield through
improved crop and nutrient management practices. Attainable annual yields were
markedly higher for R-M (17.3 t ha ) than R-R cropping (14.1 t ha ) systems,
suggesting much higher nutrient extraction and fertilizer needs for R-M than R-R
as these cropping systems approach theirYt. The estimated yield can subsequently
be used to assess evolving fertilizer needs as cropping system diversify, intensify
and increase in yield.
Likewise, Pasquin et al. (2007) demonstrated how diversification from R-R or
R-W systems to R-M systems can impact on fertilizer use. They also used
ORYZA 2000 and Hybrid-Maize and long-term satellite-derived NASA climate
data to study the impact on fertilizer demand by changing from either R-R or R-W
systems to R-M system in NW Bangladesh. The Yp of the rice transplanted
during the rainy season in June/July, is about 7-9 t ha . When grown as a crop
towards the cooler months of the year, Yp increases but with associated risks of
cold injury during the seedling stage. The Yp of maize is highest when planted
during September to November (up to 20 t ha ), while wheat is ideally planted in
Aman Boro.
Boro Aman,
Aman
Boro
-1
-1
-1 -1
-1
-1
Season Crop Planting date Yp (t ha ) 80% of Mean growthduration (d)
Mean Standard
Aman Rice 1 August 7.7 0.2 6.2 110Boro Rice 1 February 9.9 0.1 7.9 121Rabi Maize 1 December 13.9 0.3 11.1 130
-1
Yp (t ha )
error
-1
Table 11 Simulated Yp (t ha ) and growth duration (d) for rice and maize plantedduring farmers' preferred planting times in Sadar Upazilla, KustiaDistrict, Bangladesh (Source: Buresh and Timsina 2008)
-1
564 565

November achieving a Yp of about 6.5 t ha . Figure 1 shows the production
potential of R-W, R-R, and R-M systems. There is no alternative to growing rice in
the rainy season so that the production potential changes depending on the second
crop grown after T rice. The production potential is highest for R-M system
with about 25 t grain ha yr , followed by R-R (20 t ha yr ) and R-W systems (14 t
ha yr ).
Site-specific nutrient management approaches developed for rice and maize
have the potential to optimize nutrient management as farmers replace crops in
their crop rotations. Fertilizer consumption is expected to increase when farmers
shift from either a R-R or a R-W system to a R-M system due to a greater demand
for nutrients at higher production levels. Shifting from one crop to another is likely
to have moderate impact on fertilizer demand, while shifting from a single to a
double or from a double to a triple-cropping system would result in increased
fertilizer consumption and demand, as well as increased farmers' productivity
(Pasquin et al. 2007).
As maize cropping becomes more widespread and intensive in South Asia an
emerging issue of great importance is how to sustain the productivity of R-M
cropping systems through integrated soil fertility management strategies. Recent
anecdotal evidences of stagnation and declines in maize yield in R-M systems in
Bangladesh appear to be related to soil fertility problems, including deficiencies of
N, P, and K arising from improper N management and imbalanced/inadequate
-1
-1 -1 -1 -1
-1 -1
aman
Future priorities for research in nutrient management for R-M systems
fertilizer use (Ali et. al. 2009). There is a need to understand more about the extent
and rate of nutrient depletion and soil physical degradation in the intensifying R-M
systems in South Asia before formulating appropriate amelioration strategies. To
push the achieved grain yields even higher up the Yp curve will require larger
amounts of nutrients, their better management and overall soil stewardship. On-
farm nutrient management experiments with very high input and high-yielding
maize crops is required to understand how to manage such systems to meet the
requirement of maize in SouthAsia from a fixed soil resource base.
Nutrient management for the R-R and R-W systems has been widely
researched and blanket fertilizer recommendations for these systems are
somewhat available in South Asia. However, not much is known about soil and
fertilizer management practices for the emerging R-M systems, particularly
involving high-yielding maize hybrids. This system is complicated because the
component crops are grown in sharply contrasting physical, chemical and
biological environments as that for R-W systems (Timsina and Connor 2001).
Here the role of SOM becomes crucial, as a supplier of secondary and
micronutrients, and also, especially for maize, as a natural “soil amendment” that
creates a congenial soil physical environment for these crops. Organic matter
becomes more important given that most soils of South Asia currently have low
organic matter contents. In this context, integrated plant nutrition system (IPNS),
envisaging conjunctive use of inorganic and organic sources of nutrients,
including crop residues, could be considered for sustaining soil health and crop
productivity (Rao and Srivastava 2001). IPNS packages and management
guidelines for intensive R-M cropping systems can be developed for use in follow-
up technology dissemination initiatives for farmers in South Asia. Ali et al (2009)
have suggested the following IPNS research for R-M systems for Bangladesh
which can also be applied for other similar agro-ecological areas in SouthAsia:
1. Understanding soil fertility constraints in representative R-M growing areas
across the country.
2. Assessing crop nutrient requirements for optimum yield targets for both
maize and rice in the intensifying systems in the prevailing biophysical
environments.
3. Multi-location research on mineral fertilizer use, possibilities of adding quick
growing legumes such as mungbean into the system, making use of BNF in
rice, use of appropriate bio-fertilizers for legumes, and crop residue retention
and recycling techniques, etc.
4. Maximum use of residual fertility in the cropping system to reduce the cost of
fertilizers.
5. Field testing the IPNS packages in comparison with farmers' existing
practices.
6. Financial analysis of the IPNS packages to evaluate farmers' profit margins.
7. Farmers' feedback on the acceptance of IPNS packages
Fig. 1 Potential grain production (t ha ) of rice-based cropping systems in
Dinajpur, Bangladesh. (Source: Pasquin et al. 2007)
-1
J F M A M J J A S O N D
Months
J F M A M J J A S O N D
Months
7-9 t ha-1
~25 t ha yr-1 -1
7-9 t ha-1
T amanRice
6 - 6.5 t ha-1
~14 t yrha-1 -1
Wheat T aman RiceWheat
BoroRice
7-9 t ha-19-14 t ha
-1
~20 t ha yr-1 -1
T amanRiceBoro Rice
-
T aman Rice
T aman RiceMaize
13-20 t ha-1
566 567

8. Combination of IPNS packages with water management and soil physical
management, and with water-efficient maize that may be developed.
Large amounts of cow dung and poultry manure are produced in South Asia
but during the dry season most is used as household fuel for cooking. Sharma and
Biswas (2004) have presented the recommended IPNS packages for various
cropping systems for different agro-climatic regions of India, but unfortunately
little is mentioned about such packages for R-M systems. We suggest that future
research address and generate the appropriate IPNS packages for R-M systems
across different soil types and fertility levels in SouthAsia.
Research on SSNM for rice and maize separately has now been well
developed and the SSNM technologies disseminated (Fairhurst et al. 2007; Witt et
al. 1999, 2007). Future research and dissemination should now focus on SSNM for
R-M systems considering the yield goals, crop demand for nutrients, indigenous
soil nutrient levels, and residual soil fertility. Dissemination of nutrient
management technologies for R-M systems will be faster if simple computer-
based decision support systems (DSS) tools can be developed for use by farmers
and extension workers from governmental and non-governmental organizations
and from the private sector. One of such DSS is Nutrient Manager for Rice (IRRI
2009) that has already been developed, evaluated, and promoted in the Philippines
and Indonesia and is under development and evaluation for India and Bangladesh.
The partial maintenance and partial maintenance plus yield gain approaches
presented by Buresh et al. (2010) for P and K can be used in Nutrient Manager for
Rice, which is designed to quickly provide extension workers, crop advisors, or
farmers with fertilizer best management practices for specific rice fields. This tool
integrates the existing knowledge on SSNM in rice and is capable of providing
field-specific N, P, and K recommendations based on farmer responses to about 10
questions (Buresh et al., 2010). Nutrient Manager for Maize (Witt et al. 2009) and
for R-M systems for South Asia is in development and evaluation stage. Future
approach should give priority to the development and refinements of such simple
DSS tools for integration and widespread delivery of improved nutrient
management strategies to diverse R-M agro-ecologies of SouthAsia.
R-M cropping systems are emerging in SouthAsia.Area under this system is much
less compared to R-R, R-W or M-W systems but is increasing rapidly in recent
years. The increase is very rapid in Bangladesh and South India. Yield potential of
rice and maize is quite high in South Asia. However, large yield gaps between
potential and attainable yields, between attainable and actual yields, and between
potential and actual yields exist in farmers' fields. There is potential to reduce yield
gaps through better crop and nutrient management despite the challenges and
constraints in farmers' fields. This review has highlighted some of such constraints
Conclusions
and challenges and also opportunities for better nutrient management for reducing
yield gaps for R-M systems.
Nutrient demand of the R-M system is very high since high-yielding rice
varieties and maize hybrids are used. High nutrient demand is associated with high
extraction or uptake of nutrients from soils leading to declining fertility unless the
extracted nutrients are replenished from external sources. This is particularly true
for R-M systems where residues of both crops are generally removed from fields
aggravating soil fertility depletion, especially K. However, nutrient balance
studies in R-M systems are very few in South Asia. Recently some efforts are
being made in India and Bangladesh to develop nutrient balances for these systems
but conclusive results are not yet available. SSNM provides scientific principles
for optimally supplying crops with nutrients as and when needed for specific fields
in a particular cropping season.Application of SSNM principles, aided by nutrient
balance studies, can help improve nutrient management in R-M systems towards
improving yield and profitability. This will, however, require better understanding
and development of SSNM principles for maize to the extent of rice.
The paper is largely based on first author's on-going project on
“Sustainable intensification of R-M production systems in Bangladesh” funded by
the Australian Centre for International Agricultural Research (ACIAR) and on the
recently completed Intensified Production Systems inAsia (IPSA) project on R-M
systems under the IRRI-CIMMYT Alliance. The paper benefits greatly from the
first author's frequent interactions and experiences in working closely with A.
Dobermann, R. J. Buresh and J. Dixon under that Alliance. The Directorate of
Maize Research and the Indian Council of Agricultural Research are
acknowledged as we used their unpublished data conducted under the AICRP.
Finally, we acknowledge IPI-OUAT-IPNI for inviting us to present the paper in the
International Symposium on Potassium Role and Benefits in Improving Nutrient
Management for Food Production, Quality and Reduced Environmental
Damages, 5-7 November, 2009, OUAT, Bhubaneswar, Orissa, India.
Ali MY, Waddington SR, Hudson D, Timsina J, Dixon J (2008) Maize-rice
cropping system in Bangladesh: Status and research opportunities.
CIMMYT-IRRI Joint publication, CIMMYT,
Ali MY, Waddington SR, Timsina J, Hudson D, Dixon J (2009) Maize-rice
cropping systems in Bangladesh: Status and research needs. Journal of Agric
Sci Techn 3 (6): 35-53
BARC (Bangladesh Agricultural Research Council) (2005). Fertilizer
Recommendation Guide-2005. Dhaka, Bangladesh
Bijay-Singh, Shan YH, Johnson-Beebout SE,Yadvinder-Singh, Buresh RJ (2008)
Acknowledgement
References
Mexico, D.F.
568 569

Crop residue management for lowland rice-based cropping systems in Asia.
AdvAgron 98: 117-199
Bouman BAM, Kropff MJ, Tuong TP, Wopereis MCS, ten Berge HFM, van Laar
HH (2001) Oryza2000: modeling lowland rice. Los Baños (Philippines):
International Rice Research Institute, and Wageningen (Netherlands):
Wageningen University and Research Centre. 235 p.
Buresh RJ, De Datta SK (1991) Nitrogen dynamics and management in rice-
legume cropping systems.AdvAgron 45: 1-59
Buresh RJ, Timsina J (2008) Implementing field-specific nutrient management in
rice-based cropping systems. Bangladesh JAgric Environ 4: 39-49
Buresh RJ, Pampolino MF, Witt C (2010) Field-specific potassium and
phosphorus balances and fertilizer requirements for irrigated rice-based
cropping systems. Plant Soil 335: 35-64
Cassman KG, Peng S, Olk DC, Ladha JK, Reichardt W, Dobermann A, Singh U
(1998) Opportunities for increased nitrogen-use efficiency from improved
resource management in irrigated rice systems. Field Crops Res 56: 7-38
Dass S, Jat ML, Singh I (2008a) Taking maize to amazing heights. In Agriculture
TodayYear Book-2008. pp 79-82
Dass S, Sekhar JC, Jat ML (ed) (2008b) Nutrient management studies in maize
systems (Monsoon-2008). Salient Achievement of All India Coordinated
Research Project on maize 2008. Directorate of Maize Research, Indian
Council ofAgricultural Research, New Delhi, India. P. 51
Dobermann A, Cassman KG, Cruz PCS, Adviento, MAA, Pampolino, MF (1996)
Fertilizer inputs, nutrient balance, and soil-nutrient supplying power in
intensive, irrigated rice systems. II. Effective soil K-supplying capacity. Nutr
CycleAgroecosyst 46: 11-21
Dobermann A, Cassman KG, Mamaril CP, Sheehy JE (1998) Management of
phosphorus, potassium, and sulfur in intensive, irrigated lowland rice. Field
Crops Res 56: 113-138
Duxbury JM, Panaullah G (2007) Remediation of arsenic for agriculture
sustainability, food security and health in Bangladesh (Working paper).
Cornell University and Bangladesh joint publication, FAO Water, FAO,
Rome
Evan LT, Fischer RA (1999) Yield potential: Its definition, measurements, and
significance. Crop Sci 39: 1544-1551
FAO 2006. Improving plant nutrient management for better farmer livelihoods,
food security, environmental sustainability. Proceedings of a Regional
Workshop, Beijing, China, 12-16 December 2005. RAPA Publication
2006/27, FAO, Bangkok
Fairhurst TH, Witt C, Buresh RJ, Dobermann A (ed) (2007) Rice: A Practical
Guide to Nutrient Management, 2nd ed International Rice Research Institute
(IRRI), Philippines, International Plant Nutrition Institute (IPNI) and
:
International Potash Institute (IPI), Singapore. 89p text and 47p Annex with
color plates.
Gill MS, Gangwar B, Gangwar KS (2008a) Site-specific crop management
approach for high yield realisation of cereal-based cropping systems. Indian J
Fert 4(8): 31-56
Gill MS, Shukla AK, Pandey PS (2008b) Yield, nutrient response and economic
analysis of important cropping systems in India. Indian J Fert 4 (4): 11-48
Humphreys E, Roth CH (ed) (2008) Permanent beds and rice-residue management
for rice–wheat systems in the Indo-Gangetic Plain. Proceedings of a
workshop held in Ludhiana, India, 7–9 September 2006.ACIAR Proceedings
No. 127, 192 pp.
IRRI (International Rice Research Institute) (2009) Nutrient Manager for Rice:
Philippines. http://www.irri.org/nmrice.Accessed 1 March 2010
Janssen BH, Guiking F.T, Van der Eijk D, Smaling EMA, Wolf J, van Reuler H
(1990) A system for quantitative evaluation of the fertility of tropical soils
(QUEFTS). Geoderma 46: 299-318
Jat ML, Dass S, Sreelatha D, Sai Kumar R, Sekhar JC, Chandana P (2009) Corn
revolution inAndhra Pradesh: The role of single cross hybrids and zero tillage
technology. DMR Technical Bulletin 2009/5. Directorate of Maize Research.
Pusa New Delhi. pp 16
Johnston AM, Khurana HS, Majumdar K, Satyanarayana T (2009) Site-specific
nutrient management-concept, current research and future challenges in
Indian agriculture. J Indian Soc Soil Sci 57: 1-10
Kirk GJD, Yu TR, Choudhury FA (1990) Phosphorus chemistry in relation to
water regime. In: Phosphorus requirements for sustainable agriculture inAsia
and Oceania. IRRI, Los Banos, Philippines, pp. 211-223.
Pampolino MF, Laureles EV, Gines HC, Buresh RJ (2008) Soil carbon and
nitrogen changes in long-term continuous lowland rice cropping. Soil Sci Soc
Amer J 72: 798-807
Pampolino MF, Larazo WF, Buresh RJ (2010) Soil carbon and nitrogen losses
following conversion from continuous rice cropping to a rice–maize rotation.
Soil Sci SocAm J (under review)
Panaullah GM, Timsina J, Saleque MA, Ishaque M, Pathan ABMBU, Connor DJ,
Saha PK, Quayyum MA, Humphreys E, Meisner CA (2006) Nutrient uptake
and apparent balances for rice-wheat sequences. III. Potassium. J Plant
Nutrition, 29: 173-187
Pandey MP, Rao K, Srinivasa K, Sanjoy S (2008)Agro-economic analysis of rice-
based cropping systems. Indian J Fert 4 (4): 39-47
Pandey SK, Sud KC (2007) Nutrient management in potato-based cropping
systems. Indian J Fert 3(9): 91 107
Pasricha NS (1998) Sulphur and potassium inputs through irrigation water in
Indo-Gangetic alluvial soils under rice-wheat cropping systems. In:
570 571

Proceedings of the 16th World Congress Soil Sciences. ISSS/CIRAD,
Montpellier, France
Pasuquin JMCA, Timsina J, Witt C, Buresh RJ, DobermannA,Dixon J (2007) The
expansion of rice-maize systems in Bangladesh: Anticipated impact on
fertilizer demand. IFA Crossroads 2007. CD-ROM Proceedings. Bali,
Indonesia, 18 December, 2007, IPNI organizer.
Ponnamperuma FN (1972) The chemistry of submerged soils. Adv Agron 24: 29-
96.
Rao AS, Srivastava S (ed) (2001) Proceedings of the national Seminar on soil
testing for balanced and integrated use of fertilizers and manure. Indian Inst
of Soil Sci, Bhopal, 326 p.
Sah RN, Mikkelsen DS (1989) Phosphorus behaviour in flooded-drained soils. I.
Effects on phosphorus sorption. Soil Sci. Soc.Am. J. 53: 1718-1722
Sah RN, Mikkelsen DS, Hafez AA (1989a) Phosphorus behaviour in flooded-
drained soils. II. Iron transformation and phosphorus sorption. Soil Sci. Soc.
Am. J. 53: 1723-1729
Sah RN, Mikkelsen DS, Hafez AA (1989b) Phosphorus behaviour in flooded-
drained soils. III. Phosphorus desorption and availability. Soil Sci. Soc. Am.
J. 53: 1729-1732
Saleque MA, Timsina J, Panaullah GM, Ishaque M, Pathan ABMBU, Connor DJ,
Saha PK, Quayyum MA, Humphreys E, Meisner CA (2006) Nutrient uptake
and apparent balances for rice-wheat sequences. II. Phosphorus. J Plant Nutrit
28: 157-172
Sharma PD, Biswas PP (2004) IPNS packages for dominant cropping systems in
different agro-climatic regions of the country. Fertiliser News 49 (10): 43-47
Singh JP, Dua VK, Lal SS, Pandey SK (2008). Agro-economic analysis of potato-
based cropping systems. Indian J Fert 4 (5): 31-39
Talukder ASMHM, Meisner CA, Baksh ME, Waddington SR (2008)
Wheat–maize–rice cropping on permanent raised beds in Bangladesh.
Permanent beds and rice-residue management for rice–wheat systems in the
Indo-Gangetic Plain. Proceedings of a workshop held in Ludhiana, India, 7–9
September 2006.ACIAR Proceedings No. 127, 192 pp.
Timsina J, Connor DJ (2001) The productivity and management of rice-wheat
cropping systems: Issues and challenges. Field Crops Res 69: 93-132
Timsina J, Buresh RJ, Dobermann A, Dixon J, Tabali J (2010) Strategic
assessment of rice-maize systems in Asia. IRRI-CIMMYT Alliance Project
on Intensified Production Systems in Asia (IPSA), IRRI-CIMMYT Joint
Report, IRRI, Los Banos, Philippines
Timsina J, Panaullah GM, Saleque MA, Ishaque M, Pathan ABMBU, Quayyum
MA, Connor DJ, Saha PK, Humphreys E, Meisner CA(2006) Nutrient uptake
and apparent balances for rice-wheat sequences. I Nitrogen. J Plant Nutrit
29:137-155
Willet IR (1979) The effects of flooding for rice culture on soil chemical properties
and subsequent maize growth. Plant Soil 52: 373-383
Willet IR, Higgens ML (1978) Phosphate sorption by reduced and reoxidised rice
soils.Aust J Soil Res 16: 319-326
Witt C, Buresh RJ, Peng S, Balasubramanian V, Dobermann A (2007) Nutrient
management. pp 1–45. In Fairhurst TH, Witt C, Buresh R, Dobermann A (ed)
Rice: A practical guide to nutrient management. Los Baños (Philippines) and
Singapore: International Rice Research Institute (IRRI), International Plant
Nutrition Institute (IPNI), and International Potash Institute (IPI)
Witt C, Pasuquin JMCA, Dobermann A (2006) Towards a site-specific nutrient
management approach for maize inAsia. Better Crops 90(1): 28-31
Witt C, Pasuquin JMCA (2007) Research Findings IV: The principles of site-
specific nutrient management for maize [online]. Available at
Witt C, Dobermann A, Abdulrachman S, Gines HC, Wang G, Nagarajan R,
Satawatananont S, Son TT, Tan PS, Tiem, LV, Simbahan GC, Olk DC (1999)
Internal nutrient efficiencies of irrigated lowland rice and in tropical and sub-
tropicalAsia. Field Crops Res 63: 113-138
Witt C, Pasuquin JMCA, Pampolino MF, Buresh RJ, Dobermann A (2009) A
manual for the development and participatory evaluation of site-specfic
nutrient management for maize in tropical, favorable environments.
International Plant Nutrition Institute, Penang, Malaysia
Yadav RL, Subba Rao AVM (2001) Atlas of Cropping Systems in India. PDCSR
Bulletin No 2001-2, pp. 96, Project Directorate for Cropping System
Research, Modipuram, Meerut-250 110, India
Yang HS, Dobermann A, Landquist JL, Walter DT, Arkebauer TJ, Cassman KG
(2004) Hybrid maize- a maize simulation model that combines two crop
modeling approaches. Field Crops Res 87: 131-154
http://www.ipipotash.org/e-ifc/2007-14/research4.php
572 573

Proceedings IPI-OUAT-IPNI International Symposium (2009)
G Raviprasad MadhabAdhikari
Coromandel International Limited,
1-2-10, SPRoad, Secunderabad500003, India
e-mail: [email protected]
e-mail: [email protected]
Role of industry initiatives in extension activities in
India
G Raviprasad MadhabAdhikaril
l l
Abstract
Keywords
Introduction
Extension builds the bridge between lab and land. There are different
agencies available in India, who are today helping new technologies to reach the
end-customer. They carry out extension activities as per their organizational
mandate. In this paper specific methodologies are discussed which are used by the
industry in agri-input sector to take the new technologies and products to the
farming community. The methods include individual, group and mass media to
reach the end customers. It also includes number of technology interventions and
training methods, which can be used to increase the effectiveness of industry led
extension activities.
Extension activities agriculture industry
Agricultural extension was once known as the application of scientific research
and new knowledge to agricultural practices through farmer education. The field
of extension now encompasses a wider range of communication and learning
activities organised for rural people by professionals from different disciplines,
including agriculture, agricultural marketing, health, and business studies.
The term, 'extension' was first used to describe adult education programmes
in England in the second half of the 19th century. These programmes helped to
expand - or extend - the work of universities beyond the campus and into the
neighboring community. The term was later adopted in the United States of
America, while in Britain it was replaced with "advisory service" in the 20th
century.
In the US, an extension agent is a university employee who develops and
delivers educational programs to assist people in economic and community
development, leadership, family issues, agriculture and environment. Another
574 575

program area extension agents provide is 4-H and Youth. Many extension agents
work for cooperative extension service programs at land-grant universities. They
are sometimes referred to as county agents or educators.
The latest definitions of extension show some interesting trends how the
discipline has developed over the years. The essence of agricultural extension is to
facilitate interplay and nurture synergies within a total information system
involving agricultural research, agricultural education and a vast complex of
information-providing businesses (Neuchatel Group 1999). Extension [is] a series
of embedded communicative interventions that are meant, among others, to
develop and/or induce innovations which supposedly help to resolve (usually
multi-actor) problematic situations (Leeuwisand van den Ban 2004).
Government Agencies: State department of agriculture; Krishi Vigyan Kendras
(KVKs); Agricultural Research Institutes of ICAR; NGOs; and Agri. Input
Companies
Any particular extension system can be described both in terms of both how
communication takes place and why it takes place. It is not the case that
paternalistic systems are always persuasive, nor is it the case that participatory
projects are necessarily educational. Instead there are four possible combinations,
each of which represents a different extension paradigm (NAFES 2005), as
follows:
Technology Transfer (persuasive and paternalistic);
Advisory work (persuasive and participatory);
Human Resource Development, and
Facilitation for empowerment (educational and participatory).
Industry today touches all the facets of the above four paradigms of agricultural
extension in some way or other. The mandate of Industry in context with
agricultural extension is as follows:
Brand building;
Introduction of new product;
Introduction of new technology/concept;
Developing awareness of latest products/molecules;
Providing solutions for better production and better protection;
The agencies involved in extension activities in India
Four paradigms of agricultural extension
The mandate of industry
Creating awareness for integrated nutrient management and integrated pest
management, and
Differentiating its product vis-a-vis competitors.
Today all the three wings need to participate in extension activity but industry is
playing an increasing role due to number of reason. The Government wing is
suffering from lack of manpower and infrastructure. Maximum time is being spent
on administration than on extension. NGOs mostly engaged in socio-economic
developmental segment and lack of coordination due to presence of too many
agencies and accountability issues has started creeping in. Agri-input Industry's
immediate concern is higher sale of its own brand. But since most of the new
technologies come through industry it is mandatory for them to develop the
concept, which in turn helps the farming community.
The following methods are used by the industry as a whole and in most of the cases
a combination of activities are used as extension is always a holistic approach not a
singular activity done one fine morning. The popular methods are
Individual Contact, Farmer meeting, Crop Seminar, Result Demonstration, Soil
testing, Local Talent, Exhibition, Farmer mailers, Farmer testimonials, Radio and
Television Programmes, Radio and TV commercials, News paper articles, News
paper advertisements, Hoarding andAgricultural fairs.
Individual company representatives meet the farmers at their home/farm and
explain them about new technologies and products. This is the best method for
rural marketing as far as adoption rate is concerned. The tools used are leaflets,
product brochure, crop kits, detailing chart. The advantages of this are that the
success rate is very high as you spend a lot of time enforcing the communication.
The cost for this activity is very high. The availability of qualified manpower and
high attrition rate across companies is the major constraint.
Organising a group meeting for farmers at their village in some common area like
choupal/village temple etc. This is another very successful method of technology
dissemination. The tools used are leaflets, product brochure, Multimedia, film
shows etc.The advantages of this are that many farmers can be educated at a given
Why industry should participate in extension activities
Different extension approaches taken by industry
Individual Contact
Farmer Meeting, discussion forum
576 577

point of time. Two companies with complementary products can do it jointly. The
cost depends on the number of participants but definitely cheaper than individual
contact. The major constrain is that you need a qualified person for organizing
such events who can answer questions covering all aspects of agriculture.
Organising a technical meeting for farmers in collaboration with scientists at a
research station or good location. This is another very successful method of
technology dissemination. The advantages is that many farmers can be educated at
a given point of time. Scientists can add real value in participating in this kind of
programmes. The cost depends on the number of participants but definitely
cheaper than individual contact.
Using farmers testimonials in meetings and in mailers is a good method of
extension where the farmers share the benefits of the technology with his peers.
The main advantages is that it has got a good impact as the news spreads very fast
and farmers believe what their peers say. The cost of mailers is very cheap. The
constraints are due to the facts that you need a have a good farmer's data base.
Organizing a result demonstration in a prominent and easy to access farmers' field
with a control plot and show the farmers the benefits of new technology. The
farmers are normally taken to the plot at different stages and shown the benefits.
Concluded by a harvest day. The advantages is that many farmers can be educated
at a given point of time. Seeing is believing. The cost depends on the plot size and
number of farmers taken to the plot. The constraint is due to the fact that it is
difficult to monitor the farmers field on a regular basis and the results are
dependent on many uncontrolled factors
Normally a decorated jeep or van is taken through the villages and a combination
of individual contact and farmers meeting are used. The advantages is that many
farmers can be educated at a given point of time and easy to get attention of the
farmers. The cost is high. Logistics is the most critical issue to handle and the
process requires number of permission from competent authorities.
Crop Seminar
Farmers' testimonials
Result demonstration, Harvest days
Mass campaign through decorated vans
Soil testing/leaf analysis at Laboratory
Soil testing through kits
Mobile Soil testing Van
Farmers call centre
Farmers' event
Soil sample/leaf sample can be collected from the farmers' field and send to
company lab or any other designated labs. The advantages is that many numbers of
tests can be done in a year and result can be given in 15 days with good IT support
system.Along with NPKS, EC, pH, organic carbon, and micronutrients can also be
tested. The cost to company is high. Normally micronutrients and leaf analysis are
done with some minimum fees from the farmers as the cost is very high. The
sample should reach the plant in proper condition with appropriate marking.
Ahandy kit carried is by the company representative and soil testing can be done at
the farmers field in half an hour. It has the advantages that around 20 tests can be
done in a day by a person and the result can be given there itself. The kit can be used
for pH, EC, Sulphur and Organic carbon. Its cost is less compared to other forms of
testing . However the most of the tests are qualitative in nature.
A mobile van with soil testing kits goes to selected areas and organizes soil testing
camps there. The advantage is that around 50 tests can be done in a day and the
result can be given there itself. The van can conduct NPKS, EC, pH and Organic
carbon tests. The cost to company is high. The logistics is the most critical issue to
handle and requires a dedicated soil testing specialist.
Atoll free number where farmers can call about their agricultural problems and get
a solution through a panel of agricultural experts. The farmers can call at their own
time and the company can get valuable farmer data base. The cost to company is
high. Sometimes solution to pest or disease related issues can not be solved over
phone. Normally the company representative needs to visit the farmer for a follow-
up.
The company can organize an event or take part in an existing event. Normally
knowledge dissemination happens through leaflets and small group meetings
along with the event. The participation and enthusiasm level is very high among
farmers. The cost to company is medium. It is difficult to have very serious
meeting along with the same. But an excellent brand building tool.
578 579

Local talent/Puppet Show
Newspaper article
Exhibition
Channel training
Training of extension personnel
Daskathia, Burakatha, Puppet show, Kirtan are the different forms of local talent
programmes where local artists perform on the stage on some mythological
stories. They also build up a story based on the message you want to convey.
Excellent participation and the message goes right into the mind of the farmers as
they relate to it quickly. The cost to company is high. However, if the message is
not clear it will have only entertainment value.
Newspaper articles with technical issues or product is a good way of spreading
your message. It has very high reach and farmers trust the words in newsprint. The
cost to company is high. However, if used only for product publicity it is treated as
a propaganda by the company.
Farmers fair and traditional fairs are a good medium to participate. You need to
have a good stall with multimedia and few agricultural experts to solve farmers
issues. The footfall to your stall will be high and with some qualified experts you
can very well spread the technology. The cost to company is high. The constraint is
that all persons visiting the stall may not be farmers.
Technical training programme is organised for dealers and retailers where detailed
technical session is conducted along with commercial sessions. The channel
members are the persons who are in touch with the farmers. Proper training for
them helps in better technology dissemination. The cost to company is high. The
main point for consideration is that you should select participants carefully for a
better learning experience.
Technical programme for extension personnel like sugarcane officers, officers of
state department of agricultures, Village Level Workers (VLWs) is a good tool in
informing them about new technologies. It is a good public private partnership
model where both the agencies can learn from each other and work out ways to
reach the farmers.
Mass Media-TV, Cable TV, Cinema, Radio, Newspaper
What Industry has done in India
References
Mass media can be used in various forms like participation in agricultural
programmes in TV and Radio. The medium is mostly used for brand building
exercise. It has a high reach. The cost to company is high.You get limited exposure
where the message should be concise as the cost is high. You need to choose the
state based on media reach
Products like DAP, 28-28-0, MOP, Urea are in fact popularized by industry only
through its strong extension work. Brands like Gromor, Godavari, Nagarjuna,
Paras are household names for farmers today. The concept of sulphur fertilisation
is developed in India by Coromandal and its flagship brand Gromor Sulphur is
used by more than 3 million farmers. The concept of water soluble fertilisers was
started in India by Nagarjuna Fertilisers and today with the entry of Coromandal
with its strong extension network, the technology has grown manifold to the
benefit of India farmers. All new molecules of pesticides are developed by
industry only, thereby giving farmers the most important tool for plant protection.
Bt cotton seed has been popularized in India by Industry. Indian implements
industry has taught farmers the use of tractors and other advanced implements. In
short industry is the source of new technologies today and thus the onus is on the
industry to disseminate the same to the farmer for the benefit of IndianAgriculture
Neuchatel Group (1999) Common Framework onAgricultural Extension (Bureau
des politiques agricoles et de la sécurité alimentaire, 20 rue Monsieur, 75007
Par is . France . Websi te -h t tp : / /www.neuchate l in i t ia t ive .ne t /
images/cf_en.pdf)
Leeuwis C, van den Ban A (2004) Communication for rural innovation:
Rethinking agricultural extension, 3rd Ed. Blackwell, Oxford
NAFES (2005) Consolidating Extension in the Lao PDR, National Agricultural
and Forestry Extension Service, Vientiane, Laos
580 581

Proceedings IPI-OUAT-IPNI International Symposium (2009)
Volker Römheld
Institute of Plant Nutrition, University Hohenheim, 70593 Stuttgart, Germany.
e-mail : [email protected]
ErnestAKirkby
Institute of Integrative and Comparative Biology, Faculty of Biological Sciences,
University of Leeds LS2 9JT, United Kingdom
Presented at IPI-OUAT-IPNI International Symposium.Published in Plant Soil 2010.335:155-180. Printed here with permission from Plant Soil
Research on potassium in agriculture: Needs and
prospects
Volker Römheld ErnestAKirkbyl
Abstract This review highlights future needs for research on potassium (K) in
agriculture. Current basic knowledge of K in soils and plant physiology and
nutrition is discussed which is followed by sections dealing specifically with
future needs for basic and applied research on K in soils, plants, crop nutrition
and human and animal nutrition. The section on soils is devoted mainly to the
concept of K availability. The current almost universal use of exchangeable K
measurements obtained by chemical extraction of dried soil for making fertilizer
recommendations is questioned in view of other dominant controlling factors
which influence acquisition K from soils by plants. The need to take account of the
living root, which determines spatial K availability is emphasized. Modeling of K
acquisition by field crops is discussed. The part played by K in most plant
physiological processes is now well understood including the important role of K
in retranslocation of photoassimilates needed for good crop quality. However,
basic research is still needed to establish the role of K from molecular level to field
management in plant stress situations in which K either acts alone or in
combination with specific micronutrients. The emerging role of K in a number of
biotic and abiotic stress situations is discussed including those of diseases and
pests, frost, heat/drought, and salinity. Breeding crops which are highly efficient in
uptake and internal use of K can be counterproductive because of the high demand
for K needed to mitigate stress situations in farmers' fields. The same is true for
the need of high K contents in human and animal diets where a high K/Na ratio is
desirable. The application of these research findings to practical agriculture is of
great importance. The very rapid progress which is being made in elucidating the
role of K particularly in relation to stress signaling by use of modern molecular
biological approaches is indicative of the need for more interaction between
molecular biologists and agronomists for the benefit of agricultural practice. The
582 583

huge existing body of scientific knowledge of practical value of K in soils and
plants presents a major challenge to improving the dissemination of this
information on a global scale for use of farmers. To meet this challenge closer
cooperation between scientists, the agrochemical industry, extension services and
farmers is essential.
Potassium availability potassium micronutrient interaction spatial
availability of potassium K/Mg ratio abiotic stresses biotic stresses drought
resistance frost resistance food quality K/Cd relations
Large areas of the agricultural land of the world are deficient in potassium which
include 3/4 of the paddy soils of China and 2/3 of the wheat belt of Southern
Australia. Additionally export of agricultural products and leaching of K partic-
ularly in sandy soils contributes to lowering soil K content (Rengel and Damon
2008). Soils on which potassium deficiency occurs vary widely and include acidic
sandy soils, waterlogged soils and saline soils (Mengel and Kirkby 2001).
At two recent conferences held in India, the first in Ludhiana (Punjab) (IPI-
PAU Intern. Symposium 2006), and the second in Bhubanaswar (Orissa) (IPI-
OUAT-IPNI Intern. Symposium 2009) at both of which crop nutrition was
discussed, attention was drawn to the stagnation and even progressive decline in
crop yields in the Indian sub continent as a consequence of interruption of soil
recycling of organic matter and mineral nutrients, especially potassium (K). In
India animal dung (as manure cakes) and crop residues are used as a source of
bioenergy for cooking and heating without recycling the K rich ash or sludge back
to farming land which receives only low, if any, input of K fertilizers (Hasan
2002). As a consequence, a progressive decline in soil fertility including organic
matter and K status is to be expected as an important factor in restricting crop
yields.
This problem is not only restricted to India, it is a worldwide one. According
to Smil (1999), more than half the dry matter in the global harvest is in the straw of
cereal and legume crops and in the tops, stalks, leaves and shoots of tuber, oil,
sugar and vegetable crops. This global bulk of dry matter which contains nutrients
and is taken away at harvest and utilized for other purposes (e.g. heating, animal
feed, biofuels), means that large amounts of nutrients are removed from the soil.
Globally, the annual above ground parts of crops (phytomass), contains 75, 14 and
60 million tonnes of nitrogen (N), phosphorus (P) and potassium (K), respectively.
However, whereas nutrient applications of N and P are at similar levels to total
nutrient content in crop phytomass removal (80 and 14 million tonnes,
respectively), K is applied at a much lower level, to replenish only 35% of the K
removed (Smil, 1999), a figure which is likely to be much lower in developing
Keywords
Introduction
l l
l l l l
l l l
countries.
The consequence of a lack of adequate nutrient recycling leading to a loss of
soil structure and decline in soil fertility was appreciated long ago by the renowned
German agricultural chemist Justus von Liebig and discussed in the 9 edition
(1876) of his well - know text book “Chemistry in its application to agriculture and
physiology”. Justus von Liebig recognised that K as one of the major plant
nutrients played a key role in soil fertility and he developed K mineral fertilizers,
so called “patent fertilizers”, to increase crop yields. These findings are as relevant
today as they were then. The current move towards using crop residues or even
entire crops as biofuels, in order to place less dependence on fossil fuels in
developed and developing countries such as the USA or China, will also in the
long-term lead to a decline in soil fertility.
Taking a more holistic view, there is a need to consider progressive crop yield
decline not only in terms of inadequate recycling of organic matter and mineral
nutrients, but also in relation to annual flooding problems in India. The benefits of
organic matter in soil acting as a physical barrier to a run-off of rain water can not
be ignored.Also the lower infiltration of rain water on agriculturally degraded land
poor in soil structure promotes the regular flooding of river deltas during the
Monsoon period (Hermann et al. 1994). It also brings about topsoil runoff and
erosion which is evident not only in India but occurs worldwide. Yoshida (2001)
estimated an economic value of 68.8 billion USD for the multifunctional
detrimental role of agriculture in Japan on the landscape and the environment
including runoff and erosion.
Another consequence of decline in soil fertility in agricultural land is the
greater prevalence of sustained periods of drought resulting from poorer water
storage throughout the soil profile. These increasing events of drought and other
abiotic stresses (e.g.heat) arising from loss of soil fertility as well as from global
warming will necessitate a specifically high supply of K for stress mitigation (see
below). The inadequate recycling of K in Indian agriculture thus puts these soils
and the crops they carry at risk. In Germany too, farmers often respond irrationally
to drought events by decreasing rates of K fertilization (Joachim Rauch 2007 pers.
comm.).
In this paper we consider various aspects relating to K use in crop production.
This includes not only the supply of K from the soil to crop plants but also the role
of K in animal and human nutrition. Attention is drawn to the great need for more
effective transfer of information to the benefit of the farmer from the vast amount
of knowledge which has already been accumulated on K in soils and plants. We
critically discuss some of the more recent research work on K in soils and plants
included in various papers presented at the Potassium Conference at Orissa (IPI-
OUAT-IPNI Intern Symposium, 2009). We also address areas of new and
developing interest in K in soils and plants and discuss current interests in the
important role of K in protecting crops from abiotic and biotic stresses and
th
584 585

consider areas in which basic and applied research might be carried out
suggesting means by which farmers might benefit more from research findings.
On a global scale there is an enormous gap between agricultural scientific
knowledge and its dissemination and application to farming practice, particularly
in developing countries. This point was made very forcibly by Krauss (2003a), the
then Director of the International Potash Institute, when in discussing the work of
the Institute in retrospect and prospect, he wrote, “Much of the immediate future
challenge is for knowledge transfer, particularly to poor farmers and their advisors
and extension workers. Balanced K fertilization and avoidance of K mining, (K
applied by fertilizers less than that K removed by crop harvest), will prevent
farmers from falling into the poverty trap and will help them leave the vicious
circle of declining soil fertility”.
This urgent need for dissemination of scientific knowledge was made very
clear during two recent horticultural visits, one to China and the other to Italy. In
the intensive tomato production area of Shandong province in China, severe Mg
deficiency symptoms were visible on many of the plants. These symptoms were
typical of what might be expected from too high a K supply (high K-induced Mg
deficiency, Römheld and Kirkby 2007), which was confirmed later by soil and
plant analyses. The extremely high K content in the soils of these Chinese
glasshouses near Shouguang in Shandong had depressed Mg uptake, inducing low
Mg leaf concentrations (Heenan and Campbell 1981; Seggewiss and Jungk 1988).
Neither the local farmers nor even the scientific advisors were aware that these
symptoms of intercostal chlorosis of the leaves adjacent to the fruit trusses, were
caused by lack of Mg. In western Europe and the USA too, Mg deficiency
symptoms in some horticultural and agricultural crops can be widely observed
during reproductive growth stages (Römheld and Kirkby 2007).
Another example of an inappropriate recommendation for K fertilizer use,
again arising because of lack of understanding of interactions between Mg and K
in plant nutrition and the practical benefits of soil and plant analysis, was recently
demonstrated in two nearby kiwi ( ) orchards near Bologna in
Italy. In one of the orchards (“Gurini”), Mg deficiency symptoms similar to those
described above for tomato were clearly recognisable, whereas in the other
(“Dalle”), the plants were showing symptoms of necrosis of the leaf margins
clearly indicative of K deficiency. The visual diagnoses in both orchards
(Francesco Penazzi 2009 pers. comm.) were confirmed by soil and leaf analyses
which are shown in Table 1. The inappropriate use of K fertilizer
recommendations in these kiwi orchards strongly supports Krauss`s view that
“ignorance of soil tests prevents the application of balanced fertilization in the
adequate use of potash” (Krauss 2003a).
Need for knowledge dissemination
Actinidia deliciosa
Table 1
Potassium in soils: present knowledge
Visual symptoms and results of analysis of soil (0-60 cm) and
corresponding leaf samples of two kiwi ( ) orchards
near Bologna, Italy
Ensuring that appropriate scientific knowledge is passed on to farmers and
growers is still a great challenge in agriculture and horticulture. The means of
achieving this challenge for the benefit of farmers and growers are considered in
more detail in relation to research developments in "Need for future research on
potassium" and "Summary and prospects".
The present conceptual understanding of soil K availability is the existence of four
distinct K pools differing in accessibility to plant roots with reversible transfer of
K between the pools (Syers 2003). This concept is illustrated in Fig. 1 which
presents an up to date version of the K cycle in soils (see also Öborn et al. 2005).
Soil solution plays a pivotal role in providing the pathway for K uptake from the
soil to plant roots. Although this pool is very low in K content, representing only
about 5% of total crop demand at any given time (McLean and Watson 1985), or
0.1 - 0.2 % of the total soil K, it is immediately available and replenished by both
the exchangeable K (EK, readily plant available K) and the slowly or non-
exchangeable K (SEK, slowly plant available K) pools. These two pools, EK and
SEK make up about 1-2% and 1-10% of the total K respectively and are the main
contributors to K uptake by plants. The exchangeable fraction (EK) i.e. the K held
on negatively charged sites of clay minerals and soil organic matter, is in rapid
equilibrium with soil solution K and is considered to be readily available to plants.
Its measurement, as discussed below, can often, but not always, provide a useful
indicator of K soil status in relation to plant supply. Potassium is released from the
slowly or non-exchangeable K pool (SEK) from lattice wedge sites of weathered
micaceous clay minerals which are selective for K ions (see Mengel and Kirkby
2001). The remaining pool which holds the bulk of K (90-98% of the total soil K),
is held in structure of the primary K bearing minerals, such as micas and feldspars
being released very slowly by weathering to replenish the EK and SEK pools as
indicated in the figure. Most of the total soil K available to plants is usually located
in the topsoil.
Actinidia deliciosa
Kiwi orchard Visual symptoms(June 2009) soil analysis (% in leaf DM)
"Gurini" Mg deficiency K: high-very high K: 1.49(sandy soil) Mg: low-very low Mg: 0.43 (low)
"Dalle" K deficiency K: very low K: 0.80 (low)(clay loam soil) Mg: very high Mg: 0.67 (high)
Classification by Leaf analysis
(adequate)
586 587

Fig.1 Potassium cycle in soils (after Syers 2003)
These different K pools are not only of relevance to K acquisition by plants
but also to K leaching through the soil profile as evident in Fig. 1. In sandy soils as
well as in acid lateritic soils containing kaolinitic clay minerals low in CEC, rates
of K leaching can be very high so that considerable amounts of K can be lost
(Table 2, Wulff et al.1998) (Sharpley 1990). On such soils where high rainfall
conditions prevail, split application of K fertilizers during the growth period has
proved beneficial, simultaneously lowering loss of K by leaching and raising
efficiency of use of the K fertilizers applied (Kolar and Grewal 1994).
The most usual method used worldwide to assess the K status of a soil for the
likelihood of obtaining a response in crop yield to fertilizer additions is the
measurement of exchangeable K. This determination is made by extracting EK
from air dried topsoil by one of a number of various well accepted chemical
extractants which include NH OAc, NH Cl, CaCl , Mehlich No 1 and 2, the choice
depending mainly on local usage and tradition. Differences between the
extractants are only marginal in sensitivity (McLean and Watson 1985). The
relationship between the amounts of exchangeable K and crop yield can be
extremely close as reported for example by Johnston et al.(1998) for grain yields
of winter wheat and yields of field beans (Vicia faba L.) grown on a silty clay loam
soil at Rothamsted in the UK. However, as discussed by Syers (2003) much of the
reported information in the UK relates to single soils or a narrow range of soils
which may have led to an overemphasis on the usefulness of EK.
There is abundant evidence of the importance of SEK in soils and its
availability to plants (Syers 2003). For example Mengel et al. (1998) were able to
show that silt in loess derived soils which is high in 2:1 layer silicates interlayer K
is able to provide large quantities of SEK to ryegrass. It is for this reason that
Kuhlmann and Wehrmann (1984) found no response to K in grain yield of cereals
growing on these loess soils even at very high levels of K application. Also
different methods of soil analysis for available K showed no relationship to K
fertilizer requirement. In India, Prasad (2009) has recently suggested that EK
values are inadequate for fertilizer recommendations because of the contributions
of non-exchangeable (SEK) and subsoil K to uptake. Kuhlmann and Barraclough
(1987) reported that winter wheat could acquire 50% of its K from the subsoil.
Certainly although EK is used widely as a measure to determine soil K
availability and predict K fertilization needs of crops, its suitability and
reliability is unsatisfactory in soils that contain 2:1 layer silicates and have the
ability to retain K as is the case of flooded soils used for rice production (
Dobermann et al. 1996).
Plant available K can be affected by long-term changes in total K in the soil.A
simple calculation shows that in soils with a low total K content as in sandy soils,
rapid K depletion can occur over relatively short periods if K removal is not
balanced by regular K fertilization with mineral fertilizers or by adequate
recycling of crop residues and organic manures or both (Table 3 ).
On this sandy soil, low in K, with an annual negative balance of 40 kg K ha ,
only 44 years are required to remove 25% of the stock soil K. This so-called
“potassium mining” is common. According to Hasan (2002), 72% of India`s
agricultural area representing 266 districts are in immediate need of K
fertilization. Such imbalances in K are widespread in agriculture and can also be
4 4 2
-1
Table 2 Average rate of K leaching in a sandy soil during the winter seasons
1989/1990 until 1994/1995 as affected by the annual rate of K
fertilization (Wulff et al. 1998
K fertilization rate(kg K ha a ) (kg K ha a )
0 2260 42120 79180 133
K leaching-1 -1 -1 -1
588 589
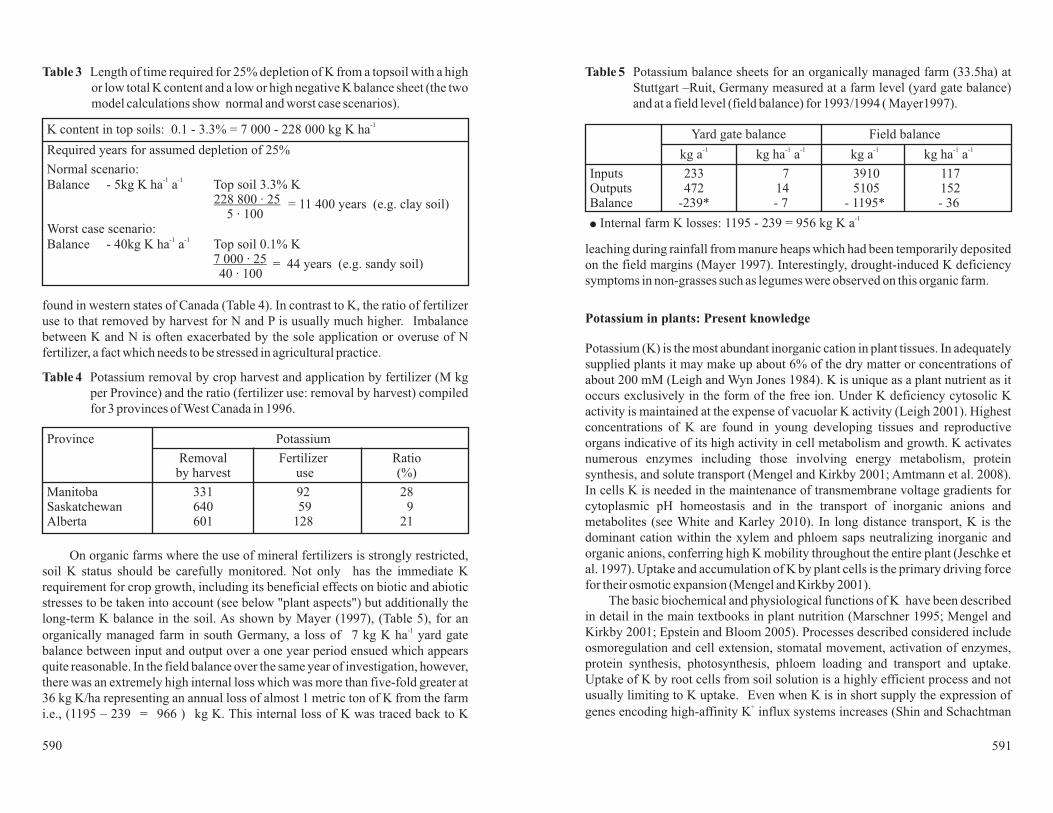
found in western states of Canada (Table 4). In contrast to K, the ratio of fertilizer
use to that removed by harvest for N and P is usually much higher. Imbalance
between K and N is often exacerbated by the sole application or overuse of N
fertilizer, a fact which needs to be stressed in agricultural practice.
On organic farms where the use of mineral fertilizers is strongly restricted,
soil K status should be carefully monitored. Not only has the immediate K
requirement for crop growth, including its beneficial effects on biotic and abiotic
stresses to be taken into account (see below "plant aspects") but additionally the
long-term K balance in the soil. As shown by Mayer (1997), (Table 5), for an
organically managed farm in south Germany, a loss of 7 kg K ha yard gate
balance between input and output over a one year period ensued which appears
quite reasonable. In the field balance over the same year of investigation, however,
there was an extremely high internal loss which was more than five-fold greater at
36 kg K/ha representing an annual loss of almost 1 metric ton of K from the farm
i.e., (1195 – 239 = 966 ) kg K. This internal loss of K was traced back to K
-1
leaching during rainfall from manure heaps which had been temporarily deposited
on the field margins (Mayer 1997). Interestingly, drought-induced K deficiency
symptoms in non-grasses such as legumes were observed on this organic farm.
Potassium (K) is the most abundant inorganic cation in plant tissues. In adequately
supplied plants it may make up about 6% of the dry matter or concentrations of
about 200 mM (Leigh and Wyn Jones 1984). K is unique as a plant nutrient as it
occurs exclusively in the form of the free ion. Under K deficiency cytosolic K
activity is maintained at the expense of vacuolar K activity (Leigh 2001). Highest
concentrations of K are found in young developing tissues and reproductive
organs indicative of its high activity in cell metabolism and growth. K activates
numerous enzymes including those involving energy metabolism, protein
synthesis, and solute transport (Mengel and Kirkby 2001; Amtmann et al. 2008).
In cells K is needed in the maintenance of transmembrane voltage gradients for
cytoplasmic pH homeostasis and in the transport of inorganic anions and
metabolites (see White and Karley 2010). In long distance transport, K is the
dominant cation within the xylem and phloem saps neutralizing inorganic and
organic anions, conferring high K mobility throughout the entire plant (Jeschke et
al. 1997). Uptake and accumulation of K by plant cells is the primary driving force
for their osmotic expansion (Mengel and Kirkby 2001).
The basic biochemical and physiological functions of K have been described
in detail in the main textbooks in plant nutrition (Marschner 1995; Mengel and
Kirkby 2001; Epstein and Bloom 2005). Processes described considered include
osmoregulation and cell extension, stomatal movement, activation of enzymes,
protein synthesis, photosynthesis, phloem loading and transport and uptake.
Uptake of K by root cells from soil solution is a highly efficient process and not
usually limiting to K uptake. Even when K is in short supply the expression of
genes encoding high-affinity K influx systems increases (Shin and Schachtman
Potassium in plants: Present knowledge
+
K content in top soils: 0.1 - 3.3% = 7 000 - 228 000 kg K ha
Required years for assumed depletion of 25%
Normal scenario:Balance - 5kg K ha a Top soil 3.3% K
5 · 100Worst case scenario:Balance - 40kg K ha a Top soil 0.1% K
40 · 100
-1
-1
-1 -1
-1
228 800 · 25
7 000 · 25
Province Potassium
Removalby harvest use (%)
Manitoba 331 92 28Saskatchewan 640 59 9Alberta 601 128 21
Fertilizer Ratio
Table 3 Length of time required for 25% depletion of K from a topsoil with a high
or low total K content and a low or high negative K balance sheet (the two
model calculations show normal and worst case scenarios).
Table 4 Potassium removal by crop harvest and application by fertilizer (M kg
per Province) and the ratio (fertilizer use: removal by harvest) compiled
for 3 provinces of West Canada in 1996.
Table 5 Potassium balance sheets for an organically managed farm (33.5ha) at
Stuttgart –Ruit, Germany measured at a farm level (yard gate balance)
and at a field level (field balance) for 1993/1994 ( Mayer1997).
Yard gate balance Field balance
kg a kg ha a kg a kg ha a
Inputs 233 7 3910 117Outputs 472 14 5105 152Balance -239* - 7 - 1195* - 36
Internal farm K losses: 1195 - 239 = 956 kg K a
-1 -1 -1 -1 -1 -1
l-1
590 591
= 11 400 years (e.g. clay soil)
= 44 years (e.g. sandy soil)
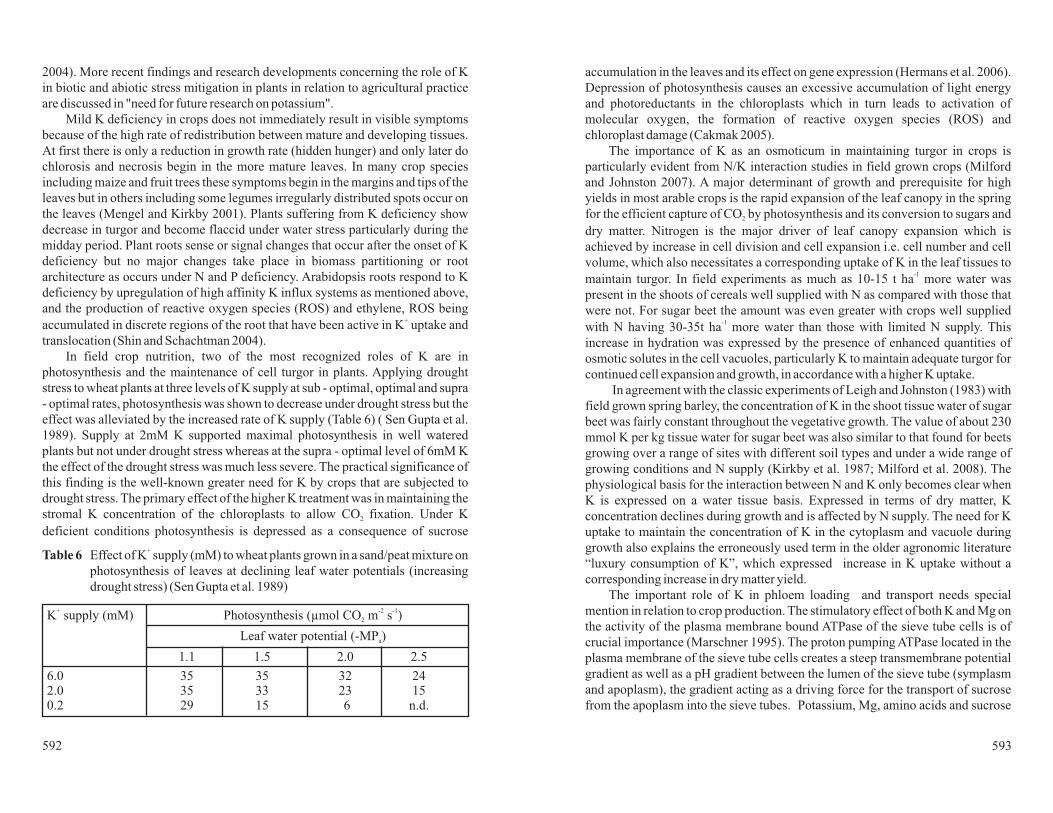
2004). More recent findings and research developments concerning the role of K
in biotic and abiotic stress mitigation in plants in relation to agricultural practice
are discussed in "need for future research on potassium".
Mild K deficiency in crops does not immediately result in visible symptoms
because of the high rate of redistribution between mature and developing tissues.
At first there is only a reduction in growth rate (hidden hunger) and only later do
chlorosis and necrosis begin in the more mature leaves. In many crop species
including maize and fruit trees these symptoms begin in the margins and tips of the
leaves but in others including some legumes irregularly distributed spots occur on
the leaves (Mengel and Kirkby 2001). Plants suffering from K deficiency show
decrease in turgor and become flaccid under water stress particularly during the
midday period. Plant roots sense or signal changes that occur after the onset of K
deficiency but no major changes take place in biomass partitioning or root
architecture as occurs under N and P deficiency. Arabidopsis roots respond to K
deficiency by upregulation of high affinity K influx systems as mentioned above,
and the production of reactive oxygen species (ROS) and ethylene, ROS being
accumulated in discrete regions of the root that have been active in K uptake and
translocation (Shin and Schachtman 2004).
In field crop nutrition, two of the most recognized roles of K are in
photosynthesis and the maintenance of cell turgor in plants. Applying drought
stress to wheat plants at three levels of K supply at sub - optimal, optimal and supra
- optimal rates, photosynthesis was shown to decrease under drought stress but the
effect was alleviated by the increased rate of K supply (Table 6) ( Sen Gupta et al.
1989). Supply at 2mM K supported maximal photosynthesis in well watered
plants but not under drought stress whereas at the supra - optimal level of 6mM K
the effect of the drought stress was much less severe. The practical significance of
this finding is the well-known greater need for K by crops that are subjected to
drought stress. The primary effect of the higher K treatment was in maintaining the
stromal K concentration of the chloroplasts to allow CO fixation. Under K
deficient conditions photosynthesis is depressed as a consequence of sucrose
+
2
accumulation in the leaves and its effect on gene expression (Hermans et al. 2006).
Depression of photosynthesis causes an excessive accumulation of light energy
and photoreductants in the chloroplasts which in turn leads to activation of
molecular oxygen, the formation of reactive oxygen species (ROS) and
chloroplast damage (Cakmak 2005).
The importance of K as an osmoticum in maintaining turgor in crops is
particularly evident from N/K interaction studies in field grown crops (Milford
and Johnston 2007). A major determinant of growth and prerequisite for high
yields in most arable crops is the rapid expansion of the leaf canopy in the spring
for the efficient capture of CO by photosynthesis and its conversion to sugars and
dry matter. Nitrogen is the major driver of leaf canopy expansion which is
achieved by increase in cell division and cell expansion i.e. cell number and cell
volume, which also necessitates a corresponding uptake of K in the leaf tissues to
maintain turgor. In field experiments as much as 10-15 t ha more water was
present in the shoots of cereals well supplied with N as compared with those that
were not. For sugar beet the amount was even greater with crops well supplied
with N having 30-35t ha more water than those with limited N supply. This
increase in hydration was expressed by the presence of enhanced quantities of
osmotic solutes in the cell vacuoles, particularly K to maintain adequate turgor for
continued cell expansion and growth, in accordance with a higher K uptake.
In agreement with the classic experiments of Leigh and Johnston (1983) with
field grown spring barley, the concentration of K in the shoot tissue water of sugar
beet was fairly constant throughout the vegetative growth. The value of about 230
mmol K per kg tissue water for sugar beet was also similar to that found for beets
growing over a range of sites with different soil types and under a wide range of
growing conditions and N supply (Kirkby et al. 1987; Milford et al. 2008). The
physiological basis for the interaction between N and K only becomes clear when
K is expressed on a water tissue basis. Expressed in terms of dry matter, K
concentration declines during growth and is affected by N supply. The need for K
uptake to maintain the concentration of K in the cytoplasm and vacuole during
growth also explains the erroneously used term in the older agronomic literature
“luxury consumption of K”, which expressed increase in K uptake without a
corresponding increase in dry matter yield.
The important role of K in phloem loading and transport needs special
mention in relation to crop production. The stimulatory effect of both K and Mg on
the activity of the plasma membrane bound ATPase of the sieve tube cells is of
crucial importance (Marschner 1995). The proton pumping ATPase located in the
plasma membrane of the sieve tube cells creates a steep transmembrane potential
gradient as well as a pH gradient between the lumen of the sieve tube (symplasm
and apoplasm), the gradient acting as a driving force for the transport of sucrose
from the apoplasm into the sieve tubes. Potassium, Mg, amino acids and sucrose
2
-1
-1
K supply (mM) Photosynthesis (µmol CO m s )
Leaf water potential (-MP )
1.1 1.5 2.0 2.5
6.0 35 35 32 242.0 35 33 23 150.2 29 15 6 n.d.
+ -2 -1
2
a
Table 6 Effect of K supply (mM) to wheat plants grown in a sand/peat mixture on
photosynthesis of leaves at declining leaf water potentials (increasing
drought stress) (Sen Gupta et al. 1989)
+
592 593

are quantitatively the main constituents of the phloem sap which are transported
from the mature source leaf to sink sites (Jeschke et al. 1997). An adequate supply
of K and Mg in the leaves is thus essential in supplying sucrose to the roots to cover
the energy requirement for root growth and development as well as ion uptake
(Cakmak et al. 1994). During the reproductive stages of crop plants, K and Mg in
source leaves play a critical role not only in ensuring an adequate supply of sucrose
but also in supplying K, Mg, N, S and P to the filling of grains fruits and tubers.
Recent findings that micronutrient demand (Zn, B, Cu) can also be particularly
high during the early reproductive growth (Kirkby and Römheld 2004) means
that the transport of these nutrients into storage tissues also depends closely on
the K (and Mg) status of source leaves.
Lack of transfer of knowledge, between scientist and farmer, of already well
established research findings concerning soil and plant K, can present a major
limiting step in agricultural production as referred to above. A further limiting
step, however, pointed out by Cakmak and Schjoerring (2008) is that despite the
key roles of K in biochemical and physiological processes in plants which affect
crop growth, there has been surprisingly little published research on the
importance of K on crop production and nutritional quality. From various
discussions during the recent International Potassium Symposium at
Bhubaneswar, Orissa, India (IPI-OUAT-IPNI Intern Symposium, 2009), it was
also obvious that there are still future needs for fundamental work including study
of K in mitigating various abiotic and biotic stresses as well as the application of
this work to basic field research on K in soils and crops. Potassium also plays a
very important role in human and animal health particularly in relation dietary
contents of Na and Mg. Below we discuss some of the current research
developments on K in soils, plants, and human and animal nutrition and discuss
needs and prospects for future research.
Soil aspects
Soil extraction methods,
particularly for exchangeable K (EK) are widely used as the basis for K
fertilization recommendations for crops. These have proved to be quite successful
for many soils not containing 2:1 clay minerals where adequate calibration has
been carried out (Mengel and Kirkby 2001). However, when the contribution of
SEK in soils is raised by the presence of 2:1 layer silicates that have the ability to
retain K, the “power of prediction” using EK soil extraction methods is lost.
Needs for future research on potassium
K fertilization recommendations
Exchangeable K (EK) and slowly exchangeable K (SEK)
On some such soils the SEK pool (i.e. K in interlayer sites) can make a
considerable contribution (80-100%) to available K to plants (Hinsinger 2002).As
discussed above, this pool plays a particularly important role under K-mining
conditions when the EK is low. The significance of the contribution of SEK has
been underestimated perhaps for two main reasons. In the first place unlike EK
there is no easy routine laboratory method for its determination and secondly the
means by which K release takes place from interlayer sites is not well understood
and in need of further research. Reports in the older literature indicate that cereals
and grasses are more effective than dicotyledonous plants in exploiting interlayer
sites for K (see Mengel and Kirkby 2001) which might relate to the higher root
length density of the grasses. Rengel and Damon (2008) in their recent review deal
with this different contribution of SEK of crop plants as a long-term process
dependent on genotype. There are observations that in general for example sugar
beet is more efficient than wheat and potatoes in the use of SEK (Steingrobe and
Claassen 2000). Trehan and Sharma (2002) and Trehan et al. (2005) suggest that in
contrast to K inefficient potato cultivars, efficient ones appear to bring about
chemical mobilization of SEK most probably via secreted root exudates. On the
other hand Springob and Richter (1998) found that a drop of K concentration
below 4 µM in the rhizosphere solution triggers the release of K from SEK.
Current research by Barré et al. (2007) investigating interlayer K in 2:1 clay
minerals uses X-ray diffraction techniques over short term periods to study the
effect of plant roots on K depletion, aims to attempt to relate clay mineral
modifications to plant uptake of interlayer K. Quantification of interlayer K
dynamics is of importance in understanding the soil K cycle and critical for
modeling K acquisition by crops on soils containing 2:1 clay minerals. From a
practical viewpoint, further work in this area might be useful in allowing a
prediction of long-term K release capacity in field balance calculations (Öborn et
al. 2005). Furthermore as also discussed by these authors the potential for
particular crops to extract K from the SEK fraction should also be explored for
possible introduction as a green manure in the crop rotation.
An important reason to question
EK and indeed also SEK as defined measures of K availability in soil is the
underlying assumption that is often made that the supply of K to plant roots is
solely dependent on K availability which can be assessed by chemical extraction
of air dried soil without taking into account the interaction of the living plant
root. There is a general misconception amongst some soil scientists that the
prediction of suitable K fertilization rates is simply a matter of refining soil testing
using chemical extraction procedures. This approach, however, takes no account
of the importance of limitation of spatial availability of K as a consequence of
variable root characteristics. Root morphology differs enormously between crop
species especially between monocots and dicots and between genotypes which
Plant root – soil interactions and K availability
594 595

may differ as for example in root length and density and frequency of root hairs.
Root hairs play a significant role in the acquisition of K which is mainly
transported from the bulk soil to the root surface by diffusion in accordance with
the low K concentration in soil solution (usually less than 1mM). The presence of
root hairs considerably increases the surface area of the root cylinder which in turn
steepens the K concentration gradient between the bulk soil and root surface which
drives K influx. In many plants, root hairs may contribute up to 70% of the total
surface thus increasing the root cylinder surface area 27 fold (Jungk 2001). Root
hair formation has energetic implications in relation to plant growth in that of all
the possible ways of increasing root surface area, it is least metabolically
demanding ( Lynch and Ho 2005). The root length can also vary considerably, that
of winter wheat for example being 6 times greater than that of the roots of the
potato crop which are relatively poor in root hairs (Johnston et al. 1998). Likewise
vegetable crops with shorter growth periods have smaller root systems. The high
importance of root length density in determining spatial availability of K for maize
growing in a sandy soil has been demonstrated by modeling work with data from a
field experiment. A root length density greater than 2 cm cm allowed delivery of
K from 50% of the topsoil volume which was reduced to only 10% when the root
length density fell below 1 cm cm (Fusseder and Kraus 1986).
Acquisition of K from soil is also dependent on numerous physical and
chemical soil factors which to a large extent determine the development and
spatial distribution of roots in the soil and thus their ability to acquire mineral
nutrients. Soil factors inhibiting root growth such as acute B deficiency,Al toxicity
in acid soils, soil compaction, salinity and drought all depress K acquisition from
the soil because of their effect in lowering spatial availability of K (Römheld and
Neumann 2006). For example, Batey and McKenzie (2006) reported poor growth
and low K content in reseeded grass as a consequence of drought stress caused by
surface compaction by over-cultivation of a moist fine sandy loam. Although the
soil was adequately supplied with nutrients, the grass K content from the
compacted soil was only 1.3% as compared with 4% of grass grown on a seedbed
from the same soil which had not been compacted. Our own observations of visual
K deficiency symptoms occurring in legumes and other dicotyledonous crops
under drought spells even on K rich soils further emphasises the importance of
considering root growth and weather data in future applied research to improve
evaluation of plant K availability. Under such conditions of transient drought-
induced K deficiency, investigation of foliar application of K might well be
worthwhile. This lack of understanding in neglecting spatial K availability was
apparent in discussion at the recent International Potassium Symposium at
Bhubaneswa, Orissa (IPI-OUAT-IPNI Intern Symposium, 2009), in relation to
the effects of low pH and possible Al toxicity in depressing root growth in the
soils of Orissa as the cause of induced K deficiency.
-3
-3
The importance of root growth in relation to K availability is stressed from
the results of the mechanistic modeling experiment of Barber and Mackay (1985)
which separated the influences of soil moisture on K uptake by corn ( L.)
between effects on root growth and the rate of K diffusion in the soil. Lowering the
volumetric soil moisture level from 0.27 to 0.22 ( i.e. from -33 to -7.5 kPa drought
conditions), induced low K acquisition which was due mainly to decrease in root
length density as a consequence of inhibited root growth in the dry soil (46-69%)
and to a lesser extent to the lower effective diffusion coefficient of K (11-27%).
An innovative approach for recommendation of K fertilizer to soils of direct
use to farmers has been tested and partially applied in Germany as the
KALIPROG system (Andres 1988). Use of data from a soil extraction method
involving the release of SEK in this information system is linked with site-specific
factors such as amount and quality of K-bearing minerals as well as weather
factors affecting root growth. Extensive field trials over many years for site-
specific optimal K fertilization allow the required recommendation (Andres and
Orlovius 1989). For general application of this KALIPROG system further GIS
data including data on mineralogy and long term weather forecasting for particular
agricultural areas is needed as well as calibration with field experiments. This
appears to be a topic for urgent research which if correctly applied could be of
direct benefit to farmers. The establishment of this system for K recommendation
from these various parameters should bring to an end the futile debate on the
benefits of improved soil extraction methods in relation to K fertilizer use.
The pioneering work of Barber in
the USA and Nye in the UK , has been described in the publications of Tinker and
Nye (2000); Barber (1995) and Jungk and Claassen (1997), in which various
mechanistic mathematical models have been described to predict nutrient
acquisition (usually P and K) by plants from the soil. These models take into
account physiochemical processes in the soil as they influence the transport of
nutrients through the soil to the rhizosphere plasma membrane interface and
uptake across the plasma membrane. By and large, the models have been
successful in their prediction of nutrient uptake under conditions of adequate
nutrient supply but have under-predicted in nutrient restricted conditions mainly
because of morphological and physiological plant adaptations which increase
nutrient acquisition not taken into account by the model. These adaptations
include increase in effective root surface area as in the development of root hairs,
upregulation of nutrient transporters in the plasma membrane and the release of
root exudates into the rhizosphere to increase nutrient concentration in soil
solution by their reaction with the soil. Although adaptive root responses are of
lesser importance for K as compared with N and P deficiency, when K supply is
restricted , root hair proliferation is increased and K transport across the plasma
Zea mays
Modelling K acquisition during plant growth
®
®
596 597

membrane is upregulated (see White and Karley 2010).
An example of a model to predict K uptake during growth is that of Claassen
(1994) which takes into account nutrient uptake by both roots and root hairs, and
has been used recently in pot experiments to study K uptake efficiency and
dynamics in the rhizosphere of maize, wheat and sugar beet (Samal et al. 2010).
The model is based on three basic processes: (i) release of K from the solid phase
into the solution phase, which is governed by sorption and desorption processes,
(ii) transport of K by mass flow and diffusion, mainly diffusion, and (iii) K uptake
into the root which depends on the nutrient concentration in the soil solution and is
measured by a modified Michaelis-Menten equation. The radial distribution of
root hairs around the root is also accounted for and an influx established. In the
experiment plants were grown on a low K soil with and without K. Soil parameters
used in the model calculation included: mean root radius, water influx, relative
shoot growth rate, relative root growth rate, root hair distribution around the root,
plant parameters related to uptake kinetics and net K influx.
The model demonstrated major differences in K uptake efficiency for the
three crop species. Sugar beet and wheat maintained a higher shoot K
concentration as compared with maize and therefore had a higher K uptake
efficiency. Wheat acquired more K from the soil because of its higher root length
to shoot dry weight ratio whereas sugar beet accumulated more K in the shoot
because of a 3- to 4-fold higher K influx in comparison with wheat and maize. At
the higher K supply, the model closely predicted K influx but under-predicted it at
low K supply and particularly so for sugar beet most probably because of an
increase in K concentration in the rhizosphere induced by chemical mobilization
of K by root exudates. Likewise, a simulated mechanistic model of K uptake at low
K supply by field grown sugar beet throughout the growing season accounted for
only 34 % of the K uptake (Dessougi et al. 2002). These finding confirm the earlier
work of Steingrobe and Claassen (2000) and further research is needed to
elucidate the underlying mechanisms between sugar beet roots and soil at low K
supply by which K release takes place into the soil solution.
One easy-to-calibrate mechanistic model for calculating arable crop response
to K fertilizer in the field was described by Greenwood and Karpinets (1997a). The
model calculates for each day the increase in crop K-uptake and growth and
changes in K activity ratio of the soil solution, exchangeable soil K and fixed soil
K. The validity of the model was tested against the results of single year multi level
K field experiments (Greenwood and Karpinets 1997b). Measurements of plant
mass, % K of the plant and K activity ratio in the soil were made at intervals during
the growing season and at harvest on spring wheat, summer cabbage and turnips.
The degree of agreement between simulation and measurement was substantial.
Some discrepancies did occur, however, interestingly enough in context of the
above discussion, on root growth, probably because of uneven root distribution.
One of the assumptions in the model was that the roots were evenly distributed
throughout the rooting layer and that K was not taken up from the subsoil.
Nevertheless the model provides an excellent approach and is of direct value to
the farmer. Simulations of the model indicate that in central England, no
response of 10 crops to K fertilizer would be likely on soils containing more than
170 mg of 1M ammonium nitrate extractable K /kg soil and having clay contents
between 15 and 45% (without any major contribution of K from interlayer sites).A
simplified version of the model runs on the Internet at: www.qpais.co.uk/moda-
djg/potash.htm.
Plant aspects
Plant breeding of crops has for generations been carried out in non limiting
environments which has led to the selection of highly productive genotypes that
are also highly demanding of plant nutrients including K. Interest is now focusing
on improving efficiency of fertilizer application and timing for nutrient uptake as
well as the introduction of nutrient efficient cultivars capable of yielding on poorer
soils with low fertilizer regimes as often occurs in the developing countries (Lynch
2007). Genotypic differences in efficiency of K uptake and utilization have been
reported for all major economically important crop plants and the underlying
physiological mechanisms for these differences have been reviewed in detail by
Rengel and Damon (2008). These authors define K efficiency as the capacity of a
genotype to grow and yield well in soils of low K availability. Both efficiency in K
uptake and utilization of K within the plant are involved.
Efficiency in uptake particularly of the less mobile nutrients like K and P is
much dependent on root architecture i.e. the configuration of the root system in
time and space (Lynch 1995). Root traits determining genetic differences in P
acquisition by bean ( L.) have been identified in detail (Bates
and Lynch 2001) and the findings of Lynch and his colleagues have been
successfully applied to breeding P efficient genotypes used in the field as for
example, Pefficient soybean lines which have yielded 15-50% more than existing
genotypes in P deficient soils in south China (Yan et al. 2006). Comparative
studies for K should be worthwhile because the acquisition of both nutrients
requires a large surface contact area between roots and topsoil and exploration of
the subsoil where water may be more available. Root hair formation differs
between crop genotypes for K (Jungk 2001) but there appears to be no literature
assessing the formation of root hairs as a mechanism for intraspecific differences
in K uptake (Rengel and Damon 2008).
Uptake of K across the plasma membrane is a highly efficient process and not
considered as a limiting step in acquisition under adequate K supply. Under K
deficient conditions however, plant species and genotypes differ in capacity in the
Plant breeding for K efficiency
Phaseolus vulgaris
698 599

high affinity uptake mechanism. In potato grown under K deficiency, a K efficient
genotype had about a two-fold higher K uptake rate than a K inefficient one
(Trehan and Sharma 2002). Under K deficiency genotypes may enhance K uptake
either by morphological or physiological response. In comparing two strains of
tomato ( Chen and Gabelman 1995) showed that one strain responded
morphologically by proliferating root length thereby producing greater root
absorbing surface areas to capture K. The other, a physiological response was
demonstrated by high net K-influx coupled with low pH around root surfaces,
presumably a K /H exchange with high accumulation of K in the apoplast.
Genotypic differences in capacity to utilize K have been attributed to (1)
differences in partitioning and redistribution of K at cellular and whole plant
levels, (2) the substitution of K by other ions e g Na in the vacuole particularly
important under salinity ( 3) the partitioning of resources into the economic
product (Rengel and Damon 2008). Differences in K distribution between
genotypes can influence capacity to produce high economic yield per unit K
uptake. For example, Yang et al. (2004) reported that K- efficient rice genotypes
grown under conditions of low supply of K, had a two fold higher concentration of
K in the lower leaves and a 30% higher concentration in the upper leaves as
compared with inefficient –K rice cultivars at the booting stage. These higher K
concentrations in the leaves (especially the lower leaves) of the K-efficient
genotypes were associated with higher RuBP carboxylase activities and net
photosynthetic rates allowing the leaves to maintain a higher photosynthetic
capacity during grain filling. Damon and Rengel (2007) showed that in terms of
grain yield of field and glasshouse grown wheat genotypes, the main factors
determining tolerance to K deficiency were a high harvest index at K deficiency
and the high ratio of harvest index at deficient to adequate K supply.
In general from an agronomic viewpoint, high K crop use efficiency is
beneficial particularly on soils low in K availability. In contrast, to this however,
as discussed by Cakmak (2005), crops of high K nutritional status are required to
provide resistance to the various common stress events which are considered
below. The same is valid in relation to the high K/Na ratio required in food
products in the human diet. It has also to be remembered in plant breeding
programmes aimed at raising K use efficiency, that unlike lack of efficiency in N
and P use by crops which can be detrimental to the environment, this is not so for K
which is completely benign, posing no threat to human health or the quality of
natural waters.
Crops exposed to various environmental stress factors such as drought, heat, high
light, chilling or salt all show increased formation of reactive oxygen species
(ROS), Cakmak (2005). This formation of ROS takes place particularly during
+ +
Role of potassium in stress mitigation
photosynthetic electron transport as well as by activation of membrane-bound
NAD(P)H oxidases (Jones et al. 2000). There is increasing evidence from the
literature that optimizing the K nutritional status of plants can reduce this
detrimental build up of ROS either by enhancing photosynthetic electron transport
or inhibiting the membrane-bound NAD(P)H oxidases.
It is well documented that K deficient plants are more susceptible to high light
intensity with associated occurrence of photooxidative damage such as chlorosis
and necrosis (Marschner and Cakmak 1989). One reason for this enhanced ROS
formation under high light is the inhibition of photosynthesis and photoassimilate
export from the leaf under K deficiency. Inhibition of sugar export via phloem
prevents root morphological adaptation of crop plants to K deficient stress
conditions, in marked contrast to N and P stresses where sugar translocation to the
roots is not restricted. Inhibited sugar export under K deficiency also restricts
shoot growth and the formation of reproductive organs such as grains.
There is ample evidence that ROS production is raised in plants low in K
exposed to various environmental stresses as for example to low temperature,
drought and salinity (Cakmak and Engels 1999; Cakmak 2005), From these above
examples it can be concluded that optimizing plant K nutritional status is needed to
raise stress tolerance of crop plants as discussed in more detail below. This
conclusion is further underlined by the involvement of K in stress signaling
Evidence is emerging from studies in molecular biology that K might play a
specific regulatory role in plant stress responses (Ashley et al. 2006; Wang and Wu
2010). These authors review links between low K plant status and activation of
signalling cascades. Low K status not only triggers an up-regulation of K
transporters, but also involves the synthesis of molecules including reactive
oxygen species (ROS) and the phytohormones jasmonic acid (JA), ethylene and
auxin. In addition to these up-regulation of transport proteins and adjustment of
metabolic processes, K deprivation triggers developmental responses in roots, all
these strategies enabling plants to survive and compete in nutrient environments in
which the availability of K may vary. Evidence of changes in expressions of
transcripts encoding K transporters and channels in response to ROS and
phytohormones are also suggestive that K may play a specific regulatory role in
plant stress responses which is very much in accord with field observations as
discussed in the sections below. The hypothetical model shown in Fig. 2 is derived
from the recent findings of Cheong et al. (2007) and Jung et al. (2009) of molecular
changes in response to K deficiency in Arabidopsis thaliana. The work of Cheong
and his colleagues indicates that in K deprived plants, drought - inducedABAmay
produce ROS which in consequence may trigger Ca flows as second messenger
and subsequently the uptake of K by roots and the regulation of stomatal guard
Role of potassium in stress signalling
+
600 601

cells. This Ca signalling which regulates leaf transpiration and root K uptake
involves membrane localized Ca sensor interacting proteins. Jung and co-workers
reported ethylene production in K deprived plants. This phytohormone signals
stimulated production of (ROS) and is important for changes in root morphology
and whole plant tolerance to low K supply. Our scientific understanding of the
role of K in stress mitigation will – without doubt – improve in the near future
which will be of major importance for agriculture. In the following subsections
below these needs for research are discussed in relation to well-known specific
stress situations.
Role of K in disease and pest resistance
It is widely accepted that in general, high K status in crops decreases the incidence
of diseases and pests (Perrenoud 1990;Prabhu et al. 2007;Bergmann 1992). This
benefit of K has been explained by its effect on primary metabolism by favouring
Fig. 2 Schematic model for a proposed common signalling pathway induced by
drought and low K nutritional status of plants regulating K uptake and
drought stress tolerance. (from findings of Jung et al. 2009 and Cheong et
al. 2007)
the synthesis of high molecular weight compounds (proteins, starch and cellulose)
thereby depressing the concentrations of soluble sugars, organic acids, amino
acids and amides in plant tissues. These low molecular weight compounds
necessary for feeding pathogens and insects are thus more prevalent in K
deficient plants which are thus more vulnerable to disease and pest attack
(Marschner 1995). For example on K deficient soils, cotton and other crops can be
susceptible to Fusarium wilt and root rot, caused by
application of K either before or after planting has been shown to be equally
effective in reducing this incidence (Prabhu et al. 2007). As pointed out by
Amtmann et al. (2008), however, because of the variability of both disease
susceptibility and metabolic profiles in K deficient plants, it is impossible at this
stage to prove their causal relationship and there is a great need for such basic and
applied studies to be undertaken in agricultural crops.
This often observed variability in the effect of K on incidence of diseases and
pests certainly relates to the differences in K nutritional status of plants or to the
amounts and the forms of applied K or to both these factors (Amtmann et al. 2008,
Perrenoud 1990). In most cases of compiled observations of experimental trials
with increasing supply of K, the K nutritional status of plants has either not been
analysed or not given (Huber and Arny 1985; Kiraly 1976, Prabhu et al. 2007).
Some recent studies on the incidence of black spot in potatoes as affected by the K
nutritional status by K+S Kali GmbH, Kassel, Germany as reported by Ebert on
the IPI-OUAT-IPNI symposium at Orissa (2009), are exceptions to this. The
frequent lack of data on the K nutritional status of plants in many investigations,
however, means that it is often not possible to relate the effects of K treatment
adequately to disease incidence. In practice this is required for a cost-benefit
calculation for the farmer (Amtmann et al. 2008) which also needs to take into
account other aspects of stress mitigation by K supply as discussed below. There is
thus a real need for more detailed and comprehensive data from applied research
and field experiments relating K supply to plant disease.
The plasma membrane is not only a barrier to ions and water transport but is
also a recognition site for potential pathogenic invaders of plant cells. As a
consequence of such possible attack, changes in the membrane potential with
concurrent rise in cytoplasmic Ca occur within seconds, which in turn acts as a
second messenger triggering a number of downstream events (Yang et al. 1997).
Calcium transporting proteins can respond to other early defence signals such as
H O (Foreman et al. 2003, Scheel 1998) and K is likely to be involved in all these
signals. The observations of Shin and Schachtman (2004) indicate that K
deficiency results in early defence signalling including phytohormones such as
ethylene in Arabidopsis roots. In addition, genes related to jasmonic acid are also
induced at low K status (Lorenzo et al. 2003;Armengaud et al. 2004; Schachtman
and Shin 2006).
Fusarium oxysporum sp.;
2 2
Drought(ABA)
Low K status
ROS(Reactive oxygen species)
Root morphology(Root hair length)
Transporterfor K uptake
K uptakeefficiency
Stomatalopening
Ethylene
Ca sensingproteins
Enhancedstress tolerance
602 603

Following the observations of Amtmann et al. (2008) and others that K
deficiency results in early defence signaling, there is need to consider how these
nutrition- and pathogen-induced responses within general signaling networks may
be applicable to agricultural practice. Basic research is necessary to confirm that
the K deficiency-induced changes in transcripts, metabolites and hormones in the
defence mechanisms of the model plant is similar to those in
crop plants. Amtmann et al. (2008) conclude that even without genetic
engineering, available data could be useful for improving timing of K fertilizer
applications. They suggest a limited but essential supply of K early in the growth
season followed by K depletion at a later growth stage could be a means to
strengthen the inherent defence potential of the plants to pathogens. This
suggested fertilization strategy is far from that of current thinking of farmers and
their consultants. This very interesting and new aspect on K-disease interactions
emphasises the urgent need for further collaborative research between molecular
biologists, plant nutritionists and agronomists.
Both chilling and frost stress events result in photooxidative damage to
chloroplasts as a consequence of high light energy absorbance in excess of the
capacity of chloroplasts to use it for CO fixation at low temperature. This excess
energy is used for ROS formation (Huner et al. 1998, Foyer et al. 2002) which
impairs the photosynthetic electron transport chain, stomatal conductance and
rubisco activity (Allen and Ort 2001).
The role of K in protecting crops against frost damage has been recognised for
many years and discussed in plant nutrition textbooks (Bergmann 1992,
Marschner 1995). This alleviating effect of K is shown in Table 7 from results of a
field experiment on potato growing on light sandy soils varying in K status in
Punjab, India (Grewal and Singh 1980). Potassium fertilization increased frost
resistance on all three soils and particularly so on the soil of lowest K status. The
marked effect of increasing K fertilizer application in mitigating frost damage on
the soil of medium K status but without effect on tuber yield is indicative of the
requirement of the higher K supply to raise frost resistance at low temperature In
this experiment which included 14 alluvial soils varying in available K, frost
damage was inversely related to the available K content of the soils and the K
concentration in the potato leaves and damage was significantly reduced by K
fertilization. Similar effects have been reported by Sharma and Sud (2001). In
various non glasshouse grown vegetable crops (tomato, pepper, egg plants) at
temperature ranging from 4 C to 16 C, (Hakerlerler et al. 1997) have observed that
increasing K fertilizer use raised low-temperature-stress tolerance which
resulted in as much as 2fold increases in yield.
In agreement with these findings, the benefit of higher K tissue concentrations
Arabidopsis thaliana
Role of K in frost resistance
2
o o
on yield and chilling damage on white carnation has been reported by Yerminyahu
and Kafkafi 1990 (cited by Kant and Kafkafi 2002). Their results showed that
plants with what might be regarded as high K tissue concentrations under non-
stress situations can be economically of advantage to the farmers by acting as an
insurance strategy against unexpected climatic events. At lower but normally
acceptable K tissue concentrations, only one night of chilling temperature can
cause severe enough damage to the crop to be equivalent to the fertilizer cost for
the entire season. Interestingly the effects of this damage on the stem of the
carnation is not obvious until several weeks after the low temperature stress event.
Nowadays in farming practice frost resistance can be a critical factor in the
early (late spring frosts) as well as the late season (early autumn frosts) particularly
in regions with short vegetation periods. Many farmers are thus at the mercy of
increasing frost damage. Various observations have been made which indicate
alleviating effects or even the prevention of frost damage by the application of
various cocktails containing K together with other mineral nutrients including Ca,
P and micronutrients. The beneficial effects of these cocktails have been obtained
by both pre- and interestingly also, post-frost applications of foliar sprays as well
as by seed dressing (Randy Saskiw, Omex company, 2009, pers. comm.).
Experiments in East Germany, Ukraine and Russia on winter rape (canola)
have demonstrated the mitigating effect of Cu on frost damage when applied as a
foliar spray, particularly under conditions of adequate K fertilizer supply. In wheat
this beneficial effect of Cu could be further enhanced by supplements of B
(Bernhard Bauer, 2009, pers. comm.). All these field observations are in
accordance with reports by Bergmann (1992) and Bunje (1979) and strongly
suggest that K should not be considered in isolation in relation to its effect in
Table 7 Effect of increasing K supply on frost damage (%) and K content of
leaves (mg g DW) and tuber yield (t ha ) of potato on sites with
different soil K status (Grewal and Singh 1980).
-1 -1
K status K fertilization rate (kg ha )
0 42 84
low Frost damage * 65 26 12K content 1.64 1.96 2.85Tuber yield 18.0 22.9 29.6
medium Frost damage 52 30 4K content 2.28 2.80 2.80Tuber yield 19.8 26.0 26.3
high Frost damage 12 12 0K content 2.61 2.79 2.82Tuber yield 20.7 22.4 23.4
* Percentage of foliage damaged by frost in the field
-1of the site
604 605

raising frost resistance.
A major function of K as an osmoticum is the maintenance of a high
concentration of K in the cell sap thus lowering its freezing point.Additionally the
activities of numerous enzymes which might play a part in frost resistance are also
dependent on adequate K cytoplasmic concentration (Kant and Kafkafi 2002).
The higher ratio of unsaturated to saturated fatty acids with phospholipids rich cell
membranes in plants of high K status can also partially explain raised frost
resistance as a consequence of enhanced membrane fluidity. Other mineral
nutrients than K also possess distinct physiological properties of direct relevance
to frost resistance. Boron, Zn and in exceptional cases also Ca may raise frost
resistance by stabilizing cell membranes. Additionally cold induced stomatal
closure induced by apoplastic calcium uptake by guard cells (Wilkinson et al.
2001), can contribute decisively to chilling tolerance and protection of leaves from
dehydration. Copper, Mn and Zn may also increase frost resistance in their role in
superoxide dismutase enzymes which detoxify oxygen radicals thereby
preventing damage to membranes and other cellular constituents (Cakmak 2000,
Kant and Kafkafi 2002). The functions of these mineral nutrients in plant
metabolism justifies their use in nutrient cocktails in mitigating frost resistance
both on scientific grounds and in accord with field observations as discussed
above. However, much is still to be learned as for example the interrelationships
between the micronutrients and K to enable adequate recommendations to
farmers. Basic as well as applied research is urgently needed in this area.
Worldwide, crops are increasingly being exposed to drought and high temperature
stresses with enhanced formation of ROS and corresponding leaf damage (Foyer
et al. 2002; Cakmak 2005). The hypothetical model in Fig. 2 tentatively indicates
the interplay of drought-induced ABA and low K nutritional status of plants in
stress signaling. Drought and heat stresses are often considered together as a
drought-heat syndrome because they often occur simultaneously, but this is not
always so. As discussed by Halford (2009), plants also have to cope with hot
conditions where water is not limiting which is of particular relevance to crops
growing under irrigation. In many parts of the world, especially in temperate
conditions, however, drought and heat stresses act together to restrict agricultural
production. In the “high maize yield” model by Yang et al. (2006) therefore both
aspects – drought and heat – are treated separately so that farmers can make
appropriate allowance for these two stress factors.
During crop production various plant physiological and soil aspects have to
be considered in mitigating or preventing damage by drought or heat stresses or
both as illustrated in Fig. 3. The numbers in circles on this figure refer to processes
discussed in the subsections below in all of which K is directly or indirectly
Role of K in drought and heat stress
involved. In general, maintaining adequate K plant nutritional status is vital in
adaptation to drought (Sen Gupta et al. 1989; Kant and Kafkafi 2002; Cakmak
2005). When drought impedes K acquisition by restricting root growth a vicious
circle comes into play in which the resulting lower plant K nutritional status
further depresses physiological resistance to drought and the acquisition of K. The
particular requirement for additional K fertilization under drought conditions is
often not appreciated by farmers (see also "introduction").
In suitable soils a worthwhile approach drought resistance of
crop plants is to induce deeper rooting to allow access to available water at lower
depths in the soil profile. This can be achieved by deep placement of K fertilizer
together with small supplements of mineral nutrients with root-signalling
functions such as P or N or both these nutrients to encourage root growth, because
K itself does not have a root-signalling function (Drew 1975, Kirkby et al. 2009).
Ensuring adequate supply of K during drought events is essential in supporting the
role of K in translocation of photoassimilates to feed root growth. This need for K
is evident from the findings of Egilla et al. (2001) in experiments with Chinese
Hibiscus, ( Leprechaun), growing under various K
regimes. Root survival was markedly reduced when water supply was limited and
K supply low, an adequate K supply being essential to enhance drought resistance
and increase root longevity. The benefits of deep K fertilizer placement have
already been demonstrated in some field experiments in which K fertilizer
placement was achieved at a depth between 25 and 45 cm. The technique and the
Forced deep rooting
Hibiscus rosa-sinensis cv
light energy
rain infiltration
Detoxification oftoxic oxygen radicals
Improved translocation
of photoassimilates
5
6
2
1
4
3
Water storage
Deep water
acquisition
Optimizedstomata openingand closure(better water use
efficiency)
Protectionagainstdehydration of
shoot tissue
Fig. 3 Possible factors for an improved drought and/or heat resistance of plants
(numbers in circles refer to subsections of section "Role of K in drought
and heat stress".
606 607

economical evaluation of deep rooting still need further invest-igation under
varied conditions including high and low input agricultural systems.
o increase plant K acquisition particularly from
depth from the soil profile requires high rainfall infiltration as well as high water
storage capacity within the profile, the latter being dependent on soil texture and
structure and to some extent also on soil organic matter (Hermann et al. 1994). In
this respect the recycling of K-rich crop residues serves a double function in
supplying K and supporting the organic matter status of the soil.
It is well documented that under low K
nutritional status, particularly during the midday, leaf damage can take place due
to wilting with subsequent tissue dehydration and necrosis. The general
physiological function of K in plants in maintaining water relations (osmotic
regulation) has been discussed in "potassium in plants: present knowledge" and is
particularly important for optimal photosynthetic activity as shown by the
findings of Sen Gupta (1989) (Table 6). Under drought stress events it is essential
that leaf K status is adequate to counter the "vicious cycle" mentioned above.
Adequate K nutritional status of crop
plants is closely associated with plant water use efficiency (Thiel and Wolf 1997).
Much work has been carried out on the physiology of K in relation to stomatal
movement. The transport of water and potassium from roots to shoots mediates in
CO -water exchange governed by transpiration through the stomatal pores. In
natrophilic crop plants like sugar beet, Na as well as K has to be considered in
adaptation of stomatal closure and opening under drought (Hampe and Marschner
1982). It seems to the authors that no further basic research is needed in this area.
Under high light intensity increased formation
of toxic oxygen radicals can bring about damage to leaves as chlorosis particularly
if photosynthate transport is limited as a consequence of K, Mg or Zn deficiency
(Cakmak 2005). Such damage by high sunlight has been reported as sunscald in fig
fruits of low K status in Turkey by Irget et al. (2008) clearly showing the need for
adequate K nutrition under high light intensity. In addition to K, however, various
micronutrients including Zn, B, Cu and Mn are also of vital importance in the
detoxification of oxygen radicals (Marschner and Cakmak 1989; Cakmak 2005).
This is another example showing the need to consider K not in isolation but
together with other mineral nutrients in mitigating heat/light stress as well as
drought stress in future applied research.
During the reproductive stage of
crop growth the high demand for photoassimilates by developing seeds and fruits
Improved rainwater capture T
Protection against tissue dehydration
Regulation of stomatal opening and closing
Detoxification of oxygen radicals
Enhanced translocation of photoassimilates
2
is often accompanied by severe chlorosis in the leaves (Table1). These chlorotic
symptoms are the consequence of inhibited translocation of photoassimilates from
leaves via the phloem to the seeds or fruits and are observed particularly at low
nutritional status in K, Mg or Zn (Marschner and Cakmak 1989, see also above
section 5.1). As proposed by Cakmak (2005) farmers should ensure that leaf
concentrations of both K and Mg are adequate and if necessary make foliar
applications of K and Mg separately to mitigate against such chlorotic symptoms
during reproductive growth. In wheat such late foliar application of Mg has been
shown to prevent Mg chlorosis under drought events (Römheld and Kirkby 2007).
As discussed during the IPI Intern. Symposium (2006) a late K foliar application in
banana and sugar cane increased the yield or at least the sugar content in harvested
products (Yadav 2006; Kumar 2008). Without doubt further field studies with
different crops are needed in this area of applied research.
Detrimental effects of salt stress on growth of crop plants are an increasing
problem for agriculture, particularly in irrigated land (Kant and Kafkafi 2002,
Shabala and Cuin 2008). There are two components to this detrimental effect, a
short term osmotic effect with consequence of decreasing water availability to
plants and a long term ionic effect, which results in salt toxicity (mainly Na and Cl)
and deficiencies of other mineral nutrients particularly K and Ca (Kafkafi and
Bernstein 1996). Roots, directly exposed to a saline environment, react by
restricting growth as a consequence of a water deficit i.e. lower water availability
caused by the more negative water potential in the rooting medium. This in turn
results in lower nutrient uptake and inhibited translocation of mineral nutrients to
the shoot in general and of K in particular.Alowering of photosynthetic activity is
a consequence. Thus under salinity, closure of stomata and inhibited
photosynthetic activity due to lower K nutritional status which induces the
formation of toxic oxygen radicals (Cakmak 2005). A higher K supply is thus
needed to counteract this effect under saline conditions (Abogadallah et al. 2010).
As pointed out by Shabala and Cuin (2008) measures for mitigation of salinity
should not focus only on lowering Na accumulation in photosynthetic active shoot
tissue but rather on K homeostasis maintaining a high K/Na ratio (Rubio et al.
2010) by preventing K losses by Na and/or Na-induced Ca deficiency.
Programmed cell death (PCD) has been proved to occur in response to biotic
and particularly to various abiotic stresses such as salinity (Shabala 2009). This
response seems to be ion specific (induced by Na ) and not due to the osmotic
component of elevated salt concentration (Huh et al. 2002). As a consequence of
membrane depolarization, massive K efflux by the outward-rectifying K channels
KORCs can be observed. In this PCD induced by salinity (NaCl), Zn can play an
additional role by increasing the cytosolic K /Na ratio (Shabala 2009). It is also
Role of potassium in salt stress resistance
+
+
+ +
608 609

suggested that ROS and some plant hormones (e.g. ethylene, jasmonic acid) are
involved in regulating salt-induced PCD. However, further direct experiments
particularly with crop plants rather than Arabidopsis are needed to reveal the full
complexity and cross-talks between multiple pathways controlling salt-induced
PCD in plant cells (Shabala 2009). Of special interest is that as a consequence of
salt-induced PCD, primary roots might be eliminated and new better salt-adapted
secondary roots formed for an adequate nutrient and water acquisition (Huh et al.
2002).
Common measures in practical agriculture to reduce salinity problems for
crops include Ca supplementation as gypsum and supplying adequate rates of K
fertilizer application rate, both of which act to reduce salinity problems by
maintaining K homeostasis. The ameliorating effect of Ca is dependent on its role
in improving soil structure via clay flocculation as well as in preventing NaCl
induced loss of K from plant roots as K efflux via KORCs (Shabala et al. 2006).
Kaya et al. (2001) have shown in tomato that foliar application of K salts is also
able to counteract salinity-induced detrimental effects on plant growth, water use
and membrane permeability. Besides raising K and Ca supply there are also
reports of positive effects of boron and specific biofertilizers (Nabti et al. 2007) on
mitigation of salt problems, particularly via seed priming. The positive effect of Si
supplementation to barley plants grown in nutrient solution under salt stress has
been shown to result from increasing plant K nutritional status and antioxidant
enzyme activities (Liang 1999; Liang et al. 2003). In view of the function of
various mineral nutrients in relation to salt tolerance by stabilizing plant
membranes ( Ca, B ) and by depressing the formation of stress induced oxygen
radicals or their detoxification ( K, Zn, Cu, Mn, P), an integrated approach is
needed to consider all these nutrients both in basic and applied research.
The physiological basis for the need of adequate K status of plants in quality
development of crops is well recognised. To a large extent it relates to the specific
effects of K which include: increasing photosynthesis as consequence of a more
efficient photosynthetic activity, increasing leaf size and number and more
effective translocation of photoassimilates and amino N compounds into
reproductive organs via the phloem (Cakmak 2005; Pettigrew 2008).An immense
number of publications report this positive role of adequate K supply in raising the
quality of various crop plants (e.g. Kumar et al. 2006; Pettigrew 2008). Yadov
(2006) very appropriately has described K as the “quality element”. From these
numerous reports on the role of K on crop quality it seems reasonable to conclude
that, rather than carrying out more applied research in this area, there is a much
greater need to make the farming community more aware of the importance of the
benefits of maintaining an adequate K status in crop plants .The widespread lack of
+
Role of potassium in crop quality
informed recommendation to farmers regarding K fertilizer use as referred to in
the examples of kiwi orchards in Italy and tomato production in Chinese
greenhouses underlines this conclusion.
In order to enhance crop quality, there is a need for both a greater as well as a
more efficient use of K (Pettigrew 2008). Increasing uptake efficiency can raise
both yields and quality, particularly under drought. However, in using K more
efficiently there is a need to avoid long-term K mining by balancing K removal
from the soil by appropriate K replacement.As discussed by Cassman (1998), crop
genotypes with longer or improved root systems could be used to achieve more
efficient removal of native soil K or applied K fertilizer. Raising efficiency of K
utilization by developing specific crop genotypes with lower K demands, has the
possible consequence of an undesired decline of the K/Na ratio in crops and
hence also in the human diet.
Human and animal nutritional aspects
As well as being of fundamental importance for plants and crops, K is an essential
element for animals and human beings, responsible among other things for an
adequate electrolytic and energy status of cells and in particular of muscle cells.
The K status of the animal body is well regulated via intake or resorption from the
gastrointestinal tract and excretion (Serfass and Manatt 1985; Preston and Linsner
1985). This optimal regulation means that there are no major problems associated
with the K status of animals and human beings as long as the K intake from the diet
is guaranteed by an adequate supply of fodder or in the case of humans, by fruit and
vegetables.
The human dietary intake of K, however, is often too low at about one third of
evolutionary intake (He and MacGregor 2008). It is very low for example in rural
populations in developing countries in which the staple diet is dominated by low K
cereal products. In the more affluent modern societies the strong decline relates to
great increase in consumption of processed food and decrease in fruit and
vegetables in the daily diet, a change also linked to an increase in prevalence of
health problems. These problems relate not directly to the lower K intake per se
but are rather associated with the dramatically increased intake of sodium (Na)
mainly as NaCl causing elevated blood pressure, cardiovascular and kidney
diseases, hypercalciuria and osteoporosis (He and MacGregor 2008).
The benefits of increasing intake of K in the human diet ( Demigné et al 2004;
He and MacGregor 2008) may be achieved by raising K concentration of food
crops and/or K salt additions to processed foods. This may be regarded as an
important challenge for the food industry, however, account must also be taken of
K-induced Mg deficiency effects in animals and human beings. Raising dietary K
status restricts Mg re-sorption from the gastrointestinal tract and thus also the
metabolic function of Mg in cells. The real challenge for the food industry and for
610 611

plant research is to reduce Na intake and at the same time to increase dietary intake
of a well balanced supply of Mg and K. Food supplements on the market focused
on human health take into account this aspect of balanced food fortification by
supplying Mg and K together with Zn. For future research the following areas need
to be considered:
.
As with the lack of understanding of the importance of K/Mg ratio in plant
production (see example kiwi orchards, Table 1), there is similarly an
undervaluation of Mg in the human diet in relation to K, although the significance
of this interaction has been known for many years in animal nutrition as in relation
grass tetany in lactating grazing cattle (see Gunes and Welch 1989). It is of high
interest that over the years from 1880 until 1960 the Mg content in some home
produced feeding stuffs of farms in South-West Germany declined by up to 40%
Potassium/magnesium ratio in food and fodder
whereas the K content increased by up to 80% leading to a change of the K/Mg
ratio from 1 to about 2.4 (Fig. 4, Arzet 1972).
A comparable change in K and Mg content in leafy vegetables may also be
assumed to have taken place as a consequence of a one-sided elevated application
of K fertilizers which occurred in the past. Documenting changes in concentration
of K and Mg, as well as Na and Ca in the main leafy vegetables such as lettuce
would be of value particularly to include periods in which K fertilizers
supplemented by Mg have been applied as has occurred over the past two decades.
Here field research is urgently needed.
As discussed above there is an increasing health burden for human beings as a
consequence of the dramatic increase in Na intake resulting mainly from
processed food products. The first essential requirement for the food processing
industry is therefore to lower Na supplementation and partly replace it by a
mixture of K and Mg. Current labeling of food products giving quasi “nutrition
facts” is of little value concerning mineral nutrients, for among the cationic
nutrients only the Na or NaCl composition is given. In view of the major
importance of K to human health, the Na/K ratio should be clearly visible on the
product label. In summary there is scarcely any need for future research in crop
production, the onus of supplying healthy food in this respect lies with the food
processing industry!
Cadmium (Cd) is an undesirable heavy metal in food products because of its high
toxicity. Contradictory reports appear in the literature on the effect of K fertilizers
on Cd availability in soils particularly when applied in the chloride form (Grant et
al.1996; Umar et al 2008; Blank 2009). Chloride can form easily soluble chloro-
Cd complexes so that plant uptake of Cd can be enhanced (Smolders and
McLaughlin 1996). Chloride is also effective in increasing Cd transport within
plants (Ozkutlu et al.2007). Increased Cd uptake by application of KCl was found
in barley (Grant et al. 1996) and under salinity in wheat (Norvell et al. 2000). At
conventional rates of application (100 – 200kg chloride ha ), Blank (2009) was
unable to find any difference in effect of chloride as compared with sulphate on Cd
extractability from soil. The influence of the K appears to be more important by its
effect in desorption of Cd from the soil. From these findings it can be concluded
that the chloride effect occurs particularly at very high application rates.At normal
application rates, the effect of cations (K or Na ) are of higher relevance than the
mobilization of Cd by formation of Cd-chloro-complexes. The findings of Zhao
et al (2003) showing no differences in Cd uptake by spring wheat between K salts
Potassium/sodium ratio in processed foods
Effect of potassium chloride on cadmium uptake by crop plants
-1
+ +
Fig. 4 Changes in the K and Mg concentrations and K/Mg ratio in fodder of farms
in the Southwest of Germany from 1880 – 1970 (according toArzet 1972)
100
120
80
%
100
140
180
%
Mg
K/Mg
K
meadow hay
oat straw
fodder potatoes
0
0.5
1.0
1.5
2.0
2.5
3.0
1860 1880 1900 1920 1940 1960 1970
612 613

in chloride or sulphate form support this conclusion. Thus in summary, in order to
give sound recommendation in agricultural practice a greater understanding is
needed of the mechanisms involved in Cd / K and Na / Cl interactions.
The various aspects of plant K discussed above such as general stress signaling,
enhanced disease resistance and adaptation to drought stress, clearly indicate that
progress in our understanding of physiological aspects of K acquisition and its
utilization, as well as the adoption of K fertilization strategies in farming practice,
are closely linked to current research findings in molecular biology. Plant
nutritionists, extension service scientists and progressive farmers need to be more
aware of the continuous achievements being made in the understanding of basic
plant physiology and its signaling network as deduced from results from this
molecular approach (Fig. 2). On the other hand it is also becoming obvious that
molecular biologists themselves need to have a basic understanding of the farmers'
problems on a global scale so that they may become more proactive in addressing
these problems and in considering the practical relevance and application of their
research findings to the real world of agriculture. We are convinced that a closer
interaction between those working in molecular biology and those in farming
practice (Fig. 5) will help to improve the urgently needed management strategies
for stress mitigation. In general, throughout agriculture there is an urgent need for
laboratory specialists to have a greater appreciation of all aspects of practical crop
production.As a part of this integration, a great challenge exists to be better able to
deal with stress events involving Kin farmers' fields.
In the use of K in crop production, there is a need to ensure balanced
fertilization and efficient usage of K in relation to the supply of other nutrients
Summary and prospects
especially N and Mg. The reported mitigating effects of particular micronutrients
acting in conjunction with K on various stresses is of immediate importance to
crop production and requires investigation. The various proposed basic and
applied research aspects relating to adequate frost resistance are good examples of
these needs. From the plant viewpoint, more basic research is required on the
drought - heat syndrome to understand the separate influences of these two often
combined stress factors.
In human and animal nutrition research, all studies providing more
information on changes in the mineral composition of food (vegetables, fruits) and
fodder over the last couple decades are of value in the aim of improving health.
From the soils viewpoint, determination of exchangeable K by soil
extractants, as a measurement of K availability in predicting K fertilizer response
to crops has been used extensively and successfully on many soils. On soils
containing 2:1 clay minerals which can both release and fix K at interlayer sites,
however, the exchangeable K extraction method has proved unsatisfactory as a
guide to K fertilizer recommendations. Prediction of crop requirements by
chemical K extraction from soils also takes no account of the limitation of spatial
availability of K to living roots which may be affected by physical and chemical
soil factors such as low pH, drought, compaction or salinity as well as by
plant factors including crop species or genotype. From this complexity of
factors relating to potassium availability including soil extraction, clay
mineralogy, weather, crop species and genotype, root distribution within the soil
profile etc, we suggest that there is a need for a reappraisal for the estimation of K
availability.
Molecular
Plant Nutrition
(Plant) Root
Physiology
Better Understanding of General
Fertilization Techniques
Implementation
for Practice
Application and Demonstration
by Progressive Farmers
Use by Conservative,
Ordinary Farmers
Deduction/Development of New/
Innovative Fertilization Techniques
Fig. 5 Various research areas and interactions needed to improve farmers' practice
614 615
Fig.6 s,Required interactions between scientist agrochemical industry and
farmers including the extension service to improve farming practice
Extension
service
Science
Farmers
Agrochemicalindustry

Much is already known about the behaviour of K in soils and plants (see
"Potassium in soils: present knowledge" and "Potassium in plants: present
knowledge"), but in general, on a global scale this information is not well passed
on to or applied by the farmer. This big gap between scientific knowledge and its
lack of use by farmers has to be bridged by better and more intensive knowledge
dissemination as appreciated by Krauss (2003b) {see also Gill and Gill 2006). In
order to achieve this aim there is an urgent need for a more responsible co-
operation between scientists, the agricultural chemical industry and farmers
together with involvement of an extension or advisory service (Fig. 6). Improving
the interaction between these various bodies is particularly needed in a global
world in which enormous progress in being made in basic sciences coupled with
ever increasing demands on the farming industry to feed the rapidly and hugely
expanding world population.
Abogadallah GM, Serag MM, Quick WP (2010) Fine and course regulation of
reactive oxygen species in the salt tolerant mutants of barnyard grass and their
wild-type parents under salt stress. Physiol Plant 138: 60-73
Allen DJ, Ort DR (2001) Impact of chilling temperatures on photosynthesis in
warm climate plants. Trends in Plant Sci 6: 36-42
Amtmann A, Troufflard S, Armengaud P (2008) The effect of potassium nutrition
on pest and disease resistance in plants. Physiol Plant 133: 682-691
Andres E (1988) KALIPROG – An information system for including site specific
factors into fertilizing recommendations In: Proceedings 9. Jahrestagung der
Gesellschaft für Informatik in der Land-, Forst- und Ernährungswissenschaft
(GIL), Münster 28.-29. Sept. 1988, Magstl A et al. (ed) Ulmer Verlag,
Stuttgart, pp 223-239
Andres E, Orlovius K (1989) Auf den Standort kommet es an. Ratgeber für die
Landwirtschaft, Heft Nr. 7, Kali und SalzAG, Kassel, Germany, pp 1-49
Armengaud P, Breitling R, Amtmann A (2004) The potassium-dependent
transcriptome of Arabidopsis reveals a prominent role of jasmonic acid in
nutrient signalling. Plant Physiol 136: 2556-2576
Arzet HR (1972) Variation of potassium and magnesium contents in some private
feeding stuffs in the past 100 years. Landwirtsch. Forsch. 25: 266-271
Ashley MK, Grant M, GrabovA(2006) Plant responses to potassium deficiencies:
Arole for potassium transport proteins. J Exp Bot 57: 425-436
Barber SA (1995) Soil Nutrient Bioavailability: A Mechanistic Approach, 2nd ed,
John Wiley, NewYork, pp 434
Barber SA, Mackay AD (1985) Sensitivity analysis of the parameters of a
mechanistic mathematical model affected by changing soil moisture. Agron J
77: 528-531
References
Barré P, Velde B, Catel N, Abbadie L (2007) Soil-plant potassium transfer: Impact
of plant activity on clay minerals as seen from X-ray diffraction. Plant and
Soil 292: 137-146
Bates TR, Lynch J (2001) Root hairs confer a competitive advantage under low
phosphorus availability Plant Soil 236: 243-250
Batey T, McKenzie DC 2006 Soil compaction: Identification directly in the field.
Soil Use and Manage 2:83-86
Bergmann W (1992) Nutritional disorders of plants. VCH, Florida, USA
Blank O-H (2009) Is there a need for the use of chloride-free mineral fertilizers for
currant as a common berry fruit? Ph.D. thesis Agric Faculty, University
Hohenheim, Stuttgart, Germany, pp 1-165
Buntje G (1979) Untersuchungen zum Einfluss der Mangan- und
Kupferversorgung auf die Kälteresistenz von Winterweizen, Hafer und Mais
anhand von Gefäßversuchen PhD thesis, University Kiel, Germany
Cakmak I (2000) Possible roles of zinc in protecting plant cells from damage by
reactive oxygen species. New Phytol 146: 185-205
Cakmak I (2005) The role of potassium in alleviating detrimental effects of abiotic
stresses in plants. J Plant Nutr Soil Sci 168: 521-530
Cakmak I, Engels C (1999) Role of minerals in photosynthesis and yield
formation. In: Rengel Z (ed) Mineral nutrition of crops – fundamental
mechanisms and implications, Haworth, NewYork, pp 141-168
Cakmak I, Hengeler C, Marschner H.(1994) Changes in phloem export of sucrose
in leaves in response to phosphorus, potassium and magnesium deficiency in
bean plants. J Exp Bot 45 1251-1257
Cakmak I, Schjoerring JK (2008) Special topics in potassium and magnesium
research. Physiol Plant 133: 623
Cassman KG (1998) Agronomic management of potassium in the 21st century:
Can plant physiology help? In: Oosterhuis DM, Berkowitz GA(eds) Frontiers
in Potassium Nutrition: New Perspectives on the Effects of Potassium on
Physiology of Plants. Potash and Phosphate Institute, Norcross, GA and
Potash and Phosphate Institute of Canada, Saskatoon, Canada, pp 165-174
Cheong YH, Pandey GK, Grant JJ, Batistic O, Li L, Kim B-K, Lee S-C, Kudia J,
Luan S (2007) Two calcineurin B-like calcium sensors, interacting with
protein kinase CIPK 23, regulate leaf transpiration and root potassium uptake
inArabidopsis. Plant J 52: 223-239
Chen J, Gabelman WH (1995) Isolation of tomato strains varying in potassium
acquisition using a sand-zeolite culture system. Plant Soil 176:65-70
Claassen N, (1994) Nährstoffaufnahme höherer Pflanzen aus dem
Boden.Ergebnis von Verfügbarkeit und aneigungsvermögen.
Habilitatsionsschrift, Universität Göttingen, SeverinVerlag ,Göttingen
Damon PM, Rengel Z (2007) Wheat genotypes differ in potassium efficiency
under glasshouse and field conditions.Aust JAgric Res 58:816-823
616 617
Desmingé C,Sabboh H, Rémésy C, Meneton P, (2004) Protective effects of high
dietary potassium: Nutritional and metabolic aspects. J Nutr 134:2903-2906
Dessougi HI, Claassen N, Steingrobe B (2003) Potassium efficiency mechanisms
of wheat barley and sugar beet grown on a K fixing soil under controlled
conditions . J Plant Nutr Soil Sci 165: 732-737
Dobermann A, Sta Cruz PC, Cassman CG (1996) Potassium balance and
potassium supplying power in intensive irrigated rice systems. In: Potassium
in Asia. Balanced Fertilization to Increase and Sustain Agricultural
Production. International Potash Institute, Basel Switzerland, pp 199-234
Drew MC (1975) Comparison of the effects of a localized supply of phosphate,
nitrate, ammonium and potassium on the growth and seminal root system, and
the shoot, in barley. New Phytol 75: 479-490
Egilla JN, Davies FT, Drew MC (2001) Effect of potassium on drought resistance
of cv. Leprachaun: Plant growth, leaf macro-and
micronutrient content and root longevity. Plant Soil 229: 213-224
Epstein E, Bloom AJ (2005) Mineral nutrition of plants: Principles and
perspectives. 2nd ed. Sinauer, Sunderland Massachusetts, pp 400
Foreman J, Demidchik V, Bothwell J H, Mylona P, Miedema H, H, Torres M A,
Linstead P, Costa S, Brownlee C, Jones J D, Davies J M, Dolan L (2003)
Reactive oxygen species produced by NADPH oxidase regulate plant cell
growth. Nature 422: 442-446
Foyer C H, Vanacker H, Gomez L D, Harbinson J (2002) Regulation of
photosynthesis and antioxidant metabolism in maize leaves at optimal and
chilling temperatures: Review. Plant Physiol Biochem 40: 659-668
Fusseder A, Kraus M (1986) Individuelle wurzelkonkurrenz und ausnutzung der
immobilen Makronährstoffe im Wurzelraum von Mais. Flora 178. 11-18
Gill SS, Gill PPS (2006) Extension as an effective tool to disseminate research to
farmers: Success and shortcomings In: Benbi DK, Brar MS, Bansal SK (ed)
Balanced Fertilization for Sustaining Crop Productivity. Proceedings of the
Intern. Symposium 22-25 Nov. 2006, Agricultural Univ. Ludhiana India,
Intern. Potash Institute Horgen, Switzerland pp 549-553
Grant CA, Bailey LD, Therrien MC (1996) Effect of N, P, and KCl fertilizers on
grain yield and Cd concentration in malting barley. Fert Res 45:153-161
Greenwood DJ, Karpinets TV (1997a) Dynamic model for the effects of K –
fertilizer on crop growth, K-uptake and soil-K in arable cropping. 1.
Description of the model. Soil Use and Management 13: 178-183
Greenwood DJ, Karpinets TV (1997b) Dynamic model for the effects of K
fertilizer on crop growth, K-uptake and the soil –K in arable cropping. 2 Field
test of the model. Soil Use and Management 13: 184-189
Grewal JS and Singh SN (1980) Effect of potassium nutrition on frost damage and
yield of potato plants on alluvial soils of the Punjab (India). Plant Soil 57: 105-
110
Hibiscus rosa-sinensis
Gunes DL, Welch RM (1989) Plant content of magnesium, calcium and potassium
in relation to ruminant nutrition. J.Animal Sci. 67: 3485-3494
Hakerlerler H, Oktay M, Eryüce N, Yagmur B (1997) Effect of potassium sources
on the chilling tolerance of some vegetable seedlings grown in hotbeds. In:
JohnstonAE (ed) Food Security in the WANARegion, the Essential Need for
Balanced Fertilization. International Potash Institute, Basel, pp.317-327
Halford NG (2009) New insights on the effects of heat stress on crops. J Exp Bot
60, 4215-4216
Hampe, T, Marschner H (1982) Effect of sodium on morphology, water relations
and net photosynthesis in sugar beet leaves. Z Pflanzenphysiol 108: 151-162
Hasan R (2002) Potassium status of soils in India. Better Crops Intern 16: 3-5
He FJ, MacGregor GA (2008) Beneficial effects of potassium on human health.
Physiol Plant 133:725-735
Heenan DP, Campbell LC (1981) Influence of potassium and manganese on
growth and uptake of magnesium by soybeans ( L.) Merr. cv.
Bragg). Plant Soil 61: 447-456
Hermann L, Hebel A, Stahr K (1994) Influence of microvariability in sandy
Sahelian soils on millet growth. Z Pflanzenernaehr Bodenkd 157:111-115
Hermans C, Hammond JP, White PJ, Verbruggen N (2006) How do plants respond
to nutrient shortage by biomass allocation? Trends Plant Sci 11:610-617
Hinsinger P (2002) Potassium In: Lal R (ed) Encyclopedia of Soil Science. Marcel
Dekker Inc. NewYork USA
Huber DM, Arny DC (1985) Interactions of potassium with plant disease. In:
Munson RD (ed) Potassium inAgriculture Amer SocAgron., Madison USA,
pp 467-488
Huh GH, Damsz B, Matsumoto TK, Reddy MP, Rus AM, Ibeas JI, Narasimhan
ML, Bressan RA, Hasegawa PM (2002) Salt causes ion disequilibrium-
induced programmed cell death in yeast and plants. The Plant J 29: 649-659
Huner N P A, Öquist G, Sarhan F (1998) Energy balance and acclimation to light
and cold. Trends Plant Sci 3: 224-230
IPI-OUAT-IPNI Intern Symposium 2009 Potassium Role and Benefits in
Improving Nutrient Management for Food Production, Quality and Reduced
Environmental Damage. Symposium proceedings, Orissa University of
Agriculture and Technology, Bhubaneswar, India, 5-7 November 2009 (ed)
Intern. Potash
Institute, Horgen, Switzerland
IPI-PAU Intern. Symposium 2006. Balanced Fertilization for Sustaining Crop
Productivity. Symposium proceedings, Punjab Agricultural University,
Ludhiana, India, 22-25 November 2006 (ed) Benbi D K , Brar M S , Bansal
S K , Vol. I 559 pp, Vol. II 613 pp Intern. Potash Institute, Horgen, Switzerland
Irget ME, Aksoy U, Okur B, Ogun AR, Tepicik M (2008) Effect of calcium based
fertilizatiion on dried fig ( L. cv Sanlop) yield and quality
Glycine max
Ficus carica
Brar MS, Mukhopadhyay SS, Vol. I 640 pp, Vol. II 390 pp
618 619

Scientia Hort 113: 308-313
Jeschke, WD, Kirkby, EA, Peuke AD, Pate JS, Hartung W (1997) Effects of P
deficiency on assimilation and transport of nitrate and phosphate in intact
plants of castor oil bean ( L.) J Exp Bot 48: 75-91
Johnston AE, Barraclough PB Poulton PR, Dawson CJ (1998) Assessment of
some spatially variable soil factors limiting crop yields. Int Fert Soc Proc No
419: 1-48
Jones RD, Hancock JT, Morice AH (2000) NADPH oxidase: A universal oxygen
sensor. Free Rad Biol Med 29:416-424
Jung J-Y, Shin R, Schachtman DP (2009) Ethylene mediates response and
tolerance to potassium deprivation inArabidopsis. The Plant Cell 91:607-621
Jungk A, (2001) Root hairs in the acquisition of plant nutrients from soil. J Plant
Nutr Soil Sci 164:121-129
Jungk A, Claassen N (1997) Ion diffusion in the soil-root system. Adv Agron
61:53-110
Kafkafi U, Bernstein N (1996) Root growth under salinity stress. In: Eshel A,
Waisel Y, Kafakai U (ed), Plant roots: The Hidden Half, 2nd edition. Marcel
Dekker, NewYork, USA, pp 435-449
Kant S and Kafkafi U (2002) Potassium and abiotic stresses in plants. In: Pasricha
NS, Bansal SK (ed) Potassium for sustainable crop production, Potash
Research Institute of India, Gurgaon and International Potash Institute Basel,
pp 233-251
Kaya C, Kirnak H, Higgs D (2001) Enhancement of growth and normal growth
parameters by foliar application of potassium and phosphorus in tomato
cultivars grown at high (NaCl) salinity. J Plant Nutr 24: 357-367
Kiraly Z (1976) Plant disease resistance as influenced by biochemical effects of
nutrients in fertilizers. Proc. 12th Collq International Potash Institute, Bern,
pp 33-46
Kirkby EA, Römheld V (2004) Micronutrients in plant physiology: Functions,
uptake and mobility. Int Fert Soc Proc No 543: 1-52
Kirkby EA, Armstrong MJ, Milford, GFJ (1987) The absorption and the
physiological roles of P and K in the sugar beet plant with reference to the
functions of Na and Mg. Proceedings of the 50th Winter Congress of the
International Institute for Sugar Beet Research, Brussels, 1-23
Kirkby EA, LeBot J, Adomowicz S, Römheld V (2009) Nitrogen in physiology –
An agronomic perspective and implications for the use of different nitrogen
forms. Int Fert Soc Proc No 653: 1- 48
Kolar JS, Grewal HS (1994) Effect of split application of potassium on growth,
yield and potassium accumulation by soybean. Fert Res 39: 217-222
Krauss A (2003a) The International Potash Institute in retrospect and prospect. In:
Johnston AE (ed) Proceedings of the IPI Golden, Jubilee Congress1952-
2002, 8-10 Oct. 2002, volume 1: Invited papers “Feed the soil to feed the
Ricinus communis
people. The role of potash in sustainable agriculture”. Basel, Switzerland,
International Potash Institute, Basel Switzerland. pp 11-22
KraussA(2003b)Acquiring and putting knowledge into practice – The role of IPI.
In: Johnston AE (ed) Proceedings of the IPI Golden Jubilee Congress 1952-
2002, 8-10 Oct. 2002 Basel, Switzerland, Intern. Potash Institute, Basel
Switzerland, pp 363-369
Kuhlmann H, Barraclough PB (1987) Comparison between the seminal and nodal
root systems of winter wheat in their activity for N and K uptake. Z.
Pflanzenernaehr. Bodenkunde 150: 24-30
Kuhlmann H, Wehrmann L (1984) Testing different methods of soil analysis for
their applicability for the determination of K fertilizer requirement of loess
soils. Z Pflanzenernaehr Bodenkd 147: 334-348
Kumar N, Kavino M, Kumar AR (2006) Balanced fertilization for sustainable
yield and quality in tropical fruit crops. In: Benbi DK, Brar MS, Bansal SK
(ed) Balanced fertilization for sustaining crop productivity. International
Potash Institute, Horgen, Switzerland, pp 387-405
Leigh RA, Johnston AE (1983) Concentrations of potassium in the dry matter and
tissue water of field-grown spring barley and their relationships to grain yield.
J Agric Sci 101: 675-685
Leigh RA, Wyn Jones RG (1984) A hypothesis relating critical potassium
concentration for the growth and distribution of this ion in the plant cell. New
Phytol 97:1-13
Leigh RA, (2001) Potassium homeostasis and membrane transport . J Plant Nut
Soil Sci 164: 193-198
Liang Y (1999) Effects of silicon on enzyme activity and sodium, potassium and
calcium concentration in barley under salt stress. Plant Soil 209: 217-224
LiangY, Chen Q, Liu Q, Zhang W, Ding R (2003) Exogenous silicon (Si) increases
antioxidant enzyme activity and reduces lipid peroxidation in roots of salt-
stressed barley ( L.). J Plant Physiol 160: 1157-1164
Lorenzo O, Piqueras R, Sanchez-Serrano JJ, Solano R (2003) Ethylene response
factor 1 integrates signals from ethylene and jasmonate pathways in plant
defence. Plant Cell 15: 165-178
Lynch JP(1995) Root architecture and plant productivity. Plant Physiol 109:7-13
Lynch JP, (2007) Roots of the second green revolution. Australian J Botany 55:
493-512
Lynch JP, Ho MD (2005) Rhizoeconomics: Carbon costs of phosphorus
acquisition. Plant Soil 269:45-56
Marschner H (1995) Mineral Plant Nutrition of Higher Plants, 2nd ed, Academic,
pp 889
Marschner H, Cakmak I 1989 High light intensity enhances chlorosis and necrosis
in leaves of zinc, potassium, and magnesium deficient bean (
L.) plants. J Plant Physiol 134: 308-315
Hordeum vulgare
Phaseolus
vulgaris
620 621

Mayer J (1997) Ist die Kaliumversorgung gesichert? Ökologie und Landbau 101:
30-33
McLean E O and Watson M E (1985) Soil measurements of plant available
potassium In: R D Munson (ed) Potassium in Agriculture CSSA SSSA
Madison WI:ASA277-308.
Mengel K, Kirkby EA (2001) Principles of Plant Nutrition, 5th ed, Kluwer
Academic, Dordrecht, The Netherlands, pp 849
Mengel K, Rahmatullah X, Dou H (1998) Release of potassium from the silt and
sand fraction of loess derived soils. Soil Sci 163: 805-813
Milford GFJ, Johnston AE ( 2007) Potassium and nitrogen interactions in crop
production. Int Fert Soc Proc No 615: 1-23
Milford, GFJ, Jarvis, PJ, Jones J,. Barraclough, PB (2008) An agronomic and
physiological re-evaluation of the potassium and sodium requirements and
fertiliser recommendations for sugar beet. JAgric Sci 146:1-15
Nabti E, Sahnoune M, Adjrad S, van Dommelen A, Ghoui M, Schmid M,
Hartmann A (2007) A halophilic and osmotolerant
strain from Algerian soil restores wheat growth under saline conditions. Eng
Life Sci 7: 354-360
Norvell WA, Wu J, Hopkins DG, Welch RM (2000) Association of cadmium in
durum wheat grain with soil chloride and chelate-extractable soil cadmium.
Soil Sci SocAm J 64: 2162-2168
Öborn, I, Andrist-Rangel Y, Askeaard M, Grant CA, Watson CA, Edwards AC
(2005) Critical aspects of potassium management in agricultural systems.
Soil Use Manage 21: 102-112
Ozkutlu F, Ozturk L, Erdem H, McLaughlin M, Cakmak I (2007) Leaf-applied
sodium chloride promotes cadmium accumulation in durum wheat grain.
Plant Soil 290:323-331
Perrenoud S (1990) Potassium and plant health. IPI-Research Topics No.3, 2nd
rev. edition. International Potash Institute, Basel, Switzerland, pp 365
Pettigrew WT (2008) Potassium influences on yield and quality production for
maize, wheat, soybean and cotton. Physiol Plant 133: 670-681
Prabhu AS, Fageria NK, Huber DM, Rodrigues FA (2007) Potassium and plant
disease In: Datnoff LE, , Elmer WH, Huber DM (ed) Mineral nutrition and
plant disease. The American Phytopathological Soc Press, Saint Paul, US, pp
57-78
Prasad R (2009) Potassium fertilization recommendations for crops need
rethinking. Indian J Fert 5: 31-33
Preston RL, Linsner JR (1985) Potassium in animal nutrition. In: Munson RD (ed)
Potassium inAgriculture, ASA-CSSA-SSSA, Madison, USA, pp 595-617
Rengel Z, Damon PM (2008) Crops and genotypes differ in efficiency of
potassium uptake and use. Physiol Plant 133: 624-636
Römheld V, Kirkby EA (2007) Magnesium functions in crop nutrition and yield.
Azospirillum brasilense
Proc. Int Fert Soc Proc No 616: 1-22
Römheld V, Neumann G (2006) The rhizosphere: Contribution of the soil-root
interface to sustainable soil systems. In: Uphoff N (ed) Biological
Approaches to Sustainable Soil Systems, CRC, Oxford, UK, pp 92-107
Rubio JS, García-Sánchez F, Rubio F, García AL, Martínez V (2010) The
importance of K in ameliorating the negative effects of salt stress on peppers.
Europ J Hort Sci 75: 33-41
Samal D, Kovar JL, Steingrobe B, Sadana US, Bhadoria PS, Claassen N (2010)
Potassium uptake efficiency and dynamics in the rhizosphere in maize (
L.), wheat ( L.) and sugar beet ( L.)
evaluated with a mechanistic model Plant Soil 332:105-121
Seggewiss B, Jungk A (1988) Influence of potassium dynamics at the soil-root
interface on magnesium uptake of plants. Z Pflanzenernaehr Bodenk 151: 91-
96
Sen Gupta A, Berkowitz GA, Pier PA (1989) Maintenance of photosynthesis at
low leaf water potential in wheat. Role of potassium status and irrigation
history. Plant. Phys 89:1358-1365
Serfass RE, Manatt MW (1985) Potassium in human nutrition. In: Munson RD
(ed) Potassium in Agriculture, ASA-CSSA-SSSA, Madison, USA, pp 577-
594
Shabala S (2009) Salinity and programmed cell death: unraveling mechanisms for
ion specific signaling. J Exp Bot 60: 709-712
Shabala S, Cuin TA(2008) Potassium transport and salt stress Phys Plant 133:651-
669
Shabala S, Demidichik V, Shabala L, Cuin TA, Smith SJ, Miller AJ, Davies JM,
Newman IA (2006) Extracellular Ca ameliorates NaCl induced loss from
Arabidopsis root and leaf cells by controlling plasma membrane K permeable
channels. Plant Phys 141 1653-1665
Schachtman D P, Shin R (2006) Nutrient sensing and signalling: NPKS.Annu Rev
Plant Biol 58: 47-69
Scheel D (1998) Resistance response physiology and signal transduction. Curr
Opin Plant Biol 1: 305-310
Sharma RC, Sud KC (2001) Potassium management for yield and quality of
potato. In: Pasricha NS, Bansal SK (ed) Proc intentional symposium on the
role of potassium in nutrient management for sustainable crop production in
India pp363-381. International Potash Institute, Basel, Switzerland
Sharpley AN (1990) Reaction of fertilizer potassium in soils of different
mineralogy. Soil Sci 149: 44-51
Shin R, Schachtman DP (2004) Hydrogen peroxide mediates plant root cell
response to nutrient deprivation. Proc NatlAcad Sci, U SA101:8827-8832
Smil V (1999) Crop residues:Agriculture's largest harvest. Biosience 49: 299-308
+
2+
Zea
mays Triticum aestivum Beta vulgaris
622 623
Smolders E, McLaughlin MJ (1996) Effect of Cl on Cd uptake by Swiss chard in
nutrient solution. Plant Soil 179: 57-64
Springob G, Richter J (1998) Measuring interlayer potassium release rate from
soil materials II.Apercolation procedure to study the influence of the variable
“solute K” in the <1.10 micro M range. Z Pflanzenernaehr Bodenkd 161: 323-
329
Steingrobe B, Claassen N (2000) Potassium dynamics in the rhizosphere and K
efficiency of crops. J Plant Nutr Soil Sci 163: 101-106
Syers JK (2003) Potassium in soils: Current concepts. In: Johnston AE (ed)
Proceedings of the IPI Golden Jubilee Congress 1952-2002 held at Basel
Switzerland 8-10 Oct 2002. Feed the soil to feed the people. The role of potash
in sustainable agriculture, International Potash Institute, Basel, Switzerland,
pp 301-310
Thiel G, WolfAH (1997) Operation of K channels in stomatal movement. Trends
in Plant Sci 2: 339-345
Tinker PB Nye PH (2000) Solute movement in the rhizosphere, 2nd ed. Oxford,
pp 444
Trehan SP, Sharma RC (2002) Potassium uptake efficiency of young plants of
three potato cultivars as related to root and shoot parameters. Commun Soil
Sci PlantAnal 33: 1813-1823
Trehan SP., El Dessoughi H., Classen N (2005) Potassium efficiency of 10 potato
cultivars as related to their capacity to use non exchangeable soil K by
chemical mobilization. Comm. Soil Sci PlantAnal 36: 1809-1822
Umar S, Diva I,Anjum NA, Igbal M (2008) Potassium nutrition reduces cadmium
accumulation and oxidative burst in mustard ( L.) IPI e-
ifc No 16
von Liebig J. (1876) Die Chemie in ihrer Anwendung auf Agrikultur und
Physiologie 9th ed, edited by PH. Zöller on behalf of the author Friedrich
Vieweg und Sohn, Braunschweig, Germany; Reprinted 1995 by Agrimedia
GmbH
Wang Y, Wu W-H (2010) Plant sensing and signaling in response to K deficiency
Molecular Plant 3: 280-287
White PJ, Karley AJ (2010) Potassium. In: Hell R, Mendel RR (ed), Cell biology
of metals and nutrients, Plant Cell Monographs 17, pp199-224 Springer,
Berlin
Wilkinson S, Clephan AL, Davies WJ (2001) Rapid low temperature-induced
stomatal closure occurs in cold-tolerant Commelina communis leaves but not
in cold-sensitive tobacco leaves, via a mechanism that involves apoplastic
calcium but not abscisic acid. Plant Phys 126: 1566-1578
Wulff F, Schulz V, Jungk A, Claassen N (1998) Potassium fertilization on sandy
soils in relation to soil test, crop yield and K-leaching. Z Pflanzenernaehr
+
+
Brassica campestris
Bodenkd 161: 591-599
Yadav DV (2006) Potassium nutrition of sugarcane. In: Benbi DK, Brar MS,
Bansal SK (ed) Balanced Fertilization for Sustaining Crop Productivity.
International Potash Institute, Horgen, Switzerland, pp 275-288
Yan X, Wu P, Ling H, Xu G, Xu F, Zhang Q (2006) Plant nutriomics in China : An
overview.Annals of Botany 98: 473-482
Yang, H, Dobermann A, Cassman KG, Walters DT (2006) Features, applications,
and limitations of the hybrid-maize simulation model.Agron J 98: 737-748
Yang, XE Liu JX, Wang WM, Li H, Luo AC, (2004) Potassium internal use
efficincy relative to growth vigor, potassium distribution and carbohydrate
allocation in rice genotypes. J Plant Nutr 27:837-852
Yang Y, Shah J, Klessig D F (1997) Signal perception and transduction in plant
defence responses. Genes Dev 11: 1621-1639
Yoshida K (2001) An economic evaluation of the multifunctional roles of
agriculture and rural areas in Japan. FFTC Technical Bulletin 154, Taipeh,
Taiwan
Zhao Z-Q, Zhu Y-G, Li H-Y, Smith SE, Smith FA(2003) Effects of forms and rates
of potassium fertilizers on cadmium uptake of two cultivars of spring wheat
( L.). Environ Intern 29: 973-978Triticum aestivum
624 625

Proceedings IPI-OUAT-IPNI International Symposium (2009)
Zed RengelSoil Science and Plant Nutrition, School of Earth and Environment, University of WesternAustralia, Crawley WA6009,Australiae-mail : [email protected]
Crop mineral nutrition under drought conditions
Zed Rengel
Introduction
Breeding for improved root architecture and function
Climate change will result in increased variability of precipitation. Moreover,
many areas in the world (e.g. Western Australian wheat belt) are projected to have
reduced rainfall, causing more frequent and longer droughts. Hence, in rain-fed
agriculture, measures designed to increase the capacity of roots to take up water
and nutrients from soil with limited water availability are needed. This review will
concentrate on 1) breeding for improved root architecture and function, 2)
fertiliser placement to encourage root proliferation deeper in the soil profile, and
3) hydraulic lift of water from wet into dry soil via roots.
Complex plant structures like roots have two developmental pathways: (i)
intrinsic (governing the basic architecture and the limits of plasticity) that is
determined genetically for a particular species, and (ii) response pathway
determined by environmental cues (Malamy 2005). These two pathways combine
in intricate ways to create a highly complex 3-D root structure influenced by
genetics as well as the availability of resources in the heterogeneous soil
environment (Baddeley et al. 2007). Although diffusion coefficients of nutrient
ions are reduced in dry soil, many reports suggest that the uptake of soil immobile
nutrients is predominantly affected by reduced root growth as soil dries out
(Crabtree et al. 1998; Rose et al. 2008).
Root systems are fundamental to crop productivity (Dunbabin 2007; Malamy
2005). In Australia, crop root systems are poorly adapted to soils, resulting in
yields averaging only 50 percent of the potential, with the major limiting factors
being poor soil water holding capacity and nutrient deficiencies (Rengasamy
2002; Wong and Asseng 2006). Growing cultivars tolerant to soil-related stresses
would be an economically- and environmentally-favourable solution most readily
adopted by farmers (Rengel 2005). Hence, successful crop genotypes in the future
will need to have enhanced efficiency of capturing water and nutrients from the
increasingly hostile soil environments (De Dorlodot et al. 2007).
626 627
Targeted development of crop genotypes with increased efficiency of water
use (Liu et al. 2007; Manschadi et al. 2006; Ober et al. 2005) and nutrient capture
(Rengel 2005) hinges on a better understanding of root structure and function
(Wang & Smith 2004). In soybean genotypes, increased capacity to take up water
from deep (1.1 m) soil horizons in the field was linked to increased yield potential
(Ober et al. 2005); similar connection was made for upland rice (Kondo et al.
1999) and also wheat in western and southernAustralia (Wong andAsseng 2006).
Because genetic loci for root properties overlap with those associated with
crop productivity in the field (Steele et al. 2007), identifying genetic loci and
eventually molecular markers to facilitate marker-assisted selection for root traits
will result in the selection of genotypes with higher productivity in the field based
on more efficient capture of water and nutrients (De Dorlodot et al. 2007). Indeed,
marker-assisted selection for the root-related genetic loci has been used to alter
root architecture and increase grain yield in the field-grown rice (Steele et al.
2007) and also to increase root size and grain yield in maize (Landi et al. 2005).
However, wide-scale use of root-related genetic information in breeding is
hampered by relatively small mapping populations and inaccurate phenotyping
(De Dorlodot et al. 2007).
Phenotyping of root traits in breeding programs is presently hindered by the
structural and functional complexity of root systems in heterogeneous soil
environments (Doussan et al. 2003; Pierret et al. 2006; Valizadeh et al. 2003),
requiring multidisciplinary analysis of root functioning in soil, characterisation of
factors limiting soil-root interactions in specific environments, and identification
of root parameters that represent potential solutions. These requirements can be
met by modelling, providing that models: (i) are 3-D and time-dynamic, (ii)
integrate biological, physical and chemical processes occurring in soil, (iii) enable
simulations of scenarios beyond those directly observed, and (iv) are capable of
simulating these scenarios in a dynamic environments that vary in time and space
(De Dorlodot et al. 2007).
It is still unknown which phenotypic traits are desirable in achieving
increased efficiency of water and nutrient capture from the drying soil
environments (Walk et al. 2006). However, defining optimal root systems can be
done via simulation computer models, eg. ROOTMAP as an interactive model of
root structure and function (Dunbabin et al. 2002b). ROOTMAP excellently
matches the patterns of root growth and nutrient uptake observed in the field
(Dunbabin et al. 2002a) and is uniquely able to search for optimality of root
structure and function regarding nitrate and P capture in variable seasonal
conditions (Dunbabin et al. 2003; 2004; 2006).
In water-limited environments where the topsoil is prone to drying, placing
Manipulating root distribution in the soil profile by fertiliser placement
fertilisers deeper in the soil profile could increase nutrient acquisition by plants
because fertilisers would be in the moist soil for a longer part of the growing
season (Ma et al. 2009). There are many reports on the yield benefit from deep
fertiliser placement (Crabtree 1999; Hocking et al. 2003; Jarvis and Bolland
1991). However, the effectiveness of deep fertiliser placement is influenced by
soil texture, tillage, fertilising history, nutrient mobility, and crop species. In
addition, when subsoils feature toxicities such as boron or salt, increasing root
proliferation into the subsoils by placing fertilisers deep may exacerbate toxicity
problems (Ma et al. 2009).
Roots can respond to localised nutrient availability by increasing the rate of
nutrient uptake, and/or by root proliferation in the enriched zones. Frequently, the
combination of these two is involved in the plastic responses of a root system to
heterogeneous nutrient conditions (Dunbabin et al. 2001a; b). Compared with
uniformly mixed fertiliser, root proliferation occurs in the vicinity of a fertilised
band (Ma et al. 2007; Trapeznikov et al. 2003), but not too close because of
toxicity caused by high nutrient concentrations (Zhang and Rengel 1999; 2002).
In agricultural systems with little soil mixing (no-till or minimum tillage) and
placement of fertilisers near the seed, vertical stratification of nutrients may occur
(with accumulation of nutrients in the topsoil (Howard et al. 1999). Between
rainfall events, nutrients in the topsoil could become unavailable as the soil dries.
In such instances, hydraulic lift may play a vital role in nutrient acquisition (Rose
et al. 2008).
Hydraulic lift is defined as the root uptake of soil water from areas of high
water potential (generally subsoil) and subsequent release into areas of low water
potential (generally topsoil) by roots at night (Caldwell et al. 1998). Hence,
hydraulic lift may maintain the root function and nutrient uptake in relatively dry
soil. Hydraulic lift could be maintained even in soils that are as dry as having only
1 percent (w/w) moisture (Rose et al. 2008). There are however, both positive
(Liebersbach et al. 2004; Rose et al. 2008; Valizadeh et al. 2003; Wan et al. 2000)
and negative reports (Crabtree et al. 1998) with respect to hydraulic lift facilitating
nutrient uptake from relatively dry soils.
Overnight, pearl millet lifted up to 27 g kg soil (Vetterlein and Marschner
1993) and wheat ~25 soil (Valizadeh et al. 2003), but canola only 2-3 g kg
soil (Rose et al. 2008). This difference might have been caused by differential root
density (greater in case of highly branched root system of cereals vs. taprooted
system of canola). Increased localised supply of P fertiliser (compared with nil
fertiliser) resulted in wheat plants lifting more water and taking up more P
(Valizadeh et al. 2003).
Hydraulic lift of water from moist deep soil layers into dry shallow layers
-1
-1g kg
-1
628 629

Conclusions
References
)
)
)
)
)
The importance of enhanced plant capacity to take up water and nutrients from soil
is becoming increasingly important in rain-fed agriculture, especially in areas that
are getting drier due to climate change and as water resources become scarcer and
more expensive. A long-term strategy to dealing with such problems is to breed
new cultivars with enhanced root architecture and function for particular drying
environments. In addition, deeper fertiliser placement and enhanced plant
capacity for hydraulic lift might contribute to increased uptake of nutrients from
drying soil.
Baddeley JA, Bingham IJ, Hoad SP(2007) Development of cereal root systems for
sustainable agriculture. In: Østergård H, Backes G, Kovács G (ed) Varietal
characteristics of cereals in different growing systems with special emphasis
on below ground traits. Velence, Hungary, pp 9-13
Caldwell MM, Dawson TE, Richards JH (1998) Hydraulic lift: Consequences of
water efflux from the roots of plants. Oecologia 113:151-161
Crabtree WL (1999) Deep placement of Mn fertiliser on a sandy soil increased
grain yield and reduced split seed in . Plant Soil 214:9-
14
Crabtree WL, Robson AD, Ritchie GSP (1998) Drying of surface soil decreased
Lupinus angustifolius root length and manganese uptake in a split-root
experiment.Aust JAgric Res 49: 1119-1123
De Dorlodot S, Forster B, Pages L, Price A, Tuberosa R, Draye X (2007) Root
system architecture: Opportunities and constraints for genetic improvement
of crops. Trends Plant Sci 12:474-481
Doussan C, Pages L, PierretA(2003) Soil exploration and resource acquisition by
plant roots:An architectural and modelling point of view.Agronomie 23:419-
431
Dunbabin V (2007 Simulating the role of rooting traits in crop-weed competition.
Field Crops Res 104, 44-51
Dunbabin V, Diggle A, Rengel Z (2003 Is there an optimal root architecture for
nitrate capture in leaching environments? Plant Cell Environ 26:835-844
Dunbabin V, Rengel Z, Diggle A (2001a has a plastic
uptake response to heterogeneously supplied nitrate while
does not.Aust JAgric Res 52:505-512
Dunbabin V, Rengel Z, Diggle A (2001b The root growth response to
heterogeneous nitrate supply differs for and
.Aust JAgric Res 52:495-503
Dunbabin V, Rengel Z, Diggle AJ (2004 Simulating form and function of root
Lupinus angustifolius
Lupinus angustifolius
Lupinus pilosus
Lupinus angustifolius Lupinus
pilosus
systems: efficiency of nitrate uptake is dependent on root system architecture
and the spatial and temporal variability of nitrate supply. Func Ecol 18:204-
211
Dunbabin VM, Diggle AJ, Rengel Z (2002a Simulation of field data by a basic
three-dimensional model of interactive root growth. Plant Soil 239:39-54
Dunbabin VM, Diggle AJ, Rengel Z, van Hugten R (2002b Modelling the
interactions between water and nutrient uptake and root growth. Plant Soil
239:19-38
Dunbabin VM, McDermott S, Bengough AG (2006 Upscaling from rhizosphere
to whole root system: Modelling the effects of phospholipid surfactants on
water and nutrient uptake. Plant Soil 283:57-72
Hocking PJ, Mead JA, Good AJ, Diffey SM (2003 The response of canola
( L) to tillage and fertiliser placement in contrasting
environments in southern New South Wales.Aust J ExpAgric 43:1323-1335
Howard DD, Essington ME, Tyler DD (1999 Vertical phosphorus and potassium
stratification in no-till cotton soils.Agron J 91:266-269
Jarvis RJ, Bolland MDA (1991 Lupin grain yields and fertilizer effectiveness are
increased by banding superphosphate below the seed. Aust J Exp Agric
31:357-366
Kondo M, Murty MV, Aragones DV, Okada K, Winn T, Kwak KS (1999
Characteristics of the root system and water uptake in upland rice. In: Ito O,
O'Toole J, Hardy B (ed) Genetic improvement of rice for water limited
environments.. Intern Rice Research Institute, Makati City, Philippines, pp
117-131
Landi P, Sanguineti MC, Salvi S, Giuliani S, Bellotti M, Maccaferri M, Conti S,
Tuberosa R (2005 Validation and characterization of a major QTL affecting
leafABAconcentration in maize. Molecular Breeding 15:291-303
Liebersbach H, Steingrobe B, Claassen N (2004 Roots regulate ion transport in
the rhizosphere to counteract reduced mobility in dry soil. Plant Soil 260:79-
88
Liu X, Zhang S, Shan L, Yang X, Wu A (2007 The heterosis of water uptake by
single root of maize.ActaAgronomica Sinica 33:1625-1629
Ma Q, Rengel Z, Bowden B (2007 Heterogeneous distribution of phosphorus and
potassium in soil influences wheat growth and nutrient uptake. Plant Soil
291:301-309
Ma Q, Rengel Z, Rose T (2009 The effectiveness of deep placement of fertilisers
is determined by crop species and edaphic conditions in Mediterranean-type
environments:Areview.Aust J Soil Res 47:19-32
Malamy JE (2005 Intrinsic and environmental response pathways that regulate
root system architecture. Plant Cell Environ 28:67-77
Manschadi AM, Christopher J, Voil PD, Hammer GL (2006 The role of root
architectural traits in adaptation of wheat to water-limited environments.
)
)
)
)
)
)
)
)
)
)
)
)
)
)
Brassica napus
630 631

Proceedings IPI-OUAT-IPNI International Symposium (2009)Func Plant Biol 33:823-837
Ober ES, Clark CJ, Bloa Ml, Smith CH (2005 Root growth, soil water extraction
and drought tolerance in sugar beet.Aspects ofAppl Biol 73:213-220
Pierret A, Doussan C, Pages L (2006 Spatio-temporal variations in axial
conductance of primary and first-order lateral roots of a maize crop as
predicted by a model of the hydraulic architecture of root systems. Plant Soil
282:117-126
Rengasamy P (2002 Transient salinity and subsoil constraints to dryland farming
inAustralian sodic soils:An overview.Aust J ExpAgric 42:351-361
Rengel Z (2005 Breeding crops for adaptation to environments with low nutrient
availability. In: Ashraf M, Harris PJC (ed) Abiotic stresses: Plant resistance
through breeding and molecular approaches. Haworth, New York, pp 239-
276
Rose TJ, Rengel Z, Ma Q, Bowden JW (2008 Hydraulic lift by canola plants aids
Pand K uptake from dry topsoil.Aust JAgric Res 59:38-45
Steele KA, Virk DS, Kumar R, Prasad SC, Witcombe JR (2007 Field evaluation
of upland rice lines selected for QTLs controlling root traits. Field Crops Res
101:180-186
Trapeznikov VK, Ivanov II, Kudoyarova GR (2003 Effect of heterogeneous
distribution of nutrients on root growth, ABA content and drought resistance
of wheat plants. Plant Soil 252:207-214
Valizadeh GR, Rengel Z, Rate AW (2003 Response of wheat genotypes efficient
in P utilisation and genotypes responsive to P fertilisation to different P
banding depths and watering regimes.Aust JAgric Res 54: 59-65
Vetterlein D, Marschner H (1993 Use of a microtensiometer technique to study
hydraulic lift in a sandy soil planted with pearl millet (
L). Plant Soil 149:275-282
Walk TC, Jaramillo R, Lynch JP (2006 Architectural tradeoffs between
adventitious and basal roots for phosphorus acquisition. Plant Soil 279:347-
366
Wan CG, Xu WW, Sosebee RE, Machado S, Archer T (2000) Hydraulic lift in
drought-tolerant and -susceptible maize hybrids. Plant Soil 219:117-126
Wang E, Smith CJ (2004 Modelling the growth and water uptake function of plant
root systems:Areview.Aust JAgric Res 55:501-523
Wong MTF, Asseng S (2006 Determining the causes of spatial and temporal
variability of wheat yields at sub-field scale using a new method of upscaling
a crop model. Plant Soil 283:203-215
Zhang XK, Rengel Z (1999 Gradients of pH, ammonium, and phosphorus
between the fertiliser band and wheat roots.Aust JAgric Res 50:365-373
Zhang XK, Rengel Z (2002 Temporal dynamics of gradients of phosphorus,
ammonium, pH, and electrical conductivity between a di-ammonium
phosphate band and wheat roots.Aust JAgric Res 53: 985-992
)
)
)
)
)
)
)
)
)
)
)
)
)
)
Pennisetum
americanum
Phosphorus acquisition efficiency: Root morphology
and physiology
Hans Lambers
WesternAustralia was a part of Gondwanaland, and some of the most ancient parts
of the Earth' crust can be found here. The rocks are up to 3.6 billion years old, with
some of the sediments being as old as 4.3 billion years. Other parts of the
landscape originated more recently from calcareous marine deposits. Therefore,
the soils of Western Australia are amongst the most heavily leached and nutrient-
impoverished in the world. Moreover, the soils on lateritic profiles tightly bind
phosphate, so that, phosphorus (P) is also poorly available to plants that are not
adapted to these conditions. The southwest of Western Australia is also one of the
world's hotspots of higher plant species diversity. Therefore, this environment
offers a unique opportunity to study plant adaptations to nutrient-poor conditions.
A relatively large proportion of species from the P-poor environments in
Western Australia cannot produce an association with mycorrhizal fungi, but
instead, produce 'root clusters' . Root clusters are an adaptation both in structure
and in functioning; they release large amounts of exudates, in particular
carboxylates. Root-cluster-bearing Proteaceae in Western Australia occur on the
most P-impoverished soils, whereas the mycorrhizal Myrtaceae tend to inhabit the
less P-impoverished soils in this region .
The functioning of 'proteoid' root clusters in Proteaceae and Fabaceae has
received considerable attention. 'Dauciform' clusters in Cyperaceae have been
explored less, but they appear to function in a similar manner as 'proteoid' clusters.
Research on the physiology of 'capillaroid' root clusters in Restionaceae has yet to
be published.
Root-cluster growth in species of the Cyperaceae, Fabaceae and Proteaceae is
systemically stimulated when plants are grown at a very low P supply, and
suppressed when leaf Pconcentrations increase. Proteoid root clusters in Fabaceae
and Proteaceae and dauciform clusters in Cyperaceae are short-lived structures,
and both release large amounts of carboxylates during an 'exudative burst' at rates
that are considerably faster than reported for non-specialised roots of a wide range
of species. Root clusters play a pivotal role in mobilisation of P from P-sorbing
soil.
Hans Lambers
School of Plant Biology, Faculty of Natural and Agricultural Sciences, The University of
WesternAustralia, 35 Stirling Highway, WA6009,Australia
e-mail : [email protected]
632 633

Because the world P reserves are being depleted whilst vast amounts of P are
stored in fertilised soils, there is a growing need for crops with a high efficiency of
P acquisition . SomeAustralian native species as well as some existing crops have
traits that would be highly desirable for future crops. The possibilities of
introducing P-acquisition efficient species in new cropping and pasture systems
are currently being explored. In addition, possible strategies to introduce traits
associated with a high P-acquisition efficiency into future crop species are
considered promising.
References
Brundrett M (2009) Mycorrhizal associations and other means of nutrition of
vascular plants: understanding the global diversity of host plants by resolving
conflicting information and developing reliable means of diagnosis. Plant
Soil 320:37-77
Grierson PF (1992) Organic acids in the rhizosphere of L.f.
Plant Soil 144: 259-265
Hopper SD (2009) OCBIL theory: Towards an integrated understanding of the
evolution, ecology and conservation of biodiversity on old, climatically
buffered, infertile landscapes. Plant Soil 322:49-86
Johnson JF, Allan DL, Vance CP (1994) Phosphorus stress-induced proteoid roots
show altered metabolism in Lupinus albus. Plant Physiol. 104:657-665
Keerthisinghe G, Hocking PJ, Ryan PR, Delhaize E (1998) Effect of phosphorus
supply on the formation and function of proteoid roots of white lupin
( L.). Plant Cell Environ 21:467-478
Lambers H, Brundrett MC, Raven JA, Hopper SD (2010) Plant mineral nutrition
in ancient landscapes: high plant species diversity on infertile soils is linked
to functional diversity for nutritional strategies. Plant Soil 334:11-31
Lambers H, Raven JA, Shaver GR, Smith SE (2008) Plant nutrient-acquisition
strategies change with soil age. Trends Ecol & Evol 23:95-103
Lambers H, Shane MW, Cramer MD, Pearse SJ, Veneklaas EJ (2006) Root
structure and functioning for efficient acquisition of phosphorus: matching
morphological and physiological traits.Annals Bot 98:693-713
Lamont B (1982) Mechanisms for enhancing nutrient uptake in plants, with
particular reference to mediterranean South Africa and Western Australia.
Bot Review 48:597-689
Playsted C, W. S. , Johnstonargaret ME, Ramage C, M. , Edwards D, G. , Cawthray
G, R. , Lambers H (2006) Functional significance of dauciform roots:
exudation of carboxylates and acid phosphatase under phosphorus deficiency
in (Cyperaceae). New Phytologist 170:491-500
Ryan MH, Ehrenberg S, Bennett RG, Tibbett M (2009) Putting the P in Ptilotus: A
Banksia integrifolia
Lupinus albus
Caustis blakei
phosphorus-accumulating herb native toAustralia.Annals Bot 103:901-911
Shane M, Cawthray G, Cramer M, Kuo J, Lambers H (2006) Specialized
'dauciform' roots of Cyperaceae are structurally distinct, but functionally
analogous with 'cluster' roots. Plant Cell & Environ 29:1989-1999
Shane M, Lambers H (2005) Cluster roots: A curiosity in context. Plant Soil
274:101-125
Shane MW, Cramer MD, Funayama-Noguchi S, Cawthray GR, Millar AH, Day
DA, Lambers H (2004) Developmental physiology of cluster-root
carboxylate synthesis and exudation in harsh hakea. Expression of
phosphoenolpyruvate carboxylase and the alternative oxidase. Plant Physiol.
135:549-560
Shane MW, de Vos M, de Roock S, Cawthray GR, Lambers H (2003) Effects of
external phosphorus supply on internal phosphorus concentration and the
initiation, growth and exudation of cluster roots in R.Br.
Plant Soil 248:209-219
Shane MW, Dixon KW, Lambers H (2005) The occurrence of dauciform roots
amongst Western Australian reeds, rushes and sedges, and the impact of
phosphorus supply on dauciform-root development in
(Cyperaceae). New Phytologist 165:887-898
Suriyagoda L, Ryan M, Renton M, Lambers H (2010) Multiple adaptive responses
of Australian native perennial legumes with pasture potential to grow in
phosphorus- and moisture-limited environments.Ann. Bot. 105:755-767
Vance CP, C.Uhde-Stone, Allan. DL (2003) Phosphorus acquisition and use:
Critical adaptations by plants for securing a nonrenewable resource. New
Phytologist 157:423-447
Watt M, Evans JR (1999) Proteoid roots. Physiology and development. Plant
Physiol. 121:317-323
Hakea prostrata
Schoenus
unispiculatus
634 635

Proceedings IPI-OUAT-IPNI International Symposium (2009)
Potassium nutrition and its effect on quality and post
harvest properties of potato
Georg Ebert
Potato is a high-value crop with world-wide significance. Potato production was
increasing continuously during the past decades. Today, China, Russia and India
are the leading potato producers. The annual per capita consumption of potato is
31.3 kg. The potato is a multi-purpose crop widely used as table potato, for
processing (crisps, chips), as seed potato and for starch production and other
industrial uses (plastics, alcohol, energy). Application of potassium to potato
improves the quality parameters such as starch content, contents of protein, citric
acid, ascorbic acid, storage attributes such as shell strength and resistance to tuber
damage as well as resistance to black spot incidence and after cooking
discoloration.
Potassium is important in many physiological processes that contribute to
tuber quality, and countering strees. Some of them are:
production, translocation, conversion and storage of carbohydrates through
enzyme activation
water use efficiency – potatoes grown with adequate K supply use less water
per kg of tubers and withstand drought periods
resistance to stress (frost, heat impact) and diseases
tuber quality and processing characteristics.
The distribution of K varies largely in different parts of potato. About 76
percent K is accumulated in tubers, 18 percent in leaves, 4 percent in stem, and 2
percent in roots. Potassium sufficiency-level varies in different parts of potato
plant. At bud stage K-sufficiency (K- percent of dry matter) range varies from 4.5
to 7.0 percent, at start of flowering from 4.0 to 6.4 percent, at end of flowering from
3.7 to 6.1 percent and at tuber formation from 3.5 to 5.7 percent. Potato is a heavy
feeder of potassium. A crop with tuber yield of 40 t ha removes about 300 kg K
ha , out of which 250 kg is removed by tubers.
Occurrence of black spots is a serious quality-reducing factor in potato. The
formation of black spots depends on both external and internal factors. The
external factor includes growing conditions eg. site, fertilization, water supply,
harvest conditions, post harvest treatment and storage conditions. Variety and
l
l
l
l
-1
-1
Georg Ebert
K+S KALI GmbH, Germany
e-mail : [email protected]
636 637

maturity of tubers are another important factors. Among internal factors are free
phenolic acids, organic acids (pH), other phenolic compounds and activities of
enzymes besides mineral content.
The importance of K for the tuber quality is due to the fact that K is involved in
the formation of free phenolic amino acids, organic acids (pH) and other phenol
compounds. Potassium induced formation of citric acid for example prevents
tubers from the occurrence of black spots by inhibiting the formation of grey ferric
complexes inside the tuber tissue. The discoloration occurs due to combination of
Fe with chlorogenic acids, which under oxidized conditions forms grey coloured
ferric complexes. By Increasing the foliar K content from 2 to 4 percent through
adequate K supply, black spot incidence can be reduced by more than 50 percent.
Potassium nutrition has a strong influence on starch formation in tubers. In a
comparative study it was found out that moderate SOP (K SO ) doses increased
starch content, whereas high MOP(KCl) supply resulted in a very low K content of
starch in tubers.
Reducing sugars are known to be problematic during tuber processing
because they induce undesired browning of chips and crisps. However, there is a
strong negative correlation between K content and the amount of reducing sugars
in tubers. Therefore an adequate K supply significantly decreases the content of
reducing sugars in tubers. It also ensures a better coloration of potato chips. Field
trials in Germany proved that SOP was more effective in preventing from
enzymatic discoloration than did MOP.
K fertilization is also an important means to increase the frost resistance in
cold growing regions. Tuber weight losses during storage was significantly
reduced by sufficient K supply during the growing period.
The field experiments testing different K rates showed that most of the
relevant potato quality and post harvest parameters were positively influenced by
K. In most cases, SOPwas the more efficient K source in comparison to MOP.
2 4
638