Timing and thermochemical constraints on multi-element mineralisation at the Nori/RA Cu–Mo–U...
18
ARTICLE Timing and thermochemical constraints on multi-element mineralisation at the Nori/RA Cu–Mo–U prospect, Great Bear magmatic zone, Northwest Territories, Canada Luke Ootes & Steve Goff & Valerie A. Jackson & Sarah A. Gleeson & Robert A. Creaser & Iain M. Samson & Norman Evensen & Louise Corriveau & A. Hamid Mumin Received: 13 March 2009 / Accepted: 25 May 2010 / Published online: 16 June 2010 # Springer-Verlag 2010 Abstract The timing of Cu–Mo–U mineralisation at the Nori/RA prospect in the Paleoproterozoic Great Bear magmatic zone has been investigated using Re–Os molybdenite and 40 Ar– 39 Ar biotite geochronology. The Re–Os molybdenite ages presented are the first robust sulphide mineralisation ages derived from the Great Bear magmatic zone. Cu–Mo–U mineralisation is hosted in early to syn-deformational hydrothermal veins consisting of quartz and K-feldspar or more commonly tourmaline- biotite-quartz-K-feldspar, with associated wall-rock alter- ation assemblages being predominantly biotite. Sulphide and oxide minerals consist of chalcopyrite, molybdenite and uraninite with lesser pyrite and magnetite. Elevated light rare earth elements and tungsten concentrations associated with the Cu–Mo–U mineralisation have also been reported at the prospect by previous workers. Molybdenite and uraninite occur intimately in dravitic tourmaline growth zones and at grain margins, attesting to their syngenetic nature (with respect to hydrothermal veining). Two molybdenite separates yield Re–Os model ages of 1,874.4±8.7 (2σ) and 1,872.4±8.8 Ma (2σ) with a weighted average model age of 1,873.4±6.1 Ma (2σ). Laser step heating of biotite from the marginal alteration of the wall-rock adjacent to the veins yields a 40 Ar– 39 Ar maximum cooling age of 1,875±8 Ma (MSWD=3.8; 2σ), indistinguishable from the Re–Os molybdenite model age and a previously dated ‘syn-tectonic’ aplitic dyke in the region. Dravitic tourmaline hosts abundant primary liquid– vapour–solid-bearing fluid inclusions. Analytical results Editorial handling: D. Lentz Steve Goff is deceased. L. Ootes (*) : S. Goff : V. A. Jackson Northwest Territories Geoscience Office, P.O. Box 1500, Yellowknife, NT X1A 2R3, Canada e-mail: [email protected] V. A. Jackson e-mail: [email protected] S. A. Gleeson : R. A. Creaser Department of Earth and Atmospheric Sciences, University of Alberta, 1-26 Earth Sciences Building, Edmonton, AB T6G 2E3, Canada S. A. Gleeson e-mail: [email protected] R. A. Creaser e-mail: [email protected] I. M. Samson Department of Earth and Environmental Sciences, University of Windsor, Windsor, ON N9B 3P4, Canada e-mail: [email protected] N. Evensen Department of Physics, University of Toronto, 60 St. George St., Toronto, ON M5S 1A7, Canada e-mail: [email protected] L. Corriveau Geological Survey of Canada, 490, rue de la Couronne, Québec City, QC G1K 9A9, Canada e-mail: [email protected] A. H. Mumin Department of Geology, Brandon University, 270 18th St., Brandon, MB R7A 6A9, Canada e-mail: [email protected] Miner Deposita (2010) 45:549–566 DOI 10.1007/s00126-010-0291-x
-
Upload
independent -
Category
Documents
-
view
3 -
download
0
Transcript of Timing and thermochemical constraints on multi-element mineralisation at the Nori/RA Cu–Mo–U...

ARTICLE
Timing and thermochemical constraints on multi-elementmineralisation at the Nori/RA Cu–Mo–U prospect, GreatBear magmatic zone, Northwest Territories, Canada
Luke Ootes & Steve Goff & Valerie A. Jackson & Sarah A. Gleeson & Robert A. Creaser &
Iain M. Samson & Norman Evensen & Louise Corriveau & A. Hamid Mumin
Received: 13 March 2009 /Accepted: 25 May 2010 /Published online: 16 June 2010# Springer-Verlag 2010
Abstract The timing of Cu–Mo–U mineralisation at theNori/RA prospect in the Paleoproterozoic Great Bearmagmatic zone has been investigated using Re–Osmolybdenite and 40Ar–39Ar biotite geochronology. TheRe–Os molybdenite ages presented are the first robustsulphide mineralisation ages derived from the Great Bearmagmatic zone. Cu–Mo–U mineralisation is hosted inearly to syn-deformational hydrothermal veins consistingof quartz and K-feldspar or more commonly tourmaline-biotite-quartz-K-feldspar, with associated wall-rock alter-ation assemblages being predominantly biotite. Sulphide
and oxide minerals consist of chalcopyrite, molybdeniteand uraninite with lesser pyrite and magnetite. Elevatedlight rare earth elements and tungsten concentrationsassociated with the Cu–Mo–U mineralisation have alsobeen reported at the prospect by previous workers.Molybdenite and uraninite occur intimately in dravitictourmaline growth zones and at grain margins, attesting totheir syngenetic nature (with respect to hydrothermalveining). Two molybdenite separates yield Re–Os modelages of 1,874.4±8.7 (2σ) and 1,872.4±8.8 Ma (2σ) with aweighted average model age of 1,873.4±6.1 Ma (2σ).Laser step heating of biotite from the marginal alterationof the wall-rock adjacent to the veins yields a 40Ar–39Armaximum cooling age of 1,875±8 Ma (MSWD=3.8; 2σ),indistinguishable from the Re–Os molybdenite model ageand a previously dated ‘syn-tectonic’ aplitic dyke in theregion. Dravitic tourmaline hosts abundant primary liquid–vapour–solid-bearing fluid inclusions. Analytical results
Editorial handling: D. Lentz
Steve Goff is deceased.
L. Ootes (*) : S. Goff :V. A. JacksonNorthwest Territories Geoscience Office,P.O. Box 1500, Yellowknife, NT X1A 2R3, Canadae-mail: [email protected]
V. A. Jacksone-mail: [email protected]
S. A. Gleeson :R. A. CreaserDepartment of Earth and Atmospheric Sciences,University of Alberta,1-26 Earth Sciences Building,Edmonton, AB T6G 2E3, Canada
S. A. Gleesone-mail: [email protected]
R. A. Creasere-mail: [email protected]
I. M. SamsonDepartment of Earth and Environmental Sciences,University of Windsor,Windsor, ON N9B 3P4, Canadae-mail: [email protected]
N. EvensenDepartment of Physics, University of Toronto,60 St. George St.,Toronto, ON M5S 1A7, Canadae-mail: [email protected]
L. CorriveauGeological Survey of Canada,490, rue de la Couronne,Québec City, QC G1K 9A9, Canadae-mail: [email protected]
A. H. MuminDepartment of Geology, Brandon University,270 18th St.,Brandon, MB R7A 6A9, Canadae-mail: [email protected]
Miner Deposita (2010) 45:549–566DOI 10.1007/s00126-010-0291-x
indicate liquid–vapour homogenisation at >260°C con-straining the minimum temperature of mineralisation. Thesolids, which are possibly trapped, did not homogenisewith the liquid–vapour by 400°C. Salinities in theinclusions are variable. Raman spectra identify that atleast some of the solids are calcite and anhydrite. Ramanspectra also confirm the vapour phases contain some CO2;whereas clathrates or CH4 was not observed or detected.Quartz grains only host secondary fluid inclusions, whichfluoresce under ultraviolet light, indicating trapped hydro-carbons. We speculate that these resulted from Phanerozoicfluid circulation through the Proterozoic basement. Thecollective interpretation of the age, hydrothermal characterand associated metals, high temperature and variablesalinity suggests that the Nori/RA Cu–Mo–U mineralisationcan be linked with the earliest stages of plutonism in theGreat Bear magmatic zone. From a regional perspective, themineralisation may pre-date the extensive multi-elementmineralisation now recognised as part of the iron oxidecopper–gold (IOCG) spectrum of deposits. As IOCGprovinces generally contain a variety of mineralisationstyles, we interpret this as the earliest phase of the extensivemineralising system.
Keywords Great Bear magmatic zone . Re–Osmolybdenite . Laser 40Ar–39Ar biotite .
Fluid inclusions, Cu–Mo–U . IOCG
Introduction
The Paleoproterozoic Great Bear magmatic zone (GBMZ)of the Wopmay orogen, Northwest Territories, Canada,hosts polymetallic (two or more of Cu, Ag, Au, Co, Bi andU) and iron-oxide-rich deposits and prospects. The formermineralisation type includes the deposits at NICO and Sue-Dianne (Fig. 1; Gandhi 1994; Goad et al. 2000; Corriveau2007) and the past-producing U–Ag mines at Echo Bay,Contact Lake and Terra (Fig. 1; Mumin et al. 2007, 2009)in addition to a number of prospects throughout the region(Gandhi 1994). The latter includes magnetite–apatite–actinolite veins and replacement zones that occur through-out the GBMZ (Hildebrand 1986; Reardon 1992; Gandhi1994; Norman and Mumin 2002; Corriveau et al. 2010;Mumin et al. 2009). Many of these mineralisation styles arenow considered part of the iron oxide copper–gold (IOCG)spectrum of mineral deposits (Hitzman et al. 1992; Gandhi1994; Goad et al. 2000; Corriveau 2007; Mumin et al.2007, 2009; Corriveau et al. 2010), and thus, the GBMZ isan attractive target area for IOCG exploration.
In other IOCG districts, such as the Olympic Dam orCloncurry regions of Australia, geochronology and fluidinclusion studies have significantly aided in unravelling the
mineralisation history (e.g. Williams et al. 2001; Bastrakovet al. 2008; Skirrow et al. 2007; Baker et al. 2008). In theGBMZ, the timing of magmatic events has been well-constrained (e.g. Bowring 1985; Gandhi et al. 2001;Bennett and Rivers 2006a). However, while some ageconstraints have been placed on uranium mineralisation inthe GBMZ (Miller 1982), the timing of the mineralisation
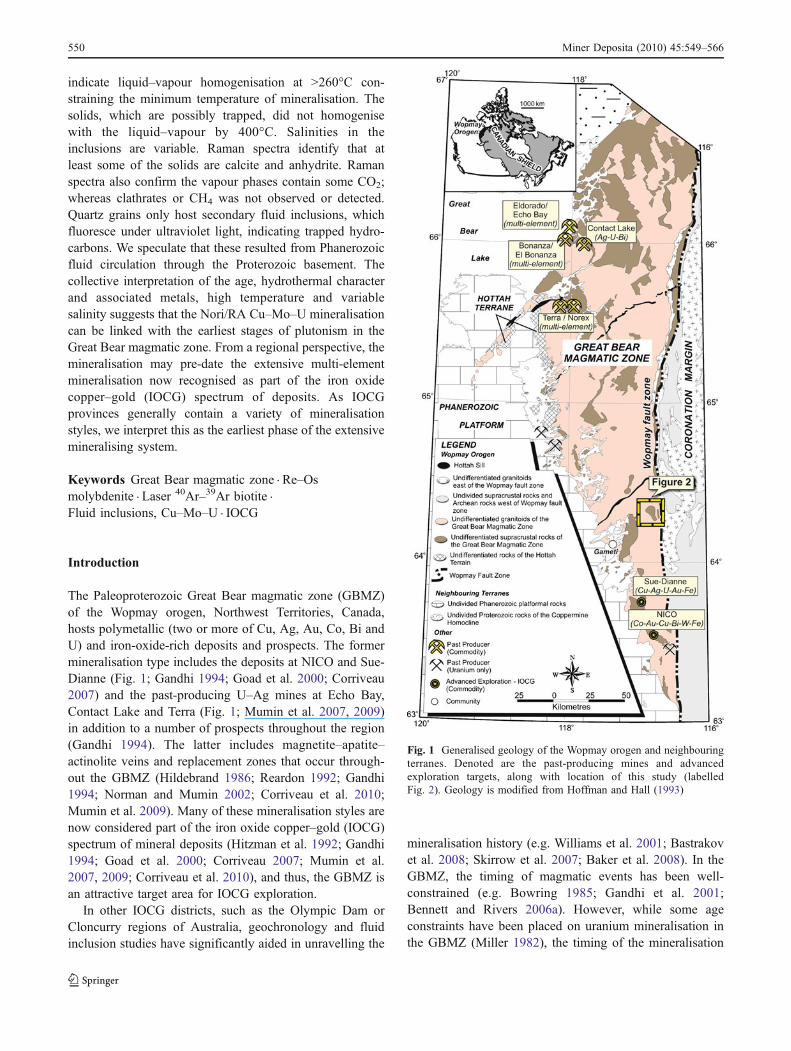
Fig. 1 Generalised geology of the Wopmay orogen and neighbouringterranes. Denoted are the past-producing mines and advancedexploration targets, along with location of this study (labelledFig. 2). Geology is modified from Hoffman and Hall (1993)
550 Miner Deposita (2010) 45:549–566

at most of the other mineral prospects and deposits ispoorly constrained (e.g. Goad et al. 2000; Gandhi et al.2001). Currently, there are only limited fluid inclusion datafrom five-element veins (Changkakoti et al. 1986) and late-stage uranium-hosting giant quartz veins (Gandhi et al.2000; Byron et al. 2009); work is continuing on samplesfrom the Port Radium-Echo Bay district (A. Somarin andA.H. Mumin, unpublished data).
The Nori/RA prospect at DeVries Lake is one of anumber of mineral occurrences in the central part of theGBMZ (Figs. 1 and 2; Gandhi and Prasad 1993; Gandhi1994; Ootes et al. 2008). As part of the South Wopmaybedrock mapping project (Jackson 2008), we re-investigated the geology and petrography of the Nori/RAprospect and report here the timing (non-uraninite) ofmineralisation in the GBMZ using Re–Os molybdeniteand 40Ar–39Ar biotite geochronology. We also reportpreliminary fluid inclusion microthermometric and Ramanspectroscopic data from tourmaline and quartz. Collective-ly, the data indicate that the Nori/RA prospect can be linkedwith the earliest recognised stages of plutonism in theGBMZ and may represent the first phase of the extensiveIOCG-type mineralisation.
Regional geology and mineral deposits
The Great Bear magmatic zone forms a central domain withinWopmay orogen (Fig. 1) and developed following a flip insubduction polarity from east to west dipping (Bowring andGrotzinger 1992) after collision of the Hottah terrane withthe Slave craton (Badham 1973; Hildebrand et al. 1987;Hoffman 1988; Bowring and Podosek 1989; Housh et al.1989; Bowring and Grotzinger 1992; Gandhi et al. 2001;Gandhi and van Breemen 2005). Age data and lithologicalconstraints indicate that there was an evolution from acontinental magmatic arc to a post-orogenic setting betweenabout 1,875 and 1,855 Ma (Hildebrand et al. 1987; Gandhiet al. 2001). The eastern limit of the GBMZ has beeninterpreted to approximately coincide with the Wopmay faultzone, a major north-trending sub-vertical crustal-scaledeformation corridor that may also delimit the westernextent of Archean rocks in the Wopmay orogen (Fig. 1;e.g. Bowring and Podosek 1989; Hildebrand and Bowring1990; Spratt et al. 2009). Remnants of the about 1,920-MaHottah arc and older Hottah terrane are preserved within thewestern part of the GBMZ (Bowring 1985; Bowring andPodosek 1989), where most exposures of these oldersequences are blanketed by a Paleozoic cover (Fig. 1).
The oldest identified rock unit within the southernGBMZ is the <1,885-Ma Treasure Lake Group metase-dimentary sequence (Gandhi and van Breemen 2005;Bennett and Rivers 2006b), interpreted to be part of theHottah terrane (Gandhi and van Breemen 2005). In the
type section, the metasedimentary sequence grades strati-graphically upward from metasiltstones, through calc-silicates, with quartzite marking the top. However, thebase of the section has nowhere been observed. Thedepositional setting of these metasedimentary rocksremains unknown due to their limited exposure and locallyextensive alteration. The metasedimentary rocks areunconformably overlain by about 1,872 to 1,866 MaFaber Group volcanic complexes (Gandhi et al. 2001;Gandhi and van Breemen 2005). The supracrustal sequenceis extensively intruded by 1,873±2 to 1,856 +2/−3 Mahypabyssal porphyries and granitoid plutons with a mode at1866 +3/−2 Ma (Gandhi et al. 2001; Bennett and Rivers2006a; V. Bennett, unpublished data). Other available agedata on volcanic and intrusive rocks from the northern partof the GBMZ indicate similar U–Pb zircon crystallisationages (Bowring 1985).
Most of the known mineral deposits and prospects inthe Wopmay orogen occur within the GBMZ (Fig. 1).These include polymetallic (Cu–Au±U, Ag, Co, Bi) andiron-oxide-rich sub-types with associated alteration sys-tems (Hildebrand 1986; Hitzman et al. 1992; Gandhi1994; Goad et al. 2000; Mumin et al. 2007, 2009;Corriveau et al. 2010) and later giant quartz vein-relateduranium mineralisation (e.g. Rayrock; Gandhi et al. 2000).The polymetallic sub-type includes the Au–Co–Bi-bearingNICO deposit (30.98 Mt at 0.91 g/t Au, 0.16% Bi, 0.12%Co proven and probable reserves) and the Cu–Ag–U–Au-bearing Sue-Dianne deposit in the south (Goad et al. 2000;Corriveau 2007). In the north, this sub-type includes thepast-producing U–Ag and five-element deposits at Eldor-ado, Echo Bay, Contact Lake and Terra mines (Fig. 1;Mumin et al. 2007, 2009). Many of these deposits are nowinterpreted to be part of a continuum in the IOCG class ofmineral deposit types (Gandhi 1994; Corriveau 2007;Mumin et al. 2007, 2009; Corriveau et al. 2010) and anumber of other, currently non-economic mineral pros-pects with similar attributes occur throughout the GBMZ(Gandhi 1994). Both the polymetallic and the iron oxide-rich types include magnetite–actinolite–apatite veins andreplacement zones and magnetite–hornblende–biotite–albite±K-feldspar, epidote stockworks and replacementveins that are proximal to and ubiquitous with the IOCG-like mineralisation (Hildebrand 1986; Reardon 1992;Gandhi 1994; Corriveau et al. 2010).
Currently, the timing of mineralisation is only con-strained by U–Pb zircon ages from plutonic bodies that hostor are interpreted to be related to the mineralisation (e.g.Goad et al. 2000; Gandhi et al. 2001; Mumin et al. 2007).The ore mineralisation at NICO and Sue-Dianne in thesouth is hosted in various rock types; however, thismineralisation is suggested to be related to quartz monzo-nite intrusions (Gandhi et al. 2001; Mumin et al. 2007). At
Miner Deposita (2010) 45:549–566 551

NICO, the quartz monzonite has a crystallisation age of1867 +1.6/−1.5 Ma, providing a maximum age formineralisation (Gandhi et al. 2001). Alternatively, at theFAB Cu–U prospect, mineralisation is interpreted to havebeen associated with the intrusion of 1856 +2/−3 Marapakivi granites (Gandhi 1988; Gandhi et al. 2001).
DeVries lake area
The geology of the DeVries Lake area in the southernWopmay orogen (Figs. 1 and 2) was described by Gandhi
and Prasad (1993), Gandhi (1994) and Jackson (2008). Theoldest exposed rocks are the >1,885 Ma, extensively alteredschists and gneisses of the Treasure Lake Group, which areprobably derived from siltstone to wacke protoliths (Fig. 2;Gandhi and van Breemen 2005; Bennett and Rivers 2006b;Landry 2006; Jackson 2008). These metasedimentary rockswere altered prior to deformation and metamorphism,commonly occurring as moderate to extensive lit-par-litmagnetite replacement of the groundmass. At some localitiesat DeVries Lake, this alteration is so pervasive that it rendersprimary sedimentary structures unidentifiable (Landry 2006;
Fig. 2 a Geology of the DeVries Lake area in the southernWopmay orogen showing the location of the Nori/RA prospect andother mineralised zones. Geology is modified from Gandhi andPrasad (1993) and Jackson (2008). b Outcrop map of the Nori/RAprospect depicting location of trenches and drill collar locations. Thefocus of this study was Trench 101, although the authors have
investigated the other trenches. Map modified after Gandhi andPrasad (1993). c Map of vertical face in Trench 101 depicting theinterrelationship between veining and host sedimentary rocks. Alsoshown are sample locations and age dating results along withlocations of photographs in Fig. 3c and d
552 Miner Deposita (2010) 45:549–566

Jackson 2008; Corriveau et al. 2010). Deformation of thealtered metasedimentary rocks is preserved throughout thearea as folds, foliations and lineations, but the relationship ofthis deformation to the adjacent Wopmay fault zone (Fig. 1)has not been reconciled.
Overlying the sedimentary rocks are variably hydrother-mally altered felsic to intermediate pyroclastic metavolcanicrocks and related subvolcanic porphyries (Fig. 2; Gandhiand Prasad 1993; Jackson 2008). The relationship betweenthe metasedimentary and overlying volcano-plutonic rocksis interpreted as unconformable, as the volcanic-relatedporphyries cross-cut the metasedimentary rocks. However,such an unconformity was not observed during mapping(Jackson 2008). Locally extensive alteration of the porphy-ries and associated metavolcanic rocks occurs as magnetite,biotite or amphibole replacement of volcanic clasts. Inaddition to the replacement alteration are what appear to behydrothermal channels that, in some localities, leave theserocks with an alternating pink-white, centimetre to metrescale striped appearance (Jackson 2008). Petrographicinterpretations and geochemical data (L. Ootes and V.A.Jackson, unpublished data) indicate that the white stripesare zones of extensive hydrothermal alteration and albitisa-tion where elements may have been removed, and the pinkstripes preserve close to primary textures and compositions.There are also magnetite–actinolite±apatite veins through-out these subvolcanic and metavolcanic porphyries. It iscurrently unclear whether the alteration in metasedimentaryrocks and the metavolcanic rocks occurred concomitantlyprior to deformation and metamorphism.
Regional-scale plutons, termed the Marion River Bath-olith (Gandhi et al. 2001), and include about 1,865 Maequigranular to seriate granite to monzonite intrude theDeVries supracrustal sequence throughout the southern andwestern part of the DeVries Lake area (Fig. 2; Bennett andRivers 2006a; Jackson 2008). These plutons are unde-formed, except adjacent to the Wopmay fault zone (Fig. 1).An about 1,860-Ma K-feldspar porphyritic to rapakivi-textured granitic pluton occurs north of DeVries Lake(Fig. 2; Bennett and Rivers 2006a; Jackson 2008). Locally,emplacement of this pluton was controlled by regional-scale fold patterns, and some intrusive contacts are nearlyhorizontal where the granite overlies the sedimentary rocks.Field observations indicate both intrusions post-date themetasedimentary-hosted hydrothermal mineralising systemdiscussed in this study.
Nori/RA Cu–Mo–U
The Nori/RA Cu–Mo–U prospect (+REE, W) sits withindeformed and extensively altered Treasure Lake Groupmetasedimentary rocks in the northwestern part of theDeVries Lake area (Figs. 1 and 2), approximately 1.5 km
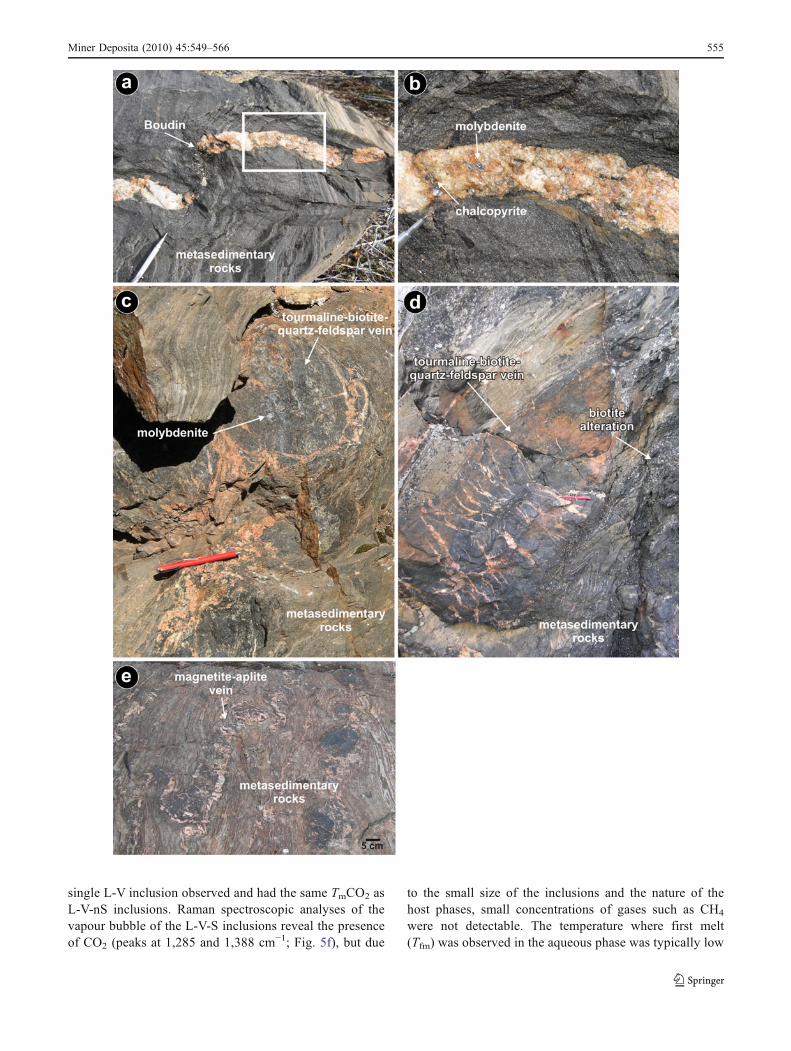
from the intrusive contact of an about 1865-Ma K-feldsparporphyritic granite (Fig. 2). These metasedimentary rocksunderwent extensive lit-par-lit magnetite alteration, provid-ing a regional magnetic anomaly, and variable potassicalteration (biotite). Primary bedding features are locallypreserved at the Nori/RA prospect, and the altered metasedi-mentary rocks are cut by 10 cm to 1 m wide tourmaline-biotite-quartz-K-feldspar veins. Biotite-rich vein alterationselvages envelopes range from millimetre to 2 cm thick(Fig. 3a–d) and overprint the previous lit-par-lit alteration.The veins cut bedding and are folded, with a shallow north-plunging fold axis and gently dipping axial traces (Fig. 2c).Commonly, the quartz and K-feldspar in tourmaline-richveins form tension-gash-like segregations (Figs. 2c and 3cand d), possibly indicating early to syn-deformationalemplacement of the veins. Notably, the associated biotitealteration envelopes are thickest in the fold hinges of theveins (Figs. 2c and 3a–d). Field observations around theprospect and thin section observations from the mineralisedveins indicate that the veins and host rock were not subjectedto significant deformation after crystallisation of the veins.Elsewhere at DeVries Lake, compositionally and structurallysimilar veins, albeit enriched in magnetite rather thantourmaline and lacking mineralisation, cross-cut alteredbedding and are deformed along with the extensively alteredmetasedimentary rocks (Fig. 3e).
The mineralisation at Nori/RA was first identified byprospecting and ground scintillometer investigations;Thorpe (1972) (p. 68–72) and Gandhi and Prasad (1993)provide historical accounts and selected assay results,including indications of light REE and tungsten concen-trations associated with Cu–Mo–U mineralisation. Nori/RAwas also part of a U–Pb uraninite and Pb–Pb sulphide studyby Miller (1982), who suggested that the molybdenite anduraninite were detrital in origin. Gandhi and Prasad (1993)and Gandhi (1994) documented the geology of the DeVriesLake area, and their subsequent reinvestigation of the Nori/RA prospect concluded that the prospect is likely hydro-thermal or intrusive in origin.
Our study focusses on mineral exploration ‘Trench 101′(Fig. 2). All of the mineralised veins at the prospect aresimilar in size (2–50 cm thick), composition and mineral-isation to those in Trench 101 (Fig. 2b and c), and thistrench provides the best exposure of the mineralised veinsand their relationship to the host metasedimentary rocks(Fig. 3c and d; see also Gandhi and Prasad 1993). Bothtypes of veins contain disseminated molybdenite and, locally,minor chalcopyrite (Figs. 2c, 3 and 4). Uraninite is not visiblein outcrop, but its presence is indicated by elevatedscintillometer counts. A thickened biotite selvage characterisesthe nose of a folded tourmaline-rich vein (Figs. 2c and 3d).
The mineralised veins and the associated hydrothermalbiotite alteration assemblage were sampled (Figs. 2c and 3a
Miner Deposita (2010) 45:549–566 553
and d) in order to (1) examine the petrographic relation-ships of silicate, sulphide and oxide minerals, (2) determinethe timing of mineralisation by the Re–Os molybdenitechronometer (e.g. Stein et al. 1998, 2001) and vein-relatedbiotite alteration by 40Ar–39Ar biotite thermochronologyand (3) assess the evolution of the mineralising system byinvestigating fluid inclusions in tourmaline and quartz. Theanalytical techniques are described in Appendix.
Results
Petrography and mineralogy
Outcrop, hand sample and petrographic observations fromthe Nori/RA Cu–Mo–U-bearing veins indicate that theyprimarily consist of tourmaline and biotite with lesserquartz and K-feldspar (Figs. 3 and 4). Petrographicinvestigations were primarily focussed on mineralised veinsamples. Observations indicate that molybdenite, uraniniteand chalcopyrite, along with lesser pyrite and magnetite,are locally intergrown with tourmaline, generally at grainboundaries or within growth zones (Fig. 4). The presence ofuraninite was easily identified microscopically due to thepresence of brown subspherical metamict halos around thegrains, a result of radiation damage from uranium decay(Fig. 4); uraninite was confirmed by electron microprobeanalyses. The intimate intergrowth of molybdenite anduraninite with the tourmaline and biotite is interpreted toindicate synchronous crystallisation of the silicate, sulphideand oxide minerals (Figs. 3 and 4).
Growth zoning in the tourmaline is complex (Fig. 4;Table 1), and we tested the chemical variability of atourmaline core and rim by an electron microprobeanalytical transect (Table 1). The results indicate that thebulk of the crystals are dravitic in composition [Na2O (∼1.5to 2 wt.%), Al2O3 (26.4–30 wt.%), MgO (7.6–8.8 wt.%)and FeO (9.1–11.9 wt.%); Table 1]. These dravitic rimscommonly occur as thick overgrowths on ferri-foitite cores[higher MgO (∼16 wt.%) and FeO (∼15 wt.%), relativelylow Al2O3 (15 wt.%) and no detectable Na2O; Table 1].These predominantly dravitic tourmalines contain abundantfluid inclusions (Figs. 4 and 5), and as the uraninite andmolybdenite are intimately intergrown with the tourmaline,these inclusions can provide a record of the thermochemicalconditions during mineralisation.
Fluid inclusions
Dravite-hosted fluid inclusions
There are several types of fluid inclusions present in thetourmaline. Primary fluid inclusions, trapped in growth
zones, are common (Fig. 5), although secondary inclu-sions trapped in trails have also been observed. The bulkof the fluid inclusions are <15 μm in diameter, areeuhedral to subhedral in shape and have consistent degreesof fill (Fig. 5a–d). However, some grains contain verylarge fluid inclusions (>60 μm maximum dimension),rarely surrounded by smaller inclusions with variabledegrees of fill and/or that have fractures radiating fromthem, suggesting that they have undergone post-entrapment modification. Homogenisation temperatureswere not measured on these inclusions. The primary fluidinclusions trapped in the dravite are mostly liquid–vapour–solid (L-V-S; Fig. 5d) inclusions that contain atleast one solid phase at room temperature. In the largerinclusions, up to four solids phases can be observed (L-V-nS). Liquid–vapour inclusions are also present (Fig. 5c),although because of the colour of the host tourmaline andthe irregular surfaces of many inclusions (Fig. 5a-c), thepresence of additional small solids cannot be ruled out.Halite is rare in the inclusions, and its presence wasindicated by a reaction to form hydrohalite upon freezing.Calcite and anhydrite have been identified using Ramanspectroscopy (Fig. 5d–e); calcite is indicated by a strongpeak at 1086±1 cm−1 and anhydrite by peaks at 1,018,415 and 1,129 cm−1 (Fig. 5e). Other unidentified solids,including opaque phases, are present. In general, solid toliquid phase ratios are variable, possibly indicating thatmany of these solids are accidentally trapped.
When cooled to −130°C and subsequently heated, thebulk of the L-V-nS inclusions showed freezing of theaqueous phase only. Formation of solid CO2 was notobserved, except in a small number of very largeinclusions. This may be due, in part, to the small size ofmany inclusions and the colour of the host tourmaline. Ingeneral, the CO2 in the large inclusions melted (TmCO2) at−57°C to −58°C, below the −56.6°C melting point of pureCO2 (Table 2). The formation of solid CO2 occurred in the
Fig. 3 a Outcrop photograph of boudinaged quartz-feldspar veincutting Treasure Lake Group sedimentary rocks near explorationTrench 102 (Fig. 2b). White rectangle outlines b. b Photograph ofquartz-feldspar vein with intergrown molybdenite and chalcopyrite.Scribe is 13 cm long. c Outcrop photograph in Trench 101 oftourmaline-biotite vein with quartz-feldspar segregations and abundantintergrown molybdenite mineralisation. Location of this photograph ison Fig. 2c. d Outcrop photograph in Trench 101 of tourmaline-biotitevein with quartz-feldspar segregations. Note that the segregationsappear to be tension-gash-like. The veins intruded and were laterdeformed along with Treasure Lake Group metasedimentary rocks(folds in metasedimentary rocks are preserved as seen in lower centralpart of photograph). The location of this photograph is on Fig. 2c. Penmagnet is 12.5 cm long. e Outcrop photograph of folded andboudinaged magnetite-quartz-feldspar vein intruding Treasure LakeGroup metasedimentary rocks. This location is on the south shore ofthe northwest arm of DeVries Lake
�
554 Miner Deposita (2010) 45:549–566
single L-V inclusion observed and had the same TmCO2 asL-V-nS inclusions. Raman spectroscopic analyses of thevapour bubble of the L-V-S inclusions reveal the presenceof CO2 (peaks at 1,285 and 1,388 cm−1; Fig. 5f), but due
to the small size of the inclusions and the nature of thehost phases, small concentrations of gases such as CH4
were not detectable. The temperature where first melt(Tfm) was observed in the aqueous phase was typically low
Miner Deposita (2010) 45:549–566 555

and in the range of −55°C to −43°C (Table 2). This phasechange is consistent with the presence of divalent saltssuch as CaCl2. Although significant time was spent tryingto nucleate clathrate, none was observed in any of theinclusions. Liquid–vapour homogenisation (ThL-V) oc-curred at temperatures between 196°C and 380°C, with themode at approximately 260°C (Table 2). All of theinclusions homogenised to the liquid phase, and L-Vhomogenisation occurred before any visible dissolutionof the solid phases. All the solid phases persisted totemperatures in excess of 400°C, and further micro-
thermometry on a high-temperature stage would benecessary to establish if the inclusions will completelyhomogenise.
Quartz-hosted inclusions
Primary inclusions were not observed in quartz. Fluidinclusions occur along annealed fractures that eitherterminate at grain boundaries or cross-cut grain boundaries(secondary inclusions). In quartz, three types of inclusionswere observed: (1) L-V-S inclusions that contain small
Fig. 4 a Photomicrograph of intimately intergrown tourmaline, biotiteand opaque minerals consisting of uraninite, molybdenite and lesscommon pyrite and magnetite. Note the common occurrence ofuraninite in growth zones of tourmaline. Cross-polarised light. bPhotomicrograph of uraninite in growth zone of tourmaline withmetamict halos around the uraninite grains. Cross-polarised light. cPlane-polarised reflected light photomicrograph of intergrown urani-
nite and molybdenite. d Backscattered electron image of uraninite intourmaline with light bulb-shaped metamict halo around the uraninite.e X-ray map highlighting uranium (yellow, red and blue) in uraninitegrains that are intergrown in tourmaline (black). Vein-like feature inthe upper left of the image is mobilised uranium. Ascending colourramp indicates increasing uranium. Tur tourmaline, Bt biotite, Ururaninite, Mo molybdenite, Qtz quartz
556 Miner Deposita (2010) 45:549–566

halite cubes, (2) inclusions with only a vapour phase and (3)a rare assemblage of two-phase (L-V) inclusions.
There was no evidence for the presence of CO2 in theL-V-S secondary inclusions. Upon heating these inclu-sions, L-V homogenisation occurred first, in the range128–154°C, followed by halite dissolution at temperaturesof 174–194°C (Table 2) corresponding to salinities ofapproximately 31 wt.% NaCl equivalent (Sterner et al.1988). The vapour-rich inclusions had no observablephase changes at low temperatures and showed no changeup to 400°C (Table 2). Under ultraviolet illumination,these inclusions can be seen to be two phase, with avolumetrically dominant non-fluorescent vapour phaseand a rim of green-fluorescent liquid (Fig. 5g).
Geochronology
The molybdenite intergrown in the groundmass of thetourmaline-rich veins yield Re–Os model ages of 1,874.4±8.7 Ma (06ns2145′A′) and 1872.4±8.8 Ma (06ns2145′B′;Table 3; ages are reported at 2σ uncertainty and include0.31% uncertainty in the decay constant). The twomolybdenite-bearing samples were collected from adjacentveins, and the two Re–Os model ages are identical withinanalytical uncertainty. Therefore, the two ages can becombined to yield a weighted average model age (WAMA)of 1,873.4±6.1 Ma.
The 40Ar–39Ar step heating of the fresh alteration zonebiotite (06ns2145′C′; Figs. 2c and 3d) yields an age
spectrum beginning at just over 1 Ga, then rising to fraction8 at ∼1,850 Ma (Fig. 6; Table 4). The spectrum then dropsto an irregular plateau, culminating in fractions 12–14, with28.7% of the total 39Ar tightly grouped at 1,807±3 Ma(MSWD=0.03; Fig. 6). This is followed by a rise to a high-temperature plateau, with 40.5% of the 39Ar, at 1,875±8 Ma (MSWD=3.8; Fig. 6). The Ca/K ratios of the twoplateaux slightly differ but are consistent with only biotitebeing analysed (Table 4). Neither of these plateauxrepresent more than 50% of the Ar released during stepheating, possibly indicating excess Ar in the biotite, Ar lossat some younger stage (McDougall and Harrison 1999) orpossibly two distinctly preserved ages (e.g. York andMartinez 1986). The best maximum age estimate forcooling of the biotite sample below approximately 350°C(e.g. McDougall and Harrison 1999) is interpreted to beindicated by the higher temperature plateau at 1,875±8 Ma(2σ; Fig. 6), which is identical within uncertainty to the Re–Os molybdenite ages and a previously derived U–Pb zirconage from an aplite dyke in the DeVries Lake area (Fig. 7).
Discussion
Fluids and metal source
The hydrothermal fluids responsible for tourmaline andCu–Mo–U mineralisation (Figs. 3, 4 and 5) were CO2-bearing, calcic brines (Table 2) with variable salinities.
Table 1 Representative results of electron microprobe analyses of tourmaline in sample 06ns2145′B′, Nori/RA
aMg-ferri-foitite and ferri-foitite core (n=7) aDravite rim (n=35)
Weightpercent
Maximum Minimum Average Standarddeviation
Weightpercent
Maximum Minimum Average Standarddeviation
SiO2 40.02 39.42 39.66 0.24 SiO2 36.70 35.59 36.22 0.30
Al2O3 15.42 15.01 15.22 0.15 Al2O3 29.67 25.98 27.43 0.92
FeO 16.29 15.61 15.88 0.22 FeO 12.55 9.14 10.93 0.78
MnO 0.08 0.02 0.05 0.02 MnO 0.05 nd 0.02 0.02
MgO 16.14 15.62 15.99 0.17 MgO 8.84 7.59 8.11 0.27
CaO 0.02 nd nd 0.01 CaO 2.50 0.65 1.67 0.44
Na2O 0.11 0.07 0.09 0.01 Na2O 2.57 1.55 1.98 0.24
UO2 nd nd nd nd UO2 nd nd nd nd
Cr2O3 0.06 nd 0.02 0.02 Cr2O3 0.08 nd 0.03 0.02
V2O3 0.06 0.04 0.05 0.01 V2O3 0.17 0.03 0.08 0.04
F 0.05 nd nd nd F nd nd nd nd
Cl 0.11 0.06 0.09 nd Cl nd nd nd nd
Total 87.31 86.87 87.08 0.15 Total 87.16 85.04 86.48 0.45
Individual data points were collected in 10 μm spaced transect, beginning in the core of a grain similar to that in Fig. 5a
nd not detecteda Name determined using the program of Yavuz et al. (2002)
Miner Deposita (2010) 45:549–566 557

The complex chemistry of these inclusions and the factthat L-V homogenisation occurs before solid dissolutionrenders isochore modelling difficult. However, the L-Vhomogenisation temperatures can be taken as minimumtrapping temperatures for tourmaline and suggests that
the minerals grew at temperatures greater than 260°C(Table 2).
Similar multi-solid-bearing inclusions have been docu-mented from areas of IOCG mineralisation, such as theAustralian Cloncurry district, including the Osborne, Starra
Fig. 5 a Photomicrograph of primary fluid inclusions in growth zonesof dravitic tourmaline. Opaque mineral at centre left of thephotomicrograph is likely molybdenite. b Photomicrograph of primaryfluid inclusions and mineral inclusions in tourmaline. Mineral inupper right with white halo is likely uraninite. c Photomicrograph ofprimary L-V inclusions in tourmaline. Growth zones in tourmaline areevident along the bottom of the photomicrograph. d Liquid–vapour–solid (L-V-S) bearing primary fluid inclusion in tourmaline. e Ramanspectrum of host tourmaline along with anhydrite and calcite solids
(labelled peaks) in L-V-S inclusions. f Raman spectrum of a vapourbubble in a L-V-S inclusion. The broad peak on the left corresponds tothe host tourmaline and the two sharp peaks correspond to CO2. gPhotomicrograph of hydrocarbon-bearing secondary fluid inclusion inquartz under mixed ultraviolet and transmitted light. Note that thefluorescence is around the edge, indicating the presence of a liquidphase that is wetting the inclusion walls and which contains thehydrocarbons causing the fluorescence illumination. Tur tourmaline,Bt biotite, Qtz quartz, L liquid, V vapour, Anh anhydrite, Cal calcite
558 Miner Deposita (2010) 45:549–566

Table 2 Fluid inclusion data from sample 06ns2145′B′, Nori/RA
Mineral Flinc number Age DOF Type TmCO2 Tfm Th (L-V) Thtotal Comments
Tourmaline 1 P 0.6 LVS n.o. n.o. 240 >400
2 P 0.6 LVS n.o. −47 277 >400
3 P 0.8 LV −57 −55 282 >400
Quartz 4 PS or Sec 0.9 LVS n.o. n.m. 197 >400
5 PS or Sec 0.9 LVS n.o. n.m. 196 >400
6 PS or Sec 0.9 LVS n.o. n.m. n.o. n.o.
7 PS or Sed 0.9 LVS n.o. n.m. 216 >400
8 PS 0.9 LVS n.o. n.m. 128 186.4
9 PS 0.9 LVS n.o. n.m. 142 173.5
10 PS 0.9 LVS n.o. n.m. 140 n.o.
11 PS 0.9 LVS n.o. n.m. 151 185.3
12 PS 0.9 LVS n.o. n.m. 152 194.1
13 PS 0.9 LVS n.o. n.m. 154 180.2
Tourmaline 14 P 0.6 LVS n.o. n.m. 297 >400
15 P 0.6 LVS n.o. n.m. 296 >400
15a PS 0.7 LVnS n.o. n.m. 329 >400
16 PS 0.5 LVS n.o. n.m. 321 >400
17 P 0.5 LVS n.o. n.m. 268 >400
18 P 0.5 LVS n.o. n.m. 261 >400
19 P 0.4 LVS n.o. n.m. 268 >400
20 P 0.5 LVS n.o. n.m. 262 >400
21 P 0.6 LVnS n.o. n.m. 318 >400 Opaque phase
22 PS 0.6 LVS n.o. n.m. 322 >400
23 P 0.6 LVnS n.o. −52 368 >400
24 P 0.6 LVnS n.o. −52 368 >400 4 solids,one opaque
25 P 0.6 LVnS n.o. −52 370 >400
26 P 0.6 LVnS n.o. −52 355 >400
27 P 0.35 LVS n.o. n.m. 332 >400
28 P 0.35 LVS n.o. n.m. 330 >400
29 P 0.35 LVS n.o. n.m. 325 >400
30 P 0.4 LV n.o. −54 277 >400
31 P 0.5 LVS n.o. −53 253 >400
32 P 0.5 LVS n.o. n.o. 274 >400
33 P 0.5 LVS n.o. n.o. 244 >400
34 P 0.5 LVS n.o. n.o. n.o. n.o.
35 P 0.5 LVS n.o. n.o. 253 >400
36 P 0.5 LVS n.o. n.o. 275 >400
Quartz 37 PS 0 V n.o. n.o. n.o.
38 PS 0 V n.o. n.o. n.o.
39 P 0.6 LVnS −57.4 −43 328 >400
40 P 0.4 LVnS −58.5 −48 380
41 P 0.6 LVnS −58.2 −48 >400 >400 necked
Tclath and ThCO2 were not observed in any of the analyses
P primary, Sec secondary, PS pseudosecondary, DOF degree of fill, L liquid, V vapour, S solid, n.o. not observed, n.m. not measured.
Miner Deposita (2010) 45:549–566 559

and Earnest Henry mines (Williams et al. 2001; Fu et al.2003) and from early copper-rich fluids in the OlympicDam district (Bastrakov et al. 2008). In the Cloncurrydistrict, several studies have described the presence of L-V-nS inclusions, which show no observable phase changes oncooling (Williams et al. 2001), similar to many of the Nori/RA inclusions. The inclusions documented by Williams etal. (2001) and Fu et al. (2003) contain halite, calcite,ferropyrosmalite and uncommon magnetite, most of whichhomogenise at temperatures between 400 and 550°C.Calcite, barite and hematite have been reported in inclu-sions in the Pea Ridge deposit, Missouri (Song 2002;Samson et al. 2002).
Unlike the studies of Williams et al. (2001) and Fu et al.(2003), abundant vapour-rich (CO2, CH4 and H2O) inclu-sions were not observed in this study, although some of theinclusions do contain minor CO2. Only in one instance wasan L-V inclusion found co-existing with a brine inclusion.This may indicate that phase separation or boiling did notoccur, or occurred rarely, at the Nori/RA level of themineralising system or alternatively that an exsolvedvapour phase was not preserved.
Utilising halogen and Cu concentrations in fluid inclu-sions, Kendrik et al. (2007) and Baker et al. (2008) suggestthat mixing of magmatic and evaporite-derived fluidsresulted in economic Cu mineralisation in the Cloncurrydistrict of Australia. Also in the Cloncurry district, Fisherand Kendrick (2008) analysed halogens and noble gases influid inclusions and suggested that mixing between meta-morphic fluids and formation waters from an evaporite-bearing sedimentary sequence resulted in ore mineralisationat the Osborne IOCG deposit. Derivation of fluids from anevaporite-bearing source has also been suggested to explainthe hypersaline nature of fluid inclusions and used toexplain boron isotope compositions in tourmaline at theIgarapé Bahia Cu–Au deposit in Brazil (Dreher et al. 2008;Xavier et al. 2008).
Mixing of a boron-enriched sedimentary-derived fluidwith a metal-enriched hydrothermal fluid is a likelyexplanation of the abundance of tourmaline and intergrownmolybdenite, uraninite and chalcopyrite at Nori/RA. Analternative remains that the boron and metal enrichment
was derived from direct precipitation from a relativelyunmodified magmatic-derived hydrothermal fluid. In such ascenario, boron prefers the vapour phase (Williams-Jonesand Heinrich 2005); therefore, it is possible that such a fluidphase escaped from the source carrying boron and metals(cf. Samson and Sinclair 1992) and that neither fluidmixing nor boiling may be required to explain the boronor metal enrichment (cf. Samson and Sinclair 1992). Asmany of the mineral deposits and prospects in the GBMZhave associated tourmaline (Mumin et al. 2007, 2009),further fluid inclusion and isotopic investigations couldhelp resolve the evolution of the mineralising fluids.
The L-V-S inclusions in quartz are trapped insecondary trails and appear to record a lower temperatureevent that involved a fluid with a salinity of approxi-mately 31 wt.% NaCl equivalent. The vapour-richinclusions found in the quartz showed no observablephase changes at temperatures between 120°C and 400°C.However, their fluorescence under ultraviolet light(Fig. 5g) suggests that they contain complex hydro-carbons. The flat-lying Phanerozoic platform is now onlypresent in the western part of the GBMZ (Fig. 1), but priorto Laurentide glaciations, it likely covered the GBMZ inits entirety. Our best interpretation of these inclusion-hosted hydrocarbons is that they are a result of a fluid flowevent related to a once overlying Phanerozoic sedimentarybasin (i.e. Cambrian to Devonian, or possibly younger).The hydrocarbons in these inclusions indicate that Phan-erozoic fluids circulated through the Proterozoic basement(e.g. Gleeson et al. 2003). It is unlikely that this low-temperature event affected the Ar in the biotite (above),but this cannot be entirely ruled out.
Timing of mineralisation
The 1,874.4±8.7 and 1,872.4±8.8 Ma Re–Os molybdeniteages represent the first reliable, direct age determination forsulphide mineralisation in the GBMZ. This is, identicalwithin uncertainty to the 40Ar–39Ar plateau at 1,875±8 Ma,the best maximum age estimate for cooling of the biotitesample below approximately 350°C. As our Re–Osmolybdenite ages are the first sulphide age data for
Table 3 Results of Re–Os analysis of molybdenite from Nori/RA
Sample Sampleweight (g)
Re (ppm) ±2σ absolute 187Os ppb ±2σ absolute Total commonOs (pg)
Modelage
±2σ absolutea WAMA
06 ns2145′A′ 0.03128 104.49 0.37 2,083 3 0.56 1,874.4 8.7 1,873.4±6.106 ns2145′B′ 0.02107 186.18 0.72 3,708 8 8.70 1,872.4 8.8
Coordinates: 7,136,578 mN, 509,100 mE (UTM Zone 11, NAD 83)
WAMA weighted average model agea Includes 0.31% uncertainty in decay constant
560 Miner Deposita (2010) 45:549–566

mineralisation in the GBMZ, it is currently difficult tocompare the timing of mineralisation to other deposits. Thisis compounded by the relatively high frequency andvariability of magmatism and mineralisation recorded in
the GBMZ (Fig. 7; Bowring 1985; Gandhi et al. 2001;Bennett and Rivers 2006a; Mumin et al. 2007, 2009;Jackson 2008). In this study, we do not have supportinggeochronological information for the 40Ar–39Ar plateau atabout 1807 Ma, as the isotope systematics in molybdenitehave been shown to be resistant to any effects of resettingby younger episodes of thermal overprinting (Stein et al.2001). We can speculate that the about 1,807 Ma age maybe related to isotopic resetting or growth of a second biotitegeneration, potentially during movement on the adjacentWopmay fault zone (Fig. 1).
Gandhi and van Breemen (2005) and Bennett and Rivers(2006b) reported maximum depositional ages of 1886±8 and 1884±6 Ma, respectively, for the Treasure LakeGroup metasedimentary rocks (Fig. 7). Bennett and Rivers(2006a) showed that an aplitic dyke that intruded theextensively altered metasedimentary rocks and interpretedas synchronous with deformation and cross-cutting previ-ous lit-par-lit alteration has a U-Pb zircon age of 1875±7 Ma, which is indistinguishable from our Re–Os molyb-denite ages and our interpreted 40Ar–39Ar biotite age(Fig. 7). The Cu–Mo–U mineralisation at Nori/RA formedsoon after deposition and metamorphism of the TreasureLake Group metasedimentary rocks. As the depositional
Number Cum 39K Age (Ma) 40Ara/39K 40Ar/36Ar 37Ca/39K
1 0.0024 1,055±28 72.24±2.57 344±2 0.0652±0.0178
2 0.0035 1,107±18 76.99±1.71 482±6 0.0248±0.0254
3 0.0044 1,354±12 101.71±1.29 791±13 0.0124±0.0286
4 0.0045 1,478±55 115.42±6.32 778±60 0.3301±0.1026
5 0.0058 1,509±9 118.94±1.00 1,144±21 0.0880±0.0156
6 0.0094 1,518±4 119.96±0.44 2,406±29 0.0184±0.0055
7 0.0235 1,817±4 157.97±0.50 6,331±261 0.0193±0.0043
8 0.0368 1,846±6 162.10±0.89 9,029±677 0.0168±0.0059
9 0.1469 1,760±4 150.30±0.55 12,900±147 0.0162±0.0013
10 0.2419 1,803±14 156.15±1.93 76,690±5,420 0.0096±0.0007
11 0.3088 1,837±3 160.75±0.40 55,010±2,590 0.0048±0.0007
12 0.4035 1,806±2 156.56±0.29 136,000±34,200 0.0017±0.0008
13 0.4957 1,807±2 156.64±0.32 64,650±8980 0.0083±0.0008
14 0.5953 1,806±5 156.47±0.67 26,030±938 0.0295±0.0023
15 0.6205 1,882±3 167.18±0.44 48,120±9,770 0.0007±0.0027
16 0.6614 1,869±3 165.37±0.44 43,970±6,470 0.0176±0.0027
17 0.7221 1,869±4 165.32±0.63 60,120±3,690 0.0249±0.0011
18 0.7926 1,868±2 165.21±0.30 130,000±36,800 0.0166±0.0014
19 0.8365 1,874±3 166.04±0.39 68,340±16,800 0.0127±0.0017
20 0.8664 1,877±4 166.50±0.51 74,280±28,670 0.0208±0.0048
21 0.9084 1,879±4 166.75±0.51 79,320±18,640 0.0271±0.0022
22 0.9465 1,880±3 166.80±0.46 191,800±137,000 0.0151±0.0017
23 1 1,880±2 166.90±0.30 −992,000±1,870,000 0.0108±0.0014
Table 4 Results of 40Ar–39Aranalysis of biotite from sample06ns2145′C′, Nori/RA
All errors are ±1σ. 40 Ara isradiogenic. 40 Ar 39 K is K-derived. 39 Ar 37 Ca is Ca-derived37 Ar. Sample coordinates:7,136,578 mN, 509,100 mE (UTMZone 11, NAD 83)
Fig. 6 40Ar–39Ar analytical results from biotite in alteration assem-blage at Nori/RA, Trench 101. The best estimate of the age of thesample is 1,875±8 Ma (2σ). See text for discussion
Miner Deposita (2010) 45:549–566 561

setting remains unclear (e.g., back-arc, fore-arc), it remainsdifficult to place this mineralising system into a regionaltectonic framework, other than to suggest that depositionwas quickly followed by burial, lit-par-lit alteration,metamorphism and deformation and hydrothermal veiningwith associated metals, coincident with the onset ofvolcanism and plutonism (Fig. 7).
Miller (1982) provided a U–Pb upper intercept age of1,853±19 Ma for Nori/RA uraninite and also a three-deposit composite age of 1,872±8 Ma using U–Pb inuraninite (Fig. 7). Although this latter result is similar to theages reported in this study, the validity of Miller’sinterpretation is unclear due to his grouping of data frompotentially unrelated mineralising systems. Miller (1982)also provides a 207Pb–206Pb pyrite age of 1,836±32 Ma,which is younger than our geochronological data. Otherregionally significant geochronological evidence, summar-ised in Fig. 7, shows that the majority of known granitoidsin the southern GBMZ post-dated the veining, mineralisa-tion and associated alteration at Nori/RA; field observationsare consistent with this suggestion, but it is noted that thereis a slight overlap in the analytical uncertainties. Thepossible exceptions are the Na-enriched pluton(s) discussedby Gandhi et al. (2001) and perhaps the hydrothermallyaltered metavolcano-plutonic rocks that post-date thesedimentary rocks at DeVries Lake (Fig. 7; Jackson 2008).
Goad et al. (2000) and Mumin et al. (2007, 2009)directly link mineralisation to volcanism and related
plutonism, which clearly post-date deposition of theTreasure Lake Group metasedimentary rocks. Given theage data of Gandhi et al. (2001) and the relationshipsbetween mineralisation and host rocks (Goad et al. 2000;Mumin et al. 2007, 2009), it appears that much of theIOCG mineralisation formed at, or slightly after about1870 Ma to about 1855 Ma (e.g. Sue-Dianne; Fig. 7;Gandhi 1988, 1994; Gandhi et al. 2001). Overall, itappears that the main stage of IOCG-associated mineral-isation was related to volcanism and plutonism that maybe younger than our age estimate of about 1875 Ma formineralisation at Nori/RA, although ages including uncer-tainties do overlap.
The overlying metavolcanic rocks in the DeVriesLake area have an interpreted crystallisation age ofabout 1,872 Ma (Fig. 7; V. Bennett, V. Jackson and S.Bowring unpublished data). These rocks have localsodic, potassic and iron replacement-style alteration,host magnetite-actinolite-apatite veins and contain localmagnetite alteration with superimposed uranium miner-alisation (Gandhi and Prasad 1993; Gandhi 1994;Jackson 2008). These metavolcanic rocks also share asimilar, shallowly north-plunging stretching lineationwith the metasedimentary rocks. Therefore, it remainspossible that the hydrothermal veining and mineralisa-tion recorded at the Nori/RA prospect occurred duringthe development and emplacement of the overlyingvolcanic rocks.
Fig. 7 Time comparison of events with chronological control in thesouthern GBMZ. Only relevant U-Pb zircon age data on volcano-plutonic phases is shown and is derived from Gandhi et al. (2001) andBennett and Rivers (2006a) unless otherwise stated. Dark grey ellipsesare regional igneous events that have similar crystallisation ages to themineralisation dated in this study, and light grey ellipses are igneous
events that post-date mineralisation and represent the vast majority ofnow preserved igneous bodies in the southern GBMZ (separated at1,870 Ma by vertical dashed line). Ellipses and lines represent ageswith assigned errors. TIMS Thermal ionisation mass spectrometry, LA-ICP-MS laser ablation-inductively coupled plasma-mass spectrometry,SHRIMP sensitive high resolution ion microprobe
562 Miner Deposita (2010) 45:549–566
Mineralisation style
Previous studies have provided conflicting interpretationsof the style of mineralisation at Nori/RA. Miller (1982)interpreted the mineralisation at Nori/RA to be detrital inorigin, calling them ‘meta-placer’ deposits. Gandhi andPrasad (1993) refer to the mineralisation as hydrothermalMo–U, and Gandhi (1994) suggests that the mineralisationis intrusion-related. Our re-investigation of the prospectindicates that the Cu–Mo–U mineralisation is hosted withintourmaline-biotite-quartz-K-feldspar veins. Observationsconfirm that the mineralisation consists of chalcopyrite,molybdenite and uraninite; allanite has been reported fromthe prospect (Thorpe 1972; Miller 1982) as have elevatedREE and other trace-element concentrations (e.g., 3.5% Ce;1.21% Y; Gandhi and Prasad 1993). The field andpetrographic evidence indicates that the Cu–Mo–U miner-alisation precipitated concomitantly with the host tourma-line and biotite in the veins (Figs. 2c, 3a and b and 4), andthese mineralised veins cross-cut altered sedimentary rocksbut appear early to be pre to syntectonic.
The fluid inclusion results presented here indicate thatthe hydrothermal fluids were trapped at temperatures >260°C and possibly >400°C, indicating they may have beenrelated to plutonism, as was previously suggested byGandhi and Prasad (1993) and Gandhi (1994). Thishydrothermal event was characterised by hot, CO2-bearingfluids of variable salinity, which resulted in tourmaline-biotite-quartz-K-feldspar veining with Cu–Mo–U±REE, Wmineralisation. The fluid inclusions tested indicate somesimilarities to other IOCG districts, but further data arerequired to compare this mineralisation with IOCG-likemineralisation in the GBMZ. Considering the metallogenicnature of the GBMZ (Hildebrand 1986; Gandhi 1994; Goadet al. 2000; Corriveau 2007; Mumin et al. 2007, 2009;Corriveau et al. 2010) and the relatively rapid andvoluminous character of melt input (Fig. 7; Bowring1985; Gandhi et al. 2001; Bennett and Rivers 2006a), it isperhaps not surprising that a wide range of varying styles ofmineralisation should occur and be part of the overallmineralising system (e.g. Bastrakov et al. 2008; Mumin etal. 2009). Although Nori/RA may not be a classic IOCG-type prospect, when considering the overall metallogenicsetting (e.g. Gandhi, 1994; Mumin et al. 2009), we interpretour age data to indicate that the Nori/RA mineralisationmay be the earliest phase of an extensive IOCG system inthe GBMZ.
Conclusions and recommendations
This study provides the first non-uraninite ages for mineral-isation in the Great Bear magmatic zone, NWT, Canada, by
utilising the Re–Os molybdenite and 40Ar–039Ar biotitechronometers. The results from the mineralising system atthe Nori/RA prospect at DeVries Lake indicate thathydrothermal tourmaline-biotite-quartz-K-feldspar veins withintergrown molybdenite, uraninite, chalcopyrite and pyrite(+W, REE) formed at about 1,875 Ma. Primary inclusions intourmaline contain liquid, vapour (commonly CO2-bearing),and a variety of solids and have liquid–vapour homogenisa-tion temperatures of ∼260°C and could have total homoge-nisation temperatures of >400°C. Therefore, since tourmalineco-precipitated with the molybdenite and uraninite, themineralising fluid was a hot, CO2-bearing fluid.
Regional metallogenic considerations (e.g. Gandhi 1994;Goad et al. 2000; Mumin et al. 2007, 2009), along with thethermochemical conditions of the mineralisation, suggest thatthe hydrothermal Cu–Mo–U mineralisation at Nori/RA maybe a variant of the IOCG family in the GBMZ. The timing ofmineralisation is interpreted to be older than the main phaseof the IOCG and affiliated mineralisation in the GBMZ (e.g.NICO and Sue-Dianne at about 1,870–1,855 Ma). As IOCGprovinces have a protracted and intricate history (e.g. Muminet al. 2007, 2009; Bastrakov et al. 2008), and the GBMZ is aPaleoproterozoic orogenic belt with a protracted and intricatehistory, it is therefore reasonable to suggest that themineralisation at Nori/RA might be the earliest recognisedphase of the regional mineralisation.
The results presented in this study necessitate recommen-dations for future studies on mineralisation in the GBMZ.First, the host-rock ages are now well-constrained (Bowring1985; Gandhi et al. 2001; Gandhi and van Breemen 2005;Bennett and Rivers 2006a, b), but direct dating of amenableminerals that are in equilibrium with ore mineralisation isrequired to build a complete metallogenic model and to trulycompare and contrast mineralisation styles. Second, pairedwith the age control, fluid inclusion and stable andradiogenic isotopic studies on amenable minerals (e.g.oxygen from oxides, sulphur and Re/Os from sulphides,Lu/Hf from apatite) will allow for mineral deposit models tobe more thoroughly developed and compared. Finally, otherpotential methods, such as boron isotopes on tourmaline (e.g.Xavier et al. 2008), a mineral which is associated with manyof the mineral prospects of the GBMZ (Mumin et al. 2007,2009), may help decipher the role of source and evolution ofthe mineralising systems.
Acknowledgements This study benefited from field assistance byN. Steeves and J.-Y. Landry and discussions and input fromJ. Ketchum and S. Cairns. Electron microprobe analyses wereundertaken under the guidance of S. Matveev at the University ofAlberta, M. Price assisted with the Raman spectroscopic analyses atthe University of Windsor and laser 40Ar–39Ar analyses was overseenby the late D. York at the University of Toronto. S. Gleesonacknowledges Dr. J. Richards for the use of the fluid inclusionmicrothermometry equipment and an NSERC Discovery Grant. The
Miner Deposita (2010) 45:549–566 563
Radiogenic Isotope Facility at the University of Alberta is supported,in part, by an NSERC Major Resources Support Grant. IMSacknowledges the support of NSERC (Discovery and Equipmentgrants). This is a contribution to the Northwest Territories GeoscienceOffice South Wopmay Bedrock Mapping project (NTGO contributionnumber 0041; ESS contribution number 20070564) and was carriedout under Aurora Research Institute Science Licences (13993R and14169R) and was funded in part by SINED. Comments andsuggestions from P Williams, D Lentz and two anonymous reviewershelped clarify aspects of this manuscript. We dedicate this paper to ourfriend and mentor, the late Dr. Steve Goff.
Appendix: Materials and methods
Mineralogy and petrography
Three fist-sized samples were collected (06ns2145′A′,06ns2145′B′ and 06ns2145′C′) from Trench 101 in theMain Zone of the Nori/RA prospect (Figs. 2 and 4).Polished thin sections were made from samples 06ns2145′A′ and 06ns2145′B′ and investigated using a transmittedand reflected-light polarising microscope. The chemicalcomposition of tourmaline was determined using a JEOL8900 electron microprobe at the University of Alberta,operated at 20 kV accelerating voltage and 20 nA probecurrent and focussed beam. In addition, a 10-µm spacedtransect was completed across an individual grain to helpconstrain compositional zoning (Table 1). Peak andbackground count times were 20 and 10 s, respectively.For calibration, a set of microbeam standards (naturalminerals) from the Smithsonian Institution were utilised(Jarosewich 2002). Data reduction was performed using theΦ(ρΖ) oxide correction of Armstrong (1995). The instru-ment calibration was deemed successful when the compo-sition of internal standards was reproduced within the errormargins defined by the counting statistics.
Fluid inclusions
Abundant fluid inclusions are hosted by both quartz andtourmaline. Microthermometric data were collected fromsample 06ns2145′B′ at the University of Alberta. This wascompleted using a Linkam THMSG 600 heating andfreezing stage calibrated at −56.6°C, 0.0°C, 374.1°C and573.4°C using synthetic fluid inclusion standards. Reportedtemperature measurements have an accuracy of ±0.1°C oncooling runs, and for heating runs within ±1°C (Table 2).
Raman spectroscopy was carried out using a RenishawinVia Reflex Raman spectrometer fitted with a CCDdetector. The exciting source was an ionised Ar laseroperating at 514 nm with an output power of ∼50 mW.Spectra were collected with a ×50 objective lens, providing∼ mW at the sampling point. Calibration was performeddaily using the 520 cm−1 line for silicon.
Geochronology
Samples 06ns2145′A′ and 06ns2146′B′ have fine-grained(<0.5 mm), disseminated molybdenite throughout thegroundmass (Figs. 2c and 4) and were selected for Re–Os molybdenite dating (Stein et al. 1998, 2001). Sampleswere crushed in a ceramic shatterbox and a molybdeniteseparate was prepared by gravity separation methods.Approximately 20–30 mg of molybdenite was producedfrom each sample, and the 187Re and 187Os concentrationsin aliquots of molybdenite from these separates weredetermined by isotope dilution mass spectrometry at theUniversity of Alberta Radiogenic Isotope Facility. Meth-ods followed the analytical protocol of Selby and Creaser(2001a, b, 2004). The decay constant used for 187Re was1.666×10−11 year−1 (Smoliar et al. 1996). All uncertaintiesare reported at 2σ levels, and model ages include anuncertainty of 0.31% in the value of l187Re.
Sample 06n2145′C′ is from the biotite alteration haloenveloping the molybdenite+uraninite-bearing tourmaline-biotite vein (Figs. 2c and 4b). The sample is composed of>80% biotite and was selected for laser 40Ar–39Ar dating. Aportion of the sample was crushed, and biotite was hand-picked using a binocular microscope and irradiated at theMcMaster Nuclear Reactor in Hamilton, ON. The irradiatedsamples and standards were placed in holes in analuminium disc for loading and analysis in the massspectrometer at the Argon Geochronology Laboratory, atthe Department of Physics, University of Toronto.Samples and Hb-3gr standards (Turner et al. 1971;assigned age=1,071 Ma) were analysed by step-heatingwith a 532 nm, frequency-doubled, Nd-YAG laser. Afterlaser extraction, purified gas fractions were inlet to a VG1200 noble-gas mass spectrometer equipped with an ionmultiplier, and the isotopic ratios were measured. Datareduction included corrections for atmospheric contami-nation and Ca and Cl interferences from the irradiation(Smith et al. 1996). The J value for the irradiation was1.0998±0.0022×10⁻². Errors in ages of the individualstep-heated gas fractions (which all have the same J value)do not include the error in J, while the errors of plateauages do include the error in J. Individual step heating dataerrors are reported at ±1σ (Table 4), and plateau age errorsare reported at ±2σ.
References
Armstrong JT (1995) A package of correction programs for thequantitative electron microbeam X-ray analysis of thickpolished materials, thin films, and particles. Microbeam Anal4:177–200
564 Miner Deposita (2010) 45:549–566
Badham JPN (1973) Calc-alkaline volcanism and plutonism fromthe Great Bear batholith, N.W.T. Can J Earth Sci 10:1319–1328
Baker T, Mustard R, Fu B, Williams PJ, Dong G, Fisher L, Mark G,Ryan CG (2008) Mixed messages in iron oxide–copper–goldsystems of the Cloncurry district, Australia: insights from PIXEanalysis of halogens and copper in fluid inclusions. Miner Depos43:599–608
Bastrakov EN, Skirrow RG, Davidson GJ (2008) Fluid evolution andorigins of iron oxide Cu–Au prospects in the Olympic Damdistrict, Gawler craton, South Australia. Econ Geol 102:1415–1440
Bennett V, Rivers T (2006a) U-Pb ages of zircon primary crystalli-zation and inheritance for magmatic rocks of the southernWopmay orogen, Northwest Territories. NWT Geosci Office,NWT Open Rep 2006-006, 65 p
Bennett V, Rivers T (2006b) U–Pb ages of detrital zircons from thesouthern Wopmay orogen, NWT. Northwest Territories GeosciOffice, NWT Open Rep 2006-007, 30 p
Bowring SA (1985) U-Pb zircon geochronology of earlyProterozoic Wopmay orogen, N.W.T. Canada: an exampleof rapid crustal evolution. Unpubl PhD thesis, Univ Kansas,148 p
Bowring SA, Grotzinger JP (1992) Implications of new chronostratig-raphy for tectonic evolution of Wopmay orogen, NorthwestCanadian Shield. Am J Sci 292:1–20
Bowring SA, Podosek FA (1989) Nd isotopic evidence from WopmayOrogen for 2.0–2.4 Ga crust in western North America. EarthPlanet Sci Lett 94:217–230
Byron SJ, Gleeson SA, Muehlenbachs K, Ootes L, Jackson VA,Samson IM (2009) Giant quartz veins in the Great Bearmagmatic zone, Northwest Territories, Canada. SGA2009:The 10th Biennial Meeting of the SGA, Townsville,Australia
Changkakoti A, Morton RD, Gray J (1986) Hydrothermal environ-ments during the genesis of silver deposits in the NorthwestTerritories of Canada: evidence from fluid inclusions. MinerDepos 21:63–69
Corriveau L (2007) Iron oxide copper-gold deposits: a Canadianperspective. In: Goodfellow WD (ed) Mineral deposits ofCanada: a synthesis of major deposit-types, district metal-logeny, the evolution of geological provinces, and explora-tion methods. Geol Assoc Can Miner Dep Div Special PublNo. 5, pp 307–328
Corriveau L, Williams PJ, Mumin H (2010) Alteration vectors toIOCG mineralization: from uncharted terranes to deposits. In:Corriveau L, Mumin AH (eds) Exploring for iron oxide copper-gold deposits: Canada and global analogues. Geol Assoc Can,Short Course Notes, No. 20:89–110
Dreher AM, Xavier RP, Taylor BE, Martini SL (2008) Newgeologic, fluid inclusion and stable isotope studies on thecontroversial Igarapé Bahia Cu–Au deposit, Carajás Province,Brazil. Miner Depos 42:161–184
Fisher LA, Kendrick MA (2008) Metamorphic fluid originsin the Osborne Fe oxide–Cu–Au deposit, Australia: evi-dence from noble gases and halogens. Miner Depos43:483–497
Fu B, Williams PJ, Oliver NHS, Dong G, Pollard PJ, Mark GM(2003) Fluid mixing versus unmixing as an ore forming processin the Cloncurry Fe-oxide–Cu–Au district, NW Queensland,Australia: evidence from fluid inclusions. J Geochem Explor 78–79:617–622
Gandhi SS (1988) Volcano-plutonic setting of U–Cu bearing magne-tite veins of FAB claims, southern Great Bear magmatic zone,Northwest Territories. Geol Surv Can, Current Res 88-1C:177–187
Gandhi SS (1994) Geological setting and genetic aspects of mineraloccurrences in the southern Great Bear magmatic zone, North-west Territories. In: Sinclair WD, Richardson DG (eds) Studiesof rare-metal deposits in the Northwest Territories. Geol SurvCan Bull 475, pp 63–96
Gandhi SS, Prasad N (1993) Regional metallogenic significance ofCu, Mo, and U occurrences at DeVries Lake, southern Great Bearmagmatic zone, Northwest Territories. Geol Surv Can Pap 93-1C:29–39
Gandhi SS, van Breemen O (2005) SHRIMP U–Pb geochronologyof detrital zircons from the Treasure Lake Group—newevidence for Paleoproterozoic collisional tectonics in thesouthern Hottah terrane, northwestern Canadian Shield. CanJ Earth Sci 42:833–845
Gandhi SS, Carrière JJ, Prasad N (2000) Implications of a preliminaryfluid-inclusion study of giant quartz veins of the southern GreatBear magmatic zone, Northwest Territories. Geol Surv CanCurrent Res 2000-C1:13
Gandhi SS, Mortensen JK, Prasad N, van Breemen O (2001)Magmatic evolution of the southern Great Bear continental arc,northwestern Canadian Shield: geochronological constraints. CanJ Earth Sci 38:767–785
Gleeson SA, Yardley BWD, Munz IA, Boyce AJ (2003) Infiltration ofbasinal fluids into high-grade basement, South Norway: sourcesand behaviour of waters and brines. Geofluids 3:33–48
Goad RE, Mumin AH, Duke NA, Neale KL, Mulligan DL, CamierWJ (2000) The NICO and Sue-Dianne Proterozoic, iron oxide-hosted, polymetallic deposits, Northwest Territories: applicationof the Olympic Dam model in exploration. Explor Min Geol9:123–140
Hildebrand RS (1986) Kiruna-type deposits; their origin and relation-ship to intermediate subvolcanic plutons in the Great Bearmagmatic zone, Northwest Canada. Econ Geol 81:640–659
Hildebrand RS, Bowring SA (1990) Themedial zone ofWopmay orogen,District of Mackenzie. Geol Surv Can Pap 90-1C:167–176
Hildebrand RS, Hoffman PF, Bowring SA (1987) Tectono-magmaticevolution of the 1.9-Ga Great Bear magmatic zone, Wopmayorogen, northwestern Canada. J Volcanol Geotherm Res 32:99–118
Hitzman MW, Oreskes N, Einaudi MT (1992) Geological characteristicsand tectonic setting of Proterozoic iron oxide (Cu-U-Au-REE)deposits. Precambrian Res 58:241–287
Hoffman PF (1988) United plates of America, the birth of a craton:early Proterozoic assembly and growth of Laurentia. Ann RevEarth Planet Sci 16:542–603
Hoffman P, Hall L (1993) Geology, Slave craton and environs, Districtof Mackenzie, Northwest Territories. Geol Surv Can Open File2559, 1 map scale 1:1,000,000
Housh T, Bowring SA, Villeneuve M (1989) Lead isotopic study ofearly Proterozoic Wopmay Orogen, NW Canada: role ofcontinental crust in arc magmatism. J Geol 97:735–747
Jackson VA (2008) Preliminary geologic map of part of thesouthern Wopmay Orogen (parts of NTS 86B and 86C; 2007updates); descriptive notes to accompany 1:100,000 scalemap. NWT Geosci Office, NWT Open Rep 2008-007 http://www.nwtgeoscience.ca
Jarosewich E (2002) Smithsonian microbeam standards. J Res NatlInst Stand Technol 107:681–685
Kendrik MA, Mark G, Phillips D (2007) Mid-crustal fluid mixing in aProterozoic Fe oxide–Cu–Au deposit, Ernest Henry, Australia:evidence from Ar, Kr, Xe, Cl, Br, and I. Earth Planet Sci Lett256:328–343
Landry J-Y (2006) Detailed relationships of iron oxide copper-goldtype alteration zones at DeVries Lake, southern Great BearMagmatic Zone, NWT. BSc thesis, University of Ottawa, Ottawa,Canada, 68 p
Miner Deposita (2010) 45:549–566 565
McDougall I, Harrison TM (1999) Geochronology and thermochro-nology by the 40Ar/39Ar method. Oxford Monogr Geol andGeophys No 9, Oxford Univ Press, 269 p
Miller RG (1982) The geochronology of uranium deposits in the GreatBear batholith, Northwest Territories. Can J Earth Sci 19:1428–1448
Mumin AH, Corriveau L, Somarin AK, Ootes L (2007) Iron oxide–copper–gold-type polymetallic mineralization in the ContactLake Belt, Great Bear Magmatic Zone, Northwest Territories,Canada. Explor Min Geol 16:187–208
Mumin AH, Somarin AK, Jones B, Corriveau L, Ootes L, Camier J(2010) The IOCG-porphyry-epithermal continuum in the GreatBear Magmatic Zone, Northwest Territories, Canada. In: Corri-veau L, Mumin AH (eds) Exploring for iron oxide copper-golddeposits: Canada and global analogues. Geol Assoc Can, ShortCourse Notes, No. 20:59–78
Norman PE, Mumin AH (2002) Iron deposits of the southern GreatBear Magmatic Zone, Northwest Territories. In: Geol AssocCan–Miner Assoc Can Annu Conf, Saskatoon, Canda, p. 82
Ootes L, Jackson VA, Corriveau L (2008) Assay results from thesouth Wopmay bedrock mapping project (2006–2007 fieldseasons). NWT Geosci Office, NWT Open Rep 2008-008.http://www.nwtgeoscience.ca
Reardon NC (1992) Magmatic-hydrothermal systems and associ-ated magnetite-apatite-actinolite deposits, Echo Bay, North-west Territories. MSc thesis, University of Ottawa, Ottawa,Canada, 154 p
Samson IM, Sinclair WD (1992) Magmatic hydrothermal fluids andthe origin of quartz-tourmaline orbicules in the Seagull batholith,Yukon Territory. Can Min 30:937–954
Samson IM, Song X, Fryer BJ (2002) Genesis of the Pea Ridge Fe oxide-REE deposit, Missouri: constraints from fluid inclusions andrelationship to the Olympic Dam class. In: Program with Abstracts,Eighth Biennial Pan-American Conference on Research on FluidInclusions, Halifax, Canada, July 22–25, pp 91–92
Selby D, Creaser RA (2001a) Re–Os geochronology andsystematics in molybdenite from the Endako porphyrymolybdenum deposit, British Columbia, Canada. Econ Geol96:197–204
Selby D, Creaser RA (2001b) Late and mid-Cretaceous mineralizationin the northern Canadian Cordillera: constraints from Re–Osmolybdenite dates. Econ Geol 96:1461–1467
Selby D, Creaser RA (2004) Macroscale NTIMS and microscale LA-MC-ICP-MS Re–Os isotopic analysis of molybdenite: testingspatial restrictions for reliable Re–Os age determinations, andimplications for the decoupling of Re and Os within molybdenite.Geochim Cosmochim Acta 68:3897–3908
Skirrow RG, Bastrakov EN, Barovich K, Fraser GL, Creaser RA,Fanning CM, Raymond OL, Davidson GJ (2007) Timing of iron
oxide Cu–Au–(U) hydrothermal activity and Nd isotope con-straints on metal sources in the Gawler Craton, South Australia.Econ Geol 102:1441–1471
Smith PE, York D, Chen Y, Evensen NM (1996) Single crystal40Ar–39Ar dating of a Late Quaternary paroxysm on Kos, Greece:concordance of terrestrial and marine ages. Geophys Res Lett23:3047–3050
Smoliar MI, Walker RJ, Morgan JW (1996) Re–Os ages of Group IIA,IIIA, IVA, and IVB iron meteorites. Nature 271:1099–1102
Song X (2002) Fluid inclusion studies of the Pea Ridge Fe oxide-REEdeposit, Missouri. MSc thesis, University of Windsor, Windsor,Canada, 101 p
Spratt JE, Jones AG, Jackson V, Collins L, Avdeeva A (2009)Lithospheric geometry of the Wopmay Orogen from a SlaveCraton to Bear Province magnetotelluric transect. J Geophys Res114:B01101. doi:10.1029/2007JB005326
Stein HJ, Morgan JW, Markey RJ, Hannah JL (1998) An introductionto Re–Os: what’s in it for the mineral industry? Soc Econ GeolNewsl 32:8–15
Stein HJ, Markey RJ, Morgan JW, Hannah JL, Scherstén A (2001) Theremarkable Re–Os molybdenite chronometer in molybdenite: howand why it works. Terra Nova 13:479–486
Sterner SM, Hall DL, Bodnar RJ (1988) Synthetic fluid inclusions V:solubility relations in the system NaCl–KCl–H2O under vapor-saturated conditions. Geochim Cosmoch Acta 52:989–1005
Thorpe RI (1972) Mineral exploration and mining activities, mainlandNorthwest Territories, 1966 to 1968 (excluding the CoppermineRiver area). Geol Surv Can Pap 70-70:204
Turner G, Huneke JC, Podosek FA, Wasserburg GJ (1971) 40Ar–39Arages and cosmic ray exposure ages of Apollo 14 samples. EarthPlanet Sci Lett 12:19–35
Yavuz F, Gültekin AH, Karakaya MÇ (2002) CLASTOUR: acomputer program for classification of the minerals of thetourmaline group. Comput Geosci 28:1017–1036
York D, Martinez ML (1986) The two-faced mica. Geophys Res Lett13:973–973
Williams PJ, Dong G, Ryan CG, Pollard PJ, Rotherham JF,Mernagh TP, Chapman LH (2001) Geochemistry of hyper-saline fluid inclusions from the Starra (Fe-oxide)–Au–CuDeposit, Cloncurry District, Queensland. Econ Geol96:875–884
Williams-Jones E, Heinrich CA (2005) Vapor transport of metals andthe formation of magmatic-hydrothermal ore deposits. Econ Geol100:1287–1312
Xavier RP, Wiedenbeck M, Trumbull RB, Dreher AM, Monteiro LVS,Rhede D, de Araújo CEG, Torresi I (2008) Tourmaline B-isotopes fingerprint marine evaporites as the source of high-salinity ore fluids in iron oxide copper-gold deposits, CarajásMineral Province (Brazil). Geology 36:743–746
566 Miner Deposita (2010) 45:549–566


![16-enteghal va fibr nori [www wikipower ir]](https://static.fdokumen.com/doc/165x107/63195d5dbc8291e22e0f1139/16-enteghal-va-fibr-nori-www-wikipower-ir.jpg)