Time-dependent density functional theory calculations of the spectroscopy of core electrons
16
Time-dependent density functional theory calculations of the spectroscopy of core electrons Nicholas A. Besley* and Frans A. Asmuruf Received 2nd February 2010, Accepted 21st June 2010 DOI: 10.1039/c002207a Recent advances in X-ray sources have led to a renaissance in spectroscopic techniques in the X-ray region. These techniques that involve the excitation of core electrons can provide an atom specific probe of electronic structure and provide powerful analytical tools that are used in many fields of research. Theoretical calculations can often play an important role in the analysis and interpretation of experimental spectra. In this perspective, we review recent developments in quantum chemical calculations of X-ray absorption spectra, focusing on the use of time-dependent density functional theory to study core excitations. The practical application of these calculations is illustrated with examples drawn from surface science and bioinorganic chemistry, and the application of these methods to study X-ray emission spectroscopy is explored. I. Introduction While less familiar than analogous techniques for valence electrons, studying and exploiting the spectroscopy of core electrons has a long history. 1 The spectroscopy of core electrons is attractive for several reasons. The spatially local nature of the core orbitals and large energy difference between the core orbitals of different elements means that the spectro- scopic techniques can provide an atom specific probe of electronic structure. A drawback of these techniques is the high energy X-ray light source required, and this has hindered the wide spread use of core-electron spectroscopic methods. However, in recent years there has been considerable advances in the quality and availability of X-ray sources. In particular, new synchrotron sources provide much greater intensity and resolution, and this has provided spectroscopy in the X-ray region with a richness in structure that can match more traditional spectroscopy in the ultraviolet region. There are a number of commonly used X-ray spectroscopic techniques. Fig. 1 shows a schematic of an absorption spectrum in the X-ray region. The structure near the absorption edge is referred to as near edge X-ray absorption fine structure (NEXAFS) or X-ray absorption near edge structure (XANES) and corresponds to the excitation of a core electron to give a bound state below the ionization continuum. This part of the X-ray absorption spectrum provides information on the unoccupied orbitals. At higher energy, usually beyond 20–30 eV of the absorption edge, are weak oscillations which correspond to extended X-ray absorption fine structure (EXAFS) and arise from excitation to states above the ionization continuum and subsequent scattering of the photoelectron by its environment. For some systems, pre-edge features are observed that arise from School of Chemistry, University of Nottingham, University Park, Nottingham NG7 2RD, UK. E-mail: [email protected] Nicholas A. Besley Dr Nick Besley studied Chemical Physics at the University of Sussex, and obtained a PhD in 1997 from the University of Birmingham, under the supervision of Professor Peter Knowles. He spent the following two years as a postdoctoral research associate at The Scripps Research Institute in California. He returned to the UK in 1999 to work as a postdoctoral fellow at the University of Nottingham with Professor Peter Gill. In 2002 he was awarded an EPSRC Advanced Research Fellowship and was subsequently appointed as a Lecturer in Theoretical Chemistry at Nottingham in 2005. His research is focused on computing the spectroscopy of large molecules. Frans A. Asmuruf Frans Asmuruf obtained a BSc degree from the University of Cenderawasih (Papua) and a MSc degree in Physical Chemistry from the Bandung Institute of Technology (Indonesia). Subsequently, he was appointed as a Junior Lecturer in the Department of Chemistry, University of Cenderawasih. In 2005 Frans was awarded a Scholarship of the Papua Government to undertake research toward a PhD degree, and he is currently completing his PhD thesis on quantum chemical calculations of core electron spectro- scopies at the University of Nottingham, UK. 12024 | Phys. Chem. Chem. Phys., 2010, 12, 12024–12039 This journal is c the Owner Societies 2010 PERSPECTIVE www.rsc.org/pccp | Physical Chemistry Chemical Physics Downloaded by University of Nottingham on 01 December 2010 Published on 23 September 2010 on http://pubs.rsc.org | doi:10.1039/C002207A View Online
-
Upload
charlessuebu -
Category
Documents
-
view
3 -
download
0
Transcript of Time-dependent density functional theory calculations of the spectroscopy of core electrons
Time-dependent density functional theory calculations of the spectroscopy
of core electrons
Nicholas A. Besley* and Frans A. Asmuruf
Received 2nd February 2010, Accepted 21st June 2010
DOI: 10.1039/c002207a
Recent advances in X-ray sources have led to a renaissance in spectroscopic techniques in the
X-ray region. These techniques that involve the excitation of core electrons can provide an atom
specific probe of electronic structure and provide powerful analytical tools that are used in many
fields of research. Theoretical calculations can often play an important role in the analysis and
interpretation of experimental spectra. In this perspective, we review recent developments
in quantum chemical calculations of X-ray absorption spectra, focusing on the use of
time-dependent density functional theory to study core excitations. The practical application
of these calculations is illustrated with examples drawn from surface science and bioinorganic
chemistry, and the application of these methods to study X-ray emission spectroscopy is explored.
I. Introduction
While less familiar than analogous techniques for valence
electrons, studying and exploiting the spectroscopy of core
electrons has a long history.1 The spectroscopy of core
electrons is attractive for several reasons. The spatially local
nature of the core orbitals and large energy difference between
the core orbitals of different elements means that the spectro-
scopic techniques can provide an atom specific probe of
electronic structure. A drawback of these techniques is the
high energy X-ray light source required, and this has hindered
the wide spread use of core-electron spectroscopic methods.
However, in recent years there has been considerable advances
in the quality and availability of X-ray sources. In particular,
new synchrotron sources provide much greater intensity and
resolution, and this has provided spectroscopy in the X-ray
region with a richness in structure that can match more
traditional spectroscopy in the ultraviolet region.
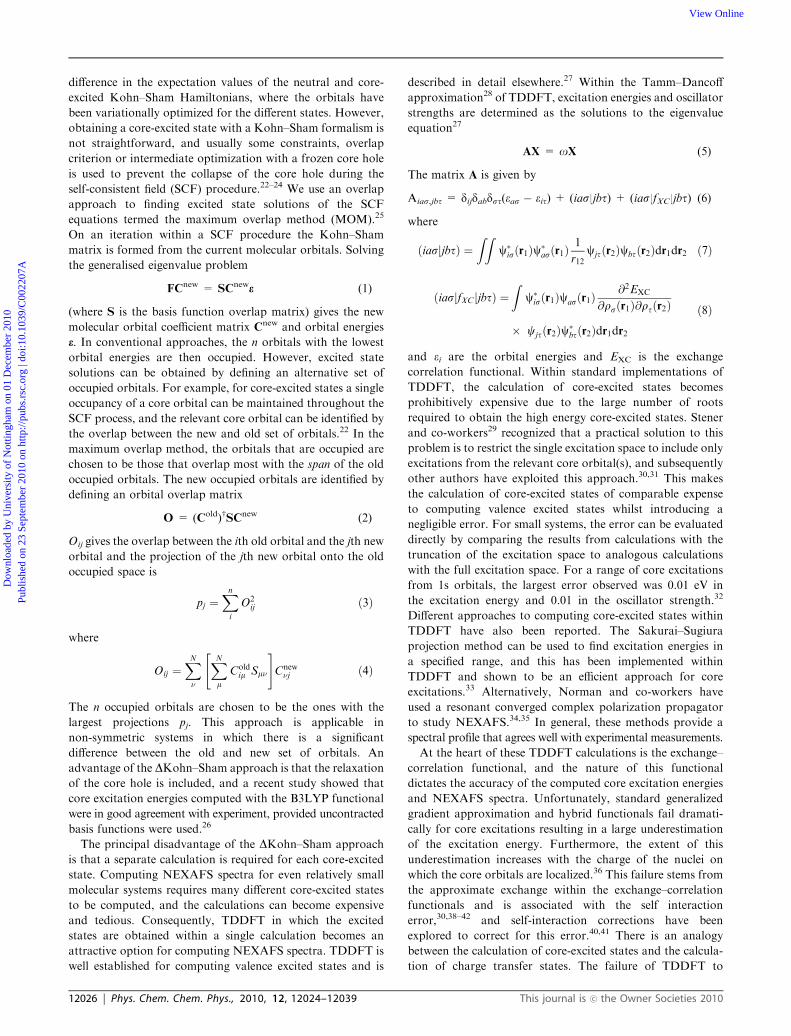
There are a number of commonly used X-ray spectroscopic
techniques. Fig. 1 shows a schematic of an absorption
spectrum in the X-ray region. The structure near the
absorption edge is referred to as near edge X-ray absorption
fine structure (NEXAFS) or X-ray absorption near edge
structure (XANES) and corresponds to the excitation of a
core electron to give a bound state below the ionization
continuum. This part of the X-ray absorption spectrum
provides information on the unoccupied orbitals. At higher
energy, usually beyond 20–30 eV of the absorption edge,
are weak oscillations which correspond to extended X-ray
absorption fine structure (EXAFS) and arise from excitation
to states above the ionization continuum and subsequent
scattering of the photoelectron by its environment. For
some systems, pre-edge features are observed that arise fromSchool of Chemistry, University of Nottingham, University Park,Nottingham NG7 2RD, UK. E-mail: [email protected]
Nicholas A. Besley
Dr Nick Besley studiedChemical Physics at theUniversity of Sussex, andobtained a PhD in 1997 fromthe University of Birmingham,under the supervision ofProfessor Peter Knowles. Hespent the following two yearsas a postdoctoral researchassociate at The ScrippsResearch Institute in California.He returned to the UK in 1999to work as a postdoctoralfellow at the University ofNottingham with ProfessorPeter Gill. In 2002 he was
awarded an EPSRC Advanced Research Fellowship and wassubsequently appointed as a Lecturer in Theoretical Chemistryat Nottingham in 2005. His research is focused on computing thespectroscopy of large molecules.
Frans A. Asmuruf
Frans Asmuruf obtained a BScdegree from the University ofCenderawasih (Papua) and aMSc degree in PhysicalChemistry from the BandungInstitute of Technology(Indonesia). Subsequently, hewas appointed as a JuniorLecturer in the Departmentof Chemistry, University ofCenderawasih. In 2005 Franswas awarded a Scholarship ofthe Papua Government toundertake research toward aPhD degree, and he iscurrently completing his PhD
thesis on quantum chemical calculations of core electron spectro-scopies at the University of Nottingham, UK.
12024 | Phys. Chem. Chem. Phys., 2010, 12, 12024–12039 This journal is �c the Owner Societies 2010
PERSPECTIVE www.rsc.org/pccp | Physical Chemistry Chemical Physics
Dow
nloa
ded
by U
nive
rsity
of
Not
tingh
am o
n 01
Dec
embe
r 20
10Pu
blis
hed
on 2
3 Se
ptem
ber
2010
on
http
://pu
bs.r
sc.o
rg |
doi:1
0.10
39/C
0022
07A
View Online
excitation from the core orbitals to singly occupied orbitals. In
addition to these absorption processes, X-ray emission can
also occur. Excitation of a core electron creates a singly
occupied core orbital, referred to as a core hole. X-ray
emission spectroscopy (XES) results from the subsequent
decay of a valence electron to the vacant core orbital with
the emission of a photon. XES is dependent on the nature of
the occupied valence orbitals, and thus provides comple-
mentary information to NEXAFS. Another related technique
is Auger spectroscopy. This also arises from the decay of a
valence electron to a core hole, but in Auger spectroscopy the
excess energy results in the emission of an electron.
Surface science is a field of research that has exploited X-ray
spectroscopy extensively, providing information on the
structure and orientation of adsorbed molecules and the
nature of the bonding to the surface.1,2 However, X-ray
spectroscopic techniques are used in a wide variety of
applications, including bioinorganic chemistry,3–5 thin films6
and recent high profile experiments probing the structure of
water,7,8 and in the future it is likely that this range of
applications will grow. In comparison to the vast literature
concerned with the calculation of excited states following the
excitation of valence electrons, the number of studies focusing
on the calculation of core-excited states is modest. However,
such calculations can play a crucial role in aiding the inter-
pretation and understanding of experimental spectra, and the
development of accurate calculations remains important to
future progress in the application of X-ray spectroscopic
methods. In this perspective, we review recent developments
in time-dependent density functional theory (TDDFT)
calculations of NEXAFS, and illustrate how they can inform
the interpretation of experiment with applications drawn from
surface science and bioinorganic chemistry, and the extension
of these methods to study X-ray emission spectroscopy is
explored.
II. Calculations of near edge X-ray absorption fine
structure
There are several theoretical approaches to computing
NEXAFS spectra. Many early calculations used the multiple
scattering Xa method.1 This approach has proved successful in
the EXAFS region, but the muffin-tin approximation in the
method has made it less satisfactory in the NEXAFS region
and led to the development of alternative approaches. One
such method is the direct static exchange (STEX) method.9–11
In this independent channel single electron approach the
contribution to the molecular potential of the excited electron
is neglected. The calculation of the absorption spectrum
comprises a number of steps. A calculation of the core–hole
state is performed with the valence orbitals frozen, followed by
optimization of the valence orbitals with the core hole frozen.
The STEX Hamiltonian is diagonalized and the excitation
energies are obtained by summing the core ionization potential
to the eigenvalues of the STEX Hamiltonian. The oscillator
strengths are calculated from the dipole matrix elements
between the ground and the final STEX states. The limitations
of this approach are the neglect of electron correlation and the
independent channel approximation. In an effort to improve
the STEX approach, the transition potential method was
introduced.12,13 In this approach, the orbital binding energy
is computed as the derivative of the total energy with respect
to the orbital occupation number. To take into account the
relaxation of the orbitals, the energy is approximated by
calculating the derivative at the point corresponding to the
occupation 0.5. Formally, this corresponds to a core orbital
with half an electron removed which captures a balance
between final and initial states. However, the procedure can
be performed with different fractional occupancies such as
0.0 which corresponds to a full core hole.14 The transition
potential method has proved successful and has been applied
to a wide variety of problems. The excitation energies obtained
from the transition potential method are about 1.5–2 eV too
low, and this error has been attributed to higher order
contributions to the core relaxation energies.13 Standard
quasi-particle theory has also been developed to study core
X-ray absorption spectra.15 An advantage of this approach is
that it is able to treat NEXAFS and EXAFS within a common
framework. Better agreement with experiment is found at
higher energies, while discrepancies close to the absorption
edge illustrate that modifications to the quasi-particle theory
are required.15 An equations of motion coupled cluster
(EOM-CCSD) based approach has been shown to provide
accurate core excitation energies.16 This approach uses a two
step procedure, firstly, a CCSD calculation on the core ionized
state is performed to describe the relaxation of the core ion.
Subsequently, an electron is added to the core ionized state
using the electron attachment EOM-CCSD method to obtain
the core-excited states of the neutral molecule. The symmetry-
adapted-cluster configuration interaction (SAC-CI) method
has also been applied to studyX-ray absorption spectroscopy.17–21
The focus of these studies has been the study of satellite peaks
and the analysis and simulation of vibrational structure.
In recent years, there has been many advances in density
functional theory (DFT) and this perspective is primarily
concerned with the the application and development of
these methods for the study of core excitations and X-ray
absorption spectra in the region close to the absorption edge.
Within DFT, a DKohn–Sham method is the most intuitively
simple approach to computing NEXAFS spectra. In a
DKohn–Sham approach the core excitation energy is the
Fig. 1 Schematic of a X-ray absorption spectrum.
This journal is �c the Owner Societies 2010 Phys. Chem. Chem. Phys., 2010, 12, 12024–12039 | 12025
Dow
nloa
ded
by U
nive
rsity
of
Not
tingh
am o
n 01
Dec
embe
r 20
10Pu
blis
hed
on 2
3 Se
ptem
ber
2010
on
http
://pu
bs.r
sc.o
rg |
doi:1
0.10
39/C
0022
07A
View Online
difference in the expectation values of the neutral and core-
excited Kohn–Sham Hamiltonians, where the orbitals have
been variationally optimized for the different states. However,
obtaining a core-excited state with a Kohn–Sham formalism is
not straightforward, and usually some constraints, overlap
criterion or intermediate optimization with a frozen core hole
is used to prevent the collapse of the core hole during the
self-consistent field (SCF) procedure.22–24 We use an overlap
approach to finding excited state solutions of the SCF
equations termed the maximum overlap method (MOM).25
On an iteration within a SCF procedure the Kohn–Sham
matrix is formed from the current molecular orbitals. Solving
the generalised eigenvalue problem
FCnew = SCnewe (1)
(where S is the basis function overlap matrix) gives the new
molecular orbital coefficient matrix Cnew and orbital energies
e. In conventional approaches, the n orbitals with the lowest
orbital energies are then occupied. However, excited state
solutions can be obtained by defining an alternative set of
occupied orbitals. For example, for core-excited states a single
occupancy of a core orbital can be maintained throughout the
SCF process, and the relevant core orbital can be identified by
the overlap between the new and old set of orbitals.22 In the
maximum overlap method, the orbitals that are occupied are
chosen to be those that overlap most with the span of the old
occupied orbitals. The new occupied orbitals are identified by
defining an orbital overlap matrix
O = (Cold)wSCnew (2)
Oij gives the overlap between the ith old orbital and the jth new
orbital and the projection of the jth new orbital onto the old
occupied space is
pj ¼Xni
O2ij ð3Þ
where
Oij ¼XNn
XNm
Coldim Smn
" #Cnewnj ð4Þ
The n occupied orbitals are chosen to be the ones with the
largest projections pj. This approach is applicable in
non-symmetric systems in which there is a significant
difference between the old and new set of orbitals. An
advantage of the DKohn–Sham approach is that the relaxation
of the core hole is included, and a recent study showed that
core excitation energies computed with the B3LYP functional
were in good agreement with experiment, provided uncontracted
basis functions were used.26
The principal disadvantage of the DKohn–Sham approach
is that a separate calculation is required for each core-excited
state. Computing NEXAFS spectra for even relatively small
molecular systems requires many different core-excited states
to be computed, and the calculations can become expensive
and tedious. Consequently, TDDFT in which the excited
states are obtained within a single calculation becomes an
attractive option for computing NEXAFS spectra. TDDFT is
well established for computing valence excited states and is
described in detail elsewhere.27 Within the Tamm–Dancoff
approximation28 of TDDFT, excitation energies and oscillator
strengths are determined as the solutions to the eigenvalue
equation27
AX = oX (5)
The matrix A is given by
Aias,jbt = dijdabdst(eas � eit) + (ias|jbt) + (ias|fXC|jbt) (6)
where
ðiasjjbtÞ ¼ZZ
c�isðr1Þc�asðr1Þ1
r12cjtðr2Þcbtðr2Þdr1dr2 ð7Þ
ðiasjfXC jjbtÞ ¼Z
c�isðr1Þcasðr1Þ@2EXC
@rsðr1Þ@rtðr2Þ
� cjtðr2Þc�btðr2Þdr1dr2
ð8Þ
and ei are the orbital energies and EXC is the exchange
correlation functional. Within standard implementations of
TDDFT, the calculation of core-excited states becomes
prohibitively expensive due to the large number of roots
required to obtain the high energy core-excited states. Stener
and co-workers29 recognized that a practical solution to this
problem is to restrict the single excitation space to include only
excitations from the relevant core orbital(s), and subsequently
other authors have exploited this approach.30,31 This makes
the calculation of core-excited states of comparable expense
to computing valence excited states whilst introducing a
negligible error. For small systems, the error can be evaluated
directly by comparing the results from calculations with the
truncation of the excitation space to analogous calculations
with the full excitation space. For a range of core excitations
from 1s orbitals, the largest error observed was 0.01 eV in
the excitation energy and 0.01 in the oscillator strength.32
Different approaches to computing core-excited states within
TDDFT have also been reported. The Sakurai–Sugiura
projection method can be used to find excitation energies in
a specified range, and this has been implemented within
TDDFT and shown to be an efficient approach for core
excitations.33 Alternatively, Norman and co-workers have
used a resonant converged complex polarization propagator
to study NEXAFS.34,35 In general, these methods provide a
spectral profile that agrees well with experimental measurements.
At the heart of these TDDFT calculations is the exchange–
correlation functional, and the nature of this functional
dictates the accuracy of the computed core excitation energies
and NEXAFS spectra. Unfortunately, standard generalized
gradient approximation and hybrid functionals fail dramati-
cally for core excitations resulting in a large underestimation
of the excitation energy. Furthermore, the extent of this
underestimation increases with the charge of the nuclei on
which the core orbitals are localized.36 This failure stems from
the approximate exchange within the exchange–correlation
functionals and is associated with the self interaction
error,30,38–42 and self-interaction corrections have been
explored to correct for this error.40,41 There is an analogy
between the calculation of core-excited states and the calcula-
tion of charge transfer states. The failure of TDDFT to
12026 | Phys. Chem. Chem. Phys., 2010, 12, 12024–12039 This journal is �c the Owner Societies 2010
Dow
nloa
ded
by U
nive
rsity
of
Not
tingh
am o
n 01
Dec
embe
r 20
10Pu
blis
hed
on 2
3 Se
ptem
ber
2010
on
http
://pu
bs.r
sc.o
rg |
doi:1
0.10
39/C
0022
07A
View Online
describe charge transfer states is well understood,43 and can be
predicted by the L diagnostic.44 This diagnostic is a measure of
the overlap between donating and accepting orbitals, and is
given by
L ¼P
i;a k2iaoiaP
i;a k2ia
ð9Þ
where oia is a measure of the spatial overlap between occupied
orbital ci and virtual orbital ca
oia =R|ci(r)||ca(r)|dr (10)
and within the Tamm–Dancoff approximation
kia = Xia. (11)
Table 1 shows computed values of L for a range of core
excitation energies. The compactness of the core orbital makes
the values of L small, and comfortably in the regime where
generalized gradient approximation (GGA) or hybrid
functionals fail.44 For nuclei with higher nuclear charge, the
core orbitals will be more compact and a greater failure of the
functional would be anticipated. In general, this under-
estimation is roughly constant across different excitations
from a given core orbital, and a pragmatic approach is to
simply apply a constant shift to the computed spectra.45,46
However, it remains desirable to compute accurate core
excitations within TDDFT, and several groups have developed
new exchange–correlation functionals designed for NEXAFS
calculations.30,37–39,47,48
Nakai and co-workers reported the first attempts to
improve the description of core-excited states within TDDFT.
The BmLBLYP exchange–correlation functional47 was
developed from the observation that the modified Leeuwen–
Baerends (mLB) exchange functional performed better for
core excitations and Becke88 (B) exchange was better for
valence excitations. The resulting functional combined these
two exchange functionals by adopting LB94 in the core and
asymptotic regions and Becke88 in the valence regions, and
gave an average error of about 1.5 eV for a set of core
excitations compared to over 13 eV for B3LYP. Subsequently,
the CV-B3LYP37 and CVR-B3LYP38,39 functionals were
introduced. These functionals were designed to be accurate
for all types of excitation, including core excitations, and
worked by using an appropriate fraction of HF exchange
depending on the type of excitation. These functionals were
applied to core-excitations from first and second row nuclei
and showed a substantial improvement in accuracy, yielding
mean absolute errors below 1 eV.
Following this work, we optimized a hybrid functional for
carbon K-edge excitations which was used to study the
NEXAFS spectroscopy of hydrocarbons adsorbed on the
Si(100)-2�1 surface.30 In this functional, the fraction of HF
exchange in B3LYP was increased to predict the 1s - p*excitation energies in acetylene, ethylene and benzene
correctly. This led to the following functional with 57% HF
exchange, with the fraction of Becke exchange reduced
proportionately
BH0.57LYP = 0.57HF + 0.35B + 0.08S
+ 0.81LYP + 0.19VWN (12)
where HF, B and S are Hartree–Fock (HF), Becke49 and
Slater50 exchange functionals, respectively, and LYP51 and
VWN52 are correlation functionals. However, while this
functional performs well for carbon K-edge excitations, its
performance is less satisfactory for excitations for core excita-
tions from other nuclei with a significantly different nuclear
charge.
Building on the analogy with charge transfer excitations,
Coulomb attenuated or range separated functionals have been
developed for core excitations. These functionals exploit a
partitioning of the 1/r12 operator in the evaluation of the
exchange energy and have provided a solution to the charge
transfer problem.53–58 In these functionals, the long-range part
of the exchange energy is evaluated primarily or completely
using HF theory, and DFT exchange is primarily used for the
short-range. However, such long-range corrected functionals
developed for valence excitations do not improve core excita-
tion energies, and the predicted values remain too low.42,48
The first work in this area was reported by Hirao and
co-workers who adapted the LCgau-DFT approach59 to core
excitations.42 In traditional long-range corrected exchange
functionals the 1/r12 operator is partitioned using the error
function (erf) according to
1
r12¼ erfðmr12Þ
r12þ erfcðmr12Þ
r12ð13Þ
where r12 = |r1 � r2| and erfc = 1 � erf.53 The first term of
eqn (13) is the long-range interaction term and the second term
accounts for the short-range interaction. In standard long-
range corrected functionals the short-range term is treated
using DFT, while the long-range term is evaluated using HF
exchange.53 The failure of these functionals to correct core
excitations can be rationalized. Long-range corrected
functionals introduce HF exchange for terms in which r12 is
large. For these terms either r1 or r2 must be large. Any of
these exchange integrals that involve a core orbital will be
vanishing small due to the fact that the core orbital is very
short-ranged. Consequently, it is perhaps not surprising that
such long-range corrected functionals have a negligible
influence on core-excitation energies.
The logical conclusion from this analysis is that it is
necessary to introduce HF exchange at short-range, i.e. when
Table 1 Values of the L diagnostic for core excitations from BLYP/6-311(2+,2+)G** calculations
Excitation L
CO C(1s) - p* 0.18CO C(1s) -3s 0.04CO O(1s) - p* 0.14CO O(1s) -3s 0.03HF F(1s) - s* 0.08SiH4 Si(1s) - s* 0.03H2S S(1s) - s* 0.04H2S S(1s) -4p 0.01HCl Cl(1s) - s* 0.02HCl Cl(1s) -4pp 0.01
This journal is �c the Owner Societies 2010 Phys. Chem. Chem. Phys., 2010, 12, 12024–12039 | 12027
Dow
nloa
ded
by U
nive
rsity
of
Not
tingh
am o
n 01
Dec
embe
r 20
10Pu
blis
hed
on 2
3 Se
ptem
ber
2010
on
http
://pu
bs.r
sc.o
rg |
doi:1
0.10
39/C
0022
07A
View Online
r12 is small. The LCgau-DFT scheme partitions the 1/r12operator as59
1
r12¼ erfcðmr12Þ
r12� k
2mffiffiffipp exp�ð1=aÞm
2r212 þ erfðmr12Þ
r12
þ k2mffiffiffipp exp�ð1=aÞm
2r212
ð14Þ
where the first two terms describe the short-range interaction
and the remaining terms give the long-range interaction. The
inclusion of the Gaussian correction provides an additional
contribution to the short-range term that can be tailored to
introduce HF exchange at short-range.42 This functional form
was optimized, through the three parameters m, k, and a, and
tested on a set of core-excitation energies from first row nuclei,
and the resulting functional was called LCgau-core-BOP.42
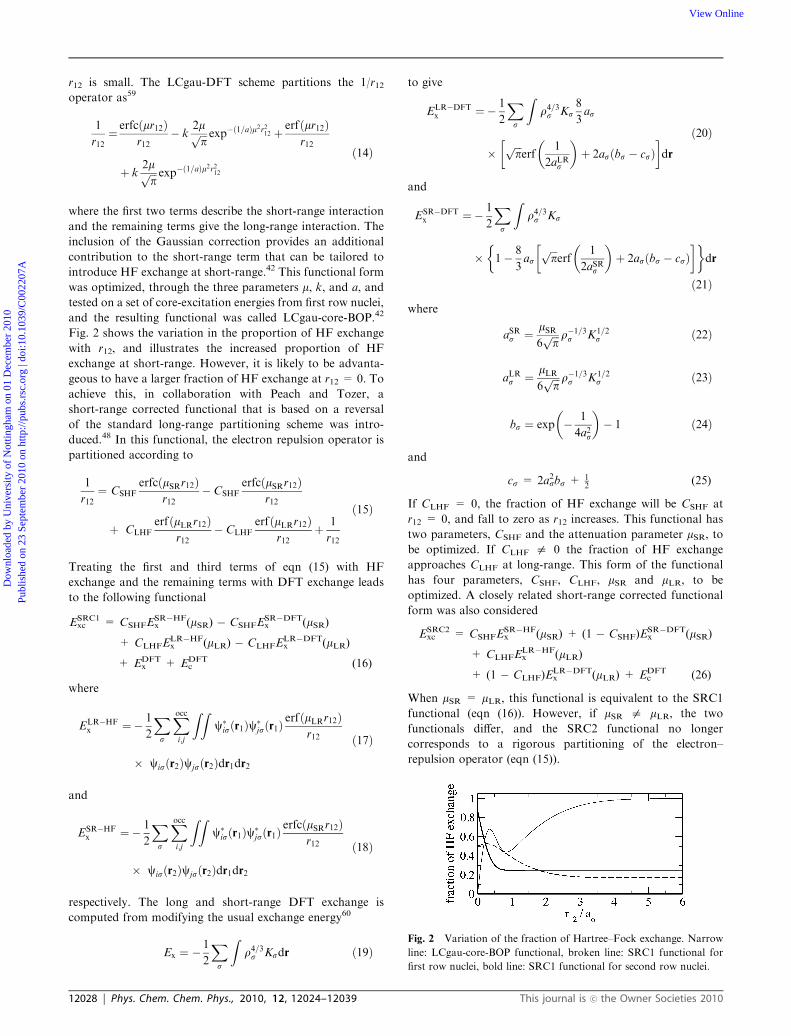
Fig. 2 shows the variation in the proportion of HF exchange
with r12, and illustrates the increased proportion of HF
exchange at short-range. However, it is likely to be advanta-
geous to have a larger fraction of HF exchange at r12 = 0. To
achieve this, in collaboration with Peach and Tozer, a
short-range corrected functional that is based on a reversal
of the standard long-range partitioning scheme was intro-
duced.48 In this functional, the electron repulsion operator is
partitioned according to
1
r12¼ CSHF
erfcðmSRr12Þr12
� CSHFerfcðmSRr12Þ
r12
þ CLHFerfðmLRr12Þ
r12� CLHF
erfðmLRr12Þr12
þ 1
r12
ð15Þ
Treating the first and third terms of eqn (15) with HF
exchange and the remaining terms with DFT exchange leads
to the following functional
ESRC1xc = CSHFE
SR�HFx (mSR) � CSHFE
SR�DFTx (mSR)
+ CLHFELR�HFx (mLR) � CLHFE
LR�DFTx (mLR)
+ EDFTx + EDFT
c (16)
where
ELR�HFx ¼� 1
2
Xs
Xocci;j
ZZc�isðr1Þc�jsðr1Þ
erfðmLRr12Þr12
� cisðr2Þcjsðr2Þdr1dr2
ð17Þ
and
ESR�HFx ¼� 1
2
Xs
Xocci;j
ZZc�isðr1Þc�jsðr1Þ
erfcðmSRr12Þr12
� cisðr2Þcjsðr2Þdr1dr2
ð18Þ
respectively. The long and short-range DFT exchange is
computed from modifying the usual exchange energy60
Ex ¼ �1
2
Xs
Zr4=3s Ksdr ð19Þ
to give
ELR�DFTx ¼� 1
2
Xs
Zr4=3s Ks
8
3as
�ffiffiffipp
erf1
2aLRs
� �þ 2asðbs � csÞ
� �dr
ð20Þ
and
ESR�DFTx ¼� 1
2
Xs
Zr4=3s Ks
� 1� 8
3as
ffiffiffipp
erf1
2aSRs
� �þ 2asðbs � csÞ
� �� �dr
ð21Þ
where
aSRs ¼mSR6ffiffiffipp r�1=3s K1=2
s ð22Þ
aLRs ¼mLR6ffiffiffipp r�1=3s K1=2
s ð23Þ
bs ¼ exp � 1
4a2s
� �� 1 ð24Þ
and
cs = 2a2sbs + 12
(25)
If CLHF = 0, the fraction of HF exchange will be CSHF at
r12 = 0, and fall to zero as r12 increases. This functional has
two parameters, CSHF and the attenuation parameter mSR, tobe optimized. If CLHF a 0 the fraction of HF exchange
approaches CLHF at long-range. This form of the functional
has four parameters, CSHF, CLHF, mSR and mLR, to be
optimized. A closely related short-range corrected functional
form was also considered
ESRC2xc = CSHFE
SR�HFx (mSR) + (1 � CSHF)E
SR�DFTx (mSR)
+ CLHFELR�HFx (mLR)
+ (1 � CLHF)ELR�DFTx (mLR) + EDFT
c (26)
When mSR = mLR, this functional is equivalent to the SRC1
functional (eqn (16)). However, if mSR a mLR, the two
functionals differ, and the SRC2 functional no longer
corresponds to a rigorous partitioning of the electron–
repulsion operator (eqn (15)).
Fig. 2 Variation of the fraction of Hartree–Fock exchange. Narrow
line: LCgau-core-BOP functional, broken line: SRC1 functional for
first row nuclei, bold line: SRC1 functional for second row nuclei.
12028 | Phys. Chem. Chem. Phys., 2010, 12, 12024–12039 This journal is �c the Owner Societies 2010
Dow
nloa
ded
by U
nive
rsity
of
Not
tingh
am o
n 01
Dec
embe
r 20
10Pu
blis
hed
on 2
3 Se
ptem
ber
2010
on
http
://pu
bs.r
sc.o
rg |
doi:1
0.10
39/C
0022
07A
View Online
These functionals were implemented in the Q-CHEM
software package61 and the parameters optimized using core
excitations from first and second row nuclei. Excellent agree-
ment with experiment was observed for excitations to valence
and Rydberg orbitals. The source of this improvement lies
with correcting the orbital energies for the core orbitals.48 The
short-range corrected functionals result in a lowering in the
energy of the core orbitals while not affecting the energies of
the valence orbitals, which in turn leads to an increase in the
excitation energy through the first term in eqn (6). However, a
disappointing feature of these functional forms was the same
set of parameters could not be used for first and second row
nuclei. The proportion of HF exchange in the functionals is
also shown in Fig. 2. To obtain correct excitation energies for
the second row nuclei requires a much greater fraction of HF
exchange at r12 = 0 that falls rapidly, while a smaller fraction
of HF exchange is required for the first row nuclei. Another
feature of these functionals is that the functional no longer has
the correct asymptotic behaviour at r12 = N. The form of the
functional does not have sufficient flexibility to have a large
fraction of HF exchange as r12 - 0, fall rapidly and then rise
again to 1 as r12 increases. For core-excitations, the errors
introduced by the incorrect behaviour in the long-range are
much smaller than the errors arising from the short-range and,
consequently, fixing the short-range takes priority.
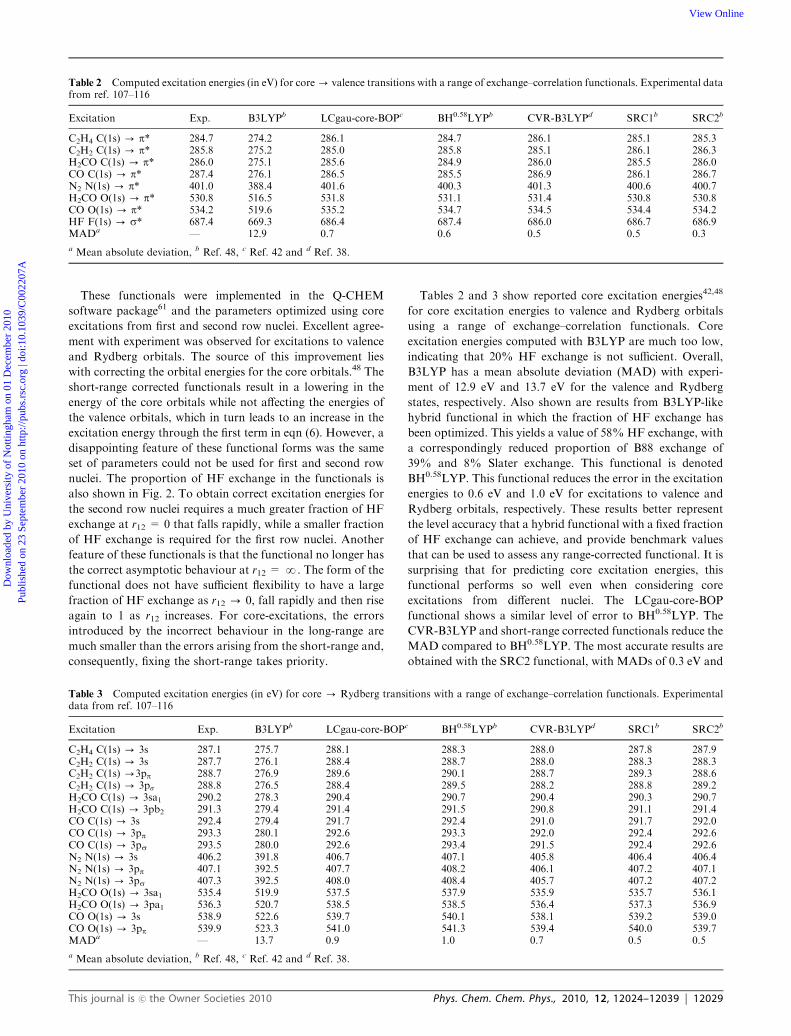
Tables 2 and 3 show reported core excitation energies42,48
for core excitation energies to valence and Rydberg orbitals
using a range of exchange–correlation functionals. Core
excitation energies computed with B3LYP are much too low,
indicating that 20% HF exchange is not sufficient. Overall,
B3LYP has a mean absolute deviation (MAD) with experi-
ment of 12.9 eV and 13.7 eV for the valence and Rydberg
states, respectively. Also shown are results from B3LYP-like
hybrid functional in which the fraction of HF exchange has
been optimized. This yields a value of 58% HF exchange, with
a correspondingly reduced proportion of B88 exchange of
39% and 8% Slater exchange. This functional is denoted
BH0.58LYP. This functional reduces the error in the excitation
energies to 0.6 eV and 1.0 eV for excitations to valence and
Rydberg orbitals, respectively. These results better represent
the level accuracy that a hybrid functional with a fixed fraction
of HF exchange can achieve, and provide benchmark values
that can be used to assess any range-corrected functional. It is
surprising that for predicting core excitation energies, this
functional performs so well even when considering core
excitations from different nuclei. The LCgau-core-BOP
functional shows a similar level of error to BH0.58LYP. The
CVR-B3LYP and short-range corrected functionals reduce the
MAD compared to BH0.58LYP. The most accurate results are
obtained with the SRC2 functional, with MADs of 0.3 eV and
Table 2 Computed excitation energies (in eV) for core- valence transitions with a range of exchange–correlation functionals. Experimental datafrom ref. 107–116
Excitation Exp. B3LYPb LCgau-core-BOPc BH0.58LYPb CVR-B3LYPd SRC1b SRC2b
C2H4 C(1s) - p* 284.7 274.2 286.1 284.7 286.1 285.1 285.3C2H2 C(1s) - p* 285.8 275.2 285.0 285.8 285.1 286.1 286.3H2CO C(1s) - p* 286.0 275.1 285.6 284.9 286.0 285.5 286.0CO C(1s) - p* 287.4 276.1 286.5 285.5 286.9 286.1 286.7N2 N(1s) - p* 401.0 388.4 401.6 400.3 401.3 400.6 400.7H2CO O(1s) - p* 530.8 516.5 531.8 531.1 531.4 530.8 530.8CO O(1s) - p* 534.2 519.6 535.2 534.7 534.5 534.4 534.2HF F(1s) - s* 687.4 669.3 686.4 687.4 686.0 686.7 686.9MADa — 12.9 0.7 0.6 0.5 0.5 0.3
a Mean absolute deviation, b Ref. 48, c Ref. 42 and d Ref. 38.
Table 3 Computed excitation energies (in eV) for core - Rydberg transitions with a range of exchange–correlation functionals. Experimentaldata from ref. 107–116
Excitation Exp. B3LYPb LCgau-core-BOPc BH0.58LYPb CVR-B3LYPd SRC1b SRC2b
C2H4 C(1s) - 3s 287.1 275.7 288.1 288.3 288.0 287.8 287.9C2H2 C(1s) - 3s 287.7 276.1 288.4 288.7 288.0 288.3 288.3C2H2 C(1s) -3pp 288.7 276.9 289.6 290.1 288.7 289.3 288.6C2H2 C(1s) - 3ps 288.8 276.5 288.4 289.5 288.2 288.8 289.2H2CO C(1s) - 3sa1 290.2 278.3 290.4 290.7 290.4 290.3 290.7H2CO C(1s) - 3pb2 291.3 279.4 291.4 291.5 290.8 291.1 291.4CO C(1s) - 3s 292.4 279.4 291.7 292.4 291.0 291.7 292.0CO C(1s) - 3pp 293.3 280.1 292.6 293.3 292.0 292.4 292.6CO C(1s) - 3ps 293.5 280.0 292.6 293.4 291.5 292.4 292.6N2 N(1s) - 3s 406.2 391.8 406.7 407.1 405.8 406.4 406.4N2 N(1s) - 3pp 407.1 392.5 407.7 408.2 406.1 407.2 407.1N2 N(1s) - 3ps 407.3 392.5 408.0 408.4 405.7 407.2 407.2H2CO O(1s) - 3sa1 535.4 519.9 537.5 537.9 535.9 535.7 536.1H2CO O(1s) - 3pa1 536.3 520.7 538.5 538.5 536.4 537.3 536.9CO O(1s) - 3s 538.9 522.6 539.7 540.1 538.1 539.2 539.0CO O(1s) - 3pp 539.9 523.3 541.0 541.3 539.4 540.0 539.7MADa — 13.7 0.9 1.0 0.7 0.5 0.5
a Mean absolute deviation, b Ref. 48, c Ref. 42 and d Ref. 38.
This journal is �c the Owner Societies 2010 Phys. Chem. Chem. Phys., 2010, 12, 12024–12039 | 12029
Dow
nloa
ded
by U
nive
rsity
of
Not
tingh
am o
n 01
Dec
embe
r 20
10Pu
blis
hed
on 2
3 Se
ptem
ber
2010
on
http
://pu
bs.r
sc.o
rg |
doi:1
0.10
39/C
0022
07A
View Online
0.5 eV. These functionals represent a significant improvement
in the accuracy of the computed core excitation energies, and
are approaching the level of accuracy achieved for traditional
valence excitations.
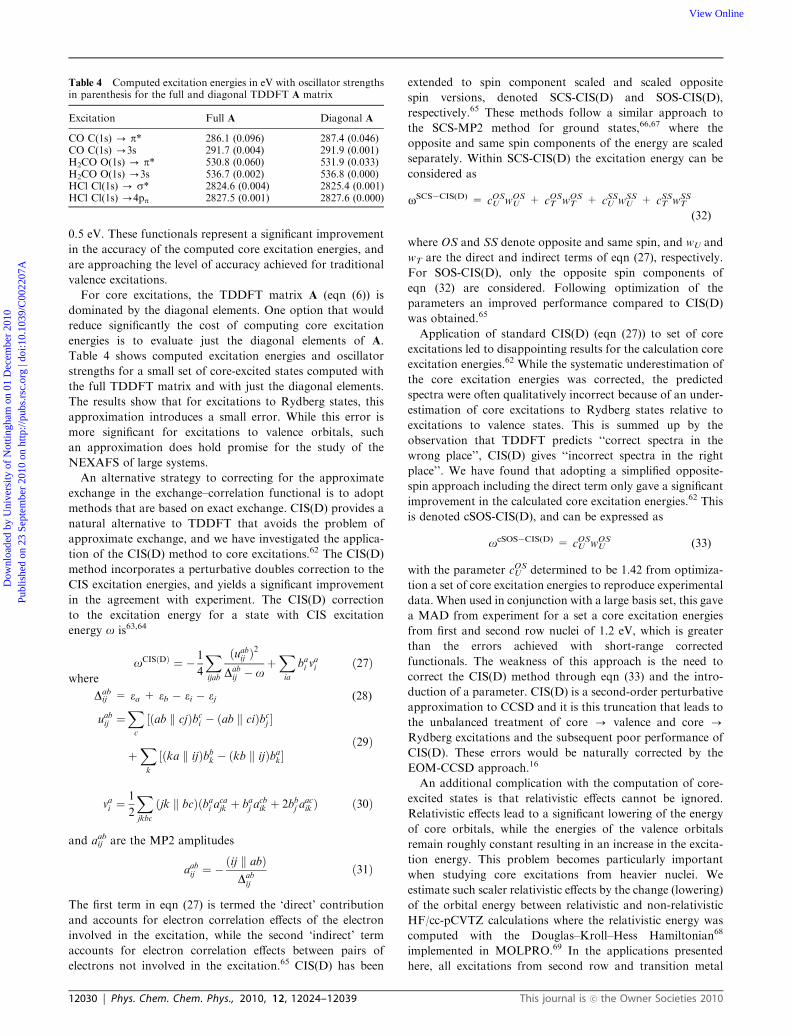
For core excitations, the TDDFT matrix A (eqn (6)) is
dominated by the diagonal elements. One option that would
reduce significantly the cost of computing core excitation
energies is to evaluate just the diagonal elements of A.
Table 4 shows computed excitation energies and oscillator
strengths for a small set of core-excited states computed with
the full TDDFT matrix and with just the diagonal elements.
The results show that for excitations to Rydberg states, this
approximation introduces a small error. While this error is
more significant for excitations to valence orbitals, such
an approximation does hold promise for the study of the
NEXAFS of large systems.
An alternative strategy to correcting for the approximate
exchange in the exchange–correlation functional is to adopt
methods that are based on exact exchange. CIS(D) provides a
natural alternative to TDDFT that avoids the problem of
approximate exchange, and we have investigated the applica-
tion of the CIS(D) method to core excitations.62 The CIS(D)
method incorporates a perturbative doubles correction to the
CIS excitation energies, and yields a significant improvement
in the agreement with experiment. The CIS(D) correction
to the excitation energy for a state with CIS excitation
energy o is63,64
oCISðDÞ ¼ � 1
4
Xijab
ðuabij Þ2
Dabij � o
þXia
bai vai ð27Þ
where
Dabij = ea + eb � ei � ej (28)
uabij ¼Xc
½ðab k cjÞbci � ðab k ciÞbcj �
þXk
½ðka k ijÞbbk � ðkb k ijÞbak�ð29Þ
vai ¼1
2
Xjkbc
ðjk k bcÞðbai acajk þ baj acbik þ 2bbj a
acik Þ ð30Þ
and aabij are the MP2 amplitudes
aabij ¼ �ðij k abÞDabij
ð31Þ
The first term in eqn (27) is termed the ‘direct’ contribution
and accounts for electron correlation effects of the electron
involved in the excitation, while the second ‘indirect’ term
accounts for electron correlation effects between pairs of
electrons not involved in the excitation.65 CIS(D) has been
extended to spin component scaled and scaled opposite
spin versions, denoted SCS-CIS(D) and SOS-CIS(D),
respectively.65 These methods follow a similar approach to
the SCS-MP2 method for ground states,66,67 where the
opposite and same spin components of the energy are scaled
separately. Within SCS-CIS(D) the excitation energy can be
considered as
oSCS�CIS(D) = cOSU wOS
U + cOST wOS
T + cSSU wSSU + cSST wSS
T
(32)
where OS and SS denote opposite and same spin, and wU and
wT are the direct and indirect terms of eqn (27), respectively.
For SOS-CIS(D), only the opposite spin components of
eqn (32) are considered. Following optimization of the
parameters an improved performance compared to CIS(D)
was obtained.65
Application of standard CIS(D) (eqn (27)) to set of core
excitations led to disappointing results for the calculation core
excitation energies.62 While the systematic underestimation of
the core excitation energies was corrected, the predicted
spectra were often qualitatively incorrect because of an under-
estimation of core excitations to Rydberg states relative to
excitations to valence states. This is summed up by the
observation that TDDFT predicts ‘‘correct spectra in the
wrong place’’, CIS(D) gives ‘‘incorrect spectra in the right
place’’. We have found that adopting a simplified opposite-
spin approach including the direct term only gave a significant
improvement in the calculated core excitation energies.62 This
is denoted cSOS-CIS(D), and can be expressed as
ocSOS�CIS(D) = cOSU wOS
U (33)
with the parameter cOSU determined to be 1.42 from optimiza-
tion a set of core excitation energies to reproduce experimental
data. When used in conjunction with a large basis set, this gave
a MAD from experiment for a set a core excitation energies
from first and second row nuclei of 1.2 eV, which is greater
than the errors achieved with short-range corrected
functionals. The weakness of this approach is the need to
correct the CIS(D) method through eqn (33) and the intro-
duction of a parameter. CIS(D) is a second-order perturbative
approximation to CCSD and it is this truncation that leads to
the unbalanced treatment of core - valence and core -
Rydberg excitations and the subsequent poor performance of
CIS(D). These errors would be naturally corrected by the
EOM-CCSD approach.16
An additional complication with the computation of core-
excited states is that relativistic effects cannot be ignored.
Relativistic effects lead to a significant lowering of the energy
of core orbitals, while the energies of the valence orbitals
remain roughly constant resulting in an increase in the excita-
tion energy. This problem becomes particularly important
when studying core excitations from heavier nuclei. We
estimate such scaler relativistic effects by the change (lowering)
of the orbital energy between relativistic and non-relativistic
HF/cc-pCVTZ calculations where the relativistic energy was
computed with the Douglas–Kroll–Hess Hamiltonian68
implemented in MOLPRO.69 In the applications presented
here, all excitations from second row and transition metal
Table 4 Computed excitation energies in eV with oscillator strengthsin parenthesis for the full and diagonal TDDFT A matrix
Excitation Full A Diagonal A
CO C(1s) - p* 286.1 (0.096) 287.4 (0.046)CO C(1s) -3s 291.7 (0.004) 291.9 (0.001)H2CO O(1s) - p* 530.8 (0.060) 531.9 (0.033)H2CO O(1s) -3s 536.7 (0.002) 536.8 (0.000)HCl Cl(1s) - s* 2824.6 (0.004) 2825.4 (0.001)HCl Cl(1s) -4pp 2827.5 (0.001) 2827.6 (0.000)
12030 | Phys. Chem. Chem. Phys., 2010, 12, 12024–12039 This journal is �c the Owner Societies 2010
Dow
nloa
ded
by U
nive
rsity
of
Not
tingh
am o
n 01
Dec
embe
r 20
10Pu
blis
hed
on 2
3 Se
ptem
ber
2010
on
http
://pu
bs.r
sc.o
rg |
doi:1
0.10
39/C
0022
07A
View Online
nuclei have been corrected for relativity in this way. A more
desirable solution is to incorporate the relativistic corrections
directly within the quantum chemical excited state calculation.
The zero-order relativistic approximation (ZORA)70,71
provides a simple approach through which this can be
achieved. However, while scalar relativistic corrections may
be sufficient for K-edge spectra, L-edge spectra are more
complicated.72 For L-edge spectra, core–hole spin–orbit inter-
action can be significant resulting in significant splitting of the
spectral bands.72,73 Furthermore, satellite transitions involving
two or more electron excitations can occur. Within a DFT
framework, these excitations can be described using a
DKohn–Sham approach but are not described by single
electron excitation methods, such as TDDFT and CIS, and
are not considered in this work.
III. Benzene adsorbed on metal surfaces
The most important test for theoretical NEXAFS calculations
is their application to current experimental problems. Today,
most experimental NEXAFS work is concerned with complex
systems rather than small molecules in the gas phase.
NEXAFS is a particularly attractive technique in surface
science because studies with linear polarized light can inform
directly on the orientation and structure of an adsorbed
molecule. Benzene adsorbed on metal surfaces is a proto-
typical system in surface science, and NEXAFS spectra have
been reported for benzene adsorbed on several metal
surfaces.74–78 These systems provide an example of how
NEXAFS spectroscopy can probe the nature of the bonding
to the surface and the structure of the adsorbate. Benzene is
physisorbed on the Au(111) surface and chemisorbed on the
Pt(111) surface and the resulting NEXAFS spectra, which are
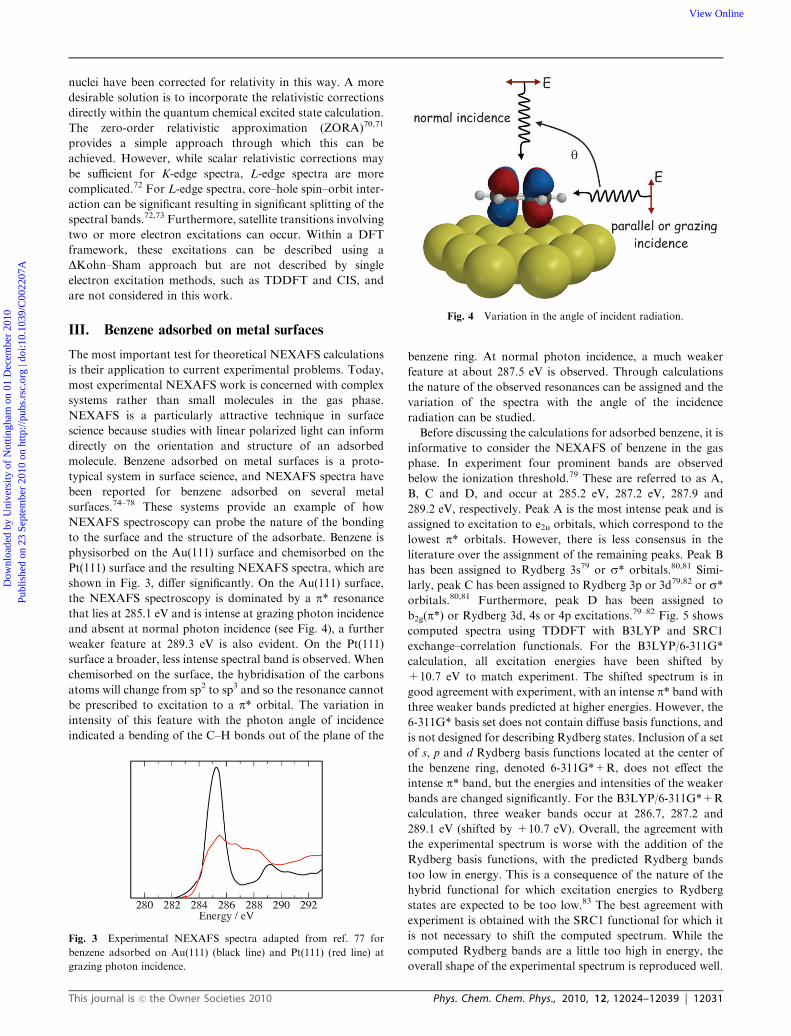
shown in Fig. 3, differ significantly. On the Au(111) surface,
the NEXAFS spectroscopy is dominated by a p* resonance
that lies at 285.1 eV and is intense at grazing photon incidence
and absent at normal photon incidence (see Fig. 4), a further
weaker feature at 289.3 eV is also evident. On the Pt(111)
surface a broader, less intense spectral band is observed. When
chemisorbed on the surface, the hybridisation of the carbons
atoms will change from sp2 to sp3 and so the resonance cannot
be prescribed to excitation to a p* orbital. The variation in
intensity of this feature with the photon angle of incidence
indicated a bending of the C–H bonds out of the plane of the
benzene ring. At normal photon incidence, a much weaker
feature at about 287.5 eV is observed. Through calculations
the nature of the observed resonances can be assigned and the
variation of the spectra with the angle of the incidence
radiation can be studied.
Before discussing the calculations for adsorbed benzene, it is
informative to consider the NEXAFS of benzene in the gas
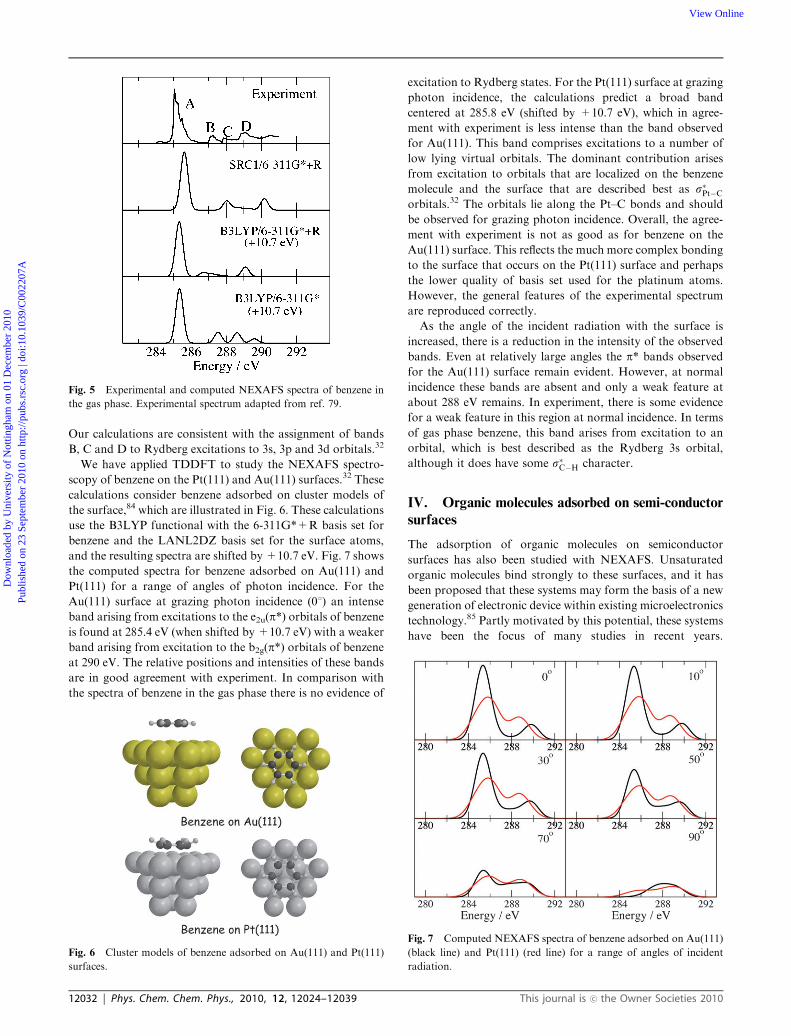
phase. In experiment four prominent bands are observed
below the ionization threshold.79 These are referred to as A,
B, C and D, and occur at 285.2 eV, 287.2 eV, 287.9 and
289.2 eV, respectively. Peak A is the most intense peak and is
assigned to excitation to e2u orbitals, which correspond to the
lowest p* orbitals. However, there is less consensus in the
literature over the assignment of the remaining peaks. Peak B
has been assigned to Rydberg 3s79 or s* orbitals.80,81 Simi-
larly, peak C has been assigned to Rydberg 3p or 3d79,82 or s*orbitals.80,81 Furthermore, peak D has been assigned to
b2g(p*) or Rydberg 3d, 4s or 4p excitations.79–82 Fig. 5 shows
computed spectra using TDDFT with B3LYP and SRC1
exchange–correlation functionals. For the B3LYP/6-311G*
calculation, all excitation energies have been shifted by
+10.7 eV to match experiment. The shifted spectrum is in
good agreement with experiment, with an intense p* band with
three weaker bands predicted at higher energies. However, the
6-311G* basis set does not contain diffuse basis functions, and
is not designed for describing Rydberg states. Inclusion of a set
of s, p and d Rydberg basis functions located at the center of
the benzene ring, denoted 6-311G*+R, does not effect the
intense p* band, but the energies and intensities of the weaker
bands are changed significantly. For the B3LYP/6-311G*+R
calculation, three weaker bands occur at 286.7, 287.2 and
289.1 eV (shifted by +10.7 eV). Overall, the agreement with
the experimental spectrum is worse with the addition of the
Rydberg basis functions, with the predicted Rydberg bands
too low in energy. This is a consequence of the nature of the
hybrid functional for which excitation energies to Rydberg
states are expected to be too low.83 The best agreement with
experiment is obtained with the SRC1 functional for which it
is not necessary to shift the computed spectrum. While the
computed Rydberg bands are a little too high in energy, the
overall shape of the experimental spectrum is reproduced well.
Fig. 3 Experimental NEXAFS spectra adapted from ref. 77 for
benzene adsorbed on Au(111) (black line) and Pt(111) (red line) at
grazing photon incidence.
Fig. 4 Variation in the angle of incident radiation.
This journal is �c the Owner Societies 2010 Phys. Chem. Chem. Phys., 2010, 12, 12024–12039 | 12031
Dow
nloa
ded
by U
nive
rsity
of
Not
tingh
am o
n 01
Dec
embe
r 20
10Pu
blis
hed
on 2
3 Se
ptem
ber
2010
on
http
://pu
bs.r
sc.o
rg |
doi:1
0.10
39/C
0022
07A
View Online
Our calculations are consistent with the assignment of bands
B, C and D to Rydberg excitations to 3s, 3p and 3d orbitals.32
We have applied TDDFT to study the NEXAFS spectro-
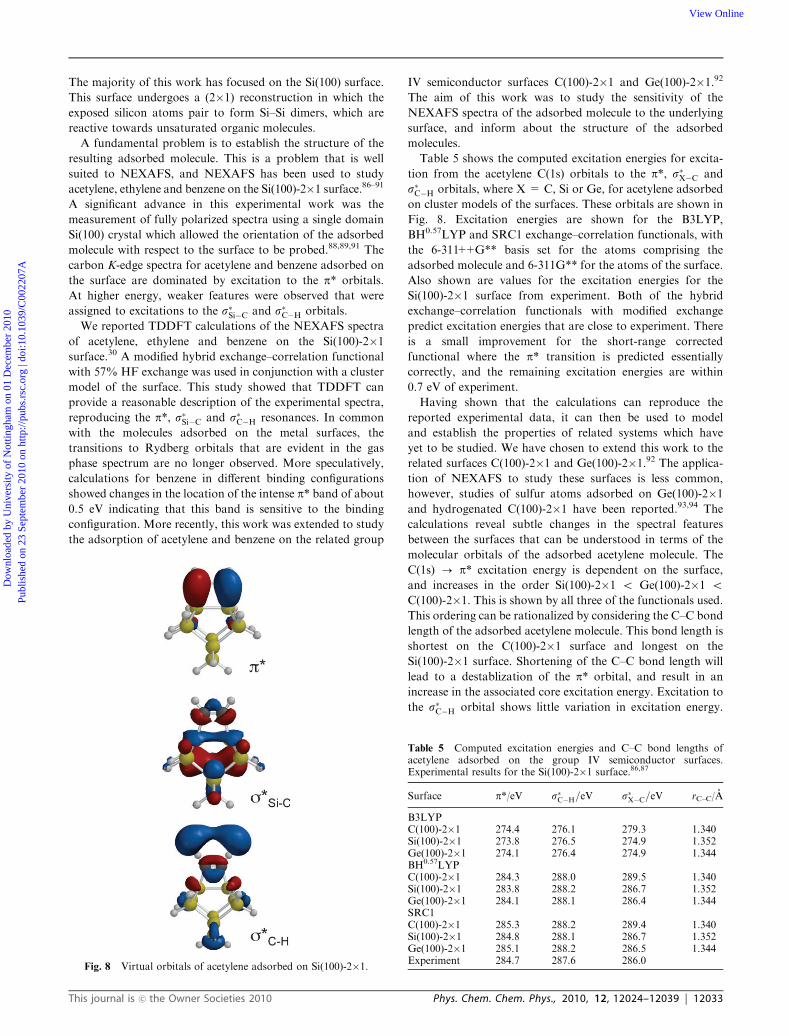
scopy of benzene on the Pt(111) and Au(111) surfaces.32 These
calculations consider benzene adsorbed on cluster models of
the surface,84 which are illustrated in Fig. 6. These calculations
use the B3LYP functional with the 6-311G*+R basis set for
benzene and the LANL2DZ basis set for the surface atoms,
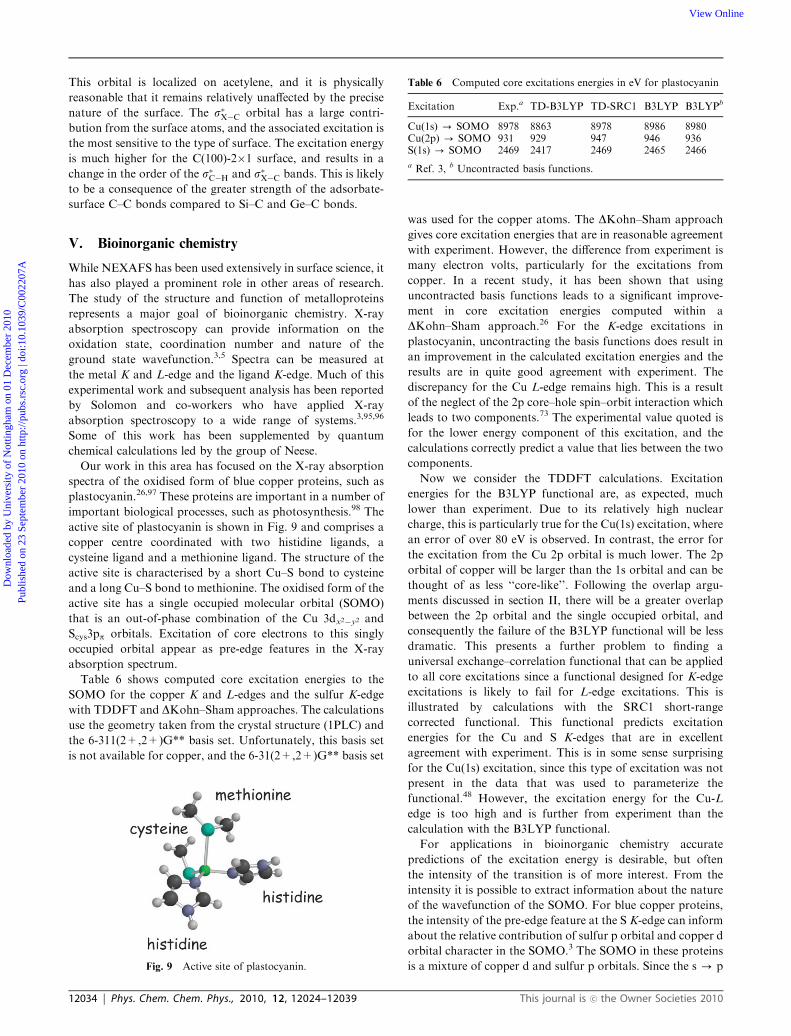
and the resulting spectra are shifted by +10.7 eV. Fig. 7 shows
the computed spectra for benzene adsorbed on Au(111) and
Pt(111) for a range of angles of photon incidence. For the
Au(111) surface at grazing photon incidence (01) an intense
band arising from excitations to the e2u(p*) orbitals of benzeneis found at 285.4 eV (when shifted by +10.7 eV) with a weaker
band arising from excitation to the b2g(p*) orbitals of benzeneat 290 eV. The relative positions and intensities of these bands
are in good agreement with experiment. In comparison with
the spectra of benzene in the gas phase there is no evidence of
excitation to Rydberg states. For the Pt(111) surface at grazing
photon incidence, the calculations predict a broad band
centered at 285.8 eV (shifted by +10.7 eV), which in agree-
ment with experiment is less intense than the band observed
for Au(111). This band comprises excitations to a number of
low lying virtual orbitals. The dominant contribution arises
from excitation to orbitals that are localized on the benzene
molecule and the surface that are described best as s�Pt�Corbitals.32 The orbitals lie along the Pt–C bonds and should
be observed for grazing photon incidence. Overall, the agree-
ment with experiment is not as good as for benzene on the
Au(111) surface. This reflects the much more complex bonding
to the surface that occurs on the Pt(111) surface and perhaps
the lower quality of basis set used for the platinum atoms.
However, the general features of the experimental spectrum
are reproduced correctly.
As the angle of the incident radiation with the surface is
increased, there is a reduction in the intensity of the observed
bands. Even at relatively large angles the p* bands observed
for the Au(111) surface remain evident. However, at normal
incidence these bands are absent and only a weak feature at
about 288 eV remains. In experiment, there is some evidence
for a weak feature in this region at normal incidence. In terms
of gas phase benzene, this band arises from excitation to an
orbital, which is best described as the Rydberg 3s orbital,
although it does have some s�C�H character.
IV. Organic molecules adsorbed on semi-conductor
surfaces
The adsorption of organic molecules on semiconductor
surfaces has also been studied with NEXAFS. Unsaturated
organic molecules bind strongly to these surfaces, and it has
been proposed that these systems may form the basis of a new
generation of electronic device within existing microelectronics
technology.85 Partly motivated by this potential, these systems
have been the focus of many studies in recent years.
Fig. 5 Experimental and computed NEXAFS spectra of benzene in
the gas phase. Experimental spectrum adapted from ref. 79.
Fig. 6 Cluster models of benzene adsorbed on Au(111) and Pt(111)
surfaces.
Fig. 7 Computed NEXAFS spectra of benzene adsorbed on Au(111)
(black line) and Pt(111) (red line) for a range of angles of incident
radiation.
12032 | Phys. Chem. Chem. Phys., 2010, 12, 12024–12039 This journal is �c the Owner Societies 2010
Dow
nloa
ded
by U
nive
rsity
of
Not
tingh
am o
n 01
Dec
embe
r 20
10Pu
blis
hed
on 2
3 Se
ptem
ber
2010
on
http
://pu
bs.r
sc.o
rg |
doi:1
0.10
39/C
0022
07A
View Online
The majority of this work has focused on the Si(100) surface.
This surface undergoes a (2�1) reconstruction in which the
exposed silicon atoms pair to form Si–Si dimers, which are
reactive towards unsaturated organic molecules.
A fundamental problem is to establish the structure of the
resulting adsorbed molecule. This is a problem that is well
suited to NEXAFS, and NEXAFS has been used to study
acetylene, ethylene and benzene on the Si(100)-2�1 surface.86–91A significant advance in this experimental work was the
measurement of fully polarized spectra using a single domain
Si(100) crystal which allowed the orientation of the adsorbed
molecule with respect to the surface to be probed.88,89,91 The
carbon K-edge spectra for acetylene and benzene adsorbed on
the surface are dominated by excitation to the p* orbitals.
At higher energy, weaker features were observed that were
assigned to excitations to the s�Si�C and s�C�H orbitals.
We reported TDDFT calculations of the NEXAFS spectra
of acetylene, ethylene and benzene on the Si(100)-2�1surface.30 A modified hybrid exchange–correlation functional
with 57% HF exchange was used in conjunction with a cluster
model of the surface. This study showed that TDDFT can
provide a reasonable description of the experimental spectra,
reproducing the p*, s�Si�C and s�C�H resonances. In common
with the molecules adsorbed on the metal surfaces, the
transitions to Rydberg orbitals that are evident in the gas
phase spectrum are no longer observed. More speculatively,
calculations for benzene in different binding configurations
showed changes in the location of the intense p* band of about
0.5 eV indicating that this band is sensitive to the binding
configuration. More recently, this work was extended to study
the adsorption of acetylene and benzene on the related group
IV semiconductor surfaces C(100)-2�1 and Ge(100)-2�1.92The aim of this work was to study the sensitivity of the
NEXAFS spectra of the adsorbed molecule to the underlying
surface, and inform about the structure of the adsorbed
molecules.
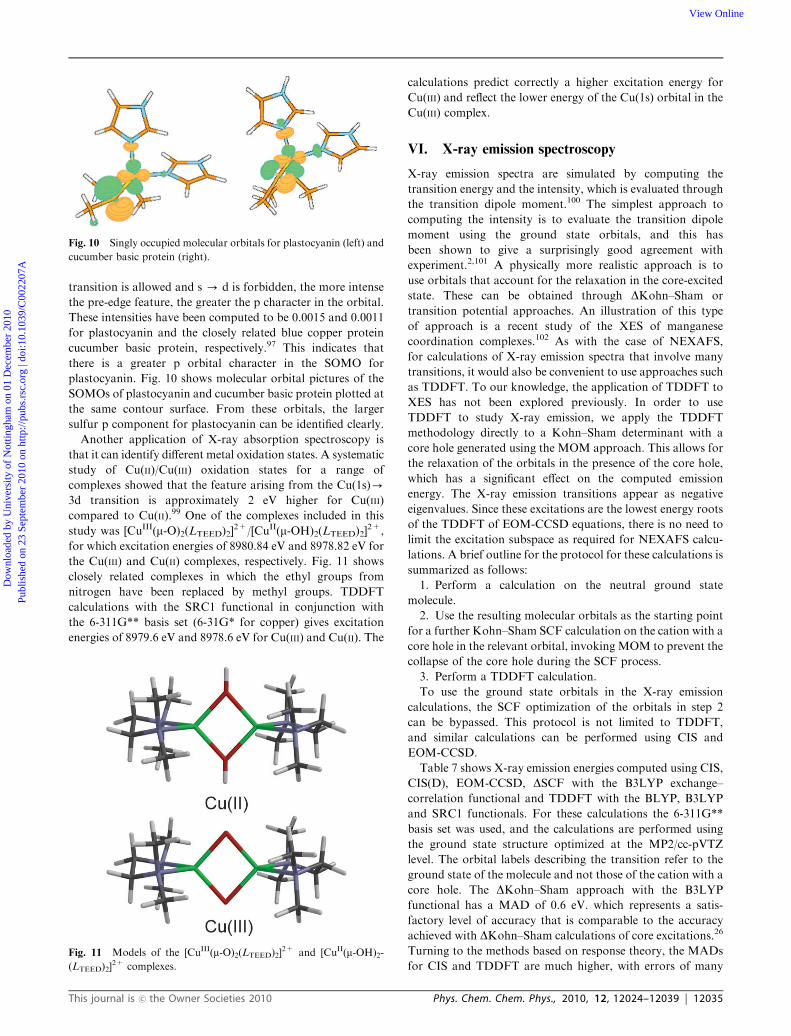
Table 5 shows the computed excitation energies for excita-
tion from the acetylene C(1s) orbitals to the p*, s�X�C and
s�C�H orbitals, where X = C, Si or Ge, for acetylene adsorbed
on cluster models of the surfaces. These orbitals are shown in
Fig. 8. Excitation energies are shown for the B3LYP,
BH0.57LYP and SRC1 exchange–correlation functionals, with
the 6-311++G** basis set for the atoms comprising the
adsorbed molecule and 6-311G** for the atoms of the surface.
Also shown are values for the excitation energies for the
Si(100)-2�1 surface from experiment. Both of the hybrid
exchange–correlation functionals with modified exchange
predict excitation energies that are close to experiment. There
is a small improvement for the short-range corrected
functional where the p* transition is predicted essentially
correctly, and the remaining excitation energies are within
0.7 eV of experiment.
Having shown that the calculations can reproduce the
reported experimental data, it can then be used to model
and establish the properties of related systems which have
yet to be studied. We have chosen to extend this work to the
related surfaces C(100)-2�1 and Ge(100)-2�1.92 The applica-
tion of NEXAFS to study these surfaces is less common,
however, studies of sulfur atoms adsorbed on Ge(100)-2�1and hydrogenated C(100)-2�1 have been reported.93,94 The
calculations reveal subtle changes in the spectral features
between the surfaces that can be understood in terms of the
molecular orbitals of the adsorbed acetylene molecule. The
C(1s) - p* excitation energy is dependent on the surface,
and increases in the order Si(100)-2�1 o Ge(100)-2�1 oC(100)-2�1. This is shown by all three of the functionals used.
This ordering can be rationalized by considering the C–C bond
length of the adsorbed acetylene molecule. This bond length is
shortest on the C(100)-2�1 surface and longest on the
Si(100)-2�1 surface. Shortening of the C–C bond length will
lead to a destablization of the p* orbital, and result in an
increase in the associated core excitation energy. Excitation to
the s�C�H orbital shows little variation in excitation energy.
Fig. 8 Virtual orbitals of acetylene adsorbed on Si(100)-2�1.
Table 5 Computed excitation energies and C–C bond lengths ofacetylene adsorbed on the group IV semiconductor surfaces.Experimental results for the Si(100)-2�1 surface.86,87
Surface p*/eV s�C�H=eV s�X�C=eV rC–C/A
B3LYPC(100)-2�1 274.4 276.1 279.3 1.340Si(100)-2�1 273.8 276.5 274.9 1.352Ge(100)-2�1 274.1 276.4 274.9 1.344BH0.57LYPC(100)-2�1 284.3 288.0 289.5 1.340Si(100)-2�1 283.8 288.2 286.7 1.352Ge(100)-2�1 284.1 288.1 286.4 1.344SRC1C(100)-2�1 285.3 288.2 289.4 1.340Si(100)-2�1 284.8 288.1 286.7 1.352Ge(100)-2�1 285.1 288.2 286.5 1.344Experiment 284.7 287.6 286.0
This journal is �c the Owner Societies 2010 Phys. Chem. Chem. Phys., 2010, 12, 12024–12039 | 12033
Dow
nloa
ded
by U
nive
rsity
of
Not
tingh
am o
n 01
Dec
embe
r 20
10Pu
blis
hed
on 2
3 Se
ptem
ber
2010
on
http
://pu
bs.r
sc.o
rg |
doi:1
0.10
39/C
0022
07A
View Online
This orbital is localized on acetylene, and it is physically
reasonable that it remains relatively unaffected by the precise
nature of the surface. The s�X�C orbital has a large contri-
bution from the surface atoms, and the associated excitation is
the most sensitive to the type of surface. The excitation energy
is much higher for the C(100)-2�1 surface, and results in a
change in the order of the s�C�H and s�X�C bands. This is likely
to be a consequence of the greater strength of the adsorbate-
surface C–C bonds compared to Si–C and Ge–C bonds.
V. Bioinorganic chemistry
While NEXAFS has been used extensively in surface science, it
has also played a prominent role in other areas of research.
The study of the structure and function of metalloproteins
represents a major goal of bioinorganic chemistry. X-ray
absorption spectroscopy can provide information on the
oxidation state, coordination number and nature of the
ground state wavefunction.3,5 Spectra can be measured at
the metal K and L-edge and the ligand K-edge. Much of this
experimental work and subsequent analysis has been reported
by Solomon and co-workers who have applied X-ray
absorption spectroscopy to a wide range of systems.3,95,96
Some of this work has been supplemented by quantum
chemical calculations led by the group of Neese.
Our work in this area has focused on the X-ray absorption
spectra of the oxidised form of blue copper proteins, such as
plastocyanin.26,97 These proteins are important in a number of
important biological processes, such as photosynthesis.98 The
active site of plastocyanin is shown in Fig. 9 and comprises a
copper centre coordinated with two histidine ligands, a
cysteine ligand and a methionine ligand. The structure of the
active site is characterised by a short Cu–S bond to cysteine
and a long Cu–S bond to methionine. The oxidised form of the
active site has a single occupied molecular orbital (SOMO)
that is an out-of-phase combination of the Cu 3dx2�y2 and
Scys3pp orbitals. Excitation of core electrons to this singly
occupied orbital appear as pre-edge features in the X-ray
absorption spectrum.
Table 6 shows computed core excitation energies to the
SOMO for the copper K and L-edges and the sulfur K-edge
with TDDFT and DKohn–Sham approaches. The calculations
use the geometry taken from the crystal structure (1PLC) and
the 6-311(2+,2+)G** basis set. Unfortunately, this basis set
is not available for copper, and the 6-31(2+,2+)G** basis set
was used for the copper atoms. The DKohn–Sham approach
gives core excitation energies that are in reasonable agreement
with experiment. However, the difference from experiment is
many electron volts, particularly for the excitations from
copper. In a recent study, it has been shown that using
uncontracted basis functions leads to a significant improve-
ment in core excitation energies computed within a
DKohn–Sham approach.26 For the K-edge excitations in
plastocyanin, uncontracting the basis functions does result in
an improvement in the calculated excitation energies and the
results are in quite good agreement with experiment. The
discrepancy for the Cu L-edge remains high. This is a result
of the neglect of the 2p core–hole spin–orbit interaction which
leads to two components.73 The experimental value quoted is
for the lower energy component of this excitation, and the
calculations correctly predict a value that lies between the two
components.
Now we consider the TDDFT calculations. Excitation
energies for the B3LYP functional are, as expected, much
lower than experiment. Due to its relatively high nuclear
charge, this is particularly true for the Cu(1s) excitation, where
an error of over 80 eV is observed. In contrast, the error for
the excitation from the Cu 2p orbital is much lower. The 2p
orbital of copper will be larger than the 1s orbital and can be
thought of as less ‘‘core-like’’. Following the overlap argu-
ments discussed in section II, there will be a greater overlap
between the 2p orbital and the single occupied orbital, and
consequently the failure of the B3LYP functional will be less
dramatic. This presents a further problem to finding a
universal exchange–correlation functional that can be applied
to all core excitations since a functional designed for K-edge
excitations is likely to fail for L-edge excitations. This is
illustrated by calculations with the SRC1 short-range
corrected functional. This functional predicts excitation
energies for the Cu and S K-edges that are in excellent
agreement with experiment. This is in some sense surprising
for the Cu(1s) excitation, since this type of excitation was not
present in the data that was used to parameterize the
functional.48 However, the excitation energy for the Cu-L
edge is too high and is further from experiment than the
calculation with the B3LYP functional.
For applications in bioinorganic chemistry accurate
predictions of the excitation energy is desirable, but often
the intensity of the transition is of more interest. From the
intensity it is possible to extract information about the nature
of the wavefunction of the SOMO. For blue copper proteins,
the intensity of the pre-edge feature at the S K-edge can inform
about the relative contribution of sulfur p orbital and copper d
orbital character in the SOMO.3 The SOMO in these proteins
is a mixture of copper d and sulfur p orbitals. Since the s - pFig. 9 Active site of plastocyanin.
Table 6 Computed core excitations energies in eV for plastocyanin
Excitation Exp.a TD-B3LYP TD-SRC1 B3LYP B3LYPb
Cu(1s) - SOMO 8978 8863 8978 8986 8980Cu(2p) - SOMO 931 929 947 946 936S(1s) - SOMO 2469 2417 2469 2465 2466
a Ref. 3, b Uncontracted basis functions.
12034 | Phys. Chem. Chem. Phys., 2010, 12, 12024–12039 This journal is �c the Owner Societies 2010
Dow
nloa
ded
by U
nive
rsity
of
Not
tingh
am o
n 01
Dec
embe
r 20
10Pu
blis
hed
on 2
3 Se
ptem
ber
2010
on
http
://pu
bs.r
sc.o
rg |
doi:1
0.10
39/C
0022
07A
View Online
transition is allowed and s - d is forbidden, the more intense
the pre-edge feature, the greater the p character in the orbital.
These intensities have been computed to be 0.0015 and 0.0011
for plastocyanin and the closely related blue copper protein
cucumber basic protein, respectively.97 This indicates that
there is a greater p orbital character in the SOMO for
plastocyanin. Fig. 10 shows molecular orbital pictures of the
SOMOs of plastocyanin and cucumber basic protein plotted at
the same contour surface. From these orbitals, the larger
sulfur p component for plastocyanin can be identified clearly.
Another application of X-ray absorption spectroscopy is
that it can identify different metal oxidation states. A systematic
study of Cu(II)/Cu(III) oxidation states for a range of
complexes showed that the feature arising from the Cu(1s)-
3d transition is approximately 2 eV higher for Cu(III)
compared to Cu(II).99 One of the complexes included in this
study was [CuIII(m-O)2(LTEED)2]2+/[CuII(m-OH)2(LTEED)2]
2+,
for which excitation energies of 8980.84 eV and 8978.82 eV for
the Cu(III) and Cu(II) complexes, respectively. Fig. 11 shows
closely related complexes in which the ethyl groups from
nitrogen have been replaced by methyl groups. TDDFT
calculations with the SRC1 functional in conjunction with
the 6-311G** basis set (6-31G* for copper) gives excitation
energies of 8979.6 eV and 8978.6 eV for Cu(III) and Cu(II). The
calculations predict correctly a higher excitation energy for
Cu(III) and reflect the lower energy of the Cu(1s) orbital in the
Cu(III) complex.
VI. X-ray emission spectroscopy
X-ray emission spectra are simulated by computing the
transition energy and the intensity, which is evaluated through
the transition dipole moment.100 The simplest approach to
computing the intensity is to evaluate the transition dipole
moment using the ground state orbitals, and this has
been shown to give a surprisingly good agreement with
experiment.2,101 A physically more realistic approach is to
use orbitals that account for the relaxation in the core-excited
state. These can be obtained through DKohn–Sham or
transition potential approaches. An illustration of this type
of approach is a recent study of the XES of manganese
coordination complexes.102 As with the case of NEXAFS,
for calculations of X-ray emission spectra that involve many
transitions, it would also be convenient to use approaches such
as TDDFT. To our knowledge, the application of TDDFT to
XES has not been explored previously. In order to use
TDDFT to study X-ray emission, we apply the TDDFT
methodology directly to a Kohn–Sham determinant with a
core hole generated using the MOM approach. This allows for
the relaxation of the orbitals in the presence of the core hole,
which has a significant effect on the computed emission
energy. The X-ray emission transitions appear as negative
eigenvalues. Since these excitations are the lowest energy roots
of the TDDFT of EOM-CCSD equations, there is no need to
limit the excitation subspace as required for NEXAFS calcu-
lations. A brief outline for the protocol for these calculations is
summarized as follows:
1. Perform a calculation on the neutral ground state
molecule.
2. Use the resulting molecular orbitals as the starting point
for a further Kohn–Sham SCF calculation on the cation with a
core hole in the relevant orbital, invoking MOM to prevent the
collapse of the core hole during the SCF process.
3. Perform a TDDFT calculation.
To use the ground state orbitals in the X-ray emission
calculations, the SCF optimization of the orbitals in step 2
can be bypassed. This protocol is not limited to TDDFT,
and similar calculations can be performed using CIS and
EOM-CCSD.
Table 7 shows X-ray emission energies computed using CIS,
CIS(D), EOM-CCSD, DSCF with the B3LYP exchange–
correlation functional and TDDFT with the BLYP, B3LYP
and SRC1 functionals. For these calculations the 6-311G**
basis set was used, and the calculations are performed using
the ground state structure optimized at the MP2/cc-pVTZ
level. The orbital labels describing the transition refer to the
ground state of the molecule and not those of the cation with a
core hole. The DKohn–Sham approach with the B3LYP
functional has a MAD of 0.6 eV. which represents a satis-
factory level of accuracy that is comparable to the accuracy
achieved with DKohn–Sham calculations of core excitations.26
Turning to the methods based on response theory, the MADs
for CIS and TDDFT are much higher, with errors of many
Fig. 10 Singly occupied molecular orbitals for plastocyanin (left) and
cucumber basic protein (right).
Fig. 11 Models of the [CuIII(m-O)2(LTEED)2]2+ and [CuII(m-OH)2-
(LTEED)2]2+ complexes.
This journal is �c the Owner Societies 2010 Phys. Chem. Chem. Phys., 2010, 12, 12024–12039 | 12035
Dow
nloa
ded
by U
nive
rsity
of
Not
tingh
am o
n 01
Dec
embe
r 20
10Pu
blis
hed
on 2
3 Se
ptem
ber
2010
on
http
://pu
bs.r
sc.o
rg |
doi:1
0.10
39/C
0022
07A
View Online
electron volts. The emission energies computed with CIS are
systematically underestimated, while those for TDDFT with
BLYP and B3LYP functionals are systematically too large.
The errors for TDDFT with the B3LYP functional are closer
to experiment than with the BLYP functional, but remain too
large. These results illustrate that X-ray emission energies
computed with TDDFT are also sensitive to the fraction of
HF exchange in the functional and indicate that the large
errors observed are associated with the self-interaction error.
However, in contrast to NEXAFS calculations, increasing the
fraction of HF exchange results in a decrease in the emission
energies. Application of the SRC1 functional that was para-
meterized for X-ray absorption does lead to an improvement
in the predicted emission energies. However, an overall MAD
of 3.0 eV remains too high and could certainly be improved by
direct parameterization on emission energies.
Also shown are results for correlated ab initio methods
CIS(D) and EOM-CCSD. The CIS(D) emission energies
are improved significantly with respect to CIS. The MAD
of 7.3 eV for CIS reduced to 1.1 eV. The most accurate
emission energies are predicted by EOM-CCSD with a
MAD of 0.5 eV. However, for this approach we have found
that it can be problematic to converge the CCSD calculation
for the wavefunction with a core hole. This has been discussed
in detail elsewhere, and practical solutions have been
described.16 Despite this current limitation, EOM-CCSD does
provide accurate X-ray emission energies where it can be
applied.
Table 7 Computed X-ray emission energies (in eV). Experimental data from ref. 103, 117–121
Excitation Exp. CIS CIS(D) EOM-CCSD DB3LYP TD-BLYP TD-B3LYP TD-SRC1
CH4 1t2 - 1a1 276.3 269.8 275.6 276.2 276.8 286.4 283.3 279.5C2H2 1pu - 1sg 278.9 272.6 280.5 279.7 280.4 289.5 286.2 282.1C2H2 3sg - 1sg 274.1 267.0 273.8 273.7 274.5 284.1 280.8 276.6CO 5s - 2s 282.0 279.6 281.4 282.7 282.9 292.9 290.3 286.9CO 1p - 2s 278.4 271.9 281.7 278.6 280.0 288.9 285.3 279.9CH3OH 2a0 0 - 2a0 281.2 271.6 278.9 280.0 282.0 291.7 287.4 282.0CH3OH 7a0 - 2a0 279.5 271.5 278.1 278.7 280.4 290.1 286.1 281.5CH3OH 6a0 - 2a0 277.4 268.5 277.8 276.6 278.0 287.5 284.1 279.8NH3 1e - 1a1 388.8 380.3 387.1 388.0 388.2 399.5 395.8 390.8NH3 2a1 - 1a1 395.1 389.7 394.6 395.6 395.3 406.3 403.0 399.0H2O 1b1 - 1a1 521.0 512.5 519.4 521.0 520.9 534.3 530.0 524.0H2O 3a1 - 1a1 525.1 518.2 524.2 525.4 525.0 538.2 534.3 528.9H2O 1b2 - 1a1 527.0 521.1 526.6 527.8 527.2 540.0 536.2 531.3CH3OH 2a0 0 - 1a0 527.8 521.0 527.4 528.0 528.2 541.3 536.7 531.5CH3OH 7a0 - 1a0 526.1 518.3 525.4 526.0 526.6 540.3 535.1 529.2CH3OH 6a0 - 1a0 523.9 513.0 522.3 522.7 524.1 537.9 532.4 525.0CH3F 5a1 - 1a1 675.6 667.1 675.4 674.9 675.5 691.7 686.1 679.2CH3F 2e - 1a1 678.6 671.1 678.0 678.4 679.5 696.1 689.5 682.7MADa — 7.3 1.1 0.5 0.6 12.2 8.1 3.0
a Mean absolute deviation.
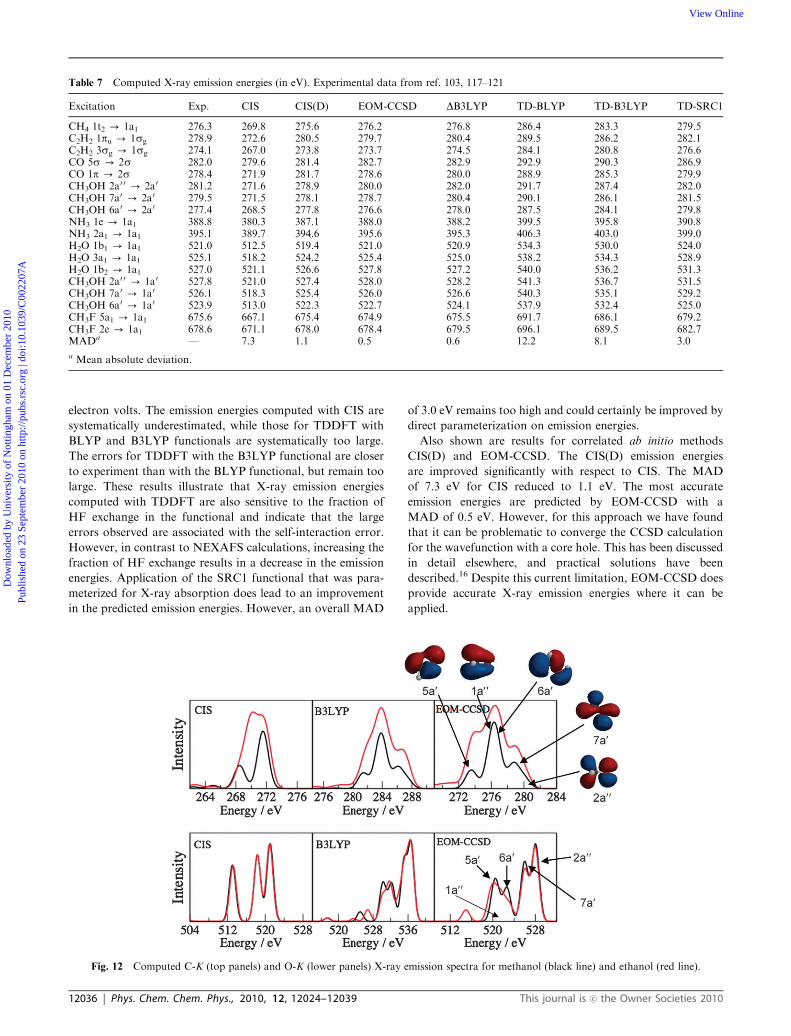
Fig. 12 Computed C-K (top panels) and O-K (lower panels) X-ray emission spectra for methanol (black line) and ethanol (red line).
12036 | Phys. Chem. Chem. Phys., 2010, 12, 12024–12039 This journal is �c the Owner Societies 2010
Dow
nloa
ded
by U
nive
rsity
of
Not
tingh
am o
n 01
Dec
embe
r 20
10Pu
blis
hed
on 2
3 Se
ptem
ber
2010
on
http
://pu
bs.r
sc.o
rg |
doi:1
0.10
39/C
0022
07A
View Online
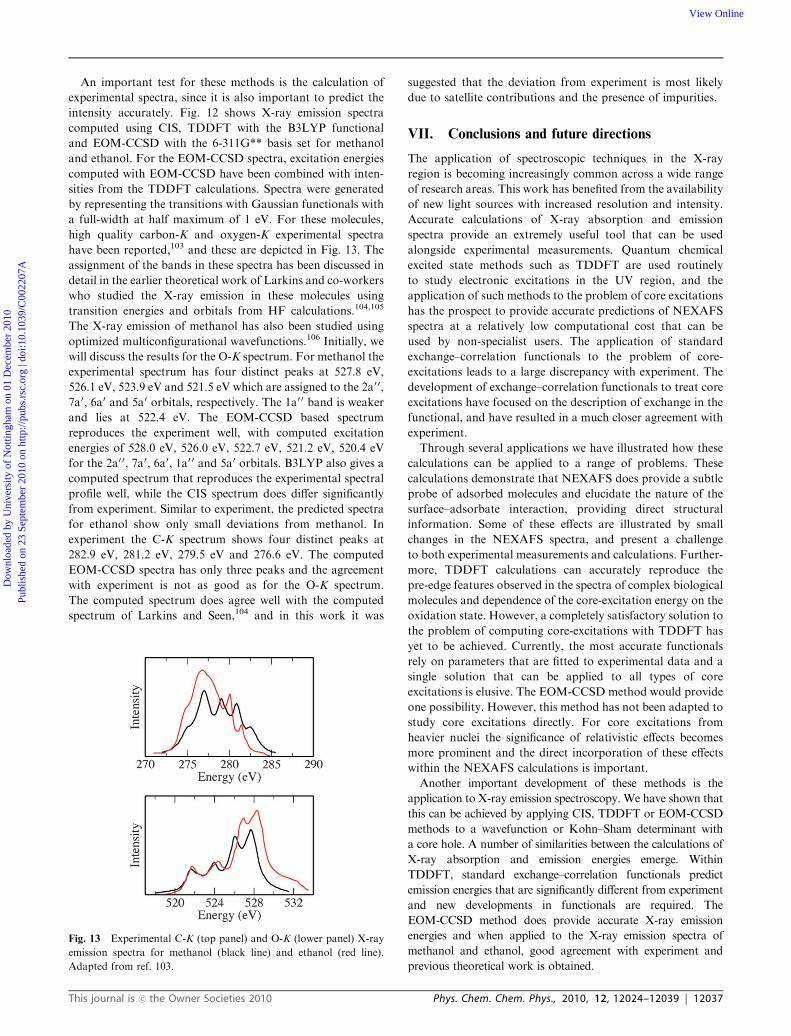
An important test for these methods is the calculation of
experimental spectra, since it is also important to predict the
intensity accurately. Fig. 12 shows X-ray emission spectra
computed using CIS, TDDFT with the B3LYP functional
and EOM-CCSD with the 6-311G** basis set for methanol
and ethanol. For the EOM-CCSD spectra, excitation energies
computed with EOM-CCSD have been combined with inten-
sities from the TDDFT calculations. Spectra were generated
by representing the transitions with Gaussian functionals with
a full-width at half maximum of 1 eV. For these molecules,
high quality carbon-K and oxygen-K experimental spectra
have been reported,103 and these are depicted in Fig. 13. The
assignment of the bands in these spectra has been discussed in
detail in the earlier theoretical work of Larkins and co-workers
who studied the X-ray emission in these molecules using
transition energies and orbitals from HF calculations.104,105
The X-ray emission of methanol has also been studied using
optimized multiconfigurational wavefunctions.106 Initially, we
will discuss the results for the O-K spectrum. For methanol the
experimental spectrum has four distinct peaks at 527.8 eV,
526.1 eV, 523.9 eV and 521.5 eV which are assigned to the 2a0 0,
7a0, 6a0 and 5a0 orbitals, respectively. The 1a0 0 band is weaker
and lies at 522.4 eV. The EOM-CCSD based spectrum
reproduces the experiment well, with computed excitation
energies of 528.0 eV, 526.0 eV, 522.7 eV, 521.2 eV, 520.4 eV
for the 2a0 0, 7a0, 6a0, 1a0 0 and 5a0 orbitals. B3LYP also gives a
computed spectrum that reproduces the experimental spectral
profile well, while the CIS spectrum does differ significantly
from experiment. Similar to experiment, the predicted spectra
for ethanol show only small deviations from methanol. In
experiment the C-K spectrum shows four distinct peaks at
282.9 eV, 281.2 eV, 279.5 eV and 276.6 eV. The computed
EOM-CCSD spectra has only three peaks and the agreement
with experiment is not as good as for the O-K spectrum.
The computed spectrum does agree well with the computed
spectrum of Larkins and Seen,104 and in this work it was
suggested that the deviation from experiment is most likely
due to satellite contributions and the presence of impurities.
VII. Conclusions and future directions
The application of spectroscopic techniques in the X-ray
region is becoming increasingly common across a wide range
of research areas. This work has benefited from the availability
of new light sources with increased resolution and intensity.
Accurate calculations of X-ray absorption and emission
spectra provide an extremely useful tool that can be used
alongside experimental measurements. Quantum chemical
excited state methods such as TDDFT are used routinely
to study electronic excitations in the UV region, and the
application of such methods to the problem of core excitations
has the prospect to provide accurate predictions of NEXAFS
spectra at a relatively low computational cost that can be
used by non-specialist users. The application of standard
exchange–correlation functionals to the problem of core-
excitations leads to a large discrepancy with experiment. The
development of exchange–correlation functionals to treat core
excitations have focused on the description of exchange in the
functional, and have resulted in a much closer agreement with
experiment.
Through several applications we have illustrated how these
calculations can be applied to a range of problems. These
calculations demonstrate that NEXAFS does provide a subtle
probe of adsorbed molecules and elucidate the nature of the
surface–adsorbate interaction, providing direct structural
information. Some of these effects are illustrated by small
changes in the NEXAFS spectra, and present a challenge
to both experimental measurements and calculations. Further-
more, TDDFT calculations can accurately reproduce the
pre-edge features observed in the spectra of complex biological
molecules and dependence of the core-excitation energy on the
oxidation state. However, a completely satisfactory solution to
the problem of computing core-excitations with TDDFT has
yet to be achieved. Currently, the most accurate functionals
rely on parameters that are fitted to experimental data and a
single solution that can be applied to all types of core
excitations is elusive. The EOM-CCSD method would provide
one possibility. However, this method has not been adapted to
study core excitations directly. For core excitations from
heavier nuclei the significance of relativistic effects becomes
more prominent and the direct incorporation of these effects
within the NEXAFS calculations is important.
Another important development of these methods is the
application to X-ray emission spectroscopy. We have shown that
this can be achieved by applying CIS, TDDFT or EOM-CCSD
methods to a wavefunction or Kohn–Sham determinant with
a core hole. A number of similarities between the calculations of
X-ray absorption and emission energies emerge. Within
TDDFT, standard exchange–correlation functionals predict
emission energies that are significantly different from experiment
and new developments in functionals are required. The
EOM-CCSD method does provide accurate X-ray emission
energies and when applied to the X-ray emission spectra of
methanol and ethanol, good agreement with experiment and
previous theoretical work is obtained.
Fig. 13 Experimental C-K (top panel) and O-K (lower panel) X-ray
emission spectra for methanol (black line) and ethanol (red line).
Adapted from ref. 103.
This journal is �c the Owner Societies 2010 Phys. Chem. Chem. Phys., 2010, 12, 12024–12039 | 12037
Dow
nloa
ded
by U
nive
rsity
of
Not
tingh
am o
n 01
Dec
embe
r 20
10Pu
blis
hed
on 2
3 Se
ptem
ber
2010
on
http
://pu
bs.r
sc.o
rg |
doi:1
0.10
39/C
0022
07A
View Online
This review has described the current state of the art in
quantum chemical calculations of X-ray absorption and X-ray
emission spectra, illustrating what can be achieved and
highlighting current deficiencies and areas for further
development. Many of these methods are available in modern
quantum chemical packages and we hope this review will
provide a catalyst for interested researchers to use them in
their own research.
Acknowledgements
FAA would like to acknowledge the Papua Government for a
PhD studentship grant. The authors are also grateful to the
University of Nottingham for access to its high performance
computing facility.
References
1 J. Stohr, NEXAFS Spectroscopy, Springer Series in SurfaceScience, Springer, Heidelberg, 1996.
2 A. Nilsson and L. G. M. Pettersson, Surf. Sci. Rep., 2004, 55, 49.3 E. I. Solomon, R. K. Szilagyi, S. D. George and L. Basumallick,Chem. Rev., 2004, 104, 419.
4 J. E. Penner-Hahn, Coord. Chem. Rev., 2005, 249, 161.5 J. Yano and V. K. Yachandra, Photosynth. Res., 2009, 102, 241.6 G. Hahner, Chem. Soc. Rev., 2006, 35, 1244.7 P. Wernat, D. Nordlund, U. Bergmann, M. Cavalleri,H. Ogasawara, L. A. Naslund, T. K. Hirsch, L. Ojamae,P. Glatzel, L. G. M. Pettersson and A. Nilsson, Science, 2004,304, 995.
8 T. Tokushima, Y. Harada, O. Takahashi, Y. Senba, H. Ohashi,L. G. M. Pettersson, A. Nilsson and S. Shin, Chem. Phys. Lett.,2008, 460, 387.
9 W. J. Hunt and W. A. Goddard III, Chem. Phys. Lett., 1969, 3,414.
10 H. Agren, V. Carravetta, O. Vahtras and L. G. M. Pettersson,Chem. Phys. Lett., 1994, 222, 75.
11 H. Agren, V. Carravetta, O. Vahtras and L. G. M. Pettersson,Theor. Chem. Acta, 1997, 97, 14.
12 A. Stener, M. Lisini and P. Decleva, Chem. Phys., 1995, 191, 141.13 L. Triguero, L. G. M. Pettersson and H. Agren, Phys. Rev. B:
Condens. Matter Mater. Phys., 1998, 58, 8097.14 M. Nyberg, Y. Luo, L. Triguero and L. G. M. Pettersson, Phys.
Rev. B: Condens. Matter Mater. Phys., 1999, 60, 7956.15 J. J. Rehr and A. L. Ankudinov, Coord. Chem. Rev., 2005, 249, 131.16 M. Nooijen and R. J. Bartlett, J. Chem. Phys., 1995, 102, 6735.17 K. Ueda, M. Hoshino, T. Tanaka, M. Kitajima, H. Tanaka,
A. De Fanis, Y. Tamenori, M. Ehara, F. Oyagi, K. Kuramotoand H. Nakatsuji, Phys. Rev. Lett., 2005, 94, 243004.
18 K. Kuramoto, M. Ehara, H. Nakatsuji, M. Kitajima, H. Tanaka,A. De Fanis, Y. Tamenori and K. Ueda, J. Electron Spectrosc.Relat. Phenom., 2005, 142, 253.
19 K. Kuramoto, M. Ehara and H. Nakatsuji, J. Chem. Phys., 2005,122, 014304.
20 M. Ehara, H. Nakatsuji, M. Matsumoto, T. Hatamoto, X.-J. Liu,T. Lischke, G. Prumper, T. Tanaka, C. Makochekanwa,M. Hoshino, H. Tanaka, J. R. Harries, Y. Tamenori andK. Ueda, J. Chem. Phys., 2006, 124, 124311.
21 T. Tanaka, K. Ueda, R. Feifel, L. Karlsson, H. Tanaka,M. Hoshino, M. Kitajima, M. Ehara, R. Fukuda, R. Tamakiand H. Nakatsuji, Chem. Phys. Lett., 2007, 435, 182.
22 P. S. Bagus, Phys. Rev., 1965, 139, A619.23 H. Hsu, E. R. Davidson and R. M. Pitzer, J. Chem. Phys., 1976,
65, 609.24 A. Naves de Brito, N. Correla, S. Svensson and H. Agren,
J. Chem. Phys., 1991, 95, 2965.25 A. T. B. Gilbert, N. A. Besley and P. M. W. Gill, J. Phys. Chem.
A, 2008, 112, 13164.26 N. A. Besley, A. T. B. Gilbert and P. M. W. Gill, J. Chem. Phys.,
2009, 130, 124308.
27 A. Dreuw and M. Head-Gordon, Chem. Rev., 2005, 105, 4009.28 S. Hirata and M. Head-Gordon, Chem. Phys. Lett., 1999, 314,
291.29 M. Stener, G. Fronzoni and M. de Simone, Chem. Phys. Lett.,
2003, 373, 115.30 N. A. Besley and A. Noble, J. Phys. Chem. C, 2007, 111, 3333.31 S. D. George, T. Petrenko and F. Neese, Inorg. Chim. Acta, 2008,
361, 965.32 F. A. Asmuruf and N. A. Besley, J. Chem. Phys., 2008, 129,
064705.33 T. Tsuchimochi, M. Kobayashi, A. Nakata, Y. Imamura and
H. Nakai, J. Comput. Chem., 2008, 29, 2311.34 U. Ekstrom and P. Norman, Phys. Rev. A: At., Mol., Opt. Phys.,
2006, 74, 042722.35 U. Ekstrom, P. Norman, V. Carravetta and H. Agren, Phys. Rev.
Lett., 2006, 97, 143001.36 Y. Imamura, T. Otsuka and H. Nakai, J. Comput. Chem., 2007,
28, 2067.37 A. Nakata, Y. Imamura, T. Ostuka and H. Nakai, J. Chem.
Phys., 2006, 124, 094105.38 A. Nakata, Y. Imamura and H. Nakai, J. Chem. Phys., 2006, 125,
064109.39 A. Nakata, Y. Imamura and H. Nakai, J. Chem. Theory Comput.,
2007, 3, 1295.40 G. Tu, Z. Rinkevicius, O. Vahtras, H. Agren, U. Ekstrom,
P. Norman, V. Carravetta, U. Elkstrom and P. Norman, Phys.Rev. A: At., Mol., Opt. Phys., 2007, 76, 022506.
41 Y. Imamura and H. Nakai, Int. J. Quantum Chem., 2007, 107, 23.42 J.-W. Song, M. A. Watson, A. Nakata and K. Hirao, J. Chem.
Phys., 2008, 129, 184113.43 A. Dreuw, J. Weisman and M. Head-Gordon, J. Chem. Phys.,
2003, 119, 2943.44 M. J. G. Peach, P. Benfield, T. Helgaker and D. J. Tozer, J. Chem.
Phys., 2008, 128, 044118.45 G. Fronzoni, R. De Francesco and M. Stener, J. Phys. Chem. B,
2005, 109, 10332.46 G. Fronzoni, R. De Francesco and M. Stener, J. Phys. Chem. B,
2006, 110, 9899.47 Y. Imamura and H. Nakai, Chem. Phys. Lett., 2006, 419, 297.48 N. A. Besley, M. J. G. Peach and D. J. Tozer, Phys. Chem. Chem.
Phys., 2009, 11, 10350.49 A. D. Becke, Phys. Rev. A: At., Mol., Opt. Phys., 1988, 38, 3098.50 P. A. M. Dirac, Proc. Cam. Phil. Soc., 1930, 26, 376.51 C. Lee, W. Yang and R. G. Parr, Phys. Rev. B: Condens. Matter,
1988, 37, 785.52 S. H. Vosko, L. Wilk and M. Nusair, Can. J. Phys., 1980, 58,
1200.53 Y. Tawada, T. Tsuneda, S. Yanagisawa, T. Yanai and K. Hirao,
J. Chem. Phys., 2004, 120, 8425.54 T. Yanai, D. P. Tew and N. C. Handy, Chem. Phys. Lett., 2004,
393, 51.55 M. J. G. Peach, A. J. Cohen and D. J. Tozer, Phys. Chem. Chem.
Phys., 2006, 8, 4543.56 J.-D. Chai and M. Head-Gordon, J. Chem. Phys., 2008, 128,
084106.57 J.-D. Chai and M. Head-Gordon, Chem. Phys. Lett., 2008, 467,
176.58 M. A. Rohrdanz, K. M. Martins and J. M. Herbert, J. Chem.
Phys., 2009, 130, 054112.59 J.-W. Song, S. Tokura, T. Sato, M. A. Watson and K. Hirao,
J. Chem. Phys., 2007, 127, 154109.60 J.-W. Song, T. Hirosawa, T. Tsuneda and K. Hirao, J. Chem.
Phys., 2007, 126, 154105.61 Y. Shao, L. F. Molnar, Y. Jung, J. Kussmann, C. Ochsenfeld,
S. T. Brown, A. T. B. Gilbert, L. V. Slipchenko, S. V. Levchenko,D. P. O’Neill, R. A. Di Stasio Jr, R. C. Lochan, T. Wang,G. J. O. Beran, N. A. Besley, J. M. Herbert, C. Y. Lin,T. V. Voorhis, S.-H. Chien, A. Sodt, R. P. Steele,V. A. Rassolov, P. E. Maslen, P. P. Korambath,R. D. Adamson, B. Austin, J. Baker, E. F. C. Byrd,H. Dachsel, R. J. Doerksen, A. Dreuw, B. D. Dunietz,A. D. Dutoi, T. R. Furlani, S. R. Gwaltney, A. Heyden,S. Hirata, C.-P. Hsu, G. Kedziora, R. Z. Khalliulin,P. Klunzinger, A. M. Lee, M. S. Lee, W. Liang, I. Lotan,N. Nair, B. Peters, E. I. Proynov, P. A. Pieniazek, Y. M. Rhee,
12038 | Phys. Chem. Chem. Phys., 2010, 12, 12024–12039 This journal is �c the Owner Societies 2010
Dow
nloa
ded
by U
nive
rsity
of
Not
tingh
am o
n 01
Dec
embe
r 20
10Pu
blis
hed
on 2
3 Se
ptem
ber
2010
on
http
://pu
bs.r
sc.o
rg |
doi:1
0.10
39/C
0022
07A
View Online
J. Ritchie, E. Rosta, C. D. Sherrill, A. C. Simmonett,J. E. Subotnik, H. L. Woodcock III, W. Zhang, A. T. Bell,A. K. Chakraborty, D. M. Chipman, F. J. Keil, A. Warshel,W. J. Hehre, H. F. Schaefer III, J. Kong, A. I. Krylov,P. M. W. Gill and M. Head-Gordon, Phys. Chem. Chem. Phys.,2006, 8, 3172.
62 F. A. Asmuruf and N. A. Besley, Chem. Phys. Lett., 2008, 463,267.
63 M. Head-Gordon, R. J. Rico, M. Oumi and T. J. Lee, Chem.Phys. Lett., 1994, 219, 21.
64 M. Head-Gordon, D. Maurice and M. Oumi, Chem. Phys. Lett.,1995, 246, 114.
65 Y. M. Rhee and M. Head-Gordon, J. Phys. Chem. A, 2007, 111,5314.
66 S. Grimme, J. Chem. Phys., 2003, 118, 9095.67 S. Grimme and E. I. Izgorodina, Chem. Phys., 2004, 305, 223.68 M. Reiher and A. Wolf, J. Chem. Phys., 2004, 121, 2037.69 MOLPRO, version 2006.1, a package of ab initio programs,
H.-J. P. Werner, P. J. Knowles, R. Lindh, F. R. Manby,M. Schutz, P. Celani, T. Korona, G. Rauhut, R. D. Amos,A. Bernhardsson, A. Berning, D. L. Cooper, M. J. O. Deegan,A. J. Dobbyn, F. Eckert, C. Hampel, G. Hetzer, A. W. Lloyd,S. J. McNicholas, W. Meyer, M. E. Mura, A. Nicklass,P. Palmieri, R. Pitzer, U. Schumann, H. Stoll, A. J. Stone,R. Tarroni and T. Thorsteinsson.
70 E. van Lenthe, E. J. Baerends and J. G. Snijders, J. Chem. Phys.,1993, 99, 4597.
71 E. van Lenthe, E. J. Baerends and J. G. Snijders, J. Chem. Phys.,1994, 101, 9783.
72 U. Ekstrom, P. Norman and V. Carravetta, Phys. Rev. A: At.,Mol., Opt. Phys., 2006, 73, 022501.
73 S. J. George, M. D. Lowery, E. I. Solomon and S. P. Cramer,J. Am. Chem. Soc., 1993, 115, 2968.
74 J. A. Horsley, J. Stohr, A. P. Hitchcock, D. A. Newbury,A. L. Johnson and F. Sette, J. Chem. Phys., 1985, 83, 6099.
75 A. C. Liu, J. Stohr, C. M. Friend and R. J. Madix, Surf. Sci.,1990, 235, 107.
76 A. C. Liu, C. M. Friend and J. Stohr, Surf. Sci., 1990, 236, L349.77 K. Weiss, S. Gerbert, M. Wuhn, H. Wadepohl and Ch. Woll,
J. Vac. Sci. Technol., A, 1998, 16, 1017.78 Ch. Woll, J. Synchrotron Radiat., 2001, 8, 129.79 E. E. Rennie, B. Kempgens, H. M. Koppe, U. Hergenhahn,
J. Feldhaus, B. S. Itchkawitz, A. L. D. Kilcoyne, A. Kivimaki,K. Maier, M. N. Piancastelli, M. Polcik, A. Rudel andA. M. Bradshaw, J. Chem. Phys., 2000, 113, 7362.
80 R. Puttner, C. Kolczewski, M. M. Martins, A. S. Schlacter,G. Snell, M. Sant’Anna, M. Viefhaus, K. Hermann andG. Kaindl, Chem. Phys. Lett., 2004, 393, 361.
81 C. Kolczewski, R. Puttner, M. Martins, A. S. Schlacter, G. Snell,M. Sant’ Anna, K. Hermann and G. Kaindl, J. Chem. Phys.,2006, 124, 034302.
82 W. H. E. Schwarz, T. C. Chang, U. Seeger and K. H. Hwang,Chem. Phys., 1987, 117, 73.
83 D. J. Tozer and N. C. Handy, Chem. Phys., 1998, 109, 10180.84 N. A. Besley, Chem. Phys., 2005, 122, 184706.85 J. Chen, M. A. Reed, A. M. Rawlett and J. M. Tour, Science,
1999, 286, 1550.86 F. Matsui, H. W. Yeom, A. Imanishi, K. Isawa, I. Matsuda and
T. Ohta, Surf. Sci., 1998, 401, L413.87 F. Matsui, H. W. Yeom, I. Matsuda and T. Ohta, Phys. Rev. B:
Condens. Matter Mater. Phys., 2000, 62, 5036.88 F. Hennies, A. Fohlisch, W. Wurth, N. Witkowski, M. Nagasono
and M. N. Piancastelli, Surf. Sci., 2003, 529, 144.89 A. Pietzsch, F. Hennies, A. Fohlisch, W. Wurth, M. Nagasono,
N. Witkowski and M. N. Piancastelli, Surf. Sci., 2004, 562, 65.90 M. J. Kong, A. V. Teplyakov, J. G. Lyubovitsky and S. F. Bent,
Surf. Sci., 1998, 411, 286.
91 N. Witkowski, F. Hennies, A. Pietzsch, S. Mattsson, A. Fohlisch,W. Wurth, M. Nagasono and M. N. Piancastelli, Phys. Rev. B:Condens. Matter Mater. Phys., 2003, 68, 115408.
92 F. A. Asmuruf and N. A. Besley, Surf. Sci., 2009, 603, 158.93 K. Newstead, A. W. Robinson, S. d’Addato, A. Patchett,
N. P. Prince, R. McGrath, R. Whittle, E. Dudzik andI. T. McGovern, Surf. Sci., 1993, 287–288, 317.
94 A. Hoffmann, G. Comtet, L. Hellner, G. Dujardin andM. Petravic, Appl. Phys. Lett., 1998, 73, 1152.
95 T. Glaser, B. Hedman, K. O. Hodgson and E. I. Solomon, Acc.Chem. Res., 2000, 33, 859.
96 K. Ray, DeBeer, S. George, K. I. Solomon, K. Wieghardt andF. Neese, Acc. Chem. Res., 2007, 13, 2783.
97 D. Robinson and N. A. Besley, Phys. Chem. Chem. Phys., 2010,DOI: 10.1039/C001805H.
98 H. B. Gray and E. I. Solomon, Copper Proteins, ed. T. G. Spiro,Wiley, New York, 1981.
99 J. L. DuBois, P. M. Mukherjee, T. D. P. Stack, B. Hedman,E. I. Solomon and K. O. Hodgson, J. Am. Chem. Soc., 2000, 122,5775.
100 T. Mukoyama, Spectrochim. Acta, Part B, 2004, 59, 1107.101 L. Triguero, L. G. M. Pettersson and H. Agren, J. Phys. Chem.,
1998, 102, 10599.102 G. Smolentsev, A. V. Soldatov, J. Messinger, K. Merz,
Weyhermuller, U. Bergmann, Y. Pushkar, J. Yani, V. K.Yachandra and P. Glatzel, J. Am. Chem. Soc., 2009, 131, 13161.
103 J. E. Rubensson, N. Wassdahl, R. Brammer and J. Nordgren,J. Electron Spectrosc. Relat. Phenom., 1988, 47, 131.
104 F. P. Larkins and A. J. Seen, Phys. Scr., 1990, 41, 827.105 A. J. Seen and F. P. Larkins, J. Phys. B: At., Mol. Opt. Phys.,
1992, 25, 4811.106 H. Agren and A. Flores-Riveros, J. Electron Spectrosc. Relat.
Phenom., 1991, 56, 259.107 M. Tronc, G. C. King and F. H. Read, J. Phys. B: At. Mol. Phys.,
1979, 12, 137.108 M. Tronc, G. C. King and F. H. Read, J. Phys. B: At. Mol. Phys.,
1980, 13, 999.109 A. P. Hitchcock and C. E. Brion, J. Phys. B: At. Mol. Phys., 1981,
14, 4399.110 C. T. Chen, Y. Ma and F. Sette, Phys. Rev. A: At., Mol., Opt.
Phys., 1989, 40, 6737.111 M. Domke, C. Xue, A. Puschmann, T. Mandel, E. Hudson,
D. A. Shirley and G. Kaindl, Chem. Phys. Lett., 1990, 173, 122.112 Y. Ma, C. T. Chen, G. Meigis, K. Randall and F. Sette, Phys.
Rev. A: At., Mol., Opt. Phys., 1991, 44, 2848.113 G. Remmers, M. Domke, A. Puschmann, T. Mandel, C. Xue,
G. Kaindl, E. Hudson and D. A. Shirley, Phys. Rev. A: At., Mol.,Opt. Phys., 1992, 46, 3935.
114 J. T. Francis, C. Enkvist, S. Lunell and A. P. Hitchcock, Can. J.Phys., 1994, 72, 879.
115 R. Puttner, I. Dominguez, T. J. Morgan, C. Cisneros, R. F. Fink,E. Rotenberg, T. Warwick, M. Domke, G. Kaindl andA. S. Schlachter, Phys. Rev. A: At., Mol., Opt. Phys., 1999, 59,3415.
116 J. Adachi, N. Kosugi, E. Shigemasa and A. Yagishita, Chem.Phys. Lett., 1999, 309, 427.
117 P. Glans, R. E. La Villa, Y. Luo, H. Agren and J. Nordgren,J. Phys. B: At., Mol. Opt. Phys., 1994, 27, 3399.
118 J. Nordgren, H. Agren, L. O. Werne, C. Nordling andK. Siegbahn, J. Phys. B: At. Mol. Phys., 1976, 9, 295.
119 R. Brammer, J.-E. Rubensson, N. Wassdahl and J. Nordgren,Phys. Scr., 1987, 36, 262.
120 P. Skytt, P. Glans, K. Gunnelin, J. Guo, J. Nordgren, Y. Luo andH. Agren, Phys. Rev. A: At., Mol., Opt. Phys., 1997, 55, 134.
121 S. Kashtanov, A. Augustsson, Y. Luo, J.-L. Guo, C. Sathe,J. E. Rubensson, H. Siegbahn, J. Nordgren and H. Agren, Phys.Rev. B: Condens. Matter Mater. Phys., 2004, 69, 024201.
This journal is �c the Owner Societies 2010 Phys. Chem. Chem. Phys., 2010, 12, 12024–12039 | 12039
Dow
nloa
ded
by U
nive
rsity
of
Not
tingh
am o
n 01
Dec
embe
r 20
10Pu
blis
hed
on 2
3 Se
ptem
ber
2010
on
http
://pu
bs.r
sc.o
rg |
doi:1
0.10
39/C
0022
07A
View Online