A well‑trained artificial neural network for predicting ... - Nature

ORIGINAL ARTICLE
Time course responses of serum GH, insulin, IGF-1, IGFBP1,and IGFBP3 concentrations after heavy resistance exercisein trained and untrained men
Shirin Hasani-Ranjbar • Ehsan Soleymani Far •
Ramin Heshmat • Hamid Rajabi • Hassan Kosari
Received: 14 May 2011 / Accepted: 24 August 2011
� Springer Science+Business Media, LLC 2011
Abstract To investigate the effect of heavy resistance
exercise on IGF-1 system, 19 healthy trained men and 15
healthy untrained men volunteered to participate in this
study. The subjects were randomly divided into experi-
mental and control groups. Subjects of experimental groups
were forced to perform a heavy resistance exercise with the
intensity of 70–80% of 1RM in selected movements. The
blood samples were taken from all subjects four times;
before (T1), immediately after (T2), 5 (T3), and 8 (T4)
hours after exercise. Analysis of data showed that a session
of heavy resistance exercise induced significant increase in
GH at T2 (P \ 0.05) and a significant decrease in insulin at
T4 (P \ 0.05) and a significant decrease in IGFBP3 at T4
(P \ 0.05) in trained group. In untrained group, no sig-
nificant change in any of the variables was observed.
However, the procedure of response in variables was
almost similar in two experimental groups. Although, the
exercise did not appreciably affect IGF-1 levels, it
decreased in all groups at length of time after exercise. In
addition, the exercise did not have any notable effect on
IGFBP1 levels over time. In conclusion, the findings of this
study indicate that the intense resistance exercise can lead
to changes in blood concentrations of IGF-1 system
components which are observable in blood circulation over
time and the amounts of changes depend on subjects’ fit-
ness levels and exercise variables.
Keywords GH � Insulin � IGF-1 � IGFBP1 � IGFBP3 �Heavy resistance exercise
Introduction
Insulin-like growth factor 1 (IGF-1) is the most important
member of Somatomedin family that plays a major role in
somatic growth and cellular proliferation, differentiation,
metabolism, and survival [1]. IGF-1 has been the subjects
of many researches, mostly because of its pivotal roles in
metabolic processes and growth [2]. Effect of exercise on
IGF-1 system is one aspect that has been investigated by
many researchers [3–6]. Though, few studies showed
concern in studying the response of IGF-1 system to
resistance exercise [7, 8]. Bermon et al. [7] examined the
impact of a single session of resistance exercise on the
levels of IGF-1 in elderly subjects, and found an increase in
IGF-1 concentrations after exercise with no significant
change in insulin-like growth factor binding protein-3
(IGFBP3) levels. Indeed 8 weeks training period on the
same study population caused a sustained release of IGF-1
in the aging subjects regardless of their training status. It
has been stated by many studies that alteration of IGF-1
components levels is the result of performing both exercise
and training session [3, 4, 7, 9]. However this idea, espe-
cially in concept of resistance exercise and training, has
been challenged by some investigators [8, 10]. In this
regard, Nindl et al. [8] performed a 13 h monitoring of
individual components of the IGF-I system, including total
and free IGF-I, IGFBP-2 and -3, and the acid-labile subunit
S. Hasani-Ranjbar (&) � R. Heshmat
Endocrinology & Metabolism Research Institute, Tehran
University of Medical Sciences, 5th Floor, Shariati Hospital,
North Kargar Ave., 14114 Tehran, Iran
e-mail: [email protected]; [email protected]
E. Soleymani Far � H. Rajabi
Physical Education & Sport Sciences, Tarbiat Moallem
University, Tehran, Iran
H. Kosari
Physical Education & Sport Sciences, Payamnoor University,
Tehran, Iran
Endocrine
DOI 10.1007/s12020-011-9537-3

(ALS), in ten young men after a high-volume, multi-set
exercise session and found that heavy resistance exercise
might rather change the partitioning of IGF-I among its
family of binding proteins instead of changing the absolute
amount of IGF-I. It is not clear yet whether resistance
exercises, as a single stimulus, is able to considerably
affect the IGF-1 system, and also whether resistance
training can make a long-term adjustment in levels of
IGF-1 system. Studying the time course of changes in
different components of IGF-1 in response to exercise by
few researchers has given us valuable information [3, 4, 6,
11, 12] including identification of recovery period, adap-
tation mode, direction and the possible shapes of answers
and changes in this system. This study aimed at evaluating
the time-course responses of serum GH, insulin, IGF-1,
IGFBP1, and IGFBP3 concentrations after heavy resistance
exercise in trained and untrained men. Since IGF1 is an
anabolic hormone, it is reasonable to expect more response
in acute and chronic resistance exercise in comparison to
other exercises. Considering this assumption resistance
exercise protocol was chosen for this research.
Methodology
Study design
Among volunteers, who were informed by flyers, 34 young
male students of Tarbiat Moallem University were selected.
The information regarding life style, past medical history,
and physical activity of the volunteers were obtained by a
questionnaire. Only the male subjects with an age range
between 20 and 30 years were included in the study [13].
The exclusion criteria were defined as: smoking (current or
previous), cardiovascular, metabolic, and musculoskeletal
disorders, and taking any medication and supplements.
Based on the training status of the participants, they were
divided into two groups. The trained group was composed
of physical education students who were on a regular
resistance training program for at least 2 h, three times per
week over the last 10 months. Untrained group was non
physical education students without any regular exercise
programs for the last 10 months. Based on this classifica-
tion, trained and untrained groups consisted of 15 and 19
students, respectively. Approval was obtained from the
Ethics Committee of Endocrinology and Metabolism
Research Center of Tehran University of Medical Science.
All the participants signed a written consent form. The
study was designed as an interventional study in which the
data was obtained both at baseline (pre-test) and at several
time points after the intervention (post-test).
At the day of test, the students arrived at the physical
activity room before 7.30 a.m and stayed till 7 p.m. After
serving breakfast body weight and height were measured.
Body mass index was calculated by dividing body weight
(kg)/height (meters squared). The first blood sample was
drawn before starting the training program (pre-test).
Afterward, the individuals of each trained and untrained
groups were randomly divided to experimental and control
groups. Therefore, the trained group was divided to
experimental trained group (E1, N = 10) and control
trained group (C1, N = 9). The untrained group also was
divided into experimental untrained group (E2, N = 8) and
control untrained group (C2, N = 7).
Exercise protocol
Resistance exercise was contained of work with weights of
70–80% maximum strength for selected movements (in
this order: chest press, stretch wire, front leg with device,
and back leg with device) in that every move was per-
formed in four consecutive sets and repeated to the extent
of disability in repetition. 70–80% of One Repetition
Maximum (1RM) was calculated by the 1RM% estimate
table, from the number frequency of one selected weights
in one time to the extent of disability to repeat it, if the
number of repetitions do not exceed 10–12 times [8, 14].
Total activity time was approximately 60 min for each
subject. It was ideal to perform routine resistance exercise
protocol for all subjects, however, since doing these heavy
movements by untrained group was impractical we chan-
ged the protocol as follows: recovery time between sets
was 2 min and between exercises was 4 min.
Data collection
At the day of the test, all the subjects consumed similar
meal as breakfast (at 7:30–8:00 a.m). Two hours after
breakfast (at 10:00 a.m) first sampling (pre-test) was per-
formed for all the participants (T1). In both E1 and E2
groups, heavy resistance exercises were performed for 3 h
while the C1 and C2 were in sitting or standing position
without any additional exercise like movements. The sec-
ond blood sampling was immediately after completion of
the exercise session (T2). It should be noted that because
we could not engage all the subjects of E1 and E2 groups
simultaneously in exercise test, and also because the order
of movements performance by the subjects should be
equal, we had to test the subjects two by two. Since, the
training session was long and the time interval could affect
the results of the study, subjects were arranged in resistance
exercise in the same manner that they had been first par-
ticipated, and then were treated by the same order in all
stages of sampling. After the second sampling (T2), the
launch was served and then the five (17:00 p.m) and eight
(20:00 p.m) hours post exercise sampling (T3 and T4
Endocrine

respectively) were performed. All research variables
including GH, insulin, IGF1, IGFBP1, and IGFBP3 were
measured in all four samples.
Research variables
Insulin (Co. DRG), Growth Hormon (GH), total IGF-1,
IGFBP1, and IGFBP3 (all from Co. Mediagnost) were
measured by ELISA. Coefficients of variations for vari-
ables (CV) for all the variables were less than 6.7%.
Statistical analysis
The statistical tests were performed using the SPSS sta-
tistical package version 16 (Chicago, IL, USA). To test
data distribution for each variable, Kolmogrov–Smirnov
test was used. The nonparametric test was used for non-
normal distributed data. To evaluate the between groups
differences of each variable at base line and after training
session ANOVA test was used. Bonferroni test was applied
in case of detecting significant effect. For non-normal
distributed variables, the Friedman test was used to com-
pare over time changes and in case of being significant,
Wilcoxon test, as post hoc test, was used. For comparing
between groups variables the Kruskal–Wallis test was used
and in case of significancy, Mann–Whitney as post hoc test
was used. Significant level was considered at P B 0.05
level.
Results
Base line
The baseline clinical and metabolic markers of four groups
are presented in Table 1. The four groups had similar BMI
however the mean age of C2 individuals were significantly
higher compared to other three groups. Analysis of bio-
chemical parameter at base line revealed any significant
difference in serum concentrations of pre-exercise vari-
ables between trained and untrained groups.
GH
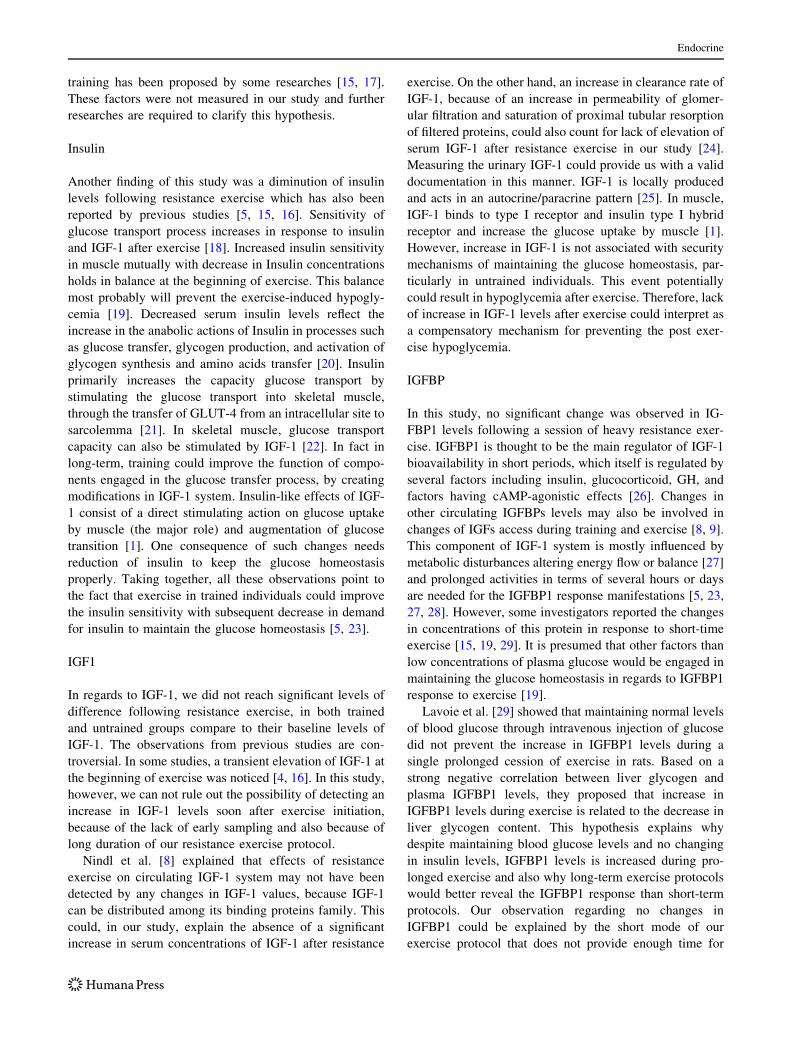
As shown in Fig. 1a and Table 2, in group E1, GH values
started to increase after initiating the exercise and reached
to its highest and significant levels at T2 (P B 0.05) and
then returned to basal levels at T3 and stayed stable till
last measurement (T4). In all other three groups, the GH
levels stayed almost without changes over all the time
points measured in this study, however, the changes in GH
levels were more prominent in E2 group compared to
other two groups (C1 and C2), thought this change was
still in a non-significant manner (P = 0.061). Between
groups analysis using the Mann–Whitney test showed only
a marked difference in GH levels at T2 between C2 and
E1 (P = 0.02).
Insulin
Analysis with ANOVA showed that in E1 group insulin
levels declined with moderate slope after exercise and
stayed at levels lower than the baseline during all times
points. The difference was statistically significant at T4
compare with T1. In E2 group, insulin levels was reduced
in a non-significant manner after exercise at T2, and then
returned to basic values and remained in the same levels
over time. The same pattern was observed for C1 and C2
groups. Between groups analysis of insulin concentra-
tions, using post hoc Bonferroni test, showed a marked
difference at T3 and T4 between E1, E2, and C2 groups
(Fig. 1b).
IGF1
In all four groups contributed in this study, serum con-
centration of IGF1 started to decrease over time and this
decrease was continued over the measure time point (T2,
T3, and T4). In E1, C1, and C2 groups, this decline in IGF1
reached significant values at T3 and T4, while for E2 the
significancy was attained only at T4 time point. For all
these four groups the final measurement of IGF1 levels was
lower than base line (Fig. 1c).
Table 1 Characteristics of study subjects in four groups
Variable Group P F
Exp. trained (E1) Con. trained (C1) Exp. untrained (E2) Con. untrained (C2)
Age (years) 22.40 ± 1.84 22.00 ± 0.87 21.75 ± 0.89 24.57 ± 1.62 6.36 0.002*
Height (cm) 179.58 ± 5.14 177.11 ± 7.66 173.63 ± 4.56 174.47 ± 5.96 1.81 0.166
Weight (kg) 75.00 ± 6.80 71.78 ± 9.00 70.38 ± 10.40 70.57 ± 10.63 0.50 0.685
Body mass index (BMI) 23.23 ± 1.50 22.80 ± 1.74 23.29 ± 2.71 23.26 ± 3.71 0.08 0.971
* C2 group differences with groups E1, C1, and E2
Endocrine

IGFBP1
The C2 individuals had higher levels of IGFBP1. After
initiation of exercise, levels of IGFBP1 started to decrease
in all four groups. In C2, this decrease was continued until
the end of the time pints. In E1 and C1 groups, the IGFBP1
stayed stable until T3 and then a sudden rise was observed
in serum levels of this cytokine in these groups. In E2, the
levels of IGFBP1 first was raised and then at T3 a sudden
diminution of IGFBP1 levels was observed in this group
(Fig. 1d).
At any time points, no significant difference in IGFBP1
levels was observed between studied groups.
Discussion
GH
In this interventional study, we observed that performing a
single session of heavy resistance exercise for 60 min with
the 70–80% of 1RM, could cause an increase in blood
concentrations of GH immediately after exercise, though
this elevation of GH levels was only significant in trained
group. Similar results have been reported by other inves-
tigators [3, 6, 10, 15]. Viewing the significant elevation of
GH levels, compared to baseline, only in trained groups,
can be explained by the fact that trained individuals have
*
0
1
2
3
4
5
6
7
0 60 120 180 240 300 360 420 480 540 600
Time (minutes)
Ser
um G
H (
ng/m
l)
E1 C1 E2 C2
*
0
5
10
15
20
25
30
35
40
45
0 60 120 180 240 300 360 420 480 540 600
Time (minutes)
Ser
um In
sulin
(uI
V/m
l)
**
*
*
*
**
0
50
100
150
200
250
300
350
400
0 60 120 180 240 300 360 420 480 540 600
Time (minutes)
Ser
um IG
F-1
(ng
/ml)
* *
-0.2
0
0.2
0.4
0.6
0.8
1
1.2
1.4
0 60 120 180 240 300 360 420 480 540 600
Time (minutes)S
erum
IGF
BP
1 (n
g/m
l)
*
0
1000
2000
3000
4000
5000
6000
7000
0 60 120 180 240 300 360 420 480 540 600
Time (minutes)
Ser
um IG
FB
P3
(ng/
ml)
A
C
B
E
DE1 C1 E2 C2
E1 C1 E2 C2
E1 C1 E2 C2
E1 C1 E2 C2
Fig. 1 Trends of changes in GH (a), insulin (b), IGF-1 (c), IGFBP1 (d), and IGFBP3 (e), in consequence of heavy resistance exercise at different
times. *Significant differences with respect to time T1, P B 0.05
Endocrine

greater GH response compared to untrained individuals,
when they were exposed to resistance exercise. It has been
proposed that reaching threshold intensity, manifested by
the peak of exercise intensity, is more powerful determi-
nant of GH secretion magnitude than just intensity of the
exercise [3, 16]. In our study, the relative intensity of
resistance exercise was similar in two groups, however, due
to the nature of the trained group, they were able to move
heavier weights. Therefore, the mean peak of exercise
intensity was higher in this group compared to untrained
individuals, which may explain, at least partially, the sig-
nificant elevation of GH levels in this group and not in
untrained group compare to their baseline levels. It is also
important to notice that pulsatile nature of GH secretion in
response to various irritants makes it very difficult to
accurately predict the proper time of GH secretion [1]. It is
possible that the time pattern of loss and escalation of GH
levels would be different among individuals with different
fitness levels and that peak of changes to be detected in the
untrained group does not follow the same time pattern as
trained group. Ehrnborg et al. [3] showed that the peak of
GH release is delayed to 15 min after starting the exercise.
By accepting the assumption that the peak of GH release is
occurred between 15 and 30 min of the exercise and with
regard to protocol of our study which contained relatively
long period of exercise, it is plausible that an increase of
GH half-life as a consequence of GH adaptation to exercise
training in this group has been occurred. The possibility of
creating changes in GHBP levels, a protein which binds to
GH and augments its half-life in blood, after exercise
Table 2 GH, IGF1, IGFBP1, IGFBP3, and insulin values in four groups in consequence of heavy resistance exercise at different times
Group Time P Explanation
T1 T2 T3 T4
GH
E1 0.65 ± 0.47 5.32 ± 6.67 0.54 ± 0.16 0.50 ± 0.001 0.002* Between T1 &T2
C1 0.50 ± 0.001 1.21 ± 1.00 0.56 ± 0.18 0.50 ± 0.001 0.112 –
E2 0.50 ± 0.001 1.87 ± 3.47 1.74 ± 2.20 0.50 ± 0.001 0.061 –
C2 0.50 ± 0.001 0.61 ± 0.30 0.70 ± 0.53 0.50 ± 0.001 0.392 –
IGFBP1
E1 0.50 ± 0.91 0.26 ± 0.34 0.31 ± 0.77 0.93 ± 1.95 0.773 –
C1 0.32 ± 0.33 0.11 ± 0.18 0.05 ± 0.001 0.56 ± 1.02 0.039* Between T1 with T2 & T3
E2 0.52 ± 1.09 0.24 ± 0.55 1.11 ± 1.49 0.39 ± 0.97 0.205 –
C2 1.12 ± 1.86 0.81 ± 1.59 0.40 ± 0.92 0.05 ± 0.001 0.145 –
Group Time F P Explanation
T1 T2 T3 T4
Insulin
E1 20.99 ± 7.71 15.71 ± 4.03 15.98 ± 4.13 11.96 ± 3.67 8.66 0.001* Between T1 with T2, T3 & T4
C1 22.13 ± 11.23 17.94 ± 7.91 25.44 ± 6.47 18.27 ± 5.32 6.09 0.003* No significance than T1
E2 27.90 ± 16.67 18.51 ± 13.34 36.11 ± 27.53 27.48 ± 16.21 3.40 0.040* No significance than T1
C2 26.30 ± 11.20 24.15 ± 8.08 34.71 ± 17.68 29.77 ± 16.60 1.11 0.366 –
IGF-1
E1 306.80 ± 73.93 331.10 ± 79.61 260.10 ± 80.73 224.50 ± 85.27 34.68 0.001* Between T1 with T3 & T4
C1 308.33 ± 73.11 311.89 ± 56.18 263.33 ± 41.03 214.56 ± 74.90 14.62 0.001* Between T1 with T3 & T4
E2 314.25 ± 92.24 341.88 ± 89.63 214.88 ± 65.45 227.50 ± 100.33 10.97 0.001* Between T1 & T4
C2 259.71 ± 55.77 247.57 ± 66.12 173.43 ± 59.63 160.86 ± 73.36 40.28 0.001* Between T1 with T3 & T4
IGFBP3
E1 4860.90 ± 882.92 4869.90 ± 728.33 4096.70 ± 722.02 3614.10 ± 519.03 11.66 0.001* Between T1 & T4
C1 4294.11 ± 568.48 4732.11 ± 416.40 3999.89 ± 686.04 3815.00 ± 640.37 4.42 0.013* No significance than T1
E2 4648.13 ± 748.42 5241.63 ± 428.49 4200.88 ± 566.38 4050.88 ± 610.30 6.29 0.003* Between T2 with T3 & T4
C2 3967.71 ± 1437.84 4631.00 ± 749.76 4144.14 ± 950.47 3562.86 ± 705.56 2.35 0.107 –
* Significance: P \ 0.05 considered to be significant
Endocrine
training has been proposed by some researches [15, 17].
These factors were not measured in our study and further
researches are required to clarify this hypothesis.
Insulin
Another finding of this study was a diminution of insulin
levels following resistance exercise which has also been
reported by previous studies [5, 15, 16]. Sensitivity of
glucose transport process increases in response to insulin
and IGF-1 after exercise [18]. Increased insulin sensitivity
in muscle mutually with decrease in Insulin concentrations
holds in balance at the beginning of exercise. This balance
most probably will prevent the exercise-induced hypogly-
cemia [19]. Decreased serum insulin levels reflect the
increase in the anabolic actions of Insulin in processes such
as glucose transfer, glycogen production, and activation of
glycogen synthesis and amino acids transfer [20]. Insulin
primarily increases the capacity glucose transport by
stimulating the glucose transport into skeletal muscle,
through the transfer of GLUT-4 from an intracellular site to
sarcolemma [21]. In skeletal muscle, glucose transport
capacity can also be stimulated by IGF-1 [22]. In fact in
long-term, training could improve the function of compo-
nents engaged in the glucose transfer process, by creating
modifications in IGF-1 system. Insulin-like effects of IGF-
1 consist of a direct stimulating action on glucose uptake
by muscle (the major role) and augmentation of glucose
transition [1]. One consequence of such changes needs
reduction of insulin to keep the glucose homeostasis
properly. Taking together, all these observations point to
the fact that exercise in trained individuals could improve
the insulin sensitivity with subsequent decrease in demand
for insulin to maintain the glucose homeostasis [5, 23].
IGF1
In regards to IGF-1, we did not reach significant levels of
difference following resistance exercise, in both trained
and untrained groups compare to their baseline levels of
IGF-1. The observations from previous studies are con-
troversial. In some studies, a transient elevation of IGF-1 at
the beginning of exercise was noticed [4, 16]. In this study,
however, we can not rule out the possibility of detecting an
increase in IGF-1 levels soon after exercise initiation,
because of the lack of early sampling and also because of
long duration of our resistance exercise protocol.
Nindl et al. [8] explained that effects of resistance
exercise on circulating IGF-1 system may not have been
detected by any changes in IGF-1 values, because IGF-1
can be distributed among its binding proteins family. This
could, in our study, explain the absence of a significant
increase in serum concentrations of IGF-1 after resistance
exercise. On the other hand, an increase in clearance rate of
IGF-1, because of an increase in permeability of glomer-
ular filtration and saturation of proximal tubular resorption
of filtered proteins, could also count for lack of elevation of
serum IGF-1 after resistance exercise in our study [24].
Measuring the urinary IGF-1 could provide us with a valid
documentation in this manner. IGF-1 is locally produced
and acts in an autocrine/paracrine pattern [25]. In muscle,
IGF-1 binds to type I receptor and insulin type I hybrid
receptor and increase the glucose uptake by muscle [1].
However, increase in IGF-1 is not associated with security
mechanisms of maintaining the glucose homeostasis, par-
ticularly in untrained individuals. This event potentially
could result in hypoglycemia after exercise. Therefore, lack
of increase in IGF-1 levels after exercise could interpret as
a compensatory mechanism for preventing the post exer-
cise hypoglycemia.
IGFBP
In this study, no significant change was observed in IG-
FBP1 levels following a session of heavy resistance exer-
cise. IGFBP1 is thought to be the main regulator of IGF-1
bioavailability in short periods, which itself is regulated by
several factors including insulin, glucocorticoid, GH, and
factors having cAMP-agonistic effects [26]. Changes in
other circulating IGFBPs levels may also be involved in
changes of IGFs access during training and exercise [8, 9].
This component of IGF-1 system is mostly influenced by
metabolic disturbances altering energy flow or balance [27]
and prolonged activities in terms of several hours or days
are needed for the IGFBP1 response manifestations [5, 23,
27, 28]. However, some investigators reported the changes
in concentrations of this protein in response to short-time
exercise [15, 19, 29]. It is presumed that other factors than
low concentrations of plasma glucose would be engaged in
maintaining the glucose homeostasis in regards to IGFBP1
response to exercise [19].
Lavoie et al. [29] showed that maintaining normal levels
of blood glucose through intravenous injection of glucose
did not prevent the increase in IGFBP1 levels during a
single prolonged cession of exercise in rats. Based on a
strong negative correlation between liver glycogen and
plasma IGFBP1 levels, they proposed that increase in
IGFBP1 levels during exercise is related to the decrease in
liver glycogen content. This hypothesis explains why
despite maintaining blood glucose levels and no changing
in insulin levels, IGFBP1 levels is increased during pro-
longed exercise and also why long-term exercise protocols
would better reveal the IGFBP1 response than short-term
protocols. Our observation regarding no changes in
IGFBP1 could be explained by the short mode of our
exercise protocol that does not provide enough time for
Endocrine

diminution of liver glycogen storage with subsequent
increase in serum IGFBP1.
In our study, serum IGFBP3 concentrations started to
decrease over time in a way that at the end of the study
(T4) it reached a significant level. This carrier protein has
long half-life [1, 2], which may count for detecting the
significant levels of difference at the time points close to
the end of the study, and is known as the key regulator of
IGF-1 availability. It is believed that this protein compel
the inhibitory effects on cell growth [1, 24].
In line with our observations, Bermon et al. [7] inves-
tigated the IGFBP3 response to a session of resistance
exercise. They found no significant changes in concentra-
tions of IGFBP3 in both athletic and rest groups. However
in their study, the IGF-1 system response was monitored
every 6 h which could be considered as a relatively long
period that let the IGFBP3 responses to be lightened up.
This study showed that detection of post-resistance exer-
cise IGFBP3 proteolysis process requires time monitoring
more than 7 h.
Nindl et al. [8] detected an augmentation of IGFBP3 in
responses to heavy resistance exercise at the first hour after
initiation of exercise. They postulated that exercise (typi-
cally resistance) is able to regulate the acute production
and immediate secretion of IGFBP3 independent of the
changes in IGF-1, probably because of the flow of meta-
bolic residues and substrates. Nevertheless, it is possible
that the physiological operators of IGFBP3 act indepen-
dently and differently from the GH and IGF-1 during
exercise [4].
Conclusions
As a result, heavy exercise (acute and typically resistance)
leads to responses of IGF-1 system components which can
be measured and observed as changes in serum concen-
trations, but this response depending on the fitness level
can be varied for both direction and size among different
individuals. In addition, the intensity of exercise is a
determinant factor for stimulating part to part response of
this system and its magnitude. Worth mentioning that
sometimes for viewing noticeable changes of some com-
ponents of this system (e.g., IGFBP1) is compulsory the
exercise be long enough (it might be named as a time
threshold) to stimulate the physiological response.
Responses of various components of IGF-1 system to
exercise might be associated with time separation, so that
the response of one component comes into view with time
delay than other component. For this purpose, it is crucial
that the consecutive observations to be carried out over
time to prevent from losing the response of a component
(time course study) in which the possible changes not to be
overlooked. Otherwise, to study IGF-1 system, it is better
to concentrate on a particular part of it and set the sampling
based on its probable behavior.
Conflict of interest None.
References
1. D.L. Roith, C. Bondy, S. Yakar, J.L. Liu, A. Butler, The
somatomedin hypothesis. Endocr. Rev. 22(1), 63–74 (2001)
2. V. Hwa, Y. Oh, R.G. Rosenfeld, The insulin-like growth factor-
binding protein (IGFBP) superfamily. Endocr. Rev. 20(6), 761–
787 (1999)
3. C. Ehrnborg, K.H.W. Lange, R. Dall, J.S. Christiansen,
P.A. Lundberg, R.C. Baxter, M.A. Boroujerdi, B.A. Bengtsson,
M.L. Healey, C. Rentecost, S. Longobardi, R. Napoli, T. Rosen,
The growth hormone/insulin-like growth factor-1 axis hormones
and bone markers in elite athletes in response to a maximum
exercise test. J. Clin. Endo. Crinal. Metab. 88(1), 394–401 (2003)
4. W.J. Kraemer, F.S. Harman, N.H. Vos, S.E. Gordon, B.C. Nindle,
Jo. Marx, A.L. Gomez, J.S. Volek, N.A. Ratames, S.A. Mazetti,
J.A. Bush, k. Dohi, R.U. Newton, k. Hakkinen, Effects of exer-
cise and alkalosis on serum. Insulin-like growth factor–I and IGF-
binding Protein-3. Can. J. Appl. Physiol. 25(2), 127–138 (2000)
5. J. Manetta, J.F. Brun, L. Maimaun, A. Callis, Prefautc, J. Mercier,
Effect of training on the GH/IGF-1 axis during exercise in mid-
dle–aged men: relationship to glucose homeostasis. Am. J. Phys-
iol. Endocrinal. Metab. 283, E929–E936 (2002)
6. K. Stokes, M. Nevill, J. Frystyk, H. Lakomy, G. Hall, Human
growth hormone responses to repeated bouts of sprint exercise
with different recovery periods between bouts. J. Appl. Physiol.
99, 1254–1261 (2005)
7. S. Bermon, P. Ferrari, P. Bernard, S. Altare, C. Dolisi, Responses
of total and free insulin–like growth factor-1 and insulin-like
growth factor binding protein-3 after resistance exercise and
training in elderly subjects. Acta. Physiol. Scant. 165, 51–56
(1999)
8. B.C. Nindl, W.J. Kraemer, J.O. Marx, P.J. Arciero, K. Dohi,
M.D. Kellogg, G.A. Loomis, Overnight responses of the circu-
lating IGF-1 system after acute, heavy-resistance exercise.
J. Appl. Physiol. 90, 1319–1326 (2001)
9. L.P. Koziris, R.C. Hickson, R.T. Chatterton, R.T. Groseth Jr.,
J.M. Christie, D.G. Goldflies, T.G. Unterman, serum levels of
total and free IGF-1 and IGFBP3 are increased and maintained in
long-term training. J. Appl. Physiol. 86(4), 1436–1442 (1999)
10. S. Mejri, F. Bchir, M.C. Ben Rayana, J. Ben Hamida, C. Ben
Slama, Effect of training on GH and IGF-1 responses to a sub-
maximal exercise in football players. Eur. J. Appl. Physiol. 95,
496–503 (2005)
11. B.C. Nindl, J.A. Alemany, M.D. Kellogg, J. Rood, S.A. Allison,
A.J. Young, S.J. Montain, Utility of circulating IGF-1 as a bio-
marker for assessing body composition changes in men during
periods of high physical activity superimposed upon energy and
sleep restriction. J. Appl. Physiol. 103, 340–346 (2007)
12. K.R. Rarick, M.A. Pikosky, A. Grediagin, T.J. Smith,
E.L. Glickman, J.A. Alemany, J.S. Staab, A.J. Young, B.C.
Nindl, Energy flux, more so than energy balance, protein intake,
or fitness level, influences insulin-like growth factor–I system
responses during 7 days of increased physical activity. J. Appl.
Physiol. 103, 1613–1621 (2007)
13. M. Mansouri, A. Keshtkar, S. Hasani-Ranjbar, E. Soleymani Far,
O. Tabatabaei-Malazy, K. Omidfar, B. Larijani, The impact of
one session resistance exercise on plasma adiponectin and RBP4
Endocrine

concentration in trained and untrained healthy young men.
Endocr. J. 58(10), 861–868 (2011)
14. M. Izquierdo, J. Ibanez, J.J. Gonzalez-Badillo, K. Hakkinen,
N.A. Ratamess, W.J. Kraemer, D.N. French, J. Eslava, A. Al-
tadill, X. Asiain, E.M. Gorostiga, Differential effects of strength
training leading to failure versus not to failure on houmonal
responses, strength, and muscle zower gains. J. Appl. Physiol.
100, 1647–1656 (2006)
15. A. Eliakim, D. Nemet, E. Zaldivar, R.G. Memurray, F.L. Culler,
P. GalasseHi, D.M. Cooper, Reduced exercise-associated
response of the GH-IGF-1 axis and catecholamines in obese
children and adolescent. J. Appl. Physiol. 100, 1630–1637 (2006)
16. N.E. Elj, M. Elloumi, M. Zaouali, I. Latiri, G. Lac, Z. Tabka,
Discrepancy in IGF-1 and GH response to submaximal exercise
in young male subjects. Sci. Sports. 22, 155–159 (2007)
17. J. Vitton, M.R. Blackman, J. Busby-Whitehead, C. Tsiao,
K.J. Steward, J. Tobin, T. Stevens, M.F. Bellantoni, M.A. Rogers,
G. Baumann, J. Roth, S.M. Harman, R.G.S. Spencer, Effect of
single nightly injection of growth hormone-releasing hormone
(GHRH 1–29) in healthy elderly men. Metabolism 46(1), 89–96
(1997)
18. E.J. Henriksen, L.L. Louters, C.S. Stump, C.M. Tipton, Effects of
prior exercise on the action of insulin-like growth factor I in
skeletal muscle. Am. J. Physiol. Endocrinol. Metab. 263, E340–
E344 (1992)
19. T.G. Anthony, J.C. Anthony, M.S. Lewitt, S.M. Donovan,
D.K. Layman, Time Course Changes in IGFBP1 after treadmill
exercise and Postexercise food intake in rats. Am. J. Physiol.
Endocrinol. Metab. 280, E650–E656 (2001)
20. F.P. Jorgen, J.F.P. Wojtaszewski, J.N. Nielson, A.R. Erik, Exer-
cise effects on muscle insulin signaling and action. Invited
Review: effect of acute exercise on insulin signaling and action in
humans. J. Appl. Physiol. 93, 384–392 (2002)
21. S. Lund, A. Flyvbjerg, G.D. Holman, F.S. Larsen, O. Pederson,
O. Schmitz, Comparative effects of IGF-I and insulin on the
glucose transporter system in rat muscle. Am. J. Physiol. Endo-
crinol. Metab. 30, E461–E466 (1994)
22. A. Taguchi, M.F. White, Insulin-Like Signaling, Nutrient
Homeostasis, and Life Span. Annu. Rev. Physiol. 70(22), 1–22
(2008)
23. J. Manetta, J.F. Brun, L. Maimoun, C. Fedou, C. Prefaut,
J. Mercier, The effects of intensive training on insulin-like growth
factor I (IGF-1) and IGF binding proteins 1 and 3 in Competitive
Cyclists: relationships with glucose disposal. J. Sports. Sci. 21,
147–154 (2003)
24. G. Turgut, B. Kaptanoglu, S. Turgut, o. Genc, S. Tekinturk,
Influence of acute exercise on uninary protein, creatinine, insulin-
like growth factor- I (IGF-1) and IGF binding Protein-3 Con-
centrations in children. Tohoku J. Exp. Med. 201, 165–170
(2003)
25. J. Pavelic, T. Matijevic, J. Knezevic, Biological & physiological
aspects of action of insulin-like growth factor peptide family.
Indian J. Med. Res. 125, 511–522 (2007)
26. T.G. Unterman, D.T. Oehler, L.J. Murphy, R.G. Lacson, Multi-
hormonal regulation of insulin-like growth factorbinding protein-
1 in rat H4IIE Hepatoma cells: the dominant role of insulin.
Endocrinology 128, 2693–2701 (1991)
27. B.C. Nindl, J.W. Castellani, A.J. Young, J.F. Patton, M.J. Khosrvi,
A. Diamandi, S.J. Montain, Differential responses of IGF-1
Molecular Complexes to military operational field training.
J. Appl. Physiol. 95, 1083–1089 (2003)
28. L. Rosendal, H. Langberg, A. Flyvbjerg, J. Frystyk, Ho. Orskov,
M. Kjar, Physical Capacity influences the response of insulin–like
growth factor and its binding proteins to training. J. Appl.
Physiol. 93, 1669–1675 (2002)
29. J.M. Lavoie, Y. Fillion, K. Couturier, P. Corriveau, Selected
Contribution: Evidence that the decrease in liver glycogen is
associated with the exercise-induced increase in IGFBP1. J. Appl.
Physiol. 93, 798–804 (2002)
Endocrine
Copyright © 2022 FDOKUMEN