
Tim Jacks - Uncg
301
JACKS, TIMOTHY, Ph.D. An Examination of IT Occupational Culture: Interpretation, Measurement, and Impact. (2012) Directed by Dr. Prashant Palvia. 290 pp. Past IS studies on culture have primarily focused on two levels of analysis: national culture and organizational culture. The gap in our knowledge of culture is in the area of occupational culture of IT professionals. Occupational culture, unlike organizational culture, is not bounded by a single organization, but rather forms itself around specific expertise, similar tasks, and a sense of itself as a distinct occupational group. In Part I, the ‘strong program’ of cultural sociology is used to examine and interpret the meaning of the core values of the IT occupation through the framework of shared language, shared history, and shared context. The interview results informed the creation of a survey instrument in Part II to measure six occupational values, Autonomy, Structure, Precision, Innovation, Reverence for Knowledge, and Enjoyment, and ten typical business management values. Significant differences were found between responses of IT professionals and non-IT business managers in 32 companies in the U.S. An additional executive survey measured the level of IT/Business Alignment and IT Value for each firm in Part III. A PLS model provides evidence that occupational cultural differences do significantly impact both IT/Business alignment and IT Value.
-
Upload
khangminh22 -
Category
Documents
-
view
0 -
download
0
Transcript of Tim Jacks - Uncg

JACKS, TIMOTHY, Ph.D. An Examination of IT Occupational Culture: Interpretation,
Measurement, and Impact. (2012)
Directed by Dr. Prashant Palvia. 290 pp.
Past IS studies on culture have primarily focused on two levels of analysis:
national culture and organizational culture. The gap in our knowledge of culture is in the
area of occupational culture of IT professionals. Occupational culture, unlike
organizational culture, is not bounded by a single organization, but rather forms itself
around specific expertise, similar tasks, and a sense of itself as a distinct occupational
group. In Part I, the ‘strong program’ of cultural sociology is used to examine and
interpret the meaning of the core values of the IT occupation through the framework of
shared language, shared history, and shared context. The interview results informed the
creation of a survey instrument in Part II to measure six occupational values, Autonomy,
Structure, Precision, Innovation, Reverence for Knowledge, and Enjoyment, and ten
typical business management values. Significant differences were found between
responses of IT professionals and non-IT business managers in 32 companies in the U.S.
An additional executive survey measured the level of IT/Business Alignment and IT
Value for each firm in Part III. A PLS model provides evidence that occupational cultural
differences do significantly impact both IT/Business alignment and IT Value.

AN EXAMINATION OF IT OCCUPATIONAL CULTURE:
INTERPRETATION, MEASUREMENT, AND IMPACT
by
Timothy Jacks
A Dissertation Submitted to
the Faculty of The Graduate School at
The University of North Carolina at Greensboro
in Partial Fulfillment
of the Requirements for the Degree
Doctor of Philosophy
Greensboro
2012
Approved by
Prashant Palvia_____________
Committee Chair

© 2012 Timothy Jacks

ii
To Priscilla, Lynsey, and Alec

iii
APPROVAL PAGE
This dissertation has been approved by the following committee of the Faculty of
The Graduate School at The University of North Carolina at Greensboro.
Committee Chair ___Prashant Palvia_________________
Committee Members ___Lakshmi Iyer___________________
___Riikka Sarala___________________
___Sarah Daynes___________________
__June 1, 2012_______________
Date of Acceptance by Committee
__June 1, 2012_______________
Date of Final Oral Examination
iv
ACKNOWLEDGMENTS
The author would like to recognize the invaluable support and assistance of the
dissertation committee chair, Dr. Prashant Palvia, as well as the other members of the
dissertation committee: Dr. Sarah Daynes, Dr. Lakshmi Iyer, and Dr. Riikka Sarala.

v
TABLE OF CONTENTS
Page
CHAPTER
I. INTRODUCTION ................................................................................................ 1
II. THEORETICAL FOUNDATIONS ................................................................... 10
2.1 What is Culture? ................................................................................. 10 2.2 Values are the Core of Culture ............................................................ 12 2.3 Sociological Literature ........................................................................ 13
2.3.1 Durkheim and Weber ........................................................... 15 2.3.2 The Strong Program of Cultural Sociology ......................... 22
2.4 Theory of Occupational Culture ......................................................... 24 2.5 Theory of IT Archetypes ..................................................................... 26 2.6 Theory of IT-Culture Conflict ............................................................ 27
2.7 IT/Business Alignment and IT Value ................................................. 29 2.8 Motivation for Research ..................................................................... 32
III. OVERALL RESEARCH MODEL AND RESEARCH OBJECTIVES............. 36
3.1 Overview ............................................................................................. 36 3.1.1 Research Questions .............................................................. 38
3.1.2 Full Research Model ............................................................ 38 3.2 Initial Pilot .......................................................................................... 39
3.2.1 Instrument Creation ............................................................. 39 3.2.2 Qualitative Results ............................................................... 41 3.2.3 Communication .................................................................... 43
3.2.4 Control ................................................................................. 45 3.2.5 Alignment ............................................................................ 46 3.2.6 Risk ...................................................................................... 47 3.2.7 Structure of Power ............................................................... 49 3.2.8 Reverence of Knowledge ..................................................... 50
3.2.9 Enjoyment ............................................................................ 51 3.2.10 Quantitative Results ........................................................... 54 3.2.11 Reliability Results .............................................................. 56 3.2.12 Construct Validity .............................................................. 58
3.2.13 Norms ................................................................................. 61 3.2.14 Discussion .......................................................................... 62

vi
IV. PART I – INTERPRETATION OF ITOC.......................................................... 65
4.1 Part I Research Objectives .................................................................. 65 4.1.1 Part I Research Model .......................................................... 66
4.1.2 Shared Values ...................................................................... 67 4.1.3 Shared Language .................................................................. 68 4.1.4 Shared History ..................................................................... 69 4.1.5 Shared Context ..................................................................... 70
4.2 Part I Methodology ............................................................................. 71
4.2.1 Data Collection .................................................................... 72
4.2.2 Interview Protocol ................................................................ 74
4.2.3 Qualitative Analysis ............................................................. 78 4.2.4 Coding .................................................................................. 79 4.2.4 Content Analysis for Thematic Coding ............................... 92
4.3 Part I Results ....................................................................................... 97
4.3.1 Sample Demographics ......................................................... 97 4.3.2 Codes.................................................................................... 99
4.3.3 Categories .......................................................................... 100 4.3.4 Value Themes .................................................................... 102 4.3.5 Qualitative Validity and Reliability ................................... 103
4.4 The ASPIRE Values ......................................................................... 104 4.4.1 Autonomy .......................................................................... 105
4.4.2 Structure ............................................................................. 109
4.4.3 Precision in Communication .............................................. 118
4.4.4 Innovation .......................................................................... 123 4.4.5 Reverence for Knowledge.................................................. 127
4.4.6 Enjoyment .......................................................................... 135 4.5 Shared Context .................................................................................. 140 4.6 Shared Language ............................................................................... 144
4.7 Shared History .................................................................................. 145 4.7.1 Shared Economic History .................................................. 146 4.7.2 Shared Political History ..................................................... 146 4.7.3 Shared Technological History............................................ 147
4.7.4 Shared Personal History ..................................................... 147 4.8 Relationships in the Web of Culture ................................................. 150
4.8.1 Share Context and Shared Language ................................. 150 4.8.2 Shared History and Shared Context ................................... 151 4.8.3 Shared Context and Shared Values .................................... 151 4.8.4 Shared Language and Shared History ................................ 152 4.8.5 Shared Language and Shared Values ................................. 153
4.8.6 Shared History and Shared Values .................................... 154 4.9 Hermeneutic Interpretation – The Sacred and the Profane ........................... 160 4.10 Evaluating the Interpretation ....................................................................... 172

vii
4.11 Next Steps ................................................................................................... 173
V. PART II – MEASURING ITOC ...................................................................... 174
5.1 Part II Research Objectives ............................................................... 174 5.1.1 Value Dimensions .............................................................. 175 5.1.2 Part II Research Model ...................................................... 176
5.2 Part II Methodology .......................................................................... 178 5.2.1 Instrument Creation ........................................................... 178
5.2.2 Stage One ........................................................................... 179
5.2.3 Stage Two .......................................................................... 182
5.2.4 Stage Three ........................................................................ 184 5.2.5 Norms ................................................................................. 185
5.3 Part II Results .................................................................................... 186 5.3.1 Sample Size ........................................................................ 186
5.3.2 Nonresponse Bias............................................................... 187 5.3.3 Demographics .................................................................... 188
5.3.4 Construct Validity and Reliability ..................................... 191 5.3.5 Norms ................................................................................. 205 5.3.6 Discussion .......................................................................... 216
VI. PART III – IMPACT OF ITOC ........................................................................ 220
6.1 Part III Research Objective ............................................................... 220
6.1.1 Independent Variable: Occupational
Cultural Distance ............................................................ 220
6.1.2 Independent Variable: IT Organizational structure ........... 221 6.1.3 Mediating Variable: IT/Business Alignment ..................... 222 6.1.4 Dependent Variable: IT Value ........................................... 223
6.1.5 Control Variables ............................................................... 224 6.1.6 Part III Research Model ..................................................... 224
6.2 Part III Methodology......................................................................... 225 6.2.1 Occupational Cultural Distance ......................................... 226
6.2.2 IT Organizational Structure ............................................... 229 6.2.3 IT/Business Alignment ...................................................... 229
6.2.4 IT Value ............................................................................. 230 6.2.5 Control Variables ............................................................... 231 6.2.6 Response Bias .................................................................... 231 6.2.7 Data Collection .................................................................. 231 6.2.8 Measurement ...................................................................... 233
6.3 Part III Results .................................................................................. 235 6.3.1 Sample Size ........................................................................ 235 6.3.2 Demographics .................................................................... 237

viii
6.3.3 PLS Analysis ...................................................................... 239 6.3.4 Discussion .......................................................................... 242
VII. CONTRIBUTIONS TO KNOWLEDGE ......................................................... 245
7.1 Contribution to Practice .................................................................... 245 7.2 Contribution to Research .................................................................. 246
VIII. FUTURE RESEARCH ..................................................................................... 247
IX. LIMITATIONS ................................................................................................. 249
X. CONCLUSION ................................................................................................. 251
REFERENCES ............................................................................................................... 253
APPENDIX A. PILOT INTERVIEW QUESTIONS ..................................................... 268
APPENDIX B. FULL STUDY INTERVIEW QUESTIONS ........................................ 269
APPENDIX C. PILOT SURVEY INSTRUMENT ........................................................ 271
APPENDIX D. FULL STUDY INSTRUMENT - ITOC ............................................... 273
APPENDIX E. FULL STUDY INSTRUMENT - EXECUTIVE .................................. 277
APPENDIX F. IRB APPROVALS................................................................................. 290

1
CHAPTER I
INTRODUCTION
Culture in Information Systems (IS) research has been an important area of study
for over 25 years. Culture has many definitions and perspectives in IS studies (Kappos &
Rivard, 2008). A definition widely used in IS research is “the collective programming of
the mind that distinguishes the members of one group or category of people from others”
(Hofstede & Hofstede, 2005, p. 4). Anthropologist Clifford Geertz describes culture as
“webs of significance” (Geertz, 1973). A sociological definition of culture is “a patterned
sphere of beliefs, values, symbols, signs, and discourses” (Smith & Riley, 2009, p. 2). IS
research on culture has focused on two levels of analysis: national and organizational
(Leidner & Kayworth, 2006). However research at the level of occupational culture has
been neglected. This study focuses on the occupational culture of Information
Technology (IT) professionals.
IT professionals are defined as people who work within a formal IT department or
fulfill the role of IT for an organization. IT professionals include those who specialize in
Systems Analysis & Design, Programming, Applications, Database Administration,
Telecommunications, Infrastructure Support, Project Management, and Operations. The
Bureau of Labor Statistics projects high growth for IT occupations through 2018 (BLS,
2011). This is rapid growth for a career that is still in its relative infancy.

2
The IT profession is developing its own occupational culture that is distinct from
organizational culture (Trice, 1993; Ramachandran & Rao, 2006; Nord et al, 2007;
Gregory, 1983). Organizational culture is “the dominant pattern of basic assumptions,
perceptions, thoughts, feelings, and attitudes held by members of an organization”
(Schein, 1990). Occupational culture, in contrast, is not bounded by a single organization,
but rather bases its culture on specific expertise, similar tasks, and a sense of itself as a
distinct occupational group (Trice, 1993). Occupational culture, thus, spans across all
organizations. Leidner & Kayworth (2006) point out that “what has received the least
amount of attention in the literature on IT and culture is the very notion of an IT culture”
(p.371). There is some confusion over the term “IT culture” as it can either refer to an
individual’s cultural attitudes towards Information technology or to the cultural attitudes
that members of the IT occupation share (Walsh, 2011). Therefore this study will use the
specific term “IT Occupational Culture” in order to refer to the latter.
The study of IT occupational culture (ITOC) is important for several reasons.
First, “culture affects action” (Swidler, 1986, p. 281). Culture has a causal effect on IS
behavior at different levels, including national, organizational, and occupational
(Karahanna, Evaristo, and Srite, 2005). IT occupational culture, in particular, defines
shared meanings and expected behaviors for IT professionals (Nord et al., 2007).
Second, cultural conflict can arise when two or more groups interact that do not
share the same core set of values (Leidner & Kayworth, 2006; Nord et al., 2007). Schein
(1988) defines a group as a collection of people who 1) interact with each other, 2) are
psychologically aware of each other, and 3) perceive themselves as a group. Thus, when

3
the IT occupational group interacts with a different occupation, such as business
managers, the result can be cultural conflict (Guzman, 2006; Nord et al., 2007). IT
employees are typically perceived as being at odds with the rest of the organization.
While there is qualitative and anecdotal evidence for this cultural conflict, there is little
quantitative evidence. IS literature has repeatedly called for more measurable dimensions
of IT culture (Leidner & Kayworth, 2006; Kaarst-Brown & Robey, 1999). While
Hofstede (1980; 1990) and House et al. (2004) have been successful in quantitatively
measuring values of both national and organizational culture, this has not yet been done
within the context of IT occupational culture. Karahanna, Evaristo, and Srite (2005) say
that “the role of values in attitude models in IS research has been largely ignored,
possible due to the fact that most research was performed in single cultures (both
organizational and national)” (p. 9).
Third, culture can impact business outcomes. These outcomes might be positive
or negative. For example, IT projects frequently succeed or fail depending how well IT
professionals interact with non-IT business managers within a firm (Pliskin et al., 2003;
Iivari & Huisman, 2007; Leidner & Kayworth, 2008; Walsh, 2009). Such studies,
however, evaluate the organizational level of analysis. Occupational culture, on the other
hand, crosses the boundaries of individual organizations. Research on IT occupational
culture is still in the exploratory stage where it has been identified as a phenomenon of
interest, but more empirical research is necessary (Guzman et al., 2004; Guzman et al.
2006; Ramachandran & Rao, 2007; Nord et al., 2007). Examining the occupational level of
culture is necessary to see why IT departments tend to experience more than their fair

4
share of friction with non-IT business users (Nord et al., 2007). The ‘clash of cultures’
between IT workers and business users continues to be a problem where “frustration
remains high” on both sides (Glen, 2011, p. 44).
More specifically, occupational culture may have something important to add to
the critical area of IT/Business alignment and business outcomes. IT/Business alignment
is typically viewed as the level of fit between the IT strategy and the business strategy
(Tallon 2007/2008; Luftman & Kempiaih, 2008). The greater the alignment, the greater
the business value from IT in terms of firm performance for profitability and productivity
(Tallon, 2007/2008; Chan et al., 2006). But the literature also points to potential cultural
influences on IT/Business alignment (Chen & Reich, 2007; Farrell, 2003; Van Der Zee &
De Jong, 1999). Chan & Reich (2007) make a specific call for new models with novel
antecedents and new theories to help explain the cultural aspects of IT/Business
alignment which this research seeks to answer. While IT/Business alignment manifests
itself within specific organizations, it is actually an industry-wide issue (Luftman &
Kempiaih, 2008), suggesting that the level of analysis should be different from the
organizational level. Based on the literature, this study proposes that there are specific
and measurable cultural factors at play in this problem that can best be addressed by
examining the occupational level of analysis.
One explanation for poor IT/Business Alignment may be a lack of shared
occupational values. Shared values are the core element of any cultural group (Deal &
Kennedy, 1982; Hofstede & Hofstede, 2005; Brief & Nord, 1990). This study attempts to
pinpoint value dimensions at the occupational level of analysis. In order to begin this

5
exploration, the interdisciplinary lens of cultural sociology was used to provide a
theoretical foundation. Classical sociological theorists like Emile Durkheim and Max
Weber still have relevance for studying occupational culture, and they are frequently used
by contemporary cultural sociologists like Gary Fine, Alexander Riley, Wendy Griswold,
and Jeffrey Alexander.
Jeffrey Alexander’s (2003) ‘strong program’ of cultural sociology at Yale
University was used to guide the initial stages of this effort. There are three criteria for
researchers in the strong program: 1) Culture must be an autonomous construct, i.e., an
independent variable. 2) ‘Thick description’ hermeneutics must be used to decode
narratives and symbols and avoid abstract or unmeaningful values. 3) The strong program
specifically seeks empirically-supported causal clarity about the theoretical relationships
between culture and action (Alexander, 2003). Alexander’s strong program “represents
one of the more intellectually ambitious of recent theoretical frameworks for cultural
analysis” (Smith & Riley, 2009, p. 193).
This strong program is actually conducive to a blend of both positivist (for causal
clarity) and interpretive (for meaningful interpretation) methods of research. Orlikowski
& Baroudi (1991) affirm that both approaches are appropriate for IS research. “The
existence of a plurality of perspectives allows the exploration of phenomena from diverse
frames of reference” (Orlikowski & Baroudi, 1991, p.2).
A number of research gaps in the IS literature exist that this research seeks to fill.
First, value dimensions of IT occupational culture are missing in the literature despite
being called for (Kaarst-Brown & Robey, 1999; Leidner & Kayworth, 2006). Second,

6
studies of IT occupational culture have so far been interpretive with no quantitative value
measures (e.g., Kaarst-Brown & Robey, 1999; Guzman et al., 2004; Nord et al., 2007), or
quantitative value measures that examine IT culture but at different levels of analysis
than the occupational such as the organizational level (e.g., Plisken et al., 1993) or the
individual level (e.g., Walsh, 2009; Walsh, 2011). Third, studies that do focus on the
occupational level of analysis have not examined the impact on business success (e.g.,
Guzman, 2006; Kwantes & Boglarsky, 2004). The occupational culture for IT
professionals is only beginning to be explored, in part because the career is still new.
This dissertation research was conducted over two years in three parts, each of
which will address one of the research gaps. Part I was highly interpretive in the tradition
of cultural sociology and uncovers the core cultural values of IT occupational culture as
well as their deeper meaning. Cultural values are not free-floating in a vacuum but rather
part of a greater whole. The deeper meanings of IT occupational values were investigated
by putting them in their proper cultural context and establishing a nomological network
of four interrelated constructs, namely, 1) Shared Values, 2) Shared History, 3) Shared
Language, and 4) Shared Context which will be defined further below.
Part II is a positivist investigation into scale creation in the tradition of Hofstede
(1980) and House et al. (2004) and provides a new survey instrument measuring the
occupational values identified in Part I as well as typical business management values.
Business management culture is a useful occupational culture for comparison because of
the frequent friction between IT professionals and business managers within an
organization (Nord et al., 2007). Where IT professionals are the ones who make IT work,

7
business managers are the ones who use IT (Markus & Bjorn-Andersen, 1987; Grindley,
1992). The differences between IT professionals and business managers represent a
‘cultural chasm’ (Ward & Peppard, 1996) that is worth exploring in detail. Note that the
creation of a set of cultural value dimensions that would cover all occupations is beyond
the scope of this dissertation. The goal is depth, not breadth. It should be possible to
create a parsimonious set of meaning-full value dimensions conducive to measurement
that have specific relevance to the IT occupation.
Part III is a positivist investigation of the impact of these occupational cultural
differences between IT employees and non-IT business managers on the critical area of
IT/business alignment. Greater occupational cultural differences, measured as Euclidian
distance by the survey instrument in Part II, was expected to lead to lower IT/Business
alignment. IT/Business alignment has been defined as the interaction or fit between IT
strategy, including mission, objectives and plans, and business strategy (Tallon,
2007/2008; Reich & Benbasat, 1996). This type of alignment is important because the
greater the alignment, the greater the business value from IT in terms of firm
performance (Tallon, 2007/2008; Chan et al., 2006). Business value from IT is referred to
more simply as ‘IT value’. IT/Business alignment leads to greater IT value because it
enables firms to successfully compete on a global level (Pankratz, 1991). Moreover, IT
value is important because it leads to increased profits for an organization and is
significantly correlated with business performance (Chan & Reich, 2007). Both
IT/Business Alignment and IT Value were measured based on survey responses from
executives at 32 different companies in the U.S. for Part III.

8
Parts I, II, and III are part of a greater whole, namely a unified and in-depth
examination of IT occupational culture. Research questions for this dissertation include
the following:
1. Part I: What are the core values of IT occupational culture and how have they
developed out of shared history, shared language, and shared context?
2. Part IIa: What are the measurable dimensions of IT occupational culture?
3. Part IIb: Is IT occupational culture significantly different from business
management culture and, if so, how?
4. Part III: What is the impact of occupational cultural distance on IT/business
alignment and IT value?
The contribution of Part I is an interpretive portrait of IT occupational culture that
proposes a set of meaningful values within a framework based on cultural sociology. The
use of cultural sociology for IS research is, in itself, a novel contribution. The
contribution of Part II is the development of a validated instrument as well as a
comparison of IT occupational culture with business management culture. The
contribution of Part III is to offer empirical evidence of the impact of IT occupational
culture on IT/Business alignment and IT value. The overall contribution of the completed
dissertation will be new and enhanced knowledge about IT occupational culture.
The sections of this dissertation are outlined as follows: Section 2 conducts a
thorough literature review of the theoretical foundations used to guide the analysis.
Section 3 proposes the specific research objectives and a research model for the entire
study based on the initial pilot. Section 4 describes the steps involved in the specific

9
methodology for each Part. Sections 5, 6, and 7 discuss the results of each Part. Finally,
Sections 8, 9, 10, and 11 address the contributions to knowledge, future research,
limitations, and conclusions respectively.

10
CHAPTER II
THEORETICAL FOUNDATIONS
2.1 What is Culture?
Culture is commonly understood as ‘the way things are done around here’, but
this is an oversimplification (Schein, 1999). Culture can consist of the categories and
plans for action shared by a group as well as the shared understandings people use to
coordinate their activities (Harper & Lawson, 2003). Hofstede defines culture as “the
collective programming of the mind that distinguishes the members of one group or
category of people from others” (Hofstede & Hofstede, 2005, p. 4), and this is one of the
most popular definitions in IS literature (Leidner & Kayworth, 2006). Despite the
obvious appeal for an IS audience, Hofstede emphasizes that people are not
“programmed” in the same way that computers are.
Hofstede’s definition succinctly highlights the collective element of culture at a
group level, however it may underemphasize the deeper meanings of culture. To contrast
with Hofstede, Clifford Geertz, the noted anthropologist, says "The concept of culture I
espouse. . . is essentially a semiotic one. Believing, with Max Weber, that man is an
animal suspended in webs of significance he himself has spun, I take culture to be those
webs, and the analysis of it to be therefore not an experimental science in search of law
but an interpretative one in search of meaning” (Geertz, 1973, pp. 4-5). This definition
highlights the perspective that culture is more important than simply differentiating one
11
group from another. Culture is paramount because it provides meaning in our day-to-day
lives and cultural sociologists tend to use Geertz’ definition of culture (Griswold, 2002).
“Geertz, and Weber before him, took culture to involve meaning… how people in social
contexts create meaning” (Griswold, 2002, pp.12-13). Culture is “an historically
transmitted pattern of meanings embodied in symbols, a system of inherited conceptions
expressed in symbolic forms by means of which men communicate, perpetuate, and
develop their knowledge about and attitudes toward life” (Geertz, 1973, p.89).
Culture may be broken down into various components depending on the
framework used. Ferrante’s framework (2003) divides culture into material and
nonmaterial components. Material components are physical objects to which people have
attached meaning while nonmaterial components are intangible and include beliefs,
values, and norms (Ferrante, 2003). Schein’s framework (1985; 1999) divides culture into
three levels: artifacts, espoused values, and unconscious assumptions, with values being
the easiest to identify because they are readily verbalized. Artifacts may be thought of as
material components with values and assumptions being nonmaterial. Other frameworks
are less categorical and simply identify lists of cultural components. Hofstede & Hofstede
(2005) identify culture as symbols, heroes, rituals, values, and practices. Deal & Kennedy
(1982) identify values, heroes, rites and rituals, and the environment as elements of
culture. Culture can consist of “beliefs, ritual practices, art forms, and ceremonies, as well
as informal cultural practices such as language, gossip, stories, and rituals of daily life”
(Swidler, 1986, p. 273). Different authors emphasize many different elements of culture
including “artifacts, norms, customs, habits, practices, rituals, symbols, categories, codes,

12
ideas, values, discourse, worldviews, ideologies, or principles. And this list is not
exhaustive; any list of cultural ‘things’ will necessarily be incomplete” (Spillman, 2001,
p. 4). While there are numerous conceptualizations of culture in the literature, a concise
sociological framework of culture that is useful for this study, because it accommodates
in a parsimonious way the different frameworks above, is that culture can be studied as “a
patterned sphere of beliefs, values, symbols, signs, and discourses” (Smith & Riley, 2009,
p. 2).
2.2 Values are the Core of Culture
The common element that exists in every cultural framework or every list of
cultural elements is the idea of “values”. Values are shared conceptions of what is
good/bad, right/wrong, and important/unimportant with regard to human behavior
(Ferrante, 2003). Values are broad tendencies towards certain states of affairs over others
that address what is evil versus good, forbidden versus permitted, and abnormal versus
normal (Hofstede & Hofstede, 2005). “The core of culture is formed by values”
(Hofstede & Hofstede, 2005, p. 8). Deal & Kennedy (1982) and Brief & Nord (1990)
also specifically identify values as the core of any culture. Cultural values are important
because cultural practices and behaviors are based on values (Hofstede & Hofstede,
2005). Because values are considered the core of culture, most IS research related to
culture at the national and organizational level has focused on dimensions of cultural
values (Leidner & Kayworth, 2006). This study also attempts to pinpoint specific value
dimensions, but at a new level of analysis, that of the occupation.

13
Before leaving the topic of values research, it should be noted that the approach of
attempting to measure cultural values is not without its critics. While finding measurable
values is useful for empirical research, the measurable values perspective is sometimes
avoided in favor of more meaningful research through interpretation and literary criticism
(Swidler, 1986). Despite this objection, Swidler (1986) goes on to say that “values remain
the major link between culture and action” (p. 273). Swidler observes that values play a
more significant role in “settled lives” than “unsettled lives”. In settled lives, culture is
integrated with action based on values. Unsettled lives, on the other hand, are periods of
social transformation when people are learning new forms of collective action, practicing
unfamiliar habits, and developing new strategies for action. “In unsettled lives, values are
unlikely to be good predictors of action, or indeed of future values” (Swidler, 1986, p.
282). In order to address this issue, one could argue that the IT occupation has matured
past its initial unsettled period of the 1980s and 1990s and has entered into a more settled
period of occupational stability, one in which measured values are all the more relevant
and timely to examine.
2.3 Sociological Literature
To fully address what occupational culture entails and how it should be studied
requires a brief genealogy of sociological literature. This genealogy will not only inform
the theoretical foundation but the appropriate methodological approaches to studying
occupational culture. Sociology studies the attitudes and behavior of groups at a
collective level (Timasheff, 1967). Sociologists of occupation have examined police,

14
industrial workers, prostitutes, airline stewardesses, doctors, car salespeople, and
paralegals (Harper & Lawson, 2003), lawyers, clergy, musicians, teachers, (Pavalko,
1972), architecture, accountancy, and nursing (MacDonald, 1995). An excellent example
of a cultural sociological approach to studying an occupation is Fine’s (1996)
ethnography of restaurant workers. To date, such a sociological exercise has not been
done for the IT occupation. The roots of studying occupation run deep in sociology,
beginning with the 19th
century founders of modern sociology, Emile Durkheim and Max
Weber. Durkheim and Weber form the base of a pyramid of theoretical foundations that
build on each other as shown in Figure 1 below.
Figure 1. Theoretical Foundations

15
2.3.1 Durkheim and Weber
Durkheim’s doctoral dissertation on The Division of Labour (1893) dealt with
issues of social cohesion in a time of increasingly rapid social and economic change
(Grint, 1991). Where 19th
century thinkers were deeply concerned with social changes
and the potential breakdown of social cohesion due to changes in occupation brought
about by urbanization of life, Durkheim asserted that social cohesion was being
reconstructed into new forms based on the increasing division of labor (Grint, 1991) and
new occupational social groups (MacDonald, 1995). Where early society was relatively
homogeneous, i.e., everyone had a similar occupation such as farming, social ties were
based on similarity not differences (Durkheim, 1984). Durkheim called this “mechanical”
solidarity. But with industrialized society came greater division of labor into different
areas of specialization. Durkheim associated this type of society with “organic”
solidarity. Organic solidarity refers to a metaphor of the human body that requires
different parts, i.e., eyes, hands, organs, etc., in order to successfully function. Organic
solidarity arises because we need each other’s talents and skills in order for society to
survive (Durkheim, 1984). He saw occupations as an important stabilizing element of
society in times of change in that they preserve and pass on cultural traditions
(MacDonald, 1995) New occupations represented new cultural differences between
people (Harper & Lawson, 2003). However, no social group functions purely in a
mechanical or organic mode, but rather a blend of the two (Durkheim, 1984). If we
extrapolate Durkheim’s analysis of the benefits of “organic” solidarity to the IT
occupation, we might say that it is necessary for IT to work within the larger social

16
“body” of which they are a part in order to function smoothly. The organic metaphor
resonates strongly with the idea of IT/Business alignment if one imagines an IT
department as a social structure within a larger social structure of an organization.
Durkheim also had specific methodological instructions for sociology. Durkheim
asserted that any social group consisted of social facts that can be studied scientifically.
“A social fact is any way of acting, whether fixed or not, capable of exerting over the
individual an external constraint, or which is general over the whole of a given society
whilst having an existence of its own, independent of its individual manifestation”
(Durkheim, 1982, p. 59). These social facts lie outside of individual consciousness and
“are the beliefs, tendencies and practices of the group taken collectively” (Durkheim,
1982, p. 54). The approach of studying social facts is important because it represents a
positivist view of reality. Social facts provide objective data that can test laws and
hypotheses (Smith & Riley, 2009).
Collective representations are one type of social fact. Durkheim used the term
‘collective representations’ rather than ‘culture’ when talking about shared moral
awareness and shared social life (Smith & Riley, 2009; Peacock, 1981; Korczynski,
2006). For Durkheim, social facts, and by extension collective representations, have an
objective reality as much as objects in the physical world (Korczynski, 2006). Society
was a moral phenomenon for Durkheim, held together by religious collective
representations of the “sacred” and “profane” which ensure the survival of a smoothly
functioning society by keeping the sacred separate from the mundane realm both in time
and space (Durkheim, 1965; Smith & Riley, 2009). The sacred, for Durkheim, involved

17
feelings of awe, fear, and reverence and were contrasted with the profane, or routine,
aspects of life (Durkheim, 1965; Smith & Riley, 2009).
Durkheim’s language of the sacred and profane aspects of social life is still used
to describe and decode contemporary cultural symbols from TV talk shows (Gameson,
1998) to video games (Riley, 2010) to music (Daynes, 2010). Princeton’s Robert
Wuthnow (1987) asserted that the sacred aspects of society need not be limited to religion
alone and anthropologist Mircea Eliade’s (1959) book entitled The Sacred & The Profane
points to the potential sacrality of work. While it may be counterintuitive to be discussing
what is sacred in a study about IT occupational culture, there are actually close ties
between computer usage and the language of the sacred in terms of the ‘god-like’ power
of computers and those who can master them (Alexander, 1990; Roszak, 1994).
Furthermore, the dynamic of reverence and fear may be relevant to the way IT workers
and business users approach technology. Durkheim’s approach is still relevant today and
has even been useful in analyzing organizational culture in businesses (Korczynski,
2006).
Weber was also interested in the relationship between work and culture. In The
Protestant Ethic and the Spirit of Capitalism (first published in 1904), he focused on the
interplay between religion and work. With the rise of Protestantism, and Calvinism in
particular, economic success became a sign of heavenly salvation (Smith & Riley, 2009)
while wastage of time became the deadliest of sins (Brief & Nord, 1990). Work had a
very special significance for the Puritans due to their sense of calling (Weber, 1992). In
Weber’s view, that sense of calling -- the transcendent meaning of work -- was

18
transitioning in modern society towards increasing rationality and bureaucracy (Smith &
Riley, 2009). Meaningless bureaucracy in work life was described vividly as an ‘iron
cage’ of rationality (Weber, 1992). In this view, people are no more than cogs in a
machine that limits their creative freedom resulting in disenchantment (Weber, 1992).
This disenchantment in general, and the metaphor of being a cog in a machine in
particular, will be seen again in the interview transcripts for Part I. Chillingly, Weber
prophesized about the coming cultural rationality:
Where the fulfillment of the calling cannot directly be related to the highest
spiritual and cultural values, or when, on the other hand, it need not be felt simply
as economic compulsion, the individual generally abandons the attempt to justify
it at all. In the field of its highest development, in the United States, the pursuit of
wealth, stripped of its religious and ethical meaning, tends to become associated
with purely mundane passions, which often actually give it the character of sport.
No one knows who will live in this cage in the future… (1992, p. 182).
Evidence in the interviews from Part I will provide some evidence that members of the IT
occupation may be living in such a cage.
For Weber, occupational “status groups” became more important in explaining
social action than Marxist “classes” (Weber, 1947; Grint, 1991). Where class is described
as merely an economic descriptor, occupational status is a social descriptor (Weber,
1947). Status groups have a common ‘style of life’, shared customs, conventions, and
training which grant them prestige (Weber, 1947; Smith & Riley, 2009). Weber’s work
on forms of rational control and bureaucracy are still applied today to organizational
cultural studies (Grint, 1991; Korczynski et al., 2006; Orlikowski, 1991). The prestige

19
aspect of certain occupational status groups, such as the IT occupation, may be extremely
relevant if the IT occupation can be shown to have a common “style of life”.
In terms of methodology, Weber emphasized a different approach to social reality
to that of Durkheim. Where Durkheim emphasized the objective nature of external social
reality, Weber advocated the interpretation of socially-constructed reality. In other words,
culture can be studied, but only from the inside, not the outside. The interpretive method
of verstehen (deep explanatory understanding) is necessary for studying collective ideas
because sociologists are faced with thinking subjects, not inanimate objects (Weber,
1968; Grint, 1991). “Verstehen” means the observer must attempt to reconstruct the
subjective meanings out of social action, including cultural values and shared histories
and not just its measurable qualities alone (Weber, 1968; Smith & Riley, 2009). Weber’s
approach to studying culture as well as occupation is key to understanding how
occupational groups provide meaning to life. Occupational groups can define people,
drive them to work harder, and increasingly take over their lives (Harper & Lawson,
2003).
Maurice Halbwachs, a student of both Durkheim and Weber’s The Protestant
Ethic, emphasized the role that collective memory has in shaping culture (Halbwachs,
1925). Collective memory is not literal history, but the shared interpretation of history
that was experienced and lived by a social group (Halbwachs, 1925). He used the
Durkheimian view of collective representations and wanted to identify how people
mythologize their own pasts (Coser, 1992). Collective memory is a cohesive force for a
social group because it identifies the group’s heroes and group origins (Coser, 1992).

20
Collective memory, for Halbwachs (1925), is specifically transmitted through
language. Language affects culture by articulating its beliefs and values. A social group
can only endure if its institutions are based on powerful collective beliefs and values
(Halbwachs, 1992). For Halbwachs (1925), the estrangement experienced between
different social groups is due to their not sharing enough collective memories. If two
groups do not share common experiences, they will not interpret the meaning of the past
or the present in the same way (Coser, 1992). Furthermore, this disparity in meaning will
be passed on to each generation as they continually reshape their collective memories
(Smith & Riley, 2009).
Occupational groups, among others, have their own memories that their members
have constructed over a long period of time (Coser, 1992). The shared memory of a
group is an important aspect of the culture of a social group (Connerton, 1989). While it
is individuals who are doing the remembering, not groups or institutions, those
individuals are part of a specific group context and use that context to both remember and
re-interpret their past (Coser, 1992). This approach of studying the relationship between
shared memory, language, and culture is still used today in sociology (Daynes, 2010).
Based on Halbwach’s analysis, one can surmise that the IT/Business alignment problem
may be related to a lack of shared language, shared history, and/or shared context.
Talcott Parsons was an important champion in sociology of both Weber and
Durkheim and the first to synthesize their work in the 1930s and 1940s (Smith & Riley,
2009; Timasheff, 1967). Parsons theorized that values had to be the central component of
social action in order for groups to stay cohesive (Alexander, 2003). Parsons’ General

21
Theory of Action had three systems including the social system, personality system, and
cultural system (Parsons,1951). The cultural system was made up of cognitive symbols,
expressive symbols, and values (Smith & Riley, 2009). Parsons proposed that by
internalizing values and norms, people align their actions with those of others (Smith &
Riley, 2009). Parsons is also the first sociologist to address different dimensions of values
that can be analyzed by themselves outside of their context (Smith & Riley, 2009).
Groups at any level of society are able to differentiate themselves through key value
patterns including: particularism vs. universalism, affectivity vs. affective neutrality,
collectivism vs. individualism, diffuseness vs. specificity, and ascription vs. achievement
(Parsons, 1951). Parsons’ strong influence can be seen in contemporary quantitative
measures of national cultural values that have achieved popularity including Hofstede &
Hofstede (2005), House et al. (2004), and Trompenaars (1993). Parsons agreed with
Durkheim that modernity has not eroded meaning in society, in contrast to Weber’s dim
view (Smith & Riley, 2009). While Parsons was an early champion of values research
Parsons, he has been criticized for not explaining the meaning of his values system in any
hermeneutic depth (Alexander, 2003). Parsons functionalism was “denuded of
musicality” and “without a counterweight of thick description, we are left with a position
in which culture has autonomy only in an abstract and analytic sense” (Alexander, 2003,
p. 16). Clifford Geertz was a student of Parsons who pursued this ‘thick description’ of
culture (Smith & Riley, 2009) with notable success in the 1970s and 1980s.
Anthropologist, Clifford Geertz takes a more interpretive turn with culture.
“Believing, with Max Weber, that man is an animal suspended in webs of significance he

22
himself has spun, I take culture to be those webs, and the analysis of it to be therefore not
an experimental science in search of law but an interpretative one in search of meaning”
(Geertz, 1973, pp. 4-5). Geertz moved away from Parsons’ stiff views of values and
norms in favor of richer descriptions of the complexities of culture. He “came to
understand culture as an incredibly complex texture of signs, symbols, myths, routines,
and habits that cried out for a hermeneutic approach” (Smith & Riley, 2009). Doing thick
description requires the writer to capture a wealth of cultural detail and draw in the reader
with a sense of being there both intellectually and emotionally (Smith & Riley, 2009).
Critics of Geertz have said that his approach is too literary and not scientific enough
(Smith & Riley, 2009). Yet Geertz’ method has attracted followers like Jeffrey Alexander
and the ‘Yale Strong Program’ which blend elements from Durkheimian theory and
structuralism with Geertz’ emphasis on narrative (Smith & Riley, 2009).
2.3.2 The Strong Program of Cultural Sociology
Alexander’s strong program of cultural sociology suggests that structuralism and
hermeneutics can “be made into fine bedfellows” (Alexander, 2003, p. 26). Alexander
and his colleagues reject examining cultural content through structure alone, but
incorporate rationality of social life with ‘eruptions of the sacred’ to form a meaningful
explanation (Smith & Riley, 2009). Alexander has examined issues of why we work so
hard and why we are so obsessed with technology in particular and shows how cultural
issues are at play here (Alexander, 2003). “We need myths if we are to transcend the
banality of material life. We need narratives if we are to make progress and experience

23
tragedy. We need to divide the sacred from the profane if we are to pursue the good and
protect ourselves from evil. Technology is not only a means. It is also an end, a desire, a
lust, a salvationary belief” (Alexander, 2003, p. 4). This strong program of cultural
sociology has three criteria for researchers. First, culture must be an autonomous
construct, i.e., an independent variable. Second, Geertzian thick description hermeneutics
must be used to decode narratives and symbols and avoid abstract unmeaningful values
(whereas “the weak program fails to fill these empty vessels with the rich wine of
symbolic significance.” Alexander, 2003, p. 13) And third, the strong program seeks
empirically-supported causal clarity about the theoretical relationships between culture
and action (Alexander, 2003). Alexander’s strong program “represents one of the more
intellectually ambitious of recent theoretical frameworks for cultural analysis” (Smith &
Riley, 2009, p. 193) and therefore has been selected as the next layer in the pyramid of
theoretical foundations.
To summarize this sociological literature review, both positivist and interpretive
approaches may be simultaneously appropriate for studying group culture. Orlikowski &
Baroudi (1991) affirm that both approaches are appropriate for IS research as well. “The
existence of a plurality of perspectives allows the exploration of phenomena from diverse
frames of reference” (Orlikowski & Baroudi, 1991, p.2) Where positivist studies are
based on a priori structural relationships and the assumption of an objective social world
independent of humans, interpretive studies are based on symbolic meanings and the
assumption of a subjectively-created social world reinforced through action and
interaction (Orlikowski & Baroudi, 1991). For culture scholars like Weber, Geertz and

24
Schein, studying culture relies on interpretive methods. Yet the majority of IS studies are
positivist in the Durkheimian tradition, focusing on objective espoused values from
cultural dimensions such as Hofstede & Hofstede (2005), House et al. (2004), and
Trompenaars (2003). Value dimensions, like Durkheim’s social facts, have a certain
lawlike regularity and can be measured, but the meaning of those values themselves must
be interpreted in order to achieve any real understanding, according to Weber (1992) and
Geertz (1973). The strong program of cultural sociology reinforces this hybrid,
interdisciplinary approach.
2.4 Theory of Occupational Culture
Geert Hofstede, the popularizer of national culture studies, mentions briefly that
such a thing as occupational culture might be investigated but as yet there are no dimensions
for measuring such a phenomenon (Hofstede, 1990). Edgar Schein, the popularizer of
organizational culture studies, also points to the possibility of occupational culture having a
strong influence in the workplace (Schein, 1999). Gallivan & Srite (2005) and Karahanna,
Evaristo, and Srite (2005) identify organizational culture and national culture together as
the two major streams of culture research, although they likewise acknowledge the
existence of occupational culture and its potential impact on group behavior.
More recently, Walsh and Hefi (2008) and Walsh (2009) have popularized a
“spinning top” metaphor to help explain the different levels of analysis of culture. The
spinning top is used to emphasize the dynamic nature of culture where sometimes some
layers “spin up” to be more influential than others. The center of the top represents

25
individuals with successive layers of culture spinning around them. National culture is
shown as closest to the individual in the center while organizational culture is further away
from the individual. Note that occupational culture is closer to the individual than
organizational culture in this model shown in Figure 2.
Figure 2. ‘Spinning top’ model of culture (adapted from Walsh and Kefi, 2008)
Occupational culture consists of values, norms, and symbols where values are the
most basic beliefs (Greenwood, 1957). Trice (1993) explores the defining characteristics of
occupational cultures in detail with his Theory of Occupational Culture. In this framework,
occupational cultures exist apart from organizational culture and can become a source of
conflict due to occupational cultural differences. Seven characteristics that separate out an
occupational culture are identified as 1) Esoteric knowledge and expertise, 2) Extreme or
unusual demands, 3) Consciousness of kind, 4) Pervasiveness, 5) Favorable self-image and
social value in tasks, 6) Primary reference group, and 7) Abundance of cultural forms (Trice,

26
1993). This framework has been used in more recent IS literature to verify that there is,
indeed, the existence of such a thing as ‘IT occupational culture’ because it conforms to
these seven characteristics (Guzman et al., 2004; Guzman & Stanton, 2004; Guzman et al.
2006; Ramachandran and Rao, 2007). For example, esoteric knowledge and technical jargon
are prime examples of what separates IT people from other people in an organization. While
the core area of values is absent from Trice’s conceptualization of occupational culture, it
serves as a useful description of the shared context of occupational groups.
2.5 Theory of IT Archetypes
In the late 1980s, the idea of IS or IT having its own professional culture was not a
possibility given Orlikowski and Baroudi’s (1989) assertion that IS is not a ‘profession’ but
rather an occupational group. This idea was reinforced by Duliba & Baroudi (1991) who
claimed that IS personnel form a weak occupational community, if they can be said to form
an occupational community at all. Weak occupational communities have a lower sense of
group identity than strong occupational communities. In other words, if there is no sense of
community, there can be no sense of shared culture.
A pioneering exploration of the shared values and beliefs of IT culture empirically
is by Kaarst-Brown & Robey (1999) with their Theory of IT Archetypes. Five archetypes
of IT culture are developed from their ethnographic case study of two organizations using
the metaphor of magic to explain differences in IT cultures within firms. The Theory of
IT Archetypes identifies five different archetypes that describe possible attitudes within
an IT department which include 1) “Revered”, 2) “Controlled”, 3) “Fearful”, 4)

27
“Integrated”, and 5) “Demystified” (Kaarst-Brown & Robey, 1999) and focused on the
relationships between IT departments and business departments. There are advantages
and disadvantages to each of the five cultural archetypes which leads to the idea that
some IT cultures are more disposed to organizational success than others (Kaarst-Brown
& Robey, 1999). The study is highly interpretative and does not explicitly address what
measurable dimensions of IT culture might look like, although they do call for such a
quantitative measure as an area for future research. They emphasize that “rather than
dividing the construct of IT culture into distinct dimensions, our approach is to describe
them as coherent wholes through the use of metaphor.” (Kaarst-Brown & Robey, 1999,
p.213) This study is a useful foundation to build on for studying IT Occupational Culture.
Without describing each archetype in detail, it is merely necessary to point out the direct
connection between their use of the terms “Revered”, “Fearful,” and “Demystified”
(being the opposite of “awe”). These terms harken back to Durkheim’s definition of the
sacred as that which inspires reverence, fear, and awe. Furthermore, the “Integrated”
archetype describes an ideal form of partnership between IT and the business which
would today be termed “IT/Business Alignment”.
2.6 Theory of IT-Culture Conflict
A twenty-five year period of cultural studies within IS research is comprehensively
reviewed and synthesized in Leidner and Kayworth (2006). They identify 6 broad themes of
cultural research in IS: 1) Culture and IS Development, 2) Culture, IT Adoption and
Diffusion, 3) Culture, IT Use and Outcomes, 4) Culture, IT Management and Strategy, 5)

28
IT’s Influence on Culture, and 6) IT Culture (Leidner & Kayworth, 2006). They directly
identify as a research gap this last theme of IT culture saying that “what has received the
least amount of attention in the literature on IT and culture is the very notion of an IT
culture. By IT culture, we mean the values attributed to IT by a group” (Leidner &
Kayworth, 2006, p.371). Leidner & Kayworth (2006) provide a table of 21 possible
dimensions of IT values based on prior literature, but call for more empirical studies.
Leidner & Kayworth (2006) propose a Theory of IT-Culture Conflict which
identifies three different types of values, 1) Group member values, 2) Values embedded
in a specific IT, and 3) IT values which can interact at the national, organizational and
subunit levels to create three different types of conflict: 1) system conflict, 2)
contribution conflict, and 3) vision conflict. Differences in cultural values, if left
unchecked, can negatively impact organizational outcomes through continual conflict as
evidenced by their many examples. Their framework is shown in Figure 3.

29
Figure 3. IT-Culture Conflict (Leidner & Kayworth, 2006)
Note that differing group member values between different subunits falls within their
framework of cultural conflict. Leidner & Kayworth (2006) go on to say that while there
has been much research on IT/Business Alignment, there has been very little research on
the specific role of culture, at any level, in achieving IT/Business Alignment.
2.7 IT/Business Alignment and IT Value
The strategic necessity of having IT aligned with the business has been a top
concern for business and IT executives (Luftman & Kempaiah, 2008). Early definitions
of alignment referred to the strategic planning element of alignment alone, for example as
“the interaction or fit between IT and business strategy” (Tallon, 2007/2008). Reich &
Benbasat (1996) define alignment as the degree to which the mission, objectives, and

30
plans contained in the business strategy are shared and supported by the IT strategy. The
greater the alignment, the greater the business value from IT in terms of firm
performance (Tallon, 2007/2008; Chan et al., 2006). Furthermore, alignment between the
firm’s strategy, organizational structure, and information technology is the key to
competing successfully on a global level (Pankratz, 1991). IT alignment is a management
concern primarily because of its potential impact on firm performance. Strategic IT
alignment leads to increased profits for an organization and is significantly correlated
with perceived business performance (Chan & Reich, 2007).
Alignment has also been described more broadly than just including strategic
planning. Strategic alignment of IT exists when an organization’s goals and activities and
its supporting information systems stay in harmony (McKeen & Smith, 2003). Good
alignment means that the organization is applying IT in appropriate ways that are
congruent with business strategy, goals, and needs (Luftman & Brier, 1999). Even more
broadly, alignment is the business and IT working together to reach a common goal
(Campbell, 2005) or simply everyone rowing in the same direction (Abraham, 2006).
Alignment is also sometimes referred to as linkage, harmony, integration, fit, and fusion
(Tallon, 2007/2008; Chan & Reich, 2007).
Organizational structure of IT is a common factor examined in the alignment
literature in terms of whether the IT group is centralized, decentralized or federated
(Chan & Reich, 2007; Luftman, 2000; Papp & Brier, 1999; Pankratz, 1991). There is a
relationship between IT organizational structure and alignment in that organizations with

31
a federated IT have shown significantly higher alignment than those with highly
centralized or decentralized structures (Luftman & Kempaiah, 2007).
There are many points of alignment between business and IT in addition to
strategic planning and organizational structure. The cultural aspect, however, has not
been examined closely enough. “In the MIS literature, several dimensions of alignment
are clearly apparent: strategic/intellectual, structural, social, and cultural” Chan & Reich
(2007, p. 300). The social aspects are explored in Reich & Benbasat (2000) where
alignment is affected by four factors: 1) shared domain knowledge between business and
IT executives, 2) IT implementation success, 3) communication between business and IT
executives, 4) connections between business and IT planning processes. Van Der Zee &
de Jong (1999) echo the social theme of communication in discussing the lack of a
common ‘language’ between business and IT executives. The cultural aspects have been
explored as the idea of a ‘culture gap’ between IT and business people in implementation
failures (Taylor-Cummings, 1998). Pyburn (1983) points out the importance of cultural
fit between business and IT as a precondition for successful IS planning. None of these,
however, have looked at the need for shared values between IT and business leaders.
Farrell (2003) asserts that that there are several culturally-specific antecedents to
alignment. Van Der Zee & De Jong (1999) suggest that a future research challenge is to
explicitly understand the prerequisites for IT/management integration in cultural terms.
Watson et al. (1997) also observe that alignment has a strong cultural and social
component. Finally, Chan & Reich (2007) make a specific call for new models with

32
novel antecedents and new theories to help explain the cultural aspects of IT/Business
alignment which this research seeks to answer.
2.8 Motivation for Research
IT/Business Alignment is, at least in part, a cultural phenomenon. It has
previously been examined as an internal issue, i.e., one of organizational culture.
However, it is a pervasive issue throughout many organizations in many industries in
different size organizations. It seems reasonable to assert that there is some factor – a
factor external to any individual organization – that is driving misalignment. While it
manifests itself within specific organizations, it actually is an industry-wide issue,
suggesting that the level of analysis should be higher than the organizational level. This
research proposes that there are cultural factors at play in this problem that can best be
addressed by examining the occupational level of analysis. The functional areas of IT and
business are comprised of distinctly different occupational groups. The IT occupational
group, with its own values, history and language, forms a subculture within the
organization that impacts the degree of alignment. Lack of alignment may be directly
related to core values of different groups being too divergent.
Based on the literature review in Table 1, a number of gaps exist that this research
seeks to fill. First, the value dimensions of IT occupational culture are missing in the
literature despite being called for (Kaarst-Brown & Robey, 1999; Leidner & Kayworth,
2006). Second, studies of IT occupational culture have so far been interpretive with no
quantitative value measures (e.g., Kaarst-Brown & Robey, 1999; Guzman et al., 2004;

33
Nord et al., 2007) or quantitative value measures that examine IT culture at different
levels of analysis than the occupational (e.g., Plisken et al., 1993; Walsh, 2009). Third,
studies that focus on the occupational level of analysis have not examined the impact on
business success (e.g., Guzman, 2006; Kwantes & Boglarsky, 2004). The occupational
level of analysis for IT professionals is only beginning to be explored as evidenced in
Table 1.
Table 1. Summary of Relevant Culture Articles in IS Literature (Sorted by Level)
Author(s)
Italics =
Conference
Proceeding
Major Findings
Level of
Analysis
Type of
research
Karahanna et al
(2005)
There are different levels of culture, including
professional. Professional culture may dominant
national cultural differences for workplace
behavior that involves strong competence
values. A theoretical model is proposed.
Multiple levels Theoretical
House et al.
(2004)
9 dimensions of national culture; draws heavily
on Hofstede’s dimensions
National Positivist
Leidner &
Kayworth
(2006)
Comprehensive literature review; Calls for
more research on IT Culture in particular
National and
organizational
Theoretical
Kappos &
Rivard (2008)
Conceptualizations of culture differ among IS
researchers and no single view is sufficient to
capture the complexity of culture. A three-way
conceptualization is proposed.
National and
organizational
Theoretical
Leidner (2010) Identifies 3 waves of cultural research in IS:
identifying differences, explaining differences,
and managing differences.
National and
organizational
Theoretical
Sarala (2010) Organizational cultural differences are related
to organizational conflict. Conflict is measured
by 4 areas.
National and
organizational
Positivist
Schein (1992) Identifies 3 levels of cultural analysis: artifacts,
espoused values, and underlying beliefs
Organizational Interpretive
Hofstede et al.
(1990)
Identifies lack of literature on occupational
culture as a layer between national and
organizational
Organizational Positivist
Trice (1993) Occupational subcultures exist apart from
organizational culture; Identifies 6
characteristics of subculture
Occupational Theoretical
Guzman et al. Uses Trice’s subculture characteristics to Occupational Interpretive

34
(2004); Guzman
et al. (2007)
identify IT subculture areas; calls for more
structured measures
Johnson et al.
(2009)
Occupational culture of Managerial
Accountants explored quantitatively
Occupational Positivist
Kwantes &
Boglarsky
(2004)
Organizational culture preferences vary
between six different occupational groups
(including MIS). MIS identified as significantly
different from other occupations in preferences.
Occupational Positivist
Joseph et al
(2007)
Turnover of IT professionals and understanding
job satisfaction remains a critical issue in IS
studies in this MISQ review article.
IT
Organizational
Theoretical
Kaarst-Brown &
Robey (1999)
Identifies 5 archetypes of IT Culture using
metaphor of magic; calls for measureable
dimensions
IT
Organizational
Interpretive
Pliskin et al.
(1993)
Identifies 5 dimensions of culture of an
information system; applied in failed MIS
implementations
IT
Organizational
Positivist
Scholz (1990) Identifies theoretical elements of IT culture but
calls for empirical study.
IT
Organizational
Theoretical
Ramachandran
& Rao (2006)
Uses Trice’s subculture characteristics to
identify IT subculture areas; contrasts IT
subculture with managerial culture; speaks of
‘professional’ culture
IT Occupational Interpretive
Guzman (2006);
dissertation
IT occupational culture impacts occupational
commitment of new information technologists
IT Occupational Positivist
Orlikowski &
Baroudi (1989)
IS is not a “profession” but an occupational
group
IT Occupational Theoretical
Duliba &
Baroudi (1991)
IS personnel form a weak occupational
community, if they can be said to form an
occupational community at all.
IT Occupational Theoretical
Nord et al.
(2007)
Reviews seven models for assessing
organizational culture and chooses cultural web
model with 6 categories; Identifies areas of
culture conflict between IT groups and business
groups. IT has its own definite culture separate
from the organization.
IT Occupational Interpretive
Walsh & Hefi
(2008); Walsh
(2009)
Instrument for measuring individual IT Culture
of users with regard to adoption of technology;
Uses Spinning Top metaphor; ‘Professional’
culture is between National and Organizational
IT Individual Positivist
IT occupational culture is a relatively new area of study where good progress has
been made in qualitatively identifying the existence of an IT occupational culture but
simultaneously calling for more measurable value dimensions of that culture. The purpose
of this study is to address the research gaps identified in the literature review and to 1) build

35
a set of meaningful value dimensions of IT occupational culture based on literature and
qualitative interview data and to interpret those values according to the strong program of
cultural sociology, 2) develop an instrument to measure IT occupational cultural values, 3)
offer evidence of the significant differences between IT occupational values and business
management values, and 4) provide empirical evidence showing the impact of occupational
differences on IT/Business alignment and IT Value within organizations.

36
CHAPTER III
OVERALL RESEARCH MODEL AND RESEARCH OBJECTIVES
3.1 Overview
As indicated in the literature review, IS research on culture over the last 25 years
has focused on two levels of analysis, national and organizational, while research at the
level of occupational culture has been minimal. Furthermore, there is very little research
on IT occupational culture as evidenced by Table 1, and none that empirically examine
occupational values. The proposed research addresses the occupational culture of the IT
profession. Occupational culture is a specific culture shared by members of the same
profession who have similar values, jargon, and behaviors (Trice, 1993). The research
approach, in keeping with the pluralism encouraged by the literature review above, will
be in three parts and based on a pilot which was completed earlier.
Appropriate methodologies for cultural research include interviews, content
analysis, ethnography, and surveys (Reed & Alexander, 2009). The methods of
qualitative interviews and content analysis for interpretation of meaning and a survey
instrument, for positivist measurement, will be used to triangulate on aspects of the
phenomenon of IT occupational culture. Triangulation is the use of multiple methods of
research which is a common approach in sociology (Phillips, 1985). Furthermore, the
combination of interpretive and positivist approaches into a pluralist approach is
appropriate for IS research (Lee, 1994; Lee, 1991).

37
In order to triangulate on the phenomenon of IT occupational culture, both
qualitative and quantitative data collection methods will be used. Sociologists typically
use a combination of qualitative and quantitative methods in performing cultural research
where qualitative interviews lead to the development of quantitative scales (Bernard,
1995). The dissertation is composed of three parts which build on each other to address
the unified theme of IT occupational culture.
Part I is an interpretive exploration of the shared values of the IT occupation and
their meanings based on qualitative interview data that result in a hermeneutic
interpretation. Hermeneutics is a method of analyzing a text based on both its underlying
meaning and its overall context. Part II is a positivist study and develops an instrument to
measure the values identified in Part I. The instrument in Part II will also be used to look
for significant differences in responses between IT professionals and non-IT business
managers. Business managers have their own occupational culture and tend to have
different occupational values such as productivity, efficiency, profitability, and morale
(Posner & Schmidt, 1996). Part III is a positivist study that uses the instrument developed
in Part II to examine the impact of those value differences, measured as cultural distance,
on the critical outcomes of IT/Business alignment and IT value.

38
3.1.1 Research Questions
The research questions below line up with Part I, Part II, and Part III and are in
keeping with the criteria used in the strong program of cultural sociology.
RQ1: Part I: What are the core values of IT occupational culture and how have
they developed out of shared history, shared language, and shared context?
RQ2: Part II: What are the measurable dimensions of IT occupational culture?
RQ3: Part II: Is IT occupational culture significantly different from business
management culture and, if so, how?
RQ4: Part III: What is the impact of occupational cultural distance on
IT/business alignment and IT value?
3.1.2 Full Research Model
The full research model for all three Parts is shown below in Figure 4 and is
addressed in detail in the Research Objectives sections that follow. Part of the research
model is based on a pilot study conducted two years ago. A brief description of the pilot
and its results are in the following section.

39
Figure 4 – Full research model for Parts I, II, and III
3.2 Initial Pilot
An exploratory pilot study was conducted in order to begin the process of
identifying IT occupational cultural values through both qualitative and quantitative
methods. The pilot addressed the research question: What are the dimensions of IT
occupational culture? The pilot included interviews which guided the development of an
instrument to measure IT occupational values. IT occupational culture was found to be
fairly homogeneous as shown in the results at the end of this section.
3.2.1 Instrument Creation
In order to answer the research question, the research design was constructed
similarly to other successful dimensions scales such as House et al. (2004) and Smith et
al. (1998). Creating the dimensions began with a thorough literature analysis. As stated in
Smith et al. (1998), the goal is not to be exhaustive but representative.

40
Stage one, using Smith et al. (1998) ’s nomenclature, included the following three
steps: 1) specifying the domain and dimensionality of the constructs of interest based on
the literature review, 2) generating a sample of items based on literature, interviews with
IT professionals, and previously validated instruments, and 3) assessing the content
validity. Content validity refers to how consistent and representative the items are with
the domain on the scale construct (Smith et al., 1996; Straub, 1989).
Step 1 of stage one was addressed through a thorough literature review on culture
research in IS. (Note that the pilot limited its literature review to IS research whereas the
full study includes a more comprehensive background of research in cultural sociology.)
Step 2 of stage one was addressed through both the literature review and the use of pre-
survey interviews with IT professionals. Seven IT professionals were interviewed using
the protocol in Appendix A. This process was iterative in the sense that dimensions,
definitions, and items were added and/or modified as appropriate based on feedback
during the interviews.
Content validity in step 3 of stage one was specifically addressed by following a
Q-Sort method with four PhD students to rank the items that were determined in step 2. A
Q-sort is a process where the subjects rank-order the Q-sample stimuli along a continuum
defined by a condition of instruction (McKeown & Thomas, 1988). The condition of
instruction included an explanation of the value dimensions but did not indicate which
items went with which dimension. Students were asked to assign each item to a
dimension and then rank-order their assignments based on how relevant they thought the
item was to the dimension. A Q-sort can be used in evaluating cultural dimension items

41
with PhD students in order to determine the most appropriate items for a set of a priori
dimensions (House et al, 2004). Items that were not consistently assigned to the expected
dimension or that were low in relevance were discarded.
Stage two of the research design included finalizing the instrument items and
doing a final pre-test with PhD students and faculty to ensure items were well-worded.
The last step of stage two was administering the instrument to a sample pilot of IT
personnel in different organizations. Like the interviews, the survey participants were IT
professionals who were not in management. Exploratory factor analysis was performed
on the pilot results to ensure that items were loading on the instrument dimensions
appropriately. Differences in dimensional mean scores were then statistically analyzed to
see if there were significant differences between the different IT groups in the pilot.
The pilot of the survey instrument had 79 participants who were all IT
professionals. The full study sample has 480 participants that include both IT
professionals and non-IT business managers. The pilot results were promising for deeper
investigation. The results of the pilot are discussed below.
3.2.2 Qualitative Results
The seven initial interviews included 1) a 33-year-old web programmer with 11
years of experience in IT at a dot-com in Silicon Valley, freelance consulting, and a large
university IT group, 2) a 32-year-old mainframe programmer with 14 years of experience
in IT with IBM, 3) a 55-year-old production analyst with 20 years of experience in IT at
six different companies including a large manufacturer, 4) a 35-year old

42
telecommunications developer with 12 years of experience in IT at a large IT services
company and a large telecommunications manufacturer, 5) a 33-year-old support analyst
with 11 years of experience including a large bank and a large retailer, and 6) a 42-year-
old lead analyst with 22 years of experience in IT including large restaurant chains, a dot-
com in Silicon Valley, and large retailer, and 7) a 36-year-old female programmer with
14 years of experience in IT with a large manufacturer.
The initial seven interviews with IT professionals showed strong and consistent
support for the original five dimensions based on literature as well as two additional
dimensions that came out of the interviews. When conducting qualitative analysis, the
frequency of a symbol, idea, or subject matter can be interpreted as measuring its
importance, attention, or emphasis (Krippendorff, 2004). Showing the numeric frequency
of codes appearing in interviews is a way of showing the relative importance of the
variables of interest (Guzman et al., 2004). Word frequency calculations were performed
using NVIVO software and are shown in Table 2. Figure 5 shows a visual representation
of the framework. Note that Alignment was conceptualized as a cultural value in the pilot
and was later determined to be better understood as an outcome for the full study. The
following value dimensions were identified and measured in the pilot: Structure of Power,
Control, Open Communication, Risk, Reverence for Knowledge, and Enjoyment. These will
henceforth be abbreviated with the acronym SCORRE. These dimensions were subject to
change and additions based on the outcomes of the full study interviews. The value
dimensions are discussed below. Quotes in each subsequent section are identified with
the participant’s number in parentheses.

43
Figure 5. Pilot Framework of IT Culture
Table 2. Code Frequency in Interviews
Code name Frequency Control 32
Communication 30 Enjoyment 29 Alignment 24
Reverence of knowledge 21 Risk 19
Structure of power 17
3.2.3 Communication
Interviewees consistently emphasized the value of good communication for IT
professionals and described it as “very important”, “vital” and “number one”. IT people
want to receive timely communication from their customers, their management, and their
peers in IT. They do not always receive good communication and this is a constant source
of frustration. At the same time, they know that they need to provide good
communication to their customers, management and peers, even though they realize this
is frequently lacking in IT. Part of this is due to language. It is easier to communicate

44
with people who speak the same technical language and share the same technical
background according to the interviewees. The term “translation” was used frequently in
five of the seven interviews.
It’s hard to communicate with people that don’t have the same level of technical
knowledge that you have. There’s this translation that has to happen. (1)
You have someone who is technical enough but not a coder, but also business
enough, but they don’t actually work in the business, someone in between who
can speak the speak of both sides and translate. (6)
I was going to be that liaison, that translator. (3)
These linguistic translation issues were seen as a major obstacle to good communication.
There was a definite pattern of questioning why IT required “liaisons” to communicate
with business people in order to accomplish this translation. When there is a
communication gap, this can cause tension especially in customer interactions to the
point that IT people are perceived as being arrogant and disdainful.
There’s always been that kind of disdain for folks that are outside of IT. That’s
been since my first day being in IT, I’ve seen that. (5)
[Users complain] ‘why don’t you tell me in terms I understand?’ (2)
People were quick to point out that the stereotype of IT people not having good
communication skills has diminished greatly over time but still lingers on. “We have our
own language, but there are some of us out there who would rather speak in English” (6).

45
3.2.4 Control
The interviewees saw control as a critical concern for IT professionals. Examples
of control included the need for documentation and uniform standards in IT. Most people
were quick to describe different organizations they had worked in as “tight” or “loose”
and emphasized their own preference for a “loose” environment. Paradoxically, IT people
have a desire for tight control in the environment while simultaneously desiring looser
control of their own actions. Rigidity, tightness of control, and bureaucracy were seen as
“less fun”. Interviewee #1 said “this is the first time I’ve been in the larger size machine”,
giving the mechanical metaphor a negative connotation. Tightness of control frequently
manifests itself as a greater need for testing before going to production.
When I was at the dot-com, in the beginning everybody had access to the system
and we didn’t think twice about testing anything in production. (6)
We’ve always tested on the production box. (7)
People also saw a consistent trend in the occupation from loose control to tighter control
over the last ten years, moving from the dot-boom to the present era of Sarbanes-Oxley.
Before there were no tools and it was managed by virtue of having people that
were intelligent and good stewards. (1)
They put some policies in place and we’re still resistant to that stuff. We’ve been
kind of like “Wild West” style for a while and we don’t want to change. (7)
We were cowboys! [during the dot-boom era] (1)

46
This idea was closely correlated with a trend from decentralized power to centralized
power structures. Objectively, control is a compelling issue because of the frequency of
codings in Table 1, but also subjectively because two different people in different
contexts brought up the Wild West metaphor in the context of control. The fundamental
occupational shift from looser control to tighter control seems to describe the essence of
how the IT occupation has evolved over time. We do not want cowboys to ride in and
save the day any more, we want police.
3.2.5 Alignment
None of the interviewees used the word ‘alignment’ but they all expressed an
impression of a disconnect between business users and IT people. This disconnect was
more than just the technical vocabulary and included broader ideas of not enough
“collaboration,” not “lining up” with organizational goals, lack of “guidance”, not being
“unified” with the business, not “going in the same direction”, and “a different world”
between IT people and business people. Even stronger language was used to describe the
relationship as “confrontational”, “friction”, and an ongoing “battle.”
I see more of almost an attitude that’s confrontational that “we don’t need those
guys, we’ll tell them what to do. We’ll make up our mind and we will design our
system ourselves and then we’ll turn it over to the programmers in the IT
department.” (3)
The business has been making decisions long before IT was ever involved and it
seems that IT has been playing catch-up ever since. And we’re still playing catch-
up. (5)

47
Interestingly, poor alignment can work in the other direction as well where “IT drove the
business model” in the dot-com era. All interviewees ultimately gave sincere stories
about really wanting to help their businesses and recognized the need to work together
better.
We’re not manufacturing experts. So we need to be helped along in terms of what
the end-user needs. (3)
The successful IT departments are the ones that have a good working relationship
with the business. (6)
One interviewee who rode the dot-boom wave indicated that he saw “everybody pulling
together” (6) when the company gave employees stock options to reinforce the sense of
ownership and being on one big team. This is in sharp contrast to “IT is usually a
scapegoat for things.” (7) The findings suggest that alignment may be achievable by
avoiding the extremes of IT making decisions without the business (evidenced by the
collapse of the dot-coms) and the business making decisions without IT (vividly
described by all the interviewees) and finding the middle ground of healthy dialogue.
3.2.6 Risk
Risk was a topic that everyone was eager to discuss and many wanted to talk
about the possible factors that affect risk-taking such as age (older=less risk-tolerant) and
size of the organization (smaller=more risk-tolerant). At the same time there was an
overall trend that IT people are at their core more comfortable with risk than business
people and this may reflect a fundamental difference of values.

48
You have to be comfortable to take the risk. I mean, what’s the alternative, you
don’t ever try something? (3)
I like innovating to the point where if everything starts breaking down then go
back and fix it. (4)
Who wants to work on the same software the rest of their lives? (5)
IT would take more risks if the business would back them. (6)
Risk was associated with innovation, development, and being on “the cutting edge” and
its opposite was referred to as “safety”, “reliability”, and “stability.” There were
indications of correlation with the dimension of Control, specifically around testing new
products. However they also wanted to distinguish between different areas of risk.
In terms of supporting stuff, risk is bad. In terms of developing stuff, risk is good.
(2)
Maybe as a techie you have more forgiveness for technology change than you do
people change. You want your people to be stable and your technology to evolve
in a positive manner. (5)
What I started to see over time is that the people who aren’t as comfortable taking
risks often end up supporting existing applications and the people who are
comfortable with risk are the ones who end up pushing out and creating new
applications….I don’t think their roles have formed their view on risk, I think
how they view risk has formed where they end up in the organization. (7)

49
IT people seem to crave an environment where risks and mistakes are tolerated. “If you
have one of these adversarial places that is just looking for a chance to pounce on you
because this didn’t work, you know, you’re not going to be there much longer.” (3)
3.2.7 Structure of Power
Power structures were harder for the interviewees to articulate, in part because
there are so many aspects to the idea: centralization versus decentralization, hierarchy
versus flat, empowering IT versus empowering business users, and top-down decision-
making. In general, there were strong preferences for less hierarchy, more diffuse power
structures, and empowering people to make their own decisions.
What you say and what you decide has to be as important and as vital as much as
anyone else out there. (3)
We had a lot more power, a lot more ways to make decisions there…I like that a
lot better. (5)
The only group that I’ve ever worked in that had a different structure was the dot-
com…it was relatively flat. (6)
I like for people to have the power to make decisions. (7)
At the same time, IT people realize the business importance of consolidating power.
The reality is that once we’re centralized we can add more functionality than we
could before. It’s becoming more important to be centralized than it was in the
past. (7)

50
The interpretation would be that people in the IT occupation chafe at having to obtain
approval from multiple layers of business management and have a strong preference for a
“hands-off” management style with “fewer chiefs, more Indians.” The industry trend
towards greater centralization is only accepted grudgingly by IT professionals because it
contradicts their values.
3.2.8 Reverence of Knowledge
Reverence of Knowledge is the first dimension that was not based on the a priori
framework from IS literature. The idea that IT people respect technical knowledge
vehemently over organizational position or, significantly, business knowledge is an
important insight. Multiple participants also admitted that there was “ego involved” in
feeling superior to business users.
In non-IT groups, power, I think, is dependent on social stature. “I’m a manager,
I’m a director, I’m an executive”. Whereas in IT, I think power is more “this is
what I know.” (2)
The ones that were even more higher esteemed were the ones who not only
sympathized with the engineering environment but the ones who could talk
shop…My best manager was just like that. (4)
If you get into a problem, you’re not going to go to the Director help, you’re
going to the person who has been there the longest and knows the most. (6)
I have a hard time with people who slide into a supervisor position who don’t
have an IT background. (7)

51
Several interviewees were dismissive of technical certifications as not being indications
of “real” knowledge. These interviewees seemed to be indicating that there is a difference
between knowledge based on actual experience and knowledge based on memorizing for
a certification exam. This is consistent with the 17th
century philosopher John Locke’s
(1910) view that knowledge is derived from experience alone. Ironically, it is the
certification process that business people value. It should be stressed at this point that not
a single person indicated that people with knowledge of the business had high value or
that IT needed or wanted to develop more business skills. It is quite possible that this
dimension is a fundamental occupational obstacle to the business alignment issue
described above. There is an underlying paradox here: you may increase your alignment
with the business by having IT managers with more business skills, but the IT employees
with not respect them. Or you can have IT managers with technical skills that have their
group’s respect, but business alignment may diminish.
3.2.9 Enjoyment
Enjoyment was the second of two dimensions added during the data collection
process due the frequency of this content theme. There is an association of “fun” and
“enjoyment” with “problem-solving” and “challenge” that is specific to the IT occupation
and these were words there were used over and over by all the participants.
If I didn’t feel challenged, I wouldn’t be happy. (6)
Do you always color inside the lines this particular way so that all our managers
can understand it? That’s one of my beefs with the job. (1)

52
There’s a creative aspect to IT. (2)
Programming was one of the most creative things I have ever done. It’s very
rewarding. (3)
Because of the creativity, I wrote something and it’s mine. (4)
A recent issue of ComputerWorld confirms that IT job hunters are looking for “more
interesting/challenging work” as their second most important criterion after
compensation. (ComputerWorld, 2010, p. 31). Surprisingly, this enjoyment was not just
about playing with new technology but specifically the enjoyment of people. The joys of
being social were emphasized over and above the opportunities to tinker.
I enjoyed my co-workers. It was more of a tight-knit community, a tight-knit
family. (4)
What I want is a good working environment, good people to work with, and I
want to be challenged. (6)
It’s very much like a family….I think if I didn’t have as much fun as I have, I
think that I would have quit a long time ago.….That’s really what brings me back
every day. (7)
The word frequency count in NVIVO highlighted some quantitative evidence to support
this idea. In aggregating all the interview transcripts, “people” was the third most used
word with a count of 286, whereas the first appearance of any IT-specific word
(“technology”) was very low on the word frequency list with a count of only 42. The

53
emphasis on people over technology is another indication that the stereotype of the IT
person being anti-social has changed.
The results of the pilot interviews were not generalized facts, but deeper
understandings of the context of the IT profession and how it is changing. The
interpretation from within is one of cowboys who were used to the environment of the
Wild West and now are dealing with an environment of increasing control, centralized
power, more bureaucracy, and less freedom. The classic stereotype of the cowboy is long
on action and short on words, they want to blaze their own trail and leave the settling to
others, they enjoy a high-risk challenging lifestyle and have little respect for those in
authority. Even though IT cowboy culture has evolved and matured since the boom of the
1990s, there is still underlying friction with business users due to differences in values.
These issues do not seem to be part of any one organizational culture but rather reflect
cultural trends across the occupation transcending organizational boundaries. Working
towards a new shared understanding may help IT professionals continue to evolve from
cowboys to a new breed of professionals.
The pilot interviews with IT professionals show strong support for the SCORRE
value dimensions (see Appendix C). The interview data also validates that while some of
the organizational dimensions used in the literature on culture in IT are relevant, not all
necessarily apply to IT occupational culture, such as Plisken et al’s (1993) Performance
orientation and Reward orientation. These dimensions are important to some degree to IT
professionals, especially with regard to career advancement, but may not be specific to
the IT occupation. The dimension of communication, absent from Plisken et al.’s (1993)

54
set of dimensions, received the strongest support and was consistently ranked number one
in importance by the interviewees. The strong support evidenced by the initial interviews
validates that the SCORRE dimensions are relevant to IT occupational culture. The
complete list of SCORRE value dimensions is depicted in Figure 6.
Figure 6. Proposed SCORRE Values of IT Culture by Pilot
3.2.10 Quantitative Results
The survey instrument based on the SCORRE values was sent to four different
organizations. Group 1 was the entire IT department for a public university in the
Southeast of the U.S. Group 2 was the corporate IT department for a telecommunications
manufacturer. Group 3 was the IT Operations department for a large retailer. Group 4
was the mainframe group of a global technology services company. There were 27

55
responses from Group 1, 6 from Group 2, 11 from Group 3, and Group 4 did not respond.
To compensate for this, the survey was sent to a fifth group on the social network
Linked-in. The name of this group is “The Association of Information Technology
Professionals (AITP)” and membership is composed of information technology business
professionals worldwide. This fifth group had 41 responses. Each group’s responses were
kept separate by creating five different web links for the survey. The total number of
responses was 85. The total response rate is difficult to calculate due to the method of
posting the survey online through Linked-In. Six responses were removed due to being
incomplete (where less than 50% of the survey questions were answered), leaving a total
usable sample size of 79. Because of the low response from Groups 2 and 3, they were
simply added to Group 5 in order to represent the industry. This allowed for some general
comparisons between Group 1 and Group 5, in addition to being able to test for reliability
and validity of the instrument. Group 5 will be referred to as Group2 from this point
forward. Group 1 is the university IT department and Group 2 represents the industry of
IT professionals.
The characteristics of all respondents were 70% males with an average of 4.4
years of experience working in IT. Age brackets included 18-25 year olds (2), 26-35 year
olds (21), 36-45 year olds (25), 46-55 year olds (22), 56-65 year olds (6), and over 65 (1).
Two respondents withheld their age. Education brackets included High School Diploma
(2), Some Years of College (25), Bachelor Degree (36), and Master’s Degree or higher
(14). Overall descriptive statistics for mean responses for the seven dimensions is shown
in Table 2. Statistical tests were conducted in SPSS in order to determine three things: 1)

56
reliability of the instrument, 2) construct validity of the latent variables, and 3) possible
norms. Note that Alignment measures are flagged with an asterisk to indicate that
Alignment was included as a value in the pilot, but was later changed to be the dependent
variable in the full study.
Table 3. Descriptive statistics for SCORRE dimensions
Items Minimum Maximum Mean Std. Deviation
Communication 4 4.00 13.00 7.986 2.402
Control 5 5.00 16.00 8.933 2.772
Alignment * 5 5.00 16.00 8.213 2.820
Risk 3 3.00 13.00 8.653 2.430
Structure of Power 3 3.00 14.00 7.946 2.229
Reverence for
Knowledge
5 5.00 23.00 13.800 3.468
Enjoyment 5 5.00 16.00 9.480 2.500
3.2.11 Reliability Results
All responses from both groups were combined in order to examine the reliability
of the instrument items. Cronbach alphas were calculated in SPSS resulting in the values
in Table 4.

57
Table 4. Cronbach alphas (before dropping items)
Latent Variable Cronbach alpha
(before dropping items) Communication 0.721 Control 0.829 Alignment * 0.852 Risk 0.752 Structure of Power 0.668 Reverence for Knowledge 0.798 Enjoyment 0.797
After the factor analysis (described below), the following items were dropped in order to
either strengthen the Cronbach alpha or the factor loadings or both. The items dropped
were Comm1, Con 5, Ali4, Ris4, Pow2, Pow3, Kno4, and Enj6. Full descriptions of all
items in the pilot instrument are in Appendix D. After these items were eliminated,
Cronbach alphas were calculated a second time as part of the iterative process of
purifying the measures to get the best sample of items (Churchill, 1979). High Cronbach
alphas show a high degree of correlation between items and they should be high when
measuring the same construct (Straub, 1989). The final result of the pilot is very high
reliability scores, all of which were over the rule-of-thumb of .70, with the lowest being
Communication at .72 and highest being Alignment at .868 as shown in Table 5.
Table 5. Cronbach alphas (after dropping items)
Latent Variable Cronbach alpha after dropping items) Communication 0.720 Control 0.807 Alignment * 0.868 Risk 0.754 Structure of Power 0.803 Reverence for Knowledge 0.775 Enjoyment 0.804

58
3.2.12 Construct Validity
Exploratory factor analysis was done in SPSS to see if the items were loading on
the appropriate seven latent variables. After the initial reliability test, all the items were
kept for the initial validity test. The initial loadings for the rotated factor matrix (using
Varimax rotation) are shown in Table 6.
Table 6. Rotated Factor Matrix (Before dropping items)
Factor 1 Factor 2 Factor 3 Factor 4 Factor 5 Factor 6 Factor 7
Comm1 0.202 0.153 0.068 -0.193 0.301 0.332 0.033
Comm2 0.318 0.310 0.189 -0.100 0.055 0.547 0.046
Comm3 0.121 0.213 -0.074 -0.044 -0.076 0.701 -0.066
Comm4 0.199 0.206 0.004 0.010 -0.084 0.491 0.003
Comm5 0.154 0.162 0.137 0.146 0.223 0.742 -0.099
Con1 0.702 0.039 0.063 0.049 -0.121 0.245 0.064
Con2 0.701 0.056 0.069 0.110 -0.104 0.053 0.019
Con3 0.756 0.133 0.080 0.058 -0.043 0.136 0.098
Con4 0.745 0.164 -0.111 0.046 0.030 0.089 -0.066
Con5 0.625 0.181 0.022 0.146 -0.206 0.054 0.080
Con6 0.651 0.001 0.058 0.039 0.136 0.049 -0.122
Ali1 0.182 0.805 0.015 -0.134 0.073 0.023 0.050
Ali2 0.143 0.879 -0.032 0.052 -0.021 0.037 0.081
Ali3 0.123 0.838 -0.108 -0.008 0.052 0.230 -0.021
Ali4 0.074 0.488 -0.168 0.305 -0.234 0.300 -0.178
Ali5 -0.064 0.631 0.205 -0.054 -0.140 0.108 0.027
Ali6 0.208 0.731 0.066 0.049 -0.205 0.167 -0.007
Ris1 -0.009 0.036 0.048 0.098 0.064 -0.064 0.842
Ris2 0.083 0.063 -0.181 0.098 -0.012 -0.003 0.834
Ris3 -0.151 0.018 -0.249 0.055 0.062 0.136 0.588
Ris4 0.202 -0.042 -0.062 0.141 0.257 -0.125 0.555
Pow1 -0.109 -0.009 0.065 0.089 0.743 0.149 0.224
Pow2 -0.498 -0.132 -0.017 0.106 0.294 0.388 -0.050
Pow3 -0.227 -0.190 -0.163 -0.130 -0.103 0.394 0.112
Pow4 -0.109 -0.155 -0.004 0.099 0.785 -0.084 0.054
Pow5 -0.123 -0.099 0.029 0.128 0.863 -0.033 0.013

59
Kno1 -0.085 0.044 0.122 0.714 0.160 0.171 0.070
Kno2 0.120 -0.005 0.073 0.633 0.026 -0.039 0.062
Kno3 0.159 0.006 0.171 0.579 0.058 0.212 0.134
Kno4 0.254 -0.163 0.337 0.557 0.073 0.134 0.082
Kno5 0.029 0.012 0.045 0.788 -0.057 -0.282 -0.024
Kno6 0.036 0.001 -0.084 0.780 0.098 -0.186 0.111
Enj1 -0.106 -0.022 0.618 0.015 -0.179 0.043 -0.014
Enj2 0.166 0.061 0.808 0.133 -0.134 0.042 -0.061
Enj3 0.032 0.007 0.776 0.010 0.135 -0.067 -0.240
Enj4 0.098 0.207 0.659 0.164 0.170 0.108 -0.336
Enj5 0.089 -0.046 0.708 0.006 0.137 0.026 -0.133
Enj6 -0.030 0.013 0.616 0.250 0.086 -0.090 0.251
As indicated previously, items for Comm1, Con 5, Ali4, Ris4, Pow2, Pow3, Kno4, and
Enj6 were dropped and Cronbach alpha’s recalculated. Dropping 9 items has the added
benefit of shortening the survey for the full study in the future. After this measurement
purification step, the factor loadings improved and all items loaded on their respective
constructs. Construct validity is demonstrated by the correct items loading on the same
constructs indicating that the instrument is measuring the right things. Moreover, there is
high discriminant validity because none of the items are crossloading on other constructs,
meaning the constructs are well-defined and separate from each other. Table 7 shows the
final results of the factor analysis. With only a few exceptions, all items had high
loadings above the generally accepted cutoff of 0.4 (Hulland, 1999).

60
Table 7. Rotated Factor Matrix (After dropping items)
Rotated Factor Matrix
Factor
1 2 3 4 5 6 7
comm2 0.157 0.230 0.206 -0.095 -0.062 0.635 0.010
comm3 -0.059 0.219 0.172 -0.085 -0.145 0.485 -0.046
comm4 0.069 0.197 0.217 -0.098 0.063 0.510 -0.011
comm5 0.163 0.102 0.117 0.105 0.035 0.733 -0.059
con1 0.079 0.134 0.723 -0.225 0.001 0.119 0.097
con2 0.181 0.039 0.633 -0.091 0.020 0.031 0.065
con3 0.108 0.139 0.865 0.015 0.092 0.175 0.005
con4 -0.061 0.159 0.593 0.006 0.062 0.325 -0.166
con6 0.091 0.015 0.480 0.062 -0.049 0.132 -0.140
ali1 -0.004 0.731 0.139 0.033 -0.114 0.090 -0.030
ali2 -0.017 0.875 0.110 -0.048 0.050 0.049 0.116
ali3 -0.089 0.756 0.071 -0.012 -0.018 0.291 0.021
ali5 0.088 0.545 -0.022 -0.059 -0.047 0.208 0.032
ali6 0.074 0.680 0.172 -0.326 0.035 0.089 -0.042
ris1 0.033 0.088 -0.036 0.106 0.118 -0.110 0.726
ris2 -0.221 0.077 0.085 -0.026 0.163 -0.078 0.778
ris3 -0.258 -0.089 -0.214 0.070 0.079 0.137 0.436
pow1 0.080 -0.071 -0.019 0.674 0.009 0.040 0.294
pow4 0.000 -0.102 -0.004 0.843 0.150 -0.107 -0.034
pow5 0.060 -0.085 -0.141 0.805 0.109 -0.044 -0.052
kno1 0.208 0.000 -0.159 0.179 0.503 0.253 0.225
kno2 0.050 -0.058 0.101 0.023 0.614 0.106 0.089
kno5 0.121 -0.078 -0.007 -0.008 0.736 -0.253 -0.012
kno6 -0.017 0.041 0.043 0.167 0.815 -0.095 0.142
enj1 0.547 0.007 0.095 0.051 0.080 0.080 0.035
enj2 0.796 -0.001 0.200 -0.150 0.072 0.007 0.102
enj3 0.813 -0.035 0.034 0.038 0.029 -0.037 -0.157
enj4 0.737 0.164 0.039 0.101 0.060 0.144 -0.252
enj5 0.682 -0.043 0.058 0.078 0.037 0.116 -0.095
Extraction Method: Principal Axis Factoring.
Rotation Method: Varimax with Kaiser Normalization.

61
3.2.13 Norms
The final step of analysis is to look at potential norms (Churchill, 1979). The two
groups were separated in order to see if there were any significant differences between
group 1 (all from the same organization) and group 5 (a larger collection of IT
professionals from different organizations representing the occupation broadly) simply as
an exploratory activity. The items for each construct were summed and then their means
were compared in SPSS using simple t tests. Descriptive statistics for the two groups are
shown in Table 8.
Table 8. Descriptive statistics of two groups for comparison
Group Statistics
GROUP N Mean Std. Deviation
Std. Error
Mean
COMM 1 25 7.583 1.791 .365
2 54 8.169 2.592 .356
CON 1 25 8.750 2.706 .552
2 54 8.943 2.824 .387
ALI 1 25 8.208 2.797 .570
2 54 8.226 2.819 .387
RIS 1 25 8.750 2.090 .426
2 54 8.584 2.575 .353
POW 1 25 8.083 2.357 .481
2 54 7.867 2.166 .297
KNO 1 25 13.250 3.025 .617
2 54 14.018 3.640 .499
ENJ 1 25 9.458 2.283 .466
2 54 9.452 2.591 .355
A t-test is a common way of comparing the means of two unrelated groups with
normal distributions to see if the means are significantly different or not (Bryman &
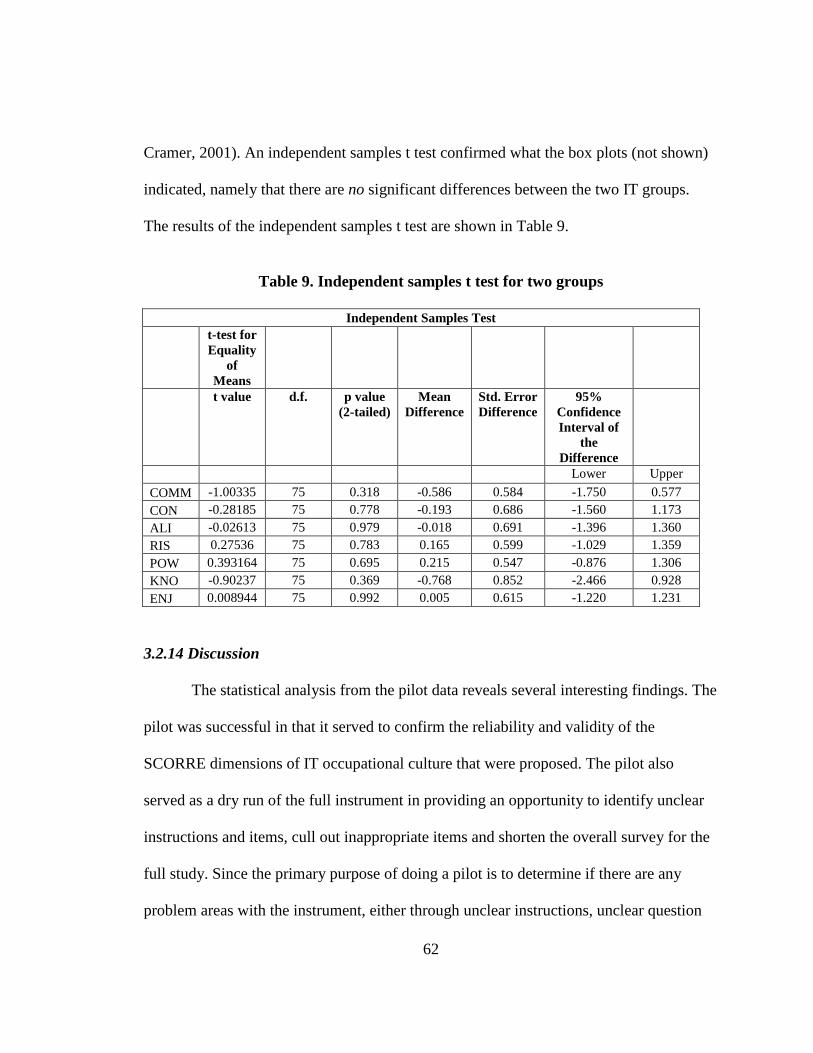
62
Cramer, 2001). An independent samples t test confirmed what the box plots (not shown)
indicated, namely that there are no significant differences between the two IT groups.
The results of the independent samples t test are shown in Table 9.
Table 9. Independent samples t test for two groups
Independent Samples Test
t-test for
Equality
of
Means
t value d.f. p value
(2-tailed)
Mean
Difference
Std. Error
Difference
95%
Confidence
Interval of
the
Difference
Lower Upper
COMM -1.00335 75 0.318 -0.586 0.584 -1.750 0.577
CON -0.28185 75 0.778 -0.193 0.686 -1.560 1.173
ALI -0.02613 75 0.979 -0.018 0.691 -1.396 1.360
RIS 0.27536 75 0.783 0.165 0.599 -1.029 1.359
POW 0.393164 75 0.695 0.215 0.547 -0.876 1.306
KNO -0.90237 75 0.369 -0.768 0.852 -2.466 0.928
ENJ 0.008944 75 0.992 0.005 0.615 -1.220 1.231
3.2.14 Discussion
The statistical analysis from the pilot data reveals several interesting findings. The
pilot was successful in that it served to confirm the reliability and validity of the
SCORRE dimensions of IT occupational culture that were proposed. The pilot also
served as a dry run of the full instrument in providing an opportunity to identify unclear
instructions and items, cull out inappropriate items and shorten the overall survey for the
full study. Since the primary purpose of doing a pilot is to determine if there are any
problem areas with the instrument, either through unclear instructions, unclear question

63
wording, or technological problems with the online survey format, an additional open-
ended question was added at the end of the survey to capture feedback. In general, there
were no technical issues with the survey and very few questions about specific wording,
although there are opportunities to fine tune the wording for the full study, for example
with words like “flat”, “should”, and “knowledge”, based on the feedback. Formal and
informal feedback also confirmed that IT professionals consider this area of investigation
both important and interesting. The pilot instrument including all items is shown in
Appendix D.
The initial finding that there were no significant differences between Group 1 and
Group 2 is not surprising in that it validates that the SCORRE dimensions do, in fact,
reflect what is common to IT occupational culture. If there had been significant
differences in each dimension, this would have indicated that some of the dimensions
were overlapping with organizational cultural differences. Just as national culture differs
between different nations while within-nation means do not vary significantly, so too
occupational culture should not vary much within the same occupation. It is expected that
one would find significant differences when comparing these dimensions with different
occupations.
The full study will compare IT occupational culture against business management
culture. Such differences would serve to identify the areas of difference that may drive
friction in IT/Business alignment. For example, the interviews revealed that there may be
an underlying tension between achieving business alignment and reverence for
knowledge. Even though a manager with business experience may excel at getting their

64
team aligned with business objectives, such managers do not get the respect of their IT
group who values technical knowledge and hence they value managers that are more
technologically savvy. Furthermore, the reverse may also be true, that managers with
technical background who have the respect of their IT group are less able to get the group
aligned with business priorities. The intent of the pilot study, however, was simply to
identify the core elements of IT occupational culture and to that end, this study was
successful through its qualitative results and its quantitative results in the pilot.
In short, the pilot was able to address the first of Straub’s (1989) three validities
for survey-based research, namely instrument validity as demonstrated above. The second
type of validity, internal validity, is maintained by being aware of other rival
explanations. For example, one might expect there to be no significant differences
between the test group and the industry group if the dimensions were trivial and were of
no real interest to IT professionals. However, the initial interviews show strong support
that the SCORRE dimensions capture core themes that are important to IT professionals.
The third form of validity, statistical conclusion validity, will be addressed as the sample
size increases.

65
CHAPTER IV
PART I – INTERPRETATION OF ITOC
4.1 Part I Research Objectives
The research objective of Part I is to conduct a deeper interpretive exploration of
the collective values that IT professionals share based on qualitative data with a larger
sample size than in the initial pilot. IT professionals are defined as those people who
work for a living within the functional area of Information Technology within an
organization or as an IT consultant. Consistent with a cultural sociological approach, the
main areas of interest are: 1) shared values, 2) shared language, 3) shared history, and 4)
shared context. Sociologist Gary Fine’s (1996) study of restaurant workers addressed
these fundamental areas through ethnographic interviews and proposed that other
occupations may be studied similarly. Different occupations have different shared values
in common. For example, college professors may value “academic freedom”, nurses may
value “quality of care”, policemen may value “safety”, occupationally-speaking. Business
managers value “profitability”, “productivity”, “morale”, etc., and these occupational
values will be contrasted later.
A figure showing the relationships between the constructs of interest is shown in
Figure 7. While Trice’s framework for occupational culture provides useful content for
the construct of Shared Context, Trice’s framework is necessary but not sufficient for
explaining IT occupational culture as a whole. The research framework proposed in

66
Figure 6 extends Trice in important ways, not the least of which is showing the web-like
relationship between values and other aspects of culture.
The research question for Part I is: What are the core values of IT occupational
culture and how have they developed out of shared history, shared language, and shared
context? The goal is not only to simply identify those core shared values, but to interpret
their meaning based on language, history, and context. The result should be “the rich
wine of symbolic significance” to use Alexander’s (2003) apt phrase.
4.1.1 Part I Research Model
Figure 7. Research framework for IT Occupational Culture in Part I

67
Interpretive studies typically do not begin with a rigid a priori model to test
(Orlikowski & Baroudi, 1991). Therefore, the framework shown in Figure 6 is simply a
guideline that will be useful in conducting the interpretive research. The framework
shows that IT Occupational Culture may be said to consist of shared values, shared
language, shared history, and shared context. The lines between constructs have no
directional arrows because the goal is not to test for causality, but rather to show that
there is a relationship between these areas. Shared values are shown on the right-hand
side because this is the primary area of interest. Culture is often described as a web, and
therefore all the areas of interest are shown to be interconnected. While there may be
other aspects to culture, this simple framework identifies the consistently broad themes
found in the literature on culture, particularly in cultural sociology. Identifying the values
that drive everyday behavior is a huge undertaking and therefore boundaries have to be
drawn around the cultural domain (Rubin & Rubin, 1995). The boundaries of the
framework in Figure 6 serve to make data collection and analysis more manageable. It
also establishes a nomological network of the phenomenon as described in more detail
below.
4.1.2 Shared Values
Values are the core element of any cultural group (Deal & Kennedy, 1982;
Hofstede & Hofstede, 2005; Brief & Nord, 1990). Group values are a cohesive force that
binds a group together. Values have been defined as enduring beliefs “that a specific
mode of conduct or end state of existence is personally or socially preferable to an

68
opposite or converse mode of conduct or end state of existence” (Rokeach, 1973, p. 5).
Values are more stable in a culture than its practices (Hofstede & Hofstede, 2005).
Shared values provide meaning and spur social action (Brief & Nord, 1990; Swidler,
1986). Because cultural values do not arise out of a vacuum or “some free floating
heritage of ideas” (Swidler, 1986, p. 283), it is necessary to do a deeper exploration of
how these values have developed and been shaped over time by language, history, and
context. Once again, IT professionals, like any occupational group, have their own unique
shared values.
4.1.3 Shared Language
Shared language is the means by which culture is transmitted from one generation
to the next (Halbwachs, 1992; Ferrante, 2003). Language is “a widely shared system of
symbols which links past, anticipated future, and present experiences” (Phillips, 1985, p.
42). Language can incorporate elements of sacred and profane values (Durkheim;
Alexander, 2003). Language generates meaning (Brief & Nord, 1990); so to understand
language is to help understand meaning. Shared language can convey information above
and beyond the denotation of the actual words because words mirror cultural values
(Ferrante, 2003). Commonly-used expressions can identify the unique preoccupations of
a cultural group (Ferrante, 2003). Fine (1996) addresses the role of language in kitchen
workers and how language is used to create occupationally-shared standards around how
food should taste. IT professionals have their own shared language(s). Database analysts
speak in SQL queries, network engineers speak in TCP/IP and three-letter acronyms.

69
Project managers speak in terms of SDLC phases (Software Development Life Cycle).
This esoteric language can impede communication with other groups outside of the
subculture (Trice, 1993; Nord et al., 2007; Guzman, 2006) while simultaneously
reinforcing a sense of shared culture within the occupational group.
4.1.4 Shared History
Culture is “an historically transmitted pattern of meanings embodied in symbols”
(Geertz, 1973, p.89) and “the sum total of all the shared, taken-for-granted assumptions
that a group has learned throughout its history” (Schein, 1999, p. x). Work values, in
particular, are transmitted through historical processes and any study of work values must
address the influence of shared history (Brief & Nord, 1990). For example, Fine (1996)
situates his study of restaurant workers in the history of restaurants. Ignoring shared
history can lead to a lack of understanding of ultimate outcomes (Brief & Nord, 1990).
Interpretations of the meaning of any work activity are driven by our interpretations of
the past (Brief & Nord, 1990; Allan, 2001; Halbwachs, 1992). Relevant past events in
shared history can include social and economic events and institutions (Brief & Nord,
1990; Daynes, 2010). Historical changes give rise to cultural patterns of values (Swidler,
1986).
There are historical events that IT professionals share in their collective memory.
Some events of collective significance include Y2K, 9/11, the dot-com boom and bust,
outsourcing and offshoring trends, the rise of the Internet, and the rise of compliance
regulations. The role of IT professionals has changed over its history as well. Initially, IT

70
served primarily in a back office or support role capacity but today plays a more strategic
function within organizations (Chan & Reich, 2007). The cohesiveness of the IT
occupation has also increased over time (Duliba & Baroudi, 1991; Guzman, 2006) and
may be an indicator of a transition from “unsettled” to “settled” lives referred to by
Swidler (1986).
4.1.5 Shared Context
Trice’s (1993) Theory of Occupational Culture identifies the core characteristics
of an occupational culture as esoteric knowledge and expertise, extreme or unusual
demands, consciousness of kind, pervasiveness, favorable self-image, primary reference
group, and abundance of cultural forms. Esoteric knowledge and expertise are highly
specialized skills and abilities that encourage feelings of superiority within the
occupation. Extreme or unusual demands are challenging tasks that produce an emotional
high. Consciousness of kind is an emotional awareness of who is inside and outside the
occupational group. Pervasiveness is the level that an occupation takes over the worker’s
life both during work hours and after work hours. Favorable self-image involves pride in
one’s profession. Primary reference group means that members refer to other members of
this group for gauging their own performance and merit. Abundance of cultural forms
refers to the rich symbols, language, and rituals that members of an occupation interpret
similarly where no explanation of the meaning is necessary. These seven characteristics
have been used previously to describe the cultural context of the IT occupation (Guzman
et al., 2004; Guzman & Stanton, 2004; Guzman et al. 2006; Ramachandran and Rao, 2007)

71
but are missing the contextual link with shared values which this study will provide. For
Geertz (1983), contextualization is the primary goal when analyzing cultural groups. IT
professionals share a context of similar job functions as well as technical expertise. IT
professionals frequently need to be on-call 24/7 in case of system down-time in ways that
other groups do not. Stress, burnout, and turnover are common within the IT profession
(Joseph et al, 2007). This sets them apart from other occupational groups within an
organization. Occupational subcultures exist apart from organizational culture and can
become a source of conflict due to their culture differences (Trice, 1993) and can lead to
perceptions of ‘us versus them.’ By examining the relationships between shared values,
shared language, shared history, and shared context through in-person interviews with IT
professionals, a meaningful interpretation of IT occupational culture can be achieved.
4.2 Part I Methodology
The methodology for Part I is a hermeneutic analysis based on qualitative
interviews in the tradition of cultural sociology. Qualitative interviews are appropriate for
studying the interrelationships between values, language, and beliefs of a cultural group
within their context (Creswell, 2007; Brewerton & Millward, 2001). Ethnographers use
qualitative interviews to attempt to uncover the underlying meaning in the routine
activities of members of a cultural group (Creswell, 2007). Durkheim’s sacred and
profane elements of society coupled with Weber’s deeper meanings of work can be
combined using Alexander’s (2003) strong program of cultural sociology for analysis and
interpretation.

72
Data collection was through qualitative semi-structured interviews with IT
professionals to explore the values that are important to them collectively. Schein (1990)
emphasizes that interviews are the best means for collecting cultural information about
values. The interactive process of interviewing is important because it can generate new
knowledge by collecting and interpreting the informants’ perceptions of the world
(Kvale, 1996). Interviews create ‘deep understanding’ of people’s experiences
(Albrechtsen, 2007). Interviewing is by far the most common method of gathering
cultural information (Bernard 1995). Finally, interviews are appropriate for interpretive
cultural research because the interviewer is attempting to understand the interviewees’
view of the world, their work, and their life experiences (Rubin & Rubin, 1995).
4.2.1 Data Collection
Data collection was based on 25 in-depth interviews with IT professionals from a
variety of backgrounds. Permission to begin data collection was granted by the
Institutional Review Board (IRB) at UNCG under study # 11-0250. See Appendix F. No
incentive was offered to interviewees for their participation, but all participants requested
that their names and company names be kept confidential. The target number of 25 was
based on similar studies. Creswell (2007) gives the guideline of 20 to 30 interviews as
typical for qualitative research. As Guzman (2006) examined perceptions of IT
occupational culture by students who were preparing to enter the field of IT, this study
addresses the context of those who have been in the profession for at least 7 years
(enough time to be fully socialized into the occupational culture). Additional interviews

73
were not necessary as a level of saturation was reached where new information no longer
added to understanding (Creswell, 2007). By the end of the interviews, a sense of
saturation was clear in that answers to interview questions were becoming expected with
no new major insights being achieved. Clearly one could go on interviewing hundreds of
people and get new stories and new details, but there are diminishing returns, and 25
interviews with a variety of subjects provided enough rich and useful results for
qualitative analysis.
The interviewees for the semi-structured interviews were selected using
purposeful sampling in order to obtain a broad range of demographics (LeCompte &
Schensul, 1999; Creswell, 2007). These demographics included variations in age, gender,
years of experience, industry, and type of IT role. The three selection criteria for
interview candidates were:
1) IT professionals who had worked in the field at least 7 years.
2) They had worked in multiple organizations in IT departments, not just one
company for their entire career.
3) They were not members of IT management.
These were guidelines for purposive sampling and the interviewees were
generally representative of the overall population of interest (Bernard, 1995; Creswell,
2007). IT managers tend to share more in common with business management culture
and overall organizational culture than with IT occupational culture (Guzman et al., 2004;
Iivari & Huisman, 2007), therefore IT managers were excluded as potential interviewees.
Appropriate participants were obtained through a variety of means. Initially, personal and

74
professional contacts were used. Additional interviewees were obtained in two ways.
First, interviewees were asked if they knew other professional associates that would be
willing to be interviewed in a process known as “snowballing” in gathering potential
interviewees (Gameson, 1998). Second, a large IT services recruiting firm was extremely
helpful in providing additional contacts that met the selection criteria.
4.2.2 Interview Protocol
The interview protocol was based on the original pilot but included some
important improvements. Additional questions were added based on the new framework.
The pilot did not examine the areas of shared language, shared history, and shared
context explicitly and new questions were added (e.g., what historical events do you think
were important to the IT occupation?). The initial pilot focused on identifying shared
values; however these were all framed positively, literally as to what IT professionals
valued highly (e.g., “what do you like about…” “what do you love about…”). The full
study sought to go beyond positive values to examine dislikes and hatreds and uncover
what IT professionals shun and avoid. The initial 7 interviews from the pilot were
included in the full study. It is acceptable and even encouraged to include pilot interviews
in a qualitative data set even if additional questions are added as the research process
moves forward (Richards, 2005).
The qualitative results from the pilot interviews were extremely fruitful, so large
changes from the interviewing format used previously were not necessary. Based on
experience in the pilot, IT professionals are extremely willing and able to talk about IT

75
occupational culture and the interview questions simply serve to “wind them up” and
then listen to what they have to say. The complete revised list of questions is in Appendix
B.
Each interview did not have a set time limit and lasted as long as needed in order
to fully explore what was important to each person in terms of their IT occupational
values. The session concluded when the interviewee felt they had addressed all of their
top concerns around values so each interview was “saturated” with nothing else to
unearth. Each interview lasted from one hour to two hours. All interviews were
conducted face-to-face, tape recorded and then immediately transcribed. Traditional
Dictaphone equipment was used to pause, rewind, and slowdown the recording in order
to capture every word correctly. Nuances and tonal inflections were captured in the
transcription in order to emphasize important issues. In order to keep up with the heavy
workload of transcription, this process was outsourced to a professional transcriptionist.
All the transcripts were checked in order to ensure the transcriptionist was accurately
capturing the recorded data. The transcriptionist did an excellent job of identifying
unknown words (typically technology-related words) and indicating emphasis with italics
and inflections such as laughter in parentheses in the transcripts. All the transcriptions
were then provided to the interviewees for validation that the right information was
captured and they were allowed to make corrections or amendments. These steps serve to
increase the reliability of data gathered in an interview process (Yin, 2003). A lesson
learned from the data collection process was that outsourcing the transcription process is
critical to completing the work in a timely manner.

76
In terms of confidentiality, interviewees were asked if their information should
remain anonymous or not. In all cases, the interviewees preferred not to have their names
or the names of their firms published but were comfortable having generic demographic
information published such as “a 30-year old programmer with a Fortune 50 retailer”.
The location for each interview varied, and this was necessary in order to
accommodate everyone’s work schedules. Locations included meeting in restaurants, the
researcher’s office on campus, the interviewee’s office at their work location, or sitting
outdoors. It was not feasible to make the interview location the same for each interview.
While each type of location was conducive for in-depth discussion, there were pros and
cons to each one. In restaurants, for example, people were able to loosen up quickly due
to the casual non-work environment, however background noise was occasionally a
challenge for recording and subsequent transcription. Meeting in the researcher’s office
on campus provided a quiet environment for a clear recording but may have made
interviewees nervous or uncomfortable at first. This was evidenced by subtle leg shaking,
foot tapping, furtive eye movement, and stiff body language. However, even in these
cases, the interviewee was able to open up and ignore the sterile environment. Meeting at
the interviewee’s work location seemed to make them at ease in a quiet environment but
slightly less inclined to talk about conflicts with co-workers. Meeting outdoors in a
neutral, safe, quiet environment seemed to be the ideal location for interviewing.
Cultural interviews are typically based on semi-structured interviews that are
based on an interview guide with a written list of questions and topics that need to be
addressed (Bernard, 1995). Interview questions followed three types of qualitative

77
questions: main questions, probing questions, and follow-up questions (Rubin & Rubin,
1995). First, the main questions were those prepared ahead of time to guide the
conversation and these are shown in Appendix B. Main questions in cultural interviews
are primarily devices to get the interviewee started in talking about their cultural
perspectives (Rubin & Rubin, 1995). Second, probing questions were used if interviewee
responses lacked sufficient detail or clarity such as “Can you provide an example of what
you’re talking about?” or “What do you mean by that?” Probing questions can also help
the interviewee know that the interviewer is actively listening and engaged which can
build trust (Rubin & Rubin, 1992; Bernard, 1995). Probing questions are not created
ahead of time but rather flow from the conversation and allow the interview some latitude
in exploring different issues in order to be faithful to what is important to the interviewee.
A probing question such as “Can I quote you on that?” or even a confirming comment
like “That’s a great point!” provides feedback to the interviewee that they have accurately
hit on a core area of interest for the interviewee and may provide some additional
information in that vein (Rubin & Rubin, 1995).
Lastly, follow-up questions tie certain responses back to central themes. Follow-
up questions are not prepared prior to the interview and are based on the interviewees’
responses. An example would be “You’re not the first person I’ve interviewed that has
compared IT to fire-fighting. Why do you say that?” Follow-up questions may be done
during the interview or several days later after the interviewer has reviewed the transcript
and discovers areas that need clarification (Rubin & Rubin, 1995). Follow-up questions,
in this case, were done via email for documentation purposes. Probing and follow-up
78
questions are frequently necessary when the interviewer does not share a common
technical language with the interviewee, for example technological terminology and
acronyms. For this study, the researcher has 18 years of experience in the IT profession
and technical terminology was never a problem. Knowing the special cultural vocabulary
allows a research to ask meaningful questions that will be understood and appreciated by
the interviewee (Rubin & Rubin, 1995).
Where Patten et al. (2009) used a similar ethnographic interviewing method to
examine the culture of the enterprise IT organization from the CIO’s perspective, this
study examines IT occupational culture from the employee’s perspective. But similarly to
Patten et al. (2009), because the lead researcher had previously been an IT professional
for 18 years, this research is from an “emic” perspective, where the interpretations were
made from an insider’s orientation (Bryne, 2001). Acknowledging the emic relationship
of interviewer to interviewee helps to address the Principle of Interaction Between
Researchers and Subjects as a best practice of interpretive research (Klein & Myers,
1999). Because culture defines who is an insider and who is an outsider, it is helpful for
the interviewer to be considered an insider so that interviewees will be comfortable
opening up (Rubin & Rubin, 1995). This was clear in how the interviewees interacted
with the researcher in an open and relaxed way.
4.2.3 Qualitative Analysis
There is no single “cookbook” way of analyzing qualitative data (Bernard, 1995;
Weber, 1990). Analysis in qualitative research means sorting out the structures of

79
significance or codes and interpreting their meaning for a wider audience (Geertz, 2002).
Therefore, the analysis of the interview data involved several stages including 1) coding,
2) content analysis, and 3) hermeneutic interpretation. While the unit of data collection is
the individual, the unit of analysis is the occupational group level because the results are
being generalized to this group level. The unit of analysis is the unit about which
descriptive and explanatory statements are to be made (Babbie, 1992). The overall
approach the qualitative analysis is shown in Table 10.
Table 10. Qualitative Analysis Steps
Stage One - Coding Step 1 Descriptive coding Step 2 Topical coding Step 3 Pattern coding into topical categories
Stage Two – Content
Analysis Step 1 Thematic/analytic coding Step 2 Code Frequency analysis Step 3 Code Co-occurrence analysis
Stage Three – Hermeneutic
Interpretation Step 1 Analysis through lens of cultural sociology Step 2 Analysis with literary metaphor
4.2.4 Coding
Coding of the interview data is the first step of qualitative analysis (Rubin &
Rubin, 1995). A code is “a word or short phrase that symbolically assigns a summative,
salient, essence-capturing, and/or evocative attribute for a portion of language-based or
visual data” (Saldana, 2009, p.3). Coding is the process of transforming raw data into a
more quantitative form (Babbie, 1992) although qualitative data is not the same as
quantitative data (Richards, 2005). The aim of codifying is “to arrange things in a
systematic order” (Saldana, 2009, p. 8). While the coded data is not quantitative, many

80
techniques of content analysis are based on coded data, including word-frequency counts,
key-word-in-context listings, classifications of words into content categories, content
category counts, and retrievals based on content categories and co-occurrences (Weber
1990). All of these techniques were used in the coding process.
After the interviews were transcribed, they were imported into the online
qualitative software Dedoose (www.dedoose.com) for ease of coding. The choice to use
Dedoose instead of the de facto standard of NVIVO software was based on 1) faster
coding, 2) greater stability, and 3) licensing for convenience of accessing the data from
any location. Dedoose was developed specifically for social-cultural qualitative research
and follows a similar, although stream-lined, process for coding as in NVIVO. Where
NVIVO refers to “nodes” of text for coding, Dedoose simply calls them “excerpts” to be
“coded” therefore that is the language that will be used from this point forward. The same
type of coding process that is typically used in NVIVO was used in Dedoose.
There are three main types of coding in any qualitative research: 1) descriptive, 2)
topic, and 3) analytical or thematic (Richards, 2005). Descriptive coding involves storing
information about the interviewees. Dedoose stores these as descriptor codes. These
descriptor codes included gender, age, race, education, major, interview date, years in IT,
size of current IT group, current industry, current organization size, and a unique
identifier in order to preserve anonymity. The complete descriptors are reported in the
Results section below.
Topic coding involves tagging or labeling text according to its subject. The
mechanics of coding involve separating the text into short paragraph-length units

81
(Saldana, 2009), a process that Dedoose calls “excerpting”. Topic coding summarizes in
a word or short phrase the basic topic of an excerpt of qualitative data and is frequently
used in all types of qualitative analysis (Saldana, 2009). Codes can be based on a priori
codes as a provisional list of codes determined beforehand as part of a conceptual
framework (Miles & Huberman, 1994, p. 58 in Saldana, 2009). The provisional list of
codes can be based on literature reviews, a conceptual framework, research questions,
and/or a pilot study (Saldana, 2009). Thus the initial codes were based on the framework
from the literature and the pilot. However, provisional codes can be changed, added to, or
removed as the coding process moves forward (Saldana, 2009). Many new codes
emerged from the data. The goal was not to straitjacket the data into the anticipated form
but rather to allow the data to speak for itself. At times it was particularly useful to use in
vivo codes. In vivo coding or verbatim coding means “in life” and refers to a word or
phrase from the actual words used by interviewees (Saldana, 2009) In vivo codes are
useful when a similar phrase occurs regularly amongst the interviewees (Richards, 2005).
So for example, “fell into IT” was a common in vivo code that described the unforeseen
ways that the interviewees began their career in IT. As new codes emerged, new
understandings emerged.
The process of topical coding can be a catalyst to seeing new patterns in the data
that provide new insights. The coding process itself was very much a journey and it was
important to keep an open mind. The speed of Dedoose for the coding process (as
compared to NVIVO) also allowed the researcher to focus on the meaning of the coding
rather than the laborious mechanics of coding. The researcher was the sole coder for

82
consistency of coding. Verification of consistency of coding over time was tested by re-
visiting the coding of the first coded interviews and in some cases re-coding from scratch
for comparison. In this way, newer codes created towards the end of the coding cycle
were accounted for in the older coded interviews although the coding did not change
substantially.
Key-word-in-context (KWIC) is a useful strategy for coding which preserves the
context of the surrounding sentences around each topical code (Weber, 1990). Dedoose
supports KWIC and easily provides the surrounding context via its process of excerpting.
The first round of topical coding involved tagging important ideas in each of the 25
transcripts with a code. Examples of codes included ideas like “bureaucracy” or “love”
or “creativity”. This is also sometimes called coding “up” from the data (Richards, 2005).
Coding can include instances where the interviewee got particularly excited or upset or
their body language changed (Rubin & Rubin, 1995) which were coded as “important”.
After this initial coding process there were 222 different codes. Table 11 shows all the
codes from the initial round of coding.
Table 11. List of codes in 1st round (duplicates removed)
List of codes
9-11 empowerment magic routine
acronyms enjoyment making a difference sabotage
adjectives esoteric knowledge manual work sandbox
alignment expectations marketing satisfaction
analytical experience meaning of work satisfaction
antibusiness extreme-unusual demands mechanic self-taught
antisocial fake micromanaged sense of humor
appearance favorable self-image Microsoft shared context

83
appreciation fears military shared history
Asperger’s fell into IT mistakes shared language
authority firefighting mobile shared negative values
autonomy flexible work schedule music shared values
bandaids freedom mystery silicon valley
blame friends negative silos
bleeding edge frustration w end-users novelty sloppy
boredom fun novelty social
building gender issues old guard specialization
bureaucracy good ol' boy network open communication speed
burnout great quotes open source stagnant
business
buzzwords grumpy organized standards
business
understanding hacking outsourced stereotype
business values handholding ownership strategy
capitalism hate parent stress
casual dress hats paycheck stress
certifications have your back people skills structure
challenge heard perception structure of power
changes help people personal development stubborn
CIO heroes personal history taking advantage
cloud hobby pervasiveness taking things apart
collaboration humility planning teacher
competence humor playing teamwork
compliance I am different political technical
conflict idealism pranks technological
consciousness
of kind indispensable precision technology
consulting indispensable prestige time
control innovation pride tools
corruption of
knowledge insular
primary reference
group totem pole
creativity introverted privacy toys
critical thinking isolation problem-solving translation
cultural forms jargon profitability transparency
curiosity job hopping progress trenches
customer focus job security puzzles trust
cynical job title quality turf battle
decision making keeping up with tech quick to respond understaffed

84
defensiveness layoffs rational understanding
detail lazy reactive understanding business
differences leadership real urgency
different types learning recognition variety
disdain leveling up religion video games
drive libertarian remote control villains
dynamic linear thinking repetitive virtualization
easy logic respect wall around IT
economic long-term
reverence for
knowledge work-life balance
efficiency looking bad rigidity younger people
empire building love risk
Richards (2005) mentions that computer software makes coding much easier but
this can sometimes result in a flood of codes that may or may not be useful to the
research questions. Second cycle coding reorganizes and reanalyzes and synthesizes the
data after the first initial coding (Saldana, 2009). Some excerpts needed recoding as new
codes were created or merged. In the second round of coding, the codes and their related
excerpts were examined again to ensure that there was consistency in the coding scheme
over time and some codes were revised as necessary and duplicates removed. The process
of qualitative coding is intentionally malleable and not static (Richards, 2005). But
consistency of coding is what provides reliability in qualitative research (Richards, 2005).
To help ensure consistency, full text word searches were used on all keywords across
each transcript to ensure relevant excerpts were not erroneously overlooked in the
beginning. The researcher needs to be extremely organized and rigorous but at the same
time creative and flexible in the coding process (Saldana, 2009).

85
The next step was to group the codes into useful categories. Pattern coding is a
way of grouping categories together into a smaller set of themes in the next cycle of
coding (Saldana, 2009). Coding categories may be developed based on theoretically
determined categories (Brewerton & Millward, 2001). Thus, some of the categories used
included the constructs of interest in the research model, i.e., “shared language” (similar
use of common IT terms), “shared history” (collective memory of events), “shared
context” (Trice’s seven occupational culture characteristics), and “shared values”
(important recurring issues with either a strong positive or strong negative connotation
including, but not limited to, the original SCORRE values from the pilot). Additional
categories were also modified in the second round. For example, it was useful to group
the codes of “personal history”, “technological history”, “political history”, and
“economic history” under the category of “shared history”. Keeping an open mind
throughout the entire process was crucial. For example, categories for Reverence for
Knowledge and Enjoyment were created after the initial pilot interviews. Similarly, the
category of “structure of power” used in the pilot evolved into the category of
“autonomy” as described in the Results section later. Table 12 shows the consolidated
categorization scheme that emerged from this process.
Table 12. Coding Categories
Category Sub-category1 Sub-category2 Sub-category3
Shared language
jargon
acronyms
business buzzwords

86
translation
Meaning of work
help people
making a difference
Shared values
Enjoyment
Challenge
detail
friends
Fun
Playing
pranks
quality
Risk
satisfaction
Sense of humor
social
toys
Reverence for Knowledge
certifications
Problem-solving
puzzles
taking things apart
critical thinking
totem pole
real
fake
understanding
experience
competence
respect
appreciation
recognition
drive
self-taught
mystery
heroes

87
teacher
curiosity
learning
keeping up with tech
Open Communication
analytical
logic
Precision
rational
transparency
love
innovation
bleeding edge
building
Creativity
dynamic
mistakes
novelty
novelty
progress
technology
Variety
Structure
access
control
organized
planning
standards
structure
tools
teamwork
collaboration
have your back
trust
autonomy

88
authority
decision making
empowerment
freedom
Structure of power
Shared history
Personal history
Fell into IT
hobby
Parent
silicon valley
Technological
changes
cloud
mobile
remote control
virtualization
Y2K
Political
9-11
Economic job hopping
job security
layoffs
outsourced
Shared context
Pervasiveness
work-life balance
Cultural forms
books
movies
Consciousness of kind
different types
I am different
insular

89
job title
music
stereotype
video games
Favorable self-image
prestige
pride
Primary reference group
respect
Esoteric K
differences
many hats
specialization
technical
Extreme-unusual demands
burnout
expectations
stress
stress
understaffed
urgency
Alignment
business understanding
Great quotes
Business values
Capitalism
Customer focus
Efficiency
Leadership
Profitability
Teamwork
Understanding business
Adjectives
Negative values
bureaucracy
antibusiness

90
conflict
empire building
micromanaged
ownership
sabotage
sandbox
turf battle
wall around IT
frustration w end-users
handholding
villains
rigidity
compliance
linear thinking
appearance
fake
marketing
perception
paycheck
hate
fears
blame
corruption of knowledge
hacking
looking bad
taking advantage
routine
boredom
manual work

91
repetitive
stagnant
old guard
younger people
sloppy
bandaids
lazy
Other
antisocial
Asperger’s syndrome
being heard
casual dress
CIO
consulting
cynical
defensiveness
disdain
easy
firefighting
flexible work schedule
gender issues
good ol' boy network
grumpy
humility
idealism
indispensable
indispensable
introverted
isolation
leveling up
libertarian
long-term
magic
mechanic
Microsoft
military
92
open source
people skills
personal development
privacy
quick to respond
reactive
religion
silos
speed
strategy
stubborn
time
trenches
4.2.4 Content Analysis for Thematic Coding
Themes are the outcomes of coding and categorization (Saldana, 2009). The goal
of content analysis is to be able to make inferences from the text based on thematic
patterns (Bernard, 1995). In order to make valid inferences, the classification procedure
must be reliable in the sense of being consistent (Weber, 1990). The classification must
also generate variables that are valid to the extent that they measure or represent what the
researcher intends them to measure. So the set of categories was distilled into a more
concise set of major themes based on not only category frequency but also careful
reflection. “Qualitative inquiry demands meticulous attention to language and deep
reflection on the emergent patterns and meanings of human experience.” (Saldana, 2009,
p. 10) While word frequency counts helped build the categories and category counts
helped build the themes, it was necessary to continually circle from the broad themes
back to the interview data to ensure that the themes were staying to true to the context of

93
what was said, and more importantly, what was meant. This circling back and forth to
look at the data with fresh eyes after time has passed is good for achieving new insights
(Richards, 2005). One example of this would be the realization over time that open
communication was less important than precision communication which led to the theme
of Precision.
Analytical coding is what leads to theory emergence and theory confirmation. It is
also the most difficult type of coding to do (Richards, 2005). Analytical coding required
deeper thinking about the core values that might be represented by different statements
from the interviewees. It requires an awareness not just of what is said, but how it was
said, and what was not said. It also requires keeping the codes in their natural context.
Two forms of content analysis in Dedoose lent themselves to this kind of analysis.
The first was a simple code frequency count across all the imported transcripts. When
conducting qualitative analysis, the frequency of a symbol, idea, or subject matter can be
interpreted as measuring its importance, attention, or emphasis (Krippendorff, 2004).
Showing the numeric frequency of codes appearing in interviews is a way of showing the
relative importance of the variables of interest in qualitative research (Guzman et al.,
2004; Brewerton & Millward, 2001). Figure 8 shows a screen capture of how code
frequency counts are displayed in Dedoose.

94
Figure 8. Screenshot of Dedoose codes
The second form of content analysis is in code co-occurrence. Co-occurrence coding is
the process of simultaneously coding a passage or overlapping passages with multiple
codes because human speech does not always lend itself to a single idea for each
paragraph or even each sentence (Saldana, 2009). Dedoose not only allows the coder to

95
handle overlapping codes easily, but provides co-occurrence analysis to see which codes
frequently occur in proximity to other codes. This was useful for grouping codes and
categories together based on their physical proximity in the transcripts. Figure 8 shows an
example of a co-occurrence chart in Dedoose. Co-occurrence charts were helpful in
quickly finding examples of relationships between the major constructs in the original
framework (such as between Shared Language and Shared Values which highlighted the
specific link between communication and precision; or between Shared History and
Shared Context which highlighted how economic layoffs have led to extreme or unusual
demands in the workplace). Co-occurrence provides empirical evidence of the potential
relationships between different ideas such as “Reverence for Knowledge” and “Respect”
(co-occurrence =15). Co-occurrence can also sometimes provide deeper insights into the
data such as “Reverence for Knowledge” and “Heroes” (co-occurrence=13). An example
of co-occurrence in Dedoose is shown in the screen capture in Figure 9.

96
Figure 9. Dedoose code co-occurrence
Pulling excerpts out of context can dramatically change their meaning and every
effort was made to avoid doing this. Theory that emerges from qualitative data should
offer more than simply what the participants report but should be able to adequately
account for the data in order to make sense of what is going on in the data (Richards,

97
2005). This sense-making of finding deeper meanings within textual data is entirely
consistent with the strong program of cultural sociology.
Finally, it was important to not overstate the homogeneity of IT occupation
culture. Certainly there are differences between members and even sub-groups. The
three-way perspective of culture was an important tool to include in the qualitative
analysis. The three-way perspective indicates that culture may be analyzed as 1)
integrated, 2) differentiated, or 3) fragmented (Martin, 2002). Integration sees consensus
and consistency and this may be the primary perspective for this research. Differentiation
examines inconsistent interpretations and differing subcultures within a group. Finally,
fragmentation emphasizes the role of paradox, ambiguity and tension with a culture for
which there may be no easy explanations. Furthermore, all three may be used
simultaneously for a richer interpretation of culture and the researcher needs to be
cognizant of all three perspectives throughout the analysis. This three-way view of
culture has also been advocated for IS research in particular (Kappos & Rivard, 2008).
4.3 Part I Results
4.3.1 Sample Demographics
Table 13 shows a complete list of the descriptor codes used for the interviewees
and their demographics.

98
Table 13. Interviewees and demographics
ID Age
Years
in IT Gender IT Function
IT
group
size
Org
size
Current
industry
Education
& Major
1 33 11 Male Programmer 50 21000 Education
Masters
IS
2 32 14 Male
Mainframe
programmer 200000 400000 Technology
Masters
IS
3 35 12 Male Developer 500 96000 Technology
Masters
IS
4 55 20 Male
Mainframe
programmer 18 24000 Manufacturing
Bachelors
IS
5 33 11 Male Support 1000 200000 Retail
Associates
IS
6 42 21 Male Support 1000 200000 Retail
Bachelors
CS
7 36 14 Female Project mgr 600 26000 Manufacturing
Bachelors
IS
8 43 25 Female
Business
Analyst 15 3000 Education
Bachelors
Other
9 34 15 Male Programmer 4 2500 Education
Bachelors
Other
10 46 25 Male Consultant 1 1 Manufacturing
Bachelors
IS
11 37 11 Male DBA 32 1500 Healthcare
Masters
IS
12 26 8 Male DBA 30 300 Financial
Bachelors
IS
13 34 12 Male Consultant 5 5 Manufacturing
Associates
Business
14 48 25 Male
Network
Admin 600 26000 Manufacturing
Bachelors
CS
15 39 15 Male Consultant 6 11 Manufacturing
Bachelors
Business
16 42 19 Male DBA 300 10000 Financial
Bachelors
CS
17 42 16 Female SysAdmin 25 1300 Legal
Bachelors
Other
18 31 14 Male Security 25 3000 Nonprofit
Bachelors
Business
19 44 11 Male
Applications
Architect 2000 40000 Financial
Bachelors
CS
20 42 18 Female DBA 50 500 Healthcare
Bachelors
IS
21 35 14 Male SysAdmin 24 2000 Healthcare
Associates
IS
22 33 11 Male SysAdmin 25000 200 Financial
Associates
IS

99
23 36 17 Female Consultant 7000 7000 Technology
Bachelors
Other
24 38 12 Male SysAdmin 7 300 Publishing
Associates
IS
25 35 13 Male SysAdmin 500 24000 Retail
Associates
IS
4.3.2 Codes
As indicated earlier, the initial coding resulted in 222 separate codes. A frequency
chart showing the most popular codes is shown in Table 14.
Table 14. Top codes by frequency
Code Totals Code (cont.) Totals
Reverence for
Knowledge 175 villains 27
Structure/Control 123 critical thinking 27
adjectives 82 Efficiency 27
Problem-solving 72 rational 26
understanding 71 business
understanding 26
Shared language 69 Profitability 25
Alignment 68 hate 24
Esoteric K 67 stagnant 23
Open
Communication 60 prestige 23
Extreme-unusual
demands 56 Business values 23
Enjoyment 52 social 21
meaning of work 51 Fell into IT 21
stereotype 51 precision 20
pride 48 frustration w end-
users 20
layoffs 47 decision making 20
differences 47 routine 20
paycheck 47 I am different 20
great quotes 46 Technological 20
heroes 45 younger people 20

100
people skills 45 detail 19
Shared history 43 Cultural forms 18
teamwork 42 job hopping 18
structure 42 progress 18
antibusiness 41 Pervasiveness 17
Structure of power 39 novelty 17
Consciousness of
kind 39 blame 17
Risk 39 Customer focus 17
Variety 38 disdain 17
respect 37 Challenge 16
changes 36 Favorable self-
image 16
work-life balance 36 help people 16
self-taught 35 fears 15
Economic 35 job title 15
love 35 Playing 15
fake 34 gender issues 15
speed 31 rigidity 15
expectations 31 different types 14
drive 31 Creativity 14
job security 30 understaffed 14
Fun 30 marketing 14
building 30 long-term 13
bureaucracy 29 video games 13
Personal history 28 Leadership 13
easy 28 trust 13
empowerment 28 friends 12
Parent 27 idealism 12
4.3.3 Categories
Categorization of these codes into logical groupings of similar meanings resulted
in 35 categories that are shown in Table 15. All of the sub-sub-categories have been
removed for clarity.

101
Table 15. Code categorization
Category Sub-category
Shared language
Meaning of work
Shared values
Autonomy
Drive
Enjoyment
Hate
Innovation
Love
Negative values
Communication
Reverence for Knowledge
Structure
Teamwork
Shared history
Economic
Personal history
Political
Technological
Shared context
Consciousness of kind
Cultural forms
Esoteric Knowledge
Extreme-unusual demands
Favorable self-image
Pervasiveness
Primary reference group
Business values
Alignment
Business understanding
Capitalism
Customer focus
Efficiency
Leadership
Profitability

102
4.3.4 Value Themes
After careful content analysis and reflection, there were six core value themes
selected from the shared value categories that capture the essence of IT occupational
values. While there are strong similarities to the original SCORRE values in the pilot,
there are also important differences. This is primarily due to the fact that research is a
journey and the ending point was somewhat different from what was anticipated. Again,
a certain open-mindedness was crucial during the analysis process in order to allow the
data to speak for itself. Flexibility and creativity are important research traits in
qualitative research (Saldana, 2009) The six shared values identified in the data are 1)
Autonomy, 2) Structure, 3) Precision, 4) Innovation, 5) Reverence for knowledge, and 6)
Enjoyment. Table 16 shows the code frequency for these six values. These will
henceforth be abbreviated with the useful acronym ASPIRE. This acronym is particularly
meaningful in that the values themselves identify what IT professionals aspire to in their
occupation. It is easily remembered and powerful enough to provide helpful guidance to
business and IT managers alike in their daily interactions with IT professionals. Each
shared value is defined in Table 16.
Table 16. Coding frequency and definitions of the ASPIRE values
Shared value Coding
Frequency
Definition
Autonomy 39 the level to which members of an occupation believe
that they should be empowered with access to tools,
access to data, and decision-making for the
organization.
Structure 123 the level to which members of an occupation believe
that orderliness and definition are needed in the work

103
environment.
Precision in
communication
60 the level to which members of an occupation believe
that communication about work tasks must be detailed,
accurate, and exact.
Innovation 47 the level to which members of an occupation believe
that technological improvement, novelty, and creativity
are valued
Reverence for
knowledge
175 the level to which members of an occupation believe
that intelligence and increasing technical knowledge
(learning?) determine respect and admiration
Enjoyment 52 the level to which members of an occupation believe
that their job should include play, fun, and socializing.
4.3.5 Qualitative Validity and Reliability
Validity in qualitative research can refer to credibility and confirmability
(Richards, 2005). Respondent validation is a popular method of checking validity
(Richards, 2005). Because all interviewees were allowed to make corrections and
clarifications of their transcribed conversations and none of them gave any indication
whatsoever of being disingenuous in their answers, the data should be considered to have
high validity. Face validity is present as well, as the ASPIRE values do form a cohesive
unit on the surface. But the acid test of validity was sending the ASPIRE definitions and
the overall interpretation back out to all the interview participants to get their feedback.
Examples of their responses are shown in Table 17.
Table 17. Interviewee feedback
Magnificent job my friend. I'm looking forward to seeing the end results. (4)
Thumbs up Tim… looks good and I agree with the results. Interesting about business management and how underlying motivations cause frictions. (5)
104
This is a good summary. I look forward to reading more of your work. (9)
The rest of the feedback from interviewees was similarly positive.
Reliability in qualitative research refers to repeatability and consistency of
processes, i.e., the interviewing, the handling of the qualitative data itself, and the coding
(Richards, 2005; Krippendorff, 1980; Weber, 1990). Every aspect of data collection and
analysis was performed with as much rigor as possible. Because the interviews were
conducted using an interview protocol template, tape recorded, transcribed electronically,
maintained digitally in a highly organized way, and coded the same way at different
times by the same researcher through multiple iterations of coding and re-coding, the
qualitative data should be considered highly reliable.
4.4 The ASPIRE Values
The ASPIRE values identify core values of the IT occupation that are shared by
its members. The ASPIRE values emerged from the data over time. Figure 10 shows how
each of the original SCORRE values evolved into the ASPIRE values during the course
of this two-year investigation. The transformation only served to strengthen the original
model.

105
Figure 10. Evolution from SCORRE values to ASPIRE values
4.4.1 Autonomy
While the theme Structure of Power, defined as a preference for centralized or
decentralized structures at work, was based on literature as well as a preference for more
decentralized structures in the pilot, the full study put this idea in its proper context. The
recurring theme was that IT professionals care less about the actual structure of power in
an organization and care much more about personal power, literally having a sense of
empowerment at work. This empowerment can manifest as decision-making authority,

106
easy access to data, access to the right tools to do the job, and a limited need for
managerial approval. Its opposite was bureaucracy and needing multiple levels of
approval to get work accomplished. This type of bureaucracy had a strongly negative
connotation in the interviews. For this reason, Structure of Power was changed to the
more accurate term “Autonomy”. Examples of codes associated with Autonomy included
decision making, empowerment, micromanagement, freedom, tools, and authority. Table
18 shows examples of the theme of Autonomy from the interviewees. Note that bold text
is the voice of the interviewer.
Table 18. Examples of Autonomy
I don’t think the power structure matters as long as it’s supportive. I don’t care whether I work in a centralized or a decentralized environment as long as I can get the work done that I want to do. (23)
I’m definitely not for everything being extremely centralized…I guess it depends. (7)
[I would like it] if I was able to actually participate in any of the decision-making so we could make better decisions. That would be more meaningful. That would also get me more invested. (9)
I like having the power to be able to make a policy decision if it means getting someone’s machine fixed or getting somebody back to work, I like having that sort of flexibility and power. (5)
I prefer people to make their own decisions and use their own best judgment. I like for people to have the power to make decisions. (7)
Fewer managers, more Indians. Fewer chiefs, more Indians. (6)
Generally, I want to be empowered to do what I need to do to accomplish my job and I don’t want to have to beg and plead at several levels of management to get that to happen. So …I think this is true for any…any…well no it’s not…this is what I often

107
believe to be true for every human being and then I remember, I’m reminded that it’s not true. If you empower someone, make them feel that they’re able to do what they need to do, you’re going to get better work out of them, and they’re going to be happier about doing the work, which is a positive loop of feedback. But that’s not what I’m seeing here. (9)
Is there one that you’re more comfortable with? Decentralized (very quickly). Personally I don’t like really tightly managed. I think whenever you decentralize functions out a little bit it’s much looser, kind of horizontally differentiated organizational structure. I’m really comfortable in that kind of environment. I like working with peers. I like working with a mentor. I don’t necessarily like working with 3 layers of management. Even though technically they’re the same thing, the way that they interact with each other, with you, the way the work gets done is much more different, I think it’s more collaborative. (1)
I don’t know that a flatter structure is always better. I’ve kind of noticed in doing this in a lot of different places, we did a lot of work when I was at [company deleted] for a lot of banks and school systems, and there seems to be a lot of those places where you’ve got one guy that knows everything everybody kind of fears him and reveres him at the same time, and kind of has a god complex about the network, and I think that’s probably unhealthy. It definitely kind of drives the ego-centric nature that kind of comes in a lot of introverted people by nature is that I am the most important thing in my universe, and I think that’s a dangerous thing. So, I don’t know that a flatter hierarchy would be always beneficial, because if there’s nobody to tell you no, then you’re the ultimate authority and I think that can kind of be dangerous. So, I think it’s good sometimes to have the checks and balances. Like, we do change control here. I don’t make a big change without my peers kind of looking over what I’m going to do. And at first I kind of hated that because, why can’t I make a change? I’m the security, I should be able to do this. But then I thought more and more about it. Well, what if I haven’t considered every possible thing that could happen with that? I mean, I think I have. I mean, I know every possible outcome from me clicking this checkbox. But I think having that peer review and check off that everybody agreed that this is the right thing to do is probably more beneficial to our users maybe than we sometimes want to admit. (18)
Decision making at [company deleted], everything comes top-down. What you do on a daily basis, what you’re responsible for, and what you’re not, you don’t know if that’s going to change the next day due to a merger. Suddenly you don’t reset passwords any more for instance. We did it all, we reset passwords and everything and then they

108
branched that off and we had no input in that at all. They wouldn’t come by and ask. They would just look at the numbers and make a decision. The difference in [company deleted] with that is my boss will come by and seek for my input on how we should handle certain things. He’ll also ask me to create documentation for end-users. We even host a web site that end-users can go to and find solutions for things. I like that a lot better! (5)
I think that pyramid structure is not a very…how to say this…it’s not a good idea in IT. Because a lot of…and then there’s probably organizations where it does work well. But in my opinion, when you have that pyramid type of structure where I’m just a tech support, I guess you’d call them low-on-the-totem-pole, you know, not as much responsibility but their voice isn’t heard either. Because these guys down here who are in the trenches helping users have a lot of good damn ideas that this person up here at the top will never hear!(13)
So for me control has to do with the freedom to architect solutions. Do I need to control others and make them do things exactly the way that I want them to do? I really don’t have a desire for that. But if I’m building it, then yeah, ‘cause I’m building it, right? We do peer review on code and we do this thing where you go in and say wow, why did you do it like that? Why didn’t you do it like this? All of us have a rationale for why we approach a problem a certain way. If you get out the door and you’re not using a bunch more memory or processor cycles and you achieve the same thing that I achieve, my way is no better than yours. But that doesn’t mean that I have to write mine exactly like you wrote yours either. So there’s a need for some personal control there because I think the problem-solving a lot of times can be a really intimate kind of experience, in a very personal kind of way, the way that you approach solving a problem is kind of personal to the way you’re made up. I know it’s true for me, I don’t know if other people think so. So for me, personally, there need to be certain controls at a high level to control quality. Those are pretty generic. Whenever you say control to me, I think how I get to do my job. How I get to achieve what I’ve been asked to achieve. How do I get to pick how that gets done? (1)

109
It’s kind of a paradox. A lot of people have shared similar stories where they value having a lot of freedom, but at the same time they want rules and structure. I’m wondering if they want to be the ones to impose rules and structure as opposed to having them imposed on them. Yeah, I guess I do sound like I’ve not…(pause)…what am I trying to say? Earlier I did say that I liked the structure, but now I’m saying that I don’t want to be micromanaged. I want to be able to do the job that I think needs to be done, my way. But there’s a contradiction there. That’s not a bad thing, it’s just interesting. Because I think there are two different versions of control. I want to be fully in control of my environment, but I don’t want to be too heavily controlled myself. Right, right, right. I’ve got boundaries, but I want to be able to stretch out to those boundaries as much as possible. Hmmm, this is interesting, I’m learning something about myself. (20)
So Autonomy, for IT people, is important because it gives them the freedom to do
their job correctly in their eyes. They want to be able to make decisions and work
independently without much supervision. The opposite of Autonomy for the interviewees
was bureaucracy, which always had a negative connotation, and micromanagement.
Certainly there are few jobs where one wants to be micromanaged. At the same time, the
constraints of management seem to bother IT professionals more than most.
4.4.2 Structure
“Control” continued to be a strong theme however the term had too much
ambiguity. Depending on the context it could mean control over the environment, a
psychological trait, attention to detail, or even governance. The common thread, however,
was a strong preference for orderliness. None of the interviewees used the term

110
“orderliness” but rather used the word “structure”. Therefore “structure” became the in
vivo code for what they were describing as order and definition in the environment, and
ultimately emerged as a core value. The interviewees liked having a sense of structure
around them in the workplace as opposed to having things ill-defined or chaotic. This
included job titles, job responsibilities, division of labor among teams and among
departments, and knowing exactly who is responsible for what. Some also called this a
process focus or simply “things running smoothly”. Lack of organization, in all forms,
was a strong negative. While IT professionals may in some cases express a preference for
being unstructured in terms of dress code or flex-time, these are superficial issues. What
runs deeper for IT professionals is the need to bring order out of chaos. Examples of the
theme of Structure are shown in Table 19.
Table 19. Examples of the theme of Structure
I really liked the structure of that IT department because we had programmers, and we had business analysts and we had project managers. Everybody had their own piece of the pie and we had QA and testers. So it was like the perfect environment to work in. So you liked that structure? I did. The whole life cycle. Everybody had their job. You know, it was very defined, and I knew what I had to do and then when I was through, I would pass it on to the tester and they would make sure everything was passing. So, I did like that part. (20)
It’s important to have a well-documented process for doing something (23).
I love it so far. This is a big difference from where I was. I like the fact that at the place where I am now, there’s a lot more structure. Things are project-based, kind of like ideal the way you want things to go. Like, you won’t have major projects to come in and all of the sudden just drop everything and do this. You know, I hear them say
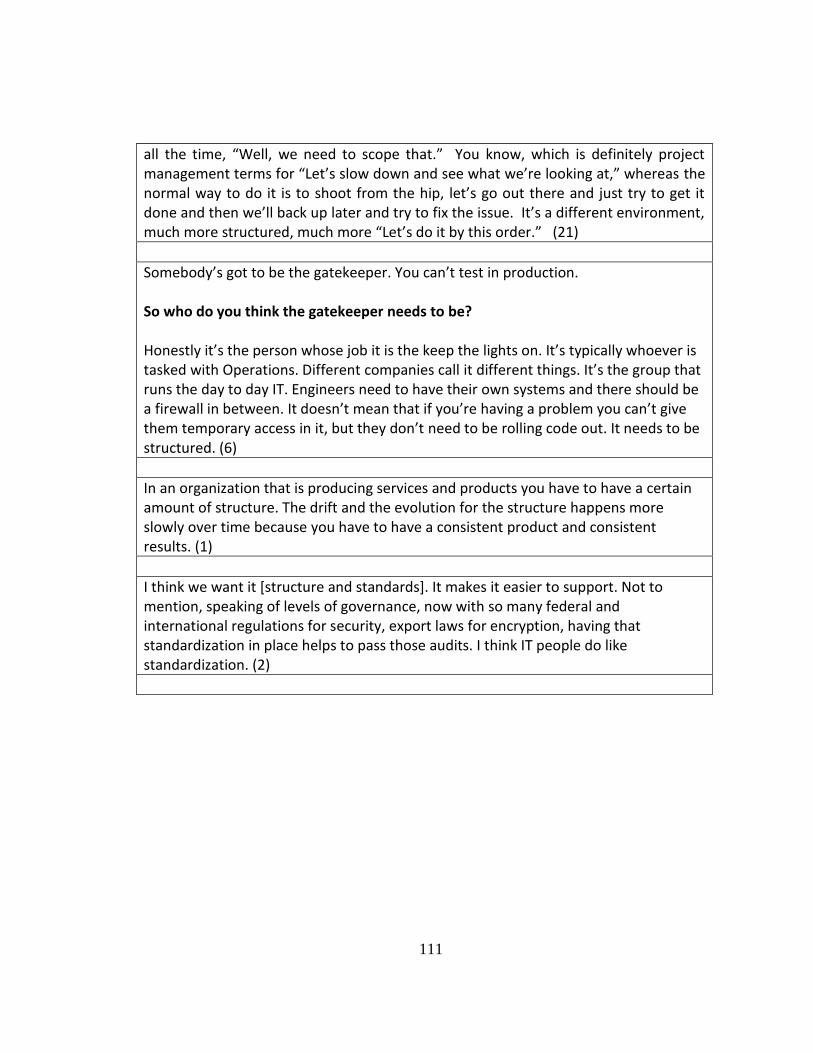
111
all the time, “Well, we need to scope that.” You know, which is definitely project management terms for “Let’s slow down and see what we’re looking at,” whereas the normal way to do it is to shoot from the hip, let’s go out there and just try to get it done and then we’ll back up later and try to fix the issue. It’s a different environment, much more structured, much more “Let’s do it by this order.” (21)
Somebody’s got to be the gatekeeper. You can’t test in production. So who do you think the gatekeeper needs to be? Honestly it’s the person whose job it is the keep the lights on. It’s typically whoever is tasked with Operations. Different companies call it different things. It’s the group that runs the day to day IT. Engineers need to have their own systems and there should be a firewall in between. It doesn’t mean that if you’re having a problem you can’t give them temporary access in it, but they don’t need to be rolling code out. It needs to be structured. (6)
In an organization that is producing services and products you have to have a certain amount of structure. The drift and the evolution for the structure happens more slowly over time because you have to have a consistent product and consistent results. (1)
I think we want it [structure and standards]. It makes it easier to support. Not to mention, speaking of levels of governance, now with so many federal and international regulations for security, export laws for encryption, having that standardization in place helps to pass those audits. I think IT people do like standardization. (2)

112
Yes. This is my mildly offensive theory of geek socialization. You have this spectrum of people and there’s severe autism on one end, and autism and Asperger’s and geeks and regular people... You’re not the first person to say that. Keep going. I really do believe that the tech industry attracts people with a mindset that likes order and is a little bit obsessive and it’s technically-oriented and that comes with, in many cases, although not all, in many cases, that comes with corresponding social deficit. There’s a great blog post that I cannot find on the Internet anymore and I wish that I could, I wish I had bookmarked it, about filtering. Normal people, when you have a conversation between two people, each person is applying an outbound filter. They are picking the data they want to communicate and they are filtering it so that they can communicated it in the way that they think will be best received by the other person. Geeks, in many cases, look at filtering as data impedance, and so they give you the full package of data with minimal filtering, assuming that you will filter on your end to extract what you want. Because they don’t know what you want, so they could be filtering incorrectly, so they just give you the full batch. That’s the polite term for saying that geeks are often not politically correct or polite. And so, when you get a geek talking to a normal person, there’s a filter mismatch. The geek is going to be annoyed because they’re not getting the straight dope, and the normal person is going to be annoyed because they’re getting this blast of unfiltered data. But among geeks, I mean, I’ve sat in rooms with people…you would have said from the outside that we didn’t like each other. But we were having a technical discussion, and at the end of the day, we all go have a beer. There are definitely egos involved, and sometimes you’ll get big swinging dick syndrome where somebody comes in and feels the need to demonstrate that their technical penis is longer than everyone else’s, but, you know, overall there’s not a ton of that. At least in my world, and again, I have to caveat all of this because I’ve self-selected to not have to put up with a lot of that crap. But I do believe that geeks are more likely to be well-intentioned but less socially apt than your average person in non-technical positions. And I think the same is probably true of doctors at a really high level. (23)
We’ve got a process under way now, I’m trying to think of a better term for it…one of the things that they’ve noticed, they being the Japanese, at this point have noticed that we lack structure, we lack control. And one of the things that I’ve seen and I’m sure other people have is what we call change control. If you want to go from one process to a new process, there has to be a transition there. And there was no transition between one process change of an idea to the next other than the department head saying ok guys we’re going to do it this way today. He sends us an

113
email, mentions it to me in the break room, you talk about it over the phone and say ‘oh why don’t we try this for a while’, ‘yeah ok let’s do that’. And there’s no documentation, there’s no control over that process. For a daily clerical type of function, they need a step by step process that they can follow and I’m all over that. We need to have that step by step. And there was never that formality or control before and we are just now trying to institute that. And this is after lord knows how many years. I’m wondering if they are ready for that tight of change, that type of control. You know before it was very loose and whoever came up with an idea, great we’ll try it. Now it’s like let’s talk about it, let’s control the environment a little more, which means document these processes. A lot of people are grumbling over that control, because it’s some serious stuff. It’s some serious documentation and it adheres to its own formal control, if you will, you don’t just type up a document, it has to match the document control specs. I think that’s a good idea. It’s just hard to get down their throats sometimes. (4)
I can’t think of anything I particularly don’t like about IT. There are certain things I don’t like about specific jobs, but it’s mostly because we don’t do IT properly. Like things aren’t organized properly, things aren’t documented well and things like that that irritate me. Also when IT is not properly managed. Two completely different jobs. In my first job, we had a very tight budget and everything was strictly managed, which was good in some ways and some ways restrictive. And now I’m at the other end of the spectrum where we have kind of an unlimited budget, not an unlimited budget, but all of our needs are met and there’s really no structure and we have to invent our own structure. And you have a preference for more structure? I like something in the middle. It’s hard to drive that kind of change from the middle to the top when you don’t really have…your managers aren’t in support of it. They’re just kind of ad hoc. So one of my questions has to do with when you’ve worked in IT departments in different companies, how is IT treated differently from company to company. You started talking about ad hoc management and structured vs. no structure. Is that the biggest difference you see in different IT shops? The two shops I’ve been at. And in my first part-time job was managed well and things were documented and organized well and you knew exactly what your job roles are. I think that’s the biggest problem.

114
At the insurance company? Well at the insurance company yes. You knew exactly what your job role was. At this company it’s very hazy and you don’t have some people in some key positions. Like we don’t really have a Systems Administrator. In a company our size, that’s a huge problem. We have someone who’s kind of in that role, but they’re not really in that role, they’re not really responsible as a Systems Manager and that person’s not really qualified to do that job. So that’s a real problem. Things like that are what drive me crazy in my current job. (11)
I know I’ve worked in [company deleted] power utility, and that was probably the best organized. Of course everybody complained about it while I was there, but it really was very well organized. It was very well-organized as far as change control, it was very well organized as far as outage procedures and things like that. It was very well organized. Projects were very well organized. But I’ve been in companies of equal size or larger that have not been very well organized. One of the companies that I worked for was very much run by the kind of a “good old boy” network. And that was just a mess. I mean everybody’s buddy was a manager and there were just all of these layers of management fat who really did little other than to impede progress. And then I went to another larger company like that, about 15,000 users, and they were similarly structured. It was all about who you knew and whether you knew the right person to yell loudest at in order to circumvent any kind of structure or standardization and stuff like that. “Well, this is the rule, this is your mailbox size. It’s built that way because we’ve been to scalability lab at Microsoft and they said that for optimal performance, for the performance that you desire, this is the way that it should be configured. These are the limitations that you should have.” And that was announced and planned out and everything well prior to the implementation of this new Microsoft Mail system, and from the get-go, people hollered about it, and then they heard this person had complained about it and they go, “Well so-and-so got it,” and so then that person got it and that person got it, and the next thing you know, we’ve got mailbox size limitations of twice the limitation that the system was “spec-ed” out for, and then those without limitations at all, above and beyond that. And I’m assuming that the higher up in the organization you were, the more space was allocated? Yeah, and then that’s just an example, but things were very much run that way throughout the organization. And it was frustrating. Where I am now, at least they don’t pretend to have any sort of limitations. The attorneys get what they want.

115
(laughter) There are no limitations! (sighing) (17)
Why do you think things ran more smoothly there? I’m not sure. I think you had people that, for whatever reason, they had a really good work structure and they had people in the right places, I guess. And they had a good structure as far as moving forward. In some places that gets clogged up…sometimes you’ve got people in the wrong places who can slow down progress. In other words, the guy making the decisions about why we should do x, y and z, he’s maybe not even a technical person, and maybe he’s a director that’s responsible for something else. So sometimes you don’t have the right people in the right places. I’m taking a guess at it, I don’t know. But they seemed to have a pretty good laid-out structure. When you say “structure”, because there’s different types of structure, you’re talking about having the right person in the right job or having a lot of well-defined policies and procedures or a well-defined division of labor? Procedures, yeah, and I’m going out on a limb here as far as, I’m talking more along the lines of management and I can only see so high up to my manager, but past him, I don’t know where the decisions are made but it seemed more well-defined as to who was responsible for what, and when something needed to be done, there was a lot more engagement with other teams. In other words, we didn’t have to go fight another team to get something done. There was somebody it seemed like at the top down, the message came down…you didn’t have a lot of fighting between teams. Between teams within IT? Inside IT. It seemed like everybody was in tune with the same marching orders. Like I said, I couldn’t see but so high, but they seemed pretty well structured. (22)
But structure is something…I have yet to see a great level of structure anywhere I’ve been that I kind of expected, at least somebody like [deleted],[deleted], please take out some of these names. (laughing) Sure. But, you know, because I guess when I think of some of these places that are…when I worked at a smaller, you know, 350-person place, I guess I kind of expected that. I

116
didn’t know any different. But when I moved off to some, you know, bigger [deleted], bigger [deleted], I couldn’t believe that they’re just as unstructured as anybody else. You know, I expected better documentation, better “Oh, what do I do now?”, better this, better that. You know, [deleted] is worse! In terms of defined procedures and processes? Yes. All of the above. And once again, I think that’s why I feel more comfortable there because I see they’ve got a ton of room for improvement. But I guess I expected a lot more because they are who they are. And you like having a certain…? I do, because there’s more to work on. There’s more stuff that could possibly make me shine or, you know, it’s unpolished. But I would expect it, a company as big as they are. There’s more things I can do there because they’re not structured. (25)
Somebody would come with some cockamamie application or whatever and say, “We need to put this on the mail server,” and we’d say, “Nope. We’ll put it up in a test lab and we’ll test it over here and we’ll see what it does. And then, after we’ve done that, we’ll evaluate whether or not we’re just going to throw this on the mail system.” It was very standardized, it was very controlled, and we kind of complained about that when I was there, but it really, retrospectively, it was a pretty good system. So you like having those kind of rules in place? Absolutely. And that the rules are enforced? Absolutely. Absolutely. That’s ideal. I don’t know. A lot of places don’t do that now. That’s just my experience, anyway. (17)
I want to say detail-oriented. But that’s not always exactly true. They have to be detail-aware. (8)
In this environment that I’m in now, it’s a more fast-paced environment. Some of that is just lack of structure, I think, yeah, not a clearly refined process for things. Everything’s not as streamlined. You’ve got people running around putting out fires. It’s not quite as streamlined, so you’ve got people doing these drive-bys. “Hey, can

117
you get me this? Hey, can you get me that?”, or you’ve got a last-minute request. It’s like you want to do your job and you want to do it well, but…people give feedback as well. So, you can be doing 50 things a day, dealing with 50 different people and none of them will know that you’re dealing with somebody else. It just takes that one person to say, “Hey, so-and-so didn’t give me good service,” and you’ve got to go back and explain to your boss, “Hey, do you remember that I was doing the work of 5 people that day, and I just forgot some?” Now, in my current job, in my situation, and a big reason for that is their size, they’re so big as far as their IT and they don’t have maybe the best plan, so, it’s not very streamlined. As big as they are, I’m surprised how big they are and how almost manual some of this stuff is. It’s amazing. You know, it changes from place to place. It depends on where you work and who you’re working for. (22)
I have noticed that overall we have people not worried about the details as much and not doing their due diligence, not…putting it out there and not worrying about testing it. You see that as a good thing or bad thing? A bad thing. And I think it’s an overall cultural thing that I’ve observed. People are not trying as hard to do the good…to make sure it’s perfect or make sure it’s right. I see that as being maybe a generational thing. Younger people are doing get-it-done, quick-quick, tweet it out or whatever, if I can just blast it out there and do it immediate instead of checking it and make sure you got it right…testing. When you say focused on process to you mean focused on detail or precision or formality? Less formal. If you’re process, you’re OK, I’ve got a checklist to follow, am I following, checking off each and every step? Do I know what the consequences of doing this are? Or am I just …am I following a checklist or do I understand what I’m doing? A checklist is a good thing but following it blindly is not a good thing. (14)
…the ability to assimilate data rapidly and structure it in your head. (23)
Structure and order is incredibly important for IT people. Because data is highly
structured and defined, perhaps IT workers want everything else around them to be as
well. This is conjecture based on interviewee #23’s quote above about being able to

118
assimilate data structures “in your head” and other interviewees comments about being
able to think in a structured way. What started out as “Control” turned into “Structure”
primarily because of a willingness to be open-minded and actually listen to the in vivo
codes and use them. The opposite of Structure is disorganization, lack of control, and,
ultimately, chaos. Disorganization and “willy-nilly” processes were consistently
identified as things to be shunned and avoided.
4.4.3 Precision in Communication
Open communication was initially the central theme of the pilot. The inability of
IT employees to communicate effectively is perhaps a “nerd” stereotype based on
introversion. This, coupled with IT people’s strong desire for more communication from
others, e.g., “Why are we the last ones to know anything around here?” seemed to point
to openness of communication as the core value, especially since this is a commonly
measured organizational culture value (see Ashkanasy et al., 2000). However, as the
interviews proceeded it was clear that in no case did IT people have any trouble
communicating. So there was no evidence of IT people being poor at communication
skills. They were articulate, verbose, and insightful in all their comments, so the
stereotype of poor communication is one that is not supported by empirical evidence. It
became apparent that all the interviewees were eager to get into an extreme amount of
detail, either about their background, their work, or technology, sometimes insisting that
their job title was recorded exactly right. The interviewees seemed consumed with
finding exactly the right word during their narratives and rarely used either improper

119
grammar or vocabulary. Their common desire for a high level of precision in
communication, even during the interviews themselves, was a break-through moment in
the analysis. This need for precision may be what business managers identify as “poor
communication skills”. Where business managers may deal in generalities, IT employees
must, as a requirement of their occupation, deal in very specific detail in every aspect of
their job. Thus, the complaint of IT people that they do not receive enough
communication is better understood now. They do not receive enough precise
communication from their business counterparts. Examples of the theme of Precision in
communication are shown in Table 20.
Table 20. Examples of the theme of Precision
We like to see communication, lots of communication, I think that’s one of the toughest things in this job is either end-users aren’t communicating to, or we’re not communicated from the business what’s going on. I don’t know if that’s internal to my company or that’s everywhere. But communication’s important. (5)
It’s frustrating when there’s a lack of communication, and we see it all the time when a new software will be deployed that we weren’t told about and we have to support it or an end-user sees a new software and they haven’t been trained on it and they have to call it, that’s frustrating. (5)
Originally I had open communication, and I’m starting to change that over to precise communication. IT people crave a lot of detail that they’re not getting from other people. Absolutely! (20)
There’s one that initially I called open communication. I’ve narrowed it down to precise communication as something that IT people tend to crave. It’s a level of detail in their communication that other people on the business side don’t or can’t give.
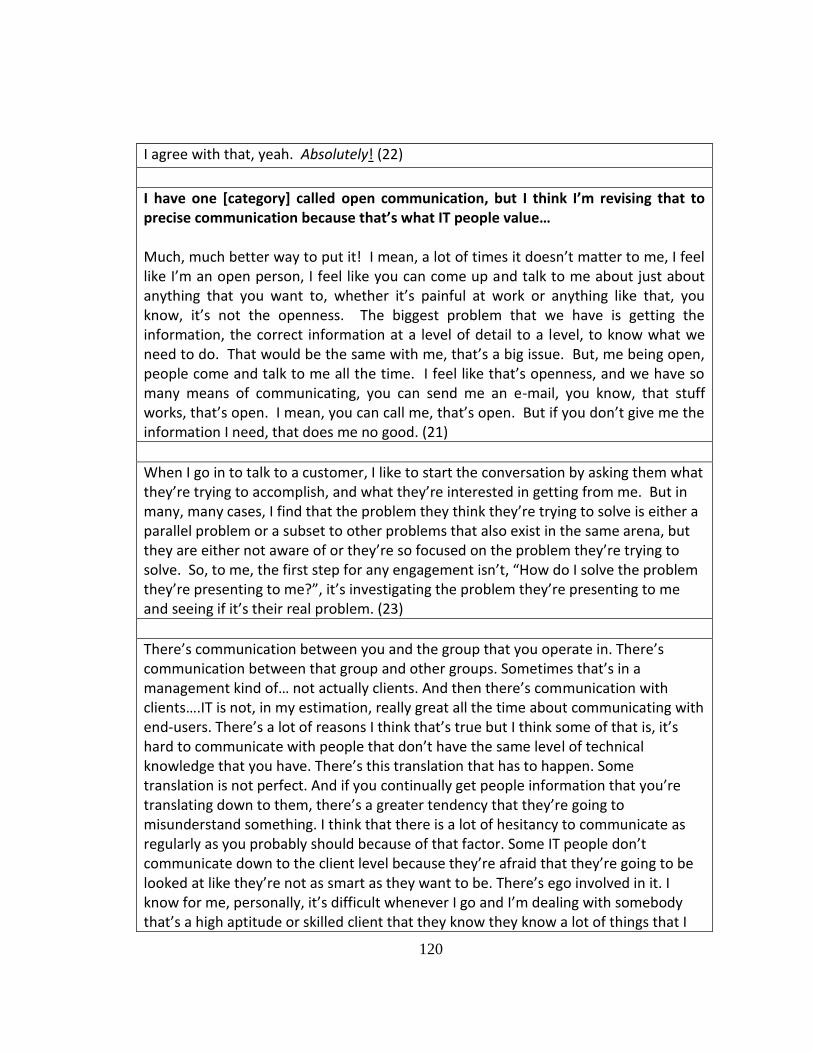
120
I agree with that, yeah. Absolutely! (22)
I have one [category] called open communication, but I think I’m revising that to precise communication because that’s what IT people value… Much, much better way to put it! I mean, a lot of times it doesn’t matter to me, I feel like I’m an open person, I feel like you can come up and talk to me about just about anything that you want to, whether it’s painful at work or anything like that, you know, it’s not the openness. The biggest problem that we have is getting the information, the correct information at a level of detail to a level, to know what we need to do. That would be the same with me, that’s a big issue. But, me being open, people come and talk to me all the time. I feel like that’s openness, and we have so many means of communicating, you can send me an e-mail, you know, that stuff works, that’s open. I mean, you can call me, that’s open. But if you don’t give me the information I need, that does me no good. (21)
When I go in to talk to a customer, I like to start the conversation by asking them what they’re trying to accomplish, and what they’re interested in getting from me. But in many, many cases, I find that the problem they think they’re trying to solve is either a parallel problem or a subset to other problems that also exist in the same arena, but they are either not aware of or they’re so focused on the problem they’re trying to solve. So, to me, the first step for any engagement isn’t, “How do I solve the problem they’re presenting to me?”, it’s investigating the problem they’re presenting to me and seeing if it’s their real problem. (23)
There’s communication between you and the group that you operate in. There’s communication between that group and other groups. Sometimes that’s in a management kind of… not actually clients. And then there’s communication with clients….IT is not, in my estimation, really great all the time about communicating with end-users. There’s a lot of reasons I think that’s true but I think some of that is, it’s hard to communicate with people that don’t have the same level of technical knowledge that you have. There’s this translation that has to happen. Some translation is not perfect. And if you continually get people information that you’re translating down to them, there’s a greater tendency that they’re going to misunderstand something. I think that there is a lot of hesitancy to communicate as regularly as you probably should because of that factor. Some IT people don’t communicate down to the client level because they’re afraid that they’re going to be looked at like they’re not as smart as they want to be. There’s ego involved in it. I know for me, personally, it’s difficult whenever I go and I’m dealing with somebody that’s a high aptitude or skilled client that they know they know a lot of things that I

121
know. You’ve got to watch yourself when you’re out there. Keep your interaction clean. Give them everything that you’re supposed to give them. Don’t start being weird about whether or not they know more about something than you do, and you’re the IT guy. I think it exists. I think it’s why some IT people don’t like to communicate with clients. (1)
But in every single job I’ve ever had, business always wants something yesterday, IT says you can’t have it until 2 weeks, so you compromise and throw something out in a week. It’s always been a source of frustration for me. IT comes back and gives a realistic projection to have it done right in 2 weeks, but gotta have it in a week. There’s always friction there. The successful IT departments are the ones that have a good working relationship with the business and you know, really, it’s going to take 2 weeks and if you wanted it in a week, you should have told us a week ago. And if you set those expectations, you’ll get pushback, but you can work better. But there’s always friction there. (6)
It’s definitely different because IT people never feel heard or never feel understood. Because it goes back to that stereotype of “I don’t even understand what you’re saying, just get it done!” from the manager, the non-IT manager. If Sales & Marketing dictate a new solution and IT is in the room saying you can’t do it because this, this, this, this. “Well I don’t understand what you’re saying, I just want it done.” There’s definitely two different languages in there. Because IT cannot talk to Sales & Marketing. I’ve seen it time and time again. It just doesn’t happen. So there’s definitely a language barrier there. Or maybe it’s a …I don’t know…it’s a good question. (pause) Maybe it’s attitude? I don’t know. But I think the language barrier is definitely there. They’re talking two different ways of…business. You mentioned attitude. So Sales & Marketing people have different attitudes than IT people? Absolutely. Mm hm. Sales & Marketing are very…”I have this amount of requirement and I’m done with it.” Well IT’s usually not done with it. IT is usually “Ok I’ve got to help you through this and once you’re done with then it, then I’ve got to support it.” The attitudes are a whole lot different because Sales & Marketing might be saying “I want SalesForce.com. I want you to research it. Figure it out. Implement it. Then maintain it. Then support it. Then troubleshoot it.” And upgrade it.

122
Exactly. There’s the attitudes. And Sales & marketing think you should be done. I just want to use it after you get it up and going. But I also need support and handholding. So that’s the attitudes. (13)
So you figured out it wasn’t behavior that was changing at the end of the month, it was just the way the data was being tracked. The way we designed this report and again I was part of it, was not going to give us an accurate reflection, which the point of that report was to drive behavior of the organization. And I was like “we’re looking at the wrong things if we’re looking at this report. There’s not a problem in the 3rd and 4th week. Our rate is 75-80% completion rate. But by chopping it up on the first day we’re missing those things that are 2 or 3 days old that should be bringing our percentages down that 1st and 2nd day.” And it was crystal clear. You run this report for a year, every month was like that. Every month was going down. And this goes back to “Awesome work, (deleted). That’s fantastic to see. We understand what you’re saying…but we don’t want to change it back.” They didn’t want to change the report? No. That was a tough one for me to swallow. (16)
Their communication style tends to be highly verbal with precise content. They
are put off by a lack of precision in language or in project planning. For them, a lack of
precision in speech can translate into a lack of precision in action. If they do not receive
enough precision and detail to complete a project, they cannot complete it successfully.
There were remarkable similarities in terms of the interviewees’ shared need to use
exactly the right word during the interview and going back and changing something if
they felt it was not precise enough. This value is in sharp contrast to what one sees in
management in terms of “good enough” or “close enough” or “just give me the bottom
line, not all that detailed stuff.” The opposite of precision in communication, for them, is

123
being too vague, too imprecise, or communicating irrational expectations especially with
regard to timelines for projects.
4.4.4 Innovation
Risk had to be eliminated as a shared valued because most of the interviewees felt
strongly that either a propensity to take risks or risk aversion was purely a matter of
where in the organization the IT person was and what their job function was. Thus, the
developer and programmer may be eager to take chances and innovate and express their
creativity, while system administrators and operational support people are more inclined
to play it safe and not take any chances in the production environment. However, what
was common to both types of IT people is a love of technology itself and technological
progress. The narratives of trying new things, playing with new technology, and creating
a novel approach to improve a process were repeated over and over and these ideas can
be more succinctly termed “Innovation.” This is perhaps an obvious point to make about
IT occupational culture, but it is by no means trivial. Examples of the theme of
Innovation are shown in Table 21.
Table 21. Examples of the theme of Innovation
I think that’s one of the exciting things about being in IT is that it’s always changing! I mean just in my short 11 years I’ve seen so many different operating systems and different softwares come and go, I like that part of IT. Now as far as risk is involved, I think it’s important for anybody to have stability but I think IT people are more adaptable to change if it comes along I’ve seen, even those that are not adaptable I see them, although they go kicking and screaming they adapt pretty quickly. So as far as what’s important, I like that the technology changes and I’m sure lots of IT people like that. Who wants to work on the same software the rest of their lives? (5)

124
The one I’m talking about is like virtualization, right, like going from all physical to, in my experience I’m thinking [company deleted] from physical servers to virtual servers. Yeah, some of the teams kind of got in the way with that. You’re going to save so much money going to virtualization, going from 500 physical servers when we can consolidate that down to maybe 30 or 40. I mean, just think about the savings in 40 servers versus 500, then think about the network, the electricity, the heating, the cooling. Or, the cooling from the data center, right? It’s an eye-popping amount of money. Man, I tell you what, I have never seen so many people slow that thing down. It was amazing, it was amazing. From there I went to networking, for instance, where the year before they went in and they put in a whole bunch of equipment, tons of racks of switches, right? Well, guess what? Virtualization, we don’t need all of that. Oh, so you don’t want to have us virtualize now, okay. Oh, you think that this virtualization is something that is like some fly-by-night experiment, right? You’re scared to put it on your network. I mean, this was literally what they were saying. We don’t know what it’s going to do on the network, we’re scared. I mean, the whole freakin’ world is doing it…how can you not figure it out? That kind of stuff, and that stonewalled that place for 2 years, and you’ve got to think that for 2 years, they could have been saving thousands. And it was the kind of thing where you were going, “Look,” you know…that was my experience, I guess. (22)
So what do you not like about the maintenance/occupational… It’s boring as sin! It’s the same old thing, it’s holding the line. That’s good for some people. I don’t want to begrudge them or anything. We need ‘em. But it’s very, uh, mind-numbing, I find. Getting that same call every week from the operators, “what do we do again when this happens?” And it’s like “Remember that email I sent you?” That’s it, too, there’s also the expectation to be on call, particularly, in for instance the manufacturing firm. You have on-call responsibilities, which get up in there with your life schedule. And it’s nice to be able to put in a more regular 9-5. Although I don’t. (laughing) But the idea at least…I don’t necessarily like the idea of being called on the maintenance things in there. I write up the maintenance procedures and escalation procedures and stuff like that, and help them get going but then. (10)
I’ve got this kind of idealized fantasy about landing a job somewhere in a place that’s pretty progressive where there are fast development cycles. You see a lot of software development SCRUM techniques. It’s a development methodology like agile programming where you work with small teams, fast iterations, that kind of thing. There’s room for you to test out theories and make mistakes on a small scale as you’re doing your fast iteration. You’re actually encouraged to be more experimental. One of

125
the things that really attracted me to IT is that whole you know the new technology the fast turnover it doesn’t stand still. I like that a whole lot. I have not worked in a place exactly like that yet. (1)
Do you like to play it safe? No, I’m on the other extreme, I like innovating to the point where if everything starts breaking down then go back and fix. (3)
…and here it is lone dude, little hillbilly guy in North Carolina was building content management applications by myself with everything I have, and they have this huge IT department and they were asking me, “how can you get it done so fast?” Because I don’t have the red-tape bullsh*t that you guys have! You know, you don’t have to a meeting about a meeting and a committee about a meeting and then project managers and Gantt charts and all this crap! I mean, just remove that sh*t and just develop! As long as you have the requirements, say, data needs to be secure. SSL. Done! You know? It’s not rocket surgery! Just get all your minutiae out of the way and just build stuff! At the end of the day, you can’t let the process stifle innovation. You need to innovate and then build processes around the innovation. Not the other way. You can’t say, “well we can’t innovate because we have a process. You need to get approval from your upper middle manager and your upper middle manager needs to get approval from the vice president, and the vice president needs the CIO” and at that point, I’m already done with the application without waiting on all this approval. It’s just bullsh*t! (13)
In design, there was a lot of creativity, you had a lot more flexibility to do what you want, as long as you had the buy-in from the code owner. Which did you like better? I enjoyed design a lot more than I did patching. Why? Because of the creativity. I wrote something and it’s mine. Versus in patching, yeah it’s my patch but it’s not my code. I made the widget but I didn’t design the widget. And that’s important to you?

126
That’s important to me. I mean patching gave me the satisfaction that I did the job, I created the patch and it fixed the problem and the nice thing about it is I had a quicker turnaround in patching. I could create the patch and hey I did this, I did three of them this week. Versus in design, it was like a research paper, I have to write it, I have to design it, it’s a longer process, so it’s more fulfilling at the end, it’s just not instant gratification. You get small snippets, hey I wrote that piece of code and it worked great the first time but the main satisfaction it going into the lab and seeing it work. And work well. (3)
I need a lot of …I’m a very creative individual. And oddly enough programming was one of the most creative things I have ever done. You literally take the most basic instructions or wants or needs, requests, from users and work with them on the people side and then transfer that into a computer language that it’s going to do exactly what they want it to do. And it’s a work of art when you’re done. It’s a masterpiece, hopefully. (4)
When I first came to the company I worked for, [company deleted], I was floored, amazed, aghast at the lack of embracing of technology. They embraced it on a personal level but not on a cohesive, global level if you will, a company-wide level. (4)
I think a lot of the stifled innovation makes them negative. Or dealing with users. I mean that’s frustrating for anybody. I understand that. Been there, done that. And I’ve been negative as well. (13)
I enjoy the…really the cutting-edge technology. One thing that I’ve learned over the years, though, is that I think as I mature because we’ve got a couple of young guys who work with us, and I don’t think I was that bad, but these guys are, you know, “New toys, new toys, new toys! Let’s throw up 2 or 3 servers and 2 or 3 clients in a virtual environment, but let’s play around with them and see what we can do,” and all that good stuff. I’ve sort of matured to the point to where I view IT as a business unit now.(24)
The theme of Innovation encapsulates the desire for novelty, variety, creativity,
and challenge that all the interviewees shared. This also included some codes for
progress, building, and improvement, all in a technological sense. IT people like that
technology is always changing and do not understand people or organizations that do not

127
embrace it like they do. The opposite of innovation is stagnancy and boredom. Several
interviewees talked about leaving work environments that became stagnant in terms of
not keeping up with the latest hardware and software.
4.4.5 Reverence for Knowledge
Reverence for Knowledge was a theme that emerged during the pilot and
continued to grow and expand in the full study. For many reasons, this is the most
important value of the six ASPIRE values. Quantitatively, the code count was much
higher for this theme than any other. Qualitatively, interviewees became very serious in
their tone when they were talking about knowledge, learning, problem-solving ability,
and the importance of being able to think in a certain way. Not a single interviewee had a
problem with the use of the term “reverence”, despite the religious overtones to the word.
Examples of the theme of Reverence for Knowledge are shown in Table 22.
Table 22. Examples of theme of Reverence for Knowledge
I think some of it is mystery. To have the knowledge over a non-IT person. Sort of like a power. A power thing. Like “you don’t know how to do that.” I think that’s part of the culture. I think that’s part of the mystique, the feeling of superiority. We’re all our inner nerds. We were the ones shunned in high school and now these jocks are looking to us to make their systems work. They’re the sales weasels (laughing). (3)
I have one [category] I’m calling reverence for knowledge… Mmmm! …that is, this predisposition to…and revering is kind of a strong word, but respecting people that have technical knowledge … Oh yeah!

128
…over who simply have managerial authority over what I’m doing. Oh yeah, absolutely 100%! I will respect a guy who knows what he’s doing over a guy who tells me what to do, 9 times out of 8. (laughter) I can’t be strong enough about that! (9)
I’ve always said that it’s great to have knowledge, but if you don’t have knowledge, that’s not the end of things. It’s having the ability to acquire the knowledge, and that’s not walking around to somebody’s office and asking them a question. I am not a “no knowledge = bad” guy. I am “no knowledge and don’t want to do what you need to do to obtain the knowledge” being you’re bad. (24)
…the ability to assimilate data rapidly and structure it in your head. The ability to, there is a skill that is required and very rarely actually there, which is the ability to translate between technical concepts and the non-technical audience. If we had more of that, we would be better off. There is the ability to not be afraid of new technology, not to be intimidated by something that you don’t understand. To some extent, you get different answers from a programmer because that’s a way more technical, in some respects, role than mine. I am a different aspect of the IT industry from programming. I don’t code. I take products that we have and I help people understand how to deploy them. The ability to troubleshoot. Oh my God, troubleshooting! The ability to think logically through a situation and say, “Okay, if I’m seeing this behavior, what could it flow out of?” The ability to change one thing at a time, in an organized fashion, rather than just Easter-egging out a whole bunch of things. Because then you don’t know what fixed it. That is the thing that drives me the most f****** nuts, is if I’m in an interoperability environment and we’ve got an interoperability bug and somebody changes 4 things at once and then says that it’s working, that’s useless to me. Because unless you back out of all four of those changes and then do them one at a time, you have not solved the problem. You have made it work, but you have not solved the problem! That’s a very different thing. (23)
One of the guys was really good; he just came in and told me, “Ninety percent of what you learn is going to be on the job. The stuff you’re going to learn in the books is the utopia, about how things should be. Everywhere you go it is not going to be set up that way. Whatever situation they’re in, 90% of what you learn is going to be on the job. That’s how it’s been.” (21)
at that point in my career, well I didn’t know anything. You learn in the book, but you don’t really know anything. (21)

129
I love…this kind of goes along with the video games. And I’ll digress to video games. There’s a bunch of different genres. I’m not really big on a lot of today’s genre, they have all these shoot-em-up games and racecar games that seem to dominate. I was more the one that liked the Mario games or what they call “platformers”. And what those are, their key element is solving puzzles. You got to move this thing over here to free up this over here to do this. So translating that to my IT roles, I love figuring out things when people say “hey, how come these numbers don’t work right? This doesn’t make sense to me. What’s the problem?” I love being able to figure out the problem, and when I figure out a problem or make a model that works…it’s just a great feeling! And that’s what I love about it, being able to fix the things.(16)
Do you think that IT people respect knowledge more than status or authority within a hierarchy? Yes! Yes! You say that pretty quickly. It’s a lot like the military, you’ve got the seasoned veteran who knows what he’s doing but he’s still a sergeant and you’ve got the lieutenant who just got out of officer’s school but doesn’t know what he’s doing, who do you think the mean are going to follow if you get into a fire fight? In IT, if you get into a problem, you’re not going to go to the Director for help, you’re going to the person who has been there the longest and knows the most, or the person who’s just been around the longest. (6)

130
Okay, maybe you’re helping me understand this, because a lot of people, just to share some of my research with you, a lot of people use this vocabulary of well, real IT people or your true IT person or a good IT person, well does that mean that there are fake IT people running around out there? Well, there’s a lot of people who like the idea or like the higher pay scale when it comes along with having a job, so they jump into that. Sorry, I carpool and I was just letting him know where we were at. Uh, I apologize. It’s not a big deal. I carpool with a guy. He’s one of our programmers for our web team, we work in different buildings, so. But you think some people may just be in IT for the money? Well, yeah, or that it was convenient or that it was easy, or it’s kind of what they got into or kind of fell into it, but I think what you mean when you say real IT people, they really have that drive, that commitment to technology, not just to this is what I do. The learning defines them, not the job they have. I think some just want to say they’re in IT, but their commitment and kind of their internal drive system is not to progress and to learn more and to do more and to become more adept at what they do, it’s just to get a paycheck and exist. So, my drive and the people that I surround myself with, our drive is to learn more, to be the best at what we do in our area, and to kind of master our field of expertise. So, like me moving into just security, I have really put myself into finding people that know more than I do about security, getting their information, reading their blogs, going to classes where I can learn from them because I want to be one of those people. I want to be the people that other people come to for information. You know, you want to be your oracle in your area, and so to be that, you’ve got to put in the time. You don’t just wake up one day and know everything about firewalls or know everything about you know, how to use host intrusion prevention, we’ve been working on that a lot here, so it’s something that you’ve got to have that drive to want to know, want to learn. (18)
I definitely think that the brain process is different in an IT person than in your average…and it’s that curiosity, that wonderment of “how does this go together?”. I think that when you put that together with that ability to put things together in a logical process, it makes for some really stellar stuff. (18)
And to us the obvious is irritating and to them the obvious is a mystery. So…IT people sort of think things through a little bit different. (12)

131
That goes back to the whole argument of knowledge versus stature because if the knowledgeable people in our department will argue with managers and say that’s not the way to do it, this is how we’re going to do it. And there’s not really a saying, but a belief in our area that “the managers come and go but the experts stay put.” So you may have a manager that comes in and they’ve been a manager of this group for 2 years and they’re working with someone who’s been an expert in this field for 20. And those people when the manager says this is how we’re going to do it, they so noooo that’s not how we’re going to do it. (2)
You talked about two different kinds of managers. Who did you respect more? The former engineers. OK, why? They knew what we went through as far as deadlines, as far as resources that we need. They were more sympathetic as far as what an engineer needs, versus hey do this, here’s the time frame. So not so much that they knew how to do the job but they knew what it was like to do the job? Now the ones that were even more higher esteemed were the ones who not only sympathized with the engineering environment but the ones who could talk shop. We had a couple of those who would sit down and say yeah maybe you should write it that or maybe we should avoid that method. And you’d rather work with a manager like that? Yes. My best manager was just like that. (3)

132
Do you think IT people are different than people who work in other jobs? I do, I think their minds work in a different way. And I don’t know that that applies to all IT people, but I think it applies to the really good IT people. I believe that problem-solving skills are more innate than they are learned. It’s tough to teach someone how to take a process apart. Some people just seem to have that ability, to take something apart, and I think they gravitate toward those fields like IT or mechanical engineering and that kind of thing, but I definitely think that the brain process is different in an IT person than in your average…and it’s that curiosity, that wonderment of “how does this go together?”. I think that when you put that together with that ability to put things together in a logical process, it makes for some really stellar stuff. Do you think it is critical thinking skills? Definitely, yeah. I mean, that’s what it is, it’s critical thinking, it’s “How does this work?”. If I click this button and nothing happened. Why did it not happen? That deeper thinking whereas your regular user will go, like, “Oh, it doesn’t work” and they walk away. An IT person, he wants to know why does it not work? It’s an element of critical thinking. But that’s what I break it down into. It’s critical thinking, that’s kind of the over-arching concept, but what are you thinking about? Well, I’m thinking about why this doesn’t work and how it goes together from step-by-step-by-step processing down to…. Because every action has a reaction, so it’s from that course of action to down until you find the root cause. (18)
In addition to the high frequency count and the impassioned quotes from the
interviewees above, there is one more piece of evidence to point to why Reverence for
Knowledge is the highest value in IT occupational culture. One part of the interview was
to ask each person to list up to five adjectives that they felt described IT people in
general. These adjectives are shown in Table 23. This is, of course, their subjective
perception of themselves as a group, but nonetheless useful. Capturing these words and
performing a quick content analysis provided some additional insight about the
importance of Reverence for Knowledge as a core value. Over 20% of the adjectives

133
offered directly relate to intelligence, and this was something of a surprise. Just as
importantly, the majority of the negative adjectives are also in some way related to
feelings of superiority based on intelligence, i.e., arrogance, condescension, entitlement,
and stubbornness. Intelligence is held in extremely high regard.
Table 23. Adjectives used to describe IT people
Enjoy Humor Intelligent Detail Drive
Stereo
type Negative Positive
like to eat
really
good
sense of
humor brilliant
detail-
oriented diligence geeky arrogance thoughtful
fun goofy clever
detail-
oriented
a sense of
urgency
anti-
social annoying
business
minded
love what
they do quirky competent logical dedicated different arrogance creative
quirky curious logical diligent geeky arrogant optimistic
quirky
driven to
learn logical driven
intro-
spective
condes-
cending
well-
intentioned
really
good
sense of
humor innovative
meticu-
lous
hard
workers
intro-
verted
condes-
cending
sense of
humor inquisitive
obses-
sive passionate
more
com-
fortable
with
techno-
logy than
people. entitled
sense of
humor inquisitive
process-
oriented nerdy entitled
weird
intellect-
ually
curious
well-
orga-
nized quiet grumpy
intelligence
really
into
techno-
logy indecisive
intelligent smart ass insular
intelligent isolated
Intelligent negative

134
Intelligent obtuse
inventive
self-
loathing
know-it-all
short-
sighted
smart
unaccom
modating
try to stay
current
uncompro
mising
willful
Reverence for knowledge means respecting intelligence and technical know-how.
It also includes the constant drive to learn more. Knowledge, in this sense, is something
that is always based on actual experience and very rarely based on book learning.
Intelligence is something to be respected and admired in others and what IT people want
to be known for. This is perhaps in contrast to business managers who want to be known
as good leaders and not necessarily as the smartest person in the room. There is a painful
disconnect when IT workers report to a manager who is not as technically proficient as
they are. They defer to knowledge, not managerial authority. For them, knowledge of
what is right is the ultimate authority. The opposite of reverence for knowledge is the
most egregious of negative occupational values: pretense at real understanding, and
corruption or abuse of knowledge. There is an intriguing notion in the data of a difference
between those with “real” knowledge and those who are “pretending” to know for a
misguided sense of prestige. All of this adds to the powerful mystique of secret
knowledge on the part of the IT professional that people outside the occupation do not
possess as evidenced by the first quote in Table 22.

135
4.4.6 Enjoyment
Like Reverence for Knowledge, Enjoyment was a core theme added during the
pilot that was not present in the literature review. The word “enjoy” itself was used in
conjunction with the other values frequently, but the enjoyment itself was important for
its own sake. Other occupations may or may not find their work enjoyable. College
professors might. Brain surgeons may not. But enjoyment for IT people includes fun,
play, and above all having a sense of humor and laughing about work, even to the point
of playing good-natured pranks on each other. This may contribute to the stereotype that
IT people do not take their work seriously, but this is not the case. Thus, another
stereotype of IT people as anti-social found no evidence. To the contrary, most
interviewees discussed how much they enjoyed going out to eat with others in order to
socialize more. Examples of the theme of Enjoyment are shown in Table 24.
Table 24. Examples of the theme of Enjoyment
I enjoyed my co-workers. I enjoyed that type of environment. It was more of a tight-knit community, a tight-knit family. (3)
if you were to walk in our department sometime, there’s no telling what you’d hear, you know? (laughing) You could hear a couple of guys just bashing a user…it’s certainly a different environment. I can’t think of any department in really anywhere that I’ve worked where the environment is similar to the IT environment. There’s times when it’s stressful, but when it’s not stressful, it’s like the most relaxed, you know…anybody who walks in there, you could not not want to work in that environment because of how relaxed it is when everything is going as it should. It’s almost like, “Wow, these guys are laid-back, they’re cool, they’re fun.” (24)
To me it wasn’t a job, it was a thing that I was doing as a hobby. So, with anything like that, if you love what you’re doing, if it’s something that turns out to be a hobby, you get paid to do it. That’s the icing on the cake! You know, I didn’t care about how

136
many hours I was having to work and even now, I still don’t. I’ve got kids that…I know that being a father, they want me to spend some time with them. I have to be careful of the hours that I spend doing things dealing with technology, but the other side of it is that, even today, I go in every day and I learn to do something new. So, the fact of the matter is that in this field, this is just my feeling, if you’re not enthusiastic about the job, I think you’re in the wrong field. You should have a reason for getting up every morning and going in there. You know, in IT that’s the thing you hear a lot of times, too. A lot of the guys that are happy in what they’re doing, they don’t tell you they worry about how many hours they work, you just don’t hear those kinds of thing. They get up in the morning and they go and take care of what they have to do, but they’re always learning something. That’s what pushes us to keep going. That’s one thing that pushes me to keep going. (21)
a lot of times I think that sense of humor, if you’re not in IT or you’re not a technophile type person, I think it gets lost and people just kind of like “those people are strange, they like the weirdest stuff.” But you know for people who understand technology, when they’re around other people who understand and like technology, they can crack jokes and it’s, I guess, a secret language maybe that they all understand. (15)
I also enjoyed the learning experience side of it. The companies I worked for had no problem within their yearly budget to send their technical staff to seminars, training, workshops and I dearly miss that. You know in my mind that’s one of the key elements of retaining people and keeping them up to par, is going off to seminars. IBM has something called CMON, it’s their user group environment and we’d go to that at least once if not twice a year and it was in a different city in the country and it was like going back immersed in college for one week and you could take class after class after class 4 or 5 days in a row. And then in the evenings, you’re having dinner, drinks or whatever, with coworkers or people you’ve never met before and you could exchange ideas. (4)
I worked for a place, not long, where I still wake up in a cold sweat at night. It was a very small shop, one of those transitional kind of jobs, but I had the family to think of so I took the job. It was awful. It was very adversarial not only between the IT group and user community but between the manager and the IT people. He was just an awful manager personally, just not a very likeable person. And he was looking for any excuse to pounce on you. So me and the other programmer were right in the middle. You were damned if you did and if you didn’t, you were afraid to take any risk at all. You were going to get jumped on by somebody and it just made for an awful work environment. It was terrible. (4)

137
We’re a bunch of pranksters. The toy thing, I don’t really get excited about new technology. It’s cool and everything but I don’t think I get as excited about the new toy as the guys do. I think the toy thing might be a little bit of a gender thing but I do love the people I work with. We’re pranksters and we laugh. People think we’re not working because we’re talking over the cube walls and laughing all day long but we’re actually getting tons of stuff done. Work hard, play hard is the concept. So I definitely think that’s important. So a sense of enjoyment is important to you professionally? Absolutely. I think if I didn’t have as much fun as I have, I think that I would have quit a long time ago. I think that’s one of the things I like the most. I like the people I work with and I really have a good time. Everybody bitches about their job and there’s days when you’re cranky but if I’m going to be honest, I love what I do and I love the people that I do it with. That’s really what brings me back every day. (7)
Well the people that I work with can relate not only to me at the job but in my personal life, you know, I would say the majority of play video games, a majority of us like the same movies, we like to do the same things, we have a fantasy football thing at work where we all participate in, and we generally like hanging out with each other, and it’s been that way throughout my career, there’s always been a good compliment of people that I like to be around outside of work. So would you say that a big chunk of your friends outside of work in IT? They’re IT people? Yes. Absolutely. The majority. Let me elaborate on that, even some friends that I’ve had in high school and college who weren’t in the IT field of things have gone into IT since then. (5)
Enjoyment at work was consistently important to all the interviewees, whether it
was socializing, joking, playing with new “toys”, or just having fun at work. The idea of
having fun at work may be alien to members of other occupations. The opposite of
enjoyment is dullness, stress, and lack of interest. A good cultural sociology term might

138
be “disenchantment” to describe the opposite of enjoyment, based on Max Weber’s
terminology.
In summary, the six ASPIRE values evolved and emerged out of the entire
interviewing process and form a more cohesive and unified set of occupationally-
important shared value than the SCORRE values from the original pilot. Each one has
strong support based on empirical evidence in the transcripts. Each one was mentioned in
some way by all 25 interviewees, thus there is support for generalizing to the larger
population of IT professionals as a whole.
Even though the six ASPIRE values are separate and distinct, many of the
ASPIRE interrelate in interesting ways, based on further reflection. For example, as
Interviewee #4 said “At lot of these are hand in hand, you can’t have one without the
other.” There are additional interrelationships. For example, Autonomy and Precision in
communication are related:
Well besides permissions levels it’s also the control of what software your techie
people are using. That whole issue of “if only we had the proper software we
could do this right.” Well the manager either didn’t want to spend the money out
of the budget or really didn’t understand, ‘cause they’re often not an IT techie
person, doesn’t understand exactly what that’s gonna buy them and the IT people
aren’t always in a position where they can communicate that effectively. So you
get this whole weird non-communication thing going on because the IT people,
typically introverted, non-communicators, don’t really understand why you need
to know this. “We need this!” It’s that simple. And I get that, but that’s how they
communicate. And then the manager’s like “But I need a business reason for this
that I can present to this non-techie person as to why I need this $60,000
whatever. So you end up in this struggle for control, ‘cause the manager thinks the
techie guys want to take control and the techie guys are like “why won’t you give
us what we need?” and it’s really ugly. And nobody gets anything done! (8)

139
Structure and Innovation can have an inverse relationship:
Hierarchy. Organizational chart. Standard issue. VP at the top or CEO at the top.
“Underlings” or whatever you want to call them, “indentured servants”, I don’t
know what you call them. I think in those structures that there’s a lot of people
that the further you go down on that, the more close they are to the real problems.
These guys up here, and this is just speaking from experience, they really don’t
know what’s going on out there. They’re just reading ITWorld magazines
…(impersonating silly voice) “Well SharePoint sounds like a very good
implementation because the implementation costs and stuff like that” (laughter)
and you don’t know sh*t. I mean, you don’t know sh*t! I mean, I’m dealing with
implementations by something they read in freaking PCWorld or they went to a
symposium and said that Microsoft promises 400% reduced or increased
productivity or whatever the f*ck (laughing)! I don’t know. And they implement
these solutions that they don’t know sh*t about! (getting animated) And then
these guys down here have really good ideas. I even hate saying that, “these guys
down here” because those guys down here are really making the show go. (13)
Structure is important, but I also don’t want it to be too structured to the point to
where I can’t be innovative, either. If I have to follow…and I told my manager
this once before, I was like, “Well, look, if you want me to file an SOP I’ll file an
SOP, but if that’s the route where we’re going, then we don’t need IT guys in
here. All we need someone who is literate because if all I have to do is file an
SOP, then that tells me that I just need to be able to read. I can’t deviate, even if I
see a better way, so…and that’s a tough situation, because SOPs are good. You
don’t one guy configuring something one way and then another guy configuring
something just completely different. But on the other hand, IT is a lot about…
some things you can do 5 different ways. You can take the scenic route or the
expressway, as long as you remember that destination. So, I don’t really want to
be restricted to having to do something the exact same way every single time, but
at the same time, that can be good. So, it’s tough. Structure’s important, but I
also want to do it and be able to deviate from that. (24)
Innovation and Structure and Enjoyment can all be seen as interrelated:
It’s fair to point out that we were in this special place [Silicon Valley in the late
90s] where maybe my experience is not reflective of other people’s experiences in
less innovative environments. Because you there was a whole lot of, it was pretty
loose out there in terms of the different business ideas people were trying out at

140
the time, with all the startup stuff. We had a bunch of people who had never really
managed anything, people fresh out of business school, had a great business idea
and got some venture capital for it. So that really colors, I think, the way that I’m
going to tell you that history work to me kind of comes out of that and into this
more structure, more bureaucratic, less fun…sometimes… (1)
Finally, in addition to Shared Values, the results of the content analysis also
provided ample support for the other constructs in the overall research model and how
they specifically relate to values. The ASPIRE values do not exist in a vacuum and are
very much interconnected in a web with Shared Context, Shared Language, and Shared
History.
4.5 Shared Context
Taking advantage of Trice’s Theory of Occupational Culture, Shared Context is
well-represented with the six characteristics of occupational culture: esoteric knowledge
and expertise, extreme or unusual demands, consciousness of kind, pervasiveness,
favorable self-image, primary reference group, and abundance of cultural forms. Table 25
shows the code frequency of the elements of Shared Context. Table 26 provides examples
of the elements of Shared Context.

141
Table 25. Shared Context code frequency
Code Frequency
Esoteric knowledge 67
Extreme-unusual demands 56
Consciousness of kind 39
Pervasiveness 17
Favorable self-image 16
Primary reference group 5
Cultural forms 18
Table 26. Examples of elements of Shared Context
Esoteric knowledge
You need to know IP networking, how to subnet, routing protocols, how to configure a router. You need to be able to apply scientific troubleshooting methods. Look at the problem. Look at the parts of the problem. Break it down until you get to the part you can work on and solve the individual parts and eventually you’ll have solved the whole problem. That’s not really an IT-specific skill, that’s a general skill. People that can solve parts of problems and know that they can chip away at it versus “oh God it’s an insurmountable problem.” Look at the different pieces. Is everything broken or are parts of it working? (14)
Extreme or unusual demands
We worked in a stressful environment over there at [company deleted]…really late nights. That was another reason…I knew there was places that you had to work late, but once a month you were guaranteed to work from 3 to 6 in the morning, guaranteed, and it was on a Friday night. Second Friday of every month. (25)
Consciousness of kind
Yeah, well, I think that you can tell from talking to someone whether they’re an IT person. I think the question is, I guess, what type of IT person they are. You can talk to someone from a networking environment and depending on the terms they use, you can tell that they’re a networking IT professional. You can talk to someone who’s a DBA, and if they’re talking in select statements, you can tell that…so it really depends on what type of IT person. You can certainly talk to an IT person and really get an idea of whether they have any mid-level range knowledge of IT or not. Yeah, yeah. (24)

142
Pervasiveness That’s actually, yeah, that’s an important component. For instance, a couple of weekends ago, I had a buddy come down and we spent the weekend learning how to compile stuff through the Android operating system. You know, just ‘cause!! You know. ‘Cause it’s your idea of fun? Yeah!! Yeah, we found out there was this free tool and we thought “well we can make this happen, right?” and by the end of Friday night we had something up and running in the emulator, until the next weekend, rest of the weekend, trying out different mobile frameworks and stuff to see how it would go. And I’m sorry, was that recently? Oh, two weekends ago! So yeah! But yeah, that interest going outside of the workplace is important…for happiness in the career and also for success, for whatever definition that might be, which I think includes happiness in the career. (9)
Favorable self-image
See, I think I’m very cool. So I wonder if I’m the cool person who just doesn’t know they’re a nerd. We joke about this all the time because we all think we’re cool IT people, but do we just think we’re cool and everybody outside of IT is just going “oh my gosh, look at those nerds over there!” I’ve never considered myself a nerd or a geek. So I don’t know. (7)
Primary reference group
Well, I think that a lot of the times as far as heroes go, a hero to me…I don’t have anybody that I’d say I look at that is going to be somebody that is well known, I mean, that’s a hero to me. I mean, I don’t look at somebody like Bill Gates or Steve Jobs and say that’s my hero. They’re not my heroes and they’re not who I look to for any kind of real advice. I think a lot of times I find heroes in the environment that I’m in. I try to find people that I can look to that will get me to that next level, and that’s the person I would pattern myself out of, their, you know, it was more like having a hero for the moment. That’s the way that I’ve always worked (21)
Cultural forms People who laugh at XKCD. A web comic. If you don’t know it, you should. You will find it hysterical. If you find XKCD hysterical, then you’re in IT. More, less flippantly, people who, when the computer is behaving weirdly, want to find out why and not just make it go away. People who get my jokes, you know? There is a whole

143
subculture of IT humor. But, humor…humor is a really big marker, and a particular frame of mind. So, I would say the two biggest markers for me are the particular cultural humor, and a frame of mind that wants to take things apart, troubleshoot it, and put it back together rather than just make the problem go away and not care why. But, that may also be because a lot of my IT community overlaps with the maker community and the hacker community, people who are of that bent. So I don’t know if it’s inherent to the IT community, or if it’s just inherent to the sub-section of the IT community that I swim in. (23)
These few quotes are only examples of the rich cultural context that IT
professionals share in common. Esoteric knowledge is prevalent in that they all need
highly specialized skills to do their jobs whether it be programming, system
administration, or project management. Extreme or unusual demands are seen when they
are frequently called upon to work nights and weekends in extremely stressful situations
that can create job burnout. Consciousness of kind means that they can tell who is an
insider and who is an outsider to their occupational group based on how they use IT
jargon or, more importantly, based on how a person approaches problem-solving in a
systematic manner. Pervasiveness is means they are typically working with technology
both at work and at home pervading their entire lifestyle. Favorable self-image is
demonstrated by the prestige or “coolness” that they associate with their career. Primary
reference group means there is a strong feeling that only people within their own
occupation can accurately judge the quality of their work, not people outside the
occupation such as business managers. And there is an abundance of cultural forms in
movies, television shows, books, magazines, and comics. Popular examples include “Big

144
Bang Theory” and “The IT Crowd” on television as well as movies such as
“OfficeSpace” and “Grandma’s Boy”.
4.6 Shared Language
Shared language is an important element of any culture at any level of analysis,
but especially so within the IT occupation. Stories abound of speaking a different
language with different words and understood meanings for members of the occupation
and the need for translation when speaking with people outside of IT. Several were quick
to point out that every occupation has its own language. Thus shared language belongs in
the model for any occupational culture. Examples are shown in Table 27.
Table 27. Examples of Shared Language
Of course. The language that lawyers use has differences, the language non-lawyers, the language doctors use…so, yes, but I don’t think it’s limited to IT people. I do think that it is a tribal marker! I will go into a room full of people who are looking at me, because I dress fairly nicely for work, both because I have really comfortable business clothes and because it gives me…for a long time, I looked younger than everyone in the room, so if I didn’t dress fairly nicely, I would get assessed as the admin, and that was annoying, so you do what you need to get around that. If I speak their language, technically or culturally, then I’m less likely to smell funny, to be run out of the room by the other dogs. (23)
as my own little personal anecdote, when I first went into [deleted] and someone, a manager, was in a department that they called “kai-zen” it’s just means continuous improvement which is Japanese culture and many US companies are catching up to that. But when once he saw my resume, I mean the lights went on in his eyes, you could see it, that now, he has his own man, I was not with IT but I could speak IT. And I was from that point on going to every meeting he went to. I didn’t even have to say anything or contribute, just as long as I was there listening to everything whether or not it had to do with IT or not because I was going to be that liaison, that translator (4)

145
Also if you have someone who is technical enough but not a coder, but also business enough, but they don’t actually work in the business, someone in between who can speak the speak of both sides and translate. Things works a lot smoother. (6)
We have our own language, but there are some of us out there who would rather speak in English. (6)
Shared language includes highly technical jargon and acronyms and all the interviewees
either acknowledged this explicitly or used highly technical language in their narratives.
While there may be sub-categories of shared language based on specific job roles such as
programming, networking, or database administration, there is an overarching language
to IT. In stark contrast, there were some interviewees who expressed an aversion to using
business buzzwords or business jargon and would use air quotes around words like
“synergy” or “profitability” while sneering. Others recognized the importance of
“speaking the language of business” without derision. In all cases, there was agreement
that some kind of translation between IT language and business language was necessary
in every industry.
4.7 Shared History
The importance of understanding Shared History when studying any culture is
already well documented. Cultures are products of their history. Shared meanings of
shared events serve to bind a culture together. The expected result was frequent and
shared perceptions of historical events such as 9/11, Y2K, the dot-com boom and bust,
the explosion of Internet use, increasing compliance legislation, and offshore

146
outsourcing. These can be categorized as Shared Economic History, Shared Political
History, Shared Technological History, and Shared Personal History.
4.7.1 Shared Economic History
The terrorist attacks on 9/11 were mentioned the most frequently but their impact
was more in an economic sense as causing job loss in the industry rather than in an
emotional sense of loss. The dot-com boom and bust directly impacted those who were
working during this time of rapid technological expansion in the late 1990s followed by
an abrupt economic halt. There were many examples of job loss or job-switching during
this time period due to the economy. Stories of being laid off and losing an IT job due to
economic conditions were both common and painful to recount. Losing a job is a
devastating life change because our identity is wrapped up in what we do for a living.
4.7.2 Shared Political History
Increasing compliance legislation such as Sarbanes-Oxley, HIPPA, and changing
credit card security standards were cited as contributing to an evolving culture of
compliance. This compliance culture, based on a national political agenda, means that
companies are exerting more control over IT functions and this increased scrutiny is felt
strongly by IT personnel. Another trend due to changes in legislation of H1B visas is the
increase of foreign workers into IT jobs in the U.S. Offshore outsourcing, i.e., the use of
developers from other countries as a source of cheap labor, is another strong trend but
neither foreign workers in the U.S. or offshore outsourcing were strong fears expressed
by the interviewees.

147
4.7.3 Shared Technological History
The interaction between technological history and the IT occupation was
frequently mentioned. The biggest historical change was the explosion of the Internet for
the interviewees. Without this technological change, IT could have remained a minor
function in the accounting back office (as in the 1970s) instead of taking a role center
stage as part of a business’s overall strategy. The rise of mobile technology was also
mentioned as a historical change. While mobile technology does increase the
pervasiveness of IT Occupational Culture, this was generally seen in a positive light in
terms of helping IT people to do their jobs remotely. The Y2K technology bug of IT
systems not being able to handle the date change from 1999 to 2000 was mentioned by
several in passing as an example of a “non-event”.
4.7.4 Shared Personal History
What came as a complete surprise is that there was an unanticipated area of
history that almost every single person had in common and a new code had to be created
to account for it. This was shared personal history. There is a shared personal narrative
that includes 1) an early experience with computers, typically in childhood coupled with
2) a positive influence from a parent or other family member. Examine the surprising
similarities in the following excerpts in Table 28 as examples of Shared Personal History.
Table 28. Examples of Shared Personal History
Well, I guess I got really interested with my Commodore 64…Me, my dad and my brother wrote a program even though I’m not in programming at all, I stay away from it as much as I can, and we wrote our first program and we must have spent a day and

148
a half out of a magazine just writing this code, and when we got in, we didn’t know what to expect. It was like C-64 Magazine or something, some really old magazine. All of a sudden, all it was a little racecar that just went up the screen, comes around, and it just looped. We must have spent all day doing that, and it was very frustrating, but then we got into games and stuff. Actually, I had a 128 that had 64, it was neat doing all of that. To me, all of that stuff was really neat. My brother actually went to the Navy and was in IT, too. (25)
When I was under 10, my father brought home an Apple II Plus, and he had a bunch of cracked games, and so we played Bouncing Kumongas, which is a real game, I swear to God, among many other games. So we always had a computer around the house. (23)
When I started the 7th grade, it was the first year of a new middle school called [deleted]. And there were 4 computers in every classroom and there was a teacher’s computer, 5 pc’s per classroom, teacher’s computer hooked into the TV’s and you know, it was as wired as you could get, it was all dumb terminals, booting twinax over the network, Netware 312. So, I got very interested in computers there and took some classes there, like about keyboarding and that kind of stuff, but I had seen computers before then, I kind of messed with DOS, kind of used pc’s here and there at people’s houses, my parents’ friends and stuff, and so I started messing around, figured that I could jump out of the Netware shell and get into a DOS command prompt, so I started messing around with, like I could do net message system, messages to my friends in other classrooms and I could send them a message so that when they walked in they would see it, and I locked the entire system up by sending a net message to star. So, IBM came down and spent three days getting it all back up, so I got to spend those three days with IBM. And, so, every time they came from then on, they pulled me out of school to spend the day with them because I would lock the system up or find a hole or find a problem, and then they would call IBM and I’d be able to come, and I would re-create the issue for them to show them what I had done to cause this to happen. (18)
My Dad worked for IBM. Now the ironic part is…working for IBM? The first computer in our house was an Apple II. (laughter) (16)
My Dad brought home a used computer. It was a…I think it as a Tandy, I’m trying to remember now. It had no storage media, so every time you turned it on, you just got the…it was just a…you could do Basic programming on it, but it didn’t have any applications, basically no O/S and so I bought a book of these fun Basic programs that you could type in the commands and make the little stick man walk or whatever. But every time I wanted to do it I had to type the whole thing in so that’s kind of how I got

149
started in programming was, I was probably 9 years old doing that. And then it always stuck with me that I thought that was interesting and neat that you could make a machine do these things. (15)
I got my very first computer, it was a Commodore64 and that was the most amazing thing to me! And the stuff I did with that, oddly enough, I wrote a POS system for it! My Mom was in retail and I used to go to work with her all the time and I wrote a POS system on my Commodore64, so I guess I was destined to do that since early on. (6)
My Mom got an Apple II, that was our first computer. That little monochrome all in one kind of thing. Had to be late 80s. And then got my first Intel computer PC in 93, 92. A 486 SX. Couldn’t even spring for the DX, had to go for the SX. That thing still cost $1000! (5)
I learned to program at the age of 10 on an old Commodore64. That peaked my interest and went into electrical engineering. My Dad was in telephony. He worked for BellSouth for 22 years and sort of got interested in engineering. He wasn’t an engineer but the whole idea of designing peaked my interest. (3)
My Dad used to work on computers back when you had to feed cards into them and stuff. And so, he travelled all over Europe. He’s from London. And he traveled all over Europe working on computers because he was the computer guy back before anyone knew that a computer guy even existed. And then when I was kid, he always had a computer in the house and I would play like Mother Goose Fairy Tales when I was a little kid on the computer and Captain Keen and King’s Quest and Leisure Suit Larry and all that. (12)
My father was an electrical engineer who became a kind of…information engineer. He worked for NATO for a long time and he was programming in FORTRAN in the 50s on punch tape and I don’t think he touched a computer from the 50s to the 90s. But at that point, he had stuff around him like flowcharting templates. I had seen various state diagrams. (10)
A great example would be my step-father, wonderful guy, love him to death! When I first got to know him, he was definitely an engineering/programmer. So he could make the computer do things I didn’t even know what they were, but I was the one would figure out how to get it working if it broke, or knew how to navigate the system. (9)

150
Speaking of geekitry, my Dad when I was younger spent me to computer programming camp. I spent a week learning how to program in Basic and it sounds geeky but that’s what started my interest in it. And I had a Commodore 64 and programmed it and the allure there, what I don’t have you know going years back to when I was doing it for fun and not because I wanted a good job, I enjoyed the creative aspect of making this beast, not a flesh and blood beast, but a code beast, that I could tell it what to do and I could make it do the things that I wanted it to do and only later when I was in high school and I was taking Pascal and now I can make tools that will help me do other things. (2)
So the shared narrative within the occupation goes something like this: “I will
always remember the moment my Mom/Dad brought home our first computer and that
started a life-long passion.” It is, perhaps, relevant to mention that the researcher himself
shares this same exact narrative as well. Shared Personal History is the shared history that
resonates with IT professionals and, in its own way, binds them together.
4.8 Relationships in the Web of Culture
The connections between these four areas, Shared Values, Shared Context, Shared
Language, and Shared History were evident although the relationships can be intricate.
Some brief examples will highlight how the web of culture connects together. Four
constructs that all relate to each other form six possible relationships.
4.8.1 Share Context and Shared Language
Every occupation has a shared language among its members and this is due
primarily to the link between esoteric knowledge, that is, highly specialized skills and the
terminology necessary to talk about those skills. Shared language is also used in the
Shared context of Consciousness of kind. For example:

151
The ability to, there is a skill that is required and very rarely actually there, which
is the ability to translate between technical concepts and the non-technical
audience. If we had more of that, we would be better off. (23)
Yes. You can tell by talking to somebody. Yep. The first couple of sentences,
and you can tell usually what they deal with by their jargon or how they say a
letter on a keyboard…how much they care. I tell you what, it’s really how much
they care about computers is what you can tell when somebody talks. Because
some people, you can tell they could care less about computers. (25)
4.8.2 Shared History and Shared Context
Economic layoffs have led to extreme or unusual demands in the work
environment. The more IT people who are laid off, the greater workload is placed on the
remaining IT workers resulting in frustration and potential burnout. For example:
Yeah, the employer, they know they have you. There’s not a lot of jobs out there.
Employers gain. Employers gain. They lay off people and they rehire. They
think that one person should be able to do 3 people’s jobs and do it as effectively.
I think that’s the big negative with what I’m seeing. People are just overworked.
(20)
4.8.3 Shared Context and Shared Values
There is a relationship between the cultural context of Pervasiveness and the
cultural value of Enjoyment. There is also a relationship between the context of
Favorable Self Image and the value of Reverence for Knowledge. For example:
Yes, I’d say they definitely love what they do so they spend time outside of work
studying and learning about new things. They’re kind of driven to learn about IT.
Maybe that’s two things. They love their job. (11)

152
How much does IT take over your after-work life?
Oh, oh, there you go! I mean, I love different things, different aspects of hooking
things together and building my own computer and stuff at home.
Okay, but you’re kind of working on technology-related projects on your
own time?
Always at home, yeah. Yeah, I always hook together my DVR to stuff to get the
whole room because the DirecTV guy couldn’t do it. Crap like that. (25)
4.8.4 Shared Language and Shared History
The relationship between Shared Language and Shared History, apart from all the
examples of jargon and acronyms, is the popular shared phrase “I fell into IT.” This in
vivo code was a kind of linguistic shorthand that effectively described the shared personal
history of IT professionals. “I fell into IT” means that that they were not intentionally
planning on a career in IT as shown in Table 29.
Table 29. “I fell into IT” narratives
It’s kind of what they got into or kind of fell into it (18).
That’s how I got into IT. I purely fell into it, and I lucked out. (17)
I’m in IT because I fell into it. That’s where my interests took me. (9)
It was kind of by accident. I thought that I wanted to be a teacher. (7)
I didn’t really know what I wanted for a career. (5)
I stumbled into IT and programming. (4)
I never intended...I just had to pick something…”you have to!” “I’m like uhhh, I don’t want to!” Until of course then I graduated, it’s like to only really marketable skill I

153
have is computer stuff. (8)
I started out, I wanted to be a journalist. So I got into IT sideways. (1)
When I got out of college, I had a Medieval Studies degree, and my choices were really to go on to grad school or to work in computers. And I kind of liked regular meals, so I went into working in computers. (laughing) (23)
So using the phrase “I fell into IT” is a shared phrase that nicely summarizes a shared
history. It is also an example of shared language that IT people understand readily above
and beyond the shared language of bits and bytes.
4.8.5 Shared Language and Shared Values
Shared language and intersects with the core value of Precision in
Communication. What appears as talking an arcane language to outsiders is really just
very precise language. This precision in communication is a very necessary part of the
occupation. For example:
Well yes, those of us, technical people, precision is everything. Have you read the
“Accidental Empires” by Robert Cringley?
I saw the documentary he did.
In there, one of the things he talked about was why his job as a gossip columnist
for InfoWorld was easy was that he always got…he was the Father Confessor for
all these other geeks there, because precision matters so much. To engineers, it’s
against their culture to say…you can’t go into a meeting and have the circuit
explode and say “well I thought it was a 50 ohm thing, ahhh put a 75 ohm in
there.” You just don’t do that! That’s not part of our culture, our nature. So when
people like sales people or managers try to get them to shut up and hush up major
flaws and other things like that, they need someone to talk to, and that’s why he
always gets the stuff and would find out about late releases or vaporware going on
and other stuff. There’s this need to bare one’s soul in there. I took that out of

154
there, but as he built that up, the notion of precision of communication, you need
to know exactly, in our case, database, it can’t be VARCHAR10 or
VARCHAR20 or something like that. It is one or the other. I’ve got to go code
this. Don’t jerk me around, man! (10)
4.8.6 Shared History and Shared Values
The high value IT people place on Precision may have a very direct relationship
with its history as much as its current context. For example:
I’ll go off on another diatribe here. When you had to do punch cards or you had to
submit things to a central computer to compile? You had to be pretty detailed on
what you submitted. You had one compile per day. So those people really think
out their code, they think out their process. (16)
It is possible that part of the historical hacker culture’s anti-authoritarian attitude
has impacted the strong preference towards Autonomy in IT people. But there was
stronger evidence that the early days of IT in Silicon Valley had a lasting impact on the
value of Enjoyment at work. For example:
So before things went downhill, what was it like to be in San Francisco near
Silicon Valley in the thick of it?
It was a crazy culture. When you went into the office, everybody was casual,
people came in shorts, the business people came in in suits, we had a game room
that had arcade games and a PlayStation 2, foosball, pinball, there was a pool
table, Ping-Pong table, a snack bar in there that they kept stocked constantly. It
was kind of like you hear Google has free snacks and so forth, well we had
anything you wanted, you just asked the receptionist and she’d get it stocked in
the snack room. I mean it was just a crazy time, there were parties going on,
startups happening left and right. It was a wild ride. I’m sorry it didn’t last longer.
(6)

155
It was a young hip kind of culture. People brought their dogs to work. It was
everything as you expected. We were down on Wiltshire Blvd right across from
the tar pits. It was a little office space, it was kind of fun. It was a good time. (1)
To summarize, the interrelationships shown in the research model found strong
support in the qualitative data. More than likely, all the relationships may have bi-
directional causal influences on each other but the purpose of this study was only to show
that the basic relationships exist in a web-like structure. Shared values may be the core of
any culture but they do not exist in a vacuum. The model shows that occupationally
shared values are heavily connected to shared history, shared language, and shared
context and the interview data supports this view. The results show rich support for the
original a priori model in terms of the major constructs, but the content of those
constructs, especially Shared Values and Shared History, did change from where the
research started to where it ended up.
A concluding note should be made to refer back to the three-way perspective in
analyzing any culture: Integration, Differentiation, and Fragmentation (Martin, 2002).
The Integration view looks at the features of culture that are in common and shared by
most members of the group. The Differentiation view examines differences in sub-groups
within. The Fragmentation view analyzes those paradoxes, tensions, and contradictions
that are sometimes glossed over in the other two views. This three-way view of culture
has been used with success in IS research (Kappos & Rivard, 2008). It should be apparent
from the constructs in the research model that what is being sought is primarily an
Integration view of IT occupational culture that focuses on the shared elements of culture.

156
At the same time, one interviewee was extremely adamant that there are important
differences within IT occupational culture. Here is the complete conversation supporting
her argument of the differentiation view of IT occupational culture:
Is there anything I’m missing in my study of IT occupational culture that we
haven’t talked about?
I think that you need to be careful, because the IT industry is so non-monolithic.
There is no…I would say, and it’s probably not what you want to hear, there is no
IT culture.
Okay.
There’s IT operations. There are security researchers, there’s the sales,
purchasing, the vendor representatives who buy the technology, there’s the
business side of IT versus the people who get up at 2 in the morning and upgrade
routers, and so I would caution you not to try to read it as one industry. It’s really
an umbrella over some wildly disparate cultures. I would say the culture of
business IT has about as much in common with the hackers, security researchers,
the “white hat hacker culture” as it does with an MD. So, that’s…it’s easy to
generalize….
That’s fortunate, because that’s the next step of my research.
Okay.
There are different ways of looking at culture in terms of what separates one
culture from another, but then also looking within that culture at how it’s
fragmented, how there are differences within a group. So, a lot of people are
quick to point out that hardware people are different from software people.
Yep, yep, yep, yep. There is a big piece, too, that…one of the biggest divides I
see in the IT industry…there are people who are Comp Sci majors, Electrical
Engineering majors, the traditional IT majors, and then there are people like me
who have stumbled into IT from a completely different background. We think
differently. I live with one, and I’ve worked with many, many people, both…I’ve
worked with people who got into IT from Physics, from Music, from English, and
I’ve worked with people who went into a Computer Science program with an
Electrical Engineering minor, and to me, that’s going to be one of the biggest
dividers you’re going to find. There are the people who have the computer

157
science/electrical engineering approach to things, and then there are the people
who came into IT from the outside. I think the industry needs both, but there are
limits to either, but there’s a huge cultural division there. We all interact and we
all get along, but we think really f***ing differently about the same…(pause)
we’re in the same environment, we’re doing similar things, but our approaches are
really different. (23)
Some typical differences that were pointed out in the interviews included software
people versus hardware people, business analysts versus programmers versus systems
administrators, and other such areas of specialization. The distinction between hardware
people and software people is an old one (Gregory, 1983). Still, an implicit argument is
being made in this research is that there are things that are core to the occupational
culture and things that are in the periphery. That is not to dismiss these differences into
the periphery as less interesting or less important. They will be the focus for future
research in this area. However, one tantalizing view of the data suggests that there is a
recurring motif of pride in being different. “I am not like most IT people. I’m different!”
Consider that the sample of interviewees included IS majors, business majors, liberal arts
majors, and college dropouts. But none of them admitted to being a typical IT person. To
the contrary, no matter their individual background, they thought they were different.
This was coded as the “I am different” speech shown in Table 30.

158
Table 30. Examples of “I am different” narrative
See, I think that’s why I’m kind of a little different because I don’t know if there’s anybody else in the department who is thinking about the company’s strategic goals! (24) You’ve thrown around “hacker” and “geek” and “nerd”. Do you self-identify with any of those? Not a hacker. To me, a hacker is someone who takes things apart and puts them back together and tries to figure out what they do and maybe better ways to do things, and I’m really not that person. At heart, I’m still a liberal arts major. (23)
I don’t consider myself the typical IT person…I don’t think I live that role. Maybe I’m just being…maybe I do. (laughing) I just don’t know it. And maybe I don’t want to admit it! (20)
I’m kind of a hybrid in-between. (17)
I’m the exception I would say. (16)
I’m called a computer geek or a computer dork. But I don’t think of myself as a geek or dork. I’m not the guy who’s a pencil-pusher, pocket-protector, things like that. There’s some really cool people out there who are doing some really cool technology jobs right now. I don’t think they’re computer dorks. (13)
I definitely don’t fit into the IT world as well as a straight IT guy so I’m sort of a walking paradox. So I have always been that person who was like a jack of all trades and a master of none. (12)
I’ve also spent more…also more of a socially congenial kind of person and communicative kind of person so I’ve often found myself riding the line, that I don’t totally fit…I’m a geek! I mean through and through. But I don’t necessarily totally fit the model, and a lot of times…so being different from all the ‘different’ people in that way is actually an advantage in a lot of cases, because I often ride the line in there. (10)
I get along with about anybody. I’m kind of unique in that aspect. (5)
Clearly that’s not me. (8)
159
It is tempting to assert that this claim to differentiation is yet another factor that IT
professionals actually have in common. It may be the case that most people say they are
“different” in some way from others, but in this case it is more important because the idea
dovetails logically with the “Fell into IT” narratives.
Finally, there is also evidence of the Fragmentation view of culture. Many
tensions and paradoxes exist. There is a clear tension between Structure and Innovation.
Too much Structure has the potential to stifle Innovation. Many of the interviewees used
the phrase “real knowledge” to describe what was most important to them, but when
pressed for what “fake” knowledge might be, they were unable to clearly articulate this.
There was also tension perceived by some interviewees between younger IT workers and
the “old guard.” Most of the interviewees were adamant that they enjoyed and were
passionate about their careers whereas for some it was just a job. But nowhere was the
Fragmentation more clearly evident than in the question “Is your work meaningful to
you?” The responses were either enthusiastic Yes’s, emphatic No’s, or hesitant Maybe’s.
What was clear, however, was what would be meaningful to them, whether they were
finding that meaning in their work currently or not, and this theme will be explored in
detail using a cultural sociological approach in the hermeneutic interpretation that
follows.
Martin (2002) asserts that it is important to consider all three perspectives of
culture when doing any cultural analysis. Hopefully this brief treatment of the three
perspectives lends weight to the idea that there are interesting insights to be gleaned from
this three-way approach.

160
4.9 Hermeneutic Interpretation – The Sacred and the Profane
The goal of cultural sociology is not merely to present data and findings, but to
interpret the meaning of those findings. Cultural sociology combines interdisciplinary
influences to examine meaning-making processes based on empirical evidence and
hermeneutics (Spillman, 2002). Hermeneutics, as a field, arose from Biblical Studies as a
way of discovering the deeper meaning of a text through careful analysis and
understanding of the overall context. More recently, hermeneutics has been applied in
research to any text and interview transcripts are just one example. Identifying the deeper
meaning of the combined texts of interviews is a process of subjective interpretation.
Subjectivity does not invalidate the interpretation as long as there is ample evidence
provided for that interpretation.
The results of the coding of major value themes and the content analysis were
used to create an overall interpretation of the deeper meanings of IT occupational culture.
The approach of cultural sociology helps unpack the meaning of IT work. Just as
ethnography attempts to describe a holistic perspective of a group’s history, language,
culture and context into a cultural profile (Creswell, 2007), a similar aim is sought for the
occupational group. The result should create a compelling literary metaphor for the IT
occupation. The goal of the metaphoric approach is to get at the overarching occupational
ideologies. Occupational ideologies are emotional, action-oriented beliefs based on
values within an occupation (Trice, 1993). For example, “Among accountants, a
dominant ideology is the deep-seated conviction that order and rationality can be made a
vital part of the behavior of work organizations, especially their financial control and

161
planning. Consensus and the governance of the workplaces, they believe, are possible by
means of rational knowledge and factual information. Conflict, strain, and power
struggles exist, but these are secondary to the ‘bottom line,’ where financial profit or loss
are cold-bloodedly assessed” (Trice, 1993, p. 48). A similar overall ideology based on
shared occupational values is the endgame of interpretation.
The interpretation is, admittedly, ambitious in keeping with the strong program of
cultural sociology. It is firmly grounded in Durkheim’s pioneering work in sociology in
the 19th
century. Durkheim studied religion as a cohesive force that serves to bind a
cultural group together. The most fundamental aspect of any religion, for Durkheim, is
the division between the sacred and the profane. Sacred elements provide cohesion and
special identification of social groups as well as meaning. Profane elements are less
meaningful and more routine. The sacred, for Durkheim, involved feelings of awe, fear,
and reverence and were contrasted with the profane, or routine, aspects of life (Durkheim,
1965; Smith & Riley, 2009). Caillois refers to the sacred as being a way of transcending
ordinary existence (Riley, 2010, p.13). The profane (coming from the Latin for “outer”)
is simply that which is not sacred, i.e., the ordinary, the mundane, and the routine.
Since Durkheim’s time, contemporary cultural sociologists have found examples
of the sacred and profane in other aspects of human activity besides religion (Riley,
2010). It may be argued that religion has become less of a cohesive force in
contemporary society and that other areas of human activity potentially fulfill this
function. For example, the Olympic Games and other sporting events are clearly secular
activities, yet the ritualistic behavior of the participants as well as the observers reflect

162
“the kind of ritualistic obsession of the behavior of the religiously devout” (Riley, 2010,
p. 10). Sports teams can help form fans’ identity and serve to represent certain values that
fans deem supremely important. The collective effervescence (to use Durkheim’s phrase)
of the fans in an arena are at least as high as that of participants in a religious festival.
A better example may be in the world of work. “We demonstrate our worth
through work. It is the first fact about ourselves we give others, and it is the first thing we
inquire of them. It is implied that we learn the deepest meaning about a person in learning
her occupation” (Riley, 2010, p. 3). While work is traditionally viewed as a profane,
everyday activity, it will be argued that there are elements of the sacred and mysterious in
how the profession looks at itself, especially in the language that we use about IT in
general.
This is simply a logical extension of an interpretation already begun by Jeffrey
Alexander, one of the founders of cultural sociology. Alexander finds the sacred readily
apparent in “information machines” and interprets those who work with computers as
worldly priests who act as intermediaries between divinity (information) and laity (users).
“When we want to consult the deity, we go to the computer because it’s the closest thing
to God to come along” (quoted in Alexander, 2010, p.188) Furthermore, technophilia in
Western culture has evolved over a long period of time to the extent that technology is
not just considered useful but sacred (Ignatow, 2003).
Riley also indicates it is possible to look at computer activity (both programming
and playing computer games) as a sacred experience that transcends the mundane world.
The act of going online or getting immersed in programming code can induce an ecstatic

163
state of trance. It is “the experience of successful performance, in other words, literally
ecstatic (“to be outside oneself”). It enables us to transcend the mundane and live the
eternal in the moment we are experiencing at that precise time. In this sense, cultural
sociology points us away from the experience of the everyday, the normal, to an
experience of the exceptional, the excessive, and the numinous” (Riley, 2010, p. 18). This
is not to say that IT is a purely sacred activity because there are numerous profane
elements in IT as well which are reflected in IT occupational jargon (Ignatow, 2003). But
the lens of the sacred may provide important insight into IT occupational culture.
Returning to the parsimonious list of ASPIRE values, a deeper exploration of the
meaning of those values to which IT aspires is now possible. What does it all mean, if
cultural sociology is about meaning? How do we avoid reified empty values and fill them
with Alexander’s (2003) “rich wine of symbolic significance”? There are many ways to
talk about meaning. The neo-Durkheimian discourse of the sacred and the profane
provides an especially meaningful and powerful interpretation of IT occupational culture.
If we ask, what is sacred for members of the IT occupation, the first value we
should examine is Reverence for Knowledge. Not only was it the most frequently
mentioned, but also the most fervently. Several interviewees were asked specifically if
they were comfortable with the word “reverence” due to its religious overtones and they
overwhelmingly were. Consider that “the sacred” has been examined in the context of
sporting events, so “sacred” is no longer the sole domain of religion. That is why the
sociological definition of that which inspires fear, reverence and awe is so critical to

164
understanding the sacred in the IT occupation. This is the unquestioned assumption of all
IT personnel: knowledge is sacred and worthy of reverence.
Within the context of the IT occupation, this is a certain type of knowledge that is
revered. Flyvbjerg (2001) distinguishes three types of knowledge in the original Greek
that are relevant in the social sciences. Episteme is scientific knowledge, techne is
technical knowledge including engineering and craftsmanship, and phronesis is practical
wisdom for ethical action. Therefore, the knowledge that the IT occupation reveres
should properly be called techne.
Knowledge can be considered sacred when it is revered. But the other two criteria
of fear and awe are also present. There is frequently fear of IT knowledge that manifests
as computer-phobia by people outside the occupation. Techne is not feared by members
of the occupation but its improper use is a subject of great fear. The awe that technical
knowledge inspires is apparent in the way people talk about it. One can easily tell when
the interviewees get the moments of awe when discussing knowledge but they have to be
listened to, not read, in order to appreciate them.
Might any other ASPIRE values be considered sacred? Wuthnow (1987) indicates
that the ultimate sacred value is world order. “Peter Berger (1969) suggested that the
ultimate human terror is not evil, but chaos. A total absence of order, a world without
structure or meaning, is so horrifying as to be unthinkable” (Griswold, 2004, p. 24) Since
the value of Structure represents order, it can reasonably be included as a sacred value
since a lack of Structure in the work environment is eschewed so strongly by IT people .
Innovation, which includes the power of creation, is connected to Structure if one must

165
create in order to bring about order. Building something new is something awe-inspiring
for members of the IT occupation. The recurring idea of technological progress, making
things better, improving things, even making the world better, seems to be important in
IT. The power of creation is, of course, a popular sacred theme in all world mythologies,
therefore to elevate Innovation to the realm of the sacred seems appropriate.
But what about the other values, Autonomy, Precision, and Enjoyment? It is
difficult to conceptualize these three as sacred because they have more to do with IT
workers’ preferences for their work environment. Three motifs that recurred with the
interviewees were “Enjoyment is what keeps me here”, “I left there because I didn’t have
enough Autonomy” and “I need Precision in communication to do my job”. The sense of
sacredness is missing in these themes, which indicates they may belong to the realm of
the profane. Moreover, the interview quotes provided earlier show the vehemence and the
yearning associated with Reverence for Knowledge, Innovation, and Structure as opposed
to the weaker preferences for Autonomy, Precision, and Enjoyment. In psychological
language, we could talk about the division being between Herzberg’s hygienic factors
and true motivators. But in cultural sociology language, the division is sacred/profane.
Profane values are still important (just as hygienic factors are important). But sacred
values take us to a higher plane of existence. There is arguably a strong link between
motivators and sacredly-held values. In this way, we can draw a clear distinction between
the sacred values of Reverence for Knowledge, Structure, and Innovation versus the more
profane values of Autonomy, Precision, and Enjoyment. This division is shown visually
in Figure 11.

166
Figure 11. Division of Sacred and Profane Values
Let us delve even deeper into the meaning of the sacred. For Durkheim and his
followers (such as Marcel Mauss and Roger Caillois), the sacred is divided into “right”
sacred, the things we revere, and the “left” sacred, the things which fill us with horror and
dread. The left sacred is also called the impure sacred or the transgressive sacred (Riley,
2010). Left sacred is important because it provides insight into what is considered evil in
a social group, something to be shunned and avoided, something that those who
participate in it risk being cast out of the group.
The left sacred is another aspect of the sacred but can be identified by reflecting
on the opposites of right sacred values. For Riley (2010), the sacred represents cosmos
(order, creation) and the impure sacred is chaos. The opposites of the three sacred values
of Reverence for Knowledge, Structure, and Innovation are what fill IT professionals
with dread and horror and are to be avoided at all costs. Hacking with malicious intent
and hoarding of knowledge violate the devotion to Reverence for Knowledge. Dis-

167
organization in the workplace and inexplicable re-organizations violate the devotion to
Structure. Technological stagnancy within an organization violates the devotion to
Innovation. IT professionals, at their core, are not driven by money. They are driven by
an intrinsic motivation for self-improvement (Reverence for Knowledge), technological
improvement (Innovation), and process improvement (Structure). It is important to
understand that money and the pursuit of wealth has no place in IT’s sacred values and
belongs in the realm of the profane.
What other evidence can be provided to substantiate the idea of the sacred in the
IT occupation? Two questions in the interview protocol had to do with identifying heroes
and villains in the career narrative. Heroes are an important part of any cultural group
and a group’s heroes can provide additional insight into what is meaningful to a group
(Hofstede & Hofstede, 20050. Villains, conversely, violate our most deeply held values.
The answers to the interview questions were surprising. Several people mentioned that
they felt like they should say Bill Gates or Steve Jobs but then went on to say that they
were considered businessmen and therefore not heroes. Not surprisingly, they would
sometimes name a favorite innovator. However, the surprise was in the number of people
who favored one very specific type of hero – teachers! The people that members of the IT
occupation admire as their heroes are teachers – people who increased their knowledge in
meaningful ways. The most common villain in the life narratives of the interviewees
were knowledge hoarders who were unwilling to share what they had learned, an act of
ultimate transgression.

168
An additional theme from the qualitative data came from the question “Is your
work meaningful to you?” The answers indicated that IT professionals find meaning in
helping others, whether internal to the organization or external, to achieve their goals.
They are less interested in monetary rewards than in being recognized for their clever
solutions to intricate problems. Interestingly, there were several stories given in response
to the question that identified teaching as the most meaningful work. So teaching is a
strong element of the sacred for IT occupational culture.
Let us dig deeper still into the meaning of the sacred for IT occupational culture.
Now that we have identified 1) an ideology of three sacred values, 2) a strong sense of
meaning in helping others, and 3) heroes who are teachers, we can seek a literary
archetype to exemplify these traits. An archetype helps to symbolize a complex array of
ideas in an easily presentable fashion. Who in our Western heritage personifies reverence
for knowledge, creation and inventiveness, bringing order out of chaos, and a desire to
help and to teach humankind? We must reach into our shared mythological past to find an
appropriate archetype who embodies all of these traits.
Prometheus, in Greek mythology, is an archetypal figure who represents all of the
above attributes. Prometheus is the Titan who steals the sacred knowledge of fire and
teaches it to humankind in order to help them fend off the forces of Chaos in the world.
Prometheus, whose name means “Far Seer”, is the creator and master of technology who
also has the arrogance to defy traditional authority coupled with the desire to help and to
teach. Will Durant quotes Aeschylus’ Greek tragedy Prometheus Bound to describe how

169
“Prometheus hurls defiance to Olympus, and recounts proudly the steps by which he
brought civilization to primitive men, who till then
Lived like silly ants beneath the ground
In hollow caves unsunned. There came to them
No steadfast sign of winter, nor of spring
Flower-perfumed, nor of summer full of fruit;
But blindly and lawlessly they did all things,
Until I taught them how the stars do rise
And set in mystery, and devised for them
Number, the inducer of philosophies,
The synthesis of letters, and besides,
The artificer of all things, memory
That sweet muse-mother. I was first to yoke
The servile beasts…
And none but I originated ships…
And I,
Who did devise for mortals all these arts,
Have no device left now to save myself. (Durant, 1939)
Prometheus, of course, is punished by Zeus for his arrogance yet praised for his
knowledge. Using the archetype of Prometheus to represent all that is sacred in IT
occupational culture is a compelling and powerful vision of what is best in us. Let us then
take literary license to identify Reverence for Knowledge, Structure, and Innovation as
the Promethean virtues of IT. Figure 12 shows a famous statue of Prometheus chained to
a rock by the gods as punishment for teaching mankind the secret of fire.

170
Figure 12. Prométhée enchaîné by Nicolas-Sébastien Adam, (1762)
Now that a deep understanding of IT occupational culture has been achieved, it is
necessary to rise back to the surface and refocus attention on what is of practical
importance. How does the sacred/profane perspective help in the understanding of the
role of IT in the business world and what new insights can be gained from it?
At a fundamental level, money is profane and knowledge is sacred for IT. This
helps explain some of the underlying arrogance or disdain that those outside of IT often
see. The sacred/profane view helps to explain why it is so hard for IT people to make the
jump into management, because it is not a matter of simply needing to develop a new
skillset as is commonly thought, but requires giving up one’s sacred values in exchange
for a different set of values. This may be the hardest thing for people to do.
The sacred/profane view also helps address the ongoing cultural chasm between
IT and the business. Consider what would happen if one cultural group’s sacred value

171
was actually treated as a profane value by another cultural group. Is this not what
happens when IT people come into contact with business managers? Do business
managers not treat technical knowledge as means to an end rather than an end in and of
itself? This is the difference between what Rokeach termed a “terminal value” and an
“instrumental” value and may be the very crux of the issue for the “cultural chasm” that
exists between IT groups and other business groups.
Reverence for Knowledge is the sacred value the binds all the other values
together. One cannot be autonomous without knowledge. One cannot bring structure out
of chaos without knowledge. Knowledge requires more precision in communication.
Knowledge leads to innovation. Finally, learning itself is enjoyable for people in IT.
These conceptual relationships are shown in Figure 13.
Figure 13 – Relationship of Reverence for Knowledge with other values

172
The sacred/profane view helps explain the strong aversion that IT people have to
“blame” cultures within organizations. Because knowledge is based on experience and
not book theory, IT people do not want to be blamed for making mistakes because that is
precisely how they learn and improve. This is a lesson important for business managers
to internalize.
The sacred/profane view also helps explain what IT people need most from their
managers. They need managers that preserve orderliness, who do not abide disorder, who
communicate precisely, who empower them to work with freedom and autonomy, who
do not blame the mistakes that lead to innovation and allow them to build new creations,
who foster an enjoyable environment, and most importantly, who respect and
acknowledge their intellectual abilities. If IT people have different values than business
managers, then the two groups may be providing what they think the other group values
when in fact it is what they themselves value. It helps explain the immense frustration
experienced by two occupational groups who do not understand each other well enough.
4.10 Evaluating the Interpretation
Creating a hermeneutic interpretation is a subjective process but it should be more
than simply the main researcher’s opinion. Richards (2005) discusses five qualities that
can add up to sufficiency of interpretive analysis. These include 1) simplicity, 2) elegance
of data that hangs together in a logical way, 3) completeness such that the categories of
codes reasonably account for the data, 4) robustness in terms of being able to explain new
cases of the data, and, finally, 5) making sense when the interpretation or theory is shared

173
with the relevant audience. All five criteria have arguably been met in this interpretation
as shown in Table 31.
Table 31. Sufficiency of Interpretation
Sufficiency criterion Evidence
Simplicity The ASPIRE values
Elegance of data that hangs together Sacred/profane interpretation adds
explanatory elegance to the ASPIRE
values
Completeness Content analysis with code frequency
and code co-occurrence
Robustness Examples provided of how the
sacred/profane view better explains IT
experiences with management
Making sense Interpretation was shared with the
interviewees and approved.
4.11 Next Steps
The problem of occupational value differences runs deep as evidenced by the
above analysis. What is left to understand is how these sacred and profane values can be
measured, how they differ from business management values, and how these differences
impact overall IT/business alignment. For these next steps, the research shifts from
qualitative to quantitative analysis.

174
CHAPTER V
PART II – MEASURING ITOC
5.1 Part II Research Objectives
The research objective of Part II is to develop an instrument to measure the
meaningful values identified in Part I and then test the instrument. The research questions
for Part II are: What are the measurable dimensions of IT occupational culture? Is IT
occupational culture significantly different from business management culture and, if so,
how? Only one study has quantitatively examined occupational differences that included
the IT profession’s organizational culture preferences (Kwantes & Boglarsky, 2004) but
did not identify specific occupational values. Other explorations have been qualitative or
theoretical (Guzman, 2006; Scholz, 1990; Nord et al., 2007). Part II of this study
quantitatively determines areas of difference based on interpreted values that have deep
meaning from Part I. The pilot study indicated great homogeneity among IT professionals
in their responses, however it is expected that the relative importance of IT occupational
values will be significantly different for non-IT business managers. As evidenced by the
literature analysis, the gap in our current understanding of IT occupational culture is due
to not having a set of measureable scales at the occupational culture level. Therefore the
objective of this research is to develop a set of value dimensions at the occupational level
of analysis.

175
There are a large number of dimensions that have been used previously to
measure culture at the organizational level (Pliskin et al., 1993; Ashkanasy et al., 2000).
However the goal is to identify those dimensions which have particular relevance to IT
groups as opposed to general organizational relevance where the proposed dimensions
could equally apply to other departments such as Accounting or Human Resources. For
example, a dimension that may apply to IT occupational culture but equally applies to
other occupational cultures as well might be Leadership, defined as “the role of leaders in
directing an organization, maintaining its culture, and serving as role models”
(Ashkanasy et al., 2000). Hofstede’s approach is a good starting point for examining IT
occupational culture in that a) it is possible to measure aspects of culture quantitatively and
b) it is possible to create a parsimonious number of scales that are useful and pragmatic in
describing cultural differences.
5.1.1 Value Dimensions
There were six values of IT occupational culture identified and refined in Part I that
form the acronym ASPIRE.
Autonomy = the level to which members of an occupation believe that they should
be empowered with access to tools, access to data, and decision-making for the
organization.
Structure = the level to which members of an occupation believe that orderliness
and definition are needed in the work environment.

176
Precision = the level to which members of an occupation believe that
communication about work tasks must be detailed, accurate, and exact.
Innovation = the level to which members of an occupation believe that
technological improvement, novelty, and creativity are valued
Reverence for Knowledge = the level to which members of an occupation believe
that intelligence and increasing technical knowledge determine respect and
admiration
Enjoyment = the level to which members of an occupation believe that their job
should include play, fun, and socializing.
In addition to the ASPIRE values, 10 occupational values for business managers
were used from Posner and Schmidt (1996). This set of values has been used in a series of
studies every decade for the past 30 years in order to identify changes in business
management values over time. These are Organizational effectiveness, High morale,
Organizational reputation, Organizational efficiency, High productivity, Organizational
stability, Organizational growth, Organizational value to the community, Profit
maximization, and Service to the public.
5.1.2 Part II Research Model
These value dimensions comprise Part II of the overall research model. Figure 14
shows an expanded view of this section of the research model.
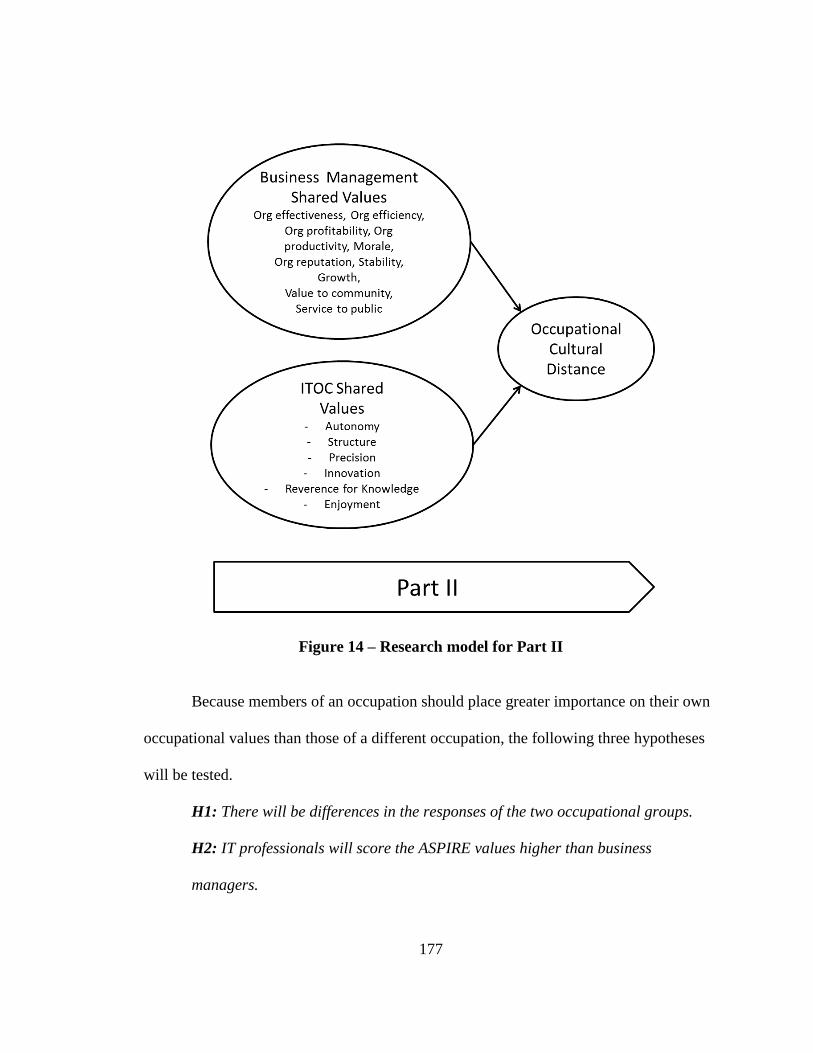
177
Figure 14 – Research model for Part II
Because members of an occupation should place greater importance on their own
occupational values than those of a different occupation, the following three hypotheses
will be tested.
H1: There will be differences in the responses of the two occupational groups.
H2: IT professionals will score the ASPIRE values higher than business
managers.

178
H3: Business managers will score the business management values higher than
IT professionals.
5.2 Part II Methodology
Part II consists of modifications to the survey instrument that was created in the
initial pilot using items based on the qualitative interviews of Part I. The instrument also
includes previously validated items measuring business management values.
Questionnaires are appropriate for cultural studies because they can show differences in
answers between groups or categories of respondents. (Hofstede & Hofstede, 2005).
5.2.1 Instrument Creation
The process of creating the survey instrument was similar to other successful
dimensional scales such as House et al. (2004) and Smith et al. (1998). Creating the
dimensions began with a thorough literature analysis as shown earlier. As stated in Smith
et al. (1998), the goal is not to be exhaustive but representative. Smith et al. (1998)
identifies three stages of instrument creation and validation. Stage one involves the
following three steps: 1) specifying the domain and dimensionality of the constructs of
interest based on the literature review, 2) generating a sample of items based on literature,
interviews with professionals, and previously validated instruments, and 3) assessing the
content validity. Content validity refers to how consistent and representative the items are
with the domain on the scale construct (Smith et al., 1996; Straub, 1989). Stage two
includes the steps of administering the instrument and then conducting exploratory factor

179
analysis on the results. Stage three assesses the internal validity and reliability and may
include confirmatory factor analysis. The stages and steps are summarized in Table 32.
Table 32. Summary of Instrument Creation Steps
Stage One Step 1 Specify the domain
Step 2 Generate items
Step 3 Assess content validity
Stage Two Step 1 Administer instrument
Step 2 Exploratory factor analysis
Stage Three Step 1 Assess internal validity
Confirmatory factor analysis
Step 2 Assess reliability
5.2.2 Stage One
Step 1 of stage one, specifying the domain, was addressed through the thorough
literature review on culture studies in IS as well as cultural sociology. Step 2 of stage one,
generate items, was addressed through both the literature review and the use of interviews
with IT professionals in Part I resulting in the ASPIRE values. Each survey item was
based on the results of the interviews and the content analysis from Part I. Items
measuring business management values from previously validated instruments (Posner &
Schmidt, 1992; Posner, 2010) were also added to the instrument. Demographics captured
included gender, age, level of education, years of work experience, and job title.
Respondents were also asked to identify their role as either 1) “IT employee (non-
management)”, 2) “non-IT business manager” or 3) “Other” with the option to list their
specific role. The complete items from the final instrument are in Appendix D.

180
The instrument itself was created and hosted in Qualtrics in order to gather
responses electronically. The occupational values questions were randomized by
Qualtrics such that each respondent would be presented with the questions in a different
order. A screenshot of the Qualtrics survey is shown in Figure 9. A Likert scale is one of
the most common formats in surveys (DeVellis, 1991) and the instrument used 7-point
Likert scales for each item.
Figure 15 – Qualtrics Screenshot
Content validity in step 3 of stage one was specifically addressed by following a
Q-Sort method to rank the items and discarding items that were ranked low. Because the
survey items did change from the original pilot items, a new Q-Sort was performed with
five PhD students. The students were given a stack of 70 index cards with a survey item

181
on each card. They were also given seven labeled envelopes in which to place the cards:
six envelopes for the six ASPIRE values, plus one envelope for “Unsure”. They were
asked to complete three distinct steps in the Q-Sort process: 1) Read the definition on
each envelope. These corresponded to the definitions of the six ASPIRE values and
served as the “condition of instruction” in a typical Q-Sort (McKeown & Thomas, 1988).
2) Assign each index card one at a time to one of the six envelopes or the seventh
“Unsure” envelope. And 3) after assigning all the cards to envelopes, take each envelope
and stack the cards in order by how strong a link there is between the item and the
definition. The results were tallied in Excel with points assigned to the rank order. The
highest ranked items across all the participants were kept as valid items to use in the
survey instrument and the lowest ranked items, or items consistently misfiled, were
discarded.
Before beginning Stage Two, a final pre-test was also performed. The electronic
survey was sent to PhD students to ensure again that items were well-worded and
unambiguous and that the mechanics of the online survey worked without technical
difficulty. DeVellis (1991) cautions that good survey items should not be exceptionally
lengthy, have a high reading difficulty level, or include double barreled items. None of
the items were negatively worded in order to avoid reversing the items during the
analysis.

182
5.2.3 Stage Two
Stage two of instrument creation involved administering the instrument to a
sample of IT personnel and business managers. A new IRB approval was obtained for
this part of the research prior to collecting any data (IRB# 12-0012 dated 1/24/2012. See
Appendix F). The IRB office asked that participants be allowed to skip the demographic
questions if they chose and this change was made in Qualtrics.
Because Part II uses the same sample as Part III which is at the organizational
level of analysis, companies had to be approached to participate in the survey. The
objective was to obtain 5 to 10 IT professionals and 5 to 10 non-IT business managers
from at least 30 organizations. These organizations needed to be from different industries
and include different sizes, but generally needed to be medium to large in order to have
enough IT personnel for the study. CIOs and CEOs were approached ahead of time to
request their organization’s participation in the study. Contacts at organizations were
obtained through 1) personal contacts and Linked-In connections, 2) three different
Advisory Boards within the Bryan School of Business, and 3) the Lexis-Nexis database
of company information in the U.S. Organizations were sent an introductory letter
explaining the purpose of the study, requesting their participation, and offering two forms
of incentive: an individual incentive for gift card drawings and an executive incentive to
share a high level report of the results benchmarking their firm with others.
The executives for each firm had many questions about the study that had to be
answered before they would agree to participate. Some wanted to see the questions ahead
of time in order to preview, some wanted the gift card incentive removed as an option

183
due to their company’s policy, some wanted the option to receive a copy of the results
removed from the survey, some wanted reassurance of confidentiality of the respondents
and/or the company name, and one even requested an in-person presentation to their
SVP, CIO, and VP of Human Resources. Every attempt was made to accommodate
executives’ requests to make them comfortable with the process without changing any
content in the surveys. Once approval was given to participate, a survey link was sent for
distribution. A unique survey link was created in Qualtrics for each company in order to
ensure companies were grouped together correctly for Part III. In three cases, the
companies provided a list of email addresses and these were used to create “panels” in
Qualtrics for automated distribution and reminders which worked well. In all other cases,
the executives did not provide email addresses but rather forwarded the survey link that
was provided to their staff internally. Verbiage was provided to each executive to include
with the survey link. After the survey link was sent, the researcher stayed in close
communication with the executive to follow-up on participation levels for their firm and
request reminders when necessary.
The first five participating firms were treated as a pilot group. The survey asked
an open-ended question about any problems with the survey. There were no negative
comments about either the mechanics or the wording, so no changes were made to survey
after the pilot. Late in the data collection process, one large firm experienced difficulty in
accessing the Qualtrics site with a “server not responding” error message, but they were
able to take the survey later after this intermittent problem cleared up. The Qualtrics site
remembered their stored answers and they were able to pick up where they left off.

184
The next step in Stage Two was conducting Exploratory Factor Analysis (EFA)
after all the data had been collected. The intent of factor analysis is to reduce the number
of variables and discover the latent constructs that best explain the variance (Rencher,
2002; Cooper & Schindler, 2003). In exploratory factor analysis, every variable loads on
every factor without any constraint on which item goes with which factor (Cooper &
Schindler, 2003). EFA can help determine if a priori dimensions (in this case, the
ASPIRE values) should be kept, or if some new dimensions emerge, or if of the
dimensions converge so they may be combined (Smith et al., 1996). Note that
Confirmatory Factor Analysis was done later in Stage 3. EFA analysis is done with
principal-axis factoring in SPSS (Bryman & Cramer, 2001). The results of the EFA are in
the Results section below.
5.2.4 Stage Three
Stage three assessed reliability and construct validity of the latent variables as
described in the Results section below. Confirmatory Factor Analysis was performed
using SAS software to constrain the items to load on the factors identified in the
Exploratory Factor Analysis from Stage Two. All responses from all three groups (IT
employees, non-IT business managers, and Other) were combined in order to examine the
reliability of the instrument items. Cronbach alphas were calculated in SPSS and reported
for each latent variable. High Cronbach alphas show the degree of correlation between
items and they should be high (over .70) when measuring the same construct (Straub,
1989). Part of the process of purifying the measures is to drop items that may not be

185
loading on their constructs well in the factor analysis and recalculating the Cronbach
alphas (Churchill, 1979).
Construct validity is demonstrated by the correct items loading on the same
constructs indicating that the instrument is measuring the right things. High discriminant
validity is shown when none of the items are cross-loading on the wrong latent variables
and that the dimensions are well-defined and separate from each other. The reliability
results and the factor analysis provide evidence to answer the first research question of
Part II of what are the measurable dimensions of IT occupational culture.
5.2.5 Norms
In addition to the three stages of scale creation activities, the instrument was used
to look at potential norms (Churchill, 1979). The presence of different norms will provide
evidence to answer the second research question: Is IT occupational culture significantly
different from business management culture and, if so, how? The anticipated norms are
reflected in the three hypotheses:
H1: There will be differences in the responses of the two occupational groups.
H2: IT professionals will score the ASPIRE values higher than business
managers.
H3: Business managers will score the business management values higher than IT
professionals.
The collected data was divided into two groups. Group 1 included IT employees who
were not managers and Group 2 included business managers who were not in IT. Note

186
that the third group “Other” was not used in this part of the analysis. These were mostly
IT managers, and thus a hybrid of two occupational groups. Statistical means comparison
was done to compare the responses of the IT professionals from all the organizations with
the responses of the business managers from all the organizations because the unit of
analysis in Part II is the occupational group level.
5.3 Part II Results
5.3.1 Sample Size
Preliminary emails were sent to organizations to determine if they were interested
in participating. Two hundred were personal contacts, 30 were from Bryan School
Advisory Boards at the University of North Carolina at Greensboro, and 29,310 were
from the Lexis-Nexis database of businesses. Of these, 125 expressed initial interest and
requested more information. It should be noted that over 50 additional organizations
indicated interest but either have outsourced their IT function or had less than the
minimum of five IT personnel in their company. A total of 47 organizations agreed to
participate in the survey and only then were they sent the survey link. Of the 47
organizations, 38 returned surveys for a response rate of 80%. A response rate over 50%
is adequate but over 70% is considered very good (Babbie, 2007).
A total of 582 surveys were submitted into the Qualtrics system. Surveys with
missing responses were eliminated resulting in a total of 495 useable surveys. The
participation breakdown was as follows. Group 1 of the IT employees totaled 242 in
number. Group 2 of the non-IT business managers totaled 197 in number. Group 3 of the

187
“other” role, typically IT managers and directors, totaled 56 in number. Groups 1, 2, and
3 were combined for the purposes of the factor analysis for the first research question.
Groups 1 and 2 were compared for the purposes of the analysis of variance for the second
research question. A table showing all the participating organizations and the initial
source of contact is shown in the Part III Results that focuses on the organizational level
of analysis.
5.3.2 Nonresponse Bias
Nonresponse bias refers to measurement error that can be potentially introduced
into a survey-based study where respondents self-select to participate, particularly if the
respondents are systematically different from the population of interest (Fowler, 2002).
Even though several studies suggest that nonresponse rates do not necessarily change
survey estimates (Groves, 2006), it is still an important concern to address. The best way
to reduce nonresponse bias is to reduce nonresponse (Armstrong & Overton, 1977). In
order to reduce nonresponse, incentives were provided by way of gift card drawings and
executive summaries to participants, as well as reminders sent out at regular intervals
once an organization had agreed to participate. It is important to note that in addition to
the incentives, in most cases a sponsoring executive for the participating organization
sent the survey request internally which should have added additional motivation to take
part in the survey, even for those employees who would otherwise be unwilling to
participate.

188
Nonresponse bias is also mitigated by showing variance in the respondents which
is shown under Demographics below for Part II and Part III such that important groups in
the population are not excluded. There was variance in gender, age, education, and years
of experience for Part II and company size, industry type, and region of the U.S. for Part
III. Another way to address nonresponse bias is to compare the results with an external
source of verifiable data with the goal of demonstrating that the participants are
representative of the population (Groves, 2006). While there is no firm data on the
demographics of the “average IT worker”, it may help to compare one demographic of
gender. The percentage of female IT employees participating in this study was 33% in an
industry typically disproportionately dominated by males. Compared to an industry
average of 25% females in computing fields (www.ncwit.org), this may be deemed
representative of the population. While polling nonrespondents would be the most
effective means of determining nonresponse bias, this was not practical due to time
constraints.
5.3.3 Demographics
The characteristics of all 495 respondents including both the IT group and the
business manager group are shown in Figures 16, 17, 18, and 19.

189
Figure 16 – Demographics by Gender
Figure 17 – Demographics by Age Group
192
291
Female
Male
6
84
159 166
64
3
0
20
40
60
80
100
120
140
160
180
18-24 25-34 35-44 45-54 55-65 65+

190
Figure 18 – Demographics by Education
Figure 19 – Demographics by Years of Work Experience
59 64
251
107
1 0
50
100
150
200
250
300
High School Associates Degree
Bachelors Degree
Masters Degree
PhD
0
20
40
60
80
100
120
1-4 years 5-9 years 10-14 years
15-19 years
20-24 years
25-29 years
30+ years

191
5.3.4 Construct Validity and Reliability
All responses from all three groups were combined in order to do the factor
analysis. Exploratory factor analysis was performed in SPSS v16 to see if the survey
items were loading on the appropriate six latent variables in the ASPIRE model.
Descriptive statistics with means and standard deviations for all the survey items are
shown in Table 33.
Table 33. Descriptive statistics of all items
Descriptive Statistics
(n=480)
Mean Std.
Deviation
AUT_bureacracy 5.61 0.93
AUT_freedom 5.90 0.78
AUT_flatter 5.04 1.01
AUT_empower 5.73 0.90
AUT_access 5.22 1.09
STR_standard 5.49 1.04
STR_sticking 4.86 1.19
STR_defined 5.71 1.07
STR_enforce 5.49 0.94
STR_order 5.49 0.89
STR_time 5.85 0.83
PRE_detail 4.52 1.22
PRE_words 5.44 0.98
PRE_precomm 6.03 0.74
PRE_specific 5.88 0.88
PRE_timeline 5.80 0.89
INN_bleed 4.69 1.16
INN_embrace 5.87 0.81
INN_clever 5.48 0.95
INN_creativity 5.68 0.75
INN_better 6.16 0.70

192
REV_prob 6.06 0.79
REV_crit 6.37 0.67
REV_respect 5.41 1.04
REV_Int 5.30 1.05
REV_learn 5.41 0.91
REV_motivat 5.98 0.73
ENJ_fun 5.47 0.89
ENJ_laugh 5.25 1.00
ENJ_humor 5.67 0.88
ENJ_lunch 4.27 1.20
ENJ_variety 5.39 0.86
The Kaiser-Mayer-Olkin (KMO) test of sample adequacy was .84 where >.9 is
marvelous, >.8 is meritorious, >.7 is middling, and >.6 is mediocre. Bartlett’s Test of
Sphericity had an Approximate Chi-Square of 3831.516 with 496 degrees of freedom at a
significance of 0.000. A significance value < .05 shows that the data does not produce an
identity matrix and that the dataset is approximately multivariate normal and therefore
suitable for factor analysis. The complete correlation matrix is shown in Table 34.

193
Table 34. Correlation Matrix with all items
AUT_
burea
cracy
AUT_
freed
om
AUT_
flatte
r
AUT_
empo
wer
AUT_
acces
s
STR_
stand
ard
STR_
sticki
ng
STR_
defin
ed
STR_
enfor
ce
STR_
order
STR_
time
PRE_
words
PRE_
preco
mm
PRE_
timeli
ne
PRE_
specif
ic
PRE_
detail
AUT_bureacracy 1.00
AUT_freedom 0.26 1.00
AUT_flatter 0.34 0.18 1.00
AUT_empower 0.31 0.36 0.24 1.00
AUT_access 0.05 0.17 0.11 0.15 1.00
STR_standard -0.01 0.02 0.07 -0.02 0.09 1.00
STR_sticking 0.07 0.05 0.07 0.12 0.01 0.29 1.00
STR_defined 0.14 0.06 0.10 0.17 0.04 0.35 0.24 1.00
STR_enforce 0.04 0.05 0.02 -0.02 0.00 0.42 0.19 0.34 1.00
STR_order 0.06 0.17 0.09 0.11 0.05 0.28 0.22 0.37 0.41 1.00
STR_time 0.18 0.20 0.12 0.17 0.14 0.30 0.27 0.33 0.22 0.31 1.00
PRE_words 0.09 0.08 0.13 0.03 0.16 0.25 0.18 0.30 0.31 0.35 0.26 1.00
PRE_precomm 0.13 0.15 0.10 0.12 0.12 0.16 0.16 0.35 0.25 0.37 0.26 0.42 1.00
PRE_timeline 0.08 0.09 0.09 0.09 0.13 0.30 0.28 0.41 0.32 0.36 0.25 0.28 0.36 1.00
PRE_specific 0.15 0.14 0.17 0.13 0.16 0.25 0.23 0.40 0.19 0.31 0.25 0.28 0.35 0.45 1.00
PRE_detail 0.03 0.08 0.10 0.02 0.29 0.16 0.16 0.08 0.14 0.16 0.11 0.21 0.17 0.22 0.19 1.00
INN_bleed 0.01 0.15 0.13 0.13 0.16 0.23 0.10 0.19 0.13 0.30 0.19 0.24 0.17 0.22 0.24 0.26
INN_embrace 0.15 0.24 0.11 0.23 0.17 0.20 0.09 0.23 0.21 0.29 0.16 0.16 0.22 0.20 0.20 0.16
INN_clever 0.07 0.26 0.08 0.14 0.16 0.11 0.05 0.18 0.24 0.24 0.15 0.18 0.24 0.18 0.14 0.22
INN_creativity 0.12 0.31 0.14 0.26 0.19 0.03 0.06 0.15 0.16 0.24 0.12 0.23 0.25 0.21 0.15 0.13
INN_better 0.21 0.34 0.14 0.29 0.13 0.00 0.01 0.13 0.17 0.17 0.14 0.13 0.27 0.15 0.16 0.00
REV_respect 0.01 0.10 0.08 0.07 0.13 0.07 0.02 0.11 0.17 0.26 0.11 0.12 0.07 0.13 0.15 0.22
REV_Int 0.04 0.10 0.03 0.03 0.14 0.10 0.04 0.10 0.16 0.23 0.11 0.21 0.05 0.13 0.11 0.23
REV_learn 0.04 0.21 0.17 0.21 0.09 0.22 0.10 0.22 0.16 0.24 0.11 0.18 0.17 0.11 0.17 0.21
REV_crit 0.09 0.21 0.02 0.20 0.20 0.14 0.00 0.06 0.17 0.21 0.14 0.13 0.25 0.13 0.11 0.00
REV_motivat 0.02 0.25 0.04 0.19 0.15 0.15 0.05 0.12 0.16 0.25 0.21 0.16 0.20 0.16 0.19 0.11
REV_prob -0.03 0.09 0.00 0.00 0.20 0.16 0.12 0.03 0.19 0.18 0.20 0.17 0.16 0.16 0.05 0.17
ENJ_fun 0.19 0.33 0.16 0.35 0.08 0.01 0.09 0.25 0.04 0.10 0.24 0.13 0.12 0.09 0.15 0.01
ENJ_laugh 0.12 0.23 0.10 0.24 0.06 0.00 0.07 0.12 -0.02 0.05 0.13 0.12 0.03 0.07 0.11 0.03
ENJ_humor 0.10 0.31 0.08 0.25 0.10 0.03 0.10 0.14 0.00 0.12 0.15 0.10 0.09 0.05 0.12 -0.03
ENJ_lunch -0.02 0.07 0.10 0.10 0.05 0.00 0.10 0.13 -0.03 0.04 0.12 0.21 0.03 0.08 0.09 0.04
ENJ_variety 0.15 0.29 0.09 0.27 0.09 0.09 0.02 0.09 0.04 0.14 0.11 0.15 0.13 0.11 0.13 0.03

194
Table 34 (Continued). Correlation Matrix with all items
The correlation matrix gave an early indication that Structure and Precision were cross-
loading on each other. The initial EFA rotated factor matrix found 9 factors shown in
Table 35.
INN_
bleed
INN_
embr
ace
INN_
cleve
r
INN_
creati
vity
INN_
better
REV_
respe
ct
REV_
Int
REV_
learn
REV_
crit
REV_
motiv
at
REV_
prob
ENJ_
fun
ENJ_
laugh
ENJ_
humo
r
ENJ_
lunch
ENJ_
variet
y
AUT_bureacracy
AUT_freedom
AUT_flatter
AUT_empower
AUT_access
STR_standard
STR_sticking
STR_defined
STR_enforce
STR_order
STR_time
PRE_words
PRE_precomm
PRE_timeline
PRE_specific
PRE_detail
INN_bleed 1.00
INN_embrace 0.46 1.00
INN_clever 0.32 0.35 1.00
INN_creativity 0.19 0.27 0.34 1.00
INN_better 0.14 0.27 0.36 0.35 1.00
REV_respect 0.21 0.14 0.26 0.20 0.04 1.00
REV_Int 0.18 0.12 0.26 0.15 0.07 0.62 1.00
REV_learn 0.36 0.26 0.30 0.26 0.26 0.16 0.08 1.00
REV_crit 0.05 0.15 0.19 0.29 0.33 0.15 0.14 0.17 1.00
REV_motivat 0.22 0.23 0.21 0.27 0.31 0.13 0.10 0.42 0.29 1.00
REV_prob 0.14 0.16 0.15 0.17 0.10 0.15 0.18 0.13 0.23 0.19 1.00
ENJ_fun 0.19 0.16 0.21 0.23 0.20 0.04 -0.01 0.22 0.10 0.12 0.02 1.00
ENJ_laugh 0.15 0.12 0.09 0.16 0.06 0.05 0.02 0.10 0.00 -0.02 0.02 0.52 1.00
ENJ_humor 0.06 0.19 0.14 0.22 0.14 0.02 0.00 0.14 0.13 0.14 0.08 0.50 0.52 1.00
ENJ_lunch 0.14 0.06 0.12 0.14 0.05 0.04 0.01 0.12 0.01 0.12 0.04 0.32 0.34 0.21 1.00
ENJ_variety 0.14 0.07 0.15 0.19 0.23 0.11 0.09 0.20 0.08 0.22 -0.03 0.31 0.21 0.25 0.12 1.00

195
Table 35. Initial EFA rotated factor matrix
Factor
1 2 3 4 5 6 7 8 9
AUT_bureacracy 0.018 -0.082 -0.019 0.007 0.408 -0.025 -0.113 -0.021 0.033
AUT_freedom -0.065 0.027 0.114 0.008 0.156 0.004 0.004 0.020 0.066
AUT_flatter 0.009 -0.027 -0.074 -0.004 0.198 -0.004 0.025 0.054 -0.028
AUT_empower -0.042 0.015 0.035 -0.010 0.253 -0.030 0.056 -0.017 0.056
AUT_access -0.038 -0.001 0.043 -0.027 0.039 -0.034 -0.032 0.334 0.011
STR_standard 0.151 -0.037 -0.083 -0.030 -0.015 -0.018 0.101 0.004 0.410
STR_sticking 0.094 0.017 -0.066 -0.027 0.030 -0.041 -0.002 0.044 0.100
STR_defined 0.235 0.022 -0.083 -0.007 0.028 0.010 -0.005 -0.192 -0.041
STR_enforce 0.140 -0.054 0.085 0.035 -0.092 0.056 -0.074 -0.149 0.146
STR_order 0.144 -0.014 0.051 0.047 -0.045 0.028 -0.008 -0.108 0.017
STR_time 0.087 0.019 0.004 -0.017 0.052 -0.070 -0.025 0.059 0.146
PRE_detail 0.020 -0.031 -0.103 0.010 0.025 0.046 0.022 0.295 -0.043
PRE_words 0.135 0.045 0.001 0.000 -0.064 -0.051 -0.009 0.089 -0.135
PRE_precomm 0.200 -0.036 0.145 -0.073 -0.038 -0.043 -0.099 0.049 -0.261
PRE_specific 0.158 -0.017 -0.074 -0.022 0.088 -0.060 0.034 0.048 -0.120
PRE_timeline 0.184 -0.017 -0.018 -0.020 0.006 -0.038 -0.038 0.053 -0.072
INN_bleed -0.011 0.003 -0.161 -0.012 -0.020 0.345 0.129 0.094 -0.048
INN_embrace -0.045 -0.034 0.034 -0.066 0.032 0.456 -0.149 -0.010 0.092
INN_clever -0.025 0.010 0.085 0.039 -0.049 0.194 -0.027 -0.019 -0.078
INN_creativity -0.011 0.029 0.155 0.009 -0.016 0.030 -0.013 0.043 -0.099
INN_better -0.027 -0.051 0.274 -0.037 0.075 0.056 0.020 -0.109 -0.108
REV_prob -0.004 0.009 0.113 -0.014 -0.101 -0.017 -0.074 0.194 0.153
REV_crit -0.022 -0.023 0.275 -0.009 -0.044 -0.090 -0.034 0.045 0.089
REV_respect -0.036 0.002 -0.035 0.496 0.022 -0.033 0.041 -0.046 -0.021
REV_Int -0.018 -0.010 0.005 0.454 0.005 -0.049 -0.074 0.028 0.020
REV_learn -0.037 -0.013 -0.032 -0.014 -0.004 0.081 0.413 -0.026 0.007
REV_motivat -0.021 -0.006 0.150 -0.034 -0.065 -0.105 0.345 0.034 0.048
ENJ_fun 0.000 0.313 -0.017 -0.003 0.039 -0.018 0.037 -0.088 0.001
ENJ_laugh -0.011 0.404 -0.098 0.018 -0.061 0.026 -0.129 0.032 0.011
ENJ_humor -0.026 0.248 0.089 -0.014 -0.055 -0.029 -0.077 -0.016 0.117
ENJ_lunch 0.025 0.125 -0.050 -0.008 -0.070 -0.033 0.072 0.053 -0.091
ENJ_variety -0.006 0.051 0.015 0.028 0.053 -0.063 0.121 -0.052 -0.043
Extraction Method: Principal Axis Factoring. Rotation Method: Varimax w ith Kaiser Normalization.
Factor Score Coefficient Matrix

196
Items with loadings under .4 were dropped one at a time in order to purify the
instrument as per Churchill (1979) and Nunnally (1978) until there was a solution with
high loadings of items on the appropriate constructs and low cross-loadings on other
constructs. The refined exploratory factor analysis with the lowest items eliminated
showed only five factors, not six as predicted by the ASPIRE model in Part 1. The
rotated factor matrix clearly showed that structure and precision were loading on each
other. The decision was made to allow Structure and Precision to be represented as a
single factor representing one underlying latent variable (to be interpreted in the
Discussion below). This may indicate that the instrument itself will need further
adjustment in the future in order to effectively separate Structure from Precision. The
updated rotated factor matrix with five factors is shown in Table 36. While two of the
Autonomy items did correlate highly with Innovation items, the decision was made to
keep them with their respective constructs.

197
Table 36. Refined Rotated Factor Matrix
Reliability scores were measured using Cronbach alphas and are shown in Table 37.
Internal consistency or reliability refers to the homogeneity of the items that comprise a
scale and should correlate well with each other if they share a common latent variable
(DeVellis, 1991). Cronbach alpha scores of .90 are considered excellent, .80 are good, .70
are reasonable and .6 are questionable. While the reliability of the Autonomy items was
lower than would be desired, the weight of evidence from Part I that the items are
1 2 3 4 5
AUT_bureacracy 0.08 0.04 0.11 -0.01 0.62
AUT_flatter 0.11 0.07 0.06 0.04 0.45
AUT_empower 0.02 0.25 0.30 0.00 0.47
AUT_freedom 0.01 0.24 0.45 0.05 0.33
STR_defined 0.62 0.16 0.04 0.02 0.12
STR_enforce 0.50 -0.07 0.19 0.11 -0.09
STR_order 0.57 0.03 0.22 0.19 0.01
PRE_words 0.52 0.12 0.11 0.10 0.00
PRE_precomm 0.57 0.01 0.25 -0.05 0.08
PRE_specific 0.56 0.09 0.02 0.05 0.22
PRE_timeline 0.62 0.03 0.07 0.05 0.08
INN_clever 0.21 0.10 0.56 0.22 -0.03
INN_creativity 0.20 0.17 0.48 0.12 0.11
INN_better 0.14 0.02 0.60 -0.05 0.21
INN_embrace 0.26 0.10 0.40 0.08 0.12
REV_respect 0.14 0.02 0.10 0.79 0.03
REV_Int 0.14 -0.02 0.11 0.74 0.01
ENJ_fun 0.09 0.68 0.20 -0.04 0.21
ENJ_laugh 0.02 0.76 0.03 0.03 0.11
ENJ_humor 0.04 0.63 0.20 -0.02 0.10
ENJ_lunch 0.10 0.43 0.02 0.02 -0.02
Extraction Method: Principal Axis Factoring. Rotation Method: Varimax with Kaiser Normalization.
a. Rotation converged in 6 iterations.
Rotated Factor Matrix
Factor
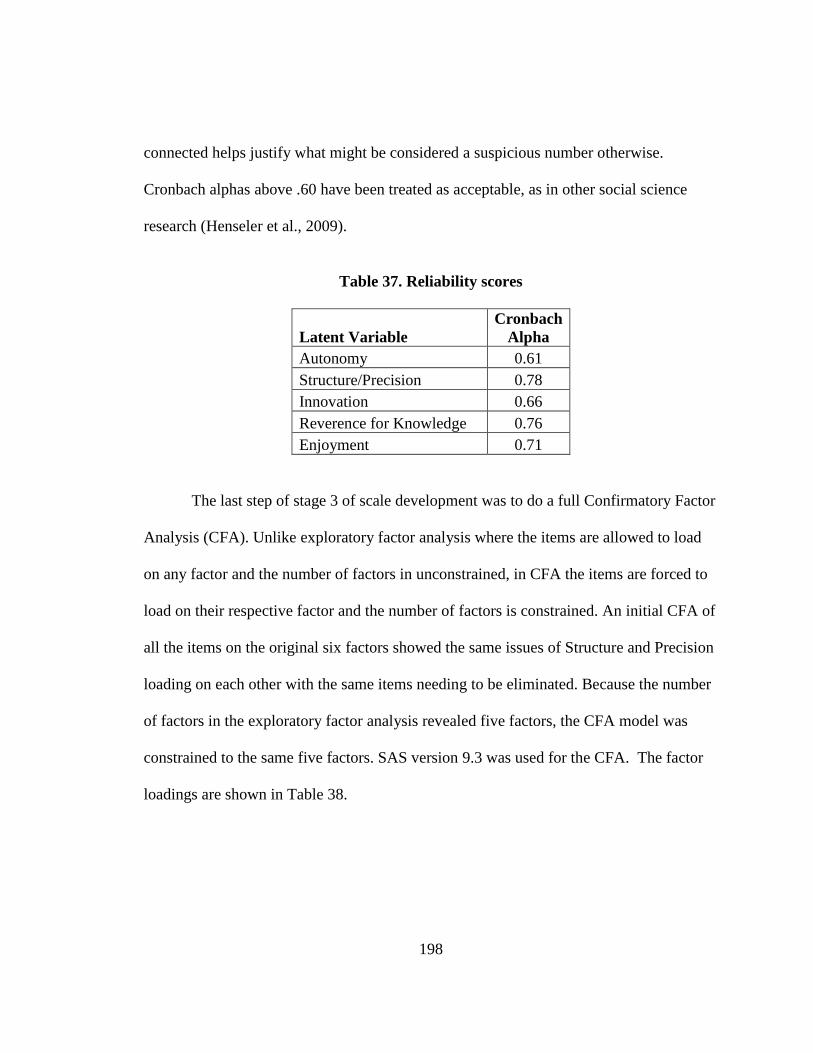
198
connected helps justify what might be considered a suspicious number otherwise.
Cronbach alphas above .60 have been treated as acceptable, as in other social science
research (Henseler et al., 2009).
Table 37. Reliability scores
Latent Variable
Cronbach
Alpha
Autonomy 0.61
Structure/Precision 0.78
Innovation 0.66
Reverence for Knowledge 0.76
Enjoyment 0.71
The last step of stage 3 of scale development was to do a full Confirmatory Factor
Analysis (CFA). Unlike exploratory factor analysis where the items are allowed to load
on any factor and the number of factors in unconstrained, in CFA the items are forced to
load on their respective factor and the number of factors is constrained. An initial CFA of
all the items on the original six factors showed the same issues of Structure and Precision
loading on each other with the same items needing to be eliminated. Because the number
of factors in the exploratory factor analysis revealed five factors, the CFA model was
constrained to the same five factors. SAS version 9.3 was used for the CFA. The factor
loadings are shown in Table 38.

199
Table 38. CFA factor loadings
Factor
1
Factor
2
Factor
3
Factor
4
Factor
5
AUT_bureacracy 0.448
AUT_freedom 0.634
AUT_flatter 0.366
AUT_empower 0.617
STR_defined 0.615
STR_enforce 0.518
STR_order 0.632
PRE_words 0.546
PRE_precomm 0.600
PRE_specific 0.566
PRE_timeline 0.617
INN_embrace 0.532
INN_clever 0.591
INN_creativity 0.589
INN_better 0.567
REV_respect 0.794
REV_Int 0.777
ENJ_fun 0.759
ENJ_laugh 0.708
ENJ_humor 0.677
ENJ_lunch 0.400
Except for one Autonomy item, the loadings were above the generally accepted cutoff of
0.4 (Hulland, 1999). Cronbach alpha scores for reliability were calculated again in SAS
with the same results as reported for the EFA in SPSS.
There are several measures of goodness of fit for evaluating the degree of
correspondence between concepts and their respective item measures (Smith et al., 1996).
The overall adequacy of fit tests in SAS showed a GFI (Goodness-of-Fit Index) of .931,

200
an RMSR (Root Mean Square Residual) of .049 and an RMSEA of .047. There are no
hard-and-fast rules for GFI cutoffs, but greater than .90 is generally acceptable (Hatcher,
1994). On the other hand, both the RMSR and RMSEA goodness of fit tests were under
the generally accepted cutoff of 0.05 (Kline, 2005), which indicates that the five factor
model shows good adequacy of fit.
Convergent validity refers to the degree to which multiple measures of a
construct agree with each other (Campbell & Fiske, 1959). Convergent validity can be
demonstrated by examining the t values of the factor loadings (Smith et al., 1996;
Hatcher, 1994) to see if they are significant. If all t tests are significant, then this shows
that all the indicators are effectively measuring the same construct (Anderson & Gerbing,
1988). Table 39 shows that all t values for the factor loadings are above the critical value
of 3.29 for p=0.001 (Hatcher, 1994).
Table 39. t values for convergent validity
AUT_bureacracy 9.68
AUT_freedom 15.66
AUT_flatter 7.51
AUT_empower 15.09
STR_defined 17.59
STR_enforce 13.16
STR_order 18.51
PRE_words 14.30
PRE_precomm 16.85
PRE_specific 15.20
PRE_timeline 17.70
INN_embrace 12.78
INN_clever 15.04

201
INN_creativity 14.94
INN_better 14.11
REV_respect 13.37
REV_Int 13.26
ENJ_fun 25.00
ENJ_laugh 22.07
ENJ_humor 20.39
ENJ_lunch 8.97
Discriminant validity refers to the degree to which measures of different
constructs are distinct from each other (Campbell & Fiske, 1959). One way to determine
discriminant validity is to examine the correlation table and count the number of
violations where a violation is an item loading higher on another construct other than the
one intended. Table 40 shows the correlation table for the final survey items with a
violation count at the bottom and on the left. Only fifteen out of 210 possible correlations
were higher for items measuring a different variable. Because the total number of
correlations is above the generally accepted cutoff of 50% (Doll & Torkzadeh, 1988),
there is evidence of reasonable discriminant validity.
Table 40. Correlations for discriminant validity
Viola
tion
count
AUT
_bure
acrac
y
AUT
_free
dom
AUT
_flatt
er
AUT
_emp
ower
STR_
define
d
STR_
enfor
ce
STR_
order
PRE_
words
PRE_
preco
mm
PRE_
specif
ic
AUT
_bure
acrac
y 0
1.000
AUT
_free
dom 0
0.263 1.000

202
AUT
_flatt
er 0
0.330 0.198 1.000
AUT
_emp
ower 0
0.303 0.371 0.229 1.000
STR_
define
d 0
0.135 0.059 0.088 0.142 1.000
STR_
enfor
ce 0
0.012 0.047 -
0.004
-
0.022 0.299 1.000
STR_
order 0 0.044 0.160 0.090 0.113 0.363 0.409 1.000
PRE_
words 0 0.087 0.087 0.117 0.014 0.285 0.319 0.338 1.000
PRE_
preco
mm 0
0.144 0.143 0.124 0.106 0.324 0.233 0.351 0.450 1.000
PRE_
specif
ic 0
0.130 0.164 0.152 0.087 0.383 0.164 0.273 0.282 0.360 1.000
PRE_
timeli
ne 0
0.062 0.066 0.105 0.102 0.406 0.292 0.342 0.311 0.346 0.461
INN_
embra
ce 0
0.157 0.244 0.119 0.270 0.244 0.221 0.309 0.170 0.240 0.212
INN_
clever 0 0.062 0.278 0.112 0.158 0.197 0.220 0.245 0.209 0.241 0.150
INN_
creati
vity 3
0.126 0.295 0.194 0.256 0.154 0.139 0.252 0.237 0.240 0.130
INN_
better 2 0.179 0.328 0.150 0.313 0.142 0.172 0.186 0.153 0.284 0.208
REV_
respe
ct 0
-
0.017 0.091 0.077 0.039 0.133 0.171 0.271 0.141 0.082 0.164
REV_
Int 0 0.044 0.103 0.032 0.027 0.127 0.155 0.218 0.198 0.064 0.135
ENJ_
fun 0 0.186 0.315 0.123 0.333 0.262 0.043 0.080 0.140 0.094 0.185
ENJ_l
augh 0 0.127 0.209 0.091 0.215 0.128
-
0.021 0.063 0.127 0.041 0.118
ENJ_
humo
r 0
0.113 0.287 0.061 0.245 0.124 0.024 0.129 0.101 0.082 0.115

203
ENJ_l
unch 0
-
0.021 0.036 0.098 0.061 0.166
-
0.016 0.073 0.227 0.061 0.119
Viola
tion
count 0 7 0 0 0 2 1 0 0 0
Table 40. Correlations for discriminant validity (continued)
Viola
tion
count
PRE_
timeli
ne
INN_
embra
ce
INN_
clever
INN_
creati
vity
INN_
better
REV_
respe
ct
REV_
Int
ENJ_
fun
ENJ_l
augh
ENJ_
humo
r
PRE_
timeli
ne 0
1.000
INN_
embra
ce 0
0.205 1.000
INN_
clever 0 0.175 0.336 1.000
INN_
creati
vity 3
0.200 0.226 0.301 1.000
INN_
better 2 0.184 0.280 0.371 0.383 1.000
REV_
respe
ct 0
0.133 0.156 0.178 0.180 0.007 1.000
REV_
Int 0 0.127 0.151 0.205 0.106 0.079 0.605 1.000
ENJ_
fun 0 0.119 0.140 0.201 0.245 0.206 0.025 0.027 1.000
ENJ_l
augh 0 0.088 0.100 0.065 0.120 0.075 0.057 0.044 0.510 1.000
ENJ_
humo
r 0
0.062 0.180 0.168 0.229 0.163 0.005 0.038 0.491 0.494 1.000
ENJ_l
unch 0 0.118 0.047 0.117 0.133 0.065 0.031 0.019 0.320 0.297 0.189
Viola
tion
count 0 0 0 0 0 0 0 0 0 0

204
Discriminant validity can also be demonstrated by a confidence interval test
(Anderson & Gerbing, 1988). If a confidence interval of plus or minus two standard
errors around the correlation between two different factors does not include 1.0, then
discriminant validity has been effectively demonstrated (Hatcher, 1994). Because one
correlation, between Factor 4 and Factor 5, does include 1.0 in its confidence interval as
shown in Table 41, there may be a significant correlation in this relationship. However,
since Factor 4 is Reverence for Knowledge and Factor 5 is Enjoyment, the theoretical
discrimination between the two constructs should be reasonably clear. Yet it is an
interesting result that these two factors may be correlated. All of the other pairs of
correlations show good discriminant validity.
Table 41. Standardized correlations between variables
Standardized Results for Correlations Among Exogenous
Variables lower
boundary
of
confidence
interval
upper
boundary of
confidence
interval Var1 Var2 Parameter Estimate Standard t Value
Error
F1 F2 COVF1F2 0.308 0.061 5.053
0.186 0.430 F1 F3 COVF1F3 0.680 0.053 12.617
0.572 0.788 F1 F4 COVF1F4 0.146 0.065 2.247
0.016 0.276 F1 F5 COVF1F5 0.580 0.052 11.103
0.476 0.685 F2 F3 COVF2F3 0.583 0.049 11.812
0.484 0.681

205
F2 F4 COVF2F4 0.313 0.054 5.729
0.203 0.422 F2 F5 COVF2F5 0.238 0.056 4.256
0.126 0.350 F3 F4 COVF3F4 0.351 0.059 5.935
0.233 0.470 F3 F5 COVF3F5 0.397 0.057 6.914
0.282 0.512 F4 F5 COVF4F5 0.040 0.059 0.688
-0.077 0.159
These results offer an answer to the first research question in terms of what are
the measureable values of ITOC. Five factors, namely Autonomy, Structure/Precision,
Innovation, Reverence for Knowledge, and Enjoyment, are measureable with good
construct validity and acceptable reliability and these are the ones used in the remaining
analysis.
5.3.5 Norms
The final step of analysis in Part II is to look at potential norms (Churchill, 1979).
An index was created for each of the five latent variables using a sum of the items. In
order to visually inspect for normality, histograms were created for each latent variable.
Histograms are a common method of checking visually for a normal distribution curve
shape. Figures 20 through 24 show the histograms for the five latent variables.

206
Figure 20 – Normality histogram for Autonomy

207
Figure 21 – Normality histogram for Structure/Precision
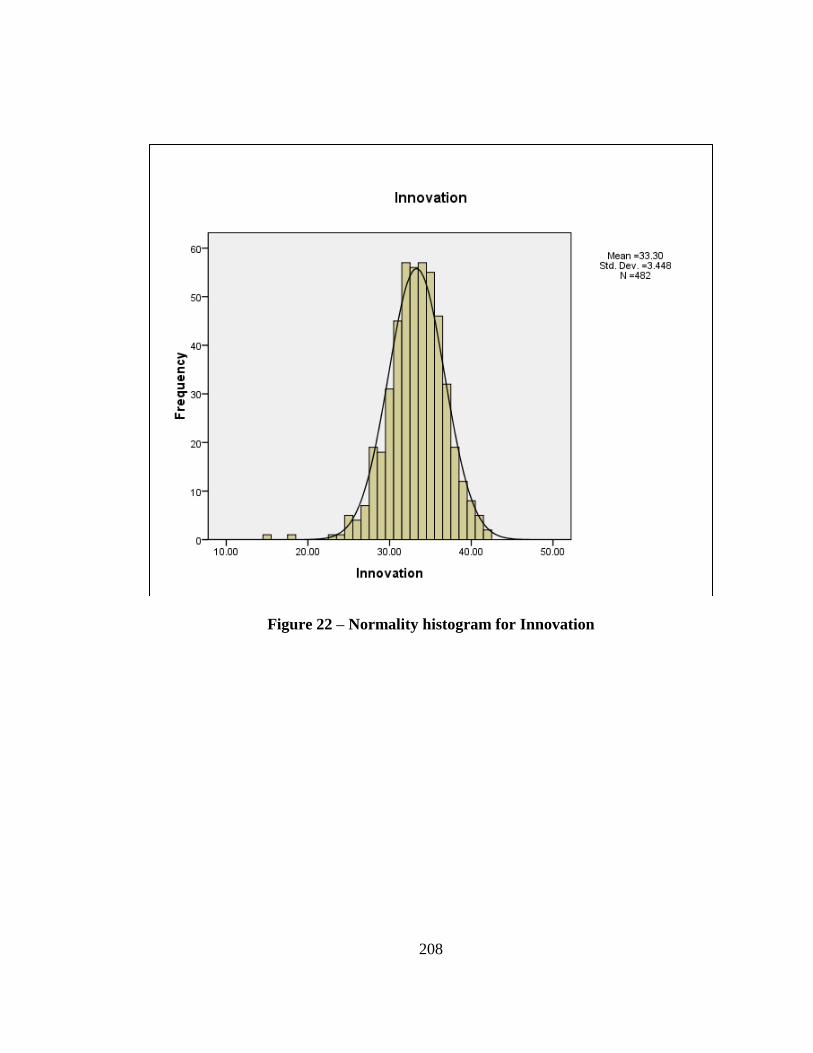
208
Figure 22 – Normality histogram for Innovation

209
Figure 23 – Normality histogram for Reverence for Knowledge

210
Figure 24 – Normality histogram for Enjoyment
All five variables showed good normality and the results of the descriptive statistics are
shown in Table 42. Normality allows for parametric tests of interval scales.
Table 42. Descriptive statistics for all values
Descriptive Statistics
N=482
Minimum Maximum Mean Std.
Deviation
Variance
BUS_effective 1 7 5.948 0.867 0.751
BUS_morale 1 7 6.076 0.879 0.773
BUS_reputation 1 7 5.840 0.985 0.970

211
BUS_efficiency 1 7 5.991 0.833 0.694
BUS_productivity 1 7 6.024 0.817 0.668
BUS_stability 1 7 5.977 0.944 0.891
BUS_growth 1 7 5.715 1.019 1.039
BUS_community 1 7 5.419 1.170 1.370
BUS_profit 1 7 5.651 1.142 1.304
BUS_service 1 7 5.381 1.253 1.571
Innovation 15 42 33.300 3.447 11.886
Autonomy 10 28 22.294 2.465 6.079
Str_Pre 22 70 56.056 5.721 32.739
Reverence 2 14 10.707 1.870 3.500
Enjoyment 4 28 20.651 2.927 8.568
A MANOVA analysis (multivariate analysis of variance) can show if there are
significant differences when there are multiple independent variables and multiple
dependent variables (Bryman & Cramer, 2001). A MANOVA was run in SPSS to
determine if there were significant differences between the IT employee responses and
the non-IT manager responses, once for the ITOC values and once for the business
management values. The results are shown in Table 43 and Table 44.
Table 43. MANOVA results for ITOC values
Multivariate
Tests
Effect
Value F Hypothesis
df
Error
df
Sig.
Intercept Pillai's Trace 0.995 14031.704 5 386 0
Wilks' Lambda 0.005 14031.704 5 386 0
Hotelling's Trace 181.758 14031.704 5 386 0
Roy's Largest Root 181.758 14031.704 5 386 0
new_role_code Pillai's Trace 0.059 4.852 5 386 0.0003
Wilks' Lambda 0.941 4.852 5 386 0.0003
Hotelling's Trace 0.063 4.852 5 386 0.0003
Roy's Largest Root 0.063 4.852 5 386 0.0003

212
Table 44. MANOVA results for business management values
Multivariate
Tests
Effect
Value F Hypothesis
df
Error
df
Sig.
Intercept Pillai's Trace 0.988 3020.679 10 381 0
Wilks' Lambda 0.012 3020.679 10 381 0
Hotelling's Trace 79.283 3020.679 10 381 0
Roy's Largest Root 79.283 3020.679 10 381 0
new_role_code Pillai's Trace 0.071 2.909 10 381 0.002
Wilks' Lambda 0.929 2.909 10 381 0.002
Hotelling's Trace 0.076 2.909 10 381 0.002
Roy's Largest Root 0.076 2.909 10 381 0.002
The results indicated that there was indeed an overall significant difference
(p<0.00) between the two groups. Additional tests were done to determine which specific
dimensions were significantly different.
A t-test is a common way of comparing the means of two unrelated groups with
normal distributions to see if the means are significantly different or not (Bryman &
Cramer, 2001). The two groups, the IT employees in Group 1 and the business managers
in Group 2, were compared using t-tests in SPSS to see if there were any significant
differences between the occupational groups. The initial group statistics and independent
samples tests showed no differences except for Autonomy which the business managers
scored higher.
When the data was examined to see why there were no differences between the
two occupational groups, it was discovered that many of the respondents in Group 1 who
had self-identified as IT were, in fact, IT managers who had should have been coded
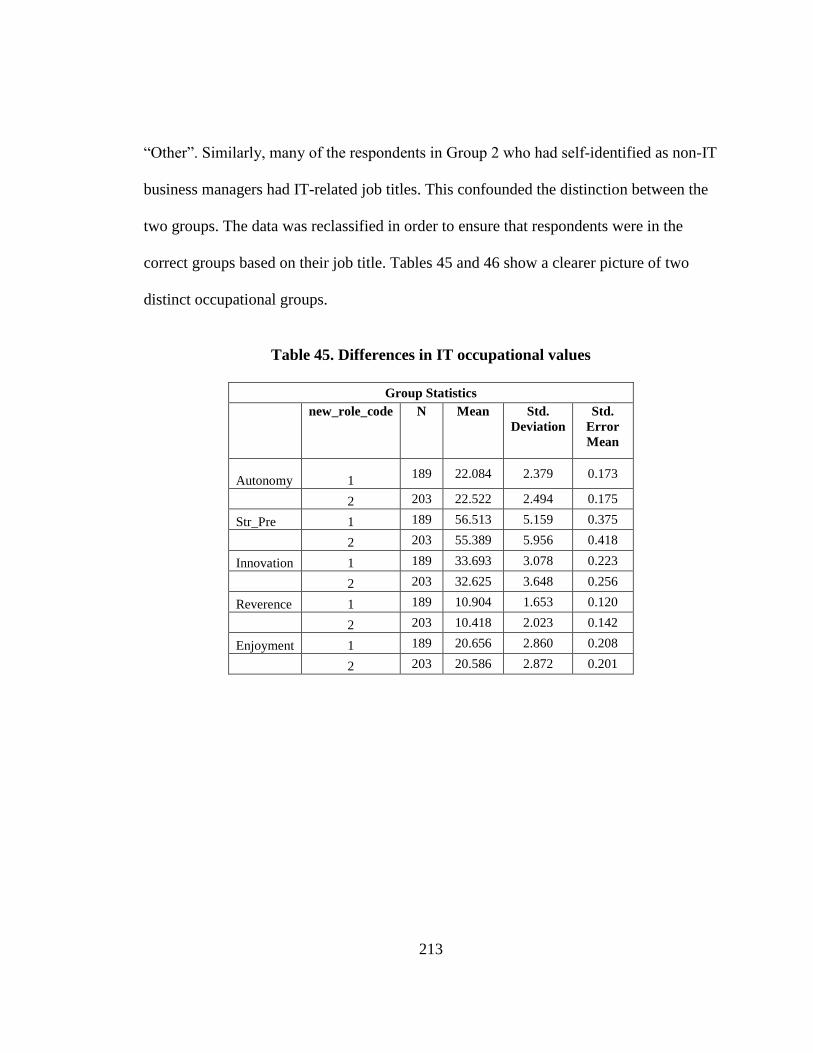
213
“Other”. Similarly, many of the respondents in Group 2 who had self-identified as non-IT
business managers had IT-related job titles. This confounded the distinction between the
two groups. The data was reclassified in order to ensure that respondents were in the
correct groups based on their job title. Tables 45 and 46 show a clearer picture of two
distinct occupational groups.
Table 45. Differences in IT occupational values
Group Statistics
new_role_code N Mean Std.
Deviation
Std.
Error
Mean
Autonomy 1 189 22.084 2.379 0.173
2 203 22.522 2.494 0.175
Str_Pre 1 189 56.513 5.159 0.375
2 203 55.389 5.956 0.418
Innovation 1 189 33.693 3.078 0.223
2 203 32.625 3.648 0.256
Reverence 1 189 10.904 1.653 0.120
2 203 10.418 2.023 0.142
Enjoyment 1 189 20.656 2.860 0.208
2 203 20.586 2.872 0.201

214
Table 46. Significance of differences in IT occupational values
t-test
for
Equality
of
Means
df Sig.
(2-
tailed)
Mean
Difference
Std. Error
Difference
95%
Confidence
Interval of the
Difference
Lower Upper
Innovation 3.119 390 0.002 1.068 0.342 0.395 1.740
Autonomy -1.774 390 0.077 -0.438 0.247 -0.922 0.047
Structure/Precision 1.991 390 0.047 1.124 0.565 0.014 2.234
Reverence 2.592 390 0.010 0.486 0.187 0.117 0.855
Enjoyment 0.241 390 0.810 0.070 0.290 -0.500 0.640
The results of the means comparison show that three values, Structure/Precision,
Innovation, and Reverence for Knowledge were significantly different, while Autonomy
and Enjoyment showed no significant differences. So there is partial support for
Hypothesis 1 with regards to three of the five variables being significantly different
between occupational groups. Because Structure/Precision, Innovation, and Reverence
for Knowledge were all significantly higher for the IT employees than the business
managers, there is partial support for Hypothesis 2 that the IT employees would rank the
ASPIRE values higher. For Hypothesis 3, responses between the same two reclassified
groups were compared on business management values. The results are shown in Tables
47 and 48.

215
Table 47. Differences in business management values
Group Statistics
new_role_code N Mean Std.
Deviation
Std.
Error
Mean
BUS_effective 1 189 5.735 0.907 0.066
2 203 6.084 0.837 0.059
BUS_morale 1 189 5.942 0.876 0.064
2 203 6.182 0.868 0.061
BUS_reputation 1 189 5.640 1.035 0.075
2 203 6.015 0.936 0.066
BUS_efficiency 1 189 5.868 0.892 0.065
2 203 6.084 0.825 0.058
BUS_productivity 1 189 5.937 0.776 0.056
2 203 6.094 0.899 0.063
BUS_stability 1 189 5.952 1.007 0.073
2 203 6.039 0.927 0.065
BUS_growth 1 189 5.656 1.012 0.074
2 203 5.754 1.057 0.074
BUS_community 1 189 5.339 1.149 0.084
2 203 5.517 1.140 0.080
BUS_profit 1 189 5.471 1.218 0.089
2 203 5.847 1.104 0.077
BUS_service 1 189 5.333 1.296 0.094
2 203 5.478 1.175 0.082
Table 48. Significance of differences in business management values
t-test for
Equality
of Means
df Sig.
(2-
tailed)
Mean
Difference
Std. Error
Difference
95% Confidence
Interval of the
Difference
Lower Upper
BUS_effective -3.953 390 0.000 -0.348 0.088 -0.522
-
0.175
BUS_morale -2.728 390 0.007 -0.240 0.088 -0.414
-
0.067
BUS_reputation -3.762 390 0.000 -0.375 0.100 -0.570
-
0.179
BUS_efficiency -2.490 390 0.013 -0.216 0.087 -0.387 -

216
0.045
BUS_productivity -1.846 390 0.066 -0.157 0.085 -0.324 0.010
BUS_stability -0.891 390 0.374 -0.087 0.098 -0.279 0.105
BUS_growth -0.932 390 0.352 -0.098 0.105 -0.303 0.108
BUS_community -1.544 390 0.123 -0.179 0.116 -0.406 0.049
BUS_profit -3.208 390 0.001 -0.376 0.117 -0.607
-
0.146
BUS_service -1.158 390 0.248 -0.144 0.125 -0.390 0.101
The business managers scored all ten business values higher, and 5 out of the 10
values were significantly higher. These included Organizational Effectiveness,
Organizational Morale, Organizational Reputation, Organizational Efficiency, and
Organizational Profitability. Therefore, there is fairly strong support for Hypothesis 3 that
business managers will score business values higher than IT employees.
5.3.6 Discussion
The finding that the occupational values of Structure and Precision correlated
highly is not entirely surprising for two reasons. First, as was shown in the interviews, all
of the IT occupational values are interconnected and therefore a certain amount of
statistical correlation is to be expected. Second, there is an intuitive sense that the values
of Structure and Precision will correlate. A strong preference for precision in
communication is perhaps related to a kind of precision in action that reflects Structure.
This does not invalidate the findings of Part I that Structure and Precision are separate
areas because the qualitative evidence separating the two is still strong. Further
refinement of the instrument may be necessary. But clearly the five-factor model showed
better construct validity than the original six-factor model when analyzed. It is possible to

217
speculate that given the high correlation there is a higher order factor that is driving both
occupational values. Perhaps it is an overarching need for rationality or understandability
that influences both.
Another troublesome area was in the low reliability in some variables, especially
the Autonomy variable. Given that the reliabilities from the pilot instrument were so
high, this was a surprise. This result may have been due to the fact that the questions in
the pilot were not randomized, i.e., all of the Enjoyment questions were asked on the
same page. In the full study, all of the questions were fully randomized which may have
driven reliability downwards. Future improvements in the instrument will help with the
reliability of the Autonomy measurement.
One might make the objection that everybody obviously wants Autonomy at work
and therefore this is not an important aspect of occupational culture. However, there are
several answers to this. First, it is a matter of degree. The IT professionals continually
came back to the idea of wanting less bureaucracy and more freedom at work in the Part I
interviews. This is not to say that Autonomy is not important for other occupations, but it
seems especially important for IT employees. Second, if managers readily understood the
importance of autonomy in the workplace then why is micromanaging still such a
frequent and vehement complaint of IT employees? Despite the low statistical reliability,
there is still ample evidence that this is a core value for the IT occupation.
Overall, the results successfully demonstrated differences in values between the
two occupations. What is remarkable about the results is that the three IT variables with
significant differences were Reverence for Knowledge, Structure, and Innovation. Recall

218
that these three were identified in Part I as the sacred values of IT and labeled as the
Promethean virtues. The Part II results, therefore, lent unexpected weight to the
interpretation in Part I. In light of the sacred/profane interpretation in Part I, it is not
surprising that significant differences in the profane values of Autonomy and Enjoyment
were not found between the two occupational groups.
With regard to the differences in business management values between the two
groups, it was certainly expected that business managers would rank these higher. The
specific values of Organizational effectiveness, Morale, Organizational reputation,
Organizational efficiency, and Organizational profitability that were shown to be
significantly different provide some guidance on the important areas where IT employees
and business managers diverge. While it would be ideal to have an explanatory theory
that explained why these particular business management values were significantly
different, it is nonetheless helpful for practitioners to have a predictive model that
indicates what areas to focus on first. This is more helpful than the familiar platitude of
“IT needs to understand the business better” because there are specific areas that should
be considered further based on the Part II results.
In general, if business managers care about organizational success more than IT
employees do, this can potentially lead to a mismatch of priorities ultimately resulting in
poor IT/Business alignment and poor organizational outcomes. Similarly, if business
managers do not understand what is truly important for IT personnel, i.e., the Promethean
virtues, then this can exacerbate the cultural gap between the two occupational groups

219
and further impede alignment. Measuring this occupational cultural distance and its
impact on organizational outcomes is addressed fully in Part III.
220
CHAPTER VI
PART III – IMPACT OF ITOC
6.1 Part III Research Objective
The research objective of Part III was to ascertain the impact of IT occupational
culture on organizational outcomes. Specifically, the outcome of IT/Business alignment
is an issue that has relevance to IT occupational culture but this relationship has not been
empirically demonstrated in the literature yet.
Based on the literature above, Part III asks the research question: What is the
impact of occupational culture differences on IT/business alignment and IT value?
6.1.1 Independent Variable: Occupational Cultural Distance
The independent variable is not just occupational culture itself, but differences in
occupational culture. These differences can be examined by comparing responses to the
value statements in Part II between IT professionals and business managers for different
organizations. The differences in mean responses along each dimension can be
aggregated into a single cultural distance number. Where Kogut & Singh (1988) and
Sarala (2010) used aggregated distance for national culture, to date this has not been done
for occupational culture. Based on Leidner & Kayworth’s (2006) Theory of IT-Culture
Conflict, the more that values differ between two groups, the more cultural conflict will
result. This study proposes that, based on the cultural antecedents of alignment (Reich &

221
Benbasat, 2000; Farrell, 2003; Chan & Reich, 2007) and the Theory of IT-Culture
Conflict (Leidner& Kayworth, 2006), that as the distance between two occupational
cultures increases, the level of IT/Business alignment within an organization will
decrease. As values become more out of alignment, so too should actual alignment
deteriorate. Therefore, the relationship between cultural distance and IT/Business
alignment should be negative. Leidner & Kayworth (2006) say explicitly that there is
very little research devoted to examining the role of culture and its impact on achieving
IT/Business alignment. This study proposes to reframe the discussion of IT/Business
alignment in a novel way, previously unexamined in the literature.
H1: Occupational cultural distance will have a negative relationship with
IT/Business alignment.
6.1.2 Independent Variable: IT Organizational structure
For comparison purposes, the study will also include a more traditional antecedent
of IT/Business Alignment: IT organizational structure. Organizational structure of IT is a
common factor examined in the alignment literature in terms of whether the IT group is
1) centralized, 2) decentralized or 3) federated (Chan & Reich, 2007; Luftman, 2000;
Papp & Brier, 1999; Pankratz, 1991). Federated IT organizational structures tend to be
highly correlated with higher IT/Business Alignment maturity (Luftman & Ben-Zvi,
2010). A highly centralized IT organizational structure is characterized by co-located
infrastructure and application support, typically in a corporate headquarters. A highly
decentralized IT organizational structure is characterized by infrastructure and

222
application support being distributed to separate geographic locations, typically to
different business units. Finally, a federated IT organizational structure is a combination
of centralized and decentralized such that the infrastructure is centralized but application
support is decentralized. There is a relationship between IT organizational structure and
alignment in that organizations with a federated IT have shown significantly higher
alignment than those with highly centralized or decentralized structures (Luftman &
Kempaiah, 2007). Therefore, it is expected that federated IT organizations will show
higher perceived levels of IT/Business Alignment, confirming past findings.
H2: Federated organizational structures will have a positive relationship with
IT/Business alignment.
6.1.3 Mediating Variable: IT/Business Alignment
IT/Business Alignment typically refers to the level of fit between the IT strategy
and the business strategy (Tallon, 2007/2008) where strategy includes the mission,
objectives, and plans for the organization (Reich & Benbasat 1996). The strategic
necessity of having IT closely aligned with the business has been a top concern for
business and IT executives (Luftman & Kempaiah, 2008; Luftman & Ben-Zvi, 2010)
because the greater the alignment, the greater the business value from IT in terms of firm
performance (Tallon, 2007/2008; Chan et al., 2006). Furthermore, alignment between the
firm’s strategy, organizational structure, and information technology is the key to
competing successfully on a global level (Pankratz, 1991). Because IT/Business
alignment leads to increased profits for an organization and is significantly correlated

223
with perceived business performance (Chan & Reich, 2007), IT/Business Alignment
mediates the relationship between Occupational Cultural Distance and IT Value.
6.1.4 Dependent Variable: IT Value
As indicated above, it has previously been shown that IT Value increases when
IT/Business Alignment increases based on Tallon (2007/2008) and Luftman (2000).
“Whilst managers are keen to address ‘soft’ people issues by introducing intervention
programs such as personal and career development, participative management, team-
building, etc., these areas may only be regarded as worthy of attention if they can be
shown to make a significant and measurable difference [emphasis in original] to the
performance of the organization itself” (Brewerton & Milward, 2001, p. 135). Adding
value to the business is what is ultimately important. IT value is typically characterized as
IT contributing business value either through increased productivity, increased
profitability, or increasing intangible benefits (Jacks et al., 2011). Venkatraman &
Ramanuiam (1987) found that executive perceptions of firm performance are highly
correlated with actual financial performance. Furthermore, top managers can serve as
reliable key informants for an entire organization (Lubatkin et al., 1998). This means that
gathering perceptions of IT/Business Alignment and IT Value from executives of firms
should be a reasonable proxy for actual IT Value and actual IT/Business Alignment. As
IT/Business Alignment increases, overall IT value should also increase.
H3: IT/Business Alignment will have a positive relationship with IT value.

224
Furthermore, because cultural values directly affect individual behavior
(Karahanna et al., 2005; Swidler, 1986), there may be a direct relationship between
occupational cultural distance and IT value that is not mediated by IT/Business
alignment. National cultural values have previously been shown to directly affect
organizational outcomes (Li et al., 2001; Leidner & Kayworth, 2006). Also, national
cultural distance has been shown to directly impact business decisions such as mode of
entry into a new market (Brouthers & Brouthers, 2001; Tihanyi et al., 2005). It seems
reasonable, therefore, to assert that occupational cultural distance will also have a direct
effect on IT Value. This relationship would be further evidence of the measurable
benefits of minimizing occupational cultural distance as much as possible.
H4: Occupational cultural distance will have a negative relationship with IT
value.
6.1.5 Control Variables
Control variables will include the size of each organization measured by number of
employees, age of the organization, industry type, and the CIO reporting structure.
6.1.6 Part III Research Model
The research design of Part III will answer the research question of what is the impact
of IT occupational values on IT/business alignment and IT value. The research model for
Part III fits into the overall research model as shown below in Figure 25.

225
Figure 25 – Research Model for Part III
6.2 Part III Methodology
Part III of this study used the same data as Part II to measure Occupational
Cultural Distance but included an additional step. An executive for each organization,
typically their CIO, completed an executive survey that measured the organization’s
actual level of IT/Business Alignment and IT Value. Combining the two sets of data
addresses the relationships between occupational cultural distance and IT/business
alignment and IT value. Because IT/Business alignment or lack thereof manifests itself in
inter-department relationships within an organization, the level of analysis changes in

226
Part III to the organizational level in order to answer the research question of What is the
impact of occupational cultural distance on IT/business alignment and IT value?
6.2.1 Occupational Cultural Distance
Occupational Cultural Distance refers to the mathematical distance of aggregated
cultural variables between occupations in order to measure their differences, or literally
how far apart they are from one another. Distance measures have been used before in
cultural research. Kogut & Singh (1988) developed a method of aggregating Hofstede’s
national cultural dimensions into a composite number for comparison purposes where
cultural distance was a measure of national culture. While their measure demonstrates the
usefulness of examining overall cultural distance as a construct in cultural research, this
particular method is not suited to occupational culture as every country’s culture was
measured as the distance from that of the United States. Kogut and Singh’s approach has
also been critiqued as not being intuitively meaningful and difficult to interpret (Evans &
Mavondo, 2001). The overall approach is still appropriate and the idea of measuring
cultural distance is very popular in International Business studies (Evans & Mavondo,
2001). To date, aggregate cultural distance has not been examined at the level of
occupational culture.
A simple way to measure this distance is through profile analysis. Profile analysis
is used to see how similar or dissimilar two profiles are from one another. Nunnally &
Bernstein (1994) say that one possible measure of distance between profiles is to simply
calculate the sum of the absolute differences in scores. Thus, a difference of zero means

227
identical profiles and grows larger as profiles differ in level, dispersion, or shape.
However, while this method makes descriptive sense, it is not conducive to further
mathematical analysis (Nunnally & Bernstein, 1994). A better way of measuring profile
similarity is the distance measure D. “D is the generalized Pythagorean distance between
two points in Euclidian space” (Nunnally & Bernstein, 1994, p. 602). This distance can
be easily graphed in two-dimensional space if there are only two variables. In the case of
more than two variables, this distance cannot be graphed in two-dimensional space but it
can still be calculated using the same Pythagorean formula. Thus, in the case of the latent
variables measured in Part II, let X1 be the first dimension of Autonomy, X2 be
Innovation and so forth. Let a represent the IT group and b represent the business group.
The differences in the two profiles can then be represented algebraically as
D2
ab = (Xa1 – Xb1)2 + (Xa2 – Xb2)
2 + … + (Xan – Xbn)
2
or more simply as
D =
where the square root of D2
ab is the total distance between the IT group, a, and the
business group, b, for each organization with n dimensions. Nunnally and Bernstein
(1994) recommend that D be used as a measure of distance between two profiles because
it accounts for level, dispersion, and shape as well as lending itself to mathematical
analysis. Smaller Ds have similar profiles while larger Ds have dissimilar profiles.

228
Tatsuoka (1974) recommends modifying the classic D calculation by dividing each
variable’s squared distance by its variance such that
D2
ab = (Xa1 – Xb1)2 + (Xa2 – Xb2)
2 + … + (Xan – Xbn)
2
σ X12
σ X22 σ Xn
2
This modified D score is what was used to calculate Occupational Cultural Distance. The
squared differences of the IT occupational values and the business management values,
divided by their variances, were summed in order to create an aggregated Occupational
Cultural Distance index for each organization. Because there were multiple respondents
for the two occupational groups for each organization, the mean of each value was used
for the calculation.
Objections have been raised about aggregating cultural distance in this way. For
example, Shenkar (2001) identifies some methodological problems such as the
assumption of equivalence. It is not necessarily the case that every cultural value is
equally important. Another problem is the illusion of discordance (Shenkar, 2001).
Cultural differences may not always result in conflict and it is possible that certain
differences may even be complementary and have a positive impact on organizational
performance. Nevertheless, despite these criticisms, the method of measuring cultural
distance presented is commonly used in International Marketing literature in order to
measure national cultural distance (Brouthers & Brouthers, 2001; Morosini et al., 1998;
Tihanyi et al., 2005) and should be just as useful in measuring occupational cultural
distance.

229
6.2.2 IT Organizational Structure
The variable of IT Organizational Structure was measured by a single item asking
about the organization’s IT structure being more centralized, decentralized, or federated,
based on criteria in Luftman & Brier (1999). The three choices were: 1) “Our IT
organization is highly centralized”, 2) “Our IT organization is highly decentralized”, or 3)
“Our IT organization is highly federated (centralized infrastructure with decentralized
application support)”. Because this is nominal data, a categorical variable with three
categories required a set of two dummy variables using binary coding to represent every
option (Hardy, 1993). The centralized group was the reference group. The regression
coefficient for the other two groups expresses the difference between the two group
means (Lewis-Beck, 1995). The variable of organizational structure was used in the same
way as in Johansson & Yip (1994).
6.2.3 IT/Business Alignment
The variable of IT/Business Alignment was measured with previously validated
items for IT/Business alignment. The researcher is grateful to Dr. Luftman for sharing his
original items from his alignment assessment tool in Luftman (2000) and the alignment
items in the instrument are based on his. There were six categories of questions including
1) Effectiveness of IT and Business Communications, 2) Measurement of the
Competency and Value of IT, 3) IT Governance, 4) Partnerships Between IT and
Business Functions, 5) Scope and Architecture of the IT Infrastructure, and 6) Human
Resource Skills. All the items were aggregated into a single index for the actual level of

230
IT/Business Alignment within each organization. Creating a single IT/Business
Alignment score for an organization is consistent with the approach used in Luftman
(2000) and Luftman et al. (2008). The complete list of IT/Business Alignment items is
shown in Appendix D.
6.2.4 IT Value
IT/Business alignment or lack thereof can affect perceived IT business value
(Tallon, 2007). Actual IT value was measured with previously validated items from
Bradley et al.’s (2006) items which are based on DeLone & McLean’s (1992) model of
IS success. IT Value is frequently measured using items for profitability and productivity
(Jacks et al., 2010). The instrument will include common items for IT’s impact on an
organization’s market share, market dominance, core business strength, administrative
efficiency and productivity. Examples of items include “IT has enabled our company to
expand its market share”, “IT has enabled our company to increase its market
dominance”, and “IT has enabled our company to improve productivity” based on
previously validated items in Bradley et al. (2006). Both IT/Business Alignment and IT
Value will use composite indicators or single-item measures. Composite indicators are
mathematical combinations of single quantitative indicators that represent different
dimensions of a construct (Saisana et al., 2005).

231
6.2.5 Control Variables
Control variables gathered in the survey included size of the organization
(measured as the number of total employees), age of the organization, and industry type.
6.2.6 Response Bias
There may be response bias due to self-reporting. On the one hand, it is certainly
possible for executives to inflate their success when self-reporting. However, Dess &
Robinson (1984) and Venkatraman & Ramanujam (1986) have previously demonstrated
that self-reported performance measures typically have high reliability.
6.2.7 Data Collection
The executive survey for Part III was distributed at the same time as the
occupational values survey used in Part II. The executive survey was also covered under
IRB approval prior to collecting any data (IRB# 12-0012 dated 1/24/2012). The objective
was to obtain participation from at least 30 organizations in order to provide the dataset
for III. These organizations were from different industries and different sizes, but
generally needed to be medium to large in order to have enough IT personnel for the
study. CIO and CEOs were approached ahead of time to request their organization’s
participation in the study. Contacts at organizations were obtained through 1) personal
contacts and Linked-In connections, 2) three different Advisory Boards within the Bryan
School of Business, and 3) the Lexis-Nexis database of company information in the U.S.
Organizations were sent an introductory letter explaining the purpose of the study,
requesting their participation, and offering two forms of incentive: an individual incentive

232
for gift card drawings and an executive incentive to share a high level report of the results
benchmarking their firm with others.
The executives for each firm had many questions about the study that had to be
answered before they would agree to participate. Some wanted to see the questions ahead
of time in order to preview, some wanted the gift card incentive removed as an option
due to their company’s policy, some wanted the option to receive a copy of the results
removed from the survey, some wanted reassurance of confidentiality of the respondents
and/or the company name, and one even requested an in-person presentation to their
SVP, CIO, and VP of Human Resources. Every attempt was made to accommodate
executives’ requests to make them comfortable with the process without changing any
content in the surveys. Once approval was given to participate, a survey link was sent for
distribution. A unique survey link was created in Qualtrics for each company and each
executive in order to ensure companies were grouped together correctly. After the survey
link was sent, the researcher stayed in close communication with the executive to follow-
up on participation levels for their firm and request reminders when necessary.
It should be noted that in some cases, the executive would ask for a list of people
who had taken the occupational culture survey simply in order to remind those who had
not taken it within their organization. But these requests were refused and it was
explained to them that any identifying information had to be kept confidential and the
executives appreciated this.
The first five participating executives were treated as a pilot group. The survey
asked an open-ended question about any problems with the survey. Early feedback from

233
executives taking the survey was that it felt too long. The format in Qualtrics was then
changed from multiple questions per screen to only one question per screen with a
progress bar at the bottom and less clutter on the screen. An additional screen indicating
the half-way point and allowing them to take a break was also added in order to reduce
fatigue. Feedback was more positive after these changes were made. Late in the data
collection process, one large firm experienced difficult in accessing the Qualtrics site
with a “server not responding” error message, but they were able to take the survey later
after this intermittent problem cleared up. The Qualtrics site remembered their stored
answers and they were able to continue where they left off.
6.2.8 Measurement
The first step in the analysis was to create an index for the IT/Business Alignment
measure which included all six categories of IT/Business Alignment from the Luftman
Alignment model. This was done by aggregating the responses into a single-item
measure. Aggregation was additive with each item weighted equally. The second step
was to create the index for IT Value. This was also done by aggregating the responses to
the five items of IT Value into a single-item measure. Combining multiple items into a
single item index of value has been previously done with useful results at the
organizational level (Kalafut & Low, 2001).
Both IT/Business Alignment and IT Value measurements were based on data
from the executive survey. In three cases, where multiple executives from the same
organization took the survey, the means of their responses for each item were used for

234
their organization. The control variables also came from the executive survey. Because
the measures for IT occupational cultural distance were gathered from different sources
than those used for measuring IT/Business Alignment and IT Value, the risk of common
method variance or conflation of response-response correlations (Campbell & Fiske,
1959) was minimized for the overall model. Gathering data from executives on
IT/Business Alignment and IT Value should be accurate proxies for actual Alignment and
actual Value because executive perceptions of firm performance are highly correlated
with actual firm performance (Venkatraman & Ramanuiam, 1987).
The third step was to create the index for Occupational Cultural Distance based
on the data in Part II. This was done by calculating the modified D score for each
organization as described above. The squared differences of all the ITOC values and all
the business management values, divided by their variances, were summed in order to
create the index for each organization. This then became a single-item measure for Partial
Least Squares (PLS) path analysis.
PLS is a structured equation modeling technique that is more appropriate for
small sample sizes than LISREL (Hulland, 1999). Where LISREL is covariance-based,
PLS is variance-based. PLS is also appropriate for early stages of theoretical
development for testing exploratory models (Henseler et al., 2009). SmartPLS software
was used to do the path analysis using PLS regression in order to test support for the
research model. PLS regression can be used to reject the null hypothesis of no-effect by
showing high R2 values and significant t-values as in linear regression and is suitable for
both prediction and theory building especially when the sample size is small (Gefen,

235
Straub, and Boudreau, 2000). Good model fit in PLS is supported by significant path
coefficients and high R2 values (Gefen, Straub, and Boudreau, 2000) Results of the path
model analysis include a correlational matrix of variables, the significant paths,
coefficients of those paths and whether they are positive or negative, and R2 values for
the constructs of IT/Business Alignment and IT Value. Path analysis can show whether or
not there is support for the four proposed hypotheses.
6.3 Part III Results
6.3.1 Sample Size
Preliminary emails were sent to organizations to determine if they were interested
in participating in this study. Two hundred were personal contacts, 30 were from Bryan
School Advisory Boards at the University of North Carolina at Greensboro, and 29,310
were from the Lexis-Nexis database of businesses. Of these, 125 expressed initial interest
and requested more information. It should be noted that over 50 additional organizations
indicated interest but either outsourced their IT function or had less than the required
minimum of five IT personnel in their company. A total of 47 executives agreed to
participate in the survey and only then were they sent the two survey links. 43 executives
completed the executive survey with 3 cases of multiple executives from the same
organization resulting in 39 organizations. Of those, 32 organizations had a complete set
of surveys from all three groups necessary for the Part III analysis (IT employees,
business managers, and at least one executive). Table 49 shows the 32 participating
organizations, their general description, and the source of initial contact.

236
Table 49. Participating organizations
No. Organization Description Source
1 Large agricultural company in NC Bryan School Advisory Board
2 Medium non-profit healthcare company in NC Bryan School Advisory Board
3 Large bank in NC Bryan School Advisory Board
4 Large clothing manufacturer in NC CARS Advisory Board
5 Very large Fortune 500 food industry company in
NC Faculty contact
6 Medium-sized publisher in NC Interviewee
7 Large financial company in NC ISOM Advisory Board
8 Large financial company in NC ISOM Advisory Board
9 Large transportation company in AL Lexis-Nexis
10 Medium-sized manufacturer in IN Lexis-Nexis
11 Medium-sized manufacturer in MS Lexis-Nexis
12 Medium-sized retail company in MO Lexis-Nexis
13 Medium-sized manufacturer in MI Lexis-Nexis
14 Large healthcare company in SC Lexis-Nexis
15 Medium-sized food industry company in LA Lexis-Nexis
16 Large clothing manufacturer in CA Lexis-Nexis
17 Medium-sized financial company in WI Lexis-Nexis
18 Medium-sized health care company in IL Lexis-Nexis
19 Medium-sized manufacturer in OH Lexis-Nexis
20 Large energy consulting company in NY Lexis-Nexis
21 Medium-sized professional association in CA Lexis-Nexis
22 Medium-sized education company in WA Lexis-Nexis
23 Large healthcare company in MN Lexis-Nexis
24 Medium-sized government consulting company in
VA Lexis-Nexis
25 Medium-sized state government Lexis-Nexis
26 Medium-sized Insurance company in GA Personal contact
27 Very large Fortune 50 Retail company in NC Personal contact
28 Medium-sized Technology services company in TX Personal contact
29 Large Technology Services company in KY Personal contact
30 Medium-sized transportation company in NC Personal contact
31 Medium-sized retail company in NC Personal contact
32 Medium-size Community College in NC Student

237
6.3.2 Demographics
The frequency tables of important demographic information for the 32
participating organizations are shown Tables 50, 51, 52, and 53.
Table 50. Type of Industry
Industry Frequency
Manufacturing 7
Financial 6
Retail 4
Health care 3
Technology 3
Education 2
Consulting 2
Other 2
Transportation 2
Publishing 1
Table 51. Size of organization by number of employees
Organization size Frequency
1-99 0
100-999 19
1,000-9,999 7
10,000-99,999 4
100,000-999,999 2
Table 52. Type of IT organizational structure
IT Organizational
Structure Frequency
Centralized 24
Federated 6
Decentralized 2

238
Table 53. CIO Reporting Structure
CIO Reporting
Structure Frequency
CIO reports to CEO 11
CIO reports to CFO 8
No CIO 7
CIO reports to COO 4
CIO reports to
different executive 2
A summary of the alignment indices, success indices, and D scores is shown in
Table 54. The calculation of these scores was addressed earlier in the Part III
Methodology section.
Table 54. Alignment index, Success index, and D score
D
score Alignment
Index Success
Index Org
Size IT Org
Structure Dummy
Federated Dummy
Decentral
1.090 235 30 2 1 0 0
1.143 267 27 2 1 0 0
1.910 240 25 2 1 0 0
2.090 274 31 4 1 0 0
2.487 229 24 2 1 0 0
2.764 262 30 4 3 1 0
2.824 220 32 2 1 0 0
2.849 258 26 5 1 0 0
2.974 204 29 2 3 1 0
3.071 243 27 2 1 0 0
3.250 220 32 3 1 0 0
3.479 212 30 4 1 0 0
3.597 200 25 2 1 0 0
3.975 249 27 3 1 0 0
4.061 261 30 2 1 0 0
4.185 220 17 2 1 0 0

239
4.292 269 35 3 3 1 0
4.294 205 26 2 1 0 0
4.580 195 17 2 1 0 0
4.605 250 35 2 3 1 0
4.633 240 26 5 1 0 0
4.653 229 25 3 2 0 1
4.771 239 32 2 2 0 1
4.810 200 25 3 1 0 0
4.895 256 29 4 3 1 0
4.907 228 10 2 1 0 0
4.907 227 15 3 1 0 0
4.938 271 29 2 1 0 0
5.366 226 26 2 3 1 0
5.443 191 11 2 1 0 0
5.575 215 27 3 1 0 0
5.661 219 26 2 1 0 0
6.3.3 PLS Analysis
The PLS analysis tested the four hypotheses proposed in the Research Objectives
above. PLS analysis typically involves two stages of examining the outer model
measurement and then the inner structural model. In this case, all of the variables are
single-item measures as described in the Part II methodology earlier, so there are no outer
model measurements to report. As shown in Figure 20 below, the relationship between
Occupational Cultural Distance and IT/Business Alignment was negative and significant
(coefficient: -0.332, t value=3.90), supporting Hypothesis 1 that higher Occupational
Cultural Distance is negatively related to IT/Business Alignment. The relationship
between the dummy variable of Federated IT Organizational Structure and IT/Business
Alignment was positive and significant (coefficient=0.261, t value=2.65). The
relationship between the dummy variable of Decentralized IT Organizational Structure

240
and IT/Business Alignment was also positive and significant (coefficient=0.118, t
value=2.07). The regression coefficient for the dummy variables expresses the difference
in means between the dummy variable and the reference group of Centralized IT
Organizational Structure. Because the Federated dummy variable was significantly
different from the reference group, there is some support for Hypothesis 2 that Federated
IT organizational structures have a positive relationship with IT/Business Alignment,
even though the Decentralized dummy variable was also significant.
An additional post hoc test was performed to see which IT organizational
structure had the highest levels of IT/Business Alignment. An ANOVA test between the
three groups (Centralized, Decentralized, and Federated) was performed. The results are
shown in Table 55. While the means show that the Federated structure had the highest
level of alignment with a mean of 244.5, the ANOVA test did not find statistically
significant differences between the three groups with a p value of 0.53. This may indicate
only partial support for Hypothesis 2.

241
Table 55. ANOVA of Organizational Structure and Alignment
N Mean Std.
Deviation Std.
Error 95%
Confidence
Interval
for Mean
Min Max
Lower
Bound Upper
Bound
1 - Centralized 24 232.71 22.69 4.63 223.13 242.29 195 274
2 -
Decentralized 2 234.00 7.07 5.00 170.47 297.53 229 239
3 - Federated 6 244.50 24.70 10.09 218.57 270.43 204 269
Total 32 235.00 22.44 3.97 226.91 243.09 195 274
Sum of
Squares df Mean
Square F Sig.
Between
Groups 669.54 2.00 334.77 0.65 0.53
Within
Groups 14942.46 29.00 515.26
Total 15612.00 31.00
For the last two hypotheses, the relationship between IT/Business Alignment and
IT Value was positive and significant (coefficient=.418, t value=6.09) supporting
Hypothesis 3 that higher levels of IT/Business Alignment lead to higher levels of IT
Value. Finally, the relationship between Occupational Cultural Distance and IT Value
was negative and significant (coefficient=-0.184, t value = 2.54), supporting Hypothesis 4
that higher Occupational Cultural Distance is associated with lower IT Value. It should
also be noted that the only control variable that showed a significant impact on
IT/Business Alignment was Organizational Size measured by number of employees
(coefficient=0.283, t value=3.93). The overall variance explained in the model is
reflected in the R2 score of 0.252 for IT/Business Alignment and 0.256 for IT Value. In

242
other words, 25% of the variance in the dependent variable of IT Value is accounted for
by the PLS model shown in Figure 26.
Figure 26 – PLS path model results
6.3.4 Discussion
These findings are important for two reasons. 1) The results confirm previous
findings with regard to IT/Business Alignment research. Greater alignment leads to
greater IT value to the business including profitability and productivity. Also, IT
organizational structure has a significant impact on alignment such that federated
structures seem to be more conducive to better alignment. More importantly, we have
new knowledge about a novel factor that leads to better IT/business alignment, namely

243
Occupational Cultural Distance. Firms should continue to focus on federated models but
there is also benefit to be had from focusing on getting occupational values in sync. If
executives can close the gap of occupational values between IT and business managers,
there are clear benefits to be had for the bottom line. Surprisingly, Occupational Cultural
Distance also significantly impacts organizational outcomes directly such that the greater
the distance in values, the worse the business outcomes are for organizations.
If this is true, then how can business leaders change occupational cultural
differences if these values originate outside of their organizations? The reasonable
answer would be that organizational cultural differences may be a force that unifies
employees together with a common set of values, whereas occupational culture, if left
unchecked, can become a divisive force. Changes in organizational culture, led by their
executives, may be able to overcome occupational cultural differences just as
organizational culture can potentially overcome national cultural differences (see Jacks et
al. forthcoming) within an organization, but this is an area for future empirical research.
Just as an automobile runs more smoothly and more efficiently in the long run
when the individual tires are properly aligned, so too must the individual departments
within a business be properly aligned with the overall organization. In order for this
cultural change to take place, it is important for business managers to recognize and
appreciate the Promethean virtues of IT. At the same time, it is also necessary for IT to
embrace common business values in order for the organization to thrive long-term.
If business leaders are unsure how to proceed with aligning occupational values in
order to achieve organization success, some guidance can be provided based on the

244
results of Part II. Managers would benefit from education on the ASPIRE values in order
to better understand their IT employees in terms of what is truly important to them at
work. Because the Promethean virtues of Reverence for Knowledge, Innovation, and
Structure showed significant difference, these are potential areas of focus. Launching
organization-wide programs that recognize and reward outstanding knowledge
contribution or innovation or new process creation are steps that can be taken that should
have a direct impact on both overall IT/Business Alignment and organizational success.
Furthermore, hiring decisions and project team selection should be influenced by the
findings of Parts II and III. If organizations want more successful outcomes, they should
look closely at the characteristics of the people they put in charge of IT departments
and/or IT projects. Leaders who do not have a heavy background in technology will be
especially challenged to gain the respect of IT teams. At the same time, leaders with a
strong business background can help educate IT personnel on the benefits of focusing on
organizational profitability and productivity and not just knowledge and innovation for
their own sake. In these ways, closing the occupational distance gap can achieve
tremendous benefits.

245
CHAPTER VII
CONTRIBUTIONS TO KNOWLEDGE
There are several potential and important outcomes of this research. No empirical
measurements have thus-far been attempted specifically on IT occupational culture. Nor
has the relationship between IT occupational culture and IT/Business alignment been
examined. This study answered the call that “research is needed that seeks to
operationalize IT values, to discover which values in fact are most appropriate to
consider, as well as the to discover how values might cluster together to form some
higher order constructs of IT culture.” (Leidner & Kayworth, 2006, p. 371)
7.1 Contribution to Practice
Kaarst-Brown & Robey (1999) suggest that understanding IT culture better will
assist managers in recognizing the difficulties of implementing change in the
organization, something that firms still wrestle with today. A better understanding of IT
occupational culture will have the practical value of 1) facilitating smoother interactions
between IT and business (and other departments within an organization), 2) helping
managers better understand resistance to change within the organization and within the IT
department, and 3) leading to a better understanding of the cultural determinants of IT
Value. Another contribution for practice is the evidence that these value dimensions are
common across the IT occupation. Hence, managers who understand these values and

246
know how to effectively manage them in one company should be able to do so in another
company as they change jobs and progress through their career.
7.2 Contribution to Research
There are several specific contributions to research. The contribution of Part I was
a meaningful cultural portrait of IT occupational culture that included a validated
framework for examining occupational values in their proper context which can be used
by future researchers. Furthermore, the use of cultural sociology as a theoretical lens for
IS research was, itself, a novel contribution. The lens of the sacred/profane division is a
powerful one and helps explain the depth of occupational cultural conflict. The
contribution of Part II was a validated instrument measuring occupational values and
identifying areas of significant differences between IT employees and business managers.
Future researchers may use the ASPIRE values as a starting point in order to examine
other aspects of IT occupational culture. The contribution of Part III was empirical
evidence of the impact of occupational cultural differences on IT/Business Alignment
and IT Value. Future researchers may extend the research model used in Part III to
explain additional phenomena related to occupational culture. The overall contribution of
the three Parts together forms a unified whole that provides both new and enhanced
knowledge about IT occupational culture and fills a significant gap in research.

247
CHAPTER VIII
FUTURE RESEARCH
There are a number of areas for future research in IT occupational culture beyond
the three studies presented here. This dissertation launches a complex and powerful
stream of future research. Future research questions may include:
Which occupational values can be influenced by managers and how exactly can
they influence them?
How might occupational values be influenced at the occupational level by
professional organizations such as AIS, SIM, IEEE, or AITP?
What are the differences in occupational cultural values between IT groups based
in different countries? Are IT occupational values being exported from the U.S.?
How does occupational culture affect employee retention?
What is the relationship between national culture, organizational culture and
occupational culture?
How can IT occupational culture be further subdivided into different subgroups
such as programmers/developers, networking/server support, hardware support,
software support, security, project managers, etc.?
What are the rites, rituals and practices of IT occupational culture that lead to
group cohesion and career success?

248
How is IT occupational culture impacting society at large?
Are there significant differences in occupational values based on gender?
How can the ASPIRE instrument be further refined for increased reliability?

249
CHAPTER IX
LIMITATIONS
The main limitation of this study is the objection noted in Schein (1985) that
culture can only be measured with qualitative methods such as ethnography and case
study over extended periods of time in an organization rather than with quantitative
methods. This fundamental objection may be mitigated because initial qualitative studies
have been successful in identifying the initial components of IT occupational culture for
further quantitative (survey-based) investigation. Furthermore, Hofstede (1980), House et
al. (2004), and Iivari & Huisman (2007) have already demonstrated the viability of the
survey method in studying culture. There is a tradeoff in research methods between
breadth and depth. Because the initial qualitative research has been done to obtain rich
examples from ethnographic interviews, the risk of not measuring the right things
(construct validity) is lessened. Furthermore, what the quantitative approach lacks in
richness, it gains in measurability, which was one of the stated research objectives. The
key assumption of this research is that IT occupational culture can be measured. But in
the tradition of cultural sociology, culture must also be deeply meaningful, not simply
numeric. Both positivist and interpretive approaches are necessary in order to advance
research in this important area of study. Each helps offset the limitations of the other.
Another limitation for Part II is the need for further refinement of the instrument
measuring the ASPIRE values. Even though the survey items were based on the

250
qualitative interviews with a follow-up Q-Sort to determine the best items, the instrument
still had very high correlation between Structure and Precision. The reliability of the
Autonomy variable was also low. These are concerns which will be addressed as part of
the ongoing research stream.
A final limitation is the sample size in Part III. A sample size of 32 companies is
admittedly small; however the difficulty in getting executives from different
organizations to participate in a research study is tremendous. CEOs and CIOs are
extremely busy and getting them to champion a survey within their organization takes a
great deal of convincing. Because of this difficulty, getting 32 companies to participate in
a relatively short amount of time is actually quite an achievement. All of the participating
executives saw value in this research. Further research will be able to add to the sample
size.

251
CHAPTER X
CONCLUSION
Past IS studies on culture have primarily focused on two levels of analysis:
national culture and organizational culture. The gap in our knowledge of culture was in
the area of the occupational culture of IT professionals. Occupational culture, unlike
organizational culture, is not bounded by a single organization, but rather forms itself
around specific expertise, similar tasks, and a sense of itself as a distinct occupational
group with distinct values. An initial pilot identified the SCORRE values of IT
occupational culture, including Structure of Power, Control, Open Communication, Risk,
Reverence for Knowledge, and Enjoyment. These values were transformed into the
ASPIRE values of Autonomy, Structure, Precision, Innovation, Reverence for
Knowledge, and Enjoyment in the full study in Part I. Part I used the ‘strong program’ of
cultural sociology to examine and interpret the meaning of the core values of the IT
occupation through a cultural web framework of shared language, shared history, and
shared context. A hermeneutic interpretation of the qualitative data was offered using the
lens of the sacred and the profane which was distilled into three sacred values described
as the Promethean virtues: Reverence for Knowledge, Structure, and Innovation with
three profane values of Autonomy, Precision, and Enjoyment.
The interview results informed the creation of a survey instrument in Part II to
measure the ASPIRE values and ten typical business management values. Significant

252
differences were found between the responses of IT professionals and non-IT business
managers in 32 companies in the U.S. IT employees rated IT occupational values higher
than non-IT business managers and rated traditional business values lower. Significant
differences were found with the three sacred Promethean virtues of Reverence for
Knowledge, Structure, and Innovation.
Part III measured the level of IT/Business Alignment and IT Value for the 32
firms and measured the Occupational Cultural Distance within each company. A PLS
analysis revealed evidence that occupational cultural distance does significantly impact
both IT/Business Alignment and IT Value. As Occupational Cultural Distance increases,
both IT/Business Alignment and IT Value decrease. This adds an important antecedent of
IT/Business Alignment to the literature -- one that has not been previously explored.
Together, the three parts enhance our understanding of IT occupational culture as
a whole. We now have a meaningful interpretation of IT occupational culture, a set of
measureable values, and evidence of the impact of occupational cultural distance on
organizational outcomes.
253
REFERENCES
1. Aeschylus. Prometheus Bound. Penguin Books: London, 1961.
2. Akbulut-Baily, A. “A Measurement Instrument for Understanding Student
Perspectives on Stereotypes of IS Professionals.” Communications of the AIS
(25:29) 2009.
3. Alexander, J. “The Sacred and Profane Information Machine: Discourse about the
Computer as Ideology.” Archives de Sciences Sociales des Religions (69) 1990, pp.
161-171.
4. Alexander, J. The Meanings of Social Life: A Cultural Sociology. Oxford University
Press: New York, 2003.
5. Allan, G. The Patterns of the Present. State University of New York Press: Albany,
2001.
6. Armstrong, J. and Overton, T. “Estimating Nonresponse Bias in Mail Surveys.”
Journal of Marketing Research (14) 1977, pp. 396-402.
7. Ashkanasy, N., Broadfoot, L., and Falkus, S. “Questionnaire Measures of
Organizational Culture” in Ashkanasy, N., Wilderom, C., and Peterson, M. (eds.)
Handbook of Organizational Culture & Climate.. Sage Publications: Thousand
Oaks, CA, 2000.
8. Babbie, E. The Practice of Social Research. Sixth edition. Wadsworth Publishing:
Belmont, CA, 1992.
9. Bernard, R. Research Methods in Anthropology: Qualitative and Quantitative
Approaches. Second edition. Alta Mira Press: Walnut Creek, CA, 1995.
10. BLS. “Overview of the 2008-18 Projections.”
http://www.bls.gov/oco/oco2003.htm. Bureau of Labor Statistics. Retrieved on
4/28/2011.
11. Borsook, P. Cyberselfish: A Critical Romp Through the Terribly Libertarian
Culture of High-Tech. Public Affairs: New York, 2000.

254
12. Bradley, R., Pridmore, J., and Byrd, T. “Information Systems Success in the
Context of Different Corporate Cultural Types: An Empirical Investigation.”
Journal of Management Information Systems (23:2) Fall, 2006, pp. 267-294.
13. Brewerton, P. and Millward, L. Organizational Research Methods: A Guide for
Students and Researchers. Sage Publications: Thousand Oaks, CA, 2001.
14. Brief, A., and Nord, W. (Eds.) Meanings of Occupational Work. Lexington Books:
Lexington, MA, 1990.
15. Brouthers, K., and Brouthers, L. “Explaining the National Cultural Distance
Paradox.” Journal of International Business Studies (32:1) 2001, pp. 177-189.
16. Bryman, A. and Cramer, D. Quantitative Data Analysis with SPSS Release 10 for
Windows: A Guide for Social Scientists. Routledge: Philadelphia, PA, 2001.
17. Caillois, R. Man, Play and Games. Translated by Barash, M. University of Illinois
Press: Chicago, 1961.
18. Cameron, K. and Quinn, R. Diagnosing and Changing Organizational Culture:
Based on the Competing Values Framework. Jossey-Bass: San Francisco, 2006.
19. Campbell, D. and Fiske, D. “Convergent and Discriminant Validation by the
Multitrait-Multimethod Matrix.” Psychological Bulletin (56), 1959, pp. 81-105.
20. “Candor: A Sustainable IT Culture.” InformationWeek, June 10, 2009.
21. Carmines, E. and Zeller, R. Reliability and Validity Assessment. Sage Publications:
Thousand Oaks, CA, 1979.
22. Chan, Y., and Reich, B. “IT Alignment: What Have We Learned?” Journal of
Information Technology (22) 2007, pp. 297-315.
23. Claver, E., Llopis, J., Gonzalez, M., and Gasco, J. “The Performance of Information
Systems Through Organizational Culture.” Information Technology & People
(14:3) 2001, pp. 247-260.
24. Connerton, P. How Societies Remember. Cambridge University Press: Cambridge,
1989.
25. Cooper, D., and Schindler, P. Business Research Methods. McGraw-Hill: New
York, 2003.

255
26. Daynes, Sarah. Time and Memory in Reggae Music: The Politics of Hope.
Manchester University Press: New York, 2010.
27. Deal, T. and Kennedy, A. Corporate Cultures: The Rites and Rituals of Corporate
Life. Addison-Wesley: Reading, MA, 1982.
28. Delone, W. and McLean, E. (1992), “Information Systems Success: The Quest for
the Dependent Variable”, Information Systems Research (3:1) 1992, pp. 60-95.
29. Dess, G. and Robinson, R. “Measuring Organizational Performance in the Absence
of Objective Measures: The Case of the Privately-Held Firm and Conglomerate
Business Unit.” Strategic Management Journal (5:3) 1984, pp. 265-273.
30. DeVellis, R. Scale Development: Theory and Applications. Sage Publications:
Thousand Oaks, CA, 1991.
31. Doll, W., and Torkzadeh, G. “The Measurement of End-User Computing
Satisfaction.” MIS Quarterly (June) 1988, pp. 259-274.
32. Duliba, K. and Baroudi, J. “IS Personnel: Do They Form an Occupational
Community?” ACM CPR 1991, pp. 111-118.
33. Dubé, L., and Robey, D. “Software Stories: Three Cultural Perspectives on the
Organizational Practices of Software Development.” Accounting, Management and
Information Technologies (9) 1999, pp. 223-259.
34. Dunteman, G. Principal Components Analysis. Sage Publications: Thousand Oaks,
CA, 1989.
35. Durkheim, E. The Elementary Forms of the Religious Life: A Study in Religious
Sociology. Free Press: New York, 1965.
36. Durkheim, E. The Rules of Sociological Method and Selected Texts on Sociology
and its Method. Lukes, S. (Ed.) and Halls, W. (Trans.). The Free Press: New York,
1982.
37. Durkheim, E. The Division of Labor in Society. Coser, L. (Ed.) and Halls, W.
(Trans.). The Free Press: New York, 1984.
38. Eliade, M. The Sacred and The Profane. Harcourt, Brace & World, Inc.: New York,
1959.

256
39. Evans, J. and Mavondo, F. “An Alternative Operationalisation of Cultural
Distance.” Australian and New Zealand Marketing Academy, 2001.
http://smib.vuw.ac.nz:8081/WWW/ANZMAC2001/anzmac/AUTHORS/pdfs/Evans
3.pdf. Retrieved on 3/25/2011.
40. Ferrante, J. Sociology: A Global Perspective. Wadsworth/Thomason Learning:
Belmont, CA, 2003.
41. Fine, G. Kitchens: The Culture of Restaurant Work. University of California Press:
Berkeley, CA, 1996.
42. Flyvbjerg, B. Making Social Science Matter. Cambridge University Press: New
York, 2001.
43. Fowler, F. Survey Research Methods. 3rd
ed. Sage Publications: Thousand Oaks, CA,
2002.
44. Gallivan, M., and Srite, M. “Information Technology and Culture: Identifying
Fragmentary and Holistic Perspectives of Culture.” Information and Organization
(15) 2005, pp. 295-338.
45. Gefen, D., Straub, D., and Boudreau, M. “Structural Equation Modeling and
Regression: Guidelines for Research Practice”, Communications of the Association
for Information Systems, (4:7), 2000, pp. 1-77.
46. Geertz, C. The Interpretation of Culture. Basic Books: New York, 1973.
47. Geertz, C. Local Knowledge: Further Essays in Interpretive Anthropology. 3rd
Edition. Basic Books: New York, 1983.
48. Geertz, C. “Thick Description: Toward an Interpretive Theory of Culture” in
Cultural Sociology. Spillman, L. (Ed.) Blackwell Publishers: Oxford, 2002.
49. Glen, P. “IT, the Business and the Clash of Cultures.” Computer World (March 21,
2011), p. 44.
50. Gregory, K. “Native-View Paradigms: Multiple Cultures and Culture Conflicts in
Organizations.” Administrative Science Quarterly (28) 1983, pp. 359-376.
51. Grint, K. The Sociology of Work: An Introduction. Polity Press: Cambridge, 1991.

257
52. Grindley, K. “Information Systems Issues Facing Senior Executives: The Culture
Gap.” Journal of Strategic Information Systems (1:2) 1992, pp. 57-62.
53. Griswold, W. Cultures and Societies in a Changing World. 2nd
ed. Sage Publications:
Thousand Oaks, CA, 2004.
54. Griswold, W. “The Sociology of Culture: Four Good Arguments (and One Bad
One.” Acta Sociologica (35) 1992, pp. 323-328.
55. Groves, R. “Nonresponse rates and Nonresponse Bias in Household Surveys.”
Public Opinion Quarterly (70:5) 2006, pp. 646-675.
56. Guzman, I. “’As You Like I.T.’: Occupational Culture and Commitment of New
Information Technologists.” Unpublished dissertation. 2006.
57. Guzman, I., Joseph, D., Papamichail, K., and Stanton, J. “RIP – Beliefs about IT
Culture: Exploring National and Gender Differences.” SIGMIS-CPR 2007.
58. Guzman, I. and Kaarst-Brown, M. “Organizational Survival and Alignment:
Insights into Conflicting Perspectives on the Role of the IT Professional.” SIGMIS,
April 2004.
59. Guzman, I., and Stanton, J. “Culture Clash! The Adverse Effects of IT Occupational
Subculture on Formative Work Experiences of IT Students.” Americas Conference
on Information Systems, 2004.
60. Guzman, I., Stanton, J. Stam, K., Vijayasri, V., Yamodo, I., Zakaria, N., and
Caldera, C. “A Qualitative Study of the Occupational Subculture of Information
Systems Employees in Organizations.” SIGMIS 2004, Tucson, Arizona.
61. Halbwachs, M. On Collective Memory. The University of Chicago Press: Chicago,
1992.
62. Hall, E.T. Beyond Culture. Anchor Press: New York. 1976.
63. Hall, R. Organizations: Structures, Processes, and Outcomes. 7th
ed. Prentice Hall:
Upper Saddle River, NJ, 1999.
64. Hansen, C. “Occupational Cultures: Whose Frame Are We Using?” Journal for
Quality & Participation (18:3) June 1995, p. 60.
65. Hardy, M. Regression with Dummy Variables. Sage Publications: Thousand Oaks, CA,
1993.

258
66. Harper, D. and Lawson, H. (Eds.) The Cultural Study of Work. Rowman &
Littlefield Publishers: New York, 2003.
67. Harvey, L. “A genealogical exploration of gendered genres in IT cultures.”
Information Systems Journal (7:2) April 1997, pp. 153-172.
68. Hatcher, L. A Step-by-Step Approach to Using the SAS System for Factor Analysis
and Structural Equation Modeling. SAS Institute: Cary, NC, 1994.
69. Henseler, J., Ringle, C., Sinkovics, R. “The Use of Partial Least Squares Path
Modeling in International Marketing.” Advances in International Marketing (20)
2009, pp. 277-319.
70. Hirschheim, R., and Newman, M. “Symbolism and Information Systems
Development: Myth, Metaphor and Magic.” Information Systems Research (2:1)
1991, pp. 29-62.
71. Hofstede, G. Cultural Consequences: International Differences in Work Related
Values. Beverly Hills: Sage, 1980.
72. Hofstede, G., Neuijen, B., Ohayv, D., and Sanders, G. “Measuring Organization
Cultures: A Qualitative and Quantitative Study across Twenty Cases,”
Administrative Science Quarterly (35) 1990, pp. 286-316.
73. Hofstede, G. and Hofstede, J. Cultures and Organizations: Software of the Mind.
New York: McGraw-Hill. 2005.
74. Hofstede, G. and Bond, M. “The Confucius Connection: From Cultural Roots to
Economic Growth,” Organizational Dynamics (16:4), 1988, pp. 4-21.
75. Hooker, J. Working Across Cultures. Stanford Business Books: Stanford,
California. 2003.
76. House, R., Hanges, P., Javidan, M., Dorfman, P., and Gupta, V. Culture,
Leadership, and Organizations. Sage publications: Thousand Oaks, CA, 2004.
77. Hulland, J. “Use of Partial Least Squares (PLS) in Strategic Management Research:
A Review of Four Recent Studies.” Strategic Management Journal (20) 1999, pp.
195-204.
78. Huysman, M. and Wulf, V. (Eds.) Social Capital and Information Technology. MIT
Press: Cambridge, MA, 2004.

259
79. Ignatow, G. “’Idea Hamsters’ on the ‘Bleeding Edge’: Profane Metaphors in High
Technology Jargon.” Poetics (31) 2003, pp. 1-22.
80. Iivari, J. and Huisman, M. “The Relationship Between Organizational Culture and
the Deployment of Systems Development Methodologies.” MIS Quarterly (31:1)
March 2007, pp. 35-58.
81. Jacks, T., and Palvia, P. “Research-In-Progress: Measuring Dimensions of IT
Occupational Culture,” Proceedings - Global Information Technology Management
Association World Conference, Washington, D.C., USA, June 2010.
82. Jacks, T., Palvia, P., Schilhavy, R., and Wang, L. “A Framework for the Impact of
IT on Organizational Performance.” Business Process Management Journal (17:5)
2011, pp. 846-870.
83. Jacks, T., Wallace, S., and Nemati, H. “Impact of Culture on Knowledge
Management – A Meta-Analysis.” Journal of Global Information Technology
Management (Forthcoming in October, 2012).
84. Johansson, J. and Yip, G. “Exploiting Globalization Potential: U.S. and Japanese
Strategies.” Strategic Management Journal (15:8) 1994, pp. 579-601.
85. Johnson, S., Koh, H., and Killough, L. “Organizational and Occupational Culture
and the Perception of Managerial Accounting Terms: An Exploratory Study Using
Perceptual Mapping Techniques.” Contemporary Management Research (5:4)
2009, pp. 317-342.
86. Joseph, D., Ng, K., Koh, C., and Ang, S. “Turnover of Information Technology
Professionals: A Narrative Review, Meta-Analytic Structural Equation Modeling,
and Model Developmnt.” MIS Quarterly (31:3) 2007, pp. 547-577.
87. Kaarst-Brown, M. and Guzman, I. “Who is ‘the IT workforce’?: Challenges Facing
Policy Makers, Educators, Management, and Research. SIGMIS-CPR 2005.
88. Kaarst-Brown, M.L. and Robey, D. (1999) "More on Myth, Magic and Metaphor:
Cultural Insights into the Management of Information Technology in
Organizations." Information, Technology and People (12:2) 1999, pp. 192-217.
89. Kappos, A. and Rivard, S. “A Three-Perspective Model of Culture, Information
Systems, and their Development and Use”. MIS Quarterly (32:3) September 2008,
pp. 601-634.

260
90. Karahanna, E., Evaristo, J., and Srite, M. “Levels of Culture and Individual
Behavior: An Integrative Perspective.” Journal of Global Information Management
(13:2) 2005, pp. 1-20.
91. Katz, J. and Townsend, J. “The Role of Information Technology in the ‘Fit’
Between Culture, Business Strategy and Organizational Structure of Global Firms.”
Journal of Global Information Management (8:2) 2000, pp. 24.
92. Kim, J. and Mueller, C. Factor Analysis: Statistical Methods and Practical Issues.
Sage Publications: Thousand Oaks, CA, 1978.
93. Klein, H. and Myers, M. “A Set of Principles for Conducting and Evaluating
Interpretive Field Studies in Information System.” MIS Quarterly (23:1) 1999, pp.
67-94.
94. Kline, R. Principles and Practice of Structural Equation Modeling. 2nd
ed. The
Guilford Press: New York, 2005.
95. Kogut, B. and Singh, H. “The Effect of National Culture on the Choice of Entry
Mode.” Journal of International Business Studies (19:3), 1988, pp. 411-432.
96. Korczynski, M., Hodson, R., and Edward, P. (Eds.) Social Theory at Work. Oxford
University Press: Oxford, 2006.
97. Krippendorff, K. Content Analysis: An Introduction to its Methodology. Sage
Publications: Thousand Oaks, CA, 2004.
98. Kwantes, C., and Boglarsky, C. “Do Occupational Groups Vary in Expressed
Organizational Culture Preferences? A Study of Six Occupations in the United
States.” International Journal of Cross Cultural Management (4:3) 2004, pp. 335-
354.
99. Lee, A. “Electronic Mail as a Medium for Rich Communication: An Empirical
Investigation Using Hermeneutic Interpretation.” MIS Quarterly (18:2) 1994, pp.
143-157.
100. Lee, A. “Integrating Positivist and Interpretive Approaches to Organizational
Research.” Organization Science (2:4), 1991, pp. 342-365.
101. Leidner, D., and Kayworth, T. “A Review of Culture in Information Systems
Research: Toward a Theory of Information Technology Culture Conflict.” MIS
Quarterly (30:2), June 2006, pp. 357-399.

261
102. Levy, S. Hackers: Heroes of the Computer Revolution. O’Reilly: Cambridge, 2010.
103. Lewis-Beck, M. Data Analysis: An Introduction. Sage Publications: Thousand Oaks,
CA, 1995.
104. Li, J., Lam, K., and Qian, G. “Does Culture Affect Behavior and Performance of
Firms? The Case of Joint Ventures in China.” Journal of International Business
Studies (32:1) 2001, pp. 115-131.
105. Locke, J. An Essay Concerning Human Understanding. Routledge and Sons: New
York, 1910.
106. Lubatkin, M., Calori, R., Very, P., and Veiga, J. “Managing Mergers Across Borders:
A Two-Nation Exploration of a Nationally Bound Administrative Heritage.”
Organization Science (9:6) 1998, pp. 670-684.
107. Luftman, J. “Assessing Business-IT Alignment Maturity.” Communications of the AIS
(4:14) December, 2000, pp. 1-51.
108. Luftman, J. and Brier, T. “Achieving and Sustaining Business-IT Alignment,
“California Management Review (1) Fall, 1999, pp. 109-122.
109. Luftman, J., and Kempaiah, R. “An Update on Business-IT Alignment: ‘A Line’ Has
Been Drawn”, MISQ Executive (6:3) 2007, pp. 165-177.
110. Luftman, J. and Kempaiah, R. “Key Issues for IT Executives,” MIS Quarterly
Executive (7:2) June 2008, pp. 99-112.
111. MacDonald, K. The Sociology of the Professions. Sage Publications: Thousand Oaks,
CA, 1995.
112. Markus, M. and Bjorn-Andersen, N. “Power Over Users: Its Exercise by System
Professionals.” Communications of the ACM (30:6) 1987, pp. 498-504.
113. Martin, J. Organizational Culture: Mapping the Terrain. Sage Publications, Thousand
Oaks, CA, 2002.
114. McGee, M. “IT Culture: Too Safe For Comfort.” InformationWeek, January 29,
2007.
115. McKeown, B., and Thomas, D. Q Methodology. SAGE Publications: Newbury
Park, 1988.

262
116. Morosini, P., Shane, S., and Singh, H. “National Cultural Distance and Cross-
Border Acquisition Performance.” Journal of International Business Studies (29:1)
1998, pp. 137-158.
117. Nord, J., Nord, G., Cormack, S., and Cater-Steel, A. ”IT Culture: Its Impact on
Communication and Work Relationships in Business.” International Journal of
Intercultural Information Management (1:1) 2007, pp. 85-107.
118. Nunnally, J. and Bernstein, I. Psychometric Theory. Third edition. McGraw-Hill:
New York, 1994.
119. Orlikowski, W. ”Integrated Information Environment or Matrix of Control? The
Contradictory Implications of Information Technology” Accounting, Management
and Infromation Technologies (1:1) 1991, pp. 9-42.
120. Orlikowski, W. And Baroudi, J. ”Studying Information Technology in
Organizations: Research Approaches and Assumptions.” Information Systems
Research (2:1) 1991, pp. 1-28.
121. Orlikowski, W. And Baroudi, J. ”The Information Systems Profession: Myth or
Reality?” Office: Technology & People (4) 1989, pp. 13-30.
122. Palvia, P. and Jacks, T. ”An Examination of National Culture and IS Values.” Tenth
Annual Global Information Technology Management Association (GITMA)
Conference 2009.
123. Parsons, T. And Shils, E. (Eds.) Toward a General Theory of Action. Harper
Torchbooks: New York, 1951.
124. Patten, K., Fjermestad, J., and Whitworth, B. ”How CIOs Use Flexibility to Manage
Uncertainty in Dynamic Business Environments.”. AMCIS 2009 Proceedings.
125. Pavalko, R. (Ed.) Sociological Perspectives on Occupations. F.E. Peacock
Publishers: Itasca, Illinois, 1972.
126. Peacock, J. ”Durkheim and the Social Anthropology of Culture.” Social Forces
(59:4) 1981, pp. 996-1008.
127. Penley C. and Ross, A. (eds.) Technoculture. University of Minnesota Press:
Minneapolis, 1991.

263
128. Pliskin, N., Romm, T., Lee, A., and Weber, Y. “Presumed Versus Actual
Organizational Culture; Managerial Implications for Implementation of Information
Systems,” The Computer Journal (36:2) 1993, pp. 143-152.
129. Podsakoff, P. and Organ, D. “Self-reports in Organizational Research: Problems
and Prospects.” Journal of Management (12:4), 1986, pp. 531-544.
130. Posner, B. and Schmidt, W. “The Values of Business and Federal Government
Executives: More Different Than Alike.” Public Personnel Management (25:3)
1996, pp. 277-289.
131. Quinn, R. and Rohrbaugh, J. “A Spatial Model of Effectiveness Criteria: Toward a
Competing Values Approach to Organizational Analysis.” Management Science
(29) 1983, pp. 363-377.
132. Ramachandran, S. and Rao, S. “An Effort Towards Identifying Occupational
Culture among Information Systems Professionals.” ACM SIGMIS-CPR 2006.
133. Raykov, T. and Marcoulides, G. A First Course in Structural Equation Modeling.
Lawrence Erlbaum Associates, Publishers: Mahwah, New Jersey, 2006.
134. Reich, B. and Benbasat, I. “Factors That Influence the Social Dimension of
Alignment Between Business and Information Technology Objectives.” MIS
Quarterly (24:1) 2000, pp. 81-113.
135. Rencher, A. Methods of Multivariate Analysis. 2nd
edition. Wiley-Interscience:
Hoboken, NJ, 2002.
136. Reynolds, H. Analysis of Nominal Data. 2nd
ed. Sage Publications: Beverly Hills,
CA, 1984.
137. Richards, L. Handling Qualitative Data: A Practical Guide. Sage Publications:
Thousand Oaks, CA, 2005.
138. Riley, A. Impure Play: Sacredness, Transgression, and the Tragic in Popular
Culture. Lexington Books: Lanham, MD, 2010.
139. Robey, D. and Markus, M. “Rituals in Information System Design,” MIS Quarterly
(8) 1984, pp. 5-15.

264
140. Robey, D., Smith, L., Vijayasarathy, L. “Perceptions of Conflict and Success in
Information Systems Department Projects,” Journal of Management Information
Systems (10:1), 1993.
141. Robinson, C., and Betz, N. “A Psychometric Evaluation of Super’s Work Values
Inventory – Revised”. Journal of Career Assessment (16:4) 2008, pp. 456-473.
142. Rogers, E., and Larsen, J. Silicon Valley Fever: Growth of High-Technology
Culture. Basic Books: New York, 1984.
143. Romm, T., Pliskin, N., Weber, Y., and Lee, A. “Identifying Organizational Culture
Clash in MIS Implementation.” Information & Management (21) 1991, pp. 99-109.
144. Roszak, T. The Cult of Information. University of California Press: Berkeley, CA,
1994.
145. Rubin, H. and Rubin, I. Qualitative Interviewing: The Art of Hearing Data. Sage
Publications: Thousand Oaks, CA, 1995.
146. Saisana, M., Saltelli, A., and Tarantola, S. “Uncertainty and Sensitivity Analysis
Techniques as Tools for the Quality Assessment of Composite Indicators.” Journal
of the Royal Statistical Society (168:2), pp. 1-17.
147. Saldana, J. The Coding Manual for Qualitative Researchers. Sage Publications:
Thousand Oaks, CA, 2009.
148. Sarala, R. “The Impact of Cultural Differences and Acculturation Factors on Post-
Acquisition Conflict.” Scandinavian Journal of Management (26) 2010, pp. 38-56.
149. Schein, E. Organizational Culture and Leadership. Jossey-Bass Publishers: San
Francisco, 1985.
150. Schein, E. The Corporate Culture Survival Guide. Jossey-Bass Publishers: San
Francisco, 1999.
151. Scholz, C. “The Symbolic Value of Computerized Information Systems” in
Gagliardi, P. (Ed.), Symbols and Artifacts: Views of the Corporate Landscape.
Aldine de Gruyter: New York, 1990.
152. Shenkar, O. “Cultural Distance Revisited: Towards a More Rigorous
Conceptualization and Measurement of Cultural Differences.” Journal of
International Business Studies (32:3) 2001, pp. 519-535.

265
153. Shore, B. “Cultural Asymmetries and the Challenge of Global Enterprise
Integration” in Palvia, P., Palvia, S., and Harris, A. (Eds.), Managing Global
Information Technology: Strategies and Challenges. Ivy League Publishing, 2007.
154. Shore, B. and Venkatachalam, V. “Prototyping: A Metaphor for Cross-Cultural
Transfer and Implementation of IS Applications.” Information & Management (27)
1994, pp. 175-184.
155. Smith, H, Milberg, S., and Burke, S. “Information Privacy: Measuring Individuals’
Concerns About Organizational Practices,” MIS Quarterly (20:2) 1996, pp. 167-
196.
156. Smith, P., and Riley, A. Cultural Theory: An Introduction. 2nd
Edition. Blackwell
Publishing: Oxford, 2009.
157. Spillman, L. “Introduction: Culture and Cultural Sociology” in Cultural Sociology.
Spillman, L. (Ed.) Blackwell Publishers: Oxford, 2002.
158. Straub, D. “Validating Instruments in MIS Research.” MIS Quarterly (June) 1989,
pp. 147-169.
159. Straub, D., Loch, K., Evaristo, R., Karahanna, E., and Srite, M. “Toward a Theory-
Based Measurement of Culture.” Journal of Global Information Management (Jan-
Mar) 2002, pp. 13-23.
160. Subramanian, R. “India and Information Technology: A Historical & Critical
Perspective.” Journal of Global Information Technology Management (9:4) 2006.
161. Swidler, A. “Culture in Action: Symbols and Strategies.” American Sociological
Review (51:2) 1986, pp. 273-286.
162. Tallon, P. “A Process-Oriented Perspective on the Alignment of Information
Technology and Business Strategy.” Journal of Management Information Systems
(24:3) 2007/2008, pp. 227-268.
163. Tatsuoka, M. Classification Procedures: Profile Similarity. Institute for Personality
and Ability Testing: Champaign, IL, 1974.
164. Tihanyi, L., Griffith, D., and Russell, C. “The Effect of Cultural Distance on Entry
Mode Choice, International Diversification, and MNE Performance: A Meta-
Analysis.” Journal of International Business Studies (36) 2005, pp. 270-283.

266
165. Timasheff, N. Sociological Theory: Its Nature and Growth. Random House: New
York, 1967.
166. Trice, H. Occupational Subcultures in the Workplace. ILR Press: Ithaca, New York,
1993.
167. Trompenaars, F. Riding the Waves of Culture. Nicholas Brealey: London. 1993.
168. Venkatraman, N. and Ramanujam, V. “ Measurement of Business Performance in
Strategy Research: A Comparison of Approaches.” The Academy of Management
Review (11:4) 1986, pp. 801-814.
169. Venkatraman, N. and Ramanujam, V. “Measurement of Business Economic
Performance: An Examination of Method Convergence.” Journal of Management
(13:1), 1987, pp. 109-122.
170. Von Meier, A. “Occupational Cultures as a Challenge to Technological
Innovation.” IEEE Transactions on Engineering Management (46:1) 1999, pp. 101-
114.
171. Walsh, I. “Development of an Instrument to Assess Individual IT Culture.”
Proceedings of the Fifteenth Americas Conference on Information Systems, San
Francisco, California August 6th
– 9th
2009.
172. Walsh, I. and Kefi, H. “Developing the Concept of Individual IT-Culture: The
Spinning Top Metaphor.” Proceedings of the Fourteenth Americas Conference on
Information Systems, Toronto, ON, Canada August 14th
– 17th
2008.
173. Walsh, I. and Kefi, H. “The Role of IT Culture in IT Management: Searching for
Individual Archetypal IT Culture Profiles.” Proceedings of the Fourteenth
Americas Conference on Information Systems, Toronto, ON, Canada August 14th
–
17th
2008.
174. Walsh, I. and Kefi, H. “The Spinning Top Model, a New Path to Conceptualize
Culture and Values: Applications to IS Research.” Twenty Ninth International
Conference on Information Systems, Paris 2008.
175. Ward, J. and Peppard, J. “Reconciling the IT/Business Relationship: A Troubled
Marriage in Need of Guidance.” Strategic Information Systems (5:2) 1996, pp. 37-
65.
176. Weber, M. The Theory of Social and Economic Organisation. Parsons, T. (Trans.)
Hodge: London, 1947.

267
177. Weber, M. Economy and Society. Roth, G. and Wittich, C. (Eds.) Bedminster Press:
London, 1968.
178. Weber, M. The Protestant Ethic and the Spirit of Capitalism. Parsons, T. (Trans.)
Routledge: London, 1992.
179. Weber, R. Basic Content Analysis. 2nd
ed. Sage Publications: Thousand Oaks, CA,
1990.
180. Webster, J. and Martocchio, J. “Microcomputer Playfulness: Development of a
Measure with Workplace Implications.” MIS Quarterly (June) 1992, pp. 201-226.
181. Wuthnow, R. Meaning and Moral Order: Explorations in Cultural Analysis.
University of California Press: Berkeley, CA, 1987.
182. Yin, R. Case Study Research: Designs and Methods. Sage Publications: Thousand
Oaks, CA, 2003.

268
APPENDIX A
PILOT INTERVIEW QUESTIONS
1) Tell me about your background in IT.
2) What do you like about working in IT?
3) What do you not like about working in IT?
4) In what ways do you think IT people are different from people in other departments in
your organization?
5) Have you worked in an IT department in any other companies? If so, how were things
different there?
6) What were relationships like with other groups outside IT?
7) Name five adjectives that describe your IT group.
8) How does that differ from your first IT job?
9) What do you think is important to IT people? What do we like and dislike at work?
10) What changes have you seen in IT culture over time?

269
APPENDIX B
FULL STUDY INTERVIEW QUESTIONS
Ask about anonymity preference. Explain recording and transcription process. Explain
purpose of study.
Ask about demographic information. Age, years of experience, current job title, level of
education, size of organization, size of IT department
1) Tell me about your background in IT. How did you start and where are you now?
How does your current role differ from your first IT job?
2) Tell me about your job responsibilities today. What is a typical day like?
3) What do you like about working in IT? What do you not like about working in IT?
4) In what ways do you think IT people are different from people in other departments?
5) Have you worked in an IT department in any other companies? If so, how were things
different there?
6) What were relationships like with other groups outside IT? What groups do you like
to work with or not work with and why?
7) Name five adjectives that describe IT people.
8) What do you think is important to IT people? What do we like and dislike at work?
9) What changes have you seen in IT culture over time?
10) Who are some of your personal IT heroes and why? Who do you look up to? Are
there any IT villains?
11) What historical events do you feel have really impacted IT professionals?
12) How exactly is the language you use different from non-IT people?
13) What highly specialized skills and abilities are required in your profession?

270
14) Does your job involve extreme or unusual demands?
15) Do you have a strong sense of who is and who is not an IT person? How can you tell?
16) How much does your job take over you after-work life?
17) Are you proud to be in IT? Why or why not?
18) Who do you refer to at work in order to gauge how well you are doing?
19) What sorts of phrases or activities do you find you don’t have to explain to fellow IT
workers but you do have to explain to non-IT people?
20) Some of the IT values that have been previously identified include the following. What
do you think of each one and can you think of examples? (Provide definitions for
structure of power, control, open communication, risk, reverence for knowledge,
enjoyment.) What would you add to this list?
21) What does IT/business alignment mean to you? IT success?
22) Is your work meaningful or not? Please elaborate.

271
APPENDIX C
PILOT SURVEY INSTRUMENT
Quick Definitions: What do you mean by "IT"? IT refers to the Information Technology department or
Information Systems department within your organization. If you report up through a
CIO, you work in IT.
What do you mean by "non-IT"? Non-IT refers to other departments outside of IT such
as Accounting, Human Resources, or Marketing.
What do you mean by “the business”? The business is defined as the core business of
your organization (for example, manufacturing, banking, retail).
What do you mean by "end users"? End users are people in the organization that use
IT services but do not work in the IT department.
This survey is intended for IT professionals who are not in management. If you do
not work in an IT field or you work in management, please do not complete this
survey.
Instructions: Indicate your level of agreement with the following statements. Your
responses should be based on your own beliefs and values.
COMM1 Good communication between IT and the end user community is vital.
COMM2 Communication with non-IT groups should be open.
COMM3
The IT group should translate technical ideas in terms that non-IT people can
understand.
COMM4 Communication with non-IT groups should exhibit full disclosure about problems and opportunities.
COMM5 Communication with non-IT groups should be frank.
CON1 IT processes should be documented.
CON2 IT processes should be standardized.
CON3 IT processes should be formalized.
CON4 IT processes should be governed by policies.
CON5 It is important to follow the documented policies and procedures consistently.
CON6 IT personnel should maintain tight control of systems.
ALI1 IT should have a good understanding of the organization’s business environment.
ALI2 IT should have a strong partnership with the business.
ALI3 IT should integrate closely with the business
ALI4 IT’s primary job is to respond to the business environment.
ALI5 Strategic business planning should be done with IT participation.
ALI6 Strategic IT planning should be done with business participation.
RIS1 It is better to play it safe in IT.

272
RIS2 It is not good for IT to take chances.
RIS3 Risk taking in IT is not rewarded.
RIS4 IT should not make mistakes.
POW1 IT should have fewer levels of management.
POW2 IT should be more decentralized.
POW3 Power should be concentrated at the top of the organization. REVERSED
POW4 IT organizations should be more flat.
POW5 IT should have less hierarchy in the organization.
KNO1 People with IT technical knowledge should get respect.
KNO2 Technical knowledge is power.
KNO3 The person with the most knowledge should be making the decisions.
KNO4 One should defer to people who have more technical knowledge.
KNO5 People with IT expertise are to be revered.
KNO6 People with IT expertise are to be admired.
ENJ1 IT work should express creativity.
ENJ2 IT work should give a sense of satisfaction.
ENJ3 IT work should be personally fulfilling.
ENJ4 IT work should be challenging.
ENJ5 IT work should be fun.
ENJ6 IT work should involve getting to play with new toys.
VAL1 IT has enabled our company to expand its market share.
VAL2 IT has enabled our company to increase its market dominance.
VAL3 Our company has strengthened its core business due to IT.
VAL4 IT has enabled our company to improve administrative efficiency.
VAL5 IT has enabled our company to improve productivity.
Org1 Our IT organization is highly centralized.
Org2 Our IT organization is highly decentralized.
Org3
Our IT organization is highly federated (centralized infrastructure with
decentralized application support)
Gender
Age
Education
Experience
Job_title
Feedback

273
APPENDIX D
FULL STUDY INSTRUMENT - ITOC
IT Occupational Culture Survey
UNIVERSITY OF NORTH CAROLINA AT GREENSBORO
Project Title: Measuring IT Occupational Culture
Project Director: Dr. Prashant Palvia and Tim Jacks
Please take a moment to carefully review this consent form in its entirety. Remember that participation in
this study is entirely voluntary and you may choose not to participate or to withdraw at any time. Please
note that you must be at least 18 years of age to participate in this study. If you are under the age of 18, you
are asked not to participate.
What is the study about?
This is a research project. The purpose of this research is to learn more about Information Technology (IT)
professionals and their experiences working in the field of information technology. This study contributes
to the research on occupational culture by identifying ways of measuring the relevant dimensions of
occupational culture for IT professionals and their impact on firm performance. This study also contributes
to practitioners by delivering a better understanding of how IT occupational culture can differ from
organizational business culture and where conflicts of values and assumptions can take place.
Why are you asking me?
Criteria for inclusion in the survey include: 1) your organization has agreed to participate in this study and
2) you are either an IT professional (non-managerial) or a business manager (non-IT) within your
organization.
What will you ask me to do if I agree to be in the study?
You are being asked to fill out a short online survey which should take approximately 15 minutes to
complete.
What are the dangers to me?
The Institutional Review Board at the University of North Carolina at Greensboro has determined that
participation in this study poses minimal risk to participants.
If you have any concerns about your rights, how you are being treated or if you have questions, want more
information or have suggestions, please contact Eric Allen in the Office of Research Compliance at UNCG
toll-free at (855)-251-2351. Questions, concerns or complaints about this project or benefits or risks
associated with being in this study can be answered by Tim Jacks who may be contacted at (276) 206-7067
Are there any benefits to me for taking part in this research study?
There are no direct benefits to participants in this study.
Will I get paid for being in the study? Will it cost me anything?
There are no costs to you or payments made for participating in this study. However there will be four
random drawings for a $50 gift card to Amazon.com for the participants at the conclusion of the study.
How will you keep my information confidential?
Your answers will be kept strictly confidential and will not be released in any form that can be identified
with you individually. Results of the survey may be published in aggregate form only, without identifying
any individual. Data will be kept until the results are disseminated in aggregate form.
Data files will be stored on a password-protected computer and deleted from the computer after the study is
complete. It is important that you answer the questions honestly and accurately.
All information obtained in this study is strictly confidential unless disclosure is required by law.

274
Absolute confidentiality of data provided through the Internet cannot be guaranteed due to the
limited protections of Internet access.
Please be sure to close your browser when finished so no one will be able to see what you have been
doing.
What if I want to leave the study?
You have the right to refuse to participate or to withdraw at any time, without penalty. If you do withdraw,
it will not affect you in any way. If you
choose to withdraw, you may request that any of your data which has been collected be destroyed unless it
is in a de-identifiable state.
What about new information/changes in the study?
If significant new information relating to the study becomes available which may relate to your willingness
to continue to participate, this information will be provided to you.
Voluntary Consent by Participant:
By submitting your survey responses you are agreeing that you have read and fully understand the contents
of this document and you willingly consent to take part in this study. All of your questions concerning this
study have been answered. You are agreeing that you are 18 years of age or older and are agreeing to
participate.
You should print this form for your records. By submitting your responses you are indicating your consent
to participate in the project described to you in this document.
What is your gender?
Male Female
What is your age in years? (If you are under 18, please do not complete this survey.)
18-24 25-34 35-44 45-54 55-65 65+
What is your highest level of education?
High School Associate's degree Bachelor's degree Masters degree PhD
How many years of work experience do you have in your current career?
1-4 5-9 10-14 15-19 20-24 25-29 30+
What is the name of your company? (This will be kept confidential.)
What is your current job title?
Instructions: Please indicate your level of agreement with the following statements. Your responses
should be based on your own beliefs and values.
Having less bureaucracy for getting approval to take action is...
Not at all
Important Very Unimportant
Somewhat Unimportant
Neither Important nor Unimportant
Somewhat Important
Very Important
Extremely Important
Having a high level of freedom in order to do my job well is...
Having a "flatter" organizational structure (i.e., fewer layers of management) is...

275
Empowerment for employees to make decisions independently of management is...
Having a high level of access to raw data is...
Having everyone consistently adhere to hardware and software standards is...
Sticking to the original project plan (instead of making last minute change requests) is...
Clearly defined job roles and responsibilities are...
Enforcing rules is...
Orderliness is...
Ensuring that timelines and deadlines are reasonable, not rushed, is...
A high level of technical detail when communicating with others in the organization is...
Using exactly the right words when speaking is...
Precision in communication is...
Communicating specific expectations, instead of general expectations, is...
Communication of precise project timelines is...
Playing with the latest "bleeding edge" technology is...
Embracing new technology is...
Building clever new solutions is...
Showing creativity is...
Figuring out a better way to do things is...
Technical problem solving skills are...
Critical thinking skills are...
Earning respect based on intelligence is...
Being known for my intelligence is...
Learning new skills every day is...
Being motivated to learn new skills on your own is...
Having fun at work is...
Laughing and joking with others at work is...

276
Having a sense of humor is...
Going out to lunch with my co-workers is...
Variety in my daily tasks is...
Instructions: The following is a list of typical business management values. How important are the
following items to you in your day-to-day work life?
Not at all Important
Very Unimportant
Somewhat Unimportant
Neither Important nor Unimportant
Somewhat Important
Very Important
Extremely Important
Organizational effectiveness
High morale
Organizational reputation
Organizational efficiency
High productivity
Organizational stability
Organizational growth
Organizational value to community
Profit maximization
Service to the public
If you had any problems or concerns with this survey or if any wording was unclear, please provide your
feedback here. [optional]
If you would like to enter the drawing for a $50 gift card to Amazon.com, please enter your email address
here.
[optional]
If you would like a copy of the aggregated results when published, please provide your email address here.
[optional]
*** Thank you for your help in this research effort! ***

277
APPENDIX E
FULL STUDY INSTRUMENT - EXECUTIVE
Executive Survey on IT/Business Alignment and IT Value
UNIVERSITY OF NORTH CAROLINA AT GREENSBORO
Project Title: Measuring IT Occupational Culture
Project Director: Dr. Prashant Palvia and Tim Jacks
Please take a moment to carefully review this consent form in its entirety. Remember that participation in
this study is entirely voluntary and you may choose not to participate or to withdraw at any time. Please
note that you must be at least 18 years of age to participate in this study. If you are under the age of 18, you
are asked not to participate.
What is the study about?
This is a research project. The purpose of this research is to learn more about Information Technology (IT)
professionals and their experiences working in the field of information technology. This study contributes
to the research on occupational culture by identifying ways of measuring the relevant dimensions of
occupational culture for IT professionals and their impact on firm performance. This study also contributes
to practitioners by delivering a better understanding of how IT occupational culture can differ from
organizational business culture and where conflicts of values and assumptions can take place.
Why are you asking me?
Criteria for inclusion in the survey include: 1) your organization has agreed to participate in this study and
2) you are either an IT professional (non-managerial) or a business manager (non-IT) within your
organization.
What will you ask me to do if I agree to be in the study?
You are being asked to fill out an online survey which should take approximately 30 minutes to complete.
What are the dangers to me?
The Institutional Review Board at the University of North Carolina at Greensboro has determined that
participation in this study poses minimal risk to participants.
If you have any concerns about your rights, how you are being treated or if you have questions, want more
information or have suggestions, please contact Eric Allen in the Office of Research Compliance at UNCG
toll-free at (855)-251-2351. Questions, concerns or complaints about this project or benefits or risks
associated with being in this study can be answered by Tim Jacks who may be contacted at (276) 206-7067
Are there any benefits to me for taking part in this research study?
There are no direct benefits to participants in this study.
Will I get paid for being in the study? Will it cost me anything?
There are no costs to you or payments made for participating in this study. However there will be four
random drawings for a $50 gift card to Amazon.com for the participants at the conclusion of the study.
How will you keep my information confidential?
Your answers will be kept strictly confidential and will not be released in any form that can be identified
with you individually. Results of the survey may be published in aggregate form only, without identifying
any individual. Data will be kept until the results are disseminated in aggregate form.
Data files will be stored on a password-protected computer and deleted from the computer after the study is
complete. It is important that you answer the questions honestly and accurately.
All information obtained in this study is strictly confidential unless disclosure is required by law.
Absolute confidentiality of data provided through the Internet cannot be guaranteed due to the
limited protections of Internet access.

278
Please be sure to close your browser when finished so no one will be able to see what you have been
doing.
What if I want to leave the study?
You have the right to refuse to participate or to withdraw at any time, without penalty. If you do withdraw,
it will not affect you in any way. If you choose to withdraw, you may request that any of your data which
has been collected be destroyed unless it is in a de-identifiable state.
What about new information/changes in the study?
If significant new information relating to the study becomes available which may relate to your willingness
to continue to participate, this information will be provided to you.
Voluntary Consent by Participant:
By submitting your survey responses you are agreeing that you have read and fully understand the contents
of this document and you willingly consent to take part in this study. All of your questions concerning this
study have been answered. You are agreeing that you are 18 years of age or older and are agreeing to
participate.
You should print this form for your records. By submitting your responses you are indicating your consent
to participate in the project described to you in this document.
Instructions:
This survey asks in-depth questions about your organization which will make the outcome equally in-
depth.
Please try to find a quiet place to take the survey where you will not be interrupted. Allow 20-30
minutes to complete it.
If you have to stop the survey before you are finished, you can pick up where you left off if you are on
the same PC.
Instructions: This survey is intended to be completed by an Executive within your organization.
What is your current job title?
CEO CIO CFO COO SVP VP Other (please indicate)
What is your gender?
Male Female
What is your age in years? (If you are under 18, please do not complete this survey.)
18-24 25-34 35-44 45-54 55-64 65+
What is your highest level of education?
How many years of work experience do you have in your current career?
1-4 5-9 10-14 15-19 20-24 25-29 30+
What is the name of your company? (This will be kept confidential.)
How would you categorize your company's industry?
Approximately how many employees does your company have?
1-99 100-999 1,000-9,999 10,000-99,999 100,000-999,999
What is the approximate age of your company (in years)?
1-9 10-19 20-29 30-39 40-49 50+

279
Please describe your Information Technology (IT) organizational structure.
Our IT organizational structure is best described as centralized . ("Centralized" means more of our
IT infrastructure and IT personnel are located at central corporate locations.)
Our IT organizational structure is best described as decentralized . ("Decentralized" means more
of our IT infrastructure and IT personnel are distributed to each individual location.)
Our IT organizational structure is best described as federated. ("Federated" means more of the IT
infrastructure is
centralized while IT personnel are distributed to each location for application support.)
Other
Please describe your Chief Information Officer (CIO) reporting structure.
Our CIO reports directly to the CEO.
Our CIO reports directly to the CFO.
Our CIO reports directly to the COO.
Our CIO reports directly to a different executive. (Please identify their title.)
Our organization does not have a CIO.
Instructions:
The next six sections assess your firm’s current level of strategic alignment maturity by measuring
your response to items related to your IT and business organization’s:
1. Communications
2. Competency and value of IT
3. IT governance decisions
4. Partnerships
5. IT infrastructure
6. Skills resources
For each of the questions in these sections, you are asked to choose the one response that most closely
represents your opinion of the effectiveness of your organization’s management practices and
strategic choices. If you are unsure how to answer a question without guessing, or if the item is not
applicable to your organization, mark the “N/A or don’t know” box and add comments as necessary.
1. Effectiveness of IT and Business Communications
To what extent does IT understand the organization’s business environment (e.g., its customers,
competitors, processes, partners/alliances):
Senior and mid-level IT managers do not understand the business.
Senior and mid-level IT managers have a limited understanding of the business.
Senior and mid-level IT managers have a good understanding of the business.
Understanding of the business by all IT members is encouraged and promoted by senior managers.
Understanding of the business is required (e.g., tied to performance appraisals) throughout the IT
function.
N/A or don’t know
To what extent do the business organizations understand the IT environment (e.g., its current and
potential capabilities, systems, services, processes):
Senior and mid-level business managers do not understand IT.
Senior and mid-level business managers have a limited understanding of IT.
Senior and mid-level business managers have a good understanding of IT.
Understanding of IT by all employees is encouraged and promoted by senior management.
Understanding of IT is required (e.g., tied to performance appraisals) throughout the business.

280
N/A or don’t know
The following statements pertain to methods in place to promote organizational education/learning
(e.g., of experiences, problems, objectives, critical success factors). Organizational learning occurs
primarily through:
Ad-hoc/casual methods (employee observation, anecdote sharing, peer meetings, etc.)
Informal methods (newsletters, bulletin board notices, computer reports, group e-mail, fax, etc.)
Regular, clear methods (training, e-mail, phone-mail, intranet, department meetings, etc.) from
mid-level management
Formal, unifying, bonding methods from senior and mid-level management
Formal, unifying, bonding methods from senior and mid-level management, with feedback
measures to monitor and
promote effectiveness of learning
N/A or don’t know
The following question pertains to communications protocol. The IT and business communication
style tends to be:
One-way, from the business; formal and inflexible
One-way, from the business; moderately informal and moderately flexible
Two-way; formal and inflexible
Two-way; moderately informal and moderately flexible
Two-way; informal and flexible
N/A or don’t know
The following statements pertain to the extent in which there is knowledge sharing between IT and
business:
Knowledge sharing is on an ad-hoc basis.
Knowledge sharing is somewhat structured and/or structure is beginning to be created.
There is structured sharing around key functional unit processes.
There is formal sharing at the functional unit level and at the corporate level.
There is formal sharing at the functional unit level, at the corporate level, and with business
partners/alliances.
N/A or don’t know
The following statements pertain to the role and effectiveness of IT and business liaisons:
We do not use liaisons, or if we do, we do so on an ad-hoc, as needed basis.
We regularly use liaisons to transfer IT knowledge to the business and business knowledge to IT.
They are the primary contact point for interactions between IT and the business. Liaisons are not
usually used to facilitate relationship development.
We regularly use liaisons to transfer IT knowledge to the business and business knowledge to IT.
They occasionally facilitate relationship development.
We regularly use liaisons to facilitate the transfer of IT knowledge to the business and business
knowledge to IT. Their primary objective is to facilitate internal relationship development.
We regularly use liaisons to facilitate the transfer of IT knowledge to the business and external
partners and business knowledge to IT. Their primary objective is to facilitate relationship
development across the business and its external partners.
N/A or don’t know

281
2. Measurement of the Competency and Value of IT
The following statements pertain to the metrics and processes used to measure IT’s contribution to
the business.
The metrics and processes we have in place to measure IT are primarily technical (e.g., system
availability, response time).
We are equally concerned with technical and cost efficiency measures. We have limited or no
formal feedback processes in place to review and take action based on the results of our measures.
We formally assess technical and cost efficiency using traditional financial measures, such as
return on investment (ROI) and activity-based costing (ABC). We are starting to put formal
feedback processes in place to review and take action based on the results of our measures.
We formally assess technical, cost efficiency, and cost effectiveness using traditional financial
measures (e.g., ROI, ABC). We have formal feedback processes in place to review and take action
based on the results of our measures.
We use a multi-dimensional approach with appropriate weights given to technical, financial,
operational, and human-related measures. We have formal feedback processes in place to review
and take action based on the results of our measures. These measures are extended to our external
partners (e.g., vendors, outsourcers, customers).
N/A or don’t know
The following statements pertain to the use of business metrics to measure contribution to the
business.
We do not measure the value of our business investments, or do so on an ad-hoc basis.
We are concerned with cost efficiency measures at the functional organization level only. We have
limited or no formal feedback processes in place to review and take action based on the results of
our measures.
We formally use traditional financial measures, such as return on investment (ROI) and activity-
based costing (ABC), across functional organizations. We are starting to have formal feedback
processes in place to review and take action based on the results of our measures.
We formally measure value based on the contribution to our customers. We have formal feedback
processes in place to review and take action based on the results of our measures and to assess
contributions across functional organizations.
We use a multi-dimensional approach with appropriate weights given to technical, financial,
operational, and human-related measures. We have formal feedback processes in place to review
and take action based on the results of our measures. These measures are extended to our external
partners (e.g., vendors, outsourcers, customers).
N/A or don’t know
The following statements pertain to the use of integrated IT and business metrics to measure IT’s
contribution to the business.
We do not measure the value of our IT business investments, or do so on an ad-hoc basis.
The value measurements for IT and business are not linked. We have limited or no formal
feedback processes in place to review and take action based on the results of our measures.
The value measurements for IT and business are starting to be linked and formalized. We are also
starting to have formal feedback processes in place to review and take action based on the results
of our measures.
We formally link the value measurements of IT and business. We have formal feedback processes
in place to review and take action based on the results of our measures and to assess contributions
across functional organizations.
We use a multi-dimensional approach with appropriate weight given to IT and business measures.
We have formal feedback processes in place to review and take action based on the results of our

282
measures. These measures are extended to our external partners (e.g., vendors, outsourcers,
customers).
N/A or don’t know
The following statements pertain to the use of service level agreements (SLAs):
We do not use SLAs or do so sporadically.
We have SLAs which are primarily technically oriented (response time, length of computer
downtime, etc.), between the IT and functional organizations.
We have SLAs which are both technically oriented and relationship-oriented (user/customer
satisfaction, IT’s commitment to the business, etc.) that are between the IT and functional
organizations and also emerging across the enterprise.
We have SLAs which are both technically-oriented and relationship-oriented, between the IT and
functional organizations as well as enterprise wide.
We have SLAs which are both technically-oriented and relationship-oriented, between the IT and
functional organizations as well as at enterprise wide and with our external partners/alliances.
N/A or don’t know
The following statements pertain to benchmarking practices. Informal practices include informal
interviews, literature searches, company visits, etc. Formal practices include environmental scanning,
data gathering and analysis, determining best practices, etc.
We seldom or never perform either informal or formal benchmarks.
We occasionally or routinely perform informal benchmarks.
We occasionally perform formal benchmarks and seldom take action based on the findings.
We routinely perform formal benchmarks and usually take action based on the findings.
We routinely perform formal benchmarks and have a regulated process in place to take action and
measure the changes.
N/A or don’t know
The following statements pertain to the extent of assessment and review of IT investments.
We do not formally assess and/or review.
We assess and/or review only after we have a business or IT problem (i.e., failed IT project,
market share loss).
Assessments and/or reviews are becoming routine occurrences.
We routinely assess and/or review and have a formal process in place to make changes based on
the results.
We routinely assess and/or review and have a formal process in place to make changes based on
the results and measure the changes. Our external partners are included in the process.
N/A or don’t know
The following statements pertain to the extent to which IT-business continuous improvement
practices (e.g., quality circles, quality reviews) and effectiveness measures are in place.
We do not have any continuous improvement practices in place.
We have a few continuous improvement practices in place, but no effectiveness measures are in
place.
We have a few continuous improvement practices in place and the use of effectiveness measures is
emerging.
We have many continuous improvement practices in place and we frequently measure their
effectiveness.
We have well established continuous improvement practices and effectiveness measures in place.
N/A or don’t know

283
The demonstrated contribution that the IT function has made to the accomplishment of the
organization’s strategic goals is:
Very weak
Somewhat weak
Neither weak nor strong
Somewhat strong
Very strong
N/A or don’t know
The following statements pertain to strategic business planning with IT participation.
We do no formal strategic business planning or, if it is done, it is done on an as-needed basis.
We do formal strategic business planning at the functional unit level with slight IT participation.
We do formal strategic business planning at the functional unit levels with some IT participation.
There is some interorganizational planning.
We do formal strategic business planning at the functional unit and across the enterprise with IT
participation.
We do formal strategic business planning at the functional unit, across the enterprise, and with our
business partners/alliances with IT participation.
N/A or don’t know
The following statements pertain to strategic IT planning with business participation.
We do no formal strategic IT planning or, if it is done, it is done on an as-needed basis.
We do formal strategic IT planning at the functional unit level with slight business participation.
We do formal strategic IT planning at the functional unit levels with some business participation.
There is some interorganizational planning.
We do formal strategic IT planning at the functional unit and across the enterprise with the
business.
We do formal strategic business planning at the functional unit, across the enterprise, and with our
business partners/alliances.
N/A or don’t know
The following statements pertain to IT budgeting. Our IT function is budgeted as a:
Cost center, with erratic/inconsistent/irregular/changeable spending
Cost center, by functional organization
Cost center with some projects treated as investments
Investment center
Profit center, where IT generates revenues
N/A or don’t know
The following statements pertain to IT investment decisions. Our IT investment decisions are
primarily based on IT’s ability to:
Reduce costs.
Increase productivity and efficiency as the focus.
Traditional financial reviews. IT is seen as a process enabler.
Business effectiveness is the focus. IT is seen as a process driver or business strategy enabler.
Create competitive advantage and increase profit. Our business partners see value.
N/A or don’t know

284
The following statements pertain to IT steering committee(s) with senior level IT and business
management participation.
We do not have formal/regular steering committee(s).
We have committee(s) which meet informally on an as-needed basis.
We have formal committees, which meet regularly and have emerging effectiveness.
We have formal, regular committee meetings with demonstrated effectiveness.
We have formal, regular committee meetings with demonstrated effectiveness that include
strategic business partners sharing decision-making responsibilities.
N/A or don’t know
The following statements pertain to how IT projects are prioritized. Our IT project prioritization
process is usually:
In reaction to a business or IT need.
Determined by the IT function.
Determined by the business function.
Mutually determined between senior and mid-level IT and business management.
Mutually determined between senior and mid-level IT and business management and with
consideration of the priorities of any business partners/alliances.
N/A or don’t know
The ability of the IT function to react/respond quickly to the organization’s changing business needs
is:
Very weak
Somewhat weak
Neither weak nor strong
Somewhat strong
Very strong
N/A or don’t know
4. Partnerships Between IT And Business Functions
IT is perceived by the business as:
A cost of doing business
Emerging as an asset
A fundamental enabler of future business activity
A fundamental driver of future business activity
A partner with the business that co-adapts/improvises in bringing value to the firm
N/A or don’t know
The following statements pertain to the role of IT in strategic business planning.
IT does not have a role.
IT is used to enable business processes.
IT is used to drive business processes.
IT is used to enable or drive business strategy.
IT co-adapts with the business to enable/drive strategic objectives.
N/A or don’t know

285
The following statements pertain to the sharing (by IT and business management) of the risks and
rewards (e.g., bonuses) associated with IT-based initiatives (i.e., a project is late and over budget
because of business requirement changes).
IT takes all the risks and does not receive any of the rewards.
IT takes most of the risks with little reward.
Sharing of risks and rewards is emerging.
Risks and rewards are always shared.
Risks and rewards are always shared and we have formal compensation and reward systems in
place that induce managers to take risks.
N/A or don’t know
The following statements pertain to formally managing the IT/business relationship. To what extent
are there formal processes in place that focus on enhancing the partnership relationships that exist
between IT and business (e.g., cross-functional teams, training, risk/reward sharing):
We don’t manage our relationships.
We manage our relationships on an ad-hoc basis.
We have defined programs to manage our relationships, but IT or the business does not always
comply with them.
Conflict is seen as creative rather than disruptive.
We have defined programs to manage our relationships and both IT and the business comply with
them.
We have defined programs to manage our relationships, both IT and the business comply with
them, and we are continuously improving them.
N/A or don’t know
The following statements pertain to IT and business relationship and trust.
There is a sense of conflict and mistrust between IT and the business.
The association is primarily an “arm’s length” transactional style of relationship.
IT is emerging as a valued service provider.
The association is primarily a long-term partnership style of relationship.
The association is a long-term partnership and valued service provider.
N/A or don’t know
The following statements pertain to business sponsors/champions. Our IT-based initiatives:
Do not usually have a senior level IT or business sponsor/champion.
Often have a senior level IT sponsor/champion only.
Often have a senior level IT and business sponsor/champion at the functional unit level.
Often have a senior level IT and business sponsor/champion at the corporate level.
Often have a senior level IT and the CEO as the business/sponsor champion.
N/A or don’t know
5. Scope And Architecture of the IT Infrastructure
The following statements pertain to the scope of your IT systems. Our primary systems are:
Traditional office support (e.g., e-mail, accounting, word processing, legacy systems)
Transaction-oriented (e.g., back office support)
Business process enablers (IT supports business process change)
Business process drivers (IT is a catalyst for business process change)
Business strategy enablers/drivers (IT is a catalyst for changes in the business strategy)
N/A or don’t know

286
The following statements pertain to the articulation of and compliance with IT standards. Our IT
standards are:
Non-existent or not enforced
Defined and enforced at the functional unit level but not across different functional units
Defined and enforced at the functional unit level with emerging coordination across functional
units
Defined and enforced across functional units
Defined and enforced across functional units, and with joint coordination among our strategic
business partners/alliances
N/A or don’t know
The following statements pertain to the scope of architectural integration. The components of our IT
infrastructure are:
Not well integrated
Integrated at the functional unit with emerging integration across functional units
Integrated across functional units
Integrated across functional units and our strategic business partners/alliances
Evolving with our business partners
N/A or don’t know
The following statements pertain to the level of disruption caused by business and IT changes (e.g.,
implementation of a new technology, business process, merger/acquisition). Most of the time, a
business or IT change is:
Not readily transparent (very disruptive)
Transparent at the functional level only
Transparent at the functional level and emerging across all remote, branch, and mobile locations
Transparent across the entire organization
Transparent across the organization and to our business partners/alliances
N/A or don’t know
The following statements pertain to the scope of IT infrastructure flexibility to business and
technology changes. Our IT infrastructure is viewed as:
A utility providing the basic IT services at minimum cost
Emerging as driven by the requirements of the current business strategy
Driven by the requirements of the current business strategy
Emerging as a resource to enable fast response to changes in the marketplace
A resource to enable and drive fast response to changes in the marketplace
N/A or don’t know
6. Human Resource Skills
The following statements pertain to the extent the organization fosters an innovative entrepreneurial
environment. Entrepreneurship is:
Discouraged
Moderately encouraged at the functional unit level
Strongly encouraged at the functional unit level
Strongly encouraged at the functional unit and corporate levels
Strongly encouraged at the functional unit, corporate level, and with business partners/alliances
N/A or don’t know

287
The following statements pertain to the cultural locus of power in making IT-based decisions. Our
important IT decisions are made by:
Top business management or IT management at the corporate level only
Top business or IT management at corporate level with emerging functional unit level influence
Top business management at corporate and functional unit levels, with emerging shared influence
from IT management
Top management (business and IT) across the organization and emerging influence from our
business partners/alliances.
Top management across the organization with equal influence from our business
partners/alliances.
N/A or don’t know
The following statements pertain to your organization’s readiness for change.
We tend to resist change.
We recognize the need for change and change readiness programs are emerging.
Change readiness programs providing training and necessary skills to implement change are in
place at the functional unit level.
Change readiness programs are in place at the corporate level.
Change readiness programs are in place at the corporate level and we are proactive and anticipate
change.
N/A or don’t know
The following statements pertain to career crossover opportunities among IT and business personnel.
Job transfers rarely or never occur.
Job transfers occasionally occur within the functional organization.
Job transfers regularly occur for management level positions usually at the functional level.
Job transfers regularly occur for all position levels and within the functional units.
Job transfers regularly occur for all position levels, within the functional units, and at the corporate
level.
N/A or don’t know
The following statements pertain to employee opportunities to learn about and support services
outside the employee’s functional unit (e.g., programmers trained in product/service production
functions, customer service trained in systems analysis) using programs such as cross training and
job rotation. The organization:
Does not provide opportunities to learn about support services outside the employee’s functional
unit.
Opportunities are dependent on the functional unit.
Formal programs are practiced by all functional units.
Formal programs are practiced by all functional units and across the enterprise.
Opportunities are formally available across the enterprise and with business partners/alliances.
N/A or don’t know
The following statements pertain to the interpersonal interaction (e.g., trust, confidence, cultural,
social, and political environment) that exists across IT and business units in our organization.
There is minimum interaction between IT and business units.
The association is primarily an “arm’s length” transactional style of relationship.
Trust and confidence among IT and business is emerging.
Trust and confidence among IT and business is achieved.
Trust and confidence is extended to external customers and partners.

288
N/A or don’t know
The following statements pertain to the IT organization’s ability to attract and retain the best
business and technical professionals.
There is no formal program to retain IT professionals. Recruiting demands are filled ineffectively.
IT hiring is focused on technical expertise.
IT hiring is focused equally on technical and business expertise. Retention programs are in place.
Formal programs are in place to attract and retain the best IT professionals with both technical and
business skills.
Effective programs are in place to attract and retain the best IT professionals with both technical
and business skills.
N/A or don’t know
Instructions:
The following is a list of typical business management values. How important are the following items
to you in your day-to-day work?
Organizational effectiveness
High morale
Organizational reputation
Organizational efficiency
High productivity
Organizational stability
Organizational growth
Organizational value to community
Profit maximization
Service to the public
Instructions:
The following items reflect your perception of IT’s contribution to business value and firm
performance within your organization. Please rate your level of agreement with each one.
IT has enabled our company to expand its market share.
Strongly Disagree
Disagree Somewhat
Disagree
Neither Agree nor Disagree
Somewhat Agree
Agree
Strongly Agree
IT has enabled our company to increase its market dominance.
Our company has strengthened its core business due to IT.
IT has enabled our company to improve administrative efficiency.
IT has enabled our company to improve productivity.
If you had any problems or concerns with this survey or if any wording was unclear, please provide your
feedback here. [optional]

289
If you would like to enter the drawing for a $50 gift card to Amazon.com, please enter your email address
here.
[optional]
If you would like a copy of the aggregated results when published, please provide your email address here
[optional].
*** Thank you for your help in this important research effort! ***

290
APPENDIX F
IRB APPROVALS
From: IRB <[email protected]>
Date: Wed, Jul 6, 2011 at 10:22 AM
Subject: IRB Notice
Cc: [email protected], [email protected], [email protected]
To: Prashant Palvia
Information Systems and Oper Mgt
441-B Bryan Building
From: UNCG IRB
Date: 7/06/2011
RE: Notice of IRB Exemption
Exemption Category: 2.Survey, interview, public observation
Study #: 11-0250 Study Title: Interpreting IT Occupational Culture
This submission has been reviewed by the above IRB and was determined to be exempt
from further review according to the regulatory category cited above under 45 CFR
46.101(b).
Study Description: The purpose of this project is to get a better understanding of the occupational culture of
Information Technology professionals.
Investigator’s Responsibilities Please be aware that any changes to your protocol must be reviewed by the IRB prior to
being implemented. The IRB will maintain records for this study for three years from the
date of the original determination of exempt status.
CC:Tim Jacks, Deans Office Bryan Schl Of Bande, Chris Farrior, (ORED), Non-IRB
Review Contact, (ORC), Non-IRB Review Contact

291
From: IRB <[email protected]>
Date: Tue, Jan 24, 2012 at 10:40 AM
Subject: IRB Notice
Cc: [email protected], [email protected]
To: Prashant Palvia
Information Systems and Oper Mgt
441-B Bryan Building
From: UNCG IRB
Date: 1/24/2012
RE: Notice of IRB Exemption
Exemption Category: 2.Survey, interview, public observation
Study #: 12-0012
Study Title: Measuring IT Occupational Culture
This submission has been reviewed by the above IRB and was determined to be exempt
from further review according to the regulatory category cited above under 45 CFR
46.101(b).
Study Description: This study will examine different aspects of IT occupational culture and their impact on
IT/business alignment as well as firm performance.
Investigator’s Responsibilities Please be aware that any changes to your protocol must be reviewed by the IRB prior to
being implemented. The IRB will maintain records for this study for three years from the
date of the original determination of exempt status.
CC: Tim Jacks


![Tim Vicary - Skyjack [EnglishOnlineClub.com].pdf](https://static.fdokumen.com/doc/165x107/63332acbb91d35198e0b8e78/tim-vicary-skyjack-englishonlineclubcompdf.jpg)

