This micro iehe was - NASA Technical Reports Server
161
This micro iehe was Yli d l eets th ec itl cat IO C owback im eresult of th racteristics of the inal document.
-
Upload
khangminh22 -
Category
Documents
-
view
3 -
download
0
Transcript of This micro iehe was - NASA Technical Reports Server

This micro iehe was
Yli d l eets th ec itl cat IO
C owback im
eresult of th racteristics of the
inal document.

SOFIWARE ENGINEERING LABORATORY SERIES SEL-941002
SOFlWARIE MEASUREMENT GUIDEBOOK
JULY 1994
National Aeronautrcs and Space Administration
Goddard Space Flight Center Greenbeft, Maryland 20771


Foreword
The Software Engineering Laboratory (SEL) is an organization sponsored by the National Aeronautics and Space AdministrationGoddard Space Flight Center (NASAiGSFC) and created to investigate the effectiveness of software engineering technologies when applied to the development of applications software. The SEL was created in 1976 and has three primary organizational members:
NASNGSFC, Software Engineering Branch
University of Maryland, Department of Computer Science
Computer Sciences Corporation, Software Engineering Operation
The goals of the SEL are ( I ) to understand the software development process in the GSFC environment; (2j to measure the effects of various methodologies, tools, and models on this process: and (3) to identify and then ! J apply successful development practices. The activities, findings, and recommendations of the SEL are recorded in the Software Engineering Laboratory Series. a continuing series of rcprts brit includes this document.
This Software bfeusurernent Guidebook has also becn released as NASA-GB-001-94. a product of the Softwarc Engineering Program established by the Office of Safety and Mission Assurance (Code Q) at NASA Headquarters.
The following are primary contributors to this document:
Mitchell j. Bassman, Computer Sciences Corporation
Frank McGarry, Goddard Space Flight Center
Rose Pajerski, Goddard Space Flight Center
Single copies of this dociiment can be obtained by writing to
Software Engineering Branch Code 552 Goddard Space Flight Center Greenbelt, Maryland 2077 1

This Sofhvare Measitrement Guidebook presents information on the purpose and importance of measurement. It discusses the specific procedures and activities of a measurement program and the roles of the people involved. The guidebook also clarifie. the role that measurement can and mus: play in the goal of continual, sustained improvement for all software production and maintenance efforts.
SEL-94-002


Contents
... Fore word .................................................................................................................................... III
Abstract ...................................................................................................................................... v
Chapter 1 . Introduction .............................................................................................................. 1 1.1 Background ................................................................................................................. 1
1.2 Purpose ........................................................................................................................ 2
Chcpter 2 . The Role of Measurement in Software Engineering ................................................... 5 Measurement To Increase Understanding ..................................................................... 6 Measurement for Managing Software ......................................................................... 12
Planning and Estimating .................................................................................. 13
2.2.3 Validatine ....................................................................................................... 16 Measurement for Guiding Improvement ..................................................................... 16 2.3.1 Understanding ................................................................................................ 18
Chapter 3 . Establishing a Measurement Program ...................................................................... 21 3.1 Goals ......................................................................................................................... 22 3.2 Scope ......................................................................................................................... 23
Roles, Responsibilities, and Structure ......................................................................... 24 3.3.1 3.3.2 Andysis and Packaging .................................................................................. 26 3.3 -3 Technical Support ........................................................................................... 26 Selecting the Measures ............................................................................................... 28 Cost of Measurement ................................................................................................ 30
. . 1.3 Organizauon ................................................................................................................. 2
2.1 2.2
2.2.1 2.2.2 Tracking ......................................................................................................... 15
2.3
2.3.2 Assessing ........................................................................................................ 19 2.3.3 Packaging ....................................................................................................... 20
3.3 The Source of Data ......................................................................................... 25
3.4 3.5
3.5.1 3.5.2 3.5.3
Cost to Development and Maintenance Component ........................................ 32 Cost of Data Processing .................................................................................. 32 Cost of -4nalysis and Packaging ...................................................................... 33
Chapter 4 . Core Measures ........................................................................................................ 35 4.1 Cost ........................................................................................................................... 36
4.1 -1 Description .................................................................................................... 37 4.1.2 Data Definition ............................................................................................... 37
4.2 crrors ......................................................................................................................... 39 4.2.1 Description .................................................................................................... 39 4.2.2 Data Definition ............................................................................................... 40
-
4.3 Process Characteristics ............................................................................................... 41
SEL-94-002

4.3.1 Description .................................................................................................... 41 4.3.2 Data Gefinition ............................................................................................... 42
4.4 Project Dynamics ...................................................................................................... 43 4.4.1 Description ..................................................................................................... 43 4.4.2 Data Definition ............................................................................................... 43
4.5 Project Characteristics ................................................................................................ 44 4.5.1 Description ..................................................................................................... 45 4.5.2 Data Definition ............................................................................................... 46
Chapter 5 . Operation of a Measurement Program ..................................................................... 51
5.1
5.2
5.3
Development and Maintenance ................................................................................... 53
Participating in Studies ................................................................................... 54 Technical Support ...................................................................................................... 54
5.1 . 1 5 . I . 2
5.2.1 Collecting Data ............................................................................................... 54 5.2.2 Storing and Quality Assuring Data .................................................................. 56 5.2.3 Summarizing, Reporting, and Exporting Data ................................................. 57
Designing Process Improvement Studies ......................................................... 59
Packaging the Results ..................................................................................... 61
Providing Data ................................................................................................ 53
Analysis and Packaging ............................................................................................. 58
Analyzing Project Data ................................................................................... 60 5.3.1 5.3.2 5.3.3
Chapter 6 . Analysis. Application. and Feedback ....................................................................... 69 6.1 Understanding ............................................................................................................ 70
6.1.3 Error Characteristics ....................................................................................... 80
6.1.1 Software Attributes ......................................................................................... 71 6.1.2 Cost Characteristics ........................................................................................ 75
6.1.4 Project Dynamics ............................................................................................ 84 6.2 Managing ................................................................................................................... 85
6.2. I Planning .......................................................................................................... 86 6.2.2 Assessing Progress .......................................................................................... 89
Chapter 7 . Experience-Based Guidelines ................................................................................. 103
Appendix B . Sample Process Study Plan ................................................................................. 127
Appendix C . List of Rules ....................................................................................................... 129
6.2.3 Evaluating Processes ....................................................................................... 95 6.3 Guiding improvement ................................................................................................. 96
Appendix A . Sample Data Collection Forms ........................................................................... 109
Abbreviations and Acronyms ................................................................................................... 131
References ............................................................................................................................... 133 Standard Bibliography of SEL Literature ................................................................................. 135
SEL-94-002 ... vlll

Figures
2- 1 2-2 2-3
2-4 2-5 2-6 2-7 2-8 2-9 3- 1 3-2 3-3 4- 1
4-2
4-3 4-4 4-5 5- 1
5-2 5-3
5-4
5-5
5-6
5-7 5-8 6- 1
6-2 6 -3 6-4
6-5 6-6
Motivation for Understanding the Software Engineering Process ..................................... 7
Effort Distribution by Activity ......................................................................................... 9 Error Class Distribution ................................................................................................. 10
Growth Rate of Source Code ........................................................................................ 1 1 Change Rate of Source Code ......................................................................................... 12 Sample Process Relationships ........................................................................................ 13
Tracking Growth Rate ................................................................................................... 15
The UnderstancUAssessflackage Paradigm .................................................................... 18
The Three Components of ~1 Measurement Program ...................................................... 25
Cost of Software Measurement ..................................................................................... 31
The Five Maturity Levels of the CMM .......................................................................... 17
The SEL as a Sample Structure for Process Improvement ............................................. 28
Cost Data Collection Summary ...................................................................................... 39 Error Dau Collection Summary .................................................................................... 41
Process Characteristics Data Collection Summary ......................................................... 43
F’roject Dynamics Collection Summary .......................................................................... 44 Project Characteristics Collection Summary ................................................................... 49 Three Data Collection Mechanisms ............................................................................... 52 Project Summary Statistics ............................................................................................ 58
Process Study Pian Outline ............................................................................................ 60 High-Level Development Project Summary Rep0 rt ........................................................ 62 High-Level Maintenance Project Summary Report ........................................................ 63
Impact of Ada on Effort Distribution ............................................................................. 64 Sample Error Rate Model .............................................................................................. 65 SME Architecture and Use ............................................................................................ 67 Language Usage Trend .................................................................................................. 73 Code Reuse Trend ......................................................................................................... 74
Derivation of 20 Percent Reuse Cost Factor for FORTRAN .......................................... 76 Derivation of 30 Percent Reuse Cost Factor for Ada ..................................................... 77 Effort Distribution Model .............................................................................................. 78
Staffing Profile iModel ................................................................................................... 78
ix SEL-94-002

6-7
6-8
6-9
6-10
6-1 1
6-12
6-13
6-14
6-15
6-16
6-17
6-18
6-19
6-20
6-2 1
6-22
6-23
6-24
7-1
A- 1
A-2
A-3
A 4
A-5
A-6
A-7
A-8
A-9
A-10
A-1 1
A-12
A-I3
Typical Allocation of Software Project Resources ......................................................... 8 1
Comparative Error-Class Distributions .......................................................................... 83
Cyclomatic Complexity and SLOC as lndicators of Eirrors (Preliminary Analysis) .......... 84
Planning Project Dynamics ............................................................................................ 89
Growth Rate Deviation ................................................................................................. 91
Change Rate Deviation .................................................................................................. 91
Tracking Discrepancies ................................................................................................. 93
Error Detection Rate by Phase ...................................................................................... 82
Growth Rate Model ...................................................................................................... 85
Staff Effort Deviation .................................................................................................... 92
Projecting Software Quality ........................................................................................... 94
Impact of the Cleanroom Method on Software Growth ................................................. 95
Impact of the Cleanroom Method on Effort Distribution ................................................ 98
Impact of IV&V on Requirements and Design Errors ................................................... 100 Percentage of Errors Found After Starting Acceptance Testing ................................... -101
Impact of IV&V on Effort Distribution ........................................................................ 102
Examples of Measures Collected Manually ................................................................... 108
Component Origination Form ....................................................................................... 112
Development Status Form ............................................................................................ 113
Personnel Resources Form ........................................................................................... 115
Personnel Resources Form (Cleanroom Version) .......................................................... 116
Project Completion Statistics Form .............................................................................. 117
Project Estimates Form ................................................................................................ 118
ServicesRroducts Form ................................................................................................ 120
Subjective Evaluation Form .......................................................................................... 121
Subsystem Information Form ........................................................................................ 124
IV&V Error Rates by Phase ......................................................................................... 101
Impact of IV&V on Cost .............................................................................................. 102
Change Report Form .................................................................................................... 110
Maintenance Change Report Form ............................................................................... 114
Project Startup Form .................................................................................................... 119
Weekly Maintenance Effort Form ................................................................................. 125
SEL-94-002 X

2- 1 2-2 2-3 4- 1
4-2 4-3 4-4
4-5 6- 1
6-2 6-3 6-4 6-5 6-6 6-7 6-8
6-9 7- 1
A- 1
. . Sample Software Charactenstlcs ...................................................................................... 8 Distribution of Time Schedule and Effort Over Phases ................................................... !4 Impact of the Cleanroom Method on Reliability and Productivity .................................. 19
Data Provided Directly by Project Personnel ................................................................. 38
Change Data ................................................................................................................. 40
Process Characteristics Data .......................................................................................... 42 Project Dynamics Data .................................................................................................. 44 Project Characteristics Data .......................................................................................... 47 Questions Leading to Understanding ............................................................................. 71
Software Attribute Data ................................................................................................ 72
Analysis of Maintenance Effort Data ............................................................................. 80
Questions Supporting Management Activities ................................................................ 86
IndicatGrs of Change Attributable to Cleanroom ............................................................ 97 Impact of the Cleanroom Method on Reliability and Productivity .................................. 99
Indicators of Change Attributable to IV&V .................................................................. 100
Examples of Automated Measurement Support Tools .................................................. 107
SEL Data Collection Forms .......................................................................................... 109
Basis of Maintenance Costs Estimates ........................................................................... 80
Project Planning Estimates ............................................................................................ 88
SEL-94-002

Chapter 1 Introduction
1 .l Background
T his Sofmare Measurement Guidebook is based on the extensive experience of several organizations that have each developed and applied significant measurement' programs over a period of at least 10 years. One of these organizations, the Software Engineering
Laboratory (SEL) at the National Aeronautics and Space Administration (NASA) Goddard Space Flight Center (GSFC), has been studying and applying various techniques for measuring software since 1976. During that period, the SEL has collected measurement data from more than 100 flight dynamics projects ranging in size from 10,OOO to over 1,000,OOO source lines of code (SLOC). These measurement activities have generated over 200,000 data collection forms, are reflected in an online database, and have resulted in more than 200 reports and papers. Mcre significantly, they have been used to generate software engineering models and relationships that have been the basis for the software engineering policies, standards, and procedures used in the development of flight dynamics softwrire.
Many other organizations in both Government and industry have documented their significant measurement experiences. (See, for example, References 1 through 7.) The lessons derived from those experiences reflect not only successes but also failures. By applying those lessons, an organization can minimize, or at least reduce, the time, effort, and frustration of introducing a software measurement program.
The Sofhvure Measurement Guidebook is aimed at helping organizations to begin or improve a measurement program. It does nut provide guidance for the extensive application of specific measures (such as how to estimate software cost or analyze software complexity) other than by providing examples to clarify points. It does contain advice for establishing and using an effective software measurement program and for understanding some of the key lessons that other organizaticns have learned. Some of that advice will appear counterintuitive, but it is all based on actual experience.
Although all of the information presented in this guidebook is derived from specific experiences of mature measurement programs, the reader must keep in mind that the characteristics of every organization are unique. Some degree of measurement is critical for all software development and maintenance organizations, and most of the key rules captured in this report will be generally applicable. Nevertheless, each organization must strive to understand its own environment so that the measurement program can be tailored to suit its characteristics and needs.
Historically, many software organizations have established development and maintenance processes and standards in an ad hoc manner, on the basis of guidance from outside the organization, or from senior personnel called upon to establish company standards. Often, this approach has led to incompatibilities, unconvinced development groups, and, occasionally, complete confusion. Too often, organizations attempt to generate policies or standards and to
~ ~~
Some organizations use the terms metrics and measurement interchangeably.
1 SEL-94-002

adopt particular technologies without first understanding the existing processes and environment. This lack of understanding can make a bad situation worse. Before establishing policies and defining standards, an organization must clearly understand the environment and the existing processes. A commitment to understand and improve local software processes requires the establishment of a software measurement program, which is the precursor to continual process improvement.
The following rul: is the single most important one regarding software measurement:
Understand that software measurement i s a means to an end, not an eord in itself.
A measurement program without a clear purpose will result in frustration, waste, annoyance, and confusion. To be successful, a measurement program must be viewed as one tool in the quest for the improved engineering of software.
1.2 Purpose The purpxe of this Sojhure Meusurernent Guidebook is threefold. First, it presents information on the purpose and importance of measurement-information that has grown out of successful measurement applications.
Second, the guidebook presents the specific procedures and activities of a measurement program and the roles of the people involved. This guidebook discusses the basic set of measures that constitutes the core of most successful measurement programs. It also provides c3me guidance for tailoring measurement activities as a program matures and an organization captures its own expeiiences.
Findly, the guidebook clarifies the role that measurcment can and must play in the goal of continual, sustained improvement for all software production and maintenance efforts throughout NASA. As NASA matiires in its understanding aid application of software, it is attempting to apply the most appropriate software technologies and methodologies available. Like any other software organization, NASA must build a firm foundation for software standards, policies, and procedures. A carefully established measurement program can provide the rationale for management decision making, leading to achievement of the goal of sustained improvement.
1.3 Organization This “Introduction” is followed by six additional chapters and three appendices.
Chapter 2, “The Role of Measurement in Software Engineering,” lays the groundwork. for establishing a measurement program. The chapter explains why any software group should have a well-defined measurement program and provides examples of supporting data that can be valuable in justifying the costs involved in implementing such a program.
Chapter 3, “Establishing a Measurement Program,” describes the essential steps for starting a measurement program. The chapter includes organization, key measurement data, classes and
SEL-94-002 2

sources of data, general cost information, and, most important, goal setting and application of the measurement program.
Chapter 4, “Core Measures,” introduces the recommended core set of measures that can benefit any software organization.
Chapter 5 , “Operation of a Measurement Program,” discusses major organizational issues, data collection and storage, quality assurance (QA) of the data, feedback of data, and cost of operations.
Chapter 6, “Analysis, Application, and Feedback,” presents information on the analysis of measurement data and the application and feedback of information derived from a measurement program.
Chapter 7, “Experience-Based Guidelines,” offers some precautions for software organizations that plan to include software measurement among their development and maintenance processes.
Appendices A, B, and C provide sample data collection forms, a sample process study plan, and a list of rules, respectively.
3 SEL-94-002


Chapter 2. The Role of Measurement in Software Engineering
- . . -
Managing Software Projects Planning and estimating
0 Tracking actuals versus estimates 0 Validating models
Guiding Process Improvement e Understanding
Assessing e Pacbging
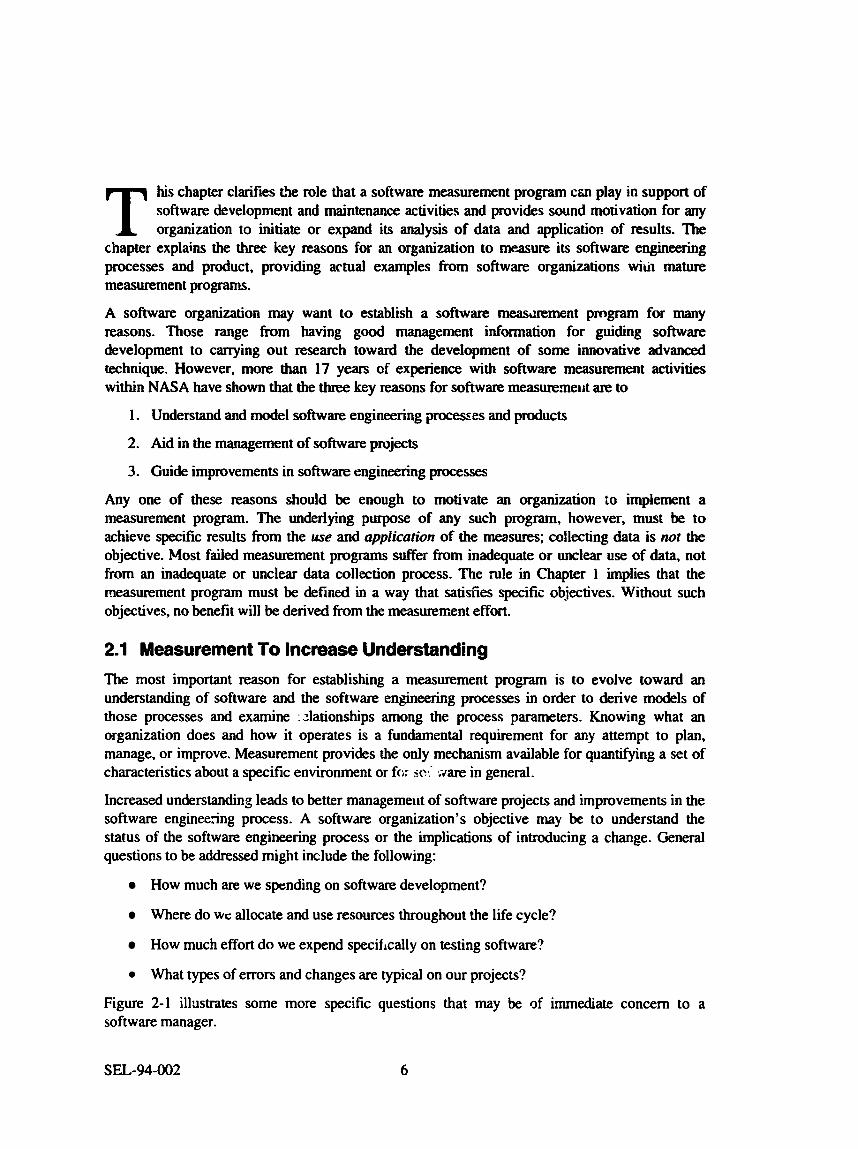
T his chapter clarifies the role that a software measurement program czn play in support of software development and maintenance activities and provides sound motivation for any organization to initiate or expand its analysis of data and applicatior? of results. The
chapter explains the three key reasons for an organization to measure its software engineering processes and product, providing actual examples from software organizations wilii mature measurement programs.
A software organization may want to establish a software measmment program for many reasons. Those range from having good management information for guiding software development to carrying out research toward the development of some innovative advanced technique. However, more than 17 years of experience with software measurement activities within NASA have shown that the three key reasons for software measuremelit are to
1. Understand and model software engineering processes and products
2. Aid in the management of software projects
3. Guide improvements in software engineering processes
Any one of these m o n s should be enough to motivate an organization to implement a measurement program. The underlying purpose of any such program, however, must be to achieve specific results from the use and application of the measures; collecting data is nor the objective. Most faded measurement programs suffer from inadequate or unclear use of data, not from an inadequate or unclear data collection process. The rule in Chapter 1 implies that the measurement program must be defined in a way that satisfies specific objectives. Without such objectives, no benefit will be derived from the measurement effort.
2.1 Measurement To Increase Understanding The most important reason for establishing a measurement program is to evolve toward an understanding of software and the software engineering processes in order to derive models of those processes and examine ::lationships among the process parameters. Knowing what an organization does and how it operates is a fundamental requirement for any attempt to plan, manage, or improve. Measurement provides the only mechanism available for quantifying a set of characteristics about a specific environment or for sc1
Increased understanding leads to better managemelit of software projects and improvements in the software enginecing process. A software organization’s objective may be to understand the status of the software engineering process or the implications of introducing a change. General questions to be addressed might include the following:
in general.
How much are we spending on software development?
Where do wc allocate and use resources throughout the life cycle?
How much effort do we expend specifically on testing software?
0 What types of errors and changes are typical on our projects?
Figure 2-1 illustrates some more specific questions that may be of immediate concern to a software manager.
SEL-94-002 6


Technology i s changing too fast.
Project results merely reflect the characteristics o f the people on the projects.
I don’t care about future projects; I care only about current results.
Each of these objections may have some merit; nevertheless, i t is essential to establish the baseline before introducing change. Managers who have never collected data to confmn or challenge basic assumptions about their environments may have inaccurate perceptions about the software processes in use within their organizations.
Experience derived from many NASA p r o m s shows that an organization establishing a baseline understanding of its software engineering pmcesw and products should concentrate on collecting measurement data to reflect certain key software chsracteristics. Table 2-1 suggests sample characteristics and refers to four examples that illustrate the points using actual NASA experience.
Table2-1. sample sofhmrre m c t e d s t f ~ S
Understanding
What are the cost (resource) characteristics of software in my organization?
What are the error (reliability) characteristics of software in my organization?
How does my organization’s rate of source code production (or change) compare to previous experience?
How does the amount of software to be developed relate to the duration of the prqect and the effort required? What is the relqtionship between estimated software size and other key parameters?
Distribution of effort among development activities-am ount spent on design, d e . test, or other activities Typical cost per line of code Cost of maintenance Hours spent on documentation Computer resources required Amount of rework expected
Number and classes of errors found during development or maintenance How and when software de:ects are found Number and classes of errors fcund in specifications Pass/fail rates for integration and system testing
-
Typical rate of growth of source code during development Typical rate of change of source code during development or maintenance Total number of lines of code produced Schedule as a function of software size Cost as a function of size Total number of pages of documentation produced Averaw. slaff size
NASA Expetiencg
Example
4
Example
2
Example
3 ~~
Example
4
SEL-94-002 8


Example 3: Software Growth and Change Characte&ics
Insight into the rates of growth and change of source code also helps to build a better understanding of software engineering processes. Code growth reflects the rate at which source code is added to a controlled library; code change reflects modifications to the controlled, or baselined, library. An understa.r,ding of the model for such rates can provide a basis for dekmnining if a new project is progressing as expected or if it is producing or changing source code at a rate that differs from the organization’s historical profile.
Figure 2-4 depicts the typical rate of growth of source code in a NASA environment. The data were derived from over 20 software projects that followed a waterfall life cycle. This information is used only to model typical projects in one particular environment, not to determine the quality of a given process.
bsign ~ ldo -
90-
80-
70-
60-
5 0 -
40-
30-
20-
10 - 10 20 30 40 50 60 70 80 90 100
%of Schedule
NOTE: SLOC = Source hnes of Code
Figure 24. Growth Rate of Source Code
Figure 2-5 shows the accumulated changes to source code during the development phases in the same environment. Both of the profiles shown here were derived from measurement data that were inexpensive to collect and analyze, sod the resulting models are quite stable.
1 1 SEL-94-002

9.00 W i n COdelTeSl YZ" I I 8.00 - 7.00 - 2 * 6.00 -
ii 5.00 -
5 4.00 - m 3.00 -
LD C m
- s! - 0 2.00 -
1.00 - 0.00
10 20 30 40 50 60 70 80 90 1
%ofscheduk?
NOTE: KSLOC = 1 .OOO Source Lines of code
fialnpki! 4: Software Process Relationships
The functional relationships between product and process parameters provide additional understanding of an organization's software engineering processes. This understanding can be applied to the planning and management of subsequent projects in the same environment.
Figure 2-6 presents examples of a few key relationships that were found useful in several NASA environments. A SEL report (Reference 8) discusses those and other such relationships and how they can be applied. The relationship constants are periodically revised to reflect evolving organizational models. After the historical database has been created, the additional effort required to develop such relationships has proved to be small and worthwhile, leading to increased understanding of the software engineering process.
2.2 Measurement for Managing Software The second key reason for establishing an effective measurement program is to provide improved management information. Having an understanding of the software environment based on models of the process and on relationships among the process and product paramcters allows for better prediction of process results and more awareness of deviations from expected results. Thus, understanding the software engineering process leads to better management decision making. The
SEL-94-002 12
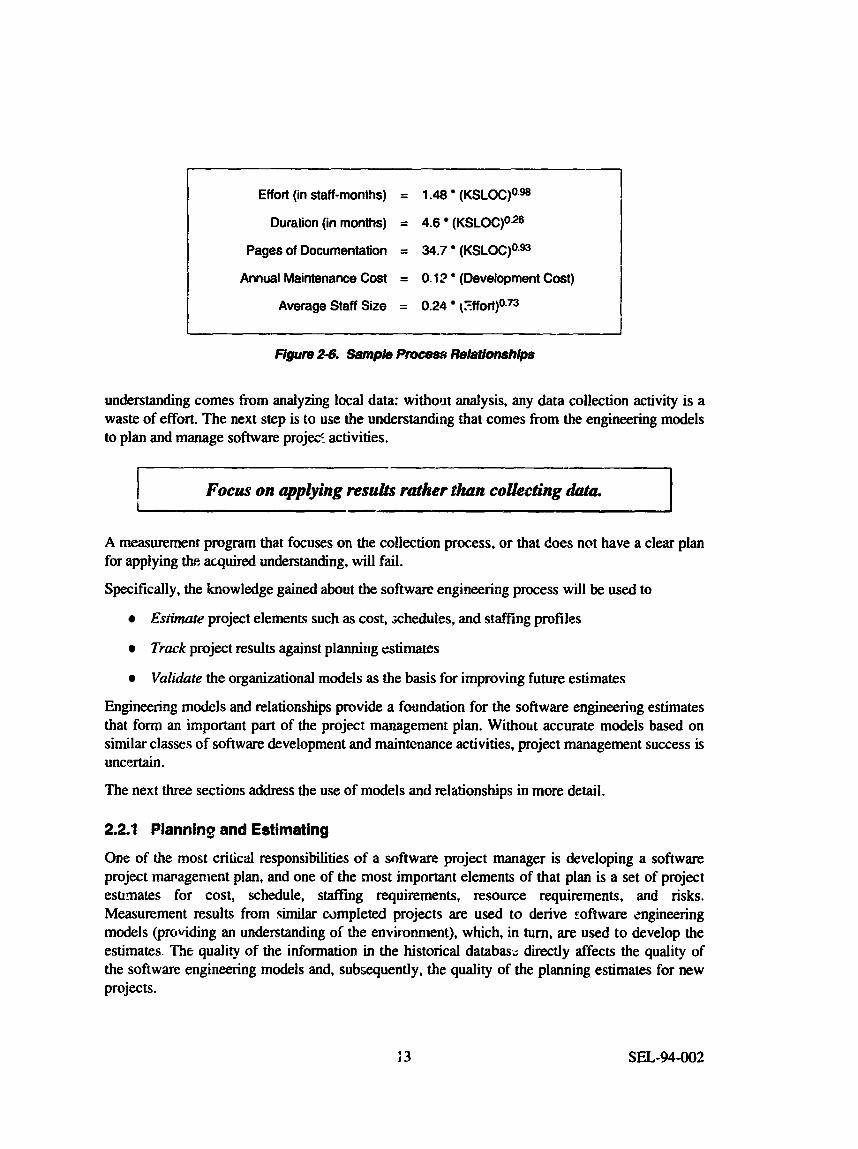
Effort (in staff-months) = 1.48 (KSLOC)0.98
Duration (in months) = 4.6 (KSLOC)Oa
Pages of Documentation = 34.7 (KSLOC)0.93
Annual Maintenance Cost = 0.12 ’ (Development Cost)
Average Staff Size = 0.24 ( E f f ~ r t ) ~ . ~
Focus on applying results rather h n coUecting CgQta L -
ffgum 2-6. Sampb Process Reladionships
understanding comes from analyzing local data: withoilt d y s i s , any data collection activity is a waste of effort. The next step is to use the understanding that comes from the engineering models to plan and manage software project activities.
A measurement program that focuses on the collection process, or that does not have a clear plan for applying the acquired understanding, will fail.
Specifically, rhe knowledge gained about the software engineering process will be used to
Estimate project elements such as cost, schedules, and staffing profiles
Track project results against plannirig estimates
Validate the organizational models as the basis for improving future estimates
Engineering madels and relationships provide a foundation for the software engineering estimates that form an important part of the projert management plan. Without accurate models based on similar classes of software development and maintenance activities, project management success is uncertain.
The next three sections address the use of models and relationships in more detail.
2.2.1 Planning land Estimating
One of the most critical responsibilities of a snfiware project manager is developing a software project mmagenient plan, and one of the most important elements of that plan is a set of project estmates for cost, schedule, staffing requirements, resource requirements, and risks. Measurement results from similar completed projects are used to derive :oftware cngineering models (providing an understanding of the environment), which, in turn, are used to develop the estimates. The quality of the information in the historical databas;: directly affects the quality of the softwm engineering models and, subsequently, the quality of the planning estimates for new projects.
;3 SEL-94-002

A manager who can produce a product size estimate based on software functionality requirements can *en derive such estimdtes as cost and schedule using organizational models and relationships. The standard size estimates within the SEL are currently hased on developed lines of code (DLOC). (For a detailed discussion of DLOC-software size with a weighting factor applied to reused code-see Reference 9 and Sections 4.5.2 and 6.1.2 of this document.) Given a product size estimate and the distribution percentages shown in Table 2-2 (Reference IO), a manager can derive project cost (measured as staff effort) and schedule estimates using the relationships
Effort (in hours) = DLOC / Productivity
Time Schedule
(%I
where
Completion Staff- Milestones Months
Effort (Months by (Allocated Phase) by Phase)
Productivity = 3.2 DLOC per Hour
35 30 35
for FORTRAN, and
30 8.4 60
40 7.2 80
30 8.4 60
Duration (in montiis) = 4.9 (Effort [in ~taff-months])~.~
for attitude ground support systems (AGSSs).
For example, assuming an estimated product size of 99,OOO DLOC for an AGSS to be developed in FORTRAN, a total effort of approximately 200 staff-months and a total duration of approximately 24 calendar months can be estimated. The table also provides derived project estimates for the cost and duration of each major life-cycle phase. In this model, the design phase comprises requirements analysis, preliminary design, and detailed design, and the test phase encompasses both system and acceptance test. Initial planning estimates may have to be adjusted for changes in requirements or schedule. It is also important to note that the specific parameters in the relationships shown here are highly dependent on environmental factors, such as the local definition of a line of code. Although anyone can use this model as a s w n g point, each organization must analyze its data to derive its own distribution model.
Table 2-2. Distribution of lime Schedule and Effort Over Phases
Life- Cycle
PhaSeS
Design
Code
Test
I
Distribution Model Sample Derived Estimates (Reference 10)
SEL-94-002 14

2.2.2 Tracking
An important responsibility of software project management is tracking the actual size, effort, budget, and schedule against the estimates in the approved plan. Successful, effective management requires visibility into the progress and general status of the ongoing project, so that timely and informed adjustments can be made to schedules, budgets, and processes. Periodic sampling of project measurement data provides that visibility.
The extent and effectiveness of the project tracking process depends on the availability and quality of a set of historical models and relationships. If the only available model is related to cost data, then management tracking will be limited to cost information. However, a more extensive set of derived models for staff size, software growth rate, software change rate, error rate, and other parameters will facilitate a broader tracking capability.
Figure 2-7 illustrates the process of tracking the actual software growth rate3 against the planning estimates. In this illustration, the planned growth estimates are based on the model introduced in Figure 2-4. A deviation of the actual values from the expected curve indicates simply that something is different from the historical model. Such a deviation does not necessarily signal a problem; rather, it can provide the program manager with an opportunity to explain the difference. In particular, the deviation may have resulted from a planned improvement. For example, a project that is reusing a larger amount of code than the typical past project may show a sharp jump in growth rate when reused code is moved into the controlled library.
1 do
90
80
70
60
50
40
30
20
10
10 20 30 40 50 80 7s 80 90 100
% of Schedule
Figurn 2-7. Tmcking Growth Rate
Software growth rate reflects the rate at which programmers complete the unit testing of source code. In Figure 2-7, the acruul percentage of Lje totill is computed with respect to the estimated s ize at completion.
IS SEL-94-02

2.2.3 Validating
Once a manager has the ability to track actual project measures against planning estimates, he or she can begin to use any observed differences to evaluate the status of the project and to support decisions to take corrective actions. Figure 2-7 also shows an allowable range of deviation around the planned or expected values on the growth curve. Observing the trend of the actual growth rate relative to the planned values can provide a management indicator of a healthy projec'i (as determined by a growth pattern within the expected range) or a potential problem that q u i r e s %rther evaluation to determine the cause (as is the case in Figure 2-7). With the insight gained by observing the trend, a manager can adjust staffing or xhedule to get the project back on track.
Although it is obvious that an actual value below the allowable range may indicate a cailse for concern, it is perhaps less obvious that an actual value that falls above the allowable range should also generate a management investigation. In this example, a software growth rate above the allowable range may indicate that some other project activities are not being performed or, perhaps, that the wrong model was used for planning and estimation. Consistent ana regular deviations may also indicate a need to adjust the organization's models.
Examples within this section have illustrated that a baseline anderstanding of the software engineering process derived from historical results provides the essential model, which leads to the planning estimate, which makes the tracking possible. The process of tracking actual versus planned growth values provides the insight for validation, which facilitates adjustments by project management. The fundamental elcment of measurement support for project management is understanding the software engineering process.
2.3 Measurement for Guiding Improvement The primary focus of any software engineering organization is to produce a high-quality product within schedule and budget. However, a constant goal, if the organization is to evolve and grow, must be continual improvement in the quality of its products and services. Product improvement is typically achieved by improving the processes used to develop the product. Process improvement, which requires introducing change, may be accomplished by m-ing management or technical processes or by adopting new technologies. Adoption of a new technology may require changing an existing process. In any case, software measurement is a key part of any process improvement program; knowing the quality of the product developed using both the initial and the changed process is necessary to assert that improvement has occurred.
There are seve,ral popular paradigms for software process improvement. For example, the Capability Maturity Model (CMM) for Software (Reference 11). produced by the Software Engineering Institute (SEI) at Carnegie Mellon University, is a widely accepted benchmark for software engineering excellence. It provides a framework for grouping key software practices into five levels of maturity. A maturity level is an evolutionary plateau on the path toward becoming a mature software organization. The five-level model, represented in Figure 2-8, provides a defined sequence of steps for gradual improvement and prioritizes the actions for improving software practices.
SEL-94-002 16

Continually Improving Process
Predictable proWESc M n e d 3 Consistent Process
Disciplined Process
Initial 1
Managed 4
Figure 2-8. The Five Maturity Levels of the CMM
The SEI provides the following characterization of the five levels:
1.
2.
3.
4.
5.
Initid-The software process is characterized as ad hoc and, occasionally, even chaotic. Few processes are defined, and success depends on the efforts of individuals.
Repeatable-Basic project management processes are established to track cost, schedule, and functionality. The necessary process discipline is in place to repeat earlier successes on projects with similar applications.
Defined-The software process for both management and engineering activities is documented, standardized, and integrated into an organization-wide software process. All projects use a documented and approved version of the organization’s process for developing and maintaining softwdm.
Managed-Detailed measures of the software process and product quaiity are collected. Both the software process and products are quantitatively understood and controlled using detailed measures.
Uptimiting-Continuous process improvement is enabled by quantitative feedback from the process and from testing innovative ideas and technologies.
The CMM is an organization-independent model that emphasizes improving processes to reach a higher maturity level when compared to a common benchmark. Such a model presupposes that the application of more mature processes will result in a higher quality product. In contrast, the SEL has introduced a process improvement paradigm for NASA fith specific emphasis on
17 SEL-94-002

producing a better product based on the individual goals of the organization. Figure 2-9 illustrates the SEL’s UnderstandAssesdPackage paradigm.
In the SEI model, a baseline assessment of an orgarization’s deficiencies, with respect to the key processes defined at each of the maturity levels, determines the priority with which the organization implements process improvements. In the S5L model, thc specific experiences and goals of the organization drive changes. (See Reference 12 for a more dctailed comparison of the two paradigms.)
Define, redefine, and tailor processes and models on the basis of new experiences
/ / I Identify changes Set goals Choose processes and experiment Execute processes Analyze dah and determine impact
Establish baselines Extract and define processes Build mcldels
Time
Figure 2-9. The UnderstandcAsseMackage Paradigm
2.3.1 Understanding
Section 2.1 introduced understanding as the primary reason for establishing a measurement program; that same understanding prov;des the foundption for NASA’s process improvement paradigm. To provide the measurement ba is for its software engineering process improvement program, an organization must begin with a baseline understanding of the current processes and products by analyzing project data to derive ( 1 ) models of the software engineering processes and (2) relationships among the process and product parameters in h e organization’s environment.
As the organization’s personnel use the models and relationships to plan and manage additional projects, they should observe trends, identify improvement opportunities, and evaluate those opportunities for potential payback to the organization. As improvements are implemented, new project measurement results are used to update the organization’s models and relationships. These updated models and relationships improve estimates for future projects.
SEL-94-002 18

Improvement plans must be made in the context of the organization’s goals. Improvement can be defined only within the 4omain of the organization-there are no universal meawes of improvement. An organizatio,: may base its process improvement goals on productivity, cost, reliability, error rate, cycle time, portability, reusability, customer satisfaction, or other relevant characteristics; however, each organization must de t edne what is most important in its local environment. Using measurement as the basis for improvement permits an organization to set specific quantitative goals. For example, rather than simply striving to reduce the error rate, an organization can establish a goal of lowering the error rate by 50 percent. Determining the effect of introducing change q u i r e s initial measurement of the baseline.
2.3.2 Assessing
Once an organization understands the current mcckls and relationships reflecting its software process and p d u c t , it may want to assess the impact of introducing a process change. It should ‘be aoted that a change is not necessarily an imprwenlent. Detenl-hing that a change is an improvement req,ires analysis of measures based on the organization’s goals. For example, assume that an organizatiorh’s goal is to decrease the error rate in delivered software while maintaining (or possibly improving) the level of productivity; further assume that the organization has decided to change the process by introducing the Cleanroom method (Reference 13). Cleanroom focuses on achieving higher reliability (Le.’ lower error rates) through defect prevention. Be:ause the organization’s primary goal is to reduce the error rate, there is no concern that the Cleanroom method does not address reuse, portability, main&nabiility, or many other process and product characteristics.
During a recent study (Reference 14). the SFL assessed ihe impact of introducing the Cleanroom method. Table 2-3 shows the error rate and productivity measures for the baseline and the first Cleanroom project. The results of the experiment appear to provide preliminary evidence of the expected imprwement in reliability following introduction of the Cleanroom metho3 and may also indicate an improvement in productivity. Chapter 6 provides additional details of the SEL Cleanroom study.
T8bk 2-3. Impact of dhe Cleanroom Method on Reliabilty end Productivity
I I 4.3 40
19 SEX-94-002

2.3.3 Packaging
NASA experience has shown that feedback and packaging of measured results must occur soon afkr completion of an impact assessment. Packaging typically includes written policies, procedures, standards, and guidebooks. Highquality training material and training courses are also essential pans of the packages.
For example, to incorporate the Cleanroom method as an integral part of its software develop ment activities, an organizaticn must first prepare the necessary documentation and provide training to all affected project personnel. Packaging is discussed in more detail in Chapter 5.
SEL-94-002 20

Chapter 3. Establishing a Measurement Program
SELECTING MEASURES
21 SEL-WM)2

A fter an organization understands the roles that measurement can play in software engineering activities, it is ready to establish a measurement program. The effective application of information derived from measurement entails building models, identifying
the strengths and weaknesses of a particular process, and aiding the management decision process. A clear, Well-defined approach for the applicaticn and analysis of measurement information will minimize the cost and disruption to the software orgmkation. Building on the advice of the preceding chapter, th is chapter addresses the fo1lowir.g topics and provides recommendations for successfully establishing a new measurement program:
0 Understanding the organization's goals
0 Defining the scope of the measurement program
0 Defining roles and responsibilities within the organization
0 Selecting the appropriate measufes
0 Controlling the cost of measurement
3.1 Goals First, the organization must determine what it wants tG accomplish through measurement This requirement leads to the next rule:
Und@rs&thegoalS.
The goals of an organizr 'ion may be to increase prodiictivity or quality. reduce costs, improve the ability to stay on schedule, or improve a manager's abiity to make informed decisions. Typically, an organization that is implementing a measurement program has all of these goals. Although it is admirable to want to improve everything immediately, establishing priorities for achieving the goals incrementally is essential. After clarifying the organizational goals, the organization must recognize the need to establish a mesurement program to achieve its goals.
I 1
Understundhow to apply measuremerst.
If the goal is to improve productivity, for example, then the organization must know its current productivity rate and undersmd its product and process characteristics. Both prerequisites are supplied by measurement.
The resuits of a measurement program will be used in different ways at each level of the organization. Senior management will be interested primarily in how the program improves the capabilities and productivity of the organization and in the effect on the bottom line. Project managers will be concerned with the impact on planning and managing current project efforts. Software developers will be interesied in how the program wil! make work easier compared with
sEL-1)4-002 22

the impact of data collection requirements. Successful measurement pmgrams begin by involving dl participants in defining the goals.
Because personnel at different organizational levels will view a new measurement program from different perspectives, the success of the prognm demands that those responsible for introducing measurement follow the next rule:
I Set expectations.
The implementation of a measurement program will inevitably introduce change; change will bring some resistance arid some initial problems. To minimize resistance, both management and technical personnel must be prepared to expect and accept the change and to encourage others to be persistcn’c and patient. Proper setting of expectations will enhance potential support and acceptance from all management and technical personnel affected Oy the changes.
F h to achieve sn early success. i The first project should be selected carefully with the objective of demonstrating evidence of early benefits. Measurement programs sometimes fail because well-intentioned measurement coordinators wait too long “for all the results to come in” before reporting progress to senior management. It is critical to report pliminary results as won as possible after establishing the program. The startup investment is significant, so management must see an early return on that investment, or the program is likely to be canceled before measurement analysts can provide “all the results.” Equally important, project personnel need to see evidence of the benefits of their efforts to reduce their inevitable resistance. The early payoff may be, for example, a better understanding of the typical classes of errors that are detected m the organization’s software projects or an understanding of the relative amounts of time that personnel spend in coding as compared with testing.
Although early feedback is essential for success, it is prudent not to promise substantial improvement during the early phases of the program. Worthwhile analysis, synthesis, and packaging take t h e and effort. Development and maintenance teams must be conditioned to expect gradual, incremental improvements.
3.2 Scope A.%r the goals of the measmment program are established and understood, measurement personnel must define the scope of the program, making the following critical decisions:
0 Which projects should be included in the organization’s measurement program?
0 Which phases of the software life cycle should be included?
23 SEL-94-002

Which elements of the project staff should be incluM, for example, is it important to include the effort of secretarial support, publication support, and two or more !evels of management?
Those responsible for making these decisions must consider both the previously defined _oals and the need to gain acceptance from project persolinel who will be affected by the new rmx.wrement program. The next two rules provide help in defining the scope.
The scope of the measurement program should be limited to the local organization. Organizational gods should have been based on the need for specific self-improvements, not for making compariscm with others. When defining processes for data collection and analysis, it is important to use concepts and terms that are understood locally. Precious effort should not be expended developing universal or unnecessarily broad-based definitions of measurement concepts and standards. Similarly, it is important to focus on developing a highquality local measurement data center. Combining local measurement data into larger information centers has never proved beneficial and has consumed significant amounts of effort. Consultation with management and software personnel can ensure proper focus and increase acceptance.
startsmau.
When establishing a measurement program. it is always important to start with a smaU scope. Limiting the number of projects, resmcting the portions of the software life cycle to those with already welldefined processes within the organization, and limiting staff involvement to essential personnel will all help to minimiZe resistance from, and impact on, managers and dcvelopment or maintenance personnel. The scope of the program will evolve. but the time to increase the size of the program is afrer it has become successful.
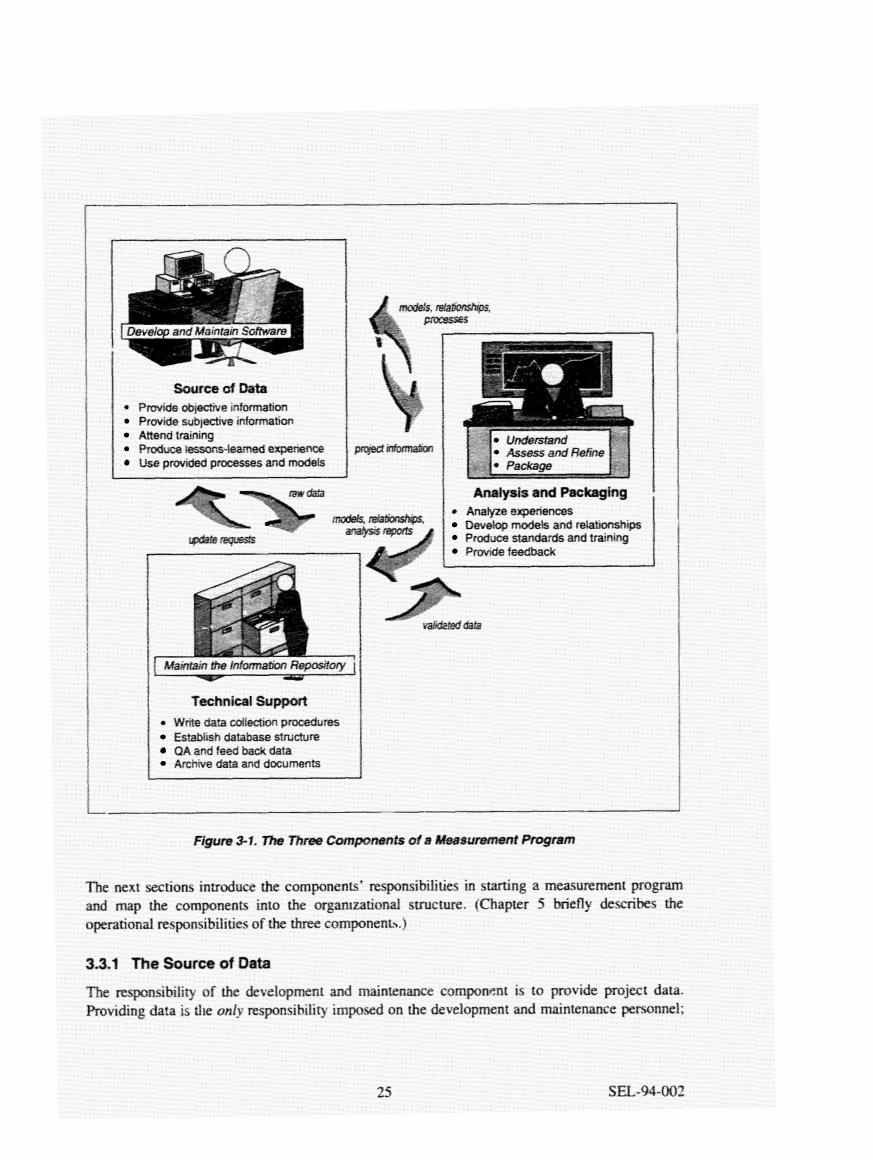
3.3 Roles, Responsibilities, and Structure After the organizational goals are well understood and the scope of the measuRment program is defined, the next step is tq define roles and responsibilities. In a successful measurement program, three distinct roles must be performed by components of the organization:
1. The source of data-providing measur:ment data fiom ongoing software development and maintenance activities
2. Analysis and packaging-examining measurement data and deriving process models and relationships
3. Technical supr ;-r-collecting, storing, and retrieving project information
Figure 3-1 illustrates the components and the relationships among them. Each component must perform its distinct role while maintaining a close relationship with the other two components.
SEL-94-002 24
i !
I ! i ! j
I
1 1
I I i ! !
saufc8ofData 4 PlwidsabJectiveinformation
Provide subjectrve infom\ahon Attend training Produceressons-leamede- Use provtded processes and models
c
madeis..
~ a k r t a i n tfie ~nformat~on ~epository 1 1, -
Technkal Support 0 write data c d l m procedures
EStablLSh database structure QA and feed back data Archwe data and documents
Urderstand Assess and Refine
Analysis and Packaging 0 Anatyzeexperiwrces
Deveiop modek and relafianships Produce standards and training Pmvtde feedback
The next sections introduce the components' responsibilities in starting a msurement program and map the components into the organizational structure. (Chapter 5 briefly describes the operational responsibilities of the three component>.)
3.3.1 The Source ut Data
The responsibility of the development and mainrenance component is to provide project data. hv id ing data is die onfy responsibility imposed on the development and maintenance personnel;
25 SEL-94-002

they are not responsible for analyzing the data. These personnel can reasonably expect to be provided with training that includes, at a minimum, the following information:
Clear descriptions of all data to be provided
Clear and precise definitions of all terms
0 Who is responsible for providing which data
When and to whom the data are to be provided
In exchange, the development and maintenance component of the measurement program receives tailored processes, refined process models, experience-based policies aid standards, and tools.
Organize the analysts separateryfiom the developers. -
3.3.2 Analysis and Packaging
The analysis and packaging component is responsible for developing and delivering the training that will provide the developers and maintainers with the specific information listed in the previous section. Analysis and packaging personnel must design and develop the data forms and receive the raw data from the repository. They are responsible for examining project data; producing tailored development and maintenance processes for the specific project domain; generating organization-specific policies and standards; and generalizing lessons, information, and process model.. This measurement program component continually receives data from the developers snd maintainers of software and, in return, continually provides organization-specific experience pdckages such as local standards, guidebooks, and models.
The analysis and packaging personnel are necessarily separate from the development and maintenance personnel because their objectives are significantly different. Measurement analysts are concerned solely with improving the software process. Software developers’ and maintainers’ concerns include product generation, schedules, and costs. It is impractical to expect personnel who must delivyr a highquality product on schedule and within budget to be responsible for the activities necessary to sustain continual improvement; hence, those functions must be the responsibility of a separate component.
3.3.3 Technical Support
The technical support component maintains the information repository, which contains the organization’s historical database. This component provides essential support services including implementing the database as specified by the analysis and packaging component. The support personnel collect data forms from the developers and maintainers on a prescribed schedule, perform data validation and verification operations to idenbfy and :eport discrepancies, and add the project data to the historical database. They are also responsible for operating supplementary software tools (e.p;., code analyzers) and for preparing reports of thc analysis results. In addition,
SEL-94-002 26

the support personnel archive data and perform all other database management system (DBMS) maintenance functions.
Example: The Sofiware Engineering Laboratory
Although their measurement roles and responsibilities are clearly distinct, the three components may be organized in different ways within different organizations. A large organization may benefit by creating separate, structural components to perform the three distinct roles of the measurement program. A small organization with a small project may simply assign the roles to individual personnel. In some cases, a single individual may perform multiple roles as long as the amount of effort allocated to separate roles is clearly identified.
Far example, the SEL is an organization of moderate size with approximately 300 softwwe developers and maintainers. The organization develops and maintains mission support software f.-; the Flight Dynamics Division at GSFC. Since 1976, the SEL has collected data from more than 100 software development projects. Typical projects range in size from 35,000 to 300,000 SLOC and require from 3 to 60 sraff-years of effort. The process and product data have been analyzed to evaluate the impact of introducing methodologies, tools, and technologies within the local environment. In recent years, the SEL has expanded the scope of its activities to include the study of sohare maintenance (Reference 15). Process improvements, introduced as a result of continual measurement activities within the SEL, have led to documented improvements in the organization’s products.
Figure 3-2 illustrates the organizational structure of the SEL. In this example, the technical support personnel who maintain the repository are administratively affiliated with the analysis and packaging component but physically located with the source of data. This structure works well in the SEL for two reasons:
1. Administratively, the required support personnel receive funding from the same source as the analysis and packaging personnel. Developers and maintainers are funded by a different source.
2. The physical environment is structured with the forms processing, database host computing support, and library facilities collocated with the developers and maintainers, so the support personnel occupy that same space.
Many alternative structures would be just as functional and successful. The important feature is that the development and maintenance personnel are not responsible for analysis and packaghg. In addition, SEL models and relationships are affected by the fact that the measurement program within this sample environment is limited to development and maintenance of operational mission support software! Organizations that include other activities may derive significantly different models. Issues related to the cost
4Although the scope of the measurement program includes no data from prototype development or research activities, the software personnel do perform such activities as a part of their jobs.
27 SEL-94-002

des additional examples and details.
3.4 Selecting the Me Another important step in establishing a measurement program i s selecting the masum to be used. Selected measures will fall into one or mote categories, including objective measures (direct ounts, obtained either manually or with the support of an automated toof), subjective measures
(interpretive assessments about the status of the quality or completion of the product), and project characteristics (factual descriptions of the type, size, and duration of the project). Chapter 4 addresses measures in more detail. When selecting measures, the next mle is &e most important:

Measures should not be selected just because a pcblished author has found them useful; they should directly relate to the defined goals of the organization. For example, if there is no goal to reduce processor time, it is a waste of time and effort to collect data on computer usage.
Keep the number of measures to a minimum.
Experiences from successful measurement programs within NASA suggest that a minimal set of measutes is usually adequate for beginning a program and sufficient to fulfill all but the most ambitious goals. A basic set of measures-which typically consists of data for schedule, staffing, and software size-is introduced in the next chapter.
This rule-to limit the number of measures and, by implication, the size of the measurement database-is a corollary of the rule to start small, which suggests limiting the scope of the measurement pmgram itself. The rule should be taken literally: if a single measure is sufficient to address the organization's goal, then collecting data on two or three will provide no added benefits. For example, if the only goal is to improve quality, only defects should be measured; cost and schedule data should not be a concern.
J Avoid over-reporting measurement Antrr.
Any measurement program can be potentially disruptive to a software project; therefore, analysts must be cautious when providing feedback to development and maintenance personnel. Providing too much feedback can be just as serious a mistake as providing not enough. Reporting the results of analyzing all available measurement data is a waste of time, because much of the information will provide no additional insight. When presented with unnecessary and exccssive charts, tables, and reports, software staff and managers may become annoyed and disenchanted with the value of the measurement program.
Collected data constitute only a small part of the overall improvement program and should alv. ays '5e treated as the means to a larger end. The tendency to assume that each set of data has some inherent value to the development and maintenance personr;lel and, therefore, should be analyzed, packaged, and fed back to them, must be avoided. Feedback must be driven by a n d or rlirected toward supporting a defined goal. If no focus has been established for the analysis of code complexity, for example, then here will be no value in-and no appreciation for-the preparation of a complexity report. Such a report would be disruptive and confusing and could dilute the effectiveness of the measurement program.
The following common reports and graphs are often packaged and provided to the development and maintenance organization, not because they are needed, but simply because the data exist:
Code complexity
Design complexity
e Number of tests executed
29 SEL-94-002

0 Plots of computer usage
0 Charts of numbers of requirements changes
0 Profiles of program execution
0 Charts of the time spent in meetings
Each of those measures may have some value when used in support of an organizational goal. However, this type of information is too often reported because it is assumed to be inhetently interesting, not because it relates to a particular need or goal.
3.5 Cost of Measurement Cost is one of the most critical, yet misunderstood, attributes of a software measurement program. Many organizations assume that the cost of measurement is so excessive that they cannot justify establishing a measurement program. Others claim that measurement can be a nonintrusive, no-cost addition to an organization and will have no impact on the organization’s overhead. The truth lies somewhere in between.
Budget for the cost of the measurement program.
Measurement is not free, but it can be tailored in size and cost to fit the goals and budgets of any software organization. A measurement program must be undertaken with the expectation that the return will be worth the investment. If the cost is not planned in the organization’s budget, there will be frustrations, attempts at shortcuts, and a failed software measurement program. Planning must incorporate all of the hidden elements of the proposed effort-elements that are often more expensive during startup than after the measurement program becomes operational. The higher startup cost is an additional reason to sfart small.
Planners often incorrectly assume that the highest cost will be to the software development or mainienance organization. This part of the overhead expense, which includes completing forms, idenwng project characteristics, and meeting with analysts, is actually the least expensive of the three major cost elements of the measurement program:
1. Cost to the software projects (development and maintenance overhead)
2. Cost of QA and of storing and archiving data (technical support overhead)
3. Cost of analyzing and packaging (measur application overhead)
The cost of the measurement program also depends on the following considerations of scope:
0 Size of the organization
0 Number of projects included in the measurement program
0 Extent of the measurement program (parts of the life cycle, number of measures, etc.)
SEL-94-002 30

NASA experience shows that there is a minimum cost associated with establishing and operating any effective measurement program. The total cost will increase depending on the extent to which the organization wants, or can afford, to expand the program to address additional projects, more comprehensive studies, and broader measurement applications.
The cost information offered in this section is based on 17 years of experience from organizations ranging in size from approximately 100 to 500 persons. Additional information has been derived fiom measurement programs in larger organizations of up to 5,000 persons. The number of projects active at any one time for this experience base has ranged from a low of 5 or 6 projects to a high of over 20 projects, ranging in size from 5 KSLOC to over one million SLOC. Because .rleasurement costs depend on a large number of parameters, citing a single definitive value that rcprwcnts the cost of any organization's measurement program is impossible. However, some general suggestions can be provided, and organizations can interpret these suggestions in the context of their own goals and environments.
Generally, the cost of measurement to the development or maintenance project will not exceed 2 percent of the total project development cost and is more likely to be less than 1 percent (which implies that the cost may be too small to be measured). The technical support element may reach a constant staff level of from one to five full-time personnel for daia processing support. The analysis and packaging element will require several full-time analysts and may cost up to 15 percent of the total development budget. For example, the SEL spends an average of about 7 percent of each project's total development budget on analysis and packaging.
Figure 3-3 illustrates the costs of the elements of a software measurement program as percentages of the total organizational cost. Individual costs are discussed in more detail in the following sections.
Devebp models (Pro-==) Analyze results
Mi6Slze Organizations (Apprcximamly 100-500 Persms)
3
Archwe results Maintain
* Q A database
- Fill out forms Provkle data
aoh 3-Ph
Train staff Define expe erne nts
-
6 1 5% "
prolm Data Processing Analysis/ Overhead cost Application
0 .Y v) = 2 P m Y C m
&
5 - m 0 1
f t 0
0 -
Large Organizations (Approximataly 5W-5,OOO Persons)
1&15 people
Prqect DataProcessing Anatysld Overbead cost Application
Figure 3-3. Cost of Software Measurement
31 SEL-94-002

3.5.1 Cost to Development and Maintenance Component
The cost of measurement should not add more than 2 percent to the software development or maintenance effort.
The smallest part of the measurement cost is the overhead to the development and maintenance organization. This overhead comprises the cost of completirg forms, participating in interviews, attending training sessions describing measurement or technology experiments, and helping to characterize project development. Although startup costs may be as high as 5 percent of the development budget, the cost of operating an effective program will normally not exceed 1 or 2 percent, regardless of the number of active projects within the organization.
Legitimate costs are associated with introducing the providers of data to a new measurement program. However, part of the higher initial cost can often be attributed to the inefficiencies in an inexperienced organization’s program. New programs typically ask developers or maintainers to complete unnecessary forms or require excruciating detail that is of little value or is not a part of the stated goal. A well-planned measurement program will never impose a significant cost impact on the development or maintenance organization.
3.5.2 Cost of Data Processing
The data processing element of the measurement program may cost from 3 to 7 percent of the total development budget.
The technical support (i.e., data processing) element of the measurement program encompasses collecting, va!idating, and archiving the measurement data. Included in these activities are database management, library maintenance, execution of support tools, and high-level reporting of summary measurement data. These essential activities must be planned, supported, and carefully executed. In addition to the cost of personnel are the costs of acquiring and maintaining database software, support tools, and other automated processing aids (e.g., code analyzers).
In an organization of over 50 management, technical, and clerical personnel, any measurement program will require three to five full-time staff members to handle the necessary support tasks. A smaller organization, with perhaps only one project and a pilot measurement program, may wish to combine the data processing effort with configuration management (CM) or independent QA activities. Implementation of a separate data processing support element may not be cost effective.
Experience within NASA has shown that the cost of the data processing tasks for measurement programs involving 100 to 200 software developers or maintainers is approximately 7 percent of the total effort. That cost includes approximately five full-time data technicians and database support personnel, plus the costs of the DBMS and associated software tools and equipment. For larger measuremerlt programs with 250 to 600 software personnel, experience indicates that only one additional full-time support person is required. Thus, for organizations with 50 to 600 de,elopers and maintainers, the overhead cost is approximately 6 percent of the projv! c x t . For organizations with approximately 500 to 1 ,OOO software personnel, the overhead cost approaches 3 percent of the project cost or about seven full-time personnel added to the cost of tools and equipment.
SEL-94-002 32

The cost estimates are based on the assumption that an organization is actively working on 5 to 15 development or maintenance projects at an] one time. The overall cost of the data processing element will vary significantly depending on the number of projects participating in the measwment program. An organization of 200 or 300 people actively wmking on a single large project will q u i r e much less support than the same organization with 20 active smaller projects. Limited experience with larger organizations of over 5,000 persons indicates that the data pmcesing support cost is escsmially the same as for an organization of 500. As its size increases, an organization tends to collect measurement daia at a less detailed level.
3.5.3 Cost of Analysis and Packaging
The cost of the analysis element of the measurement prcrgram ranges from 5 to 15 percent of the total project budget.
Analysis and packaging is the most critical part of the measurement program and the most costly of the three elements of cost overhead. Without a sufficient allocation of effort to this function, the measufement program cannot be a success.
F h to spend at least three fimes as much on data analysis d use as on datu C Q & C ~ ~ O ~ .
Packaging is !he culmination of al l measurement activities and the primary purpose for the masmment program.
Key activities associated with this element are
&sign of proccss studies (determining what is to be measured)
aformation analysis (e.g., analysis of data ana synthesis of mdels)
Project interaction (clarifying the purposes of measurement, training developers, providing feedback to projects)
Packaging (producing standards, policies, anrf training p ~ r j ~ g m s and capturing
NASA experience shows that the cost of this element in successful measurement programs far ex& the combined costs of the other two. A successful measurement program dictates that this cost be recogaized and budgeted. For measurement programs involving 50 !a 250 software developers or maintainers, the cost of this activity has consistently run from approximately 7 to 12 percent of the organization's total budget. Costs are incurred by the researchers who design studies and de=.elop new concept$, by the process staff responsible for developing and writing standards, and by all the personnel required for analyzing, providing feedback, and developing improvement guidelines. The analysis and packaging portion of the measurement costs depends on the number of projects active within the organization. The figu-es provided here assume at least 10 active projects and an archive of data fmm at least 15 projects available for analysis. With fewer active projects. the analysis overhead would be smaller than indicated.
assessments of analyzed processes)
33 SEL-94-002

NASA’s historical data indicate that organizations spending between $20 million and $30 million for development and maintenance projects have spent between $1 million and $3 million for extensive and mature analysis efforts (in fiscal year 1993 dollars). For efforts Oli a much larger scale, the measurement analysis must necessarily be conducted on a comparably higher level; consequently, the overhead percentage decreases significantly. An expenditure of an equivalent amount of analysis resources, plus a modest increase due to the size of the organization, need not exceed the 5 percent level for measurement programs of any size. Because application of the measurement data is the primary reason for the measurement program, adequate resources must be allocated for this critical measurement program element.
SEX-94-002 34


T his chapter describes a set of core measures that any organization can use to begin a measurement program. There is KO unived , generally applicable collection of measures that will satisfy the needs and characteristics of all organizations. However, on the basis
of the experiences of mature measurement programs throughout NASA, a set of measures in the following five categories will typically be required by any software development and maintenance organization:
1. cost
3. Process characteristics
4. Projectdynamics
5. Project c-ristic~
Although organizations beginning a measufement program may want to use the core set as a baseline, they will soon find that additional infomation is required to satisfy their specific goals and that some of the core measures are not required. Each organization should use those measures that reflect its own goals. As its rneasuremt pgram matures, the organization will recognk which measures support those goals and which provide no added value.
The recommended core measures in each of the categories exhibit the following important amibvtes. They
0 Address the three key reasons for measurement
1. Understanding
2. Managing
3. Guiding improvement
0 Support both software development and software maintenance activities
Are easy to collect and archive
Ar: based on the experience of mature NASA measurement programs
The following Sections provide further infomation on the core measures.
4.1 Cost Cost is the mo-t universal and commonly accepted measure for understanding and managing software processes and products. Consequently, cost data represent the most essential part of any measwment propam. Althmgh m : y development organizations assume that the cost data must 'be extensive and detailed to capture the overall cost characteristics of a software project adequately, the cost data should actually be easy to capture. If a programmer needs more thar. a
much data. As long as the managers are aware of the total amount of effort required for the software projects, an organization can gain a significant amount of insight by ohserving the wends
few minutes each week (on the average) to record his or her effort, then the forms q U ; a r e too
SEL-94-002 36

over time. The simplest, yet most critical, cost measure is the record of the total expenditures for a project.
4.1.1 Description
Every project must capture staff effort data on a consistent, periodic basis. A monthly schedule is recommended, at a minimum; however, many major NASA measurement programs capture effort data biweekly or even weekly. The higher f q u e n c y requires little additional work and provides m r e project characterization detail.
The scope of the effort data collection depends on the organization's goals. Each organization must determine precisely who will supply effort data, at what point during the software life cycle measurement will begin, and when data collection wiU terminate. Typically, effort data must be collected for all personnel who charge their time to the software project, specifically, technical, management, secretarial, and publications staff.
For every data reporting period, each individual must mhimally report the total number of hours of effort and a breakout of the number of hours per activity (e.g., design, code, test. or other).
A decision concerning the reporting of unpaid extra hours of effort must be based on whether the intent is to measure the actual effort expended or the actual effort charged. Some organizations maintain separate records of ucpaid overhead hours.
Within the SEL, every programmer and every first- or second-line manager provide effort data. Data collection starts when the functional requirements have been completed and the software requirements analysis phase begins. For development projects, data collection continues until the system is turned over for operational use. For muintemnce projects, data collection starts at the beginning of the operations phase and continues until the analysts determine that no additional value w.ll be gained from further collection. Each maintermce p j e c t is judged on its own merits. Some may provide data for 1 year only, whereas others provide data until the software is retired.
4.1.2 Data Definition
When the measurement pmgram is first established, personnel from the analysis component must define the activities to ensure clarity and intemal consistency. Focus should be on using locally developed definitions for the activities. Excessive time should not be spent trying to be consistent with outside organizations.
37 SEL-94-002

All project personnel (e.g.. pmgrarnmers, managers, QA staff, CM staff, and testers) provide the data listed in Table 4- 1. Additional resource data on the documentation effort (total hours by publications) and the clerical effort (total hours charged by secretarial support) may be extracted from project management accounting records, as long as there is a definition of scope and characteristics. The data must be consistent from project to project and should provide an accurate history of the cost required to produce and to maintain the software product.
&ita m p t i o n s
Total eofort I Totalhourschargedtotheprojectduringthatperiod
Redesign crfstedesign Readandreviewdesign Write code Readandreviewcode Test code units oekrgging Integration test Acceptance test Other
Hwrs by maintemnce Clsss
Hours by maintenam3 actMty
correction Enhancement Adaptation Other
Isolation changedesign Implementation Unit test and system test Acceptance test and benchmark test Other
The SEL Personnel Resources Foms (see Figures A-5 and A 4 in Appendix A) and the Weekly Maintenance Effort Form (see Figure Fa- 13) are examples of foms used to capture effort data for development and maintenance projects, respectively. Programmers and managers typically complete a form every week. Both fonns provide space for recording total hours and the distribution of hours by activities. To reduce questions and confusion, the definitions of the activities are supplied on the forms. Other organizations may use different definitions as long L they are applier, consistently throughout the organization’s measiiment program.
SEL-94-00? 38

Figure 4-1 summarizes the lifecycle phases, wirces, and frequency for cost data collection. Typicdly, organizations separate the costs of development and maintenance activities.
I I
4.2 Errors Error data make up the secoild most important category of core measures. A better understanding of the characteristics of software defects is necessary to support a goal of higher quality and greater reliability. Error data may minimally include only counts of &fects detected during a specific lifecycle phase; at the other extreme, error data niiy include detailed descriptions of the characteristics of the errors and information on where the errors came from, how they were found, and how they were corrected. The level of detail must be driven by the goals and needs of the particular organization. This section recommends core error measures based on those collected within a successful measurement ;nogram in a medium-sized NASA organization.
49.1 Description
The core measures consist of the
Date the error was found
0 Date the error was c o m t e d
0 Effort rcquired to isolate and correct the error
Source of the error
Errorclass
When the measurement program is first established, the measurement analysts must define the scope of the error reporting activity.
Error data should be captured only after a unit of software has been placed under configuration management control. This recommendation, which is based on 17 years of experience, may seem counterintuitive. However, until CM checkout and checkin procedures have been established as prerequisites for maicing changes, consistent error reporting cannot be guaranteed. Usually, a unit
39 SEL-94-002

is turned over for configuration control only after it has been c d e d and, in some organizations, unir resred. An organization that places unit designs under CM control, however, could begin to capture error data at that earlier point in the life cycle.
Data
Do not expect to measure e m r cometion eflortprecisely. I
DeSCriptiOnS
Programmers focusing on their technical activities may not be able to report the exact amount of time required for a particular change. Forms should allow them to estimate the approximate time expended in isolating and correcting an error.
Date error reported
4.2.2 Data Definition
Year, month, and day
After completing a software change, a programmer submits the appropriate change form with the data shown in Table 4-2. A change form is reqcired whenever a controlled software component is modified, whether or not the detection of an error necessitated the change. Experience has shown that the process of reporting such changes enhances configuration management and that the infomation proves useful in modeling the dynamics of the software in an organization. In addition to the measures already cited, a maintenance change form must include the type of modification. As always, it is important to fucus locally when defining the error classes.
Effort to implement Approximate number of hours
Date error corrected I Year, month. and day
Type of modification
source of =;d’o< Requirements, specification, design. codr;t, previous change, other
Initialization, logic/con;rol, interface, data, computational
-- Class of error
Correction, enhancement, adaptation
Effort to idate error I Approximate number of hours
SEL-94-002 40

The SEL Change Report Form and the Maintenance Change Report Form (see Figures A-1 and A 4 in Appendix A) are examples of forms used to capture error data for development and maintenance projects, respectively. In either case, a sirsle form is used to report both software errors detected and software changes to correct the errors. Programmers use only one form to report one error that requires changes to multiple components.
Figure 4-2 summarizes the life-cycle phases, sources, and frequency for error data collection.
Figure 4-2. Error Data Collection Summary
4.3 Process Characteristics
1 Do not expect to jind generalized, well&@ed process measures. I Focilsing on the proce- characteristics category of software measures allows investigation into the effectiveness of vantus software engineering methods and techniques. Looking at process characteristics also provides insight into which projects use related processes and can thus be grouped together within the measurement program to derive models and relationships or to guide improvements.
Because few process features are consistently defined and can be objectively measured, few core measures are recommendexi in tnis category. Rather than capturing extensive process characteristics, it is suggested that some basic information be collected about the development process used for the project being measured.
4.3.1 Description
The recommended core process measures are limited to the following three:
1. Identification of development language(s)
2. Indication of the us2 of specific processes or technology [e.g., the Cleanrmm method or a particular computer-aided software engineering (CASE) tool]
3. Description of measurement study goals
Common descriptions of measures do not exist for such iundamental software engineering process elements as methodology, policies, automation, and management expertise. Therefore,
41 SEL-94-002

recommending that such measures be included in the core set is not useful. Measures such as these must be defined and analyzed locally for consistency with the organization’s goals.
I Do not expect to find u e a s e of process measurements. I Detailed process description5 cannot be stored in a database. Instead, important process information is often provided in papers and reports. For example, if an organization is studying the impact of using different testing strategies, the analysts must capture the detailed information about the results of applying difftmnt techniques and report on the results.
I Understand the high-level process charwcterktics. i Before attempting to capture advanced process measurement d.-.ta, an organizztion must have a clear understanding of the core process measures. Experience d h i n the SEL has shown that the most important process characteristic is the choice of programming language; the availability of this information may provide further insight during the analysis of other measurement data.
4.3.2 Data Definition
Table 4-3 summarizes the core process characteristics measures. Figure 4-3 summarizes the We- cycle phases, sources, and frequency for process characteristics data collection.
Table 44. Process Characteristics Data
Data
Development language
Important process characteristics (if any)
Study goals
Language name: percentage used Language name: percentage used
I ...
One-line textual description (e.g., “used Cleanroom”)
Brief description of the goals and results of the measurement study associated witt., the project
SEL-94-002 42

Phases: n SOlJrCa: Analysis and packaging personnel
Frequency: At the complebon of the development phase
Figure 4-3. Process Chamctedstfcs Data Collection Summary
4.4 Project Dynamics The next category of core measures-project dynamics-captures changes (to requirements, to controlled components, and in the estimates for completion) during the software life cycle. Experience has shown that such information aids management and improves understanding of the software process and product.
4.4.1 Description
The core measures in this category characterize observed changes in the project requirements and the product code, as well as predicted changes in the software end product. These measures consist of
0 Changes to requirements
0 Changes to baseline code
0 Growth in baseline code
0 Predicted product characteristics
Requirements changes represent the overall stability of *,'1: software requirements and can be used effectively to manage the development effort and to improve understanding of the characteristics of the software problem definition in the local environment.
Records of changes to the code and the growth of the code provide insight into how the various phases of Be life cycle affect the production of software, the most tangible product that a development process generates. Change measures are useful in managing ongoing configuration control processes, as well as in building models of the development process itself.
The measures of predicted product characteristics are excellent management aids and are useful for studying the cause and effect of changes, as well as process and problem complexity. The characteristics should be captured on a regular basis, at least monthly.
4.4.2 Data Definition
The Project Estimates Form (see Figure A-8 in Appendix A) is an example of a form used to provide predicted product characteristics at the start of the project and periodically throughout
43 SEL-94-002

the life cycle. Table 4-4 summarizes the core project dynamics measures, and Figure 4-4 summarizes the life-cycle phases, sources, and frequency for project dynamics data collection.
Data
Changes to requirements
Table 4-4. Projwt Dynamics Data
Descriptions
Count and date of any change made to the baselined requirements specnkatinns
Grovvth of code
Predicted characteristics
Changes to code
~ ~ ~~
Biweekly count of the total number of components and total lines of code in the controlled library
Monthly record of the estimated completion dates and software
Weekly count of the number of software components changed
Dates
Size
size
End design End code End testing System completed
Total compon mi3 Total lines of code (new, reused, modified)
Source: Automated tools and managers
FrequWCy: Weekly, biweekly, or monthly (see Table 4 4 )
Figure 4-4. Project Dynamlcs Collection Summary
4.5 Project Characteristics The core measures that characterize the completed project constitute another essential part of the measurement program. Organizations derive models and relationships from project chzracteristics
SEL-94-002 44

in the historical database. Without a basic description of the overall software project effort, it is difficult to apply the other measurement infomiation in a meaningful manner.
4.5.1 Description
The project characteristics can be broken down into five categories of core measures
I . Development dates
2. Total effort
3. Project size
4. Component information
5 . Software classification
Use simple &finitions of lge-cycle phuses.
The important dates are the beginning and the end of each life-cycle phase and the final project completion date. If the organii-ation is using a strict waterfall life cycle with nonoverlapping phases, then the end of a nonterminal phase is defined by the beginning of the subsequent phase. When a different life-cycle methodology is applied, the organization will have to adjust the structure of the project characteristics data. Each organization must determine how it wants to capture details of the key phase dates within the software life cycle. The simplest approach is to use the classical phase definitions of a standard life-cycle methodology. However, as long as an organization has its own consistent internal definitions, there is no overwhelming reason to adopt an external standard. Multiple releases can be treated as multiple projects or as a single project followed by maintenance enhancements. . The total effort expended on the project should be divided into hours used by programmers, managers, and support services. At the conclusion of the project, the totals should be determined from accounting information or another official source. The sum of the effort data collected during the development or maintenance project should be compared with the value obtained from the alternative source to cross-check the accuracy.
The core size measures are the total size of the software product and the total number of components within the product. NASA experience shows that archiving additional details about the origin of the code (e.g., whether it is new, reused, or modified) can lead to useful models.
I Use lines of code to represent size.
NASA programs typically measure software size in terms of lines of code. Some authorities recommend other size measures [e.g., function points (see Reference 17)]. Huwever, no other measure is as well understood or as easy to collect as lines of code.
45 SEL-94-OGL

This guidebook also recommends collecting size and origin information for software components and defines a software component as a separately compilable unit of software for the project being measured. Some organizations define components as subprograms or subsystems, whir . I is fine as long as the organization applies that definition consistently and derives useful resuh. The SEL captures the basic information for each separately compilable unit of source code and has found that the overhead required to extract the information using an automated tool is trivial. As a result, programmers can be freed from expending additional effort in providing that information.
The final category of project characteristics core measures is software classification. This measure is abstract and of limited value. Consequently, most organizations are advised to spend only limited effcrt collecting and analyzing classification data. Nevertheless, several NASA organizations have found a high-level classification scheme to be both adequate and useful. Thesc organizations use three bmadly defined classes:
1. Business or administrative applications
2. Sciwtific or engineering applications
3. Systems support
Other organizations may want to record more detailed classification data, such as
0 Embedded versus nocembedded
0 Real-time versus nonreal-time
Secure versus nonsecure
4.5.2 Data Definition
The recording of project characteristics data can often be substantialiy automated to minimize the burden on the development and maintenance organization. Dates and effort, for example, are normally available from management accounting reports; automated tools frequently can he used to report size and component information, and the time and effort needed to indicate software classification is minimal. Table 4-5 summarizes the project characteristics data.
No universally accepted definition exists for the start and stop times of various phases, such as when a project starts or when a design ends. Experience within NASA has led to the use of phase dates as follows:
0 Start of software developmenr-delivery of functional requirements documents
End of requirements analysis-<ompietion of specifications review
0 End of design-completion of design review
End of coding-completion of code and unit test
E d of testing-delivery to acceptance testing
0 End of developmenAelivery to operations
SEL-94-002 46

Data
Dates
Phase start dates (year, month, and day)
End date
Eflort
Tatal hours
Project size (lines of d e )
Other (count)
Component infomation (for each component)
Componect size (lines of code)
Component origin
Descriptions
Requirements analysis Design Implementation System test Acceptance test Cleanup Maintenance
Project end
Project Management Technia! personnel support senrices
Delivered Developed Executable Comments New Extensively modified Slightly modified Reused
Number of components Pages of documentation
Total Executable
New Extensively modified Slightly modified Reused
Businesdadministrative Scientificlengineering %stems suppon
47

The effort data, compiled at the conclusion of the project, are used as part of h e high-level summary irlformation for the project. The information represents the total cost of the project broken down among developers, managers, and support services.
Table 4-5 lists several measures fur lines of code. Consensus may never be reached on what constitutes a line of code. Thexfore, to facilimte various f m of comparison and analysis, this guidebook recommends recording muitiple values. The core measures include counts of
Total lines deliverekvery logical line, including comments. blacks, executable, and nonexecutable
Developed fhes-total lines with a reuse factor
Executable stutements-total number of executable statements
Comment lines-total number of lines containing only comments err blanks
The SEL captures source lines of code in four categories:
1. N e w d in new units
2. Exrensively modijied--code for reused units in which 25 percent or more of the lines were modified
3. Slightly d ( f i e d + x d e for reused units in which fewer than 25 percent of the lines were modified
4. Reused verbatim-code for units that were reused with no changes
For estimation purposes, lines of code are often classified into two categories thal combine newly written and extensively modit7ed units as nav code and slightly modified and verbatim code as reused code. Consequently, the SEL relationships (see Reference 9) for estimating developed lines are
FORTRAN developed lines = new lines + 20% of reused lines
Ada developed lines = new lines + 30% of reused lines
(See Sections 2.2.1 and 6.1.2 for more discussion of developed lines of de.)
Specijj which software is to be counted
It is important to be specific about which software is to be included in the size counts. For example, it is usually appropriate to exclude throw-away prototypes, test harnesses, and commercial off-the-shelf (COTS) software from the reported totals.
Component information can provide insight into the overall development charxteristics. Although the total amount of information may be extensive, it should be easy to compile at the conclusion of the project and can be almost completely remeved via automated software tools such as code counters, auditors, or analyzers.
SEL-94-002 48

The Pmject Completion Statistics Form (see Figure A-7 in Appendix A) is an example of a form used for collecting project characteristics at the comp!etion of a project. Figure 4-5 summarizes the lifecycle phases, sources, and frequency for project chmcteristics data co:iect;.on.
49 SEL-94-002


Occasionally, there may be other process and product information sources that do not fall neatly into one of the three categories. For example, personnel often have insights during document or code reviews. Any information that can be useful within the organization’s measurement program should be exploited.
Figure 3-1 illustrates the operational relationships among the three components of the measurement program.
5.1 Development and Maintenance Personnel whose primary responsibility is developing or maintaining software must not be burdened with heavy measurement program duties.5 The measurefnent pmgram musk be designed so that it is deemed to be a help, not a hindrance, to development and maintenance personnel. nK operational responsibilities of the development and maintenance component are . providingdata
hticipafing in studies
5.1.1 Providing Data
Project personnel are responsible for completing data forms that should have been designed for simplicity. At project initiatiofi, the project chancteristics (discussed in Chapter 4) are provided to establish a baseline. Throughout the life of the project. measures must be provided on a regular schedule, as agreed upon by the analysts and management. Possibly the most important data to be provided by the development team are the accurate final project statistics (see Figure A-7). These data are often overlooked in an immature measurement program.
The process for submitting completed forms must be equally simple. Developers and maintainers must be able to deliver forms to a specified, convenient location or hand them to a designated individual and then forget about them. A representative of the technical support component will be respons;Sle for collecting the forms and initiating the data entry process.
Occasionally, developers and maintainers are asked to meet with the analysts. Although vitally important, these meetings must be brief and well planned so that they do not interfere with development and delivery schedules. Meetings may be feedback sessions for the purpose of verifying preliminary data analysis, interviews to gather additional project characteristics data or subjective information, or mining sessions to reinforce the proper use of specific processes beiiig applied by the developers.
most organizations, the managers of the development organization will continue to be responsible for collecting and applying certain data needed for ongoing prognlm management activities without impact from the analysts. Some data collected in support of earned value analysis or planned versus actual budget information, for example. will cuntiaue to be collected and analyzed by managers and their p j e c t control support personnel. The role of the measurement analysts is to provide accunte models and relationships to support those management activities.
53 SEL-94-002

5.1.2 Participating in Studies
The analysts may ask the developers and maintainers to participate in the experimental use of some process, technique, tool, or model that is not part of the organization’s standard practice. Such studies sometimes necessitate the use of new forms and typically require that development and maintenance personnel attend briefings or a training session on using the new process.
Most projects experience little, if any, process change driven by the analysts. For these projects, training is typicmlly limited to discussions of new forms and new data reporting agreements. For projects that undergo significant process changes, however, training sessions are important to ensure that development and maintenance personnel thoroughly understand the new process and fully agree that the study supports the organizational goals. The study must be a cooperative team effort: analysts must provide regular feedback of interim results, and developers or maizziners must contribute their insight regarding the value and relevance of those results.
When development and maintenance personnel participate in such studies, they should always receive feedback from the analysts. At feedback sessions, developers and maintainers also have an opportunity to report their impressions of the degree of success derived from the innovation and to dixuss any difficulties experienced in applying the new process.
5.2 Technical Support The primary operational responsibilities of the technical support personnel are
Collectingdata
Storing and quality assuring data
Summarizing and reporting data
5.2.1 Collecting Data
Satisfactory collection of data by the technical support component depends on a clearly established interface with the development and maintenance component and on clearly defined terms and concepts provided by the analysis and packaging component.
Although many organizations put a great deal of effort into automating data collection, many years of experience have led to the following rule:
A t t e ~ ~ t s to automate the data collection process shouid be limited. Becaw mutine, manual data collection efforts add an overhead of only 1 to 2 percent (see Reference is), automation may not result in a cost saving. In practice, extensive efforts to develop automated tools may actually incrence cost to the total organization. It is more important to ensure that the amount of data is driven by specific organizational goals (which will also minimize the amount required) and that the data collection process is well defined and operationally smooth.
SEL-94-002 54

Regardless of the s k of the automated data collection effort, it is essential that management communicate with the developers and maintainers about which parts of the process will be monitored electronically.
Interface With Data Providers
Technical support personnel must ensure that members of the management ami technical staffs within the development and maintenance component anderstand their responsibilities with respect to furnishing the selected project measures. Technical support personnel must also communicate with the providers of the data to ensure that everyone understands the details of the collection requirements, for example,
Which personnel are responsible for collecting and furnishing project measures
0 How frequently tk mllection will occur
Which portions of the software life cycle will be reflected in the data
0 What type of personnel (management, technical, or rrdministrative) will be included m level-of-effort measurements
M&e providing datu easy.
Personnel within the technical support component must make furnishing data as painless as possible for development and maintenance personnel to reduce the chances for aggravation and resentment on the part of those data providers. Publishing a list of technical support contacts can make it easy for the data providers to ask questions or deal with measuremat problems. Making it obvious where to deposit the data forms and collecting them promptly to emphasize the importance of providing the forms on schedule are also useful tactics.
Definitions
To ensure that the data provided are based on a consistent understanding of the measurement terms and concepts, support personnel must supply concise, clear definitions to the development and mainter.dnce personnel. It is the responsibility of the analysis and packaging component to write definitions that are consistent with organiiational goals and locally understood ideas; however, the dsta collectors are responsible for furnishing the definitions to the data providers. The importance of focusing locally, rather than adhering to ahitrary industry-wide conventions, cannot be overemphasized.
55 SEL-94-002
. .

5.2.2 Storing and Quality Assuring Data
The seccnd important responsibility of the technical support component is storage of highquality data. For project data to be used effectively in support of the goals of a measurement program, they must be complete and accurate as defined by QA procedures and readily available.
Data Storage
To be readily available, project data must be stored in an online database. This requirement leads to the next rule:
1 Using a COTS DBMS to support the organization’s measurement program is highly recommended. The time and effort required to develop custom tools will outweigh their benefits. A relational DBMS will provide the most appropriate support for data retrieval and analysis using a variety of table combinations and user views. Spreadsheets, indexed sequential files, and even networked or hierarchical DBMSs are simply inadequate. See Reference 19 for a detailed description of a mature measurement database using a commercial DBMS.
Data Quality
The quality of the stored data must also be considered. From the perspective of the support component, data quality assurance is a two-step process:
1. Verification of source data-Discrepancies must be tracked to the source and corrected. This step includes checking that the
a. Data forms have been submitted and are complete (i.e., all required values are provided).
b. Values are of the specified type (e.g., numeric fields do not contain non-numeric values).
c. Values are within specified ranges (e.g., the number of hours of effort per day per person is never greater than 24).
d. Values are reported on the prescribed schedule.
2. Verification of data in the database-After the values have been entered into the database, b second check is performed to verify that the entries match the source value.
An organization with a mature measurement program may be able to use automated tools that allow developers to enter data directly into the database via online forms, thereby eliminating paper forms and the manual QA process. Although this approach may seem ideal, experience has shown that it often leads to unreliable data and that the cost of a manual process is relatively small.
SEL-94-02 56

Despite the quality assurance steps, *e next rule still applies:
Expect measurement data to $@&wed, inexact, and inconsistent.
The collection and verification processes are fallible, and some data will be incomplete and imperfect. A third quality assurance step, beyond the scope of the support personnel, will subsequently be performed by the analysts to determine the accuracy and usefulness of the data. The analysts will perform cross-checking, back tracking, and general qualitative analysis on the data.
5.2.3 Summarizing, Reporting, and Exporting Data
Technical support personnel are also responsible for producing and distributing reports and data summaries to data users in all three measurement program components. Occasionally, they are also responsible for exporting raw data to external organizations. Reports can be tabular or graphical, printed or displayed. Summary reports are designed to highlight particular trends or relationships.
Not all reports are generated by the support personnel, however. High-level data analysis reports, prepared by the analysis and packaging component, are discussed in the next section. Routine management reports of project control information remain the responsibility of management.
Many of the raw data and summary reports are generated on a regular schedule. These reports range from singre-project summaries focused on a particular data type to multiple-project roll-ups that provide high-level statistics in a format compact enough to facilitate project-to-project comparisons. Support personnel distribute those reports to development and maintenance personnel to provide feedback on project measures. Analysis and packaging per2onnel alr 3 use the reports to identify projects and data to be used in studies and model generation.
Figure 5-2 provides an example of a regularly scheduled Project Summary Statistics report, showing actual data for projects in a NASA organization with a mature measlirement program. The report also contains several questionable entries (e.g., 0.0 hours for support where there probably should be a positive value) and illustrates the rule that data may be flawed, inexact, or inconsistent.
The technical support component also generates some of the raw data and summary reports on an ad hoc b d i s , as requested by users of the data. Requests for specific data on specific projects come from both the development and maintenance component and the analysis and packaging component. Such reports also include low-level data dumps used by support personnel during the data verification process.
A related responsibility of the support component is preparing measurement data for export to another organization. Sharing data across domains an5 interpreting data out of context are nmma!ly not meaningful, as cautioned in the “focus locally” rule. Nevertheless, exporting data to another organization occasionally makes sense. For example, the organization may intend to use acquired data to support the establishment of its own measurement program. In addition to
57 SEL-94-002

Pro:ect Svmaary Stetintic#
Projec: data are not final
:c :32 15500 11800
5 224 16000 i4100
2 17) 34902 34902
2 415 4i829 4020:
40 292 50911 45343
20 397 Gi78 49712
76 8547 8041
494 : 81434 70951
267 j 72412 SS289
I4 930 I 270602 141084 I
4 322 36305 26986
6 244 52817 45825
- 9 I. .. *-
0 0 . 0 0
0 0 : 0 0
Incarapiete data for this project
i; 278 26844 24367
0 0 1 0 0
3c 392 ~ 2573; 25510
0 o i 0 0
txttslsively
llodlfled
SLOC
0
0
0
450
J
0
0
1879
16017
0
1342
0
0
0
0
0
0
Slightly
Hoiiified
stoc
0
0
0
IO44
4673
10364
446
0
lie4
13647
7363
2156
0
0
2477
0
0
0
Old
stoc
3'106
1900
0
*34
893
i102
60
10483
11060
7934
2556
4494
0
0
0
0
22:
0
P r o i e e t Crireria : ALL
tzo. of
chaoees
2670
213
413
544
12S5
221
307
1776
427
1494
412
344
0
0
1:77
0
124
0
Technical
SllDmt
HOUrS
177iS.O
3498.0
7965.3
32083.4
i2S88 -0
17039.0
2285.6
17057.0
13214.6
49930.3
11005.0
6106.3
19208.9
59.0
10946.0
24662.2
1514.0
0.0
support
semicea
lhU8
1774.0
11.0
0.0
4407.6
1109.0
3056.0
0.0
1875.0
1365 .8
4322.9
1524.5
0.0
3612.5
0.0
967.0
3739.2
0.0
0.0
issuing a caveat about the danger of misinteqretation, support personnel must sanitize the data before export to preserve the confidentiality of the data providers. Sanitizing the data requires eliminating names of individuals and substituting generic project names for the mnemo&s used to identify projects within the local environment.
5.3 Analysis and Packaging Analysis and packaging responsibilities Consist of
Designitgstudies
Analyzingprojectdata
Packagingresults
The analysis and packaging component has the heaviest burden within the measurement program. The analysts must first design measmment studies to collect and analyze project data in support of the organization's process improvement goals. Next, they must use the data to develop and maintain organizational models, such as cost estimation models and error profiles, and to
SEL94-002 58

determine the impact of new technologies, such as object-oriented design or code reading, on the Organization. Fmally, they must provide the derived information to the project organization in a useful form, such as guidebooks. tools, and trai :?g courses. The analysis and packaging effort should always be transparent to the development and maintenance projects providing the data. Developers have a right to inderstand why they are providing the data. Moreover, a clear understanding of the connection between the data they provide and the models and guidelines produced by the analysts leads to higher quality project data and a higher degree of confidence in the resulting products.
By analyzing and packaging measimment data, these personnel support the three reasons for establishing a measurement program:
1. Understunding-Analysts use routine data from the core measures to build models and relationships an4 to characterize the overall software processes and products.
2. Munuging--EJthough the analysts do not play an active role in managing the software developmen1 and maintenance projects, they provide information and models to the development and maintenance personnel to improve the quality of project management.
3. Guiding improvement-Analysts consider each project an experiment, and the goals for collecting specific measures are clearly defined in project experiment plans. These experiments, which are actually studies of software engineering processes, can range m scope from straightforward validation of the current organizational models to controlled investigations of the impact of introducing a new methodology. Data from projects with similar goals are analyzed and synthesized to produce models and to understand the impact of process changes. Beneficial new technologies and organizational process and product models are then packaged for use by the projects.
5.3.1 Designing Process Improvement Studies
On the basis of the overall goals of the organization and the characteristics of the individual projects, the analysts, working with the project leaders, prepare plans that define specific study goals and specify the data to be collected. Figure 5-2 provides an outline of a process study plan. In some cases, analysts prepare detailed plans for projects participating in the measurement program. In most cases, however, no significant changes will be proposed, and the study goals will be primarily to refine the understanding of the s o h a r e process or product; routine measurement data will be sufficient, and no training will be needed. Many of the study plans will, therefore, be relatively brief, containing simple desm’pfims of the data to be collected, the analysis to be performed, and the study goals (e.g., “gain insight into the classes and origins of software errors,’).
Analysts must also prepare higher level organizational plans to coordinate the studies across projects and to ensure that all high-priority organizational goals are being addressed. They work closely with the organization’s managers to choose appropriate projects for major studies.
Appendix B includes a sample process study plan. The plan summarizes key characteristics of the project, specifies study goals, identifies key questions to be answered by analyzing project data and information, and clearly defines the data to be provided by the project.
59

Process Study Plan for {Project Name}
plan Originator Name}
Pate)
1. Project Description
Briefly describe the application and the project team.
2. Key Facts
Briefly state the life-cycle methodology, methods, sc;iedule, project size, implementation language, and any other important details.
3. Goals of the Study
Explain the goals of this study.
4. Approach
Describe the steps planned to accomplish the goals.
5. Data Collection
Itemize the measurement data and information to be collected during the study.
Figure 5-3. Process Study Plan Outiine
A key reason for a study is to assess and guide change. Any change, such as ir,rroducing a new method, tool, or language, may involve an element of risk, so any sigtllficant change to a standard development or maintenance process must be jointly approved by the analysts and the project manager. When asked by the analysts to introduce evolving technologies on a project, a manager must consider the risk, use comrnor sense, be cautious, and even refuse the change if the risk is too great. Nevertheless, process studies are important to every organization, and each development or maintenance project is expected to add some amount of process information to the organization’s experience base.
Just as the organization’s high-level measurement plans must relate to its overall goals, a process study plan for a praject (or for a related set of projects) must show a clear connection between the data being collected and the goals of the study. The sample plan in Appendix B was developed for an ongoing project within an organization that already had developed a high-level plan. It includes a high-level description of the approach for analyzing the project information and defines a study intended to support new organizational goals.
5.3.2 Analyzing Project Data
The analysts continually synthesize data from many projects to gain an understanding of both the product and process characteristics of the organization. They look for distinguishing project characteristics that identify subgroups within the organization-for example. 911 projects using the Ada language or all projects applying object-oriented requirements analysis and design methods. That effort results in a baseline set of process and product models for the organization and may reveal changes (to models and relationships) that aii not the result of explicitly introducing new
SEL-94-002 60

processes. Baseline analysis is a major effort, and it is a critical prerequisite for any analysis or packaging of the results of izdividual project studies. Experience has shown that the baseline characteristics change slowly, even with the infusion of new processes. Therefore, packagers generate new handbooks and guidebooks only every 3 to 5 yes;-.
Analysts also examine individual pr+cct data to determine how trends co. clate with project successes and difficulties. They design the content of the high-level analysis re; ts and work with technical support personnel to establish the frequency for producing and distributing reports. These reports generally provide high-level summaries of project characteristics or support specific study objectives. Figure 5-4 provides an example of a high-level development project summary report. Figure 5-5 shows a similar report for a maintenance project.
Once the crganization’s pimesses and products have been characterized, the analysts shift their focus to assessing the impact of change. They compare current project measures with the organization’s historical models to measure the impact of evolutionary changes introduced by either explicit changes to the software processes (such as a new method or tool) or external influences (such as changing the problem complexity). This analysis xsults in updated process, product, or management models.
Analysts also focus on determining the impact of new technologies and approaches introduced m major experiments. They compare experimental data with the historical baseline models to assess success or failure. Often the result indicates a guarded success, suggesting that continued study iS needed to refine the technique and confrnn success.
Figure 5-6 shows the results of a study designed to determine the impact on the distribution of effort across software activities and lifecycle phases when the Ada programming language was intrcduced into an organization that had previously relied on FORTRAN. A f r x the organization had gained the experience of using Ada on nine projects, the models stabilized as shown in the figure (see Reference 10).
Although analysts use objective measurement extensively, they also depend heady on subjective information gathered directly from project personnel and recorded in project history reports to help interpret the data. Each project has a unique set of drivers and circumstances that must be considered when interpreting the data. Chapter 6 addresses the analysis, application, and feedback of measurement information in more detail.
5.3.3 Packaging the Results
As analysts gain greater insight into the characteristics of the current software Jevelopment and maintenance environment and the impacts of specific software methodologies on that environment, they must infuse that understanding back into the development organization, packaging the appropriate software practices for the problem domain in well-founded standards and policies so that they can be applied on ensuing projects. Packaging entaiis generating the following items:
0 Software management policies and guidelines
Software development and maintenmce standards
61 SEL-94-02


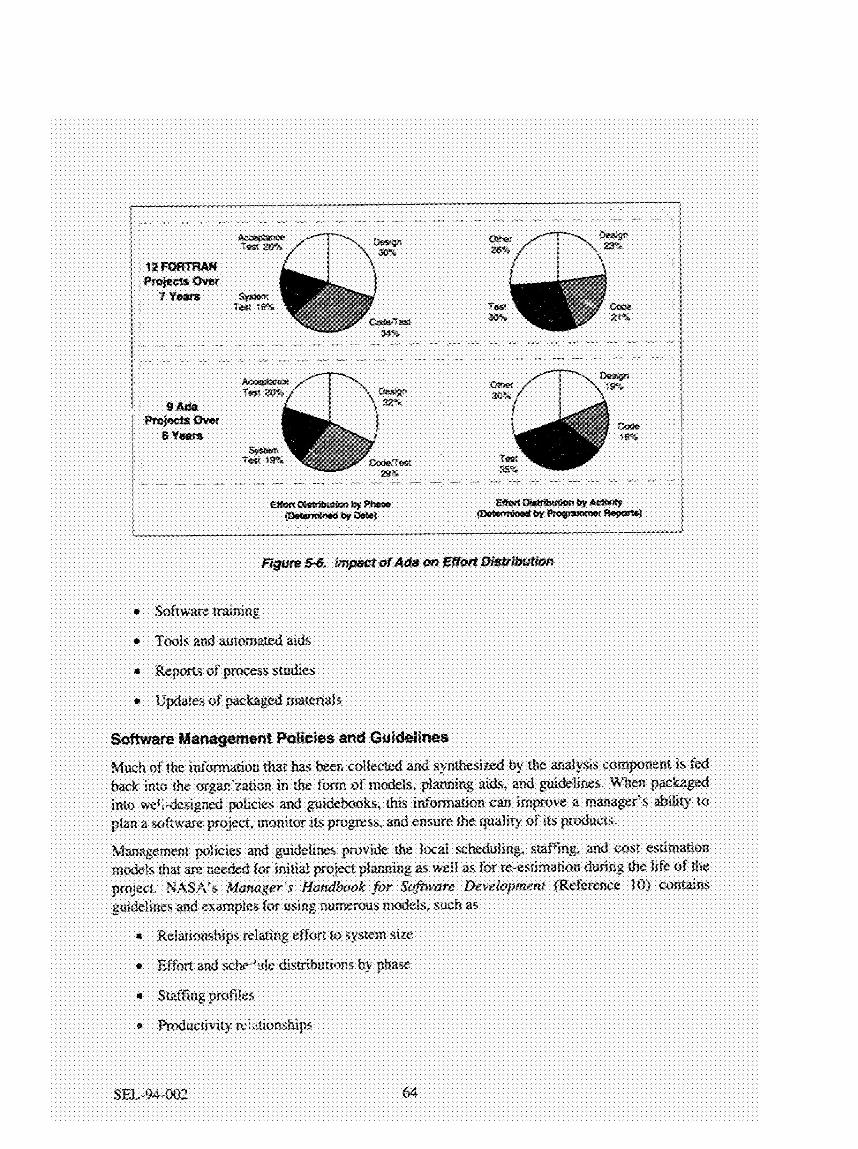

The key models used for gauging project pmews and quality are organized and packaged together, preferably with the planning models, in a single reference source. Typical progress models include local profiles of software growph, computer use, and test completion. Quality models include error rates, reported and corrected software discrepancies, and software change rates. Figure 5-7 shows an example of an error rate model used to predict and track errors throughout the life cycle. The model was calibrated by measuring the error characteristics cf over 25 projects with more thar. 5,000 e m s reponed. It depicts the typical rate of finding e m m code (four emrs per KSLOC). during the system test phase (two errors per KSLOC), and during acceptance testing (one error per KSLOCj. a reduction of 50 percent in each subsequent phase. Because no data were collected during the design phase, the error rate is zero. The variation was also computed, as shown in the figure. An actual emr rate above the bounds of the model may be the result of misinterpreted requirements or may be caused by highly unreliable or complex software. An actual rate below the bounds may be the result of particularly well-built software, a relatively simple problem, or inadequate testing.
Every organization can and should produce a document contairing the complete set of models, relationships, and management guidelines used wittin the organization. (See Reference 8 for an example of such a document.)
Software Development and Maintenance Standards
In a mature measurement program, standards for software development and maintenance address each phase of the software life cycle, covering the entire range of technical activities. These standards define thz products, methods, tools, data collection procedures, and certification criteria
65 SEL-94-002

that have been identified as beneficial to the organization. Separate, detailed standards characterize programming practices unique to the local ewimnment or to a specific development language; they also address sDecialized techniques, such as the Cleanroom method or object- oriented design.
The most useful, highquality software engineering standards are derived from the practices of the organization for which they are intended; that is, they are measurement driven. A standard requiring the use of processes that are incompatible with the organization’s development and maintenance methodology cannot be successful.
Software Training
The organization’s goals. environment, and measured experiences must drive the planning and execution of the training cniculurn. Courses reflect the understanding of the characteristics of the local environment, and each course must respond
Training becomes essential when new technologies, ;tmdards, tools, or pmcesses are in* into the software engineering envimnment Personnel are more likely to accept a new approbch when it has been introduced in well-organized stages within the interactive setthis of a traini~g course.
Training must be provided first to those who are pankiptirig in an experiment with a new technology and then to a wider audience as soon as the technology has been adopted for general use within the organization. A training program should also include courses that introduce new personnel to the softwiue dcvelopment and maintenance environment.
a specific need.
Tools and Automated Aids
Packaging personnel also build tools and other automated aids to facilitate software management, development, maintenance, or data collection processes. Such tools include
0 Cost estimation aids based on local models
Management aids that compare actual measured values with baseline estimates
Design aids that are driven by experimental rzsults inlcating beneficial design approaches
In addition, more sophisticated tools may use the organization’s extensive historical infomztion for managing and for analysis. An example of such a tool is the Software Management Environment (SME) (Reference 20). It encapsulates experience (Le., data, research results, and management knowledge) gained from past development projects in a practical tool designed to assist current software development managers in their day-today management and planning activities. The SME provides integrated graphical features that enable a manager to predict characteristics such as milestones, cost, and reliability; track software project parameters; compare the values of the parameters to past projects; a n a l y ~ the differences between current and expected development patterns within the environment; and assess the overall quality of the project’s development progress. Figure 5-8 illustrates the architecture and typical uses of such a tool.
SEL-94-002 66

- 4 I
- ANALYZE
?! e 3 - 0
E 1
L
- Cment Project
Model
1
Reports of Process Studies
For each process study, analysts prepare one or more reports that address the goal, the specific questions to be answered, the methods employed, the results measured, and the conclusions drawn. Interim reports document partial results during lengthy or ongoing studies, and final reports are prepared immediately after the study is completed.
67 SEL-94-002

Final reports are vital sources of information when the time comes to integrate study recommendations with other standard practices before packaging them as policies, guidebooks, courses, or tools. An organization may, therefore, find it helpful to collect all study reports produced within a year into a single annual reference volume.
Some organizations repackage study reports for dismbution outside the local environment as conference papers and presentations, thus gaining valuable feedback by subjecting the results to peer review. Such scrutiny can offer comparisons, suggest other interpretations or conclusions, and help improve the data collection procedures and analytical methods employed by the organization.
Updates of Packaged Materials
All packaged materials-policies, standards, course materials, tools, and study reports-must be maintained in an organizational repository. Together with the information in the measurememt database, the repository of packaged materials functions as the memory of the organization. It is essential that the contents of the library be catalogued ami that the catalog be kept up-to-date as new material is added. In the SEL, for example, a bibliography containing abstracts of al l SEL documents is revised and republished annually.
The analysis and packaging component also updates guidebooks, training courses, policies, and tools on a regular basis to keep the organization abreast of current software engineerin:: practices.
SEL-94-002 68
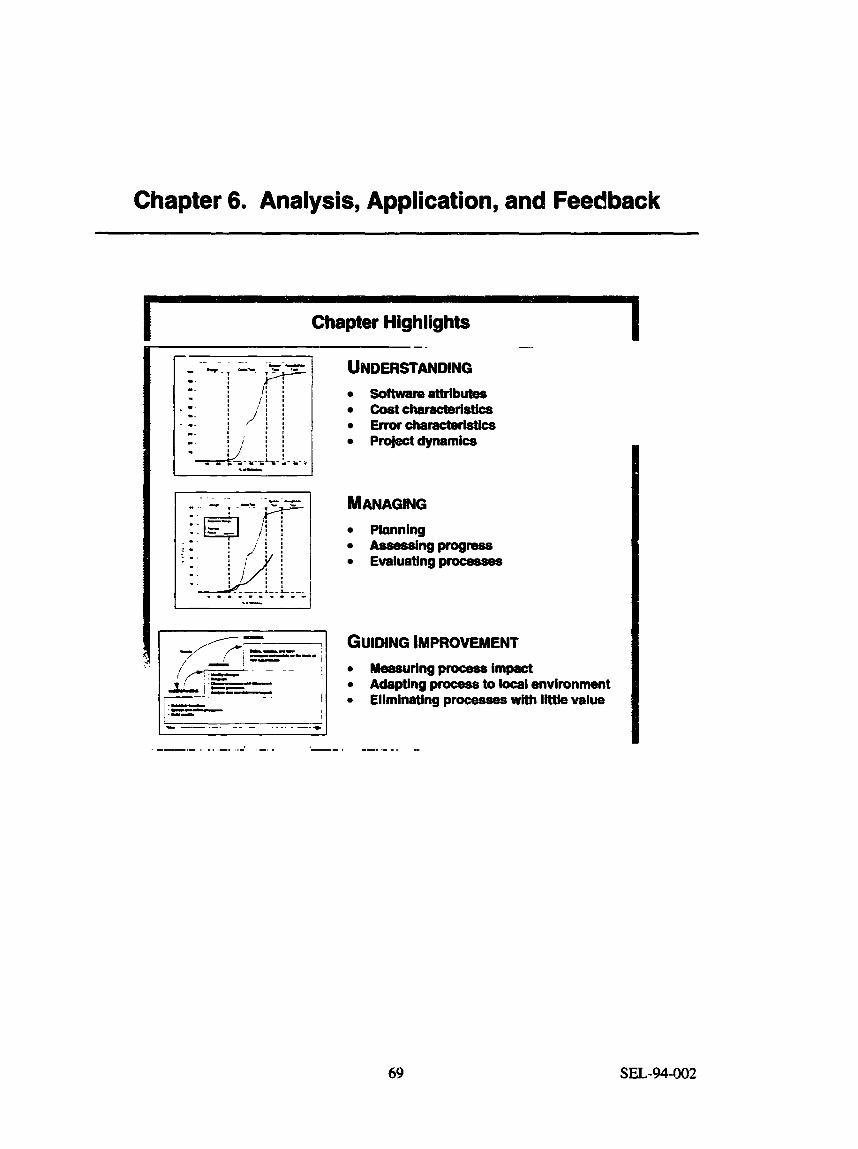
Chapter 6. Analysis, Application, and Feedback
Chapter Highlights
UNDERSTANDING softwareattributes c o s t c ~ s t i c s E r r o r ~ s t i c s Pmjectdynemks
MANAGING Phnnlng Assessingprogress
0 Evaluatlngprocesses
GUIDING IMPROVEMENT 0 Measuringprocessimpact 0
0
Adapting process to local environment Eliminating processes with 1- value
69 SEL-94-02

T his chapter describes specific approaches for using measurement information effectively. Software measurement programs must focus on the use of data rather than on their collection. Thus, the appmach to using measurement data must be clearly defined, and
the data must be analyzed and packaged in a witable form. The effective use of measurement data is an outgrowth of the planning exercise that establishes the organization’s goals, which drive the measurement activities.
The following sections address the analysis, application, and feedback of measurement information in the context of the *bee key reasons for establishing a measmment program, as discussed in Chapter 2:
1. Understanding
2. Managing
3. Guiding improvement
Examples drawn from experiences within NASA illustrate the important points. Because each organization’s measurement goals may differ, the examples presented here may not relate directly to the rids of other organizations.
6.1 Understanding The first reason for measurement-undersfanding-includes generating models of software engineering processes and the relationships among the process parameters. As an organization builds more models and relatioashps and refines them to improve their accuracy and reliability, its personnel develop more insight into the characteristics of the software processes and products.
True understanding requires qualitative analysis of objective and subjective measurement information, including exanination for accuracy and checks for flawed, missing, or inconsistent data values. If used properly, subjective information is as valuable as objective counts. Unlike objective data, which are used in statistical analysis, subjective information reflects the experience of managers and developers within the organization’s local environment. The resulting models and relationships, whether derived from objective or subjective infomiation, are relevant only within the local environment.
The underst;.Lng process includes the following major measurement applications:
Software attributes
0 Cost characteristics
0 Error characteristics
Project dynamics
Increased understanding provides the foundation for building models and relationships and for developing the key infonnation required for managing subsequent software development efforts.
The examples in this section depict various measurement application. that have proven beneficial to experienced me-surement organizations. All of the models can be developed from the core measures described in Chapter 4. The example descriptions are by no means exhaustive.
SEL-94-002 70

Finding tfe answers to the questions posed in Table 6-1 is an essential activity in applying measurement. Any software organization will benefit from analyzing the fundamental infomation shown in the examples that appear throughout the rest of the chapter.
What are the error rates during development and maintenance?
What types of errors are most prevalent?
What is the expected rate of requirements chznges during
How do size and complelaty affect error rates?
development?
How fast does code grow during development, and how fast does it change?
Table 6 1 . Questions Leading to Understanding
6
7
8
9
Measurement Application
Software Attributes
~
cost Characteristics
Understanding
What languages are used, and how is the use evolvi?g?
What are the system sizes. reuse levels, and module profiles?
What is the typical cost to develop my software?
What percentagss of my software resources are consumed in the various life-cycle phases and activities?
How much is spent on maintenance, QA, CM, management, and documentation?
Examples
1
2
Error Characteristics
Project Dynamics
6.1.1 Software Attributes
Information about software attributes is easy to record and use but is too often overlooked. At a minimum, organizations should record the sizes, dates, and languages used on every project. Those basic characteristics are necessary for developing cost models, planning aid$, and general management principles. Table 6-2 shows a subset of the actual data used in calculating the information shown in the examples that follow. For a more complete listing of the hta, see Reference 9.
finmple I : Language Evolution
Goal:
Measures needed h j e c t thtes, sizes, and hguages. (See Sections 4.3 and 4.5.)
71 SEL-94-(102

Table 6-2. Software Attribute Data
C 7.965
23,707 I 1,526 c- 341902
ACME FORTRAN I 01i88-09/90
U ARSTELS Ada 02/88-12/89 44,441 r I EUVEAGSS FORTRAN 10/8&09/90 55,149 193,860 I 21,658
EUVEDSIM I Ada I 10/88-09/90 I 57,107 I 126,910 I 20,775
EUVETELS Ada 10/88-05/90 2,532 64,164 4,727
SAMPEX I FORTRAN I 03/90-11/91 I 12,221 I 142,288 I 4,598
SAMPEXTS
SAMPEXTP I FORTRAN I 03/90-11/91 I 17,819 I 1,813 I 6,772
Ada 03/9043/91 3,301 58,146 2,516
POWITS
TOMSTELS
FASTELS
FASTAGSS
SEL-94-002
Ada 03/90-05/92 20,954 47,153 11,695
Ada 04/92-09/93 1,768 50,527 6,915
Ada 08/92-10/93 5,306 59,417 7,874
FORTRAN 08/92-04/94 21,750 125,405 7,550 -
72

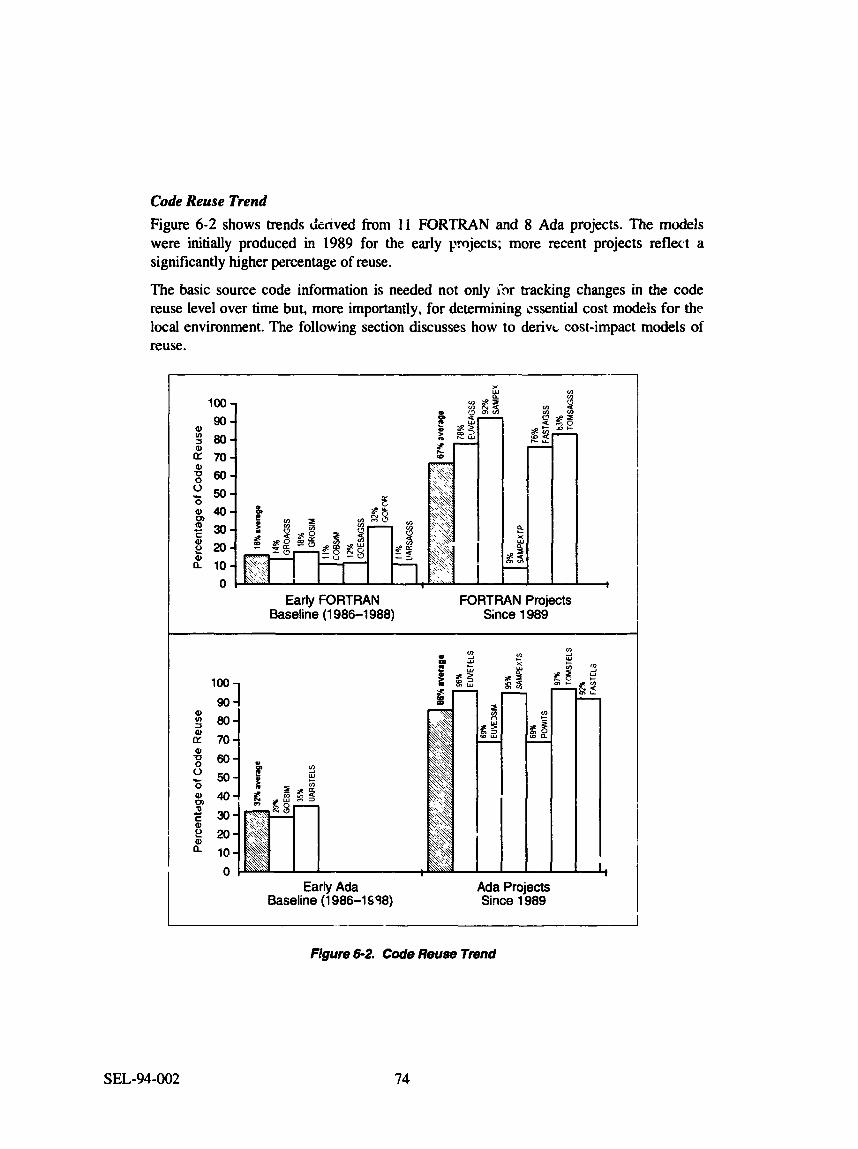
Code Reuse Trend Figure 6-2 shows trends derived from 1 1 FORTRAN and 8 Ada projects. The models were initially produced in 1989 for the early projects; more recent projects reflect a significantly higher percentage of reuse.
The basic source code information is needed not only f x tracking changes in the code reuse level over time but, more importantly, for determining cssential cost models for the local environment. The following section discusses how to derivt cost-impact models of reuse.
100 - 90-
2 80- al
70- $ 60- 2 50- & # - 2 30- I? 10-
0
20-
o c
X W a Q Z
g:
23
Early FORTRAN FORTRAN Projects Baseline (1 986-1 988) Since 1989
I
100
90 z 8 0 al
al IY 70
0 - 5 0 a 4 0 0
0,
2 3 0 al
al 2 2 0
10
0 Early Ada
Baseline (1 986-1 638) Ada Projects Since 1989
Figure 6-2. Code Reuse Tmnd
SEL-94-002 74

6.1.2 Cost Characteristics
Software cost characteristics are probably the most important set of attributes that contribute to an understanding of software. Cost characteristics include productivity, cost of phases, cost of activities, cost of changes, and many other attributes required for managing, planning, and monitoring software development and maintenance.
Example 3: Cost Versus Size
Goals: Evaluate the cost of reusing code.
Determine the cost of producing code in the organization.
Measures needed: Project size, dates, reuse, and eflort data.
(See Section 4.5.)
Cost of Reusing Code Simple measures can be used to derive a local model for the cost of producing software. One major factor that must be analyzed is the impact of code reuse on cost. Borrowing code written for an earlier software project and adapting it for the curren. project usually requires less effort than writing entirely new code. Testing reused code also typically requires less effort, because most software errors in reused code have already been eliminated. Software projects using a significant amount of reused code usually require less overall effort than do projects with all code written frc 7 cratch.
Chapter 2 introduced the following relationship among the values of effort (cost of personnel), DLOC, and productivity:
Effort (in hours) = DLOC / Productivity
where
DLOC = New SLOC + Reuse Cost Factor x Reused SLOC
The reuse cost factor is a weighting factor applied to reused source code. Several simplifying assumptims can be made to compute an approximate value for this factor. The most significant assumption is that all similar projects reflect approximately the same productivity; hence, the only variable is the cost of reuse. In this case, the similarity of the projects comes from their having been developed within the same environment and in the same language (FORTRAN). Although numerous other factors affect the cost of development, it is best to apply simple measures to arrive at an approximation before attempting detailed analysis oi more complex factors.
75 SEL-94-002

Points derived from values in Table 6-2 can be plotted to illustrate the relationship between lines of code per hour and the reuse percentage as shown in Figure 6-3. Assuming that productivity (DLOCEffort) is constant, the straight line fit to the DLOC points indicates h a t 20 percent is a reasonable approximation for the reuse cost factor for FORTRAN.
I I i
i I
20- A
f
t n .- c 10 =!.
c’ 5 -
0 0
I trevelopeciSou~ Lines cn
i r c. - I 0
3 0 *
0 . - - I / IOO i 0 20 40 60 80
i Yo Reuse
ngum 6-3. Derivation of 20 Percent Reuse Cost Factor for F O m A N
Figur, 6 4 shows a slightly different approach for Ada language projects. Analysts within the same environment studied size, effort, and reuse data from five projects developed between 1987 and 1990 to derive the Ada reuse cost factor. Attempting to produce a constant productivity valup, they computed the productivity as DLOC per hour for each of the five projects whit-. varyin: me reuse cost factors. In this case, the 30 percent factor resulted in the In-:est standard deviation for the computed productivity values and was adopted for this organization.
Every organization can develop its own reuse cost factor with the simple measures listed in Ttble 6-2.
cos1 of PrOlit1cing code One of the most basic aspects of software engineering understanding is the ability to model the cost of a system on th. basis of size or functionality. Sexxion 2.2 discussed the basic estimation models, relauna cost to software size, which have proven useful in one environment. Those models were derivcd by analyzing da*l, from over 100 nrojects spanning many years an ’ j naking careful decisions about which projects to ‘nclude in the baseline made1 and which to exclude. Organizations just starting to apply measurement shvuld begin to establish cost r; d e l s v ii! heir own data.
SLL-94-02 76


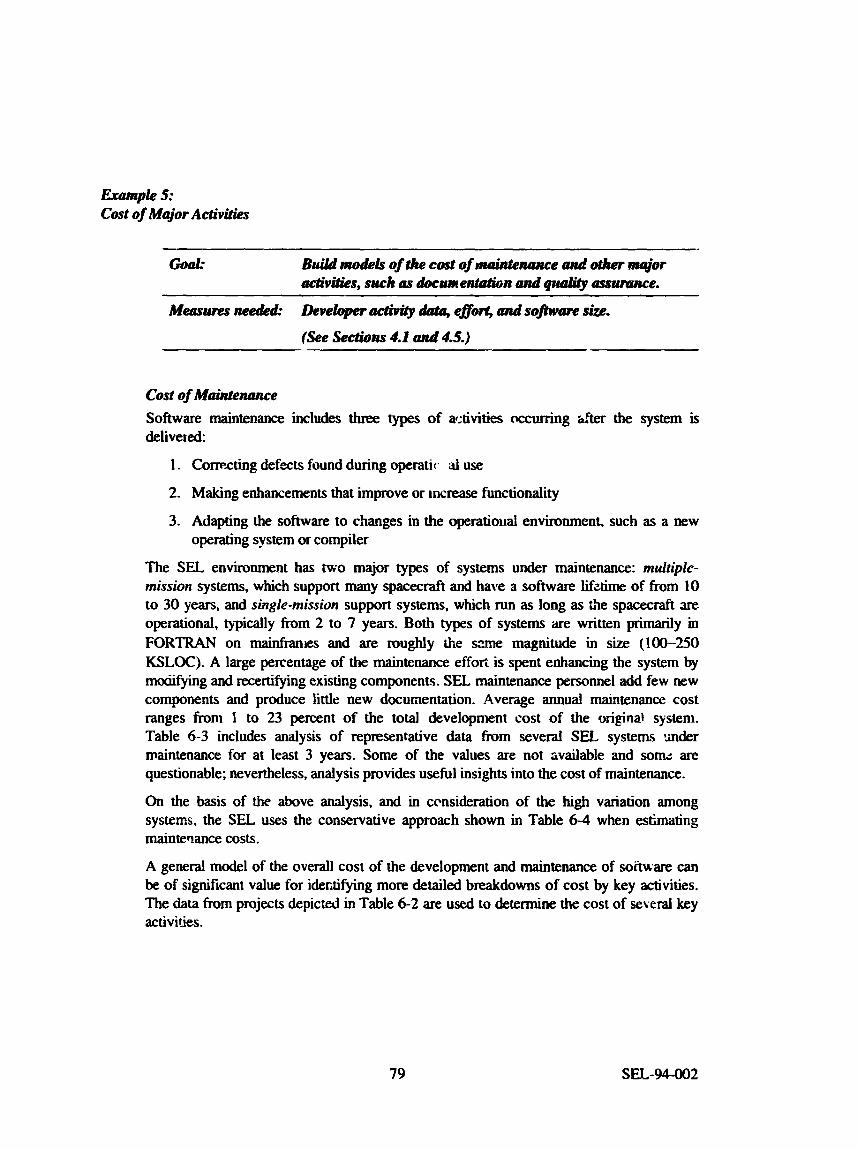
Example 5: Cost of Major Activities
~ ~ ~
Goal=
Measues need&
Build m&k of tke cost of maintenance and other mqjor activi&s, such as documerrtation andqrralilp assumnce.
Developer activity data, e#o* dsoftwrve size.
(See Sedions 4.1 and 4.5.)
Cost of Maintenance Software maintenance includes three types of activities occuning aEter the system is delivered:
1. Comxting defects found during operatic al use
2. Making enhancements that improve or i n c m functionality
3. Adapting the software to changes in the operatiod environment, such as a new operating system or compiler
The SEL environment has two major types of systems under maintenance: multiple- mission systems, which support many spacecraft and have a software I i f h of from 10 to 30 years, and single-mission support systems, which mn as long as ihe spacecraft are operational, typically from 2 to 7 years. Both types of systems are written primarily m FORTRAN on mainfranles and are roughly the s2me magnitude in size (100-250 KSLOC). A large percentage of the maintenance effort is spent enhancing the system by mo&fying and recertifying existing components. SEL maintenance personnel acid few new components and produce little new documentation. Average annual maintenance cost ranges froni 1 to 23 percent of the total development cost of the wiginat systeni. Table 6-3 includes analysis of representative data from several SEL systems mder maintenance for at least 3 years. Some of the values are not mailable and some are questionable; nevertheless, analysis provides useful insights into the cost of maintenance.
On the basis of the above analysis, and in ccnsideration of the high variation among systens, the SEL uses the conservative approach shown in Table 6-4 when estimating mainteclance costs.
A general model of the overall cost of the development and maintenance of software can be of significant value for idectifylng more detailed breakdowns of cost by key activities. The data from projects depicted in Table 6-2 are used to determine the cost of several key activities.
79 sm-94-02
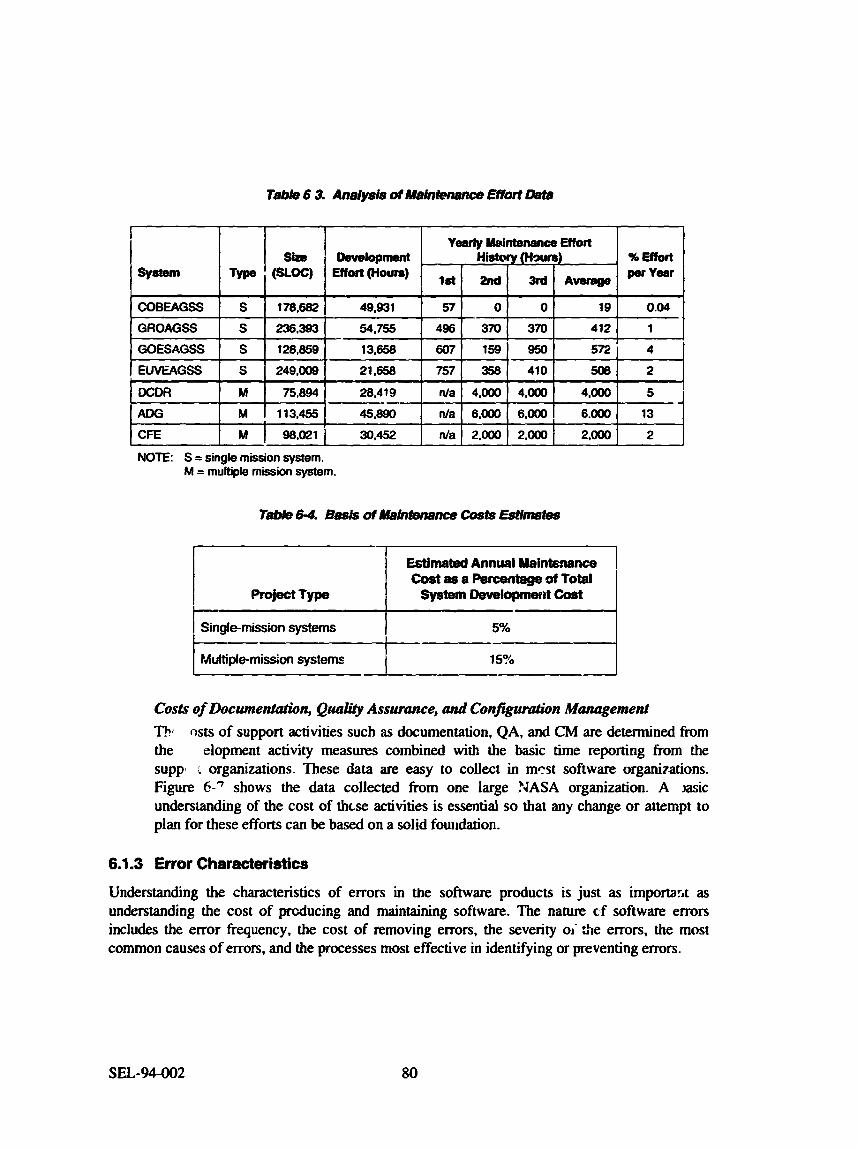
COBEAGSS
GROAGSS
I I
s 178.682 49.931 57 0 0 19 0.04
s 236.393 54,755 496 370 370 412 1
GOESAGSS
EUVEAGSS
NOTE: S = single mission system. M = multiple mission system.
~ ~
s 128.859 13,658
S 249.009 21.658
I I 1
DCDR ADG CFE
1 ~ a i m a ~ ~ n n u a l ~ i n t s n a n c e I Cost as a Percentage of Total
PrOiectTYPe
Multiple-mission systems 15%
M 75.894 28.419 n/a 4.000 4.000 4,000 5
M 113.455 45,890 Ma 6.000 6.000 6.000 13
M 98.021 I 30,452 n/a 2.000 2.000 2.000 2
Costs of Documentation, Qualily Assurance, and Configrarrstion Management nc osts of support activities such as documentation, QA, and CM are determined from the elopment activity measures combined with the basic time reporting from the supp~ t organizations. These data are easy to collect in mcst software organbations. Figure 6-7 shows the data collected from one large PJASA organization. A xisic understanding of the cost of thtse activities is essential so that any change or attempt to plan for these efforts can be based on a solid foulidation.
6.1.3 Error Characteristics
Understanding the characteristics of errors in the software products is just as importarit as understanding the cost of producing and maintaining software. The nature clf software errors includes the error frequency, the cost of removing errors, the severity 01' tffe errors, the most common causes of errors, and the p m s s e s most effective in identifying or preventing errors.
SEL-94-002 80

Example 6: EmrRates
Goals: &&mine the average ride of uncovering emm.
Determine which fife-cyckphuser yield Ure most errors.
Corrrpute the e m r rate in &fivemd s o e m .
Project size, phase &es, and reported errors.
(See ~ c t i 0 n . s 4.2 and 4.5.)
-.
Measures net-&
Error Rates by Phase Figure 6-8 illus' .xes a mock1 of the number of reponed errors (normalized by the product size) over the various phases of the life cycle. This model conibines product and process data .,id providcs two types of information.
The first type is the absolute error rate expected in each phase. The rates shown here are based on SEL development projects from the mid-1980s. The model predicts about four errors per KSLOC during implemen*-tion, two during system testing, one during acceptance testing, and one-half during o,xration and maintenance. Those error rates by phase yield an overall average rate of seven crrm per KSI.OC during development. An analysis of more recent projects indicates that mor rates are declining as improvements are made in the software process and technology.
81 SEL-94-002

Figure 6-8. Error Dedection Rate by phase
The second piece of information is that error detection rates are halved in each subsequent phase. In the SEL, this trend seems to be independent of the actual rate values, because the 50 percent duct ion by phase is holding me even as recent error rates have decked.
Example 7: Error Classes
Goal= Measures needed= Reported error hfomafion.
Deternine what types of emrs occur most O&R.
(See Section 4.2.)
Types of Eimm Figure 6-9 depicts two models of error class distribution. The model on the left shows the distribution of errors among five classes for a sample of project.. implemented in FORTRAN. A manager can use such a model (introduced in Section 2.2.1) to help focus attention where it is most needed during reviews and inspections. In addition, this type of baseline can show which amfiles seem to be consistent across differing project characteristics, such as in the choice of development language.
The model on !he right shows the distribution across the same classes of errors for Ada projects in the same environment. Contrary to expectation, there is little difference in the error class profiles between the FORTRAN and Ada development efforts. One possible interpretation of this result is that the organization’s overall lifecycle methodology and the experience of the people in that environment are stronger influences on process profiles than any one specific technology.
SEL-94-02 82


1 0.05251
L
a2 ..I . . . . . Lz ...... 2 0.0225 ......... .. ...
.... 0.0150 ........... . . . .. .... .-. .......... ........ ....... .. ... . . . . .
I I 15 45 75 105 135 165 195
McCabe Complexity
0.06oO
0.0525 1 . . ....... ....... .. .... . ..- .... ........... ........... ......... ..................
0.0075 1 ....................... loo r)vu 500 7 9 0 900 1100 1300
S L W
Figure 6-10. Cyclomafic Complexity and SLOC as Indicators of Errors (Preiminary dnalysh)
6.1.4 Project Dynamics
An analysis of project dynamics data can give managers weful insight into changes to requirements, to controlled components, and in the estimates to comp!r?tion.
Example 9: Growth Rate Dynamics
Goai: Derive a model that charcrcterizes the local rate of cod? production.
~~~ ~~ ~
Measures nee.?ed: Phase dates and weekly count of cont#eted code.
(See Section 4.4.) -
The gro\.Lh rate of die source code in the configuration-controlled library closely reflects the completeness of the requhments prodwt a:d some aspects of the software process. In the SEL envlrwment, periods of shprp growth in SLOC are separatd bl. penb4s of more moderate growth, as shown in Figure 6-1 1. This phenomenon reflects the SEL approach of imFlementing systems in multiple bi45s. The model also shows that, k responLe to requirements changes, 10 percent of the code is typically produced after the start of system testing The uncertaiqty a d highligh s the typical variation expected with this model.
SEL-94-002 84

I I I I I I I I I 1'-
10-
10 20 30 40 50 60 70 80 90 % of Schedule
Figure 6-1 1. Growth Rate Model
6.2 Managing The management activities of planning, estimating, tracking, and validating mr '4s, introduced m Section 2.2, all require insight into the charac%ristics of the organization's software engineering environment and processes. Measurement data extracted during the development and maintenance phases will provide quantitative insight into whether a project is progressing as expected.
An analysis of the following types of measurement information can lead to better management decision making:
Planned versus actual values. Tracking ongoing progress requires not only the actual data but also planning data based on estimates from local models. Candidates for such analysis include effort, errors, software changes, software size, and software growth.
Convergence of estimates. A manager should expect to revise estimates periodically. The frequency of revisions can be based on the pattern of the data being tracked. If the acluals are deviating from the current plan, more frequent updates are needed. The est mates themselves should eventually converge and not vary wildly from one estimate to another.
Error history Qll(i classes of errors. An analysip of error data can pinpoint problems in the quality of development or maintenance processes. Possible focus areas include design or code inspections, training, and requirements management. Data from relatively few projects can be effectively used in this manner.
85 SEL-94-002

An effective measurenient program enhances tnanagement activities:
0 Planning. Historical information, along with estimates of the current pioject, enable the manager to prepare schedules, budgets, and implementation strategies.
0 Assessing progress. Measures indicate whether projected schedules, cost, and quality will be met and also show whether changes are required.
0 Evaluating processes. The manager needs insight into whether a selected software engineering process is being applied correctly and bow it is manifested in the final product.
Using the information gained from tracking software measures, managers have numerous options for addressing possible progress or quality problems. Those options include adjusting staff, adding resources, changing nrocesses, replanning, and enforcing a process, among others. Table 6-5 lists the examples preserlted in this section, which are derived from actual data on NASA software projects.
What is my basis for estimating cost, schedule, and effort?
What is n y basis for projecting code growth and change? What is my organization’s model of expected error rate?
Is my project development proceeding as expected?
How stable are the requirements an: design?
Is my original staffing estimate on track?
Are we correcting defects faster than they are detected? When will testing be complete?
Are we producing high-quality and reliable software?
TaMe 6-5. Questions Supporting Management Activities
I I
Measurement Application
Planning
_ _ _ _ _ ~
Assessing Progress
Evaluating Processes
Managing Examples
~ ~
Are our standard processes being applied properly? Are they having the expected effects?
I I
10
11
12
13
14
15
16
6.2.1 Planning
A software manager’s major responsibilities include effective planning at the start of a project. The manager must estimate cost, schedules, and effort; define the processes; and initiate a mechanism for tracking against the plan. The major application of measurement information for the planning phase is to make use of the derived models, relationships, and insights gained from measurement understanding efforts.
SEL-94-002 86
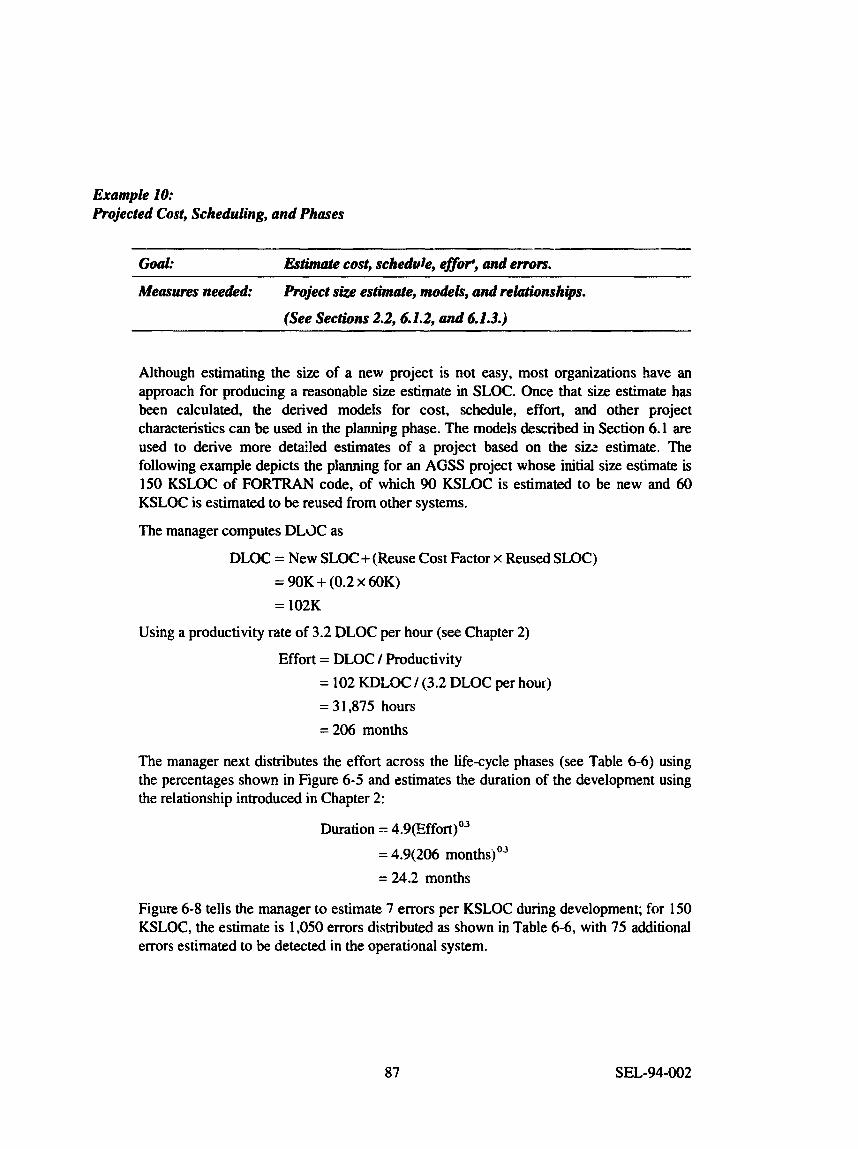
Example 10: Projected Cost, Scheduling, and Phases
Goal: Estimate cost, schedule, eflor+, and errors.
Measures needed: Project size estimate, mo&ls, and relrrtionships.
(See Sections 2.2,6.1.2, and 6.1.3.)
Although estimating the size of a new project is not easy, most organizations have an approach for producing a reasonable size estimate in SLOC. Once that size estimate has been calculated, the derived models for cost, schedule, effort, and other project characteristics can be used in the planning phase. The models described in Section 6.1 are used to derive more detailed estimates of a project based on the si= estimate. The following example depicts the planning for an AGSS project whose initial size estimate is 150 KSLOC of F O R M code, of which 90 KSLOC is estimated to be new and 60 KSLOC is estimated to be reused from other systems.
The manager computes DLdC as
DLOC = New SLOC + (Reuse Cost Factor x Reused SLOC) = 90K + (0.2 x 60K) = 102K
Using a productivity rate of 3.2 DLOC per hour (see Chapter 2)
Effort = DLOC / Productivity = 102 KDLOC / (3.2 DLOC per hour) = 3 1,875 hours =206 months
The manager next distributes the effort across the life-cycle phases (see Table 6-6) using the percentages showr. in Figure 6-5 and estimates the duration of the development using the relationship introduced in Chapter 2:
Duration = 4.9(Effort)03
= 4.9(206 monthsjo3 =24.2 months
Figure 6-8 tells the manager to estimate 7 errors per KSLOC during development; for 150 KSLOC, the estimate is 1,050 errors distributed as shown in Table 6-6, with 75 additional errors estimated to be detected in the operational system.
87 SJX-94-002
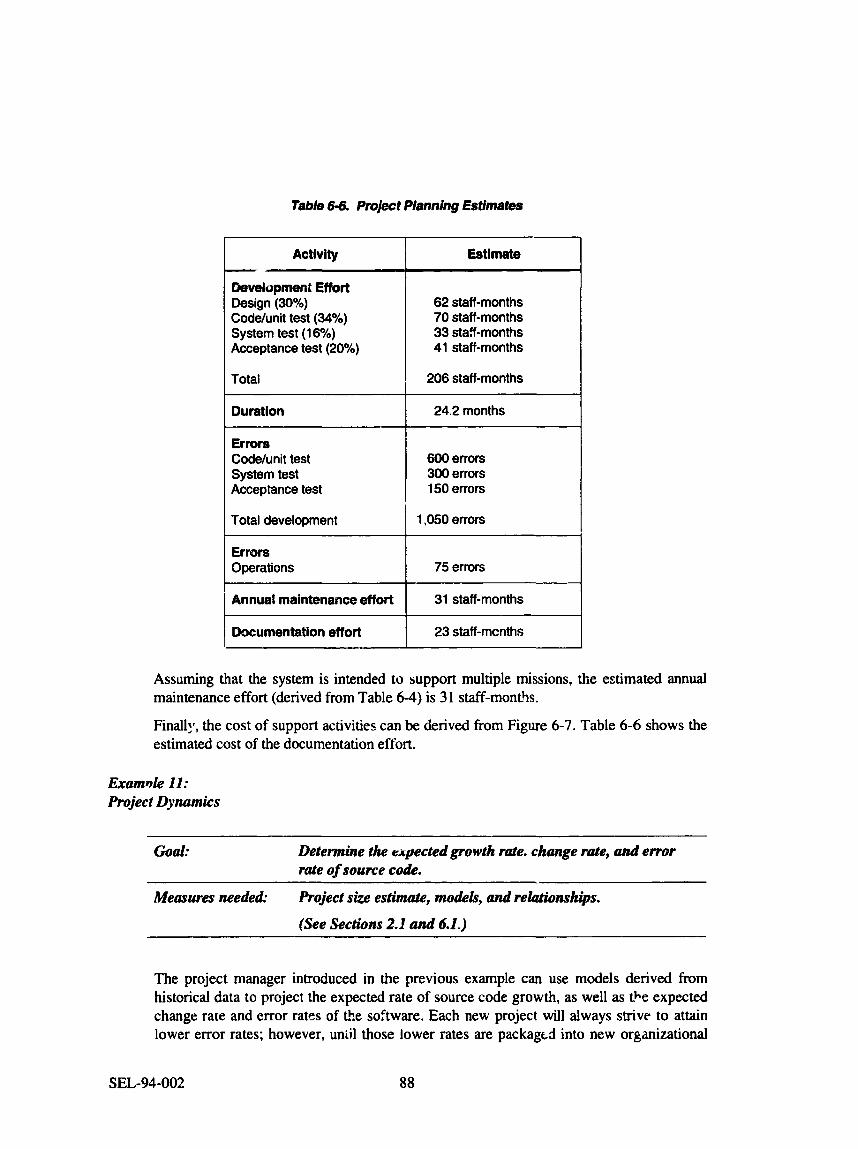
Tabla 6-6. Project Planning Estimates
Activity - Estimate
Development Effort Design (30%) Coddunit test (34%) System test (1 6%) Acceptance test (20%)
Annual maintenance effort
Documentation effort
62 staff-months 70 staff-months 33 staff-months 41 staff-months
31 staff-months
23 staff-mcnths
Total 1 206 staff-months
Duration I 24.2 months
Errors Coddunit test System test Acceptance test
Total development
600 errors 300 errors 150 errors
1 1,050errors
Errors Operations 75 errors
Assuming that the system is intended to support multiple missions, the estimated annual maintenance effort (derived from Table 6-4) is 3 1 staff-months.
Finally, the cost of support activities can be derived fiom Figure 6-7. Table 6-6 shows the estimated cost of the documentation effort.
Exam& ZZ: Project Dynamics
Goal: Determine the espeeted growth rate. change rate, and error rate of source code.
Measures needed: Project size estimate, models, and relationships.
(See Sections 2.1 and 6.1.)
The project manager introduced in the previous example can use models derived from historical data to project the expected rate of source code growth, as well as the expected change rate and error rates of th.e software. Each new project will always strive to attain lower error rates; however, uniil those lower rates are packagtd into new organizational
SEL-94-002 88

models, the manager should use the current histwical models. Figure 6-12 illustrates the planning charts derived from the models discussed in Section 6.1.
Growth Rate
% of Schedule
Change Rate
1,200 - 1.050-
900-
g: P m - 8 600-
450 - 300-
150 - 10 20 30 40 50 a, 70 80 80 100
% of Schedule 1
Figure 6-12. Planning Project Dynamics
Estimating the final software size is the most understood and useful basis for project planning, and the basic historical models derived during the understanding stage of a measurement program are the most important planning aids. As an organization completes more detailed analyses of the local environment, additional models will provide even more accurate planning data. Such parameters as problem complexity, team experience, maturity of the development environment, schedule constraints, and many others are all valid considerations during the planning activity. Until the measurement program provides some guidance on the effect of such parameters, project planning should rely primarily on lines of code estimates, alcng with h e basic historical models.
6.2.2 Assessing Progress
A second important management responsibility is to assew the progress of the development and maintenance acLAvity. Project managers must track the activities and inkrpret any deviations from the historical models. Although experience is the best asset for carrying out this responsibility,
89 SEL-94-002
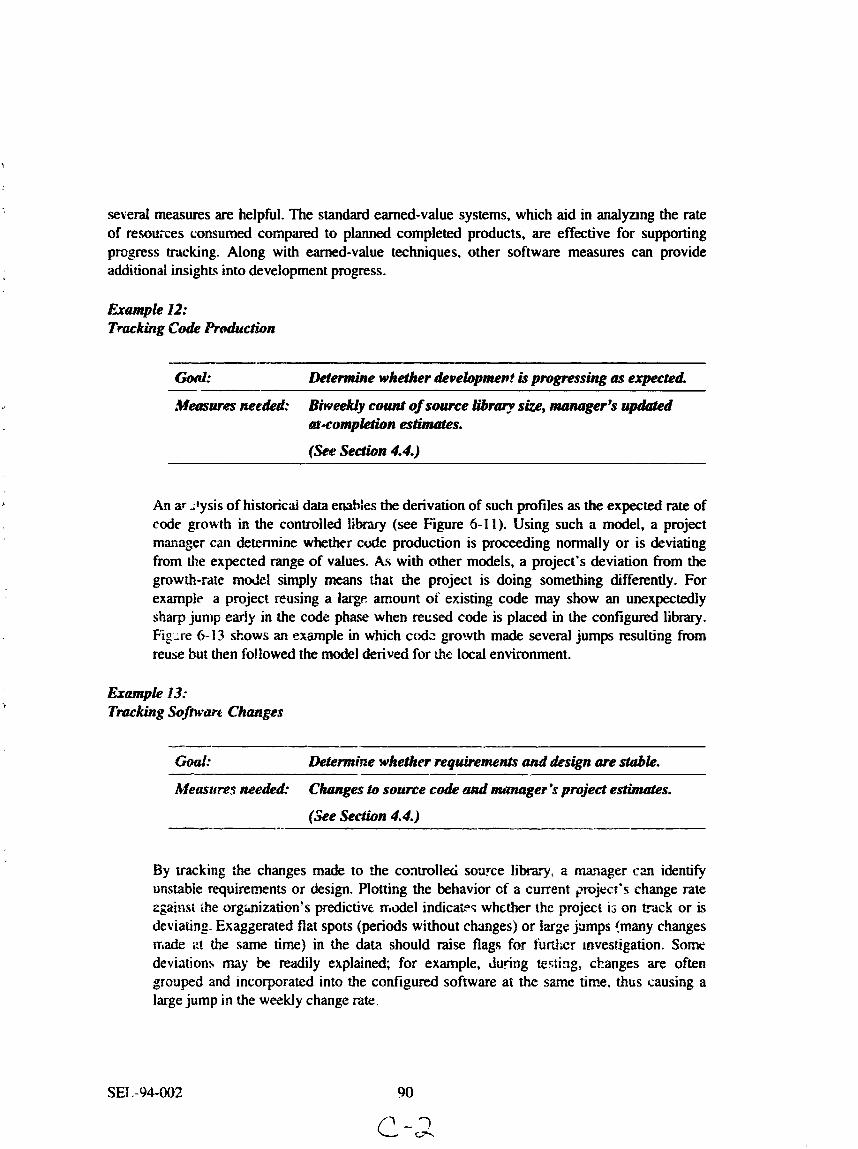
several measures are helpful. The standard earned-value systems, which aid in analyvng the rate of resouices consumed compared to planned completed products, are effective for supporting progress trtlcking. Along with earned-value techniques, other software measures can provide additional insights into development progress.
Eranrple 12: Tracking Code W u c t i o n
God:
.Measures needed:
fitermine whether devebpment is progtwssing as expected
Biweekly count of source lib- size, manager’s uplizted &completion estimates.
(See Section 4.4.)
An ar ,lysis of historical data enables the derivation of such profiles as the expected rate of code growth in the controlled libnry (see Figure 6-11). Using such a model, a project masager can determine whether code production is proceeding normally or is deviating from the expected range of values. As with other models, a project’s deviation from the growth-rite mdc l simply means hat the project is doing something differently. For example a project reusing a lape amount of existing code may show an unexpectedly sharp jump early in the code phase when recsed code is placed in the configured library. Figdre 6-13 shows an example in which cod: growth made several jumps resulting from reuse but then foflowed the model derived for h e local environment.
Goal: Lktemine whether requirements (ULd &sign are stable.
Measures me&d C h g e s to s o m e code d mmager’s project estimates.
(See Section 4.4.)
By tracking the changes made to the coatroiled souwe library, a rnmager can identify unstabie requirements or design. Plotting the behavior cf a current pojest’s change rate zgaitist ihe orgsnization’s predictive model indicaps whether the project is on track or is deviating. Exaggerated flzt spots (periods without changes) or large jamps !many changes made i:t the same time) in the data should raise flags for fufJ;er invesdgation. Some deviations m y be readily explained; for example, during tes:ing, ckanges are often grouped and incorporated into the configured software at the same time, thus causing a large jump in the weekly change rate.
SEL - 94-OO2 90

I I I I
1 . 1 . 1 1 1 . 1 . 1 .
0.00
10 20 30 40 50 60 70 80 90 100
x of ScherhIle
- . . . I . I l . 1 . I .
Figure 6-13. Growth Rare Deviation ’
~
Demn
Figure 6-14 presents an example from actual data for a project that experienced a higher than normal change rate. The requirements for this 130-KSLOC system were highly unstable, resulting in a deviation from the existing model (introduced in Figure 6- 12). By recognizing the change rate early, managers could compensate by tightening CM procedures to maintain the quality and the schedule.
Syst0i Aaeptam c d d r e s t Test Test
10.00
9.00
8 8.00
d ti E
Y 7.00
yl 6.00
2 5.00 V
g 4.00 - 3
E, 3.00 V
2.00
1 .OO
~ ~
Figum 6-14. Change Rate Deviation
91 SEL-94-002

Example 14: Tracking SkaflEflort
Goal.-
Measrures needed.
Deternrine whether replanning is necessary.
Idhlpmjec t pkur a d weekly efiort drtta. (See Sections 4.1 and 4.4.)
By using the expected effort distribution and staffing profile over the life-cycle phase;, a manager can predict the total cost and schedule based on the effort spent to date. If more effort than was planned is required to complete the design of a system, the remaining phases will probably require proportionately more effort. After determining why a deviation occurred, a manager can make an informed response by adjusting staffing, increasing the schedule, or scaling back functionality.
Deviations in effort expenditures can also raise quality flags. If all milestones are being met on an understaffed project, the team may appear to be highly productive, but the product quality may be sufkring. In such a case, the manager should not automatically reduce effort predictions. An audit of design and code products, using both effort data and error data, can support an informed decision about whether to add staff to compensate for work not thoroughly completed in earlier phases.
Figure 6-15 presents an example of the use of measurement data in monitoring a project to determine whether replanning is necessary. Effort data were a key factor in management’s detection and correction of several problems that would have jeopardized this project’s eventual success.
SEL-94-002 92

The original staffhg plan was based on an underestimation of the system size. Toward the end of the design phase, 40 percent more effort than planned was regularly required, indicating that the system had grown and that replanning was necessary. Although the manager's estimates of size did not reflect the significant increase, the staffing profile indicated that the system was probably much larger than anticipated. The required effort continued to grow, however, in spite of the new plan that projected a leveling off and then a decline. A subsequent audit revealed that an unusually high number of requirements were still unresolved or changing, resulting in excessive rework. As a part of the corrective action, a second replanning activity was needed.
&le 15: Tracking Test Progress
G o d Detennine whetherthe tedngphase isprogtessingas
Measures nee&&
expected
Failum mpud data and change data
(Spe Section 4.2.) --
By consistently tracking reported versus fixed Cimpancies, a manager gains insight into software reliability, testing progress, and staffing problems. The open failure reports should decline as testing progresses unless the project is understaffed or the software has many defects.
When the "open" curve falls below the "fixed" curve, defects are being corrected faster than new ones are reported. At that time, a manager can more con- fidently predict the completion of the testing phase. Figure 6-16 shows an example of discrep- ancy tracking that gave the manager an early indication of poor software quality (at Week 15). Staff members were added to increase the error-comtion rate (during Weeks 20 through 35). and the system attained stability (at Week 35).
Figum 616. Tmcklng D i a c ~ n c l e s
93 SEL-94-02
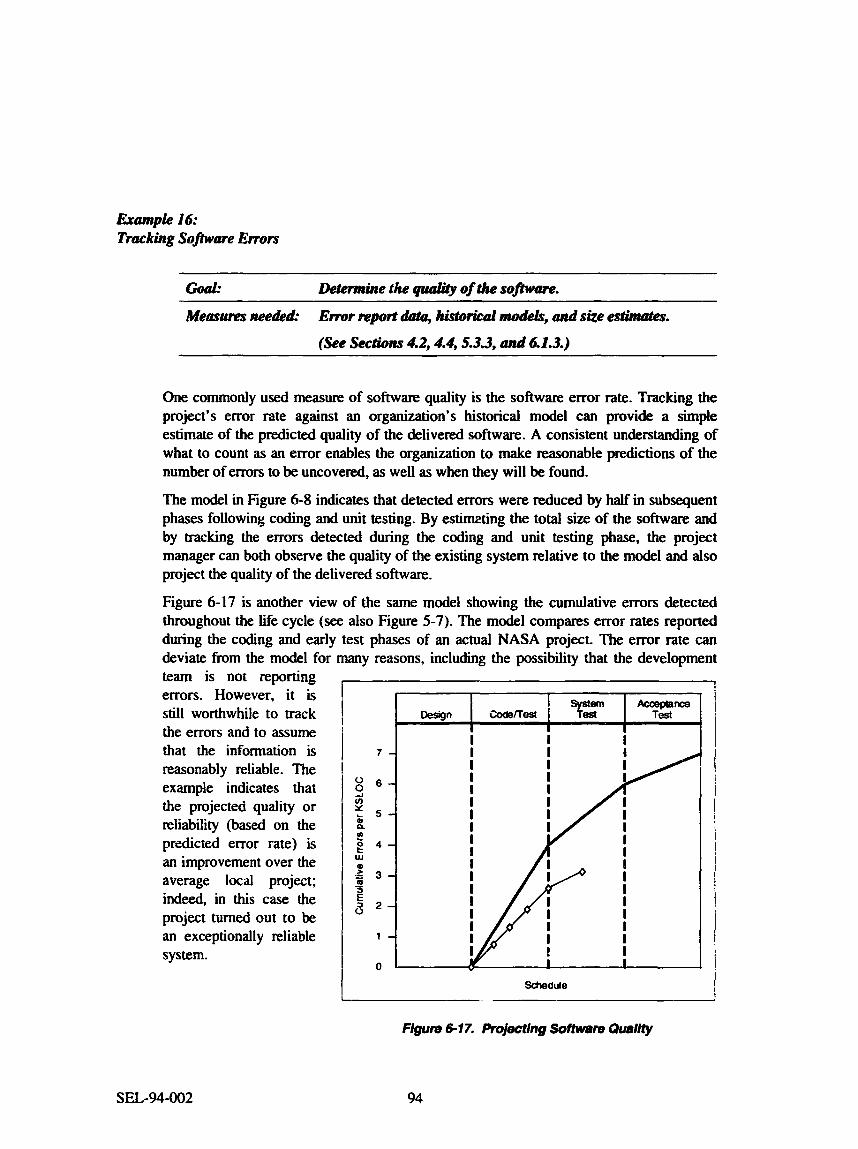
Goal= Measrues nee&&
DeterPnine the qwlity of the sofiare. Error report dater, hktorktal nmdkls, and size estinurtes.
(See scctionS 4.2,4.4,5.3.3, d6 .1 .3 . )
One commonly used measure of software quality is the software error rate. Tracking the project's error rate against an organization's historical model can provide a simple estimate of the predicted quality of the delivered software. A consistent understanding of what to count as an error enables the organization to make reasonable predictions of the number of errors to be uncovered, as well as when they will be found.
The model in Figure 6-8 indicates that detected errors were reduced by half in subsequent phases following coding and unit testing. By estimeting the total size of the software and by tracking the errors detected during the coding and unit testing phase, the project manager can both observe the quality of the existing system relative to the model and also project the quality of the delivered software.
Figure 6-17 is another view of the same model showing the cumulative errors detected throughout the life cycle (see also Figure 5-7). The model compares error rates reported during the coding and early test phases of an actual NASA project. The error rate can deviate from the model for many reasons, including the possibility that the development team is not reporting errors. However, it is still worthwhile to track the errors and to assume that the information is reasonably reliable. The example indicates that the projected quality or reliability (based on the predicted error rate) is an improvement over the average local project; indeed, in this case the project turned out to be an exceptionally reliable system.
Schedule - -
Figure 617. Projecting SofhKen, Quality
$EL-94-002 94

6.2.3 Evaluating Processes
A third responsibility of the software manager is to determine whether the project’s standard software processes are, in fact, being used, and if there is any impact on the product. Project personnel may fail to apply a standard process because of inadequate training. team inexperience, misunderstandings, or lack of enforcement. Whatever the reasons, the manager must try to determine whether the defined process is being used.
Example 17: Source Code Growth
coal= Lktemine whether the Cleanroonr method is being applied
Measures nee&& Pmjectphase date estimates? completed source code? and historical models.
(See Section 4.4.)
One characteristic of the Cleanroom method is an increased emphasis on source code reading before the code is released for system integration. This emphasis can be confirmed by tracking the source code growth a d observing two phenomena:
1. A delay in the phasing of the code completion profile
2. A significant step function profile of the code completion -?te caused by the strict incremental development of Cleanroom
The sample plot in Figure 6-18 i s based on actual data from an organization’s first use of the Cleanroom method. The data exhibited both expected phenomena, suggesting that the Cleanroom method was indeed part of the project process. Such measurement analysis is useful only to identitjt occasions when expected differences do not occur, so that the manager can try to determine the cause.
Ry tracking the values of process parameters, the manager can determine whether the process is helping to attain the organization’s goals. If not, the manager should consider changing the process. The following section disclrsses using measurement to guide process improvement.
Figum 6-18. /mpsct of the Clesnroom Method on Software Growth
95 SEL-94-002

6.3 Guiding Improvement One key reason for software measurement is to guide continual improvement in the organization’s products and services. The same measurement activities that support understanding and managing can provide a basis for improvement.
To be able to assess how a process change affects a product, the manager must measure both the processes applied and the products developed. Two key analyses must be performed:
1. Verify that the process tinder study shows the expected measured behavior (either changed or similar to other processes).
2. Compare ongoing activities with the baseline measures developed to establish an understanding.
A specific innovation may result in many changes to process elements, some helpful and others not. Experience on subsequent projects is needed to adapt the process change to an environment. The types of adaptations include the following:
0 Eliminate processes that provide little or no value.
Accentuate processes that help.
Determine the impact of specific techniques.
0 Write new policies, standards, and procedures.
0 Tailor processes for specific needs.
The two cxamples in this section illustrate the application of measurement for guiding improvement.
Example 18: Cleanroom
Assume that an organization’s goal is to decrease the error rate in delivered software while maintaining (or possibly improving) the level of productivity. The organization must understand the current software engineering process, using historical data to establish a baseline for its error rate and productivity measures.
In this example, the organization has decided to change the process by introducing the Cleanroom method (see Reference 13). Cleanroom focuses on achieving higher reliability by preventing defects. Because the organization’s primary goal is to reduce the error rate, there is no concern that the Cleanroom method does not address reuse, portability, mainQinability, or many other process and product characteristics.
As the organization develops new products using the modified process, which incorporates the Cleanroom method, it must continue to collect data for both process and product measures and look for possible changes. Keep in mind that a change is not always an improvement; it must be possible to measure two things: (1) that a diffewnce exists between the. original and the changed product and (2) that the new product is better than the original. Table 6-7 lists the measures that are important indicators for this example and
SEL-94-OG2 96

summarizes their usage. Other software process and product characteristics, such as schedule, maintainability, and amount of reuse, may also reveal deviations beyond the expected baseline ranges. Such deviations must be investigated to determine whether the effect is related to the introduction of the Cleanroom method.
Table 6-7. Indicators of Change Attributable to Cimnmom
Measure
cost
Effort
Effort distribution
Site
Software size
Size growth
Number of Errors
-- Type
Product
ProcesS
Product
--
Process
Product
Indicator
Expectation: Cleanroom should not decrease productivity.
Expectation: Cleanroom may show increased design time.
Expectation: Cleanroom should have no impact.
Expectation: Cleanroom may affect measured profile.
Expectation: Cleanroom should increase reliability.
To observe changes, the organization must analyze the measurement data at regular intervals during the Cleanroom development period and compare the results with the baseline. For example, Figure 6-1 9a compares the results of measuring development activities on several SEL projects that used the Cleanroom method against the current baseline activity profile in the same organization. The slight changes in the effort distribution profiles suggest that the new method may have affected the development process, but the difference in percentages is not conclusive. A closer look (see Figure 6-19b) at the subactivities within the “code” category reveals more substantial differences and provides clear evidence of an impact on the relative percentages of the code writing and code reading processes.
During the Cleanroom experiment (see Reference 14). the SEL also compared another measure, software size growth, with the baseline. Figure 6-18 illustrates the markcd differences between the profiles. The Cleanroom profile exhibits a more pronounced stepwise growth pattern, which results from the higher number of software builds required by the Cleanroom method. Whereas developers typically used two or three builds on projects that made up the baseline, they used from five to eight builds during the Cleanroom experiment.
97 SEL-94-02


Table 6-8. Impact of the Cleanroom Method on Reliability and Productivity
Baseline
Cleanroom 1
5.3 26
4.3 40
Cleanroom 3
2. Product measures can quantify the impact (positive, negative, or none) of a new technology on the product.
Both types of measures can then be used to model the new process and expand the experience baseline.
20 6.0 I
Example 19: Independent Verifiatbn 2nd Validation
Not all process changes result in measured product benefits. In 1981, the SEL studied a testing approach using an independent verification and validation CIV&V) process. IV&V promised to improve error detection and correction by finding errors earlier in the development cycle, thus reducing cost and increasing 0vc:rall reliability with no negative impact on productivity. Determining the effect of this tcsting process on reliability and cost were two major study goals. Table 6-9 lists the measures that are important indicators for this example and summarizes the use of each.
Measurement analysts selected two projects for IV&V study -,id two similar ones for use as baseline coinparison efforts. For this study, the activities performed by the IV&V team included the following:
0 Verifying requirements and design
0 Performing independent system testing
0
0 Reporting all findings
Ensuring consistency from requirements to testing
The next series of figures shows the measured results of the study.
99 SEL-94-002

Table 6-9. Indicators of Change Attributable to IV& V
Measure ~~
Cost
Effort
Effort distribution
Staffing profile
Errors
Number
Source
~
Product
Process
Process
Product
Process
lndicator
Expectation: Cost of IV&V effort would be offset by reductions in error correctim effort and decreases in system and acceptance test effort.
Expectation: IV&V process would shcw increased effort in early phases.
Expectation: Greater startup staffing for IV&V would affect profile model.
Expectation: IV&V process would increase reliability.
Expectation: The number of requirements and design errors found in later phases would decrease.
Figure 6-20 illustriites the effect of IV&V on requirements and design errors. Requirements ambiguities and misinterpretations were reduced by 87 percent. The results show relatively little effect on design errors, however, especially on complex design errors.
Baseline IV&V
Requirements Functional
Simple: Design 92% 'a 70%
Complex: 18% Complex: 22%
Figure 6-28. Impact of IV&V on Requirements and Design E m r s
Figure 6-21 depicts the percentage of errors found after the start of acceptance testing. The IV&V projects exhibited a slight decrease in such errors but showed no significant increase in the early detection of errors.
SEL-94-002 100

I 20% 2 0 -
18 - 16 - 14 -
g 12 - 10 -
0 a? 8 -
8 -
4 -
2 3
16%
I 1
Basdine IVhV
Figure 6-21. Percentage of Errors Found After Starting Acceptance Testing
Figure 6-22 shows the error rates by phase; the rates in the operations phase are the key indicators of IV&V effectiveness. The baseline error rate during operations is 0.5 errors per KSLOC; however, the error rate for the IV&V projects was slightly higher.
12
11
to
9
a 8 $ 7
k 6
: s
Y
!?
W
4
3
2
x IVBVPrOjaCtl
0 CodeNm Test System Test Acceptance Test Opwabons
Figure 6.22. IV& V Error Rates by Phase
The final indicators for this experiment were effort distribution and overall cost. Figure 6-23 shows that process change in the effoit distribution by phase did occur with the IV&V projects. According to expectation, developers' design effort slightly decreased; however, the substantial increase in coding and unit testing was somewhat surprising.
101 SEL-94-002

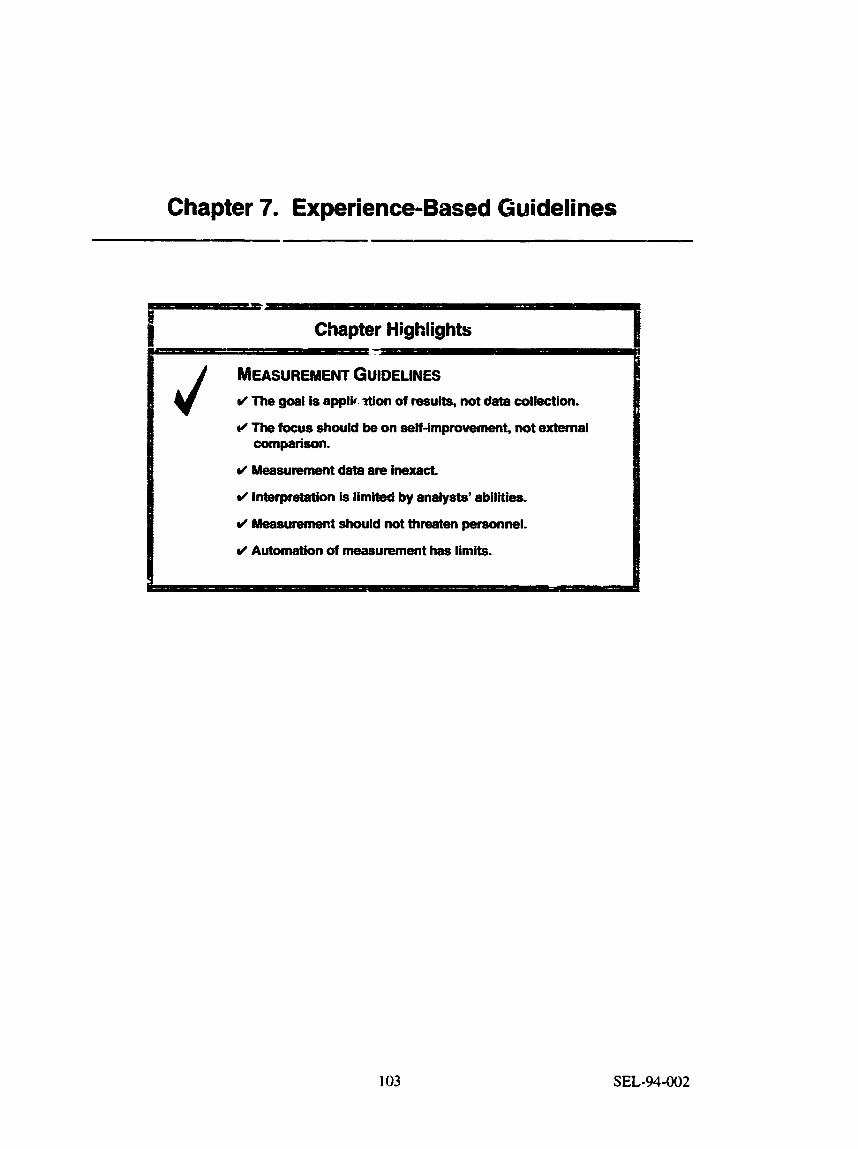
Chapter 7. Experience-Based Guidelines
rrrrr-
Chapter Highlights I I
MEASUREMENT GUIDELINES d The goal is applir- don of results, not data collection.
@ The focus should be on self-improvement, not external
d Measurement data are inexact
d Interpretation is limited by analysts’ abilities.
d Measurement should not threaten personnel.
d Automation of measurement has limits.
! J I i
comparison.
i
103 SEL-94-002

he following guidelines are precadtionary notes for any softway organization that plans to ixlude softwere measurement as part of its developmerx process. Some of these T guidelines have been repeated several times throughout this document. Although some
may Seem counterintuiti\’e. each has been derived from the experiences of extensive, mature measurcmcnt programs.
Guideline I : Data collection should nut be the dominant element of process J improvement; application of measures is the goal.
Focusing on collecting data rather than on analyzing and applying the data wastes time, effort, and energy. Although many organizations are conviiiced that measurement is a Jseful addition to their software development and maintenance activities, they do not fully pian for the ~i 2. benefits, and applications of the collected measures. As a result, the measurement program focuses on defining the list of measures to be collected and the forms that will be used to collect the Gata, rather than on the specific goals of the measurement efforts.
Having specific and clearly defined goals facilitates the task of determining which data are required For example, if a goal is to determine error class distribution characteristics for each phase of the software life cycle, then data must be gathered on what classes of errors occur in what phases.
Experience in major mature measurement programs has shown that at least three times as much effort should be spent on analyzing and using collected data as on the data collection process itself. Focusing on data collection is a common mistake, similar to that of focusing on the development of “lessons learned” from software efforts rather than on applying previous lessons learned. More software lessons-learned reports are written than are ever rzad or used.
Software developers who are asked to collect data have the right to know how the data will be used and how that use will benefit their organization. Plans for analysis and application of the data must be well developed befo.-e the collection process is initiated. A measurement Frogram that focuses on the collection, as opposed to the application, of the measurement data will fail.
Guideline 2: The focus of a measurement program must be self improvement, not J external comparison.
Bscause the primary reasons for measurement are to guide, manage, and improve within specific software domains, the analysis and use of any measurement information must logically focus on local improvement. Little emphasis should be placed on comparing local results and information with that from other domains, because combining data across dissimilar domains rarely produces meaningful results. In fact, organizations rarely define specific goals requiring external comparison.
SEL-94-002 !04
There are two significant corollaries to this guideline:
1. Define standard terminology locally instead of generating widely accepted standard definitions. For example, provide a standard local definition of a line of code, because there is no universally accepted definition.
2. Use measurement data locally. Combining measurement data into larger, broader information centers has never proved beneficial and consumes unnecessary effort. Focus, instead, on producing higher quality, local data centers.
Guideline 3: J Measurement data are fal6ble, inconsistent, and incomplete.
Measurement programs that rely significantly on the high accuracy of raw software measurement data are probably doomed to failure. Because of the nature of the measurement process and the vast number of uncertainties that are part of it, the measurement data will always be inexact.
Relying primarily on the statistical analysis of the data collected for software development is a serious mixdce Collection of measurement data is one small component of the overall set of factors required to analyze software and software technologies effectively. The following additional factors must be considered:
Sutjective informution-The general observations and assessments of developers, managers, rnd analysts are as vital as the objective data collected via forms and tools.
Context of the information-Each set of data must be analyzed within a well-understood and defined context. Attempting to analyze larger and larger sets of measurement data adds to the confusion and difficulty of putting each set of data in its appropriate class of interpretation.
Qualitative analysis-Because of the ever present danger that measures are erroneous, biased, or missing, each analysis and application of measurement data must include an analysis of the quality of the information. The measurement data characteristics must first be determined by analyzing patterns, inconsistencies, gaps, and accuracy. Any interpretation of measurement data results must include compensation for the quality of the data.
Defined puls-Successful analysis of available data requires that the analyst fmt understand the goais that motivated the data collectioc. By understanding the goals of the measurement efforts, an analyst can interpret data gaps, biases, definitions, and even levels of accuracy. The goals will significantly influence the quality, consistency, and level of detail of the data analysis.
Because of the limited accuracy of measurement data, overdependence on statistical analysis of these data can lead to erroneous conclusions and wasted efforts. Although statistical analysis is a poweiful mechanism for determining the strengths and weaknesses of collected measures and providing insight into the meaning of the data, it must be used as only one limited tool toward the goal of meaningful application of measurement data.
1 05 SEL-94-02

Another potential pitfall exists in the use of subjective data to characteiize software development. Many measurement programs attempt to characterize the processes of each development project by recording a rating factor for several process elements such as “degree of use of modem programming practices.” “experience of the team,” “complexity of the problem,” or “quality of the environment.” Although successful analysis of measurement data must consider the context, problem, domain, and other factors, extensive studies within NASA measurement programs have repeatedly failed to show any value in analyzing such rating information. Because there are many inconsistencies in the definition and interpretation of terms such as ”problem complexity’, or “madern programming practices” and because of the inconsistencies in the value judgments of the people doing the ratings, the use of measurement data should be Limited to providing a general understanding of the project--nothing more.
J limited by the abilities of the analysts.
Measurement data must be interpreted properly to provide meaningful results. For example, if an analyst cannot clearly and precisely define “software complexity,” then no tool or measure can determine if software is too complex. There is a danger in expecting that a large amount of data combined with some software tool will provide a manager or analyst with a clear representation of software quality. The data and tool can represent only what the manager or analyst interprets as quality.
Inexperienced measurement programs occasionally assume the existence of a generally accepted threshold defining the boundary between acceptable and unacceptable values for some measures. For example, a program unit that is larger than some predetermined code size might be deemed undesirable. Similar thresholds are sometimes assumed for complexity, error rate, change rate, test failure rate, and many other measures. Establishing control limits for comparing rneasurement values is important, but the limits must be computed on the basis of local experience. It should not be assumed that there is some predefined threshold that defines an absolute boundary of acceptable values for local measures.
J Personnel tieaf measurement as an annoyance, not a significant threat.
Guideline 4: the capability to qualify a process or product with measurement data is
Guideline 5:
One of the most obvious and important guidelines for any measurement program is to emphasize consideration for the concerns of development and maintenance personnel. Measurement programs should not be used to qualify or characterize differences between individuals providing measurement data. If confidentiality is assured, project personnel will provide requested measurement information as freely as they provide other documentation or reports.
Experience has shown that, as long as managers ensure that measurements will never be used to evaluate performance or rate programmers, the development and maintenance teams will treat measurement responsibilities as just one additional task that is a part of their job.
SEL-94-002 106

Guideline 6: J Automation of measurement has limits.
DBMS tools
CM tools
Nearly every measurement program starts with two well-intentioned goals:
1. Measurement will be nonintrusive.
Store, validate, and retrieve icformation
Provide counts of changes to source code
2. Measurement will k automated.
Operating system accountins tools
The process of measurement, however, cannot be totally automated. Essential human processes cannot be replaced by automated tools unless the measurement program is limited to a high-level survey activity, because the opinions, insight, and focus of individual programmers and managers are necessary to carry out effective measurement programs.
Tools can automate a limited set of routine processes for counting such measures as code size, code growth, errors, and computer usage; however, insight into the reasons for errors, changes, and problems requires human intervention. Without that insight and the verification of measurement information, collected data of limited value.
Provide computer usage data
One NASA organization with a mature measurement program uses the automated tools listed in Table 7-1.
T&/e 7-1. Examples of Automaded hfeasurement Support Tools
d3 Code analyzers Record code characteristics at project
l iJs same organizatic 1 has found that many other measures must be compiled manually; some examples are listed in Figure 7-1.
Even a well-defined and focused measurement program requires manual intervention. Because the team provides only the limited amount of information needed to satisfy the organizational goals, however, the measurement program will have a correspondingly limited intrusive impact on the development and maintenance organization.
107 SEL-94-002


Appendix A.
Name
Change Report Form
Component Origination I Form
Sample Data Collection Forms
purpose
Records information on changed units; is filled out each time a configured unit is modified
Provides information on software units as %ey are entered into the project's configured library
T
Development Status Form
his appendix contains many of the data collection forms that are used within the NASA GSFC SEL measurement program. Reference 19 provides a detailed guide to using all of the SEL forms. An organization estabiistmg a new measurement program may want to
base its own set of forms on the samples. Table A-1 summarizes the purpose of the forms, which appear in alphabetical order on the following pages.
Provides a record of the current status of the project parameters; is filled I out by the project manager on a regular basis I
Table A-1. SEL Data Collectfon Fonns
Maintenance Change Report Form
Personnel Resources Form
Characterizes the maintenance performed in response to a change request
Provides information on hours spent on a prqect and how the effort was
Project Completion Statistics Form
Project Estimates Form
Project Startup Form
Records final project statistics
Records the completion estimates for project parameters; is filled out by project managers
Records general project information collected at the prqect startup meeting
ServicesProducts Form
Subjective Evaluation Form
Subsystem Information
Records use of computer resources, growth history, and services effort; is completed weekly
Records opinions that characterize project problems, processes. environment, resources, and products
Provides subsystem infomation at preliminary dasign review and
Weekly Maintenance Effort I Form
109
Records hours expended on maintenance activities
SEL-94-02

CHANGE REPQRT FORM
Type of Change (Check one) 0 Errorcorrection 0 Optimrnonoftirnspa@ 0 Planned enhan~emen: =w 0 lmplementatlon of reqlnrements 0 to emironme*
0 I Y O f d a n t y .
0 lmpmvement 01 user services 0 Insertddelet~on of debug code
cclanae 0 Other (Describe below)
change
maintamab~ly. or doarmentation
Name: nppr- by:
Project: Date:
Effects of Change Y N a ~wasthechangeor~ont0oneandon)yone
component? (Must match Effed in Section A)
0 ODid you look at any other component? (Must
0 Did you have totmaware of parameters p a ~ e d
match Effort in Sect~on A)
e- or impliciUy (e.g , COMMON blocks) to or hwnthedlangedcompooents?
I Section A - Identification I Describe the changs: (What, why, how)
Effect What components are changed? Eflort: What additional components were examined in daennining what change was needed?
(Attach list if more space is needed)
Location of developer's source files:
Need for change cktermined on: Change complsted (incorporated into system):
Effort in person time to isolate the change (or error): Effort in person time to implement the change (or correction):
check here if change lmr0hres Ada components. (If so. complete questions on reverse side.)
I JANUARY l9S4
Br Corrections Only Class of Error characteristics
(Check most applicable)' (Check Y or N for all)
Figure A-1. Change Report Form (1 of 2)
SEL-94-002 110
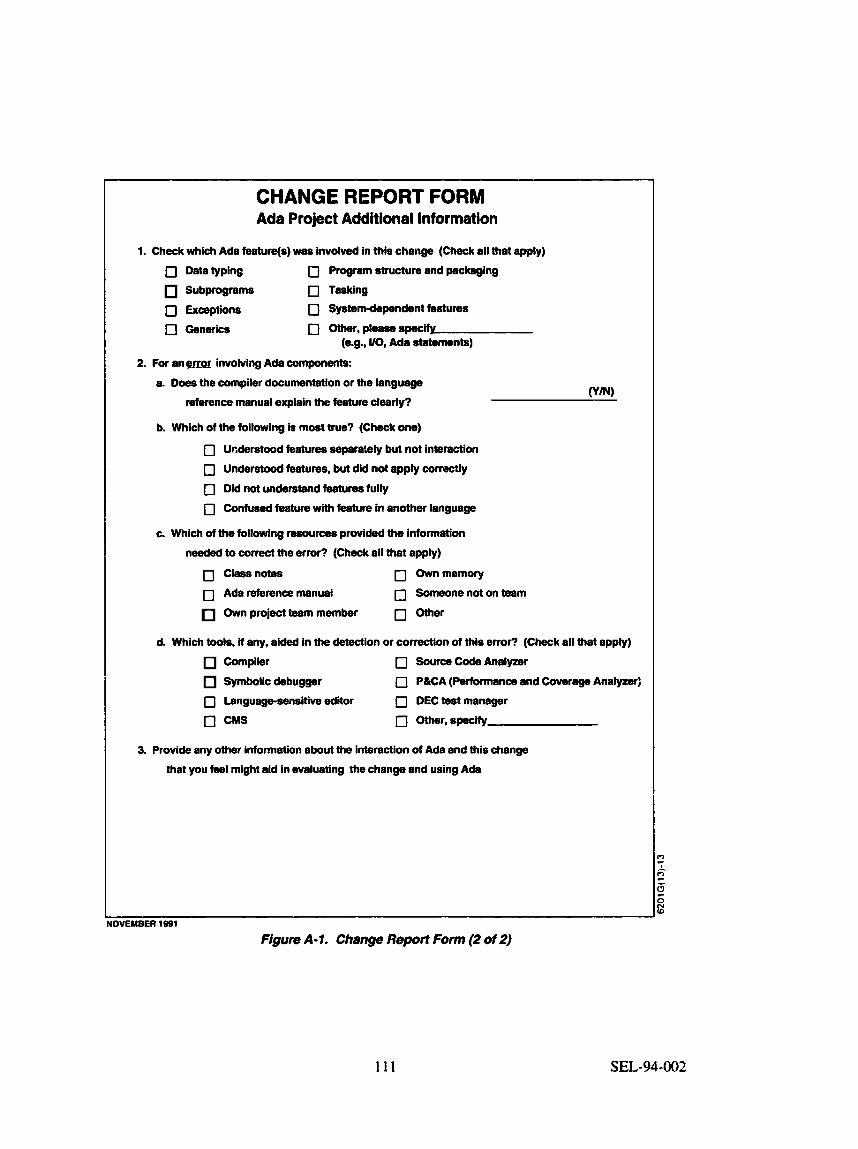
CHANGE REPORT FORM Ada Project Additional Information
1. Check which Ada feature@) was involved in this chaflge (Check all that apply) 0 Datatyping 0 Program structure and packaging
Subprograms 0 Tasking 0 Exceptions 0 Systemdependentfeatures
(e.g., 110, Ada statements) 0 Generics 0 - r . P - - s p e c L
2 For an emr involving Ada compmenw
a Does the compiler documentation or the language WN) reference manual explain the feature clearly?
b. Which of the following is most true? (Check one)
0 Uriderstood features separately but not interaction
0 Understood features, but did not apply correctly
0 Did not understand features fully 0 Confused feature with feature in another language
c. Which of the following sources provided the information
needed to correct the error? (Check all that apply)
0 Classnotes 0 Ownmemory
0 Ada reference manual 0 Someonenotonteam
Own project team member 0 Other
d. Which tools, if any, aided in the detection or correction of this error? (Check all that apply) Compiler [7 SaurceCodeAnalyzer
Symbolic debugger 0 P&CA (Performance and Coverage Anafyzsr; 0 Language-sensitive ediior [7 DECtestmanager
0 CMS c] Other,specify
3. Provide any other information about the interaction of Ada and this change that you feel might aid in evaluating the change and using Ada
1 NOVEMBER 1 W l
Figure A-1. Change Report Form (2 of 2)
1 1 1 SEL-94-002

Identification
Name:
Project: Date:
Subsystem Prefix:
Component Name:
Configuration Management Information Date entered into controlled library (supplied by configuration manager):
Library or directory containing developeh source file:
Member name:
Relative Difficulty of Developing Component Please indicate your judgment by circliny one of the numbers below.
ESY Medium Hard 1 2 3 4 5
Origin If the component was modified or derived from a different project, please indicate the approximate amount of change and from where it was acquired; if it was coded new (from detailed design) indicate NEW.
Number:
Date:-___-
Entered by: __
NEW - Extensively modified (more than 25% of
statements changed) Slightly modified Old (unchanged)
If not new, what project or library is it from? Component or member name:
Type of Component - - INCLUDE file (e.g., COMMON)
Control language (e.g., JCL, DCL, CLIST) ALC (assembler code) FORTRAN source Pascal source C source NAMELIST or parameter list Display identification (e.g., GESS, FDAF) Menu definition or help Reference data files
(Check one only)
BLOCK DATA file Ada subprogram specification Ada subprogram body Ada package specification Adapackagebody Ada task body Ada generic instantiation Ada generic specification Ada generic body Other
Purpose of Executable Component For executable code, please identify the major purpose or purposes of this component. (Check all that apply).
I/O processing Control module Algorithmidcomputational Interface to operating system Data transfer Process abstraction Log iddecision Data abstraction
DVEMBER 1991
Figure A-2. Component Origination Fom
SEL-94-002 112

DEVELOPMENT STATUS FORM
Name: Project: Date:
Please complete the sectton(s) Mat )9 appropnate for the current status of the project.
I Design Status I - ~~ ~~
number of components to be designed (New, m o d i . and reused) r- 1 Number of components designed (Prolog and PDL have been completed) I
I W e Status 1 Planned total number of amponants to be coded I (New, modhed. and r e d )
Number of componen*, completed (Added to controlled library) I
~~ I Tesbng Status 1 systemTest ~ I AcceptanceTest I I Total number of separate tests planned I I I
Number of tests executed at IecW one time
Number of tests based I I I
D m p a n c y Tracking Status (from beginning of system test~nq)
I Total number 01 dscreoanaes W e d
Total number 01 drsaepanaes resdved I I Specification M o d i t i o n Status (from beginning of requirements analyss) I
Total number of specificatuon m o d E c a m received Total number of speaficatlon m o d i o n s completed (implemented)
I I -
Requimments Queshons Status (front beginning of requirements anatyss) ~ ~~ ~~~ ~
Total number 01 questionisubmilled to andysts Total number of questms answered by analysts I I
For Libranan's Use Only are no changes
Number: Date. Entered by Ch0cked by:
OVEMBER 1991
Figura A-3. Development Status Form
113 SEL-94-002

MAINTENANCE CHANGE REPORT FORM Name: OSMR Number:
Project: Date:
SECTION A Change Request Information Functional Description of Change:
For Ltbranens Use Only
Number - Date Entered by
a - w
What was the type of modification?
- Correction - Enhancement - Adaptation
Estimate effort spent isolatingldetermining the change: Estimate eftort to design, implement, and test the change:
What caused the I :hange? - Requiremenwspacmcations
-- Sottwaredesign -- - Pm$ous change - Other
I I I I I
SECTION B: Change Implementation Information
Components AddedEhangadlDeleted:
~~ ~ ~~~
Check all changed objects:
- RequirementslSpecifications Document - Design Document -code - SysremDescription - Umr'sGuide - Other
If code changed, characterlza the change (check most applicable): - lnltialization - Logic/~ntr0lstruchmt
- Interface (internal)
- Interface (external)
- Dam (value or structure)
- Computational
- Other hone of the above emlv)
(e.g., changed flow of control)
(module to module communication)
(module-toaxternel communication)
(e.g., variable or value changed)
(e.g., change of math expression)
Estimate the number d lines of code (including c o m m t s ) :
Enter the number of components: - Enter the number of the added components that am:
- - added changad deleted -
added changed dedeted
mtaiiy n m totaiiy m u d mused modmcations
DVEMBER 1991
Figure A-4. Maintenance Change Report Form
SEL-94-002

Personnel Resources Form Name: -
Project: Date (Friday): .
ActNQ Pmdesign
Create Desgn
SECTION A: Total Hours Spent on Project for the Week: SECTION 8: Hours By Activrty (Total of hours in Seciion B should equal total hours in Section A)
Actnrity Definitions Hours Understanding the concepts of the system. Any work pnor to the actual design (such as requirements analysis).
Development of the system, subsystem, or components design. Includes development of PDL, design diagrams, etc.
h ! a i n g
Integration Test
I Readmeview Design Hours spent reading or reviewing design. Includes deslgn meetings, formal and informal I reviews, or walkthroughs.
Hours spent finding a known error in the system and developing a solution. Includes gen- eration and execution of tests associated with finding the e m .
Writing and executing tests that integrate system components, including system tests.
Write code I Actually coding system components. Includes both desk and terminal code development. I I ~ ~~
Readmeview Code I Code reading for any purpose other than isolation of errors 1 - I Test Code Units I Testing individual components ofthe system. Includes wnting test drivers. I I
Acceptance Test I Runningkupporting acceptance t&ng. I I -1 - I ~~ ~~ - -~ - ~~
I other hours spent on the project ,iot covered above. Includes management, meetrngs, I
~
m e r I training hours, notebooks, system descnptrons, user's guides, etc. - I 1 SECTLN C: Effort On Specific Activities (Need not add to A)
R e m Estimate of total hours spent that were caused by unplanned changes or errors. Includes effort caused by unplanned changes to specifications, erroneous or changed design, errors or unplanned changes to code, changes to documents. (This includes all hours spent debugging.)
code, or documemon. These are not caused by required changes or errors in the system.
prdogs. in-line comrnentaly, test plans, system descriptions, user's guides, or any other system documentation.
system(s) design, code, or documentation. Count total hours in searching, applying, and testing.
(Some hours may be counted in more than one area; view each act* separately)
0 EnhancinglRefininglOptimizing: &mate of total hours spent improving the efficiency or clarity of design, or
Documenting: Hours spent on any documentation of the system. Includes development of design documents, n Reuse: Hours spent in an effort to reuse components of the system. lndudes effort in looking at other I
JOVEMBEA 1991
Figure A-5. Personnel Resources Form
115 SEL-94-02

Personnel Resources Form
Actnnty Predesign
(CLEANROOM VERSION) Uame:.
'role&-- Date (Friday):
Actnnty Minitions I Hours
I I Understanding the concepts of the system. Any work prior to the actual design (such as requirements analysis).
SECTION P.: Total Hours Spent on Project for the Week: SECTION B: Hours By Activity (Total of hours in Section B should equal total hours in Section A)
Pretest
Create Design
VenfylReview Design
Developing a test plan and building the test environment. Indudes generating test cases, generating JCL, compiling components, building libraries, and defining inputs and probabilies.
Development of the system, subsystem, or components desgn. Includes box structure decomposflion, stepwise refinement development of PDL, desgn diagrams, etc.
Includes design meetings, formal and informal reviews, and walkthroughs.
Write Code
ReadlReview Code
Actually coding system components. Indudes both desk and terminal code development.
Code reading for any purpose other than isolation of emrs. Includes venfylng and reviewing code for correctnes,
Response to SFR
Acceptance Test
Other
SECTION C: Effort On Specific Activities
Isdabng a tester-reported problem and developing a solution. Indudes wnbng and reviewing design or code to d a t e and correct a tester-reported problem.
Runningkuppotting acceptance tesbng.
Other hours spent on the project not covered above. Indudes management, meehngs, training hours, notebooks, system descriptions user's guides, etc.
Methodology Understandngllliswssion: Estimate the total hours spent learning, discussing, reviewing or attemptmg 10 understand deanroom-related methods and techniques. Indudes all time spent in training.
F G f ~ S u S a O n r y
Numbgf
m - Mdbv c-bl
JVEMBER 1991
Figum Ab. Personnel Resources Form (Cleanroom Version)
SEL-94-002 116

PROJECT COMPLETION STATISTICS FQRM Name: - PfDjt3Ct: - Date:
Phase Dates (Saturdays) I Phase I Start Date
i
I Staff Resource Statistics I Technical and Management Hours
Computer Resource Statistics
I I
Project Size Statistics
Generai Parameters I source Linesof code
I Number of components I I New I I
New I I New ! I New I I
117 SEL- 94 -002

PROJECT ESTIMATES FORM
~ ~~~ ~ ~
Programmer Hours
Management Hours
Name:
Project:
I
Date:
I PhaseDates(Saturdays) I I phsse I smt- I
services Hours I I
I Project Size Estimates I
Total
New Modified
Old
Note: All of the values on this form are to be estimates of projected values at completion
submitted with updated estimates every 6 to of phs project. This form should be
8 weeks during the course of the project.
ForLmrulmSawOn
chsc’ 3d by:
SEL-94-002 118

PROJECT STARTUP FQRM
I
Name: Project: Date:
PLEASE PROVIDE ALL AVAILABLE INFORMATION
Project Full Name:
Project Type:
contacts:
Language: I Computer System: - Account:
Task Number:
Forms To Be Collected: (Circle forms that appty)
PEF PRF CLPRF DSF SPF SIF COF CCF CRF SEF PCSF WMEF MCRF
General Notes:
I Personnel Names (indicate with * if not in database):
I
119 SEL-94-002

SERVICEWRODUCTS FORM
Computer
t
Project:
Date (Friday):
CPU Hours No. of Runs
COMPUTER RESOURCES
GROWTH HISTORY
Components
SERVICES EFFORT
Tech Pubs
I ProjMgmt
I 1 NOVEMBER 1991
RgUm A-10. SerViceslProducts F o ~
SEL-94-002 120

SUBJECTIVE EVALUATION FORM
Name
FOR LIBRARIANS USE ONLY I
1 2 3 4 5 Lease Averaga w
Number. Entered by I
1 2 3 4 5 LOW Avecage w
5. nowextanwvewsredoamentaoon . reqvrtmenb'
1 2 3 4 5 LOW Average High
Date -by
OVEMBER 1991
121 SEL-94-002

SUBJECTIVE EVALUATION FORM
22. Towhat extent M Umdevekpmam team prepa-e and fallow test plans? 1 2 3 4 5
LOW Averege "gh
Figure A-1 1. Subjective Evaluation Form (2 of 3)
SEL-94-02 122

SUBJECTIVE EVALUATION FORM ~ ~
IV. PROCESS CHARAClEAlSnCS (CONTO)
23. To what exlent dtd the dw&qmmt team u h welMefvled and disapllned quahty assurance procedures (revhw.inspems . and waikthrarghs)7
1 2 3 4 5 LOW Average Hgh
24. To what extent dtd development team use welcdehned of drscipllned configurclbon management procedures?
1 2 3 4 5 LOW Average High
V. ENVlRONMENTCMARACTERSTICS
25. HOW wculd yw chamdmm the development team’s degm of BCC~SS to the development system? 1 2 3 4 5
LOW Average High
26. What was the rata d programmers btemurals? 1 2 3 4 5
8: 1 4: 1 2 1 1:l 1 2
~ ~ ~~
Figure A-11. Subjecth Evaluation Form (3 of 3)
123 SEL-94-002

SUBSYSTEM INFORMATION FORM Name:
Project: Date:
Subsystem Subsystem Subsystem Prefix Name Function
Old Subsystem Prefix (Must exist in the database)
t 1 I
Action (R - Rename, D - Delete)
New Subsystem Prefix (Must not exist in the database)
I
Number: .-
Date
Ernered by:------.---.-
Checkedby' -
1
REALTl M E: Real-time Control MATHCOMP: Mathema:.caVComputational GRAPH: CPEXEC: Control ProcessingExecutive SYSSERV: System Services
Graphics and Speaal Device Support
SEL-93-002 1 24

- I F ~ I Lbram's uls ( h k j
WEEKLY MAINTENANCE EFFORT FORM
Section 8 -Hours By Classof Maintenance CT01.tdhounh8.dbn~ mhouldrmmltmlhou8in (kakn Al
ctasr I 1 Hours
I
Section C - H w ~ By Maintenance Acthrity (iota1 ol h m h section c 8 k l d equt t m t how in SoUion A)
Houn spent undemtmding the failure or request for en~s-nt 5
Houn spent actually ndsrigning the system bated on an unde-standing
unii TW
Houn rpentchafiging theryrtmto comploiothenocessary changa This induda changing not only the code. but the sfwd.ted doarnnntauon.
othsc
NOMWER lgsl
Flgum A-13. Weekiy Malntenance Effort Form
125 SEL-94-002


Appendix EL Sample Process Study Plan
SEL Representative Study Plan for
SOHOTELS
October 11,1993
1. h j e c t Description
The Solar and Heliospheric Observatory Telemetry Simulator (SOHOTELS) software de*clopment project will provide simulated telemetry and engineering data for use in testing the SOH0 Attitude Ground Support System (AGSS). SOHOTELS is being developed by a team of four GSFC personnel in Ada on the STL VAX 8820. The project is reusing design, code, and data files from several previous projects but primarily from the Solar, Anomalous, and Magnetospheric Particle Explorer Telemetry Simulator (SAMPEXTS). The SOHOTELS team held a combined preiiminary design review (PDR) and critical design review (CDR) in April 1993. In their detailed design document, the SOHOTELS team stated the following goals for the development effort:
To maximize reuse of existing code
0 Where reuse is not possible, to develop code that will be as reusable as possible
To make sure performance does not suffer when code is reused
2. Key Facts
SOHOTELS is being implemented in three builds so that it can be used to generate data for the early phases of the AGSS (which is a Cleanroom project). Build developmerrt and independent acceptance testing are being conducted in parallel. At present, the test team has finished testing SOHOTELS Build 1. The development team expects to complete Build 2 and deliver it to the independent test team by the end of the week.
SOHOTELS consists of six subsystems. As of June, the estimated total number of components was 435, of which 396 (91 percent) have currently been completed. Total SLOC for SOHOTELS was estimated at 67.6K SLOC, with 46.6K SLOC of code to be reused verbatim and 15.7K SLOC to be reused with modifications. As of September 13, 1993, there were 65.4K SLOC in the SOHOTELS system, or 97 percent of the estimated total.
The SOHOTELS task leader is currently re-estimating the size of the system because SOHOTELS will be more complex than was originally predicted. The new estimates will also include SLOC for the schema files that are being developed.
The phase start dates for SOHOTELS are
September 9, 1992 October 3, ' Y 92
Requirements Definition Design
127 SEL-94-002

May 1,1993 June 26,1993 May 7, 1993
3. CoalsoftheStudy
Code and Unit Test Acceptance Test Cleanup
?he study goals for SOHOTELS are
To validate the SEL’s recommended tailoring of the development life cycle for high- reuse Ada projects
To refine SEL models for high-reuse software development projects in Ada, specifically - - - Errors (number per KSLOCDLOC) - - Growth in schedule estimates and size estimates (from initial estimates to
Effort (per DLOC, by phase and by activity) Schedule (duration for telemetry simulators and by phase)
Classes of errors (e.g., initialization errors, data errors)
completion and from PDWCDR to completion)
4. Approach
The following steps will be taken to accomplish the study goals:
e Understand which of the standard development processes are being followed (per Reference 10) and which have been tailored for the SOHOTELS project. Ensure that information is entered into the SEL database that will allow SOHOTELS data to be correctly interpreted in light of this tailoring.
Analyze projecthuild characteristics, effort and schedule estimates, effort and schedule actuals, and error data on a monthly basis while development is ongoing.
e At project completion, plot the effort, schedule, error rate, and estirnatc data. Compare these plots with current SEL models and with plots from other high-reuse projects in Ada. Compare and Contrast the error-class data with data from FORTRAN projects, from Ada projects with low reuse, and from other high-reuse Ada projects.
S. Data Collection
To address these study goals, the following standard set of SEL data for Ada projects will be collected:
Size, effort, and schedule estimates (Project Estimates Forms)
0 Weekly development effort (Personnel Resources Forms)
Growth data (Component Origination Forms and SJX librarians)
e Change and error data (Change Report Forms and SEL librarians)
SEL-94-002 128

Appendix C . List of Rules
. Rule ms Understand that software measurement is a means to an end, not an end in itself ......................... 2 Focus on applying results rather than collecting data ................................................................. 13 Understand the goals ................................................................................................................. 22 Understand how to apply measurement ..................................................................................... 22
Plan to achieve an early success ................................................................................................ 23 Focus locally ............................................................................................................................. 24 Start small ................................................................................................................................. 24 Organize the analysts separately from the developers ................................................................. 26 Make sure the measures apply to the goals ................................................................................ 28 Keep the number of measules to a minimum ............................................................................. 29
Budget for the cost of the measurement program ...................................................................... 30 Plan to spend at least three times as much on data analysis and use as on data collection ........... 33 Collect effort data at least monthly ............................................................................................ 37 Clarify the scope of effort data collection .................................................................................. 37 Collect error data only for controlled software .......................................................................... 39 Do not expect to measure error correction effort precisely ........................................................ 40
Do not expect to find a database of process measurements ........................................................ 42
Set expectations ........................................................................................................................ 23
Avoid over-reporting measurement data .................................................................................... 29
Do not expect to find generalized, well-defined process measures ............................................. 41
Understand the high-levei process characteristics ...................................................................... 42 Use simple definitions of life-cycle phases ................................................................................. 45 Use lines of code to represent size ............................................................................................. 45 Specify which software is to be counted .................................................................................... 48 Do not expect to automate data collection ................................................................................ 54 Make providing data easy ...................................................................................................... 55 Use commercially available tools ............................................................................................... 56
Expect measurement data to be flawed, inexact, and inconsistent .............................................. 57
129 SEL-94-002


Abbreviations and Acronyms
AGSS
CASE
CDR
CM
CMM
Code Q
COTS
CPU
DBMS
DLOC
GSFC
IV&V
JSC
KDLOC
KSLOC
NASA
PDR
QA
R&D S AMPEXTS
1 ::I
SEL
SLOC
SME
SOHOTELS
attitude ground support system
computer-aided software engineering
critical design review
configuration management
Capability Maturity Model
Office of Safety and Mission Assurance (NASA)
commercial off-the-shelf
central processing unit
database management system
developed lines of code
Goddard Space Flight Center
independent verification and validation
Johnson Space Center
1,OOO developed lines of code
1 ,OOO source lines of code
National Aeronautics and Space Administration
preliminary design review
quality assurance
r e s t z h and development
Solar, Anomalous, and Ma,,ietospheric Particle Explorer Telemetry Simulator
Software Engineering Institute
Software Engineering Laboratory
source lines of code
Software Management Environment
Solar and Heliospheric Observatory Telemetry Simulator


References __
1.
2.
3.
4.
5 .
6.
7.
8.
9.
Grady, R. B., and Caswell, D. L., Software Metrics: Establishing a Company-Wide Program. Prentice-Hall Inc., Englewood Cliffs, NJ, 1989.
NASA, DA3 Software Development Metrics Handbook, Version 2.1, JSC-255 19, Office of the Assistant Director for Program Support, Mission Operations Directorate, Johnson Space Center, Houston, April 1992.
, DA3 Software Sustaining Engineering Metrics Handbook, Version 2.0, JSC-26010, Office of the Assistant Director for Program Support, Mission Operations Directorate, Johnson Space Center, Houston, December 1992.
, DA3 Development Project Metrics Handbook, Version 5.0, JSC-36112, Office of the Assistant Director for Program Support, Mission Operations Directorate, Johnson Space Center, Houston, March 1993.
Musa, J. D., Iannino, A., and Okumuto, K , Software Reliability: Measurement, Prediction, Application, McGraw-Hill, New York, 1987.
Rifkin, S., and Cox, C., Measurement in Practice, CMIJ/SEI-91-TR-l6, Software Engineering Institute, Carnegie Mellon University, August 1991.
Daskalantonakis, M. K., “A Practical View of Software Measurement and Implementation Experiences With Motorola,” IEEE Transactions on Software Engineering, Volume SE-18, November 1992.
Decker, W., Hendrick, R., and Valett, J . , Software Engineering Laboratory Relationships, Models, and Management Rules, SEL-91-001. Software Engineering Laboratory, NASNGSFC, February 199 1.
Condon, S., Regardie, M., Stark, M., and Wdigora, S., Cost and Schedule Estimation Study Report, SEL-93-002, Software “ngineering Laboratory, NASNGSFC, November 1993.
10. Landis. L., McGarry, F., Waligora, S., et al., Manager’s Handbook for Software Development (Revision I ) , SEL-84-101, Software Engineering Laboratory, NASNGSFC, November 1990.
11. Paulk, M. C., Curtis, B., Chrissis, M. B., and Weber, C. V., Capability Mziurity Model fnr Software, Version 1.1, CMU/SE1-93-TR-24, Software Engineering Institute, Cwnegie Mellon University, February 1993.
12. McGany, F., and Jeletic, K., “Process Improvement as an Investment: Measuring Its Worth,” Proceedings of the Eighteenth Annual Software Engineering Workshop, SEL 93-003, NASNGSFC, December 1993.
13. Currit, P. A., Dyer, M., and Mills, H. D., “Certifying the Reliability of Software,” IEEE Transactions on Software Engineering, Vol. SE- 12, No. 1. January 1986, pp. 3-1 1.

14. Basili, V. R.. and Green, S., “The E\olution of Software Processes Based Upon Measurement in the SEL: The Cleanroom Example,” IEEE Software, To be published in 1994.
15. Rombach, H. D.. Ulery. B. T.. and Valett. J. D.. “Toward Full Life Cycle Control: Adding Maintenance Measurement to the SEL,” Journal of Systems and Software. Vol. 18. 1992, pp. 125-138.
16. Caldiera, G., McGarry, F., Waligora, S., Jeletic, K., and Basili. V. R., Software hocess
17. International Function Point Users Group. Function Point Counting Practices Manual, Release
18. McGarry. F.. “Experimental Software Engincering: Seventeen Years of Lessons in the SEL,” Proceedings of the Seventeenth Annual Software Engineering Workshop, SEL-92-004, NASNG -C, December 1992.
19. Heller, G., Valett, J., and Wild. M., Data Collection Procedures for the Software Engineering Laboratory Database, SEL-92-00?. Software Engineering Laboratory, NASNGSFC, March 1992.
lngrovcment Guidebook, NASA-GB-002-94, Software Engineering Program, 1994.
3.2, Westerville, Ohio, 1991.
20.Decker, W. and Valett. J., Software Management Environment (SME) Concepts and Architecture, SEL-89-03. Software Engineering Laboratory, NASNGSFC, August 1989.
21. Hall, D., Sinciair, C., and McGarry, F., Profile of Software at the Goddard Space Flight Center, NASA-RFT-002-94, Software Engineering Program, April i 994.
22. Basili, CI. R., and Perricone, B. T., “Software Errors and Complexity: An Empirical Investigation,” Communkations of the ACM, Vol. 27, No. 1. Janudry 1984, pp. 42-53.
SEL-94-002 134

Standard Bibliography of SEL Literature
The technical papers, memorandums, and documents listed in this bibliography are organized into t\.o groups. The first group is composed of documents issued by the Software Engineering Laboratory (SEL) during its research and development activities. The second group includes materials that were published elsewhere but pertain to SEL activities.
SEL-ORIGINATED DOCUMENTS
SEL-76-00], Proceedings From the First Summer Sojhvare Engineering Workshop, August 1976
SEL-77-002, Proceedings From the Second Summer Sojbare Engineering Workshop, September 1977
SEL-78-005, Proceedings From the Third SwnmEr Sofnare Engineering Workshop. September 1978
SEL-78-006, GSFC Software Engineering Research Requirements Analysis Study, P. A. Scheffer and C. E. Velez, November 1978
SEL-78-007, Applicability of the Rayleigh Curve to the SEL Environment, T. E. Mapp, December 1978
SEL-78-302, FORTRAN Static Source Code Analyzer Program (SAP) User’s Guide (Revision 3). W. J. Decker, W. A. Taylor, et al., July 1986
SEL-79402, The Software Engineering Laboratory: Relationship Equations, K. Freburger and V. R. Basili, May 1979
SEL-79-004, Evaluation of the Caine, Farber, and Gordon Program Design Language (PDL) in the GDddard Space Flight Center (GSFC) Code 580 Software Design Environment, C. E. Goorevich, L-. L. Green, and W. J. Decker, September 1979
SEL-79-005, Proceedings From the Fourth Summer Software Engineering Workshop, November 1979
SEL-80-002. Multi-Level Expression Design Language-Requirement Level (MEDL-R) SystOrn Svaluation, W. J. Decker and C. E. Goorevich. May 1980
$EL-80-005, A Study of the Musa Reliability Model, A. M. Miller, November 1980
SEL-80-006, Proceedings From the Fifth Annual Software Engineering Workshcp, November 1980
SEL-80-007, An Appraisal of Selected CostResource Estimation Models for Software Systems, J. F. Cook and F. E. McGarry, December 1980
SEL-80-008, Tutorial on Models and Metrics for Software Management and Engineering, V. R. Basili, 1980
135 SEL-94-02
SEL-81-011, Evaluating Software Development by Analysis of Change Data, D. M. Weiss, November 198 1
SEL-81-012, The Rayleiph Curve as a Model for Effort Distribution Over the Life of Medium Scale Software Systems, G. 0. Picasso, December 1981
SEL-8 1 -01 3, Proaxdings of the Sixth Annual Software Engineering Workshop, December 198 1
SEL-81-014, Automated Collection of Software Engineering Data in the Software Engiileering Laboratory (SEL), A. L. Green, W. J. Decker, and F. E. McGan-y, September 1981
SEL-81-101, Guide to Data Collection. V. E. Church, D. N. Card, F. E. McGarry. et al., August 1982
SEL-81-101, The Software Engineering Laboratory, D. N. Card, F. E. McGany, G. Page, et al., February 1982
SEL-8 1 - 1 10, Evaluation of an Independent Verification and Validation (IV&V) Methodology for Flight Dynamics, G. Page, F. E. McGarry. and D. N. Card, June 1985
SEL-81-305, Recommended Approach to Software Development, L. Landis, S. Waligora, F. E. McC-any, et al., June 1992
SEL-8 1 -305SP1. Ada Developers' Supplement to the Recommended Approach, R. Kester and L. Landis. November 1993
SU-82-001, Evaluation of Management Measures of Software Development, G. Page, D. N. Card, and F. E. McGarry, September 1982, vols. 1 and 2
SEL-82-004, Collected Software Engineering Papers: Volume 1, July 1982
SEL-82-097, Proceedings of the Seventh Annual Software Engineering Worbhop, Deceniber 1982
SEL-82-008, Evaluating Software Development by Analysis of Changes: The Data From the Software Engineering Laboratory, V. R. Basili and D. M. Weiss, December 1982
SEL-82-102, FORTRAN Static Source Code Analyzer Program (SAP) System Description (Revision 1). W. A. Taylor and W. J. Decker, April 1985
SEL-82-105, Glossary of Software Engineering Laboratory Terms, T. A. Babst, M. G. Rohleder, and F. E. McGany, October 1983
SEL-82-1206, Annotated Bibliography of Software Engineering Laboratory Literature, L. Morusiewicz and J. Valett, November 1993
SEL-83-001, An Approach to Software Cost Eqtimation, F. E. McGany, G. Page, D. N. Card, et al.. February 1984
SEL-83-002, Measures and Metrics for Software Development, D. N. Card, F. E. McGany, G. Page, et al., March 1984
SEL-83-03, Collected Software Engineering Papers: Volume 11, November 1983
SEL-94-002 136

SEL-83-00?, Proceedings of the Eighth Annual Software Engineering Workshop, November 1983
SEL-83-106, Monitoring Software Development Through Dynamic Variables (Revision 1). C. W. Doerflinger, November 1989
SEL-84-03, Investigation of Specification Measures for the Software Engineering Laboratory (SEL), W. W. Agresti, V. E. Chum.. and F. E. McGany, December 1984
SEL-84-004, Proceedings of the Ninth Annual Software Engineering Workshop. November 1984
SEL-84-101, Manager's Handbook for Software Development (Revision 1). L. Landis, F. E. McGany, S. Waligora, et al., November 1990
SEL-85-01, A Comparison of Software Verification Techniques, D. N. Card, R. W. Selby, Jr., F. E. McGarry, et al., April 1985
SEL-85-002, Ada Training Evaluation and Recommendations From the Gamma Ray Observatory Ada Development Team. R. Murphy and M. Stark, October 1985
SEL-85-003, Collected Software Engineering Papers: Volume III, November 1985
SEL-85-OoQ. Evaluations of Software Technologies: Testing, CLEANROOM, and Metria, R. W. Selby, Jr., and V. R. Basili, May 1985
SEL-85-005, Software Verification and Testing, D. N. Card. E. Edwards, F. McGarry, and C. Antle, Cxember 1985
SEL-85-06. Proceedings of the Tenth Annual Software Engineering Workshop, December 1985
SEL-86-001, Programmer's Handbook for Flight Dynamics Software Development, R. Wood and E. Edwards, March 1986
SEL-S5-002, General Object-Oriented Software Development E. Seidewitz and M. Stark, August 1986
SEL-86-003, Flight Dynarmcs System Software Development Environment (FDVSDE) Tutorial, J. Buell and P. Myers, July 1986
SEL-86-004. Collected Software Engineering Papers: Volume IV, November 1986
SEL-86-005. Measuring Software Design, D. N. Card et al., November 1986
SEL-86-006. Proceedings of the Eleventh Annual Software Engineering Workshop, December I986
SEL-87-001. Product Assurance Policies and Procedures for Flight Dynamics Software Development, S. Perry et d., March 1987
SEL-87-002, Ada@ Style Guide (Version 1.1) . E. Seidewitz et al., May 1987
SEL-87-003, Guidelines for Applying the Composite Specification Model (CSM), W. W. A p t i , June 1987
137 SEL-94-002

SEL-87-004, Aswsing the Ada@ Design Process and Its Impiications: Godfrey, C. Brophy, et al., July 1987
SEL-87-009, Collected Software Engineering Papers: Volume V, November 1987
SEL-87-010, Proceedings of the Twelfth Annual Software Engineering Workshop, December 1987
A Case Study, S.
SEL-88-001, System Testing of a Production Ada Roject: The GRODY Study, J. Seigle, L. Esker, and Y. Shi, November 1988
SEL-88-02. Collected Software Engineering Papers: Volume VI, November 1988
SU-88403 , Evolution of Ada Technology in the Flight Dynamics Area: Design phase Analysis. K. Quimby and L. Esker, December 1988
SEL-88-004, Proceedings of the Thirteenth Annual Software Engineering Workshop, November 1988
SEL-88-005. Roceedings of the First NASA Ada User's Symposium, December 1988
SEL-89-002, Implementation of a Production Ada Project: The GRODY Study, S. Godfrey and C. Brophy, September 1989
SEL-89-004, Evolution of Ada Technology in the Flight Dynamics Area: Implementatioflesting Phase Analysis, K. Quimby, L. Esker, L. Smith, M. Stark, and F. McGany, November 1989
SEL-89-05, Lessons Learned in the Transition to Ada From FORTRA-N at NASNGoddard, C. Brophy, November 1989
SEL-89-006, Collected Software Engineering Papers: Volume VII, November 1989
SEL-89-007, Proaxdings of the Fourteenth Annual Software Engineering Workshop, November 1989
SEL-89-008, Proceedings of the Second NASA Ada Users' Symposium, November 1989
SEL-89-103, Software Management Environment (SME) Concepts and Architecture (Revision 1). R. Hendrick, D. Kistler, and J. Valet& September 1992
SEL-89-301, Software Engineering Laborary (SEL) Database Organization and User's Guide (Revision 3), L. Morusiewicz, December 1993
SEL-90-001, Database Access Manager for the Software Engineering Laboratory (DAMSEL) User's Guide, M. Buhler, K. Pumphrey, and D. Spiegel, March 1990
SEL-90402, The Cleanroom Case Study in the Sofnkrare Engineering Laboratory: Project Description and Early Analysis, S. Green et al., March 1990
SEL-90-003, A Study of the Portability of an Ada System in the Software Engineering Laboratory (SEL), L. 0. Jun and S. R. Valett, June 1990
SEL-90-004, Gamma Ray Observatory Dynamics Simulator in Ada (GRODY) Experiment Summary, T. McDermott and M. Stark, September 1990
SEL-94-02 138

SEL-90-005, Collected Software Engineering Papers: Volume VIII, November 1990
SEL-90-006. Proceedings of the Fifteenth Annual Software Engineering Workshop. November 1 990
SEL-91-001, Software Engineering Laboratory (SEL) Relationships, Models, and Management Rules, W. Decker, R. Hendrick. and J. Valett. February
SEL-91-03. Software Engineering Laboratory (SEL) Booth and M. E. Stark, July 1991
SEL-9 1 - 0 4 , Software Engineering Laboratory (SEL November 199 1
99 1
Ada Performance Study Report, E. W.
Cleanroom Process Model, S. Green,
SEL-91-005, Collected Software Engineering Papers: Volume IX, November 1991
SEL-91-006, Proceedings of the Sixteenth Annual Software Engineering Workshop, December 1991
SEL-91-!02, Software Engineering Laboratory (SEL) Data and Infomation Policy (Revision l) , F. McGarry, August 1991
SEL-92401, Software Management Environment (SME) Installation Guide, D. Kistler and K. Jeletic, January 1992
SEL-92-002. Data Collection F’rocedures for the Software Engineering Labratory (SEL) Database, G. Heller, J. Valett, and M. Wild, March 1992
SEL-92-03, Collected Software Engineering Papers: Volume X, November 1992
SEX-92-04, Proceedings of the Seventeenth Annual Software Engineering Workshop, December 1992
SEL-93-001. Collected Software Engineering Papers: Volume XI, November 1993
SEL-93-02. Cost and Schedule Estimation Study Report, S. Condon, M. Regardie, M. Stark, et al., November 1993
SEL-93-003, Proceedings of the Eighteenth Annual Software Engineering Workshop, December 1993
SEL-94-OO1, Software Management Environment (SME) Components and Algorithms, R. Hendrklr, D. Kistler. and J. Valett, February 1994
SEL-94-02, Software Measurement Guidebook, M. Bassman, F. McGarry, R. Pajerski, July 1994
SEL-RELATED LITERATURE
I0Abd-El-Hafiz. S. K., V. R. Basili, and G. Caldiera, “Towards Automated Support for Extraction of Reusable Components,” Proceedings of the IEEE Conference on Software Maintenance- 199 1 (CSM 9 1 ), October 1 99 1
I39 SEL-94-002

4Agresti, W. W., V. E. Church, D. N. Card, and P. L. Lo, “Designing With Ada for Satellite Simulation: A Case Study,” Proceedings of the First International Symposium on Ada for the NASA Space Station, June 1986
-Agresti, W. W., F. E. McGarry, D. N. Card, et al., “Measuring Software Technology,” Program Transformation and Programming Environments. New York: Springer-Verlag, 1984
‘Bailey. J. W., md V. R. Basili, “A Meta-Model for Software Development Resource Expenditures,” Proceedings of the Fifth International Conference on Software Engineering. New York: IEEE Corriputer Society Press, 1981
8Bailey. J. W., and V. R. Basili, “Software Reclamation: Improving Post-Development Reusability,” Proceedings of the Eighth Annual National Coaference on Ada Technology, March 1 990
‘OBailey, J. W., and V. R. Basili, “The Software-Cycle Model for Re-Engineering and Reuse,” Proceedings of the ACM Tri-Ada 91 Conference, October 1991
‘Basili. V. R., “Models and Metrics for Software Management and Engineering,” ASME Advances in Computer Technology, January 1980, vol. 1
Basili, V. R., Tutorial on Models and Metrics for Software Management and Engineering. New York: IEEE Computer Society Press, 1980 (also designated SEL-80-008)
3Basili. Y. R., “Quantitative Evaluation of Software Methodology,” Proceedings of the First Pan- Pacific Computer Conference. September 1985
’Basili, V. R., Maintenance = Reuse-Oriented Software Development, University of Maryland, Technical Report TR-2244, May 1989
7Basili, V. R., Software Development: A Paradigm for the Futiire, University of Maryland, Technical Report TR-2263, June 1989
8Basili, V. R., “Viewing Maintenance of Reuse-Oriented Software Development,” IEEE Software, January 1990
‘Basili, V. R., and 3. Beane. ‘‘Can the Parr Curve Help With Manpower Distribution and Resource Estimation Problems?,” Journal of Systems and Software, February 1981 , vol. 2, no. 1
9Basili, V. R., G. Caldiera, and G. Cantone, “A Referencc Architecture for the Component Factory,”ACM Transactions on Software Engineering and Methodology, January 1992
‘%asili, V., G. Caldiera, F. McGarry, et al., ‘The Software Engineering Laboratory-An Operational Software Experience Factory,” Proceedings of the Fourteenth International Conference on Software Engineering (ICSE 92). May 1992
‘Basili, V. R., and K. Freburger, ‘‘Programming Measurement and Estimaticn in the Software Engineering Laboratory,” Journal of Systems and Software, February 1981, vol. 2, no. 1
3Basili, V. R., and N. M. Panlilio-Yap, “Finding Relationships Between Effort and Other Variables in the SEL,” Proceedings of the International Computer Software and Applications Conference, October 1985
7
SEL-94-002 140

4Basili, V. R., and D. Patnaik, A Study on Fault hdiction and Reliability Assessment in the SEL Environment, University of Maryland, Technical Report TR- 1699, August 1986
2Basili, V. R., and B. T. Pemcone, “Software Errors and Complexity: An Empirical Investigation,” Communications of the ACM, January 1984, vol. 27, no. 1
‘Basili, V. R., and T. Phillips, “Evaluating and Comparing Software Metrics in the Software Engineering Laboratory,” Proceedings of the ACM SIGMETRICS Sympsiuflorkshop: Quality Metrics, March 1981
3Basili, V. R., and C. L. Ramsey, “ARROWSMITH-P-A Prototype Expert System for Software Engineering Management,” Proceedings of the IEEE/MITRE Expert Systems in Government Symposium, October 1985
Basili, V. R., and J. Ramsey, Structural Coverage of Functional iesting, University of Maryland, Technical Report TR-1442, September 1984
Basili, V. R.. and R. Reiter, “Evaluating Automatable Measures for Software Development,” Proceedings of the Workshop on Quantitative Software Models for Reliability, Complexity, and Cost. New York: IEEE Computer Society Press, 1979
5Basili, V. R., and H. D. Rombach, ‘Tailoring the Software Process to Project Goals and Environments,” Proceedings of the 9th International Conference on Software Engineering, March 1987
SBasili, V. R., and H. D. Rombach, “TAME: Tailoring an Ada Measurement Environment,” Proceedings of the Joint Ada Conference, March 1987
SBasili, V. R., and H. D. Rombach, “TAME: Integrating Measurement Into Software Environments,” University of Maryland, Technical Report TR- 1764, June 1987
6Basili. V. R.. and H. D. Rombach, ‘The TAME Project: Towards Improvement-Oriented Software Environments,” IEEE Transactions on Software Engineering, June 1988
7Basili, V. R., and H. D. Rombach, Towards A Comprehensive Framework for Reuse: A Reuse- Enabling Software Evolution Environment, University of Maryland, Technical Report TR-2158, December 1988
SBasili, V. R., and H. D. Rombach, Towards A Comprehensive Framework for Reuse: Model- Based Reuse Characterization Schemes, University of Maryland, Technical Report TR-2446, April 1990
%hili, V. R., and H. D. Rombach, “Support for Comprehensive Reuse,” Software Engineering Journal, September 1991
3Basili, V. R., and R. W. Selby, Jr., “Calculation and Use of an Environment’s Characteristic Software Metric Set,” Proceedings of the Eighth Internatiord Conference on Software Engineering. New York: IEEE Computer Society Press, 1985
Basili, V. R., and R. W. Selby, “Comparing the Effectiveness of Software Testing Strategies,” IEEE Transactions on Software Engineering, December 1987
141 SEL-94-002

3Basili, V. R., and R. W. Selby, Jr., “Four Applications of a Software Data Collection and Analysis Methodology,” Proceedings of the NATO Advanced Study Institute, August 1985
SBasili, V. R., and R. Selby, “Comparing the Effectiveqess of Software Tes’Ling Strategies,” IEEE Transactions on Software Engineering, December 1987
9Basili. V. R., and R. W. Selby, “Paradigms for Experimentation and Empirical Studies m Software Engineering,” Reliability Engineering and System Safety, January 1991
4Basili, V. R., R. W. Selby, Jr., and D. H. Hutchens, “Experimentation in Software Engineering,” IEEE Transactions on Software Engineering, July 1986
*Basili, V. R., R. W. Selby, and T. Phillips, “Metric Analysis and Data Validation Across FORTRAN Projects,** IEEE Transactions on Software Engineering, November 1983
*Basili, V. R., and D. M. Weiss, A Methodology for Collecting Vaiid Software Engineering Data, University of Maryland, Technical Report TR- 1235, December 1982
3Basili, V. R., and D. M. Weiss, “A Methodology for Collecting Valid Software Engineering Data,” IEEE Transactions on Software Engineering, November 1984
‘Basili, V. R., and M. V. Zelkowitz, “The Software Engineering Laboratory: Objectives,” Proceedings of the Fifteenth Annual Conference on Computer Personnel Research, August 1977
Basili, V. R., and M. V. Zelkowitz, “Designing a Software Measurement Experiment,” Proceedings of the Software Life Cycle Management Workshop, September 1977
‘Basili, V. R., and M. V. Zelkowitz, “Operation of the Software Engineering Laboratory,” Proceedings of the Second Software Life Cycle Management Workshop, August 1978
IBadi, V. R., and M. V. Zelkowitz, “Measuring Software Dewlopment Characteristics in the Local Environment,” Computers and Structures, August 1978, vol. 10
Basili, V. R., and M. V. Zelkowitz, “Analyzing Medium Scale Software Development,’, Proceedings of the Third International Conference on Software Engineering. New Yofk IEEE Computer Society Press, 1978
Bassman, M. J., F. McGarry, and R. Pajerski, Software Measurement GuidebooK, NASA-GB- 001 -94, Software Engineering Program, July 1994
9Booth, E. W., and M. E. Stark, “Designing Configurable Software: COMPASS Implementation Concepts,” Proceedings of Tri-Ada 1991, October 1991
lOBooth, E. W., and M. E. Stark, “software Engineering Laboratory Ada Performance Study-Results and Implications,” Proceedings of the Fourth Annual NASA Ada User’s Symposium, April 1992
l%riand, L. C., and V. R. Basili, “A Classification Procedure for the Effective Management of Changes During the Maintenance Process,” Proceedings of the 1992 IEEE Conference on Software Maintenance (CSM 92), November 1992
SEL-94-002 142

‘OBriand, L. C., V. R. Basili, and C. J. Hetmanski, “Providing an Empirical Basis for Optimizing the Verification and Testing Phases of Software Development,,’ Proceedings of the Third E E E International Symposium on Software Reliability Engineering (ISSF& 92)- October 1992
“Briand, L. C., V. R. Basili, and C. J. Hetmanski, Developing Interpretable Models with Optimized Set Reduction for Identifying High Risk Software Components, TR-3048, University of Maryland, Technical Report, March 1993
%nand, L. C., V. R. Basili, and W. M. Thomas, A Pat2rn Recognition Approach for Software Engineering Data Analysis, University of Maryland, Technical Report TR-2672. May 199 1
IiBriand, L. C., S . Morasca, and V. R. Basili, “Measuring and Assessing Maintainability at the End of High Level Design,” Proceedings of the 1993 IEEE Conference on Software Maintenance (CSM 93). November 1993
“Briand, L. C., W. M. Thomas, and C. J. Hetmanski, “Modeling and Managing Risk Early in Software Development,” Proceedings of the Fifteenth International Conference on Software Engineering (ICSE 93), May 1993
5Brophy, C. E., W. W. Agresti, and V. R. Basili, “Lessons barned in Use of Ada-Oriented Design Methods,” Proceedings of the Joint Ada Conference, March 1987
6Brophy, C. E., S. Godfrey, W. W. Aps t i , and V. R. Rasili, “Lessons Learned in the Implementation Phase of a L;ge Ada Project,” Proceedings of the Washington Ada Technical Conference, March 1988
qard. D. N., “Early Estimation of Resource Expenditures and Program Size.” Compute: Sciences Corporation, Technical Memorandum, June 1982
qard, D. N., “Comparison of Regression Mode!ing Techniques for Resource Estimation,” Computer Sciences Corporation, Technical Memorandum, November 1982
3Card, D. N., “A Software Technology Evaluation Program,” Annais do XVIII Congress0 Nacional de Informatica, October 1985
5Card, D. N., and W. W. Agresti, “Resolving the Software Science Anomaly,” Joamal of Systems and Software, 1987
6Card, D. N., and W. W. Agresti, “Measuring Software Design Complexity,” Joiunal of Systems and Software, June 1988
4Card, D. N., V. E. Church, and W. W. Agresti, “An Empirical Study of Software Design Practices,” IEEE Transactions on Software Engineering, February 1986
Card, D. N., V. E. Church, W. W. Agresti, and Q. L. Jordan, “A Software Engineering View of Flight Dynamics Analysis System,” Parts I and 11, Computer Sciences Corporation, Technical Memorandum, February 1984
Card, D. N., Q. L. Jordan, and V. E. Church, “Characteristics of FORTRAN Modules,” Computer Sciences Corporation, Technical Memorandum, June 1984
SCard, D. N., F. E. McGany, and G. T. Page, “Evaluating Software Engineering Technologies,” IEEE Transactions on Software Engineering, July 1987
143 SEX-94-002

3Card, D. N., G. T. Page, and F. E. McGany, “Criteria for Software Modularization,” Proceedings of the Eighth International Conference on Software Engineering. New York: IEEE Computer Society Press, 1985
‘Chen, E., and M. V. Zelkowitz, “Use of Cluster Analysis To Evaluate Software Engineering Methodologies,” Proceedings of the Fifth International Conference on Software Engineering. New York: IEEE Computer Society Press, 1981
4Church, V. E., D. N. Card, W. W. Agresti, and Q. L. Jordan, “An Approach for Assessing Software Prototypes,” ACM Software Engineering Notes, July 1986
*Doerflinger, C. W., and V. R. Basili, “Monitoring Software Development Through Dynamic Variables,” Proceedings of the Seventh International Computer Software and Applications Conference. New York: IEEE Computer Society Press, 1983
Doubleday, D., ASAP: An Ada Static Source Code Analyzer Program, University of Maryland, Technical Report TR-1895, August 1987 (NOTE: 1 0 0 pages long)
6Godfrey, S., and C. Brophy, “Experiences ;n the Implementation of a Large Ada Project,” Proceedings of the 1988 Washington Ada Symposium, June 1988
SJeffexy, D. R., and V. Basili, Characterizing Resource Data: A Model for Logical Association of Software Data, University of MLyland, Technical Report TR- 1848, May 1987
6Jeffery, D. R., and V. R. Basili, “Validating the TAME Resource Data Model,” Proceedings of the Tenth International Conference on So€tware Engineering, Auril 1988
llLi, N. R., and M. V. Zelkoa;tz, “An Information Model for Use in Software Management Estimation and Prediction,” Proceedings of the Second International Conference on Information Knowledge Management, November 1993
5Mark, L., and H. D. Rombach, A Meta Information Base for Software Eagineering, University of Maryland, Technical Report TR-1765, July 1987
6Mark, L., and H. D. Rombach, “Generating Cusiomized Software Engineering Information Bases From Software Process and Product Specifications,” Proceedings of the 22nd Annual Hawaii International Conference on Syste XI Sciences, January 1989
5McGarry, F. E.. and W. W. Agresti, “Measuring Ada for Software Development in the Software Engineering Laboratory (SEL),” Proceedings of the 21 st Annual Hawaii International Conference on System Sciences, January 1988
’McGany, F., L. Esker, and K. Quimby, “Evolution of Ada Technology in a Production software Environment,” Proceedings of the Sixth Washington Ada Symposium (WADAS), June 1989
3McGarry, F. E., J. Valett, and D. Hall, “Measuring the Impact of Computer Resource Quality on the Software Development Process and Product,*’ Proceedings of the Hawaiian International Conference on System Sciences, January 1985
3Page, G., F. E. McGany, and D. N. Card, “A Practical Experience With Independent Verification and Validation,” Proceedings of the Eighth International Computer Software and Applications Conference, November 1984
SEL-94-02 144

%&nsey, C. L., and V. R. Basili, “An Evaluation of Expert Sys,ms for Software Engineering Management,” IEEE Transactions on Software Engineering, June 1989
3Ramsey, J., and V. R. Basili, “Analyzing the Test Process Using Structural Coverage,” Proceedings of the Eighth International Conferepce on Software Engineering. New York: IEEE Computer Society Press, 1985
SRombach, H. D., “A Controlled Experiment on the Impact of Software Structure on Maintainability,” W E Transactions on Software Engineering, March 1987
8Rombach. H. D., “Design Measurement: Some Lessons Learned,” IEEE Software, March 1990
9Rombach, H. D., “Software Reuse: A Key to the Maintenance Problem,” Butterworth Journal of Information and Software Technology, JanuaryFebruary 199 1
bRombach, H. D., and V. R. Basili, “Quantitative Assessment of Maintenance: An Industrial Case Study,” Proceedings From the Conference on Software Maintenance, September 1987
6Rombach, H. D., and L. Mark, “Software Process and Product Specifications: A Basis for Generating Customized SE Information Bases,” Proceedings of the 22nd Annual Hawaii International Conference on System Sciences, January 1989
TRombach, H. D., and B. T. Ulery, Establishing a Measurement Based Maintenance Improvement Program: Lessons Learned in the SEL, University of Maryland, Technical Report TR-2252, May 1989
1°Rambach, H. D., B. T. Ulery, and J. D. Valett; “Toward Full Life Cycle Control: Adding Maintenance Measurement to the SEL,” Journal of Systems acd Software, May 1992
bSeidewitz, E., “Object-Oriented Programming in Smalltalk and Ada,” Proceedings of the 1987 Conference on Object-Oriented Programming Systems, Languages, and Applications, October 1987
SSeidewitz. E., “General Object-Oriented Software Development: Background and Experience,” Proceedings of the 21st Hawaii Internation.
bseidewitz, E., “General Object-Oriented Software Development with Ada: A Life Cycle Approach,” Proceedings of the CASE Technology Conference, April 1988
gSeidewitz, E., “Object-Oriented Programming Through Type Extension in Ada 9X,” Ada Letters, MarcldApril 1991
IOSeidewitz, E., “Object-Oriented Programming With Mixins in Ada,” Ada Letters, MarcWApril 1992
4Seidewitz, E., and M. Stark, “Towards a General Object-Oriented Software Development Methodology,” Proceedings of the Fist International Symposium on Ada for the NASA Space Station, June 1986
9Seidewitz. E., and M. Stark, “An Object-Oriented Approach to Parameterized Software in Ada,” Proceedings of the Eighth Washington Ada Symposium, June 1991
:onference on System Sciences, January 1988
145 SEL-94-002

@hark, M., “On Designing Parametrized Systems Using Ada,’’ Proccedings of the Seventh Washington Ada Symposium, June 1990
‘Stark, M., “Impacts of Object-Oriented Technologies: Seven Years of SEL Studies,” Proceedings of the Conference on Object-Oriented Programming Systems, Languages, and Apylications, September 1993
’Stark, M. E. and E. W. Booth, “Using Ada to Maximize Verbatim Software Reuse,” Proceedings of TRI-Ada 1989, October 1989
SStark, M., and E. Seidewitz, “Towards a General Object-Oriented Ada Lifecycle,” Proceedings of the Joint Ada Conference, March 1987
1°Stracb, P. A., and M. V. Zelkowitz, “On the Nature of Bias and Defects in the Software Specification Process,” Proceedings of the Sixteenth International Computer Software and Applications Copference (COMPSAC 92), September 1992
*Straub, P. A., and M. V. Zelkowitz, “PUC: A Functional Specification Language for Ada,” Proceedings of the Tenth International Conference of the Chilean Computer Science Society, July 1990
7Sunazuka, T., and V. R. Basili, Integrating Automated Support for a Software Management Cycle Into the TAME System, Uimersity of Maryland, Technical Report TR-2289, July 1989
lqian, J., A. Porter, and M. V. Zelkowitz, “An Improved Classification Tree Analysis of High Cost Modules Based Upon an Axiamatic Definition of Complexity,” Proceedings of the Third IEEE International Symposium on Software Reliability Engineering (ISSRE 92), October 1992
Turner, C., and G. Caron, A Cornpaikon of RADC and NASNSEL Software Development Data, Data and Analysis Center for Software, Special Publication, May 198 1
1Walett, J. D., “Automated Support for Experience-Based Software Management,” Proceedings of the Second Irvine Software Symposium (ISS -92), March 1992
5Valett, J. D., and F. E. McGarry, “A Summary of software Measurement Experiences in the Software Engineering Laboratory,” Proceedings of the 2 1 st An?ual Hawaii International Conference on System Sciences, January 1988
3Weiss, 9. M., and V. R. Basili, “Evaluating Software Development by Analysis of Changes: Some Data From the Software Engineering Laboratory,” IEEE Transactions on Software Engineering, February 1985
5Wu, L., V. R. Basili, and K. Reed, “A Structure Coverage Tool for Ada Softwxe Systems,” Proceedings of the Joint Ada Conference, March 1987
lZelkowitz, M. V., “Resource Estimation for Medium-Scale Softwaii Projects,” Proceedings of the Twelfth Conference on the Interface of Statistics and Computer Science. New York: IEEE Computer Society Press, 1979
2Zelkowitz, M. V.. “Data Collection and Evaluation for Experimental ComputLr Science Research,” Empirical Foundations for Computer and Information Science (Proceedings), November 1982
SEL-94-002 146

6Zelkowitz. M. V .( “The Effectiveness of Software Prototyping: A Case Study,” Proceedings of the 26th Annual Technical Symposium of the Washington, D.C., Chapter of the ACM, June 1987
6Zelkowitz. M. V., “Resource Utilization During boftware Development,” Journal or Systems and Software, 1988
8Zelkowitz, M. V., “Evolution Towards Specificadons Environment: Experiences With Syctax Editors,” Information and Software Technology, April 1990
147 SEL-94-002
NOTES 'This article also appears in SEL-82-04. Collected Sofiare Engineering Papers: Volume I , July 1982.
* n i s article also appears in SEL-83-003, Collected Software Engineering Papers: Volume 11, Noveir.kr 1983.
3This article also appears in SEL-85-003, Collected Software Engineering Papers: Volume Zll, November 1985.
4This article also appears in SEL-86-004, Collected Software Engineering Papers: Volume N, November 1986.
article also 31,'~ m in SEL-87-009, Collected Software Engineering Papers: Volume V, Novemkr 1987.
%s article also appears in SEL-88-002, Colle...dd Software hgineering Papers: Volume VI, November 1988.
7This article also appears in SEL-89406, Collected Sofhyare Engineering Papers: Volume VZZ, November 1989.
8This article 4x1 appears in SEL-9O-005, Collected Sofnyare Engineering Papers: Volume Vilf, November 1990.
%s article also appears in SEL-91-05. Collected Sojiware Engineering Papers: Volwne IX, Navtmber 199 1 .
I h s article also appears in SEL-92-003, Collected Sqfmare Engineering Papers: Volume X, November 1992.
IIThis anicle also appears in SEL-93-001. Collecicd Soware Engimering Papers: Vohme XI , November 1993.
SEL-94 002

REPORT DOClJMENTdklON PAGE
. *> . " c . L-'
FonnAppmved I OM6 NO. 0704-0188
Software Engineering Laboratory
SEL-94-02
CR- 1 89407
I
11. SUPPLaaaCTARVNOrrS r 1%. ~ A V A U B U W S T A l E M E N r
Unclassified-Unlimited Subject Category: 61 Report is available from the NASA Center for AeroSpace Information. 800 Elkridge Landing Road. Linthicum Heights, MD 21090. (301) 621-0390.
13. ABsmcT~mHordsJ
This software Measurement Guidebook presents information on the purpose and importance of measurement. It discusses the specific procedures and activities of a measurement program and the roles of the people involved. The glide book also clarifies the roles that measurement can and must play in the goal of contiual, sustained improvement for all softwarc production and maintenance efforts.
I--- -
b5 NUMEER OF PAGES
Software Measurement I t--- 16. PRICECODE