Third Party Punishment and Criminal Behavior: An experiment with Italian Camorra Inmates
10
-
Upload
independent -
Category
Documents
-
view
5 -
download
0
Transcript of Third Party Punishment and Criminal Behavior: An experiment with Italian Camorra Inmates


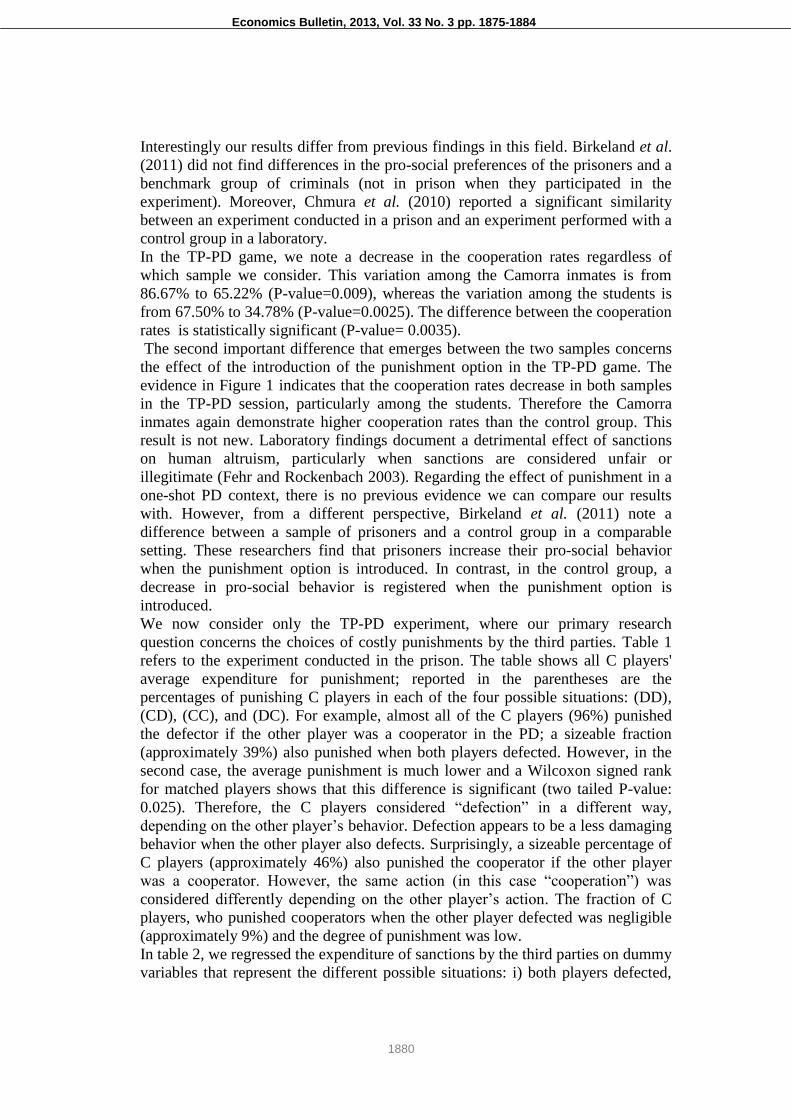
Economics Bulletin, 2013, Vol. 33 No. 3 pp. 1875-1884
1. Introduction
Criminal activity represents a significant cost for society, and considerable
resources are devoted to preventing crime. Economic analysis of crime provides
important theoretical contributions toward understanding this phenomenon.
Economists have been particularly interested in understanding the individuals'
incentives associated with breaking the law. To this purpose, since the seminal
paper of Becker (1968), the economic research has mainly focused on the
individual's propensity to commit crimes on the basis of the expectation of profits.
However, the decision to undertake illegal activities is likely to be influenced by
the individuals' degree of morality, their social preferences (altruism, cooperative
behavior), their attitude to risk, their level of education or even the presence of
peer effects (Kling et al. 2005). These elements, along with economic incentives,
are likely to play an important role when an individual decides whether to break
the law. In fact, one can assume that with more relevant crimes and more
organized criminal groups, the higher the importance of such elements in
comparison with the mere economic incentives become. There is vast experimental
literature documenting the role played by morality, social preferences and risk in
shaping individuals' economic choices and behaviors; however, there is little
evidence of how these same elements affect criminals' choices and behaviors. Only
recently, a number of experimental research efforts (see Block et al. 1995;
Birkeland et al. 2011; Chmura et al. 2010) have compared social preferences and
attitude with risk in samples of prison inmates and in samples of the general
population or university students (Block et al. 1995). The results indicate relevant
differences between university students and prisoners only in risk attitudes. Our
experimental study extends this literature, focusing on cooperative and sanctioning
behavior of a sample of Camorra inmates. We introduced several novel features.
First, we focused on cooperation and sanctioning behavior by reproducing an
experiment reported in Fehr et al. (2004)1. Altruism, in fact, is related to both
morality and individual's preference structure, whereas cooperativeness is related
to both individual's preference structure and degree of sociality; therefore,
cooperativeness is more relevant when studying criminal behavior. Second, we
selected a specific group of prisoners, the Camorra inmates, who differ from other
prisoners in that they belong to a criminal organization. The Italian criminal
organizations are very similar to large companies, whose employees share
common moral values and behavioral codes2. Moreover, Camorra inmates are
high-security prisoners whose life conditions in prison minimize the existence of a
"prison effect", which may produce an estimation bias when measuring inmates’
1 We run two sessions; one is based on a one-shot prisoner dilemma game, and the other reproduces
a third party punishment on a one-shot prisoner dilemma (TP-PD), as in the paper by Fehr et al.
2004.
2 Camorra is a criminal organization originated in Italy (specifically, in the region of Campania)
and has several similarities with the Mafia. Because the Camorra cannot appeal to a legal system, it
relies on strong internal social norms.
1876

Economics Bulletin, 2013, Vol. 33 No. 3 pp. 1875-1884
behavior3. In fact, measuring social preference (altruism, generosity,
cooperativeness) within a prison may be a difficult task because the prison
environment, as well as the very particular type of sociality, is likely to
significantly affect the individuals' behavior. In the case of high-security prisoners
(as Mafiosi and Camorristi), however, the prison effect has little impact on
behavior for different reasons. First, Camorra inmates are grouped with members
of other (non rival) Camorra clans. To prevent friendships among roommates, each
inmate is frequently moved to other prison cells and to other prison facilities in
Italy. Second, high-security prisons do not allow prisoners to spend much time in
recreational areas. Instead, inmates spend most of their time confined in cells.
To control for the "prison effect", Birkeland et al. (2011) compared the behavior of
current prisoners with convicted criminals outside the prison; however, many
convicted criminals have passed through the prison and hence could have been
conditioned by their previous prison experience4. Notably, the Camorra and Mafia
inmates view their permanence in prison in a very different way from the manner
in which common criminals view prison. In fact, long detention periods are
considered a likely life occurrence and do not alter their personal and professional
choices (Saviano 2006).
The final novel feature of our work consists of our comparison between the
behaviors of the sample of Camorra inmates with the behavior of a sample of
Italian university students coming from the same geographical area (Campania).
As such, we assumed a high degree of homogeneity within each sample.
Our research hypothesis is that there are significant differences in cooperative and
sanctioning behavior between the two samples, thus justifying the claim that
economic analyses of crime must be integrated with a behavioral perspective.
Alternatively, if cooperative and sanctioning rates do not differ between the
samples, the expectation of monetary benefits may be considered as the main
motivation to break the law.
The results of the experiments fully support our research hypothesis. Cooperative
and sanctioning behavior are significantly higher among the Camorra inmates.
Interestingly, we find similarities between the results of the Italian students'
behavior in the TP-PD with the students performing the experiment in the original
Fehr et al. paper, even though the two samples come from two very different social
and institutional contexts. In our opinion, these similarities mark a significant
difference in social preferences between the criminal and the non-criminal groups
in Italy.
2. The samples and the recruiting procedures
The student sample was recruited at the University of Naples II, which is located
in the Province of Caserta. The students were enrolled in different colleges (law,
psychology, political science and economics) and were recruited by
advertisements on the college websites. The sessions were conducted over two
days in the central university laboratory. The Province of Caserta has several
3 See also Birkeland et al. 2011 for a discussion on the prison effect.
4 We are grateful to the referee for some useful comments on the relevance of the "prison effect".
1877

Economics Bulletin, 2013, Vol. 33 No. 3 pp. 1875-1884
Camorra family groups (Saviano 2006), and there are large prisons located in the
area. However, for the inmate sample, we selected a prison that was not in the
same area. In fact, the Camorra sample was recruited at the Secondigliano prison,
one of the most important Neapolitan prisons with four high-security branches.
Each branch houses approximately 400 inmates. The Camorra inmates were
recruited through advertisements posted in the prison recreation areas. The
advertisements stated i) a number of researchers from the University of Naples and
Salerno were conducting a study on several population groups in Campania, ii)
these researchers would conduct sessions in the prison and, iii) participation would
be rewarded with a fee of 10-18 euro5. The inmates were free to choose among
enrollment in the experiments, participation in courses or sport activities, or
remaining in the recreation area. Thus, the sessions did not overlap with the
inmates' usual daily outdoor hours. We conducted both sessions on the same day,
one after the other, and each session was advertised in a different branch. All
sessions were conducted in June and July 2012. A total of 109 students and 129
Camorra inmates participated in the four sessions.
3. The design
The experiments consisted of two different designs: a one-shot PD and a one-shot
TP-PD. For the latter design, we reproduced the design adopted in Fehr et al.
(2004). All sessions consisted of paper-pencil experiments6. In the PD design, the
session began when each subject was provided with an envelope labeled A or B
and a number identifying the subject. The envelope contained an instruction sheet,
a decision sheet and a questionnaire (we have omitted the details). The instructions
were read aloud by the experimenters, and in both sessions, we stated that the
participants could ask questions only privately and after the reading of the
instructions. The game in the PD session was one-stage. Therefore, the game
consisted of a single decision, which the participants were required to report on the
decision sheet. Subjects A (B) were endowed with 10 experiment tokens and were
paired with subjects B (A). The subjects had to determine whether to keep the
tokens or send them to the partner. If the subjects sent an amount of tokens to their
partners, the researcher would triple it. Therefore, the game had four possible
outcomes: (10, 10), (40, 0), (0, 40), and (30, 30). The four outcomes were
illustrated in a table provided on both the instruction and decision sheets. The TP-
PD is a two-stage design where three subjects (A, B and C) participate. The first
stage is equivalent to the PD with the fundamental difference being that A and B
were aware that the C player would act in the second stage and could affect their
payoffs. In fact, at the beginning of the second stage, after A and B had determined
5 This amount corresponds to the average amount an inmate can spend at the prison canteen for
cigarettes and food in a day.
6 The data are available on request. The instructions of the experiment can be downloaded from:
www.economiasperimentale.it/instructioneb.docx;www.economiasperimentale.it/instructionsecono
micbulletin.pdf.
1878

Economics Bulletin, 2013, Vol. 33 No. 3 pp. 1875-1884
whether to send the tokens, the C player was endowed with 40 tokens. Then, the C
player had to determine whether to keep the tokens or to spend the endowment to
attribute deduction points to A and B. One deduction point would decrease A and
B's total number of tokens by three units (C was allowed to attribute a maximum
of 20 deduction points to each player). We retained certain important features of
the design created by Fehr et al. (2004). First, at the beginning of the second stage,
A and B's endowments were increased by 15 tokens (avoiding the focal point: 40,
40, and 40). Second, the participants received a show-up fee of 10 tokens to
prevent a subject from experiencing a loss after C's decision. Finally, C's decisions
were recorded using a strategy method (Selten 2003). According to the strategy
method, C was asked to indicate on the decision sheet how many deduction points
he/she would allocate for each of the four possible outcomes in the PD: (CC),
(DD), (CD), and (DC). In our design, the three subjects acted concurrently in
different rooms with different experimenters. The pairing procedure was
conducted after the experiments. In each room, the experimenter collected the
closed envelopes and asked one participant to mix them and form pairs. The pairs
and their identification numbers were then read aloud. Next, privately and in the
presence of only the participant who had randomly selected the pairs, we opened
the envelopes and calculated the gains. The final gains were then posted in the
recreation area and on the faculty websites. For the TP-PD the procedure was the
same. However, participant A or B of the first stage formed triplets rather than
pairs. To make forming triplets possible, the C decisions were collected first and
brought to the first room. Once the triplets had been privately formed, but in the
presence of participant A, B or C (selected randomly), the experimenters
calculated the final gains. Then, the gains were reported in a table and the results
posted in the recreation area and on the university website.7 As in Fehr et al.
(2004), the exchange rate was one token = 0.3 euro cents, whereas the average
earnings were between 12-15 euro for both the students and the Camorra inmates.
The final gains were provided directly to the students after the experiments and
credited to the inmates' internal accounts.
4. The results
Figure 1 shows Player A and B’s decisions in the PD and TP-PD sessions that
were performed in prison and performed with the university students. We are
interested in two points: i) the comparison of the prisoners and students’
cooperation rates and ii) the effect of sanctions on cooperative behavior in both
samples. In the PD game, 86.67 % of the prisoners (both A and B players) sent
their tokens to the partner, whereas the percentage of cooperative choices among
the students in the same session was much lower (approximately 67.50%). A chi-
square test shows that this difference is significant (P-value=0.021).
7 Posting the results on the boards of the recreational area was the only way to communicate the
outcome of the experiment to the inmates, and - being a one-shot game - did not create reputational
effects.
1879
Economics Bulletin, 2013, Vol. 33 No. 3 pp. 1875-1884
Interestingly our results differ from previous findings in this field. Birkeland et al.
(2011) did not find differences in the pro-social preferences of the prisoners and a
benchmark group of criminals (not in prison when they participated in the
experiment). Moreover, Chmura et al. (2010) reported a significant similarity
between an experiment conducted in a prison and an experiment performed with a
control group in a laboratory.
In the TP-PD game, we note a decrease in the cooperation rates regardless of
which sample we consider. This variation among the Camorra inmates is from
86.67% to 65.22% (P-value=0.009), whereas the variation among the students is
from 67.50% to 34.78% (P-value=0.0025). The difference between the cooperation
rates is statistically significant (P-value= 0.0035).
The second important difference that emerges between the two samples concerns
the effect of the introduction of the punishment option in the TP-PD game. The
evidence in Figure 1 indicates that the cooperation rates decrease in both samples
in the TP-PD session, particularly among the students. Therefore the Camorra
inmates again demonstrate higher cooperation rates than the control group. This
result is not new. Laboratory findings document a detrimental effect of sanctions
on human altruism, particularly when sanctions are considered unfair or
illegitimate (Fehr and Rockenbach 2003). Regarding the effect of punishment in a
one-shot PD context, there is no previous evidence we can compare our results
with. However, from a different perspective, Birkeland et al. (2011) note a
difference between a sample of prisoners and a control group in a comparable
setting. These researchers find that prisoners increase their pro-social behavior
when the punishment option is introduced. In contrast, in the control group, a
decrease in pro-social behavior is registered when the punishment option is
introduced.
We now consider only the TP-PD experiment, where our primary research
question concerns the choices of costly punishments by the third parties. Table 1
refers to the experiment conducted in the prison. The table shows all C players'
average expenditure for punishment; reported in the parentheses are the
percentages of punishing C players in each of the four possible situations: (DD),
(CD), (CC), and (DC). For example, almost all of the C players (96%) punished
the defector if the other player was a cooperator in the PD; a sizeable fraction
(approximately 39%) also punished when both players defected. However, in the
second case, the average punishment is much lower and a Wilcoxon signed rank
for matched players shows that this difference is significant (two tailed P-value:
0.025). Therefore, the C players considered “defection” in a different way,
depending on the other player’s behavior. Defection appears to be a less damaging
behavior when the other player also defects. Surprisingly, a sizeable percentage of
C players (approximately 46%) also punished the cooperator if the other player
was a cooperator. However, the same action (in this case “cooperation”) was
considered differently depending on the other player’s action. The fraction of C
players, who punished cooperators when the other player defected was negligible
(approximately 9%) and the degree of punishment was low.
In table 2, we regressed the expenditure of sanctions by the third parties on dummy
variables that represent the different possible situations: i) both players defected,
1880

Economics Bulletin, 2013, Vol. 33 No. 3 pp. 1875-1884
ii) the punished player defected and the other player cooperated, iii) the other
player was a defector and the punished player cooperated and iv) the excluded
dummy represented the situation of mutual cooperation. The estimates confirm
that the tendency to punish is highly significant when the punished player is a
defector (and the other is a cooperator). In contrast, there is no significant
difference in the punishing behavior between the two cases of mutual defection
and cooperation.
We now compare the figures in table 1 with the results (in table 3) from the
experiment conducted in the university laboratory. As above, the highest
percentage (56.52%) of punishments is reported for defectors when the other
player cooperated. A Wilcoxon signed rank test for paired players shows that
defection is considered to be a less severe violation of the norm when the other
player also defects (P-value=0.015). However, the differences between the
evidence from the two samples are noticeable because i) students never punished
cooperators and ii) the fraction of C players who punished defectors (when the
other player cooperated) in the student sample was much lower than that one in the
prisoner sample (approximately 56% and 96%, respectively). The results in table 3
are similar to the evidence reported in Fehr et al. (2004) for a sample of students:
“the punishment of a cooperator is negligible, irrespective of whether the other
player defected or cooperated” and “the sanctioning of a defector becomes much
more severe if the other player changes from defection to cooperation” (Fehr et al.
p.74). Similarly, in Fehr’s study, the sanctioning rate is low (approximately 45%)
compared with the evidence in table 1. Briefly, the most important patterns that
emerge from our study are that the Camorra inmates are more willing than the
students to adopt costly punishments to sanction non-cooperative behavior,
particularly when the defection is "unfair".
5. Concluding remarks
The theories of the economics of crime have investigated the reasons why people
break the law mainly on the basis of expected high profits. A growing research
area (Birkeland et al. 2011; Chmura et al. 2010), however, adopts a different
perspective by focusing on criminal pro-social behavior and investigating whether
it is possible to identify specific characteristics of criminal behavior. Similarly, we
claim that economic analyses of crime must be integrated with a behavioral
perspective. We focus on individual propensity to cooperate and punish violating
behavior as a specific trait characterizing individuals engaged in criminal
organizations. We measured the behavioral distance between two groups of
individuals with similar social and historical backgrounds but very different
institutional cultures. Our results confirm that there are significant differences
between the two samples: the Camorra inmates showed a higher propensity than
the benchmark group of students to cooperate and punish non-cooperative
behavior, particularly when the defection is considered to be “unfair”. When
comparing the results of the Italian students' behavior TP-PD with the students
performing the experiment in the original Fehr et al. paper, we find remarkable
similarities between the two samples, thus reinforcing the hypothesis that social
1881

Economics Bulletin, 2013, Vol. 33 No. 3 pp. 1875-1884
preferences and social norm enforcement completely differ between Camorra
prisoners and the non-criminal population.
The research raised some further interesting questions that could stimulate future
research: Do criminal organizations create strong social norms? and Do more
cooperative criminals select into criminal organizations?
References
Becker, G. (1968) “Crime and punishment: an economic approach” The Journal
of political economy 76 (2), 169-217.
Birkeland, S., A.W. Cappelen, A.W., Sorensen, E. and B. Tungodden (2011)
“Immoral criminals? An experimental study of social preferences among
prisoners” NHH Discussion Paper number 15.
Block, M.K. and V.E. Gerety (1995) “Some experimental- evidence on differences
between student and prisoner reaction to monetary penalties and risk” Journal of
legal studies 24 (1),123-138.
Chmura, T., Engel, C., Englerth, M. and T. Pitz (2010) “At the mercy of the
prisoner. Using an experimental measure of selfishness a criminological tool” Max
Planc Institute For Research on collective goods, Preprints 27.
Fehr, E. and B. Rockenback (2003).“Detrimental effects of sanctions on human
altruism” Nature 422, 137-140.
Fehr, E. and U. Fischbacher (2004) “Third- party punishment and social norms”
Evolution and Human Behavior 25, 63-87.
Kling, J.R., Ludwig, j. and L.F. Katz ( 2005) “Neighborhood Effects on Crime for
Female and Male Youth: Evidence from a Randomized Experiment” The
Quarterly Journal of Economics 120 (1), 87-130.
Saviano, R. (2006) Gomorra, Mondadori: Milano.
Selten, R., Abbink., K., Buchta, J. and A. Sadrieh (2003) ” How to play (3x3)-
games: A strategy method experiment” Games and Economic Behavior 45 (1),
19-37.
1882

Economics Bulletin, 2013, Vol. 33 No. 3 pp. 1875-1884
Appendix. Tables and figures
Figure 1. PD, PD-TP GAME - Camorra vs Students
Table 1. TP-PD – Camorra sample (main statistics)
Punished player is Other player is a defector
Other player is a cooperator
defector 1.76 (39.13%) 9.65 (95.65%)
cooperator 0.54 (8.69%) 2.91 (45.65%)
The first number in each cell indicates the average punishment of player C, whereas the number in parentheses indicates the percentage of C players who punish (N=23).
1883

Economics Bulletin, 2013, Vol. 33 No. 3 pp. 1875-1884
Table 2 . TP-PD - Camorra sample (Ols regressions)
Punished player is a defector
Other player is a defector
Both players are defectors
Constant
7.89 (1.46)***
-1.22(0.56)**
1.15 (0.96)
1.76 (0.61)***
Adj. R-sq.: 0.44. N. =184.
Notes: ***Statistically significant at 1% level; ** significant at 5% level. Robust
standard errors clustering on individuals.
Table 3. TP-PD - Students' sample (main statistics)
Punished player is a Other player is a defector
Other player is a cooperator
defector 1.48 (43.48%) 6.09 (56.52%)
cooperator 0 0
The first number in each cell indicates the average punishment of player C, whereas the number in parentheses indicates the percentage of C players who punish (N=23)
1884