Electoral Politics in The Philippines in terms of Political Parties in General
Upload
khangminh22Category
view
1download
0
Political Parties’ Welfare Image, Electoral Punishment and Welfare State Retrenchment1
Gijs Schumacher, University of Southern Denmark & VU University Amsterdam www.gijsschumacher.nl, [email protected] Barbara Vis2, VU University Amsterdam www.barbaravis.nl, [email protected] Kees van Kersbergen, University of Aarhus [email protected]
Abstract
Will voters punish the government for cutting back welfare state entitlements? The com-
parative literature on the welfare state suggests that the answer is yes. Unless governments
are effectively employing strategies of blame avoidance, retrenchment leads to vote loss.
Because a large majority of voters supports the welfare state, the usual assumption is that
retrenchment backfires equally on all political parties. This study contributes to an emerg-
ing body of research that demonstrates that this assumption is incorrect. Based on a re-
gression analysis of the electoral fate of the governing parties of 14 OECD countries be-
tween 1970 and 2002, we show that most parties with a positive welfare image lose after
they implemented cutbacks, while most parties with a negative welfare image do not. In
addition, we show that positive welfare image parties in opposition gain votes, at the ex-
pense of those positive welfare image parties in government that implemented welfare
state retrenchment.
1
Introduction
If we would use the comparative literature on the welfare state and the literature on elec-
toral change to write a manual for parties on how not to lose votes, the two main lessons
would read as follows. Lesson one: Do not pursue policy reforms that the median voter
does not support. Lesson two: Make sure that the economy stays on track. It is not hard to
see why diverting from these, so to speak, rules might cause the incumbent party or par-
ties to lose votes. First, if a reform is unpopular, such as a cutback in public pensions,
implementing it leads to unhappy voters who – consequently – are likely to vote for a
rival party. Second, the literature on economic voting suggests that voters, at least partly,
blame the governing parties for a deteriorating economic performance (Lewis-Beck and
Paldam, 2000; Van der Brug et al., 2007).3
The dilemma for governing parties is that they cannot take up both lessons simul-
taneously. Given the existing pressures to reform the welfare state, such as ageing popula-
tions, declining fertility rates, structural unemployment, increasing budget deficits, and
low growth rates, the need for reform is on the agenda in all advanced democracies. The
broad (electoral) support for core social programs makes cutting them back unpopular
(e.g. Boeri et al., 2001). In fact, the political riskiness of reform is one of the key assump-
tions of the comparative literature on welfare state reform (Huber and Stephens, 2001;
Pierson, 2001; Starke, 2006). Some recent studies, however, cast doubt on this assump-
tion. Armingeon and Giger (2008), for example, demonstrate that voters often did not
punish governing parties at the following election for having curtailed benefit entitle-
ments. Of the 30 governments that cut entitlements by minimally 5 per cent in the period
1980–2003, most (16) were not punished for it by losing 5 per cent of the vote or more.
Some governments (7) did lose at least 5 per cent of the vote, but not because of the cut-
backs. Still, some governments (7) lost votes because of the enacted cutbacks (Armingeon
and Giger, 2008: 570, Table 3). Moreover, Giger and Nelson (2011) show that rather than
being punished for retrenchment, liberal parties and to a lesser extent religious parties
gain votes by retrenching and, surprisingly, left parties do not lose votes by retrenching.
In line with Giger and Nelson, we propose that the risk of vote loss after retrenching the
welfare state is likely to vary across types of parties. Different types of governing parties
are neither punished nor rewarded equally for what they have done (or have failed to do)
2
during a period in office. We extend this earlier work by arguing that this derives from
voters’ conflicting preferences and the varying consequences thereof for political parties
with different ideological profiles regarding the welfare state. Specifically, we hypothesize
that whether the electorate retaliates or not after a government has pursued retrenchment
during its time in office, depends on the positive or negative position of the governing
parties vis-à-vis the welfare state and the corresponding image voters have of these par-
ties.
By means of regression analyses of the electoral fate of the governing parties of 14
OECD countries between 1970 and 2002 (n=269), we test the following hypothesis.4 Par-
ties that historically have supported the construction of the welfare state and claimed
credit for it (labelled positive welfare image parties) will be punished when retrenching the
welfare state, while parties that have always opposed the welfare state and did not claim
credit for it (labelled negative welfare image parties) will avoid such blame. We demonstrate
that the party voter of both types of parties hold views that are difficult to square. She
supports the expensive welfare state, but simultaneously supports cuts in government
spending. Under difficult economic conditions, voters accept the choice for cutting gov-
ernment spending at the expense of the welfare state, as long as it is done by a party with
a negative welfare image. When parties with a positive welfare image take such a decision,
voters sanction the party and switch vote for a rival party. These findings have important
implications for comparative welfare state research because they suggest that one of the
core assumptions of the literature – that retrenchment is always electorally dangerous –
does not hold. Also, that voters systematically punish positive welfare image parties for
retrenchment indicates that strategies aimed at avoiding the blame for unpopular retren-
chment (Vis and van Kersbergen 2007) are at least not fully effective for positive welfare
image parties. The findings contribute to the emerging body of research that arrives at
similar conclusions. However, in contrast to Giger and Nelson’s (2011) empirical results,
we find that positive welfare image parties (left-wing parties and Christian Democrats) are
punished for welfare state retrenchment.
The next sections elaborate on voters’ conflicting preferences and show how these
tie into the observation that the logic of the “old politics” of the expansion of the welfare
state is still at work in the retrenchment of social policies (cf. Scarbrough, 2000). Political
parties (still) matter, because different types of parties are facing distinct electoral conse-
3
quences of their actions. A party’s welfare image is crucial for whether and how hard the
voters penalize the parties involved. Subsequently, we discuss the data and method. The
empirical analysis tests our hypotheses. Next, we assess to what extent the vote losing
parties are unsuccessful in avoiding electoral punishment. We then examine to which par-
ties the lost votes go and whether vote loss can be attributed to voters’ discontent with
welfare state reform.
Voters’ conflicting preferences
It is well established that voters strongly support the core programs of the welfare state
(e.g. Boeri et al., 2001; Becker, 2005; Brooks and Manza, 2006). The extent of support
varies across welfare state programs, with support being higher the more “deserving” the
benefit recipients are considered to be. The literature typically identifies five criteria for
deservingness (see e.g. Van Oorschot, 2000). First, the less one can control one’s neediness,
the more deserving one is deemed. Second, a higher need induces greater deservingness.
Third, benefit recipients are considered to be more deserving if they belong to one’s own
group (identity). Fourth, a recipient’s grateful and compliant attitude has a positive impact
on deservingness. Fifth and finally, a higher likeliness of payback from the recipient in-
creases deservingness (reciprocity). Voters can most easily identify with the sick, the disa-
bled and the old and see these groups as least in control over their state of neediness and.
As a result, these groups are seen as more deserving than for example the unemployed
and accordingly the welfare state programs for these groups enjoy most support.
The degree of support for the welfare state also varies across welfare state regimes.
Support is typically highest among voters in the social democratic regime, medium in the
conservative regime and lowest in the liberal regime. The observed pattern relates to the
welfare state’s institutional structure and the corresponding perceived “deservingness” of
beneficiaries. Specifically, as Larsen (2008) argues, institutions, as defined by their univer-
salism, inequality and employment, frame the public’s perception of the poor and unem-
ployed, which influences support for social policy. Where policies are more universal and
redistributive, and where the government is obliged to guarantee employment (like in the
social democratic regime), non-beneficiaries are better able to identify with beneficiaries.
This increases the perceived “deservingness” of those receiving support and, in turn,

4
boosts the support for the welfare state.
However, despite this variation in support across programs and welfare state re-
gimes, and leaving aside intricate issues such as how exactly to measure public opinion
(see e.g. Burstein, 2010), the welfare state is broadly cherished among voters and cutbacks
remain unpopular. Recent protests against proposed cutbacks or increases in the pension
age in countries as distinct as for example Denmark, France, Greece, the Netherlands,
and the United Kingdom illustrate this.
However, voters also have preferences other than upholding the welfare state sta-
tus quo. This is important for the argument we make here, because this may give rise to
conflicting demands. Consequently, parties catering to just one of these demands may
wish to avoid the blame for neglecting or hurting other demands. The comparative wel-
fare state literature typically assumes that, as a rule, voters reject welfare state retrench-
ment and that retrenchment is thus always unpopular. However, the story is more com-
plicated. First, preferences for welfare state policies are not the sole determinants of vote
choice. Giger (2010), for example, finds that the performance of a government on social
policy has a similar influence on voters’ decision to vote for the incumbent party (or par-
ties) as the government’s performance on other issues. Some issues, such as the economy,
turn out to be more pertinent than performance on social policy.
We assume that voters determine their choice on the basis of the positive return
they expect to receive from that choice. This may be because the choice nurtures feelings
of solidarity or more straightforwardly yields an insurance against future drops in income.
Retrenchment in a universal pension system is a direct loss of income for all voters and is
therefore unpopular. Retrenchment in other core social programs may not necessarily
constitute a direct loss of income, but does affect a voter’s calculation of the risks at-
tached to illness or unemployment. Because for a majority of the voters such risks are
palpable, most voters oppose welfare state retrenchment.
However, the welfare state itself can also be considered as a source for loss of in-
come. Since the 1970s, arguments that the welfare state acts as a brake on economic
growth have become more salient. The welfare state, among other things, is argued to
create or reinforce unemployment, to be incapable of dealing with the consequences of an
ageing society, and to discourage or even crowd out private investment (O’Connor, 1973;
OECD, 1981). If voters consider their loss of income due to the welfare state as larger

5
than their potential gain in terms of protection against risks, voters will support retrench-
ment.
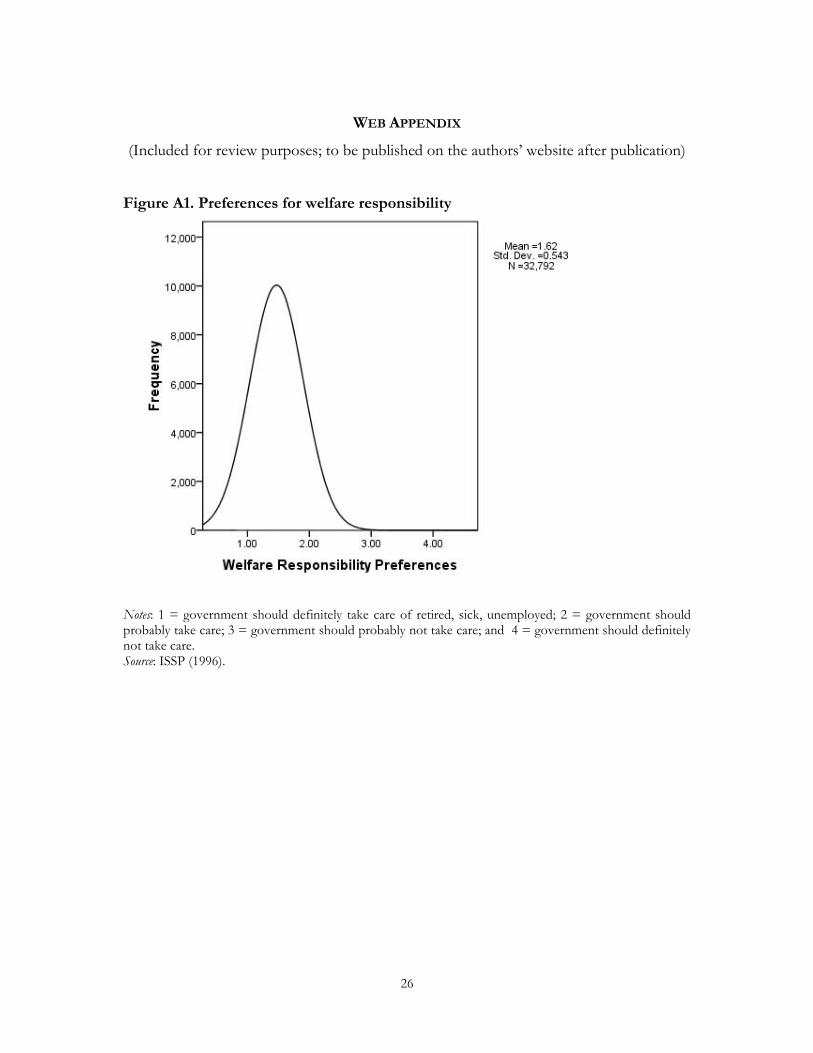
Data on voter preferences from the International Social Survey Programme’s
(ISSP) 1996 Role of Government II dataset indicate the conflicting nature of voter pref-
erences. Almost 95 per cent of the survey respondents think the government should be
responsible for taking care of the unemployed, the sick and the retired (see figure A1 in
the web appendix).5 The mean voter preferences over time based on the Role of Gov-
ernment dataset I through IV (ISSP, 1985, 1990, 1996, 2006), show that these preferences
remain remarkably stable over time. While the support for cuts in government spending
declines somewhat between 1996 and 2006, the substantive conclusions to be drawn from
the data do not change. We report the 1996 data here because 2006 lies outside this
study’s timeframe. If we focus on the preferences of spending on the welfare state, only
6.2 per cent of the respondents believe that the level of current welfare state spending
should be decreased. Over 90 per cent of the respondents favor the status quo or an ex-
pansion in spending (see figure A2 in the web appendix). However, the majority of the
respondents also supports cutbacks in government spending (figure A3). Only 12 per cent
of the respondents advocate more government spending while almost 50 per cent advo-
cate more spending on the welfare state. This indicates that voters have conflicting pref-
erences. Arguably, some respondents may believe the government should spend more on
the welfare state, but much less in general. However, the results point to some general
feature of political preferences: (rational) individuals maximize their access to government
services, but minimize their costs of these services (Erikson et al., 2002). Hence, an over-
whelming majority supports the welfare state, but at the same time is not willing to accept
the status quo in government spending. The extent to which they do, varies among voters
of the different parties, as we show below.
Do parties matter?
Much of the comparative welfare state literature typically assumes that welfare reform is
electorally dangerous for all political parties alike. As Pierson (1994) explains, also the
constituencies of right-wing parties have developed into advocates of the welfare state.
Over time, these parties’ voters have come to see the core welfare state programs, such as

6
pensions, as their established rights, thereby opposing cutbacks in these programs (see
also Pierson, 2001). Consequently, the differences as regards the welfare state between
left-wing and right-wing parties have disappeared. An underlying assumption of this rea-
soning is that policymaking is – at least partly – responsive to voters’ opinions. By now,
there is a large body of literature suggesting that such a link indeed exists (e.g. Burstein,
1998; Brooks and Manza, 2006). Although not focusing on social policy specifically,
Burstein (1998) finds strong evidence that public opinion is an important factor influenc-
ing policy. Admittedly, the literature on the relationship between public opinion and poli-
cymaking is still riddled with methodological and theoretical problems, such as biased
samples of public opinion and ambiguity with respect to the conceptualization of public
opinion and its measurement (Burstein, 2010). Nevertheless, the assumption is plausible
that governments wishing to retrench the welfare state take into account, at least to some
extent, the voters’ positive attitude towards key welfare state programs.
For the finding that parties still matter for welfare state retrenchment, the link be-
tween public opinion and policymaking seems irrelevant. For instance, some studies re-
port that right-wing parties achieve larger cutbacks than left-wing ones (e.g. Allan and
Scruggs, 2004; Korpi and Palme, 2003). Other research puts forward that, instead, left-
wing parties are better at retrenchment, because voters trust these parties more to do so.
Here a ‘Nixon-goes-to-China’ logic applies. Just like the American voters trusted the anti-
communist Nixon more than any Democrat to develop diplomatic relationships with
China, voters allow pro-welfare parties to reform the welfare state more drastically and
successfully in electoral terms than political parties with an anti-welfare state legacy (e.g.
Ross, 2000).
The underlying assumption of the majority of the literature is thus that reform
constitutes an electoral risk for all political parties, because the median voter supports the
welfare state status quo. In line with Giger and Nelson (2011), we propose that the risk of
vote loss after retrenching the welfare state is likely to vary across types of parties. Differ-
ent types of governing parties are neither punished nor rewarded equally for what they
have done (or have failed to do) during a period in office. We argue that the reason is that
voters hold conflicting preferences and that these have dissimilar consequences for politi-
cal parties with different welfare images. This would explain why some voters actually
reward rather than punish retrenchment. This complements the work of Giger and Nelson
7
by identifying the logic of why voters punish retrenching governments.
Parties’ welfare image and the degree of electoral punishment
If we think of electoral competition in terms of the spatial voting tradition of Downs
(1957), we assume that parties take positions on a distribution of voter preferences. A
party’s aim is to find a position on that distribution that gives the highest pay-off in terms
of vote share. By moving from a popular position (supporting the welfare state) to an un-
popular one (enacting retrenchment), a party risks losing votes according to a spatial vot-
ing logic. Moreover, voters need to recognize the party’s position, and flip-flopping from
the right to the left and back confuses voters and limits voter’s likelihood to vote for that
party. Hence, a coherent party position is a valuable asset (Downs, 1957). If we think of
electoral competition in terms of issue competition (Green-Pedersen, 2005), vote choices
are determined by the perceived competence a party has on issues that voters find im-
portant (Belanger and Meguid, 2008). Hence, voters associate parties with positive quali-
ties on certain issues. For example, being a left-wing party and therefore strong on wel-
fare, voters associate Social Democrats with being competent on the welfare issue (e.g.
Petrocik, 1996). However, because voters associate parties with a number of issues (e.g.
welfare state, European Union, economy), this limits parties’ strategic opportunities to
take positions that do not tally well with the original ideological position, because voters
perceive them as less competent on these issues. Hence, voters may punish this party out
of disagreement with the new position taken (spatial voting logic) or because the party has
lost issue ownership on an issue important to voters.
Parties should thus carefully manage their ideological profiles. Our first main theo-
retical point is that parties’ original position on welfare state provision determines the risk
of electoral punishment associated with welfare state retrenchment. Parties cultivate a
specific ideological orientation on the welfare state, which we label the welfare image. The
roots of this image go back to the expansion phase of the welfare state, which lasted until
around the first oil crises of the early 1970s. In that so-called Golden Age of the welfare
state, some parties politically committed themselves to expanding and later maintaining
the level of welfare provisions achieved. It is the political dedication to expanding the wel-
fare state and the credible commitment to the defense of an achieved high level of social

8
protection and provision that establishes a party’s positive welfare image. Adopting the Com-
parative Manifesto Project’s categorization of party families (Budge et al., 2001), the main
architects of the welfare state are the Social Democratic and Christian Democratic party
families, while the more radical left-wing parties frequently supported their efforts (see
e.g. Huber and Stephens, 2001; Van Kersbergen and Manow, 2009). Voters therefore as-
sociate Social Democratic, Christian Democratic and Socialist parties with a positive posi-
tion vis-à-vis the welfare state. Although Liberal and Conservative parties historically sup-
ported the welfare state and were often welfare state pioneers, they have been generally
much more reluctant if not opposed to either expanding the welfare state much beyond
its basics or defending the comprehensive welfare state. This establishes their negative wel-
fare image (but see Jensen, 2010). We assume that voters do not associate other parties,
such as Agrarian, Special Interest, Green and Ethnic parties with either a positive or a
negative attitude towards the welfare state. Therefore, we subsume these under the label
neutral welfare image. Our second main theoretical argument is derived from behavioral
economics that teaches us that people are generally loss averse, because ‘losses loom larg-
er than gains’ (Kahneman and Tversky, 1979: 279) and ‘losses hurt more than equal gains
please’ (McDermott, 2004: 298). Individuals adapt more rapidly to positive changes in
their situation (such as a pay rise) than to negative ones (such as a pay cut), and losing €
20 hurts more than finding € 20 pleases. Generally, the electorate dislikes it if cherished
programs are cut back. However, loss aversion hits harder positive welfare image parties,
because these parties are reputed to have promoted the welfare state and own the issue.
Contrarily, parties with a negative welfare image face a lower risk for electoral punish-
ment. Their voters do not associate these parties with the advancement of the welfare
state and therefore do not expect them to keep the status quo.
Table 1 shows empirically that the welfare images still have relevance today. Surely,
voters for parties with a negative welfare image too believe that the state should take re-
sponsibility for the elderly, the sick and the unemployed and that the level of spending
should remain at the status quo. But they also believe that the government should cut its
level of spending. The voters for parties with a positive welfare image have stronger opin-
ions about the welfare state status quo, although they also favor cuts, albeit less so. Parties
with a negative welfare image are likely to face far less problems when retrenching the
welfare state than parties with a positive welfare image. While voters for positive welfare
9
image parties also support cuts in government spending, their more positive attitude to-
wards the welfare state status quo means that they are likely to be disappointed by a gov-
ernment that chooses to make cuts in the welfare state rather than in other sectors.
--- Table 1 about here ---
The different welfare images shape voters’ expectations of whether and how parties will
reform the welfare state. A voter of a party with a positive welfare image expects that this
party will support the welfare state status quo or propose an expansion of entitlements. If
such a party decides to retrench the welfare state, the voter will be disappointed and un-
certain whether in the future this party will remain the best choice. Because the voter
takes utility in maintaining the welfare state status quo, he or she is likely to vote for an-
other party of which he or she is more certain that it will defend the status quo. Hence,
retrenching is particularly risky business for positive welfare image parties.
To sum up, we expect that parties with a positive welfare image will be more se-
verely punished by voters if they retrench than parties with a negative welfare image.
Since parties with a positive and negative welfare state image sometimes govern together,
the degree of electoral punishment is likely to vary across coalition partners.
Based on the above, we formulate the following two hypotheses:
H1: Voters sanction parties with a positive welfare image more for retrenchment than
parties with a negative welfare image.
H2: If voters sanction parties with a positive welfare image, they will vote for rival parties
with a positive welfare image or new parties with a pro-welfare stance.
Data
The dependent variable of this study is the aggregate loss (gain) of votes in an election
inflicted on parties that were member of the cabinet (government) in the period before the
election. Our unit of analysis is thus the party_cabinet, which means that we study the
electoral results of all parties that were part of the cabinet. We collect data for all elections
10
between 1970 and 2002 for 14 parliamentary democracies (n=269) using various issues of
the Political Data Yearbook (European Journal of Political Research) as well as Woldendorp et
al.’s Party Government Data book (2000). This period marks the end of the Golden Age
of welfare state expansion in the 1970s and the subsequent period of economic stagnation
and government budgetary problems resulting from the substantial increases in the costs
of the welfare state.
To test hypothesis 1 that voters punish parties with a positive welfare state image
more for having enacted cutbacks than parties with a negative welfare state image, we
construct three dummy variables that categorize the parties in the three different party
images: positive (Socialist, Social Democratic or Christian Democratic), negative (Liberal
and Conservative) and neutral (Green, Ethnic, Nationalist and Agrarian, Special Interest)
welfare image. Parties do not change party family over time, which operationalizes the
long-term image a party has vis-à-vis certain policies.6 Note that we remain close to Giger
and Nelson’s (2011) operationalization with the crucial difference that we cluster parties
on their image rather than the party family, because we theorize that important differ-
ences are explained by differences in image. To capture the effect of retrenchment, we
focus on the overall retrenchment in social policy, whereby we sum the percentage point
change in the welfare program replacement rates of the pension scheme, sick pay and un-
employment benefits, using the Comparative Welfare Entitlement Dataset (Scruggs,
2004). All negative values are coded as retrenchment (1) and positive or zero values are
coded as non-retrenchment (0). Since a change in a program’s replacement rate directly
affects the income of current as well as future benefit recipients, it is the best measure to
use for assessing the effect of the degree of retrenchment on the electorate’s voting be-
haviour. Spending data, for example, would be unsuitable for this purpose because a de-
crease in spending may or may not affect the income situation of (potential) benefit re-
cipients. Also it seems plausible that voters take the whole spectrum of welfare programs
into account when using this information for the voting decision. Both retrenchment of
pension benefits and, say, unemployment benefits can lead to unhappy voters. Therefore,
analyzing the effects of retrenchment of these programs separately could bias the results.
We create a dummy variable for retrenchment, rather than using the degree of retrench-
ment, because empirical research shows that punishment for retrenchment is conditional
upon whether retrenchment is politicized in election campaigns (Armingeon and Giger,

11
2008). Hence, it is not the degree of retrenchment per se that is important, but retrench-
ment’s political implications. To check the effect of this choice, we ran additional analyses
using the degree of retrenchment. We discuss these findings in the analysis section.
We include a number of variables to control for alternative explanations for the
electoral fate of governing parties, largely in line with the economic voting literature. The
first is a measurement to distinguish between electoral systems and the different types of
government that electoral systems produce. This variable, labelled single member district,
controls for the fact that electoral gains and losses may differ across electoral systems. A
single member district system distorts the transformation of votes into seats (Lijphart,
1999). This distortion may motivate voters of parties that are clearly losing in the district
to stay at home because their vote does not matter. Also, these voters have no serious
alternative to vote for. This may overstate the support for the winning party. Another
reason to include this variable is that single member districts tend to create single party
governments. In a single party government it is clear that voters can blame only one party
for unpopular measures, while in a multiparty government parties can always play the card
that they were forced to take unpopular measures because the other parties told them to.
The clarity of responsibility (Powell and Whitten, 1993) that single-party government en-
tails, thus, has consequences for the severity of the punishment that may be inflicted on
the governing party. To operationalize the electoral system, we code Austria, Belgium,
Denmark, Finland, Germany, Netherlands, Norway and Sweden as 0 indicating that these
countries have a proportional representation electoral system. We code France, Ireland
and Australia, UK, Canada and New Zealand (until 1996, afterwards coded as 0) as 1, in-
dicating that they have majoritarian electoral systems.
Moreover, we include the change in unemployment rate, the change in the gross
domestic product (GDP) and the change in inflation rate as typical indicators of positive
or negative economic circumstances. We took start and end levels of these economic data
from the monthly economic reports of the OECD database and calculated the differences
(OECD, 2010). An increasing unemployment and inflation rate and a depressed growth
of GDP are typical reasons for voters to sanction their government for poor economic
management (Duch and Stevenson, 2008). Finally, we include cabinet duration in months
as a control variable (Woldendorp et al., 2000). Cabinets that have been in power for a full
term have more opportunity to apply blame avoidance strategies than cabinets that are

12
terminated prematurely (Armingeon and Giger, 2008). Table 2 includes the descriptive
statistics of the dependent variable and the independent variables.
--- Table 2 about here ---
Method
Do governing parties lose votes if they retrench? And do governing parties with a positive
welfare image lose more than governing parties with a negative welfare image? To assess
this we introduce an interaction effect between retrenchment and the positive welfare
image variable, as well as add the two constituent effects of this interaction variable
(Brambor et al., 2006). This model is specified below.
Δ% votes governing party = β0 + β1 positive welfare image + β2 retrenchment +
β3retrenchment x positive welfare image + β4neutral welfare image + β5 single member
districts + β6 Δ unemployment rate + β7 Δ inflation rate + β8 Δ growth + β10cabinet dura-
tion
Since our observations are clustered in cabinets, countries, and time periods, the assump-
tion of independence of observations for standard OLS regression may be violated. How-
ever, there is no a priori reason to assume that autocorrelation and panel heteroskedasticity
cause problems in the analysis of our data. Parties within the same government do not
necessarily receive the same electoral punishment and institutional country differences
should largely be absorbed by the single member district variable. In fact, testing the data
for autocorrelation found Durbin-Watson values of around 2, indicating that the errors of
our observations are not or only weakly correlated. Time effects should also be limited. At
every election the governing parties may be different parties, and there is no reason to
assume that the electoral results of the previous governing parties systematically affect the
electoral results of the new governing parties. In conclusion, we have statistical and theo-
retical reasons to believe that a standard OLS regression is an appropriate method to ana-
lyze the data. Nevertheless, we run robustness checks using a pooled (country and time &
country) setup and a clustered (by cabinet) setup. The results are almost identical to the

13
cross-sectional setup. These results are reported in the web appendix.
The outlier analysis suggests that our results are strongly driven by the 2003 elec-
tions in Austria.7 Here the Christian democratic ÖVP gained an impressive 15 per cent at
the expense of its coalition partner the right-wing populist FPÖ, which lost an equally
striking 15 per cent. Both are absolute outliers in the distribution of electoral results. The
change of heart of the electorate was mainly due to the erratic behaviour of the FPÖ’s
leader Jörg Haider, who shortly before the election twice visited Saddam Hussein
(Fallend, 2003). Since this cabinet therefore constitutes both theoretically and statistically
an outlier, we omit it from our analyses.
Findings
Do voters punish parties with a positive welfare image when they retrench welfare enti-
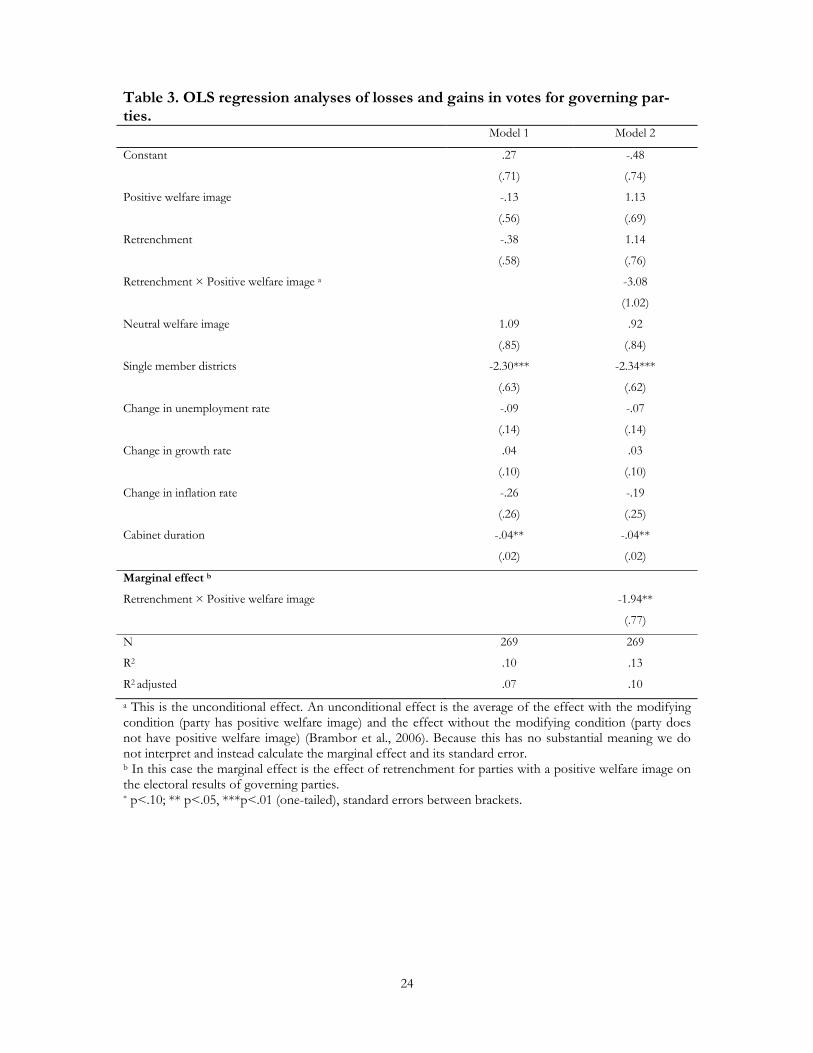
tlements? Table 3 presents the results of the OLS regressions for this hypothesis. Model 1
excludes the interaction effect between retrenchment and positive welfare image. We do
this to analyze the independent effects of the positive welfare image and retrenchment
variable without the interaction term. We find that both variables are insignificant. This
means that parties with a positive welfare image do not lose more votes in general and
that retrenchment does not lead to vote loss in general. This already contradicts Pierson’s
statement that all parties will be punished equally (Pierson, 2001).
Our model 2 includes the interaction term between the positive welfare image and
retrenchment. Model 2 shows the unconditional effect of the interaction term as well as
the substantially interesting marginal effect of the interaction term and its standard error
(Brambor et al., 2006). The marginal effect represents the effect of retrenchment if a party
has a positive welfare image. This effect is negative and significant. This means that par-
ties with a positive welfare image lose on average almost 2 per cent of the vote when they
enact welfare state retrenchment measures. The standard error of .77 suggests that at the
edges of the coefficients 95% confidence interval positive welfare image parties lose .42
per cent and 3.46 per cent of the vote. Because the positive welfare image variable and the
retrenchment variable are insignificant we can conclude that parties with a positive wel-
fare image or parties that retrench do not lose systematically, and that on average if re-
trenchment is carried out by a party with a positive welfare image will retrenchment lead

14
to electoral punishment. Parties in single member districts lose 2.34 per cent more votes
on average than parties in proportional representation systems. As expected, the blame of
retrenchment cannot be shared in these systems and voters find the culprit of retrench-
ment more easily than in proportional representation systems. As for the other control
variables, the inflation, growth and unemployment variables are not significant. Yet, cabi-
net duration is significant and negative. This means that the longer one is in office, the
more likely it becomes that one receives electoral punishment.
--- Table 3 about here ---
Clearly, retrenchment does not wipe out positive welfare image parties. Yet, the negative
electoral consequences of retrenchment are clearly negative, which makes it all the more
puzzling why positive welfare image parties do not refrain from enacting these retrench-
ment measures.
We run several sensitivity analyses to test the robustness of our results. First, we
test two substantial effects. Does more retrenchment lead to more severe punishment?
And is the punishment for positive welfare image parties in case of retrenchment constant
over time? The answer to both question is no. We replace the retrenchment dummy in the
original analysis with a variable that taps the degree of retrenchment and introduce an
interaction term between this new retrenchment variable and the positive welfare image
parties variable. The analysis shows that the more retrenchment, the more punishment
positive welfare image parties receive (model A1, table A1 in the web appendix). How-
ever, this result is not significant. This further supports Armingeon and Giger’s (2008)
finding that whether the degree of retrenchment matters is conditional upon whether it is
made politically relevant in, for example, an election campaign. To test period-specific
effects, we distinguish between three time periods by making dummy variables (1970-
1980, 1980-1990, and 1990-end) and test whether the interaction term is significantly dif-
ferent for these periods. To do this, we introduce three-way interaction terms between
retrenchment, positive welfare image and the time period dummy. We find no consistent
significant effect for any of the time periods (model A2, table A1 in the web appendix).
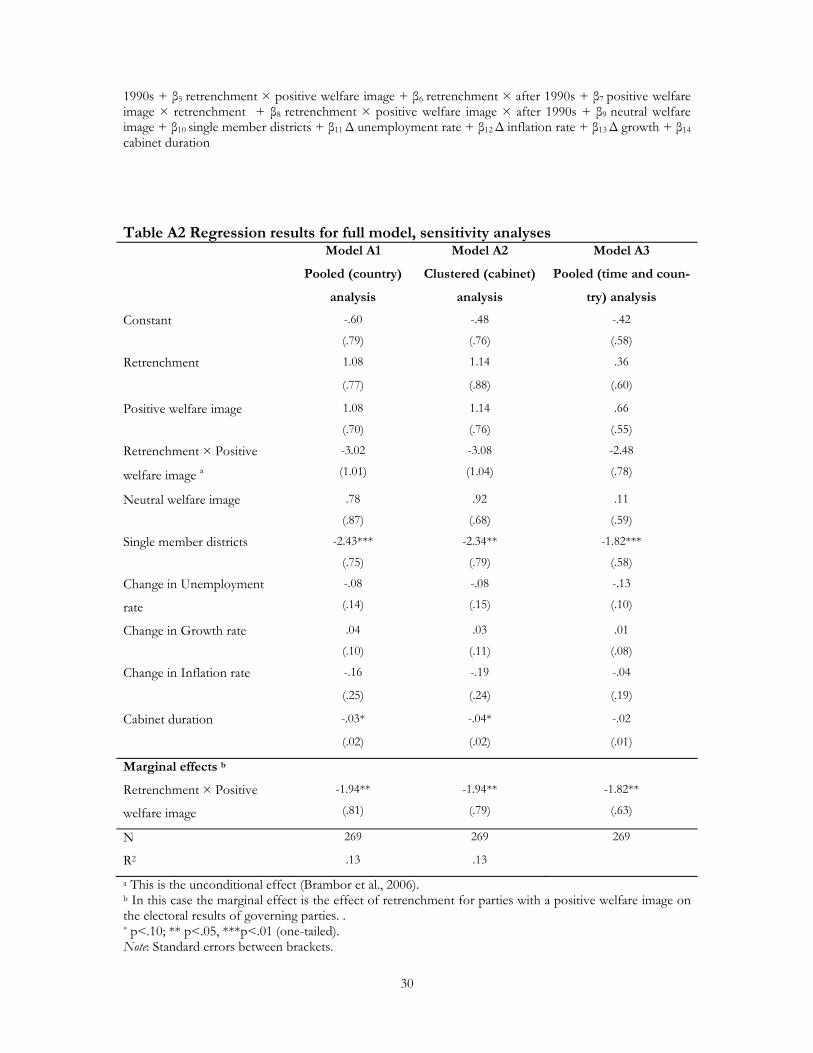
Second, we test several different model specifications. Because our cases are gov-
erning parties nested in cabinets, countries and time, we conduct sensitivity analyses in
15
which we pool the countries (model A1 in table A2 in the web appendix), cluster the
cabinets (model A2 in table A2 in the web appendix) and pool observations between
countries and over time (model A3). These results do not differ substantively from those
in model 2, indicating that our findings are robust. In conclusion, we find solid evidence
for the hypothesis that voters sanction welfare image parties for pursuing retrenchment,
while voters are much milder towards negative welfare image parties.
To which party do disappointed voters turn?
The next question is whether voters sanction positive welfare image parties by moving to
a rival with an equally positive welfare image, as hypothesis 2 posits. If they do, it is plau-
sible to assume that the retrenchment of the welfare state had some effect on the voters’
decision. Did opposition parties win or lose after a positive welfare state image party pur-
sued retrenchment? Do the winnings or losses vary across the different party families, and
thus welfare state images? To test this hypothesis, we analyze which opposition parties
gain votes in the elections after positive welfare image parties enacted retrenchment
measures. We simply present the means of each welfare image, controlling for differences
between PR systems and single member districts. An independent samples t-test is ap-
plied to test whether the means of the positive, negative and neutral welfare image parties
are significantly different. Although this is a rather crude method, it offers a useful test of
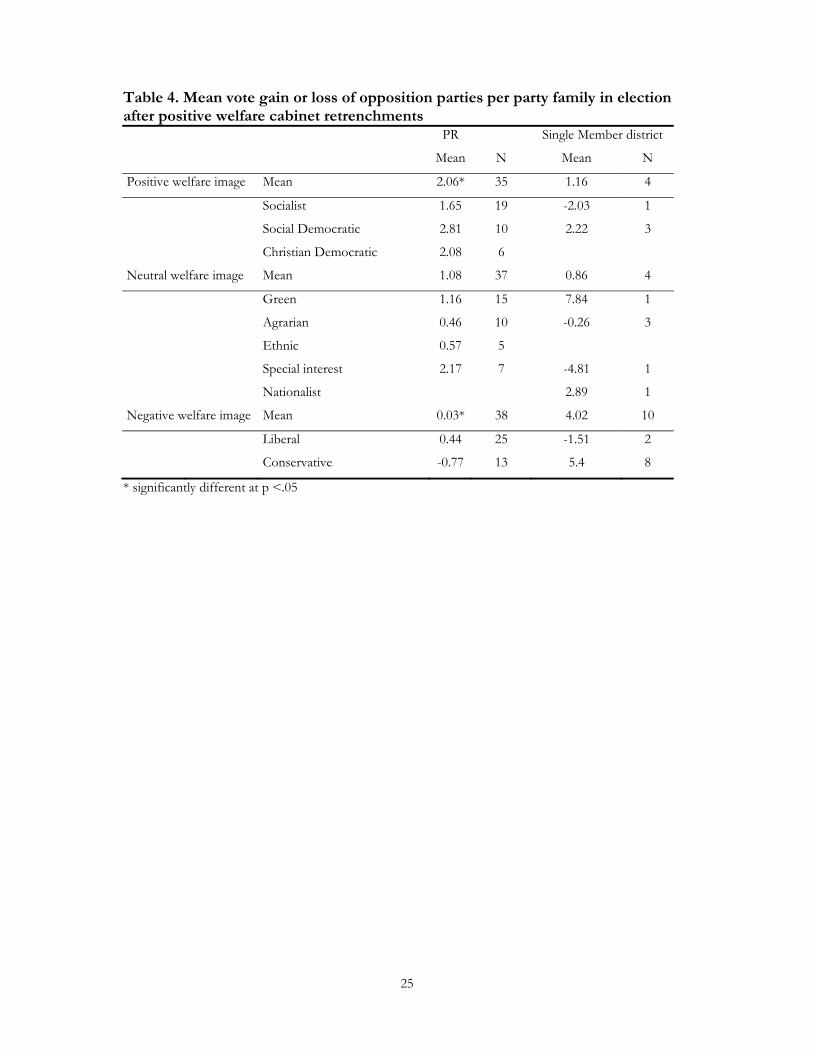
our hypothesis. Table 4 displays opposition parties’ mean gains or losses of votes after a
positive welfare image party enacted cutbacks in welfare state entitlements. The table dis-
tinguishes proportional representation systems and single member district systems. We
find that in countries with a PR system, voters reward opposition parties with a positive
welfare image significantly more than negative or neutral welfare image parties. This result
suggests that voters move away from the governing party to an opposition party that also
has a positive welfare image. Also Green and Special Interest parties seem to gain in this
situation. Although Green parties are not associated with the expansion of the welfare
state, they are associated with a positive welfare stance. In the case of the Special Interest
parties, there are at least two Pensioner Parties, whose sole purpose was to defend the
status quo level of welfare for the elderly.

16
--- Table 4 about here ---
Table 4 also demonstrates that for countries with single member districts, the story is dif-
ferent. Social Democratic and Green parties gain strongly (again), but there are only few
of them and therefore there is not a significant different with other welfare image parties.
Voting for these parties is far less attractive than in PR systems. For example, the Austra-
lian Greens and Democrats saw a strong increase in votes after the Australian Labour
Party enacted retrenchment measures in the 1990s. However, both parties failed to obtain
parliamentary seats due to the electoral system distortion. In single member district party
systems there is much more direct and open battle for the median voter than in PR sys-
tems. Therefore, it makes sense that conservative parties win over the median voter and
gain at the expensive of the positive welfare image parties.
Conclusion
This study’s main finding is that whether voters punish governing parties for cutting back
welfare state entitlements depends on the party’s welfare image. If a party has a positive
welfare image, it loses after cutbacks. Opposition parties with an equally positive welfare
image benefit from this. Our findings hereby reaffirm the intuitive expectation that pro-
welfare parties, such as Social Democratic and Christian Democratic ones that decide to
cutback welfare entitlements will trigger a fairly harsh negative response from the elector-
ate. In addition and equally intuitively, political parties that have never endorsed the wel-
fare state project are not punished in their attempt to reduce social entitlements, especially
if they can credibly argue that the economy (growth, employment) will benefit. These
findings contribute to the emerging literature that demonstrates that some parties gain
from retrenchment (negative welfare image parties). Yet in contrast to Giger and Nelson
(2011), but in line with the theoretical and intuitive expectations, we do find evidence that
parties with a positive welfare image are systematically punished for retrenchment.
Moreover, our findings go against the ‘Nixon-goes-to-China’ logic. We find no
evidence that ‘owning’ the welfare issue is a recipe for evading electoral punishment for
retrenchment. We see here, in line with the work of for instance Kitschelt (2001) and
Green-Pedersen (2002), a crucial role for the degree of party competition that the re-
17
trenching party or parties face. Most cabinets in multiparty settings face several parties
with welfare credentials that are happy to take in disappointed voters. Our analysis
demonstrates that if voters are disappointed with a positive welfare image party, they in-
deed flock to positive welfare image parties in the opposition. Given the potential for
electoral defeat, an intriguing question is under which conditions a positive welfare image
party is likely to pursue retrenchment. This study demonstrates that, for example, Social
Democratic parties do not enact retrenchment measures because they can get away with it
in electoral terms.

18
References
Allan, J.P., & Scruggs, L.A. (2004). ‘Political Partisanship and Welfare State Reform in
Advanced Industrial Democracies’, American Journal of Political Science, 48(3): 496-
512.
Armingeon, K., Engler, S., Gerber, M., Leimgruber, P., & Beyeler, M. (2009). Comparative
Political Data Set 1960-2007. Institute of Political Science, University of Berne
(http://www.ipw.unibe.ch/content/team/klaus_armingeon/comparative_political
_data_sets/index_ger.html, accessed 27.01.2010).
Armingeon, K., & Giger, N. (2008). ‘Conditional Punishment: A Comparative Analysis of
the Electoral Consequences of Welfare State Retrenchment in OECD Nations,
1980–2003’, West European Politics, 31(3): 558-580.
Becker, J. (2005). ‘De Steun voor de Verzorgingsstaat in de Publieke Opinie, 1970-2002:
Een Analyse van Trends in Meningen’ (SCP-Publicatie No. 2005/3). Den Haag:
Sociaal en Cultureel Planbureau.
Bélanger, E. & Meguid, B. (2008). Issue Salience, Issue Ownership, and Issue-Based Vote
Choice. Electoral Studies, 27: 477-491.
Boeri, T., Börsch-Supan, A., & Tabellini, G. (2001). ‘Would You Like to Shrink the Wel-
fare State? A Survey of European Citizens’, Economic Policy, 16(32): 9-50.
Brooks, C., & Manza, J. (2006). ‘Why Do Welfare States Persist?’, Journal of Politics, 68(4):
816-827.
Budge, I., Klingemann, H.D., Volkens, A., Bara, J., & Tanenbaum, E. (2001). Mapping
Policy Preferences: Estimates for Parties, Electors, and Governments 1945-1998. Oxford:
Oxford University Press.
Burstein, P. (2010). ‘Public Opinion, Public Policy, and Democracy: Old Expectations
and New’, in Leicht, K.T., & Jenkins, J.C. (Eds.), Handbook of Politics (pp. 63-80).
New York: Springer.
Brambor, T., Clark, W.R., & Golder, M. (2006). ‘Understanding Interaction Models: Im-
proving Empirical Analysis’, Political Analysis 14(1): 63-82.
Downs, A. (1957). An Economic Theory of Democracy. New York: Harper and Row.
Duch, R. M. & Stevenson, R. T. (2008). The Economic Vote. How Political and Eco-
nomic Institutions Condition Election Results. Cambridge: Cambridge University
19
Press.
Erikson, R. S., Mackuen, M. B., & Stimson, J. A. (2002). The Macro Polity. Cambridge:
Cambridge University Press.
Fallend, F. (2003). ‘Political Data Yearbook 2002: Austria’, European Journal of Political Re-
search 42(7-8): 887-899.
Giger, N. (2010). ‘Do Voters Punish the Government for Welfare State Retrenchment? A
Comparative Study of Electoral Costs Associated with Social Policy’, Comparative
European Politics 8(4): 415-443.
Giger, N., & Nelson, M. (2011). ‘The Electoral Consequences of Welfare State Re-
trenchment: Blame Avoidance or Credit Claiming in the Era of Permanent Auster-
ity?’, European Journal of Political Research 50(1): 1-23.
Green-Pedersen, C. (2002). The Politics of Justification: Party Competition and Welfare-State Re-
trenchment in Denmark and the Netherlands from 1982 to 1998. Amsterdam: Amsterdam
University Press.
Green-Pedersen, C. (2007). ‘The Growing Importance of Issue Competition. The Chang-
ing Nature of Party Competition in Western Europe’, Political Studies 35: 607-629.
Huber, E., & Stephens, J.D. (2001). Development and Crisis of the Welfare State: Parties and
Policies in Global Markets. Chicago: The University of Chicago Press.
International Social Survey Programme (ISSP) (1985). Role of Government. ZA No.1490
(http://www.gesis.org/en/services/data/survey-data/issp/modules-study-
overview/role-of-government/1985/, accessed 28.01.10).
---- (1990). Role of Government II. ZA No. 1950
(http://www.gesis.org/en/services/data/survey-data/issp/modules-study-
overview/role-of-government/1990/, accessed 28.01.10).
----- (1996). Role of Government III. ZA No. 2900
(http://www.gesis.org/en/services/data/survey-data/issp/modules-study-
overview/role-of-government/1996/, accessed 28.01.10).
---- (2006). Role of Government IV. ZA No. 4700
(http://www.gesis.org/en/services/data/survey-data/issp/modules-study-
overview/role-of-government/2006/, accessed 28.01.10).
Jensen, C. (2010). ‘Issue Compensation and Right-Wing Government Social Spending’,
European Journal of Political Research 49 (2): 282-299.
20
Kahneman, D., and Tversky, A. (1979). ‘Prospect Theory: An Analysis of Decision Under
Risk’, Econometrica 47(2): 263-291.
Kitschelt, H. (2001). ‘Partisan Competition and Welfare State Retrenchment: When do
Politicians Choose Unpopular Policies?’, In Pierson, P. (Ed.), The New Politics of the
Welfare State (pp.265-302). Oxford: Oxford University Press.
Korpi, W., & Palme, J. (2003). ‘New Politics and Class Politics in the Context of Austerity
and Globalization: Welfare State Regress in 18 Countries, 1975-95’, American Politi-
cal Science Review, 97(3): 425-446.
Larsen, C.A. (2008). ‘The Institutional Logic of Welfare Attitudes: How Welfare Regimes
Influence Public Support’, Comparative Political Studies, 41(4): 145-168.
Lewis-Beck, M.S., & Paldam, M. (2000). ‘Economic Voting: An Introduction’, Electoral
Studies, 19(2): 113-121.
Lijphart, A. (1999). Patterns of Democracy: Government Forms and Performance in Thirty-Six Coun-
tries. New Haven & London: Yale University Press.
McDermott, R. (2004). ‘Prospect Theory in Political Science: Gains and Losses from the
First Decade’, Political Psychology 25(2): 289-312.
Meguid, B.M. (2005). ‘Competition between Unequals: The Role of Mainsteam Party
Strategy in Niche Party Success’, American Political Science Review 99(3): 347-359.
O’Connor, J.R. (1973).The Fiscal Crisis of the State. New York: St. Martins.
Organization for Economic Co-operation and Development (OECD) (1981). The Welfare
State in Crisis. Paris: OECD.
Pierson, P. (1994). Dismantling the Welfare State? Reagan, Thatcher, and the Politics of Retrench-
ment. Cambridge: Cambridge University Press.
Pierson, P. (Ed.) (2001). The New Politics of the Welfare State. Oxford: Oxford University
Press.
Powell, G.B., & Whitten, G.D. (1993). ‘A Cross-National Analysis of Economic Voting:
Taking Account of the Political Context’, American Journal of Political Science, 37(2):
391-414.
Ross, F. (2000). ‘“Beyond Left and Right”: The New Partisan Politics of Welfare’, Govern-
ance: An International Journal of Policy and Administration, 13(2): 155-183.
Scarbrough, E. (2000). ‘West European Welfare States: The Old Politics of Retrench-
ment’, West European Politics, 38(2): 225-259.
21
Scruggs, L.A. (2004). Welfare State Entitlement Data Set: A Comparative Institutional Analysis of
Eighteen Welfare States, version 1.1. (http://sp.uconn.edu/~scruggs/wp.htm).
Starke, P. (2006). ‘The Politics of Welfare State Retrenchment: A Literature Review’, Social
Policy & Administration, 40(1): 104-120.
Van der Brug, W., Van der Eijck, C., & Franklin, M. (2007). The Economy and the Vote: Eco-
nomic Conditions and Elections in Fifteen Countries. New York: Cambridge University
Press.
Van Kersbergen, K., & Manow, P. (Eds.) (2009). Religion, Class Coalitions, and Welfare States.
Cambridge: Cambridge University Press.
Van Oorschot, W. (2000). ‘Who Should Get What, and Why? On Deservingness Criteria
and the Conditionality of Solidarity among the Public’, Policy & Politics, 28(1): 33-
48.
Woldendorp, J., Keman, H. & Budge, I, 2000. Party Government in 48 Democracies
(1945-1998). Composition, Duration, Personnel. Dordrecht: Kluwer Academic
Publishers.

22
Table 1. Mean values of voters’ preferences, per welfare image Welfare
Responsibility
Welfare
Spending
Cuts in Government
Spending
Negative welfare image voters 2.02 2.71 2.01
Positive welfare image voters 1.73 2.39 2.45
Average 1.88 2.56 2.21
Notes: Welfare Responsibility ranges from 1 to 4, with higher scores indicating that the government should be less responsible. Welfare Spending and Cuts in Government Spending range from 1 to 5, with higher scores indicating less positive attitude towards welfare spending and a less positive attitude towards cuts in government spending. All differences between negative and positive welfare image voters are significant. Source: ISSP (1996).

23
Table 2 Descriptive statistics of dependent and independent variables Min Max Mean St.Dev. N
Vote Gain / Loss -17.16 15.39 -2.11 4.51 116
Change in growth rate -5.47 6.48 0.05 2.57 116
Change in unemployment rate -5.87 6.21 -0.57 2.34 116
Change in inflation rate -3.15 2.13 -0.13 0.80 116
Single member district 0 1 0.22 0.42 116
Change in replacement rates -39.8 -0.1 -5.41 5.38 116
Positive welfare image 0 1 0.50 0.50 116
Neutral welfare image 0 1 0.13 0.34 116
Negative welfare image 0 1 0.37 0.48 116
Cabinet duration (in months) 1 61 38.95 12.88 116
Note: These are the descriptive statistics only for cabinets that enacted retrenchment measures.
24
Table 3. OLS regression analyses of losses and gains in votes for governing par-ties. Model 1 Model 2
Constant .27
(.71)
-.48
(.74)
Positive welfare image -.13
(.56)
1.13
(.69)
Retrenchment -.38
(.58)
1.14
(.76)
Retrenchment × Positive welfare image a -3.08
(1.02)
Neutral welfare image 1.09
(.85)
.92
(.84)
Single member districts -2.30***
(.63)
-2.34***
(.62)
Change in unemployment rate -.09
(.14)
-.07
(.14)
Change in growth rate .04
(.10)
.03
(.10)
Change in inflation rate -.26
(.26)
-.19
(.25)
Cabinet duration -.04** -.04**
(.02) (.02)
Marginal effect b
Retrenchment × Positive welfare image -1.94**
(.77)
N 269 269
R2 .10 .13
R2 adjusted .07 .10
a This is the unconditional effect. An unconditional effect is the average of the effect with the modifying condition (party has positive welfare image) and the effect without the modifying condition (party does not have positive welfare image) (Brambor et al., 2006). Because this has no substantial meaning we do not interpret and instead calculate the marginal effect and its standard error. b In this case the marginal effect is the effect of retrenchment for parties with a positive welfare image on the electoral results of governing parties. * p<.10; ** p<.05, ***p<.01 (one-tailed), standard errors between brackets.
25
Table 4. Mean vote gain or loss of opposition parties per party family in election after positive welfare cabinet retrenchments PR Single Member district
Mean N Mean N
Positive welfare image Mean 2.06* 35 1.16 4
Socialist 1.65 19 -2.03 1
Social Democratic 2.81 10 2.22 3
Christian Democratic 2.08 6
Neutral welfare image Mean 1.08 37 0.86 4
Green 1.16 15 7.84 1
Agrarian 0.46 10 -0.26 3
Ethnic 0.57 5
Special interest 2.17 7 -4.81 1
Nationalist 2.89 1
Negative welfare image Mean 0.03* 38 4.02 10
Liberal 0.44 25 -1.51 2
Conservative -0.77 13 5.4 8
* significantly different at p <.05
26
WEB APPENDIX
(Included for review purposes; to be published on the authors’ website after publication)
Figure A1. Preferences for welfare responsibility
Notes: 1 = government should definitely take care of retired, sick, unemployed; 2 = government should probably take care; 3 = government should probably not take care; and 4 = government should definitely not take care. Source: ISSP (1996).

27
Figure A2. Preferences for welfare spending
Notes: 1 = should spend much more; 2 = should spend more; 3 = should stay the same; and 4 = should spend less, 5 = should spend much less. Source: ISSP (1996).

28
Figure A3. Preferences for cuts in government spending
Notes: 1 = strongly in favour of cuts; 2 = in favour; 3 = in-between; 4 = not in favour; and 5 = strongly not in favour. Source: ISSP (1996).

29
Table A1. Interaction term for specific periods and with degree of retrenchment Model A1 Model A2
Degree of retrenchment
-.15*
(.09)
Positive welfare image .10
(.62)
.95
(.78)
Retrenchment .17
(1.23)
After 1990 -2.91**
(1.23)
Retrenchment × Positive Welfare Imagea -1.94
(1.61)
Retrenchment × After 1990a 3.28
(1.60)
Positive Welfare Image × After 1990a 1.57
(1.62)
Retrenchment × Pos. Welf. Image x After 1990a -3.05
(2.38)
Marginal effectsb
2.5% retrenchment × Positive welfare image -.39
(.34)
5% retrenchment × Positive welfare image
-.62
(.63)
10% retrenchment × Positive welfare image
-1.09
(1.21)
15% retrenchment × Positive welfare image
-1.56
(1.80)
Retrenchment × Positive welfare image × Before 1990 -1.77
(1.08)
Retrenchment × Positive welfare image × After 1990 -1.54
(1.15)
N 269 269
R2 .11 .15
a = unconditional effects, with substantively irrelevant effects omitted. b = marginal effects are the effects of X when moderating variable Z is present. In both models we present the marginal effect for different levels of retrenchment and the effect of retrenchment x positive welfare image for two different periods, note that these are different values of the same interaction term (see be-low).
* p<.10; ** p<.05, ***p<.01 (one-tailed), Note: Standard errors between brackets. Model A1 = Δ% votes governing party = β0 + β1 positive welfare image + β2 degree of retrenchment + β3
degree of retrenchment x positive welfare image + β4 neutral welfare image + β5 single member districts + β6 Δ unemployment rate + β7 Δ inflation rate + β8 Δ growth + β10cabinet duration Model A2 = Δ% votes governing party = β0 + β1 positive welfare image + β2 retrenchment + β4 after
30
1990s + β5 retrenchment × positive welfare image + β6 retrenchment × after 1990s + β7 positive welfare image × retrenchment + β8 retrenchment × positive welfare image × after 1990s + β9 neutral welfare image + β10 single member districts + β11 Δ unemployment rate + β12 Δ inflation rate + β13 Δ growth + β14
cabinet duration Table A2 Regression results for full model, sensitivity analyses Model A1
Pooled (country)
analysis
Model A2
Clustered (cabinet)
analysis
Model A3
Pooled (time and coun-
try) analysis
Constant -.60
(.79)
-.48
(.76)
-.42
(.58)
Retrenchment 1.08 1.14 .36
(.77) (.88) (.60)
Positive welfare image 1.08
(.70)
1.14
(.76)
.66
(.55)
Retrenchment × Positive
welfare image a
-3.02
(1.01)
-3.08
(1.04)
-2.48
(.78)
Neutral welfare image .78
(.87)
.92
(.68)
.11
(.59)
Single member districts -2.43***
(.75)
-2.34**
(.79)
-1.82***
(.58)
Change in Unemployment
rate
-.08
(.14)
-.08
(.15)
-.13
(.10)
Change in Growth rate .04
(.10)
.03
(.11)
.01
(.08)
Change in Inflation rate -.16 -.19 -.04
(.25) (.24) (.19)
Cabinet duration -.03* -.04* -.02
(.02) (.02) (.01)
Marginal effects b
Retrenchment × Positive
welfare image
-1.94**
(.81)
-1.94**
(.79)
-1.82**
(.63)
N 269 269 269
R2 .13 .13
a This is the unconditional effect (Brambor et al., 2006). b In this case the marginal effect is the effect of retrenchment for parties with a positive welfare image on the electoral results of governing parties. . * p<.10; ** p<.05, ***p<.01 (one-tailed). Note: Standard errors between brackets.
31
Notes 1 This article was presented at the NIG Work Conference 2009, the Research Seminar of
the Department of Governance Studies, VU University Amsterdam and at the ECPR
Joint Sessions 2010. Thanks to the participants of these workshops, especially to Mark
Bovens and Duco Bannink, and to Carsten Jensen for their useful comments and sugges-
tions.
2 Barbara Vis’ research is supported by a Veni grant from Netherlands Organization for
Scientific Research (grant nr. 451-08-012).
3 These two implications suggest that voters base their voting decision on a party’s past
performance, that is to say, voters vote retrospectively. However, this line of argument does
not rule out the possibility that at least some voters, some of the time, vote prospectively,
that is to say, based on what they expect that a party will do. Even in the latter situation,
however, voters will always draw on a party’s past performance too, as they need infor-
mation from the past to assess to what extent promises made in, for example, a party’s
manifesto are credible. If, say, a conservative party promises in its manifesto to increase
the generosity of unemployment benefits by 20 per cent, voters will know, based on the
party’s past performance, that the party is unlikely to keep its promise.
4 Australia, Austria, Belgium, Canada, Denmark, Finland, France, Germany, Ireland,
Netherlands, New Zealand, Norway, Sweden, and the United Kingdom (UK). We ex-
clude the United States because it is a presidential democracy. We exclude Switzerland
because – due to the so-called magic formula that divides the seven executive positions
between the four main parties – there is no traditional party competition. Consequently,
these two countries are not well suited for testing our hypotheses.

32
5 The web appendix is included for review purposes with this submission and will be
posted on the authors’ website after publication.
6 The attention of parties for welfare issues is a candidate for a time-varying measure. We
chose not to do this, because voter images of parties do not directly change when parties
change their policy intent. Also, parties hardly discuss retrenchment in their manifestos.
For example, the mean of the ‘per505 welfare state retrenchment’ category in the Com-
parative Manifesto project indicates that on average parties spend only 0.05% of their
manifesto on welfare state retrenchment. In comparison, parties spend on average about
8% of their manifesto to the item ‘welfare state expansion’.
7 Our sample of governments ends in 2002, but because our dependent variable is the
electoral result of governing parties at the next elections the observations can be from af-
ter 2002.
Copyright © 2022 FDOKUMEN