ThinPrep® Imaging System Image Processor - Hologic
202
Operator’s Manual ThinPrep ® Imaging System Image Processor
-
Upload
khangminh22 -
Category
Documents
-
view
1 -
download
0
Transcript of ThinPrep® Imaging System Image Processor - Hologic
Operator’s Manual
ThinPrep® Imaging System Image Processor
ThinPrep® Imaging System
Image ProcessorOperator’s Manual
HOLOGIC. INC.250 CAMPUS DRIVEMARLBOROUGH, MA 01752 USATEL: 1-800-442-9892
1-508-263-2900FAX: 1-508-229-2795WEB: WWW.HOLOGIC.COM
For Use With Version 3.x.y Software MAN-04199-001 Rev. 002

The ThinPrep® Imaging System is a PC-based and automated review system for use with ThinPrep cervical cytology sample slides. The ThinPrep Imaging System is intended to help a cytotechnologist or pathologist highlight areas of a slide for further manual review. The Product is not a replacement for manual review. Determination of slide adequacy and patient diagnosis is at the sole discretion of the cytotechnologists and pathologists trained by Hologic to evaluate ThinPrep prepared slides. If and only if it is finally determined by a court of competent jurisdiction that the Product sold to Customer hereunder was defective in design or contained a manufacturing defect and that such defect was solely responsible for an error in diagnosis that caused harm to a patient, Hologic shall indemnify Customer for the compensatory damages paid by Customer to discharge the personal injury judgment with respect to Product.
© Hologic, Inc., 2016. All rights reserved. No part of this publication may be reproduced, transmitted, transcribed, stored in a retrieval system, or translated into any language or computer language, in any form, or by any means, electronic, mechanical, magnetic, optical, chemical, manual, or otherwise, without the prior written permission of Hologic, 250 Campus Drive, Marlborough, Massachusetts, 01752, United States of America.
Although this guide has been prepared with every precaution to ensure accuracy, Hologic assumes no liability for any errors or omissions, nor for any damages resulting from the application or use of this information.
This product may be covered by one or more U.S. patents identified at http://hologic.com/patentinformation
Hologic, ThinPrep and PreservCyt are registered trademarks of Hologic, Inc. and/or its subsidiaries in the United States and other countries. All other trademarks, registered trademarks and product names are the property of their respective owners.
Changes or modifications to this unit not expressly approved by the party responsible for compliance could void the user’s authority to operate the equipment.
Document Number: AW-04689-001 Rev. 002

Th
e Th
inP
rep®
Imag
ing
System T
he
Th
inP
rep
®
Imag
ing
Sys
tem
Operation Summary and Clinical Information
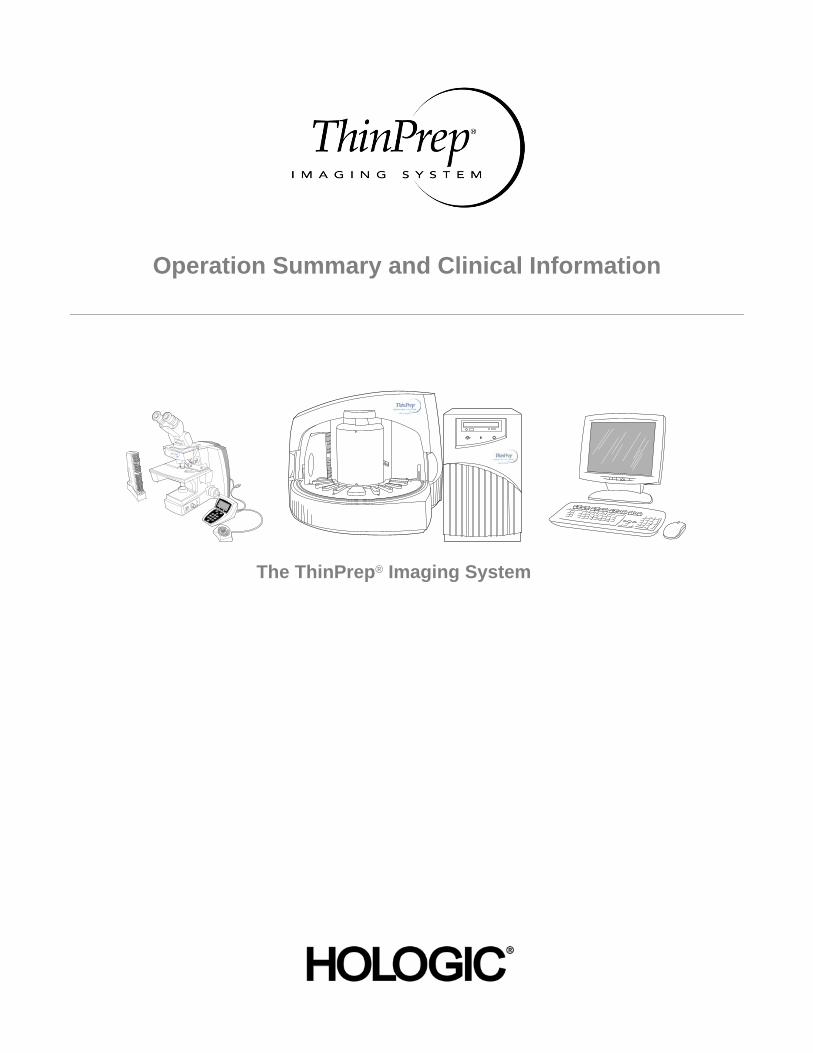
The ThinPrep® Imaging System
MAN-03938-001 Rev. 002 page 2 of 23
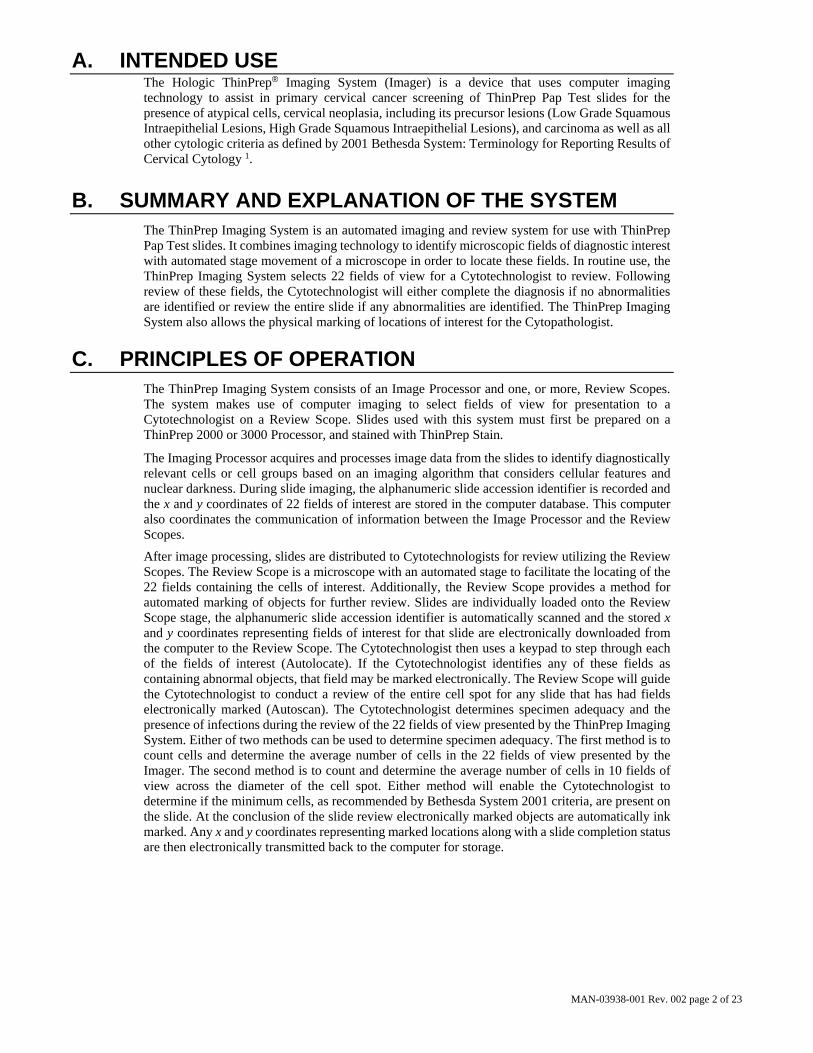
A. INTENDED USE The Hologic ThinPrep® Imaging System (Imager) is a device that uses computer imaging technology to assist in primary cervical cancer screening of ThinPrep Pap Test slides for the presence of atypical cells, cervical neoplasia, including its precursor lesions (Low Grade Squamous Intraepithelial Lesions, High Grade Squamous Intraepithelial Lesions), and carcinoma as well as all other cytologic criteria as defined by 2001 Bethesda System: Terminology for Reporting Results of Cervical Cytology 1.
B. SUMMARY AND EXPLANATION OF THE SYSTEM The ThinPrep Imaging System is an automated imaging and review system for use with ThinPrep Pap Test slides. It combines imaging technology to identify microscopic fields of diagnostic interest with automated stage movement of a microscope in order to locate these fields. In routine use, the ThinPrep Imaging System selects 22 fields of view for a Cytotechnologist to review. Following review of these fields, the Cytotechnologist will either complete the diagnosis if no abnormalities are identified or review the entire slide if any abnormalities are identified. The ThinPrep Imaging System also allows the physical marking of locations of interest for the Cytopathologist.
C. PRINCIPLES OF OPERATION The ThinPrep Imaging System consists of an Image Processor and one, or more, Review Scopes. The system makes use of computer imaging to select fields of view for presentation to a Cytotechnologist on a Review Scope. Slides used with this system must first be prepared on a ThinPrep 2000 or 3000 Processor, and stained with ThinPrep Stain.
The Imaging Processor acquires and processes image data from the slides to identify diagnostically relevant cells or cell groups based on an imaging algorithm that considers cellular features and nuclear darkness. During slide imaging, the alphanumeric slide accession identifier is recorded and the x and y coordinates of 22 fields of interest are stored in the computer database. This computer also coordinates the communication of information between the Image Processor and the Review Scopes.
After image processing, slides are distributed to Cytotechnologists for review utilizing the Review Scopes. The Review Scope is a microscope with an automated stage to facilitate the locating of the 22 fields containing the cells of interest. Additionally, the Review Scope provides a method for automated marking of objects for further review. Slides are individually loaded onto the Review Scope stage, the alphanumeric slide accession identifier is automatically scanned and the stored x and y coordinates representing fields of interest for that slide are electronically downloaded from the computer to the Review Scope. The Cytotechnologist then uses a keypad to step through each of the fields of interest (Autolocate). If the Cytotechnologist identifies any of these fields as containing abnormal objects, that field may be marked electronically. The Review Scope will guide the Cytotechnologist to conduct a review of the entire cell spot for any slide that has had fields electronically marked (Autoscan). The Cytotechnologist determines specimen adequacy and the presence of infections during the review of the 22 fields of view presented by the ThinPrep Imaging System. Either of two methods can be used to determine specimen adequacy. The first method is to count cells and determine the average number of cells in the 22 fields of view presented by the Imager. The second method is to count and determine the average number of cells in 10 fields of view across the diameter of the cell spot. Either method will enable the Cytotechnologist to determine if the minimum cells, as recommended by Bethesda System 2001 criteria, are present on the slide. At the conclusion of the slide review electronically marked objects are automatically ink marked. Any x and y coordinates representing marked locations along with a slide completion status are then electronically transmitted back to the computer for storage.
MAN-03938-001 Rev. 002 page 3 of 23
D. LIMITATIONS Only personnel who have been appropriately trained should operate the ThinPrep® Imaging System
Image Processor or Review Scope.
All slides that undergo primary automated screening with the Image Processor require manual rescreening of the selected fields of view by a Cytotechnologist using a Review Scope.
The ThinPrep Imaging System is only indicated for use with the ThinPrep Pap Test.
The laboratory Technical Supervisor should establish individual workload limits for personnel using the ThinPrep Imaging System. The maximum daily limit specified is only an upper limit and should never be used as an expectation for daily productivity or as a performance target.
The ThinPrep Imaging System has not been proven to be safe or effective at workload levels which exceed product labeling.
ThinPrep slides with fiducial marks must be used.
Slides must be stained using the ThinPrep Stain according to the applicable ThinPrep Imaging System slide staining protocol.
Slides should be clean and free of debris before being placed on the system.
The slide coverslip should be dry and located correctly.
Slides that are broken or poorly coverslipped should not be used.
Slides used with the ThinPrep Imaging System must contain properly formatted accession number identification information as described in the operator’s manual.
Slides once successfully imaged on the Image Processor cannot be imaged again.
The performance of the ThinPrep Imaging System using slides prepared from reprocessed sample vials has not been evaluated; therefore it is recommended that these slides be manually reviewed.
E. WARNINGS The Imager generates, uses, and can radiate radio frequency energy and may cause interference to
radio communications.
A Hologic authorized service representative must install the ThinPrep Imaging System.
F. PRECAUTIONS Caution should be used when loading and unloading glass slides on the ThinPrep Imaging System
to prevent slide breakage and/or injury.
Care should be taken to assure that slides are correctly oriented in the ThinPrep Imaging System cassettes to prevent rejection by the system.
Partially processed slide cassettes should not be removed from the Image Processor, as data may be lost.
The Image Processor should be placed on a flat, sturdy surface away from any vibrating machinery to assure proper operation.
MAN-03938-001 Rev. 002 page 4 of 23
G. PERFORMANCE CHARACTERISTICS A multi-center, two-armed clinical study was performed over an eleven (11) month period at four (4) cytology laboratory sites within the United States. The objective of the study entitled “Multi-Center Trial Evaluating the Primary Screening Capability of the ThinPrep® Imaging System” was to show that routine screening of ThinPrep Pap Test slides using the ThinPrep Imaging System is equivalent to a manual review of ThinPrep slides for all categories used for cytologic diagnosis (specimen adequacy and descriptive diagnosis) as defined by the Bethesda System criteria2.
The two-arm study approach allowed a comparison of the cytologic interpretation (descriptive diagnosis and specimen adequacy) from a single ThinPrep prepared slide, screened first using standard laboratory cervical cytology practices (Manual Review) and then after a 48 day time lag were screened with the assistance of the ThinPrep Imaging System (Imager Review). A subset of slides from the study were reviewed and adjudicated by a panel of three (3) independent Cytopathologists to determine a consensus diagnosis. The consensus diagnosis was used as a “gold standard” for truth to evaluate the results of the study.
G.1 LABORATORY AND PATIENT CHARACTERISTICS
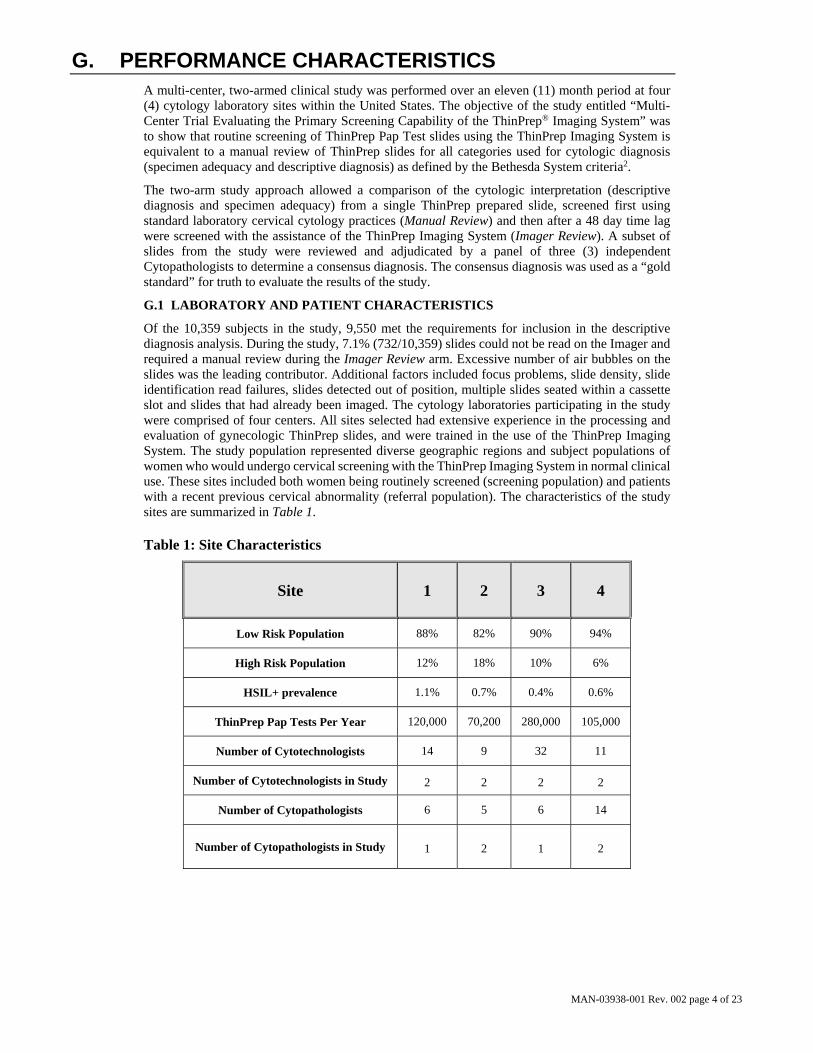
Of the 10,359 subjects in the study, 9,550 met the requirements for inclusion in the descriptive diagnosis analysis. During the study, 7.1% (732/10,359) slides could not be read on the Imager and required a manual review during the Imager Review arm. Excessive number of air bubbles on the slides was the leading contributor. Additional factors included focus problems, slide density, slide identification read failures, slides detected out of position, multiple slides seated within a cassette slot and slides that had already been imaged. The cytology laboratories participating in the study were comprised of four centers. All sites selected had extensive experience in the processing and evaluation of gynecologic ThinPrep slides, and were trained in the use of the ThinPrep Imaging System. The study population represented diverse geographic regions and subject populations of women who would undergo cervical screening with the ThinPrep Imaging System in normal clinical use. These sites included both women being routinely screened (screening population) and patients with a recent previous cervical abnormality (referral population). The characteristics of the study sites are summarized in Table 1.
Table 1: Site Characteristics
Site 1 2 3 4
Low Risk Population 88% 82% 90% 94%
High Risk Population 12% 18% 10% 6%
HSIL+ prevalence 1.1% 0.7% 0.4% 0.6%
ThinPrep Pap Tests Per Year 120,000 70,200 280,000 105,000
Number of Cytotechnologists 14 9 32 11
Number of Cytotechnologists in Study 2 2 2 2
Number of Cytopathologists 6 5 6 14
Number of Cytopathologists in Study 1 2 1 2
MAN-03938-001 Rev. 002 page 5 of 23
G.2 DESCRIPTIVE DIAGNOSIS SENSITIVITY AND SPECIFICITY ESTIMATES
A panel of three independent Cytopathologists adjudicated slides from all discordant (one-grade or higher cytologic difference) descriptive diagnosis cases (639), all concordant positive cases (355) and a random 5% subset of the 8550 negative concordant cases (428). The Cytopathologists on the adjudication panel were board-certified, all of whom had a subspecialty certification in Cytopathology. Their experience levels in Cytopathology ranged from 6 to 12 years. Two of the adjudicators were from university practices and one adjudicator was from a private medical center. The volumes for the adjudicator’s institutions ranged from 12,000 to 30,000 ThinPrep® Pap Tests annually.
A consensus diagnosis was defined as agreement by at least 2 of 3 Cytopathologists. All slides sent to the panel of Cytopathologists were not identified by site nor ordered in any fashion. When a consensus diagnosis could not be obtained by at least 2 of 3 Cytopathologists, the full panel of Cytopathologists reviewed each case simultaneously using a multi-headed microscope to determine a consensus diagnosis.
The adjudicated results were used as a “gold standard” to define the following major “true” descriptive diagnosis classifications of the Bethesda System: Negative, ASCUS, AGUS, LSIL, HSIL, Squamous Cell Carcinoma (SQ CA) and Glandular Cell Carcinoma (GL CA). Estimates of sensitivity and specificity together with 95% confidence intervals were calculated for the Manual Review and Imager Review arms of the study. The differences in sensitivity and specificity between the two arms, together with their 95% confidence intervals were also calculated. Among the random 5% subset of 8,550 cases (428 slides) that were found to be negative by both arms and adjudicated, there were 425 “true” negative and 3 “true” ASCUS slides. A multiple imputation technique was used to adjust the numbers of true positives and true negatives for the 8,550 negative concordant cases based on the 5% of cases that were adjudicated3.
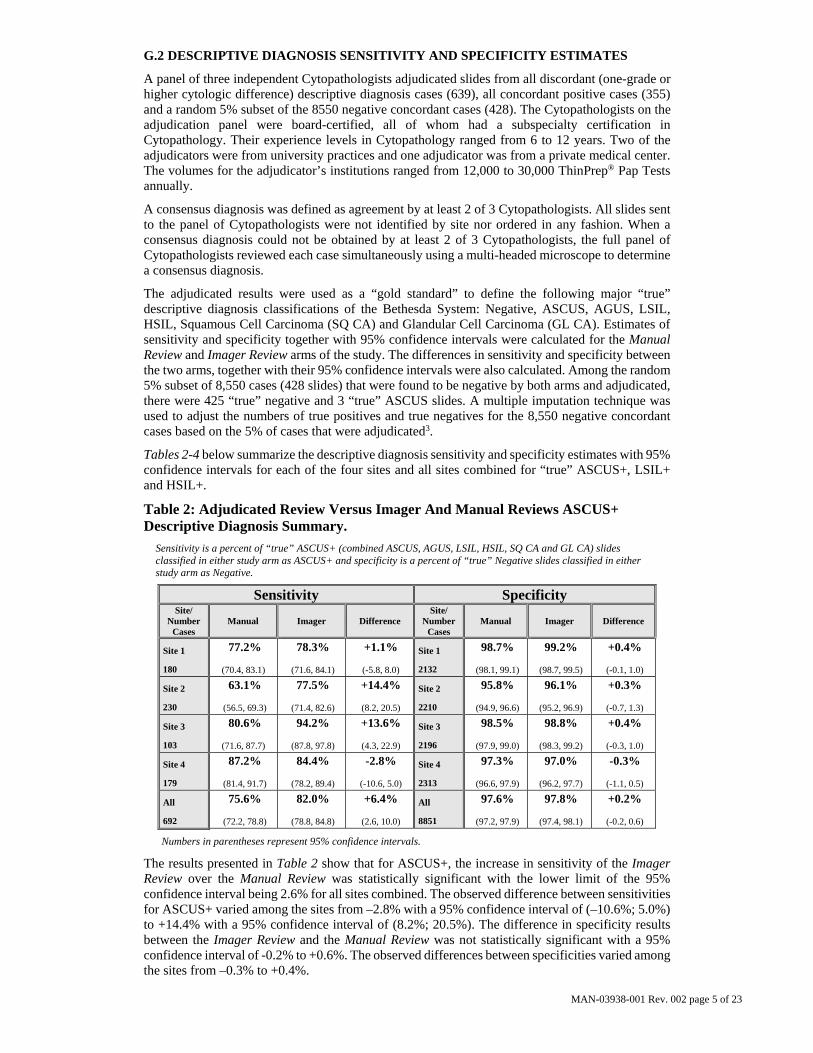
Tables 2-4 below summarize the descriptive diagnosis sensitivity and specificity estimates with 95% confidence intervals for each of the four sites and all sites combined for “true” ASCUS+, LSIL+ and HSIL+.
Table 2: Adjudicated Review Versus Imager And Manual Reviews ASCUS+ Descriptive Diagnosis Summary.
Sensitivity is a percent of “true” ASCUS+ (combined ASCUS, AGUS, LSIL, HSIL, SQ CA and GL CA) slides classified in either study arm as ASCUS+ and specificity is a percent of “true” Negative slides classified in either study arm as Negative.
Sensitivity Specificity Site/
Number Cases
Manual Imager Difference Site/
Number Cases
Manual Imager Difference
Site 1
180
77.2%
(70.4, 83.1)
78.3%
(71.6, 84.1)
+1.1%
(-5.8, 8.0)
Site 1
2132
98.7%
(98.1, 99.1)
99.2%
(98.7, 99.5)
+0.4%
(-0.1, 1.0)
Site 2
230
63.1%
(56.5, 69.3)
77.5%
(71.4, 82.6)
+14.4%
(8.2, 20.5)
Site 2
2210
95.8%
(94.9, 96.6)
96.1%
(95.2, 96.9)
+0.3%
(-0.7, 1.3)
Site 3
103
80.6%
(71.6, 87.7)
94.2%
(87.8, 97.8)
+13.6%
(4.3, 22.9)
Site 3
2196
98.5%
(97.9, 99.0)
98.8%
(98.3, 99.2)
+0.4%
(-0.3, 1.0)
Site 4
179
87.2%
(81.4, 91.7)
84.4%
(78.2, 89.4)
-2.8%
(-10.6, 5.0)
Site 4
2313
97.3%
(96.6, 97.9)
97.0%
(96.2, 97.7)
-0.3%
(-1.1, 0.5)
All
692
75.6%
(72.2, 78.8)
82.0%
(78.8, 84.8)
+6.4%
(2.6, 10.0)
All
8851
97.6%
(97.2, 97.9)
97.8%
(97.4, 98.1)
+0.2%
(-0.2, 0.6)
Numbers in parentheses represent 95% confidence intervals.
The results presented in Table 2 show that for ASCUS+, the increase in sensitivity of the Imager Review over the Manual Review was statistically significant with the lower limit of the 95% confidence interval being 2.6% for all sites combined. The observed difference between sensitivities for ASCUS+ varied among the sites from –2.8% with a 95% confidence interval of (–10.6%; 5.0%) to +14.4% with a 95% confidence interval of (8.2%; 20.5%). The difference in specificity results between the Imager Review and the Manual Review was not statistically significant with a 95% confidence interval of -0.2% to +0.6%. The observed differences between specificities varied among the sites from –0.3% to +0.4%.
MAN-03938-001 Rev. 002 page 6 of 23
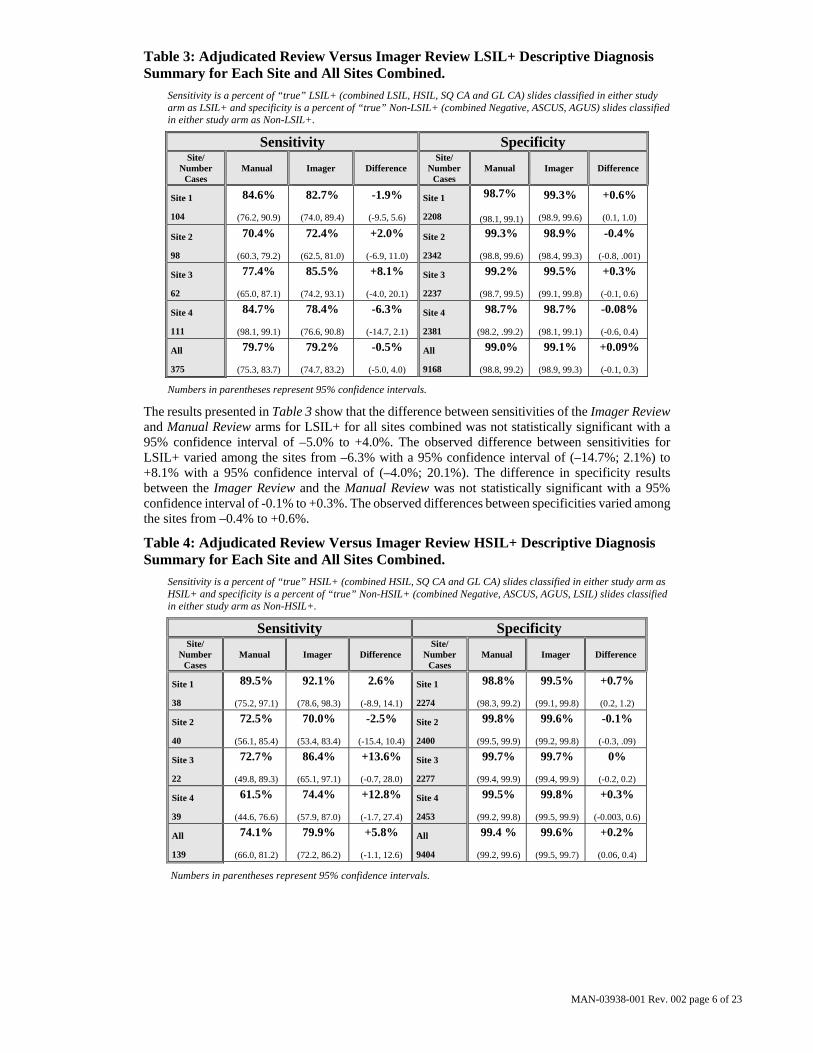
Table 3: Adjudicated Review Versus Imager Review LSIL+ Descriptive Diagnosis Summary for Each Site and All Sites Combined.
Sensitivity is a percent of “true” LSIL+ (combined LSIL, HSIL, SQ CA and GL CA) slides classified in either study arm as LSIL+ and specificity is a percent of “true” Non-LSIL+ (combined Negative, ASCUS, AGUS) slides classified in either study arm as Non-LSIL+.
Sensitivity Specificity Site/
Number Cases
Manual Imager Difference Site/
Number Cases
Manual Imager Difference
Site 1
104
84.6%
(76.2, 90.9)
82.7%
(74.0, 89.4)
-1.9%
(-9.5, 5.6)
Site 1
2208
98.7%
(98.1, 99.1)
99.3%
(98.9, 99.6)
+0.6%
(0.1, 1.0)
Site 2
98
70.4%
(60.3, 79.2)
72.4%
(62.5, 81.0)
+2.0%
(-6.9, 11.0)
Site 2
2342
99.3%
(98.8, 99.6)
98.9%
(98.4, 99.3)
-0.4%
(-0.8, .001)
Site 3
62
77.4%
(65.0, 87.1)
85.5%
(74.2, 93.1)
+8.1%
(-4.0, 20.1)
Site 3
2237
99.2%
(98.7, 99.5)
99.5%
(99.1, 99.8)
+0.3%
(-0.1, 0.6)
Site 4
111
84.7%
(98.1, 99.1)
78.4%
(76.6, 90.8)
-6.3%
(-14.7, 2.1)
Site 4
2381
98.7%
(98.2, .99.2)
98.7%
(98.1, 99.1)
-0.08%
(-0.6, 0.4)
All
375
79.7%
(75.3, 83.7)
79.2%
(74.7, 83.2)
-0.5%
(-5.0, 4.0)
All
9168
99.0%
(98.8, 99.2)
99.1%
(98.9, 99.3)
+0.09%
(-0.1, 0.3)
Numbers in parentheses represent 95% confidence intervals.
The results presented in Table 3 show that the difference between sensitivities of the Imager Review and Manual Review arms for LSIL+ for all sites combined was not statistically significant with a 95% confidence interval of –5.0% to +4.0%. The observed difference between sensitivities for LSIL+ varied among the sites from –6.3% with a 95% confidence interval of (–14.7%; 2.1%) to +8.1% with a 95% confidence interval of (–4.0%; 20.1%). The difference in specificity results between the Imager Review and the Manual Review was not statistically significant with a 95% confidence interval of -0.1% to +0.3%. The observed differences between specificities varied among the sites from –0.4% to +0.6%.
Table 4: Adjudicated Review Versus Imager Review HSIL+ Descriptive Diagnosis Summary for Each Site and All Sites Combined.
Sensitivity is a percent of “true” HSIL+ (combined HSIL, SQ CA and GL CA) slides classified in either study arm as HSIL+ and specificity is a percent of “true” Non-HSIL+ (combined Negative, ASCUS, AGUS, LSIL) slides classified in either study arm as Non-HSIL+.
Sensitivity Specificity Site/
Number Cases
Manual Imager Difference Site/
Number Cases
Manual Imager Difference
Site 1
38
89.5%
(75.2, 97.1)
92.1%
(78.6, 98.3)
2.6%
(-8.9, 14.1)
Site 1
2274
98.8%
(98.3, 99.2)
99.5%
(99.1, 99.8)
+0.7%
(0.2, 1.2)
Site 2
40
72.5%
(56.1, 85.4)
70.0%
(53.4, 83.4)
-2.5%
(-15.4, 10.4)
Site 2
2400
99.8%
(99.5, 99.9)
99.6%
(99.2, 99.8)
-0.1%
(-0.3, .09)
Site 3
22
72.7%
(49.8, 89.3)
86.4%
(65.1, 97.1)
+13.6%
(-0.7, 28.0)
Site 3
2277
99.7%
(99.4, 99.9)
99.7%
(99.4, 99.9)
0%
(-0.2, 0.2)
Site 4
39
61.5%
(44.6, 76.6)
74.4%
(57.9, 87.0)
+12.8%
(-1.7, 27.4)
Site 4
2453
99.5%
(99.2, 99.8)
99.8%
(99.5, 99.9)
+0.3%
(-0.003, 0.6)
All
139
74.1%
(66.0, 81.2)
79.9%
(72.2, 86.2)
+5.8%
(-1.1, 12.6)
All
9404
99.4 %
(99.2, 99.6)
99.6%
(99.5, 99.7)
+0.2%
(0.06, 0.4)
Numbers in parentheses represent 95% confidence intervals.

MAN-03938-001 Rev. 002 page 7 of 23
The results presented in Table 4 show that the difference between sensitivities of the Imager Review and Manual Review arms for HSIL+ for all sites combined was not statistically significant with a 95% confidence interval of -1.1% to +12.6%. The observed difference between sensitivities for HSIL+ varied among the sites from –2.5% with a 95% confidence interval of (–15.4%; 10.4%) to +13.6% with a 95% confidence interval of (–0.7%; 28.0%). The increase in specificity of the Imager Review over the Manual Review was statistically significant with a 95% confidence interval of +0.06% to +0.4%. The observed differences between specificities varied among the sites from –0.1% to +0.7%.
Tables 5-9 show the performance of the Imager Review and Manual Review compared to the final consensus diagnosis made by the adjudication panel (truth) for the following major descriptive diagnosis classifications of the Bethesda System: Negative, ASCUS, AGUS, LSIL, HSIL, Cancer* (CA) *Includes SQ CA and GL CA. Abbreviations for Diagnoses: NEG = Normal or negative, ASCUS = Atypical Squamous Cells of Undetermined Significance, AGUS = Atypical Glandular Cells of Undetermined Significance, LSIL = Low-grade Squamous Intraepithelial Lesion, HSIL = High-grade Squamous Intraepithelial Lesion, SQ CA = Squamous Cell Carcinoma, GL CA = Glandular Cell Adenocarcinoma.
Table 5: 6x6 “True Negative” Contingency Table For All Sites Combined
All 786 Cases Determined To Be Negative By Adjudication
Unadjudicated Manual Review Arm Diagnosis
Un
adju
dic
ated
Im
ager
R
evie
w A
rm D
iagn
osis
NEG ASCUS AGUS LSIL HSIL CA TOTAL
NEG 425 138 6 10 6 2 587
ASCUS 130 39 1 3 - - 173
AGUS 5 - - - - - 5
LSIL 9 5 - 2 - - 16
HSIL 1 1 - - 3 - 5
CA - - - - - - 0
TOTAL 570 183 7 15 9 2 786
Among the 786 cases determined by the adjudication panel to be Negative, 587 (74.7%) cases in the Imager Review arm and 570 (72.5%) cases in the Manual Review arm were diagnosed as Negative and 21 (2.7%) cases in the Imager Review arm and 26 (3.3%) cases in the Manual Review arm were diagnosed as LSIL+.
Table 6: 6x6 “True ASCUS” Contingency Table For All Sites Combined
All 251 Cases Determined To Be ASCUS By Adjudication
Unadjudicated Manual Review Arm Diagnosis
Un
adju
dic
ated
Im
ager
R
evie
w A
rm D
iagn
osis
NEG ASCUS AGUS LSIL HSIL CA TOTAL
NEG 3 32 - 7 3 - 45
ASCUS 70 47 1 20 4 - 142
AGUS 1 - - - - - 1
LSIL 6 21 - 16 7 - 50
HSIL 2 3 - 5 1 1 12
CA 1 - - - - - 1
TOTAL 83 103 1 48 15 1 251
Among the 251 cases determined by the adjudication panel to be ASCUS, 142 (56.6%) cases in the Imager Review arm and 103 (41.0%) cases in the Manual Review arm were diagnosed as ASCUS and 45 (17.9%) cases in the Imager Review arm and 83 (33.1%) cases in the Manual Review arm were diagnosed as Negative.
MAN-03938-001 Rev. 002 page 8 of 23
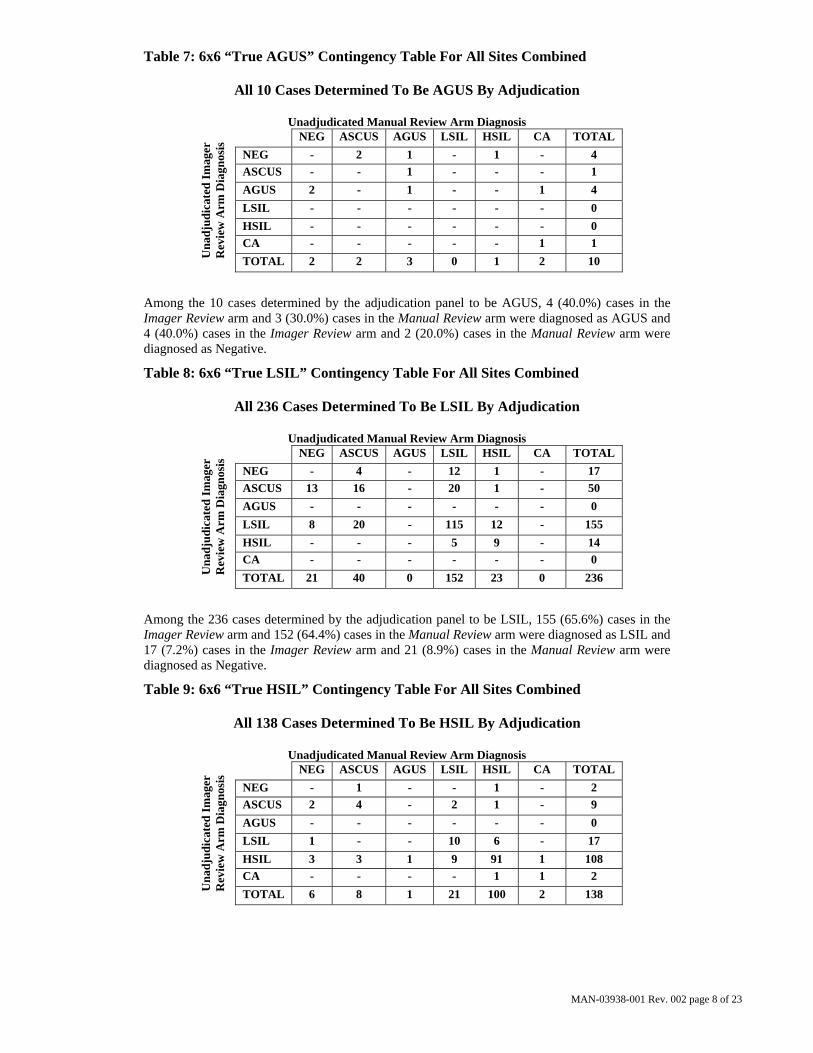
Table 7: 6x6 “True AGUS” Contingency Table For All Sites Combined
All 10 Cases Determined To Be AGUS By Adjudication
Unadjudicated Manual Review Arm Diagnosis
Un
adju
dic
ated
Im
ager
R
evie
w A
rm D
iagn
osis
NEG ASCUS AGUS LSIL HSIL CA TOTAL
NEG - 2 1 - 1 - 4
ASCUS - - 1 - - - 1
AGUS 2 - 1 - - 1 4
LSIL - - - - - - 0
HSIL - - - - - - 0
CA - - - - - 1 1
TOTAL 2 2 3 0 1 2 10
Among the 10 cases determined by the adjudication panel to be AGUS, 4 (40.0%) cases in the Imager Review arm and 3 (30.0%) cases in the Manual Review arm were diagnosed as AGUS and 4 (40.0%) cases in the Imager Review arm and 2 (20.0%) cases in the Manual Review arm were diagnosed as Negative.
Table 8: 6x6 “True LSIL” Contingency Table For All Sites Combined
All 236 Cases Determined To Be LSIL By Adjudication
Unadjudicated Manual Review Arm Diagnosis
Un
adju
dic
ated
Im
ager
R
evie
w A
rm D
iagn
osis
NEG ASCUS AGUS LSIL HSIL CA TOTAL
NEG - 4 - 12 1 - 17
ASCUS 13 16 - 20 1 - 50
AGUS - - - - - - 0
LSIL 8 20 - 115 12 - 155
HSIL - - - 5 9 - 14
CA - - - - - - 0
TOTAL 21 40 0 152 23 0 236
Among the 236 cases determined by the adjudication panel to be LSIL, 155 (65.6%) cases in the Imager Review arm and 152 (64.4%) cases in the Manual Review arm were diagnosed as LSIL and 17 (7.2%) cases in the Imager Review arm and 21 (8.9%) cases in the Manual Review arm were diagnosed as Negative.
Table 9: 6x6 “True HSIL” Contingency Table For All Sites Combined
All 138 Cases Determined To Be HSIL By Adjudication
Unadjudicated Manual Review Arm Diagnosis
Un
adju
dic
ated
Im
ager
R
evie
w A
rm D
iagn
osis
NEG ASCUS AGUS LSIL HSIL CA TOTAL
NEG - 1 - - 1 - 2
ASCUS 2 4 - 2 1 - 9
AGUS - - - - - - 0
LSIL 1 - - 10 6 - 17
HSIL 3 3 1 9 91 1 108
CA - - - - 1 1 2
TOTAL 6 8 1 21 100 2 138
MAN-03938-001 Rev. 002 page 9 of 23
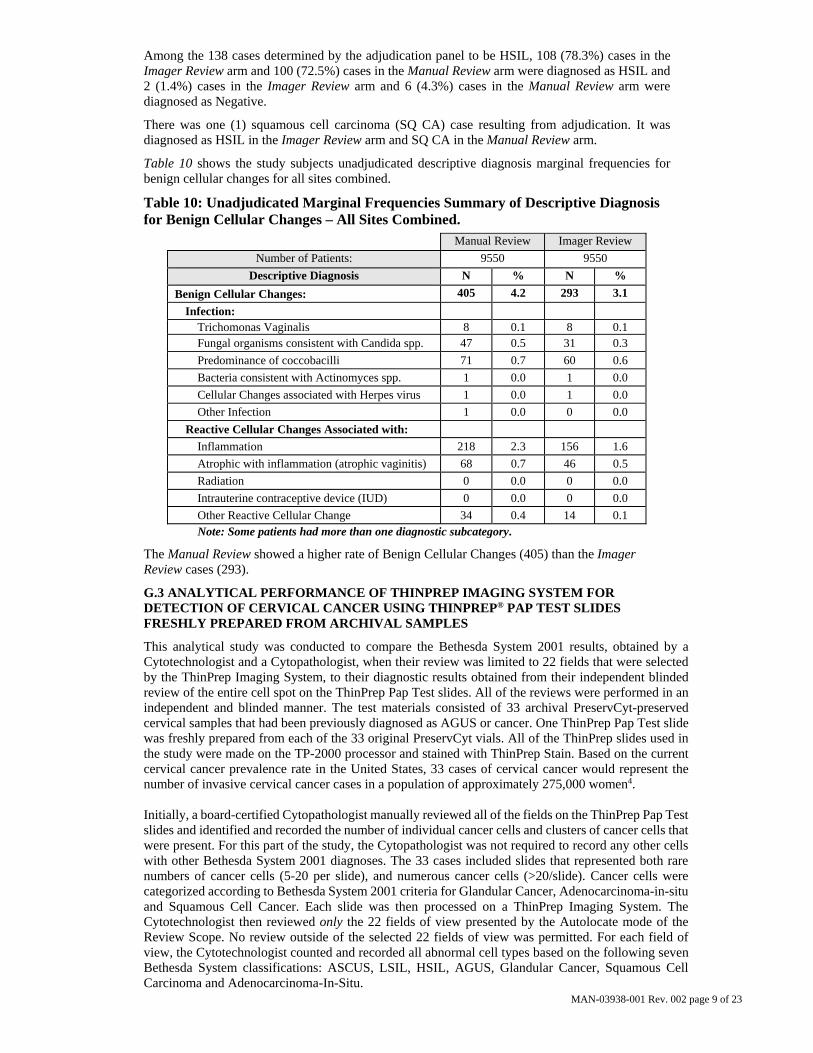
Among the 138 cases determined by the adjudication panel to be HSIL, 108 (78.3%) cases in the Imager Review arm and 100 (72.5%) cases in the Manual Review arm were diagnosed as HSIL and 2 (1.4%) cases in the Imager Review arm and 6 (4.3%) cases in the Manual Review arm were diagnosed as Negative.
There was one (1) squamous cell carcinoma (SQ CA) case resulting from adjudication. It was diagnosed as HSIL in the Imager Review arm and SQ CA in the Manual Review arm.
Table 10 shows the study subjects unadjudicated descriptive diagnosis marginal frequencies for benign cellular changes for all sites combined.
Table 10: Unadjudicated Marginal Frequencies Summary of Descriptive Diagnosis for Benign Cellular Changes – All Sites Combined.
Manual Review Imager Review
Number of Patients: 9550 9550
Descriptive Diagnosis N % N %
Benign Cellular Changes: 405 4.2 293 3.1
Infection:
Trichomonas Vaginalis 8 0.1 8 0.1 Fungal organisms consistent with Candida spp. 47 0.5 31 0.3
Predominance of coccobacilli 71 0.7 60 0.6
Bacteria consistent with Actinomyces spp. 1 0.0 1 0.0
Cellular Changes associated with Herpes virus 1 0.0 1 0.0
Other Infection 1 0.0 0 0.0
Reactive Cellular Changes Associated with:
Inflammation 218 2.3 156 1.6
Atrophic with inflammation (atrophic vaginitis) 68 0.7 46 0.5
Radiation 0 0.0 0 0.0
Intrauterine contraceptive device (IUD) 0 0.0 0 0.0
Other Reactive Cellular Change 34 0.4 14 0.1 Note: Some patients had more than one diagnostic subcategory.
The Manual Review showed a higher rate of Benign Cellular Changes (405) than the Imager Review cases (293).
G.3 ANALYTICAL PERFORMANCE OF THINPREP IMAGING SYSTEM FOR DETECTION OF CERVICAL CANCER USING THINPREP® PAP TEST SLIDES FRESHLY PREPARED FROM ARCHIVAL SAMPLES
This analytical study was conducted to compare the Bethesda System 2001 results, obtained by a Cytotechnologist and a Cytopathologist, when their review was limited to 22 fields that were selected by the ThinPrep Imaging System, to their diagnostic results obtained from their independent blinded review of the entire cell spot on the ThinPrep Pap Test slides. All of the reviews were performed in an independent and blinded manner. The test materials consisted of 33 archival PreservCyt-preserved cervical samples that had been previously diagnosed as AGUS or cancer. One ThinPrep Pap Test slide was freshly prepared from each of the 33 original PreservCyt vials. All of the ThinPrep slides used in the study were made on the TP-2000 processor and stained with ThinPrep Stain. Based on the current cervical cancer prevalence rate in the United States, 33 cases of cervical cancer would represent the number of invasive cervical cancer cases in a population of approximately 275,000 women4. Initially, a board-certified Cytopathologist manually reviewed all of the fields on the ThinPrep Pap Test slides and identified and recorded the number of individual cancer cells and clusters of cancer cells that were present. For this part of the study, the Cytopathologist was not required to record any other cells with other Bethesda System 2001 diagnoses. The 33 cases included slides that represented both rare numbers of cancer cells (5-20 per slide), and numerous cancer cells (>20/slide). Cancer cells were categorized according to Bethesda System 2001 criteria for Glandular Cancer, Adenocarcinoma-in-situ and Squamous Cell Cancer. Each slide was then processed on a ThinPrep Imaging System. The Cytotechnologist then reviewed only the 22 fields of view presented by the Autolocate mode of the Review Scope. No review outside of the selected 22 fields of view was permitted. For each field of view, the Cytotechnologist counted and recorded all abnormal cell types based on the following seven Bethesda System classifications: ASCUS, LSIL, HSIL, AGUS, Glandular Cancer, Squamous Cell Carcinoma and Adenocarcinoma-In-Situ.
MAN-03938-001 Rev. 002 page 10 of 23
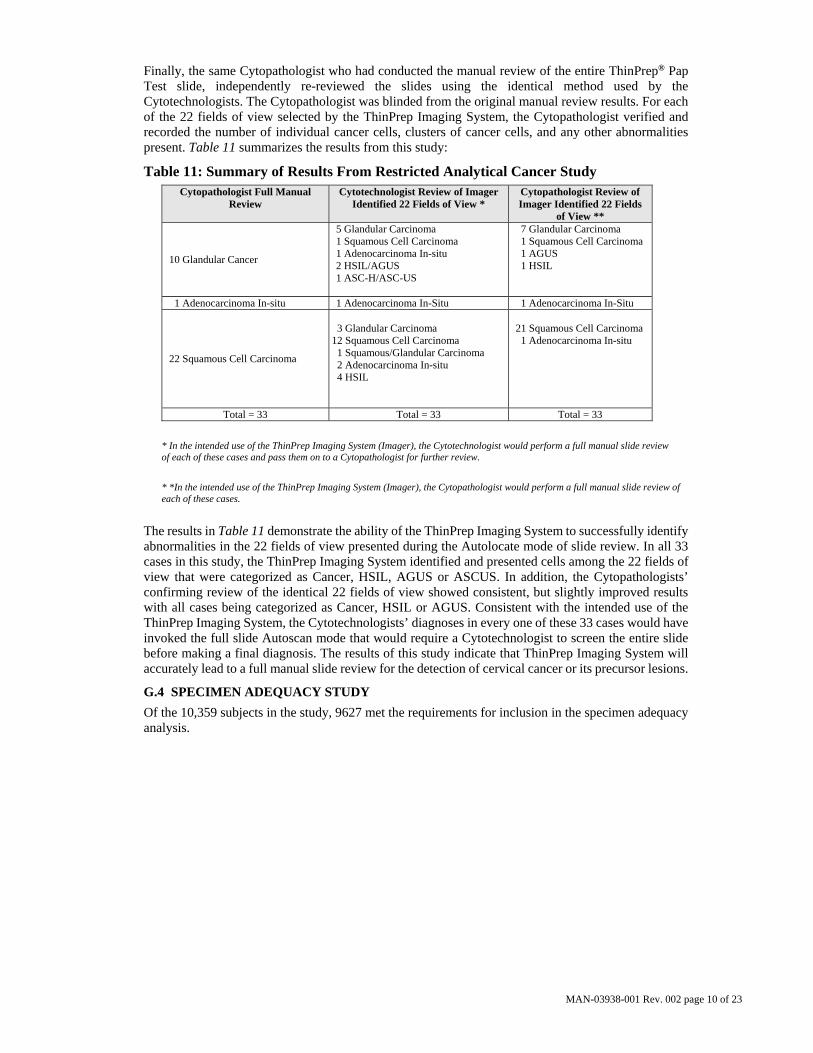
Finally, the same Cytopathologist who had conducted the manual review of the entire ThinPrep® Pap Test slide, independently re-reviewed the slides using the identical method used by the Cytotechnologists. The Cytopathologist was blinded from the original manual review results. For each of the 22 fields of view selected by the ThinPrep Imaging System, the Cytopathologist verified and recorded the number of individual cancer cells, clusters of cancer cells, and any other abnormalities present. Table 11 summarizes the results from this study:
Table 11: Summary of Results From Restricted Analytical Cancer Study Cytopathologist Full Manual
Review Cytotechnologist Review of Imager
Identified 22 Fields of View * Cytopathologist Review of Imager Identified 22 Fields
of View **
10 Glandular Cancer
5 Glandular Carcinoma 1 Squamous Cell Carcinoma 1 Adenocarcinoma In-situ 2 HSIL/AGUS 1 ASC-H/ASC-US
7 Glandular Carcinoma 1 Squamous Cell Carcinoma 1 AGUS 1 HSIL
1 Adenocarcinoma In-situ 1 Adenocarcinoma In-Situ 1 Adenocarcinoma In-Situ
22 Squamous Cell Carcinoma
3 Glandular Carcinoma 12 Squamous Cell Carcinoma 1 Squamous/Glandular Carcinoma 2 Adenocarcinoma In-situ 4 HSIL
21 Squamous Cell Carcinoma 1 Adenocarcinoma In-situ
Total = 33 Total = 33 Total = 33
* In the intended use of the ThinPrep Imaging System (Imager), the Cytotechnologist would perform a full manual slide review of each of these cases and pass them on to a Cytopathologist for further review.
* *In the intended use of the ThinPrep Imaging System (Imager), the Cytopathologist would perform a full manual slide review of each of these cases.
The results in Table 11 demonstrate the ability of the ThinPrep Imaging System to successfully identify abnormalities in the 22 fields of view presented during the Autolocate mode of slide review. In all 33 cases in this study, the ThinPrep Imaging System identified and presented cells among the 22 fields of view that were categorized as Cancer, HSIL, AGUS or ASCUS. In addition, the Cytopathologists’ confirming review of the identical 22 fields of view showed consistent, but slightly improved results with all cases being categorized as Cancer, HSIL or AGUS. Consistent with the intended use of the ThinPrep Imaging System, the Cytotechnologists’ diagnoses in every one of these 33 cases would have invoked the full slide Autoscan mode that would require a Cytotechnologist to screen the entire slide before making a final diagnosis. The results of this study indicate that ThinPrep Imaging System will accurately lead to a full manual slide review for the detection of cervical cancer or its precursor lesions.
G.4 SPECIMEN ADEQUACY STUDY
Of the 10,359 subjects in the study, 9627 met the requirements for inclusion in the specimen adequacy analysis.
MAN-03938-001 Rev. 002 page 11 of 23
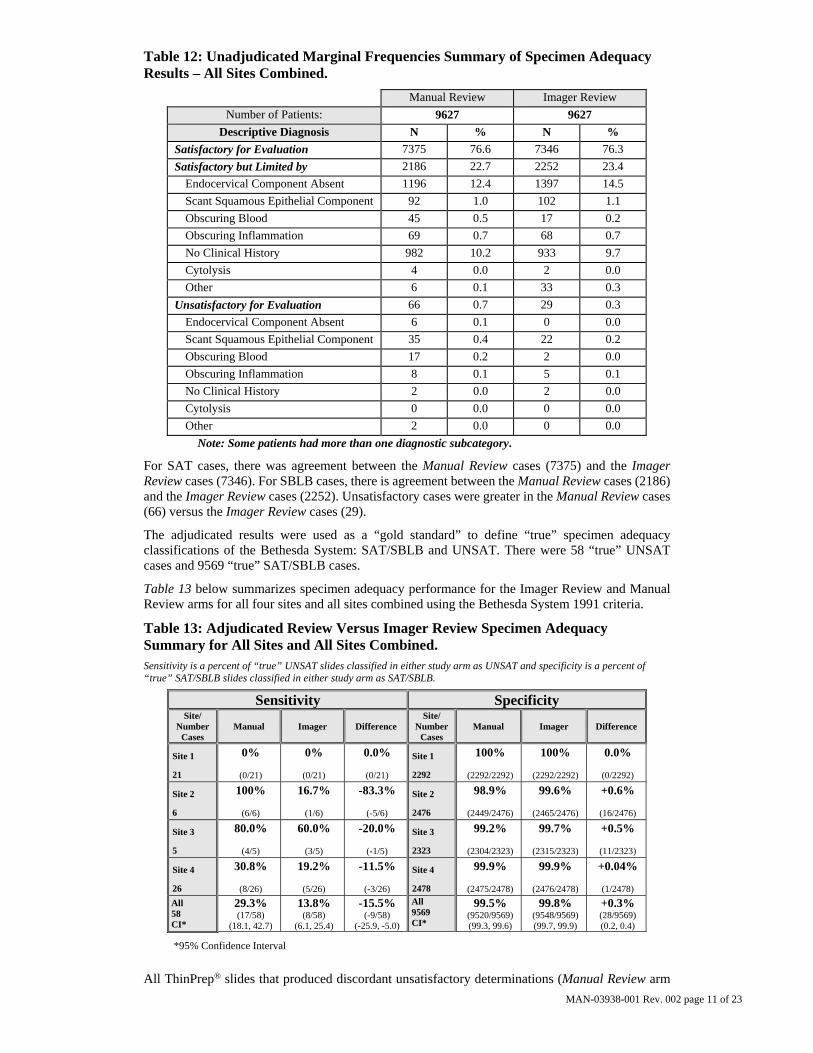
Table 12: Unadjudicated Marginal Frequencies Summary of Specimen Adequacy Results – All Sites Combined.
Manual Review Imager Review
Number of Patients: 9627 9627
Descriptive Diagnosis N % N %
Satisfactory for Evaluation 7375 76.6 7346 76.3
Satisfactory but Limited by 2186 22.7 2252 23.4
Endocervical Component Absent 1196 12.4 1397 14.5
Scant Squamous Epithelial Component 92 1.0 102 1.1
Obscuring Blood 45 0.5 17 0.2
Obscuring Inflammation 69 0.7 68 0.7
No Clinical History 982 10.2 933 9.7
Cytolysis 4 0.0 2 0.0
Other 6 0.1 33 0.3
Unsatisfactory for Evaluation 66 0.7 29 0.3
Endocervical Component Absent 6 0.1 0 0.0
Scant Squamous Epithelial Component 35 0.4 22 0.2
Obscuring Blood 17 0.2 2 0.0
Obscuring Inflammation 8 0.1 5 0.1
No Clinical History 2 0.0 2 0.0
Cytolysis 0 0.0 0 0.0
Other 2 0.0 0 0.0
Note: Some patients had more than one diagnostic subcategory.
For SAT cases, there was agreement between the Manual Review cases (7375) and the Imager Review cases (7346). For SBLB cases, there is agreement between the Manual Review cases (2186) and the Imager Review cases (2252). Unsatisfactory cases were greater in the Manual Review cases (66) versus the Imager Review cases (29).
The adjudicated results were used as a “gold standard” to define “true” specimen adequacy classifications of the Bethesda System: SAT/SBLB and UNSAT. There were 58 “true” UNSAT cases and 9569 “true” SAT/SBLB cases.
Table 13 below summarizes specimen adequacy performance for the Imager Review and Manual Review arms for all four sites and all sites combined using the Bethesda System 1991 criteria.
Table 13: Adjudicated Review Versus Imager Review Specimen Adequacy Summary for All Sites and All Sites Combined. Sensitivity is a percent of “true” UNSAT slides classified in either study arm as UNSAT and specificity is a percent of “true” SAT/SBLB slides classified in either study arm as SAT/SBLB.
Sensitivity Specificity Site/
Number Cases
Manual Imager Difference Site/
Number Cases
Manual Imager Difference
Site 1
21
0%
(0/21)
0%
(0/21)
0.0%
(0/21)
Site 1
2292
100%
(2292/2292)
100%
(2292/2292)
0.0%
(0/2292)
Site 2
6
100%
(6/6)
16.7%
(1/6)
-83.3%
(-5/6)
Site 2
2476
98.9%
(2449/2476)
99.6%
(2465/2476)
+0.6%
(16/2476)
Site 3
5
80.0%
(4/5)
60.0%
(3/5)
-20.0%
(-1/5)
Site 3
2323
99.2%
(2304/2323)
99.7%
(2315/2323)
+0.5%
(11/2323)
Site 4
26
30.8%
(8/26)
19.2%
(5/26)
-11.5%
(-3/26)
Site 4
2478
99.9%
(2475/2478)
99.9%
(2476/2478)
+0.04%
(1/2478)
All 58 CI*
29.3% (17/58)
(18.1, 42.7)
13.8% (8/58)
(6.1, 25.4)
-15.5% (-9/58)
(-25.9, -5.0)
All 9569 CI*
99.5% (9520/9569) (99.3, 99.6)
99.8% (9548/9569) (99.7, 99.9)
+0.3% (28/9569) (0.2, 0.4)
All ThinPrep® slides that produced discordant unsatisfactory determinations (Manual Review arm
*95% Confidence Interval
MAN-03938-001 Rev. 002 page 12 of 23
vs. Imager Review arm) during the clinical study were assessed in an additional clinical support study to compare the method used for specimen adequacy in the clinical study with a control cell count of the slides and 3 different methods as follows: (1) Manual assessment of specimen adequacy on the entire microscope slide based on ThinPrep Bethesda System 1991 criteria; (2) Using the “diameter” method of Bethesda System 2001, which requires that the Cytotechnologist counts cells in 10 fields of view along the diameter of the cell spot and calculate the number of cells on the slide; (3) Having the Cytotechnologist count the cells in the 22 fields of view presented by the system and calculate the number of cells on the slide.
This additional support study demonstrated that the Bethesda System 1991 estimation methods, including the method used in the clinical study, do not generate similar specimen adequacy determinations when compared against each other or with the control method. Therefore, the recommended methods for determining specimen adequacy on the ThinPrep Imaging System are (1) the Bethesda System 2001 count of fields along a diagonal of the cell spot or (2) counting the cells in the 22 fields-of-view selected by the ThinPrep Imager System. Refer to the ThinPrep Imaging System Review Scope Operator’s Manual for instructions on the proper use of these methods.
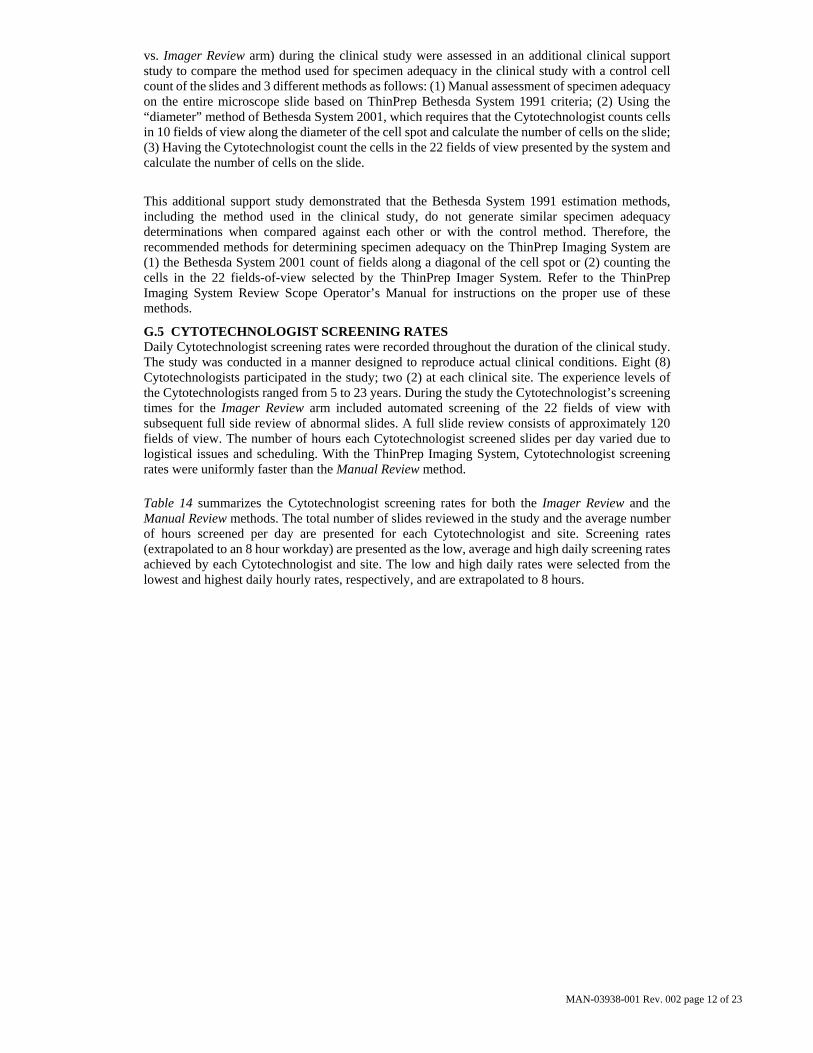
G.5 CYTOTECHNOLOGIST SCREENING RATES Daily Cytotechnologist screening rates were recorded throughout the duration of the clinical study. The study was conducted in a manner designed to reproduce actual clinical conditions. Eight (8) Cytotechnologists participated in the study; two (2) at each clinical site. The experience levels of the Cytotechnologists ranged from 5 to 23 years. During the study the Cytotechnologist’s screening times for the Imager Review arm included automated screening of the 22 fields of view with subsequent full side review of abnormal slides. A full slide review consists of approximately 120 fields of view. The number of hours each Cytotechnologist screened slides per day varied due to logistical issues and scheduling. With the ThinPrep Imaging System, Cytotechnologist screening rates were uniformly faster than the Manual Review method.
Table 14 summarizes the Cytotechnologist screening rates for both the Imager Review and the Manual Review methods. The total number of slides reviewed in the study and the average number of hours screened per day are presented for each Cytotechnologist and site. Screening rates (extrapolated to an 8 hour workday) are presented as the low, average and high daily screening rates achieved by each Cytotechnologist and site. The low and high daily rates were selected from the lowest and highest daily hourly rates, respectively, and are extrapolated to 8 hours.
MAN-03938-001 Rev. 002 page 13 of 23
Table 14: Cytotechnologist Screening Rates
Site/CT
Review
Methods
Total Number of
Slides Evaluated
Average Number of
Hours Screened Per
Day
Extrapolated Daily Rates (8-hour workday)
Low Day
Average Day
High Day
Site 1 Manual 2568 7.4 49 69 94 Imager 2297 6.0 107 153 206
1-1 Manual 1284 7.5 49 60 72 Imager 1168 6.1 117 153 182
1-2 Manual 1284 7.3 70 78 94 Imager 1129 5.9 107 154 206
Site 2 Manual 2686 7.7 40 68 80 Imager 2665 7.8 69 109 131
2-1 Manual 1348 7.6 40 71 80 Imager 1309 7.9 97 110 118
2-2 Manual 1338 7.8 55 66 75 Imager 1356 7.7 69 109 131
Site 3 Manual 2738 7.9 20 80 101 Imager 2726 4.5 148 204 320
3-1 Manual 1368 7.9 63 82 91 Imager 1460 4.2 167 230 320
3-2 Manual 1370 7.8 20 78 101 Imager 1266 4.7 148 178 212
Site 4 Manual 2612 7.6 42 69 94 Imager 2524 5.1 86 138 198
4-1 Manual 1305 8.2 59 75 84 Imager 1252 5.1 86 150 190
4-2 Manual 1307 6.9 42 63 94 Imager 1272 5.0 109 126 198
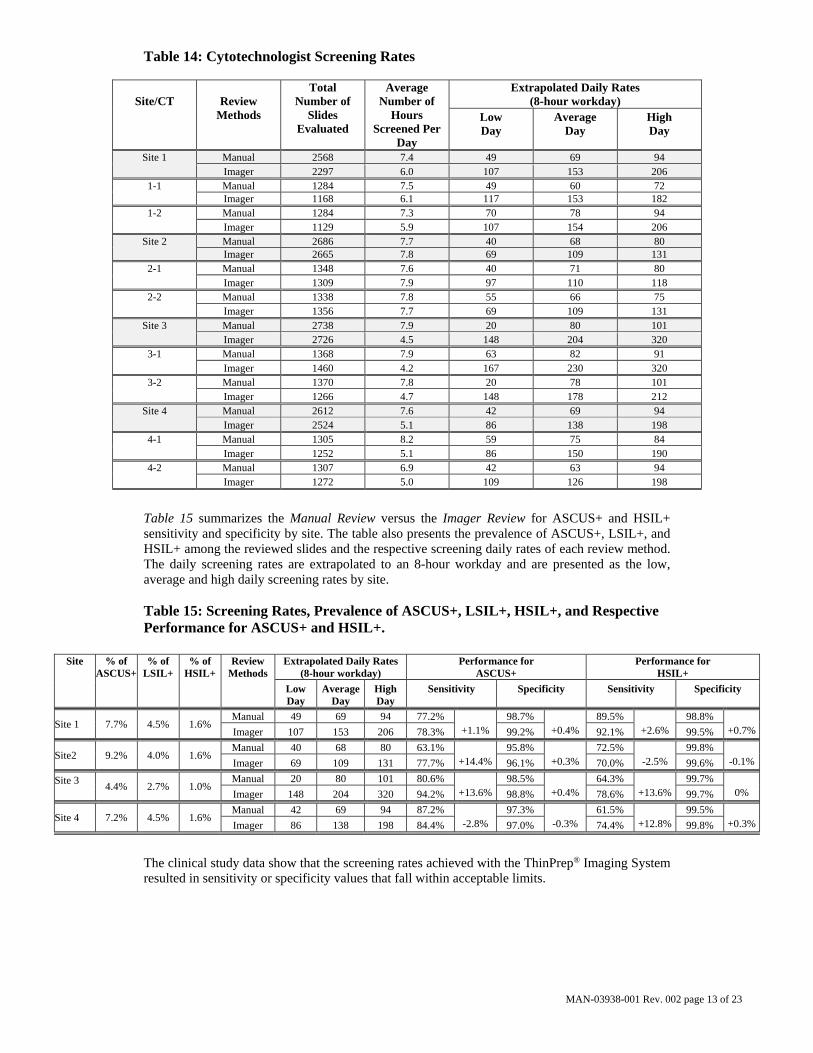
Table 15 summarizes the Manual Review versus the Imager Review for ASCUS+ and HSIL+ sensitivity and specificity by site. The table also presents the prevalence of ASCUS+, LSIL+, and HSIL+ among the reviewed slides and the respective screening daily rates of each review method. The daily screening rates are extrapolated to an 8-hour workday and are presented as the low, average and high daily screening rates by site.
Table 15: Screening Rates, Prevalence of ASCUS+, LSIL+, HSIL+, and Respective Performance for ASCUS+ and HSIL+.
Site % of
ASCUS+ % of
LSIL+ % of
HSIL+ Review
Methods Extrapolated Daily Rates
(8-hour workday) Performance for
ASCUS+ Performance for
HSIL+
Low Day
AverageDay
High Day
Sensitivity Specificity Sensitivity Specificity
Site 1 7.7% 4.5% 1.6% Manual 49 69 94 77.2%
+1.1% 98.7%
+0.4% 89.5%
+2.6% 98.8%
+0.7%Imager 107 153 206 78.3% 99.2% 92.1% 99.5%
Site2 9.2% 4.0% 1.6% Manual 40 68 80 63.1%
+14.4%95.8%
+0.3% 72.5%
-2.5% 99.8%
-0.1%Imager 69 109 131 77.7% 96.1% 70.0% 99.6%
Site 3
4.4% 2.7% 1.0% Manual 20 80 101 80.6%
+13.6%98.5%
+0.4% 64.3%
+13.6%99.7%
0% Imager 148 204 320 94.2% 98.8% 78.6% 99.7%
Site 4 7.2% 4.5% 1.6% Manual 42 69 94 87.2%
-2.8% 97.3%
-0.3% 61.5%
+12.8%99.5%
+0.3%Imager 86 138 198 84.4% 97.0% 74.4% 99.8%
The clinical study data show that the screening rates achieved with the ThinPrep® Imaging System resulted in sensitivity or specificity values that fall within acceptable limits.
MAN-03938-001 Rev. 002 page 14 of 23
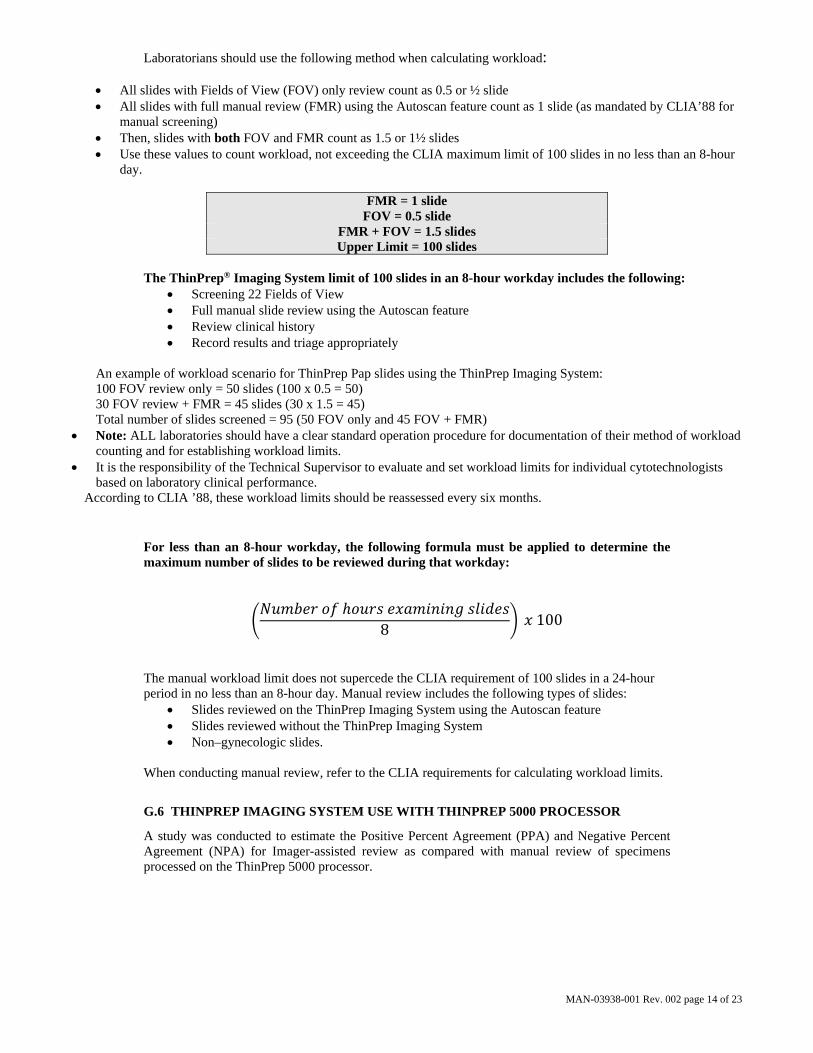
Laboratorians should use the following method when calculating workload:
All slides with Fields of View (FOV) only review count as 0.5 or ½ slide All slides with full manual review (FMR) using the Autoscan feature count as 1 slide (as mandated by CLIA’88 for
manual screening) Then, slides with both FOV and FMR count as 1.5 or 1½ slides Use these values to count workload, not exceeding the CLIA maximum limit of 100 slides in no less than an 8-hour
day.
FMR = 1 slide FOV = 0.5 slide
FMR + FOV = 1.5 slides Upper Limit = 100 slides
The ThinPrep® Imaging System limit of 100 slides in an 8-hour workday includes the following:
Screening 22 Fields of View Full manual slide review using the Autoscan feature Review clinical history Record results and triage appropriately
An example of workload scenario for ThinPrep Pap slides using the ThinPrep Imaging System: 100 FOV review only = 50 slides (100 x 0.5 = 50) 30 FOV review + FMR = 45 slides (30 x 1.5 = 45) Total number of slides screened = 95 (50 FOV only and 45 FOV + FMR)
Note: ALL laboratories should have a clear standard operation procedure for documentation of their method of workload counting and for establishing workload limits.
It is the responsibility of the Technical Supervisor to evaluate and set workload limits for individual cytotechnologists based on laboratory clinical performance.
According to CLIA ’88, these workload limits should be reassessed every six months.
For less than an 8-hour workday, the following formula must be applied to determine the maximum number of slides to be reviewed during that workday:
8
100
The manual workload limit does not supercede the CLIA requirement of 100 slides in a 24-hour period in no less than an 8-hour day. Manual review includes the following types of slides:
Slides reviewed on the ThinPrep Imaging System using the Autoscan feature Slides reviewed without the ThinPrep Imaging System Non–gynecologic slides.
When conducting manual review, refer to the CLIA requirements for calculating workload limits.
G.6 THINPREP IMAGING SYSTEM USE WITH THINPREP 5000 PROCESSOR
A study was conducted to estimate the Positive Percent Agreement (PPA) and Negative Percent Agreement (NPA) for Imager-assisted review as compared with manual review of specimens processed on the ThinPrep 5000 processor.
MAN-03938-001 Rev. 002 page 15 of 23
Clinical Study Design The study was a prospective, multi-center, blinded evaluation of ThinPrep slides of known diagnoses generated from residual cytological specimens which were prepared, reviewed and adjudicated in a previous study.
One thousand two hundred sixty (1260) slides were prepared on a ThinPrep 5000 processor and were reviewed independently by a Cytotechnologist and confirmed by a Pathologist. All cytologic diagnoses were determined in accordance with the Bethesda System 2001 criteria for all slides1. The study was conducted at Hologic, Inc., Marlborough, MA and at two external laboratories in the United States.
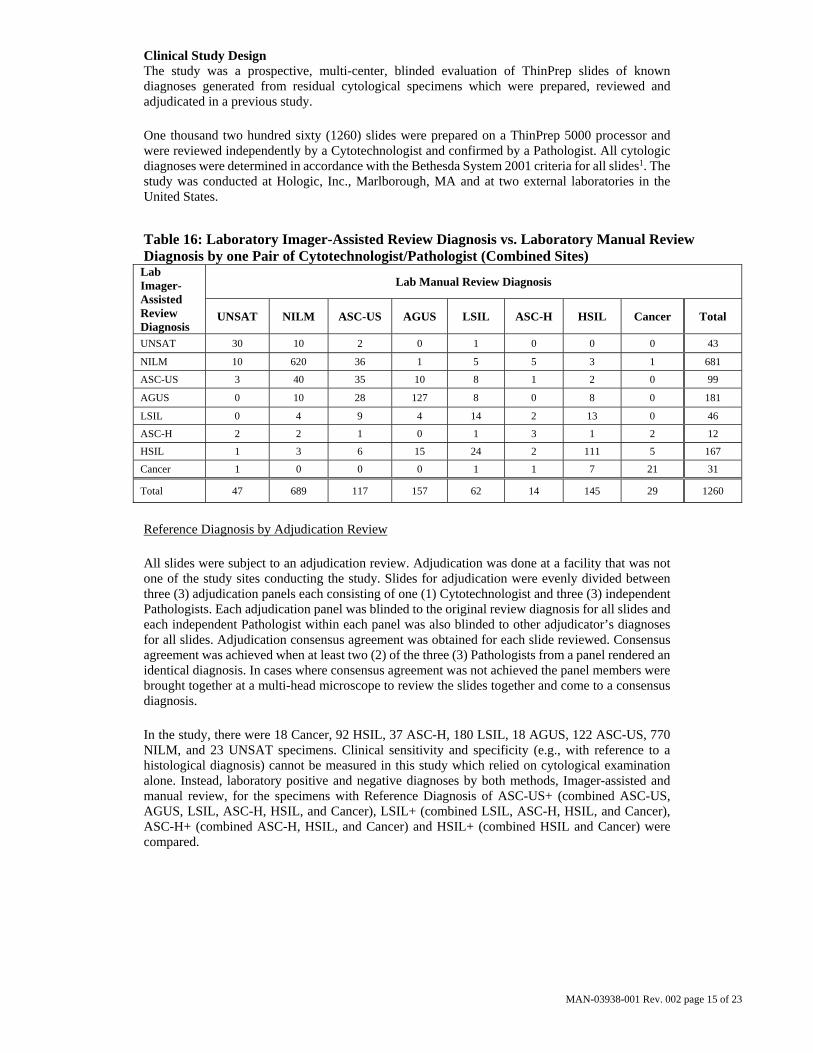
Table 16: Laboratory Imager-Assisted Review Diagnosis vs. Laboratory Manual Review Diagnosis by one Pair of Cytotechnologist/Pathologist (Combined Sites)
Lab Imager-Assisted Review Diagnosis
Lab Manual Review Diagnosis
UNSAT NILM ASC-US AGUS LSIL ASC-H HSIL Cancer Total
UNSAT 30 10 2 0 1 0 0 0 43
NILM 10 620 36 1 5 5 3 1 681
ASC-US 3 40 35 10 8 1 2 0 99
AGUS 0 10 28 127 8 0 8 0 181
LSIL 0 4 9 4 14 2 13 0 46
ASC-H 2 2 1 0 1 3 1 2 12
HSIL 1 3 6 15 24 2 111 5 167
Cancer 1 0 0 0 1 1 7 21 31
Total 47 689 117 157 62 14 145 29 1260
Reference Diagnosis by Adjudication Review
All slides were subject to an adjudication review. Adjudication was done at a facility that was not one of the study sites conducting the study. Slides for adjudication were evenly divided between three (3) adjudication panels each consisting of one (1) Cytotechnologist and three (3) independent Pathologists. Each adjudication panel was blinded to the original review diagnosis for all slides and each independent Pathologist within each panel was also blinded to other adjudicator’s diagnoses for all slides. Adjudication consensus agreement was obtained for each slide reviewed. Consensus agreement was achieved when at least two (2) of the three (3) Pathologists from a panel rendered an identical diagnosis. In cases where consensus agreement was not achieved the panel members were brought together at a multi-head microscope to review the slides together and come to a consensus diagnosis.
In the study, there were 18 Cancer, 92 HSIL, 37 ASC-H, 180 LSIL, 18 AGUS, 122 ASC-US, 770 NILM, and 23 UNSAT specimens. Clinical sensitivity and specificity (e.g., with reference to a histological diagnosis) cannot be measured in this study which relied on cytological examination alone. Instead, laboratory positive and negative diagnoses by both methods, Imager-assisted and manual review, for the specimens with Reference Diagnosis of ASC-US+ (combined ASC-US, AGUS, LSIL, ASC-H, HSIL, and Cancer), LSIL+ (combined LSIL, ASC-H, HSIL, and Cancer), ASC-H+ (combined ASC-H, HSIL, and Cancer) and HSIL+ (combined HSIL and Cancer) were compared.
MAN-03938-001 Rev. 002 page 16 of 23
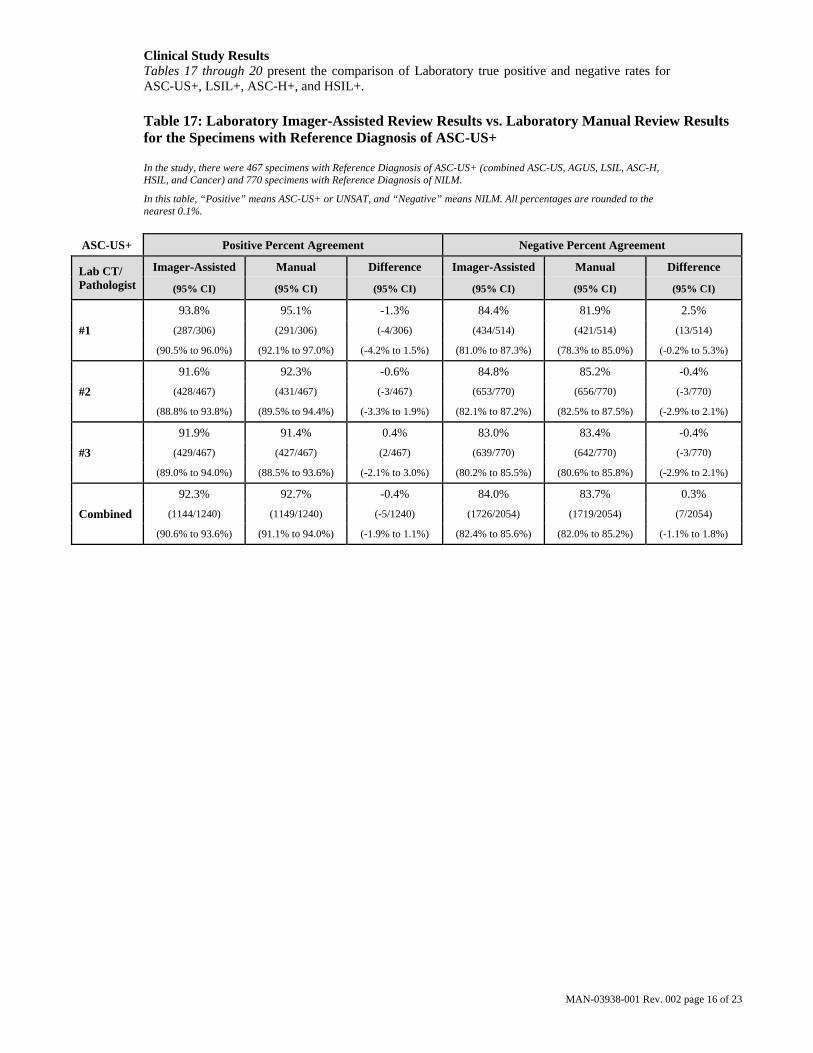
Clinical Study Results Tables 17 through 20 present the comparison of Laboratory true positive and negative rates for ASC-US+, LSIL+, ASC-H+, and HSIL+.
Table 17: Laboratory Imager-Assisted Review Results vs. Laboratory Manual Review Results for the Specimens with Reference Diagnosis of ASC-US+
In the study, there were 467 specimens with Reference Diagnosis of ASC-US+ (combined ASC-US, AGUS, LSIL, ASC-H, HSIL, and Cancer) and 770 specimens with Reference Diagnosis of NILM.
In this table, “Positive” means ASC-US+ or UNSAT, and “Negative” means NILM. All percentages are rounded to the nearest 0.1%.
ASC-US+ Positive Percent Agreement Negative Percent Agreement
Lab CT/ Pathologist
Imager-Assisted Manual Difference Imager-Assisted Manual Difference
(95% CI) (95% CI) (95% CI) (95% CI) (95% CI) (95% CI)
93.8% 95.1% -1.3% 84.4% 81.9% 2.5%
#1 (287/306) (291/306) (-4/306) (434/514) (421/514) (13/514)
(90.5% to 96.0%) (92.1% to 97.0%) (-4.2% to 1.5%) (81.0% to 87.3%) (78.3% to 85.0%) (-0.2% to 5.3%)
91.6% 92.3% -0.6% 84.8% 85.2% -0.4%
#2 (428/467) (431/467) (-3/467) (653/770) (656/770) (-3/770)
(88.8% to 93.8%) (89.5% to 94.4%) (-3.3% to 1.9%) (82.1% to 87.2%) (82.5% to 87.5%) (-2.9% to 2.1%)
91.9% 91.4% 0.4% 83.0% 83.4% -0.4%
#3 (429/467) (427/467) (2/467) (639/770) (642/770) (-3/770)
(89.0% to 94.0%) (88.5% to 93.6%) (-2.1% to 3.0%) (80.2% to 85.5%) (80.6% to 85.8%) (-2.9% to 2.1%)
92.3% 92.7% -0.4% 84.0% 83.7% 0.3%
Combined (1144/1240) (1149/1240) (-5/1240) (1726/2054) (1719/2054) (7/2054)
(90.6% to 93.6%) (91.1% to 94.0%) (-1.9% to 1.1%) (82.4% to 85.6%) (82.0% to 85.2%) (-1.1% to 1.8%)
MAN-03938-001 Rev. 002 page 17 of 23
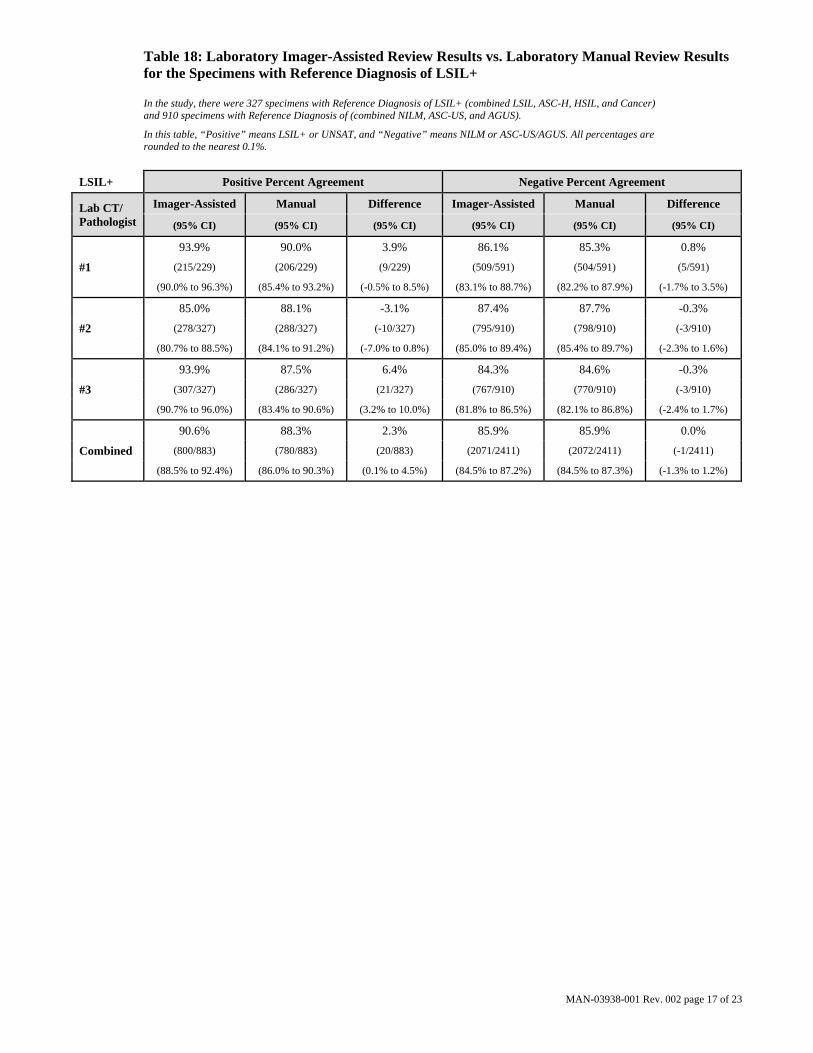
Table 18: Laboratory Imager-Assisted Review Results vs. Laboratory Manual Review Results for the Specimens with Reference Diagnosis of LSIL+
In the study, there were 327 specimens with Reference Diagnosis of LSIL+ (combined LSIL, ASC-H, HSIL, and Cancer) and 910 specimens with Reference Diagnosis of (combined NILM, ASC-US, and AGUS).
In this table, “Positive” means LSIL+ or UNSAT, and “Negative” means NILM or ASC-US/AGUS. All percentages are rounded to the nearest 0.1%.
LSIL+ Positive Percent Agreement Negative Percent Agreement
Lab CT/ Pathologist
Imager-Assisted Manual Difference Imager-Assisted Manual Difference
(95% CI) (95% CI) (95% CI) (95% CI) (95% CI) (95% CI)
93.9% 90.0% 3.9% 86.1% 85.3% 0.8%
#1 (215/229) (206/229) (9/229) (509/591) (504/591) (5/591)
(90.0% to 96.3%) (85.4% to 93.2%) (-0.5% to 8.5%) (83.1% to 88.7%) (82.2% to 87.9%) (-1.7% to 3.5%)
85.0% 88.1% -3.1% 87.4% 87.7% -0.3%
#2 (278/327) (288/327) (-10/327) (795/910) (798/910) (-3/910)
(80.7% to 88.5%) (84.1% to 91.2%) (-7.0% to 0.8%) (85.0% to 89.4%) (85.4% to 89.7%) (-2.3% to 1.6%)
93.9% 87.5% 6.4% 84.3% 84.6% -0.3%
#3 (307/327) (286/327) (21/327) (767/910) (770/910) (-3/910)
(90.7% to 96.0%) (83.4% to 90.6%) (3.2% to 10.0%) (81.8% to 86.5%) (82.1% to 86.8%) (-2.4% to 1.7%)
90.6% 88.3% 2.3% 85.9% 85.9% 0.0%
Combined (800/883) (780/883) (20/883) (2071/2411) (2072/2411) (-1/2411)
(88.5% to 92.4%) (86.0% to 90.3%) (0.1% to 4.5%) (84.5% to 87.2%) (84.5% to 87.3%) (-1.3% to 1.2%)

MAN-03938-001 Rev. 002 page 18 of 23
Table 19: Laboratory Imager-Assisted Review Results vs. Laboratory Manual Review Results for the Specimens with Reference Diagnosis of ASC-H+
In the study, there were 147 specimens with Reference Diagnosis of ASC-H+ (combined ASC-H, HSIL, and Cancer) and 1,090 specimens with Reference Diagnosis of (combined NILM, ASC-US/AGUS, and LSIL).
In this table, “Positive” means ASC-H+ or UNSAT, and “Negative” means NILM, ASC-US/AGUS, or LSIL. All percentages are rounded to the nearest 0.1%.
ASC-H+ Positive Percent Agreement Negative Percent Agreement
Lab CT/ Pathologist
Imaged Manual Difference Imaged Manual Difference
(95% CI) (95% CI) (95% CI) (95% CI) (95% CI) (95% CI)
93.7% 88.3% 5.4% 86.7% 86.7% 0.0%
#1 (104/111) (98/111) (6/111) (615/709) (615/709) (0/709)
(87.6% to 96.9%) (81.0% to 93.0%) (-0.6% to 12.0%) (84.0% to 89.0%) (84.0% to 89.0%) (-2.2% to 2.2%)
86.4% 86.4% 0.0% 89.4% 89.4% -0.1%
#2 (127/147) (127/147) (0/147) (974/1090) (975/1090) (-1/1090)
(79.9% to 91.0%) (79.9% to 91.0%) (-6.8% to 6.8%) (87.4% to 91.1%) (87.5% to 91.1%) (-1.8% to 1.6%)
95.2% 89.8% 5.4% 88.2% 87.4% 0.7%
#3 (140/147) (132/147) (8/147) (961/1090) (953/1090) (8/1090)
(90.5% to 97.7%) (83.8% to 93.7%) (-0.1% to 11.4%) (86.1% to 90.0%) (85.3% to 89.3%) (-1.0% to 2.5%)
91.6% 88.1% 3.5% 88.3% 88.0% 0.2%
Combined (371/405) (357/405) (14/405) (2550/2889) (2543/2889) (7/2889)
(88.5% to 93.9%) (84.6% to 90.9%) (0.0% to 7.0%) (87.0% to 89.4%) (86.8% to 89.2%) (-0.8% to 1.3%)
MAN-03938-001 Rev. 002 page 19 of 23
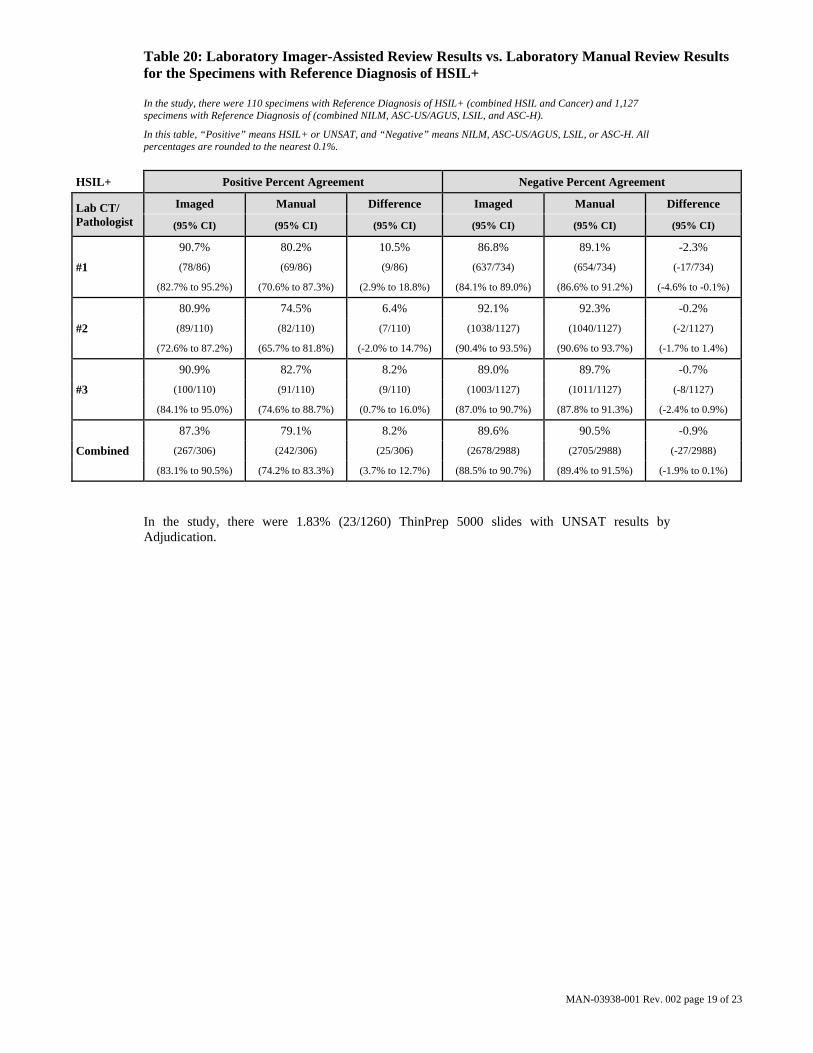
Table 20: Laboratory Imager-Assisted Review Results vs. Laboratory Manual Review Results for the Specimens with Reference Diagnosis of HSIL+
In the study, there were 110 specimens with Reference Diagnosis of HSIL+ (combined HSIL and Cancer) and 1,127 specimens with Reference Diagnosis of (combined NILM, ASC-US/AGUS, LSIL, and ASC-H).
In this table, “Positive” means HSIL+ or UNSAT, and “Negative” means NILM, ASC-US/AGUS, LSIL, or ASC-H. All percentages are rounded to the nearest 0.1%.
HSIL+ Positive Percent Agreement Negative Percent Agreement
Lab CT/ Pathologist
Imaged Manual Difference Imaged Manual Difference
(95% CI) (95% CI) (95% CI) (95% CI) (95% CI) (95% CI)
90.7% 80.2% 10.5% 86.8% 89.1% -2.3%
#1 (78/86) (69/86) (9/86) (637/734) (654/734) (-17/734)
(82.7% to 95.2%) (70.6% to 87.3%) (2.9% to 18.8%) (84.1% to 89.0%) (86.6% to 91.2%) (-4.6% to -0.1%)
80.9% 74.5% 6.4% 92.1% 92.3% -0.2%
#2 (89/110) (82/110) (7/110) (1038/1127) (1040/1127) (-2/1127)
(72.6% to 87.2%) (65.7% to 81.8%) (-2.0% to 14.7%) (90.4% to 93.5%) (90.6% to 93.7%) (-1.7% to 1.4%)
90.9% 82.7% 8.2% 89.0% 89.7% -0.7%
#3 (100/110) (91/110) (9/110) (1003/1127) (1011/1127) (-8/1127)
(84.1% to 95.0%) (74.6% to 88.7%) (0.7% to 16.0%) (87.0% to 90.7%) (87.8% to 91.3%) (-2.4% to 0.9%)
87.3% 79.1% 8.2% 89.6% 90.5% -0.9%
Combined (267/306) (242/306) (25/306) (2678/2988) (2705/2988) (-27/2988)
(83.1% to 90.5%) (74.2% to 83.3%) (3.7% to 12.7%) (88.5% to 90.7%) (89.4% to 91.5%) (-1.9% to 0.1%)
In the study, there were 1.83% (23/1260) ThinPrep 5000 slides with UNSAT results by Adjudication.
MAN-03938-001 Rev. 002 page 20 of 23
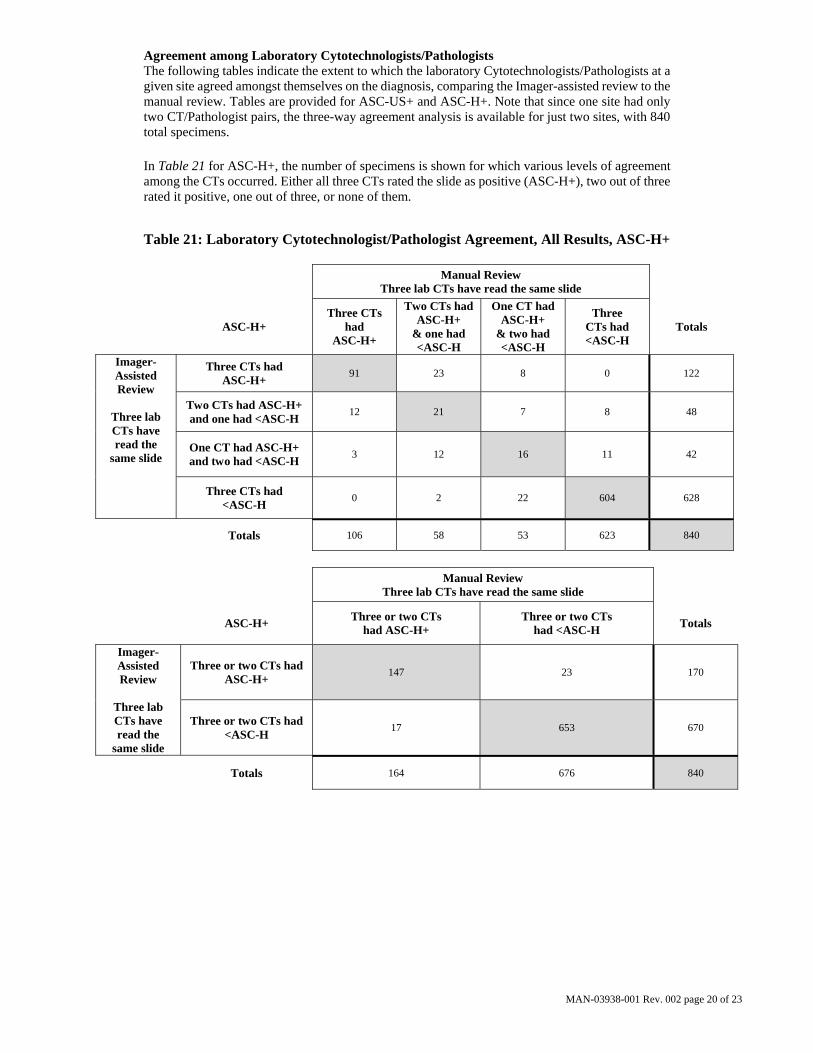
Agreement among Laboratory Cytotechnologists/Pathologists The following tables indicate the extent to which the laboratory Cytotechnologists/Pathologists at a given site agreed amongst themselves on the diagnosis, comparing the Imager-assisted review to the manual review. Tables are provided for ASC-US+ and ASC-H+. Note that since one site had only two CT/Pathologist pairs, the three-way agreement analysis is available for just two sites, with 840 total specimens.
In Table 21 for ASC-H+, the number of specimens is shown for which various levels of agreement among the CTs occurred. Either all three CTs rated the slide as positive (ASC-H+), two out of three rated it positive, one out of three, or none of them.
Table 21: Laboratory Cytotechnologist/Pathologist Agreement, All Results, ASC-H+
Manual Review Three lab CTs have read the same slide
ASC-H+
Three CTs had
ASC-H+
Two CTs had ASC-H+
& one had <ASC-H
One CT had ASC-H+
& two had <ASC-H
Three CTs had <ASC-H
Totals
Imager-Assisted Review
Three lab CTs have read the
same slide
Three CTs had ASC-H+
91 23 8 0 122
Two CTs had ASC-H+ and one had <ASC-H
12 21 7 8 48
One CT had ASC-H+ and two had <ASC-H
3 12 16 11 42
Three CTs had <ASC-H
0 2 22 604 628
Totals 106 58 53 623 840
Manual Review
Three lab CTs have read the same slide
ASC-H+
Three or two CTs had ASC-H+
Three or two CTs had <ASC-H
Totals
Imager-Assisted Review
Three lab CTs have read the
same slide
Three or two CTs had ASC-H+
147 23 170
Three or two CTs had <ASC-H
17 653 670
Totals 164 676 840
MAN-03938-001 Rev. 002 page 21 of 23
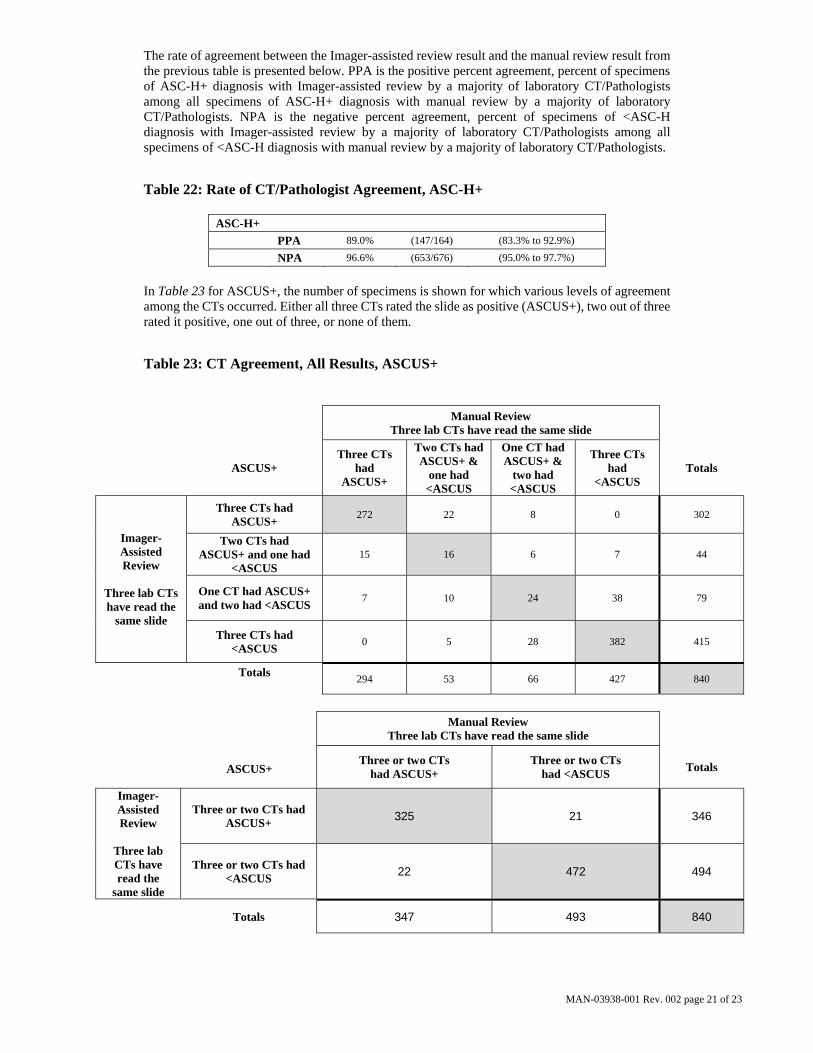
The rate of agreement between the Imager-assisted review result and the manual review result from the previous table is presented below. PPA is the positive percent agreement, percent of specimens of ASC-H+ diagnosis with Imager-assisted review by a majority of laboratory CT/Pathologists among all specimens of ASC-H+ diagnosis with manual review by a majority of laboratory CT/Pathologists. NPA is the negative percent agreement, percent of specimens of <ASC-H diagnosis with Imager-assisted review by a majority of laboratory CT/Pathologists among all specimens of <ASC-H diagnosis with manual review by a majority of laboratory CT/Pathologists.
Table 22: Rate of CT/Pathologist Agreement, ASC-H+
ASC-H+
PPA 89.0% (147/164) (83.3% to 92.9%)
NPA 96.6% (653/676) (95.0% to 97.7%)
In Table 23 for ASCUS+, the number of specimens is shown for which various levels of agreement among the CTs occurred. Either all three CTs rated the slide as positive (ASCUS+), two out of three rated it positive, one out of three, or none of them.
Table 23: CT Agreement, All Results, ASCUS+
Manual Review Three lab CTs have read the same slide
ASCUS+
Three CTs had
ASCUS+
Two CTs had ASCUS+ &
one had <ASCUS
One CT had ASCUS+ &
two had <ASCUS
Three CTs had
<ASCUS Totals
Imager-Assisted Review
Three lab CTs have read the
same slide
Three CTs had ASCUS+
272 22 8 0 302
Two CTs had ASCUS+ and one had
<ASCUS 15 16 6 7 44
One CT had ASCUS+ and two had <ASCUS
7 10 24 38 79
Three CTs had <ASCUS
0 5 28 382 415
Totals
294 53 66 427 840
Manual Review
Three lab CTs have read the same slide
ASCUS+
Three or two CTs had ASCUS+
Three or two CTs had <ASCUS
Totals
Imager-Assisted Review
Three lab CTs have read the
same slide
Three or two CTs had ASCUS+
325 21 346
Three or two CTs had <ASCUS
22 472 494
Totals 347 493 840

MAN-03938-001 Rev. 002 page 22 of 23
The rate of agreement between the Imager-assisted review result and the manual review result from the previous table is presented below. PPA is the positive percent agreement, percent of specimens of ASCUS+ diagnosis with Imager-assisted review by a majority of laboratory CT/Pathologists among all specimens of ASCUS+ diagnosis with manual review by a majority of laboratory CT/Pathologists. NPA is the negative percent agreement, percent of specimens of <ASCUS diagnosis with Imager-assisted review by a majority of laboratory CT/Pathologists among all specimens of <ASCUS diagnosis with manual review by a majority of laboratory CT/Pathologists.
Table 24: Rate of CT Agreement, ASCUS+
ASCUS+
PPA 93.7% (325/347) (90.6% to 95.8%)
NPA 95.7% (472/493) (93.6% to 97.2%)
H. Clinical Investigation Conclusions For all sites combined for ASCUS+, the improvement in sensitivity of the Imager Review
method over the Manual Review method is statistically significant. This increase is 6.4% with a 95% confidence interval of 2.6% to 10.0% for all sites combined. The differences in sensitivity varied among the sites from –2.8% to +14.4%. For LSIL+ and HSIL+ the sensitivity of the Imager Review method is equivalent to the Manual Review method.
For all sites combined for HSIL+, the improvement in specificity of the Imager Review method over the Manual Review method is statistically significant. This increase is 0.2% with a 95% confidence interval of 0.06% to 0.4% for all sites combined. The differences in specificity varied among the sites from –0.1% to +0.7%. For ASCUS+ and LSIL+ the specificity of the Imager Review method is equivalent to the Manual Review method.
Specimen adequacy can be determined using the method described in Bethesda System 2001 or by having the Cytotechnologist count the cells in the 22 fields of view presented by the Imager.
The workload limit for the ThinPrep Imaging System has been established at 200 slides in no less than an 8-hour workday. This workload limit of 200 slides includes the time spent for manual review of slides that is not to exceed 100 slides in an 8 hour workday.
For these clinical sites and these study populations, the data from the clinical trial and clinical support studies demonstrate that the use of the ThinPrep Imaging System to assist during primary screening of ThinPrep Pap Test slides for all cytologic interpretations, as defined by the Bethesda System, is safe and effective for the detection of cervical abnormalities. Performance may vary from site to site as a result of differences in patient populations and reading practices. As a result each laboratory using this device should employ quality assurance and control systems to ensure proper use and selection of appropriate workload limits.

MAN-03938-001 Rev. 002 page 23 of 23
I. Bibliography
1. Solomon D., Davey D, Kurman R, Moriarty A, O’Connor D, Prey M, Raab S, Sherman M, Wilbur D, Wright T, Young N, for the Forum Group Members and the 2001 Bethesda Workshop. The 2001 Bethesda System Terminology for Reporting Results of Cervical Cancer. JAMA. 2002;287:2114-2119.
2. Kurman RJ, Solomon D. The Bethesda System for Reporting Cervical/Vaginal Cytologic Diagnoses. Springer-Verlag 1994.
3. Schafer, J.L. Multiple imputation: a primer. Statistical Methods in Medical Research, 1999, 8:3-15.
4. National Cancer Institute. SEER Cancer Statistics Review 1973-1998. Available at: http://www.seer.cancer.gov. Accessed February 2002.
Hologic, Inc. 250 Campus Drive Marlborough, MA 01752 USA 1-800- 442-9892 www. hologic.com
AW-12515-001 Rev. 001
© 2015 Hologic, Inc. All rights reserved.

Table o
f Co
nten
ts Tab
le o
f C
on
ten
ts
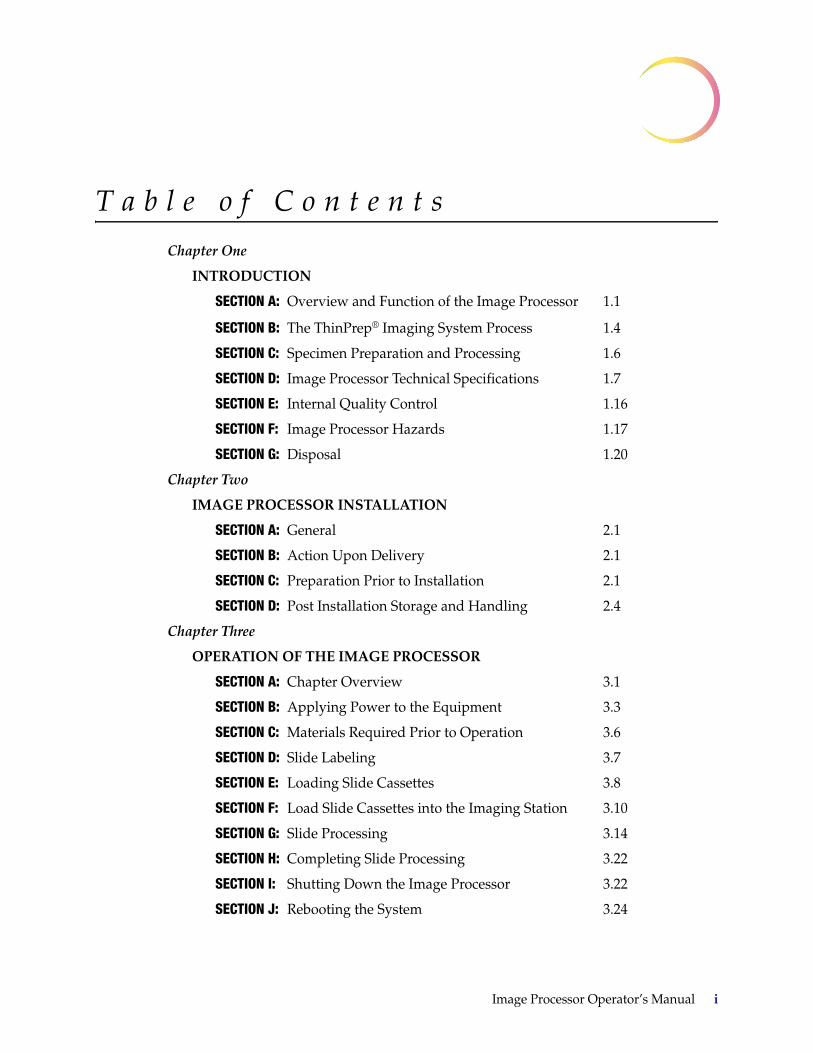
T a b l e o f C o n t e n t s
Chapter One
INTRODUCTION
SECTION A: Overview and Function of the Image Processor 1.1
SECTION B: The ThinPrep® Imaging System Process 1.4
SECTION C: Specimen Preparation and Processing 1.6
SECTION D: Image Processor Technical Specifications 1.7
SECTION E: Internal Quality Control 1.16
SECTION F: Image Processor Hazards 1.17
SECTION G: Disposal 1.20
Chapter Two
IMAGE PROCESSOR INSTALLATION
SECTION A: General 2.1
SECTION B: Action Upon Delivery 2.1
SECTION C: Preparation Prior to Installation 2.1
SECTION D: Post Installation Storage and Handling 2.4
Chapter Three
OPERATION OF THE IMAGE PROCESSOR
SECTION A: Chapter Overview 3.1
SECTION B: Applying Power to the Equipment 3.3
SECTION C: Materials Required Prior to Operation 3.6
SECTION D: Slide Labeling 3.7
SECTION E: Loading Slide Cassettes 3.8
SECTION F: Load Slide Cassettes into the Imaging Station 3.10
SECTION G: Slide Processing 3.14
SECTION H: Completing Slide Processing 3.22
SECTION I: Shutting Down the Image Processor 3.22
SECTION J: Rebooting the System 3.24
Image Processor Operator’s Manual i
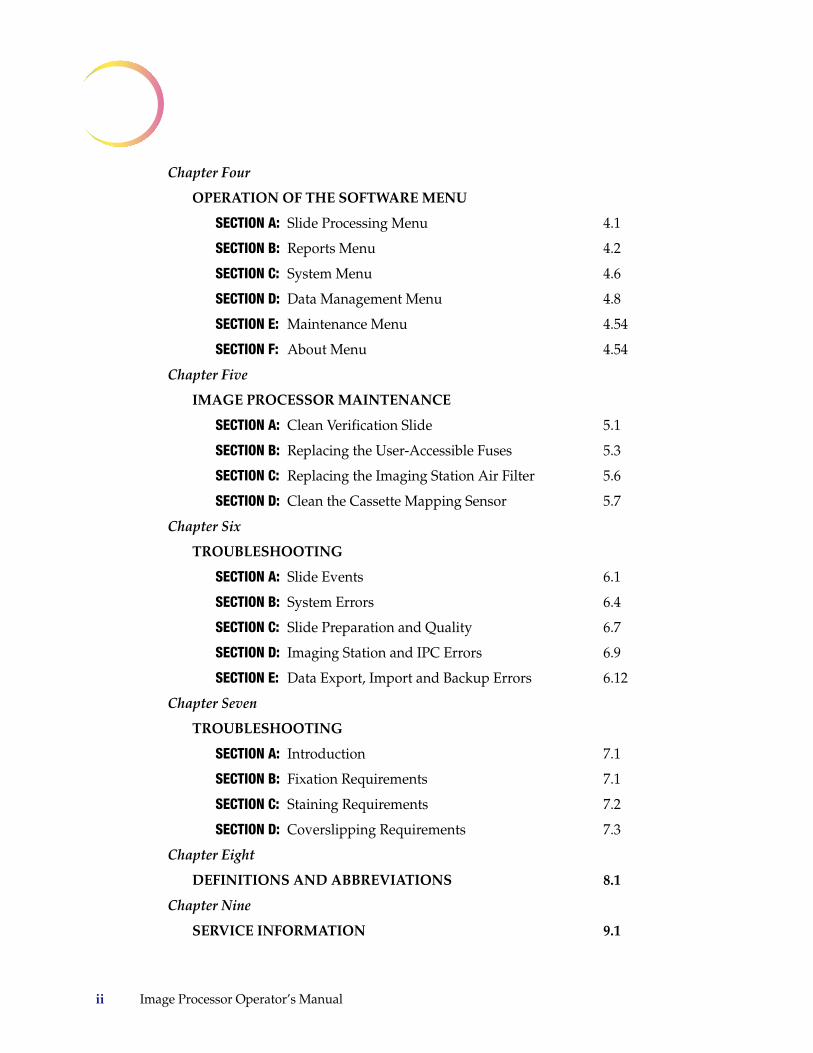
Chapter Four
OPERATION OF THE SOFTWARE MENU
SECTION A: Slide Processing Menu 4.1
SECTION B: Reports Menu 4.2
SECTION C: System Menu 4.6
SECTION D: Data Management Menu 4.8
SECTION E: Maintenance Menu 4.54
SECTION F: About Menu 4.54
Chapter Five
IMAGE PROCESSOR MAINTENANCE
SECTION A: Clean Verification Slide 5.1
SECTION B: Replacing the User-Accessible Fuses 5.3
SECTION C: Replacing the Imaging Station Air Filter 5.6
SECTION D: Clean the Cassette Mapping Sensor 5.7
Chapter Six
TROUBLESHOOTING
SECTION A: Slide Events 6.1
SECTION B: System Errors 6.4
SECTION C: Slide Preparation and Quality 6.7
SECTION D: Imaging Station and IPC Errors 6.9
SECTION E: Data Export, Import and Backup Errors 6.12
Chapter Seven
TROUBLESHOOTING
SECTION A: Introduction 7.1
SECTION B: Fixation Requirements 7.1
SECTION C: Staining Requirements 7.2
SECTION D: Coverslipping Requirements 7.3
Chapter Eight
DEFINITIONS AND ABBREVIATIONS 8.1
Chapter Nine
SERVICE INFORMATION 9.1
ii Image Processor Operator’s Manual
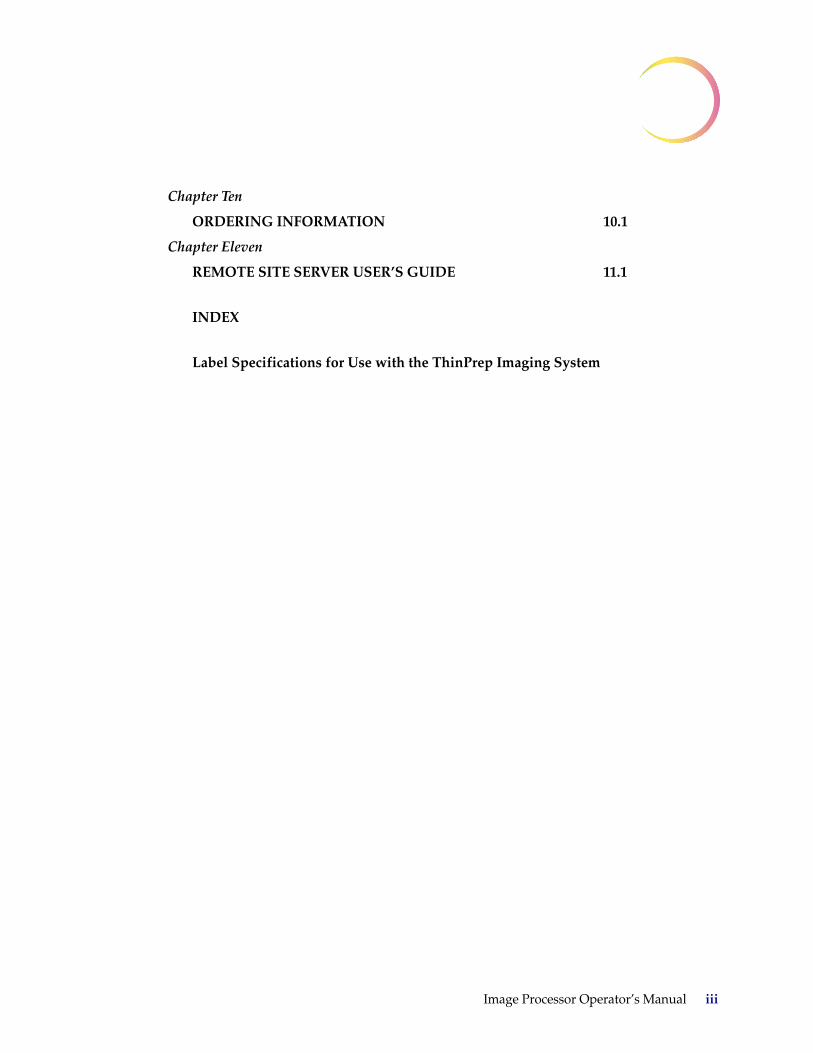
Chapter Ten
ORDERING INFORMATION 10.1
Chapter Eleven
REMOTE SITE SERVER USER’S GUIDE 11.1
INDEX
Label Specifications for Use with the ThinPrep Imaging System
Image Processor Operator’s Manual iii

This page intentionally left blank.
iv Image Processor Operator’s Manual

1. Intro
du
ction
1. In
tro
du
ctio
n
INTRODUCTION 1
C h a p t e r O n e
Introduction
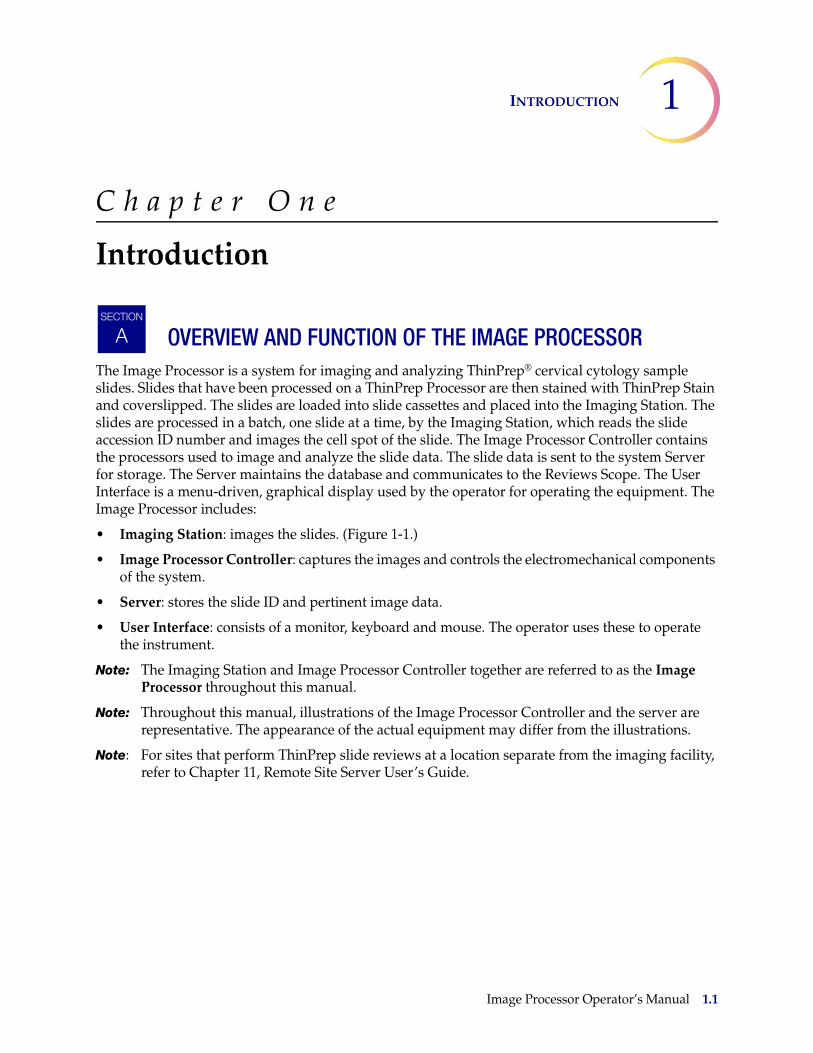
OVERVIEW AND FUNCTION OF THE IMAGE PROCESSORThe Image Processor is a system for imaging and analyzing ThinPrep® cervical cytology sample slides. Slides that have been processed on a ThinPrep Processor are then stained with ThinPrep Stain and coverslipped. The slides are loaded into slide cassettes and placed into the Imaging Station. The slides are processed in a batch, one slide at a time, by the Imaging Station, which reads the slide accession ID number and images the cell spot of the slide. The Image Processor Controller contains the processors used to image and analyze the slide data. The slide data is sent to the system Server for storage. The Server maintains the database and communicates to the Reviews Scope. The User Interface is a menu-driven, graphical display used by the operator for operating the equipment. The Image Processor includes:
• Imaging Station: images the slides. (Figure 1-1.)
• Image Processor Controller: captures the images and controls the electromechanical components of the system.
• Server: stores the slide ID and pertinent image data.
• User Interface: consists of a monitor, keyboard and mouse. The operator uses these to operate the instrument.
Note: The Imaging Station and Image Processor Controller together are referred to as the Image Processor throughout this manual.
Note: Throughout this manual, illustrations of the Image Processor Controller and the server are representative. The appearance of the actual equipment may differ from the illustrations.
Note: For sites that perform ThinPrep slide reviews at a location separate from the imaging facility, refer to Chapter 11, Remote Site Server User’s Guide.
SECTION
A
Image Processor Operator’s Manual 1.1
1 INTRODUCTION
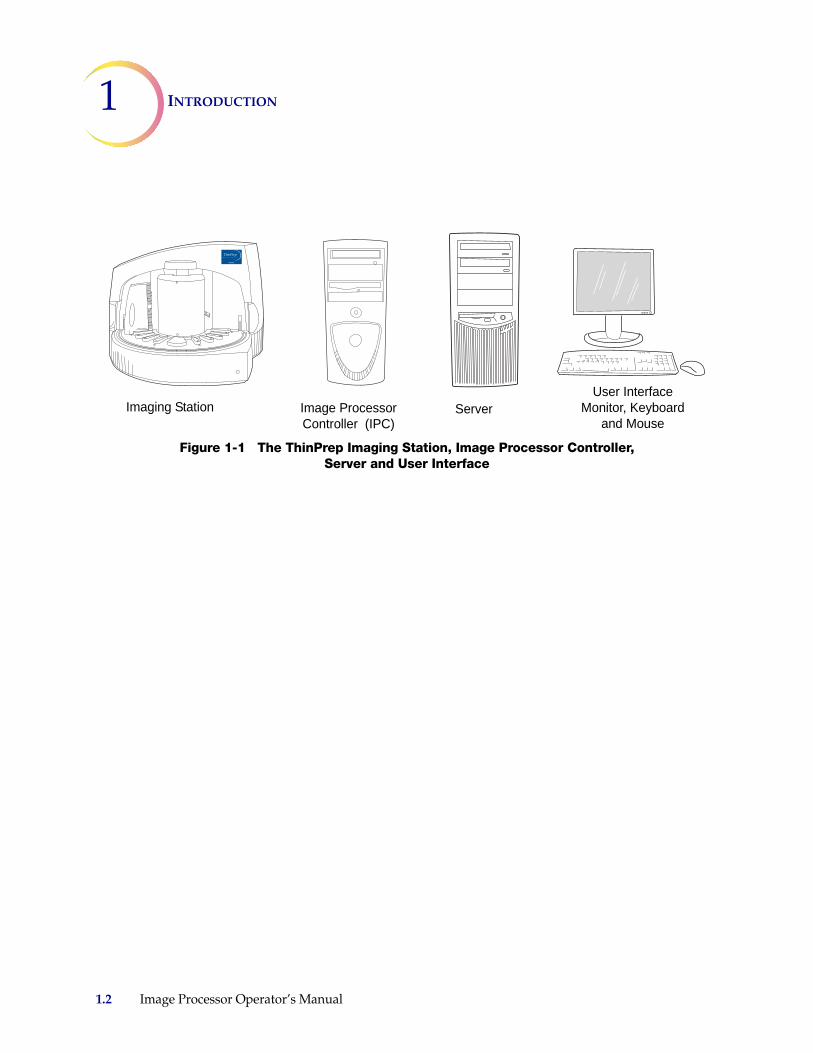
Figure 1-1 The ThinPrep Imaging Station, Image Processor Controller, Server and User Interface
Imaging StationUser Interface
Monitor, Keyboard and Mouse
Image Processor Controller (IPC)
Server
1.2 Image Processor Operator’s Manual
INTRODUCTION 1
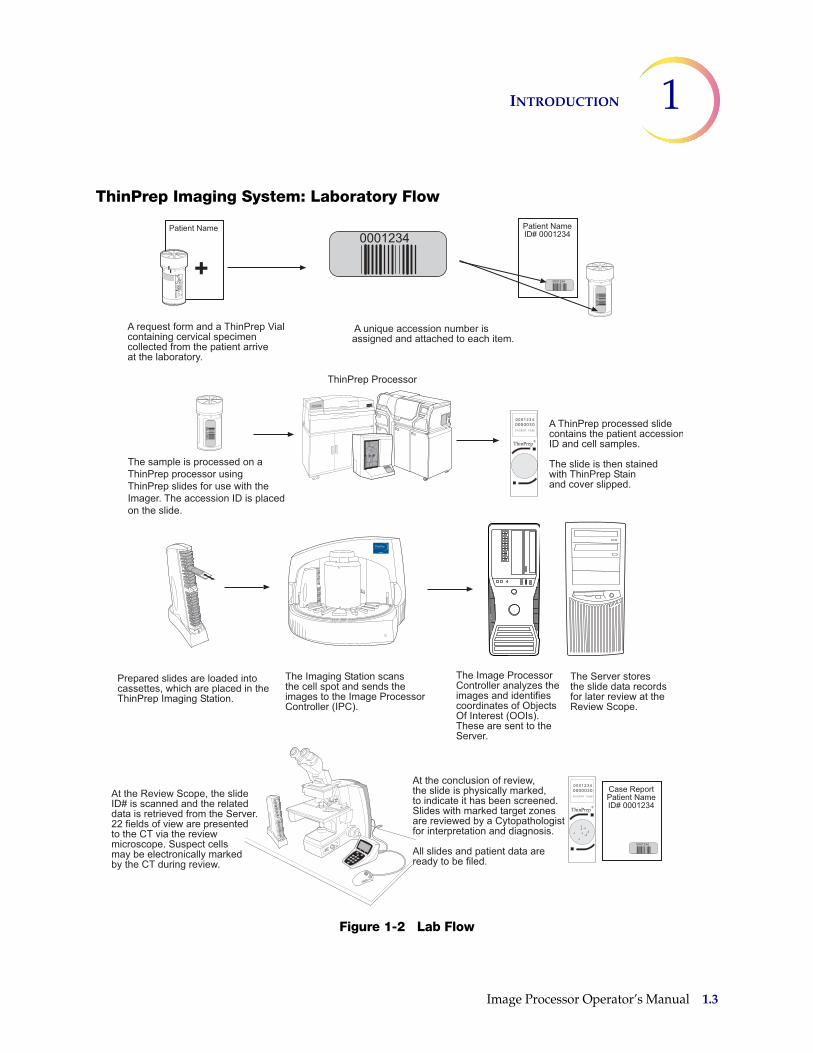
ThinPrep Imaging System: Laboratory Flow
Figure 1-2 Lab Flow
Image Processor Operator’s Manual 1.3
1 INTRODUCTION
THE THINPREP IMAGING SYSTEM PROCESSSlides that have been prepared for screening are loaded into cassettes which are placed into the Imaging Station. The operator uses a PC keyboard, mouse and monitor to interact with the instru-ment via a graphic, menu driven interface.
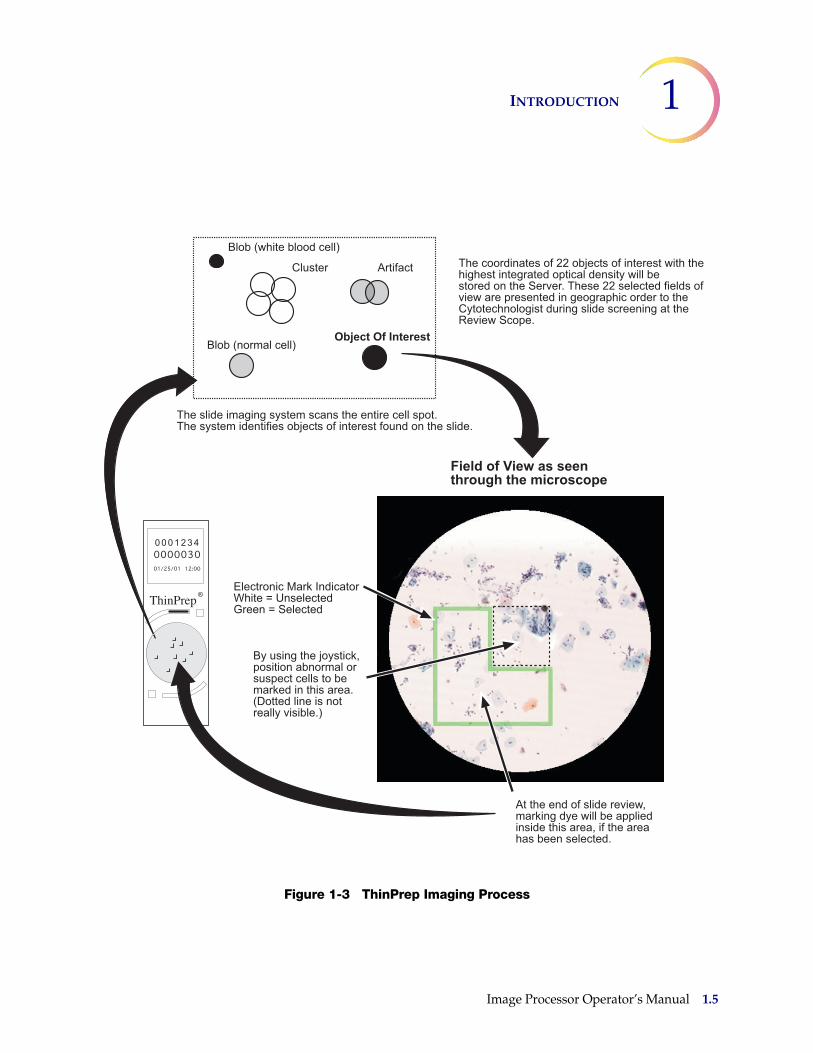
An optical character recognition (OCR) camera reads the slide accession ID and then the Imaging Station scans the entire ThinPrep cell spot. The system identifies objects of interest found on the slide, based on integrated optical density. (Refer to Figure 1-3, ThinPrep Imaging Process.) The coordinates of 22 of those objects are recorded and the slide is returned to its cassette. Following processing of each cassette of slides, the slide ID and associated data record are sent to the Server.
The Server acts as the central data manager for the ThinPrep Imaging System. As slides are imaged by the Image Processor and reviewed at the Review Scope, the Server stores, retrieves and transmits information based on the slide ID. For installations with multiple controllers, the server also controls the communication between all devices on the network. Some facilities only perform slide screening, and a Server is used at that location to import data (via CD) from an imaging site.
The Cytotechnologist (CT) reviews slides at the Review Scope (RS). The RS consists of elements of a standard microscope, augmented with automated capabilities for viewing and marking the micro-scope slides. The RS contains an OCR camera which reads the slide ID when a slide is loaded on the stage. When a valid slide accession ID has been identified at the RS, the Server sends the object of interest coordinates for that ID and the CT is presented with the 22 fields of view determined for that slide. It is required that the CT review each of these fields of view before completing a slide review.
As each field of view is being reviewed, the CT has the option to electronically mark the contents of the target zone for subsequent physical marking at completion of the slide review. The CT always has the option to control the position of the stage/slide manually, which provides complete freedom to move any portion of the cell spot into the field of view for examination.
Note: The CT must screen the entire field of each of the 22 fields of view presented.
Before completing the review, the CT may revisit any locations and electronically mark or unmark tar-get zones, as desired. At the conclusion of electronically marking the slide, physical marks are applied at those locations with semi-permanent translucent marker. A physical ‘slide reviewed mark’ is placed on the slide at the end of the review whether or not any physical marks were placed.
SECTION
B
1.4 Image Processor Operator’s Manual
INTRODUCTION 1
Figure 1-3 ThinPrep Imaging Process
Image Processor Operator’s Manual 1.5
1 INTRODUCTION
SPECIMEN PREPARATION AND PROCESSING
Specimens for the ThinPrep Pap Test cytology slide are collected by a clinician, then immersed and rinsed in a PreservCyt® Solution sample vial. The sample is then capped, labeled, and sent to a labo-ratory equipped with a ThinPrep Processor. After being processed, the slides are stained with Thin-Prep Stain and coverslipped.
Please refer to the operator’s manuals of these instruments for more information regarding prepara-tion and processing of ThinPrep slides. Please refer to the ThinPrep Stain User’s Manual for informa-tion regarding use of the stain and recommendations for coverslipping.
Special PrecautionsThere are conditions that might result in a slide not being successfully imaged. Some conditions may be prevented or corrected by following these guidelines.
• ThinPrep microscope slides with fiducial marks are being used. The fiducial marks should not be scratched or marred.
• The coverslip media is dry (wet media could cause equipment malfunction).• The slides are clean (no fingerprints, dust, debris, bubbles). Handle the slides by the edges.• The coverslip does not extend beyond the surface of the slide.• The label is applied smoothly, without overhang. (Lifted edges may stick during handling, caus-
ing broken slides or instrument malfunction.)• The slide is appropriately labeled for use with the ThinPrep Imaging System (refer to Chapter 3,
Section D, Slide Labeling, page 3.7).
SECTION
C
1.6 Image Processor Operator’s Manual
INTRODUCTION 1
Specimen IntegrityPreservCyt Solution with cytologic sample intended for ThinPrep Pap testing must be stored between 15°C (59°F) and 30°C (86°F) and tested within 6 weeks of collection.
Slides processed by a ThinPrep® Processor should be stained within 5 days.
Stained slides should be imaged by the Imager in a timely manner, according to normal laboratory practices. Imaging performance has not been assessed beyond 4 months.
Interfering SubstancesSpecimen sample - the use of lubricants (e.g., KY Jelly) should be minimized prior to specimen collec-tion. Lubricants can adhere to the filter membrane and may cause poor cell transfer to the slide.
Stain - do not substitute solutions for the ThinPrep Stain solutions. Follow the stain protocols exactly as they are written. Refer to the ThinPrep Stain User’s Manual.
Specimen HandlingThe ThinPrep slides are stored, transported and handled the same as conventional cytology slides. Please refer to your laboratory guidelines for specimen handling.
IMAGE PROCESSOR TECHNICAL SPECIFICATIONS
Overview of ComponentsRefer to Figures 1-4 to 1-13 for information regarding components and specifications.
SECTION
D
Image Processor Operator’s Manual 1.7
1 INTRODUCTION
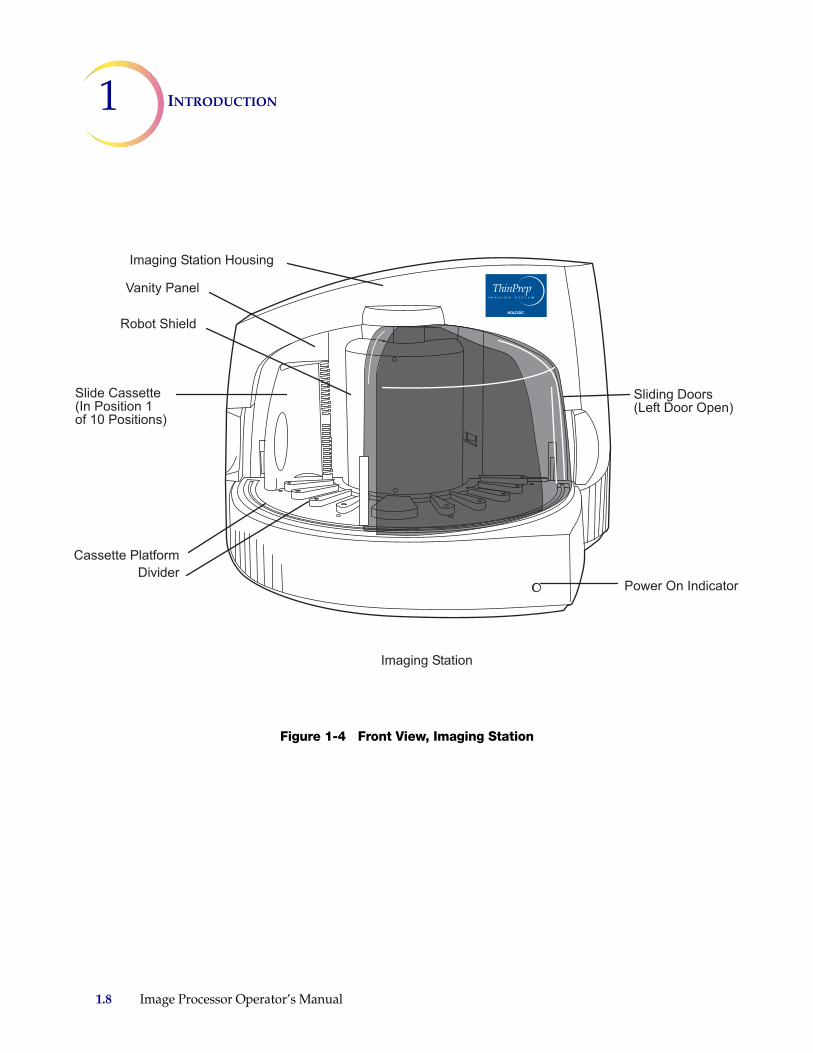
Figure 1-4 Front View, Imaging Station
1.8 Image Processor Operator’s Manual
INTRODUCTION 1
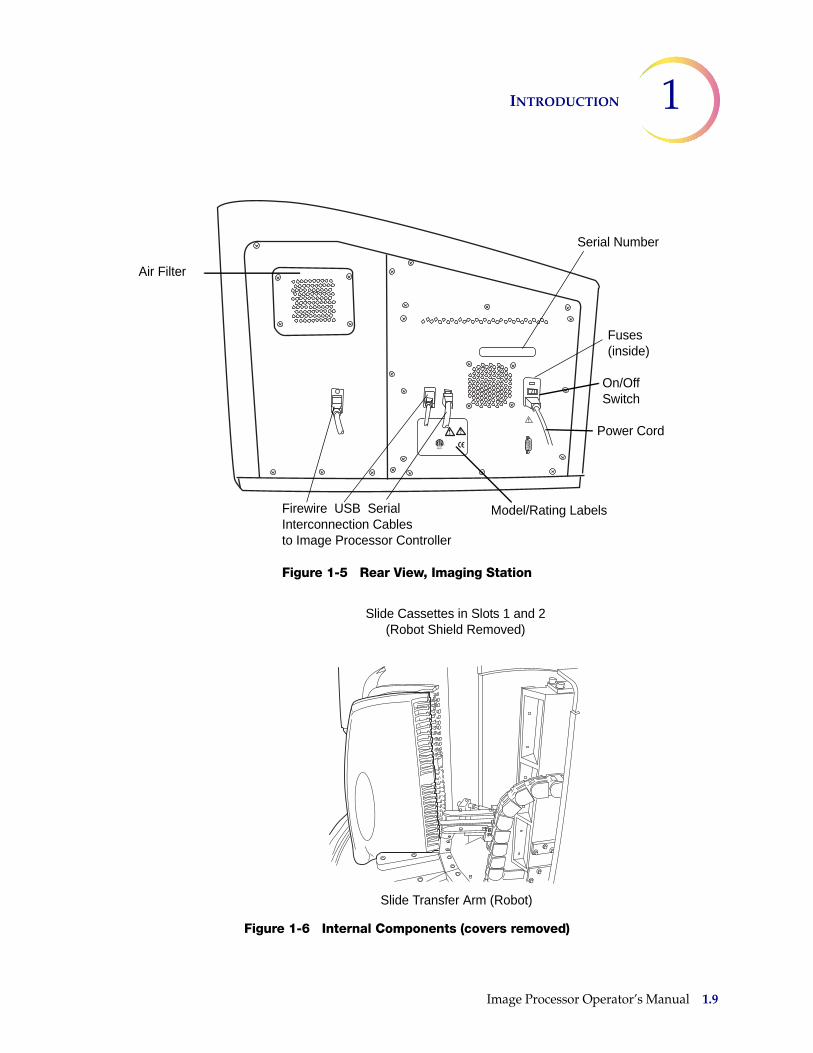
Figure 1-5 Rear View, Imaging Station
Figure 1-6 Internal Components (covers removed)
Fuses (inside)
On/Off Switch
Power Cord
Firewire USB SerialInterconnection Cablesto Image Processor Controller
Air Filter
Model/Rating Labels
Serial Number
Slide Cassettes in Slots 1 and 2(Robot Shield Removed)
Slide Transfer Arm (Robot)
Image Processor Operator’s Manual 1.9
1 INTRODUCTION
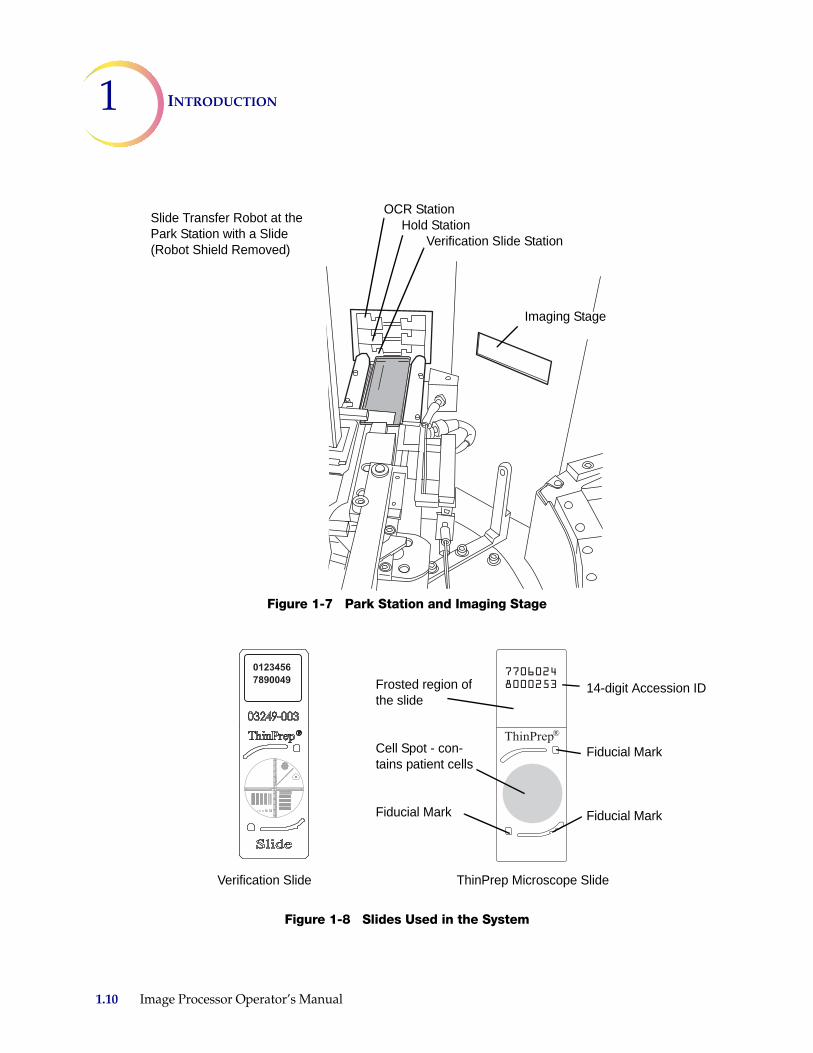
Figure 1-7 Park Station and Imaging Stage
Figure 1-8 Slides Used in the System
Slide Transfer Robot at the Park Station with a Slide (Robot Shield Removed)
OCR Station Hold Station Verification Slide Station
Imaging Stage
������������
Verification Slide ThinPrep Microscope Slide
14-digit Accession ID
Fiducial Mark
Fiducial Mark
Frosted region of the slide
Cell Spot - con-tains patient cells
Fiducial Mark
1.10 Image Processor Operator’s Manual
INTRODUCTION 1
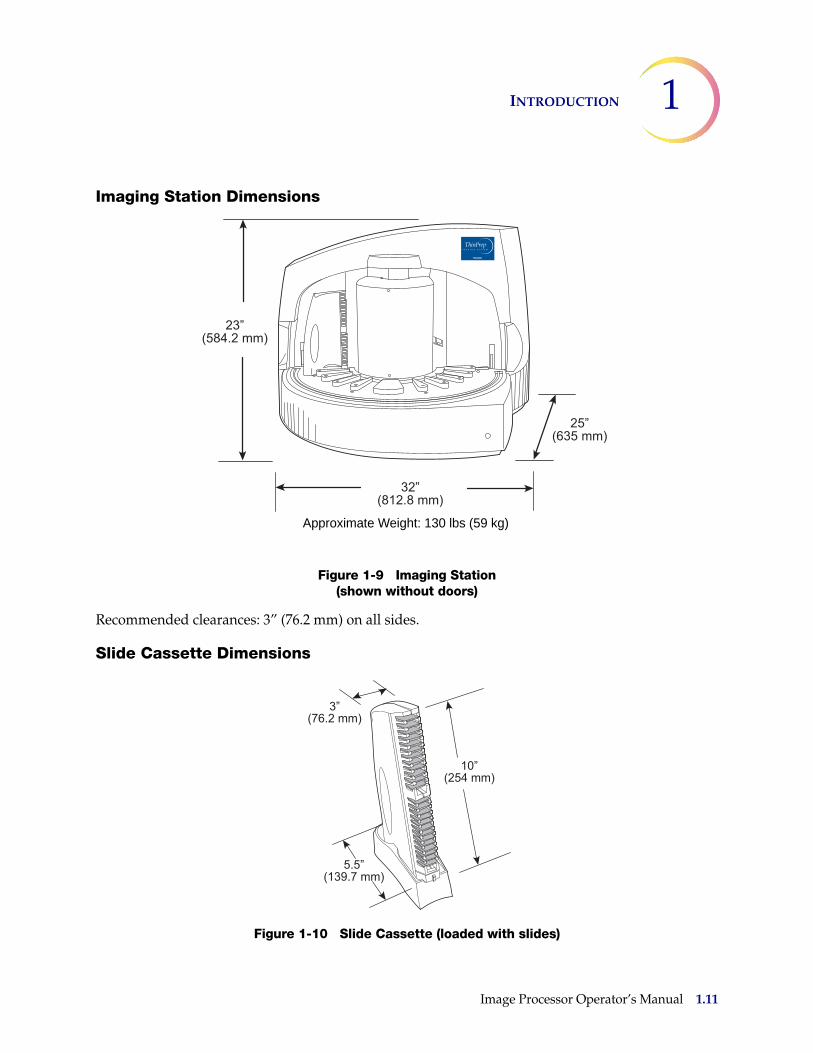
Imaging Station Dimensions
Figure 1-9 Imaging Station(shown without doors)
Recommended clearances: 3” (76.2 mm) on all sides.
Slide Cassette Dimensions
Figure 1-10 Slide Cassette (loaded with slides)
Approximate Weight: 130 lbs (59 kg)
��������
������ ����
�������
Image Processor Operator’s Manual 1.11
1 INTRODUCTION
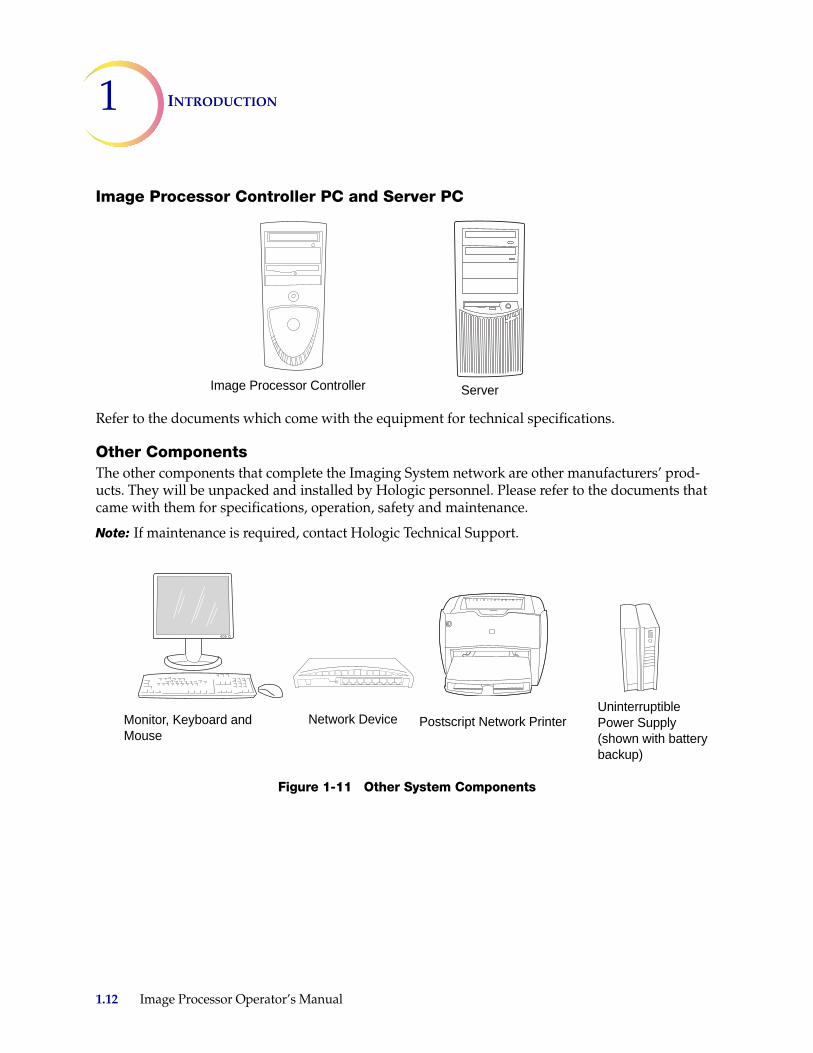
Image Processor Controller PC and Server PC
Refer to the documents which come with the equipment for technical specifications.
Other ComponentsThe other components that complete the Imaging System network are other manufacturers’ prod-ucts. They will be unpacked and installed by Hologic personnel. Please refer to the documents that came with them for specifications, operation, safety and maintenance.
Note: If maintenance is required, contact Hologic Technical Support.
Figure 1-11 Other System Components
Image Processor Controller Server
Monitor, Keyboard and Mouse
Postscript Network PrinterUninterruptible Power Supply (shown with battery backup)
Network Device
1.12 Image Processor Operator’s Manual

INTRODUCTION 1
Environmental
Operating Temperature Range16°C to 32°C
Non-Operating Temperature Range-28°C to 50°C
Operating Humidity Range20 to 80% relative humidity, non-condensing
Non-Operating Humidity Range15% to 95% relative humidity, non-condensing
Pollution Degree: II, in accordance with IEC 61010-1.
Category II, the ThinPrep Imaging System is for indoor use only in an office or a clean laboratory environment.
Altitude: 0 meters (sea level) to 2000 meters.
Atmospheric Pressure: 1100 millibar to 500 millibar.
Power
Voltage: 100 - 240 Volts Alternating Current, no selection required Mains supply voltage not to exceed ± 10% of the nominal voltage
Frequency: 50 to 60 Hz.
Power: Imaging Station 4A maximumImage Processor Controller Refer to the documents that come with the equipment.Server Refer to the documents that come with the equipment.
Heat Generated: Imaging Station approximately 1600 BTU/HR (470 W)Image Processor Controller Refer to the documents that come with the equipment.Server Refer to the documents that come with the equipment.
Fusing: Imaging Station Two 5 x 20mm, 6.3A time delay glass fusesImage Processor Controller Refer to the documents that come with the equipment.Server Refer to the documents that come with the equipment.
Image Processor Operator’s Manual 1.13
1 INTRODUCTION
Protective Temperature Coefficient DevicesThe Imaging Station contains protective temperature coefficient (PTC) devices intended for protec-tion against occasional overcurrent or overtemperature fault conditions. These devices automatically reset after the overcurrent or overtemperature condition has been removed.
The PTCs locations and functions are as follows:
System Hardware Electromechanical Processor (SHEMP)F1 - 1A PTC - 5V sensor power to sensor ports J4 and J5F2 - 1A PTC - 5V sensor power to sensor ports J2 and J3F3 - 1A PTC - Isolated 5V for the CAN BUSF4 - 500ma PTC - 24V line to protect against motor or drive failure
Servo Interface Module (SERVIM)R21 - 1.85A PTC - 24V line to protect FETS and motors
Stepper Interface Module (STEPIM)R22, R28 1.85A PTC
Digital I/O ModuleF1 - 300ma PTC - 12V sensor power to connector J1F2 - 1A PTC - 5V sensor power to connector J2
Dimensions and Weight (Approximate)Imaging Station: 23” (584.2 mm) H x 32” (812.8 mm) W x 25” (635 mm) D 139 lbs (59 kg) uncrated
Image Processor Controller, Server and other components: Refer to the documents that come with the equipment.
1.14 Image Processor Operator’s Manual
INTRODUCTION 1
ThinPrep Imaging System StandardsThe ThinPrep Imaging System has been tested and certified by a U.S. nationally recognized testing Laboratory (NRTL) to comply with current Safety, Electro-Magnetic Interference (EMI) and Electro-Magnetic Compatibility (EMC) standards. Refer to the product label, located on the rear of the instrument, to see the safety certification markings.
Do not use this device in close proximity to sources of strong electromagnetic radiation (e.g., unshielded intentional RF sources), as these may interfere with the proper operation.
This product is in vitro diagnostic (IVD) medical equipment.
This product contains a device classified per EN 60825-1: 1994, Issue 2, June 1997 as a Class 1 LED Product.
This equipment meets the emission and immunity requirements of IEC 61326-2-6. This equipment has been designed and tested to CISPR 11 Class A. In a domestic environment it may cause radio interference, in which case, you may need to take measures to mitigate the interference. The electro-magnetic environment should be evaluated prior to operation of the equipment.
Image Processor Operator’s Manual 1.15
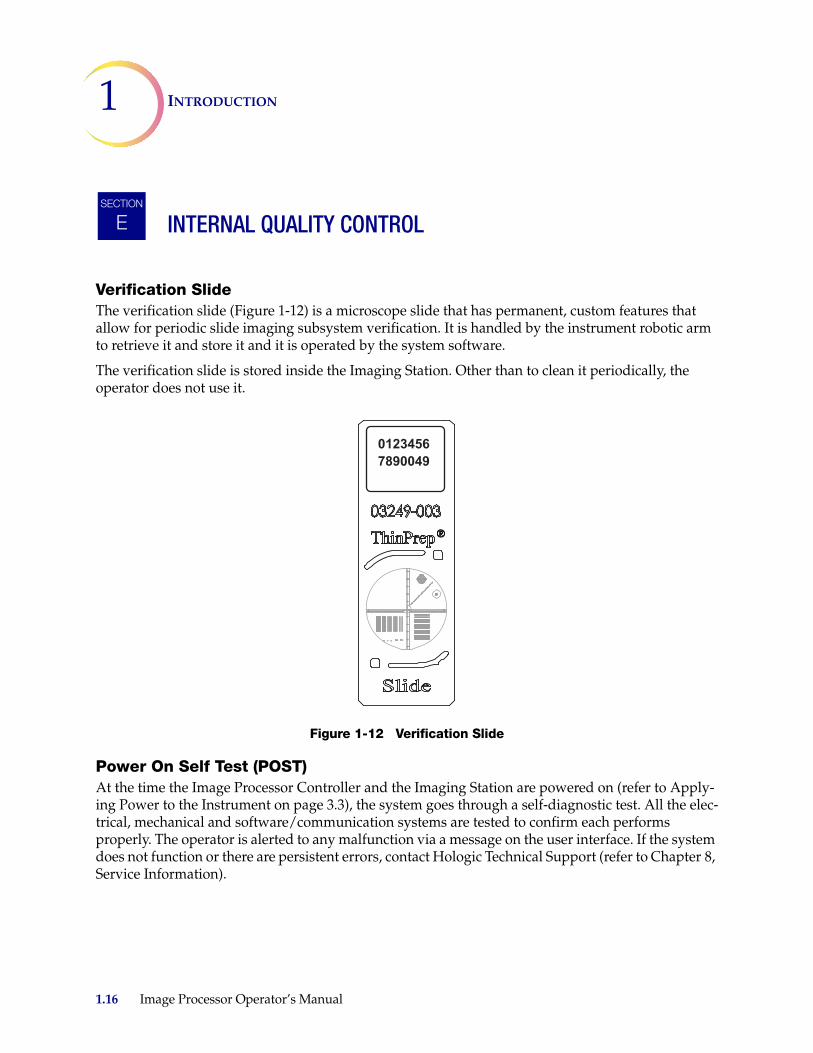
1 INTRODUCTION
INTERNAL QUALITY CONTROL
Verification SlideThe verification slide (Figure 1-12) is a microscope slide that has permanent, custom features that allow for periodic slide imaging subsystem verification. It is handled by the instrument robotic arm to retrieve it and store it and it is operated by the system software.
The verification slide is stored inside the Imaging Station. Other than to clean it periodically, the operator does not use it.
Figure 1-12 Verification Slide
Power On Self Test (POST)At the time the Image Processor Controller and the Imaging Station are powered on (refer to Apply-ing Power to the Instrument on page 3.3), the system goes through a self-diagnostic test. All the elec-trical, mechanical and software/communication systems are tested to confirm each performs properly. The operator is alerted to any malfunction via a message on the user interface. If the system does not function or there are persistent errors, contact Hologic Technical Support (refer to Chapter 8, Service Information).
SECTION
E
������������
1.16 Image Processor Operator’s Manual
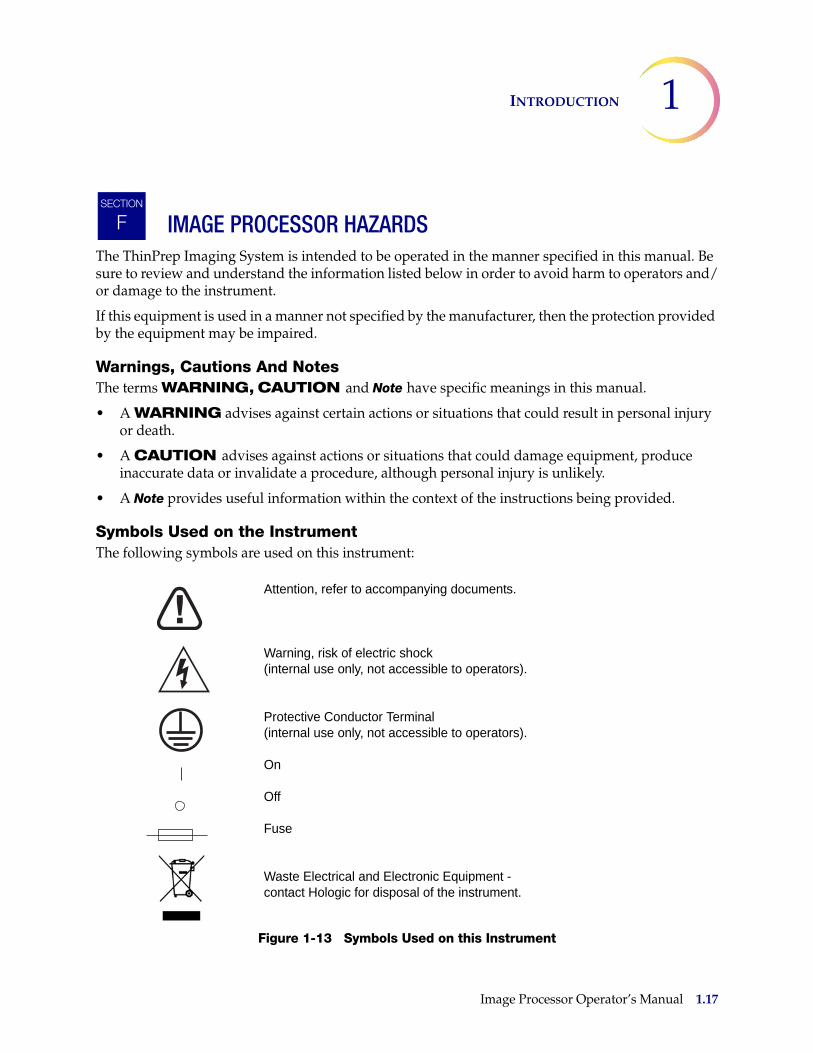
INTRODUCTION 1
IMAGE PROCESSOR HAZARDSThe ThinPrep Imaging System is intended to be operated in the manner specified in this manual. Be sure to review and understand the information listed below in order to avoid harm to operators and/or damage to the instrument.
If this equipment is used in a manner not specified by the manufacturer, then the protection provided by the equipment may be impaired.
Warnings, Cautions And NotesThe terms WARNING, CAUTION and Note have specific meanings in this manual.
• A WARNING advises against certain actions or situations that could result in personal injury or death.
• A CAUTION advises against actions or situations that could damage equipment, produce inaccurate data or invalidate a procedure, although personal injury is unlikely.
• A Note provides useful information within the context of the instructions being provided.
Symbols Used on the InstrumentThe following symbols are used on this instrument:
Figure 1-13 Symbols Used on this Instrument
SECTION
F
Attention, refer to accompanying documents.
Warning, risk of electric shock (internal use only, not accessible to operators).
Protective Conductor Terminal (internal use only, not accessible to operators).
On
Off
Fuse
Waste Electrical and Electronic Equipment - contact Hologic for disposal of the instrument.
Image Processor Operator’s Manual 1.17
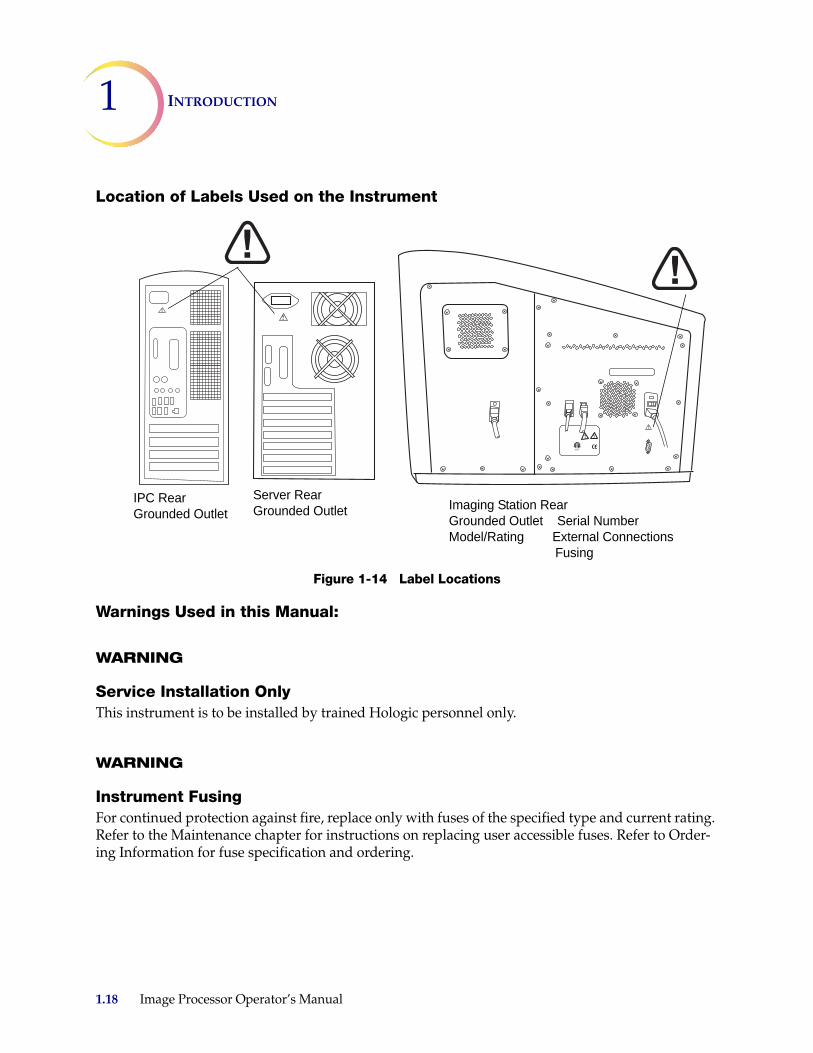
1 INTRODUCTION
Location of Labels Used on the Instrument
Figure 1-14 Label Locations
Warnings Used in this Manual:
WARNING
Service Installation OnlyThis instrument is to be installed by trained Hologic personnel only.
WARNING
Instrument FusingFor continued protection against fire, replace only with fuses of the specified type and current rating. Refer to the Maintenance chapter for instructions on replacing user accessible fuses. Refer to Order-ing Information for fuse specification and ordering.
IPC RearGrounded Outlet
Server RearGrounded Outlet Imaging Station Rear
Grounded Outlet Serial NumberModel/Rating External Connections Fusing
1.18 Image Processor Operator’s Manual
INTRODUCTION 1
WARNING
Moving PartsThe instrument contains moving parts. Keep hands, loose clothing, jewelry, etc., clear.
WARNING
Grounded OutletTo ensure safe operation of the instruments use a three-wire grounded outlet.
WARNING
GlassThe instrument uses microscope slides, which have sharp edges. In addition, the slides may be bro-ken in their storage packaging or on the instrument. Use caution when handling glass slides and when cleaning the instrument.
Image Processor Operator’s Manual 1.19
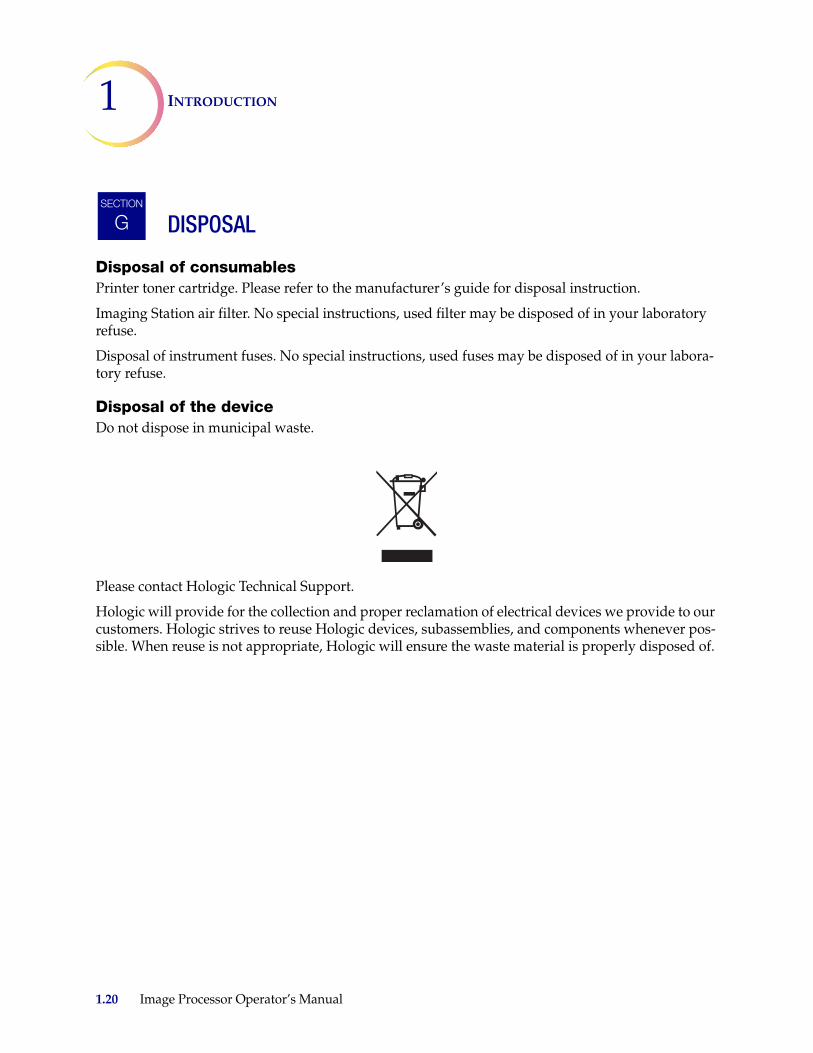
1 INTRODUCTION
DISPOSAL
Disposal of consumablesPrinter toner cartridge. Please refer to the manufacturer’s guide for disposal instruction.
Imaging Station air filter. No special instructions, used filter may be disposed of in your laboratory refuse.
Disposal of instrument fuses. No special instructions, used fuses may be disposed of in your labora-tory refuse.
Disposal of the deviceDo not dispose in municipal waste.
Please contact Hologic Technical Support.
Hologic will provide for the collection and proper reclamation of electrical devices we provide to our customers. Hologic strives to reuse Hologic devices, subassemblies, and components whenever pos-sible. When reuse is not appropriate, Hologic will ensure the waste material is properly disposed of.
SECTION
G
1.20 Image Processor Operator’s Manual

2. Installatio
n2.
Inst
alla
tio
n
IMAGE PROCESSOR INSTALLATION 2
C h a p t e r T w o
Image Processor Installation
WARNING: Service Installation Only
GENERALThe ThinPrep® Image Processor and peripherals must be installed by Hologic Service Personnel. When installation is complete, the Service personnel trains the operator(s), using the Operator’s Manual as the training guide.
In the event the equipment must be moved after installation, please contact Hologic Technical Sup-port. (Refer to Chapter 8, Service Information.)
ACTION UPON DELIVERYRemove and read the Operating Instructions Prior to Installation sheet attached to the packing carton.
Inspect the packing cartons for damage. Report any damage immediately to the shipper and/or Hologic Service as soon as possible. (Refer to Chapter 8, Service Information.)
Leave the equipment in the packing cartons for Hologic Service installation.
Store the equipment in a suitable environment until installation (cool, dry, vibration-free area).
PREPARATION PRIOR TO INSTALLATION
Pre-Installation Site AssessmentA pre-installation site assessment is performed by Hologic Service Personnel. Be sure to have pre-pared any and all site configuration requirements as instructed by the Service personnel.
Location And Configuration
Local Network ConfigurationCAUTION: Route all connectors carefully to avoid pinching the cables. To avoid tripping over or disconnecting cabling, do not place cabling near foot traffic.
The Image Processor Controller, the Imaging Station, the monitor, keyboard, mouse, the printer and a multiport Ethernet hub must be located in the same area, so that interconnection cables easily reach each component (within 1.8 meters [6 feet] of each other). Refer to Figure 2-1. Review Scopes con-
SECTION
A
SECTION
B
SECTION
C
Image Processor Operator’s Manual 2.1
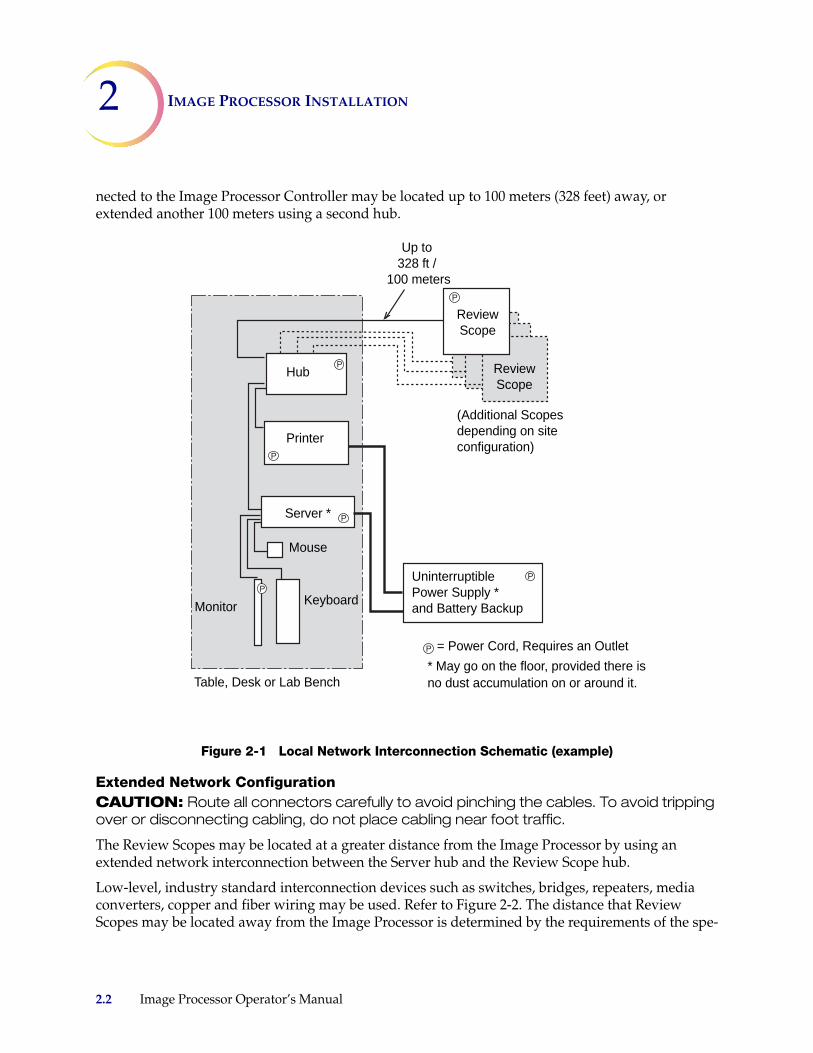
2 IMAGE PROCESSOR INSTALLATION
nected to the Image Processor Controller may be located up to 100 meters (328 feet) away, or extended another 100 meters using a second hub.
Figure 2-1 Local Network Interconnection Schematic (example)
Extended Network ConfigurationCAUTION: Route all connectors carefully to avoid pinching the cables. To avoid tripping over or disconnecting cabling, do not place cabling near foot traffic.
The Review Scopes may be located at a greater distance from the Image Processor by using an extended network interconnection between the Server hub and the Review Scope hub.
Low-level, industry standard interconnection devices such as switches, bridges, repeaters, media converters, copper and fiber wiring may be used. Refer to Figure 2-2. The distance that Review Scopes may be located away from the Image Processor is determined by the requirements of the spe-
Hub
Printer
Server *
Monitor Keyboard
Uninterruptible Power Supply *and Battery Backup
= Power Cord, Requires an Outlet
Up to 328 ft /
100 meters
(Additional Scopes depending on site configuration)
Table, Desk or Lab Bench
Mouse
* May go on the floor, provided there is no dust accumulation on or around it.
Review Scope
Review Scope
2.2 Image Processor Operator’s Manual
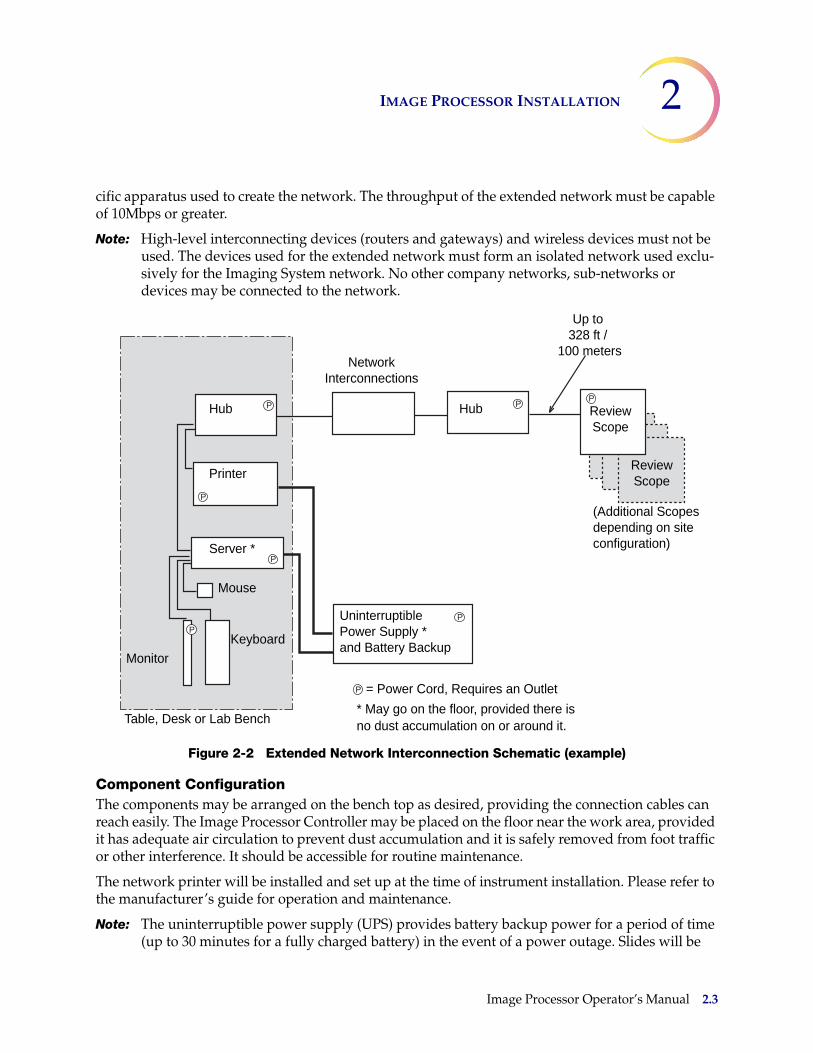
IMAGE PROCESSOR INSTALLATION 2
cific apparatus used to create the network. The throughput of the extended network must be capable of 10Mbps or greater.
Note: High-level interconnecting devices (routers and gateways) and wireless devices must not be used. The devices used for the extended network must form an isolated network used exclu-sively for the Imaging System network. No other company networks, sub-networks or devices may be connected to the network.
Figure 2-2 Extended Network Interconnection Schematic (example)
Component ConfigurationThe components may be arranged on the bench top as desired, providing the connection cables can reach easily. The Image Processor Controller may be placed on the floor near the work area, provided it has adequate air circulation to prevent dust accumulation and it is safely removed from foot traffic or other interference. It should be accessible for routine maintenance.
The network printer will be installed and set up at the time of instrument installation. Please refer to the manufacturer’s guide for operation and maintenance.
Note: The uninterruptible power supply (UPS) provides battery backup power for a period of time (up to 30 minutes for a fully charged battery) in the event of a power outage. Slides will be
Hub Hub
Printer
Server *
Monitor
Keyboard
Uninterruptible Power Supply *and Battery Backup
= Power Cord, Requires an Outlet
Network Interconnections
Up to 328 ft /
100 meters
Review Scope
(Additional Scopes depending on site configuration)
Table, Desk or Lab Bench
Mouse
* May go on the floor, provided there is no dust accumulation on or around it.
Review Scope
Image Processor Operator’s Manual 2.3

2 IMAGE PROCESSOR INSTALLATION
stored and the robotic arm is safely parked. The operator may then shut down the Imaging System (refer to page 3.22).
WARNING: Grounded Outlet
The uninterruptible power supply will be installed and setup at the time of instrument installation. Please refer to the manufacturer’s guide for proper operation, maintenance and disposal.
STORAGE AND HANDLING - POST INSTALLATION Environmental Considerations
• The Imaging Station and the Image Processor Controller are sensitive to sudden thermal or humidity changes. Do not locate them next to windows, heaters, air conditioners, HVAC vents or doors that are frequently opened and shut.
• During operation, the Imaging Station is sensitive to vibrations. It should be placed on a sturdy flat surface away from centrifuges, vortexors or any equipment that may cause vibrations. Keep away from other environmental activity, such as constant foot traffic, proximity to elevators or doors that are frequently open and shut.
SECTION
D
2.4 Image Processor Operator’s Manual

3. Op
eration
3. O
per
atio
n
OPERATION OF THE IMAGE PROCESSOR 3
C h a p t e r T h r e e
Operation of the Image Processor
CHAPTER OVERVIEW
For Operators using a Server at a non-imaging site, see also Chapter 11, Remote Site Server User’s Guide, for an operation overview.
Routine operation of the ThinPrep® Image Processor consists of powering on the monitor, the Image Processor Controller and the Imaging Station, loading prepared cassettes of slides and starting the slide processing function. At the conclusion of slide processing, slide cassettes are removed from the Imaging Station. A Slide Processing Event Log, visible on the user interface during slide processing, indicates which slide(s) may require further operator attention.
At any time during slide processing, the operator may interrupt and resume batch processing or interrupt and cancel processing.
System database queries may be viewed and printed while processing a batch. (Refer to "Operation of the Software Menu" on page 4.1)
If necessary, the equipment may be shut down, following a prescribed sequence. (Refer to Shutting Down the Image Processor on page 3.22.)
Refer to Figure 3-1 for a diagram of a typical batch process.
Note: Review Scopes are connected to the Server during slide screening sessions by the Cytotechnologists (CTs). If the Imaging System is to be shut down, the CTs need to be notified in order to save slide data prior to losing the communication connection. Preferably, any equipment shut down should be planned to occur during off hours.
SECTION
A
Image Processor Operator’s Manual 3.1
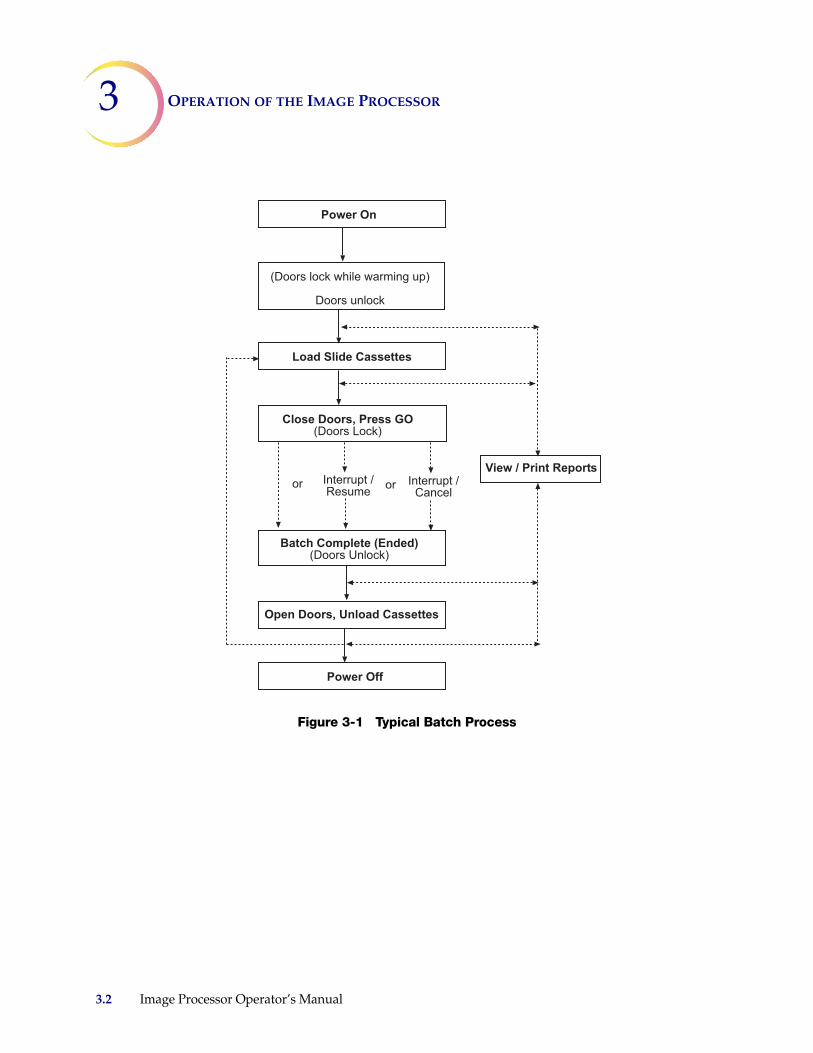
3 OPERATION OF THE IMAGE PROCESSOR
Figure 3-1 Typical Batch Process
���������������
����������������
� �������
������ ������� ������������
� ��� �!������������
�� ��� �!"#$��"��$�%���
� ����� �!
� ������
"!���#���!���$�� ���
%��&'�� (������)*����+�� ��&�� �!�
�� ���� ����������,��� ��' �!�
� �
3.2 Image Processor Operator’s Manual

OPERATION OF THE IMAGE PROCESSOR 3
APPLYING POWER TO THE EQUIPMENT
WARNING: Grounded Outlet Instrument Fusing Do not power on or operate if equipment has been damaged.
Apply power to the Server, the Imaging Station and the Image Processor Controller according to the following procedure.
Note: All power cords must be plugged into a grounded outlet. Disconnection from the power sup-ply source is by removal of the power cord.
Make sure the uninterruptible power supply (UPS) is plugged in to a grounded outlet and all devices are plugged into the UPS backup outlets. Do not operate any devices if the UPS is not plugged in.
Application of power to the equipment must be performed in the sequence described in order to establish proper communication between the Server, the Image Processor Controller and the remain-ing system elements (i.e., the Monitor, Keyboard, Mouse, Imaging Station and Review Scopes). In addition, do NOT touch any buttons on the Keyboard when turning on the Image Processor Control-ler.
1. Make sure the doors of the Imaging Station are fully shut.2. At the monitor, turn on the power. (Figure 3-2.)
Figure 3-2 Power On the Monitor
SECTION
B
Power On Indicator&Power Switch
Image Processor Operator’s Manual 3.3
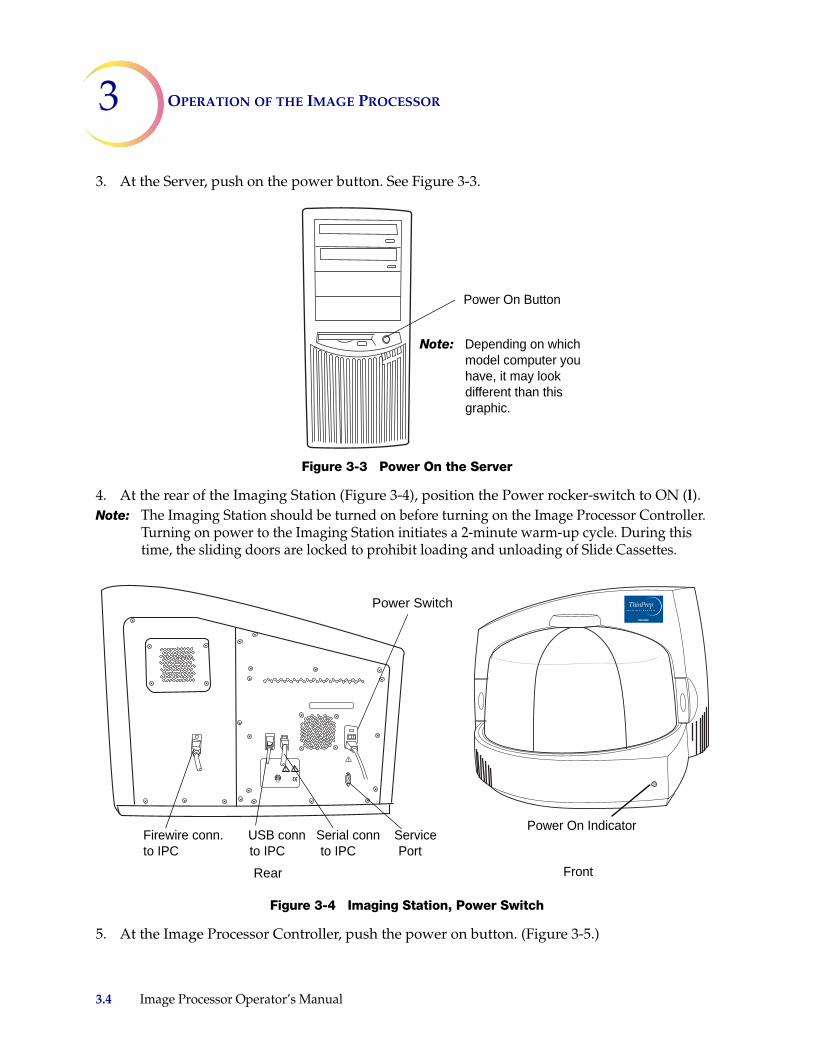
3 OPERATION OF THE IMAGE PROCESSOR
3. At the Server, push on the power button. See Figure 3-3.
Figure 3-3 Power On the Server
4. At the rear of the Imaging Station (Figure 3-4), position the Power rocker-switch to ON (l).Note: The Imaging Station should be turned on before turning on the Image Processor Controller.
Turning on power to the Imaging Station initiates a 2-minute warm-up cycle. During this time, the sliding doors are locked to prohibit loading and unloading of Slide Cassettes.
Figure 3-4 Imaging Station, Power Switch
5. At the Image Processor Controller, push the power on button. (Figure 3-5.)
Power On Button
Note: Depending on which model computer you have, it may look different than this graphic.
Power Switch
Rear Front
Power On IndicatorFirewire conn. USB conn Serial conn Serviceto IPC to IPC to IPC Port
3.4 Image Processor Operator’s Manual

OPERATION OF THE IMAGE PROCESSOR 3
Figure 3-5 Image Processor Controller, Power Switch
6. At the Monitor, observe that the message “System warmup will be complete in 2 minutes... please wait” is displayed on the user interface. (Figure 3-6.)
Figure 3-6 Warmup in Progress
Note: When the warmup cycle ends, the message disappears and the doors are unlocked.
To power the Imaging System off, refer to "SHUTTING DOWN THE IMAGE PROCESSOR" on page 3.22. The IS, IPC and Server should be shut off in the sequence described there.
Power On Button
Image Processor Operator’s Manual 3.5
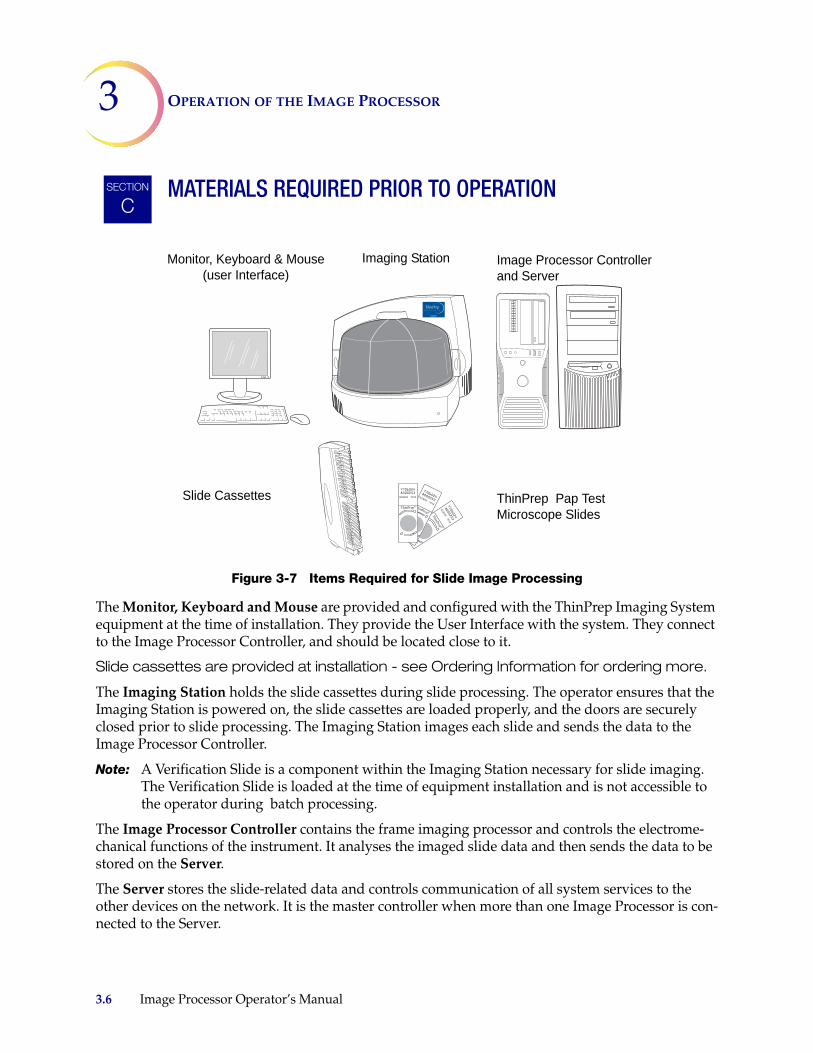
3 OPERATION OF THE IMAGE PROCESSOR
MATERIALS REQUIRED PRIOR TO OPERATION
Figure 3-7 Items Required for Slide Image Processing
The Monitor, Keyboard and Mouse are provided and configured with the ThinPrep Imaging System equipment at the time of installation. They provide the User Interface with the system. They connect to the Image Processor Controller, and should be located close to it.
Slide cassettes are provided at installation - see Ordering Information for ordering more.
The Imaging Station holds the slide cassettes during slide processing. The operator ensures that the Imaging Station is powered on, the slide cassettes are loaded properly, and the doors are securely closed prior to slide processing. The Imaging Station images each slide and sends the data to the Image Processor Controller.
Note: A Verification Slide is a component within the Imaging Station necessary for slide imaging. The Verification Slide is loaded at the time of equipment installation and is not accessible to the operator during batch processing.
The Image Processor Controller contains the frame imaging processor and controls the electrome-chanical functions of the instrument. It analyses the imaged slide data and then sends the data to be stored on the Server.
The Server stores the slide-related data and controls communication of all system services to the other devices on the network. It is the master controller when more than one Image Processor is con-nected to the Server.
SECTION
C
Monitor, Keyboard & Mouse(user Interface)
Imaging Station Image Processor Controllerand Server
Slide Cassettes ThinPrep Pap TestMicroscope Slides
3.6 Image Processor Operator’s Manual
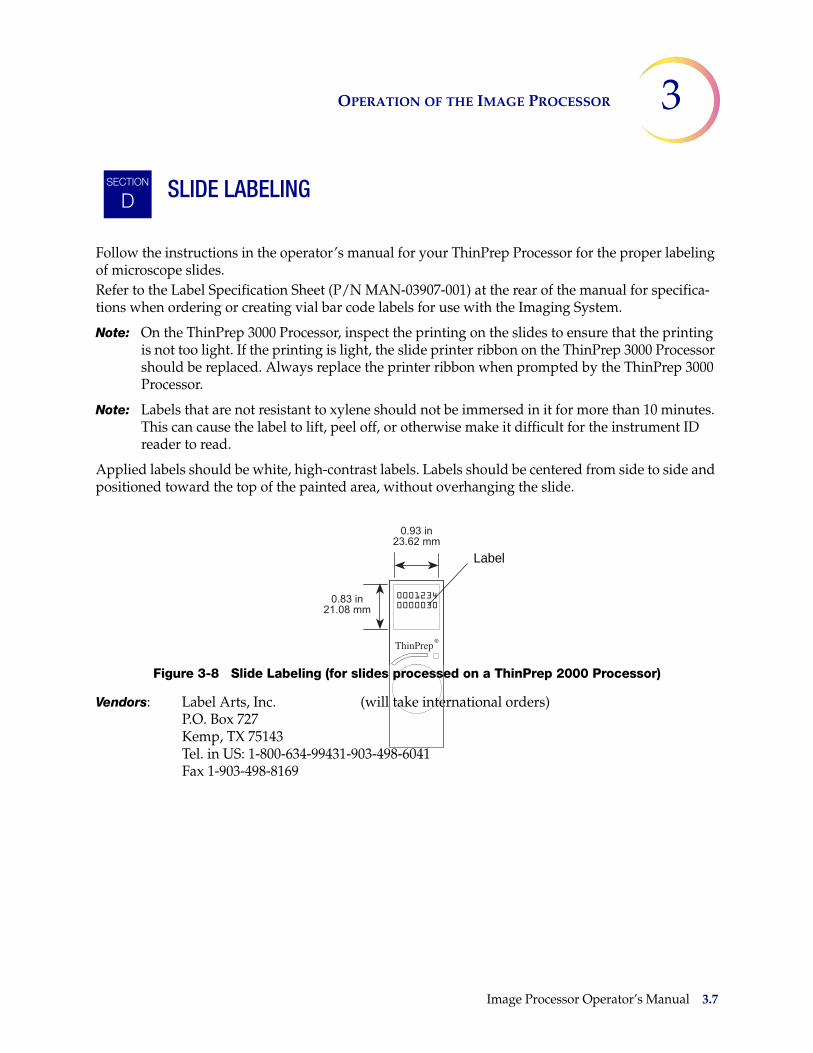
OPERATION OF THE IMAGE PROCESSOR 3
Image Processor Operator’s Manual 3.7
SLIDE LABELING
Follow the instructions in the operator’s manual for your ThinPrep Processor for the proper labeling of microscope slides.Refer to the Label Specification Sheet (P/N MAN-03907-001) at the rear of the manual for specifica-tions when ordering or creating vial bar code labels for use with the Imaging System.
Note: On the ThinPrep 3000 Processor, inspect the printing on the slides to ensure that the printing is not too light. If the printing is light, the slide printer ribbon on the ThinPrep 3000 Processor should be replaced. Always replace the printer ribbon when prompted by the ThinPrep 3000 Processor.
Note: Labels that are not resistant to xylene should not be immersed in it for more than 10 minutes. This can cause the label to lift, peel off, or otherwise make it difficult for the instrument ID reader to read.
Applied labels should be white, high-contrast labels. Labels should be centered from side to side and positioned toward the top of the painted area, without overhanging the slide.
Figure 3-8 Slide Labeling (for slides processed on a ThinPrep 2000 Processor)
Vendors: Label Arts, Inc. (will take international orders) P.O. Box 727 Kemp, TX 75143 Tel. in US: 1-800-634-99431-903-498-6041 Fax 1-903-498-8169
SECTION
D
(
��� $�� ���
��) $�����)
Label
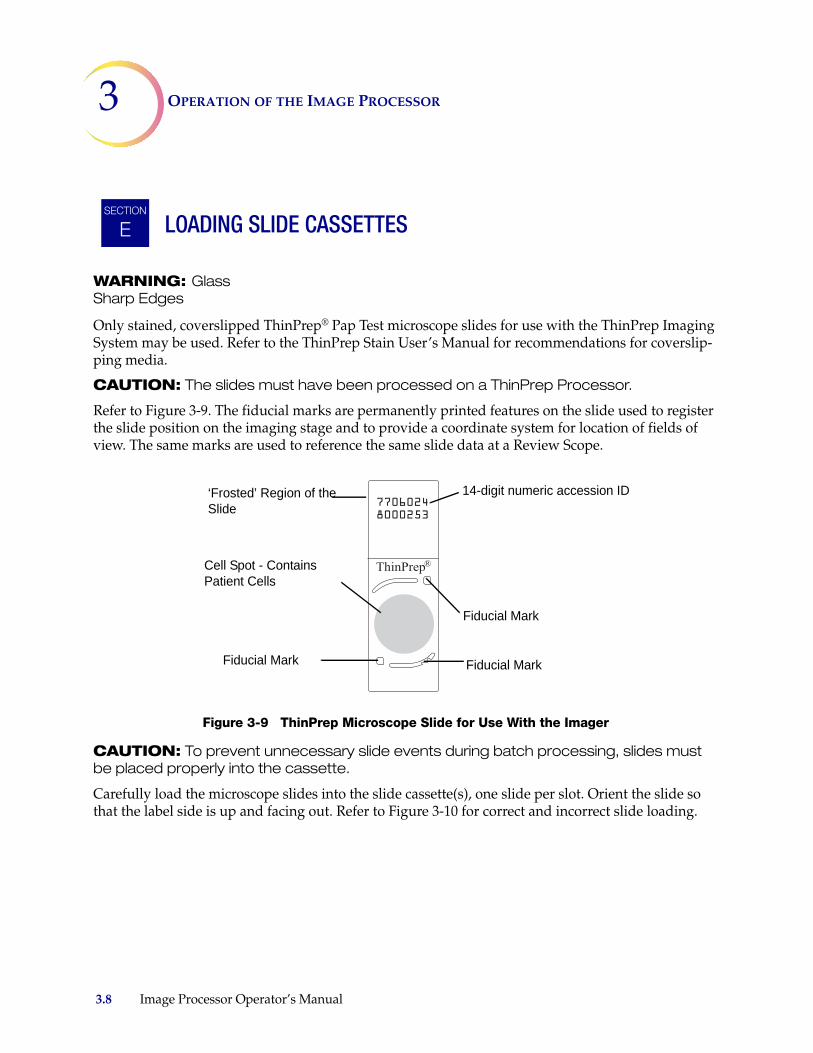
3 OPERATION OF THE IMAGE PROCESSOR
LOADING SLIDE CASSETTES
WARNING: Glass Sharp Edges
Only stained, coverslipped ThinPrep® Pap Test microscope slides for use with the ThinPrep Imaging System may be used. Refer to the ThinPrep Stain User’s Manual for recommendations for coverslip-ping media.
CAUTION: The slides must have been processed on a ThinPrep Processor.
Refer to Figure 3-9. The fiducial marks are permanently printed features on the slide used to register the slide position on the imaging stage and to provide a coordinate system for location of fields of view. The same marks are used to reference the same slide data at a Review Scope.
Figure 3-9 ThinPrep Microscope Slide for Use With the Imager
CAUTION: To prevent unnecessary slide events during batch processing, slides must be placed properly into the cassette.
Carefully load the microscope slides into the slide cassette(s), one slide per slot. Orient the slide so that the label side is up and facing out. Refer to Figure 3-10 for correct and incorrect slide loading.
SECTION
E
‘Frosted’ Region of the Slide
Fiducial Mark Fiducial Mark
Fiducial Mark
14-digit numeric accession ID
Cell Spot - Contains Patient Cells
3.8 Image Processor Operator’s Manual
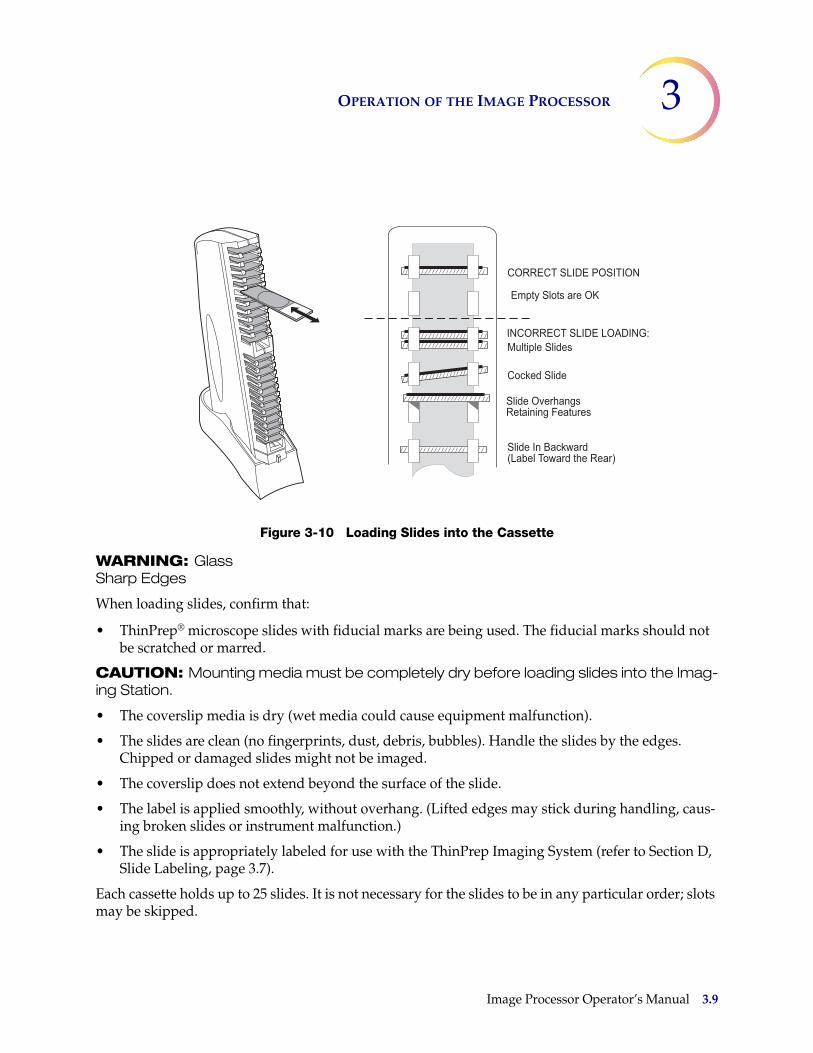
OPERATION OF THE IMAGE PROCESSOR 3
Figure 3-10 Loading Slides into the Cassette
WARNING: Glass Sharp Edges
When loading slides, confirm that:
• ThinPrep® microscope slides with fiducial marks are being used. The fiducial marks should not be scratched or marred.
CAUTION: Mounting media must be completely dry before loading slides into the Imag-ing Station.
• The coverslip media is dry (wet media could cause equipment malfunction).
• The slides are clean (no fingerprints, dust, debris, bubbles). Handle the slides by the edges. Chipped or damaged slides might not be imaged.
• The coverslip does not extend beyond the surface of the slide.
• The label is applied smoothly, without overhang. (Lifted edges may stick during handling, caus-ing broken slides or instrument malfunction.)
• The slide is appropriately labeled for use with the ThinPrep Imaging System (refer to Section D, Slide Labeling, page 3.7).
Each cassette holds up to 25 slides. It is not necessary for the slides to be in any particular order; slots may be skipped.
�*��+�,-'��+.*-�,�*/
0���$���-�$1��
� �!�1-�$1�
-�$1�*2��#��%�����$�$�%3�������
-�$1���4��!"��1�'�5��, "��1�#������
�/�*��+�,-'��+'*6��/78
+��9-� �����*:
Image Processor Operator’s Manual 3.9
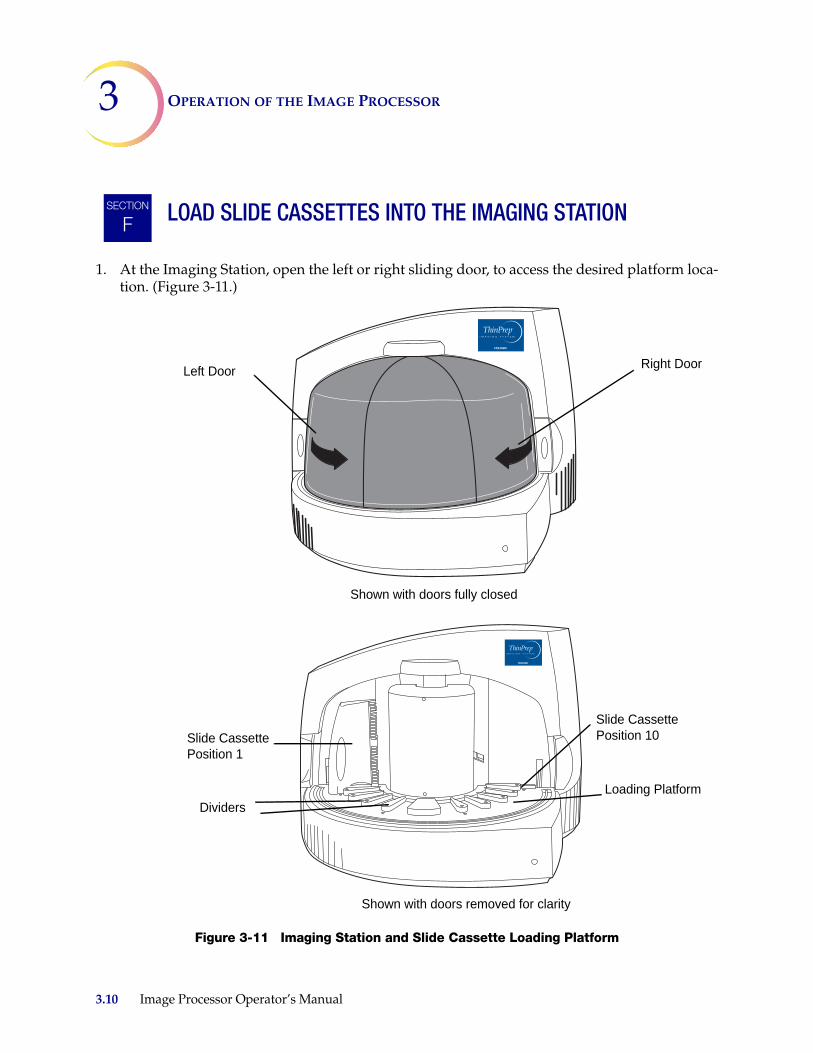
3 OPERATION OF THE IMAGE PROCESSOR
LOAD SLIDE CASSETTES INTO THE IMAGING STATION
1. At the Imaging Station, open the left or right sliding door, to access the desired platform loca-tion. (Figure 3-11.)
Figure 3-11 Imaging Station and Slide Cassette Loading Platform
SECTION
F
Right DoorLeft Door
Shown with doors fully closed
Slide Cassette Position 10
Shown with doors removed for clarity
Loading PlatformDividers
Slide Cassette Position 1
3.10 Image Processor Operator’s Manual
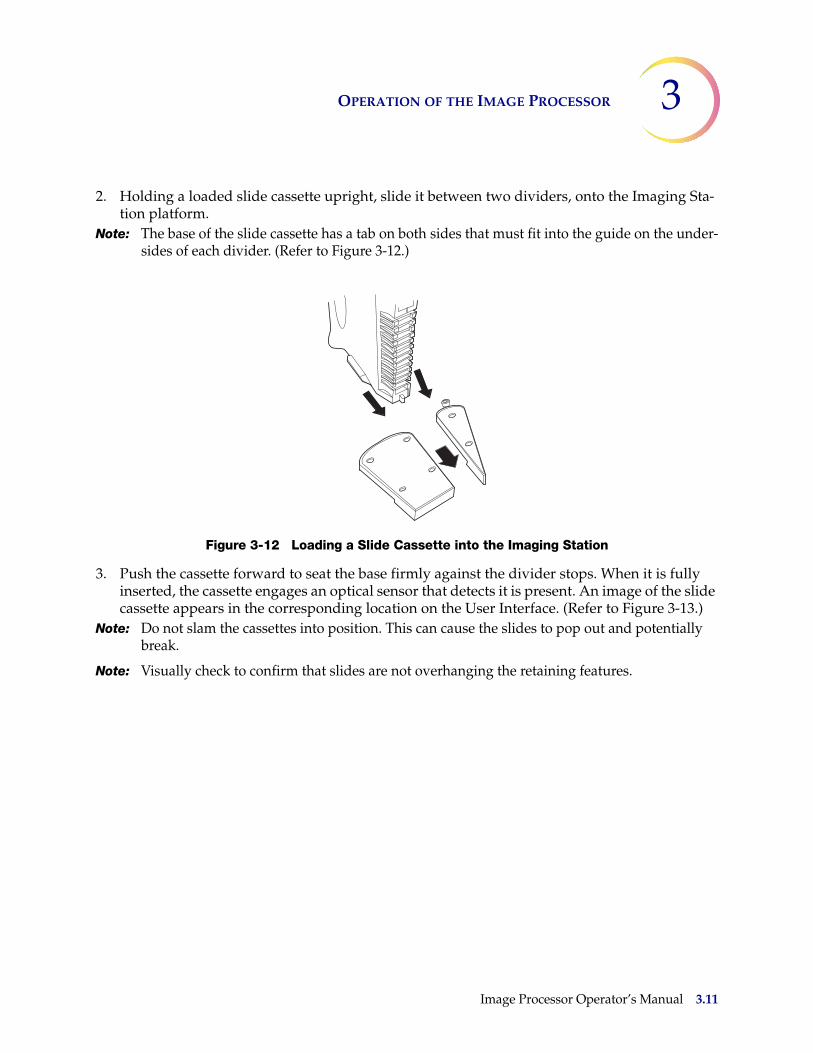
OPERATION OF THE IMAGE PROCESSOR 3
2. Holding a loaded slide cassette upright, slide it between two dividers, onto the Imaging Sta-tion platform.
Note: The base of the slide cassette has a tab on both sides that must fit into the guide on the under-sides of each divider. (Refer to Figure 3-12.)
Figure 3-12 Loading a Slide Cassette into the Imaging Station
3. Push the cassette forward to seat the base firmly against the divider stops. When it is fully inserted, the cassette engages an optical sensor that detects it is present. An image of the slide cassette appears in the corresponding location on the User Interface. (Refer to Figure 3-13.)
Note: Do not slam the cassettes into position. This can cause the slides to pop out and potentially break.
Note: Visually check to confirm that slides are not overhanging the retaining features.
Image Processor Operator’s Manual 3.11
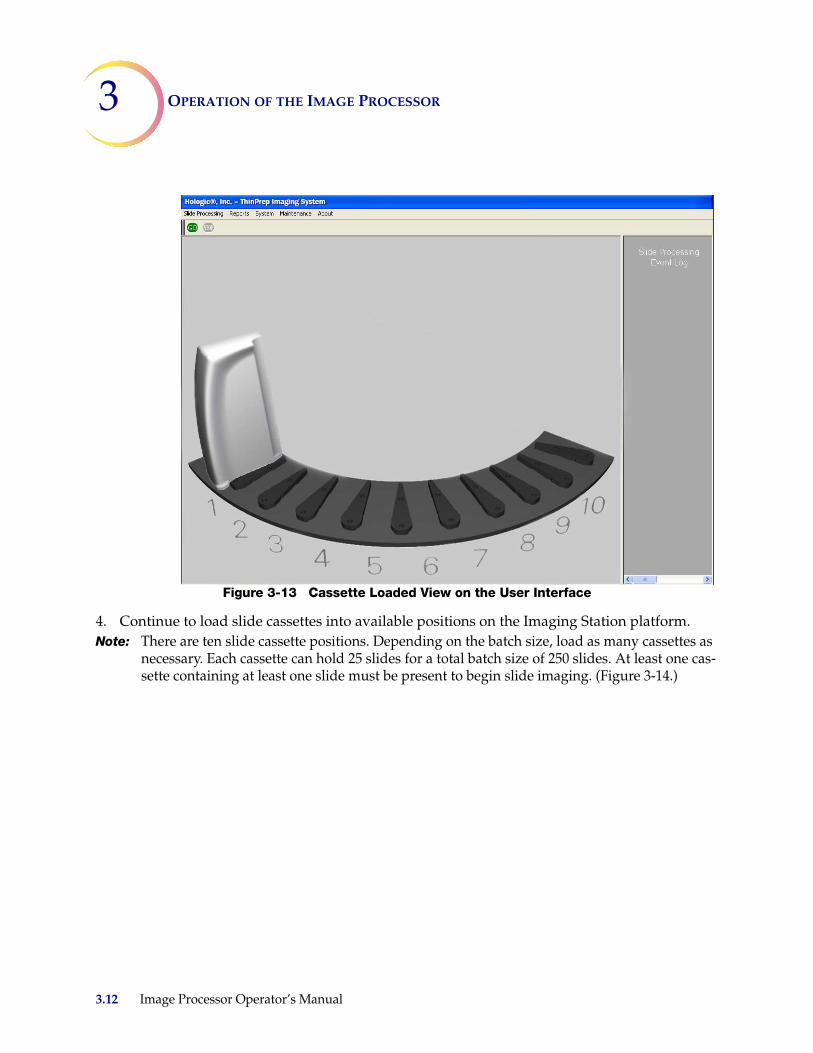
3 OPERATION OF THE IMAGE PROCESSOR
Figure 3-13 Cassette Loaded View on the User Interface
4. Continue to load slide cassettes into available positions on the Imaging Station platform.Note: There are ten slide cassette positions. Depending on the batch size, load as many cassettes as
necessary. Each cassette can hold 25 slides for a total batch size of 250 slides. At least one cas-sette containing at least one slide must be present to begin slide imaging. (Figure 3-14.)
3.12 Image Processor Operator’s Manual
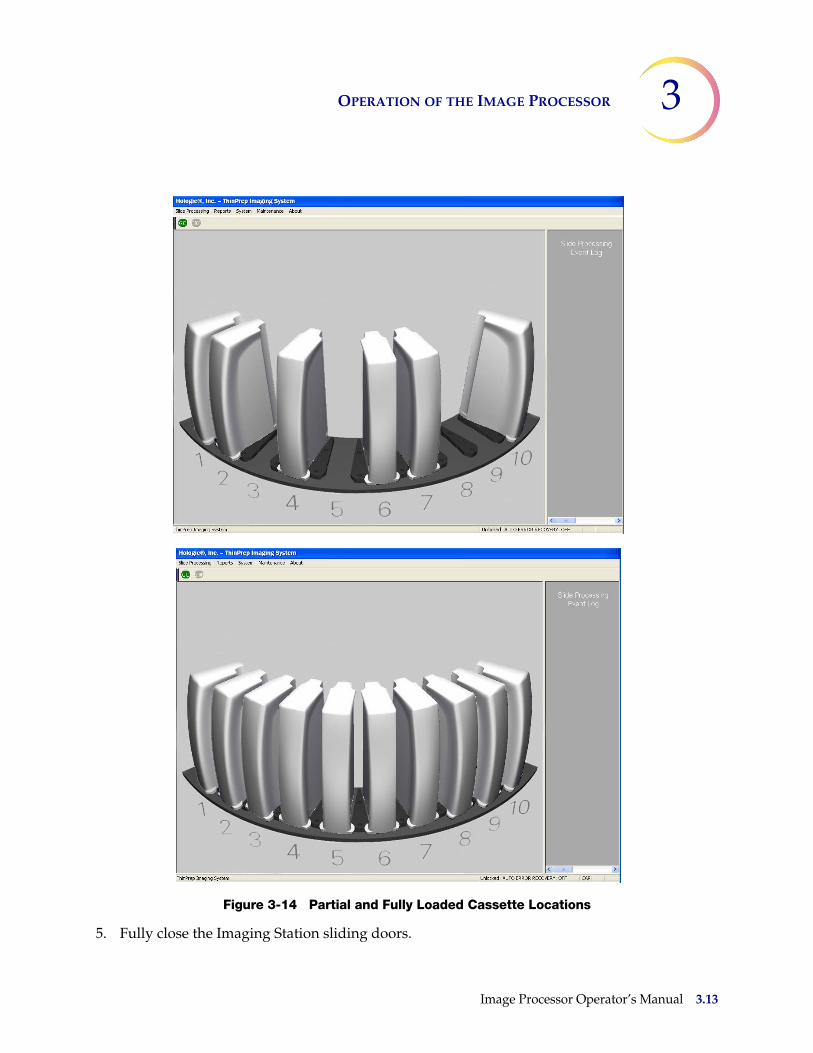
OPERATION OF THE IMAGE PROCESSOR 3
Figure 3-14 Partial and Fully Loaded Cassette Locations
5. Fully close the Imaging Station sliding doors.
Image Processor Operator’s Manual 3.13
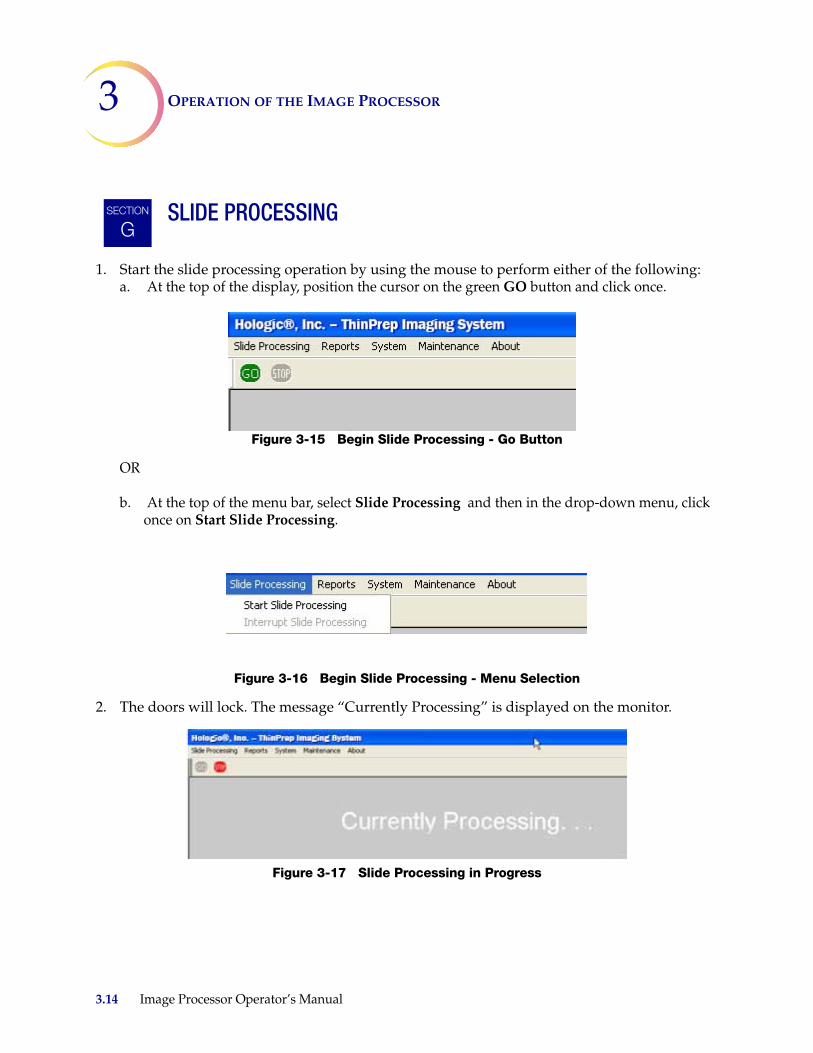
3 OPERATION OF THE IMAGE PROCESSOR
SLIDE PROCESSING
1. Start the slide processing operation by using the mouse to perform either of the following:a. At the top of the display, position the cursor on the green GO button and click once.
Figure 3-15 Begin Slide Processing - Go Button
OR
b. At the top of the menu bar, select Slide Processing and then in the drop-down menu, click once on Start Slide Processing.
Figure 3-16 Begin Slide Processing - Menu Selection
2. The doors will lock. The message “Currently Processing” is displayed on the monitor.
Figure 3-17 Slide Processing in Progress
SECTION
G
3.14 Image Processor Operator’s Manual
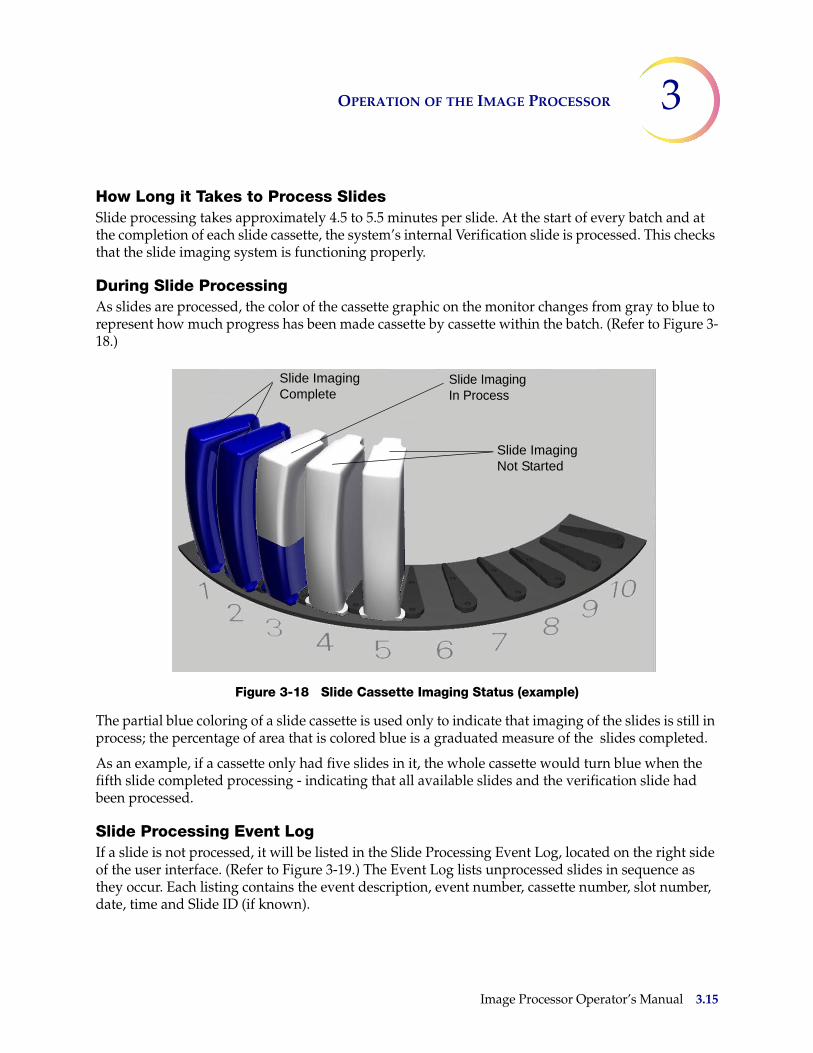
OPERATION OF THE IMAGE PROCESSOR 3
How Long it Takes to Process SlidesSlide processing takes approximately 4.5 to 5.5 minutes per slide. At the start of every batch and at the completion of each slide cassette, the system’s internal Verification slide is processed. This checks that the slide imaging system is functioning properly.
During Slide ProcessingAs slides are processed, the color of the cassette graphic on the monitor changes from gray to blue to represent how much progress has been made cassette by cassette within the batch. (Refer to Figure 3-18.)
Figure 3-18 Slide Cassette Imaging Status (example)
The partial blue coloring of a slide cassette is used only to indicate that imaging of the slides is still in process; the percentage of area that is colored blue is a graduated measure of the slides completed.
As an example, if a cassette only had five slides in it, the whole cassette would turn blue when the fifth slide completed processing - indicating that all available slides and the verification slide had been processed.
Slide Processing Event LogIf a slide is not processed, it will be listed in the Slide Processing Event Log, located on the right side of the user interface. (Refer to Figure 3-19.) The Event Log lists unprocessed slides in sequence as they occur. Each listing contains the event description, event number, cassette number, slot number, date, time and Slide ID (if known).
Slide Imaging Complete
Slide Imaging In Process
Slide Imaging Not Started
Image Processor Operator’s Manual 3.15
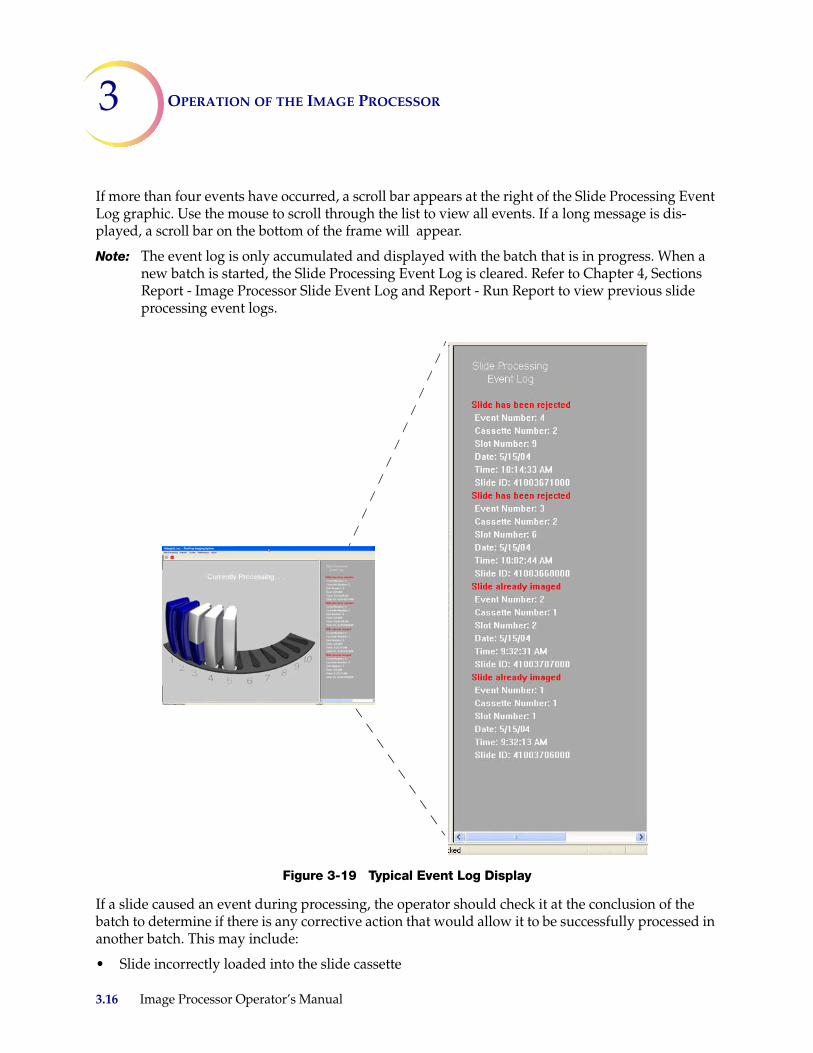
3 OPERATION OF THE IMAGE PROCESSOR
If more than four events have occurred, a scroll bar appears at the right of the Slide Processing Event Log graphic. Use the mouse to scroll through the list to view all events. If a long message is dis-played, a scroll bar on the bottom of the frame will appear.
Note: The event log is only accumulated and displayed with the batch that is in progress. When a new batch is started, the Slide Processing Event Log is cleared. Refer to Chapter 4, Sections Report - Image Processor Slide Event Log and Report - Run Report to view previous slide processing event logs.
Figure 3-19 Typical Event Log Display
If a slide caused an event during processing, the operator should check it at the conclusion of the batch to determine if there is any corrective action that would allow it to be successfully processed in another batch. This may include:
• Slide incorrectly loaded into the slide cassette
3.16 Image Processor Operator’s Manual
OPERATION OF THE IMAGE PROCESSOR 3
• Slide was not completely dry when loaded into the cassette
• Mounting media was on the frosted portion of the slide
• Slide contains bubbles
• Slide coverslip protrudes over the edge & causes interference
• Slide not labeled for use with the ThinPrep Imaging System
• Slide is dirty (dust, fingerprints)
• Slide label not legible for scanning of the accession ID
• Slide has already been imaged (accession ID already in the Server database)
Note: Always check Slide Already Imaged against the patient record, to confirm that it is not a duplicate accession ID.
Other slide related errors (but not necessarily user correctable) may include:
• Sample too dense
• Sample is sparse
• Other biological artifacts
• Occlusions or holes in the cell spot
• The slide is not a ThinPrep microscope slide for use with the Imaging System
Note: If a slide is not successfully processed by the Image Processor, the same slide cannot be auto-matically reviewed at the Review Scope. A manual review must be performed.
Interrupt Slide ProcessingThe batch may be interrupted and resumed or interrupted and canceled via the user interface. A batch might be interrupted for reasons below:
CAUTION: Do not remove a partially processed slide cassette. Data may be lost.
• To remove completed cassettes from a large batch in order for a Cytotechnologist to start the screening process
• To shut the system down prior to a known power outage event
• To shut the system down in order to do maintenance or repair
• To address observable slide loading errors
Note: When the slide cassette is properly loaded onto the platform, it engages a ‘cassette-present’ sensor, which indicates its presence and position to the Imaging System. During batch pro-cessing, the system uses this information as a ‘landmark’ in determining cassette status (in progress, not been processed, completely processed). Pulling a cassette part way out or removing it renders the cassette “unknown” to the system. For a partially completed cassette,
Image Processor Operator’s Manual 3.17
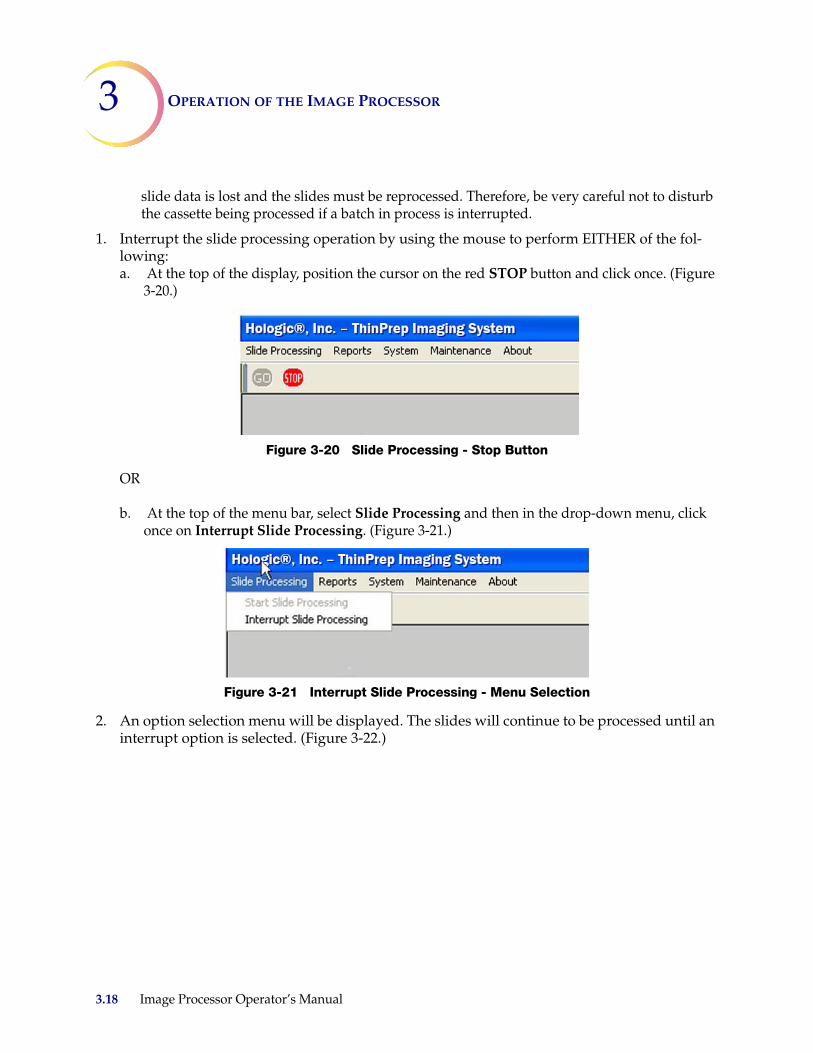
3 OPERATION OF THE IMAGE PROCESSOR
slide data is lost and the slides must be reprocessed. Therefore, be very careful not to disturb the cassette being processed if a batch in process is interrupted.
1. Interrupt the slide processing operation by using the mouse to perform EITHER of the fol-lowing:a. At the top of the display, position the cursor on the red STOP button and click once. (Figure
3-20.)
Figure 3-20 Slide Processing - Stop Button
OR
b. At the top of the menu bar, select Slide Processing and then in the drop-down menu, click once on Interrupt Slide Processing. (Figure 3-21.)
Figure 3-21 Interrupt Slide Processing - Menu Selection
2. An option selection menu will be displayed. The slides will continue to be processed until an interrupt option is selected. (Figure 3-22.)
3.18 Image Processor Operator’s Manual
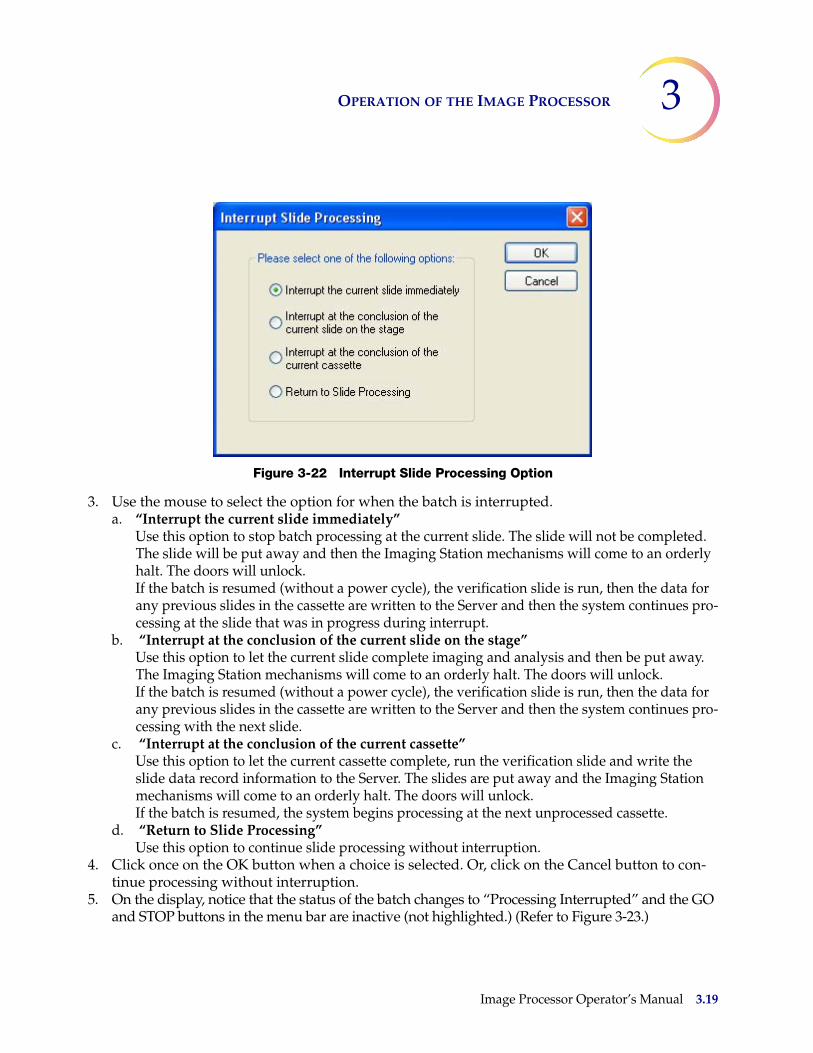
OPERATION OF THE IMAGE PROCESSOR 3
Figure 3-22 Interrupt Slide Processing Option
3. Use the mouse to select the option for when the batch is interrupted. a. “Interrupt the current slide immediately”
Use this option to stop batch processing at the current slide. The slide will not be completed. The slide will be put away and then the Imaging Station mechanisms will come to an orderly halt. The doors will unlock.If the batch is resumed (without a power cycle), the verification slide is run, then the data for any previous slides in the cassette are written to the Server and then the system continues pro-cessing at the slide that was in progress during interrupt.
b. “Interrupt at the conclusion of the current slide on the stage”Use this option to let the current slide complete imaging and analysis and then be put away. The Imaging Station mechanisms will come to an orderly halt. The doors will unlock.If the batch is resumed (without a power cycle), the verification slide is run, then the data for any previous slides in the cassette are written to the Server and then the system continues pro-cessing with the next slide.
c. “Interrupt at the conclusion of the current cassette”Use this option to let the current cassette complete, run the verification slide and write the slide data record information to the Server. The slides are put away and the Imaging Station mechanisms will come to an orderly halt. The doors will unlock.If the batch is resumed, the system begins processing at the next unprocessed cassette.
d. “Return to Slide Processing”Use this option to continue slide processing without interruption.
4. Click once on the OK button when a choice is selected. Or, click on the Cancel button to con-tinue processing without interruption.
5. On the display, notice that the status of the batch changes to “Processing Interrupted” and the GO and STOP buttons in the menu bar are inactive (not highlighted.) (Refer to Figure 3-23.)
Image Processor Operator’s Manual 3.19
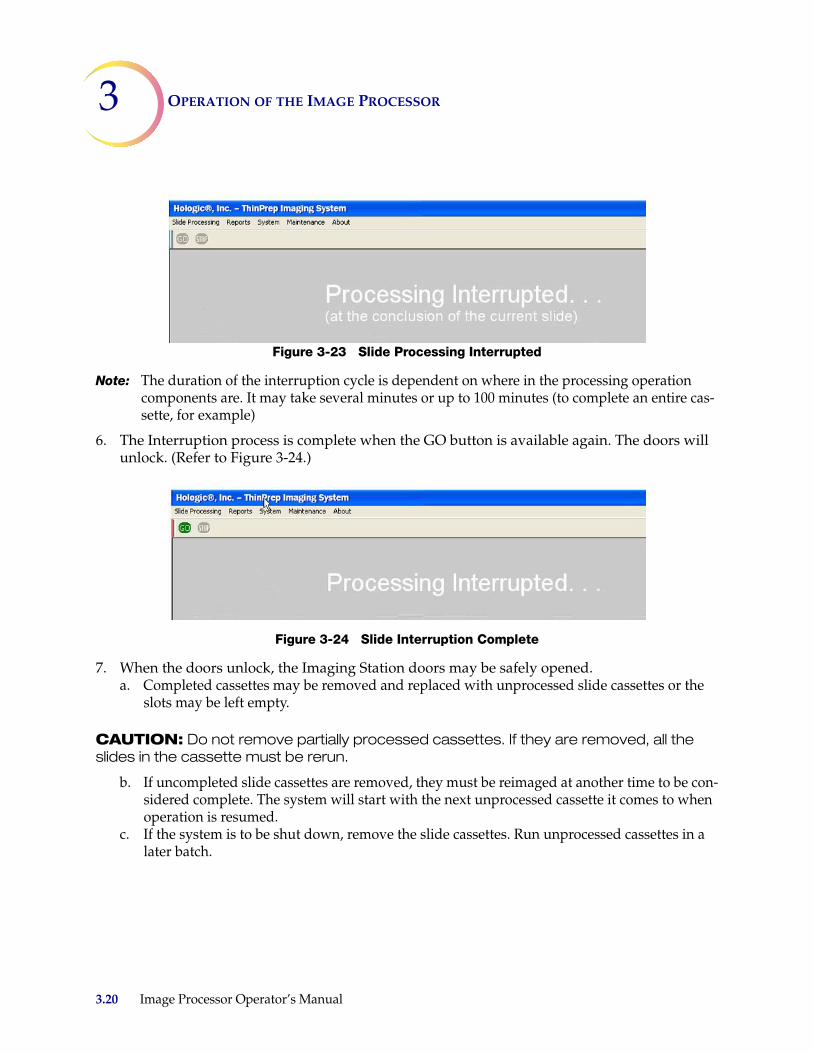
3 OPERATION OF THE IMAGE PROCESSOR
3.20 Image Processor Operator’s Manual
Figure 3-23 Slide Processing Interrupted
Note: The duration of the interruption cycle is dependent on where in the processing operation components are. It may take several minutes or up to 100 minutes (to complete an entire cas-sette, for example)
6. The Interruption process is complete when the GO button is available again. The doors will unlock. (Refer to Figure 3-24.)
Figure 3-24 Slide Interruption Complete
7. When the doors unlock, the Imaging Station doors may be safely opened. a. Completed cassettes may be removed and replaced with unprocessed slide cassettes or the
slots may be left empty.
CAUTION: Do not remove partially processed cassettes. If they are removed, all the slides in the cassette must be rerun.
b. If uncompleted slide cassettes are removed, they must be reimaged at another time to be con-sidered complete. The system will start with the next unprocessed cassette it comes to when operation is resumed.
c. If the system is to be shut down, remove the slide cassettes. Run unprocessed cassettes in a later batch.
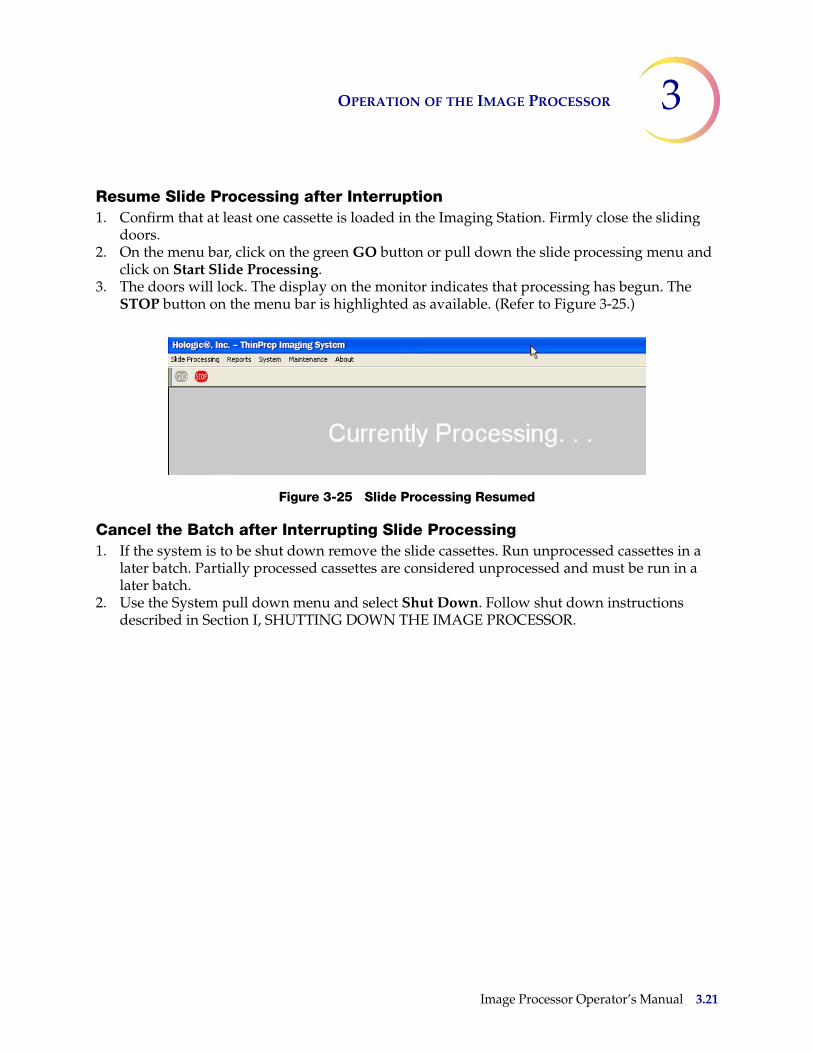
OPERATION OF THE IMAGE PROCESSOR 3
Resume Slide Processing after Interruption1. Confirm that at least one cassette is loaded in the Imaging Station. Firmly close the sliding
doors.2. On the menu bar, click on the green GO button or pull down the slide processing menu and
click on Start Slide Processing.3. The doors will lock. The display on the monitor indicates that processing has begun. The
STOP button on the menu bar is highlighted as available. (Refer to Figure 3-25.)
Figure 3-25 Slide Processing Resumed
Cancel the Batch after Interrupting Slide Processing1. If the system is to be shut down remove the slide cassettes. Run unprocessed cassettes in a
later batch. Partially processed cassettes are considered unprocessed and must be run in a later batch.
2. Use the System pull down menu and select Shut Down. Follow shut down instructions described in Section I, SHUTTING DOWN THE IMAGE PROCESSOR.
Image Processor Operator’s Manual 3.21
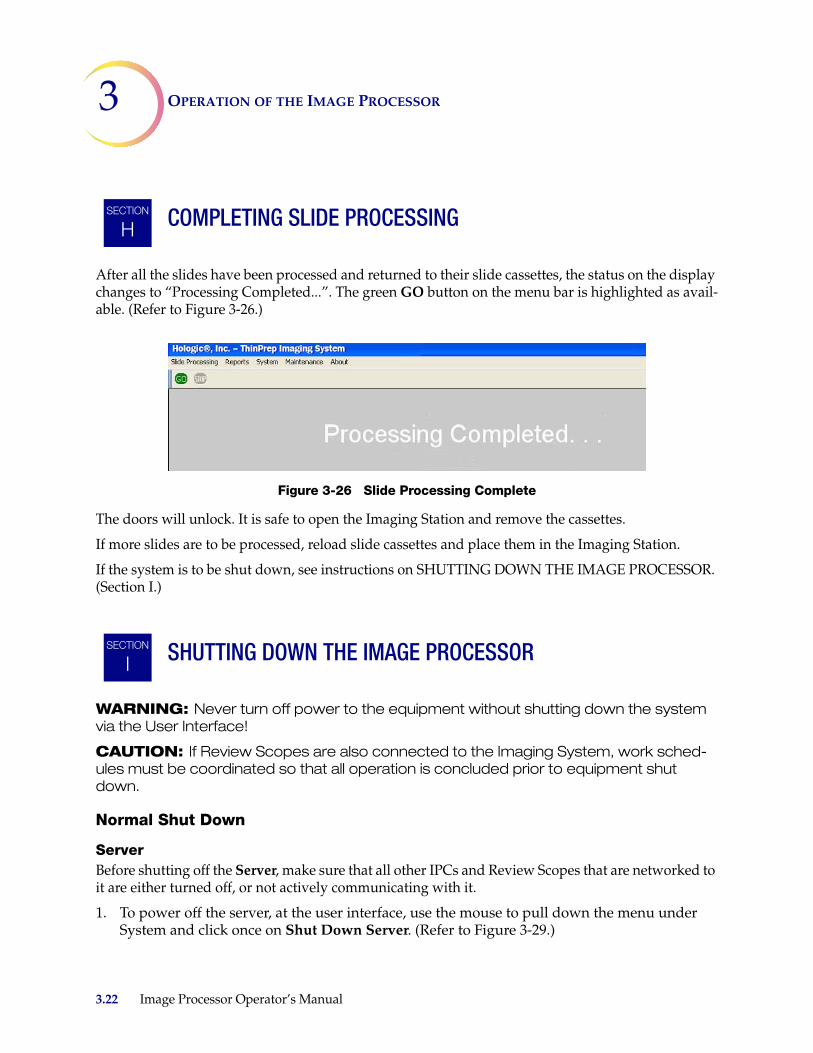
3 OPERATION OF THE IMAGE PROCESSOR
COMPLETING SLIDE PROCESSING
After all the slides have been processed and returned to their slide cassettes, the status on the display changes to “Processing Completed...”. The green GO button on the menu bar is highlighted as avail-able. (Refer to Figure 3-26.)
Figure 3-26 Slide Processing Complete
The doors will unlock. It is safe to open the Imaging Station and remove the cassettes.
If more slides are to be processed, reload slide cassettes and place them in the Imaging Station.
If the system is to be shut down, see instructions on SHUTTING DOWN THE IMAGE PROCESSOR. (Section I.)
SHUTTING DOWN THE IMAGE PROCESSOR
WARNING: Never turn off power to the equipment without shutting down the system via the User Interface!
CAUTION: If Review Scopes are also connected to the Imaging System, work sched-ules must be coordinated so that all operation is concluded prior to equipment shut down.
Normal Shut Down
ServerBefore shutting off the Server, make sure that all other IPCs and Review Scopes that are networked to it are either turned off, or not actively communicating with it.
1. To power off the server, at the user interface, use the mouse to pull down the menu under System and click once on Shut Down Server. (Refer to Figure 3-29.)
SECTION
H
SECTION
I
3.22 Image Processor Operator’s Manual

OPERATION OF THE IMAGE PROCESSOR 3
Figure 3-27 Shut Down System Menu Selection
2. Select “Yes” to continue with shut down. (Figure 3-30).
Figure 3-28 Confirm Shut Down
Image Processor1. To power off the Image Processor, at the user interface, use the mouse to pull down the menu
under System and click once on Shut Down System. (Refer to Figure 3-29.)
Figure 3-29 Shut Down System Menu Selection
2. Select “Yes” to continue with shut down. (Figure 3-30).
Figure 3-30 Confirm Shut Down
3. The application quits, and then Windows shuts down and the Image Process Controller and monitor turn off.
Image Processor Operator’s Manual 3.23

3 OPERATION OF THE IMAGE PROCESSOR
Imaging Station4. At the rear of the Imaging Station, position the Power rocker switch to OFF.
Shut Down Due to Power OutageCAUTION: Be sure to shut down the Image Processor before the UPS backup power runs out.
If a power outage condition occurs, the Uninterruptible Power Supply (UPS) issues an audible alarm when providing backup power. There will be approximately 30 minutes of power provided. Follow the instructions for shutting down the Image Processor in the previous section. Turn off the UPS when the instrument has been safely turned off.
Taking the Instrument Out of Service (Extended Shut Down)If the Image Processor is to be shut down for an extended time, follow the shut down instructions for Shutting Down the Image Processor (page 3.22).
Remove and safely store any patient slides that might be in the slide cassettes.
Close the Imaging Station doors.
Unplug the power cord to the Imaging Station, the monitor, the Image Processor Controller and the Server.
REBOOTING THE SYSTEM
If the Image Processor is being rebooted for any reason:
1. Shut down components as described in Section I.2. Allow 15 seconds to pass before powering on the monitor, Server, Imaging Station and Image
Processor Controller.
SECTION
J
3.24 Image Processor Operator’s Manual

4. So
ftware M
enu
4. S
oft
war
e M
enu
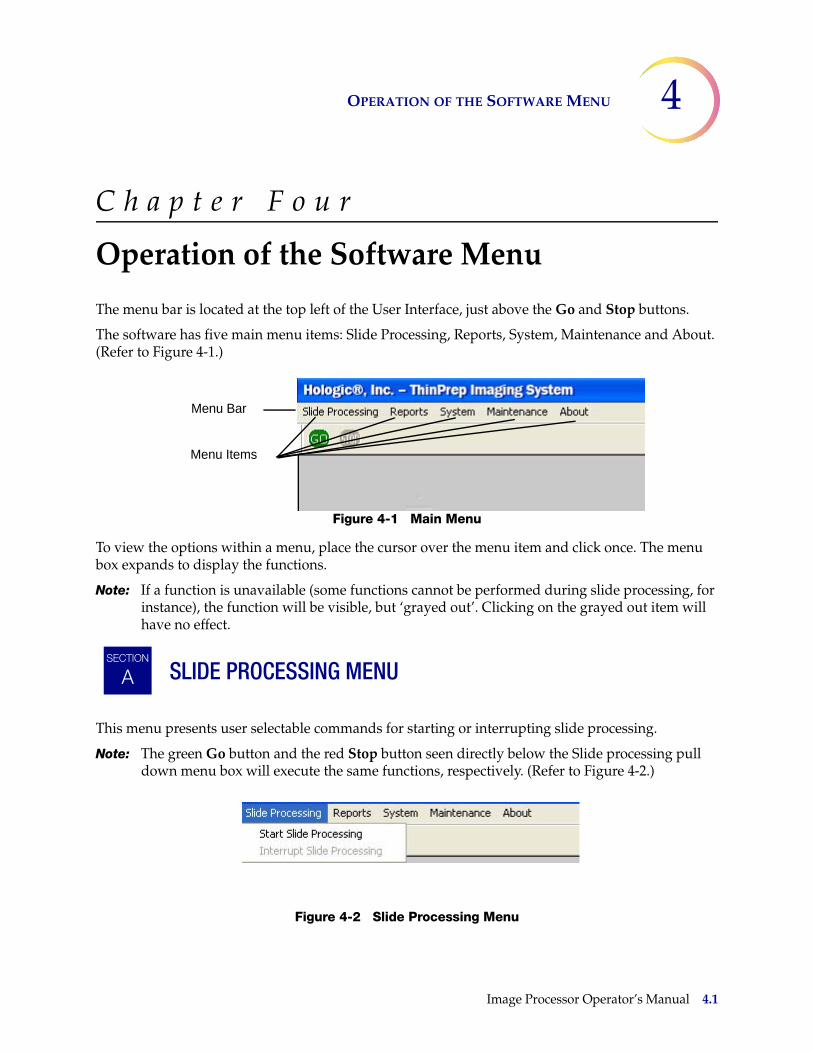
OPERATION OF THE SOFTWARE MENU 4
C h a p t e r F o u r
Operation of the Software Menu
The menu bar is located at the top left of the User Interface, just above the Go and Stop buttons.
The software has five main menu items: Slide Processing, Reports, System, Maintenance and About. (Refer to Figure 4-1.)
Figure 4-1 Main Menu
To view the options within a menu, place the cursor over the menu item and click once. The menu box expands to display the functions.
Note: If a function is unavailable (some functions cannot be performed during slide processing, for instance), the function will be visible, but ‘grayed out’. Clicking on the grayed out item will have no effect.
SLIDE PROCESSING MENU
This menu presents user selectable commands for starting or interrupting slide processing.
Note: The green Go button and the red Stop button seen directly below the Slide processing pull down menu box will execute the same functions, respectively. (Refer to Figure 4-2.)
Figure 4-2 Slide Processing Menu
Menu Bar
Menu Items
SECTION
A
Image Processor Operator’s Manual 4.1
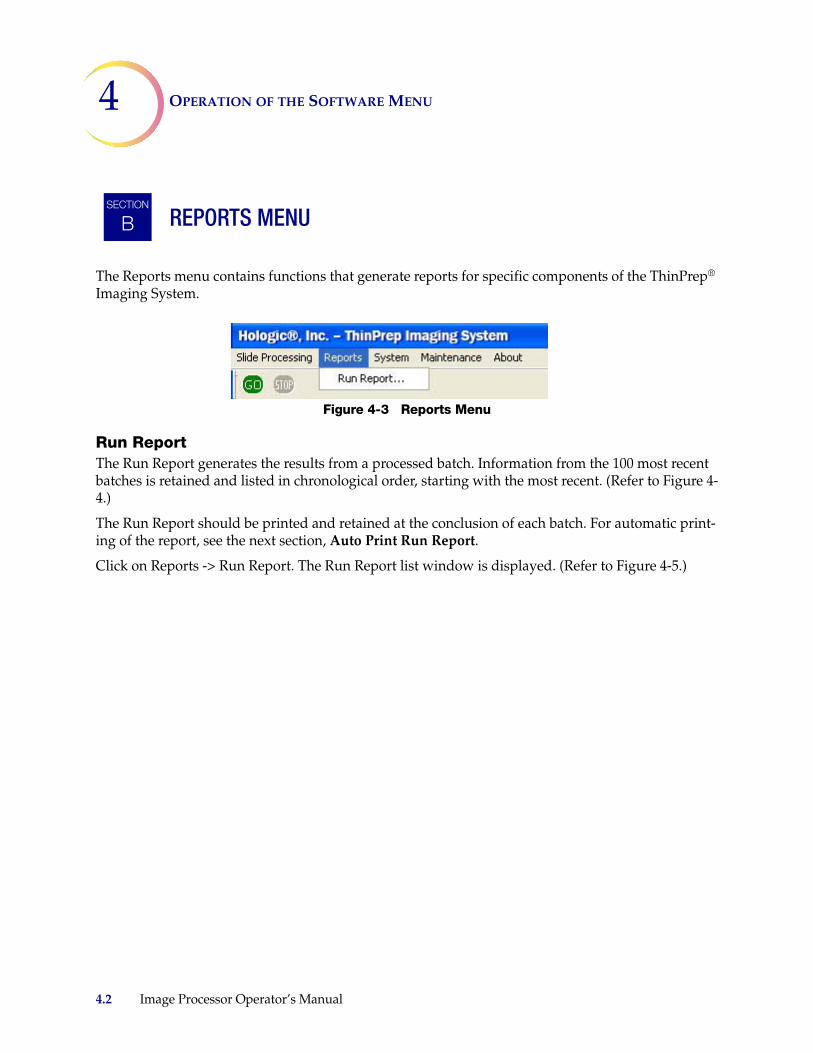
4 OPERATION OF THE SOFTWARE MENU
REPORTS MENU
The Reports menu contains functions that generate reports for specific components of the ThinPrep® Imaging System.
Figure 4-3 Reports Menu
Run ReportThe Run Report generates the results from a processed batch. Information from the 100 most recent batches is retained and listed in chronological order, starting with the most recent. (Refer to Figure 4-4.)
The Run Report should be printed and retained at the conclusion of each batch. For automatic print-ing of the report, see the next section, Auto Print Run Report.
Click on Reports -> Run Report. The Run Report list window is displayed. (Refer to Figure 4-5.)
SECTION
B
4.2 Image Processor Operator’s Manual

OPERATION OF THE SOFTWARE MENU 4
Figure 4-4 Run Report List
Select the report to view or print by clicking on it to highlight it and then clicking the View button or by double clicking on the report date.
Select this checkbox to automatically print the run report at the conclusion of a batch.
Image Processor Operator’s Manual 4.3
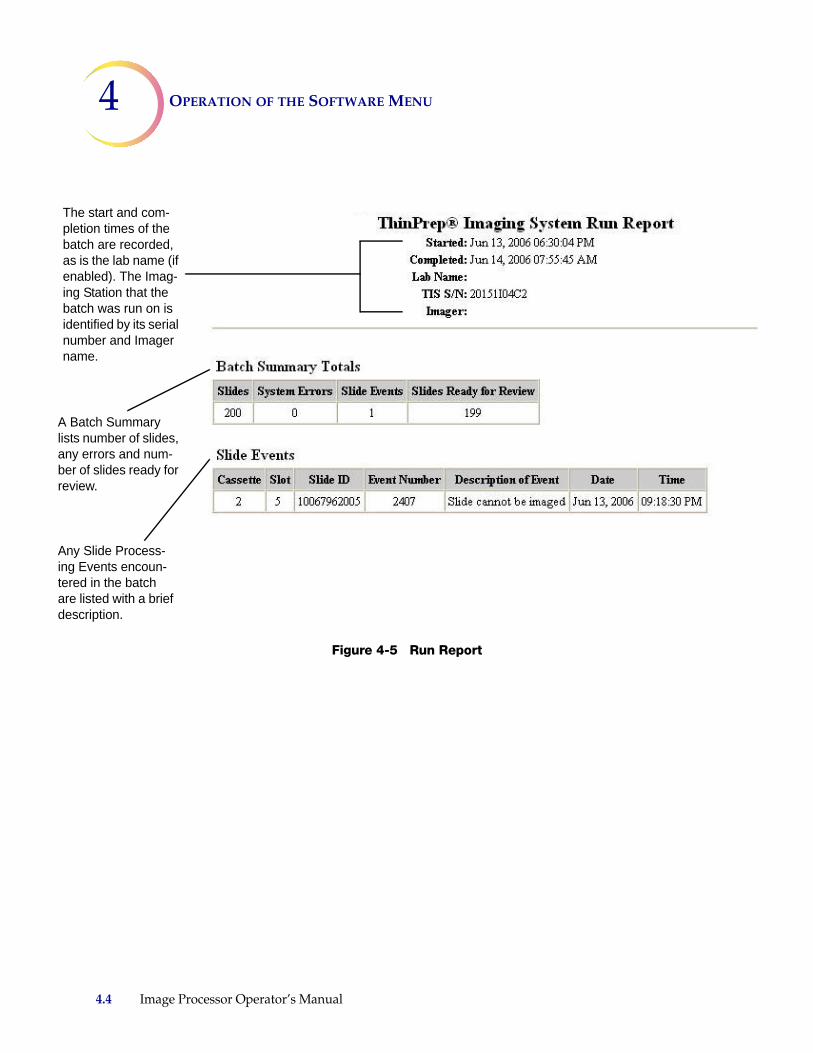
4 OPERATION OF THE SOFTWARE MENU
Thepletibatcas isenaing Sbatcidennumnam
A Balists nany eber orevie
Any Sing Eteredare lidesc
Figure 4-5 Run Report
start and com-on times of the h are recorded, the lab name (if
bled). The Imag-tation that the
h was run on is tified by its serial ber and Imager e.
tch Summary umber of slides, rrors and num-f slides ready for w.
lide Process-vents encoun- in the batch sted with a brief ription.
4.4 Image Processor Operator’s Manual
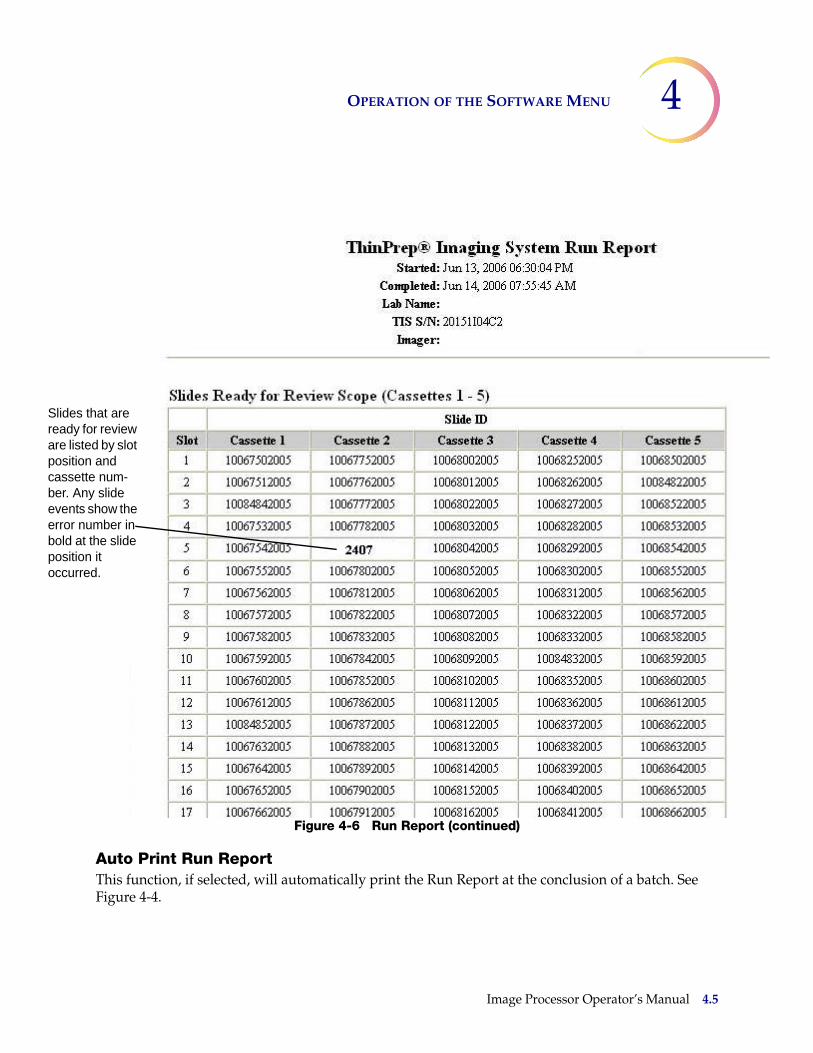
OPERATION OF THE SOFTWARE MENU 4
Slides ready fare listpositiocassetber. Aneventserror nbold atpositiooccurre
Figure 4-6 Run Report (continued)
Auto Print Run ReportThis function, if selected, will automatically print the Run Report at the conclusion of a batch. See Figure 4-4.
that are or review ed by slot n and te num-y slide show the umber in the slide n it d.
Image Processor Operator’s Manual 4.5
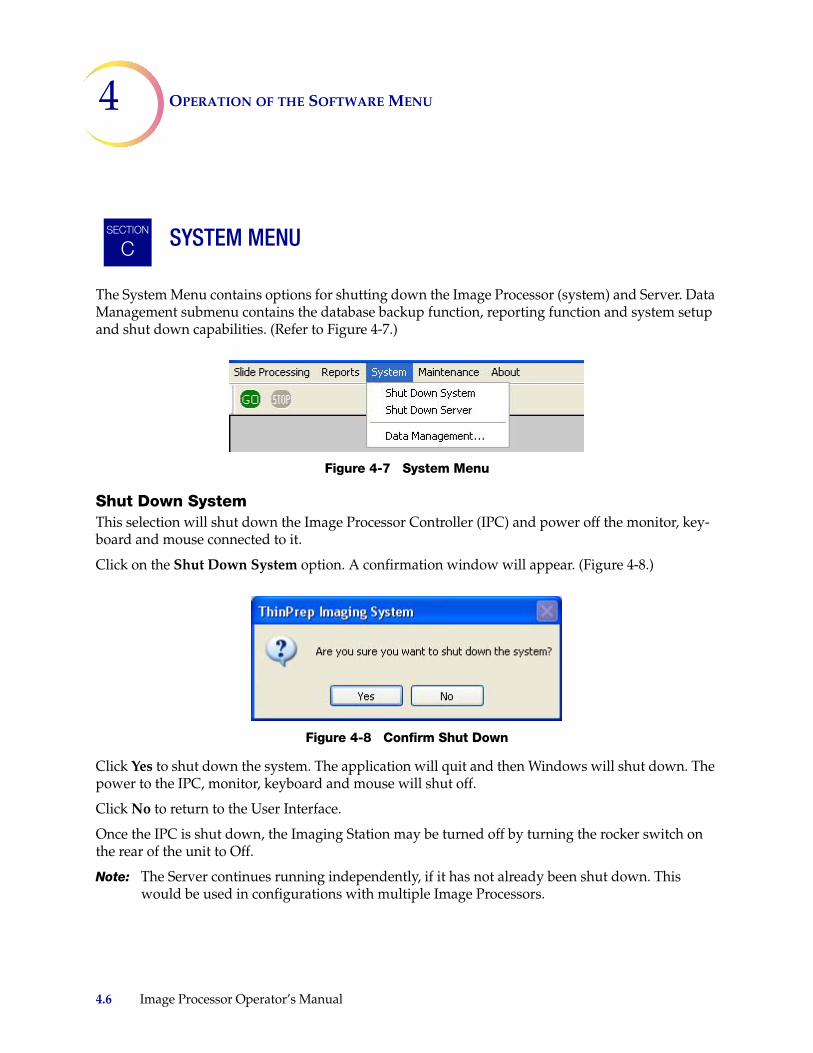
4 OPERATION OF THE SOFTWARE MENU
SYSTEM MENU
The System Menu contains options for shutting down the Image Processor (system) and Server. Data Management submenu contains the database backup function, reporting function and system setup and shut down capabilities. (Refer to Figure 4-7.)
Figure 4-7 System Menu
Shut Down SystemThis selection will shut down the Image Processor Controller (IPC) and power off the monitor, key-board and mouse connected to it.
Click on the Shut Down System option. A confirmation window will appear. (Figure 4-8.)
Figure 4-8 Confirm Shut Down
Click Yes to shut down the system. The application will quit and then Windows will shut down. The power to the IPC, monitor, keyboard and mouse will shut off.
Click No to return to the User Interface.
Once the IPC is shut down, the Imaging Station may be turned off by turning the rocker switch on the rear of the unit to Off.
Note: The Server continues running independently, if it has not already been shut down. This would be used in configurations with multiple Image Processors.
SECTION
C
4.6 Image Processor Operator’s Manual
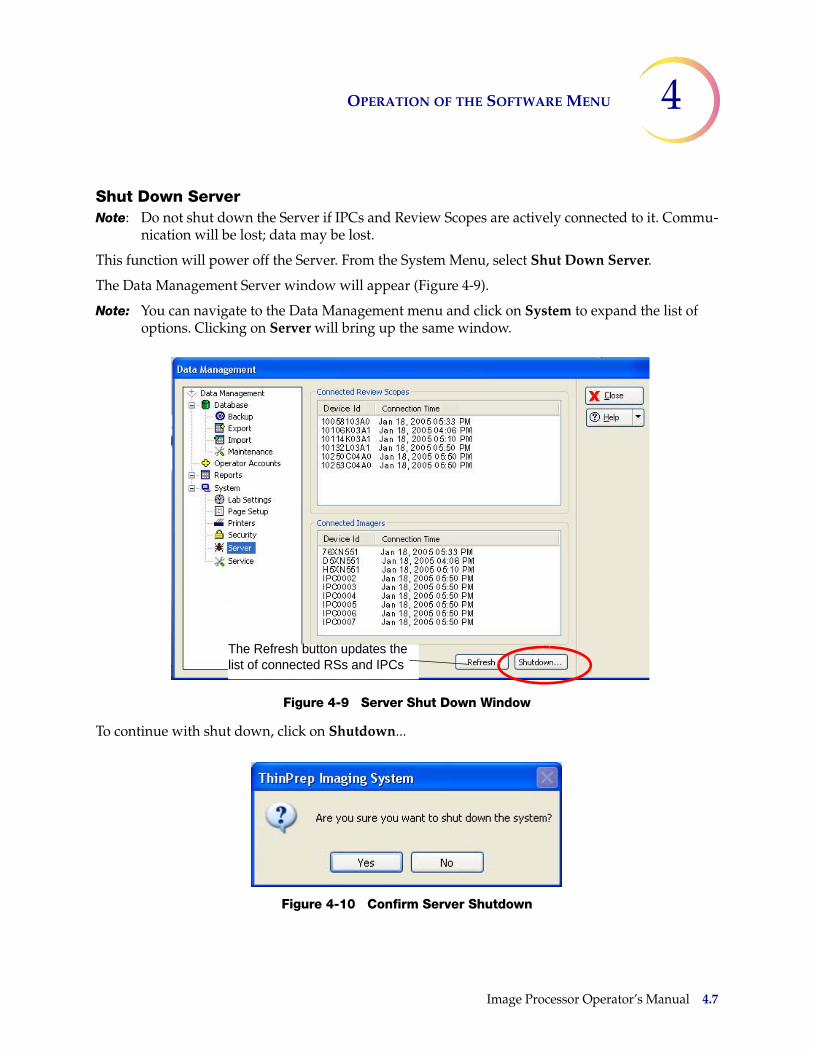
OPERATION OF THE SOFTWARE MENU 4
Shut Down ServerNote: Do not shut down the Server if IPCs and Review Scopes are actively connected to it. Commu-
nication will be lost; data may be lost.
This function will power off the Server. From the System Menu, select Shut Down Server.
The Data Management Server window will appear (Figure 4-9).
Note: You can navigate to the Data Management menu and click on System to expand the list of options. Clicking on Server will bring up the same window.
Figure 4-9 Server Shut Down Window
To continue with shut down, click on Shutdown...
Figure 4-10 Confirm Server Shutdown
The Refresh button updates the list of connected RSs and IPCs
Image Processor Operator’s Manual 4.7

4 OPERATION OF THE SOFTWARE MENU
DATA MANAGEMENT MENUThe Data Management menu contains functions for backing up and maintaining the database, main-taining Operator accounts, generating reports and setting system printer, time, date and alarm options.
Clicking on System - Data Management... will bring up the Data Management window (Figure 4-11).
Figure 4-11 Data Management Window
Database - BackupThe Backup function enables the operator to make back ups of the database onto CD ROM located on the Server.
Click on the Backup selection. The Backup window will appear (Figure 4-12.)
SECTION
D
The window appears with all submenu options collapsed.
Items with a + symbol indi-cates there is more than one item as a submenu.
Expanded Data Manage-ment Menus
Click on this button to close the window and return to the main interface.
* Note: Run Report function is not available on the Server User Interface - Run reports must be accessed from IPCs
*
The Help button displays the soft-ware version
4.8 Image Processor Operator’s Manual
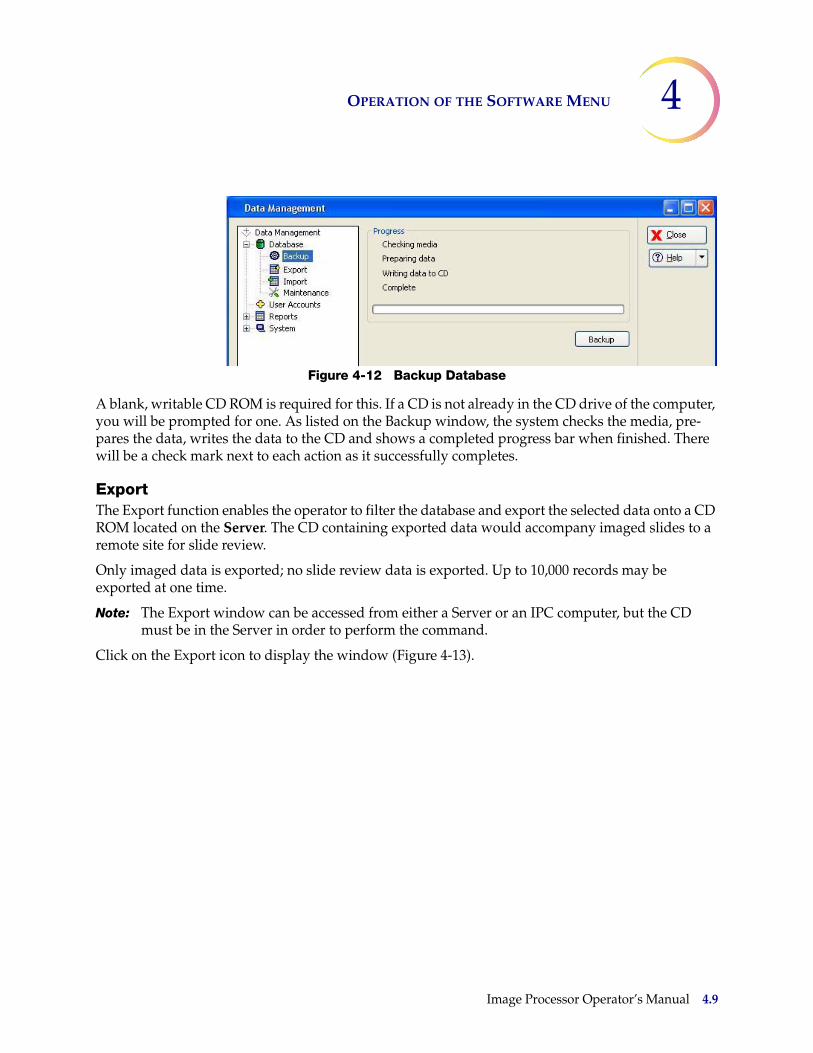
OPERATION OF THE SOFTWARE MENU 4
Figure 4-12 Backup Database
A blank, writable CD ROM is required for this. If a CD is not already in the CD drive of the computer, you will be prompted for one. As listed on the Backup window, the system checks the media, pre-pares the data, writes the data to the CD and shows a completed progress bar when finished. There will be a check mark next to each action as it successfully completes.
ExportThe Export function enables the operator to filter the database and export the selected data onto a CD ROM located on the Server. The CD containing exported data would accompany imaged slides to a remote site for slide review.
Only imaged data is exported; no slide review data is exported. Up to 10,000 records may be exported at one time.
Note: The Export window can be accessed from either a Server or an IPC computer, but the CD must be in the Server in order to perform the command.
Click on the Export icon to display the window (Figure 4-13).
Image Processor Operator’s Manual 4.9
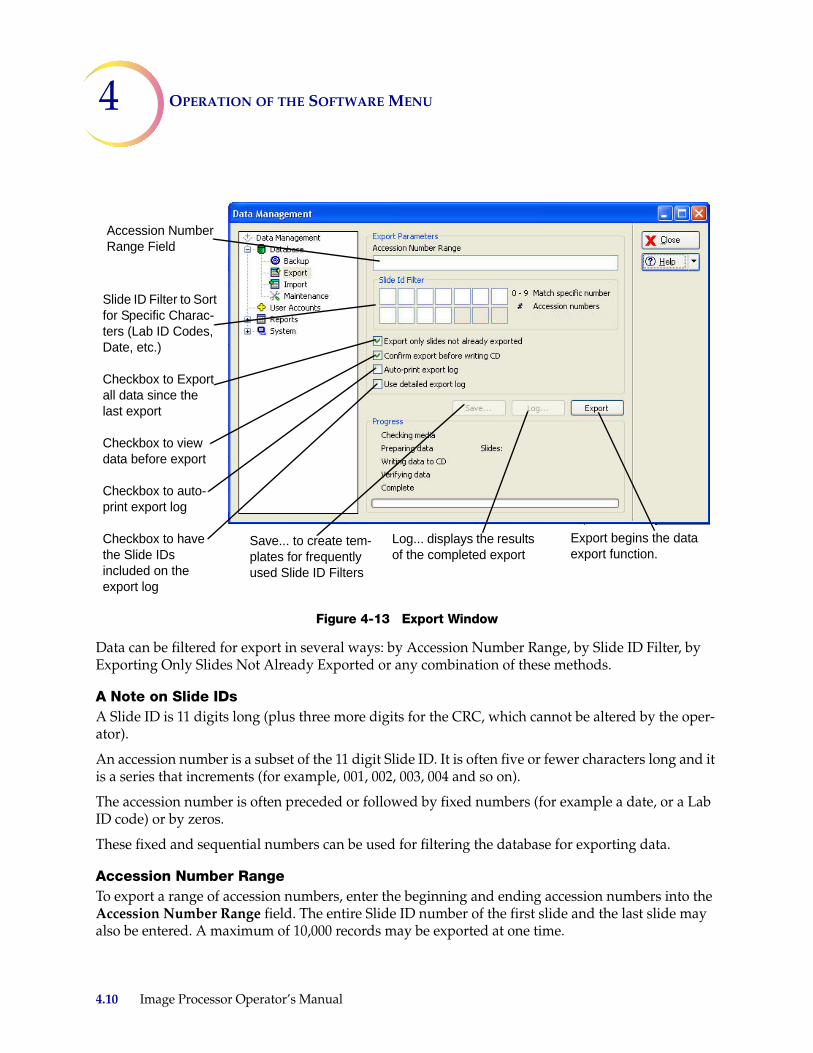
4 OPERATION OF THE SOFTWARE MENU
Figure 4-13 Export Window
Data can be filtered for export in several ways: by Accession Number Range, by Slide ID Filter, by Exporting Only Slides Not Already Exported or any combination of these methods.
A Note on Slide IDsA Slide ID is 11 digits long (plus three more digits for the CRC, which cannot be altered by the oper-ator).
An accession number is a subset of the 11 digit Slide ID. It is often five or fewer characters long and it is a series that increments (for example, 001, 002, 003, 004 and so on).
The accession number is often preceded or followed by fixed numbers (for example a date, or a Lab ID code) or by zeros.
These fixed and sequential numbers can be used for filtering the database for exporting data.
Accession Number RangeTo export a range of accession numbers, enter the beginning and ending accession numbers into the Accession Number Range field. The entire Slide ID number of the first slide and the last slide may also be entered. A maximum of 10,000 records may be exported at one time.
Accession Number Range Field
Slide ID Filter to Sort for Specific Charac-ters (Lab ID Codes, Date, etc.)
Checkbox to Export all data since the last export
Checkbox to view data before export
Checkbox to auto-print export log
Checkbox to have the Slide IDs included on the export log
Save... to create tem-plates for frequently used Slide ID Filters
Log... displays the results of the completed export
Export begins the data export function.
4.10 Image Processor Operator’s Manual
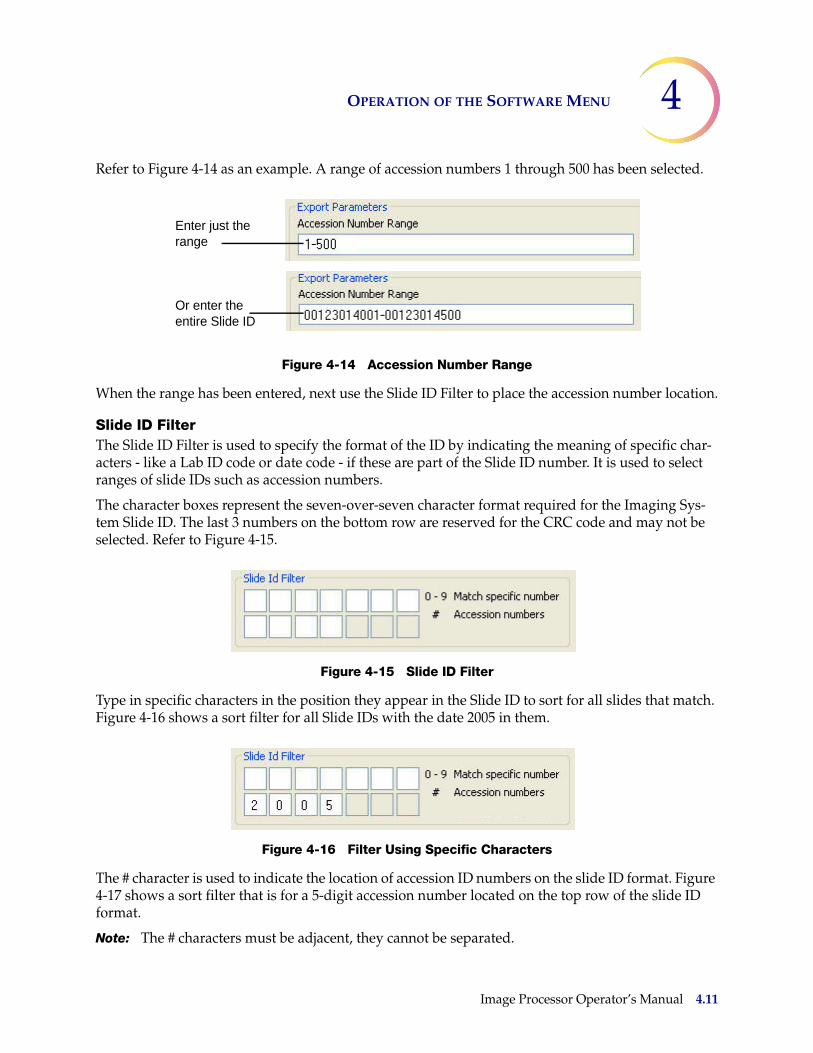
OPERATION OF THE SOFTWARE MENU 4
Refer to Figure 4-14 as an example. A range of accession numbers 1 through 500 has been selected.
Figure 4-14 Accession Number Range
When the range has been entered, next use the Slide ID Filter to place the accession number location.
Slide ID FilterThe Slide ID Filter is used to specify the format of the ID by indicating the meaning of specific char-acters - like a Lab ID code or date code - if these are part of the Slide ID number. It is used to select ranges of slide IDs such as accession numbers.
The character boxes represent the seven-over-seven character format required for the Imaging Sys-tem Slide ID. The last 3 numbers on the bottom row are reserved for the CRC code and may not be selected. Refer to Figure 4-15.
Figure 4-15 Slide ID Filter
Type in specific characters in the position they appear in the Slide ID to sort for all slides that match. Figure 4-16 shows a sort filter for all Slide IDs with the date 2005 in them.
Figure 4-16 Filter Using Specific Characters
The # character is used to indicate the location of accession ID numbers on the slide ID format. Figure 4-17 shows a sort filter that is for a 5-digit accession number located on the top row of the slide ID format.
Note: The # characters must be adjacent, they cannot be separated.
Enter just the range
Or enter the entire Slide ID
Image Processor Operator’s Manual 4.11
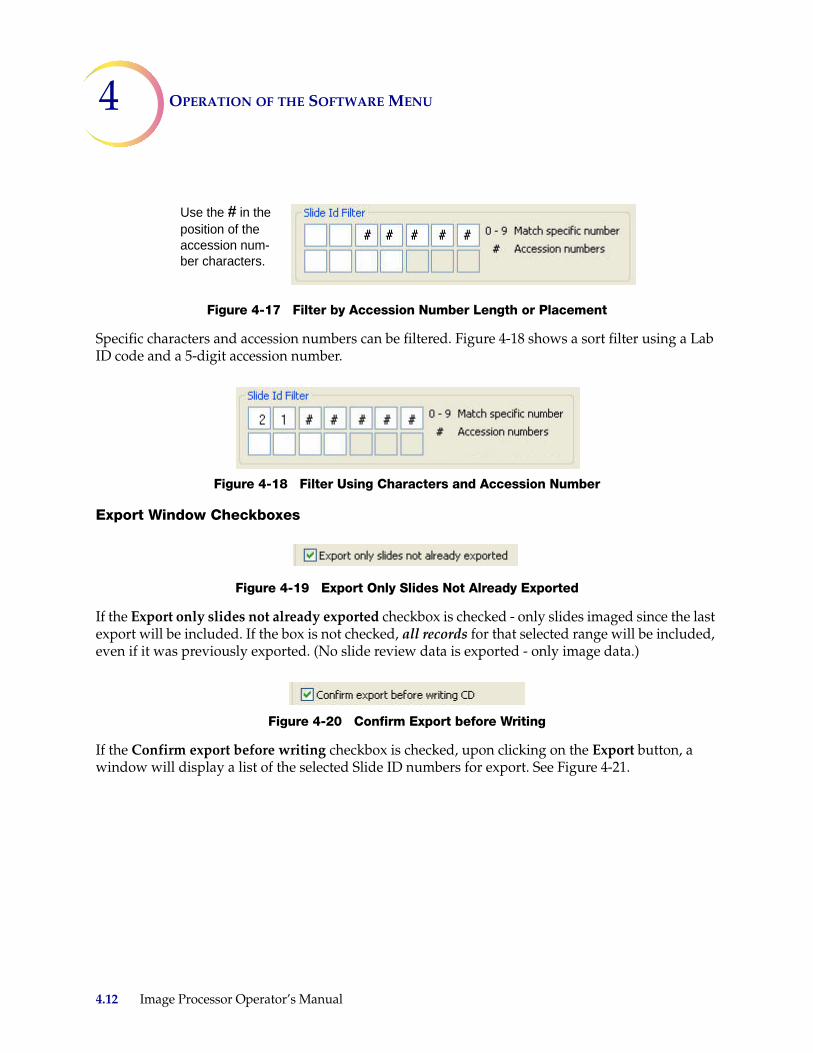
4 OPERATION OF THE SOFTWARE MENU
Figure 4-17 Filter by Accession Number Length or Placement
Specific characters and accession numbers can be filtered. Figure 4-18 shows a sort filter using a Lab ID code and a 5-digit accession number.
Figure 4-18 Filter Using Characters and Accession Number
Export Window Checkboxes
Figure 4-19 Export Only Slides Not Already Exported
If the Export only slides not already exported checkbox is checked - only slides imaged since the last export will be included. If the box is not checked, all records for that selected range will be included, even if it was previously exported. (No slide review data is exported - only image data.)
Figure 4-20 Confirm Export before Writing
If the Confirm export before writing checkbox is checked, upon clicking on the Export button, a window will display a list of the selected Slide ID numbers for export. See Figure 4-21.
Use the # in the position of the accession num-ber characters.
4.12 Image Processor Operator’s Manual
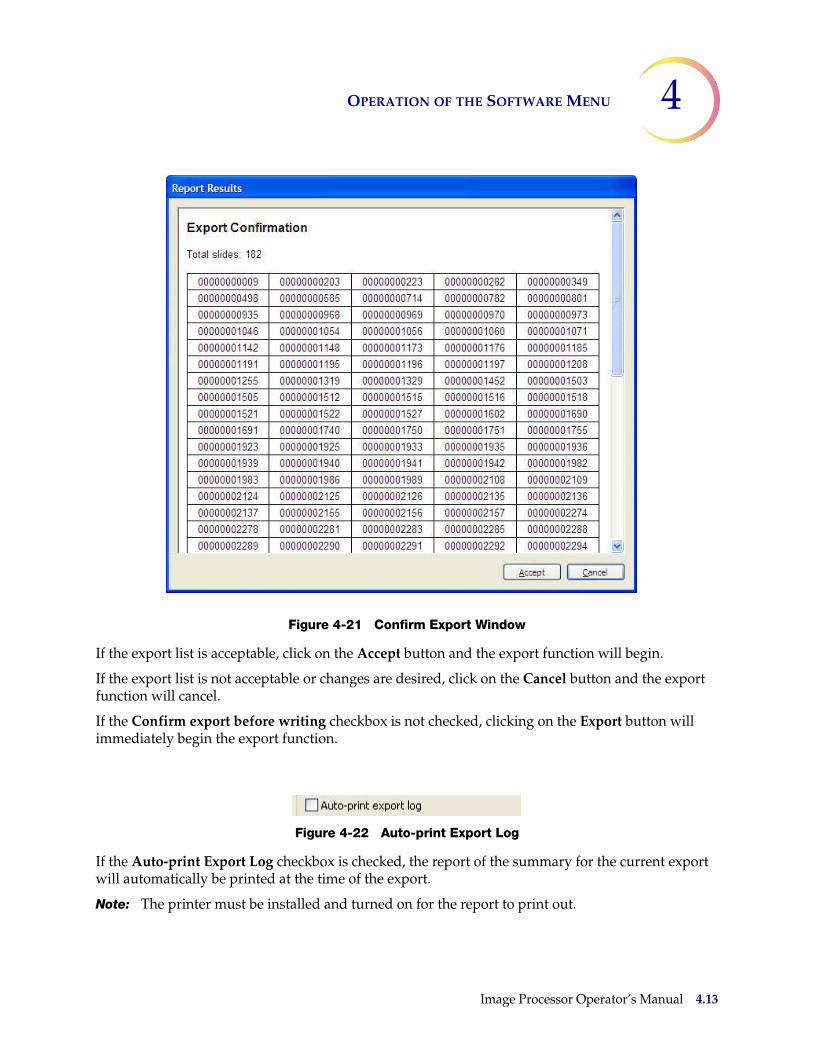
OPERATION OF THE SOFTWARE MENU 4
Figure 4-21 Confirm Export Window
If the export list is acceptable, click on the Accept button and the export function will begin.
If the export list is not acceptable or changes are desired, click on the Cancel button and the export function will cancel.
If the Confirm export before writing checkbox is not checked, clicking on the Export button will immediately begin the export function.
Figure 4-22 Auto-print Export Log
If the Auto-print Export Log checkbox is checked, the report of the summary for the current export will automatically be printed at the time of the export.
Note: The printer must be installed and turned on for the report to print out.
Image Processor Operator’s Manual 4.13
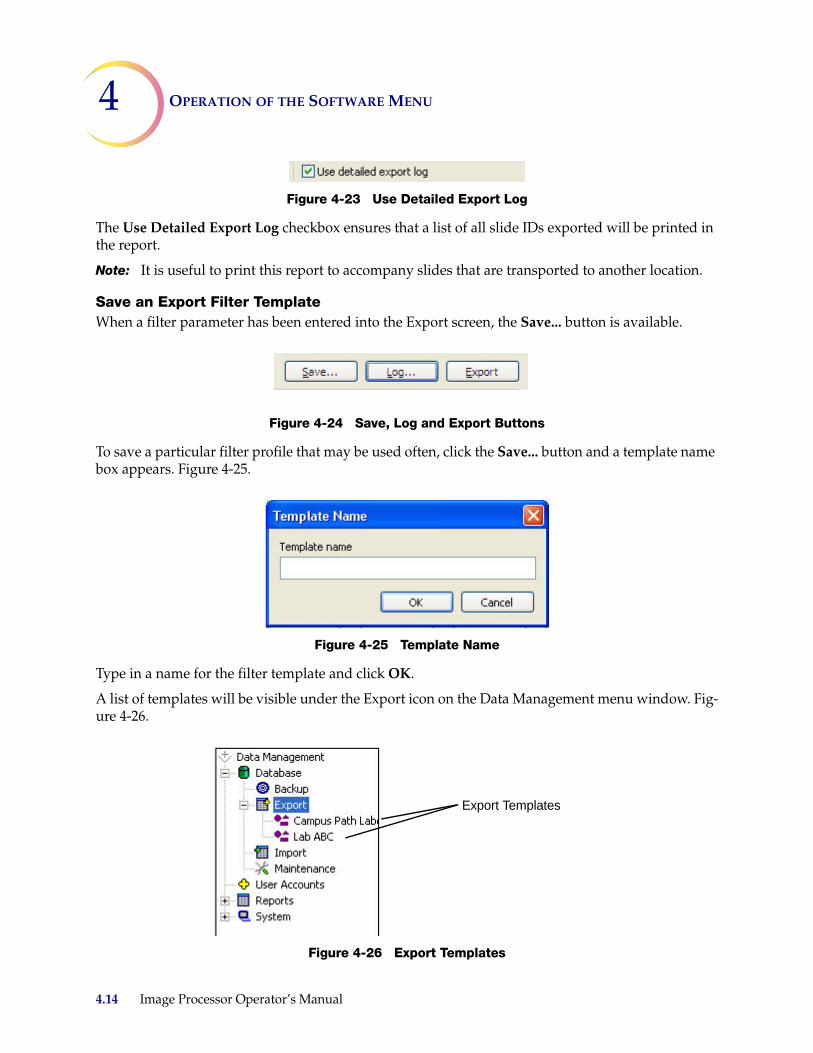
4 OPERATION OF THE SOFTWARE MENU
Figure 4-23 Use Detailed Export Log
The Use Detailed Export Log checkbox ensures that a list of all slide IDs exported will be printed in the report.
Note: It is useful to print this report to accompany slides that are transported to another location.
Save an Export Filter TemplateWhen a filter parameter has been entered into the Export screen, the Save... button is available.
Figure 4-24 Save, Log and Export Buttons
To save a particular filter profile that may be used often, click the Save... button and a template name box appears. Figure 4-25.
Figure 4-25 Template Name
Type in a name for the filter template and click OK.
A list of templates will be visible under the Export icon on the Data Management menu window. Fig-ure 4-26.
Figure 4-26 Export Templates
Export Templates
4.14 Image Processor Operator’s Manual
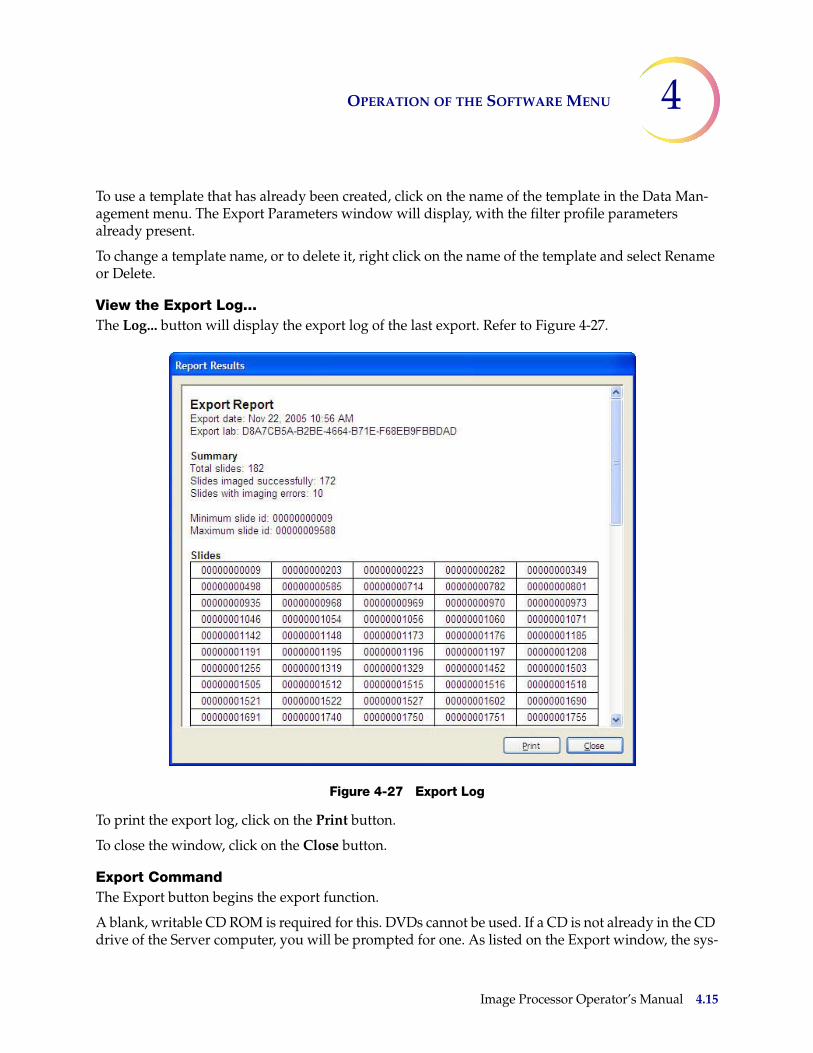
OPERATION OF THE SOFTWARE MENU 4
To use a template that has already been created, click on the name of the template in the Data Man-agement menu. The Export Parameters window will display, with the filter profile parameters already present.
To change a template name, or to delete it, right click on the name of the template and select Rename or Delete.
View the Export Log...The Log... button will display the export log of the last export. Refer to Figure 4-27.
Figure 4-27 Export Log
To print the export log, click on the Print button.
To close the window, click on the Close button.
Export CommandThe Export button begins the export function.
A blank, writable CD ROM is required for this. DVDs cannot be used. If a CD is not already in the CD drive of the Server computer, you will be prompted for one. As listed on the Export window, the sys-
Image Processor Operator’s Manual 4.15
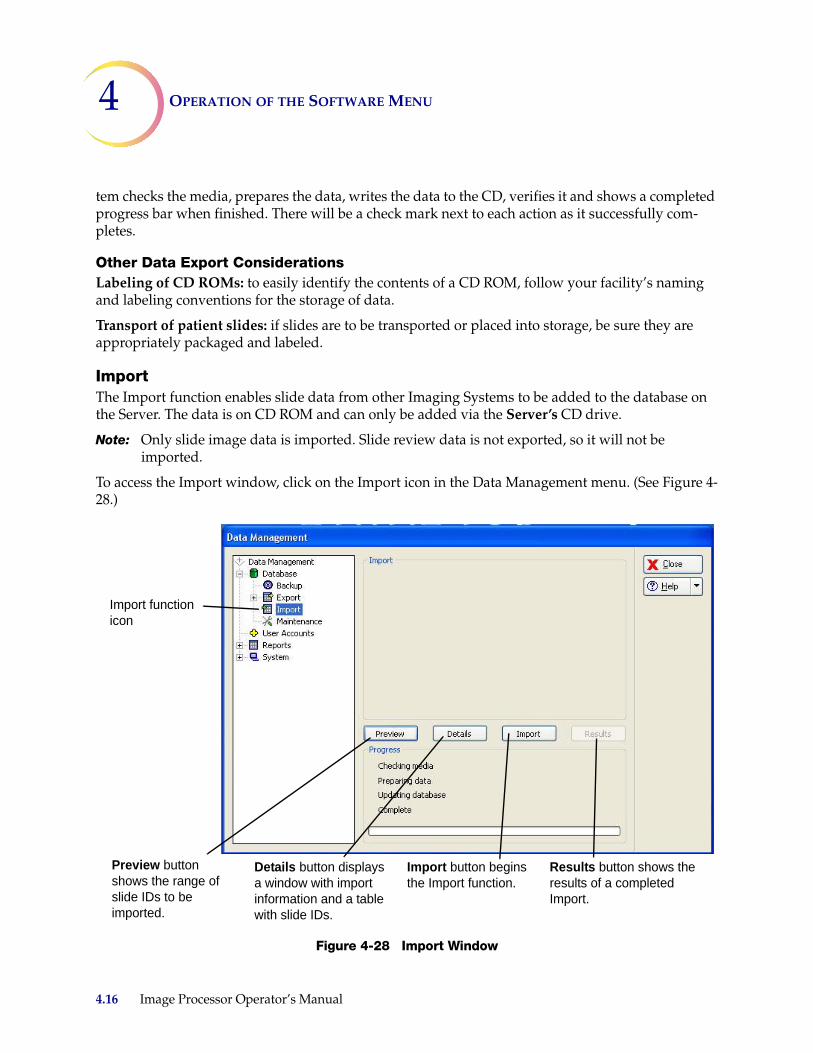
4 OPERATION OF THE SOFTWARE MENU
tem checks the media, prepares the data, writes the data to the CD, verifies it and shows a completed progress bar when finished. There will be a check mark next to each action as it successfully com-pletes.
Other Data Export ConsiderationsLabeling of CD ROMs: to easily identify the contents of a CD ROM, follow your facility’s naming and labeling conventions for the storage of data.
Transport of patient slides: if slides are to be transported or placed into storage, be sure they are appropriately packaged and labeled.
ImportThe Import function enables slide data from other Imaging Systems to be added to the database on the Server. The data is on CD ROM and can only be added via the Server’s CD drive.
Note: Only slide image data is imported. Slide review data is not exported, so it will not be imported.
To access the Import window, click on the Import icon in the Data Management menu. (See Figure 4-28.)
Figure 4-28 Import Window
Import function icon
Results button shows the results of a completed Import.
Preview button shows the range of slide IDs to be imported.
Import button begins the Import function.
Details button displays a window with import information and a table with slide IDs.
4.16 Image Processor Operator’s Manual

OPERATION OF THE SOFTWARE MENU 4
Place a CD with slide data into the CD drive of the Server. Click on the Preview button to see a brief status of the CD: date of export, name of lab, number of slides. Refer to Figure 4-29.
Figure 4-29 Import Preview Window
To see the import data details, click on the Details button. A window will open to show the import data information and a table of slide IDs that will be imported. Refer to Figure 4-30.
Click on Print to print a hard copy of this report. Click Close to close the window and return to the Import screen.
Import CD ContentsExport date
Exporting lab
Total slides Slides imaged successfullySlides with imaging errors
Minimum slide ID Maximum slide ID
Image Processor Operator’s Manual 4.17
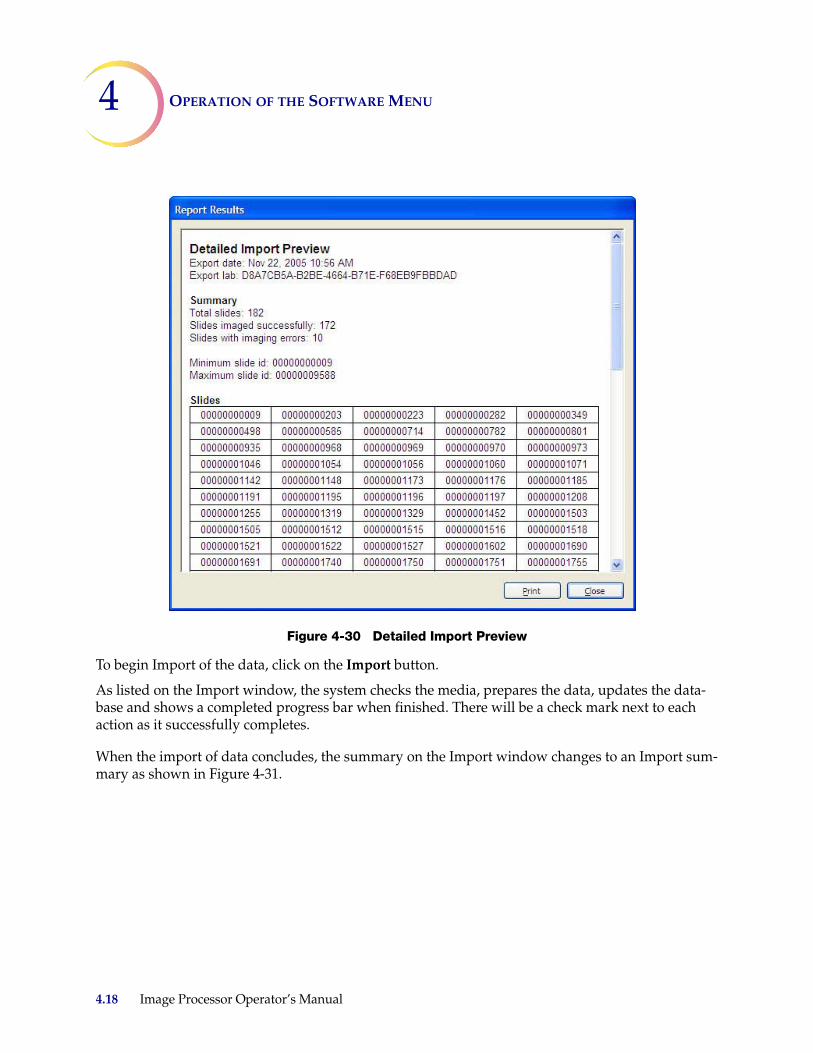
4 OPERATION OF THE SOFTWARE MENU
Figure 4-30 Detailed Import Preview
To begin Import of the data, click on the Import button.
As listed on the Import window, the system checks the media, prepares the data, updates the data-base and shows a completed progress bar when finished. There will be a check mark next to each action as it successfully completes.
When the import of data concludes, the summary on the Import window changes to an Import sum-mary as shown in Figure 4-31.
4.18 Image Processor Operator’s Manual
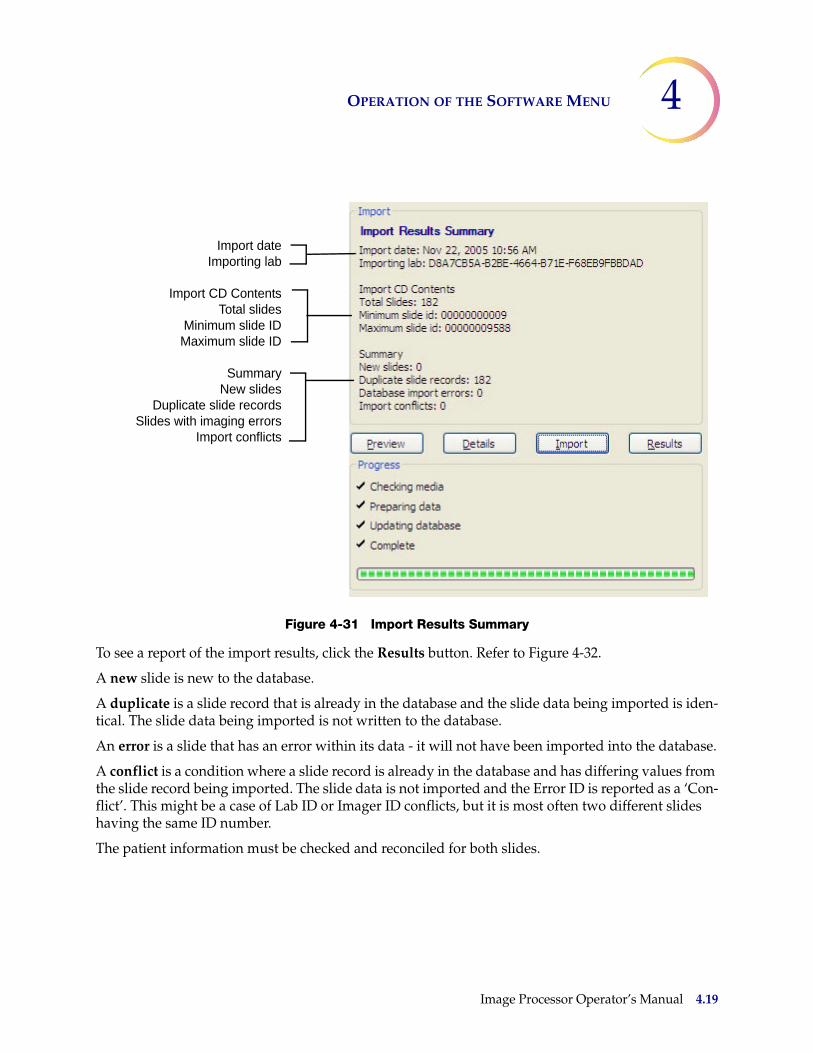
OPERATION OF THE SOFTWARE MENU 4
Figure 4-31 Import Results Summary
To see a report of the import results, click the Results button. Refer to Figure 4-32.
A new slide is new to the database.
A duplicate is a slide record that is already in the database and the slide data being imported is iden-tical. The slide data being imported is not written to the database.
An error is a slide that has an error within its data - it will not have been imported into the database.
A conflict is a condition where a slide record is already in the database and has differing values from the slide record being imported. The slide data is not imported and the Error ID is reported as a ‘Con-flict’. This might be a case of Lab ID or Imager ID conflicts, but it is most often two different slides having the same ID number.
The patient information must be checked and reconciled for both slides.
Import date Importing lab
Import CD ContentsTotal slides
Minimum slide ID Maximum slide ID
SummaryNew slides
Duplicate slide records Slides with imaging errors
Import conflicts
Image Processor Operator’s Manual 4.19
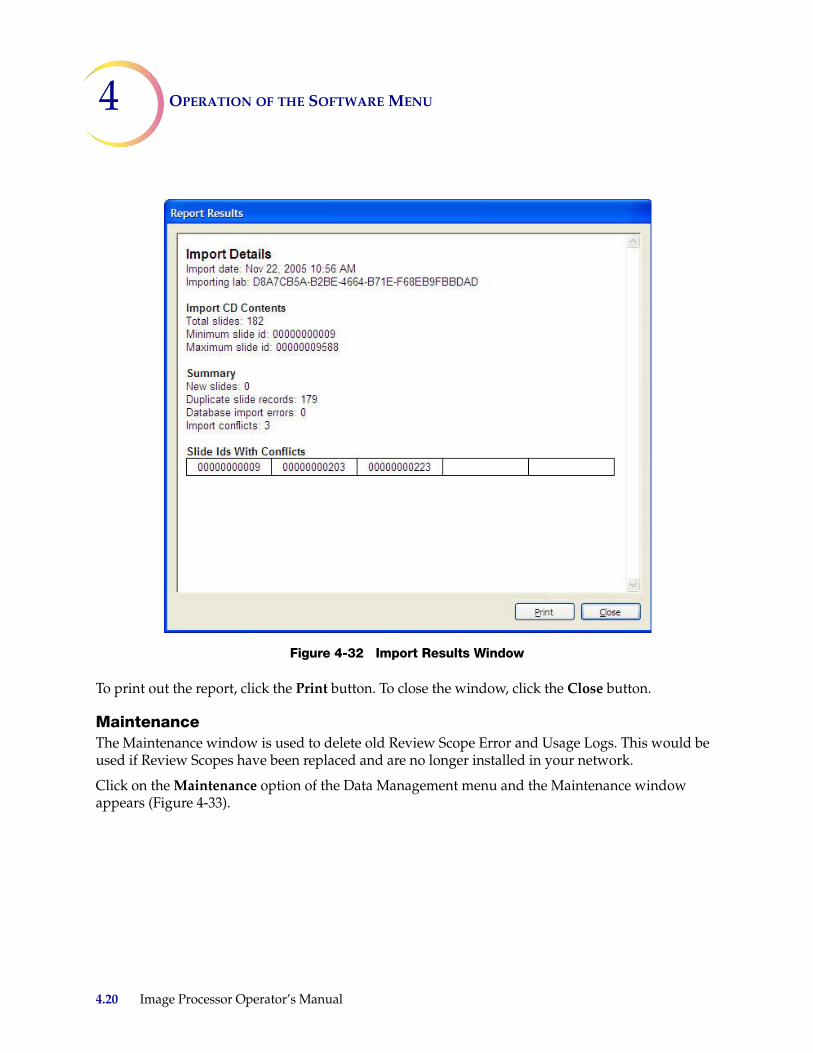
4 OPERATION OF THE SOFTWARE MENU
Figure 4-32 Import Results Window
To print out the report, click the Print button. To close the window, click the Close button.
MaintenanceThe Maintenance window is used to delete old Review Scope Error and Usage Logs. This would be used if Review Scopes have been replaced and are no longer installed in your network.
Click on the Maintenance option of the Data Management menu and the Maintenance window appears (Figure 4-33).
4.20 Image Processor Operator’s Manual
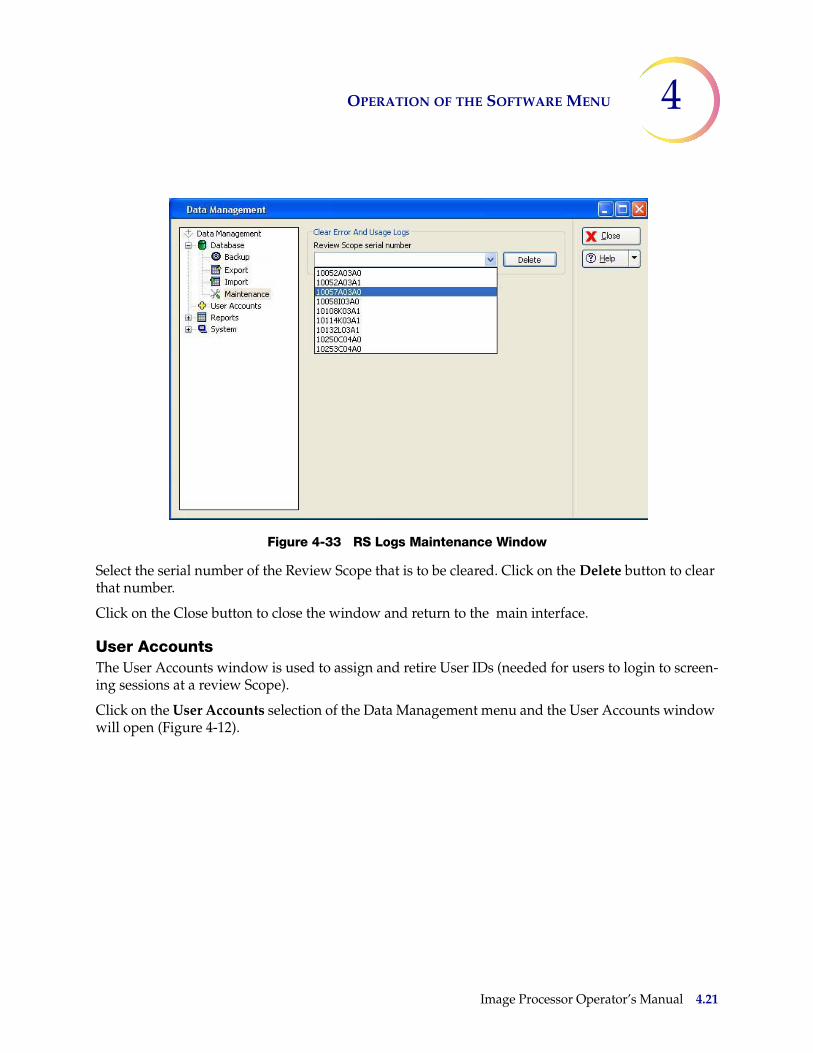
OPERATION OF THE SOFTWARE MENU 4
Figure 4-33 RS Logs Maintenance Window
Select the serial number of the Review Scope that is to be cleared. Click on the Delete button to clear that number.
Click on the Close button to close the window and return to the main interface.
User AccountsThe User Accounts window is used to assign and retire User IDs (needed for users to login to screen-ing sessions at a review Scope).
Click on the User Accounts selection of the Data Management menu and the User Accounts window will open (Figure 4-12).
Image Processor Operator’s Manual 4.21
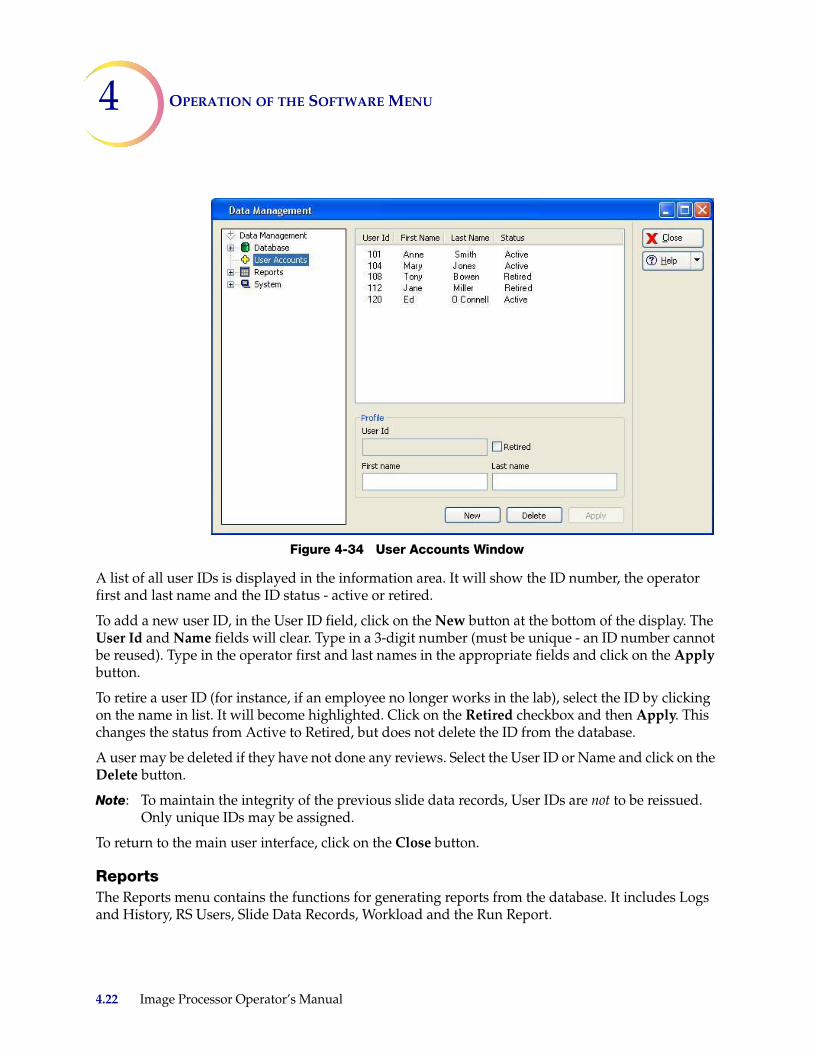
4 OPERATION OF THE SOFTWARE MENU
Figure 4-34 User Accounts Window
A list of all user IDs is displayed in the information area. It will show the ID number, the operator first and last name and the ID status - active or retired.
To add a new user ID, in the User ID field, click on the New button at the bottom of the display. The User Id and Name fields will clear. Type in a 3-digit number (must be unique - an ID number cannot be reused). Type in the operator first and last names in the appropriate fields and click on the Apply button.
To retire a user ID (for instance, if an employee no longer works in the lab), select the ID by clicking on the name in list. It will become highlighted. Click on the Retired checkbox and then Apply. This changes the status from Active to Retired, but does not delete the ID from the database.
A user may be deleted if they have not done any reviews. Select the User ID or Name and click on the Delete button.
Note: To maintain the integrity of the previous slide data records, User IDs are not to be reissued. Only unique IDs may be assigned.
To return to the main user interface, click on the Close button.
ReportsThe Reports menu contains the functions for generating reports from the database. It includes Logs and History, RS Users, Slide Data Records, Workload and the Run Report.
4.22 Image Processor Operator’s Manual
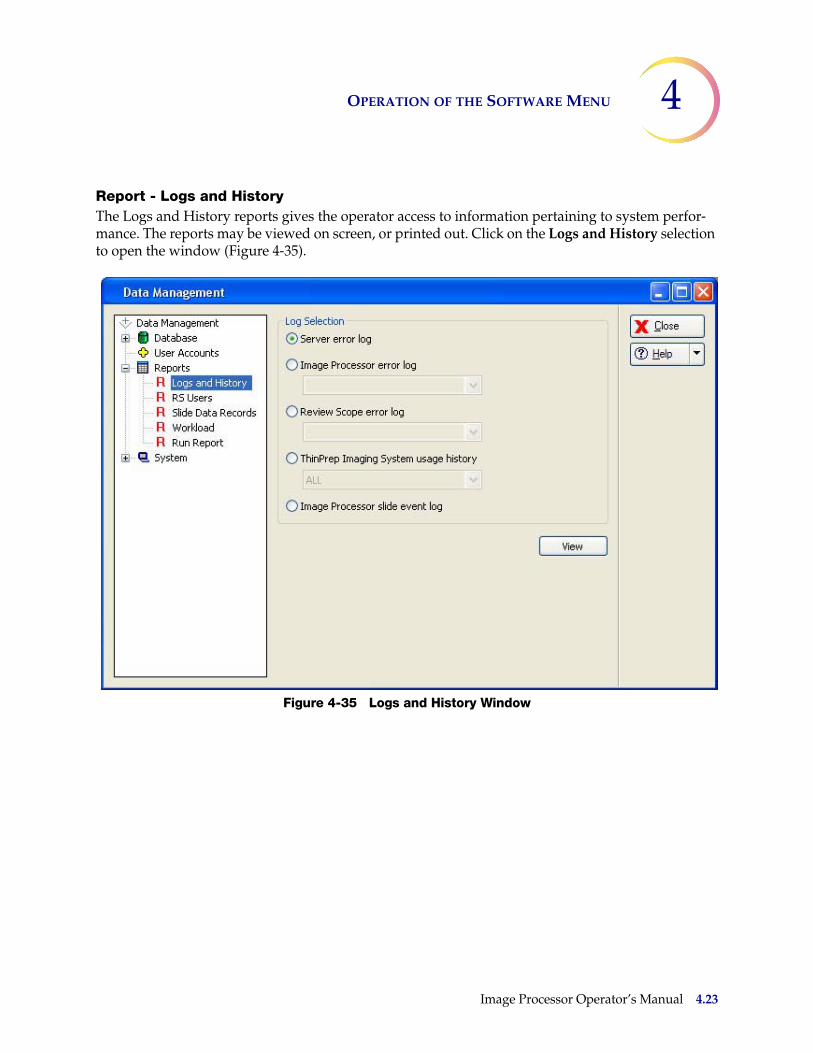
OPERATION OF THE SOFTWARE MENU 4
Report - Logs and HistoryThe Logs and History reports gives the operator access to information pertaining to system perfor-mance. The reports may be viewed on screen, or printed out. Click on the Logs and History selection to open the window (Figure 4-35).
Figure 4-35 Logs and History Window
Image Processor Operator’s Manual 4.23
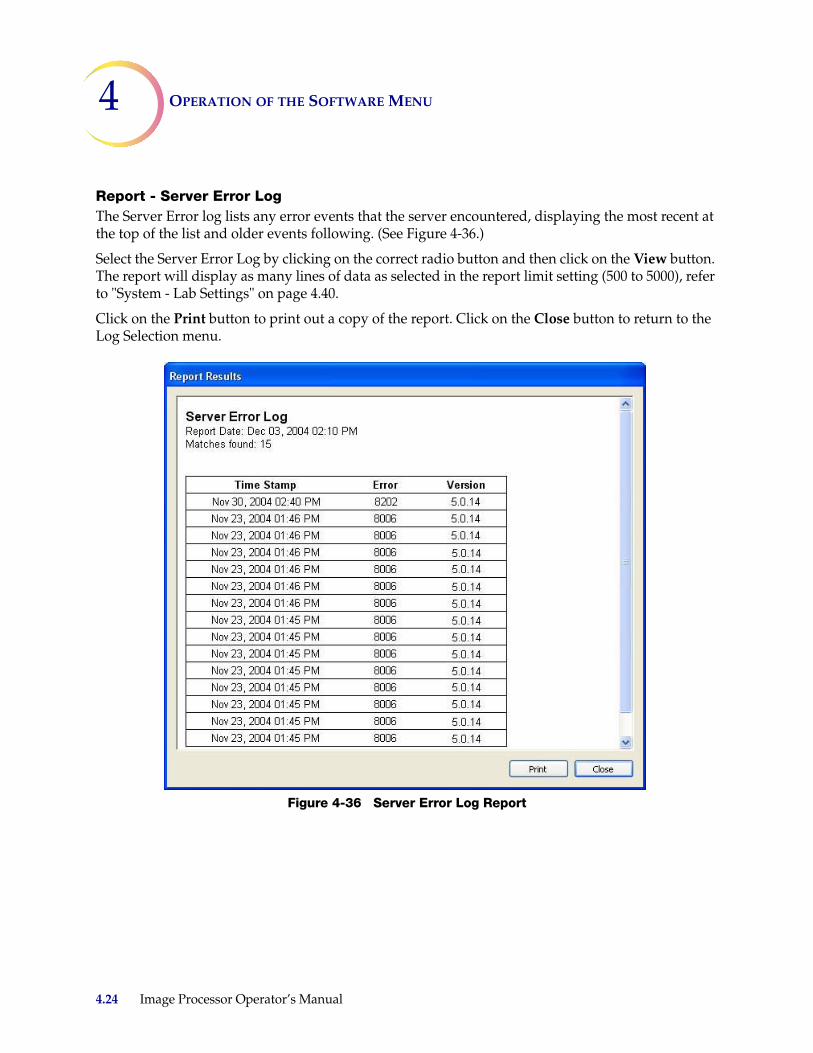
4 OPERATION OF THE SOFTWARE MENU
Report - Server Error LogThe Server Error log lists any error events that the server encountered, displaying the most recent at the top of the list and older events following. (See Figure 4-36.)
Select the Server Error Log by clicking on the correct radio button and then click on the View button. The report will display as many lines of data as selected in the report limit setting (500 to 5000), refer to "System - Lab Settings" on page 4.40.
Click on the Print button to print out a copy of the report. Click on the Close button to return to the Log Selection menu.
Figure 4-36 Server Error Log Report
4.24 Image Processor Operator’s Manual
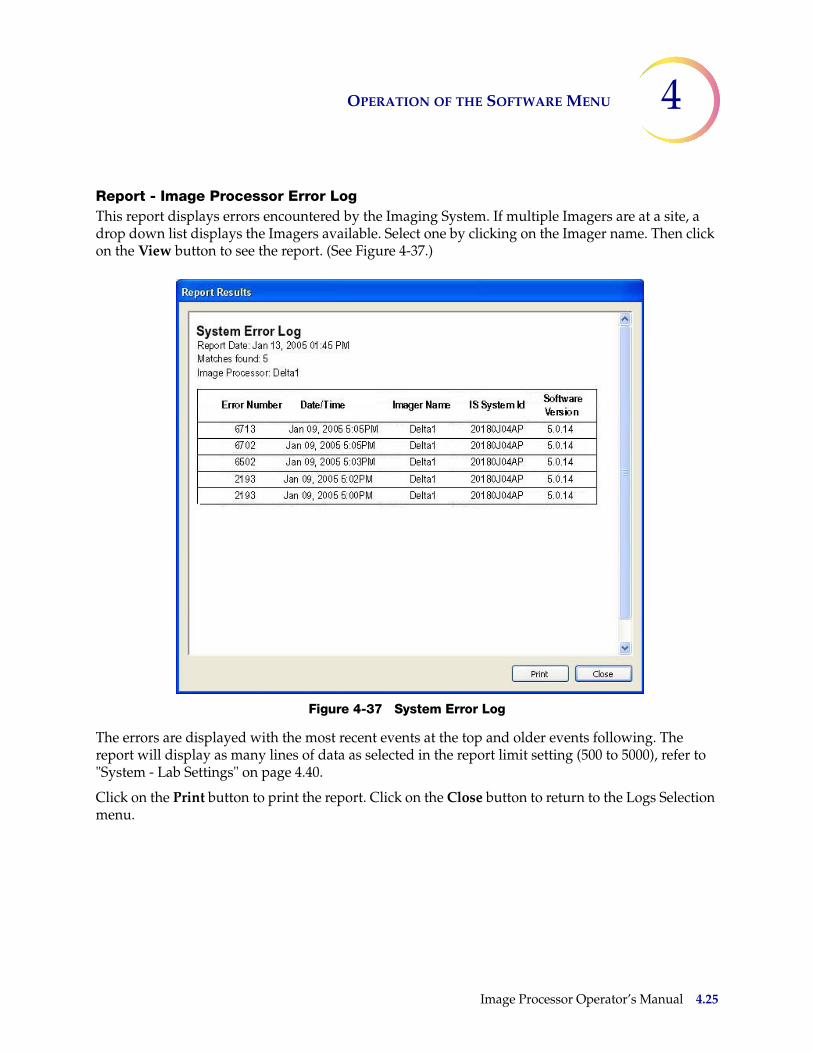
OPERATION OF THE SOFTWARE MENU 4
Report - Image Processor Error LogThis report displays errors encountered by the Imaging System. If multiple Imagers are at a site, a drop down list displays the Imagers available. Select one by clicking on the Imager name. Then click on the View button to see the report. (See Figure 4-37.)
Figure 4-37 System Error Log
The errors are displayed with the most recent events at the top and older events following. The report will display as many lines of data as selected in the report limit setting (500 to 5000), refer to "System - Lab Settings" on page 4.40.
Click on the Print button to print the report. Click on the Close button to return to the Logs Selection menu.
Image Processor Operator’s Manual 4.25
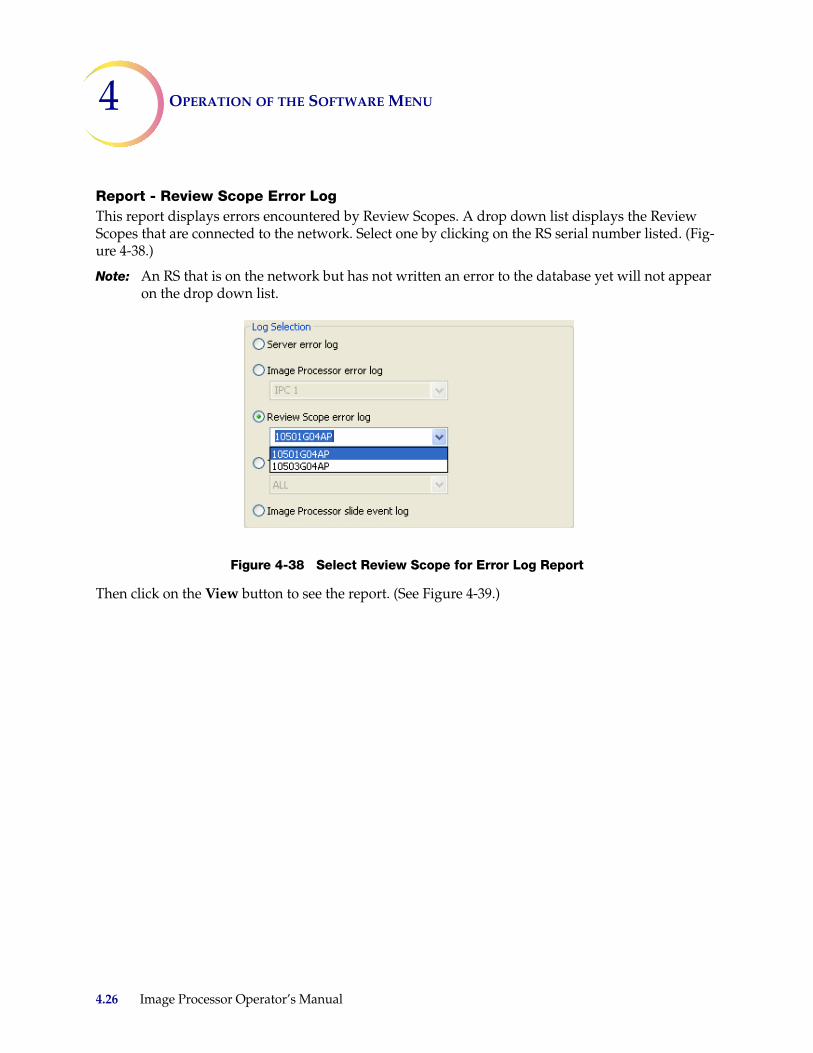
4 OPERATION OF THE SOFTWARE MENU
Report - Review Scope Error LogThis report displays errors encountered by Review Scopes. A drop down list displays the Review Scopes that are connected to the network. Select one by clicking on the RS serial number listed. (Fig-ure 4-38.)
Note: An RS that is on the network but has not written an error to the database yet will not appear on the drop down list.
Figure 4-38 Select Review Scope for Error Log Report
Then click on the View button to see the report. (See Figure 4-39.)
4.26 Image Processor Operator’s Manual
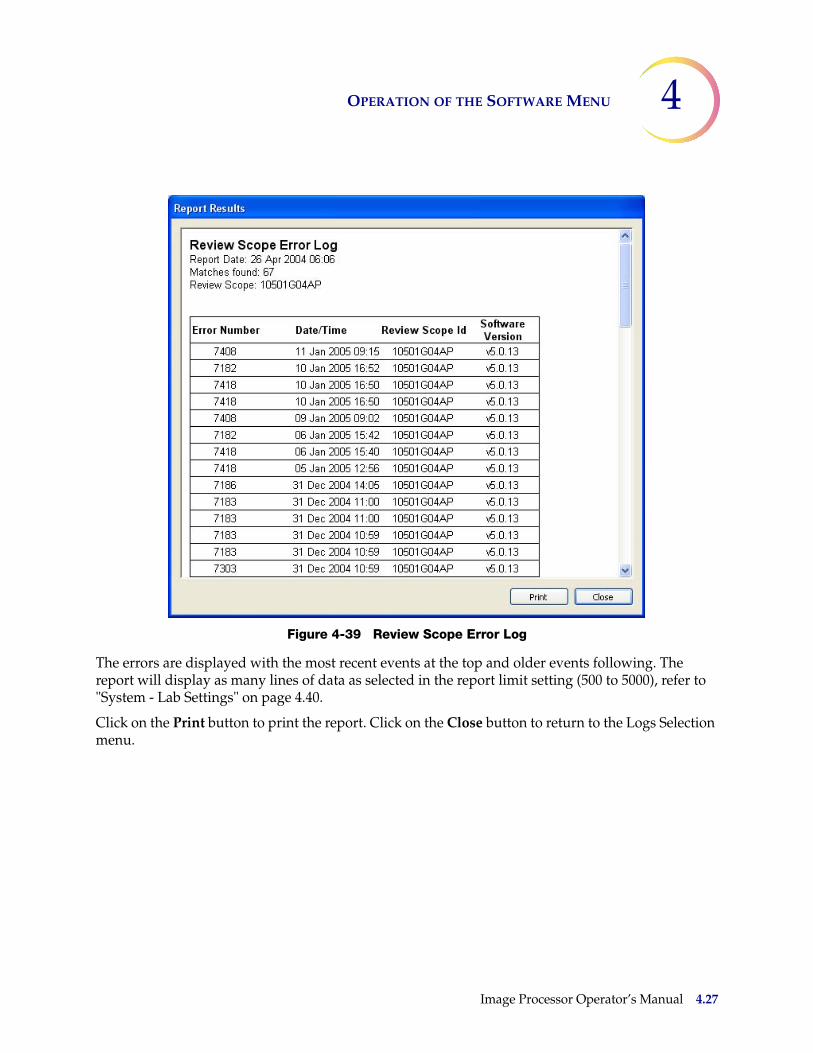
OPERATION OF THE SOFTWARE MENU 4
Figure 4-39 Review Scope Error Log
The errors are displayed with the most recent events at the top and older events following. The report will display as many lines of data as selected in the report limit setting (500 to 5000), refer to "System - Lab Settings" on page 4.40.
Click on the Print button to print the report. Click on the Close button to return to the Logs Selection menu.
Image Processor Operator’s Manual 4.27
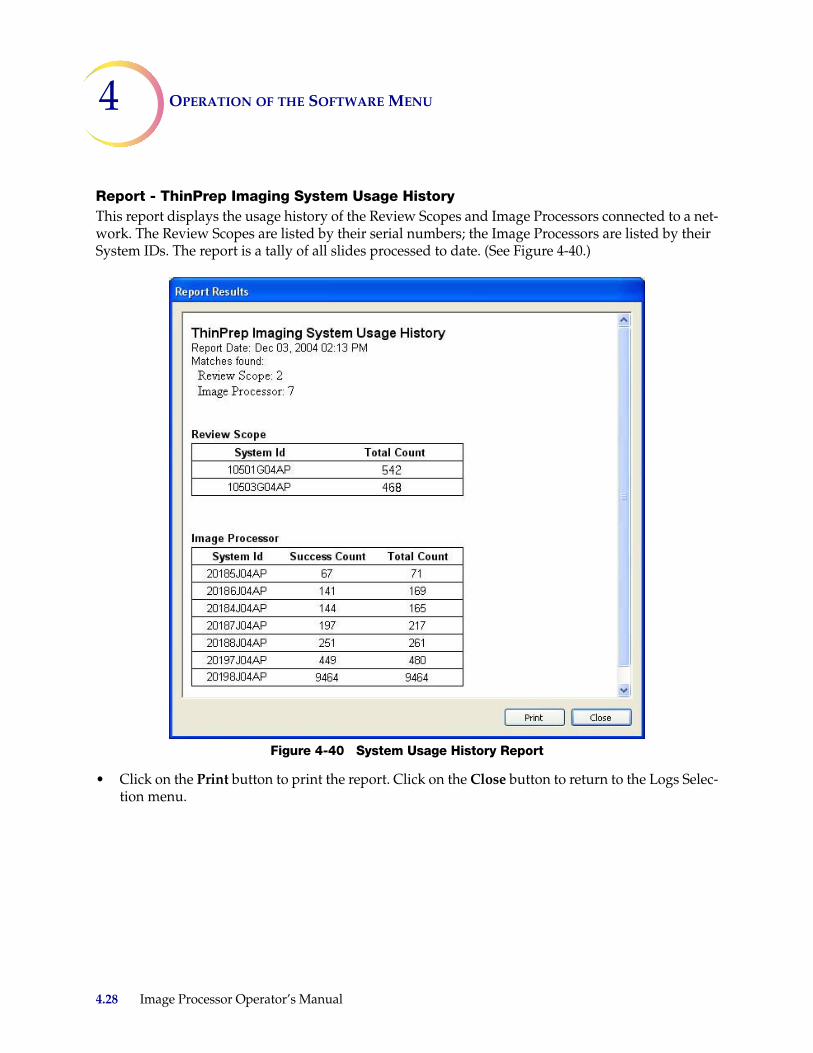
4 OPERATION OF THE SOFTWARE MENU
Report - ThinPrep Imaging System Usage HistoryThis report displays the usage history of the Review Scopes and Image Processors connected to a net-work. The Review Scopes are listed by their serial numbers; the Image Processors are listed by their System IDs. The report is a tally of all slides processed to date. (See Figure 4-40.)
Figure 4-40 System Usage History Report
• Click on the Print button to print the report. Click on the Close button to return to the Logs Selec-tion menu.
4.28 Image Processor Operator’s Manual
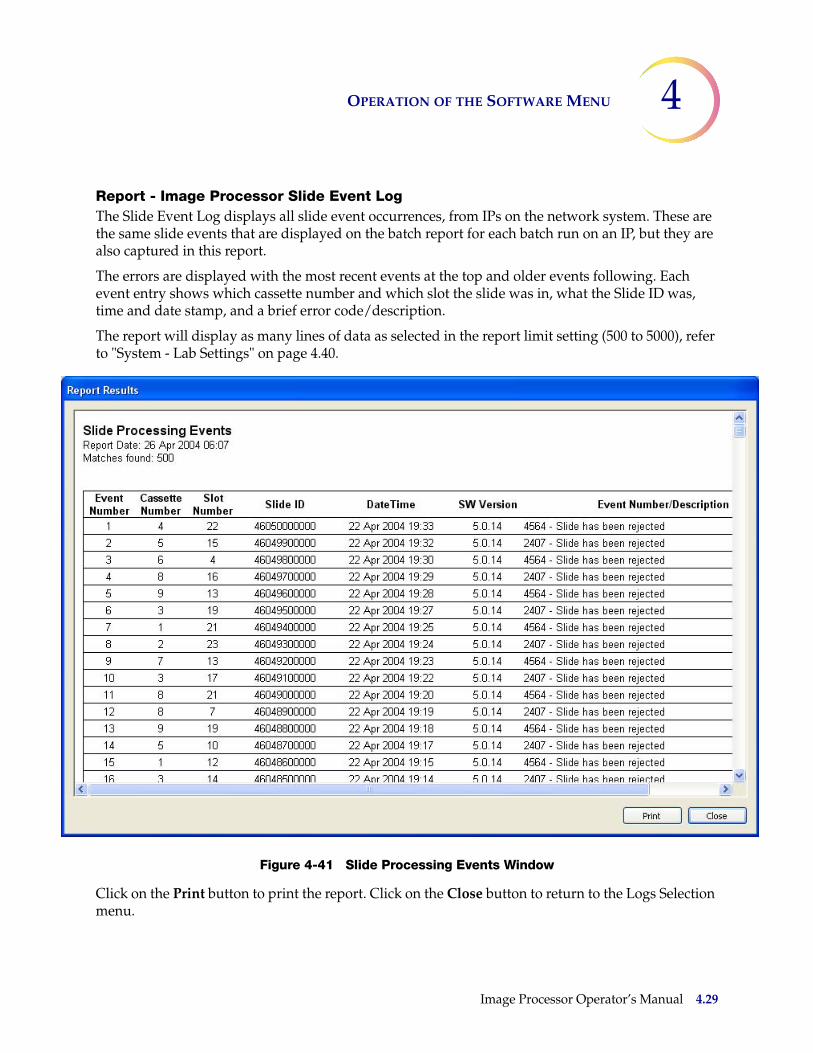
OPERATION OF THE SOFTWARE MENU 4
Report - Image Processor Slide Event LogThe Slide Event Log displays all slide event occurrences, from IPs on the network system. These are the same slide events that are displayed on the batch report for each batch run on an IP, but they are also captured in this report.
The errors are displayed with the most recent events at the top and older events following. Each event entry shows which cassette number and which slot the slide was in, what the Slide ID was, time and date stamp, and a brief error code/description.
The report will display as many lines of data as selected in the report limit setting (500 to 5000), refer to "System - Lab Settings" on page 4.40.
Figure 4-41 Slide Processing Events Window
Click on the Print button to print the report. Click on the Close button to return to the Logs Selection menu.
Image Processor Operator’s Manual 4.29
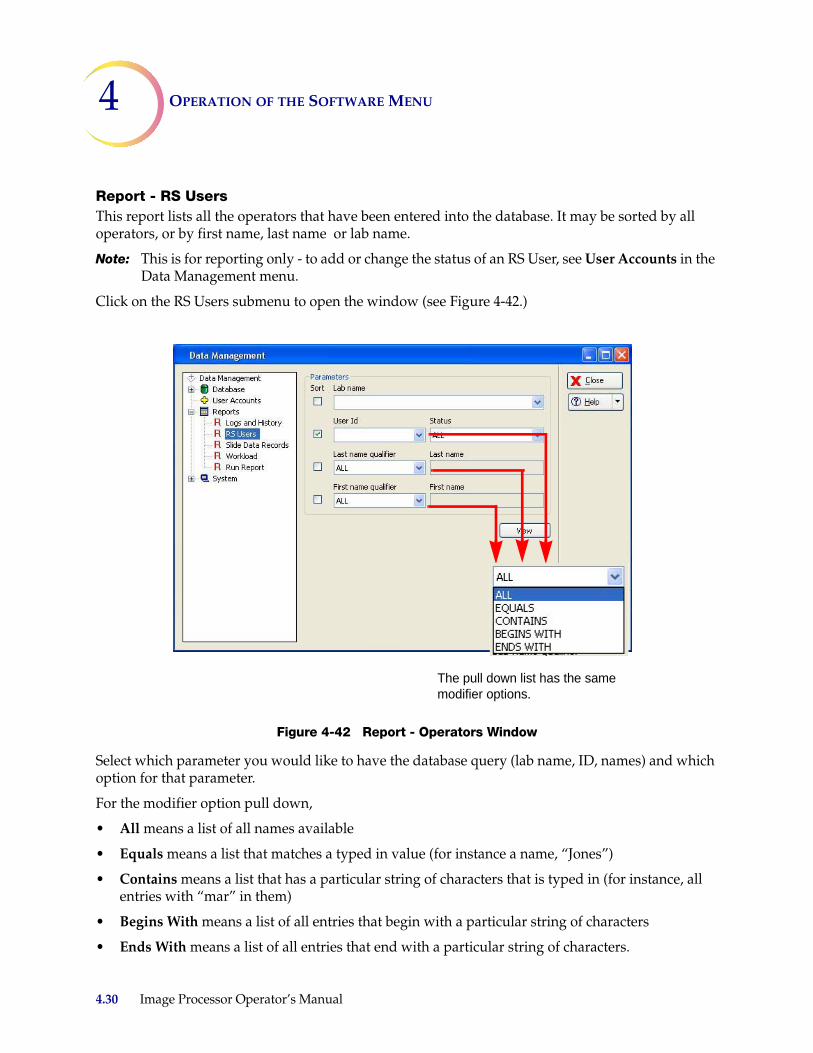
4 OPERATION OF THE SOFTWARE MENU
Report - RS UsersThis report lists all the operators that have been entered into the database. It may be sorted by all operators, or by first name, last name or lab name.
Note: This is for reporting only - to add or change the status of an RS User, see User Accounts in the Data Management menu.
Click on the RS Users submenu to open the window (see Figure 4-42.)
Figure 4-42 Report - Operators Window
Select which parameter you would like to have the database query (lab name, ID, names) and which option for that parameter.
For the modifier option pull down,
• All means a list of all names available
• Equals means a list that matches a typed in value (for instance a name, “Jones”)
• Contains means a list that has a particular string of characters that is typed in (for instance, all entries with “mar” in them)
• Begins With means a list of all entries that begin with a particular string of characters
• Ends With means a list of all entries that end with a particular string of characters.
The pull down list has the same modifier options.
4.30 Image Processor Operator’s Manual
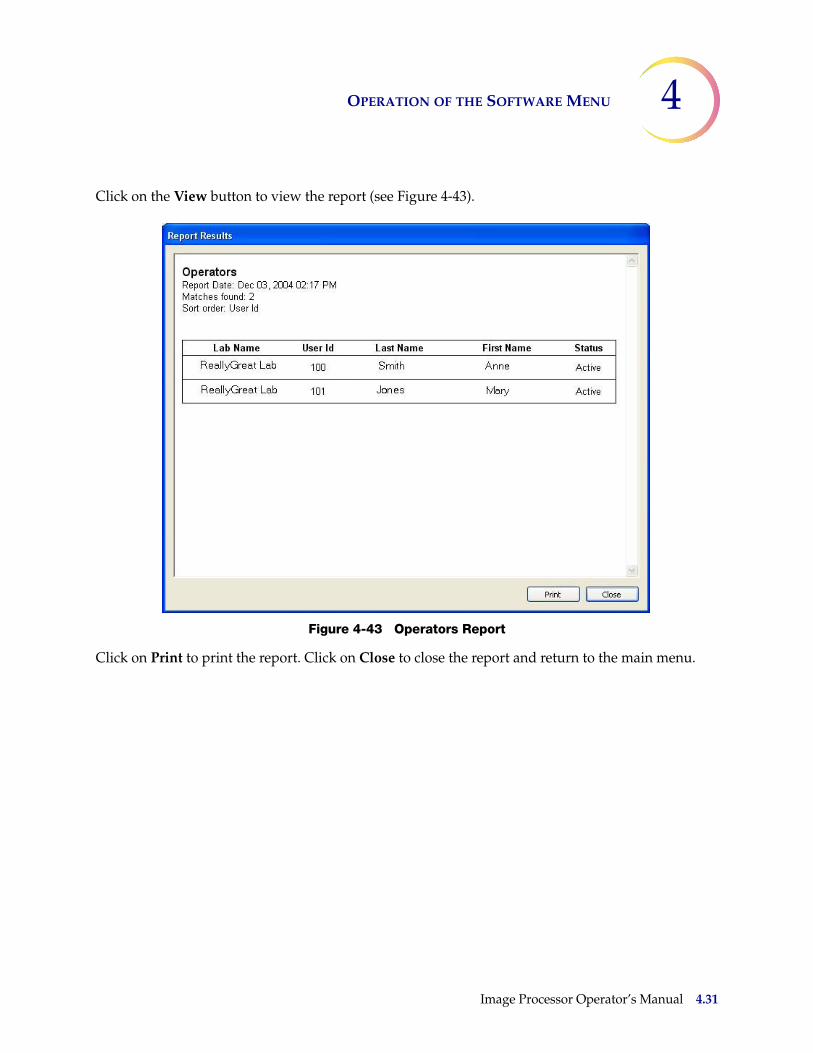
OPERATION OF THE SOFTWARE MENU 4
Click on the View button to view the report (see Figure 4-43).
Figure 4-43 Operators Report
Click on Print to print the report. Click on Close to close the report and return to the main menu.
Image Processor Operator’s Manual 4.31
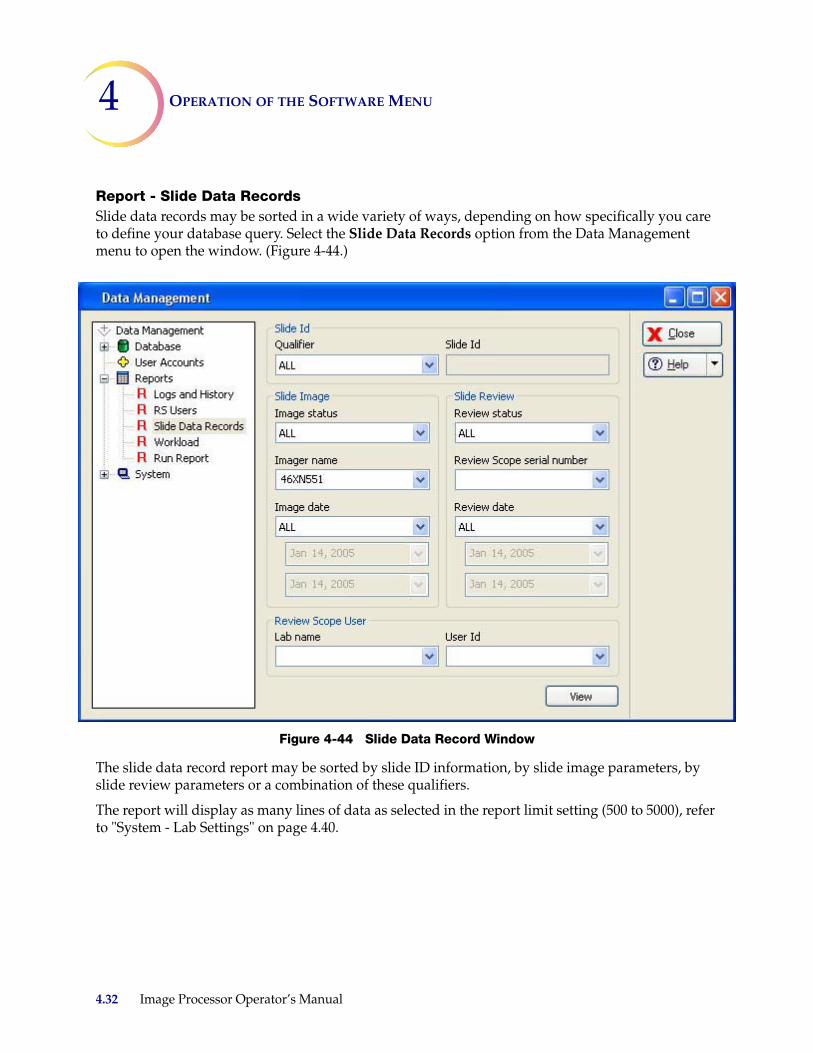
4 OPERATION OF THE SOFTWARE MENU
Report - Slide Data RecordsSlide data records may be sorted in a wide variety of ways, depending on how specifically you care to define your database query. Select the Slide Data Records option from the Data Management menu to open the window. (Figure 4-44.)
Figure 4-44 Slide Data Record Window
The slide data record report may be sorted by slide ID information, by slide image parameters, by slide review parameters or a combination of these qualifiers.
The report will display as many lines of data as selected in the report limit setting (500 to 5000), refer to "System - Lab Settings" on page 4.40.
4.32 Image Processor Operator’s Manual
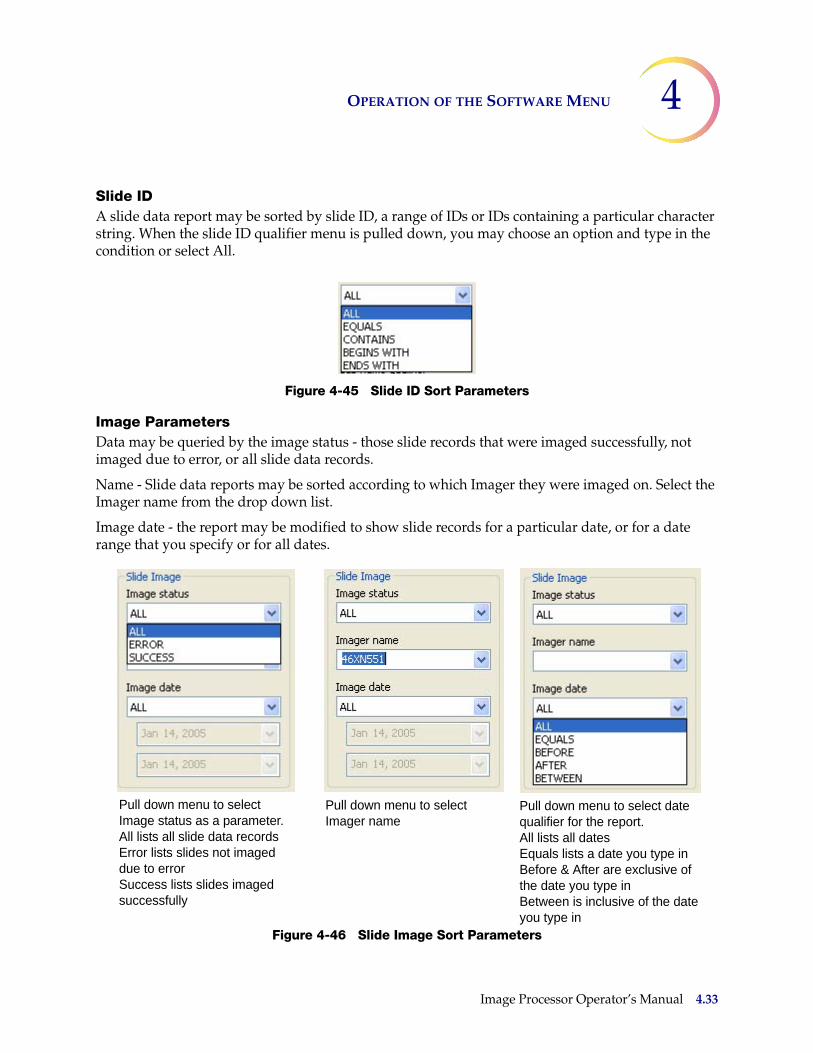
OPERATION OF THE SOFTWARE MENU 4
Slide IDA slide data report may be sorted by slide ID, a range of IDs or IDs containing a particular character string. When the slide ID qualifier menu is pulled down, you may choose an option and type in the condition or select All.
Figure 4-45 Slide ID Sort Parameters
Image ParametersData may be queried by the image status - those slide records that were imaged successfully, not imaged due to error, or all slide data records.
Name - Slide data reports may be sorted according to which Imager they were imaged on. Select the Imager name from the drop down list.
Image date - the report may be modified to show slide records for a particular date, or for a date range that you specify or for all dates.
Figure 4-46 Slide Image Sort Parameters
Pull down menu to select Imager name
Pull down menu to select Image status as a parameter.All lists all slide data recordsError lists slides not imaged due to errorSuccess lists slides imaged successfully
Pull down menu to select date qualifier for the report.All lists all datesEquals lists a date you type inBefore & After are exclusive of the date you type inBetween is inclusive of the date you type in
Image Processor Operator’s Manual 4.33
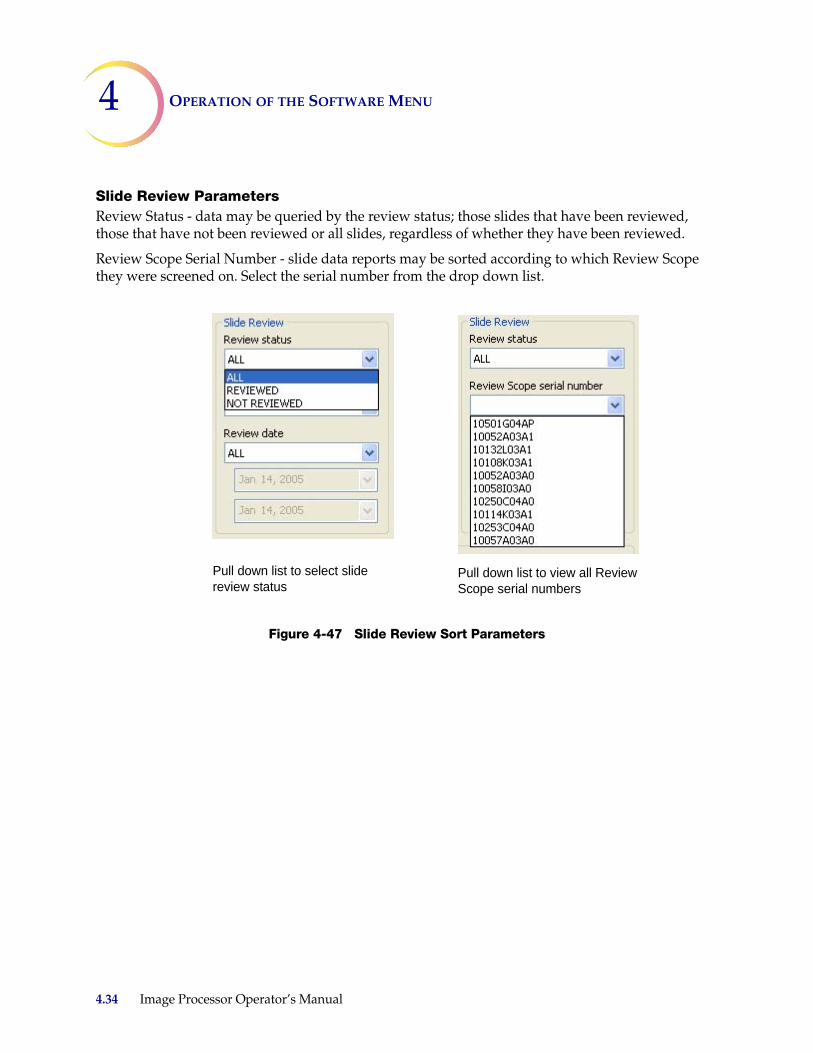
4 OPERATION OF THE SOFTWARE MENU
Slide Review ParametersReview Status - data may be queried by the review status; those slides that have been reviewed, those that have not been reviewed or all slides, regardless of whether they have been reviewed.
Review Scope Serial Number - slide data reports may be sorted according to which Review Scope they were screened on. Select the serial number from the drop down list.
Figure 4-47 Slide Review Sort Parameters
Pull down list to view all Review Scope serial numbers
Pull down list to select slide review status
4.34 Image Processor Operator’s Manual
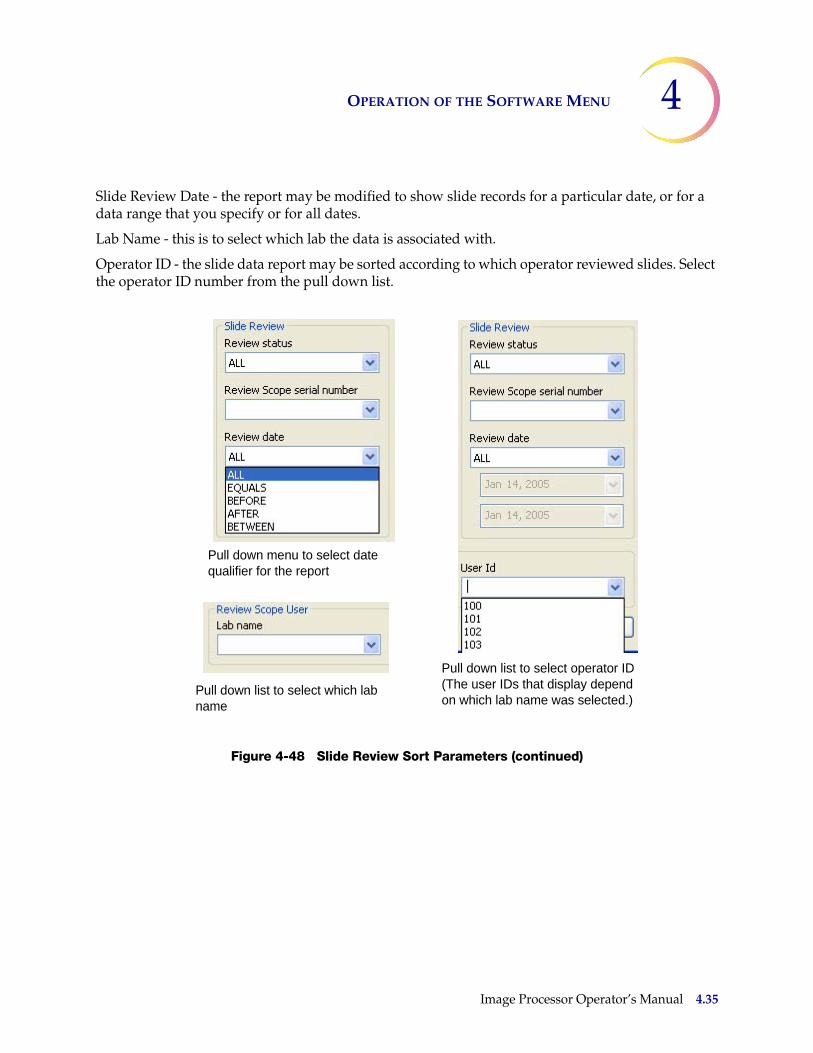
OPERATION OF THE SOFTWARE MENU 4
Slide Review Date - the report may be modified to show slide records for a particular date, or for a data range that you specify or for all dates.
Lab Name - this is to select which lab the data is associated with.
Operator ID - the slide data report may be sorted according to which operator reviewed slides. Select the operator ID number from the pull down list.
Figure 4-48 Slide Review Sort Parameters (continued)
Pull down menu to select date qualifier for the report
Pull down list to select operator ID(The user IDs that display depend on which lab name was selected.)
Pull down list to select which lab name
Image Processor Operator’s Manual 4.35
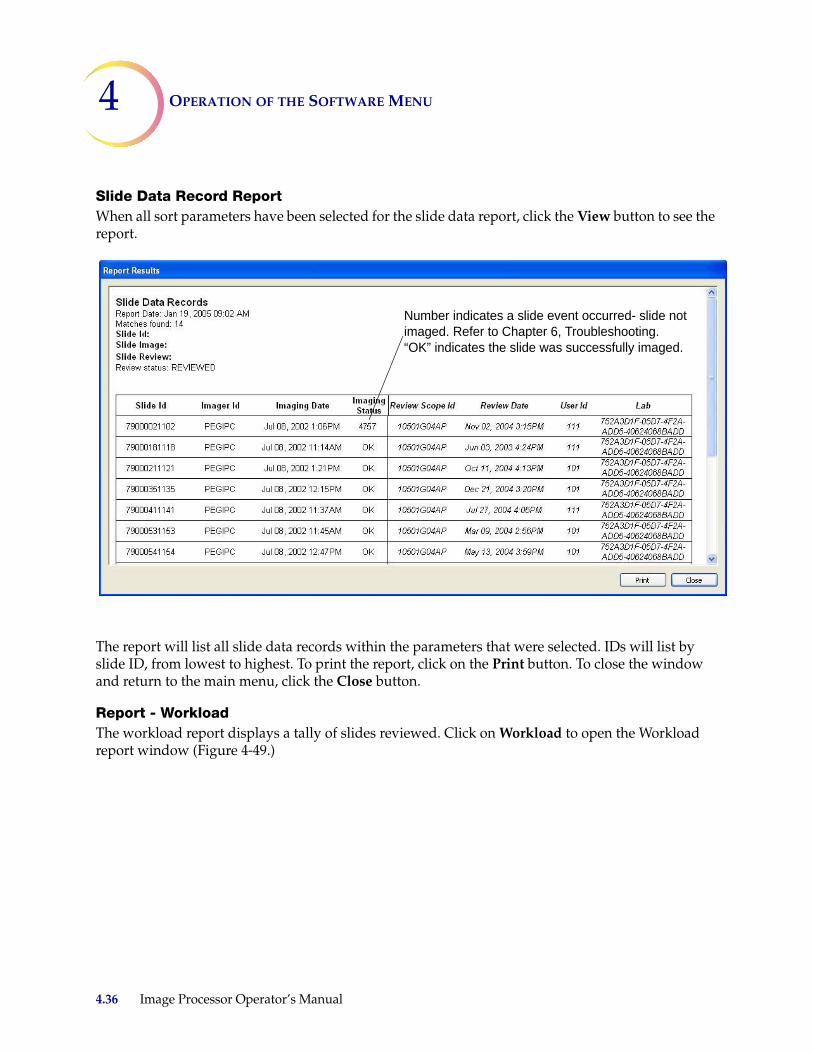
4 OPERATION OF THE SOFTWARE MENU
Slide Data Record ReportWhen all sort parameters have been selected for the slide data report, click the View button to see the report.
The report will list all slide data records within the parameters that were selected. IDs will list by slide ID, from lowest to highest. To print the report, click on the Print button. To close the window and return to the main menu, click the Close button.
Report - WorkloadThe workload report displays a tally of slides reviewed. Click on Workload to open the Workload report window (Figure 4-49.)
Number indicates a slide event occurred- slide not imaged. Refer to Chapter 6, Troubleshooting.“OK” indicates the slide was successfully imaged.
4.36 Image Processor Operator’s Manual
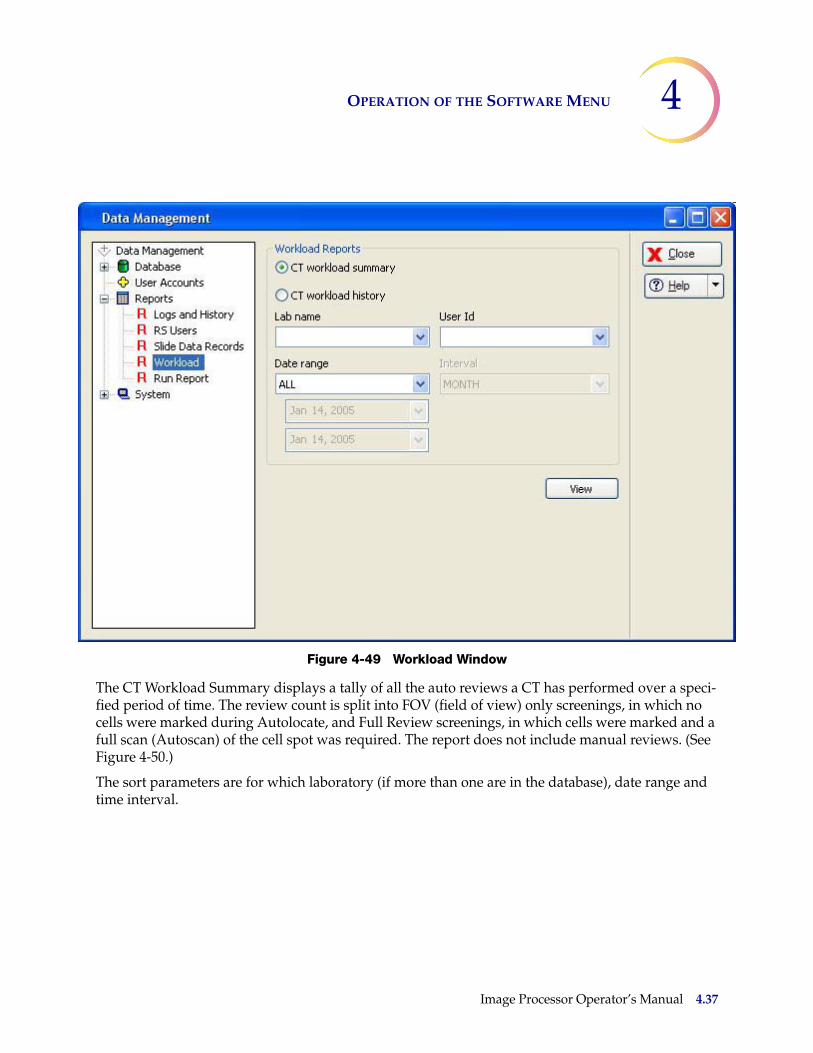
OPERATION OF THE SOFTWARE MENU 4
Figure 4-49 Workload Window
The CT Workload Summary displays a tally of all the auto reviews a CT has performed over a speci-fied period of time. The review count is split into FOV (field of view) only screenings, in which no cells were marked during Autolocate, and Full Review screenings, in which cells were marked and a full scan (Autoscan) of the cell spot was required. The report does not include manual reviews. (See Figure 4-50.)
The sort parameters are for which laboratory (if more than one are in the database), date range and time interval.
Image Processor Operator’s Manual 4.37
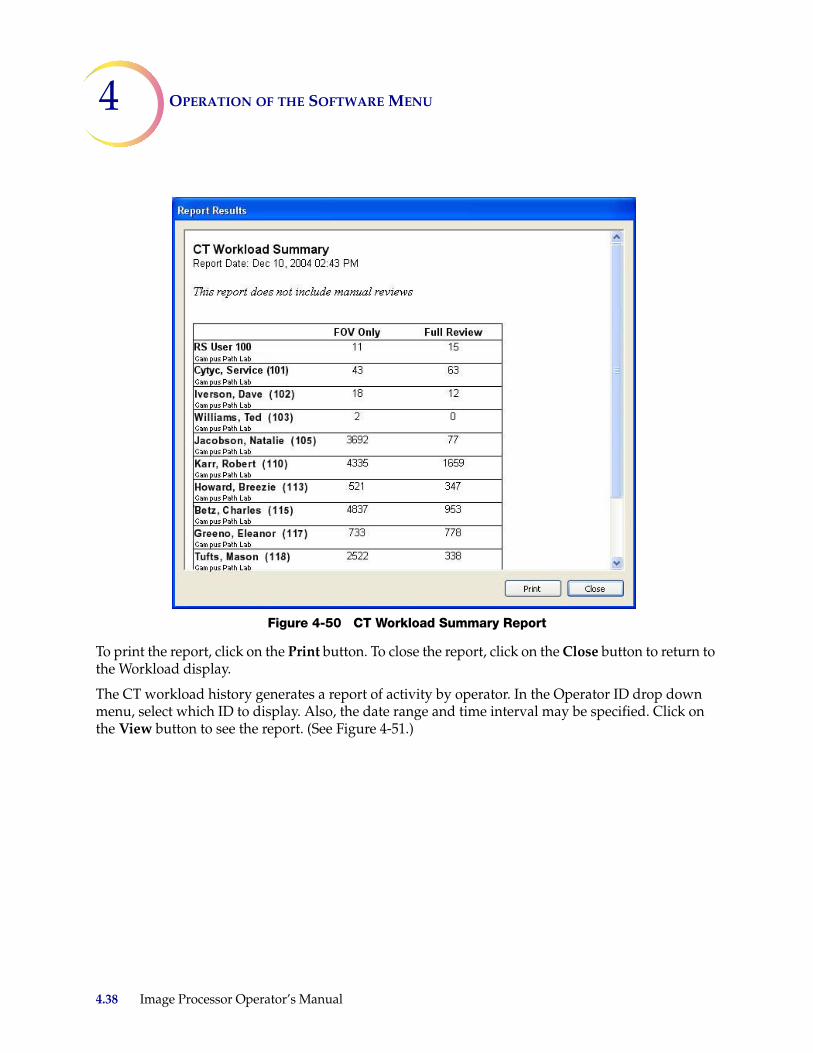
4 OPERATION OF THE SOFTWARE MENU
Figure 4-50 CT Workload Summary Report
To print the report, click on the Print button. To close the report, click on the Close button to return to the Workload display.
The CT workload history generates a report of activity by operator. In the Operator ID drop down menu, select which ID to display. Also, the date range and time interval may be specified. Click on the View button to see the report. (See Figure 4-51.)
4.38 Image Processor Operator’s Manual
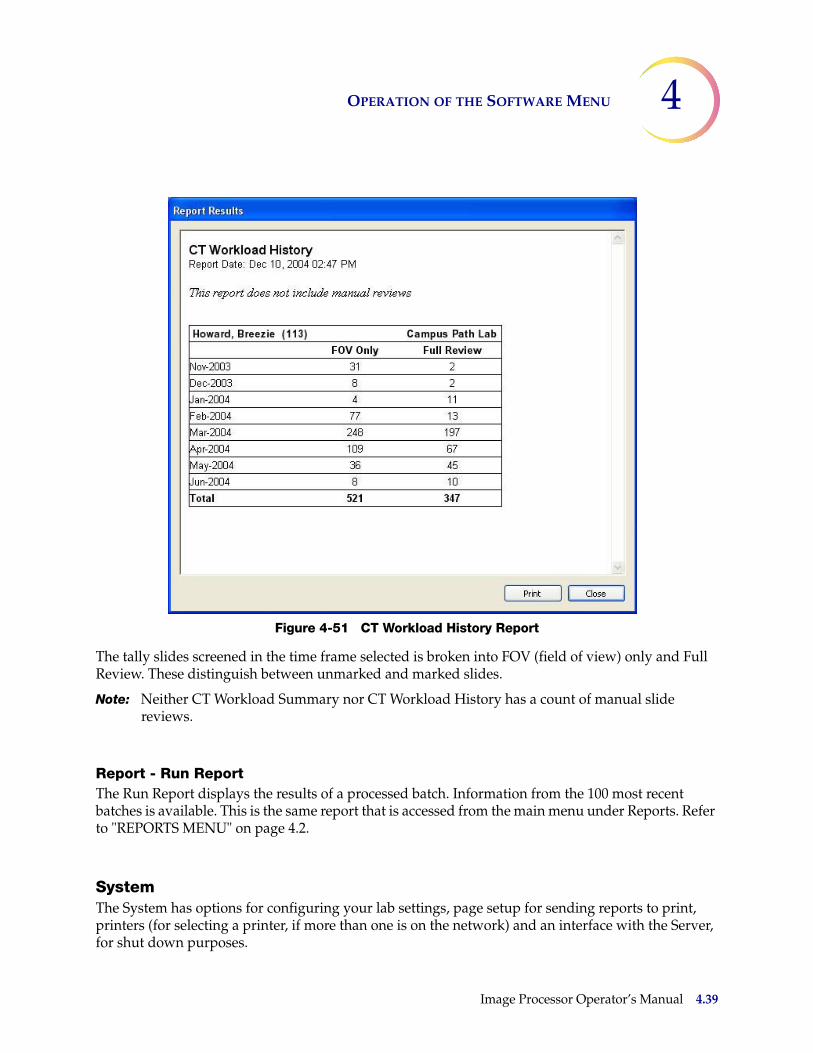
OPERATION OF THE SOFTWARE MENU 4
Figure 4-51 CT Workload History Report
The tally slides screened in the time frame selected is broken into FOV (field of view) only and Full Review. These distinguish between unmarked and marked slides.
Note: Neither CT Workload Summary nor CT Workload History has a count of manual slide reviews.
Report - Run ReportThe Run Report displays the results of a processed batch. Information from the 100 most recent batches is available. This is the same report that is accessed from the main menu under Reports. Refer to "REPORTS MENU" on page 4.2.
SystemThe System has options for configuring your lab settings, page setup for sending reports to print, printers (for selecting a printer, if more than one is on the network) and an interface with the Server, for shut down purposes.
Image Processor Operator’s Manual 4.39
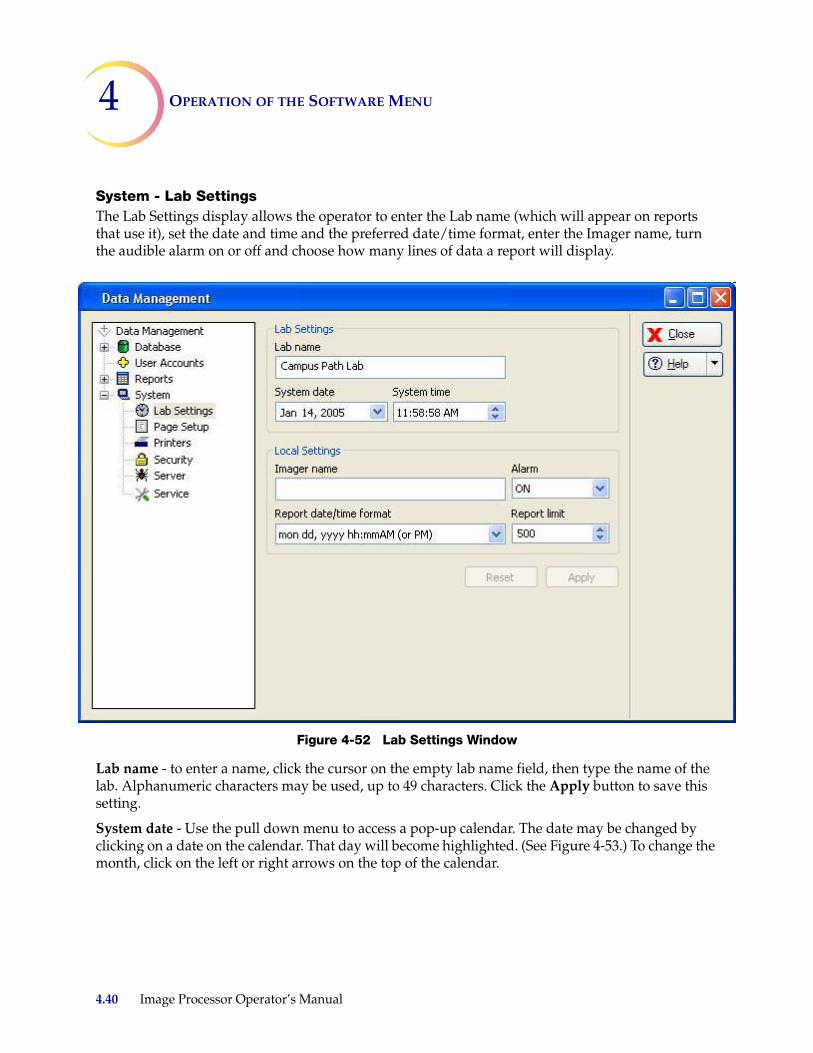
4 OPERATION OF THE SOFTWARE MENU
System - Lab SettingsThe Lab Settings display allows the operator to enter the Lab name (which will appear on reports that use it), set the date and time and the preferred date/time format, enter the Imager name, turn the audible alarm on or off and choose how many lines of data a report will display.
Figure 4-52 Lab Settings Window
Lab name - to enter a name, click the cursor on the empty lab name field, then type the name of the lab. Alphanumeric characters may be used, up to 49 characters. Click the Apply button to save this setting.
System date - Use the pull down menu to access a pop-up calendar. The date may be changed by clicking on a date on the calendar. That day will become highlighted. (See Figure 4-53.) To change the month, click on the left or right arrows on the top of the calendar.
4.40 Image Processor Operator’s Manual
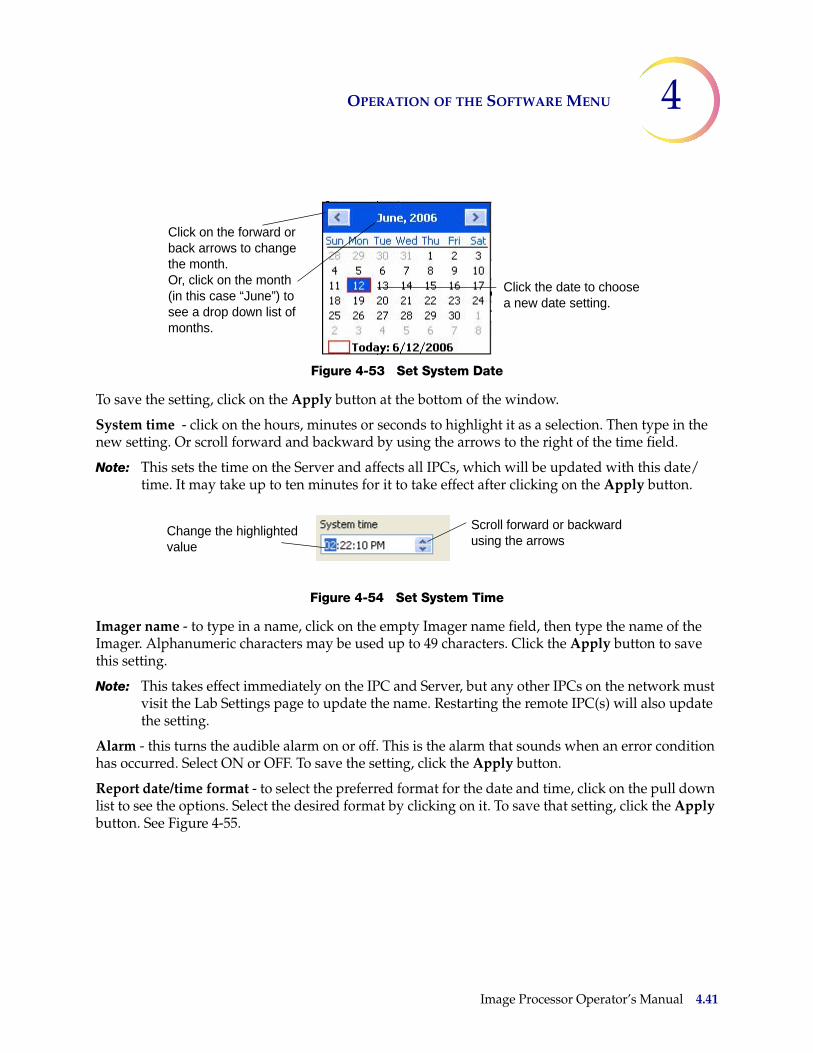
OPERATION OF THE SOFTWARE MENU 4
Figure 4-53 Set System Date
To save the setting, click on the Apply button at the bottom of the window.
System time - click on the hours, minutes or seconds to highlight it as a selection. Then type in the new setting. Or scroll forward and backward by using the arrows to the right of the time field.
Note: This sets the time on the Server and affects all IPCs, which will be updated with this date/time. It may take up to ten minutes for it to take effect after clicking on the Apply button.
Figure 4-54 Set System Time
Imager name - to type in a name, click on the empty Imager name field, then type the name of the Imager. Alphanumeric characters may be used up to 49 characters. Click the Apply button to save this setting.
Note: This takes effect immediately on the IPC and Server, but any other IPCs on the network must visit the Lab Settings page to update the name. Restarting the remote IPC(s) will also update the setting.
Alarm - this turns the audible alarm on or off. This is the alarm that sounds when an error condition has occurred. Select ON or OFF. To save the setting, click the Apply button.
Report date/time format - to select the preferred format for the date and time, click on the pull down list to see the options. Select the desired format by clicking on it. To save that setting, click the Apply button. See Figure 4-55.
Click the date to choose a new date setting.
Click on the forward or back arrows to change the month. Or, click on the month (in this case “June”) to see a drop down list of months.
Change the highlighted value
Scroll forward or backward using the arrows
Image Processor Operator’s Manual 4.41
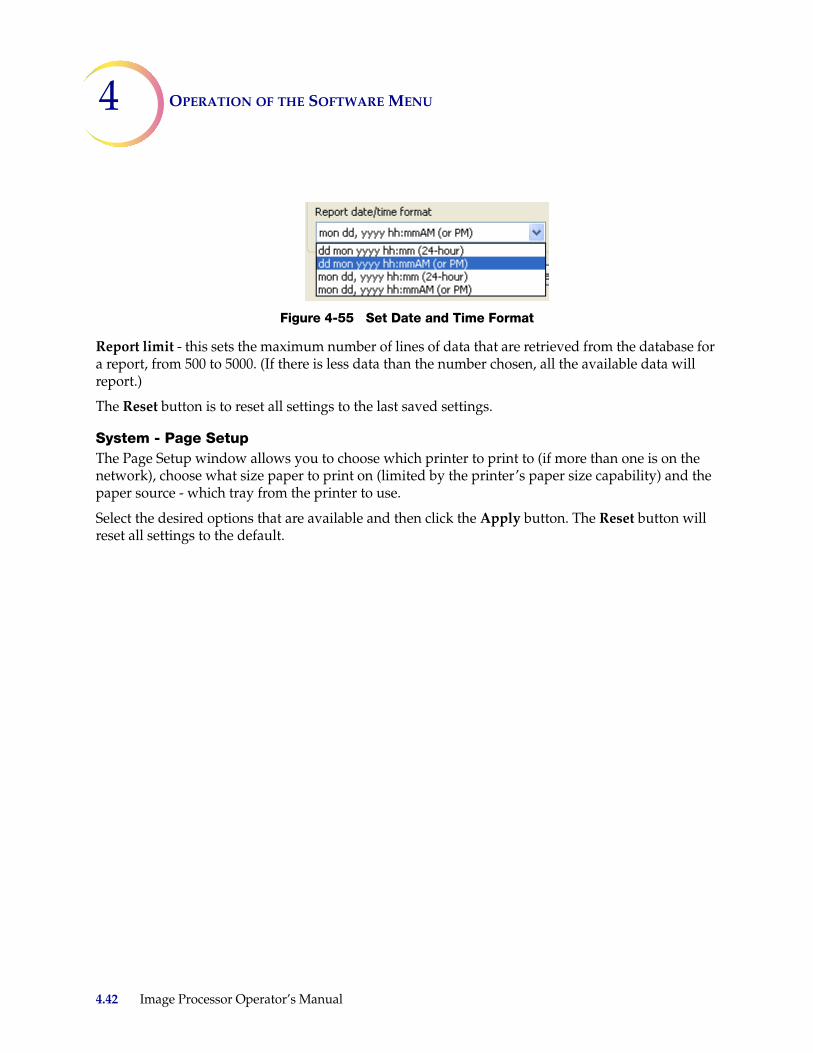
4 OPERATION OF THE SOFTWARE MENU
Figure 4-55 Set Date and Time Format
Report limit - this sets the maximum number of lines of data that are retrieved from the database for a report, from 500 to 5000. (If there is less data than the number chosen, all the available data will report.)
The Reset button is to reset all settings to the last saved settings.
System - Page SetupThe Page Setup window allows you to choose which printer to print to (if more than one is on the network), choose what size paper to print on (limited by the printer’s paper size capability) and the paper source - which tray from the printer to use.
Select the desired options that are available and then click the Apply button. The Reset button will reset all settings to the default.
4.42 Image Processor Operator’s Manual
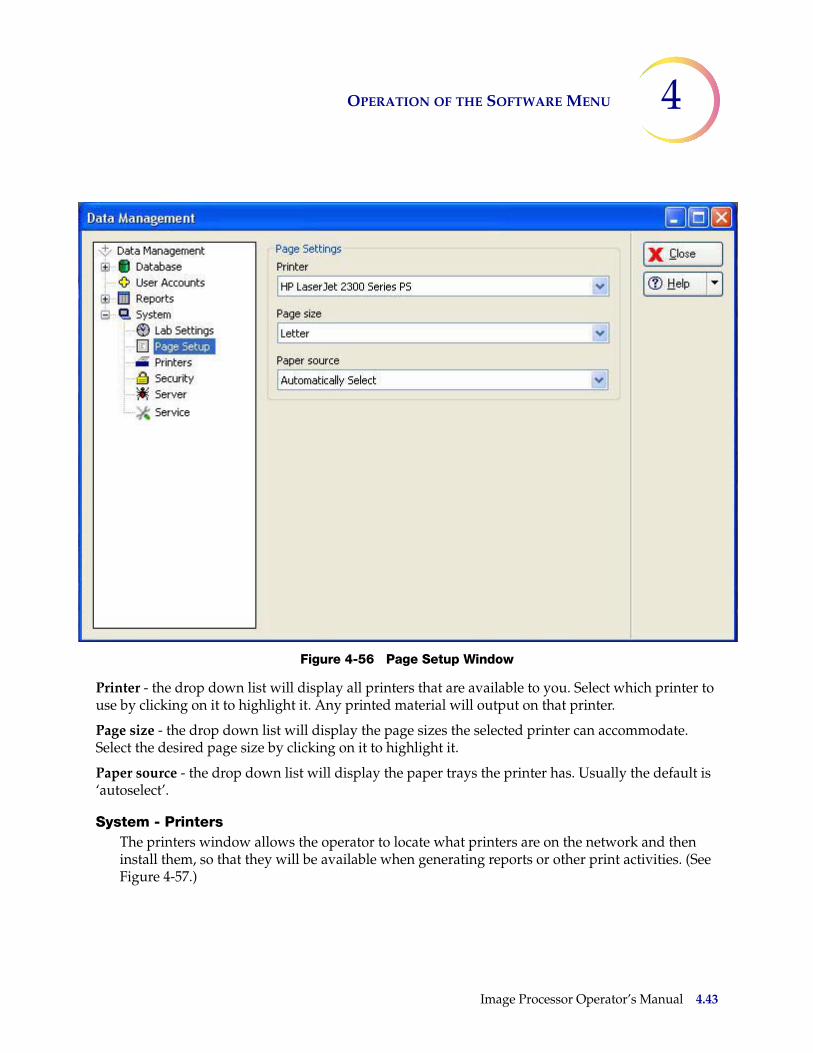
OPERATION OF THE SOFTWARE MENU 4
Figure 4-56 Page Setup Window
Printer - the drop down list will display all printers that are available to you. Select which printer to use by clicking on it to highlight it. Any printed material will output on that printer.
Page size - the drop down list will display the page sizes the selected printer can accommodate. Select the desired page size by clicking on it to highlight it.
Paper source - the drop down list will display the paper trays the printer has. Usually the default is ‘autoselect’.
System - PrintersThe printers window allows the operator to locate what printers are on the network and then install them, so that they will be available when generating reports or other print activities. (See Figure 4-57.)
Image Processor Operator’s Manual 4.43
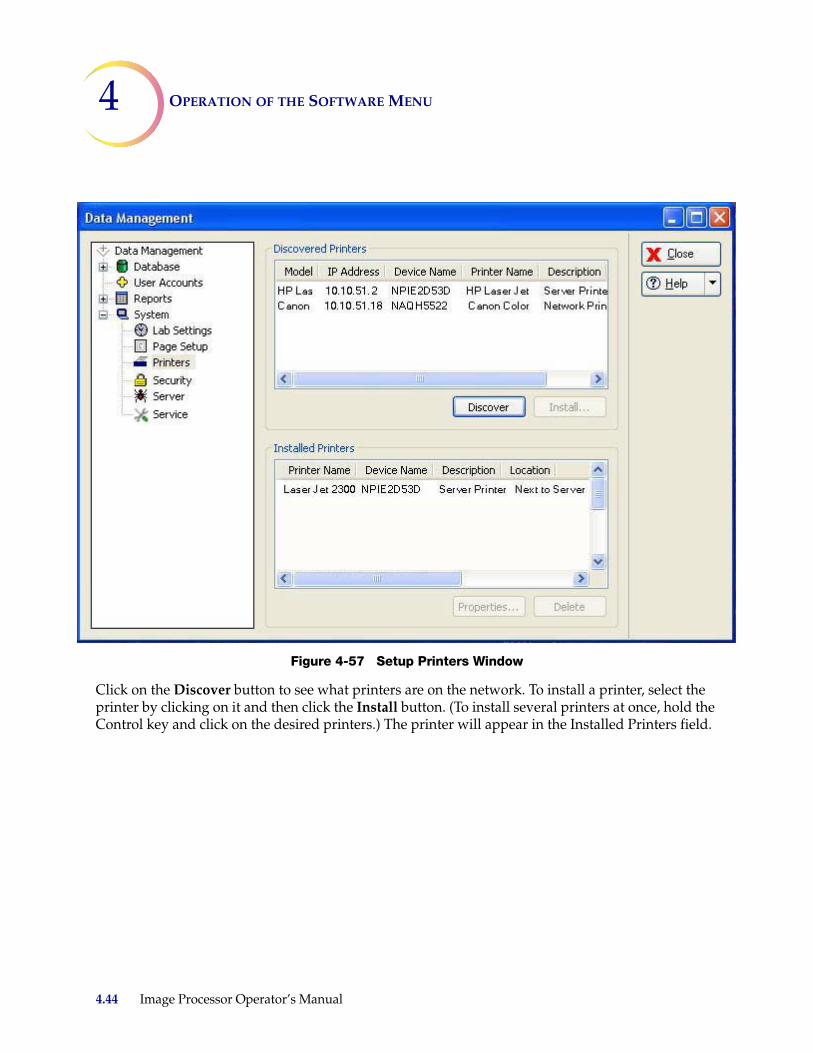
4 OPERATION OF THE SOFTWARE MENU
Figure 4-57 Setup Printers Window
Click on the Discover button to see what printers are on the network. To install a printer, select the printer by clicking on it and then click the Install button. (To install several printers at once, hold the Control key and click on the desired printers.) The printer will appear in the Installed Printers field.
4.44 Image Processor Operator’s Manual
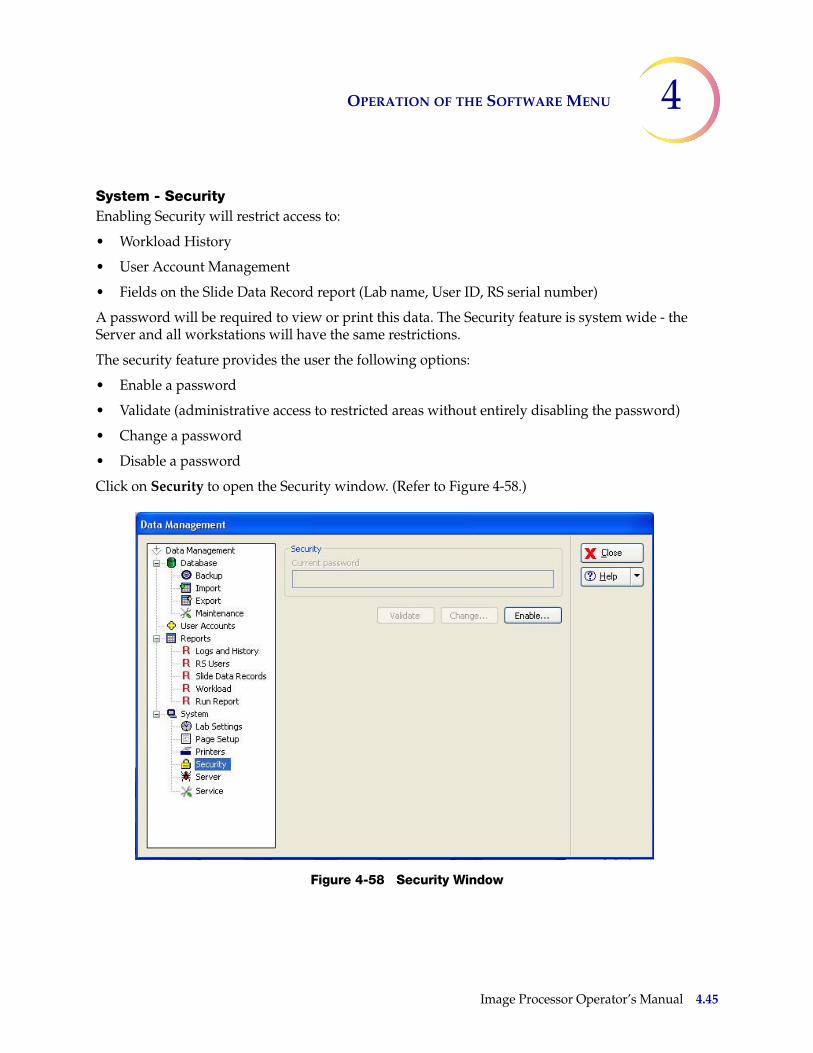
OPERATION OF THE SOFTWARE MENU 4
System - SecurityEnabling Security will restrict access to:
• Workload History
• User Account Management
• Fields on the Slide Data Record report (Lab name, User ID, RS serial number)
A password will be required to view or print this data. The Security feature is system wide - the Server and all workstations will have the same restrictions.
The security feature provides the user the following options:
• Enable a password
• Validate (administrative access to restricted areas without entirely disabling the password)
• Change a password
• Disable a password
Click on Security to open the Security window. (Refer to Figure 4-58.)
Figure 4-58 Security Window
Image Processor Operator’s Manual 4.45
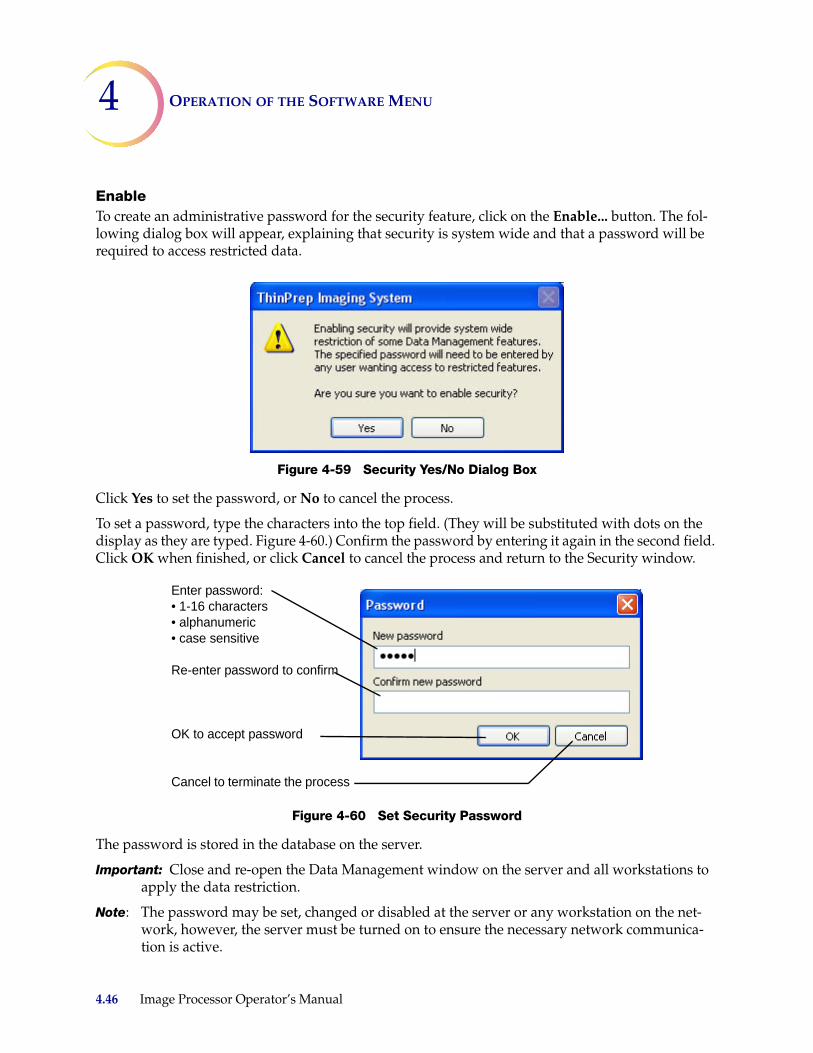
4 OPERATION OF THE SOFTWARE MENU
EnableTo create an administrative password for the security feature, click on the Enable... button. The fol-lowing dialog box will appear, explaining that security is system wide and that a password will be required to access restricted data.
Figure 4-59 Security Yes/No Dialog Box
Click Yes to set the password, or No to cancel the process.
To set a password, type the characters into the top field. (They will be substituted with dots on the display as they are typed. Figure 4-60.) Confirm the password by entering it again in the second field. Click OK when finished, or click Cancel to cancel the process and return to the Security window.
Figure 4-60 Set Security Password
The password is stored in the database on the server.
Important: Close and re-open the Data Management window on the server and all workstations to apply the data restriction.
Note: The password may be set, changed or disabled at the server or any workstation on the net-work, however, the server must be turned on to ensure the necessary network communica-tion is active.
Enter password:• 1-16 characters• alphanumeric• case sensitive
Re-enter password to confirm
OK to accept password
Cancel to terminate the process
4.46 Image Processor Operator’s Manual
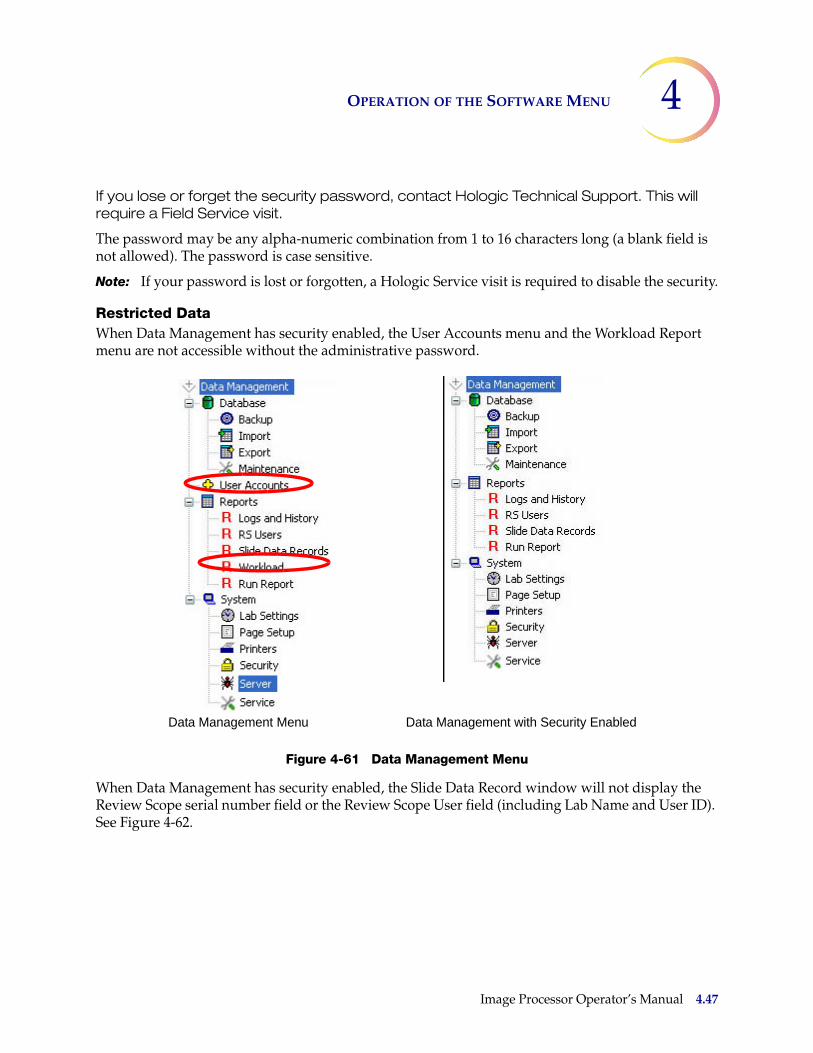
OPERATION OF THE SOFTWARE MENU 4
If you lose or forget the security password, contact Hologic Technical Support. This will require a Field Service visit.
The password may be any alpha-numeric combination from 1 to 16 characters long (a blank field is not allowed). The password is case sensitive.
Note: If your password is lost or forgotten, a Hologic Service visit is required to disable the security.
Restricted Data When Data Management has security enabled, the User Accounts menu and the Workload Report menu are not accessible without the administrative password.
Figure 4-61 Data Management Menu
When Data Management has security enabled, the Slide Data Record window will not display the Review Scope serial number field or the Review Scope User field (including Lab Name and User ID). See Figure 4-62.
Data Management Menu Data Management with Security Enabled
Image Processor Operator’s Manual 4.47
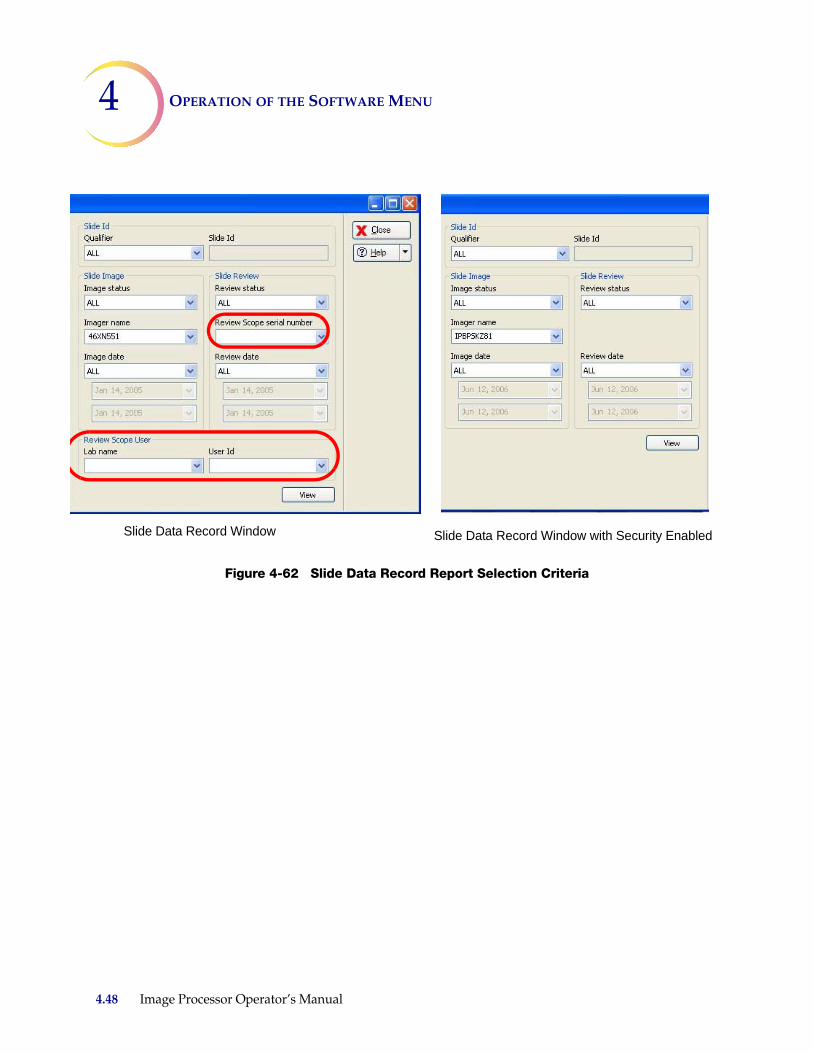
4 OPERATION OF THE SOFTWARE MENU
Figure 4-62 Slide Data Record Report Selection Criteria
Slide Data Record Window Slide Data Record Window with Security Enabled
4.48 Image Processor Operator’s Manual
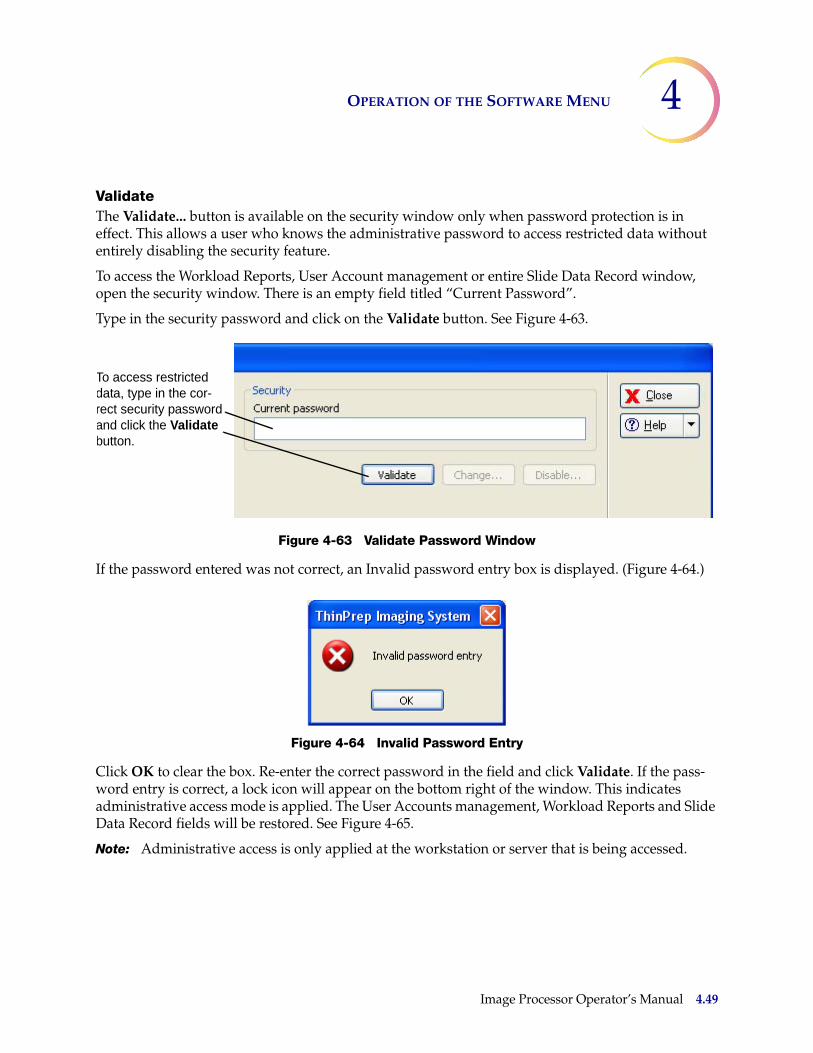
OPERATION OF THE SOFTWARE MENU 4
ValidateThe Validate... button is available on the security window only when password protection is in effect. This allows a user who knows the administrative password to access restricted data without entirely disabling the security feature.
To access the Workload Reports, User Account management or entire Slide Data Record window, open the security window. There is an empty field titled “Current Password”.
Type in the security password and click on the Validate button. See Figure 4-63.
Figure 4-63 Validate Password Window
If the password entered was not correct, an Invalid password entry box is displayed. (Figure 4-64.)
Figure 4-64 Invalid Password Entry
Click OK to clear the box. Re-enter the correct password in the field and click Validate. If the pass-word entry is correct, a lock icon will appear on the bottom right of the window. This indicates administrative access mode is applied. The User Accounts management, Workload Reports and Slide Data Record fields will be restored. See Figure 4-65.
Note: Administrative access is only applied at the workstation or server that is being accessed.
To access restricted data, type in the cor-rect security password and click the Validate button.
Image Processor Operator’s Manual 4.49
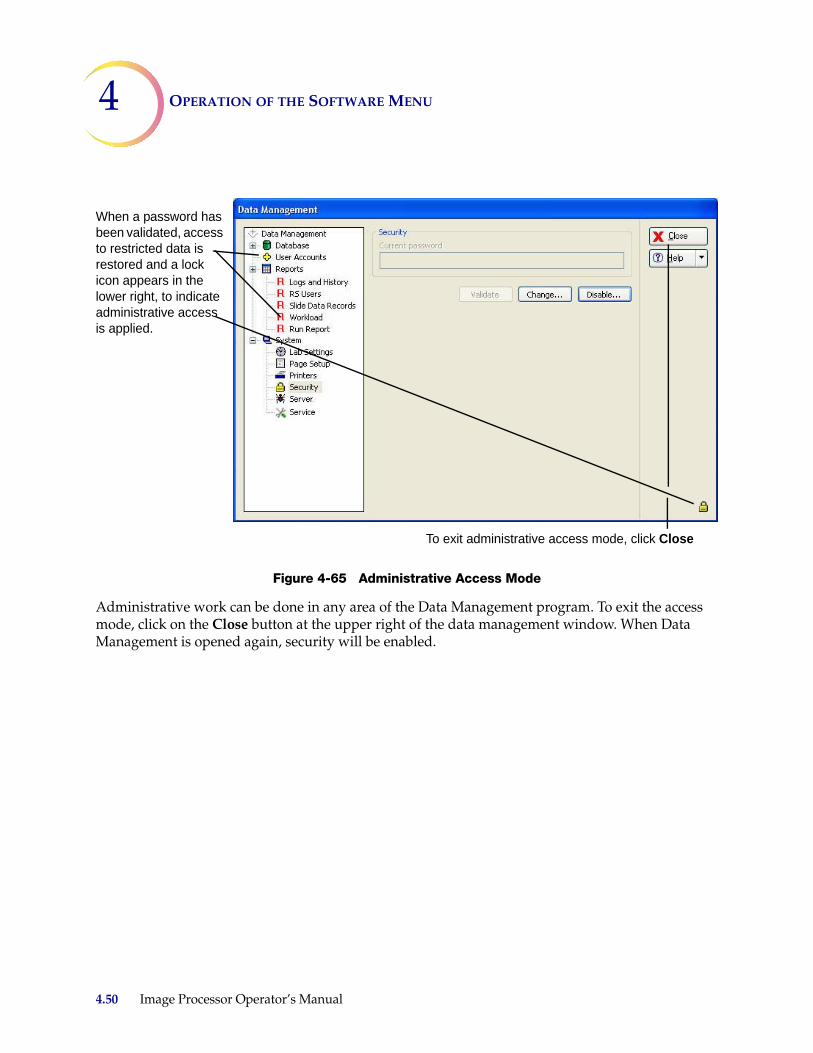
4 OPERATION OF THE SOFTWARE MENU
Figure 4-65 Administrative Access Mode
Administrative work can be done in any area of the Data Management program. To exit the access mode, click on the Close button at the upper right of the data management window. When Data Management is opened again, security will be enabled.
When a password has been validated, access to restricted data is restored and a lock icon appears in the lower right, to indicate administrative access is applied.
To exit administrative access mode, click Close
4.50 Image Processor Operator’s Manual
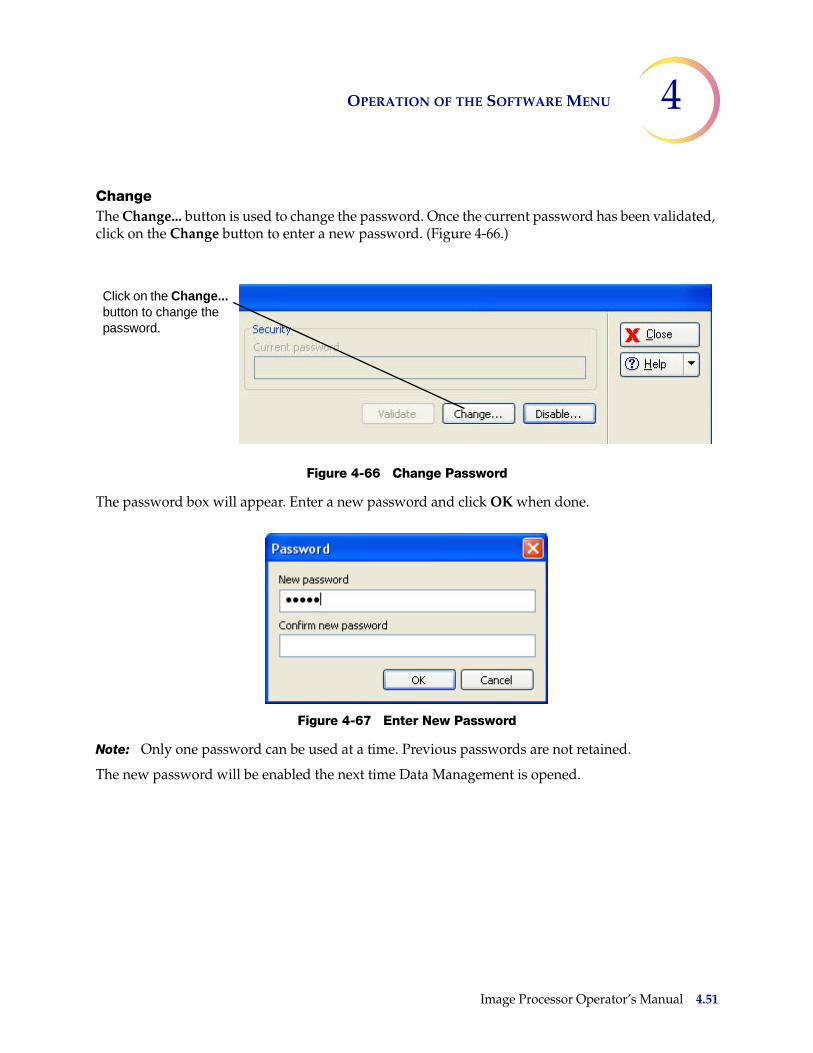
OPERATION OF THE SOFTWARE MENU 4
ChangeThe Change... button is used to change the password. Once the current password has been validated, click on the Change button to enter a new password. (Figure 4-66.)
Figure 4-66 Change Password
The password box will appear. Enter a new password and click OK when done.
Figure 4-67 Enter New Password
Note: Only one password can be used at a time. Previous passwords are not retained.
The new password will be enabled the next time Data Management is opened.
Click on the Change... button to change the password.
Image Processor Operator’s Manual 4.51
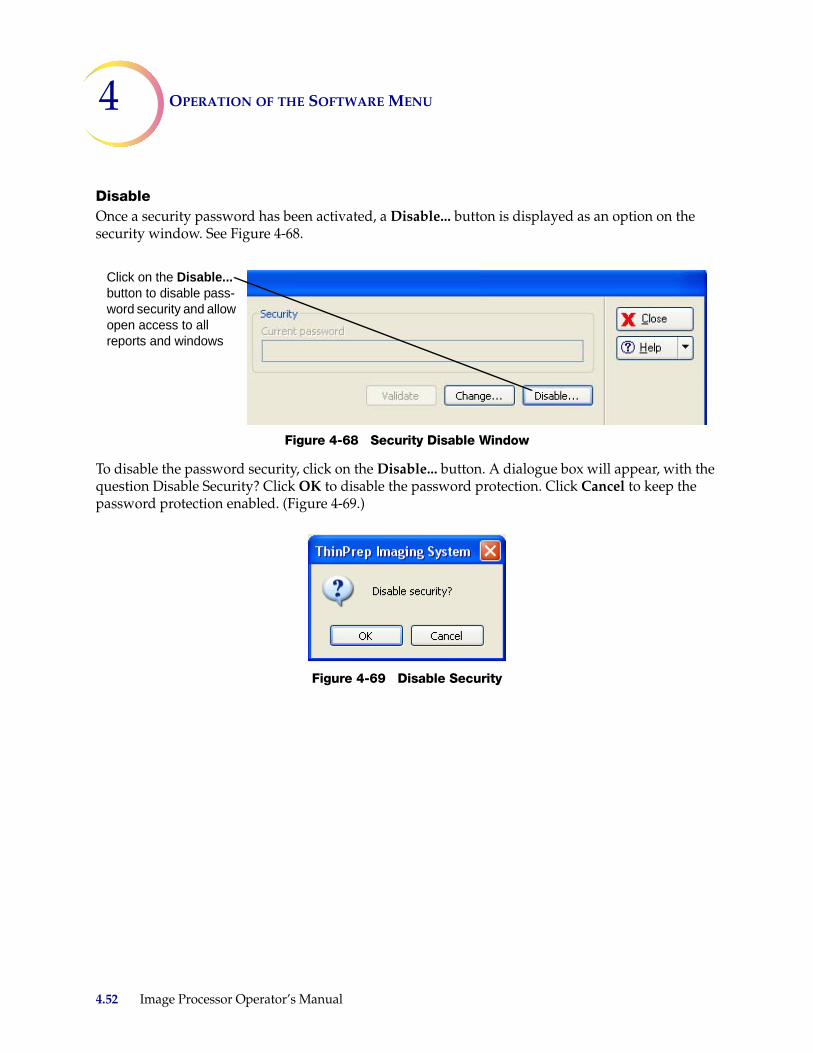
4 OPERATION OF THE SOFTWARE MENU
DisableOnce a security password has been activated, a Disable... button is displayed as an option on the security window. See Figure 4-68.
Figure 4-68 Security Disable Window
To disable the password security, click on the Disable... button. A dialogue box will appear, with the question Disable Security? Click OK to disable the password protection. Click Cancel to keep the password protection enabled. (Figure 4-69.)
Figure 4-69 Disable Security
Click on the Disable... button to disable pass-word security and allow open access to all reports and windows
4.52 Image Processor Operator’s Manual

OPERATION OF THE SOFTWARE MENU 4
System - ServerThe server window displays all Imagers and Review Scopes that are actively communicating with the network. The Refresh button is used to review active network connections. Instruments that have been turned off and are no longer communicating will not appear on the list. Instruments that have been turned on will appear on the list.
To shut down the server, click on the Shutdown button.
Figure 4-70 Server Window
System - Service
The service feature is for use by Hologic Service personnel. It is password-protected. The icon may not be visible on your system.
Image Processor Operator’s Manual 4.53
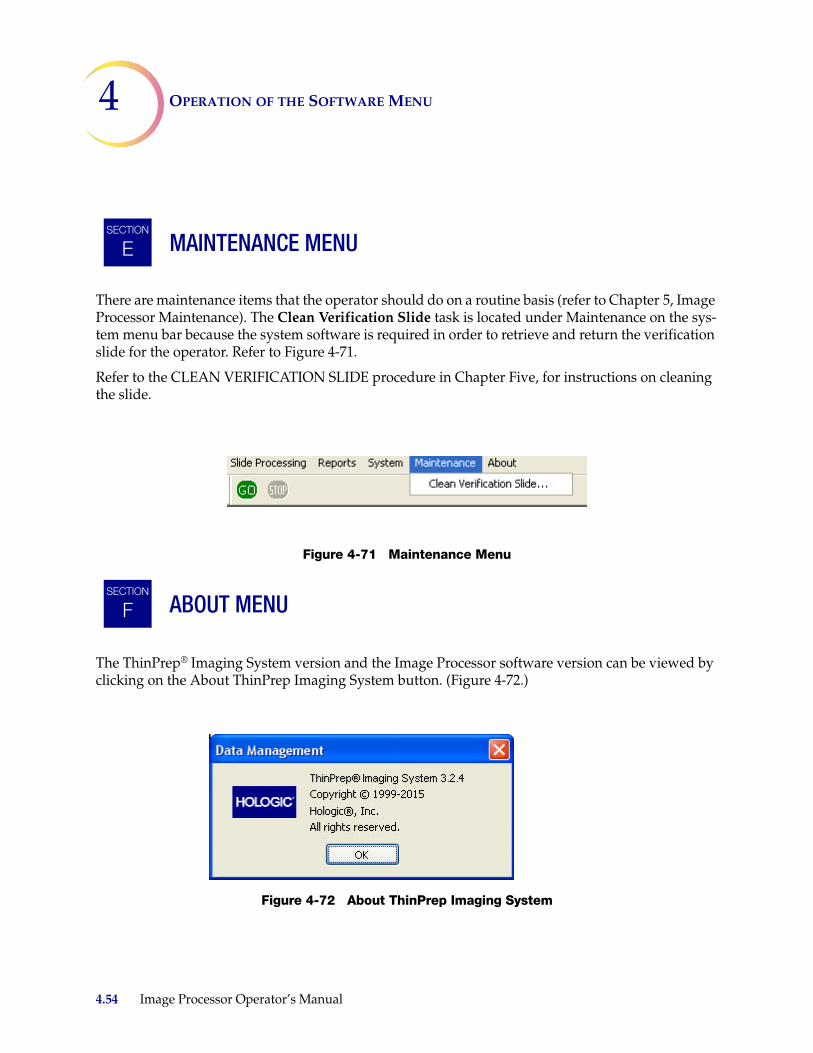
4 OPERATION OF THE SOFTWARE MENU
MAINTENANCE MENU
There are maintenance items that the operator should do on a routine basis (refer to Chapter 5, Image Processor Maintenance). The Clean Verification Slide task is located under Maintenance on the sys-tem menu bar because the system software is required in order to retrieve and return the verification slide for the operator. Refer to Figure 4-71.
Refer to the CLEAN VERIFICATION SLIDE procedure in Chapter Five, for instructions on cleaning the slide.
Figure 4-71 Maintenance Menu
ABOUT MENU
The ThinPrep® Imaging System version and the Image Processor software version can be viewed by clicking on the About ThinPrep Imaging System button. (Figure 4-72.)
Figure 4-72 About ThinPrep Imaging System
SECTION
E
SECTION
F
4.54 Image Processor Operator’s Manual

5. Main
tenan
ce 5. M
ain
ten
ance
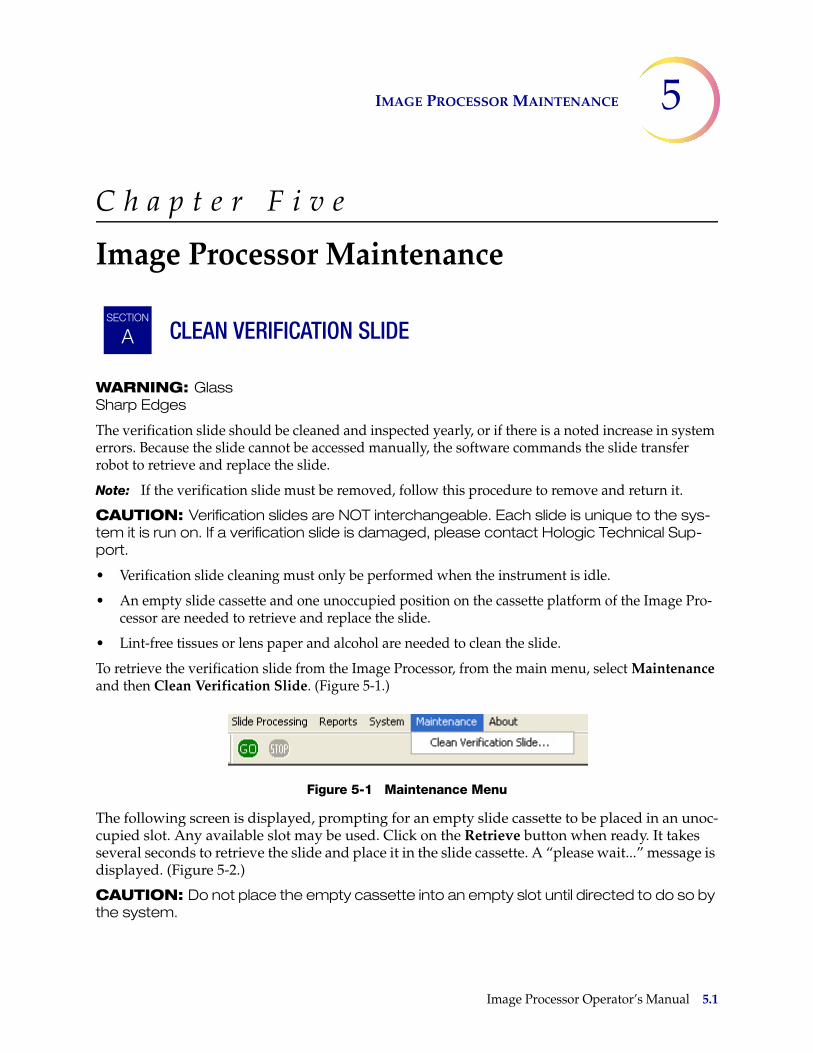
IMAGE PROCESSOR MAINTENANCE 5
C h a p t e r F i v e
Image Processor Maintenance
CLEAN VERIFICATION SLIDE
WARNING: Glass Sharp Edges
The verification slide should be cleaned and inspected yearly, or if there is a noted increase in system errors. Because the slide cannot be accessed manually, the software commands the slide transfer robot to retrieve and replace the slide.
Note: If the verification slide must be removed, follow this procedure to remove and return it.
CAUTION: Verification slides are NOT interchangeable. Each slide is unique to the sys-tem it is run on. If a verification slide is damaged, please contact Hologic Technical Sup-port.
• Verification slide cleaning must only be performed when the instrument is idle.
• An empty slide cassette and one unoccupied position on the cassette platform of the Image Pro-cessor are needed to retrieve and replace the slide.
• Lint-free tissues or lens paper and alcohol are needed to clean the slide.
To retrieve the verification slide from the Image Processor, from the main menu, select Maintenance and then Clean Verification Slide. (Figure 5-1.)
Figure 5-1 Maintenance Menu
The following screen is displayed, prompting for an empty slide cassette to be placed in an unoc-cupied slot. Any available slot may be used. Click on the Retrieve button when ready. It takes several seconds to retrieve the slide and place it in the slide cassette. A “please wait...” message is displayed. (Figure 5-2.)
CAUTION: Do not place the empty cassette into an empty slot until directed to do so by the system.
SECTION
A
Image Processor Operator’s Manual 5.1
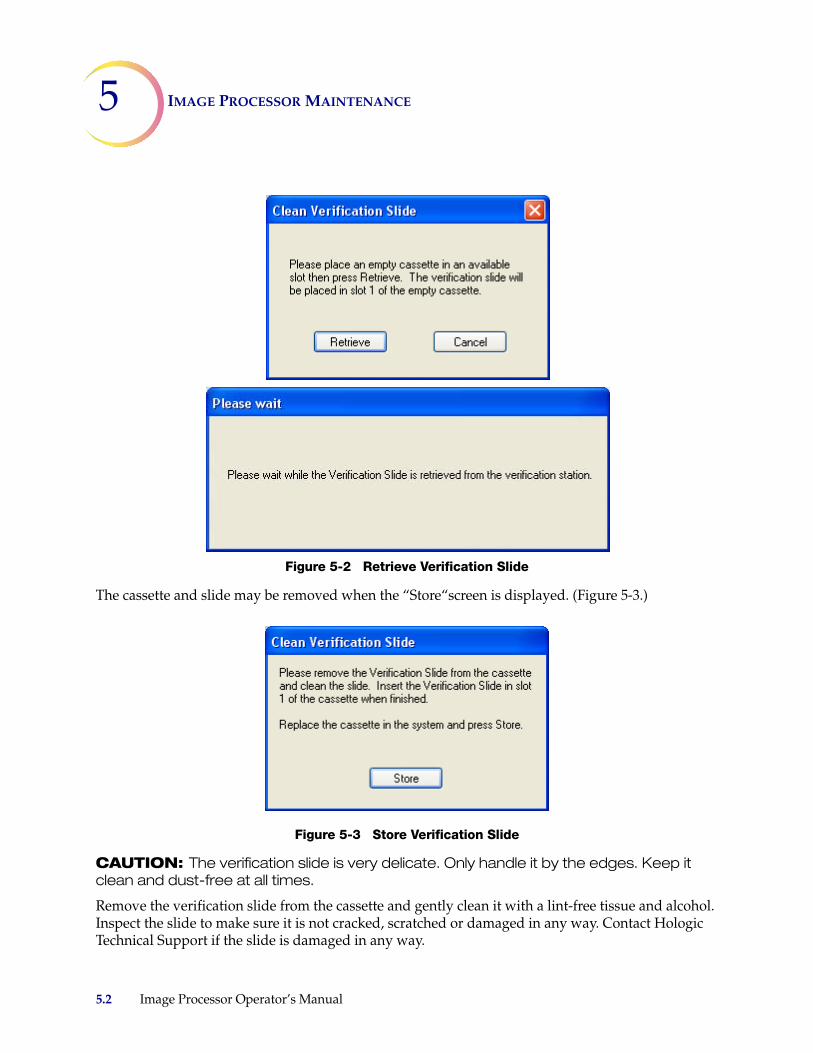
5 IMAGE PROCESSOR MAINTENANCE
Figure 5-2 Retrieve Verification Slide
The cassette and slide may be removed when the “Store“screen is displayed. (Figure 5-3.)
Figure 5-3 Store Verification Slide
CAUTION: The verification slide is very delicate. Only handle it by the edges. Keep it clean and dust-free at all times.
Remove the verification slide from the cassette and gently clean it with a lint-free tissue and alcohol. Inspect the slide to make sure it is not cracked, scratched or damaged in any way. Contact Hologic Technical Support if the slide is damaged in any way.
5.2 Image Processor Operator’s Manual
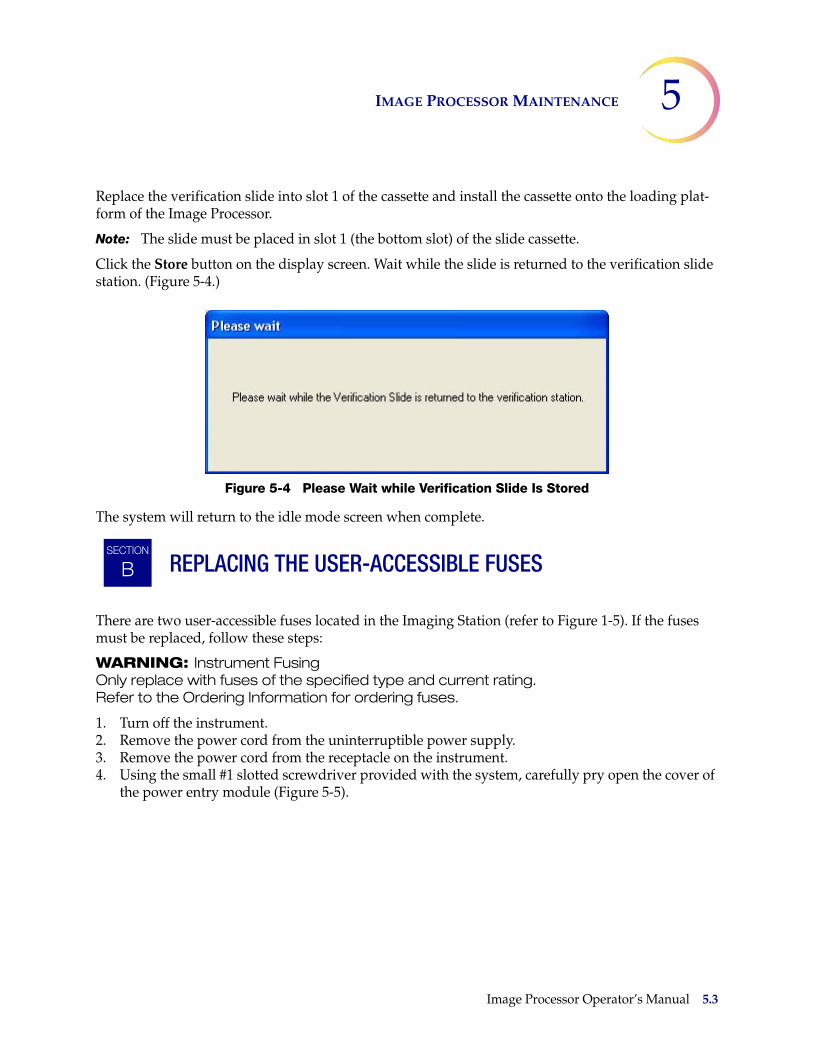
IMAGE PROCESSOR MAINTENANCE 5
Replace the verification slide into slot 1 of the cassette and install the cassette onto the loading plat-form of the Image Processor.
Note: The slide must be placed in slot 1 (the bottom slot) of the slide cassette.
Click the Store button on the display screen. Wait while the slide is returned to the verification slide station. (Figure 5-4.)
Figure 5-4 Please Wait while Verification Slide Is Stored
The system will return to the idle mode screen when complete.
REPLACING THE USER-ACCESSIBLE FUSES
There are two user-accessible fuses located in the Imaging Station (refer to Figure 1-5). If the fuses must be replaced, follow these steps:
WARNING: Instrument Fusing Only replace with fuses of the specified type and current rating. Refer to the Ordering Information for ordering fuses.
1. Turn off the instrument.2. Remove the power cord from the uninterruptible power supply.3. Remove the power cord from the receptacle on the instrument.4. Using the small #1 slotted screwdriver provided with the system, carefully pry open the cover of
the power entry module (Figure 5-5).
SECTION
B
Image Processor Operator’s Manual 5.3
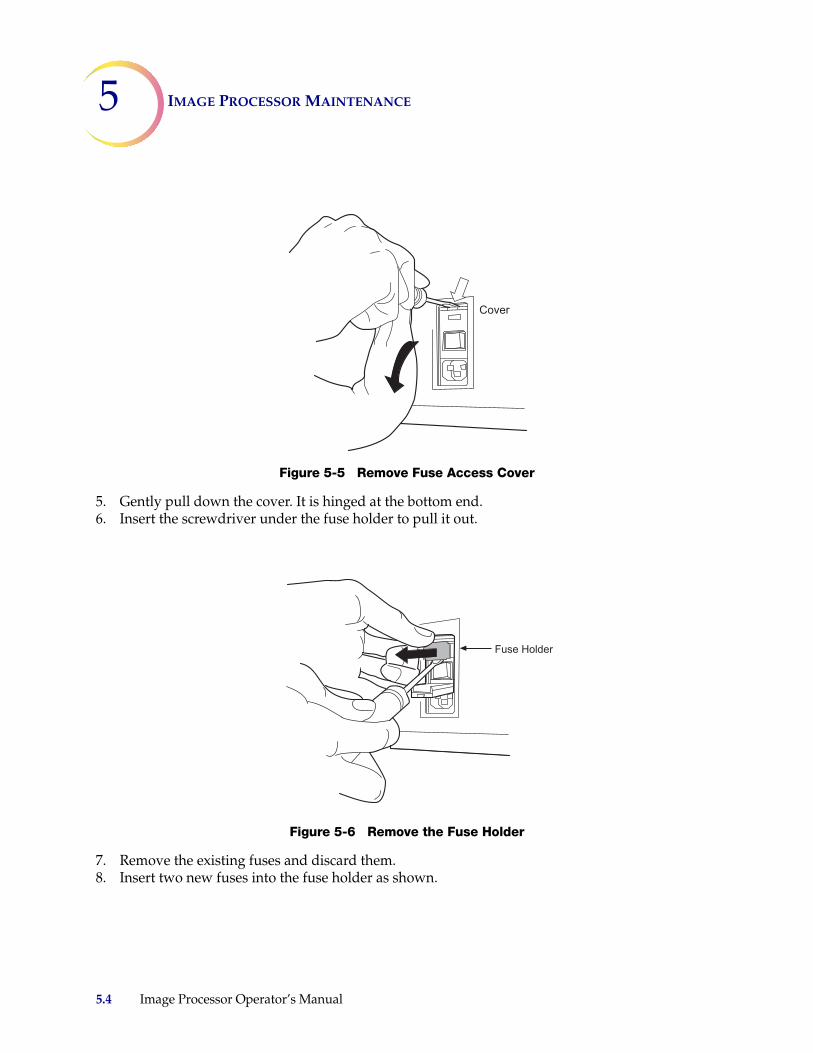
5 IMAGE PROCESSOR MAINTENANCE
Figure 5-5 Remove Fuse Access Cover
5. Gently pull down the cover. It is hinged at the bottom end.6. Insert the screwdriver under the fuse holder to pull it out.
Figure 5-6 Remove the Fuse Holder
7. Remove the existing fuses and discard them.8. Insert two new fuses into the fuse holder as shown.
� 2��
3���; �1��
5.4 Image Processor Operator’s Manual
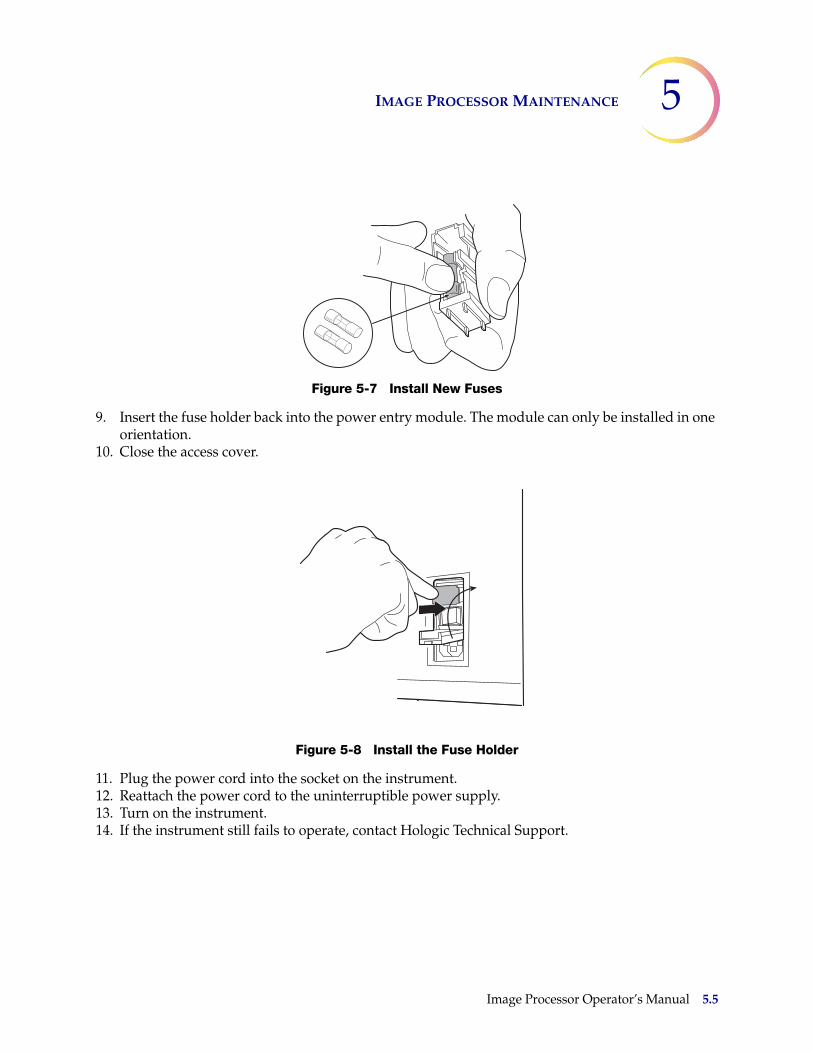
IMAGE PROCESSOR MAINTENANCE 5
Figure 5-7 Install New Fuses
9. Insert the fuse holder back into the power entry module. The module can only be installed in one orientation.
10. Close the access cover.
Figure 5-8 Install the Fuse Holder
11. Plug the power cord into the socket on the instrument.12. Reattach the power cord to the uninterruptible power supply.13. Turn on the instrument.14. If the instrument still fails to operate, contact Hologic Technical Support.
Image Processor Operator’s Manual 5.5
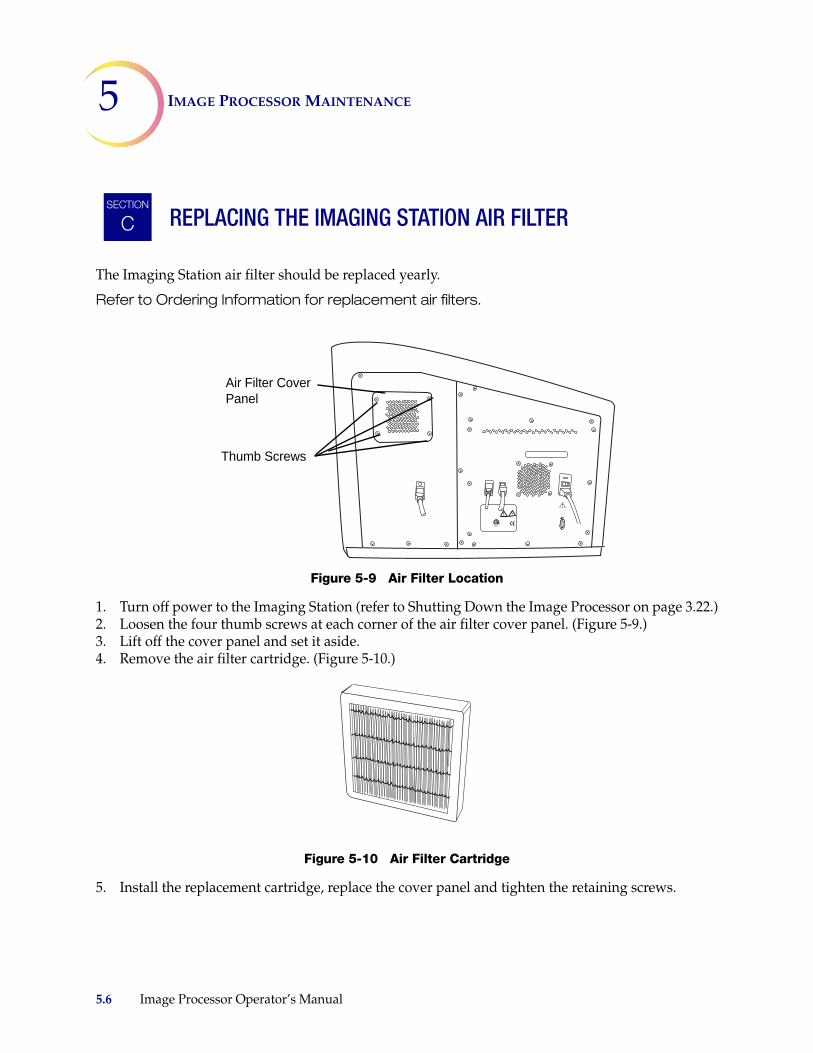
5 IMAGE PROCESSOR MAINTENANCE
REPLACING THE IMAGING STATION AIR FILTER
The Imaging Station air filter should be replaced yearly.
Refer to Ordering Information for replacement air filters.
Figure 5-9 Air Filter Location
1. Turn off power to the Imaging Station (refer to Shutting Down the Image Processor on page 3.22.)2. Loosen the four thumb screws at each corner of the air filter cover panel. (Figure 5-9.)3. Lift off the cover panel and set it aside.4. Remove the air filter cartridge. (Figure 5-10.)
Figure 5-10 Air Filter Cartridge
5. Install the replacement cartridge, replace the cover panel and tighten the retaining screws.
SECTION
C
Air Filter Cover Panel
Thumb Screws
5.6 Image Processor Operator’s Manual
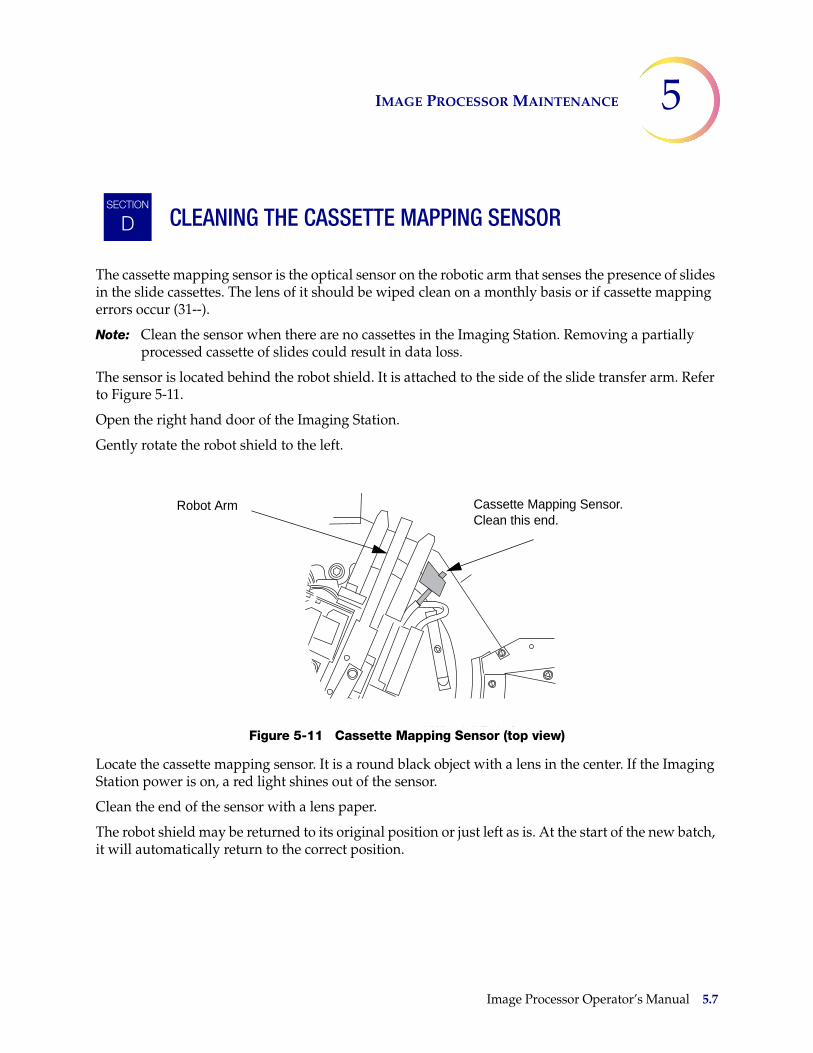
IMAGE PROCESSOR MAINTENANCE 5
CLEANING THE CASSETTE MAPPING SENSOR
The cassette mapping sensor is the optical sensor on the robotic arm that senses the presence of slides in the slide cassettes. The lens of it should be wiped clean on a monthly basis or if cassette mapping errors occur (31--).
Note: Clean the sensor when there are no cassettes in the Imaging Station. Removing a partially processed cassette of slides could result in data loss.
The sensor is located behind the robot shield. It is attached to the side of the slide transfer arm. Refer to Figure 5-11.
Open the right hand door of the Imaging Station.
Gently rotate the robot shield to the left.
Figure 5-11 Cassette Mapping Sensor (top view)
Locate the cassette mapping sensor. It is a round black object with a lens in the center. If the Imaging Station power is on, a red light shines out of the sensor.
Clean the end of the sensor with a lens paper.
The robot shield may be returned to its original position or just left as is. At the start of the new batch, it will automatically return to the correct position.
SECTION
D
Robot Arm Cassette Mapping Sensor. Clean this end.
Image Processor Operator’s Manual 5.7

5 IMAGE PROCESSOR MAINTENANCE
This page intentionally left blank.
5.8 Image Processor Operator’s Manual

6. Trou
blesh
oo
ting
6. T
rou
ble
sho
oti
ng
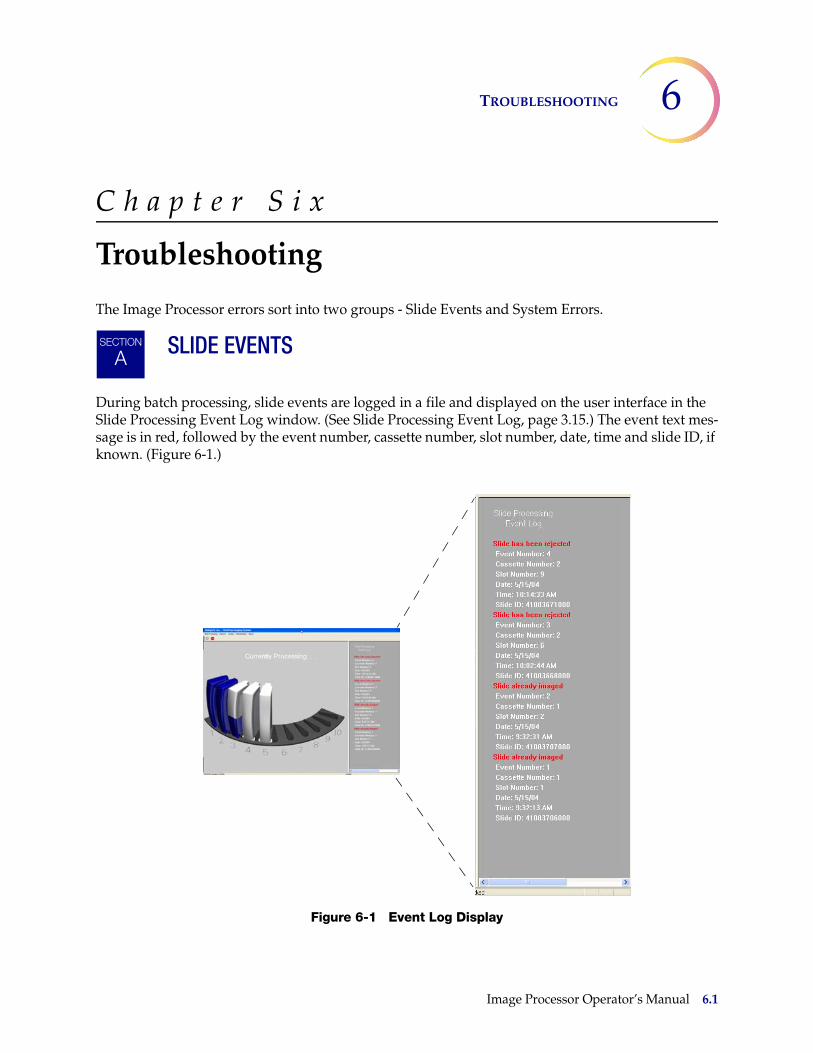
TROUBLESHOOTING 6
C h a p t e r S i x
Troubleshooting
The Image Processor errors sort into two groups - Slide Events and System Errors.
SLIDE EVENTS
During batch processing, slide events are logged in a file and displayed on the user interface in the Slide Processing Event Log window. (See Slide Processing Event Log, page 3.15.) The event text mes-sage is in red, followed by the event number, cassette number, slot number, date, time and slide ID, if known. (Figure 6-1.)
Figure 6-1 Event Log Display
SECTION
A
Image Processor Operator’s Manual 6.1
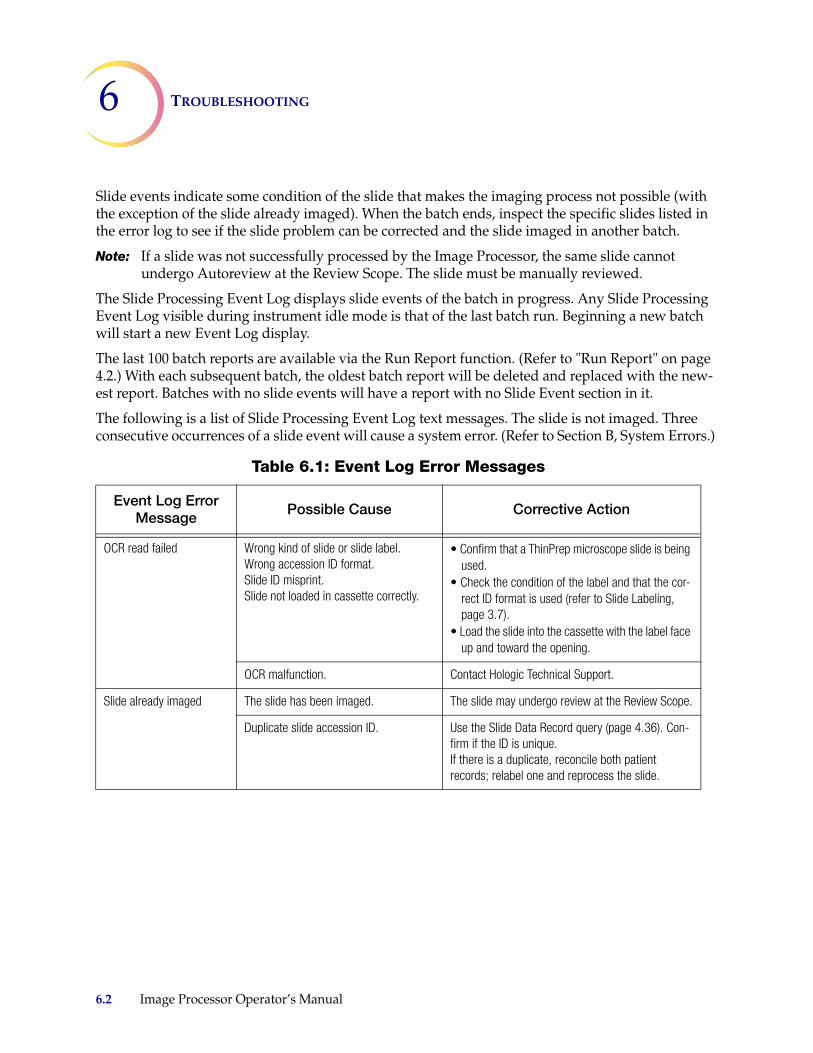
6 TROUBLESHOOTING
Slide events indicate some condition of the slide that makes the imaging process not possible (with the exception of the slide already imaged). When the batch ends, inspect the specific slides listed in the error log to see if the slide problem can be corrected and the slide imaged in another batch.
Note: If a slide was not successfully processed by the Image Processor, the same slide cannot undergo Autoreview at the Review Scope. The slide must be manually reviewed.
The Slide Processing Event Log displays slide events of the batch in progress. Any Slide Processing Event Log visible during instrument idle mode is that of the last batch run. Beginning a new batch will start a new Event Log display.
The last 100 batch reports are available via the Run Report function. (Refer to "Run Report" on page 4.2.) With each subsequent batch, the oldest batch report will be deleted and replaced with the new-est report. Batches with no slide events will have a report with no Slide Event section in it.
The following is a list of Slide Processing Event Log text messages. The slide is not imaged. Three consecutive occurrences of a slide event will cause a system error. (Refer to Section B, System Errors.)
Table 6.1: Event Log Error Messages
Event Log Error Message
Possible Cause Corrective Action
OCR read failed Wrong kind of slide or slide label.Wrong accession ID format.Slide ID misprint.Slide not loaded in cassette correctly.
• Confirm that a ThinPrep microscope slide is being used.
• Check the condition of the label and that the cor-rect ID format is used (refer to Slide Labeling, page 3.7).
• Load the slide into the cassette with the label face up and toward the opening.
OCR malfunction. Contact Hologic Technical Support.
Slide already imaged The slide has been imaged. The slide may undergo review at the Review Scope.
Duplicate slide accession ID. Use the Slide Data Record query (page 4.36). Con-firm if the ID is unique.If there is a duplicate, reconcile both patient records; relabel one and reprocess the slide.
6.2 Image Processor Operator’s Manual

TROUBLESHOOTING 6
Slide has been rejected The slide was not successfully imaged. Inspect the slide and confirm that• ThinPrep microscope slide with fiducial marks is
being used• The slide is clean (no fingerprints, debris, bub-
bles. etc.)• The coverslip media is completely dry• The coverslip does not extend beyond the edge of
the slide• The label is applied smoothly - no wrinkles or
lifted edgesThe slide must be manually reviewed.
Slide ID not valid Wrong accession ID format. Label the slide with the correct ID format.
Slide not found Slide not loaded into the slide cassette correctly.
Confirm that the slide is loaded with the label up and toward the front opening of the cassette.
Slot below has slide out of position or multiple slides
Slides not loaded into the slide cassette correctly.
Confirm that the slide is loaded with the label up and toward the front opening of the cassette.Load one slide per slot.
Slot has multiple slides Slides not loaded into the slide cassette correctly.Slide with a lifted label edge.
Load one slide per slot.Correct label issue.
Slot has slide out of posi-tion
Slide not loaded into the slide cassette correctly.Slide with a lifted label edge.
Confirm that the slide is loaded with the label up and toward the front opening of the cassette.Check that the slide is not cocked or overhanging the retaining feature.Correct label issue.
Table 6.1: Event Log Error Messages
Event Log Error Message
Possible Cause Corrective Action
Image Processor Operator’s Manual 6.3
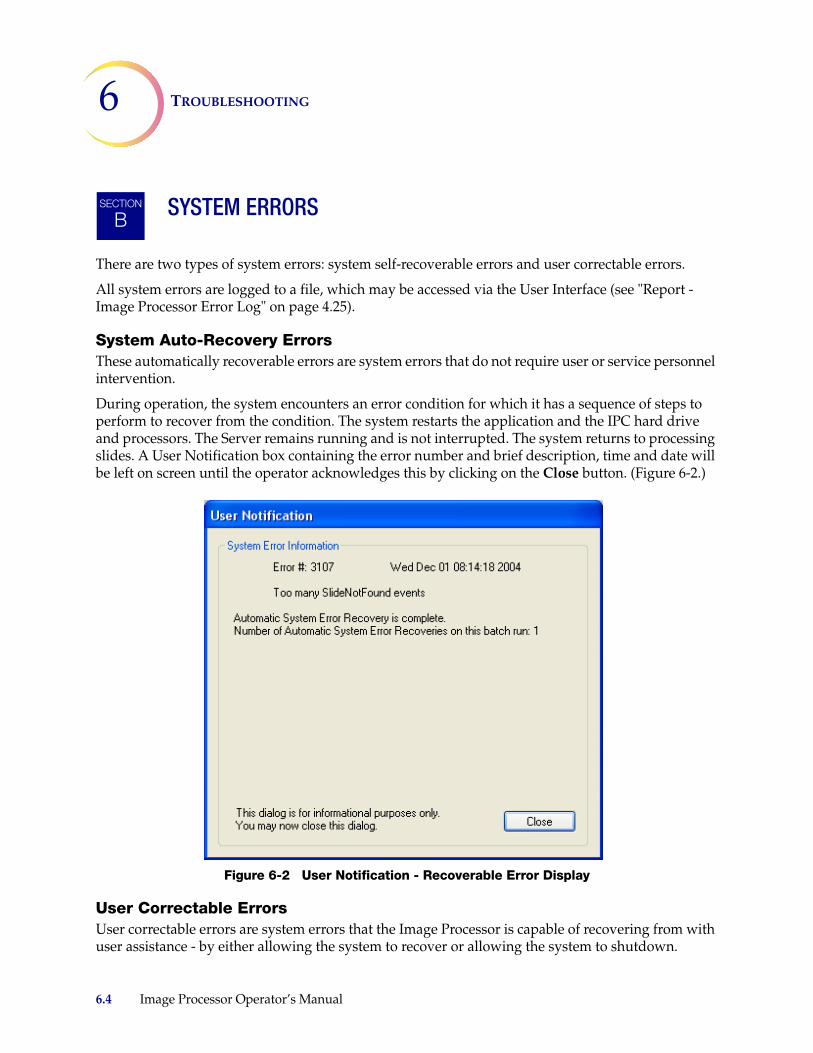
6 TROUBLESHOOTING
SYSTEM ERRORS
There are two types of system errors: system self-recoverable errors and user correctable errors.
All system errors are logged to a file, which may be accessed via the User Interface (see "Report - Image Processor Error Log" on page 4.25).
System Auto-Recovery Errors These automatically recoverable errors are system errors that do not require user or service personnel intervention.
During operation, the system encounters an error condition for which it has a sequence of steps to perform to recover from the condition. The system restarts the application and the IPC hard drive and processors. The Server remains running and is not interrupted. The system returns to processing slides. A User Notification box containing the error number and brief description, time and date will be left on screen until the operator acknowledges this by clicking on the Close button. (Figure 6-2.)
Figure 6-2 User Notification - Recoverable Error Display
User Correctable ErrorsUser correctable errors are system errors that the Image Processor is capable of recovering from with user assistance - by either allowing the system to recover or allowing the system to shutdown.
SECTION
B
6.4 Image Processor Operator’s Manual
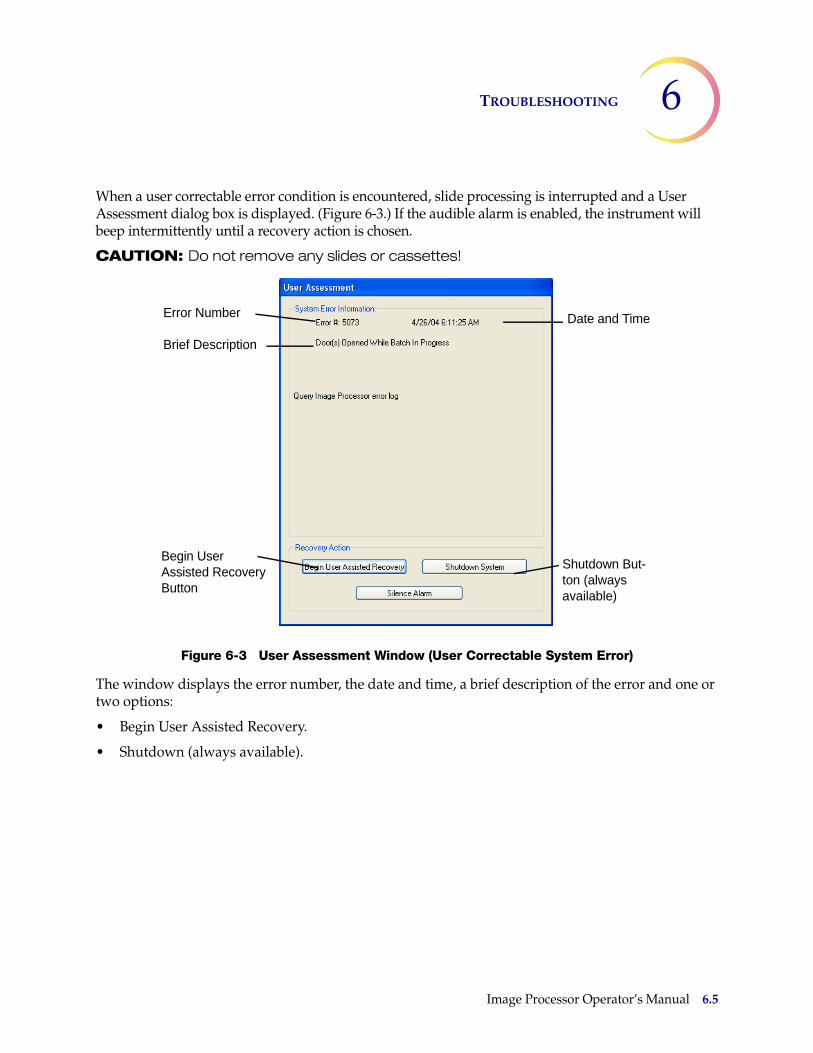
TROUBLESHOOTING 6
When a user correctable error condition is encountered, slide processing is interrupted and a User Assessment dialog box is displayed. (Figure 6-3.) If the audible alarm is enabled, the instrument will beep intermittently until a recovery action is chosen.
CAUTION: Do not remove any slides or cassettes!
Figure 6-3 User Assessment Window (User Correctable System Error)
The window displays the error number, the date and time, a brief description of the error and one or two options:
• Begin User Assisted Recovery.
• Shutdown (always available).
Date and TimeError Number
Brief Description
Shutdown But-ton (always available)
Begin User Assisted Recovery Button
Image Processor Operator’s Manual 6.5
6 TROUBLESHOOTING
User Assisted Recovery OptionClick on the Begin User Assisted Recovery button. (The beeping will stop at this point.) The system will return slides to their original locations and enter idle mode. This process will take a couple of minutes from the time the Recovery button is clicked.
When the system has recovered, the doors will unlock and the display will show the slide cassettes colored blue or gray, as they were at the time of the error condition. At this point the operator may do one of the following:
• Begin processing by clicking on the green GO button. The system will start processing at the point where it left off.
• Remove completed slide cassettes (all blue) and replace with unprocessed cassettes. Do NOT remove partially completed cassettes. Leave them in place to be processed to completion.
Note: The batch was terminated at the time of the error. The Run Report (refer to Run Report in Chapter 4) will list any completed cassettes as a completed batch.
Note: If the recovery is not successful, a User Assessment window with a Shutdown System button will appear.
Shutdown System OptionIf the system encounters an error condition that it cannot recover from, the User Assessment dialog box will display and only the Shutdown System button is available. (Figure 6-4.) The system must be restarted.
6.6 Image Processor Operator’s Manual
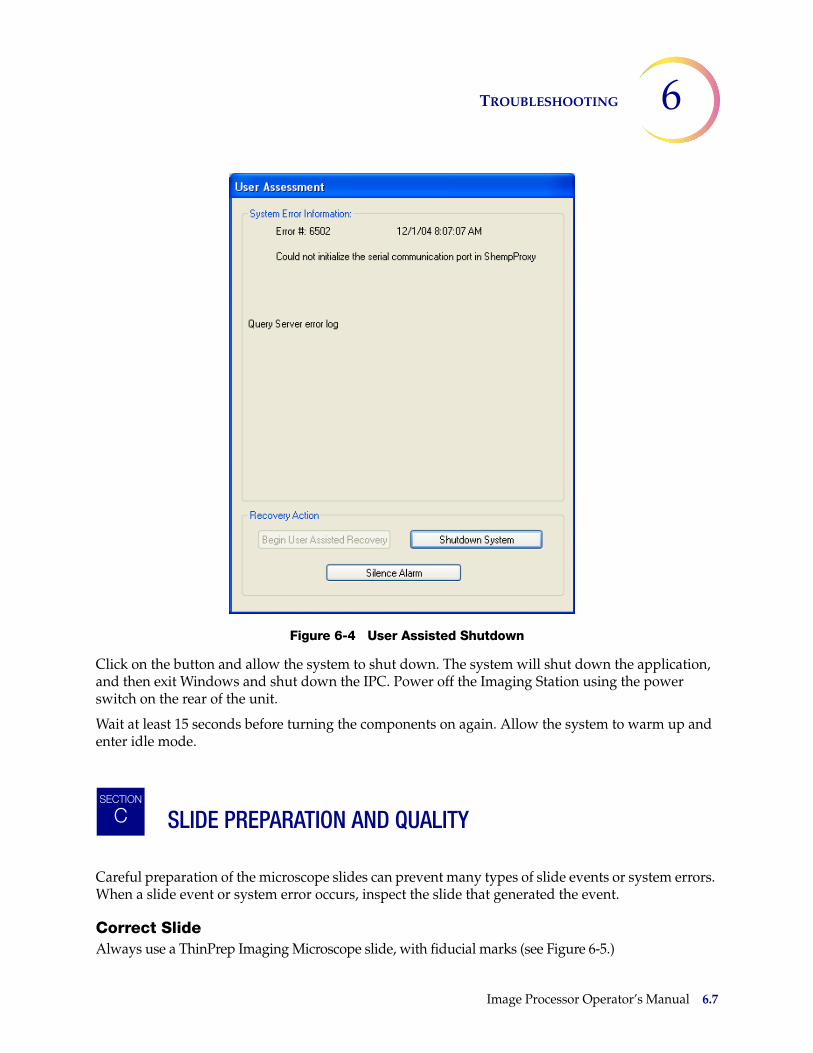
TROUBLESHOOTING 6
Figure 6-4 User Assisted Shutdown
Click on the button and allow the system to shut down. The system will shut down the application, and then exit Windows and shut down the IPC. Power off the Imaging Station using the power switch on the rear of the unit.
Wait at least 15 seconds before turning the components on again. Allow the system to warm up and enter idle mode.
SLIDE PREPARATION AND QUALITY
Careful preparation of the microscope slides can prevent many types of slide events or system errors. When a slide event or system error occurs, inspect the slide that generated the event.
Correct SlideAlways use a ThinPrep Imaging Microscope slide, with fiducial marks (see Figure 6-5.)
SECTION
C
Image Processor Operator’s Manual 6.7
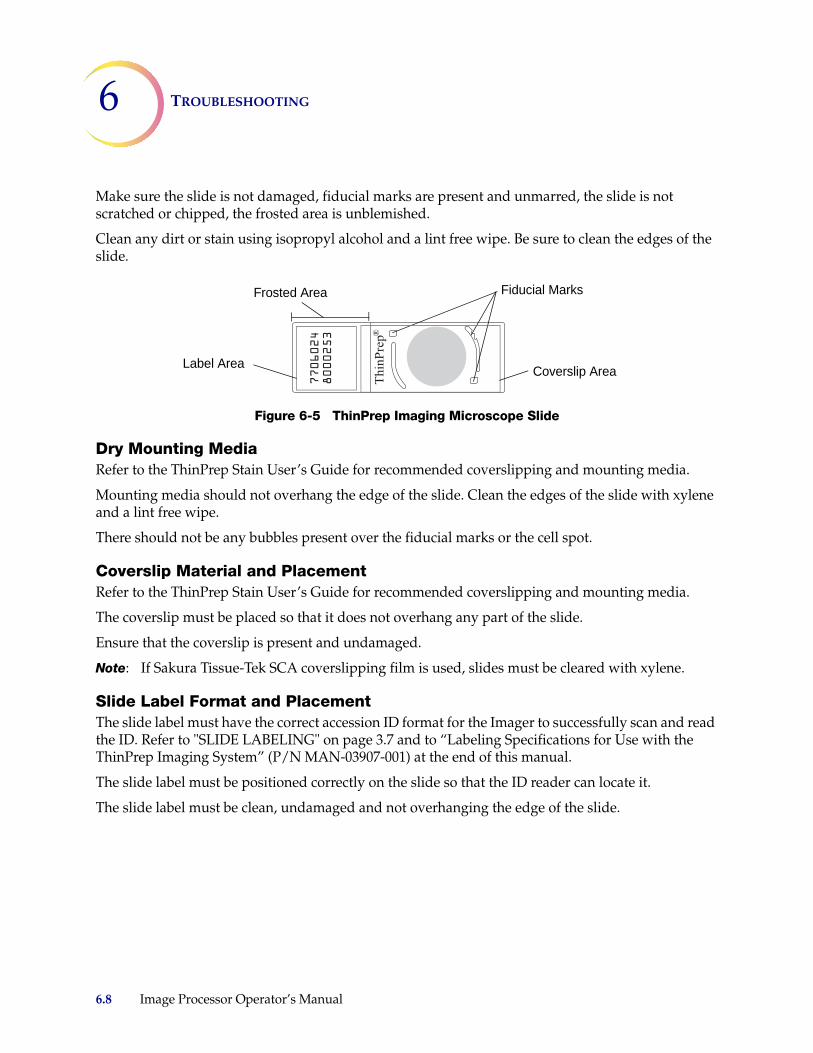
6 TROUBLESHOOTING
Make sure the slide is not damaged, fiducial marks are present and unmarred, the slide is not scratched or chipped, the frosted area is unblemished.
Clean any dirt or stain using isopropyl alcohol and a lint free wipe. Be sure to clean the edges of the slide.
Figure 6-5 ThinPrep Imaging Microscope Slide
Dry Mounting MediaRefer to the ThinPrep Stain User’s Guide for recommended coverslipping and mounting media.
Mounting media should not overhang the edge of the slide. Clean the edges of the slide with xylene and a lint free wipe.
There should not be any bubbles present over the fiducial marks or the cell spot.
Coverslip Material and PlacementRefer to the ThinPrep Stain User’s Guide for recommended coverslipping and mounting media.
The coverslip must be placed so that it does not overhang any part of the slide.
Ensure that the coverslip is present and undamaged.
Note: If Sakura Tissue-Tek SCA coverslipping film is used, slides must be cleared with xylene.
Slide Label Format and PlacementThe slide label must have the correct accession ID format for the Imager to successfully scan and read the ID. Refer to "SLIDE LABELING" on page 3.7 and to “Labeling Specifications for Use with the ThinPrep Imaging System” (P/N MAN-03907-001) at the end of this manual.
The slide label must be positioned correctly on the slide so that the ID reader can locate it.
The slide label must be clean, undamaged and not overhanging the edge of the slide.
Fiducial MarksFrosted Area
Label AreaCoverslip Area
6.8 Image Processor Operator’s Manual
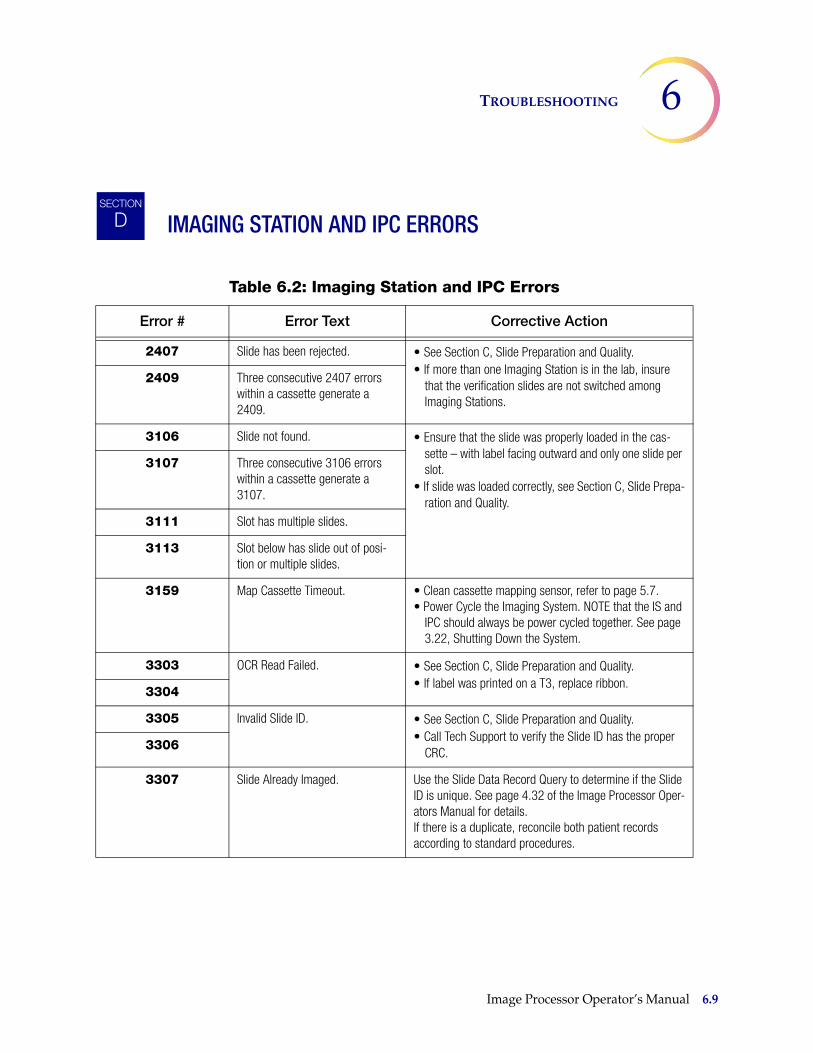
TROUBLESHOOTING 6
IMAGING STATION AND IPC ERRORS
Table 6.2: Imaging Station and IPC Errors
Error # Error Text Corrective Action
2407 Slide has been rejected. • See Section C, Slide Preparation and Quality.• If more than one Imaging Station is in the lab, insure
that the verification slides are not switched among Imaging Stations.
2409 Three consecutive 2407 errors within a cassette generate a 2409.
3106 Slide not found. • Ensure that the slide was properly loaded in the cas-sette – with label facing outward and only one slide per slot.
• If slide was loaded correctly, see Section C, Slide Prepa-ration and Quality.
3107 Three consecutive 3106 errors within a cassette generate a 3107.
3111 Slot has multiple slides.
3113 Slot below has slide out of posi-tion or multiple slides.
3159 Map Cassette Timeout. • Clean cassette mapping sensor, refer to page 5.7.• Power Cycle the Imaging System. NOTE that the IS and
IPC should always be power cycled together. See page 3.22, Shutting Down the System.
3303 OCR Read Failed. • See Section C, Slide Preparation and Quality.• If label was printed on a T3, replace ribbon.
3304
3305 Invalid Slide ID. • See Section C, Slide Preparation and Quality.• Call Tech Support to verify the Slide ID has the proper
CRC.3306
3307 Slide Already Imaged. Use the Slide Data Record Query to determine if the Slide ID is unique. See page 4.32 of the Image Processor Oper-ators Manual for details.If there is a duplicate, reconcile both patient records according to standard procedures.
SECTION
D
Image Processor Operator’s Manual 6.9
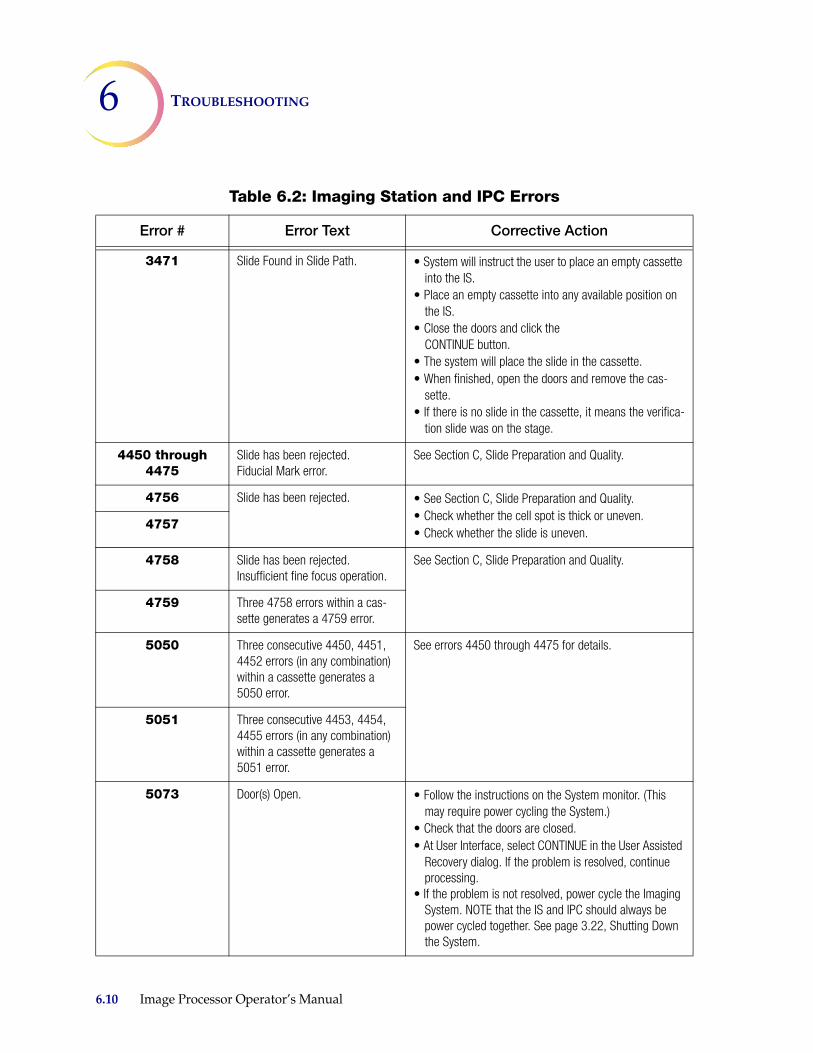
6 TROUBLESHOOTING
3471 Slide Found in Slide Path. • System will instruct the user to place an empty cassette into the IS.
• Place an empty cassette into any available position on the IS.
• Close the doors and click the CONTINUE button.
• The system will place the slide in the cassette.• When finished, open the doors and remove the cas-
sette.• If there is no slide in the cassette, it means the verifica-
tion slide was on the stage.
4450 through 4475
Slide has been rejected.Fiducial Mark error.
See Section C, Slide Preparation and Quality.
4756 Slide has been rejected. • See Section C, Slide Preparation and Quality.• Check whether the cell spot is thick or uneven.• Check whether the slide is uneven.
4757
4758 Slide has been rejected. Insufficient fine focus operation.
See Section C, Slide Preparation and Quality.
4759 Three 4758 errors within a cas-sette generates a 4759 error.
5050 Three consecutive 4450, 4451, 4452 errors (in any combination) within a cassette generates a 5050 error.
See errors 4450 through 4475 for details.
5051 Three consecutive 4453, 4454, 4455 errors (in any combination) within a cassette generates a 5051 error.
5073 Door(s) Open. • Follow the instructions on the System monitor. (This may require power cycling the System.)
• Check that the doors are closed.• At User Interface, select CONTINUE in the User Assisted
Recovery dialog. If the problem is resolved, continue processing.
• If the problem is not resolved, power cycle the Imaging System. NOTE that the IS and IPC should always be power cycled together. See page 3.22, Shutting Down the System.
Table 6.2: Imaging Station and IPC Errors
Error # Error Text Corrective Action
6.10 Image Processor Operator’s Manual
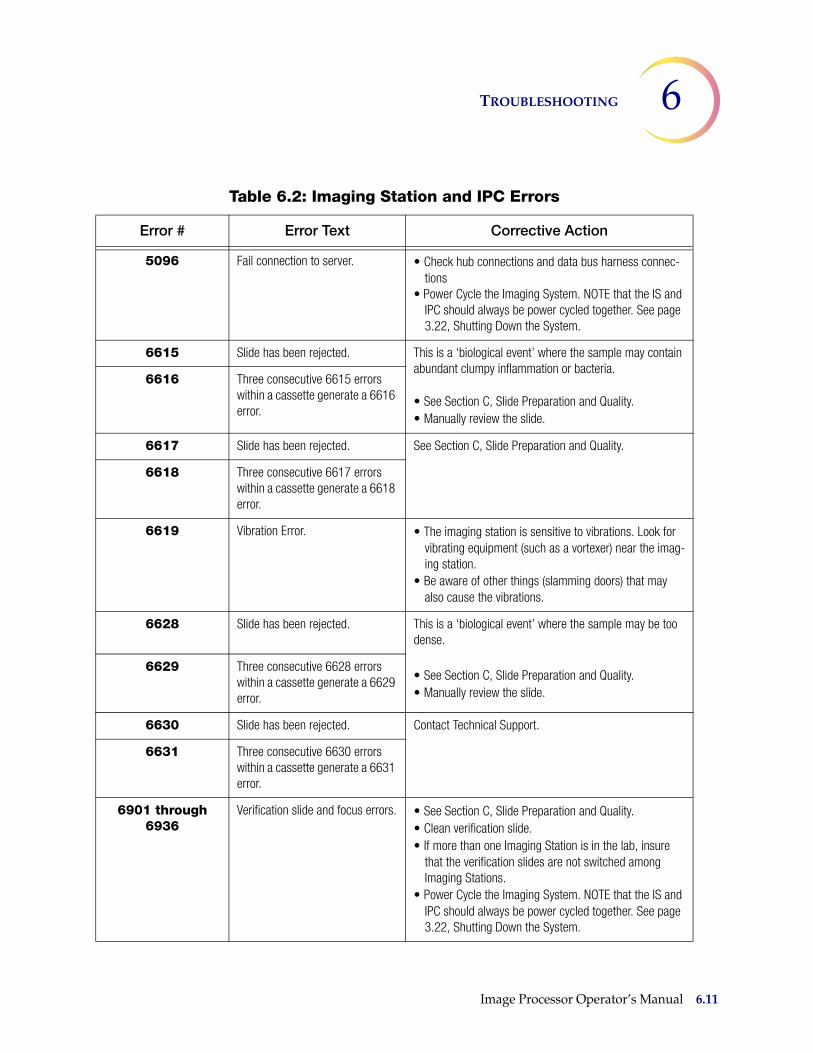
TROUBLESHOOTING 6
5096 Fail connection to server. • Check hub connections and data bus harness connec-tions
• Power Cycle the Imaging System. NOTE that the IS and IPC should always be power cycled together. See page 3.22, Shutting Down the System.
6615 Slide has been rejected. This is a ‘biological event’ where the sample may contain abundant clumpy inflammation or bacteria.
• See Section C, Slide Preparation and Quality.• Manually review the slide.
6616 Three consecutive 6615 errors within a cassette generate a 6616 error.
6617 Slide has been rejected. See Section C, Slide Preparation and Quality.
6618 Three consecutive 6617 errors within a cassette generate a 6618 error.
6619 Vibration Error. • The imaging station is sensitive to vibrations. Look for vibrating equipment (such as a vortexer) near the imag-ing station.
• Be aware of other things (slamming doors) that may also cause the vibrations.
6628 Slide has been rejected. This is a ‘biological event’ where the sample may be too dense.
• See Section C, Slide Preparation and Quality.• Manually review the slide.
6629 Three consecutive 6628 errors within a cassette generate a 6629 error.
6630 Slide has been rejected. Contact Technical Support.
6631 Three consecutive 6630 errors within a cassette generate a 6631 error.
6901 through 6936
Verification slide and focus errors. • See Section C, Slide Preparation and Quality.• Clean verification slide.• If more than one Imaging Station is in the lab, insure
that the verification slides are not switched among Imaging Stations.
• Power Cycle the Imaging System. NOTE that the IS and IPC should always be power cycled together. See page 3.22, Shutting Down the System.
Table 6.2: Imaging Station and IPC Errors
Error # Error Text Corrective Action
Image Processor Operator’s Manual 6.11
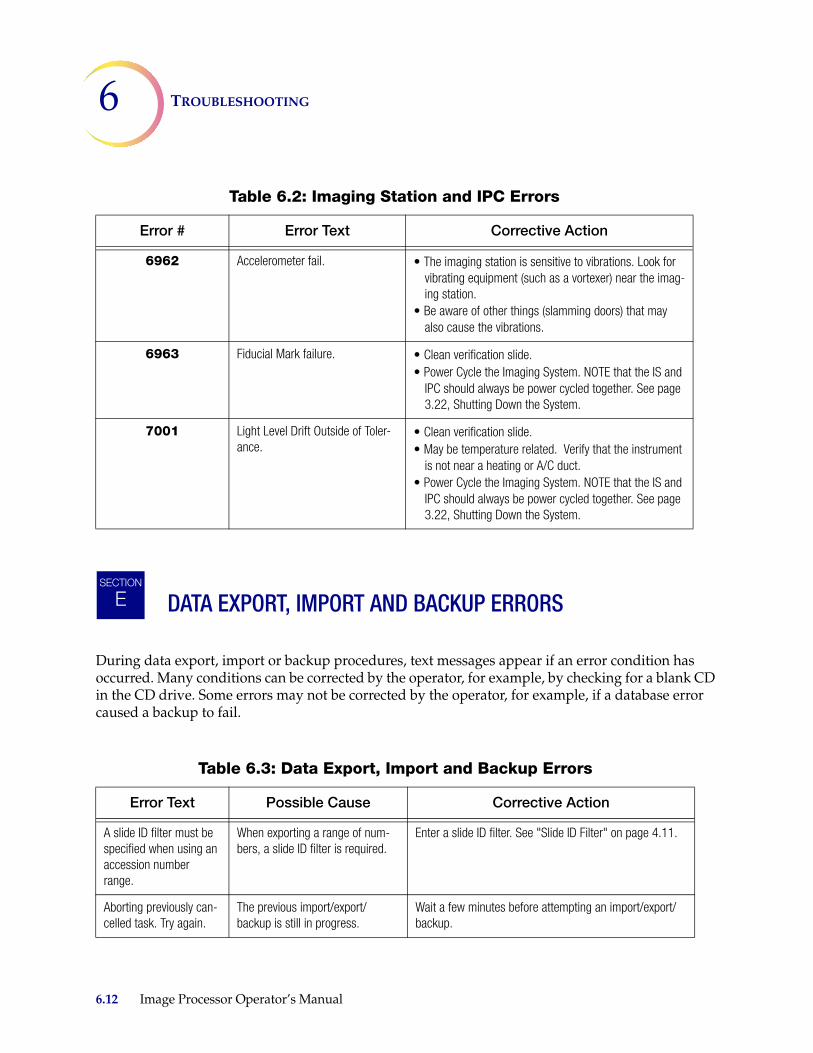
6 TROUBLESHOOTING
DATA EXPORT, IMPORT AND BACKUP ERRORS
During data export, import or backup procedures, text messages appear if an error condition has occurred. Many conditions can be corrected by the operator, for example, by checking for a blank CD in the CD drive. Some errors may not be corrected by the operator, for example, if a database error caused a backup to fail.
6962 Accelerometer fail. • The imaging station is sensitive to vibrations. Look for vibrating equipment (such as a vortexer) near the imag-ing station.
• Be aware of other things (slamming doors) that may also cause the vibrations.
6963 Fiducial Mark failure. • Clean verification slide.• Power Cycle the Imaging System. NOTE that the IS and
IPC should always be power cycled together. See page 3.22, Shutting Down the System.
7001 Light Level Drift Outside of Toler-ance.
• Clean verification slide.• May be temperature related. Verify that the instrument
is not near a heating or A/C duct.• Power Cycle the Imaging System. NOTE that the IS and
IPC should always be power cycled together. See page 3.22, Shutting Down the System.
Table 6.3: Data Export, Import and Backup Errors
Error Text Possible Cause Corrective Action
A slide ID filter must be specified when using an accession number range.
When exporting a range of num-bers, a slide ID filter is required.
Enter a slide ID filter. See "Slide ID Filter" on page 4.11.
Aborting previously can-celled task. Try again.
The previous import/export/backup is still in progress.
Wait a few minutes before attempting an import/export/backup.
Table 6.2: Imaging Station and IPC Errors
Error # Error Text Corrective Action
SECTION
E
6.12 Image Processor Operator’s Manual
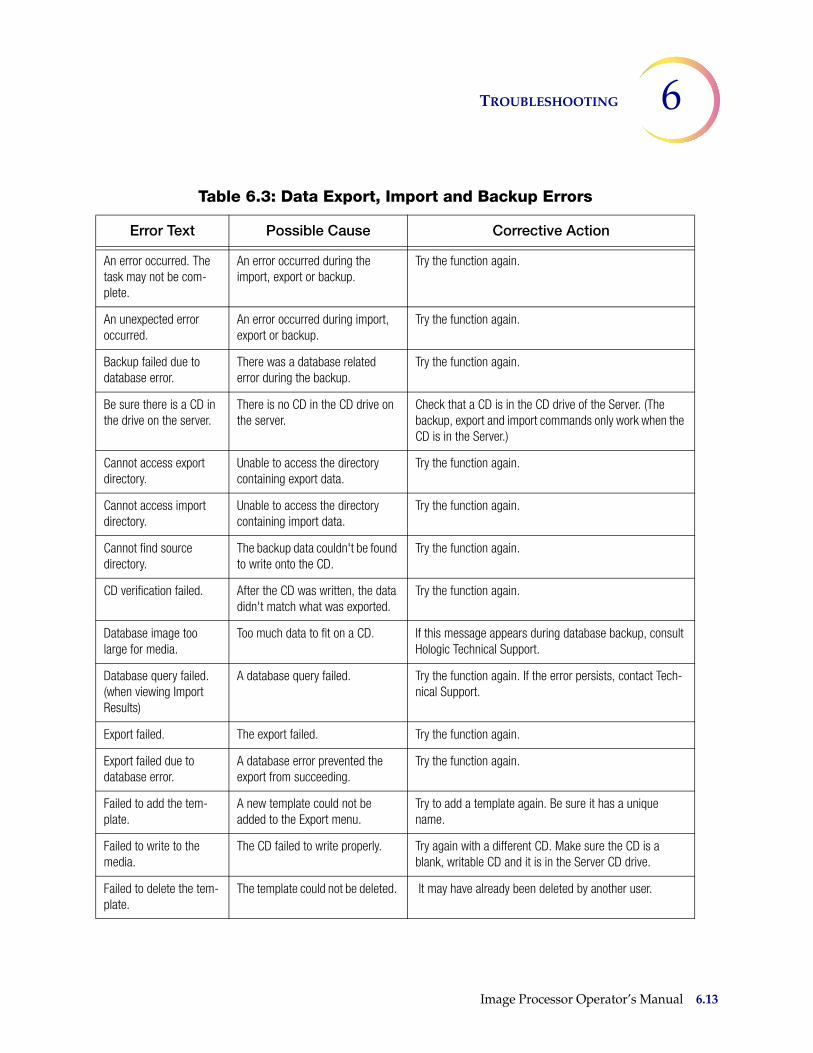
TROUBLESHOOTING 6
An error occurred. The task may not be com-plete.
An error occurred during the import, export or backup.
Try the function again.
An unexpected error occurred.
An error occurred during import, export or backup.
Try the function again.
Backup failed due to database error.
There was a database related error during the backup.
Try the function again.
Be sure there is a CD in the drive on the server.
There is no CD in the CD drive on the server.
Check that a CD is in the CD drive of the Server. (The backup, export and import commands only work when the CD is in the Server.)
Cannot access export directory.
Unable to access the directory containing export data.
Try the function again.
Cannot access import directory.
Unable to access the directory containing import data.
Try the function again.
Cannot find source directory.
The backup data couldn't be found to write onto the CD.
Try the function again.
CD verification failed. After the CD was written, the data didn't match what was exported.
Try the function again.
Database image too large for media.
Too much data to fit on a CD. If this message appears during database backup, consult Hologic Technical Support.
Database query failed. (when viewing Import Results)
A database query failed. Try the function again. If the error persists, contact Tech-nical Support.
Export failed. The export failed. Try the function again.
Export failed due to database error.
A database error prevented the export from succeeding.
Try the function again.
Failed to add the tem-plate.
A new template could not be added to the Export menu.
Try to add a template again. Be sure it has a unique name.
Failed to write to the media.
The CD failed to write properly. Try again with a different CD. Make sure the CD is a blank, writable CD and it is in the Server CD drive.
Failed to delete the tem-plate.
The template could not be deleted. It may have already been deleted by another user.
Table 6.3: Data Export, Import and Backup Errors
Error Text Possible Cause Corrective Action
Image Processor Operator’s Manual 6.13
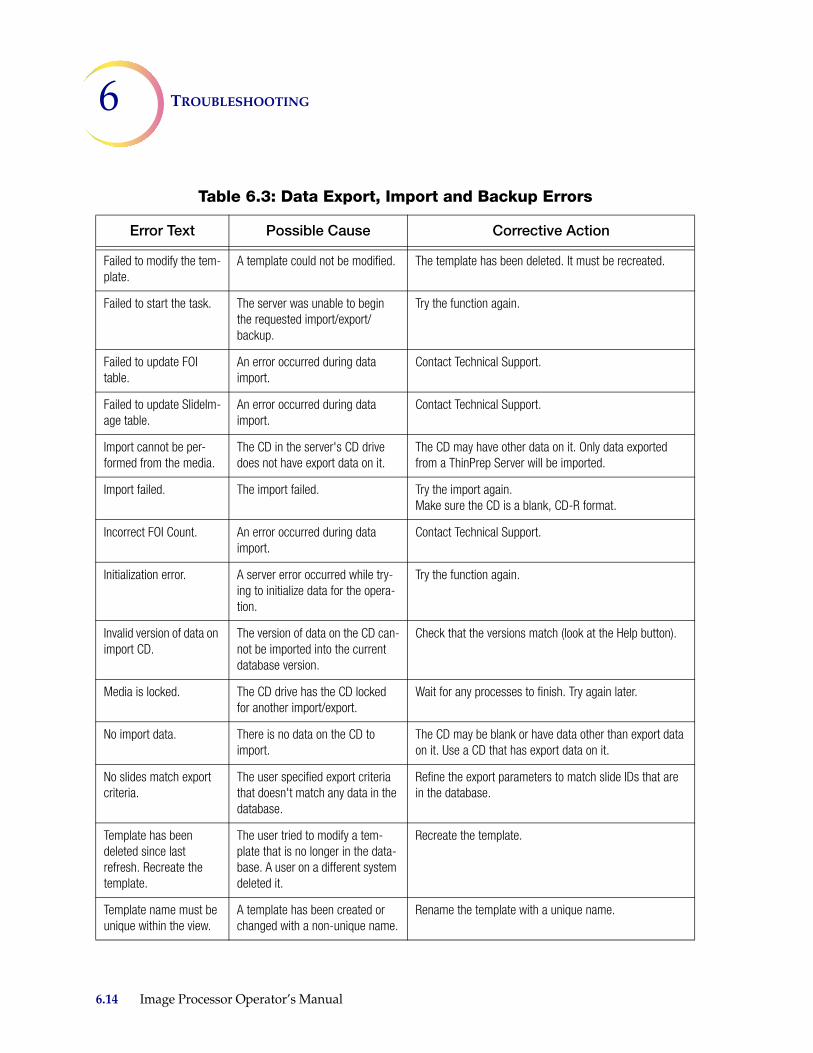
6 TROUBLESHOOTING
Failed to modify the tem-plate.
A template could not be modified. The template has been deleted. It must be recreated.
Failed to start the task. The server was unable to begin the requested import/export/backup.
Try the function again.
Failed to update FOI table.
An error occurred during data import.
Contact Technical Support.
Failed to update SlideIm-age table.
An error occurred during data import.
Contact Technical Support.
Import cannot be per-formed from the media.
The CD in the server's CD drive does not have export data on it.
The CD may have other data on it. Only data exported from a ThinPrep Server will be imported.
Import failed. The import failed. Try the import again.Make sure the CD is a blank, CD-R format.
Incorrect FOI Count. An error occurred during data import.
Contact Technical Support.
Initialization error. A server error occurred while try-ing to initialize data for the opera-tion.
Try the function again.
Invalid version of data on import CD.
The version of data on the CD can-not be imported into the current database version.
Check that the versions match (look at the Help button).
Media is locked. The CD drive has the CD locked for another import/export.
Wait for any processes to finish. Try again later.
No import data. There is no data on the CD to import.
The CD may be blank or have data other than export data on it. Use a CD that has export data on it.
No slides match export criteria.
The user specified export criteria that doesn't match any data in the database.
Refine the export parameters to match slide IDs that are in the database.
Template has been deleted since last refresh. Recreate the template.
The user tried to modify a tem-plate that is no longer in the data-base. A user on a different system deleted it.
Recreate the template.
Template name must be unique within the view.
A template has been created or changed with a non-unique name.
Rename the template with a unique name.
Table 6.3: Data Export, Import and Backup Errors
Error Text Possible Cause Corrective Action
6.14 Image Processor Operator’s Manual
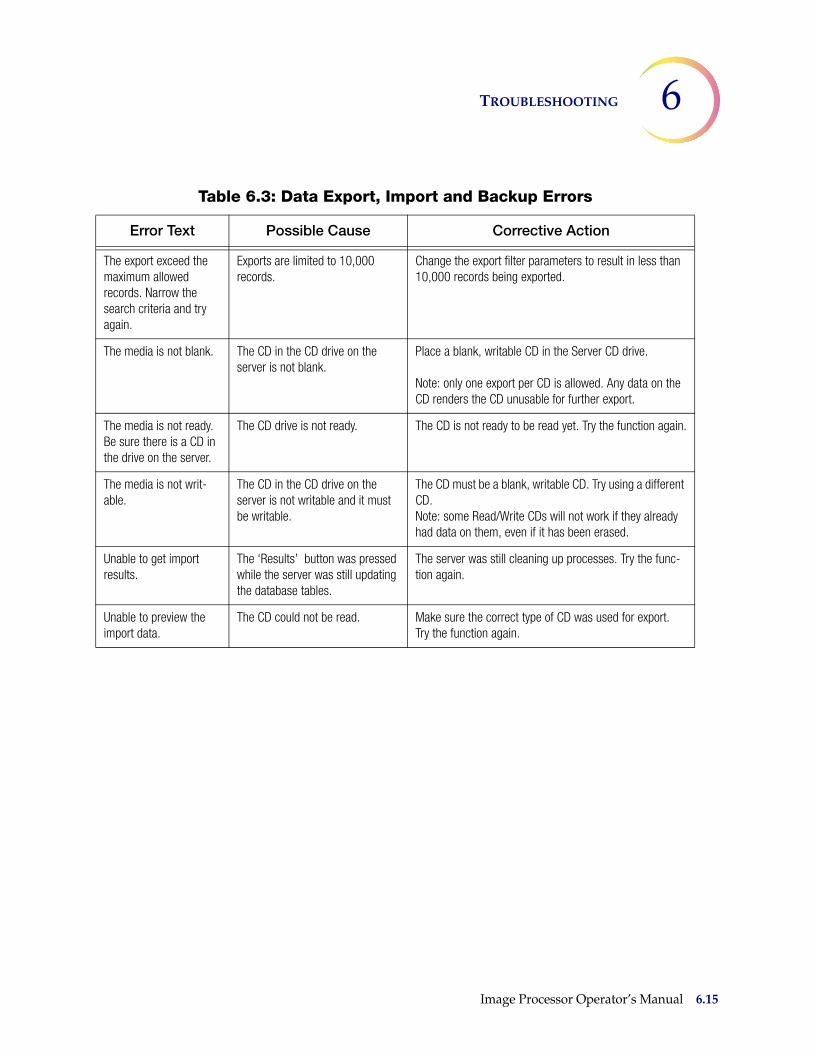
TROUBLESHOOTING 6
The export exceed the maximum allowed records. Narrow the search criteria and try again.
Exports are limited to 10,000 records.
Change the export filter parameters to result in less than 10,000 records being exported.
The media is not blank. The CD in the CD drive on the server is not blank.
Place a blank, writable CD in the Server CD drive.
Note: only one export per CD is allowed. Any data on the CD renders the CD unusable for further export.
The media is not ready. Be sure there is a CD in the drive on the server.
The CD drive is not ready. The CD is not ready to be read yet. Try the function again.
The media is not writ-able.
The CD in the CD drive on the server is not writable and it must be writable.
The CD must be a blank, writable CD. Try using a different CD.Note: some Read/Write CDs will not work if they already had data on them, even if it has been erased.
Unable to get import results.
The ‘Results’ button was pressed while the server was still updating the database tables.
The server was still cleaning up processes. Try the func-tion again.
Unable to preview the import data.
The CD could not be read. Make sure the correct type of CD was used for export.Try the function again.
Table 6.3: Data Export, Import and Backup Errors
Error Text Possible Cause Corrective Action
Image Processor Operator’s Manual 6.15

6 TROUBLESHOOTING
This page intentionally left blank.
6.16 Image Processor Operator’s Manual

7. Th
inP
rep S
tain7.
Th
inP
rep
Sta
in

ThinPrep Stain 7
C h a p t e r S e v e n
ThinPrep Stain
INTRODUCTION
ThinPrep® Stain must be used with the ThinPrep Imaging System. The stain’s unique properties enable the Imager to scan the ThinPrep Pap slide and correctly identify objects of interest found on the slide (based on integrated optical density), while maintaining an appearance consistent with a traditional Papanicolaou stain.
FIXATION REQUIREMENTS
Slides Prepared on the ThinPrep 2000 ProcessorThe ThinPrep 2000 Processor deposits completed slides into a fixative vial that contains 95% reagent alcohol or 95% ethyl alcohol.
1. Remove each slide after it is deposited into the fixative vial in the ThinPrep 2000 System.Note: The alcohol in the ThinPrep 2000 fixative vial should be changed every 100 slides or daily.
2. Place the slide into a multi-slide holder (e.g., staining rack) immersed in a bath of 95% reagent alcohol or 95% ethyl alcohol.
Notes: Do this step quickly, to minimize exposure of the ThinPrep slide to air. Change the fixative bath every two weeks (maximum).
3. The slides must remain in 95% reagent alcohol or 95% ethyl alcohol for at least 10 minutes prior to staining.
Notes:
• Solutions should be kept covered when not in use to minimize evaporation.
• Do not allow the slides to air-dry at any time prior to staining.
• For slides which must be shipped prior to staining, CellFyx™ Solution fixative must be applied. Contact Hologic Customer Service for ordering.
SECTION
A
SECTION
B
Image Processor Operator’s Manual 7.1

7 ThinPrep Stain
Slides Prepared on the ThinPrep 3000 ProcessorSlides prepared on the ThinPrep 3000 Processor are automatically treated with fixative (CellFyx™ Solution) in the instrument. No further fixation is required.
Slides Prepared on the ThinPrep 5000 ProcessorThinPrep Pap Test slides prepared on a ThinPrep 5000 Processor should be fixed for at least 10 minutes prior to staining, if the slides will be used on the ThinPrep Imaging System. If the slides must be shipped to another site prior to staining, CellFyx Solution fixative must be applied.
Note: No other spray fixative has been validated for use with the ThinPrep Imaging System.
STAINING REQUIREMENTS
Refer to the ThinPrep Stain User’s Manual and follow all the staining instructions for the appli-cable staining protocol being used.
CAUTION: Follow the staining instructions and applicable protocols exactly as stated in the ThinPrep Stain User’s Manual. Altering these instructions and protocols may compro-mise the performance of the ThinPrep Imaging System.
CAUTION: Do not substitute any solutions or stain reagents required in the protocols, as that may compromise the performance of the ThinPrep Imaging System.
Recycled AlcoholAlcohols recycled via the following systems are acceptable for use with the ThinPrep Imaging Sys-tem:
Filtration SystemsCreative Waste Solutions, Inc. (Bench Top Alcohol Recycling System) www.cwsincorp.com
SunCycle Technologies, Inc. (Gravity Recycling Alcohol Cartridge (GRAC)) www.suncycletech.com
Distillation SystemsCBG Biotech™ (Solvent Recyler model SLV-99U (L)
SECTION
C
7.2 Image Processor Operator’s Manual
ThinPrep Stain 7
Recycled Alcohol GuidelinesGeneral Guidelines (applies to all alcohol recycling)
• Laboratories must follow manufacturers recommendations for alcohol recycling.
• Only Hologic-recommended alcohols should be used - Reagent or Ethyl alcohol.
• Laboratories are responsible for ensuring that the recycled alcohol concentration used in the ThinPrep staining protocol meets Hologic’s recommendation.
Filtration Systems
• Only the 95% and 100% alcohols from the ThinPrep Stain set up should be put through the filtra-tion system.
• 95% and 100% alcohols combined on the filtration system will result in an output alcohol concen-tration that will need to be adjusted to 95% prior to use in the ThinPrep Stain set up.
Distillation System
• Only 70% and greater alcohols from the ThinPrep® Stain set up should be combined and recy-cled through the recycler at one time.
• Laboratories who wish to recycle solvents other than alcohol (xylene or xylene substitutes) on the same recycler are responsible to ensure the resultant alcohol is not contaminated with residual solvent.
The CBG Biotech Solvent Recycler Installation and Operating Instructions Manual provides step by step instructions for recycling alcohols and solvents on the same recycler.
The laboratory should perform a xylene-water test to ensure the recycled alcohols are not contaminated with residual solvent prior to being placed in the ThinPrep Stain set up. Refer to the CBG Biotech Solvent Recycler Installation and Operating Instructions Manual Troubleshoot-ing section for details.
• Recycling 70% or greater alcohols will result in an output alcohol concentration that will need to be readjusted to the appropriate concentration prior to being used in the ThinPrep Stain set up.
COVERSLIPPING REQUIREMENTS
Required MaterialsTable 7.1 lists the mounting media, clearing agents, coverslips and combinations of these items that have been evaluated and approved for use with the ThinPrep Imaging System.
SECTION
D
Image Processor Operator’s Manual 7.3
7 ThinPrep Stain
CAUTION: Use of other mounting media, clearing agents coverslips or approved com-binations of these items may compromise the performance of the Imager. Use of lint-free wipes is recommended.
Automated CoverslippingRefer to manufacturer’s instructions for use of automated coverslipping instruments.
Note: Refer to Table 7.2 at the end of this section for recommendations for setting up a Sakura Tis-sue-Tek® FILM™ coverslipper for use with a ThinPrep Imaging System.
Manual Coverslipping1. Quickly drain excess clearing agent from the slide.2. Immediately apply sufficient mounting medium to the slide to minimize cornflaking, air bubbles
or retraction. Avoid excessive medium, which may ooze out from under the coverslip and run down the edges of the slide.
3. Apply the coverslip using standard laboratory practice.4. Using a lint-free wipe moistened in clearing agent, wipe the edges of the coverslip to clear any
residual mounting medium.5. Allow slides to dry completely (a minimum of 16 hours at room temperature or in a slide oven
set at 37°C ± 1°C for 3 to 12 hours) before placing in a slide folder or in Imager slide cassettes.
CAUTION: Make sure the coverslips do not overhang any edges of the slide.
Coverslip Drying TimeAfter coverslipping, slides must be allowed to adequately “dry” before being placed in the Thin Prep Imaging System. A slide can be considered “dry” when the medium has cured sufficiently so there is no movement of the coverslip in response to normal laboratory handling.
Table 7.1 illustrates drying times for slides placed in an oven set at 37o C after automatic coverslip-ping.
Note: Drying times will differ depending upon variables such as the type of mounting medium, quantity of medium used, mounting method, temperature, and humidity. Manually coverslipped slides may have drying times longer than those indicated in Table 7.1.
It is the responsibility of the laboratory to monitor and ensure that adequate, but not exces-sive, medium is applied to the slides and that they “dry” sufficiently prior to being placed on the ThinPrep Imaging System.
CAUTION: Failure to allow slides to dry sufficiently may compromise the performance of the Imager.
7.4 Image Processor Operator’s Manual
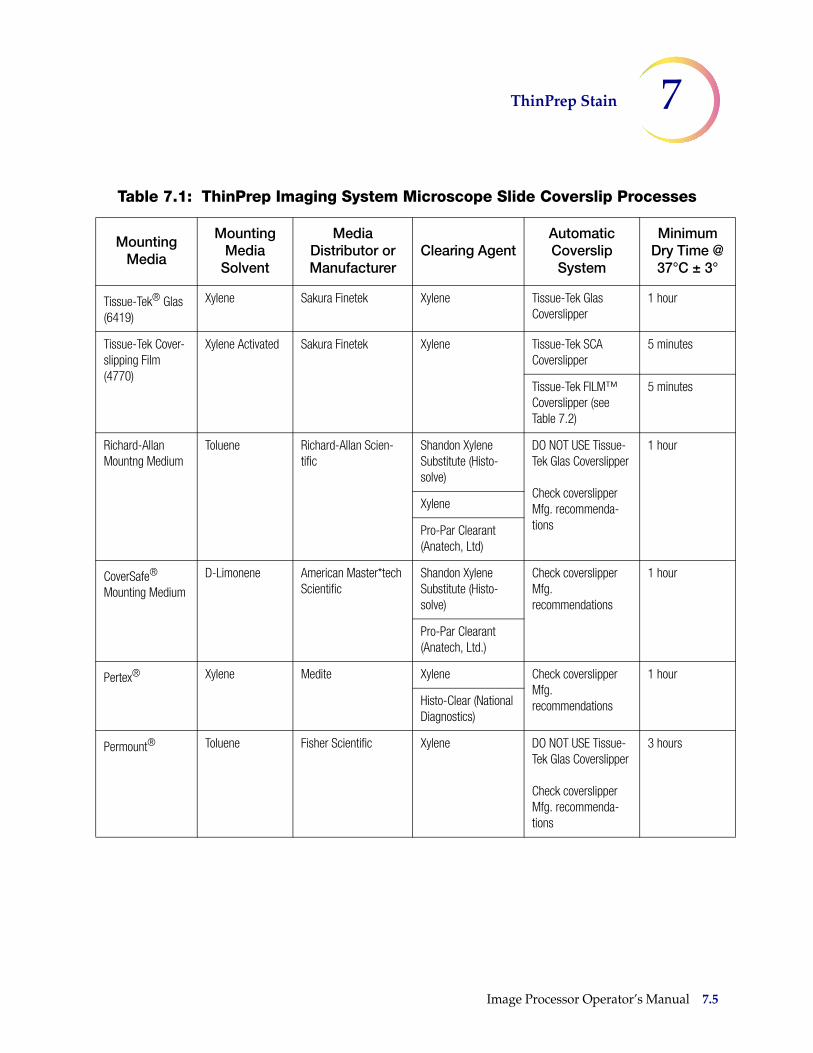
ThinPrep Stain 7
Table 7.1: ThinPrep Imaging System Microscope Slide Coverslip Processes
Mounting Media
Mounting Media
Solvent
Media Distributor or Manufacturer
Clearing AgentAutomatic Coverslip System
Minimum Dry Time @ 37°C ± 3°
Tissue-Tek® Glas (6419)
Xylene Sakura Finetek Xylene Tissue-Tek Glas Coverslipper
1 hour
Tissue-Tek Cover-slipping Film (4770)
Xylene Activated Sakura Finetek Xylene Tissue-Tek SCA Coverslipper
5 minutes
Tissue-Tek FILM™ Coverslipper (see Table 7.2)
5 minutes
Richard-Allan Mountng Medium
Toluene Richard-Allan Scien-tific
Shandon Xylene Substitute (Histo-solve)
DO NOT USE Tissue-Tek Glas Coverslipper
Check coverslipper Mfg. recommenda-tions
1 hour
Xylene
Pro-Par Clearant (Anatech, Ltd)
CoverSafe® Mounting Medium
D-Limonene American Master*tech Scientific
Shandon Xylene Substitute (Histo-solve)
Check coverslipper Mfg. recommendations
1 hour
Pro-Par Clearant (Anatech, Ltd.)
Pertex® Xylene Medite Xylene Check coverslipper Mfg. recommendations
1 hour
Histo-Clear (National Diagnostics)
Permount® Toluene Fisher Scientific Xylene DO NOT USE Tissue-Tek Glas Coverslipper
Check coverslipper Mfg. recommenda-tions
3 hours
Image Processor Operator’s Manual 7.5
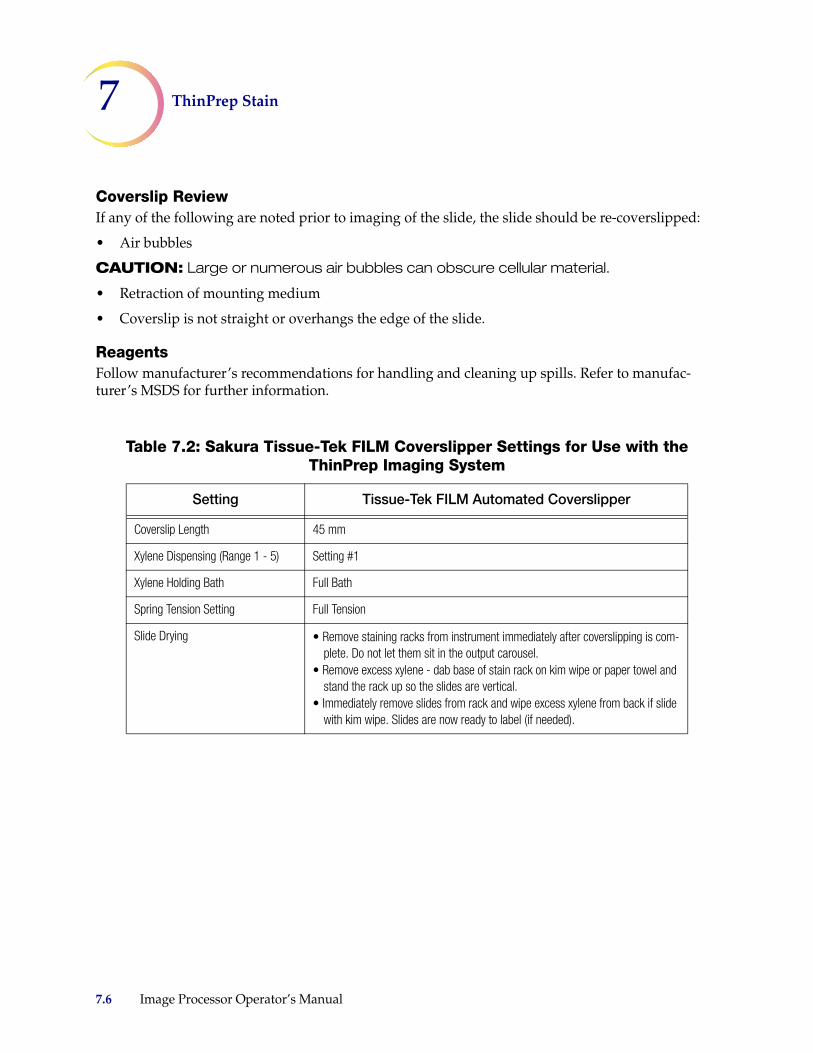
7 ThinPrep Stain
Coverslip ReviewIf any of the following are noted prior to imaging of the slide, the slide should be re-coverslipped:
• Air bubbles
CAUTION: Large or numerous air bubbles can obscure cellular material.
• Retraction of mounting medium
• Coverslip is not straight or overhangs the edge of the slide.
ReagentsFollow manufacturer’s recommendations for handling and cleaning up spills. Refer to manufac-turer’s MSDS for further information.
Table 7.2: Sakura Tissue-Tek FILM Coverslipper Settings for Use with the ThinPrep Imaging System
Setting Tissue-Tek FILM Automated Coverslipper
Coverslip Length 45 mm
Xylene Dispensing (Range 1 - 5) Setting #1
Xylene Holding Bath Full Bath
Spring Tension Setting Full Tension
Slide Drying • Remove staining racks from instrument immediately after coverslipping is com-plete. Do not let them sit in the output carousel.
• Remove excess xylene - dab base of stain rack on kim wipe or paper towel and stand the rack up so the slides are vertical.
• Immediately remove slides from rack and wipe excess xylene from back if slide with kim wipe. Slides are now ready to label (if needed).
7.6 Image Processor Operator’s Manual

8. Defi n
ition
s and
A
bb
reviation
s8.
Defi
nit
ion
s an
d
Ab
bre
viat
ion
s

DEFINITIONS AND ABBREVIATIONS 8
C h a p t e r E i g h t
Definitions and Abbreviations
Batch
A group of slides, or cassettes containing slides, that are being processed by the Image Processor. Each cassette holds up to 25 slides. 10 cassettes may be loaded into the Image Processor, therefore a batch may have up to 250 slides in it.
Cassette
The container that holds slides for batch processing. Each cassette may hold up to 25 slides. The cas-settes have a footprint designed to hold them securely in the Image Processor during slide process-ing. There are locations for 10 cassettes to be loaded into the Image Processor.
Cassette Status
“Not Present” No cassette present in the slot on the loading platform.
“Unknown” Unknown, with respect to their completion status, may occur as the result of an unex-pected loss of power. This status applies to any cassettes depicted as gray on the User Interface.
“Processed” All slides in the cassette have been processed. Cassettes are depicted as entirely blue.
“In Process” Currently processing slides within a cassette. Depicted as partially blue on the User Interface.
Cell Spot
The area within the pre-printed arcs on a ThinPrep® microscope slide that contains the patient sam-ple cells.
Fiducial Marks
Permanently printed features on the ThinPrep. microscope slide and the Verification slide, used as a reference axis to establish the X, Y coordinates of Objects Of Interest and Fields Of Interest. The fidu-cial marks are also used to register the slide position on the imaging stage at the beginning and end of slide imaging.
Image Processor Operator’s Manual 8.1
8 DEFINITIONS AND ABBREVIATIONS
FOV
Field of View. A circular area of the slide, as viewed through the microscope. The CT is responsi-ble for looking at the entire field while reviewing slides.
IPC
Image Processor Controller. The computer that interacts with the Imaging Station in order to image the slides.
IS
Imaging Station. Stores and monitors slide cassettes and slide processing. The slides are imaged at the IS. Slide data is communicated to and retrieved from the Server once imaging has success-fully occurred.
OCR
Optical Character Recognition. The Image Processor and the Review Scope each contain an Opti-cal Character Recognition camera that reads a slide label ID and matches it against patient ID’s already stored in the Server database.
OOI
Object of Interest. An object of interest is a blob that has passed filtering (which removes normal cells and recognized artifacts) and undergone algorithmic rating. An object of interest may be a single cell or a cluster.
Power Cycle
Turning the Imaging System off and then on again, usually to clear an error condition. Refer to SHUTTING DOWN THE IMAGE PROCESSOR in Chapter 3 before turning off power to any of the components.
RS
Review Scope.
8.2 Image Processor Operator’s Manual
DEFINITIONS AND ABBREVIATIONS 8
Slide Data Record
The data associated with a specific accession ID/slide. The data is stored on the Server database. It is generated at the time a slide ID is successfully scanned in the Imaging Station prior to imaging. The data record is updated when the slide has been imaged and image analysis completed and again when the slide has completed automated review at the RS.
Slide Processing Event Log
Slide events during processing are displayed on the right hand side of the user interface. There is a brief description of the kind of error in red text, followed by the event number, cassette number, slot number, date, time and slide ID, if known. Only events pertaining to the current batch are listed.
SV
Server. The computer that controls communication between the Imaging System components. It is where all data such as user preferences, slide data records, system history logs are maintained.
ThinPrep® Microscope Slide
A specific brand of glass microscope slide that must be used with the ThinPrep system of instru-ments. The slide has features on it that enable automated registration of the slide with the Image Pro-cessor and the Review Scope.
UPS
Uninterruptible Power Supply
Verification Slide
This is a special slide (stored inside of the Imaging Station) that has custom features that allow for periodic slide imaging subsystem adjustment and verification required for imaging slides.
Image Processor Operator’s Manual 8.3

8 DEFINITIONS AND ABBREVIATIONS
This page intentionally left blank.
8.4 Image Processor Operator’s Manual

9. Service
Info
rmatio
n 9. S
ervi
ce
Info
rmat
ion
SERVICE INFORMATION 9
C h a p t e r N i n e
Service Information
Corporate AddressHologic, Inc.
250 Campus Drive
Marlborough, MA 01752 USA
Business HoursHologic’s business hours are 8:30 a.m. to 5:30 p.m. EST Monday through Friday, excluding holidays.
Customer ServiceProduct orders, which include standing orders, are placed through Customer Service by phone during business hours at 1-800-442-9892 Option 5 or 508-263-2900.
Orders can also be faxed to the attention of Customer Service at 508-229-2795.
WarrantyA copy of Hologic’s limited warranty and other terms and conditions of sale may be obtained by contacting Customer Service at the numbers listed above.
Technical SupportFor questions about ThinPrep® Imaging System issues and related application issues, representatives from Technical Support are available by phone 7:00 a.m. to 7:00 p.m. EST Monday through Friday at 1-800-442-9892 Option 6 or 508- 263-2900.
Service contracts can also be ordered through Technical Support.
Protocol for Returned GoodsFor returns on warranty-covered ThinPrep Imaging System supplies and consumable items, contact Technical Support.
Image Processor Operator’s Manual 9.1

9 SERVICE INFORMATION
This page intentionally left blank.
9.2 Image Processor Operator’s Manual

10. Ord
ering
In
form
ation
10. O
rder
ing
In
form
atio
n

ORDERING INFORMATION 10
C h a p t e r T e n
Ordering Information
Mailing AddressHologic, Inc.
250 Campus Drive
Marlborough, MA 01752
Remittance AddressHologic, Inc.
PO Box 3009
Boston, MA 02241-3009
Business HoursHologic’s business hours are 8:30 a.m. to 5:30 p.m. EST Monday through Friday, excluding holidays.
Customer ServiceProduct orders, which include standing orders, are placed through Customer Service by phone during business hours at 1-800-442-9892 Option 5 or 508-263-2900.
Orders can also be faxed to the attention of Customer Service at 508-229-2795.
WarrantyA copy of Hologic’s limited warranty and other terms and conditions of sale may be obtained by contacting Customer Service at the numbers listed above.
Image Processor Operator’s Manual 10.1
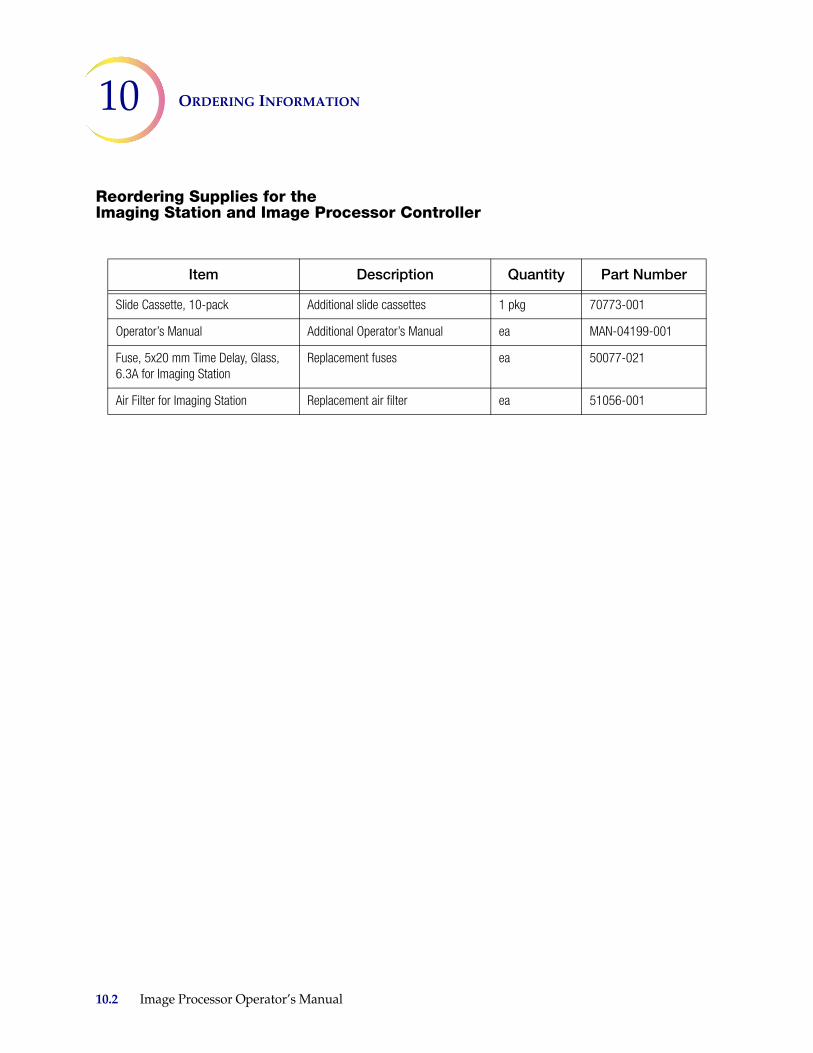
10 ORDERING INFORMATION
Reordering Supplies for the Imaging Station and Image Processor Controller
Item Description Quantity Part Number
Slide Cassette, 10-pack Additional slide cassettes 1 pkg 70773-001
Operator’s Manual Additional Operator’s Manual ea MAN-04199-001
Fuse, 5x20 mm Time Delay, Glass, 6.3A for Imaging Station
Replacement fuses ea 50077-021
Air Filter for Imaging Station Replacement air filter ea 51056-001
10.2 Image Processor Operator’s Manual

11. Rem
ote
Site S
erver 11. R
emo
te
Sit
e S
erve
r
REMOTE SITE SERVER USER’S GUIDE 11
C h a p t e r E l e v e n
Remote Site Server User’s Guide
Some facilities screen ThinPrep slides on Review Scopes in a location that is remote from or, indepen-dent of, the site where the slide imaging is done. These sites do not require the equipment needed for imaging slides, only that needed for reviewing slides. The slide data is exported onto CD ROM from the imaging site and is shipped with the patient slides to the remote review site. There the data is imported into a Server PC and slide review is performed.
A remote site is equipped with a Server PC (with monitor, keyboard and mouse), printer, Uninter-ruptible Power Supply, interconnection hub(s) and a Review Scope.
Refer to the ThinPrep Imaging System Review Scope Operator’s Manual for operation, maintenance and troubleshooting of Review Scopes.
This chapter provides a getting-started overview for remote sites using a Server PC.
INSTRUMENT DESCRIPTIONRefer to Chapter 1, Introduction, for a complete description of the ThinPrep Imaging System, techni-cal specifications and warnings.
INSTALLATIONWARNING: Service Installation Only
Refer to Chapter 2, Image Processor Installation, for information regarding delivery, unpacking, stor-age and handling.
Network ConfigurationCAUTION: Route all connectors carefully to avoid pinching the cables. To avoid tripping over or disconnecting cabling, do not place cabling near foot traffic.
The Server monitor, keyboard, mouse, printer and a multiport Ethernet hub must be located in the same area, so that interconnection cables easily reach each component (within 1.8 meters [6 feet] of each other). Refer to Figure 11-1. Review Scopes connected to the Server may be located up to 100 meters (328 feet) away, or extended another 100 meters using a second hub.
Image Processor Operator’s Manual 11.1

11 REMOTE SITE SERVER USER’S GUIDE
Figure 11-1 Local Network Interconnection Schematic (example)
Extended Network ConfigurationCAUTION: Route all connectors carefully to avoid pinching the cables. To avoid tripping over or disconnecting cabling, do not place cabling near foot traffic.
The Review Scopes may be located at a greater distance from the Server by using an extended net-work interconnection between the Server hub/switch and the Review Scope hub/switch.
Low-level, industry standard interconnection devices such as bridges, repeaters, media converters, copper and fiber wiring may be used. Refer to Figure 11-2. The distance that Review Scopes may be located away from the Server is determined by the requirements of the specific apparatus used to create the network. The throughput of the extended network must be capable of 10Mbps or greater.
.
.
.
.
.
.
.
Review Scope
Review Scope
Additional Scopes depending on site configuration
Uninterruptible Power Supply* and Battery Backup
= Power Cord, Requires an Outlet*May go on the floor, provided there is no dust accumulation on or around it.
Table, Desk or Lab Bench
MonitorKeyboard
Mouse
Server*
Printer
Hub
Up to 328 ft/100 meters
11.2 Image Processor Operator’s Manual
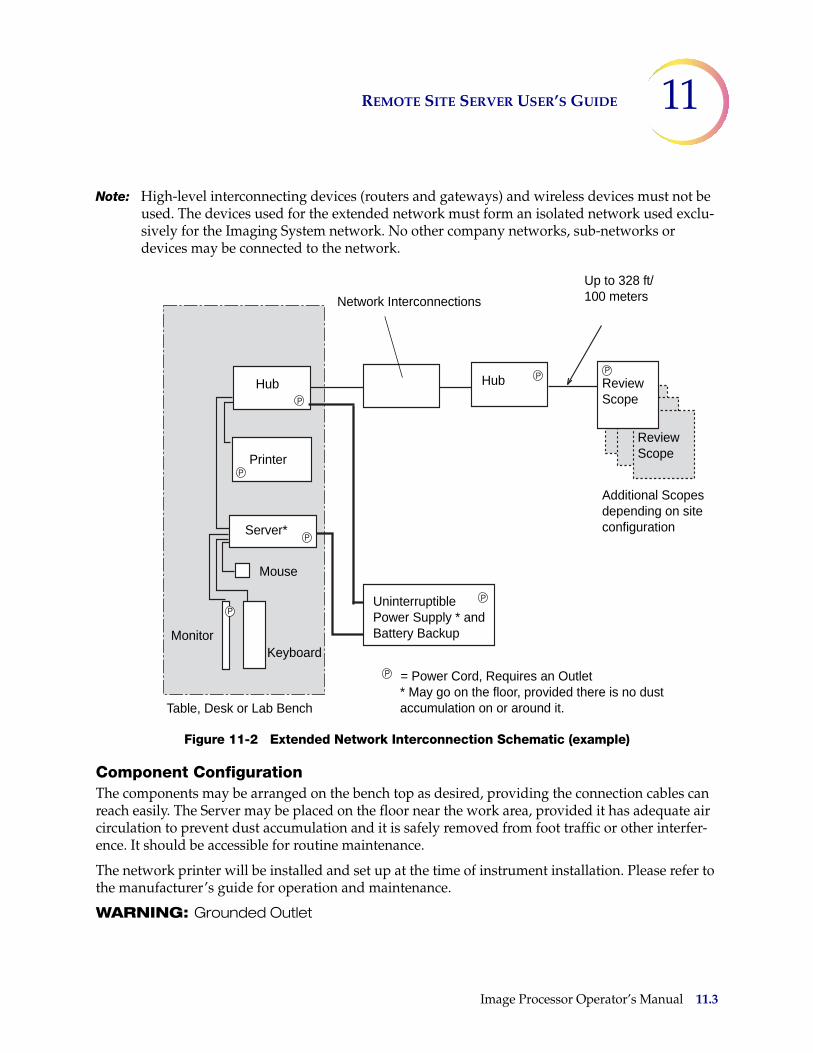
REMOTE SITE SERVER USER’S GUIDE 11
Note: High-level interconnecting devices (routers and gateways) and wireless devices must not be used. The devices used for the extended network must form an isolated network used exclu-sively for the Imaging System network. No other company networks, sub-networks or devices may be connected to the network.
Figure 11-2 Extended Network Interconnection Schematic (example)
Component ConfigurationThe components may be arranged on the bench top as desired, providing the connection cables can reach easily. The Server may be placed on the floor near the work area, provided it has adequate air circulation to prevent dust accumulation and it is safely removed from foot traffic or other interfer-ence. It should be accessible for routine maintenance.
The network printer will be installed and set up at the time of instrument installation. Please refer to the manufacturer’s guide for operation and maintenance.
WARNING: Grounded Outlet
.
.
.
.
.
.
..
= Power Cord, Requires an Outlet* May go on the floor, provided there is no dust accumulation on or around it.
Uninterruptible Power Supply * and Battery Backup
Table, Desk or Lab Bench
MonitorKeyboard
Mouse
Server*
Printer
Hub Hub Review Scope
Review Scope
Additional Scopes depending on site configuration
Network Interconnections
Up to 328 ft/100 meters
Image Processor Operator’s Manual 11.3
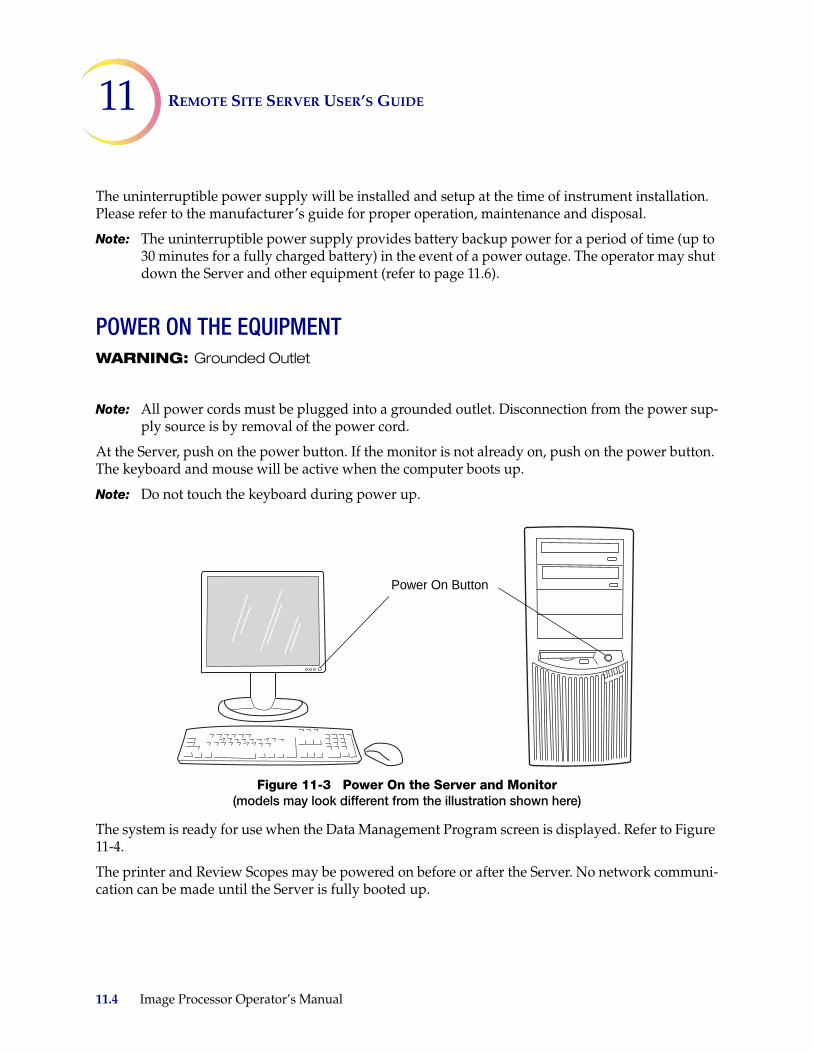
11 REMOTE SITE SERVER USER’S GUIDE
The uninterruptible power supply will be installed and setup at the time of instrument installation. Please refer to the manufacturer’s guide for proper operation, maintenance and disposal.
Note: The uninterruptible power supply provides battery backup power for a period of time (up to 30 minutes for a fully charged battery) in the event of a power outage. The operator may shut down the Server and other equipment (refer to page 11.6).
POWER ON THE EQUIPMENTWARNING: Grounded Outlet
Note: All power cords must be plugged into a grounded outlet. Disconnection from the power sup-ply source is by removal of the power cord.
At the Server, push on the power button. If the monitor is not already on, push on the power button. The keyboard and mouse will be active when the computer boots up.
Note: Do not touch the keyboard during power up.
Figure 11-3 Power On the Server and Monitor(models may look different from the illustration shown here)
The system is ready for use when the Data Management Program screen is displayed. Refer to Figure 11-4.
The printer and Review Scopes may be powered on before or after the Server. No network communi-cation can be made until the Server is fully booted up.
Power On Button
11.4 Image Processor Operator’s Manual

REMOTE SITE SERVER USER’S GUIDE 11
Figure 11-4 Server Data Management Program Display
Click on the Data Management Program link to access the Data Management menu options.
Figure 11-5 Data Management Window
Image Processor Operator’s Manual 11.5
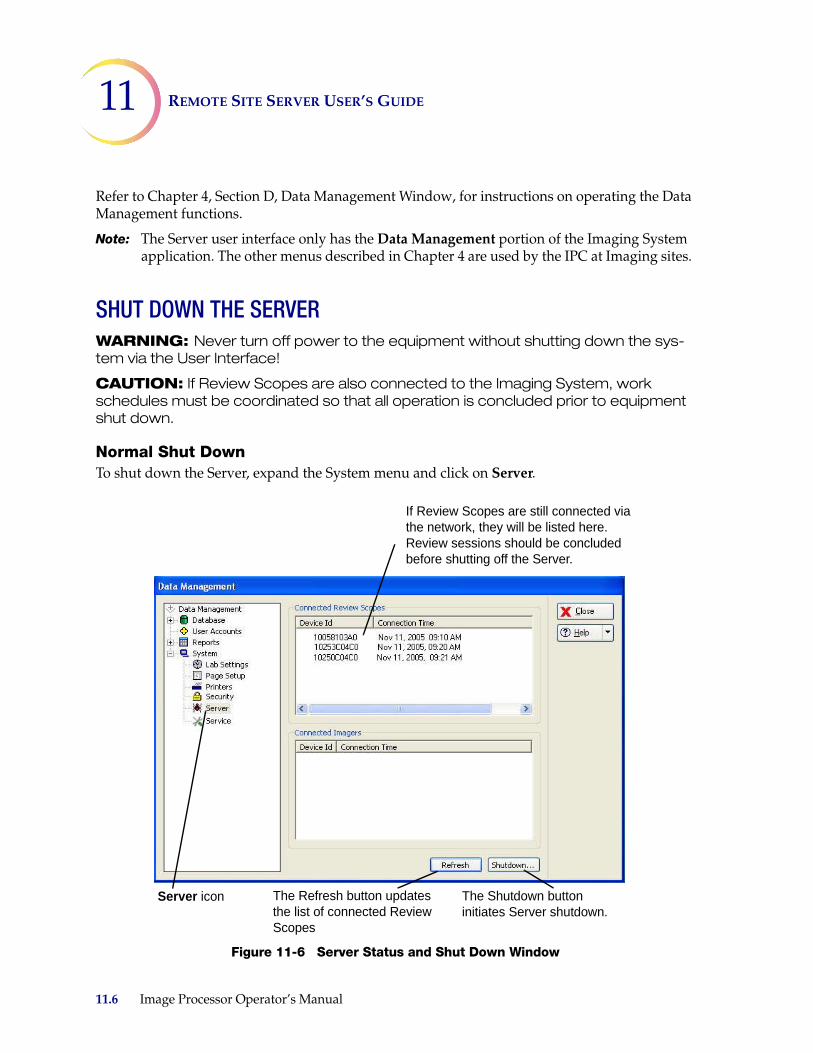
11 REMOTE SITE SERVER USER’S GUIDE
Refer to Chapter 4, Section D, Data Management Window, for instructions on operating the Data Management functions.
Note: The Server user interface only has the Data Management portion of the Imaging System application. The other menus described in Chapter 4 are used by the IPC at Imaging sites.
SHUT DOWN THE SERVERWARNING: Never turn off power to the equipment without shutting down the sys-tem via the User Interface!
CAUTION: If Review Scopes are also connected to the Imaging System, work schedules must be coordinated so that all operation is concluded prior to equipment shut down.
Normal Shut DownTo shut down the Server, expand the System menu and click on Server.
Figure 11-6 Server Status and Shut Down Window
If Review Scopes are still connected via the network, they will be listed here. Review sessions should be concluded before shutting off the Server.
The Refresh button updates the list of connected Review Scopes
The Shutdown button initiates Server shutdown.
Server icon
11.6 Image Processor Operator’s Manual
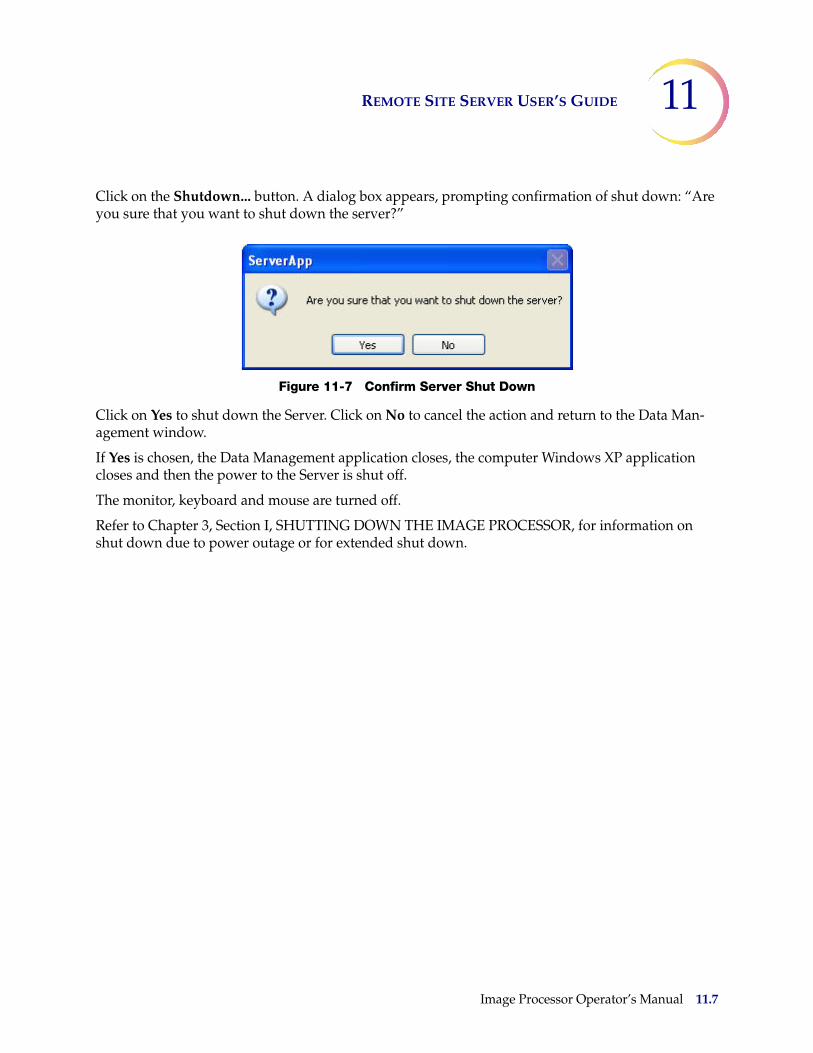
REMOTE SITE SERVER USER’S GUIDE 11
Click on the Shutdown... button. A dialog box appears, prompting confirmation of shut down: “Are you sure that you want to shut down the server?”
Figure 11-7 Confirm Server Shut Down
Click on Yes to shut down the Server. Click on No to cancel the action and return to the Data Man-agement window.
If Yes is chosen, the Data Management application closes, the computer Windows XP application closes and then the power to the Server is shut off.
The monitor, keyboard and mouse are turned off.
Refer to Chapter 3, Section I, SHUTTING DOWN THE IMAGE PROCESSOR, for information on shut down due to power outage or for extended shut down.
Image Processor Operator’s Manual 11.7

11 REMOTE SITE SERVER USER’S GUIDE
This page intentionally left blank.
11.8 Image Processor Operator’s Manual

Ind
exIn
dex
INDEX
Index
AAbout Menu 4.54Accession Number Range 4.10Accessories 10.2Air Filter, Imaging Station 5.6Alarm 4.41Applying power to the equipment 3.3Auto print batch reports 4.5
BBatch 8.1Batch process diagram 3.2
CCancel The Batch After Interrupting Slide Processing 3.21Cassette 8.1cassette locations 3.12cassette status 3.15, 6.6, 8.1CellFyx Solution fixative 7.1Clean Verification Slide 4.54Clearing agents 7.5Completing Slide Processing 3.22conflict 4.19coverslip drying time 7.4, 7.5Coverslip processes 7.5coverslipping requirements 7.3CT Workload History 4.38CT Workload Summary 4.37Customer Service 9.1, 10.1
Image Processor Operator’s Manual Index.1
INDEX
DData Management menu 4.8Data, how many lines in a report 4.42Database backup 4.8database conflict 4.19Date, setting 4.40Date/Time format 4.41Dimensions 1.14Disposal
consumables 1.20device 1.20electrical and electronic equipment 1.20
During Slide Processing 3.15
EEnvironmental specifications 1.13Errors 6.9Event Log 3.15Event Log Display 3.16Event Log window 6.1Export data 4.9Export template 4.14extended network 2.2, 11.2
Ffiducial marks 3.8, 8.1Fixation requirements 7.1fixative 7.1Fuses 5.3
Index.2 Image Processor Operator’s Manual
INDEX
GGO button 3.14, 3.20, 3.21, 4.1, 6.6
HHow Long it Takes to Process Slides 3.15
IImage Processor 8.2Image Processor Controller 3.6, 8.2Imager Name, setting 4.41Imaging Station 3.6Imaging Station and IPC Errors 6.9Imaging System Usage History 4.28Import data 4.16Install Printers 4.44Installation 2.1Interrupt Slide Processing 3.17, 3.18Items Required For Slide Image Processing 3.6
LLab Settings 4.40Loading Slide Cassettes 3.8local network 2.1, 11.1Logs and History Reports 4.23
MMAINTENANCE MENU 4.54Maintenance, Data Management menu 4.20menu bar 4.1Monitor, Keyboard and Mouse 3.6
Image Processor Operator’s Manual Index.3
INDEX
OOCR 8.2OCR read failed 6.2optical character recognition 1.4Ordering Information 10.1
PPage Setup 4.42Password 4.45
change 4.51disable 4.52enable 4.46validate 4.49
Power on equipment 3.3Power Specifications 1.13Printers 4.43Processing Completed... 3.22Processing Interrupted 3.19Protective Temperature Coefficient Devices 1.14
RRebooting the System 3.24Recycled alcohol 7.2Remote site 11.1Replace/Clean Verification Slide 5.1Replacing Fuses 5.3Report Limit 4.42Reports - Data Management menu 4.22REPORTS MENU 4.2Resume Slide Processing After Interruption 3.21Retrieve verification slide 5.1Review Scope Error Log 4.26RS Users - Data Management menu 4.30Run Report 4.39
Index.4 Image Processor Operator’s Manual

INDEX
SSecurity 4.45Server - Data Management menu 4.53Server Error Log 4.24Service Information 9.1Set Date 4.40Set Imager Name 4.41Set Time 4.41Shut Down IP 3.21, 3.22, 3.23Shut down server 4.7, 4.53, 11.6Shut down system 4.6Shutdown System 6.6Shutting Down the Image Processor 3.22Slide already imaged 6.2Slide Cassette 10.2Slide Cassette Imaging Status 3.15Slide Data Record 8.3Slide Data Record Report 4.36Slide Data Records - Data Management menu 4.32SLIDE EVENTS 6.1Slide has been rejected 6.3Slide ID conflict 4.19Slide ID not valid 6.3Slide ID report 4.33Slide IDs 4.10Slide labeling 3.7Slide not found 6.3slide preparation and quality 6.7SLIDE PROCESSING 3.14Slide Processing Event Log 3.15, 4.29SLIDE PROCESSING MENU 4.1Slot below has slide out of position or multiple slides 6.3Slot has multiple slides 6.3Slot has slide out of position 6.3Staining requirements 7.2
Image Processor Operator’s Manual Index.5
INDEX
Start Slide Processing 3.14, 3.21STOP button 3.18, 4.1Store verification slide 5.3System - Data Management menu 4.39System Auto-Recovery Errors 6.4System Error Log 4.25SYSTEM ERRORS 6.4System Printers 4.43System warmup 3.5
TTechnical Support 2.1, 9.1Template, export 4.14Time, setting 4.41Troubleshooting 6.1
UUPS (uninterruptible power supply) 2.3, 3.3User Accounts 4.21User Assessment 6.5User Assisted Recovery 6.6User Correctable Errors 6.4User ID 4.22User Notification 6.4
VVerification Slide 3.6, 3.15, 5.1, 8.3
WWorkload Report 4.36
Index.6 Image Processor Operator’s Manual
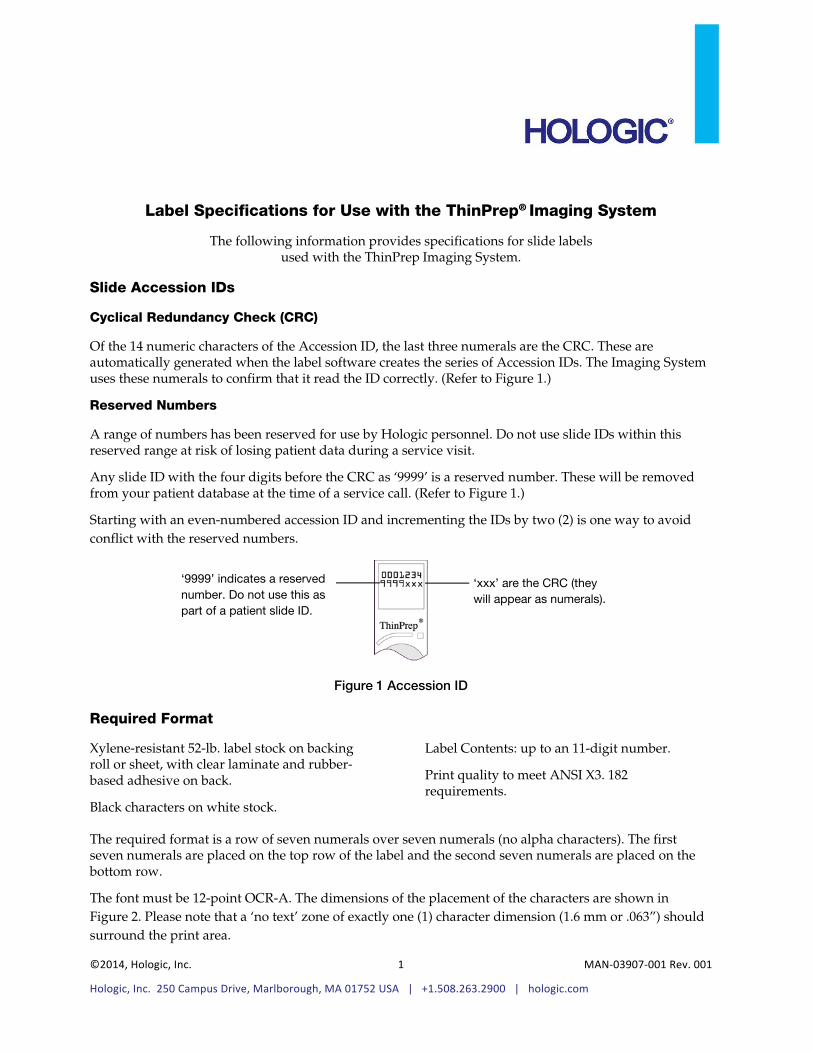
©2014, Hologic, Inc. 1 MAN‐03907‐001 Rev. 001
Hologic, Inc. 250 Campus Drive, Marlborough, MA 01752 USA | +1.508.263.2900 | hologic.com
Label Specifications for Use with the ThinPrep® Imaging System
The following information provides specifications for slide labels used with the ThinPrep Imaging System.
Slide Accession IDs
Cyclical Redundancy Check (CRC)
Of the 14 numeric characters of the Accession ID, the last three numerals are the CRC. These are automatically generated when the label software creates the series of Accession IDs. The Imaging System uses these numerals to confirm that it read the ID correctly. (Refer to Figure 1.)
Reserved Numbers
A range of numbers has been reserved for use by Hologic personnel. Do not use slide IDs within this reserved range at risk of losing patient data during a service visit.
Any slide ID with the four digits before the CRC as ‘9999’ is a reserved number. These will be removed from your patient database at the time of a service call. (Refer to Figure 1.)
Starting with an even-numbered accession ID and incrementing the IDs by two (2) is one way to avoid conflict with the reserved numbers.
Figure 1 Accession ID
Required Format
Xylene-resistant 52-lb. label stock on backing roll or sheet, with clear laminate and rubber-based adhesive on back.
Black characters on white stock.
Label Contents: up to an 11-digit number.
Print quality to meet ANSI X3. 182 requirements.
The required format is a row of seven numerals over seven numerals (no alpha characters). The first seven numerals are placed on the top row of the label and the second seven numerals are placed on the bottom row.
The font must be 12-point OCR-A. The dimensions of the placement of the characters are shown in Figure 2. Please note that a ‘no text’ zone of exactly one (1) character dimension (1.6 mm or .063”) should surround the print area.
‘9999’ indicates a reserved number. Do not use this as part of a patient slide ID.
‘xxx’ are the CRC (they will appear as numerals).
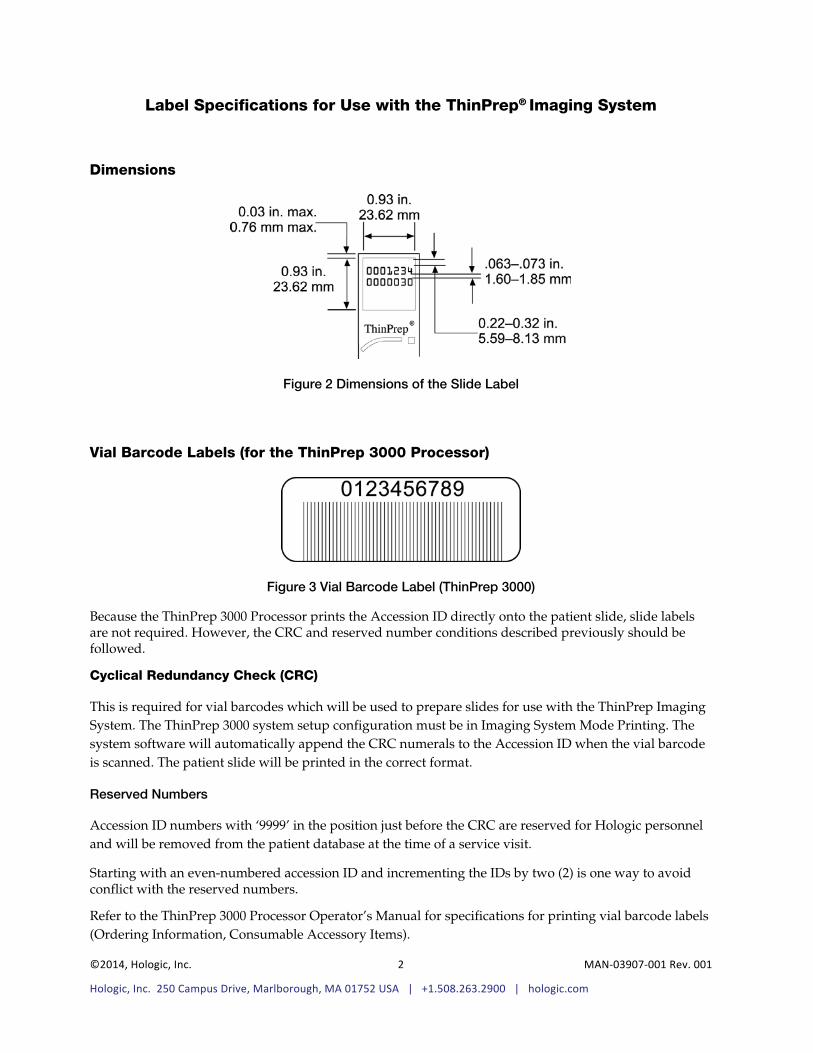
©2014, Hologic, Inc. 2 MAN‐03907‐001 Rev. 001
Hologic, Inc. 250 Campus Drive, Marlborough, MA 01752 USA | +1.508.263.2900 | hologic.com
Label Specifications for Use with the ThinPrep® Imaging System
Dimensions
Figure 2 Dimensions of the Slide Label
Vial Barcode Labels (for the ThinPrep 3000 Processor)
Figure 3 Vial Barcode Label (ThinPrep 3000)
Because the ThinPrep 3000 Processor prints the Accession ID directly onto the patient slide, slide labels are not required. However, the CRC and reserved number conditions described previously should be followed.
Cyclical Redundancy Check (CRC)
This is required for vial barcodes which will be used to prepare slides for use with the ThinPrep Imaging System. The ThinPrep 3000 system setup configuration must be in Imaging System Mode Printing. The system software will automatically append the CRC numerals to the Accession ID when the vial barcode is scanned. The patient slide will be printed in the correct format.
Reserved Numbers
Accession ID numbers with ‘9999’ in the position just before the CRC are reserved for Hologic personnel and will be removed from the patient database at the time of a service visit.
Starting with an even-numbered accession ID and incrementing the IDs by two (2) is one way to avoid conflict with the reserved numbers.
Refer to the ThinPrep 3000 Processor Operator’s Manual for specifications for printing vial barcode labels (Ordering Information, Consumable Accessory Items).

Op
erator’s Manual
ThinP
rep®
Imaging S
ystem Im
age Processor

MAN-04199-001 Rev. 002
Hologic, Inc.250 Campus Drive Marlborough, MA 01752 USA1-800-442-98921-508-263-2900www.hologic.com