Coordinating Capacity Calculation via Electricity Market ...

Think College naTional CoordinaTing CenTer Annual Report on the Transition and Postsecondary Programs for Students with Intellectual Disabilities
2010–2011 and 2011–2012
Institute for Community InclusionUniversity of Massachusetts Boston


Think College naTional CoordinaTing CenTer Annual Report on the Transition and Postsecondary Programs for Students with Intellectual Disabilities
Meg Grigal, PhD Debra Hart, MSFrank A. Smith, MADaria Domin, MSWJennifer Sulewski, PhD
Project OfficerShedita Alston, Program AnalystU.S. Department of Education, Office of Postsecondary Education

FOLLOW US
On the Webwww.thinkcollege.net
On Facebookwww.facebook.com/thinkcollege
On Twitterwww.twitter.com/thinkcollegeICI
COntaCt US
SUbSCribe
www.thinkcollege.net/subscribe-to-newsletter
Copyright 2013, University of Massachusetts Boston
reCOmmended CitatiOn
Grigal, M., Hart, D., Smith, F. A., Domin, D., Sulewski, J. (2013). Think College National Coordinating Center: Annual report on the
transition and postsecondary programs for students with intellectual disabilities. Boston, MA: University of Massachusetts Boston,
Institute for Community Inclusion.
aCknOWLedgementS
The authors would like to thank all of the TPSID staff for their patience in obtaining access to the evaluation system and for
diligently submitting their data to the National Coordinating Center. We also appreciate the support of our Project Officer
Shedita Alston who has been highly committed to keeping the TPSID programs and the National Coordinating Center
informed and up to date about their funding status and reporting requirements. Additionally, the authors acknowledge the
contributions of ICI’s National Coordination Center TPSID Liaisons, Maria Paiewonsky, Maria Dragoumanos, Lori Cooney and
Molly Boyle. The authors also extend sincere thanks to David Temelini and Anya Weber, who worked a small miracle to get this
report edited, designed, and produced.
FUnding
This publication was produced by Think College, a project of the Institute for Community Inclusion at the University of
Massachusetts Boston, funded by a grant from the Office of Postsecondary Education (Award No. P407B100002). The opinions
contained in this document are those of the grantee and do not necessarily reflect those of the funder.
diSCLOSUre OF pOtentiaL COnFLiCtS OF intereSt
The research team for this report consists of key staff from the Institute for Community Inclusion at the University of
Massachusetts Boston. The organizations and the key staff members do not have financial interests that could be affected by
findings from the evaluation.

tabLe OF COntentS
Year One (2010-2011)
Executive Summary ........................................................................................................................................................................................................1Primary Findings ................................................................................................................................................................................................................2Introduction .........................................................................................................................................................................................................................4Method ..................................................................................................................................................................................................................................5Overview of Student Characteristics ...................................................................................................................................................................7Academic Access ............................................................................................................................................................................................................8Career Development and Employment .........................................................................................................................................................11Self-determination .......................................................................................................................................................................................................14Campus Membership .................................................................................................................................................................................................17Summary of Student Exit Outcomes ................................................................................................................................................................20Alignment with College and University Systems and Practices ........................................................................................................23Coordination and Collaboration ........................................................................................................................................................................24Sustainability ..................................................................................................................................................................................................................27Limitations ........................................................................................................................................................................................................................31Conclusion .......................................................................................................................................................................................................................32
Year tWO (2011-2012)
Executive Summary .....................................................................................................................................................................................................33Primary Findings .............................................................................................................................................................................................................34Introduction ......................................................................................................................................................................................................................36Method ...............................................................................................................................................................................................................................37Overview of Student Characteristics ................................................................................................................................................................39Academic Access .........................................................................................................................................................................................................40Career Development and Employment .........................................................................................................................................................43Self-determination .......................................................................................................................................................................................................46Campus Membership .................................................................................................................................................................................................49Summary of Student Exit Outcomes ................................................................................................................................................................52Alignment with College and University Systems and Practices ........................................................................................................55Coordination and Collaboration ........................................................................................................................................................................56Sustainability ..................................................................................................................................................................................................................60Limitations ........................................................................................................................................................................................................................64Conclusion .......................................................................................................................................................................................................................65
References .............................................................................................................................................................................................................................67
appendiCeS
Appendix A: The TPSID 2010 Grantees ..........................................................................................................................................................71Appendix B: TPSID Government Performance and Results Act Measures .................................................................................73Appendix C: Glossary of Terms ............................................................................................................................................................................75Appendix D: Statutory Language and Definitions Pertaining to the TPSID Programs .........................................................81

Year One (2010-2011)Table 1. Campuses Operating a TPSID program, 2010–2011 .............................................................................................................................................................................................................6Table 2. Race of Participating TPSID Students, 2010–2011 ...................................................................................................................................................................................................................7Table 3. Most common Student Disabilities, 2010–2011 ..................................................................................................................................................................................................................... 7Table 4. Educational Setting while in High School, 2010–2011 ...........................................................................................................................................................................................................7Table 5. Career Development Activities among TPSID Students, 2010–2011 ........................................................................................................................................................................11Table 6. How Students Got to Campus/Class, 2010–2011 ...............................................................................................................................................................................................................19Table 7. Frequency and Type of Follow-up Data Collected by TPSID Programs, 2010–2011 ........................................................................................................................................22Table 8. Overall Annual Cost of Attendance for TPSID Students, 2010–2011 .......................................................................................................................................................................30Table 9. Charges to TPSID Students Attending Programs, 2010–2011 .......................................................................................................................................................................................30
Figure 1. Status of TPSID Students No Longer in High School, 2010–2011 ...............................................................................................................................................................................7Figure 2. Course Access by Inclusive and Specialized Course Enrollment Status, 2010–2011 .........................................................................................................................................9Figure 3. Accommodations Received by TPSID Students, 2010–2011 ........................................................................................................................................................................................10Figure 4. Credentials Offered by TPSID Programs, 2010–2011 .......................................................................................................................................................................................................10Figure 5. Paid Jobs held by TPSID Students, 2010–2011 ......................................................................................................................................................................................................................11Figure 6. Wage Distribution by Job Type, 2010–2011 ............................................................................................................................................................................................................................12Figure 7. Percent of Jobs where Particular Job Supports Were Provided, 2010–2011 ......................................................................................................................................................13Figure 8. Unpaid Career Development Experiences, 2010–2011 ..................................................................................................................................................................................................13Figure 9. Percentage of Course Enrollments by Reason for Enrollment, 2010–2011 .........................................................................................................................................................15Figure 10. Students’ Social Participation, 2010–2011 .............................................................................................................................................................................................................................17Figure 11. Strategies Used to Support Participation in Social Activities, 2010–2011..........................................................................................................................................................18Figure 12. On-campus Living Situations, 2010–2011 .............................................................................................................................................................................................................................18Figure 13. Off-campus Living Situations, 2010–2011 .............................................................................................................................................................................................................................18Figure 14. Reasons for Exit from TPSID Programs, 2010–2011 ......................................................................................................................................................................................................20Figure 15. Credentials Earned by Exiting TPSID Students, 2010–2011 .......................................................................................................................................................................................21Figure 16. TPSIDs Reporting Use of Campus Resources by Students, 2010–2011 .............................................................................................................................................................23Figure 17. TPSID Partnerships with External Organizations, 2010–2011 ...................................................................................................................................................................................24Figure 18. Roles of TPSID External Partners, 2010–2011 .................................................................................................................................................................................................................25Figure 19. Non-OPE Sources of Program Funding, 2010–2011 .....................................................................................................................................................................................................27Figure 20. Funding Sources Used by Students to Pay Tuition, 2010–2011 ................................................................................................................................................................................28Figure 21. Funding Sources Used by Students to Pay Non-tuition Expenses, 2010–2011 ..............................................................................................................................................29
Year tWO (2011-2012)Table 1. Campuses Operating a TPSID Program, 2011-2012 ...........................................................................................................................................................................................................38Table 2. Race of Participating TPSID Students, 2011-2012 .................................................................................................................................................................................................................39Table 3. Most Common Student Disabilities, 2011-2012 ....................................................................................................................................................................................................................39Table 4. Educational Setting while in High School, 2011-2012 .........................................................................................................................................................................................................39Table 5. Career Development Activities among TPSID Students, 2011-2012 .........................................................................................................................................................................43Table 6. How Students Got to Campus/Class, 2011-2012 ................................................................................................................................................................................................................51Table 7. Frequency and Type of Follow-up Data Collected by TPSID Programs, 2011–2012 ........................................................................................................................................54Table 8. External Partnerships with TPSID Sites across Project Years ..........................................................................................................................................................................................59Table 9. Overall Annual Cost of Attendance for TPSID Students, 2011-2012 ........................................................................................................................................................................63Table 10. Charges to TPSID Students Attending Programs, 2011-2012 .....................................................................................................................................................................................63
Figure 1. Status of TPSID Students No Longer in High School, 2011-2012 .............................................................................................................................................................................39Figure 2. Course Access by Inclusive and Specialized Course Enrollment Status, 2011-2012 .......................................................................................................................................41Figure 3. Accommodations Received by TPSID Students, 2011-2012 .........................................................................................................................................................................................42Figure 4. Credentials Offered by TPSID Programs, 2011-2012 ........................................................................................................................................................................................................42Figure 5. Paid Jobs Held by TPSID Students, 2011-2012 ....................................................................................................................................................................................................................44Figure 6. Wage Distribution by Job Type, 2011-2012 .............................................................................................................................................................................................................................44Figure 7. Percent of Jobs Where Particular Job Supports Were Provided, 2011-2012 ......................................................................................................................................................45Figure 8. Unpaid Career Development Experiences, 2011-2012 .................................................................................................................................................................................................45Figure 9. Percentage of Course Enrollments by Reason for Enrollment, 2011-2012 ........................................................................................................................................................47Figure 10. Types of Outreach Conducted by TPSIDs to Potential Students, 2010–11 and 2011–2012 ...................................................................................................................48Figure 11. Students’ Social Participation, 2011-2012 ..............................................................................................................................................................................................................................49Figure 12. Strategies Used to Support Participation in Social Activities, 2011-2012 ...........................................................................................................................................................50Figure 13. Strategies Used to Track Participation in Social Activities, 2011–2012 .................................................................................................................................................................50Figure 14. On-campus Living Situations, 2011-2012 ..............................................................................................................................................................................................................................50Figure 15. Off-campus Living Situations, 2011-2012 ..............................................................................................................................................................................................................................51Figure 16. Reasons for Exited from TPSID Programs, 2010-11 and 2011–2012 ...................................................................................................................................................................52Figure 17. Credentials Earned by Exiting TPSID Students, 2010-11 and 2011–2012..........................................................................................................................................................53Figure 18. Paid Jobs held by Students Who Exited a TPSID Program, 2011–2012 ..............................................................................................................................................................53Figure 19. Use of Campus Resources by Students Enrolled, 2010–11 and 2011–2012 ...................................................................................................................................................55Figure 20. TPSID Partnerships with External Organizations, 2011-2012 ....................................................................................................................................................................................56Figure 21. Roles of TPSID External Partners, 2011-2012 ..................................................................................................................................................................................................................57Figure 22. Non-OPE Sources of Program Funding, 2011-2012 .....................................................................................................................................................................................................60Figure 23. Funding Sources Used by Students to Pay Tuition, 2011-2012 .................................................................................................................................................................................61Figure 24. Funding Sources Used by Students to Pay Non-tuition Expenses, 2011-2012 ...............................................................................................................................................61
LiSt OF tabLeS and FigUreS

exeCUtive SUmmarY
Higher education leads to a variety of personal and financial benefits, and is an integral part of
establishing a successful career path and enhancing earnings over a lifetime (Carnevale, Rose, & Cheah,
2011). However, up until recently, low expectations coupled with minimal opportunities have prevented
people with intellectual disabilities (ID) from receiving these benefits. Reauthorization of the Higher Education
Act in 2008 contained several new provisions aimed at increasing access to higher education for youth and
adults with ID. To address these provisions, Congress appropriated $10.6 million for creation of a new model
demonstration program via the Office of Postsecondary Education (OPE) (Duncan, 2010).
In 2010, the Office of Postsecondary Education (OPE) awarded grants to 27 institutes of higher education
(IHEs) to fund model demonstration projects. These are referred to as Transition and Postsecondary
Programs for Students with Intellectual Disability (TPSIDs). The goal of the TPSID program is to create,
expand, or enhance high-quality, inclusive higher education experiences to support positive outcomes for
individuals with ID.
The OPE also awarded a TPSID National Coordinating Center (NCC) grant to the Institute for Community
Inclusion at the University of Massachusetts Boston. Among the responsibilities of the TPSID NCC was the
development of a valid and reliable evaluation framework for the TPSID programs. This report provides a
summary of the creation of this evaluation framework and a comprehensive look at critical components of
the TPSID programs throughout the US in the 2010–2011 academic year.
The report describes the types of IHEs that received TPSID grants, characteristics of attending students, and
detailed information about academic access, employment and career development, campus membership, and
program elements that supported self-determination skills, such as person-centered planning. The report also
details the TPSID programs’ efforts at collaborating with internal and external partners, the extent to which
the TPSID programs are integrated into the existing policies and practices of the college, efforts aimed at
sustaining these programs, and evaluation strategies employed by the TPSID programs.
YEAR ONE (2010-2011)

2 • ThInk College nATIonAl CooRDInATIng CenTeR
primarY FindingS OF thiS Year i repOrt inCLUde:
demographics. In 2010–2011, 15 TPSID programs operated on single campuses and 12 operated as consortia with satellite campuses,
for a total of 27 model demonstration projects on 42 campuses. Four hundred sixty students attended TPSID programs
(across 30 sites). Twelve TPSID projects were in a planning year and not serving students during Year One. Fifty-nine
percent of students were male and 41% were female. The majority of students (89%) were between the ages of 19 and 28.
The most commonly reported disability categories for students were intellectual disability, autism, and developmental delay.
Approximately one fifth of the students (21%) were dually enrolled and were receiving transition services via their local
K-12 education agency.
academic access. In Year One, 394 TPSID students were enrolled in a total of 1,897 courses, an average of nearly five enrollments per student.
Over half of those course enrollments (58%) were in specialized courses, i.e., courses that were only attended by TPSID
students. The remaining 42% of course enrollments were in inclusive courses, i.e., attended by TPSID and non-TPSID students.
employment. Of the 460 students who attended TPSID programs, 124 (27%) held a total of 143 paid jobs during the first year of the
program. One hundred five students held one paid job, 18 students had two paid jobs, and one student had three paid jobs.
Two fifths of the students with paid jobs (44%) had never held a paid job prior to entering the TPSID program. Individual
jobs accounted for more than half of the paid jobs held by students (52%), and paid internships (non-credit) accounted for
23% of the paid jobs held by students.
Self-determination. In the first year of the program, 97% of TPSIDs reported using person-centered planning with participating students.
Twenty-three percent of the TPSIDs reported using existing academic advising offices, and another 29% used both
specialized and typical academic advising systems. Forty-five percent of TPSIDs (n = 14) had a separate advising system
specially designed only for TPSID students and administered by TPSID staff.
Campus membership. Students participated in numerous social activities, including attending events on campus, going out with friends, and
participating in clubs or student organizations. Of the 30 TPSIDs serving students in Year One, 11 provided access to
housing, 10 had student housing but did not provide access to TPSID students, and nine did not offer housing to any
student. Nearly three-quarters (72%) of TPSID students lived with family.

AnnuAl RePoRT on The TRAnSITIon AnD PoSTSeConDARy PRogRAmS foR STuDenTS wITh InTelleCTuAl DISAbIlITIeS, yeAR one (2010–2011) • 3
exiting Students. A total of 136 TPSID students exited their program in Year One. Eighty-six of these students (63%) earned a credential.
Roughly one quarter of the students who exited in Year One (29%) were reported as having a paid job, participating in
unpaid career development activities, or doing both at the point when they exited the TPSID program. Students who
exited with paid employment on average worked 17 hours per week and earned $8.21 per hour.
alignment with College Systems and practices. The vast majority of TPSID programs followed the academic calendar used by the IHE (90%), held students to the same
code of conduct as other students (97%), and issued student identification cards (97%) to TPSID students. Campus facilities
and resources accessed by TPSID students included the student center/dining hall, bookstores, library, computer lab/
student IT services, sports and recreational facilities, and arts/cultural center.
Coordination and Collaboration. The 42 participating TPSID sites partnered with a total of 190 external organizations. The most common partners were
local education agencies (LEAs) and vocational rehabilitation (VR) agencies, with over half of the TPSID sites partnering
with these organizations.
Sustainability. IHE resources and student/family funds were the most common sources of funds (aside from the OPE grants) received
by TPSIDs. Fifty-five percent of programs serving students in Year One (n=17) received funding from family and students.
TPSIDs also received support from human services agencies that serve individuals with ID, including VR, LEAs, and state
intellectual/developmental disability agencies. Average annual costs to students ranged from $2,000 to $16,000, and
depended upon the type of institution (two-year or four-year) and whether the IHE charges were residency-dependent.
evaluation. Each TPSID, in addition to entering data into the NCC evaluation system, created its own mechanisms for self-assessment.
The evaluation tools used by TPSIDs included assessment of students’ academic and career interests and progress,
goal attainment, and self-determination. TPSIDs regularly sought feedback from students, faculty, peer mentors, family
members, TPSID staff, and employers of TPSID students via interviews and meetings.
This Year One TPSID Annual Report demonstrates that given the opportunity, the charge, and sufficient funding,
institutions of higher education can partner effectively with LEAs as well as state and regional agencies to serve students
with an intellectual disability. The TPSID programs described here have provided an unprecedented opportunity for 460
students with ID to access college courses, participate in internships and integrated competitive employment, and engage in
the same social and personal development activities that other college students enjoy throughout the country.
While a significant amount of progress is evident, the report reflects remaining barriers as well. Achievement of program
goals related to inclusive course access and attainment of paid integrated employment and meaningful credentials will take
additional and sustained efforts on the part of those implementing the TPSID programs.

4 • ThInk College nATIonAl CooRDInATIng CenTeR
intrOdUCtiOn
Over the last decade, the United States has seen growth in the number of students with disabilities accessing
postsecondary education (PSE) (Newman, Wagner, Cameto, Knokey, & Shaver, 2010; Raue & Lewis, 2011; Snyder &
Dillow, 2010). This trend is also evident with people with intellectual disabilities who are seeking access to higher education
more frequently than ever before (Grigal & Hart, 2010; Kleinert, Jones, Sheppard-Jones, Harp, & Harrison, 2012). Just as
special education legislation created new expectations for access, instruction and outcomes for children with disabilities in the
K-12 education system, legislation has also been a catalyst for program development and systems change in higher education
for people with intellectual disabilities. The most recent, and likely most impactful piece of legislation that has fueled the
growth of college opportunities for students with intellectual disability is the reauthorization of the Higher Education Act of
1965 with the enactment of the Higher Education Opportunity Act (P.L. 110- 315) (HEOA) in 2008.
Education policies and practices reflect the knowledge base and values of their time, and the passage of the HEOA
reflected the newly emerging demand for postsecondary education opportunities for youth with ID. The decade prior
to its passage saw the emergence of various types of programs and services for youth and adults with intellectual and
developmental disabilities at colleges and universities throughout the country (Grigal, Hart, & Weir, 2012). The emergence
of these college options brought forth the opportunity to gather information about the etiology of these programs, their
composition and their impact on student outcomes. However, the wide disparity of programs’ focus and the lack of any
central repository of information made it difficult to capture, let alone compare, common measures on these programs.
The expansion of these widely varying higher education options as well as emerging research about the purpose and
intended outcomes of these education experiences created the need for federal guidance and investment in higher
education programs for people with ID.
The Higher Education Opportunity Act of 2008 contained several new provisions aimed at increasing access to higher
education for youth and adults with intellectual disabilities. To address these provisions, in 2010 Congress appropriated $10.6
million for creation of a new model demonstration program via the Office of Postsecondary Education (OPE) (Duncan,
2010). OPE awarded five year grants to 27 institutes of higher education (IHEs) to fund demonstration projects referred
to as Transition and Postsecondary Programs for Students with Intellectual Disability (TPSIDs). Congress also appropriated
$330,000 for the establishment of a national coordinating center for the TPSID program. OPE awarded the TPSID National
Coordinating Center (TPSID NCC) to the Institute for Community Inclusion at the University of Massachusetts Boston in
October 2010. The mission of the TPSID NCC is to provide technical assistance to IHEs that offer comprehensive transition
and postsecondary programs for students with intellectual disabilities, evaluate the TPSID projects, create recommended
standards for programs and build a valid and reliable knowledge base around program components.
The TPSID program was designed to assist students with intellectual disabilities (ID) to transition to and fully participate
in inclusive higher education opportunities that will ultimately lead to gainful employment. The goal of the program is to
create, expand, or enhance high-quality, inclusive higher education experiences to support positive outcomes for individuals
with ID. The TPSID NCC was charged with the development of a valid and reliable evaluation framework to assess the
effectiveness of the TPSID programs.

AnnuAl RePoRT on The TRAnSITIon AnD PoSTSeConDARy PRogRAmS foR STuDenTS wITh InTelleCTuAl DISAbIlITIeS, yeAR one (2010–2011) • 5
This report provides a summary of the creation of this evaluation framework, and provides a comprehensive look at critical
components of the TPSID programs throughout the US in the 2010-2011 academic year. The report is primarily organized
around the eight standard areas presented in the Think College Standards for Inclusive Higher Education, however there
are additional sections reflective of data that is not reflected in the standards. The report describes the types of IHEs that
received TPSID grants, characteristics of attending students, and detailed information about academic access, employment
and career development, campus membership, and program elements that supported self-determination such as person
centered planning. The report also details the TPSID programs’ efforts at collaborating with internal and external partners,
the extent to which the TPSID programs are integrated into the existing policies and practices of the college, efforts aimed
at sustaining these programs, and evaluation strategies employed by the TPSID programs.
methOdOne role of the NCC is development of a valid and reliable evaluation framework to assess the effectiveness of the TPSID
programs. To do this, first the NCC staff conducted a comprehensive review of each TPSID grant application to determine
the common measures and terminology that would best reflect the various programs. Then NCC staff reviewed online
data management tools to ensure that the platform chosen for the evaluation system met the needs of both the NCC and
the TPSID users, and would be both reliable and flexible. Our priority was to select a management system that provided
TPSID personnel with ease of access and use.
After selecting the management platform, the NCC created a draft evaluation tool. The variables in this draft tool reflected
the Government Performance and Results Act (GPRA) measures that TPSID grant recipients were expected to report on
and were aligned with the Think College Standards for Inclusive Postsecondary Education (Grigal, Hart, & Weir, 2012).
In February 2011 draft versions of the tool were shared with all TPSID Principal Investigators to gather input on clarity
of questions, adequacy of response options, and comprehensiveness of the variables. The extensive comments received
from TPSID personnel were reviewed in detail by project staff in March 2011 and incorporated into the second version of
the tool. This tool was then programmed into a secure online database using software purchased from Intuit Quickbase
(quickbase.intuit.com).
In May through August 2011, the online evaluation system was piloted in three waves of nine sites each, and further
feedback on content as well as function was obtained and a third version of the tool was created. The resulting tool was
submitted in August 2011 to the Office of Management and Budget (OMB) for approval under the Paperwork Reduction
Act (44 U.S.C. 3501). After extensive feedback and revision, the OMB approved the evaluation tool in July 2012. Upon
receipt of this approval, NCC staff made the required modifications to the tool and the system as deemed necessary by
the OMB. The evaluation system was then made available to the TPSIDs for ongoing data entry starting in August 2012.
Between August 2012 and February 2013, TPSID program staff entered data into the system for the first two years of
implementation (2010–2011 and 2011–2012). Various TPSID personnel entered data into the system, including Principal
Investigators, program staff, administrative staff, student interns, graduate assistants, and external evaluators. This report
summarizes the first year’s TPSID data.
6 • ThInk College nATIonAl CooRDInATIng CenTeR
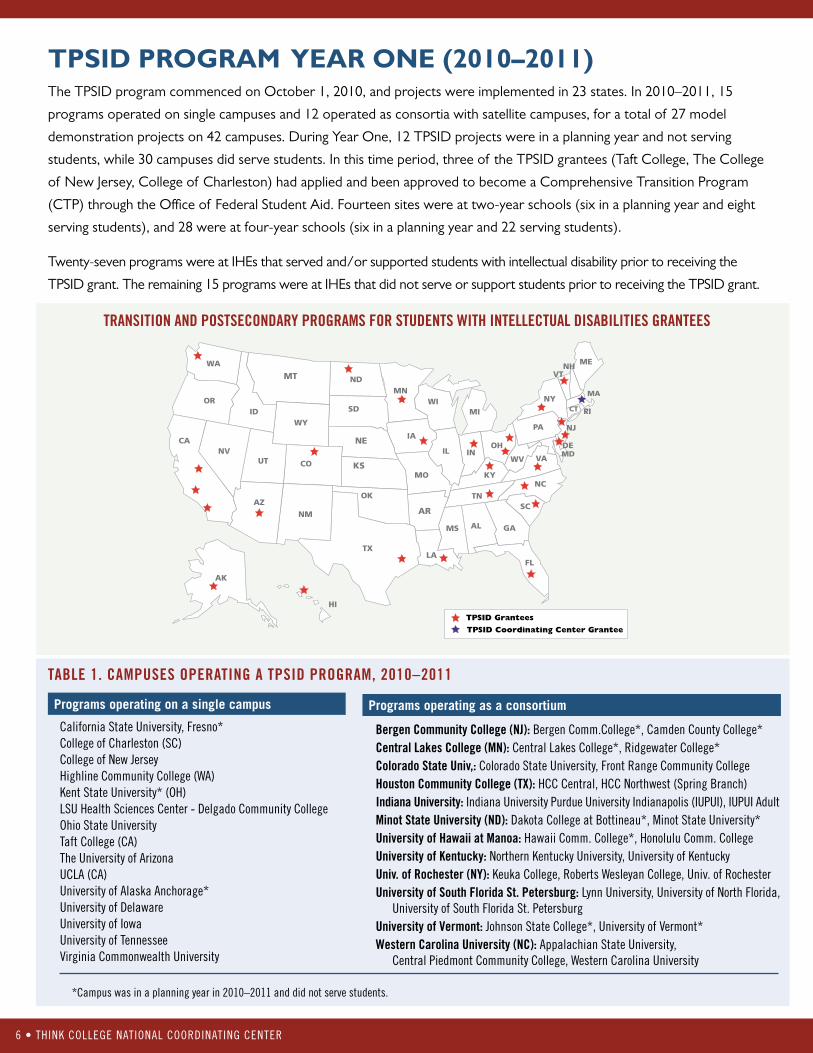
tpSid prOgram Year One (2010–2011)The TPSID program commenced on October 1, 2010, and projects were implemented in 23 states. In 2010–2011, 15
programs operated on single campuses and 12 operated as consortia with satellite campuses, for a total of 27 model
demonstration projects on 42 campuses. During Year One, 12 TPSID projects were in a planning year and not serving
students, while 30 campuses did serve students. In this time period, three of the TPSID grantees (Taft College, The College
of New Jersey, College of Charleston) had applied and been approved to become a Comprehensive Transition Program
(CTP) through the Office of Federal Student Aid. Fourteen sites were at two-year schools (six in a planning year and eight
serving students), and 28 were at four-year schools (six in a planning year and 22 serving students).
Twenty-seven programs were at IHEs that served and/or supported students with intellectual disability prior to receiving the
TPSID grant. The remaining 15 programs were at IHEs that did not serve or support students prior to receiving the TPSID grant.
TransiTion and PosTsecondary Programs for sTudenTs wiTh inTellecTual disabiliTies granTees
Programs operating as a consortium
bergen community college (nJ): bergen Comm.College*, Camden County College*central lakes college (mn): Central lakes College*, Ridgewater College*colorado state univ,: Colorado State university, front Range Community Collegehouston community college (TX): hCC Central, hCC northwest (Spring branch)indiana university: Indiana university Purdue university Indianapolis (IuPuI), IuPuI Adultminot state university (nd): Dakota College at bottineau*, minot State university*university of hawaii at manoa: hawaii Comm. College*, honolulu Comm. Collegeuniversity of Kentucky: northern kentucky university, university of kentuckyuniv. of rochester (ny): keuka College, Roberts wesleyan College, univ. of Rochesteruniversity of south florida st. Petersburg: lynn university, university of north florida,
university of South florida St. Petersburguniversity of Vermont: Johnson State College*, university of Vermont*western carolina university (nc): Appalachian State university,
Central Piedmont Community College, western Carolina university
Programs operating on a single campus
California State university, fresno*College of Charleston (SC)College of new Jerseyhighline Community College (wA)kent State university* (oh)lSu health Sciences Center - Delgado Community Collegeohio State universityTaft College (CA)The university of ArizonauClA (CA)university of Alaska Anchorage*university of Delawareuniversity of Iowauniversity of TennesseeVirginia Commonwealth university
*Campus was in a planning year in 2010–2011 and did not serve students.
Table 1. camPuses oPeraTing a TPsid Program, 2010–2011
TPSID Grantees
TPSID Coordinating Center Grantee

AnnuAl RePoRT on The TRAnSITIon AnD PoSTSeConDARy PRogRAmS foR STuDenTS wITh InTelleCTuAl DISAbIlITIeS, yeAR one (2010–2011) • 7
OvervieW OF StUdent CharaCteriStiCS
Student demographicsDuring the 2010–2011 academic year, 460 students
attended TPSID programs across 30 sites. Fifty-nine
percent of students were male and 41% female. The
majority (72%) were white, and 21% of students were
black or African American (Table 2). Nine percent of
students were Hispanic or Latino. These figures indicate
that both women and minorities are less present in
TPSID programs than in the general college population,
in which 59% were female, 39% were non-white,
and 13% were Hispanic in 2010 (U.S. Department of
Education, 2011). Students’ ages ranged from 17 to
53, with a median age of 23. The majority (89%) were
between the ages of 19 and 28.
disabilityThe most commonly reported disability categories
for students were intellectual disability, autism, and
developmental delay (Table 3). In fact, over 95% of
students had an intellectual disability and/or autism.
The majority of students had more than one reported
disability, with 15% having three or more disabilities.
Among the 42 students not identified as having ID, the
most common disabilities were autism and specific
learning disability.
previous educational SettingWhen asked to describe students’ previous educational
setting, the majority of students were reported to have
been partially included in general education while in high
school (Table 4). Partial inclusion includes a wide range
of possibilities; from being in a segregated classroom
most of the time and only taking one or two general
education classes to being included in general education
most of the time.
Student StatusAbout one fifth of all students (21%) were dually
enrolled, that is, still receiving special education services
from a public school system while attending the program.
Of those students who were no longer in high school,
most had already received either a certificate of
completion or a standard diploma (Figure 1).
Table 2. race of ParTiciPaTing TPsid sTudenTs, 2010–2011
number Percentwhite 330 72%
black or African American 99 21%
Asian 24 5%
native hawaiian or Pacific Islander 3 1%
unknown 8 2%
Table 3. mosT common sTudenT disabiliTies, 2010–2011 (n = 460)
number PercentIntellectual disability 418 91%
Autism 108 23%
Developmental delay 67 15%
Specific learning disability 41 9%
other health impairment 40 9%
number Percentfully included in general education curriculum in general education classes
45 10%
Student spent part of their time in general education and part in special education
268 58%
not included – spent all of their time in special education
64 14%
Don’t know 75 16%
other* 8 2%
*“other” responses include: home-schooled, private school
Table 4. educaTional seTTing while in high school, 2010–2011 (n = 460)
figure 1. sTaTus of TPsid sTudenTs no longer in high school, 2010–2011 (n = 355)
37%
38%
16%
1%8%
Certificate of completion or attendance Standard diploma
Modified or special diploma
Dropped out
Other

8 • ThInk College nATIonAl CooRDInATIng CenTeR
aCademiC aCCeSSTPSIDs are charged with providing inclusive academic access to authentic college courses for students with intellectual
disabilities. TPSIDs provide access to a wide array of college courses, including specialized courses attended only by TPSID
students and inclusive courses attended by both TPSID and non-TPSID students. Courses may be either for-credit or non-
credit, and students may be enrolled for credit, enrolled not-for-credit, auditing, or simply sitting in on a course.
Course enrollments by tpSid studentsIn Year One, 394 TPSID students enrolled in a total of 1,897 courses, an average of nearly five enrollments per student. Over
half of those course enrollments (58%) were in specialized courses, i.e., courses that were only attended by TPSID students.
The remaining 42% of course enrollments were in inclusive courses, i.e., attended by TPSID and non-TPSID students.
Figure 2 shows how students accessed inclusive and specialized courses in Year One. Most enrollments in inclusive courses
either were for standard IHE credit, were audited, or were not for credit. Most enrollments in specialized courses were for
credit that could only be used for a TPSID credential, i.e., credit for those courses would not count towards an inclusive
certificate or degree program.
The variability in academic access in the TPSID programs seems to mirror access in other programs for students with
intellectual disabilities. In 2008, Papay and Bambara surveyed 52 college-based transition programs in the U.S. for students with
intellectual and developmental disabilities, and found that less than one quarter of all students (24%) in the programs surveyed
were reported to be taking college classes. Students who were more academically prepared were more likely to be taking
classes for credit, whereas students who were less academically prepared were more likely to be taking classes informally.
The majority of classes taken for credit were vocational and remedial classes; the majority taken informally or audited were
academic, health and fitness, and arts classes.
Grigal, Hart, and Weir (2012) surveyed 149 programs in IHEs in 39 states. They found that access to noncredit college
classes was offered by 57% of respondents, and access to credit-bearing college courses by 51%. As 75% of respondents
in the Grigal et al. survey affirmed that students with an ID in their program participated in group instruction or activities
only with other students with an ID it appears that the TPSIDs programs are providing a higher level of typical course
access. This is likely a reflection of their efforts to address the inclusive requirements outlined by the HEOA. Whereas
the programs reflected in the national survey had no such requirements which may account for the finding that 45% of
respondents indicated that 76% to 100% of the instruction students received in their program was provided only with
other students with ID. (Grigal, et al 2012)
Matthew: Exploring Ecological Research
Entering the University of Tennessee FUTURE Program Matthew chose to take General Ecology class because he was interested in science. Though the class was huge (over 200 students) the professor was interesting and made the lectures easy to understand with her PowerPoint and illustrations.
Each day at the beginning of class, the professor gave a quiz. Mathew found that reading his assignments allowed him to answer many of the questions correctly, which made him feel good about himself. Matthew did his own lab work and explored the ecosystems at Ijams Nature Park. The rock quarries were interesting and he chose to investigate them more. Matthew’s research project for his Ecology class focused on rock quarries, and he discovered that marble was mined in the area. Water filled the quarry, and over time different types of fish and plants could be found there. After gathering information at the library and on hikes in the park, Matthew was able to create a Powerpoint and, just like his peers, present his research on rock quarries to the class.
“I appreciate Matthew participating in the General Ecology class. I am happy that he is gaining something from my class.”
—Matthew’s instructor

AnnuAl RePoRT on The TRAnSITIon AnD PoSTSeConDARy PRogRAmS foR STuDenTS wITh InTelleCTuAl DISAbIlITIeS, yeAR one (2010–2011) • 9
figure 2. course access by inclusiVe and sPecialized course enrollmenT sTaTus, 2010–2011
69%
0%
30%
1%
9%
42%
38%
10%
Credit that can only be used towards the TPSID credential
Enrolled for standard IHE credit
Audit or enrolled not for credit
Unofficially attending the course/sitting in
Credit that can only be used towards the TPSID credential
Enrolled for standard IHE credit
Audit or enrolled not for credit
Unofficially attending the course/sitting inSp
ecia
lized
(Num
ber o
fco
urse
enr
ollm
ents
=
1097
)
Inclu
sive
(Num
ber o
fco
urse
enr
ollm
ents
=
815)
accommodationsStudents in the TPSID programs used a variety of accommodations. Figure 3 reflects that the majority of accommodations
received by students come from the TPSID program (or staff in that program), and not from the Disability Services Office
(DSO). The most common accommodations received were academic accommodations, such as access to professors’
notes, advance access to materials, alternative test formats, and modified assignments. Also common were enrollment
accommodations, such as modified course loads, substitutes for required courses, and priority or early registration. Use
of technology (both information technology, such as laptops or specialized software, and assistive technology, such as FM
listening devices and screen enlargers) was relatively rare.
Students with ID receiving services in other postsecondary education programs appear to use the DSO more frequently
than did TPSID students. In one national survey of PSE programs, 58% of programs indicated that students with
Examples of inclusive courses taken by TPSID students in 2010-2011
» American Popular Music: Highline Community College » Beginning Library and Info Systems: University of North Florida » Community Living: Central Piedmont Community College » Current Events/World Politics: Keuka College » Disability, Power, and Privilege: College of Charleston » Drawing and Composition: Taft College » Foundations of College Writing II: University of Kentucky » Foundations of Information Technology: Western Carolina University » Intro to American Government: University of North Florida » Intro to Literature I: Front Range Community College » Intro to Sociology: Northern Kentucky University » Introduction to Teaching: Indiana University Purdue University Indianapolis » Organic Chemistry: Colorado State University » Performance Improvisation: Highline Community College » Perspectives in Early Childhood: Keuka College » Positive Behavioral Supports for Students with Severe Disabilities: Western Carolina University » Social Studies: Keuka College » Spanish I: Lynn University » Study Skills: Ohio State University » Yoga: Indiana University Purdue University Indianapolis

10 • ThInk College nATIonAl CooRDInATIng CenTeR
ID received services from the college or university’s disability services office (DSO). The most frequently available
accommodations to students with ID were priority seating, professor notes, or a peer note taker (Grigal et al., 2012).
Another national survey reflected that students with ID most frequently sought accommodations available to all students
with disabilities under the Americans with Disabilities Act (Papay & Bambara, 2011).
figure 3. accommodaTions receiVed by TPsid sTudenTs, 2010–2011 (n = 460)
25 233 8 2 1
264
223
178
13 7
4124 26 32
3 3 30
50
100
150
200
250
300
Academic accommodations
Enrollment accommodations
Academic supports by individuals
Information technology
Assistive technology Other
DSO TPSID BOTH
CredentialsEach TPSID program is required to create and offer a meaningful credential for students with intellectual disabilities upon
the completion of the model program. In FY 2010–2011, most TPSIDs that were not in a planning year (24/30) offered
some type of credential to students (Figure 4). Credentials could be either certificates or degrees, and could be available
either to TPSID students only or to all students. They could be granted by the hosting IHE, by the TPSID program, or by a
partnering local education agency (LEA). The most common credentials offered were certificates, with the largest number
being certificates granted by the IHE but available only to TPSID students.
Over half of the TPSID students (57%) sought the program’s meaningful credential in 2010–2011. Another 8% were not
seeking the credential, and 34% were enrolled in programs not offering a credential.
figure 4. credenTials offered by TPsid Programs, 2010–2011 (ToTal number of Programs = 30)
0
0
0
2
3
6
8
8
14
0 5 10 15 20
Associate's or bachelor's degree specifically for TPSID students
Associate's degree available to all students
Bachelor's degree available to all students
Specialized certificate issued from LEA
Another credential not listed
Program does not offer a credential
Certificate available to all students
Specialized certificate granted by TPSID program
Certificate for TPSID students granted by IHE

AnnuAl RePoRT on The TRAnSITIon AnD PoSTSeConDARy PRogRAmS foR STuDenTS wITh InTelleCTuAl DISAbIlITIeS, yeAR one (2010–2011) • 11
Career deveLOpment and empLOYmentA primary goal of the TPSID program is facilitating career development and supports necessary for students to seek and
sustain integrated competitive employment. The benefits of integrated competitive employment include higher wages,
access to benefits, greater independence and economic self-sufficiency, greater integration with people without disabilities
in the workplace and the community, more opportunities for choice and self-determination, and expanded career options
and increased job satisfaction (Wehman & Scott, 2013).
Employment outcomes for young adults with intellectual disabilities consistently lag behind youth with no disabilities and
even youth with other disabilities (Butterworth et al., 2013). According to the American Community Survey, in 2010, young
adults with intellectual disabilities ages 22 to 30 were about half as likely to be employed as their peers with no disabilities
(33% compared to 73%).
While the transition from childhood and adolescence into adulthood is typically characterized by graduating high school or
college and finding work, this does not appear to happen for transition-age youth with ID. Wages and hours are also lower
for youth with intellectual disabilities. TPSIDs could potentially play a role in reducing these gaps.
Career development for students with ID is essential for future job attainment and retention (Fabian & Luecking, 2012).
Identifying career goals; providing access to job coaches/developers; offering internships, service learning opportunities,
and paid work experiences; and connecting with service providers to sustain employment are just some of the steps that
TPSIDs are taking to propel their students toward gainful employment.
Each year, TPSIDs report information on
the paid and unpaid employment and career
development experiences in which students
participate. In Year One 59% of TPSID
students participated in some sort of career
activities whether it was paid employment,
unpaid career development, or both.
Student paid employmentOf the 460 TPSID students who attended
TPSID programs in 2010–2011, 124 (27%)
held a total of 143 paid jobs during this first
year of the program. One hundred five
students held one paid job, 18 held two
paid jobs, and 1 student had three paid jobs.
Two fifths of the students with paid jobs
(44%) had never held a paid job prior to
entering the TPSID program.
Individual jobs accounted for more than
half of the paid jobs held by students
(52%), and paid internships (non-credit)
accounted for 23% of the paid jobs held by
students (see Figure 5). Each of the other
types of paid jobs accounted for 10% or
fewer of all paid jobs held by students in
Year One.
Table 5. career deVeloPmenT acTiViTies among TPsid sTudenTs, 2010–2011 (n = 460)
counT PercenTPaid employment only 36 8%
unpaid career development only 149 32%
Paid employment and unpaid career development 88 19%
no career development activities 187 41%
Total 460 100%
figure 5. Paid Jobs held by TPsid sTudenTs, 2010–2011 (n = 143 Jobs)
75
1
33
5
15
2 8 4
Individual paid jobPaid internship (for-credit)Paid internship (non-credit)Group paid work (enclave or mobile work crew) Individual work training site paid by stipendGroup work training site paid by stipendSheltered workshopInformation missing

12 • ThInk College nATIonAl CooRDInATIng CenTeR
Seventy-seven percent of paid jobs held by students were at or above minimum wage, 21% paid less than minimum wage,
and wage status was unknown for the remaining 3% of jobs. As we can see from Figure 6, three of the eight job types
reported paid students more than minimum wage. This includes the two categories with the most students: individual paid
jobs and paid internships (non-credit). Students who were working in sheltered workshops or individual work training sites
paid by stipend, and the one student whose job type was not specified, made less than minimum wage. In terms of number
of hours worked, a majority of students (78%) worked between 5 and 20 hours per week at their job.
figure 6. wage disTribuTion by Job TyPe, 2010–2011 (n = 139 Jobs*)
2% 3%
60%
100%
50%
100% 100%
18%
53%
0%
78%
40%
52%
46%
100%
19%31%
0%
20%
40%
60%
80%
100%
Individual paid job (N=74)
Federal work-study (N=0)
Paid internship (for-credit)
(N=1)
Paid internship (non-credit)
(N=33)
Group paid work (enclave
or mobile work crew) (N=5)
Individual work training site
paid by stipend (N=45)
Group work training site
paid by stipend (N=2)
Sheltered workshop
(N=8)
Job type not specified (N=1)
All jobs (N=139)
Below minimum wageMinimum wageAbove minimum wage
50%
Molly’s Path to Becoming a Certified Nursing Assistant
Molly got a job as a Certified Nursing Assistant (CNA) in her hometown in Minnesota. The University of Iowa REACH Program helped her achieve this goal.
When Molly started the program, she wanted to become a teacher. After learning about degree requirements and hearing success stories from alumni who work in health care, her goals evolved. Molly asked for help in becoming a CNA. The REACH Program helped her identify related courses. Program staff also worked with the VA hospital to set up Molly’s internship, and to carve out tasks so Molly could learn more about working as a CNA.
Three afternoons per week, Molly worked as a CNA intern. Although she did not have direct patient contact, she performed many CNA supportive tasks and observed the hands-on tasks. When Molly finished her assigned tasks, she was paired with a CNA to job shadow. This whole process helped Molly learn what to expect as a CNA.
*Job records that are missing wage information are omitted from this chart.
Examples of Paid Jobs Held by Students in 2010-2011
» Paid extra on a television show » Childcare assistant at an early childhood
development center » Student worker at their college » Warehouse supply and delivery at a health care facility
for older adults » Research Assistant at a university lab » Personal Care Provider Assistant at a healthcare facility » Data entry at a telemarketing firm » Medical office aide at an Endocrinologist clinic
» Library staff at a public library » Customer Service Representative at a university
medical center » Cafeteria Worker » Classroom Aide at a public school » Wait Staff at a restaurant » Stock and sales associate at a university bookstore » Men’s Basketball Team Assistant Manager at their
university » Stock room worker at craft and art supply store

AnnuAl RePoRT on The TRAnSITIon AnD PoSTSeConDARy PRogRAmS foR STuDenTS wITh InTelleCTuAl DISAbIlITIeS, yeAR one (2010–2011) • 13
Job SupportsFor each paid job reported, respondents
were asked to report which supports,
if any, a student received at their paid
job. Natural supports and job coaching
were the most commonly used supports
on the job (see Figure 7). Respondents
who indicated that a student received
job coaching as a support were asked a
follow-up question about the percentage
of time a job coach was present at a job. In
the majority of instances where a student
received job coaching at their job, the job
coach was present for no more than 25%
of the time.
Student Unpaid Career development activitiesIn addition to paid employment, TPSID
students also participated in unpaid career
development activities. Just over half of
the students enrolled in Year One (52%)
participated in some form of career
development activities. The most common
career development activities were
volunteering and/or community service
(24%) and unpaid internships that were not
credit bearing (15%).
Zach: Learning Skills to Build a Career
Starting a new job is an exciting and often intimidating rite of passage, especially when it is a young man’s first job. When Zach started the FUTURE Program at the University of Tennessee (UT), he knew he was setting out on an adventure full of new exciting and unfamiliar experiences. Working at his first job was just one of the rewarding challenges Zach would meet.
Zach’s first job was with the UT athletics department. Given his interest in sports and his focus on classes pertaining to sports management, this job was a perfect fit. The job came complete with official UT Adidas clothing and footwear, made exclusively for the UT athletic department. Zach’s job duties included attending exciting sporting events and stocking suites for football games.
Zach has grown to understand what is important to him in his employer, as well as critical skills to be an effective employee. Zach values supervisors who treat him with respect and are fair, honest, and loyal. Zach suggests people be team players, be sensitive to others, and have the confidence to be successful in the workplace. These are skills he learned and applied in his first job. They will serve him well in his future employment.
figure 7. PercenT of Jobs where ParTicular Job suPPorTs were ProVided, 2010–2011 (n = 143 Jobs)
0%
1%
2%
25%
47%
52%
0% 10% 20% 30% 40% 50% 60%
Personal Care Assistant
Other support
Assistive technology
Off-site coaching/instruction
Job coaching
Natural supports
1%
7%
9%
10%
15%
24%
0% 5% 10% 15% 20% 25% 30%
Other unpaid experience
Unpaid individual work training sites
Unpaid internships for credit
Service learning opportunities
Unpaid internships not for credit
Volunteering and/or community service
figure 8. unPaid career deVeloPmenT eXPeriences, 2010–2011 (n = 460 sTudenTs)
» Library staff at a public library » Customer Service Representative at a university
medical center » Cafeteria Worker » Classroom Aide at a public school » Wait Staff at a restaurant » Stock and sales associate at a university bookstore » Men’s Basketball Team Assistant Manager at their
university » Stock room worker at craft and art supply store

14 • ThInk College nATIonAl CooRDInATIng CenTeR
SeLF-determinatiOnTo facilitate the development of self-determination skills in students with intellectual disabilities, the TPSID program ensures
student involvement in and control of setting personal goals through use of person-centered planning and academic
advising. Also, the majority of the TPSIDs have a stated process for family involvement.
planning and advising
Person-centered planning The TPSIDs were required to use some type of person-centered planning in the development of the course of study for
each student with an intellectual disability participating in the model project. This helped to ensure student involvement in
and control of their career and other personal goals.
In the first year of the program, 97% of TPSIDs reported using person-centered planning with participating students. While
there are many different existing models for person-centered planning, the majority of TPSIDs (79%; n = 23) did not pick
one model exclusively but instead used a combination of different approaches. Of those that did choose a single model,
21% used Planning Alternative Tomorrows with Hope (PATH), and 14% used Personal Futures Planning.
Jose: Exploring Future Career Paths in Florida
School was always tough for Jose--but not because of the curriculum. He just couldn’t stand the
ridicule that came with being in special education classes. After high school, Jose tried his hand at
auto mechanics at a local technical institution. Between the intensity of the labor and the greasy work
environment, he decided there had to be something better for him out there.
After hearing about Project Stingray at the University of South Florida St. Petersburg, Jose
enrolled and began to take courses and participate in internships that allowed him to explore his
interests. Jose interned at an animal shelter and at a
restaurant. These experiences boosted his confidence and
showed him that he had skills and talents.
In a Career Development course, Jose narrowed his top
two career choices to chef and firefighter. Jose and his
academic mentor toured an upscale restaurant, where
Jose cooked some mussels using his own recipe. He also
rode along with a firefighter, toured the training facility,
sprayed the hose, and climbed four stories to the top of
a lookout tower. Realizing that his asthma could get in
the way of firefighting, Jose decided to become a chef.
After completing his college program, he was hired full
time at a hotel resort working in the kitchen with full
benefits. He is now the primary source of income for
his mother and sister. As he puts it, “Why should I keep
getting Social Security if I am able and willing to work?
I’d rather work for my money than get it for free.”

AnnuAl RePoRT on The TRAnSITIon AnD PoSTSeConDARy PRogRAmS foR STuDenTS wITh InTelleCTuAl DISAbIlITIeS, yeAR one (2010–2011) • 15
AdvisingThe role of academic advisors in college is to assist students to develop their course of study, establish a schedule, and
achieve their academic goals. For students on a traditional college pathway toward a degree, academic advising is geared
toward credit accumulation, monitoring GPA, and advancing toward the desired degree. The role of the academic advisor
in TPSIDs is somewhat different, as the majority of students are seeking an alternative path rather than a degree.
In a national survey of postsecondary education programs, almost half (47%) of the respondents indicated that students
received academic advising from college faculty or staff in the same manner as other students (Grigal et al., 2012). While
only 23% of the TPSIDs reported using solely an existing academic advising office used by non-TPSID students, another
29% used both specialized and typical academic advising systems. Forty-five percent of TPSIDs (n= 14) only had a separate
advising system specially designed for TPSID students and administered by TPSID staff.
Enrollment MotivationThe most common motivation for course enrollment was that it related to a student’s personal interest (60% of course
enrollments). Taking a course that fulfills personal interests is a common occurrence in postsecondary experiences for all
college students. However, it will be important to monitor the reasons for course enrollments throughout the five-year
TPSID funding cycle, as these are programs tasked with providing students the opportunity to earn a meaningful credential
and gain access to integrated competitive employment.
figure 9. PercenTage of course enrollmenTs by reason for enrollmenT, 2010–2011 (n = 1897 course enrollmenTs)
3%
32%
43%
44%
60%
0% 10% 20% 30% 40% 50% 60% 70%
Other reason
Required for degree/certificate
Required for TPSID credential
Related to career goals
Related to personal interest
Family Outreach and involvement
Marketing and recruitment. Informing the families of potential students about the availability of the TPSID program is a vital aspect of sustainability.
Too often, families of transition-age youth with ID are not given sufficient information about available postsecondary
education options from transition professionals (Martinez, Conroy, & Cerreto, 2012). Goals related to college or any kind of
postsecondary learning are often not included in a student’s IEP or transition plan (Grigal et al., 2011; Migliore & Domin, 2011;
Papay et al., 2011), and students are not supported to seek access to alternative pathways to college.

16 • ThInk College nATIonAl CooRDInATIng CenTeR
More than 50% of TPSIDs employed a variety of outreach activities to educate families and recruit students for the TPSID
program. These activities included creating and distributing TPSID marketing materials, conducting presentations to local
schools (public, private, charter), creating a TPSID website, participating in transition fairs, offering tours of the campus,
including information about the TPSID in general IHE marketing materials, and presenting at parent advocacy and support
group meetings.
Information shared with students’ families.
TPSIDs shared various kinds of information with family members of students who were attending a TPSID program. This
included general information about the IHE, transition information, and student-specific information. More than 50% of
TPSIDs offered families IHE-related information about:
• available social activities (84%),
• the IHE code of conduct (74%),
• non-disability-related services (68%),
• disability laws that impact higher education and how they differ from special education (65%),
• disability-related services available at the IHE (61%),
• the Family Educational Rights and Privacy Act (61%), and
• financial aid (52%).
Most programs (87%) also shared student-specific information with parents. This included information about academics and
social and career development/employment. Other transition-specific information was also shared with parents, including:
• information on person-centered planning (93%),
• connections to agencies/service providers (83%), and
• employer/workplace expectations (63%).

AnnuAl RePoRT on The TRAnSITIon AnD PoSTSeConDARy PRogRAmS foR STuDenTS wITh InTelleCTuAl DISAbIlITIeS, yeAR one (2010–2011) • 17
CampUS memberShipTPSIDs were required to provide individual supports and services for the inclusion of students with intellectual disabilities
in extracurricular campus activities, and all other aspects of the IHE’s regular campus offerings. To facilitate campus
membership for students with intellectual disabilities, TPSIDs provided access to and supports for campus facilities and
technology, and supports for participation in social organizations.
Social LifeFacilitating the development of social networks is key to providing a well-rounded college experience for students with ID.
Test et al. (2009) reviewed studies that have shown a strong association between greater social competence, increased
postsecondary educational participation, and improved employment outcomes after leaving high school.
In addition, possessing greater social skills may be associated with increased self-determination (Carter, Trainor,
Owens, Swedeen, & Sun, 2010). Supporting students in social organizations, giving them access to technology for social
communication, and engaging students without disabilities as natural supports in social activities all help provide a well-
rounded authentic college experience.
In 2010–2011, students participated in numerous social activities, including attending events on campus, going out with
friends, and participating in clubs or student organizations (see Figure 10). The vast majority of TPSID students participated
in such activities, with just 2% reporting that they did not participate in any social activities.
figure 10. sTudenTs’ social ParTiciPaTion, 2010–2011 (n = 460)
78
96
164
165
313
314
0 50 100 150 200 250 300 350
Other social activity*
Join Best Buddies (peer friendship organization)
Join clubs or community/student organizations
Attend or participate in sporting events
Attend organized event on campus
Go out with friends
*other social activities include attending church, going out with non-school friends, and self-advocacy groups.
All TPSIDs that were not in a planning year in 2010–2011 indicated they facilitated or supported TPSID student
participation in campus social activities. TPSIDs used a variety of approaches to facilitate social participation, with the most
common being facilitation by TPSID staff and independent participation, and the least common being events organized
by TPSID students, staff, and/or peer mentors (Figure 11). Most TPSIDs also had ways of tracking which social activities
TPSID students were participating in on campus. The most frequently used tracking mechanism was student self-reporting,
followed by person-centered planning follow-up, peer mentor monitoring, and staff monitoring.

18 • ThInk College nATIonAl CooRDInATIng CenTeR
figure 11. sTraTegies used To suPPorT ParTiciPaTion in social acTiViTies, 2010–2011 (n = 30)
3
15
16
21
21
26
28
0 5 10 15 20 25 30
Other
TPSID students organize
TPSID staff and/or peer mentors organize
Peer mentors facilitate
Non-TPSID students facilitate
TPSID students independently participate
TPSID staff facilitate
residential Life and accessParticipation in residential life programs on campus may lead
to increase in academic performance (de Araujo & Murray,
2010) and influence personal and social development
(Flowers, 2004) of college students. To capitalize on these
positive experiences and to further facilitate integration with
college systems and practices, TPSIDs hosted by IHEs that
offered student housing were encouraged to provide access
to college campus housing resources for students, such as
inclusive and independent living arrangements.
In 2010–2011, the 30 TPSIDs not in a planning year were
almost evenly divided among those where TPSID students
could access student housing (11 sites), those where TPSID
students could not access student housing (10), and those
that did not provide housing (9). Nearly three-quarters
(72%) of students lived with family. The remaining quarter
was evenly divided among residences provided by the IHE
or TPSID (12%) and other residences not provided by the
IHE or TPSID (13%).
Most of the 56 students living in TPSID- or IHE-provided
housing lived in residence halls or off-campus apartments
where most residents were non-TPSID students (Figure 12).
Those living off campus were divided among several living
situations, including independent living, group home, and
“other” settings (Figure 13).
figure 12. on-camPus liVing siTuaTions, 2010–2011
figure 13. off-camPus liVing siTuaTions, 2010–2011
64%
21%
2% 2% 11%
Residence hall or section where majority are non-TPSID studentsOff-campus apts where majority are non-TPSID studentsOn-campus apts primarily for TPSID studentsOff-campus apts primarily for TPSID studentsOther
34%
24%
10%
32%
IndependentGroup homeSupervised apartment or supported living Other*
*“other” responses included family Care home and mentor-Supported housing

AnnuAl RePoRT on The TRAnSITIon AnD PoSTSeConDARy PRogRAmS foR STuDenTS wITh InTelleCTuAl DISAbIlITIeS, yeAR one (2010–2011) • 19
Most students not living with family received some sort of residential supports, typically from intermittent or on-call staff (30%), a
residential assistant or advisor (30%), and/or a roommate/suitemate who received compensation (28%).
navigating CampusMost TPSID students who lived on campus walked to classes. Others drove, rode a bike or took the campus bus. Students
not living on campus most frequently relied on friends or family members for transportation. Public transportation, para-
transit, and taxis were common transportation modes for both groups (Table 6). Few students relied on TPSID staff,
intellectual and developmental disability (IDD) agency transportation, or local education agency provided transportation.
Table 6. how sTudenTs goT To camPus/class, 2010–2011 (n = 446)
sTudenTs liVing in ihe or TPsid housing (n = 56)
sTudenTs liVing elsewhere (n = 390)
exISTIng TRAnSPoRTATIon oPTIonS
Drives self /walks/rides bike 79% 17%
Ihe transportation (campus bus) 63% 2%
Public transportation or para-transit or taxi 54% 32%
friend or family member 4% 46%
Transportation provided by IDD agency 0 5%
PRogRAm-SPeCIfIC TRAnSPoRTATIon oPTIonS
leA provided transport 0 16%
TPSID staff 0 8%
we do not know how this student gets to campus 0 9%
This student does not go to campus 0 2%
other* 4% 4%
*“other” responses include personal care worker, nurse, and residential services. figure 13. off-camPus liVing siTuaTions, 2010–2011

20 • ThInk College nATIonAl CooRDInATIng CenTeR
SUmmarY OF StUdent exit OUtCOmeSA total of 136 TPSID students exited their program in Year One. Figure 14 summarizes the reasons for exit as indicated
by TPSID program staff. The most common reason for exit from the TPSID program was having completed the program
and earned a credential. Around 10% of students who exited were in programs where they completed the academic
component of a program and moved on to a job placement component that followed. Other reasons for exit were that
students no longer wanted to attend the program, or had completed the program but were not able to earn a credential
because the program did not yet offer one.
Fifteen percent of students exiting TPSID programs had “Other” listed as their reason for program exit. Among the
“other” reasons were that the student’s family was moving, thereby making attendance impractical; not having access to
supports needed to attend the program; leaving the TPSID program in favor of focusing on a different program such as job
placement; and having their family make the decision not to continue attendance.
figure 14. reasons for eXiT from TPsid Programs, 2010–2011
Completed TPSID program with no credentialand transitioned to job placement
1%
2%
4%
6%
8%
10%
13%
15%
39%
0% 5% 10% 15% 20% 25% 30% 35% 40% 45%
Was dismissed from program
Completed degree or certificate program
Did not have sufficient funds to continue attending
Completed TPSID program with no credential
Transferred to another PSE program
No longer wanted to attend program
Other reason
Completed TPSID program and earned credential
Credentials earned by Students who exited tpSid programs in Year OneEighty-six of the 136 TPSID students who exited a program in Year One (63%) earned a credential. Figure 15 shows the
percentage of students who exited that earned each type of credential. A certificate specifically for TPSID students was
the most common credential earned, followed by an “Other” credential. Some of these “Other” credentials included
certificates from LEAs available to non-TPSID students, and certificates awarded for completing a training program from a
private employer.

AnnuAl RePoRT on The TRAnSITIon AnD PoSTSeConDARy PRogRAmS foR STuDenTS wITh InTelleCTuAl DISAbIlITIeS, yeAR one (2010–2011) • 21
figure 15. credenTials earned by eXiTing TPsid sTudenTs, 2010–2011 (n = 86 who eXiTed and earned a credenTial)
Associate's or bachelor's degree specificallyfor TPSID students
Associate's or bachelor's degree available to TPSID and non-TPSID students
Certificate available to TPSID and non-TPSID students
Certificate issued from LEA
Certificate or exit document granted by TPSID program (not the IHE)
Another credential
Certificate specifically for TPSID students
0%
0%
2%
4%
8%
11%
40%
0% 5% 10% 15% 20% 25% 30% 35% 40% 45%
employment and Career Outcomes for Students who exited tpSid programs in Year OneRoughly one-quarter of the students who exited in Year One
(29%) were reported as having a paid job, participating in unpaid
career development activities, or doing both when they exited the
TPSID program. Thirty students were working in a paid job, and 19
participated in some sort of unpaid career development activities.
All but one of the paid jobs held by students at exit were individual
paid jobs.
On average, students with paid employment at exit worked 17
hours per week and earned $8.21 per hour. Some TPSIDs said that
they could not reach some students to ask about employment at
the point of program exit, so it is possible that employment and
career development information are under-reported.
tpSid evaluation activitiesIn addition to participating in the evaluation conducted by the NCC, each TPSID has its own mechanisms for evaluating
its programs. NCC staff monitored these activities via communications with TPSID Liaisons as well as through the TPSID
Program Evaluation Special Interest Group. The kinds of evaluation activities being conducted by TPSIDs include but are
not limited to:
• Assessment of students’ academic progress
• Assessment of students’ career interests and progress
Sample Paid Jobs Held by TPSID Students After Program Exit
» Childcare attendant at YMCA
» Peer mentor and outreach at Americorps
» Data entry at TeleSource
» Photo shop clerk at Walgreens
» Receptionist at chiropractic office

22 • ThInk College nATIonAl CooRDInATIng CenTeR
• Goal Attainment Scaling to track students’ progress on goals
• Assessments of students’ self-determination levels
• Feedback forms for students, faculty, peer mentors, family members, TPSID staff, and employers of TPSID students
• Interviews and meetings with students, peer mentors, and staff
In addition, some TPSIDs were beginning to collect follow-up data on exiting students. Of the 30 TPSID sites that were not
in a planning year in 2010–2011, seven were already collecting follow-up data on students who exited the TPSID program;
the remaining 23 programs responded they were not yet collecting follow-up data on students who exited.
Of the seven sites collecting follow-up data, five were collecting data for one year after students exited the program,
and two were collecting data for two years after exit. Employment outcomes, volunteer or community service activities,
and living situation were the most commonly collected, while few programs collected measures of quality of life, self-
determination, and postsecondary education outcomes (Table 7). None were collecting data on high school graduation
status or independent living measures.
Table 7. frequency and TyPe of follow-uP daTa collecTed by TPsid Programs, 2010–2011 (n = 7)
TyPe of daTa number of TPsids
Type of job 7
length of employment 5
living situation 5
hours worked per week 4
Volunteer or community service activities 4
Social or community involvement measures 3
earnings 2
Postsecondary graduation rate 2
Transfer to 2- or 4-year colleges and universities 2
Self-determination measures 1
Quality of life measures 1

AnnuAl RePoRT on The TRAnSITIon AnD PoSTSeConDARy PRogRAmS foR STuDenTS wITh InTelleCTuAl DISAbIlITIeS, yeAR one (2010–2011) • 23
aLignment With COLLege and UniverSitY SYStemS and praCtiCeS
integration with the iheOut the 30 TPSIDs that reported data on integrating their programs with the larger IHE that they were affiliated with, 90%
reported that TPSID students followed the academic calendar used by the IHE. Ninety-seven percent indicated that TPSID
students were held to the IHE’s code of conduct and received college student identification cards.
Another indicator of aligning services with existing IHE practices is the type of transcripts that were issued to TPSID
students. In the 2010–2011 academic year, almost half of TPSID programs (n = 14) issued the same transcript to TPSID
students as they did to non-TPSID students (46%). Seventeen percent of TPSIDs offered transcripts specifically for TPSID
students (n = 5), and the same number of TPSIDs offered two transcripts: a regular transcript and transcript specifically for
TPSID students. Twenty percent (n = 6) of TPSIDs did not offer a transcript.
Use of Campus resources Over two-thirds of TPSIDs reported that students used an array of available campus resources. The student center/dining
hall, bookstores, library, and computer lab/student IT services, and sports and recreational facilities or arts/cultural center
were some of the most commonly reported facilities accessed by students.
figure 16. TPsids rePorTing use of camPus resources by sTudenTs, 2010–2011 (n = 30)
17%
33%
37%
53%
57%
73%
73%
77%
83%
87%
0% 10% 20% 30% 40% 50% 60% 70% 80% 90% 100%
Students did not use any of these resources
Career services
Tutoring services
Registrar, bursar, or financial aid office
Health center/counseling services
Sports and recreational facilities or arts/cultural center
Computer lab/student IT services
Library
Bookstores
Student center or dining hall

24 • ThInk College nATIonAl CooRDInATIng CenTeR
COOrdinatiOn and COLLabOratiOn
external partnershipsPartnerships with external organizations and collaboration with other entities and offices within an IHE are instrumental
in helping sustain TPSID programs. External organizations maintain expertise on serving transition-age youth in numerous
areas, and partnerships with these organizations strengthen individual TPSID programs and increase their chances of
attaining successful outcomes for their students (Lindstrom, Flannery, Benz, Olszewski, & Slovic, 2009; GAO, 2012).
Strong external partnerships allow TPSIDs to take advantage of the knowledge, expertise, and practices of organizations
whose focus is relevant to TPSIDs and their students, e.g., employment, residential services, etc. This section summarizes
types of partnerships and the nature of the organizations that partnered with IHEs implementing the TPSID program in the
2010–2011 year.
In Project Year One, the 42 participating sites partnered with a total of 190 external organizations. Each TPSID site
partnered with, on average, four external organizations (4.52). As reflected in Figure 17, the most common external
partnerships in Year One were with LEAs and vocational rehabilitation (VR) agencies, with over half of the TPSID sites
partnering with these organizations. More than one-quarter of the sites partnered with other IHEs, University Centers
on Excellence and Disability, state education agencies, state intellectual and developmental disability services agencies,
employers, and community rehabilitation providers.
Fewer than 25% of TPSID sites partnered with developmental disabilities councils. It is notable that very few TPSIDs partnered
with their state’s One-Stop Career Centers (American Job Centers), advocacy organizations, or department of labor, as each of
these entities has a mission that overlaps with the mission of the TPSIDs.
figure 17. TPsid ParTnershiPs wiTh eXTernal organizaTions, 2010–2011 (ToTal n = 42 TPsids)
0
0
0
1
1
2
4
5
5
5
6
7
8
9
11
12
13
16
17
17
25
26
0 5 10 15 20 25 30
Chambers of commerce/business councils
State department of health
Health and wellness orgs
State department of labor
State or local ARC
Business Leadership Network (BLN)
Public transportation agency
Self-advocacy groups
One-Stop Career Centers
Private foundations
Parent/family advocacy or support groups
Parent Training & Information Centers
DD councils
Other
Community Rehabilitation Provider(s)
Employers
State IDD services agency
State education agency
UCEDDs
Other IHEs
Vocational rehabilitation
LEAs

AnnuAl RePoRT on The TRAnSITIon AnD PoSTSeConDARy PRogRAmS foR STuDenTS wITh InTelleCTuAl DISAbIlITIeS, yeAR one (2010–2011) • 25
Figure 18 shows a matrix of external partners and the function or role of each partner. Each cell contains a symbol that shows
the frequency with which external partners played particular roles when working with TPSIDs. The most common functions of
external partners in Year One were participating in the project advisory committee and serving as a consultant.
figure 18. roles of TPsid eXTernal ParTners, 2010–2011 (ToTal n = 42 TPsid siTes)
Team /
consortia member
serves as a consultant
Participates in project advisory
committee
Provides direct
service to students
Provides transpor-tation for students
Provides training to students
Provides training to
staff
Participates in PcP
Provides career
dev. / emp. opportunities for students
conducts recruitment / outreach
Provides instructional opportunities for students
other
leAs (n=26) 3 3 4 3 2 3 2 3 3 4 3 2
Vocational rehabilitation (N=25)
2 3 4 3 2 2 2 2 4 3 2 1
Other IHEs (N=17) 4 3 3 3 2 2 3 2 3 3 3 2
UCEDDs (N=17) 4 4 4 2 2 3 4 3 3 4 3 2
State education agency (n=16)
2 3 3 2 2 2 2 1 2 2 2 2
State IDD services agency (N=13)
3 3 2 4 3 2 2 2 2 3 2 1
employers (n=12) 1 2 3 2 1 4 2 2 4 2 2 2
Community Rehabilitation Provider(s) (n=11)
4 4 4 3 1 3 3 2 3 2 2 1
other (n=9) 3 3 3 2 2 2 1 1 1 3 1 1
DD councils (n=8) 3 4 3 2 1 2 2 2 1 2 2 1
Parent Training & Information Centers (N=7)
3 4 4 1 1 1 1 1 1 2 1 1
Parent/family advocacy or support groups (n=6)
2 2 ! 1 1 1 1 1 1 3 1 1
Self-advocacy groups (N=5) 2 3 3 2 2 3 3 1 2 3 1 3
one-Stop Career Centers (N=5)
2 2 1 1 1 2 1 1 ! 2 2 1
Private foundations (N=5) 1 1 1 4 1 2 3 2 1 1 3 1
Public transportation agency (n=4)
1 1 1 2 3 3 2 1 1 1 2 2
business leadership network (bln) (n=2)
1 3 1 1 1 1 1 1 ! 3 1 1
State department of labor (n=1)
1 1 ! 1 1 1 1 1 1 1 1 1
State or local ARC (n=1) ! ! 1 1 1 1 1 1 1 ! 1 1
Chambers of commerce/business councils (n=0)
1 1 1 1 1 1 1 1 1 1 1 1
State department of health (n=0)
1 1 1 1 1 1 1 1 1 1 1 1
health and wellness orgs (n=0)
1 1 1 1 1 1 1 1 1 1 1 1
All partnerships (n=190) 3 3 3 3 2 3 2 2 3 3 2 2
1 0% of partnerships 2 1-25% of partnerships 3 26-50% of partnerships 4 51-75% of partnerships !>75% of partnerships

26 • ThInk College nATIonAl CooRDInATIng CenTeR
LEA partner roles were primarily seen as participants
in project advisory committees (58%), and providers of
recruitment and outreach (54%) and direct services (50%).
VR agencies were primarily involved in the development of
career development/employment opportunities for TPSID
students (60%), participants in project advisory committees
(52%), and to a lesser extent as consultants and providers
of direct service to TPSID students (40% each).
Pilot programs and articulation agreements between
TPSIDs and VR have led to increased VR support for
students with ID to access higher education (Bailey, 2012;
Thacker & Sheppard-Jones, 2011). The state of Florida VR
program sought and received guidance from RSA indicating
the appropriate use of VR funds to support students with
ID in college-based dual enrollment programs in that state (L.M. Rutledge, personal communication, March 21, 2011).
Increased support and involvement of VR may be a key mechanism to expanding access to higher education for youth and
adults with ID beyond the work that is happening in the TPSID programs.
As 21% of TPSID students are dually enrolled, partnerships with LEAs are critical to ensure that the IHE and LEA are
working together. In 2010–2011, 14 TPSID programs served students who were dually enrolled. Most of the programs
that served dually enrolled students (12/14) partnered with LEAs.
Staff trainingTPSID staff also coordinated and collaborated with offices internal and external to their IHE for the purposes of
professional development. In Year One, 34 of 42 TPSID sites (81%) had staff that participated in professional development
available from their IHE. Nearly four out of five TPSID sites (79%) had staff who attended professional development on
software/information technology training, and half had staff who attended Universal Design for Learning and diversity
training. Nearly all TPSID sites (91%) had staff who participated in professional development that provided by an entity
external to the IHE. Over two-thirds of the TPSID sites provided or facilitated professional development in Year One.
Number of Sites and Type of Professional Development Accessed by TPSID Staff in Year One (Total number of sites = 42)
» Software/IT training (n = 27)
» Universal Design for Learning (n = 17)
» Diversity training (n = 17)
» Leadership training (n = 13)
» Academic advising (n = 11)
» Project management (n = 11)
» Career services (n = 10)
» Other topics (n = 10)
» Staff supervision training (n = 9)
Hawaii: Expanding Collaboration with Vocational Rehabilitation (VR)
The Hawai‘i DEIS Project (TPSID project) sought to cultivate collaborative partnerships with agencies such as VR,
the Hawai‘i Department of Education, and the University of Hawai‘i community college system. Although Hawai‘i
VR had a long history of supporting local, state, and federal projects, the concept of postsecondary enrollment for
students with ID was a stretch for some VR administrators and counselors. The typical postsecondary trajectory for
individuals with ID served by VR was comprised of participation in sheltered workshops or supportive employment.
A VR plan that included college participation was rarely considered for these individuals.
DEIS project staff facilitated discussions with agency collaborators at interagency meetings to advance interest
in the TPSID initiative and address preconceptions. One VR administrator admitted that this initiative “tickled”
his “brain.” He added that PSE participation provided an opportunity for VR clients with ID not only to develop
academic skills, but also to build and refine soft skills that would positively impact their employability.
Today, the state VR agency has committed to serving students with ID in college settings. It has played a principal
role in the DEIS project by providing students with supportive counseling and funds for tuition and books, and by
sponsoring workshop development activities.

AnnuAl RePoRT on The TRAnSITIon AnD PoSTSeConDARy PRogRAmS foR STuDenTS wITh InTelleCTuAl DISAbIlITIeS, yeAR one (2010–2011) • 27
SUStainabiLitYTPSIDs were required to include plans for the sustainability of the model program after the end of the grant period. In
most cases, this included exploring and engaging in funding mechanisms that were external to the grant funds.
Accessing program funding from disparate sources supports sustainability in the long term, thus TPSIDs sought funding
from a variety of sources. TPSID program funding from non-Office of Postsecondary Education grant sources are
important, because these funds will ensure TPSID programs will continue to be able to enroll students after the five-year
funding period is completed.
Funding from non-Ope SourcesIn Year One, TPSIDs received financial support from a number of sources in addition to their OPE grant funds. It is not
surprising to see in Figure 19 that IHE resources and student/family funds were the most common sources of funds
received by TPSIDs, as these are funds traditionally used to support higher education programs. Fifty-five percent of
programs serving students in Year One (n=17) received funding from family and students.
TPSIDs also received support from human services agencies that serve individuals with ID, including VR, LEAs, and state
IDD agencies. It is promising to see that over one quarter of TPSID sites received funds from individual or corporate
donors, eight programs received additional grant funds from private foundations, and seven received additional
government grant funds.
figure 19. non-oPe sources of Program funding, 2010–2011 (n = 42 siTes)
2
3
4
5
5
7
8
11
13
19
20
23
26
0 5 10 15 20 25 30
Don't use any of these sources
Veterans Affairs funds
Medicaid
Other funding sources
Funding from state budget
Other government-funded grants
Private foundation grants
State IDD services agency funds
Individual and/or corporate donors
State VR agency funds
Local school districts
Student/family funds
IHE resources

28 • ThInk College nATIonAl CooRDInATIng CenTeR
Sources of Funds for Student tuition and FeesTPSID students used a variety of funding sources to pay for attendance at TPSID programs during Year One, as we can see
in Figures 20 and 21. For tuition and non-tuition expenses, private pay, i.e., personal funds were most commonly used to
pay for attendance at TPSID programs. Forty-six percent of students enrolled in Year One used private pay for tuition, and
65% used this source for non-tuition.
Private pay being the most frequently used funding source to attend TPSID programs may be a positive sign. It shows that
many students are able to generate the money needed to attend these TPSID programs without relying wholly on outside
sources. However, it could also reflect that only students from families who have substantial financial means are able to
afford to go to the TPSID programs.
Data from the National Center for Education Statistics indicated that 66% of all undergraduates in the United States
received some sort of financial aid in the 2007–2008 year (Wei et al., 2009). Forty-eight percent of students at two-year
public schools received some sort of aid during the year, and just over 70% of undergraduates at public four-year schools
received aid. Most undergraduate students at private schools, between 80% and 98% depending on the type of private
institution (e.g., two- or four-year; private or not-for-profit), received some sort of aid.
Only three TPSIDs serving students in Year One were approved as Comprehensive Transition Programs (Taft College,
College of New Jersey, and College of Charleston). This makes it difficult to compare information about TPSID student
financing of education to the general U.S. undergraduate population.
As more TPSIDs seek to become approved as CTPs, this may address in part the financial disparity that is emerging in
these programs. Once a TPSID is approved as a CTP, it may offer eligible students with ID the chance to seek Pell and
Supplementary Education Opportunity grant funds, as well as work study funds. Also, it will be interesting to see if TPSID
student financing follows similar patterns to funding for all undergraduates in the U.S. in terms of financial aid.
figure 20. funding sources used by sTudenTs To Pay TuiTion, 2010–2011 (n = 460 sTudenTs)
0%
.2%
1%
1%
1%
1%
3%
5%
7%
8%
9%
13%
14%
46%
0% 10% 20% 30% 40% 50% 60% 70%
National service grants
Tuition waivers via VR or Social Security
Private student loans
State IDD agency: HCBS Waiver
Foundation/private grant
State IDD agency: state or local funds
Social Security funds, e.g., PASS
Tuition is waived
Federal/state grant
Local Education Agency
Scholarships
Other funding source
State VR agency funds
Private pay

AnnuAl RePoRT on The TRAnSITIon AnD PoSTSeConDARy PRogRAmS foR STuDenTS wITh InTelleCTuAl DISAbIlITIeS, yeAR one (2010–2011) • 29
figure 21. funding sources used by sTudenTs To Pay non-TuiTion eXPenses, 2010–2011 (n = 460 sTudenTs)
0%
0.4%
0.4%
3%
4%
4%
5%
6%
7%
8%
15%
17%
65%
0% 10% 20% 30% 40% 50% 60% 70%
National service grants
Private student loans
Tuition waivers via VR or Social Security
Social Security funds, e.g., PASS
Scholarships
State IDD agency: HCBS Waiver
Other funding source
Foundation/private grant
Federal/state grant
State IDD agency: state or local funds
State VR agency funds
Local Education Agency
Private pay
Cost of attendance for tpSid StudentsTPSIDs were asked to provide information on the amount students pay to attend their programs and how charges are
structured. Programs were first asked whether or not they charge different rates for in-state and out-of-state students, and
then asked to specify charges based on their response to that question.
Certain TPSIDs were unable to report charges because their charge structure did not fit into existing categories, e.g., some
TPSIDs charge a different rate for in-county students. The NCC re-designed these questions to ensure all TPSIDs will be
able to respond in future years. Table 8 displays the average cost of attendance for TPSID students who attend two- and
four-year schools, split by programs that charge the same rate for all students and programs that charge different rates for
in- and out-of-state students.
While the small sample size makes it difficult to make comparisons, it is evident that costs for out-of-state students are
more than costs for in-state students. Also, the annual cost of attendance for a program at a two-year school was less on
average than the annual cost of attendance at a four-year school. This reflects a general trend for two-year and four-year
programs for all undergraduates in the U.S. It is interesting to note that programs that charge the same rate to all students
regardless of residential status tend to be the more expensive programs at two-year schools and the less expensive
programs at four-year schools.

30 • ThInk College nATIonAl CooRDInATIng CenTeR
Table 8. oVerall annual cosT of aTTendance for TPsid sTudenTs, 2010–2011 (# of siTes ProViding daTa in ParenThesis)*
aVerage annual cosT aT Two-year schools
aVerage annual cosT aT four-year schools
Charge same rate to all students (in- or out-of-state)
$6,738 (5) $6,175 (4)
In-state students $2,253 (2) $10,187 (11)
out-of-state students $3,701 (2) $16,477 (9)
*Responses were only included if cost > $0 per year.
TPSID sites were also asked whether they charge a comprehensive program fee or break charges out into more specific
categories. In Year One, only two sites serving students charged a comprehensive fee that was all-inclusive. Both of these
sites charged the same rate to all students regardless of residential status.
Required fees were more common than tuition charges among schools that broke out charges into specific categories.
Room and board charges were less common than tuition and fees, but this is largely due to the fact that only 11 of 31 sites
serving students in Year One offered residential options to TPSID program students.
Table 9. charges To TPsid sTudenTs aTTending Programs, 2010–2011 (# of siTes ProViding daTa in ParenTheses)*
charge sTrucTure
aVg. cosT To aTTend Program
ThaT charges comPrehensiVe
(all inclusiVe) fee
cosT To aTTend Programs ThaT breaK uP charges inTo comPonenTs
aVg. ToTal cosT To aTTend schools ThaT
breaK uP charges
aVg.TuiTion
aVg.required fees
aVg.room
aVg.board
Charges same rate to all students (in- or out-of-state)
$10,250 (2) $4,761 (8) $1,612 (5) $2,072 (7) $4,866(2) $6,789 (2)
In-state students -- $9,464 (12) $5,062 (8) $1,188 (8) $5,618 (3) $2,452 (3)
out-of-state students -- $15,269 (10) $10,875 (6) $1,215 (6) $5,950 (2) $2,445 (2)
*Responses were only included if total cost > $0 per year. --no data reported in this category

AnnuAl RePoRT on The TRAnSITIon AnD PoSTSeConDARy PRogRAmS foR STuDenTS wITh InTelleCTuAl DISAbIlITIeS, yeAR one (2010–2011) • 31
LimitatiOnS
The 27 TPSID model demonstration sites represent a unique subset of postsecondary programs serving
individuals with ID. The data collected by the TPSID National Coordinating Center is appropriate for evaluating
these programs but does not allow for an impact assessment of program activities as they relate to program and
student outcomes. The data collected by the NCC is a population file appropriate for describing TPSID model
demonstration programs. The data does not necessarily provide a representative sample of all US higher education
programs serving students with ID.
The Think College National Coordinating Center evaluation instrument was developed via an iterative process that
involved input from NCC staff, experts on postsecondary education, and TPSID personnel, most of which were
project directors or principal investigators (see Methods section for a description of the instrument development).
Despite the NCC’s best efforts to develop questions and response choices to fit the needs of all TPSIDs, and to
define key terms in a way that allowed for consistency across reporting sites, responses may have been subject to
respondent bias due to different interpretations of program operations and student experiences in relation to the
questions on the evaluation. While in many instances the NCC provided a text response field to allow respondents
to report additional information, some TPSIDs respondents may have neglected to report information that would
allow for better program evaluation.
Finally, Office of Management and Budget (OMB) approval for collection effort substantially delayed the NCC
opening of the evaluation system as the approval process took over a year to be completed. Approval to
commence data collection was given to the NCC during the final quarter of the second year of the project. To
address this lag in data entry, the NCC advised personnel at all TPSID sites that they should continue to capture
data in preparation for the system to be opened based upon the piloted evaluation tool. However, the OMB
approval process resulted in many changes to items and response choices in the evaluation system. In some
instances, TPSIDs were unable to go back to students to collect data they were not previously prepared to report.
This is particularly relevant to students who only attended in Year One. This issue should not affect data reporting
in the subsequent years as no additional changes are anticipated to be made to the system.

32 • ThInk College nATIonAl CooRDInATIng CenTeR
COnCLUSiOn
The TPSID model demonstration programs represent the first federal effort to implement higher education
services reflective of the guidance provided in the Higher Education Opportunities Act of 2008. The extent to
which the programs have achieved their goals, as described in Appendix B, varies at the end of Year One. Success
was impacted by each program’s longevity, as well as its staffing and resources.
Given that 12 programs were in a planning year, we anticipate that there will be an increase in the number of students
served, as well as the nature of services and student outcomes, in subsequent years. Certainly the existence of these
projects has created opportunities for students who might have otherwise had few alternatives. Twelve of the grant
recipients had not previously provided access to students with ID on their campuses. These new initiatives offer the
choice of a higher education in their local communities to students with ID who did not have access to college prior
to establishment of the TPSID program. Institutions of higher education that received TPSID funding that had existed
previously are using the TPSID resources to expand student access to inclusive courses, increase staffing and better
train their staff, and improve their focus on campus-wide integration.
The overall purpose of model demonstration programs is to implement a model and determine the variables of that
model that work, those that do not, and what might be worth continued exploration and scale-up. This first year, the
TPSID program has demonstrated that given the opportunity, charge, and funding, institutions of higher education
can partner effectively with LEAs, as well as state and regional agencies, to serve students with intellectual disability.
Of particular note is the collaborative nature of the TPSIDs that have formed extensive internal and external
partnerships with a wide range of individuals who represent different areas of expertise, organizations, and
resources. These partnerships will also serve to assist the TPSIDs with sustainability efforts once TPSID funding
ends. Additionally, the students with ID who access these programs now have an unprecedented opportunity to
access college courses, participate in internships and paid integrated employment, and engage in the same social and
personal development activities that other college students enjoy throughout the country.
One of the key responsibilities of the National Coordinating Center is to capture how these programs, services, and
student experiences evolve and change over time. Time is a critical element, as these programs represent not only a
change in higher education systems but also in many cases a change in K-12 systems as well as rehabilitation and other
adult agency systems. Given that systems change is a slow and methodical process, we hope that through this work
we can capture the smallest of changes in where the needle is and guide it to the next tick on the incremental path
toward better student outcomes.

ExEcutivE SummaryHigher education leads to a variety of personal and financial benefits, and is an integral part of establishing a
successful career path and enhancing earnings over a lifetime (Carnevale, Rose, & Cheah, 2011). However, up
until recently, low expectations coupled with minimal opportunities have prevented people with intellectual
disabilities (ID) from receiving these benefits. Reauthorization of the Higher Education Act in 2008 contained
several new provisions aimed at increasing access to higher education for youth and adults with ID. To address
these provisions, Congress appropriated $10.6 million for creation of a new model demonstration program via
the Office of Postsecondary Education (OPE) (Duncan, 2010).
In 2010, the Office of Postsecondary Education (OPE) awarded grants to 27 institutes of higher education (IHEs)
to fund model demonstration projects. These are referred to as Transition and Postsecondary Programs for
Students with Intellectual Disability (TPSIDs). The goal of the TPSID program is to create, expand, or enhance
high-quality, inclusive higher education experiences to support positive outcomes for individuals with ID.
The OPE also awarded a TPSID National Coordinating Center (NCC) grant to the Institute for Community
Inclusion at the University of Massachusetts Boston. Among the responsibilities of the TPSID NCC was the
development of a valid and reliable evaluation framework for the TPSID programs. This Year Two Report
provides a summary of the creation of this evaluation framework and a comprehensive look at critical
components of the TPSID programs throughout the U.S. in the 2011–2012 academic year, which was the
second year the program was funded.
The report describes the types of colleges that received TPSID grants, characteristics of attending students,
and detailed information about academic access, employment and career development, campus membership,
and program elements that supported self-determination, such as person-centered planning. The report also
details the TPSID programs’ efforts at collaborating with internal and external partners, the extent to which the
TPSID programs are integrated into the existing policies and practices of the college, efforts aimed at sustaining
these programs, and evaluation strategies employed by the TPSID programs beyond those used by the NCC.
Year two (2011-2012)

34 • Think College naTional CoordinaTing CenTer
Primary FindingS oF thiS yEar two rEPort includE:
demographics. In 2011–2012, 16 TPSID programs operated on single campuses and 11 operated as consortia with satellite campuses,
for a total of 27 model demonstration projects on 43 campuses in 23 states. During Year Two, there were a total of 792
students who attended TPSID programs (across 42 sites). Of those students, 318 students also attended the program in
Year One, while 474 were new students. One TPSID project site was in a planning year and not serving students while 42
campuses served students during Year Two. Male students were more prevalent (59%) than were female students (41%).
Most students (90%) were between the ages of 18 and 28. The most frequently reported disability categories for students
were intellectual disability, autism, and developmental delay. Close to one quarter of the students (24%) were dually
enrolled and were receiving transition services via their local K-12 education agency.
academic access. In Year Two, 663 TPSID students were enrolled in a total of 4,806 courses, an average of just over 7 course enrollments
per student. Over half of those course enrollments (53%) were in specialized courses, i.e., courses that were specifically
designed for and only attended by TPSID students. The remaining 47% of course enrollments were in inclusive courses, i.e.,
attended by TPSID and typical college (non-TPSID) students.
career development and Employment. Of the 792 TPSID students who attended TPSID programs during Year Two, 236 (30%) held a total of 304 paid jobs.
Seventy-four of these jobs (24%) were ones that students had also worked in during Year One. Of students who were
employed, 168 students held one paid job, 59 students had two paid jobs, and 9 students had 3 paid jobs. Additionally, 45%
of employed students had never held a paid job prior to entering the TPSID program. Individual jobs accounted for more
than half of the paid jobs held by students (57%), and paid internships (non-credit) accounted for 18% of the paid jobs held
by students. Eighty-two percent of the students who held jobs were paid at or above minimum wage, 11% paid less than
minimum wage, and wage status was unknown for the remaining 8% of jobs.
Self-determination. The majority of the TPSIDs (93%) reported using person-centered planning with participating students. Twelve percent of
the TPSIDs reported using existing academic advising offices, and another 37% used both specialized and typical academic
advising systems. Forty-four percent of TPSIDs (N = 19) had a separate advising system specially designed only for TPSID
students and administered by TPSID staff.
campus membership. Students participated in a wide range of formal and informal social activities, including attending events on campus (n=490),
going out with friends (n=513), and participating in clubs or student organizations (n=317). Of the 42 TPSIDs serving
students in Year Two, 12 provided access to housing, 6 had student housing but did not provide access to TPSID students
and 24 did not offer housing to any student. The majority of TPSID students (64%) lived with family.

annual reporT on The TransiTion and posTseCondary programs for sTudenTs wiTh inTelleCTual disabiliTies, year Two (2011–2012) • 35
Exiting Students. A total of 304 TPSID students exited their program in Year Two. Of these, 163 students (54%) earned a credential upon
exit. Roughly one-half of the students who exited in Year Two (48%) were reported as having a paid job, participating
in unpaid career development activities, or doing both at the point when they exited the TPSID program. Students who
exited with paid employment on average worked 18 hours per week and earned $7.89 per hour.
alignment with college Systems and Practices.The majority of TPSID programs followed the academic calendar used by the IHE (95%), held students to the same code of
conduct as other students (98%) and issued TPSID students college ID cards. Almost two-thirds of TPSIDs also issued TPSID
students a college transcript. Campus facilities and resources accessed by TPSID students included the student center/dining
hall, bookstores, library, computer lab/student IT services, and sports and recreational facilities or arts/cultural center.
coordination and collaboration.The 43 participating TPSIDs sites partnered with a total of 187 external organizations. The most common partners were
local education agencies and vocational rehabilitation (VR) agencies, with over half of the TPSID sites partnering with
these organizations.
Sustainability. IHE resources and student/family funds were the most common sources of funds (aside from the federal grant funds)
received by TPSIDs. Forty-percent of programs serving students in Year Two (n=17) received funding from family and
students. TPSIDs also received support from human services agencies that serve individuals with ID, including Vocational
Rehabilitation, Local Education Agency, and state Intellectual /Developmental Disability agencies. Average annual costs to
students ranged from $2,000 to $16,000 and depended upon the type of institution (2 or 4 year), and whether the IHE
charges were residency dependent.
Evaluation. Each TPSID in addition to entering data into the NCC evaluation system used various other mechanisms for self-assessment.
The evaluation tools being used by TPSIDs included assessment of students’ academic and career interests and progress, goal
attainment, and assessments of students’ self-determination. TPSIDS regularly sought feedback from students, faculty, peer
mentors, family members, TPSID staff, and employers of TPSID students via interviews and meetings.
This Year Two Annual Report on the Transition and Postsecondary Programs for Students with Intellectual Disabilities
(TPSID) Model Demonstration Projects reflects continued growth of higher education options. The development of new
consortia partners as well as expanded access to inclusive courses and integrated paid employment for TPSID students
demonstrate some of the potential outcomes of partnerships between institutes of higher education and LEA and state
and regional agencies. The TPSID programs described here have provided an unprecedented opportunity for 792 students
to access college courses, participate in internships and integrated competitive employment, and engage in the same social
and personal development activities that other college students enjoy throughout the country. While this report reflects
progress, it also reflects that the long-term goals of the TPSID program have yet to be fully attained. Continued efforts
must focus on expanded inclusive course access, increased credential attainment, as well as an increase in the number of
students with ID who achieve integrated competitive employment along with an increase in the number of hours worked
weekly especially upon exiting the TPSID program.

36 • Think College naTional CoordinaTing CenTer
introduction
Over the last decade, the United States has seen growth in the number of students with disabilities accessing
postsecondary education (PSE) (Newman, Wagner, Cameto, Knokey, & Shaver, 2010; Raue & Lewis, 2011;
Snyder & Dillow, 2010). This trend is also evident with people with intellectual disabilities who are seeking
access to higher education more frequently than ever before (Grigal & Hart, 2010; Kleinert, Jones, Sheppard-Jones, Harp,
& Harrison, 2012). Just as special education legislation created new expectations for access, instruction and outcomes
for children with disabilities in the K-12 education system, legislation has also been a catalyst for program development
and systems change in higher education for people with intellectual disabilities. The most recent, and likely most impactful
piece of legislation that has fueled the growth of college opportunities for students with intellectual disability is the
reauthorization of the Higher Education Act of 1965 with the enactment of the Higher Education Opportunity Act (P.L.
110- 315) (HEOA) in 2008.
Education policies and practices reflect the knowledge base and values of their time, and the passage of the HEOA
reflected the newly emerging demand for postsecondary education opportunities for youth with ID. The decade prior
to its passage saw the emergence of various types of programs and services for youth and adults with intellectual and
developmental disabilities at college and universities throughout the country (Grigal, Hart, & Weir, 2012). The emergence
of these college options brought forth the opportunity to gather information about the etiology of these programs, their
composition and their impact on student outcomes. However, the wide disparity of programs’ focus and the lack of any
central repository of information made it difficult to capture, let alone compare common measures on these programs.
The expansion of these widely varying higher education options as well as emerging research about the purpose and
intended outcomes of these education experiences created the need for federal guidance and investment in higher
education programs for people with ID.
The Higher Education Opportunity Act of 2008 contained several new provisions aimed at increasing access to higher
education for youth and adults with intellectual disabilities. To address these provisions, in 2010 Congress appropriated
$10.6 million for creation of a new model demonstration program via the Office of Postsecondary Education (OPE)
(Duncan, 2010). OPE awarded five year grants to 27 institutes of higher education (IHEs) to fund demonstration
projects referred to as Transition and Postsecondary Programs for Students with Intellectual Disability (TPSIDs).
Congress also appropriated $330,000 for the establishment of a national coordinating center for the TPSID program.
OPE awarded the TPSID National Coordinating Center (TPSID NCC) to the Institute for Community Inclusion at the
University of Massachusetts Boston in October 2010. The mission of the TPSID NCC is to provide technical assistance
to IHEs that offer comprehensive transition and postsecondary programs for students with intellectual disabilities,
evaluate the TPSID projects, create recommended standards for programs and build a valid and reliable knowledge base
around program components.
The TPSID program was designed to assist students with intellectual disabilities (ID) to transition to and fully participate
in inclusive higher education opportunities that will ultimately lead to gainful employment. The goal of the program is to
create, expand, or enhance high-quality, inclusive higher education experiences to support positive outcomes for individuals
with ID. The TPSID NCC was charged with the development of a valid and reliable evaluation framework to demonstrate
the effectiveness of the TPSID programs.

annual reporT on The TransiTion and posTseCondary programs for sTudenTs wiTh inTelleCTual disabiliTies, year Two (2011–2012) • 37
This report provides a summary of the creation of this evaluation framework, and provides a comprehensive look at critical
components of the TPSID programs throughout the U.S. in the 2011-2012 academic year. The report is primarily organized
around the eight standard areas presented in the Think College Standards for Inclusive Higher Education, however there
are additional sections reflective of data that is not reflected in the standards. The report describes the types of colleges
that received TPSID grants, characteristics of attending students, and detailed information about academic access,
employment and career development, campus membership, and program elements that supported self-determination such
as person centered planning. The report also details the TPSID programs’ efforts at collaborating with internal and external
partners, the extent to which the TPSID programs are integrated into the existing policies and practices of the college,
efforts aimed at sustaining these programs, and evaluation strategies employed by the TPSID programs.
mEthodOne role of the NCC is development of a valid and reliable evaluation framework to assess the effectiveness of the TPSID
programs. To do this, first the NCC staff conducted a comprehensive review of each TPSID grant application to determine
the common measures and terminology that would best reflect the various programs. Then NCC staff reviewed online
data management tools to ensure that the platform chosen for the evaluation system met the needs of both the NCC and
the TPSID users, and would be both reliable and flexible. Our priority was to select a management system that provided
TPSID personnel with ease of access and use.
After selecting the management platform, the NCC created a draft evaluation tool. The variables in this draft tool reflected
the Government Performance and Results Act (GPRA) measures that TPSID grant recipients were expected to report on
and were aligned with the Think College Standards for Inclusive Postsecondary Education (Grigal, Hart, & Weir, 2012).
In February 2011 draft versions of the tool were shared with all TPSID Principal Investigators to gather input on clarity
of questions, adequacy of response options, and comprehensiveness of the variables. The extensive comments received
from TPSID personnel were reviewed in detail by project staff in March 2011 and incorporated into the second version of
the tool. This tool was then programmed into a secure online database using software purchased from Intuit Quickbase
(quickbase.intuit.com).
In May through August 2011, the online evaluation system was piloted in three waves of nine sites each, and further
feedback on content as well as function was obtained and a third version of the tool was created. The resulting tool was
submitted in August 2011 to the Office of Management and Budget (OMB) for approval under the Paperwork Reduction
Act (44 U.S.C. 3501). After extensive feedback and revision, the OMB approved the evaluation tool in July 2012. Upon
receipt of this approval, NCC staff made the required modifications to the tool and the system as deemed necessary by
the OMB. The evaluation system was then made available to the TPSIDs for ongoing data entry starting in August 2012.
Between August 2012 and February 2013, TPSID program staff entered data into the system for the first two years of
implementation (2010–2011 and 2011–2012). Various TPSID personnel entered data into the system, including Principal
Investigators, program staff, administrative staff, student interns, graduate assistants, and external evaluators. This report
summarizes the second year’s TPSID data.

38 • Think College naTional CoordinaTing CenTer
tPSid Program yEar two (2011–2012)The second year of the TPSID program commenced on October 1, 2011 and projects were implemented in 23 states. In
2011–2012, 16 programs operated on single campuses and 11 operated as consortia with satellite campuses with a total of 27
model demonstration projects being implemented on 43 campuses. During Year Two, one project was in a planning year and not
serving students while programs on 42 campuses served students. Fifteen sites were at two-year schools (one in a planning year)
and 28 were at four-year schools, all of which were serving students.
There were 27 programs at IHEs that served and/or supported students with intellectual disability prior to receiving the TPSID
grant. The remaining 16 programs were at IHEs that did not serve or support students prior to receiving the TPSID grant.
TransiTion and PosTsecondary Programs for sTudenTs wiTh inTellecTual disabiliTies granTees
PROGRAMS OPERATING AS A CONSORTIUM
bergen community college (nJ): bergen Community College, Camden County Collegecentral lakes college (mn): Central lakes College, ridgewater Collegecolorado state university: Colorado state university, front range Community Collegehouston community college (TX): hCC Central, hCC northwest (spring branch)ohio state university: ohio state university, university of Toledouniversity of hawaii at manoa: hawaii Community College*, honolulu Comm.Collegeuniversity of Kentucky: northern kentucky university, university of kentuckyuniversity of rochester (ny): keuka College, monroe Community College, roberts
wesleyan College, university of rochesteruniversity of south florida st. Petersburg: lynn university, university of north florida,
university of south florida st. petersburguniversity of Vermont: Johnson state College, university of Vermontwestern carolina university (nc): alamance Community College, appalachian state
university, Central piedmont Community College, western Carolina university
PROGRAMS OPERATING ON A SINGLE CAMPUS
California state university, fresnoCollege of Charleston (sC)College of new Jerseylouisiana state university health sciences Center - delgado Community Collegehighline Community College (wa)indiana university purdue university indianapolis (in)kent state university (oh)minot state university (nd)Taft College (Ca)The university of arizonauCla (Ca)university of alaska anchorageuniversity of delawareuniversity of iowauniversity of TennesseeVirginia Commonwealth university
*Campus was in a planning year in 2011–2012 and did not serve students.
Table 1. camPuses oPeraTing a TPsid Program, 2011–2012
TPSID Grantees
TPSID Coordinating Center Grantee

annual reporT on The TransiTion and posTseCondary programs for sTudenTs wiTh inTelleCTual disabiliTies, year Two (2011–2012) • 39
ovErviEw oF StudEnt charactEriSticS
Student demographicsIn the 2011–2012 school year, 792 students attended TPSID
programs (across 42 sites). Of these, 318 students had also
attended the TPSID program in 2010-11, 474 students were
newly enrolled in Year Two. In 2011-12, 59% of students
were male and 41% female. The majority of students (74%)
were white and 18% were black or African American (Table
2). Nine percent of students were Hispanic or Latino. Both
women and minorities continued to be less present in TPSID
programs than in the general college population, in which 59%
were female, 39% were non-white, and 13% were Hispanic in
2010 (U.S. Department of Education, 2011). Students’ ages
ranged from 18 to 53 with a median age of 21. The vast
majority (90%) was between the ages of 18 and 28.
disabilityThe most common disabilities reported for TPSID students
in 2011–2012 were intellectual disability, autism, and
specific learning disability (Table 3). In fact, 95% of
enrolled students had an intellectual disability and/or
autism. The majority of students had more than one
reported disability, with 13% having three or more
disabilities. Among the 76 students not identified as
having ID, the most common disabilities were autism (24
students) and specific learning disability (15 students).
Previous Educational SettingWhen asked to describe students’ previous educational
setting, respondents indicated that the majority of
students had been partially included in general education
while in high school (Table 4). Partial inclusion includes
a wide range of possibilities from being in a segregated
classroom most of the time and only taking one or two
general education classes such as gym or art, to being
included in general education most of the time.
Student StatusAbout one quarter of TPSID students (24%) were dually
enrolled, i.e. receiving special education services from
a public school system while attending the TPSID. This
reflected a slight increase from the 21% dually enrolled in
Year One. Of those students who were no longer in high
school, most had received a standard diploma (Figure 1).
Table 2. race of ParTiciPaTing TPsid sTudenTs, 2011–2012
number PercenTwhite 588 74%
black or african american 141 18%
asian 33 4%
american indian or alaska native 9 1%
native hawaiian or other pacific islander 6 1%
This students race is unknown 24 3%
Table 3. mosT common sTudenT disabiliTies, 2011–2012 (n = 792)
number PercenTintellectual disability 716 90%
autism 184 23%
specific learning disability 104 13%
developmental delay 100 13%
other health impairment 95 12%
number PercenTfully included in general education curriculum in general education classes
118 15%
student spent part of their time in general education and part in special education
483 61%
not included in general education curriculum or classes/only in special education classes (e.g. life skills)
120 15%
don’t know 47 6%
other * 24 3%
*“other” responses include: home-schooled, private school, project search
Table 4. educaTional seTTing while in high school, 2011–2012 sTudenTs (n = 792)
figure 1. sTaTus of TPsid sTudenTs no longer in high school, 2011–2012 (n = 578)
Certificate of completion or attendance Standard diploma
Modified or special diploma
Dropped out
Other
GED or high school equivalency certificate
24%
53%
16%
2% 1%4%

40 • Think College naTional CoordinaTing CenTer
acadEmic accESSYouth with disabilities may experience structural and personal barriers to post-secondary enrollment that are not
experienced by their counterparts without disabilities (Butterworth, et al., 2012). Structural obstacles may include
campuses and campus communities that are not adequately designed to support the needs of individuals with disabilities.
Personal obstacles may include difficulty meeting entrance requirements and/or struggling to meet the demands of rigorous
academic programs without appropriate supports.
TPSIDs were charged with providing students with intellectual disability access to inclusive authentic college courses. To
meet this charge, TPSIDs provide access to a wide array of college courses, including inclusive courses attended by both
TPSID and typical college students and specialized courses attended only by TPSID students. Courses may be for-credit
or non-credit. The manner in which students enroll in these courses can include taking the course for credit, enrolling as a
non-credit student, auditing the course, or simply sitting in on a course.
course enrollments by tPSid studentsIn Year Two, 663 TPSID students enrolled in a total of 4,806 courses, an average of just over seven courses per student. A
majority of those course enrollments (53%) were in specialized courses, i.e. courses that were only attended by TPSID students.
The remaining 47% of course enrollments were in inclusive courses, i.e. attended by TPSID and other college students.
Figure 2 shows the enrollment methods used by students accessing inclusive and specialized courses in Year Two. A majority
of students in inclusive courses were enrolled for standard IHE credit (58%). In most specialized courses (86%), students
earned credit that could only be used towards the TPSID credential.
Slight increases are evident between Years 1 and 2 in terms of the numbers of courses student enrolled in as well as in the
levels of inclusive vs. specialized course access. These increases are trending in a positive direction. Yet the majority of courses
taken by TPSIDs students remain specialized in nature and the associated credits earned are not widely recognized by the
host IHE. As the TPSID programs are charged with ensuring access to courses attended by students in the typical college
Examples of inclusive courses taken by TPSID students in 2011-2012
» Art Appreciation: Northern Kentucky University » Automotive Assistant: Alamance Community College » Child, Family and Society: Highline Community College » Comparative Religion: University of North Florida » Cooperative Education: Highline Community College » English 1: Keuka College » Essential Reading and Math: Highline Community College » Figure Drawing: Roberts Wesleyan College » First Aid and Safety Education: Western Carolina University » History and Appreciation of Rock: University of North Florida » Introduction to Business: Keuka College » Leisure Studies: University of Iowa » Music In Your Life: University of South Florida St. Petersburg » Reading & Writing Workshop: Keuka College » Social Psychology: University of North Florida » Spanish I: Lynn University » Study Skills: Ohio State University » Tai Chi: Indiana University Purdue University Indianapolis » The University Experience: Western Carolina University » Weight Lifting and Conditioning: Indiana University Purdue University Indianapolis

annual reporT on The TransiTion and posTseCondary programs for sTudenTs wiTh inTelleCTual disabiliTies, year Two (2011–2012) • 41
student body, it appears that access to inclusive college courses remains a challenge for the grantees in this program. It is also
important to note that running a series of specialized courses only for TPSID students is a costly practice because each class
requires an instructor, classroom space, curriculum development, and other related supports. Overall, this practice does not
lend itself to sustainability.
In order to address the need for greater access to authentic inclusive courses the NCC has created a Special Interest Group on
Inclusion to facilitate communication between the grantees about effective strategies and to create a forum for discussing and
addressing challenges related to inclusive course access. The NCC has also provided onsite training and technical assistance to a
number of TPSIDs on strategies that promote greater access to inclusive courses such as Universal Design for Learning and the
role of tablet technology in creating greater access and success in courses. Finally, the NCC has also developed an online module
on Universal Design for Learning in Higher Education that will be available on the Think College website.
figure 2. course access by inclusiVe and sPecialized course enrollmenT sTaTus, 2011–2012
86%
1%
13%
0%
20%
58%
20%
2%
Credit that can only be used towards the TPSID credential
Enrolled for standard IHE credit
Audit or enrolled not for credit
Unofficially attending the course/sitting in
Credit that can only be used towards the TPSID credential
Enrolled for standard IHE credit
Audit or enrolled not for credit
Unofficially attending the course/sitting in
Spec
ializ
ed (N
umbe
r of
cour
se e
nrol
lmen
ts =
25
41)
Inclu
sive
(Num
ber o
fco
urse
enr
ollm
ents
=
2219
)
accommodationsAnother important component to academic access for students with disabilities is receiving necessary accommodations.
As can be seen in Figure 3, most accommodations received by TPSID students came from the TPSID program staff rather
than the Disability Services Office (DSO). The most common accommodations received were academic accommodations
such as access to professors’ notes, advance access to materials, alternative test formats, and modified assignments. Also
common were academic supports provided by individuals such as note takers, readers, and mentors, and enrollment
accommodations such as modified course loads, substitutes for “required” courses, and priority or early registration.
Use of information and assistive technology for accommodations was less common but had grown considerably (nearly
tenfold) since Year One.
Of those students who sought academic accommodations, 17% received those solely from the DSO, which is an increase
of 10% from Year One. The percentage of students who received academic accommodations from both the DSO and the
TPSID more than doubled between Years 1 and 2, reflecting an increased level of partnership and engagement with the
DSO by the TPSID programs. If the TPSID programs continue to support greater access to inclusive courses it is likely that
students will require increased supports from the DSO.

42 • Think College naTional CoordinaTing CenTer
figure 3. accommodaTions receiVed by TPsid sTudenTs, 2011–2012 (n = 792)
109
1947
19 11 3
405
331311
93 8668
99 102
57 46 4615
0
50
100
150
200
250
300
350
400
450
Academic accommodations
Other
DSO TPSID BOTH
Academic supports by individuals
Information technology
Assistive technology
Enrollmentaccommodations
credentials
Each TPSID program is required to create and offer a meaningful credential for students with intellectual disabilities upon
completion of the model program. In FY 2011–2012, most TPSIDs not in a planning year (35 out of 42) offered some type
of credential to students (Figure 4). Credentials could be either certificates or degrees and could be available either to TPSID
students only or to all students. Credentials could be granted by the hosting IHE, by the TPSID program, or by a partnering
local education agency (LEA). The most common credentials offered were certificates, with the largest number being
certificates available to TPSID students only but granted by the IHE. It was far more common for TPSIDs to offer specialized
credentials specifically for TPSID students than for them to offer credentials also available to other college students.
Similar to Year One, a majority of TPSID students (57%) sought the program’s meaningful credential in 2011–2012.
Another 7% were not seeking the credential, and 33% were enrolled in programs not offering a credential.
figure 4. credenTials offered by TPsid Programs, 2011–2012 (ToTal number of Programs = 42)
0
2
3
4
7
7
8
12
17
0 2 4 6 8 10 12 14 16 18
Associate's or bachelor's degree
Bachelor's degree available to all
Specialized certificate issued from LEA
Another credential not listed
Associate's degree available to all
Program does not offer a credential
Certificate available to all students
Specialized certificate granted by TPSID
Certificate for TPSID students granted by IHE

annual reporT on The TransiTion and posTseCondary programs for sTudenTs wiTh inTelleCTual disabiliTies, year Two (2011–2012) • 43
carEEr dEvEloPmEnt and EmPloymEntA primary goal of the TPSID program is facilitating career development and supports necessary for students to seek and
sustain integrated competitive employment. The benefits of integrated competitive employment include higher wages,
access to benefits, greater independence and economic self-sufficiency, greater integration with people without disabilities
in the workplace and the community, more opportunities for choice and self-determination, and expanded career options
and increased job satisfaction (Wehman & Scott, 2013).
Youth with ID have the lowest rates of education, work, or preparation for work after high school of all disability groups
(Migliore, Butterworth, & Hart, 2009). According to the American Community Survey, in 2010, young adults with
intellectual disabilities ages 22 to 30 were about half as likely to be employed as their peers with no disabilities (33%
compared to 73%). For those who are employed, wages and hours are also lower for youth with intellectual disabilities.
Career development for students with ID is essential for future job attainment and retention (Luecking & Fabian, 2000).
Identifying career goals; providing access to job coaches/developers; offering internships, service learning opportunities,
and paid work experiences; and connecting with service providers to sustain employment are just some of the steps that
TPSIDs are taking to propel their students toward gainful employment.
Each year, TPSIDs report information on the
paid employment experiences and unpaid career
development experiences in which students
participate. In Year Two, 66% of TPSID students
participated in some sort of career activity
whether it was paid employment, unpaid career
development, or both. Unfortunately, 35% of
TPSID students did not participate in any career
development activities.
Student Paid EmploymentOf the 792 students who attended TPSID programs in 2011–2012, 236 students (30%) held a total of 304 paid jobs.
Seventy-four of these jobs (24%) were ones the student also worked in during Year One, i.e. jobs that spanned both the
2010–11 and 2011–2012 academic years. There were 168 students who had one paid job, 59 students had two paid jobs,
and 9 students had three paid jobs in Year Two. During Year Two, 45% of students employed had never held a paid job
prior to entering the TPSID program.
Table 5. career deVeloPmenT acTiViTies among TPsid sTudenTs, 2011–2012 (n = 792)
counT PercenTpaid employment only 80 10%
unpaid career development only 282 36%
paid employment and unpaid career development 156 20%
no career development activities 274 35%
Total 792 100%
Stirling Peebles: On My Way to a Studio InternshipI was thrilled when I got an internship at WCAX Channel 3 News. I interviewed with the news director and the education reporter. The interview was intense, I showed them my resume and because I had experience, they gave me the intern position on the spot. Keith gave me a tour of the studio and showed me around the sets. He also introduced me to the staff in the newsroom.On my first day at WCAX I felt a little nervous and a little scared, but this did not last long. I got to know the ropes of what to do and what not to do. I got to watch the news live from the set at noon. Things only got better after the first day on the job. Since then I have gone on location, went on a real commercial shoot, and I have edited video footage. I totally enjoy working with the professionals who know their stuff inside and out. I get to share my knowledge and my experience with these incredible people. I spent a lot of time on the set with the anchorman and the weather guy. As I advance to a future career in the TV and film industry, I hope to use WCAX as a reference.I had mentor support at first, but eventually the mentor started to fade out. I will earn a professional certificate next December and my internship credits will count towards my professional certificate. Overall my internship has been very successful. I want to work for a studio someday and now I have hands- on experience and I’m on my way.
stirling peebles, pictured on right

44 • Think College naTional CoordinaTing CenTer
Employment First initiatives around the
country are emphasizing the importance of
seeing integrated competitive employment
as the first choice and goal for people with
intellectual disability (Niemiec, Lavin, & Owens,
2009). One critical outcome of enrollment in
a TPSID programs is integrated competitive
employment. It is encouraging that in the
second year of the program, individual jobs
accounted for more than half of the paid jobs
held by students (57%) and paid internships
(non-credit) accounted for 18% of the paid jobs
held by students (see Figure 5).
Of the jobs held by students 82% paid at or above minimum wage, 11% paid less than minimum wage, and wage status was
unknown for the remaining 8% of jobs. As reflected in Figure 6, four of the eight job types reported paid students above
minimum wage. All eight students working in sheltered workshops and the two students working at a group work training
site paid by stipend earned below minimum wage and most working in individual work training sites paid by stipend made
less than minimum wage. The majority of students (74%) worked between 5 and 20 hours per week at their job.
While the data on employment is trending in a positive direction it is still necessary to point out that integrated competitive
employment is a critical student outcome for the TPSID program. As a result, it is important to emphasize the need for
the TPSIDs to increase the number of students who have secured individual paid jobs at minimum wage or above and to
increase the number of hours of work per week for each student. Alternatively, even though the number is small, there are
TPSID students placed in sheltered work and group work training sites. These students must be given the opportunity to
secure integrated competitive employment both during and after their college experience.
figure 6. wage disTribuTion by Job TyPe, 2011–2012 (n = 281 Jobs*)
2%
40%
93%100% 100%
0% 11%
60%
14%
50%
83%
60%
7%
57%
39%
86%
50%
17%33%
0%
20%
40%
60%
80%
100%
Individual paid job (N=169)
Federal work-study (N=16)
Paid internship (for-credit) (N=4)
Paid internship (non-credit)
(N=54)
Group paid work (enclave or
mobile work crew) (N=7)
Individual work training site paid
by stipend (N=21)
Group work training site paid
by stipend (N=2)
Sheltered workshop
(N=8)
Job type not specified (N=0)
All jobs (N=281)
Below minimum wageMinimum wageAbove minimum wage
*Job records that are missing wage information are omitted from this chart.
figure 5. Paid Jobs held by TPsid sTudenTs, 2011–2012 (n = 304 Jobs)
173
4
54
7
21
2 819
16
Individual paid jobPaid internship (for-credit)Paid internship (non-credit)Group paid work (enclave or mobile work crew) Individual work training site paid by stipendGroup work training site paid by stipendSheltered workshopInformation missingFederal work-study

annual reporT on The TransiTion and posTseCondary programs for sTudenTs wiTh inTelleCTual disabiliTies, year Two (2011–2012) • 45
Job SupportsFor each paid job reported, respondents were
asked to report which supports, if any, were
received by a student at their paid job. Natural
supports and job coaching were the most
commonly used supports on the job (see Figure
7). If respondents indicated that a student
received job coaching as a support, they were
then asked a follow-up question about the
percentage of time a job coach was present at a
job. In the majority of instances where a student
received job coaching at their job, the job coach
was present for no more than 25% of the time.
Student unpaid career development activitiesIn addition to paid employment, TPSID students
also prepare for the workforce by participating
in unpaid career development activities. Over
half of the students enrolled in Year Two (56%)
participated in some form of career development
activities. The most common career development
activities were volunteering and/or community
service (27.8%) and unpaid internships that were
for- and non-credit bearing (16.7% each). Over
100 students participated in service learning
opportunities in Year Two. Given that one of
the primary outcomes TPSIDs are charged
with is to help students achieve integrated
competitive employment, the finding that 35%
of TPSID students are not engaged in any career
development activities demonstrates a need
for continued focus and development on the
employment focus of the TPSID programs.
figure 7. PercenT of Jobs where ParTicular Job suPPorTs were ProVided, 2011–2012 (n = 304 Jobs)
1%
1%
5%
22%
31%
52%
0% 10% 20% 30% 40% 50% 60%
Personal Care Assistant
Assistive technology
Other support
Off-site coaching/instruction
Job coaching
Natural supports
2%
8%
16%
17%
17%
28%
0% 5% 10% 15% 20% 25% 30%
Other unpaid experience
Unpaid individual work training sites
Service learning opportunities
Unpaid internships for credit
Unpaid internships not for credit
Volunteering and/or community service
figure 8. unPaid career deVeloPmenT eXPeriences, 2011–2012 (n = 792 sTudenTs)
Examples of paid jobs held by students in 2011-2012
» Public Relations Intern at a medical university » Museum Interpreter Intern at a historic foundation » Childcare assistant at a day care center » Library Assistant at a public library » Assistant Manager of a bakery and cafe » Secretary at an accounting firm » Teachers Assistant at a child development center » Office Aid at a middle school » Dietary Aide at an assisted living facility
» Box Office/ Stage Crew at a college theater department
» Childcare Intern at an early childhood development center
» General labor on an oilrig » Scout Leader with Boy Scouts of America » Special Events Staff at the Veterans of
Foreign Wars » Front desk worker at a chiropractic office

46 • Think College naTional CoordinaTing CenTer
SElF-dEtErminationTo facilitate the development of self-determination in students with intellectual disabilities, the TPSID programs focused
on student involvement in and control of the establishment of personal goals through use of person-centered planning,
academic advising, and family involvement. While some of the TPSIDs addressed self-determination in additional ways, the
following common measures on planning and advising, course selection, and family outreach reflect what was done across
each of the TPSID sites.
Planning and advising
Person-centered planningThe TPSIDs were required to use some type of person-centered planning (PCP) in the development of the course of study
for each student with an intellectual disability participating in the model project. This helped to ensure student involvement
in and control of their career and other personal goals.
In Year Two of the program, 93% of TPSIDs reported using PCP with participating students. Over half of TPSID programs
reported using a combination of PCP models in Year Two. Twenty-one percent were using PATH, and 18% were not using
a specific PCP model.
AdvisingThe role of academic advisors in college is to assist students to develop their course of study, establish a schedule and achieve
their academic goals. For students on a traditional college pathway toward a degree, academic advising is geared toward credit
accumulation, monitoring GPA, and advancing toward the desired degree. The role of the academic advisor in TPSIDs is
somewhat different as the majority of students in TPSID programs are seeking an alternative path rather than a degree.
In a national survey of other PSE programs, almost half (47%) of the respondents indicated that students received
academic advising from college faculty or staff in the same manner as other students (n=130) (Grigal et al., 2012). Forty-
four percent of TPSIDs (n=19) had a separate advising system specially designed only for TPSID students and administered
by TPSID staff. Twelve percent of TPSIDs reported using an existing academic advising office used by other college
students, and 37% used both the typical academic advising and advising provided by the TPSID program.
Becky*: Learning how to speak up and live a richer life
When Becky was in high school, staff and students knew her to be helpful, easy going, quiet, good at following
the rules and taking direction, and skilled in many areas of food preparation. But Becky didn’t like to answer
questions, take initiative, or express herself. When asked at that time what she did when she was not in school
(evenings, weekends, and summer break), Becky said, “I stay at home, watch TV, and sleep.” Unstructured
time was a challenge for her. While attending her TPSID program, Becky learned how to get around the entire
city on the public bus system, and became a much better communicator. She also learned how to manage
her personal schedule by making and keeping plans. These skills helped Becky to gain a great deal of self-
confidence. Her improved attitude also helped her to build a social life and gain career skills. Since completing
the program, Becky leads a busy life, far from the “stay at home, watch TV, and sleep” days. She is working
at a fast-food restaurant three mornings a week. After work and on days she does not work, Becky makes
plans and rides the bus to various places and activities with friends. She goes to the local YMCA to exercise
and recently discovered Zumba class. The downtown central library is one of her favorite spots for all that it
offers, including computer access. It is not unusual to run into Becky downtown, on her way to meet up with a
friend after work.
*Becky is a pseudonym

annual reporT on The TransiTion and posTseCondary programs for sTudenTs wiTh inTelleCTual disabiliTies, year Two (2011–2012) • 47
Again, it is important to note that using existing IHE structures and resources rather than creating separate “TPSID only”
structures does not lend itself to sustainability of the practice once the funding is no longer available. As a result, all TPSIDs
will be encouraged to use, in this case, existing student advising mechanisms that are in place for all other college students.
Enrollment MotivationAs shown in Figure 9, the most common motivation for course enrollment was that it was required for the TPSID
credential (54% of course enrollments), it was related to the student’s career goals (39%) or personal interests (38%), or
was required for a degree or certificate (33%). When compared to Year One, percentages in Figure 9 show a promising
shift in reasons for enrolling in a particular course. In Year One, the most common reason for enrolling in a course was
because it was related to a student’s personal interests. In Year Two, primary motivations shifted to “required for TPSID
credential” and “related to career goals” While taking a course that fulfills personal interests is a positive outcome, it is
important to see students enrolling in courses because they will lead to a credential and help further career opportunities
as these are expressed goals of the TPSID program.
figure 9. PercenTage of course enrollmenTs by reason for enrollmenT, 2011–2012 (n = 4806 course enrollmenTs)
5%
33%
38%
39%
54%
0% 10% 20% 30% 40% 50% 60%
Other reason
Required for degree/certificate
Related to personal interest
Related to career goals
Required for TPSID credential
Family outreach and involvement
Marketing and recruitment.Informing the families of potential students about the availability of the TPSID program is a vital aspect of sustainability. Too
often, families of transition-age youth with ID are not given sufficient information about available higher education options
from transition professionals (Martinez, Conroy, & Cerreto, 2012). Goals related to college or any kind of postsecondary
learning are often not included in a student’s IEP or transition plan (Grigal et al., 2011; Migliore & Domin, 2011; Papay et al.,
2011), and students are not supported to seek access to alternative pathways to college.
Out of 43 sites operating in Year Two, more than 50% of TPSIDs engaged in the following outreach activities to attract
students to their programs: TPSID marketing materials, presented to local schools (public, private, charter), a TPSID website,
participated in transition fairs, offered tours of the IHE, included information about the TPSID in general IHE marketing
materials, presentations at parent advocacy and support groups, and open houses at the TPSID. See Figure 10 for a more
detailed look, and a comparison of Year One and Year Two.

48 • Think College naTional CoordinaTing CenTer
Information shared with students’ families.
TPSIDs shared various kinds of information with family members of attending students. This included general information
about the IHE, transition information, and student specific information. More than 50% of TPSIDs offered students’ families
information about IHE related issues. In Year Two, TPSIDs offered information to family members about:
• available social activities (88%),
• the IHE code of conduct (76%),
• non-disability-related services (71%),
• disability laws that impact higher education and how they differ from IDEA (63%),
• disability-related services available at the IHE (68%),
• the Family Educational Rights and Privacy Act (FERPA) (66%), and
• financial aid (56%).
Most programs also shared student-specific information with parents. This included information about academics and social
and career development. Other transition-specific information was also shared with parents including:
• information on person-centered planning (81%),
• connections to agencies/service providers (85%), and
• employer/workplace expectations (63%).
figure 10. TyPes of ouTreach conducTed by TPsids To PoTenTial sTudenTs, 2010–11 and 2011–2012
TPSID marketing materials
Presentations to local schools (public, private,
charter)
TPSID website Participation in Transition Fairs Tours of TPSID
Include information
about TPSID in general IHE marketing materials
Presentations at parent
advocacy and support groups
Open houses at TPSID
Attendance at IEP meetings
Participation in Adult services/
CRP eventsOther
We do not do outreach to
potential students and
families
2010-11 81% 65% 60% 67% 53% 53% 63% 44% 47% 40% 14% 5%2011-12 83% 79% 76% 76% 71% 60% 57% 52% 43% 31% 14% 2%
0%
10%
20%
30%
40%
50%
60%
70%
80%
90%

annual reporT on The TransiTion and posTseCondary programs for sTudenTs wiTh inTelleCTual disabiliTies, year Two (2011–2012) • 49
camPuS mEmbErShiPTPSIDs were required to provide individual supports and services for the inclusion of students with intellectual disabilities
in extracurricular activities, and all other aspects of the IHE’s regular campus offerings. To facilitate campus membership for
students with intellectual disabilities, TPSIDs provided access to and supports for campus facilities and technology as well as
supports for participation in existing social organizations.
Social lifeFacilitating the development of social networks is key to providing a well-rounded college experience for students with ID.
Test et al. (2009) reviewed studies that have shown a strong association between greater social competence, increased
postsecondary educational participation, and improved employment outcomes after leaving high school.
In addition, possessing greater social skills may be associated with increased self-determination (Carter, Trainor, Owens,
Swedeen, & Sun, 2010). Supporting students in existing social organizations, giving them access to technology for social
communication, and engaging students without disabilities serving as natural supports in social activities all help provide a
well-rounded authentic college experience.
In 2011–2012, students participated in numerous social activities including going out with friends, attending events
on campus, and participating in clubs or student organizations (see Figure 11). The vast majority of TPSID students
participated in a variety of activities. Seven percent of students were reported as not participating in any social activities, an
increase from the 2% in 2010-11.
figure 11. sTudenTs’ social ParTiciPaTion, 2011–2012 (n = 792)
79
137
238
317
490
513
0 100 200 300 400 500 600
Other social activity*
Join Best Buddies (peer friendship organization)
Attend or participate in sporting events
Join clubs or community/student organizations
Attend organized event on campus
Go out with friends
*other social activities include church, spending time with friends and family, and volunteering.
All TPSIDs not in a planning year in 2011–2012 indicated that they facilitated or supported TPSID student participation in
campus social activities. TPSIDs used a variety of approaches to facilitate social participation, with the most common being
independent participation and facilitation by peer mentors or TPSID staff, and the least common being events organized by
TPSID students, staff, and/or peer mentors (Figure 12).

50 • Think College naTional CoordinaTing CenTer
figure 12. sTraTegies used To suPPorT ParTiciPaTion in social acTiViTies, 2011–2012 (n = 42)
2
22
22
27
37
38
40
0 5 10 15 20 25 30 35 40 45
Other
TPSID students organize
TPSID staff and/or peer mentors organize
Non-TPSID students facilitate
Peer mentors facilitate
TPSID staff facilitate
TPSID students independently participate
Most TPSIDs also had mechanisms to track social activities TPSID students were participating in on campus (Figure 13). The
most frequently used mechanism for doing so was student self-reporting, followed by staff and peer mentor monitoring.
figure 13. sTraTegies used To TracK ParTiciPaTion in social acTiViTies, 2011–2012 (n = 42)
residential life and accessIn order to facilitate integration with college
systems and practices, TPSIDs are encouraged
to provide access to college campus resources
for students such as inclusive and independent
living arrangements. Living in an integrated setting
contributes to a myriad of positive outcomes for
college students enhancing both their academic
performances and their personal and social
development (de Araujo & Murray, 2010; Flowers,
2004). In 2011–2012, the majority of TPSIDs
(24/42) were at IHEs that did not provide housing
to students. Of those that did offer housing, twelve
allowed TPSID students access to that housing and
six did not.
figure 14. on-camPus liVing siTuaTions, 2011–2012
59%
30%
2% 7%
2%
Residence hall or section where majority are non-TPSID studentsOff-campus apts where majority are non-TPSID studentsOn-campus apts where majority non-TPSID studentsOff-campus apts primarily for TPSID studentsResidence hall or section primarily for TPSID students
3
4
5
13
15
15
22
23
24
33
0 5 10 15 20 25 30 35 40
Other
We do not track participation in social
Check student organization membership
Regular review of students program plan
Scheduling system
Use of activity planners
As a follow-up to person-centered planning
Peer mentor monitoring
Staff monitoring
Student self report

annual reporT on The TransiTion and posTseCondary programs for sTudenTs wiTh inTelleCTual disabiliTies, year Two (2011–2012) • 51
The majority (64%) of 2011–2012 students lived
with family, a decrease from 2010-11 when 72% lived
with family. The remaining students were fairly evenly
divided among residences provided by the IHE or
TPSID (16%) and other residences not provided by
the IHE or TPSID (20%).
Most of the 122 students living in TPSID- or IHE-
provided housing lived in residence halls or off
campus apartments where most residents were non-
TPSID students (Figure 14). Just over half of those
living off-campus lived independently, a substantial
increase from the 34% living independently in 2010-
11. The remaining half were divided among several
living situations including supervised living, group
home, and “other” settings (Figure 15).
figure 15. off-camPus liVing siTuaTions, 2011–2012
IndependentGroup homeSupervised apartment or supported living
Other*Host family/foster care
53%
12%
11%
4%
20%
*”other” responses included family Care home, mentor-supported housing, independent living facility, and respite Care facility.
Most students not living with family received some sort of residential supports, most typically from intermittent or on-call
staff (47%), a residential assistant or advisor (29%), and/or a roommate/suitemate who received compensation (17%).
navigating campusTPSID students who lived on campus got to class by way of walking, driving, or bicycling (most likely by walking to class),
and/or by taking the campus bus. Students not living on campus most frequently relied on friends or family members for
transportation. Public transportation, para-transit, and taxis were common transportation modes for both groups (Table
6). Few students relied on TPSID staff, intellectual and developmental disability (IDD) agency transportation, or local
education agency transportation.
Table 6. how sTudenTs goT To camPus/class, 2011–2012 (n = 766)
sTudenTs liVing in ihe or TPsid housing (n = 122)
sTudenTs liVing elsewhere (n = 644)
exisTing TransporTaTion opTions
drives self /walks/rides bike 91% 32%
ihe transportation (campus bus) 36% 8%
public transportation or para-transit or taxi 62% 32%
friend or family member 10% 45%
Transportation provided by idd agency 0% 6%
program-speCifiC TransporTaTion opTions
lea provided transport 0% 11%
Tpsid staff 7% 7%
we do not know how this student gets to campus 1% 7%
This student does not go to campus 0% 1%
other* 1% 3%
*“other” responses include personal care worker, nurse, and residential services.

52 • Think College naTional CoordinaTing CenTer
Summary oF StudEnt Exit outcomESA total of 304 TPSID students exited their TPSID program in Year Two. A reason for exiting the program was provided
for a vast majority of these students (92%). Figure 16 summarizes the reasons for exit indicated by TPSID program staff
for Years 1 and 2. In Year Two, the most common reason for exit from the TPSID program was having completed the
TPSID program and earned a TPSID credential (29%). Nearly one-fifth of students who exited TPSID programs in Year
Two (18%) exited because they no longer wanted to attend the program suggesting TPSIDs may face challenges with
student retention and should explore strategies for keeping students in their program until completion. There were 16%
who exited after completing a degree or certificate program, a big increase from 2% in Year One. This may be because a
majority of the TPSIDs offer a two-year program and this was the second year.
The percent of students exiting TPSID programs that had “Other” listed as their reason for program exit increased from 15%
in Year One to over 25% in Year Two. TPSIDs provided clarification on why a student exited for many of the cases where
“Other” was selected. Reasons that came up frequently included students leaving to work or focus on finding work, students
not having the funding to continue attendance, students dropping out without providing a reason, and students aging out of
receiving school-age services. This last group was made up of dual enrollment students who also attended secondary school.
figure 16. reasons for eXiT from TPsid Programs, 2010-11 and 2011–2012
Completed TPSID program
and earned credential
Other reasonNo longer wanted to
attend program
Completed degree or certificate program
Transferred to another PSE
programHealth Reasons
Completed TPSID program
with no credential
Completed TPSID program
with no credential and transitioned to job placement
Did not have sufficient funds
to continue attending
Was dismissed from program
2010-11 (N = 136) 39% 15% 13% 2% 8% 0% 6% 10% 4% 1%2011-12 (N=304) 29% 27% 18% 16% 7% 4% 3% 2% 1% 1%
0%
10%
20%
30%
40%
credentials Earned by Students who Exited tPSid Programs in year twoJust over half the TPSID students (n=163) who exited a program in Year Two (54%) earned a credential when they exited.
This was down from 63% in Year One. Figure 17 shows the percentage of students who exited that earned each type of
credential in Years 1 and 2. In Year Two, a certificate specifically for TPSID students was the most common credential
earned followed by certificates available to TPSID and non-TPSID students which increased from 2% of students who
exited in Year One to 18.1% of students who exited in Year Two. This is a positive finding as it shows that TPSID students
can complete inclusive postsecondary education academic programs.

annual reporT on The TransiTion and posTseCondary programs for sTudenTs wiTh inTelleCTual disabiliTies, year Two (2011–2012) • 53
figure 17. credenTials earned by eXiTing TPsid sTudenTs, 2010-11 and 2011–2012
Did not earn a credential before exiting
Certificate specifically for TPSID students
Certificate available to TPSID and non-TPSID
studentsCertificate issued from LEA Another credential
Certificate or exit document granted by
TPSID program (Not the IHE)
Associate's or bachelor's degree available to TPSID and non-TPSID students
Associate's or bachelor's degree specifically for
TPSID students
2010-11 (N = 136) 37% 40% 2% 4% 11% 8% 0% 0%2011-12 (N = 304) 46% 25% 18% 4% 4% 3% 1% 0%
0%
5%
10%
15%
20%
25%
30%
35%
40%
45%
50%
Employment and career outcomes for Students who Exited tPSid Programs in year two
Nearly half of the TPSID students who exited
in Year Two (48%) were reported as having
a paid job, participating in unpaid career
development activities, or doing both at the
point when they exited the TPSID program.
This is a statistically significant increase from
Year One when 29% of those who exited
had a paid job and/or participated in unpaid
career development. There were 67 students
who were working in a paid job and 116
participated in some sort of unpaid career
development activities. Figure 18, reflects
that the majority of the paid jobs held by
students at exit were individual paid jobs
(82%). This finding indicates an increase in paid
employment at exit from Year One.
On average, students with paid employment
at exit worked 18 hours per week and earned
$7.89 per hour. Some TPSIDs indicated
Sample paid jobs held by TPSID students after program exit
» Receptionist at a community action organization
» Assistant manager of a restaurant
» Childcare assistant at a daycare center
» Park assistant at an arboretum
» Stable attendant at a farm
figure 18. Paid Jobs held by sTudenTs who eXiTed a TPsid Program, 2011–2012 (n = 67 Jobs)
82%
6%
4%4% 2% 1% 1%
Individual paid jobIndividual work training site (< minimum wage)Group paid work (enclave or mobile work crew)Sheltered workshopPaid internshipFederal work-studyGroup work training site (< minimum wage)

54 • Think College naTional CoordinaTing CenTer
that they were unable to reach some students to ask about employment at the point of program exit so it is possible
employment and career development information is under-reported. As these model demonstrations continue, it will
be imperative that TPSIDs continue to increase the number of students in integrated competitive employment and
the number of hours worked per week upon exiting the TPSID program.
tPSid Evaluation activitiesIn addition to participating in the evaluation conducted by the NCC, each TPSID has its own mechanisms for evaluating
its programs. While the data collection tool did not track individual evaluation activities, NCC staff has captured relevant
information about these evaluation strategies via our monthly cohort meetings and through the TPSID Program Evaluation
Special Interest Group. The evaluation tools being used by TPSIDs include but are not limited to:
• Assessment of students’ academic progress;
• Assessment of students’ career interests and progress;
• Goal Attainment Scaling to track students’ progress on goals;
• Assessments of students’ self-determination levels;
• Feedback forms for students, faculty, peer mentors, family members, TPSID staff, and employers of TPSID students;
• Interviews and meetings with students, peer mentors, and staff.
Of the 42 TPSID sites that were serving students in 2011–2012, 10 were already collecting follow-up data on students who
exited the TPSID program, 31 responded they were not yet collecting this data, and one responded “no.”
Of the 10 sites collecting follow-up data, six were collecting data for one year after students exited the program, one
was collecting data for two years after exit, and three were collecting five or more years’ data. Employment outcomes,
volunteer or community service activities, and living situation were the most commonly collected data. Fewer programs
collected measures of quality of life and postsecondary graduation rate (Table 7). None were collecting data on high
school graduation status.
Table 7. frequency and TyPe of follow-uP daTa collecTed by TPsid Programs, 2011–2012 (n = 10)
TyPe of daTa number of TPsids
Type of job 10
hours worked per week 8
Volunteer or community service activities 7
living situation 6
earnings 5
length of employment 4
Transfer to 2- or 4-year colleges and universities 4
social or community involvement measures 3
self-determination measures 3
independent living measures 3
Quality of life measures 2
postsecondary graduation rate 1

annual reporT on The TransiTion and posTseCondary programs for sTudenTs wiTh inTelleCTual disabiliTies, year Two (2011–2012) • 55
alignmEnt with collEgE and univErSity SyStEmS and PracticES
integration with the ihETPSID students followed the academic calendar used by the IHE at 95% of the reporting TPSIDs (n=42). The vast
majority of the TPSIDs (98%) indicated that they held TPSID students to the IHEs code of conduct and issued students
college or university ID cards. All the TPSIDs in Year Two issued a transcript. Almost two thirds of programs issued
regular transcripts.
use of campus resources As figure 19 demonstrates, there was a significant increase in reported use of campus facilities from the previous academic
year in every category. In Year Two, 52%-98% of TPSIDs stated that their students accessed all available campus resources.
figure 19. use of camPus resources by sTudenTs enrolled, 2010–11 and 2011–2012
0%
52%
57%
69%
64%
95%
93%
95%
98%
98%
17%
33%
37%
53%
57%
73%
73%
77%
83%
87%
0% 10% 20% 30% 40% 50% 60% 70% 80% 90% 100%
Students did not use any of these resources
Career services
Tutoring services
Registrar, bursar, or financial aid office
Health center/counseling services
Sports and recreational facilities or arts/cultural center
Computer lab/student IT services
Library
Bookstores
Student center or dining hall
2010/11
2011/12

56 • Think College naTional CoordinaTing CenTer
coordination and collaboration
External PartnershipsPartnerships with external organizations and collaboration with other entities and offices within an IHE are instrumental
in helping sustain TPSID programs. External organizations maintain expertise on serving transition-age youth in numerous
areas and partnerships with these organizations strengthen individual TPSID programs and increase their chances of attaining
successful outcomes for their students (Lindstrom, Flannery, Benz, Olszewski, & Slovic, 2009; GAO, 2012).
Strong external partnerships allow TPSIDs to take advantage of the knowledge, expertise, and practices of organizations
whose focus is relevant to TPSIDs and their students, (e.g., employment, residential services). This section summarizes
partnerships with TPSID sites in the 2011–2012 year and makes comparisons to partnerships in 2010-2011 when appropriate.
In Year Two, the 43 participating sites partnered with a total of 187 external organizations. On average, each TPSID
site partnered with around four external organizations (4.35). As we can see in Figure 20, the most common external
partnerships in Year Two were with vocational rehabilitation (VR) agencies and LEAs with over half of the TPSID sites
partnering with these organizations.
figure 20. TPsid ParTnershiPs wiTh eXTernal organizaTions, 2011–2012 (ToTal n = 43 TPsids)
0
1
1
1
1
1
2
2
3
4
6
6
8
8
8
11
11
12
19
20
30
32
0 5 10 15 20 25 30 35
Health and wellness orgs
Chambers of commerce/business councils
State department of labor
State or local ARC
Business Leadership Network (BLN)
One-Stop Career Centers
State department of health
Public transportation agency
Parent Training & Information Centers
Self-advocacy groups
Private foundations
Parent/family advocacy or support groups
DD councils
Other
State education agency
Employers
Other IHEs
Community Rehabilitation Provider(s)
UCEDDs
State IDD services agency
LEAs
Vocational rehabilitation
Figure 21 shows a matrix of external partners and roles played by external partners. Each cell in this figure contains a
symbol that shows the frequency with which external partners played particular roles when working with TPSIDs.
Looking across all roles played by external partners in Year Two, it appears that the two most common partner roles were
participating in the project advisory committee and providing direct service to TPSID students. More than half of the time the

annual reporT on The TransiTion and posTseCondary programs for sTudenTs wiTh inTelleCTual disabiliTies, year Two (2011–2012) • 57
figure 21. roles Played by eXTernal ParTners, 2011–2012 (ToTal n = 43 TPsids)
Team /
consortia member
serves as a consultant
Participates in project advisory
committee
Provides direct
service to students
Provides transpor-tation for students
Provides training to students
Provides training to
staff
Participates in PcP
Provides career
dev. / emp. opportunities for students
conducts recruitment / outreach
Provides instructional opportunities for students
other
Vocational rehabilitation (n=32)
3 3 4 4 2 2 2 3 4 3 2 2
leas (n=30) 2 3 4 4 3 3 2 4 3 4 3 2
state idd services agency (n=20)
3 3 3 3 2 2 2 3 2 2 1 1
UCEDDs (N=19) 4 3 ! 2 2 3 4 2 3 3 3 2
Community rehabilitation provider(s) (n=12)
2 3 3 ! 2 3 3 4 4 3 3 1
employers (n=11) 1 2 4 3 1 3 2 1 4 1 3 2
other ihes (n=11) 4 3 3 3 1 2 3 1 2 3 2 1
state education agency (n=8)
2 2 4 2 1 1 2 1 1 2 1 1
dd councils (n=8) 3 2 4 1 1 1 2 1 1 2 2 1
other (n=8) 2 4 4 3 2 2 2 3 4 3 2 2
parent/family advocacy or support groups (n=6)
3 4 3 1 1 1 1 1 1 3 1 1
private foundations (n=6) 2 2 2 2 1 2 2 2 2 2 3 3
self-advocacy groups (n=4) 2 3 4 3 1 2 3 1 2 3 3 2
parent Training & information Centers (n=3)
3 3 4 1 1 1 1 1 1 3 1 1
state department of health (n=2)
3 3 3 1 1 1 1 1 1 3 1 1
public transportation agency (n=2)
1 1 1 3 ! 1 1 1 1 1 1 1
Chambers of commerce/business councils (n=1)
1 ! 1 1 1 1 1 1 1 1 1 1
business leadership network (bln) (n=1)
1 1 ! 1 1 1 1 1 ! 1 1 1
state department of labor (n=1)
1 1 ! 1 1 1 1 1 1 1 1 1
one-stop Career Centers (n=1)
1 ! 1 1 1 1 1 1 1 1 1 1
state or local arC (n=1) ! ! ! ! ! ! ! ! ! ! ! 1
health and wellness orgs (n=0)
1 1 1 1 1 1 1 1 1 1 1 1
All Partnerships (N=187) 3 3 4 3 2 2 3 3 3 3 2 2
1 0% of partnerships 2 1-25% of partnerships 3 26-50% of partnerships 4 51-75% of partnerships !>75% of partnerships

58 • Think College naTional CoordinaTing CenTer
VR agencies that partnered with a TPSID site participated in the project advisory committee (63% of the time), provided
career development/employment opportunities for TPSID students (56%), and provided direct service to TPSID
students (53%).
LEA partners participated in person centered planning (PCP) and conducted recruitment/outreach 63% of the time,
participated in the project advisory committee 60% of the time, and provided direct services to students more than half of
the time. State IDD Services Agencies served a wide variety of functions when working with TPSIDs including participating
in PCP, serving as a consultant, providing direct service to TPSID students, being a team/consortia member (state or
regional), and participating in project advisory committees. All of these functions were served between 30 and 40% of the
time these agencies partnered with TPSIDs.
change in Partnerships across years one & twoAdditional analysis of external partnerships showed the
absolute number of TPSIDs partnering with each external
organization in Years One and Two is not necessarily indicative
of growth or shrinkage in partnerships with particular external
organizations from Year One to Year Two. The absolute
number of TPSIDs partnering with external organizations
contains different combinations of TPSID sites in each year.
Table 8 exemplifies this. For each external organization, TPSIDs
could partner in both years, Year One only, Year Two only,
or not partner with an organization in either year. The most
frequent organizations that TPSIDs partnered with in both years
were VR, LEAs, UCEDDs, and State IDD Services Agencies.
We observed that many TPSIDs who did not partner with
these organizations in Year One did so in Year Two. This is
likely because these are organizations that can serve students directly and in Year Two a number of TPSID sites that did not
serve students in Year One began serving students. There were 11 instances each where TPSID sites partnered with other
IHEs and State Education agencies in Year One, but not in Year Two. This could be due to the fact that these TPSIDs were
setting up their programs and getting assistance from these organizations to do this in Year One.
The Gift of Learning
The best gifts are the ones that stay with you forever.
The gift doesn’t necessarily have to be something you
unwrap, but to have the knowledge to grow and succeed
in life. A gift for me is to continue to learn and go back
to college. Getting into college was the best gift I have
had in my lifetime now. Being in my English class and
having a super great professor makes me happy and
excited. It’s like opening a present over and over again.
And it’s a magical gift that no one can ever take away
from me for a long time.
—Nicole Villemaire, 2nd Year TPSID Student Spring 2012
Sites With Professional Development Taken by TPSID Staff in Year Two (Total number of sites = 43)
» Software/information technology training (n = 30)
» Universal Design for Learning (n = 24)
» Diversity training (n = 24)
» Leadership training (n = 14)
» Academic advising (n = 13)
» Staff supervision training (n = 12)
» Career services (n = 11)
» Project management (n = 7)
» Other topics (n = 6)
nicole Villemaire, pictured on left

annual reporT on The TransiTion and posTseCondary programs for sTudenTs wiTh inTelleCTual disabiliTies, year Two (2011–2012) • 59
Table 8. eXTernal ParTnershiPs wiTh TPsid siTes across ProJecT years
ParTnered in boTh years 1 and 2 year one only year Two only
did noT ParTner wiTh organizaTion in
eiTher year
leas 22 4 8 10
Vocational rehabilitation 22 3 10 9
uCedds 12 5 7 20
state idd services agencies 11 2 9 22
Community rehabilitation provider(s) 7 4 5 28
other ihes 6 11 5 22
state education agency 5 11 3 25
employers 5 7 6 26
dd Councils 5 3 3 33
self-advocacy groups 4 1 0 39
parent/family advocacy or support groups 3 3 3 35
private foundations 3 2 3 36
parent Training information Centers 2 5 1 36
state department of labor 1 0 0 43
one-stop Career Centers 1 4 0 39
public transportation agency 1 3 1 39
Chambers of Commerce/business councils 0 0 1 43
business leadership network (bln) 0 2 1 41
health and wellness organizations 0 0 0 44
state department of health 0 0 2 42
state or local arC 0 1 1 42
other 0 6 5 32
Staff trainingTPSID staff coordinated and collaborated with offices internal and external to their IHE for the purposes of
professional development. In Year Two, 39 of 43 TPSID sites (91%) had staff who participated in professional
development available from their IHE. More than half of the TPSID sites had staff who attended professional
development on software/information technology training, Universal Design for Learning, and diversity. Three-
quarters of TPSID sites (77%) had staff who participated in professional development that was provided by an entity
external to the IHE. While this figure is high, this represents a 14% decrease in the percentage of TPSIDs that had
staff attend this type of training between Years One and Two. Similar to in Year One, two-thirds of the TPSID sites
provided or facilitated professional development in Year Two.

60 • Think College naTional CoordinaTing CenTer
SuStainabilityTPSIDs were required to include plans for the sustainability of the model program after the end of the grant period. In
most cases, this included exploring and engaging in funding mechanisms that were external to the grant funds.
Individual TPSIDs sought funding from a variety of sources. Accessing program funding from disparate sources supports
sustainability in the long term. TPSID program funding that does not stem from the Office of Postsecondary Education
grant sources are important because these funds will ensure TPSID programs will continue to be able to enroll students
after the five-year funding period is completed.
Funding from non-oPE SourcesIn Year Two, TPSIDs received financial support from a number of sources in addition to their OPE grant funds. Half
of the TPSID sites received funds from state VR agencies. Seventeen of the 43 programs serving students in Year One
(40%) received funding from family and students. TPSIDs also received support from human services agencies that serve
individuals with ID including LEAs (40%), and state IDD agencies (40%). It is promising to see that over one quarter of
TPSID sites received funds from individual or corporate donors, 10 programs received additional grant funds from private
foundations, and 8 received additional government grant funds.
figure 22. non-oPe sources of Program funding, 2011–2012 (n = 43 siTes)
1
2
4
5
8
8
10
12
15
16
17
22
28
0 5 10 15 20 25 30
Veterans Affairs funds
Don't use any of these sources
Funding from state budget
Other funding sources
Medicaid
Other government-funded grants
Private foundation grants
Individual and/or corporate donors
State IDD services agency funds
Local school districts
Student/Family funds
State VR agency funds
IHE resources
Sources of Funds for Student tuition and FeesTPSID students used a variety of funding sources to pay for their attendance at TPSID programs during Year Two, as
reflected in Figures 23 and 24. For both tuition and non-tuition expenses, private pay, i.e., personal funds, were most
commonly used to pay for attendance at TPSID programs. Forty-five percent of students enrolled in Year Two used private
pay for tuition and 60% used this source for non-tuition.

annual reporT on The TransiTion and posTseCondary programs for sTudenTs wiTh inTelleCTual disabiliTies, year Two (2011–2012) • 61
figure 23. funding sources used by sTudenTs To Pay TuiTion, 2011–2012 (n = 792 sTudenTs)
0%
.1%
.4%
3%
3%
3%
3%
4%
10%
12%
12%
15%
18%
45%
0% 5% 10% 15% 20% 25% 30% 35% 40% 45% 50%
National Service grants
State IDD Agency: HCBS Waiver funds
Tuition Waivers via VR or Social Security
Foundation/Private grant
State IDD agency: state or local funds
Private student loans
Local Education Agency
Social Security funds e.g. PASS plan
Scholarships
Tuition is waived
Other funding source
Federal/State grant
State VR agency funds
Private pay
figure 24. funding sources used by sTudenTs To Pay non-TuiTion eXPenses in 2011–2012 (n = 792 sTudenTs)
.3%
2%
3%
4%
5%
6%
6%
7%
9%
13%
20%
20%
60%
0% 10% 20% 30% 40% 50% 60% 70%
Tuition Waivers via VR or Social Security
Private student loans
National Service grants
Foundation/Private grant
Scholarships
Social Security funds e.g. PASS plan
State IDD Agency: HCBS Waiver funds
Other funding source
State IDD agency: state or local funds
Local Education Agency
Federal/State grant
State VR agency funds
Private pay

62 • Think College naTional CoordinaTing CenTer
The high percentage of private pay may be a double-edged sword.
It could be a reflection that many students are able to generate
the money needed to attend these TPSID programs without
relying wholly on outside sources. However, it could also reflect
that only students from families who have substantial financial
means are able to afford to go to the TPSID program. The
percentage of students who used Federal/State grant funds to
pay tuition and non-tuition expenses more than doubled between
Years One and Two, possibly reflecting the growth of programs
that were able to offer federal student aid.
Data from the National Center for Education Statistics (NCES)
indicated that 66% of all undergraduates in the United States
received some sort of financial aid in the 2007-08 year (Wei et al.,
2009). Forty-eight percent of students at two-year public schools
received some sort of aid during the year and just over 70% of undergraduates at public four-year schools received aid.
Most undergraduate students at private schools, between 80% and 98% depending on the type of private institution, e.g.
two- or four-year, private or not-for-profit, received some sort of aid.
Seven TPSIDs serving students in Year Two were approved to offer federal student aid, making it difficult to compare
information about TPSID student financing of education to the general U.S. undergraduate population.
As more TPSIDs seek to become approved as CTPs, this may address in part the financial disparity that is emerging in
these programs. Once a TPSID is approved as a CTP, it may offer eligible students with ID the chance to seek Federal Pell
and Supplemental Education Opportunity grant funds as well as work study funds. Also, it will be interesting to see if TPSID
student financing of education follows similar patterns to funding for all undergraduates in the U.S. in terms of financial aid.
cost of attendance for tPSid StudentsIn Year Two, TPSIDs were asked to provide information on what students pay to attend their programs and how charges
are structured. Programs were first asked whether or not they charge different rates for in-state and out-of-state students
and then asked to specify charges based on their response to that question.
Certain TPSIDs were unable to report charges because their charge structure did not fit into existing categories, e.g. some
TPSIDs charge a rate for in-county students. The NCC re-designed these questions to ensure all TPSIDs will be able to
respond in future years. Table 9, shows the average cost of attendance for TPSID students who attended two- and four-
year schools split by schools’ programs that charge the same rate for all students and programs that charge different rates
for in- and out-of-state students.
While the small sample size makes it difficult to make comparisons between different settings, it is not surprising to see that
costs for out-of-state students are more than costs for in-state students. Also, the annual cost of attendance for a program
at a two-year school was on average less than the annual cost of attendance at a four-year school. This follows general
trends for two-year and four-year programs for all undergraduates in the U.S. It is interesting to note that among programs
that charge the same rate to all students regardless of residential status, these tend to be the more expensive programs at
two-year schools and the less expensive programs at four-year schools.
TPSID sites operating in 2011–2012 approved as Comprehensive Transition Programs
» Appalachian State University
» California State University
» College of Charleston
» Kent State University
» Taft College
» The College of New Jersey
» Western Carolina University

annual reporT on The TransiTion and posTseCondary programs for sTudenTs wiTh inTelleCTual disabiliTies, year Two (2011–2012) • 63
Table 9. oVerall annual cosT of aTTendance for TPsid sTudenTs, 2011-2012 (# of siTes ProViding daTa in ParenThesis)*
aVerage annual cosT aT Two-year schools
aVerage annual cosT aT four-year schools
Charge same rate to all students (in- or out-of-state) $2,964 (6) $5,414 (10)
in-state students $1,982 (5) $11,041 (15)
out-of-state students $2,838 (2) $15,160 (7)
*responses were only included if cost > $0 per year.
TPSID sites were also asked whether they charge a comprehensive program fee or break charges out into more specific
categories. In Year Two, 10 of the 41 sites serving students (< 25%) charged a comprehensive fee that was all-inclusive.
Tuition charges were more common than required fees among schools that broke out charges into specific categories. This
represents a change from Year One when required fees were more common than tuition charges.
Room and board charges were less common than tuition and fees, but this is largely due to the fact that only 12 of 41 sites
serving students in Year Two (29%) offered residential options to TPSID program students.
Table 10. charges To TPsid sTudenTs aTTending Programs, 2011–2012 (# of siTes ProViding daTa in ParenTheses)*
charge sTrucTure
aVg. cosT To aTTend Program
ThaT charges comPrehensiVe
(all inclusiVe) fee
cosT To aTTend Programs ThaT breaK uP charges inTo comPonenTs
aVg. ToTal cosT To aTTend schools ThaT
breaK uP charges
aVg.TuiTion
aVg.required fees
aVg.room
aVg.board
Charges same rate to all students (in- or out-of-state)
$9,458 (3) $3,761 (10) $2,332 (9) $479 (6) -- --
in-state students $4,800 (1) $8,985 (19) $4,481 (18) $1,312 (12) $5,985 (6) $2,177 (4)
out-of-state students $5,500 (1) $13,287 (8) $11,630 (8) $1,434 (4) $7,359 (3) $2,925 (2)
*responses were only included if total cost > $0 per year. --no data reported in this category

64 • Think College naTional CoordinaTing CenTer
limitationSThe 27 TPSID model demonstration sites represent a unique subset of postsecondary programs serving individuals with
ID. The data collected by the TPSID National Coordinating Center is appropriate for evaluating these programs but does
not allow for an impact assessment of program activities as they relate to program and student outcomes. The data
collected by the NCC is a population file appropriate for describing TPSID model demonstration programs. The data does
not necessarily provide a representative sample of programs serving students with ID or students with ID who attend
postsecondary education programs for students with ID.
The Think College National Coordinating Center Program and Student instruments were developed via an iterative
process that involved input from NCC staff, experts on postsecondary education, and TPSID personnel, most of whom
were project directors or principal investigators (see Methods section for a description of the instrument creation).
Despite the NCC’s best efforts to develop questions and response choices to fit the needs of all TPSIDs, and to define
key terms in a way that allows for consistency across reporting sites, responses may be subject to respondent bias due to
different interpretations of program operations and student experiences in relation to the questions on the instrument.
While in many instances the NCC provides a text response field to allow respondents to report additional information,
some TPSIDs may have neglected to report information that would allow for better program evaluation.
Finally, Office of Management and Budget (OMB) approval for the system to be opened for data collection was given
to the NCC during Year Two of TPSID program funding. While the NCC advised all TPSID sites on data to collect in
preparation for the system to be opened for reporting, the OMB approval process resulted in many changes to items and
response choices on the instruments. It also substantially delayed the collection of Year One and Two data. It is possible
that these changes and delays impacted TPSID grantees’ management of data.

annual reporT on The TransiTion and posTseCondary programs for sTudenTs wiTh inTelleCTual disabiliTies, year Two (2011–2012) • 65
concluSionThe findings of this Annual Report demonstrate that the TPSID programs are making substantial progress toward their
goals. The development of new consortia partners as well as expanded access to inclusive courses and integrated paid
employment for TPSID students demonstrate some of the potential outcomes that can be achieved when effective
partnerships are established between institutes of higher education (IHEs) and LEA and state and regional agencies.
The TPSID programs described here have provided an unprecedented opportunity for 792 students with intellectual
disabilities (ID) to access college courses, participate in internships and integrated competitive employment, and engage
in the same social and personal development activities that other college students enjoy throughout the country. While
this report reflects progress, it also reflects that the long-term goals of the TPSID program have yet to be fully attained.
Continued efforts must focus on expanded inclusive course access, increased credential attainment, and an increase in the
number of students with ID who achieve integrated competitive employment both during their college experience and as
they exit from the TPSID program.
The establishment and expansion of these higher education options offered by the TPSID programs directly impact
students with and without disabilities, as well as IHE professionals who are directly involved with these initiatives. The
TPSID program also has the potential to impact students, families, educators, and other professionals outside of this new
network, who can learn by these examples. The TPSID programs provide a foundation upon which other IHEs can build
their intentions and capacity to serve students who reflect intellectual diversity. The program also serves as a model on
how IHEs can partner with LEAs or state agencies to creatively address the resources needed to achieve a shared goal of
higher learning for youth and adults with ID.
The TPSID program can impact the transition goals of students with ID, allowing students and families with college dreams
to point to these programs as proof that their high expectations are not unrealistic. The legacy of the investments made in
the TPSID program will exceed the sum of its parts. These programs serve as an emblem of possibility, demonstrating that
students with ID can be college students who can not only benefit from higher education but contribute to the evolution of
what higher education has the potential to be.

66 • Think College naTional CoordinaTing CenTer

annual reporT on The TransiTion and posTseCondary programs for sTudenTs wiTh inTelleCTual disabiliTies, appendiCes • 67
rEFErEncES
Bailey, D. (2012). Life Learning Is For everyone: the true Story of How South Carolina Came to be a Leader in Providing
opportunities for Postsecondary education to Young adults with Intellectual Disabilities: IUniverse
Butterworth, J., Hall, a.C., Smith, F. a., Migliore, a., winsor, J., Domin, D., & Sulewski, J. (2013). StateData: the national report on
employment services and outcomes. Boston, Ma: University of Massachusetts Boston, Institute for Community Inclusion.
Butterworth, J., Smith, F., a., Hall, a.C., Migliore, a., winsor, J., Domin, D., timmons, J.C. (2012). StateData: the national
report on employment services and outcomes. Boston, Ma: University of Massachusetts Boston, Institute for
Community Inclusion.
Carnevale, a.P., rose, S.J., & Cheah, B. (2011). The college payoff: Education, occupations, lifetime earnings. washington, DC:
Georgetown University Center on education and the workforce.
Carter, e. w., trainor, a., owens, L., Sweden, B., & Sun, Y.(2010). Self-determination prospects of youth with high incidence
disabilities. Journal of Emotional and Behavioral Disorders, 18, 67–81.
de araujo, P. & Murray, J. (2010). estimating the effects of Dormitory Living on Student Performance. the Center for applied
economics and Policy research resides in the Department of economics at Indiana University Bloomington. CaePr
working Paper #002-2010 retrieved from www.iub.edu/~caepr/rePec/PDF/2010/CaePr2010-002.pdf
Duncan, a. (2010, october 5). U.S. Secretary of Education Duncan announces $10.9 million in awards under new programs that
help students with intellectual disabilities transition to postsec- ondary education. retrieved from http://www.ed.gov/news/
press-releases/us-secretary-education-duncan-announces-109- million-awards-under-new-programs-he
Gao (2012). Students with Disabilities: Better Federal Coordination Could Lessen Challenges in the transition from High School. Government accountability office, washington, DC. July. retrieved from www.gao.gov/products/Gao-12-594
Grigal, M., & Hart, D. (2010). Think college! Postsecondary education options for students with intellectual disabilities. Baltimore,
MD: Brookes Publishing Company.
Grigal, M., Hart, D., & weir, C. (2012). a survey of postsecondary education programs for students with intellectual disabilities
in the United States. Journal of Policy and Practice in Intellectual Disabilities. Vol 9, 4 pp 223- 233.
Higher education opportunity act of 2008, Pub. L. No. 110–315 § 122 Stat. 3078 (2008).
Kleinert, H. L., Jones, M. M., Sheppard-Jones, K., Harp, B., & Harrison, e. M. (2012). Students with intellectual disabilities going to
college? absolutely! Teaching Exceptional Children, 44, 26–35.
Lindstrom, L. e., Flannery, K. B., Benz, M. r., olszewski, B., Slovic, r. (2009). Building employment training Partnerships
Between Vocational rehabilitation and Community Colleges. Rehabilitation Counseling Bulletin, april 2009, Vol. 52 Issue
3, p189-201, 13p.
Luecking, r., & Fabian, e. (2000). Paid internships and employment success for youth in transition. Career Development for
exceptional Individuals, 23, 205–221. Flowers, L. a. (2004). effects of Living on Campus on african american Students’
educational Gains in College. NASPA Journal, 41, 277-293.
Martinez, D. C., Conroy, J. w., & Cerreto, M. C. (2012). Parent involvement in the transition process of children with
intellectual disabilities: the influence of inclusion on parent desires and expectations for postsecondary education. Journal
of Policy and Practice in Intellectual Disabilities, 9, 279–288.

68 • Think College naTional CoordinaTing CenTer
Migliore, a. & Butterworth, J., Hart, D. (2009). Postsecondary education and employment outcomes for Youth with
Intellectual Disabilities. Fast Facts Series, No. 1. Boston, Ma: Institute for Community Inclusion.
Migliore, a., and Domin, D. (2011). Setting higher employment expectations for youth with intellectual disabilities. Data Note
Series, Data Note 34. Boston, Ma: University of Massachusetts Boston, Institute for Community Inclusion.
Newman, L., wagner, M., Cameto, r., Knokey, a. M., & Shaver, D. (2010). Comparisons across time of the outcomes of youth
with disabilities up to 4 years after high school: A report of findings from the National Longitudinal Transition Study-2 (NLTS2).
Menlo Park, Ca: SrI International. retrieved from: www.nlts2. org/reports/2010_09/nlts2_report_2010_09_complete.pdf
Niemiec, r., Lavin, D., & owens, L. (2009). establishing a national employment First agenda. Journal of Vocational Rehabilitation,
31, 139-144.
Papay, C., & Bambara, L. (2011). Postsecondary education for transition-age students with intellectual and other
developmental disabilities: a national survey. Education and Training in Autism and Developmental Disabilities, 46, 78–93.
raue, K., and Lewis, L. (2011). Students with disabilities at degree-granting postsecondary institutions (NCeS 2011–018). U.S.
Department of education, National Center for education Statistics. washington, DC: U.S. Government Printing office.
Snyder, t. D., & Dillow, S. a. (2010). Digest of education statistics 2009 (NCeS 2010-013, table 231). washington, DC: National
Center for education Statistics, Institute of education Sciences, U.S. Department of education.
test, D.w., Mazzotti, V.L. Mustian, a.L., Fowler, C.H., Kortering, L., & Kohler, P. (2009). evidenced-based predictors for improving
postschool outcomes for students with disabilities. Career Development for Exceptional Individuals Vol 32, 3 pp 160-181.
thacker, J., & Sheppard-Jones, K. (2011). research brief: Higher education for students with intellectual disabilities: a Study of
KY oVr counselors. Lexington, KY: University of Kentucky, Human Development Institute. retrieved from http://www.
hdi.uky.edu/SF/Files/ researchBrief_Summer2011.pdf
wei, C.C., Berkner, L., He, S., Lew, S., Cominole, M., and Siegel, P. (2009). 2007–08 National Postsecondary Student aid Study
(NPSaS:08): Student Financial aid estimates for 2007–08: First Look (NCeS 2009-166). National Center for education
Statistics, Institute of education Sciences, U.S. Department of education. washington, DC.
wehman, P. & Scott, L. (2013). applications for Youth with Intellectual Disabilities. In P. wehman (ed.), Life Beyond the
Classroom: Transition Strategies for Young People with Disabilites. Baltimore: Brookes Publishing.

annual reporT on The TransiTion and posTseCondary programs for sTudenTs wiTh inTelleCTual disabiliTies, appendiCes • 69
aPPEndicES
appendix a
The Transition and Postsecondary Programs for Students with Intellectual Disabilities (TPSID) 2010 Grantees
appendix b
Transition and Postsecondary Programs for Students with Intellectual Disabilities (TPSID) Government Performance and Results Act (GPRA) Measures
appendix c
Glossary of Terms
appendix d
Statutory Language and Definitions Pertaining to the TPSID Programs from the Higher Education Act of 1965 as amended by the Higher Education Opportunities Act of 2008

70 • Think College naTional CoordinaTing CenTer

annual reporT on The TransiTion and posTseCondary programs for sTudenTs wiTh inTelleCTual disabiliTies, appendiCes • 71
aPPEndix a
the transition and Postsecondary Programs for Students with intellectual disabilities (tPSid) 2010 grantees
state City College or university
ak anchorage university of alaska-anchorage
aZ Tucson university of arizona
Ca fresno California state university-fresno
Ca los angeles university of California at los angeles (uCla)
Ca Taft west kern Community College district
Co fort Collins Colorado state university
de newark university of delaware
fl st. petersburg university of south florida-st. petersburg
hi honolulu university of hawaii
in bloomington indiana university
ia iowa City university of iowa
ky lexington university of kentucky
la baton rouge louisiana state university
mn brainerd Central lakes College
ny rochester university of rochester
nJ paramus bergen Community College
nJ Trenton College of new Jersey
nC Cullowhee western Carolina university
nd minot minot state university
oh Columbus ohio state university
oh kent kent state university
sC Charleston College of Charleston
Tn knoxville university of Tennessee
Tx houston houston Community College
VT burlington university of Vermont and state agricultural College
Va richmond Virginia Commonwealth university
wa des moines highline Community College

72 • Think College naTional CoordinaTing CenTer

annual reporT on The TransiTion and posTseCondary programs for sTudenTs wiTh inTelleCTual disabiliTies, appendiCes • 73
aPPEndix b
transition and Postsecondary Programs for Students with intellectual disabilities (tPSid) government Performance and results act (gPra) measures
A grant recipient must use grant funds to
Establish a model comprehensive transition and postsecondary program for students with intellectual disabilities
that:
Serves students with intellectual disabilities;
Provides individual supports and services for the academic and social inclusion of students with intellectual
disabilities in academic courses, extracurricular activities, and other aspects of the IHE’s regular postsecondary
program;
Provides a focus on academic enrichment, socialization, independent living skills, including self- advocacy, and
integrated work experiences and career skills that lead to gainful employment;
Integrates person-centered planning in the development of the course of study for each student with an intellectual
disability participating in the model program;
Partners with one or more local educational agencies to support students with intellectual disabilities participating in
the model program who are still eligible for special education and related services under the IDEA;
Plans for the sustainability of the model program after the end of the grant period;
Creates and offers a meaningful credential for students with intellectual disabilities upon the completion of the
model program.
Priority to applicants that form a sustained and meaningful partnership with any relevant agency serving students
with intellectual disabilities, such as a vocational rehabilitation agency.
Priority to applicants that demonstrate that their institution of higher education provides institutionally owned or
operated housing for students attending the institution that integrate students with intellectual disabilities into the
housing offered to all students.
Priority to applicants that involve students attending the institution of higher education who are studying special
education, general education, vocational rehabilitation, assistive technology, or related fields in the model program.
This priority is: Applicants that demonstrate that the institution will use TPSID funds to extend or enhance an
existing program, rather to supplant other non-federal resources that are allocated to the program. Applicants
responding to this priority should describe any existing programs at their institutions, including the number and
characteristics of the students served, how well integrated students with intellectual disabilities are in regard to
academic courses, extracurricular activities and other aspects of the IHE’s regular postsecondary program, and
describe how the TPSID grant will build upon current efforts.

74 • Think College naTional CoordinaTing CenTer

annual reporT on The TransiTion and posTseCondary programs for sTudenTs wiTh inTelleCTual disabiliTies, appendiCes • 75
aPPEndix c
glossary of terms
504 PlanSpells out the modifications and accommodations that will be needed for students with disabilities to have an opportunity
to perform at the same level as their peers. It might include such things as wheelchair ramps, un-timed tests, electronically
formatted textbooks, preferential seating, or a digital recorder or laptop for taking notes.
AccommodationChanges in an environment to meet the access needs of an individual in accordance with the Americans with Disabilities
Act.
Americans with Disabilities Act (ADA)The ADA guarantees civil rights protections for persons with disabilities and protects them from discrimination on the
basis of disability.
ARCA national community-based organization advocating for and serving people with intellectual and developmental
disabilities and their families.
Assistive TechnologyTechnology that helps individuals to participate in activities as independently as possible. This can include “low
technology” (e.g., timers, Velcro, calculators) to more advanced technology (e.g., wheelchairs, computers, talkers).
AutismA developmental disability significantly affecting verbal and nonverbal communication and social interaction, generally
evident before age three, that adversely affects a child’s educational performance. Other characteristics often associated
with autism are engaging in repetitive activities and stereotyped movements, resistance to environmental change or
change in daily routines, and unusual responses to sensory experiences.
Community Rehabilitation Providers (CRPs)Local community organizations that provide services to adults with disabilities. Typically CRPs provide three main types
of day services: (a) employment services leading to integrated employment in the general labor market, (b) work
opportunities in a sheltered workshop with other workers with disabilities, or (c) non-work day activities in either a
program facility or in the community.
Comprehensive Transition Program (CTP)Degree, certificate, or non-degree programs for students with intellectual disabilities that:
• Are offered by a college or career school and approved by the U.S. Department of Education;
• Are designed to support students with intellectual disabilities who want to continue academic, career, and
independent living instruction to prepare for gainful employment;
• Offer academic advising and a structured curriculum; and
• Require students with intellectual disabilities to participate, for at least half of the program, in: regular enrollment in
credit-bearing courses with nondisabled students; auditing or participating (with nondisabled students) in courses for
which the student does not receive regular academic credit; enrollment in noncredit-bearing, non-degree courses with
nondisabled students, or internships or work-based training with nondisabled individuals.

76 • Think College naTional CoordinaTing CenTer
CredentialDocuments that prove a person’s achievements at an institute of higher education (e.g., transcripts or diplomas) or
competence/skills in a particular field (e.g., certificates).
DD CouncilsCouncils on Developmental Disabilities engage in advocacy, capacity building, and systemic change activities that are
consistent with the purpose of the DD Act; and contribute to a coordinated, consumer and family-centered, consumer
and family-directed, comprehensive system of community services, individualized supports, and other forms of assistance
that enable individuals with developmental disabilities to exercise self-determination, be independent, be productive, and
be integrated and included in all facets of community life.
Developmental delayFor children from birth to age three (under IDEA Part C) and children from ages three through nine (under IDEA Part B),
the term “developmental delay,” as defined by each state, means a delay in one or more of the following areas: physical
development; cognitive development; communication; social or emotional development; or adaptive (behavioral)
development.
Dual EnrollmentStudents with disabilities who are receiving special education transition services while also enrolling in a postsecondary
program. Students are typically between the ages of 18-22.
Enrollment accommodationModified course load, course substitute for “required” course, priority or early registration.
Federal Work Study (FWS)Program that provides funds that are earned through part-time employment to assist students in financing the costs of
postsecondary education. Hourly wages must not be less than the federal minimum wage.
FERPAThe Family Educational Rights and Privacy Act (FERPA) (20 U.S.C. § 1232g; 34 CFR Part 99) is a federal law that protects
the privacy of student education records. The law applies to all schools that receive funds under an applicable program
of the U.S. Department of Education. FERPA gives parents certain rights with respect to their children’s education
records. These rights transfer to the student when he or she reaches the age of 18 or attends a school beyond the high
school level. Students to whom the rights have transferred are “eligible students.”
Group paid workA group of individuals with disabilities working in a particular setting doing the same type of work (e.g., cleaning crew),
often making less than minimum wage. Also known as enclaves or mobile work crews.
Group work training siteA group work experience for the purpose of training that is not compensated under wage and hour regulations and does
not resemble an employment relationship.
Home and Community Based Services (HCBS) WaiverHome and Community-Based Services Waivers (1915[c] waivers) provide long-term supports to individuals who would
receive institutional care without a waiver. HCBS waivers were created by the Omnibus Reconciliation Act of 1981 (P.L.
97-35) as a way for states to provide long-term care in the community rather than in institutions, and provide states with
the flexibility to design a menu of supports that lead to community inclusion and participation.

annual reporT on The TransiTion and posTseCondary programs for sTudenTs wiTh inTelleCTual disabiliTies, appendiCes • 77
Individuals with Disabilities Education Act (IDEA)The Individuals with Disabilities Education Act (IDEA) is the United States’ federal special education law that ensures
public schools serve the educational needs of students with disabilities. IDEA requires that schools provide special
education services to eligible students as outlined in a student’s Individualized Education Program (IEP). IDEA also
provides very specific requirements to guarantee a Free Appropriate Public Education (FAPE) for students with disabilities
in the least restrictive environment (LRE).
Individualized Education Program (IEP)Written document that is developed for each public school child who is determined eligible to receive special education
services. The IEP is created through a team effort and reviewed at least once a year.
Individual paid jobA person works in the competitive labor market and receives at least minimum wage paid by the employer directly
related to the work performed.
Individual work training siteAn individual work experience for the purpose of training that is not compensated under wage and hour regulations and
does not resemble an employment relationship.
Institute of Higher Education (IHE)An institution that provides education beyond the secondary level, e.g., an accredited college or university.
Intellectual disability (ID)A disability characterized by significant limitations both in intellectual functioning and in adaptive behavior, which covers
many everyday social and practical skills. This disability originates before the age of 18.
Job coachingUse of structured intervention techniques to help the employee learn and perform job tasks to the employer’s
specifications and to learn the interpersonal skills necessary to be accepted as a worker at the job site and in related
community contacts.
Local Education Agencies (LEAs)A public board of education or other public authority legally constituted within a state for either administrative control
or direction of, or to perform a service function for, public elementary schools or secondary schools in a city, county,
township, school district, or other political subdivision of a state, or of or for a combination of school districts or
counties that is recognized in a state as an administrative agency for its public elementary schools or secondary schools.
MedicaidA government insurance program for persons of all ages whose income and resources are insufficient to pay for health
care. Medicaid is state-administered and financed by both the states and the federal government.
Natural supportsNatural supportive relationships that are fostered and developed among individuals with disabilities and non-disabled co-
workers, classmates, activity participants, neighbors, etc.
Office of Postsecondary Education (OPE)Federal office that formulates federal postsecondary education policy and administers programs that address critical
national needs to increase access to quality postsecondary education.
78 • Think College naTional CoordinaTing CenTer
One-Stop Career Centers (American Job Centers)Federally sponsored community centers created to serve individuals seeking employment.
Paid internshipA paid supervised work or service experience where the individual has intentional learning goals and reflects actively on
what he or she is learning throughout the experience.
ParatransitTransportation service for people with disabilities that supplements larger public transit systems by providing
individualized rides without fixed routes or timetables.
Planning Alternative Tomorrows with Hope (PATH)PATH is a planning tool that has team members start by imagining and then detailing the future that the focus person aspires
to. The team then works backward to what they consider should be the first steps towards achieving the future envisioned.
Person-Centered Planning (PCP)Planning that focuses on the individual and his/her interests, strengths, and needs. There are numerous models of this
type of planning available (e.g., Whole Life Planning, MAPS, Essential Lifestyles Planning, COACH).
Personal Futures Planning (PFP)PFP employs an on-going process in which planning teams replace system-centered methods with person-centered
methods. This process is meant to encourage the focus person and those working with them to become aware of the
potential for the focus person to become an integral, contributing member of the community.
Plans for Achieving Self Support (PASS)Work incentive policy which allows a person with a disability to set aside otherwise countable income and/or resources
for a specific period of time in order to achieve a work goal.
Self-advocacySelf-advocacy means that individually or in groups, people with disabilities speak or act on behalf of themselves or others
on behalf of issues that affect people with disabilities.
Self-determinationThe skills needed to understand and address one’s wants and needs through decision-making, problem solving, and goal
setting.
Service learningEducational model in which learning opportunities are derived from structured service activities rather than traditional
classrooms.
Sheltered workshopEmployment in a facility where most people have disabilities, where some individuals may earn a sub-minimum wage and
receive continuous job-related supports and supervision.

annual reporT on The TransiTion and posTseCondary programs for sTudenTs wiTh inTelleCTual disabiliTies, appendiCes • 79
Specific learning disabilityA disorder in one or more of the basic psychological processes involved in understanding or in using language,
spoken or written, that may manifest itself in the imperfect ability to listen, think, speak, read, write, spell, or to do
mathematical calculations. The term includes such conditions as perceptual disabilities, brain injury, minimal brain
dysfunction, dyslexia, and developmental aphasia. The term does not include learning problems that are primarily the
result of visual, hearing, or motor disabilities; of intellectual disability; of emotional disturbance; or of environmental,
cultural, or economic disadvantage.
State Education Agencies (SEAs)The state-level government agencies within each U.S. state responsible for providing information, resources, and
technical assistance on educational matters to schools and residents.
State IDD Services AgenciesThe state agency or department that funds and manages services for individuals with intellectual and developmental
disabilities.
Transition-age youthAccording to IDEA 2004, the legal definition of transition aged youth is:
(VIII) beginning not later than the first IEP to be in effect when the child is 16, and updated annually thereafter--(aa)
appropriate measurable postsecondary goals based upon age appropriate transition assessments related to training,
education, employment, and, where appropriate, independent living skills;
(bb) the transition services (including courses of study) needed to assist the child in reaching those goals; and
(cc) beginning not later than 1 year before the child reaches the age of majority under State law, a statement that the
child has been informed of the child’s rights under this title, if any, that will transfer to the child on reaching the age of
majority under section 615(m).
Universal Design for LearningA scientifically valid framework for guiding educational practice that (a) provides flexibility in the ways information is
presented, in the ways students respond or demonstrate knowledge and skills, and in the ways students are engaged; and
(b) reduces barriers in instruction, provides appropriate accommodations, supports, and challenges, and maintains high
achievement expectations for all students, including students with disabilities and students who are limited English proficient.
University Centers for Excellence in Developmental Disabilities (UCEDDs)Originally created to serve people with developmental disabilities, UCEDDs are a resource for Americans with a wide
range of disabilities. Each UCEDD is affiliated with a major research university and serves as a resource for all people in
the areas of education, research, and service relative to the needs of people with developmental disabilities.
Vocational rehabilitation (VR) agenciesThis program provides grants to states to support a wide range of services designed to help individuals with disabilities
prepare for and engage in gainful employment consistent with their strengths, resources, priorities, concerns, abilities,
capabilities, interests, and informed choice. Eligible individuals have a physical or mental impairment that results in
a substantial impediment to employment, who can benefit from VR services for employment, and who require VR
services. Priority must be given to serving individuals with the most significant disabilities if a state is unable to serve all
eligible individuals.

80 • Think College naTional CoordinaTing CenTer

annual reporT on The TransiTion and posTseCondary programs for sTudenTs wiTh inTelleCTual disabiliTies, appendiCes • 81
aPPEndix d
Statutory language and definitions Pertaining to the tPSid Programs from the higher Education act of 1965 as amended by the higher Education opportunities act of 2008
(Sections 766-769, 20 USC 1140f-1140i)
Institution of Higher Education. For purposes of this Act, other than title IV, the term `institution of higher education’
means an educational institution in any State that--
(1) admits as regular students only persons having a certificate of graduation from a school providing secondary education,
or the recognized equivalent of such a certificate or persons who meet the requirements of section 484(d)(3);
(2) is legally authorized within such State to provide a program of education beyond secondary education;
(3) provides an educational program for which the institution awards a bachelor’s degree or provides not less than a 2-
year program that is acceptable for full credit toward such a degree or awards a degree that is acceptable for admission to
a graduate or professional degree program, subject to review and approval by the Secretary;
(4) is a public or other nonprofit institution; and
(5) is accredited by a nationally recognized accrediting agency or association, or if not so accredited, is an institution that
has been granted preaccreditation status by such an agency or association that has been recognized by the Secretary for
the granting of pre accreditation status, and the Secretary has determined that there is satisfactory assurance that the
institution will meet the accreditation standards of such an agency or association within a reasonable time.
(b) ADDITIONAL INSTITUTIONS INCLUDED.—For purposes of this Act, other than title IV, the term ‘‘institution of
higher education’’also includes—
(1) any school that provides not less than a 1-year program of training to prepare students for gainful employment in a
recognized occupation and that meets the provision of paragraphs (1), (2), (4), and (5) of subsection (a); and
(2) a public or nonprofit private educational institution in any State that, in lieu of the requirements in subsection (a)(1),
admits as regular students individuals—
(A) who are beyond the age of compulsory school attendance in the State in which the institution is located; or
(B) who will be dually or concurrently enrolled in the institution and a secondary school.
(Sec 101. General Definition of an Institution of Higher Education (http://frwebgate.access.gpo.gov/cgi-bin/getdoc.
cgi?bname=110_cong_public_laws&docid=f:publ315.110)).
Person Centered Planning (PCP). Person Centered Planning is a way of helping people to think about what they want now
and in the future. It is about supporting people to plan their lives, work towards their goals and get the right support. It is a
collection of tools and approaches based upon a set of shared values that can be used to plan with a person - not for them.
Planning should build the person’s circle of support and involve all the people who are important in that person’s life.
Person Centered Planning is built on the values of inclusion and looks at what support a person needs to be included and
involved in their community. Person centered approaches offer an alternative to traditional types of planning which are
based upon the medical model of disability and which are set up to assess need, allocate services and make decisions for
people www.inclusive-solutions.com/pcplanning.asp).

82 • Think College naTional CoordinaTing CenTer
Student with an Intellectual Disability. The term ‘student with an intellectual disability’ means a student—
(A) with mental retardation or a cognitive impairment, characterized by significant limitations in—
(i) intellectual and cognitive functioning; and
(ii) adaptive behavior as expressed in conceptual, social, and practical adaptive skills; and
(B) who is currently, or was formerly, eligible for a free appropriate public education under the Individuals with
Disabilities Education Act (section 760 (20 U.S.C. 1140 sec 760 (2) http://frwebgate.access.gpo.gov/cgi- bin/getdoc.
cgi?dbname=110_cong_public_laws&docid=f:publ315.110.pdf ).
Comprehensive transition and postsecondary program for students with intellectual disabilities (section 760(1) of the
HEA).
The term “comprehensive transition and postsecondary program for students with intellectual disabilities” means a degree,
certificate, or nondegree program that meets each of the following:
(A) Is offered by an institution of higher education.
(B) Is designed to support students with intellectual disabilities who are seeking to continue academic, career and technical,
and independent living instruction at an institution of higher education in order to prepare for gainful employment.
(C) Includes an advising and curriculum structure.
(D) Requires students with intellectual disabilities to participate on not less than a half-time basis as determined by the
institution, with such participation focusing on academic components, and occurring through one or more of the following
activities:
(i) Regular enrollment in credit-bearing courses with nondisabled students offered by the institution.
(ii) Auditing or participating in courses with nondisabled students offered by the institution for which the student does
not receive regular academic credit.
(iii) Enrollment in noncredit-bearing, nondegree courses with nondisabled students.
(iv) Participation in internships or work-based training in settings with nondisabled individuals.
(E) Requires students with intellectual disabilities to be socially and academically integrated with non-disabled students to
the maximum extent possible.

Notes

Institute for Community InclusionUniversity of Massachusetts Boston
Copyright © 2022 FDOKUMEN