Theta activity in the waking EEG is a marker of sleep propensity in the rat
8
Research Report Theta activity in the waking EEG is a marker of sleep propensity in the rat Vladyslav V. Vyazovskiy 1 , Irene Tobler * Institute of Pharmacology and Toxicology, University of Zurich, Winterthurerstr., 190 CH-8057 Zurich, Switzerland Accepted 10 May 2005 Available online 22 June 2005 Abstract In humans, EEG power in the theta frequency band (5 – 8 Hz) during quiet waking increases during sleep deprivation (SD), and predicts the subsequent homeostatic increase of sleep slow-wave activity (SWA; EEG power between 0.5 and 4.0 Hz). These findings indicate that theta power in waking is an EEG variable, which reflects the rise in sleep propensity. In rodents, a number of short sleep attempts, as well as SWA in the waking EEG increase in the course of SD, but neither variable predicts the subsequent homeostatic increase of EEG SWA during recovery sleep. To investigate whether there is an EEG marker for sleep propensity also in rodents, the EEG of the rat was recorded during 6 h SD in the first half of the light period (SDL, n = 7). During SDL, power of the waking EEG showed an increase in the delta (1.5 – 4 Hz) and low theta (5 – 6.5 Hz) band. Based on the neck muscle EMG, wakefulness was subdivided into active (high EMG activity) and quiet (low EMG activity) waking. During quiet waking, the theta peak occurred at 5.5 Hz, the frequency at which the increase of EEG power during SD was most pronounced. This increase was due to higher amplitude of theta waves, while wave incidence (frequency) was unchanged. Correlation analysis showed that the rise in EEG power in the 5– 7 Hz band during SD predicted the subsequent enhancement of SWA in non-rapid eye movement sleep. The analysis of data of a further batch of rats which were sleep deprived for 6 h after dark onset (SDD, n = 7) revealed a significant increase in theta-wave amplitude during the SD and a tendency for a similar, positive correlation between the increase of theta power (5–7 Hz) and subsequent SWA. The results indicate that in rats, as in humans, a specific waking EEG frequency, i.e., theta power in quiet waking is a marker of sleep propensity. D 2005 Elsevier B.V. All rights reserved. Theme: Neural basis of behavior Topic: Biological rhythms and sleep Keywords: Theta EEG activity; Waking EEG; Sleep homeostasis; Sleep regulation; EMG; Behavior 1. Introduction Sleep propensity rises progressively during waking and declines monotonically during sleep. The level of EEG slow- wave activity (SWA; EEG power between 0.5 and 4.0 Hz) increases proportionally to the duration of prior wakefulness, and thus reflects the homeostatic aspect of sleep regulation [5,11,26]. This fundamental property of sleep has been demonstrated for a wide variety of different species [6,25]. In the two-process model of sleep regulation, the time course of the rise of the homeostatic Process S was derived from the level of SWA in non-rapid eye movement (NREM) sleep preceding and following a waking episode [1,5]. In humans, a marker of Process S was identified also in the waking EEG. Thus, an increase of delta or theta power occurred in the course of wakefulness [2,3,9,12,22,28]. Further evidence for a link between theta activity in the waking EEG and sleep homeostasis was provided by a between-subject correlative study [12]. The rate of increase of theta power during 40 h of waking correlated positively with the increase of SWA in NREM sleep. Moreover, theta 0006-8993/$ - see front matter D 2005 Elsevier B.V. All rights reserved. doi:10.1016/j.brainres.2005.05.022 Abbreviations: ANOVA, analysis of variance; EEG, electroencephalo- gram; EMG, electromyogram; NREM, non-rapid eye movement; SEM, standard error of the mean; SD, sleep deprivation; SDL, sleep deprivation in the light period; SDD, sleep deprivation in the dark period; SWA, slow- wave activity * Corresponding author. Fax: +41 01 635 57 07. E-mail address: [email protected] (I. Tobler). 1 Present address: University of Wisconsin-Madison, Psychiatric Institute and Clinics, 6001 Research Park Blvd., Madison, WI 53719, USA. Brain Research 1050 (2005) 64 – 71 www.elsevier.com/locate/brainres
Transcript of Theta activity in the waking EEG is a marker of sleep propensity in the rat
www.elsevier.com/locate/brainres
Brain Research 1050
Research Report
Theta activity in the waking EEG is a marker of sleep propensity in the rat
Vladyslav V. Vyazovskiy1, Irene Tobler*
Institute of Pharmacology and Toxicology, University of Zurich, Winterthurerstr., 190 CH-8057 Zurich, Switzerland
Accepted 10 May 2005
Available online 22 June 2005
Abstract
In humans, EEG power in the theta frequency band (5–8 Hz) during quiet waking increases during sleep deprivation (SD), and predicts
the subsequent homeostatic increase of sleep slow-wave activity (SWA; EEG power between 0.5 and 4.0 Hz). These findings indicate that
theta power in waking is an EEG variable, which reflects the rise in sleep propensity. In rodents, a number of short sleep attempts, as well as
SWA in the waking EEG increase in the course of SD, but neither variable predicts the subsequent homeostatic increase of EEG SWA during
recovery sleep. To investigate whether there is an EEG marker for sleep propensity also in rodents, the EEG of the rat was recorded during 6
h SD in the first half of the light period (SDL, n = 7). During SDL, power of the waking EEG showed an increase in the delta (1.5–4 Hz) and
low theta (5–6.5 Hz) band. Based on the neck muscle EMG, wakefulness was subdivided into active (high EMG activity) and quiet (low
EMG activity) waking. During quiet waking, the theta peak occurred at 5.5 Hz, the frequency at which the increase of EEG power during SD
was most pronounced. This increase was due to higher amplitude of theta waves, while wave incidence (frequency) was unchanged.
Correlation analysis showed that the rise in EEG power in the 5–7 Hz band during SD predicted the subsequent enhancement of SWA in
non-rapid eye movement sleep. The analysis of data of a further batch of rats which were sleep deprived for 6 h after dark onset (SDD, n = 7)
revealed a significant increase in theta-wave amplitude during the SD and a tendency for a similar, positive correlation between the increase
of theta power (5–7 Hz) and subsequent SWA. The results indicate that in rats, as in humans, a specific waking EEG frequency, i.e., theta
power in quiet waking is a marker of sleep propensity.
D 2005 Elsevier B.V. All rights reserved.
Theme: Neural basis of behavior
Topic: Biological rhythms and sleep
Keywords: Theta EEG activity; Waking EEG; Sleep homeostasis; Sleep regulation; EMG; Behavior
1. Introduction
Sleep propensity rises progressively during waking and
declines monotonically during sleep. The level of EEG slow-
wave activity (SWA; EEG power between 0.5 and 4.0 Hz)
increases proportionally to the duration of prior wakefulness,
0006-8993/$ - see front matter D 2005 Elsevier B.V. All rights reserved.
doi:10.1016/j.brainres.2005.05.022
Abbreviations: ANOVA, analysis of variance; EEG, electroencephalo-
gram; EMG, electromyogram; NREM, non-rapid eye movement; SEM,
standard error of the mean; SD, sleep deprivation; SDL, sleep deprivation in
the light period; SDD, sleep deprivation in the dark period; SWA, slow-
wave activity
* Corresponding author. Fax: +41 01 635 57 07.
E-mail address: [email protected] (I. Tobler).1 Present address: University of Wisconsin-Madison, Psychiatric Institute
and Clinics, 6001 Research Park Blvd., Madison, WI 53719, USA.
and thus reflects the homeostatic aspect of sleep regulation
[5,11,26]. This fundamental property of sleep has been
demonstrated for a wide variety of different species [6,25].
In the two-process model of sleep regulation, the time
course of the rise of the homeostatic Process S was derived
from the level of SWA in non-rapid eye movement (NREM)
sleep preceding and following a waking episode [1,5]. In
humans, a marker of Process S was identified also in the
waking EEG. Thus, an increase of delta or theta power
occurred in the course of wakefulness [2,3,9,12,22,28].
Further evidence for a link between theta activity in the
waking EEG and sleep homeostasis was provided by a
between-subject correlative study [12]. The rate of increase
of theta power during 40 h of waking correlated positively
with the increase of SWA in NREM sleep. Moreover, theta
(2005) 64 – 71
V.V. Vyazovskiy, I. Tobler / Brain Research 1050 (2005) 64–71 65
activity in the waking EEG paralleled subjective sleepiness
[2,12,15,20,21,24].
In animals, an EEG correlate for sleep pressure during
waking has not been reported. Rodents exhibit a variety of
waking behaviors including active exploration and quies-
cence with low locomotion. These differences in behavior
are reflected in the EEG [29]. During active waking,
associated with voluntary movements, the EEG is
desynchronized, dominated by fast frequencies and regular
theta activity, while quiet waking is characterized by a
mixed pattern with slower waves [14,16,29].
The changes in arousal level and EEG activity are
interrelated because both depend on the tonic depolarizing
input from the brainstem [18,23]. Several neurotransmitters
play a major role in the ‘‘arousal brain system’’ [18]. The
neurons comprising the ascending reticular activating sys-
tem, as well as thalamocortical neurons, use glutamate as a
transmitter; pontomesencephalic neurons use acetylcholine,
while locus coeruleus neurons, projecting in a diffuse manner
from the brainstem to the entire forebrain, are adrenergic [18].
Activation of these nuclei results in the blockage of
synchronized low-frequency oscillations in the thalamocort-
ical system that are typical for NREM sleep, and in the
generation of fast activity, typical for wakefulness [23].
We hypothesized that an increase of sleep propensity
could be manifested in the EEG during quiet wakefulness
also in rodents in the course of prolonged wakefulness. To
test this hypothesis, we subdivided the waking epochs during
a 6-h sleep deprivation (SD) into quiet waking and active
waking on the basis of EMG activity, analyzed the changes in
the power spectrum, and investigated whether the changes
were related to the increase of SWA during recovery sleep.
2. Materials and methods
2.1. Animals
The local governmental commission for animal research
approved the experiments. Adult male albino rats of the
Sprague–Dawley strain (n = 14) with a mean body weight
277.5 T 5.1 (SEM) g were used. The animals were kept
individually in Macrolon cages (53� 34� 37 cm) with food
and water available ad libitum, and maintained on a 12-h
light–12-h dark cycle (light from 8.00 to 20.00 h; 7 W
OSRAM Dulux EL energy saving lamp, approximately 30
lx). Ambient temperature wasmaintained at 21–22 -C.Underdeep pentobarbital anesthesia (Nembutal sodium, 80 mg/kg
i.p., volume approximately 0.5 ml), the rats were implanted
with gold-plated miniature screws (0.9 mm diameter) that
served as EEG electrodes. The right parietal electrode was
implanted 5.5 mm lateral to the midline, 2.5 mm posterior to
the bregma, and referenced to the electrode above the
cerebellum (2 mm posterior to the lambda, on midline).
Two gold wires (diameter 0.2 mm) inserted into the
neck muscles served to record the electromyogram (EMG).
The electrodes were connected to stainless steel wires that
were fixed to the skull with dental cement. At least 10 days
were allowed for recovery. The rats were connected to the
cable and amplifier via a swivel one day before the
baseline was recorded.
2.2. Experimental protocol and data acquisition
The EEG and the EMG were recorded continuously. A
24-h baseline day was followed by 6 h sleep deprivation
(SD) starting at light onset (8:00 a.m., SDL, n = 7) and 18
h recovery. To investigate whether the timing of the
intervention would play a role, a second batch of rats was
sleep deprived for 6 h beginning at dark onset (8:00 p.m.,
SDD, n = 7). SD was performed by introducing a variety
of objects (e.g., nesting material, pieces of wood, paper,
and tissue) into the cage, and by tapping on the cage
whenever the animal appeared drowsy or the EEG
exhibited slow waves. Halfway through the SD, the cages
were exchanged to provide additional stimulation [17,30].
Due to the increased occurrence of EEG artifacts during
this manipulation, the second 2-h interval of SD (hours 3–
4) was excluded from the analysis. The rats were never
disturbed when they were spontaneously awake, or during
feeding and drinking.
The EEG and the EMG signals were amplified
(amplification factor approximately 2000), conditioned by
analog filters (high-pass filter: �3 dB at 0.016 Hz; low-
pass filter: �3 dB at 40 Hz, less than �35 dB at 128 Hz)
sampled with 512 Hz, digitally filtered (EEG: low-pass
FIR filter 25 Hz; EMG: band-pass FIR filter 20–50 Hz)
and stored with a resolution of 128 Hz. EEG power spectra
were computed for 2-s epochs by a Fast Fourier Transform
(FFT) routine (linear detrending, Hanning window, 0.5 Hz
resolution). Frequencies between 0.5 and 25 Hz were
analyzed. Period–amplitude analysis was performed on the
5–7 frequency band. The raw EEG signal was band-pass
filtered (5–7 Hz, 4th order Chebyshev type II filter,
forward and reverse filtering), and the amplitude of
positive peaks of individual theta waves, and their number
per second (frequency) were computed.
2.3. Vigilance states
Two vigilance states, NREM sleep and waking were
scored for 4-s epochs. They were determined off-line by
visual inspection of the parietal EEG and the EMG records
and EEG power in the slow-wave range (0.75–4.0 Hz).
Special care was taken to exclude from the waking EEG
those epochs during SD where clear signs of NREM sleep
(i.e., delta waves concomitant with low EMG activity)
were evident. Epochs containing EEG artifacts were
excluded from spectral analysis (Table 1). The sleep
deprivation procedure was effective, since only 0.3 T 0.1
(n = 7) and 1.8 T 0.9 min (n = 7) of NREM sleep occurred
during SDL and SDD, respectively.
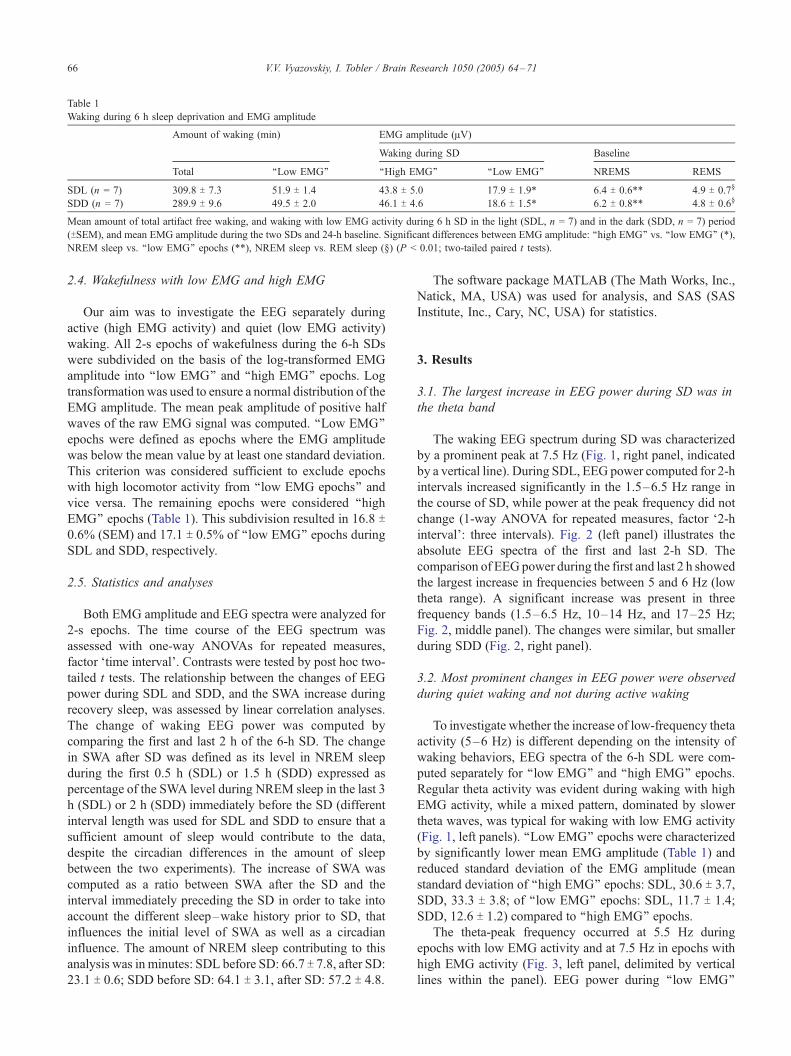
Table 1
Waking during 6 h sleep deprivation and EMG amplitude
Amount of waking (min) EMG amplitude (AV)
Waking during SD Baseline
Total ‘‘Low EMG’’ ‘‘High EMG’’ ‘‘Low EMG’’ NREMS REMS
SDL (n = 7) 309.8 T 7.3 51.9 T 1.4 43.8 T 5.0 17.9 T 1.9* 6.4 T 0.6** 4.9 T 0.7‘
SDD (n = 7) 289.9 T 9.6 49.5 T 2.0 46.1 T 4.6 18.6 T 1.5* 6.2 T 0.8** 4.8 T 0.6‘
Mean amount of total artifact free waking, and waking with low EMG activity during 6 h SD in the light (SDL, n = 7) and in the dark (SDD, n = 7) period
(TSEM), and mean EMG amplitude during the two SDs and 24-h baseline. Significant differences between EMG amplitude: ‘‘high EMG’’ vs. ‘‘low EMG’’ (*),
NREM sleep vs. ‘‘low EMG’’ epochs (**), NREM sleep vs. REM sleep (‘) (P < 0.01; two-tailed paired t tests).
V.V. Vyazovskiy, I. Tobler / Brain Research 1050 (2005) 64–7166
2.4. Wakefulness with low EMG and high EMG
Our aim was to investigate the EEG separately during
active (high EMG activity) and quiet (low EMG activity)
waking. All 2-s epochs of wakefulness during the 6-h SDs
were subdivided on the basis of the log-transformed EMG
amplitude into ‘‘low EMG’’ and ‘‘high EMG’’ epochs. Log
transformation was used to ensure a normal distribution of the
EMG amplitude. The mean peak amplitude of positive half
waves of the raw EMG signal was computed. ‘‘Low EMG’’
epochs were defined as epochs where the EMG amplitude
was below the mean value by at least one standard deviation.
This criterion was considered sufficient to exclude epochs
with high locomotor activity from ‘‘low EMG epochs’’ and
vice versa. The remaining epochs were considered ‘‘high
EMG’’ epochs (Table 1). This subdivision resulted in 16.8 T0.6% (SEM) and 17.1 T 0.5% of ‘‘low EMG’’ epochs during
SDL and SDD, respectively.
2.5. Statistics and analyses
Both EMG amplitude and EEG spectra were analyzed for
2-s epochs. The time course of the EEG spectrum was
assessed with one-way ANOVAs for repeated measures,
factor Ftime interval_. Contrasts were tested by post hoc two-tailed t tests. The relationship between the changes of EEG
power during SDL and SDD, and the SWA increase during
recovery sleep, was assessed by linear correlation analyses.
The change of waking EEG power was computed by
comparing the first and last 2 h of the 6-h SD. The change
in SWA after SD was defined as its level in NREM sleep
during the first 0.5 h (SDL) or 1.5 h (SDD) expressed as
percentage of the SWA level during NREM sleep in the last 3
h (SDL) or 2 h (SDD) immediately before the SD (different
interval length was used for SDL and SDD to ensure that a
sufficient amount of sleep would contribute to the data,
despite the circadian differences in the amount of sleep
between the two experiments). The increase of SWA was
computed as a ratio between SWA after the SD and the
interval immediately preceding the SD in order to take into
account the different sleep–wake history prior to SD, that
influences the initial level of SWA as well as a circadian
influence. The amount of NREM sleep contributing to this
analysis was in minutes: SDL before SD: 66.7 T 7.8, after SD:23.1 T 0.6; SDD before SD: 64.1 T 3.1, after SD: 57.2 T 4.8.
The software package MATLAB (The Math Works, Inc.,
Natick, MA, USA) was used for analysis, and SAS (SAS
Institute, Inc., Cary, NC, USA) for statistics.
3. Results
3.1. The largest increase in EEG power during SD was in
the theta band
The waking EEG spectrum during SD was characterized
by a prominent peak at 7.5 Hz (Fig. 1, right panel, indicated
by a vertical line). During SDL, EEG power computed for 2-h
intervals increased significantly in the 1.5–6.5 Hz range in
the course of SD, while power at the peak frequency did not
change (1-way ANOVA for repeated measures, factor F2-hinterval_: three intervals). Fig. 2 (left panel) illustrates the
absolute EEG spectra of the first and last 2-h SD. The
comparison of EEG power during the first and last 2 h showed
the largest increase in frequencies between 5 and 6 Hz (low
theta range). A significant increase was present in three
frequency bands (1.5–6.5 Hz, 10–14 Hz, and 17–25 Hz;
Fig. 2, middle panel). The changes were similar, but smaller
during SDD (Fig. 2, right panel).
3.2. Most prominent changes in EEG power were observed
during quiet waking and not during active waking
To investigate whether the increase of low-frequency theta
activity (5–6 Hz) is different depending on the intensity of
waking behaviors, EEG spectra of the 6-h SDL were com-
puted separately for ‘‘low EMG’’ and ‘‘high EMG’’ epochs.
Regular theta activity was evident during waking with high
EMG activity, while a mixed pattern, dominated by slower
theta waves, was typical for waking with low EMG activity
(Fig. 1, left panels). ‘‘Low EMG’’ epochs were characterized
by significantly lower mean EMG amplitude (Table 1) and
reduced standard deviation of the EMG amplitude (mean
standard deviation of ‘‘high EMG’’ epochs: SDL, 30.6 T 3.7,SDD, 33.3 T 3.8; of ‘‘low EMG’’ epochs: SDL, 11.7 T 1.4;
SDD, 12.6 T 1.2) compared to ‘‘high EMG’’ epochs.
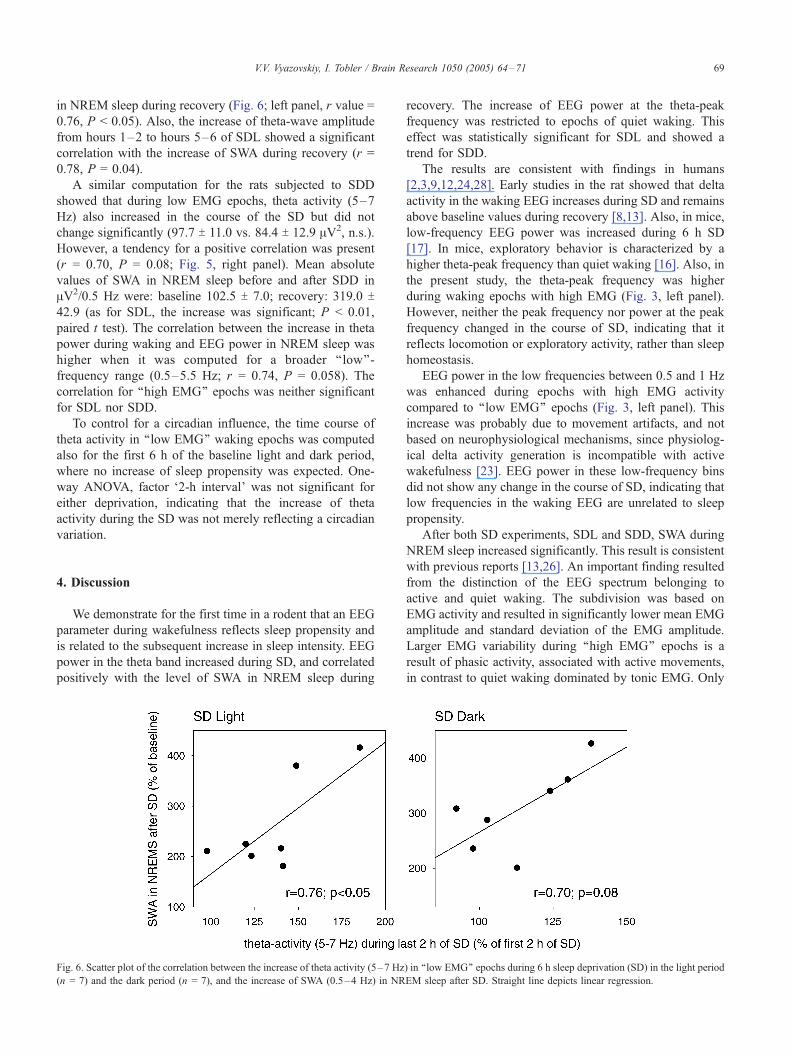
The theta-peak frequency occurred at 5.5 Hz during
epochs with low EMG activity and at 7.5 Hz in epochs with
high EMG activity (Fig. 3, left panel, delimited by vertical
lines within the panel). EEG power during ‘‘low EMG’’
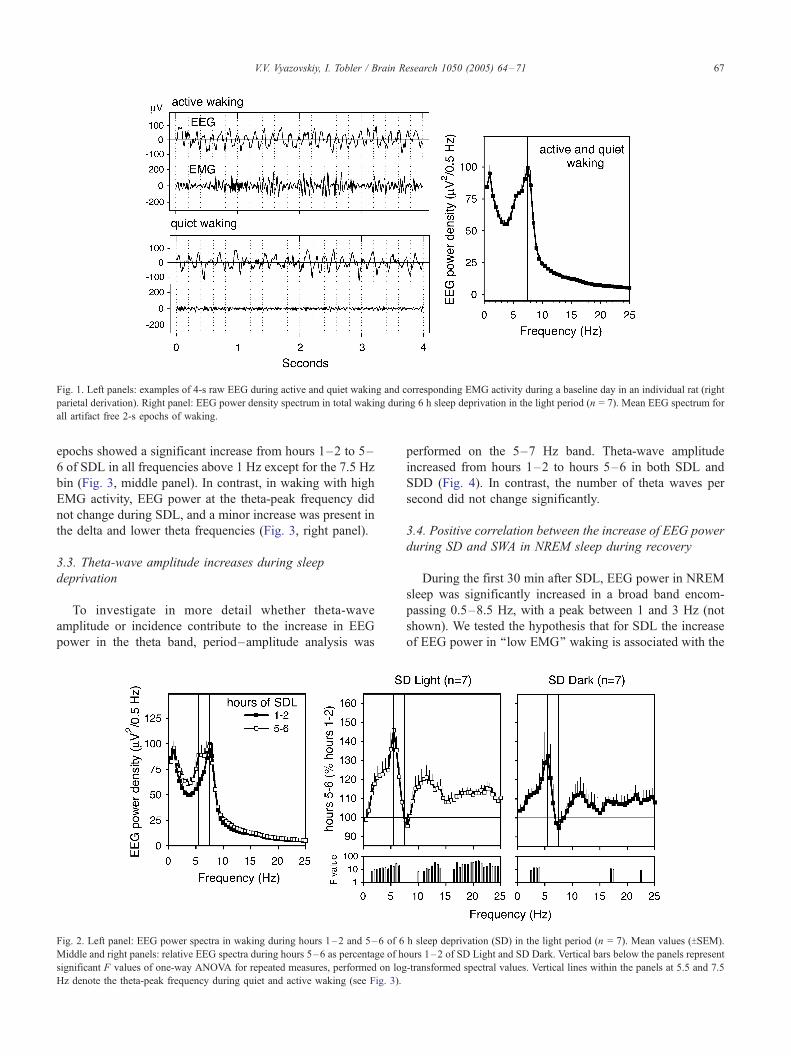
Fig. 1. Left panels: examples of 4-s raw EEG during active and quiet waking and corresponding EMG activity during a baseline day in an individual rat (right
parietal derivation). Right panel: EEG power density spectrum in total waking during 6 h sleep deprivation in the light period (n = 7). Mean EEG spectrum for
all artifact free 2-s epochs of waking.
V.V. Vyazovskiy, I. Tobler / Brain Research 1050 (2005) 64–71 67
epochs showed a significant increase from hours 1–2 to 5–
6 of SDL in all frequencies above 1 Hz except for the 7.5 Hz
bin (Fig. 3, middle panel). In contrast, in waking with high
EMG activity, EEG power at the theta-peak frequency did
not change during SDL, and a minor increase was present in
the delta and lower theta frequencies (Fig. 3, right panel).
3.3. Theta-wave amplitude increases during sleep
deprivation
To investigate in more detail whether theta-wave
amplitude or incidence contribute to the increase in EEG
power in the theta band, period–amplitude analysis was
Fig. 2. Left panel: EEG power spectra in waking during hours 1–2 and 5–6 of 6
Middle and right panels: relative EEG spectra during hours 5–6 as percentage of h
significant F values of one-way ANOVA for repeated measures, performed on log
Hz denote the theta-peak frequency during quiet and active waking (see Fig. 3).
performed on the 5–7 Hz band. Theta-wave amplitude
increased from hours 1–2 to hours 5–6 in both SDL and
SDD (Fig. 4). In contrast, the number of theta waves per
second did not change significantly.
3.4. Positive correlation between the increase of EEG power
during SD and SWA in NREM sleep during recovery
During the first 30 min after SDL, EEG power in NREM
sleep was significantly increased in a broad band encom-
passing 0.5–8.5 Hz, with a peak between 1 and 3 Hz (not
shown). We tested the hypothesis that for SDL the increase
of EEG power in ‘‘low EMG’’ waking is associated with the
h sleep deprivation (SD) in the light period (n = 7). Mean values (TSEM).
ours 1–2 of SD Light and SD Dark. Vertical bars below the panels represent
-transformed spectral values. Vertical lines within the panels at 5.5 and 7.5
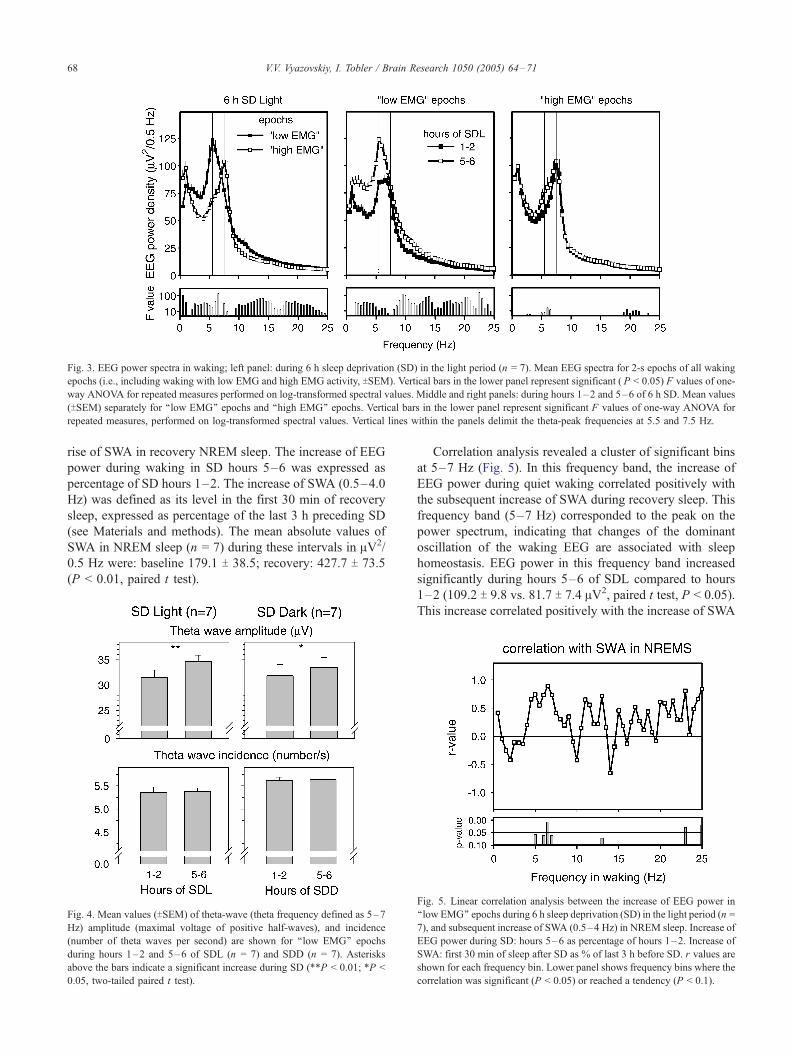
Fig. 3. EEG power spectra in waking; left panel: during 6 h sleep deprivation (SD) in the light period (n = 7). Mean EEG spectra for 2-s epochs of all waking
epochs (i.e., including waking with low EMG and high EMG activity, TSEM). Vertical bars in the lower panel represent significant ( P < 0.05) F values of one-
way ANOVA for repeated measures performed on log-transformed spectral values. Middle and right panels: during hours 1–2 and 5–6 of 6 h SD. Mean values
(TSEM) separately for ‘‘low EMG’’ epochs and ‘‘high EMG’’ epochs. Vertical bars in the lower panel represent significant F values of one-way ANOVA for
repeated measures, performed on log-transformed spectral values. Vertical lines within the panels delimit the theta-peak frequencies at 5.5 and 7.5 Hz.
V.V. Vyazovskiy, I. Tobler / Brain Research 1050 (2005) 64–7168
rise of SWA in recovery NREM sleep. The increase of EEG
power during waking in SD hours 5–6 was expressed as
percentage of SD hours 1–2. The increase of SWA (0.5–4.0
Hz) was defined as its level in the first 30 min of recovery
sleep, expressed as percentage of the last 3 h preceding SD
(see Materials and methods). The mean absolute values of
SWA in NREM sleep (n = 7) during these intervals in AV2/
0.5 Hz were: baseline 179.1 T 38.5; recovery: 427.7 T 73.5
(P < 0.01, paired t test).
Fig. 4. Mean values (TSEM) of theta-wave (theta frequency defined as 5–7
Hz) amplitude (maximal voltage of positive half-waves), and incidence
(number of theta waves per second) are shown for ‘‘low EMG’’ epochs
during hours 1–2 and 5–6 of SDL (n = 7) and SDD (n = 7). Asterisks
above the bars indicate a significant increase during SD (**P < 0.01; *P <
0.05, two-tailed paired t test).
Correlation analysis revealed a cluster of significant bins
at 5–7 Hz (Fig. 5). In this frequency band, the increase of
EEG power during quiet waking correlated positively with
the subsequent increase of SWA during recovery sleep. This
frequency band (5–7 Hz) corresponded to the peak on the
power spectrum, indicating that changes of the dominant
oscillation of the waking EEG are associated with sleep
homeostasis. EEG power in this frequency band increased
significantly during hours 5–6 of SDL compared to hours
1–2 (109.2 T 9.8 vs. 81.7 T 7.4 AV2, paired t test, P < 0.05).
This increase correlated positively with the increase of SWA
Fig. 5. Linear correlation analysis between the increase of EEG power in
‘‘low EMG’’ epochs during 6 h sleep deprivation (SD) in the light period (n =
7), and subsequent increase of SWA (0.5–4 Hz) in NREM sleep. Increase of
EEG power during SD: hours 5–6 as percentage of hours 1–2. Increase of
SWA: first 30 min of sleep after SD as % of last 3 h before SD. r values are
shown for each frequency bin. Lower panel shows frequency bins where the
correlation was significant (P < 0.05) or reached a tendency (P < 0.1).
V.V. Vyazovskiy, I. Tobler / Brain Research 1050 (2005) 64–71 69
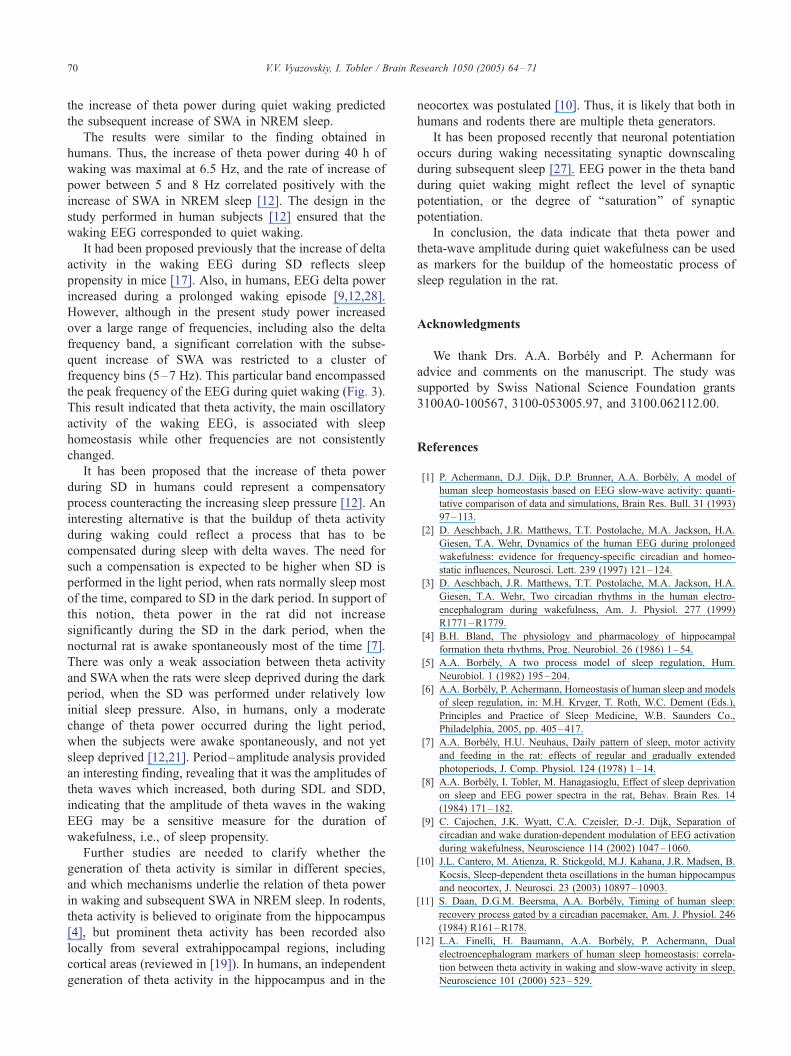
in NREM sleep during recovery (Fig. 6; left panel, r value =
0.76, P < 0.05). Also, the increase of theta-wave amplitude
from hours 1–2 to hours 5–6 of SDL showed a significant
correlation with the increase of SWA during recovery (r =
0.78, P = 0.04).
A similar computation for the rats subjected to SDD
showed that during low EMG epochs, theta activity (5–7
Hz) also increased in the course of the SD but did not
change significantly (97.7 T 11.0 vs. 84.4 T 12.9 AV2, n.s.).
However, a tendency for a positive correlation was present
(r = 0.70, P = 0.08; Fig. 5, right panel). Mean absolute
values of SWA in NREM sleep before and after SDD in
AV2/0.5 Hz were: baseline 102.5 T 7.0; recovery: 319.0 T42.9 (as for SDL, the increase was significant; P < 0.01,
paired t test). The correlation between the increase in theta
power during waking and EEG power in NREM sleep was
higher when it was computed for a broader ‘‘low’’-
frequency range (0.5–5.5 Hz; r = 0.74, P = 0.058). The
correlation for ‘‘high EMG’’ epochs was neither significant
for SDL nor SDD.
To control for a circadian influence, the time course of
theta activity in ‘‘low EMG’’ waking epochs was computed
also for the first 6 h of the baseline light and dark period,
where no increase of sleep propensity was expected. One-
way ANOVA, factor F2-h interval_ was not significant for
either deprivation, indicating that the increase of theta
activity during the SD was not merely reflecting a circadian
variation.
4. Discussion
We demonstrate for the first time in a rodent that an EEG
parameter during wakefulness reflects sleep propensity and
is related to the subsequent increase in sleep intensity. EEG
power in the theta band increased during SD, and correlated
positively with the level of SWA in NREM sleep during
Fig. 6. Scatter plot of the correlation between the increase of theta activity (5–7 Hz
(n = 7) and the dark period (n = 7), and the increase of SWA (0.5–4 Hz) in NR
recovery. The increase of EEG power at the theta-peak
frequency was restricted to epochs of quiet waking. This
effect was statistically significant for SDL and showed a
trend for SDD.
The results are consistent with findings in humans
[2,3,9,12,24,28]. Early studies in the rat showed that delta
activity in the waking EEG increases during SD and remains
above baseline values during recovery [8,13]. Also, in mice,
low-frequency EEG power was increased during 6 h SD
[17]. In mice, exploratory behavior is characterized by a
higher theta-peak frequency than quiet waking [16]. Also, in
the present study, the theta-peak frequency was higher
during waking epochs with high EMG (Fig. 3, left panel).
However, neither the peak frequency nor power at the peak
frequency changed in the course of SD, indicating that it
reflects locomotion or exploratory activity, rather than sleep
homeostasis.
EEG power in the low frequencies between 0.5 and 1 Hz
was enhanced during epochs with high EMG activity
compared to ‘‘low EMG’’ epochs (Fig. 3, left panel). This
increase was probably due to movement artifacts, and not
based on neurophysiological mechanisms, since physiolog-
ical delta activity generation is incompatible with active
wakefulness [23]. EEG power in these low-frequency bins
did not show any change in the course of SD, indicating that
low frequencies in the waking EEG are unrelated to sleep
propensity.
After both SD experiments, SDL and SDD, SWA during
NREM sleep increased significantly. This result is consistent
with previous reports [13,26]. An important finding resulted
from the distinction of the EEG spectrum belonging to
active and quiet waking. The subdivision was based on
EMG activity and resulted in significantly lower mean EMG
amplitude and standard deviation of the EMG amplitude.
Larger EMG variability during ‘‘high EMG’’ epochs is a
result of phasic activity, associated with active movements,
in contrast to quiet waking dominated by tonic EMG. Only
) in ‘‘low EMG’’ epochs during 6 h sleep deprivation (SD) in the light period
EM sleep after SD. Straight line depicts linear regression.
V.V. Vyazovskiy, I. Tobler / Brain Research 1050 (2005) 64–7170
the increase of theta power during quiet waking predicted
the subsequent increase of SWA in NREM sleep.
The results were similar to the finding obtained in
humans. Thus, the increase of theta power during 40 h of
waking was maximal at 6.5 Hz, and the rate of increase of
power between 5 and 8 Hz correlated positively with the
increase of SWA in NREM sleep [12]. The design in the
study performed in human subjects [12] ensured that the
waking EEG corresponded to quiet waking.
It had been proposed previously that the increase of delta
activity in the waking EEG during SD reflects sleep
propensity in mice [17]. Also, in humans, EEG delta power
increased during a prolonged waking episode [9,12,28].
However, although in the present study power increased
over a large range of frequencies, including also the delta
frequency band, a significant correlation with the subse-
quent increase of SWA was restricted to a cluster of
frequency bins (5–7 Hz). This particular band encompassed
the peak frequency of the EEG during quiet waking (Fig. 3).
This result indicated that theta activity, the main oscillatory
activity of the waking EEG, is associated with sleep
homeostasis while other frequencies are not consistently
changed.
It has been proposed that the increase of theta power
during SD in humans could represent a compensatory
process counteracting the increasing sleep pressure [12]. An
interesting alternative is that the buildup of theta activity
during waking could reflect a process that has to be
compensated during sleep with delta waves. The need for
such a compensation is expected to be higher when SD is
performed in the light period, when rats normally sleep most
of the time, compared to SD in the dark period. In support of
this notion, theta power in the rat did not increase
significantly during the SD in the dark period, when the
nocturnal rat is awake spontaneously most of the time [7].
There was only a weak association between theta activity
and SWAwhen the rats were sleep deprived during the dark
period, when the SD was performed under relatively low
initial sleep pressure. Also, in humans, only a moderate
change of theta power occurred during the light period,
when the subjects were awake spontaneously, and not yet
sleep deprived [12,21]. Period–amplitude analysis provided
an interesting finding, revealing that it was the amplitudes of
theta waves which increased, both during SDL and SDD,
indicating that the amplitude of theta waves in the waking
EEG may be a sensitive measure for the duration of
wakefulness, i.e., of sleep propensity.
Further studies are needed to clarify whether the
generation of theta activity is similar in different species,
and which mechanisms underlie the relation of theta power
in waking and subsequent SWA in NREM sleep. In rodents,
theta activity is believed to originate from the hippocampus
[4], but prominent theta activity has been recorded also
locally from several extrahippocampal regions, including
cortical areas (reviewed in [19]). In humans, an independent
generation of theta activity in the hippocampus and in the
neocortex was postulated [10]. Thus, it is likely that both in
humans and rodents there are multiple theta generators.
It has been proposed recently that neuronal potentiation
occurs during waking necessitating synaptic downscaling
during subsequent sleep [27]. EEG power in the theta band
during quiet waking might reflect the level of synaptic
potentiation, or the degree of ‘‘saturation’’ of synaptic
potentiation.
In conclusion, the data indicate that theta power and
theta-wave amplitude during quiet wakefulness can be used
as markers for the buildup of the homeostatic process of
sleep regulation in the rat.
Acknowledgments
We thank Drs. A.A. Borbely and P. Achermann for
advice and comments on the manuscript. The study was
supported by Swiss National Science Foundation grants
3100A0-100567, 3100-053005.97, and 3100.062112.00.
References
[1] P. Achermann, D.J. Dijk, D.P. Brunner, A.A. Borbely, A model of
human sleep homeostasis based on EEG slow-wave activity: quanti-
tative comparison of data and simulations, Brain Res. Bull. 31 (1993)
97–113.
[2] D. Aeschbach, J.R. Matthews, T.T. Postolache, M.A. Jackson, H.A.
Giesen, T.A. Wehr, Dynamics of the human EEG during prolonged
wakefulness: evidence for frequency-specific circadian and homeo-
static influences, Neurosci. Lett. 239 (1997) 121–124.
[3] D. Aeschbach, J.R. Matthews, T.T. Postolache, M.A. Jackson, H.A.
Giesen, T.A. Wehr, Two circadian rhythms in the human electro-
encephalogram during wakefulness, Am. J. Physiol. 277 (1999)
R1771–R1779.
[4] B.H. Bland, The physiology and pharmacology of hippocampal
formation theta rhythms, Prog. Neurobiol. 26 (1986) 1–54.
[5] A.A. Borbely, A two process model of sleep regulation, Hum.
Neurobiol. 1 (1982) 195–204.
[6] A.A. Borbely, P. Achermann, Homeostasis of human sleep and models
of sleep regulation, in: M.H. Kryger, T. Roth, W.C. Dement (Eds.),
Principles and Practice of Sleep Medicine, W.B. Saunders Co.,
Philadelphia, 2005, pp. 405–417.
[7] A.A. Borbely, H.U. Neuhaus, Daily pattern of sleep, motor activity
and feeding in the rat: effects of regular and gradually extended
photoperiods, J. Comp. Physiol. 124 (1978) 1–14.
[8] A.A. Borbely, I. Tobler, M. Hanagasioglu, Effect of sleep deprivation
on sleep and EEG power spectra in the rat, Behav. Brain Res. 14
(1984) 171–182.
[9] C. Cajochen, J.K. Wyatt, C.A. Czeisler, D.-J. Dijk, Separation of
circadian and wake duration-dependent modulation of EEG activation
during wakefulness, Neuroscience 114 (2002) 1047–1060.
[10] J.L. Cantero, M. Atienza, R. Stickgold, M.J. Kahana, J.R. Madsen, B.
Kocsis, Sleep-dependent theta oscillations in the human hippocampus
and neocortex, J. Neurosci. 23 (2003) 10897–10903.
[11] S. Daan, D.G.M. Beersma, A.A. Borbely, Timing of human sleep:
recovery process gated by a circadian pacemaker, Am. J. Physiol. 246
(1984) R161–R178.
[12] L.A. Finelli, H. Baumann, A.A. Borbely, P. Achermann, Dual
electroencephalogram markers of human sleep homeostasis: correla-
tion between theta activity in waking and slow-wave activity in sleep,
Neuroscience 101 (2000) 523–529.
V.V. Vyazovskiy, I. Tobler / Brain Research 1050 (2005) 64–71 71
[13] P. Franken, D.-J. Dijk, I. Tobler, A.A. Borbely, Sleep deprivation in
rats: effects on EEG power spectra, vigilance states, and cortical
temperature, Am. J. Physiol. 261 (1991) R198–R208.
[14] P. Franken, A. Malafosse, M. Tafti, Genetic variation in EEG activity
during sleep in inbred mice, Am. J. Physiol. 275 (4 Pt. 2) (1998)
R1127–R1137.
[15] J.A. Horne, S.D. Baulk, Awareness of sleepiness when driving,
Psychophysiology 41 (2004) 161–165.
[16] R. Huber, T. Deboer, I. Tobler, Prion protein: a role in sleep
regulation? J. Sleep Res. 8 (Suppl. 1) (1999) 30–36.
[17] R. Huber, T. Deboer, I. Tobler, Effects of sleep deprivation on sleep
and sleep EEG in three mouse strains: empirical data and simulations,
Brain Res. 857 (2000) 8–19.
[18] B.E. Jones, Basic mechanisms of sleep–wake states, in: M.H. Kryger,
T. Roth, W.C. Dement (Eds.), Principles and Practice of Sleep
Medicine, W.B. Saunders Co., Philadelphia, 2000, pp. 134–154.
[19] M.J. Kahana, D. Seelig, J.R. Madsen, Theta returns, Curr. Opin.
Neurobiol. 11 (2001) 739–744.
[20] G. Kecklund, T. Akerstedt, Sleepiness in long distance truck driving:
an ambulatory EEG study of night driving, Ergonomics 36 (1993)
1007–1017.
[21] H.P. Landolt, J.V. Retey, K. Tonz, J.M. Gottselig, R. Khatami, I.
Buckelmuller, P. Achermann, Caffeine attenuates waking and sleep
electroencephalographic markers of sleep homeostasis in humans,
Neuropsychopharmacology 29 (2004) 1933–1939.
[22] S. Makeig, T.P. Jung, T.J. Sejnowski, Awareness during drowsiness:
dynamics and electrophysiological correlates, Can. J. Exp. Psychol. 54
(2000) 266–273.
[23] M. Steriade, The corticothalamic system in sleep, Front. Biosci. 8
(2003) d878–d899.
[24] A.M. Strijkstra, D.G.M. Beersma, B. Drayer, N. Halbesma, S. Daan,
Subjective sleepiness correlates negatively with global alpha (8–12
Hz) and positively with central frontal theta (4–8 Hz) frequencies in
the human resting awake electroencephalogram, Neurosci. Lett. 340
(2003) 17–20.
[25] I. Tobler, Phylogeny of sleep regulation, in: M.H. Kryger, T. Roth,
W.C. Dement (Eds.), Principles and Practice of Sleep Medicine, W.B.
Saunders Co., Philadelphia, 2005, pp. 77–90.
[26] I. Tobler, A.A. Borbely, Sleep EEG in the rat as a function of prior
waking, Electroencephalogr. Clin. Neurophysiol. 64 (1986) 74–76.
[27] G. Tononi, C. Cirelli, Sleep and synaptic homeostasis: a hypothesis,
Brain Res. Bull. 62 (2003) 143–150.
[28] L. Torsvall, T. Akerstedt, Sleepiness on the job: continuously
measured EEG changes in train drivers, Electroencephalogr. Clin.
Neurophysiol. 66 (1987) 502–511.
[29] C.H. Vanderwolf, Cerebral activity and behavior: control by central
cholinergic and serotonergic systems, Int. Rev. Neurobiol. 30 (1988)
225–340.
[30] V.V. Vyazovskiy, P. Achermann, A.A. Borbely, I. Tobler, Inter-
hemispheric coherence of the sleep electroencephalogram in mice
with congenital callosal dysgenesis, Neuroscience 124 (2004)
481–488.