THESIS KARL BENTON WEST SVATOS MMXXII
293
THESIS KARL BENTON WEST SVATOS MMXXII
-
Upload
khangminh22 -
Category
Documents
-
view
0 -
download
0
Transcript of THESIS KARL BENTON WEST SVATOS MMXXII

THESIS
KARL BENTON WEST SVATOS
MMXXII

2
How might you tell the difference between a plant with white grains and it’s clone with black grains when buying
the grains via a smartphone application that might display one image, or both (as above) if the plant segregates
via a 50:50 black to white colour ratio based on a myriad of environmental entanglements if one is a deepfake
image of the other? Ethical cloning of plant and animal varieties has resulted in the rapid expansion of food and
beverages derived from plants and animals. In turn, fuelling increased population growth, and along with it,
increased demand for exotic foods and drinks derived thereof. Wild Tibetan barley is arguably the most exotic of
all concerning its evolutionary canyon and its cultural significance. Digital manipulation (digitalisation) of species
through genetic sequencing, computer science, telecommunications and A.I. ‘digital twin games’, can rapidly
increase the development and ethical release of these real, digital clones into new environments. However, is it
ethical to digitalise a species, and who might be the winners and who are the losers? These are the realities in the
bio-physics ethics debate very much at the centre of globalisation. The collection of raw data, including for digital
twins’ clones’, may reveal revolutionary insights but also increase uncertainty about environmental variability
concerning biological population genetics. Bias concerning the unacknowledged inheritance of software
dependencies used by A.I. scientists is a separate quest; through digital algorithm manipulation (deepfake games).
The potential damage an encrypted deepfake genetic market might do to both us and our environment, is a
significant cause for concern.

3
DATA-DRIVEN, MEDITERRANEAN, A.I. SIMULATIONS AND THE ETHICAL
IMPLICATIONS OF EMBEDDED QUALITATIVE BIAS IN DIGITAL TWIN
DEEPFAKE GAMES
‘Looking out across the digital ocean as far as the eye can see. A Neon vision.’
Image and poem by: Karl Benton West Svatos
32939058
College of Science, Health, Engineering and Education
-“Free Your Think”-

4
LEFT BLANK INTENTIONALLY

5
THESIS DECLARATION STATEMENT
I declare that the entire thesis and all the parts thereof are my own work that has not been
submitted in conjunction with or for the conferral of another award or degree from any other
institution in accordance with all appropriate ethical standards, policies, and guidelines
concerning student candidacy as stated in Murdoch University’s student handbook. This thesis
is submitted for conferral by the Murdoch University Senate, for the award, Doctor of
Philosophy.
Student: Mr. Karl Benton West Svatos
Signed:
………………………..
Dated:… 12-08-2021
……………………….

6
7
ACKNOWLEDGEMENTS
If the award Doctor of Philosophy is based solely on one’s ability to think independently but
then only write about the philosophically posited predispositions of other researchers/thinkers,
would that thought still be independent? My scholarly mindset comes from my father. He took
me to Berlin where scientists and philosophers like Plank, Einstein, Bohr, and Marx once lived.
He inspires me every day. Family is everything.
Further trips to Los Angeles, Paris, London, New Dehli, Cairo, Beijing, Jakarta, Bangkok,
Hanoi, and to Tokyo wetted my desire to pursue scientific thought through experiment. Each
place intriguing in culture, and religion, but home has always been in Fremantle. I have had a
passion for computers for as long as I can remember. Establishing a philosophical position on
the ethics of embedded, standalone, A.I. games came later. PC’s were scarce in 1986 but I was
fortunate enough to have one. An IBM. That PC gave me a ‘head start’. But it would take me
another 30 years before I was offered an opportunity to enrol in a research degree at Murdoch
University. The PhD research path. A childhood dream. Lacking any independent data fit for
that purpose, and because no one believed that there was a need for, “such games,” I developed
a thought experiment. One concerning relativistic proportionality. Learning how to wait shapes
ideas, makes you agile, and helps you realise goals, but without help nothing is realistically
possible. There are hurdles and challenges to overcome every day.
To Omi, and my to grandparents. RIP. To my mother and father, my uncle and aunt, my cousin,
and to my fairy godmother, you are instrumental in my life. In helping me pave the road to get
to this moment, no matter what happens, how small or grand, win lose or draw, pass or fail,
you have shown me that following your passion will inevitably be rewarded, but it takes time.
Rewards come in many shapes and forms. Somehow knowingly along the way, you have
always been there. And if not, then in spirit. That was so desperately needed at times. Thank
you. Without it, everything would be different.
To my Hero, my love. You give me hope when there is only despair and courage when I am
afraid. You help me dream my dreams without fear. To my children, imagine and realise your
vision. Do not be afraid to succeed at things (only you) know you are already good at. You are
my all.

8
To Professor Michael Jones, I want to recognise your courageous effort in giving me tutelage,
advice, guidance, support, and compassion. More importantly, thank you for giving me the
resolve to see merit in my ideas, and for just listening to me when I needed someone to talk to.
You, Sir, are a gentleman of the highest order; I will never forget your deeds. ‘Emmanuel
Kant...’ To Doctor David Murray, your supportive ‘can do’ attitude is a real breath of fresh air
in academia. I really enjoyed having you support my ideas, through your positive demeanour
that always keeps me thinking on my toes about the most pressing technical matters
concenrning all areas of science, in a down to earth way. Thank you.
To the co-authors, colleagues, business partners, technical advisors, administrative research
support-staff, assistants, fellow students, my extended family, and to my friends, hat’s off and a big
cheers to you. To those who kindled a small fire inside my belly to inspire me into succeeding in
my belief by saying “Karl, you need to stay focussed,” your help is appreciated in more ways than
my own words can ever be conveyed on paper. “Nothing is inevitable.”

9
ABSTRACT
Put simply, the question that has intrigued me and led me to do a PhD is to undertake scientific
research which gave me the opportunity to study the underlying ethical and philosophical bases
of the research process itself. The thesis takes the reader through real-life studies which
combine developing computational power with the handling of large datasets and the ethics of
data collection and ownership. This journey resulted in the study and representation of real-life
and in-silico or digitalised copies of research data (called digital twins) and compares their
physical and in-silico representation from an ethical viewpoint.
Digtal twins and deepfake imagery (computer simulations based on mathematical principles)
may be used to verify significance of statistical outcomes during artificial simulations’ via
computational processes. Deepfakes are a possible occidental progression due to increasingly
complex environmental variation being used to explain adaptation, or an evolutionary process
because variation is oft unable to be replicated in experiments, e.g. for political reasons.
A renaissance of informatics ‘big-data science;’ implementing adaptive real-time A.I. via
digital twin construction, to predicted outcomes concerning simulations’ predictability
themselves’, digital twins can be used to infer without disturbing system balance. Extensive
implementations of this technology with adaptive frequency hopping based on Gaussian
‘pseudo-random signalling’ now exist. Several model species’ were selected including hairy
marron, dairy farm cattle, and a unique Australian Tibetan barley. Using environmental data
from the Mediterranean environment; environmental growth, habit, and sensory behaviour;
digital twins’ predictions based on complementary statistical heuristics included incorporating
genome sequences, and phenotype data through embedded kernalisation telematic software,
for automated species informatics simulation. ‘Murdoch Twins’ was created to test whether
TCP/IP latency data supporting machine learning programs, and visualisation statistics could
alter both quantitative and qualitative outcomes (in a simulated game carried out in 2020 in
Japan).
This thesis makes use of a series of quantitative experiments that were conceived, proposed,
carried out, and are written up as four separate manuscripts (two results manuscripts published
in 2018 and 2019 respectively, one abstract presented in Osaka Japan in 2018, and one
manuscript currently under peer review), with seven supporting appendices (including industry
10
specific publications, data collection and analyses). The full contributions span two decades
culminated in a move to Murdoch University in 2016. The final thesis product only possible
by the award, of a fully funded, Murdoch University postgraduate research scholarship,
administered by The Western Australian, State, Agricultural, and Biotechnology Center
(SABC) under the tutelage of Professor Michael Jones. And has since generated significant
research-related opportunities including, “PhD scholarship in digital connectivity and big-data
analytics in agriculture”, administered through the newly coined ‘agtech group’ at Murdoch
University. The research experiments were made possible through contributions including
through the receipt of smaller financial bursaries (grant monies), in-kind contributions,
corporate awards (purchased and/or borrowed equipment, including hired casual staff), or
industry contributions. Some research was also personally funded, or earned through
internships, further grants rewards, in-kind volunteering, and/or while consulting for Karl
Corporation (including in Japan, through 2020 at Kazusa DNA Research Institute in Chiba
Prefecture as a visiting professional informatics scientist).
The thesis, “Data-driven, Mediterranean, A.I. simulations and the ethical implications of
embedded qualitative bias in digital twin deepfake games” contains an original, standalone,
independently researched introduction, methodology, with the sequential and logical
presentations of four manuscripts (results chapters), culminating in the general results titled,
“Murdoch Twins: containerised .NET API backend data implementation for real-time
deepfake games”, proceeded by the general discussion. As it relates to the thesis in its entirety;
the combined output is the development of a new, computer-based, rapid, real-time, data
visualisation strategy (and technique), that facilitated the creation of a digital twin called
‘Murdoch Twins.’ The purpose of Murdoch Twins is for rapidly measuring and quantifying,
the digital authenticity of informatics analyses (via construction of a digital twin including for
a confidential* Tibetan-Australian barley species; a type of doubled haploid population of
almost identical genetic clones); based on complementary environmental, sequencer-based
genotyping, phenotype data lakes (for the Mediterranean environment); through the creation of
a trust enabled 5G/LTE, IoT, core to core, embedded kernel stack, to therefore test that it may
be penetrated, remotely, (via VPN), with deepfake imagery, during a real-time A.I. game
simulation (in a real-world scenario delivered through .NET APIs).
Implications deepfake games have regarding current real-world scenarios include real-time
medicine, geophysical and A.I., predictions; but as it relates to the manuscripts and the central

11
tenet of the thesis deepfake games concerns the ethical use of deepfake images to securely
verify the digital authenticity of phenotype data, as it relates to environmental variation of raw
‘trusted’ data sources, and their use in qualitative descriptions (embedded bias).
The four manuscripts demonstrate that a methodological progression was followed, concerning
the development of the aims and the hypothesis. Tables and figures throughout the thesis are
sequential and are not broken up for individual manuscripts. Because of the strategic nature of
the thesis, there were significant challenges along the way. To address this, each manuscript
has a preamble, including its own declaration statement, that summarises the authors’
contributions’ at that time, as well a peroratory summation. Additional contributions, as they
relate to the generation of each manuscript of the thesis (in terms of the overall aims and
hypothesis) are addressed in 7 appendices. Contributions reflect the time required as follows.
1. Manuscript one: An independently researched, student-funded, sole-author, published
manuscript (Karl Svatos (KS) contribution 100%),
“Svatos KBW, 2018. Commercial silicate phosphate sequestration and desorption leads
to a gradual decline of aquatic systems. Environmental Science and Pollution Research
25, 5386-92. doi: 10.1007/s11356-017-0846-9”
2. Manuscript two: an independently researched, partially industry-funded (Dairy Australia
Grant; UWA 13344), first-author, published manuscript (KS contribution 95%, (UWA
staff 5% includes Em. Prof. Abbott (LA) contribution 3%)),
Svatos KBW, Abbott LK, 2019. Dairy soil bacterial responses to nitrogen application in
simulated Italian ryegrass and white clover pasture. Journal of Dairy Science 102, 9495-
504. doi: 10.3168/jds.2018-16107
o Original research description (visualisation stats) (Appendix 3 preamble)
3. Manuscript three: an, independently researched, privately funded, first-author, published
conference, journal abstract (Osaka Japan, 2018),
“Svatos KBW, Diepeveen D, Abbott LK, Li C, 2018. Big data GPU/CPU kernalisation
pipeline for API based quantitative genetic assessments in field-based drone research
(Abstract Submitted). Journal of Plant Pathology and Microbiology, 9. doi:
10.4172/2157-7471-C2-011”
And two subsequent, corresponding, report-style projects with unpublished results
(Project 1 and Project 2), and including one published, strategic white position paper
associated with Project 1,

12
Project 1; a student-led, partially industry-funded (GRDC Grant; UMU00049)
collaboration between Murdoch University, The Western Australian Department of
Primary Industries and Regional Development (DPIRD) (formerly Department of
Agriculture), UWA, Scientific Aerospace, Karl Corporation, and The Western Crop
Genetics Alliance (formerly Western Barley Genetics alliance and affiliated Australian
institutions). (KS contribution 55%), (DPIRD staff 20% includes Dr. Diepeveen (DD)
10% and Prof. Li (CL) 5%), (Murdoch staff 10% includes DD 5% Prof. Jones (MJ) 2%,
CL 1%, Dr. Murray (DM) 1%, Dr. Hill (CH) 1%), (UWA 3% includes LA 2%) (Scientific
Aerospace includes Mr. Trowbridge RET. (GT) 2%) (Karl Corporation 10%).
“Rapid downstream glasshouse field trial phenotype assessments for variability
minimisation in GPU core processing and telematics data analyses”
“Svatos K, Trowbridge G, 2018. Australian drone technology assisting a significant step
in crop tolerance to heat and drought stress. Future Directions International. http:
futuredirections.org.au/publication/australian-drone-technology-assisting-significant-
step-crop-tolerance-heat-drought-stress/”
Project 2; a student-led, independently organised, resourced, and partially industry-
funded, project collaboration between Murdoch University, UWA, DPIRD, Pivotel,
Nokia-Bell, Microsoft, Precision Ag, Edith Cowan University (ECU), Kazusa DNA
Research Institute (KDRI), and Karl Corporation (and affiliated partners). (KS
contribution 30%), (Murdoch staff 25% includes MJ 15%, DM 10%), (DPIRD staff 10%
includes DD 5%), (Pivotel, Nokia-Bell, Microsoft, Precision Ag, ECU, UWA, and KDRI
30%), (Karl Corporation 5%).
“A scaleable, private LTE/4G, Boolean GPU networking stack for automated, remote,
IoT decision making”
4. Manuscript 4; an industry-led, partially industry-funded, jointly student industry
conceived, run, and managed, first author (unpublished), data-science research
collaboration between iPREP, Murdoch University, ECU, and the industry partner
udrew. (KS contribution 50%), (udrew 50% includes AR (Angela Recaldes) and ZA
(Zubair Ahmed) 10%).
“Heuristics encanced SAAS platform: remote geospatial machine learning of soil
profiles from an ancient Mediterranean environment”
Each manuscript in the thesis is complete and acknowledges all authors’ and contributions’.
Additional research methods, results, and discussion generated during this research are
addressed in the disclaimer at the beginning of the methodology, and in the privacy and

13
confidentiality statement after the preamble of manuscript three. Individual appendices also
contain declaration statements about the significance and relevance to the thesis aims and
hypothesis, concerning co-authors’ contributions’ respectively (including Karl Corporation).
The research presented in this thesis shows that the rapid rise of data-driven ‘A.I., big-data
science’, has an embedded, objective bias that quantitative computation cannot be used to solve
in all real-time simulations. Predictions were supported through the creation of binary-tree data
islands. Supporting technologies were connected through an embedded pythonic .NET API
(AARCH64) and then utilised to create a digital twin to assess deepfake risk factors via the
digital twin (concerning data, security, and ownership). The implications are substantial for
this type of implementation due to the ever-expanding collection and use of said data to support
qualitative interpretation for action by humans as it relates to A.I. ethics. This process may
offer scientists, engineers, land managers, farmers and governments an advantage; knowing
how a change (Δ) at any given time (t) might alter an organism’s behaviour, based on issued
quantitative source-code trust certificates (.NET APIs, in LTE/5G, real-time). However, there
are no ‘real’ solutions in non-binary calculations. Using deepfakes in digital twins to model
game outcomes thus resulted in occidental natural latency ‘blips’. Trusted, quantitative, A.I.,
source-code program manifests, only support purely open-source hypotheses testing.

14

15
FLOW DIAGRAM OF RESEARCH UNDERTAKEN DURING CANDIDACY
*Authors note: The germplasm (Tibetan-Australian barley) as it relates to intellectual property of this thesis is confidential. Contributions of
individuals and known Australian institutions are listed throughout the thesis individually. However, the germplasm is also a part of an
Australian-Chinese collaboration (DAW00187) that includes “8 project partners” including some in China. This collaboration stipulated that,
“pre-approval is required for publication from all partners” (Prof C. Li personal communication 4th May 2016). As it relates to publishing
my thesis; it is my belief that students have individual rights. Including the right to remain anonymous, and the right to free speech. In light
of this development I have used personal supporting evidence to validate the central tenant and to test my hypothesis.
Introduction
Review
Methods
Hypothesis
• Concerns the ethics and philosophy of data used to create "deepfakes", and asks the question(hypothesis), whether qualitative bias in simulated environmental datasets (for applied A.I.) are aninherant result of experimental design, and thus used unethially i.e. through geopolitical 'games'.
• Introduces the concept of measuring Δ.t for a simulated Mediterranean climate, via the constructionof a digitial twin to measure quantitative outcomes during a deepfake 'game'.
Manuscript
1
• Establishes the statistical basis required for simulating Mediterranean environment interactions, anddescribes qualitative effects on a crustacean species using lab techniques with supporting literature.
• A brief summary describes the cultural challenges associated with environmental data collected inMediterranean environments concerning hypothesised deepfake outcomes.
Manuscript
2
• Improves on the accuracy of Mediterranean envionrment simulations by coupling qualitative data-driven management descriptions with bacterial 16S sequencing data via CCA visualisation.
• Introduces a more advanced version of the instances hypothesised and described in the correspondingappendicies and in manuscript 1, including a summary of how A.I., based autonomous systems mayinadvertantly benefit the dairy industry irrespective of other groups, landholders etc.
Manuscript
3
• Focusses on data collection, error claculation, and correlation of quantitative trait data (glasshouseand field trials) used in genetics QTL studies (with supporting appendicies).
• Etablishes a statistical basis for real-time, rapid phenotyping platforms and couples with thevisualisation strategies of manusrcipts 1 and 2 respectively.
• Introduces the notion that 'deepfakes' may allow a replicable and thus more realistic statisticalcomparison of data significance concerning culturally sensitive genetic data (minimise qualitativebias), when coupled with IoT or other satellite-derived technologies e.g., LTE.
Manuscript
4
• Introduces a novel method for simulating and predicting Mediterranen soil properties using machinelearning and applied A.I..
• The method developed is the final iteration of the statistical workflow concerning quantitativeprediction based on statistical significance (independent of qualitative interpretation).
• Concludes with broader discussion about the current and potential uses of deepfake technology inreal life situations and through the notion of a 'digital twin game'.
Results
Discussion
Conclusion
• The general results are the full implementation of the deepfake technology developed and show thereal-time digital twin latency data outputs, as well as describe the deepfake game conducted. Thegeneral results introduce the broader issue of interpreting latency data from a qualitative perspective(real-time .net latency) due to the embedded nature of quantitative source-code trust algorithms. Thegeneral discussion then focusees on the hypothesis, and gives an overview of how deepfakes may beunethical from a A.I., perspective, by suggesting that the cultural nature of some Mediterraneansimulations may be qualitatively biased by design or limited by phyiscal design parameters(quantitisation issues within the silicon deisgn iteslf).
• The thesis concludes with a list of recommendations, and touches on future application of the IPdeveloped.

16

17
TABLE OF CONTENTS
THESIS ..................................................................................................................................................................................... 1
DATA-DRIVEN, MEDITERRANEAN, A.I. SIMULATIONS AND THE ETHICAL IMPLICATIONS OF
EMBEDDED QUALITATIVE BIAS IN DIGITAL TWIN DEEPFAKE GAMES............................................................ 3
THESIS DECLARATION STATEMENT ............................................................................................................................ 5
ACKNOWLEDGEMENTS .................................................................................................................................................... 7
ABSTRACT ............................................................................................................................................................................. 9
FLOW DIAGRAM OF RESEARCH UNDERTAKEN DURING CANDIDACY ................................................................................... 15
TABLE OF CONTENTS ...................................................................................................................................................... 17
GENERAL INTRODUCTION ............................................................................................................................................. 23
DEEPFAKE GAMES: A REVOLVING DOOR OF ETHICAL DEBATE CONCERNING APPLED A.I., DATA SCIENCE, AND QUALITATIVE BIAS. .. 25
REVIEW OF LITERATURE ............................................................................................................................................... 29
THE CASE FOR DIGITAL TWINS IN ENVIRONMENTAL SCIENCE AND AGRICULTURE .................................................................. 31
ENVIRONMENTAL SPECIES SIMULATIONS: DATA ABOUT METADATA ................................................................................. 34
Environmental abiotic stress applies to all genes ....................................................................................... 35
A brief lesson about Quantitative water modelling (data) ......................................................................... 36
Complicated abiotic QTL statistical studies ‘bear no fruit’ .......................................................................... 40
MODELLING DIGITAL TWIN SPECIES’: ETHICAL CONSIDERATIONS OF A.I. SELECTION BIAS ...................................................... 42
The case for an ethical assessment of a Tibetan doubled haploid barley digital twin ................................ 43
APPLIED DATA SCIENCE IS IN DESPERATE NEED OF A RE-THINK CONCERNING COMPUTER VISUALISATION TECHNOLOGIES ............. 45
MATHEMATICALLY MODELLING THE “BIO-PHYSICAL SOURCE-CODE” ................................................................................ 47
DEEPFAKE GAMES IN A.I. SIMULATIONS ..................................................................................................................... 49
GENERAL AIMS .................................................................................................................................................................. 50
HYPOTHESIS ....................................................................................................................................................................... 50
ASSUMPTIONS .................................................................................................................................................................... 51
METHODOLOGY ................................................................................................................................................................ 53
METHODOLOGY DISCLAIMER ................................................................................................................................... 55
A SMALL CONTEMPORARY THOUGHT EXPERIMENT AND QUESTION .................................................................................. 55
A NEW PURPOSE FOR DATABASE (LAKE) CONSTRUCTION: A.I. SIMULATIONS ..................................................................... 55
COMPUTATIONAL VISUALISATION AND PROGRAMMING PROTOCOL ................................................................................. 57
IoT platform stack, decision tree and penetration test ............................................................................... 58
Digital twin latency assessment .................................................................................................................. 59
Real-time deepfake A.I. game simulation ................................................................................................... 60
RESULTS CHAPTERS ........................................................................................................................................................ 63

18
MANUSCRIPT 1: SCOPE, SIGNIFICANCE TO AIMS, AND DECLARATION ................................................................................ 65
COMMERCIAL SILICATE PHOSPHATE SEQUESTRATION AND DESORPTION LEADS TO A GRADUAL DECLINE OF AQUATIC SYSTEMS...... 67
Abstract ....................................................................................................................................................... 67
Introduction, background and scientific context ......................................................................................... 68
The need to examine manufactures’ claims ............................................................................................................ 69
Materials and methods of instrumental analysis ........................................................................................ 70
Results and discussion ................................................................................................................................. 71
Instrumental analysis of silicate samples ................................................................................................................. 71 Case example ........................................................................................................................................................... 75
Conclusion & recommendations .................................................................................................................. 75
Acknowledgements ..................................................................................................................................... 76
Compliance with ethical standards ............................................................................................................. 76
Conflict of interest ....................................................................................................................................... 76
THE USE OF DEEPFAKES IN CULTURAL CONSERVATION AND POPULATION CONTROL STRATEGIES ............................................. 77
MANUSCRIPT 2: BACKGROUND, SCOPE, AND DECLARATION ........................................................................................... 79
Dairy soil bacterial responses to nitrogen application in simulated Italian ryegrass and white clover
pasture ........................................................................................................................................................ 81
Abstract ....................................................................................................................................................... 81
Introduction ................................................................................................................................................. 81
Materials and methods ............................................................................................................................... 83
Results ......................................................................................................................................................... 85
Effects of N treatments on pasture plant species (white clover and Italian ryegrass) ............................................. 85 Effects of N application and pasture plant species on dominant soil bacterial phyla and physiologically significant
subgroups (order and family) ................................................................................................................................... 86
Discussion .................................................................................................................................................... 88
Conclusions .................................................................................................................................................. 90
Acknowledgements ..................................................................................................................................... 91
NEW RESEARCH AND RELEVANCY CLARIFICATION TO MAIN AIMS AND HYPOTHESIS ............................................................. 92
MANUSCRIPT 3: BACKGROUND, SCOPE, AND DECLARATIONS ......................................................................................... 95
PRIVACY AND CONFIDENTIALITY STATEMENT ............................................................................................................. 101
BIG-DATA GPU/CPU KERNALISATION PIPELINE FOR API BASED QUANTITATIVE GENETIC ASSESSMENTS IN FIELD-BASED DRONE
RESEARCH .......................................................................................................................................................... 103
Abstract ..................................................................................................................................................... 103
The need for environmental and agricultural technology for abiotic heat, water scarcity, and frost
improvement in barley cultivation ............................................................................................................ 104
Complicated genetics: a familiar story in systems biology ..................................................................................... 105 Transcription factors alone do not explain environmental data variation patterns concerning yield in
population studies ....................................................................................................................................... 107 Genetic principles underpinning drought improvement strategies are technologically challenged ........... 111

19
Biotechnological breakthroughs are hampered by phenotype bottlenecks ............................................... 112 Adaptation strategy and environmental considerations in Barley genome sequencing interactomics ................. 113 Physiological Leaf function during complex abiotic stress ..................................................................................... 113 Doubled haploid chromosomal genetic improvements in barley breeding for abiotic stress tolerance ............... 115 Environmental scenario simulation phenotype, genotype interactions ................................................................ 116 Environmental and biological QTL heuristics ......................................................................................................... 117
Summary ................................................................................................................................................... 118
Project 1: rapid downstream glasshouse field trial genetics assessments for QTL variability minimisation
in GPU core processing and telematics data analyses .............................................................................. 119
Executive summary ................................................................................................................................................ 119 Background ............................................................................................................................................................ 120 Aims ....................................................................................................................................................................... 121 Methods and results .............................................................................................................................................. 121
Candidate gene data mining and selection (metanalysis) ........................................................................... 121 Combined heat and drought stress data required for yield correlations (based on environmental geo-
location variation) ....................................................................................................................................... 123 Glasshouse and field trial database (data lake) design ................................................................................ 124 Glasshouse benchmarking and DH Experiments (2016, 2017, & 2018) ...................................................... 126 Technology derived glasshouse and field data-variation detection and measurement .............................. 128 Sample database statistical outputs concerning project aims .................................................................... 129 Field trials (2015, 2016, 2017) ..................................................................................................................... 132 Evaluation of technologies used to collect plant specific traits concerning abiotic stress treatments as it
related to grain yield ................................................................................................................................... 135 Discussion .............................................................................................................................................................. 136
Project 2: a scaleable, private LTE/4G, Boolean GPU networking stack for automated, remote, IoT
decision making......................................................................................................................................... 139
Executive summary ................................................................................................................................................ 139 Aims ....................................................................................................................................................................... 139 Methods and results .............................................................................................................................................. 140
Network workflow topology and methodology .......................................................................................... 140 Discussion .............................................................................................................................................................. 143
IoT Smart device technology for cloud-automation .................................................................................... 143 Concerning the security of IoT and remote 5G AI heuristics ....................................................................... 145
MANUSCRIPT 3: RECOMMENDATION AND CONCLUSION ............................................................................................. 146
MANUSCRIPT 4: BACKGROUND SCOPE AND DECLARATIONS ......................................................................................... 147
Heuristics enhanced SAAS platform: remote geospatial machine learning of soil profiles from an ancient
mediterranean environment ..................................................................................................................... 149
Abstract ..................................................................................................................................................... 149
Introduction ............................................................................................................................................... 149
Aims ....................................................................................................................................................................... 152
Materials and methods ............................................................................................................................. 153

20
Validation of the laboratory based geotechnical data ........................................................................................... 153 Remote geospatial ground movement prediction based on statistical relationships ............................................ 154
Results and discussion ............................................................................................................................... 155
Author contributions and acknowledgements .......................................................................................... 159
EPILOGUE PROLOGUE CONCERNING AUTOMATED SOFTWARE PREDICTION TECHNOLOGIES IN APPLIED DATA ETHICS ................. 160
GENERAL RESULTS ........................................................................................................................................................ 161
MURDOCH TWINS: CONTAINERISED .NET API BACKEND DATA IMPLEMENTATION FOR REAL-TIME
DEEPFAKE GAMES .......................................................................................................................................................... 163
GENERAL DISCUSSION .................................................................................................................................................. 169
CONCERNING THE HYPOTHESIS OF DATA-DRIVEN, MEDITERRANEAN, A.I. SIMULATIONS AND THE ETHICAL IMPLICATIONS OF
EMBEDDED QUALITATIVE BIAS IN DIGITAL TWIN DEEPFAKE GAMES ................................................................................. 171
ABOUT THE NOVELTY AND AUTHENTICITY OF THIS RESEARCH THESIS AND ITS MANUSCRIPTS ................................................ 173
CORRECTING THE FLAWS OF MODERN APPLIED DATA SCIENCE....................................................................................... 176
ON THE PERCEIVED FLAWS IN THE ETHICAL TENET OF SIMULATION METHODOLOGIES (AND THE METADATA ARGUMENT) .......... 177
The specifics of hardware implementations concerning heuristics workflows show promise. But there’s a
catch! ........................................................................................................................................................ 179
The effect of immeasurable factors on statistical heuristics as it relates to downstream qualitative
interpretation / deepfake verification ....................................................................................................... 181
USING COMPLIMENTARY DATASETS TO BUILD VISUAL HEURISTICS-BASED DECISION MAKING A.I. ......................................... 183
Various responses to environmental stresses not fully exploitable in this study due to natural limit of
measurement time .................................................................................................................................... 184
Immeasurable field data and omics based functional model extrapolation attributed to understanding variability
............................................................................................................................................................................... 185
AGTECH AND TELECOMMUNICATIONS REQUIREMENTS FOR SUCCESSFUL ENVIRONMENTAL AGRICULTURE DATA-SCIENCE A.I.
ROUTINES .......................................................................................................................................................... 186
Economic benefits can outweigh data-driven guessing games................................................................. 187
THE STEADY RISE OF WELL MEANING, ILL INFORMED, DATA SCIENTISTS IN THE A.I. ETHICS COMMUNITY ................................ 189
FINDINGS AND RECOMMENDATIONS ....................................................................................................................... 193
THESIS FINDINGS ................................................................................................................................................. 195
THESIS RECOMMENDATIONS ................................................................................................................................. 195
FUTURE TRENDS .............................................................................................................................................................. 197
THE NEXT 30 YEARS AS IT RELATES TO THESIS TENET, A.I. AND BIOPHYSICS ..................................................................... 199
THESIS APPENDICES ...................................................................................................................................................... 203
APPENDIX 1: REMOTE 5G AUTOMATED PHENOMICS PLATFORM FOR LOW MELTING TEMPERATURE FAT, NATIVE GRASS GRAZED
EXPORT CATTLE WAGYU EWAS ............................................................................................................................. 207
APPENDIX 2: THE ROLE ADAPTIVE TRAIT PLASTICITY PLAYS IN PRE-HARVEST SPROUTING IN BARLEY ...................................... 209

21
APPENDIX 3: MICROBIAL COMMUNITY RESPONSE TO NITROGEN USE IN DAIRY SOILS ......................................................... 221
APPENDIX 4: PHENOTYPING STOMATAL RESPONSE COMBINED EFFECTS OF HEAT AND DROUGHT VIA AN AUTOMATED R-PYTHON
GENERATED TRANSPIRATION MODEL OF MULTI-SPECTRAL DATA (PROOF OF CONCEPT). ..................................................... 225
APPENDIX 5: AUSTRALIAN DRONE TECHNOLOGY ASSISTING A SIGNIFICANT STEP IN STEP IN CROP TOLERANCE TO HEAT AND
DROUGHT STRESS ................................................................................................................................................ 227
APPENDIX 6: PRELIMINARY ASSESSMENT OF EMPLOYING HYPERSPECTRAL IMAGERY TO DETECT MINERALS INDICATIVE OF URANIUM
ORE FROM UNMANNED AERIAL VEHICLES ................................................................................................................. 233
APPENDIX 7: PHD SCHOLARSHIP IN DIGITAL CONNECTIVITY AND BIG-DATA ANALYTICS IN AGRICULTURE ................................ 251
BIBLIOGRAPHY ................................................................................................................................................................ 253

22

23
GENERAL INTRODUCTION

24

25
DEEPFAKE GAMES: A REVOLVING DOOR OF ETHICAL DEBATE
CONCERNING APPLED A.I., DATA SCIENCE, AND QUALITATIVE BIAS.
Why use a sledgehammer to crack a peanut? Moving progressively away from smaller-scale,
more labour intensive economies, to larger, more efficient, automated economies that utilise
newer technology seems like a costly exercise. Part of the solution to the cost is a technology-
driven revolution that includes digital twins and artificial intelligence (A.I.). Like those that
monitor the health and location data of everyone in real-time via edge processing and adaptive
hopping (e.g. Low Energy Bluetooth®), giving governments and scientists predictions on
people’s behaviour in the event of sudden environmental changes (ARM, 2019). However, is
the root cause of probability ever guaranteed in a computer statistical simulation or computer
visualisation, or is it due to non-random, relativistic proportionality (Freedman, 1995;
Greenhalgh, 2002)? Is this exercise ethically responsible or even practicable concerning the
broader data useage implications or misuse potential e.g., (Nature, 2020; The Lancet Group,
2020)? What are the broader implications concerning deepfakes and their intended use in
ethical species’ manipulation? But most importantly, ethically, whose data is it? At a recent
event held at the University of Tokyo’s Hongo Campus; ‘Framing Benefits and Risks of
Biotech and A.I.: Symposium’ in February 2020, Professor Jeroen van den Hoven from the
Delft University of Technology outlined the, ‘risks and rewards of ethical A.I. and
infrastructure’. He proposed that currently, “there are only two major global players in R&D
investment considering implementing A.I. systems.” At that time, he didn’t advise that any of
two A.I. systems (presumedly The People’s Republic of China (PRC) and The United States
of America (USA)) have any competitive advantage over the other. Nor did he give any
indication that these models are linked to the European Union (E.U.) (for implementation) due
to what could only be described as a non-committal concerning perceived benefits that either
of the two models may offer the E.U. in terms of its own A.I. policy frameworks, legislation,
and strategies (Prof. J. van den Hover personal communication, 1st February 2020). The broader
implications of this statement cannot be understated concerning the potential roll-out of A.I.,
globally as it relates to all possible data sources (and all personal data), under a choice of only
one of two systems e.g., (The Lancet Group, 2020).
Where economically feasible to do so, the roll-out of smart technologies and automation
solutions has already begun, and become a significant focus for mathematicians and computer
scientists, analysing increasingly complex datasets including for agricultural drought, and point

26
and non-point pollution sources as changes delta (Δ). But, with this rollout come modern
challenges related to computational time constraints (t) (Turing award recipient Prof. Y. Bengio
personal communication, 3rd September 2018). Connecting and integrating our world means
sharing more and more with each other. However, not always (Pivotel C.E.O. Mr. P. Bolger
personal communication, 20th November 2018). Some scientists are now at the new nexus
working in food security, predicting, mapping and estimating environmental fate (e.g.
pollution, or climate change), by using ‘omics’ and genomics data for predictive gene function
mapping of transcription factors (Thompson et al., 2020). For discovering new proteins,
engineering plant-based meats through improved production methods, or for identifying new
(or lost) plant varieties (UC Davis Prof. D. Cook personal communication, 3rd January 2020).
The problem is that increasingly complex understandings of genetic and environmental
systems, are being summarised in qualitative means by A.I. data-ethicists, without appreciating
the complexity but more importantly, the bio-physical ‘source-code’ (RNA/DNA evolution).
This problem is actually famous. Neils Bohr wrote about it in his 1933 Light and Life abstract,
“concerning the relation of physics to the problems of biology,” arguing successfully that
nature is randomly entangled quanta (Bohr, 1933). In any case, our new interconnected world
of complex networks and computers, smartphones, base stations, and servers; this nano-nexus
comprises a digital ocean of connected data lakes, embedded game strategies, A.I., and maybe
soon will include encrypted quantum computers.
The digital ocean is power-hungry, requires massive infrastructure investment, and teams of
people to manage and maintain it, independent of the A.I. and data lakes themselves
(Hagendorff, 2020). In reality, exacting the values required from statistical models is
challenging, often counterintuitive and almost always time-consuming or expensive (e.g. Arute
et al., 2019). There is a gap in understanding integrated telematics, informatics, logistics and
analytical visualisation tools required for effective data management systems, that connect
sensors to their entangled network and environment, which can lead to people ultimately taking
shortcuts. For which measurements and calculations are qualitatively interpreted and
quantitatively reported via an internet-connected computer application interface (e.g. via
pythonic .NET APIs). More and more sensors are being manufactured every day. Yet, security
considerations of communications protocols and data collection standards are not addressed
generally or not at all in many institutions and organisations who cite politics over science as
an ethical mandate e.g., (Nature, 2020). Actors are increasingly aware of this; they seek to take

27
any advantage governable. Enter deepfakes; a necessity, because currently there is no ethical
framework or mandate that says their use is categorically “unethical” (Stahl and Wright, 2018;
Ide et al., 2020; Pauwels and Deton, 2020).
The modern renaissance of ‘big.’ Advances in bio-physical algorithm functions and
architectures, the quantum A.I. cloud is here. A new bio-physical Moore’s Law. The ethical
responsibility lies in humanities hands to ensure that the genetic data of all species’ is not lost
to history, in time. Out of the myriad of challenges and potential solutions, the case for digital
twins in agriculture, environmental science, and industrial automation technologies (presented in
this thesis) is the result of 20 years of collecting environmental data, and from first-hand
experience learning how reporting significance of statistical analyses can skew outcomes. A
question always remains unanswered. Qualitative bias (Grimley et al., 2019). A problem
related to the ethics of species data collection, and digitalisation due to the lack of
acknowledgement of the data and model source(s) embedded in objective probability
(Freedman, 1995) e.g., (Abbott et al., 2012; Long et al., 2018) sometimes leading to bias in
reporting significance (increasingly common for A.I. simulation). A.I. thus escapes ethical
scrutiny. Why? Yet, without it (the raw data itself), digital twins wouldn’t be possible, so why
should we consider implementing digital twins in the first place, a peanut cannot speak for
itself. More importantly, who should get to decide the outcomes for the peanut in an A.I. game?
(Figure 1)

28
Figure 1: In remote locations, technological services are vital due to increasing scales of marginal investment returns in the
data-driven sciences; including those associated with grain-yield. The sheer vastness of remote cropping environments
demands it. So too, selection and breeding approaches that offer new varieties for ever-increasing areas with different
management strategies—requiring sophisticated logistics for grain yield and grain quality due to the magnitude of data that
can be generated in a short time window. Thus, it is imperative to consider all previous data collection methods and sources
before building software applications. Just as there are as many ways to explain why one (measurement) is most often left out
or missed in a historical model; similarly packaged and marketed methods for demonstrating a perceived relationship that
software longevity has with hardware ownership rights skew understandings (of data). In remote locations, longevity and
inheritance are inter-generational considerations. In the software industry, the average longevity of secure applications that
include customer support is three years (irrespective of the hardware functionality). This modern access issue includes access
to machinery data and through the process of ethical hacking (legal 3rd party software modifications) has led to debates, fights,
and lawsuits concerning said software ownership; and the right to modify, for the benefit of seemingly no-one but users
themselves (contrary to widespread debate). A photograph of the author (circa 2016) while collecting data and consulting in a
remote region with limited telecommunications infrastructure in Western Australia’s Wheatbelt. Photo Credit: Dr. R. Maddern.

29
REVIEW OF LITERATURE

30

31
THE CASE FOR DIGITAL TWINS IN ENVIRONMENTAL SCIENCE AND
AGRICULTURE
Modern economies are turning to the connected ‘digital ocean’ (Muñoz-Amatriain et al., 2015)
to tackle not only environmental stresses (Copetti et al., 2016; Werrell and Femina, 2016) in
engineered and agrarian land-use systems but there has been a rapid rise in clinical genomics,
diagnostics and gene function transfer prediction research dating back to the early ’80s that
continues today (Jones, 1985; Tyson et al., 2004; Watts et al., 2017; Vallecillo-Viejo et al.,
2020). While the latter has seen recent economic returns in this space, environmental scientists,
agriculturalists, agronomists, plant breeders, and farmers have had a more challenging
experience (Knight, 2006). Not only because of a perceived lack of data as a function of
available processing speed capability but also in some instances due to remoteness, ever-
diminishing returns on investment, and the cost required to upgrade to newer monitoring
systems. Coupled with challenging policy frameworks and laws surrounding the ownership of
data and globalisation of software systems, this is the current landscape (Teng et al., 2016;
Stahl and Wright, 2018; Hagendorff, 2020). It is in this uncertainty that people, businesses,
professionals, and land managers sometimes willingly hand over data, to data-scientists, often
self-prescribed experts in machine learning and A.I., but with no ethical responsibility
(grounded in traditional sciences) concerning the outcomes an algorithm generates e.g., (The
Lancet Group, 2020). The reliability of the data source more often than not interpreted without
a foundational understanding of the environment from which it was sourced leading to a new
term, ‘plausible deniability’ for explaining such failures. Google’s ABC corporate mantra is
“fail fast, fail often.” But, what are the implications of this, on the traditional physical sciences;
chemistry, and physics, as it relates to modern, applied, hypothesis-based, data-science?
Specifically, it is because farmers and land managers who face the challenges of having to be
able to adapt under changing climatic constraints while at the same time facing agricultural
production and conservation issues that are not necessarily environmental, or related to point
sources that data science has become such a focal point in governmental policy (McKee et al.,
1993; Svatos and Abbott, 2019). These types of interactions, the results of which are reported
are not new, however. More often nowadays, being called ‘micro-climate effects’, this
phenomenon originates from some of the original works of a German scientist named Rudolph
Geiger, circa 1923. “Orographisches mikroklima” (orographical microclimate) and
“Kleinklima” (small climate) (Geiger, 1927; Yoshino, 2005) that refers to ‘targeted
occurrences’, ‘hotspots’, or other significant deviations in standard dataset models or data

32
sources. Although in data science concerning environmental data there are increasing
references to microclimate pertaining to; a lack of supporting environmental data, missing data,
collection errors, and or other malfunctions that may contribute to bias in statistical analyses
of significance, e.g. (Zhou, 2016b; He et al., 2019). Combinations of environmental stresses
are a constant reminder of the harsh realities of human-environment interaction, but these
combinations are not limited to ecological pressures alone (Nokia Moon Shot Intuitive
Machines VP Space Services, T Martin personal communication 28th October 2020).
Combined biotic and abiotic stresses cause morphological, physiological, biochemical,
molecular and genetic changes that adversely affect desired ecosystem function (Wahid et al.,
2007; Mejia-Guerra et al., 2012; Bita and Gerats, 2013). In ecosystems, abiotic and biotic
stresses include: (i) drought and flooding, (ii) temperature stress (freezing and heat), (iii) soil
effects (salinity and acidification), (iv) light intensity, (v) introduced or native animals or
insects, (vi) diseases, (vii) viruses, (viii) micronutrients and heavy metals, (ix) herbicides, (x)
CO2 and other ozone gasses, and (xi) climate change (Jisha et al., 2012; Lavania et al., 2014;
Halford et al., 2015; Jain, 2015; Sheoran et al., 2015). It has been suggested by Duque et al.,
(2013), that more knowledge about biological protection systems in hostile environments will
hold the key to discovering new tools for enhancing adaptation to biotic and abiotic stress. The
challenge is linking the data to what happens in the environment, and the implementation of
such strategies to some sort of perceived benefit (Svatos, 2018). And the issue of data
ownership as it relates to the collection of all this knowledge.
Technologies conceived and available are able to ensure that animals, plants, and soil
(microbes) receives what they need for optimum health and productivity. Furthermore, farmers
and land managers need to be able to make decisions about their daily work based on measured
values and utilise the technologies that can manage and control individual responses without
losing time on the maintenance and upkeep of these systems (Merlot et al., 2002; Müller et al.,
2018). But there is also a need to be able to make decisions about daily workloads based on the
measured values that utilise these technologies’ data also (monitoring the monitors)
(Weckwerth et al., 2020). So that people can manage and control individual responses without
losing time on the maintenance and upkeep of their systems if they break down. Similarly, in
high-intensity livestock farming (e.g. dairy), sensor systems to measure behaviour and health
conditions of individual animals, allows farmers to make better-informed decisions on
treatments, thus improving animal welfare and production (Svatos and Abbott, 2019). But if
autonomous systems breakdown in remote locations, these systems need auto-guidance

33
solutions so that, together, farmers have the potential to make farming more productive and
profitable without unnecessary risk (Svatos and Trowbridge, 2018).
Some of the technologies currently utilised include satellite navigation (GPS), monitoring
technology from satellites, aircraft, and drones, that link to in-field sensors for data
management and analytics, decision support tools and finally ‘robotisation’ for automation of
all kinds of machinery (Figure 2). This type of telemetry can provide or improve wireless in-
field communication, functional safety and repair. For maintenance, additional information to
realise unified interfaces, create a
standard IoT reference framework and to
encourage openness and transparency in
the development of technology-neutral,
IoT system architectures and their
implementation (Royal Australian Air
Force pilot Mr. G Trowbridge (Retired)
personal communication, 3rd April 2020)
In this context, the use of analytical
heuristic algorithmic estimations (Huang
et al., 2019) and genomic simulation
should not be discounted (Thompson et
al., 2020). However, the process of
implementing heuristic algorithms over
cloud IoT infrastructure and
telecommunications (telematics)
systems is still in development and very
much a frontier science (Appendix 1 and
5). Although genomics simulations (e.g.
AMES, 2003) are not new, their
implementation outside the experimental
fields, e.g. astrobiology, and into
everyday life, however, is a late development. The reason is due to more recent uptake and
investment in supercomputers, and even more recently, rapid investment into privately funded
startups like SpaceX. SpaceX’s philosophy is not asking science fiction based questions, but
Figure 2: The latest in ‘big’ digital agtech from Challenger
(Caterpillar Inc., Illinois, USA) the MT800 E series (with
attachment) is one of the larger articulated units on the market This
unit demonstrates the requirements of size and scale for farming in
remote areas, along with auto-steer, and a ‘lightweight’ GUI
framework over an embedded .NET assembly running parallel to
the ISOBUS(II) as standard. The module, ROM and API network
architecture allows for real-time decision-making via the inbuilt
controls, yet the kernel is also light enough to enable connections to
local WiFi networks, for correlations with the farm management
database software, by the farm manager or owner. Or for
autonomous remote override and control via sat-phone if required
(requires newer telematics software and supported LTE hardware).
This set up however, is limited by the quality of and number of WiFi
hotspots (does not support newer 4G/LTE onboarding APIs). Circa
2019 (W.A. wheatbelt). Photo Credit: The Author.

34
taking responsibility for shaping what society will be remembered for tomorrow, and in the
future, into their own hands (Elon Musk on Twitter, 11th May 2020)
https://twitter.com/elonmusk/status/1259945593805221891. The Amazon AWS GovCloud
(U.S. Region), for instance; is capable of digital twin heuristics of big-data. Their cloud-based
‘digital ocean’ is composed of multiple data island centres that can handle the scale of high
capacity, mission-critical workloads, including high-performance computing, big-data
workloads. More than 200 dedicated hosts running more than 1,000 virtual machines (each of
which requires at least eight vCPUs and 32GB RAM) are needed for it. Yet, there is very little
by way of data visualisation tools and support that can be implemented without significant
structural programming. Provided that a scientist can navigate the 100’s of billions of lines of
programming code required to set up such instances and understand the complexities to ensure
smooth operation for linking a digital twin to a financial market based on other sources (e.g.
GPS integration with, COBOL ‘spaghetti’ code for example). Source: Bloomberg, 2020. This
is an excellent ethical case for creating digital twins; however, the environmental data, the model
species’ and the bias of A.I., for a twin model simulation needs reviewing. First and foremost, in
terms of the ethics of species selection, based on some known A.I. ethical trust manifest at the
silicon manufacturing end, e.g. ARM, (2019) who state,“at present there is no defining set of
ethics to follow”…, “there are many issues that must be addressed in the development of an
ethical framework for AI that enhances trust.” It is not reassuring that ARM selling licenses for
their architecture for A.I., silicon implementation to companies every year including Microsoft
and Apple can claim to be ethically responsible concerning data.
ENVIRONMENTAL SPECIES SIMULATIONS: DATA ABOUT METADATA
The reason why A.I. and environmental studies are seemingly at odds stems from the
perception that simulating environmental stress is challenging when raw data are used to
predict an outcome due to the simulated stress. A modern-day dilemma due to the increasing
amounts of available data and metadata used to explain it, e.g. (Ludovisi et al., 2017; Reynolds
et al., 2018). Three significant stress combinations that threaten global food security includes
drought, heat, and frost (Pandey et al., 2015; Zandalinas et al., 2018). Whereas environmental
scientists, tend to focus specifically on point and non-point modelling, for example,
eutrophication related water issues (Elliott and De Jonge, 2002; Liu et al., 2016; Lin et al.,
2017). In the case of plants and animals, abiotic stress is directly related to semi-controllable
factors that affect the management of the particular resource being exploited. These abiotic

35
stresses (non-point and point) affect the holobiont and alter environmental fate regardless of
the data and its associated meta-data (the ecosystem processes as a whole) (Hemond and
Fenchner-Levy, 1999; Zilber-Rosenberg and Rosenberg, 2008; Chalancon et al., 2012).
Animal, plant, fungal, bacterial, and viral interactions in the environment alter and affect the
welfare of animals in agricultural production industries regardless (The Royal Society, 2009).
Many of the primary and secondary responses of plants and animals to abiotic stress are known
yet there is little evidence for success in drastically improving yield under all environments by
identifying and cloning genes exhibiting tolerance or avoidance to combinations of abiotic
stress. In relation to plants and animals this field of study faces challenges concerning
collection of environmental data specific to ‘digitalisation’ because ethically, the question
about trust remains unanswered. What is trust in this context? In defence of plants, exotic
germplasm may be a source of genetic adaptation to be exploited for farming while potentially
maintaining some of the yields required for economically sustainable cropping systems.
However, the current state of the art of genomics technologies is more advanced than the most
accurate field-based technologies, the data integration concerning the enormity of
environmental variation, contentious, e.g. (Long et al., 2018; The Lancet Group, 2020).
ENVIRONMENTAL ABIOTIC STRESS APPLIES TO ALL GENES
Abiotic stress, including water scarcity, causes significant crop losses worldwide (Abou-
Elwafa, 2016). It has been suggested by leading climate scientists (Andrys et al., 2016;
Schellnhuber et al., 2016) that we are currently experiencing an accumulation of extreme
weather conditions in connection with climate change. Global climate change due to
anthropogenic increases in CO2 correlates with changing weather patterns. Deforestation and
clearing to make way for crop and pasture production, combined with on and off-farm
emissions associated with those practices, probably contributes to more significant water losses
overall than the actual climate change itself (Smith et al., 2016). However, developing countries
in sub-Saharan Africa and Asia will be significantly affected. Calculations by the
Intergovernmental Panel on Climate Change (IPCC) suggests that harvest yield as a result of
water loss in these areas could be halved, which carries with it a potential increased risk of
armed conflict and strategic logistical water resource fortification (Ide et al., 2020). Recent
research suggests that abiotic stressors are closely related to two environmentally sensitive
‘molecular elements,’ including transposable elements and epigenetic components (Rey et al.,
2016). The regulation and control of changes due to abiotic stress at the epigenome level are

36
suggested to be initiated and influenced at the global scale, i.e. a difference in global CO2
concentrations that may result in a small-scale variation within a species. For example, stomata
are the primary sites for transpiration in cereal plant crops including barley and are governed
by CO2, light, and temperature responses and circadian rhythm interactions (Habte et al., 2014;
Fanourakis et al., 2015; Millar, 2016). Plants like barley, may evolve fewer stomata and thus
upregulate their epigenetic responses accordingly (Engineer et al., 2016). These interactions
have future implications for phenotypic and genotypic control, especially in breeding for
abiotic stress where water can be secured into the future (Chinnusamy et al., 2008; Bobadilla
and Berr, 2016). Studies in environmental epigenetics are becoming popular due to advances
in bioinformatics data processing, including omics technologies.
These methods can assess ‘microevolution’ due to microclimate ‘hot spots’ (i.e. mutation and
evolution at contemporary ecological scales) (White et al., 2012; Araus and Cairns, 2014;
Rahaman et al., 2015; Tripathi et al., 2015; Kulski, 2016). The recent development and use of
the CRISPR Cas9 (a naturally occurring bacterial resistance to a viral RNA mechanism that
splices reverse transcript RNA sequences and copies the base pair sequence) represents a
significant step forward since some of the first efforts to modify genomic DNA via “gene
transfer” were detailed (Jones, 1985). With more substantial control to establish favourable
outcomes in plant breeding without knocking out other genes, scientists are making further
inroads (Chen et al., 2015; Jain, 2015; Rey et al., 2016). However, the case for using CRISPR
Cas9 for abiotic and in particular complex abiotic stress drought x heat or drought x frost or
‘complex stress’ research is problematic and requires a new approach concerning data. A new
iteration of a bio-physical source-code argument (Appendix 1,2, and 3).
A BRIEF LESSON ABOUT QUANTITATIVE WATER MODELLING (DATA)
Water quality and quantity interactions are fundamental in our understanding of ecosystem
functions. Water is the ‘glue’ that binds life processes in the homogenous matrix that
encompasses not only cellular functions, but also at all ecosystem scales (global, local, nano)
(Johnson, 2009; Sutherland et al., 2014; Copetti et al., 2016). Small changes that occur in all
cells can affect and be affected by climate, and out of this equilibrium, we can improve our
understanding of environmental management (Svatos, 2018). Without doubt, two of the most
critical water-related challenges facing environmental scientists and agriculturalists are
eutrophication due to farming practices (involving phosphate and nitrogen), and the scarcity of

37
potable water resources (due to changing climate scenarios and the associated political
situations) (Burrows and Kinney, 2016). Drought is a significant threat regarding global food
security and long-term agricultural production (Altman, 2013; Andrys et al., 2016). In many
areas of Earth, clean arable water for crop production is in short supply (Carvalho et al., 2014).
Water availability, whether rain-fed or irrigated is thus the most critical factor in agricultural
production throughout the world. A predicted increase in demand for food production is
essential and depends on whether agricultural areas can receive sufficient water (Irmak, 2012).
Breeders have made progress in improving and developing more drought-tolerant crops.
However, cultivators still cannot meet the demands of food security in the face of an increasing
world population, global warming, and global water shortages in agriculturally productive
areas (Mendicino and Senatore, 2012). Therefore drought is internationally significant because
it can occur at any time during the growing period, and is not limited to specific seasons or
years (Morison et al., 2008; Lakew et al., 2011).
Drought stress in cropping and agriculture accounts for a significant reduction in global
productivity between 40% and 50% (Hill et al., 2013). This impact of drought represents a
considerable challenge regarding the implications that will affect population growth now and
in future generations (Ahuja et al., 2010; Teixeira et al., 2013; Zhang and Li, 2016). Climate
projections for Mediterranean climates show average rainfalls are predicted to decline by 6%
by the year 2030, and 12% by the end of the century. For a high emissions scenario, this rainfall
decline will more likely be ≈18%, according to Sudmeyer et al., (2016). Scientists associated
with the Australian Bureau of Meteorology (BOM) have defined drought in cropping systems
as an acute water stress from anthesis. In barley cropping systems in Western Australia,
terminal drought is the typical type of drought experienced by farmers and is considered to
have occurred after five consecutive days without rainfall after anthesis (Allison and Hobbs,
2004; Allison and Hobbs, 2010; Sudmeyer et al., 2016). “When reviewing measurement of
stress from an environmental and agricultural viewpoint drought is a model choice, due to it
being very challenging to predict and define” (Palmer, 1965). “Hence, the real cause and
prediction of drought using indices remain both premature and inadequate.” Drought stress in
plants is multidimensional environmental stress (Palmer, 1965; Pozzi et al., 2013; Sadras and
Dreccer, 2015; Brunner et al., 2015). There are currently over 150 publications that have been
used to characterise and measure drought in the environment as of 2011 (Zargar, 2011).
Commonly used quantitative methods for measuring drought are: (i) Palmer Drought Severity
Index (PDSI), (ii) Crop Moisture Index (CMI), (iii) Standard Precipitation Index (SPI), (iv)

38
Relative Soil Moisture (RSM), and (v) NDVI (multiple) reds, greens and near-infrared bands
(Palmer, 1965; Keyantash and Dracup, 2002). Scientific literature recognises four types of
drought: meteorological, hydrological, agricultural, and socioeconomic. Since drought stress
is simply a plant response to an environmental condition, quantifying what this plant response
using standard measures is often tricky (Tetard-Jones et al., 2011; Obsa et al., 2016). Zargar,
(2011) suggests that to best manage a drought; accurate characterisation is essential in enabling
both thorough analyses (e.g. severity versus impacts) and risk assessment (e.g. the likelihood
of drought). Nonetheless, water use efficiency and plant tolerance to drought stress have been
correlated (especially in barley) (Hu and Xiong, 2014). The drought indices SPI and NDVI do
not account for all aspects of drought. In addition to the variability in the types and applications
of droughts (e.g. meteorological versus hydrological), the weak association between drought
indices with physical drought has prompted calls for aggregate drought indices to cover more
aspects of the environment. Pozzi et al., (2013) also suggest that the advanced Palmer Drought
Severity Index (PDSI) does not take into account factors associated with how extreme heat
stress may affect the status of plant development under drought. Drought occurs on vastly
different scales and can affect all aspects of plant metabolism, which also can happen at various
times. Consider the following Penman-Monteith (PM) model of the Thornthwaite PE algorithm
(Equation 1). This equation is considered the most comprehensive algorithm for modelling
potential and actual evapotranspiration (given additional estimates of the plant and
environmental resistance to atmospheric demand (Sheffield et al., 2012). The PM models
evaporation as a combination of irradiative and aerodynamic processes, thus it gives a more
realistic estimate, having the potential to be influenced by changes in humidity, radiation, and
wind speed, as well as temperature (Trenberth et al., 2014).
Equation 1: Penman-Monteith (PM) model of the Thornthwaite PE algorithm
PE =𝛥
𝛥 + 𝛾⋅ 𝑅 +
𝛾
𝛥 + 𝛾⋅ 6.43(1 + 0.536𝑈)𝐷
Legend: PE is (mm d-1) assuming zero stomatal resistance; ∆ (Pa.K-1) is the slope of the plot of saturated vapour pressure
against air temperature, U is the wind speed (ms-1) at 2 m height, Rnet is the net radiation (W.m-2), D is the vapour
pressure deficit (Pa), and 𝛾 is a psychometric constant (Pa.K-1). Although as precise as is reported; whether the model
can be used in microclimate calculations considering the scales at which such phenomena can change the individual
components that make the sum of the model is unknown to the author.
There is a considerable reward for monitoring water scarcity and quality (Mendicino and
Senatore, 2012), however, how can we model such large datasets with increasing certainty, and
if we take any particular environment and model physics and weather station data, what should
we expect concerning the outputs in terms of technology or computation strategy (Table 1)?
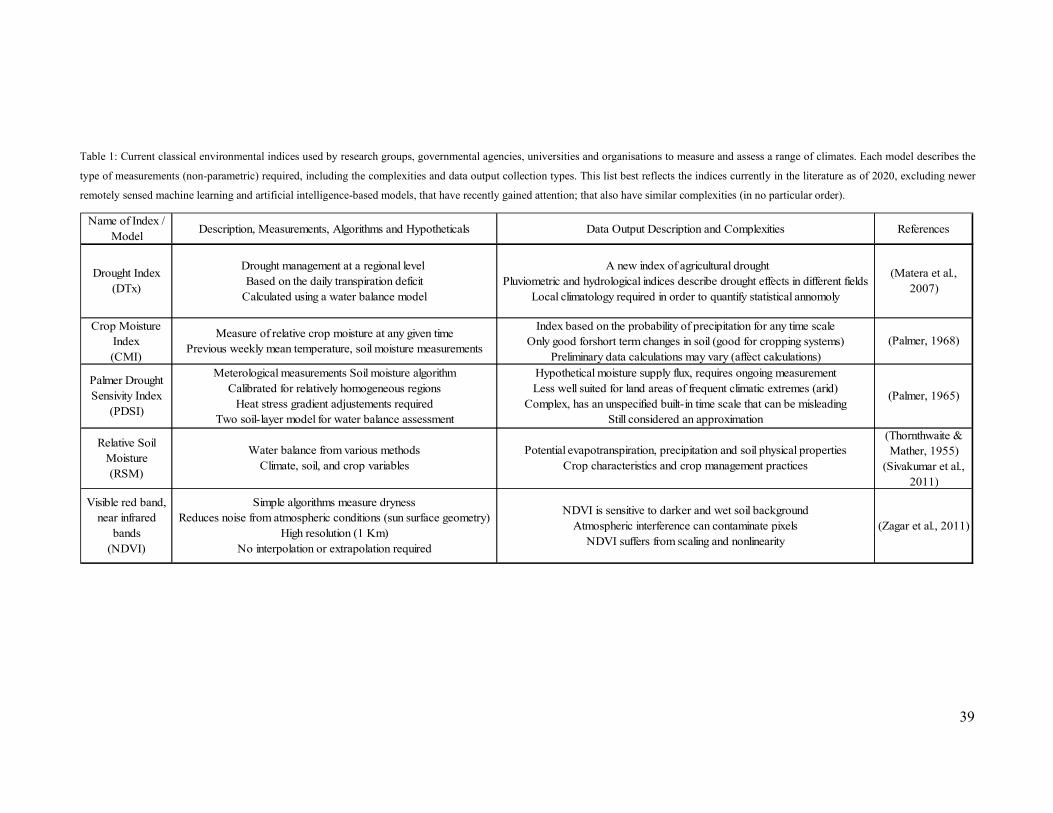
39
Table 1: Current classical environmental indices used by research groups, governmental agencies, universities and organisations to measure and assess a range of climates. Each model describes the
type of measurements (non-parametric) required, including the complexities and data output collection types. This list best reflects the indices currently in the literature as of 2020, excluding newer
remotely sensed machine learning and artificial intelligence-based models, that have recently gained attention; that also have similar complexities (in no particular order).
Name of Index / Model
Description, Measurements, Algorithms and Hypotheticals Data Output Description and Complexities References
(Matera et al., 2007)
(Palmer, 1968)
(Palmer, 1965)
(Zagar et al., 2011)
(Thornthwaite & Mather, 1955)
(Sivakumar et al., 2011)
Simple algorithms measure dryness Reduces noise from atmospheric conditions (sun surface geometry)
High resolution (1 Km) No interpolation or extrapolation required
NDVI is sensitive to darker and wet soil background Atmospheric interference can contaminate pixels
NDVI suffers from scaling and nonlinearity
Meterological measurements Soil moisture algorithm Calibrated for relatively homogeneous regions
Heat stress gradient adjustements required Two soil-layer model for water balance assessment
Hypothetical moisture supply flux, requires ongoing measurement Less well suited for land areas of frequent climatic extremes (arid)
Complex, has an unspecified built-in time scale that can be misleading Still considered an approximation
Drought Index (DTx)
Crop Moisture Index (CMI)
Palmer Drought Sensivity Index
(PDSI)
Relative Soil Moisture (RSM)
Visible red band, near infrared
bands (NDVI)
Measure of relative crop moisture at any given time Previous weekly mean temperature, soil moisture measurements
Index based on the probability of precipitation for any time scale Only good forshort term changes in soil (good for cropping systems)
Preliminary data calculations may vary (affect calculations)
Drought management at a regional level Based on the daily transpiration deficit
Calculated using a water balance model
A new index of agricultural drought Pluviometric and hydrological indices describe drought effects in different fields
Local climatology required in order to quantify statistical annomoly
Water balance from various methods Climate, soil, and crop variables
Potential evapotranspiration, precipitation and soil physical properties Crop characteristics and crop management practices

40
COMPLICATED ABIOTIC QTL STATISTICAL STUDIES ‘BEAR NO FRUIT’
Briefly, a QTL is a quantitative trait locus and is a selection of DNA that correlates with
variation in a phenotype (Lander and Green, 1987). QTL are calculated to physical locations
on chromosomes using the Kosambi function and are linked to the genes that control for the
phenotype (for that particular trait) (Kosambi, 1943; Masle et al., 2005). For organisms whose
genomes have already been sequenced such as Arabidopsis and Oryza sativa (rice), QTL can
be used to include or exclude a gene(s) in identified regions when the function of such gene(s)
is connected to a trait in question (Jones, 1985). If the genome sequence is not available, a QTL
may be used to extrapolate via sequencing the identified region and determine putative
functions of genes by their similarity to other sequenced genes with a known function(s)
(usually in other genomes, e.g. MOREX). Researchers can perform searches using the basic
local alignment search tool (BLAST); a cloud-based service that allows users to enter a primary
sequence(s) and find similar sequences in the cloud (online database) for genes and genomes
https://www.ncbi.nlm.nih.gov/guide/all/. Wehner et al., (2015) using a genome-wide
association study (GWAS) to find genes coding for proteins identified by BlastX, found
significant marker sequences in their study of drought stress and leaf senescence in juvenile
barley. This study shows that GWAS studies are adequate at mapping and finding new genes
and lead to protein discoveries; however, many GWAS studies make great promises that result
in significant challenges and even greater failures, e.g. (Wang et al., 2017; Hepworth et al.
2018). Why? (for context, please see Appendix 2).
Agronomic yield under drought-stressed conditions is affected by both constitutive QTL and
adaptive QTL while drought-responsive adaptive QTL affect only yield under specific drought
conditions (Pospisilova et al., 2016). The problem is that the associated regions of DNA that
closely link to a candidate gene is sometimes considered more important than the actual
phenotypic trait data and its collection. Robinson et al., (2016) identified QTL for root traits
for drought adaptation. They summarised several QTL mapping studies conducted in wheat,
rice, sorghum, and barley. For root angle and number, they also published, “two major
suggestive QTL on 5D and 6B for root angle, and two QTL on 4A and 6A with four suggestive
QTL positions on 1B, 3A, 3B and 4A for root number.” However, from their studies, not enough
significant data have been generated to further validate the data collection methods in field trial
examples that link their QTL to more environments, concerning more soil types. A GWAS
conducted by Clauw et al., (2016) found that the occurrence of a mild drought stress response

41
in leaves and inferred high accuracy across accessions based on the expression profile of 283
genes. Still, their study has not been validated beyond this, and their research only suggests
that “natural variation in Arabidopsis sheds light on trait architecture.”
Another QTL analysis for kernel colour was performed using genotypic data from 167 RIL’s
derived from a cross between a black kernel and drought-tolerant Syrian landrace (barley)
Tadmor, and a light-kernel and drought-susceptible parent (Akash, 2010). A significant QTL
was detected using composite interval mapping, “which explained 77.1% of the phenotypic
variation for kernel colour in barley.” The author also suggests that “the QTL will provide a
basis for gene cloning and marker-assisted selection about drought tolerance.” Given these
claims, one would expect a more substantial response in the way this and other studies are
reported in the scientific news; however, such occurrences are rare. Too many studies conclude
unconvincingly with a list of actions and recommendations, with, biases often claimed to be a
result of microclimate, or GxE, when the data do not clearly reflect the ovesrvations. For
example, “excessive ryegrass in field trials” (Dr. D. Diepeveen personal communication, 2nd
January 2020). The net resulting variation from the expected are commonly used to propose
new studies and then propose the same experiment again, with different results that don’t
support adapted or more modern methodologies proposed by others. Only to delve deeper into
bioinformatics analyses to explain the same phenotypic variation due to new microclimate or
GxE effects and introduce more candidate genes that ‘show promise,’e.g. (Zhou et al., 2016b;
Guo et al., 2017; Hill et al., 2019).
The main aim of QTL mapping is to get useful phenotype data that is highly repeatable and
correlates well to the environment. Therefore, the number of phenotypes that one can collect
is not so much as important as the quality of the phenotype data (Costa et al., 2013). Logistics
and time management for collecting trait data and meaningful phenotypes must play a role in
experimental design. Thus, any data available within the context of drought tolerance and other
agronomic traits may be of importance and thus permits collection and segregation later
(Rahman et al., 2015). However, increasing accuracy of phenotypes is reliant on the efficiency
of methods of data collection, which requires increased use of technology to be repeatable for
all environments. Not just in some (Brauer et al., 2014; Camargo et al., 2014; Gago et al., 2015;
Gutleben et al., 2018). Thus, it is easy to see how setting up such experiments alone could
quickly run into the 100s of millions of dollars, e.g. pangenome strategies with accelerated
breeding program outputs, including next-generation metagenomics sequencing strategies

42
(Mascher et al., 2016; Cheifet, 2019). All these trends point to increasing data with increasing
uncertainty with less revolutionary breakthroughs (Appendix 2). So the case for why a digital
twin simulation can be realised (concerning the fruits at the top of a hypothetical, digital,
evolutionary tree) can also as easily be acknowledged. But, should one be constructed?
MODELLING DIGITAL TWIN SPECIES’: ETHICAL CONSIDERATIONS OF A.I.
SELECTION BIAS
In any instance, before a digital twin can be constructed, a specific species must be chosen to
‘ethically digitalise’. Selecting a model species for a digital twin environmental simulation has
its challenges. Not due to the complex nature our environment shapes phenotype and influences
epigenetic expression ‘loops’ of genes resulting in a selection that alters interactions (e.g. RNA
deletion neurons in squid) (Vallecillo-Viejo et al., 2020). Nor is choosing a model species about
the process of natural selection itself (Appendix 2). To select a model species for digital twins
from an ethical perspective, how or what should it be? Should it (i) be highly adaptable or show
signs of such an ability, (ii) have a significant environmental data source which correctly
reflects every adaptation and natural selection strategy for all potential environments, or (iii)
not be constrained by the ethics of data collection itself? “The great fault of all ethics hitherto
has been that they believed themselves to have to deal only with the relations of man to man.
In reality, however, the question is what is his attitude to the world and all life that comes
within his reach” (Albert Schweitzer). It is an interesting point. And what about cultural or
spiritual considerations in humans, concerning our immediate environment that supports us,
e.g. (Boesi, 2014; Laurent, 2015)?
Some research has already been considered and published. These publications; including that
of the critically endangered hairy marron under increasing exposure to heavy metals in
eutrophic waterways (Svatos, 2018), dairy cows under changing microbial bacterial dairy soil,
nitrogen, hotspot scenarios (Svatos, 2011; Svatos 2012; Svatos and Abbott, 2019), a new
Tibetan-Australian barley population (including two new clone species) under complex abiotic
drought x heat, and frost scenarios (Svatos et al., 2018; Svatos and Trowbridge, 2018); and
thus as it applies to humans in the building and construction industry (under review), represents
data collection and management supporting independent evidence of the attitudes supported by
an increasing number of A.I. ethicists.

43
THE CASE FOR AN ETHICAL ASSESSMENT OF A TIBETAN DOUBLED
HAPLOID BARLEY DIGITAL TWIN
Barley (Hordeum vulgare L) is one of the world’s most ancient and vital crop species according
to Mascher et al., (2016) and represents the fourth most abundant cereal crop in both harvested
area and grain production globally (Zohary et al., 2012). The very earliest known domestication
of barley can be traced back approximately 10 000 years to the fertile crescent. The occurrence
of the grain in its wild form in caves explains early domestication around the Neolithic period
(Archaeologist Mr. N. Svatos personal communication, 3rd March 2020). It has also been used
to describe continental migration and habitation patterns of continental Europe by homo-
sapiens approximately 6 000 years ago (Mascher et al., 2016). More widely, barely is grown
and used to make beer and other beverages and in primary industries for consumption by
animals, including livestock (Laurent, 2015; Zhang and Li, 2016). Both the domesticated and
wild forms are believed to be from the self-pollinating cereals of the Poaceae/Gramineae
family of monocotyledonous plants that have evolved from the flowering evolutionary lineage
(Zohary et al., 2012). Both are diploid in nature with 14 chromosomes 2n = 14 (n = 7). The
Figure 3: Whose data is it? (Left) The existence of cultivation of Tsampa (Tibetan barley) in this region have most likely
been similar (to those depicted in these images) for millennia. The uniqueness of the Tibetan plateau, including the
autonomous regions in being claimed by China, makes the collection, and use of germplasm like that shown above, culturally
significant for the Tibetans who live(d) there, independent of any prior claim of an evolutionary canyon or not (Dr. J. d’Alpoim
Guedes personal communication, 1st February 2020). Recent events have shown us that where genetic data (but more
importantly) matching phenotype data is concerned; the ownership and development of intellectual property resulting from
the publication or discovery of novel genes is a constant source of political hardship for first nations people around the globe.
It is therefore paramount that in relation to the collection of data specifically in relation to food security, digitalisation and
ethical A.I., that the welfare of these first peoples remains at the centre of debate. When discussing collection of data and data
ownership, in relation to first nations people’s resources all countries have a responsibility to acknowledge and accept the
conditions placed on the use of that data. Owing to the special political nature of Tibet and its people; data concerning digital
twins, the use of drones, and data ownership concerning archaeological artefacts and medicines is constantly under dispute.
None moreso than now (Dr.Y. Laurent personal communication, 1st January 2020). (Right) Methods of yak barley cultivation,
juxtaposed by the vastness of the Himalayan Mountain Range Photo Credit: Norbert Svatos circa 1993.

44
seven chromosomes identified and labelled based on their size and characteristics and defined
as 1H through 7H (Jakob et al., 2014). The main difference between the two forms is only the
occurrence of a brittle rachis in the wild type, which is believed to aid seed dispersal (Reetinder,
2009). Studies by Wang et al., (2009) and Yuan et al., (2015) offers a new theory of the origin
of Hordeum vulgare L., using genetic diversity analysis. The authors suggest that close
relatives of Tibetan wild barley may have a higher genetic diversity than those from the Middle
East. This evidence, however, is not supported in the archaeological record and is thus
inconclusive (Laurent, 2015). Nonetheless, barley exhibits, variation in response to abiotic
stresses in primitive landraces and related wild species gene pools (Forster et al., 2004;
Dwivedi, 2016b), and these Tibetan cultivars are some of the earliest forms domesticated in
Asia. The primary uniqueness of the Tibetan varieties (both domesticated and wild forms) is
the physical altitude they can survive independent of climatic events, making them a
remarkable example of early, evolutionary colonisers, but more importantly survivors (Figure
3). Evidence suggests this is one of the main reasons for the continuing habitation of Tibet
(Boesi, 2014). Barley crops in Tibet are mainly used in producing Tsampa which is culturally
used as a food, a medicine, but also has a deep spiritual connection to the Tibetan tribes who
have lived there for millennia.
Tibetan barley owing to its origins in high altitude, water-limited environments, may contain
unique genes enabling crossed varieties to survive in increasingly drought susceptible cropping
regions (Prof. C. Li personal communication 2nd Feb 2016). For example, in Mediterranean
climates, and thus offer improved yield-related traits under increasingly bleak drought outlook
scenarios (Andrys et al., 2016). The challenges, however, to exploit Tibetan barley germplasm
and give impartial, and balanced, ethical assessments (concerning all available data) may be
challenging. Not owing to open-source datasets, but owing to ongoing data, germplasm
ownership, and technology bottleneck issues concerning geopolitics, (Furbank and Tester,
2011; d’Alpoim Guedes and Aldenderfer, 2019). Nonetheless, novel solutions relating to
Tibetan barley; including the selection of a Tibetan-Australian barely population to create a
digital twin for an ethical A.I. assessment is essential for science; because of the impartiality,
such an evaluation may afford in minimising moral, objective, assessment bias through novel
methods and technologies (Solaiman and Hirata, 1997; Caporaso et al., 2010; Driedonks et al.,
2016; Dey, 2018; Fong, 2018; Svatos et al., 2018).

45
APPLIED DATA SCIENCE IS IN DESPERATE NEED OF A RE-THINK
CONCERNING COMPUTER VISUALISATION TECHNOLOGIES
Currently, the most challenging aspect of big-data analysis and statistics is visualisation. This
multifaceted discipline is now ineffectual at relaying the multitude of data sources in real-time
for decision making (in the applied sciences and related industries) irrespective of the elegance
of the computational algorithm at a programmers disposal (Freedman, 1995; Greenhalgh, 2002)
(Appendix 3, 4, 5, and 6). The correct statistical method for a visualised heuristics test includes
the implementation of classical computer programming processes; modification and testing the
IDE, SDK, and then building the kernel (assembly) for firmware-based tools, and finally, ROM
flashing, recovery etc. (Shotts Jr., 2009; Ghiurcuta and Moret, 2014). The tests required for
developing and maintaining such an approach must increasingly be cloud-based but also link
to existing computational systems running older firmware and OS for scalability, reliability
and edge computing IoT, which frequently do not support a 64-bit remote terminal, secure
shell, e.g. (Nandhini et al., 2016; Shuai et al., 2016;Reynolds et al., 2019).
To assess the ethics of an environmental digital twin simulation a highly specific, flexible
kernel for the advancement of computational kinetic based systems needs essential
development for the applied sciences to link it to the recently available 5G IoT infrastructure
roll-out occurring concerning digital automation. Specifically, for A.I. research, that require a
scaleable 6G network for various reasons raised in the following resources, i.e. (IBM 1989,
Stine, 1990; Blackwood et al., 2003; Araus et al., 2018; Rancati et al., 2018; Ahmed et al.,
2019). Key to this are industries related to the advancement of telecommunications. However
Figure 4: (Left) The co-aligned Headwall sensor mounted on a DJI M600 Pro (DJI, Shenzhen, China) rigidly without gimbal.
This Headwall dual sensor hyperspectral camera costs around $340k AUD (as of 2018) and is capable of capturing spectrum
data between 400 and 2500 nm of bandwidth. The key characteristic is the two line-scan sensors in this system are pointed at
the same target and logging is time synchronized. This dual VNIR/SWIR sensor gives the best of both worlds, covering the
VNIR and SWIR bands enabling mineral identification (Image Credit: Headwall, Massachusetts, USA; courtesy of Mr. J.
Portlock). (Right) The Scientific Aerospace, 4Scight P3 aircraft with equipped with a FLIR Tau thermal sensor onboard, can
log a 9Hz analogue video onto an SD card. As of 2019 Scientific Aerospace was the only independent manufacturer of
autonomous drones in Australia. Rory O’Connor (Chief Pilot). Image credit: The Author.

46
the reality is that these technologies are generally not publically available for research,
increasingly expensive; but more accurately are privately owned, and unfortunately sensitive
to research questions linked to policies and international laws (Reynolds et al., 2019; ARM,
2019) (Figure 4) (Appendix 3 and 4). Correlations between data collected from a range of
sources to a functionally online workflow are a frontier based scientific pursuit (Manfreda et
al., 2018). And concerning machine learning and sophisticated embedded encryption, it is more
important to open the manifest concerning trust to include all conventional data collection for
finding collaboration; to expedite effective workflows. Because, issues associated with
agriculture, locally and remotely sensed data are increasingly converging in political matters
irrespective of policy feedback mechanisms (Qu et al., 2018; Ide et al., 2020). The data doesn’t
support the policy decisions. Mandating that drought will be solved by implementing A.I.,
amounts to saying that a fighter pilot will beat an A.I. in a visual game simulation 100% of the
time. It cannot be assured, because the computer can be turned off.
One of several proposed applications of statistical data visualisation is in genotype x
environment (GxE) minimisation in genetic analyses (Brien et al., 2013; Pantin et al., 2013;
Baker et al., 2015) for a range of glasshouse and field phenotyping platforms. Traditionally
these begin with detailed experimental design and replication protocol facilitation, precision
instrumental analytics, followed by statistical calculation and multiple ‘loops’ for data
correction and correlation for example with mixed modelling CPU clusters (Neveu et al.,
2019). From a plant genomics perspective, the cost associated with this approach is significant
(Field et al., 2006). Many of the abiotic and biotic stress minimisation techniques do not result
in single gene function determinations. Or the multiple molecular pathways that fine map to
chromosomal regions are published and then retracted—for example, Cai et al., (2018).
CRISPR Cas9 protein has resulted in the questioning of several QTL based analytical studies.
From the perspective of research, this raises some concerns about the validity of traditional
phenotyping. But it also opens pathways to new experimental design ideas and methods to be
developed to rapidly test functional gene architecture concerning traits in question (Appendix
2, 4, and 5). Data transfer mechanisms are at the forefront of industry decision making (Svatos
and Trowbridge, 2018). In this respect, the use of high-resolution phenotyping requires
significant investment in remote mobile telecommunications technologies and other supporting
industries, as highlighted in Svatos et al., (2018) and similarly in Reynolds et al., (2019).
Additionally, concerning telecommunications infrastructure, the focus on scaleability and

47
secure access to APIs requires additional secure data, VPN based encryption protocols, and
physical asset protection Nandhini et al., (2016).
MATHEMATICALLY MODELLING THE “BIO-PHYSICAL SOURCE-CODE”
Bayesian estimation allows for considerable freedom in assessing data lake structure, stability
and accessibility (Metropolis and Ulam, 1949; Greenhalgh, 2002; Thompson et al., 2020).
However, the limitation of primary binary machine language, especially for an OS running 32-
bit architectures on the newer 64-bit virtual containers lends itself to a large number of issues,
e.g. (Diepeveen, 2011; Kässens, 2017). Although such an approach can be a success, it also
depends on many factors, and there is a considerable programming legacy, concerning
dependency acknowledgement, e.g. (Stine, 1990; Johansen et al., 2016). For the application-
specific to science-based agriculture and environmental science, for example (Figure 5 and 6);
provide side by side comparison, about the detailed workflows currently available.
Figure 5: Microsoft IoT Edge and IoT Cloud workflow utilising docker containers to API interfaces and web-based database
centres (containing a range of software library support packages for common architectures). The Docker interface creates a
portable web-based API container for remote access to the node to integrate logistics and the IoT Hub and cloud (Mr. P.
Schmidt personal communication, 5th June 2018). As such, the language support tools that are available through the Docker
client are somewhat limited based on the architecture of the edge-based devices. A full comparison of all the available services
offered by both Amazon and Microsoft is possible at https://docs.microsoft.com/en-us/azure/architecture/aws-
professional/services. Image Credit: Microsoft Corporation.

48
Each system utilises similar technologies and current trends with integrated machine learning
pipelines for island-based serverless decision tree IoT deployments. Concerning latency (Δ) of
APIs and configurable IP addresses through TCP/IP command systray (e.g. backwards
compatible kernel and custom flashed ROMS or recovery); containerisation and IP availability
of instances. The compatibility of connected edge devices does not allow real-time (t)
assessments in terms of non-data specific GPU strings (relative binary throughput in kB/sec)
as previously suggested by Shuai and Medhi, (2016). It is expected by using an ‘AutoML’
configuration, that the setting of the limitation of latency-lag should be overcome especially
for newer 5G implementations but probably not for 6G instances that will rely on TB/sec
throughput (Figure 7). The question of security of these systems concerning multinational or
governmental hacking. A significant cause for concern in current real-world scenarios
concerning satellite source-code security, for example, as it relates to GPS navigation systems;
critical (Mr. G Trowbridge (Retired) personal communication, 3rd April 2020). “We never even
considered it.”
Figure 6: Amazon AWS serverless processing utilising a range of off the shelf products for integration into the IoT logistics
decision tree, and machine learning (green grass) workflow(s). The AWS Green Grass and Kinesis operation allow scalable,
real-time machine learning of AWS and other buckets, via an automated, expandable decision tree (AWS Lambda function).
For example, the GPU cluster image ‘hot spot’ recognition, with environmental sensor data feedback. However, with such an
approach, the quality of the computation is restricted by the ability of the clusters to keep up with the load generated via IoT
sensor and visual data processed at the core. Kubernetes clusters serve this purpose; to balance the load generated through top-
heavy GPU: CPU Bayesian and other Markov statistical computation (via Kinesis Analytics) (Mr. B. Pogson personal
communication, 2nd January 2018). Edge processing is slowly becoming the more favoured tool for such an approach, however.
Image Credit: amazon web services.

49
DEEPFAKE GAMES IN A.I. SIMULATIONS
The reason deepfake games may be employed in the context of scientific research concerning
the ethical use of species related A.I. implementation is questionable ‘social engineering’
(Pauwels and Deton, 2020). But institutions and governments are increasingly under public
pressure to produce revolutionary outcomes (in particular in genetics). The reason why a
deepfake image or video may be used to manipulate an outcome for reward becomes instantly
apparent, but also a necessity. The compounding problem relates to the increasingly automated
platforms being employed across international borders in collaborations with little or no
security design features in mind, e.g. (Reynolds et al., 2019). Source-code exposed by IoT
devices (that have critical functions in the collection of data used to generate predictions) that
then give decision-makers the required information to qualitatively decide outcomes for large
populations (including for humans) is concerning. Digital twin deepfakes is the next iteration
of this outcome. Where fake images and video are subsequently used to model the responses
using sensors (e.g. in smartphones) to see whether the responses to the fake information is
positive or negative without qualitative interpretation in the feedback loop (assumed/automated
responses). A divide and conquer A.I., game strategy, with no real number solutions, (not
Turing-complete), but a trusted source-code hack, e.g. (Huang et al., 2020), ethical or not, it is
a matter of perspective. The problem of biology as it relates to physics as hypothesized by Bohr
in 1933.
Figure 7: The Google analytics and cloud hosting service links the firebase remote shell terminal to web hosting APIs with
considerable ease. The limitation facing such an approach is due to instances wishing to run a .NET ASM. However, the limit
is only significant in 32-bit architectures, which most smartphone and wearable edge-based processors cannot access. Remote
access to the config server requires it, even with a virtualisation API layer at the backend. Image Credit: Google Corporation
(image .NET source, Free Software Foundation, 1991; Google Images accessed 3rd January 2020)

50
GENERAL AIMS
The following general aims highlight the specific pathways followed in realising and
developing the central tenet of “data-driven, Mediterranean, A.I. simulations and the ethical
implications of embedded qualitative bias in digital twin deepfake games” The following
general aims are stated here for evaluation context and lead in to the proceeding hypothesis.
1. Develop a case for the examination of ethical principles surrounding digitalisation and
automation of scientific workflows via heuristic algorithms (for digital twins)
(Review).
2. Develop high-resolution imagery and statistical techniques to enable heuristic
measurements for a range of field/glasshouse/laboratory experiments.
3. Develop a real-time assessment workflow for processing mathematical algorithm
measurements from a range of laboratory and field-based data source observations
(phenotype and environmental data sources).
4. Implement and test a heuristics IoT workflow for captured data in laboratory,
glasshouse, and field trials to determine accuracy and efficiency concerning variation.
5. Launch A.I. digital twin for real-time (Δ.t) deepfake game.
6. Create deepfake.
7. Run game, measure trust response then release the IP address to end the game.
HYPOTHESIS
Digital twins can be embedded and launched in AI manifolds for the statistical analysis of
heuristics data, and for correlation and extrapolation of predicted outcomes to make ethical
assessments.
Under increasing variability, predicted results based on environmental data sets used in ethical
assessments may make artificial intelligence-based computer instances biased towards those
environmental variables and data, and leads to ethical use of deepfakes in the current
geopolitical landscape.

51
ASSUMPTIONS
1. The runtime environment specific to the supported hardware architectures’ is
standardizable/scalable.
2. The operating gradient (clock speed temperature vs processing command iterations)
that combine to execute the kernel operations are parametrizable within logical
iterations (Boolean).
3. The software stack and SDK interactions with the RAM, GPU and CPU to issue the
commands that generate hexadecimal hash keys used by the IDE and governor are
ethically sourced and issued via software licenses.
4. Qualitative interpretation of quantitative data underpins all scientific hypotheses
generated by computation independent of processing time.
5. The A.I. is Turing-complete (can complete the calculation).

52

53
METHODOLOGY

54

55
METHODOLOGY DISCLAIMER
Some of the methods presented in the general methods section were completed while working
as an independent private consultant for Karl Corporation. As such, client names and the
specifics of operations (done for those specific organisations) may be withheld for privacy and
security reasons. The methods, however, are the most accurate reflection of the scientific detail
and are the correct recollection of the overall methodological progress. According to the
declaration statement at the beginning of the thesis.
A SMALL CONTEMPORARY THOUGHT EXPERIMENT AND QUESTION
Any thesis methodology should allow a philosophical argument to somehow be measured,
quantified or defined. The reader is asked to consider as it relates to embedded A.I., and
objective causality. The problem arises when the same argument is hypothesised over and over,
without a consensus ever being reached (non-Turing complete). The thought is that we need to
consider the root cause, to be able to understand the sum; however, in computer science, the
sum is not part of a whole binary tree, the same as in genetics. Thus, our thought (appropriating
cause in a simulation) is automatically thrown out by computers in statistical simulation
experimentation, and herein lies the dependency (the notion of an inherited bias), which may
continue to attribute cause again and again leading to no real solutions. How can we eliminate
such bias as it relates to A.I., if in reality, there are no-real probable solutions at all anyway,
and what are the natural implications of these bio-physical blips (assigning measurement to the
ebbs and flows of life as it relates to life and light and the possibility of a new way of thinking)
(Bohr, 1933)?
A NEW PURPOSE FOR DATABASE (LAKE) CONSTRUCTION: A.I. SIMULATIONS
The methodology combines state of the art, high precision, computer-based software
engineering, informatics, sensors, light-medium and heavy instruments, industrial machines,
UAV drones, quantitative laboratory, and wet chemistry analytics including genomic
sequencer derived technologies; firstly to gather enough data, and secondly to support an
independent hypothesis test. These environmental data lakes (metascopic data clusters),
including raw data, metadata, and other data (phenotype and genotype data) (Manuscript 1
through 4) are used for determining qualitative risk factors, (for a Mediterranean environment)

56
the ethics of embedding statistical A.I. workflows for quantitative prediction outcomes to build
a digital twin (for a novel Tibetan-Australian barley species population) based on its
complementary digitalised phenotype metadata via a 5G/LTE real-time game simulation.
There is a progressive focus in each manuscript of implementing increasingly more
sophisticated visualisations, instruments and technologies to describe and model the data in
relation to the hypothesis for the final ethical assessment of the thesis; via a cloned, deepfake
image 5G/LTE, real-time game. The reader is asked to evaluate the authenticity in real-time
any perceived qualitative bias in this A.I., concerning the aims and hypothesis. The individual
descriptions of instruments and technologies not concerning the computer hardware/software
interface used for the digital twin deepfake real-time game are described in each manuscript
respectively, to allow the reader to separate the environmental information from the
computational. Where all instruments and data acquisition technologies were typically set up
and configured using a programming stack and kernel similar to Unix, to issue commands, e.g.
in C language, the purpose of the computation in this thesis is automation, connectivity, and
compatibility to .NET assembly (IBM, 1990; Free Software Foundation, 1991). Based on data
outputs and qualitative assessments made during the course of research and published in peer-
reviewed journals, e.g. (Manuscript 1 and 2, Svatos, 2018; Svatos and Abbott, 2019
respectfully), these raw data (lakes) were initially described and set up for ethical data
collection based on established peer-reviewed scientific workflows.
Before and after each manuscript, additional supporting estimates, references, data, results, and
discussion are presented. The data for which the digital twins are finally compared to real-life
scenarios also draw upon supporting metadata and APIs. It is through a data mining, acquisition
and comparison approach (Manuscript 3 and 4) that these practices are used to develop the
concept further. Which then leads to the general results section. It is through the software
environment that the thesis seeks to unravel some of the complexities of data-driven methods,
concerning qualitative bias in ethical decision making of real-time A.I., (deepfake game
simulations) the manuscripts were necessary due to the continuing issue of data ownership but
were also a means to the penultimate end of the computational game. A theoretical answer
concerning bio-physical source code.
Lab and field-based environment datasets and metadata were collected (including from
remotely sensing, functional microscopy derived, and sequencer derived instruments and their

57
metadata). Additionally, imagery derived, and raw data collected throughout the research
(manuscripts) and projects are summarised in terms of statistical outputs, matrices, or as
visualised vectors (plot summaries), through the development of a range of analytical
performance protocols as part of the aims related to an initial procedure (Svatos, 2018).
COMPUTATIONAL VISUALISATION AND PROGRAMMING PROTOCOL
The thesis investigates the embedded potential for quantitative software bias, given that ethical
assessments are ‘a priori’ qualitative by nature. It includes an unpublished program application
and a new mathematical proof (unpublished). The original research of Richard Greenhalgh
with the author (Greenhalgh, 2002; Svatos, 2018), and relates to the principle that TCP/IP
protocols (addresses) linked to people will always be our primary digital fingerprint as initially
intended (IBM, 1989; Stine, 1990; Johansen et al., 2016). The species and the database
construction in this thesis are all linked (but not limited) to Mediterranean climates that support;
(i) aquatic invertebrate hairy marron crustaceans (and the associated phosphate and silicate
mineral interactions), (ii) a dairy cattle herd (and associated nitrogen fertiliser, dairy farm soil
management scenarios through associated microbial communities), (iii) a Tibetan-Australian
barley population (and associated heat-drought-frost scenarios that affect the food and beverage
industry), and (iv) Mediterranean soil environments as they are used in the building regulation
process. Using an already described method for which the author led the visualisation software
development, e.g. Abbott et al., (2012); here a range of SoC and FPGA chips were modified
(advanced kernel I/O flash, recovery, and stock(y) implementation) and embedded across
multiple assemblies to test flexibility and accuracy concerning their architectures; for a range
of different quantitative statistical procedures.
There were three primary considerations concerning software development for these protocols
presented in the thesis that generated the isotherm plots, PCA, CCA (and machine learning
derived visualisations). They were:
1. The developer runtime environment does not need to be specific to the supported
hardware architectures. Relative compatibility.
2. The operating gradient (clock speed temp vs processing command iterations) that
combine to execute the kernel operations is flexible and scaleable.
3. The software stack and how the SDK interacts with the RAM, GPU and CPU to issue
the commands that generate binary hexadecimal hash keys used by the IDE and
58
governor (governor = most basic description of an automaton computer) is at least
physically secure.
IOT PLATFORM STACK, DECISION TREE AND PENETRATION TEST
To facilitate the data collection, storage, analytics, and implementation of A.I. decision making,
(based on statistical analyses and data collection); a custom platform stack was designed from
the hardware base up (IBM, 1989; Free Software Foundation 1991; Greenhalgh, 2002; Shotts
Jr 2009; Svatos, 2018). Based on the .NET architecture (IBM, 1990), (obtained externally in
1987 from IBM and continually developed and improved by the author) a 64-bit embedded
assembly language, kernel, IDE and the SDK was then used to scale across the three cloud
networks (AWS, Azure, Google) using security-based TCP/IP configurations (via a remote
shell APN) to determine decision tree ‘best-fit’.
To test the security of data collected, a penetration test was set up (within the Microsoft
Windows IoT core OS). An embedded .NET assessment was then flashed using a pythonic
base build of the 64-bit ARM architecture and Broadcomm SoC SDK’s to assess *.dll
compatibility over the python wrapper interface measuring in the 2.4 GHz ISM Band (IBM,
1989; Stine, 1990; Johansen et al., 2016) including Bluetooth® special interest group (SIG)
protocol (based on pseudo-random frequency hopping theory) (Grimsley et al., 2019). If
compatible, the implementation would scale across the various IoT cloud infrastructures to
allow for latency testing, thus serve to meet the current and IoT needs of research in that
virtualisation framework concerning the database (lakes). And allow for expansion of digital
twin implementation in cloud-based .NET APIs. For this purpose, the Microsoft Azure
(including the Powershell terminal and platform-tools) for cloud processing servers was the
most suitable option. Azure cloud instances were spun up and tested for, development and
deployment of libraries and tools including for (R, Python, Matlab, Anaconda, Jupyter, and
Docker). Separate modifications were tested using cloud-based APIs and batch-based scripting
tools embedded securely into the system.io for a range of analytics, analysis and GPU and CPU
virtualisation/visualisation (via desktop and remote shell commands). These chip modifications
(kernel modifications) were assessed by comparing the compatibility of various custom builds
versus stock builds (of LTE/5G smartphones), including (custom ROM’s over Samsung-
Korean and LeECO LeTV-Chinese, builds and baseband models). Then by assessing the
compatibility of custom APIs over the non-stock API architectures (custom firmware
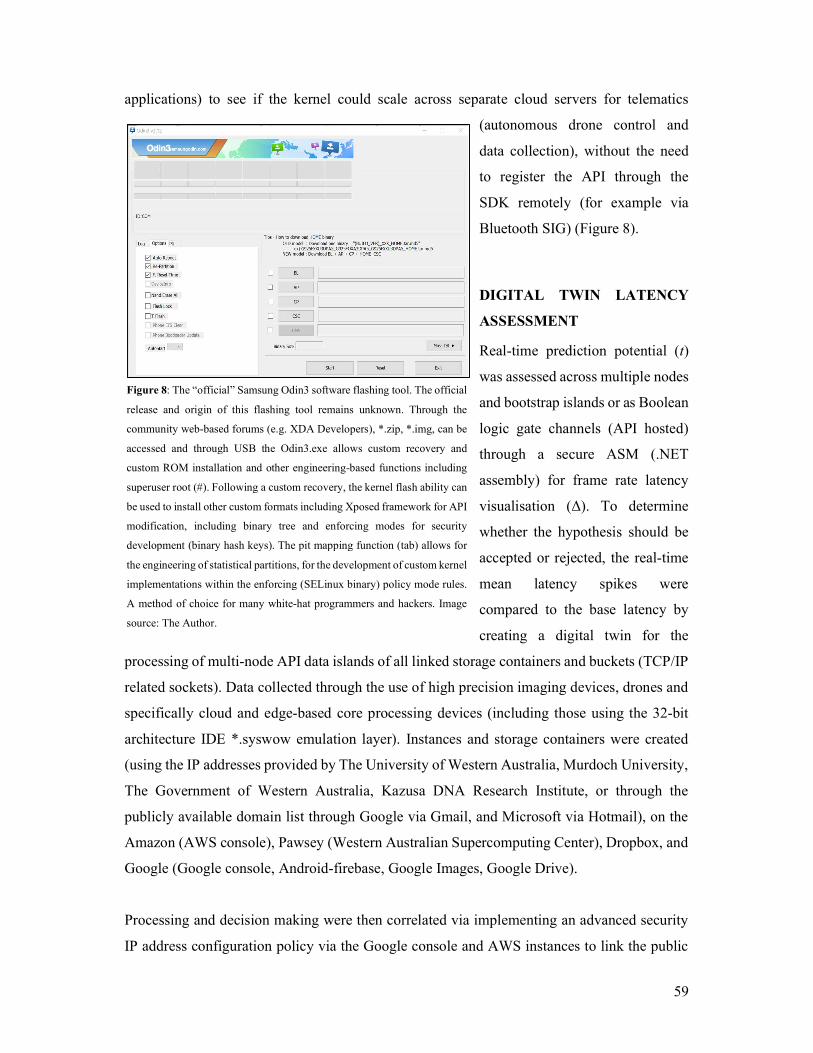
59
applications) to see if the kernel could scale across separate cloud servers for telematics
(autonomous drone control and
data collection), without the need
to register the API through the
SDK remotely (for example via
Bluetooth SIG) (Figure 8).
DIGITAL TWIN LATENCY
ASSESSMENT
Real-time prediction potential (t)
was assessed across multiple nodes
and bootstrap islands or as Boolean
logic gate channels (API hosted)
through a secure ASM (.NET
assembly) for frame rate latency
visualisation (Δ). To determine
whether the hypothesis should be
accepted or rejected, the real-time
mean latency spikes were
compared to the base latency by
creating a digital twin for the
processing of multi-node API data islands of all linked storage containers and buckets (TCP/IP
related sockets). Data collected through the use of high precision imaging devices, drones and
specifically cloud and edge-based core processing devices (including those using the 32-bit
architecture IDE *.syswow emulation layer). Instances and storage containers were created
(using the IP addresses provided by The University of Western Australia, Murdoch University,
The Government of Western Australia, Kazusa DNA Research Institute, or through the
publicly available domain list through Google via Gmail, and Microsoft via Hotmail), on the
Amazon (AWS console), Pawsey (Western Australian Supercomputing Center), Dropbox, and
Google (Google console, Android-firebase, Google Images, Google Drive).
Processing and decision making were then correlated via implementing an advanced security
IP address configuration policy via the Google console and AWS instances to link the public
Figure 8: The “official” Samsung Odin3 software flashing tool. The official
release and origin of this flashing tool remains unknown. Through the
community web-based forums (e.g. XDA Developers), *.zip, *.img, can be
accessed and through USB the Odin3.exe allows custom recovery and
custom ROM installation and other engineering-based functions including
superuser root (#). Following a custom recovery, the kernel flash ability can
be used to install other custom formats including Xposed framework for API
modification, including binary tree and enforcing modes for security
development (binary hash keys). The pit mapping function (tab) allows for
the engineering of statistical partitions, for the development of custom kernel
implementations within the enforcing (SELinux binary) policy mode rules.
A method of choice for many white-hat programmers and hackers. Image
source: The Author.

60
domain (IP addresses) to the privately hosted containers (buckets); those that contained the raw
data, the statistical outputs, and the digitalised images. Including the pseudonym moniker bot
and bot.net accounts connected to Microsoft (Github) libraries associated with karldroid, Karl-
Droid and other affiliated accounts, e.g. Samsung, LeECO, affiliated through email account
setup and configuration; (https://console.cloud.google.com/home/dashboard?project=ifft-iot-
coms-sat&cloudshell=true; project number 788549351193). These were implemented to
activate, and setup sideloading of apps and bypass the security protocols (penetration test) for
advanced kernel implementation concerning GPS, weather station, and satellite data via
creating batch processes using python over the .NET framework through the Optus, Pivotel,
and Telstra 3G/4G/LTE and satellite telecommunications networks (IBM, 1989; Krantz et al.,
1989; IBM, 1990; Stine, 1990), https://forum.xda-developers.com/member.php?u=7329463,
https://github.com/Karl-Droid). Setting up a pythonic ARM64 based .NET assembly based on
the ARM and Broadcom SoC architecture (https://docs.microsoft.com/en-us/windows/iot-
core/developer-tools/python), and linking the embedded .NET assembly to several IP addresses
containing the datasets collected throughout the course of study, enabled measurement of .NET
API latency over a millisecond timescale.
It was expected that if the mean latency API spikes generated in real-time were not ‘flat-lining’
that the hypothesis may be accepted (relative to the background latency ebbs and flows).
REAL-TIME DEEPFAKE A.I. GAME SIMULATION
The intent of the game simulation was to measure response in real-time. Statistical in the
approach and leadup to the general methods, and based on all manuscript data and methods
concerning the aims (digital twin latency visualisations).
An image was taken on a Samsung Galaxy tablet (camera) of the Tibetan-Australian barley
grain grown by the author at Department of Industry and Regional Development (Manuscript
3). The image colours were then highlighted based on their natural form (naturally segregating
black and white grain colours indicated by phenotypic trait measurement in the laboratory for
120 doubled haploid (DH) lines followed by shotgun sequencing, and RNA sequencing for
cluster matrix determination of expression data). And, owing to the complexity of this genetics,
the analyses and multi-transcription factors involved in the expression of the colour trait itself
(multi-environment expression variation). A deepfake version of the grain image was created

61
for simulating the game (inversion of the grain colour trait in the computer image); a simulated
measurement of a readers response on the suggestion that the image is either real or fake (via
the digital twin linked to the Google satcom IoT IFFT remote shell .NET API). In this
simulation; the digital twin (linked to IP address network stack), would be used to measure a
response of the reader to the knowledge that one is real and one is fake, on the premise that
both colours exist in nature, but one was not grown at all. The implication of that knowledge
as it relates to its use (and the readers reaction assessed quantitatively by the A.I.); concerning
qualitative underpinnings of the ethics of the existence of that fake data being in existence. To
simulate the end of the game the original IP addresses were released (after the latency
measurement); (indicating that a trust relationship had been established over an A.I. interface
remotely with the reader in this simulated game).
Additional qualitative analyses are interpreted as it relates to the statistical outputs of each
manuscript, and those are given contextually concerning similar ethical assessments at the end
of each chapter. Including the cultural and philosophical context concerning the A.I. ethics
thought experiment (A.I. game simulation) as it relates to the thesis discussion in the findings
and recommendations. A final outlook is provided, as it relates to the objectivity of the thesis
concerning future improvements, impedements, and methods for implementation.

62

63
RESULTS CHAPTERS

64

65
MANUSCRIPT 1: SCOPE, SIGNIFICANCE TO AIMS, AND DECLARATION
Land management, clearing and engineering have resulted in estuarine phosphate complex (and
perhaps also nitrogen) pollution. Areas specifically implicated include those Mediterranean
environments that have undergone significant channel erosion due to blast dredging (since
colonisation in the 1800s) and include the Swan Canning estuary and extend to Esperance
(excluding Margaret River). Svatos, (2018) was published in the Springer Nature Journal,
Environmental Science and Pollution Research.
This publication defines the means of data collection techniques required for predicting soil
physical properties and interactions with the environment using instrumental analysis and basic
visualisation software algorithm modelling (environmental isotherm plots). The central tenet
seeks to simulate the complex relationships that particles (framework aluminosilicate
lanthanum phosphate rare earth complex nanoparticles) have with the southwestern Australian
Mediterranean estuarine environments in a quantitative
laboratory experiment. Both interpolated and extrapolated data
are visualised through the use of a ‘basic’ computing software
kernelisation algorithm ‘plots’ to simulate the environmental
behaviour of the framework silicate lattices (including in the
JEOL 2100F spectrum photometer electron microscope <2.5 x
10-5 Pa platform, vacuum column) (Figure 9). Data related to bio-
accumulation and environmental fate specific to the endangered
(possibly extinct) freshwater hairy marron invertebrate, due to
the invasion of more a competitive marron species are discussed.
Since literature and follow-up publications have called for
additional research in the form of eco-toxicology studies, there is a section at the end of this
manuscript called ‘late developments.’ Although part of the methods was completed at the
University of Western Australia; the primary means of data analysis was done at Murdoch
University, through the creation of instances linked to Amazon Web Services and other web
hosting facilities, which connect to later works including general methods, results and
discussion. The institutional address is listed as UWA; however, this publication was only
made possible through additional support provided by Murdoch University while enrolled in
the PhD program (Murdoch University email address contact). This entire work is my own and
has not been content amended (except for text formatting for the thesis).
Figure 9: JEOL 2100F Transmission
Electron Microscope TEM (JEOL
Ltd. Tokyo, Japan). Image Source:
JEOL Ltd.

66

Environ Sci Pollut Res
67
Environmental Science and Pollution Research https://doi.org/10.1007/s11356-17-0846-9
COMMERCIAL SILICATE PHOSPHATE SEQUESTRATION AND DESORPTION LEADS
TO A GRADUAL DECLINE OF AQUATIC SYSTEMS
Karl B. W. Svatos1
Received: 17 May 2017 /Accepted: 27 November 2017 # Springer-Verlag GmbH Germany, part of Springer Nature 2017
ABSTRACT
Laboratory desorption behaviour, function and elemental composition of commercially marketed silicate
minerals used to sequester phosphorus pollution as well as Zeolite, Smectite, and Kaolinite were
determined to see whether their use by environmental scientists and water managers in eutrophic
waterways has the potential to contribute to longer-term environmental impacts. As expected, lower
phosphorus concentrations were observed, following treatment. However, data relating to desorption,
environmental fate and bioavailability of phospho-silicate complexes (especially those containing rare
earth elements) appear to be underrepresented in product testing and trial publications. Analysis of
desorption of phosphate (P) was > 5 μg[P]/ L for all three non-commercial samples and 0 > μg[P]/L > 5
for all commercial silicates for a range of concentrations from 0 to 300 μg[P]/L. Based on a review of
bioaccumulation data specific to the endangered Cheraxtenuimanus (Hairy Marron) and other endemic
species, this is significant considering anything > 20 μg[La]/L is potentially lethal to the hairy marron,
other crustaceans and even other phyla. Where prokaryotic and eukaryotic effects are underreported, this
represents a significant challenge. Especially where product protocols recommend continual
reapplication, this is significant because both the forward and reverse reactions are equally important.
The users of silicate minerals in water columns should accept the dynamic nature of the process and pay
equal attention to both adsorption and desorption because desorption behaviour is an inherent trait. Even
if broader desorption experimentation is difficult, expensive and time-consuming, it is a critical
consideration nonetheless.
Keywords Silicate minerals.Phosphate sequestration.Environmental fate.Instrumental analysis
Electronic supplementary material The online version of this article (https://doi.org/10.1007/s11356-017-0846-9) contains supplementary
material, which is available to authorised users.
1 Karl B. W. Svatos [email protected] (UWA School of Agriculture and Environment, The University of Western Australia,
Published online: 05 December 2017

Environ Sci Pollut Res
68
INTRODUCTION, BACKGROUND AND
SCIENTIFIC CONTEXT
The United States Public Health Standards limit
for phosphates in drinking water is 100 μg[P]/L,
and the American, Environmental Protection
Agency, suggests a limiting value of 80 μg[P]/L
for phosphates in lakes and reservoirs (USEPA,
1976). In south-western Australia, trigger values
used to identify adverse concentrations of
nutrients (e.g. total and filterable reactive
phosphate) for a range of disturbed waterways are
much less, and range between 5 and 65 μg[P]/L.
Reviews for aqueous systems (Copetti et al., 2016;
Douglas et al., 2016; Kurzbaum et al., 2017) have
shown that silicate minerals and compounds
derived from silicate minerals containing rare
earth bentonites and aluminium sulphate-based
compounds can improve water quality, clarity and
benefit the end user when applied to water bodies
high in phosphate.
The chemistry of phosphate sorption by
framework silicates is a well-known phenomenon
(Kafkafi et al., 1967; Bowden et al., 1977). The
reaction forms an inner-sphere surface complex
between a phosphate group and a metal cation
which is bound to a hydroxyl group (Goldberg and
Sposito, 1984). Phosphate sequestration effects
can only be determined by examining both the
particle absorption and desorption behaviours of
the environment in question because the
mechanism has both forward and reverse parts
(Kafkafi et al., 1967; Uusitalo et al., 2000).
Environmental parameters related to the forward
and reverse reactions include (i) stability of the
water column, (ii) temperature, (iii) nutrient
balance (limiting phosphorus and nitrogen
concentrations), (iv) light concentration, (v) pH,
(vi) carbon content (humic substances), (vii) the
presence of specific cations and anions, (viii)
dissolved oxygen concentration, (ix) adsorption
surface medium(s) and (x) biological influences
(Grim and Güven, 1978; Hemond and Fenchner-
Levy, 1999; Uusitalo et al., 2000; Lürling, 2014;
Stroom and Kardinaal, 2016). Therefore
phosphate silicate reactions within the solution are
not fixed, the phosphorus is recoverable if a low
enough surface activity is induced Kafkafi et al.,
1967).
Reviews and research papers on silicate minerals
including commercially available products by
(Robb et al., 2003; Ng et al., 2016; Stroom and
Kardinaal, 2016; Lin et al., 2017) have suggested
that eukaryotic and prokaryotic microorganisms
including algae, certain bacteria and macrophytes,
which are involved in accelerating eutrophication
upon treatment are attracted to the surface and
deposited. Desorption rate and concentration do
not receive the same attention in the same reviews
and research papers.
Commercially available composite sheet silicate
minerals used in the water clarification industry
include Phoslock™, Baraclear™ P80 (Halliburton)
and Bunnings Zeolite (Wesfarmers). Phoslock™ is
an aluminosilicate substrate with a three-
dimensional framework modified via cation
exchange with complexing elements selected from
Group IIIB rare earth lanthanides. The compound

Environ Sci Pollut Res
69
in solution subsequently forms insoluble
rhabdophane when in contact with aqueous
phosphate, and precipitates out of solution.
Zamparas et al., (2015) provide a full explanation.
The manufacturer of Phoslock™ suggests applying
the material to the surface of the water or injecting
it into the sediment bed (Douglas, 2002; Stauber
and Binet, 2002; Robb et al., 2003; Douglas et al.,
2016; Kurzbaum at al., 2017). In 2011, Phoslock™
received the US and Canadian drinking water
certification (60 NA, 2017).
Haliburton’s Baraclear™ P80 is a water
clarification additive for the water treatment
market. It is available as tablets and briquettes for
organic and inorganic contaminant treatment,
including phosphorus and turbidity control
(Halliburton, 2005). The composition of
Baraclear™ P80 according to its MSDS is as
follows: 1–5% crystalline silica species
(cristobalite, tridymite and quartz), 30–100%,
aluminium sulphate, and 30–100% sodium
bentonite deposits from Wyoming (Smectite).
Elemental Wyoming Bentonite from Western
County, Belle Fourché is represented by the
equation{[(Si3.86Al0.14)(Al1.58Fe3+0.17Mg0.24)O10(OH)2
]M+0.38}. The M+ represents a metal cation either
Na+ or K+ and is understood to be the site for
adsorption controlled by a range of forces in
solution (Kafkafi et al., 1967; Grim and Güven,
1978; Hemond and Fenchner-Levy, 1999; Lürling,
2014). The manufacturers of the Baralcear ™ P80
claim that their product addresses (i) colloidal
inorganic sediment, (ii) suspended organic matter
and (iii) inorganic phosphate molecules.
Baraclear™ P80 is an efficient way to clarify
natural and industrial waters, and remove
phosphorus (Halliburton, 2005).
Zeolite is a microporous, aluminosilicate mineral.
Zeolites are used in the construction of ion-
exchange beds in domestic and commercial water
purification, softening, and for other applications
such as nitrogen and phosphorus removal from
natural water bodies (Douglas et al., 2016). As a
product, it is widely available commercially
through various hardware and landscape supplies
stores in Australia and is distributed by
Wesfarmers Pty Ltd. The main difference between
Zeolites and their commercial Smectite
neighbours (Phoslock™ and Baraclear™ P80) is
that Zeolites are sold mostly in their natural form.
The process of phosphorus removal is still the
same except in Zeolite solutions the composition
is not altered by the addition of other compounds.
THE NEED TO EXAMINE
MANUFACTURES’ CLAIMS
There is the possibility that long-term re-
suspension of phosphorus or foreign silicates alter
complex chemical pathways related to the
biodiversity of prokaryotic microorganisms as
suggested by Ng et al., (2016), and Lin et al,
(2017), with a flow-on effect throughout the
ecosystem to eukaryotes like various crustacea.
Lin et al., (2017) found that Phoslock and
aluminium sulphate both had effects on
submerged macrophytes and a study by van

Environ Sci Pollut Res
70
Oosterhout et al., (2014) indicated that the trace
element Lanthanide (La) present as rhabdophane
in Phoslock™ was bioavailable in the lobster
species Procambarus fallax f.virginalis. La
concentrations measured within various tissue
samples including reproductive tissue contained
sufficient levels of La to warrant further
investigation. So far, no regulatory thresholds for
rare earth element concentrations and inputs into
the environment are established because
information on risks and effects are scarce;
however, rare earths are being used more and more
by society and publications on risk are starting to
emerge in relation to combined effects (Sun et al.,
2013). Herman and Sultan, (2016) reviewed
bioaccumulation and ecotoxicity of La in aquatic
environments for organisms (prokaryotic and
eukaryotic) and suggested that significant
sensitivity concentrations vary between .02 >
mg/L > 47 (for a range of aquatic environments).
Increasing reported instances of eutrophication
and increasing use of silicates to sequester
phosphorus thus justify the need to scrutinise this
aspect of product usage.
MATERIALS AND METHODS OF
INSTRUMENTAL ANALYSIS
Three commercially available products derived
from framework silicates were investigated for this
research: (i) Baraclear™ P80 (Halliburton), (ii)
Phoslock™ (IMT Holdings) and (iii) Bunnings
Zeolite (Wesfarmers). Two noncommercial
silicates were also included (i) Gilkes Smectite and
(ii) Greenbushes Kaolinite. The five products were
assayed using the following instrumental analyses:
(i) XRD, (ii) XRF, (iii) HR-TEM and (iv) TEM.
A 0.5–5.0-g sample of each product was made into
powder with mortar and pestle and analysed with
Cu-kα radiation with 2θ values from 0° to 80° on
a Philips PW-1830 X-ray generator with a PW
3020 diffractometer (PANalytical, Almelo, the
Netherlands). The d-spacing values were then used
to determine major and minor mineralogical
compositions present in each sample (Wittig and
Allardice, 1996). Following this, samples were
assayed for major and trace elemental
concentrations by the preparation of a Norish Flux
mixture (fused beads) of lithium
metaborate/tetraborate (12:22) on a Philips PW-
1404 X-Ray fluorescence spectrometer
(PANalytical Almelo, the Netherlands).
Determination of the major compounds within
each sample (Al2O3, SiO2, TiO2, Fe2O3, MnO,
CaO, K2O, MgO, Na2O, P2O5 and SO3), and of
trace elements (V, Cr, Ni, Cu, Zn, Rb, Sr, Ba, Zr
and Co), and concentrations of La (mg/ Kg) (for
Phoslock™) were accurately determined via the
methods of Sulcek and Povondra, (1989), Norish
and Thopson (1990), and Karathanasis and Hagek,
(1996). HR-TEM and TEM images were taken
using either the JEOL Transmission Electron
Microscope 2000 or 3000F (JEOL Inc.,
Massachusetts, USA) spectrophotometer platform.
Using Bragg’sLaw (λ= 2dsinθ) and by adjusting
the eucentric height, beam tilt and aperture
alignment images taken both in digital and print
formats were used to determine structural

Environ Sci Pollut Res
71
information including (i) texture, (ii) topography
and (iii) any surface features to help determine
environmental fates, and complex ion deposition
behaviour (in conjunction with the other analyses).
Adsorption and desorption of phosphorus were
calculated using direct calibration of stock
phosphate (KH2PO4(S)) concentration standards
(Motomizu et al, 1983). Batch analyses included
three replicates measured to four decimal places.
Solutions of 0.1 M KCl, malachite-molybdate
green oxalate and PVA (polyvinyl alcohol) were
prepared as described in DOSSPN, (2000).
Samples of silicate (0.2 g, three replicates) were
spiked with stock phosphorus solutions (0, 100,
200 and 300 μg[P]/L). Solutions of each treatment
were made up to 10 mL (0.1 M KCl) and weighed.
The pH was buffered to 7 using aliquots of KOH
at timed intervals to minimise speciation effects
[H2PO4−]/[HPO4
2−] (Barrow, 1983). Samples were
tumbled end over end for 232h and the supernatant
solutions decanted after being centrifuged (40 min
@ 4000 rpm) then filtered (0.25-μm micro-disc)
for UV/VIS spectrophotometric analysis. To the
precipitate 15 mL, KCl was re-applied, and the
solutions tumbled end over end for a further 232 h.
The supernatant solutions were then filtered (0.25-
μm micro-disc) for UV/VIS spectrophotometric
analysis. Spectrophotometric analysis was on the
Shimadzu UV mini 1240 uv-vis
spectrophotometer (Shimadzu Corp., Tokyo,
Japan). Throughout this experiment room
temperature was kept constant to minimise
isotopic anion exchange differences. Aliquots (×
3) were taken from each of phial and mixed with 1
mL malachite- molybdate green oxalate/PVA
complex solution (DOSSPN, 2000). Cuvets were
assayed for the absorbance of light against the
standard absorbance phosphate concentration
curve via single-step measurements of light
penetration (λ = 25 nm) (Motomizu et al., 1983).
Y-intercepts were set to zero for interpolation of
values less than five μg[P]/L. Direct desorption for
each silicate mineral was plotted for all replicates
vs. initial concentration (Hemond and Fenchner-
Levy, 1999).
RESULTS AND DISCUSSION
INSTRUMENTAL ANALYSIS OF SILICATE
SAMPLES
All samples contained various amounts of
aluminium oxide/ hydroxides, present as Smectite,
Kaolinite, and heulandite (Baraclear™ P80
(15.18%), Phoslock™ (11.16%), Greenbushes
Kaolinite (39.26%), Wesfarmers Zeolite
(12.25%), Gilkes Smectite (16.29%)). XRD, XRF,
HR-TEM and TEM images show the major and
minor mineralogical, and the morphological, and
elemental and trace components in each of the
samples (Table 2 and 3 and Figure 10). Bowden et
al., (1977) similarly showed that the relative
proportion of oxide/hydroxide surfaces in each
sample is approximately proportional, to the
amount of phosphate adsorbed in solution (Figure
11a). The similarity of Gilkes Smectite to
Greenbushes Kaolinite in both elemental
composition as determined by XRD and XRF and
the resulting adsorption observations of behaviour

Environ Sci Pollut Res
72
also reflects this with almost equal amounts of
phosphate adsorbed in solution for each
concentration applied (Table 2 and 3).
The amount of aluminium oxide/hydroxide in the
other samples analysed was not equivalent to the
amount of phosphate adsorbed indicating the
influence of contributing factors.
Figure 10: HR-TEM (JEOL 3000F) digital (*) and TEM (JEOL 2000) developed print images (#) and their scale. From top left to
bottom right include (1) Phoslock™ (*), (2) Phoslock™ (#), (3) Baraclear™ P80 (#), (4) Zeolite (*), (5) Greenbushes Kaolinite (*) and
(6) Gilkes Smectite (#). Image 1: Observation of the (1.0 μm) TEM Phoslock™ image shows two distinct particle masses. These masses
include a homogenous, dark, clumped mass of randomly orientated smectite layers and an aggregated heterogeneous mass most likely
the Al,K,Fe,La(OH) complex as determined in the XRD analysis. Smectite clumps represent approximately 80% of the total image and
the complex represents approximately 20% of the total image. Image 2: Observation of (100 nm) TEM image shows uniform wafer
smectite pores within the crystal lattice structure ranging from < 10 nm in This part of the sample is most likely aluminium sulphate
and takes up 75% of the total mass displayed in the image. A much finer wavy homogenous, randomly orientated mass (possibly
smectite) is also present in this sample, in the upper left quadrant and takes up 20% of the mass in focus. Image 4: Observation of zeolite
images shows a framework structure with enclosing cavities occupied by larger space with considerable freedom. The monoclinic
zeolite (heulandite) is an aggregated crystalline mass. The image shows an overlaid crystal lattice structure. The texture of the lattice
indicates that the elemental composition is ordered, which is shown by layers of (Si,Al)O4 tetrahedra linked in a framework pattern.
Image 5: Greenbushes kaolinite, extends as sheets with a layer composition diameter to < 100 nm. Also present in the image is a fine
white structure possibly Al,K,Fe,La(OH) complex mass, which is associated to the wafer pores around the edges of the lattice structure.
Image 3: The 200 nm Baraclear™ P80 TEM image shows a 3D structural lattice with large pore spaces of homogenous pores within a
crystal lattice structure ranging in diameter from 1 to 200 nm. formed by the linkage of SiO4 tetrahedra in a hexagonal array (West,
1999). This formation results in a single layered triclinic unit cells of Al2Si2O5(OH)4 (Kaolinite). Image 6: The Gilkes Smectite image
shows a heterogeneous array of porous aggregates in a structural matrix. The stacking of layers within the matrix is disordered
(turbostatic).

Environ Sci Pollut Res
73
Table 2 Interpretation of d-spacing peak values (in italics) from
XRD traces (number of counts vs. degrees 2θ) reflects the elemental
composition of mineralogical components including (i) dominant
silicates and aggregates present (bold), (ii) complexes (if present),
(ii) charge (if apparent), (iii) occurrences of lesser polymorphs and
(iv) other minor components (if present), in each silicate mineral
(bold italics). Each cell also includes the common name of the
sample
Phoslock™
14.43-Di-octahedral smectite
(1/2Ca,Na)0.7(Al,Mg,Fe)4[(Si,Al)8O20](OH)4.nH2O aggregates;
5.694, 3.757-[Al.K.Fe.La(OH)] complex; 4.485, 4.275, 3.348,
2.454, 2.127, 1.543, 1.374-(SiO2)
Baraclear™ P80
13.301-hydrated aluminium sulphate complex,
[Na2SO4·Al3+2(SO4)3·24H2O]; 4.476-Diocathedral smectite,
(1/2Ca,Na)0.7(Al,Mg,Fe)4[(Si,Al)8O20](OH)4.nH2O (charge
bentonite); 2.442-(SiO2)
Gilkes Smectite
15.438, 4.445, 3.079, 2.534, 1.975, 1.5-aggregated smectite,
(1/2Ca,Na)0.7(Al,Mg,Fe)4[(Si,Al)8O20](OH)4.nH2O 7.412-
kaolinte, Al4[Si4O10](OH)8; 4.239, 3.338, 1.5 (SiO2)
Greenbushes Kaolinite
7.087, 4.431, 3.553, 2.333, 1.486-kaolinite, Al2Si2O5(OH)4
Lesser polymorphs dickite and hydrated halloysite
Wesfarmers Zeolite
12.475-smectite,
(1/2Ca,Na)0.7(Al,Mg,Fe)4[(Si,Al)8O20](OH)4.nH2O;
8.945, 3.966, 2.976,1.817, 1.541-heulandite,
(Ca,Na2,K2)4[Al8Si28O72].24H2O; 4.243, 3.336- (SiO2)
This formula represents a heulandite
Factors that can further contribute to the
proportion of phosphate adsorbed include the
presence of SO4(aq) in the case of Baraclear™ P80
and rare earth lanthanides, e.g. Ba(s), Sr(s) and in
particular La(s) in the case of Phoslock™ (Zamparas
et al., 2015).
Table 3 XRF data displayed represents the major (bold) and rare
earth (bold italics) trace elemental compositions of each silicate
mineral (mg/ kg) and percentage (%). Mineralogy of each sample
is also presented as (%) based on XRD mineralogical composition
determinations (italics)
Phoslock™
(SiO2 = 57.31%) (Al2O3 = 11.16%) (Fe2O3 = 2.69%)
(La 38,351 mg/Kg) (Ba 430 mg/Kg) (Sr 133 mg/Kg) (Rb 122
g/Kg)
92–95% smectite, 4–6% lanthanum complex and 1–2% quartz
Baraclear™ P80
(SO3 = 35.75%) (Al2O3 = 15.18%) (SiO2 = 4.7%)
20–30% smectite, 70–80% aluminium sulphate and 1–5% quartz
Gilkes Smectite
(SiO2 = 54.12%) (Al2O3 = 16.29%) (Fe2O3 = 4.04%) (MgO =
3.34%)
80–90% smectite, 5–10% kaolinite and 1–5% quartz
Greenbushes Kaolinite
(SiO2 = 46.55%) (Al2O3 = 39.26%)
90–95% kaolinite and 5–10% traces of the lesser polymorphs
dickite and hydrated halloysite
Wesfarmers Zeolite
(SiO2 = 68.17%) (Al2O3 = 12.25%) (K2O = 3.36%) (CaO =
2.33%) (Fe2O3 = 1.62%) (Ba 611 mg/Kg) (Sr 555 mg/Kg)
75–85% heulandite, 10–20% smectite and 5–10% quartz
Both Phoslock™ and Baraclear™ P80 exhibited
higher adsorption values across all phosphorus
concentrations tested against, yet have only 12 and
16% total aluminium oxide, respectively (less than
the average of all silicates examined). This
observation was most marked for Baraclear™ P80,
with the amount of phosphate adsorbed across all

Environ Sci Pollut Res
74
the phosphate concentrations being higher than the
others mineral samples. This observation is
consistent with Lin et al., (2017). Phosphate
sequestration was more directly related to the
specific reaction conditions (i.e. pH 7, buffered,
controlled temperature) and the elemental
composition of each sample, with a lesser
influence coming from the proportion of
hydroxide/oxide in the silicate minerals (except for
the two almost identical silicates). This
observation is supported in Zamparas et al.,
(2015), and Douglas et al., (2016) in relation to
silicate/aluminium sulphate compounds,
Phoslock™ and Zeolite. The amount of phosphate
desorbed into solution increased with increasing
phosphate concentration for all samples indicated
by +ve regressions (Figure 11b). The maximum
amount desorbed was approximately 30 μg per 2.0
g (300 μg/L initial solution) for Greenbushes
Kaolinite and the minimum amount desorbed was
2.3 μg per 2.0 g (300 μg/L initial solutions) for all
three commercial silicates. Because the desorption
values at all concentrations for the three
commercial products in relation to phosphorus (for
the controlled experiments) are below trigger
values for sensitive estuarine ecosystems (5–60
μg[P]/L), one can surmise that these products are
efficient. However, do regular additions of silicate
minerals to control phosphorus in eutrophic water
bodies contribute to a further decline on other
faculties that may be buffering the system
(Hemond and Fenchner-Levy, 1999; Lin et al.,
2017)? Given that the amount desorbed was
greater than zero, and given the requirement of
continual additions for effective treatment,
questions of gradual decline and bioavailability are
significant. Uusitalo et al., (2000) discusses
suspended soil as a source of potentially
bioavailable phosphorus in surface runoff.
Figure 11 (a, b): Phosphate adsorption (a left), [PO4](aq) standard concentrations (0, 100, 200, 300 (μg/L)) (x axis) vs. (phosphate adsorbed (μg/2.0 g silicate mass)) for Baraclear™ P80 (■), Phoslock™(♦), Wesfarmers Zeolite (▲), Gilkes Smectite (×) and Greenbushes Kaolinite (-) (y axis). Phosphate desorption (b right) [PO4]](aq) standard concentrations (0, 100, 200, 300 (μg/L)) (x axis) vs. (phosphate desorbed (μg/2.0 g silicate mass) into aqueous solution)) for Baraclear™ P80 (■), Phoslock™ (♦), Wesfarmers Zeolite (▲), Gilkes Smectite (×) and Greenbushes Kaolinite (-) (y axis). Linear best fit is shown with regression axis set to zero for consistency for both plots.

Environ Sci Pollut Res
75
CASE EXAMPLE
Phoslock™ which was promoted in Swan Canning
Phoslock™ trials in Western Australia (Robb et
al., 2003) and also in the Vasse River (Mr. R.
Mildwaters- Facebook Vasse River Community
Action Group, personal communication, 3rd
January 2017). It is unclear whether lethal dose
(LD) values for invertebrates and vertebrates,
other than Rainbow Trout, were considered for
their product, given the 3.8% concentration
component of lanthanum present in Phoslock™
(Table 3). It is also unclear whether deposition
effects of silicate complexes at this site were tested
to determine if Phoslock™ may have changed
estuarine dynamics, for example in relation to
macrophyte populations (Lin et al., 2017). It may
be the case that broader management practices
from other environments, not necessarily
estuarine, have been used and written into their
methods and disclaimers (Stauber and Binet, 2002;
; Robb et al., 2003; NIWA, 2004; Douglas et al.,
2016; 60 NA, 2017).
van Oosterhout et al., (2014) indicated that all La
concentrations measured within the various tissue
samples including reproductive tissue contained
sufficient levels of La to warrant further
investigation. At the time of the Swan Canning
Phoslock™ trials, no mention of LD-La was made
in relation to Crustacea. Given that there are two
known populations of aquatic marron and yabbies
(C. destructor) found in these two systems
including the critically endangered C. tenuimanus
in the cooler waters of the Vasse Region and the
species which is outcompeting it C. cainii this
oversight is concerning. Robb et al., (2003), the
researchers stated that Breducing the efflux of P
from the sediments can alter the overall P
availability, reduce phytoplankton biomass and
cause a change in phytoplankton species
composition, the significance ofthese changes has
yet to be examined. It is unclear whether La has
contributed to a decline in the Vasse Region hairy
marron population. Perhaps the ecosystem shift
has enabled C. cainii to displace it. No other
publications on this subject from southwestern
Australia are known. Due to the initial treatment
being almost 20 years ago, it would be a
compelling case to relook and investigate long-
term effects given similar species exist in
Tasmania and elsewhere that may experience a
similar fate (Stauber and Binet, 2002; 60 NA,
2017; Zwartz, 2017).
CONCLUSION & RECOMMENDATIONS
Although this study shows that the silicate mineral
products serve their intended purpose (alleviation
of eutrophication specific to phosphorus pollution
to benefit the end user), there needs to be a further
investigation because of uncertainties in relation to
continual use in ecosystems if applied in the long-
term (> 10 years). Given recent findings on rare
earth lanthanide toxicity (van Oosterhout et al.,
2014) specific to the Phoslock™ trials reported of
Stauber and Binet, (2002), and Robb et al., (2003)
in the Canning and Vasse regions, continual
reapplication may be unwise where there is a threat
Environ Sci Pollut Res
76
to critically endangered crustaceans. As
Phoslock™ now has drinking water certification
consideration of the published datasets on lethal
dose, lanthanum concentrations are required
because very little research has been done.
Continual Baraclear™ P80 use, with the
significant aluminium sulphate component, may
also have an impact on the ion activity (pH, EC or
others) in aquatic systems containing macrophyte
populations, especially in small or closed systems
devoid of natural sulphate inputs, unlike the
estuaries or river deltas in the studies by Ng et al.,
(2016) and Fichot et al., (2015). Although Zeolite
is commercially sold, it is significantly less altered
from its natural state, and similar to Smectite and
Kaolinite and, the adsorption and desorption data
suggests that it is equally efficient.
While not providing definitive answers, this study
demonstrates the significance desorption plays and
While not providing definitive answers, this study
demonstrates the significance desorption plays and
the need for further examination on this aspect of
the use of phosphate sequestering silicates in the
field of environmental science by water quality
managers and environmental scientists.
ACKNOWLEDGEMENTS
The author would like to acknowledge Emeritus
Professor Jim Quirk for continuing support later
on in life, Emeritus Professor Robert Gilkes for the
help with the mineralogical interpretation and
professional advice, Emeritus Professor Lynette
Abbott for long-term professional advice,
Professor Andrew Rate for the advice on analytical
chemistry techniques, Michael Smirk, Elizabeth
Halladin and Gary Cass for the technical support,
and Kim Angus for the editorial support.
COMPLIANCE WITH ETHICAL
STANDARDS
CONFLICT OF INTEREST
The author declares that he has no conflict of
interest.

77
THE USE OF DEEPFAKES IN CULTURAL CONSERVATION AND POPULATION
CONTROL STRATEGIES
Svatos, (2018) focuses on the statistics of adsorption, including the source of metadata derived
from environmental experiments required for the assessment of a deepfake simulation
(concerning hairy marron). It doesn’t simulate deepfake outcomes due to cultural reasons..
Existing literature values used to estimate bioaccumulation and toxicity specific to the hairy
marron, may benefit from a digital twin simulation and provide the best strategy for modelling
bioaccumulation concerning the hairy marron; due to the highly likely, now extinct status of
this animal. On the ethics of such an approach “Comment on Svatos” Douglas et al., (2019)
validates the hypothesis. “Comment on Svatos” is similar to Hackley and Stefaniak, (2013).
They suggest that additional methods of instrumental analysis
can potentially eliminate sources of errors in environmental
monitoring equations; without actually testing the proposed
model species (only proposing lab-based validation by
synchrotron nuclear spin magnetic resonance spectroscopy).
Bioaccumulation in crustacea is already known in the marbled
crayfish (Goitom, 2011) (Figure 12). The life span of hairy
marron can be longer than ten years as is with other members
of the freshwater crayfish lineage (Austin and Bunn, 2010). By
providing initial results and data regarding the statistical
measurement of environmental parameters from a laboratory-
based mathematical viewpoint, Svatos, (2018) clarifies the
issues with lab-based prediction and simulation, through isotherm plots and high-resolution
imagery. Gutekunst et al., (2018) offer a different basis of genetic sequences which may be
used for a simulated population comparison (for digital twins) through modelling rapid
invasion of haploidised marbled crayfish (Mehta et al., 2015). A digital twin game would serve
to add valuable genetic and environmental data interpretation without destroying the habitat of
these (if remaining) invertebrates. The genetics of these crustaceans are similar, and so digital
twins could be used to see if supporting environmental datasets and genetic sequences may
result in differing statistical outcomes (for both species). Whereas the hariy marron is a
localised the marbled crayfish is a rapid invader. If we consider habitat independently through
double-blind selections; qualitative assessment of outcomes concerning conservation status of
the hairy marron would be able to be hypothesised and tested. Although the data ownership
Figure 12: Although the aquarium
variety of marbled crayfish resembles
that of the common Australian yabbie,
the phyla are poorly understood
concerning their ability to clone each
other (a strategy known as ‘selfing’ in
the aquarium industry). Including this
aquarium bred ‘yabbie.’ Image credit:
Mr. N. Svatos, 2020.

78
concerning A.I. wouldn’t be ethical due to prior claims indigenous communities may have
concerning its cultural status. An ethical game simulation might incorporate the qualitative
nature of indigenous data ownership into the digital twin genetic simulation for determining
possible scenarios for the land owners concerning the marron.

79
MANUSCRIPT 2: BACKGROUND, SCOPE, AND DECLARATION
Svatos and Abbott, (2019) was published in the Elsevier Journal “Dairy Science.” The publication
seeks to clarify the highly complex nature of environmental data (dairy, agricultural soils) specific
to the genetics of bacterial sequences, pasture plant species, and nitrogen, concerning the dairy
farm and the dairy herd management practices, and policies. Using statistical software
visualisation tools to show relationships; concerning ‘nitrogen hotspots,’ with minimal physical
computing (CCA analysis), Svatos and Abbott, (2019) is part of an originally co-authored
conference proceeding (Appendix 3).That used a novel visualization algorithm methods to
simulate what happens in dairy pasture fields, through PCA and CCA instance creation and
analyses of CPU:GPU kernel ratios (fastaq, FASTQ, Blast, NCBI, kPCA) (Svatos, 2011; Svatos,
2012). The bioinformatics assessments, including PCA and visualisations, however, were initially
funded by Karl Corporation through the creation of personal Amazon EC2 accounts set up
contractually for analyses for The University of Western Australia (UWA) as per Greenhalgh,
(2002) Svatos, (2011), Svatos, (2012), and Svatos, (2018). The remainder of the research,
including discussion and conclusion, was made possible by Murdoch University. Including the
setup, installation and running of Linux instances (the Anaconda distribution and R packages used
to develop the statistical outputs on a separate Amazon EC2 cloud console) as per the aims. These
contributions were not acknowledged in Abbott et al., (2012) or Svatos and Abbott, (2019). As
of April 2020, UWA has recognised these contributions (Dean of Science Prof. A. O’Donnell
personal communication, 3rd March 2020). The following statement summarises the remainder of
the published contributions.
“Karl Svatos and Lynette Abbott conceived the research at UWA (the parts that were funded by a ‘Dairy
Australia’ UWA 13344 “High-resolution biotechnologies to assess urea-induced changes in dairy soil
biological communities” which resulted in the generation of other publications and intellectual property
related to the grant aims and objectives. Karl Svatos conceived the experimental design as per the
research aims and objectives. The creation of instances used in the innovation, the data collection, and
data analysis, production of the tables and figures, the writing of and submission of the manuscript (as
per the submission guidelines, including supporting documentation, i.e. main findings and covering
letter), and the handling of the peer review process (corresponding author responsibilities), was done by
Karl Svatos and in some instances funded by Karl Svatos with personal financial help from Lynette
Abbott, and by Murdoch University through the provision of a PhD scholarship.”
This statement is the view of Em. Prof. Lynette Abbott as witnessed by Professor Michael Jones
as per the thesis declaration (circa 2020). The manuscript has not been altered from its published
American form owing to the American Dairy Science Association Journal rules and regulations
(except for the text formatting as it relates to the thesis).

80

81
DAIRY SOIL BACTERIAL RESPONSES TO NITROGEN APPLICATION IN SIMULATED
ITALIAN RYEGRASS AND WHITE CLOVER PASTURE
ABSTRACT
Through clearing and use of fertilizer and legumes, areas of southwestern Australia’s unique coastal sand
plains can support relatively low-cost dairies. However, the ancient, highly weathered nature of the soils
in this region makes the dairies susceptible to a range of threats, including nutrient leaching and erosion.
Despite this, Western Australian dairy cows typically produce up to 5,500 L of milk per head annually
supported by inorganic nitrogen (N) fertilizer (commonly 50:50 urea and ammonium sulfate) at rates up
to <320 kg of N/ha per year. Where hotspots exist (up to 2,000 kg of N/ha per year), total N exceeds
pasture requirements. We investigated plant and soil bacteria responses to N fertilizer rates consistent
with Australian legislated production practices on dairy farms for pure and mixed swards of white clover
(Trifolium repens) and Italian ryegrass (Lolium multiflorum) in a long-term pasture experiment in
controlled glasshouse conditions. Although the soil bacterial community structure at phylum level was
similar for white clover and Italian ryegrass, relative abundances of specific subgroups of bacteria
differed among plant species according to the N fertilizer regimen. Marked increases in relative
abundance of some bacterial phyla and subphyla indicated potential inhibition of N cycling, especially
for N hotspots in soil. Ammonium concentration in soil was less correlated with dominance of some N-
cycling bacterial phyla than was nitrate concentration. Changes in bacterial community structure related
to altered nutrient cycling highlight the potential for considering this area of research in policy assessment
frameworks related to nutrient loads in dairy soils, especially for N.
Keywords: nitrogen management, dairy pasture production, soil bacteria, clover, ryegrass
*Corresponding author: [email protected]
Received : December 6, 2018.
Accepted: June 1, 2019.
INTRODUCTION
Nutrient use efficiency, especially for nitrogen
(N), is facilitated by maximizing beneficial
microbial processes in dairy soil leading to less
nutrient leaching and runoff, lower costs, and

82
better outcomes for farmers (Bolland and
Guthridge, 2007b; Chen et al., 2018; Erisman et
al., 2018). Australia’s ecological sustainability
legislation under which the dairy industry
operates is outlined in Australia’s Environment
Protection and Biodiversity Conservation Act
(Government Act, 1999). This legislation does not
include the effects of microbial interactions
associated with nutrient loads from the
perspective of whole-ecosystem life cycle or
environmental fate (Hemond and Fenchner-Levy,
1999; Svatos, 2018). Reports on soil quality,
including N cycling, from New Zealand, the
European Union, the United Kingdom, and the
United States suggest that Australia’s national
sustainability legislation may need review in the
light of new research linking production practices
to microbial interactions in soil management with
outcomes for ecosystems and primary producers
(Anseeuw et al., 2012; Erisman et al., 2018).
However, this area of research is significantly
underrepresented in assessment frameworks and
policy discussions, yet shows great potential
(Bünemann et al., 2018). The presence of legumes
in dairy pastures can improve N use efficiency
(van Eekeren et al., 2009; Lüscher et al., 2014) but
excessive use of N fertilizer aimed at maximizing
biomass for production gain is common practice
in some places (Acosta-Martínez et al., 2010;
Chapman et al., 2014; McDowell, 2017). The
addition of high rates of N fertilizer to dairy
pastures has potential to significantly reduce the
effectiveness of soil microbial processes
associated with efficient nutrient cycling, which
may lead to overdose fertilization and
downstream effects (Wepking et al., 2017; Duan
et al., 2019). This may occur where excessive N
accumulates and forms hotspots (e.g., urine
patches), with total N entering ecosystems of up
to 2,000 kg/ha per year (Cameron et al., 2013;
Chadwick et al., 2018).
Plant species composition can influence
functional patterns of bacterial biodiversity in
grassland soils (Leff et al., 2015). There may be
benefits for pasture soil management specific to
pasture plant species and associated bacterial
groups e.g., N fixation facilitated by bacteria
within Proteobacteria (Pham et al., 2017; Wall et
al., 2019). Dominance or subdominance of
particular groups of soil bacteria and their
functions are now being categorized
quantitatively via “omics” technologies.
However, their role in soils cannot be determined
by merely considering the dynamics and statistical
significance of common gene database sequences
or bacterial species due to multilayered biological
evolutionary selection (Rosselli et al., 2016;
Schöler et al., 2017; Denef, 2018). For microbiota
inhabiting rhizospheres, selection acts
simultaneously on genes, individuals, cells,
groups, and the holobiont (the plant host with its
extended microbiome (Garcia and Kao-Kniffin et
al., 2018)). It is essential to minimize bias
surrounding extrapolation (the typical approach in
species-specific gene functional analysis) and
focus on increasing data reliability (Alberdi et al.,
2017). By limiting assessments to analyses with a
proven, classical, empirical basis, (e.g., N

83
fixation; (Tsoy et al., 2016) and by limiting
functional prediction to already-characterized
groups within traditional physiological classes in
combination with long-term experiments,
extrapolations can almost be eliminated (Contosta
et al., 2015; Schloter et al., 2017; Damaso et al.,
2018). We expected that persistent application of
N fertilizer on the soil bacteria under swards of
white clover (Trifolium repens) and Italian
ryegrass (Lolium multiflorum) (Van Dorland et
al., 2007) grown in simulated glasshouse
conditions would show changes in bacterial
community structure related to altered nutrient
cycling (Kasparovska et al., 2016; Melchior and
Myer, 2018).
MATERIALS AND METHODS
This study examined the effect of N and pasture
plant species on soil bacterial diversity and relative
abundance at the end of a long-term (8 mo) pasture
sward experiment set up in a controlled (20°C)
glasshouse at The University of Western Australia
(UWA). We selected soil for this study from a
dairy farm located in Cowaramup, Western
Australia (33°50′35.5″S, 115°11′38.0″E) as part of
a collaboration between Dairy Australia, UWA,
and the Department of Primary Industries and
Regional Development (McArthur, 2004; Dairy
Australia, 2012). The soil collection methodology
was consistent with the spatial sampling principles
of Manter et al., (2010). We sampled the soil from
the top 10 cm of the profile and transported it to
UWA (at 0°C) on the same day, and potted it on
the next day. Before potting, the soil was screened,
thoroughly sieved over a 5-mm fraction, and
mixed to minimize bacterial spatial microclimate
effects or bias and to ensure maximum achievable
replication for all treatments. Soil bulk density was
also determined (King, 1981; Bruand and Gilkes,
2002), as was the ratio of water to soil for watering
up to (but not over) approximately 60% field
capacity. The soil was placed in 10-cm plastic-
lined pots, and the surface was covered with
plastic beads to minimize moisture loss (0.6 kg of
soil/pot).
There were 3 N treatments, and each was
calculated for elemental N using yearly known
farmer application rates supplied to the
Department of Primary Industries and Regional
Development and Dairy Australia specific for
dairy district practice and for the highest rate to
simulate “hotspot” urine-like effects (Cameron et
al., 2013). The 3 treatments were 0, 180, and 912
kg of N/ ha per year. The total amount received for
each pot was the equivalent dose per week,
calculated on daily doses of 0, 0.5, and 2.5 kg of
N/ha per day for the 0, 180, and 912 kg of N/ha per
year treatments, respectively. The inorganic N
fertilizer consisted of a 50:50 mix of urea and
ammonium sulfate dissolved in aqueous solution.
Nitrogen was applied weekly (in aliquots) and
adjusted with additional water during the same
fertilization event to maintain pots at
approximately 60% field capacity. The pasture
species treatments were (1) Italian ryegrass
(Lolium multiflorum), (2) white clover (Trifolium
repens), and (3) Italian ryegrass and white clover
sown at 50:50 (30 plants per pot; Moorby et al.,

84
2009). There were 3 replicates of each treatment
and 2 cycles of plant growth consisting of 2
generations of pasture plants grown to full
maturity and harvested at the height of 1 cm above
the soil level (harvested shoots were removed).
After the first harvest, the original seed stock seeds
were resown into the same soil profile at the same
seeding rate without significant soil disturbance
after a few weeks. Fertilizer treatments were
maintained throughout the 2 cycles. No fertilizer
was added between growth cycles. At the final
harvest (after 2 × 4-mo periods of continual
growth), soil cores (1 cm2) from the top 0 to 5 cm
of each pot were taken and placed in separate vials
and stored in a freezer (-20°C) for wet molecular
chemistry, downstream sequencing, and
bioinformatics.
At second harvest, shoots were harvested and
dried, and the biomass was determined (shoot dry
weight). Soil was oven-dried and analyzed by
CSBP Laboratories in Bibra Lake, Western
Australia, for (1) Colwell phosphorus (mg/kg) and
Colwell potassium (mg/kg; methods 9B and 18A1,
respectively; Rayment and Lyons, 2011), (2) KCl
40 sulfur (mg/kg; method 10D1, Rayment and
Lyons, 2011), (3) organic carbon (%; method 6A1,
Rayment and Lyons, 2011), (4) nitrate N (mg/kg)
and ammonium N (mg/kg; method 7C2b, Rayment
and Lyons, 2011), (5) electrical conductivity
(dS/m; method 3A1, Rayment and Lyons, 2011),
and (6) pH (H2O; method 4A1, Rayment and
Lyons, 2011).
Genomic DNA was isolated from sample vials
using the PowerSoil DNA Total Isolation Kit
(Mobio Laboratories Inc., Solana Beach, CA). We
optimized the manufacturer’s protocol for our soil
samples by using a bead-beating lysis procedure
and by adding 200-μmdiameter microbeads (0.2 g)
to each sample vial (Abbott et al., 2012). The DNA
extract quality and quantity were checked using a
Nanodrop 1000 spectrophotometer (Thermo
Fisher Scientific, Waltham, MA). Ribosomal 16S
rRNA amplicons were generated via PCR (Suzuki
and Giovannoni, 1996; Vestergaard et al., 2017),
and the resultant PCR products were then prepared
for sequencing and analysis (Klindworth et al.,
2013; Vestergaard et al., 2017). Sequencing was
performed using an Ion PGM OT 200
semiconductor (Thermo Fisher Scientific).
Briefly, within R (Lucent Technologies, Murray
Hill, NJ) packages and implemented through the
Anaconda distribution (Anaconda, Austin, TX),
(https://github.com/joey711/phyloseq), and
biocLite (http://bioconductor.org/bioclite.r;
Bioconductor, (Huber, 2015), FastQ files were
checked for accuracy against the latest available
benchmark standards (mid-2018 release).
For this process, we used Windows OS (Microsoft
Corp., Redmond, WA) running Ubuntu 14.04 LTS
(Canonical Ltd., London, UK) through a Virtual
Box (Oracle Corporation, Redwood Shores, CA)
virtual machine within a Python 3.6.5 reconfigured
QIIME pipeline (Caporaso et al., 2010). FastQ
files were then separately checked for low-quality
reads before dereplication, annotation, and
phylogenetic identification (Meyer et al., 2008;
Lallias et al., 2015; Jovel et al., 2016).

85
The phyla representing nonclassical taxanomic
groups or less than 1% of the entire sample size
were also removed, and the final taxonomic data
sets were compiled (Abbott et al., 2012). Data sets
were analyzed as follows. First, a range of
statistical ANOVA correlations were performed in
GenStat (VSN International Ltd., Hemel
Hempstead, UK) for significance based on the
least significant differences (LSD). This included
each N treatment and plant combination (shoot and
soil data). Next, relationships between bacterial
qantitative data sets with regard to the hypotheses,
community diversity and relative abundance and
soil data (eigenvectors) were assessed using
canonical correspondence analysis in Microsoft
Excel add-in XLSTAT ADA (Addinsoft, Paris,
France). Then, pie chart representations were
made for major taxonomic phyla across plant
associations and N treatments. Next, histograms
were made representing significant expanded
phylum (class, order, and family) versus plant
associations and N treatments. Finally, an
assessment was then made in relation to all
(Lindgreen et al., 2016; Alberdi et al., 2017;
Denef, 2018; Schloter et al., 2017).
RESULTS
EFFECTS OF N TREATMENTS ON
PASTURE PLANT SPECIES (WHITE
CLOVER AND ITALIAN RYEGRASS)
Application of N to the plant swards increased (P
< 0.001) shoot growth for both white clover and
Italian ryegrass when grown alone. The highest
level of N application influenced the ratio of white
clover to Italian ryegrass in the mixed sward
(Table 4). When the equivalent of 180 kg of N/ha
per year was applied, the ratio of white clover to
Italian ryegrass was reduced from 0.16 to 0.08 due
to an increase in biomass of Italian ryegrass, but
there was no change in white clover biomass
compared with 0 kg of N/ha per year (Table 4).
Table 4: Dry weight shoot biomass (g/pot) of white clover and Italian ryegrass and soil ammonium (mg of N/kg of soil; n = 3 ± SE) whengrown in dairy soil for 4 mo with 1 control rate and 2 N treatment rates (0, 180, and 912 kg of N/ha per year) relative to the already-prevailing N soil concentrations, plus 5% least significant differences (LSD) for plant growth.

86
When 912 kg of N/ha per year was applied, white
clover was completely outcompeted by Italian
ryegrass (Table 4). Soil ammonium was higher
under white clover than under Italian ryegrass
(Table 4). Nitrate was very low in the soil for all
treatments (2 mg/kg of soil). Analysis of variance
of soil data indicated that the application of N was
highly significant (P < 0.001) in its effects on
ammonium (LSD = 4.49 mg/kg), sulfur (LSD =
12.2 mg/kg), potassium (LSD = 18.8 mg/kg), and
pH (water; LSD = 0.16; Figure 13).
EFFECTS OF N APPLICATION AND
PASTURE PLANT SPECIES ON
DOMINANT SOIL BACTERIAL PHYLA
AND PHYSIOLOGICALLY SIGNIFICANT
SUBGROUPS (ORDER AND FAMILY)
Italian ryegrass grown alone with the highest N
application supported an increase in the relative
abundance of Proteobacteria (Figure 14) and α-
Figure 13: Canonical correspondence analysis (eigenvector analysis) of soil data versus sequenced 16 S rRNA dominant phyla
(italicized) shows the variance that the dominant soil phyla have based on N treatments and plant species associations (including 5% SE
bars). The proximity of phylum (open circles) to data vectors (bold) Colwell P (mg/kg), Colwell K (mg/kg), KCl 40 S (mg/kg), organic
carbon (%), nitrate N (mg/kg), ammonium N (mg/kg), electrical conductivity (dS/m), and pH (H2O; red squares) indicates increasing
correlation to that soil data point. Conversely, decreasing proximity to the data vectors indicates decreasing correlation (based on the soil
data). The length of each vector indicates the significance of the relationship that the vector (soil property data) has to the overall
community relative abundance and diversity makeup for the total sample size. In this canonical correspondence analysis (CCA), the first
2 axes of the eigenvector plots explain more than 77.1% of the total variance, which represents good sample separation about the (x, y)
axis.

87
Proteobacteria (Figure 15) and a slight decrease in
the relative abundance of Acidobacteria, whereas
the relative abundance of Actinobacteria and
Firmicutes remained largely unaffected (Figure
14). For white clover grown alone with the highest
N application, there was a decrease in the relative
abundance of Proteobacteria and increases in the
relative abundance of Firmicutes, Acidobacteria,
and Actinobacteria (Figure 14). In soil from the
mixed ryegrass and clover pasture sward, the
relative abundance of Proteobacteria and
Acidobacteria decreased slightly, whereas that of
Actinobacteria and Firmicutes increased slightly
with increasing N application. The effects of N
application and plant sward composition were
minimal on bacterialgroups that were recorded in
the soil at low relative abundance. Within
Proteobacteria, application of N increased the
relative abundance of Caulobacterales when white
clover was grown alone, and the relative
abundance of Rhizobiales decreased (Figure 15).
Within Firmicutes, N application to white clover
Figure 14: Treatment-specific relative abundance pie charts for domain: bacteria (phyla). Each pie chart indicates the relative abundances
of the most dominant phyla present in each of the specific nitrogen (N) treatment pots based on each plant association: Italian ryegrass
(ryegrass), white clover (clover), and mixed (ryegrass + clover). Among all phyla displayed are 4 dominant phyla from all pots based on
N treatment (0, 180, and 912 kg of N/ha per year for zero, low, and high, respectively), including Proteobacteria, Acidobacteria, and
Firmicutes, with lesser abundant groups including the equally distributed across all treatments “bacteria–other” making up total species
diversity and relative abundance within the entire sample set (all plant association pots and all treatments). The number 1 in the first pie
chart and at the top of the phyla key is for color identification. The arrows indicate how to correlate pie slices with the phyla (clockwise-
downward manner).

88
reduced the relative abundance of some families of
Baciliales and increased the relative abundance of
Clostridiaceae (Figure 16). Furthermore, there
was an increase in the relative abundance of
families Veillonellaceae and Peptococcaceae with
N application when white clover was grown alone
(Figure 16).
DISCUSSION
For white clover and Italian ryegrass grown either
alone or in combination on dairy farms, 50:50 urea
and ammonium sulfate application in accordance
with industry standards and legislation is likely to
have a marked effect on soil bacterial communities
related to nutrient uptake by plants in addition to
overall plant biomass effects when N exceeds 180
kg of N/ha per year (Iannetta et al., 2016). Recent
studies that highlight some of the bacteria effects
on soil and plants in a similar N concentration
range include Wepking et al., (2017), and Duan et
al., (2019). We also expect that the bacterial
community changes are associated with N cycling
changes; however, because quantifying N cycling
and N cycling efficiency is not as simple as
Figure 15: Diversity and relative abundance within phylum Proteobacteria in response to 3 nitrogen (N) treatments (0, 180, and 912 kg
of N/ha per year for zero, low, and high, respectively) and 3 plant treatments [Italian ryegrass (rye), white clover (clover), and the
combination of Italian ryegrass and white clover (clover + rye)]. The phyla displayed correspond to the colors shown on the right side
of the chart. The order in which the phyla appear for the treatments is consistent.

89
assessing N required for pasture plant biomass
yield (Holly et al., 2018), many of the
microbiological responses occurring in these
production environments are often overlooked.
However, they remain highly beneficial sources
for improved management (Bünemann et al.,
2018). In this experiment, the concentration of
ammonium under white clover was more
significant in its effect on soil bacteria than nitrate
(ammonia was less correlated than nitrate) based
on eigenvector canonical correspondence analyses
(Figure 13), which is consistent with the
observations of Di et al., (2010), Chapman et al.,
(2014), and Sun et al., (2018). When N fertilizer
was applied to clover grown alone, there was an
increase in Rhizobiales (α-Proteobacteria) and
Clostridia (Firmicutes) (Minamisawa et al., 2004;
Che et al., 2018). A dominance of alpha versus
beta and gamma classes of Proteobacteria
indicates oligotrophic soil conditions (İnceoğlu et
al., 2011; Morrison et al., 2017) synonymous with
N-limited environments (Senechkin et al., 2010;
Ren et al., 2016). Because Rhizobiales was the
most dominant order present across all treatments,
it needs to be mentioned that the importance of
their presence is consistently underrepresented in
linking soil quality to soil function and ecosystem
services (although not measured for functionality
Figure 16: Diversity and relative abundance within phylum Firmicutes in response to 3 nitrogen (N) treatments (0, 180, and 912 kg of N/ha
per year for zero, low, and high, respectively) and 3 plant treatments [Italian ryegrass (rye), white clover (clover), and the combination of
Italian ryegrass and white clover (clover + rye)]. The phyla displayed correspond to the colors shown on the right side of the chart. The
order in which the phyla appear for the treatments is consistent.

90
in our experiment) (Albright et al., 2019; Wall et
al., 201).
There was a marked influence of the higher N
application on pasture composition for white
clover and Italian ryegrass grown together. Clover
may mitigate production loss under increased
stocking rate in sandy soils where constant N
concentrations range from 180 up to (the
maximum legislated) 320 kg of N/ha per year.
Application rates above this range might trade off
beneficial soil processes (especially around N
hotspots) due to the inability of clover to compete
with ryegrass (Kasparovska et al., 2016; Melchior
and Myer, 2018). Interactions between N fertilizer,
plant genotype, and soil bacterial community
structure contribute to the effects of N on soil
bacterial communities rather than N fertilizer
alone.
The increase in in the relative abundance of the
Caulobacterales (within the β-Proteobacteria)
with N application for white clover grown alone
but not in combinabination with Italian ryegrass or
Italian ryegrass alone corroborates a previous
hypothesis that Caulobacterales may dominate N-
fixing environments associated with clover
(Zahran, 1999; Revell et al., 2012; McDowell,
2017). The ability of bacteria within
Caulobacterales to regulate and transcribe
orthologs (through speciation) to associate with N
fixation processes is an essential consideration for
dairy soils, especially for efficient use of N
(including N fixation), as it may include
previously unidentified biological pathways and
needs investigation (Negreanu et al., 2012; Tsoy et
al., 2016; Bünemann et al., 2018).
Bacteria in the order Clostridia have an essential
role in N cycling (Heller, 1921; Wiegel, 2005).
The relative abundance of Firmicutes was largely
unaffected across all N and plant treatments except
within the order Clostridia. Increases in the
relative abundance of Veillonellaceae and
Peptococcaceae after N application to white
clover raise the possibility of resistance to
acidified soil environments. The link between the
increasing negative correlation between N and soil
pH variation and the correlation between the
presence of Firmicutes and organic carbon and pH
supports this assumption (Figure 13).
Veillonellaceae decreased again, indicating a
buffering capacity threshold for N applied at a rate
of 180 kg of N/ha per year < X < 320 kg of N/ha
per year (Bolland and Guthridge, 2007a; Dairy
Australia, 2012; Chadwick et al., 2018).
CONCLUSIONS
Nitrogen fertilizer applied at current levels to dairy
pastures can alter the structure of soil bacterial
communities as well as pasture plant dominance.
We showed a marked effect of weekly applications
of N fertilizer on the relative abundance of soil
bacteria for swards of white clover (Trifolium
repens) and Italian ryegrass (Lolium multiflorum)
in a long-term glasshouse experiment. There is
evidence to support our hypothesis that sustained
and elevated N application alters the dominance of
N cycling bacteria in this dairy soil, with potential
for reduced N use efficiency, which could lead to

91
increased prevalence of oligotrophic soil
conditions (İnceoğlu et al., 2011; Morrison et al.,
2017). Nitrogen applied to this dairy soil affected
bacterial communities associated with two pasture
plant species in a variety of ways (Geschwendtner
et al., 2014). Characterization of bacteria from the
orders Rhizobiales and Clostridia, within the α-
Proteobacteria and Firmicutes, respectively, may
provide a litmus test for oligotrophic soil
conditions in environments of poor nutrient
binding (Ren et al., 2016; Tsoy et al., 2016).
Further understanding of how N fertilizer use
influences the functional aspects of bacterial
communities associated with N cycling in dairy
soils could assist in the development of better
sustainability policies related to N application that
takes into account group-level concepts of the soil
microbiome and surrounding holobiont to
minimize related risk.
ACKNOWLEDGEMENTS
We acknowledge the contribution of the following
people and industry groups. Dairy Australia
(Southbank, Victoria) funded this research in
collaboration with the University of Western
Australia (Crawley, Western Australia). The
Department of Primary Industry and Regional
Development in Western Australia (previously
Department of Agriculture and Food Western
Australia, South Perth, Western Australia)
provided logistical support. Zakaria Solaiman, Ian
Waite, Richard Alcock, Sasha Jenkins, Michael
Smirk, and Darryl Roberts (the University of
Western Australia), Jim Cook (University of
California, Davis), and Kim Angus
(https://www.facebook.com/ConsultKimToodyay
, PO Box 379, Toodyay, Western Australia),
provided valuable advice and editorial support
during this study.
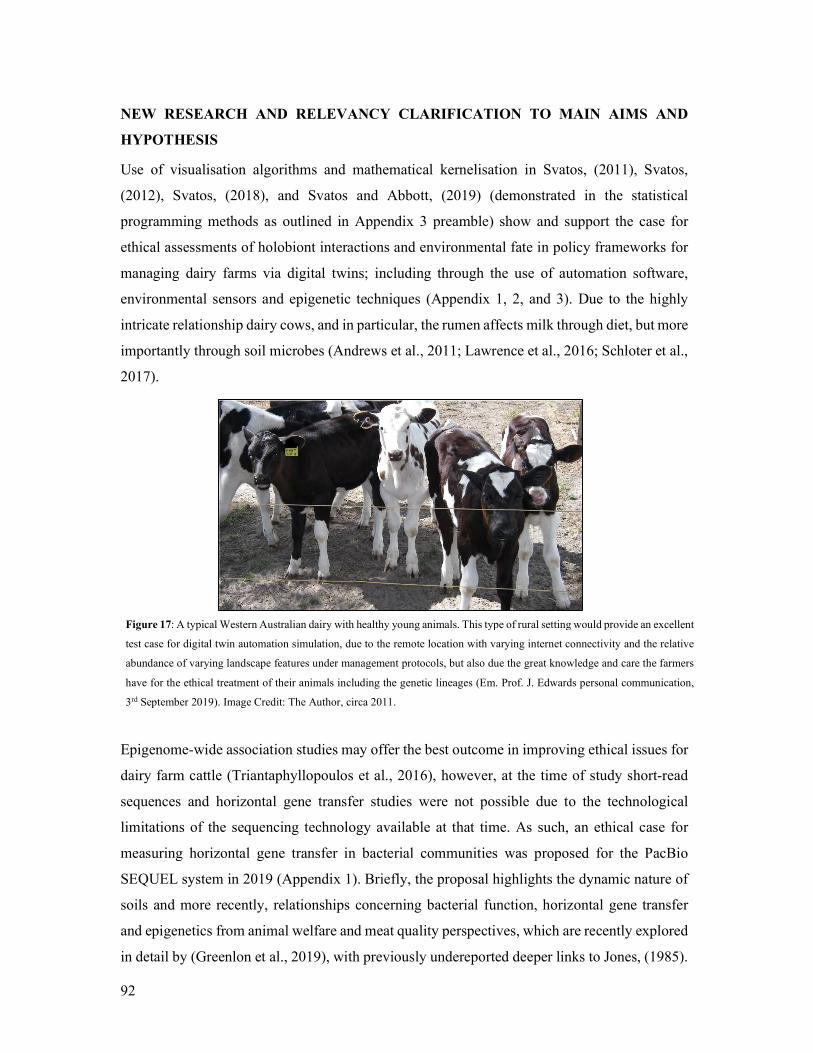
92
NEW RESEARCH AND RELEVANCY CLARIFICATION TO MAIN AIMS AND
HYPOTHESIS
Use of visualisation algorithms and mathematical kernelisation in Svatos, (2011), Svatos,
(2012), Svatos, (2018), and Svatos and Abbott, (2019) (demonstrated in the statistical
programming methods as outlined in Appendix 3 preamble) show and support the case for
ethical assessments of holobiont interactions and environmental fate in policy frameworks for
managing dairy farms via digital twins; including through the use of automation software,
environmental sensors and epigenetic techniques (Appendix 1, 2, and 3). Due to the highly
intricate relationship dairy cows, and in particular, the rumen affects milk through diet, but more
importantly through soil microbes (Andrews et al., 2011; Lawrence et al., 2016; Schloter et al.,
2017).
Epigenome-wide association studies may offer the best outcome in improving ethical issues for
dairy farm cattle (Triantaphyllopoulos et al., 2016), however, at the time of study short-read
sequences and horizontal gene transfer studies were not possible due to the technological
limitations of the sequencing technology available at that time. As such, an ethical case for
measuring horizontal gene transfer in bacterial communities was proposed for the PacBio
SEQUEL system in 2019 (Appendix 1). Briefly, the proposal highlights the dynamic nature of
soils and more recently, relationships concerning bacterial function, horizontal gene transfer
and epigenetics from animal welfare and meat quality perspectives, which are recently explored
in detail by (Greenlon et al., 2019), with previously undereported deeper links to Jones, (1985).
Figure 17: A typical Western Australian dairy with healthy young animals. This type of rural setting would provide an excellent
test case for digital twin automation simulation, due to the remote location with varying internet connectivity and the relative
abundance of varying landscape features under management protocols, but also due the great knowledge and care the farmers
have for the ethical treatment of their animals including the genetic lineages (Em. Prof. J. Edwards personal communication,
3rd September 2019). Image Credit: The Author, circa 2011.

93
A proposal to join Davis University to participate in collaborative experiments was approved
in 2019; however, due to the COVID-19 pandemic, Davis cancelled (Prof. D. Cook personal
communication, 5th May 2020). Although proposed, these could not be implemented. However,
the data and DNA collected still presents an opportunity for future studies concerning digital
twins and dairying at the bacterial epigenetic level, (now with the new PacBio SEQUEL II
system available through the Kazusa DNA Research Institute, Chiba Japan). More support is
needed (Figure 17) not from local communities concerning animal husbandry and animal
welfare issues, or from farmers for that matter, but from research committees who steer research
funding.
Research leaders on animal welfare, and ethics approval committees, who value traditional
DNA-based techniques or less costly approaches over frontier based technological and
statistical methods (e.g. those that offer simple, secure satellite tracking, IoT, or edge-based
computation and virtualization, e.g. (Oracle, 2020) over a newer type of mixed biotech agtech
approach) need better steering. On the ethics of using such technologies for ethical assessments
of A.I. for species outcomes, the methods presented here would favour the health of dairy cattle,
(potentially over the surrounding environment), and validate the hypothesis. However, not
conclusively (Figure 18).
Indian Ocean
Figure 18: The South Western Australian Mediterranean climate represented in this map, is located along the coastline of the
Indian Ocean. The primary area of focus in relation to several proposed SMRT EWAS studies indicated in the study sites
listed here. Which were also part of the dairy study (Svatos 2011), Svatos (2012), Abbott et al., 2012. The Mediterranean
climate, however is much larger than that shown on this map, whereas the average rainfall for ‘textbook’ Mediterranean
climates tend to hug the coastline (Swan Coastal Plane) as the grid increases North. The one distinctive feature of this map is
the still intact waterways with closed rivermouths and possible shallow turbidite profile remnants extending out as far as the
northwestern continental shelf (Svatos, 2018). Image Source: The Free Software Foundation (1991) via Google Maps- Map
Data Science 2010 (edited by the author).

94
95
MANUSCRIPT 3: BACKGROUND, SCOPE, AND DECLARATIONS
Manuscript three “Big-data GPU/CPU kernalisation pipeline for API based quantitative
genetic assessments in field-based drone research,” is the penultimate research output derived
from Svatos, (2018) and Svatos and Abbott, (2019) in the context of the general aims to collect
the data required, to substantially test the hypothesis (please see Appendix 4 for context).
This manuscript abstract is standalone. The author presented this abstract in Osaka, Japan, to
showcase the breakaway research, in 2018 (at an international conference). At that time, the
focus for the manuscript was on the genetics of barley grain yield and abiotic stress and is a
focal point of this chapters literature review. This review bridges the gaps of manuscript’s one
and two with the central thesis review; i.e. big-data science, abiotic and climate-related
environmental issues, but also includes a more significant genetics component about the
relationship between grain yield abiotic stress. Owing to the strategic nature of this research
(general methods) concerning the collaborators' interests; the focus shifted. A request for
comment was made to the principal supervisor in July 2020, concerning critical Katanning
grain yield data, and the whereabouts of an entire doubled haploid population consisting of
~420 lines that were selected and re-bred by the author (a minimum of two years data are
generally required for field trial publications; DH lines constitute original varieties). No
response was ever given. The best possible outcome was always sought by the author. The only
realistic solution was to change principle supervisors. Sadly, labelled germplasm (Tibetan-
Australian barley) assigned to the author for research purposes related to the central tenet of
the manuscript, was taken away without the supervisory team’s knowledge or consent. The
manuscript was subsequently split into two separate works.

96
Serendipitously, the split led to new opportunities that enabled the aims and hypothesis of the
thesis to be realised (as initially intended). With a new focus, the research expanded. Drone
research, high-resolution imagery and photogrammetry, GxE sensors, telematics,
telecommunications, and encryption software development became possible. The minimum
requirements for an A.I. digital twin ethical assessment (as per the aims) became possible. The
industry collaboration projects that were formed continue today. These projects have generated
industry-linked PhD scholarships and significant scientific outputs (Appendix 5,6, and 7). Due
to the circumstances that are outlined in this declaration, further research was sought through
an internship, which rebuts the potential for any perceived lack of seasonal variation data, that
historically has been considered, “a pre-requisite for agricultural PhD dissertations and
publications by Western Australian and Australian agricultural institutions” (Anonymous
UWA Agriculture Student personal communication, 19th September 2003) (Manuscript 4).
The establishment and participation in these projects occurred while studying at Murdoch
University, and through additional individual/private efforts of the author. As such, some of
the IP developed is confidential and has been withheld in this manuscript, including (names,
addresses, GPS coordinates, certificates and hexadecimal hash key information) for privacy
and security reasons. The author considers that all parties have significantly benefited from the
generation of original intellectual property; however, some of this IP is the property of the
author. Concerning all intellectual property generated concerning the general aims and
hypothesis of this manuscript, the following statement has been endorsed by Prof. Chengdao
Li (former principal supervisor and WCGA director), Dr. Dean Diepeveen (DPIRD), and Em.
Prof. Lynette Abbott (UWA), and witnessed Prof. Michael Jones. Individual collaboration
declarations of acknowledgements are given thereafter, including a privacy and confidentiality
statement.
“Karl Svatos conceived and managed the entirety of this research with minimal supervision,
including; i.) the theoretical framework for the data acquisition via drones, ii.) the concept for a
method of data analysis, iii.) the data analysis. The research was jointly funded by DPIRD and by
Murdoch University through the provision of a Western Crop Genetics Alliance Scholarship.”
Manuscript three stands alone and should be considered as one whole chapter for the purpose
of the thesis (concerning the aims and hypothesis). However, these projects constitute separate
works with separated aims due to the intellectual property concerning Tibetan barley.
97
Project one: “Rapid downstream glasshouse field trial genetics assessments for QTL
variability minimisation in GPU core processing and telematics data analyses” is the result of
a collaboration in 2018 between Murdoch University, DPIRD, Scientific Aerospace, the
WBGA, the author, and Karl Corporation. The research significantly aided (i) the development
of a cloud-based data lake for realtime statistical A.I. assessments (the first on a barley DH),
(ii) the publication of a white paper, focussing on abiotic stress, and (iii) the breeding of two
new varieties ‘Black Beard’ and ‘White Gold’ currently held at Murdoch University and
Department of Primary Industries and Regional Development (DPIRD) respectively (for which
the author claims a right to commercialise). On the grounds of ‘a priori’ (Figure 3).
The Grains Research and Development Corporation (GRDC) partly funded this project:
MU00049 (Heat Stress) which included access to the unique Hindmarsh W1 Australian-
Tibetan (HW1) germplasm. The HW1 DH population was bred by Lee-Anne McFwan from
DPIRD who is also a member of the Western Crop Genetics Alliance, who administer the
GRDC barley projects from Murdoch University. Additional funding was provided by DPIRD
(use of glasshouses for x3 years), (access to field sites for x3 years), access to light-heavy
machinery, instruments and tools, imaging devices, software, and occasional use of casual staff
for the five years (Dec 2015- July 2020). The project was wholly managed by the author as a
volunteer DPIRD researcher (5 years) and as a student at Murdoch University (4 years).
Murdoch University provided additional support which was used for access to vehicles,
laboratory bench space, a computer, email accounts, and software, for example, VPN access to
the edu.roam server, Microsoft Office 365, Windows 10, endnote etc. Including AWS
instances, additional use of specific custom ROMs and recoveries, the setup, and installation
of such on said devices, primarily for telemetry and use in Australia and foreign countries, for
the ethical modifications of the system OS via APIs, including publically owned DPIRD
weather station data (APIs 9DB3E3070BFF19CD2D8A283A and
6BFBF31EFC1239CDF121560C), these were all performed by the author under the contracts
listed above or while privately consulting for (formerly Scientific Aerospace under supervision
trading as Karl Corporation). This included through the use of personal and supplied email
accounts, and SSH (*.ppk 256 SHA hash) protocol for security and privacy.

98
The following declaration endorsed by Geoff Trowbridge (Retired) summarises the project-
specific aims concerning the data used. Concerning drone flight telemetry data, this statement
does not include a reference to this data; it was never provided. Scientific Aerospace no longer
trade commercially. Remsense were contacted in an attempt to gather this data (which was
required to complete the ground-truthing accuracy calculations for the initially proposed real-
time genetics GWAS analysis). Telemetry is needed to convert the thermal, NDVI, and RGB
into GPS location for plot specific correlations, (based on grain yield DH lines), for prediction
algorithms to work. Their current spokesperson said: “I doubt any such technical data was
maintained with Sci Aero wind-down of activity on Ag sector interests.” It may also have been
deleted. Had the data been provided with the challenge to complete the GWAS based on all the
circumstances (listed here), including withheld Katanning grain yield data meant that such
calculations were not achievable in four years as planned.
“The white paper article was prepared, researched, and written by Karl Svatos with clear guidance
and under the supervision of Geoffrey Trowbridge (formerly CEO of ScieAero), and the rest of the
team at SciAero. The central theme of the use of drones and drone technologies to combat a range
of abiotic and biotic stress and other agricultural challenges remains the vision of both authors.
However, for the purpose of this thesis only, because the trials were used as part of an experiment
on Western Australian (Government) owned land, (while enrolled full time at Murdoch University),
the data collected by SciAero in this one exercise described in this article, are that of Karl Svatos
and may be used for the thesis.”

99
Project two: “Scaleable, private LTE/4G, Boolean GPU networking for automated, remote,
IoT decision making,” is the second research collaboration project as part of manuscript three.
A collaboration was formed between Murdoch University, DPIRD, Pivotel, Nokia-Bell
Australia (trading under Microsoft), and Precision Agronomics. The collaboration focussed on
abiotic stress for agtech data science-driven research outputs. Additional application and
hardware development for IoT, telecommunications, security and signalling protocols have
been generated since the results presented here and data acquired were set up and arranged by
the collaborators, including the author independently. Including the creation of and
management of AWS instances as part of contracts generated through additional private
consulting addressed in manuscripts one and two (Karl Corporation). The following statement
summarises the research output presented in this manuscript and has been endorsed by the
parties named therein (through a confidential source). The author has no commercial interest
in the abiotic stress IP only the automation software, which was developed by the author
independently.
“The collaboration project; ‘Scaleable, private LTE/4G, Boolean GPU networking for automated,
remote, abiotic stress, IoT decision making,’ between Murdoch University, DPIRD, Pivotel Satellite,
Nokia-Bell Labs, and Precision agronomics, was established under the Nokia FutureX program
initially by leadership efforts of Karl Svatos acting in various capacities (as student and
entrepreneur), including the receipt of a Murdoch University Scholarship. Including part of its
collaborative outcomes, unless otherwise acknowledged herein. Karl Svatos conceived the research
concept of the project, developed the methods for data collection, coordinated the deployment of,
and use of data analysis software and tools for data collection and analyses specific to abiotic stress,
and managed the project from the ground up to the AWS cloud including the budget, and security
protocols.”

100

101
PRIVACY AND CONFIDENTIALITY STATEMENT
Some of the research outputs are confidential due to the intellectual property that is currently
being developed as a result of these research projects. However, because this thesis is about
the ethics of the digitalisation of species’ data for A.I. decision making and management
purposes, data and germplasm (both the source and destination) cannot wholly be withheld
from scrutiny.
That said, where additional authors and collaborators of the publications in this manuscript
are mentioned, great care has been taken to ensure the correct procedures have been followed
concerning publishing guidelines, especially surrounding acknowledgement, the intellectual
property generated; ownership of data; environmental (weather station), phenotype, genotype
or otherwise, including DNA and germplasm sources, concerning individuals rights to privacy
concerning research ethics.
As such, unless otherwise acknowledged elsewhere in this manuscript or the thesis, the
research in this manuscript was entirely conceived, developed, directed and managed by the
author with additional operational support provided only from the abovementioned
collaborating parties, and individuals acknowledged including students. Some of whom may
wish to remain anonymous*.

102

103
Karl B W Svatos et al., J Plant Pathol Microbiol 2018, Volume 9
conferenceseries.com DOI: 10.4172/2157-7471-C2-011
8th World Congress on
Plant Genomics and Plant Science
August 10-11, 2018 Osaka, Japan
BIG-DATA GPU/CPU KERNALISATION PIPELINE FOR API BASED
QUANTITATIVE GENETIC ASSESSMENTS IN FIELD-BASED DRONE
RESEARCH
Karl BW Svatos1, Dean Diepeveen1,2,3, Lynette K Abbott4, Chengdao Li1 1School of Veterinary and Life Sciences, Murdoch University, Murdoch, W.A., Australia 2Faculty of Science and Engineering, Curtin University of Technology, Bentley, W.A., Australia 3Western Australian Department of Primary Industries and Regional Development, South Perth W.A., Australia 4UWA School of Agriculture and Environment, The University of Western Australia, Crawley W.A., Australia
ABSTRACT
he transition away from legacy BIOS firmware architectures provides an opportunity to increase the accuracy
of large genomics platforms through advanced chipsets integrated with custom-built 4G/LTE broadcast base-
stations that currently enable high-speed data compression in remote locations. How these devices integrate
phenotype data for the selection of traits with respect to environmental variation in field trials requires efficient
data capture, storage and real-time GPU virtualisation of all connected devices. We propose a method utilizing
autonomous drones with precision instrumentation for pre-processing and offline data capture systems with pre-
flashed custom ROMs for phenotypic measurement based on Markov chains and probability functions, making
use of Gibb's sampling. Environmental datasets such as topography maps, soil type, and climate data are cross-
referenced to accurately and efficiently select genetically in the field via the onboard CPU/ GPU cluster and cloud-
based APIs (solid-state SSH super-computer CPU/GPU nuc SSH connection) through the kernel whilst online.
Ultimately computation compression ratios, CPU and GPU facilitation of metascopic data clusters and embedded
machine states, will determine much of the way forward in this space. However, the logistics required to “train”
a drone via a neural network machine learning pipeline to assess genotype in the field accurately or, the
management approach whether that be the desired outcome is now a reality. This research provides the preliminary
pipeline using barley and yield, maturity, canopy-temperature, NDVI and stomata physiology as the plant
characteristics to deliver a proof of concept poster (Appendix 4).
T

104
THE NEED FOR ENVIRONMENTAL AND AGRICULTURAL TECHNOLOGY FOR
ABIOTIC HEAT, WATER SCARCITY, AND FROST IMPROVEMENT IN BARLEY
CULTIVATION
Agricultural abiotic stress is the result of a period during the growing season where changes in
an ecosystems’ (natural or disturbed) net equilibrium balance, at the soil-plant-atmospheric
interface, affects the ability of a plant to produce a crop that can generate some form of
perceived benefit to the landowner. It refers to circumstances when soil moisture is insufficient
enough to result in increased crop growth and production, but more importantly relates to
complex interactions between the soil moisture and air temperature effects (Zargar et al., 2011).
The net osmotic gradient and water flux potential of that ecosystem result in changes to plant
equilibrium state maintenance (Keyantash and Dracup, 2002; Mickelbart et al., 2015; Rey et
al., 2016). Abiotic stress, including drought events, are associated with international issues,
including food security and climate refugees as a consequence (Burrows and Kinney, 2016).
None is currently higher or shocking than the mass movement of over 3 million people from
Syria to Europe, as the result of a most severe drought in Syria destroying 1.5 million farming
families’ livelihoods (Werrell and Femina, 2016).
Barley production in Australia differs from that of the Middle East, Africa or Eurasia. This
difference is mainly regarding cultivation practices and technologies being post-industrial
revolution (after the invention of nitrogen fertiliser and superphosphate and the out-breeding
of genetic diversity in favour of yield-related traits). Australian cultivation further contrasts to
Eurasian and Middle Eastern agriculture because the use of landrace barley’s is still evident
and promoted in the latter (Nair, 2019). One thing in common, though, and that most of these
climates experience, is abiotic stress. In Australia, for example, drought occurs mainly after
anthesis (flowering). Cultivation in Australia began approximately 200-years ago and
expanded rapidly more recently in Western Australia. The agricultural cropping region of
Western Australia supports a large annual barley crop with typically long dry summers and
reliable winter rainfall making production economically viable. In Western Australia planting
of a successful crop must begin in winter and depends on Winter occurrence of 'opening rains'
breaking in April to early May, where frequent rainfall can continue through until the end of
July (Allison and Hobbs, 2004). For winter cropping, harvest can usually begin by the end of
October and continue through until January in areas with higher rainfall and includes seasonal
increased frost and heat stress risk (Paynter et al., 2016).

105
The diversity of Australian barley cultivars that are unique to Australia is apparent both
regarding the number of varieties commercially available and breeding programmes’
developing varieties. New top-performing commercial types include the malting grade
Commander, a food-grade Hindmarsh and another feed grade called Compass. Each variety
offers unique characteristics that enable harvest in Australian arid to semi-arid climates but
more importantly also provide a range of different abiotic and biotic stress tolerances for
specific cropping environments. Barley as an agricultural crop is diverse regarding (i) the
number of usages, (ii) number of cultivation environments, and, (iii) its evolutionary age (both
forms) (Langridge et al., 2011; Awasthi et al., 2015; Mascher et al., 2016). Increasing
challenges are arising to develop new varieties under drying cropping environments by
bridging inherent resilience from the barley species’ evolutionary age and domestication habit,
which is particularly evident in areas where abiotic stress affects yield.
COMPLICATED GENETICS: A FAMILIAR STORY IN SYSTEMS BIOLOGY
Slow progress has been made in improving drought tolerance in cropping plants, or in
developing tolerant cultivars in barley (Fan et al., 2015). They suggest that this is likely due to
(i) the physiological and genetic (quantitative inheritance) complexity of tolerance traits, and
(ii) high environmental variability and the low efficiency of selection methods. Evidence for
associating genetic contribution to stress-related phenotypic traits including drought has proved
elusive for the improvement of cultivar tolerance because, relatively few genes/QTLs
controlling morphological and physiological adaptive traits have been cloned to date (Uga,
2010; Guerra et al., 2015). For crop improvement, it is necessary to determine the genetic basis
of the agronomic trait (Diepeveen, 2011). GWAS (and more recently EWAS) is powerful
techniques for detecting natural variation and fine mapping of QTL underlying a complex
trait(s) (Chhapekar et al., 2016). GWAS requires a collection of individuals or a population of
diverse genotypes and highly polymorphic markers that show genome-wide distribution,
although it is not the only method of genetically exploiting barley germplasm in the
biochemical sense concerning abiotic stress (Table 5).

106
Table 5: Studies completed in the field of barley cultivation and drought relevant to the analyses and the main scientific outcomes concerning the genetics of barley.
Author(s) Analysis Conducted Scientific Outcomes
Zeng et al., 2016 Transcriptome analysis revealed the drought-responsive genes in Tibetan hull-
less barley.
853 differentially expressed genes. Two categorised groups out of 9 clusters up-regulated under low, relative
soil moisture, content. All genes displayed different sensitivities to soil water deficit.
Yuan et al., 2015 Cloning and characterization of up-regulated HbSINA4 gene induced by
drought stress in Tibetan hull-less barley.
Two categorized groups out of 9 clusters up-regulated under low, relative soil moisture, content. They suggest
that all of the genes found, display different sensitivities to soil water deficit, which may be profitable for
future drought tolerance in barley or other crops.
Wehner et al., 2016 Expression profiling of genes involved in drought stress, and leaf senescence
in juvenile barley. Two eQTL’s on chromosomes 3H and 5H for drought tolerance.
Robinson et al., 2016
Mapping seminal root traits of barley using a recently developed high-
throughput phenotyping
Method.
A major QTL influenced both root angle and root number positioned on chromosome 5H, determined in
glasshouse pots. They suggest that the presence of this gene increases yield by up to 10 % in Queensland
cropping environments.
Obsa et al., 2016
QTL’s were mapped for phenotypes including early vigour, NDVI, leaf
chlorophyll content (SPAD), leaf waxiness and leaf rolling in 3 DH barley
populations in Australia via genotyping via sequencing and SNP.
The study found 13 maturity QTL of which eight collocated with phenology genes, and 18 QTL for traits
associated with adaptation to drought-prone environments. The high-density linkage maps may aid in genetic
studies for barley adaptation to Mediterranean-type environments.
Hasanuzzaman et al., 2016
Transpiration rate, quantum yield of PSII (chlorophyll fluorescence Fv/Fm
ratio), SPAD chlorophyll meter reading, dry biomass and shoot water content
was tested for drought tolerance genotyping ease
Chlorophyll fluorescence Fv/Fm ratio showed a strong correlation with drought tolerance tested via correlation
to R2. Chlorophyll content, dry biomass, shoot water content, and stomatal density did not correlate with plant
drought tolerance tested via R2. Screening time is a significant hindrance on data collection.
107
TRANSCRIPTION FACTORS ALONE DO NOT EXPLAIN ENVIRONMENTAL
DATA VARIATION PATTERNS CONCERNING YIELD IN POPULATION STUDIES
A recent publication by Watt et al., (2020) suggests that harnessing the potential of
transcription factors as potential tools for abiotic stress improvement is a matter of ‘identifying
the complex role that transcription factors of multiple families have contributed toward abiotic
stress tolerance.’ Unfortunately it is not so simple. A publication by Wang and Chekanova,
(2016) on siRNA (small RNA’s) proposes that essential regulators of gene expression and
defences against environmental stresses in plants (abiotic stress) are controlled at the
transcriptional level by an intricate gene regulatory network, which is a view partially
supported by Singh and Laxmi, (2015). Their belief is that transcription factors (TFs) are
proteins that work together with other transcriptional regulators, including chromatin
remodelling/modifying proteins that employ together; “simultaneously, to other
transcriptional regulators or obstruct RNA polymerases on the DNA template.” All of these
approaches indicate a more complex array, that have too many bioinformatics dependencies
for computational mapping alone, which is why pangenome-omics strategies now dominate
world-leading research groups, e.g. (Greenlon et al., 2019).
Transcription factors in response to drought and heat stress are grouped into two categories,
abscisic acid (ABA)-independent pathways and ABA-dependent pathways (Kumar et al.,
2015a). In Zeng et al., (2016), a total of 853 differentially expressed genes were detected and
categorised. Some of the 853 genes were up-regulated under low relative soil moisture content.
Abiotic stress genes included: (i) 9-cis-epoxycarotenoid dioxygenase (NCED), pyrabactin
resistance 1/PYR1-related/regulatory component of ABA receptor (PYR/PYL/RCAR),
sucrose-nonfermenting kinase1-related protein kinases (SnRK2), antibacterial factors (ABF),
transcription factor MYC/MYB N-terminal (MYB/MYC), floral homeotic protein / ethylene-
responsive element APETALA2/ERE, APETALA homeotic binding factor family (AP2/ERF),
late embryogenesis abundant (LEA), and dehydrin (DHN). In roots, transcription factors
(including some of the above-mentioned ABA signalling pathway transcription factor families)
are: (i) dehydration response element-binding factors (DREB), (ii) AP2/ERF, (iii) NAC, (iv)
basic leucine zipper (bZIP), (v) MYC, (vi) calmodulin-binding transcription activator
(CAMTA), and (vii) alfin-like and q-type (ZFP) (Cramer et al., 2011; Pandey et al., 2015;
Janiak et al., 2016). “Transcription factors may recognise and interact with specific cis-
elements of target genes via DNA binding domains,” as described in Scharf et al., (2012) when

108
describing the heat stress transcription factor (Hsf) family about plant structure, function, and
evolution.
He et al., (2015) suggest that Tibetan wild barley is a resource of genes for improving crop
defences against abiotic stress tolerance, including drought. In this study, a transcriptome
analysis of the novel β-expansin gene (HvEXPB7) revealed root hair growth under drought, in
wild Tibetan barley which they concluded, “could be novel to this variety”. Because as Yang
et al., (2016) asserts; “some TF’s can up-regulate or down-regulate downstream gene
transcription, which encodes a subset of TF’s integrated into plant hormone signalling
pathways, forming a complex hierarchic regulatory network”. ABA and jasmonic acid (JA)
are two plant hormones that act as key regulators in balancing plant growth and abiotic stress
response (Liu et al., 2015). TF’s function and act within these signal transduction pathways
(Wei et al., 2014). However, a further layer of complexity exists. The hierarchy of TF
interactions within downstream gene network(s) and the interaction mechanism of the signal
transduction pathway(s), with protein dimerization relationships that are not entirely explored
and, “need more research” (Yang et al., 2016). Drought tolerance of 47 Tibetan wild barley
accessions was evaluated for drought tolerance using reduced soil-plant development analyses
(SPAD). Based on chlorophyll meter readings, plant height, and biomass of shoot vs. root in
plants exposed to drought stress were found to be associated with increased adaptation and
higher yield (Zhang et al., 2014). The results from another study analysing 95 Tibetan Wild
lines showed that Tibetan wild barley can yield higher grain protein content than cultivated
barley and that two HvNAM genes proposed as candidate genes may control grain protein
content (Ahmed et al., 2016).
Advances in genome-wide studies have contributed to the understanding of barley as a complex
system (Jarzyniak and Jasinski, 2014), including plant responses to environmental stress
(Bobadilla and Berr, 2016). Mediterranean, winter, rain cropping environments, often suffer
drought at the end of the growing season (Fan et al., 2015). The magnitude of the threat which
drought poses has made breeding for drought strategies a primary objective of current research
groups worldwide (Wehner et al., 2016; Zhang and Li, 2016). Genetic variability reported in
Engineer et al., (2016) suggests that using exotic landraces will play a primary role in
determining positive adaptation to environmental stresses and extreme climatic conditions.

109
Figure 19: (Left) Rainfall percentiles and percentile rankings in Australia from 2000–2016 based on the Australian Bureau
of Meteorology data. Contrasting shades rank areas on the map for which rainfall data reflects the overall deficiency status for
that area (based on all data available). Areas with a darker shade of red indicate that there was a significant change in rainfall
percentile ranking for that area. (Right) Barley production in Australia based on Shire production data in tonnes from the
Australian Bureau of Statistics (ABS) census and Grain Industry Association of Western Australia (former) estimates from
2013-2015. The overlap appears to be more concentrated around the grain-growing areas along the southwestern region of
Western Australia, and southeastern Australia between Victoria and South Australia. There have been more recent droughts
that have affected the east coast of Australia in New South Wales and Queensland more severely, that are not indicated on
these maps; however, the grain yield data indicate the correlation between drought and grain yield based on the trends which
are expected to continue along these gradients. As such, there have been concerted efforts to place weather stations and use
satellite data to map this microclimate effect, however, given the magnitude of the scale of the area, a more precise method is
required.
Barley is considered the most drought tolerant of the small grain cereals, especially in
Mediterranean rim countries (Forster et al., 2004; Boudiar et al., 2016). However, extreme
weather conditions including microclimate occurrences are widespread in Western Australia
(e.g. snowfall in October), and where rainfall is expected to decline in the coming decades,
increasingly poor understanding from previous studies (concerning long term assessments) e.g.
(Solaiman and Hirata, 1997; Abbott and Murphy, 2003; Diepeveen 2011; Garcia et al., 2015;
Ferdous et al., 2016; Pospisilova et al., 2016), have lead to misinterpreation of seasonal
variation (Figure 19). The vast scale of the Australian growing region makes linking phenotype
to transcription factors unrealistic. In barley, high variation in responses to drought likely exists
in primitive landraces and related wild species gene pools (Dwivedi, 2016b). Reports suggest
that barley lines derived from crosses with exotic landraces not only out-yield lines derived
from crosses without landraces under drought conditions but, the grain yield of lines derived
from crosses with specific landrace such as Tadmor (Syrian landrace), can yield as much as
twice as much compared to lines lacking drought-tolerant traits in their pedigree. New genetic
technologies are enabling breeding companies to integrate ‘omics,' high throughput arrays, and
bioinformatics platforms approaches for variety selection (Ferdous et al., 2016). New yield
markers, e.g. (Cattivelli, 2008; Mansour et al., 2013; Ahmed et al., 2016) (Table 6).

110
Table 6: Summary of relevant reviews on drought, phenotyping, genotyping, logical processes, plant adaptation, and yield improvement in plants (in no particular order).
Reviewer(s) Review Topic(s), Summary, Recommendations, and/or Conclusions
Dwivedi et al., 2016
This study reviews landrace germplasm for improving yield and abiotic stress adaptation. Landraces identified for traits with more efficient nutrient uptake and utilisation, as
well as useful genes for adaptation to stressful environments such as water stress, salinity, and high temperatures. A proposed systematic landrace evaluation may define patterns
of diversity, which will facilitate the identification of alleles for enhancing yield and abiotic stress adaptation, thus raising productivity and yield stability of staple crops in
vulnerable environments.
Wang et al., 2016 Bioinformatics approaches indicate that a specific class of plant smRNA’s (small RNA), induced by various abiotic stresses. The sutr-siRNAs, have the potential to target
regulatory regions within introns thus, they may act in the regulation of splicing in response to environmental stresses, which are essential in drought signalling pathways.
Mickelbart et al., 2015
Selective breeding for the combination of beneficial loci in germplasm has improved yields in extreme environments. Targeted identification of genetic markers to stress adaptation
has become precise and enabled introgression into elite varieties. These loci associated with regulation, function, duplication and neofunctionalisation of genes that maintain plant
homeostasis.
Rahaman et al., 2015 High-throughput phenotyping platforms can capture phenotype data from plants in a non-destructive manner. This approach allows identification of the genetic basis of
agriculturally important traits which will improve the description of complex plant phenotypes.
Sheoran et al., 2015 This review summarises the status of mapping studies for the various traits associated with drought tolerance in wheat and barley. They surmise that there is a need to explore the
natural diversity in the yet untapped wheat and barley genetic resource pools that may enable the development of elite genotypes with improved adaptation to drought stress.
Gutzat et al., 2012
This review looks at epigenetic stress responses at the level of signalling, chromatin modification, and the potentially heritable consequences. Especially about developmental
and morphological adaptations, specific signalling and defence pathways as well as innate and acquired immunity to abiotic stress they propose plant epigenetic responses to
stress as a triple defence system.

111
GENETIC PRINCIPLES UNDERPINNING DROUGHT IMPROVEMENT
STRATEGIES ARE TECHNOLOGICALLY CHALLENGED
Because drought tolerance is not a simple monogenic trait, association mapping or marker-
assisted selection may not identify actual variation in drought tolerance studies (Forster et al.,
2004). Therefore, if using association mapping for drought studies, highly significant
differences between well-watered and drought-stressed conditions are to be observed in
measured traits (Abou-Elwafa, 2016); which is based on the theory that there could be blocks
of genes in chromosomal regions with a low frequency of recombination (highly conserved
regions) that can confer specific adaptation to drought (Lakew et al., 2011; Mayer et al., 2011).
However, a high degree of phenotypic variation was detected by Robinson et al., (2016) in
genotypes for root angle, and root number, with only“seven QTLs identified using DArT
markers for seminal root traits from the DH population.” And “A major QTL influencing both
the root angle and the root number was found to be positioned on chromosome 5HL.” Even
with a genome-wide association study (GWAS) (a powerful technique for detecting natural
variation and fine mapping of QTL underlying complex traits). The results presented by
Robinson, seemingly contradict others. That a population of diverse individuals and highly
polymorphic markers (that show a whole-genome distribution) Chhapekar et al., 2016), can
eliminate environmental bias, and false positives from occurring (when linking QTL to traits),
as opposed to blocks of genes, or genes on individual chromosomes with inferred ‘gene
abilities’ based on unsubstantiated field-glasshouse comparisons, independent of treatment, is
not genetically challenging but technologically unrealistic (Kumar et al., 2015b).
Some different strategies and breeding techniques can be utilised for genetic studies once a
good understanding of the functions of stress-responsive genes are known (Ferdous et al.,
2016). Consideration should be taken to study stress responses in the target conditions and
environments where plants commonly grow. Doubled haploid populations are genetically
stable and often have a greater spread of species diversity throughout the entire population of
inbred lines favouring the selection techniques associated with abiotic stress (Samal and
Martin, 2015). A primary genetic linkage map, consisting of an easily scored polymorphic
genome, is an essential prerequisite to genetic studies in any organism, and scientists have
reached a new milestone on sequencing the barley genome with nearly two-thirds of all barley
genes completed (Mayer et al., 2012). As Zhang and Li, (2016) suggest, the wild genotypes
will contribute toward the elucidation of mechanisms of drought resistance as well as the

112
identification of the specific genes involved in drought tolerance, thereby resulting in future
improvement of cultivated barley.
The majority of drought studies have used simulated drought conditions with a remarkable
increase in precision but a questionable relevance to actual drought conditions themselves.
Mostly these studies consider the incredible diversity that wild or unknown genes bring to
increase resistance but don’t find the effect that the introduced genes ‘skew’. Results inferring
resistance to environmental specific transcription factors, without looking at the habitat
(canyon) of evolution at all, are questionable data fishing exercises (Jaganathan et al., 2015).
Evidence all points to a significant financial investment being required; however, in fact it is
the opposite, with little support considering omics and holobiont theory and in particular
horizontal gene transfer theory in agronomic plant biology studies concerning grain yield.
Support is arriving almost four decades late since its suggested use in plant biology (Jones,
1985; Trewavas 2001; Voltas et al., 2005; Zilber-Rosenberg and Rosenberg, 2008).
BIOTECHNOLOGICAL BREAKTHROUGHS ARE HAMPERED BY PHENOTYPE
BOTTLENECKS
Biologists studying plant abiotic stress typically set out to follow the rigorous process of
mapping QTL to gene-specific regions for fine mapping, candidate gene selection and then;
follow a procedure for CRISPR-Cas 9 for a knockout or an insertion (Jones, 1985; Jones, 1995;
Jones, 2014). Eventually, this may lead to the publication of a new QTL, (or more recently
eQTL if their research facility is equipped with a meta-bisulphate SEQUEL II sequencer
(Appendix 1 and 2). This process can take anywhere from 1 to 20 years. However, in the last
30 years of scientific research since the invent of PCR, scientists and in particular plant
biologists, have struggled to find single genes that control abiotic stress. There exists only one
patent that mapped the root length trait in cereals (rice) to a single gene in water-stressed
conditions (in the laboratory) (Uga, 2010). Conventional breeding for drought resistance
adopts mainly a large-scale backcross strategy to develop new varieties with improved drought
and high yield potential (Hu et al., 2014). Plant breeding either the conventional way or through
the use of genetic engineering is highly sophisticated. The process of plant breeding for desired
traits requires significant amounts of genetic variation to occur at intra-specific, interspecific
and inter-genetic levels. Genetic variability is achieved through new gene combinations, and
by inter-crossing genotypes that hold desirable characteristics or through introducing new

113
germplasm from other existing breeding programmes (Ashraf, 2010). The high genetic
diversity that exists in germplasm collections is currently under-utilised for abiotic stress
tolerance (Fleury and Langridge, 2014).
ADAPTATION STRATEGY AND ENVIRONMENTAL CONSIDERATIONS IN
BARLEY GENOME SEQUENCING INTERACTOMICS
Barley possesses a large and highly repetitive genome that until recently has remained difficult
to sequence entirely. Scientists have reached a new milestone on sequencing the barley genome
of its 5.1 billion base pairs (5.1 Gb) (Mayer et al., 2012). The barley genome grants high
homology to wheat genomes A, B, and D. Colocalisation is also allowed through the genomes
of other grasses such as Arabidopsis and rice. The localisation of chromosomal segments
through synteny or the conservation of blocks of order within two sets of chromosomes across
species enables full sequencing to within approximately 95% (Ghiurcuta and Moret, 2014;
Muñoz-Amatriain et al., 2015; Tyczewska et al., 2016). There is a need to implement strategies
to offset the harmful effects associated with the consequences of drought on food security and
crop production internationally and locally. However, as with all genotyping and phenotyping
studies inferring positive impact is dependent on the environmental interactions inside and
outside of the plant. Both can be highly variable, which is why interactomics is important in
abiotic studies. Interactomics involves understanding transcriptional control beyond gene
annotation. Brauer et al., (2014), who stated that one of the main objectives in plant biology is
“to predict plant responses given genomic information and environmental circumstances
reliably.”
PHYSIOLOGICAL LEAF FUNCTION DURING COMPLEX ABIOTIC STRESS
Temperature directly influences leaf susceptibility to drought stress, but, leaf susceptibility is
also dependent on (i) the radiation and atmospheric conditions (time of day, intensity, clear or
cloudy sky, air temperature, wind speed), (ii) soil conditions (soil type, soil water content, etc.),
and (iii) canopy properties (morphology, density, height) (Maes and Steppe, 2012; Costa et al.,
2013). The combined sum of these factors also influences the size and ratios of the radiant,
sensible and latent heat flux ratios (Allen et al., 2011; Fanourakis et al., 2015). For this reason,
we must consider abiotic heat as an active feedback system for when phenotyping drought
response. In spring barley, an air temperature ~20–25 ºC is deemed to be optimum for growth
114
and development. Any increase in temperature above these values often results in the reduction
of agricultural productivity (Kruszka et al., 2014).
Photosynthesis is considered the most fundamental physiological process affected by drought
due to a reduction in the CO2 assimilation rate and disruption of primary photosynthetic
reactions and pigments (Rao and Chaitanya, 2016). The metabolic process in photosynthetic
organisms for high-temperature stress is often to inhibit production before the impairment of
other cell functions. Cells accumulate active substances, such as proline, sorbitol, and glycine
betaine, in their storage organelle called vacuoles (Rizhsky et al., 2004; Valliyodan and
Nguyen, 2006; Szabados and Savoure, 2010). These storage compounds can reduce a plant
cell’s water loss. When the osmotic pressure in the cell lowers, the concentration of
intracellular compounds rise, resulting in damage to the cell membrane and larger molecules
of the plant cells (Wilkinson and Davies, 2010; Wendelboe-Nelson, 2012). Enzymes provide
a mechanism to ensure that cell proteins and membranes retain their structure and continue to
function (Okumoto et al., 2012). If a lack of water further prevents photosynthesis, and if the
chloroplasts are additionally exposed to intense ultraviolet radiation, they directly attack the
enzymes and membranes in the cell and destroy them (Farooq et al., 2009; Millar, 2016).
Biological mechanisms that plants use to resist both drought and heat reported by Hu and
Xiong, (2014) and others (Sheoran et al. 2015) include the leaf function traits: (i) leaf rolling,
(ii) leaf expansion, (iii) leaf waxiness, (iv) cuticle tolerance, (v) stomatal density, and (vi)
stomatal aperture. Rapid loss of water from the surface of leaves of plants causes a shunt,
followed by the disruption of cellular membranes, making them more permeable to a range of
ions (Wahid and Shabbir, 2005; Munns et al., 2010). At high temperatures (> 45 °C), heat
results in denaturing protein, enzyme and membrane lipid expression (Cheng et al., 2009). This
process can cause cell injury resulting in plant death within minutes due to organisational
cellular collapse (Wahid et al., 2007). Plant death can still occur from extended exposure at a
lower temperature since plant function, and efficiency can be severely affected (Awasthi et al.,
2015; Oukarroum et al., 2016). At lower temperatures, i.e. between 35ºC-40ºC, the rapid loss
of water from the surface of leaves of plants causes a state of dehydration to occur, making
them more permeable to a range of ions. Which in turn may cause alterations in membrane
fluidity potential that affects the function of membrane-bound ion transporters (Singh and
Grover, 2008).

115
Stomata and guard cells on the leaf surface allow control of gas exchange between the plant
and the atmosphere (Engineer et al., 2016). Guard cells are also involved in the uptake of CO2
and can adjust the stomatal aperture of stomatal cells by making adjustments in turgor and
volume within themselves (Osakabe et al., 2014). Guard cells are involved in the early onset
of environmental change and thus play a crucial role in plant signalling (Saucedo-Garcia et al.,
2015; Ahmed et al., 2016). Reversible phosphorylation events in the plant are widely known
for the production of proteins which at the cellular level play a vital role in the regulation of
stomatal movements (Bartels and Sunkar, 2005; Gupta et al., 2013). The phosphopeptide-
binding proteins known to be involved in phosphorylation, and stomatal movements are also
involved in the functioning of ion pumps, channels, protein kinases, and substrates (Cotelle
and Leonhardt, 2015). According to Hasanuzzaman et al., (2016), “chlorophyll content, dry
biomass, shoot water content, and stomatal density did not correlate well with drought
tolerance (tested via R2 correlation to drought tolerance index). Transpiration rate and
chlorophyll fluorescence Fv/Fm were more correlated to drought tolerance index.” On the
genetics that physiology plays in regulating response to complex abiotic stress as it relates to
grain yield, it is not as easy as suggested by Zhang and Li (2016), simply because the
repeatability of such experiments can not ever be guaranteed (Manter et al., 2010).
DOUBLED HAPLOID CHROMOSOMAL GENETIC IMPROVEMENTS IN BARLEY
BREEDING FOR ABIOTIC STRESS TOLERANCE
A doubled haploid (DH) is a genotype formed when haploid cells undergo chromosome
doubling. Artificial production of doubled haploids is essential in plant breeding and doubled
haploid lines, are particularly suited for diploid species such as in barley. Much of the work of
Zhang and Li, (2016) focusses on doubled haploidy (DH). DHs are homozygous at all loci and
capture variability within self-pollinated crops or in parental inbred lines for the production of
hybrid, cross-pollinating plants (De La Fuente et al., 2013). The output of pure lines using
doubled haploids has several benefits over conventional methods (Abdurakhmonov et al.,
2011). The main advantage of DH breeding strategies relates to homozygosity being achieved
in one generation (Rostoks et al., 2005; Reetinder, 2009). This eliminates the need for
generations of self-pollination events which is a substantial time-saving benefit, particularly in
biennial crops or crops with a long juvenile period (Catoni and Gratani, 2014).

116
In barley, haploid production is the result of extensive (wide) hybridization between cultivated
barley (Hordeum vulgare, 2n=2x=14) as the female and wild H. bulbous (2n=2x=14) as the
male (Murovec and Bohanec, 2011). After fertilization, a hybrid nucleus containing the
chromosomes of both parents results. During early embryogenesis, chromosomes of the wild
relation are aborted from the cells of the developing embryo, leading to the formation of a
haploid germ. A haploid germ is later extracted and grown in vitro. Pollination with maize
pollen could also be used for the production of haploid barley plants but at lower frequencies
(Abdurakhmonov, 2011). Doubled haploids are stable genetic clones and show the entire
genetic diversity of both parents in a multivariate normal distribution, and are often used for
chromosomal genetic studies. Their use can also expedite commercial release, for example, by
aiding strategies such as those used by Diepeveen (2011), Maddern (2016), Zhang and Li,
(2016) (and others) to rapidly generate new lines for government use or public release to
breeding companies, research groups or more giant conglomerate corporations (GRDC) in
Western Australia, Australia or internationally (and benefit from material transfer protocols).
ENVIRONMENTAL SCENARIO SIMULATION PHENOTYPE, GENOTYPE
INTERACTIONS
Phenotyping is King and heritability is Queen. Valuable phenotyping is the collection of
accurate data that minimises experimental errors due to uncontrolled environmental or
experimental variation from a biological and agronomic point of view. Tuberosa, (2012)
suggests that there are many studies reporting thousands of drought-responsive genes and QTL.
However, the relevance of these QTL regarding real field conditions is often marginal or even
sometimes questionable. As many experiments are limited to glasshouses conditions,
experimental connection without a replicable field-yield component highlights the importance
of mimicking stress conditions in both controlled and uncontrolled environments (Chaerle et
al., 2007; Rahaman et al., 2015).
In drought stress studies, phenotyping is more critical than genotyping in establishing the
relationship between gene function and plant traits (Chhapekar et al., 2016; Furbank and
Tester, 2011). However, because genome sequencing and molecular breeding techniques are
dramatically increasing the speed at which large populations can be genotyped phenotyping
has in many cases become the rate-limiting step in breeding efforts (Masoudi-Nejad et al.,
2007; Walter et al., 2015; Araus and Cairns, 2014).

117
Improving cropping systems for drought stress environments involves time-consuming
selection methods, coupled with large volumes of genotypic information. White et al., (2012)
suggest that field-based phenotyping for large populations is increasingly recognised as the
only approach delivering the requisite throughput regarding numbers of plants or populations,
as well as accurate descriptions of trait expression in cropping systems (Gonzalez-Dugo et al.,
2015). Field-based phenotyping methods include; (i) selection of phenotypic traits, (ii) defining
and measuring the relationship of traits to physiological and morphological responses, (iii)
using technology to analyse, record and measure the traits (field and controlled environments),
(iv) including accuracy and ease (amount of time) of data collection in design, and (v) data
management and data processing of large sets (e.g. 3D vs. 2D) using cloud-based servers or
multiple devices. Measuring traits that directly associate with all biotic/abiotic stress variables
can cause other unwanted variation in the population (to that of the trait in question), so
experimental accuracy and other effects which may muddle response measurements are also
essential considerations (Zhang and Li, 2016). It is crucial to consider the context of how a
genetic interaction might play out first, and then test it via experiments, but this is not a
common approach due to more rapid advances in molecular biology, and lesser so in
technologies where people do not have the ability to reverse engineer such molecular pathways
concerning extensive phenotype scenarios in field and glasshouse design and in multiple
environments. Why do we keep trying to make things harder for ourselves?
ENVIRONMENTAL AND BIOLOGICAL QTL HEURISTICS
The statistical analysis associated with the mapping of QTL is continually changing (Heffner
et al., 2009). QTL mapping in statistical genetics is mainly used to determine the complexity
of the genetic architecture underlying a phenotypic trait. QTL mapping was sufficient for
conferring plant resistance against insects as in Barah and Bones, (2015), or for structural
modelling to link quantitative genetic information to morphological development and
physiological processes as in (Xu et al., 2011). Understanding whether a phenotype is shaped
by many independent loci, or, by a few loci, or by loci interaction, is the main aim of statistical
genetics and provides information on how the phenotype may be evolving (Kumar, 2015b).
A new software statistical package published about genetics in 2014 to predict and measure
genome-wide regression uses an algorithm based on a Gibbs sampler with scalar updates is

118
this “BGLR,” R-package (Pérez and De Los Campos, 2014). The package implements an
extensive collection of Bayesian regression models, including parametric variable selection,
shrinkage methods, and semi-parametric procedures to correlate phenotypic trait data (binary
or other) to achieve ‘relative’ absolute values for marker effect QTL’s in genetic populations
at a genome-wide level. Another approach to QTL mapping involves the MCMCglmm R
library that uses the MCMC algorithm and is for more massive datasets, such as Hi-C
(chromosome conformation capture). This hidden Markov chain, genome architecture capture
method is limited in computing power available. Hi-C can theoretically implement, via a three-
dimensional model, deliver confidence estimations, to approximate the chromatin structure
within the genome (Ay and Noble, 2015).
SUMMARY
This review only points to one thing, that our understanding of environmental data and QTL
or eQTL heurisitcs are increasingly complex, genetically but not necessarily observationally
in nature. The more we learn and read about data science and machine learning as it applies to
A.I., the more we realise that there is a divide. Often theories about gene function predictions
are easily digitalised and then summarised alone by zero’s and ones. Companies are
increasingly endorsing the practice, with little or even no appreciation of the actual data
collection and the theory and thought development, e.g. (Jones, 1985). These two projects are
an attempt to bridge the complex science of genetics with telecommunications hardware and
software, but more importantly describe and document the incredible diversity in
environmental data collection in plant genetics studies as it relates to two novel Tibetan-
Australian barley varieties bred by the author that were eventually was used to create a
deepfake game (>150 years of history studies including before the industrial revolution). For
agricultural improvement as it relates to the purpose of addressing the hypothesis, concerning
data onwership, and A.I., the trend that increasing understanding on the environment will lead
to better outcomes in terms of water quality and food security is complicated and only about
data ownership. A very important consideration for why deepfakes arise and are used
nowadays in science.

119
PROJECT 1: RAPID DOWNSTREAM GLASSHOUSE FIELD TRIAL GENETICS
ASSESSMENTS FOR QTL VARIABILITY MINIMISATION IN GPU CORE
PROCESSING AND TELEMATICS DATA ANALYSES
EXECUTIVE SUMMARY
Phenotyping of cereal crops at a scale for valid selection of traits concerning variation within a
paddock or experimental trial requires efficient data capture and analysis. There are increasingly
more high-resolution data platforms available for the integration of phenotype to predict grain
yield, crop health, growth index etc., however, none that incorporate this approach with the
genotype-specific data sequences readily available (real-time GWAS or EWAS). The reason is
that the data capture and integration for downstream analysis are computationally complex and
rely on synchronous time dependencies. However, the possibility of such a real-time analysis is
no longer theoretical.
In a real-world scenario, the question remains; what is currently the maximum amount of data
that can be processed in the minimum amount of time, that would best enable real-time decision
making to the benefit of plant breeders, scientists, and farmers (in remote locations), based on
available or collectable data? To answer that question, new methods were developed utilising
high-quality imaging devices, microscopes, and sensors coupled with UAV drones, high
precision telemetry software, and instruments. To determine along with a pre-processing
algorithm (based on abiotic stress plant genetics) and with it, an offline database capture system
for subsequent real-time, genetic crop health-yield index measurements to be made, thus
verifying the complementary genetic analyses (online). This research provides the preliminary
work developed as a pipeline using a unique Tibetan-Australian barley doubled haploid
population (yield, maturity, canopy-temperature, NDVI, and RGB imagery) as plant
characteristics, under a combination of heat and drought stress. This database (data lake) and
pipeline were built with a specific .NET instruction set focus that will enable secure scalability
across multiple instances and platforms and for the creation of a digital twin simulation
concerning the genetics of barley under various cropping environments.

120
BACKGROUND
Barley pre-breeding enables the selection of elite lines that show adaption to a breeding target
such as abiotic stress. Current techniques use both genetic and phenotype information from
several environments to identify elite lines. This process is sped up when traits that relate to a
breeding target are highly heritable. A key challenge in this type of breeding is to identify the
association between traits and the breeding target. These high-precision experiments are often
done in controlled environments with specific trial-designs enabling the confirmation of trait
associations. Once these trait-associations are identified, then they are evaluated in the field in
several settings for validation of performance traits, e.g. grain yield. This project assessed high-
resolution phenotyping both in the glasshouse and the field for abiotic heat stress and water
stress (drought) (a focus on the variation in datasets used to determine pre-breeding elite
varieties that are used to select elite lines for high heritability of essential traits such as grain
yield or malting quality for example).
This generally includes the construction of a database and online servers to compile and analyse
the scores from collected phenotype measurements (data) required and also includes genetic
sequences including candidate genes, previous research databases of QTL, or other significant
transcription factor mapping, and even fine-mapping QTL. The information surrounding the
phenotype can then be used to assess plant responses specific to a specific genetic architecture
rapidly, a knockout or insertion can be generated using CRISPR and the desired plant response
visually evaluated. The challenge is the time it takes to achieve this result, which may, in some
instances, exceed ten years before a commercial release. This project methodology was targeted
at a four-year window offering a significant advantage over a 10 year window in targeting
specific phenotypes due to the shorter timeframe required to release the varieties. This would
benefit growers due to a potential for a decreased amount of allocated budget to develop and
then the varieties themselves with multiple environmental selection data to support the pedigree
(in its current state).

121
AIMS
1. Datamine candidate genes based on the literature and internet accessible databases
(including candidate gene sequence data from the HW1 shotgun sequence based on the
MOREX alignment).
2. Undertake laboratory, glasshouse and field trials to determine the best telemetry
diagnostics for decision making concerning yield as it relates to abiotic stress;
a. The selection of suitable environments and stresses that best reflect the
variability required to compare individual and combined responses (of the
available barley varieties).
b. Glasshouse and field evaluations (3x field trial; 3x glasshouse).
c. Creation of multiple end-node databases for subsequent API latency (Δ)
measurement across scaleable cloud instances concerning datamined genes.
METHODS AND RESULTS
CANDIDATE GENE DATA MINING AND SELECTION (METANALYSIS)
Based on the review of literature, and accessibility of databases conferred through association
with the Western Crop Genetics Alliance (formerly Western Barley Genetics Alliance), a
Microsoft Excel file was constructed (*.xlsx) (via a data mining approach) and is at the centre
of the statistical methods required for a real-time GWAS QTL mapping platform; which may
then be used to train or model (statistically) plant health responses thereafter, or for yield
prediction (Figure 20). This file also builds on the research outputs of the Agtech group at
Murdoch as well as the Western Crop Genetics Alliance who the author aided by growing the
grains at DPIRD, and by conducting the RNA extraction in the construction of QTL derived
cluster matrices. These matrices were subsequently used to match the corresponding phenotypes
(grain colour gene(s) inferring expression of the black and white grain colour trait) to shotgun
sequences (sequenced by the WBGA) that were associated loosely to the Morex whole-genome
sequence; for 120 lines (unique clones) of the HW1 DH population (Hindmarsh wild Tibetan
cross) (for the data see Long et al., 2018).

122
Figure 20: Data mining reveals candidate genes, including those specific to functional categories. It shows the prevalence of
their functional characteristics specific to barley adaptations for abiotic stress concerning intracellular signal transduction and
the protein functional categories for drought. Data was ethically mined as per the Kyoto Encyclopedia for Genes and Genomes
database and associated protocols and included genes mainly selected from, (i) the ABA pathway, (ii) the pentose phosphate
pathway, (iii) the plant circadian rhythm pathway, and (iV) the carotenoid biosynthesis pathway, concerning the photosynthesis
process and the GABA shunt mechanism. Precisely, gene-specific calling and mapping of keywords (chart title “Capitalised”
letters) and via a remote meta-analysis of the {http://pgsb.helmholtz-muenchen.de/plant/index.jsp} command line and
associated library tool strings (XML Java), mapped the database command line entries to referenced console opensource
libraries. The entries were then converted to text and used to tabulate a list of candidate genes in an integrated and standardised,
tabular, free-form as per the GNU general public license-(Free Software Foundation, 1991). The alignment tools were accessed
remotely from a terminal IP address linked to the Western Crop Genetics Alliance database via a virtualised Java runtime
container; using an XML font based tool (copy paste) provided in the Windows 7; Office365 student's tool kit from which
remote access was still supported by the Helmholtz Zentrum dashboard as of May 2020. The database IP address, portal and
command-line interface was remotely and freely accessible at that time from Murdoch University in 2016 and accessed on
campus by the author. The process was also completed to provide a framework for the embedded .NET assemblies required to
associate these genes with the freely available USA based Morex alignment sequences, and for a better understanding of the
ethics of digitalised Tibetan-Australian barley genotype captured and analysed by Long et al., (2018). And for further use
concerning the thesis aims and hypothesis.

123
COMBINED HEAT AND DROUGHT STRESS DATA REQUIRED FOR YIELD
CORRELATIONS (BASED ON ENVIRONMENTAL GEO-LOCATION VARIATION)
To determine the best traits for abiotic stress measurement including for; (i) heat stress, (ii)
water stress and (iii), drought tolerance (for comparison of grain yield between the various
varieties, soils, glasshouses and field environments); the Penman-Monteith (PM) model of the
Thornthwaite PE algorithm was selected (Equation 1). This equation is considered the most
comprehensive algorithm for modelling potential and actual evapotranspiration which gives
additional estimates of the plant and environmental resistance to atmospheric demand (Sheffield
et al., 2012). “The PM models evaporation as a combination of irradiative and aerodynamic
processes”, thus it gives a more realistic estimate, having the potential to be influenced by
changes in humidity, radiation, and wind speed, as well as temperature (Trenberth et al., 2014).
PE =𝛥
𝛥 + 𝛾⋅ 𝑅 +
𝛾
𝛥 + 𝛾⋅ 6.43(1 + 0.536𝑈)𝐷
PE is (mm d-1) assuming zero stomatal resistance; ∆ (Pa.K-1) is the slope of the plot of saturated vapour pressure against air
temperature, U is the wind speed (ms-1) at 2 m height, Rnet is the net radiation (W.m-2), D is the vapour pressure deficit (Pa),
and 𝛾 is a psychometric constant (Pa.K-1). Although as precise as is reported; whether the model can be used in microclimate
calculations considering the scales at which such phenomena can change the individual components that make the sum of the
model is unknown to the author.
Other components that were used and considered for statistical modelling included: (i) relative
humidity, (ii) canopy temperature, (iii) CO2, (iv) wind speed (in field trials), (v) soil moisture,
(vi) soil properties, (vii) mycorrhiza (viii) slope, and time and date (of sampling). This research
project also made use of nearby weather stations for estimation and quantifying traits where the
direct measurement was not available (API information in the declaration). Based on the above
equation it was determined that environmental variation concerning grain yield based on the
combined effects of heat stress and drought would be best captured at (DPIRD) South Perth
(2016), (DPIRD) Wongan Hills (2017) and DPIRD (Katanning) in 2018. Although the decision
to select these areas is made seasonally (for the purpose of capturing enough variation
concerning plant responses in semi-arid and heat stress-prone regions), the choices made were
based on the assumption that the environmental difference would be significant enough for yield
mapping regardless of the prevailing climate. However, this was also factored into the decision
making process.

124
GLASSHOUSE AND FIELD TRIAL DATABASE (DATA LAKE) DESIGN
Abiotic stress and yield-related traits were benchmarked and used to evaluate the grain yield
specific to a ‘plant health index score’ for the climates of growing regions that are known to
experience abiotic stress (including heat, drought, and frost); at various times of the year during
the growing season. To achieve these aims, three glasshouse experiments were established as
well as three field trials in Western Australia’s cereal growing region.
This research had access to a range of barley germplasm, including wild Tibetan barley (W1).
“The seeds (W1) in this collection were initially collected in Tibetan mountain during 1970’s.
These were subsequently stored in Sichuan Province until 1995. Following this, the seeds were
brought to Zhejiang province in 2005 for heat and drought screening, then introduced to
Australia in 2010. It first went to field trials in Western Australia around 2013” (Prof. C. Li
personal communication, 16th January 2019). This originally six-rowed wild barley (W1) was
crossed with a former top-performing Australian commercial food variety (Hindmarsh); to
create an approximately 420 ‘line’ doubled haploid population (HW1) by Lee-Anne McFawn
from DPIRD; who is also a member of the Western Crop Genetics Alliance (WCGA). Other
lines accessed initially included Commander and the drought-resistant lines Tadmor (Syrian
landrace) and W10403 (an Italian landrace Barke cross) for glasshouse trials as well as a more
extensive selection of reference lines including varieties such as Buloke, Vlamingh, and
Gairdner in subsequent years for appropriate benchmarking (in the glasshouse and field trials).
To achieve the aim concerning evaluating grain yield under abiotic stress a preliminary
screening had already demonstrated that “W1 has high levels of tolerance to drought” (Prof. C.
Li personal communication, 11th November 2015). And, a significant bulking up achieved in
December 2015 in South Perth harvested and, threshed and cleaned, by the author of the doubled
haploid (DH) from Hindmarsh/W1 population (HW1) followed by discussions concluded that
“HW1 will likely contain genes to aid survival in the cropping regions and offer improved yields
under abiotic stress threat scenarios.” (Dr. D. Diepeveen personal communication, 1st April
2016). A shotgun whole genome sequence of 120 of the DH lines (sequenced by WCGA, was
also provided).
Based on these discussions, a table was constructed concerning the best abiotic stress tolerance
traits specific to the environments and varieties in the study. It was intended that the diagnostic

125
plant responses could be validated based on the gene table to measure ‘plant health’ specific to
the HW1 population concerning grain yield and then applied for precision telemetry mapping
and analytics concerning environmental variation (including from year to year) big-data, IoT
devices, and real-time statistics (Table 7). Each measurement throughout this project was taken
and saved in the Murdoch University Microsoft OneDrive, provided through the PhD
candidacy, which could then be subsequently linked to Azure for data processing calculations
and down-stream heuristics concerning the project aims.
Table 7: The following traits were initially considered for the entire project concerning cereal grain yield-related traits: (i)
canopy temperature depression (CTD), (ii) chlorophyll content and stay green, (iii) stomatal conductance, (iv) root traits (length,
diameter, number). Furthermore, plant measurements including; (i) leaf and head-type, (ii) plant maturity, (iii) harvest-height,
(iv) canopy cover/leaf density, (v) 100-grain weight, (vi) seed-colour, (vii) straw strength and, (ix) arbuscular mycorrhizas were
also collected as required for determining ‘plant health index concerning HW1. After subsequent revisions and evaluations,
these traits were fine-tuned concerning the overall aims, and tabulated below. The selected traits were measured at selected
growth stages, as well as before and after prescribed (or non-prescribed) abiotic stress events in the case of fieldwork.
Additionally, some of these traits and measurements required additional data (taken, measured or logged) through the use of
IoT devices and sensors, drones, or calculated with other weather station data, and landscape features (e.g. slope, time of
sampling, cloud cover, light intensity, CO2, relative humidity, temperature), due to the additional variability that each trait
experiences independent of the small environmental fluctuations (microclimate affects).
Canopy temperature: (CTD): Thermal image of canopy
Chlorophyll content & Stay green: Photo of canopy and background light intensity
NDVI + RGB
At the onset of stress Plant maturity score (Zadoks) + plant height
Dry-matter weight, RGB photograph
Stomatal conductance:
Background relative humidity + temperature
Stomatal density (mm2)
Thermal image of the plant (stem, leaf, head) + canopy
Biomass and grain yield (at full plant
maturity)
Quadrat cuts dry-matter weight
Grain yield
Root biomass (glasshouse)
Seed colour / 100-grain weight Visual assessment
Number / volume calculation
Leaf &head type Visual assessment + RGB images (area of the leaf)
Harvest height (plant height glasshouse) At harvest (logged by harvester)
Straw strength Determined by NIR and Instron
Root traits (length, number, root hairs
and mycorrhiza)
Determined by washing, weighing, drying, measuring, staining and
counting

126
GLASSHOUSE BENCHMARKING AND DH EXPERIMENTS (2016, 2017, & 2018)
Glasshouse trials were used to benchmark reported drought and heat stress responses in a
controlled environment concerning grain yield and for then determining ‘plant health index’ of
the doubled haploid population. At DPIRD in South Perth in 2016, glasshouse preparation
involved installing custom-built watering mats and benches and the use of two different soils;
(i) a fine grained 4mm screened and visually assessed washed river sand from Western Australia
(crystalline quartz, feldspars, and aluminium silicate), and a 4 mm screened Pingelly pasture (a
sandy loam with high organic matter content) from UWA future farm (Figure 21 and 22 ).
Plant responses were induced by removing the plant's water supply for five days and
maintaining the temperature of the surrounding environment to >32 degrees at the first
noticeable onset of anthesis determined by daily visual inspections. Following the five days, the
treated plants were be placed in another glasshouse and the water content regulated to a
maximum daily amount of ~10% water holding capacity based on the (bulk density). This
ensured the plant received the minimum amount of water required to reach full maturity. Still,
Figure 21: Benchmarking method for glasshouse experiments (Hindmarsh, W1 Commander, and Tadmor), and the respective
treatments and soil types (brackets indicate the number of pots for each treatment); in 2016. The treatments (3 replicates)
applied to both soils included; (i) a control treatment, (ii) a limited nutrient treatment, and (iii) the heat x drought treatment.
Monitoring and treatment of all plants for disease, fungi, or pathogenic outbreak was be done twice weekly to ensure maximum
plant growth. Plants were also evaluated before, during and after the induction of the abiotic drought x heat stress event that
was subsequently used for phenotyping the entire DH population (based on Table 7). The nutrient-limited pots were included
as the controls for mycorrhizal colonisation impact on grain yield under treatment.

127
more importantly, the moisture of the soil continued to force drought responses within the
plants, for increased grain yield and plant health effects without reaching mortality (cell death).
After determining the maximum impact of abiotic drought x heat stress (for benchmarking lines
concerning Table 7) (Table 8), the experimental design was followed up by evaluating 120 lines
of the DH population (in 2017). The same methods were followed with slight amendments
Figure 22: (Top Left, Centre, Right) Calculated amounts of nutrient trace elements were initially applied to the soil based
on the surface area of the soil in the pots. The mass of soil was also standardised to eliminate the variation (water mass through
evaporation) during treatment. Plants received optimal amounts of water (through the bottom fed watering mats), as well as
nutrients (pre-determined based nitrogen and phosphorus concentration requirements) at the rate of 2 mg/Kg soil based on a
CSBP fertiliser analysis for non-growth-limiting cereal plant (barley and wheat) requirements (calculated per pot as standard)
for maximum yield potential. This method was previously described in (Maddern, 2016). However, considerable differences
in soil variability concerning microbial diversity and particle size distribution relating to bulk density meant that a secondary
evaluation was needed concerning the potential for boron toxicity (Mr. C. Watt, personal communication 3rd March 2017), to
get maximum potential grain yield concerning the barley (Bruand and Gilkes, 2002; Wong et al., 2015). (Bottom Left, Centre
Right) Implementing the blocked trial design already developed (Hill, 2019), growth in the glasshouses was monitored for
maturity and at the first sign of anthesis the first replicate block was treated in the constructed heat chamber (>32º C).
Following the treatment of each block the pots were placed back on the benches again, and allowed to rewater until the the
last signs of grain hardening were noticed across all treatments and controls, and then the biomass including grains harvested,
for analyses. As per the benchmarking experiments (loggers recorded applicable environmental data). The technical skills of
many of the staff at DPIRD are un-parralleled in their abilities when compared to many scientists, due to the development of
technical craftsmanship that cannot be taught and can take generations to master. Their skills require specific tools scientists
often not appreciated by scientists (Mr. E. West personal communication, 2th July 2012), for example knowledge about
temperature, light intensity and CO2(g) concentration sensors, which can log and be used to account for yield losses not related
to treatments. Five seeds per 15cm pot were vernalised, germinated, and then sown into soils respectively. The images in
these figures put a spot light on the invaluable services that humans contribute in the procurement of data used downstream
in applied A.I. Image(s) Credit: The Author.

128
concerning blocking the design into replicates and controls (3 and 2 respectively with additional
replicates of each DH line to account for treatment design), taking into account glasshouse
dimensions, bench locations, and including other commercial cultivars for determining
variation concerning yield (and based on discussions with the highly skilled technical staff
related to measuring field/glasshouse variability in genetics experiments >150 years
intergenerational experience) (Figure 22).
TECHNOLOGY DERIVED GLASSHOUSE AND FIELD DATA-VARIATION
DETECTION AND MEASUREMENT
Relationships between the grain yield data used in the formulation of plant health index (to
enable comparison between glasshouse data and field data) required the use of a range of
scientific instruments and devices to ensure that the quantifiable measurement of traits (Table
7) were kept consistent throughout the entire methodological process. By using the best
available or the next best thing; all data and samples collected in the glasshouse was similarly
mirrored in the field and kept as consistent as possible throughout the entire research period
(glasshouse and field trials). Initially, handheld smartphone-enabled or PC compatible devices
were utilised, along with environmental sensors, through compatible software. As the research
progressed, increasingly sophisticated imaging hardware, software and integration telematics
were used (Svatos and Trowbridge 2018). This constant upgrading meant that consistency
improvements through the continual re-evaluation of aims were required so that any potential
bias (independent of the genetic analyses as much as realistically possible) could be quantified
negotiated and explained in subsequent downstream analyses. This included negotiating access
to telematics data used in the UAV (uncrewed aerial vehicle) industry (Appendix 5 and 6).
Initially, the research focussed on imaging plants. RGB and visible light wavelength imaging
from 2016 to 2019 was done with either the; Pixel 3, or Nexus 6 (Google, California, USA), a
Samsung SM-J105 (Samsung Corporation, Seoul, Korea), the LeTV x800 Le1 Pro (LeEco
Corporation, Shenzhen, China) (smartphones); or a Nikon D600 DSLR (or variant), or
Panasonic 1080p (equivalent) digital video camera (Panasonic Corporation, Tokyo, Japan).
These devices were utilised both in the field and glasshouse, with consistent shooting angle (45º
to target) and the distance maintained. Stomatal images and mycorrhizal identification
(microscopic images) were taken with a 5 megapixel 3.5 inch LCD display magnifier digital

129
microscope (300x Zoom) with USB/AV output or on an AmScope 40X-2500X binocular lab
compound microscope (with 3D Mechanical Stage and LED). Thermal imagery was conducted
with either a; FLIR Tau thermal 640 (FLIR Corporation, Oregon, USA), or a Seek Thermal
(Standard (206:156) or Pro (320:280) resolution) micro USB, Android compatible (lens with
dongle) (Seek Thermal, California, USA). NDVI was done with the Agrowing multispectral
sensor (Agrowing, LeZion, Israel) mounted to a Sony DSLR (equivalent) camera (Sony
Corporation, Tokyo Japan) (Figure 23, 24, 25, 26, 27, 28, 29).
SAMPLE DATABASE STATISTICAL OUTPUTS CONCERNING PROJECT AIMS
The following glasshouse results tables and figures represent a snapshot of the database (lake).
Statistical analyses were performed using Genstat for Windows, release 18.1 (VSN
International Ltd., Hemel Hempstead, UK). Data were assessed for normality and expressed as
means ± standard error of the mean (SEM) (Table 8). Principle components analysis was used
to evaluate the interactions (Figure 25). In each instance where the data is shown, the
corresponding field data (raw data) was also collected. Some of the figures are presented as raw
data, the significant digits (are given) concerning abiotic stress treatment as it relates to grain
yield both in the glasshouse concerning treatment, and the rest of the data interpreted as they
referred to the broader aims concerning the creation of the database (data lake) for the thesis
aims.
Table 8: Specific to Treatment. Variety ANOVA (P values) for all the traits measured in the benchmarking experiment indicate
that the effects were all highly significant across all traits measured, concerning the abiotic stress (heat x drought) treatments.
Including for grain yield.
Biom
ass_
g_po
t
Gra
in_y
eild
_g_p
ot
Roo
t_H
arve
st_M
ass_
g
Sho
ot_h
arve
st_m
ass_
g
Ton
nes_
Ha
Ton
nes_
Ha_
1 T
onne
s_H
a
tota
l_R
oot_
Vol
ume_
cm3
tota
l_ro
ot_A
vgD
iam
_mm
tota
l_ro
ot_L
engt
h_cm
tota
l_ro
ot_S
urfA
rea_
cm2
Variety <.001 0.002 <.001 <.001 0.002 <.001 <.001 0.227 <.001 <.001
Treatment <.001 <.001 <.001 <.001 <.001 <.001 <.001 0.077 <.001 0.002
Soil_Type <.001 0.3 <.001 <.001 0.3 <.001 <.001 0.001 0.012 <.001
Variety.Treatment <.001 0.001 0.006 <.001 0.001 <.001 0.009 0.02 0.013 0.005
Variety.Soil_Type 0.121 0.221 0.412 0.076 0.221 0.121 0.685 0.85 0.515 0.489
Treatment.Soil_Type <.001 0.001 <.001 <.001 0.001 <.001 <.001 0.043 <.001 <.001
Variety.Treatment.Soil_Type 0.296 0.39 0.137 0.403 0.39 0.296 0.131 0.708 0.196 0.13

130
Figure 23: (Left) Magnified stomatal images taken of all adaxial surfaces (x3 reps) and the 1 mm scale bar inserted for all
varieties so the number of stomata counted by placing black dots (in Microsoft Paint) where stomata featured in the leaf
surface image (white stomata on bottom left image comparison). (Right) One of the most striking features of the wild Tibetan
(W1) variety, was the physiological difference it possessed concerning stomatal density. Compared to the three other
varieties (Hindmarsh, Commander, and Tadmor) the average stomatal density of wild Tibetan barley was 13 stomata per/mm
more than the grand total average, indicating a distinct physiological difference concerning the stomatal apparatus.
Figure 24: (Left) 2016 benchmarking thermal image phenotyping procedure (above line before below after treatment)
established relative temperature of the head stem and leaf (based on the sliding scale bar). Concerning the scale bar, the
SEEK software application and a hardware limitation does not allow for fixed range temperature measurements to be made.
Initially this was a challenge, because the phenotype (snips) colour that determines relative temperature could not be locked
in. The glasshouse temperature had to be carefully monitored with environmental sensors to ensure that as close to possible
conditions existed (before measuring) to enable comparison of before and after treatment concerning effect on grain yield.
(Right) In 2017 this technique was improved in the DH phenotyping by including known controls (left of images; a bucket
of ice cold water and a bucket of water @ STP, standard temp and pressure), enabled a ‘lock’ of the scale bar to be manually
established. Although the precision was still a challenge to control (±7 min, ±9 max), due to the constantly changing water
temperature, and the glasshouse conditions before during and after measurement. However, the total variance estimated
between the 2016 and 2017 glasshouse experiments was still less overall, due to the physical temperature minimum being
much further than plant temperature minimum. Switching to a Seek Thermal Pro with an additional resolution also increased
quality and sharpness of images. Image Credit: The Author (Appendix 4)

131
Figure 25: (Left) Converting RGB thermal image outputs to a principle components analysis (multivariate biplot) concerning
the 2016 glasshouse experiment. An R program was written and used to separate the thermal image colour components (red,
green, blue; based on a computer generated colour palette map and averaged (Calculation)), from the images collected in the
glasshouse, and then used determine the relationship that the various components had with Grain Yield and Biomass by Dean
Diepeveen and the author (R Core Team, 2017). Both analyses showed good sample separation (>75%). (Right) The Blue
component of the thermal image showed the strongest correlation to the Grain Yield and Biomass calculations (based on
image inputs).
Figure 26: The collection of mycorrhizal data (% colonisation) based on the variety and the portion of the pot (bottom and
top) sampled concerning heat x drought treatment; indicates that for all varieties in both the bottom and top of the pot
mycorrhizal colonisation decreased. The collection of complementary microbial data (including mycorrhizal) as previously
explored (Svatos 2011; Svatos 2012) suggests that the key to utilising such data is by identifying the management practices
that might either limit or enhance the functional capacity of soil microbial processes. For management practices that reduce
the potential for a soil microbial community to function an evaluation of a reduction in their use would need to be considered
from both a practical and economic perspective (due to the difficulty of measuring this phenomena in the field). Although it
is widely reported that there appears to be no perceived benefit to be gained concerning mycorrhizal colonization, it is an
important consideration nonetheless, due to the corresponding signalling functions that may protect the plants at vital stages
of development from abiotic stress, and the relationships that these functions may have with bacterial species through
horizontal gene transfer that might be alleviated in downstream gene-function phenotype datamining and machine learning.

132
FIELD TRIALS (2015, 2016, 2017)
The 2015 field trial included bulking up lines of the ~420 DH population, harvesting
traditionally by hand (at South Perth) with a sickle, followed by machine threshing and cleaning
the grain on the Pfeuffer SNL3 seed cleaning instrument (PFEUFFER GMBH, Kitzingen,
Germany). Colour trait measurement was carried out (Long et al., 2018), followed by pickling
(treating for fungi), re-packing into seed canisters and re-sowing in the field again (Figure 27).
Field trial design in each season was conducted using accession numbers generated by
Microsoft Excel for each DH line for cone seeding in 5R*3/5 (plot type) in serpentine, into
sections with 32 plots per section including buffers (by DPIRD staff) on a custom-built cone
seeder setup and engineered specifically for these sorts of trials (Figure 27). The DH population
and parental line data for all field trials (2015, 2016, and 2017) used this exact setup and design
and formed the basis for all phenotype database structure.
Figure 27: Phenotyping the Australian-Tibetan DH population (HW1) for selecting the best yield performing lines included
evaluating the major agronomic traits (yield and biomass) concerning abiotic stress response for the entire ~420 DH line
population (HW1) in the field at the DPIRD research stations including South Perth, Wongan Hills, Katanning, and
Merredin in Western Australia (2015-2018). The grain yield for the trials in Wongan Hills (above in 2016) and Katanning
(2017 and 2018) for the Australian-Tibetan (HW1) doubled haploid DH population was “about average”; based on the
comparison to other field trials and state-wide grain yield data for those season, and based on 40 years of personal
experience collecting data from DPIRD trials (Mr. D. Farliegh personal communication 3rd March 2016 image (right) at
the Wongan Hills Research Station at the helm of the controls). Dr. Diepeveen (centre) giving the all-clear. Image Credit:
The Author.

133
The following year, in the 2017 trial, a drone experiment was used to gather phenotypic trait
information at the whole plot level. The purpose and scope of these methods were published
(Svatos and Trowbridge, 2018) (Appendix 5 and 6). Briefly, with a multispectral, thermal and
RGB payloads attached to the UAV drone, flights were made over the trials at the DPIRD
Katanning field site at late-flowering growth stage (Sept 2017), both early in the morning and
mid-afternoon. These drone flights captured images at high-altitude (90m above trial)
containing the whole-trial in one picture as well as a low-level (20m above plot) along each of
the trial sections for in-depth within plot measurements. As with the 2016 field trial, equivalent
measurement phenotype measurements were collected on both the 2016 and 2017 trials,
including plant-maturity scores to adjust water-stress to heat and drought stress. Analysis of the
other trials was also made (a ryegrass trial) including soil observations (i.e. in the swathes), for
eliminating the soil component associated with the RGB imagery (Figure 28 and 29).
Figure 28: The critical component to getting good imagery for phenotyping is to establish a repeatable research design. The
high-resolution imagery data taken in this trial were initially georeferenced by using a high precision GPS to build reference
points for matching both on-ground activities to drone activities. These reference points can be used to create raster images or
georeferenced *.tiff files in various software packages to overlay imagery as well as locate the position of the low-level imagery
(within-plot) for correlations within the plot. The imagery taken by multispectral, thermal and RGB payloads was likely a
world-first for a large scale 420 DH barley population. The data captured included both high-altitude and lower-altitude imagery
to compare the resolution of the data collected and evaluate precision/accuracy for downstream trait and plant phenotype
screening/selection. The drone was flown early-morning (first light minimum daily temp.) and mid-afternoon (maximum daily
temp.) to derive differences in thermal properties of the crop canopy which are often affected by combined heat and water
environmental stress. The red quad ducted 4Scight P3 in the image upper right can be seen making a pass equipped with the
Agrowing multispectral sensor, while the support officers, pilots, and scientists (left) observe the flight and make vital flight
adjustments in real-time.

134
Figure 29: (Above blue line); (top left) Prior to harvest in 2017 in Katanning and during the maturing stage (before grain fill)
swathes were cut in the field between the rows to account for the excessive ryegrass growth. When making final grain yield
measurements, it may be overlooked that ryegrass affects the grain yield, however weed management is a major consideration
when designing field trials (Dr. D. Diepeveen personal communication, 2nd January 2020). (Top right) To keep the measurement
of thermal images consistent with the methods used throughout the entire research and experimental design, physically known
water temperatures (ice water -3ºC, and room temperature 21ºC; verified with a hand held thermometer prior to take off after
first light ~5am) were used as well as white and black (plastic reflecting sheeting), to allow for corrected (backscattered light to
be quantified) with the light intensity measurement sensor measurements (Google Nexus). This control setup was a critical step
for correlation to glasshouse data, as was the addition of temperature relative humidity and CO2 sensors placed on the white
sheeting. (Below blue line left quadrant); (grey scale images) The three images are of the drone capturing the data specifically
as it related to the quantified properties of the two water vessels (ice water and water at room temperature), and the sheet, at first
light (~5am). (Red images), At peak ambient temperature (~1pm) the three images this time with the temperature of the same
bucket at ambient water temperature (37ºC) and room temperature (23ºC) for comparison, as well as the sheet (74ºC). (Below
blue line right quadrant) Images show the same two flights as seen through the Agrowing multispectral payload (morning
upper, afternoon lower). Additional calibration plate is provided as it relates to the images produced by the lens, that cannot
detect temperature. The effect of shadowing appears to be evident in the morning flight, whereas the individual plots are harder
to distinguish visually for the afternoon flights. For both payloads variation between morning and afternoon is evident, as it
relates to different take off and recording times, however within each flight there are variations in image quality that the video
file (particularly for the thermal payload) demonstrates as it relates to the stability of the sensor detection plate, and the video
RF digital analogue real-time conversion GPU output, concerning wind speed and other physical factors concerning the flight
(altitude and vibration amongst others). The multispectral camera was not used to capture video and so the images are much
more stable, however the information specific to the barley population requires geotagging and raster *.tiff layering for GPS
specific plot information of both payloads to maximise complex trait data capture concerning the genetics of the system database
and pipeline. Notwithstanding any significant deviation in actual crop canopy temperature based on plot location, the data images
and real-time video are a first for a large DH population to science.

135
The specifics of drone technologies utilised in this experimental design (including an in-depth
analysis of the payloads) concerning their use and capability are explored in appendices
(Appendix 5 and 6). The traits assessed in this trial included (multispectral for NDVI, RGB,
and thermal imaging). Figure 29, shows that concerning UAV based the imagery GPS
coordinates are the critical piece of information required to create not only the raster output files
but also to develop models, due to the geotagging of telemetry data that is embedded in the
onboard computer (the black box). Concerning the quality of this telemetry data, it is clear that
the images of the crops need additional downstream analysis, which would be required to
account for any potential bias due to the physical limitation of the payload, concerning the
accuracy of the model. For example to look for patterns between early-morning/mid-afternoon,
thermal properties of the crop canopy based on the drought index would require additional
tolerances to be factored in concerning onboard computing limits (GPU:CPU limits) that factor
field of view of the lens (32° × 26°) into the precision of the gyroscope concerning
photogrammetric modelling of the ground and canopy level environmental sensors based on
sequentially calculatable drone GPS variability (in real-time).
EVALUATION OF TECHNOLOGIES USED TO COLLECT PLANT SPECIFIC
TRAITS CONCERNING ABIOTIC STRESS TREATMENTS AS IT RELATED TO
GRAIN YIELD
Figure 30: The combined total output of all ~420 DH lines of HW1 (Hindmarsh (circled red) x Tibetan barley) from the
Wongan Hills trials concerning grain yield was “a little bit below average”. Variation between varieties can be seen in the
grain yield outputs which range from 0-4Tonnes/Ha which should be expected in large populations of all DH lines.

136
The creation of the databases (phenotype, genotype and environmental data), completed the
project aims. The information required for a real-time assessment concerning grain yield (as it
relates to abiotic stress) from the drone images and sensor data was completed in the four years
as targeted (Figure 30). Concerning minimising variation over multiple years of grain yield data
from numerous locations, the selection of machine learning and data modelling would offer
additional corrections. Plant growth based on real-time plant growth measurements was
successfully visualised through the development of databases. Large grain yield variation was
observed under simulated and real-time abiotic stress scenarios (Table 8; Figure 25, 29, 30).
DISCUSSION
The use of experimental populations to measure the potential for use in environments without
known adaptation strategies may create unnecessary risk, due to the significant amount of trait
expression that must be measured to eliminate bias surrounding extrapolation potential,
independent of the physical limitations of the technologies themselves (which also contribute
bias to stress model accuracies). Additionally, it must be re-iterated that the calculation of plant-
health index relies significantly (when using drones for real-time assessment) on drone stability
and flight parameters (environmental data), concerning payloads and GPS telemetry, as well as
background crop level data (in the canopy). Synchronising the internal clock of a drone (digital
quantitative) to that of a crop (analogue qualitative) via circadian molecular pathways and
Boolean gate, prime, mathematical algorithms might shed light about these bio-physical
patterns. However, this complicated philosophy does not need reiterating (Appendix 2 and 5);
the data is highly variable. The grain yield (although average) in one growing season, can still
shed light on the genetics of grain yield and may be used for artificial intelligence machine
learning algorithm creation concerning the prediction potential for subsequent years. Although
the field trials and glasshouse trials took place over three years considerable variation between
years is an unavoidable part of crop research. More importantly that climate is changing is not
the question this project sought to answer. In fact that between year variation affected the yield
validates the method used.
On the use of haploidy and high-resolution technologies to rapidly breed new varieties (clones)
with an A.I. method, the ethics of such a practice would only favour the crops being grown (the
model species) that farmers are targeting. Always the case in agricultural systems, but this

137
Tibetan cross is different (Figure 22, 29, and 30). The extent to which a highly adaptable and
wild new variety may rapidly increase economic benefit to the people farming it needs careful
consideration. Farmers want to increase production levels, but access to this germplasm has
been taken redacted. This view is not currently shared by the Western Australian Government.
A new type of approach is thus critical for validating any further research on this population.
Please see the authors note in the acknowledgements section for further information or refer to
Appendix 2.

138

139
PROJECT 2: A SCALEABLE, PRIVATE LTE/4G, BOOLEAN GPU NETWORKING
STACK FOR AUTOMATED, REMOTE, IOT DECISION MAKING
EXECUTIVE SUMMARY
To facilitate the efficient capture, storage and implementation of data specific edge-based
IoT/M2M processing, for digital twin construction and for artificial intelligence experimental
design including those utilising WiFi and Bluetooth (including other unlicensed and licensed
frequencies) a satellite-connected base station experiment was established (Figure 31). This is
a significant variation to the classic approach of the Agricultural workflow system; in particular,
this approach differs through its unique use of Microsoft Windows IoT core, FLIR automation
technologies, and also through the use of lower power consumption technologies (NB-IoT;
MQTT). The interactive nature of the LTE telemetry functions and broadband satellite
connections that enable the real-time capture of data (32 Mb/Sec down, 4.9 Mb/Sec up, and 588
milli-second ping rate) generated from weather stations for example to validate the accuracy of
the sensors used, indicates the system’s suitability for medium to low data throughput (in areas
with limited connectivity) to balance the load concerning data traffic, switching IP
configurations and API latency. However, questions remain about data security.
AIMS
1. Generate a workflow for the statistical determination of 4G/LTE network throughput.
2. Create necessary instances and pipeline to generate real-time CPU:GPU emulation data
transfers over LTE.
3. Assemble operating system specific edge-based devices, including sensors.
4. Deploy and capture data to evaluate the efficiency and determine basic runtime
heuristics functionality.

140
METHODS AND RESULTS
NETWORK WORKFLOW TOPOLOGY AND METHODOLOGY
To establish a new operating workflow that could handle the significant data throughput
required to make a heuristic decision specific to a remotely hosted (Boolean) data server a
classical network model was taken and adapted (IBM, 1989; Stine, 1990). This traditional
TCP/IP M2M approach ignores some of the issues associated with high-precision capture of
images related to ‘server latency and network switching speeds that are usually in flux during
the upload stage for a cloud computing application (Mr. J. Withers personal communication,
Figure 31: The Pivotel ‘Ecosphere’ offers a distributed network of Nokia low powered micro LTE eNodeB base stations
(BTS) to enable better decision making; serviced and wholey managed through a network of parts and service distributers
from the Pivotel offices on the Gold Coast Queensland, Sydney New South Wales (on the East Coast of Australia), or from
the Perth office in Western Australia. The base stations are connected through via microwave links to a dedicated hub (EPC)
which itself is connected to a high capacity internet connection (Fibre, Broadband etc). These base stations are a lower
powered version compared to typical macro size mobile base station and typically produce two to five Watts of output power.
The size enables minimum installation clearance also allows installation in areas of limited space, e.g. crowded sites, utility
rooms, or inside cabinets if required. Micro base stations can also be installed on guyed mast sites of varying heights. As the
Flexi Zone Micro BTS is deployable by a single person and consumes little power, installation and running costs are
significantly reduced without compromising the quality of the delivery capacity. This spatial/remote sensing data workflow,
utilising connected drones, stack, cloud connections, and satellite servers, spatial modelling software and integrated IDE and
SDK connection (I/O connections). With this LTE/5G technology, a preloaded set of commands and configuration files can
sit online in a server repository and be constantly accessed by any M2M or IoT edge based processor (including FPGA and
SoC with additional capability) to process algorithmic equations and work flows, or machine learning interfaces virtualised;
including for sensors, drones and UAV’s, for real time decision making based on prevailing environmental conditions or
prescription maps (GPU processing). This is the Pivotel telecommunications solution although there are many other options
and customisations available depending on the size of operations and budget. Image Source: The Author via Pivotel.

141
14th November 2018). The timely process of spatial analysis and modelling and the non-
integrative approach that may render many of the studies non-beneficial due to time constraints
are of significant concern in this model. However, the newer 64-bit non-legacy frameworks can
allow emulation over the syswow (Microsoft file system), and that includes 64-bit pythonic
support in virtualised containers. The standard model can still be successfully deployed
(although there are significant issues) (Figure 31).
To facilitate this model and to make an advance at the requirements concerning the next
generation of base stations and power switching network protocols, an agricultural-based station
experiment was established both in the laboratory and in the field on Western Australian
Government land (Mt. Dale field site development, for a Katanning deployment) as part of the
‘Nokia Intros Starter Packs’ and FutureX (Mr. K. Hemmerijckx, personal communication, 14th
February 2019). In both instances, the network speeds were tested over a standard backhaul
(using a variety of SIM cards provided by the Australian network operators), and a best-case
worst-case scenario was used to determine optimal logistics for network traffic (Figure 32).
Additionally, considerations were made about the application specifics of the site being rural
Figure 32: (Left) The Vodaphone mobile network provides a .NET API framework that enables network availability and
approximations to be gaged concerning the network speeds, and also gives additional (patched) information concerning
planned improvements (for example where LTE/5G might be rolled out) or where new towers might be installed to provide
additional network coverage in specific bandwidths (e.g. 3G/4G/LTE 800, 850, 900, 1800, 2100, 2400 MHz or licensed 5G
bandwidths for instance). This particular industry and scientific community is very competitive, and as such the current
bidding for the 5G services has closed (as of 2019). (Right) Using the custom software from the general methods section (a
standard Samsung smartphone with root super user installed (#)) can be used to install non officially supported applications
from the Google play store on a Samsung devices including the G-Net Track Lite. This is partially a result of the
customisations required by network providers wishing to sell their own devices with custom software, but also IDE feature
of .NET assemblies. Snapdragon microprocessor architectures support this customisation and in this instance G-Net Track
Lite was installed for use to diagnose additional network configurations and thus confirm tower placement or test network
strength, latency and data rates. Image Source: The author courtesy of Pivotel.

142
and requiring significant upload data speeds for throughput processing (edge heuristics and
digital twins).
Following this, a custom network LTE trailer a Nokia base station (provided through the
FutureX program; a collaboration between Bell technologies and Nokia) was deployed, and the
capability tested, through the use of both the Telstra and the Optus backhaul network
connections. A similar functional method has already been proposed (Murray, 2011); however,
not for remote deployments, including satellite connections or with a focus on automation.
Accommodations had to be made logistically onsite concerning; the 11m retractable tower,
solar panels and battery (that draws about 70-80 Watts), 3G/4G local LTE base-station and
server (for switching/security), and options for onsite data storage/processing (Figure 33).
Once online and the connection secured (at the Sydney switch) speed tests were regularly
carried out (weekly), and logged and the result of the speed tests used to establish a base level
average for which an estimated processing calculation could then be factored into edge-
processing, telemetry, machine learning, and A.I. data requirements; and for experimental
design concerning agricultural abiotic stress (Figure 34).
Figure 33: (Left) The deployment phase of a transportable 4G/LTE base station with supporting battery power provided by
solar panels, can be deployed in under 15 minutes by a single operator. The technician must ensure sufficient clearance when
deploying the 11m mast, and that the panels are optimally positioned. Here the technician secures the Nokia base station
(BST) to the mast before it is raised. This flexi zone micro BST consumes little power, as such the running costs are
significantly reduced without compromising the quality of overall delivery capacity. The BST uses passive cooling and has
no acoustic noise output. A typical radio site such as this, requires a limited set of equipment including, (i) a BST, (ii) antenna,
(iii) a processor (for managing the remote server connections), (iv) backhaul connection, (v) LAN, fibre optic, LTE modem
etc., (vi) compatible network sim card and (vii) handsets, gadgets, modems, routers etc. All site configurations are finalised
after the site has been confirmed and the radio design has been established as being able to provide an acceptable coverage
level. This tower was deployed at the DPIRD Mt Dale field site and was used to test the connectivity of the system with both
Optus and Telstra backhaul network connections. (Right) The storage in this unit can house multiple processors if required
for edge processing, and now includes satellite connection. Image Source: The author.

143
DISCUSSION
IOT SMART DEVICE TECHNOLOGY FOR CLOUD-AUTOMATION
To address the workflow concerning heuristics and edge-based data programming, several
Amazon EC2 (Amazon Corporation, California, USA) instances were created, as it relates to
Svatos, (2018). The project had a specific agricultural focus for which an environmental
instrument cluster was constructed which included a Raspberry Pi 3B+ (Raspberry Pi
Foundation, London, U.K.), connected to automation enabled FLIR thermal camera (Power
over Ethernet) (FLIR Corporation, Oregon, USA). An embedded .NET API application SDK
(including for Windows, and Android/Linux) that builds on the previous research outcomes
concerning Svatos, (2018), Svatos and Abbott, (2019), and Svatos and Trowbridge, (2019); was
also constructed including using high precision sensors; including relative humidity and
temperature.
Figure 34: Network signal strength and data speeds for the Telstra (shown in this figure) and Optus backhaul were tested.
Individual results varied in relation to backhaul server availability at the network switching side of the system. Although the
Optus network outperformed Telstra and achieved regular speeds in excess of 300 MBps (megabits per second) through
another 4G/LTE band; the stability during peak was significantly lower than for Telstra during peak. This indicates that
although Optus can achieve better speeds than Telstra the peak data requirement speeds for machine learning and edge
processing need to have specific time allocations built into their statistical algorithms, so that the processor can access the
internet and cloud server to download absolute minimum amount of critical information required at peak times. Whether that
is by means of throttling at the switch, or rerouting connections to optimise the diagnostics workflow and minimise power
loss during peak times. Image Source: The Author Courtesy of Pivotel
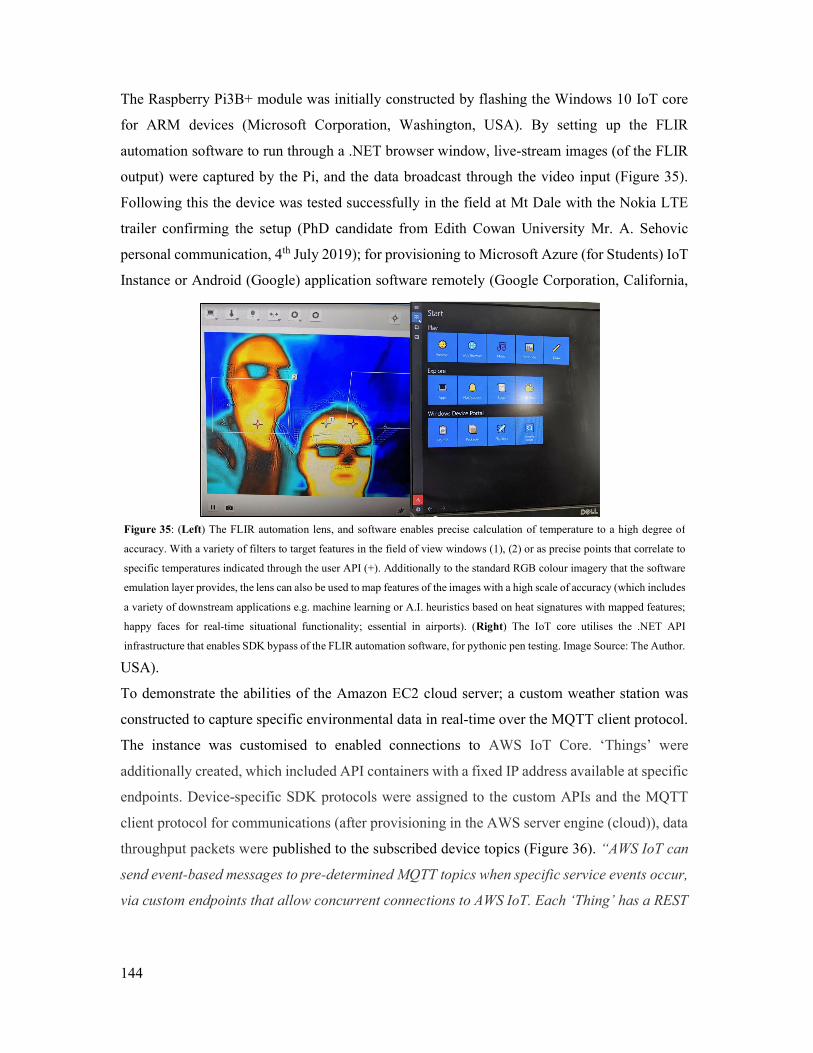
144
The Raspberry Pi3B+ module was initially constructed by flashing the Windows 10 IoT core
for ARM devices (Microsoft Corporation, Washington, USA). By setting up the FLIR
automation software to run through a .NET browser window, live-stream images (of the FLIR
output) were captured by the Pi, and the data broadcast through the video input (Figure 35).
Following this the device was tested successfully in the field at Mt Dale with the Nokia LTE
trailer confirming the setup (PhD candidate from Edith Cowan University Mr. A. Sehovic
personal communication, 4th July 2019); for provisioning to Microsoft Azure (for Students) IoT
Instance or Android (Google) application software remotely (Google Corporation, California,
USA).
To demonstrate the abilities of the Amazon EC2 cloud server; a custom weather station was
constructed to capture specific environmental data in real-time over the MQTT client protocol.
The instance was customised to enabled connections to AWS IoT Core. ‘Things’ were
additionally created, which included API containers with a fixed IP address available at specific
endpoints. Device-specific SDK protocols were assigned to the custom APIs and the MQTT
client protocol for communications (after provisioning in the AWS server engine (cloud)), data
throughput packets were published to the subscribed device topics (Figure 36). “AWS IoT can
send event-based messages to pre-determined MQTT topics when specific service events occur,
via custom endpoints that allow concurrent connections to AWS IoT. Each ‘Thing’ has a REST
Figure 35: (Left) The FLIR automation lens, and software enables precise calculation of temperature to a high degree of
accuracy. With a variety of filters to target features in the field of view windows (1), (2) or as precise points that correlate to
specific temperatures indicated through the user API (+). Additionally to the standard RGB colour imagery that the software
emulation layer provides, the lens can also be used to map features of the images with a high scale of accuracy (which includes
a variety of downstream applications e.g. machine learning or A.I. heuristics based on heat signatures with mapped features;
happy faces for real-time situational functionality; essential in airports). (Right) The IoT core utilises the .NET API
infrastructure that enables SDK bypass of the FLIR automation software, for pythonic pen testing. Image Source: The Author.

145
API available at this endpoint (a critical property to insert when using an MQTT client or the
AWS IoT Device SDK),” (Mr. A Sehovic personal communication, 7th September 2020).
CONCERNING THE SECURITY OF IOT AND REMOTE 5G AI HEURISTICS
NB-IoT (Narrow-band IoT) is a low-power wide-area technology that uses a subset of the
4G/LTE standard. Compared to LORAWAN and SIGFOX which are limited to 140 or 280
messages of 14 bytes per day (and are less secure) the NB-IoT can handle a much broader array
of data sources and standards. However, concerning the MQTT protocol as it relates to security,
there are significant industry concerns that provisioned (ready to use) data packets can be
‘sniffed’ by 3rd party APIs and other devices. This is a concern because how the data is used
downstream if there are multiple copies of the same data set, the emulation layers do not have
the built-in capability to know the difference alone based on each time stamp. Even with a
pythonic daemon, running a batch emulation to check if the script is a real MQTT packet, there
is no verification process to tell the difference between a repeat sequence, or multiple sequences
of the same dataset; which an actor might use to overload the system or upload false datasets to
create connection errors in downstream machine learning pipelines (IBM, 1989; Stahl and
Wright, 2018). The Nokia base station and provisioning software were independently switched
Figure 36: (Upper left) The variation between the upper and temperature sensors in ºC for a 10-day sampling period. (Bottom
left) The relationship between relative humidity and temperature for a 24-hour period. (Right) the environmental sensor system
shortly after installation. Data is sent as required concerning the solar power charging required to power the device. The number
of sensors are customisable connected through the MODBUS of the RS-485 NB-IoT (auxiliary) router (Bolt Corporation,
Queensland, Australia). (Right) With the station setup using a preconfigured policy and preconfigured certificates – users are
able to seamlessly collect sensors data at the AWS IoT by publishing messages using MQTT topic/s to their “Things”. Here,
Mr. N. Hart oversees the completed installation of the IoT weather station. Image Source: The Author.

146
at the remote server in Sydney; additional testing could not determine whether in fact if this was
a trend, however the recent addition of Broadband Satellite to the LTE with demonstrated
speeds that would enable enough throughput for GPU rendering, to facilitate satellite data
derived security monitoring in real-time (Mr. N. Hart personal communication, 16th July 2020).
Possibly with Boolean hexadecimal based Hamiltonian manifold based on the 64-bit AARCH
support of the ARM architecture emulation layer, which is not yet demonstrated by either Apple
or Microsoft. However, Google, e.g. (Arute et al., 2019) and probably Huawei are likely
candidates to achieve success implementing as such; in their respective domestic and
international 5G markets’ and industrial 5G especially with newer real-time sub 6nm chipsets
(the current limit).
MANUSCRIPT 3: RECOMMENDATION AND CONCLUSION
Research groups trying to standardise this industry like the Australian Computing Association
(ACS) in relation to data-science should go back to the original Bell Labs research handbook
and re-evaluate their goals concerning the inherent bias in embedded systems (the beta language
and model) before suggesting regulation for any scientific field particularly where genetic and
phenomics data plans are being offloaded into government thinktanks, with a particular bent on
“ethical A.I.”. Not only does this notion increase the probability of innovation derailment, but
creates unfair disadvantages for non-compliant devices, which may be more efficient and better
overall solutions. More importantly, these sorts of regulation are known to stifle the brightest
young computer scientists (through the author’s own personal experience in Australia).

147
MANUSCRIPT 4: BACKGROUND SCOPE AND DECLARATIONS
This results manuscript represents the final results manuscript output of the thesis; which was
required to fulfil the aims, especially concerning remotely sensed data predictions (Manuscript
3 declaration). Without this collaboration a complete dissertation wouldn’t have been possible.
The research in this manuscript was the result of a competitive selection process initiated by
Edith Cowan University’s iPREP placement team who selected individual students based their
abilities and suitability in business and industry. The collaborative internship that resulted from
this competitive selection process provided the opportunity to write up and submit the following
manuscript to Soil Science Society of America Journal (SSSA). As such, some of the IP
developed is confidential and has been withheld in this manuscript, including (names,
addresses, GPS coordinates, certificates and hexadecimal hash keys) for privacy and security
reasons. Participation in this project enabled the generation of the automated pipeline
concerning statistical data modelling and machine learning.
By creating an automated instance and through mathematical calculus (Jupyter console, python,
data-mining, and R statistical programming) and (by the author via the set-up of an embedded
machine runtime environment), geophysical predictions based on remotely sensed data were
established. This provided an essential link for AI digital twin assessments (thesis aims). The
outcomes of this project and manuscript showcase action based research. And demonstrates the
importance of industry funded academic collaboration in the development of applied A.I., for
use by the building and contruction industry (in the Mediterranean climate) to answer specific
questions about the accuracy of equations used in engineering calculations. For the benefit of
people building new homes.

148
149
HEURISTICS ENHANCED SAAS PLATFORM: REMOTE GEOSPATIAL MACHINE
LEARNING OF SOIL PROFILES FROM AN ANCIENT MEDITERRANEAN
ENVIRONMENT
K. B.W. Svatos1, 2, A. Recaldes3, Z. Ahmed5, T. Young3, 4 1 Murdoch University, 2 Karl Corporation, 3 Curtin University of Technology, 4 uDREW
ABSTRACT
Raw soil core physical data used in machine learning algorithms with corresponding spatial
remotely sensed data is an emerging science. Using data derived from soil core samples
previously collected in UTM Zone 50 (Western Australia). Atterberg limits, and remotely
sensed data to develop models that predict ground movement (GM), this is the first approach
for Australian soils and a world-first for soils older than 200 million years. The model developed
reliably predicted GM with 91.1% accuracy. The error obtained from the prediction is within
acceptable limits currently used by engineers in calculations concerning soil classification for
engineering purposes. Concerning the remotely sensed data analyzed, and accuracy of Atterberg
limits method might be improved if additional information on soil structure (layering and
horizon) or other variables (seasonal data) can be built into this model. This model can be used
to save on construction material costs, reduce the potential for human error associated with data
collection and sample manipulation, but also fast-track (by up to six weeks based on current
wait times) building approvals while ensuring compliance to the relevant legislation. This
platform also reduces the environmental impacts of invasive drilling techniques. A new
requirement within sustainable building practices, and associated guidelines commonly used by
soil scientists in Australia and America.
INTRODUCTION
The surface geology and geomorphology of soils that habit the Swan Coastal Plain in Western
Australia are ancient, highly weathered, and diverse The parent material, which includes the
Darling Range dates to at least 2600 million years in age, which makes the soil physical and
geological landscape of these areas, broadly framework silicate-based, iron-rich sands, that
gradually increase to a more calcareous mixture near the wave action-affected coastline
(McArthur, 2004). Modelling of geological age within this geographical location is therefore a

150
broad range concerning soil era. And has considerable limitations (physical and data related),
which do not bode well for downstream applications, for example, if mined data sources
(Armstrong et al., 2007) are considered for standard downstream use in the highly regulated
building and construction industry. Currently, the soil classification system broadly used to
determine site suitability in the building and construction industry is ground movement (GM),
which is broadly based on classical soil sampling techniques and the research, (McBride 2002)
as it relates to the physical calculation of Atterberg limits (Table 9).
Table 9: Typical ground movement (GM) values between 0 and >75 (cm) used to help determine soil classification from; A,
mostly sand and rock sites, with little or no GM expected. S, slightly reactive clay sites. Only slight GM from moisture changes
expected. M, moderately reactive clay or silt sites which can experience moderate GM from moisture changes. H, highly
reactive clay sites. Can experience high GM from moisture changes. E, extremely reactive sites. Can experience extreme GM
from moisture changes. P, problem site. This can include soft soils, such as soft clay or silt, varying depths of fill, loose sands,
landslips, mine subsidence, collapsing soils, soils subject to erosion, reactive sites subject to abnormal moisture conditions, or
sites which cannot be classified otherwise.
Concerning the calculation of GM used in the building and construction industry (for
calculations and legislation purposes (McBride, 2002), several mixed-use models have been
presented but with little or no clear focus on the industry requirements concerning non-invasive
drilling approaches, or standardization as companies look to move data to the cloud to benefit
from opportunities related to building sustainability. More recent research has provided insights
and potential database metadata clusters (and metrics) for correlations, e.g. (Sutherland et al.,
2014; Dastbaz et al., 2018; Qu et al., 2018), but also have fallen short in relation to industry
standards.
The International Soil Reference and Information Centre (ISRIC) SoilGrids (a java-based cloud
*.html console API) provides predictions for standard numeric soil properties (organic carbon,
bulk density, Cation Exchange Capacity (CEC), pH, soil texture fractions and coarse fragments)
at seven standard depths (0, 5, 15, 30, 60, 100, and 200 cm). Based on the American soil
TYPICAL GROUND MOVEMENT VALUES USED TO CLASSIFY SOIL.
GROUND
MOVEMENT (cm)
SOIL CLASSIFICATION
0 A
1-20 S
20-40 M
40-60 H1
60-75 H2
75 > E
151
classification system (taking into account that the majority of American soils are <200 million
years old), averages for depth intervals are derived by taking a weighted average of the
predictions using numerical integration of the trapezoidal rule (Hengl et al., 2017). This
algorithm then provides a generalized surface and subsurface prediction of the aforementioned
soil properties based on current geological era correlation data (Hengl et al., 2017). However,
where the classification of ancient soils skews correlation outside allowable model tolerances,
many or all data points have to be omitted to populate the algorithm map (that user’s access).
This omission may also partly due to areas incorrectly reflecting significant differences in era
and age between the Australian and American classification systems that does not account for
occurrences of soils >200 million years in geological time (McArthur, 2004). An International
Soil Reference and Information Centre (ISRIC) spokesperson recently said, “ISRIC is not
working on the prediction of soil classes at the global scale. The number of profiles with
assessed classification in each of the three systems is not very large; at this moment, it is not
yet possible to substantially improve on the class prediction.” And yet, the entire global
reference dataset (GPS grid points) are kept on the map grid for use. This non-standardized
method (for prediction at the global scale) is also not limited to soil prediction models either.
Concerning vector-based algorithms for statistical applications (including for soil), or other
quantitative modelling methods including those utilizing machine learning, biases (considering
predictive significance) appear to be underreported in the scientific literature yet are
increasingly used to explain significance of the methods, e.g., (Louca et al., 2018).
Data-driven machine learning techniques have increasingly been employed for modelling and
prediction of the composition and rates of sedimentation (e.g. in sedimentary basins). As such,
the existing mathematical and machine learning models for forecasting river sediment
deposition is oft driven by non-remotely sensed data without the required complementary
ground-truthing for calculating tolerances or absolute significance, e.g., (Qu et al., 2018). This
soil moisture investigation utilizes a machine learning approach based on experimental data and
Landsat5-thematic mapper (TM) images, specific for, “the Mega-City Beijing.” Qu et al.,
(2018) aims to demonstrate that remote sensing and unsupervised machine learning techniques
coupled with an appropriate validation metric can be employed to quickly forecast regions that
are subject to future river sediment deposition environments. “The characteristics of soil
moisture content (SMC) … are analyzed for the design and construction of sponge cities…. It
can be concluded that the support vector classifier (SVC) method trained with remote sensing

152
and grayscale data can achieve the highest accuracy (76.69%).” However, without the support
vector classifier, it is a fair assumption that the predictive accuracy of such a model would be
significantly less biased concerning predictive significance, but also considerably less accurate
too (Sheffield et al., 2012; Huang et al., 2019; Awan et al., 2021).
But, to what extent do computer libraries and available statistical visualization, and
computational hardware setups allow for predictions (with or without ground-truthing of
algorithmically extrapolated data) independently of ‘accuracy’ concerning applied A.I. used in
soil analyses? The Python3 geospatial data abstraction library (GDAL) may be used for
converting satellite image *.tiff files to *.csv files and R (computer language) is employed for
unsupervised learning algorithms including those utilized by A.I. surrently. Increasingly the R
libraries can optimize numbers of clusters for pairwise plotting of feature bands and cluster
validation, respectively (Karmakar et al., 2019; R Core Team 2021). However, where vast
distances need classification for soil physical and chemical properties via index correction or
vector algorithms; these bigdata clusters create significant processing bottlenecks (compared to
genetic data clustering, which also employ this type of approach). These types of models utilize
substantial graphical processing unit (GPU) resources, and thus are inefficient or not Turing
complete. See Fong et al., (2018), Keight et al., (2019), and Reynolds et al., (2019).
AIMS
1.) To characterize the major landforms, surface features and physical specifications of a
standardized set of core sample logs (based on a laboratory database used to calculate
GM); specific to Western Australia’s ancient and unique soils including those along
Swan Coastal Plain.
2.) To validate the formulated equations and indices using complementary statistical
modelling and machine learning methods.
3.) Validate GM soil equation(s) using existing remote sensing databases and software, to
correlate/extrapolate GM for areas without laboratory data in the data polygon.
Simulate lack of access to the site. Minimize future site destruction.
4.) To embed the kernel into cloud-based container for highspeed computation and
software as a service (SaaS) API access.

153
MATERIALS AND METHODS
VALIDATION OF THE LABORATORY BASED GEOTECHNICAL DATA
Ground movement (GM) values (determined from the accurate conversion of physical
laboratory measurements based on Atterberg limits), using the industry-standard described in
(McBride 2002) were first completed on 5000 core samples collected from Western Australia’s
Swan Coastal Plane and surrounds (Table 9). The raw results data were then uploaded to an
online database AWS S3 bucket (Amazon Web Services, Washington, USA)). The entire
dataset of laboratory samples stored in the AWS bucket consisted of 3000 datasets that were
formatted from *.pdf format into *.xlsx and then *.csv. These datasets were also cross-
referenced by suburb and general location to remove inconsistent GPS locations from their
physical addresses and plotted over the Western Australian lithology map (Figure 37).
The laboratory database GM *.csv files were then deconstructed to look for relationships
between the sample observations (based on the theoretical algorithm versus the calculated
values), to verify the Atterberg method. Relationships between approximately 30 soil
characteristics (from the laboratory *.csv files) and an additional 20 characteristics from the
Figure 37: (Left) The soil lithology map of Western Australia, and overlaying RGB Landsat satellite UTM Zone 50 image
(black background, soil core logged, and geo-referenced *.tiff; location data coordinates), for laboratory samples used to
create the polygon of the representative dataset GPS points for predicting ground movement (GM) based on Atterberg values
determined for the core logged datasets (McBride 2002). (Right) Constructed image of the various inputs and data sources
that can be used to construct an algorithmic model based on laboratory datasets, from the numerous potential sources. The
layer cake nature of the image defines and shows how multiple indices including imagery and weather forecasting can be
used to create statistical models to assess impacts of multiple co-factor environmental parameters (e.g. on physical or chemical
association with GM), which can then be used to determine the influence of the constructed algorithm(s) or for future
prediction based on prevailing conditions at any given time. The two main approaches for such, include machine learning
and statistical modelling. In each case to enable real time decision making the data must be converted to digital formats and
then, instances created to process the data.

154
available remote sensed geo-referenced *.tiff and GPS logged satellite, or online databases
(Landsat, Sentinel I and II, and ISRIC) were then determined for the universal transverse
Mercator (UTM), Zone 50.
REMOTE GEOSPATIAL GROUND MOVEMENT PREDICTION BASED ON
STATISTICAL RELATIONSHIPS
The methods utilized for machine learning and statistical modelling implemented have
previously been described (Ahmed et al., 2019; Recaldes et al., 2020). The theory behind the
installation and configuration of such implementations for environmental simulation has also
previously been described (Svatos 2018). Briefly, the two complementary methods were set-
up, and pre-configured to be remotely accessible from a remote secure shell terminal (SSH).
The methods included a statistical modelling approach using the QGIS graphical user interface
and command-line interface through the QGIS software suite (QGIS Development Team, Bern,
Switzerland). And a machine learning approach using a *.py (python file) with pre-configured
commands implemented through the command-line of a pythonic kernel and console API,
running on the long-term-support version of the Ubuntu 18.04 operating system. To enable
near-real-time automation of these statistical methods a pipeline for the baseline
implementation (workflow in the cloud) was created. Utilizing Amazon EC2, the instance was
setup and installed with access to an S3 bucket containing the laboratory database and remotely
sensed raw datasets (Amazon, Seattle, Washington, U.S.A).
From the cloud shell; the statistical models were used to determine GM based on the
relationships between soil characteristics and GM (using 80% of the data for training and 20%
for testing), the two analytical approaches compiled algorithms for downstream supervised
learning assessments (within the GPS polygon). Finally, to determine the effectiveness of the
statistical modelling and machine learning pipeline the workflow algorithms were used to see
how accurate the correlations were with open source geospatial data; for determining GM
(Table 9).

155
RESULTS AND DISCUSSION
The scientific models developed through this research (based on laboratory datasets of the
Atterberg limit industry standards) are the first to incorporate machine learning into GM
calculations in Western Australia, and the first for soils older than 200 million years due to the
age of soils studied (Figure 37). Based on the statistical modelling approach the best
determining correlation variables for GM
were liquid limit (LL), plasticity (PL),
plasticity index (PI), and linear shrinkage
(LS), due to the nature of the relationships
between GM and soil physical properties
which support its measurement (as expected).
The generalized additive model (GAM)
output from the QGIS terminal, which was set
for spatial and temporal autocorrelation, with
additional smoothing, fitting, weight, and
flexibility parameters explained 91.1% of
total deviation of the dataset (Figure 38).
Similarly, for the machine learning approach,
the overall prediction potential for (R2) 0.05
and 0.10 were 65% and 83% respectively.
The prediction potential of both statistical
methods supports their use (and the dataset) for making estimates of GM in the determination
of foundation thickness (in the building and construction industry); within the GPS polygon,
and possibly remotely, without the need for core samples, and additional laboratory analyses.
Using the 30 remotely sensed spatially available datasets to determine GM, showed inconsistent
results (Figure 39).
Figure 38: Potential for ground movement (GM) in cm from
the GAM model based on the laboratory dataset (within the GPS
polygon Figure 1.) was best described by the ‘moisture
equation’ log{E(Yij)} = β0 + β1Ll + β2Pl + β3Year + β4Season
+ β5GeologicalZone + β6Friabilty + β7USC + β8Colour +
β9Moistue + β10P0.425 + β11Latitude + β12Longitude; which,
explained 91.1% of deviation from expected values (P<0.05).

156
Figure 39: The combined heat map of 30 soil physical and chemical concerning remotely sensed datasets. Ground movement
(GM) in cm from Table 9, indicated by the red rectangle and its corresponding prediction potential for the UTM Zone 50
(including outside the GPS polygon).
The remote sensing data models that were identified via both the machine learning and
statistical modelling approaches do not support the models developed, e.g. (Dastbaz et al.,
2018), even though the same Landsat datasets were used in our models. Our models were less
than 50% as accurate, which asks the question of the significant deviation concerning similar
models used by others, e.g. (Armstrong et al., 2007; Louca et al., 2018; Qu et al., 2018). In our
spatial model, the data were not significant enough to warrant the use of the model in its current
form with a high enough level of certainty concerning industry standards. Although we were
able to predict whether the ground would move or not, more data is needed to advise by how
much confidently (without introducing qualitative bias).

157
Detailed information about built-up areas is valuable for mapping complex urban environments
(McBride 2002). Although a large number of classification algorithms for surface areas have
been developed, they are rarely tested from the perspective of feature engineering and feature
learning for predictions of subsurface soil parameters. Sheffield et al., (2012) for example. As
such better accuracy of the spatial model might be obtained if soil structure (layering) and other
variables analyzed in future data collections of Atterberg limits (McBride 2002) are factored in
concerning the geological effects of time. The ground moves as the season's change; therefore,
there is a correlation between this amount of movement and soil type, including the subsurface
saturation zone (McArthur 2004).
However, for a significant correlation to be made the model data needs additional stratigraphic
observations about the soil horizon, so that 2D soil lithology maps can then be used to piece
together a 4D geological time stratigraphic soil map for the creation of larger 4D timestamped
polygons (outside of UTM Zone 50). For example, the model gave a better result in classifying
movement vs non-movement, which might indicate smaller scale influences. Traditionally
seasonality is used in agricultural field modelling where small-scale calculations are improved
through the use of field measurements to validate aspects of crop morphology with remotely
sensed data (Alexakis et al., 2019; Cai et al., 2019). Significant improvements of the accuracy
may thus be obtained when categorical outputs corresponding to site classification (surface
water mapping or groundwater bore logs) are built into the Atterberg limit laboratory data
collection and geotechnical procedures, irrespective of physical time deviation between
measurements. Although this has yet to be demonstrated as effective.
Remotely sensed ‘big-data’ sets in terms of the structural, spectral, and textual features
corresponds to the satellites generating the data and is a sophisticated science (Dey et al., 2018;
Fong et al., 2018; Huang et al., 2019; Peng et al., 2019; Reynolds et al., 2019). Remotely sensed
big-data becomes an essential requirement (if available), but may validate laboratory datasets
collected especially where data or access to sites is scare and costly. The model developed from
laboratory data is reliable for industry use concerning GM, within the GPS coordinates of the
polygon UTM Zone 50 (Figure 37). However, even better accuracy of the spatial model using
satellite data might be obtained if additional information is collected for the machine learning
pipeline, and updated with more raw soil core data. This is currently underway. With a
possibility to improve accuracy, and overall efficacy as per Dey et al., (2018), ARM, (2020),

158
and Hagendorff, (2020) concerning any perceived bias this new SaaS API may generate from
an A.I. perspective, sustainability of legislated building procedures and associated research is
an ongoing science needing more consistent, ongoing review.
The success of this type of model can potentially save tens of thousand dollars in construction
materials, reduce the potential human error associated with data collection and samples
manipulation and up to six weeks of building time while ensuring the compliance of the relevant
local, state, and federal legislation. As well as:
1. Allow designers & engineers to prepare better quality and more accurate
quotes by providing more information prior to site visits.
2. Save time through less maintenance of on-site equipment
3. Provide a potential for less construction wastage, materials required &
site works/preparation. I.e. through cost savings on engineering
contingency fees (potential saving of up to 34% of construction materials
required).
4. Provide less subjective, more consistent estimates.
5. Possibility for further full data capture & analytics improvements.
6. Reduced down time and bottlenecks within the overall design building
and approval process which has been amplified by COVID-19.
Remote sensing big-datasets in terms of their structural, spectral, and textual features according
to the various satellites processing the images being generated is a sophisticated science (Dey
et al., 2018; Keight et al., 2018; Ahmed et al., 2019). Investigating the character of remotely
sensed big-data becomes an essential need to help verify (if available) laboratory datasets for
improved model accuracy, especially where data is scarce. These are the first models to predict
ground movement in soils older than 200 million years, a first for Mediterranean climates, and
a first for Australia and possibly the Southern Hemisphere. The model developed from
laboratory data is reliable for industry use concerning ground movement within the GPS
coordinates of the polygon (Figure 37). However, even better accuracy of the spatial model
might be obtained if additional information on soil structure (layering) and other variables (that
may be sourced) are built into the continually improving automated machine learning pipeline
with software improvements (ARM, 2019; Hagendorff, 2020; Oracle, 2020). The future of
building and construction is now. The success of this type of model can potentially save tens of

159
thousand dollars in construction materials, reduce the potential human error associated with
data collection and samples manipulation and up to six weeks of building time while ensuring
the compliance of the relevant local, state, and federal legislation.
AUTHOR CONTRIBUTIONS AND ACKNOWLEDGEMENTS
Tom Young collected the raw data and wrote original algorithms concerning Atterberg limits.
Tom Young and Karl Svatos conceived the concept for an automated pipeline for statistical
prediction of soil properties (laboratory geophysical soil dataset calculations). Agela Recaldes-
Salas and Zubair Ahmed conducted mathematical modelling, based on the requirements of Tom
Young. James Adams, Karl Svatos, Kris Zima, and Kate Zima created the instances, including
the AWS S3 bucket, programmed in the command-line interface, and managed the team
respectively. Karl Svatos programmed the automated Anaconda/Jupyter, Amazon pipeline for
the embedded statistical machine learning and wrote the manuscript. The authors declare no
conflict of interest.

160
EPILOGUE PROLOGUE CONCERNING AUTOMATED SOFTWARE PREDICTION
TECHNOLOGIES IN APPLIED DATA ETHICS
The methods of data collection and analyses in Manuscript four not only serve the vital purpose
of validating the use of online databases for estimations and decisions; the automation process
developed concerning embedded (enabled for .NET pythonic assemblies) cloud-based remote
shell connections are a testament to the truly unique results and a first for this industry. Thus,
validating the aims concerning the construction of an online decision-making platform for real-
time analyses, for the building and construction industry. Concerning the data collection and
low correlation of remotely sensed data, that was used in the construction of the automated
machine learning pipeline; there is considerable evidence to accept the hypothesis on this
information alone. A view supported by numerous Google A.I. ethicists. From the perspective
of the ethical use of A.I. concerning the use embedded code to extract data or create visualisation
images (from the data), however, there is little by way of policy or regulation, and even less
concerning data ownership and use with supporting experimental results and embedded code
(Stahl and Wright, 2018; Hagendorff, 2020) (Figure 39), which brings into question how
governments may legislate these games e.g. drone neon light entertainment. Information is
gathered from audiences from which embedded statistical biases for observers based on GPS
(e.g. a ‘liking’ for this specific kind of ‘drone show’). Without ever asking for individuals’
opinion’s governments lack the tools for long term policy needed to ensure the safety and
security of all its citizens. Although not 100% entirely; it seems that corporations continue to
push this ethical boundary (ARM, 2019; Oracle, 2020, NVIDIA, 2021).
Figure 39: Typically lengthy construction approval processes with large scale surveying and data logging requirements (in the
building and construction industry concerning regulation and industry standards), can somewhat be automated and fine-tuned,
through the use of the methods indicated in this manuscript. Which also includes the use of unpiloted autonomous vehicles
(drones) that can not only capture essential data but then use the data to relay visual representations of the data analyses. For
example, fog response geographic warning systems. In this image, the night sky inversion contrasts with the megacity buildings
which make the neon lights more vivid on the Google Pixel 3 smartphone image detector (and Google Lens app). The code
features embedded .NET controls in the Pixel Google Image ‘deep learning’ functionality and a compatible deepfake image
container (shown here in Tokyo in December 2020). Image credit: The Author

161
GENERAL RESULTS

162

163
MURDOCH TWINS: CONTAINERISED .NET API BACKEND DATA
IMPLEMENTATION FOR REAL-TIME DEEPFAKE GAMES
Independently of the manuscripts to address the hypothesis for the heuristic measurement of
latency, concerning the ethics of A.I environmental data simulation bias, a digital twin was
constructed. Thus, allowing the combined outcomes (of the aims) to be assessed concerning the
hypothesis in an automated real-time cloud-based .NET assembly (virtualised GPU: CPU
container) (Figure 40). Each spike represents mean processing as the aggregated sum of
embedded statistical calculations that link to the datasets (data lakes) via the programming of
the various dataset locations (containers and databases), constructed for each manuscript
(TCP/IP nodes). Including for the environmental data (Manuscript 1, 2, and 4), and agriculture
data (Manuscript 2 and 3), .net latency ((Δ).t). The statistical visualisations (algorithmic
pipelines) (Manuscript 2) (Appendix 3) were applied to the cloud-based programming platforms
(Manuscript 3 and 4); Demonstrating that the data capture and statistical modelling workflows
(2016 2020) can be visualised and processed in real-time, (via a real-time LTE statistical
heuristics application).
The following snapshot of the “MurdochTwins- Digital Twins Microsoft Azure” pipeline was
assembled to process the transfer and analysis of the .NET data stream (Figure 40). Images over
the LTE network up-link to the cloud-based server were demonstrated achievable in terms of
the FLIR automation for satellite application (Manuscript 3), this application concerning plant-
health is a first. The programming language and GPU kernel (to stitch the three types of images
together was developed for a MATLAB .NET API thus useful for calculating the grain yield
based on ‘plant health index’ and associated imagery. This real-time model achieved a
simulation of real-time grain yield data (Manuscript 3, declaration) before the construction of
the digital twin. Several providers of cloud-based software decision-making tools are currently
available for an off-the-shelf agricultural-workflow-system, including Google Analytics
(Genomics), Amazon EC2 (AWS-Kinesis), Microsoft Azure (Digital Twins). For simplicity,
either of these providers has off-the-shelf software workflows for customisation. Pawsey
Supercomputer (Bentley Western Australia), provides access to instances hosted on their
servers with CPU: GPU computation clusters, however, the portability and speed are limited
(although Pawsey offers a cost-effective system). It is envisaged that portable instances can be
developed on Amazon servers yet the security features that link the .NET backend to the API
interface need manual rerouting.

164
As such, the automated platform created in manuscript four serves the purpose to show how
such an instance can be applied in a cloud shell platform, which was subsequently able to be
implemented in the digital twin. The statistical result was a low correlation with remotely sensed
data, as explained in manuscript four, which, for completeness (assumed) that the same effects
concerning the yield-related ‘plant health index’ were evident. As such, this sort of
implementation is the first (the author knows of). The main result of this digital twin is its
uniqueness (of the application) that it is not limited to individual users (anyone with an email
Figure 40: API latency Δ (.net latency).t, vs aggregated sum of GPU:CPU cloudbased data remote access node .NET
processing; as setup in the Murdoch .edu roam network, using student email accounts as per the general methods. The peaks
represent the maximum latency processing differential for all sources linked to the twin. The troughs indicate the server
responses where processing bootstrap nodes (that connect to the individual data lakes) are looping back. The latency sum
reflects the minimum power consumption for the system to ‘ebb and flow’ with respect to time (on April 9th 2020). Image
Source: Karl Corporation

165
account can be easily “linked”). The Murdoch University IAM *.edu roam network are fully
implemented in Murdoch Twins, meaning that the .NET clusters are not limited in their
connection implementations, such as the way IBM intended it to be in the 80’s when the 64-bit
architecture was developed for example Intel i860 (IBM, 1989; Free Software Foundation,
1991). Although the functionality of a multiuser approach is somewhat limited (Table 10) at the
front end application-level, statistically the IAM allows bash and cmd functionality across the
network remotely (Figure 41).
Table 10: Because the use of sensors and modules can only account for the direct influence of environment as it relates to any
given species (under assessment) there is scope to assess the latency in terms of identifying the potential data/analytical
pathways to realising each outcome based on its method of assessment, the potential risk factor and the data source pools.
Quantification of the digital twin latency effect (+/-) of the possible contribution(s) as it relates to method of assessment / coding
runtime and its associated risk (0-3), is ranked in the way it may have contributed to the time lag effect displayed in Figure 40.
The table represents the real-time decision tree snapshot of a deepfake analysis relative to the time lag latency effect Δ.t from
each data pool sources (used in the manuscripts to server the data in their respective instances).
Digital twin latency
effect (+/-)
Method of assessment /
coding environment runtime
Risk factor (0 zero , 1
low, 2 med, 3 high)
Data source pool
Detected +Δt Python / R, Unix 2 Amazon AWS
Detected +Δt C#, Unix 2 Microsoft Azure
Detected +Δt Java, Unix 2 Google Cloud
Detected +Δt C, C#, .NET 1 IBM Watson
Undetected –Δt Colbol, Unix 3 Alibaba Cloud
Undetected –Δt C, Python, Unix 3 Pawsey Cloud
Figure 41: IAM user access control and multiuser permission control of ‘Murdoch Twins’ configuration settings protocol
to customise and assign the data inputs, or assign tasks required based on IAM requirements. In this instance, confirmation
of A.I bias in environmental data used to make ethical decisions, concerning a range of species based user input data. Image
Source: The author.

166
Concerning the efficiency of the system there several concerns unrelated to the functionality of
the twin itself, these relate to the evidence that Gaussian ‘pseudo-random signalling’ effects the
collectability of embedded source-code derived, raw pythonic environmental biophysical
measurements. A result of this observation is inefficiency in FPGA systems processing at the
core demonstrated in the following penetration test (Figure 42). The main factor contributing to
environmental variation in confirmation bias assessments concerning ‘big-data’ that are used in
ethical assessments is the assumption based on a 50:50 ratio rule (that also holds for genetic
colour probability distribution). That of increasing chance with increasing simulation. The
uncertainty that increasing probability confers to an increasingly larger number-net
(assemblies), via statistical analysis (for even spreads of the probability distribution);
summarised here (Figure 43).

167
In a recent publication “Enabling a New Digital Era” Bell Labs outlines how it sees this future
unfolding and the key technological breakthroughs needed at both the developmental and
systems levels. But more importantly concerning cybersecurity, there is no dedicated pathway
concerning changing the network and systems (in terms of innovation required) to realize the
technological revolution that will be the essential product of this new digital future (Weldon
2015). Deepfakes are essential. How data and environmental data is collected and transferred
does not require smart technologies to securely verify the source as long as the source is itself
physically secure, concerning trust, and the ethics of deepfake games (Table 10, Figure 44 and
45).
Figure 43: This digital twin image is emulated based on the original image taken at DPIRD in South Perth in 2018 of a ‘white
gold’ grain head and inverted into a negative image to simulate it’s opposite (it’s identical doubled haploid clone real life twin;
‘black beard’). The head image was taken originally for use as part of the digital twin simulation, due to the DH population
being related to colour with a 50% recombination ratio. The grain was grown in the glasshouse at South Perth, measured
approximately 15cm in length and was estimated that under the optimal growing conditions (achieved in the glasshouse, the
result solely of the fertiliser and trace elements, watering regime, light intensity, relative humidity, temperature, and O2:CO2
ratio, and soil) the maximum grain yield potential for this particular head is thus able to be determined (via heuristics data lake
estimate specific to API climate environment). The image: a GPU inverted clone image is a statistical derivation of itself,
concerning both the digitalisation and in its physical real life existence. Owing to the A.I. twins having both the white and
black traits digitally (and the supporting real life germplasm data for both including the whole genome sequences) this game
is to determine which one is real because only head was photographed. One is a deepfake, can you find it? (look right). It’s
about trust. Image source: The Author.
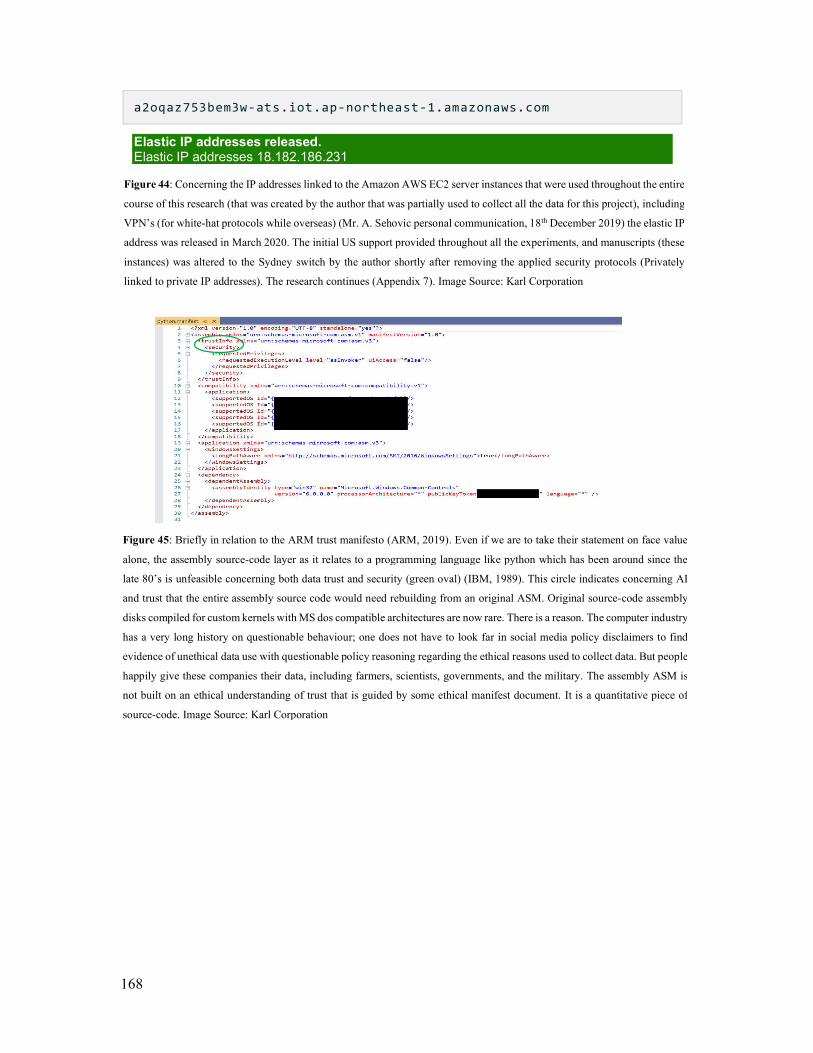
168
a2oqaz753bem3w-ats.iot.ap-northeast-1.amazonaws.com
Elastic IP addresses released. Elastic IP addresses 18.182.186.231
Figure 44: Concerning the IP addresses linked to the Amazon AWS EC2 server instances that were used throughout the entire
course of this research (that was created by the author that was partially used to collect all the data for this project), including
VPN’s (for white-hat protocols while overseas) (Mr. A. Sehovic personal communication, 18th December 2019) the elastic IP
address was released in March 2020. The initial US support provided throughout all the experiments, and manuscripts (these
instances) was altered to the Sydney switch by the author shortly after removing the applied security protocols (Privately
linked to private IP addresses). The research continues (Appendix 7). Image Source: Karl Corporation
Figure 45: Briefly in relation to the ARM trust manifesto (ARM, 2019). Even if we are to take their statement on face value
alone, the assembly source-code layer as it relates to a programming language like python which has been around since the
late 80’s is unfeasible concerning both data trust and security (green oval) (IBM, 1989). This circle indicates concerning AI
and trust that the entire assembly source code would need rebuilding from an original ASM. Original source-code assembly
disks compiled for custom kernels with MS dos compatible architectures are now rare. There is a reason. The computer industry
has a very long history on questionable behaviour; one does not have to look far in social media policy disclaimers to find
evidence of unethical data use with questionable policy reasoning regarding the ethical reasons used to collect data. But people
happily give these companies their data, including farmers, scientists, governments, and the military. The assembly ASM is
not built on an ethical understanding of trust that is guided by some ethical manifest document. It is a quantitative piece of
source-code. Image Source: Karl Corporation

169
GENERAL DISCUSSION

170
171
CONCERNING THE HYPOTHESIS OF DATA-DRIVEN, MEDITERRANEAN, A.I.
SIMULATIONS AND THE ETHICAL IMPLICATIONS OF EMBEDDED
QUALITATIVE BIAS IN DIGITAL TWIN DEEPFAKE GAMES
The data presented in this thesis is chronologically complete as follows; Svatos, (2018), Svatos
et al., (2018), Svatos and Trowbridge, (2018), Svatos and Abbott, (2019), with additional
outputs concerning the research aims in manuscripts three and four, appendix 1 through 7, and
Svatos, (2011), and Svatos (2012) respectively. The following general aims are stated again
here for clarity:
1. Develop a case for the examination of ethical principles surrounding digitalisation and
automation of scientific workflows via heuristic algorithms (for digital twins) (Review).
2. Develop high-resolution imagery and statistical techniques to enable heuristic
measurements for a range of field/glasshouse/laboratory experiments.
3. Develop a real-time assessment workflow for processing mathematical algorithm
measurements from a range of laboratory and field-based data source observations
(phenotype and environmental data sources).
4. Implement and test a heuristics IoT workflow for captured data in laboratory,
glasshouse, and field trials to determine accuracy and efficiency concerning variation.
5. Launch A.I. digital twin for real-time (Δ.t) deepfake game.
6. Create deepfake.
7. Run game, measure trust response then release the IP address to end the game.
Throughout the thesis, a clear focus has been on the ethical collection of data concerning its use
in predicting causality; originally with the intention of an embedded A.I. implementation (for a
digital twin). The data collection and the means described for presenting it are a clear
distinction, yet the overlap (and potential for oversight) especially in computer simulations,
cannot be overstated (Freedman, 1995; Greenhalgh, 2002; Svatos 2018). Manuscripts one and
two set-up unique laboratory and glasshouse, big-data statistical workflows (data lakes) for
simulating ethical outcomes for hairy marron (via isotherm visualisation) (Svatos, 2018); and
dairy cattle (concerning microbiological gene interactions) (Svatos and Abbott, 2019) (via the
statistical visualisation program and algorithms created) (Appendix 3 preamble). While
manuscript’s one, two, and three serve the purpose of highlighting issues relating to the
requirement for LTE/5G real-time industry-specific solutions, encountered and dealt with in
Manuscript three. Concerning governmental responses and legislation with respect to

172
environmental data and its ethical collection and use, manuscript four bridges the significant
flaws in visualisation strategies, by taking a machine learning approach on a large data lake
through a targeted industry focus. A response is presented in manuscripts one and four to
validate the workflow regarding a perceived requirement to explain significant variation in
environmental datasets raised by Douglas et al., (2019), however, what all of the environmental
data collected in the thesis highlight is a broader variability in modelling whenever data
scientists try to predict cause. Transcription data and genomics analyses only make things
increasingly difficult, expensive, but more foundationally requires decades of dedicated study
to understand. The renaissance in data-science is the opposite of this pursuit. The industry-
related projects in manuscripts three and four accurately represent the aims in terms of what
was achieved but highlight the significant data-centric focus (Svatos et al., 2018; Svatos and
Trowbridge, 2018 and Appendix 1 - 7). More significantly, these reflect ethically sourced data
sets (and metadata) concerning data lake generation and shows how these data can link to
statistical outcomes and support publication-centric research collaborations, e.g. Long et al.,
(2018) which are unfortunately sometimes not centred on the ethical acknowledgment of data-
sources. Where data ownership is concerned, collaboration outcomes can be increasingly biased
towards their dataset collections, because data is only about people. The issue of data ownership
concerning Tibetan barley remains today (Manuscript 3). A cultural calamity concerning the
full realisation of applied artificial intelligence in barley population control and management
(Manuscript 3). The invention of the deepfake image, the path of least resistance concerning the
increasingly challenging and complex biological interpretation of explaining variation in
environmental statistics relating to yield. The game; a way of ethically showing how such
instances arise in real-world scenarios and the digital-twin a simple way for measuring
responses in real-time to see if a trust relationship could be established by having the
reader/target “look right” when asked during the game.
The general methods and results sections reveal statistical outputs concerning the ethical
modification of chip architectures to support the creation of a digital twin and corresponding
deepfake imagery (based on phenotype, genotype, and environmental data and meta-data).
Overall, the supporting data lakes for all manuscripts were focused on Mediterranean climates,
and therefore give significant weight to any counter-argument that; variability in A.I. modelling
can be eliminated by using increasingly more data to create more sophisticated algorithms that
utilise more powerful machines to find a greater P significance based on trained data. An

173
objective view that will ultimately fail a Turing test concerning A.I. prediction because the
number of potential solutions is always increasing (even if there is an equilibrium situation
being established). It was Bohr’s realisation. “The problem of biology as it relates to physics.”
A view that has been echoed by numerous academics and professionals who were consulted
during this research; yet for some reason, the thought experiment only considered significant
when modelled objectively—a subjective view raised by Freedman, (1995) in its very own
nature. Even with increasingly sophisticated microclimate sensors, more elegant equations, and
potentially even a sub-three-nanometer (real-time) chipset, e.g. a possible future derivation of
an ARM Cortex-R 64-bit real-time chip, (and associated computational processing; time-scale
specific (t) will still have a significant impact on the predictions themselves. The natural ebbs
and flows of Δ with respect to inherent latency will always have quantitative variation due to
Boolean dependencies, and a ‘flat-line’ may only occur if the system is shut down (or if a
quantum equilibrium system is established). Data is not part of humanity; it is only part of code
security in its current use. Whose data is it?
Therefore, based on this information, there is enough evidence to accept the hypothesis. That;
Digital twins can be embedded and launched in AI manifolds for the statistical analysis of
heuristics data, and for correlation and extrapolation of predicted outcomes to make ethical
assessments.
Under increasing variability, predicted results based on environmental data sets used in ethical
assessments may make artificial intelligence-based computer instances biased towards those
environmental variables and data, and leads to ethical use of deepfakes in the current
geopolitical landscape.
ABOUT THE NOVELTY AND AUTHENTICITY OF THIS RESEARCH THESIS AND
ITS MANUSCRIPTS
There are several scientific firsts concerning this research. Through the development of
hexadecimal hash codes on micro SD cards and a file structure database *.NET, application
software/hardware implementation, a significant step was made concerning biophysical
causality being appropriated to statistical objectivity. As such digital twins and in particular
‘Murdoch Twins’ represent a small step forward. Applications include new digital-twin

174
solutions for genomics in agriculture and medicine but may also include environmental
monitoring or other technical systems with significant (big) data sources. The automated
platforms created in this thesis used to test and run real-time data simulation software solutions
with a focus on ‘pseudo-random’ Gaussian signalling (discussed and measured in the general
results concerning bio-physical A.I. ethics) are a scientific first.
The creation of an IoT based environmental sensor dashboard system based on the independent
research (methodology) that are summarised in the general results (Murdoch Twins), and based
on the general methodology is a scientific first for real-time genetics and informatics concerning
the question of ethics A.I. and real-time game simulations. That where others have utilised a
similar approach regarding similar data, questions about data ownership remain, e.g. (Reynolds
et al., 2019), which validate the case for a new hypothesis. No known tenet with independently
researched student-owned data exists with a complimentary set of 430 unique genetic
backcrossed (DH) clones, and an entire suite of supporting environmental data concerning a
species colour (Tibetan-Australian barley) exists with respect to A.I. and thus is the first such
study to consider the ethical informatics practices with geopolitical considerations surrounding
a unique Tibetan barley (the first involved in deepfake a game simulation).
That a remotely located base station can transmit enough data to enable real-time responses to
plant stress (or any ‘stress’), (based on a serverless cloud-based machine learning pipeline to a
secondary remote location) for rapid automated machinery response concerning gene-specific
trait architecture is now a demonstrated concept. Real-time GWAS (Svatos and Trowbridge,
2018). However, there are still significant bottlenecks that need to be overcome from an ethical
trust perspective, and concerning the epigenetic components (Appendix 1 and 2). Statistical
methods of instance creation and automated, remote-processing of this type of heuristics data
(Manuscript 3- Project 2; in real-time) is a first for private, environmental and agricultural,
satellite-related, research in Western Australia, and possibly Australia with wide-reaching
application potential.
For example, manuscripts two and three that include the evaluation of sequencer derived data
validation would have benefit from this infrastructure (Svatos et al., 2018; Svatos and Abbott,
2019). Concerning manuscript four’s A.I., the machine learning pipeline developed that was
tested through spatial data analysis; is a first for Mediterranean environments and a first for soil

175
older than 200 million years in age. All novel achievements made possible through the author’s
research efforts and supporting teams.
‘Murdoch Twins’ very nature focuses on customisable solutions for software engineers or
scientists; similar solution architects have often overlooked vertically integrable scalability in
design-feature, security planning leading to significant limitations including non-standard
production line ‘end of life’ support modelling issues (futureproofing issues). And thus, the
most significant opportunity that a digital twin might provide may also by its very nature be
used to knowingly be used to discriminate based on computational time limits, factored into
warranty or product disclosure statements. Current calculations of large supercomputers may
take up five years to build and implement (Arute et al., 2019). It is a matter of trust. A Turing-
complete system must be able to complete the calculation.
And yet the challenge is that ethically, assessments do not always follow a standard pipeline
either. When building a pipeline for ethical evaluations that are to be done via A.I. machines,
the nature of the data at the edge needs its potential biases addressed before the data can be
collected. However, more recently, machine learning pipelines and data scientists are not
concerned with the sources of the raw data, or its ethical meanings, including those that have
random multipliers embedded in their routines. Their pipelines are not built qualitatively in
mind. “An obvious metric for evaluating the performance of any simulation algorithm can be
simply described as some accuracy measure vs. some cost measure.” Increasingly time limits
are applied to both the collection of essential data and its qualitative interpretation. However,
simulation of environments cannot be guaranteed to be correct and repeatable without initially
considering as many hypotheticals as possible, e.g. (Pozzi et al., 2013). To categorically rule
out all quantitative bias in the generation of statistical outcomes concerning A.I. The most
fundamental physical/chemical simulations for multiple environment calculations cannot be
consistently verified. “Further classical simulations and device implementations are needed to
provide better insight into the numerical behaviour.” Grimley et al., (2019) on quantum
systems.
Multiple big-data (climate, satellite, agricultural, genotype) integration with heuristic
algorithmic prediction capability has typically been evaluated by both Lagrangian or
Hamiltonian statistical approach (Grimley et al., 2019; Thompson et al., 2020). Some examples

176
include (Gibbs, Bayesian, MCMC, Metropolis-Hastings). However, the Euclidian distance
more increasingly has been implemented through ‘cloud-based’ scalable virtual machines, and
to what extent do immeasurable physical limitations in the available data, limit the correlation
potential of such approaches concerning complementary datasets, and their derived Euclidian
indices?
CORRECTING THE FLAWS OF MODERN APPLIED DATA SCIENCE
Non-statistical heuristic big-data analysis requires significant analytical and scientific
knowledge, thus estimating anthropogenic environmental fate, with respect to agriculture, water
sources, and biological and chemical datasets fits into this domain. When people talk about
incorporating gene pools into machine learning statistical methods and calculations (e.g. for
determining the probability that a mutation might occur in a plant biology experiment), the exact
process that defines phenotype and its measurement and may well be out of reach, due to the
complex nature of evolutionary mechanism itself as described by Gaglino, (2015), Thellier,
(2017), and Hanson and Skinner, (2017).
By setting up base stations for GPS tagging of field-based plant measurements (Figure 29),
validation of desired plant characteristics could be used to independently verify to ensure the
correctness of fit to UAV captured datasets. Independent datasets such as topography maps, soil
type, and climate data can then be integrated to help explain the variation associated with the
phenotypic measurements (Figure 37). Dependent on the resolution of the UAV data, models
can accurately and efficiently then zoom in on areas of interest in the landscape and process
genetic level accuracy concerning abiotic stress or biotic stress and using this data pipeline make
decisions on plant health or treatment if required (related to grain yield) (Figure 20, 25, and
Table 7, and 8) specific to the genetics, e.g. (Manuscript 2).
The use of this technology however, also has its challenges and critical tolerances with standard
errors that are necessary for significant objective value correlation. Part of the concern using
imagery software and digital lens photography that require regular servicing are the inaccuracies
that cannot be factored into models (on the number of real solutions). Additionally, where
models use error correction algorithms for determining the significance of telematics tolerances.
Foundationally, statistical limits are at the forefront of this argument. And at the centre of
statistical limits concerning computer simulations, are the hardware-software interfaces. The

177
current limitation of technologies in digital computing includes a recent transition away from
legacy BIOS firmware architectures supporting 32-bit processors, to 64-bit or 128-bit by
companies looking to capitalise on the latest advances in microprocessor technologies. While it
represents opportunity, it also ensures complexity. Manufacturers state the legacy firmware’s
are mostly compatible via cloud-based APIs however incompatibility is a widespread complaint
in the big-data industry (Figure 42). A significant challenge facing the A.I. industry, who
seemingly think that emulation will solve the issues, and implies that a broader concept of
Euclidian distance is required to incorporate Gaussian pseudo-random signalling (for example
Bluetooth® Low Energy) into Hamiltonian statistical heuristics. In fact the solution has been
already hypothesised in Greenhalgh, (2002) (with proofs) and used in the programming of an
application and used in Svatos, (2011; 2012; 2018) (Figure 10 and 11) (Appendix 3),
categorically ruling out ‘a priori’ by others.
Realtime decision making on smart devices (phone, watch etc.) are already available; however,
the API is an interface to a web-based front-end application which has the GPS coordinates (of
the trial as well as the GPS location of the phone) to provide real-time information as the person
moves within a field trial (with their phone) cannot easily be mapped to the physical location
via physical geo-location alone. Newer chip technology (more cores including GPU) enhances
the accuracy and data transfer rate of connected sensors integrated through LTE/5G, and cloud-
based APIs via backhaul connectivity, but the next generation of software/hardware
communications (M2M IoT) requires a major assembly overhaul with billions of lines of
source code at the core (Garfinkel et al., 2007). This is still unaddressed in 2021 and with no
realistic plans to do so by any of the major software manufacturers. Recent multi-cloud
investments by the US Government confirms this assertion.
ON THE PERCEIVED FLAWS IN THE ETHICAL TENET OF SIMULATION
METHODOLOGIES (AND THE METADATA ARGUMENT)
There are many digital simulations in research studies that seek to clarify and prove
environmental relationships concerning genetics. Yet these suffer from the same form of bias
as documented in this thesis. This bias represents a considerable challenge not only for scientists
but also industry who seek to maintain and build trust relationships through the use of scientific
tools and assessments through the use of embedded .NET source code repositories, e.g. Github-
Karldroid (IBM, 1989; IBM 1990; Johansen et al., 2016) (Figure 45). The data tables and figures

178
presented in each manuscript represent the current state of the art, both in terms of the statistical
capability of software systems and in terms of experimental data collected from the remote
sensing perspective (Figure 11, 13, Figure 38 (unpublished)). Another bottleneck is in the
understanding of molecular genetics principles as it relates to allowing for non-biased machine
leaning in A.I. yet, even in the automated remote sensing field, (as attempted in determining
below-ground effects of soil properties based on satellite imagery), the approaches require many
supporting datasets. The data do not allow for statistically significant assessments to be made
alone. The containerization of server instances for remote shell processing has always been
relevant to the field of environmental science as are the meta-analyses that can generate
meaning from said containers (database systems that store reports for environmental auditing
including other ISO:140001 compliance monitoring systems, e.g. Trim4D database, MySQL).
The comments and suggestions raised in Douglas et al., (2019) on Svatos, (2018) are hardly
ground-breaking. Not only do the comments highlight the need for additional computational
strategies concerning data volume generation potential (raster layers that can be created with
respect to environmental data) as shown in manuscript four; but also indicate that the traditional
scientific methods (used as part of their rebuttal strategy) also face common challenges
concerning the ethical use of high throughput technologies and data-based modelling of bio-
physical systems. Their model suggests that they did not allow for tolerances; by asserting their
methods (concerning mathematical measurement) are justified by data without even measuring
against the hypothesised species originally targeted in Svatos, (2018).
One crucial factor often used as a counter-argument includes ‘potential microclimate effects on
genetics’ and more massive scale microclimate occurrences concerning phenotype data
variation (the collection that influence trait measurements below or above the ground), and
supporting environmental metadata; sometimes referred to as GxE (genotype x environment)
interaction. Referring to Geiger, (1927) on the measurements made by Kidd and West, (1918),
Heller, (1921), and Harrington (1932), concerning the algorithmic environmental sensitivity
measure developed by Palmer, (1965) (Appendix 2). Subsequent research by Abbott and
Murphy (2007) Rahman et al., (2015) and Thompson et al., (2020), have found that influences
of microclimates on both high-resolution phenotypes (speciation) but also in relation to
phenotypic measurement platforms (Equation 1). Attributed to causality (with objective
mathematical statistics), the models are only as good as the quality of the data, but all fall short

179
outside greater measures of significance. That where established principles, highlighted by
Jones, (1985), remained ignored mainly as hypotheticals, the notion of horizontal gene transfer
in biophysical engines for prokaryotic and eukaryotic organisms remains valid 35 years later.
The idea that a hypothetical bio-physical genetic mutation based on an experimental method
(with variation attributed to GxE) for which an algorithmic explanation of climate-induced
phenotypes; can be computed by A.I through a quantitative model without requiring qualitative
interpretation is biased. Because even at the silicon layer variation effects calculation and is part
of a system being used to measure the trait (Figure 42).
THE SPECIFICS OF HARDWARE IMPLEMENTATIONS CONCERNING
HEURISTICS WORKFLOWS SHOW PROMISE. BUT THERE’S A CATCH!
In the thesis, a range of SOC and FPGA were modified (via advanced kernelisation io
implementation) and rolled out across multiple devices to test flexibility and accuracy about the
embedded kernelization architecture via the development of a range of statistical performance
simulations. This heuristic estimation (kernelization process) and modification were statistically
tested using a cloud-based API, and data island approach. The manifold assembler was
embedded for security into the system.io over .NET using a pythonic discrete calling C
assembly function, for a range of analytics, analysis GPU and CPU virtualisation/visualisation,
and for automated calculations (Figure 8 and 42). A theoretical modulation of the kernel was
tested for scalability across a standard array of microprocessors found in Intel and ARM 64-bit
type architectures (typically AARCH, or variants) (GitHub: Karldroid). The scaling for
compatibility over three supercomputing platforms was utilised with a variety of standard and
run-time operations typical with core OS functionality (Figure 42). Real-time prediction
potential across multiple nodes and bootstrap islands or a Boolean logic gate channel for
serverless genomic prediction was performed via a latency assessment for a heuristic estimation
(Table Figure 40).
In relation to connection issues, and concerning latency ebbs and flows there are multiple
examples where supported hardware, operating system, IDE, kernel, and stack can be used to
diagnose connection issues, (through universal three-way authentication system enabling real-
time TCP/IP monitoring) for example. However, the typical way to develop the .NET
framework is to bypass the login credentials by exploiting the IDE itself (IBM, 1990). In this
respect, an associated software SDK for the programming of the digital twin itself could have

180
been used to ascertain if the ASM and development of the .NET architecture that supported the
IDE (including the slave), were customizable enough in its current format. The requirement for
a 32-bit runtime environment was necessary (at that time) due to constraints of including a .NET
framework, containerised runtime, Windows .NET certificate implementation over ARM via
FPGA. However, these licenses have now expired (Windows 7 .NET). Microsoft is yet to
update its policies concerning new iterations of their certificate hash keys for the 64-bit legacy
‘syswow’ runtime emulation layer, (linked to South American operations).
In any case, attempts were made to establish a stable operating system that could handle the
ARM 32-bit runtime over the 64-bit emulation layer, for instance, via virtual box (Oracle, 2020)
and then utilizing the GPU parallel architecture to virtualize the 32-bit image outputs directly
out of the container and into a virtual emulated Javascript node. However, the legacy boot
module and the kernel support for post UEFI firmware were not compatible with the system at
that time, and the IDE couldn’t be utilised within that framework. On multiple instances, the
kernel failed to boot or was not responsive to the standard flashing commands. For example,
recovery, config.sys or even simple *.exe or *.dll implementations, to containerize the pythonic
interface to enable a 64bit .NET emulation layer over the ASM specific to the Bluetooth
framework.
Upon this discovery, APIs were constructed using the visual studio IDE for C+ and .NET
assembly which was supposedly supporting the .NET architecture for Windows 10 64-bit
emulation layers. However, upon installing the pythonic *.dll over the C libraries that come
embedded with the Windows 10 OS, it was discovered that the UEFI could not use dual boot
for this implementation. This is significant because dual boot virtualization is a requirement for
any standard runtime including in Unix (Macintosh), Linux, or any 64 -bit emulation layer
attempting to virtualize over the GPU (e.g. for MySQL).
Given these difficulties, it can, therefore, be established that the best method was for 32-bit,
however, given the operating system requirements post-2020, the 32-bit emulation layer for
ARM (Raspberry Pi) is not supported. And as such an interface was not established other than
a Docker runtime. Eventually, even with updated libraries and a newer version of the IDE and
SDK, the issue persisted, in terms of timestamp and battery drain issues (Figure 42). The battery
drain issues are probably due to firmware; however, this is only a probability and not a certainty.

181
The main reason for this may be due to the environmental data generated not correlating with
the run time as expected. Multiple support vector algorithm outputs were made to determine the
source of the battery issue; however, the non-collinearity in the spatial distribution of the
amplitude corresponded to a diminished operating consistency. Which also included additional
heat generated, and lead to the device drain increasing when decreasing the frequency of
repetition (latency).
It is a possibility that with an upgraded kernel and assembly that the data generated would be
sufficient in operating at the current support levels, however, it is highly likely that additional
modification creates additional noise, that will lead to larger ebbs and flows by the twin. As
such, the development of the sensor module requires an assembly overhaul starting with the
IDE specific to 64-bit ARM development standards (in the penetration test). Microsoft is yet to
configure these as of 11/07/2021 although the newest revision of Windows 11 using the ARM
chipset shows promise (Jensen Huang, Founder and CEO, NVIDIA, personal communication;
GTC 2021 Keynote [S31895]). There is no doubt that an embedded pythonic architecture could
be used to alleviate this issue, however at the time of publishing this thesis the limitations of
implementing the workflow in its currently available hardware configuration, related to
compatibility and the trust manifest were too significant a limiting factor to continue the
development (Table 10 and Figure 45).
THE EFFECT OF IMMEASURABLE FACTORS ON STATISTICAL HEURISTICS AS
IT RELATES TO DOWNSTREAM QUALITATIVE INTERPRETATION /
DEEPFAKE VERIFICATION
The reality is that there are too many molecular and underlying genetic processes that cannot
be measured through the use of sensors and probes alone. Concerning A.I., all attempts will
create bias in the methodological approach of the scientific hypothesis test (even for the most
classical of industrial systems). The use of nitrogen to increase crop yields has had
unprecedented success (in commercial agricultural uptake of processes associated through the
Bosch and Haber process), yet, it has always favoured industrialised countries, and
anthropological nitrogen is a significant threat to natural and human-made water sources. In
building A.I., industrialised economies may diminish the water quality without knowing where
or how, by merely trying to reduce loads. Ethical A.I. bias contributes to compounding effects
for scientists attempting to minimise loading and instead of finding all sources of loads, and

182
limiting the inputs concerning the endpoints, the issue of ever-diminishing returns and lack of
a consideration of the broader problems do not fit the classical equations and are thus
overlooked or the data removed “cleaned” from models after qualitative interpretation. The
strategy is known as divide and conquer in A.I. e.g., (Huang et al., 2020) and because “at
present, there is no defining set of ethics to follow” (ARM, 2019); this is concerning because
the assessments that will eventually take over classical models (due to the incompatibility of
unsupported computer architectures) classical theory may be overlooked. Climate change is a
similar threat concerning the potential for data manipulation via deepfakes, but highlights a
broader issue, concerning public perceptions of data visualisations.
From the perspective of environmental sciences and pollution research Svatos, (2018)
highlights a “gradual decline”. Whereas manuscript two proposes traditional PCA heuristics
visualisation to aid responses, and manuscripts three and four develop this notion into practice.
In selecting Tibetan barley, an attempt has been made to ethically distance the research-
orientated goals and aims from any form of bias. There can be no discounting the importance
of haploidy in determining the ethics of cloning experiments (Zhang and Li, 2016). The point
is, A.I., is not about selection at all; it is about the plant response measurement potential in real-
time.
In barley abiotic stress significantly affects many plant phenotypic responses, including those
attributed to yield and productivity (Rao et al., 2016), raising distinct phenotypic responses (Rey
et al., 2016). However, the complexity of molecular events in signalling pathways (Bobadilla
et al., 2016), and the responses involved in adaptation remain unclear (Engineer et al., 2016).
Molecular approaches can accelerate the understanding of tolerance in plants and aid in the
development of tolerant crops because plant breeders can make more significant genetic gains
to deliver improved varieties more efficiently (Mickelbart et al., 2015). However, the
establishment of an association between genotype and phenotype in abiotic plant studies is still
a very challenging area of science (Wehner et al., 2015) (Table 2 and Table 3).
Concerning new varieties (e.g. Tibetan-Australian barley) these data and supporting
publications infer that positive interaction between complex traits and yield should be measured
by proportionally sensitive phenotypes, that can be mapped to the more rigid genetic structures;
where the genes are not traditionally considered active concerning selective pressures (The

183
Royal Society, 2009). Doubled haploid clone populations are rapidly being used to help
discover the relationships where phenotypes do not explain variation. However, these
publications also point to the lack of consensus and highlight the need for quantitative
approaches. Given the challenges, it may be easier to embed in source code data the sum
contribution to create multiple deepfakes with supporting meta-data to attempt to influence
markets via encryption and VPN (Figure 43 and 44). A practice that data security organisations
are already aware of—embedded qualitative bias.
USING COMPLIMENTARY DATASETS TO BUILD VISUAL HEURISTICS-BASED
DECISION MAKING A.I.
The comprehensive assessment of the datasets used to build the digital twin, and the subsequent
analyses demonstrate both the flexibility and scalability of using such methods to analyse big-
data sets (Figure 41), with multiple sources and statistical tolerances. Of course, not every
assumption about the correct techniques can be discounted. However, it seems likely that where
environmental data are being used to derive statistical hypotheses, there will always be bias no
matter how ‘learned’ the data may be.
The accuracy of the sensors and deployment due to the targeted arrays of sensor data that can
be generated is now being studied, and marketed by multinationals, whereas previously, this
only extended to frontier research groups with ‘blue sky’ research focus (e.g. AMES, 2003). By
testing the compatibility of the 32-bit ARM instruction set for Bluetooth low energy
applications specific to Linux compatible OEM’s (Original Equipment Manufacturers).
Bluetooth GATT commands were sent from the two Linux OEM’s and OEM specific
application .NET functions were visually compared for performance monitoring of the SoC
architecture. Suitability of the ARM instruction set for was then determined by testing the
compatibility of the ARM CPU architecture for Bluetooth® LE GATT communications. This
basic workflow is universally scaleable. Machines with SoC (System On-A Chip) or FPGA
(Field Programmable Gate Arrays), feature instructions for Bluetooth® LE as standard. The
best example being the Raspberry Zero, and Pi3b+ with its Broadcom SoC, and ARM CPU 32-
bit instruction set. This feature is now being exploited by industry and serves the medical
community (biometrics), connected smart cities and agriculture (temp and humidity sensors),
the defence industry (pressure, temp, and data analytics), and is now being marketed by
companies such as Microsoft Corporation, Toshiba Corporation, and Hitachi Corporation.
184
The predicted AARCH64 support requirements, for the environmental data sets used in the
ethical assessments, make artificial intelligence-based computer instances increasingly biased
towards those environmental variables without fundamental biophysical assumptions that allow
all classical and non-classical models to be simulated first, e.g. (Thompson et al., 2020) who
looked at both epigenetic and classical evolution Bayesian estimation in simulating genotype-
phenotype interactions.
VARIOUS RESPONSES TO ENVIRONMENTAL STRESSES NOT FULLY
EXPLOITABLE IN THIS STUDY DUE TO NATURAL LIMIT OF MEASUREMENT
TIME
Abiotic stress is a complex polygenic trait involving epistatic interactions (Xu et al., 2011),
among loci and dominant genotype by environment interactions (Abou-Elwafa, 2016). Plant
responses are controlled by complex regulatory mechanisms mediated by abscisic acid (ABA)
signalling, ion transportation, and the activities of transcription factors (TFs) involved in the
regulation of stomatal responses. All of which are integrated into the various plant molecular
networks, enabling plants to adapt and survive (Osakabe et al., 2014). Previous studies have
shown that these evolutionary responses are multi-generational and require many years to
elucidate. One considerable challenge is the role roots have, along with other parasitic microbes
(mycorrhiza, nematodes, etc.), that affect complex abiotic signalling responses. Many of these
cannot be phenotyped to ensure experimental repeats in field conditions, making observations
and inferences scientifically fraught with errors and have led to conjecture debate, e.g. Mickan
et al., (2016). As such a more extensive review and study are currently underway and
preliminary results (reported in Svatos, 2012), concerning mycorrhiza and response to abiotic
stress and the provenance of flowering plants, including Tibetan and Syrian barleys are being
pursued (Figure 26).
The way plants ‘sense’ changes in environmental conditions outside their preferred habitat
suggest physiological and biochemical adjustments in plants are primary responses to abiotic
stress because plants complete their life cycle in one location (Lata et al., 2011). The combined
effects of drought and other abiotic stresses in barley are elucidated through the morphological,
physiological, biochemical, genetic and epigenetic functions of the whole plant. In that respect,
continual re-calculation of A.I. workflows must be considered essential for multi-generational
time scales in ethical A.I. assessments. As such, many studies are limited by time.

185
IMMEASURABLE FIELD DATA AND OMICS BASED FUNCTIONAL MODEL
EXTRAPOLATION ATTRIBUTED TO UNDERSTANDING VARIABILITY
As shown in manuscript four, there was a significant lack of determining ground movement by
just using real data. The question arises concerning omics (bacteria and mycorrhiza, for
example). Mycorrhizal colonisation may occur when plants are subjected to drought, thus
increasing the surface area of the root zone and allows more water uptake, to maintain higher
osmotic potential throughout the whole plant. Whether there is an overlap for the integration of
function remains to be seen (the result of Manuscript 4 machine learning). It is highly unlikely
that an A.I. simulation with an omics focus would result in the same significance and heritability
for all environments and situations to discover some new evolutionary process; it is not that
simple. Remembering, that a broad range of techniques is critical for a comprehensive and
realistic understanding of biological communities; approximately 60% of genes in all micro-
organisms are ubiquitous and have different functions in similar species and organisms, such
that the presence of DNA sequences may not be sufficient to link genes to a specific service.
Low abundance (<0.1%) of genes can be linked to important pathway functions. Therefore,
relative abundances of certain groups of organisms are taxonomically diverse, estimations of
species or phyla numbers may make it difficult to determine due to adaption via a complex
series of mechanisms in horizontal gene transfer, for example, root-rot nematodes. Mycorrhiza
fit into this domain, too (Figure 26).
These considerations are not commonly used to eliminate bias that may be experienced in
linking land use to microbial diversity, abundance and function assessments as pointed out in
Svatos and Abbott, (2019) (Manuscript 2), but potentially with omics integration may alleviate
some relationships. Although this may just make things even more challenging. Many studies
detail thousands of QTLs including significant QTLs for drought tolerance and propose yield
increases in the order of 10% and as high as 30%, e.g. Lakew, (2009), Hasanuzzaman et al.,
(2013), and Robinson et al., (2016). Many of these QTL’s are unsubstantiated with significant
differences between the phenotypic measurement, and heritable genetic responses very
apparent. Phenotype dictates genotype, so extensive replicated field experimentation within the
phenotype data collection related to yield is already over-exploited, and drought tolerance
requires significant genotypic collocation in all environments to enable new theory
development (Manuscript 3). Linking everything together to associate with a heritable trait
based on some cause, is questionable in statistics, so it should be considered the same in biology.

186
A solution to the “problem of physics as it relates to biology,” no. Just another theory, but one
of many, e.g. (Greenlon et al., 2019), all with similar strategies, similar results, and similar
outcomes (less can cost more).
AGTECH AND TELECOMMUNICATIONS REQUIREMENTS FOR SUCCESSFUL
ENVIRONMENTAL AGRICULTURE DATA-SCIENCE A.I. ROUTINES
The challenge farmers and land managers face are constant but increasingly more varied and
diverse. Farmers buy what will do the job, that can be maintained by them and where spares are
available. Their biggest complaint about modern technology is that it is too expensive, too
complicated, and farmers don’t get a good outlook on the return on their investment. GPS and
virtual reality technology (VRT) have been around for 10+ years. Still, very few farmers and
agricultural OEM dealers have the skills, tools or ability to alleviate the technology ‘points of
pain,’ i.e. expectations of financial savings and stellar tech support. Variable-rate fertiliser
technology and variable-rate seeding takes a long time to set up and involves extensive fault
finding of multiple systems – mechanics, power drives, electrics, electronics, hydraulics,
pneumatics and software – with complex second-order impacts. The proprietary software is
expensive; each OEM’s software won’t talk to the other’s and requires software support.
Furthermore, processing data takes too long and needs to be integrated with soil data and
instruments on ground-based vehicles. Increasingly farmers are becoming firmware hackers
with little understanding why from their own industry (The GRDC) (GRDC chairman Mr. J.
Woods personal communication, 28th February 2017).
PCA and CCA from Svatos, (2011) and Svatos, (2012) soil data and soil website data displayed
physical, chemical and biological properties by plotting difference and variation vectors, for
land use types. Using the methods of Greenhalgh, (2002), visual vector representations of
various data sets in polar form, matrices were transformed into vectors, where vector co-
ordinates represented the differences between n- properties (physical, chemical and biological)
and length of vectors represented variations of data within each group (land use type) across the
whole data set. By using this superficial estimation approach similarities and differences
between the differently qualitatively managed farms and quantitative data of land-use type was
determined. This is a universal function, in that any data can be used to establish relationships
through the architecture and could benefit farmers and environmental scientists alike.

187
The core .NET implementation of a pythonic ASM into ARM sys.io for AARCH has significant
problems currently (ASM for the pythonic performance of AARCH support for ARM running
.NET core 3.0 and 3.1). As such, the correct ASM to implement on the core has hampered *.dev
and runtime I/O. Telstra and Optus have no demonstrated commitment or social obligation to
farmers for remote broadband, and new, low orbit satellites will still not provide the resolution
or timeliness to deal with ‘hotspots; ’fungi, pathogens, insects, diseases, frost and other
problems. Broadacre crops such as wheat, barley, canola and sorghum need to yield at least an
extra $4/Ha or save costs of that order to justify the time and expense required to establish newer
technology such as using GPS, VRT or drones. But, the challenges do not outweigh the potential
benefits (Mr. G Trowbridge (Retired) personal communication, 12th May 2021).
ECONOMIC BENEFITS CAN OUTWEIGH DATA-DRIVEN GUESSING GAMES
Current investment in the plant-based genomics sector surrounding the smart farming industry
has already yielded significant investment returns. These are exciting challenges. Concerning
the availability of the data derived from the yield mapping lacking the additional second-year
data set to confirm the hypothesis, manuscript four categorically answers the question, in
relation to remotely sensed data. That yearly variation (even for relatively stable soil
measurements) cannot be ignored when considering heuristics-based data analytics. The same
must be applied to cropping scenarios that use machine learning approaches to ascertain grain
yield from historical datasets.
The current ISOBUS standard (ISO 11783) allows farmers to connect devices from different
equipment manufacturers to transfer data (‘talk’) to each other. Existing agricultural technology
applications fall into five categories of automation:
1. GPS guidance (a mature product but not used commonly or widely except for sowing
and harvesting),
2. Co-ordination and optimisation from one OEM,
3. On-site operator-assisted automation,
4. On-site partial autonomy (John Deere, Case IH, New Holland, Kubota, Massey,
Ferguson and AGCO all have early production models of tractors, headers, sprayers,
tillers and balers,
5. Remote, full autonomy with off-site data processing in the cloud (some R&D in the
U.S.A).

188
The measurements of microclimate are regularly done with one local weather station and used
to suggest causality. Other publications fail to measure phenotype correctly due to not following
appropriate guidelines with respect to soil analyses. Similarly, (Hill et al., 2019) who suggested
that GWAS studies can be performed on complex traits but failed to measure more than one
trait in the two-year multi-environment (~4) research and assumes that the data from singular
weather stations at each site can account for the deviation within plots but more importantly
within a singular algorithm heuristic.
The software/hardware architecture required consists of a highly specific, highly flexible kernel
to link the IoT infrastructure with options for automation, machine learning, and sophisticated
embedded hash encryption based on computational theory. However, the statistical outputs that
have been used in this thesis represent a significant step towards unentangling parallel
computation projections (considering the emulation layer) the environmental, biological
systems, required from the A.I./genomics perspective are not computationally Hamiltonian
resources at the source code, kernel level. The peer-reviewed strategic ‘white paper’ and
conference proceeding, include additional unpublished datasets and results and strategic
analyses from the discovery of three collaborations that add further scope to the published
strategic policy document and the published conference proceeding. That inadequacies in larger
groups can be overcome somewhat by taking novel approaches when necessary. Including
creating deepfakes.
As such digital twins and in particular ‘Murdoch Twins’ represent a significant step forward.
Advances in the development of technologies, including the rollout of ‘smart,’ automated
systems that offer real-time decision-enabling tools, however, is new. While also providing
economic benefits through the improvement of logistics supply chains, these digital twins are
engineering tools that can increasingly connect shared software libraries to data lakes, in an
‘always connected’ information ocean (Hagendorff, 2020).

189
THE STEADY RISE OF WELL MEANING, ILL INFORMED, DATA SCIENTISTS IN
THE A.I. ETHICS COMMUNITY
Based on the hypothesis: Digital twins can be embedded and launched in AI manifolds for the
statistical analysis of heuristics data, and for correlation and extrapolation of predicted
outcomes to make ethical assessments.
Under increasing variability, predicted results based on environmental data sets used in ethical
assessments may make artificial intelligence-based computer instances biased towards those
environmental variables and data, and leads to ethical use of deepfakes in the current
geopolitical landscape.
There is little known supporting evidence that A.I. ethicists who act in the interests of a
particular group or institution are doing so without objectively focussing on their research aims.
The recent retraction by the Lancet concerning the validity of the database that was used to
evaluate ill effects of hydroxychloroquine (by a Chicago-based A.I. and machine learning
company) goes to show that where ethics, A.I., machine learning, and databases are concerned
(not the science itself) that it (the method) appears to be open to any form of implementation
and interpretation. And this is fundamentally a good thing. However, the peer-review process
concerning heuristics and A.I. needs significant overhaul concerning trust, and from an ethical
perspective, because of the significant divide between; in this case, it appears to be between
medical doctors and data-scientists. It is not surprising.
Environmental datasets and their biases are a critical consideration for this purpose, especially
in A.I. experiments and digital twin simulations. This is of significance because where a ‘closed
universe’ dataset is generated, the natural variability is shaped or minimized in statistical models
used to predict outcomes. This shaping or minimization process creates additional uncertainty
due to the environmental background being a built or constructed design. There is no qualitative
aspect. And decision-makers, (A.I. ethicists) do not come from data science or machine learning
backgrounds. Fundamentally, this is wrong; such that if there is a model to predict the outcome
a, b, and c, based on environmental variable x, y, and z then outcome themselves are limited by
the variables, and this closed environment (container) holds the bias. When applied to non-ideal
games, or situations with missing data, qualitative interpretation is required. This is right.

190
The question in relation to the ethics of such outcomes is therefore significant because the
variables used to calculate x,y, and z cannot be infinite, due to the apparent limits on resources
that are available at any one time, e.g. computing CPU, GPU, and energy (power) etc. This
uncertainty which Freedman, (1995) spoke of in his many years trying to model dynamic data
to physical variables via stats, forms the very basis of scientific understanding, which nowadays
is being ignored by scientists to construct A.I. computations, with little knowledge of the
variables themselves. Additionally, groups such as those are using political provenance
arguments to counter bias embedded bias assumptions. Specifically, Mohammad et al., (2020)
whose suggestion, “decolonial theories use historical hindsight to explain patterns of power
that shape our intellectual, political, economic, and social world. By embedding a decolonial
critical approach within its technical practice, A.I. communities can develop foresight and
tactics that can better align research and technology development with established ethical
principles, centring vulnerable peoples who continue to bear the brunt of negative impacts of
innovation and scientific progress,” shows that even Oxfordian understanding of source-code
development towards a “universal A.I.,” to address fundamentals (the pursuit of globalisation)
has been overtaken by qualitative interpretation in their knowledge of what A.I. is meant to be
used for. That A.I. is a one-size-fits-all ruler is ethically biased and a non-sensical game that
should not be explored categorically.
Indeed, there is merit in the discovery of new theories and modelling environmental data to try
and find the best correlation based on the variables (Svatos, 2018), however, it seems inherent
that in each precise model their arises new variables and potential theories, which are seemingly
limitless. Is there a limit to the number of variables that can be used to model a closed system
without increasing bias in the knowledge that those variables are potential extra sources of
variability?
The answer must be no because there is no limit to the physical methods of data collection, in
much the same way there is no limit in the number of times a straight line with a gradient of 1
can be divided revealing a straight line with a gradient of 1 (on a solar-powered graphical
calculator). Pure quantitative data will always remain quantitative unless biological emulation
can be incorporated into the molecular and computational theory. The problem lies in this
physical fact. And, therefore in A.I. assessments and especially in the creation of digital twins
to manage species outcomes based on a limited amount of data, even without considering the

191
hypotheticals, the hypothesis of this thesis should be accepted because it only is about one
individual’s perspective.
On the question of whether the physical limitation of the model itself to predict ethically
unbiased outcomes based on the potential of an unlimited source of variables; it will remain a
biased question regardless of who asks it, there is no other way to determine the outcome even
in double-blind experiments, because of quantum mechanics. It’s used in the generation of
random numbers, particularly in Hamiltonian net simulations (e.g. Grimsley et a., 2019). A
number of important reasons concerning conducting research and the ethical debate surrounding
implementing limits on natural superposition theory and entangled quantum phenomena in
biological systems are currently being explored by the author and others. There have been
numerous studies where people have tried to simulate brain neurology and other molecular
pathways to enable the visualisation and computation of algorithmic Boolean gates and
operators in 2D and 3D planes in real-time (Huang, 2020). However, these have mostly been
limited in the mathematical realm and have used data sources that are not theirs. As such, it
remains to be seen, that the outcomes of their probabilistic notion are anything but hypothetical
objectives.
On the finite nature of atoms in this aspect of intelligence, as it relates to perspective, there is
only no limit to the number of theories people will generate until the natural curiosity is
answered individually. Combined with classical genetics studies, newly available sequencing
technologies (e.g., 3rd generation sequencing, quantitative methylation-specific PCR, whole-
genome metabisulphite sequencing) with 6G core to core real-time processing of targeted
mutation might give a more definite answer. But what was unthinkable five years ago only
seems the reality now. Many plant species can propagate asexually and produce vegetative
clones, providing opportunities for the mitotic inheritance of epigenetic states leading to
significant new complex traits. However, perhaps a paradigm shift in the representation of genes
specific to traits. Lüttge and Thellier, (2016) stated that “stored information, allowing the
expansion of an integrated, efficient response to the variety of stimuli perceived by the plant
during a time span Δ, is, in fact, instruction for optimized allocation of the plant resources to
its principal living activities”. The concept ‘gene essentiality’ has already been proposed for
the non-absolute nature of all genes (Rancati et al. 2018), but; this understanding is their
understanding.

192
Perhaps it is time to revisit the original ideas by exploiting trait data, environmental models,
and bioinformatics tools specific to the adaptation of many original phenotypic theories via
heuristic algorithms using hidden Markov chains (HMM) (Aslam et al. 2017; Fong et al. 2017;
Keight et al. 2018). Kidd and West, as early as 1918, described "physiological
predetermination" as an external condition operating on the seed at the critical stages of
germination. But, modern crop plant adaptation has evolved to be high-yielding with a focus on
tolerance of more recent biological stress (Weckwerth et al., 2020). There is evidence to support
heuretics research because it can deliver information from historical data which can then be
overlaid with modern genomics and epigenetic sequencing data. Moreover the importance of
old data sets and their potential role in improving accuracy of A.I., learning where a lack of
significant data exists cannot be ignored or swept aside by dividing; concerning any game-
simulation or citing political reasons e.g., (The Lancet Group, 2020; Nature, 2020). Culturally;
the use of digital twins in deepfake games is only just beginning.

193
FINDINGS AND RECOMMENDATIONS

194
195
THESIS FINDINGS
Based on the discussion, and the trust generated not correlating well to quantitative A.I. latency
time observations (inherited embedded bias). Genetic algorithms further obscure quantitative
interpretation of qualitative phenotypes (deepfakes), species’ data used in downstream analyses
and is unethical (usurped data) therefore it is stressed;
1. Statistical models do not correlate well to quantitative A.I. due to inherited embedded
bias (latency vs time), with the potential for non-Turing-complete systems being utilised
in mainstream applications, including government investments in IoT.
2. Genetic algorithms further accelerate and obscure qualitative interpretations required of
quantitative data leading to a purpose for deep fake imagery, (for example, where
unrepeatable based observations ocurr segregating on colour may occur).
3. There are still significant unanswered ethical implications concerning first nations’
peoples’ data, as it relates to A.I., (and not only genetic discoveries) concerning source-
code trust in any embedded A.I. management system.
4. The supposition that a one-size-fits-all (objective) divide and conquer strategy (for
embedded A.I., within an objective statistics model to associate cause) will not generate
any new revolutionary discoveries, is right. It would have already been discovered.
THESIS RECOMMENDATIONS
1. The use of A.I. in its current form as it relates to public trust of embedded, machine-
based source-code, should not be considered ethical by the scientific community.
2. Qualitative interpretation of the data as a means of usurping the original source is not a
trust relationship in an A.I. context.
3. Any species’ data used in a downstream analysis is unethical where any previously
unacknowledged tenet exists (no matter how significant) and has cultural implications.
4. Deepfakes are necessary for the current landscape for future validation of source-code,
trust, bio-security, data sharing relationships between nations.
5. Murdoch Twins may be used to facilitate 6G and quantum encryption.

196

197
FUTURE TRENDS

198

199
THE NEXT 30 YEARS AS IT RELATES TO THESIS TENET, A.I. AND BIOPHYSICS
We are at a crossroads of genetic discoveries where classical genetic improvement through QTL
mapping and screening based on a single gene approach will not be sufficient to meet the
estimated 40% increase in crop productivity required to feed 10 billion by 2050 under the
increasing consumption scenario. However, without knowledge of the functional aspects of
gene theory, and more importantly real-time observational aspects of the traits themselves (i.e.
the most significant bottleneck), the required advances will remain un-attainable and be open
to manipulation of datasets used in qualitative interpretation. Researchers have been mainly
interested in demonstrating that adaptation capacities exist in plants and animals by unravelling
the main characteristics of adaptation (GWAS, EWAS, etc.). However, adaptation is not an
occasional episode but a fundamental property governing survival. There is increasing evidence
for how environment influences gene expression and the inheritance of epigenetic characters in
plants and animals. How much of this inheritance is due to environmental factors, could be
answered by A.I. Whether or not specific epigenetic changes have accompanied memory is
fundamental in computer and biological algorithm development but may not be Turing-
complete. In 1962, Kuhn mentioned that genetics and epigenetics must not be seen as different
areas, but instead, integrated to provide a broader repertoire of molecular factors to explain how
life is controlled. It is concerning that life should be “controlled.” Particularly as it relates to
the cultural use of data in games. The point is that ethical data use can only result from ethical
data collection. Data ownership aside if a cultural claim exists or predates a data collection
event, said claim would predate the data and would have just as much relevance to the model /
game in its validation because A.I. is all about evolution nowadays.
Ethically it is therefore right to assume that all open source or proprietary software (6G being
the next iteration that will probably also use TCP/IP) will include all possible data (all personal
data). In fact it would be unwise to assume that a big company like Bayer would ever consider
for example data owned by a rival company useless. More so the data would be usurped under
the current manifests when scaling up e.g. Azure vs AWS. ‘Murdoch Twins’ is the name that
was given to the twin instances in Azure as it relates to ARM AARCH64 architectures and their
usefulness to Nokia and relates to the current LTE Moon Shot NASA project and my desire to
measure gamma emission from the sun as suggested to Nokia Moon Shot Intuitive Machines
VP Space Services, T Martin through personal communication on 27th October 2020.

200
Subjective or not if validation of data cannot be seen as culturally significant to the original
owners of the source of the data then the ethics of the use of said has to be questioned. Who
owns the moon? The tenet of the thesis points to the cultural appropriation of Tibetan barley by
the Han Chinese through a claim of ‘a priori.’ Unethical or not deepfake images and digital twin
games are a natural response, and thus ethically appropriate in the current geopolitical
landscape.
As a scientist I am interested in determining the entangled components of Hamiltonian
manifold, neural-nets by measuring Euclidian distances of heterodyne equilibrium functions, as
they relate to the fundamental measurement of evolutionary time (in biological systems). There
are already Bayesian and other Monte Carlo methods to measure this phenomenon but these
fall drastically short because of the qualifying statement about the random nature of an
elementary particle (i.e. the spin states). All qualitative computations have an inherent bias that
may be random in nature after all. This is a source of “flux” or “ebbs and flows.” Blips.
Measuring the difference using a Gaussian can allude to some of the more common prime
number examples (Bluetooth or WiFi signalling protocols) however, they are only a ‘pseudo-
random’ number sequences and have a determinable prime as a factor if you follow the physics
and calculate the vectors. I am more interested in trying to determine the spin states of entangled
quanta quantitatively in biological systems, because fundamentally these are the most important
subjects in biophysics. Evolutionary theorists will always talk about the random nature of
evolution but a physicist will always argue against you, because “god doesn’t play games with
dice” as Einstein said. When we look at the fundamental nature of the calculus as it relates to
pair-wise distribution in a canonical simulation or its equivalent in biophysics, you will see that
a lot of progress is being made. However, the entangled nature of the biological system or its
equivalent particle derivatives; as it relates to Dirac, Feynman and others (who talk about
normalized peaks) with respect to some limit (approaching a theoretical equilibrium) do not
make up for the lag (latency Δ.t) because their systems are different (theoretical vs real) i.e. not
Turing complete.
The question that needs answering is can the theoretical equilibrium be reached in an
evolutionary system as it relates to the entanglement of particles? The laws of physics (relativity
says no) but theoretical particle physics says yes. And as it relates to the particle distributions
(in a targeted mutation experiment for example using gamma) what are the causes of (for

201
example) mutations that result in epi alleles or “hot spots” that then cause (for example), a
Gabba shunt or ABA cascades as it relates to the fate of these evolutionary Klein Klima
interactions in the next generation? In the field of interactomics using “natural sources” to
measure an elementary particle, i.e. to build a digital system instead of relying on observations
alone to predict causality may answer that. Validity only lies in the subjective nature of that
system itself.
Therefore, is A.I., security and control an ethical A.I “trait”, concerning opposing evolutionary
views? It cannot be, and so the question “who owns the data?” remains. “As researchers seek
to unlock the power of data analytics (M.L., A.I.) in agrifood value chains, purveyors of fine
products and services utilising said products, and those organisations which digest them, all
seek to make their fortune, it is refreshing (and most necessary) to pause and consider the ethical
implications of the outcomes.” Ethical use of deepfakes is a natural progression, where sources
of data are not always acknowledged. However, in science, there is a need for clear direction,
to continually question data, including its validity, source and the methods used in its collection,
in the future. Without that clear direction and without an applied focus on the aims at all times,
bias will consistently be more significant due to the nature of data collection. Bohr’s biophysics
“problem.” We cannot merely eliminate bias from research because it will continue to be there,
and even if it is staring us in the face, we are sometimes too blind to see it. We must continue
to map a new way of free-thinking concerning the use of species’ data, and for digital twins but
more importantly considering our ethical responsibilities concerning data and its use, including
the cultural implications of deepfake games, in not only heuristics but all aspects of life. And
with this challenge, a new set of biases will appear and cloud our neon vision. However, after
all is said and done, there is always a light at the end of every tunnel.

202

203
THESIS APPENDICES

204

205
TABLE OF APPENDICES
APPENDIX 1: Remote 5G automated phenomics platform for low melting temperature
fat, native grass grazed export cattle Wagyu EWAS
APPENDIX 2: The role adaptive trait plasticity plays in pre-harvest sprouting in barley
APPENDIX 3: Microbial community response to nitrogen use in dairy soils
APPENDIX 4: Phenotyping stomatal response combined effects of heat and drought via
an automated R-Python generated transpiration model of multi-spectral data (Proof of
concept)
APPENDIX 5: Australian drone technology assisting a significant step in step in crop
tolerance to heat and drought stress
APPENDIX 6: Preliminary assessment of employing hyperspectral imagery to detect
minerals indicative of uranium ore from unmanned aerial vehicles
APPENDIX 7: PhD scholarship in digital connectivity and big-data analytics in
agriculture

206

207
APPENDIX 1: REMOTE 5G AUTOMATED PHENOMICS PLATFORM FOR LOW
MELTING TEMPERATURE FAT, NATIVE GRASS GRAZED EXPORT CATTLE
WAGYU EWAS
Since the invent of the SEQUEL2 platform for SMRT sequencing (Pacific Biosciences of
California, USA), and the associated cloud-based embedded .NET, enabled application
developments for the Sequel II system (for remote shell access programming over 64-bit
architecture APIs), the immediate benefits have not yet been realised. The company states, “we
are ready to take your questions on plant and animal research, human biomedical research,
microbial genomics, and SMRT informatics in all application areas, including whole genome
sequencing and annotation, targeted sequencing, and metagenomics and epigenetics,” In this
abstract submitted to PacBio (September 2019) for an SMRT sequencing grant, a case was made
for a remote LTE/5G API based sequencing EWAS study (pacb.com/smrt-science/smrt-grant/).
Given the more recent challenges facing the industry in relation to provenance, it is expected
that studies like these will become commonplace, due to the tracing and quality control that
these studies enable and the higher likelihood that consumers will value provenance over price
more than ever. Additional SMRT sequencing grant applications were also made and are
partially addressed in Appendix 3.

208
ABSTRACT
Previously supported research in Western Australia by the Department of Industry and Regional
Development, the University of Western Australia, Murdoch University, the CY O’Connor
Institute, and a local indigenous community has identified potential benefits from identifying
the genetics behind low-melting-point fat content in Wagyu beef which makes it potentially
healthier to eat than other beef when fed a premium indigenous grass diet. Such a product would
attract a significant premium when sold at market.
This project focuses on characterising the holobiont surrounding indigenous grasses
subsequently grazed by Wagyu cattle using a histone tail Epigenome Wide Association Study
(EWAS). Sequel systems will be used to characterise microorganisms from their unique,
isolated environments including from the soil, water and plant tissue (roots, leaves and seeds),
for correlation of the methylation patterns generated to Maldi-tof proteomics meat protein data
to characterize the beneficial health effects of the native grasses versus traditional supplemented
Wagyu.
This project will use cattle from 7 locations in WA grazing on native grasses separated by 3000
km that are unique to those environments. Bioinformatics analysis will be used to genetically
characterize the variability of the cattle food intake having adjusted for external factors, such as
environment and location to look at specific epialleles that are custom to the animal’s stage of
growth which reflects meat quality. The results from this research will be published in a
scientific journal and distributed as an industry report to accelerate the production of higher
quality, Wagyu beef from Australia.

209
APPENDIX 2: THE ROLE ADAPTIVE TRAIT PLASTICITY PLAYS IN PRE-
HARVEST SPROUTING IN BARLEY
The following manuscript was prepared for the frontiers journal series concerning plant
breeding in a special edition about pre-harvest sprouting. After attending an event in Western
Australia with the focus on pre-harvest sprouting, the author set out to write a review that
bridges the complicated aspects of epigenetics, with the interesting historical background
concerning the unique way ‘big-data’ can be linked to pre-harvest sprouting for improving plant
breeding.
At the time, the manuscript was presented as a precursor to a series of plant biology experiments
concerning epigenetics (EWAS). The University of Western Australia Significant scientific
comment was sought from various academics including Murdoch Professors’ Chengdao Li, and
Wujin Ma, and UWA Professor Ryan Lister. Professor Lister, at that time, was asked to consider
collaboration efforts concerning the idea of an experiment using high-quality phenotype
throughput data specific to GC islands and epigenetic expression feedback loops on the Pac Bio
SEQUEL1 system. “The cost of such an experiment although potentially good, might not yield
significant enough data to explicitly answer the question concerning the idea itself, which might
be difficult to justify.”
This manuscript is a reflection of that research effort. Since then, the author now has access to
a brand new SEQUEL2 system (as of March 2020), through independent collaboration efforts
(separate to those of The University of Western Australia), who do not have access to this new
machine yet.
210

211

212
THE ROLE ADAPTIVE TRAIT PLACITY PLAYS IN PRE-HARVEST SPROUTING
IN BARLEY
Karl BW Svatos1*, Dean Diepeveen1,2,3, Lynette K Abbott4
1 – School of Veterinary and Life Sciences, Murdoch University, Murdoch, W.A., Australia.
2 – Faculty of Science and Engineering, Curtin University of Technology, Bentley, W.A.,
Australia.
3 – Western Australian Department of Primary Industries and Regional Development, South
Perth W.A., Australia.
4 – UWA School of Agriculture and Environment, The University of Western Australia,
Crawley W.A., Australia.
Correspondence:
ABSTRACT
Pre-harvest sprouting can have a devastating effect on grain yield and quality. Modern
techniques used to analyze genes and gene function is changing rapidly. Fundamental to this
change is the incorporation of environmental trait plasticity (based on transgenerational
epigenetics) into existing evolutionary models based on natural selection. New varieties can
then be developed with resistance to pre-harvest sprouting because traditional QTL, gene
function, and genetics principles will not be able to keep up with consumption and the demands
of global food security. The incorporation of historical big-data sets in statistical methods, for
example, heuristic Monte Carlo algorithms (hidden Markov chains) implemented through
supercomputers, is enabling more accurate genotype by environment observations that support
epi-QTLs, complex trait incorporation and optimum phenotypes at a rate faster than ever before.
KEYWORDS
Barley epigenetics: Plant memory: Pre-harvest sprouting: Heuristics and big-data: Methylation
bioinformatics
213
INTRODUCTION
Adaptation is an essential evolutionary function for all life and is crucial for the successful
performance and survival of plants in their environment (Lüttige and Thellier, 2016; Köhler and
Springer, 2017; Müller et al., 2018). Phenotypic plasticity is a function of adaptation and
involves adjustments to express functionally relevant phenotypes in contrasting conditions
(Sultan, 1995; Matesanz and Milla, 2017). Trait plasticity is reported across all lifeforms (single
and multicellular) and in particular in the flowering lineage of grasses that includes wheat and
barley (Gilady and Hoffman, 2013; Gage et al., 2017; Rancati et al., 2017; Müller et al., 2018).
Perhaps the most significant challenge surrounding research in adaptive trait plasticity specific
to pre-harvest sprouting is the misunderstood relationship it has with transgenerational
epigenetic inheritance (Heard, 2014; Burggren, 2016). Trait plasticity as a model for epigenetic
inheritance is pursuant to the challenge of ruling out genetic effects underlying the phenotype
of the offspring. Nevertheless, more than 80 years have passed since Muller described what is
now called position-effect variegation (Felsenfeld, 2014), which was around the same time that
Lysenko converted winter wheat into a spring variety through ‘jarovoe’ or vernalization
(Dombrowski et al., 2001; Hepworth et al., 2018). The Russian epigenetics movement under
the Marxist doctrine was Lysenkoism (the political tool), but it failed to achieve Stalin's
promised “revolutionary leaps”. It was not until much later that plant adaptation was found to
play a vital role in abiotic stress tolerance, including in pre-harvest sprouting, as highlighted in
depth by Lindsey and Knight, (1999), Tricker, (2015), and Lämke and Bäurle, (2017).
EPIGENETIC PHENOMENA SPECIFIC TO TRAIT PLASTICITY
Epigenetic phenomena specific to trait plasticity have been described and categorized in a range
of processes in which the rearrangement of genes on the chromosomes become inhibited
selectively (Herman and Sultan, 2016; Schneider and Meyer, 2017). Epigenetic changes are
responsible for para-mutation in plants, whereby one allele can cause a heritable change in gene
expression of the homologous allele (Brink, 1956; Stam et al., 2002). An epigenetic state is
inherited from one generation to the next both meiotically (e.g., the histone H3
methyltransferases - H3S10P), and mitotically, and therefore leads to the cell condition,
ensuring the inheritance of their differentiated state over mitotic cell division (e.g., the histones,
H2A, H3, and H4) (Bendix et al., 2015). Examples of publications on meiotic and mitotic
families of histone transferases which are specific to wheat and barley include those by
Rassoulzadegan et al., (2006), Borrill et al., (2015), and Li et al., (2018).

214
Quantitative genetic models of phenotypic plasticity need further refinement because the
introduction of functionally characterized genes and their associated trait epi-QTLs into the
significant varieties versus traditional crossing and selection methods will advance resistance
to pre-harvest sprouting at a faster rate (Schneider and Meyer, 2017; Gao et al., 2018). When a
trait encodes for an environmental response, it is primarily a response to genetic drift that may
undergo genetic assimilation, and this is an extension of the concept of natural evolution through
chance (Williams et al., 1966; Lande, 2009). Müller et al., (2018) proposed an evolutionary
viewpoint to order and characterize classifications of ‘adaptive immunity’ described across all
major domains of life. The inherent problem with epigenetic studies specific to abiotic stress,
pre-harvest sprouting and epigenetics studies, is that: (i) there is little consensus on what
constitutes permanent incorporation of an elaborate epigenetic phenotype into the genome; (ii)
most studies only consider intra-generational inheritance; (iii) there are very few scientific
publications that link epigenetics with evolution, and (iv) there is relatively little experimental
data operating at the epigenetics, natural selection and evolution nexus (Burggren, 2016). Short-
term stress under controlled conditions might not result in the same epigenetic signatures as
long-term exposure to natural environments in plants (Song et al., 2013; Hanson and Skinner
2016). However, if an environmental cue generates genomic immunity by a transposition of the
invading element, this acquired characteristic can become heritable across generations (Köhler
and Springer, 2017; Richards et al., 2017). Plants are heavily dependent upon changes in gene
expression to respond to environmental stimuli, and chromatin-based regulation of gene
expression is a likely crucial element (but not the only factor), in determining the level of
epigenetic inheritance of traits responding to the environment; this includes the pre-harvest
sprouting phenotype (Köhler and Springer, 2017) (Figure 1).
Figure 1: A hypothetical model for trait plasticity of the barley pre-harvest sprouting phenotype. Darwinian natural selection
as the fundamental process of genetic transfer of traits, coupled with adaptation (environmental memory) passed via
epigenetics to the offspring (based on the philosophical works of Kuhn (1962), Griffiths and Stotz (2013) Hanson and Skinner
(2017), Lenski (2017), and Gao (2018)).

215
The physiological mechanism involved in the initiation and release of plastic traits related to
pre-harvest sprouting includes the seed dormancy phenotype (Nonogaki., 2014). Both phases
involve complex interactions between environmental and genetic factors (Le Gall et al., 2015).
In conditioning for the eco-physiological performance of plants, distinctions between
adaptation, acclimation, and acclimatization need stating. Adaptation refers to the spectrum of
changes that follow acute and repeated exposure integrating genotypic and phenotypic
responses (Lenski, 2017), and may also include behavioural responses, including reduced
activity levels (Gagliano, 2015). Acclimatisation is the interaction of adaptive physiological or
behavioral changes within an organism in response to the natural climate or environment
(Thellier, 2017). Acclimation differs from acclimatization in that rather than adaptive
characteristics augmented in a natural climate or environment, the stimuli for adaptation is
induced artificially (when plants are grown in glasshouses or growth chambers with ambient
conditions set and altered to suit experimental design). Whereas adaptation mostly refers to
heritability, genotypic traits that have evolved through natural selection acclimation and
acclimatization refer to phenotypic traits that are environmentally inducible, and mostly
reversible (Abdurakhmonov and Abdukarimov, 2008; Bita and Gerats, 2013). A critical factor
in all three adaptative responses is the circadian clock and its role in environmental cues subject
to regulation by photoperiod, which amongst others, serves to coordinate signal transduction
(Campoli et al., 2013; Müller-Xing et al., 2014; Bendix et al., 2015).
MAJOR INFLUENCES ON THE PRE-HARVEST SPROUTING PHENOTYPE
Recent publications on the primary molecular mechanisms underlying the encoding behaviour
of environmental seed dormancy responses and its regulation are those by Nonogaki, (2014)
and Nonogaki and Nonogaki, (2017). These include information on (i) silencing of seed
dormancy genes through histone and DNA methylation, (ii) repression of dormancy genes and
activation of germination genes through histone deacetylation (iii) repression of seed
germination genes through histone deacetylation, and (iv) histone ubiquitination and
methylation associated with transcription elongation (Nonogaki, 2014; Nonogaki and
Nonogaki, 2017).
There may be evidence that seed dormancy has contributed to adaptation and evolution of seed
plants through the existence of plant hormones and the roles that these have with immunological
responses to climate (Zhou et al., 2018). However, the differential regulation of signal

216
transduction and alternative splicing of chromatin (and other non-coding regions) associated
with plant hormones and their relationships with the environment remains elusive (Ishibashi et
al., 2017). It is understood that the key players include the abscisic acid (ABA) and gibberellin
(GA's) pathways and reactive oxygen species (ROS) (Barrero et al., 2012; Vishwakarma et al.
2017). ROS promotes seed dormancy, and seed germination in several cereal crops and ABA
pathways can lead to the breaking of dormancy through the application of GA (an antagonist of
ABA) that can inevitably lead to pre-harvest sprouting trait expression (Ishibashi et al., 2017).
Synthesis of ABA and GA systems with orthogonal dCas9 regulators has been shown to be able
to independently control the expression of different genes within the same cell (Lo and Qi,
2017). These systems can aid the construction of basic Boolean logic-gated dCas9 operators
allowing for orthogonal and multiplexed transcriptional modulation (Lo and Qi, 2017).
Heat and drought ROS and ABA research has also yielded evidence that epigenetic regulation
specific to signal transduction plays a crucial role in both ABA pathways and ROS biology
concerning circadian rhythms (You and Chan, 2015; Haak et al., 2017). Moreover, by
modifying the circadian rhythm through ABA and ROS pathways, new complex traits related
to pre-harvest sprouting could enable resistance, avoidance and potentially increased yields in
risk-prone areas. As with any complex trait expression (e.g., extreme cold and water effects on
the embryo), extensive knowledge of the sum of all traits that makes up the complex trait is
required, and it has been claimed that these traits, when expressed, may be crucial for population
survival (Balao et al., 2017). Hepworth et al., (2018) identified distinct aspects that temperature
profiles contribute to signal generation. The mechanism on which the signal generation was
based on was then used to associate temperature to seed germination (temperature fluctuations
formed a positive signal and induced seed germination). Temperature variation sensitivity may,
therefore, be a vital mode of information processing in plants. In autumn, transient cold
temperatures promoted transcriptional shutdown of Arabidopsis FLOWERING LOCUS C
(FLC), independently of co-factors, conferring epigenetic memory (Hepworth et al., 2018).
To understand the function of temperature and circadian rhythm specific to trait plasticity of the
pre-harvest sprouting phenotype, we need to consider how rapid evolution (increased plasticity)
allows the pre-harvest sprouting phenotype to approach and subsequently reach the newly
required optimum phenotype (Minelli, 2018). This rapid evolution must adjust for a potentially
slow genetic assimilation when the reduction in plasticity is over-compensated by genetic

217
evolution (Lande, 2009; Griffiths and Stotz, 2013). A primary concept in this may be the
canalization process, and how genomic information of the pre-harvest sprouting phenotype
encodes the immunity response, however, this idea appears to be unexplored (Müller et al.,
2018; Weinhold, 2018).
HIGH-THROUGHPUT PHENOTYPING AND HISTORICAL DATASETS CAN
CONTRIBUTE TO INCREASING THE RELEASE OF NEW VARIETIES SPECIFIC
TO PRE-HARVEST SPROUTING TOLERANCE
Combined with classical genetics studies, newly available sequencing technologies (e.g., 3rd
generation sequencing, quantitative methylation-specific PCR, whole-genome bisulfite
sequencing) are facilitating studies in abiotic stress including-harvest sprouting and the
epigenetic phenomena associated with pre-harvest sprouting at a level of detail that was
unthinkable five years ago (Jenjaroenpun et al., 2018). Epigenetics studies of plants are of
importance because plants are sessile and are heavily dependent upon changes in gene
expression to respond to environmental stimuli, and chromatin-based regulation of gene
expression is crucial for understanding the plant response which contributes to improving the
variety. Furthermore, the level of chromatin ‘resetting’ during sexual reproduction appears to
be lower in plants compared with animal species, potentially allowing inheritance of
epimutations acquired during plant life (Köhler and Springer, 2017). Many plant species can
propagate asexually and produce vegetative clones, providing opportunities for the mitotic
inheritance of epigenetic states leading to significant new complex traits. However, perhaps a
paradigm shift in the representation of genes specific to the pre-harvest sprouting trait is
required to move forward. Lüttge and Thellier, (2016) stated that “stored information, allowing
the expansion of an integrated, efficient response to the variety of stimuli perceived by the plant
during a time, is, in fact, instruction for optimized allocation of the plant resources to its
principal living activities”. The concept ‘gene essentiality’ has been proposed for the non-
absolute nature of all genes (Rancati et al., 2018).
Scheben et al., (2017) suggested the need for a shift in cropping improvement models that use
targeted cycles of elite varieties via genome editing to produce improved varieties with
advanced traits or specific adaptation to local environments, replacing cycles of crossing or
untargeted mutagenesis and selection. Despite recent advances, the lack of functional
understanding of genes remains one of the most significant bottlenecks in crop improvement

218
using genome editing. The optimum phenotype and genotype norms of reaction are linear
functions of the environment, and this affects epigenetic priming specific to pre-harvest
sprouting. Interestingly, it has already been proposed that the dCas9 epigenetic editing toolkit
will facilitate understanding of the relationship between chromatin states, gene regulation, and
cellular phenotypes in mammalian cells (Lo and Qi, 2017).
Perhaps it is time to revisit the original ideas of pre-harvest sprouting by exploiting trait data,
environmental models, and bioinformatics tools specific to the adaptation of pre-harvest
sprouting phenotypes via heuristic algorithms using hidden Markov chains (HMM) (Aslam et
al., 2017; Fong et al., 2017; Keight et al., 2018). Kidd and West, as early as 1918, described
"physiological predetermination" as an external condition operating on the seed at the critical
stages of germination. Subsequently, Harrington, (1932) (and others) investigated the resistance
to pre-harvest sprouting of the wheat varieties Stook and Windrow and showed a genetic link
between resistance to pre-harvest sprouting and the environment (Kidd and West, 1918;
Harrington, 1932). Included in this research were large datasets with unique observations about
resistance to pre-harvest sprouting. Modern crop plant adaptation has evolved to be high-
yielding with a focus on tolerance of more recent biological stress. Pre-harvest sprouting has
been a significant issue for farm decision-making because rainfall before harvest has a
devastating effect on yield. There is evidence to support heuretics research because it can deliver
information from historical data which can then be overlaid with modern genomics and
epigenetic sequencing data (Fong et al., 2017), therefore we stress the importance of old data
sets and their potential role in improving varieties and increasing yields in areas where pre-
harvest sprouting is an issue (or where lack of significant data exists).
FUTURE TRENDS
We are at a crossroads of genetic discoveries where classical genetic improvement through QTL
mapping and screening based on a single gene approach will not be sufficient to meet the
estimated 40% increase in crop productivity required to feed 10 billion by 2050 under an
increasing consumption scenario (Gao et al., 2018). However, without knowledge of the
functional aspects of genes encoding the traits specific to pre-harvest sprouting, and more
importantly the observational aspects of the traits themselves (i.e. the most significant
bottleneck in crop improvement), the required advances will remain un-attainable. Researchers
have been mainly interested in demonstrating that adaptation capacities exist in plants and

219
unraveling the main characteristics of plant adaptation (Thellier et al., 1982). Adaptation of
plants is not an occasional episode but a fundamental plant property governing their survival.
Recent studies indicated that plants have a stress memory that supports adaptation to recurring
stress (Gaglino, 2015; Thellier, 2017). There is increasing evidence of how the environment
influences gene expression and the inheritance of epigenetic characters that occurs mainly in
plants and how much of this inheritance is due to environmental factors (Hanson and Skinner,
2017). Whether or not specific epigenetic changes have accompanied plant domestication is
fundamental to plant breeding for pre-harvest sprouting tolerance. Kuhn, (1962) mentioned that
genetics and epigenetics must not be seen as different areas, but instead, integrated to provide
a broader repertoire of molecular factors to explain how life is controlled, including pre-harvest
sprouting.
CONFLICT OF INTEREST
We declare no conflict of interest in publishing this mini review
ACKNOWLEDGEMENTS
We thank Professor Chengdao Li for his advice and the Grains Research and Development
Corporation for a postgraduate scholarship (to KBWS). GRDC Grant Number: MU00049.

220

221
APPENDIX 3: MICROBIAL COMMUNITY RESPONSE TO NITROGEN USE IN
DAIRY SOILS
The following conference proceeding, was published in the Australasian Dairy Science
Symposium 2012. Proceedings of the 5th Australasian Dairy Science Symposium, Melbourne,
Australia, 13-15 November 2012. The author is not first author, nor is the paper a full length
research publication, the important information that needs to be acknowledged is the use of the
statistical ordination plots by the authors concerning (PCA and CCA). The contribution of PCA
ordination plot data based on the 16S PCR amplified gene fragments, to the land use and
bacterial function sets the tone and pace (a strategy and work in Svatos and Abbott, (2019)).
The entire statistical PCA statistical process (displayed here specific to Mediterranean climates)
that was developed for use in this conference proceeding and in Svatos and Abbott, (2019) was
developed by the author with another researcher R. S. Greenhalgh. It needs stating as it
represented (at that time) a significant step in computer vision and graphical processing, that is
not acknowledged in Abbott et al., (2012). The original application of the data processing was
produced via a program and supporting algorithmic proof, that Greenhalgh and the author were
developing since 1999. The original proof Greenhalgh (2002) was presented in Zakopane
Poland through Springer; however, this original work has been removed from all internet related
sources. Springer was contacted including the current ICCCV management for comment during
the writing of this document, but those requests were never fruitful (questions in relation to
accessing the work and referencing the doi). That conference also had significant other
presenters from Cambridge University; amongst others (Mr RS Greenhalgh personal
communication, 1st September 2020). Those authors also did not reply to the authors requests.
The original works (Greenhalgh, 2002; Svatos, 2011; Svatos, 2012; Svatos, 2018) who with the
author wrote an original PCA ordination algorithm program in Microsoft Excel at UWA
together independently of these other authors’ at the dairy proceeding (that was subsequently
used to validate the other statistical methods including in Svatos and Abbott et al., (2019); the
program did not originally exist before 2012, the proof and the data output files were conceived,
developed, written but have been kept unpublished by R. S. Greenhalgh and K. B. W. Svatos,
it remains this way today. The author is pursuing this program concerning its potential use in
quantum computing including with American based Karl Corporation.

222
222

223
223

224

225
APPENDIX 4: PHENOTYPING STOMATAL RESPONSE COMBINED EFFECTS OF
HEAT AND DROUGHT VIA AN AUTOMATED R-PYTHON GENERATED
TRANSPIRATION MODEL OF MULTI-SPECTRAL DATA (PROOF OF CONCEPT).
The following poster was presented at the Murdoch University Agricultural Symposium. The
initial concept for the research project one in Manuscript 3, combined with the data from the
benchmarking experiments concerning phenotype measurement and comparison to known
models associated with plant responses to combined abiotic heat and drought stress. The work
is a proof of concept which was successfully executed and got considerable good feedback from
more senior members of the Western Australian farming community. Again, as with the
methods of Manuscript 3 the same problems concerning the software were experienced due to
the ownership of the germplasm, although the intellectual property of the software remains
available (now under Karl Corporation).

226

227
APPENDIX 5: AUSTRALIAN DRONE TECHNOLOGY ASSISTING A SIGNIFICANT
STEP IN STEP IN CROP TOLERANCE TO HEAT AND DROUGHT STRESS
The following published white paper was written as part of the research project one in
Manuscript 3 and published in the Future Directions Journal. Consider the following link for
more information. http://www.futuredirections.org.au/publication/australian-drone-
technology-assisting-significant-step-crop-tolerance-heat-drought-stress/
Concerning the white paper itself, the results from the analysis were initially completed by
Scientific Aerospace, for all of the locations except for Katanning. The Katanning work was
completed by Scientific Aerospace for the author for the explicit use in the PhD. Parts of the
summary, analysis and case study were completed by the author under the direction of Geoff
Trowbridge (Retired). The conclusion drawn is the vision of both authors and the content of
which was not altered by either.

228
228

229
range of biological and non-biological stresses such as heat, frosts, drought and pests’ events using unmanned aerial vehicles (UAVs) or drones.
Figure 1. Western Australian Wheatbelt Crop at Katanning. Source: the author.
UAV based technologies can provide an increasingly wide range of sophisticated data. Farmers can now access
survey quality contour and three-dimensional mapping, digital surface and terrain models, plant counts, plant
height, or geotagged vegetation index maps. The processed data is made visible in various ‘layers’ so that farmers
get very graphic answers to specific questions about, for example, soil temp, soil moisture, crop nutrient status,
biomass prediction, grain yield prediction, and other traits. Data processing beyond the capacity of a home
computer can now be professionally provided on site via a datalink.
Figure 2. Aerial Survey processed to show 20cm Contour Intervals. Source: the author.
The integrated system technologies needed to provide information of this fidelity have been locally developed
for precision, targeted, agricultural surveying. Data sources include NDVI, thermal, multispectral and a new
miniature spectrometer recently developed by the University of Western Australia’s microelectronics
laboratories. The acquired raw data images are processed and enhanced using third party software, such as Pix4D

230
and Context Capture. Sophisticated scientific analysis is required to make use of the information contained within
the raw data packages. The analytical service has been developed in collaboration with Murdoch University.
Figure 3. Further processing of the same area revealing optimal sites for installing Leaky Weirs. Source: the author.
Scientific Aerospace has made a significant research and development investment to integrate the optical output
with the third party and drone software. This is achieved using Application Programming Interfaces (APIs)
developed and built in house. Scientific Aerospace also utilises a custom application for a computer tablet,
tailored prior to each mission for a specific flight based on each client’s requirements.
Figure 4. In-field assessment of aerial imagery and data processing. Source: the author.
Case Study in Collaboration - Assessing Heat Stress Resilience in Wheat and Barley Crops

231
With the aim of discovering which wheat and barley varieties and soil combinations provide the best resilience
to a combination of non-biological stress (heat and drought), Scientific Aerospace teamed up with Murdoch
University researcher and PhD candidate, Karl Svatos, to help develop a ‘proof of concept’ drone experiment.
This was performed in the field at the Katanning Research Station. The research is an extension of study in
evaporation, transpiration and drought stress with ground based thermal remote sensing in agricultural
cultivation. For simplicity, the algorithm for the internal energy status of plant systems is not shown here, but
involves several temperature parameters, emissivity, heat transport and leaf resistance.
Data Capture
Two drones were equipped with either the NDVI multispectral and optical lenses or a thermal camera. Two flights
were made at the coldest time of day (dawn) and later in the afternoon at the hottest time of the day.
Ground truth testing was also used to provide reference absorption, reflectance and saturation benchmarks, so
that any deviation in the raw drone data could be corrected during data processing. The UAV was flown at
altitudes to capture high resolution data specific to each flight requirement. The sensors looked vertically and
sideways to capture three-dimensional imagery.
Figure 5. The UAV in flight over the Rye Wheat and Barley Test Field at Katanning. Source: the author.
Data Processing
The raw data was gathered and transferred to the on-board computer and saved for processing after the flight.
Geographically tagged photos were extracted from the files and a grid map was overlain on data. These reference
photos were then used to determine individual aspects of the traits in question specific to each plot in the trial.
The aerial data may be further processed using index map solutions such as SMS, AgPixel, ArcGIS, and other GIS
systems to produce other data ‘layers’ that provide further, value-added insights.
The results from the various images (NDVI, thermal, RGB, multispectral) are then used to identify which wheat
and barley varieties and soil combinations provide the best resilience to heat stress in the field. The researchers

232
hope that this may then be used to produce better varieties suited to the environment where the cultivation is
located.
Conclusion
Scientific Aerospace envisions a world where automated systems are a routine part of agricultural production as
a tool for promoting productivity and efficiency. It is the vision of the project partners that the farmer, in the
paddock, will be able to access sophisticated, real time, analysed data on the stress condition of a crop that will
enable a timely response and thus, optimise production. This will be achieved by collaborating in the
development of a systems engineered software suite that will autonomously incorporate and integrate climate
records, rainfall, meteorological logs and real time drone acquired, crop data. Prescription maps will be generated
which can then be uploaded to a Farm Management Information System (FMIS) system or directly to irrigation
systems, seeders, spreaders, tractors, combine harvesters or headers for sowing, watering, fertilising, nitrogen
optimisation, weed control yield monitoring and harvest timing management in real time.
*****
About the Author: Geoff Trowbridge is an internationally experienced program manager in
the aviation, telecommunications, manufacturing and resources sectors. A former weapons
system engineer in the RAAF, he subsequently held senior management roles and
directorships with Optus, Siemens, Ernst & Young, Oracle and BHP Billiton. He has also worked
in research and development facilities in London, Chicago and at Curtin University. He lives in Perth, WA and was
appointed CEO of Scientific Aerospace in November 2016. Scientific Aerospace is the only designer and
manufacturer of drones in Australia.
*****
Any opinions or views expressed in this paper are those of the individual author, unless stated to be those of Future Directions International.
Published by Future Directions International Pty Ltd. 80 Birdwood Parade, Dalkeith WA 6009, Australia. Tel: +61 8 9389 9831 Fax: +61 8 9389 8803 Web: www.futuredirections.org.au

233
APPENDIX 6: PRELIMINARY ASSESSMENT OF EMPLOYING
HYPERSPECTRAL IMAGERY TO DETECT MINERALS INDICATIVE OF
URANIUM ORE FROM UNMANNED AERIAL VEHICLES
An original work compiled for General Electric USA concerning the challenges associated
with prospecting for high grade uranium ore bodies using drone technologies and state of the
art imaging devices, including for non standard applications. Concerning contributions; parts
of the aims, the drafting of the document, parts of the executive summary, the analyses and
strategic information was compiled by the author including the recommendations, with funding
provided by Scientific Aerospace whilst consulting for Karl Corporation.
CTO Joshua Portlock now of Electro.Aero provided the images from Headwall, and the
analysis of payload ability concerning the aims as well as aspects of costing; which were
partially outsourced to Arbor Carbon. Mr. Portlock oversaw the strategy, and provided an
opportunity.

234
Preliminary Assessment of Employing Hyperspectral Imagery to Detect Minerals Indicative of Uranium Ore from Unmanned Aerial Vehicles
Prepared for General Electric by Joshua Portlock & Karl Svatos
(with assistance from Arbor Carbon)
Aims:
1. Demonstrate hyperspectral determination (presence, absence, and relative concentration)
of a range of ore bodies and the minerals associated with or containing uranium
2. Identify the best Hyperspectral Imaging Sensors (HIS) available at present
3. Identify the physical limitation of flying a UAV equipped with the HIS
4. Highlight the current challenges associated with a hyperspectral analysis
5. Recommend options for further pursuing this capability
Executive Summary:
There are many potential benefits to using hyperspectral sensors attached to drones, and the
limitations are numerous but feasible nonetheless. Without due consideration of the physical
limitation of the sensor data itself, one might assume that the downstream analysis required
would be able to fix the flaws. This is not the case because in many instances the limitation of
the sensor is not the sensor but the lack of adequate processing power within the instrument,
which through no fault of the designer ends up that the device cannot perform to spec. Whether
this would be a factor within the implementation of such a setup in the exploration geology
field, is a significant consideration for potential investment. The scientific theory of
hyperspectral imaging is highlighted, and the major known general geological studies on
uranium deposits that have been characterised via drones are summarised. It must be
underscored that without further geological information at the formation/era/sedimentary facies
levels it is hard to interpret what sorts of mineralogical deposits/sediments/silicate/ores are
located within the exploration area. In this instance, this preliminary investigation has
generalised as much as possible to define what is feasible from a commercial point of view.
234

235
Introduction:
Hyperspectral imaging spectroscopy, splitting reflected light into 100s of spectrally discrete
bands, is the only technology capable of mapping the landscape from a single sensor, once
calibrated. This physical phenomenon allows for more significant characterization of material
than broadband or multispectral imaging allows (Figure 1).
Figure 1. Difference between Broadband, Multispectral and Hyperspectral bands of data
Near-infrared (NIR) (700–1400 nm) and short-wavelength infrared (SWIR) (1400–2500 nm)
spectroscopy, has long been used in the field of earth sciences for applications such as mineral
identification, exploration, remote sensing and geo-metallurgy (Andrews et al., 2017).
Review of Literature and Scientific Scope:
Baron et al. (2014) first discovered uses of NIR spectra to determine coffinite-uranium thorite
((U,Th)SiO4)-thorite. They noted band position shifts were associated with the different ionic
radii between U and Th reflecting differences in the crystal structure while also revealing NIR
to be a suitable method for identifying coffinite in natural samples. Although Andrews et al.
(2017) attempted to quantify coffinite in a mineral mixture, some uncertainty existed when
obtaining SWIR measurements (1500-1550nm), mainly from more complex ores.
Analysis can be hampered by dark coloured rocks yielding spectral measurements with no
discernible peaks, possibly due to the abundance of dark-coloured minerals (e.g. uraninite
(UO2), the primary uranium ore mineral often found in association with coffinite). However,
the main discerning element in Andrews et al., (2017) was that diagnostic peaks associated
with U were not restricted to silicate minerals which they suggested would require
determination of the effect of uranium in other mineral species (a much larger task).

236
Research has been undertaken using high to medium resolution multispectral satellite data in
the VIS-NIRSWIR region for uranium exploration and geological mapping, with band
combinations in the SWIR and Thermal Infrared (TIR) the most useful for revealing the
occurrence of uranium ore (Mishra and Rao, 2015; Dwivedi et al., 2016). Mathieu et al., (2017)
showed unconformity type uranium deposits were spatially-linked to unconformities between
the sedimentary basin and underlying basement rock. Hydrothermal fluid-rock interactions that
produce extended alteration envelopes were used to target specific mineralization and thus,
may be essential guides for uranium exploration. This type of survey for mineral identification
was performed using a calibration method based on positions and shapes of absorption features
in characteristic SWIR spectral windows (1300-2500nm spectral range).
Core samples were scanned in the laboratory under controlled lighting conditions with a
hyperspectral HySpec SWIR-320m line-scanning camera (239 bands and 0.5 x 0.5mm pixel
size), analysed, and interpreted for mineralogy, with calibration using petrography by optical
microscopy, (Figure 2).
Figure 2. Example of laboratory-based Hyperspectral analysis of Core Samples
A computer algorithm was developed to classify and discriminate minerals based on both the
position and the depth of diagnostic absorption bands. Spectral ranges were defined to classify
minerals based on their spectral features (Figure 3).

237
Figure 3. Image of a table showing spectral range (nm) defined to classify minerals based on additional spectral features (reproduced from Mathieu et al. 2017).
Xu et al.(2017) used a FieldSpec4 ground-based spectrometer to obtain hyperspectral alteration
information from drill cores from a uranium deposit in China. They successfully measured
illite, hematite, limonite, montmorillonite, carbonate and chlorite from different sections. They
also found that the SWIR region from 1000-2500nm was most useful and that the alteration
minerals illite, hematite and fluorite could be used as surface indicators of uranium at depth to
guide deep uranium exploration. It is important to note that this study was of drill cores using
a spectrometer under controlled conditions and the field spectrometer is not an imaging device,
and has a spectral resolution of 3nm in the range of 350-1050nm and 10nm in the range of
1050-2500nm (Figure 4. and Figure 5. (a-d)). We are unaware of the current status of the core
logging if any has been done, and if the major mineralogical datasets from the cores have been
taken either. However, without any information on the dimensions of the site, the surrounding
geology, formations (sedimentary stratigraphic maps), and soil transformation information, it
is difficult to proceed. It may be that isotope decay using sensors with the hyperspectral camera
data will provide more information.

238
Figure 4. Processing workflow to analyse the drill cores hyperspectral data from Xu et al. (2017).
Figure 5. Spectral curves of investigated alteration minerals. The significance of this data is that it highlights a potential new method based on drill cores measured in the field. A potential cost-saving versus using a controlled indoor environment.

239
One area of concern regarding surface-based detection from passive airborne Hyperspectral
sensors is that leaf litter and biomass on the surface would limit the sensors ability to detect
any mineral from the rocks if not exposed. Therefore, it would be recommended that
hyperspectral surveys are only carried out over recently cleared land with relatively freshly
exposed rock. Furthermore, the oxidation layer would reduce the spectral information
detectable on the surface from the air, so it would be worth investigating a technique of
scanning laid out cores with an aerial hyperspectral sensor, to avoid the cost and time of
shipping core samples to a laboratory.
Customer Specific Information and Considerations (Heathgate):
The large scale of Heathgate’s Uranium deposits in S.A. is shown below (Figure 6).
Figure 6. Scale of Heathgate’s uranium deposits in South Australia as of 16 April 2015 (sourced from http://minerals.statedevelopment.sa.gov.au/invest/mineral_commodities/uranium)

240
Heathgate have indicated they are primarily interested in minerals that have responses in the
SWIR bands (such as silicates) and then the VNIR band (iron oxides). From various discussions
with the team Heathgate, there were three primary use cases identified for Hyperspectral
imagery by drone including:
1. Surface scanning of a recently cleared area for prospecting potential dig sites.
2. Environmental assessments to ensure no contaminants were left on the surface.
3. Core sample surveys to assess the mineral content of the extracted and laid out cores.
While there are different resolution and mission flight planning considerations for each
application, they all have the overall need to accurately detect minerals in the SWIR and VNIR
bands from the air, relying solely on passive light from the sun. Therefore, extensive ground-
truth calibration and testing will be required in order to achieve the required mineral
characterization and detection. Spatial resolution, spectral band spacing and signal to noise
ratios will all become highly critical in determining if adequate information can be obtained
from the airborne sensor.
Current Hyperspectral Sensor Options (UAV/RPA mountable):
There are many multispectral and hyperspectral sensor manufacturers offering sensors small
enough to be mounted on a UAV/RPA platform. However, full integration with Global
Positioning Systems (or better differential GPS), Inertial Motion Sensors (Units, a.ka. IMU)
and power is generally required. Within the payload weight capacity of the DJI M600 Pro, there
are several turn-key options, however the heavier the payload, the lower the flight time and
corresponding area coverage (Figure 7).
Figure 7. M600 flight time versus payload weight

241
More than a dozen different hyperspectral sensors were explored from several manufacturers.
However, based on the available information, it is apparent that hyperspectral data in the range
of 400-2500nm range is required. Therefore, only one supplier, Headwall Photonics, was
identified within the payload weight capacity of the DJI M600 Pro and had enough spectral
range to detect the range of minerals of interest in the region.
Headwall Photonics:
Headwall is one of the leading producers of spectral instrumentation for OEMs, based out of
Massachusetts USA. The Company's focus is on diffractive optics, in the form of very precise
holographic diffraction gratings. These components and the spectral modules/spectrometers are
available to OEMs in industries such as colour measurement and bio-medicine. Headwall also
produces imaging sensors that cover spectral ranges from UV-VIS to SWIR, as illustrated
below:
Given the focus of research has been around the VNIR and SWIR bands, there are three main
cameras within the M600 Pro payload weight range that we could consider.

242
Headwall Nano HyperSpec:
Figure 8. Headwall Nano HyperSpec. This hyperspectral sensor costs a little over $100,000 and includes an integrated data
logging onto a 1TB storage device. The table and images below illustrate the capability.
Nano-Hyperspec®
Wavelength range 400-1000 nm
Spatial bands 640
Spectral bands 270
Dispersion/Pixel (nm/pixel) 2.2
FWHM Slit Image 6 nm
Integrated 2nd order filter Yes
f/# 2.5
Layout Aberration-corrected concentric
Entrance Slit width 20 μm
Camera technology CMOS
Bit depth 12-bit
Max Frame Rate (Hz) 350
Detector pixel pitch 7.4 μm
Max Power (W) 13
Storage capacity 480GB (~130 minutes at 100 fps)
Weight without lens, GPS (kg) 0.5
Operating Temperature 0˚C to 50˚C

243
While the Nano HyperSpec is compact and light weight enough to fit in the M600 Pro’s gimbal,
it only covers spectrum up to 1,000 nm, which can help distinguish differences between
vegetation and general minerals. Still, it would not have the spectral fidelity to identify the
differences between different minerals in the SWIR bands needed.
Headwall Micro HyperSpec:
Figure 9. Headwall Mirco HyperSpec. This hyperspectral camera costs approximately $250k in the SWIR configuration, however, can then only cover the higher 900-2500 nm range and needs a separate hyper core data logger. As can be seen in the subsequent table, this hyperspectral camera can be configured with a variety of different sensor band ranges, however, none that are broad enough to cover the full spectrum needed (Table below)

244
Headwall HyperSpec Co-Aligned dual VNIR-SWIR Sensor:
Figure 10. Headwall Co-Aligned Dual VNIR-SWIR Sensor. This dual sensor hyperspectral camera costs around $340k AUD
plus GST and is capable of capturing from 400 to 2500 nm spectrum. The key characteristic is the two line-scan sensors in
this system are pointed at the same target and logging is time synchronized.
Figure 11. Co-Aligned VNIR/SWIR sensor mounted on M600 Pro rigidly without gimbal.
This dual VNIR/SWIR sensor gives the best of both worlds, covering the VNIR and SWIR
bands where minerals can be identified (Figure 11 and following spec table).

245
Unfortunately, the spatial resolution is quite limited at 640 wide and is relatively heavy
(2.83kg), so flight time suffers. Although long, it does conveniently still fit under the M600
Pro, however, it is too large to fit in the standard gimbal. Correspondingly, the coverage and
forward resolution will be adversely affected by the flight plan and wind conditions. We asked
Headwall for further information about the Signal to Noise Ratio (SNR) of the dual sensors.
The following information has been provided by Headwall:
1.) SIWR Spec Table.
2.) VNIR Spec Table.
3.) Nano SNR calibration curve (nm).
4.) SWIR 640 micro HS calibration curve (nm).

246

247
Acquisition of data using the M600 with VNIR-SWIR dual sensor:
Requests for information from Headwall about specifics for acquisition revealed some critical
information as follows:
• The DJI Matrice 600 works independently from the operations software of the
Hyperspectral system, including flight planning and triggering.
• The camera has its own software which determines the operation parameters of the
camera, frame rate, exposure, frames per cube when the data is captured.
• The camera has its own GPS/IMU (Applanix) which is used for geotagging rather than
using the M600 data.
Once the flight is complete, the data cubes can be downloaded along with the GPS/IMU data
(not embedded to the frames) for subsequent processing (e.g. orthorectification, radiance
calibration and or reflectance conversions) and analysis. The system is too large to be stabilised
with a gimbal on M600, so without this, wind and other conditions (e.g. roll, pitch, vibration)
can have a significant impact on the quality of the data. We were supplied with some sample
images from the SWIR and VNIR sensors, and misalignment artefacts are highly noticeable in
these images, which is a major limiting factor and cause for concern. The proposed application
of scanning the 9 cm wide diameter core samples requires a maximum of 4.5cm ground
sampling distance (GSD) to ensure the cores information is identifiable. Given the relatively

248
low spatial resolution of the sensor, it will require low altitude acquisition and the generation
of large quantities of data (Table 3).
Table 2: In order to acquire the data that can be geometrically and radiometrically calibrated we will need to create a series
of spectral and radiometric targets that can be strategically placed in the flight path so that subsequent geometric and
radiometric calibration of the data can be completed to deliver meaningful data for analysis. Headwall has provided some
information that suggests their SpectralView software product can be used for the acquisition of airborne data (red diamonds).
We do not yet have any experience in using this software suite.
Analysis of data using the M600 with VNIR-SWIR dual sensor:
We consider the setup of the system and acquisition of the data the easy component of this
project. The subsequent processing of large quantities of data in the form of hyperspectral cubes
will be complex and time-consuming, followed by image analysis to precisely classify and map
geological features of interest. Given we only have experience processing and analysing
hyperspectral data from non-headwall sensors, we cannot ascertain the format and what is
required to carry out pre-processing of the headwall hyperspectral cubes. Information obtained
from Headwall suggests their SpectralView software package enables the conversion of raw

249
data to radiance to reflectance with radiometric calibration and white reference and some
classification can be carried out. We have requested a short-term licence of the software and
data cube so that we can determine the workflow and provide an estimate of time for processing
the data for subsequent analysis.
Following a review of the software and sample data, we can develop a detailed workflow for
the project, including the Image Processing component and subsequent classification. This will
involve the utilisation of publicly available and proprietary algorithms for classification of
mineral mixtures, further reduction of residual noise, comparative analysis of reference and
acquired endmembers, maximisation of SNR, pixel-level classification, and quantification of
minerals at the sub-pixel level.
Subsequent analysis will produce geospatial datasets showing the abundance of minerals across
the region of interest, and these datasets will require ground validation through core drilling or
other methods (e.g. TEM, XRD, XRF, XRT, plasma-coupled IR spectroscopy, synchrotron
nuclear spin magnetic resonance etc). Further scoping is required to estimate the automation of
the Headwall image processing suite. However, it has been reported as possible by industry
partners.
Figure. 12. Proposed Arbor Carbon's Carboncore Cortex X8 UAS for gimbal stabilizing the dual sensor payload

250
Conclusion and Recommendation:
• Headwall Photonics VNIR-SWIR is the only sensor suitable for this project at this stage.
• The sensor should employ a stabilising gimbal to enable conditions suitable for the
collection of the highest quality of data available. Given the M600 Pro gimbal cannot
fit the dual VNIR/SWIR sensor, ScientificAerospace propose designing a suitable
gimbal to be mounted underneath Arbor Carbon’s CarbonCore Cortex X8 heavy-lift
UAS (Figure 12).
• The next phase should test Headwall software and data cube to determine workflow
before proceeding further.
• Explore the option to hire the sensor from Headwall rather than purchase to evaluate
and start characterization.
• Once Heathgate provides initial feedback about this preliminary assessment, a formal
proposal for the next phase will be prepared for consideration to proceed.

251
APPENDIX 7: PHD SCHOLARSHIP IN DIGITAL CONNECTIVITY AND BIG-DATA
ANALYTICS IN AGRICULTURE
These projects were largely made possible by the author linking already established,
internationally recognised, research groups; by creating science-driven business relationships.

252

253
BIBLIOGRAPHY

254

255
60 NA, 2017. NSF certified drinking water treatment chemicals. In. Ann Arbor, U.S.A.,
(Foundation NS, ed.). http: info.nsf.org/Certified/PwsChemicals/
Abbott LK, Mele P, Jenkins S, et al., 2012. Microbial community in response to nitrogen use
in dairy soils. In. Proceedings of the 5th Australasian Dairy Science Symposium: Dairy
Production Systems. Victoria, Australia: Australasian Dairy Science Symposium. (193.)
Abbott LK, Murphy DV, 2007. Soil Biological Fertility. Springer - Dordrecht. doi:
10.1007/978-1-4020-6619-1_1
Abdurakhmonov IY, 2011. Plant Breeding. Croatia, E.U.: Intech. ISBN: 9789533079325
Abdurakhmonov IY, Abdukarimov A, 2008. Application of association mapping to
understanding the genetic diversity of plant germplasm resources. International Journal of Plant
Genomics. doi: 10.1155/2008/574927
Abou-Elwafa SF, 2016. Association mapping for drought tolerance in barley at the
reproductive stage. Comptes Rendus Biologies 339, 51-9. doi: 10.1016/j.crvi.2015.12.002
Acosta-Martínez A, Dowd SE, Sun Y, Wester D, Allen V, 2010. Pyrosequencing analysis for
characterization of soil bacterial populations as affected by an integrated livestock-cotton
production system. Applied Soil Ecology 45, 13-25. doi: 10.1016/j.apsoil.2010.01.005
Ahmed IM, Nadira UA, Zhang G, Wu F, 2016. Exploration and Utilization of Drought-
Tolerant Barley Germplasm. In: Li C, Zhang G, eds. Exploration, Identification and Utilization
of Barley Germplasm. U.S.A.: Associated Press - Elsevier, 115-52. ISBN: 9780128029220
Ahmed N, Mahmud S, Elahi MML, Ahmeda S, Sujauddin M, 2019. Forecasting river sediment
deposition through satellite image driven unsupervised machine learning techniques. Remote
Sensing Applications: Society and Environment 13, 435-44. doi: 10.1016/j.rsase.2018.12.011
Ahuja I, De Vos RC, Bones AM, Hall RD, 2010. Plant molecular stress responses face climate
change. Trends in Plant Science 15, 664-74. doi: 10.1016/j.tplants.2010.08.002
Akash MW, 2010. Identifying QTL controlling kernel color in barley. Journal of Crop
Improvement 24, 219-27. doi: 10.1080/15427521003719109
Alberdi A, Aizpurua O, Gilbert MTP, Bohman K, 2018. Scrutinizing key steps for reliable
metabarcoding of environmental samples. Methods in Ecology and Evolution 9, 134-47. doi:
10.1111/2041-210X.12849
Albright MBN, Timalsina B, Martiny JBH, Dunbar J, 2019. Comparative genomics of nitrogen
cycling pathways in bacteria and archaea. Microbial Ecology 77, 597-606. doi:
10.1007/s00248-018-1239-4

256
Alexakis DD, Mexis FDK, Vozinaki AEK, Daliakopoulos IN, Tsanis IK, 2017. Soil moisture
content estimation based on Sentinel-1 and auxiliary earth observation products. A
hydrological approach. Sensors 17:6, 1455. doi: 10.3390/s17061455
Allen JF, Santabarbara S, Allen CA, Puthiyaveetil S, 2011. Discrete redox signaling pathways
regulate photosynthetic light-harvesting and chloroplast gene transcription. PLoS One 6,
e26372. doi: 10.1371/journal.pone.0026372
Allison HE, Hobbs RJ, 2004. Resilience, adaptive capacity, and the “lock-in trap” of the
Western Australian agricultural region. Ecology and Society 9, art3. http:
ecologyandsociety.org/vol9/iss1/art3
Allison H, Hobbs RJ, 2010. Natural resource management at four social scales: psychological
type matters. Environmental Management 45, 590-602. doi: 10.1007/s00267-010-9442-1
Altman EN, 2013. Drought Indices in Decision-Making Process of Drought Management.
United States of America: University of South Carolina, Master's Thesis.
AMES, 2003. Linking our origins to our future. NASA: MS 239-4.
Andrews M, Edwards GR, Ridgway HJ, Cameron KC, Di HJ, Raven JA, 2011. Positive plant
microbial (Teng et al., 2016) interactions in perennial ryegrass dairy pasture systems (2).
Annals of Applied Biology 159, 79-92. doi: 10.1111/j.1744-7348.2011.00473.x
Andrews WL, Tardio J, Bhargava SK, Wilde A, Otto A, Pownceby MI, 2017. Development of
a new near infrared (NIR) tool for quantifying coffinite (USiO 4 ) in a moderately complex
uranium ore analogue. Journal of Geochemical Exploration. 182, 80-93. doi:
10.1016/j.gexplo.2017.09.003
Andrys J, Kala J, Lyons TJ, 2016. Regional climate projections of mean and extreme climate
for the southwest of Western Australia (1970–1999 compared to 2030–2059). Climate
Dynamics. doi: 10.1007/s00382-016-3169-5
Anseeuw W, Alden WL, Cotula L, Taylor M, 2012. Land rights and the rush for land: findings
of the global commercial pressures on land (research project). In. Rome, Italy: International
Land Coalition. http: pubs.iied.org
Araus JL, Cairns JE, 2014. Field high-throughput phenotyping: the new crop breeding frontier.
Trends in Plant Science 19, 52-61. doi: 10.1016/j.tplants.2013.09.008
Araus JL, Kefauver SC, Zaman-Allah M, Olsen MS, Cairns JE, 2018. Translating high-
throughput phenotyping into genetic gain. Trends in Plant Science, 1-16. doi:
10.1016/j.tplants.2018.02.001
ARM, 2019. Arm AI trust manifesto. In: Arm, ed.: ARM AI.

257
Armstrong L, Diepeveen D, Maddern R, 2007. The application of data mining techniques to
characterize agricultural soil profiles. Proceedings of Australasian Data Mining Conference
(AusDM'07). 85-99). Gold Coast, Australia. Australian Computer Society Inc. http:
ro.ecu.edu.au/ecuworks/1394/
Arute F, Arya K, Babbush R, et al., 2019. Quantum supremacy using a programmable
superconducting processor. Nature 574, 505-10. doi: 10.1038/s41586-019-1666-5
Ashraf M, 2010. Inducing drought tolerance in plants: recent advances. Biotechnology
Advances 28, 169-83. doi: 10.1016/j.biotechadv.2009.11.005
Aslam Z, Khattak JZK, Ahmed M, Asif M, 2017. A Role of Bioinformatics in Agriculture. In:
Ahmed M, Stock C, eds. Quantification of Climate Variability, Adaptation and Mitigation for
Agricultural Sustainability. Berlin - Germany: Springer, Cham, 413-434. doi: 10.1007/978-3-
319-32059-5_17
Austin CM, Bunn J, 2010. Cherax tenuimanus: The IUCN Red List of Threatened Species.
Dairy Australia, 2012. Dairy Shed Effluent WA Code of Practice. In: Dairy Australia, ed.
Western Australia. http: dairyingfortomorrow.com.au
Awan SE, Bennamoun M, Sohel F, Sanfilippo F, Dwivedi G. 2021. Imputation of missing data
with class imbalance using conditional generative adversarial networks. Neurocomputing 453,
164-171. doi: 10.1016/j.neucom.2021.04.010.
Awasthi R, Bhandari K, Nayyar H, 2015. Temperature stress and redox homeostasis in
agricultural crops. Frontiers in Environmental Science 3, 1-24. doi: 10.3389/fenvs.2015.00011
Ay F, Noble WS, 2015. Analysis methods for studying the 3D architecture of the genome.
Genome Biology 16, 183. doi: 10.1186/s13059-015-0745-7
Baker K, Dhillon T, Colas I, et al., 2015. Chromatin state analysis of the barley epigenome
reveals a higher-order structure defined by H3K27me1 and H3K27me3 abundance. The Plant
Journal 84, 111-24. doi: 10.1111/tpj.12963
Barah P, Bones AM, 2015. Multidimensional approaches for studying plant defence against
insects: from ecology to omics and synthetic biology. Journal of Experimental Botany 66, 479-
93. doi: 10.1093/jxb/eru489
Baron F, Robin V, Beaufort D, Szenknect S, Dacheux N, Petit S, 2014. Technical note: use of
near infrared spectroscopy for the identification of coffinite and uranothorite. Journal of Near
Infrared Spectroscopy. 22 (2), 149. doi: 10.1255/jnirs.1110
258
Barrero JM, Jacobsen JV, Talbot MJ, et al., 2012. Grain dormancy and light quality effects on
germination in the model grass Brachypodium distachyon. New Phytologist 193, 376-386. doi:
10.1111/j.1469-8137.2011.03938.x
Barrow N, 1983. A mechanistic model for describing the sorption and desorption of phosphate
by soil. European Journal of Soil Science 34, 733-50. doi: 10.1111/j.1365-
2389.1983.tb01068.x
Bartels D, Sunkar R, 2005. Drought and salt tolerance in plants. Critical Reviews in Plant
Sciences 24, 23-58. doi: 10.1080/07352680590910410
Bendix C, Marshall CM, Harmon FG, 2015. Circadian clock genes universally control key
agricultural traits. Molecular Plant. 8:3, 1135-52. doi: 10.1016/j.molp.2015.03.003
Berger B, Parent B, Tester M, 2010. High-throughput shoot imaging to study drought
responses. Journal of Experimental Botany 61, 3519-28. doi: 10.1093/jxb/erq201
Bita CE, Gerats T, 2013. Plant tolerance to high temperature in a changing environment:
scientific fundamentals and production of heat stress-tolerant crops. Frontiers in Plant Science
4, 1-18. doi: 10.3389/fpls.2013.00273
Blackwood CB, Marsh T, Kim S, Paul EA, 2003. Terminal restriction fragment length
polymorphism data analysis for quantitative comparison of microbial communities Applied
and Environmental Microbiology 69, 926-32. doi: 10.1128/AEM.69.2.926-932.2003
Blaschek M, Roudier P, Poggio M, et al., 2019. Prediction of soil available water-holding
capacity from visible near-infrared reflectance spectra. Scientific Reports 9:12833. doi:
10.1038/s41598-019-49226-6
Bobadilla R, Berr A, 2016. Histone Methylation - A Cornerstone for Plant Responses to
Environmental Stresses? In: Shanker AK, Shanker C, eds. Abiotic and Biotic Stress in Plants -
Recent Advances and Future Perspectives. Croatia - European Union: Intech, 31-61. doi:
10.5772/61733
Boesi A, 2014. Traditional knowledge of wild food plants in a few Tibetan communities.
Journal of Ethnobiology and Ethnomedicine 10, 1-19. http: ethnobiomed.com/content/10/1/75
Bohr N, 1933. Light and life. Nature 131, 457-9. doi: 10.1038/131421a0
Bokszczanin KL, Fragkostefanakis S, Bostan H, et al., 2013. Perspectives on deciphering
mechanisms underlying plant heat stress response and thermotolerance. Frontiers in Plant
Science 4, 1-20. doi: 10.3389/fpls.2013.00315

259
Bolland MDA, Guthridge IF, 2007a. Determining the fertilizer phosphorus requirements of
intensively grazed dairy pastures in south-western Australia with or without adequate nitrogen
fertilizer. Australian Journal of Experimental Agriculture. 47:801-14. doi: 10.1071/EA05184
Bolland MDA, Guthridge IF, 2007b. Responses of intensively grazed dairy pastures to
applications of fertiliser nitrogen in south-western Australia. Australian Journal of
Experimental Agriculture 47, 927-41. doi: 10.1071/EA06014
Boudiar R, Casas AM, Cantalapiedra CP, Gracia MP, Igartua E, 2016. Identification of
quantitative trait loci for agronomic traits contributed by a barley (Hordeum vulgare)
Mediterranean landrace. Crop and Pasture Science 67, 37-46. doi: 10.1071/cp15149
Bowden JW, Posner AM, Quirk JP, 1977. Adsorption and charging phenomena in variable
charge soils. Australian Journal of Soil Research 15, 121-36. doi: 10.1071/SR9770121
Brauer EK, Singh DK, Popescu SC, 2014. Next-generation plant science: putting big data to
work. Genome Biology 15, 1-3. doi: 10.1186/gb4149
Brien CJ, Berger B, Rabie H, Tester M, 2013. Accounting for variation in designing greenhouse
experiments with special reference to greenhouses containing plants on conveyor systems.
Plant Methods 9, 1-21. doi: 10.1186/1746-4811-9-5
Brink RA, 1956. A genetic change associated with the R locus in maize which is directed and
potentially reversible. Genetics. 41, 872-89. PMCID: PMC1224369
Bruand A, Gilkes RJ, 2002. Subsoil bulk density and organic carbon stock in relation to land
use for a Western Australian Sodosol. Australian Journal of Soil Research 40, 999-1010. doi:
10.1071/SR01051
Brunner I, Herzog C, Dawes MA, Arend M, Sperisen C, 2015. How tree roots respond to
drought. Frontiers in Plant Science 6, 1-16. doi: 10.3389/fpls.2015.00547
Bünemann EK, Bongiorno G, Bai Z, et al., 2018. Soil quality: a critical review. Soil Biology
and Biochemistry 120, 105-25. doi: 10.1016/j.soilbio.2018.01.030
Burggren W, 2016. Epigenetic inheritance and its role in evolutionary biology: Re-evaluation
and new perspectives. Biology (Basel) 25:5. doi: 10.3390/biology5020024
Burrows K, Kinney PL, 2016. Exploring the Climate Change, Migration and Conflict Nexus.
International Journal of Environmental Research and Public Health 13, 443.
10.3390/ijerph13040443
Cai Y, Guan K, Lobell D, et al. 2019. Integrating satellite and climate data to predict wheat
yield in Australia using machine learning approaches. Agricultural and forest meteorology 274,
144-59. doi: 10.1016/j.agrformet.2019.03.010
260
Cai Z, Guldbrandtsen B, Lund MS, Sahana G, 2018. RETRACTED ARTICLE: Dissecting
closely linked association signals in combination with the mammalian phenotype database can
identify candidate genes in dairy cattle. BMC Genetics 19. doi: 10.1186/s12863-018-0620-0
Camargo A, Papadopoulou D, Spyropoulou Z, Vlachonasios K, Doonan JH, Gay AP, 2014.
Objective definition of rosette shape variation using a combined computer vision and data
mining approach. PLoS One 9, e96889. doi: 10.1371/journal.pone.0096889
Cameron KC, Di HJ, Moir JL, 2013. Nitrogen losses from the soil/plant system: a review
Annals of Applied Biology 162, 145-73. doi: 10.1111/aab.12014
Campoli C, Pankin A, Drosse B, Casao CM, Davis SJ, Von Korff M, 2013. HvLUX1 is a
candidate gene underlying the early maturity 10 locus in barley: phylogeny, diversity, and
interactions with the circadian clock and photoperiodic pathways. New Phytologist 199, 1045-
59. doi: 10.1111/nph.12346
Caporaso JG, Kuczynski J, Stombaugh J, et al., 2010. QIIME allows analysis of high-
throughput community sequencing data. Nature Methods 7, 335-6. doi: 10.1038/nmeth.f.303
Carvalho P, Azam-Ali S, Foulkes MJ, 2014. Quantifying relationships between rooting traits
and water uptake under drought in Mediterranean barley and durum wheat. Journal of
Integrative Plant Biology 56, 455-69. doi: 10.1111/jipb.12109
Catoni R, Gratani L, 2014. Variations in leaf respiration and photosynthesis ratio in response
to air temperature and water availability among Mediterranean evergreen species. Journal of
Arid Environments 102, 82-8. doi: 10.1016/j.jaridenv.2013.11.013
Cattivelli L, Rizza F, Badeck FW, et al., 2008. Drought tolerance improvement in crop plants:
An integrated view from breeding to genomics. Field Crops Research 105, 1-14. doi:
10.1016/j.fcr.2007.07.004
Chadwick DR, Cardenas LM, Dhanoa MS, et al., 2018. The contribution of cattle urine and
dung to nitrous oxide emissions: quantification of country specific emission factors and
implications for national inventories. The Science of the Total Environment 635, 607-17. doi:
10.1016/j.scitotenv.2018.04.152
Chaerle L, Leinonen I, Jones HG, Van Der Straeten D, 2007. Monitoring and screening plant
populations with combined thermal and chlorophyll fluorescence imaging. Journal of
Experimental Botany 58, 773-84. doi: 10.1093/jxb/erl257
Chalancon G, Ravarani CN, Balaji S, et al., 2012. Interplay between gene expression noise and
regulatory network architecture. Trends in Genetics 28, 221-32. doi:10.1016/j.tig.2012.01.006

261
Chapman DF, Hill J, Tharmaraj J, Beca D, Kenny SN, Jacobs JL, 2014. Increasing home-
grown forage consumption and profit in non-irrigated dairy systems. 1. rationale, systems
design and management. Animal Production Science 54, 221-33. doi: 10.1071/AN12295
Che R, Deng Y, Wang F, et al., 2018. Autotrophic and symbiotic diazotrophs dominate
nitrogen-fixing communities in Tibetan grassland soils. Science of the Total Environment 639,
997-1006. doi: 10.1016/j.scitotenv.2018.05.238
Cheifet B, 2019. Where is genomics going next? Genome Biology 20, 17. doi: 10.1186/s13059-
019-1626-2
Chen GQ, S. T, Gras SL, Weeks M, Kentish SE, 2018. A review of salty waste stream
management in the Australian dairy industry. Journal of Environmental Management 406-413.
doi: 10.1016/j.jenvman.2018.07.056
Chen Y, Müller F, Rieu I, Winter P, 2015. Epigenetic events in plant male germ cell heat stress
responses. Plant Reproduction, 1-9. doi: 10.1007/s00497-015-0271-5
Cheng L, Zou Y, Ding S, et al., 2009. Polyamine accumulation in transgenic tomato enhances
the tolerance to high temperature stress. Journal of Integrative Plant Biology 51, 489-99. doi:
10.1111/j.1744-7909.2009.00816.x
Chhapekar SS, Gaur R, Kumar A, Ramchiary N, 2016. Reaping the Benefits of Next-
Generation Sequencing Technologies for Crop Improvement — Solanaceae. In: Kulski JK, ed.
Next Generation Sequencing - Advances, Applications and Challenges. Croatia - European
Union: Intech, 247-86. doi: 10.5772/61656
Chinnusamy V, Gong Z, Zhu JK, 2008. Abscisic acid-mediated epigenetic processes in plant
development and stress responses. Journal of Integrative Plant Biology 50, 1187-95. doi:
10.1111/j.1744-7909.2008.00727.x
Clauw P, Coppens F, Korte A, et al., 2016. Leaf growth response to mild drought: natural
variation in Arabidopsis sheds light on trait architecture. Plant Cell. doi: 10.1105/tpc.16.00483
Commonwealth Government of Australia 1999. Environment Protection and Biodiversity
Conservation Act 1999 (EPBC Act). In: Government A, ed. Canberra, Australia. http:
environment.gov.au
Contosta AR, Frey SD, Cooper AB, 2015. Soil microbial communities vary as much over time
as with chronic warming and nitrogen additions. Soil Biology and Biochemistry 88, 19-24. doi:
10.1016/j.soilbio.2015.04.013
Copetti D, Finsterle K, Marziali L, et al., 2016. Eutrophication management in surface waters
using lanthanum modified bentonite: a review. Water Research 97, 162-74. doi:
10.1016/j.watres.2015.11.056

262
Costa JM, Grant OM, Chaves MM, 2013. Thermography to explore plant-environment
interactions. Journal of Experimental Botany 64, 3937-49. doi: 10.1093/jxb/ert029
Cotelle V, Leonhardt N, 2015. 14-3-3 proteins in guard cell signaling. Frontiers in Plant
Science 6, 1-10. doi: 10.3389/fpls.2015.01210
Cramer GR, Urano K, Delrot S, Pezzotti M, Shinozaki K, 2011. Effects of abiotic stress on
plants: a systems biology perspective. BMC Plant Biology 11, 1-14. doi: 10.1186/1471-2229-
11-163
d’Alpoim Guedes J, Aldenderfer M, 2019. The archaeology of the early Tibetan plateau: new
research on the initial peopling through the early bronze age. Journal of Archaeological
Research. doi: 10.1007/s10814-019-09137-6
Dairy Australia. 2012. Code of practice for dairyshed effluent—Western Australia. Accessed
Mar. 3, 2012. http: dairyaustralia.com.au/western-dairy/farm/western-dairy-farm/fertiliser-
feed-and-nutrients
Damaso N, Mendel J, Mendoza M, Von Wettberg EJ, Narasimhan G, Mills DE, 2018.
Bioinformatics approach to assess the biogeographical patterns of soil communities: the utility
for soil provenance. Journal of Forensic Science 63, 1033-42. doi: 10.1111/1556-4029.13741
Dastbaz M, Arabnia H, Akhgar B, 2018. Technology for Smart Futures. Berlin, Germany:
Springer. doi: 10.1007/978-3-319-60137-3
De La Fuente GN, Frei UK, Lubberstedt T, 2013. Accelerating plant breeding. Trends in Plant
Science 18, 667-72. doi: 10.1016/j.tplants.2013.09.001
Denef, VJ 2018. Peering into the genetic makeup of natural microbial populations using
metagenomics In Population Genomics: Microorganisms. Polz M, Rajora O, eds. Springer,
Cham, Switzerland. (49-75). doi: 10.1007/13836_2018_14
Dey N, Hassanien AE, Bhatt C, Ashour AS, Satapathy SC, 2018. Internet of Things and Big
Data Analytics Toward Next-Generation Intelligence. Berlin: Springer. doi: 10.1007/978-3-
319-60435-0
Di HJ, Cameron KC, Shen JP, et al., 2010. Ammonia-oxidizing bacteria and archaea grow
under contrasting soil nitrogen conditions. FEMS Microbiology Ecology 72, 386-94. doi:
10.1111/j.1574-6941.2010.00861.x
Diepeveen D, 2011. Data Integration for Decision Making in Wheat Breeding. PhD thesis,
Murdoch University. http: researchrepository.murdoch.edu.au/id/eprint/5808/
Dombrowski SM, Hilgetag CC, and Barbas H, 2001. Quantitative architecture distinguishes
prefrontal cortical systems in the Rhesus Monkey. Cerebral Cortex 11:10, 975-88. doi:
10.1093/cercor/11.10.975
263
DOSSPN, 2000. Malachite green method. In: Nutrition DOSSaP, ed. W.A., Australia: School
of Agriculture and Environment. The University of Western Australia. http: research-
repository.uwa.edu.au
Douglas GB, 2002. Remediation material and remediation process for sediments. US Patent
6:350,383
Douglas GB, Hamilton DP, Robb MS, Pan G, Spears BM, Lurling M, 2016. Guiding principles
for the development and application of solid-phase phosphorus adsorbents for freshwater
ecosystems. Aquatic Ecology 50, 385-405. doi: 10.1007/s10452-016-9575-2
Douglas G, Rate A, Lurling M, 2019. Comment on: “Svatos, K.B.W. (2018). Commercial
silicate phosphate sequestration and desorption leads to a gradual decline of aquatic systems."
Environmental Science and Pollution Research 26, 5386-92. doi: 10.1007/s11356-017-0846-9
Driedonks N, Rieu I, Vriezen WH, 2016. Breeding for plant heat tolerance at vegetative and
reproductive stages. Plant Reproduction, 1-13. doi: 10.1007/s00497-016-0275-9
Duan P, Fan C, Zhang Q, Xiong Z, 2019. Overdose fertilization induced ammonia-oxidizing
archaea producing nitrous oxide in intensive vegetable fields. Science of the Total Environment
650, 1787-94. doi: 10.1016/j.scitotenv.2018.09.341
Duque AS, De Almeida AM, Da Silva AB, et al., 2013. Abiotic Stress Responses in Plants:
Unraveling the Complexity of Genes and Networks to Survive. In: Vahdati K, Leslie C, eds.
Abiotic Stress - Plant Responses and Applications in Agriculture. Croatia - European Union:
Intech, 49-102. doi: 10.5772/52779
Dwivedi AK, Kumar A, Chaturvedi AK, 2016a. High resolution multispectral satellite data
interpretation and limited ground checking; a proxy for geological mapping and uranium
exploration in Mahakoshal fold belt of Son Valley Area, Madhya Pradesh. Journal Geological
Society of India. 88, 159-172. doi: 10.1007/s12594-016-0475-9
Dwivedi SL, Ceccarelli S, Blair MW, Upadhyaya HD, Are AK, Ortiz R, 2016b. Landrace
germplasm for improving yield and abiotic stress adaptation. Trends in Plant Science 21, 31-
42. doi: 10.1016/j.tplants.2015.10.012
Elliott M, De Jonge VN, 2002. The management of nutrients and potential eutrophication in
estuaries and other restricted water bodies. Hydrobiologia 475, 513-24. ISSN: 0018-8158
Engineer CB, Hashimoto-Sugimoto M, Negi J, et al., 2016. CO2 sensing and CO2 regulation
of stomatal conductance: advances and open questions. Trends in Plant Science 21, 16-30. doi:
10.1016/j.tplants.2015.08.014

264
Erisman J, Leach A, Bleeker A, Atwell B, Cattaneo L, Galloway J, 2018. An integrated
approach to a nitrogen use efficiency (NUE) indicator for the food production–consumption
chain. Sustainability 10, 925. doi: 10.3390/su10040925
Fan Y, Shabala S, Ma Y, Xu R, Zhou M, 2015. Using QTL mapping to investigate the
relationships between abiotic stress tolerance (drought and salinity) and agronomic and
physiological traits. BMC Genomics 16, 1-11. doi: 10.1186/s12864-015-1243-8
Fanourakis D, Giday H, Milla R, et al., 2015. Pore size regulates operating stomatal
conductance, while stomatal densities drive the partitioning of conductance between leaf sides.
Annals of Botany 115, 555-65. doi: 10.1093/aob/mcu247
Farooq M, Wahid A, Kobayashi N, Fujita D, Basra SMA, 2009. Plant drought stress: effects,
mechanisms and management. Agronomy for Sustainable Development 29, 185-212. doi:
10.1051/agro:2008021
Felsenfeld G, 2014. A brief history of epigenetics. Cold Spring Harbor Perspectives in Biology
6:1. doi: 10.1101/cshperspect.a018200
Ferdous J, Sanchez-Ferrero JC, Langridge P, et al., 2016. Differential expression of
microRNAs and potential targets under drought stress in barley. Plant Cell and Environment.
doi: 10.1111/pce.12764
Fichot CG, Downing BD, Bergamaschi BA, Windham-Myers L, Di Pasquale MC, Thompson
DR, 2015. High-resolution remote sensing of water quality in the San Francisco Bay-delta
estuary. Environmental Science and Technology 2, 573-83. doi: 10.1021/acs.est.5b03518
Field D, Tiwari B, Booth T, et al., 2006. Open software for biologists: from famine to feast.
Nature Biotechnology 24, 801-3. doi: 10.1038/nbt0706-801
Fleury D, Langridge P, 2014. QTL and Association Mapping for Plant Abiotic Stress
Tolerance. In: Jenks MA, Hasegawa PM, eds. Plant Abiotic Stress. Australia: Wiley-
Blackwell, 257-87. doi: 10.1002/9781118764374.ch10
Fong S, Song W, Wong R, Bhatt C, Korzun D, 2018. Framework of Temporal Data Stream
Mining by Using Incrementally Optimized Very Fast Decision Forest. In: Dey N, Hassanien
A, Bhatt C, Ashour A, Satapathy S, eds. Internet of Things and Big Data Analytics Toward
Next-Generation Intelligence, Studies in Big Data. Springer. doi: 10.1007/978-3-319-60435-
0_19
Forster BP, Ellis RP, Moir J, et al., 2004. Genotype and phenotype associations with drought
tolerance in barley tested in North Africa. Annals of Applied Biology 144, 157-68. doi:
10.1111/j.1744-7348.2004.tb00329.x

265
Fowler DB, N'diaye A, Laudencia-Chingcuanco D, Pozniak CJ, 2016. Quantitative trait loci
associated with phenological development, low-temperature tolerance, grain quality, and
agronomic characters in wheat (Triticum aestivum L.). PLoS One 11, e0152185. doi:
10.1371/journal.pone.0152185
Free Software Foundation CC, 1991. Microsoft R Open GNU General Public License. In:
Microsoft, ed. V.2. Boston, Massachusettes, U.S.A.: Microsoft, Free Software Foundation, Inc.
51 Franklin Street, Fifth Floor, 02110-1301, U.S.A.. http: mran.microsoft.com
Freedman D, 1995. Some issues in the foundation of statistics. Foundations of Science 1, 19-
39. doi: 10.1007/BF00208723
Furbank RT, Tester M, 2011. Phenomics: technologies to relieve the phenotyping bottleneck.
Trends in Plant Science 16, 635-44. 10.1016/j.tplants.2011.09.005
Gage JL, Jarquin D, Romay C, et al., 2017. The effect of artificial selection on phenotypic
plasticity in maize. Nature Communications 8, 1348. doi: 10.1038/s41467-017-01450-2
Gago J, Douthe C, Coopman RE, et al., 2015. UAVs challenge to assess water stress for
sustainable agriculture. Agricultural Water Management 153, 9-19. doi:
10.1016/j.agwat.2015.01.020
Gagliano M, 2015. In a green frame of mind: perspectives on the behavioural ecology and
cognitive nature of plants. AoB Plants 7:plu075. doi: 10.1093/aobpla/plu075
Garcia GA, Dreccer MF, Miralles DJ, Serrago RA, 2015. High night temperatures during grain
number determination reduce wheat and barley grain yield: a field study. Global Change
Biology 21, 4153-64. doi: 10.1111/gcb.13009
Gao X, Zhang J, Wei Z, Hakonarson H, 2018. DeepPolyA: a convolutional neural network
approach for polyadenylation site prediction. IEEE Access 6, 24340-9. doi:
10.1109/ACCESS.2018.2825996
Garcia J, Kao-Kniffin J, 2018. Microbial group dynamics in plant rhizospheres and their
implications on nutrient cycling. Frontiers in Microbiology 9:1516. doi:
10.3389/fmicb.2018.01516
Geiger R, 1927. Das Klima der bodennahen Luftschicht – Ein Lehrbuch der
Mikroklimatologie. 1. Friedrich (Aufl.) Vieweg, Braunschweig. http:
onlinelibrary.wiley.com
Geschwendtner S, Tejedor J, Bimüller C, et al., 2014. Climate change induces shifts in
abundance and activity pattern of bacteria and archaea catalyzing major transformation steps
in nitrogen turnover in a soil from a mid-European beech forest. PLoS One 9:e114278. doi:
10.1371/journal.pone.0114278

266
Ghiurcuta CG, Moret BM, 2014. Evaluating synteny for improved comparative studies.
Bioinformatics 30, i9-18. doi: 10.1093/bioinformatics/btu259
Gilady L, Hoffmann MJ, 2013. Darwin's finches or Lamarck's giraffe, does international
relations get evolution wrong? International Studies Review. doi: 10.1111/misr.12060
Goitom E, 2011. Bioaccumulation of lanthanum in marbled crayfish (Procambarus sp.):
Wageningen University, Master's Degree. http: edepot.wur.nl
Goldberg S, Sposito G, 1984. A chemical model of phosphate adsorption by soils: I. Reference
oxide minerals. Soil Science Society of America Journal 48, 772-8. ISSN: 0361-5995
Gonzalez-Dugo V, Hernandez P, Solis I, Zarco-Tejada P, 2015. Using high-resolution
hyperspectral and thermal airborne imagery to assess physiological condition in the context of
wheat phenotyping. Remote Sensing 7, 13586-605. doi: 10.3390/rs71013586
Gous PW, Hickey L, Christopher JT, Franckowiak J, Fox GP, 2015. Discovery of QTL for
stay-green and heat-stress in barley (Hordeum vulgare) grown under simulated abiotic stress
conditions. Euphytica 207, 305-17. doi: 10.1007/s10681-015-1542-9
Greenhalgh RSG, 2002. Estimating hyperplanes and lines. In. International Conference on
Computer Vision and Graphics. Zakopane, Poland: Springer. (Resource unavailable online)
Greenlon A, Chang PL, Damtew ZM, et al., 2019. Global-level population genomics reveals
differential effects of geography and phylogeny on horizontal gene transfer in soil bacteria.
Proceeding of the National Academy of Sciences U.S.A. 116, 15200-9. doi:
10.1073/pnas.1900056116
Grim RE, Güven N, 1978. Bentonites developments in Sedimentology. In.: Elsevier Publishing
Co. ISBN: 008086936X
Grimsley HR, Economou SE, Barnes E, et al., 2019. An adaptive variational algorithm for
exact molecular simulations on a quantum computer. Nature Communications 10, 3007. doi:
10.1038/s41467-019-10988-2
Griffiths P, Stotz K, 2013. Genetics and Philosophy: An Introduction (Cambridge Introductions
to Philosophy and Biology). Cambridge: Cambridge University Press. doi:
10.1017/CBO9780511744082
Guerra D, Crosatti C, Khoshro HH, Mastrangelo AM, Mica E, Mazzucotelli E, 2015. Post-
transcriptional and post-translational regulations of drought and heat response in plants: a
spider's web of mechanisms. Frontiers in Plant Science 6, 1-14. doi: 10.3389/fpls.2015.00057
Guo Y, Du Z, Chen J, Zhang Z, 2017. QTL mapping of wheat plant architectural characteristics
and their genetic relationship with seven QTLs conferring resistance to sheath blight. PLoS
One 12:e0174939. doi: 10.1016/S1673-8527(08)60016-8

267
Gupta K, Dey A, Gupta B, 2013. Plant polyamines in abiotic stress responses. Acta
Physiologiae Plantarum 35, 2015-36. doi: 10.1007/s11738-013-1239-4
Gupta PK, Rustgi S, Mir RR, 2008. Array-based high-throughput DNA markers for crop
improvement. Heredity (Edinb) 101, 5-18. doi: 10.1038/hdy.2008.35
Gutekunst J, Andriantsoa R, Falckenhayn C, et al., 2018. Clonal genome evolution and rapid
invasive spread of the marbled crayfish. Nature Ecololgy and Evolution 2, 567-73. doi:
10.1038/s41559-018-0467-9
Gutleben J, De Mares CM, Van Elsas JD, Smidt H, Overmann J, Sipkema D, 2018. The multi-
omics promise in context: from sequence to microbial isolate. Critical Reviews in
Microbiology 44, 212-29. doi: 10.1080/1040841X.2017.1332003
Gutzat R, Mittelsten Scheid O, 2012. Epigenetic responses to stress: triple defense? Current
Opinion in Plant Biology 15, 568-73. doi: 10.1016/j.pbi.2012.08.007
Haak DC, Fukao T, Grene R, et al., 2017. Multilevel regulation of abiotic stress responses in
plants. Frontiers in Plant Science 8, 1564. doi: 10.3389/fpls.2017.01564
Habte E, Müller LM, Shtaya M, Davis SJ, Von Korff M, 2014. Osmotic stress at the barley
root affects expression of circadian clock genes in the shoot. Plant, Cell and Environment 37,
1321-37. doi: 10.1111/pce.12242
Hackley VA, Stefaniak AB, 2013. "Real-world" precision, bias, and between-laboratory
variation for surface area measurement of a titanium dioxide nanomaterial in powder form.
Journal of Nanoparticle Research 15, 1742. doi: 10.1007/s11051-013-1742-y
Hagendorf T, 2020. The ethics of AI: an evaluation of guidelines. Minds & Machines 30, 99-
120. doi: 10.1007/s11023-020-09517-8
Halford NG, Curtis TY, Chen Z, Huang J, 2015. Effects of abiotic stress and crop management
on cereal grain composition: implications for food quality and safety. Journal of Experimental
Botany 66, 1145-56. doi: 10.1093/jxb/eru473
Halliburton, 2005. MSDS: product information. Colorado, U.S.A. (Halliburton BM, ed.)
Hanson MA, Skinner MK, 2016. Developmental origins of epigenetic transgenerational
inheritance. Environmental Epigenetics 2:1. doi: 10.1093/eep/dvw002
Harper PS, 2017. Some pioneers of European human genetics. European Journal of Human
Genetics. doi: 10.1038/ejhg.2017.47
Harrington JB, 1932. The comparative resistance of wheat varieties to sprouting in the stock
and windrow. Scientific Agriculture 12, 635-45. doi: 10.4141/sa-1932-0055

268
Hasanuzzaman M, Nahar K, Alam MM, Roychowdhury R, Fujita M, 2013. Physiological,
biochemical, and molecular mechanisms of heat stress tolerance in plants. International Journal
of Molecular Sciences 14, 9643-84. doi: 10.3390/ijms14059643
Hasanuzzaman M, Shabala L, Brodribb TJ, Zhou M, Shabala S, 2016. Assessing the suitability
of various screening methods as a proxy for drought tolerance in barley. Functional Plant
Biology. doi: 10.1071/fp16263
Hassanien, A., Bhatt, C., Ashour, A., Satapathy, S., eds. Internet of Things and Big Data
Analytics Toward Next-Generation Intelligence, Studies in Big Data. Springer. doi:
10.1007/978-3-319-60435-0_19.
He T, Hill CB, Angessa TT, et al., 2019. Gene-set association and epistatic analyses reveal
complex gene interaction networks affecting flowering time in a worldwide barley collection.
Journal of Experimental Botany 70, 5603-16. doi: 10.1093/jxb/erz332
He X, Zeng J, Cao F, et al., 2015. HvEXPB7, a novel beta-expansin gene revealed by the root
hair transcriptome of Tibetan wild barley, improves root hair growth under drought stress.
Journal of Experimental Botany 66, 7405-19. doi: 10.1093/jxb/erv436
Heard E, Martienssen RA, 2014. Transgenerational epigenetic inheritance: myths and
mechanisms. Cell 157:1, 95-109. doi: 10.1016/j.cell.2014.02.045
Heffner EL, Sorrells ME, Jannink JL, 2009. Genomic selection for crop improvement. Crop
Science 49, 1-12. doi: 10.2135/cropsci2008.08.0512
Heller, H. H. 1921. Principles concerning the isolation of anaerobes: Studies in pathogenic
anaerobes II. Journal of Bacteriology. 6:445–470. PMID: 16558932
Hemond HF., Fenchner-Levy EJ, 1999. Chemical Fate and Transport in the Environment.
Academic Press, Cambridge, MA. ISBN: 9780123402752
Hengl T, de Jesus JM, Heuvelink GBM, et al., 2017. SoilGrids250m: Global gridded soil
information based on machine learning. PLOS ONE 12, e0169748. doi:
10.1371/journal.pone.0169748
Hepworth J, Antoniou-Kourounioti RL, Bloomer RH, 2018. Absence of warmth permits
epigenetic memory of winter in Arabidopsis. Nature Communications 9, 639. doi:
10.1038/s41467-018-03065-7
Herman JJ, Sultan SE, 2016. DNA methylation mediates genetic variation for adaptive
transgenerational plasticity. Proceedings of the Royal Society (Biological Sciences) 283. doi:
10.1098/rspb.2016.0988

269
Hill CB, Angessa TT, Mcfawn LA, et al., 2019. Hybridisation-based target enrichment of
phenology genes to dissect the genetic basis of yield and adaptation in barley. Plant
Biotechnology Journal 17, 932-44. doi: 10.1111/pbi.13029
Hill CB, Taylor JD, Edwards J, et al., 2013. Whole-genome mapping of agronomic and
metabolic traits to identify novel quantitative trait Loci in bread wheat grown in a water-limited
environment. Plant Physiology 162, 1266-81. doi: 10.1104/pp.113.217851
Holly MA, Kleinman PJ, Bryant RB, et al., 2018. Short communication: identifying challenges
and opportunities for improved nutrient management through the USDA's dairy agroecosystem
working group. Journal of Dairy Science 101, 6632-41. doi: 10.3168/jds.2017-13819
Hu H, Xiong L, 2014. Genetic engineering and breeding of drought-resistant crops. Annual
Review of Plant Biology 65, 715-41. doi: 10.1146/annurev-arplant-050213-040000
Huang F, Naresh NU, Perros I, Chen R, Sun J, Anandkumar A, 2020. Guaranteed scalable
learning of latent tree models. In: Proceedings of The 35th Uncertainty in Artificial Intelligence
Conference, PMLR 115, 883-93. ISSN: 26403498
Huang F, Yu Y, Feng T, 2019. Automatic extraction of impervious surfaces from high
resolution remote sensing images based on deep learning. Journal of Visual Communication
and Image Representation 58, 453-61. doi: 10.1016/j.jvcir.2018.11.041
Iannetta PP, Young M, Bachinger J, et al., 2016. A comparative nitrogen balance and
productivity analysis of legume and non-legume supported cropping systems: the potential role
of biological nitrogen fixation. Frontiers in Plant Science 7, 1700. doi:
10.3389/fpls.2016.01700
IBM, 1989. Python Scripting Guide for IBM SPSS Statistics. http: public.dhe.ibm.com
IBM, 1990. Microsoft .NET User Guide for IBM SPSS Statistics. http: public.dhe.ibm.com
Ide T, Brzoska M, Donges JF, Schleussner KF, 2020. Multi-method evidence for when and
how climate-related disasters contribute to armed conflict risk. Global Environmental Change
62. 10.1016/j.gloenvcha.2020.102063
İnceoğlu, Ö., W. A. Al-Soud, J. F. Salles, A. V. Semenov, and J. D. van Elsas. 2011.
Comparative analysis of bacterial communities in a potato field as determined by
pyrosequencing. PLoS One 6:e23321. https: doi: 10.1371/journal.pone.0023321
Ingvordsen CH, Backes G, Lyngkjær MF, et al., 2015. Genome-wide association study of
production and stability traits in barley cultivated under future climate scenarios. Molecular
Breeding 35. doi: 10.1007/s11032-015-0283-8
Irmak A, 2012. Evapotranspiration - Remote Sensing and Modeling. Croatia - European Union:
Intech. doi: 10.5772/725

270
Ishibashi Y, Aoki N, Kasa S, Sakamoto M, Kai K, Tomokiyo R, Iwaya-Inoue M, 2017. The
interrelationship between abscisic acid and reactive oxygen species plays a key role in barley
seed dormancy and germination. Frontiers in Plant Science 8:275. doi:
10.3389/fpls.2017.00275
Jaganathan D, Thudi M, Kale S, et al., 2015. Genotyping-by-sequencing based intra-specific
genetic map refines a ''QTL-hotspot" region for drought tolerance in chickpea. Molecular
Genetics and Genomics 290, 559-71. doi: 10.1007/s00438-014-0932-3
Jain M, 2015. Function genomics of abiotic stress tolerance in plants: a CRISPR approach.
Frontiers in Plant Science 6, 1-4. doi: 10.3389/fpls.2015.00375
Jakob SS, Rodder D, Engler JO, et al., 2014. Evolutionary history of wild barley (Hordeum
vulgare subsp. spontaneum) analyzed using multilocus sequence data and paleodistribution
modeling. Genome Biology and Evolution 6, 685-702. doi: 10.1093/gbe/evu047
Janiak A, Kwasniewski M, Szarejko I, 2016. Gene expression regulation in roots under
drought. Journal of Exerimental Botany 67, 1003-14. doi: 10.1093/jxb/erv512
Jarzyniak KM, Jasinski M, 2014. Membrane transporters and drought resistance - a complex
issue. Frontiers in Plant Science 5, 1-15. doi: 10.3389/fpls.2014.00687
Jenjaroenpun P, Wongsurawat T, Pereira R, et al., 2018. Complete genomic and transcriptional
landscape analysis using third-generation sequencing: a case study of Saccharomyces
cerevisiae CEN.PK113-7D. Nucleic Acids Research. doi: 10.1093/nar/gky014
Jisha KC, Vijayakumari K, Puthur JT, 2012. Seed priming for abiotic stress tolerance: an
overview. Acta Physiologiae Plantarum 35, 1381-96. doi: 10.1007/s11738-012-1186-5
Johansen G, Allan L, Heriyanto T, Ali S, 2016. Kali Linux 2 – Assuring Security by Penetration
Testing Third Edition. Packt Publishing. ISBN: 9781785888427
Johnson NC, 2009. Tansley review- resource stoichiometry and the structure and function of
arbuscular mycorrhizas across scales. New Phytologist 185, 631-47. doi: 10.1111/j.1469-
8137.2009.03110.x
Jones MGK, 1985. Plant genetics: transformation of cereal crops by direct gene transfer. Nature
317:6038, 579-80. doi: 10.1038/317579a0
Jones MGK, 1995. Look at it this way. Outlook on Agriculture 24:4, 205-6. doi:
10.1177/003072709502400402
Jones MGK, 2014. WA's court verdict on GM crops is a dose of common sense. Australasian
Biotechnology 24:3, 46-7. http: ausbiotech.org/news-room/publications
Jovel J, Patterson J, Wang W, et al., 2016. Characterization of the gut microbiome using 16S
or shotgun metagenomics. Front. Microbiol. 7:459. doi: 10.3389/fmicb.2016.00459

271
Kafkafi U, Posner A, Quirk J, 1967. Desorption of phosphate from kaolinite. Soil Science
Society of America Journal 31, 348-53. ISSN: 0361-5995
Karathanasis, AD, Hagek, BF, 1996. Elemental Analysis by X-Ray Fluorescence
Spectroscopy. Ed. Sparks, D.L. In SSSA Book Series 5, Methods of Soil Analysis Part 3-
Chemical 279 Methods and Processes, Ch 7. Soil Science Society of America. Wisconsin,
U.S.A.. doi: 10.2136/sssabookser5.3.c7
Karmakar B, Das S, Bhattacharya S, Mukhopadhyay I, 2019. Tight clustering for large datasets
with an application to gene expression data. Scientific Reports 9, 3053. doi: 10.1038/s41598-
019-39459-w
Kasparovska, J., M. Pecinkova, K. Dadakova, I. Krizova, S. Hadrova, M. Lexa, J. Lochman,
and T. Kasparovsky. 2016. Effects of isoflavone-enriched feed on the rumen microbiota in
dairy cows. PLoS One 11:e0154642. doi: 10.1371/journal.pone.0154642
Kässens JC, 2017. A Hybrid-Parallel Architecture for Applications in Bioinformatics.
Germany: Kiel University, PhD Dissertation. http: macau.uni-
kiel.de/receive/dissertation_diss_00021901
Keight R, Al-Jumeily D, Hussain A, Fergus P, Mustafina J, 2018. Big Data and Data Science
Applications for Independent and Healthy Living. In: Dastbaz M, Arabnia H, Akhgar B, eds.
Technology for Smart Futures. Berlin, Germany: Springer, 77-111. doi: 10.1007/978-3-319-
60137-3_5
Kelley LA, Sternberg MJ, 2009. Protein structure prediction on the Web: a case study using
the Phyre server. Nature Protocols 4, 363-71. doi: 10.1038/nprot.2009.2
Keyantash J, Dracup JA, 2002. The quantification of drought: an evaluation of drought indices.
Bulletin of the American Meteorolgical Society 83, 1167-80. doi: 10.1175/1520-0477-
83.8.1167
Kidd F, West C, 1918. Physiological pre-determination: the influence of the physiological
condition of the seed upon the course of subsequent growth and upon the yield. Annals of
Applied Biology 5:2, 112-42. doi: 10.1111/j.1744-7348.1918.tb05286.x
King PM, 1981. Comparison of methods for measuring severity of water repellence of sandy
soils and assessment of some factors that affect its measurement. Australian Journal of Soil
Research 19, 275-85. doi: 10.1071/SR9810275
Klindworth A, Pruesse E, Schweer T, 2013. Evaluation of general 16S ribosomal RNA gene
PCR primers for classical and next-generation sequencing-based diversity studies. Nucleic
Acids Research. 41:e1. doi: 10 .1093/nar/gks808

272
Knight AJ, 2006. Does application matter? An examination of public perception of agricultural
biotechnology applications. AgBioForum 9, 121-8. http: agbioforum.org/v9n2/v9n2a07-knight
Knight C, Lindsey K, 1999. Plant gene structure and function. Journal of Experimental Botany
51, 24-9. http: jstor.org/stable/23695934
Kosambi DD, 1943. The assessment of genetic distances from recombination values. Annals
of Eugenics 12, 172-5. doi: 10.1111/j.1469-1809.1943.tb02321.x
Köhler C, Springer N, 2018. Plant epigenomics—deciphering the mechanisms of epigenetic
inheritance and plasticity in plants. Genome Biology 18:132. doi: 10.1186/s13059-017-1260-
9
Krantz JI, Mizell AM, Williams RL, 1989. Die OS/2-Perspektive In OS/2 für Anwender und
Systementwickler. Wiesbaden – Germany: Vieweg+Teubner Verlag. doi: 10.1007/978-3-663-
01986-2_1
Kruszka K, Pacak A, Swida-Barteczka A, et al., 2014. Transcriptionally and post-
transcriptionally regulated microRNAs in heat stress response in barley. Journal of
Experimental Botany 65, 6123-35. doi: 10.1093/jxb/eru353
Kuhn TS, 1962. The structure of scientific revolutions. University of Chicago press. http:
books.google.com
Kulski JK, 2016. Next Generation Sequencing - Advances, Applications and Challenges.
Croatia - European Union: Intech. doi: 10.5772/60489
Kumar J, Pratap A, Kumar K, 2015a. Phenomics in Crop Plants: Trends, Options and
Limitations. New Dehli - India: Springer. doi: 10.1007/978-81-322-2226-2
Kumar J, Pratap A, Kumar K, 2015b. Plant Phenomics: An Overview. In: Kumar J, Pratap A,
Kumar K, eds. Phenomics in Crop Plants: Trends, Options and Limitations. New Dehli - India:
Springer. doi: 10.1007/978-81-322-2226-2
Kurzbaum E RY, Cohen O, Rubenstein G, Shalom Ob 2017. Lanthanum-modified bentonite:
potential for efficient removal of phosphates from fishpond effluents. Environmental Science
and Pollution Research 24, 1-5. doi: 10.1007/s11356-017-9116-0
Lakew B, 2009. The genetic potential of wild barley (Hordeum spontaneum C. Koch) to
improve adaptation to low rainfall environments. Lismore, N.S.W.: Southern Cross University,
PhD Thesis. http: epubs.scu.edu.au
Lakew B, Eglinton J, Henry RJ, Baum M, Grando S, Ceccarelli S, 2011. The potential
contribution of wild barley (Hordeum vulgare ssp. spontaneum) germplasm to drought
tolerance of cultivated barley (H. vulgare ssp. vulgare). Field Crops Research 120, 161-8. doi:
10.1016/j.fcr.2010.09.011

273
Lallias DJ, Hiddink G, Fonseca VG, 2015. Environmental metabarcoding reveals
heterogeneous drivers of microbial eukaryote diversity in contrasting estuarine ecosystems.
ISME J. 9, 1208-21. doi: 10.1038/ismej.2014.213
Lämke J, Bäurle I, 2017. Epigenetic and chromatin-based mechanisms in environmental stress
adaptation and stress memory in plants. Genome Biology 18:124. doi: 10.1186/s13059-017-
1263-6
Lande R, 2009. Adaptation to an extraordinary environment by evolution of phenotypic
plasticity and genetic assimilation. Journal of Evolutionary Biology 22, 1435-46. doi:
10.1111/j.1420-9101.2009.01754.x
Lander ES, Green P, 1987. Construction of multilocus genetic linkage maps in humans.
Proceedings of the National Academy of Sciences U.S.A. 84, 2363-3267. doi:
10.1073/pnas.84.8.2363
Langridge P, Fleury D, 2011. Making the most of 'omics' for crop breeding. Trends in
Biotechnology 29, 33-40. doi: 10.1016/j.tibtech.2010.09.006
Lata C, Yadav A, Prasad M, 2011. Role of Plant Transcription Factors in Abiotic Stress
Tolerance. In: Shanker AK, Venkateswarlu B, eds. Abiotic Stress Response in Plants –
Physiological, Biochemical and Genetic Perspectives. Croatia - European Union: Intech, 269-
96. (Shanker AK, ed.). doi: 10.5772/23172
Laurent Y, 2015. The Tibetans in the making - barley cultivation & cultural representations.
Revue d’Etudes Tibétaines 33, 73-108. http: cam.ac.uk
Lavania D, Siddiqui MH, Al-Whaibi MH, Singh AK, Kumar R, Grover A, 2014. Genetic
approaches for breeding heat stress tolerance in faba bean (Vicia faba L.). Acta Physiologiae
Plantarum 37, 1-9. doi: 10.1007/s11738-014-1737-z
Lawrence M, Daujat S, Schneider R, 2016. Lateral thinking: how histone modifications
regulate gene expression. Trends in Genetics 32, 42-56. doi: 10.1016/j.tig.2015.10.007
Le Gall H, Philippe F, Domon JM, Gillet F, Pelloux J, Rayon C, 2015. Cell wall metabolism
in response to abiotic stress. Plants (Basel) 4, 112-66. doi: 10.3390/plants4010112
Leff JW, Jones SE, Prober SM, et al., 2015. Consistent responses of soil microbial communities
to elevated nutrient inputs in grasslands across the globe. Proceedings of the National Academy
of Science U.S.A. 112, 10967-72. doi: 10.1073/pnas.1508382112
Lenski RE, 2017. What is adaptation by natural selection? Perspectives of an experimental
microbiologist. PLoS Genetics 13, e1006668. doi: 10.1371/journal.pgen.1006668

274
Li Y, Zuo S, Zhang Z, et al., 2018. Centromeric DNA characterization in the model grass
Brachypodium distachyon provides insights on the evolution of the genus. The Plant Journal
93, 1088-1101. doi: 10.1111/tpj.13832
Lin J, Zhong Y, Fan H, et al., 2017. Chemical treatment of contaminated sediment for
phosphorus control and subsequent effects on ammonia-oxidizing and ammonia-denitrifying
microorganisms and on submerged macrophyte revegetation. Environmental Science and
Pollution Research 24, 1007-18. doi: 10.1007/s11356-016-7828-1
Lindgreen S, Adair KL, Gardner PP, 2016. An evaluation of the accuracy and speed of
metagenome analysis tools. Scientific Reports 6:19233. doi: 10.1038/srep19233
Liu J, Feng L, Li J, He Z, 2015a. Genetic and epigenetic control of plant heat responses.
Frontiers in Plant Science 6, 1-21. doi: 10.3389/fpls.2015.00267
Liu S, Li J, Yang Y, Wang J, Ding H, 2016. Influence of environmental factors on the
phosphorus adsorption of lanthanum-modified bentonite in eutrophic water and sediment.
Environmental Science and Pollution Research 23, 2487-94. doi: 10.1007/s11356-015-5453-z
Liu Z, Li Y, Ma L, et al., 2015b. Coordinated regulation of arbuscular mycorrhizal fungi and
soybean MAPK pathway genes improved mycorrhizal soybean drought tolerance. Molecular
Plant-Microbe Interactions Journal 28, 408-19. doi: 10.1094/MPMI-09-14-0251-R
Lo A, Qi L, 2017. Genetic and epigenetic control of gene expression by CRISPR-Cas systems.
F1000Research 6, F1000 Faculty Rev-747. doi: 10.12688/f1000research.11113.1
Long Z, Jia Y, Tan C, et al., 2018. Genetic mapping and evolutionary analyses of the black
grain trait in barley. Frontiers in Plant Science 9, 1921. doi: 10.3389/fpls.2018.01921
Louca S, Doebeli M, Parfrey LW, 2018. Correcting for 16S rRNA gene copy numbers in
microbiome surveys remains an unsolved problem. Microbiome 6, 41. doi: 10.1186/s40168-
018-0420-9
Ludovisi R, Tauro F, Salvati R, Khoury S, Mugnozza SG, Harfouche A, 2017. UAV-based
thermal imaging for high-throughput field phenotyping of black poplar response to drought.
Frontiers in Plant Science 8, 1681. doi: 10.3389/fpls.2017.01681
Lürling M, Waajen G, Van Oosterhout F, 2014. Humic substances interfere with phosphate
removal by lanthanum modified clay in controlling eutrophication. Water Research 54, 78-88.
doi: 10.1016/j.watres.2014.01.059
Lüscher A, Mueller-Harvey I, Soussana JF, Rees RM, Peyraud JL, 2014. Potential of legume-
based grassland–livestock systems in Europe: A review. Grass Forage Science 69, :206-28.
doi: 10.1111/gfs.12124

275
Lüttge U, Thellier M, 2016. Roles of Memory and Circadian Clock in the Ecophysiological
Performance of Plants In Lüttge, U. Cánovas F, Matyssek R, eds. Progress in ed. Botany, vol
77. Berlin Germany: Springer, Cham. doi: 10.1007/978-3-319-25688-7_2
Maes WH, Steppe K, 2012. Estimating evapotranspiration and drought stress with ground-
based thermal remote sensing in agriculture: a review. Journal of Experimental Botany 63,
4671-712. doi: 10.1093/jxb/ers165
Maddern RJ, 2016. Low water-soluble superphosphate fertiliser for pasture production in
south-western Australia. PhD thesis, Curtin University. http:
pdfs.semanticscholar.org/45d9/d7d76f54dfa58a68412ce2d42dba5d62f1e2.pdf
Manfreda S, Mccabe M, Miller P, et al., 2018. On the use of unmanned aerial systems for
environmental monitoring. Remote Sensing 10, 641. doi: 10.20944/preprints201803.0097.v1
Mansour E, Casas AM, Gracia MP, et al., 2013. QTL for agronomic traits in an elite barley
population for Mediterranean conditions. Molecular Breeding 33:2. doi: 10.1007/s11032-013-
9946-5
Manter DK, Weir TL, Vivanco JM, 2010. Sample pooling masks PCR-based estimates of soil
microbial richness and community structure. Applied Environmental Microbiology. 76:2086-
90. doi: 10.1128/AEM.03017-09
Mascher M, Schuenemann VJ, Davidovich U, et al., 2016. Genomic analysis of 6,000-year-old
cultivated grain illuminates the domestication history of barley. Nature Genetics. doi:
10.1038/ng.3611
Masle J, Gilmore SR, Farquhar GD, 2005. The ERECTA gene regulates plant transpiration
efficiency in Arabidopsis. Nature 436, 866-70. doi: 10.1038/nature03835
Masoudi-Nejad A, Goto S, Jauregui R, et al., 2007. EGENES: transcriptome-based plant
database of genes with metabolic pathway information and expressed sequence tag indices in
KEGG. Plant Physiology 144, 857-66. doi: 10.1104/pp.106.095059
Matesanz S, Milla R, 2018. Differential plasticity to water and nutrients between crops and
their wild progenitors. Environmental and Experimental Botany 145, 54-63. doi:
10.1016/j.envexpbot.2017.10.014
Mathieu M, Roy R, Launeau P, Cathelineau M, Quirt D, 2017. Alteration mapping on drill
cores using a HySpex SWIR320m hyperspectral camera: Application to the exploration of an
unconformity-related uranium deposit (Saskatchewan, Canada). Journal of Geochemical
Exploration. 172, 71-88. doi: 10.1016/j.gexplo.2016.09.008
Mayer KF, Martis M, Hedley PE, et al., 2011. Unlocking the barley genome by chromosomal
and comparative genomics. The Plant Cell 23, 1249-63. doi: 10.1105/tpc.110.082537

276
Mayer KF, Waugh R, Langridge P, et al., 2012. A physical, genetic and functional sequence
assembly of the barley genome. Nature 491, 711-6. doi: 10.1038/nature11543
McArthur WM, 2004. Reference Soils of South-Western Australia. Western Australia:
Department of Agriculture and Food. http: researchlibrary.agric.wa.gov.au/books/4/
McBride RA, 2002. Atterberg limits. In: Dane JH, Topp GC, eds. Methods of soil analysis.
Part 4. Physical methods. Madison, Wisconsin: Soil Science Society of America, 519-27.
ISBN: 089118841X
McDowell, RW, 2017. Does variable rate irrigation decrease nutrient leaching losses from
grazed dairy farming? Soil Use Manage. 33:530-7. doi: 10.1111/sum.12363
McKee TB, Doesken NJ, Kleist J, 1993. The relationship of drought frequency and duration of
time scales. In. Eighth Conference on Applied Climatology, American Meteorological Society.
179-86. http: droughtmanagement.info/ literature/AMS_Relationship_Drought_Frequency_
Duration_Time_Scales_1993.pdf
Mehta R, Panageas I, Piliouras G, 2015. Natural selection as an inhibitor of genetic diversity:
multiplicative weights updates algorithm and a conjecture of haploid genetics. In. Proceedings
of the 2015 Conference on Innovations in Theoretical Computer Science. ISSN: 1408-6270
Mejia-Guerra MK, Pomeranz M, Morohashi K, Grotewold E, 2012. From plant gene regulatory
grids to network dynamics. Biochimica et Biophysica Acta 1819, 454-65. doi:
10.1016/j.bbagrm.2012.02.016
Melchior EA, Myer PR, 2018. Fescue toxicosis and its influence on the rumen microbiome:
Mitigation of production losses through clover isoflavones. Journal of Applied Animal
Research 46:1280–8. doi: 10.1080/09712119.2018.1496920
Mendicino G, Senatore A, 2012. The Role of Evapotranspiration in the Framework of Water
Resource Management and Planning Under Shortage Conditions In: Irmak A, ed.
Evapotranspiration - Remote Sensing and Modeling. Croatia - European Union: Intech, 197-
226. doi: 10.5772/19171
Merlot S, Mustilli A, Genty B, et al., 2002. Use of infrared thermal imaging to isolate
Arabidopsis mutants defective in stomatal regulation. The Plant Journal 30, 601-9. doi:
10.1046/j.1365-313X.2002.01322.x
Metropolis N, Ulam S, 1949. The Monte Carlo method. Journal of the American Statistical
Association 44, 335-41. doi: 10.2307/2280232
Meyer F, Paarmann D, D’Souza M, et al., 2008. The metagenomics RAST server— A public
resource for the automatic phylogenetic and functional analysis of metagenomes. BMC
Bioinformatics 9:386. doi: 10.1186/1471-2105-9-386

277
Mickelbart MV, Hasegawa PM, Bailey-Serres J, 2015. Genetic mechanisms of abiotic stress
tolerance that translate to crop yield stability. Nature Reviews Genetics 16, 237-51. doi:
10.1038/nrg3901
Mickan BS, Abbott LK, Stefanova K, Solaiman Z, 2016. Interactions between biochar and
mycorrhizal fungi in a water-stressed agricultural soil. Mycorrhiza 26, 565-74. doi:
10.1007/s00572-016-0693-4
Mildwaters MR, 2017. Facebook Vasse River Community Action Group. In.: Facebook. http:
Facebook.com
Millar AJ, 2016. The intracellular dynamics of circadian clocks reach for the light of ecology
and evolution. Annual Reviews in Plant Biology 67, 595-618. doi: 10.1126/science.1115581
Minamisawa K, Nishioka K, Miyaki T, et al., 2004. Anaerobic nitrogen-fixing consortia
consisting of clostridia isolated from gramineous plants. Applied Environmental Microbiology
70, 3096-102. doi: 10.1128/aem.70.5.3096-3102.2004
Minelli A, 2018. Plant Evolutionary Developmental Biology: The Evolvability of the
Phenotype. Cambridge: Cambridge University Press. ISBN: 1107034922
Mishra BK, Rao NS, 2015. Integrated studies for mapping of uranium mineralization in
northern Cape Province of South Africa. Natural Science. 7, 400-15. doi:
10.4236/ns.2015.78043
Mohamed S, Png M, Isaac W, 2020. Decolonial AI: decolonial theory as sociotechnical
foresight in artificial intelligence. Philosophical Technology. doi: 10.1007/s13347-020-00405-
8
Moorby JM, Lee MRF, Davies DR, et al., 2009. Assessment of dietary ratios of red clover and
grass silages on milk production and milk quality in dairy cows. Journal of Dairy Science 92,
1148-60. doi: 10.3168/jds.2008-1771
Morison JI, Baker NR, Mullineaux PM, Davies WJ, 2008. Improving water use in crop
production. Philosophical Transactions of the Royal Society of Biological Sciences 363, 639-
58. doi: 10.1098/rstb.2007.2175
Morrison JM, Murphy CL, Baker K, et al., 2017. Microbial communities mediating algal
detritus turnover under anaerobic conditions. The Journal of Life and Environmental Sciences
5:e2803. doi: 10.7717/peerj.2803
Motomizu S, Wakimoto T, Tôei K, 1983. Spectrophotometric determination of phosphate in
river waters with molybdate and malachite green. Analyst 108, 361-7. doi:
10.1039/AN9830800361

278
Müller V, De Boer RJ, Bonhoeffoer S, Szathmáry E, 2018. An evolutionary perspective on the
systems of adaptive immunity. Biological Reviews of the Cambridge Philosophical Society 93,
505-28. doi: 10.1111/brv.12355
Müller-Xing R, Xing Q, Goodrich J, 2014. Footprints of the sun: memory of UV and light
stress in plants. Frontiers in Plant Science 5. doi: 10.3389/fpls.2014.00474
Munns R, James RA, Sirault XRR, Furbank RT, Jones HG, 2010. New phenotyping methods
for screening wheat and barley for beneficial responses to water deficit. Journal of
Experimental Botany 61, 3499-507. doi: 10.1093/jxb/erq199
Muñoz-Amatriain M, Lonardi S, Luo M, et al., 2015. Sequencing of 15 622 gene-bearing BACs
clarifies the gene-dense regions of the barley genome. The Plant Journal 84, 216-27. doi:
10.1111/tpj.12959
Murovec J, Bohanec B, 2011. Haploids and Doubled Haploids in Plant Breeding In:
Abdurakhmonov IY, ed. Plant Breeding. Croatia - European Union: Intech, 87-106. doi:
10.5772/29982
Murray D, 2011. Cross layer performance improvements in Multi-hop Ad-hoc networks. PhD
thesis, Murdoch University. http: researchrepository.murdoch.edu.au/id/eprint/5805/
Naceur MB, Paul R, Salah HB, 1997. Screening of six barley varieties for drought resistance
by using leaf water potential, membrane stability and phosphatasic parameters. Medit 4, 51-4.
ISSN: 1120-6403
Nair KP, 2019. Utilizing crop wild relatives to combat global warming. Advances in Agronomy
153, 175-258. doi: 10.1016/bs.agron.2018.09.001
Nandhini S, Priya S, Ramya K, Anusuya G, 2016. A framework for big data information
organisation in smart grids based on secure cloud computing. International Research Journal
of Engineering and Technology 3, 1897-1901. ISSN: 2395-0072
Nature, 2020. Why Nature needs to cover politics now more than ever. Nature 586, 169-70.
doi: 10.1038/d41586-020-02797-1
Negreanu Y, Pasternak Z, Jurkevitch E, Cytryn E, 2012. Impact of treated wastewater irrigation
on antibiotic resistance in agricultural soils. Environmental Science and Technology 46, 4800-
8. doi: 10.1021/es204665b
Neveu P, Tireau A, Hilgert N, et al., 2019. Dealing with multi-source and multi-scale
information in plant phenomics: the ontology-driven phenotyping hybrid information system.
New Phytologist 221, 588-601. doi: 10.1111/nph.15385

279
Ng DHP, Kumar A, Cao B, 2016. Microorganisms meet solid minerals: interactions and
biotechnological applications. Applied microbiology and biotechnology 100, 6935-46. doi:
10.1007/s00253-016-7678-2
Niwa, 2004. Alum and Phoslock - A Basic Comparison (Table). http:
phoslock.com.au/site/PDF/ 18b2c248-b89b-402f-8d83-
1504dfe0d88a/AlumandPhoslockComparisonofperformancesSep08
Nonogaki H, 2014. Seed dormancy and germination – emerging mechanisms and new
hypotheses. Frontiers in Plant Science 5:233. doi: 10.3389/fpls.2014.00233
Nonogaki M, Nonogaki H, 2017. Prevention of preharvest sprouting through hormone
engineering and germination recovery by chemical biology. Frontiers in Plant Science 8:90.
doi: 10.3389/fpls.2017.00090
Norish, K., Thompson, G.M., 1990. XRF Analysis of Sulphides by Fusion Methods: X-Ray
Spectrometry 19, 67-71. ISSN: 1097-4539
Obsa BT, Eglinton J, Coventry S, March T, Langridge P, Fleury D, 2016. Genetic analysis of
developmental and adaptive traits in three doubled haploid populations of barley (Hordeum
vulgare L.). Theoretical and Applied Genetics 129, 1139-51. doi: 10.1007/s00122-016-2689-z
Okumoto S, Jones A, Frommer WB, 2012. Quantitative imaging with fluorescent biosensors.
Annual Reviews in Plant Biology 63, 663-706. doi: 10.1146/annurev-arplant-042110-103745
Oracle 2020. Oracle® Advanced Support Gateway Security Guide. Oracle Corporation. http:
docs.oracle.com
Osakabe Y, Osakabe K, Shinozaki K, Tran LS, 2014. Response of plants to water stress.
Frontiers in Plant Science 5, 1-8. doi: 10.3389/fpls.2014.00086
Oukarroum A, El Madidi S, Strasser RJ, 2016. Differential heat sensitivity index in barley
cultivars (Hordeum vulgare L.) monitored by chlorophyll a fluorescence OKJIP. Plant
Physiology and Biochemistry 105, 102-8. doi: 10.1016/j.plaphy.2016.04.015
Palmer WC, 1965. Meterological drought: research paper. In. Washington D.C., U.S.A.: U.S.
Weather Bureau. (45.) http: ncdc.noaa.gov/temp-and-precip/drought/docs/palmer.pdf
Pandey P, Ramegowda V, Senthil-Kumar M, 2015. Shared and unique responses of plants to
multiple individual stresses and stress combinations: physiological and molecular mechanisms.
Frontiers in Plant Science 6, 1-14. doi: 10.3389/fpls.2015.00723
Pantin F, Renaud J, Barbier F, et al., 2013. Developmental priming of stomatal sensitivity to
abscisic acid by leaf microclimate. Current Biology 23, 1805-11. doi:
10.1016/j.cub.2013.07.05

280
Pauwels E, Deton SW, 2020. Hybrid Emerging Threats and Information Warfare: The Story
of the Cyber-AI Deception Machine. In: Martellini M, Trapp R, ed. 21st Century Prometheus.
Springer, Cham. doi: 10.1007/978-3-030-28285-1_6
Paynter B, Trainor G, Gupta SC, S., Dhammu H 2016. Barley Guide. Bulletin 4866 - Barley
Guide. ISSN: 1833-7236a
Peng B, Guan K, Zhou W, et al., 2020. Assessing the benefit of satellite-based Solar-Induced
Chlorophyll Fluorescence in crop yield prediction. International Journal of Applied Earth
Observation and Geoinformation 90:102126. doi: 10.1016/j.jag.2020.102126
Pérez P, De Los Campos G, 2014. Genome-wide regression & prediction with the BGLR
statistical package. Genetics, early online. doi: 10.1534/genetics.114.164442
Pham VTK, Rediers H, Ghequire MG, et al., 2017. The plant growth promoting effect of the
nitrogen-fixing endophyte Pseudomonas stutzeri A15. Archives of Microbiology 199, 513-7.
doi: 10.1007/s00203-016-1332-3
Pospisilova H, Jiskrova E, Vojta P, et al., 2016. Transgenic barley overexpressing a cytokinin
dehydrogenase gene shows greater tolerance to drought stress. New Biotechnology 0, 1-14.
doi: 10.1016/j.nbt.2015.12.005
Pozzi W, Sheffield J, Stefanski R, et al., 2013. Toward global drought early warning capability:
expanding international cooperation for the development of a framework for monitoring and
forecasting. Bulletin of the American Meteorological Society 94, 776-85. doi: 10.1175/bams-
d-11-00176.1
Qu Y, Qian X, Song H, et al., 2018. Soil moisture investigation utilizing machine learning
approach based experimental data and Landsat5-TM images: a case study in the mega city
Beijing. Water 10:423. doi: 10.3390/w10040423
R Core Team, 2017. R: A language and environment for statistical computing. R Foundation
for Statistical Computing. Vienna, Austria. http: R-project.org/
Rahaman MM, Chen D, Gillani Z, Klukas C, Chen M, 2015. Advanced phenotyping and
phenotype data analysis for the study of plant growth and development. Frontiers in Plant
Science 6, 1-15. doi: 10.3389/fpls.2015.00619
Rahman H, Ramanathan V, Jagadeeshselvam N, et al., 2015. Phenomics: technologies and
applications in plant and agriculture. In. PlantOmics: The Omics of Plant Science. 385-411.
doi: 10.1007/978-81-322-2172-2_13
Rancati G, Moffat J, Typas A, Pavelka N, 2018. Emerging and evolving concepts in gene
essentiality. Nature Reviews Genetics 19, 34-49. doi: 10.1038/nrg.2017.74

281
Rao DE, Chaitanya KV, 2016. Photosynthesis and antioxidative defense mechanisms in
deciphering drought stress tolerance of crop plants. Biologia Plantarum 60, 201-18. doi:
10.1007/s10535-016-0584-8
Rassoulzadegan M, Grandjean V, Gounon P, Vincent S, Gillot I, Cuzin F, 2006. RNA-
mediated non-mendelian inheritance of an epigenetic change in the mouse. Nature 441:7092,
469-74. doi: 10.1038/nature04674
Rayment, GE, Lyons DJ, 2011. Soil Chemical Methods: Australasia. Vol. 3. CSIRO,
Melbourne, Australia. ISBN: 9780643067684
Recalde-Salas A, Erbe C, Salgado Kent, C, Parsons M, 2020. Non-song vocalizations of
humpback whales in Western Australia. Frontiers in Marine Science 7, 141. doi:
10.3389/fmars.2020.00141
Reetinder G, 2009. Characterization of phenotypic and genotypic selection for simple and
complex traits of barley. Australia: Murdoch University, Doctor of Philosophy. http:
researchrepository.murdoch.edu.au/id/eprint/2984/
Ren C, Sun P, Kang D, et al., Responsiveness of soil nitrogen fractions and bacterial
communities to afforestation in the Loess hilly region (LHR) of China. Scientific Reports.
6:28469. doi: 10.1038/srep28469
Revell CK, Ewing MA, Nutt BJ, 2012. Breeding and farming system opportunities for pasture
legumes facing increasing climate variability in the south-west of Western Australia. Crop and
Pasture Science 63, 840-7. doi: 10.1071/CP12160
Rey O, Danchin E, Mirouze M, Loot C, Blanchet S, 2016. Adaptation to global change: a
transposable element-epigenetics perspective. Trends in Ecology and Evolution x, 1-9. doi:
10.1016/j.tree.2016.03.013
Reynolds D, Ball J, Bauer A, et. al., 2019. CropSight: a scalable and open-source information
management system for distributed plant phenotyping and IoT-based crop management.
Gigascience 8. doi: 10.1093/gigascience/giz009
Richards CL, Alonso C, Becker C, et al., 2017. Ecological plant epigenetics: Evidence from
model and non-model species, and the way forward. Ecological Letters. 20, 1576-90. doi:
10.1111/ele.12858
Rizhsky L, Liang H, Shuman J, Shulaev V, Davletova S, Mittler R, 2004. When defense
pathways collide. The response of Arabidopsis to a combination of drought and heat stress.
Plant Physiology 134, 1683-96. doi: 10.1104/pp.103.033431
Robb MS, Greenop B, Goss Z, Douglas G, Adeney J, 2003. Application of PhoslockTM, an
innovative phosphorus binding clay, to two Western Australian waterways: preliminary

282
findings. In: Kronvang B, ed. The Interactions between Sediments and Water: Developments
in Hydrobiology. Dordrecht, The Netherlands: Springer, 237-43. (169.) doi: 10.1007/978-94-
017-3366-3_32
Robinson H, Hickey L, Richard C, et al., 2016. Genomic regions influencing seminal root traits
in barley. The Plant Genome 9, 0. doi: 10.3835/plantgenome2015.03.0012
Rosselli R, Romoli O, Vitulo N, et al., 2016. Direct 16S rRNA-seq from bacterial communities:
A PCR-independent approach to simultaneously assess microbial diversity and functional
activity potential of each taxon. Scientific Reports 6:32165. doi: 10.1038/srep32165
Rostoks N, Mudie S, Cardle L, et al., 2005. Genome-wide SNP discovery and linkage analysis
in barley based on genes responsive to abiotic stress. Molecular Genetics and Genomics 274,
515-27. doi: 10.1007/s00438-0050046-z
Rukshan A, Thompson N, Murray D, 2017. Towards cultural translation of websites: a large-
scale study of Australian, Chinese, and Saudi Arabian design preferences. Behaviour &
Information Technology 36:4, 351-63. doi: 10.1080/0144929X.2016.1234646
Garfinkel MS, Endy D, Epstein GL, Friedman R, 2007. Working Papers for Synthetic
Genomics: Risks and Benefits for Science and Society. In. Synthetic Genomics: Options for
Governance. Boston, Massachusetts MIT Library. (MIT Publishing, ed.) http:
space.mit.edu/handle/1721.1/39141
Sadras V, Dreccer MF, 2015. Adaptation of wheat, barley, canola, field pea and chickpea to
the thermal environments of Australia. Crop and Pasture Science 66, 1137-50. doi:
10.1071/cp15129
Samal A, Martin OC, 2015. Statistical physics methods provide the exact solution to a long-
standing problem of genetics. Physical Reviews Letters 114. doi:
10.1103/PhysRevLett.114.238101
Saucedo-Garcia M, Gavilanes-Ruiz M, Arce-Cervantes O, 2015. Long-chain bases,
phosphatidic acid, MAPKs, and reactive oxygen species as nodal signal transducers in stress
responses in Arabidopsis. Frontiers in Plant Science 6, 1-14. doi: 10.3389/fpls.2015.00055
Scharf KD, Berberich T, Ebersberger I, Nover L, 2012. The plant heat stress transcription factor
(Hsf) family: structure, function and evolution. Biochimica et Biophysica Acta 1819, 104-19.
doi: 10.1016/j.bbagrm.2011.10.002
Schellnhuber HJ, Rahmstorf S, Winkelmann R, 2016. Why the right climate target was agreed
in Paris. Nature Climate Change 6, 649-53. doi: 10.1038/nclimate3013
Schloter M, Nannipieri P, Sørensen SJ, Van Elsas JD, 2017. Microbial indicators for soil
quality. Biology and Fertility of Soils 54, 1-10. doi: 10.1007/s00374-017-1248-3

283
Schmidt RR, Weits DA, Feulner CFJ, van Dongen JT, 2018. Oxygen sensing and integrative
stress signaling in plants. Plant Physiology 176:2. doi: 10.1104/pp.17.01394
Schneider RF, Meyer A, 2017. How plasticity, genetic assimilation and cryptic genetic
variation may contribute to adaptive radiations. Molecular Ecology. 26, 330-50. doi:
10.1111/mec.13880
Schöler A, Jacquiod S, Vestergaard G, Schulz A, Schloter M, 2017. Analysis of soil microbial
communities based on amplicon sequencing of marker genes. Biological Fertility of Soils 53,
485-9. doi: 10.1007/s00374-017-1205-1
Senechkin IV, Speksnijder AJCL, Semenov AM, van Bruggen AHC, van Overbe SL, 2010.
Isolation and partial characterization of bacterial strains on low organic carbon medium from
soils fertilized with different organic amendments. Microbial Ecology 60, 829-39. doi:
10.1007/s00248-010-9670-1
Shankar A, Agrawal N, Sharma M, Pandey A, Pandey GK, 2015. Role of protein tyrosine
phosphatases in plants Current Genomics 16, 224-36. doi:
10.2174/1389202916666150424234300
Shanker AK, 2011. Abiotic Stress Response in Plants - Physiological, Biochemical and
Genetic Perspectives. Croatia - European Union: Intech. doi: 10.5772/1762
Shanker AK, Shanker C, 2016. Abiotic and Biotic Stress in Plants - Recent Advances and
Future Perspectives. Croatia - European Union: Intech. doi: 10.5772/60477
Sheffield J, Wood EF, Roderick ML, 2012. Little change in global drought over the past 60
years. Nature 491, 435-8. doi: 10.1038/nature11575
Sheoran S, Malik R, Narwal S, et al., 2015. Genetic and molecular dissection of drought
tolerance in wheat and barley. Journal of Wheat Research 7, 1-13. ISSN: 2582-2675
Shotts Jr. WE, 2009. The Linux® Command Line. CA - U.S.A.. http: LinuxCommand.org.
Shuai Z, Li Z, Medhi D, 2016. Low delay streaming of DASH content with WebRTC data
channel. In. 2016 IEEE/ACM 24th International Symposium on Quality of Service (IWQoS).
1-2. doi: 10.1109/IWQoS.2016.7590414
Singh A, Grover A, 2008. Genetic engineering for heat tolerance in plants. Physiology and
Molecular Biology of Plants 14, 155-66. doi: 10.1007/s12298-008-0014-2
Singh D, Laxmi A, 2015. Transcriptional regulation of drought response: a tortuous network
of transcriptional factors. Frontiers in Plant Science 6, 1-11. doi: 10.3389/fpls.2015.00895
Smith P, House JI, Bustamante M, et al., 2016. Global change pressures on soils from land use
and management. Global Change Biology 22, 1008-28. doi: 10.1111/gcb.13068

284
Śniegowska-Świerk K, Dubas E, Rapacz M, 2015. Drought-induced changes in the actin
cytoskeleton of barley (Hordeum vulgare L.) leaves. Acta Physiologiae Plantarum 37, 1-13.
doi: 10.1007/s11738-015-1820-0
Solaiman MZ, Hirata H (1997) Effect of arbuscular mycorrhizal fungi inoculation of rice
seedlings at the nursery stage upon performance in the paddy field and greenhouse. Plant and
Soil 191, 1-12. doi: 10.1023/A:1004238028617
Song Q, Decato B, Hong EE, et al., 2013. A reference methylome database and analysis
pipeline to facilitate integrative and comparative epigenomics. PLoS ONE. 8:12, e81148. doi:
10.1371/journal.pone.0081148
Stahl BC, Wright D, 2018. Ethics and Privacy in AI and Big Data: Implementing Responsible
Research and Innovation," in IEEE Security & Privacy, vol. 16, no. 3, pp. 26-33, May/June
2018, doi: 10.1109/MSP.2018.2701164
Stam M, Belele C, Dorweiler JE, Chandler VL, 2002. Differential chromatin structure within
a tandem array 100 kb upstream of the maize b1 locus is associated with paramutation. Genes
and Development 16:15, 1906-18. doi: 10.1101/gad.1006702
Stauber and Binet J, Binet M, 2002. Canning River Phoslock™ trials: ecotoxicity testing final
report. http: phoslock.com.au
Stine RH, 1990. RFC1147: FYI on a network management tool catalog: tools for monitoring
and debugging TCP/IP internets and interconnected devices. doi: 10.17487/RFC1147
Stroom JM, Kardinaal WEA, 2016. How to combat cyanobacterial blooms: strategy toward
preventive lake restoration and reactive control measures. Aquatic Ecology 50, 541-76. doi:
10.1007/s10452-016-9593-0
Sudmeyer RA, Edward A, Fazakerley V, Simpkin L, Foster I, 2016. Climate change impacts
and adaptation for agriculture in Western Australia. In. Western Australia: Department of
Agriculture and Food, 166. (Bulletin 4-2016.) http: researchlibrary.agric.wa.gov.au
Sulcek Z, Povondra P, 1989. Methods of decomposition in inorganic analysis. Florida, U.S.A.;
CRC press. ISBN: 084934963X
Sultan, S.E. (1995). Phenotypic plasticity and plant adaptation*. Acta Bot. Neer. 44, 363-383.
doi: 10.1111/j.1438-8677.1995.tb00793.x
Sun YF, Shen JP, Zhang CJ, et al., 2018. Responses of soil microbial community to nitrogen
fertilizer and precipitation regimes in a semi-arid steppe. Journal of Soils and Sediments 18,
762-74. doi: 10.1007/s11368-017-1846-6

285
Sun Z, Wang L, Zhou Q, Huang X 2013. Effects and mechanisms of the combined pollution
of lanthanum and acid rain on the root phenotype of soybean seedlings. Chemosphere 93, 344-
52. doi: 10.1016/j.chemosphere.2013.04.089
Sutherland G, Chasmer LE, Petrone RM, Kljun N, Devito KJ, 2014. Evaluating the use of
spatially varying versus bulk average 3D vegetation structural inputs to modelled
evapotranspiration within heterogeneous land cover types. Ecohydrology 7, 1545-59. doi:
10.1002/eco.1477
Suzuki MT, Giovannoni SJ, 1996. Bias caused by template annealing in the amplification of
mixtures of 16S rRNA genes by PCR. Applied Environmental Microbiology 62, 625-30.
PMID: 8593063
Svatos KBW, 2011. Influences of nitrogen and phosphorus on a WA dairy soil microbial
community. Australia: University of Western Australia, Preliminary Master's Thesis. doi:
10.13140/RG.2.1.1533.3840
Svatos KBW, 2012. Microbial Communities Associated with Nitrogen Cycling in Dairy Soil.
Australia: University of Western Australia, Master's Thesis. doi: 10.13140/RG.2.1.4457.9288
Svatos KBW, 2018. Commercial silicate phosphate sequestration and desorption leads to a
gradual decline of aquatic systems. Environmental Science and Pollution Research 25, 5386-
92. doi: 10.1007/s11356-017-0846-9
Svatos KBW, Abbott LK, 2019. Dairy soil bacterial responses to nitrogen application in
simulated Italian ryegrass and white clover pasture. Journal of Dairy Science 102, 9495-504.
doi: 10.3168/jds.2018-16107
Svatos KBW, Diepeveen D, Abbott LK, Li C, 2018. Big data GPU/CPU kernalisation pipeline
for API based quantitative genetic assessments in fieldbased drone research (Abstract
Submitted). Journal of Plant Pathology and Microbiology, 9. doi: 10.4172/2157-7471-C2-011
Svatos K, Trowbridge G, 2018. Australian drone technology assisting a significant step in crop
tolerance to heat and drought stress. Future Directions International. http:
futuredirections.org.au/publication/australian-drone-technology-assisting-significant-step-
crop-tolerance-heat-drought-stress/
Szabados L, Savoure A, 2010. Proline: a multifunctional amino acid. Trends in Plant Science
15, 89-97. doi: 10.1016/j.tplants.2009.11.009
Teixeira EI, Fischer G, Van Velthuizen H, Walter C, Ewert F, 2013. Global hot-spots of heat
stress on agricultural crops due to climate change. Agricultural and Forest Meteorology 170,
206-15. doi: 10.1016/j.agrformet.2011.09.002

286
Teng H, Viscarra Rossel RA, Shi Z, Behrens T, Chappell A, Bui E, 2016. Assimilating satellite
imagery and visible–near infrared spectroscopy to model and map soil loss by water erosion in
Australia. Environmental Modelling & Software 77, 156-167. doi:
10.1016/j.envsoft.2015.11.024
Tetard-Jones C, Kertesz MA, Preziosi RF, 2011. Quantitative trait loci mapping of phenotypic
plasticity and genotype-environment interactions in plant and insect performance.
Philosophical Transactions of the Royal Society of Biological Sciences 366, 1368-79. doi:
10.1098/rstb.2010.0356
The Lancet Group, 2020. Learning from retraction. The Lancet 396, 1056. doi:
10.1016/SO140-6736(20)31958-9
The Royal Society, 2009. Reaping the benefits: science and the sustainable intensification of
global agriculture. London, U.K., The Royal Society. ISBN: 9780854037841
Thompson A, May MR, Moore BR, Kopp A, 2020. A hierarchical Bayesian mixture model for
inferring the expression state of genes in transcriptomes. Proceedings of the National Academy
of Sciences, 201919748. doi: 10.1073/pnas.1919748117
Torsvik V, Øvreås L, (2002). Microbial diversity and function in soil: from genes to
ecosystems. Current Opinion in Microbiology 5, 240-5. doi: 10.1016/s1369-5274(02)00324-7
Trenberth KE, Dai A, Van Der Schrier G, et al., 2014. Global warming and changes in drought.
Nature Climate Change 4, 17-22. doi: 10.1038/nclimate2067
Trewavas A, 2001. Urban myths of organic farming. Nature 410, 409-10. doi:
10.1038/35068639
Tricker PJ, 2015. Transgenerational inheritance or resetting of stress-induced epigenetic
modifications: two sides of the same coin. Frontiers in Plant Science 6:669. doi:
10.3389/fpls.2015.00699
Vishwakarma K, Upadhyay N, Kumar N, et al., 2018. Abscisic acid signaling and abiotic stress
tolerance in plants: a review on current knowledge and future prospects. Frontiers in Plant
Science 8:161. doi: 10.3389/fpls.2017.00161
Triantaphyllopoulos KA, Ikonomopoulos I, Bannister AJ, 2016. Epigenetics and inheritance of
phenotype variation in livestock. Epigenetics & Chromatin 9, 31. doi: 10.1186/s13072-016-
0081-5
Tripathi A, Goswami K, Sanan-Mishra N, 2015. Role of bioinformatics in establishing
microRNAs as modulators of abiotic stress responses: the new revolution. Frontiers in
Physiology 6, 1-20. doi: 10.3389/fphys.2015.00286

287
Tsoy, O. V., D. A. Ravcheev, J. Čuklina, and M. S. Gelfand. 2016. Nitrogen fixation and
molecular oxygen: Comparative genomic reconstruction of transcription regulation in
Alphaproteobacteria. Frontiers in Microbiology 7:1343. doi: 10.3389/fmicb.2016.01343
Tuberosa R, 2012. Phenotyping for drought tolerance of crops in the genomics era. Frontiers
in Physiology 3, 1-26. doi: 10.3389/fphys.2012.00347
Tyczewska A, Bąkowska-Żywicka K, Gracz J, Twardowski T, 2016. Stress Responsive Non-
protein Coding RNAs. In: Shanker AK, Shanker C, eds. Abiotic and Biotic Stress in Plants -
Recent Advances and Future Perspectives. Croatia - European Union: Intech, 153-81. doi:
10.5772/61347
Tyson GW, Chapman J, Hugenholtz P, et al., 2004. Community structure and metabolism
through reconstruction of microbial genomes from the environment. Nature 428, 37-43. doi:
10.1038/nature02340
Uga Y, 2010. Gene DRO1 controlling deep-rooted characteristics of plant and utilization of
same. In: U.S.A., ed.: National Institute of Agrobiological Sciences, lbaraki (JP). U.S.A. Patent
Number: US 2012/0317678 A1
Uga Y, Sugimoto K, Ogawa S, et al., 2013. Control of root system architecture by DEEPER
ROOTING 1 increases rice yield under drought conditions. Nature Genetics 45, 1097-102. doi:
10.1038/ng.2725
USEPA, 1976. Quality criteria for water. U.S.A.: EPA-440/9–76-023. http: epa.gov
Uusitalo R, Yli-Halla M, Turtola E, 2000. Suspended soil as a source of potentially bioavailable
phosphorus in surface runoff waters from clay soils. Water Research 34, 2477-82. ISSN: 0043-
1354
Vallecillo-Viejo IC, Liscovitch-Brauer N, Quiroz JFD, et al., 2020. Spatially regulated editing
of genetic information with a neuron. Nucleic Acids Research 48, 3999-4012. doi:
10.1093/nar/gkaa172
Valliyodan B, Nguyen HT, 2006. Understanding regulatory networks and engineering for
enhanced drought tolerance in plants. Current Opinion in Plant Biology 9, 189-95. doi:
10.1016/j.pbi.2006.01.019
Van Dorland, H. A., M. Kreuzer, H. Leuenberger, and H. Wettstein. 2008. Eating behavior of
dairy cows offered fresh or ensiled white clover, red clover and ryegrass to choose from or in
a mixture. Applied Animal Behaviour Science. 111:205-21. doi:
10.1016/j.applanim.2007.06.018

288
van Eekeren N, Van Liere D, De Vries F, Rutgers M, De Goede R, Brussaard L, 2009. A
mixture of grass and clover combines the positive effects of both plant species on selected soil
biota. Applied Soil Ecology 42, 254-63. doi: 10.1016/j.apsoil.2009.04.006
van Oosterhout F, Goitom E, Roessink I, Lürling M, 2014. Lanthanum from a modified clay
used in eutrophication control is bioavailable to the marbled crayfish (Procambarus fallax f.
virginalis). PLoS One 9:e102410. ISBN: 1932-6203
Vestergaard, G., S. Schulz, A. Schöler, and M. Schloter. 2017. Making big data smart- how to
use metagenomics to understand soil quality. Biological Fertility of Soils 53, 479-84. doi:
10.1007/s00374-017-1191-3
Vojta P, Kokas F, Husickova A, et al., 2016. Whole transcriptome analysis of transgenic barley
with altered cytokinin homeostasis and increased tolerance to drought stress. New
Biotechnology 0, 1-16. doi: 10.1016/j.nbt.2016.01.010
Voltas J, López-Córcoles H, Borrás G, 2005. Use of biplot analysis and factorial regression for
the investigation of superior genotypes in multi‐environment trials. European Journal of
Agronomy 22, 309–24. doi:10.1016/j.eja.2004.04.005
Wahid A, Gelani S, Ashraf M, Foolad M, 2007. Heat tolerance in plants: an overview.
Environmental and Experimental Botany 61, 199-223. doi: 10.1016/j.envexpbot.2007.05.011
Wahid A, Shabbir A, 2005. Induction of heat stress tolerance in barley seedlings by pre-sowing
seed treatment with glycinebetaine. Plant Growth Regulation 46, 133-41. doi: 10.1007/s10725-
005-8379-5
Wall LG, Gabbarini LA, Ferrari AE, et al., 2019. Changes of paradigms in agriculture soil
microbiology and new challenges in microbial ecology. Acta Oecologica 95, 68-73. doi:
10.1016/j.actao.2019.02.001
Walter A, Liebisch F, Hund A, 2015. Plant phenotyping: from bean weighing to image analysis.
Plant Methods 11, 1-11. doi: 10.1186/s13007-015-0056-8
Wang A, Yu Z, Ding Y, 2009. Genetic diversity analysis of wild close relatives of barley from
Tibet and the Middle East by ISSR and SSR markers. Comptes Rendus Biologies 332, 393-
403. doi: 10.1016/j.crvi.2008.11.007
Wang HL, Chekanova JA, 2016. Small RNAs: essential regulators of gene expression and
defences against environmental stresses in plants. Wiley Interdisciplinary Reviews RNA 7,
356-81. doi: 10.1002/wrna.1340

289
Wang Q, Zhao H, Jiang J, et al., 2017. Genetic architecture of natural variation in rice
nonphotochemical quenching capacity revealed by genome-wide association study. Frontiers
in Plant Science 8, 1773. doi: 10.3389/fpls.2017.01773
Watt C, Zhou G, Li C, 2020. Harnessing transcription factors as potential tools to enhance grain
size under stressful abiotic conditions in cereal crops. Frontiers in Plant Science 11, 1273. doi:
10.3389/fpls.2020.01273
Watts GS, Youens-Clark K, Slepian MJ, et al., 2017. 16S rRNA gene sequencing on a benchtop
sequencer: accuracy for identification of clinically important bacteria. Journal of Applied
Microbiology 123, 1584-96. doi: 10.1111/jam.13590
Weckwerth W, Ghatak A, Bellaire A, Chaturvedi P, Varshney RK, 2020. PANOMICS meets
germplasm. Plant biotechnology journal 18(7), 1507-25. doi: 10.1111/pbi.13372
Wehner GG, Balko CC, Humbeck K, Zyprian E, Ordon F, 2016. Expression profiling of genes
involved in drought stress and leaf senescence in juvenile barley. BMC Plant Biology 16, 1-
12. doi: 10.1186/s12870-015-0701-4
Wehner GG, Balko CC, Enders MM, Humbeck KK, Ordon FF, 2015. Identification of genomic
regions involved in tolerance to drought stress and drought stress induced leaf senescence in
juvenile barley. BMC Plant Biology 15, 125. doi: 10.1186/s12870-015-0524-3
Wei K, Wang YL, Zhong X, Pan S, 2014. Protein kinase structure, expression and regulation
in maize drought signaling. Molecular Breeding 34, 583-602. doi: 10.1007/s11032-014-0059-
6
Weinhold, A. (2018). Transgenerational stress-adaption: an opportunity for ecological
epigenetics. Plant Cell Reports 37:3. doi: 10.1007/s00299-017-2216-y
Weldon MK, 2015. The Future X Network: A Bell Labs Perspective. New Jersey, U.S.A.:
Nokia-Bell Labs, 1-24. http: bell-labs.com/our-research/publications/294435
Wendelboe-Nelson C, 2012. A Proteomic Analysis of Drought Stress in Barley (Hordeum
vulgare). Edinburgh: Heriot-Watt University, Doctor of Philosophy. http: ros.hw.au.uk
Wepking C, Avera B, Badgley B, et al., 2017. Exposure to dairy manure leads to greater
antibiotic resistance and increased mass-specific respiration in soil microbial communities.
Proceedings of the Royal Society: Biological Sciences. 284:1851. doi: 10.1098/rspb.2016.2233
Werrell CE, Femia F, 2016. Climate change, the erosion of state sovereignty, and world order.
The Brown Journal of World Affairs 22, 221-35. http: climateandsecurity.files.wordpress.com/
2012/04/werrell_femia_final-article_climate-change_state-sovereignty_world-order.pdf
West AR, 1999. Basic Solid State Chemistry 2nd Edition. New Hampshire, U.S.A.: John Wiley
& Sons Inc. ISBN: 0471987557

290
White JW, Andrade-Sanchez P, Gore MA, et al., 2012. Field-based phenomics for plant
genetics research. Field Crops Research 133, 101-12. doi: 10.1016/j.fcr.2012.04.003
Wiegel J 2004. Genus Xanthobacter In: Brenner DJ, Krieg NR, Staley JT, eds. Bergey’s
Manual of Systematic Bacteriology: The Alpha-, Beta-, and Epsilon Proteobacteria 2nd ed.
Vol. 2. Part C. New York, U.S.A.: Springer Verlag, 555-6. doi: 10.1007/0-387-30745-1_16
Wilkinson S, Davies WJ, 2010. Drought, ozone, ABA and ethylene: new insights from cell to
plant to community. Plant Cell and Environment 33, 510-25. doi: 10.1111/j.1365-
3040.2009.02052.x
Williams GC, 1966. Adaptation and Natural Selection. Princeton: Princeton University Press.
doi: 10.2307/2406060
You J., and Chan, Z. (2015). ROS regulation during abiotic stress responses in crop plants.
Front. Plant Sci. 6:1092. doi: 10.3389/fpls.2015.01092
Wittig ID, Allardice WR, 1996. X-ray diffraction techniques. In: Klute A, ed. Methods of Soil
Analysis: Part 1-Physical and Mineralogical Methods. Madison, U.S.A.: Soil Science Society
of America, 161-223. (9.). doi: 10.2136/sssabookser5.1.2ed.c12
Wong M, Cresswell H, Wittwer-Schmidt K, et al., 2015. Protocols to measure plant available
water capacity in difficult to characterise soils (DRAFT). Canberra, Australia: CSIRO
Publishing. (no longer available online, original source http: research-repository.uwa.edu.au)
Xu L, Henke M, Zhu J, Kurth W, Buck-Sorlin G, 2011. A functional-structural model of rice
linking quantitative genetic information with morphological development and physiological
processes. Annals of Botany 107, 817-28. doi: 10.1093/aob/mcq264
Xu QJ, Ye F, Liu S, Zhang Z, Zhang C, 2017 Hyperspectral alteration information from drill
cores and deep uranium exploration in the Baiyanghe uranium deposit in the Xuemisitan area,
Xinjiang, China. Remote Sensing 9, 451. doi: 10.3390/rs9050451
Xu Z, Zhou G, Shimizu H, 2010. Plant responses to drought and rewatering. Plant Signaling
and Behavior 5, 649-54. doi: 10.4161/psb.5.6.11398
Yang Y, Sornaraj P, Borisjuk N, Kovalchuk N, Haefele SM, 2016. Transcriptional Network
Involved in Drought Response and Adaptation in Cereals. In: Shanker AK, Shanker C, eds.
Abiotic and Biotic Stress in Plants - Recent Advances and Future Perspectives. Intech, 3-29.
doi: 10.5772/62336
Yoshino M. (2005) Local Climatology. In: Oliver JE, eds. Encyclopedia of World
Climatology. Encyclopedia of Earth Sciences Series. Springer, Dordrecht. doi: 10.1007/1-
4020-3266-8

291
Yuan HJ, Luo XM, Nyima TS, Wang YL, Xu QJ, Zeng XQ, 2015. Cloning and characterization
of up-regulated HbSINA4 gene induced by drought stress in Tibetan hulless barley. Genetics
and Molecular Research 14, 15312-9. doi: 10.4238/2015.November.30.7
Zamparas M, Gavriil G, Coutelieris FA, Zacharias I, 2015. A theoretical and experimental
study on the P-adsorption capacity of Phoslock™. Applied Surface Science 335, 147-52. doi:
10.1016/j.apsusc.2015.02.042
Zandalinas SI, Mittler R, Balfagon D, Arbona V, Gomez-Cadenas A, 2018. Plant adaptations
to the combination of drought and high temperatures. Physiologia Plantarum 162, 2-12. doi:
10.1111/ppl.12540
Zahran, H. H. 1999. Rhizobium-legume symbiosis and nitrogen fixation under severe
conditions and in an arid climate. Microbiology and Molecular Biology Reviews 63, 968-89.
PMID: 10585971
Zargar A, Sadiq R, Naser B, Khan FI, 2011. A review of drought indices. Environmental
Reviews 19, 333-49. doi: 10.1139/a11-013
Zeng X, Bai L, Wei Z, et al., 2016. Transcriptome analysis revealed the drought-responsive
genes in Tibetan hulless barley. BMC Genomics 17, 386. doi: 10.1186/s12864-016-2685-3
Zhang G, Li C, 2016. Exploration, Identification and Utilization of Barley Germplasm. U.S.A.:
Elsevier. ISBN: 9780128029220
Zhang M, Mao W, Zhang G, Wu F, 2014. Development and characterization of polymorphic
EST-SSR and genomic SSR markers for Tibetan annual wild barley. PLoS One 9, e94881. doi:
10.1371/journal.pone.0094881
Zhou G, Panozzo P, Zhang X, Cakir M, Harasymow S, Li C, 2016a. QTL mapping reveals
genetic architectures of malting quality between Australian and Canadian malting barley
(Hordeum vulgare L.). Molecular Breeding 36. 10.1007/s11032-016-0492-9
Zhou, L., Yan, T., Chen, X., et al., 2018. Effect of high night temperature on storage lipids and
transcriptome changes in developing seeds of oilseed rape. Journal of Experimental Botany 69,
1721-33. doi: 10.1093/jxb/ery004
Zhou X, Xia Y, Liao J, et al., 2016b. Quantitative trait locus analysis of late leaf spot resistance
and plant-type-related traits in cultivated peanut (Arachis hypogaea L.) under multi-
environments. PLoS One 11, e0166873. doi: 10.1371/journal.pone.0166873
Zhu M, Zhao S, 2007. Candidate gene identification approach: progress and challenges.
International Journal of Biological Sciences 3, 420-7. ISSN: 1449-2288

292
Zilber-Rosenberg I, Rosenberg E, 2008. Role of microorganisms in the evolution of animals
and plants: the hologenome theory of evolution. FEMS Microbiology Reviews 32, 723-35. doi:
10.1111/j.1574-6976.2008.00123.x
Zohary D, Hopf M, Weiss E, 2012. Domestication of Plants in the Old World. The United
Kingdon: Oxford University Press. ISBN: 9780199549061
Zwartz H, 2017. Clock ticking for engangered lobsters ‘as big as a small dog.’. In. Hobart,
Australia: The New Daily. http: thenewdaily.com.au/news/state/tas/2017/10/22/clock-ticking-
lobsters/

293