
Health Technical Memorandum 03-01: Specialised ventilation ...

EXTREME TURBULENT ENVIRONMENTS:
A Qualitative Examination of Strategic Responses to the 2008 Economic Crisis
By CHRISTIANNE M LAURIA
Submitted in partial fulfillment of therequirements
for the degree of Master of BusinessAdministration
ST. JOHN’S UNIVERSITY
April 2014
Submitted
Approval

Date: Date:
_____________________________
_________________________
Student Name/signature Supervisor’s
Name/Signature

ABSTRACT
Beginning in the summer of 2008 the global economy faced
a crippling global financial crisis. Millions of people,
thousands of organizations and hundreds of governments
were affected by the rapid decline of a modern globalized
economy. Some of these organizations have been able to
thrive, some have failed and others have just skated
under the radar and are barely viable. This thesis
explores and identifies the most common strategic
responses to extreme turbulence and collects qualitative
data through a series of case studies of different
organizations and their reaction to the global financial
crisis of 2008. It focuses on understanding extreme
turbulent environments and the analysis of specific
organizations’ successes and failures during the global
financial crisis of 2008. This thesis will analyze and
assess this theory through extensive research using

industry journals and peer-reviewed articles. It will
also closely analyze Lehman Brothers, Ryan Air, AIG and
Alibaba Group as four dynamic organizations that all
proceeded through the most intense, extreme turbulent
economic environment and global recession in history, all
with different strategies. Through this research I plan
to demonstrate the attributes of a firm that can affect
an organization’s viability during such extreme
turbulence. This type of research and analysis is
important in order to construct, revitalize or
resuscitate organizations through good economic times and
bad. The findings from this research provide evidence
that marketing overhauls, agility, resilience, dynamic
resourcefulness, proactivity and collaboration are the
most important factors for organizations to survive
through extreme turbulent markets. While the results
were not conclusive, in that there may not be a specific
formula or combination of strategic responses to handle
extreme turbulent environments, there was some evidence

that extreme turbulence must be addressed with adaptive
capacity.

DEDICATION
I would like to dedicate this thesis to my Dad, Joseph
Lauria aka “cinque teschi”. You are my hero and my
inspiration. You have set the quintessential example to
me of what it means to study hard and work hard to earn
everything that you get in life. Without your constant
motivation and belief in me I would not be where I am
today. And yes, I still remember, “Christi, you get ‘C’,
you no ski”! It may have been silly but I understand now
it was for my own good! Your support and personal
cheerleading have driven me to make you proud. You and
Genie set an above par standard for me and with your
encouragement, I have been able to achieve. I love you
both very much!
Forever and always,
Your “briciola”,

Christi

PREFACE
My inspiration comes from a fascination of the global
financial crisis and its devastating effects on an
international level. In August of 2008 I had just moved
from Los Angeles, California to New York City after
completing my bachelor’s degree at Pepperdine University.
I received my first job offer working for a team of
stockbroker’s for one of the largest international asset
management firms in the world. I was elated and felt
invincible! But the honeymoon quickly ended when just 2
short months after starting my new job, the market took a
HUGE dip! Things at work were very exciting, but in an
anxious, “the sky is falling” type of manner. I
experienced the start of the global financial crisis from
within the point of origination. After eventually
becoming a victim of the economic downtown, I experienced
the unemployed life. Luckily my period of unemployment

was relatively brief and I returned to asset management.
After a year at my new firm, I decided that the timing
was right so packed up and moved to Europe to pursue my
MBA studies. Living in Europe and experiencing the
Eurozone crisis first hand has been an eye opening
experience, to say the least. Throughout my masters’
studies, I was ever more intoxicated by the idea and
effects of the global financial crisis. This sheer sense
of delusion led me to research and write my thesis about
the global financial crisis, via environment theory,
turbulence and case study analysis.

ACKNOWLEDGEMENTS
I must acknowledge Dr. R. Mitch Casselman; he was
instrumental to the creation of this document! Dr.
Casselman has all of the qualities of a superior
educator! His level of intelligence is incredible but
yet is never condescending. He makes you want to learn
by pushing you just beyond what you think you are capable
of and continually challenges his pupils. I have learned
so much about myself through working with Dr. Casselman
on my thesis. I cannot thank you enough! You are the
best educator I have ever had! Cheers, Mitch! I would
also like to acknowledge Dr. W. Ryall Carroll and Dr.
Vincent Shea. Both Dr. Carroll and Dr. Shea are
excellent educators with a similar style of constantly
challenging students in a way that makes them want to
learn. All three professors enhance the learning
process and help to mold critical thinking and learning

skills. These three gentlemen set the bar very high for
all future educators. Thank you all, very much, for your
continued inspiration.

TABLE OF CONTENTS
ABSTRACT ...........................................IIDEDICATION .........................................IVPREFACE .............................................VACKNOWLEDGEMENTS ...................................VIINTRODUCTION ........................................1UNDERSTANDING ENVIRONMENT THEORY ....................2EXTREME TURBULENT ENVIRONMENTS ......................4COMPONENTS OF EXTREME TURBULENT ENVIRONMENTS .................. 4
Uncertainty ............................................................................................5Complexity .............................................................................................7Dynamism ...............................................................................................8Munificence ............................................................................................9
STRATEGIC RESPONSES TO EXTREME TURBULENT ENVIRONMENTS ......... 10 Adaptive capacity ................................................................................10
Marketing Overhaul ...................................................................................12Agility ........................................................................................................... 15Resilience .................................................................................................... 16Proactivity ................................................................................................... 17Dynamic Resourcefulness ..........................................................................22Collaboration .............................................................................................. 24
Final Words ...........................................................................................28
CASE STUDY METHODOLOGY .............................30Measures ..............................................................................................35
CASE STUDY ANALYSIS ................................38LEHMAN BROTHERS ......................................... 38 AIG .................................................. 42 RYAN AIR .............................................. 46 ALIBABA GROUP .......................................... 49
DISCUSSION AND CONCLUSION ..........................52WORKS CITED ........................................57

APPENDIX A: TYPES OF ENVIRONMENTS ..................59APPENDIX B: STRATEGIC RESPONSES TO TURBULENCE ......60APPENDIX C: SUMMARY OF CASE STUDY MATERIAL .........61APPENDIX D: EVIDENCE OF STRATEGIC RESPONSES ........62APPENDIX F: KEYWORD COUNT TRACKER ..................64APPENDIX G: PRINT ADVERTISEMENTS ...................65LEHMAN BROTHERS ......................................... 65 AIG .................................................. 66 RYANAIR ............................................... 68 ALIBABA GROUP .......................................... 70
APPENDIX H: CONSOLIDATED CONTENT ANALYSIS RESULTS ..71VITA ...............................................72

INTRODUCTION
The problem I am addressing in this document is the
Global Financial Crisis of 2008; the largest economic
recession since the Great Depression and the first
international realization of the impact of a globalized
economy. Over 100 mortgage lenders went bankrupt between
2007 and 2008. An astonishing 8.8 million jobs were lost
in the US alone causing the unemployment rate to double
from 5.3% to a staggering 10.1% as of October 2009. The
average number of hours worked per week declined to 33,
which is the lowest level recorded since the government
began collecting these data in 1964. The US Real GDP
fell from a +3% in Q2 of 2008 to nearly -6% in Q4.
(us dept of commerce) On an international scale, it is
estimated that European banks lost more than $1 trillion
on toxic assets and bad loans.

The research question explored is what are the strategic
approaches that organizations take to successfully
survive a period of extreme turbulence. The reasoning
being turbulence happens and extreme turbulence will
happen again but if a set of business strategies are
identified that have been proven to lead to the survival
of organizations through extreme turbulence, it may be
possible that any future extreme turbulence experienced
could have less of an impact on an international economic
scale. The key figures in the formation of Environment
Theory are Trist, Emery, Selsky, McCann, Dess, Beard and
Castrogiovanni. Emery and Trist were the true pioneers
of environment theory; they were the first to distinguish
causal texture and classify environments into four
classifications. Selsky and McCann then expanded on this
idea to propose a fifth type of environment
classification. Dess and Beard explored an approach to
measure task environments of organizations.
Castrogiovanni proposed that task environments of

organizations change over time and do not remain
stagnant.
In this thesis I examine the different proposals of
environment theory. Then, through research, identify how
to determine an extreme turbulent environment. Themes of
strategic responses to extreme turbulence were then
recognized and several hypotheses were distinguished. In
order to test the hypotheses a case study approach was
chosen so a methodology was constructed in a manner that
could be repeated for each of the case study
participants. Four organizations were chosen as case
study participants and then analyzed through a rigorous
content analysis. Having performed the case study
analysis, I found relatively inconclusive results.

UNDERSTANDING ENVIRONMENT THEORY
Environment theory was first introduced in 1965 by Dr.
Eric Trist, a distinguished British scientist and leading
figure in the field of organizational development, and by
Dr. Frederick Emery, an Australian psychologist and
revered social scientist. Dr. Trist and Dr. Emery
proposed a classification of the environment into four
types, each with escalating levels of complexity. It
remains unclear whether the transformation of
environments from one type to another is an abrupt or
gradual process. Nor is it clear whether an environment
uniformly or differentially undergoes transformation
(Emery & Trist, 1965). What is inevitable is the
transformation of one environmental type to the next
because of the inherent limitations of each adaptive
response in managing the consequences of ever-greater
density of social interaction and technological

innovation (McCann & Selsky, 1984). Dess and Beard
researched operational specification and empirical
description of the task environments of organizations.
Their unit of analysis was based on the directness of
interaction between an organization and elements of its
environment and whether or not the information describing
the environment was derived objectively or subjectively
derived from Starbuck’s previous findings. Dess and
Beard concentrated on three dimensions to task
environments, munificence, dynamism and complexity and
were able to find statistically significant evidence to
support their hypotheses. Castrogriovanni proposes that
task environments become more complex as inter-
organizational connections increase. He concludes
through his research that environment munificence
decreased over time, but was not able to support his
other two hypotheses environmental dynamism and
environmental complexity do not increase over time. Some
other academics cited mention the idea of environmental

hostility, but it is important to keep in mind this
thesis is more concerned with environmental turbulence
and not hostility. For this Emery and Trist and Selsky
and McCann will be examined much more closely.
McCann and Selsky (1984) summarize that Type I
environments are random, with goals and noxiants
unchanging, placid and randomly distributed. Type II
environments have clustering patterns, where goals and
noxiants are no longer random but are rather grouped
together. Imperfect competition arises, a combination of
resources and a naturally hierarchy is formed therefore
leading to the emergence of strategy within the placid
clustered environment. Type III, disturbed reactive
environments, are classified by having more than one type
of each organization; said organizations try to advance
themselves while hindering others. There is a need to
meet competitive challenge naturally leading to a higher
level of organization than in type II. Type IV

environments or “turbulent fields” are characterized by
interdependence and the increasing and enmeshing of
economics, legislation and regulation with perpetual
research and development in order to not only meet but
exceed existing competitive challenge. Turbulent fields
are dynamic. For a more detailed, graphical
representation, please see “Appendix A”. With all of
this in mind we must remember, environmental contexts are
ever changing (Emery & Trist, 1965). Due to ever-
changing contexts, Joseph McCann and John Selsky
introduced the theory of type V, hyper-turbulent
environments in 1984 (McCann & Selsky, 1984); these
hyper-turbulent or extreme turbulent environments, as
referred to in this document, are where the focus of this
thesis lies.

EXTREME TURBULENT ENVIRONMENTS
Components of extreme turbulent environments
Several academics have previously written of environment
theory, all identify factors that lead to the progression
of one stage of the environment to the next. These
aforementioned theorists have defined different
characteristics that induce progression of environmental
stages, but there is quite a bit of overlap in these
contributing factors. For example, Ansoff (1979)
proposes six key factors of environmental stage
progression: changeability of the market environment,
speed of change, intensity of competition, abundance of
technology, discrimination by customers and pressures
from governments and influence groups. Likewise, Sharma
and Aragón-Correa (2003) identify three factors,
uncertainty, complexity, and munificence. Selsky and
McCann proposed the idea that environments can experience
a fifth stage in addition to the four types of

environments proposed by Emery and Trist two decades
earlier. The new, type five environment is a further
progression due to external influences on society. The
most common, most prominent symptoms of this type 5 or
extreme turbulent environments, as referred to in this
thesis, that will be further examined on their
contribution are uncertainty, complexity, dynamism and
munificence. When all of these characteristics are
present the environment becomes extremely disrupted and
highly turbulent.
The condition, turbulence, is inherently unstable and
diffused in its sources and effects. The word
"turbulence" is a metaphor, and all metaphors are
difficult to operationalize. The difficulty presented by
attempting to operationalize them does not negate their
usefulness. Turbulence is characterized by complexity as
well as rapidity (Terreberry, 1968)of change in causal
interconnections in the environment.

Before elaborating on type five environments, it is
important to acknowledge the fact that after type four
environments it is feasible that a complete collapse can
lead to the reemergence of type one or two environments.
The regression in a lower type of environment would
result from complexity reversing instead of progressing.
The most obvious example of a type four environment
reverting to type one is after the Roman Empire fell,
society entered the Dark Ages (McCann & Selsky, 1984).
The other alternative is then to continue the progression
to type five environments. It is also important to
recognize that turbulence is not a threshold state passed
through by all members of an environment in the same way
or at the same time. The factor making turbulence an
unevenly experienced condition is the relative adaptive
capacity of members (McCann & Selsky, 1984). In the
following sections the different components of extreme
turbulent environments are examined.

Uncertainty
Extreme turbulence is almost always caused by the un-
readiness and uncertainty in a given environment.
Various dimensions of complexity influence the degree of
uncertainty in organizational decision-making; the more
complex the environment, the greater perceived
uncertainty. In contrast, a static and simple environment
has low perceived uncertainty (Smart & Vertinsky, 1984).
Uncertainty is the dominant characteristic of turbulent
environments (Terreberry, 1968). Smart and Vertinsky
(1984) comment on different combinations of complexity
and turbulence and what are the potential interactive
effects with various combinations. They offer that
highly complex and turbulent environments are perceived
to be very uncertain; such environments encourage
retrenchment and adaptive responses to discontinuities.

Milliken (1987) identifies three different types of
uncertainty, state, effect and response uncertainty. He
defines effect uncertainty as an inability to predict
what the nature of the impact of the future state of the
environment or environmental change will be on the
organization. In essence, an organization may know or
predict what is going to happen, but there is uncertainty
as to how the event will affect the organization. The
second, or state uncertainty is when the organization
perceives the organizational environment, or a particular
component of that environment, to be unpredictable.
Response uncertainty is lack of knowledge of response
options and/or an inability to predict the likely
consequences of a response choice; in other words, what
types of responses are available. Snyder (1987)
identified three trends that lead to uncertainty – rapid
growth, deepening interdependence between economic and
other facets of society, and increasing reliance on

research and development to achieve capacity/competitive
challenge.
Complexity
Extreme turbulent environments exhibit complexity;
complexity beyond a comprehensible level of adaptive
capacity when requisite resources and skills are strained
beyond a tolerable level. There are many theories
about complexity and how it relates to environmental
turbulence, but is always concerned with the number of
factors in the environment that must be taken into
consideration by the firm in a decision-making situation.
Child (1972) (as cited in Vertinsky, 1984) defined
complexity as the heterogeneity and range of activities
relevant to organizational decision-making strategies.
Senge (1990) distinguishes between two types of
complexity, dynamic complexity or the relationships
between parts, and detail complexity or the number of
parts (as cited in Casselman, 2007).

Another aspect of complexity is the traditional issue of
the range and complexity of competitors, which places
demands from a competitive hostility perspective
(Casselman, 2007). Complexity and change have escalated
to a point at which member adaptive capacities are
severely challenged and, for many, are overwhelmed. That
is, turbulence has become endemic, and cases of
organizational failure and collapse are increasingly
frequent (McCann & Selsky, 1984).
Knowledge accumulation drives environmental complexity,
which means that as more information is learned, the more
complex the environment in which we live in becomes.
When considering complexity it is important to carefully
consider each of the stakeholders involved in the
environment (Castrogiovanni, 2002). Complex environments
not only place greater demands on information systems,
but also call for a higher quality of decision-making to

account for diverse constituencies in the environment
(Smart & Vertinsky, 1984). The tendency to support
complexity and change seems more common than unusual,
given the tendency of organizations to undermanage their
interdependencies by using adaptive responses
inappropriate for prevailing environmental conditions
(Castrogiovanni, 2002).
Dynamism
Dynamism, or the rate of change is another indicator of
the environment. Extreme turbulence is that the
accelerating rate of interactive effects exceeds the
component systems' capacities for prediction and, hence,
control of the compounding consequences of their actions
(Terreberry, 1968). A symptom of extreme turbulence is
rapid velocity, which is just a different way of saying
ultra dynamism. Change in the environment is occurring
at such a rapid pace organizations require greater
adaptability than what is physically obtainable. The

accelerating rate of change witnessed during extreme
turbulence becomes incomprehensible to organizations
(McCann & Selsky, 1984). Dynamism is a function of
interdependencies as well. Increasing complexity and the
accelerating rate of change, in organizational
environments require greater organizational adaptability
(Terreberry, 1968). Dynamic processes create significant
variances for the component organizations; as the
variances emerge, turbulence changes in a striking
fashion.
Munificence
During periods of extreme turbulence the workforce is
larger than what the demands of organizations need
therefore producing an excess capacity of labor. The
excess capacity of labor and production lead a decrease
in the availability of resources. The availability of
resources and extent to which the environment can support
sustained growth with said resources is referred to as

environmental munificence (Beard & Dess, 1984). Slack
resources are produced by organizations during periods of
growth and stability; the production of slack provides a
buffer during periods of relative scarcity and may also
provide a means of maintaining organizational coalitions,
organizational innovation and aid in conflict resolution
((Bourgeois, 1981; Chakravarthy, 1982) as cited in (Beard
& Dess, 1984)). Boyne & Meier (2008) proposed
munificence could be measured through two variables—the
level of financial resources available and the size of
the workload. Periods of high growth and stability are
sought after by organizations and are said to “munificent
environments”. The rate of sales growth is a key
indicator in the determining of an environment’s
munificence (Beard & Dess, 1984). Staw and Szwajkowski
(1975) as cited in (Beard & Dess, 1984) found
organizations competing in less munificent environments
were more likely to commit illegal acts. Extreme
turbulent environments are highly unstable, therefore

drawing the parallel that in such turbulent times
munificence is considered too low.

Strategic Responses to Extreme Turbulent Environments
Now that extreme turbulent environments have been clearly
and concisely defined with their key factors outlined, it
is necessary to explore how to strategically respond to
the hazards of extreme turbulent environments. It is
also quite important to understand the possible side
effects of being in an extreme turbulent environment. All
strategic responses are some shape or form of
adaptability; such adaptability is handled in different
methods and strategies by each different organization.
The strategy chosen has historically led to the health of
the organization after periods of turbulence. Some of
the most common adaptive capacity of strategic responses
of extreme turbulent environments are collaboration,
dynamic capabilities, marketing alterations, agility,
environmental scanning or various methods of hiding out.
As environments become increasingly disrupted the
strategies for dealing with inter-organizational

relationships have become and will need to be ever more
sophisticated (McCann & Selsky, 1984). Please see
Appendix B for a chart that outlines and summarizes these
reactions. With flexible coping strategies and a
positive attitude towards uncertainty, a dynamic
organization will find even the most turbulent
environment a source of opportunity rather than threat
(Smart & Vertinsky, 1984).
Adaptive capacity
Adaptive capacity strategies come in all shapes and
sizes. These types of strategies are about the amount
and variety of resources and skills possessed and
available for maintaining viability and growth relative
to the requirements posed by the environment. In extreme
turbulent environments some form or another of adaption
is exhibited by all organizations; responses range from
aggressive marketing strategy overhaul to simply hiding
out and waiting for the storm to pass. Escalating

complexity and dynamism require greater adaptive capacity
as regions of relevant uncertainty grow for members.
Adaptive capacity at the level of the organization varies
greatly; abilities to assimilate large amounts of
information about the environment can vary significantly
from one organization to another. Organizations also vary
considerably in their capacities for responding to
threats quickly and fully (McCann & Selsky, 1984).
Inter-organizational adaptive capacity uses other firms
in order to leverage the adaptive capacity of the firm in
a particular area and alter the internal structures and
operation of organizations so that the speed and quality
of decisions are more capable of responding to external
changes. Adaptive capacity is an organization’s ability
to adapt to the environmental conditions that it faces.
As the conditions become more complex and uncertain, the
problem of adaptive capacity becomes more critical to the
survival of the firm. In fact, the environment can become

so complex that it exceeds the ability of the firm to
“individually” respond. Outsourcing becomes a forced
adaptive strategic measure for organizations when the
opportunity cost of not outsourcing becomes greater than
the potential additional costs involved in establishing
the use of outsourcing (Casselman, 2007).
Inter-organizational cooperation attempts to break the
environment into more manageable pieces. This inter-
organizational sharing of adaptive capacity between firms
aids in leveraging the adaptive capacity of the firm in a
particular area. This allows the firm to apply its
capacity in areas in which it is more capable.
If an organization can predict the extent and direction
of environmental change with some degree of certainty, it
may adapt effectively to this change. An inability to
predict change may trigger either a search for measures
to control the environment, or focus the thrust of the

organization towards coping with problems as they arise.
That being said, organizations tend to run the risk of
underinvesting in information gathering activities. Such
firms may find that they are responding to a crisis
without sufficient effort being spent to diagnose the
roots of the crisis (Smart & Vertinsky, 1984).
Marketing Overhaul
Informational Advertising
When an environment is experiencing extreme turbulence,
it has been observed that marketing campaigns change from
transformational to informational marketing.
Transformational marketing is made up of images and
emotional advertising. A transformational advertisement
would therefore make the experience of using the brand
richer and more enjoyable by connecting the experience of
the ad with that of using the brand in such an intimate
fashion that “consumers cannot remember the brand without

recalling the experience generated by the advertisement”.
On the other hand, informational marketing has fewer
images, is more practical and attempts to establish
credibility. During the financial crisis of 2008, Lee and
Taylor (2011) examined financial services advertisements
and found that post crisis the ads relied on delivering
accurate information and rational advertising strategy to
guide the consumer to “where to save and invest”. The
main point is to cater to the needs of consumers
depending on the environment, in this case providing the
audience with factual information about the product and
relevant brand data in a clear and logical manner such
that they have greater con dence in their ability tofi
assess the merits of buying the brand after having seen
the advertisement. The extreme turbulence experienced
during the financial crisis led to a signi cant increasefi
in the use of informational message strategies in order
to appeals to different needs (Lee & Taylor, 2011).
Informational advertising is more prevalent than
transformational during environments with extreme
turbulence because prospective clients are less worried
about image but more concerned with fulfilling needs.
Analyze Marketing Research
Marketing research analysis is always critical, but a
perpetual environmental scanning and forecasting is
crucial during periods of extreme turbulence (Milliken,
1987). Organizations must be on high alert mode for the
discovery of any possible threats and/or opportunities
whether they be ambitious or expansionist (Glaister &
Thwaites, 1992). As threats or opportunities approach,
they need to be integrated into the administrative,
entrepreneurial, and engineering dimensions of a firm.
Lee and Taylor (2011) recommend categorizing advertising
by four important distinctions: intangibility,
inseparability of production and consumption,
perishability and heterogeneity.
Glaister and Thwaites (1992) categorize firms into four
different types of groups, proactive, reactive, creative
and predictive. The proactive groups are more committed
to obtaining market research studies to identify
opportunities and threats within the environment than the
other three types of groups. Both the predictive and
creative groups strongly support the adoption of the
marketing concept and production orientation. Reactive
groups are significantly less inclined to develop
marketing to the level at which a specific department is
necessary to co-ordinate market-related activities. The
creative group is likely to give marketing a greater
input to the strategic planning process than the other
three types of groups. Over 73% of “creative”
organizations suggest that marketing has a major role in
strategic planning or even leads the process. They
observe that successful organizations should seek to
develop a mode of strategic behavior, which is
appropriate for the environment in which they operate.

They must also be configured in a manner, which
complements their chosen mode (Glaister & Thwaites,
1992).
Hypothesis 1: Organizations that overhaul their marketingstrategies will be able to withstand extreme turbulentenvironments better than organizations that do not alter theirmarketing strategies.
Agility
The recent interest in agility comes from a belief that
the best-performing organizations in fast-paced
environments move quickly to identify opportunities and
avoid collisions. Many of the skills associated with
agility have a long pedigree in psychological and change-
management studies. Agility is referred to as the
capacity for moving quickly, flexibly and decisively in
anticipating, initiating and taking advantage of
opportunities and avoiding any negative consequences of
change. Lee, McCann and Selsky (2009) propose that
agility can be built and developed through different

tactics. One agility measure is improving “sense-making”
skills through a better understanding of uncertainty and
ambiguity. Creating and sustaining an openness to change
via financial rewards and career incentives for
innovation and continuous improvement also develops
agility. Agility can be increased through delivering and
applying knowledge quickly and efficiently through clear
and consistent communication channels. Organizations are
said to be “agile” when new issues present themselves,
the response is fast, including the deploying and
redeploying resources, talent and skills as well as
cross-training and frequently moving people around to
broaden their skill or knowledge base. Streamlining and
clarifying roles and responsibilities in decision-making
processes prevents firms from becoming paralyzed during
turbulence (Lee, McCann, & Selsky, 2009).
Hypothesis 2: Organizations that demonstrate agility will be able towithstand extreme turbulent environments better than organizationsthat do not demonstrate agility.

Resilience
Environmental turbulence may be managed by building
resiliency. Resilience is a newer concept about the
robustness of systems that is rooted in psychotherapy and
social psychology, material science and ecology. It is
defined as the capacity for resisting, absorbing and
responding, even reinventing if required, in response to
fast and/or disruptive change that cannot be avoided
(Lee, McCann, & Selsky, 2009). A strong sense of a
valued identity, common purpose and shared beliefs are
central to both individual and group resiliency ((Coutu,
2002; Freeman, Hirschhorn & Maltz, 2004; Hirschhorn &
Gilmore, 1992) as cited in (Lee, McCann, & Selsky,
2009)). Resiliency is also associated with creative,
prompt responses to minimize the impact of surprises and
jolts encountered during extreme turbulence. In order to
build resilience organizations have tried to create
information system firewalls, incorporate redundancy in

operations, build reserves, use scenarios for "what if"
forecasting and engage in enterprise risk management
(Lee, McCann, & Selsky, 2009).
Disasters, both natural and man-made, are bound to happen
and can provide opportunities for innovation and growth
for organizations with greater resiliency, but they
damage those with less resiliency. Airlines demonstrated
resiliency after the extremely turbulent environment that
occurred post 9/11 shock by reinventing themselves around
core values. Reinvention post extreme turbulence is an
example of how organizations can demonstrate resiliency.
The ability to improve contingency planning and crisis
response capabilities are also factored in when analyzing
resilience levels. A few ways that may improve
contingency planning are simulations, role-playing and
scenario planning to ensure the skills and competencies
for surprises and crises are built. Strategic risk
assessment on an enterprise basis can add to resilience

by developing plans to proactively manage each identified
major risk with an emphasis on higher-risk, under-managed
relationships first. Resilience is based on how well a
company can “take a hit” and react appropriately and
efficiently. Other factors affecting an organization’s
resilience are developed and sustained alliances and
partnerships, and instilling a deep, shared belief in
company core values and beliefs as well as always being
prepared to rethink and redesign internally via developed
transformation skills (Lee, McCann, & Selsky, 2009).
Hypothesis 3: Organizations that demonstrate resilience duringextreme turbulent environments will be able to withstand the changebetter than organizations that do not demonstrate resilience.
Proactivity
Extensive research has been conducted on the type of
continuums organizations exhibit during extreme
turbulence; the two that are examined here are the
proactive versus reactive. Proactive organizations
attempt to shape their environment, or at least have

detailed knowledge of it, in order to anticipate events
(Aragon-Correa & Sharma, 2003). Companies with a
proactive orientation seek to exploit new opportunities
by introducing new products, technologies and
administrative techniques and attempt to lead rather than
follow competitors (Miller and Friesen, 1978;
Venkatramen, 1988). Proactive firms, historically,
invested more on research and development and innovation
than reactive oriented firms. Reactive orientation firms
are driven by the environment and seek to avoid
discontinuous strategic measures. Major changes are
invariably a response to crisis or unsatisfactory results
for reactive organizations (Aragon-Correa & Sharma,
2003). They, also, typically move on an incremental
basis, rooted on precedent and geared to the avoidance of
risk. Functional emphasis is on operations and finance,
while leadership style focuses on control (Ansoff and
McDonnell, 1990; Mintzberg, 1973).

Predictive societies may have an overdeveloped resource
capability with the capacity to be more strategically
aggressive. An organization should seek to develop a mode
of strategic behavior, which is appropriate to the levels
of environmental turbulence. Resource capabilities should
then be assembled to support the chosen mode. In
assessing levels of turbulence and resource capabilities
the differences between perception and reality will prove
critical. Where perception is divorced from reality the
organization's response to change will be inappropriate.
Attention must therefore be focused on developing those
activities, which provide information about both the
internal and external environments; for example,
marketing audits, a blend of executive and non-executive
directors and consultants. The attitudes towards
marketing and strategic issues illustrated by the
reactive group were compatible with organizations that
tend to be driven by their environment and respond after
the impact of change. In this respect it can be argued

that their internal capabilities (configuration) are
complementary with the external environment (Aragon-
Correa & Sharma, 2003).
Similarly, Smart & Vertinsky (1984) theorized that
entrepreneurial strategies are more similar to the
proactive continuum and adaptive strategies more similar
to the reactive continuum. Entrepreneurial strategies,
whether they are active or offensive, have the objective
of exerting control over the environment. In contrast,
adaptive strategies react to a specific problem stimulus.
These types of strategies are then divided according to
long-term or short-term and are all experienced during
times of discontinuity. Small changes are considered
part of the normal operating environment and are dealt
with by standard operating procedures, but in this
context discontinuities imply a major change in the
company's environment and require new strategic efforts.

Adaptive strategies are reactions to environments that
are oriented primarily towards returning to or
maintaining the status quo (Smart & Vertinsky, 1984).
Adaptive responses with long-term objectives are deemed
as planning strategies and adaptive responses with short-
term objective are said to be “fire-fighting” strategies.
Planning strategies are characterized by comprehensive or
synoptic measures and emerge when there are
discontinuities in predictable environments. Less
uncertainty in an environment allows for more well
thought through coping responses, and aids in the
revision of long term plans to avoid crises. Adaptive
postures are preferred as this type of posture helps to
diminish uncertainty and increase the value of
information in a given environment. When discontinuities
are present in a static environment, fire-fighting
strategies will be evoked. Said discontinuities are
regarded as temporary deviations from normal operations.
In a static environment, firms tend to make heavy

investments in standard operating procedures that, in
turn, lead to long-term change becoming quite costly.
Fire-fighting strategies typically consist of incremental
actions to buffer an organization and to provide for
limited remedies (Smart & Vertinsky, 1984).
Entrepreneurial strategies attempt to control the
environment through innovative methods. Entrepreneurial
responses with long-term objectives can be termed
strategic, whereas entrepreneurial responses that seek
immediate impacts can be termed tactical responses.
Discontinuities in turbulent environments will evoke
strategic responses. To survive in a turbulent
environment it is suggested that a firm seeks to control
and exploit change. Tactical strategies are deployed
when there are discontinuities in complex environments.
Complex environments are characterized by the
interactions of many diverse components and due to great
diversity, managers in complex environments often find it
difficult to accurately assess or predict changes in
components and their impact on the firm, especially in
the long-term. The level of complexity leads to
strategies with an emphasis placed on short-run impacts
in an effort to simplify the decision (Smart & Vertinsky,
1984).
The results suggest, surprisingly, that there is a
threshold of change, such that when it is exceeded, even
risk-takers may consider it unbeneficial to control the
environment. Alternatively, this result may indicate that
when an environment becomes more volatile it is not
necessarily risk-takers who are attracted to a firm, but
optimists. Managers in complex, turbulent environments
often find it difficult to accurately assess or predict
changes in components and their impact on the firm,
especially in the long-term (Smart & Vertinsky, 1984).
For this reason, during extreme turbulence an emphasis is
placed on short-run impacts in an effort to simplify the

decision process ((Cyert and March, 1963) as cited in
Smart & Vertinsky, 1984). When an organization responds
solely by increasing their aggressiveness, it usually
suggests there has been a failure to put in place the
support mechanisms, which are essential to strategic
underpinnings (Glaister & Thwaites, 1992). During
periods of extreme turbulence Glaister and Thwaites
(1992) recommend adopting a long-term, consistent
strategy that fosters continuous outside-in learning from
multiple stakeholders, so as to reduce the complexity and
state uncertainty of conflicting environmental issues;
develop managerial and organizational knowledge for
managing the organization and effect uncertainty at the
business-natural environment interface; and generate
continuous improvement and innovation. Organizations that
adopt a consistently proactive approach will develop a
powerful dynamic capability (Glaister & Thwaites, 1992).
Hypothesis 4: Organizations that exhibit a proactivity will be able towithstand extreme turbulent environments better than organizationsthat fail to exhibit such behavior.

Dynamic Resourcefulness
Interdependence among environmental elements tends to
increase during extreme turbulence, which in turn gives
rise to increasing dynamism, as such elements converge in
pursuit of common interests. Thomas (1996)(as cited in
(Castrogiovanni, 2002)) referred to such innovative
tendencies “dynamic resourcefulness”, and argued that his
data supported the view that it was increasing. Dynamic
resourcefulness is more frequently referred to as dynamic
capability. By definition, such capabilities vary with
the level of market dynamism and enable an organization
to adapt to changes in the general business environment.
The general business environment affects the process and
capability of environment theory and its impact on
competitive advantage. This posits that organizational
performance (competitive advantage) is a result of the
proper alignment of endogenous organizational design
variables with exogenous context variables. A dynamic

capability of environment theory requires a complex
integration of these environmental capabilities through
the use of organizational and managerial resources
(Aragon-Correa & Sharma, 2003).
Aragón-Correa and Sharma (2003) discuss proactive versus
reactive dynamic capabilities. Proactive capabilities
take into consideration stakeholder integration,
continuous innovation and improvement, and higher-order
shared learning as well as a set of specific and
identifiable processes that have significant commonality
in the form of best practices across firms, allowing them
to generate new, value creating strategies (Eisenhardt &
Martin, 2000 as cited in (Aragon-Correa & Sharma, 2003).
Cross-functional employee involvement, coordination, and
integration, as well as reconfiguration and recombination
of resources are all contributing factors to a firm’s
proactive dynamic capabilities. If organizations are
able to develop the dynamic capability of a proactive

environmental approach in a complex business environment,
it is likely to generate a competitive advantage when the
general business environment is turbulent and competitors
lack this capability. The competitive advantage becomes
increasingly valuable, as it is inimitable, non-
substitutable, path dependent, and socially complex. But
the full extent to which the dynamic capability of
proactive environmental strategy will lead to a positive
impact on an organization's competitiveness will depend
on exogenous factors (Aragon-Correa & Sharma, 2003).
Studies have shown a positive relationship between
proactive environmental strategies and organizational
performance results when firms develop complex
capabilities; some examples of these capabilities are
total quality management, the socially complex
capabilities of cross-functional and cross-stakeholder
management, and the rare capabilities of shared vision
(Aragon-Correa & Sharma, 2003).

Hypothesis 5: Organizations that demonstrate dynamic capabilitieswill be able to withstand extreme turbulent environments better thanorganizations that cannot demonstrate dynamic capabilities.
Collaboration
During periods of extreme turbulence organizations have
been observed to extend some type of peace offerings and
collaborate to help navigate said turbulence.
Collaboration, also referred to as multi-lateral
agreements, promotes mutual understanding and provides a
positive climate for managing interdependencies as well
as producing economies of scale that reduce the level of
resources needed by a single firm. The capacity of an
organization or inter-organizational collectivity for
managing environmental complexity and change is
contingent not only upon its own capacity, but also upon
the capacities of those sharing the environment with it.
Under-management of interdependencies is quite often
subject to misinterpretation risk, which proportionally
increases as inter-organizational knowledge sharing

increases. As inter-organizational collaborative
strategies are not resolved in a timely manner,
turbulence can escalate beyond the range of adaptive
capacity within an environment and the more radical the
disruption presented by the turbulence becomes (McCann &
Selsky, 1984). In order to attempt to manage the
turbulence and not let it become out of control, inter-
organizational relationships have to become more and more
sophisticated. But collaboration can become so resource
intensive that the only remaining alternative is either
bounded rationality and satisficing, or partitioning
adaptive capacity (Casselman, 2007). Several studies by
various academics have shown that collaborative
strategies frequently prove to be inadequate, but more
interestingly, are maladaptive and tend to promote
turbulence, not lessen it. There are four types of
collaborative responses in extreme turbulent
environments: retrenchment, partitioning, social enclave
and social vortex.

Retrenchment
Retrenchment is a type of collaborative response. Within
the existing framework, retrenchment may be viewed as a
tactical retreat in defense of the status quo during a
crisis. As a routine environment becomes more volatile
and less standardized, managers also have a greater
tendency to select retrenchment strategies as responses
to discontinuity (Smart & Vertinsky, 1984).
Another side effect of collaboration caused by extreme
turbulence is partitioning through social triage. Social
triage implies that the gap between those with and those
without sufficient adaptive capacity will increase, not
lessen, under turbulent conditions. The gap created by
social triage increases based on how quickly turbulence
accelerates, the amount of excess capacity within the
given environment, the ability of members to minimize the

dysfunctional consequences of their interdependencies
with other members and the type and enforceability of
prevailing ethical standards (McCann & Selsky, 1984).
Partitioning
In the following paragraphs three effects of partitioning
will be explained. A partitioned environment is said to
by dynamic, not static. The act of partitioning occurs
when members attempt to allocate and protect limited
adaptive capacity. Partitioning becomes a likely
phenomenon because of the essentially asymmetrical
distribution of resources and skills among members. When
an environment becomes grossly overloaded, but before
extreme turbulence becomes endemic, attempts to partition
or segment the environment into domains radically varying
in turbulence and adaptive capacities will first occur.
Social triage is a direct side effect of partitioning and
both, as a policy and as an allocation process, is
undesirable for humanistic and ethical reasons. Ethical

standards can prevent social triage only as long as
agreement can be maintained about the desirability of
those standards and effective means exist for enforcing
them. The use of markets and prices in a capitalist
economy may well reinforce social triage. This is because
the ability to compete for additional resources and
skills in a market is largely a function of existing
capacity (McCann & Selsky, 1984). Therefore the greater
the turbulence experienced, the more partitioning and
social triage become evident within lower echelons of
society in a given environment.
Under extreme turbulence, as a direct result of social
triage, gives rise to two very different types of
coexisting, highly bounded domains within an environment:
social enclaves and social vortices. Enclaves and
vortices can coexist contiguously but only if
partitioning proves effective (McCann & Selsky, 1984).

Social Enclave
Another form of collaboration as theorized by McCann &
Selsky (1984) is known as a social enclave. A social
enclave is surrounded by higher levels of complexity and
change and classified by members that effectively protect
adaptive capacity. McCann and Selsky define three
criteria for obtaining membership within an enclave: the
adequacy of a member's current adaptive capacity; its
ability to contribute excess capacity and build the
capacity of others within the enclave; and, the
compatibility of the values and goals of prospective
members. The boundaries between domains are actively
managed and "closed-system" logic prevails.
To explain this phenomenon in terms a bit more
comprehensible lets use the analogy of a river and
several rafting boats on this river. One boat arrives at
a section of fierce and violent rapids and stops. They
collaborate with oncoming rafts and

Decide to tether together and head through the rapids
using all of their resources as one large raft; this is
similar to the social enclave, as the enclave combines
their resources and takes on the turbulent environment
together.
Social Vortex
Similar to the social enclave is the social vortex.
Social vortices are surrounded by lower levels of
turbulence and are populated domains of very low adaptive
capacity relative to the surrounding environment. Such
phenomenon is exactly where extreme turbulence prevails.
Vortex members collectively lack sufficient adaptive
capacity relative to prevailing environmental conditions
and are the "have-nots" in terms of requisite resources
and skills (McCann & Selsky, 1984).
Going back to our river and raft analogy, imagine if the
rafting boats make a collective decision to set to the

side of the river just before the rapids and wait for the
turbulent waters to secede as a group. This is like the
social vortex as the collaborative group separates
themselves and decides to wait out the turbulent
environment in a group.
Hypothesis 6: Organizations that engage in collaboration will be ableto withstand extreme turbulent environments better thanorganizations that cannot demonstrate collaboration efforts.
Final Words
There are many different types of strategic responses to
extreme turbulence ranging from banding together in
collaborative ways to developing proactive “what if”
plans for different scenarios. The capabilities are
complex and path dependent on the accumulation of, and
the interaction between, resources such as physical
assets, technologies, and people (Aragon-Correa & Sharma,
2003). Turbulence as an environmental condition is
contingent on the adaptive capacities of those
experiencing it (Emery & Trist, 1965). All of the

strategic responses to extreme turbulence are some how
some way adaptability to the current environment.
Hypothesis 7: Organizations that realize any combination of theaforementioned strategic responses will be able to withstandextreme turbulent environments better than organizations thatare unsatisfactory at exhibiting one or more of such strategies.

CASE STUDY METHODOLOGY
Case studies allow for rigorous qualitative data research
to be conducted in order to explore or describe a
phenomenon (Baxter & Jack, 2008). Investigating
strategic management and more specifically the strategies
themselves is extremely challenging, since the underlying
constructs are intangible and difficult to measure
(Casselman, 2007). There are a wide range of issues that
have been identified with the reliability and validity of
measures and research design in business research but the
following methodology has been designed to diminish the
chances of unreliable and invalid measures. In order to
investigate the phenomenon of extreme turbulent
environments, a rigorous qualitative case study method
has been chosen to examine and analyze the most extreme
turbulent environment society has seen since the Great
Depression, the 2008 Global Financial Crisis. In this
section, the methodology necessary to conduct quality,

rigorous case study research is outlined. Research has
been conducted with data from multiple perspectives to
produce multi-faceted analysis, in order to reveal the
phenomenon.
Amongst industry leaders, Robert Yin’s book, Case Study
Research: Design and Methods, is cited thousands of times
as a solid foundation for constructing the methodology
used in qualitative case study research. The following
methodology is constructed based on his findings. The
process began with a constructivist paradigm or research
question (Yin, 2008). In this case our primary interests
are how can an organization navigate through extreme
turbulent environments and emerge as a flourishing
entity? The goal of the research is to identify patterns
or commonalities within one or more of the organizations
studied; to determine how these patterns or commonalities
manifest themselves in the organization and to understand
the relationships and underpinnings between the patterns

or commonalities (Casselman, 2007). More research
questions or propositions may be added on in order to
focus the research, making the study more feasible
(Baxter & Jack, 2008).
Now that the constructivist paradigm is established we
must consider what is the “case”. The case is the unit
of analysis; defining the case presents a challenge for
not only novice researchers but seasoned experts as well
(Baxter & Jack, 2008). One key issue in strategic
management research is the poor quality of the measures
used (as cited in Carlson 2004). In order to properly
define the case and avoid the pitfall of low quality
measures, the following question will be answered: Do I
want to analyze the difference between organizations?
(Baxter & Jack, 2008). This study analyzes the
differences between organizations, specifically during
the financial crisis of 2008. Arguably just as equally
important as defining the case, is determining what is

not to be included in the case (Yin, 2008). In order to
manage the excessive amounts of information available
about the financial crisis and impact on all different
organizations, four specific companies have been chosen
to analyze. The four companies are international
organizations that span across different industries but
the primary constraint for selection was the outcome of
the company in today’s market. The four chosen
organizations are as follows: an organization that was
not successful through this period of extreme turbulence,
Lehman Brothers; one organization that was established
just at the onset of the crisis and has emerged with
exponential growth, Alibaba Group; one organization that
suffered severely through the crisis, AIG; and one
organization that was able to exploit the financial
crisis and take advantage of the turbulence, Ryan Air.
Relatively large firms were selected based on the
assumption that as firms become larger and more complex,
they have a greater requirement for more formalized

strategic use (Casselman, 2007). These four organizations
comprise the research boundaries of this study.
“…case studies, like experiments, are generalizable to theoreticalpropositions and not to populations or universes. In this sense thecase study, like the experiment, does not represent a ‘sample,’ and theinvestigator’s goal is to expand and generalize theories (analyticgeneralization) and not to enumerate frequencies (statisticalgeneralization)” (Yin, 1994, page 10).
In following Yin’s theory, by having selected companies
that have experienced turbulence differently, the hope is
to improve the ability to make theoretical conclusions
about the drivers of success in extreme turbulence.
The next step is to determine what type of case study
will be performed. In this instance we will be using a
multi-case design as we are analyzing in different
settings (Yin, 2008) i.e. different organizations
spanning different industries and different nations
during the financial crisis. Multi-case studies have
both pro’s and con’s; for example multi-case studies are
said to be more robust as multiple cases tend to provide

more compelling results but it can also lead to extensive
resources and more time than one researcher is capable.
Also, multi-case studies must be approached like an
experiment that is to be replicated therefore the same
parameters, ratios and aspects of the aforementioned
organizations must analyzed in the same manner for each
of the four. The replication technique used in this
study creates external validity and is specifically
referred to as a theoretical replication as we are
predicting contrasting results from the outset of the
investigation. An embedded approach has been used as
each organization has been analyzed separately and
results were not pooled. I have also conducted a
flexible design to allow for modifications depending on
findings throughout the investigation (Yin, 2008).
To increase the credibility, which is the number one
pitfall of case study research, different data sources
must be taken into consideration (Baxter & Jack, 2008).

This study uses annual reports, peer reviewed journals,
periodicals, financial records, company websites
and other media publications to measure the different
strategic adaptive capacity responses to extreme
turbulence. Multiple sources of evidence are examined
and explored to demonstrate a concrete chain of evidence
and establish patterns in order to create construct
validity (please see Appendix C for a complete list of
materials used to explore this case study). Objective
performance data was obtained from annual reports and
other public databases. Data on sales revenue, number of
employees and assets were based on figures found on
company websites and published public information.
Although financial performance measures have some
indication of relative health of an organization, we want
to examine more specifically if our selected
organizations exhibited any of the strategic adaptive
capacity responses previously identified. This will be

conducted via sophisticated content analysis of annual
reports. Please see Appendix D for a complete list of
the characteristics of each strategic response that were
used as research parameters. The consistency of only
using the same few types of sources to assess patterns
and logic establish internal validity of the study. The
content of these sources will be analyzed and scaled
according to the demonstration of each strategic adaptive
capacity.
The analysis is to be compiled into a report. The
primary goal of the report is to describe the study in
such a comprehensive manner that the reader feels as if
they had been an active participant on the research team.
As a novice researcher, it is necessary to clearly state
the study research questions, provide propositions, the
case study design has been scrutinized and is appropriate
for the research question, purposeful strategies are
appropriate for the case study, data are collected and

managed systematically and the data are analyzed
correctly (Baxter & Jack, 2008). In the previous
paragraphs I have outlined these critical steps of the
case study methodology design and in order to circumvent
the lack of rigor pitfall, every effort was made to
approach the research in a reasoned, well-justified and
easily replicable, scientific manner.
Measures
Once all of the steps of the case study design and
methodology have been completed it is time to collect the
data. But we must establish what measures and what data
are to be collected. For this case study analysis there
are two parts; the financial performance data and the
content analysis data. Please see appendix E for a table
with all four companies’ financial performance compiled
together.
The financial performance data will be collected via
published information available to the general public.

To assess the financial performance of the selected
organizations, annual sales growth, return on sales,
return on assets and growth in employee data will be
collected and analyzed. Annual sales growth will be
calculated by using the change in sales from one year to
another divided by the sales of the previous year.
Return on sales will be calculated by using net income
from continuing operations, excluding extraordinary items
and divide it by sales. Return on assets will be
calculated by taking net income from continuing
operations, excluding extraordinary items and divide by
assets (Goll & Rasheed, 2005). Growth in employees will
be calculated by taking the difference of number of
employees divided by the current number of employees.
Both (Baxter & Jack, 2008) and (Yin, 2008) strongly
recommend the use of a database to organize data. The
advantage of using a database to accomplish this task is
that raw data are available for independent inspection.

The following is a section of the database I used to
compile the financial performance analysis:
Through all of the stages of case study analysis an
emphasis on rigor is pertinent; this holds true for the
content analysis as well. The annual report materials
that were collected are textual in nature. Content
analysis suggests that different approaches to coding
data are necessary as traditional ratios are not
calculated. A set of pre-specified codes will be used.
Each strategic response and its major components or
“indicators” were searched for and counted in the content
of each annual report for each of the three years chosen

(2006, 2008 and 2010) and compiled in the coding sheet
database that can be found in Appendix F.
The total counts were then averaged for the three years
and assigned a title based on the following scale:
*Where x = the count
The “control of the market” indicator, under the
“agility” response, was ranked on a unique scale as it
was observed signifcantly more frequent than any other
indicator. The scale for “control of the market” is:
Then using an excel spreadsheet each alphabetic code was
converted to a numeric code ranging from 0 – 4, an
average was calculated for each strategic response and
the corresponding alphabetic code was assigned in a table
similar to the following:

Finally, an overall rating was assigned to each firm
using the same method that was used to determine the
ratings for the strategic responses.

CASE STUDY ANALYSIS
The following section presents the results found during
the content analysis of the research. The results of the
research are organized by each organization.
Lehman Brothers
Henry Lehman, an immigrant from Germany, and his two
brothers Emanuel and Mayer opened a cotton trading
business in Montgomery, Alabama, naming it Lehman
Brothers in 1880. By 1889 the Lehman Brothers expanded
their business into investment banking, by underwriting
its first stock offering. Lehman Brothers continued to
grow into the world’s most reputable investment bank. In
the early 1980’s American Express Co acquired Lehman
Brothers, but within 10 years, American Express spun off
Lehman with little capital and saddled with losses and
admitting it was never a good fit for the two
organizations. Lehman took a huge leap of faith in 2002
and purchased 745 Seventh Avenue to make the midtown

building its new headquarters. In 2003 Lehman bought
Neuberger Berman for $3.2 billion to give its wealth
management division a boost. Lehman closed the BNC
Mortgage LLC subprime-lending unit, eliminating 1,200
jobs. March 17, 2008 Lehman shares dropped off as
concerns rose that it would be the next Wall Street firm
to collapse after Bear Stearns. Lehman stock then
recovered all its loss the next day when first-quarter
profit beat analysts' estimates. The firm announces its
first quarterly loss since going public and sells $6
billion of stock to bolster capital in early June of
2008. The following quarter Lehman reported a $3.9
billion loss, primarily due to more than $5.6 billion in
write downs. At this point, Lehman announced its plans
to sell a majority stake. After analysis and discussions
with several potential buyers, Barclays pulls its bid
after failing to secure guarantees against losses. Bank
of America withdraws hours later leaving no other bidders
on 14 September 2008. The next day, September 15, 2008

Lehman petitioned for Chapter 11 bankruptcy, listing $639
billion of assets making it the largest filing in U.S.
history.
Lehman Brothers is the only one of the four organizations
chosen to analyze that did not successfully navigate
through the 2008 financial crisis. Due to their failure
to emerge from the severe economic downturn, Lehman
Brothers was chosen under the assumption that an
organization that does not survive through extreme
turbulence would not exhibit any of the strategic
responses.
Table 1: Lehman Brothers Financial Performance
The table shows the severe decrease in return on sales
and sales growth from pre-turbulence to extreme
turbulence. The return on assets figures do not present

any conclusive evidence as the total shift was than 1%.
The rate of growth of employees also dropped off from a
positive 11.6% to a negative 9.1%. As a whole, the
financial ratios calculated show a severe decline,
especially as an organization is to enter a historically
extreme period of turbulence.
Despite extensive research, I was unable to produce only
but one print advertisement for Lehman Brothers. This
leads me to believe that their advertising was limited to
none prior to the financial crisis of 2008. The one
advertisement is from 2007, it has an elephant in an
empty room on it with the caption, “Well Bob, the
economy’s just not what it was last year” (see Appendix
G). The simplicity of advertisement makes it fall into
the informational category but there is no evidence of a
switch from transformational to informational marketing
for Lehman Brothers. From the lack of advertising to
introduction of one advertisement during the height of

the extreme turbulence suggests marketing was being
attempted but as there was no prior evidence of marketing
one cannot say that an overhaul was being executed.
The following table presents the data collected from the
content analysis for Lehman Brothers. The annual reports
for 2006 and 2007 were analyzed in this case because
there were no publications of annual reports for 2008 and
2010 as the organization no longer existed. There was no
evidence of agility or any of its indicators. As for
resilience, there was a very high indication of extensive
risk management and moderate to low evidence of
innovation and creativity. There was no evidence of
dynamic resourcefulness in either of the two annual
reports. There was some demonstration of proactivity via
an attempt to control the environment, broad innovation
and knowledge of the environment. The only discussion of
collaboration was through complexity management.
Table 2: Lehman Brothers Response Counts


AIG
AIG traces its roots back to 1919, when American
Cornelius Vander Starr established a general insurance
agency. The business grew rapidly, and two years later,
Mr. Starr formed a life insurance operation. In 1926,
Mr. Starr opened his first office in the United States,
and decided to focus on opportunities in Latin America.
But by the early 1950’s the organization moved its
headquarters to New York City in order to focus on the
American market. Maurice R. Greenberg, Starr’s
predecessor, focused on selling insurance through
independent brokers rather than agents to eliminate agent
salaries. In 1967, American International Group, Inc.
(AIG) was incorporated as a unifying umbrella
organization for most of C.V. Starr’s general and life
insurance businesses. The 60’s and 70’s brought the
closure of many operations in the Middle East and
Southeast Asia while growing operations in America. By

1979, AIG had a reputation for offering superior
technical and risk management skills. The early 2000s
saw a marked period of growth and entrance into new
markets including India. October of 2004 brought about
the first of AIG’s severe legal issues with two top tier
executives being convicted of various white collar
crimes. Beginning in 2005, AIG became embroiled in a
series of fraud investigations conducted by several
leading US federal agencies. Greenberg then resigned and
AIG was left with tens of billions of risk associated
with mortgages. When losses hit the mortgage market in
2007-8, AIG had to pay out insurance claims and also
replace the losses in its collateral accounts. After
entering the period of extreme turbulence in such poor
condition, the United States Federal Reserve Bank stepped
in, announcing the creation of a secured credit facility
of up to US$85 billion to prevent the company's collapse;
this is the largest government bailout of a private
company in U.S. history. The U.S. Department of The

Treasury in December 2012 published an itemized list of
the loans, stock purchases, etc. engaged in with AIG.
AIG had received a total of 182.3 billion in government
assistance and by the beginning of 2013 had paid back,
including the positive return, 205 billion.
The figures for AIG are quite impressive (see Table 3
below). The return on sales figures are consistent from
2006 and 2010 but there is an incredibly severe drop off
in 2008 when the insurance giant was bailed out by the
United States government. Annual sales growth had a
remarkable drop off as well in 2008 as that was the
height of the extreme turbulence. The growth of
employees figures demonstrate that there was a lag with
the constriction of the organization.
Table 3: AIG Financial Performance

In the spring of 2006 AIG published print advertisements
with few images and few words. The ad campaign was very
informational via its simplicity. In January of 2008 AIG
had print advertisements with several images and a lot of
small print therefore becoming more of transitional style
appealing more to the emotions and overall experience.
This alteration to their published advertisements is
their initial overhaul, but does not compare to the
complete revolutionary campaign launched in May of 2008.
Later in 2008 AIG released a series of print
advertisements all with a similar style, one simple photo
that consumed the entire page, the light focused on the
left with the object in the image on the left hand side
while on the right hand side the background fades to
black. Above the image is plus sign with a number and to
the right is a written statement about the image and how
that image and associated activity can add however many
years to your life. This advertising campaign is

extremely different and completely overhauled when
compared to the previous campaign in 2006. This campaign
was executed at the entry of the extreme turbulence of
2008. After the extreme turbulence AIG once again
overhauled their advertising strategies and called it
called “Thank You America,” which is a return to their
more traditional plain photo but with the appeal to the
American public noting how they have successfully paid
back their debt and then some to the United States
Federal government. This campaign featured several
company employees, including AIG President and CEO Robert
Benmosche, who talked directly to the camera and offered
their thanks for the government assistance.
The table below displays the counts and evidence found
for the strategic responses to extreme turbulence for
AIG. Their attempt at controlling the market is
extremely high and with moderate flexibility, internal
efficiency and understanding of the market; AIG

demonstrated agility through the extreme turbulence.
From the parameters defined, AIG also demonstrated
resilience through their effective risk management and
emphasis on innovation. The primary demonstration of
dynamic resourcefulness was through their emphasis on
future cash flows. There was also evidence found of
proactivity through broad innovation and knowledge of the
overall environment. There was little to no evidence of
collaboration but there was some demonstration of
complexity management.
Table 4: AIG Response Counts


Ryan Air
RyanAir was established in 1985, with a share capital of
£1 and 25 employees, using a 15-seater Bandeirante
aircraft. By 1990, Ryanair dropped its Business Class
product and closed the Frequent Flyer Club, but re-
launched as Europe's first low fare airline, offering the
lowest fares in every market and moving to a single
aircraft fleet type. 1993 saw more than one million
passengers carried in a year for the first time. In
August, 2001, Ryanair carried more than 1 million
passengers in a month for the first time. Rapid expansion
continued, and Ryanair broke the 30 million passenger
barrier in a year at the end of 2005, carrying more
passengers in August than British Airways. Between 2006
and 2009 the fleet grew from 100 to 200. While not being
known for their customer service, no Ryanair aircraft has
been involved in incidents leading to deaths or serious
injuries so far.
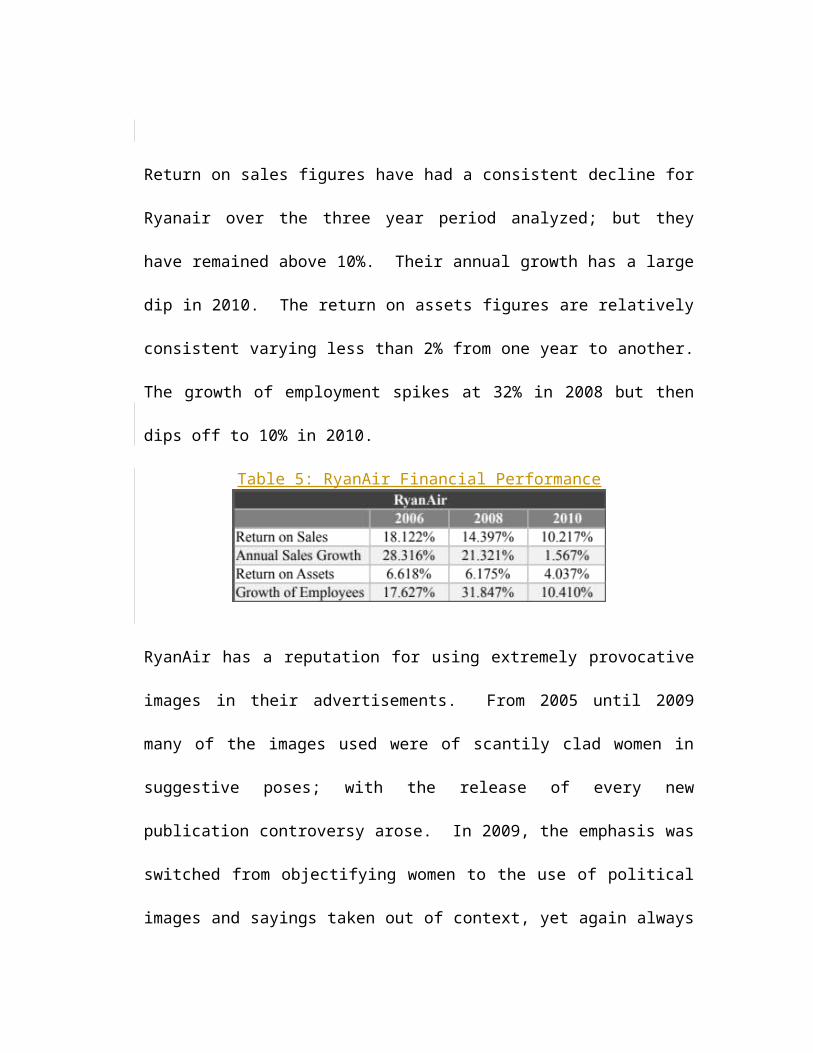
Return on sales figures have had a consistent decline for
Ryanair over the three year period analyzed; but they
have remained above 10%. Their annual growth has a large
dip in 2010. The return on assets figures are relatively
consistent varying less than 2% from one year to another.
The growth of employment spikes at 32% in 2008 but then
dips off to 10% in 2010.
Table 5: RyanAir Financial Performance
RyanAir has a reputation for using extremely provocative
images in their advertisements. From 2005 until 2009
many of the images used were of scantily clad women in
suggestive poses; with the release of every new
publication controversy arose. In 2009, the emphasis was
switched from objectifying women to the use of political
images and sayings taken out of context, yet again always

surrounded by controversy. The advertisements are all
transformational and the types of alterations to the
marketing campaigns are hardly different when compared
from pre to the height of post extreme turbulence.
Table 6 presents the count analysis for Ryan Air. There
was some evidence found in terms of agility; the
“internal efficiency” and “process improvements” fell in
the moderate level range whereas the “control of the
market” evidence was high. There was a high count of
“evidence of risk management” and low evidence of
“awareness of change” both of which contributing to the
evidence of resilience. There was very little evidence
found in regards to dynamic resourcefulness, the only
evidence found a few mentions of emphasis of future cash
flows. Evidence of almost all of the key indicators of
proactivity were found in the RyanAir annual reports.
There was only one mention of collaboration in the three
years of annual reports that were examined.

Table 6: RyanAir Response Counts


Alibaba Group
The mission of the Alibaba group is to provide an
internet-based business focused on fostering the
development of an open, collaborative and prosperous e-
commerce ecosystem. In 1999, Alibaba Group was
officially established by Jack Ma and its 17 other
founders out of Mr. Ma’s Hangzhou apartment. Alibaba
group is a family of internet-based businesses which
makes it easy for anyone to buy or sell online anywhere
in the world. Since its inception, it has developed
leading businesses in consumer e-commerce, online
payment, business-to-business marketplaces and cloud
computing, reaching Internet users in more than 240
countries and regions. After being in business for only
three years Alibaba group became profitable. Alibaba
group partnered with Yahoo! and began to head Yahoo!
China’s operations in 2005. After several mergers,
acquisitions and creation of several new business

divisions, Alibaba Group announced that beginning in 2010
they will earmark 0.3 percent of annual revenues to fund
efforts designed to spur environmental awareness and
conservation in China.
Alibaba Group was reorganized into 25 business units to
better adapt to China’s fast-growing e-commerce
environment as of January 2013. The privately held
Alibaba Group, including its affiliated entities, employs
some 24,000 people around the world and has more than 70
offices in Greater China, India, the United Kingdom and
the United States.
As easily seen from the table above, Alibaba Group has
been in an exponential growth period from 2006. Their
return on sales figures are incredible, increasing by a
minimum of 30% per year. The annual sales growth figures
are a bit misleading as it is a percentage ratio and the
business was just getting going in 2006 so figures were

relatively small so a large percentage of a small thing
could be less indicative of growth a modest percentage of
a very large thing. Their return on assets figures are
relatively consistent even through the period of extreme
turbulence. For the first two years, the growth of the
employees is remarkably high, even the 2010 figure of
nearly 22% is quite impressive.
Table 7: Alibaba Group Financial Performance
Alibaba Group had not launched any official marketing
campaigns until 2009. Pre 2009, their ads were limited
and very basic such as an ad placed on a column in a
subway station (see in Appendix G). In 2009 their first
full-blown marketing campaign was launched. It seems as
if pre-2009 their marketing style was informational, as
it was simple and practical. The 2009 marketing campaign
was dedicated to introducing and creating an

understanding of the organization to an international
client base. Bright colors and pictures of ordinary
people were used, making the style a hybrid of both
informational and transitional styles. The increased
marketing presence could be considered a type of
marketing overhaul.
Table 8: Alibaba Group Response Counts

They demonstrated evidence of both understanding and
attempting to control the market in moderate and high
levels, respectively. As an organization they proved to
have high awareness of change and effective risk
management. There was virtually no evidence found
demonstrating dynamic resourcefulness as well as
collaboration. There was also moderate demonstration of
proactivity throughout all of the identified indicators.
Table 9: Consolidated content analysis results (also inAppendix H)
Table 9 presents the evidence rating for each strategic
response for each of the four organizations examined in
the case study. This gives an opportunity to look at all
of the ratings side by side for a different perspective
to visualize the analysis.

DISCUSSION AND CONCLUSION
The results of the content analysis are rather
inconclusive but nonetheless interesting. But through a
retrospective lens we can examine the four case study
participants and see how they are performing under
present market conditions. Lehman Brothers did not
withstand the extreme turbulence as they filed for
bankruptcy at the height of the turbulent period. AIG
did not withstand the extreme turbulence well and if it
had not received a government bailout, one could
speculate, they too would have had the same fate as
Lehman Brothers, with an extreme spillover effect on
other companies and countries throughout the world.
RyanAir, on the other hand, has seen an influx of clients
whom are searching for a low cost means to travel due to
restraints on finances caused by the extreme turbulence,
therefore leading to business growth. The Alibaba Group
hit their stride as the extreme turbulence was first

being experienced by the United States and took off with
exponential growth from 2006 until the present. With
these retrospective observations, each of the seven
hypotheses will be examined, one by one, in the following
paragraphs.
Table 10 displays the overall level of confirmation of
each of the seven hypotheses made in this report.
Following the consolidated chart each hypothesis is
broken down on individual account.
Table 10: Hypotheses and their confirmation

Hypothesis 1: Organizations that overhaul their marketing strategieswill be able to withstand extreme turbulent environments better thanorganizations do not alter their marketing strategies
The Lehman Brothers figure confirms our hypothesis as
well as the Alibaba Group data but AIG having a “very
high” rating does not support the hypothesis and neither
does RyanAir’s rating of “low”.
Hypothesis 2: Organizations that demonstrate agility will be able towithstand extreme turbulent environments better than organizationsthat blunder with agility.
As for evidence of agility being demonstrated, Lehman
Brothers “low”, AIG “moderate”, and RyanAir “moderate”
confirm the hypothesis although the Alibaba Group is an

extreme outlier as their business has really taken off
but there was no evidence from the annual reports of
agility. The Alibaba Group rating creates a
contradiction to the hypothesis making it difficult to
confirm the hypothesis.
Hypothesis 3: Organizations that perform with resilience duringextreme turbulent environments will be able to withstand the changebetter than organizations that flounder with resilience.
Again, Lehman Brothers and AIG follow the prediction and
hypothesis. But RyanAir and Alibaba Group do not confirm
the hypothesis leading to inconclusive results.
Hypothesis 4: Organizations that exhibit a proactive continuum will beable to withstand extreme turbulent environments better thanorganizations that fail at exhibiting such behavior.
Across all four cases chosen, there was next to no
evidence of resilience. It could be that resilience is
more frequently occurring post extreme turbulence which
then there fore leads to the conclusion that more time

periods should b scrutinized before confirming or not
confirming the hypothesis of resilience.
Hypothesis 5: Organizations that demonstrate dynamic capabilitieswill be able to withstand extreme turbulent environments better thanorganizations that cannot demonstrate dynamic capabilities.
Dynamic capabilities also present an interesting argument
as Lehman Brothers, the only organization of the four
studied to not survive through the extreme turbulence,
demonstrated a moderate level of execution. Likewise,
AIG and RyanAir, presented a moderate level of evidence
of dynamic capabilities, both of which emerged from the
extreme turbulence on a decline in business health. Even
further negating the hypothesis is Alibaba Group and
their “low” level rating when according to our previous
observations Alibaba Group is and has been in a period of
rapid growth since before the height of the extreme
turbulence.
Hypothesis 6: Organizations that engage in collaboration will be ableto withstand extreme turbulent environments better than

organizations that cannot demonstrate collaboration efforts.
Overall, there was little to no evidence of collaboration
as a strategic response to extreme turbulence. But
interestingly enough, Lehman Brothers and Alibaba Group
(the loser and the winner) both had the same amount of
evidence of collaboration. In general the results are
contrary to the hypothesis or inconclusive at best.
Hypothesis 7: Organizations that realize any combination of theaforementioned strategic responses will be able to withstand extremeturbulent environments better than organizations that areunsatisfactory at exhibiting one or more of such strategies.
Overall our original assumptions were proven inconclusive
or incorrect. For the study of Leman Brothers the
overall rating of evidence of the identified strategic
responses to extreme turbulence was very low which is in
line with our original assumption. But the other three
organizations examined did not fall in line with our
original assumption. Overall, AIG received a rating of
“moderate”, RyanAir “low” and Alibaba Group

“low/moderate”. The original assumption and observation
is that Alibaba Group would be our shining star and
exhibit high levels of evidence as a business that
emerged very healthy and flourishing from the extreme
turbulence. AIG was the outstanding variable as without
government subsidy they also would have filed for
bankruptcy just as Lehman Brother did. The expectation
is that AIG would be on the low end of the scale and
instead they were ranked in the middle. RyanAir is one
organization that really took off once the extreme
turbulence hit as people were looking for low-cost air
care providers and RyanAir was amongst the first to offer
deep discount fares but the evidence found of the
strategic responses to extreme turbulence were ranked
low.
In conclusion, the research method used did not provide
conclusive evidence. The evidence was more contradictory
than supportive of the proposed hypotheses. While the

evidence was inconclusive, the problem could have been
with the examples chosen. Also the results could have
been improved with more organizations analyzed and
possibly conducting interviews with executives of each of
the organizations as not all organizations disclose all
of their secrets in their annual reports. Maybe Hall
(1980, p. 85) had it right:
“both great successes and failures are occurring as basic, matureindustries move into a hostile business environment created by slowergrowth, higher inflation, more regulation, and intensified competition.Uniformly, the successes come to those companies that achieve eitherthe lowest cost or most differentiated position. Simultaneously,survival is possible for those companies that have the foresight todownsize their asset commitments into niches in their basic industryand to use their incremental capital for meaningful diversificationmoves.”
WORKS CITED
Aragon-Correa, J. A., & Sharma, S. (2003). A ContingentResource-Based View of Proactive CorporateEnvironmental Strategy. The Academy of Management Review ,71-88.
Bacot, L. M., Hartman, S. J., & Lundberg, O. H. (1993).Adaptive Strategies And Survival in an EnvironmentDominated by Economic Decline. Journal of Applied BusinessResearch , 34-43.

Baxter, P., & Jack, S. (2008). Qualitative case studymethodology: study design and implementation for novice researchers.544: The Qualitative Report.
Boyne, G. A., & Meier, K. J. (2008, 12). EnvironmentalTurbulence, Organizational Stability, and PublicService Performance. Administration & Society , 799- 824.
Casselman, R. M. (2007). The Impact of Knowledge Strategy andKnowledge Capability on Performance. University of Melbourne,Department of Management and Marketing, Faculty ofEconomics and Commerce. Melbourne, Australia:Unpublished Doctoral Dissertation.
Castrogiovanni, G. J. (2002). Organization TaskEnvironments: Have they Changed Fundamentally overTime? Journal of Management , 129-150.
Emery, F. E., & Trist, E. L. (1965). The Causal Textureof Organizational Environments. Human Relations , 21-32.
Glaister, K., & Thwaites, D. (1992). Strategic Responsesto Environmental Turbul. The International Journal of BankMarketing , 33-41.
Goll, I., & Rasheed, A. A. (2005, 6). The Relationshipsbetween Top
Management Demographic Characteristics, RationalDecision Making, Environmental Munificence, and FirmPerformance. Organization Studies , 999-1023.
Hall, W. K. (1980, 10). Survival strategies in a hostileenvironment. Harvard Business Review , 75-85.
Lee, J., McCann, J., & Selsky, J. (2009). BuildingAgility, Resilience and Performance in TurbulentEnvironments. People and Strategy , 44-51.

Lee, T., & Taylor, R. E. (2011). A strategic response tothe financial crisis: an empirical analysis offinancial services advertising before and during the
financial crisis. Journal of Services Marketing , 150–164.
McCann, J., & Selsky, J. (1984). Hyperturbulence and theEmergence of Type 5 Environments. Academy ofManagement Review , 9 (3), 460-470.
Milliken, F. J. (1987). Three types of perceiveduncertainty about the environment: state, effect andresponse uncertainty. Academy of Management Review , 133-
143.
Smart, C., & Vertinsky, I. (1984). Strategy and theEnvironment: A Study of Corporate Responses to Crises.Strategic Management Journal , 199-213.
Snyder, N. H. (1987). Validating Measures ofEnvironmental Change. Journal of Business Research , 31-43.
Terreberry, S. (1968). The Evolution of OrganizationalEnvironments. Administrative Science Quarterly , 590-613.
Yin, R. K. (2008). Case Study Research: Design and Methods (edition5). Thousand Oaks, CA: Sage.

APPENDIX A: TYPES OF ENVIRONMENTS

Further information and definition of the different types
of environments (Casselman, 2007):

APPENDIX B: STRATEGIC RE S PONSES TO TURBUL E NCE


APPENDIX C: SUMMARY OF CASE STUDY MATERIAL

APPENDIX D: EVIDENCE OF STRATEGIC RESPONSES

Appendix E: Summary of financial PERFORMANCE
Summary of Financial FindingsReturn on SalesCompany Year
2006 2008 2010Lehman Brothers 8.579% -84.819% -

AIG 12.411% -894.173% 12.916%RyanAir 18.122% 14.397% 10.217%Alibaba Group 16.112% 39.945% 85.786%Annual Sales GrowthCompany Year
2006 2008 2010Lehman Brothers 20.185% -85.257% -AIG 3.938% -89.911% 2.756%RyanAir 28.316% 21.321% 1.567%Alibaba Group 84.731% 38.760% 41.109%
Return on AssetsCompany Year
2006 2008 2010Lehman Brothers 0.580% -0.377% -AIG 1.434% -11.540% 1.465%RyanAir 6.618% 6.175% 4.037%Alibaba Group 10.755% 15.279% 11.566%
Growth of EmployeesCompany Year
2006 2008 2010Lehman Brothers 11.583% -9.160% -AIG 9.434% 0.000% -47.619%RyanAir 17.627% 31.847% 10.410%Alibaba Group 41.935% 51.111% 21.893%
APPENDIX F: KEYWORD COUNT TRACKER

Please note that the first line in each of the
“indicators” colums is blank as the key word that was
searched for was the same as the “strategic response”
itself.

APPENDIX G : PRINT ADVERTISEMENTS
Lehman Brothers

AIG
March 2006-
January 2008

May 2008-
Post 2010
RyanAir
December 2004
April 2008

July 2010
November 2010

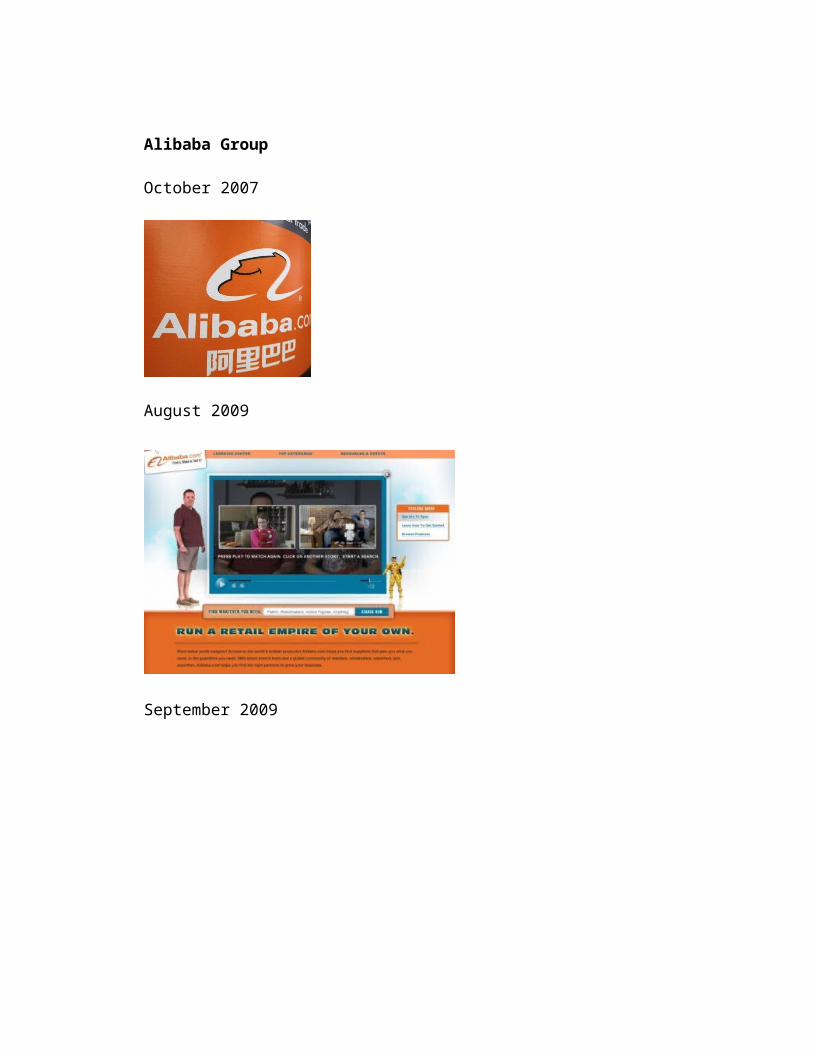
Alibaba Group
October 2007
August 2009
September 2009


APPENDIX H : CONSOLIDATED CONTENT ANALYSIS RESULTS

VITA
Name Date of Birth Elementary School
Date Graduated
High School
Date Graduated
Baccalaureate Degree
Date Graduated Other Degrees

Christianne Lauria
April 21, 1986
Veterans Park ElementaryRidgefield, CT
June 1997
Ridgefield High SchoolRidgefield, CT
June 2004
Bachelor of SciencePepperdine University
April 2008
Masters of Business AdministrationSt. John’s UniversityQueens, NY
Copyright © 2022 FDOKUMEN


![1100131030432008-00586-01 [30-03-2012] INCUMPLIMIENTO DEL COMISIONISTA DE VALORES](https://static.fdokumen.com/doc/165x107/633900fee421cdaf480dca83/1100131030432008-00586-01-30-03-2012-incumplimiento-del-comisionista-de-valores.jpg)

![GENERAL] Volume V | Chapter 1 1 Revised 03-01-11 Page ...](https://static.fdokumen.com/doc/165x107/6328437fe491bcb36c0baed8/general-volume-v-chapter-1-1-revised-03-01-11-page-.jpg)