Thermodynamic Assessment of the Phase Equilibria in the Al-Ca-Sr System Using the Modified...
11
Thermodynamic assessment of the phase equilibria in the Al–Ca–Sr system using the modified quasichemical model M. Aljarrah, M. Medraj * Department of Mechanical Engineering, Concordia University, 1455 de Maisonneuve Boulevard West, Montreal, Canada H3G 1M8 Received 29 June 2007; received in revised form 1 October 2007; accepted 4 October 2007 Available online 17 October 2007 Abstract A thermodynamic description of the Al–Ca–Sr system is carried out using the modified quasichemical model. The three binary sys- tems Al–Ca, Al–Sr, and Ca–Sr have been re-optimised based on the experimental phase equilibria and thermodynamic properties avail- able in the literature. Good agreement was obtained for the calculated binary phase diagrams and their thermodynamic properties. The established database of this system predicted one saddle point, one peritectic, seven quasi-peritectics, and two ternary eutectics. Ó 2007 Elsevier Ltd. All rights reserved. Keywords: Ternary phase diagram; Thermodynamic modelling; Modified quasichemical model; Al–Ca–Sr system 1. Introduction The Al–Ca–Sr ternary system is an important subsystem in the family of creep resistant Mg–Al–Ca–Sr alloys [1,2]. Therefore, accurately assessing the thermodynamics and phase stability in Al–Ca, Ca–Sr, and Al–Sr binary systems is important for developing a reliable thermodynamic data- base of Mg-alloys as well as Al-alloys. To create an accu- rate thermodynamic model of a ternary system, it is necessary to have thermodynamic descriptions of the three constituent binary systems first. In order to provide a good prediction for the thermodynamic properties of the Al–Ca– Sr system, it is necessary to use the suitable model that describes the excess Gibbs free energy. If a model based on random mixing is used for the liquid phase, higher order interaction parameters are needed to reproduce the liquidus around the intermetallic compounds and it often results in a less satisfactory liquidus at other compositions. In the Al– Ca system, the measured heat of mixing forms a V-shape with a minimum around 0.4 at.% Ca, which indicates a ten- dency for short-range ordering. Furthermore, according to You et al. [3], there is a strong evidence for the existence of molecular, such as Al 2 Ca, species that are called associates, in the liquid phase. To deal with short range ordering, the associates model was proposed in the literature. However, this model is not physically sound, since it assumes that some molecules occupy specific atomic positions. Further- more, using a random solution model to treat liquids with short range ordering continues to appear in the literature. In reality, a random solution model is only expected at very high temperature when the entropy term overwhelms any tendency for ordering or clustering of atoms. It follows that the configurational entropy of mixing should vary with temperature. The modified quasichemical solution model provides a better treatment of configurational entropy that accounts for a non-random distribution of atoms. There- fore, models based on the random mixing can not properly describe the influence of short-range ordering, as they do not solve the problem of the configurational entropy. The description of short-range ordering can be taken into account with bond energy models by considering the inter- actions between atoms that extend beyond the nearest neighbours approximation. This problem has been treated 0021-9614/$ - see front matter Ó 2007 Elsevier Ltd. All rights reserved. doi:10.1016/j.jct.2007.10.003 * Corresponding author. Tel.: +1 514 848 2424x3146; fax: +1 514 848 3175. E-mail address: [email protected] (M. Medraj). URL: http://www.me.concordia.ca/~mmedraj (M. Medraj). www.elsevier.com/locate/jct Available online at www.sciencedirect.com J. Chem. Thermodynamics 40 (2008) 724–734
Transcript of Thermodynamic Assessment of the Phase Equilibria in the Al-Ca-Sr System Using the Modified...
Available online at www.sciencedirect.com
www.elsevier.com/locate/jct
J. Chem. Thermodynamics 40 (2008) 724–734
Thermodynamic assessment of the phase equilibria in theAl–Ca–Sr system using the modified quasichemical model
M. Aljarrah, M. Medraj *
Department of Mechanical Engineering, Concordia University, 1455 de Maisonneuve Boulevard West, Montreal, Canada H3G 1M8
Received 29 June 2007; received in revised form 1 October 2007; accepted 4 October 2007Available online 17 October 2007
Abstract
A thermodynamic description of the Al–Ca–Sr system is carried out using the modified quasichemical model. The three binary sys-tems Al–Ca, Al–Sr, and Ca–Sr have been re-optimised based on the experimental phase equilibria and thermodynamic properties avail-able in the literature. Good agreement was obtained for the calculated binary phase diagrams and their thermodynamic properties. Theestablished database of this system predicted one saddle point, one peritectic, seven quasi-peritectics, and two ternary eutectics.� 2007 Elsevier Ltd. All rights reserved.
Keywords: Ternary phase diagram; Thermodynamic modelling; Modified quasichemical model; Al–Ca–Sr system
1. Introduction
The Al–Ca–Sr ternary system is an important subsystemin the family of creep resistant Mg–Al–Ca–Sr alloys [1,2].Therefore, accurately assessing the thermodynamics andphase stability in Al–Ca, Ca–Sr, and Al–Sr binary systemsis important for developing a reliable thermodynamic data-base of Mg-alloys as well as Al-alloys. To create an accu-rate thermodynamic model of a ternary system, it isnecessary to have thermodynamic descriptions of the threeconstituent binary systems first. In order to provide a goodprediction for the thermodynamic properties of the Al–Ca–Sr system, it is necessary to use the suitable model thatdescribes the excess Gibbs free energy. If a model basedon random mixing is used for the liquid phase, higher orderinteraction parameters are needed to reproduce the liquidus
around the intermetallic compounds and it often results ina less satisfactory liquidus at other compositions. In the Al–Ca system, the measured heat of mixing forms a V-shape
0021-9614/$ - see front matter � 2007 Elsevier Ltd. All rights reserved.
doi:10.1016/j.jct.2007.10.003
* Corresponding author. Tel.: +1 514 848 2424x3146; fax: +1 514 8483175.
E-mail address: [email protected] (M. Medraj).URL: http://www.me.concordia.ca/~mmedraj (M. Medraj).
with a minimum around 0.4 at.% Ca, which indicates a ten-dency for short-range ordering. Furthermore, according toYou et al. [3], there is a strong evidence for the existence ofmolecular, such as Al2Ca, species that are called associates,in the liquid phase. To deal with short range ordering, theassociates model was proposed in the literature. However,this model is not physically sound, since it assumes thatsome molecules occupy specific atomic positions. Further-more, using a random solution model to treat liquids withshort range ordering continues to appear in the literature.In reality, a random solution model is only expected at veryhigh temperature when the entropy term overwhelms anytendency for ordering or clustering of atoms. It follows thatthe configurational entropy of mixing should vary withtemperature. The modified quasichemical solution modelprovides a better treatment of configurational entropy thataccounts for a non-random distribution of atoms. There-fore, models based on the random mixing can not properlydescribe the influence of short-range ordering, as they donot solve the problem of the configurational entropy. Thedescription of short-range ordering can be taken intoaccount with bond energy models by considering the inter-actions between atoms that extend beyond the nearestneighbours approximation. This problem has been treated
M. Aljarrah, M. Medraj / J. Chem. Thermodynamics 40 (2008) 724–734 725
using the modified quasichemical model [4,5]. The model isthe so-called because it has a mass-action equation that istypical in chemical reaction theory.
No information on phase equilibria, ternary com-pounds, or experimental thermodynamic data for the Al–Ca–Sr ternary system could be found in the literature, thusthis work was initiated to evaluate critically the thermody-namic description of this system using the modified quasi-chemical model.
2. Experimental data
2.1. Al–Sr system
According to Burylev et al. [6], Vakhobov et al. [7], andVakhobov et al. [8], the assessed phase diagram of the Al–Sr system consists of liquid, Sr-fcc and Sr-bcc, Al4Sr, Al2Sr,Al7Sr8, and terminal solid solution, Al-fcc, with a low sol-ubility of 0.6 at.% Sr at T = 773.15 K after annealing for aperiod of 450 h [8]. Vakhobov et al. [8] reported that Sr dis-solved 5.0 at.% Al at T = 873.15 K, whereas Closset et al.
[13] found a negligible solid solubility in this system. Fur-thermore, comparing the mutual solubility between Aland Sr with a similar system such as Al–Ca, the most reli-able measurements show very low solubility of Ca in Al.Moreover, in view of the relative atomic radii of Al andSr atoms, the ratio of Al radius to that of Sr is 0.67 indicat-ing the chance for low solid solubility. Therefore, theexperimental solubility of [8] is not considered reliable. Inthis work, it is assumed that the mutual solubility of thecomponents in Al–Sr system is negligible. The intermetalliccompound Al3Sr8 was predicted using first-principle calcu-lations by Wolverton et al. [9] based on the existence of theAl3Ca8 compound in the Al–Ca system [10,11].
Over a complete composition range using differentialthermal analysis (DTA), the Al–Sr system was investigatedby Burylev et al. [6] and Vakhobov et al. [7,8]. Whereas, Bru-zzone and Merlo [12] studied this system by thermal analysis,X-ray diffraction (XRD), and metallographic methods, thestarting materials were 99.8 wt% Sr and 99.99 wt% Al. Theyreported that Al4Sr melts congruently at T = 1313.15 K.However, Burylev et al. [6] and Closset et al. [13] reportedthis melting point as T = (1273.15 ± 20) and T = 1298.15K, respectively. In addition, Al2Sr melts congruently atT = 1209.15 K according to [12] compared to Closset’s [13]result at T = 1193.15 K. Furthermore, Bruzzone and Merlo[12] concluded that Al7Sr8 decomposes by peritectic reactionat T = 939.15 K.
Sato et al. [14] studied the Al-rich region of the Al–Srsystem using thermal analysis, XRD and optical micros-copy. They reported that the invariant reaction in Al-richregion occurs at 0.85 at.% Sr and T = 927.15 ± 1 K,compared to the results of Closset et al. [13] as 0.75at.% Sr and T = 927.15 K. Whereas, Hanna and Hella-well’s [15] values are 1.3 at.% Sr and T = 926.15 K. Clos-set et al. [13] and Burylev et al. [6] reported that theeutectic reaction in the Sr-rich region occurs at
T = 853.15 K and 73.5 at.% Sr, and at T = 833.15 Kand �70 at.% Sr, respectively. Closset et al. [13] men-tioned that they had difficulties with detection of thethermal arrests in the alloys containing more than60 at.% Sr. Therefore, the liquidus points at higher Srconcentrations seem to be less reliable than that in thework of Bruzzone and Merlo [12].
Alcock and Itkin [16] first reviewed and optimised theAl–Sr system. Subsequently, several efforts [17–20] havebeen made to calculate this system. The Al–Sr phase dia-gram presented by Chartrand and Pelton [17] is differentfrom that published by Alcock and Itkin [16], especiallyin the Sr-rich part. The calculated phase diagram agreesreasonably well with most of the experimental data exceptfor the melting behaviour of Al2Sr. The calculations of theAl–Sr phase diagram [16,18,19] show that Al2Sr meltsincongruently because of symmetry in the Al4Sr liquidus.In contrast, the interpretations of the experimental dataof Closset et al. [13], and Bruzzone and Merlo [12] showedasymmetry in Al4Sr liquidus and congruent melting ofAl2Sr which is in agreement with Chartrand and Pelton’s[17] assessment. In this work, therefore, melting of the inter-metallic compound Al2Sr is considered to be congruent.
Sommer et al. [20] and Esin et al. [21] measured theenthalpy of mixing of the Al–Sr liquid at T = (1070.15,1125.15, 1130.15, 1173.15, and 1175.15) K, using a hightemperature mixing calorimeter. Burylev et al. [6] and Vak-hobov et al. [7] measured the vapour pressure of Sr over thetemperature range of (1123.15 to 1373.15) K using theKnudsen effusion method. Based on these data, they [6,7]derived the activities of Sr in Al–Sr liquid. Srikanth andJacob [23] measured the activity of Sr in Al–Sr liquid atT = 1323.15 K in the composition range less than 17 at.%Sr and greater than 28 at.% Sr using Knudsen effusion-mass loss technique and pseudo isopiestic technique,respectively. These data are employed in the current work.
2.2. Al–Ca system
In 1908, Donski [24] carried out the first attempt to con-struct the Al–Ca system using thermal analysis. This ledMatsuyama [25] to investigate the Al–Ca system by ther-mal analysis, electrical resistance and microscopic exami-nation. His samples were prepared from 99.4 wt% Al and98.34 wt% Ca. He determined the liquidus line, two eutecticreactions; one in the Al-rich region occurring at 5.2 at.%Ca and T = 889.15 K, compared to Donski’s [24] resultsas 5.5 at.% Ca and T = 883.15 K. Whereas, Kevorkovand Schmid-Fetzer’s [11] values are 5.1 at.% Ca andT = 886.15 K. The other eutectic is in the Ca-rich sideand according to Matsuyama [25], it occurs at 64.5 at.%Ca and T = 818.15 K, compared to Donski’s [24] valuesas 66.9 at.% Ca and T = 823.15 K, and Kevorkov and Sch-mid-Fetzer’s [11] results as 66.3 at.% Ca and T = 829.15 K.These results will be used for comparison with the currentassessment.
726 M. Aljarrah, M. Medraj / J. Chem. Thermodynamics 40 (2008) 724–734
In the Al–Ca system, most of the experimental investiga-tions deal mainly with the Al-rich corner, which is technicallyinteresting for aluminium alloys. Nevertheless, Kevorkovand Schmid-Fetzer [11] investigated the entire Al–Ca systemusing X-ray diffraction, SEM/EDX analysis, metallo-graphic, and diffusion couple techniques. They [11] reportedfour intermetallic compounds; Al2Ca which melts congru-ently at T = 1359.15 K compared to Matsuyama’s [25] valueat T = 1352.15 K, Al3Ca8 which melts congruently atT = 852.15 K, Al4Ca which decomposes at T = 973.15 Kcompared to Donski’s [24] and Matsuyama’s [25] values atT = 963.15 and T = 973.15 K, and AlCa which melts incon-gruently at T = 906.15 K. However, Huang and Corbett [10]reported, also, the occurrence of Al14Ca13 compound withmonoclinic structure instead of AlCa. Nowotny et al. [26]determined the crystal structure of Al4Ca and Al2Ca as bctand fcc, respectively. Huang and Corbett [10] investigatedthe crystal structures of Al14Ca13 and Al3Ca8 using X-rayanalysis and noted that they have monoclinic and triclinicstructures, respectively.
Several researchers [25,27–30] measured the solubility ofCa in Al. Among them Edwards and Taylor [29] andJaquet and Warlimont [30] reported negligible solubilityand their results agree fairly well. Therefore, the mutualsolubility of the components in Al–Ca system is considerednegligible in this work.
The enthalpy of formation of Al2Ca and Al4Ca com-pounds was measured by many researchers [31–36]. Notinet al. [31,32] determined the enthalpy of formation of thesecompounds at T = 953.15 K and T = 1038.15 K precisely.They recorded calorimetric signals that corresponded tothe enthalpy change during the addition of a solid Ca tothe Al melt. There is a reasonable agreement with the val-ues of enthalpy of formation for Al2Ca between [32,36].According to Kevorkov et al. [36], the small differencebetween them may be due to the difference in heat capacity,DCp, for the formation reaction between room temperatureand T = 1038.15 K. There are no experimental data on theenthalpy of formation of the Al14Ca13 intermetallic com-pound reported in the literature up to date and accordingto Kevorkov et al. [36]. This is due to the sluggish forma-tion kinetics of the phase and thus difficulty of preparingan Al14Ca13-rich sample. The enthalpy of formation ofthe Al3Ca8 phase was measured using drop solution calo-rimetry by Kevorkov et al. [36].
Notin et al. [32], Sommer et al. [20], and Kevorkov et al.[36] measured the heat of mixing of liquid Al–Ca alloys.Their experimental results are in good agreement. Jacobet al. [37] determined the activity of the components inthe Al–Ca liquid using Knudsen effusion method for alloysin the composition range less than 38 at.% and greater than44 at.% Ca at T = 1373 K. Schurmann et al. [38] measuredthe activities of Ca in the liquid alloys using boiling pointdetermination technique. The activity measurements byJacob et al. [37] and Schurmann et al. [38] agree fairly well.
Kevorkov and Schmid-Fetzer [11] calculated the phasediagram of the Al–Ca system using the random solution
model. In order to adjust the liquidus around Al2Ca, theircalculated enthalpy of mixing deviated from the experi-mental data, whereas fitting the enthalpy of mixing to theexperimental data resulted in shifting the liquidus line ofAl2Ca to a higher temperature. When the random solutionmodel is used for the liquid, higher order interactionparameters in the liquid are needed to reproduce the liqui-
dus around Al2Ca and it often results in less satisfactoryliquidus at other compositions. Ozturk et al. [39] used bothrandom and associate model to re-optimise the Al–Ca sys-tem. They found that while the random solution modelgives better agreement with the experimental phase dia-gram, the associate model agrees well with the experimentalthermodynamic data.
2.3. Ca–Sr system
Several researchers [40–47] studied the Ca–Sr phase dia-gram. Among them Schottmiller et al. [40] determined theliquidus and solidus lines by thermal analysis with ±6 Kuncertainty. They prepared Ca–Sr alloys from 99.8 wt.%Ca and 99.7 wt.% Sr in an iron crucible under an argonatmosphere. Schottmiller et al. [40] reported that the liqui-
dus line has a minimum at 62 at.% Sr and T = 1011.15 K,and there are three allotropies of Ca and Sr. Accordingto Peterson and Fattore [44], however, this is due to thehydrogen contamination in the Ca and Sr samples. A morereliable work by Smith et al. [43] stated that there are onlytwo allotropies occurring in both pure Ca and Sr.
Mutual solubility between Ca and Sr throughout theentire composition range is considered in the current work.Both pure Ca and Sr have the same type of allotropic phasetransformation from fcc to bcc at T = 716.15 K andT = 829.15 K [41], respectively.
Predel and Sommer [48] measured the enthalpy of mixingof the Ca–Sr liquid at T = 1143.15 K using high tempera-ture calorimetry. The excess entropy of mixing of the Ca–Sr liquid is assumed to be zero by Predel and Sommer [48].
2.4. Al–Ca–Sr system
No data describing the experimental thermodynamic orphase equilibrium for the Al–Ca–Sr ternary system couldbe found in the literature. Thus, this work was initiatedto evaluate critically the thermodynamic description of thissystem using the modified quasichemical model. The phaseequilibria will be established for this system based on theoptimised binary subsystems.
3. Thermodynamic models
For a pure element with a certain structure /, its Gibbsfree energy, referenced at room temperature, is described as
�GuA¼aþbðT =KÞþcðT=KÞlnðT=KÞþdðT =KÞ2þ
eðT=KÞ3þf ðT=KÞ�1þgðT =KÞ7þhðT=KÞ�9; ð1Þ
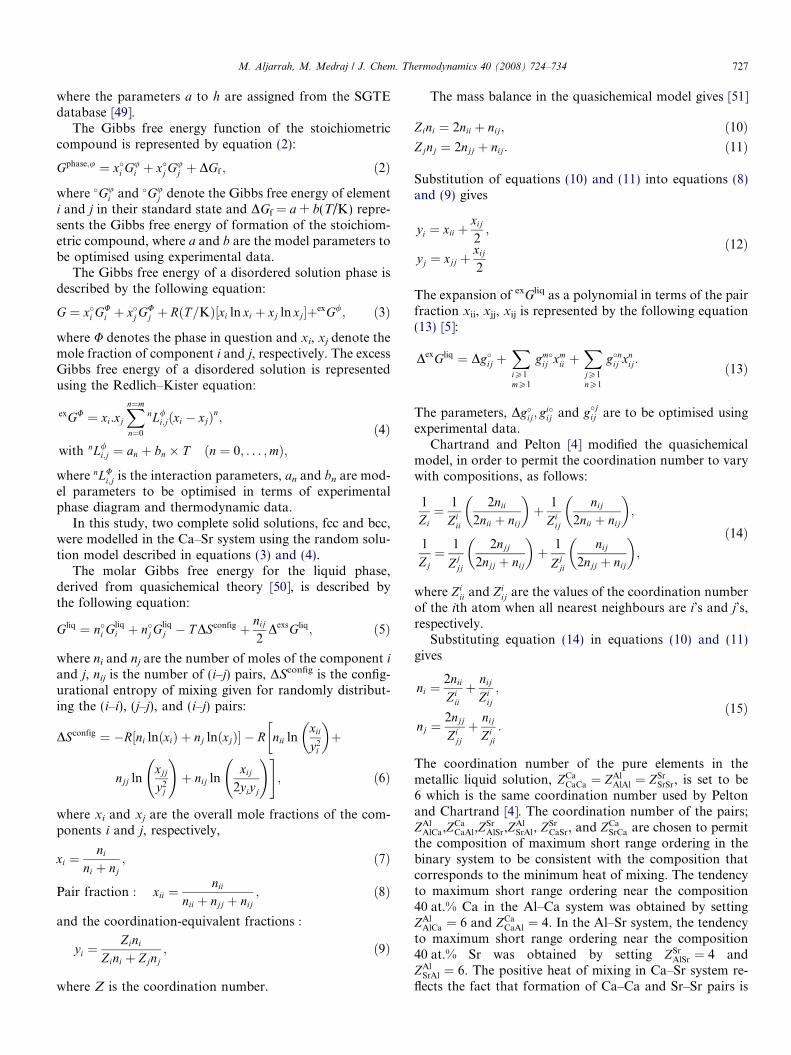
M. Aljarrah, M. Medraj / J. Chem. Thermodynamics 40 (2008) 724–734 727
where the parameters a to h are assigned from the SGTEdatabase [49].
The Gibbs free energy function of the stoichiometriccompound is represented by equation (2):
Gphase;u ¼ x�i Gui þ x�j Gu
j þ DGf ; ð2Þ
where �Gui and �Gu
j denote the Gibbs free energy of elementi and j in their standard state and DGf = a + b(T/K) repre-sents the Gibbs free energy of formation of the stoichiom-etric compound, where a and b are the model parameters tobe optimised using experimental data.
The Gibbs free energy of a disordered solution phase isdescribed by the following equation:
G ¼ x�i GUi þ x�j GU
j þ RðT=KÞ½xi ln xi þ xj ln xj�þexG/; ð3Þ
where U denotes the phase in question and xi, xj denote themole fraction of component i and j, respectively. The excessGibbs free energy of a disordered solution is representedusing the Redlich–Kister equation:
exGU ¼ xi:xj
Xn¼m
n¼0
nL/i;jðxi � xjÞn;
with nL/i;j ¼ an þ bn � T ðn ¼ 0; . . . ;mÞ;
ð4Þ
where nLUi;j is the interaction parameters, an and bn are mod-
el parameters to be optimised in terms of experimentalphase diagram and thermodynamic data.
In this study, two complete solid solutions, fcc and bcc,were modelled in the Ca–Sr system using the random solu-tion model described in equations (3) and (4).
The molar Gibbs free energy for the liquid phase,derived from quasichemical theory [50], is described bythe following equation:
Gliq ¼ n�i Gliqi þ n�j Gliq
j � TDSconfig þ nij
2DexsGliq; ð5Þ
where ni and nj are the number of moles of the component i
and j, nij is the number of (i–j) pairs, DSconfig is the config-urational entropy of mixing given for randomly distribut-ing the (i–i), (j–j), and (i–j) pairs:
DSconfig ¼ �R½ni lnðxiÞ þ nj lnðxjÞ� � R nii lnxii
y2i
� ��þ
njj lnxjj
y2j
!þ nij ln
xij
2yiyj
!#; ð6Þ
where xi and xj are the overall mole fractions of the com-ponents i and j, respectively,
xi ¼ni
ni þ nj; ð7Þ
Pair fraction : xii ¼nii
nii þ njj þ nij; ð8Þ
and the coordination-equivalent fractions :
yi ¼Zini
Zini þ Zjnj; ð9Þ
where Z is the coordination number.
The mass balance in the quasichemical model gives [51]
Zini ¼ 2nii þ nij; ð10ÞZjnj ¼ 2njj þ nij: ð11Þ
Substitution of equations (10) and (11) into equations (8)and (9) gives
yi ¼ xii þxij
2;
yj ¼ xjj þxij
2
ð12Þ
The expansion of exGliq as a polynomial in terms of the pairfraction xii, xjj, xij is represented by the following equation(13) [5]:
DexGliq ¼ Dg�ij þXiP1mP1
gm�ij xm
ii þXjP1nP1
g�nij xnij: ð13Þ
The parameters, Dg�ij; gi�ij and g�jij are to be optimised using
experimental data.Chartrand and Pelton [4] modified the quasichemical
model, in order to permit the coordination number to varywith compositions, as follows:
1
Zi¼ 1
Ziii
2nii
2nii þ nij
� �þ 1
Ziij
nij
2nii þ nij
� �;
1
Zj¼ 1
Zjjj
2njj
2njj þ nij
� �þ 1
Zjji
nij
2njj þ nij
� �;
ð14Þ
where Ziii and Zi
ij are the values of the coordination numberof the ith atom when all nearest neighbours are i’s and j’s,respectively.
Substituting equation (14) in equations (10) and (11)gives
ni ¼2nii
Ziii
þ nij
Ziij
;
nj ¼2njj
Zijj
þ nij
Ziji
:
ð15Þ
The coordination number of the pure elements in themetallic liquid solution, ZCa
CaCa ¼ ZAlAlAl ¼ ZSr
SrSr, is set to be6 which is the same coordination number used by Peltonand Chartrand [4]. The coordination number of the pairs;ZAl
AlCa,ZCaCaAl,Z
SrAlSr,Z
AlSrAl, ZSr
CaSr, and ZCaSrCa are chosen to permit
the composition of maximum short range ordering in thebinary system to be consistent with the composition thatcorresponds to the minimum heat of mixing. The tendencyto maximum short range ordering near the composition40 at.% Ca in the Al–Ca system was obtained by settingZAl
AlCa ¼ 6 and ZCaCaAl ¼ 4. In the Al–Sr system, the tendency
to maximum short range ordering near the composition40 at.% Sr was obtained by setting ZSr
AlSr ¼ 4 andZAl
SrAl ¼ 6. The positive heat of mixing in Ca–Sr system re-flects the fact that formation of Ca–Ca and Sr–Sr pairs is
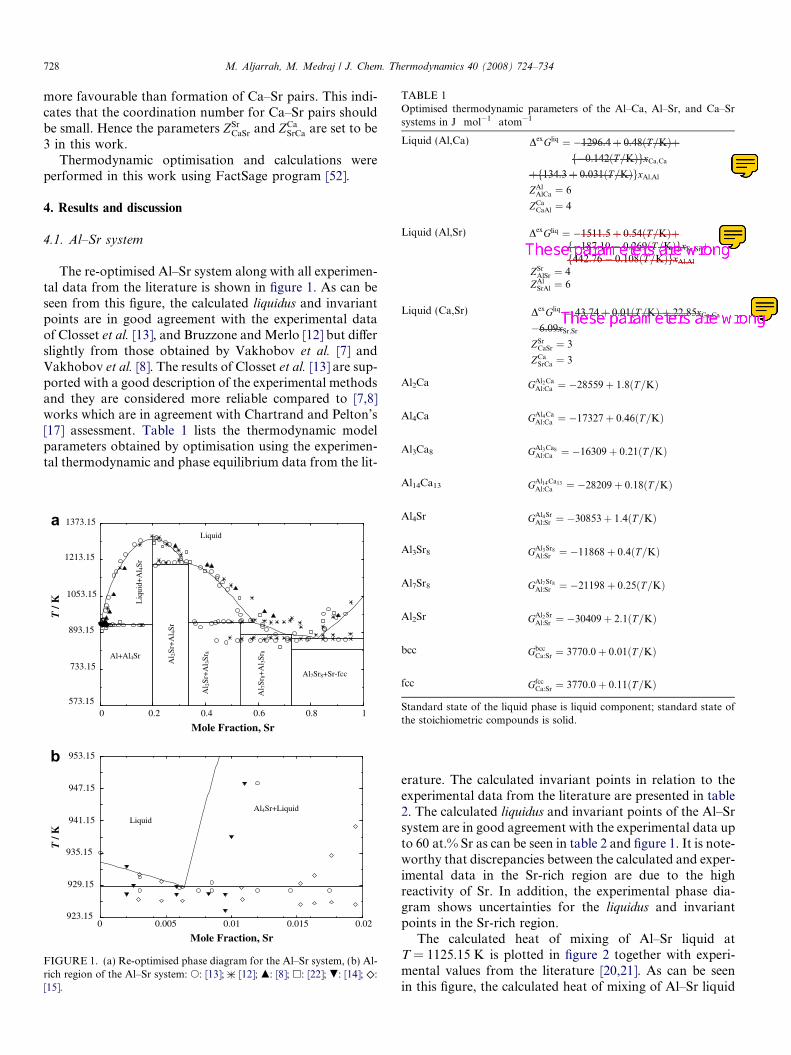
TABLE 1Optimised thermodynamic parameters of the Al–Ca, Al–Sr, and Ca–Srsystems in J Æ mol�1 Æ atom�1
Liquid (Al,Ca) DexGliq ¼ �1296:4þ 0:48ðT=KÞþf�0:142ðT=KÞgxCa;Ca
þf134:3þ 0:031ðT=KÞgxAl;Al
ZAlAlCa ¼ 6
ZCaCaAl ¼ 4
Liquid (Al,Sr) DexGliq ¼ �1511:5þ 0:54ðT=KÞþf�187:10� 0:269ðT=KÞgxSr;Srþf442:76� 0:108ðT=KÞgxAl;Al
ZSrAlSr ¼ 4
ZAlSrAl ¼ 6
Liquid (Ca,Sr) DexGliq ¼ 43:74þ 0:01ðT=KÞ þ 22:85xCa;Ca
�6:09xSr;Sr
ZSrCaSr ¼ 3
ZCaSrCa ¼ 3
Al2Ca GAl2CaAl:Ca ¼ �28559þ 1:8ðT=KÞ
Al4Ca GAl4CaAl:Ca ¼ �17327þ 0:46ðT=KÞ
Al3Ca8 GAl3Ca8Al:Ca ¼ �16309þ 0:21ðT=KÞ
728 M. Aljarrah, M. Medraj / J. Chem. Thermodynamics 40 (2008) 724–734
more favourable than formation of Ca–Sr pairs. This indi-cates that the coordination number for Ca–Sr pairs shouldbe small. Hence the parameters ZSr
CaSr and ZCaSrCa are set to be
3 in this work.Thermodynamic optimisation and calculations were
performed in this work using FactSage program [52].
4. Results and discussion
4.1. Al–Sr system
The re-optimised Al–Sr system along with all experimen-tal data from the literature is shown in figure 1. As can beseen from this figure, the calculated liquidus and invariantpoints are in good agreement with the experimental dataof Closset et al. [13], and Bruzzone and Merlo [12] but differslightly from those obtained by Vakhobov et al. [7] andVakhobov et al. [8]. The results of Closset et al. [13] are sup-ported with a good description of the experimental methodsand they are considered more reliable compared to [7,8]works which are in agreement with Chartrand and Pelton’s[17] assessment. Table 1 lists the thermodynamic modelparameters obtained by optimisation using the experimen-tal thermodynamic and phase equilibrium data from the lit-
Mole Fraction, Sr
T /
K
0 0.2 0.4 0.6 0.8 1573.15
733.15
893.15
1053.15
1213.15
1373.15
Liquid
Al+Al4Sr
Al 2
Sr+
Al 4
Sr
Al 2
Sr+
Al 3
Sr8
Al7Sr8+Sr-fcc
Al 7
Sr8+
Al 3
Sr8
Liq
uid+
Al 4
Sr
Mole Fraction, Sr
T /
K
0 0.005 0.01 0.015 0.02923.15
929.15
935.15
941.15
947.15
953.15
Liquid
Al4Sr+Liquid
a
b
FIGURE 1. (a) Re-optimised phase diagram for the Al–Sr system, (b) Al-rich region of the Al–Sr system: s: [13]; [12]; m: [8]; h: [22]; .: [14]; �:[15].
Al14Ca13 GAl14Ca13Al:Ca ¼ �28209þ 0:18ðT=KÞ
Al4Sr GAl4SrAl:Sr ¼ �30853þ 1:4ðT=KÞ
Al3Sr8 GAl3Sr8Al:Sr ¼ �11868þ 0:4ðT=KÞ
Al7Sr8 GAl7Sr8Al:Sr ¼ �21198þ 0:25ðT=KÞ
Al2Sr GAl2SrAl:Sr ¼ �30409þ 2:1ðT=KÞ
bcc GbccCa:Sr ¼ 3770:0þ 0:01ðT=KÞ
fcc GfccCa:Sr ¼ 3770:0þ 0:11ðT=KÞ
Standard state of the liquid phase is liquid component; standard state ofthe stoichiometric compounds is solid.
erature. The calculated invariant points in relation to theexperimental data from the literature are presented in table2. The calculated liquidus and invariant points of the Al–Srsystem are in good agreement with the experimental data upto 60 at.% Sr as can be seen in table 2 and figure 1. It is note-worthy that discrepancies between the calculated and exper-imental data in the Sr-rich region are due to the highreactivity of Sr. In addition, the experimental phase dia-gram shows uncertainties for the liquidus and invariantpoints in the Sr-rich region.
The calculated heat of mixing of Al–Sr liquid atT = 1125.15 K is plotted in figure 2 together with experi-mental values from the literature [20,21]. As can be seenin this figure, the calculated heat of mixing of Al–Sr liquid
maljarra
Cross-Out
-22694+8.37T+{-2.49/T}xCa,Ca +{2351.41+0.544T} xAl,Al
maljarra
Sticky Note
Delta Gex= -22694+8.37T+{-2.49/T}xCa,Ca+{2351.41+0.544T} xAl,Al
maljarra
Cross-Out
maljarra
Cross-Out
maljarra
Sticky Note
Delta Gex= -26459.6+9.41T+{-3066.2-3.87T}xSr,Sr+{7750.86-1.89T} xAl,Al
maljarra
Cross-Out
maljarra
Cross-Out
maljarra
Sticky Note
Delta Gex= 765.25+0.25T+{400.0}xSr,Sr+{-106.69-0.042T} xCa,Ca
maljarra
Typewritten text
These parameters are wrong. For the correct parameters, see the pop-up note.
maljarra
Typewritten text
These parameters are wrong
maljarra
Typewritten text
These parameters are wrong
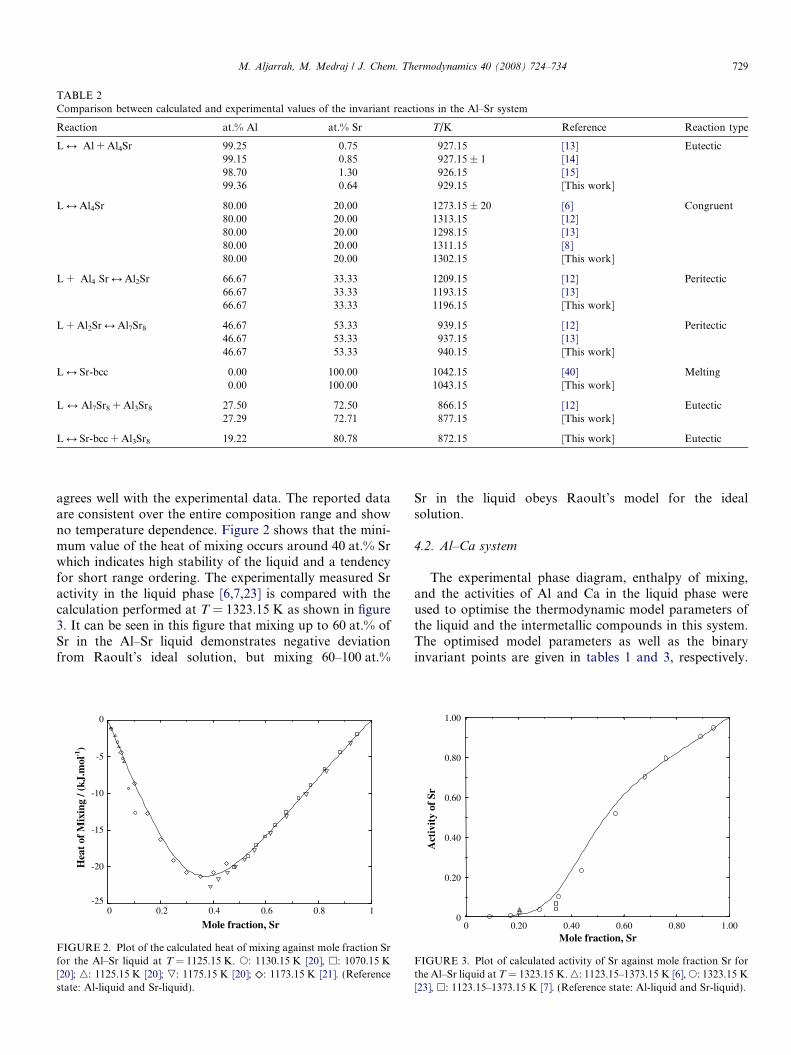
TABLE 2Comparison between calculated and experimental values of the invariant reactions in the Al–Sr system
Reaction at.% Al at.% Sr T/K Reference Reaction type
L M Al + Al4Sr 99.25 0.75 927.15 [13] Eutectic99.15 0.85 927.15 ± 1 [14]98.70 1.30 926.15 [15]99.36 0.64 929.15 [This work]
L M Al4Sr 80.00 20.00 1273.15 ± 20 [6] Congruent80.00 20.00 1313.15 [12]80.00 20.00 1298.15 [13]80.00 20.00 1311.15 [8]80.00 20.00 1302.15 [This work]
L + Al4 Sr M Al2Sr 66.67 33.33 1209.15 [12] Peritectic66.67 33.33 1193.15 [13]66.67 33.33 1196.15 [This work]
L + Al2Sr M Al7Sr8 46.67 53.33 939.15 [12] Peritectic46.67 53.33 937.15 [13]46.67 53.33 940.15 [This work]
L M Sr-bcc 0.00 100.00 1042.15 [40] Melting0.00 100.00 1043.15 [This work]
L M Al7Sr8 + Al3Sr8 27.50 72.50 866.15 [12] Eutectic27.29 72.71 877.15 [This work]
L M Sr-bcc + Al3Sr8 19.22 80.78 872.15 [This work] Eutectic
M. Aljarrah, M. Medraj / J. Chem. Thermodynamics 40 (2008) 724–734 729
agrees well with the experimental data. The reported dataare consistent over the entire composition range and showno temperature dependence. Figure 2 shows that the mini-mum value of the heat of mixing occurs around 40 at.% Srwhich indicates high stability of the liquid and a tendencyfor short range ordering. The experimentally measured Sractivity in the liquid phase [6,7,23] is compared with thecalculation performed at T = 1323.15 K as shown in figure3. It can be seen in this figure that mixing up to 60 at.% ofSr in the Al–Sr liquid demonstrates negative deviationfrom Raoult’s ideal solution, but mixing 60–100 at.%
Mole fraction, Sr
Hea
t of
Mix
ing
/ (kJ
.mol
-1)
0 0.2 0.4 0.6 0.8 1-25
-20
-15
-10
-5
0
FIGURE 2. Plot of the calculated heat of mixing against mole fraction Srfor the Al–Sr liquid at T = 1125.15 K. s: 1130.15 K [20], h: 1070.15 K[20]; n: 1125.15 K [20]; ,: 1175.15 K [20]; �: 1173.15 K [21]. (Referencestate: Al-liquid and Sr-liquid).
Sr in the liquid obeys Raoult’s model for the idealsolution.
4.2. Al–Ca system
The experimental phase diagram, enthalpy of mixing,and the activities of Al and Ca in the liquid phase wereused to optimise the thermodynamic model parameters ofthe liquid and the intermetallic compounds in this system.The optimised model parameters as well as the binaryinvariant points are given in tables 1 and 3, respectively.
Act
ivit
y of
Sr
Mole fraction, Sr0 0.20 0.40 0.60 0.80 1.00
0
0.20
0.40
0.60
0.80
1.00
FIGURE 3. Plot of calculated activity of Sr against mole fraction Sr forthe Al–Sr liquid at T = 1323.15 K. n: 1123.15–1373.15 K [6], s: 1323.15 K[23], h: 1123.15–1373.15 K [7]. (Reference state: Al-liquid and Sr-liquid).
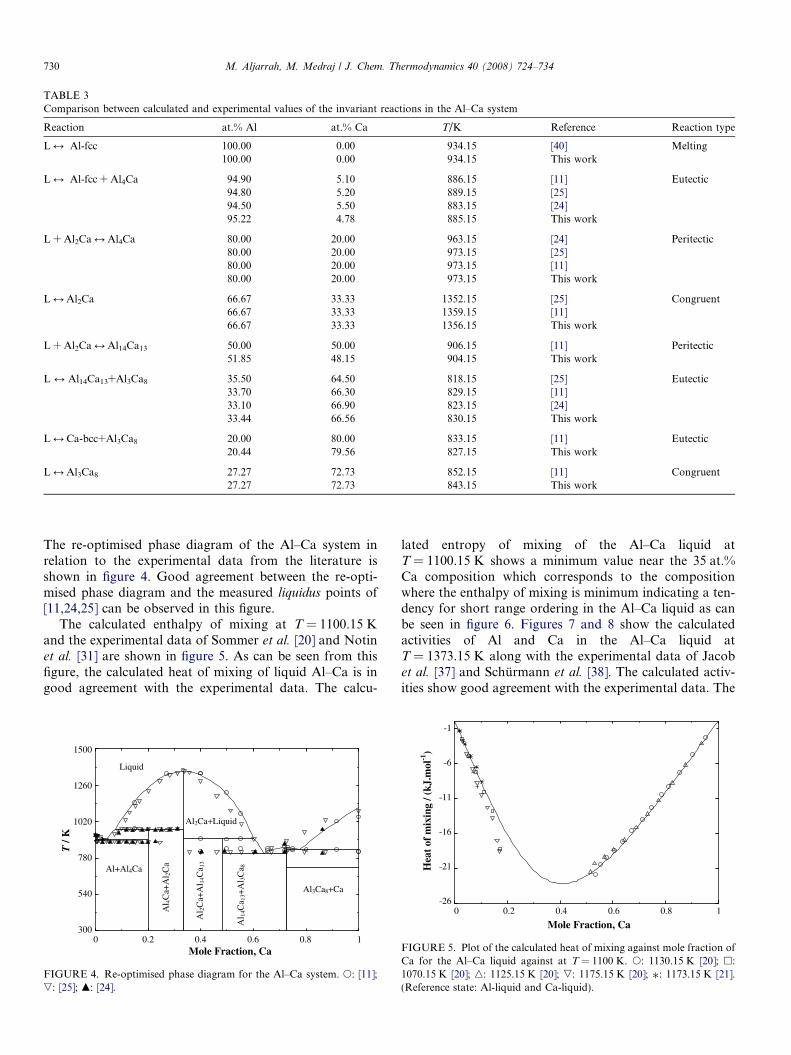
TABLE 3Comparison between calculated and experimental values of the invariant reactions in the Al–Ca system
Reaction at.% Al at.% Ca T/K Reference Reaction type
L M Al-fcc 100.00 0.00 934.15 [40] Melting100.00 0.00 934.15 This work
L M Al-fcc + Al4Ca 94.90 5.10 886.15 [11] Eutectic94.80 5.20 889.15 [25]94.50 5.50 883.15 [24]95.22 4.78 885.15 This work
L + Al2Ca M Al4Ca 80.00 20.00 963.15 [24] Peritectic80.00 20.00 973.15 [25]80.00 20.00 973.15 [11]80.00 20.00 973.15 This work
L M Al2Ca 66.67 33.33 1352.15 [25] Congruent66.67 33.33 1359.15 [11]66.67 33.33 1356.15 This work
L + Al2Ca M Al14Ca13 50.00 50.00 906.15 [11] Peritectic51.85 48.15 904.15 This work
L M Al14Ca13+Al3Ca8 35.50 64.50 818.15 [25] Eutectic33.70 66.30 829.15 [11]33.10 66.90 823.15 [24]33.44 66.56 830.15 This work
L M Ca-bcc+Al3Ca8 20.00 80.00 833.15 [11] Eutectic20.44 79.56 827.15 This work
L M Al3Ca8 27.27 72.73 852.15 [11] Congruent27.27 72.73 843.15 This work
730 M. Aljarrah, M. Medraj / J. Chem. Thermodynamics 40 (2008) 724–734
The re-optimised phase diagram of the Al–Ca system inrelation to the experimental data from the literature isshown in figure 4. Good agreement between the re-opti-mised phase diagram and the measured liquidus points of[11,24,25] can be observed in this figure.
The calculated enthalpy of mixing at T = 1100.15 Kand the experimental data of Sommer et al. [20] and Notinet al. [31] are shown in figure 5. As can be seen from thisfigure, the calculated heat of mixing of liquid Al–Ca is ingood agreement with the experimental data. The calcu-
Mole Fraction, Ca
T /
K
0 0.2 0.4 0.6 0.8 1300
540
780
1020
1260
1500
Liquid
Al+Al4Ca
Al 4
Ca+
Al 2
Ca
Al 2
Ca+
Al 1
4Ca 1
3
Al 1
4Ca 1
3+A
l 3C
a 8
Al3Ca8+Ca
Al2Ca+Liquid
FIGURE 4. Re-optimised phase diagram for the Al–Ca system. s: [11];,: [25]; m: [24].
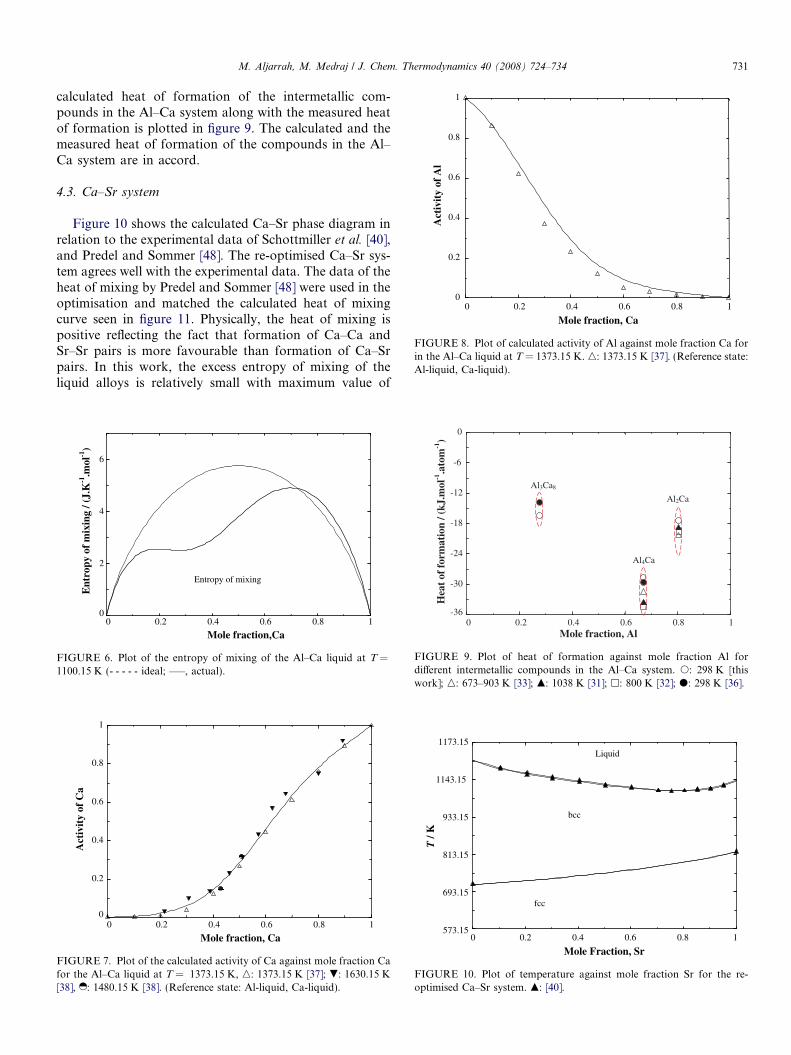
lated entropy of mixing of the Al–Ca liquid atT = 1100.15 K shows a minimum value near the 35 at.%Ca composition which corresponds to the compositionwhere the enthalpy of mixing is minimum indicating a ten-dency for short range ordering in the Al–Ca liquid as canbe seen in figure 6. Figures 7 and 8 show the calculatedactivities of Al and Ca in the Al–Ca liquid atT = 1373.15 K along with the experimental data of Jacobet al. [37] and Schurmann et al. [38]. The calculated activ-ities show good agreement with the experimental data. The
Mole Fraction, Ca0 0.2 0.4 0.6 0.8 1
-26
-21
-16
-11
-6
-1
Hea
t of
mix
ing
/ (kJ
.mol
-1)
FIGURE 5. Plot of the calculated heat of mixing against mole fraction ofCa for the Al–Ca liquid against at T = 1100 K. s: 1130.15 K [20]; h:1070.15 K [20]; n: 1125.15 K [20]; ,: 1175.15 K [20]; �: 1173.15 K [21].(Reference state: Al-liquid and Ca-liquid).
Mole fraction, Ca
Act
ivit
y of
Al
0 0.2 0.4 0.6 0.8 10
0.2
0.4
0.6
0.8
1
FIGURE 8. Plot of calculated activity of Al against mole fraction Ca forin the Al–Ca liquid at T = 1373.15 K. n: 1373.15 K [37]. (Reference state:Al-liquid, Ca-liquid).
M. Aljarrah, M. Medraj / J. Chem. Thermodynamics 40 (2008) 724–734 731
calculated heat of formation of the intermetallic com-pounds in the Al–Ca system along with the measured heatof formation is plotted in figure 9. The calculated and themeasured heat of formation of the compounds in the Al–Ca system are in accord.
4.3. Ca–Sr system
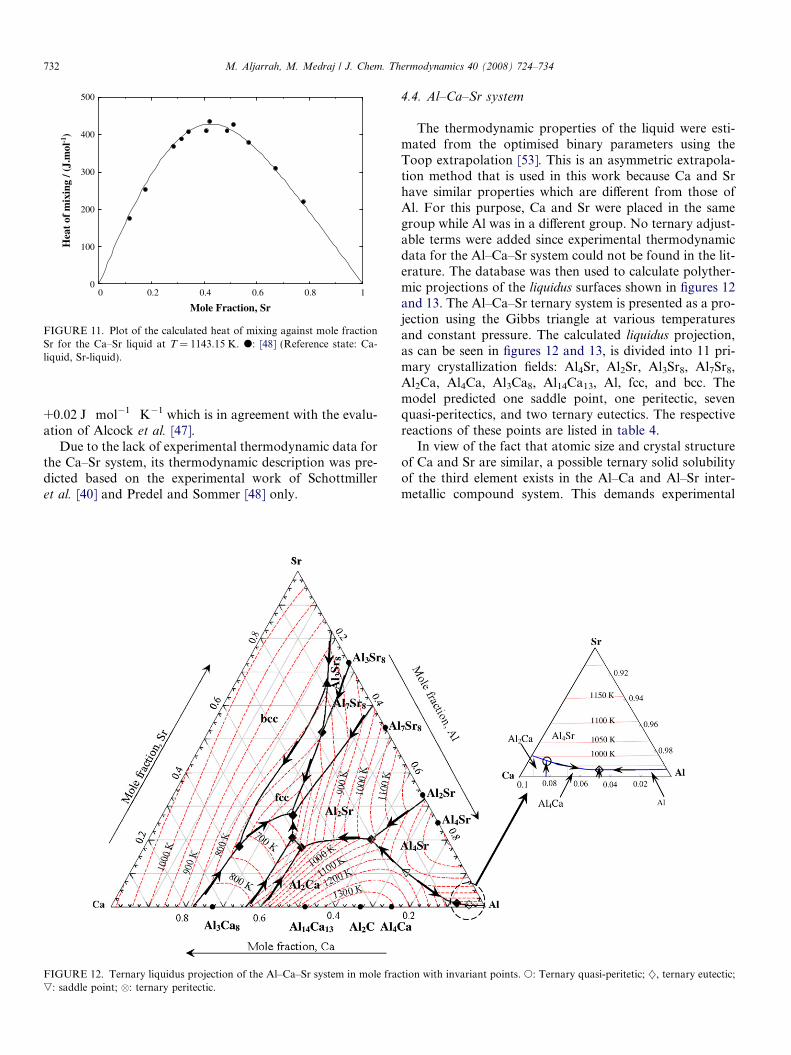
Figure 10 shows the calculated Ca–Sr phase diagram inrelation to the experimental data of Schottmiller et al. [40],and Predel and Sommer [48]. The re-optimised Ca–Sr sys-tem agrees well with the experimental data. The data of theheat of mixing by Predel and Sommer [48] were used in theoptimisation and matched the calculated heat of mixingcurve seen in figure 11. Physically, the heat of mixing ispositive reflecting the fact that formation of Ca–Ca andSr–Sr pairs is more favourable than formation of Ca–Srpairs. In this work, the excess entropy of mixing of theliquid alloys is relatively small with maximum value of
0 0.2 0.4 0.6 0.8 10
2
4
6
Mole fraction,Ca
Ent
ropy
of
mix
ing
/ (J.
K-1
.mol
-1)
Entropy of mixing
FIGURE 6. Plot of the entropy of mixing of the Al–Ca liquid at T =1100.15 K (- - - - - ideal; —–, actual).
Mole fraction, Ca
Act
ivit
y of
Ca
0 0.2 0.4 0.6 0.8 10
0.2
0.4
0.6
0.8
1
FIGURE 7. Plot of the calculated activity of Ca against mole fraction Cafor the Al–Ca liquid at T = 1373.15 K, n: 1373.15 K [37]; .: 1630.15 K[38], g: 1480.15 K [38]. (Reference state: Al-liquid, Ca-liquid).
0 0.2 0.4 0.6 0.8 1-36
-30
-24
-18
-12
-6
0
Mole fraction, Al
Hea
t of
for
mat
ion
/ (kJ
.mol
-1.a
tom
-1)
Al2Ca
Al4Ca
Al3Ca8
FIGURE 9. Plot of heat of formation against mole fraction Al fordifferent intermetallic compounds in the Al–Ca system. s: 298 K [thiswork]; n: 673–903 K [33]; m: 1038 K [31]; h: 800 K [32]; d: 298 K [36].
Mole Fraction, Sr
T /
K
0 0.2 0.4 0.6 0.8 1573.15
693.15
813.15
933.15
1143.15
1173.15Liquid
bcc
fcc
FIGURE 10. Plot of temperature against mole fraction Sr for the re-optimised Ca–Sr system. m: [40].
Mole Fraction, Sr
0 0.2 0.4 0.6 0.8 10
100
200
300
400
500
Hea
t of
mix
ing
/ (J.
mol
-1)
FIGURE 11. Plot of the calculated heat of mixing against mole fractionSr for the Ca–Sr liquid at T = 1143.15 K. d: [48] (Reference state: Ca-liquid, Sr-liquid).
732 M. Aljarrah, M. Medraj / J. Chem. Thermodynamics 40 (2008) 724–734
+0.02 J Æ mol�1 Æ K�1 which is in agreement with the evalu-ation of Alcock et al. [47].
Due to the lack of experimental thermodynamic data forthe Ca–Sr system, its thermodynamic description was pre-dicted based on the experimental work of Schottmilleret al. [40] and Predel and Sommer [48] only.
FIGURE 12. Ternary liquidus projection of the Al–Ca–Sr system in mole frac,: saddle point; : ternary peritectic.
4.4. Al–Ca–Sr system
The thermodynamic properties of the liquid were esti-mated from the optimised binary parameters using theToop extrapolation [53]. This is an asymmetric extrapola-tion method that is used in this work because Ca and Srhave similar properties which are different from those ofAl. For this purpose, Ca and Sr were placed in the samegroup while Al was in a different group. No ternary adjust-able terms were added since experimental thermodynamicdata for the Al–Ca–Sr system could not be found in the lit-erature. The database was then used to calculate polyther-mic projections of the liquidus surfaces shown in figures 12and 13. The Al–Ca–Sr ternary system is presented as a pro-jection using the Gibbs triangle at various temperaturesand constant pressure. The calculated liquidus projection,as can be seen in figures 12 and 13, is divided into 11 pri-mary crystallization fields: Al4Sr, Al2Sr, Al3Sr8, Al7Sr8,Al2Ca, Al4Ca, Al3Ca8, Al14Ca13, Al, fcc, and bcc. Themodel predicted one saddle point, one peritectic, sevenquasi-peritectics, and two ternary eutectics. The respectivereactions of these points are listed in table 4.
In view of the fact that atomic size and crystal structureof Ca and Sr are similar, a possible ternary solid solubilityof the third element exists in the Al–Ca and Al–Sr inter-metallic compound system. This demands experimental
tion with invariant points. s: Ternary quasi-peritetic; }, ternary eutectic;
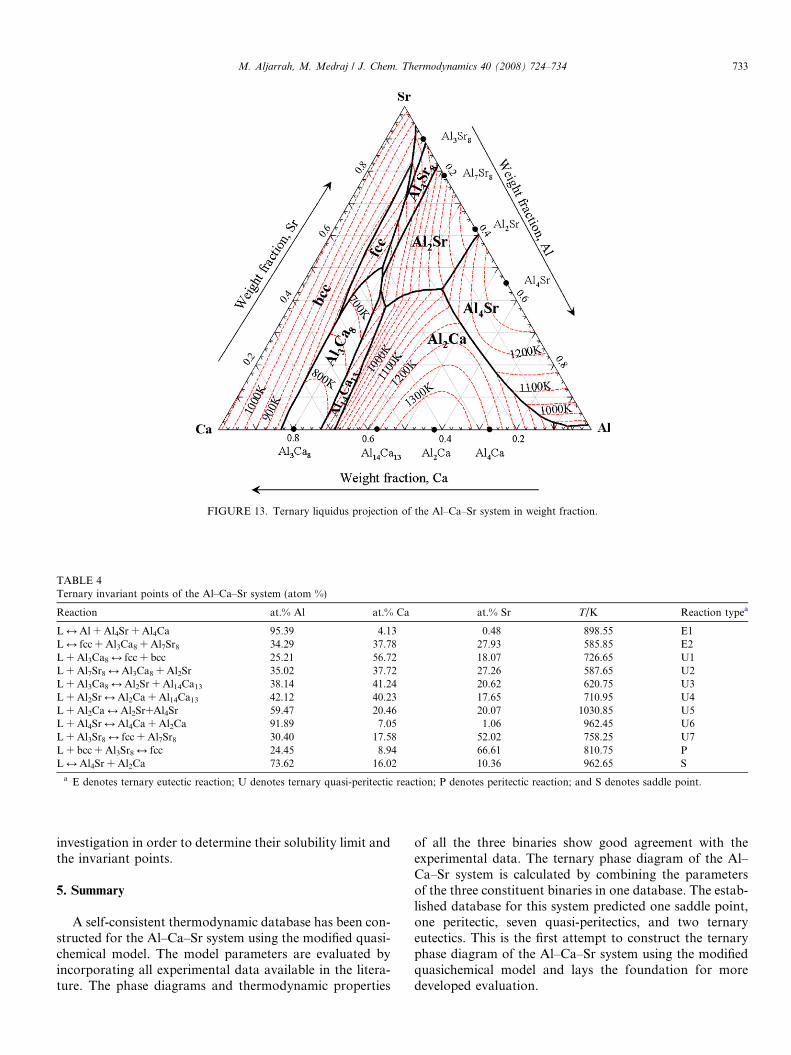
FIGURE 13. Ternary liquidus projection of the Al–Ca–Sr system in weight fraction.
TABLE 4Ternary invariant points of the Al–Ca–Sr system (atom %)
Reaction at.% Al at.% Ca at.% Sr T/K Reaction typea
L M Al + Al4Sr + Al4Ca 95.39 4.13 0.48 898.55 E1L M fcc + Al3Ca8 + Al7Sr8 34.29 37.78 27.93 585.85 E2L + Al3Ca8 M fcc + bcc 25.21 56.72 18.07 726.65 U1L + Al7Sr8 M Al3Ca8 + Al2Sr 35.02 37.72 27.26 587.65 U2L + Al3Ca8 M Al2Sr + Al14Ca13 38.14 41.24 20.62 620.75 U3L + Al2Sr M Al2Ca + Al14Ca13 42.12 40.23 17.65 710.95 U4L + Al2Ca M Al2Sr+Al4Sr 59.47 20.46 20.07 1030.85 U5L + Al4Sr M Al4Ca + Al2Ca 91.89 7.05 1.06 962.45 U6L + Al3Sr8 M fcc + Al7Sr8 30.40 17.58 52.02 758.25 U7L + bcc + Al3Sr8 M fcc 24.45 8.94 66.61 810.75 PL M Al4Sr + Al2Ca 73.62 16.02 10.36 962.65 S
a E denotes ternary eutectic reaction; U denotes ternary quasi-peritectic reaction; P denotes peritectic reaction; and S denotes saddle point.
M. Aljarrah, M. Medraj / J. Chem. Thermodynamics 40 (2008) 724–734 733
investigation in order to determine their solubility limit andthe invariant points.
5. Summary
A self-consistent thermodynamic database has been con-structed for the Al–Ca–Sr system using the modified quasi-chemical model. The model parameters are evaluated byincorporating all experimental data available in the litera-ture. The phase diagrams and thermodynamic properties
of all the three binaries show good agreement with theexperimental data. The ternary phase diagram of the Al–Ca–Sr system is calculated by combining the parametersof the three constituent binaries in one database. The estab-lished database for this system predicted one saddle point,one peritectic, seven quasi-peritectics, and two ternaryeutectics. This is the first attempt to construct the ternaryphase diagram of the Al–Ca–Sr system using the modifiedquasichemical model and lays the foundation for moredeveloped evaluation.
734 M. Aljarrah, M. Medraj / J. Chem. Thermodynamics 40 (2008) 724–734
Acknowledgement
This study is carried out with financial supports fromNSERC and NATEQ.
References
[1] E. Baril, P. Labelle, M.O. Pekguleryuz, JOM 55 (2003) 34–39.[2] M.O. Pekguleryuz, J. Renaud, TMS (2000) 279–284.[3] D. You, H.S. Schnyders, J.B. Van Zytveld, J. Phys. Condens Mat. 9
(1997) 1407–1415.[4] A.D. Pelton, P. Chartrand, Metal. Mater. Trans. A 32A (2001) 1355–
1360.[5] A.D. Pelton, S.A. Degterov, G. Eriksson, C. Robelin, Y. Dessureault,
Metal. Mater. Trans. B 31B (2000) 651–659.[6] B.P. Burylev, A.V. Vakhobov, T.D. Dzhuraev, Russ. J. Appl. Chem.
48 (1974) 809–811.[7] A.V. Vakhobov, T.T. Dzhuraev, B.N. Vigdorovich, Russ. J. Appl.
Chem. 48 (1974) 1306–1308.[8] A.V. Vakhobov, K.K. Eshonov, T.D. Dzhuraev, Russ. Metall. 4
(1979) 167–172 (English Translation).[9] C. Wolverton, X.Y. Yan, R. Vijayaraghavan, V. Ozolins, Acta
Mater. 50 (2002) 2187–2197.[10] B.Q. Huang, J.D. Corbett, Inorg. Chem. 37 (1998) 5827–5833.[11] D. Kevorkov, R. Schmid-Fetzer, Z. Metallkd. 92 (2001) 946–952.[12] G. Bruzzone, F. Merlo, J. Less-Common Met. 39 (1975) 1–6.[13] B. Closset, H. Dugas, M. Pekguleryuz, J.E. Gruzleski, Metal. Mater.
Trans. A 17A (1986) 1250–1253.[14] E. Sato, N. Kono, I. Sato, H. Watanbe, Chiba Inst. Technol. 35
(1985) 71–78.[15] M.D. Hanna, A. Merlo, Alloy Phase Diagram, Symp., NY (1983)
411–416.[16] C.B. Alcock, V.P. Itkin, Bull. Alloy Phase Diagram 10 (1989) 624–630.[17] P. Chartrand, A.D. Pelton, J. Phase Equilibr. 15 (1994) 591–605.[18] Y. Zhong, C. Wolverton, Y.A. Chang, Z.K. Liu, Acta Mater. 52
(2004) 2739–2754.[19] C. Wang, Z. Jin, Y. Du, Alloy. Compd. 358 (2003) 288–293.[20] F. Sommer, J.J. Lee, B. Predel, Z. Metallkd. 74 (1983) 100–104.[21] Y.O. Esin, V.V. Litovski, S.E. Demin, M.S. Petrushevski, Russ. J.
Appl. Chem. 59 (1985) 446.[22] A.V. Vakhobov, T.D. Dzhuraev, V.A. Bardin, G.A. Zademidko,
Russ. Metall. 1 (1975) 163–166.[23] S. Srikanth, K.T. Jacob, Z. Metallkd. 82 (1991) 675–683.[24] L. Donski, Z. Anorg. Allg. Chem. 57 (1908) 201–205.[25] K. Matsuyama, Sci. Rep. Tohoku Univ. 17 (1928) 783–789.[26] H. Nowotny, E. Wormnes, E. Mohrnheim, Z. Metallkd. 32 (1940)
39–42.
[27] E.D. Trubnyakova, N.A. Alekseeva, Yu.B. Lyskova, A.V. Vakho-bov, I.N. Ganiev, Dokl. Akad. Nauk. Tadzh. SSR 22 (1979) 672–674.
[28] G. Falkenhagen, W. Hofmann, Z. Metallkd. 43 (1952) 69–81.[29] J.D. Edwards, C.S. Taylor, Trans. Am. Electrochem. Soc. 50 (1926)
391–397.[30] J.C. Jaquet, H. Warlimont, Z. Metallkd. 72 (1981) 13–20.[31] M. Notin, J.C. Gachon, J. Hertz, J. Chem. Thermodyn. 14 (1982)
425–434.[32] M. Notin, J.C. Gachon, J. Hertz, CALPHAD 6 (1982) 49–56.[33] E. Velesckis, J. Less-Common Met. 80 (1981) 241–255.[34] P.V. Kocherov, Yu.M. Gertman, P.V. Geld, Zh. Neorg. Khim. 4
(1959) 1106–1112.[35] S.K. Preto, L.E. Ross, A.E. Martin, M.F. Roche, Proc. Inter. Energ.
Conv. Eng. 77 (1977) 241–255.[36] D. Kevorkov, R. Schmid-Fetzer, A. Pisch, F. Hodaj, C. Colinet, Z.
Metallkd. 92 (2001) 953–958.[37] K.T. Jacob, S. Srikanth, Y. Waseda, J. Jpn. Inst. Met. 29 (1988) 50–
59.[38] E. Schurmann, C.P. Funders, H. Litterscheidt, Arch. Eisenhuttenews
46 (1975) 473–476.[39] K. Ozturk, L.Q. Chen, Z.K. Liu, J. Alloy. Compd. 340 (2002) 199–
206.[40] J.G. Schottmiller, A.J. King, F.A. Kanda, J. Phys. Chem. 62 (1958)
1446–1449.[41] M.W. Chase, Bull. Alloy Phase Diagrams 4 (1983) 123–124.[42] R.P. Elliott, Constitution of Binary Alloys, First Supplement,
McGraw-Hill Book Comp., New York, 1965.[43] J.F. Smith, O.N. Carlson, R.W. Vest, J. Electrochem. Soc. 103 (1956)
409–413.[44] D.T. Peterson, V.G. Fattore, J. Phys. Chem. 65 (1961) 2062–2064.[45] A.J. King, J. Am. Chem. Soc. 64 (1942) 1226–1227.[46] W. Klemm, G. Mika, Z. Anorg. Allg. Chem. 248 (1941) 155–166.[47] C.B. Alcock, V.P. Itkin, Bull. Alloy Phase Diagrams 7 (1986) 455–
457.[48] B. Predel, F. Sommer, J. Phys.-Condens. Mat. 17 (1974) 249–265.[49] A.T. Dinsdale, CALPHAD 15 (1991) 317–425.[50] M. Blander, J. Braunstein, Ann. N.Y. Acad. Sci. 79 (1960) 838–
852.[51] R.H. Fowler, E.A. Guggenheim, Statistical Thermodynamics, Cam-
bridge University Press, Cambridge, UK, 1939, pp. 350–366.[52] C.W. Bale, P. Chartrand, S.A. Degterov, G. Eriksson, K. Hack, R.
Ben Mahfoud, J. Melancon, A.D. Pelton, S. Petersen, CALPHAD 26(2002) 189–228.
[53] G.W. Toop, Trans. Am. Inst. Min., Metall. Petr. Eng. 233 (1965)850–854.
JCT 07-210