Thermal composition fluctuations near the isotropic Lifshitz critical point in a ternary mixture of...
19
Thermal composition fluctuations near the isotropic Lifshitz critical point in a ternary mixture of a homopolymer blend and diblock copolymer Dietmar Schwahn Forschungszentrum Ju ¨lich GmbH, Institut fu ¨r Festko ¨rperforschung, D-52425 Ju ¨lich, Germany Kell Mortensen Risø National Laboratory, Condensed Matter Physics and Chemistry Department, DK-4000 Roskilde, Denmark Henrich Frielinghaus Risø National Laboratory, Condensed Matter Physics and Chemistry Department, DK-4000 Roskilde, Denmark Kristoffer Almdal Risø National Laboratory, Condensed Matter Physics and Chemistry Department, DK-4000 Roskilde, Denmark Lars Kielhorn Bayer AG, D-51368 Leverkusen, Germany ~Received 30 September 1999; accepted 29 December 1999! We have studied thermal composition fluctuations of a ternary symmetric homopolymer/diblock copolymer system of PEE/PDMS/PEE-PDMS @PEE and PDMS being poly~ethyl ethylene! and poly~dimethyl siloxane!, respectively# in its disordered state with small angle neutron scattering for concentration F of diblocks up to 15%. The phase diagram shows three characteristic regimes; ~1! below the Lifshitz concentration F LL >9%; ~2! in the very near vicinity of the Lifshitz concentration; and ~3! above F LL . In the regime ~1! of low diblock content the maximum neutron intensity is obtained at Q 50 and phase separation into macroscopic large domains is observed at low temperatures. With increasing diblock content the thermal fluctuations indicate a crossover from 3d-Ising to isotropic Lifshitz critical behavior with critical exponents of the susceptibility g 5(1.6260.01) and correlation length n 5(0.9960.04) appreciably larger than in the 3d-Ising case. In the structure factor this crossover is accompanied by a strong reduction of the Q 2 term leading to the dominance of the Q 4 term; the restoring force of the thermal fluctuations is strongly reduced as the Q 2 term is proportional to the surface energy. Near the Lifshitz critical temperature a further crossover was observed leading to the appreciably larger critical exponents g 5(2.4460.08) and n 5(1.2260.08) and a stabilization of the disordered regime visible through a decrease of the phase boundary by nearly 10 K. This crossover is interpreted by the formation of fluctuation induced inhomogeneous diblock distribution at the interface of the thermal fluctuations. ~2! In the intermediate regime between 9% and 12% diblock content the Lifshitz line was crossed twice upon increasing the temperature from low to high temperatures; at low and high temperatures the structure factor S ( Q ) shows diblock character ~maximum of S ( Q ) at Q 0 ! while at intermediate temperature blendlike character ~maximum of S ( Q ) at Q 50 !. At low temperatures a transition to a bicontinuous microemulsion phase is proposed. ~3! At diblock content of 15% a weak order-disorder transition was observed. The data in the Lifshitz critical range and larger than the Lifshitz line could be interpreted by a recently developed theory of Kielhorn and Muthukumar who considered the effect of thermal fluctuations in ternary homopolymer/diblock copolymer samples and from which the Flory–Huggins parameter could be evaluated. © 2000 American Institute of Physics. @S0021-9606~00!50512-1# I. INTRODUCTION The characterization of different states of matter and the phase transitions between them is of fundamental scientific interest. Each phase transition belongs to a universality class with a set of unique critical exponents describing material properties in the vicinity of the phase transition. The critical fluctuations and the associated classification have been stud- ied experimentally and theoretically in great details in both polymer blends 1–5 and in diblock copolymers. 2,6–8 Upon ap- proaching the critical point by changing the external fields such as temperature a crossover from the universality classes of mean field to a ‘‘fluctuation’’ renormalized state is ob- served. The renormalized state is for homopolymer blends in the 3d-Ising universality class 3,4 while the state of diblock copolymers is of the Brasovskii type. 6–8 The temperature defining the crossover from mean field to renormalized criti- cal characteristics is estimated by the Ginzburg criterion, which in the incompressible mean field theory predicts a 1/N and 1/A N ~N is degree of polymerization! scaling behavior JOURNAL OF CHEMICAL PHYSICS VOLUME 112, NUMBER 12 22 MARCH 2000 5454 0021-9606/2000/112(12)/5454/19/$17.00 © 2000 American Institute of Physics Downloaded 21 Dec 2006 to 134.94.122.39. Redistribution subject to AIP license or copyright, see http://jcp.aip.org/jcp/copyright.jsp
Transcript of Thermal composition fluctuations near the isotropic Lifshitz critical point in a ternary mixture of...

JOURNAL OF CHEMICAL PHYSICS VOLUME 112, NUMBER 12 22 MARCH 2000
Thermal composition fluctuations near the isotropic Lifshitz critical pointin a ternary mixture of a homopolymer blend and diblock copolymer
Dietmar SchwahnForschungszentrum Ju¨lich GmbH, Institut fu¨r Festkorperforschung, D-52425 Ju¨lich, Germany
Kell MortensenRisø National Laboratory, Condensed Matter Physics and Chemistry Department,DK-4000 Roskilde, Denmark
Henrich FrielinghausRisø National Laboratory, Condensed Matter Physics and Chemistry Department, DK-4000 Roskilde,Denmark
Kristoffer AlmdalRisø National Laboratory, Condensed Matter Physics and Chemistry Department,DK-4000 Roskilde, Denmark
Lars KielhornBayer AG, D-51368 Leverkusen, Germany
~Received 30 September 1999; accepted 29 December 1999!
We have studied thermal composition fluctuations of a ternary symmetric homopolymer/diblockcopolymer system of PEE/PDMS/PEE-PDMS@PEE and PDMS being poly~ethyl ethylene! andpoly~dimethyl siloxane!, respectively# in its disordered state with small angle neutron scattering forconcentrationF of diblocks up to 15%. The phase diagram shows three characteristic regimes;~1!below the Lifshitz concentrationFLL>9%; ~2! in the very near vicinity of the Lifshitzconcentration; and~3! aboveFLL . In the regime~1! of low diblock content the maximum neutronintensity is obtained atQ50 and phase separation into macroscopic large domains is observed atlow temperatures. With increasing diblock content the thermal fluctuations indicate a crossover from3d-Ising to isotropic Lifshitz critical behavior with critical exponents of the susceptibilityg5(1.6260.01) and correlation lengthn5(0.9960.04) appreciably larger than in the 3d-Ising case.In the structure factor this crossover is accompanied by a strong reduction of theQ2 term leadingto the dominance of theQ4 term; the restoring force of the thermal fluctuations is strongly reducedas theQ2 term is proportional to the surface energy. Near the Lifshitz critical temperature a furthercrossover was observed leading to the appreciably larger critical exponentsg5(2.4460.08) andn5(1.2260.08) and a stabilization of the disordered regime visible through a decrease of the phaseboundary by nearly 10 K. This crossover is interpreted by the formation of fluctuation inducedinhomogeneous diblock distribution at the interface of the thermal fluctuations.~2! In theintermediate regime between 9% and 12% diblock content the Lifshitz line was crossed twice uponincreasing the temperature from low to high temperatures; at low and high temperatures thestructure factorS(Q) shows diblock character~maximum ofS(Q) at QÞ0! while at intermediatetemperature blendlike character~maximum ofS(Q) at Q50!. At low temperatures a transition toa bicontinuous microemulsion phase is proposed.~3! At diblock content of 15% a weakorder-disorder transition was observed. The data in the Lifshitz critical range and larger than theLifshitz line could be interpreted by a recently developed theory of Kielhorn and Muthukumar whoconsidered the effect of thermal fluctuations in ternary homopolymer/diblock copolymer samplesand from which the Flory–Huggins parameter could be evaluated. ©2000 American Institute ofPhysics.@S0021-9606~00!50512-1#
thtifilariaa
stuth
ldssses-
s in
iti-on,/
I. INTRODUCTION
The characterization of different states of matter andphase transitions between them is of fundamental scieninterest. Each phase transition belongs to a universality cwith a set of unique critical exponents describing mateproperties in the vicinity of the phase transition. The criticfluctuations and the associated classification have beenied experimentally and theoretically in great details in bopolymer blends1–5 and in diblock copolymers.2,6–8 Upon ap-
5450021-9606/2000/112(12)/5454/19/$17.00
Downloaded 21 Dec 2006 to 134.94.122.39. Redistribution subject to AIP
ecsslld-
proaching the critical point by changing the external fiesuch as temperature a crossover from the universality claof mean field to a ‘‘fluctuation’’ renormalized state is observed. The renormalized state is for homopolymer blendthe 3d-Ising universality class3,4 while the state of diblockcopolymers is of the Brasovskii type.6–8 The temperaturedefining the crossover from mean field to renormalized crcal characteristics is estimated by the Ginzburg criteriwhich in the incompressible mean field theory predicts a 1Nand 1/AN ~N is degree of polymerization! scaling behavior
4 © 2000 American Institute of Physics
license or copyright, see http://jcp.aip.org/jcp/copyright.jsp
ni
th
seraa.a
teedcaemtuthe
des
uli
us
nu
end
us
itz
isno
ar
he
ca
-;o
ighoE
ly-s;ion
tic
erzrlynt,poly-s
ratedS,
dth
oly-
inby
ults
Parter
ub-eanre
reted16eitzhe
entaly-
ryal-s oftiono-eu-
ruc-ithre-he-uffi-
of
5455J. Chem. Phys., Vol. 112, No. 12, 22 March 2000 Thermal composition fluctuations
for blends1,2 and diblock copolymers,6 respectively. In real-ity, however, the renormalized ranges appear to be sigcant larger in both blends5 and block copolymers.7 In blendsthe larger 3d-Ising critical range has been attributed toeffect of compressibility,9 and it is likely that this also playsan important role in the critical behavior of copolymers.10
When systems belonging to different universality clasof critical phenomena are combined, the various phase tsitions influence each other and create new phenomenthis paper we investigate the interference of macroscopicmicroscopic phase transitions in a model polymer syscomposed of a critical blend of two homopolymers mixwith small amounts of the corresponding symmetridiblock copolymer. The molar sizes of the ternary systhave been tuned in such a way, that the critical temperaof the pure homopolymer blend is closely matched toorder–disorder temperature of the pure diblock copolymWith the molar volumesVA5VB for the homopolymersAandB and with the molar volumeV for the diblock copoly-mer, the Flory–Huggins parametersG must then obey theconditionsGODT>GC , GODT andGC representing the Flory–Huggins parameter of the diblock copolymer and the blenthe order–disorder transition and at the critical point, resptively. Within mean field approximation the molar volumemust fulfil the ratioV/VA5V/VB>5. To first order the com-bined effect of the enthalpy and the entropy of mixing shoneither increase nor decrease the line of critical pointssuch homopolymer/copolymer phase diagram. Still, becaof the loss in configurational entropy in the ordered phaGODT will decrease upon the addition of homopolymers.11 Ifmore homopolymer is added, the microdomain size contiously increases until in the thermodynamic limit atQ* 50where the domains are of macroscopic size. Thus, in mfield theory the critical lines of a homopolymer mixture athe corresponding diblock copolymer meet together at a mticritical point. This point represents a new universality clawhich is generally referred to as the isotropic Lifshtype.11–13
The critical behavior near the Lifshitz critical pointexpected to be strongly influenced by thermal fluctuatiogiving rise to larger critical exponents, and suppressionthe phase boundaries. This is a consequence of the lcritical dimensions relative to the dimensional space,m, inwhich the wave vector instability occurs, and which for tstudied polymer system is withm5d53 equal to the dimen-sion of space. It is the current belief that the upper critidimension for the isotropic Lifshitz point isdU58.12–14Thislarge value ofdU makes it further difficult to calculate critical exponents by the usuale[(dU2d) expansion techniqueit should be compared with the upper critical dimensionbinary blends, wheredU54.
In a recent study on a ternary system of relatively hmolar mass symmetric polyolefins composed of two hmopolymers and the corresponding diblock copolymer: PPEP/PE-PEP@PE being polyethylene and PEP being po~ethylene propylene!#, mean field Lifshitz-type behavior waobserved near the predicted isotropic Lifshitz critical point15
the critical exponents of the susceptibility and correlatlength were determined withg51 and n50.25, respec-
Downloaded 21 Dec 2006 to 134.94.122.39. Redistribution subject to AIP
fi-
e
sn-In
ndm
l
reer.
atc-
dnsee,
-
an
l-s
s,fge
l
f
-/
tively, and the structure factor followed the characterismean field Lifshitz behavior,S(Q)}Q24. This is opposed tothe commonS(Q)}Q22 characteristic known for binaryblends, and is observed for samples of less copolymcontent.15 In the very near vicinity of the mean field Lifshitcritical point, however, the influence of fluctuations cleamanifested itself by the absence of the Lifshitz critical poiand instead the appearance of a one-phase channel ofmeric microemulsion.16 An equivalent one-phase gap waobserved between the micro- and macrophase sepastates in the more low-molar mass system of PEE-PDMPEE and PDMS being poly~ethyl ethylene! and poly~dim-ethyl siloxane!, respectively.17–19 Moreover, in the near vi-cinity of the mean field Lifshitz point, this system showecritical exponents that are significantly larger relative to bomean field and 3d-Ising behavior.17 In another SANS studyon the PE-PP, PE, and PP mixture, PE and PP being p~ethyl ethylene! and head-to-head poly~propylene!, respec-tively, a qualitatively similar phase behavior was found;particular, the microemulsion phase could be identifiedthe use of contrast variation technique.20
In the present paper further detailed experimental resobtained from small angle neutron scattering~SANS! arepresented on the latter PEE/PDMS/PEE-PDMS system.of the experimental data ranging from pure homopolymblend to the regime close to the Lifshitz concentration,FLL
>0.09, have already been published in Ref. 17. In that plication we focused on the crossover phenomena from mfield to 3d-Ising critical behavior characteristic for publends and small values ofF, and from mean field to Lif-shitz critical behavior nearF5FLL . The critical exponentsof the Lifshitz critical point and the Ginzburg number aappreciably larger than for the 3d-Ising case as expecfrom the larger upper dimension, as summarized in Fig.below, and as given in Table V and VI. In the following wwill present experimental data below and above the Lifshline and give an interpretation mainly on the basis of tKielhorn–Muthukumar theory.13 In the first part we will re-view some of the main theoretical background of the preswork and then present the experimental data and their ansis.
II. THEORETICAL BACKGROUND
The investigated ternary mixtures of a critical binapolymer blend and the corresponding copolymer wereways prepared as a symmetric mixture with equal amountthe two monomers by the same homopolymer concentraand a symmetric diblock copolymer. As one of the monmers was partially deuterated with the same degree of dterium, according to the neutron scattering contrast the stture factor measures thermal composition fluctuations wrespect to the total monomer fractions and which corsponds to a scalar (n51) order parameter represented by tlocal concentrationF5F(r ). The basic thermodynamic features of those systems near their consolute line are sciently well described by the common Landau expansionthe free energy according to
license or copyright, see http://jcp.aip.org/jcp/copyright.jsp

ucil
tentca-
n
thdt
c
, t
r-o
mas
-
ntq
poinap
ore
er-
f
tosedof
ter-
-
ck
the
ility,tz
tedr.
5456 J. Chem. Phys., Vol. 112, No. 12, 22 March 2000 Schwahn et al.
H51
2 E ddx$c2~¹F!21c4~¹2F!21rF21uF4
1u6F6% ~1!
with this order parameter.21,22 A principal effect of diblockcopolymers dissolved with a homopolymer blend is a redtion of the surface energy which according to the Hamtonian, Eq.~1!, is described by a reduction of the paramec2 . This parameter is positive at low copolymer contebecomes zero at the concentration of the Lifshitz critipoint ~Lifshitz line!, and negative for large copolymer content. The Hamiltonian Eq.~1! accounts for the compositiofluctuations in the homogeneous~disordered! one-phase re-gime. The composition fluctuations are described bystructure factorS(Q), Q being the momentum transfer, ancan be measured directly in a scattering experiment asscattered intensity withQ given byQ5(4p/l)sinu, l beingthe wavelength of the used radiation, andu being half of thescattering angle.
For positivec2-values the structure factorS(Q) as ob-tained from the Hamiltonian, Eq.~1!, has the characteristibehavior of polymer blends;S(Q) is maximum atQ50, andthe susceptibility,r 21, is correspondingly given by thisS(Q50) value,r 21[S(0). At the critical temperatureTC
of macrophase separation the susceptibility diverges, i.e.inverse susceptibilityr[S21(0) is zero. For negativec2-values the structure factor,S(Q), has the basic characteistics of block copolymer melts, i.e., the maximum valueS(Q) appear at a finiteQ-value,Q5Q* . The susceptibilityis then given by the structure factor at thisQ* -value. Withinmean field theory of symmetric copolymers theS(Q* )-valuewill diverge at the critical point, and beyond that the systewill order on a mesoscopic length scale through microphseparation.
The Lifshitz critical point is determined by the two conditions c250 andr 5S21(0)50. With c2>0 in the vicinityof the Lifshitz point, the forth order term of the gradieenergy,c4 , becomes a leading term in the free energy, E~1!, giving rise to the characteristic LifshitzS(Q)}Q24 be-havior of the structure factor.
A. Structure factor of a three component polymerblend–diblock copolymer mixture in meanfield approximation
The expression for the structure factor of a three comnent mixture of a polymer blend and the corresponddiblock copolymer is described within the random phaseproximation according to6,8,13
S21~Q!5F~Q!/V22G, ~2!
whereG is the effective Flory–Huggins~FH! parameter,G5Gh /T2Gs , including both an enthalpic term,Gh and anentropic termGs . F(Q) is the inverse form factor, whichcan be calculated in terms of the partial structure factSAA , SBB , and SAB describing the correlation between thmonomers of typeA andB,11
F~Q!/V5SAA~Q!1SBB~Q!12SAB~Q!
SAA~Q!SBB~Q!2SAB2 ~Q!
.
Downloaded 21 Dec 2006 to 134.94.122.39. Redistribution subject to AIP
--r,l
e
he
he
f
e
.
-g-
s
For a ternary system composed of a critical mixture ofA andB homopolymers of equal volume,VA5VB , and conforma-tion ~and thereby also of equal concentrationFA5FB andequal partial structure factorsSAA andSBB , SAA5SBB! andan AB diblock with volumeV, F(Q) can be reduced to
F~Q!/V52/@SAA~Q!2SAB~Q!#. ~3!
Assuming that the polymers in the mixture remain as unpturbed Gaussian chains,F(Q) can be written in terms of theDebye-function,
gD~x!52@ f x1exp~2 f x!21#/x2
as
F~x!54/@~12F!agD~1, xa!2FgD~1, x!
14FgD~0.5, x!#, ~4!
where x5Rg2Q2, Rg being the radius of gyration of the
diblock copolymer; anda the ratio of the molar volumes othe homopolymers relative to the diblock copolymer,a5AVAVB/V.8,13Figure 1 shows the inverse form factorF(x)given by Eq. ~4!, as calculated with parameters equalthose of the experimentally investigated samples discusbelow and given in Table I. Form the minimum valuesF(x) one gets both the Flory–Huggins parameterGS at thespinodal and critical point, and the corresponding characistic Q5Q* value. For concentrations,F, smaller than theLifshitz critical value according toFLL52a2/(112a2)50.0596 the critical point occurs forQ50, corresponding tomacrophase separation.11,23 For largerF the maximum oc-curs at a steadily growingQ* value, corresponding to microphase separation. These critical values of (GS ,Q* ) aredepicted by the open circles in Fig. 1, and plotted vs dibloconcentrationF in Figs. 2~a! and 2~b!. The values forGS arefurther summarized in Tables II and III.
The structure factor in Eqs.~2! and~3! can be expandedinto powers ofQ2,
S21~Q!5S21~0!1L2Q21L4Q41¯ , ~5!
with the coefficients given in terms of the parameters ofHamiltonian in Eq.~1!. The first term isS21(0)5r , as dis-cussed above, and equal to the inverse susceptibS21(0)52(GS2G), for concentrations less than the Lifshi
FIG. 1. Inverse form factor for different diblock concentrations calculabased on Eq.~4!. The circles indicate the maximum value of the form facto
license or copyright, see http://jcp.aip.org/jcp/copyright.jsp

5457J. Chem. Phys., Vol. 112, No. 12, 22 March 2000 Thermal composition fluctuations
Downloaded 21 De
TABLE I. Sample characteristics.
Sample Polymer blend Diblock copolymer
Polymer Polyethyl-ethylene
Polydimethyl-siloxane
Polyethyl-ethylene
Polydimethyl-siloxane
Chem structure PEE PDMS PEE PDMS(C4H5.2D2.8) (SiOC2H6) (C4H5.2D2.8) (SiOC2H6)
d ~g/cm3! 0.91 0.98 0.91 0.98V ~cm3/mol! 66 77.7 66 77.7s ~Å! 5.35 5.92 5.35 5.92Scibi /V i (1010 cm22) 1.79 0.0628 1.79 0.0628VW ~cm3/mol! 2010 2270 12000N 30.5 29.2 168Volume fraction PEE F50.516 f 50.5GS(1023 mol/cm3) 0.942 0.875
-
ce
ld.
d/x-
hise
po-x-ma-
heure
value. The coefficientsL2 andL4 are proportional to, respectively, c2 and c4 in the Hamiltonian Eq.~1!, and can bedetermined in terms of the polymer parameters and contration F,13
c2;L25~Rg2/V!@4a2~12F!22F#/@3a2~12F!2#, ~6a!
c4;L45~Rg4/V!@~12F!2~4a4116a229a14!
2~12F!~16a229a18!14#/@36~12F!3a3#.
~6b!
At the Lifshitz concentration, the characteristic mean fiebehavior,S21(Q)}Q4, clearly appears from this equation
c 2006 to 134.94.122.39. Redistribution subject to AIP
n-
B. Effect of thermal fluctuations in blend Õcopolymermixtures
Near the Lifshitz line of a three component blendiblock mixture thermal composition fluctuations are epected to become strong as its upper critical dimension,dU
58, is twice as large as that of binary polymer blends. Tlarge value ofdU is related to the reduction of the surfacenergy described through thec2-term in the Hamiltonian, Eq.~1!, and which acts as a threshold force for thermal comsition fluctuations. The structure factor of blend/diblock mitures was recently derived beyond the mean field approxition by Kielhorn and Muthukumar.13 They used the Hartreeapproximation in the Brazovskii formalism, equivalent to tprocedure developed by Fredrickson and Helfand for p
lf
f
-
.
t
FIG. 2. ~a! Theoretical Flory–Hugginsparameter at the spinodal and criticapoint evaluated from the minimum oF(x) in Fig. 1. ~b! The value ofQ5Q* representing the maximum oS(Q) evaluated fromF(x) in Fig. 1.Below the Lifshitz line Q* 50 andnear the Lifshitz lineQ* follows ascaling behavior with good approximation.~c! First and second derivativeof the second order vertex function~d! Fourth order vertex function forvarious a5ANPEENPDMS/NPEE2PDMS
and diblock concentration. Note, thathe concentrationF of ~d! covers therange 0–1, while that of~a!, ~b!, and~c! covers 0–0.2 only.
license or copyright, see http://jcp.aip.org/jcp/copyright.jsp

5458 J. Chem. Phys., Vol. 112, No. 12, 22 March 2000 Schwahn et al.
Downloaded 21 De
TABLE II. Parameters of samples larger than Lifshitz line from the structure functionS(Q).
F ~%! TODT °C G Gi GS(1023 mol/cm3) Gh ~mol K/cm3! Gs(1024 mol/cm3) GODTV
9.3 63 0.187 1.560.1 1.025 0.3360.005 2.260.2 ¯
10 81 0.396 1.360.5 1.029 0.5260.01 2(2.960.3) ¯
10.9 75 0.325 1.160.3 1.032 0.4360.005 2(0.6560.12) ¯
12.1 37 0.464 1.260.1 1.036 0.4460.005 2(0.8460.15) ¯
14.9 30 0.456 1.360.1 1.041 0.3960.004 0.1860.09 15.3100a 83.3 0.54 1.460.2 0.875 0.2960.04 2(2.760.6) 13
aHas been evaluated from the Fredrickson–Helfand theory@Eq. ~17!# with N5900 as evaluated assumings56.5 Å.
p
ein
onoe
re-
rm
b
a-
,by
el-ofef.ill
:-
diblock copolymer melts.6 The structure factor, Eq.~2!, wasthereby approximated and parameterized into a more simform according to
S21~Q!5a/~b1Q2!1c1dQ2 ~7!
with the parameters,a[A/(s2V), b[B/s2, c[C/V, andd[Ds2/V, wheres is the statistical segment length of thcopolymer and is related to the radius of gyration accordto Rg
25s2V/6V5s2N/6, V and N being the respectivelymonomer molar volume and the degree of polymerizatiThe effects of thermal fluctuations are included by the renmalized parametersA, B, C, andD. These parameters wercalculated assuming that the general shape ofS(Q) is unal-tered compared to the mean field result. The detailed expsions are given in Eqs.~3.9!–~3.12! of Ref. 13. The susceptibility S(Q* ) is thereby given in the form of
S21~Q* !52@GCV2G renV#/V ~8!
with the renormalized Flory–Huggins parameterG ren that in-cludes the effect of thermal fluctuations. The detailed foof G ren is given separately for the two cases,F.FLL andF,FLL corresponding to the susceptibility representedrespectivelyS(Q* ) at finite Q* and S(0). In the ‘‘blockcopolymerlike’’ case ofF.FLL , G ren is given as13
G renV5GV2GA6x* d1
3b/Q* 22A11b/~dQ* 4S~Q* !!1221/~dQ* 2S~Q* !!
A1/~dQ* 2S~Q* !!2212A11b/~dQ* 4S~Q* !!].
~9!
c 2006 to 134.94.122.39. Redistribution subject to AIP
le
g
.r-
s-
y
The parameterG is determined by the degree of polymeriztion N, the monomer molar volume,V, and the relative vol-ume fractions of the polymer componentsFA , FB , andFaccording to
G5NG4~0,0!
16pAd13
1
AN~10!
and with the parametersd andd1 given by@Eq. ~3.9! in Ref.13#,
d[d1s2/V; d151/$12~FA1 f F!@FB1~12 f !F#%.~11!
The parameterG4(0,0) is the fourth order vertex functionwhich was evaluated by the same procedure as usedLeibler8 but is a function off, FA , FB , anda.13 In Fig. 2~d!for the studied samples the numbers ofNG4(0,0) have beengiven for various diblock concentrationsF and a. The pa-
rameterAN5(R03/V) ~R05A6Rg is the end-to-end distanc
of the polymer! is the average number of chains in the voume R0
3; its reciprocal value is a measure of the effectthermal fluctuations as discussed for blends on p. 112 of R1 and therefore proportional to the Ginzburg number as wbe defined in Eq.~18!. The value ofN was estimated with900 assuming a mean statistical segment length ofs56.5 Å ~Fig. 19!. There exists the following identitydQ* 2V[6d1x* , i.e., Rg
2[dV/6d1 . So, the statistical segment lengths can be evaluated from the parametersd andd1 and the monomer molar volumeV according to s5AV(d/d1).
by
TABLE III. Parameters of samples less than the Lifshitz concentration evaluated from the susceptibilityS(0)with Eq. ~12! and the crossover function~1!. The 0 and 4.3 samples could not appropriately be describedEq. ~12!. N5900 was evaluated assumings56.5 Å.
F ~%! TC ~°C! G GS(1023 mol/cm3) Gh(mol K/cm3) Gs(1024 mol/cm3) b0 c0a
01 141.4 ¯ 0.937 0.44 1.14 ¯ ¯
4.31 129.7 ¯ 0.984 0.44 1.34 ¯ ¯
6 121.2 0.41 1.002 0.4460.01 1.1760.09 0.0160.005 0.256.7 104.9 0.4 1.008 0.3660.01 2(0.960.2) 0.2960.05 0.197.4 109.5 0.39 1.014 0.3160.005 2(2.260.1) 0.0460.01 0.148.3 86.7 0.39 1.02 0.3560.008 2(1.160.2) 0.460.05 0.06
aCalculatedc0 .
license or copyright, see http://jcp.aip.org/jcp/copyright.jsp
-
r-al
cicE
ong
he
th
n
it
th
he
-
,e
-
, ins
d
theueor
-y
ly-ve
e of
nd
sre
ter-
5459J. Chem. Phys., Vol. 112, No. 12, 22 March 2000 Thermal composition fluctuations
In the ‘‘blendlike’’ case ofF,FLL , where the susceptibility is represented byS(0), the renormalized FH-parameter is given according to Ref. 13,
G ren5GV2G@b02V/S~0!
2Ab0V/S~0!#/AV/S~0!1b0c012Ab0V/S~0!
~12!
with the parameters,b0512d1(6d12NG28(0))/(NG29(0))andc05NG28(0)/6d1 , NG2(x) being the second order vetex function8 which within mean field approximation is equto the inverse structure factor according toNG2(x)[V/S(Q).13 Its derivatives with respect tox are obtainedfrom Eq. ~5! according toNG28(0)5L2V/Rg
2 and NG29(0)50.5L4V/Rg
4; both derivatives ofG2(0) have been plotted inFig. 2~c!.
C. The scaling ansatz for blend Õcopolymer mixtures
The decrease of the surface energy with increasingpolymer content leads to a structure factor near the crittemperature, which in analogy with the mean field case,~5!, can be given as
S21~Q!5S21~0!1 l 2Q21 l 4Q4, ~13!
with the coefficientl 4 of the additionalQ4 term proportionalto the c4 term in the Hamiltonian, as discussed above. Fconvenience the structure function is written in the followiform:12
S21~Q!5S21~0!@11~Qj!21Kp22~Qj!4#, ~14!
where the susceptibility according to scaling laws follow trelation,
S21~0!5C121tg ~15!
with the reduced temperaturet5(T2TC)/T, and the criticalamplitudeC1 .21 The parameterj, given by
j5AS~0!l 2
is the correlation length of the thermal fluctuations andprefactorKp22 is given as
Kp225 l 4 /~ l 22S~0!!.
The parameterp is a scaling field amplitude, which is giveby the square gradient term of the Hamiltonian Eq.~1! as
p5c2 /A4c4ur u5c2 /A4c4uS21~0!u
and is thus a measure of the deviation from the Lifshpoint.12
At the Lifshitz critical temperature the correlation lengj losses its meaning asl 250. j has then to be redefined fromthe then dominatingQ4 term in Eq.~14!; the correspondingscaling fieldp is constant. At smaller copolymer content, tQ4 term in the structure factor in Eqs.~5! and~15! becomesnegligible, andj follows the usual scaling lawj0t2n;p isgiven asp2}j (21h)/ l 4 and l 2 as l 2}jh ~Ref. 24! with theFisher exponenth522g/n obtained from the critical expo
Downloaded 21 Dec 2006 to 134.94.122.39. Redistribution subject to AIP
o-alq.
r
e
z
nentsg and n of the susceptibility and correlation lengthrespectively.j andp become accordingly both infinite at thcritical temperature.
The Lifshitz critical point leads to a new critical exponentbQ describing the change inQ* with F. By increasingthe copolymer content past the Lifshitz concentration, i.e.the rangeFLL<F<1, Q* changes from zero to finite valueaccording to the scaling law22
Q* }uF2FLubQ. ~16!
The exponent is found to be,bQ50.4 according to the re-sults in Fig. 2~b!, it is a theoretical result within mean fielapproximation.
D. Effect of thermal fluctuations in diblockcopolymers
Composition fluctuations indiblock copolymersare rel-evant only on the length scale of polymer chains. This isreason thatS(Q) shows an interference peak at a finite valof Q* . The renormalized Flory–Huggins parameter fdiblock copolymers can be approached from Eq.~9! in thelimit b/(dQ* 4S(Q* ))!1 according to
G renV5GV2GiAS~Q* !/V1G/AS~Q* !/V ~17!
with the Ginzburg number G˜ i
Gi56x* d1G~11b/Q* 2! ~18!
and with x* 5(RgQ* )2 as before.13 The corresponding expression forG ren derived for pure diblock copolymers bFredrickson–Helfand,6
G renV5GV2GiAS~Q* !/V ~19!
is the same as Eq.~17! with the third term equal to zero.
E. Effect of thermal fluctuations in polmer blends
The theoretical approaches for the susceptibility of pomer blends is conceptually different from those of the abodiscussed ones for block copolymer like systems. In caspolymer blendsthe susceptibilityS(0) is interpreted with theasymptotic crossover model derived by Belyakov aKiselev,25,26
t5~112.333S~0!D/g!~g21!/D
3@S21~0!1~112.333S~0!D/g!2g/D#. ~20!
The exponentsg>1.24 andD50.5 are the critical exponentof the 3d-Ising model. The rescaled reduced temperatut5t/Gi (t5uTC2Tu/T) is formulated as a function of therescaled susceptibilityS(0)5S(0)Gi/CMF . The parametersGi, CMF , andTC are the experimental parameters characizing the system. Gi is the Ginzburg number andCMF themean field critical amplitude ofS(0). In theasymptotic lim-its t@1 and t!1 the susceptibility in Eq.~20! follows thewell-known scaling lawsS(0)5CMFt21 of the mean fieldapproximation, andS(0)5C1t2g of the 3d-Ising model, re-spectively. Experimentally,S(0) is obtained from theOrnstein–Zernike approximation,21
license or copyright, see http://jcp.aip.org/jcp/copyright.jsp

thep
s
ine
-s
uanck
r
trn
atemer
whioo
aer
S
nald.
E-ndfioris-illtal
ole
s:d by
itee
n is%.n-theowved,
in
ntry–-
rtenter-
lledpic
es-
5460 J. Chem. Phys., Vol. 112, No. 12, 22 March 2000 Schwahn et al.
S21~Q!5S21~0!1 l 2Q2.
The Ginzburg number is related to the ratio betweencritical amplitudes of the 3d-Ising and the mean field susctibilities according to Refs. 5, 21, and 26
Gi50.069~C1 /CMF!1/~g21!. ~21!
Within the FH-model the susceptibility is given asS(0)/V5@2(GCV2GV)#21 with the FH-parameterG5Gh /T2Gs
and the respective enthalpic and entropic contributionsGh
andGs ~Refs. 1 and 2!. The mean field critical amplitude ithus related to the FH-parameters according to
CMF51/2uGS1Gsu5TCMF/2Gh ~22!
which in the limit Gs50 leads to the scaling relation G}V21 ~Ref. 5!. In order to evaluate the enthalpic term oneeds the ‘‘mean field’’ critical temperatureTC
MF which isrelated to the ‘‘real’’ critical temperatureTC according toTC
MF5TC /(12Gi) ~Ref. 26!. Thermal composition fluctuations stabilize, in analogy with the block copolymer systemthe disordered phase of the system, and lower therebyTC .
III. EXPERIMENT
Small-angle neutron scattering technique was usedmeasure the structure factor of thermal composition flucttions in a number of ternary mixtures of similar size PEE aPDMS homopolymers and symmetric PEE-PDMS diblocopolymer with varying concentrationsF ranging from vol-ume fractionsF50 to F515%. PEE is the acronym fopartially deuterated poly~ethyl ethylene!, and PDMS ispoly~dimethylsiloxane!.
A. Sample preparation
The homopolymers PEE and PDMS and the symmediblock copolymer PEE-PDMS were all synthesized by aionic polymerization followed by catalytic hydrogenation.27
The PEE-monomers were partly deuterated during the clytic saturation. Based on the measured densities, the chcal formula of the PEE monomers in both the homopolymand the block copolymer are of C4D2.8H5.2. The degree ofdeuteration was not measured independently, but it is knothat only limited isotope exchange takes place during sucprocess.28 The level of exchange depends on the reactconditions. The samples were all saturated under similar cditions and the measured densities are consistent withequal degree deuteration. The molecular characteristicssummarized in Table I. The ratio of the degree of polymization of the homopolymers and copolymer isa5ANPEENPDMS/NPEE-PDMS50.178.
B. Small-angle neutron scattering
The scattering experiments were performed at the KWsmall-angle neutron scattering~SANS! diffractometer at theFRJ-2 research reactor of the Forschung Zentrum, Ju¨lich~FZJ!.29 The composition fluctuations were measuredin situat the corresponding temperatures. The scattered neutrotensity was corrected for background contributions and cbrated in absolute units by a Lupolen secondary standar
Downloaded 21 Dec 2006 to 134.94.122.39. Redistribution subject to AIP
e-
,
to-
d
ic-
a-i-
s
na
nn-anre-
1
in-i-
IV. EXPERIMENTAL RESULTS AND INTERPRETATION
A. Phase diagram
The phase diagram of the ternary PEE/PDMS/PEPDMS mixture with the near critical PEE/PDMS blend athe diblock copolymer of contentF is shown in the range oF50 – 20% in Fig. 3. It was determined from the behavof the susceptibility at the phase boundaries as will be dcussed in the following. The phase diagram in Fig. 3 wgive us orientation in the presentation of the experimendata. A phase diagram of this system including the whconcentration range is published elsewhere.18
The phase diagram in Fig. 3 is divided into five sectionThe disordered regime at high temperatures is separatethe Lifshitz line~LL !. At F lower than the Lifshitz line, themaximum intensity occurs atQ50 while for F larger thanthe Lifshitz line the maximum intensity is observed at a finQ* -value. Theoretically, the Lifshitz line is estimated to b6% according toFLL52a2/(112a2) ~Ref. 11!. The ob-served Lifshitz line, however, is observed at a largerF and itdepends on temperature; its smallest Lifshitz concentratiofound at 9.3% and its largest value around 100 °C at 10.9At low and high temperatures the Lifshitz line appears costant at about 9%. For block copolymer contents aboveLifshitz line mesoscopic ordering is expected to occur belan ordering temperature. Such an ordering was obserhowever, only for copolymer contents atF514.9% andabove. BelowF514.9% experiments were performedsome cases down to210 °C without any indications of anordering transition from the susceptibility alone. Apparechanges in the temperature dependence of the FloHuggins parameter@Fig. 18~a!# and changes in the temperature and concentration dependence ofQ* nearT565 °C andF>11.5% ~Fig. 10! give further indications of a crossoveto a separate regime between 9% and 14% diblock conwhich together with the results in Ref. 16 has been int
FIG. 3. Experimental phase diagram of PEE/PDMS/PEE-PDMS. The ficircles ~d! represent the critical temperatures of the 3d-Ising and isotroLifshitz case separated by the dashed area, the open circles~s! the criticaltemperatures of the renormalized Lifshitz case, the solid square~j! thebinodal, the diamonds~l! the order–disorder transition, and the triangl~,! the Lifshitz line, and the open squares~h! are the crossover to microemulsion characteristics. The order–disorder transition atF50.18 was in-dependently determined by rheology.
license or copyright, see http://jcp.aip.org/jcp/copyright.jsp

h
c-spranalo
ntesaina
ns
itzhemf
te
,
e-
ctedthe
-
ofyldalrgd-bysly-ntso-ss-
. 5ns
Eq.theFor
-
ndtaresis
and
1%s
-
a-ztedin-
ding
infac-of
y–ticalre of
.
ennd
5461J. Chem. Phys., Vol. 112, No. 12, 22 March 2000 Thermal composition fluctuations
preted as a bicontinuous microemulsion phase and whicindicated by the symbolmE in the phase diagram.
For F below the Lifshitz line, ordering occurs on a maroscopic scale by phase separation. The binodal and theodal phase boundaries are depicted in the phase diagThe F50 system is at a slightly off-critical concentratiowhile for the systems with finite copolymer content criticbehavior was observed where the phase decomposition ccided with infinite susceptibility. So, the solid line represethe critical points. The Lifshitz critical point is a multiplcritical point connecting the line of transitions to macrophaseparation with the line of microphase separation, as alrediscussed in the theoretical parts above. The Lifshitz pocan, however, only be realized within mean field approximtion; according to the Ginzburg criterion thermal fluctuatiostabilize the disordered phases differently in blends anddiblock copolymers and thereby destroy the Lifshpoint.11–13The phase diagram shown in Fig. 3, including tordered mE-phase is qualitatively similar to the diagrafound in an analogous polymer mixture oPE/PEP/PE-PEP.16
B. Structure factor and susceptibility below theLifshitz line
In Fig. 4 the structure factorS(Q) of three samples withcopolymer content below the Lifshitz line has been plotfor various temperatures vs the momentum transferQ inZimm representation, e.g.,S21(Q) vs Q2. The solid linesrepresent fits of Eq.~13! from which three parametersnamely the susceptibilityS(0) and the coefficientsl 2 and l 4
are obtained. AtF54.3%S(Q) is sufficiently well describedby the Ornstein–Zernike approximation withl 450 similarlyto blends. For largerF theQ4 term inS(Q) becomes visibleas demonstrated for theF56% and 8.3% samples and b
FIG. 4. Structure factor in Zimm representation for three diblock conctrations. At 4.3%S(Q) is described by the Ornstein–Zernike law, at 6% aabove contributions from theQ4 term becomes visible.
Downloaded 21 Dec 2006 to 134.94.122.39. Redistribution subject to AIP
is
in-m.
in-s
edyt-
in
d
comes more relevant for the 8.3% sample as is expefrom the reduction of the surface energy caused bydiblock component.
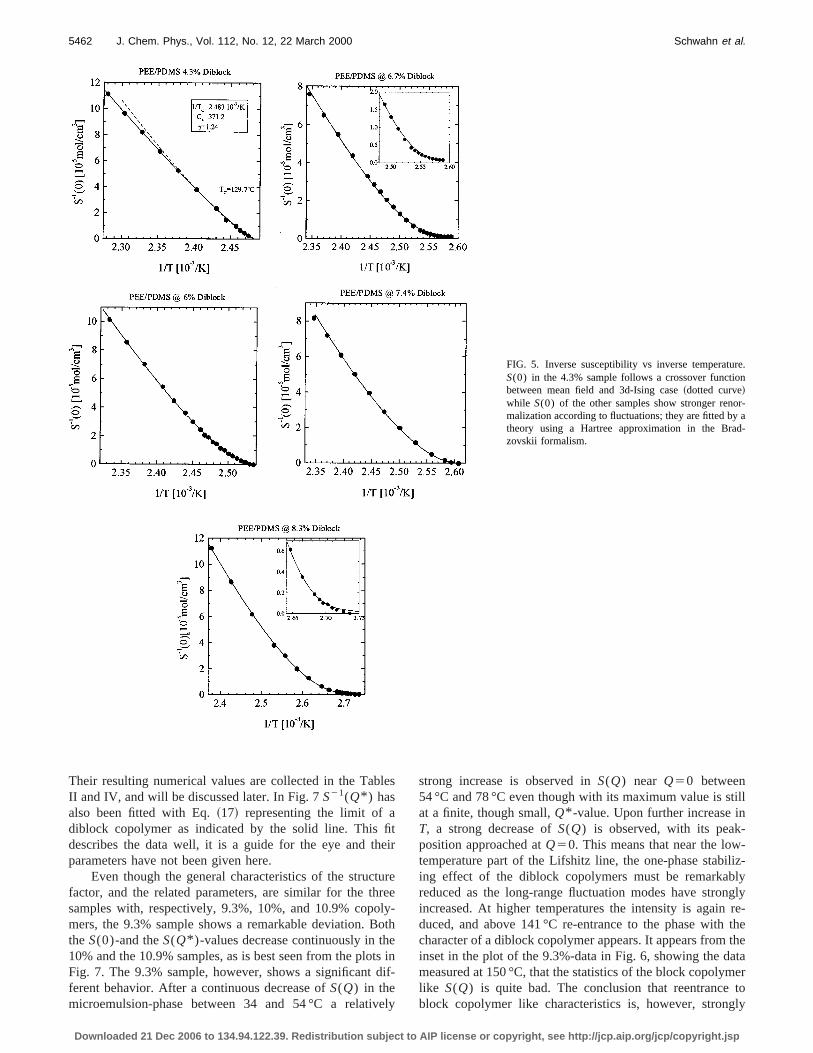
In Fig. 5 the inverse susceptibilityS(0) has been plottedvs the inverse temperature 1/T for the five investigatedsamples withF less than the Lifshitz line. The critical temperatures determined fromS21(0)50 decreases with in-creasingF; the solid and open points in the phase diagramFig. 3 depict them. TheF54.3% sample behaves similarlto pure blends;S21(0) shows at high temperature mean fiecharacteristics, and near the critical point 3d-Ising criticbehavior with a crossover regime given by the Ginzbunumber in Eq.~21!. This is demonstrated by the corresponing fitted solid line obtained from the crossover functionBelyakovet al. in Eq. ~20!.25,26 This crossover function hasuccessfully been used by us for the interpretation of pomer blends.5 The second dashed line in the figure represethe asymptotic 3d-Ising scaling law with the critical expnentg51.24 as calculated from the parameters of the croover function.
The susceptibilities of the other samples plotted in Figwith slightly largerF could be analyzed with the expressioof the susceptibilityS(0) derived from Eq.~8! with Q* 50and the corresponding renormalized FH-parameter of~12!. The fits are depicted by solid lines; they describestronger curvature of the experimental data rather well.the 8.3% sample the data points nearTC are not well de-scribed andTC is fitted at a lower temperature. The parameters obtained from the fit are the FH-parameterG, and b0
andc0 . The two latter parameters are related to the first asecond derivative of the second order vertex function aQ50 as discussed in Sec. II B. Their numerical valuescollected in Table III. A discussion of these data on the baof scaling laws and the corresponding critical exponentsamplitudes will be given later in Sec. III E.
C. Structure factor and susceptibility near the Lifshitzline
The SANS data of the samples between 9% and 1diblock concentrationF show at low and high temperaturethe characteristic behavior of diblock copolymers, i.e.,S(Q)shows maximum at finiteQ* -value, but at intermediate temperatures that of homopolymer blends, i.e.,S(Q) maximumat Q50. The curved Lifshitz line shown in the phase digram ~Fig. 3! reflects this behavior. Apparently, the Lifshitline is not constant in diblock copolymer content as expecfrom theory. The measured structure factors of the threevestigated samples are shown in Fig. 6. The corresponsusceptibilities,S(0) or S(Q* ) are plotted in Fig. 7 vs theinverse temperature, while thel 2 coefficient ofQ2 and theQ* -values of the maximum intensity have been plottedFig. 8 and 9 as a function of temperature. The structuretor S(Q) has been fitted with the approximate expressionEq. ~7! as demonstrated by the solid lines. The FlorHuggins parameter, the Ginzburg number, and the statissegment length have been evaluated for each temperatuthe experiment from the expressions ofa, b, c, din Ref. 13and Eq.~9! and directly fromS(0) with Eq. ~12!, assumingthat the parameters in Eq.~12! are constant with temperature
-
license or copyright, see http://jcp.aip.org/jcp/copyright.jsp
re.n
r-a
d-
5462 J. Chem. Phys., Vol. 112, No. 12, 22 March 2000 Schwahn et al.
FIG. 5. Inverse susceptibility vs inverse temperatuS(0) in the 4.3% sample follows a crossover functiobetween mean field and 3d-Ising case~dotted curve!while S(0) of the other samples show stronger renomalization according to fluctuations; they are fitted bytheory using a Hartree approximation in the Brazovskii formalism.
le
fite
turelyoetsdi
e
till
--liz-ly
nglyre-thethe
atamertoly
Their resulting numerical values are collected in the TabII and IV, and will be discussed later. In Fig. 7S21(Q* ) hasalso been fitted with Eq.~17! representing the limit of adiblock copolymer as indicated by the solid line. Thisdescribes the data well, it is a guide for the eye and thparameters have not been given here.
Even though the general characteristics of the strucfactor, and the related parameters, are similar for the thsamples with, respectively, 9.3%, 10%, and 10.9% copomers, the 9.3% sample shows a remarkable deviation. BtheS(0)-and theS(Q* )-values decrease continuously in th10% and the 10.9% samples, as is best seen from the ploFig. 7. The 9.3% sample, however, shows a significantferent behavior. After a continuous decrease ofS(Q) in themicroemulsion-phase between 34 and 54 °C a relativ
Downloaded 21 Dec 2006 to 134.94.122.39. Redistribution subject to AIP
s
ir
ree-th
inf-
ly
strong increase is observed inS(Q) near Q50 between54 °C and 78 °C even though with its maximum value is sat a finite, though small,Q* -value. Upon further increase inT, a strong decrease ofS(Q) is observed, with its peakposition approached atQ50. This means that near the lowtemperature part of the Lifshitz line, the one-phase stabiing effect of the diblock copolymers must be remarkabreduced as the long-range fluctuation modes have stroincreased. At higher temperatures the intensity is againduced, and above 141 °C re-entrance to the phase withcharacter of a diblock copolymer appears. It appears frominset in the plot of the 9.3%-data in Fig. 6, showing the dmeasured at 150 °C, that the statistics of the block copolylike S(Q) is quite bad. The conclusion that reentranceblock copolymer like characteristics is, however, strong
license or copyright, see http://jcp.aip.org/jcp/copyright.jsp

tht on
5463J. Chem. Phys., Vol. 112, No. 12, 22 March 2000 Thermal composition fluctuations
FIG. 6. Structure factor for concentrations between 9.3% and 10.9%. Inconcentration range, transitions from diblock to blend and from blenddiblock character are observed by increasing the temperature.
Downloaded 21 Dec 2006 to 134.94.122.39. Redistribution subject to AIP
iso
FIG. 7. S(0) and S(Q* ) values from different PEE/PDMS/PEE-PDMSsystems as obtained fromS(Q) in Fig. 6 and the corresponding fits.S(0)and S(Q* ) are given logarithmically, while the inset shows the datalinear scale.
license or copyright, see http://jcp.aip.org/jcp/copyright.jsp

,in
fitprd
taeotni
ab
-if-
is
nde
heto
on
-te
is
re
n
ele
s oftures
5464 J. Chem. Phys., Vol. 112, No. 12, 22 March 2000 Schwahn et al.
supported by the temperature dependence ofl 2 , given in Fig.8, showing a pronounced maximum.
Both S(Q) and S(Q50), as shown in Figs. 6 and 7have been fitted with the theoretical expressions accordto, respectively, Eqs.~8!, ~9!, and ~12!. The fit of S(0) isdepicted as a solid line in the figure, and the resultingparameters are collected in Table IV. Only the 10% samis well described by theory in the whole measured tempeture range. The temperature range of this sample exceehowever, only slightly the lower Lifshitz line. For the 9.3%sample the theoreticalS(0) describes the experimental daonly above the lower Lifshitz temperature, while the dcrease ofS(0) near the lower Lifshitz temperature is ndescribed by theory. The 10.9% sample shows also sigcant deviations; theS(0)-susceptibility is only well de-scribed above the lower Lifshitz temperature and theS(Q5Q* )-value above and below the Lifshitz temperature conly be fitted with different sets of parameters. This oserved discrepancy betweenS(0) and theory might be a further indication for an ordered regime below the lower Lshitz line.
Crossing the Lifshitz temperature becomes clearly vible from the temperature behavior of the coefficientl 2 of theQ2 term of the inverse structure factor in Eq.~13!, and whichhas been plotted in Fig. 8 for threeF-values. The positiveand negative values ofl 2 corresponds to the respective bleand diblock character of the samples. There is yet no thretical description of the observations in Fig. 8. Within tmean field approximation the Lifshitz line is predictedoccur at a constant diblock concentrationF as the vertexfunction G28(0) becomes zero at the Lifshitz concentratishown in Fig. 2~c!, which means thatL2 in S(Q) of Eq. ~5!becomes zero at this concentration. The parameterl 2 ob-tained via Eq.~13! is of course influenced by thermal fluctuations which are not included in the mean field parameG28(0) andL2 in Eq. ~5!. A theoretical expression forl 2 isnot known to us.
An even more clear impression of the Lifshitz lineobtained from theQ* -values of theS(Q)-peak, as shown in
FIG. 8. Coefficientl 2 of the Q2 term of the inverse structure factor. Thnegative and positive numbers determine the respective diblock and bcharacter. The Lifshitz line is defined forl 250.
Downloaded 21 Dec 2006 to 134.94.122.39. Redistribution subject to AIP
g
-lea-ed,
-
fi-
n-
-
o-
rsFig. 9 givingQ* vs temperature. At the Lifshitz temperatuQ* becomes zero. The behavior ofQ* near the Lifshitz linecan approximately be described by a scaling lawQ* }uT2TLLu2bT with an exponentbT between 0.3 and 0.4 whe
nd
FIG. 9. Q* values vs temperature for three concentrations. The rangediblock and blend character are clearly seen. Near the Lifshitz temperaQ* can be fitted by a scaling ansatz.
license or copyright, see http://jcp.aip.org/jcp/copyright.jsp

ur
Fiv
exav-
thaasur
heca
eileretronig
tur
v–
ntaxb-
ei
he
ed
sict de-isto
ob-
ureso a
, as
nceiond
the
se
r
e of%ter-
sion
5465J. Chem. Phys., Vol. 112, No. 12, 22 March 2000 Thermal composition fluctuations
approachingTLL from both low and high temperatures.Q*becomes only to some extent constant at low temperatfar from the Lifshitz line. The change ofQ* with F, aspredicted from the mean field theory, has been plotted in2~b!, very near the Lifshitz concentration a power law behaior with an exponent of 0.4 is predicted. CorrespondingperimentalQ* values measured at 65, 100, and 145 °C hbeen plotted vsF in Fig. 10. As in a first order phase transition theQ* value seems to discontinuously change atLifshitz concentration which is about 11.5% and 9%100 °C and 145 °C, respectively, and then further increwith diblock concentration approaching the value of the pdiblock copolymer. At 65 °C two steps ofQ* are visible oneat the corresponding Lifshitz concentration of 9% the otat 11.5%. The latter step at 11.5% might be a further indition for a transition to a microemulsion phase@see also dis-cussions in context with Fig. 18~a!#. The dashed lines havbeen plotted as a guide for the eye. For a more detaanalysis and proof of the microemulsion phase one suneeds more experimental data from more diblock concentions and also from application of the D/H contrast variatitechniques.20 It seems, however, clear from the data in F10 that no scaling withF occur near the Lifshitz line aspredicted by theory@see Fig. 2~b!# and as it is observed aconstantF between 9% and 11% with changing temperat~see Fig. 9!.
D. Structure factor and susceptibility beyond theLifshitz line
Two samples beyond 12% diblock concentration habeen studied and the results are presented in Figs. 11Figure 11 shows the structure factorS(Q) of the 12.1% and14.9% samples, as plotted in a semilogarithmic represetion. For all temperatures between 143 and 17 °C the mmum value ofS(Q), and thereby the susceptibility, was oserved at finiteQ* -values indicating thatF is beyond theLifshitz line at all temperatures. The solid lines in the figurare the result of the theoretical scattering function given
TABLE IV. Parameters of samples larger than the Lifshitz line fromS(0).
F ~%! Gh ~mol K/cm3! Gs(1024 mol/cm3) b0 c0a
9.3 0.760.06 2(0.9361.5) 3.961 20.0310 0.4960.04 2.3861.03 2.260.3 20.0910.9 0.4460.02 1.0660.6 1.4860.08 20.1812.1 0.4860.03 2.0360.7 2.860.1 20.314.9 0.3360.01 2(1.0760.2) 3.160.04 20.61
aCalculatedc0 .
Downloaded 21 Dec 2006 to 134.94.122.39. Redistribution subject to AIP
es
g.--e
etee
r-
dlya-
.
e
e14.
a-i-
sn
Eq. ~7!. The correspondingS(Q50) andS(Q5Q* )-valuesare plotted in Fig. 12 andQ* together withx* are given inFig. 13. The solid lines in Fig. 12 represent best fits of trenormalized susceptibility, according to Eq.~8! for theS(Q* ) andS(0) values, and the corresponding renormalizFH-parameter of Eq.~17! and of Eq.~12!. The parametersfrom the fit ofS(0) are summarized in Table IV. The valueof S(Q50) and S(Q5Q* ) show the same characteristtemperature dependence. For the 14.9% sample a slighviation of the susceptibility from its theoretical descriptionobserved at 30 °C, reflecting the order–disorder transitiona lamella phase. A corresponding discontinuity is alsoserved in theS(0) andQ* -values~Figs. 12 and 13!. In the12.1% sample, there was no similar changes for temperatdown to 14 °C, showing that the sample did not order intlamella phase, to at least down to 14 °C. TheQ* -value forthe peak position is theoretically predicted to be constantshown in the calculations given in Fig. 2~b!. In reality, how-ever,Q* changes with temperature, likely as a consequeof the influences of the degree of the thermal compositfluctuations. Close toT>100 °C a relative pronouncechange appear in the temperature dependence ofQ* -value, resulting in an only weakT dependence at lowtemperature. The observed change of slope of theQ* -datafor the 12.1% sample at 98 °C might result from the cloapproach to the Lifshitz line.
Figure 14 shows the susceptibilityS(Q5Q* ) and thepeak position,Q* , of the pure diblock copolymer. A clea
FIG. 10. Q* vs concentration at 145, 100, and 65 °C.Q* changes discon-tinuously at the Lifshitz concentration and increases very fast to the valuthe pure diblock copolymer. At 65 °C two transitions at 9% and 11.5diblock concentration are observed. The transition at 11.5% might be inpreted as an order–disorder transition to a bicontinuous microemulstructure.
ed by
TABLE V. Critical parameters of the isotropic Lifshitz critical range. The 4.3% sample has been analyzthe crossover function between mean field and 3d-Ising ranges.F ~%! TC ~°C! Gi (1022) C1(cm3/mol) g j0 ~Å! n h522g/n
4.3 129.7 1.560.6 3236148 1.24 ¯ 0.632 0.0386 121.9 ¯ 293660 1.3760.03 3.560.3 0.8460.01 0.3760.016.7 116 ¯ 227630 1.6260.02 2.760.6 0.9560.03 0.2960.017.4 111.4 ¯ 269634 1.6160.02 2.260.5 160.03 0.3960.018.3 97.9 ¯ 279663 1.6260.03 1.960.6 1.0360.05 0.4360.02
license or copyright, see http://jcp.aip.org/jcp/copyright.jsp

een
isolo
ionnex-eluc. 4
or-epti-
m
y
netotic
ckf
eaknot
5466 J. Chem. Phys., Vol. 112, No. 12, 22 March 2000 Schwahn et al.
step wise change of the susceptibility is seen at the orddisorder phase transition at 83.3 °C. The solid line represthe theoretical expression in Eq.~17! and the correspondingfit parameters are given in Table II. The peak positionQ*linearly decreases with decreasing temperature in the ddered regime and shows a clear change in its behavior bethe order–disorder transition.
E. Lifshitz critical range and crossover behavior
We now discuss the behavior of thermal compositfluctuations in the disordered regime below the Lifshitz lifrom another point of view, namely, in terms of critical eponents of the susceptibility and the corresponding corrtion length obtained from asymptotic scaling laws. The strture factorS(Q) of three samples have been plotted in Figfor various temperatures in Zimm representationS21 vs Q2.The solid lines represent fits according to Eq.~13! from
FIG. 11. Structure factor for two concentrations with exclusively diblocharacter~see phase diagram in Fig. 3!. The solid lines represents a fit oS(Q) in Eq. ~7!.
Downloaded 21 Dec 2006 to 134.94.122.39. Redistribution subject to AIP
r–ts
r-w
a--
which the susceptibilityS(0) and the two coefficientsl 2 andl 4 emerges. In theF54.3% sample,S(Q) is sufficientlywell described by the Ornstein–Zernike approximation cresponding tol 450. For larger block copolymer contents thQ4 term becomes visible and relevant. The inverse suscebility S21(0) vs 1/T is shown in Figs. 5 and 15. TheF54.3% mixture behaves similarly to blends, namely, frohigh to low temperatures a transition frommean-fieldto 3d-Ising critical behavioris observed. This is demonstrated bthe corresponding fit~solid line! of the crossover function byBelyakov et al.25 as already discussed. The second lithrough some of the 4.3% data represents the asymp3d-Ising scaling law with the critical exponentg51.24 as
FIG. 12. S(Q* ) andS(0) vs inverse temperature 1/T. The data are fitted bythe theory of Kielhorn and Muthukumar. For the 14.9% sample a worder–disorder transition was found at 30 °C; such a transition wasobserved for the 12.1% sample.
license or copyright, see http://jcp.aip.org/jcp/copyright.jsp

p
tha
lit
t
thov%th
in16
asea
epti-on-or-icalig.tion
dotob-ra-e intald theoon
uig
.
tem-the
5467J. Chem. Phys., Vol. 112, No. 12, 22 March 2000 Thermal composition fluctuations
evaluated from the crossover function. The inverse suscebilities of the diblock concentrationF56%, 7.4%, and8.3% are characterized by curvatures far beyond that ofF54.3%. Such larger curvature corresponds to an increof the n-exponent, indicating a crossover to the universaclass of theisotropic Lifshitz case. These susceptibilitiescould be analyzed over the whole temperature range byscaling law according toS21(0)5C1
21tg with the reducedtemperature,t5(T2TC)/T, and the critical exponent,g, asdemonstrated by the solid lines. This also means thatGinzburg number corresponding to the critical range abTC has strongly increased in comparison with the 4.3sample. A similar analysis has also been performed forcorrelation length according toj5j01t2n with the criticalexponentn. The obtained critical exponents are collectedTable VI and are shown vs the copolymer content in Fig.
In two samples with concentration 6.7%~not shown inFig. 15 for clarity! and 8.3% an additional crossover wobserved very near the critical temperature and phase sration was observed at a lower critical temperature plotted
FIG. 13. Q* values ofS(Q) from Fig. 11 vs 1/T. Strong shifts of the peakmaximum are observed with temperature. In the 12.1% sample a mstronger slope is observed at higher temperature above 100 °C. This mbe related to the close approach to the Lifshitz line at this temperature
Downloaded 21 Dec 2006 to 134.94.122.39. Redistribution subject to AIP
ti-
esey
he
ee
e
.
pa-s
open dots in the phase diagram. In this range the suscbilities were analyzed by the same scaling law as demstrated for the 8.3% sample in the inset of Fig. 15; the cresponding appreciably larger exponents and the crittemperatures are summarized in Table VI and plotted in F16. On the other hand, in the 7.4% sample phase separaoccurred at the higher critical temperature shown as a fullin the phase diagram and no additional crossover wasserved. This experiment was performed with larger tempeture steps and therefore the sample spent much less timthe region of strong thermal fluctuations. The experimenprocedure was always the same; after the sample reachedesired temperature within the limits of less than 0.1 K twexperimental runs of 10 and 30 min were started. Based
chht
FIG. 14. Susceptibility andQ* for the pure diblock copolymer. A relativelystrong change of the order parameter is observed at the order–disorderperature. In the disordered regime the susceptibility was fitted byFredrickson–Helfand theory according to Eq.~17!.
license or copyright, see http://jcp.aip.org/jcp/copyright.jsp

aex
irsthnoerhi
som
socmckth
efhrtmtu
thimhe
ryis-be-
e-osi-al-
heti-on.
a-
earss-nd
gof
-
less
caal
outalz
5468 J. Chem. Phys., Vol. 112, No. 12, 22 March 2000 Schwahn et al.
these data we conclude that for the samples between 6%9% diblock content two consolute lines can be realizedperimentally. These are plotted by the open and full dotsthe phase diagram, respectively; phase separation occuther at the upper or at the lower lines, depending on whethe crossover to the new universality class can occur orSuch a crossover, however, is observed only if the expments are performed sufficiently slowly. We abbreviate tas therenormalized Lifshitz critical behavior. An interpreta-tion of this crossover might be related to rearrangementthe diblock copolymers as caused by the strong thermal cposition fluctuations nearTC and which further stabilize thesample against phase decomposition. Such an effect wadeed observed in a ternary symmetric homopolymer/diblcopolymer system by a simulation study on spinodal decoposition; in the early to intermediate time regime the blocopolymers became accumulated at the interface ofdomains.30 In our experiments we already observed thisfect in the disordered phase near the critical point. Sucbehavior was not observable in the simulations as one stafrom a mean field free energy expression neglecting therfluctuation. Because of the observed large thermal fluctions near the critical point an early stage~e.g., a linear re-gime! of spinodal decomposition is not observable asfluctuation modes already interact in the disordered regleading to nonlinear effects right from the beginning of tphase decomposition process.2,31 This crossover might bequite analogous to the transition to arenormalized 3d-Ising
FIG. 15. Inverse susceptibility vs inverse temperature.S(0) in the 0.043sample follows a crossover function between mean field and 3d-Isingwhile S(0) of the other samples follows a scaling law with larger criticexponents.
Downloaded 21 Dec 2006 to 134.94.122.39. Redistribution subject to AIP
nd-nei-
ert.i-s
of-
in-k-
e-aedala-
ee
critical behavior, which have been observed in some binapolymer blends,32,33in those blends an inhomogeneously dtributed free volume could account for such a crossoverhavior.
F. The Q4 term of S„Q… near the Lifshitz critical point
The structure factor plotted in Fig. 4 in the Zimm prsentation shows that in the ranges where thermal comption fluctuations are described within the 3d-Ising university class the coefficientl 4 in Eq. ~13! is negligible andS(Q)is described by the Ornstein–Zernike approximation. Tcrossover to the Lifshitz critical behavior shown for the crical exponents in Fig. 16 starts at 6% diblock concentratiAt this F we also begin to observe a contribution froml 4 toS(Q) from a slight deviation from linearity in the presenttion of Fig. 4. This contribution becomes stronger at largerFas is visible for the 8.3% sample. This observation is a clexperimental indication of the connection between the croover between the critical universality classes of 3d-Ising aisotropic Lifshitz cases and the reduction of thec2 and l 2
terms in the Hamiltonian@Eq. ~1!# and structure factorS(Q)@Eq. ~13!#, respectively, being proportional to the restorinforces of thermal composition fluctuations. The strengththe Q4 term can be also characterized byKp22 in the struc-ture factor of Eq.~14! and which is plotted in Fig. 17 vs thecorrelation lengthj in double logarithmic scale. Approaching the critical temperaturej becomes infinite andKp22
approaches zero as is expected for diblock compositionsthan the Lifshitz value.12 At constantj the Kp22 increases
se
FIG. 16. Critical exponents of susceptibility and correlation length. At ab6% diblock content a crossover from 3d-Ising to isotropic Lifshitz criticbehavior is observed. NearTC a further crossover to a renormalized Lifshitcritical behavior was observed.
TABLE VI. Parameters in the renormalized case.
F ~%! Tc ~°C! C1(cm3/mol) g j0 ~Å! n h522g/n
6.7 107.4 78 2.4460.1 3.5 1.1460.12 2(0.1460.02)7.4 not observed because of a faster cooling rate by larger temperature steps8.3 91.4 55 2.4360.06 2.4 1.160.05 2(0.2160.01)
license or copyright, see http://jcp.aip.org/jcp/copyright.jsp

me
oener
ie
he
rseiinc
e
Liwanit
F
onram
pti-
justn-malr-
ss-thetted.
rf
he
icaL
ng
e
resmul-s;
Lif-
5469J. Chem. Phys., Vol. 112, No. 12, 22 March 2000 Thermal composition fluctuations
by about one order of magnitude changing the diblock coposition from 6.7 to 8.3% and which is the result of a dcreasingc2 parameter in the Hamiltonian@Eq. ~1!#.
G. Flory–Huggins parameter, Ginzburg number, andsegment length
The analysis of the structure factorS(Q) measuringthermal composition fluctuations in the disordered statethe three component polymer mixture was mainly performon the basis of the formalism developed by Kielhorn aMuthukumar in Ref. 13 and which takes the effects of thmal fluctuations into consideration, as reviewed aboveSec. II B. For samples with a diblock concentration largthan the Lifshitz line with the maximum ofS(Q) occurringat a finiteQ, the most general application started with tanalysis ofS(Q) by Eq.~7! ~see solid lines in Figs. 6 and 11!which for each equilibrium state delivers four parametenamely, a, b, c, d. Based on these four values and thexpressions given in Ref. 13, the FH-parameter, the Gzburg parameter, and the statistical segment length wereculated for each temperature from Eq.~9!. The so obtainedFH-parameter has been plotted in Fig. 18~a! vs 1/T. The datamainly follow a straight line according toG5Gh /T2Gs
with the enthalpic and entropic contributions whose numbhave been plotted in Fig. 18~b! and are given in Table II. TheFH-parameters in Fig. 18~a! follow a straight line at hightemperatures while at temperatures just below the lowershitz line deviations are observed as indicated by the arroThis means that at low temperature the theoretical approdoes no longer describe the experimental data; a transitioa different state could be the reason for this deviation. Wreference to the results of Bateset al.16 we interpret thisbehavior and the temperatures as indicated by arrows in
FIG. 17. Coefficient of theQ4 term of S(Q) in Eq. ~14! vs the correlationlength. This coefficient follows a scaling law approaching zero at the crittemperature as is expected for diblock concentrations smaller than theshitz concentration. For constant correlation length the coefficient stroincreases according the decrease of the surface energy proportional toc2 inthe Hamiltonian. The appearance of a finiteKp22 is accompanied by thecrossover from 3d-Ising to the isotropic Lifshitz case; this is reasonablthe restoring force for thermal composition fluctuations proportional toc2
becomes weaker.
Downloaded 21 Dec 2006 to 134.94.122.39. Redistribution subject to AIP
--
fdd-nr
,r-
al-
rs
f-s.chtoh
ig.
18~a! as the borderline to a bicontinuous microemulsiphase. This borderline has been plotted in the phase diagof Fig. 3.
In addition, the FH-parameter was evaluated fromS(0)using Eqs.~8! and ~12!, which for diblock concentrationssmaller than the Lifshitz line becomes the system suscebility. In order to analyzeS(0) the parameters in Eq.~12!had to be assumed independent of temperature. Thementioned formalism could not be applied for diblock cocentrations smaller than 5%; for those samples the therfluctuations show the critical behavior of the 3d-Ising univesality class as in binary polymer blends, including the croover to the mean field behavior. So, the FH-parameter ofpure blend and 4.3% sample was evaluated from the ficrossover function in Eq.~20! and has been depicted in Fig18~b!.
The statistical segment lengths is another parameteobtained from the parameterd in the parameterized form othe structure factor of Eqs.~7! and ~11!. It describes thepolymer conformation according to its relationship with tradius of gyration (Rg
25s2N/6). In Fig. 19 the values ofs
lif-ly
as
FIG. 18. ~a! Flory–Huggins parameter vs 1/T as evaluated fromS(Q) withEqs.~8! and~9!. The deviations from the straight lines at low temperatuare interpreted related to an ordering transition to a bicontinuous microesion structure.~b! Flory–Huggins parameter for all investigated samplethey were derived from the fitted straight lines in~a! and from Eqs.~20! and~12!, depending on whether the sample is in the 3d-Ising or isotropicshitz critical region.
license or copyright, see http://jcp.aip.org/jcp/copyright.jsp

eme
t
pnh
anehe,peyml seioerby
iocwde
heaxtyonan
a
erast
thee
mes-
thengand
EE-er,alitzce
x-as
ashelockoflsions
r ofE/itz
p-
by/
onts,ingreeearplesse
e
m-
–The
anhted
inig.%
owvioren
ontio
om
5470 J. Chem. Phys., Vol. 112, No. 12, 22 March 2000 Schwahn et al.
of the 14.9% sample is shown as an example; at high tperatures one finds in all samples a very good agreemwith the expected values&55.64 Å from the literature.34
Upon decreasing the temperature a marked increase insegment length reflects a stretching of the polymers.
V. DISCUSSIONS AND CONCLUSIONS
We presented SANS experiments on the three comnent mixture composed of the near critical polymer blePEE/PDMS and the corresponding diblock copolymer. Tratio of the molar volumes between homogeneousdiblock copolymer isa50.178. From measurements of thstatic structure factorS(Q) the phase boundaries between tdisordered states at high temperatures and, respectivelymicro- and the macrophase separated states at low temtures were determined for the PEE/PDMS/PEE-PDMS stem. These results are summarized in the phase diagraFig. 3. The macrophase separation is realized as a usuaond order phase transition in the low diblock copolymlimit. For higher copolymer content, microphase separatappears as a first order phase transition to a lamella ordstate above 14% diblock content with a periodicity giventhe size of the diblock copolymer and to a bicontinuous mcroemulsion phase between roughly 9% and 14% diblconcentration. The phase boundary of the latter phaseproposed indirectly from anomalies of the concentrationpendence ofQ* ~Fig. 10!, the FH-parameter@Fig. 18~a!# andfrom information in Ref. 16. In the disordered regime, tfluctuations are reflected through the structure factor mmum, S(0) andS(Q* ), which represents the susceptibiliand the maximum amplitude of the thermal fluctuatimodes. The fluctuations resulting in respectively macromicrophase separation is occurring for a maximum inS(Q)at, respectively,Q50, and Q5Q* , Q* being finite. TheLifshitz line separating these two disordered ranges widentified experimentally, as shown in the phase diagram
FIG. 19. Statistical segment length for the sample with 14.9% diblock ccentrations as obtained from the fit. At high temperatures the conformaof an ideal coil is approached while at lower temperature the coils becstretched.
Downloaded 21 Dec 2006 to 134.94.122.39. Redistribution subject to AIP
-nt
he
o-ded
thera-
s-in
ec-rned
-kas-
i-
d
sin
Fig. 3. According to the mean field theory the Lifshitz linshould be at a constant block copolymer content in contto the observation.
Beyond the characteristic border lines presented inphase diagram in Fig. 3 the ‘‘critical’’ characteristics of ththermal composition fluctuations in the disordered regiwere determined, including the identification of the crosover behavior from the universality classes of 3d-Ising toisotropic Lifshitz and to a renormalized Lifshitz case leadito a lower phase boundary indicated by the crossed areathe open dots, respectively. In the ternary PEE/PDMS/PPDMS system the mean field approximation can, howevonly be a rather poor approximation. In particular, criticfluctuations will become strong near the isotropic Lifshcritical point since the stabilizing effects from the surfaenergy, expressed by thec2 term and by thel 2 term in Eqs.~1! and ~13!, respectively, becomes small. This effect is epressed by an upper critical dimension, which is deriveddU58 at the Lifshitz line.12–14 The Lifshitz point, however,is destroyed by these thermal composition fluctuations,according to the Ginzburg criterion the stabilization of tdisordered phases is much weaker in blends than in dibcopolymers.11,13 On the other hand in the ternary systemPE/PEP/PE-PEP, where the appearance of a microemuphase was first established16 the observed critical exponentremained the mean field values.15 This situation is differentfrom the present system and must be related to the ordemagnitude smaller molar volume of the polymers in the PEPDMS system, relative to the PE/PEP system. At the Lifshpoint the Ginzburg number scales withN22/5 in comparisonwith blends where aN21 is proposed, which means an apreciably stronger sensitivity of Gi with molar volume.
A detailed analysis of the structure factorS(Q) andS(0)were performed with the theoretical approach formulatedKielhorn and Muthukumar13 which for homopolymer blendscopolymer systems takes fluctuations into considerationthe basis of the Hartree approximation. The resulting fiwhich are represented by the solid lines in the correspondfigures, represent the experimental data rather well. Thcharacteristic different diblock concentration ranges appin the phase diagram. First, we considered the two samof largest diblock content at 12.1% and 14.9%. In thesamples the susceptibility always occurs at the finiteQ*value. The fit ofS(Q) is presented in Fig. 11 from which thparameters are collected in Table II. In additionS(0) wasfitted as depicted in Fig. 12 and the corresponding paraeters are collected in Table IV. The susceptibilityS(Q* )itself was fitted by Eq.~17! representing the FredricksonHelfand approach and is demonstrated by the solid line.corresponding parameters are not given. The transition toordered state is observed in the 14.9% sample, as highligin the inset of Fig. 12 showing the deviations ofS(0) fromtheir theoretical prediction. The deviations are still weakcomparison to that of the pure diblock sample, shown in F14. A similar deviation was not observed for the 12.1sample and those with lower diblock content.
The samples between 9% and 11% diblock content shan intermediate behavior between the characteristic behaof blends and diblock copolymers. This is most clearly se
-ne
license or copyright, see http://jcp.aip.org/jcp/copyright.jsp

tighv
e-h
neitit
b
iit
a
is.ei
n
raas
is
nth
he
en
aaslyedq
3d
th
ted
ndo
pl
0%isnthn
esag-
les.ly-hasn ofFH-ich
tes.3%twoer.
19calforerslighter–
drome
wses.
us-or
thes of
picnt
fterto
heralosega-to
i-alp-een
t
Eu-
5471J. Chem. Phys., Vol. 112, No. 12, 22 March 2000 Thermal composition fluctuations
in the plots of Fig. 9 showing the peak positionQ* vs tem-perature. According to these figures the samples showcharacteristic behavior of diblocks both at low and at htemperatures, while at intermediate temperature the behais polymer blend like with the susceptibility given atQ50of S(Q). These observations imply that the Lifshitz line dpendents on the diblock content as depicted by the dascurve in the phase diagram in Fig. 3. Near the Lifshitz litheQ* approaches with temperature zero exponentially wan exponent roughly between 0.3 and 0.4, which is qusimilar to the theoretical exponent ofQ* upon approachingthe Lifshitz line by changing concentrations, as proposedthe mean field calculation shown in Fig. 2~b!. The change ofQ* with concentration depicted for three temperaturesFig. 10, however, shows a different behavior; at the Lifshconcentration a stepwise increase ofQ* is observed as istypical for an order parameter change at a first order phtransition. At 65 °C even two stepwise changes ofQ* areobserved, while at 9% diblock content the Lifshitz linepassed the second step to a finiteQ* is observed at 11.5%This change inQ* we interpret as the phase transition bordto a bicontinuous microemulsion phase in consistence wresults from Ref. 16. TheS(Q) of these samples is shown iFig. 6, and theirS(Q* ) and S(0) in Fig. 7; the solid anddashed lines represent the corresponding fits whose paeters are collected in Tables II and IV. An irregularity wobserved in the 9.3% sample in so far as a continuouscrease ofS(Q* ) andS(0) with decreasing temperature wanot observed; at the lower Lifshitz line a decrease ofS(Q* )andS(0) is observed. This means that in this sample the lowavelength fluctuations became partly unbounded fromdiblock copolymers if approaching the lower Lifshitz line.
In the samples with a diblock content lower than tLifshitz line the susceptibility is always represented byS(0)which have been plotted in Fig. 5. The solid lines represthe corresponding fits with Eqs.~12! and ~13!; their param-eters are collected in Table III. The Kielhorn–Muthukumtheory could not be applied for the 4.3% sample; in this cthe fluctuations showed the characteristic behavior of pomer blends, namely a crossover behavior from cases of mfield approximation to the 3d-Ising model. The corresponing solid line represents a fit of the crossover function in E~20! and the dashed line the scaling law according theIsing model with the critical exponentg51.24.
The main parameters obtained from applicationKielhorn–Muthukumar theory toS(Q) andS(0) are the FH-parameter, the Ginzburg number G˜ i, and polymer conforma-tion. The enthalpic and entropic terms of the FH-paramefrom all samples are shown in Fig. 18 and are summarizeTables II–IV. The values obtained fromS(Q) andS(0) andEqs. ~12! and ~16! are the same within the error bars aindependent from the diblock content. The enthalpic termthe FH-parameter of the pure blend and the 4.3% samderived from the crossover function Eq.~20! is the same asfor the other three component samples while a roughly 3smaller value was found for pure diblock copolymer. Dtinctly different entropic terms were evaluated for the 0 a4.3% sample and the pure diblock copolymer being oforder of 1024 and negative for the latter sample. The e
Downloaded 21 Dec 2006 to 134.94.122.39. Redistribution subject to AIP
he
ior
ed
he
y
nz
se
rth
m-
n-
ge
t
re-an-.-
e
rin
fes
-de-
tropic terms ofG for the other three component samplshow a rather strong scattering within the same order of mnitude of the pure diblock and of the 0 and 4.3% sampThe apparent difference of the FH-parameter of binary pomer blends and the corresponding diblock copolymersbeen discussed in Refs. 10, 35, and 36. The conclusioRefs. 10 and 36 was that the absolute values of theparameters are always smaller in diblock copolymers whis consistent with the data of the present work.
The Ginzburg parameter G˜ i in Table II is rather constanfor the diblock copolymer and the three component mixturThe corresponding Ginzburg number of the 0 and 4.sample evaluated from the crossover function is aboutorders of magnitude smaller than for the diblock copolymSimilar ratios were also found for another system.10
The values for the segment length are plotted in Fig.for the 14.9% sample. At high temperature the statistisegment length approaches the value given in literaturethe corresponding linear polymer components. The polymbecome stretched by decreasing the temperature. A sshrinkage of the chains is observed by passing the orddisorder temperature.
The susceptibilities for a diblock content of 6% anlarger as depicted in Fig. 5 have also been interpreted fthe point of view of scaling laws, valid asymptotically closto a critical point and plotted in Fig. 15. These scaling laare characterized by the critical exponents and amplitudThe numerical numbers of the critical exponents of the sceptibility and correlation length are depicted in Fig. 16. Fconcentrations with block copolymer content below 5.5%thermal fluctuations are described by the universality clasthe 3d-Ising behavior. BetweenF55 and 7%, approxi-mately, the system crosses gradually over to the isotroLifshitz critical behavior characterized by a critical expone(g51.62) significantly larger than the 3d-Ising value (g51.24). Even larger critical exponents were obtained athe crossover to the Lifshitz renormalized state very closethe critical temperature (g52.44). The critical exponentsgandn are related by the Fisher scaling relation to the Fisexponenth presented in Tables II and III. The experimenth values are of the order of one magnitude larger than thof polymer blends in the 3d-Ising regime, and become netive in the renormalized state. A crossover from 3d-Isingan isotropic Lifshitz and renormalized isotropic Lifshitz critcal behavior is observed even though the Lifshitz criticpoint itself cannot be reached experimentally; it is supressed by strong thermal composition fluctuations as is sby the parameterp in Eq. ~14! which is not constant busingular near the critical temperature~Fig. 17!.
ACKNOWLEDGMENTS
We would like to thank M. Heiderich from FZ-Ju¨lich fortechnical support. The work has been supported by theropean program for large-scale facilities~TMR!.
1P. G. deGennes,Scaling Concepts in Polymer Physics~Cornell UniversityPress, Ithaca, 1979!.
2K. Binder, Adv. Polym. Sci.112, 181 ~1994!.
license or copyright, see http://jcp.aip.org/jcp/copyright.jsp

.
ett
K
.
ev
l,
a
ules
.
les
W.
ol.
G.
5472 J. Chem. Phys., Vol. 112, No. 12, 22 March 2000 Schwahn et al.
3D. Schwahn, K. Mortensen, and H. Yee-Madeira, Phys. Rev. Lett.58,1544 ~1987!.
4F. S. Bates, J. H. Rosedale, P. Stepanek, T. P. Lodge, P. Wiltzius, GFredrickson, and R. P. Hjelm, Phys. Rev. Lett.65, 1893~1990!.
5D. Schwahn, G. Meier, K. Mortensen, and S. Janssen, J. Phys. II4, 837~1994!.
6G. H. Fredrickson and E. Helfand, J. Chem. Phys.87, 697 ~1987!; 89,5890 ~1988!.
7F. S. Bates and G. H. Fredrickson, Annu. Rev. Phys. Chem.41, 525~1990!.
8L. Leibler, Macromolecules13, 1602~1980!.9D. Schwahn, T. Schmackers, and K. Mortensen, Phys. Rev. E52, R1288~1995!.
10H. Frielinghaus, B. Abbas, D. Schwahn, and L. Willner, Europhys. L44, 606 ~1998!.
11D. Broseta and G. H. Fredrickson, J. Chem. Phys.93, 2927~1990!.12R. Holyst and M. Schick, J. Chem. Phys.96, 7728~1992!.13L. Kielhorn and M. Muthukumar, J. Chem. Phys.107, 5588~1997!.14J. F. Nicoll, G. F. Tuthill, T. S. Chang, and H. E. Stanley, Physica86–
88B, 618 ~1977!.15F. S. Bates, W. Maurer, T. P. Lodge, M. F. Schulz, M. W. Matsen,
Almdal, and K. Mortensen, Phys. Rev. Lett.75, 4429~1995!.16F. S. Bates, W. W. Maurer, P. M. Lipic, M. A. Hillmyer, K. Almdal, K
Mortensen, G. H. Fredrickson, and T. P. Lodge, Phys. Rev. Lett.79, 849~1997!.
17D. Schwahn, K. Mortensen, H. Frielinghaus, and K. Almdal, Phys. RLett. 82, 5056~1999!.
18M. A. Hillmyer, W. W. Maurer, T. P. Lodge, F. S. Bates, and K. AlmdaJ. Phys. Chem.103, 4814~1999!.
19T. L. Morkved, B. R. Chapman, F. S. Bates, T. P. Lodge, P. Stepanek,K. Almdal, Faraday Discuss.112, 335 ~1999!.
Downloaded 21 Dec 2006 to 134.94.122.39. Redistribution subject to AIP
H.
.
.
.
nd
20H. S. Jeon, J. H. Lee, N. P. Balsara, and M. C. Newstein, Macromolec31, 3340~1998!.
21D. I. Uzunov,Theory of Critical Phenomena~World Scientific, Singapore,1993!.
22W. Selke, inPhase Transitions and Critical Phenomena, edited by C.Domb and J. L. Lebowitz~Academic, New York, 1992!, Vol. 15.
23G. H. Fredrickson and F. S. Bates, J. Polym. Sci., Part B: Polym. Phys35,2775 ~1997!.
24S. Janßen, D. Schwahn, and T. Springer, Phys. Rev. Lett.68, 3180~1992!.25M. Y. Belyakov and S. B. Kiselev, Physica A190, 75 ~1992!.26J. v. Sengers, inSupercritical Fluids: Fundamentals for Application, ed-
ited by E. Kiran and J. M. H. Levelt Sengers~Kluwer Academic, Dor-drecht, 1994!.
27K. Almdal, K. Mortensen, A. J. Ryan, and F. S. Bates, Macromolecu29, 5940~1996!.
28N. P. Balsara, L. J. Fetters, N. Hadjichristidis, D. J. Lohse, C. C. Han,W. Graessley, and R. Krishnamoorti, Macromolecules25, 6137~1992!.
29Neutronenstreuexperimente am FRJ-2 in Ju¨lich ~German and English textavailable at Forschungzentrum Ju¨lich, 1997!.
30L. Kielhorn and M. Muthukumar, J. Chem. Phys.110, 4079~1999!.31G. Muller, D. Schwahn, and T. Springer, Phys. Rev. E55, 7267~1997!; D.
Schwahn, G. Mu¨ller, and H. Frielinghaus, Recent Res. Dev. MacromRes.2, 107 ~1997!.
32D. W. Hair, E. K. Hobbie, J. Douglas, and C. C. Han, Phys. Rev. Lett.68,2476 ~1992!.
33D. Schwahnet al., Phys. Rev. Lett.73, 3427~1994!.34L. Fetters~private communication!.35J. Dudowicz and K. F. Freed, Macromolecules26, 213 ~1993!.36W. W. Maurer, F. S. Bates, T. P. Lodge, K. Almdal, K. Mortensen, and
M. Fredrickson, J. Chem. Phys.108, 2989~1998!.
license or copyright, see http://jcp.aip.org/jcp/copyright.jsp