Thermal bioclimate analysis for Europe and Italy
10
DOI 10.1393/ncc/i2007-10268-0 IL NUOVO CIMENTO Vol. 30 C, N. 6 Novembre-Dicembre 2007 Thermal bioclimate analysis for Europe and Italy A. Matzarakis( 1 )( ∗ ), T. Georgiadis( 2 ) and F. Rossi( 2 ) ( 1 ) Meteorological Institute, University of Freiburg - Werthmannstrasse 10, D-79085 Freiburg, Germany ( 2 ) IBIMET - Via Gobetti 101, 40129 Bologna, Italy (ricevuto il 23 Ottobre 2007; revisionato il 22 Gennaio 2008; approvato il 28 Gennaio 2008; pubblicato online il 3 Luglio 2008) Summary. — Thermal bioclimate indexes (as thermal comfort or heat stress in- dexes) are one of the main issues concerning tourism and health conditions especially for expected climate change. The Mediterranean area and countries such as Italy, Spain, France, Turkey and Greece, whose economies are markedly dependent on tourism, are vulnerable regions concerning climate change. In the present study thermal comfort and heat stress (here with the thermal index physiologically equiv- alent temperature—PET) are analysed in order to quantify the monthly conditions in this area. Additionally, based on climate change scenarios, the seasonal pattern of PET for the period 2070-2100 has been calculated. The results show that the expected conditions of thermal comfort especially for the Mediterranean and Italy will be higher, during summer, about two to three classes of thermal stress for the “business as usual” climate scenarios, and one class of thermal stress for winter. Adaptation and mitigation strategies are hence required for the protection of human health and tourism state and potentialities. PACS 92.60.Ry – Climatology, climate change and variability. PACS 92.70.-j – Global change. PACS 92.70.Kb – Regional climate change. 1. – Introduction An increasing awareness concerning Anthropogenic Global Warning (AGW) induced Governments to take actions to prevent and mitigate the effects on local climate and environment. IPCC analysis reported in the 4AR shows a differentiated heating for different parts of the globe which presumable will induce also differentiated impacts [1,2]. Prior to the publication of the IPCC-4AR, a document produced by the European Commission titled document “Limiting global change to 2 degrees Celsius: the way ahead ( ∗ ) E-mail: [email protected] c Societ` a Italiana di Fisica 623
Transcript of Thermal bioclimate analysis for Europe and Italy

DOI 10.1393/ncc/i2007-10268-0
IL NUOVO CIMENTO Vol. 30 C, N. 6 Novembre-Dicembre 2007
Thermal bioclimate analysis for Europe and Italy
A. Matzarakis(1)(∗), T. Georgiadis(2) and F. Rossi(2)(1) Meteorological Institute, University of Freiburg - Werthmannstrasse 10, D-79085
Freiburg, Germany(2) IBIMET - Via Gobetti 101, 40129 Bologna, Italy
(ricevuto il 23 Ottobre 2007; revisionato il 22 Gennaio 2008; approvato il 28 Gennaio 2008;pubblicato online il 3 Luglio 2008)
Summary. — Thermal bioclimate indexes (as thermal comfort or heat stress in-dexes) are one of the main issues concerning tourism and health conditions especiallyfor expected climate change. The Mediterranean area and countries such as Italy,Spain, France, Turkey and Greece, whose economies are markedly dependent ontourism, are vulnerable regions concerning climate change. In the present studythermal comfort and heat stress (here with the thermal index physiologically equiv-alent temperature—PET) are analysed in order to quantify the monthly conditionsin this area. Additionally, based on climate change scenarios, the seasonal patternof PET for the period 2070-2100 has been calculated. The results show that theexpected conditions of thermal comfort especially for the Mediterranean and Italywill be higher, during summer, about two to three classes of thermal stress forthe “business as usual” climate scenarios, and one class of thermal stress for winter.Adaptation and mitigation strategies are hence required for the protection of humanhealth and tourism state and potentialities.
PACS 92.60.Ry – Climatology, climate change and variability.PACS 92.70.-j – Global change.PACS 92.70.Kb – Regional climate change.
1. – Introduction
An increasing awareness concerning Anthropogenic Global Warning (AGW) inducedGovernments to take actions to prevent and mitigate the effects on local climate andenvironment. IPCC analysis reported in the 4AR shows a differentiated heating fordifferent parts of the globe which presumable will induce also differentiated impacts [1,2].
Prior to the publication of the IPCC-4AR, a document produced by the EuropeanCommission titled document “Limiting global change to 2 degrees Celsius: the way ahead
(∗) E-mail: [email protected]
c© Societa Italiana di Fisica 623
624 A. MATZARAKIS, T. GEORGIADIS and F. ROSSI
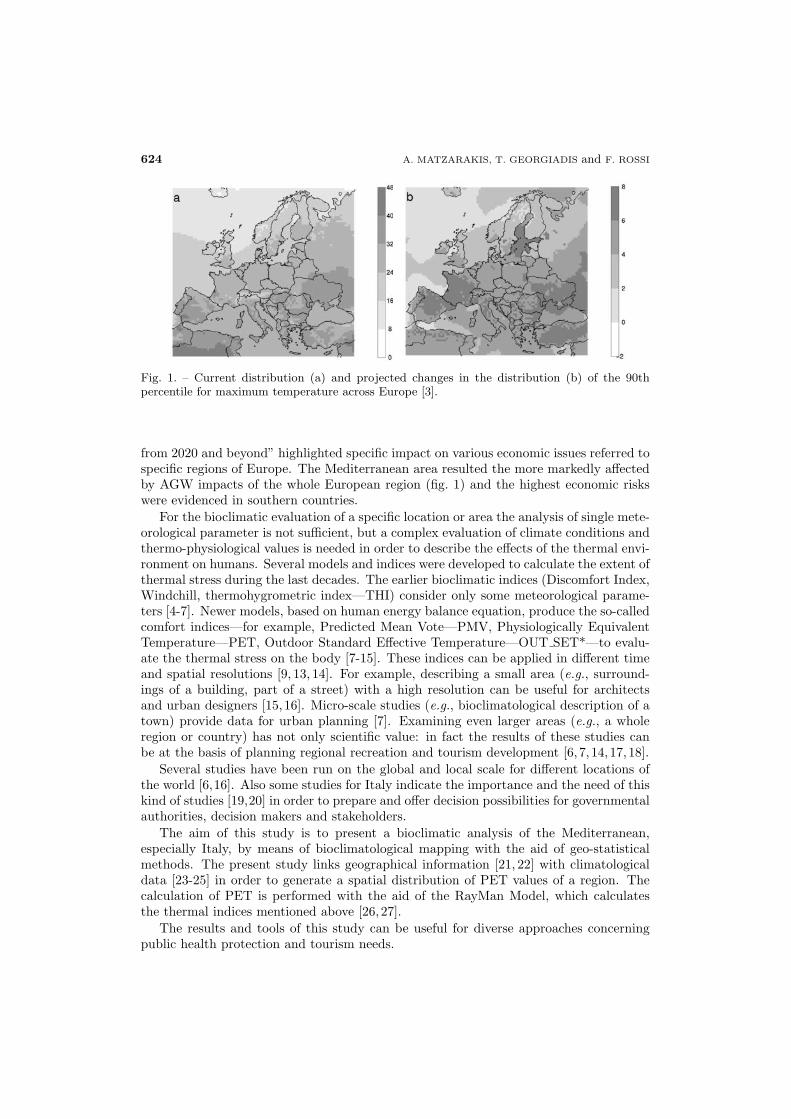
Fig. 1. – Current distribution (a) and projected changes in the distribution (b) of the 90thpercentile for maximum temperature across Europe [3].
from 2020 and beyond” highlighted specific impact on various economic issues referred tospecific regions of Europe. The Mediterranean area resulted the more markedly affectedby AGW impacts of the whole European region (fig. 1) and the highest economic riskswere evidenced in southern countries.
For the bioclimatic evaluation of a specific location or area the analysis of single mete-orological parameter is not sufficient, but a complex evaluation of climate conditions andthermo-physiological values is needed in order to describe the effects of the thermal envi-ronment on humans. Several models and indices were developed to calculate the extent ofthermal stress during the last decades. The earlier bioclimatic indices (Discomfort Index,Windchill, thermohygrometric index—THI) consider only some meteorological parame-ters [4-7]. Newer models, based on human energy balance equation, produce the so-calledcomfort indices—for example, Predicted Mean Vote—PMV, Physiologically EquivalentTemperature—PET, Outdoor Standard Effective Temperature—OUT SET*—to evalu-ate the thermal stress on the body [7-15]. These indices can be applied in different timeand spatial resolutions [9, 13, 14]. For example, describing a small area (e.g., surround-ings of a building, part of a street) with a high resolution can be useful for architectsand urban designers [15,16]. Micro-scale studies (e.g., bioclimatological description of atown) provide data for urban planning [7]. Examining even larger areas (e.g., a wholeregion or country) has not only scientific value: in fact the results of these studies canbe at the basis of planning regional recreation and tourism development [6, 7, 14,17,18].
Several studies have been run on the global and local scale for different locations ofthe world [6,16]. Also some studies for Italy indicate the importance and the need of thiskind of studies [19,20] in order to prepare and offer decision possibilities for governmentalauthorities, decision makers and stakeholders.
The aim of this study is to present a bioclimatic analysis of the Mediterranean,especially Italy, by means of bioclimatological mapping with the aid of geo-statisticalmethods. The present study links geographical information [21, 22] with climatologicaldata [23-25] in order to generate a spatial distribution of PET values of a region. Thecalculation of PET is performed with the aid of the RayMan Model, which calculatesthe thermal indices mentioned above [26,27].
The results and tools of this study can be useful for diverse approaches concerningpublic health protection and tourism needs.
THERMAL BIOCLIMATE ANALYSIS FOR EUROPE AND ITALY 625
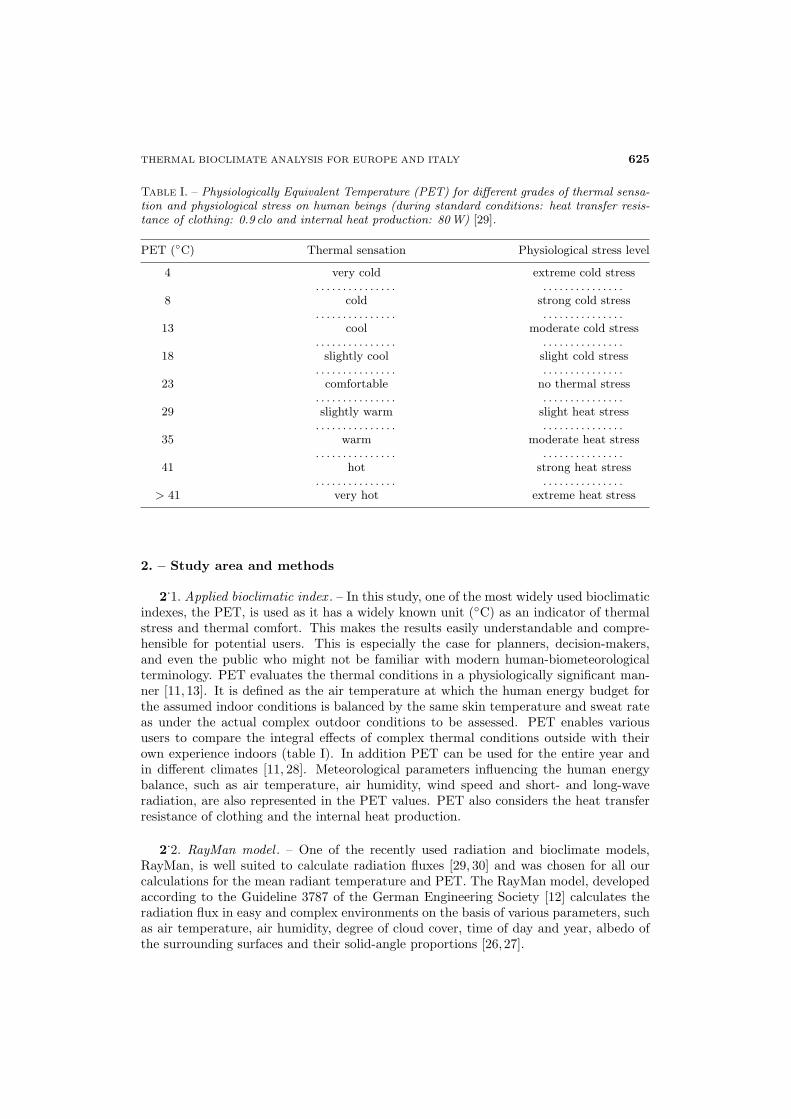
Table I. – Physiologically Equivalent Temperature (PET) for different grades of thermal sensa-tion and physiological stress on human beings (during standard conditions: heat transfer resis-tance of clothing: 0.9 clo and internal heat production: 80W) [29].
PET (◦C) Thermal sensation Physiological stress level
4 very cold extreme cold stress. . . . . . . . . . . . . . . . . . . . . . . . . . . . . .
8 cold strong cold stress. . . . . . . . . . . . . . . . . . . . . . . . . . . . . .
13 cool moderate cold stress. . . . . . . . . . . . . . . . . . . . . . . . . . . . . .
18 slightly cool slight cold stress. . . . . . . . . . . . . . . . . . . . . . . . . . . . . .
23 comfortable no thermal stress. . . . . . . . . . . . . . . . . . . . . . . . . . . . . .
29 slightly warm slight heat stress. . . . . . . . . . . . . . . . . . . . . . . . . . . . . .
35 warm moderate heat stress. . . . . . . . . . . . . . . . . . . . . . . . . . . . . .
41 hot strong heat stress. . . . . . . . . . . . . . . . . . . . . . . . . . . . . .
> 41 very hot extreme heat stress
2. – Study area and methods
2.1. Applied bioclimatic index . – In this study, one of the most widely used bioclimaticindexes, the PET, is used as it has a widely known unit (◦C) as an indicator of thermalstress and thermal comfort. This makes the results easily understandable and compre-hensible for potential users. This is especially the case for planners, decision-makers,and even the public who might not be familiar with modern human-biometeorologicalterminology. PET evaluates the thermal conditions in a physiologically significant man-ner [11, 13]. It is defined as the air temperature at which the human energy budget forthe assumed indoor conditions is balanced by the same skin temperature and sweat rateas under the actual complex outdoor conditions to be assessed. PET enables varioususers to compare the integral effects of complex thermal conditions outside with theirown experience indoors (table I). In addition PET can be used for the entire year andin different climates [11, 28]. Meteorological parameters influencing the human energybalance, such as air temperature, air humidity, wind speed and short- and long-waveradiation, are also represented in the PET values. PET also considers the heat transferresistance of clothing and the internal heat production.
2.2. RayMan model . – One of the recently used radiation and bioclimate models,RayMan, is well suited to calculate radiation fluxes [29, 30] and was chosen for all ourcalculations for the mean radiant temperature and PET. The RayMan model, developedaccording to the Guideline 3787 of the German Engineering Society [12] calculates theradiation flux in easy and complex environments on the basis of various parameters, suchas air temperature, air humidity, degree of cloud cover, time of day and year, albedo ofthe surrounding surfaces and their solid-angle proportions [26,27].
626 A. MATZARAKIS, T. GEORGIADIS and F. ROSSI
2.3. Data. – The climate data used to fit RayMan and calculate PET for thisanalysis [27] were provided by the data collection program at the Climatic ResearchUnit [23-25]. The required data (air temperature, relative humidity, sunshine and windspeed) are available at monthly resolution for the climate period 1961 to 1990 at tenminute resolution for the study area. The available monthly data have been used which,although not performing for daily observations since lacking of the demanded resolution,fit well in offering mean monthly conditions of human-biometeorological conditions asbasic information.
The dataset of future climatic conditions was based on an integration of the HadleyCentre’s HadCM3 model forced with the SRES emissions scenarios. The HadCM3 modelproduces gridded data with a spatial resolution of 2.5◦ latitude ×3.75◦ longitude, whichis significantly coarser than that of the CRU 1.0 dataset. The used HadCM3 dataset con-sists of monthly averages for two time slices: 1961-1990 and 2070-2099. The uncertaintiesand difficulties of the climate projections data are described in [31] and [32].
2.4. Study area. – The Mediterranean area is one of the most appreciated regions fortourism, and at the time, one of the more vulnerable concerning the expected climateconditions for the future. Most of the economies of the countries of the Mediterraneanbasin are dependent on tourism, both during summer holidays and through the year ascultural trips and visits.
For Italy, an analysis of the thermal conditions over the entire territory is important.In the interior, the cultural and monumental heritages offer a variety of different journeyscapable to satisfy the requirements of thousands of guests (millions over a whole touristseason). In addition to major itineraries (important big cities and monuments), maintouristic tools come from some attractive characteristic of the national landscape, assmall historical towns that came to us unchanged from the Middle Age, maintainingoriginal materials in terms of buildings and pavements and, sometimes, the same wayto “live” the town itself through centuries. The economic importance of the Italiancoasts is not lower that the in-land one because, starting from the second world war,tourist activities in these areas has been increasing step by step, assuming nowadays aparamount importance for visiting people and local population. Consequently, changesin thermal patterns, mainly during the summer, can strongly affect not only the humanhealth conditions but, also, the local economies [33].
3. – Results and discussion
Based on the described methods and models and the use of the geo-statistical methods,mean monthly maps of physiologically equivalent temperature have been constructed.The maps presented here show the conditions for Europe and the Mediterranean for adirect comparison between the conditions of the western and north European countries,which are the main sources for tourists for the target area. Figure 2 illustrates thePET conditions for January, which represents the coldest month of the year, and fig. 3the same for July, the warmest month of the year. In January, PET values in NorthEurope (Scandinavian countries and the Alps) are between 0 and −20 to −30. For theMediterranean area and the coasts, the range of the PET values goes from +5 up to 15 ◦Cin the North Africa zones. From fig. 2 is can be derived that, for the 1961-1990 situation,the conditions are lying in the area of light to strong cold stress in the Mediterranean.
For July (fig. 3) the conditions show that thermal comfort conditions can be obtainedonly in the Northern Europe countries and high-lying areas such as the Alps. For the

THERMAL BIOCLIMATE ANALYSIS FOR EUROPE AND ITALY 627
Fig. 2. – Map of physiologically equivalent temperature for January for the period 1961-1990.
Fig. 3. – Map of physiologically equivalent temperature for July for the period 1961-1990.
628 A. MATZARAKIS, T. GEORGIADIS and F. ROSSI
0
10
20
30
40
50
60
Winter Spring Summer Autumn
PET
(°C
) BaseA1FA2AB1AB2A
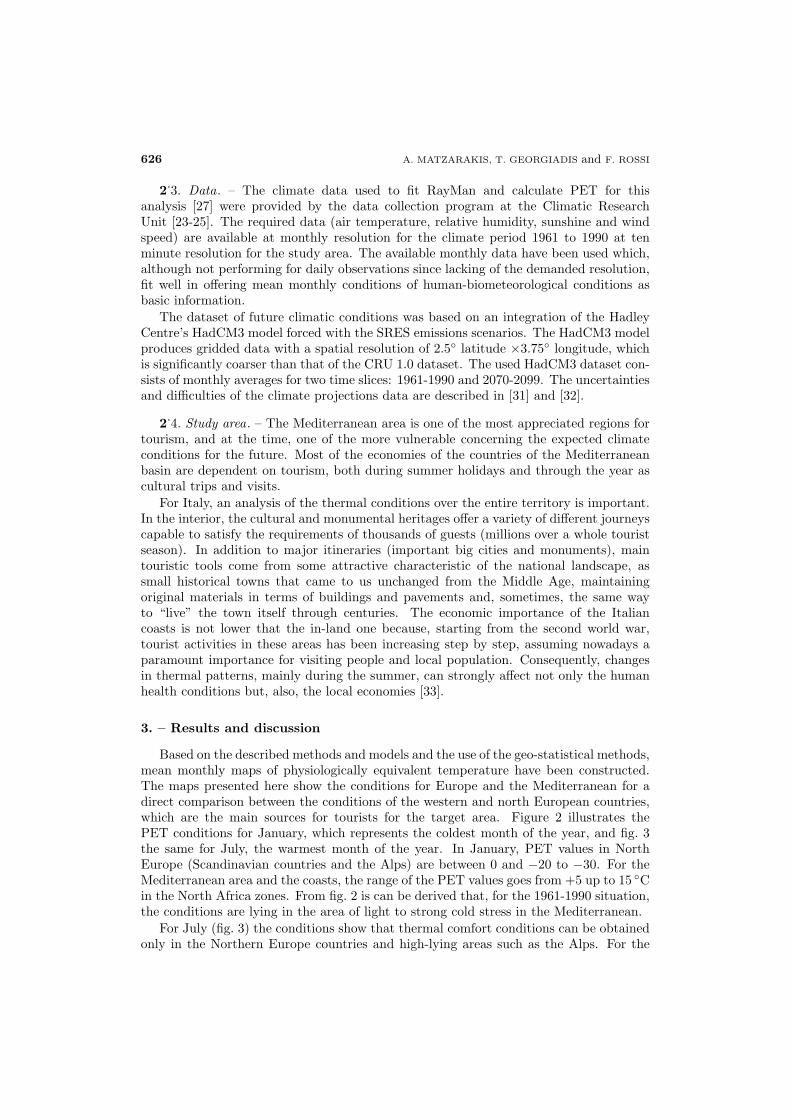
Fig. 4. – Maximum seasonal values of PET for Base and four IPCC-scenarios for 1960-1990 and2070-2100 for Europe.
Mediterranean coast, the PET values are in the range of 30 to 40 ◦C and higher, evidenc-ing the extreme heat stress occurring in most of the target areas. For southern countriesthe PET values are higher than 35 or 41 ◦C, values that, according to table I, are qualifiedas strong and extreme heat stress. So, the conditions during July are, currently, quitebad as far as heat stress is concerned.
Based on the IPCC-emission scenarios [34], four scenarios have been chosen and thePET values calculated on monthly and seasonal resolution. The scenarios represent re-spectively two “worse scenarios” (A1F and A2A) and “two moderate emission scenarios”(B1A and B2A) conditions. Additionally, the base conditions for 1961-1990 are also cal-culated. For the scenarios the simulations represent the period 2070-2100 based on the
-30
-25
-20
-15
-10
-5
0
5
10
Winter Spring Summer Autumn
PET
(°C
) BaseA1FA2AB1AB2A
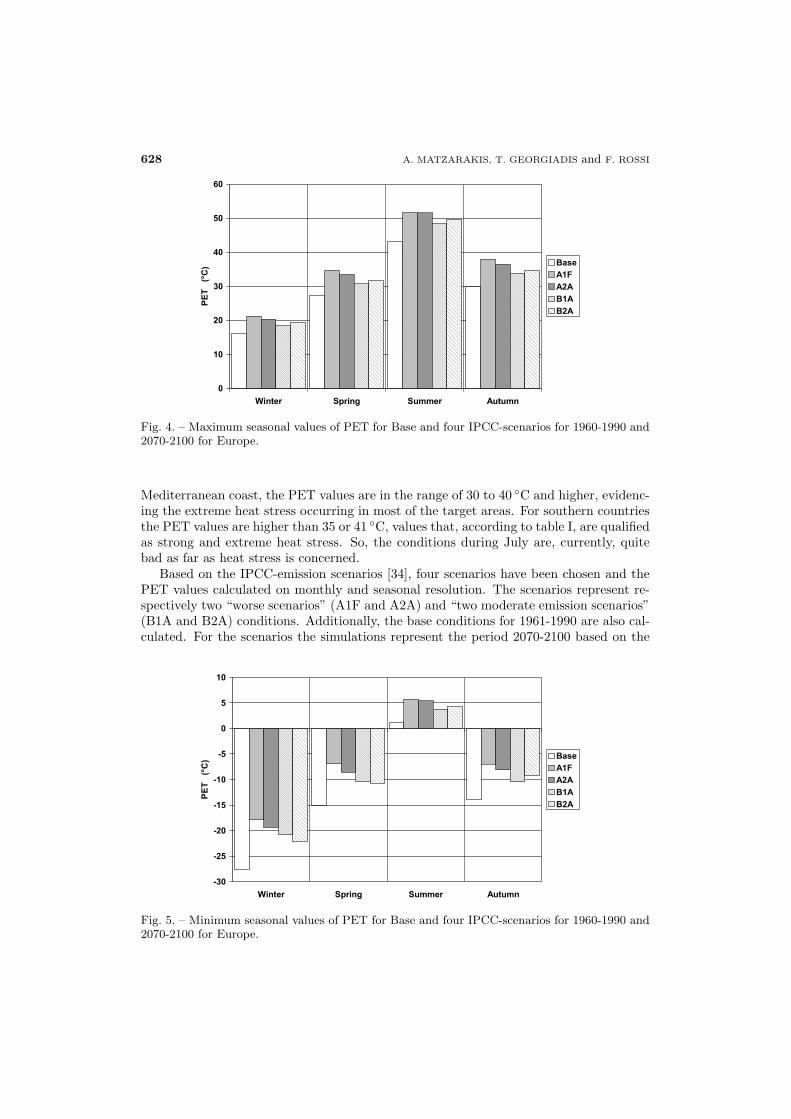
Fig. 5. – Minimum seasonal values of PET for Base and four IPCC-scenarios for 1960-1990 and2070-2100 for Europe.

THERMAL BIOCLIMATE ANALYSIS FOR EUROPE AND ITALY 629
0
5
10
15
20
25
30
35
40
45
Winter Spring Summer Autumn
PET
(°C
) BaseA1FA2AB1AB2A
Fig. 6. – Maxima seasonal values of PET for based and four IPCC-scenarios for 1960-1990 and2070-2100 for Italy.
data described in the methods section. Figures 4 and 5 represent the seasonal values ofmaxima and minima PET conditions for all Europe and the mentioned scenarios. Thedifferences of PET in relation to the base conditions are, for the two A-scenarios, about5 ◦C higher than present for winter, which is equal in terms of range of thermal comfort.For spring and autumn, the increases are up to 8 ◦C PET, and lying in the range be-tween one and two thermal stress classes. For summer, the increase is similar in valuesas for spring and autumn. The highest values for the base are about 43 ◦C, and higherthan 51 ◦C PET for the A-scenarios. When more moderate scenarios are simulated, theincrease is lying in the range of one thermal stress class for winter, spring and autumnand up to more than one thermal stress classes for the summer.
-20
-15
-10
-5
0
5
10
15
Winter Spring Summer Autumn
PET
(°C
) BaseA1FA2AB1AB2A
Fig. 7. – Minima seasonal values of PET for based and four IPCC-scenarios for 1960-1990 and2070-2100 for Italy.

630 A. MATZARAKIS, T. GEORGIADIS and F. ROSSI
The seasonal conditions of PET for Italy are summarized in figs. 6 and 7. The highestpresent values in Italy occur in summer, with 30.3 PET and the lowest during winter−14.9 in the Alps area. So according to the mean monthly and seasonal values, Italysuffers are less than those of southern or western Mediterranean countries.
In this country, for the future climate conditions (2070-2100) based on the twoA-scenarios, the conditions will be in the range of one and two thermal stress classesduring winter, spring and autumn and about two and higher classes of thermal stressduring summer. When compared to the eastern and western Mediterranean zones, thepredicted increase of PET for summer in Italy is little lower. For the moderate scenariosin winter, the increase is quantified at one thermal comfort class and for summer therange of up to 1.5 classes of thermal stress.
From figs. 4 to 7, it can be expected that in summer more intense thermal stressin the coastal areas of the Mediterranean, Italy included, will occur. The expectedthermal comfort and stress conditions will change, with a shifting of the thermal comfortconditions to northern areas and high-lying regions.
4. – Conclusion
The analysis of the thermal indicators on humans, when applied to the present cli-mate conditions and to climate change may deliver information which can assist decisionmaking on various levels, including health, tourism and regional planning. Changes inthe overall bioclimatic conditions for humans (here PET has been used as an exhaustiveindicator) are expected to be considerably greater than changes in air temperature alone.
In many regions of Europe and the Mediterranean sea, the projected climate changewill produce more stressful bioclimatic conditions (the calculated PET values of morethan 35 mean extremely hot conditions for Europeans) to people and will affect theirhealth and well being, also changing tourism behaviour. Regions with PET > 35 ◦Cwill increase when compared to those in the present bioclimatic conditions, and thepossibility of heat waves will concomitantly grow, reflecting on tourists who will avoidthese regions. In addition, the changed thermal conditions will presumably lead to higherenergy consumption (and higher emissions of greenhouse gases) as a result of the increasedneed for cooling. These needs will set regional and local authorities under pressure,because of the increased energy demand and higher negative impacts due to climate.
The results presented in this paper have to be considered as preliminary. Additionalanalyses, based on daily data from regional models, able to describe in more detailsthe climate conditions and predict the extreme events for sensible and vulnerable areascan be helpful in the development of adaptation strategies for tourism planning andprotection of tourism facilities. Additional information can be strategic in the detectionof extreme events, i.e. heat waves and possible mitigation strategies on the regional andurban planning level.
Nevertheless, the information and results in their current form are satisfactory in orderto address towards the main climate impacts on human health, tourism management andplanning at a regional scale level.
∗ ∗ ∗Thanks to M. Zygmuntowski for writing the IDL-Program for the maps construc-
tion. The work was partially supported by Regione Emilia-Romagna “Programma Re-gionale per la Ricerca Industriale, l’Innovazione e il Trasferimento Tecnologico” withinthe scientific frame of Laboratorio LARIA.

THERMAL BIOCLIMATE ANALYSIS FOR EUROPE AND ITALY 631
REFERENCES
[1] IPCC, 4th Assessment Report – Contribution of Working Group I (2007) www.ipcc.ch.[2] EC, Limiting Global Climate Change to 2 degree Celsius: The way ahead for 2020 and
beyond. Commission Staff Working Document. Brussels (2007), p. 57.[3] Mcgregor G. R., Ferro C. A. T. and Stephenson D. B., Projected changes in extreme
weather and climate events in Europe, edited by Kirch W., Menne B. and Bertollina
R., in Extreme Weather Events and Public Health Responses (Springer Publ.) 2005, p. 13.[4] Thom E. C., Weatherwise, 12 (1959) 57.[5] Steadman R. G., J. Appl. Meteorol., 10 (1971) 674.[6] Matzarakis A., De Freitas C. and Scott D., Advances in Tourism Climatology, Ber.
Meteorol. Inst. Univ. Freiburg, Vol. 12 (2004), p. 260.[7] Unger J., Int. J. Biometeorol., 43 (1999) 144.[8] Fanger P. O., Thermal Comfort (New York Mc Graw-Hill) 1972.[9] Jendritzky G., Menz H., Schirmer H. and Schmidt-Kessen W., Methodik zur
raumbezogenen Bewertung der thermischen Komponente im Bioklima des Menschen(Fortgeschriebenes Klima-Michel-Modell). Beitr. Akad. Raumforsch. Landesplan (1990),p. 114.
[10] Hoppe P. R., Experientia, 49 (1993) 745.[11] Hoppe P. R., Int. J. Biometeorol., 43 (1999) 75.[12] VDI., Methods for the human-biometeorological assessment of climate and air hygiene for
urban and regional planning. – Part I: Climate. VDI guideline 3787 (Beuth, Berlin) 1998.[13] Matzarakis A., Mayer H. and Iziomon M., Int. J. Biometeorol., 43 (1999) 84.[14] Koch E., Marktl W., Matzarakis A., Nefzger H., Rudel E., Schunder-Tatzber
S. and Zygmuntowski M., Klimatherapie in Osterreich. Broschure zu den Potentialender Klimatherapie in Osterreich (Bundesministerium fur Wirtschaft und Arbeit) 2005.
[15] Spagnolo J. and De Dear R., Building and Environment, 38 (2004) 721.[16] Matzarakis A., Die thermische Komponente des Stadtklimas, Ber. Meteorol. Inst. Univ.
Freiburg, Nr. 6 (2001).
[17] Unger J., Gulyas A. and Matzarakis A., Legkor, 50 (2005) 9.[18] Mayer H. and Matzarakis A., The urban heat island seen from the angle of human-
biometeorology, Proceedings of International Symposium on Monitoring and Managementof Urban Heat Island, Fujisawa, Japan, 84-95 (1997).
[19] Morabito M., Crisci A., Barcaioli G., Maracchi G., in Matzarakis A., De
Freitas C. and Scott D. (Editors), Advances in Tourism Climatology, Ber. Meteorol.Inst. Univ. Freiburg, Vol. 12 (2004), p. 56.
[20] Morabito M., Cecchi L., Modesti P. A., Crisci A., Orlandini S., Maracchi G.,
Genuini G. F., in Matzarakis A., De Freitas C. and Scott D. (Editors), Advancesin Tourism Climatology, Ber. Meteorol. Inst. Univ. Freiburg, Vol. 12 (2004), p. 158.
[21] WMO: WMO/OMM-No. 847, Geneva (1996).[22] Hastings D. A., Dunbar P. K., Elphingstone G. M., Bootz M., Murakami H.,
Maruyama H., Masaharu H., Holland P., Payne J., Bryant N. A., Logan T.,
Muller J.-P., Schreier G. and Macdonald J. S. (Editors), The Global Land One-kilometer Base Elevation (GLOBE) Digital Elevation Model, Version 1.0. (1999).
[23] New M., Hulme M. and Jones P., J. Climate, 12 (1999) 829.[24] New M., Hulme M. and Jones P., J. Climate, 13 (2000) 2217.[25] New M., Lister D., Hulme M. and Makin I., Climate Res., 21 (2002) 1.[26] Matzarakis A., Rutz F. and Mayer H., in De Dear R. J., Kalma J. D., Oke T. R.
and Auliciems A., Biometeorology and Urban Climatology at the Turn of the Millennium.Selected Papers from the Conference ICB-ICUC’99, WCASP-50, WMO/TD No. 1026,Sydney (2000).
[27] Matzarakis A., Rutz F. and Mayer H., Int. J. Biometeorol., 51 (2007) 323.[28] Mayer H. and Hoppe P., Theor. Appl. Climatol., 38 (1987) 43.

632 A. MATZARAKIS, T. GEORGIADIS and F. ROSSI
[29] Matzarakis A. and Mayer H., Another kind of environmental stress: Thermal stress,Newsletters 18, WHO Collaborating Centre for Air Quality Management and Air PollutionControl (1996), p. 7.
[30] Matzarakis A., Validation of modelled mean radiant temperature within urban structures,AMS Symposium on Urban Environment, Norfolk, 7.3 (2002).
[31] Amelung B., Global (environmental) change and tourism. Issues of scale and distribution(Universitaire Pers Maastricht) 2006.
[32] Hulme M., Jenkins G. J., Lu X., Turnpenny J. R., Mitchell T. D., Jones R. G.,
Lowe J., Murphy J. M., Hassell D., Boorman D., Mcdonald R. and Hill S.,Climate change scenarios for the UK: UKCIP02 scientific report, Tyndall Centre (2002),p. 112.
[33] Georgiadis T., Monitoraggio del clima e del territorio, Proceedings Piano Telematico2007-2009, Emilia Romagna regione digitale: le reti R3 e Lepida. Bologna, 4 giugno.
[34] IPCC, Emission scenarios: A special report of working group III of the IntergovernmentalPanel on climate change (Cambridge University Press, Cambridge) 2000.