Theory and Application of Artificial Immune Systems in Fault ...
204
Guilherme Costa Silva Theory and Application of Artificial Immune Systems in Fault Detection and Diagnosis in Dynamic Systems Thesis presented to the Graduate Program in Electrical Engineering of the Federal University of Minas Gerais (PPGEE-UFMG) in partial fulfill- ment of the requirements for the degree of Doctor in Electrical Engineering. Advisor: Prof. Walmir Matos Caminhas Co-Advisor: Prof. Reinaldo Martinez Palhares Belo Horizonte, MG 2014
-
Upload
khangminh22 -
Category
Documents
-
view
1 -
download
0
Transcript of Theory and Application of Artificial Immune Systems in Fault ...

Guilherme Costa Silva
Theory and Application of Artificial Immune Systems inFault Detection and Diagnosis in Dynamic Systems
Thesis presented to the Graduate Program inElectrical Engineering of the Federal University ofMinas Gerais (PPGEE-UFMG) in partial fulfill-ment of the requirements for the degree of Doctorin Electrical Engineering.
Advisor: Prof. Walmir Matos CaminhasCo-Advisor: Prof. Reinaldo Martinez Palhares
Belo Horizonte, MG2014

ii
Dedico este trabalho a memoria de meu tio e professor do Departamento deEngenharia Eletrica, Selenio Rocha Silva, que infelizmente faleceu apos a
finalizacao deste trabalho. Nunca esquecerei o apoio, a compreensao e as dicasmuito uteis oferecidas durante toda a minha formacao profissional na UFMG.
Tambem o dedico a todas aquelas pessoas que, assim como eu, tem lutadoincessantemente para encontrar seu legıtimo lugar em suas vidas, sem desistir
jamais, pois essas pessoas nao estao sozinhas...
I dedicate this work to the memory of my uncle and professor at theDepartment of Electrical Engineering, Selenio Rocha Silva, who sadly passedaway after the completion of this work. His support, his understanding, and
his very useful tips o!ered during my formation at UFMG will never beforgotten.
I also dedicate it to all those people who, like me, strive ceaselessly to findtheir rightful place in their lives without ever giving up, because these people
are not alone...

Resumo
O trabalho busca contribuir no sentido de avaliar a modelagem e contextualizacao dossistemas imunoinspirados, assim como a aplicacao destes no problema de deteccao de falhas emsistemas dinamicos. Sao apresentadas muitas abordagens para este proposito, algumas delasnovas, como por exemplo o metodo de Reconhecimento Antigenico Nebuloso, um algoritmosupervisionado de deteccao inspirado no processo de maturacao das celulas T. Outro aspectoapontado neste trabalho envolve a definicao formal do problema segundo o Modelo do Perigo,com abordagens baseadas na avaliacao de evidencias de operacao normal ou de falhas e aaplicacao de abordagens tradicionais como o Algoritmo das Celulas Dendrıticas e o Algoritmodos Receptores Toll-Like. Os resultados obtidos com as tecnicas, no problema de deteccao defalhas em motor de corrente contınua e no Benchmark DAMADICS, apresentados no trabalho,sao promissores e condizentes com os propositos da tese, validando as tecnicas.
Palavras-chave: Sistemas Imunoinspirados, Deteccao de Falhas, Sistemas Dinamicos,Modelagem de Algoritmos, .
Abstract
The work aims to contribute in order to assess the modeling and contextualization of arti-ficial immune systems, as well as their application to the fault detection in dynamic systemsproblem. Many approaches are presented for this purpose, some of them are new, such as theFuzzy Antigen Recognition method, a supervised detection algorithm inspired on a view onthe T cells maturation process. Another aspect discussed in this work involves the formal def-inition of the problem according to the Danger Model, with approaches based on the evidenceevaluation of normal operation or faults and the application of traditional approaches such asDendritic Cell Algorithm and the Toll-Like Receptors Algorithm. The results obtained withthe techniques, the problem of detecting faults in DC motor and DAMADICS Benchmark,presented in the study, are promising and consistent with the purposes of the thesis, validatingthese techniques.
Keywords: Artificial Immune Systems, Fault Detection, Dynamic Systems, AlgorithmModeling.
iii

iv

Agradecimentos
Ao Pai Universal (Deus), que permitiu toda minha trajetoria profissional e pessoal, e gracas aEle, acabo de finalizar esta etapa!
A minha mae, Fatima, que me acompanhou durante toda a minha jornada profissional e pelacompreensao das ausencias e de minha falta de paciencia em certos momentos.
A meu pai, Stenio, pelos conselhos e por uma valiosa ajuda que tive durante meu estagio nosEstados Unidos.
A meu irmao Gustavo, meu companheiro de todas as horas.
A todos os familiares, que contribuıram indireta ou diretamente para minha vida nos demaismomentos. Agradeco tambem a Enio, por alguns conselhos muito uteis.
Ao meu orientador, o Prof. Walmir Caminhas, pela parceria, oportunidade, paciencia e princi-palmente pela confianca em meu trabalho e licoes oferecidas que me proporcionaram um grandeaprendizado e fazem parte de minha vida desde entao.
Ao meu co-orientador, o Prof. Reinaldo Palhares, pela parceria em meu projeto de doutoradodesde o inıcio e pelos conselhos que sempre me foram uteis, tanto na parte academica quantoem processos mais burocraticos, com os quais eu tinha muitas dificuldades.
Ao prof. Andre Paim, meu colega desde os tempos do mestrado, por ter sido sempre utildurante todo esse tempo. Ao prof. Leandro de Castro, que foi precursor da linha de pesquisae cujo trabalho motivou minha iniciacao ao tema. A profa. Lane, que tambem me apoioumuitas vezes na minha formacao e ao Douglas, pelo incentivo de comecar o doutorado. Comoavaliadores do trabalho, a contribuicao de voces foi bastante valiosa e aprimorou bastante oconteudo desta tese. Sem esquecer tambem as consideracoes feitas pela Prof. Ana do ICB, queenriqueceram o trabalho de alguma forma.
Aos meus colegas do DIFCOM, dentre eles Alisson Marques, Arthur Porto, Celso ”Las Pimbas”Araujo, Fulvia Oliveira, Heitor Savino, Leandro Mendes, Luciana Balieiro, Klenilmar Dias,Maurilio Inacio, Marcia Platilha, Renato Maia, Rosileide Lopes, Sajad Azizi, Steve Lacerda,dentre outros, pelos momentos inesquecıveis que tive com voces durante meus dias no labo-ratorio e fora dele tambem, e pela ajuda que tive de cada um de voces.
Ao meu grande amigo, Marcos Flavio ”Trixa” D’angelo, pelas tardes no bar, pela paciencia e
v

vi
pelos conselhos sempre na hora certa.
Ao prof. Luciano de Errico, pela assistencia em momentos decisivos e por conselhos bastantevaliosos, ao prof. Rodney Saldanha, pelo auxılio em varios trabalhos, como tambem por outrosconselhos, ao prof. Fernando Souza, pela valiosa ajuda antes de eu ir aos EUA, como tambempela troca de ideias e pelas caronas, ao prof. Felipe Campelo, pelas dicas valiosas no geral, aoprof. Hani Yehia, pelas importantes discussoes filosoficas, ao prof. Ricardo Takahashi, que meinfluenciou em uma importante decisao quanto ao final do projeto, e ao prof. Benjamim, peloexemplo e pelas sempre sabias palavras durante todos os momentos pertinentes. E aos demaisprofessores que contribuıram em minha formacao na UFMG.
Ao Dr. Dipankar Dasgupta, por ter me recebido e me aceitado na Universidade de Memphis,pela oportunidade do estagio sanduıche no Intelligent Security Systems Research Laboratory nogrupo de pesquisa de sistemas imunes artificiais, e pelo importantıssimo aprendizado duranteos seis meses do estagio.
Agradeco tambem aos colegas: Abhijit Nag, pela ajuda durante o perıodo inicial do estagio epelos conselhos, Kul Subedi, pela ajuda, conselhos, contribuicoes e brincadeiras, Sanjib Shuvro,pelas dicas e os momentos de diversao, e Charles Lancaster, pela ajuda em momentos finais doestagio.
Agradecimentos especiais aos Estudantes Internacionais da U of M, principalmente Yang Zhou,pela amizade e pelos inesqueciveis momentos de diversao, e a Sudip, Nam, Quang, dentre outrosestudantes, pelo grande apoio oferecido.
Ao Ben Humphreys, pela ajuda em diversas situacoes (principalmente idiomaticas) duranteminha visita a Memphis.
Gostaria de aproveitar para agradecer tambem aos amigos de outras atividades realizadas du-rante a etapa do doutorado, uma vez que foram estas que me mantiveram em condicoes paracontinuar o projeto, por exemplo, a Isaac Lopes, da Abracame Studio de Danca, pela opor-tunidade de aprimorar minha pratica da danca Lambazouk nas horas vagas, e aos amigos daAbracame, pelo incentivo e amizade, e a Izabela Miranda, pelo apoio, incentivo, e conversasencorajadoras. Agradecimentos especiais ao Leo Bruno, com quem comecei meu aprendizadode danca anteriormente. Isso sem esquecer todo o pessoal com quem fiz amizade ao longo dotempo, muito obrigado de todo meu coracao!
Agradecimentos tambem aos amigos das demais academias de danca de BH e regiao: Inco-modanca, Ponto da Danca, Pe de Valsa, Passo Basico, Giros, Luciana Costa, Acacio de Souza,Rodrigo Delano, dentre outras escolas. E aos organizadores dos projetos de danca, como Casade Bamba (Atila), Dance com Prazer BH (Beto) e Zouk dos Amigos (DJ Vlad), com muitosdeles tive otimos contatos e amizades!
Agradecimentos especiais tambem ao pessoal da energia em Porto Seguro: os irmaos Braz,Didi, Patricia, Rominita, Natasha, Gilson, Berg, a famılia Lira, e muitos outros dancarinosprofissionais que inspiraram minha danca, contribuındo para minha saude mental durante meu

vii
doutorado.
A todas as minhas amigas parceiras de danca, pelas respectivas amizades e inesquecıveis dancasque tivemos.
Agradecimentos ao grupo Red Hot Lindy Hop de Memphis por me dar a oportunidade depratica do swing nas horas vagas e,principalmente a Justin, por otimos momentos de diversaoe nossas grandes conversas.
Agradecimentos especiais a Scarlet, pela amizade, confianca, nossas dancas e diversao nos EUAe pela inspiracao para eu seguir em frente e continuar meus projetos de vida.
Agradeco tambem a Flavia, apesar de nosso pouco tempo de interacao, foi o suficiente para meinspirar a tomar novas decisoes, principalmente apos o exame de qualificacao do meu doutorado.
Agradeco tambem a Brenda, pelas nossas dancas em Porto Seguro e pelo apoio, carinho, oracoese nossas conversas a distancia.
E a todas aquelas pessoas ou grupos que providenciaram otimas inspiracoes em minha vida...
Quero agradecer tambem a mestra Jade Antunes, pelo utilıssimo reiki que sempre me ajudou,meu psiquiatra antroposofo, Marcelo Friedlaender, que descobriu meu potencial e passou a meincentivar sempre que possıvel e a psicologa Rafaela Cosenza, pelas consultas durante o inıciodo doutorado.
Agradecimento tambem a Cristina Cox, pelo valioso apoio e pelas palavras de incentivo.
Nao poderia esquecer tambem os amigos e parceiros de atividades de quem tive apoio, seja daepoca do Colegio Padre Eustaquio, ou da epoca de minha graduacao em Sistemas de Informacaona PUC-MG, ou mesmo alguns conhecidos, que sempre torceram por mim, antes, durante edepois desta etapa.
Agradecimentos especiais as agencias de fomento, como o CNPq que financiou meu projetodurante o tempo habil do mesmo no Brasil, a CAPES, que financiou meu projeto nos EUA, aFAPEMIG que tem financiado os projetos do laboratorio.
E a todos aqueles que nao mencionei aqui, porem, direta ou indiretamente, contribuıram dealguma forma para meu bem estar durante esta etapa de minha vida...

viii

Acknowledgements
To the Universal Father (God), who allowed all my professional and personal trajectory, andthanks to Him, I just finish this step!
To my mother, Fatima, who accompanied me during my professional journey and her under-standing of my absences as well as my lack of patience sometimes.
To my father, Stenio, by his advice and valuable support I had during my internship in theUnited States.
To my brother Gustavo, my full-time friend.
To all my relatives, who have contributed indirectly or directly to my life at other times. Thanksalso to Enio, for some very helpful advice.
To my advisor, Prof. Walmir Caminhas for his partnership, opportunity, patience and aboveall the trust in my work, as well as his o!ered lessons that have given me a great learningexperience and are part of my life since then.
To my co-advisor, Prof. Reinaldo Palhares, for his partnership my doctoral project from thebeginning and by his always helpful advice, both in the academic portion as in more bureaucraticprocesses, in which I had many di"culties.
To prof. Andre Paim, my colleague since the Masters, as he was always helpful during thistime. To prof. Leandro de Castro, who was a pioneer of the research field and whose work ledto my initiation to my research. To Prof. Lane, who also supported me often and to Douglas,who encouraged me to start the doctorate. As examiners of this thesis, the contribution of youwas quite valuable and quite improved the content of this thesis. One should also recall theconsiderations made by Prof. Ana of Biological Sciences Institute (ICB), which enriched thework somehow.
To my colleagues from DIFCOM, including Alisson Marques, Arthur Porto, Celso ”Las Pimbas”Araujo, Fulvia Oliveira, Hector Savino, Leandro Mendes, Luciana Balieiro, Klenilmar Dias,Maurilio Inacio, Marcia Platilha, Renato Maia, Rosileide Lopes, Sajad Azizi, Steve Lacerda,among others, for the unforgettable moments I had with you all during my days in the laboratoryand outside too, and for the help they had to each of you.
To my good friend, Marcos Flavio “Trixa” D’Angelo, for some evenings at some bars, his
ix

x
patience and his useful advises always on time.
To prof. Luciano de Errico, for assistance at decisive moments and his very valuable advice,to prof. Rodney Saldanha, for his help in several studies, but also by few advice, to prof.Fernando Souza, for their valuable help before I go to the US, for our exchange of ideas, andfor the rides as well, to prof. Felipe Campelo, the valuable tips in general, to prof. Hani Yehia,for our important philosophical discussions, to prof. Ricardo Takahashi, who influenced me inan important decision by the end of the project, and to prof. Benjamin, by his example and byhis always wise words during all relevant times. And to the other professors who contributedto my education at UFMG.
To Dr. Dipankar Dasgupta, to have received and accepted me at the University of Memphis,to the opportunity of internship in Intelligent Security Systems Research Laboratory at AISResearch Group, and the important learning o!ered during the six months of the internship.
I also thank my colleagues in ISSRL: Abhijit Nag, for help during the initial stage and hisadvice, Kul Subedi, for his constant help, advice, contributions and jokes, Sanjib Shuvro, forhis tips and some moments of fun, and Charles Lancaster, for some help by the end of theinternship.
Special thanks to International Students of U of M, mainly Yang Zhou, for her friendship andthe unforgettable moments of fun, and Sudip, Nam, Quang, among other students, for theirgreat support o!ered.
To Ben Humphreys, for his help in various (especially idiomatic) situations during my visit toMemphis.
I would also like to thank the friends of other activities performed during the doctorate, sincethese activities kept me able to continue the project, for example, I thank Isaac Lopes ofAbracame Studio de Danca, for the opportunity to enhance my Lambazouk dance on the sparetime; all friends from Abracame, for their incentives and friendship; and Izabela Miranda forher support and encouraging conversations. Special thanks to Leo Bruno, with whom I beganmy dance learning earlier. Without forgetting all the people with whom I became friends overtime, thank you with all my heart!
Thanks also to friends of other dance studios from Belo Horizonte and region: Incomodanca,Ponto da Danca, Pe de Valsa, Passo Basico, Giros, Luciana Costa, Acacio de Souza, RodrigoDelano, among others. And the organizers of the dance projects such as Casa de Bamba (Atila),Dance com Prazer BH (Beto) and Zouk dos Amigos (DJ Vlad), with many of them had greatcontacts and friendships!
Special thanks also to the energy sta! in Porto Seguro: Braz, Didi, Patricia, Rominita, Natasha,Gilson, Berg, the Lira family, and many other professional dancers that inspired my dancing,contributing to my mental health during my doctorate.
To all my dance partner friends, for their friendships and unforgettable dances we had.

Thanks to the group Red Hot Lindy Hop Memphis for giving me the opportunity to practiceswing in my spare time and, especially Justin, for a great time of fun and our great conversations.
Special thanks to Scarlet, for friendship, trust, our dances and fun in the USA, and the inspi-ration for me to move on and continue my life projects.
I also thank Flavia, despite our little interaction time, it was enough to inspire me to takefurther decisions, especially after the qualification test of my doctorate.
I also thank Brenda, for our dances in Porto Seguro and support, a!ection, prayers and ourconversations at a distance.
And to all those people or groups who provided great inspiration in my life...
I also thank master Jade Antunes, for her useful reiki which always helped me, my psychiatristanthroposophist, Marcelo Friedlaender, who discovered my potential and began to encourageme whenever possible and psychologist Rafaela Cosenza, for consultations during the earlydoctorate.
Thanks also to Cristina Cox, for her valuable support and words of encouragement.
I should not forget to thank my friends and activity partners who supported me, from my HighSchool at Padre Eustaquio’s (CPE), or from my undergraduate course of Information Systemsat PUC-MG, or even some acquaintances who always supported me before, during and afterthis doctorate.
Special thanks to funding agencies, the CNPq which funded my project for its right time framein Brazil; CAPES, which funded my project in the US; and FAPEMIG, which has funded labprojects.
And to all those I have not mentioned here, however, directly or indirectly, contributed in someway to my welfare being during this stage of my life...
xi

xii

Contents
Contents xv
List of Figures xix
List of Tables xxii
List of Algorithms xxiii
List of Abbreviations xxvii
List of Symbols xxix
Published Papers xxix
Expanded Abstract (In Portuguese) 1
1 Introduction 231.1 Motivation and Relevance . . . . . . . . . . . . . . . . . . . . . . . . . . . . . . 231.2 Objectives and Methodology . . . . . . . . . . . . . . . . . . . . . . . . . . . . . 24
1.2.1 General Purposes . . . . . . . . . . . . . . . . . . . . . . . . . . . . . . . 241.2.2 Specific Objectives . . . . . . . . . . . . . . . . . . . . . . . . . . . . . . 241.2.3 Approaches used in the thesis . . . . . . . . . . . . . . . . . . . . . . . . 25
1.3 Thesis Contributions . . . . . . . . . . . . . . . . . . . . . . . . . . . . . . . . . 261.4 Text Organization . . . . . . . . . . . . . . . . . . . . . . . . . . . . . . . . . . . 28
2 Fault Detection and Diagnosis in Dynamic Systems 292.1 Introduction . . . . . . . . . . . . . . . . . . . . . . . . . . . . . . . . . . . . . . 292.2 Problem Statement . . . . . . . . . . . . . . . . . . . . . . . . . . . . . . . . . . 30
2.2.1 Redundancy in FDI . . . . . . . . . . . . . . . . . . . . . . . . . . . . . . 312.2.2 Characterization of faults . . . . . . . . . . . . . . . . . . . . . . . . . . 32
2.3 Approaches . . . . . . . . . . . . . . . . . . . . . . . . . . . . . . . . . . . . . . 322.3.1 Quantitative Models . . . . . . . . . . . . . . . . . . . . . . . . . . . . . 332.3.2 Qualitative Models . . . . . . . . . . . . . . . . . . . . . . . . . . . . . . 33
2.4 FDI as a classification problem . . . . . . . . . . . . . . . . . . . . . . . . . . . 342.5 Benchmarks . . . . . . . . . . . . . . . . . . . . . . . . . . . . . . . . . . . . . . 35
xiii
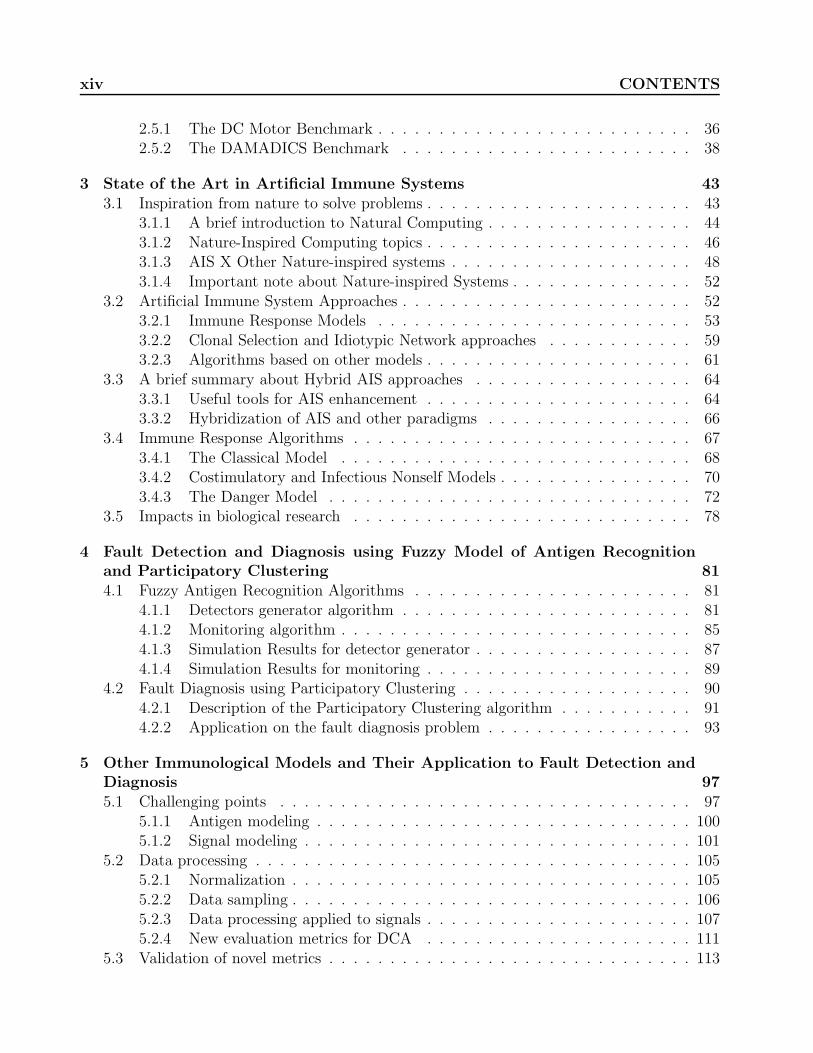
xiv CONTENTS
2.5.1 The DC Motor Benchmark . . . . . . . . . . . . . . . . . . . . . . . . . . 362.5.2 The DAMADICS Benchmark . . . . . . . . . . . . . . . . . . . . . . . . 38
3 State of the Art in Artificial Immune Systems 433.1 Inspiration from nature to solve problems . . . . . . . . . . . . . . . . . . . . . . 43
3.1.1 A brief introduction to Natural Computing . . . . . . . . . . . . . . . . . 443.1.2 Nature-Inspired Computing topics . . . . . . . . . . . . . . . . . . . . . . 463.1.3 AIS X Other Nature-inspired systems . . . . . . . . . . . . . . . . . . . . 483.1.4 Important note about Nature-inspired Systems . . . . . . . . . . . . . . . 52
3.2 Artificial Immune System Approaches . . . . . . . . . . . . . . . . . . . . . . . . 523.2.1 Immune Response Models . . . . . . . . . . . . . . . . . . . . . . . . . . 533.2.2 Clonal Selection and Idiotypic Network approaches . . . . . . . . . . . . 593.2.3 Algorithms based on other models . . . . . . . . . . . . . . . . . . . . . . 61
3.3 A brief summary about Hybrid AIS approaches . . . . . . . . . . . . . . . . . . 643.3.1 Useful tools for AIS enhancement . . . . . . . . . . . . . . . . . . . . . . 643.3.2 Hybridization of AIS and other paradigms . . . . . . . . . . . . . . . . . 66
3.4 Immune Response Algorithms . . . . . . . . . . . . . . . . . . . . . . . . . . . . 673.4.1 The Classical Model . . . . . . . . . . . . . . . . . . . . . . . . . . . . . 683.4.2 Costimulatory and Infectious Nonself Models . . . . . . . . . . . . . . . . 703.4.3 The Danger Model . . . . . . . . . . . . . . . . . . . . . . . . . . . . . . 72
3.5 Impacts in biological research . . . . . . . . . . . . . . . . . . . . . . . . . . . . 78
4 Fault Detection and Diagnosis using Fuzzy Model of Antigen Recognitionand Participatory Clustering 814.1 Fuzzy Antigen Recognition Algorithms . . . . . . . . . . . . . . . . . . . . . . . 81
4.1.1 Detectors generator algorithm . . . . . . . . . . . . . . . . . . . . . . . . 814.1.2 Monitoring algorithm . . . . . . . . . . . . . . . . . . . . . . . . . . . . . 854.1.3 Simulation Results for detector generator . . . . . . . . . . . . . . . . . . 874.1.4 Simulation Results for monitoring . . . . . . . . . . . . . . . . . . . . . . 89
4.2 Fault Diagnosis using Participatory Clustering . . . . . . . . . . . . . . . . . . . 904.2.1 Description of the Participatory Clustering algorithm . . . . . . . . . . . 914.2.2 Application on the fault diagnosis problem . . . . . . . . . . . . . . . . . 93
5 Other Immunological Models and Their Application to Fault Detection andDiagnosis 975.1 Challenging points . . . . . . . . . . . . . . . . . . . . . . . . . . . . . . . . . . 97
5.1.1 Antigen modeling . . . . . . . . . . . . . . . . . . . . . . . . . . . . . . . 1005.1.2 Signal modeling . . . . . . . . . . . . . . . . . . . . . . . . . . . . . . . . 101
5.2 Data processing . . . . . . . . . . . . . . . . . . . . . . . . . . . . . . . . . . . . 1055.2.1 Normalization . . . . . . . . . . . . . . . . . . . . . . . . . . . . . . . . . 1055.2.2 Data sampling . . . . . . . . . . . . . . . . . . . . . . . . . . . . . . . . . 1065.2.3 Data processing applied to signals . . . . . . . . . . . . . . . . . . . . . . 1075.2.4 New evaluation metrics for DCA . . . . . . . . . . . . . . . . . . . . . . 111
5.3 Validation of novel metrics . . . . . . . . . . . . . . . . . . . . . . . . . . . . . . 113

CONTENTS xv
5.4 Simulations . . . . . . . . . . . . . . . . . . . . . . . . . . . . . . . . . . . . . . 1275.4.1 More about the algorithms . . . . . . . . . . . . . . . . . . . . . . . . . . 1315.4.2 Results . . . . . . . . . . . . . . . . . . . . . . . . . . . . . . . . . . . . . 132
6 Concluding Remarks 1516.1 Main aspects of the research . . . . . . . . . . . . . . . . . . . . . . . . . . . . . 1516.2 Further works . . . . . . . . . . . . . . . . . . . . . . . . . . . . . . . . . . . . . 152
References 154

xvi CONTENTS

List of Figures
1 Modelagem de um sistema dinamico. . . . . . . . . . . . . . . . . . . . . . . . . 22 Problema de Deteccao e Isolamento de Falhas como um problema de classificacao. 33 Comparacao entre o treinamento de algoritmos supervisionados e a geracao de
detectores nos algoritmos de selecao negativa. . . . . . . . . . . . . . . . . . . . 54 Descricao do reconhecimento antigenico nebuloso e consequente maturacao das
celulas T. . . . . . . . . . . . . . . . . . . . . . . . . . . . . . . . . . . . . . . . 65 Ilustracao dos metodos propostos na tese: (I) Geracao dos Detectores e (II)
Monitoramento. . . . . . . . . . . . . . . . . . . . . . . . . . . . . . . . . . . . . 86 Reprentacao do benhcmark do motor de corrente contınua. . . . . . . . . . . . . 107 Fluxograma que descreve os principais passos do DCA. . . . . . . . . . . . . . . 138 Fluxograma que descreve os principais passos do algoritmo TLR. . . . . . . . . . 159 Descricao do benchmark DAMADICS. . . . . . . . . . . . . . . . . . . . . . . . 16
1.1 Preview of all studied AIS approaches and their origins and immunological mod-els of inspiration. . . . . . . . . . . . . . . . . . . . . . . . . . . . . . . . . . . . 26
2.1 Generic Model of a fault detection system, based on [Ding, 2008]. . . . . . . . . 332.2 Illustration of the Fault Classification Problem, based on [Caminhas, 1997]. . . . 342.3 Representation of the DC Motor system. . . . . . . . . . . . . . . . . . . . . . . 362.4 Block diagram of the DC Motor system. . . . . . . . . . . . . . . . . . . . . . . 372.5 The actuator of DAMADICS benchmark, based in [bmd, 2002]. . . . . . . . . . 392.6 Inputs and Outputs of DAMADICS. . . . . . . . . . . . . . . . . . . . . . . . . 39
3.1 The Natural Computing paradigms and their main research topics, with focus onNature-Inspired Systems, based on [De Castro, 2006,Kari and Rozenberg, 2008]. 45
3.2 Nature-inspired systems examples, with focus on Artificial Immune Systems.(adapted from [De Castro, 2006] . . . . . . . . . . . . . . . . . . . . . . . . . . . 47
3.3 All immunological models related to the immune response. [Matzinger, 2002]This illustration may provide analogies to anomaly detection applications. . . . 55
3.4 Description of immunological models discussed. . . . . . . . . . . . . . . . . . . 683.5 Illustration of similarities between one-class supervised classification and anomaly
detection based on Self/Nonself principles. . . . . . . . . . . . . . . . . . . . . . 693.6 Biological processing of Toll-Like Receptors and its analogy with data processing
systems. . . . . . . . . . . . . . . . . . . . . . . . . . . . . . . . . . . . . . . . . 703.7 Agents used by the algorithms of Toll-Like Receptors and their possible states. . 71
xvii

xviii LIST OF FIGURES
3.8 Summary of the Toll-Like Receptor algorithm. . . . . . . . . . . . . . . . . . . . 713.9 Flowchart of the Toll-Like Receptor Algorithm. . . . . . . . . . . . . . . . . . . 743.10 Fundamental steps of the DCA. . . . . . . . . . . . . . . . . . . . . . . . . . . . 763.11 Flowchart of the Dendritic Cell Algorithm. . . . . . . . . . . . . . . . . . . . . . 78
4.1 Illustration of the hypothesis of T cell fuzzy recognition according to [Leng andBentwich, 2002]. The process of self / nonself discrimination, their member-ship functions describing the relationship between the a"nity between cell andantigen with a biological reaction of the immune system. . . . . . . . . . . . . . 82
4.2 Membership functions for detectors generator version. . . . . . . . . . . . . . . . 834.3 Description of the proposed algorithm in a two-dimensional space. . . . . . . . . 834.4 Flowchart describing the steps of Detector Generation in Fuzzy NSA. . . . . . . 854.5 Membership functions for monitoring algorithm version . . . . . . . . . . . . . . 864.6 Description of the proposed algorithm in a two-dimensional space. . . . . . . . . 874.7 Flowchart describing the steps of Monitoring of Fuzzy NSA. . . . . . . . . . . . 884.8 Flowchart representing the participatory clustering applied after NSA detection. 93
5.1 Fundamental steps of Fault Detection tasks. . . . . . . . . . . . . . . . . . . . . 985.2 Relationship among immunological models that can be considered in the devel-
opment of new immune-inspired systems. . . . . . . . . . . . . . . . . . . . . . . 995.3 Example of a converted variable in the safe signals. . . . . . . . . . . . . . . . . 1035.4 Example with periodic signals (5.7) which invalidates H1. . . . . . . . . . . . . . 1045.5 Example of a converted variable in the danger signals. . . . . . . . . . . . . . . . 1055.6 Analysis of a noisy signal converted to danger signal metric. . . . . . . . . . . . 1055.7 Example of sliding window mechanisms applied to antigen data. . . . . . . . . . 1085.8 An illustrative example of direct rule processing. . . . . . . . . . . . . . . . . . . 1095.9 Fuzzy processing example. . . . . . . . . . . . . . . . . . . . . . . . . . . . . . . 1105.10 Complete steps of fault diagnosis applied after DCA detection in this work. . . . 1145.11 DC Motor system data for Normal Case. . . . . . . . . . . . . . . . . . . . . . . 1165.12 DC Motor residuals data for Normal Case. . . . . . . . . . . . . . . . . . . . . . 1165.13 DC Motor converted signals for Normal Case. . . . . . . . . . . . . . . . . . . . 1175.14 DC Motor alarm data for Normal Case. . . . . . . . . . . . . . . . . . . . . . . . 1175.15 DC Motor system data for Fault 1. . . . . . . . . . . . . . . . . . . . . . . . . . 1185.16 DC Motor residuals data for Fault 1. . . . . . . . . . . . . . . . . . . . . . . . . 1185.17 DC Motor converted signals for Fault 1. . . . . . . . . . . . . . . . . . . . . . . 1195.18 DC Motor alarm data for Fault 1. . . . . . . . . . . . . . . . . . . . . . . . . . . 1195.19 DC Motor system data for Fault 2. . . . . . . . . . . . . . . . . . . . . . . . . . 1205.20 DC Motor residuals data for Fault 2. . . . . . . . . . . . . . . . . . . . . . . . . 1205.21 DC Motor converted signals for Fault 2. . . . . . . . . . . . . . . . . . . . . . . 1215.22 DC Motor alarm data for Fault 2. . . . . . . . . . . . . . . . . . . . . . . . . . . 1215.23 DC Motor system data for Fault 3. . . . . . . . . . . . . . . . . . . . . . . . . . 1225.24 DC Motor residuals data for Fault 3. . . . . . . . . . . . . . . . . . . . . . . . . 1225.25 DC Motor converted signals for Fault 3. . . . . . . . . . . . . . . . . . . . . . . 1235.26 DC Motor alarm data for Fault 3. . . . . . . . . . . . . . . . . . . . . . . . . . . 123

LIST OF FIGURES xix
5.27 DC Motor system data for Fault 4. . . . . . . . . . . . . . . . . . . . . . . . . . 1245.28 DC Motor residuals data for Fault 4. . . . . . . . . . . . . . . . . . . . . . . . . 1245.29 DC Motor converted signals for Fault 4. . . . . . . . . . . . . . . . . . . . . . . 1255.30 DC Motor alarm data for Fault 4. . . . . . . . . . . . . . . . . . . . . . . . . . . 1255.31 Evaluation of the CCAFA variable with sample time Ts = 1s. . . . . . . . . . . 1265.32 Neural Network for residuals calculation in fault-free simulations of DAMADICS,
based in [Kourd et al., 2011]. . . . . . . . . . . . . . . . . . . . . . . . . . . . . . 128

xx LIST OF FIGURES

List of Tables
1 Regras nebulosas do metodo de reconhecimento antigenico nebuloso baseado emgeracao de detectores. . . . . . . . . . . . . . . . . . . . . . . . . . . . . . . . . 7
2 Regras nebulosas do metodo de reconhecimento antigenico nebuloso baseado emmonitoramento. . . . . . . . . . . . . . . . . . . . . . . . . . . . . . . . . . . . . 7
3 Falhas do motor de corrente contınua. . . . . . . . . . . . . . . . . . . . . . . . . 104 Resultados com o algoritmo de geracao de detectores. . . . . . . . . . . . . . . . 115 Resultados com o algoritmo de monitoramento. . . . . . . . . . . . . . . . . . . 116 Resultados para w = 3000 e ! = 0.0005. . . . . . . . . . . . . . . . . . . . . . . 127 Falhas simuladas no estudo de caso do DAMADICS. . . . . . . . . . . . . . . . 168 Detectando falhas com o DCA, com Ts = 2. . . . . . . . . . . . . . . . . . . . . 179 Detectando falhas com o TLR usando o SVM para o espaco Nonself e W = 1. . 1810 Detectando falhas com o TLR usando o Reconhecimento Antigenico Fuzzy para
o espaco Nonself e W = 1. . . . . . . . . . . . . . . . . . . . . . . . . . . . . . . 1911 Detectando falhas com o metodo baseado no Modelo do Perigo. . . . . . . . . . 2012 Detectando falhas com o SVM de uma classe, e com pre processamento realizado
pelo PCA. . . . . . . . . . . . . . . . . . . . . . . . . . . . . . . . . . . . . . . . 2013 Valores de Taxa de Distinguibilidade de Distancia para os antıgenos coletados
pelo DCA. . . . . . . . . . . . . . . . . . . . . . . . . . . . . . . . . . . . . . . . 2214 Valores de Taxa de Ambiguidade para os antıgenos coletados pelo DCA. . . . . 22
2.1 Summary of DC Motor system faults. . . . . . . . . . . . . . . . . . . . . . . . . 382.2 Summary of DAMADICS benchmark faults. . . . . . . . . . . . . . . . . . . . . 41
3.1 Parallel between AIS and ANN . . . . . . . . . . . . . . . . . . . . . . . . . . . 493.2 Parallel between AIS and EC . . . . . . . . . . . . . . . . . . . . . . . . . . . . 503.3 Parallel between AIS and Swarm Intelligence . . . . . . . . . . . . . . . . . . . . 51
4.1 fuzzy rules used in the antigen recognition system for the generation of detectors. 834.2 rules used in fuzzy system for monitoring of antigen recognition. . . . . . . . . . 864.3 Results of tests performed on the generator algorithm detectors. . . . . . . . . . 904.4 Results of tests performed on a normal Negative Selection Algorithm, for com-
parison purposes. . . . . . . . . . . . . . . . . . . . . . . . . . . . . . . . . . . . 914.5 Results of tests made with the monitoring algorithm. . . . . . . . . . . . . . . . 924.6 Results for w = 1000 and ! = 0.005. . . . . . . . . . . . . . . . . . . . . . . . . 954.7 Results for w = 2000 and ! = 0.0001. . . . . . . . . . . . . . . . . . . . . . . . . 95
xxi

xxii LIST OF TABLES
4.8 Results for w = 3000 and ! = 0.0005. . . . . . . . . . . . . . . . . . . . . . . . . 964.9 Results for w = 4000 and ! = 0.0005. . . . . . . . . . . . . . . . . . . . . . . . . 964.10 Results for w = 3000 and ! = 0.0001. . . . . . . . . . . . . . . . . . . . . . . . . 96
5.1 Null hypothesis regarding signal variations. . . . . . . . . . . . . . . . . . . . . . 1035.2 DCA parameters and functions. . . . . . . . . . . . . . . . . . . . . . . . . . . . 1155.3 Test results for DCA applied to Fault Detection. . . . . . . . . . . . . . . . . . . 1155.4 Alarm duration time according to anomaly metrics. . . . . . . . . . . . . . . . . 1265.5 Results of antigen indexation through the proposed AIFD index. . . . . . . . . 1275.6 Description of tests performed in DAMADICS benchmark. . . . . . . . . . . . . 1295.7 DCA parameters and functions. . . . . . . . . . . . . . . . . . . . . . . . . . . . 1315.8 TLR parameters and functions. . . . . . . . . . . . . . . . . . . . . . . . . . . . 1315.9 Method of [de Almeida et al., 2010] parameters and functions. . . . . . . . . . . 1325.10 Test results for DCA applied to Fault Detection. . . . . . . . . . . . . . . . . . . 1335.11 Test results for TLR algorithm applied to Fault Detection. . . . . . . . . . . . . 1365.12 Test results for the danger model approach applied to Fault Detection. . . . . . 1435.13 Test results for the SVM one class with PCA applied to Fault Detection. . . . . 1455.14 Runtime execution data of the algorithms evaluated in this study (in seconds). . 1465.15 DDR values for antigens collected by DCA in DAMADICS tests. . . . . . . . . . 1475.16 AR values for antigens collected by DCA in DAMADICS tests. . . . . . . . . . . 148

List of Algorithms
3.1 Pseudocode of TLR Algorithm . . . . . . . . . . . . . . . . . . . . . . . . . . . . 733.2 Pseudocode of DCA . . . . . . . . . . . . . . . . . . . . . . . . . . . . . . . . . 774.1 Pseudocode of Detector Generation in Fuzzy NSA . . . . . . . . . . . . . . . . . 844.2 Pseudocode of Monitoring based on Fuzzy NSA . . . . . . . . . . . . . . . . . . 894.3 Pseudocode of the Participatory Clustering applied to the Fuzzy NSA . . . . . . 94
xxiii

xxiv LIST OF ALGORITHMS

List of Abbreviations
ABS - Agent-Based SimulationAEM - Anomalous Event Management (Gerenciamento de Eventos Anomalos)AIN - Artificial Immune/Idiotypic Network (Rede Imune/Idiotıpica Artificial)AIS - Artificial Immune Systems (Sistemas Imunes Artificiais)AIFD - Antigen Index of Fault Di!erentiation (Indice Antigenico de Diferenciacao da
Falha)ALa - Large intensity abrupt fault (Falha abrupta de intensidade alta)AMe - Medium intensity abrupt fault (Falha abrupta de intensidade media)ANN - Artificial Neural Network (Rede Neural Artificial)APC or APCs - Antigen-Presenting Cells (Celulas Apresentadoras de Antıgeno)ASm - Small intensity abrupt fault (Falha abrupta de intensidade pequena)NC - Natural Computing (Computacao Natural)NIS - Nature Inspired Systems (Sistemas Inspirados na Natureza)AR - Ambiguity Ratio (Taxa de Ambiguidade)CLONALG - Clonal AlgorithmCSA - Clonal Selection-based Algorithms (Algoritmos baseados na Selecao Clonal)CSM - Costimulatory molecule (Molecula Coestimulatoria)CSPRA - Conserved Self Pattern Recognition Algorithm (Algoritmo de Reconhecimento de
Padrao do Proprio Conservado)CCAFA - Cell Context-Aware Fault Alarm (Alarme de Falha Ciente do Contexto Celular)DCA - Dendritic Cell Algorithm (Algoritmo das Celulas Dendrıticas)DC Motor - Direct Current Motor (Motor de Corrente Contınua)DDR - Distinguishable Distance Ratio (Taxa de Distinguibilidade de Distancia)DM - Danger Model (Modelo do Perigo)DMIA - Danger Model Immune Algorithm (Algoritmo Imunoinspirado baseado no Modelo
do Perigo)DS - Danger/Damage Signals (Sinais Indicadores de Perigo/Dano)EC - Evolutionary Computation (Computacao Evolucionaria)FDD - Fault Detection and Diagnosis (Deteccao e Diagnostico de Falhas)FDI - Fault Detection and Isolation (Deteccao e Isolamento de Falhas)FD-DM - Fault Detection based on Danger Model MethodFuzzyNSA - Fuzzy Negative Selection-based Algorithm (Fuzzy model of Antigen Recognition)CI - Computational Intelligence (Inteligencia Computacional)IC - Immunocomputation (Imunocomputacao)
xxv

xxvi List of Abbreviations
IDS - Intrusion Detection Systems (Sistemas de Deteccao de Intrusao)INS - Infectious-Nonself Model (Modelo do Nonself Infeccioso)Inc - Incipient fault (Falha incipiente)NK - Natural Killer Cells (Celulas Exterminadoras Naturais)NSA - Negative Selection-Based Algorithms (Algoritmos baseados em Selecao Negativa)MCAV - Mature Context Antigen ValueMHC - Major Histocompatibility ComplexMLP - Multi-Layer PerceptronMSE - Mean Square ErrorNIDS - Network Intrusion Detection System (Sistemas de Deteccao de Intrusao baseados
em Rede)oc-SVM - One-Class Support Vector Machine (PAMP or PAMPs - Pathogen-Associated Molecular Patterns (Padroes Moleculares Associados a
Patogenos)PCA - Principal Component Analysis (Analise dos Componentes Principais)PRR or PRRs - Pattern Recognition ReceptorsRBF - Radial Basis FunctionSDS - System Dynamics SimulationSIS - Swarm Intelligence-based Systems (Sistemas baseados em Inteligencia de Enx-
ame)SOM - Self-Organizing MapsSTLR - Structured Toll-Like Receptor Algorithm (Algoritmo Estruturado dos Receptores
Toll-Like)SVM - Support Vector Machine (Maquina de Vetores de Suporte)SS - Safe Signals (Sinais indicadores de Seguranca)TCR or TCRs - T-Cell Receptors (Receptores das Celulas T)TLR or TLRs - Toll-Like Receptors (Receptores Toll-Like)TLR Algorithm - Toll-Like Receptor Algorithm (Algoritmo dos Receptores Toll-Like)

List of Symbols
" - Learning rate of the participatory clustering method! - Significance level of the participatory clustering methodµ - Threshold for One-class SVM#x - Binding function of x in NSAAg - Antigen variable (most algorithms)Agk - Antigen variable at an instant k (most algorithms)AIFD(a) - Antigen Index of Fault Di!erentiation of an antigen a (DCA)AR(i,j) - Ambiguity Ratio of a group i related to the group jAT - SVM tolerance index of negative class labelDist(a, b) - Euclidean distance between a and bcg - Centroid of a group gCCAFA - Cell Context-Aware Fault Alarm (DCA)CSM - Costimulatory/Migration variable (DCA)CV - Process control external signal (DAMADICS)dr% - Detection rate of an algorithmDDR(i,j) - Distinguishable Distance Ratio of a group i related to the group jDS - Necrotic or Danger/Damage signal (DCA)DS(k) - Danger/Damage signal of an instant kDS !
(k) - Normalized Danger/Damage signal of an instant kDC(a) - Number of cells that collected the antigen a (DCA)F - Liquid flow rate (DAMADICS)f($) - Function of a set of variables $fa% - False alarm rate of an algorithmG+
K - Sum of positive values of K (DCA)G"
K - Sum of negative values of K (DCA)h - Value for hill functionsJ(a, A) - Jaccard coe"cient of an element a related to a set AK - Signal combination variable (DCA)K+ - Positive values of a signal combination variable (DCA)K" - Negative values of a signal combination variable (DCA)K(a) - Signal combination variable associated to antigen a (DCA)K"(a) - K" index of an antigen a (DCA)M(a) - Number of mature cells that collected an antigen a (DCA)
xxvii
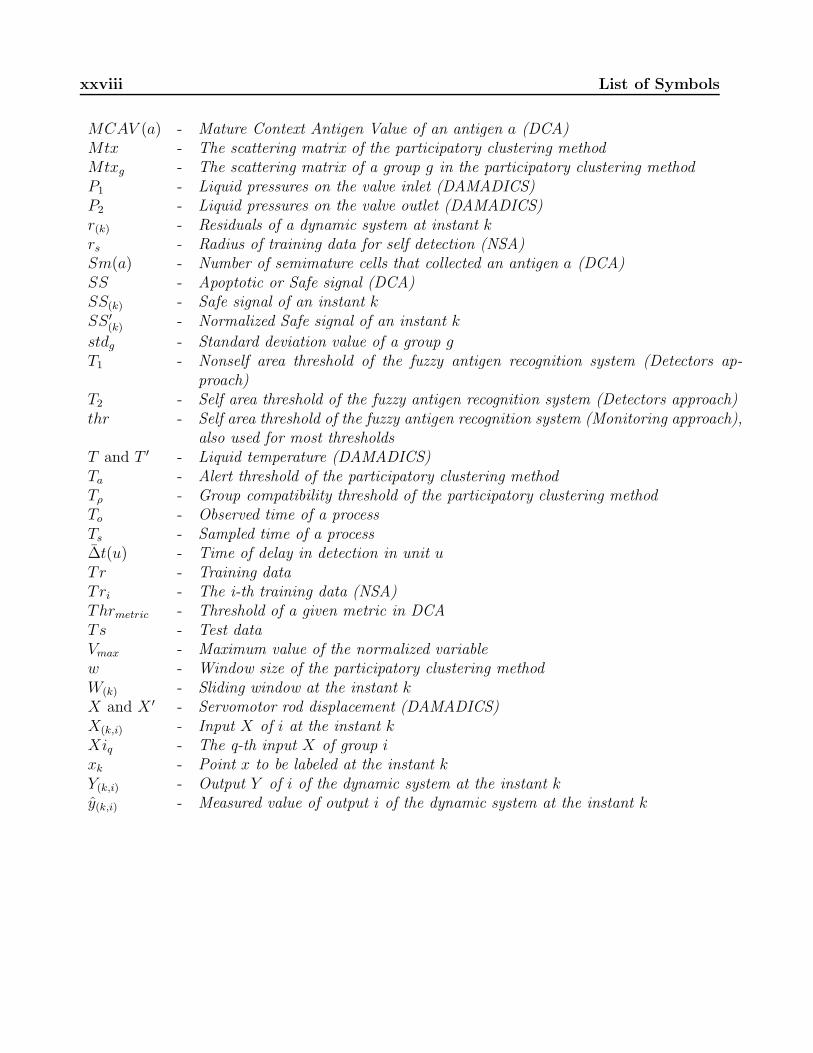
xxviii List of Symbols
MCAV (a) - Mature Context Antigen Value of an antigen a (DCA)Mtx - The scattering matrix of the participatory clustering methodMtxg - The scattering matrix of a group g in the participatory clustering methodP1 - Liquid pressures on the valve inlet (DAMADICS)P2 - Liquid pressures on the valve outlet (DAMADICS)r(k) - Residuals of a dynamic system at instant krs - Radius of training data for self detection (NSA)Sm(a) - Number of semimature cells that collected an antigen a (DCA)SS - Apoptotic or Safe signal (DCA)SS(k) - Safe signal of an instant kSS !
(k) - Normalized Safe signal of an instant kstdg - Standard deviation value of a group gT1 - Nonself area threshold of the fuzzy antigen recognition system (Detectors ap-
proach)T2 - Self area threshold of the fuzzy antigen recognition system (Detectors approach)thr - Self area threshold of the fuzzy antigen recognition system (Monitoring approach),
also used for most thresholdsT and T ! - Liquid temperature (DAMADICS)Ta - Alert threshold of the participatory clustering methodT! - Group compatibility threshold of the participatory clustering methodTo - Observed time of a processTs - Sampled time of a process#t(u) - Time of delay in detection in unit uTr - Training dataTri - The i-th training data (NSA)Thrmetric - Threshold of a given metric in DCATs - Test dataVmax - Maximum value of the normalized variablew - Window size of the participatory clustering methodW(k) - Sliding window at the instant kX and X ! - Servomotor rod displacement (DAMADICS)X(k,i) - Input X of i at the instant kXiq - The q-th input X of group ixk - Point x to be labeled at the instant kY(k,i) - Output Y of i of the dynamic system at the instant ky(k,i) - Measured value of output i of the dynamic system at the instant k

Published Papers
International Journals
1. Guilherme Costa Silva, Reinaldo Martinez Palhares, Walmir Matos Caminhas,“Immune inspired
Fault Detection and Diagnosis: A fuzzy-based approach of the negative selection algorithm and
participatory clustering’, Expert Systems with Applications, Volume 39, Issue 16, 15 November
2012, Pages 12474-12486, ISSN 0957-4174, http://dx.doi.org/10.1016/j.eswa.2012.04.066. Most
of the Chapter 4 is based on this paper.
International Conferences
1. Guilherme Costa Silva, Reinaldo M. Palhares, Walmir M. Caminhas: A Transitional View
of Immune Inspired Techniques for Anomaly Detection. IDEAL 2012: 568-577, Natal (RN),
Brazil Some important aspects of Chapter 3 are based on this paper. This work also serves as
an introduction to the Chapter 5.
Book Chapter
1. Guilherme Costa Silva, Dipankar Dasgupta. A survey of recent works in artificial immune
systems. Handbook on Computational Intelligence, Volume 2 (part - III), edited by Plamen
Angelov. World Scientific. 2014. Despite being part of another project, some parts of the
Chapter 3 are based on the survey.
National Conferences (In Portuguese)
1. Guilherme Costa Silva, Carlos A. L. de Almeida, Reinaldo M. Palhares, Walmir M. Caminhas:
Um sistema imunoinspirado para deteccao de anomalias baseado no reconhecimento antigenico
e na logica fuzzy. CBSF2010, Sorocaba (SP). This is the paper that proposes the antigen recog-
nition method presented in Chapter 4.
xxix

xxx Published Papers
2. Guilherme Costa Silva, Reinaldo M. Palhares, Walmir M. Caminhas: Algoritmo imunoinspirado
nebuloso com agrupamento participativo aplicado ao problema se Deteccao e Diagnostico de
Falhas em Sistemas Dinamicos. SBAI 2011, Sao Joao Del Rei (MG). This paper has some further
analysis of the monitoring-based method and introduces the clustering algorithm presented in
Chapter 4.
3. Guilherme Costa Silva, Reinaldo M. Palhares, Walmir M. Caminhas: Introducao ao algoritmo
das celulas dendrıticas no contexto de deteccao de falhas em sistemas dinamicos. CBA2012,
Campina Grande (PB). In this paper, there are some preliminary results that lead the analysis
of the Chapter 5.
4. Guilherme Costa Silva, Reinaldo M. Palhares, Walmir M. Caminhas: Classificador de padroes
imunoinspirado baseado no modelo do reconhecimento nebuloso de antıgenos, CBSF2012, Natal
(RN). In this paper, a classification method based on the method proposed in Chapter 4 is
presented.

Resumo Expandido
Introducao
Detectar e isolar Falhas sao duas atividades que fazem parte do Gerenciamento de Eventos
Anormais (AEM), um conjunto de tarefas que consiste em monitorar um sistema dinamico
apontando a ocorrencia de anomalias e, com isso, evitando possıveis transtornos decorrente
das mesmas. Entretanto, tais operacoes ainda sao realizadas manualmente e a automatizacao
destas sera necessaria com o objetivo de reduzir os problemas e melhorar a confiabilidade.
Nas ultimas decadas, os Sistemas Imunoinspirados (AIS) tem sido empregados com sucesso
em diversos problemas de computacao e de engenharia, como a deteccao de anomalias. Asso-
ciando o problema da Deteccao e Diagnostico de Falhas e os princıpios imunologicos, supoe-se
que ha diversos pontos em comum entre ambos. Isto possibilita o uso de diversas analogias e,
assim, o desenvolvimento de diversas alternativas que possam oferecer resultados interessantes
para a solucao dos problemas.
Objetivos da Tese
Esta tese busca explorar as analogias imunologicas, demonstrando a relacao entre os conceitos
da imunologia e a aplicacao na pesquisa sobre o problema de deteccao e isolamento das falhas
em sistemas dinamicos e, atraves de novas contribuicoes e melhorias, viabilizar a resolucao dos
problemas. Especificamente, o trabalho busca atingir os seguintes objetivos.
1. Desenvolvimento de novas tecnicas que aperfeicoam metodos anteriormente desenvolvidos,
como os algoritmos baseados na selecao negativa.
2. Facilitar o desenvolvimento de abordagens inspiradas em outros modelos imunologicos
(como o Modelo do Perigo), melhorar a modelagem do conhecimento de especialistas, e
explorar melhor o uso destes algoritmos aplicados ao problema de FDI.
1

2 RESUMO EXPANDIDO
3. Propor metodologias de isolamento das falhas capaz de distinguir diferentes tipos de
falhas, uma vez detectadas pelo sistema imunoinspirado.
4. Aprofundar o estudo das inspiracoes imunologicas e apresentar a aplicabilidade das mes-
mas no problema de deteccao de falhas.
Deteccao e Diagnostico de Falhas
O problema pode ser definido como um caso particular da Deteccao de Anomalias, no qual um
sistema dinamico e monitorado e, eventualmente, a falha e detectada. Apos a deteccao, sao
extraıdas informacoes como a localizacao (requerida para o isolamento), o tipo e o tamanho
(requeridos para a identificacao) e o tempo da falha, caracterizando a etapa de diagnostico.
Grande parte dos sistemas de FDI empregam modelos de redundancia, que consistem na
estimacao das variaveis de saıda do sistema dinamico para gerar o resıduo a partir da diferenca
entre o valor estimado e o valor obtido. Uma vez gerado, este resıduo e analisado pelo sistema
de FDI para a tomada de decisao em relacao ao status do sistema dinamico, conforme os valores
obtidos. A Figura 1 mostra um sistema de FDI conforme descrito.
Fig. 1: Modelagem de um sistema dinamico.
Um outro aspecto e a caracterizacao das falhas quanto a natureza temporal das mesmas,
definidas a seguir:
1. Abruptas - Caracterizadas pela mudanca abrupta e repentina do valor observado.

Resumo Expandido 3
2. Incipientes - Caracterizadas pela mudanca gradual e progressiva do valor observado. Sao
falhas mais difıceis de detectar.
3. Intermitentes - Caracterizadas pela repeticao de variacoes anormais no valor observado.
Nesta tese, os dois primeiros tipos sao considerados. O problema de deteccao e isolamento
de falhas pode tambem ser definido como um problema de classificacao, no qual sao possıveis
as seguintes situacoes, tambem utilizadas como fatores de desempenho:
• Alarme falsos (Dado de operacao normal classificado como falha);
• Falha detectada e corretamente isolada;
• Falha detectada mas incorretamente isolada;
• Falha nao detectada (Falha classificada como operacao normal);
• e o Tempo de deteccao da falha.
A Figura 2 ilustra o cenario descrito acima.
Fig. 2: Problema de Deteccao e Isolamento de Falhas como um problema de classificacao.
Nos casos estudados nesta tese, a etapa de diagnostico e realizada apos a deteccao, e em
todos os casos, e considerado que as falhas nao sao conhecidas a priori.

4 RESUMO EXPANDIDO
Sistemas Imunoinspirados
Os sistemas imunoinspirados sao desenvolvidos com base em abstracoes oriundas do sistema
imune da biologia, cujas analogias servem como metaforas para o desenvolvimento de metodos
e tecnicas com a finalidade de prover solucoes eficientes para problemas computacionais ou de
engenharia. A linha de pesquisa foi consolidada como um metodo emergente de inteligencia
computacional e tambem como uma das principais linhas de pesquisa da computacao natural.
Estes sistemas exploram varios tipos de analogias, que podem ser analisadas em pontos de
vistas diferentes e de acordo com o contexto do problema em questao. As principais abordagens,
assim como as principais aplicacoes estao listadas a seguir, dentre outros exemplos:
• Resposta Imune - Deteccao de Anomalias / Novidades:
– Discriminacao Self-Nonself ;
– Modelo do Nonself Infeccioso;
– Modelo do Perigo;
• Selecao Clonal - Otimizacao e Aprendizado;
• Rede Idiotıpica - Agrupamento.
As primeiras abordagens foram inspiradas na discriminacao self-nonself e aplicadas a prob-
lemas de seguranca computacional. Os algoritmos entao desenvolvidos possuem um mecanismo
de geracao de detectores inspirado na selecao negativa, que e analogo ao treinamento de algorit-
mos de aprendizado de maquina para uma classe, conforme ilustrado na Figura 3. Os detectores
gerados sao comparados com os demais dados (antıgenos), exatamente como na etapa de teste
de tais abordagens.
Apos a consolidacao da linha de pesquisa, uma segunda geracao de algoritmos imunoinspi-
rados foi introduzida com base nos outros modelos de resposta imune conhecidos. Dentre estes
algoritmos estao o Algoritmo das Celulas Dendrıticas (DCA), inspirado no modelo do perigo,
e o Algoritmo de Receptores Toll-Like (TLR), inspirado principalmente no modelo do nonself
infeccioso. Estes algoritmos tem sido aplicados a problemas de seguranca computacional com
resultados promissores. Ao longo da tese, estes algoritmos sao estudados sob o ponto de vista
da aplicacao ao problema de FDI.
O modelo do nonself infeccioso considera a importancia de um sinal caracterıstico para a de-
teccao de uma anomalia, mesmo com o uso de dados de treinamento para a definicao dos limites
entre falhas e operacao normal, representados pelo antıgeno. Ja o modelo do perigo e voltado

Resumo Expandido 5
Fig. 3: Comparacao entre o treinamento de algoritmos supervisionados e a geracao de detectoresnos algoritmos de selecao negativa.
para a definicao e uso mais elaborado de tais conhecimentos, sendo o antıgeno considerado
apenas como um identificador para os sinais analisados.
Em termos computacionais, estes modelos sao inerentemente complementares, definindo a
necessidade de um mecanismo de treinamento (biologicamente representado pela selecao tımica)
ou a necessidade do conhecimento de especialistas sobre o problema (biologicamente repre-
sentado pela apoptose e necrose celular, segundo o modelo do perigo). Nessa representacao
transitoria, quatro modelos sao definidos a seguir.
• Discriminacao Self-Nonself ;
• Self-Nonself com sinal Co-estimulatorio;
• Modelo do Nonself Infeccioso;
• Modelo do Perigo;
Estes modelos imunologicos possuem vınculos de transicao entre os sistemas imunoinspi-
rados, que podem servir de referencia para o desenvolvimento de abordagens imunoinspiradas
mais elaboradas.
Nesta tese, estes modelos sao utilizados para entender como as abordagens imunoinspiradas
funcionam no contexto do problema em questao, no caso o problema de deteccao e isolamento
de falhas (FDI).

6 RESUMO EXPANDIDO
Reconhecimento Antigenico Nebuloso
O metodo do Reconhecimento Antigenico Nebuloso foi proposto a partir de uma visao nebu-
losa da selecao ocorrida no timo, conforme a Discriminacao Self-Nonself. Segundo esta visao,
ilustrada na Figura 4, as celulas T que estiverem associadas com uma afinidade intermediaria
aos antıgenos Self sofrem selecao positiva e sobrevivem ao processo. Isso indica que o objetivo
deste processo e selecionar os clones reativos sub-otimos com base nos padroes Self.
Fig. 4: Descricao do reconhecimento antigenico nebuloso e consequente maturacao das celulasT.
A partir deste princıpio, sao considerados dois metodos que exploram estas ideias em um
sistema de deteccao de anomalias, conforme descrito a seguir:
1. Geracao de Detectores - Usando qualquer algoritmo baseado na selecao negativa, o modelo
nebuloso e aplicado para decidir se o detector sera alocado ou nao.
2. Monitoramento - Usando apenas os dados de treinamento e uma metrica de distancia,
classifica-se os dados de teste como ’normal’ ou ’anomalia’.

Resumo Expandido 7
O primeiro metodo reforca a geracao dos detectores no espaco nonself atraves da regra
nebulosa aplicada a distancia entre o potencial detector e os dados self de treinamento. Na
Tabela 1, as funcoes nebulosas estao representadas e definidas.
Tab. 1: Regras nebulosas do metodo de reconhecimento antigenico nebuloso baseado em geracaode detectores.
Rule Feedback1 Se distancia e Entao resposta e
baixa selecao_negativa
2 Se distancia e Entao resposta e
media selecao_positiva
3 If distancia e Entao resposta e
alta morte_or_negligencia
Ja o segundo metodo dispensa a etapa de geracao dos detectores, uma vez que a distancia
entre o dado self de treinamento mais proximo e o dado de teste determina a classificacao
deste ultimo. Porem, sao necessarias apenas duas regras (das tres consideradas no modelo)
para o funcionamento deste metodo, conforme Tabela 2. Ambos os metodos estao ilustrados
na Figura 5.
Tab. 2: Regras nebulosas do metodo de reconhecimento antigenico nebuloso baseado em mon-itoramento.
Rule Feedback1 Se distancia e Entao resposta e
baixa selecao_negativa
2 Se distancia e Entao resposta e
alta selecao_positiva
Agrupamento Participativo
O algoritmo de agrupamento participativo e baseado na metodologia de aprendizado participa-
tivo, proposta na decada de 90 como um mecanismo que define o funcionamento do aprendizado
humano no contexto de revisao de conceitos aprendidos.
Este metodo de agrupamento consiste no emprego de um ındice de compatibilidade aplicado
aos grupos gerados e de um ındice de alerta que e utilizado para medir a necessidade da geracao
de um novo grupo.
O algoritmo de agrupamento conta tambem com quatro variaveis de entrada: a taxa de
aprendizado " para atualizacoes nos grupos, o tamanho de janela w que verifica mudancas no

8 RESUMO EXPANDIDO
(I) (II)
Fig. 5: Ilustracao dos metodos propostos na tese: (I) Geracao dos Detectores e (II) Monitora-mento.
ındice de compatibilidade, o nivel de significancia !, e o valor inicial da matriz de espalhamento
Mtx, usada ao gerar os grupos.
O algoritmo consiste em gerar e verificar um conjunto de grupos c ao verificar a distancia
entre um ponto xk e o centro do grupo cg e atraves da matriz de espalhamento Mtxg conforme
(1).
D(xk, cg) = (xk ! cg)(Mtxg)"1(xk ! cg)
! (1)
Em (2), e calculado o ındice de compatibilidade %g de um grupo.
%g = exp{!1
2D(xk, cg)} (2)
Em seguida, o valor de %g e comparado com um limiar T%, de acordo com o calculo em (3).
T% = exp{!1
2&2n,"} (3)
Atraves de variaveis booleanas Ok que indicam violacoes no ındice de compatibilidade ao
longo do tempo, o ındice de alerta ag e calculado segundo uma distribuicao de Bernoulli em
(4). Em seguida, um limiar de alerta Ta e definido em (5).
ag =
!
w
v
"
!v(1! !)(v"w), v = 0, ..., w (4)
Ta = 1!!
w(5)
Conforme violacoes percebidas nos limiares, o algoritmo pode gerar novos grupos ou atu-

Resumo Expandido 9
alizar um grupo existente. No segundo caso, o centro do grupo cg e a matriz de espalhamento
Mtxg apos o calculo do fator Gg em (6).
Gg = "(%g1"ag) (6)
cg = cg +Gg(xk ! cg) (7)
Mtxg = (1!Gg)(Mtxg !Gg(xk ! cg)!(xk ! cg)) (8)
Em alguns casos, pode haver redundancia na geracao de grupos, em (9), um mecanismo de
comparacao de grupos e utilizado para tratar este problema.
D(ca, cb) = (cb ! ca)(Ma)"1(cb ! ca)
! (9)
E em seguida, um ındice de compatibilidade e calculado entre os grupos a e b, que sao
unidos caso este ındice seja maior que o limiar T%.
Este algoritmo de agrupamento e utilizado para o diagnostico das falhas detectadas com
o metodo de reconhecimento antigenico nebuloso, no estudo de caso do Motor de Corrente
Contınua, apresentado nesta tese.
Estudo de caso - Motor de Corrente Contınua
O sistema de acionamento do motor de corrente contınua e uma simulacao de um motor baseada
em equacoes de estado elaboradas para o estudo das condicoes normais ou de falha. O sistema
e composto por duas fontes de alimentacao, conversores estaticos controlados, uma maquina de
corrente contınua e uma carga mecanica, como ilustrado na Figura 6.
Neste benchmark, existem onze falhas que podem ser simuladas de acordo com as pos-
sıveis situacoes ocorridas em um motor, influenciando as variaveis observadas. Destas, sete sao
avaliadas neste estudo de caso, conforme a Tabela 3. Neste estudo de caso, os algoritmos de
reconhecimento antigenico nebuloso e o algoritmo de agrupamento participativo sao aplicados.
Para todos os testes, considera-se 1000ms de dados de treinamento (operacao normal) e
3000ms de teste (normal e/ou falha), para o motor em regime, sem ruıdos e sem uso de
modelos de redundancia. Todos os resultados sao apresentados em termos de um problema
de classificacao.
Com o metodo de geracao de detectores, utiliza-se os limiares T1 = 0.15 e T2 = 0.95, o

10 RESUMO EXPANDIDO
Fig. 6: Reprentacao do benhcmark do motor de corrente contınua.
Tab. 3: Falhas do motor de corrente contınua.
Indice Tipo de falhada falha
1 Desconexao do conversor da armadura2 Desconexao do conversor de campo3 Curto circuito no conversor da armadura4 Curto circuito no conversor de campo9 Falha no sensor de armadura10 Falha no sensor de campo11 Falha no sensor de velocidade
algoritmo utilizado e o V-Detector,com a cobertura desejada de 97, 5%, e o criterio de parada
apos 250 detectores alocados ou 100 tentativas. Os resultados estao disponıveis na Tabela 4.
Para o metodo de monitoramento, adota-se um limiar thr = 0.95. Os resultados estao
disponıveis na Tabela 5.
Ambos os metodos apresentaram resultados interessantes, principalmente a abordagem
baseada em monitoramento, na qual foi possıvel distinguir os dados normais dos dados de
falha.
A definicao do metodo de monitoramento pode ser uma boa alternativa para os problemas de
custo computacional dos demais algoritmos baseados na selecao negativa, uma vez que dispensa
a geracao de detectores e a posterior comparacao dos dados de teste com os mesmos.
Em seguida, foram feitos os experimentos com o algoritmo de agrupamento participativo,
com o objetivo de isolar as falhas encontradas. A taxa de aprendizado foi definida como " = 0.1,
enquanto os valores de w e de ! variam conforme analise parametrica. O melhor resultado foi

Resumo Expandido 11
Tab. 4: Resultados com o algoritmo de geracao de detectores.
Cenario Pontos Atraso FP FNdetectados
Normal 0 - 0% 0%Falha 1 2001 0 0% 0%Falha 2 2001 0 0% 0%Falha 3 2001 0 0% 0%Falha 4 1994 6 0% 3%Falha 9 2001 0 0% 0%Falha 10 2001 0 0% 0%Falha 11 2001 0 0% 0%
Detectores Detectores DetectoresUsados Inuteis Descartados
Numero 83 17 0
Tab. 5: Resultados com o algoritmo de monitoramento.
Cenario Pontos Atraso FP FNdetectados
Normal 0 - 0% 0%Falha 1 2000 0 0% 0%Falha 2 2000 0 0% 0%Falha 3 2000 0 0% 0%Falha 4 2000 0 0% 0%Falha 9 2000 0 0% 0%Falha 10 2000 0 0% 0%Falha 11 2000 0 0% 0%
o obtido para w = 3000 e ! = 0.0005, conforme a Tabela 6.
O agrupamento participativo e uma alternativa interessante, porem com uma sensibili-
dade parametrica alta, no sentido de influenciar na geracao dos grupos conforme variacao nos
parametros escolhidos, seja na distincao entre grupos, seja no numero de grupos gerados.
Algoritmos de Segunda Geracao
Nesta tese, mais dois algoritmos sao apresentados como alternativas para deteccao de falhas em
sistemas dinamicos: o Algoritmo das Celulas Dendrıticas (DCA) e o Algoritmo dos Receptores
Toll-Like (TLR), com aplicabilidade ate entao desconhecida ao problema de FDI.

12 RESUMO EXPANDIDO
Tab. 6: Resultados para w = 3000 e ! = 0.0005.
Cenario Acertos Erros GruposNormal 4000 0 1 (0)Falha 1 2000 0 1 (1)Falha 2 2000 0 1 (2)Falha 3 2000 0 1 (3)Falha 4 2000 0 1 (4)
Estes metodos, porem, requerem o uso de um conhecimento baseado de especialistas sobre
a aplicacao, que neste contexto sao representados pelos sinais. Estes sinais sao os responsaveis
pela emissao do alarme nestes metodos, enquanto o antıgeno e o dado a ser classificado por
estes algoritmos.
No problema de FDI, este fator pode ser considerado um desafio, uma vez que o conhec-
imento sobre o sistema dinamico nem sempre esta disponvel ou pode ser inferido no mesmo,
pois em muitos sistemas dinamicos, os dados sAco limitados. Alem disso, tais dados do sistema
dinAcmico muitas vezes possuem caracterısticas como ruıdos e perturbacoes por exemplo.
Os modelos de redundancia, definidos para gerar o resıduo utilizado na comparacao com
a saıda do sistema, podem ser interpretados pelos metodos como os sinais requeridos para a
deteccao da falha. Outros testes foram feitos, considerando por exemplo a diferenca entre dados
entre instantes de tempo, porem, em sistemas nao lineares ou com ruıdos consideraveis, estes
dados podem corromper a analise, gerando alarmes falsos.
Nestes algoritmos, o antıgeno foi definido como sendo a saıda do sistema dinamico, o dado
a ser classificado.
Algoritmo das Celulas Dendrıticas
O DCA funciona atraves da correlacao entre os sinais processados, que representam o comporta-
mento da aplicacao, e os antıgenos, coletados para serem classificados e associados ao contexto
relativo aos sinais analisados. As celulas dendrıticas sao os agentes que coletam os antıgenos e
estao expostas as informacoes representadas pelos sinais, coletadas de forma cumulativa.
Os sinais possuem quatro categorias na formulacao original do algoritmo, sendo que duas
delas, o sinal apoptotico (SS) que evidencia o comportamento normal do sistema e o sinal
necrotico (DS) que evidencia uma possıvel anomalia, sao consideradas nesta tese, considerando
a versao determinıstica do algoritmo. A partir destes sinais, sao gerados outros dois sinais, um
sinal migratorio CSM , calculado em (10), que representa o tempo de vida da celula antes
de ser analisada, e o sinal resultante K, calculado em (11), cujo valor revela o contexto da

Resumo Expandido 13
aplicacao, conforme a celula e os antıgenos analisados. Todos os passos acima sao resumidos
no fluxograma da Figura 7.
CSM = DS + SS (10)
K = 2DS ! SS (11)
Fig. 7: Fluxograma que descreve os principais passos do DCA.
Para calcular SS e DS, e utilizado o seguinte conjunto de equacoes em (12) e (13).
r(k) =
#Ni=1(y(k,i) ! y(k,i))2
Njo = max(1, k ! w)
SS(k) =
#kj=jo
r(j)
k ! jo(12)
DS(k) =N$
i=1
(max(r(k), w)!min(r(k), w)) (13)

14 RESUMO EXPANDIDO
Sendo os sinais normalizados conforme as regras em (14) e (15).
DS !
(k) = min(0, max(100DS(k), 10)) (14)
SS !
(k) = max(0, min(1 ! 10SS(k), 1)) " 5 (15)
Em seguida, metricas sao utilizadas para determinar o status da aplicacao de acordo com
os valores obtidos. Nesta tese foram propostos duas novas metricas para serem usadas no DCA
aplicado ao problema de deteccao de falhas: o Alarme de Falha Ciente do Contexto Celular
(CCAFA) usado para a emissao do alarme e calculado conforme (16), e o Indice Antigenico
de Diferenciaccao da Falha (AIFD), usado para medir a associaccao dos antıgenos ao contexto
do sistema e calculado em (17).
$
DC
G+K =
#
DC K+
#
DC M
$
DC
G"
K =
#
DC K"
#
DC Sm
f($) = 1! e"#
CCAFA = f(G+K)! f(G"
K) (16)
AIFD(a) =
%
Jaccard(a,M) "#
(K(a)), CCAFA > thr
0, Caso contrario(17)
Algoritmo dos Receptores Toll-Like
O Algoritmo TLR estruturado possui um mecanismo de treinamento no qual sao modelados
tanto o espaco de classificacao do antıgeno, relativo a discriminacao self-nonself, quanto as
regras para definicoes dos sinais processados pelo algoritmo. De forma semelhante ao DCA,
celulas sao utilizadas para o processamento do algoritmo, porem, com um processamento muito
diferente.
Existe apenas um sinal a ser avaliado, que e relativo as regras construıdas durante o treina-
mento. Neste caso a categorizacao e binaria, relativa ao sinal estar de acordo com as regras
processadas . O valor 1 provoca a maturacao da celula, enquanto o valor 0, persistente ate
um determinado limiar, causa semimaturacao da celula. Para a ativacao do alarme, a celula

Resumo Expandido 15
deve sofrer maturacao e o antıgeno deve ser classificado como nonself, qualquer outro resultado
classifica o status da aplicacao como normal. Estes passos sao resumidos no Fluxograma da
Figura 8.
Fig. 8: Fluxograma que descreve os principais passos do algoritmo TLR.
O TLR, assim como o DCA, sao aplicados ao estudo de caso do benchmark DAMADICS,
com o objetivo de verificar o desempenho dos metodos em diferentes tipos de falhas e aplica-
bilidade destes ao problema de deteccao de falhas.
Estudo de Caso - DAMADICS
O DAMADICS e um benchmark de um processo industrial que consiste em simular as condicoes
da operacao de uma fabrica polonesa de acucar. Sao obtidos como saıda as informacoes sobre o
status de atuadores do sistema, de acordo com a Figura 9. O benchmark contem 19 falhas que
podem ser simuladas, destas, seis sao estudadas no trabalho conforme descricao da Tabela 7,
tanto nas formas abruptas quanto incipientes, quando houver.
Para este estudo de caso, alem dos dois algoritmos estudados neste trabalho, outras duas
abordagens sao usadas para o estudo de caso. Uma delas consiste na modelagem de um metodo

16 RESUMO EXPANDIDO
Fig. 9: Descricao do benchmark DAMADICS.
Tab. 7: Falhas simuladas no estudo de caso do DAMADICS.
Codigo Localizacao Descricaof0 - Operacao Normalf1 Valvula de Controle Entupimentof7 Valvula de Evaporacao ou
Controle Fluxo crıticof13 Posicionador Falha no sensor de
posicionamento da hastef15 Posicionador Falha na mola do posicionadorf17 Geral ou Variacao inesperada de pressao
Externa ao longo da valvulaf19 Geral ou Externa Falha no sensor de fluxo
inspirado no modelo do perigo, desenvolvido anteriormente para o problema de detecccao de
falhas e que utiliza apenas resıduos como sinais, o metodo e utilizado neste trabalho tanto para
analise quanto para comparaccao. A outra abordagem consiste no classificador SVM de uma
classe com pre processamento realizado pelo PCA, usada apenas para comparaccoes com os
outros tres metodos.
Para o Algoritmo das Celulas Dendrıticas, utiliza-se o numero de 25 celulas, que podem
armazenar ate 10 antıgenos, um tempo de vida de aproximadamente 10 avaliacoes e o tempo
de Amostragem na faixa de valores de Ts = {120, 60, 30, 2}.
No Algoritmo dos Receptores Toll-Like, sao usadas 20 celulas APC, tempo de vida de 5
avaliacoes, e com possibilidade de usar dois algoritmos para avaliar o espa.co self: o reconheci-
mento antigenico nebuloso ou o SVM de uma classe. Alem disso, o antıgeno pode ser avaliado

Resumo Expandido 17
em uma janela movel na faixa de valores de W = {10, 5, 1}.
O Algoritmo baseado no Modelo do Perigo usa entradas e saıdas do modelo nebuloso nor-
malizadas no intervalo [0, 1] conforme (18), e o limiar de alarme imune correspondente a funcao
de estresse do sistema. Sendo que rmax = 80std(rtr).
SS(t) =
%
1, rts(t) > rmaxrts(t)"rminrmax"rmin
, Caso contrario(18)
Para o SVM de uma classe com pre processamento usando PCA, usa-se µ = 0.0000028, o
kernel de base radial e um ındice de tolerancia AT = 2, para minimizar alarmes falsos ocorridos
previamente.
Nos testes realizados com o DCA (Tabela 8, todas as falhas foram detectadas na maioria
dos casos. O algoritmo nao apresentou alarmes falsos e o tempo entre o instante de ocorrencia
da falha e a deteccao foi relativamente baixo. As falhas incipientes foram detectadas, porem
apenas uma delas apresentou um baixo ındice de atraso. O algoritmo apresenta um custo
computacional consideravelmente baixo, mas com um pre processamento consideravel.
Tab. 8: Detectando falhas com o DCA, com Ts = 2.
Test
(ID)Scenario dr% fa% #t(TS)
f0 No fault - 0% -
f1
ASm 99.1667% 0% 2.4349
AMe 100% 0% 2.4771
ALa 100% 0% 2.2715
f7
ASm 100% 0% 1.5479
AMe 100% 0% 1.5219
ALa 100% 0% 1.5376
f13
ASm 99.1667% 0% 1.8702
AMe 100% 0% 1.6303
ALa 99.1667% 0% 2.4545
Inc 100% 0% 3.3937
f15 ALa 97.5% 0% 19.2597
f17ALa 100% 0% 1.5631
Continued on next page

18 RESUMO EXPANDIDO
Tab. 8 – continued from previous page
Test
(ID)Scenario dr% fa% #t(TS)
Inc 97.5% 0% 19.2597
f19
ASm 100% 0% 3.9451
AMe 100% 0% 2.2386
ALa 100% 0% 1.9204
Nos testes realizados com o Algoritmo TLR, a maioria das falhas foram detectadas, apenas
uma delas o algoritmo nao foi capaz de detectar (f19 de baixa intensidade). O algoritmo
tambem nao apresentou alarmes falsos. O tempo de resposta a falha foi um pouco maior que
o do DCA na maior parte dos casos. Quanto ao uso do algoritmo SVM (Tabela 9) em relacao
ao NSA fuzzy (Tabela 10) nao houve uma diferenca significantemente grande. O TLR possui
um custo computacional consideravel devido as avaliacoes necessarias.
Tab. 9: Detectando falhas com o TLR usando o SVM para o espaco Nonself e W = 1.
Test
(ID)Scenario dr% fa% #t(sec)
f0 No fault - 0% -
f1
ASm 99.1667% 0% 112.9664
AMe 100% 0% 42.9667
ALa 100% 0% 99.275
f7
ASm 100% 0% 1.3
AMe 100% 0% 1.3167
ALa 100% 0% 1.2917
f13
ASm 99.1667% 0% 24.3866
AMe 100% 0% 12.7417
ALa 99.1667% 0% 44.437
Inc 100% 0% 157.8917
f15 ALa 100% 0% 20.5333
f17ALa 100% 0% 1.2667
Inc 97.5% 0% 1608.2393
f19
ASm 0% 0% -
Continued on next page

Resumo Expandido 19
Tab. 9 – continued from previous page
Test
(ID)Scenario dr% fa% #t(sec)
AMe 96.6667% 0% 270.1379
ALa 100% 0% 20.9917
Tab. 10: Detectando falhas com o TLR usando o Reconhecimento Antigenico Fuzzy para oespaco Nonself e W = 1.
Test
(ID)Scenario dr% fa% #t(sec)
f0 No fault - 0% -
f1
ASm 99.1667% 0% 112.9244
AMe 100% 0% 42.8833
ALa 100% 0% 99.3417
f7
ASm 100% 0% 1.325
AMe 100% 0% 1.2333
ALa 100% 0% 1.3
f13
ASm 99.1667% 0% 24.437
AMe 100% 0% 12.7833
ALa 99.1667% 0% 44.4706
Inc 100% 0% 157.8667
f15 ALa 100% 0% 20.5333
f17ALa 100% 0% 1.2583
Inc 97.5% 0% 1608.3077
f19
ASm 0% 0% -
AMe 96.6667% 0% 270.2069
ALa 100% 0% 21.1583
Nos testes realizados com o algoritmo baseado no modelo do perigo (Tabela 11), a maioria
das falhas foram detectadas, com ındices menores de acertos em algumas falhas, como nos
outros dois algoritmos, sem alarmes falsos. O tempo de resposta a falha foi consideravelmente
grande. A maior vantagem desta abordagem se deve a seu custo computacional baixo em
relacao as demais abordagens.

20 RESUMO EXPANDIDO
Tab. 11: Detectando falhas com o metodo baseado no Modelo do Perigo.
Test
(ID)Scenario dr% fa% #t(sec)
f0 No fault - 0% -
f1
ASm 99.1667% 0% 380.46
AMe 99.1667% 0% 432.16
ALa 95.85% 0% 430.96
f7
ASm 99.1667% 0% 132.03
AMe 100% 0% 118.89
ALa 100% 0% 136.8
f13
ASm 96.6667% 0% 287.02
AMe 100% 0% 225.03
ALa 95.8333% 0% 452.85
Inc 99.1667% 0% 365.56
f15 ALa 97.50% 0% 351.3846
f17ALa 99.1667% 0% 139.1765
Inc 99.1667% 0% 1297.4
f19
ASm 96.6667% 0% 2326.2
AMe 95% 0% 820.44
ALa 95.85% 0% 464.36
Nos testes realizados com o SVM de uma classe (Tabela 12), a taxa de deteccao foi rela-
tivamente baixa e houve alarmes falsos em todos os testes. O tempo de resposta a falha foi
muito alto, mostrando que os algoritmos imunoinspirados obtiveram um desempenho maior em
relacao a esta estrategia.
Tab. 12: Detectando falhas com o SVM de uma classe, e com pre processamento realizado peloPCA.
Test
(ID)Scenario dr% fa% #t(sec)
f0 No fault 0% 42% 0
f1
ASm 90.8333% 9.1667% 44.6606
AMe 0% 10.8333% 0
Continued on next page

Resumo Expandido 21
Tab. 12 – continued from previous page
Test
(ID)Scenario dr% fa% #t(sec)
ALa 88.3333% 11.6667% 37.5566
f7
ASm 86.6667% 13.3333% 2.7885
AMe 86.6667% 13.3333% 2.8942
ALa 82.5% 17.5% 2.899
f13
ASm 45.8333% 15% 12947.0182
AMe 43.3333% 13.3333% 14046.4231
ALa 0% 15% 0
Inc 87.5% 10.8333% 735.3905
f15 ALa 86.6667% 13.3333% 13.6827
f17ALa 89.1667% 10.8333% 2.972
Inc 90% 10% 380.0093
f19
ASm 23.3333% 13.3333% 23389.3214
AMe 1.6667% 13.3333% 29916
ALa 0.83333% 13.3333% 39102
Para isolamento de falhas utilizando o DCA, foi considerada uma similaridade maxima de
D < 0.4 entre os pontos de falha, usando a distancia euclideana, conforme aplicacao do algo-
ritmo, todos os antıgenos com ındice AIFD > 0 sao armazenados e marcados para avaliacao.
Com este procedimento, os dados de antıgenos sao agrupados e medidos mutuamente quanto
a taxas de distinguibilidade (Tabela 13) e de ambiguidade (Tabela 14). Na primeira, quanto
mais distante de 0, mais distintas e a classe/falha detectada. Ja na segunda, a ambiguidade e
menor quando os valores sao proximos de 0.
Os resultados mostram que o DCA consegue isolar algumas falhas atraves da correlacao
antigenica seguido do uso de uma metrica de distincao.
Tais resultados obtidos sao promissores para estes algoritmos, embora a exigencia de modelos
esteja evidente na aplicacao destas tecnicas, tornando-se uma condicao essencial para o uso
destas no problema, tais abordagens podem prover recursos interessantes para a deteccao das
falhas.

22 RESUMO EXPANDIDO
Tab. 13: Valores de Taxa de Distinguibilidade de Distancia para os antıgenos coletados peloDCA.
f1 f7 f13 f15 f17 f19
f1 0 0.9074 0.7437 1.3932 0.7168 1.8803f7 0.9074 0 1.2187 1.7834 1.2938 1.3155f13 0.7437 1.2187 0 1.1213 0.6342 1.0069f15 1.3932 1.7834 1.1213 0 1.2237 1.1003f17 0.7168 1.2938 0.6342 1.2237 0 0.7284f19 1.8803 1.3155 1.0069 1.1003 0.7284 0
Tab. 14: Valores de Taxa de Ambiguidade para os antıgenos coletados pelo DCA.
f1 f7 f13 f15 f17 f19
f1 1 0.0202 0.0909 0 0.0241 0f7 0 1 0 0.0309 0 0f13 0 0.0349 1 0.0844 0.1530 0f15 0 0.0268 0 1 0.0057 0f17 0 0.0419 0 0.1057 1 0f19 0 0.0132 0.0909 0 0.0494 1

Chapter 1
Introduction
This chapter presents the main aspects of this Thesis: motivations - describing the relevance
of the problem in question - objectives, methodologies, contributions and its structure.
1.1 Motivation and Relevance
The Abnormal Events Management (AEM) in real-time processes provides a set of tasks, which
includes detection, diagnosis and anomalies correction. These tasks should be e!ectively ob-
served and planned. The AEM is useful since the anomaly early detection allows a high degree
of reliability to operate the systems, avoiding any downtime, material losses, fall in production
quality and even accidents involving humans.
According to [Venkatasubramanian et al., 2003a], 7 out of 10 accidents are caused by human
error that are usually ignored or misdetected. The need for automation of these processes comes
from their size and complexity due to the fact, that these tasks has been performed manually.
For these reasons presented, the demand for such systems that provides automatic management
of abnormal events increases.
In order to reduce these problems and increase the reliability, the Fault Detection and
Isolation systems (FDI), also termed as Fault Detection and Diagnostic Systems (FDD) have
been widely used to automate the processes of AEM. Several principles and methodologies are
discussed in works as [de Almeida et al., 2010, de Almeida et al., 2011,D’Angelo et al., 2011].
Definitions and terminology used are considered in [Isermann, 2011].
Artificial Immune Systems (AIS) is a research field, part of Computational Intelligence and
Nature-inspired Computing that emerged in the mid 1980s and has grown in recent times,
o!ering the analogy with the body’s defense system as an alternative that seeks to provide
solutions to di!erent categories of computational and engineering problems, such as anomaly
23

24 Introduction
detection, optimization problems, clustering, pattern recognition, among others.
The biological immune system and the problem of Fault Detection and Isolation have many
points in common that can be exploited, such as the need of di!erentiation and adaptability
in the case of unknown fault detection. These functions, among others, may provide some
powerful tools that can cope with FDI applications accordingly.
AIS research has increased with works such as those in [De Castro and Timmis, 2002], which
provides various methodologies inspired by immunology. It is considered that FDI problems
have features that AIS approaches can deal with, and after the research in [Forrest et al., 1994],
most approaches have presented interesting results with some anomaly detection problems.
Some new initiatives related to the development of immune-inspired systems were advocated
in [Aickelin and Cayzer, 2002] by proposing the Danger Model as a more suited alternative to
the problem of detecting anomalies. The subsequent work in [Aickelin et al., 2003] demonstrates
how to develop such systems applied to computer security.
Fault detection tasks have been addressed in works such as [Guzella et al., 2007], based on
the dynamics of regulatory T cells; [de Almeida et al., 2010,de Almeida et al., 2010,de Almeida
et al., 2011], with approaches based on Negative Selection, Danger Model and NK cells, respec-
tively.
This thesis aim at exploring in depth some immunological analogies, showing the relationship
between the concepts in immunology and application in the detection of faults in dynamical
systems and, through new contributions and enhancements, provide new ways of solving FDI
problems.
1.2 Objectives and Methodology
1.2.1 General Purposes
The purpose of this work is to review and improve immunological analogies to study the Fault
Detection and Isolation (FDI) application since such systems have many points in common
with the biological immune system. The main objective of FDI systems is the recognition of
anomalies of a process component, or even the process itself through its monitoring. Fault
detection is the first task of the system, the next step is its proper isolation.
1.2.2 Specific Objectives
1. Development of new fault detection approaches, which improve previously developed
methods, such as Negative Selection based approaches.

1.2 Objectives and Methodology 25
2. To facilitate the development of Danger model-based approaches, improving the expert
modeling considered, to better explore the use of these algorithms applied to this problem.
3. To propose Fault Isolation methodologies capable of distinguish di!erent types of faults,
once a fault is detected by the AIS approach.
4. To deepen immunological models and to present the applicability of all models to Fault
Detection applications.
1.2.3 Approaches used in the thesis
One of proposed approaches for fault detection makes use of an approach based on a fuzzy model
of antigen recognition (Self-nonself Discrimination), which measures recognition of anomalies
across the distance between the data and the Self space, as two models:
1. Detector generator-based model. In this model, detectors generated in the Self space
(normal patterns) su!er negative selection, the detectors generated away from the other
regions are eliminated by neglect. The detectors generated in the nonself region (outliers)
remain through Positive Selection.
2. Monitoring-based model. In this case, there is no generation of detectors, since the fuzzy
system which defines the region where the data are entered.
The proposed method, unlike other techniques, sets the fuzzy model of self-nonself discrimi-
nation.
Other methodologies define the inspiration of new FDI systems inspired by the Infectious
Nonself and Danger Models. Some of these approaches are listed below:
• The Dendritic Cell algorithm (DCA) from [Greensmith and Aickelin, 2008];
• The Toll-like Receptors (TLR) algorithm from [Nejad et al., 2012];
• The Danger Model approach in [de Almeida et al., 2010].
However, as Danger model inspired still has several issues related to the context of the algo-
rithm, data monitoring will require an expert modeling so that the system operates correctly.
Most of these approaches are based on a previously proposed algorithm, such as most
NSA approaches. The CSPRA, proposed in [Yu and Dasgupta, 2008] is based on the original
NSA, but is based on the INS model, and the Multioperational Negative Selection Algorithm
(MO-NSA), proposed in [de Almeida et al., 2010] is based on the V-detector algorithm. The
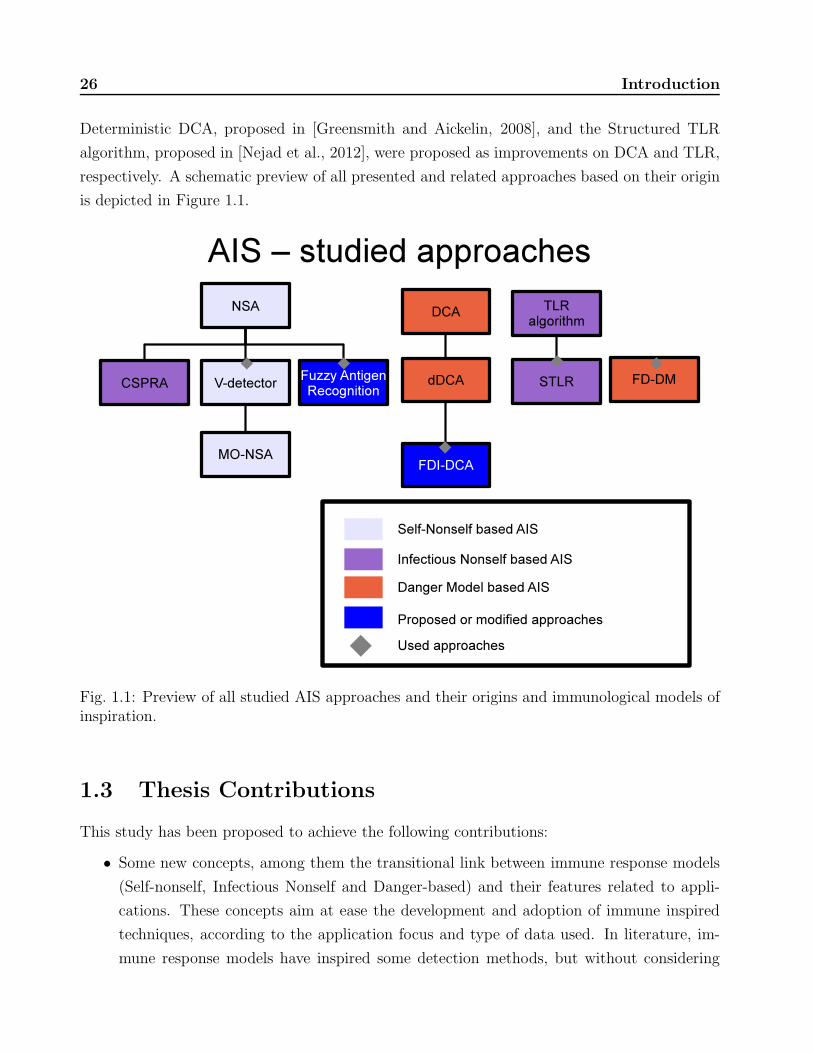
26 Introduction
Deterministic DCA, proposed in [Greensmith and Aickelin, 2008], and the Structured TLR
algorithm, proposed in [Nejad et al., 2012], were proposed as improvements on DCA and TLR,
respectively. A schematic preview of all presented and related approaches based on their origin
is depicted in Figure 1.1.
Fig. 1.1: Preview of all studied AIS approaches and their origins and immunological models ofinspiration.
1.3 Thesis Contributions
This study has been proposed to achieve the following contributions:
• Some new concepts, among them the transitional link between immune response models
(Self-nonself, Infectious Nonself and Danger-based) and their features related to appli-
cations. These concepts aim at ease the development and adoption of immune inspired
techniques, according to the application focus and type of data used. In literature, im-
mune response models have inspired some detection methods, but without considering

1.3 Thesis Contributions 27
how far their features should be properly exploited. In [Aickelin and Cayzer, 2002], a
brief study was done in favor of proposing novel approaches based on the Danger Model.
• Analysis of expert knowledge gathering in the context of Fault Detection in Dynamic
Systems, which identifies each process and then application of AIS approaches. Some
immune-inspired models rely on expert knowledge, and since most FDI systems use re-
dundancy models to provide residuals, this work presents how residuals can be combined
to immune-inspired methods and provide decision. This was done in [de Almeida et al.,
2010], but this analysis was not the focus of the authors’ research.
• A New Negative Selection model based on Fuzzy Antigen Recognition. Di!erently from
most negative selection-based approaches, which are mostly based on detectors genera-
tion, this model is inspired on the theory of sub-optimal antigen recognition to the immune
response, and the algorithm focuses on the decision making process regarding the detec-
tion of an anomaly. This mechanism, as it can be noticed along this work, may provide
an interesting training mechanism for some algorithms. In this model, two approaches
were considered, as follows:
– An extension of detector generation-based Negative Selection algorithms, in which
the decision process defines where anomaly detectors can be generated.
– Monitoring algorithm based on Self data (training) analysis, as the decision process
defines the classification of the data as a normal or anomaly process.
• A study on algorithms inspired in other immunological models that employ mechanisms
of innate immunity and analyzing the important fundamentals and basic considerations
for their use in FDI applications. Some approaches, such as the Dendritic Cell Algo-
rithm [Greensmith, 2007] and the Toll-Like Receptors [Twycross et al., 2010] were devel-
oped for other anomaly detection problems, such as IDS, but their applicability to FDI
Problems has not been widely studied in literature as well as their performance in this
class of problems are still unknown.
• Some improvements in dendritic cell algorithm-based approaches and their application
to FDI problems, as well as in other algorithms, the Toll-Like Receptor based algorithm.
Since these kind of techniques were not initially developed for FDI problems, these im-
provements were proposed in order to provide a suitable detection for these algorithms.
A comparison among these techniques, the method developed in [de Almeida et al., 2010],
and some other machine learning were also considered, as well as a fault isolation mech-
anism for DCA.

28 Introduction
1.4 Text Organization
This Thesis is organized as follows: Chapter 2 presents the most important aspects of the
problem of Fault Detection and Isolation, main application of the thesis. In Chapter 3, a
survey about AIS, with description of the state-of-the-art, methodologies, applications and also
a brief description of each immunological model with their transitional link, are presented and
discussed. In Chapter 4, the negative selection algorithm is discussed and the fuzzy model
of antigen recognition is introduced, as well as their respective results applied to the Direct
Current motor (DC Motor) benchmark proposed in [Caminhas, 1997]. In Chapter 5, systems
based on other immunological models (infectious nonself and danger model) are presented,
as well as their application to Fault Detection, the discussion about expert knowledge in the
problem, and some improvements to each algorithm in order to provide a proper solution to
FDI problems, in particular the DAMADICS benchmark, which is the main application in this
chapter. Finally, the Chapter 6 presents the concluding remarks and contributions made in
this work, as well as further and ongoing research still to be considered.

Chapter 2
Fault Detection and Diagnosis in
Dynamic Systems
2.1 Introduction
Fault detection in dynamic systems is a particular case of anomaly detection, which according
to [Chandola et al., 2009], consists of the activity or task to find the data, patterns that do not
match the expected behavior. These standards are defined as anomalies, outliers, exceptions,
among other terms. The anomaly detection is applicable to various contexts and domains,
such as intrusion detection in computer networks, fraud detection, fault detection, lie detection,
among other applications.
Developing these approaches is an ongoing challenge in the literature, considering various
aspects defined in [Chandola et al., 2009] or inferred during the research, such as:
• the definition of normal behavior, due to the uncertainties encountered in establishing
boundaries between patterns of normality and abnormality;
• the existence of malicious actions that make such behaviors as normal to the system;
• the notion of normal behaviors may change with time;
• di!erences between the exact notion of anomaly in various application domains;
• availability of training data;
• existence of factors like noise, which complicate the analysis techniques;
• uncertainties or inaccuracies in the existing models built for detection, which can lead to
errors in the analysis (False Positives, and False Negatives);
29

30 Fault Detection and Diagnosis in Dynamic Systems
• many techniques do not contextualize the scope of the considered problem.
The definition of abnormality is closely related to the context of novelty detection, which
according to [Markou and Singh, 2003], aims identify data or signals considered novel or un-
known, not contextualized by a learning machine during the training phase. In [Steinwart et al.,
2005], both are similar, as anomaly can be seen as something di!erent from what is normal or
not in accordance with the standards and therefore is not considered satisfactory.1
The context of fault detection systems involves the monitoring of a dynamic system. In
addition to this, diagnosis task should be performed, which generally considers some prior
knowledge, the obtaining of these is often a di"cult task to be performed. The diagnosis is
usually made during or after the detection of a fault, considering some relevant information,
as the type, location and time of a fault. A Fault Detection and Diagnosis system, according
to [Gao and Dai, 2013], may detect the occurrence of faults as soon as possible and identify
location and type of these faults with the best accuracy. These systems are a particular case
of anomaly detection systems, since their goal is, once a fault is detected, to verify each fault
behavior, identify them and then classify the fault based on its characteristics. According
to [Yang, 2004], there are two categories of diagnostic methods considered: Knowledge-based
(or Physical model based) Methods and Data-driven Methods.
2.2 Problem Statement
In process engineering, the importance of system monitoring for fault conditions has been
widely defended, since the detection, the diagnosis and correction of system conditions, are
components of AEM [Taylor and Sayda, 2005].
The major challenge in this context is to automate the process, since the AEM has been
performed manually and increasingly complex processes have been analyzed. In the literature,
many studies have been conducted to automate the processes of fault detection, according
to [de Almeida et al., 2011], whose line of research predicts detection and isolating a fault (FDI
- Fault Detection and Isolation).
According to [Yu et al., 2012], three steps are defined as follows.
1. Detection, in which occurrence of a fault is indicated after its occurrence;
2. Isolation, which defines the fault location;
3. Identification, in which the fault size and other features are estimated.
1Definition provided by the Cambridge dictionary

2.2 Problem Statement 31
In this chapter, some related concepts are presented to the fault detection problem, focusing
on the application environment and approaches based on Intelligent Systems for solving the
problem. Some relevant information for fault detection in dynamic systems can be checked
in [de Almeida et al., 2011,D’Angelo et al., 2011].
2.2.1 Redundancy in FDI
Redundancy models, as defined in [Frank, 1990], are based on the following methodologies:
1. Physical Redundancy - defined as replication elements required for performance measure-
ment and process.
2. Analytical Redundancy - defined by calculating the residue corresponding to di!erences
between measured values and the estimated / observed variables, defined by the models
to be shown in section 3.4.
3. Abstraction - representation which corresponds to the adequacy of the data obtained
in the process to algorithms. The goal of this representation is to adapt the models to
algorithms that require a more abstract representation of the problem. This represen-
tation can be based on the two previous terminology, often being interpreted as some
calculations on the measured data in the process.
According to [Chow and Willsky, 1984], which defines mechanisms for robust fault detection
and whose work is based on analytical redundancy, there are two steps in the task of FDI
systems:
1. Generation of residuals;
2. Decision making.
The first task is the use of models for fault detection and the second consists in analyzing
the information represented by the residuals to detect and to even isolate a fault. The follow-
ing section discusses these strategies in the analysis of dynamical system state of qualitative
approaches, instead of using redundancy models, a symptom extraction can be performed us-
ing classifiers, as implied in [Liu, 2004]. According to [Mayorga and Sellier, 2006], adaptive
observers can be employed for state and unknown values estimation at same time, when certain
values are unknown and subject to changes.

32 Fault Detection and Diagnosis in Dynamic Systems
2.2.2 Characterization of faults
In [Liu, 2004], faults are defined by their location, informed by their actuators, sensor or
components, and according to variables, as additive or multiplicative. According to [Nayyeri,
2013,Carl et al., 2012], faults can be described according to their temporal characteristics, these
concepts are relevant considering the nature of each fault.
1. Abrupt - Faults characterized by sudden and abrupt change of an observed value. Usually
modeled by the step function.
2. Incipient - Faults characterized by gradual and progressive change of an observed value,
di!erent from abrupt faults, this type can be more di"cult to detect, because it represents
a more subtle signal variation. Can be modeled through the ramp function, whose slope
indicates the speed at which the fault progresses. Depending on the process, is not a
trivial type of fault is detected due to delay in detection issues.
3. Intermittent - Fault characterized by the repetition of abnormal variations in the observed
values. Can be modeled by pulses at di!erent instants.
In a study applied to power systems in [Joshua, 2012], two types of faults are considered
(abrupt and incipient faults), since these are most common in case studies, as most of them
consider the occurrence of a fault as an event.
Throughout this work, especially in Chapters 4 and 5, it can be seen that the modeling of
these detectors is a di"cult process due to the occurrence of noise considered in many existing
dynamic systems in daily life.
2.3 Approaches
Many strategies have been adopted to provide detection with a high degree of reliability of
operation of the systems. According to [D’Angelo et al., 2011], this demand resulted in the
need for these systems supervision, which may be based on knowledge of the process or data
using mathematical models or computational intelligence systems.
In a more general classification, strategies for fault detection can be based on quantitative
models (residual or classification based models), and qualitative models (symptom or search
based models).

2.3 Approaches 33
2.3.1 Quantitative Models
Quantitative models employ analytical approaches for the signals generation measuring di!er-
ences between measured and observed values of a dynamic system to measure the state of the
system as its normality degree, as in [Wang et al., 2011b]. These approximations are generated
by state observers, or also by neural networks trained with data to be in the Normal states, as
in the flowchart in Figure 2.1.
Fig. 2.1: Generic Model of a fault detection system, based on [Ding, 2008].
Residuals can also be used to isolate faults, and also can be used in same way as in pattern
recognition, enabling the use of various tools. Some of these methods are described in [Venkata-
subramanian et al., 2003a]. And the first stage of an FDI system is the fault detection, consid-
ered on most algorithms presented in this work.
2.3.2 Qualitative Models
Qualitative models are developed, according to [Venkatasubramanian et al., 2003b], based on
some fundamental understanding of physical features of a dynamic system. These models are
usually based on causal properties (cause and e!ect analysis) or on diagnostic search (based on
topographies or symptoms) of possible abnormal states.
These systems may have some advantages over quantitative approaches, and the major
disadvantage of them is the generation of spurious solutions and the need of a reasoning tool
in order to generate the qualitative knowledge based on the modeling.

34 Fault Detection and Diagnosis in Dynamic Systems
2.4 FDI as a classification problem
It is assumed that the main objective of a Fault Detection and Isolation system is the recognition
of abnormal behavior (faults) of a process component, or process itself, through the monitoring
of its variables and then recognizing adequately the fault patterns or the normal operation.
This idea of this approach can be understood from Figure 2.2. To enable a two-dimensional
preview, consider a dynamic system which can be associated with this pattern to obtain this
information on their operation. Consider coordinates xp1(t) and xp2(t) as inputs, outputs,
estimated states, residue, or combination of these parameters. These coordinates define the
space characterized as the ordered pair (xp1(t), xp2(t)).
Fig. 2.2: Illustration of the Fault Classification Problem, based on [Caminhas, 1997].
For this system, consider three operating situations (classes): normal; Class-1 Fault and
Class-2 Fault. These situations are separated by the border highlighted in Figure 2.2. Whereas
the boundary is obtained by a pattern classification algorithm used to detect and isolate faults.
Based on the boundaries of separation and classification may be illustrated indices for assessing
the quality of a system fault detection, namely:
• False alarm (a normal operation classified as a fault class);
• Fault detected and properly isolated;

2.5 Benchmarks 35
• Fault detected but incorrectly isolated;
• Failure to detect (a fault classified as a normal operation);
• and The fault detection time.
To graphically analyze these situations assume that the initial situation is normal system
operation at t = t0, characterized by the pair (xp1(t0),xp2(t0)) represented by the point P1.
Consider the following situations:
• System operation at point P2, which belong to the region defined by the separation
border, corresponding to a Class-1 fault operation. Based on the classification border,
this point is also a Class-1 fault operation. Therefore, for the situation, the point P2 is
detected and the fault is isolated correctly;
• The P3 point, based on the classification border, is classified as Class-2 fault operation,
but corresponds to a normal condition, which is seen as a false alarm;
• The P5 point is labeled as Class-2 fault operation. As this point corresponds to a Class-1
fault operation, in which case the fault is detected, but isolated incorrectly;
• The point P4 represents a failure to detect the fault (Class-2 fault operation labeled as a
normal point);
• The fault detection time: if a Class-1 fault occurs, represented by P2 point, the time
spent to detect it is defined as the time in which the dynamic system has led P1 to reach
Class-1 border.
It is observed that the more closer to the real separation border is the classification border,
the better detection is provided by the FDI system.
Usually, the first stage of an FDI system is the fault detection, considered on most algorithms
studied in this thesis. Fault isolation is performed if and only if an alarm is triggered by fault
detection system. In addition, some fault types are not prior known, as considered in all case
studies in this work.
2.5 Benchmarks
Some benchmarks were employed in the literature in order to provide validation on most FDI
techniques. In this thesis, two benchmarks are employed and simulated to validate the algo-
rithms proposed in this work.

36 Fault Detection and Diagnosis in Dynamic Systems
2.5.1 The DC Motor Benchmark
The DC Motor benchmark was proposed in [Caminhas, 1997] in order to simulate the conditions
of a Direct Current Motor in normal and anomalous states.
This benchmark can be described as a drive system which consists of two power supplies,
controlled static converters, a direct current machine and a mechanical load. The system can be
represented in shown in Figure 2.3. The block diagram of the entire system, including control,
is shown in Figure 2.4. The speed controller, proportional integral gives the value of armature
current reference. The control of the armature current is done by varying the supply voltage.
This voltage is a function of trigger angle of the converter provided by current controller. The
loop field, and provide the current control allows the drive system to operate above the rated
speed at constant power, through field weakening.
Fig. 2.3: Representation of the DC Motor system.
In Figure 2.3, we can describe each variable as the following:
• va represents the voltage of the armature circuit,
• vfd represents the voltage of the field circuit,
• ia represents the armature circuit current,
• ifd represents the field circuit current.
and in Figure 2.4:
• 'r represents mechanical rotation speed in rad/s,

2.5 Benchmarks 37
Fig. 2.4: Block diagram of the DC Motor system.
• "fd represents the trigger angle of the field circuit converter,
• "a represents the trigger angle of the armature circuit converter,
Those variables are indexed by n, which is related to the machine nominal values. The state
variables are defined by:
• x1 = ia,
• x2 = ifd,
• x3 = 'r
All state variables are measured, i.e. y(t) = Ix(t).
In terms of fault analysis of the benchmark, three groups can be defined:
1. Actuators (armature and field converters);
2. Plant or process (in the DC Motor);
3. Sensors (current meters and speed).
Actuator faults usually occur in static converters. In the context of the DC Motor, this
type of fault is characterized by short-circuit or disconnection of the machine components.
Plant faults can be represented by variations in resistance and inductance of the armature
and field, faults in the ventilation system, that results in simultaneous variations of armature
and field resistances, or poorly lubricated bearings, caused by variation in friction in the motor.

38 Fault Detection and Diagnosis in Dynamic Systems
Sensor faults are characterized by shutdowns of current sensors (armature and field) and
the velocity sensor.
Considering the three faults types discussed above, a summary of the fault modeling in the
DC Motor benchmark is given in Table 2.1.
Tab. 2.1: Summary of DC Motor system faults.
Fault Fault TypeIndex1 Armature converter disconnection2 Field converter disconnection3 Armature converter short circuit4 Field converter short circuit5 Armature turns short-circuit6 Field turns short-circuit7 Ventilation system fault8 Bearing lubrication fault9 Armature current sensor fault10 Field current sensor fault11 Machine speed sensor fault
This benchmark has been previously used in [de Almeida et al., 2010] for tests with the
multioperational version of NSA. In this work, the DC Motor is tested at Chapter 4, for tests
with the fuzzy antigen recognition method, and at Chapter 5 for the validation of Dendritic
Cell Algorithm metrics.
2.5.2 The DAMADICS Benchmark
This benchmark was proposed in [Bartys et al., 2006], for its purpose, three industrial actuators
have been considered, with their structure being the same. The benchmark actuator belongs
to the class of intelligent electro-pneumatic devices and is considered as an assembly of devices
consisting of:
1. Control valve;
2. Spring-and-diaphragm pneumatic servomotor;
3. Positioner.
The actual conditions of the operation of a Polish sugar factory are simulated, in order
to model actuators for industrial valves and to generate valid databases to validate detection
methods and fault diagnosis features. The Figure 2.5 presents an illustration of the actuators.

2.5 Benchmarks 39
Fig. 2.5: The actuator of DAMADICS benchmark, based in [bmd, 2002].
Basically, according to [Kourd et al., 2013], this benchmark has the following mesurements:
process control external signal CV , liquid pressures on the valve inlet P1 and outlet P2, liquid
temperature T , liquid flow rate F and servomotor rod displacement X . Based on these inputs
and outputs, the model is described in Figure 2.6.
Fig. 2.6: Inputs and Outputs of DAMADICS.
DAMADICS faults can be simulated according to their intensity or nature (abrupt or in-
cipient). There are 19 faults described for simulation in Table 2.2.
The DAMADICS benchmark was applied in several works in [Guzella et al., 2007,de Almeida
et al., 2011,Lemos et al., 2013,D’Angelo et al., 2011], as well as in the earlier implementation of
the Danger-based method, in [de Almeida et al., 2010], among others. Some previous researches
have applied immune-inspired algorithms in DAMADICS using neural networks to generate

40 Fault Detection and Diagnosis in Dynamic Systems
residuals for the decision phase, performed by AIS approaches.
In Chapter 5, some faults of the benchmark are tested with several immune-inspired tech-
niques.

2.5 Benchmarks 41
Tab. 2.2: Summary of DAMADICS benchmark faults.
Fault Fault DescriptionIndex Location0 - Normal Conditions1 Control Valve Valve clogging2 Control Valve Valve or valve
seat sedimentation3 Control Valve Valve or valve
seat erosion4 Control Valve Increase of
valve friction5 Control Valve External leakage6 Control Valve Valve tightness7 Control Valve Medium evaporation or
critical flow8 Servomotor Twisted servomotor stem9 Servomotor Servomotor housing or
terminal tightness10 Servomotor Servomotor diaphragm
perforation11 Servomotor Servomotor spring fault12 Servomotor Electro-pneumatic
transducer fault13 Positioner Stem displacement
sensor fault14 Positioner Pressure sensor fault15 Positioner Positioner spring fault16 General or Positioner supply
External pressure drop17 General or Unexpected pressure change
External across valve18 General or Fully or partly opened
External bypass valves19 General or External Flow rate sensor fault

42 Fault Detection and Diagnosis in Dynamic Systems

Chapter 3
State of the Art in Artificial Immune
Systems
Artificial Immune Systems, alternatively known as Immune-inspired Systems or Immunological
Computation, is a research line which is developed based on abstractions derived from the
biological immune system. These abstractions are based on analogies that serve as metaphors
for the development of methods and techniques inspired by the immune system in order to
reproduce some features found in the biological immune system.
The AIS research field has been consolidated in [De Castro and Timmis, 2002], as an
emerging computational intelligence method. Since then, some algorithms and methods have
been developed in order to provide e"cient solutions to many computational or engineering
problems, such as anomaly detection, optimization, clustering, machine learning, among others
as described in [Dasgupta and Nino, 2008, Dasgupta et al., 2011].The following section will
bring some concepts and advances in these approaches.
3.1 Inspiration from nature to solve problems
Natural systems may be considered one of the richest sources of inspiration for the development
of new systems, according to [De Castro, 2006,Afaq and Saini, 2011,Rozenberg et al., 2012].
Due to the complexity of most problems, obtaining reasonable solutions may be a demanding
task and most conventional methods are unable to perform this task in a feasible time.
Many computational paradigms have been proposed, some of these inspired by natural phe-
nomena to provide a system with same or similar features in order to solve complex problems,
such as optimization, classification, clustering, machine learning, anomaly detection, among
others.
43

44 State of the Art in Artificial Immune Systems
These paradigms have been rearranged and categorized into a research field named Nature-
Inspired Systems, a subdivision of Natural Computing research field which, according to [De Cas-
tro, 2006], consists of extracting ideas from nature to develop computational systems, or sim-
ulating and emulating natural phenomena, or even using natural resources to perform compu-
tation. And according to [Rozenberg et al., 2012], this field of study investigates models and
computational techniques inspired by nature, as well as phenomena taking place in nature in
terms of information processing.
3.1.1 A brief introduction to Natural Computing
Many computational systems or events have inspirations in natural or biological mechanisms.
As defined by [De Castro, 2006], this principle, which provides several methods or solutions
based on natural resources or inspirations, is the essential of the Natural Computing research
field, which has three branches, namely:
1. Nature-Inspired Computing models - Solving of problems using nature as inspiration;
2. Simulation and Emulation of Natural Phenomena - Simulation of natural phenomena and
mechanisms in computers;
3. Computing with Natural mechanisms - Using nature as source for hardware or information
processing.
Data structures implementation that can complement or replace current computers devel-
oped in silicon may be studied in the third subdivision, Computing with Natural mecha-
nisms. Such structures may constitute in DNA, RNA, quantum bits or membranes, allowing
the development of “natural” computers.
The study of behaviors, patterns and natural or biological processes, as well as their sim-
ulations are discussed in the second subdivision, Simulation and Emulation of Natural
Phenomena. In which Artificial Life models and some phenomena such as Fractal Geometry
are considered.
Finally, the study of computational tools inspired by natural phenomena is the main pro-
posal of the first subdivision, Nature-Inspired Computing models. In this group, strategies
based on biological or natural mechanisms are proposed in order to provide the same features
found in biological systems for solving complex problems. This subdivision includes the main
focus of this research, as Artificial Immune Systems researches are methods inspired by natural
and biological phenomena.

3.1 Inspiration from nature to solve problems 45
Some researches, as in [Kari and Rozenberg, 2008], may consider subdivisions 1 and 2 as
a single subdivision in which nature serves as inspiration, including other researches, such as
Cellular Automata and L-Systems, those applied both for problem solving and simulations;
Membrane Computing, which has some applications as natural mechanism or to solve com-
putational problems; and even Artificial Life simulations. However, in this particular case,
simulating life or natural phenomena cannot be considered equal to use nature abstractions to
solve problems, as the context and purpose of both subdivisions are di!erent. Figure 3.1 shows
a schematic representation of the connection between all main paradigms of Nature Computing,
as well as their recurrent subjects in literature.
Fig. 3.1: The Natural Computing paradigms and their main research topics, with focus onNature-Inspired Systems, based on [De Castro, 2006,Kari and Rozenberg, 2008].
As an emerging field the Natural Computing research has three major challenges according
to [de Castro et al., 2011]: its consolidation as a transdisciplinary discipline, a more refined
definition of information processing, and the definition of engineering of these systems. It is
stated in the paper that this research field represents an environment of intellectual synergy
that instigates the scientific community to reflect and rethink ideas and proposals in a trans-
disciplinary way. It is described in [De Castro, 2006] that Natural Computing yields novel and
exciting capabilities for computer science, engineering, philosophy and the biosciences.

46 State of the Art in Artificial Immune Systems
The Nature-Inspired Computing paradigm can be alternatively known as Bio-Inspired Com-
puting, Computing with Biological Metaphors or even Biological Motivated Computing [De Cas-
tro, 2006], considering many of these inspirations related to biological phenomena. In addition,
biology can have a broad meaning which incorporates not only biological, but also chemical and
physical systems as well [De Castro, 2006]. This paradigm is widely applied to a large number
of complex problems in literature, which will be further discussed.
3.1.2 Nature-Inspired Computing topics
The list of Nature-inspired systems includes, but is not limited to, the following types of com-
putational intelligence approaches:
• Artificial Neural Networks
• Evolutionary Computation
• Swarm Intelligence-based Systems
• Artificial Immune Systems
All these systems have the biological inspiration as a feature, and may be applied to a
wide number of problems. Computational intelligence systems have been heavily influenced by
biological inspiration, especially in this context.
The biological influence is due to relevant features present in biological systems, such as
memory, organization, learning, recognition, adaptation, robustness, tolerance and diversity in
employment of these techniques. The expected result of using bio-inspired systems in their
applications is to achieve better results in the solution of problems as the same features from
biological system are provided by their computational counterpart.
For example, Artificial Neural Networks systems have an analogy with the brain and human
connectionism. These systems are bio-inspired alternatives for machine learning systems. These
systems can use supervised learning, as Perceptron or Radial Basis Functions, or unsupervised
learning, as Kohonen’s Self-organizing maps.
Evolutionary Computation systems are based on the evolution theory and use population
based concepts. These algorithms rely on crossover operators, in which individuals from a
given generation are able to produce new individuals, and mutation operators, in which an
individual undergoes changes. These individuals are also influenced by selection mechanisms,
which determines how satisfactory is the solution for a given application. Mostly applied for

3.1 Inspiration from nature to solve problems 47
optimization problems, some examples of systems from this paradigm are Genetic Algorithms,
Di!erential Evolution, and Genetic Programming approaches.
Systems based on swarm intelligence, are also based on populations. However, unlike Evo-
lutionary Computation systems, they are based on the influence of some individuals on the
population according to the environment. In these systems, the behavior of one individual can
influence the behavior of others and of the overall system according to predetermined rules.
Systems based on Ant Colony follow this reasoning. Another system considered in this group
is Particle Swarm Optimization, whose rules are based on the behavior of the best individual,
either globally or locally.
Artificial Immune Systems are typically dependent on the application environment. For
example, Anomaly Detection are determined by system functions according to the inspiration
model adopted, which will be further discussed. For other applications, as in the case of Clonal
Selection or Idiotypic Network based systems, this paradigm may have great similarities with
Evolutionary Computation, however, within immunological contexts.
In addition to their application to Anomaly Detection problems, Artificial Immune Systems
can also be applied to optimization, pattern recognition, clustering, machine learning, among
other problems. As the biological immune system have many aspects to serve as inspirations,
it is possible to apply AIS to these problems according to them [Dasgupta et al., 2003, De
Castro and Timmis, 2002,Dasgupta and Nino, 2008,Dasgupta et al., 2011]. In Figure 3.2 AIS
and their algorithms and abstractions are illustrated as a Nature-inspired system as well as the
other paradigms.
Fig. 3.2: Nature-inspired systems examples, with focus on Artificial Immune Systems. (adaptedfrom [De Castro, 2006]

48 State of the Art in Artificial Immune Systems
Newer AIS approaches are focused on innate immunity, possibly because of its relation
to adaptive immunity in some immunological models, like the Infectious Nonself [Janeway Jr.,
1989] and the Danger Model [Matzinger, 1994], considering the role of innate immunity in these
models. Since Antigen Presenting Cells (APCs) such as dendritic cells and macrophages are
represented as mediators for Th cells, some applications have exploited these features, one of
them is the Dendritic Cell Algorithm (DCA), proposed in [Greensmith et al., 2005] and based
on the Danger Model and APC functions.
Some other functions and models may include other functions or models that are not usu-
ally employed for analogies, such as the T-Cell Receptor Density [Owens et al., 2013], the
Complement System [Aitken et al., 2008], Natural Killer Cells [de Almeida et al., 2011, Fu
et al., 2012], Cross-Regulation mechanism [Abi-Haidar and Rocha, 2010], Tunable Activation
Threshold [Antunes and Correia, 2009a] and the Cohen’s Cognitive model [Andrews and Tim-
mis, 2007], among others.
As AIS have many approaches which may be suitable for many sets of applications, they
also can be compared to most Nature-inspired approaches as well. This comparison is also
considered in [De Castro and Timmis, 2002] and may be extended as novel immune-inspired
approaches have been introduced to literature.
3.1.3 AIS X Other Nature-inspired systems
In the Nature-inspired computing research field, Immune-inspired systems can be defined by
their multiple aspects, incorporating some features from other approaches in di!erent ways.
These features in common with other nature-inspired systems will be further defined in a
comparison between these approaches.
One of the advantages of Immune-inspired system is its applicability in various contexts and
the possibility of multiple applications. Most nature-inspired paradigms would be applied to a
particular set of applications, as further described in this comparison between AIS and them,
based on some considerations of [De Castro and Timmis, 2002].
Artificial Immune Systems and Artificial Neural Networks
Artificial Neural Networks (ANN) are inspired by the human nervous system in the same way as
AIS are inspired by human immune system as the neuron represents the information processing
agents, interconnected by other neurons and forming the neural network, in order to provide
learning features. Each neuron relies on weights, which defines the learning function and are
adjusted during the training phase. Learning is the main feature found at these systems.

3.1 Inspiration from nature to solve problems 49
Tab. 3.1: Parallel between AIS and ANN
Artificial Immune Artificial NeuralSystems (AIS) Networks (ANN)
Bioinspiration Antigen recognition by immune cells Connection among neurons(According to a given model or feature)
Representation Shape-space, agents or Mathematical modelingmathematical modeling based. based
Architecture Population or network based Network basedAdaption Learning (NSA) or evolution (CSA/AIN) LearningPlasticity and According to their Using constructive orDiversity components evaluation pruning algorithmsApplications Classification, anomaly/novelty Classification or regression
detection, regression, clustering, problems.optimization, among other problems.
ANNs are mainly represented by Multi-Layer Perceptrons, which may use a Feedforward
architecture and the Backpropagation algorithm for a supervised learning; Radial Basis Func-
tions, another supervised method; and Self-Organizing Maps, an unsupervised method which
relies on a competition mechanism applied to neurons in the network. Recurrent Networks and
Reinforcement Learning algorithms also represent this set of bio-inspired applications.
AIS, like ANN, can be applied to a large set of learning problems. Based on immune memory
concepts, as memory cells are able to store information of a particular antigen in order to provide
a faster and more e!ective response, learning is a feature implied by the immune memory in
the adaptive immune system and can be provided by some immune-inspired approaches like
Clonal Selection based algorithms.
The negative (and also positive) selection of lymphocytes, according to Self and Nonself
Discrimination and assuming that a naive cell is presented to a given self antigen from body,
is also a valid analogy which matches to the same supervised machine learning principles that
are adopted by most neural network models. This feature will be further discussed throughout
this work. At most, learning feature is the recurring similarity between both approaches. In
Table 3.1, the di!erences between AIS and ANN are shown.
Artificial Immune Systems and Evolutionary Computation
Evolutionary Computation approaches are inspired by evolution theories, in which a population
of individuals represents the set of potential solutions to a given problem and each individual

50 State of the Art in Artificial Immune Systems
Tab. 3.2: Parallel between AIS and EC
Artificial Immune EvolutionarySystems (AIS) Computation (EC)
Bioinspiration Antigen recognition by immune cells Evolution of individuals(According to a given model or feature) based on chromosomes
Representation Shape-space, agents or Stochastic modelingmathematical modeling based. based
Architecture Population or network based Population basedAdaption Learning (NSA) or evolution (CSA/AIN) EvolutionPlasticity and According to their Selection of mostDiversity components evaluation fitted chromosomesApplications Classification, anomaly/novelty Mostly for optimization
detection, regression, clustering, problems.optimization, among other problems.
has a genotypic (variables) and a phenotypic representation (fitness function). Best values
for fitness solution represent potential best solutions for the problem. Through processes of
reproduction, selection and genetic operations, population evolves in order to improve these
solutions by generations.
Evolutionary Algorithms are mainly represented by Genetic Algorithms (GA), which relies
on crossover and mutation operators as well as its selection operator applied to the population
individuals, usually represented as binary chromosomes. Older algorithms as Evolutionary
Programming (EP) and Evolution Strategies (ES) were also considered. Genetic Programming
(GP), which is applied in a di!erent context, as representation of computer programs, and
Di!erential Evolution (DE), another evolutionary algorithm, also represent this paradigm.
Some AIS approaches applied to optimization problems have evolution based mechanisms.
The main di!erence between these algorithms is regarding how the selection of best solutions
may occur. In essence, clonal selection based algorithms have some resemblances with evolu-
tionary approaches. In Table 3.2, the di!erences between both paradigms are shown.
Artificial Immune Systems and Swarm Intelligence-based Systems
Swarm Intelligence systems are a set of applications inspired in the dynamics of populations in
a group, these approaches reproduce collective behaviors of a swarm, which can also represent
good solutions for many applications, in particular, for optimization related problems.
This set of applications includes the Ant Colony Optimization System (ACO), inspired in the

3.1 Inspiration from nature to solve problems 51
Tab. 3.3: Parallel between AIS and Swarm Intelligence
Artificial Immune Swarm IntelligenceSystems (AIS) based Systems (SIS)
Bioinspiration Antigen recognition by immune cells Collective behavior of many(According to a given model or feature) individuals
Representation Shape-space, agents or Stochastic and mathematicalmathematical modeling based. modeling based
Architecture Population or network based Population basedAdaption Learning (NSA) or evolution (CSA/AIN) Collective behaviorPlasticity and According to their Population changing accordingDiversity components evaluation to collective behaviorApplications Classification, anomaly/novelty Mostly for optimization
detection, regression, clustering, or clustering problems.optimization, among other problems.
ant communication through pheromones which represents pathways to find food; the Particle
Swarm Optimization System (PSO), inspired in the collective behavior by most individuals
imitate the best of their population or their own best experiences; and other algorithms such as
Bee Colony [Bitam et al., 2010,Maia et al., 2012,Xu et al., 2013], Bacterial Foraging [Passino,
2002], Water Drops [Shah-Hosseini, 2009], Fish Swarms [Neshat et al., 2012], among others.
The main idea of these algorithms is to exploit the main features of such inspirations as long
as a given problem can be solved, once necessary.
These nature-inspired paradigm have been widely applied to optimization problems and
then, comparisons to AIS approaches have been discussed in [Timmis et al., 2010], since both
paradigms have many aspects of direct parallels, since Swarm Intelligence exploits the result of
individual behaviors in coordinated population behavior as a whole and AIS exploits immune
functions and models. Both approaches have been also discussed in terms of self-organization,
positive and negative feedbacks, amplification factors and multiple signals of phenomena. The
scientific and abstract aspects of swarm interactions have been discussed and both approaches
can be considered as complementary fields of research that also can be combined to develop
new techniques. In Table 3.3, the di!erences between both approaches are shown.
Similarities between AIS and SIS have been discussed in [Xiao et al., 2011], such as structure
of individuals, their interaction, and system structures, as well as their learning, memory,
feedback, and adaptability aspects, among other points. It is possible that Swarm Intelligence-
based approaches, as well as AIS, are emerging approaches whose potential is still high for

52 State of the Art in Artificial Immune Systems
analogy exploiting.
3.1.4 Important note about Nature-inspired Systems
Importantly, Nature-inspired systems do not necessarily have all the features of a particular
biological system. For practical reasons, some implementation or specification of these systems
may omit or even extrapolate some aspects. Moreover, Nature-inspired systems do not imitate
biology like in Artificial Life based applications. Instead, nature serves as inspiration to develop
computational systems in order to reproduce the same e!ect as a biological phenomenon to solve
a problem.
3.2 Artificial Immune System Approaches
Artificial Immune Systems are developed based on abstractions derived from mechanisms
present in the human immune system. According to the literature some of these mechanisms
may provide key features such as distributed detection, imperfect detection, anomaly detec-
tion, adaptability, use of only positive samples, and uniqueness for solving problems, among
others. These and the immune memory feature, are attractive for solving some engineering or
computational problems.
Early works, starting from [Forrest et al., 1994], are focused on the Self/Nonself Discrimi-
nation principle applied to anomaly detection. These methods consist on supervised learning
based techniques inspired on the negative selection process, which has a censoring feature oc-
curred in the thymus.
As the biological immune system is a complex and distributed system with a large set
of cells and molecules, and molecules serve as communicators, maintenance, transportation
and signaling for cells, AIS-based solutions may rely on signaling based data applied to these
systems, mainly for the novel approaches that requires a prior expert knowledge about the
system behavior. Even some Self-Nonself based algorithms may require signal-based resources
for a proper anomaly detection, as in [Guzella et al., 2007,Yu and Dasgupta, 2008].
The reason for inspiration in the biological immune system may be related to its robustness
and the faster response provided in the human immune system, in which a more e!ective and
faster response to an antigen is expected for its next occurrences, after the first time this same
antigen was seen in the body. The expected objective of developing such approaches applied
to a given problem is to reproduce expected behaviors from the biological inspiration in order
to solve the problem e!ectively.

3.2 Artificial Immune System Approaches 53
A first survey about AIS was done in [Dasgupta and Attoh-Okine, 1997]. A brief description
about immune models, such as Immune Networks and Negative Selection, and applications of
first immune-inspired approach, such as Computer Security, Pattern Recognition, Time Series
Anomaly Detection and Fault Diagnosis, were reported in the survey, and then, in the first
book about these systems in [Dasgupta, 1998].
The development of novel engineering tools based on immunological theories and models
have been provided for many applications as seen on [de Castro, 2001], in which a framework
for the development of immune-inspired engineering systems, as well as their applications,
comparisons to other computational intelligence paradigms and also proposal for some hybrid
systems were considered. Since then, applications such as Optimization approaches based on
the Clonal Selection Theory or on the B cells, Pattern Recognition approaches and Clustering
approaches based on the Immune Idiotypic Network.
Novel approaches to anomaly detection based on alternate models of the biological immune
system, like the infectious nonself and danger models, have appeared. These models, implied
by their biological counterpart, may depend on prior expert knowledge which defines normal
and abnormal events, suggested by biological analogies, as the Self-Nonself principle, which
relies on the Negative Selection process, analogous to a supervised machine learning method
that defines the normal and anomalous feature space.
Most aspects of these algorithms, including alternate versions and improvements developed,
are seen in [Dasgupta and Nino, 2008], a book in which many aspects and most immunological
computation objectives and proposals are reviewed and discussed.
Algorithms that adopt multiple models for immunological abstraction (i.e. clonal selection
algorithm applied to optimization of negative selection algorithms), the predominant model
related to its research and applications focus will be considered in the list of methods in each
subsection, since these methods can be combined and are not mutually exclusive.
3.2.1 Immune Response Models
An anomaly detection system evaluates data and verifies that these data follow normal patterns
usually defined by prior knowledge achieved under training algorithms or some information
provided by experts. As the accuracy of these systems relies on the specificity of normal data,
some systems may present significant false alarm rates and misdetect some anomalies. For
this reason, computational intelligence based systems has been widely employed, including
Immune-inspired methods.
The main bottleneck of immunology was to define how the nature of the immune responses
is in fact. The first accepted model in biology is the one based on clonal selection, whose

54 State of the Art in Artificial Immune Systems
improvements are usually related to the concepts of Self-nonself Discrimination. However, as
this principle has some controversial points, other immunological models have been proposed
in order to explain some issues regarding some biological functions and immunity.
The Self-Nonself principle, which relies on the Negative Selection process, is analogous to a
supervised machine learning method that defines the normal and anomalous feature space, as
the Negative Selection Algorithms use Self-based training data for detectors generation through
Nonself space.
As in biology, it was discovered that“nonself”antigens alone is not su"cient to trigger T cell
activation, the model of costimulation signals would explain this issue, and then, other models
of immune response were proposed to explain several immunological phenomena. These models
have o!ered other analogies for AIS approaches, mainly related to anomaly detection systems,
which would be applied to di!erent problems, depending on the analogy.
Novel approaches to anomaly detection based on alternate models of the biological immune
system. The danger model was stated at [Aickelin and Cayzer, 2002,Aickelin et al., 2003] as
another way to develop novel AIS approaches, incorporating some aspects, such as, according
to the authors: signals being indicators of behavior in the application rather than antigens;
signals may indicate not only ’danger’, but ’interesting’ or ’relevant’ information; and data
analysis may require less human intervention than previous approaches, among other aspects.
Some of these aspects were considered in further approaches, as in [Greensmith, 2007,
Greensmith and Aickelin, 2008, Twycross et al., 2010]. These alternate models, implied by
their biological counterpart, may depend on prior expert knowledge, represented by signals,
that defines how normal and abnormal events are detected.
All immune models, suggested by how response is triggered, according to their biological
analogies, can be defined on Figure 3.3. Each approach has di!erences related to data analysis.
However, all of them have a transitional link as described in [Costa Silva et al., 2012b]. With
complementary functions to be further discussed, each immunological model has advantages
and disadvantages that should be taken into account for each application environment.

3.2 Artificial Immune System Approaches 55
Fig. 3.3: All immunological models related to the immune response. [Matzinger, 2002] Thisillustration may provide analogies to anomaly detection applications.
Usually, Self-nonself and negative selection approaches are seen as a distinct group in AIS
approaches, as well as immune networks and clonal selection approaches. In this survey, Self-
nonself approaches and most models of immune response are grouped into algorithms based on
the immune response, since these techniques are applied to anomaly detection and they have
points in common, being a part of a transitional link.
The response models which inspire anomaly detection systems will be further discussed
regarding the corresponding model, usually based on T cells or their interaction with antigen
presenting cells (APCs), but not limited to this analogy. Since the immune system analogy is
closely related to the anomaly detection problem, by providing a response to pathogens which
may threaten the body, most algorithms are related to anomaly detection, but not all of them,
as there are other aspects to be explored in these models. The following section will bring some
concepts and advances in these approaches.
Self-Nonself/Negative Selection-based Algorithms
The concept of Self-nonself Discrimination defines the Biological Immune System with the pur-
pose of defending the body against foreign substances (nonself). Considering these substances
as potential causes of diseases, the body must respond to these. For this purpose, the immune
cells, especially lymphocytes, should not recognize the substances in the body (Self) through a

56 State of the Art in Artificial Immune Systems
maturation process, known as the negative selection. This process eliminates all lymphocytes
which have high a"nity to self antigens.
In Computer Networks Security, there are many problems related to system reliability and
some Intrusion Detection Systems (IDS) are based on anomaly detection. In this case, according
to [Catania and Garino, 2012] and [Chen et al., 2010], the normal tra"c behavior is analyzed
in order to generate a normal activity profile, and then, any deviation from this profile is
considered an anomaly. The main advantage of these approaches is the high performance
of unknown attacks recognition. However, these systems may provide some false positive or
changes on user behavior problems. Some statistical or machine learning based methods, as
well as some AIS approaches have been developed to provide more accurate systems. Initial
works were performed in [Forrest et al., 1996] and an initial framework for NIDS was proposed
in [Dasgupta, 1999].
In order to improve the training mechanism of NSA, several approaches were considered, as
the V-detector, a well developed Negative Selection-based approach with coverage estimation.
This algorithm was exposed to sensitivity tests in [Ji and Dasgupta, 2009] in order to expose
its advantages and drawbacks.
Some other improvements for NSA were employed, as in [de Almeida et al., 2010] with some
operators such as radius and detector overlap checking, in [Li et al., 2010] with an outlier robust
inspired by immune suppression and applied for noise in [Wang et al., 2011a] with boundary
management for detectors and in [Gong et al., 2012] with a further training mechanism. De-
tector generation aspects were reviewed in [Jinyin and Dongyong, 2011], and the cooperative
co-evolution detector generation, a parallel gene-based model, is included. In [Wang et al.,
2012], fractional distances are tested in order to verify their applicability to high dimensional
problems, since data relative contrast is related to data dimensionality.
The traditional shape-space representations were evaluated in [McEwan and Hart, 2009],
then, some classifiers and an alternative representational abstraction based in linear squares
were presented to demonstrate the flaws of a n-dimensional based technique and how they
can be outperformed by alternative representations. The basis discovery and decomposition in
the immune repertoire representation were represented by a Matching Pursuit like process and
based on equivalent algebraic and algorithmic mechanisms. The shape-space representation for
machine learning AIS was considered inferior, because it is considered to reduce potential value
of immune-inspired approaches.
The development of NS based approaches without detectors was considered in [Liskiewicz
and Textor, 2010], for string based applications. In this work, a fuzzy view of negative and
positive selection processes was discussed with approaches proposed. In this view, antigen

3.2 Artificial Immune System Approaches 57
recognition has a fuzzy nature and the objective of thymic selection is the maturation of cells
with an intermediate a"nity to self. This model considers both positive and negative selection
mechanisms. Two approaches were proposed based on the model, one of them without detector
generation but considering the nonself space as a deviation of self patterns according to a fuzzy
inference system. The work in [Costa Silva et al., 2012a] introduces this method.
The main advantages of Negative Selection based algorithms are the ease implementation
and intuitive principle, based on the input training data, the shape-space concepts, often based
on r-contiguous or r-chunks for binary or strings data, and distance metrics like euclidean or
hamming distance, depending on the data. The training phase of the algorithm also favors the
approach by the management of the nonself Space. However, the algorithm has issues regarding
the test phase, mainly because of its limitations due to the curse of dimensionality issue, as
considered in [Balachandran et al., 2007]. In addition, these approaches may have some context
issues that may represent a hindrance to a proper anomaly detection.
The Infectious Nonself/Pattern Recognition Receptors-based Algorithms
Some models were proposed in order to provide a proper explanation about biological immune
system and its problems. One of them was the Infectious Nonself model, which extends the two-
signal costimulatory model and tries to explain some elements that could lead to an immune
response.
An approach considered in this group was the Conserved Self Pattern Recognition Algo-
rithm, applied to a recurrent database of anomaly detection problems and improved with selec-
tive mechanisms and tests performed with comparative datasets among di!erent approaches.
The algorithm is also based on the Negative Selection, however, with costimulatory mecha-
nisms based in the PRRs. An improved version of the algorithm applied to computer security
was developed in [Yu and Dasgupta, 2011] with a near deterministic mechanism of detector
allocation.
The Infectious Nonself model has also inspired a Dendritic Cell based approach: The Toll-
like Receptor Algorithm was designed to intrusion detection problems with training mechanisms
and a simplified signal scheme. The interaction between APCs and T cells is the basis of the
algorithm. A Structured version of the algorithm was proposed in [Nejad et al., 2012], this
version considers the Nonself space analysis a criterion for antigen recognition after signal
exposure.
A NSA-based approach with PRR inspired mechanisms was proposed in [Zheng et al.,
2013]. The named PRR-2NSA combines the inspiration on Pattern Recognition Receptors,
whose data are generated via hard clustering and dissimilarity measurements, and a “Dual

58 State of the Art in Artificial Immune Systems
Negative Selection” strategy, in which NSA is applied to classifier maturation to assure if it
does not match with any other classifier, and once again to training data, to assure if it does
not match with any normal data. The proposed algorithm is tested to dataset benchmarks
and is compared to the 2NSA without PRR and the V-detector, with better performance. A
similar strategy for APC data generation was adopted in the Semi-supervised Immune Classifier
Generation Algorithm (SICGA) in [Ying, 2013], but with APC and PRR data being generated
based on K-means algorithm and APC radius metric, and tests being performed in Iris, Chess
and Breast Cancer Wisconsin datasets in comparison to V-detector results.
In summary, there are few approaches inspired on the Infectious Nonself model of immune
response. However, this model is supposed to be a halfway between Self-Nonself-based Model
and the Danger Model in terms of development of AIS approaches, as the concept of signals,
implied by the pattern recognition receptors, and contextualization of anomaly represented by
PAMPs or by a conserved self pattern are features that indicate anomalies in an application.
Danger Model-based Algorithms
Another proposal was the Danger Model, usually referred as Danger Theory1, which defines
that the immune response occurs during a distress event from the body, and activation signals
are sent by damaged cells. Both models also define a higher influence of innate immunity on
adaptive immunity.
Introduced in [Aickelin and Cayzer, 2002] as a new immune-inspired paradigm and designed
for computer security applications in [Aickelin et al., 2003], this immunological model would
provide a second generation of immune-inspired algorithms. Mainly represented by the Den-
dritic Cell Algorithm, proposed in [Greensmith et al., 2005,Greensmith, 2007,Greensmith and
Aickelin, 2008] and evaluated in [Greensmith and Aickelin, 2009], these algorithms were based
in the correlation between system behavior (Danger and Safe signals) and potential anomalous
processes (Antigens).
The algorithm was further simplified in order to work as a deterministic algorithm, with
further formalization, formulations, advances, comparison to other algorithms, functionality
analysis and complexity analysis, which clarifies most implementing issues for the algorithm.
Mathematical aspects related to its geometrical interpretation and linearity are also discussed.
A progress analysis and some suggestions about all these DCA mechanisms were discussed
in [Ding et al., 2013], and an updated study is seen in [Gu et al., 2013].
Besides DCA, there are more approaches inspired on this immunological model, such as an
1The Danger Model is seen as a theory, but according to immunologists, it is postulated as a model ratherthan a theory. This is also applied to Infectious Nonself Model.

3.2 Artificial Immune System Approaches 59
optimization method (DMIA), seen in [Xu et al., 2012]; another fault detection method, seen
in [de Almeida et al., 2010], a classification method in [Zhang and Yi, 2010], among others.
The Danger Model inspiration can provide many interpretations about the problem envi-
ronment, mainly in anomaly detection problems, for which this paradigm is widely employed.
The expert knowledge is one of the main forms of representation for the analogy, which does
not necessarily need to represent danger contexts. Unlike most models representation, Danger
Model based approaches may not need a training phase for its algorithms, but a proper repre-
sentation of its signals is necessary, as stated in [Costa Silva et al., 2012b], and how to obtain
this representation for some problems is still a recurring challenge in literature. Some tests in
malware detection in [Shafiq et al., 2008] indicate that DCA detection is good, as it has a low
rate of false alarms, but compared to other approaches, is far from perfect, even the real-valued
negative selection has a higher detection rate according to some results.
Even in some intrusion detection problems, the Danger Model has some limitations such as
antigen sampling, robust signal selection and time correlation problems, and some adaptations
may be provided for the analogy, as discussed in [Vella et al., 2010]. Depending on the context,
these algorithms may need an expert model to be employed and provide proper results.
3.2.2 Clonal Selection and Idiotypic Network approaches
The Clonal Selection Theory2 is related to the expansion of lymphocytes, antibody formation
in response to the antigen presence, and faster responses in further new exposures to the same
antigen. This theory has inspired the Clonal Algorithm (CLONALG) [de Castro and Von
Zuben, 2002] applied to optimization and machine learning problems, as well as classification
problems, as in [Sharma and Sharma, 2011]. The algorithm has somatic hypermutation, with
some insights reported in [Jansen and Zarges, 2011] and their importance to an application
context in [Ulutas and Kulturel-Konak, 2013], diversity features and is able to search for local
and global optima solutions. Since then, it has been widely applied to many optimization
problems in the literature. A deep and comparative survey of some approaches, with the
emerging research about these algorithms are discussed in [Al-Sheshtawi et al., 2010, Ulutas
and Kulturel-Konak, 2011].
Some possibilities of improvements are being considered, such as in [McEwan and Hart,
2010], the Competitive Exclusion mechanism of clonal selection was discussed, based on gen-
eration and filtering aspects, the mathematical models involved and some biological aspects
discussed. And in [Oliveira et al., 2013] which adopts an alternative representation for the
algorithm inspired by the Pittsburgh-style representation in Genetic-Based Machine Learn-
2The Clonal Selection, according to immunologists, is in fact accepted as a theory.

60 State of the Art in Artificial Immune Systems
ing, selecting as few instances as possible to represent the training set data without accuracy
losses and number of required instances is set dynamically and evaluated during the a"nity
assessment.
Some other interesting algorithms were also developed, such as multiobjective versions
of the algorithm evaluated in [Yunfang, 2012], a Genetic Programming based approaches
in [Jabeen and Baig, 2010,Gan et al., 2009] or a combination with the Gene Expression Pro-
gramming (GEP) in [Karakasis and Stafylopatis, 2008,Tang et al., 2010], implementation of
Immunoglobulin-based mechanisms in [Chung and Liao, 2013], some improvements in AIRS
algorithm in [Jenhani and Elouedi, 2012,Golzari et al., 2011], the application to reinforcement
learning in [Karakose, 2013,Ri! et al., 2013], associative rules for classification in [Mohamed El-
sayed et al., 2012] and as a motif tracker for time series in [Wilson et al., 2010], among other
approaches.
Clonal selection theory has contributed in several aspects for the development of di!erent
systems, many of them applied to optimization related problems. Immunological memory and
cloning have been explored, and some operations such as somatic hypermutation, a"nity matu-
ration and the selection itself, have been exploited in order to solve more complex optimization,
or even machine learning problems. Since the proposal of Clonal Selection-based algorithms,
these approaches have been widely studied and some improvements were proposed.
The Artificial Immune Network paradigm is inspired on the Idiotypic Network Hypoth-
esis [Jerne, 1973], in which is postulated that immune responses may be triggered through
idiotypes, possibly unique to antibody and supposely expressed on Immunoglobins (B-cells),
also discovered on TCRs. These idiotypes are able not only to recognize antigens, but they can
recognize paratopes from other receptors, allowing mutual interactions between immune cells
and providing more e!ective responses. The network theory has inspired some approaches,
such as an immune network for diagnosis in [Ishida, 1990], a learning model in [Hunt and
Cooke, 1996] and a data mining application in [Knight and Timmis, 2001,Timmis et al., 2000],
among other models. These approaches may share many features with Clonal Selection-based
approaches and employs more sophisticated features.
The aiNET approaches, which shares some functions with clonal selection algorithms, are
studied in [de Franca et al., 2010, Zhang et al., 2013, Xu et al., 2010, Liu et al., 2010], for
di!erent applications. Some example of Immune Network approaches can be applied to data
mining applications as a decentralized algorithm in [Swiecicki, 2008] or the autopoietic model
based in [Nanas et al., 2010], or clustering applications as the Adaptive Immune Response
Network in [Liu et al., 2009] or a hierarchical clustering approach in [Chen and Zang, 2011], or
resource allocation in [Li and He, 2013,Yang et al., 2011], and multi-agent systems as in [Hilaire
3.2 Artificial Immune System Approaches 61
et al., 2010], among other applications.
Some interesting applications of immune network theory are in automated systems, such as
in [Khan and de Silva, 2012], in which the immune network is applied to a self regulated fault
tolerant multi-robot cooperation system, as a robot is modeled an antibody and its interaction
environment is modeled as antigen. The objective of the application is to provide coordination
and cooperation among robots. Other robotic-based applications of immune-inspired systems
can be seen in [Raza and Fernandez, 2012].
Some earlier immune network approaches have been developed as an extension for the clonal
selection based methods. However, since the analogy has been more explored throughout last
years, some novel and interesting approaches have also appeared in literature in order to provide
solution of other problems, such as robotics and data mining. Clustering and optimization are
still a recurrent application of the immune network based approaches as well. These aspects
will be further discussed in the research analysis.
3.2.3 Algorithms based on other models
The further approaches presented here are based on other models or features of the immune
system and these approaches are focused on other analogies provided by the immune system.
Some of them can serve as alternative approaches to di!erent applications.
A novel AIS approach based on the density of T cell receptors is proposed in [Owens et al.,
2009] and further explained in [Owens et al., 2013], the algorithm is based on a mathematical
model of TCR density and feedback estimation, with a comparative to some kernel density
estimation based techniques. The algorithm was applied to 2-type anomaly detection tests, to
a chemical agent monitor detection in [Hilder et al., 2012], and in a system of fraud detection
in [Huang et al., 2011].
The Artificial Immune system with DENsity sensitiveness (AIDEN), proposed in [Pathak
et al., 2012], is a clustering method that also adopted a density concept. The method considers
the stimulation of the TCRs and their interaction to B cells in the form of Antigen Recognition
Balls. Some tests were performed in artificial data, with qualitative evaluation of clusters found.
The complement system, which has three pathways for its activation, was explored in [Aitken
et al., 2008], as the algorithm developed is inspired on its alternative pathway, based also on
the message passing process among software agents and requires a matching function. The
authors, however, have discussed the model aplicability to engineering problems, which is still
unknown.
In [de Almeida et al., 2011], a novel AIS appied to fault detection was developed. The
novel approach is inspired on Natural Killer cells functions, which employs receptor balance

62 State of the Art in Artificial Immune Systems
and the education process, features of NK cells in their lifetime. The algorithm was tested in
DAMADICS benchmark and evaluated, with interesting results compared to other approaches.
Natural Killer Cells have inspired another algorithm in [Fu et al., 2012], in which are ex-
ploited the analogy of activating and inhibitory signals to monitor a computational system for
spyware detection. The induction of cytokines by NK cells corresponds to each action per-
formed by the system through web, indicating the presence of spyware. Experiments have
shown some promising results and the applicability of NK analogies to the problem.
A constraint optimization algorithm based on T cells was developed in [Aragon et al., 2008],
in which T cell are divided in three groups and the model is adapted througt the dynamic tol-
erance factor, which changes according to a new population and is calculated according to
violated constraints and their relation to each cell type population. Three mutation opera-
tors are proposed according to cell types. Benchmark problems were tested and compared to
stochastic ranking algorithm. An improved version of the algorithm was proposed in [Aragon
et al., 2010] to handle constrained optimization problems and in [Aragon et al., 2011] for dy-
namic optimization problems.
The Dynamic E!ector Regulatory Algorithm (DERA) was proposed in [Guzella et al., 2007].
This method incorporates cytokines and regulatory cells in the algorithm and adopts a di!erent
concept of Self and Nonself spaces, which relies on the distribution of e!ector and regulatory
cells that recognize normal and abnormal processes. The algorithm was applied to the fault
detection DAMADICS benchmark, with a considerable performance over other approaches.
In [Twycross and Aickelin, 2010] it is shown how innate immunity can be modeled in terms of
multi-level data fusion mechanisms and how real-world problems should reflect an environment
which can be seen as a combination of innate and adaptive immune systems as well. These
models should provide a framework for realtime computer intrusion detection and further AIS
approaches.
The Humoral Artificial Immune System (HAIS) in [Narayanan and Ahmad, 2012] applies
diverse concepts for supervised learning and relies on similarity measures, a"nity thresholds,
maturation and hypermutation, among other mechanisms. The algorithm is applied to some
benchmark datasets, with its parameters explained and memory cells feature evaluated in com-
parison to ANN training. The HAIS has a comparable performance as the obtained by AIRS
algorithm.
In [Suarez-Tangil et al., 2011] the immune system learning and memory features are explored
to study how to turn the generation of event correlation rules an automatic and e"cient features
and detect novel multi-step attacks by applying AIS to optimize Security information event
managements.

3.2 Artificial Immune System Approaches 63
The work in [Figueredo et al., 2011] proposes some comparison regarding two types of
simulation: Simulation of Dynamic System (SDS), a mathematics-based immune model, and
Simulation Based in Agents (ABS), in which e!ector cells of the immune system and their
behavior facing tumor cells are modeled. For these two models, two AIS approaches were
derived.
The T-cell Cross-Regulation model has inspired an application in [Abi-Haidar and Rocha,
2011,Abi-Haidar and Rocha, 2010], which consists in an agent-based method inspired by the
dynamics of a population of T-cells and APCs for a single antigen recognition. The model is
applied to data classification and feature selection, particularly in Biomedical Article Classifi-
cation problem, for which the proposed method is tested and validated, the authors, however,
state that the model needs to be improved with more sophisticated features.
Another AIS approach was developed in [Antunes and Correia, 2009a,Antunes and Correia,
2010,Antunes et al., 2009], the algorithm is based in the tunable activation threshold (TAT),
which is a key mechanism for homeostasis, a dynamic equilibrium which represents one of two
immunological concepts adopted in the algorithm, the other is cells clonal size regulation. The
algorithm (TAT-AIS) employs this model for T cells and is able to recognize unknown patterns
in temporal anomaly detection problems. The TAT hypothesis based algorithm has also applied
to intrusion detection in [Antunes and Correia, 2009b,Antunes and Correia, 2011].
The cognitive paradigm of immune system [Cohen, 2000], which states that immune system
recognizes both self and nonself and immune responses are mediated through cooperation of
immune cells, has inspired an information retrieval architecture in [Hu et al., 2008]. The pro-
posed system relies on interactive networks between agents of the system and a co-evolutionary
mechanism led by an a"nity maturation through the networks. Studies about development of
systems inspired on this paradigm have started in [Andrews and Timmis, 2007,Voigt et al.,
2007], but since then, few works have explored this paradigm of immune system, which can
provide interesting analogies.
According to [Hart et al., 2009], modeling collaborative network among immune entities
can lead to the development of novel approaches fit for their purpose of solving engineering
problems. Analogies are taken from innate immunity and their interaction to the adaptive
immunity elements, modern models of immune networks, and the cognitive paradigm. These
analogies were discussed and then related to some real-world applications.

64 State of the Art in Artificial Immune Systems
3.3 A brief summary about Hybrid AIS approaches
AIS can also be combined to other approaches as described in [De Castro and Timmis, 2002],
with description of diverse combinations of paradigms, and in [Dasgupta and Nino, 2008], with
the example of Negative Selection and Self Organized Maps model described. The development
of hybrid systems has increased in the literature, not only for AIS, but for many other nature-
inspired algorithms. This survey will further describe the influence of hybrid approaches in AIS
research.
Hybrid system can be divided in two groups. In the first group, it will be discussed the
use of tools or methods that can extend or enhance AIS to provide proper features in problem
solving, such as Probability Theory, Fuzzy Logic, Information-based Tools, among others. In
the other group, systems that employ di!erent algorithms or techniques with their functions
mixed will be discussed, such as Artificial Neural Networks, Evolutionary Algorithms, Swarm
Intelligence Algorithms, other machine learning methods, among others.
3.3.1 Useful tools for AIS enhancement
Several tools can be employed in order to extend AIS features or to enhance most aspects,
such as probability or tools based on the Bayesian theory, fuzzy set theory, information theory,
kernel methods, among others since they are not considered as specific algorithms. Hybrid
approaches involving multiple algorithms will be further discussed in the other group.
Some of these tools have been already adopted in early approaches, as in the example of
the first Self-Nonself based system in [Forrest et al., 1994], whose detection is probabilistic.
Several methods rely on these tools for modeling purposes, according to features that should be
provided for a particular problem. In addition, algorithms based on clonal selection need these
features because of their stochastic nature as these are applied to generation of antibodies and
in the somatic hypermutation operators. However, since these features were not the focuses
of their respective approaches, but features incorporated to these systems, they cannot be
considered as hybrid approaches at all. As each tool can enhance AIS functionalities, a further
discussion will be presented of some of these tools.
In this group, some tools can be used to provide enhancement for AIS, in terms of functions
and mechanisms. The following list includes, but is not limited to these considered approaches:
• Probabilistic methods, such as Gaussian or Bayesian;
• Fuzzy and Rough sets theory;
• Information theory tools;

3.3 A brief summary about Hybrid AIS approaches 65
• Kernel Functions;
• Other learning and memory mechanisms;
• Chaos theory, quantum computing and other methods.
These tools can be used to improve or replace mechanisms on AIS approaches, in the case
of probabilistic methods. Examples of these techniques are the family of Probabilistic Ar-
tificial immune Systems based on Negative Selection in [Mohammadi et al., 2012] and both
Bayesian Artificial Immune System (BAIS) [Castro and Von Zuben, 2008] and Gaussian Artifi-
cial Immune System (GAIS) [Castro and Von Zuben, 2010] applied to optimization, with these
algorithms also having multiobjective versions.
Fuzzy Set Theory, which can deal with uncertain or imprecise information, may o!er proper
models of aspects and mechanisms of the immune systems, providing powerful interactions,
according to [De Castro and Timmis, 2002]. These aspects are considered mainly for adaptive
immunity features, as the antigen recognition is approximate. However, the use of Fuzzy Logic
is not limited to these aspects, as the immune system has several components. Some examples
of algorithms are an Immune Network based in [Szabo et al., 2012], a Dendritic Cell-based
in [Chelly et al., 2012], and the fuzzy recognition algorithms proposed in [Costa Silva et al.,
2012a].
Information theory tools have been used to enhance AIS functions through entropic di-
vergence metrics, such as Kullback-Leibler, Renyi and von Neumann, or the Dempster-belief
Theory, which performs classification by computing evidences. One example of these approaches
are the Local Concentration (LC), proposed in [Zhu and Tan, 2011b], to perform feature ex-
traction and is based on tendency calculation via probability of occurrences, the vector of local
concentrations is constructed by sliding window measurements of both censored and legitimate
genes. The LC model can be constructed based on term selection that can be employed by
information-based methods.
The use of kernel functions was less considered, and the discussion in [Guzella et al., 2008]
has presented how kernel functions should extend AIS functions and features in the same way as
used in machine learning paradigms such as SVM algorithms. The possibility of replacement of
a"nity functions by kernel functions were considered to map feature space. A test using aiNet
approach mapped in a Gaussian space was performed in the research. In [Ozsen et al., 2009],
a kernel-based AIS for classification inspired on clonal selection was proposed, and the a"nity
function between Ag-Ab is replaced by a kernel-based distance measurement. Benchmarks of
UCI Database were applied to the proposed method.

66 State of the Art in Artificial Immune Systems
These are some examples of useful tools in the development of di!erent techniques or the
improvement of existing ones without altering significantly the main idea of either the abstract
model of an algorithm or functions for which these algorithms were designed for. Instead,
these tools should provide a better suitability of the model or even permit the feasibility of an
analogy for the development of new techniques applied to problem solving. Approaches that
are developed mixing multiple techniques or employing features of di!erent algorithms or even
paradigms will be further discussed in the next subsection.
3.3.2 Hybridization of AIS and other paradigms
In this subsection, hybrid approaches that use mechanisms from AIS and other algorithms
or even multiple algorithms will be discussed. Di!erently from the other group, in which
paradigms or tools are implemented in terms of AIS modeling, in this group, all approaches
employ di!erent algorithms in the same system, in a high level of system hybridization. The
list of approaches that can be used for this purpose include, but are not limited to the following:
• Nature Inspired approaches:
– Artificial Neural Networks;
– Genetic Algorithms and other evolutionary algorithms;
– Swarm intelligence approaches;
• other Machine Learning systems:
– Naive Bayes;
– K-Nearest Neighbors (KNN);
– Support Vector Machines (SVM);
– most Clustering algorithms.
• Fuzzy systems:
– Fuzzy C-means;
– Takagi-Sugeno systems;
• Meta-heuristics;
• Meta-learning tools;

3.4 Immune Response Algorithms 67
Examples of applications for possible hybrid AIS are mining rules from neural networks,
weight optimization, ensemble in classification problems and generation of rule bases, among
others.
Other examples of these approaches are combinations of AIS and PSO, as PSO may be
applied to antibody improvements under mutation operators in classifiers or clustering methods.
Several approaches were discussed in [Wu, 2012], including a novel immune-inspired method,
presented to solve constrained global optimization problems.
There are many possibilities of hybrid approaches, since there are many paradigms to be
considered. How these algorithms can be applied to a given problem is also another aspect of
these mixed systems, since these algorithms, as well as AIS approaches, can serve as ensemble
for one or many algorithms, or improve features or results of a given algorithm, or even be a
part of the algorithm processing. The approaches cited here are some examples of how AIS can
improve or be improved by other techniques to solve harder problems, as for their complexity,
a single algorithm may not be enough.
Some of these combinations, however, may imply redundant features, since AIS have features
in common with other paradigms of machine learning or mainly nature-inspired applications,
which are subject to similarities between paradigms, as in the example of Clonal Selection
algorithms and Evolutionary Algorithms approaches. Some other examples will be further
discussed in the sense of AIS research.
3.4 Immune Response Algorithms
According to [Beutler, 2004], a “true” immune system, independent of its complexity, must
provide three features: the recognition of diverse array of pathogens, their posterior elimination,
and protection of host tissues through self-tolerance. If these concepts provide an analogous
vision of an immune response based anomaly detection, the features considered in these systems
should be described as follows:
1. An AIS is able to recognize diverse types of anomalies;
2. Once recognized, an alarm signal is sent, or proper actions are performed;
3. Performs detection without interference on other operations, or in the normal operation
as well.
Early works have been inspired by self-nonself discrimination principle, such as the com-
puter virus detection approach of Forrest in [Forrest et al., 1994], and many approaches and
improvements were done since then.

68 State of the Art in Artificial Immune Systems
The models studied in this work follow the description of [Greensmith and Aickelin, 2009],
describing the evolution of immunological theories, along with the corresponding immune in-
spired approaches. These models are based on signal presences required for immune response,
as defined in Figure 3.4.
Fig. 3.4: Description of immunological models discussed.
In the following subsections, some immunological models and their respective algorithms
will be discussed. Their characteristics and applicable situations, as well as the advantages and
disadvantages of these algorithms will be exposed in the research.
3.4.1 The Classical Model
The model is based on the Self-Nonself Discrimination principle, in which immature cells which
recognize Self patterns are eliminated by the Negative Selection process. The first immune
inspired algorithms were developed from this principle.
The Negative Selection Algorithm (NSA), defined in [Forrest et al., 1994], is an anomaly
detection system that consists of analyzing the feature space, and through it, generating de-
tectors in the Nonself region. The algorithm has resemblance to supervised machine learning
methods, since the Self data is used as a reference, so that the detectors are located outside of
Self region.
The method in fact, can be summarized as the one-class supervised classification problem,
in which only one of the patterns (Self) is known and the outliers may belong to another class
(Nonself), as shown in Figure 3.5.

3.4 Immune Response Algorithms 69
Fig. 3.5: Illustration of similarities between one-class supervised classification and anomalydetection based on Self/Nonself principles.
Many approaches appeared trying to improve operational aspects such as optimization of
the coverage area to detectors [Ji and Dasgupta, 2004b], allocation considering boundaries of
Self space [Ji, 2005], or overlap on two or more detectors [de Almeida et al., 2010]. In [Gong
et al., 2012], it is considered a training method that optimizes the computational cost of the
algorithm. Other improvements are considered in [Ji and Dasgupta, 2007].
The algorithm is very intuitive and quite simple but has many issues: to allocate the
detectors and measure the similarity between these and the data may imply something quite
costly and redundant, especially in high-dimensional problems. Furthermore, the algorithm has
serious problems concerning the system context. Other issues can be seen in the analysis of [Ji
and Dasgupta, 2006].
Despite the issues, the NSA is applicable to problems where there are few abstractions on
the application and it is possible to set normal behavior. However, the algorithm is very limited
considering the application environment.

70 State of the Art in Artificial Immune Systems
3.4.2 Costimulatory and Infectious Nonself Models
The costimulatory model defines that two signals are required for the activation of the immune
response: the nonself antigen presence and a signal emitted by Antigen-Presenting Cells. This
model has inspired few researches in computer networks, such as [Hofmeyr, 1999, Balthrop,
2005]. These models can be considered intermediate or transitional between the Negative
Selection and the Danger Model.
The model was proposed in [Janeway Jr., 1989] in attempting to explain some phenomena
that, in theory, Self-nonself discrimination could not deal with. In this model, T cells rely on
pattern recognition receptors (PRR) which recognize infectious pathogens and collect Pathogen
Associated Molecular Patterns (PAMP) for the activation of immune response.
This model represents a “half-way” between the classical immunology, and the next model
combining known data sampling and some priori information about the application context.
The Infectious Nonself has provided few AIS models in the literature so far. One of these
techniques is the Toll-Like Receptors algorithm. Proposed in [Twycross et al., 2010] with ideas
presented in [Aickelin and Cayzer, 2002], the TLR is inspired by an immune model defined
in [Kapsenberg, 2003], and employs functions analogous to Toll-like receptors in information
processing tasks, as explained in Figure 3.6.
Fig. 3.6: Biological processing of Toll-Like Receptors and its analogy with data processingsystems.

3.4 Immune Response Algorithms 71
This algorithm consists of a technique based on the interaction between two agents: APCs
and T cells that are exposed to stimulus analogous to PAMPs and collect the antigens repre-
sented by process identifiers. These agents and their possible states are illustrated in Figure 3.7.
Fig. 3.7: Agents used by the algorithms of Toll-Like Receptors and their possible states.
Signals are defined by Boolean variables and once the APCs are exposed to these signals,
they su!er full maturation. This is essential for antigen recognition by T cells in communication
with mature APCs. When APCs cannot see this signal, during their lifetime, these cells goes
semimature, and if a semimature APC presents an antigen to the T-cell, the latter undergoes
apoptosis. This mechanism can be summarized by Figure 3.8.
Fig. 3.8: Summary of the Toll-Like Receptor algorithm.

72 State of the Art in Artificial Immune Systems
Despite the ease of abstraction, implementation requires the definition of mechanisms of
training, a proper definition of signals and most features of the algorithm for the two types of
considered cells.
In [Nejad et al., 2012], the Structural TLR (STLR) algorithm was proposed. The algorithm
provide some changes in which T cells were related to the self and nonself spaces with the
detection mechanism provided by antigen-presenting cells. Once exposed to the signals and
defined as mature cells. This algorithm associates T cells to nonself space modeling, defined
as the complement of the self space. Then, the nonself space is defined by antigen structure
as recognition is given by the binding function between the antigen and a sample self space,
according to (3.1).
#Ag =
%
1, #i $ Tr, Dist(Tri, Ag) > rs
0, otherwise(3.1)
(3.2)
Where Ag is the antigen (data structure) and Dist(a, b) is a distance metric between a and
b, and is usually defined by the Euclidean distance or the Mahalanobis distance. In summary,
the STLR has features of algorithms based on Negative Selection, however, most mechanisms
are described in the original TLR in [Twycross et al., 2010].
Main functions of Toll-like Receptor Algorithm can be summarized in the flowchart of
Figure 3.9 and in Algorithm 3.1.
STLR was applied to intrusion detection problems with interesting results and a relative
superiority to the original TLR. As this algorithm has been only applied to intrusion detection
problems, some changes should be considered for its application FDI problems. Some ways to
process the algorithm will be described in the following sections, considering its modeling.
3.4.3 The Danger Model
The Danger model3, postulated by [Matzinger, 1994], is an alternative to classical immunology
defending another point of view related to the immune system: immune response aims to
respond to the damage su!ered by cells instead of reacting against foreign antigens.
This immunological model would inspire a set of new AIS approaches [Aickelin and Cayzer,
2002,Aickelin et al., 2003] in which the application context can be exploited, once the set of
3In the literature, this model is often called “Danger Model”. However, considering its nature, the best nameshould be “Damage Model”.

3.4 Immune Response Algorithms 73
Algorithm 3.1 Pseudocode of TLR Algorithm
1: procedure TrainingTLRAlgorithm(AgTr,SignalTr)2: Self % BuildNonselfSpace(AgTr) ( Build Nonself Space with a detection
algorithm.3: SignalRules % BuildSignalRules(SignalTr) ( Build rule database from training.4: return Self ,SignalRules5: end procedure
6: procedure TestTLRAlgorithm(AgTs,SignalTs,Self ,SignalRules,NumCells)7: Cell % GenerateCells(NumCells) ( Generate cells to evaluate data.8: c % 19: k % 1
10: while not(StopCriteria) do11: Cell(c).Ag % GetAntigen(AgTs, k) ( Cell collects antigen.12: Unseen % UnseenSignal(Cell(c), SignalTs, k, SignalRules) ( Cell receptor
senses signals.13: if Unseen = true then14: Cell(c).Status % Mature15: Migrated & c16: else17: if Cell(c).Lifetime ' 0 then18: Cell(c).Status % Semimature19: else20: Cell(c).Lifetime % Cell(c).Lifetime ! 121: Migrated & c22: end if23: end if24: for all m $ Migrated do25: Match % EvaluateNonselfSpace(Cell(m), Self)26: if Cell(m).Status = Mature then ( APC is mature.27: if Match = true then ( Antigen is Nonself.28: Alarm % true29: else ( Antigen is Self.30: Alarm % false31: end if32: else ( APC is semimature.33: Alarm % false34: end if35: Cell(m) % RenewCell(Cell(m)) ( Replace migrated cells.36: end for37: Migrated & (38: c % mod(c, NumCells)39: k % k + 140: end while41: return Alarm42: end procedure

74 State of the Art in Artificial Immune Systems
Fig. 3.9: Flowchart of the Toll-Like Receptor Algorithm.
signals and analogies are well defined in this model.
Dendritic Cell Algorithm, proposed in [Greensmith et al., 2005], has these characteristics.
Antigen in this approach are identifiers to be evaluated and the signals set corresponds to the
system behavior. The original algorithm formulation determines four possible types of input
signals, two stimuli signals (Danger and PAMPs), an inhibition signal (Safe) and an amplifier
that depends on the other three signals; and three output signals, one of which corresponding
to the lifespan of the cell and the other two corresponding to the context of dendritic cells,
indicating that the immune response.
Unlike the TLR algorithm, DCA does not represent the T cell by an agent of the algorithm.
Their representation is inferred by a decision mechanism that evaluates the antigen according
to the maturation of dendritic cells that have collected. Such signals consider the conditions of
the application environment in the problem, without training on the system.

3.4 Immune Response Algorithms 75
Em [Greensmith, 2007], the algorithm would be applied to problems related to intrusion
detection in computer networks, among they SYN scan, and is promising for the application
in the problem. Then the algorithm was applied to similar applications in [Al-Hammadi et al.,
2008,Manzoor et al., 2009,Fu et al., 2010], and engineering [Bi et al., 2010,Amaral, 2011,Hart
and Davoudani, 2009].
These signals correspond to representations of expert knowledge about a particular problem
and for the application of DCA to a specific problem, by the context of an application.
In [Greensmith and Aickelin, 2008], Danger and Safe signals are required and the other
two signals are optional. The input signals are processed to generate the CSM values in(3.3),
which determines the lifespan of the cell, and K values in (3.4), which combines two maturation
signals. These equations define the basic formulation of anomaly detection problems in DCA.
CSM = DS + SS (3.3)
K = 2DS ! SS (3.4)
Usually, safe signals is stronger than danger signals, so the equation defines a high weight
to the latter in K.
When the variable CSM reaches a threshold for cell migration, a maturation process occurs.
If K is positive, cell becomes mature, which means the activation the immune response, and if
K is negative, cell becomes semimature, which means suppression.
After maturation of dendritic cells, antigens collected by such cells should be placed accord-
ing to mature cells obtained considering the type and maturity su!ered by these cells. One way
to classify the antigen using the DCA is under an index of cells collected by a certain antigen
(MCAV ) calculated in (3.5). This index has been proposed in the classical DCA [Greensmith,
2007], and if an antigen reaches a MCAV value larger than a certain threshold, the antigen is
flagged as anomalous.
MCAV (a) =M(a)
M(a) + Sm(a)(3.5)
Another metric considered is the K$, proposed in [Greensmith and Aickelin, 2008]. Unlike
theMCAV , theK$ considers the magnitude ofK related to all cells which collected the antigen
a, as in (3.6).
K$(a) =
#
K(a)#
DC(a)(3.6)

76 State of the Art in Artificial Immune Systems
Basically, the illustration of Figure 3.10 summarizes the main functions of the algorithm.
Fig. 3.10: Fundamental steps of the DCA.
The Dendritic Cell Algorithm main idea can be summarized in the flowchart of Figure 3.11
and in Algorithm 3.2.
Analogies and knowledge representation implied by the algorithm makes it an interesting
alternative to problems of anomaly detection, with some potential applications. However, the
prior knowledge of these problems are very important, especially in FDI applications.
In [de Almeida et al., 2010] another algorithm based on the danger model was developed
especially for the problem of fault detection. Unlike DCA, the algorithm does not use cells
agents, neither depend on interpretation of antigen data, but defines signals as a basis for its
operation and provides a fuzzy inference model as an input and an immune mathematical model
as an output, and alarms according to model metrics.
Other approaches that also exploit aspects contained in the Danger model consist in [Zhu
and Tan, 2011a] regarding a model applied to di!erent classifiers, and in [Zhang et al., 2008]
which applies concepts to define an interest region of an algorithm applied to optimization
problems.
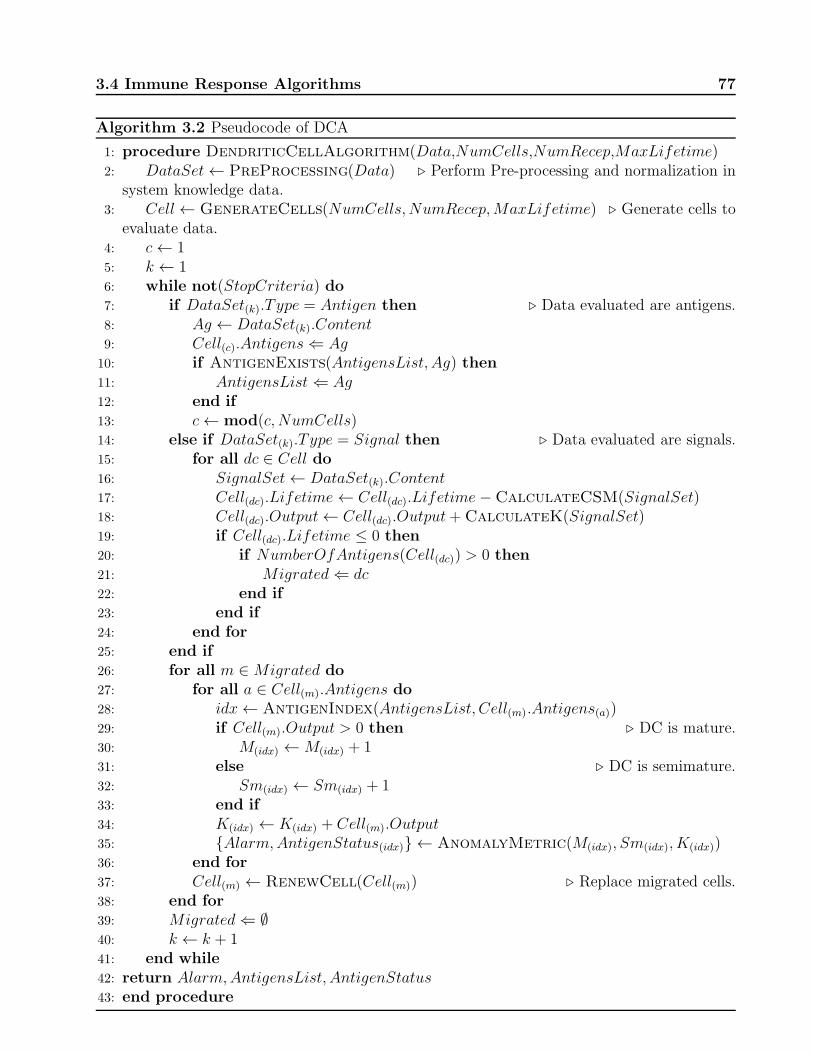
3.4 Immune Response Algorithms 77
Algorithm 3.2 Pseudocode of DCA
1: procedure DendriticCellAlgorithm(Data,NumCells,NumRecep,MaxLifetime)2: DataSet % PreProcessing(Data) ( Perform Pre-processing and normalization in
system knowledge data.3: Cell % GenerateCells(NumCells, NumRecep,MaxLifetime) ( Generate cells to
evaluate data.4: c % 15: k % 16: while not(StopCriteria) do7: if DataSet(k).T ype = Antigen then ( Data evaluated are antigens.8: Ag % DataSet(k).Content9: Cell(c).Antigens & Ag
10: if AntigenExists(AntigensList, Ag) then11: AntigensList & Ag12: end if13: c % mod(c, NumCells)14: else if DataSet(k).T ype = Signal then ( Data evaluated are signals.15: for all dc $ Cell do16: SignalSet % DataSet(k).Content17: Cell(dc).Lifetime % Cell(dc).Lifetime !CalculateCSM(SignalSet)18: Cell(dc).Output % Cell(dc).Output+CalculateK(SignalSet)19: if Cell(dc).Lifetime ' 0 then20: if NumberOfAntigens(Cell(dc)) > 0 then21: Migrated & dc22: end if23: end if24: end for25: end if26: for all m $ Migrated do27: for all a $ Cell(m).Antigens do28: idx % AntigenIndex(AntigensList, Cell(m).Antigens(a))29: if Cell(m).Output > 0 then ( DC is mature.30: M(idx) % M(idx) + 131: else ( DC is semimature.32: Sm(idx) % Sm(idx) + 133: end if34: K(idx) % K(idx) + Cell(m).Output35: {Alarm,AntigenStatus(idx)} % AnomalyMetric(M(idx), Sm(idx), K(idx))36: end for37: Cell(m) % RenewCell(Cell(m)) ( Replace migrated cells.38: end for39: Migrated & (40: k % k + 141: end while42: return Alarm,AntigensList, AntigenStatus43: end procedure

78 State of the Art in Artificial Immune Systems
Fig. 3.11: Flowchart of the Dendritic Cell Algorithm.
3.5 Impacts in biological research
Immunology serving as a source of inspiration for computational systems may provide some
multidisciplinary links and many interactions among researchers from di!erent fields of study
and a perspective of benefits for immunology, computer science and engineering respective
researches, as further discussed in terms of AIS impact in biology and how computation could
inspire biological models in research.
Reviews done in [Timmis et al., 2008] point that the development of AIS algorithms may
provide interdisciplinary links between immunology, computer science, mathematics and engi-
neering, since the immunology provides metaphors for the creation of novel solutions to prob-
lems. The authors have provided a framework for modeling novel approaches from immunology
through a methodology evaluation, some reference models and the further development of

3.5 Impacts in biological research 79
techniques from the abstract model, as well as some features to be provided in newer AIS
approaches. It is also suggested that these models may help immunologists in bringing some
understanding of the immune system as well as proper representations in AIS for engineering
systems through greater interaction between each group of researchers.
As immunology may inspire computer systems, computation can also be an inspiration for
insights about immunology, as defined by Cohen [Cohen, 2007], in this work are described
the view of the immune system as a computational entity and immunological concepts and
functions in terms of computation. Some computation concepts were applied to immunological
components, such as the system states, its cells and their actions in the immune system. The
paper also reinforces the need of interactions between immunologists and computer scientists.
The research in [Navlakha and Bar-Joseph, 2011] was related to biological modeling and
inspiration for strategies to problem solving as well as the similarities between computation
and biology and their di!erences. According to the authors, computational systems are often
focused on speed and biological systems are focused in dynamic adaptability to changes and
their decision-making mechanisms. This suggests that biological inspirations are very useful
to computational systems. Features of biological and analogous computational systems are
discussed and their research was considered as a computational thinking of biological systems,
which provides more understanding of biological processes as well as improvements in algorithms
development.
The ecology of immune system is discussed in [Tauber, 2008], in this paper, the author also
discuss the ‘Immunocomputing’ research described as immunology formalization aspects and
its quality as a fruitful source for applications to various problems. It is also implied that AIS
is involved in multidisciplinary studies including fields of immunology modeling, mathematical
modeling and computer simulations, among other forms of simulating immune models.
The artificial immune systems research, as seen on these works, may provide some signif-
icant contributions to immunology in the sense of understanding the immune system, as well
as providing a multidisciplinary research between immunologists and computer scientists or
engineers in order to establish interactions that should improve the understanding of the real
functions of immune systems and reinforce the development of novel techniques and provide
better results in problem solving.
At the present moment, there are few works pointing this aspect of AIS. However, there are
some definitions stated in [Hart et al., 2009], such as ‘Immunoengineering’, which is inspired on
immunoecology (study of principles applied to immunological functions) and immunoinformat-
ics (related to decision making paradigms), whose elements are reunited to provide adaption
and applications. Thus, the concept of an ‘Immunoengineering’ has been started in [de Castro,

80 State of the Art in Artificial Immune Systems
2001], with the purpose of AIS approaches for problem solving.
These studies would provide a framework that supports the development of mathematical
and computational models, as well as their validation through benchmark problems. In sum-
mary, understanding AIS may reinforces the understanding of immunological principles and
models, as well as provide the growth of the research on bio-inspired systems.
Algorithms that adopt multiple models for immunological abstraction (i.e. clonal selection
algorithm applied to optimization of negative selection algorithm), the predominant model
related to its research and applications focus will be considered in the list of methods in each
subsection, since these methods can be combined and are not mutually exclusive.

Chapter 4
Fault Detection and Diagnosis using
Fuzzy Model of Antigen Recognition
and Participatory Clustering
A model which presents the immune response as a process of fuzzy nature is defined in [Leng
and Bentwich, 2002]. The model considers the T and B cells selection in the body through
on fuzzy recognition of molecules as follows: i) in the case of low a"nity, cell su!ers death
by neglect and ii) when a"nity is high, cell dies in the negative selection process. This model
defines that the immune response objective would be the generation of sub-optimal clones.
This model is illustrated in Figure 4.1 and can provide inspiration for anomaly detection
systems, mainly for negative selection based algorithms, which can be described by these rules.
The inference system considered in this work is described in [Chen and Mahfouf, 2009], in which
the fuzzy output is used for the immune response of the fault detection system.
4.1 Fuzzy Antigen Recognition Algorithms
4.1.1 Detectors generator algorithm
The presented model complements some previous algorithms used for negative selection based
detector generation, with the fuzzy inference mechanism to control detectors generated in a
proper way.
The algorithm uses some system normal operation sampling as reference (training) data
and system with fuzzy recognition of antigens to manage the allocation of detectors in nonself
region. The rules are described in Table 4.1, and these rules provide fuzzy inference system in
81

82Fault Detection and Diagnosis using Fuzzy Model of Antigen Recognition and
Participatory Clustering
Fig. 4.1: Illustration of the hypothesis of T cell fuzzy recognition according to [Leng andBentwich, 2002]. The process of self / nonself discrimination, their membership functionsdescribing the relationship between the a"nity between cell and antigen with a biologicalreaction of the immune system.
Figure 4.2, based on the model described in Figure 4.1.
Analyzing the model, the fuzzy system considers negative selection process as the allocation
of a detector in the region of normal operation and positive selection as the successful allocation
of a detector (in the anomaly region), detectors placed in regions considered unfeasible, far away
compared to other detectors, su!er a process called death by neglect, i.e. these detectors are
considered useless for system monitoring.
Figure 4.3 shows some examples of the algorithm functioning in a two-dimensional space.
Membership functions are generated through two thresholds T1 and T2, which are respec-
tively for the positive selection (Rule 3 to rule 2) and negative selection (rule 2 to rule 1),

4.1 Fuzzy Antigen Recognition Algorithms 83
Tab. 4.1: fuzzy rules used in the antigen recognition system for the generation of detectors.
Rule Feedback1 If distance is Then response is
low negative_selection
2 If distance is Then response is
medium positive_selection
3 If distance is Then response is
high death_by_neglect
Fig. 4.2: Membership functions for detectors generator version.
Fig. 4.3: Description of the proposed algorithm in a two-dimensional space.
and being T1 < T2. The set of thresholds specifying detector borders and the stopping criteria
(number of detectors or the same coverage rate) are parameters evaluated by the algorithm,
described as in flowchart of Figure 4.4 and also in Algorithm 4.1.
This algorithm can also be used to enhance other negative selection based techniques which
employ detectors to assess fault detection in the system.

84Fault Detection and Diagnosis using Fuzzy Model of Antigen Recognition and
Participatory Clustering
Algorithm 4.1 Pseudocode of Detector Generation in Fuzzy NSA
1: procedure FuzzyNSATraining(AgTr,T1,T2)2: S & (3: while not(StopCriteria) do4: D % Randomize(n) ( Generate a random n-dimensional point.5: parameters % NegativeSelectionRules(D) ( Calculate parameters based on
the NSA version.6: for all i $ AgTr do7: disti % EuclideanDistance(D,AgTr(i)) ( Calculate distance of D between
Training Data.8: end for9: bind % AffinityNSA(min(dist), parameters) ( Calculate a"nity based on NSA
version.10: decision % FuzzyRules(bind, T1, T2) ( Apply fuzzy system.11: for all m $ Migrated do12: if decision = positive_selection then ( Positive Selection.13: S & D ( Allocate S in Detector Set.14: end if15: end for16: end while17: return S18: end procedure

4.1 Fuzzy Antigen Recognition Algorithms 85
Fig. 4.4: Flowchart describing the steps of Detector Generation in Fuzzy NSA.
4.1.2 Monitoring algorithm
This model serves as a simplification of the negative selection algorithm and uses the Euclidean
distance as a anomaly metric, in which the similarity to the training data defines conditions
of sampled (validation) data. The fuzzy inference system used will define the data labeling
based on the distance between the data and reference. Assuming that outliers may represent
anomalous compared to normal data, it is possible to detect anomalies in this way.
The algorithm works fundamentally using the distance between sampling to the nearest
reference for labeling the sampling data as normal or anomalous and the fuzzy inference system
is similar to the one described in detectors generation algorithm, except for the rule of death by
neglect, which is not considered in this approach because the context for its use in this model
is still unknown. In this case, the monitoring is reduced to two rules: positive selection and
negative selection.
The rules are represented as in Table 4.2. Inputs are fuzzified as membership functions in

86Fault Detection and Diagnosis using Fuzzy Model of Antigen Recognition and
Participatory Clustering
trapezoid form, representing the degree distance between data presented and reference data,
and outputs are represented by triangular membership functions, which represent the immune
response (status of the system). The membership functions are represented in Figure 4.5.
Tab. 4.2: rules used in fuzzy system for monitoring of antigen recognition.
Rule Feedback1 If distance is Then response is
low negative_selection
2 If distance is Then response is
high positive_selection
Fig. 4.5: Membership functions for monitoring algorithm version
The algorithm depends on a threshold used to adjust the membership function and to
define boundaries between normal data and data anomaly. The threshold is dependent on the
problem, because there are cases where the outliers can be quite common.
This algorithm di!ers from other negative selection algorithms, because there is no need to
generate detectors for discovering anomalous processes in a system. The algorithm verifies if
test data are su"ciently discrepant for the indication of an anomaly.
The algorithm also relies on a normalization factor of the distance metric, based on a hill
function. This factor is used to avoid values out of the range, and is shown in (4.1).
#Agk = 1!Dist(Agk, T rnearest)h
1 +Dist(Agk, T rnearest)h(4.1)
Where Dist(Agk, T rmin) is the distance metric between antigen and training samples, usu-
ally the Euclidean Distance, and h is the value for the hill function. In all tests performed,
h = 2 is adopted.
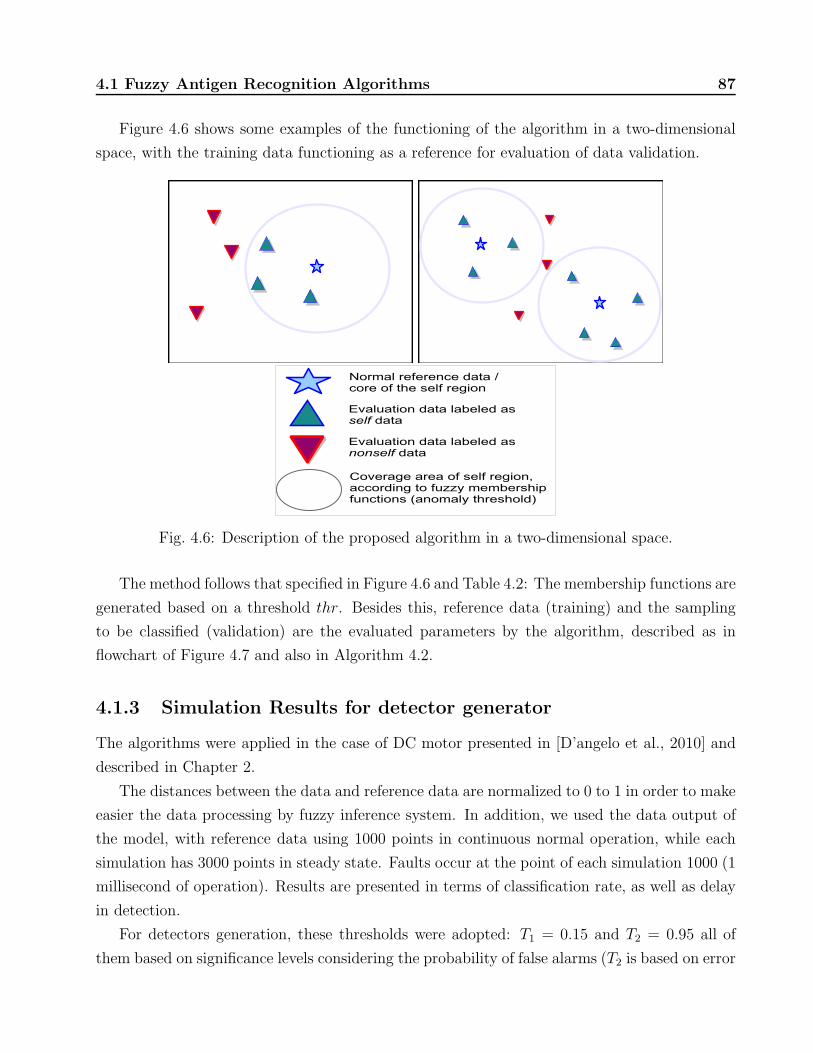
4.1 Fuzzy Antigen Recognition Algorithms 87
Figure 4.6 shows some examples of the functioning of the algorithm in a two-dimensional
space, with the training data functioning as a reference for evaluation of data validation.
Fig. 4.6: Description of the proposed algorithm in a two-dimensional space.
The method follows that specified in Figure 4.6 and Table 4.2: The membership functions are
generated based on a threshold thr. Besides this, reference data (training) and the sampling
to be classified (validation) are the evaluated parameters by the algorithm, described as in
flowchart of Figure 4.7 and also in Algorithm 4.2.
4.1.3 Simulation Results for detector generator
The algorithms were applied in the case of DC motor presented in [D’angelo et al., 2010] and
described in Chapter 2.
The distances between the data and reference data are normalized to 0 to 1 in order to make
easier the data processing by fuzzy inference system. In addition, we used the data output of
the model, with reference data using 1000 points in continuous normal operation, while each
simulation has 3000 points in steady state. Faults occur at the point of each simulation 1000 (1
millisecond of operation). Results are presented in terms of classification rate, as well as delay
in detection.
For detectors generation, these thresholds were adopted: T1 = 0.15 and T2 = 0.95 all of
them based on significance levels considering the probability of false alarms (T2 is based on error

88Fault Detection and Diagnosis using Fuzzy Model of Antigen Recognition and
Participatory Clustering
Fig. 4.7: Flowchart describing the steps of Monitoring of Fuzzy NSA.
correlation) or the probability of a detector being placed in an infeasible region (T1 is based
on the coverage through self area distance). The fuzzy system was applied in the V-Detector
algorithm presented in [Ji and Dasgupta, 2004a], which uses some mechanisms that may provide
high coverage of the nonself area. The self radius is about rs = 0.1, the desired coverage is up
to 97.5 % coverage per detector and the other stopping criterion is occurs when 150 detectors
are placed or after 250 attempts. The algorithm was run 50 times, as the algorithm places
detectors in random locations through positive selection.
The proposed algorithm, according to the results in Table 4.3, is able to detect most faults in
the test without false alarms, however, in fault 4, the algorithm was unable to detect few points,
The algorithm succeeded to generate most detectors and no detectors have been discarded
(Allocated in the region of normal operation). The useless detectors su!er death by neglect,
which happened in some cases.
In Table 4.4, we can see the results with the same algorithm, but without the fuzzy inference
system for antigen recognition. The purposed system has improved the algorithm performance,

4.1 Fuzzy Antigen Recognition Algorithms 89
Algorithm 4.2 Pseudocode of Monitoring based on Fuzzy NSA
1: procedure FuzzyNSAMonitoring(xTs, xTr, thr, h)2: for all i $ xTs do3: for all j $ xTr do4: dist(j) % EuclideanDistance(xTs(i), xTr(j)) ( Calculate distance of Test
sample between Training Data.5: end for6: nearest % argmin(dist)
7: # % 1!disth(nearest)
1+disth(nearest)
( Calculate a"nity between all Training Data.
8: decision % FuzzyRules(# , thr) ( Apply fuzzy system.9: if decision = positive_selection then ( Positive Selection.
10: yi % anomaly11: else ( Negative Selection.12: yi % normal13: end if14: end for15: return y16: end procedure
considering that the algorithm was able to detect more fault points than the original algorithm.
4.1.4 Simulation Results for monitoring
For the monitoring algorithm, it is expected to overcome weak points of the detectors generation
algorithm. Threshold adopted for use by the fuzzy inference system was thr = 0.95.
According to Table 4.5, in all simulations the monitoring algorithm was able to detect faults
in the instant in which they occurred, this indicates that the algorithm was able to distinguish
the normal points from anomaly points with no false alarms or misdetection.
In fact, the algorithm works on normal data and the same distance in relation to sampled
data. Anomaly detection is performed when the data are far from the reference data, through
the threshold of the fuzzy system.
This result shows that the approach based on monitoring may be an alternative to the
generation of detectors and is promising as the proposed objectives, detecting faults, however,
still requires some modifications to achieve the objectives. With its fuzzy nature, other immune-
inspired fuzzy inference rules may be implemented in order to provide a more enhanced data
processing and its subsequent detection.

90Fault Detection and Diagnosis using Fuzzy Model of Antigen Recognition and
Participatory Clustering
Tab. 4.3: Results of tests performed on the generator algorithm detectors.
Scenario Found Delay False Misdetectionpoints Alarms
Normal 0 - 0% 0%Fault 1 2001 0 0% 0%Fault 2 2001 0 0% 0%Fault 3 2001 0 0% 0%Fault 4 1994 6 0% 3%Fault 9 2001 0 0% 0%Fault 10 2001 0 0% 0%Fault 11 2001 0 0% 0%
Generated Discarded Detectors Discarded DetectorsDetectors (Death by Neglect) (Negative Selection)
Number 83 17 0
4.2 Fault Diagnosis using Participatory Clustering
The participatory clustering algorithm was developed in [da Silva et al., 2007] as an algorithm
that uses the method of participatory learning, defined in [Yager, 1990]. The model represents
better the functioning of human learning because it contains a mechanism that allows reviewing
in learned concepts.
The algorithm is based on two indices: the Compatibility index of data cluster centers,
which measures in which group data may be included, and the Alert index, which measures the
reliability of the acquired knowledge in each cluster, checking if its structure should be revised,
which implies the inclusion of a new group in the system.
In [Lemos et al., 2011], the participatory clustering algorithm has been improved with some
mechanisms complementary to compatibility and alert threshold. In Compatibility index, we
use a distance metric which uses a scattering matrix to measures the co-variance of the groups,
and the threshold definition follows a chi-square distribution. The Alert index calculation is
based on a sliding window mechanism that defines how many observations are made in relation
to compatibility threshold violations, analyzed by a Bernoulli distribution which have a window
size dependent level of significance.
Thus, the participatory clustering algorithm was defined through four influence parameters:
a learning rate " which updates the cluster parameters, the window size w that monitors
changes in compatibility index, the level of significance ! used in the calculations, and initial
scattering matrix Mtx, which defines the creation of new groups.

4.2 Fault Diagnosis using Participatory Clustering 91
Tab. 4.4: Results of tests performed on a normal Negative Selection Algorithm, for comparisonpurposes.
Scenario Found Delay False Misdetectionpoints Alarms
Normal 0 - 0% 0%Fault 1 1964 37 0% 18.56%Fault 2 2001 0 0% 0%Fault 3 1951 50 0% 2.48%Fault 4 1994 6 0% 0%Fault 9 1841 160 0% 8%Fault 10 2001 0 0% 0%Fault 11 1961 40 0% 2%
Used Useless DiscardedDetectors Detectors Detectors
Number 17 - 0
4.2.1 Description of the Participatory Clustering algorithm
The participatory clustering algorithm is used when the Fuzzy Antigen Recognition Algorithm
sends an alarm signal. After the fault event, the system searches the list c of the existing
clusters and calculates the distance between the detected data xk and the center cg of the
cluster, and using the scattering matrix Mtxg information, as shown in (4.2).
D(xk, cg) = (xk ! cg)(Mtxg)"1(xk ! cg)
! (4.2)
Thus, the calculation of the compatibility index %g is performed using (4.3).
%g = exp{!1
2D(xk, cg)} (4.3)
Then, the %g compatibility index is compared with a threshold T%, calculated by the chi-
square distribution &2 with a significance level ! and depends on the number of dimensions of
input data n, as shown in (4.4).
T% = exp{!1
2&2n,"} (4.4)
A boolean variable Ok stores the value resulting from comparing %g and T%, then the sum
v of w last observations in Ok value is calculated. The alert index ag is calculated through the
Bernoulli distribution in (4.5). If the number of points is greater than the window w or equal

92Fault Detection and Diagnosis using Fuzzy Model of Antigen Recognition and
Participatory Clustering
Tab. 4.5: Results of tests made with the monitoring algorithm.
Scenario Found Delay False Misdetectionpoints Alarms
Normal 0 - 0% 0%Fault 1 2000 0 0% 0%Fault 2 2000 0 0% 0%Fault 3 2000 0 0% 0%Fault 4 2000 0 0% 0%Fault 9 2000 0 0% 0%Fault 10 2000 0 0% 0%Fault 11 2000 0 0% 0%
to it, otherwise the rate of alert is 0.
ag =
!
w
v
"
!v(1! !)(v"w), v = 0, ..., w (4.5)
The alert threshold Ta, used to generate new clusters, is defined through (4.6).
Ta = 1!!
w(4.6)
Once compatibility is compared to the indexes of the nearest cluster g and the alert index ag
with their respective thresholds, the algorithm can generate a new cluster or update an existing
cluster g including the new point and by modifying center position and the scattering matrix
Mtxg . The factor Gg is calculated to update existing clusters.
Gg = "(%g1"ag) (4.7)
cg = cg +Gg(xk ! cg) (4.8)
Mtxg = (1!Gg)(Mtxg !Gg(xk ! cg)!(xk ! cg)) (4.9)
However, in some cases, the algorithm can create redundant clusters. To minimize this
problem, as new clusters a and b are created, these are compared, as in (4.10).
D(ca, cb) = (cb ! ca)(Ma)"1(cb ! ca)
! (4.10)
Likewise, the distance between clusters is calculated by (4.3), using the generated value in
(4.10). If this metric is greater than the threshold T%, a and b are united.

4.2 Fault Diagnosis using Participatory Clustering 93
With the clustering algorithm used in the system used at work, it can distinguish the
faults occurred to aid in the diagnose task. It is noteworthy that only the data classified by
the system as faults pass through the stage of generating and updating of the groups by the
clustering algorithm participatory, which can also update the structure of groups as new data
is entered.
In short, the system can be described using the flowchart in Figure 4.8 and in Algorithm 4.3.
Fig. 4.8: Flowchart representing the participatory clustering applied after NSA detection.
This algorithm will be applied to the same scenario presented in section 4.1.2, where the
fuzzy antigen recognition monitoring algorithm was used to fault detection alarms.
4.2.2 Application on the fault diagnosis problem
The fuzzy antigen recognition system with diagnosis based on participatory clustering is applied
to DC Motor experiments. The algorithm will use the four fault data in sequence as data

94Fault Detection and Diagnosis using Fuzzy Model of Antigen Recognition and
Participatory Clustering
Algorithm 4.3 Pseudocode of the Participatory Clustering applied to the Fuzzy NSA
1: procedureParticipatoryClusteringFaultDiagnosis(xTs, xTr, thr, h,", ), w,!,Mtx1st)2: ng % 13: c1 % CreateNewGroup(xk,Mtx1st)4: Ta % 1! "
w
5: T% % exp{!12&
2n,"}
6: for all k $ xTs do7: yk % FuzzyNSAMonitoring(xTs(k), xTr, thr, h)8: if yk % anomaly then9: for g % 1 to ng do
10: dist(g) % DistanceMetric(xk, cg,Mtxg)11: %g % exp{!1
2dist(i)}12: end for13: b % argmin(%)14: ok % IsFalse(dist(g) < &2
n,$)15: abest % ObservationViolations(!, w, o)16: if %g < T! and abest > Ta then17: ng % ng + 118: {cng,Mtxng} % CreateNewGroup(xk,Mtx1st)19: idx % ng20: else21: {cb,Mtxb} % UpdateGroup(xk, cb,Mtxb, ), %b, ab)22: idx % b23: end if24: for i % 1 to ng do25: dist % DistanceMetric(ci, cidx,Mtxidx)26: %i % exp{!1
2dist}27: if %g < T! then28: merge & i29: end if30: end for31: for all i $ merge do32: cidx % MergeGroups(ci, cidx,Mtxidx)33: UpdateGroupIndex(C, idx)34: end for35: merge & (36: Ck % idx37: else38: Ck % 039: end if40: end for41: return y, C42: end procedure

4.2 Fault Diagnosis using Participatory Clustering 95
sampled (with a total of 12,000 points), using 1000 points of normal operation as reference
data.
Using the threshold thr of the fuzzy system, the parameters of the clustering algorithm
should be defined as the rate of learning ", the window size w, the significance level ! and the
initial values of the matrix Mtx scattering.
For these tests, we set the following parameters, thr = 0.95, " = 0.1 and the initial matrix
M has been obtained covariance of the starting point, since values of the covariance matrix
groups can make a scattering singular matrix along the iterations.
The values of w is test dependent, showing situations in which the algorithm has good
performance, when the values of ! vary the values of w also vary, because the lower is the level
of significance, the larger should the window size be, considering that lower window values can
generate allocation of data in wrong clusters, while it can also happen spurious generation of
many clusters for the same fault case, in addition, any inappropriate combination of values can
generate a very large number of clusters for the same fault.
Table 4.6 shows the result with w = 1000 and ! = 0.005, the values in parentheses are the
clusters indicated by the algorithm, some values that classified as a fault of the group, while
Table 4.7 shows the result with w = 2000 and ! = 0.0001, which led to one more group.
Tab. 4.6: Results for w = 1000 and ! = 0.005.
Scenario Hits Errors ClustersNormal 4000 0 1 (0)Fault 1 2000 0 1 (1)Fault 2 1983 17 (1) 1 (2)Fault 3 1983 17 (1) 1 (3)Fault 4 1983 17 (1) 1 (4)
Tab. 4.7: Results for w = 2000 and ! = 0.0001.
Scenario Hits Errors ClustersNormal 4000 0 1 (0)Fault 1 1000 (1) 0 2 (1
1000 (2) and 2)Fault 2 2000 0 1 (3)Fault 3 2000 0 1 (4)Fault 4 2000 0 1 (5)
These values indicate that the performance is close to the desirable, where the goal is to
generate the smallest number of clusters as possible, so the algorithm can distinguish each fault
as correctly as the clusters are being generated by the algorithm.
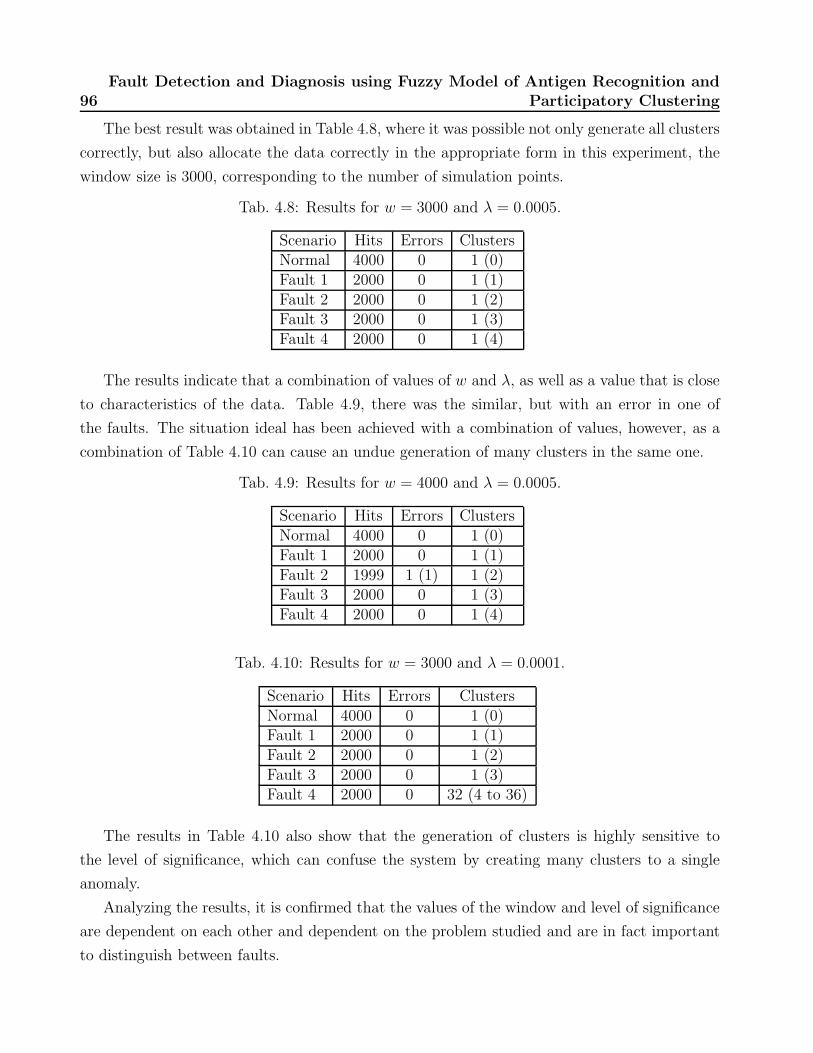
96Fault Detection and Diagnosis using Fuzzy Model of Antigen Recognition and
Participatory Clustering
The best result was obtained in Table 4.8, where it was possible not only generate all clusters
correctly, but also allocate the data correctly in the appropriate form in this experiment, the
window size is 3000, corresponding to the number of simulation points.
Tab. 4.8: Results for w = 3000 and ! = 0.0005.
Scenario Hits Errors ClustersNormal 4000 0 1 (0)Fault 1 2000 0 1 (1)Fault 2 2000 0 1 (2)Fault 3 2000 0 1 (3)Fault 4 2000 0 1 (4)
The results indicate that a combination of values of w and !, as well as a value that is close
to characteristics of the data. Table 4.9, there was the similar, but with an error in one of
the faults. The situation ideal has been achieved with a combination of values, however, as a
combination of Table 4.10 can cause an undue generation of many clusters in the same one.
Tab. 4.9: Results for w = 4000 and ! = 0.0005.
Scenario Hits Errors ClustersNormal 4000 0 1 (0)Fault 1 2000 0 1 (1)Fault 2 1999 1 (1) 1 (2)Fault 3 2000 0 1 (3)Fault 4 2000 0 1 (4)
Tab. 4.10: Results for w = 3000 and ! = 0.0001.
Scenario Hits Errors ClustersNormal 4000 0 1 (0)Fault 1 2000 0 1 (1)Fault 2 2000 0 1 (2)Fault 3 2000 0 1 (3)Fault 4 2000 0 32 (4 to 36)
The results in Table 4.10 also show that the generation of clusters is highly sensitive to
the level of significance, which can confuse the system by creating many clusters to a single
anomaly.
Analyzing the results, it is confirmed that the values of the window and level of significance
are dependent on each other and dependent on the problem studied and are in fact important
to distinguish between faults.

Chapter 5
Other Immunological Models and
Their Application to Fault Detection
and Diagnosis
5.1 Challenging points
The new approaches have significant representation for anomaly detection problem, with a
greater contextualization of data for a given application. Such alternatives, however, may face
some limitations regarding the context analysis of the problem: prior expert knowledge should
be suitable as represented by these algorithms. In many anomaly detection problems, such as
FDI applications, such representation may not be trivial.
In the Fault Detection and Isolation (FDI) particular case, there are some features that
imply challenges in the approach due to di"culties of the adequacy of the data to the problem.
In some cases, the use of redundant models is quite common and according to [Chow and
Willsky, 1984], two steps may be defined in the task of FDI: the generation of residuals through
these models and the decision making regarding system state. The first task is the use of
models to generate relevant data and the second is the analysis of information represented by
residuals.
The immune-inspired algorithms reviewed considered in Chapter 3 would be responsible
for decision making tasks after residuals generation, which would be considered as a suitable
representation for expert knowledge required by these algorithms and abstracted translation of
input signals. However, these representations can be redundant for these algorithms and may
result in high computational costs.
Since these approaches were designed to require a more abstract representation for anomaly
97

98Other Immunological Models and Their Application to Fault Detection and
Diagnosis
detection, such information required for a given event to be classified as a faulty behavior may
not be trivial to obtain, depending on the dynamic system.
These algorithms usually adopt some representations of signals corresponding to the evalu-
ation of dynamic system behavior through prior knowledge. Obtaining this model is one of the
steps implied in the development of FDI systems.
For a dynamic system, antigen-based data correspond to the output data, and may be
evaluated according to the behavior. In DCA and TLR, the correlation mechanisms between
signals and antigens can be interpreted as the process classification scheme.
However, many of these systems are not consistent with the representation by these algo-
rithms required and often this model must be inferred using the available data.
This scenario can be summarized by Figure 5.1, which also describes the organization re-
lated to monitoring systems based on the immune-inspired techniques further presented in this
chapter.
Fig. 5.1: Fundamental steps of Fault Detection tasks.
The anomaly detection inspired by the self-nonself discrimination applied to fault detection
is based on direct evaluation of the antigen represented by feature space considering two impor-
tant characteristics: the need for training data, implied by the process negative and/or positive
selection, and similarity measures for evaluation of the data as the space characteristics.
Despite these facilities, these algorithms have problems arising from the lack of context in
relation to the application environment and the computational cost provided by the evaluation
of these algorithms, making the implementation unfeasible in real time applications.
It is considered that immunological models have, in the transcription of AIS features that
represent transitional links considering how to handle input data and treatment of the problem
of detecting anomalies. In Figure 5.2, such features are defined as a way of understanding how

5.1 Challenging points 99
AIS can be applied to Anomaly Detection problems, such as Fault Detection.
Fig. 5.2: Relationship among immunological models that can be considered in the developmentof new immune-inspired systems.
With these considerations, it is possible to represent immune-inspired approaches according
to the following principles.
• The Infectious Nonself and Danger models should consider the use of signals, usually
defined by expert knowledge;
• In Self-Nonself Discrimination in association with the training of machine learning algo-
rithms is inherent, since the Self patterns should be known;
• The signals used by AIS algorithms must adequately represent the current status of
important events to the objective of the problem;
• Prior knowledge models can also be obtained through training based methods (ANN, for
example);
• The representation of antigens is not a mandatory feature in algorithms based on Infec-
tious nonself or Danger models (as in [de Almeida et al., 2010]).

100Other Immunological Models and Their Application to Fault Detection and
Diagnosis
Importantly, some of these assumptions are interpreted according to the adopted immuno-
logical model for the development of a technique. For FDI problems, some abstractions are
necessary for the implementation of such algorithms.
Some techniques for processing information used in this work will be presented to generate
the signals interpreted and used by these AIS approaches.
5.1.1 Antigen modeling
Most dynamic systems have only the input and output variables as available information with-
out markers or identifiers. However, there are some ways to deal with this issue.
Since the goal of FDI problems is the classification of fault data, output data can be used
as antigens, which will simply indicate the current state of the system.
The disadvantage of this principle comes from the problem dimensionality. However, con-
sidering data storage, each information must be identified by a code, as in a database system.
This code, which represent the antigen used by the algorithm, can be generated by several
ways.
Another possible method is to use similarity metrics and consider zero as the exact location
of the antigen, in addition, searches can be approximated by a threshold based similarity of
the antigen, as demonstrated in the examples using the equation (5.1), however, the problem
of this approach is precisely the overlap of some antigens in certain cases.
N$
i=1
(Y(k,i) ! Agi)2 <= thr (5.1)
Antigen overlap is similar to the approximate recognition seen in Self-nonself discrimination,
the adoption of this data format using the feature space becomes intuitive, and the overlap is
regarded as a similarity data, which has been used in the STLR algorithm in [Nejad et al.,
2012].
However, if the antigen is used as an identifier, a discretization process in data may be
considered or even the ID can be associated with antigen data.
In fact, the antigen processing of these algorithms is important in terms of correlation with
the signals to evaluate system behavioral aspects. In AIS based on the Infectious nonself model
the antigen can be considered in training or procedural rules, the signal can be modeled through
these mechanisms.
In the Danger Model, signals modeling is the most important aspect. On the issue of
FDI, it is one of the challenges of application modeling. This point will be further discussed,
considering some important information regarding processing and practicality.

5.1 Challenging points 101
5.1.2 Signal modeling
There are two options of signal modeling: using a quantitative model as a reference, such
that the immune inspired algorithm acts as a supervisor, or measuring variations between data
output between past and current instants.
In any case, the information should be pre-processed so that the anomaly will be accurately
detected. The following aspects should be considered:
• Adequacy of available information in the application;
• Data processing with time and space properties;
• Evaluation of the data quality and relevance.
Besides these there are many other aspects that can be crucial to a successful anomaly
detection, such aspects can also be included within these mentioned as a detection delay due
to sampling problems, for example.
Some alternatives for the signals modeling applied to the immune-inspired fault detection
in dynamic systems will be further presented.
Using Redundancy Models
A redundancy model has the advantage of being robust to noise and allows other ways of
interpreting the data, and it can be used for periodic time series. This approach is characterized
by the use of residuals as the expert knowledge interpretation of the immune-inspired algorithm
and their conversion to required signals.
In TLR algorithm, a signal is modeled by the square error of the estimated value by the
observer states relative to the value observed at the output of the dynamic system, according
to (5.2).
Signal(k) = (y(k,i) ! y(k,i))2 (5.2)
The signal is a binary value that characterizes the signal was perceived or not by APCs,
therefore, this condition is checked in (5.3), through a threshold thr, corresponding to the
maximum value allowed by the residual, to be considered in the training algorithm.
SeenSignal % Signal(k) ) thr (5.3)
In DCA, the basic formulation requires the use of two signals which verify system conditions,
considering the information obtained by the observer .

102Other Immunological Models and Their Application to Fault Detection and
Diagnosis
Thus, the problem safe signal (SS) is similar to the one required by TLR Algorithm, but
without the threshold, as in (5.4), and danger signal (DS), which considers the conditions of a
possible faulty state, is calculated through the absolute value of variations in residue considered
in (5.5).
SS(k) = Signal(k) (5.4)
DS(k) =
%
SS(k,i) ! SS(k"1,i), SS(k,i) > SS(k"1,i)
0, SS(k,i) ' SS(k"1,i)#i(5.5)
The redundancy models has the advantage of requiring less details on the system, however,
has many disadvantages: Using these models to generate signals, algorithms can treat data
and generate alarms but it may reduce the utility of these algorithms. Furthermore, the use of
many tools can lead to high computational cost in some cases.
An analytical model can ease the FDI problem solving, considering that the system is
observable and data collection is trivial, regardless how to obtain the model.
The possibility of obtaining data without using the redundancy models will be further
studied, as these methods will take advantage only from the output of dynamic system.
Using output di!erential information
Data extraction from variations in output data of a dynamic systems may correspond to a
practical alternative for data evaluation.
This solution has some advantage, such as using only data from the system without re-
dundancy models and using it in the immune-inspired approaches. However, the generation of
such signals in many cases may be a di"cult task, subject to some issues of extracting data in
engineering problems, such as noise, for example.
For TLR algorithms, which relies on antigen processing for the definition of signals or their
rules, the problem is only regarding the required signals for the fault detection task. In DCA
case, however, the problem is regarding the quantitative and qualitative features of each signal,
since the detection is entirely dependent on their behavior.
The most intuitive signal that can be considered is the Euclidean distance between data from
an instant k compared to its predecessor, according to (5.6). This metric variation considers
that a high value should indicate that the dynamic system has an anomalous behavior.

5.1 Challenging points 103
Signal(k) =N$
i=1
(X(k,i) !X(k"1,i))2 (5.6)
However, considering the set of null hypothesis of Table 5.1:
Tab. 5.1: Null hypothesis regarding signal variations.
Hypothesis DescriptionA signal defined algebraically
H1 based on variations of adynamic system is applicable inany case.The presence of noise in the system
H2 does not alter significantly theevaluation of AIS algorithms.
Consider a variation based on step functions whose impulse response results in the changing
values, as shown in Figure 5.3. The signal conversion in (5.6) has resulted as expected.
20 40 60 80 100
1
1.2
1.4
1.6
1.8
2
Time (sec)
Sign
al
20 40 60 80 1000
1
2
3
4x 10⁷
Time (sec)
SS −
Out
put V
aria
tion
Fig. 5.3: Example of a converted variable in the safe signals.
However, if we consider a periodic signal, the behavior of the proposed metric will be
significantly di!erent from the expected, as shown in Figure 5.4. Rejecting H1, a di!erent
formulation for this case is necessary.
X(k) = sin(k/50) (5.7)

104Other Immunological Models and Their Application to Fault Detection and
Diagnosis
20 40 60 80 100−1
−0.5
0
0.5
1
Time (sec)
Sign
al
20 40 60 80 1000
0.2
0.4
0.6
0.8
1
Time (sec)SS
− O
utpu
t Var
iatio
n
Fig. 5.4: Example with periodic signals (5.7) which invalidates H1.
Another recurring problem in dynamic systems is the noise issue. It is assumed a secondary
danger signal based on the safe signal, considering the weighted average of the earlier values,
according to (5.8).
DS(k) =k
$
kk=1
SS(k) !W(kk)
k(5.8)
W(k) =k ! SS(k)
k ! SS(argmax)(5.9)
Consider the same signal of Figure 5.3, the signal behaves as described in Figure 5.5, which
possibly measures a change indicator. However, the situation in Figure 5.6 is shown, considering
a noisy signal.
Figure 5.6 shows that the noise feature a!ects most values of danger signals, leading to the
rejection of H2, as the metric is not robust to noise.
The classification of noisy data was considered in [Gu et al., 2011], in which some tests
using a supervised algorithm were performed. The main problem is to produce input signals
that are robust to noise e!ects in the preprocessing step.

5.2 Data processing 105
20 40 60 80 100
1
1.2
1.4
1.6
1.8
2
Time (sec)
Sign
al
20 40 60 80 1000
0.2
0.4
0.6
0.8
Time (sec)D
S −
Wei
ghte
d m
ean
Fig. 5.5: Example of a converted variable in the danger signals.
20 40 60 80 100
0.95
1
1.05
1.1
Time (sec)
Sign
al
20 40 60 80 1000
0.2
0.4
0.6
0.8
Time (sec)
DS −
Wei
ghte
d m
ean
Fig. 5.6: Analysis of a noisy signal converted to danger signal metric.
5.2 Data processing
5.2.1 Normalization
The step of data normalization is a factor of great importance, especially in generation of
numerical input signals, which follow certain values.

106Other Immunological Models and Their Application to Fault Detection and
Diagnosis
One way to normalize the signals is to adopt ranges of values for them, as an example in
(5.10) valid for PAMP and Danger signals.
DS(k) =
&
'
(
'
)
0, DS(k) < DSminDS(k)"DSmin
DSmax"DSmin, DSmin < DS(k) < DSmax
Vmaxd, DS(k) > DSmax
(5.10)
In these equations, DSmin e DSmax are thresholds and Vmaxdis the maximum value of signal
range, during k instant.
For safe signals, the process is di!erent, as higher values indicate that system may be
operating in normal conditions, so these values have to be inverted as at the example in (5.11).
Importantly, Vmaxs and Vmaxdmay be di!erent according to each problem.
SS(k) =
&
'
(
'
)
Vmaxs , SS(k) < SSminDSmax"SS(k)
SSmax"SSmin, SSmin < SS(k) < SSmax
0, SS(k) > SSmax
(5.11)
In addition, as the safe signal has a very large suppressive e!ect, output calculation must
reflect these factors in order to provide better performance.
Normalization of signals provides a well organized and finite range of data. For DCA
algorithms it results in structured and non biased data processing, as well as a proper cell
lifetime distribution and signals with reasonable values, without outliers.
The TLR algorithm also relies on signal normalization, these should be not only finite, but
also discretized. This factor implies the need of discretization signals, and normalization. All
these signals are considered in the rules applied to TLR and whose signals unseen in training
will be considered a possible anomaly in the algorithm. On DCA, discretization of data is
not required, and to solve this problem of TLR algorithm, processing rules are used as further
described.
5.2.2 Data sampling
The DCA, being based on cell population, should consider the sampling factor during the
pre-processing step, since these cells can collect antigens during the algorithm processing time.
Furthermore, it is estimated that the algorithm processes the input signals by approximately
1 second. In a shorter sampling, DCA loses in performance due to the delays inherent in runtime

5.2 Data processing 107
cells processing.
The observation time To of a dynamic system is considered, from the data obtained. The
DCA should process the data in a sampling time Ts, which must satisfy the condition of (5.12)
for the correct processing of the algorithm.
Ts ) To (5.12)
For example, a dynamic system operates To = 1ms, such as the DCA has default ts = 1s,
sampling should contain 1000 observable points. For instant k = 0, the first point of the
sample is used, then for k = 1 is applied from 1 to 1001 point, and signal is generated from
these information.
It is stipulated that the ratio To and Ts should not be smaller, because in this case the DCA
will have a reduced performance, neither larger, to minimize delays in detection.
Besides its importance in processing the DCA, there is another factor: other signals based
on the input samples can be generated from sampling, such as some statistical resources for
example.
TLR algorithm does not have an explicit definition on temporal factor, although the method
can be similarly employed. In this work, sampling is restricted to the DCA, while TLR is
employed by iterations.
Antigen multiplier and interpolation
A particular case of sampling in which multipliers are applied to the fault points in a range of
values between Xk e Xk"1. Antigens are replicated or interpolated to allow cells to analyze
them, once exposed by signals.
This procedure is applied in cases where Ts = To.
Another way to amplify antigen sampling to be considered is the Sliding Window mech-
anism. As most fault detection problems are considered as time series representations, each
sample can be collected multiple times as information required. This mechanism has several
purposes, such as reproducing observed patterns and to improve performance.
An example of antigen sampling by sliding window mechanisms is shown in Figure 5.7.
5.2.3 Data processing applied to signals
The signals used by immune-inspired algorithms must correspond properly to the problem in
which the algorithm is being applied. These algorithms have di!erences concerning the way
how these signals are processed:

108Other Immunological Models and Their Application to Fault Detection and
Diagnosis
Fig. 5.7: Example of sliding window mechanisms applied to antigen data.
• In Toll-Like Receptor algorithms (TLR and STLR), the signal is evaluated for its presence
in Boolean form, 0 for signal absence and 1 for signal presence, as specified in [Aickelin and
Greensmith, 2007]. These signal are indicative of abnormal activity and are analogous to
PAMPs.
• In DCA, each signal is numerical and they have specific and well-defined categories, being
converted to output signals based on weights whose calculation defines the influence of
input categories in each output. This processing is described by a matrix, according
to [Greensmith, 2007]. In the deterministic version [Greensmith and Aickelin, 2008], this
calculation is simplified.
• The algorithm in [de Almeida et al., 2010] considers two signals, which are based on fuzzy
processing and whose output is based on a defined mathematical model for fault alarm
calculus.
Such processing can be used both to combine some signals that have complementary fea-
tures, and in terms of adequacy of data to a certain algorithm. The processing of DCA does not
require a rigorous use of these mechanisms. For the other algorithms, one of these processing
can be defined:
• Direct, with the definition of thresholds for the signal, once necessary;
• Fuzzy, based on inference rules and language processing.

5.2 Data processing 109
These processing forms are further discussed. Importantly, these processing activities are
related to the interaction between the signals and detection agents (APCs), analogous to re-
ceptors in a cell. These models are similar to signal receptors by APCs.
Direct Processing
In this processing model, processing rules will always be based on thresholded values and the
produced output signal will be binary, where its value is related to the presence of a certain
signal.
This type of processing is based on If-Then-Else rules, and depending on the need, all
rules are aggregated in common, processed by the logical operator OR. Figure 5.8 shows an
illustrative example with a flowchart.
Fig. 5.8: An illustrative example of direct rule processing.
This is the type of processing algorithms as adopted by TLR in [Twycross et al., 2010] with
description also in [Aickelin and Greensmith, 2007] mentions the processing as a signal presence
indicator, a condition of APCs receptor activation, all rules are considered in this processing
regardless of relevance or influence on signal generation.
Fuzzy Processing
The fuzzy processing method combines elements of the other processes, based on the use of fuzzy
set theory and the use of rules defined by the membership functions characterizing relations
between signals and an output.

110Other Immunological Models and Their Application to Fault Detection and
Diagnosis
The variable type generated by the method is defined by categorical attributes of rules devel-
oped through membership functions and fuzzy operators. According to inference mechanisms,
numeric variables can also be generated by this method.
The rules used come from the membership functions associated with dynamic system model-
ing, as in the example of Figure 5.9 which shows the association between membership functions,
rules and output processing, corresponding if those signals have been seen (in TLR algorithm).
Fuzzy Signal ProcessingExample:
X1Min X1Max
0
0.2
0.4
0.6
0.8
1
Signal 1
Mem
bers
hip
Deg
ree
function1 function2 function3
X2Min X2Max
0
0.2
0.4
0.6
0.8
1
Signal 2
Mem
bers
hip
Deg
ree
function1 function2
X3Min X3Max
0
0.2
0.4
0.6
0.8
1
Signal 3
Mem
bers
hip
Deg
ree
function1 function2 function3 function4
Fuzzy Rules:
1. If Signal1 is Function1 , ThenOutput =absent
2. If Signal1 is Function2 AND Signal2 isFunction1 AND Signal3 is Function1 ,Then Output = absent
3. If Signal1 is Function2 AND Signal2 isFunction1 AND Signal3 is Function2 ,Then Output = absent
4. If Signal1 is Function2 AND Signal3 isFunction3 , Then Output = present
5. If Signal1 is Function2 AND Signal2 isFunction2 AND Signal3 is Function1 ,Then Output = absent
6. If Signal1 is Function2 AND Signal2 isFunction2 AND Signal3 is Function3 ,Then Output = present
7. If Signal1 is Function3 AND Signal2 isFunction1 , Then Output = absent
8. If Signal1 is Function2 AND Signal2 isFunction2 , Then Output = present
9. If Signal3 is Function4 , ThenOutput =present
Fig. 5.9: Fuzzy processing example.
This processing model is used in immune-inspired algorithm [de Almeida et al., 2010] for
detecting faults in such work, the fuzzy processing is used in the induction of signals with
associated rules to four input functions and four output functions, used as numerical information
based on mathematical modeling of NK cells production against tumors in [de Pillis et al., 2005],
whose variables would be used to generate an alarm index in the method.
The major disadvantage of this modeling is the case of using various inputs and functions
related pertinence in which is necessary to include a large number of rules to match these

5.2 Data processing 111
information.
These methods are considered a part of the process between the treatment of the information
generated and the stage of decision making by the immune-inspired algorithm applied to the
problem of FDI. There are some other processing forms, however, in this work, only these two
forms were used.
5.2.4 New evaluation metrics for DCA
The Dendritic Cell algorithm has two anomaly detection metrics considered in [Greensmith
and Aickelin, 2008]: MCAV and K$, both adopted for antigens and are associated to system
contexts, the K$ metric is defined by signals magnitude of exposed cells, proposed to solve
di"culties related to biased values of signals (signals of value !1 are treated in the same way
that the signal value !100 are treated).
The the MCAV and K$ metrics can be properly exploited for detection or even prevention
purposes. However, for the development of an appropriate metric for the FDI applications,
both metrics are specific for antigens evaluation and are not suitable in terms of evaluating
faults in the dynamic system.
Since the FDI problem is di!erent from anomaly detection problems for which DCA was
originally proposed in [Greensmith, 2007], the anomaly metrics applied to the problem should
explore the objectives of FDI systems using the outputs of DCA.
In order to achieve the objectives of FDI systems, two additional metrics were proposed
in this work. Similar to the other metrics, the outputs of DCA are processed and indexed
according to FDI problems.
The Cell Context-Aware Fault Alarm
A new metric, Cell Context-Aware Fault Alarm (CCAFA), is proposed to provide alarms for
DCA. This metric consists in the calculation of alarms according to cell responses.
Unlike earlier metrics, the CCAFA is not focused on antigens, instead, this metric relies
on the information provided by K, as well as the cell analysis, considering the cell maturation
(signal of K).
In CCAFA variable, cells that achieved positive and negative signals of K are evaluated
separately and independently of antigens, and then collected in GK variables, as in (5.13) and
(5.14).

112Other Immunological Models and Their Application to Fault Detection and
Diagnosis
$
DC
G+K =
#
DC K+
#
DC M(5.13)
$
DC
G"
K =
#
DC K"
#
DC Sm(5.14)
To generate normalized and optimized values between !1 and +1, the exponential func-
tion is employed for both variables, as in (5.15), which turns the metric suitable to detection
purposes.
f($) = 1! e"#
CCAFA = f(G+K)! f(G"
K) (5.15)
The alarm condition is given by CCAFA > Alarmthr, whose value is usually greater than
0 to avoid false alarms. The objective of this metric is to provide a proper fault alarm in the
DCA, since most metrics may provide imperfect detection features.
Once presented a detection alarm, an isolation feature will be also presented.
The Antigen Index of Fault Di!erentiation
Another metric is proposed in this work, The Antigen Index of Fault Di!erentiation (AIFD) is
employed to perform fault isolation in the Dendritic Cell Algorithm. Unlike the CCAFA, this
metric is a database oriented index which relies in the antigen correlation and is related to the
magnitude of K.
As first implementations of DCA in [Greensmith et al., 2005] were designed to be applied
to computer data-based anomaly detection problems, antigens were designed as an identifier of
processes, with few influences in signals processing of DCA. Instead, the antigens are influenced
by these signals.
In AIS applied to FDI problems, antigens are analogous to the output data of a dynamic
system and signals correspond to the behavioral model or some expert system that lead to
indicative of faults. In this approach, each antigen can also be evaluated by content, after the
evaluation of signals within the cell.
However, at first, the main evaluation consists on identify such di!erences by DCA variables.
Antigens may be defined by their collection by DCs and their association to the exposed signals.
The other proposed metric, Antigen Index of Fault Di!erentiation, aims to collect all antigens

5.3 Validation of novel metrics 113
by their quantitative features in the analysis. The index is calculated in (5.16). With J(a,M)
being the Jaccard Coe"cient of antigens collected by mature cells. The value of K is useful as
antigens collected with di!erent magnitude are grouped di!erently.
AIFD(a) =
%
J(a,M) "#
(K(a)), Alarm = 1
0, Otherwise(5.16)
After antigen indexing through DCA variables, all non-zero values are grouped through this
indexes, then, each index is compared to the others by using Euclidean Distance. If the distance
does not match any set of stored indexes in the database, a new pattern is stored in database
and a new profile is assigned to the detected fault.
Fault profile construction
Once defined both metrics, a fault profile based on antigens is defined through their evaluation.
Antigen data will compose rules for fault diagnosis. These rules will be applied for each antigen
collected during signal evaluation and fault databases are updated with these information.
As the algorithm performs this task in a deterministic way and each fault has a pattern of
antigen collection, each fault point collected through non-zero AIFD variables is attached to a
fault profile, even if this antigen is a normal pattern collected during abnormal behavior. The
entire scheme is illustrated in Figure 5.10.
It is expected that DCA may achieve satisfactory performance for fault detection and a
reasonable results for fault diagnosis based on this strategy.
5.3 Validation of novel metrics
In order to validate the DCA proposed metrics, some tests were performed on the simulations
of DC Motor Benchmark. In the experiments analyzed, actuators faults are considered and
appropriate signals for detection (the residuals) generated from a linear observer based on the
physics of the process.
To provide these simulations, data were collected with observation time To = 1ms. Each
point is collected by their features and all test samples were simulated by Ts = 4s. A training
sample of Ts = 1s was also collected.
Safe signals are represented as described in Section 5.2.1 for Danger model-based algorithms,
and danger signals of DCA are also defined similarly. The algorithm parameters are defined in

114Other Immunological Models and Their Application to Fault Detection and
Diagnosis
Fig. 5.10: Complete steps of fault diagnosis applied after DCA detection in this work.
Table 5.2. These parameters were defined based on the problem complexity and according to
other works in literature.
Deterministic DCA results are presented in Table 5.3, with information about gathered data
and the most relevant variables, such as K$ and the proposed metric CCAFA, each test has
been performed using 4000 points, corresponding to 1ms of observed data.
These results point that antigen collection features, which is an important feature of DCA,
may not provide the collection of all antigens, related to the exposed signals, by the algorithm
agents. Instead, these cells can collect antigens that were exposed to these once during the
sampling. However, the fault starts by one second after tests have started. All data processed
are represented in figs. 5.11 to 5.14 for Normal Data and figs. 5.15 to 5.30 for Faulty Data.

5.3 Validation of novel metrics 115
Tab. 5.2: DCA parameters and functions.
Algorithm DataAlgorithm dDCA-FDI, adapted from dDCAVersion [Greensmith and Aickelin, 2008].DC population 50Antigen Storage 10Average Lifetime 5PAMP NDSafe Signal (SS) Based on Eq. 5.11Danger Signal (DS) Based on Eq. 5.10Min / Max SS [0 5]Min / Max DS [0 10]Sampling Time (Ts) 1sEvaluation Metrics MCAV , K$ and CCAFA
Tab. 5.3: Test results for DCA applied to Fault Detection.
Test Detection Antigens K$ Max K$ Mean CCAFAScenario Instant Collected value value Mean valueNormal - - 0 -29.8 -0.60Fault 1 1s 3 200 +8.69 +0.51Fault 2 1s 1 200 -0.27 +0.35Fault 3 1s 40 190 +2.6 +0.49Fault 4 1s 200 13 -0.32 +0.11

116Other Immunological Models and Their Application to Fault Detection and
Diagnosis
0 500 1000 1500 2000 2500 30007446
7448
7450
7452Normal System Data
arm
atur
e ci
rcui
t cur
rent
0 500 1000 1500 2000 2500 300060
61
62
63
Fiel
d ci
rcui
t cur
rent
0 500 1000 1500 2000 2500 300049.578
49.58
49.582
Time (milliseconds)
Mec
hani
cal r
otat
ion
spee
d (ra
d/s)
Fig. 5.11: DC Motor system data for Normal Case.
0 500 1000 1500 2000 2500 300060.2
60.4
60.6Normal Residual Data
Arm
atur
e ci
rcui
t cur
rent
0 500 1000 1500 2000 2500 3000−2
0
2
Fiel
d ci
rcui
t cur
rent
0 500 1000 1500 2000 2500 3000−0.2562
−0.2562
−0.2561
Time (milliseconds)
Mec
hani
cal r
otat
ion
spee
d (ra
d/s)
Fig. 5.12: DC Motor residuals data for Normal Case.

5.3 Validation of novel metrics 117
0 500 1000 1500 2000 2500 30000
0.5
1x 10⁻³
Dan
ger S
igna
lNormal DCA Signals
0 500 1000 1500 2000 2500 30002.98
2.985
2.99
Time (milliseconds)
Safe
Sig
nal
Fig. 5.13: DC Motor converted signals for Normal Case.
0 500 1000 1500 2000 2500 3000−1
0
1
MC
AV
Normal Data − DCA Alarm (Based on indexes)
0 500 1000 1500 2000 2500 3000−200
−100
0
K−al
pha
0 500 1000 1500 2000 2500 3000−1
−0.5
0
Time (milliseconds)
CC
AFA
Fig. 5.14: DC Motor alarm data for Normal Case.

118Other Immunological Models and Their Application to Fault Detection and
Diagnosis
0 500 1000 1500 2000 2500 30000
2000
4000
6000
8000Fault 1 System Data
Arm
atur
e ci
rcui
t cur
rent
0 500 1000 1500 2000 2500 300060
62
64
Fiel
d ci
rcui
t cur
rent
0 500 1000 1500 2000 2500 30000
20
40
Time (milliseconds)Mec
hani
cal r
otat
ion
spee
d (ra
d/s)
Fig. 5.15: DC Motor system data for Fault 1.
0 500 1000 1500 2000 2500 3000−10000
−5000
0
5000Fault 1 Residual Data
Arm
atur
e ci
rcui
t cur
rent
0 500 1000 1500 2000 2500 3000−1
−0.5
0
0.5
1
1.5
Fiel
d ci
rcui
t cur
rent
0 500 1000 1500 2000 2500 3000−0.4
−0.3
−0.2
−0.1
0
Time (milliseconds)
Mec
hani
cal r
otat
ion
spee
d (ra
d/s)
Fig. 5.16: DC Motor residuals data for Fault 1.
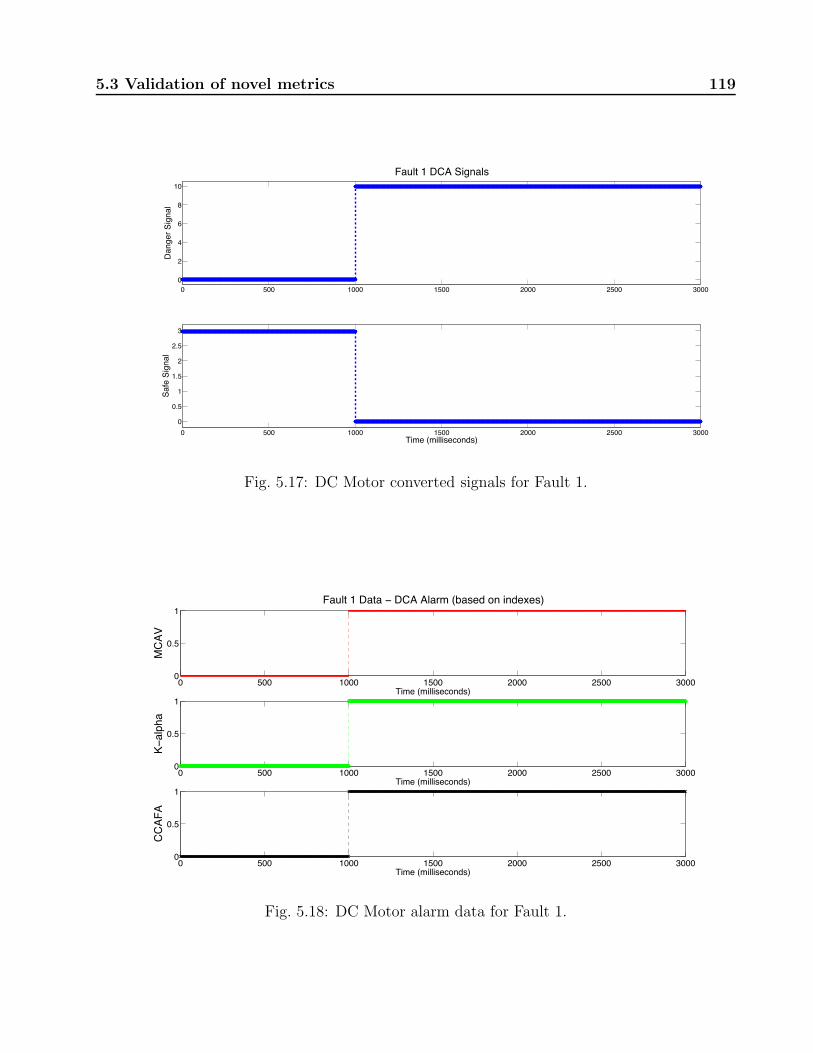
5.3 Validation of novel metrics 119
0 500 1000 1500 2000 2500 30000
2
4
6
8
10
Dan
ger S
igna
lFault 1 DCA Signals
0 500 1000 1500 2000 2500 30000
0.5
1
1.5
2
2.5
3
Time (milliseconds)
Safe
Sig
nal
Fig. 5.17: DC Motor converted signals for Fault 1.
0 500 1000 1500 2000 2500 30000
0.5
1
Time (milliseconds)
MC
AV
Fault 1 Data − DCA Alarm (based on indexes)
0 500 1000 1500 2000 2500 30000
0.5
1
Time (milliseconds)
K−al
pha
0 500 1000 1500 2000 2500 30000
0.5
1
Time (milliseconds)
CC
AFA
Fig. 5.18: DC Motor alarm data for Fault 1.

120Other Immunological Models and Their Application to Fault Detection and
Diagnosis
0 500 1000 1500 2000 2500 30000
1
2 x 10⁵ Fault 2 System Data
Arm
atur
e ci
rcui
t cur
rent
0 500 1000 1500 2000 2500 30000
50
100
Fiel
d ci
rcui
t cur
rent
0 500 1000 1500 2000 2500 30000
20
40
60
Time (milliseconds)
Mec
hani
cal r
otat
ion
spee
d (ra
d/s)
Fig. 5.19: DC Motor system data for Fault 2.
0 500 1000 1500 2000 2500 3000−3000
−2000
−1000
0
1000Fault 2 Residual Data
Arm
atur
e ci
rcui
t cur
rent
0 500 1000 1500 2000 2500 3000−60
−40
−20
0
20
Fiel
d ci
rcui
t cur
rent
0 500 1000 1500 2000 2500 3000−0.5
−0.4
−0.3
−0.2
−0.1
0
Time (milliseconds)
Mec
hani
cal r
otat
ion
spee
d (ra
d/s)
Fig. 5.20: DC Motor residuals data for Fault 2.

5.3 Validation of novel metrics 121
0 500 1000 1500 2000 2500 30000
2
4
6
8
10
Dan
ger S
igna
lFault 2 DCA Signals
0 500 1000 1500 2000 2500 3000
0
0.5
1
1.5
2
2.5
3
3.5
4
4.5
5
Time (milliseconds)
Safe
Sig
nal
Fig. 5.21: DC Motor converted signals for Fault 2.
0 500 1000 1500 2000 2500 30000
0.5
1
Time (milliseconds)
MC
AV
Fault 2 Data − DCA Alarm (based on indexes)
0 500 1000 1500 2000 2500 30000
0.5
1
Time (milliseconds)
K−al
pha
0 500 1000 1500 2000 2500 30000
0.5
1
Time (milliseconds)
CC
AFA
Fig. 5.22: DC Motor alarm data for Fault 2.
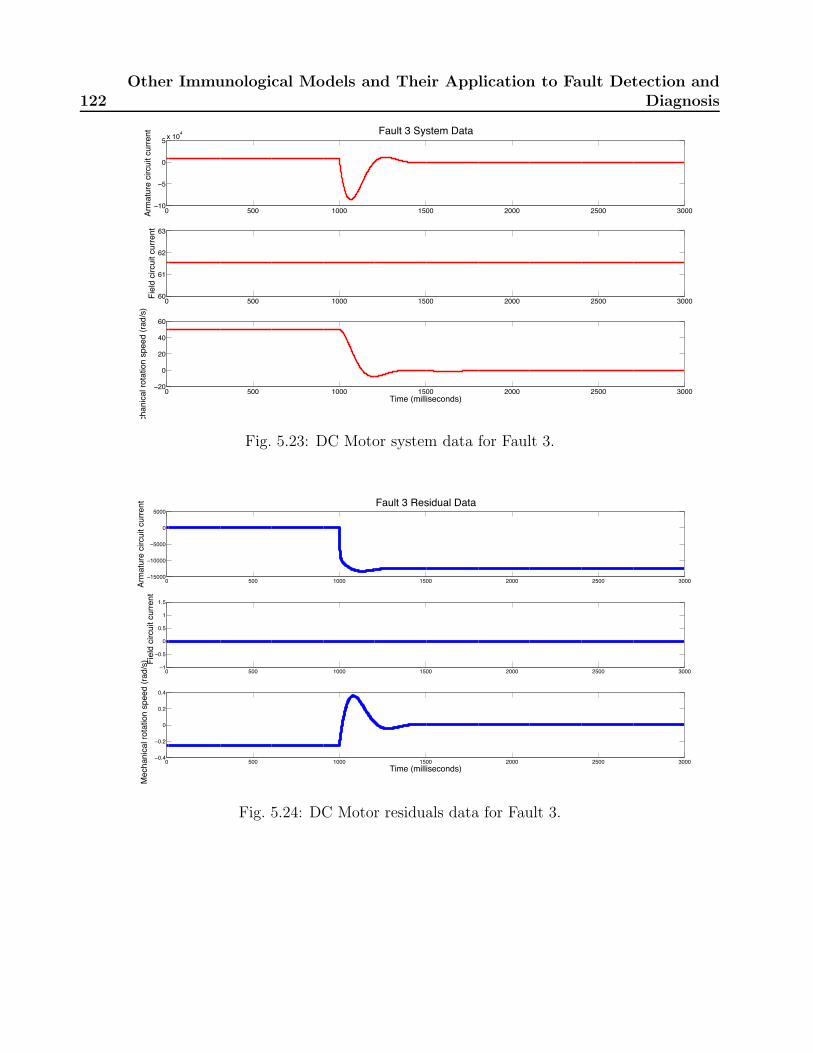
122Other Immunological Models and Their Application to Fault Detection and
Diagnosis
0 500 1000 1500 2000 2500 3000−10
−5
0
5 x 10⁴ Fault 3 System DataAr
mat
ure
circ
uit c
urre
nt
0 500 1000 1500 2000 2500 300060
61
62
63
Fiel
d ci
rcui
t cur
rent
0 500 1000 1500 2000 2500 3000−20
0
20
40
60
Time (milliseconds)
Mec
hani
cal r
otat
ion
spee
d (ra
d/s)
Fig. 5.23: DC Motor system data for Fault 3.
0 500 1000 1500 2000 2500 3000−15000
−10000
−5000
0
5000Fault 3 Residual Data
Arm
atur
e ci
rcui
t cur
rent
0 500 1000 1500 2000 2500 3000−1
−0.5
0
0.5
1
1.5
Fiel
d ci
rcui
t cur
rent
0 500 1000 1500 2000 2500 3000−0.4
−0.2
0
0.2
0.4
Time (milliseconds)
Mec
hani
cal r
otat
ion
spee
d (ra
d/s)
Fig. 5.24: DC Motor residuals data for Fault 3.

5.3 Validation of novel metrics 123
0 500 1000 1500 2000 2500 30000
2
4
6
8
10
Dan
ger S
igna
lFault 3 DCA Signals
0 500 1000 1500 2000 2500 3000
0
0.5
1
1.5
2
2.5
3
Time (milliseconds)
Safe
Sig
nal
Fig. 5.25: DC Motor converted signals for Fault 3.
0 500 1000 1500 2000 2500 30000
0.5
1
Time (milliseconds)
MC
AV
Fault 3 Data − DCA Alarm (based on indexes)
0 500 1000 1500 2000 2500 30000
0.5
1
Time (milliseconds)
K−al
pha
0 500 1000 1500 2000 2500 30000
0.5
1
Time (milliseconds)
CC
AFA
Fig. 5.26: DC Motor alarm data for Fault 3.

124Other Immunological Models and Their Application to Fault Detection and
Diagnosis
0 500 1000 1500 2000 2500 30000
5
10
15 x 104 Fault 4 System Data
Arm
atur
e ci
rcui
t cur
rent
0 500 1000 1500 2000 2500 30000
20
40
60
80
Fiel
d ci
rcui
t cur
rent
0 500 1000 1500 2000 2500 300040
60
80
100
120
Time (milliseconds)Mec
hani
cal r
otat
ion
spee
d (ra
d/s)
Fig. 5.27: DC Motor system data for Fault 4.
0 500 1000 1500 2000 2500 3000−100
−50
0
50
100Fault 4 Residual Data
Arm
atur
e ci
rcui
t cur
rent
0 500 1000 1500 2000 2500 3000−0.6
−0.4
−0.2
0
0.2
Fiel
d ci
rcui
t cur
rent
0 500 1000 1500 2000 2500 3000−0.6
−0.5
−0.4
−0.3
−0.2
Time (milliseconds)
Mec
hani
cal r
otat
ion
spee
d (ra
d/s)
Fig. 5.28: DC Motor residuals data for Fault 4.
Despite the sampling time is di!erent from observed time of the dynamic system, the de-
tection of faults was performed in a relatively accurate time. An interesting data is regarding
the mean values of K$ and CCAFA indexes, the latter was proposed to serve as an alarm
feature rather than another value to classify antigens, since signals are more relevant to detect
faults, which can be shown in Table 5.31. In these data, the CCAFA index seems to be more
applicable to detection than K$, according to their mean values.

5.3 Validation of novel metrics 125
0 500 1000 1500 2000 2500 30000
2
4
6
8
10
Dan
ger S
igna
l
Fault 4 DCA Signals
0 500 1000 1500 2000 2500 30002.8
3
3.2
3.4
3.6
3.8
4
4.2
Time (milliseconds)
Safe
Sig
nal
Fig. 5.29: DC Motor converted signals for Fault 4.
0 500 1000 1500 2000 2500 30000
0.5
1
Time (milliseconds)
MC
AV
Fault 4 Data − DCA Alarm (based on indexes)
0 500 1000 1500 2000 2500 30000
0.5
1
Time (milliseconds)
K−al
pha
0 500 1000 1500 2000 2500 30000
0.5
1
Time (milliseconds)
CC
AFA
Fig. 5.30: DC Motor alarm data for Fault 4.
However, to verify their suitability for the fault detection problems, a comparison among
these indexes may provide such aspects. For this purpose, the detection through each index
was measured using a detection threshold as follows.
• ThrMCAV = 0.6
• ThrK! = 2
• ThrCCAFA = 0.2

126Other Immunological Models and Their Application to Fault Detection and
Diagnosis
0 500 1000 1500 2000 2500 3000−1
−0.5
0
Time (milliseconds)
Nor
mal
cas
e C
CAF
A DCA Fault Detection Data
0 500 1000 1500 2000 2500 30000
0.5
1
Time (milliseconds)Faul
t 1 C
CAF
A
0 500 1000 1500 2000 2500 30000
0.5
1
Time (milliseconds)Faul
t 2 C
CAF
A
0 500 1000 1500 2000 2500 30000
0.5
1
Time (milliseconds)
Faul
t 3 C
CAF
A
0 500 1000 1500 2000 2500 30000
0.5
1
Time (milliseconds)Faul
t 4 C
CAF
A
Fig. 5.31: Evaluation of the CCAFA variable with sample time Ts = 1s.
The results are given in Table 5.4. Most faults are detectable in such conditions, and the
alarm generation is based on these indexes. Unlike in disconnection cases (1 and 2), detection
was possible in all instants of detection, short circuit cases (3 and 4) have presented some
di!erences.
Tab. 5.4: Alarm duration time according to anomaly metrics.
TestScenario MCAV K$ CCAFANormal 0s 0s 0sFault 1 3s 3s 3sFault 2 3s 3s 3sFault 3 2s 2s 3sFault 4 3s 3s 3s
These tests point that the new alarm metric proposed in this work is a proper metric for
fault detection using DCA functions, since this metric can detect most faults like the other
metrics and a comparable performance in most tests as well.
Unlike most anomaly detection cases, FDI problems need some special resources in order
to provide identification of di!erent anomaly cases. Most AIS approaches have been often
developed to provide well defined detection features. Fault isolation is, however, still limited
to other methods.
In the Dendritic Cell Algorithm, an isolation index for antigens, the AIFD was proposed

5.4 Simulations 127
in Subsection 5.2.4 as an aggregation factor that identifies the fault sequence in the algorithm.
In Table 5.5, some information about the indexes found and antigen patterns are presented
with the number of collected antigens with these indexes and when these antigens were collected
during DCA evaluation.
Tab. 5.5: Results of antigen indexation through the proposed AIFD index.
Test AIFD Antigens No. of Order ofScenario Indexes Evaluated Antigens OccurrencesNormal - 0 11 -
67.20 2 3, 98Fault 1 38.82 2 98 55-56
2.69 1 54Fault 2 250 1 552 3
100.81 1 3Fault 3 0.65 12 808 Both between
0.16 13 629 and 652Fault 4 7.59 1 2010 3
0.07 26 636-660
This index can also generate distinct sequences of antigen patterns based on the DCA
correlation mechanism, as in some cases, consecutive antigens has the same value of AIFD
index. Noteworthy, this index is only applicable to the deterministic version of DCA, since the
index is a pattern generator that can be reproduced under the same circumstances, according
to antigen data.
5.4 Simulations
In this sections, the algorithms reviewed analyzed will be tested, applied to some fault detection
benchmarks aiming is to achieve faults as e!ective as possible. The methods used are the
following:
• The Deterministic Dendritic Cell Algorithm (dDCA-FDI).
• Structural Toll-Like Receptors Algorithm (STLR).
• Danger Model-based approach of [de Almeida et al., 2010] (DM-FD).
These tests are proposed to verify and validate all of immune-inspired approaches studied
in this work based on performance and how the problem is addressed in each of the employed

128Other Immunological Models and Their Application to Fault Detection and
Diagnosis
methods. These are not explicitly compared to each other, although the performance of each
approach is analyzed.
One of the common benchmarks of application in FDI problems is the DAMADICS, intro-
duced in [Bartys et al., 2006] and described in Chapter 2.
There are some methods to generate a redundancy model of the given system, as in [Kourd
et al., 2011,Kourd et al., 2013], in which two neural networks are employed to generate the
model X ! and F ! for the residuals of the two outputs, obtained for fault-free and faulty cases.
The fault-free case is illustrated in Figure 5.32, whose variables are often evaluated to detect
and isolate faults.
Fig. 5.32: Neural Network for residuals calculation in fault-free simulations of DAMADICS,based in [Kourd et al., 2011].
In those works, detection is based on threshold and residuals evaluation. Some faults can
be detected through these strategies, which compare residuals to some sets of range values.
Tests are organized as shown in Table 5.6, with some information as the faults simulated
and their strength in the benchmark.

5.4 Simulations 129
Tab. 5.6: Description of tests performed in DAMADICS benchmark.
Fault Intensity/Type
IDType of fault
Abrupt (Intensity)Inc
ASm AMe ALaf0 - - - -f1 X X X -f7 X X X -f13 X X X Xf15 N/A N/A X -f17 N/A N/A X Xf19 X X X -
Caption for fault types
None No FaultASm Abrupt, SmallAMe Abrupt, MediumALa Abrupt, LargeInc Incipient
Residual calculation is provided through the MSE (Mean Square Error) of the estimated and
obtained values in all N output variables (Eq. 5.17). For the DCA detection, the calculation
of SS is based on a sliding window mechanism, defined by the w value, defined by the period
k of the evaluation.
r(k) =
#Ni=1(y(k,i) ! y(k,i))2
N(5.17)
SS(k) =
#kj=jo
r(j)
k ! jo(5.18)
jo = max(1, k ! w) (5.19)
This is the information provided for signals of the evaluated methods. In DCA, the Safe
Signal is based on Eq. 5.18, considering the sliding window mechanism calculated upon Eq. 5.19,
as the benchmark samples are provided in Ts = 1s. Noteworthy, initial value of safe signal is
the residual at first instant (i.e. SS(0) = r(0)). In this approach, tests are performed in
Samples are given in di!erent observed periods, To = {2, 10, 30, 60, 120}secs. And each window,
proportional to the period (w = To
Ts) is evaluated once.
DS calculation is based on the distance between minimum and maximum values of the
sliding window, based on (5.20).
DS(k) =N$
i=1
(max(r(k), w)!min(r(k), w)) (5.20)

130Other Immunological Models and Their Application to Fault Detection and
Diagnosis
Normalization equations are defined in Eq. 5.21 for DS and Eq. 5.22 for SS, defining that
danger signals have values within range [0, 10] and safe signals have values within range [0, 5].
DS !
(k) = min(0, max(100DS(k), 10)) (5.21)
SS !
(k) = max(0, min(1 ! 10SS(k), 1)) " 5 (5.22)
Finally, both proposed indexes CCAFA and AIFD are used in these tests as well, in order
to provide detection and isolation of faults in this context.
For the TLR algorithm, the antigen is sampled through the sliding window mechanism,
instead of the signals, whose processing are still based on the residuals (Eq. 5.17). The sliding
window of antigens have the following variation of values W = {1, 5, 10, 20}, according to the
processing, based on the signals. Noteworthy, processing starts from the first instant after the
sliding window. (i.e. if W = 10, ko = 10 as well), sliding window is also used during the
training, as required by processing. As the antigen size is aN = 2, with the sliding window,
antigen size becomes aN = 2 "W .
The FD-DM method uses only signal information, which is the same as previous algorithms,
and training data (from TLR) will be used during pre-processing. Signals are based on SS used
for DCA with normalization considered in 5.23 for rmax = 80std(SStr). The Immune Alarm
Threshold ITA is based on the stressed fuzzy membership.
¯Signal(t) =
%
1, SSts(t) > rmaxSSts(t)"rminrmax"rmin
, Otherwise(5.23)
For these tests, DCA parameters are defined in Table 5.7, TLR algorithm parameters in Ta-
ble 5.8 and DF-DM Model in Table 5.9, based on this study.
Each scenario is simulated 120 times, and each simulation is considered as an event in
which the first detection alarm or maximum time reached are the stopping criteria of the
evaluated algorithms. These simulations have random duration (among 4, 8, 16 and 24 hours),
and random instant of fault occurrence. Performance measurements, such as detection rate
(dr%), false alarm rate (fa%), and the average detection delay time (#t) are displayed for
each scenario.

5.4 Simulations 131
Tab. 5.7: DCA parameters and functions.
Algorithm DataAlgorithm Version dDCA-FDI
APC population 25Antigen Storage 10Average DC Lifetime 10PAMP NDSafe Signal (SS) Based on Eq. 5.18Danger Signal (DS) Based on Eq. 5.20Min / Max SS [0 5]Min / Max DS [0 10]Sampling Time (Ts) 2, 30, 60 or
120 seconds.Evaluation Metrics CCAFA
Tab. 5.8: TLR parameters and functions.
Algorithm DataAlgorithm Version STLR
APC Population 20Average Lifetime 5Anomaly Detection Fuzzy-NSAAlgorithms (T-Cell) or oc-SVMSignals Residuals-based rulesProcessing Direct, based on
Nonself signals.Sampling Time (Ts) 1sAntigen Sliding Window 1, 5 or 10
5.4.1 More about the algorithms
Some points that can be highlighted are using a detector of anomalies that corresponds to
the action of T-Cell in TLR Algorithm, whose version used in this work corresponds to the
structured version (STLR), and being used with two choices of anomaly detectors, the method
of fuzzy antigen recognition proposed in the previous chapter, or a machine learning technique:
One-Class SVM proposed in [Scholkopf et al., 2001]. Moreover, two models presented for
information processing are adopted: for TLR, the direct processing, based on the original
formulation of the algorithm, and the fuzzy processing for the Danger-based approach. And for
the Dendritic Cell algorithm, the proposed anomaly detection metrics (CCAFA and AIFD,
the latter in a further analysis), are considered in this work for evaluation purposes.
The approach in [de Almeida et al., 2010] has few parameters required, and most operations

132Other Immunological Models and Their Application to Fault Detection and
Diagnosis
Tab. 5.9: Method of [de Almeida et al., 2010] parameters and functions.
Algorithm DataAlgorithm DM-FD
Safe Signal Based on Eq. 5.11Min / Max SS [0 1]Processing Fuzzy with 4 inputs
and 4 outputs.Input Based on Costimulatoryrules Signals or CytokinesOutput Based on tumor modelingrules in [de Pillis et al., 2005].
in the method are based on fuzzy inference analogous to costimulatory signal. The system
output was normalized considering the maximum value obtained using training data.
Once defined the three algorithms and their applications, the work will evaluate each algo-
rithm and discuss their obtained performance. The original purpose of these tests is to evaluate
the detection capability of the algorithms.
5.4.2 Results
The Benchmark DAMADICS has several points which require a deep analysis of each fault and
how to detect them. Each algorithm, as shown throughout this work, has di!erent aspects in
which fault detection is performed and the analysis of the benchmark implies analyzing the
detection in these di!erent perspectives. Results will be shown in terms of accuracy, detection
rate and false alarms.
Deterministic DCA
Deterministic DCA results are presented in Table 5.10 in which sampling is performed in
di!erent periods, as shown in the test presentation.
Performance measurements are provided by the Benchmark, whose detection is provided by
the CCAFA index. The alarm threshold is CCAFA ) 0.05 for all cases.
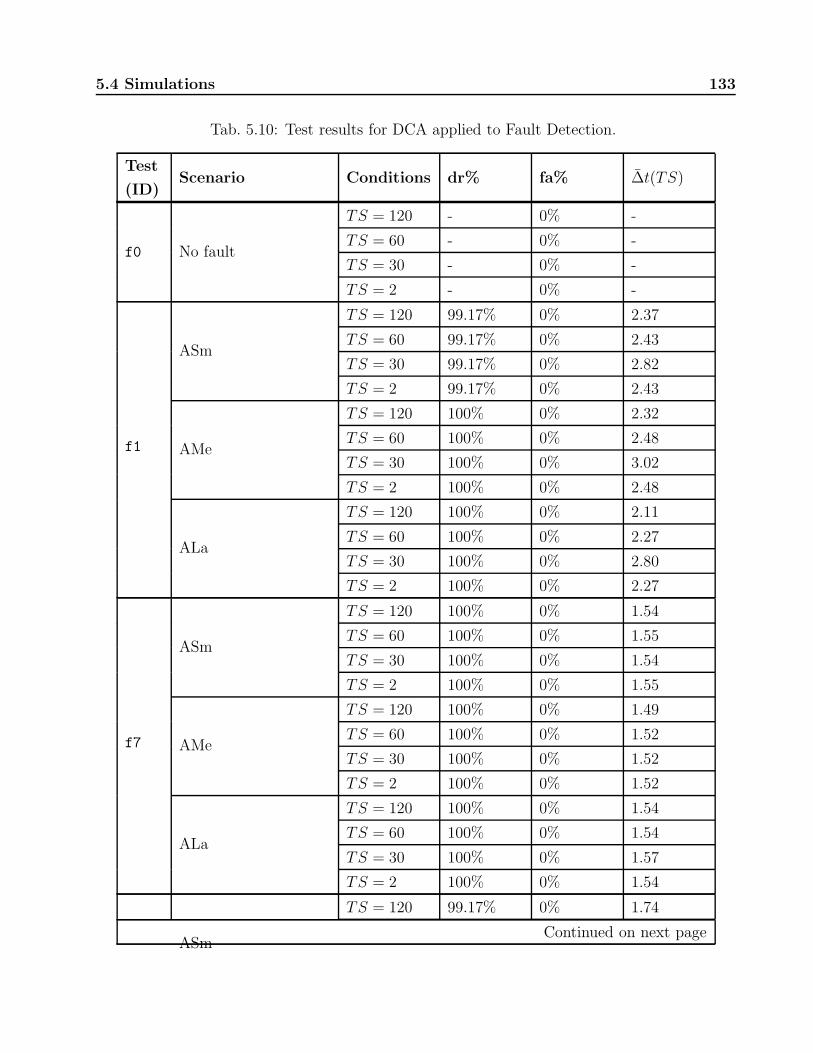
5.4 Simulations 133
Tab. 5.10: Test results for DCA applied to Fault Detection.
Test
(ID)Scenario Conditions dr% fa% #t(TS)
f0 No fault
TS = 120 - 0% -
TS = 60 - 0% -
TS = 30 - 0% -
TS = 2 - 0% -
f1
ASm
TS = 120 99.17% 0% 2.37
TS = 60 99.17% 0% 2.43
TS = 30 99.17% 0% 2.82
TS = 2 99.17% 0% 2.43
AMe
TS = 120 100% 0% 2.32
TS = 60 100% 0% 2.48
TS = 30 100% 0% 3.02
TS = 2 100% 0% 2.48
ALa
TS = 120 100% 0% 2.11
TS = 60 100% 0% 2.27
TS = 30 100% 0% 2.80
TS = 2 100% 0% 2.27
f7
ASm
TS = 120 100% 0% 1.54
TS = 60 100% 0% 1.55
TS = 30 100% 0% 1.54
TS = 2 100% 0% 1.55
AMe
TS = 120 100% 0% 1.49
TS = 60 100% 0% 1.52
TS = 30 100% 0% 1.52
TS = 2 100% 0% 1.52
ALa
TS = 120 100% 0% 1.54
TS = 60 100% 0% 1.54
TS = 30 100% 0% 1.57
TS = 2 100% 0% 1.54
ASm
TS = 120 99.17% 0% 1.74
Continued on next page

134Other Immunological Models and Their Application to Fault Detection and
Diagnosis
Tab. 5.10 – continued from previous page
Test
(ID)Scenario Conditions dr% fa% #t(Ts)
TS = 60 99.17% 0% 1.87
TS = 30 99.17% 0% 2.14
TS = 2 99.17% 0% 1.87
AMe
TS = 120 100% 0% 1.55
TS = 60 100% 0% 1.63
TS = 30 100% 0% 1.77
TS = 2 100% 0% 1.63
ALa
TS = 120 99.17% 0% 2.34
TS = 60 99.17% 0% 2.45
TS = 30 99.17% 0% 3.23
TS = 2 99.17% 0% 2.45
Inc
TS = 120 100% 0% 2.61
TS = 60 100% 0% 3.39
TS = 30 100% 0% 5.39
TS = 2 100% 0% 3.39
f15 ALa
TS = 120 100% 0% 1.88
TS = 60 100% 0% 1.95
TS = 30 100% 0% 2.23
TS = 2 100% 0% 1.95
f17
ALa
TS = 120 100% 0% 1.60
TS = 60 100% 0% 1.56
TS = 30 100% 0% 1.56
TS = 2 100% 0% 1.56
Inc
TS = 120 97.5% 0% 10.24
TS = 60 97.5% 0% 19.26
TS = 30 97.5% 0% 39.21
TS = 2 97.5% 0% 19.26
f19
ASm
TS = 120 99.17% 0% 2.91
TS = 60 100% 0% 3.94
TS = 30 100% 0% 6.81
Continued on next page

5.4 Simulations 135
Tab. 5.10 – continued from previous page
Test
(ID)Scenario Conditions dr% fa% #t(Ts)
TS = 2 100% 0% 3.94
AMe
TS = 120 100% 0% 2.1735
TS = 60 100% 0% 2.24
TS = 30 100% 0% 2.689
TS = 2 100% 0% 2.24
ALa
TS = 120 100% 0% 1.81
TS = 60 100% 0% 1.92
TS = 30 100% 0% 2.08
TS = 2 100% 0% 1.92
These results point that DCA may have a good performance when applied to fault detection
problems. In most cases, DCA has been successfully applied for most fault cases in DAMADICS
Benchmark, even for the incipient faults (f13 and f17), in which the algorithm has detected
the fault with minimum delay. For abrupt faults, DCA has achieved good performance mainly
in the strong cases.
The algorithm has achieved satisfactory performance for Ts = 2s, which is the best sampling
time for such experiments, as this sampling time provides the most realistic simulation case.
This sampling time has achieved good results considering the detection delay, however, for 10
seconds of sampling, the detection delay was longer than most cases.
All of these tests presented no false alarms, as faulty behavior has not been detected during
normal behaviors, indicating that DCA is able to monitor dynamic systems without indicating
normal behaviors as faults.
Structural TLR
The other algorithm considered, the Structural version of Toll-like Receptors algorithm has
been tested and its results are presented in Tab. 5.11.

136Other Immunological Models and Their Application to Fault Detection and
Diagnosis
Tab. 5.11: Test results for TLR algorithm applied to Fault Detection.
Test
(ID)Scenario Conditions dr% fa% #t(sec)
f0 No fault
W = 10 and
ocSVM100% - -
W = 5 and
ocSVM100% - -
W = 1 and
ocSVM100% - -
W = 10 and
FuzzyNSA100% - -
W = 5 and
FuzzyNSA100% - -
W = 1 and
FuzzyNSA100% - -
f1
ASm
W = 10 and
ocSVM99.17% 0% 112.93
W = 5 and
ocSVM99.17% 0% 112.95
W = 1 and
ocSVM99.17% 0% 112.97
W = 10 and
FuzzyNSA99.17% 0% 113.04
W = 5 and
FuzzyNSA99.17% 0% 113
W = 1 and
FuzzyNSA99.17% 0% 112.92
AMe
W = 10 and
ocSVM100% 0% 42.96
W = 5 and
ocSVM100% 0% 42.97
W = 1 and
ocSVM100% 0% 42.97
Continued on next page

5.4 Simulations 137
Tab. 5.11 – continued from previous page
Test
(ID)Scenario Conditions dr% fa% #t(sec)
W = 10 and
FuzzyNSA100% 0% 42.90
W = 5 and
FuzzyNSA100% 0% 42.93
W = 1 and
FuzzyNSA100% 0% 42.88
ALa
W = 10 and
ocSVM100% 0% 99.26
W = 5 and
ocSVM100% 0% 99.23
W = 1 and
ocSVM100% 0% 99.28
W = 10 and
FuzzyNSA100% 0% 99.29
W = 5 and
FuzzyNSA100% 0% 99.26
W = 1 and
FuzzyNSA100% 0% 99.34
f7
ASm
W = 10 and
ocSVM100% 0% 1.28
W = 5 and
ocSVM100% 0% 1.34
W = 1 and
ocSVM100% 0% 1.30
W = 10 and
FuzzyNSA100% 0% 1.28
W = 5 and
FuzzyNSA100% 0% 1.32
W = 1 and
FuzzyNSA100% 0% 1.33
Continued on next page

138Other Immunological Models and Their Application to Fault Detection and
Diagnosis
Tab. 5.11 – continued from previous page
Test
(ID)Scenario Conditions dr% fa% #t(sec)
AMe
W = 10 and
ocSVM100% 0% 1.23
W = 5 and
ocSVM100% 0% 1.36
W = 1 and
ocSVM100% 0% 1.32
W = 10 and
FuzzyNSA100% 0% 1.21
W = 5 and
FuzzyNSA100% 0% 1.36
W = 1 and
FuzzyNSA100% 0% 1.23
ALa
W = 10 and
ocSVM100% 0% 1.24
W = 5 and
ocSVM100% 0% 1.32
W = 1 and
ocSVM100% 0% 1.29
W = 10 and
FuzzyNSA100% 0% 1.28
W = 5 and
FuzzyNSA100% 0% 1.23
W = 1 and
FuzzyNSA100% 0% 1.30
ASm
W = 10 and
ocSVM99.17% 0% 24.46
W = 5 and
ocSVM99.17% 0% 24.51
W = 1 and
ocSVM99.17% 0% 24.39
Continued on next page
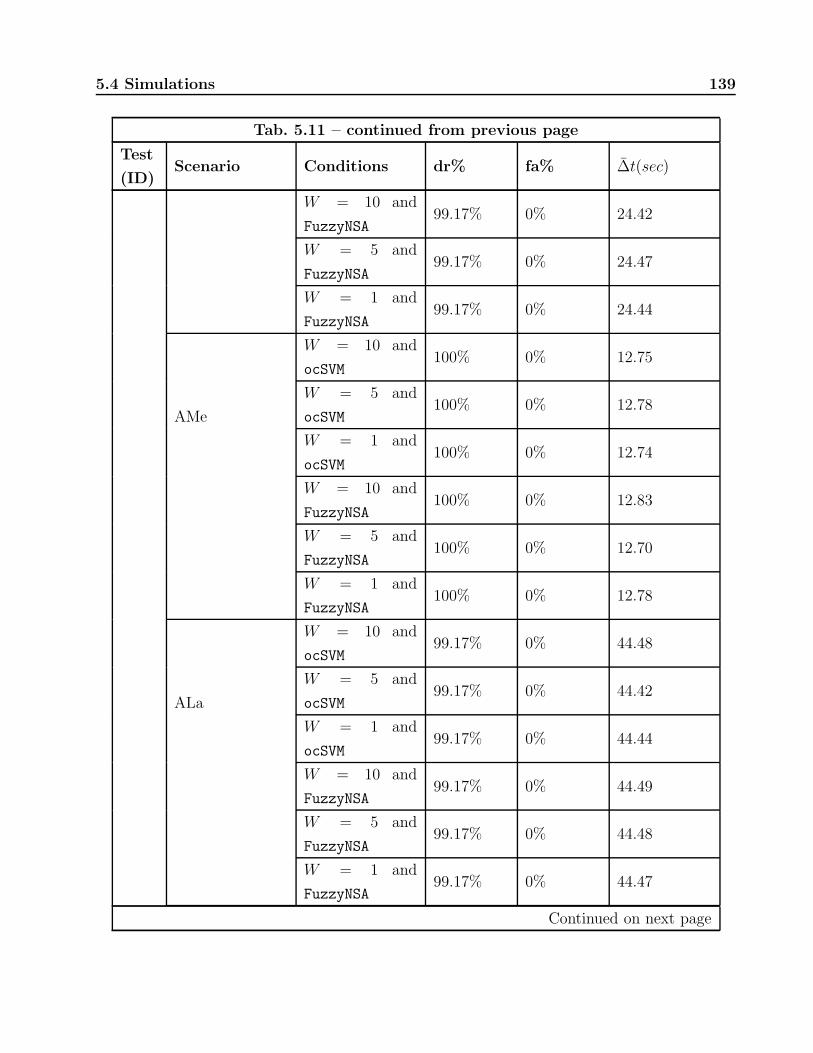
5.4 Simulations 139
Tab. 5.11 – continued from previous page
Test
(ID)Scenario Conditions dr% fa% #t(sec)
W = 10 and
FuzzyNSA99.17% 0% 24.42
W = 5 and
FuzzyNSA99.17% 0% 24.47
W = 1 and
FuzzyNSA99.17% 0% 24.44
AMe
W = 10 and
ocSVM100% 0% 12.75
W = 5 and
ocSVM100% 0% 12.78
W = 1 and
ocSVM100% 0% 12.74
W = 10 and
FuzzyNSA100% 0% 12.83
W = 5 and
FuzzyNSA100% 0% 12.70
W = 1 and
FuzzyNSA100% 0% 12.78
ALa
W = 10 and
ocSVM99.17% 0% 44.48
W = 5 and
ocSVM99.17% 0% 44.42
W = 1 and
ocSVM99.17% 0% 44.44
W = 10 and
FuzzyNSA99.17% 0% 44.49
W = 5 and
FuzzyNSA99.17% 0% 44.48
W = 1 and
FuzzyNSA99.17% 0% 44.47
Continued on next page

140Other Immunological Models and Their Application to Fault Detection and
Diagnosis
Tab. 5.11 – continued from previous page
Test
(ID)Scenario Conditions dr% fa% #t(sec)
Inc
W = 10 and
ocSVM100% 0% 157.87
W = 5 and
ocSVM100% 0% 157.85
W = 1 and
ocSVM100% 0% 157.89
W = 10 and
FuzzyNSA100% 0% 157.88
W = 5 and
FuzzyNSA100% 0% 157.92
W = 1 and
FuzzyNSA100% 0% 157.87
f15 ALa
W = 10 and
ocSVM100% 0% 20.58
W = 5 and
ocSVM100% 0% 20.59
W = 1 and
ocSVM100% 0% 20.60
W = 10 and
FuzzyNSA100% 0% 20.53
W = 5 and
FuzzyNSA100% 0% 20.57
W = 1 and
FuzzyNSA100% 0% 20.53
f17
ALa
W = 10 and
ocSVM100% 0% 1.26
W = 5 and
ocSVM100% 0% 1.31
W = 1 and
ocSVM100% 0% 1.27
Continued on next page

5.4 Simulations 141
Tab. 5.11 – continued from previous page
Test
(ID)Scenario Conditions dr% fa% #t(sec)
W = 10 and
FuzzyNSA100% 0% 1.33
W = 5 and
FuzzyNSA100% 0% 1.31
W = 1 and
FuzzyNSA100% 0% 1.26
Inc
W = 10 and
ocSVM97.5% 0% 1608.27
W = 5 and
ocSVM97.5% 0% 1608.15
W = 1 and
ocSVM97.5% 0% 1608.24
W = 10 and
FuzzyNSA97.5% 0% 1608.19
W = 5 and
FuzzyNSA97.5% 0% 1608.28
W = 1 and
FuzzyNSA97.5% 0% 1608.31
f19
ASm
W = 10 and
ocSVM0% 0% -
W = 5 and
ocSVM0% 0% -
W = 1 and
ocSVM0% 0% -
W = 10 and
FuzzyNSA0% 0% -
W = 5 and
FuzzyNSA0% 0% -
W = 1 and
FuzzyNSA0% 0% -
Continued on next page

142Other Immunological Models and Their Application to Fault Detection and
Diagnosis
Tab. 5.11 – continued from previous page
Test
(ID)Scenario Conditions dr% fa% #t(sec)
AMe
W = 10 and
ocSVM96.67% 0% 270.11
W = 5 and
ocSVM96.67% 0% 270.10
W = 1 and
ocSVM96.67% 0% 270.14
W = 10 and
FuzzyNSA96.67% 0% 270.10
W = 5 and
FuzzyNSA96.67% 0% 270.14
W = 1 and
FuzzyNSA96.67% 0% 270.21
ALa
W = 10 and
ocSVM100% 0% 21.06
W = 5 and
ocSVM100% 0% 21.04
W = 1 and
ocSVM100% 0% 20.99
W = 10 and
FuzzyNSA100% 0% 21.01
W = 5 and
FuzzyNSA100% 0% 21.09
W = 1 and
FuzzyNSA100% 0% 21.16
The TLR algorithm achieved a good performance even for incipient faults without false
alarms in any test. However, for f19, TLR failed to detect them in the small case. The
detection time was relatively satisfactory in some faults, but DCA achieved a better result in
most cases.
Using the antigen sliding window mechanism for 10 samples, TLR has achieved a good
performance, mainly for incipient faults. however, changing the size of the window, the per-

5.4 Simulations 143
formance has not increased significantly. TLR can also achieve detection for 1 sample in the
sliding window
It was assumed that use of another algorithm to define self and nonself regions should also
influence in the performance, however, comparing the One Class SVM method and the Fuzzy
version of Negative Selection, TLR has achieved similar performance in both cases.
In counterpart, the mechanism used for detection has prevented the occurrence of false
alarms in the algorithm, in a similar way to DCA. Compared to the latter algorithm, TLR had
better performance, but still with some false alarms in few cases.
Danger Model inspired fault detection
The danger model approach proposed in [de Almeida et al., 2010] used for simulations is tested
for comparisons among all approaches. The Table 5.12 presents the results achieved in the
research.
Tab. 5.12: Test results for the danger model approach applied to Fault Detection.
Test
(ID)Scenario dr% fa% #t(sec)
f0 No fault - 0% -
f1
ASm 99.17% 0% 380.46
AMe 99.17% 0% 432.16
ALa 95.85% 0% 430.96
f7
ASm 99.17% 0% 132.03
AMe 100% 0% 118.89
ALa 100% 0% 136.80
f13
ASm 96.67% 0% 287.02
AMe 100% 0% 225.03
ALa 95.83% 0% 452.85
Inc 99.17% 0% 365.56
f15 ALa 97.50% 0% 351.38
f17ALa 99.17% 0% 139.18
Inc 99.17% 0% 1297
f19
ASm 96.67% 0% 2326
AMe 95% 0% 820.44
Continued on next page

144Other Immunological Models and Their Application to Fault Detection and
Diagnosis
Tab. 5.12 – continued from previous page
Test
(ID)Scenario dr% fa% #t(sec)
ALa 95.85% 0% 464.36
The algorithm was able to detect most faults, but with poor performances, mainly for f1,
f15 and f19 cases. A reasonable performance for incipient faults was achieved, but in some
cases, the algorithm had some problems related to the delay in fault detection.
Another algorithm - One-class SVM and PCA
The One-class Support Vector Machine, proposed in [Scholkopf et al., 2001], was chosen in
order to provide comparisons to immune-inspired approaches. Once used as nonself space in
TLR tests in this work, the method was evaluated taking into account that one-class methods
are more suitable approaches for fault detection problems.
The SVM approach was tested with the output pre-processed by PCA considering the
strategy performed in [Zhanchun et al., 2006], using gaussian kernel as separation surface, with
threshold µ = 0.0000028. Considering the high rate of false alarms of such methods, an alarm
tolerance index AT was considered, with AT = 2, which means that only the third point of
negative class being an alarm. Results for this test are presented in Figure 5.13.

5.4 Simulations 145
Tab. 5.13: Test results for the SVM one class with PCA applied to Fault Detection.
Test
(ID)Scenario dr% fa% #t(sec)
f0 No fault 0% 42% 0
f1
ASm 90.83% 9.17% 44.67
AMe 0% 10.83% 0
ALa 88.33% 11.67% 37.56
f7
ASm 86.67% 13.33% 2.79
AMe 86.67% 13.33% 2.89
ALa 82.5% 17.5% 2.89
f13
ASm 45.83% 15% 12947
AMe 43.33% 13.33% 14046
ALa 0% 15% 0
Inc 87.5% 10.83% 735.4
f15 ALa 86.67% 13.33% 13.68
f17ALa 89.17% 10.83% 2.97
Inc 90% 10% 380
f19
ASm 23.33% 13.33% 23389
AMe 1.67% 13.33% 29916
ALa 0.83% 13.33% 39102
Compared to AIS approaches, these algorithms had some false alarm rate. In addition, the
strategy failed to detect some faults and provided a longer delay in detection, being unfeasible
for this application.
Computational Costs and Runtime Complexity analysis
It is known that classical immune-inspired approaches based on the negative selection have
high computational costs, as described in [de Almeida et al., 2010]. Regarding the approaches
considered in this work, particularly in the case study of DAMADICS, some information has
been achieved.
Based on [Gu et al., 2013], the runtime complexity of DCA has been calculated based on
theorems. These theorems state that complexity relies on the data size and, in segmented

146Other Immunological Models and Their Application to Fault Detection and
Diagnosis
processing, also relies on the population of APCs and the segment size. The DCA worst case
has a quadratic runtime complexity based on the data size. Other algorithms, such as TLR
Algorithm, have not been analyzed so far in the literature.
In this work, most of the DCA computational cost is regarding the consequences of its
pre-processing phase, in which data are converted to signal and antigen format in order to be
analyzed by the algorithm, whose computational cost can be relatively low.
The TLR Algorithm, however, have its computational cost based on the signal rules and
antigen data evaluations, implying a possibly high computational cost, depending on the pro-
cessed data.
The approach proposed in [de Almeida et al., 2010] presents a low computational cost as
implied by its data processing, which requires few evaluations compared to the other approaches.
In order to evaluate these aspects, some data regarding the runtime of algorithms applied
to DAMADICS were obtained and presented in Table 5.14. These data are presented in terms
of execution time.
Tab. 5.14: Runtime execution data of the algorithms evaluated in this study (in seconds).
Algorithm Min Max Mean Median StandardDeviation
DCA Ts = 120 (Pre-processing) 0.741 38.11 11.37 13.39 11.47DCA Ts = 120 (Algorithm) 0.049 18.78 4.99 4.03 4.21DCA Ts = 60 (Pre-processing) 0.734 41.02 11.37 13.39 11.42DCA Ts = 60 (Algorithm) 0.036 20.36 5.35 4.03 4.56DCA Ts = 30 (Pre-processing) 0.782 38.98 11.69 13.76 11.78DCA Ts = 30 (Algorithm) 0.028 24.03 6.09 4.82 5.32DCA Ts = 2 (Pre-processing) 1.468 53.9 15.76 18.81 14.62DCA Ts = 2 (Algorithm) 0.014 465 92.29 43.08 115TLR+ocSVM W = 1 0.0023 54.06 14.87 11.49 12.52TLR+ocSVM W = 5 0.0019 53.75 14.91 11.53 12.57TLR+ocSVM W = 10 0.0012 53.03 14.75 11.37 12.44TLR+FuzzyNSA W = 1 0.0037 99.91 27.83 21.47 23.44TLR+FuzzyNSA W = 5 0.0036 131.46 36.58 28.18 30.83TLR+FuzzyNSA W = 10 0.0034 170.38 47.40 36.57 39.96FD-DM 0.014 69.0 17.52 13.71 14.46
Considering these data, most immune-inspired approaches may present some complexity as
implied by their mechanisms. For the 2-second sampling case, DCA presented a large runtime
complexity, probably because of the cell evaluation. TLR also presents large execution runtimes,
considering these results, however, using One-class SVM, the runtime execution can be lower
than using the Fuzzy Antigen Recognition. For the Danger Model method, as expected, low

5.4 Simulations 147
Tab. 5.15: DDR values for antigens collected by DCA in DAMADICS tests.
f1 f7 f13 f15 f17 f19
f1 0 0.9074 0.7437 1.3932 0.7168 1.8803f7 0.9074 0 1.2187 1.7834 1.2938 1.3155f13 0.7437 1.2187 0 1.1213 0.6342 1.0069f15 1.3932 1.7834 1.1213 0 1.2237 1.1003f17 0.7168 1.2938 0.6342 1.2237 0 0.7284f19 1.8803 1.3155 1.0069 1.1003 0.7284 0
runtime execution data was obtained, since this method performs few evaluations in signal
data.
DCA Fault Isolation Scheme
The AIFD index generated by DCA has produced 6 to 8 distinct profiles related to a part of
the monitored variables of the benchmark. In DAMADICS Benchmark, the isolation considers
the antigen related to the monitored output and its gathered values during fault occurrence.
The stimulated variables present AIFD values greater than zero, as these are properly
influenced by DCA detection. This stimulation may depend on the fault strength and the
type of fault considered. Noteworthy, the minimum threshold of isolation for each antigen is
D < 0.4, considering the Euclidean Distance between each monitored point.
In order to provide a proper fault isolation, two metrics were adopted, the Distinguishable
Distance Ratio (DDR) proposed in [Wang and Liu, 2009], and the Ambiguity Ratio (AR)
improved in [Wang and Liu, 2011]. These metrics can be used to provide measurements on
class ambiguity in classification problems.
The DDR is a metric based on the Euclidean Distance between two centroids and the
standard deviation of both classes, as described in (5.24). This metric consists of measuring
the distinction of a class i related to j, values close to zero imply that both classes are similar.
In addition, the relation of DDR is symmetric, that is, DDR(i,j) = DDR(j,i).
DDR(i,j) =Dist(ci, cj)
* " (stdi + stdj)(5.24)
Where * is a given constant considering the number of standard deviations from each
centroid.
A matrix of distincion between classes was obtained. This matrix is shown at Table 5.15.

148Other Immunological Models and Their Application to Fault Detection and
Diagnosis
Tab. 5.16: AR values for antigens collected by DCA in DAMADICS tests.
f1 f7 f13 f15 f17 f19
f1 1 0.0202 0.0909 0 0.0241 0f7 0 1 0 0.0309 0 0f13 0 0.0349 1 0.0844 0.1530 0f15 0 0.0268 0 1 0.0057 0f17 0 0.0419 0 0.1057 1 0f19 0 0.0132 0.0909 0 0.0494 1
The AR metric has a di!erent context, consists of an algorithm that provides the ambiguous
degree of class j relative to class i. The algorithm equations are available in 5.25 to 5.28.
AR(i, j) =A(i, j)
A(i, i)(5.25)
A(i, j) =
#nj
q=1 Ui(Xjq) " Pi(Xjq)
nj
(5.26)
Ui(Xjq) =
%
1, Dist(Xjq, ci) ' Dist(Xjq, cj)
0, Dist(Xjq, ci) > Dist(Xjq, cj)(5.27)
Pi(Xjq) =
&
'
'
(
'
'
)
0, Dmaxi < Dist(Xjq, ci)*
Dmaxi"Dist(Xjq ,ci)Dmaxi
, Dmini ' Dist(Xjq, ci) ' Dmaxi
1, Dist(Xjq, ci) < Dmini
(5.28)
Where Dmin and Dmax are the minimum and the maximum of Euclidean Distances from
all instances in i to the centroid ci, respectively, for all ni values of class i.
In AR, values close to one indicate a high ambiguity degree between two classes, while values
close to zero indicate that both classes are not ambiguous. Di!erent from DDR, the relation of
AR(i, j) is not symmetric, that is, AR(i, j) *= AR(j, i).
The ambiguity matrix between isolated faults is shown at Table 5.16.
According to both matrices, faults could be isolated properly, with high degrees of distinction
and low degrees of ambiguity. Some cases, such as distinction relations between f13 and f17
for example, may indicate possibilities of the fault being isolated wrongly. Noteworthy, faults
like f1 and f19 are di"cult to isolate, as AIFD values were critically low at most tests for
these faults.
These results point that the AIFD index is applicable, and most faults in these tests are

5.4 Simulations 149
possible to isolate. However, isolation can be harder than in other benchmark studies and it
can occur under certain circumstances.
Discussion
The main point in common about these approaches is the false alarm rate, which is nonexistent
for all approaches tested in this work. Considering the performance in DAMADICS tests and
the use of certain threshold values, these approaches have di!erent ways to deal with processing,
mainly in the decision phase.
Dendritic Cell and Toll-Like Receptor algorithms have achieved good performance in these
tests. DCA has provided a persistent detection, as well as a satisfactory isolation mechanism,
and the TLR algorithm has provided two signals for detection: residuals (PAMP) and a di!erent
pattern (Antigen). Both algorithms have detected most faults in DAMADICS case study.
The other Danger Model inspired approach has achieved reasonable, but worse results con-
sidering the delay in fault detection. Since the processing is totally di!erent from the other
algorithms, the delay in detection may represent an issue in this algorithm.
These algorithms are capable to provide a low rate of false alarms. But since the expert
knowledge is very important for the application, the discussion regarding the application of
these approaches as FDI systems may be conditioned to the use of models. For all purposes,
Danger Model inspired approaches, mainly the DCA, may provide some interesting resources
for detection in these cases.

150Other Immunological Models and Their Application to Fault Detection and
Diagnosis

Chapter 6
Concluding Remarks
This chapter presents the overall conclusion of the work, as well as subjects for future researches
that are yet to be explored in AIS studies.
6.1 Main aspects of the research
In this work, several studies were consolidated, such as the study of immunological models and
which features they can o!er to provide some enhanced techniques for fault detection and, in
some cases, fault isolation.
Initially, an immune-inspired anomaly detector based on fuzzy antigen recognition of T cells
was presented in two forms: one of them verifies if a detector to be allocated is in a feasible
region (nonself) in order to detect anomalies; the other form detects anomalies based on the
distance between of training and validation points.
Both algorithms are based on the two phases of negative selection, each of them correspond-
ing to an algorithm, both approaches uses information of distance and fuzzy inference system
to achieve the anomaly detection.
Although the algorithms based on negative selection has inherent flaws on context or appli-
cations, it is possible to make them applicable in certain cases, especially in learning machine
problems, moreover, the addition of other immune mechanisms algorithms can be considered.
Infectious Nonself and Danger Models based algorithms have an expert knowledge required
to model the signals, which usually is not implicit in the databases. However, this feature may
be extended to statistical or qualitative aspects.
The main issue about using Dendritic Cell Algorithm in the FDI problems is the antigen
correlation mechanism, which performs a pattern building rather than collecting the faulty
points during signal evaluation through cells. This function has been exploited in this work
151

152 Concluding Remarks
and adds a question in the research: how good the exploitation of the antigen correlation
mechanism in FDI problems should be.
The Toll-Like Receptor Algorithm has a scheme similar to DCA representation, inspired in
the Infectious nonself model and innate immunity. This algorithm requires a minimum experts
knowledge, and also has a training mechanism which defines signals and conditions of activation.
The algorithm in [Twycross et al., 2010] was based on data from censorship, both for signals
as to the antigens. Receptors may, however, be based on processing rules, consideration taken
in this work, which makes it simpler to define if these signals are infectious.
In fact, many dynamic systems have few operational information, it becomes the indication
of possible anomalies a challenging task. It is assumed that traditional approaches can also be
applied, based on the supervised training mechanism, which can also be adopted for modeling
experts knowledge database. This study studies also confirmed some idea about these algo-
rithms: There is no better immune inspired model than another, thus, some features of each
model can be integrated in some approaches, allowing possible extensions in the AIS theory.
Overall, the present work has o!ered some alternatives to improve the reviewed AIS ap-
proaches and apply them to fault detection problems in order to provide satisfactory and en-
couraging results with good detection rates and no false alarm rates, showing that the alternate
immune response models can represent a good metaphor for fault detection.
6.2 Further works
The modeling of immune inspired systems has been significantly enhanced with the study of the
transitional link between the approaches, allowing some analogies to be employed as follows.
For the fuzzy antigen recognition algorithm, other immune-inspired fuzzy rules may be
exploited in some future works, some of them related to other immunological models, which
may be used to define the valid conditions for negative selection rules, and others such as anergy,
exploited in [Cayzer and Sullivan, 2007], when the system may not respond to anomalous
conditions in some cases. In addition, the mechanism can also be applied to evaluation of
training performance in machine learning algorithms, as the negative selection may provide a
good strategy in order to avoid over-fitting in these approaches.
It is noteworthy that the model is incomplete and may require other mechanisms to improve
their operation. However, the results show that it is possible to apply the algorithm approaches
relatively simple, with some applicability in the literature, since the fuzzy recognition immune
system may be an attractive alternative in terms of systems engineering.
The fuzzy antigen recognition algorithm still has features that should be analyzed, such as

6.2 Further works 153
implementation of other fuzzy rules inspired by immunological mechanisms and the thresholds
generation for fault detection, as well as the mechanism of death by neglect in monitoring,
which may play a role that is still unknown.
In DCA, there are still many other factors to be considered in addition to the expert knowl-
edge required to assess the problem. Among them study of the parameters and the challenge
of finding an optimal combination of parameters. In this deterministic version, considered in
the work, there are few parameters required for adjustments. Since biological inspiration may
o!er other analogies, there are some other ways to improve such algorithms and gather better
results for anomaly detection problems. Another aspect that can be studied is the applicability
of DCA to fault prognosis problems, as the signal analysis can be used to assess the remaining
useful life of a system.
However, TLR and FD-DM approaches have not a potential mechanism for fault isolation
as the antigen correlation for DCA, for this purpose, these algorithms may have to su!er some
changes to allow fault isolation and identification tasks. Some other aspects yet to be studied
are alternatives to redundancy models in order to serve as expert model for these approaches.
Since the transitional links among immunological models have been studied, these aspects
can be combined in order to o!er an evolving model for AIS approaches based on each feature
provided by these models, then developing an alternate immune inspired system able to evolve
and optimize its structure to improve detection and isolation capabilities.
Another feature of the biological immune system that studies should deepen is the biological
signaling feature. Some AIS have immune signaling features, but these features are treated
basically. Since immune signaling rules the biological immune system in order to provide
changes, the study of signaling features and their application to engineering problems can be
an interesting study and may enrich the analysis.
The cognitive paradigm of immune system also have interesting features that can enrich AIS
approaches and provide an interesting inspiration for novel approaches. There are few studies
in this paradigm and its analysis can also improve some existing approaches significantly. A
combination of these features (evolving, signal-focused and cognition) may provide interesting
models for novel AIS approaches.
Most approaches, however, are designed for centralized dynamical systems. For large dis-
tributed systems, the application of these methods would be a complicated task. Such systems
require the employment of methods that evaluate data hierarchically and these method also
must be distributed to deal with system complexity. Most AIS approaches are centralized and
they may not work on distributed environments. Deal with large distributed systems is quite
challenging and novel approaches should be developed in order to solve these problems.

154 Concluding Remarks

Bibliography
[bmd, 2002] (2002). Advanced Control Systems Research Group. SAC.
http://sac.upc.edu/research-projects/ue-projects/damadics. [Online; accessed
23-March-2014].
[Abi-Haidar and Rocha, 2010] Abi-Haidar, A. and Rocha, L. (2010). Biomedical article clas-
sification using an agent-based model of t-cell cross-regulation. In Hart, E., McEwan, C.,
Timmis, J., and Hone, A., editors, Artificial Immune Systems, volume 6209 of Lecture Notes
in Computer Science, pages 237–249. Springer Berlin Heidelberg.
[Abi-Haidar and Rocha, 2011] Abi-Haidar, A. and Rocha, L. M. (2011). Collective classifica-
tion of textual documents by guided self-organization in t-cell cross-regulation dynamics.
Evolutionary Intelligence, 4(2):69–80.
[Afaq and Saini, 2011] Afaq, H. and Saini, S. (2011). On the solutions to the travelling sales-
man problem using nature inspired computing techniques. IJCSI - International Journal of
Computer Science, 8(4):326–334.
[Aickelin et al., 2003] Aickelin, U., Bentley, P., Cayzer, S., Kim, J., and Mcleod, J. (2003).
Danger theory: The link between ais and ids. In In Proc. of the Second International
Conference on Artificial Immune Systems (ICARIS-03), pages 147–155.
[Aickelin and Cayzer, 2002] Aickelin, U. and Cayzer, S. (2002). The danger theory and its
application to artificial immune systems. volume abs/0801.3549.
[Aickelin and Greensmith, 2007] Aickelin, U. and Greensmith, J. (2007). Sensing danger: In-
nate immunology for intrusion detection. Information Security Technical Report, 12(4):218
– 227.
[Aitken et al., 2008] Aitken, J. M., Clarke, T., and Timmis, J. I. (2008). The pathways of com-
plement. In Bentley, P. J., Lee, D., and Jung, S., editors, Artificial Immune Systems, volume
5132 of Lecture Notes in Computer Science, pages 364–375. Springer Berlin Heidelberg.
155

156 BIBLIOGRAPHY
[Al-Hammadi et al., 2008] Al-Hammadi, Y., Aickelin, U., and Greensmith, J. (2008). Dca for
bot detection. In IEEE Congress on Evolutionary Computation 2008., pages 1807 –1816.
[Al-Sheshtawi et al., 2010] Al-Sheshtawi, K. A., Abdul-Kader, H. M., and Ismail, N. A. (2010).
Artificial immune clonal selection algorithms: A comparative study of clonalg, opt-ia, and
bca with numerical optimization problems. International Journal of Computer Science and
Network Security (IJCSNS), 10(4):24–30.
[Amaral, 2011] Amaral, J. L. M. (2011). Fault detection in analog circuits using a fuzzy den-
dritic cell algorithm. In ICARIS ’11: Proceedings of the 10th international conference on
Artificial Immune Systems, pages 294–307.
[Andrews and Timmis, 2007] Andrews, P. and Timmis, J. (2007). Alternative inspiration for
artificial immune systems: Exploiting cohen’s cognitive immune model. In Flower, D. and
Timmis, J., editors, In Silico Immunology, pages 119–137. Springer US.
[Antunes and Correia, 2009a] Antunes, M. and Correia, M. (2009a). An artificial immune sys-
tem for temporal anomaly detection using cell activation thresholds and clonal size regula-
tion with homeostasis. In Bioinformatics, Systems Biology and Intelligent Computing, 2009.
IJCBS ’09. International Joint Conference on, pages 323–326.
[Antunes and Correia, 2009b] Antunes, M. and Correia, M. (2009b). Tat-nids: An immune-
based anomaly detection architecture for network intrusion detection. In Corchado, J. M.,
Paz, J. F., Rocha, M. P., and Fernandez Riverola, F., editors, 2nd International Workshop
on Practical Applications of Computational Biology and Bioinformatics (IWPACBB 2008),
volume 49 of Advances in Soft Computing, pages 60–67. Springer Berlin Heidelberg.
[Antunes and Correia, 2011] Antunes, M. and Correia, M. E. (2011). Tunable immune detec-
tors for behaviour-based network intrusion detection. In Lio, P., Nicosia, G., and Stibor,
T., editors, Artificial Immune Systems, volume 6825 of Lecture Notes in Computer Science,
pages 334–347. Springer Berlin Heidelberg.
[Antunes and Correia, 2010] Antunes, M. J. and Correia, M. E. (2010). Temporal anomaly
detection: An artificial immune approach based on t cell activation, clonal size regulation
and homeostasis. In Arabnia, H. R., editor, Advances in Computational Biology, volume 680
of Advances in Experimental Medicine and Biology, pages 291–298. Springer New York.
[Antunes et al., 2009] Antunes, M. J., Correia, M. E., and Carneiro, J. (2009). Towards an
immune-inspired temporal anomaly detection algorithm based on tunable activation thresh-

BIBLIOGRAPHY 157
olds. In International Conference on Bio-inspired Systems and Signal Processing (BIOSIG-
NALS 2009), Porto, Portugal. INSTICC Press.
[Aragon et al., 2008] Aragon, V. S., Esquivel, S. C., and Coello, C. A. C. (2008). Solving con-
strained optimization using a t-cell artificial immune system. Inteligencia Artificial. Revista
Iberoamericana de Inteligencia Artificial, 12(40):7–22.
[Aragon et al., 2010] Aragon, V. S., Esquivel, S. C., and Coello, C. A. C. (2010). A modified
version of a t-cell algorithm for constrained optimization problems. International Journal
for Numerical Methods in Engineering, 84(3):351–378.
[Aragon et al., 2011] Aragon, V. S., Esquivel, S. C., and Coello, C. A. C. (2011). A t-cell
algorithm for solving dynamic optimization problems. Information Sciences, 181(17):3614 –
3637.
[Balachandran et al., 2007] Balachandran, S., Dasgupta, D., Nino, F., and Garrett, D. (2007).
A framework for evolving multi-shaped detectors in negative selection. In IEEE Symposium
on Foundations of Computational Intelligence, 2007. FOCI 2007., pages 401–408.
[Balthrop, 2005] Balthrop, J. L. (2005). Riot: A responsive system for mitigating computer
network epidemics and attacks.
[Bartys et al., 2006] Bartys, M., Patton, R., Syfert, M., de las Heras, S., and Quevedo, J.
(2006). Introduction to the damadics actuator fdi benchmark study. Control Engineering
Practice, 14(6):577 – 596.
[Beutler, 2004] Beutler, B. (2004). Innate immunity: an overview. Molecular Immunology,
40(12):845 – 859.
[Bi et al., 2010] Bi, R., Timmis, J., and Tyrrell, A. (2010). The diagnostic dendritic cell algo-
rithm for robotic systems. In IEEE Congress on Evolutionary Computation 2010, pages 1
–8.
[Bitam et al., 2010] Bitam, S., Batouche, M., and Talbi, E. (2010). A survey on bee colony
algorithms. In Parallel Distributed Processing, Workshops and Phd Forum (IPDPSW), 2010
IEEE International Symposium on, pages 1–8.
[Caminhas, 1997] Caminhas, W. M. (1997). Estrategias de Deteccao e Diagonostico de Falhas
Em Sistemas Dinamicos. Tese de doutorado, Universidade Estadual de Campinas. (In
portuguese).

158 BIBLIOGRAPHY
[Carl et al., 2012] Carl, J. D., Tantawy, A., Biswas, G., and Koutsoukos, X. D. (2012). De-
tection and estimation of multiple fault profiles using generalized likelihood ratio tests: A
case study. In Sysid 2012, 16th IFAC Symposium on System Identification, pages 386–391,
Brussels, Belgium.
[Castro and Von Zuben, 2010] Castro, P. A. D. and Von Zuben, F. (2010). A gaussian artificial
immune system for multi-objective optimization in continuous domains. In Hybrid Intelligent
Systems (HIS), 2010 10th International Conference on, pages 159–164.
[Castro and Von Zuben, 2008] Castro, P. A. D. and Von Zuben, F. J. (2008). MOBAIS: A
Bayesian artificial immune system for multi-objective optimization. In Bentley, P. J., Lee,
D., and Jung, S., editors, ICARIS, volume 5132 of Lecture Notes in Computer Science, pages
48–59. Springer.
[Catania and Garino, 2012] Catania, C. A. and Garino, C. G. (2012). Automatic network
intrusion detection: Current techniques and open issues. Computers & Electrical Engineering,
38(5):1062 – 1072. Special issue on Recent Advances in Security and Privacy in Distributed
Communications and Image processing.
[Cayzer and Sullivan, 2007] Cayzer, S. and Sullivan, J. (2007). Modelling danger and anergy
in artificial immune systems. In Proceedings of the 9th annual conference on Genetic and
evolutionary computation, GECCO ’07, pages 26–32, New York, NY, USA. ACM.
[Chandola et al., 2009] Chandola, V., Banerjee, A., and Kumar, V. (2009). Anomaly detection:
A survey. ACM Comput. Surv., 41(3):15:1–15:58.
[Chelly et al., 2012] Chelly, Z., Smiti, A., and Elouedi, Z. (2012). Coid-fdcm: The fuzzy main-
tained dendritic cell classification method. In Rutkowski, L., Korytkowski, M., Scherer, R.,
Tadeusiewicz, R., Zadeh, L., and Zurada, J., editors, Artificial Intelligence and Soft Com-
puting, volume 7268 of Lecture Notes in Computer Science, pages 233–241. Springer Berlin
Heidelberg.
[Chen and Zang, 2011] Chen, B. and Zang, C. (2011). Emergent damage pattern recognition
using immune network theory. Smart Structures and System, 8(1):69–92.
[Chen et al., 2010] Chen, C.-M., Chen, Y.-L., and Lin, H.-C. (2010). An e"cient network
intrusion detection. Computer Communications, 33(4):477 – 484.
[Chen and Mahfouf, 2009] Chen, J. and Mahfouf, M. (2009). An artificial immune systems
based predictive modelling approach for the multi-objective elicitation of mamdani fuzzy

BIBLIOGRAPHY 159
rules: A special application to modelling alloys. In Systems, Man and Cybernetics, 2009.
SMC 2009. IEEE International Conference on, pages 4203–4209.
[Chow and Willsky, 1984] Chow, E. and Willsky, A. (1984). Analytical redundancy and the de-
sign of robust failure detection systems. IEEE Transactions on Automatic Control, 29(7):603
– 614.
[Chung and Liao, 2013] Chung, T.-P. and Liao, C.-J. (2013). An immunoglobulin-based ar-
tificial immune system for solving the hybrid flow shop problem. Applied Soft Computing,
13(8):3729 – 3736.
[Cohen, 2000] Cohen, I. (2000). Tending Adam’s Garden: Evolving the Cognitive Immune Self.
Academic Press.
[Cohen, 2007] Cohen, I. R. (2007). Real and artificial immune systems: computing the state
of the body. Nat Rev Immunol, 07(07):569–574.
[Costa Silva et al., 2012a] Costa Silva, G., Palhares, R. M., and Caminhas, W. M. (2012a).
Immune inspired fault detection and diagnosis: A fuzzy-based approach of the negative selec-
tion algorithm and participatory clustering. Expert Systems with Applications, 39(16):12474
– 12486.
[Costa Silva et al., 2012b] Costa Silva, G., Palhares, R. M., and Caminhas, W. M. (2012b). A
transitional view of immune inspired techniques for anomaly detection. In Yin, H., Costa,
J. A., and Barreto, G., editors, Intelligent Data Engineering and Automated Learning -
IDEAL 2012, volume 7435 of Lecture Notes in Computer Science, pages 568–577. Springer
Berlin Heidelberg.
[da Silva et al., 2007] da Silva, L. R. S., Gomide, F., and Yager, R. (2007). Fuzzy clustering
with participatory learning and applications. In de Oliveira, J. V. and (Org.)., W. P., editors,
Advances in Fuzzy Clustering and its Applications, volume 1, pages 137–154. John Wiley and
Sons.
[D’Angelo et al., 2011] D’Angelo, M. F. S., Palhares, R. M., Takahashi, R. H. C., and Loschi,
R. H. (2011). Fuzzy/bayesian change point detection approach to incipient fault detection.
IET Control Theory Applications, 5(4):539 –551.
[D’angelo et al., 2010] D’angelo, M. F. S. V., Palhares, R. M., Caminhas, W. M., Takahashi, R.
H. C., Maia, R. D., Lemos, A. P., and Inacio, M. J. (2010). Deteccao de falhas: uma revisao
com aplicacoes (tutorial). In Congresso Brasileiro de Automatica 2010. (in Portuguese).

160 BIBLIOGRAPHY
[Dasgupta, 1998] Dasgupta, D. (1998). Artficial Immune Systems and Their Applications.
Springer-Verlag New York, Inc., Secaucus, NJ, USA, 1st edition.
[Dasgupta, 1999] Dasgupta, D. (1999). Immunity-based intrusion detection system: a general
framework. In Proc. of the 22nd NISSC, volume 1, pages 147–160.
[Dasgupta and Attoh-Okine, 1997] Dasgupta, D. and Attoh-Okine, N. (1997). Immunity-based
systems: a survey. In Systems, Man, and Cybernetics, 1997. Computational Cybernetics and
Simulation., 1997 IEEE International Conference on, volume 1, pages 369–374.
[Dasgupta et al., 2003] Dasgupta, D., Ji, Z., and Gonzalez, F. (2003). Artificial immune system
(ais) research in the last five years. In Evolutionary Computation, 2003. CEC ’03. The 2003
Congress on, volume 1, pages 123–130 Vol.1.
[Dasgupta and Nino, 2008] Dasgupta, D. and Nino, L. (2008). Immunological Computation:
Theory and Applications. Auerbach Publications, Boston, MA, USA, 1 edition.
[Dasgupta et al., 2011] Dasgupta, D., Yu, S., and Nino, F. (2011). Recent advances in artificial
immune systems: Models and applications. Applied Soft Computing, 11(2):1574 – 1587.
[de Almeida et al., 2010] de Almeida, C. A. L., Palhares, R. M., and Caminhas, W. M. (2010).
Design of an artificial immune system based on danger model for fault detection. Expert
Systems with Applications, 37:5145–5152.
[de Almeida et al., 2011] de Almeida, C. A. L., Palhares, R. M., and Caminhas, W. M. (2011).
A novel artificial immune system for fault behavior detection. Expert Systems with Applica-
tions, 38:6957–6966.
[de Almeida et al., 2010] de Almeida, C. A. L., Ronacher, G., Palhares, R. M., and Caminhas,
W. M. (2010). Design of an artificial immune system for fault detection: A negative selection
approach. Expert Systems with Applications, 37(7):5507 – 5513.
[De Castro, 2006] De Castro, L. (2006). Fundamentals of Natural Computing: Basic Concepts,
Algorithms, And Applications. Chapman & Hall/CRC Computer and Information Science
Series. Chapman & Hall/CRC.
[de Castro, 2001] de Castro, L. N. (2001). Engenharia Imunologica: Desenvolvimento e Apli-
cacao de Ferramentas Computacionais Inspiradas em Sistemas Imunologicos Artificiais. Tese
de doutorado, DCA-FEEC/UNICAMP, Campinas, SP. (In portuguese).

BIBLIOGRAPHY 161
[De Castro and Timmis, 2002] De Castro, L. N. and Timmis, J. (2002). Artificial Immune
Systems: A New Computational Intelligence Approach. Springer-Verlag.
[de Castro and Von Zuben, 2002] de Castro, L. N. and Von Zuben, F. J. (2002). Learning
and optimization using the clonal selection principle. IEEE Transactions on Evolutionary
Computation, 6:239–251.
[de Castro et al., 2011] de Castro, L. N., Xavier, R. S., Pasti, R., Maia, R. D., Szabo, A., and
Ferrari, D. G. (2011). The grand challenges in natural computing research: The quest for a
new science. 2(4):17–30.
[de Franca et al., 2010] de Franca, F. O., Coelho, G. P., Castro, P. A. D., and Von Zuben, F. J.
(2010). Conceptual and practical aspects of the ainet family of algorithms. International
Journal of Natural Computing Research (IJNCR), 1(1):1–35.
[de Pillis et al., 2005] de Pillis, L. G., Radunskaya, A. E., and Wiseman, C. L. (2005). A Val-
idated Mathematical Model of Cell-Mediated Immune Response to Tumor Growth. Cancer
Research, 65(17):7950–7958.
[Ding et al., 2013] Ding, L., Yu, F., and Yang, Z. (2013). Survey of dca for abnormal detection.
Journal of Software, 8(8).
[Ding, 2008] Ding, S. (2008). Model-Based Fault Diagnosis Techniques: Design Schemes, Al-
gorithms, and Tools. Springer-Verlag Berlin Heidelberg.
[Figueredo et al., 2011] Figueredo, G. P., Aickelin, U., and Siebers, P.-O. (2011). Systems dy-
namics or agent-based modelling for immune simulation? In Proceedings of the 10th interna-
tional conference on Artificial immune systems, ICARIS’11, pages 81–94, Berlin, Heidelberg.
Springer-Verlag.
[Forrest et al., 1996] Forrest, S., Hofmeyr, S. A., Somayaji, A., and Longsta!, T. A. (1996).
A sense of self for unix processes. In Security and Privacy, 1996. Proceedings., 1996 IEEE
Symposium on, pages 120–128. IEEE.
[Forrest et al., 1994] Forrest, S., Perelson, A. S., Allen, L., and Cherukuri, R. (1994). Self-
nonself discrimination in a computer. In Proceedings of the 1994 IEEE Symposium on Re-
search in Security and Privacy, page 202.
[Frank, 1990] Frank, P. M. (1990). Fault diagnosis in dynamic systems using analytical and
knowledge-based redundancy: A survey and some new results. Automatica, 26(3):459–474.

162 BIBLIOGRAPHY
[Fu et al., 2010] Fu, J., Liang, Y., Tan, C., and Xiong, X. (2010). Detecting software keyloggers
with dendritic cell algorithm. In 2010 International Conference on Communications and
Mobile Computing (CMC), volume 1, pages 111 –115.
[Fu et al., 2012] Fu, J., Yang, H., Liang, Y., and Tan, C. (2012). Bait a trap: introducing
natural killer cells to artificial immune system for spyware detection. In Proceedings of
the 11th international conference on Artificial Immune Systems, ICARIS’12, pages 125–138,
Berlin, Heidelberg. Springer-Verlag.
[Gan et al., 2009] Gan, Z., Zhao, M.-B., and Chow, T. W. (2009). Induction machine fault
detection using clone selection programming. Expert Systems with Applications, 36(4):8000
– 8012.
[Gao and Dai, 2013] Gao, Z. and Dai, X. (2013). From model, signal to knowledge: A data-
driven perspective of fault detection and diagnosis. Industrial Informatics, IEEE Transac-
tions on, PP(99):1–1.
[Golzari et al., 2011] Golzari, S., Doraisamy, S., Sulaiman, M. N., and Udzir, N. I. (2011). An
e"cient and e!ective immune based classifier. Journal of Computer Science, 7(2):148–153.
[Gong et al., 2012] Gong, M., Zhang, J., Ma, J., and Jiao, L. (2012). An e"cient negative
selection algorithm with further training for anomaly detection. Knowledge-Based Systems,
30(0):185 – 191.
[Greensmith, 2007] Greensmith, J. (2007). The Dendritic Cell Algorithm. PhD thesis, Univer-
sity of Nottingham.
[Greensmith and Aickelin, 2008] Greensmith, J. and Aickelin, U. (2008). The deterministic
dendritic cell algorithm. In ICARIS ’08: Proceedings of the 7th international conference on
Artificial Immune Systems, pages 291–302, Berlin, Heidelberg. Springer-Verlag.
[Greensmith and Aickelin, 2009] Greensmith, J. and Aickelin, U. (2009). Artificial dendritic
cells: Multi-faceted perspectives. In Bargiela, A. and Pedrycz, W., editors, Human-Centric
Information Processing Through Granular Modelling, volume 182 of Studies in Computational
Intelligence, pages 375–395. Springer Berlin / Heidelberg.
[Greensmith et al., 2005] Greensmith, J., Aickelin, U., and Cayzer, S. (2005). Introducing
dendritic cells as a novel immune-inspired algorithm for anomaly detection. In Artificial
Immune Systems, LNCS, pages 153–167. Springer.

BIBLIOGRAPHY 163
[Gu et al., 2011] Gu, F., Feyereisl, J., Oates, R., Reps, J., Greensmith, J., and Aickelin, U.
(2011). Quiet in class: Classification, noise and the dendritic cell algorithm. In ICARIS
’11: Proceedings of the 10th international conference on Artificial Immune Systems, pages
173–186.
[Gu et al., 2013] Gu, F., Greensmith, J., and Aickelin, U. (2013). Theoretical formulation and
analysis of the deterministic dendritic cell algorithm. Biosystems, 111(2):127 – 135.
[Guzella et al., 2008] Guzella, T., Mota-Santos, T., and Caminhas, W. (2008). Artificial im-
mune systems and kernel methods. In Bentley, P., Lee, D., and Jung, S., editors, Artifi-
cial Immune Systems, volume 5132 of Lecture Notes in Computer Science, pages 303–315.
Springer Berlin / Heidelberg.
[Guzella et al., 2007] Guzella, T. S., Mota-Santos, T. A., and Caminhas, W. M. (2007). A
novel immune inspired approach to fault detection. In Proceedings of the 6th international
conference on Artificial immune systems, ICARIS’07, pages 107–118, Berlin, Heidelberg.
Springer-Verlag.
[Hart and Davoudani, 2009] Hart, E. and Davoudani, D. (2009). Dendritic cell tra"cking:
From immunology to engineering. In Andrews, P., Timmis, J., Owens, N., Aickelin, U.,
Hart, E., Hone, A., and Tyrrell, A., editors, Artificial Immune Systems, volume 5666 of
Lecture Notes in Computer Science, pages 11–13. Springer Berlin / Heidelberg.
[Hart et al., 2009] Hart, E., McEwan, C., and Davoudani, D. (2009). Exploiting collaborations
in the immune system: The future of artificial immune systems. In Mumford, C. and Jain,
L., editors, Computational Intelligence, volume 1 of Intelligent Systems Reference Library,
pages 527–558. Springer Berlin Heidelberg.
[Hilaire et al., 2010] Hilaire, V., Lauri, F., Gruer, P., Koukam, A., and Rodriguez, S. (2010).
Formal specification of an immune based agent architecture. Engineering Applications of
Artificial Intelligence, 23(4):505 – 513.
[Hilder et al., 2012] Hilder, J., Owens, N., Neal, M., Hickey, P., Cairns, S., Kilgour, D., Tim-
mis, J., and Tyrrell, A. (2012). Chemical detection using the receptor density algorithm.
Systems, Man, and Cybernetics, Part C: Applications and Reviews, IEEE Transactions on,
42(6):1730–1741.
[Hofmeyr, 1999] Hofmeyr, S. A. (1999). An immunological model of distributed detection and
its application to computer security. PhD thesis, University of New Mexico.

164 BIBLIOGRAPHY
[Hu et al., 2008] Hu, Z.-H., Ding, Y.-S., and Lua, X.-J. (2008). Cognitive immune system-
based co-evolutionary information retrieval model. 2007 Workshop on Intelligent Information
Technology Applications,, 3:212–215.
[Huang et al., 2011] Huang, R., Tawfik, H., and Nagar, A. (2011). Towards an artificial im-
mune system for online fraud detection. In Lio, P., Nicosia, G., and Stibor, T., editors,
Artificial Immune Systems, volume 6825 of Lecture Notes in Computer Science, pages 383–
394. Springer Berlin Heidelberg.
[Hunt and Cooke, 1996] Hunt, J. E. and Cooke, D. E. (1996). Learning using an artificial
immune system. Journal of Network and Computer Applications, 19(2):189 – 212.
[Isermann, 2011] Isermann, R. (2011). Terminology in fault detection and diagnosis. In Fault-
Diagnosis Applications, pages 321–323. Springer Berlin Heidelberg.
[Ishida, 1990] Ishida, Y. (1990). Fully distributed diagnosis by pdp learning algorithm: towards
immune network pdp model. In Neural Networks, 1990., 1990 IJCNN International Joint
Conference on, pages 777–782 vol.1.
[Jabeen and Baig, 2010] Jabeen, H. and Baig, A. (2010). Clonal-gp framework for artificial
immune system inspired genetic programming for classification. In Setchi, R., Jordanov, I.,
Howlett, R., and Jain, L., editors, Knowledge-Based and Intelligent Information and Engi-
neering Systems, volume 6276 of Lecture Notes in Computer Science, pages 61–68. Springer
Berlin Heidelberg.
[Janeway Jr., 1989] Janeway Jr., C. A. (1989). Approaching the asymptote? evolution and
revolution in immunology. Cold Spring Harbor Symposia on Quantitative Biology, 54(0):1–
13.
[Jansen and Zarges, 2011] Jansen, T. and Zarges, C. (2011). variants of immune inspired so-
matic contiguous hypermutations. Theoretical Computer Science, 412(6):517 – 533. Theo-
retical Aspects of Artificial Immune Systems.
[Jenhani and Elouedi, 2012] Jenhani, I. and Elouedi, Z. (2012). Re-visiting the artificial im-
mune recognition system: a survey and an improved version. Artificial Intelligence Review,
pages 1–13.
[Jerne, 1973] Jerne, N. K. (1973). Towards a network theory of the immune system. Annals of
Immunology, 125(C):373–389.

BIBLIOGRAPHY 165
[Ji, 2005] Ji, Z. (2005). A Boundary-Aware Negative Selection Algorithm. In Proceedings of
the 9th International Conference on Artificial Intelligence and Soft Computing. ACTA Press.
[Ji and Dasgupta, 2004a] Ji, Z. and Dasgupta, D. (2004a). Augmented negative selection al-
gorithm with variable-coverage detectors. In Evolutionary Computation, 2004. CEC2004.
Congress on, volume 1, pages 1081 – 1088 Vol.1.
[Ji and Dasgupta, 2004b] Ji, Z. and Dasgupta, D. (2004b). Real-valued negative selection al-
gorithm with variable-sized detectors. In In LNCS 3102, Proceedings of GECCO, pages
287–298. Springer-Verlag.
[Ji and Dasgupta, 2006] Ji, Z. and Dasgupta, D. (2006). Applicability issues of the real-valued
negative selection algorithms. In Proceedings of the 8th annual conference on Genetic and
evolutionary computation, GECCO ’06, pages 111–118, New York, NY, USA. ACM.
[Ji and Dasgupta, 2007] Ji, Z. and Dasgupta, D. (2007). Revisiting negative selection algo-
rithms. Evolutionary Computation, 15(2):223–251.
[Ji and Dasgupta, 2009] Ji, Z. and Dasgupta, D. (2009). V-detector: An e"cient negative
selection algorithm with “probably adequate” detector coverage. Information Sciences,
179(10):1390 – 1406. Including Special Issue on Artificial Imune Systems.
[Jinyin and Dongyong, 2011] Jinyin, C. and Dongyong, Y. (2011). A study of detector gener-
ation algorithms based on artificial immune in intrusion detection system. In 2011 3rd In-
ternational Conference on Computer Research and Development (ICCRD), volume 1, pages
4–8.
[Joshua, 2012] Joshua, C. (2012). Fault Isolation for Spacecraft Systems: An Application to a
Power Distribution Testbed. pages 168–173.
[Kapsenberg, 2003] Kapsenberg, M. (2003). Dendritic-cell control of pathogen-driven t-cell
polarization. Nat Rev Immunol, 3(12):984–93.
[Karakasis and Stafylopatis, 2008] Karakasis, V. and Stafylopatis, A. (2008). E"cient evolu-
tion of accurate classification rules using a combination of gene expression programming and
clonal selection. Evolutionary Computation, IEEE Transactions on, 12(6):662–678.
[Karakose, 2013] Karakose, M. (2013). Reinforcement learning based artificial immune classi-
fier. The Scientific World Journal, 2013:7.

166 BIBLIOGRAPHY
[Kari and Rozenberg, 2008] Kari, L. and Rozenberg, G. (2008). The many facets of natural
computing. Commun. ACM, 51(10):72–83.
[Khan and de Silva, 2012] Khan, M. T. and de Silva, C. W. (2012). Autonomous and robust
multi-robot cooperation using an artificial immune system. International Journal of Robotics
and Automation, 27(1).
[Knight and Timmis, 2001] Knight, T. and Timmis, J. (2001). Aine: an immunological ap-
proach to data mining. In Data Mining, 2001. ICDM 2001, Proceedings IEEE International
Conference on, pages 297–304.
[Kourd et al., 2011] Kourd, Y., Lefebvre, D., and Guersi, N. (2011). Early fdi based on residuals
design according to the analysis of models of faults: Application to damadics. Advances in
Artificial Neural Systems.
[Kourd et al., 2013] Kourd, Y., Lefebvre, D., and Guersi, N. (2013). Fault diagnosis based
on neural networks and decision trees: Application to damadics. International Journal of
Innovative Computing, Information and Control, 9(8):3185–3196.
[Lemos et al., 2013] Lemos, A., Caminhas, W., and Gomide, F. (2013). Adaptive fault detec-
tion and diagnosis using an evolving fuzzy classifier. Information Sciences, 220(0):64 – 85.
Online Fuzzy Machine Learning and Data Mining.
[Lemos et al., 2011] Lemos, A. P., Caminhas, W. M., and Gomide, F. A. C. (2011). Multi-
variable gaussian evolving fuzzy modeling system. IEEE Transactions on Fuzzy Systems,
19(1):91 –104.
[Leng and Bentwich, 2002] Leng, Q. and Bentwich, Z. (2002). Beyond self and nonself: Fuzzy
recognition of the immune system. Scandinavian Journal of Immunology, 56:224–232.
[Li et al., 2010] Li, G., Li, T., Zeng, J., and Li, H. (2010). An outlier robust negative selection
algorithm inspired by immune suppression. Journal of Computers, 5(9).
[Li and He, 2013] Li, Z. and He, C. (2013). Optimal scheduling-based {RFID} reader-to-
reader collision avoidance method using artificial immune system. Applied Soft Computing,
13(5):2557 – 2568.
[Liskiewicz and Textor, 2010] Liskiewicz, M. and Textor, J. (2010). Negative selection algo-
rithms without generating detectors. In Proceedings of the 12th annual conference on Genetic
and evolutionary computation, GECCO ’10, pages 1047–1054, New York, NY, USA. ACM.

BIBLIOGRAPHY 167
[Liu, 2004] Liu, F. (2004). Data-based fault detection and isolation (fdi) methods for a nonlin-
ear ship propulsion system. Master’s thesis, Simon Fraser University, Canada.
[Liu et al., 2010] Liu, R., Jiao, L., Li, Y., and Liu, J. (2010). An immune memory clonal
algorithm for numerical and combinatorial optimization. Frontiers of Computer Science in
China, 4(4):536–559.
[Liu et al., 2009] Liu, T., Zhang, L., and Shi, B. (2009). Adaptive immune response network
model. In Huang, D.-S., Jo, K.-H., Lee, H.-H., Kang, H.-J., and Bevilacqua, V., editors,
Emerging Intelligent Computing Technology and Applications. With Aspects of Artificial In-
telligence, volume 5755 of Lecture Notes in Computer Science, pages 890–898. Springer Berlin
Heidelberg.
[Maia et al., 2012] Maia, R., de Castro, L., and Caminhas, W. (2012). Bee colonies as model for
multimodal continuous optimization: The optbees algorithm. In Evolutionary Computation
(CEC), 2012 IEEE Congress on, pages 1–8.
[Manzoor et al., 2009] Manzoor, S., Shafiq, M. Z., Tabish, S. M., and Farooq, M. (2009). A
sense of ’danger’ for windows processes. In Andrews, P. S., Timmis, J., Owens, N. D. L.,
Aickelin, U., Hart, E., Hone, A., and Tyrrell, A. M., editors, ICARIS, volume 5666 of Lecture
Notes in Computer Science, pages 220–233. Springer.
[Markou and Singh, 2003] Markou, M. and Singh, S. (2003). Novelty detection: a review - part
1: statistical approaches. Signal Processing, pages 2481–2497.
[Matzinger, 1994] Matzinger, P. (1994). Tolerance, danger and the extended family. Annual
Reviews in Immunology, pages 991–1045.
[Matzinger, 2002] Matzinger, P. (2002). The danger model: A renewed sense of self. Science,
296:301–305.
[Mayorga and Sellier, 2006] Mayorga, J. H. P. and Sellier, A. G. (2006). Clasificacion y detec-
cion de fallas en sistemas dinamicos. Revista de Ingenierıa, 23:1 – 12. (in Spanish).
[McEwan and Hart, 2009] McEwan, C. and Hart, E. (2009). Representation in the (artificial)
immune system. Journal of Mathematical Modelling and Algorithms, 8(2):125–149.
[McEwan and Hart, 2010] McEwan, C. and Hart, E. (2010). Clonal selection from first princi-
ples. In Hart, E., McEwan, C., Timmis, J., and Hone, A., editors, Artificial Immune Systems,
volume 6209 of Lecture Notes in Computer Science, pages 18–32. Springer Berlin Heidelberg.

168 BIBLIOGRAPHY
[Mohamed Elsayed et al., 2012] Mohamed Elsayed, S., Rajasekaran, S., and Ammar, R. (2012).
An artificial immune system approach to associative classification. In Murgante, B., Gervasi,
O., Misra, S., Nedjah, N., Rocha, A., Taniar, D., and Apduhan, B., editors, Computational
Science and Its Applications - ICCSA 2012, volume 7333 of Lecture Notes in Computer
Science, pages 161–171. Springer Berlin Heidelberg.
[Mohammadi et al., 2012] Mohammadi, M., Akbari, A., Raahemi, B., and Nassersharif, B.
(2012). A real time anomaly detection system based on probabilistic artificial immune based
algorithm. In Coello Coello, C. A., Greensmith, J., Krasnogor, N., Lio, P., Nicosia, G., and
Pavone, M., editors, Artificial Immune Systems, volume 7597 of Lecture Notes in Computer
Science, pages 205–217. Springer Berlin Heidelberg.
[Nanas et al., 2010] Nanas, N., Vavalis, M., and Roeck, A. (2010). Words, antibodies and their
interactions. Swarm Intelligence, 4(4):275–300.
[Narayanan and Ahmad, 2012] Narayanan, A. and Ahmad, W. (2012). Humoral artificial im-
mune system (hais) for supervised learning. International Journal of Computational Intelli-
gence and Applications, 11(01):1250004.
[Navlakha and Bar-Joseph, 2011] Navlakha, S. and Bar-Joseph, Z. (2011). Algorithms in na-
ture: the convergence of systems biology and computational thinking. Mol Syst Biol, 7.
[Nayyeri, 2013] Nayyeri, S. H. (2013). Aircraft jet engine condition monitoring through system
identification by using genetic programming. Master’s thesis, Department of Electrical and
Computer Engineering, Concordia University, Montreal, Quebec, Canada.
[Nejad et al., 2012] Nejad, F., Salkhi, R., Azmi, R., and Pishgoo, B. (2012). Structural tlr
algorithm for anomaly detection based on danger theory. In 9th International ISC Conference
on Information Security and Cryptology (ISCISC), pages 156–161.
[Neshat et al., 2012] Neshat, M., Sepidnam, G., Sargolzaei, M., and Toosi, A. (2012). Artificial
fish swarm algorithm: a survey of the state-of-the-art, hybridization, combinatorial and
indicative applications. Artificial Intelligence Review, pages 1–33.
[Oliveira et al., 2013] Oliveira, L. V. B., Drummond, I., and Pappa, G. (2013). A new represen-
tation for instance-based clonal selection algorithms. In Evolutionary Computation (CEC),
2013 IEEE Congress on, pages 2259–2266.
[Owens et al., 2009] Owens, N., Greensted, A., Timmis, J., and Tyrrell, A. (2009). T cell re-
ceptor signalling inspired kernel density estimation and anomaly detection. In Andrews, P.,

BIBLIOGRAPHY 169
Timmis, J., Owens, N., Aickelin, U., Hart, E., Hone, A., and Tyrrell, A., editors, Artifi-
cial Immune Systems, volume 5666 of Lecture Notes in Computer Science, pages 122–135.
Springer Berlin Heidelberg.
[Owens et al., 2013] Owens, N. D., Greensted, A., Timmis, J., and Tyrrell, A. (2013). The
receptor density algorithm. Theoretical Computer Science, 481(0):51 – 73.
[Ozsen et al., 2009] Ozsen, S., Gunes, S., Kara, S., and Latifoglu, F. (2009). Use of kernel
functions in artificial immune systems for the nonlinear classification problems. Information
Technology in Biomedicine, IEEE Transactions on, 13(4):621–628.
[Passino, 2002] Passino, K. (2002). Biomimicry of bacterial foraging for distributed optimiza-
tion and control. Control Systems, IEEE, 22(3):52–67.
[Pathak et al., 2012] Pathak, V., Dhyani, P., and Mahanti, P. (2012). Aiden: A density con-
scious artificial immune system for automatic discovery of arbitrary shape clusters in spatial
patterns. Broad Research in Artificial Intelligence and Neuroscience (BRAIN), 3(3):5–11.
[Raza and Fernandez, 2012] Raza, A. and Fernandez, B. R. (2012). Immuno-inspired robotic
applications: a review. CoRR, abs/1202.4261.
[Ri! et al., 2013] Ri!, M. C., Montero, E., and Neveu, B. (2013). Reducing calibration e!ort
for clonal selection based algorithms: A reinforcement learning approach. Knowledge-Based
Systems, 41(0):54 – 67.
[Rozenberg et al., 2012] Rozenberg, G., Back, T., and Kok, J. (2012). Handbook of Natural
Computing. Number v.2 in Springer Reference. Springer.
[Scholkopf et al., 2001] Scholkopf, B., Platt, J. C., Shawe-Taylor, J. C., Smola, A. J., and
Williamson, R. C. (2001). Estimating the support of a high-dimensional distribution. Neural
Comput., 13(7):1443–1471.
[Shafiq et al., 2008] Shafiq, M. Z., Khayam, S. A., and Farooq, M. (2008). Improving accuracy
of immune-inspired malware detectors by using intelligent features. In Proceedings of the 10th
annual conference on Genetic and evolutionary computation, GECCO ’08, pages 119–126,
New York, NY, USA. ACM.
[Shah-Hosseini, 2009] Shah-Hosseini, H. (2009). The intelligent water drops algorithm:
a nature-inspired swarm-based optimization algorithm. Int. J. Bio-Inspired Comput.,
1(1/2):71–79.

170 BIBLIOGRAPHY
[Sharma and Sharma, 2011] Sharma, A. and Sharma, D. (2011). Clonal selection algorithm
for classification. In Lio, P., Nicosia, G., and Stibor, T., editors, Artificial Immune Sys-
tems, volume 6825 of Lecture Notes in Computer Science, pages 361–370. Springer Berlin
Heidelberg.
[Steinwart et al., 2005] Steinwart, I., Hush, D., and Scovel, C. (2005). A classification frame-
work for anomaly detection. J. Machine Learning Research, 6:211–232.
[Suarez-Tangil et al., 2011] Suarez-Tangil, G., Palomar, E., Pastrana, S., and Ribagorda, A.
(2011). Artificial immunity-based correlation system. In Lopez, J. and Samarati, P., editors,
SECRYPT 2011 - Proceedings of the International Conference on Security and Cryptography,
Seville, Spain, 18 - 21 July, 2011, SECRYPT is part of ICETE - The International Joint
Conference on e-Business and Telecommunications, pages 422–425. SciTePress.
[Swiecicki, 2008] Swiecicki, M. (2008). An algorithm of decentralized artificial immune network
and its implementation. In Darzentas, J., Vouros, G., Vosinakis, S., and Arnellos, A., editors,
Artificial Intelligence: Theories, Models and Applications, volume 5138 of Lecture Notes in
Computer Science, pages 407–412. Springer Berlin Heidelberg.
[Szabo et al., 2012] Szabo, A., de Castro, L., and Delgado, M. (2012). Fainet: An immune
algorithm for fuzzy clustering. In 2012 IEEE International Conference on Fuzzy Systems
(FUZZ-IEEE), pages 1–9.
[Tang et al., 2010] Tang, W., Peng, L.-M., Yang, X.-M., Xie, X., and Cao, Y. (2010). Gep-
based framework for immune-inspired intrusion detection. TIIS, 4(6):1273–1293.
[Tauber, 2008] Tauber, A. I. (2008). The immune system and its ecology. Philosophy of Science,
75(2):224–245.
[Taylor and Sayda, 2005] Taylor, J. and Sayda, A. (2005). An intelligent architecture for in-
tegrated control and asset management for industrial processes. In Proceedings of the 2005
IEEE Mediterrean Conference on Control and Automation, pages 1397 –1404.
[Timmis et al., 2010] Timmis, J., Andrews, P., and Hart, E. (2010). On artificial immune
systems and swarm intelligence. Swarm Intelligence, 4(4):247–273.
[Timmis et al., 2008] Timmis, J., Andrews, P., Owens, N., and Clark, E. (2008). Immune
systems and computation: An interdisciplinary adventure. In Calude, C., Costa, J., Freund,
R., Oswald, M., and Rozenberg, G., editors, Unconventional Computing, volume 5204 of
Lecture Notes in Computer Science, pages 8–18. Springer Berlin Heidelberg.

BIBLIOGRAPHY 171
[Timmis et al., 2000] Timmis, J., Neal, M., and Hunt, J. (2000). An artificial immune system
for data analysis. Biosystems, 55(1-3):143–150.
[Twycross and Aickelin, 2010] Twycross, J. and Aickelin, U. (2010). Information fusion in the
immune system. CoRR, abs/1003.1598.
[Twycross et al., 2010] Twycross, J., Aickelin, U., andWhitbrook, A. (2010). Detecting anoma-
lous process behaviour using second generation artificial immune systems. International
Journal of Unconventional Computing, 6:301–326.
[Ulutas and Kulturel-Konak, 2011] Ulutas, B. H. and Kulturel-Konak, S. (2011). A review of
clonal selection algorithm and its applications. Artificial Intelligence Review, 36(2):117–138.
[Ulutas and Kulturel-Konak, 2013] Ulutas, B. H. and Kulturel-Konak, S. (2013). Assessing
hypermutation operators of a clonal selection algorithm for the unequal area facility layout
problem. Engineering Optimization, 45(3):375–395.
[Vella et al., 2010] Vella, M., Roper, M., and Terzis, S. (2010). Danger theory and intrusion
detection: Possibilities and limitations of the analogy. In Hart, E., McEwan, C., Timmis, J.,
and Hone, A., editors, Artificial Immune Systems, volume 6209 of Lecture Notes in Computer
Science, pages 276–289. Springer Berlin Heidelberg.
[Venkatasubramanian et al., 2003a] Venkatasubramanian, V., Rengaswamy, R., and Kavuri,
S. N. (2003a). A review of process fault detection and diagnosis - part I: Quantitative model-
based methods. Computers and Chemical Engineering, 27(3):293–311.
[Venkatasubramanian et al., 2003b] Venkatasubramanian, V., Rengaswamy, R., and Kavuri,
S. N. (2003b). A review of process fault detection and diagnosis - part II: Qualitative models
and search strategies. Computers and Chemical Engineering, 27(3):313–326.
[Voigt et al., 2007] Voigt, D., Wirth, H., and Dilger, W. (2007). A computational model for
the cognitive immune system theory based on learning classifier systems. In Proceedings of
the 6th international conference on Artificial immune systems, ICARIS’07, pages 264–275,
Berlin, Heidelberg. Springer-Verlag.
[Wang et al., 2011a] Wang, D., Zhang, F., and Xi, L. (2011a). Evolving boundary detector for
anomaly detection. Expert Systems with Applications, 38(3):2412 – 2420.
[Wang and Liu, 2009] Wang, J.-D. and Liu, H.-C. (2009). Evaluating the ambiguities between
two classes via euclidean distance. Asian Journal of Health and Information Sciences, 4(1):21
– 35.

172 BIBLIOGRAPHY
[Wang and Liu, 2011] Wang, J.-D. and Liu, H.-C. (2011). An approach to evaluate the fitness
of one class structure via dynamic centroids. Expert Systems with Applications, 38(11):13764
– 13772.
[Wang et al., 2012] Wang, S., Yang, T., and Wang, K. (2012). Self/non-self discrimination
based on fractional distance. In Computer Science Service System (CSSS), 2012 International
Conference on, pages 1777–1780.
[Wang et al., 2011b] Wang, Y., Ma, G., Ding, S. X., and Li, C. (2011b). Subspace aided data-
driven design of robust fault detection and isolation systems. Automatica, 47(11):2474 –
2480.
[Wilson et al., 2010] Wilson, W. O., Birkin, P., and Aickelin, U. (2010). The motif tracking
algorithm. CoRR, abs/1006.1526.
[Wu, 2012] Wu, J.-Y. (2012). Solving constrained global optimization problems by using hybrid
evolutionary computing and artificial life approaches. Mathematical Problems in Engineering,
2012:36.
[Xiao et al., 2011] Xiao, R., Chen, T., and Tao, Z. (2011). An analytical approach to the
similarities between swarm intelligence and artificial immune system. In Innovations in Bio-
inspired Computing and Applications (IBICA), 2011 Second International Conference on,
pages 112–115.
[Xu et al., 2010] Xu, Q., Wang, L., and Si, J. (2010). Predication based immune network
for multimodal function optimization. Engineering Applications of Artificial Intelligence,
23(4):495 – 504.
[Xu et al., 2012] Xu, Q., Wang, S., and Zhang, C. (2012). Structural design of the danger
model immune algorithm. Inf. Sci., 205:20–37.
[Xu et al., 2013] Xu, Y., Fan, P., and Yuan, L. (2013). A simple and e"cient artificial bee
colony algorithm. In Mathematical Problems in Engineering, pages 1–9.
[Yager, 1990] Yager, R. (1990). A model of participatory learning. Systems, Man and Cyber-
netics, IEEE Transactions on, 20(5):1229–1234.
[Yang et al., 2011] Yang, H., Guo, J., and Deng, F. (2011). Collaborative rfid intrusion detec-
tion with an artificial immune system. J. Intell. Inf. Syst., 36(1):1–26.

BIBLIOGRAPHY 173
[Yang, 2004] Yang, Q. (2004). Model-Based and Data Driven Fault Diagnosis Methods with
Applications to Process Monitoring. PhD thesis, Case Western Reverse University.
[Ying, 2013] Ying, W. (2013). The semi-supervised immune classifier generation algorithm
based on data clustering. Journal of Computational Information Systems, 9(9):3407–3414.
[Yu et al., 2012] Yu, M., Wang, D., Luo, M., Zhang, D., and Chen, Q. (2012). Fault detec-
tion, isolation and identification for hybrid systems with unknown mode changes and fault
patterns. Expert Systems with Applications, 39(11):9955 – 9965.
[Yu and Dasgupta, 2008] Yu, S. and Dasgupta, D. (2008). Conserved self pattern recognition
algorithm. In Bentley, P., Lee, D., and Jung, S., editors, Artificial Immune Systems, volume
5132 of Lecture Notes in Computer Science, pages 279–290. Springer Berlin Heidelberg.
[Yu and Dasgupta, 2011] Yu, S. and Dasgupta, D. (2011). An e!ective network-based in-
trusion detection using conserved self pattern recognition algorithm augmented with near-
deterministic detector generation. In Computational Intelligence in Cyber Security (CICS),
2011 IEEE Symposium on, pages 17–24.
[Yunfang, 2012] Yunfang, C. (2012). A General Framework for Multi-Objective Optimization
Immune Algorithms. International Journal of Intelligent Systems and Applications, 4(6):1–
13.
[Zhanchun et al., 2006] Zhanchun, L., Zhitang, L., and Bin, L. (2006). Anomaly detection sys-
tem based on principal component analysis and support vector machine. Wuhan University
Journal of Natural Sciences, 11(6):1769–1772.
[Zhang et al., 2008] Zhang, C., Liu, G., and Hu, W. (2008). An immune algorithm based on
danger model. In Cybernetics and Intelligent Systems, 2008 IEEE Conference on, pages
242–247.
[Zhang and Yi, 2010] Zhang, C. and Yi, Z. (2010). A danger theory inspired artificial im-
mune algorithm for on-line supervised two-class classification problem. Neurocomputing,
73(7-9):1244 – 1255. Advances in Computational Intelligence and Learning 17th European
Symposium on Artificial Neural Networks 2009 – 17th European Symposium on Artificial
Neural Networks 2009.
[Zhang et al., 2013] Zhang, R., Li, T., Xiao, X., and Shi, Y. (2013). A danger-theory-based
immune network optimization algorithm. The Scientific World Journal, page 13.
174 BIBLIOGRAPHY
[Zheng et al., 2013] Zheng, X., Zhou, Y., and Fang, Y. (2013). The dual negative selection
algorithm based on pattern recognition receptor theory and its application in two-class data
classification. Journal of Computers, 8(8).
[Zhu and Tan, 2011a] Zhu, Y. and Tan, Y. (2011a). A danger theory inspired learning model
and its application to spam detection. In Proceedings of the Second international confer-
ence on Advances in swarm intelligence - Volume Part I, ICSI’11, pages 382–389, Berlin,
Heidelberg. Springer-Verlag.
[Zhu and Tan, 2011b] Zhu, Y. and Tan, Y. (2011b). A local-concentration-based feature ex-
traction approach for spam filtering. Information Forensics and Security, IEEE Transactions
on, 6(2):486–497.