The X-Ray View Of OB Star Wind Structure And Dynamics
11
Swarthmore College Swarthmore College Works Works Physics & Astronomy Faculty Works Physics & Astronomy 12-1-2012 The X-Ray View Of OB Star Wind Structure And Dynamics The X-Ray View Of OB Star Wind Structure And Dynamics David H. Cohen Swarthmore College, [email protected] Follow this and additional works at: https://works.swarthmore.edu/fac-physics Part of the Astrophysics and Astronomy Commons Let us know how access to these works benefits you Recommended Citation Recommended Citation David H. Cohen. (2012). "The X-Ray View Of OB Star Wind Structure And Dynamics". Circumstellar Dynamics At High Resolution: Proceedings Of A Joint ESO/Brazilian Workshop. Volume 464, 267-276. https://works.swarthmore.edu/fac-physics/75 This work is brought to you for free by Swarthmore College Libraries' Works. It has been accepted for inclusion in Physics & Astronomy Faculty Works by an authorized administrator of Works. For more information, please contact [email protected].
-
Upload
khangminh22 -
Category
Documents
-
view
2 -
download
0
Transcript of The X-Ray View Of OB Star Wind Structure And Dynamics
Swarthmore College Swarthmore College
Works Works
Physics & Astronomy Faculty Works Physics & Astronomy
12-1-2012
The X-Ray View Of OB Star Wind Structure And Dynamics The X-Ray View Of OB Star Wind Structure And Dynamics
David H. Cohen Swarthmore College, [email protected]
Follow this and additional works at: https://works.swarthmore.edu/fac-physics
Part of the Astrophysics and Astronomy Commons
Let us know how access to these works benefits you
Recommended Citation Recommended Citation David H. Cohen. (2012). "The X-Ray View Of OB Star Wind Structure And Dynamics". Circumstellar Dynamics At High Resolution: Proceedings Of A Joint ESO/Brazilian Workshop. Volume 464, 267-276. https://works.swarthmore.edu/fac-physics/75
This work is brought to you for free by Swarthmore College Libraries' Works. It has been accepted for inclusion in Physics & Astronomy Faculty Works by an authorized administrator of Works. For more information, please contact [email protected].
Circumstellar Dynamics at High ResolutionASP Conference Series, Vol. 464A. C. Carciofi and Th. Rivinius, eds.c©2012 Astronomical Society of the Pacific
The X-Ray View of OB Star Wind Structure and Dynamics
D. H. Cohen
Department of Physics and Astronomy, Swarthmore College, Pennsylvania,USA
Abstract. High-resolution X-ray grating spectroscopy enables us to measure thekinematics and spatial distribution of the shock-heated wind plasma in O and early Bstars, testing the predictions of the embedded wind shock scenario of massive star X-ray production. By fitting models to the resolved, Doppler broadened X-ray emissionline profiles measured by the Chandra X-ray Observatory’s grating spectrometer, wefind an onset radius of X-ray production of roughly Ro = 1.5R? for the O supergiants,ζ Pup and HD 93129A. From the profile fitting we also find that the terminal velocityof the X-ray emitting plasma is consistent with that of the bulk, UV absorbing wind.We also use the X-ray emission line profiles to measure the wind mass-loss rates andbreak the degeneracy between mass-loss rate and clumping factor that affects traditionalHα and radio free-free diagnostics. We find clumping factors of order fcl = 10, whichalso agrees with the simulations of the wind instability. And we find that clumpingbegins very close to the photosphere, significantly lower in the wind than the onset ofX-ray production. For lower density B star winds, the X-ray emission lines are muchnarrower than in the O supergiants, and are inconsistent with the hot plasma sharing thekinematics of the bulk wind.
1. Introduction
The focus of this paper will be normal, effectively single, non-magnetic OB stars. Inthe context of the meeting’s topic, circumstellar dynamics at high resolution, we willfocus on the highly supersonic and structured stellar winds of O and early B stars,rather than the disks and magnetospheres that surround Be and Bp stars, respectively.And in terms of the wind structure, clumping, and dynamics, we will have to rely onspectroscopy, as X-ray imaging and interferometry do not currently achieve the highresolution that would be needed to measure the expected small-scale structure in thenear-star acceleration region of these winds.
Moderate-to-high resolution X-ray spectroscopy with the diffraction grating ar-rays on Chandra and XMM-Newton has been producing results on OB stars for the pastdecade. In this review, we will show how X-ray spectral diagnostics, in conjunctionwith modeling and numerical simulations can be used to address the following ques-tions: (1) How is the hot (T > 106K), X-ray emitting plasma produced in the wind? (2)What are its kinematics and spatial distribution? (3) What are the relationships amongwind instabilities, X-ray production, and wind structure/clumping?
267
268 Cohen
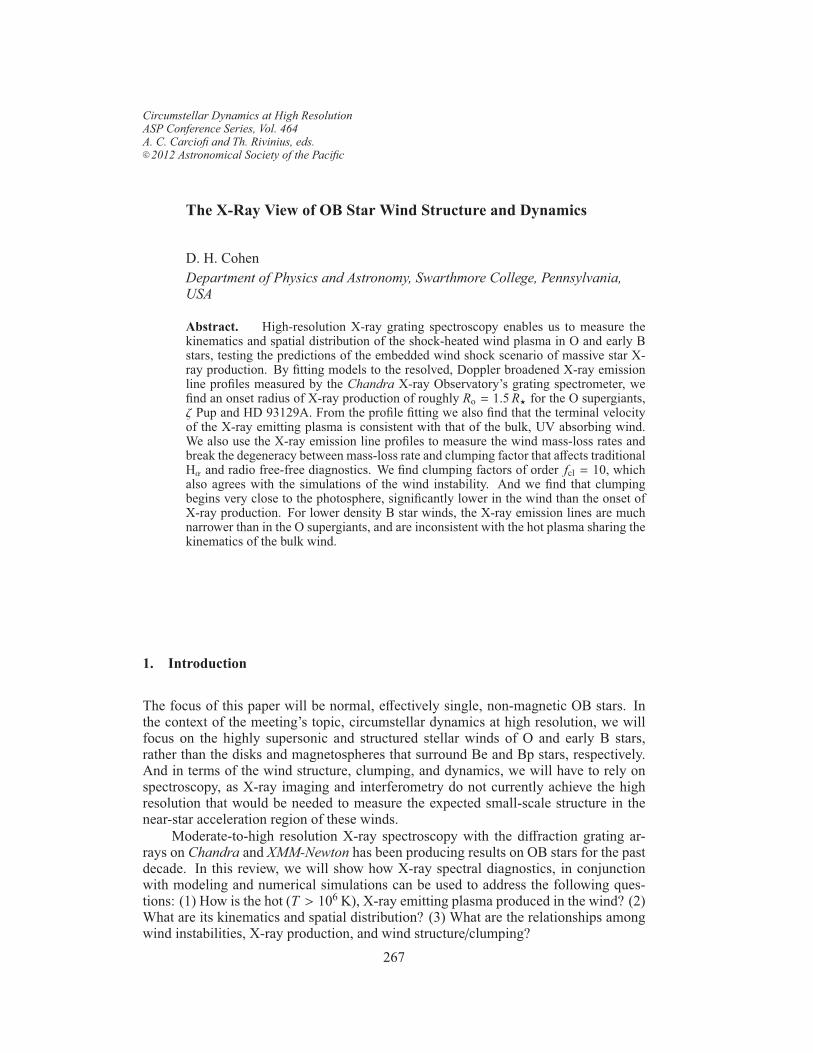
Figure 1. A portion of the Chandra MEG spectrum of the O supergiant ζ Pup isshown in the top panel, with the G star Capella in the bottom panel, for compari-son. Capella’s lines are unresolved, and so they indicate the instrumental resolution.Clearly, the emission lines in ζ Pup are significantly Doppler broadened. It can alsobe seen that the same lines are present in both star’s spectra, and also that the higherionization Ne x is weaker relative to Ne ix in ζ Pup than in Capella, indicating thatthe plasma temperature is lower for the O star.
2. Data
The data we present here was taken with the High Energy Transmission Grating Spec-trometer (HETGS) on the Chandra X-ray Observatory (Canizares et al. 2005). Chan-dra’s state-of-the-art X-ray optics produce a spatial resolution of ∼ 0.5′′, which is un-precedented (the ROSAT HRI had resolution of 5′′, Trumper 1982), and which will notbe exceeded by any currently planned future mission. The sensitivity of the combinedmirror assembly, HETGS, and ACIS CCD detector array is quite low, with an energy-dependent effective area of several tens of cm2 from roughly 30Å to 1.5Å, althoughthe sensitivity is quite poor at the short wavelength end and interstellar attenuation sup-presses X-ray flux from distant O stars at the long wavelength end. The low sensitivitymeans that fewer than two-dozen O and early B stars have been observed with theChandra gratings.
The HETGS consists of two grating arrays, with a factor of two difference indispersion: the Medium Energy Grating (MEG) and the High Energy Grating (HEG).Their FWHM resolutions are 23 and 12mÅ, respectively, corresponding to resolvingpowers of λ/∆λ ≈ 300 to 1000 (1000 km s−1 to 300 km s−1). Given wind velocitiesapproaching and even exceeding 3000 km s−1 in early O stars, emission lines from hotplasma embedded in these stars’ winds should be well resolved.
The XMM Reflection Grating Spectrometer has similar properties to the ChandraHETGS. The spatial resolution, internal noise, and calibration of XMM are not as goodas Chandra’s, although the sensitivity is higher. Interesting results are being producedby the XMM RGS, but we will focus on the ChandraHETGS data here, primarily due tospace limitations, although the constraints provided by Chandra data on OB star windstructure and dynamics are generally superior.
X-Ray View of OB Star Winds 269
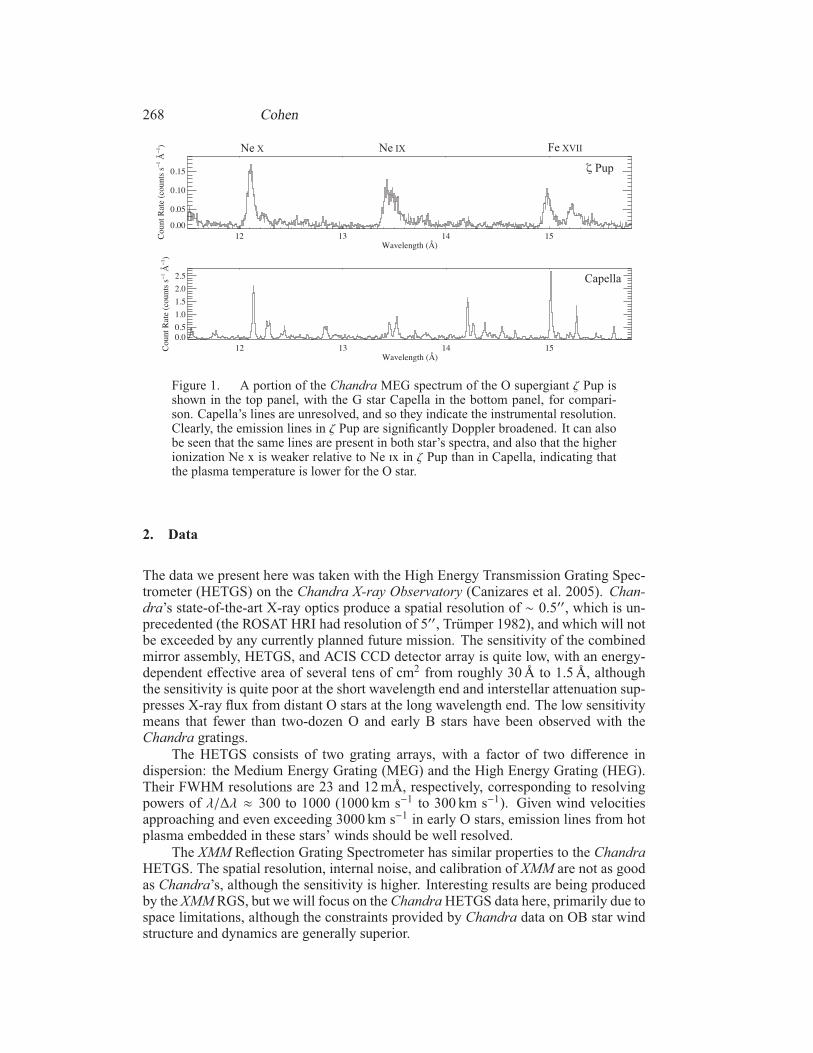
Figure 2. The Fe xvii line at 15.014Å (left) andMg xii Lyα line measured in ζ Pupwith the Chandra MEG. in each panel the laboratory rest wavelength is indicatedby the vertical dashed line, and the two dotted lines represent the Doppler shiftsassociated with ±v∞. The best-fit model is indicated by the red histogram.
3. X-Ray Emission From O Star Winds
The X-rays we see are from a low density (n ∼ 1010 cm−3), collisional plasma, close tostatistical equilibrium but far from LTE. In all of these senses, the hot, X-ray emittingplasma in OB star winds is similar to coronal plasma on solar-type stars. Indeed, themassive star community uses coronal spectral synthesis codes to model massive starX-ray spectra. The X-ray spectral emission properties of OB stars are described in thefirst subsection, below. The X-ray emitting plasma in nonmagnetic effectively singleOB stars is assumed to be produced in embedded wind shocks (EWS) generated by theline-deshadowing instability (LDI), which we describe in the second subsection.
3.1. Thermal X-Ray Emission
The low-density, quasi-steady-state nature of the X-ray emitting plasma means thatnearly all of the ions have their bound electrons in the ground state configuration, andthat collisional ionization is balanced by radiative and dielectronic recombination. Elec-trons, protons, and ions are assumed to be in thermal equilibrium, with each specieshaving a Maxwellian velocity distribution. While these assumptions may be calledinto question under certain circumstances, there is no observational evidence for non-equilibrium effects in X-ray spectra (although photoionization out of metastable excitedstates can be important in helium-like species, and can, in fact, be used as a diagnosticof the location of the hot plasma with respect to the photosphere, Leutenegger et al.2006).
The coronal approximation, steady-state spectral emission described above is com-puted for millions of transitions in, for example, the Astrophysical Plasma EmissionCode (APEC, Smith et al. 2001). This code, and others like it, assume that the plasmais optically thin, so that the emergent spectrum is proportional to the emissivity. For Ostars, with the densest winds, line optical depth effects—resonance scattering—can beimportant in some lines of the most abundant elements (Leutenegger et al. 2007), butoverall this is a second-order effect. However, the cold, unshocked portion of the windcan be optically thick (in the bound-free continuum) to the X-ray emission from EWSs(Leutenegger et al. 2010).
270 Cohen
5 10 15 20Wavelength (Å)
1.0
1.5
2.0
2.5
3.0
Ro (R
*)
5 10 15 20Wavelength (Å)
1000
1500
2000
2500
v nf (km
s−1 )
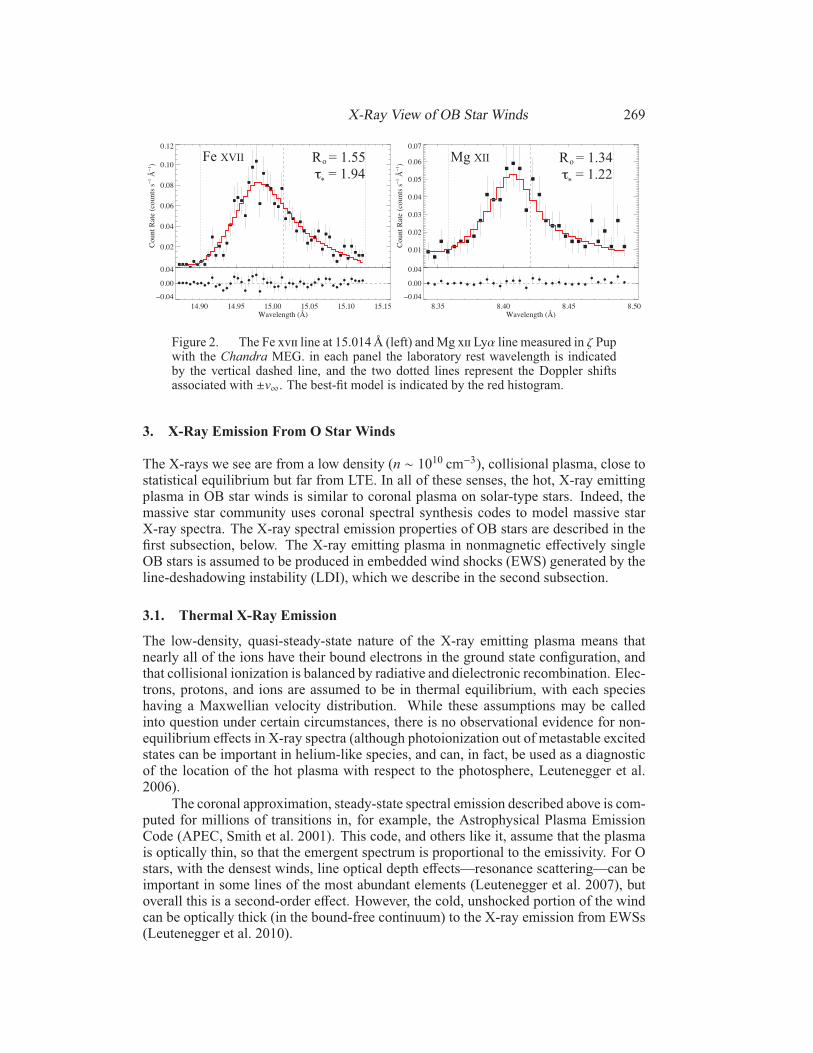
Figure 3. The fitted shock onset radii (left) and terminal velocities (right) for ζPup. The cross-hatched region on the terminal velocity plot represents the 68 percentconfidence limits on the average terminal velocity derived from the five line fits,while the solid horizontal line represents the UV wind terminal velocity.
The spectra synthesized with the coronal codes match observed X-ray spectra quitewell. They are dominated by a small number of emission lines from hydrogen-likeand helium-like ionization stages of abundant elements such as N, O, Ne, Mg, Si, Sand L-shell emission from Fe; primarily Fe xvii. Carbon’s contributions are generallyoutside of the effective Chandra bandpass, while H and He are fully ionized and do notcontribute to the X-ray line emission. The emission lines are superimposed on a weakcontinuum due to bremsstrahlung and, to a lesser extent, recombination radiation. Attemperatures above 30MK or so, most abundant elements are fully ionized and lineemission weakens and bremsstrahlung becomes dominant. A portion of the ChandraMEG spectrum of ζ Pup (O4 If) is shown in Fig. 1.
Fitting the observed Chandra grating spectra with APEC models yields plasmatemperature distributions and, in principle, abundances; both, effectively, from fittingline strength ratios. While significant nitrogen enhancement and oxygen depletion canbe seen in the X-ray spectra of some O stars, in general, detailed abundance determina-tions cannot be reliably made from the X-ray data.
3.2. Embedded Wind Shocks
For the effectively single O and early B stars that are the focus of this paper, the X-ray emitting plasma is thought to be formed in numerous shock structures distributedthroughout the wind. The lack of observed X-ray time variability suggests that there are(at least) hundreds of sites of X-ray production in a given wind. We do note that in someclose O+O and WR binaries, wind-wind interactions can lead to stronger and usuallyharder X-ray emission, often modulated on the orbital period, and for some magneticO stars, wind channeling can also lead to stronger and harder X-ray emission. Whilequite interesting, discussion of these two alternate mechanisms is beyond the scope ofthis paper (see review by Gudel & Naze 2009). However, we will note that X-rays fromthe binary wind interaction region can be spatially resolved in Chandra X-ray imagesof at least one massive star, WR 147 (Zhekov & Park 2010).
The mechanism that produces the wind shocks in normal, effectively single O andearly B stars is the line-deshadowing instability, in which the ions that mediate themomentum transfer from the photospheric radiation field to the wind via resonance
X-Ray View of OB Star Winds 271
5 10 15 20Wavelength (Å)
0
1
2
3
4
5
6
τ*
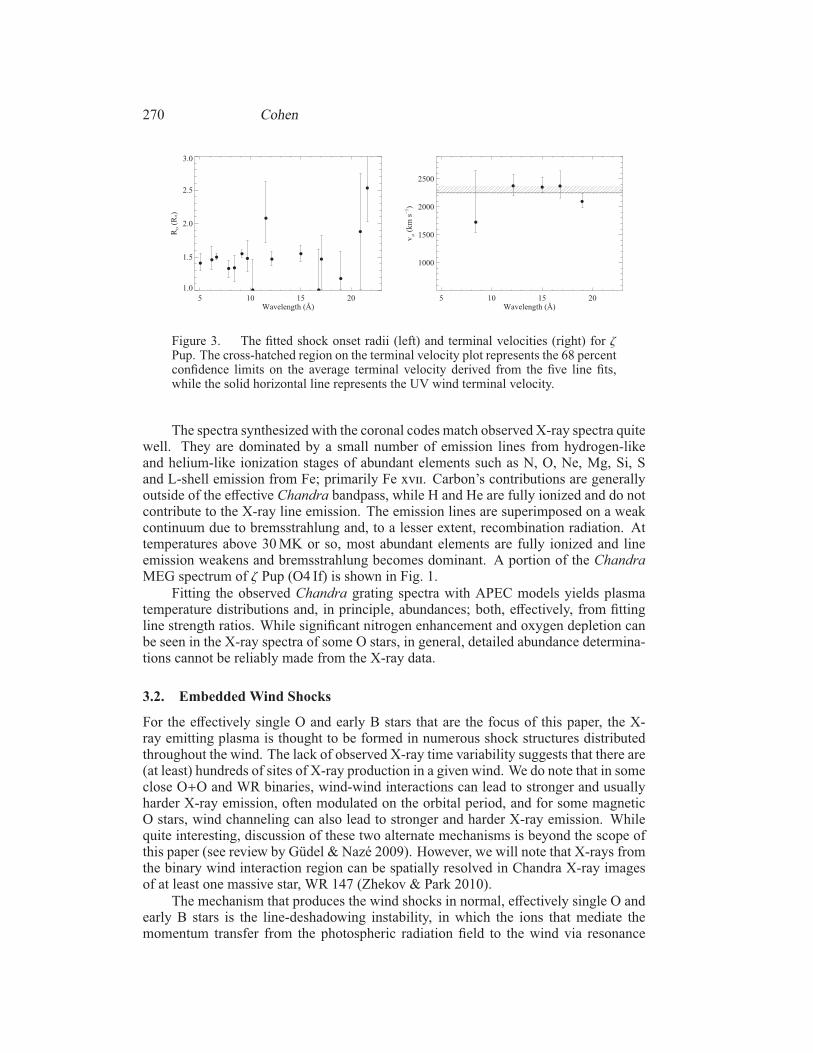
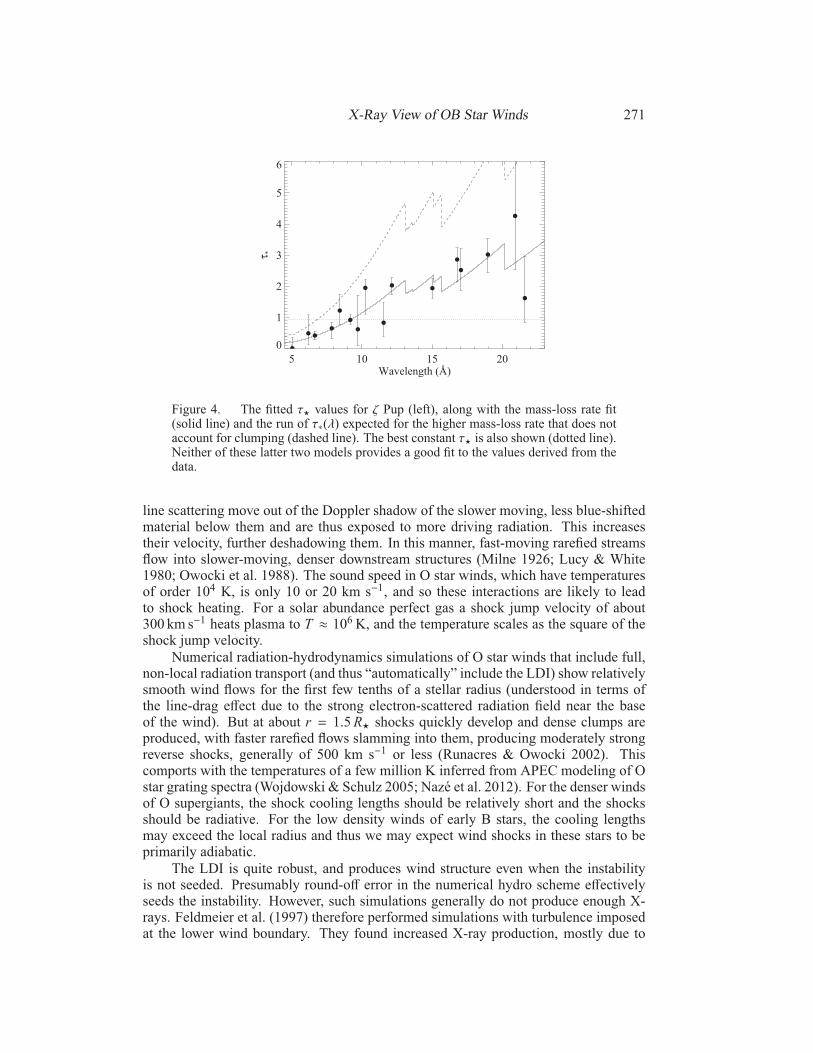
Figure 4. The fitted τ? values for ζ Pup (left), along with the mass-loss rate fit(solid line) and the run of τ∗(λ) expected for the higher mass-loss rate that does notaccount for clumping (dashed line). The best constant τ? is also shown (dotted line).Neither of these latter two models provides a good fit to the values derived from thedata.
line scattering move out of the Doppler shadow of the slower moving, less blue-shiftedmaterial below them and are thus exposed to more driving radiation. This increasestheir velocity, further deshadowing them. In this manner, fast-moving rarefied streamsflow into slower-moving, denser downstream structures (Milne 1926; Lucy & White1980; Owocki et al. 1988). The sound speed in O star winds, which have temperaturesof order 104 K, is only 10 or 20 km s−1, and so these interactions are likely to leadto shock heating. For a solar abundance perfect gas a shock jump velocity of about300 km s−1 heats plasma to T ≈ 106K, and the temperature scales as the square of theshock jump velocity.
Numerical radiation-hydrodynamics simulations of O star winds that include full,non-local radiation transport (and thus “automatically” include the LDI) show relativelysmooth wind flows for the first few tenths of a stellar radius (understood in terms ofthe line-drag effect due to the strong electron-scattered radiation field near the baseof the wind). But at about r = 1.5R? shocks quickly develop and dense clumps areproduced, with faster rarefied flows slamming into them, producing moderately strongreverse shocks, generally of 500 km s−1 or less (Runacres & Owocki 2002). Thiscomports with the temperatures of a few million K inferred from APEC modeling of Ostar grating spectra (Wojdowski & Schulz 2005; Naze et al. 2012). For the denser windsof O supergiants, the shock cooling lengths should be relatively short and the shocksshould be radiative. For the low density winds of early B stars, the cooling lengthsmay exceed the local radius and thus we may expect wind shocks in these stars to beprimarily adiabatic.
The LDI is quite robust, and produces wind structure even when the instabilityis not seeded. Presumably round-off error in the numerical hydro scheme effectivelyseeds the instability. However, such simulations generally do not produce enough X-rays. Feldmeier et al. (1997) therefore performed simulations with turbulence imposedat the lower wind boundary. They found increased X-ray production, mostly due to
272 Cohen
clump-clump collisions. All of the published simulations that include an energy equa-tion in order to compute X-ray emission are one-dimensional. This severe limitationis necessitated by the expense of the radiation transport in the hydrodynamics code.The geometry dictates that clumps are in fact spherical shells. This significantly limitsthat shock dynamics, and probably artificially inflates the clump spacing and perhapsaffects the strengths of the shocks and the total mass flux through shocks. Exploratory2-D simulations have been performed in the last decade, and these show Rayleigh-Taylor breakup of shells and the formation of very small clumps (Dessart & Owocki2005). Thus far, these 2-D simulations have not included an energy equation and thuspredictions of X-ray properties are lacking.
There is clearly much work to be done on the LDI and on the properties of Ostar wind shocks from the theoretical and numerical side. But the basic predictions ofthe EWS scenario and the LDI simulations can be tested with the Chandra and XMMgrating spectra. These predictions include: shock heated plasma sharing the overallkinematics of the wind; an X-ray onset at several tenths of a stellar radius, thus im-plying that all X-ray emitting plasma will be traveling at an appreciable fraction of thewind terminal velocity; and the formation of clumps with an overdensity correspondingto fcl ≈ 10, where the clumping factor, fcl ≡ 〈ρ2〉/〈ρ〉2. Information about these kine-matic and spatial properties can be determined from the observed X-ray line profiles.Furthermore, simulations predict that only a small fraction of the wind is shock heated,and so the colder bulk wind should absorb the shock-produced X-rays.
In the next section, we examine what we can learn from line profile modeling,in terms of wind shock kinematics, mass-loss rates, and clumping properties of the Osupergiants, ζ Pup (O4 If) and HD 93129A (O2 If*).
4. X-Ray Emission Line Profile Analysis
We use the Owocki & Cohen (2001) profile model, which assumes the same β velocitylaw for the bulk wind and the X-ray emitting plasma, and assumes a sudden X-ray onsetat r = Ro with X-ray emission above that scaling with the square of the wind density.The larger the Ro parameter is, the broader the line, as more of the hot plasma is movingwith velocities close to v∞. For exceptionally high signal-to-noise lines, we can allowv∞ to also be a free parameter, although it usually is fixed at the value observed inUV lines for the bulk wind. The effect of wind attenuation is to preferentially absorbphotons from the red wing of the emission line, because those photons are produced inthe receding back hemisphere of the wind. In the context of this spherically symmetricmodel, one parameter, τ? ≡ κM/4πR?v∞, describes the degree of attenuation.
Profile models with Ro, τ?, the line flux, and sometimes v∞ as free parameters arefit to each line in the Chandra grating spectrum of a given star. Details of the proce-dure and a discussion of the sensitivity of the derived parameters to various modelingassumptions and uncertainties are discussed in Cohen et al. (2010). Two representativefits—to the Fe xvii line at 15.014Å and to the Mg xii Lyα line in the Chandra MEGspectrum of ζ Pup—are shown in Fig. 2. Both lines are significantly Doppler broad-ened, consistent with X-ray onset radii, Ro, several tenths of a stellar radius above thephotosphere.
We obtain similar results for the other fourteen lines in the Chandra HETGS spec-trum of ζ Pup. The results are summarized in Fig. 3, where it can be seen that the linewidths are consistent with a single value of Ro ≈ 1.5R∗. For five of the higher signal-
X-Ray View of OB Star Winds 273
6 8 10 12Wavelength (Å)
0
1
2
3
4
5
6
7
τ*
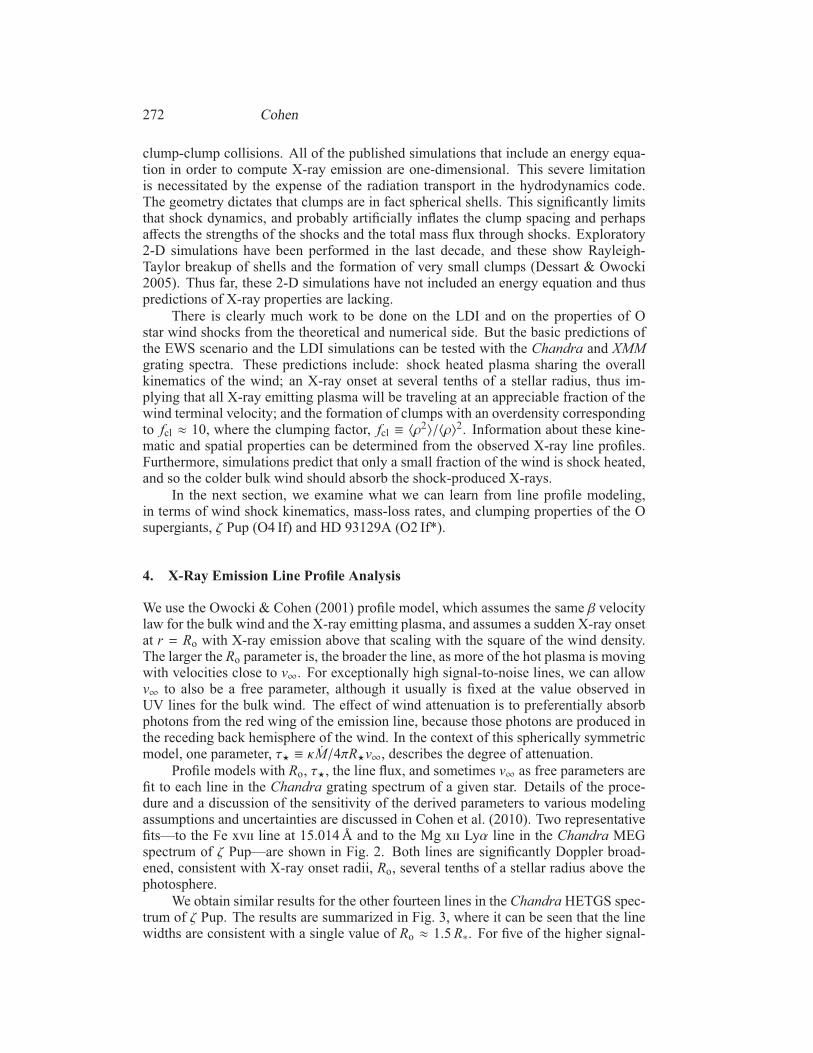
Figure 5. The Lyman-α line of Mg xii in HD 93129A (left) shows a similar blue-shift and skewness as that seen in the same line in the ζ Pup spectrum (Fig. 2). Thederived mass-loss rate for this star is about 7× 10⁻⁶ M� yr−1 (solid line, right panel),two times larger than the value we determine for ζ Pup, but almost four times lowerthan the unclumped Hα mass-loss rate (dashed line).
to-noise lines, the terminal velocity was allowed to be a free parameter of the fit, andthose results are also summarized in that same figure. They are consistent with the UVwind terminal velocity of v∞ = 2250 km s−1.
The two lines shown in Fig. 2 both have wind absorption signatures, with a deficitof red-shifted counts leading to a net blue-shift and skewness. The degree of windattenuation is greater in the longer wavelength Fe xvii line, as is expected from thetrend in the wavelength-dependent opacity. Indeed, this enables us to fit a group of τ?values derived for a given star with a single mass-loss rate, M. Such an X-ray-basedmass-loss rate determination is not susceptible to uncertainties due to density-squaredclumping effects. In fact, by combining this (column) density sensitive X-ray mass-loss rate with the density-squared mass-loss diagnostics such as Hα or radio free-free(which provide the quantity M f 0.5cl ), the clumping factor can effectively be measured.
In Fig. 4 we show the distribution of τ∗ values for the sixteen lines we fit in theChandra HETGS spectrum of ζ Pup. The run of τ? vs. wavelength, corresponding tothe best-fit mass-loss rate, is also shown. That value—3.5 × 10⁻⁶ M� yr−1—is abouta factor of 2.5 below the unclumped Hα value, implying a clumping factor in the Hαformation region of fcl ≈ 6 (but smaller clumping factors farther out in the wind, Pulset al. 2006). Interestingly, in order to fit the observed Hα profile, the clumping muststart at 1.1R?, while the X-ray plasma exists only above 1.5R?.
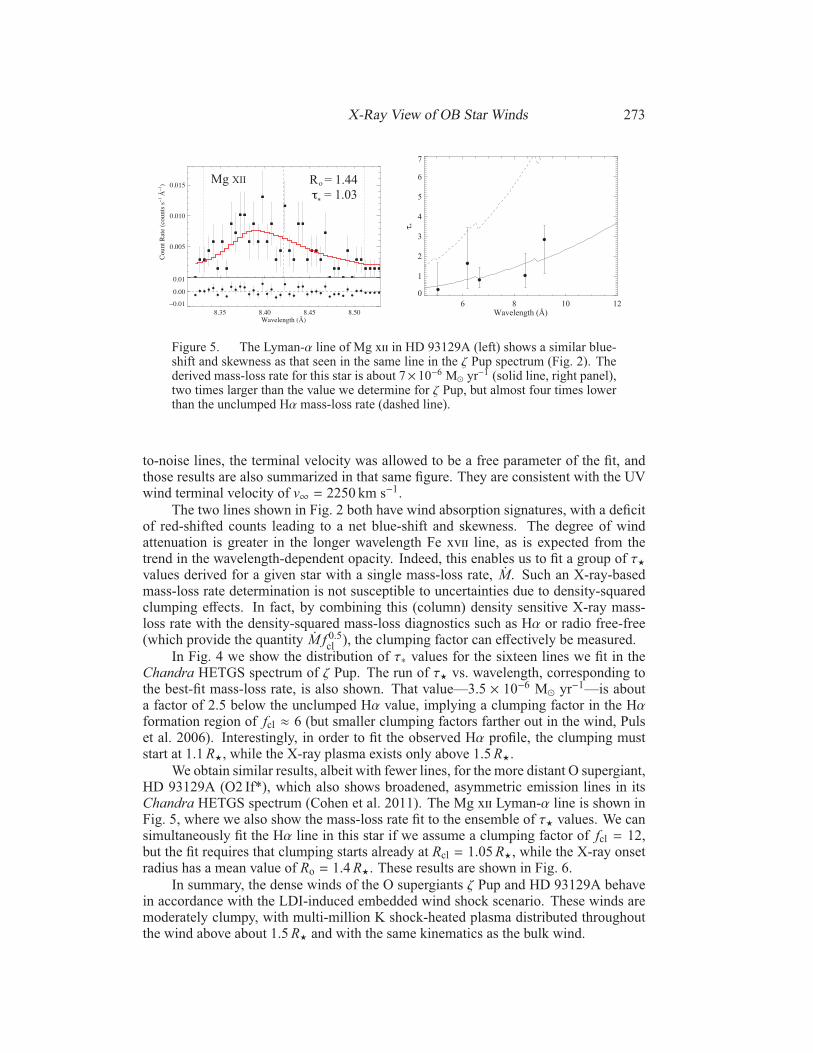
We obtain similar results, albeit with fewer lines, for the more distant O supergiant,HD 93129A (O2 If*), which also shows broadened, asymmetric emission lines in itsChandra HETGS spectrum (Cohen et al. 2011). The Mg xii Lyman-α line is shown inFig. 5, where we also show the mass-loss rate fit to the ensemble of τ? values. We cansimultaneously fit the Hα line in this star if we assume a clumping factor of fcl = 12,but the fit requires that clumping starts already at Rcl = 1.05R?, while the X-ray onsetradius has a mean value of Ro = 1.4R?. These results are shown in Fig. 6.
In summary, the dense winds of the O supergiants ζ Pup and HD 93129A behavein accordance with the LDI-induced embedded wind shock scenario. These winds aremoderately clumpy, with multi-million K shock-heated plasma distributed throughoutthe wind above about 1.5R? and with the same kinematics as the bulk wind.
274 Cohen
6 8 10 12Wavelength (Å)
1.0
1.5
2.0
2.5
3.0
Ro (R
*)
Figure 6. The Hα line in HD 93129A (black, solid; left panel) overplotted withseveral models. Note that the wind clumping must start very close to the photospherein order to fit this line. The values of Ro derived from fitting the lines in the Chandraspectrum are also shown (right panel); they are consistent with a value of Ro = 1.4R?and inconsistent with the value of r = 1.05R? inferred for the clumping onset radius.
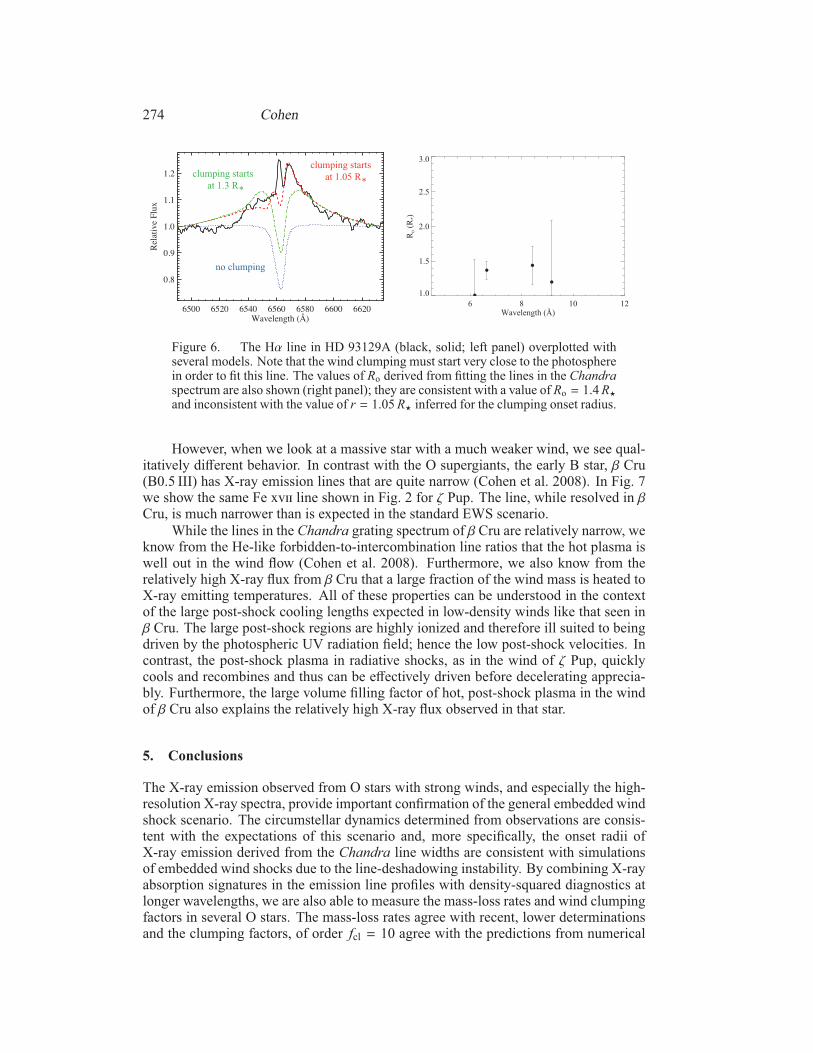
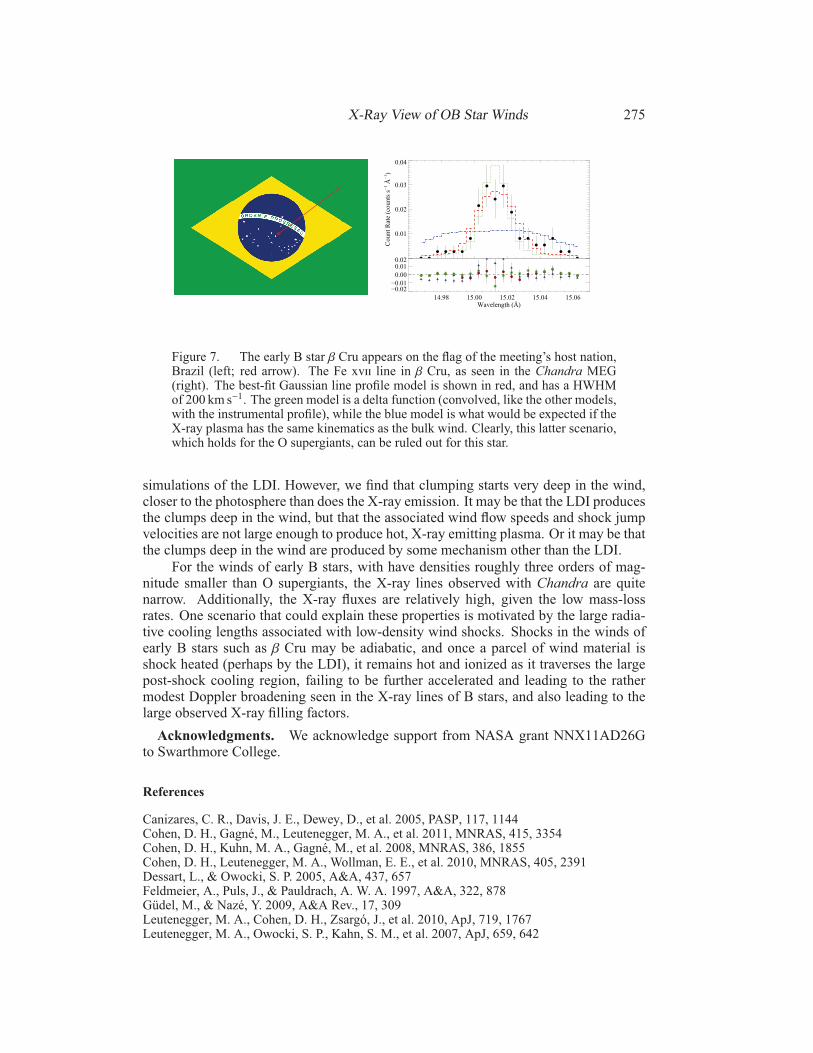
However, when we look at a massive star with a much weaker wind, we see qual-itatively different behavior. In contrast with the O supergiants, the early B star, β Cru(B0.5 III) has X-ray emission lines that are quite narrow (Cohen et al. 2008). In Fig. 7we show the same Fe xvii line shown in Fig. 2 for ζ Pup. The line, while resolved in βCru, is much narrower than is expected in the standard EWS scenario.
While the lines in the Chandra grating spectrum of β Cru are relatively narrow, weknow from the He-like forbidden-to-intercombination line ratios that the hot plasma iswell out in the wind flow (Cohen et al. 2008). Furthermore, we also know from therelatively high X-ray flux from β Cru that a large fraction of the wind mass is heated toX-ray emitting temperatures. All of these properties can be understood in the contextof the large post-shock cooling lengths expected in low-density winds like that seen inβ Cru. The large post-shock regions are highly ionized and therefore ill suited to beingdriven by the photospheric UV radiation field; hence the low post-shock velocities. Incontrast, the post-shock plasma in radiative shocks, as in the wind of ζ Pup, quicklycools and recombines and thus can be effectively driven before decelerating apprecia-bly. Furthermore, the large volume filling factor of hot, post-shock plasma in the windof β Cru also explains the relatively high X-ray flux observed in that star.
5. Conclusions
The X-ray emission observed from O stars with strong winds, and especially the high-resolution X-ray spectra, provide important confirmation of the general embedded windshock scenario. The circumstellar dynamics determined from observations are consis-tent with the expectations of this scenario and, more specifically, the onset radii ofX-ray emission derived from the Chandra line widths are consistent with simulationsof embedded wind shocks due to the line-deshadowing instability. By combining X-rayabsorption signatures in the emission line profiles with density-squared diagnostics atlonger wavelengths, we are also able to measure the mass-loss rates and wind clumpingfactors in several O stars. The mass-loss rates agree with recent, lower determinationsand the clumping factors, of order fcl = 10 agree with the predictions from numerical
X-Ray View of OB Star Winds 275
0.01
0.02
0.03
0.04
Count Rate (counts s−
1 Å
−1 )
14.98 15.00 15.02 15.04 15.06Wavelength (Å)
−0.02−0.010.000.010.02
Figure 7. The early B star β Cru appears on the flag of the meeting’s host nation,Brazil (left; red arrow). The Fe xvii line in β Cru, as seen in the Chandra MEG(right). The best-fit Gaussian line profile model is shown in red, and has a HWHMof 200 km s−1. The green model is a delta function (convolved, like the other models,with the instrumental profile), while the blue model is what would be expected if theX-ray plasma has the same kinematics as the bulk wind. Clearly, this latter scenario,which holds for the O supergiants, can be ruled out for this star.
simulations of the LDI. However, we find that clumping starts very deep in the wind,closer to the photosphere than does the X-ray emission. It may be that the LDI producesthe clumps deep in the wind, but that the associated wind flow speeds and shock jumpvelocities are not large enough to produce hot, X-ray emitting plasma. Or it may be thatthe clumps deep in the wind are produced by some mechanism other than the LDI.
For the winds of early B stars, with have densities roughly three orders of mag-nitude smaller than O supergiants, the X-ray lines observed with Chandra are quitenarrow. Additionally, the X-ray fluxes are relatively high, given the low mass-lossrates. One scenario that could explain these properties is motivated by the large radia-tive cooling lengths associated with low-density wind shocks. Shocks in the winds ofearly B stars such as β Cru may be adiabatic, and once a parcel of wind material isshock heated (perhaps by the LDI), it remains hot and ionized as it traverses the largepost-shock cooling region, failing to be further accelerated and leading to the rathermodest Doppler broadening seen in the X-ray lines of B stars, and also leading to thelarge observed X-ray filling factors.
Acknowledgments. We acknowledge support from NASA grant NNX11AD26Gto Swarthmore College.
References
Canizares, C. R., Davis, J. E., Dewey, D., et al. 2005, PASP, 117, 1144Cohen, D. H., Gagne, M., Leutenegger, M. A., et al. 2011, MNRAS, 415, 3354Cohen, D. H., Kuhn, M. A., Gagne, M., et al. 2008, MNRAS, 386, 1855Cohen, D. H., Leutenegger, M. A., Wollman, E. E., et al. 2010, MNRAS, 405, 2391Dessart, L., & Owocki, S. P. 2005, A&A, 437, 657Feldmeier, A., Puls, J., & Pauldrach, A. W. A. 1997, A&A, 322, 878Gudel, M., & Naze, Y. 2009, A&A Rev., 17, 309Leutenegger, M. A., Cohen, D. H., Zsargo, J., et al. 2010, ApJ, 719, 1767Leutenegger, M. A., Owocki, S. P., Kahn, S. M., et al. 2007, ApJ, 659, 642
276 Cohen
Leutenegger, M. A., Paerels, F. B. S., Kahn, S. M., et al. 2006, ApJ, 650, 1096Lucy, L. B., & White, R. L. 1980, ApJ, 241, 300Milne, E. A. 1926, MNRAS, 86, 459Naze, Y., Flores, C. A., & Rauw, G. 2012, A&A, 538, A22Owocki, S. P., Castor, J. I., & Rybicki, G. B. 1988, ApJ, 335, 914Owocki, S. P., & Cohen, D. H. 2001, ApJ, 559, 1108Puls, J., Markova, N., Scuderi, S., et al. 2006, A&A, 454, 625Runacres, M. C., & Owocki, S. P. 2002, A&A, 381, 1015Smith, R. K., Brickhouse, N. S., Liedahl, D. A., et al. 2001, ApJ, 556, L91Trumper, J. 1982, Advances in Space Research, 2, 241Wojdowski, P. S., & Schulz, N. S. 2005, ApJ, 627, 953Zhekov, S. A., & Park, S. 2010, ApJ, 721, 518
Discussion
de la Reza: You mentioned that in the case of wind collisions in binaries the X-rayradiation can increase. Do you mean that new emission lines appear? That there isemission of hard X-rays?
D. Cohen: Yes, as the stars approach periastron, the X-ray flux generally increases andoften, but not always, hardens, too.
J. Groh: Do you have long-term monitoring of the X-ray lines of ζ Pup? Would youexpect variability based on the hydro simulations?
D. Cohen: The Chandra data covers less than a day, while there is almost a millionseconds of XMM data. The XMM data shows no variability at the few percent level,implying under the most generic assumptions and using Poisson statistics, that thereare several hundred sites of X-ray production in the wind. They must have relativelysmall lateral scale. In the 1-D simulations only a few locations at any given time areshock-heated because there’s only so much variation that can be packed into the radialdirection over the 10 to 100R? computational domain that is typically used. And those1-D simulations do show a lot of variability; hence the inference about the small lateralscale.
J. Bjorkman: A number of years ago I worked on a crazy paper where we suggested thatthe red shifted absorption in the O vi lines of τ Sco was produced by infalling blobs.In your talk you suggested that the shocks in B star winds are adiabatic and that thecollisional ionization will shut off the CAK line driving. What is the wind speed whenthis occurs? If this is less than the local escape speed, then this material would fall backonto the star. So this could be a possible mechanism for creating such infalling blobsin τ Sco.
D. Cohen: This is certainly an interesting idea, and τ Sco has a complex magneticfield and harder and stronger X-ray emission than typical early B stars (and narrowemission lines, too). τ Sco is also unusual, if not unique, in showing red shifted UVabsorption. More generally, I think there would be ram pressure from the upstreamwind flow pushing on “stalled” shocked gas. To answer your question directly, thewind flow speeds where the X-rays turn on are of order the local escape speed, so it isdefinitely something to consider.