The Value of Theatre and Dance for Tyneside's Audiences
43
1 The value of theatre and dance for Tyneside’s audiences Joshua Edelman Maja Šorli Mark Robinson Arts and Humanities Research Council • Cultural Value Project The Royal Central School of Speech and Drama, University of London Thinking Practice The Empty Space July 2014
Transcript of The Value of Theatre and Dance for Tyneside's Audiences
1
The value of theatre and dance for
Tyneside’s audiences
Joshua Edelman Maja Šorli Mark Robinson Arts and Humanities Research Council • Cultural Value Project The Royal Central School of Speech and Drama, University of London Thinking Practice The Empty Space July 2014

2
Table of contents Executive summary ........................................................................................ 3 Background .................................................................................................... 3 Our study ........................................................................................................ 8 Demographics ................................................................................................. 11 Audience motivation ...................................................................................... 12 Group size ....................................................................................................... 14 Loyalty ............................................................................................................ 16 Price ................................................................................................................ 18 The audience experience ................................................................................ 18 Factor analysis ................................................................................................ 23 Factor analysis for amateur theatre ................................................................ 28 Key findings ................................................................................................... 29 Responses ....................................................................................................... 30 Conclusion ...................................................................................................... 32 Acknowledgements ........................................................................................ 33 Appendix A: Performances studied ................................................................ 34 Appendix B: Audience demographics ............................................................ 35 Appendix C: The survey ................................................................................ 36 Appendix D: Key survey results .................................................................... 40 Appendix E: Factor analysis defining the ‘E Factor’ and ‘F Factor’ ............. 42
List of figures 1. Responses to the question ‘I came to this performance because of….’ .................. 12 2. Selected responses to the question ‘I came to the performance because of…’ ...... 13 3. Selected responses to the question ‘I came to the performance because of…’ ...... 14 4. Average reported sizes of audience attendance group for amateur, commercial and subsidised theatregoers ......................................................................................... 15 5. Frequency of theatregoing to different Tyneside venues ........................................ 17 6. Characterizations of performances by survey respondents (selected questions) ..... 20 7. Characterizations of performances by survey respondents (selected questions) ..... 20 8. Overall evaluation of performances ....................................................................... 22 9. Audience responses to commercial and subsidised theatre and dance, measured by E Factor and F Factor ............................................................................. 24 10. Audience responses to commercial and subsidised theatre and dance (excluding Swan Lake), measured by E Factor and F Factor ...................................... 24 11. E Factor and F Factor for survey responses to four selected productions ............. 26 12. E Factor and F Factor for survey responses to five selected productions ............. 27 13. E Factor and F Factor for three productions at Live Theatre. These E and F Factors are not directly comparable to those from previous figures for technical reasons ...... 28 14. E Factor and F Factor for all responses to amateur theatre ................................... 28 15. E Factor and F Factor for responses to five amateur theatre productions ............. 28
3
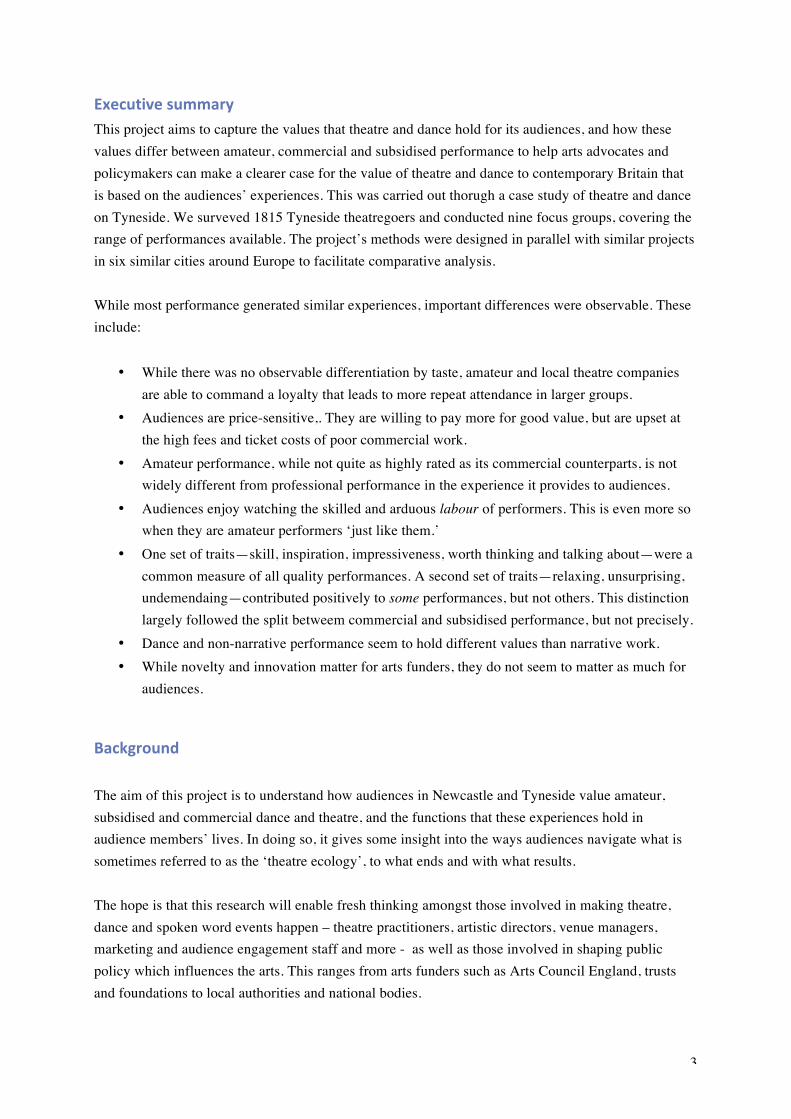
Executive summary This project aims to capture the values that theatre and dance hold for its audiences, and how these values differ between amateur, commercial and subsidised performance to help arts advocates and policymakers can make a clearer case for the value of theatre and dance to contemporary Britain that is based on the audiences’ experiences. This was carried out thorugh a case study of theatre and dance on Tyneside. We surveved 1815 Tyneside theatregoers and conducted nine focus groups, covering the range of performances available. The project’s methods were designed in parallel with similar projects in six similar cities around Europe to facilitate comparative analysis. While most performance generated similar experiences, important differences were observable. These include:
• While there was no observable differentiation by taste, amateur and local theatre companies are able to command a loyalty that leads to more repeat attendance in larger groups.
• Audiences are price-sensitive,. They are willing to pay more for good value, but are upset at the high fees and ticket costs of poor commercial work.
• Amateur performance, while not quite as highly rated as its commercial counterparts, is not widely different from professional performance in the experience it provides to audiences.
• Audiences enjoy watching the skilled and arduous labour of performers. This is even more so when they are amateur performers ‘just like them.’
• One set of traits—skill, inspiration, impressiveness, worth thinking and talking about—were a common measure of all quality performances. A second set of traits—relaxing, unsurprising, undemendaing—contributed positively to some performances, but not others. This distinction largely followed the split betweem commercial and subsidised performance, but not precisely.
• Dance and non-narrative performance seem to hold different values than narrative work. • While novelty and innovation matter for arts funders, they do not seem to matter as much for
audiences.
Background The aim of this project is to understand how audiences in Newcastle and Tyneside value amateur, subsidised and commercial dance and theatre, and the functions that these experiences hold in audience members’ lives. In doing so, it gives some insight into the ways audiences navigate what is sometimes referred to as the ‘theatre ecology’, to what ends and with what results. The hope is that this research will enable fresh thinking amongst those involved in making theatre, dance and spoken word events happen – theatre practitioners, artistic directors, venue managers, marketing and audience engagement staff and more - as well as those involved in shaping public policy which influences the arts. This ranges from arts funders such as Arts Council England, trusts and foundations to local authorities and national bodies.

4
This research is informed by and responds to a particular time and place and the context that creates: that of Tyneside in 2014. This section aims to set out the key elements of that context in relation to arguments around public funding and support of the arts. These can be thought of as relating to historic justifications of government funding (whether characterised as ‘subsidy’ or ‘investment’ with their very different connotations), to the regional history of arts activity and local government support, and to the current political situation around arts funding. How the arts demonstrate their value to both politicians and the general public is a question that has particular urgency in a period of ‘austerity’ and huge reduction in public expenditure, but it is a hardy perennial with roots as far back as Plato. His banishment of the poets from The Republic led to the development of a positive but defensive case for the arts, which included both self-improvement (through the cathartic and educative effect of theatre) and civic-improvement (through either distracting the populace from less savoury activity or promoting received ideas). These have been persistent strains in justifying cultural policy ever since. In the UK, government legislative support for arts and culture, and the strains of instrumentalism within it, can be traced back to the Victorian era, where ironically enough for today’s situation, it sat alongside a paternalistic but civic-minded philanthropic culture in which some industrialists endowed towns and cities with galleries and museums, many of which are still used today. In 1841, one MP testifying to a Parliamentary Select Committee of Fine Arts admitted ‘that the object of the Committee is, not so much, to forward the arts themselves, as through their influence to advance their great end, towards which the promotion of the fine arts can be considered but as means, the civilization of our people’.1 It could be said this ‘civilization of the people’ is what some who argue for the so-called ‘intrinsic’ benefits of the arts cherish. But implicit in the MP’s argument is a certain causal chain: that the development of the arts leads to an enriching of the social fabric (‘the civilization of our people’) which leads in turn to a more productive populace. The founding of the Arts Council of Great Britain in the post-war period, building on, and to a certain extent over, the war-time success of the Council for the Encouragement of Music and the Arts (CEMA) rested on the justifications about the arts’ position within a civilized life. The Arts Council was not justified on the basis of a direct economic return, but rather on access to a wide swath of the population and increased artistic education. (At least, this was the rhetoric of the Council’s founding documents; its early funding decisions suggest an emphasis on the high arts and ‘national’ bodies which some would argue persists to this day.)
1 Quoted in The Social Impact of the Arts: An Intellectual History by Eleonora Belfiore and Oliver Bennett

5
At local and regional level, arguments for supporting the arts reflect these paradigms: ‘civilization’, access and education, economic development, and the prestige of internationally-leading fine arts. In some places, a number of others have been added to them over the years. As the political ‘centre ground’ gradually shifted in the UK from the nationalization of the 1940s towards an increasing focus on consumption and market values as the dominant mode of understanding everything, with even tax and benefit increasingly seen as an exchange in which one can profit or lose, the case for arts funding shifted from the rather vague ‘public goods’ case, or one of market failure, to one based on a concept of ‘return on investment.’ This has been defined in a variety of ways. If we borrow an image from HG Wells, and imagine a Cultural Value Time Machine in a study somewhere in Northern England, we would see papers, books, headlines and ideas hurtling past our intrepid cultural practitioner, each leaving behind or revealing another layer of confusion, complexity or richness, depending on your view. (If the Time Machine moved in space as well the next paragraphs would be more international. But it is fixed, and therefore we are surrounded by UK policies and debates.) We would move past the current campaigns and mission statements in a second. What’s Next, a network of senior folk meeting across the country. Save The Arts, a campaign of statistics and animations. Great Arts and Culture for Everyone, Arts Council England’s current strategic framework. All flash by. Sir Brian McMaster and James Purnell’s ‘Excellence’ pincer movement against ‘targetolatry’ lands nearby with a flash and a whallop. loudly proclaiming the only basis for public funding was excellence. It effectively argued that true excellence filtered through to the commercial sector, via the talent and the innovation nurtured in the subsidized sector. Public subsidy was needed to support experimentation, involvement and to encourage people to go to see truly ‘excellent’ work. (The implication being that the commercially popular was not likely to contain excellence as defined by Sir Brian McMaster.) We would move through the phase of concentrating on the power of the arts to ‘transform’ individual lives and communities alike under Peter Hewitt’s leadership of Arts Council England that marked the integration of the English arts funding system into a single body in 2002. Richard Florida would stroll urbanely past us, spreading the idea that post-industrial places could regenerate themselves through capital-led cultural investment to build the creative city. In the late 1990s, we would listen intently as Chris Smith, New Labour’s Culture Minister, persuades colleagues to invest hugely in culture, based on a newly broad definition of creative industries and the role of the arts in education, health, improving landscapes, communities and local economies (‘regeneration’ as it might be termed) and inclusion. We would see a rapid spread of arts in regeneration and urban development programmes. (At some point, up would pop the Angel of the North by Anthony Gormley, surrounded by now long-forgotten opposition.)

6
The creation of the National Lottery and the ‘Ministry of Fun’ and then the Thatcherite policies of commercial sponsorship and the arts as enterprise would remind us the arts have had funding shifts in both directions before. In the distance, though, we would see the Greater London Council simultaneously arguing for a wider definition of the arts that became the cultural industries and breaking down barriers with popular culture. Speeding up now, the community arts movement would change the terms of participation and investment, promoting social justice, public involvement and popular expression through radical ways of organising and promoting the arts . Disused churches and public buildings would become arts centres in small towns across England. Transformation would be a persistent theme with Raymond Williams and others arguing for the power of the arts coming from below, carried by the common tongue. In opposition to this, advocates of the canon and its civilizing influence from above such F.R Leavis, T.S Eliot and their predecessor Arnold would shake their heads over the baleful influence of the untutored. All these ‘stops’ reveal, on closer inspection, varying views on the different roles of subsidized arts – often seen as ‘high’ or experimental in some way – and their commercial and voluntary cousins. Sometimes funding is seen as fuel for the innovation the commercial sector will not fund, or as enabling the quality the voluntary sector cannot afford. Sometimes the perceived distinctions are blurred, or even erased, in arguments that one part connects to and supports another. If there is no subsidized theatre, goes the argument, then there are no Oscar-winners and no directors for the 2012 Olympic Opening Ceremony such as Danny Boyle. These mini-narratives form the underlying rationales or justifications for public investment into arts and culture. The arguments are often unspoken, sometimes only half-articulated and rarely backed up with universally-accepted evidence. Most recently these have been synthesized by Arts Council England into what it calls ‘the holistic case’. This puts the so-called intrinsic benefits of Culture – identity, empathy, ideas – at the heart of other benefits clustered under the headings of Economy, Society and Education. What is important for this research is that this most recent case is no more based on what the audience says about its experience of the arts than any of the previous ‘cases for culture’ have been. North East England and Tyneside in particular has a long history of support for arts and culture, albeit with fluctuations of political support. The Tyne & Wear Metropolitan Authority, abolished in 1986, supported major institutions. The local authorities of North East England and Cumbria were instrumental in the founding of the Northern Sinfonia in 1958. This in turn led to the founding of the Northern Arts Association in 1961. Northern Arts was built with local government support, the charity’s company members being elected local councilors from across the region. Northern Arts, by then a Regional Arts Board, was merged into Arts Council England in 2002, having been instrumental in a wave of capital and cultural regeneration projects.
7
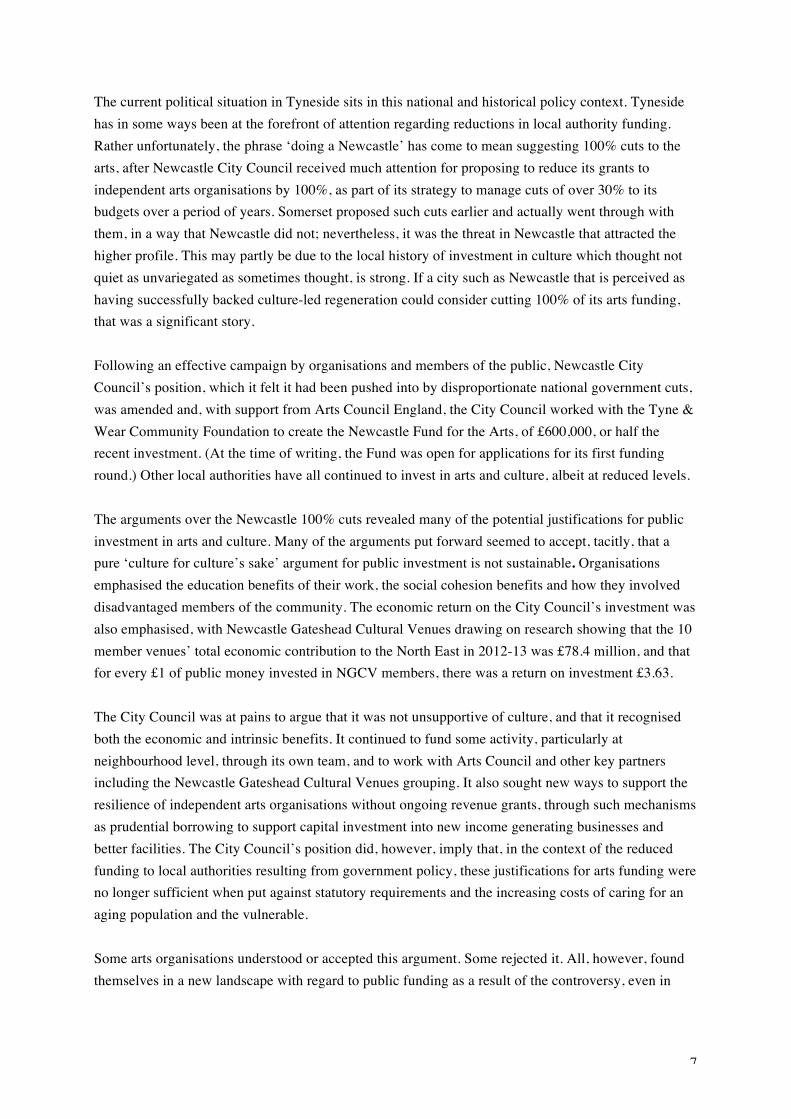
The current political situation in Tyneside sits in this national and historical policy context. Tyneside has in some ways been at the forefront of attention regarding reductions in local authority funding. Rather unfortunately, the phrase ‘doing a Newcastle’ has come to mean suggesting 100% cuts to the arts, after Newcastle City Council received much attention for proposing to reduce its grants to independent arts organisations by 100%, as part of its strategy to manage cuts of over 30% to its budgets over a period of years. Somerset proposed such cuts earlier and actually went through with them, in a way that Newcastle did not; nevertheless, it was the threat in Newcastle that attracted the higher profile. This may partly be due to the local history of investment in culture which thought not quiet as unvariegated as sometimes thought, is strong. If a city such as Newcastle that is perceived as having successfully backed culture-led regeneration could consider cutting 100% of its arts funding, that was a significant story. Following an effective campaign by organisations and members of the public, Newcastle City Council’s position, which it felt it had been pushed into by disproportionate national government cuts, was amended and, with support from Arts Council England, the City Council worked with the Tyne & Wear Community Foundation to create the Newcastle Fund for the Arts, of £600,000, or half the recent investment. (At the time of writing, the Fund was open for applications for its first funding round.) Other local authorities have all continued to invest in arts and culture, albeit at reduced levels. The arguments over the Newcastle 100% cuts revealed many of the potential justifications for public investment in arts and culture. Many of the arguments put forward seemed to accept, tacitly, that a pure ‘culture for culture’s sake’ argument for public investment is not sustainable. Organisations emphasised the education benefits of their work, the social cohesion benefits and how they involved disadvantaged members of the community. The economic return on the City Council’s investment was also emphasised, with Newcastle Gateshead Cultural Venues drawing on research showing that the 10 member venues’ total economic contribution to the North East in 2012-13 was £78.4 million, and that for every £1 of public money invested in NGCV members, there was a return on investment £3.63. The City Council was at pains to argue that it was not unsupportive of culture, and that it recognised both the economic and intrinsic benefits. It continued to fund some activity, particularly at neighbourhood level, through its own team, and to work with Arts Council and other key partners including the Newcastle Gateshead Cultural Venues grouping. It also sought new ways to support the resilience of independent arts organisations without ongoing revenue grants, through such mechanisms as prudential borrowing to support capital investment into new income generating businesses and better facilities. The City Council’s position did, however, imply that, in the context of the reduced funding to local authorities resulting from government policy, these justifications for arts funding were no longer sufficient when put against statutory requirements and the increasing costs of caring for an aging population and the vulnerable. Some arts organisations understood or accepted this argument. Some rejected it. All, however, found themselves in a new landscape with regard to public funding as a result of the controversy, even in
8
other local authority areas, as these issues are far from unique to Newcastle. The supposed third leg of the English arts funding model – involving earned or contributed income alongside Arts Council and local authority funding – faces a serious challenge to its future viability, with implications for organisations, funders and policy makers. This also affects the main contributors of that earned income in theatres: the audience, who find themselves asked to contribute differently. We can analyse the influences on and the implications of policy, but how well can we currently analyse what the audience feel, want and will do? This project does not ask people their views of public funding for the arts. It looks instead specifically at people attending performing arts events in Tyneside, including theatre, dance, and musical theatre shows, and asks them to consider their actual experience of those theatrical experience. This allows some of the common ‘truisms’ about the performing arts and the people that attend them to be tested against the data. Does the data support the assumptions behind common justifications for public investment, and for developing an arts sector in that context, or does it challenge those orthodoxies? Are audiences in fact having those experiences that funding justifications assume they ought to have? Do people move from one art form to another, or can they be encouraged to do so? Do the subsidized, voluntary and commercial sectors serve different populations, and if so, is this because audiences perceive them as offering distinct theatrical experiences? Or is the difference a matter of appealing to a different demographic segment of the audience? In the end, our method draws on the realization that subsidy is not the only form of investment that the theatre requires. Audiences invest their time, money, attention and energy in the theatre, and they have good reasons for doing so. By asking audiences about their experiences and why the theatre is attractive to them, this project hopes to use these reasons to propose clearer and more accurate justifications for supporting the arts, ones grounded in what they, in fact, do, and not in what each wave of political reasoning suggests they ought to do.
Our Study To answer some of these questions, we conducted a survey of the audiences of 26 different dance and theatre productions—commercial, subsidized and amateur—that were presented on Tyneside from February to June of 2014. We also conducted a series of 9 focus groups after 9 different performances. A list of the performances at which we conducted surveys and focus groups can be found below in Appendix A. These surveys were conducted online, or occasionally using hard copies for those who did not have online access. In most cases, volunteers from the venue or student assistants stood in the lobby before performances, explaining the project and collecting email addresses of audience members. We then sent those audience members a link to complete the survey online. In some cases (notably the Theatre
9
Royal, but also Live Theatre, The Customs House, Mill Volvo Tyne Theatre, Dance City), the theatre sent out the link directly to their mailing list of all who had purchased tickets for that performance. Surveys generally went out a day or two after performance. As an incentive, everyone who completed the survey was entered in a draw for a £150 shopping voucher that was won by a 58 year old woman who attended Swan Lake at Theatre Royal. We had a total of 1815 survey responses, but these were not evenly distributed between genres and modes (commercial, subsidized, and amateur) theatre. Because of the size of Theatre Royal and their high level of cooperation with the survey (for which we are very grateful), we have more data on commercial theatre than on amateur and subsidized. Some theatres who surveyed their audiences regularly already were conscious of not ‘over-burdening’ audiences. As a consequence, the vast majority (71%) of the surveys respond to commercial theatre, with smaller proportions responding to subsidised (20%) and amateur (9%) performances. The survey was quite different than those typical of theatre marketing departments. We did ask questions about demographics and the respondents’ theatergoing habits, but these were not the focus of the survey. Our primary interest was not who goes to theatre, but why they go—that is, what the nature of the experience they have there is. So while we were interested in overall opinion that audience members had of the performance, the survey tried to dig deeper that that. We asked, for instance, if the performance made audience members use their imagination, or if it made them see reality differently, if it was captivating or surprising, and so on. We asked about individual aspects of the performance (acting, direction, choreography, design), and whether or not audience members talked with others about the performance afterwards. We asked them why they came to the performance, and what other theatres they attend. The most useful question offered a list of 26 adjectives with which to characterise the performance (beautiful, skillful, complicated, relaxing, etc.), and respondents were asked to what extent they agreed or disagreed with each characterization. This question was quick to answer and provided a wealth of information to help us characterize the experience of theatergoing. Because this data was quantitative, it allowed us to observe patterns in the data. This meant we could find correlations between, for example, the mode of performance (subsidiesd, amateur or commercial) and the nature of the experience, and to notice how different demographic groups reacted differently. It also allowed us to paint a more detailed portrait of how theatre functions for audiences, and to modify this portrait for different genres, modes, and audiences. The other advantage of a quantitative method is its comparability. This project in Tyneside is based on a model created by the Project on European Theatre Systems (STEP), a working group of theatre sociologists from seven European countries of which both the principal investigator and research assistant of this project are members. STEP has done research on the function of theatre in contemporary Europe and, based on its observations and a synthesis of prominent theories of artistic function over the last few decades, STEP has developed a model for analyzing theatre’s social
10
function.2 This involves a common set of survey questions and a means of asking them that STEP is using to study the function of theatre in six other smaller cities around Europe (Tartu, Estonia; Maribor, Slovenia; Berne, Switzerland; Groningen, the Netherlands, Aarhus, Denmark; and Debrecen, Hungary). By asking the same questions as these other projects did, we will, in future papers, be able to compare the shape and function of theatre on Tyneside to that of other countries. The data from these other cities is still being collected, and so the present report cannot make these comparisons. The experience of theatergoing is complex and rich, of course, and so no matter how well designed a questionnaire is, it can capture at best a small amount of information about that experience. By asking specific questions—which is important in order to create useful data—we necessarily limit that part of the experience the survey can capture. To address this, we also conducted a series of 9 focus groups after 9 different performances with the 28 participants (aged 20 to 65, 16 female, 12 male) on 6 different venues. Through our own networks and those of the theatres and universities on Tyneside, we set up three groups of between 7 and 9 members. Participants applied via email with some basic data bout themselves. Each group was taken to a series of three different performances at three different venues and had a group discussion afterwards over tea and biscuits, hosted by a moderator and assistant. The groups were designed to be reasonably mixed in age, gender and theatergoing habits, and the three performances were selected by the researchers – not the audience members – so that most focus group members were attending performances that they otherwise would not have considered. In the small number of cases where one focus group member could not attend a performance, a substitute was found. In total, 28 different Northeasterners participated in the focus groups. In these discussions, which were transcribed, the focus group members were asked to talk about their experience of the performance, but beyond that, there was very little guidance from the moderator. The initial question usually was “How did you find the performance?” and after that similar questions regarding the venue and the experience of theatre in general followed. The discussions lasted between 60 and 80 minutes.3 Of course, with such a small number of performances visited, we cannot not make the claims to statistical relevance for data from the focus groups that we could from the surveys. Yet, this qualitative data provides a useful complement to the quantitative material from the survey. Looking through the transcripts can help us explain the patterns we see from the statistics and place them into a comprehensible narrative. Also, it is important that our focus group members were not theatrical
2 The best single summary of this method was published in How To Study Art Worlds (Amsterdam Univ. Press, 2009) by Hans van Maanen, the group’s leader. 3 Our methods for these focus groups were derived from the work of our STEP colleague Louise Hansen of Aarhus, Denmark. These methods and their justification are spelled out most clearly in “Behaviour and attitude: the Theatre Talks method as audience development.” in International Journal of Cultural Policy, 2014 and in “The Democratic Potential of Theatre Talks.” in Nordic Theatre Studies, Vol. 25, 2014, p. 10-21.
11
experts—they were not critics or academics. Building off the focus groups transcripts will help us articulate the value of theatergoing in a way that is derived from and speaks to the ways that ordinary audience members experience the theatre for themselves.
Demographics There is good demographic work already available about theatre audiences in the UK, largely coming out of the Audience Agency.4 While it was not the main purpose of our work to study audience demographics, we did note that the demographic profile of our survey respondents is broadly in line with that which the Audience Agency has found in its work. However, there has been relatively little work done on the demographics of amateur audiences. The Audience Agency developed out of the Arts Council England, and while it has begun to work with commercial clients, it has little relation to the amateur sector. A set of charts describing the demographics of our survey respondents in detail can be found below as Appendix B, but a few points bear mentioning. First, 77% of our respondents were women. Theatre audiences do tend to have a female majority, but the audiences for the performances we visited did not appear to be over three-quarters female. In many cases, we observed couples in which the woman filled out the survey and the man did not; our speculation is that this pattern accounts for the bulk of the gender imbalance. Our survey respondents were well educated, with over 50% holding a university degree. There was a noticeable difference in education between commercial and subsidised theatre audiences: just under half of commercial audiences had a university degree, while 70% of subsidised audiences did. In terms of age, the response was relatively balanced, with around half of audiences aged between 45-64 and a trailing off in either direction from there. (It should be noted that we did not survey any productions specifically aimed at children or young adults.). However, there was a noticeable difference between commercial and subsidised audiences in their age profile. Subsidised audiences are noticeably younger, with a higher proportion of 25-34-year-olds and a much higher proportion 16-24-year-olds than commercial theatre attracts. While amateur theatre audiences do contain a significant proportion of young people (24 or younger) in a way that commercial audiences simply do not, they also draw a far larger share of their audience from those over 65 than commercial or subsidised audiences do. The downward taper of ages above 65 does not exist in amateur theatre the way it does in commercial and subsidised theatre.
4 More information about the Audience Agency and their work can be found at www.theaudienceagency.org.
12
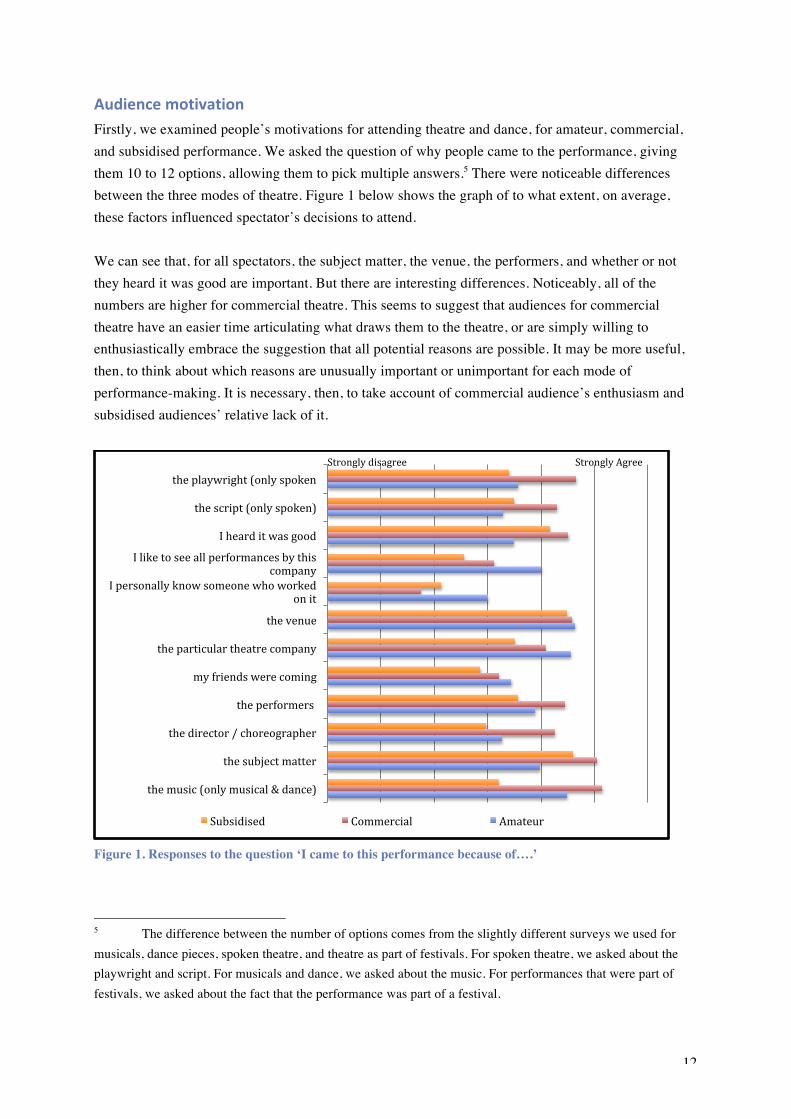
Audience motivation Firstly, we examined people’s motivations for attending theatre and dance, for amateur, commercial, and subsidised performance. We asked the question of why people came to the performance, giving them 10 to 12 options, allowing them to pick multiple answers.5 There were noticeable differences between the three modes of theatre. Figure 1 below shows the graph of to what extent, on average, these factors influenced spectator’s decisions to attend. We can see that, for all spectators, the subject matter, the venue, the performers, and whether or not they heard it was good are important. But there are interesting differences. Noticeably, all of the numbers are higher for commercial theatre. This seems to suggest that audiences for commercial theatre have an easier time articulating what draws them to the theatre, or are simply willing to enthusiastically embrace the suggestion that all potential reasons are possible. It may be more useful, then, to think about which reasons are unusually important or unimportant for each mode of performance-making. It is necessary, then, to take account of commercial audience’s enthusiasm and subsidised audiences’ relative lack of it.
Figure 1. Responses to the question ‘I came to this performance because of….’
5 The difference between the number of options comes from the slightly different surveys we used for musicals, dance pieces, spoken theatre, and theatre as part of festivals. For spoken theatre, we asked about the playwright and script. For musicals and dance, we asked about the music. For performances that were part of festivals, we asked about the fact that the performance was part of a festival.
the music (only musical & dance)
the subject matter
the director / choreographer
the performers
my friends were coming
the particular theatre company
the venue
I personally know someone who worked on it
I like to see all performances by this company
I heard it was good
the script (only spoken)
the playwright (only spoken
Subsidised Commercial Amateur
Strongly disagree Strongly Agree
13
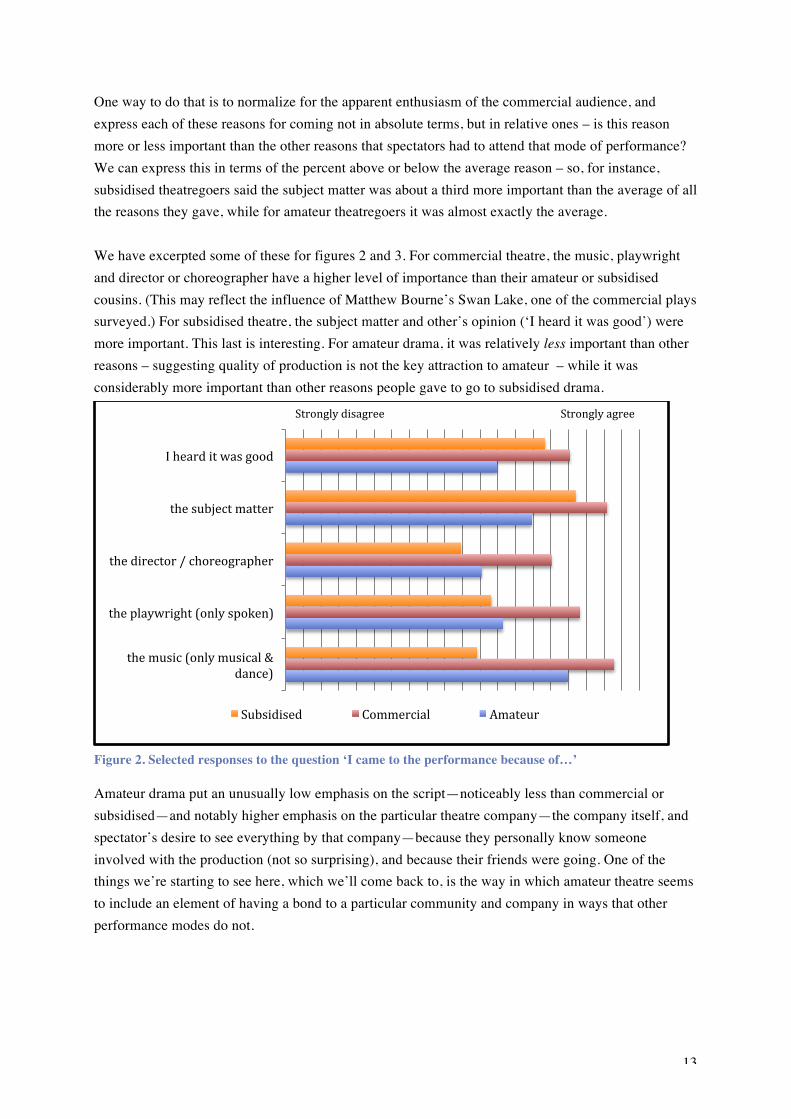
One way to do that is to normalize for the apparent enthusiasm of the commercial audience, and express each of these reasons for coming not in absolute terms, but in relative ones – is this reason more or less important than the other reasons that spectators had to attend that mode of performance? We can express this in terms of the percent above or below the average reason – so, for instance, subsidised theatregoers said the subject matter was about a third more important than the average of all the reasons they gave, while for amateur theatregoers it was almost exactly the average. We have excerpted some of these for figures 2 and 3. For commercial theatre, the music, playwright and director or choreographer have a higher level of importance than their amateur or subsidised cousins. (This may reflect the influence of Matthew Bourne’s Swan Lake, one of the commercial plays surveyed.) For subsidised theatre, the subject matter and other’s opinion (‘I heard it was good’) were more important. This last is interesting. For amateur drama, it was relatively less important than other reasons – suggesting quality of production is not the key attraction to amateur – while it was considerably more important than other reasons people gave to go to subsidised drama.
Figure 2. Selected responses to the question ‘I came to the performance because of…’
Amateur drama put an unusually low emphasis on the script—noticeably less than commercial or subsidised—and notably higher emphasis on the particular theatre company—the company itself, and spectator’s desire to see everything by that company—because they personally know someone involved with the production (not so surprising), and because their friends were going. One of the things we’re starting to see here, which we’ll come back to, is the way in which amateur theatre seems to include an element of having a bond to a particular community and company in ways that other performance modes do not.
the music (only musical & dance)
the playwright (only spoken)
the director / choreographer
the subject matter
I heard it was good
Subsidised Commercial Amateur
Strongly disagree Strongly agree

14
Figure 3. Selected responses to the question ‘I came to the performance because of…’
Group size We will return to the particular attraction amateur audiences have to particular theatre companies, but let us first note that it was relatively rare for respondents to report that they were coming to a performance because others are, but it is not evenly distributed. It was notably more common for amateur work, despite the tendency of commercial audiences to be more enthusiastic in their all their replies. This leads us to another factor. We asked people how many others they attended the theatre with. The results are shown in figure 4. The majority – 59% — attended in groups of exactly two, and this was not significantly different between the three modes of performance. There were, however, two significant differences.. First, far more people attend subsidised theatre alone. It was 16.5% of all subsidised theatregoers, while only 8% of commercial theatregoers and 4% of amateur. (Second, spectators at amateur theatre came in noticeably larger groups than other kinds of theatre. The average group size for commercial theatre was 2.7, and for subsidised it was 2.6 – not a statistically significant difference. For amateur theatre, however, the average was 3.38 – significantly higher.6
6 We also were able to observe a small but statistically significant difference in the education level of different audiences. Subsidised theatre audiences had a higher average level of education (4.46 on a five-point scale, with a university degree at the top) than amateur (4.14) or commercial (4.01) audiences did.
my friends were coming
the particular theatre company
I personally know someone who worked on it
I like to see all performances by this company
the script (only spoken)
Subsidised Commercial Amateur
Strongly disagree Strongly agree

15
Figure 4. Average reported sizes of audience attendance group for amateur, commercial and subsidised theatregoers.
Interestingly, when we asked survey respondents with whom they attended, there was a noticeable difference between the forms. Commercial theatre was disproportionately attended by families, while spouses and partners were less likely to attend commercial performances. Families were less likely to attend commercial performances; perhaps they feared they were not child-friendly. Very few people attended with the theatre with colleagues (virtually no groups of colleagues attended commercial theatre), and the amateur theatre was attended by friends and partners but very rarely by individuals alone. (See the charts in Appendix B for more information about this.) Some of the focus group members helped articulate why so few theatregoers attended by themselves. Very few said it was because they simply did not want to spend time on their own. Rather, the tendency to go to the theatre in group had to do with the high social capital attributed to theatergoing (sometimes expressed in terms of the economic cost of tickets). One focus group member said:
I don’t think I would go on my own. I would go to the cinema on my own but I think it’s because the tickets are more expensive. I can make a decision on the day to go the cinema I think I wouldn’t probably book in advance to go to the theatre on my own. Not because I wouldn’t mind doing that just because it tends to be a bit more expensive.
This does not actually make sense: why would the fact that theatre is more expensive mean that spectators would be less likely to go on their own? Buying more tickets means, of course, more money. If the argument was, in fact, economic, one would expect audience members to attend theatre on their own but the cinema in groups. This is does not appear to be the case. Another focus group member
I would often have dinner attached at one side as well. I guess when we were kids we would go to the theatre and it was always a big event, really. It was
0% 25% 50% 75% 100%
Subsidised
Commercial
Amateur 1
2
3
4
5
6
7
8
>8
Avg: 2.7
Avg: 2.6
Avg: 3.38
16
always a bit special, and we had to get a bit more dressed up and I suppose in my head it does become an outing rather than just, I might go and see a film that I wanted to see.
This sense of ‘making a night of it’ (a quote from another focus group member, which received generally agreement) is interesting. It points towards a value in the practice of theatergoing that is not contained in the aesthetic experience of the performance itself. A performance is part of, but perhaps not the most essential element of, the social event of theatergoing with all of its accompanying activities. If we want to understand the social function of theatergoing and the value it holds for audiences, we ought to look beyond the content of the performances themselves.
Loyalty
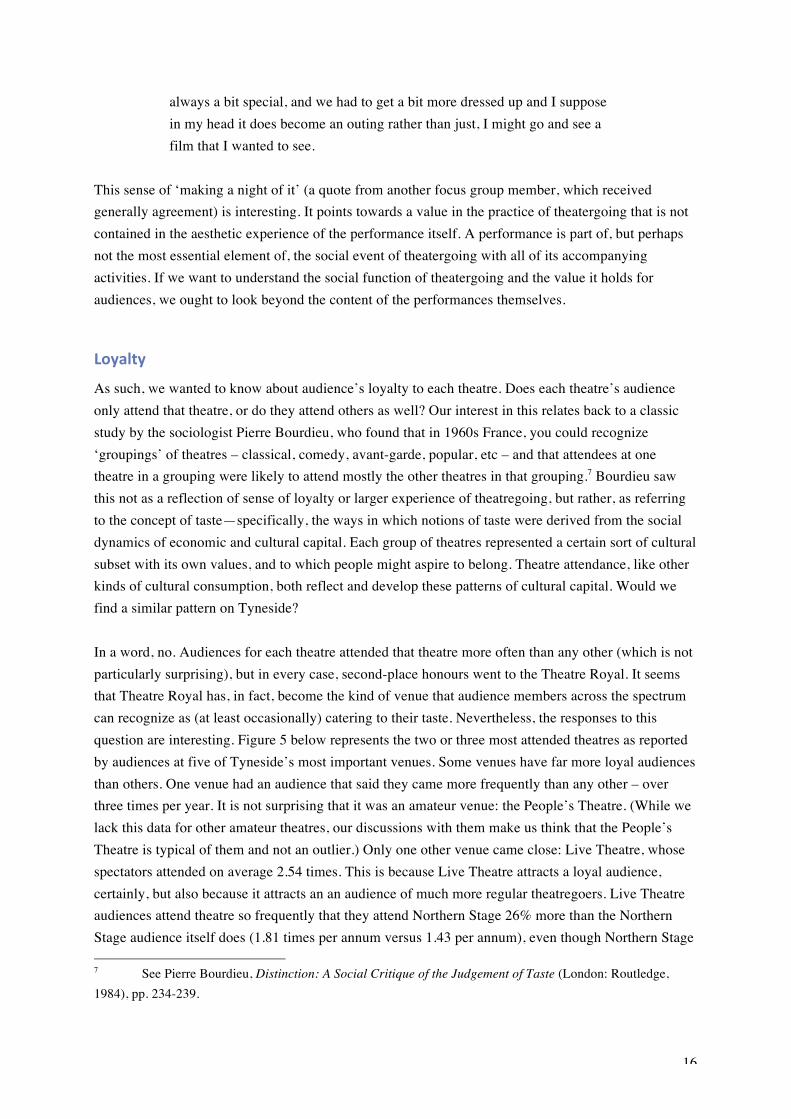
As such, we wanted to know about audience’s loyalty to each theatre. Does each theatre’s audience only attend that theatre, or do they attend others as well? Our interest in this relates back to a classic study by the sociologist Pierre Bourdieu, who found that in 1960s France, you could recognize ‘groupings’ of theatres – classical, comedy, avant-garde, popular, etc – and that attendees at one theatre in a grouping were likely to attend mostly the other theatres in that grouping.7 Bourdieu saw this not as a reflection of sense of loyalty or larger experience of theatregoing, but rather, as referring to the concept of taste—specifically, the ways in which notions of taste were derived from the social dynamics of economic and cultural capital. Each group of theatres represented a certain sort of cultural subset with its own values, and to which people might aspire to belong. Theatre attendance, like other kinds of cultural consumption, both reflect and develop these patterns of cultural capital. Would we find a similar pattern on Tyneside? In a word, no. Audiences for each theatre attended that theatre more often than any other (which is not particularly surprising), but in every case, second-place honours went to the Theatre Royal. It seems that Theatre Royal has, in fact, become the kind of venue that audience members across the spectrum can recognize as (at least occasionally) catering to their taste. Nevertheless, the responses to this question are interesting. Figure 5 below represents the two or three most attended theatres as reported by audiences at five of Tyneside’s most important venues. Some venues have far more loyal audiences than others. One venue had an audience that said they came more frequently than any other – over three times per year. It is not surprising that it was an amateur venue: the People’s Theatre. (While we lack this data for other amateur theatres, our discussions with them make us think that the People’s Theatre is typical of them and not an outlier.) Only one other venue came close: Live Theatre, whose spectators attended on average 2.54 times. This is because Live Theatre attracts a loyal audience, certainly, but also because it attracts an an audience of much more regular theatregoers. Live Theatre audiences attend theatre so frequently that they attend Northern Stage 26% more than the Northern Stage audience itself does (1.81 times per annum versus 1.43 per annum), even though Northern Stage 7 See Pierre Bourdieu, Distinction: A Social Critique of the Judgement of Taste (London: Routledge, 1984), pp. 234-239.
17
is their third-most-popular theatre. Loyalty to a particular theatre does seem to be a real phenomenon – especially for amateur work – but also that it seems perfectly possible to sustain a theatre based on a somewhat smaller group of more regular theatregoers. While Bourdieu would recognize the position that Live Theatre takes up in the Tyneside theatre field as the high-cultural-capital role of the small-scale experimenter making work for fellow culture-makers, there does not seem to the differentiation between theatres based on taste, style of work, or class that Bourdieu saw of France in the 1960s. The contemporary Tyneside audience demonstrates an omnivorism that Bourdieu would struggle to recognize.
Figure 5. Frequency of theatregoing to different Tyneside venues.
This notion of loyalty to a particular company, indicated but not explained by the survey, was filled out in the focus groups. Audience members felt a sense of communal obligation to support particular theatres, especially smaller, local venues which were assumed to have less financial stability. When these obligations were not fulfilled—when, in fact, audience members did not attend them—there was a sense of guilt. One focus group member said:
It gives me a certain sense of guilt as well that fact that perhaps in the past I’ve ignored venues and one man performances and the thing is that if they don’t get bums on seats these are the sorts of things, it’s not the big productions that will stop coming it’s the small things that stop being put on and I haven’t booked at those as much.
There does seem to be a premium that audiences place on the small and unusual and the local, even if, as they acknowledge, this does not always trump other considerations in deciding what performances to attend. This sometimes was expressed in a desire for more marketing from small theatres, to have a better sense of the work they were doing and why it was interesting. One focus group member said:
Everyone just thinks of the big theatres don’t they. You don’t want to step outside that because you don’t know what it’s all about.
Another said:
0
0.5
1
1.5
2
2.5
3
3.5
Customs House Live Theatre Northern Stage Theatre Royal People's Theatre Num
ber of times attended per annum
(reported)
Self Theatre Royal Live/NS

18
When I lived in Whitley Bay, I used to look and see what was on at the Playhouse sometimes because that was literally round the corner a bit like you said you (indicating another focus group member) would go to the Priory and you would come here (People’s Theatre, and indicating a third focus group member). I think if you live near a theatre you’re much more likely to go and see things but there wasn’t very often things on at Whitley Bay that I wanted to see.
Theatres—especially smaller and amateur ones—can make use of this notion of loyalty to develop relationships with their audiences, but nevertheless, audiences will not see performances in which they have no interest.
Price For those who did attend, ticket price did not appear to be a major issue or barrier to attendance,for any sort of theatre. Almost three quarters of survey respondents said that ticket prices were ‘about right.’ That number rises to 90% for subsidised theatre and 92% for amateur theatre. 29% of respondents did think that commercial theatre ticket prices were too high, but 4% of subsidised (and 6% of amateur) audiences said that ticket prices were, in fact, too low. In the focus groups, however, there was great debate about prices.. he belief that theatre is expensive is still persistent, and participants compared it to cinema, which is cheaper, but also to more expensive entertainments such as music concerts and football matches. It was also said that people were unaware that less expensive tickets were also available. There was some anger towards processing charge or administrative fees or other additional monies that ticket buyers have to pay due to outsourced booking. When one focus group participant said he wouldn’t go to an expensive performance at all, a reason for attending expensive productions was given: “We do for a treat.” In another moment, a participant was comparing two broadly similar productions, and said she was willing to pay double price for one performance, commenting that: “It’s the content. For me it’s just the content.” This is largely consistent with the survey results that most people ranked most performances quite highly, and that most thought ticket prices were ‘about right’ (though noticeably less so for commercial work).
The audience experience What, though, about the audience experience itself? What can we say about it, and how is it different from one mode of performance to another? Most of the answers to this question come from questions 4 and 6 of the survey (attached below as Appendix C). Question 4 asks respondents to rate a series of statements (such as ‘I was involved with the world of the performance,’ and ‘the performance was worth thinking about again after seeing it’) in a six-point scale from strong agreement to strong disagreement. Question 6 offered a list of 26 adjectives (‘challenging’ ‘relaxing,’ ‘recognizeable,’ etc.) and asked to what extent these traits characterized the performance for the respondents. Again, there was a six-point scale from ‘not at all’ to ‘very much so.’ Together, these questions give us a detailed portrait of the shape of audience experience for each survey respondent. We can categorize them in
19
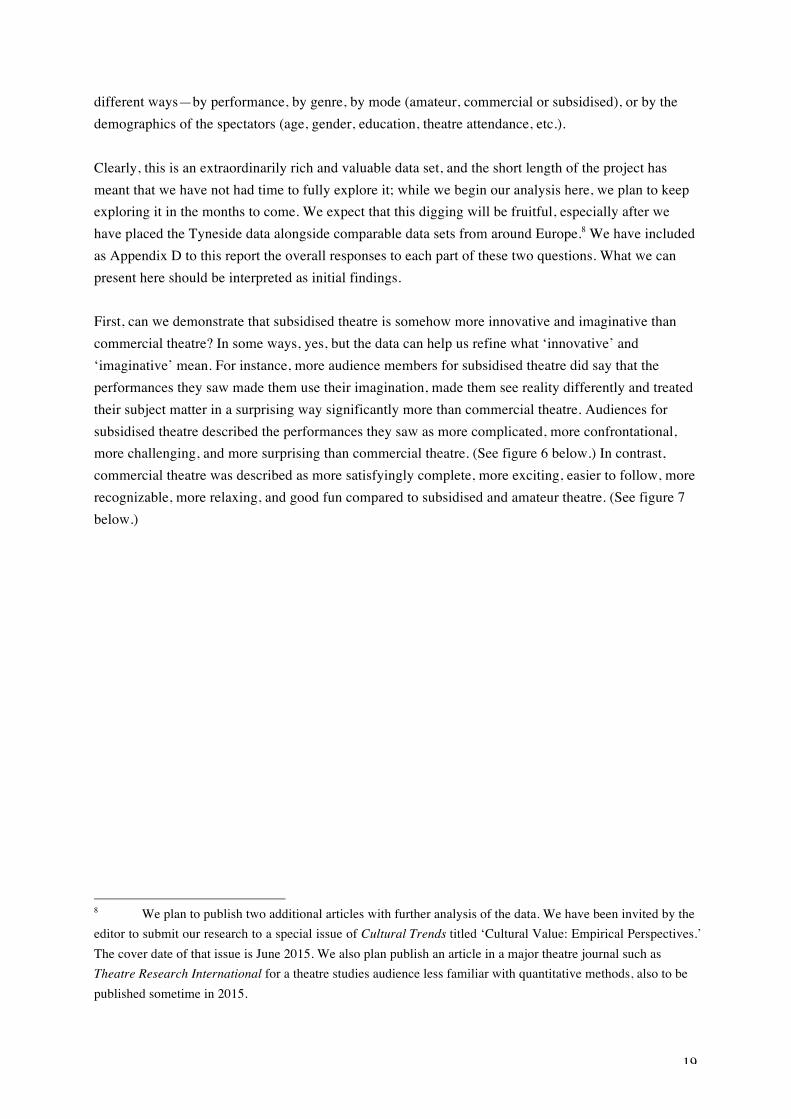
different ways—by performance, by genre, by mode (amateur, commercial or subsidised), or by the demographics of the spectators (age, gender, education, theatre attendance, etc.). Clearly, this is an extraordinarily rich and valuable data set, and the short length of the project has meant that we have not had time to fully explore it; while we begin our analysis here, we plan to keep exploring it in the months to come. We expect that this digging will be fruitful, especially after we have placed the Tyneside data alongside comparable data sets from around Europe.8 We have included as Appendix D to this report the overall responses to each part of these two questions. What we can present here should be interpreted as initial findings. First, can we demonstrate that subsidised theatre is somehow more innovative and imaginative than commercial theatre? In some ways, yes, but the data can help us refine what ‘innovative’ and ‘imaginative’ mean. For instance, more audience members for subsidised theatre did say that the performances they saw made them use their imagination, made them see reality differently and treated their subject matter in a surprising way significantly more than commercial theatre. Audiences for subsidised theatre described the performances they saw as more complicated, more confrontational, more challenging, and more surprising than commercial theatre. (See figure 6 below.) In contrast, commercial theatre was described as more satisfyingly complete, more exciting, easier to follow, more recognizable, more relaxing, and good fun compared to subsidised and amateur theatre. (See figure 7 below.)
8 We plan to publish two additional articles with further analysis of the data. We have been invited by the editor to submit our research to a special issue of Cultural Trends titled ‘Cultural Value: Empirical Perspectives.’ The cover date of that issue is June 2015. We also plan publish an article in a major theatre journal such as Theatre Research International for a theatre studies audience less familiar with quantitative methods, also to be published sometime in 2015.
20
Figure 6. Characterizations of performances by survey respondents (selected questions)
Figure 7. Characterizations of performances by survey respondents (selected questions)
Use my imagination
See reality differntly
Subject matter treated surprisingly
Complicated
Confrontational
Challenging
Surprising
Amateur Commercial Subsidised
Not at all Very much so
Satisfyingly complete
Exciting
Easy to follow
Recognizeable
Relaxing
Good fun
Beautiful to look at
Full of new images
What I expected it to be
Amateur Commercial Subsidised
Not at all Very much so
21
Much of this might be expected based on the common expectation of commercial theatre as a ‘high’ art and subsidised theatre as a ‘low’ one, but there is also data which questions this. Commercial theatre was described as considerably more ‘beautiful to look at’ than subsidised or amateur theatre, and it also was reported to be ‘full of new images’ to a (slightly) greater extent than other sorts of theatre (though not greatly so). Notions of beauty itself do not seem to follow the distinction between subsidised and commercial work, nor do other distinctions that one might expect. There was no statistical significance between commercial and subsidised theatre in the audience’s assessments of how well the performers performed, or how interesting they found the characters, or how much they found the performance worth talking about with others after seeing it. With this data, it is hard to make the case that subsidised theatre is providing an overall higher level of value for its audience than commercial theatre is for its, if we construe value in the broadest sense. What of amateur theatre? It is hard to see large differences between the experience of amateur and professional theatre from this data. Certainly, some of the measurements of what you might call technical quality (the actors performed well, the play was well directed, etc.) were lower for amateur performance than professional (that is, commercial and subsidised). But what is striking is that more ‘artistic’ measurements (‘the performance told a story that captivated me,’ ‘the performance had characters that I found interesting,’ ‘the performance was worth thinking about again after seeing it’) were also slightly lower for amateur than professional (that is, commercial or subsidised) performance, nearly across the board. When we asked for an overall rating for the performance, amateur work had a small but statistically significant lower mark than professional work, though all ratings were quite high. (See figure 8.) These seems largely to be due to fewer top marks pulling down the average. We turned to the focus groups to tease this difference out. They said that they thought of amateur performance as more unreliable; performances were, as one focus group member put it, ‘hitty missy’. When they were good, what was impressive about them was that they were able to achieve a near-professional standard. One focus group participant offered a typical evaluation: “If I didn’t know I would swear I was watching a professional performance because they were that good.” (Of course, no one would need to say such a thing about a professional performance.) But when amateur performances were bad, they could be quite dire indeed. The attraction seemed to be the impressiveness of watching people for whom this was not their profession give their all, push themselves, and achieve remarkable things. There was a desire to support the local community and actors starting out, and there was a feeling that it represented better value for money. One focus group participant said:
It is nice to go to the Theatre Royal or the Empire in Sunderland but the tickets are about £40 or more if you want a decent seat. You go to an amateur it’s half, less that half price. You still have a good performance not so polished but they put everything into it.

22
Figure 8. Overall evaluation of performances
But the main attraction of amateur theatre seems to be the direct connection between the audience and the performers (who are just ‘people like us’). This was not often expressed in terms of creating a community within the audience, though you could certainly see how analysts might interpret it that way. Rather, it was a question of seeing a person who, though like them, is doing the job of a professional. There is a sense of being impressed at the level of work the performers are putting in. One focus group member explained that, in a commercial or subsidised context, a certain level of professionalism on the performer’s part was expected and thus not really interesting. But for amateurs, it was different. ‘I find it amazing that people who have other things going on in their lives, it’s not there main job can remember all those words,’ they said. This interest in watching the labour of performers was not confined to the amateur sector. Many of the comments on the survey explicitly refer to the spectator’s pleasure in watching performers’ extraordinary craft of the performers: both their level of effort and the results they achieve. One survey respondent named Liz Humby, on her own initiative, decided to email us to further describe her experience at the theatre. Her email is worth quoting in length both because of her clarity in describing her experience and motivation, and the degree to which it resembles a number of other descriptions we collected:
My partner and I have season tickets to watch Newcastle United and go every other week during the football season. I go to the theatre intermittently, while he does not, but we both go to see live music and comedy. I had a spare ticket for Mathew Bourne's Swan Lake (one of my favourite theatre productions). To my surprise my partner Andrew offered to come with me, although I was very hesitant as to whether he would enjoy it. He absolutely loved it, and talked about it for several days afterwards. A few days later we watched another abysmal football match at St. James's park. At the end Andrew turned to me and said how for a similar amount of money we had watched a whole company of such talented dancers, as well as the
The performance The experience in general The venue
Amateur Commercial Subsidised
Good
Very good (6 on 6-‐point scale)
(5 on 6-‐point scale)

23
inspiring visual scenery, yet that day we had watched such overpaid footballers putting in a lack of effort. He questioned why we rarely go to the theatre, yet unthinkingly go to the football every other week. Straight from the match he marched me down to the theatre to buy more tickets. We ended up joining as friends of the theatre and bought a fortunes worth of tickets for throughout the year, starting with Pygmalion the following week.9
This comparison between the value of attending theatre and attending other major public cultural events—popular music concerts, but especially home matches of the beloved Newcastle United F.C.—was also a common trope. Those who responded to our survey or joined our focus groups, unsurprisingly, tended to prefer theatre and dance to football and concerts. Of course, we cannot say what NUFC spectators who never attend theatre would have said. A variation on this love of labour developed in the focus groups was an emphasis on physical closeness between the performers and spectators and, in particular, on the audience’s ability to see details of the actors’ facial expressions. That proximity was highly valued by our focus group members, and enhanced the feeling of connection between performer and audiences. This is part of why many focus groups preferred smaller, more intimate venues, whether they were subsidised or amateur.
Factor analysis In order to get a better handle on this multitude of data, we subjected the answers to these questions to a statistical factor analysis. We attempted to see if we could identify the set of characteristics that seem to contribute to audience members’ positive experience at a piece of theatre. Through this analysis, we identified two factors, each of which is a particular weighted blend of answers to those two questions about experience. (The specifics of what makes up each blend is below as Appendix E.) The first factor is primarily concerned mostly with the audience’s emotional, dramatic and aesthetic engagement with the performance. It measures, amongst other things, that the performance was impressive, inspiring, worth thinking and talking about again, and skillful. This category includes both dramatic quality (‘I was involved with the world of the performance,’ ‘I was captivated by the way the story was told’) and the skill of the artists (‘the play was well directed,’ ‘I enjoyed the form of the performance (acting, design, etc.)’), even though many art theoretical ideas about the way that audiences process performances separate these as different artistic functions.10 The second is more about having a good time without thinking too hard – it measures that performances were relaxing, not confrontational, good fun, not challenging, undemanding, and so on.
9 Liz Humby, email to the author [JE], 28 May 2014. Used with permission of Ms. Humby. 10 It should be noted that questions of ‘relevance’ – either for the particular audience member or for society as a whole – were a part of this factor, but were far less important than a performance’s emotional appeal or dramatic potency.

24
One needs to give names to these statistical clusters in order to refer to them, of course, but one should not confuse the name with the thing described by it. At first, we referred to the first factor as Engagement and the second as Fun. But, in an effort not to oversimplify these factors and make them into caricatures of themselves, we will more refer to them as the ‘E Factor’ and the ‘F Factor.’ The interesting and important finding is that, while there is only a small difference between commercial and subsidised work in terms of the E factor, there is a noticeable difference between them in terms of the F factor.11 Figure 9 graphs each survey respondent who attended commercial or subsidised theatre or dance in terms of the E factor (horizontal axis) and the F factor (vertical axis). The red squares indicate commercial performance, and the green triangles indicate subsidised.12 To make it clearer, Figure 10 shows the same information removing s surveys responding to the production of Matthew Bourne’s Swan Lake, which though technically a commercial product, seems
Figure 9. Audience responses to commercial and subsidised theatre and dance, measured by E Factor and F Factor
to be a bit of a hybrid. There is quite a bit of overlap, certainly, and we should perhaps ask questions about those performances that tend to generate experiences in that zone of overlap. But it does seem that we have, in the F factor, identified a metric that can starts to differentiate between the experience of subsidised and commercial theatre. It is also worth noticing that this difference grows stronger as
11 While averages are not, perhaps, the best way to compare these, it will give a sense. The average E Factor for subsidised work is 94.5. For commercial work, it is 91.1. The average F factor for subisdised work is 1.7. For commercial work, it is 9.6. (If Swan Lake is excluded from the commercial work, the commercial numbers go to an E Factor average of 86.4 and an F factor average of 11.8.) 12 For clarity’s sake, this chart does not include audiences for amateur theatre, which will be added in a later chart.
25
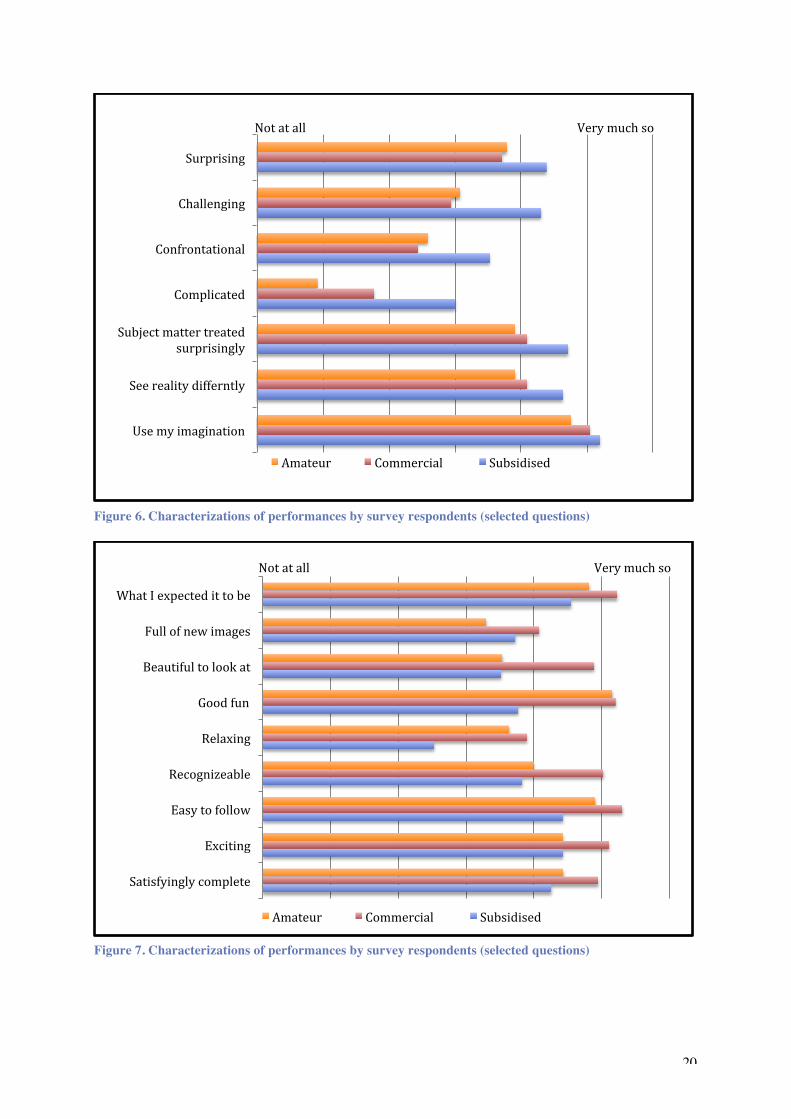
the E Factor—which seems to be a more general measure of what attracts audiences to a performance—goes up. If the E Factor is not particularly high, the differentiation between high and low F Factors does not seem to come into play. Clearly, the terms ‘subsidised’ and ‘commercial’ are imprecise terms, as the Swan Lake case demonstrates. There are performances which may play commercial venues, but have received subsidy in the past. Can we actually tell the difference between them on the basis of audience experiences they generate? Would that be a better way of defining what ‘subsidised’ and ‘commercial’ feel like, to an audience? Does this chart actually show two patterns, not one?
Figure 10. Audience responses to commercial and subsidised theatre and dance (excluding Swan Lake), measured by E Factor and F Factor.
We cannot be sure, of course, but we want to suggest that it might. By taking the nine productions for which we have the most responses, and breaking them down into two groups, we can see the emergence of two different patterns that resembles, but is not identical to, that between subsidised and commercial theatre.13 This refined distinction is a more useful way of understanding what we mean by the different social functions that we expect to be occupied by commercial and subsidised theatre. Figure 11, below, shows the E- and F-factors for four of these nine productions: two commercial, two amateur. While of course there is considerable variation, the responses to these productions do seem to form a pattern: as ‘Engagement’ increases, ‘Fun’ slowly rises, and the graph seems to concentrate
13 For technical reasons, this group of nine does not include any of the performances at Live Theatre. If they had been included, some Live Theatre productions would be part of the top 9. See below, pp. 27-28.
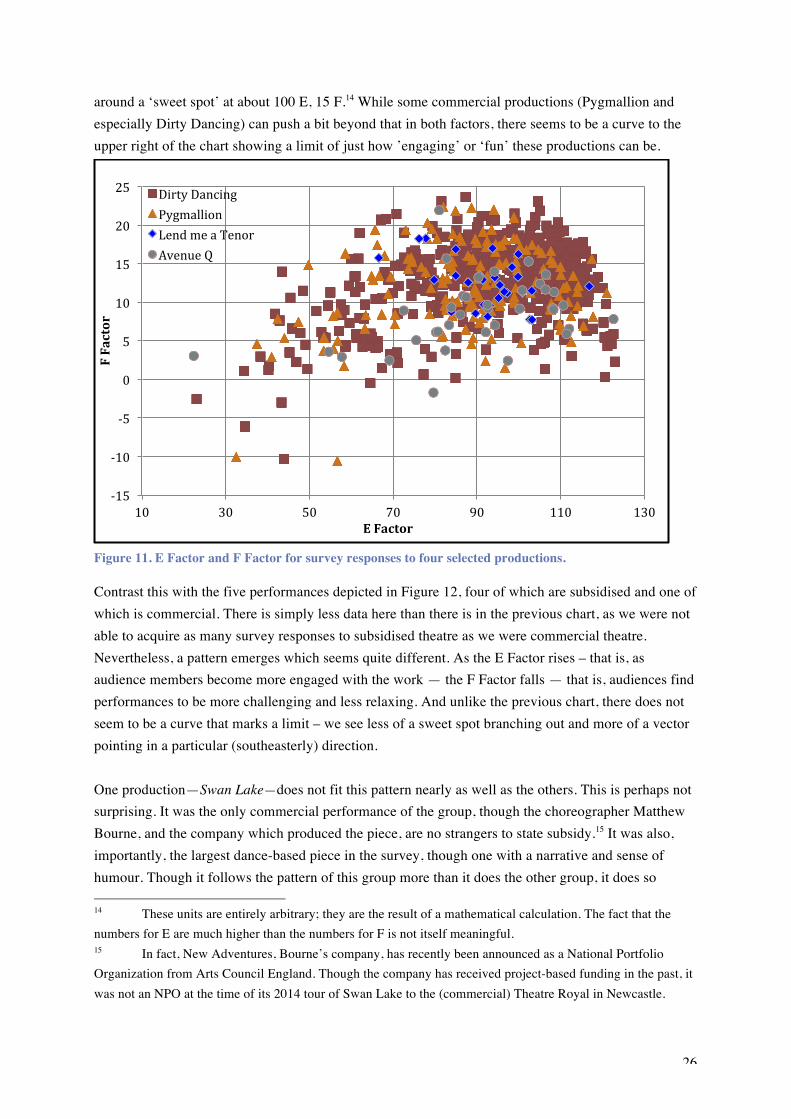
26
around a ‘sweet spot’ at about 100 E, 15 F.14 While some commercial productions (Pygmallion and especially Dirty Dancing) can push a bit beyond that in both factors, there seems to be a curve to the upper right of the chart showing a limit of just how ’engaging’ or ‘fun’ these productions can be.
Figure 11. E Factor and F Factor for survey responses to four selected productions.
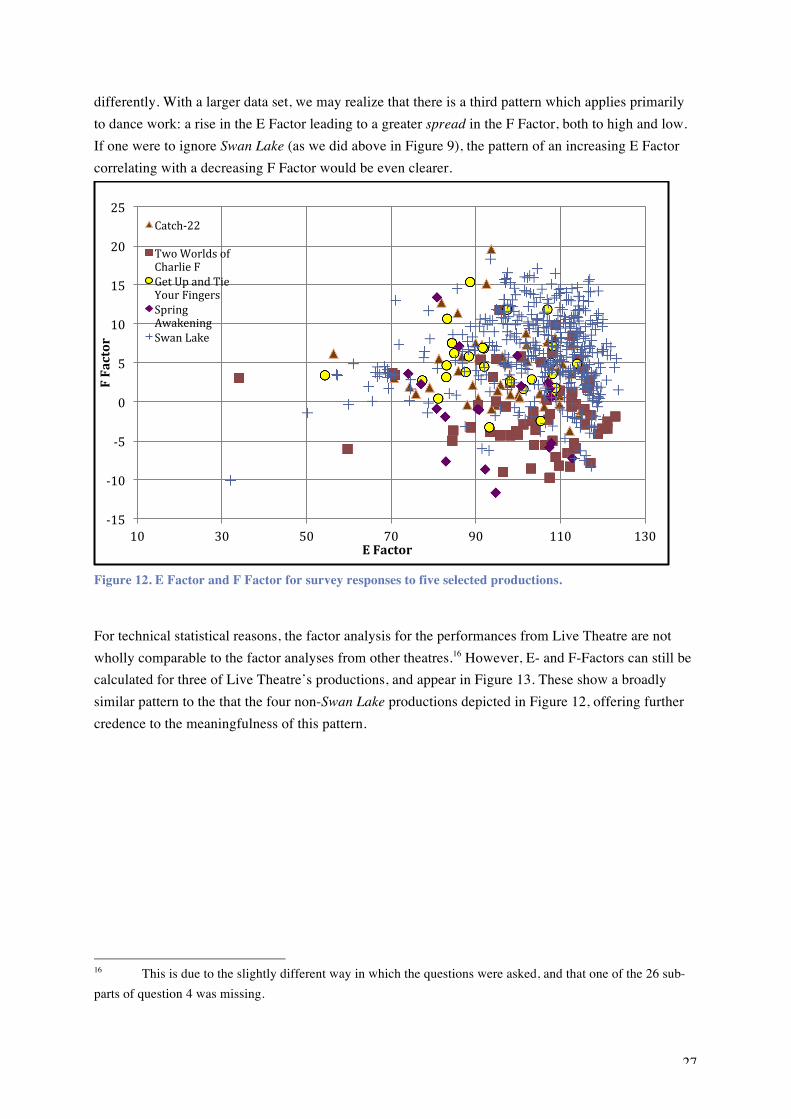
Contrast this with the five performances depicted in Figure 12, four of which are subsidised and one of which is commercial. There is simply less data here than there is in the previous chart, as we were not able to acquire as many survey responses to subsidised theatre as we were commercial theatre. Nevertheless, a pattern emerges which seems quite different. As the E Factor rises – that is, as audience members become more engaged with the work — the F Factor falls — that is, audiences find performances to be more challenging and less relaxing. And unlike the previous chart, there does not seem to be a curve that marks a limit – we see less of a sweet spot branching out and more of a vector pointing in a particular (southeasterly) direction. One production—Swan Lake—does not fit this pattern nearly as well as the others. This is perhaps not surprising. It was the only commercial performance of the group, though the choreographer Matthew Bourne, and the company which produced the piece, are no strangers to state subsidy.15 It was also, importantly, the largest dance-based piece in the survey, though one with a narrative and sense of humour. Though it follows the pattern of this group more than it does the other group, it does so 14 These units are entirely arbitrary; they are the result of a mathematical calculation. The fact that the numbers for E are much higher than the numbers for F is not itself meaningful. 15 In fact, New Adventures, Bourne’s company, has recently been announced as a National Portfolio Organization from Arts Council England. Though the company has received project-based funding in the past, it was not an NPO at the time of its 2014 tour of Swan Lake to the (commercial) Theatre Royal in Newcastle.
-‐15
-‐10
-‐5
0
5
10
15
20
25
10 30 50 70 90 110 130
F Factor
E Factor
Dirty Dancing Pygmallion Lend me a Tenor Avenue Q
27
differently. With a larger data set, we may realize that there is a third pattern which applies primarily to dance work: a rise in the E Factor leading to a greater spread in the F Factor, both to high and low. If one were to ignore Swan Lake (as we did above in Figure 9), the pattern of an increasing E Factor correlating with a decreasing F Factor would be even clearer.
Figure 12. E Factor and F Factor for survey responses to five selected productions.
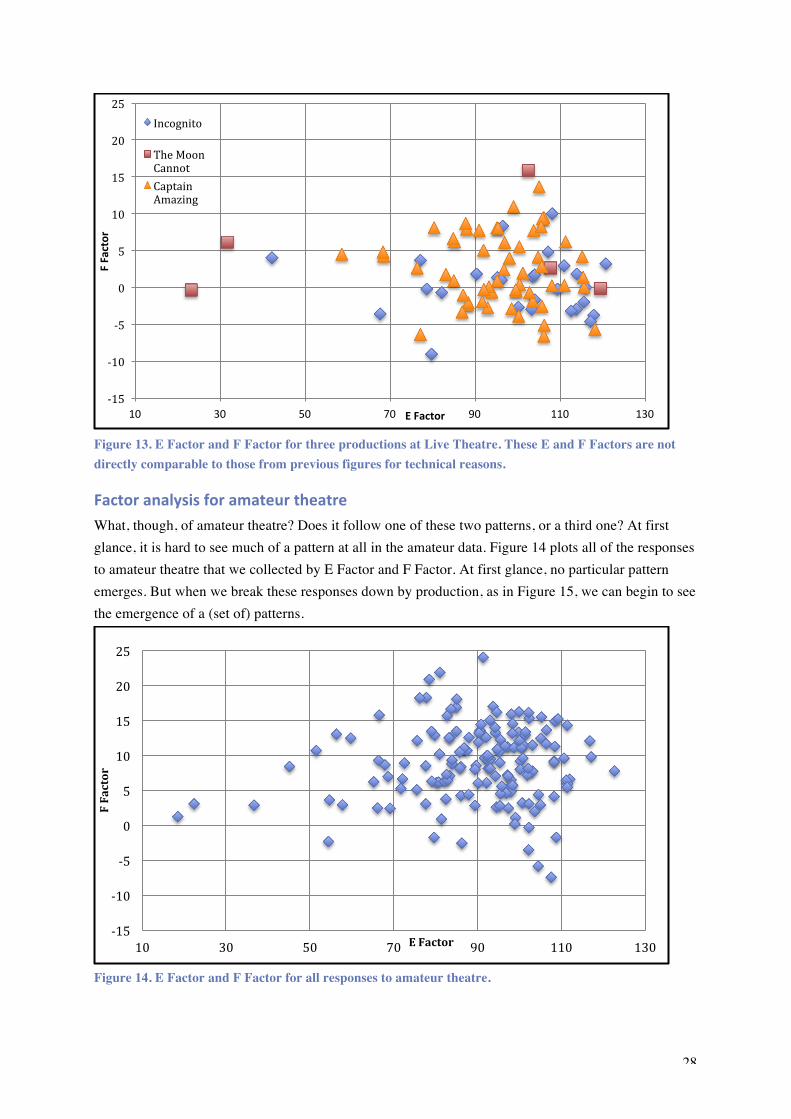
For technical statistical reasons, the factor analysis for the performances from Live Theatre are not wholly comparable to the factor analyses from other theatres.16 However, E- and F-Factors can still be calculated for three of Live Theatre’s productions, and appear in Figure 13. These show a broadly similar pattern to the that the four non-Swan Lake productions depicted in Figure 12, offering further credence to the meaningfulness of this pattern.
16 This is due to the slightly different way in which the questions were asked, and that one of the 26 sub-parts of question 4 was missing.
-‐15
-‐10
-‐5
0
5
10
15
20
25
10 30 50 70 90 110 130
F Factor
E Factor
Catch-‐22
Two Worlds of Charlie F Get Up and Tie Your Fingers Spring Awakening Swan Lake
28
Figure 13. E Factor and F Factor for three productions at Live Theatre. These E and F Factors are not directly comparable to those from previous figures for technical reasons.
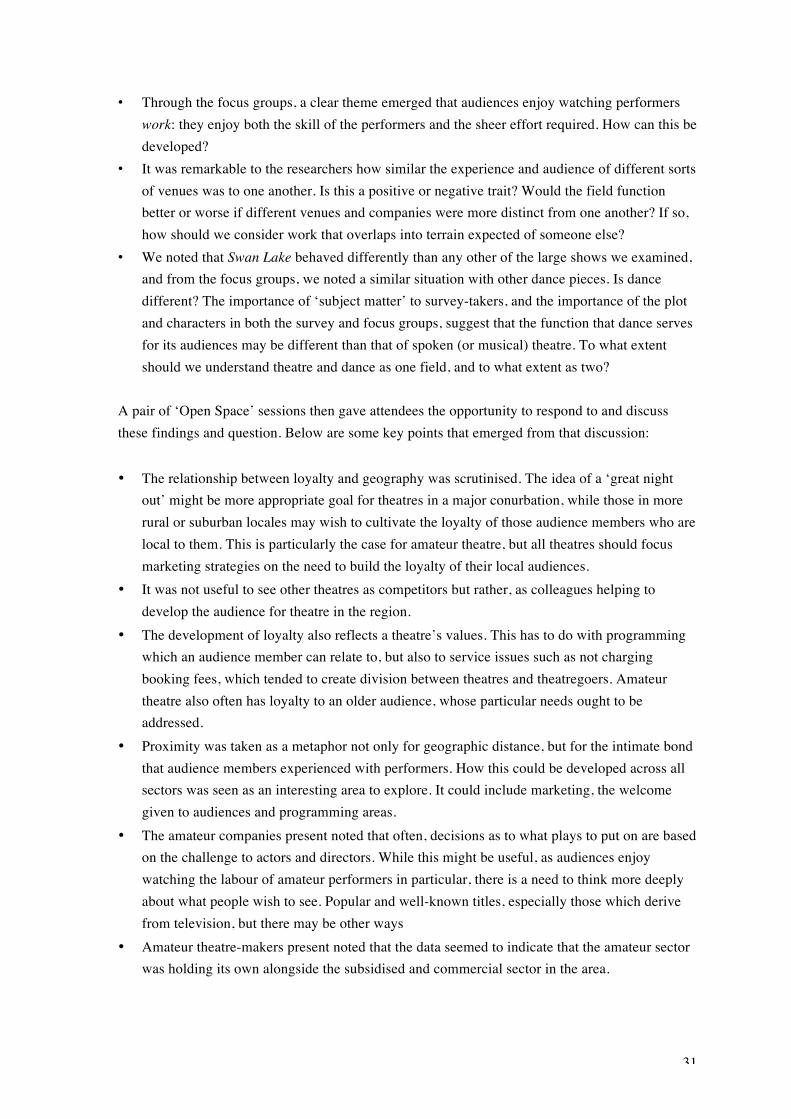
Factor analysis for amateur theatre What, though, of amateur theatre? Does it follow one of these two patterns, or a third one? At first glance, it is hard to see much of a pattern at all in the amateur data. Figure 14 plots all of the responses to amateur theatre that we collected by E Factor and F Factor. At first glance, no particular pattern emerges. But when we break these responses down by production, as in Figure 15, we can begin to see the emergence of a (set of) patterns.
Figure 14. E Factor and F Factor for all responses to amateur theatre.
-‐15
-‐10
-‐5
0
5
10
15
20
25
10 30 50 70 90 110 130
F Factor
E Factor
Incognito
The Moon Cannot Captain Amazing
-‐15
-‐10
-‐5
0
5
10
15
20
25
10 30 50 70 90 110 130
F Factor
E Factor

29
Figure 15. E Factor and F Factor for responses to five amateur theatre productions.
It appears that most amateur productions are following the first pattern, as laid out in Figure 10, of a gradually increasing F Factor correlating with a rise in the E Factor.17 This is the case for four of the five productions depicted in Figure 14. One production, however—Woman in Mind—seems to follow the second pattern, as laid out in Figure 11. It seems that different sorts of amateur productions can aspire to different models of the professional audience experience. Our sample size is small, but it is worth noting that when they attempt to do so, they tend to create a wider range of audience experiences than does the professional theatre.
Key findings From the perspective of those who make, distribute and market theatre, we can point to six key findings of this research. First, most theatregoers tend find the same sorts of value in a performance, the same set of things in a performance. These are the set of criteria we have brought together in the E factor. That these measures—impressiveness, skill, inspiration, encouraging one to talk and think about it afterwards—are relatively consistent between genres and forms does not mean that the means of achieving them
17 It is worth noting that amateur theatre does have a slightly lower E Factor than commercial or subsidised work. This perhaps reflects the same information depicted in Figure 8 that there is a standard of professional quality which amateur work struggles to achieve. Certainly, however, there are individual amateur productions that are more highly regarded than individual commercial or subsidised productions.
-‐15
-‐10
-‐5
0
5
10
15
20
25
10 30 50 70 90 110 130
F Factor
E Factor
Lend me a Tenor
Avenue Q
Woman in Mind
The Steamie
Murder in Play

30
will be consistent, of course, but it is worth noting that, at its best, the experience of theatregoing is more like itself than like anything else. Second, the key elements that draw theatregoers to attend are the subject matter, the perceived quality of the performance, and their loyalty to a community or a particular theatre. The nature of that ‘quality’ is best summarised by the E- and F-factors, but these factors seem remarkably consistent as draws. Third, there is a real and observable difference between comforting performances and challenging ones. We have expressed this in terms of the F Factor. This difference is related to the difference between subsidised and commercial performance, but not precisely so. This raises questions about those subsidised and commercial productions which seem to stray from where others are, and about the aspirations that amateur theatre has for its audiences. It also means that we cannot show any clear, direct and simple alignment between subsidy and either innovation or quality. Fourth, audiences overwhelmingly attend in pairs. Subsidised theatre, however, attracts a larger number of solo visitors, and amateur theatre attracts notably larger groups. Fifth, while audiences are price-sensitive in choosing what performances to attend, their concern is far more about value than price as such. Audiences are willing to pay more for particularly excellent work, but are frustrated by unexplained extra fees or when they pay more for substandard work. They also appreciate the excellent value of the lower prices of amateur productions. Sixth and finally, audiences seem remarkably open in their tastes. While some theatregoers attended more than others, regular attenders seemed happy to attend a wide variety of performances in a range of settings. While amateur theatre does have a particular audience, we do not see the segmentation of the audience based on taste and theatrical genre that other observers have seen in other places and times.
Responses We presented these findings to a group of theatre professionals, artists, marketers, amateur theatre-makers, cultural policy experts, Arts Council officers and members of the general public at a public event at Dance City in Newcastle on 18th July 2014. After presenting the above findings, we suggested six questions to consider:
• What is the balance between loyalty to a particular company and the audience’s experience on the evening? Are there short term and long-term business models here, and how can theatres negotiate them?
• Are novelty and innovation, in fact, important? If so, for whom do they matter? While challenging work was valued by some audience members, innovation and newness themselves were not values the audience seemed to hold.
31
• Through the focus groups, a clear theme emerged that audiences enjoy watching performers work: they enjoy both the skill of the performers and the sheer effort required. How can this be developed?
• It was remarkable to the researchers how similar the experience and audience of different sorts of venues was to one another. Is this a positive or negative trait? Would the field function better or worse if different venues and companies were more distinct from one another? If so, how should we consider work that overlaps into terrain expected of someone else?
• We noted that Swan Lake behaved differently than any other of the large shows we examined, and from the focus groups, we noted a similar situation with other dance pieces. Is dance different? The importance of ‘subject matter’ to survey-takers, and the importance of the plot and characters in both the survey and focus groups, suggest that the function that dance serves for its audiences may be different than that of spoken (or musical) theatre. To what extent should we understand theatre and dance as one field, and to what extent as two?
A pair of ‘Open Space’ sessions then gave attendees the opportunity to respond to and discuss these findings and question. Below are some key points that emerged from that discussion: • The relationship between loyalty and geography was scrutinised. The idea of a ‘great night
out’ might be more appropriate goal for theatres in a major conurbation, while those in more rural or suburban locales may wish to cultivate the loyalty of those audience members who are local to them. This is particularly the case for amateur theatre, but all theatres should focus marketing strategies on the need to build the loyalty of their local audiences.
• It was not useful to see other theatres as competitors but rather, as colleagues helping to develop the audience for theatre in the region.
• The development of loyalty also reflects a theatre’s values. This has to do with programming which an audience member can relate to, but also to service issues such as not charging booking fees, which tended to create division between theatres and theatregoers. Amateur theatre also often has loyalty to an older audience, whose particular needs ought to be addressed.
• Proximity was taken as a metaphor not only for geographic distance, but for the intimate bond that audience members experienced with performers. How this could be developed across all sectors was seen as an interesting area to explore. It could include marketing, the welcome given to audiences and programming areas.
• The amateur companies present noted that often, decisions as to what plays to put on are based on the challenge to actors and directors. While this might be useful, as audiences enjoy watching the labour of amateur performers in particular, there is a need to think more deeply about what people wish to see. Popular and well-known titles, especially those which derive from television, but there may be other ways
• Amateur theatre-makers present noted that the data seemed to indicate that the amateur sector was holding its own alongside the subsidised and commercial sector in the area.

32
• Many participants noted how rare and valuable it was to discuss these issues with such a broad range of the theatre community, including those who work in both the professional and amateur sectors. While audiences may perceive the theatre field as a whole, those who work in it are often too busy to step back and build links across the sector. This kind of research, stepping back from individual productions or companies, offers a valuable opportunity to do just that.
Of course, these thoughts represent only the initial reactions of those who were present on the day. We hope that the findings of this study will continue to influence the work of Tyneside theatremakers, programmers, and cultural policymakers in the months and years to come. As we continue to analyse these data, both on their own and in comparison with the other data collected from around Europe, we hope to remain engaged with the local theatre community in order to share further findings and hear more of what is happening on the ground. This meeting represented the beginning of a conversation, not its end.
Conclusion Theatre audiences are far from monolithic. Each individual audience member has their own experience of each individual performance they attend. No performance is quite like any other, no spectator is quite like any other, and thus no single audience experience is quite like any other. This is, of course, what keeps us coming: the possibility (even if unrealized) of experiencing something powerful that we never have before. As cultural sociologist Nathalie Heinich puts it, it is the ‘singularity’ of an artwork or a performance that makes it interesting and relevant to us.18 She is rightly skeptical of the effort of any sociological methods that attempts to capture that singularity. We share her skepticism, and do not wish to claim that these surveys or focus groups have captured the essential, singular core of the artistic experience. In that this core exists, it must be so infinitely variable as to easily escape from any statistical net in which we would try to catch it. We cannot here describe the nature of theatre. Our aim is more modest, but it is more useful for it. While audience experiences of the arts are singular, that does not mean that they are random or unpredictable. In this study, we hope to have demonstrated some of the patterns that emerge when these singular responses are examined in bulk, and we hope to have come up with a set of useful means of categorising and organizing them. We have done so not on the basis of theories of what the arts ought to act like that aesthetic philosophers or cultural policy advocates have put forward, but rather on the basis of how audiences themselves describe their own experience. 18 See Natalie Heinich, Le Triple Jeu De l’Art Contemporain, Paris: Editions de Minuit, 1998, or Rudi Laermans, ‘Natalie Heinich, sociologist of the arts: a critical appraisal,’ Boekmancahier 12 (2000), pp. 389-402.
33
In listening to audience voices, we have seen patterns. There are ways in which these hundreds of singular experiences of theatergoing resemble each other, and there are ways in which we can find differences between the experiences of commercial, subsidised, and amateur work. Of course there are outliers and exceptions; these are patterns, not physical laws. But these patterns are observable and demonstrable. If theatre and dance are not just art forms but also social practices, these patterns are meaningful and important. They can help us better understand the ways in which theatre and dance are valued by their audiences and the roles these artistic practices play in a modern, democratic society such as Britain. This may have implications for the various ‘cases for the arts’ related to public investment. Our findings suggest it is hard to make a special case for the effects of subsidized performances on audiences, as opposed to commercial or amateur, but they also suggest that there is indeed a continuum of practice across those definitions which engages people, and that people are willing, even keen, to move across that continuum. The need to draw out the connections between the sectors when making the case, to better reflect audience perspectives, is perhaps something which future research should consider. The effects on people are a good fit with a holistic case for arts investment, but for arts investment that stimulates work and audience experiences beyond the immediately subsidized sector. It is our hope that this research will help theatre artists better understand the artistic and institutional context in which work will be perceived, whether they intend it to or not. We hope that it will help those charged with managing the public’s relationship with theatre and dance get a better sense of what audiences might expect and desire, so that communication can be more accurate, relevant and effective. We hope it will give audiences a better sense of the theatre world around them and its shape. We hope it will encourage our academic colleagues in theatre studies to embrace a mix of quantitative and qualitative methods in examining the audience. And finally, we hope that it will allow funders, politicians, cultural policy officials and advocates for the arts to make a more specific, accurate and helpful case for the important functions that theatre and dance serve in contemporary British society.
Acknowledgements A project this large necessarily requires the participation of a great many people. The project has been funded by the Arts and Humanities Research Council’s Cultural Value Project, and administered by the research office of the Royal Central School of Speech and Drama, University of London. We are grateful for their support. The project was hosted by Natalie Querol of the Empty Space in Dance City, Newcastle, without whose support, guidance and deep understanding of the local theatre and dance community this project would not have been possible. We would particularly like to thank all of the members of the Tyneside theatre community who facilitated our survey and focus group work and generously allowed us into their lobbies and bars to speak with their audiences. In particular, we would like to think Nina Bryne, Sally Hoban, Jo Kirby, Maggie Watson, Rebecca Preston, Ken Allen, Ray Lowry, Claire Cockroft, and Kate Cradock. We would like to thank all of the students and theatre

34
volunteers who helped us administer the survey, and all of our focus group participants who gave so generously of their time for this project. Thanks also to Kay Hepplewhite of Northumbria University, Prof Eric Cross of Newcastle University, Fiona Fitzpatrick of Streetwise Opera, Jim Rice of the Little Theatre, and Oliver Mantell of The Audience Agency. Jo Blackett was our focus group assistant, Gaz Dick took our photographs, and we had statistical help from Robert Peacock and Samuel James. Our methods were developed by the Project on European Theatre Systems under the leadership of Prof Hans van Maanen of the University of Groningen, the Netherlands. The whole of STEP has been important in shaping this work, and we would particularly like to thank Hedi-Liis Toome, Antine Zijstra, Dr Quirijn van den Hoogen, Dr Louise Hansen and Prof Anneli Saro. Our thanks to all of Tyneside theatre and cultural professionals who attended our launch event. Finally, we owe a debt of thanks to the 1815 people who took the time to complete our questionnaire and were so generous in describing their experiences for us. Without them, we would literally have nothing to say.
Appendix A: Performances studied Performance Surveyed Venue Category The Steamie The People's Theatre Amateur Woman in Mind The People's Theatre Amateur Lend me a Tenor Tynemouth Priory Th. Amateur February 11th 1963 & Road Postures
Dance City Subsidised
Motherland Dance City Subsidised The Two Worlds of Charlie F Theatre Royal Subsidised Pygmalion Theatre Royal Commercial Swan Lake Theatre Royal Commercial A Midsummer Night's Dream Theatre Royal Commercial The Comedy of Errors Theatre Royal Commercial Dirty dancing Theatre Royal Commercial Avenue Q The Customs House Amateur Encore The Customs House Commercial Get up & Tie Your Fingers The Customs House Subsidised The Little Mermaid The Customs House Commercial Jimmy Cricket & Alfie Joey The Customs House Commercial Incognito Live Theatre Subsidised Captain Amazing Live Theatre Subsidised The Moon Cannot Be Stolen Live Theatre Subsidised Alphabetti Soup Alphabetti Spaghetti Subsidised Sarah Millican Homebird Mill Volvo Tyne Theatre Commercial Cape Wrath GIFT Subsidised When We Were Birds GIFT Subsidised Catch-22 Northern Stage Subsidised Spring Awakening Northern Stage Subsidised Murder in Play Westovians, The Pier Pavilion Amateur
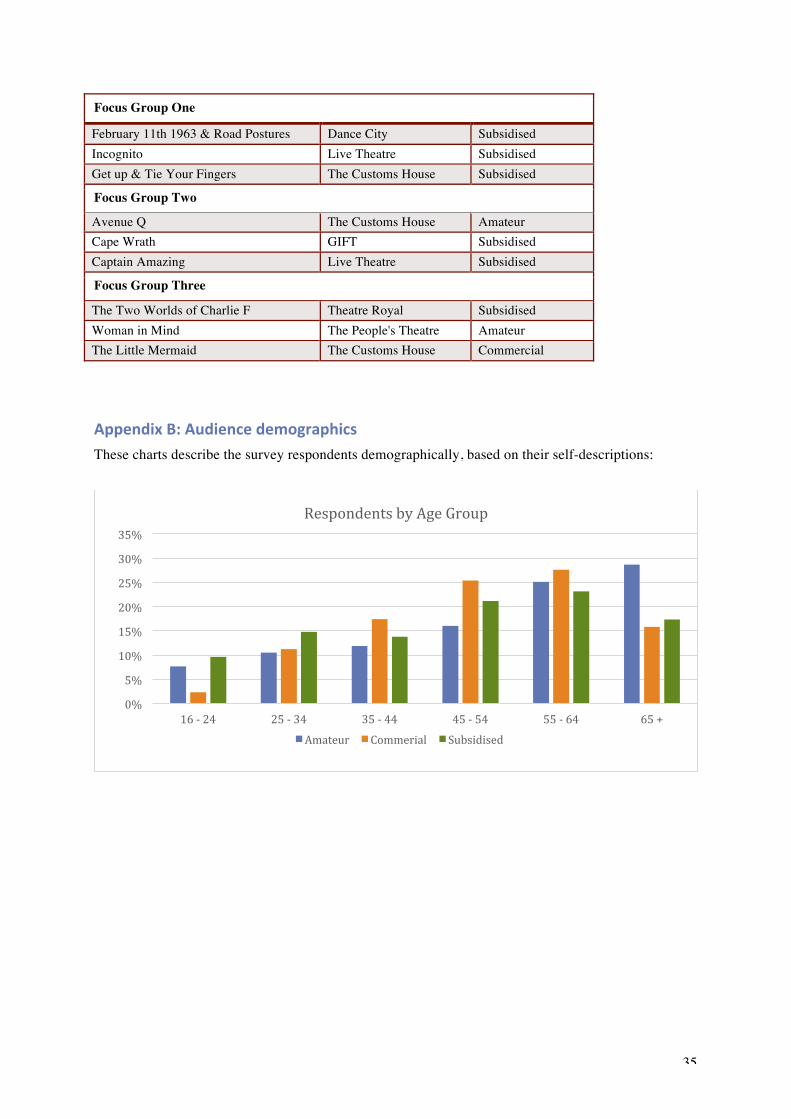
35
Focus Group One
February 11th 1963 & Road Postures Dance City Subsidised Incognito Live Theatre Subsidised Get up & Tie Your Fingers The Customs House Subsidised
Focus Group Two
Avenue Q The Customs House Amateur Cape Wrath GIFT Subsidised Captain Amazing Live Theatre Subsidised
Focus Group Three
The Two Worlds of Charlie F Theatre Royal Subsidised Woman in Mind The People's Theatre Amateur The Little Mermaid The Customs House Commercial
Appendix B: Audience demographics These charts describe the survey respondents demographically, based on their self-descriptions:
0%
5%
10%
15%
20%
25%
30%
35%
16 -‐ 24 25 -‐ 34 35 -‐ 44 45 -‐ 54 55 -‐ 64 65 +
Respondents by Age Group
Amateur Commerial Subsidised
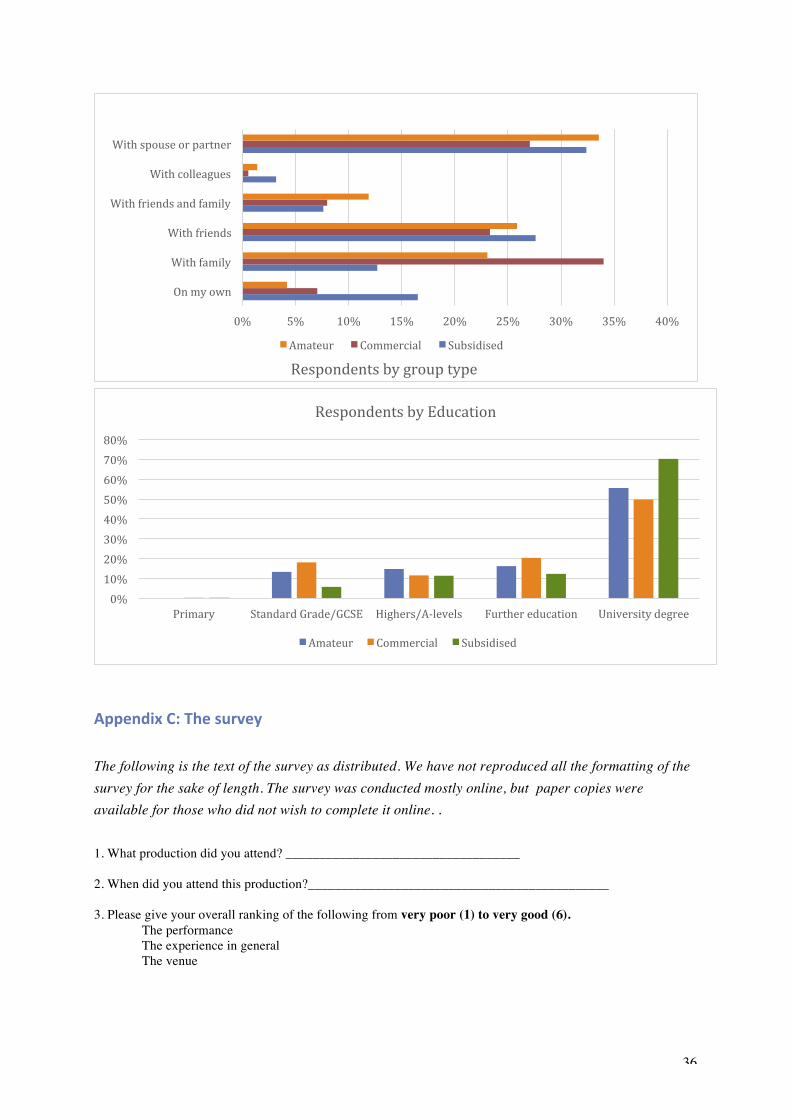
36
Appendix C: The survey The following is the text of the survey as distributed. We have not reproduced all the formatting of the survey for the sake of length. The survey was conducted mostly online, but paper copies were available for those who did not wish to complete it online. . 1. What production did you attend? ___________________________________ 2. When did you attend this production?_____________________________________________ 3. Please give your overall ranking of the following from very poor (1) to very good (6). The performance The experience in general The venue
0% 5% 10% 15% 20% 25% 30% 35% 40%
On my own
With family
With friends
With friends and family
With colleagues
With spouse or partner
Respondents by group type Amateur Commercial Subsidised
0% 10% 20% 30% 40% 50% 60% 70% 80%
Primary Standard Grade/GCSE Highers/A-‐levels Further education University degree
Respondents by Education
Amateur Commercial Subsidised

37
4. Thinking about the performance you saw, please indicate your level of agreement or disagreement with the following statements. Please answer every line. 1- Strongly disagree 2-Disagree 3-Somewhat disagree 4-Somewhat agree 5-Agree 6-Strongly Agree The performance was what I expected it to be. The performance offered more than I thought it would. The performance was about something that I liked. The performance told a story that captivated me. I felt drawn to the world that the performance built. The play made me use my imagination. The performance was well directed/choreographed. The performers (actors, dancers, etc.) performed well. The performance had characters that I found interesting. The play’s subject matter was recognisably presented. The performance made me see reality differently. I enjoyed the forms of the performance (acting, dance, design etc.) I had the sense that the actors and dancers also expected something from me. The subject matter was treated in a surprising way. I experienced what I saw and heard very directly, almost physically. This performance was worth thinking about again after seeing it. This performance was worth talking about with other people after seeing it. 5. Please indicate your level of agreement or disagreement with the following statements. 'I came to the performance...' 1- Strongly disagree 2-Disagree 3-Somewhat disagree 4-Somewhat agree 5-Agree 6-Strongly Agree … because of the music. … because of the subject matter. … because of the choreographer / director. … because of the performers (actors, dancers, etc.) . … because my friends were also coming. … because of the particular dance / theatre company that put on this production. … because of the venue. … because I personally know someone who worked on it. … because I like to see all the performances by this company. … because I heard that it was good. … because of something else, namely: _________________ 6. Please answer the question for every line. We know some of these questions may sound odd, but they are very useful for us. To what extent did you find the performance…
1- Not at all 2- 3- 4- 5- 6-Very much so Complicated? Surprising? Relaxing? Inspiring? Beautiful to look at? Confrontational? Good fun? Boring? Conventional? Recognisable? Full of new images? Socially relevant? Relevant for you personally? Easy to follow? Challenging? Comforting? Satisfyingly complete? Exciting? Superficial?
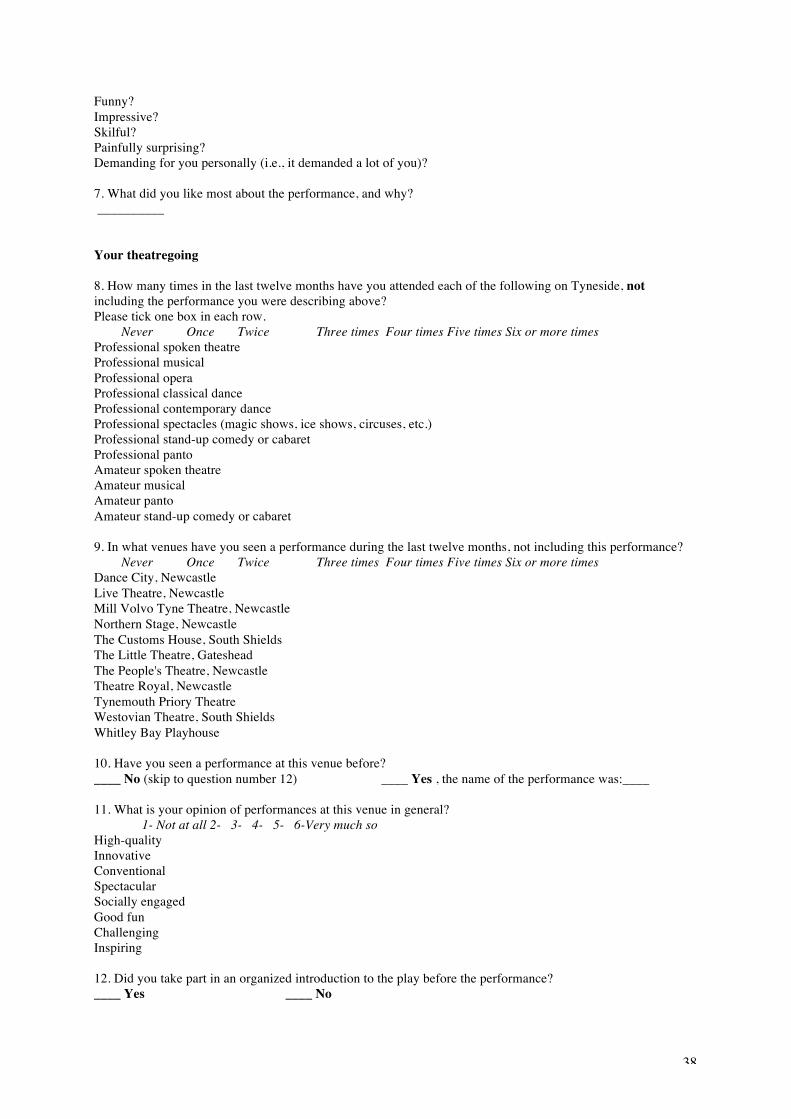
38
Funny? Impressive? Skilful? Painfully surprising? Demanding for you personally (i.e., it demanded a lot of you)? 7. What did you like most about the performance, and why? __________ Your theatregoing 8. How many times in the last twelve months have you attended each of the following on Tyneside, not including the performance you were describing above? Please tick one box in each row. Never Once Twice Three times Four times Five times Six or more times Professional spoken theatre Professional musical Professional opera Professional classical dance Professional contemporary dance Professional spectacles (magic shows, ice shows, circuses, etc.) Professional stand-up comedy or cabaret Professional panto Amateur spoken theatre Amateur musical Amateur panto Amateur stand-up comedy or cabaret 9. In what venues have you seen a performance during the last twelve months, not including this performance? Never Once Twice Three times Four times Five times Six or more times Dance City, Newcastle Live Theatre, Newcastle Mill Volvo Tyne Theatre, Newcastle Northern Stage, Newcastle The Customs House, South Shields The Little Theatre, Gateshead The People's Theatre, Newcastle Theatre Royal, Newcastle Tynemouth Priory Theatre Westovian Theatre, South Shields Whitley Bay Playhouse 10. Have you seen a performance at this venue before? ____ No (skip to question number 12) ____ Yes , the name of the performance was:____ 11. What is your opinion of performances at this venue in general?
1- Not at all 2- 3- 4- 5- 6-Very much so High-quality Innovative Conventional Spectacular Socially engaged Good fun Challenging Inspiring 12. Did you take part in an organized introduction to the play before the performance? ____ Yes ____ No

39
13. Did you participate in a talkback session or organised discussion after the performance? ____Yes ____ No 14. Did you read a programme before the performance? ____ Yes ____ No 15. After the play, did you discuss it with other people? ____ a. Yes, extensively. ____ b. Yes, but not extensively. _____c. No, I didn't discuss it. 16. Please choose one. ____ a.I don’t know how much the ticket cost. ____b. I thought the ticket price was too expensive. ____c. I thought the ticket price was about right. ____d. I thought the ticket price was too cheap. 17. Did you hear or read something about the performance before going to see it? ____ Yes ____ No (please skip to question 19) 18. If yes, where? Please tick all that apply. In the newspapers In a magazine From advertising From a notice on the radio From social media (Facebook, Twitter, etc.) From a blog From an online article From friends, acquaintances or colleagues From the theatre’s brochure From the theatre’s website From a flyer or poster Elsewhere (please specify:____) 19. Did you hear or read something about the play after seeing it? ____Yes ____No (Please skip to question 21) 20. If so, where? Please tick all that apply. (Same choices as question 18) 21. Thinking back over the performance, which of the following ware most important about it to you? Please rank your choices from most important (1) to least important (5). Having an enjoyable time The narrative (or story) The skill of the performers Its relevance to me The visual design 22. To what extent did the venue in which you saw the performance contribute to....
1- Not at all 2- 3- 4- 5- 6-Very much so ...a relaxing evening? ...an enjoyable evening? ...a sociable evening? ...an inspiring evening? Demographics 23. My age is: ______________ 24. Gender: ________________ 25. Where do you live? ____ Newcastle ____ Gateshead ____ South Tyneside ____ North Tyneside ____ Elsewhere in the Northeast ____ Elsewhere in the UK ____ Outside the UK
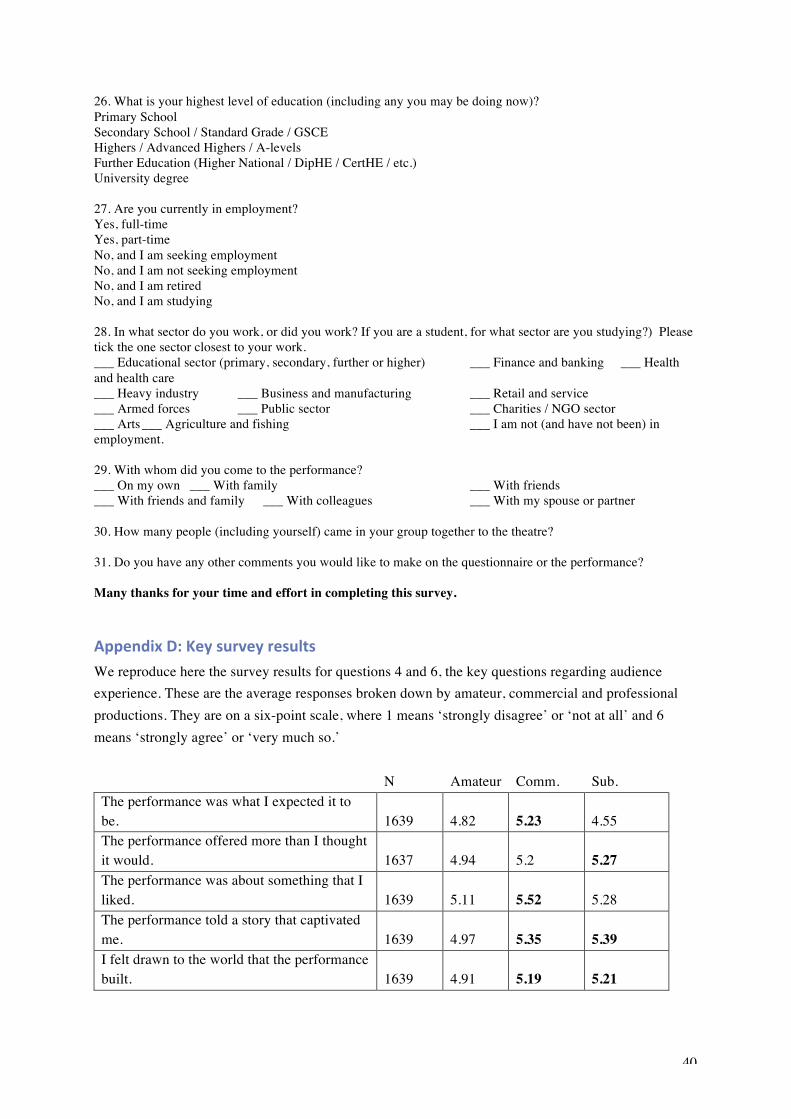
40
26. What is your highest level of education (including any you may be doing now)? Primary School Secondary School / Standard Grade / GSCE Highers / Advanced Highers / A-levels Further Education (Higher National / DipHE / CertHE / etc.) University degree 27. Are you currently in employment? Yes, full-time Yes, part-time No, and I am seeking employment No, and I am not seeking employment No, and I am retired No, and I am studying 28. In what sector do you work, or did you work? If you are a student, for what sector are you studying?) Please tick the one sector closest to your work. ___ Educational sector (primary, secondary, further or higher) ___ Finance and banking ___ Health and health care ___ Heavy industry ___ Business and manufacturing ___ Retail and service ___ Armed forces ___ Public sector ___ Charities / NGO sector ___ Arts ___ Agriculture and fishing ___ I am not (and have not been) in employment. 29. With whom did you come to the performance? ___ On my own ___ With family ___ With friends ___ With friends and family ___ With colleagues ___ With my spouse or partner 30. How many people (including yourself) came in your group together to the theatre? 31. Do you have any other comments you would like to make on the questionnaire or the performance? Many thanks for your time and effort in completing this survey.
Appendix D: Key survey results We reproduce here the survey results for questions 4 and 6, the key questions regarding audience experience. These are the average responses broken down by amateur, commercial and professional productions. They are on a six-point scale, where 1 means ‘strongly disagree’ or ‘not at all’ and 6 means ‘strongly agree’ or ‘very much so.’
N Amateur Comm. Sub. The performance was what I expected it to be. 1639 4.82 5.23 4.55 The performance offered more than I thought it would. 1637 4.94 5.2 5.27 The performance was about something that I liked. 1639 5.11 5.52 5.28 The performance told a story that captivated me. 1639 4.97 5.35 5.39 I felt drawn to the world that the performance built. 1639 4.91 5.19 5.21

41
The play made me use my imagination. 1638 4.76 5.05 5.2 The performance was well directed/choreographed. 1637 5.31 5.63 5.43 The performers (actors, dancers, etc.) performed well. 1638 5.51 5.75 5.74 The performance had characters that I found interesting. 1637 5.2 5.51 5.51 The play’s subject matter was recognisably presented. 1639 5.27 5.52 5.39 The performance made me see reality differently. 1638 3.92 4.1 4.64 I enjoyed the forms of the performance (acting, dance, design etc.) 1638 5.25 5.54 5.41 I had the sense that the actors and dancers also expected something from me. 1636 3.92 4.2 4.21 The subject matter was treated in a surprising way. 1638 4.11 4.46 4.72 I experienced what I saw and heard very directly, almost physically. 1636 4.17 4.68 4.72 This performance was worth thinking about again after seeing it. 1551 4.77 5.13 5.45 This performance was worth talking about with other people after seeing it. 1638 5.13 5.5 5.55
N Amateur Comm. Sub. Complicated? 1646 1.92 1.78 3.01 Surprising? 1633 3.79 3.72 4.39 Relaxing? 1638 3.64 3.9 2.53 Inspiring? 1633 3.64 4.58 4.53 Beautiful to look at? 1631 3.54 4.89 3.52 Confrontational? 1632 2.59 2.44 3.53 Good fun? 1625 5.16 5.21 3.77 Boring? 1635 1.32 1.26 1.42 Conventional? 1628 2.33 2.5 2.05 Recognisable? 1629 4 5.03 3.83 Full of new images? 1620 3.3 4.08 3.73 Socially relevant? 1628 3.92 4.07 4.83 Relevant for you personally? 1622 3.39 3.73 3.85 Easy to follow? 1632 4.91 5.31 4.43 Challenging? 1632 3.08 2.95 4.31 Comforting? 1619 2.91 3.61 2.56 Satisfyingly complete? 1632 4.44 4.95 4.26 Exciting? 1625 4.13 5.11 4.43 Superficial? 1621 2.11 1.9 1.72 Funny? 1630 5.29 4.48 4.05

42
Impressive? 1632 4.87 5.31 5.05 Skilful? 1620 5.02 5.34 5.19 Painfully surprising? 1585 2.5 2.31 3.69 Demanding for you personally (i.e., it demanded a lot of you)? 1608 2.07 1.99 3.33
Appendix E: Component matrix defining the ‘E Factor’ and ‘F Factor’
E Factor
weighting
F Factor
weighting
The performance was what I expected it to be. .360 .434
The performance offered more than I thought it would. .740 .033
I liked the play’s subject matter. .613 .310
I was captivated by the way the story was told. .821 .162
I was involved with the world of the performance. .809 .064
The play made me use my imagination. .739 .010
The performance was well directed. .755 .233
The actors performed well. .714 .205
I found the behaviour of the characters interesting. .789 .091
The play’s subject matter was recognisably presented. .608 .142
The performance made me see reality differently. .652 -.291
I enjoyed the forms of the performance (acting, design etc.) .756 .118
I had the sense that the actors also expected something from me. .605 -.226
The subject matter was treated in a surprising way. .643 -.295
I experienced what I saw and heard very directly, almost physically. .670 -.192
This performance was worth thinking about again after seeing it. .769 -.182
This performance was worth talking about with other people after seeing it. .768 -.030
Complicated? .061 -.523
Surprising? .482 -.412
Relaxing? .125 .646
Inspiring? .755 -.137
Beautiful to look at? .468 .275
Confrontational? .410 -.604
Good fun? .321 .690
Boring? -.479 -.297
Conventional? -.218 .287
Recognisable? .161 .270
Full of new images? .547 -.310
Socially relevant? .515 -.336
Relevant for you personally? .481 -.213
Easy to follow? .260 .470

43
Challenging? .513 -.556
Comforting? .308 .470
Satisfyingly complete? .636 .283
Exciting? .693 .059
Superficial? -.390 -.073
Funny? .422 .552
Impressive? .785 .091
Skilful? .699 .130
Painfully surprising? .312 -.634
Demanding for you personally (i.e., it demanded a lot of you)? .430 -.653
Extraction Method: Principal Component Analysis.