
“The value of integrating Scan-to-BIM and Scan-vs-BIM techniques for Construction Monitoring using...
13
The value of integrating Scan-to-BIM and Scan-vs-BIM techniques for construction monitoring using laser scanning and BIM: The case of cylindrical MEP components Frédéric Bosché a, ⁎, Mahmoud Ahmed b , Yelda Turkan c , Carl T. Haas b , Ralph Haas b a School of the Built Environment, Heriot-Watt University, Edinburgh, Scotland, United Kingdom b Department of Civil Engineering, University of Waterloo, Ontario N2L 3G1, Canada c Civil, Construction and Environmental Engineering, Iowa State University, Ames, IA 50010, USA abstract article info Article history: Accepted 25 May 2014 Available online 20 June 2014 Keywords: MEP 3D laser scanning BIM Scan-vs-BIM Scan-to-BIM Hough transform Progress tracking Percent built as planned There is a growing need for tools automating the processing of as-built 3D laser scanned data, and more particularly the comparison of this as-built data with planned works. This paper particularly considers the case of tracking MEP components with circular cross-sections, which essentially include pipes, and some conduits and ducts. Discrepancies between the as-built and as-planned status of pipes, conduit and ductwork result from changes that occur in the field and that are either unnoticed (human error) or not reflected in the 3D model. Previous research has shown that the Hough transform, with judiciously applied domain constraints, is a practical and cost-effective approach to find, recognize and reconstruct cylindrical MEP works within point clouds automatically. Previous research has also shown that “Scan-vs-BIM” sys- tems that are based on the geometric alignment and comparison of as-built laser scans with as-designed BIM models can effectively recognize and identify MEP components as long as they are constructed near their as-planned locations. The research presented in this paper combines the two techniques in a uni fied approach for more robust automated comparison of as-built and as-planned cylindrical MEP works, thereby providing the basis for automated earned value tracking, automated percent-built-as- planned measures, and assistance for the delivery of as-built BIM models from as-designed ones. The proposed approach and its improved performance are validated using data acquired from an actual construction site. The results are very encouraging and demonstrate the added value of the proposed integrated approach over the rather simpler Scan-vs-BIM system. The two main areas of improved performance are: (1) the enabled recognition and identification of objects that are not built at their as- planned locations; and (2) the consideration for pipe completeness in the pipe recognition and identifi- cation metric. © 2014 Elsevier B.V. All rights reserved. 1. Introduction Traditional progress tracking practice depends on visual inspections, and daily or weekly reports created based on those inspections. The inspectors' duty is to ensure that work meets contract specifications and schedule. They use checklists during inspections and logs to report deficiencies that are discussed at follow-up weekly meetings [1]. This traditional practice relies heavily on the inspectors' personal judgment, observational skills, and experience which come with a high probability of incomplete and inaccurate reports. In the early 2000s, the Architectural–Engineering–Construction/Facility Management (AEC/FM) industry realized the urgent need for fast and accurate project progress tracking. In response to this need, researchers have studied several emerging technologies for automating project inspection. These include Radio Frequency Identification (RFID) [2–7], Ultra-Wide Band (UWB) [8–11], Global Navigation Satellite System (GNSS) [6,12], 2D imaging [13–19], Photogrammetry [20–25,29], and three-dimensional (3D) Terrestrial Laser Scanning (TLS) [22,26–54]. All these approaches hold much promise for automated progress tracking, however they have so far only focused on a few areas of application: progress in the supply chain (prefabrication and laydown yards), workers' productivity (through location and action tracking), and tracking structural work progress and quality. One of the important areas where tracking could provide significant value is the tracking of Mechanical, Electrical and Automation in Construction 49 (2015) 201–213 ⁎ Corresponding author. Tel.: +44 131 451 4659. E-mail addresses: [email protected] (F. Bosché), [email protected] (M. Ahmed), [email protected] (C.T. Haas), [email protected] (R. Haas). http://dx.doi.org/10.1016/j.autcon.2014.05.014 0926-5805/© 2014 Elsevier B.V. All rights reserved. Contents lists available at ScienceDirect Automation in Construction journal homepage: www.elsevier.com/locate/autcon
-
Upload
independent -
Category
Documents
-
view
0 -
download
0
Transcript of “The value of integrating Scan-to-BIM and Scan-vs-BIM techniques for Construction Monitoring using...

Automation in Construction 49 (2015) 201–213
Contents lists available at ScienceDirect
Automation in Construction
j ourna l homepage: www.e lsev ie r .com/ locate /autcon
The value of integrating Scan-to-BIM and Scan-vs-BIM techniques forconstruction monitoring using laser scanning and BIM: The case ofcylindrical MEP components
Frédéric Bosché a,⁎, Mahmoud Ahmed b, Yelda Turkan c, Carl T. Haas b, Ralph Haas b
a School of the Built Environment, Heriot-Watt University, Edinburgh, Scotland, United Kingdomb Department of Civil Engineering, University of Waterloo, Ontario N2L 3G1, Canadac Civil, Construction and Environmental Engineering, Iowa State University, Ames, IA 50010, USA
⁎ Corresponding author. Tel.: +44 131 451 4659.E-mail addresses: [email protected] (F. Bosché), mfo
[email protected] (C.T. Haas), [email protected]
http://dx.doi.org/10.1016/j.autcon.2014.05.0140926-5805/© 2014 Elsevier B.V. All rights reserved.
a b s t r a c t
a r t i c l e i n f oArticle history:Accepted 25 May 2014Available online 20 June 2014
Keywords:MEP3D laser scanningBIMScan-vs-BIMScan-to-BIMHough transformProgress trackingPercent built as planned
There is a growing need for tools automating the processing of as-built 3D laser scanned data, and moreparticularly the comparison of this as-built data with planned works. This paper particularly considersthe case of tracking MEP components with circular cross-sections, which essentially include pipes, andsome conduits and ducts. Discrepancies between the as-built and as-planned status of pipes, conduit andductwork result from changes that occur in the field and that are either unnoticed (human error) or notreflected in the 3D model. Previous research has shown that the Hough transform, with judiciously applieddomain constraints, is a practical and cost-effective approach to find, recognize and reconstruct cylindricalMEP works within point clouds automatically. Previous research has also shown that “Scan-vs-BIM” sys-tems that are based on the geometric alignment and comparison of as-built laser scans with as-designedBIM models can effectively recognize and identify MEP components as long as they are constructednear their as-planned locations. The research presented in this paper combines the two techniques in aunified approach for more robust automated comparison of as-built and as-planned cylindrical MEPworks, thereby providing the basis for automated earned value tracking, automated percent-built-as-planned measures, and assistance for the delivery of as-built BIM models from as-designed ones. Theproposed approach and its improved performance are validated using data acquired from an actualconstruction site. The results are very encouraging and demonstrate the added value of the proposedintegrated approach over the rather simpler Scan-vs-BIM system. The two main areas of improvedperformance are: (1) the enabled recognition and identification of objects that are not built at their as-planned locations; and (2) the consideration for pipe completeness in the pipe recognition and identifi-cation metric.
© 2014 Elsevier B.V. All rights reserved.
1. Introduction
Traditional progress tracking practice depends on visual inspections,and daily or weekly reports created based on those inspections. Theinspectors' duty is to ensure that work meets contract specificationsand schedule. They use checklists during inspections and logs to reportdeficiencies that are discussed at follow-up weekly meetings [1]. Thistraditional practice relies heavily on the inspectors' personal judgment,observational skills, and experience which comewith a high probability
[email protected] (M. Ahmed),(R. Haas).
of incomplete and inaccurate reports. In the early 2000s, theArchitectural–Engineering–Construction/Facility Management (AEC/FM)industry realized the urgent need for fast and accurate project progresstracking.
In response to this need, researchers have studied several emergingtechnologies for automating project inspection. These include RadioFrequency Identification (RFID) [2–7], Ultra-Wide Band (UWB) [8–11],Global Navigation Satellite System (GNSS) [6,12], 2D imaging [13–19],Photogrammetry [20–25,29], and three-dimensional (3D) TerrestrialLaser Scanning (TLS) [22,26–54]. All these approaches hold muchpromise for automated progress tracking, however they have so faronly focused on a few areas of application: progress in the supplychain (prefabrication and laydown yards), workers' productivity(through location and action tracking), and tracking structural workprogress and quality. One of the important areas where tracking couldprovide significant value is the tracking of Mechanical, Electrical and

202 F. Bosché et al. / Automation in Construction 49 (2015) 201–213
Plumbing (MEP) components, which includes piping installation. Thebenefits of efficient tracking of MEP components' installation include:
1) Early identification of deviations between the as-built and as-designsituations, so that required remedial actions can be taken before highrework costs are experienced;
2) Faster acceptance of work by the main contractor, so that sub-contractors can be paid on time and even earlier than is commonpractice; and
3) Assistance through automation of some of the steps involved inupdating Building Information Modeling (BIM) models to reflectas-built works that deviate or add to original BIM models, but willnot require rework. Indeed, in many cases liquidated damages andan updated as-built BIM model may be preferable to rework.
However, tracking of MEP works is made difficult by significantdiscrepancies between the as-built and as-planned status of MEP com-ponents that result from changes that occur in the field that are eitherunnoticed (human error) or not reflected in the design documents.These unreported discrepancies also challenge the delivery of reliableas-built design documents (e.g. as-built BIM model) to clients.
Among the technologies discussed earlier, 3D TLS has beenconsidered by many as the best available technology to capture 3Dinformation on a project with high accuracy and speed. It holdsmuch promise in a variety of applications in the AEC/FM industry[26–30]. For example, it has already been proven to be valuable forconstruction managers to help them track progress, control quality,monitor health, as well as create as-built 3D models of facilities[31–54]. The best demonstration of this value has been the exponen-tial growth of the laser scanning hardware and software market inthe last decade. Much of this growth is now focusing on the interfacebetween laser scanned data and BIMmodels. Nonetheless, the recog-nition (and identification) of objects in 3D TLS data remains an openchallenge with marketed software offering only semi-automated,and often limited solutions. This is the case of MEP components,including pipes. Robust automated recognition and tracking ofcylindrical MEP components would enable:
1. Improved identifications of discrepancies between as-planned andas-built conditions of MEP components, so that corrective actionscan be taken in a timely manner. This is particularly important formechanical contractors, since an increasing number of them areusing BIM models for fabricating pipes and ductwork.
2. Having accurate as-built conditions of MEP components, so thatmechanical remodelings can be planned confidently from the BIMmodel, and thus help prevent material wastes and rework, therebysaving cost and time. Furthermore, there is a growing interest anddemand from industry for implementing BIM models for FacilitiesManagement. Having accurate as-built conditions of MEPcomponents included in BIM models would allow facility managersto integrate their building operation and maintenance scheduleswith BIM models, which would allow them to locate and maintainthese components efficiently.
Recent research in the recognition of MEP works in 3D TLS data hasshown that the Hough transform, with judiciously applied domainconstraints, is a practical approach to automatically find, recognizeand reconstruct cylindrical objects (e.g. pipes) from point clouds [48,49].However, this approach is not sufficient on its own to identify objectsto support reliable progress tracking and quality control. In parallel,previous research has also shown that “Scan-vs-BIM” systems, thatare based on the geometric alignment and comparison of as-builtlaser scans with as-designed BIM models, can effectively recognizeand identify in point clouds 3D objects contained in the BIM models[31–33] — as long as they are constructed near their as-plannedlocations. The research reported here combines these two approachesin a single framework to better meet the need for automated compari-son of built and planned cylindrical MEP components, hereby providing
the basis for automated earned value tracking, automated discrepancyidentification and calculation of “percent built as-planned”, andassistance for the generation as-built BIM models.
This paper is organized as follows. Section 2 first reviews significantresearch and developments in the area of object recognition in 3D pointclouds. Our novel approach for the recognition and identification ofcylindrical objects in 3D point clouds is described in Section 3. Experi-mental results are reported in Section 4 and the performance of thenew approach is discussed in Section 5.
2. Background
2.1. 3D point cloud data processing
Using 3D point clouds produced by laser scanners for generating as-built information is becoming a standard practice in construction, reha-bilitation and facilities maintenance in areas ranging from processplants to historical preservation. Building on basic research in roboticsand machine vision, research on automated as-built generation goesback over twenty years (e.g. [13]).
Acquisition of 3D information with laser-scanning (but also struc-tured lighting and photogrammetry) has led to significant research ondeveloping processes and algorithms for processing the 3D pointcloud data, with focus on different applications. These include: as-builtmodeling [29,34,36,40–44,48–51], quality assessment of existing infra-structure and construction sites [25,35,37,45,54], progress tracking[20–24,31–33,46,47,52,53], and structural health monitoring [38,39].Some of the knowledge thereby created has influenced or been adoptedby practitioners. Yet, in the commercial sphere, the level of automationof current software solutions for processing TLS data, and in particularfor recognizing objects in TLS data, remains limited.
With the advent of 3D BIM, many of the newer approaches activelyuse the (3D) information contained in BIMmodels to develop supervisedobject detection and recognition algorithms that more effectivelyprocess the point cloud data [20,21,31,32,27,33,35,46,47,52–54].Reliance of these approaches on prior BIM information certainlyimposes limitations; but BIM is very rapidly being adopted across theindustry for building design, construction and asset management, sothat these limitations will diminish over time.
Focusing specifically on cylindrical MEP components, despite somesignificant effort in the processing of point clouds generated by TLS[48–50] or low-cost photogrammetry [23,24], progress remains limited.In particular, the automatic detection of occlusions of pipes (so that apipe is not recognized as two different ones) remains an issue thatneeds to be investigated. Additionally, the automatic recognition ofelbows and T-connections between pipe segments (so that pipes arerecognized as a continuous pipe spools or networks as opposed to aset of disconnected pipe segments) needs further investigation.Effective detection of occlusions and connecting components wouldsignificantly improve the speed of generating accurate pipe networkmodels.
Before getting into more details with specific techniques, it is worthpointing that the terms “detection”, “recognition” and “identification”are commonly used, but their use is not always consistent across theliterature. In this manuscript, we use them as follows:
• Detection: an object is present. More specifically here, this means thatsome specific features are found in the data (e.g. circular cross-sections).
• Recognition: the type of object can be discerned. More specificallyhere, this means that the analysis of the features enables discerningobjects of a specific type (e.g. pipes with circular cross-sections).
• Identification: a specific object can be discerned. More specificallyhere, this means that each recognized object can be matched to aspecific object in a known list (e.g. a recognized pipe is discerned asbeing a certain pipe present in the project BIM model).

203F. Bosché et al. / Automation in Construction 49 (2015) 201–213
Surface feature detection, and in particular smooth curved surfacedetection, are topics of fundamental importance to 3D point cloud pro-cessing and have been widely studied. For detecting specified simpleparametric surfaces, such as planes, cylinders, spheres and tori inpoint clouds, transform approaches have been considered, in particularthe Hough transform [55–57] that is used here (see Section 2.2 for de-tails). Other types of transforms have been investigated for objectshape detection, such as the Radon transform. For example, van Ginkelet al. [58] investigated the generalized Radon transform to detectcurves. However, the Radon transform has several drawbacks thatmake it unsuitable for the investigated point clouds. Its brute-force ap-proach demands extensive computational resources; and its restrictionto line drawings or sketch-like formats mandate an additional edge de-tection step. Van Ginkel et al. [59] studied the Hough transform, theRadon transform, and the mathematical relationship between them.
Alternatively, curved surfaces can also be searched directly in noisypoint clouds, without employing any transform. Such approaches havebeen widely studied and typically consist in first capturing local surfacecurvature at each point using neighboring points, and then segmentingthe point cloud using some region growing and clustering methods[60–68]. For example, Besl and Jain [60] proposed an approach that es-timates local curvature using the mean and Gaussian curvature andthen applies a region growing algorithm employing the fitting of qua-dratic surfaces. Methods proposed by Hoppe et al. [61] and Shafferet al. [62] estimate local surface properties by analyzing the eigenvaluesand eigenvectors of the covariance matrix of point neighborhood clus-ters. Pauly et al. [65] presented a multi-scale technique that worksacrossmultiple resolutions of the point cloud to extract the line featuresof 3D object surfaces. Rabbani et al. [66] presented a curved surface re-gion growing method based on surface normal and local smoothnessconstraints. Klasing et al. [68] presented a review and experimentalcomparison of surface normal estimation methods. The challenges insurface growing (curved or planar) are over-segmentation (which istypically addressed through a post-processing step) and noise handling.The latter is a key issue which has been addressed bymany researchersincluding Carr et al. [69] in a fundamental sense and Xiong et al. [70] asapplied to building construction. Future research is desirable tocompare the use of the Hough transform as described in this paperwith curvature based surface growing approaches. However, this is out-side the scope of the research reported here.
In the following two sections, we focus on the Hough transform forthe detection of simple parametric surfaces, in particular cylindrical sur-faces. Then, the employed Scan-vs-BIM technique for object recognitionis reviewed.
2.2. Hough transform
The Hough transform is a technique that can be utilized to detectparametric features within noisy data. It is usually carried out in threesteps. The first step is concerned with creating and quantizing aparameter space, which is followed by the application of a voting rulein that parameter space [55,56]. The shape parameters within the accu-mulated array of votes are extracted during thefinal step. The techniquewasfirst introduced to detect straight lines using a parametric represen-tation of the line in an image. In this case, the Hough transform requirestwo parameters: the slope and intercept [55], or the length and orienta-tion of thenormal vector to the line from the image origin [56].Modifiedversions of the technique were developed by Duda and Hart [56] forextracting 2D curved shapes and by Cheng and Liu [57] for extractingellipses. A comprehensive review of basic and probabilistic Houghbased methods can be found in [71].
In construction engineering, Haas [13] implemented a 2D Houghtransform for underground pipe detection. Vosselman et al. [51] inves-tigated using a 3D Hough transform to extract planar surfaces frompoint-clouds. Newman et al. [72] proposed a method that combinestheHough transformand a regressionprocedure to recognize 3D shapes
such as cylinders, spheres and cones. Rabbani et al. [44] have investigat-ed a 5D Hough transform approach to extract cylindrical objects frompoint clouds. While that work was seminal research, its applicationwas severely limited by the computational complexity resulting fromthe dimensionality of the Hough space. In general, high-dimensionalHough spaces are not practical. Working in Hough-space with morethan two dimensions requires simplifications through judicious use ofdomain constraints, as described by Rabbani et al. themselves.
To address the memory and computational complexity constraintsof the Hough transform, Borrmann et al. [73] proposed the Houghspace accumulator structure, while Pietrowcew [74] presented a FuzzyHough methodology that adjusts the votes in the parameter space toextract special shapes.
Ahmed et al. [48,49] demonstrate the application of judicious useof domain constraints to efficiently detect circular-cross-sections inorthogonal directions (XYZ) of 3D TLS data, and consequently recog-nize objects with cylindrical shapes. In their approach, it is assumedthat most cylindrical MEP components are built in orthogonal direc-tions along the main axes of a facility. Circular cross-sections shouldthen be identifiable in 3D point cloud data slices taken along thosethree directions. The recognition of cylindrical pipes could then beinferred from the set of circular cross-sections detected in slicesalong each of the directions. In summary, the technique implementsthe following steps:
1) Resample the original point-cloud to a number of thin slices. Slicesare defined at a pre-determined interval along the X, Y and Z direc-tions (e.g. 10 cm);
2) For each slice, apply the Hough transform to find circles of expecteddiameters;
3) Connect centers of collinear detected circles (using rules describedin Ahmed et al. [48,49]), then fit straight lines through the circles'centers,
4) Filter out the systematic errors due to slicing tilt,5) Reconstruct the 3D pipes using the computed centerlines and their
respective radii.
Applications of the Hough transform to laser scanned data havefocused on detection of simple geometric features (e.g. straight lines,circular sections) and subsequent recognition of objects having thosefeatures; but these steps alone do not enable the identification of thoseobjects —which is necessary for robust progress tracking. For example,the Hough transform can be used to detect all pipes with a pre-defined radius within a scanned point cloud, but it is just a firststep in their identification, i.e. the mapping between the detectedpipes and those defined in the designed 3D BIMmodel of the facility.Further steps are required for recognition and identification, includ-ing: (1) registration of sets of detected cylindrical objects and sets ofcylindrical objects from the BIM model, (2) application of reasoningbased on cylindrical object characteristics such as diameter,direction and proximity, (3) application of reasoning based on objectconnectivity, and (4) recognition and identification decision makingbased on these preceding steps.
2.3. Scan-vs-BIM method
In the case when an as-designed BIM model of the works to betracked is available, the prior information contained in the model canbe leveraged to not only detect and recognize the objects contained inthemodel, but also identify them [31–33]. Bosché and Haas [31,32] pro-posed such an approach and refer to it as “Scan-vs-BIM” [53]. In theScan-vs-BIM approach, 3D laser scanned point clouds are first alignedin the coordinate system of the 3D model. This can be done using sitebenchmarks or using automated or semi-automated registration tech-niques [75,76]. Once the registration is completed for all availablescans, objects contained in the as-designed BIM model are recognized

Fig. 1. Data processing system for life-cycle BIM model dimensional information management proposed in Bosché et al. [53].
204 F. Bosché et al. / Automation in Construction 49 (2015) 201–213
and identified in the combined point cloud using the following four-step process:
1. Matching/Recognized Point Clouds: For each scan, each point ismatched with a 3D model object. Matching is done by projectingthe point orthogonally on the surfaces of all NObj objects of the 3DBIM model. Then, the object with (1) the closest surface to thepoint, but with distance not larger than a threshold δmax (we useδmax = 50 mm), and (2) a surface normal vector not further thanαmax (we use αmax = 45°) from that at the as-built TLS point is con-sidered matching object. This process effectively segments each ini-tial scan into NObj + 1 point clouds; one per object that includes allthe points matched to that object and another one containing allthe points not matched to any model object. We call the latter the“NonModel” point cloud.
2. Occluding Point Clouds (i.e. point clouds acquired from objects thatdo not seem to correspond to any object in the BIM model but thatare occluding objects that are contained in the BIM model): Foreach as-built scan, the NonModel point cloud is further processed toidentify the NonModel points that lay between the scanner and 3Dmodel objects. The result of this process is not just an overall
Fig. 2. Summary of the proposednovel approach to automatically recognize and identify inTLS data objects with circular cross-sections (e.g. pipes) contained in a project's as-designed BIM model.
Occlusion point cloud, but also its segmentation intoNObj point clouds;one per object that includes all the points occluding that object.
3. As-planned Point Clouds: For each scan, a corresponding virtualas-planned scan is calculated. This is done using the 3D modeland the same scanner's location and scan resolution as those ofthe actual (as-built) scan obtained from the registration process.Each as-planned point is calculated by projecting a ray from thescanner onto the 3D model. The result of this process is not justan as-planned scan, but also its segmentation into NObj pointclouds; one per object that includes all the points matched tothat object. Note that we do not retain any NonModel as-plannedpoint cloud.
4. Object Recognition: The results of the first three steps are finallyaggregated. Each model object then has:• A matched/recognized surface area, Srecognized (derived from thepoints contained in the matching Point Cloud).
• An occlusion surface area, Soccluded.• An as-planned surface area, Splanned.
These surface areas allow the calculation of two metrics used forinferring the recognition of the object:
%recognized ¼ SrecognizedSrecognizable
¼ SrecognizedSplanned−Soccluded
%confidence ¼SwrecognizedSrecognizable
¼ SwrecognizedSplanned−Soccluded
where Swrecognized ¼ ∑ni¼1 1− δi
δmax
��������
� �Si
� �.
%recognized estimates the level of recognition by calculating the per-centage of surface expected to be recognized that is actually recognized.Srecognizedw is a weighted recognized surface where the contribution ofeach point to the recognized surface (i.e. the surface it covers, Si) isweighted based on the quality of its matching (i.e. the distance δi fromthe as-built point to the matching surface). %confidence thus extends %-recognized by taking account for the deviation between the as-built anddesigned positioned of objects. %confidence can be used as a measure ofthe level of confidence in the recognition of each object, or the level towhich the object can be considered built as planned. We refer the readerto [52,53] for details.
It has been shown through experiments with real-life data that theScan-vs-BIM approach performs extremely well for structural workstracking. Furthermore, this approach directly enables the identificationof objects. However, the features used by the approach (surface orienta-tion and point proximity) work only for objects withminor geometricaldiscrepancy between their as-built and as-planned states. For example,any object built at a location further away than δmax (50mm) cannot berecognized and identified; in fact, it was shown in [53] that theperformance of this approach can drop significantly in the case of MEPworks.

205F. Bosché et al. / Automation in Construction 49 (2015) 201–213
2.4. Contribution
The review of the Hough transform and Scan-vs-BIM techniqueshighlights a radical complementarity in terms of performance. Whilethe Hough transform can robustly detect circular cross-sections in thepresence of significant amounts of occlusions, and Ahmed et al. [48,49] have shown that those detections can support the recognition ofcylindrical objects, their method cannot be used on its own to infertheir identification. Furthermore, the method of Ahmed et al. can onlyrecognize objects with cylindrical shape, i.e. circular cross-sectionsalong a straight centerline; it cannot recognize objects with non-collinear circular cross-sections (e.g. curved pipes, elbows). On theother hand, the Scan-vs-BIM technique of [31,32,53] enables the recog-nition and identification of simple and complex objects, but itsrecognition metrics are not robust to recognize objects that are signifi-cantly displaced from their designed location. It also cannot recognizeobjects that are not contained in the BIM model.
Bosché et al. [53] have suggested that, given an as-designed BIMmodel, as-built 3Ddata could bemore effectively processed by integratingScan-vs-BIM with Scan-to-BIM techniques (such as Hough Transform-based techniques) (Fig. 1). How to do so remains a significant gap in theknowledge base.
This paper presents an approach that attempts to achieve this. It in-tegrates theHough transform-based circular cross-section detection ap-proach of Ahmed et al. [48,49]with the Scan-vs-BIM approach of Boschéet al. [31,32,53] to robustly and automatically recognize and identify allobjects with circular cross-sections in as-built TLS point clouds. It is alsoable to detect cylindrical objects that are not contained in the BIMmodels— such as those that are “field run”, which is an extremely com-mon practice. It attempts to benefit from the strengths of both ap-proaches while simultaneously elevating their respective limitations.The approach is detailed in Section 3 and validated with an experimentconducted with data acquired on a real-life project (Section 4). The per-formance is discussed in Section 5, which is followed with the conclu-sions and suggestions for future work (Section 6).
3. Proposed approach
Our proposed approach integrates the Hough transform-based cir-cular cross-section detection approach of Ahmed et al. [48,49] within
Fig. 3. Possible interpretation of the combined values of %matched and S.
the Scan-vs-BIM system of Bosché et al. [31,32,53]. The process containsfive steps (see also Fig. 2):
1. Register as-built point cloud with the (as-planned) BIM model. Theas-built point cloud data is registered in the coordinate system ofthe (as-planned) BIM model. This is the same procedure as the step1 of the Scan-vs-BIM approach described in Section 2.3. We referthe reader to [32,53,54] for details.
2. Generate “virtual” as-planned point cloud. From Step (1), the loca-tions of the scanners (when acquiring the as-built data) are nowknown in the coordinate system of the BIMmodel. It is thus possibleto generate a “virtual” as-planned point cloud where the BIMmodelacts as the scanned scene. This is the same procedure as the step 3 ofthe Scan-vs-BIM approach described in Section 2.3. We refer thereader to [32,53] for details.
3. Extract circular cross-sections from the as-built and as-planned pointclouds; see Section 3.1.
4. Match the cross-sections extracted from the as-built point cloud tothe cross-sections extracted from the as-planned point cloud; seeSection 3.2.
5. For each (as-planned) object contained in the BIM model and withcircular cross-section (e.g. pipe), infer its recognition/identification,and to which extent it can be considered “built as planned”; seeSection 3.3.
Steps 3 to 5 are detailed in Sections 3.1 to 3.3 respectively.
3.1. Circular cross-section detection
The application of Steps 1 and2 of the proposedmethod produces anas-planned 3D point cloud, with the same characteristics as the as-builtpoint cloud (field of view and point density), and in the same coordinatesystem as the as-built point cloud.
The Hough transform-based circular cross-section detectionmethod of Ahmed et al. [48,49] is then applied to both point clouds.Very importantly, this is done using this exact same slicing of thedata (in three orthogonal directions and at constant intervals alongthose directions) for both point clouds.
The result of this process is a set of circular cross-sections detectedwithin the as-built point cloud, and another set of circular cross-sections detected within the as-planned point cloud. Furthermore,each data slice is associated with a set of as-built cross-sections and aset of as-planned cross-sections.
3.2. Circular cross-section matching
Once circular cross-sections have been extracted from both the as-built and as-planned point clouds, the goal is to find, for each as-builtcross-section, its best matching as-planned cross-section, if any. Forthis, we use a cross-section similarity criterion that integrates threesub-criteria with respect to:
• Location: the similarity sub-criterion, SL, is calculated based on thedistance between the centers of the as-built and as-planned cross-sections relative to a maximum distance dmax:
SL ¼ 1−cap−cab
��� ���dmax
;
where cab is the coordinate vector of the center of the as-built cross-section, cap is the coordinate vector of the center of the as-plannedcross-section. We set dmax = 2 m, but one could also consider settingdmax as a multiple of the as-planned radius of the object's cross-section. SL = 1 when the centers are exactly the same; SL = 0 whenthe distance between the centers is dmax. Furthermore, we discardany match between cross-sections that are further away than dmax,i.e. for which SL b 0.

Fig. 4. 3D model of the 5th floor corridor of Engineering VI.
206 F. Bosché et al. / Automation in Construction 49 (2015) 201–213
• Radius: the similarity sub-criterion, SR, is calculated based on thedifference between the radii of the as-built and as-planned circularcross-sections relative to a maximum value Δmax:
SR ¼ 1−rap−rab��� ���Δmax
;
where rab is the radius of the extracted as-built cross-section, rap is thedesigned radius of the as-planned cross-section, and Δmax= αrap. Wesetα= 0.25. SR=1when the radii are exactly the same; SR=0whenthey differ by Δmax. Furthermore, we discard any match betweencross-sections with differences in radii larger than Δmax, i.e. forwhich SR b 0.
• Orientation: the similarity sub-criterion, SO, is calculated as theabsolute value of the cosine of the angle between the normal vectorsto the as-built and as-planned cross-sections.
SO ¼ cos nap � nab
� ���� ���;where nab and nap are the normal vectors of the extracted as-built andas-planned cross-sections, respectively. SO = 1 when the normalvectors are collinear; SO = 0 when they are orthogonal.
The resulting cross-section similarity criterion, integrating the threesub-criteria above, is then calculated as:
SO ¼ wLSL þwRSR þwOSO;
wherewL,wR,wO and are three weights adding up to 1. S=1when thecross-sections have the same center, radius and orientation.
With a view on speeding up the matching process, as well as ensur-ing meaningful and consistent matches, we search for matches onlywithin each data slice. In other words, for each as-built cross-section,we search for matching as-planned cross-sections only within thesame TLS data slice. This implies that all considered matches are be-tween cross-sections having the same orientation; or, for all consideredmatches SO = 1. The orientation criterion can thus be discarded fromthe overall matching criterion, which becomes:
S ¼ wLSL þwRSR;
where wL and wR are two weights adding up to 1.Because SL and SR are both designed to take values in the range [0;1]
and our discarding strategy leads to a situation where there is no obvi-ous reason to advantage one of the criteria over the other, we propose toset the weights as: wL = wR = 0.5.
Table 1Characteristics of the FARO LS 880 HE scanner.
Laser type 785 nm; near infraredDistance Range 0.6 m to 76 m
Accuracy ±3 mm at 25 mAngle Range Hor: 360°; vert: 320°
Accuracy Hor: 16 μrad; vert: 16 μradMaximum resolution Hor: 13 μrad; vert: 157 μradAcquisition speed Up to 120,000 pts/s
3.3. Object recognition/identification
For each (as-planned) object with circular cross-sectioncontained in the BIM model, we analyze the cross-sectionmatching results to: (1) infer whether it can be consideredrecognized/identified; and (2) to which extent it can be considered“built as planned”. We propose to calculate the corresponding twometrics: %matched, that can beused to infer recognition and identification,and S, that estimates the extent to which each object is geometrically“built as planned”, as:
%matched ¼ Nmatched
Nplanned
S ¼XNmatched
i¼1Sið Þ
Nmatched
where Nplanned is the number of as-planned cross-sections for the givenobject; Nmatched is the number of those cross-sections that have beenmatched to as-built cross-sections; and Si is the similarity measure forthe ith match.
%matched=1when all as-planned cross-sections have beenmatched,which implies that the object ismost likely recognized and identified. Incontrast, %matched = 0 when none of the cross-sections are matched,implying that the object is most likely not recognized.
S ¼ 1 when all the matches between as-planned and as-builtcross-sections are exact; i.e. the recognized/identified part of theobject (whether complete or incomplete) is “built as planned”. Incontrast, S b 1 implies that the recognized/identified part of the ob-ject is not built exactly as planned. Fig. 3 qualitatively summarizeshow these two metrics can be collectively analyzed to interpret theresults.
It is also possible to integrate the two metrics above into a singleone, S
0:
S0 ¼XNmatched
i¼1Sið Þ
Nplanned
where S0 can be interpreted as a measure of the level to which eachentire object is “built as planned” (not just the detected parts, i.e.cross-sections). S0 ¼ 1 when all the planned cross-sections arematched to as-built cross-sections and these matches are exact; i.e.the object is “built as planned”. In contrast, S0b1 implies that the ob-ject is not complete, not built as planned, or a combination of thosetwo cases. For example, S0 ¼ 0:5 could result from half the as-planned cross-sections being perfectly matched but the other halfbeing not matched at all (which could mean that only a section ofthe object is fully installed); alternatively, it could result from allthe as-planned cross-sections being matched, but the matching sim-ilarities are on average only 0.5, which means that the object is built,but not as planned.
It is interesting to note that the individual object S0values can be ag-
gregated to derive measures of the level to which overall systems or

Fig. 5. Combined six laser scans of the 5th floor corridor Engineering VI; the dots show the scanning locations.
207F. Bosché et al. / Automation in Construction 49 (2015) 201–213
areas are “built as planned”. The following formula, implementing aweighted average of the objects' S
0values, can be used:
S0system ¼XMobjects
j¼1Nplanned; jS
0j
� �Mobjects
¼XMobjects
j¼1
XNmatched; j
i¼1Sj;i
� �� �Mobjects
where Mobjects is the number of objects in the considered system (orarea), and S0j is the estimation of the extent to which the jth object canbe considered “built as planned”.
It is important to note that, in contrast with the original Scan-vs-BIMtechnique that takes occlusions from other objects into account in theobject recognition and identificationmetric (see definitions of %recognized
and %confidence in Section 2.3), the effect of occlusions is not considered inthe metric %matched. This could be considered in future work. We pointout however that S and S
0directly work with the matched cross-
sections and therefore are not impacted by occlusions.
3.4. As-built modeling
Once the as-planned pipes have been recognized, it is possible toconduct their as-built modeling by generating pipes along the cross-sections matched to each as-planned pipe. In this paper, we simplypropose to split the cross-sections into groups of collinear cross-sections (across several slices), and then apply the method proposedby Ahmed et al. [48,49]. This method generates the best fittingcenterline (filtering out any false cross-sections) from the group ofcross-sections, and then uses this centerline along with the cross-sections radius to generate cylinders representing the straight pipe.
4. Experiments
4.1. Data
We conducted an experiment with data collected during theconstruction of the Engineering VI Building at the University ofWaterloo that is designed to shelter the Chemical Engineering Depart-ment of the university (a five-story, 100,000-square-foot building).The data collected include 2D drawings and a set of field laser scans.The authors created a 3D CAD/BIM model of the 5th floor based on theinformation provided on 2D drawings.
This project was chosen for the study as the building includes nu-merous pipes and ducts, to provide water and gas to different labora-tories and to collect and evacuate chemical fumes from them. Thisstudy focused specifically on the service corridor of the fifth floor(31 m × 3.4 m) as it contains all the pipes coming from the lower
Fig. 6. Top view of the corridor highlighting the pipes visually identified as present (at least parabsent are in blue. In brown are ducts that were also present.
levels and going all the way up to the penthouse. Fig. 4 shows theservice corridor section of the 3D CAD/BIM model.
Laser scans were acquired from the corridor using the FARO LS 880HE laser scanner, which employs phase-based technology (see Table 1for the technical characteristics of the scanner). Six scanswere acquiredalong the corridor because of the density of the pipes and ducts and thenarrowness of the corridor (Fig. 5).
4.2. Results
4.2.1. Cross-section detectionAfter aligning the point cloud of the six scans in the coordinate
system of the project 3D CAD/BIM model, the as-planned point cloudis automatically calculated and the circular cross-sections automaticallyextracted from the as-planned and as-built point clouds. Because thepipes contained in the corridor are essentially all vertical, we focus onthose only, and apply the Hough transform-based method of Ahmedet al. [49] solely with slices along the vertical (Z) axis. Twenty six slicesare automatically generated with 10 cm intervals. From this, the systemautomatically detects 1176 as-planned circular cross-sections and 164as-built circular cross-sections (see Fig. 7).
After applying the circular cross-section matching approach de-scribed in Section 3.1, 112 of the 164 as-built cross-sections arematchedto as-planned cross-sections, and all with similarity levels N0.95.Looking at the 52 as-built cross-sections that are not matched, thesecome from two sets of 26 cross-sections:
• The first 26 cross-sections were detected at the same location as an-other set of 26 as-built cross-sections but for a different radius (seeFig. 8a). The system matched the latter set to the locally correspond-ing as-planned cross-sections because they had the exact same radius;the other set was thus correctly rejected.
• The second set of 26 cross-sections comes from a very small pipepresent in the corridor at the time of scanning but that did notcorrespond to any pipe in the 3D model (see Fig. 8b). These cross-sections were thus correctly rejected by the system. Note that, usingthe same dataset, the original Scan-vs-BIM approach of Bosché et al.had wrongly suggested that this pipe was present in the scene (albeitwith some low level of confidence) [53].
In conclusion, the 52 cross-sections that are not matched to any as-planned cross-section, are actually correctly notmatched by the system.Note, however, that the non-matched detected cross-sections could stillbe used to inform and partially automate a manual update of the BIMmodel. For example, the pipe with small diameter found by the systemcould be added directly to the BIM model.
tially) in the corridor at the time of scanning. The pipes present are shown in yellow, those
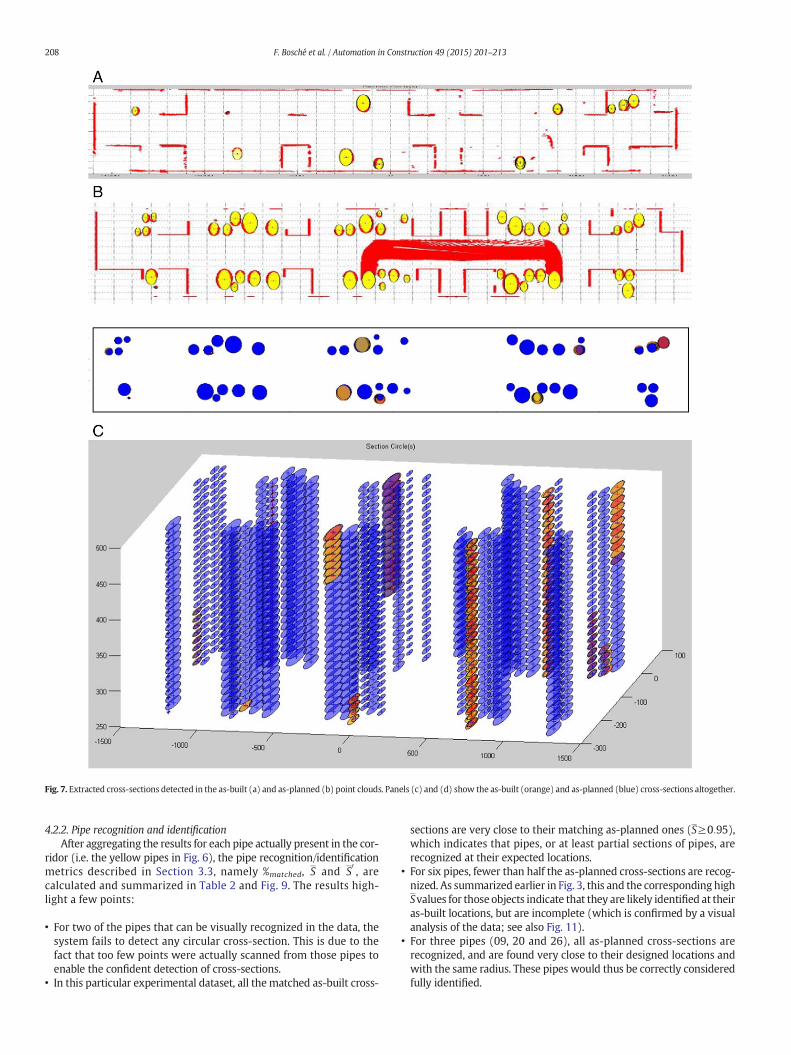
Fig. 7. Extracted cross-sections detected in the as-built (a) and as-planned (b) point clouds. Panels (c) and (d) show the as-built (orange) and as-planned (blue) cross-sections altogether.
208 F. Bosché et al. / Automation in Construction 49 (2015) 201–213
4.2.2. Pipe recognition and identificationAfter aggregating the results for each pipe actually present in the cor-
ridor (i.e. the yellow pipes in Fig. 6), the pipe recognition/identificationmetrics described in Section 3.3, namely %matched, S and S
0, are
calculated and summarized in Table 2 and Fig. 9. The results high-light a few points:
• For two of the pipes that can be visually recognized in the data, thesystem fails to detect any circular cross-section. This is due to thefact that too few points were actually scanned from those pipes toenable the confident detection of cross-sections.
• In this particular experimental dataset, all thematched as-built cross-
sections are very close to their matching as-planned ones (S≥0:95),which indicates that pipes, or at least partial sections of pipes, arerecognized at their expected locations.
• For six pipes, fewer than half the as-planned cross-sections are recog-nized. As summarized earlier in Fig. 3, this and the corresponding highSvalues for those objects indicate that they are likely identified at theiras-built locations, but are incomplete (which is confirmed by a visualanalysis of the data; see also Fig. 11).
• For three pipes (09, 20 and 26), all as-planned cross-sections arerecognized, and are found very close to their designed locations andwith the same radius. These pipes would thus be correctly consideredfully identified.
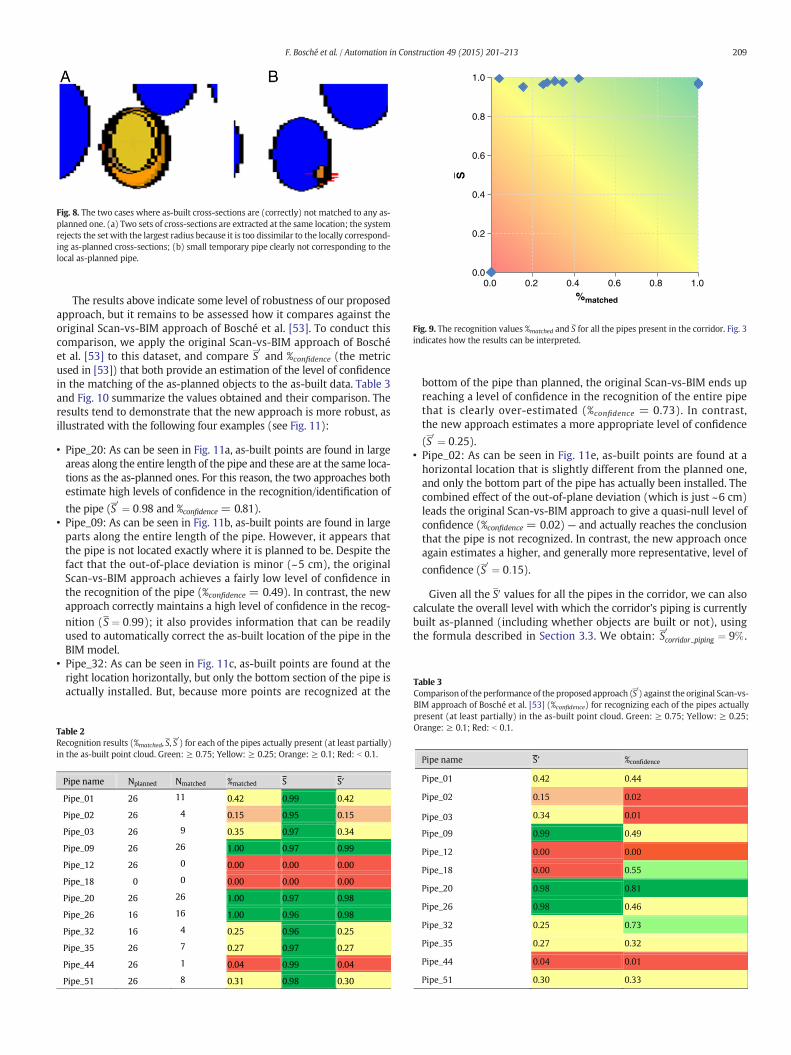
Fig. 8. The two cases where as-built cross-sections are (correctly) not matched to any as-planned one. (a) Two sets of cross-sections are extracted at the same location; the systemrejects the set with the largest radius because it is too dissimilar to the locally correspond-ing as-planned cross-sections; (b) small temporary pipe clearly not corresponding to thelocal as-planned pipe.
0.0
0.2
0.4
0.6
0.8
1.0
0.0 0.2 0.4 0.6 0.8 1.0
S
%matched
Fig. 9. The recognition values %matched and S for all the pipes present in the corridor. Fig. 3indicates how the results can be interpreted.
able 3omparison of the performance of the proposed approach (S
0) against the original Scan-vs-
209F. Bosché et al. / Automation in Construction 49 (2015) 201–213
The results above indicate some level of robustness of our proposedapproach, but it remains to be assessed how it compares against theoriginal Scan-vs-BIM approach of Bosché et al. [53]. To conduct thiscomparison, we apply the original Scan-vs-BIM approach of Boschéet al. [53] to this dataset, and compare S
0and %confidence (the metric
used in [53]) that both provide an estimation of the level of confidencein the matching of the as-planned objects to the as-built data. Table 3and Fig. 10 summarize the values obtained and their comparison. Theresults tend to demonstrate that the new approach is more robust, asillustrated with the following four examples (see Fig. 11):
• Pipe_20: As can be seen in Fig. 11a, as-built points are found in largeareas along the entire length of the pipe and these are at the same loca-tions as the as-planned ones. For this reason, the two approaches bothestimate high levels of confidence in the recognition/identification of
the pipe (S0 ¼ 0:98 and %confidence = 0.81).
• Pipe_09: As can be seen in Fig. 11b, as-built points are found in largeparts along the entire length of the pipe. However, it appears thatthe pipe is not located exactly where it is planned to be. Despite thefact that the out-of-place deviation is minor (~5 cm), the originalScan-vs-BIM approach achieves a fairly low level of confidence inthe recognition of the pipe (%confidence = 0.49). In contrast, the newapproach correctly maintains a high level of confidence in the recog-nition (S ¼ 0:99); it also provides information that can be readilyused to automatically correct the as-built location of the pipe in theBIM model.
• Pipe_32: As can be seen in Fig. 11c, as-built points are found at theright location horizontally, but only the bottom section of the pipe isactually installed. But, because more points are recognized at the
Table 2Recognition results (%matched, S, S
0) for each of the pipes actually present (at least partially
in the as-built point cloud. Green: ≥ 0.75; Yellow: ≥ 0.25; Orange: ≥ 0.1; Red: b 0.1.
Pipe name
Pipe_01 26 11 0.42 0.99 0.42
Pipe_02 26 4 0.15 0.95 0.15
Pipe_03 26 9 0.35 0.97 0.34
Pipe_09 26 26 1.00 0.97 0.99
Pipe_12 26 0 0.00 0.00 0.00
Pipe_18 0 0 0.00 0.00 0.00
Pipe_20 26 26 1.00 0.97 0.98
Pipe_26 16 16 1.00 0.96 0.98
Pipe_32 16 4 0.25 0.96 0.25
Pipe_35 26 7 0.27 0.97 0.27
Pipe_44 26 1 0.04 0.99 0.04
Pipe_51 26 8 0.31 0.98 0.30
Nplanned Nmatched %matched S S′
IM approach of Bosché et al. [53] (%confidence) for recognizing each of the pipes actuallyresent (at least partially) in the as-built point cloud. Green: ≥ 0.75; Yellow: ≥ 0.25;range: ≥ 0.1; Red: b 0.1.
Pipe name
Pipe_01 0.42 0.44
Pipe_02 0.15 0.02
Pipe_03 0.34 0.01
Pipe_09 0.99 0.49
Pipe_12 0.00 0.00
Pipe_18 0.00 0.55
Pipe_20 0.98 0.81
Pipe_26 0.98 0.46
Pipe_32 0.25 0.73
Pipe_35 0.27 0.32
Pipe_44 0.04 0.01
Pipe_51 0.30 0.33
%confidenceS′
)
bottom of the pipe than planned, the original Scan-vs-BIM ends upreaching a level of confidence in the recognition of the entire pipethat is clearly over-estimated (%confidence = 0.73). In contrast,the new approach estimates a more appropriate level of confidence
(S0 ¼ 0:25).
• Pipe_02: As can be seen in Fig. 11e, as-built points are found at ahorizontal location that is slightly different from the planned one,and only the bottom part of the pipe has actually been installed. Thecombined effect of the out-of-plane deviation (which is just ~6 cm)leads the original Scan-vs-BIM approach to give a quasi-null level ofconfidence (%confidence = 0.02) — and actually reaches the conclusionthat the pipe is not recognized. In contrast, the new approach onceagain estimates a higher, and generally more representative, level of
confidence (S0 ¼ 0:15).
Given all the S0 values for all the pipes in the corridor, we can alsocalculate the overall level with which the corridor's piping is currentlybuilt as-planned (including whether objects are built or not), usingthe formula described in Section 3.3. We obtain: S
0corridor piping ¼ 9% .
TCBpO

0.0
0.2
0.4
0.6
0.8
1.0
0.0 0.2 0.4 0.6 0.8 1.0
%co
nfi
den
ce
S'
Fig. 10. Graphical representation of the results summarized in Table 3.
210 F. Bosché et al. / Automation in Construction 49 (2015) 201–213
This value is low essentially becausemany of the pipes are currently notinstalled. But, arguably, it provides a meaningful estimation of the levelto which piping works in the corridor have progressed to date.
Fig. 11. The as-built and as-planned point-clouds for objects Pipe_20 (a), Pipe_09 (b), Pipe_32clouds, the second columns top views of the as-planned point clouds, the third column top vie
4.2.3. As-built modelingOnce the cross-sections have been matched, the system not only
calculates the S0value to infer the recognition/identification of each
BIM model object (and infer whether it is built as planned), but italso generates the as-built model of each pipe. The result of thisprocess with our experimental data is shown in Fig. 12. In this figure,the pipes are labeled so that they can be related to the results reportedin Tables 2 and 3.
5. Discussion
The experiment reported above, albeit arguably of a limited nature,does demonstrate the added value of the proposed new approach todetect, recognize and identify cylindrical MEP components, incomparison with the original Scan-vs-BIM approach of Bosché et al.[53]. The two main areas of improved performance are:
1. Out-of-plane deviations (or, out-of-centerline deviations): Theoriginal approach can only recognize objects within 5 cm or sofrom their as-planned locations. In contrast, the new approach isfar less sensitive to such deviations, and maintains high levels ofconfidence up to and actually far beyond such distances.
2. Pipe completeness recognition: The original approach is not able todistinguish whether the recognized points are acquired at different
(c), and Pipe_02 (d). From the left, the first column shows top views of the as-built pointws of both point clouds, and the last column side views of both point clouds.

09 01
03
20
26
32
35
51
02
44
Fig. 12. The as-built 3D models of the recognized/identified pipes, in comparison with the centerlines of the as-planned pipes.
211F. Bosché et al. / Automation in Construction 49 (2015) 201–213
locations along the pipes, and may consequently over-estimate itslevel of confidence. In contrast, the new approach, by matchingcross-sections at regular intervals along the pipes, is able to takethis factor into account when estimating its level of confidence.
Additionally, the proposed approach is capable of identifying objects(i.e. identify to which object each cross-section corresponds to).Therefore, it addresses the issue of “pipe occlusions” — i.e. ensuringthat an occluded pipe is not recognized as two or more different ones.
Naturally, this performance needs to be confirmed with additional,more complex scenarios, in particular with pipes going in differentdirections (not just vertically). Yet, some limitations can already bepointed at that would require further investigation, in particular:
• The Hough transform-based approach for detecting circular cross-sections analyzes the data in pre-determined directions, in particularthe main three orthogonal directions.While pipes and other cylindri-cal MEP objects tend to be run in these main, these three main direc-tions could be complemented with at least 6 other ones to search forcross-sections oriented 45° from the main directions (this would alsohelp in recognizing elbows). However, increasing the number ofslicing directions proportionally increases the processing time. Analternative more general approach to extract cylindrical pipes, suchas the one proposed by Son et al. [50], could be investigated.
• While the proposed new method to recognize and identify objectswith circular cross-sections is more robust than the original approachemployed by Bosché et al. [53], false positive and false negative recog-nitions could still occur. For example, the current approach cannotrecognize a pipe that is further away than dmax from its planned loca-tion (false negative). Or, if a pipe is mis-located but happens to havean as-built location and radius that are the same as those of anotherpipe, then the systemwill wrongly recognize the pipe (false positive).Preventing such errors would require further prior information to beconsidered in the recognition and identification process, such ascomponent connectivity.
6. Conclusions
This paper presented a novel approach to automatically recognizeand identify objects with circular cross-sections (e.g. pipes) in 3D TLSdata acquired from construction sites, and given the project's 3D designBIM model. This approach uniquely integrates an object detection andrecognition technique (typically employed in Scan-to-BIMapplications)with a Scan-vs-BIM approach inferring object recognition and identifi-cation from proximity analysis. Specifically, the approach integratesthe efficient Hough transform-based circular cross-section detectionapproach of Ahmed et al. [48,49] within the Scan-vs-BIM object
recognition and identification framework of Bosché et al. [31,32,53].Objects are recognized based on the matching of as-built and as-planned cross-sections in terms of proximity, orientation and radius.The proposed object recognition metrics can be used not only to inferrecognition, but also to estimate the extent to which each object is“built as planned”. These individual estimations can also be aggregatedto assess the extent to which a system, area or other grouping is built asplanned, i.e. its “percentage built as planned”.
An experiment has been conducted using scans acquired from autility corridor under construction. The results are very encouragingand already demonstrate the added value of the proposed integratedapproach over the rather simpler Scan-vs-BIM approach of Boschéet al. [53]. While these results need to be confirmedwithmore complexscenarios, two main limitations are already identified that will requirefurther investigations, namely: the search for pipes by the proposedHough transform approach in pre-defined directions only; and the factthat false positive and false negatives may still occur (although theproposed approach already significantly reduces their chance ofoccurrence). Alternative approaches to the circular cross-sectiondetection method employed here could be investigated that are moregeneral and able to detect circular cross-sections, or more generallycylindrical pipes, in any direction. The metric used to recognize andidentify the as-planned objects also presents some limitations that canonly be addressed by applying higher-level reasoning, for example byanalyzing object connectivity.
Acknowledgments
The authors would like to thank Gary Caldwell from Aecon GroupInc. for providing the 2D drawings of Engineering V Building, and forallowing us to take the scans of the construction. The authors wouldalso like to thank to Arash Shahi and Yazan Chaban from the Universityof Waterloo for their help during this work.
This research is partially funded by NSERC CRD Grant#CRDPJ375615-08 with complementary support from CII and SNCLavalin, and NSERC Discovery Grant #102035.
References
[1] J.E. Schaufelberger, L. Holm, Management of Construction Projects: A Constructor'sPerspective, , Prentice Hall, 2002.
[2] D. Grau, C.H. Caldas, C.T. Haas, P.M. Goodrum, J. Gong, Assessing the impact ofmaterials tracking technologies on construction craft productivity, Autom. Constr.18 (2009) 903–911.
[3] E. Ergen, B. Akinci, R. Sacks, Life-cycle data management of engineered-to-ordercomponents using radio frequency identification, Autom. Constr. 21 (2007)356–366.

212 F. Bosché et al. / Automation in Construction 49 (2015) 201–213
[4] N. Li, B. Becerik-Gerber, Performance-based evaluation of RFID-based indoorlocation sensing solutions for the built environment, Adv. Eng. Inform. 25 (3)(2011) 535–546.
[5] A. Pradhan, E. Ergen, B. Akinci, Technological assessment of radio frequencyidentification technology for indoor localization, ASCE J. Comput.n Civ. Eng. 23 (4)(2009) 230–238.
[6] S.N. Razavi, C.T. Haas, Multisensor data fusion for on-site materials tracking inconstruction, Autom. Constr. 19 (2010) 1037–1046.
[7] S.N. Razavi, O. Moselhi, GPS-less indoor construction location sensing, Autom.Constr. 28 (2012) 128–136.
[8] J. Teizer, M. Venugopal, A. Walia, Ultra-wide band for automated real-time three-dimensional location sensing for workforce, equipment, and material positioningand tracking, Transportation Research Record, , Transportation Research Board ofthe National Academies, Washington D.C., 2008. 56–64.
[9] T. Cheng, M. Venugopal, J. Teizer, P.A. Vela, Performance evaluation of ultra-wideband technology for construction resource location tracking in harsh environ-ments, Autom. Constr. 20 (2011) 1173–1184.
[10] A. Shahi, A. Aryan, J.S. West, C.T. Haas, R.G. Haas, Deterioration of UWB positioningduring construction, Autom. Constr. 24 (2012) 72–80.
[11] K.S. Saidi, J. Teizer, M. Franaszek, A.M. Lytle, Static and dynamic performance evalu-ation of a commercially-available ultra-wide band tracking system, Autom. Constr.20 (2011) 519–530.
[12] D. Grau, C.H. Caldas, C.T. Haas, P.M. Goodrum, J. Gong, Assessing the impact of ma-terials tracking technologies on construction craft productivity, Autom. Constr. 18(2009) 903–911.
[13] C. Haas, Algorithms to Map Subsurface Ferrous Conductors, MSc Thesis CarnegieMellon University Department of Civil Engineering, 1986. (Aug. 1986).
[14] C. Haas, H. Shen, W.A. Phang, R. Haas, Application of Image Analysis Technologyto Automation of Pavement Condition Surveys, , Publication of Balkema (AA),1984.
[15] J. Abeid, E. Allouche, D. Arditi, M. Hayman, PHOTO-NET II: a computer-basedmonitoring system applied to project management, Autom. Constr. 12 (5) (2003)603–616.
[16] Y.M. Ibrahim, T.C. Lukins, X. Zhang, E. Trucco, A.P. Kaka, Towards automatedprogress assessment of workpackage components in construction projects usingcomputer vision, Adv. Eng. Inform. 23 (1) (2009) 93–103.
[17] S. Chi, C.H. Caldas, D.Y. Kim, A methodology for object identification and tracking inconstruction based on spatial modeling and image matching techniques, Comput.Aided Civ. Infrastruct. Eng. 24 (3) (2009) 199–211.
[18] Y. Wu, H. Kim, C. Kim, S.H. Han, Object recognition in construction-site images using3D CAD-based filtering, J. Comput. Civ. Eng. 24 (1) (2009) 56–64.
[19] J. Teizer, C.H. Caldas, C.T. Haas, Real-time three-dimensional occupancy gridmodelingfor the detection and tracking of construction resources, J. Constr. Eng. Manag. 133(11) (2007) 880–888.
[20] M. Golparvar-Fard, F. Pena-Mora, S. Savarese, Application of D4AR — a 4-Dimensional augmented reality model for automating construction progress moni-toring data collection, processing and communication, J. Inf. Technol. Constr. 14(2009) 129–153.
[21] M. Golparvar-Fard, F. Peña-Mora, S. Savarese, Automated progress monitoring usingunordered daily construction photographs and IFC-based building informationmodels, ASCE J. Comput. Civ. Eng. (2014), http://dx.doi.org/10.1061/(ASCE)CP.1943-5487.0000205 (in press).
[22] S. El-Omari, O. Moselhi, Integrating 3D laser scanning and photogrammetryfor progress measurement of construction work, Autom. Constr. 18 (1)(2008) 1–9.
[23] M. Ahmed, C. Haas, J. West, R. Haas, Rapid tracking of pipe-works progress usingdigital photogrammetry, Proceedings of the 9th Construction Specialty Conference,Ottawa, Ontario, Canada, 2011, pp. 14–17.
[24] M. Ahmed, C. Haas, R. Haas, Using digital photogrammetry for pipe-works progresstracking, Canadian Journal for Civil Engineering Special Issue Constr. Eng. Manag. 39(9) (2012) 1062–1071.
[25] M. Ahmed, C.T. Haas, R. Haas, Toward low-cost 3D automatic pavement distresssurveying: the close range photogrammetry approach, Can. J. Civ. Eng. 38 (12)(2011) 1301–1313.
[26] G.S. Cheok, W.C. Stone, R.R. Lipman, C. Witzgall, Ladars for construction assessmentand update, Autom. Constr. 9 (5) (2000) 463–477.
[27] W. Stone, G. Cheok, LADAR sensing applications for construction, Building and FireResearch, , National Institute of Standards and Technology (NIST), Gaithersburg,MD, 2001.
[28] E.J. Jaselskis, Z. Gao, R.C. Walters, Improving transportation projects using laserscanning, J. Constr. Eng. Manag. 131 (3) (2005) 377–384.
[29] I. Brilakis, M. Lourakis, R. Sacks, S. Savarese, S. Christodoulou, J. Teizer, A.Makhmalbaf, Toward automated generation of parametric BIMs based on hybridvideo and laser scanning data, Adv. Eng. Inform. 24 (4) (2010) 456–465.
[30] G. Jacobs, 3D scanning: using multiple laser scanners on projects, Prof. SurveyorMag. 28 (2008).
[31] F. Bosché, C.T. Haas, Automated retrieval of 3D CAD model objects in constructionrange images, Autom. Constr. 17 (2008) 499–512.
[32] F. Bosché, Automated recognition of 3D CAD model objects in laser scans and calcu-lation of as-built dimensions for dimensional compliance control in construction,Adv. Eng. Inform. 24 (1) (2010) 107–118.
[33] C. Kim, H. Son, C. Kim, Automated construction progress measurement using a 4Dbuilding information model and 3D data, Autom. Constr. 31 (2013) 75–82.
[34] P. Tang, D. Huber, B. Akinci, R. Lipman, A. Lytle, Automatic reconstruction of as-builtbuilding information models from laser-scanned point clouds: a review of relatedtechniques, Autom. Constr. 19 (7) (2010) 829–843.
[35] P. Tang, E. Anil, B. Akinci, D. Huber, Efficient and effective quality assessment of as-isbuilding information models and 3D laser-scanned data, ASCE InternationalWorkshop on Computing in Civil Engineering, Miami, FL, USA, 2011.
[36] J. Lee, H. Son, C. Kim, C. Kim, Skeleton-based 3D reconstruction of as-built pipelinesfrom laser-scan data, Autom. Constr. 35 (2013) 199–207.
[37] B. Lijing, Z. Zhengpeng, Application of point clouds from terrestrial 3D laser scannerfor deformation measurements, The International Archives of the Photogrammetry,Remote Sens. Spat. Inf. Sci., 37, 2008.
[38] H.S. Park, H.M. Lee, H. Adeli, I. Lee, A new approach for health monitoring ofstructures: terrestrial laser scanning, Comput. Aided Civ. Infrastruct. Eng. 22(2007) 19–30.
[39] D.W. Qui, J.G. Wu, Terrestrial laser scanning for deformation monitoring of thethermal pipeline traversed subway tunnel engineering, XXIst ISPRS Congress:Commission V, WG 3, Beijing, 2008, pp. 491–494.
[40] E. Valero, A. Adán, C. Cerrada, Automatic method for building indoor boundarymodels from dense point clouds collected by laser scanners, Sensors 12 (2012)16099–16115.
[41] X. Xiong, A. Adán, B. Akinci, D. Huber, Automatic creation of semantically rich 3Dbuilding models from laser scanner data, Autom. Constr. 31 (2013) 325–337.
[42] S.-W. Kwon, F. Bosche, C. Kim, C.T. Haas, K.A. Liapi, Fitting range data to primitivesfor rapid local 3D modeling using sparse range point-clouds, Autom. Constr. 13(1) (2003) 67–81.
[43] J. McLaughlin, S.V. Sreenivasan, C.T. Haas, K.A. Liapi, Rapid human-assisted creationof bounding models for obstacle avoidance in construction, Comput. Aided Civ.Infrastruct. Eng. 19 (2004) 3–15.
[44] T. Rabbani, F. van den Heuvel, Efficient Hough transform for automatic detection ofcylinders in point clouds, ISPRS WG III/3, III/4, V/3 Workshop on Laser Scanning,Enschede, NL, 2005.
[45] N.J. Shih, S.T. Huang, 3D scan information management system for constructionmanagement, J. Constr. Eng. Manag. 132 (2) (2006) 134–142.
[46] Y. Turkan, F. Bosche, C.T. Haas, R. Haas, Automated progress tracking using 4Dschedule and 3D sensing technologies, Autom. Constr. 22 (2012) 414–421.
[47] Y. Turkan, F. Bosché, C.T. Haas, R. Haas, Toward automated earned value trackingusing 3D imaging tools, J. Constr. Eng. Manag. 139 (4) (2012) 423–433.
[48] M. Ahmed, C.T. Haas, R. Haas, Autonomous modeling of pipes within point clouds,Proceedings of the 30th ISARC, Montréal, Canada, 2013, pp. 1093–1100.
[49] M. Ahmed, C.T. Haas, R. Haas, Automatic detection of cylindrical objects in builtfacilities, ASCE J. Comput. Civ. Eng. 28 (3) (2014), http://dx.doi.org/10.1061/(ASCE)CP.1943-5487.0000329.
[50] H. Son, C. Kim, C. Kim, Knowledge-based approach for 3D reconstruction of as-builtindustrial plant models from laser-scan data, Proceedings of the 30th ISARC,Montréal, Canada, 2013, pp. 885–893.
[51] G. Vosselman, S. Dijkman, 3D building model reconstruction from point clouds andground plans, International Archives of Photogrammetry and Remote Sensing,Volume XXXIV-3/W4 Annapolis, MD, 2001, (22–24 Oct. 2001).
[52] Y. Turkan, F. Bosché, C.T. Haas, R.G. Haas, Tracking of secondary and temporary ob-jects in structural concrete work, emerald, construction innovation: information,process and management 14 (2) (2014) 145–167, http://dx.doi.org/10.1108/CI-12-2012-0063.
[53] F. Bosché, A. Guillemet, Y. Turkan, C.T. Haas, R.G. Haas, Tracking the Built Status ofMEP Works: Assessing the Value of a Scan-vs.-BIM System, ASCE J. Comput. Civ.Eng. (2014), http://dx.doi.org/10.1061/(ASCE)CP.1943-5487.0000343.
[54] F. Bosche, C. Haas, B. Akinci, Automated recognition of 3D CAD objects in site laserscans for project 3D status visualization and performance control, J. Comput. Civ.Eng. 23 (2009) 311–318 (SPECIAL ISSUE: Graphical 3D Visualization in Architecture,Engineering, and Construction).
[55] Hough, P. V. C., 1962. Method, and means for recognizing complex patterns, U.S.Patent 3069654.
[56] R.O. Duda, P.E. Hart, Use of the Hough transformation to detect lines and curves inpictures, Commun. ACM 15 (1972) 11–15.
[57] Z. Cheng, Y. Liu, Efficient technique for ellipse detection using restricted randomizedHough transform, Proceedings of the International Conference on InformationTechnology (ITCC'04), vol. 2, 2004, pp. 714–718.
[58] M. van Ginkel, M.A. Kraaijveld, L.J. van Vliet, E.P. Reding, P.W. Verbeek, H.J.Lammers, Robust curve detection using a Radon transform in orientationspace, Proceedings of the 13th Scandinavian Conference on Image Analysis,2003, pp. 125–132.
[59] M. van Ginkel, C.L. Luengo Hendriks, L.J. van Vliet, A short introduction to the Radonand Hough transforms and how they relate to each other, Technical Report No.QI-2004-01, Quantitative Imaging Group, Imaging Science & TechnologyDepartment, Faculty of Applied ScienceDelft University of Technology, 2004.
[60] P.J. Besl, R.C. Jain, Segmentation through variable-order surface fitting, IEEE Trans.Pattern Anal. Mach. Intell. 10 (2) (1988) 167–192.
[61] H. Hoppe, T. DeRose, T. Duchamp, J. McDonald, W. Stuetzle, Surface reconstructionfrom unorganized points, Proceedings of SIGGRAPH '92, Chicago, Illinois, 1992.
[62] J. Koenderink, A. van Doorn, Surface shape and curvature scales, Image and VisionComputing, 1992. 557–565.
[63] C. Dorai, A. Jain, COSMOS—a representation scheme for 3D free-form objects, IEEETrans. Pattern Anal. Mach. Intell. 19 (10) (1997) 1115–1130.
[64] E. Shaffer, M. Garland, Efficient adaptive simplification of massive meshes, IEEEVisualization, 2001.
[65] M. Pauly, R. Keiser, M. Gross, Multi-scale feature extraction on point-sampledsurfaces, Comput. Graph. Forum 22 (3) (2003) 281–289.
[66] T. Rabbani, F.A. van den Heuvel, G. Vosselman, Segmentation of point clouds usingsmoothness constraint, APRS Volume XXXVI, Part 5, Dresden 25–27 September,2006.

213F. Bosché et al. / Automation in Construction 49 (2015) 201–213
[67] A. Jagannathan, E. Miller, Three-dimensional surface mesh segmentation usingcurvedness-based region growing approach, IEEE Trans. Pattern Anal. Mach. Intell.29 (12) (2007) 2195–2204.
[68] K. Klasing, D. Althoff, D.Wollherr, M. Buss, Comparison of surface normal estimationmethods for range sensing applications, IEEE Int. Conf. Robot. Autom. (2009)3206–3211.
[69] J.C. Carr, R.K. Beatson, B.C. McCallum, W.R. Fright, T.J. McLennan, T.J. Mitchell,Smooth surface reconstruction from noisy range data, International Conference onComputer Graphics and Interactive Techniques, 2003, pp. 119–126.
[70] X. Xiong, A. Adan, B. Akinci, D. Huber, Automatic creation of semantically rich 3Dbuilding models from laser scanner data, Autom. Constr. (2012) 325–337.
[71] V.F. Leavers, Which Hough transform? CVGIP Image Underst. 58 (2) (1993)250–264.
[72] T.S. Newman, P.J. Flynn, A.K. Jain, Model-based classification of quadric surfaces,CVGIP Image Underst. 58 (2) (1993) 235–249.
[73] D. Borrmann, J. Elseberg, K. Lingemann, A. Nüchter, The 3D Hough transform forplane detection in point clouds: a review and a new accumulator design, 3D Res.2 (2) (2011).
[74] A. Pietrowcew, Face detection in colour images using fuzzy Hough transform,Opto-Electron. Rev. 11 (3) (2003) 247–251.
[75] F. Bosché, Plane-based coarse registration of 3D laser scans with 4D models, Adv.Eng. Inform. 26 (2011) 90–102.
[76] C. Kim, H. Son, C. Kim, Fully automated registration of 3D data to a 3D CADmodel forproject progress monitoring, Autom. Constr. 35 (2013) 587–594.