
The value of domestic building energy efficiency - evidence from Ireland
40
ISSN 1471-0498 DEPARTMENT OF ECONOMICS DISCUSSION PAPER SERIES THE VALUE OF DOMESTIC BUILDING ENERGY EFFICIENCY - EVIDENCE FROM IRELAND Marie Hyland, Ronan C. Lyons and Sean Lyons Number 614 June 2012 Manor Road Building, Oxford OX1 3UQ
Transcript of The value of domestic building energy efficiency - evidence from Ireland

ISSN 1471-0498
DEPARTMENT OF ECONOMICS
DISCUSSION PAPER SERIES
THE VALUE OF DOMESTIC BUILDING ENERGY EFFICIENCY - EVIDENCE FROM IRELAND
Marie Hyland, Ronan C. Lyons and Sean Lyons
Number 614 June 2012
Manor Road Building, Oxford OX1 3UQ
1
The value of domestic building energy
efficiency – evidence from Ireland
Marie Hylanda,d
, Ronan C. Lyonsb,c,d
and Sean Lyons,a,d,*
aEconomic and Social Research Institute, Dublin
bDepartment of Economics, University of Oxford
cSpatial Economics Research Centre, London School of Economics
dDepartment of Economics, Trinity College Dublin
*Corresponding author. Address for correspondence: Economic and Social Research Institute,
Whitaker Square, Sir John Rogerson’s Quay, Dublin 2, Ireland. Email: [email protected], Tel: +353
1 863 2019, Fax: +353 1 863 2100
Abstract
Following the transposition of the EU Energy Performance of Buildings Directive
into Irish law, all properties offered for sale or to let in Ireland are obliged to have an
energy efficiency rating. This paper analyses the effect of energy efficiency ratings
on the sale and rental prices of properties in the Republic of Ireland. Using the
Heckman selection technique we model the decision to advertise the energy
efficiency rating of a property and the effect of energy efficiency ratings on property
values. Our results show that energy efficiency has a positive effect on both the sales
and rental prices of properties, and that the effect is significantly stronger in the sales
segment of the property market. We also analyse the effect of energy efficiency
across different market conditions and we find that the effect of the energy rating is
stronger where market conditions are worse.
JEL classifications: Q51, R31, Q58
Key words: domestic building energy ratings, hedonic valuation, Ireland

2
1. Introduction
Buildings, in particular homes, account for a significant proportion of emissions in
developed economies. In the EU, residential emissions account for roughly one sixth of
emissions (European Commission, 2011), while in the U.S., buildings accounted for 41%
of all energy consumption in 2010, up from 33% in 1980, with residential buildings alone
accounting for 22.5% (U.S. Department of Energy, 2012).
In order to limit the extent of global warming to 2°C, world leaders have endorsed
proposals in the Copenhagen and the Cancun Agreements for developed economies to
drastically reduce their emissions. For example, the European Union aims to reduce
greenhouse gas emissions by 80-95% by 2050. The European Commission believes that
the key to achieving this reduction will be increased energy efficiency, estimating that by
2050 built environment emissions could be 90% lower (ibid.).
However, upgrading a home to improve its energy efficiency could, depending on the
property, involve a significant financial investment. Likewise, new properties being built
to high standards of efficiency are likely to have higher input costs. Therefore, an
important question to ask is: are potential renters or buyers willing to pay for this
increased energy efficiency, and if so how much? Furthermore, as property purchasers are
likely to reap the rewards of owning an energy efficient home for longer than renters, is
there a difference in the premium purchasers and renters are willing to pay? And does this
willingness to pay extra vary by market conditions?
In this paper we examine the effect of the Irish system of energy efficiency ratings on
house prices and rental rates, using an extensive dataset of property listings from 2008 to
2012. A Building Energy Rating (BER) is an objective measurement of the energy
efficiency of a building. Homes which have been assessed are given a rating from A1 to G
(where A1 is the most efficient) on the basis of the efficiency of the space and water

3
heating, ventilation, insulation and lighting fixtures in the building. A higher efficiency
rating for a home is expected to translate to lower energy bills. As well as the energy
efficiency of a building, a BER certificate also reports the carbon dioxide emissions
associated with the building (expressed as kgCO₂/m²/year) (SEAI).
BER certificates were adopted in Ireland following the passing of the EU Directive on the
Energy Performance of Buildings into Irish law in 2006. The Sustainable Energy
Authority of Ireland (SEAI) was designated as the issuing authority for BER certificates in
Ireland. As of January 1st 2007, if planning permission is sought for a new dwelling, a
BER certificate is compulsory and, as of January 1st 2009, any existing home offered for
sale or for rental must have a BER cert. In 2013, new legislation (the Recast Energy
Performance of Buildings Directive) will ensure that when properties are offered for sale
or to let, provided the property has a BER certificate, the energy rating must be stated in
the advertisement (European Parliament and Council, 2010). Certain buildings are exempt
from the BER legislation, these include protected structures. A fine of up to €5,000 can be
levied for non-compliance with the legislation (European Communities, 2006).
The BER assessment can be carried out by any assessor who has been certified by the
SEAI, and the charge per assessment depends upon the assessor but, on average, ranges
between €109 and €250 depending on the size of the building (from various assessor
websites). Once a BER assessment has been carried out, the BER certificate is valid for 10
years, provided that no significant change is made to the building within that time (SEAI,
2010). Any building which is being let or sold on the basis of plans must have a
provisional BER certificate, which is valid for a maximum of two years.
There is a small existing literature on this subject, principally based on the commercial
property sector, almost all of which find a positive effect of energy ratings on property
prices and rental rates, although there is no consensus yet on the scale of the effect. The

4
literature on residential energy ratings is much smaller, although studies from the
Netherlands, Australia and China all find a positive effect.
The contribution of this paper is threefold. First, it is the first paper to examine Ireland’s
BER system and the impact it has on property valuations. Second, it is the first paper that
we know of which examines the extent to which there is a residential lettings premium for
more energy efficient properties, and thus it is also the first to compare valuation of
efficiency across residential sales and lettings segments. In this sense, it is the residential
market equivalent of Eichholtz, Kok & Quigley (2010a). Finally, it is the first paper to
examine whether there are structural variations in the house price premium associated with
greater energy efficiency, including between urban and rural markets, between large and
small properties and in different periods with different market conditions.
The rest of the paper is structured as follows: Section 2 contains a review of the relevant
literature, Section 3 describes the data used in our analysis, Section 4 outlines the
methodology used, Section 5 presents the results and, finally, Section 6 concludes.
2. Previous research
The literature on the effect of energy efficiency and energy performance certificates is
young, dating back only to 2008, but growing. One of the first studies was by Banfi et al.
(2008), who examine households’ willingness-to-pay for more energy efficient buildings
in Switzerland, based on a choice experiment, rather than market data. The study asks both
owner-occupiers and renters how much they would, hypothetically, be willing to pay for a
range of energy saving attributes. For their sample, the authors choose households that
have recently moved in order to capture the willingness-to-pay of households who have
recently faced a housing choice decision. The results show a similar level of willingness-

5
to-pay among owner-occupiers and tenants; respondents are willing to pay approximately
8% for improved ventilation in new and existing buildings, and 6-7% for façade
insulation. However, the authors note that these figures may be an over-estimation as the
survey was carried out during an exceptionally warm summer; the sample may not be
representative of the population in terms of income, education and environmental
awareness; and finally, consumers were asked to choose between hypothetical options and
therefore their willingness-to-pay might be different when faced an actual economic
decision.
The first study of the impact of energy efficiency in the residential market using market
data was by the Australian department of the Environment, Water, Heritage and the Arts
(ABS 2008). The study looks specifically at the price of detached houses sold in 2005 and
2006 in the Australian Capital Territory using five different specifications of a basic
hedonic model. The study finds that in 2005, for each additional 0.5 score on the energy
rating scale, house prices increases by 1.23 per cent, ceteris paribus; this figure increases
to 1.91 per cent for the 2006 house price data. These results are for the basic model
estimated; when the study takes account of the energy label and energy efficiency
characteristics of the house separately, the size of the label effect falls, but it remains
positive and significant in almost all cases.
Brounen and Kok (2011) examine the effect of energy ratings on house prices in the
Netherlands. The authors use a two-stage selection model to look at the factors that
influence whether or not a home has an energy rating, and given that a home does have an
energy rating, what effect that has on the transaction price of the home. The authors find
that larger buildings are less likely to have an energy label and that label adoption tends to
be associated with difficult selling conditions. They find that for homes that do have an
energy rating, a positive rating has a significant, positive effect on the transaction price of
6
the property; homes with an A, B or C energy label (“green” labels) receive a price
premium of 3.7% ceteris paribus. Furthermore, they find a very significant premium for
“A” rated homes: homes with an “A” rating receive a transaction price 10.2% higher than
similar homes with a “D” rating. They also find that homes with a “G” rating sell at 5%
less than similar “D” rated homes.
Zheng et al. (2011) examine the emerging market for eco-friendly real estate in China. The
authors construct a measure of “greenness”, based on marketing by property developers,
and use hedonic regression techniques to estimate the effect of energy efficiency on
residential property prices. The authors find that “green-marketed” properties initially
receive a price premium but subsequently resell or are leased at a price discount. They
note that this may be due to the fact that buildings marketed as “green” may not be more
energy efficient. The authors thus recommend the introduction of an official system of
energy efficiency ratings.
All these studies agree on the positive relationship between residential property values
and energy efficiency. However, studies by Yoshida and Suguira (2011) and Amecke
(2012) have found more mixed results. Analysing the transaction prices of condominiums
in Tokyo, Yoshida and Suguira (2011) find that while greener buildings generally trade at
a price premium, once building age and quality are controlled for this price effect
disappears and, in some cases, having an energy-efficient rating may actually lead to a fall
in transaction prices. The authors divide the “green” rating into its constituent parts and
find that the use of eco-friendly materials and “planting” has the largest negative effect on
price. The authors believe that this may be due to a perception of higher future
maintenance costs, and uncertainty about the quality of materials amongst potential
buyers. The authors do note that there is a potential omitted variable bias: it may be that

7
certain buildings are built in an energy efficient way in order to compensate for factors
such as poor location or a developer’s unfavourable reputation.
Amecke (2012) examines the effectiveness of energy performance certificates in helping
home buyers to incorporate energy efficiency into their purchasing decisions. The author
conducted a survey of property owners who had purchased their homes since 2009, and
examined the factors which effect purchasing decisions in general, and specifically energy
efficiency considerations. The results show that energy efficiency certificates had only a
limited effect on purchasing decisions. However, the authors do note that new mandatory
legislation which will come into effect in 2013 is likely to boost the effectiveness of the
energy ratings.
A slightly more established literature has examined the effect of energy ratings in the
commercial property market. Evidence of a positive association between “green”
certification and the financial performance of commercial property in the United States
has been found by Wiley et al. (2008), Das et al. (2011), Fuerst and McAllister (2011b)
and Reichardt et al. (2012). In the United Kingdom, evidence on this positive relationship
has been found by Chegut et al. (2011).
Eichholtz, Kok & Quigley have published two of the most well-known studies in the area.
Using matching techniques, Eichholtz et al. (2010a) find a significant positive effect for
buildings which were certified “green”: on average green offices command approximately
3% higher rents ceteris paribus. Furthermore, they find that green labels increase effective
rent (rent adjusted for occupancy) by 7% and sales prices by 16%. While these results are
consistent across specifications, the authors note that the premium for green buildings is
higher in areas where market conditions are generally worse, i.e.: areas that generally
command lower rents. In a second paper with an expanded dataset and more refined
econometric techniques, Eichholtz et al. (2010b) confirm their original finding that energy

8
efficiency is capitalised in property values and find no evidence that the relative demand
for energy efficient office space weakened during the recent economic downturn.
Kok and Jennen (2011) examine the effect of energy efficiency ratings and accessibility on
the commercial property market in the Netherlands and find a significant relationship
between a building’s energy efficiency rating and the level of rent its owners can
command. Using hedonic regression techniques the authors find that being certified as an
energy inefficient building is associated with a 6.5 per cent discount in rental rates,
controlling for building age, size and location.
As with the residential market, not all studies find a positive effect. Fuerst and McAllister
(2011a) look at the effect of energy ratings on the valuation of commercial property in the
UK, using a hedonic regression model to measure the effect of energy ratings on the rental
value, capital value and equivalent yields of commercial office space. While they find that
energy rating certificates have no effect on the market rent and market value of these
properties, they also note the relative small sample size (n=708) and the fact that the study
was based on assessor valuations rather than transaction prices.
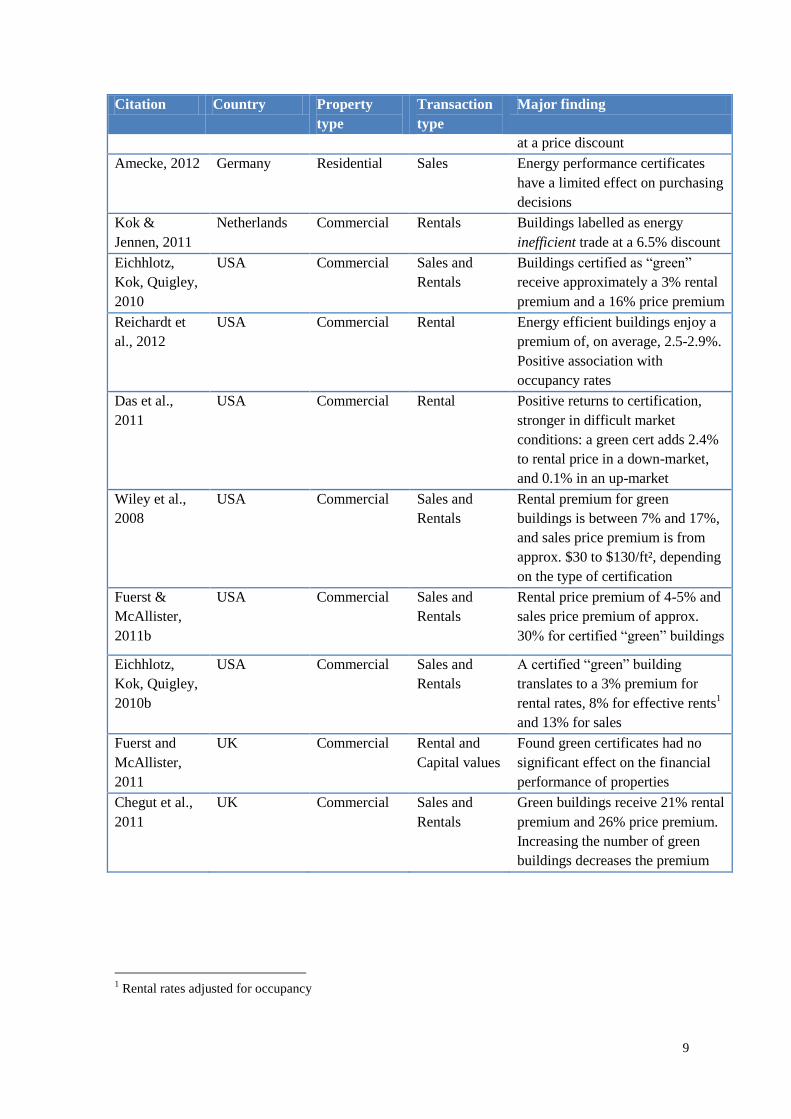
The main findings from the literature are summarised in the table below.
Table 1: Summary of research results
Citation Country Property
type
Transaction
type
Major finding
Brouen &
Kok, 2011
Netherlands Residential Sales Buildings certified as “green”
receive approx. 3.7% sales
premium
ABS, 2008 Australia Residential Sales House prices increase by 1.2% in
2005 and 1.91 in 2006 for each
increase along the efficiency scale
Yoshida &
Suguira, 2011
Japan Residential Sales Green buildings trade at a price
discount of approx. 5.5%
Zheng et al.,
2011
China Residential Sales “Green-marketed” residential
projects receive an initial sales
price premium, but resell or are let
9
Citation Country Property
type
Transaction
type
Major finding
at a price discount
Amecke, 2012 Germany Residential Sales Energy performance certificates
have a limited effect on purchasing
decisions
Kok &
Jennen, 2011
Netherlands Commercial Rentals Buildings labelled as energy
inefficient trade at a 6.5% discount
Eichhlotz,
Kok, Quigley,
2010
USA Commercial Sales and
Rentals
Buildings certified as “green”
receive approximately a 3% rental
premium and a 16% price premium
Reichardt et
al., 2012
USA Commercial Rental Energy efficient buildings enjoy a
premium of, on average, 2.5-2.9%.
Positive association with
occupancy rates
Das et al.,
2011
USA Commercial Rental Positive returns to certification,
stronger in difficult market
conditions: a green cert adds 2.4%
to rental price in a down-market,
and 0.1% in an up-market
Wiley et al.,
2008
USA Commercial Sales and
Rentals
Rental premium for green
buildings is between 7% and 17%,
and sales price premium is from
approx. $30 to $130/ft², depending
on the type of certification
Fuerst &
McAllister,
2011b
USA Commercial Sales and
Rentals
Rental price premium of 4-5% and
sales price premium of approx.
30% for certified “green” buildings
Eichhlotz,
Kok, Quigley,
2010b
USA Commercial Sales and
Rentals
A certified “green” building
translates to a 3% premium for
rental rates, 8% for effective rents1
and 13% for sales
Fuerst and
McAllister,
2011
UK Commercial Rental and
Capital values
Found green certificates had no
significant effect on the financial
performance of properties
Chegut et al.,
2011
UK Commercial Sales and
Rentals
Green buildings receive 21% rental
premium and 26% price premium.
Increasing the number of green
buildings decreases the premium
1 Rental rates adjusted for occupancy

10
3. Methodology
Hedonic regression techniques are commonly used to estimate the value of individual
attributes of a property whose prices are not directly observed. As outlined by Rosen
(1974), hedonic prices are revealed by the observed price of the house and the attributes
associated with it. The implicit prices of the characteristics are estimated by regressing the
observed price of a house on its attributes (such as size, number of bedrooms/bathrooms,
location, etc.).
As Rosen (1974) explains, in the hedonic regression the size of the coefficient on each
variable represents the value each characteristic contributes to overall value. A hedonic
regression takes the following form:
( )
In this case, refers to the price of the property, is a vector of house/apartment
characteristics, is a vector of location characteristics, is the energy rating (i.e.: the BER
certificate) and is the error term.
Running this regression should yield an estimate of the implicit value of a more energy
efficient home. However, in Ireland not all homes have a BER certificate and, for those
that do have one, not all owners advertise the BER when listing the property for sale or
rent. Thus, it is possible that the sample used in this study is subject to selection bias,
meaning it would be unsafe to apply the inferences from a simple hedonic regression to
unobserved groups, i.e., the results may apply only to an atypical set of houses. According
to Heckman (1979) when individuals self-select into a sample “…fitted regression
functions confound the behavioral parameters of interest with parameters of the function
determining probability of entrance into the sample”. In order to control for sample

11
selection bias (which may be thought of as a form of omitted variable bias), we employ the
Heckman selection model.
A detailed explanation of the Heckman procedure can be found in Greene (2002), who
outlines that the problem of “incidentally truncated” or non-randomly selected samples
can be formulated in a two equation model. The first equation determines selection into
the sample and takes the following form:
The second equation is the outcome equation, which is the equation of interest:
Where is observed if is greater than zero, i.e.:
{
Greene notes that and are bivariate normal with correlation coefficient :
( )
( )
( )
If and are uncorrelated (i.e. if = 0), estimating the selection and outcome equations
with OLS will yield consistent estimates of . However, in the case of property prices and
BER certificates we have reason to believe that the error terms from the two equations are
correlated; it may be that sellers of better quality homes are more likely to advertise their
BER and also more likely to command a higher price, i.e.: there is an unobserved
“quality” effect that affects both the decision to advertise a BER and the value of a

12
property. As such we estimate our equation using the Heckman procedure. In this case, the
first stage of the Heckman procedure models the decision to include a BER in the house
listing on the daft.ie site (see Section 4), and the second stage models the effect of having
a higher or lower BER on house prices or rental rates.
In order to employ the Heckman model it is necessary to have an instrument which is an
important determinant of the decision to advertise the BER (the selection equation) but
which is uncorrelated with property price (the outcome equation). In our analysis we use
mandatory BER legislation as our instrument. As of January 1st 2009 all homes offered for
sale or rental were obliged to possess a BER certificate. Although this regulation did not
require sellers and lessors to advertise the BER to potential purchasers or lessees, it seems
reasonable to expect that possessing a BER makes advertising it more likely. We therefore
include a dummy variable in the selection equation set equal to zero before this date and 1
after it. It is important in the second stage of the model that the instrument be independent
of property value; therefore, to control for any correlation between property prices or rents
and our instrument we include time dummies in our regressions.
4. Data employed
According to the Sustainable Energy Authority of Ireland, the body responsible for energy
certificates in Ireland, in early 2012 there were 269,843 properties in Ireland with BER
cert. With preliminary results from the 2011 census indicating 2,004,175 houses in
Ireland, this means that approximately 13% of the total housing stock has a BER cert. It is
a subset of these properties, i.e. those offered for sale or rental on property website daft.ie,
as explained below, that we are using in our analysis of the effectiveness of BER
certificates. Furthermore, bearing in mind the potential for selection bias, it is worth noting
that the properties in the BER data set are different from the population of Ireland’s

13
properties in a number of significant ways; see Appendix, Section 1 for a more detailed
discussion of these differences.
4.1 Daft.ie data
Data on house prices and rental rates are from daft.ie, the largest property website in
Ireland, with approximately 90% of all properties for sale or to rent in Ireland advertised
on daft.ie. The data used in our analysis cover the period from January 2008 to March
2012.
The daft data contain information on the list price (sales) or rental rate (lettings) of a
property, the location of the property, the number of bedrooms and bathrooms in the
property, for sales properties details on the property type (detached, semi-detached,
apartment, etc.), and the period in which the property was advertised for sale or rental. The
dataset contains 397,258 properties listed for sale and 888,211 properties listed to rent. Of
these listings, the BER certificate is known for 5.0% of properties for sale and 2.3% of
properties to let.
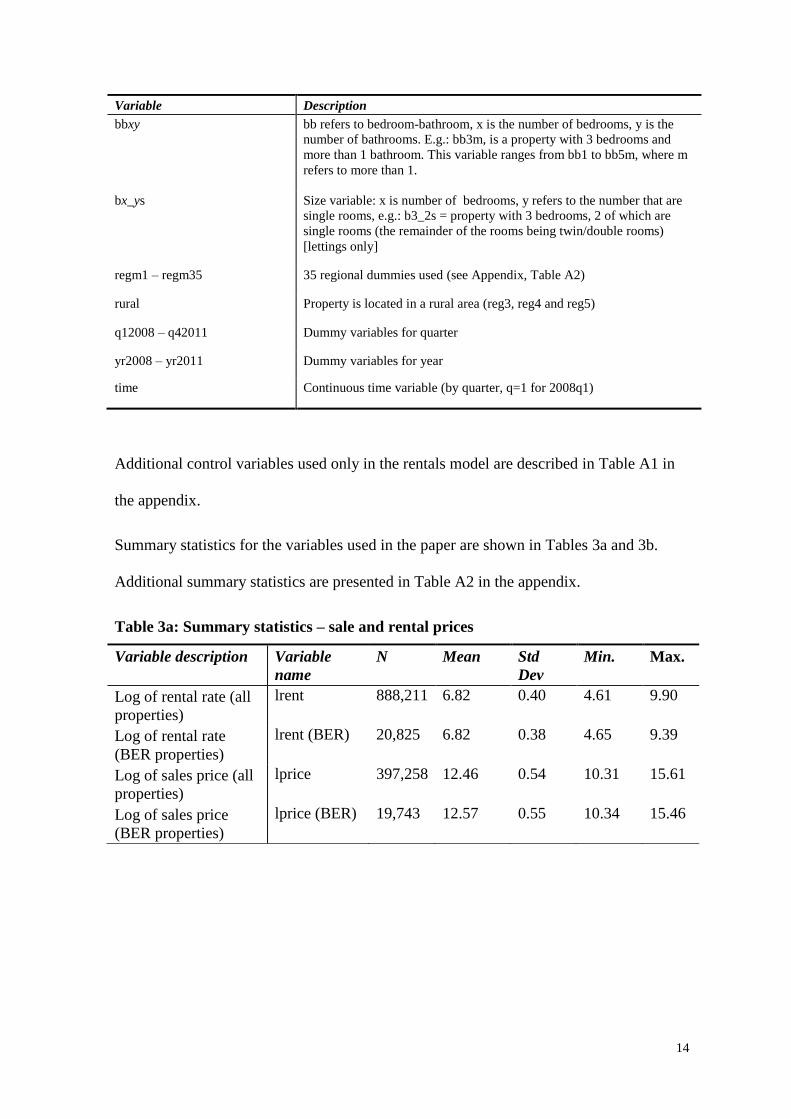
Table 2 below summarises the variables drawn from the Daft data.
Table 2: Variable descriptions
Variable Description
ber_id: 1-15 A categorical variable for each BER from A1 (most efficient) to G least
efficient)
ber_A – ber_F/G Sub-ratings grouped by letter; F and G grouped together
ber_law A dummy variable indicating the date at which the legislation came into
effect on the mandatory labelling of properties offered for sale/rental
ht1 – ht6 ht = house_type; 1 = terraced, 2 = semi-detached (control), 3 = detached,
4 = apartment, 6 = bungalow [sales only; for lettings, types or house,
apartment and flat]
new_dev A dummy variable that indicates whether or not a property is in a new
development
beds1 – beds5 The number of bedrooms in the property
14
Variable Description
bbxy bb refers to bedroom-bathroom, x is the number of bedrooms, y is the
number of bathrooms. E.g.: bb3m, is a property with 3 bedrooms and
more than 1 bathroom. This variable ranges from bb1 to bb5m, where m
refers to more than 1.
bx_ys Size variable: x is number of bedrooms, y refers to the number that are
single rooms, e.g.: b3_2s = property with 3 bedrooms, 2 of which are
single rooms (the remainder of the rooms being twin/double rooms)
[lettings only]
regm1 – regm35 35 regional dummies used (see Appendix, Table A2)
rural Property is located in a rural area (reg3, reg4 and reg5)
q12008 – q42011 Dummy variables for quarter
yr2008 – yr2011 Dummy variables for year
time Continuous time variable (by quarter, q=1 for 2008q1)
Additional control variables used only in the rentals model are described in Table A1 in
the appendix.
Summary statistics for the variables used in the paper are shown in Tables 3a and 3b.
Additional summary statistics are presented in Table A2 in the appendix.
Table 3a: Summary statistics – sale and rental prices
Variable description Variable
name
N Mean Std
Dev
Min. Max.
Log of rental rate (all
properties)
lrent 888,211 6.82 0.40 4.61 9.90
Log of rental rate
(BER properties)
lrent (BER) 20,825 6.82 0.38 4.65 9.39
Log of sales price (all
properties)
lprice 397,258 12.46 0.54 10.31 15.61
Log of sales price
(BER properties)
lprice (BER) 19,743 12.57 0.55 10.34 15.46
15
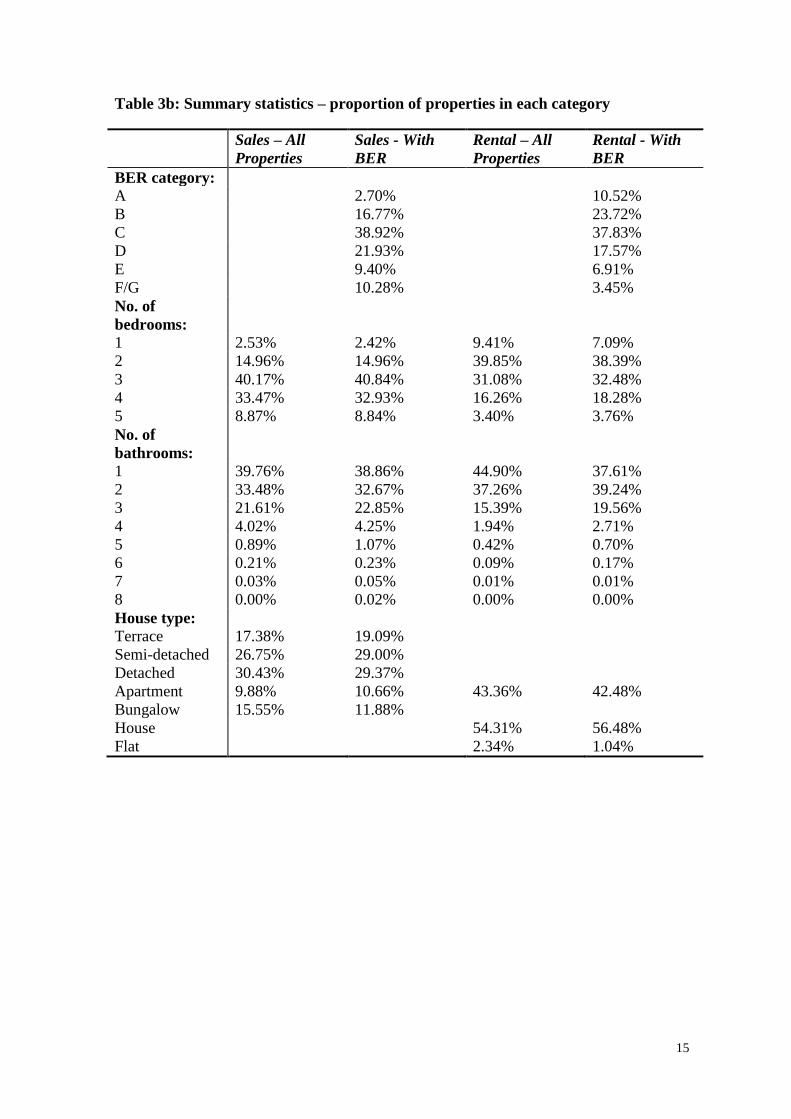
Table 3b: Summary statistics – proportion of properties in each category
Sales – All
Properties
Sales - With
BER
Rental – All
Properties
Rental - With
BER
BER category:
A 2.70% 10.52%
B 16.77% 23.72%
C 38.92% 37.83%
D 21.93% 17.57%
E 9.40% 6.91%
F/G 10.28% 3.45%
No. of
bedrooms:
1 2.53% 2.42% 9.41% 7.09%
2 14.96% 14.96% 39.85% 38.39%
3 40.17% 40.84% 31.08% 32.48%
4 33.47% 32.93% 16.26% 18.28%
5 8.87% 8.84% 3.40% 3.76%
No. of
bathrooms:
1 39.76% 38.86% 44.90% 37.61%
2 33.48% 32.67% 37.26% 39.24%
3 21.61% 22.85% 15.39% 19.56%
4 4.02% 4.25% 1.94% 2.71%
5 0.89% 1.07% 0.42% 0.70%
6 0.21% 0.23% 0.09% 0.17%
7 0.03% 0.05% 0.01% 0.01%
8 0.00% 0.02% 0.00% 0.00%
House type:
Terrace 17.38% 19.09%
Semi-detached 26.75% 29.00%
Detached 30.43% 29.37%
Apartment 9.88% 10.66% 43.36% 42.48%
Bungalow 15.55% 11.88%
House 54.31% 56.48%
Flat 2.34% 1.04%

16
5. Results
5.1 Modelling the decision to advertise a BER
The first stage of the Heckman model is the selection equation which models the decision
to advertise a BER when listing a property for sale or rental. There are four principal
results, which are broadly consistent across sales and lettings segments: time matters (later
being more likely to have a BER), size matters (larger is more likely) and location matters
(in general, more urban areas are more likely to have a BER) – but a property’s type,
perhaps surprisingly, does not matter.
The results show that house type is generally an insignificant predictor of the decision to
advertise a BER; only in the lettings equation is one dwelling type (apartment) significant.
On the other hand the number of bedrooms in a home does have an effect on the decision
to include a BER. Relative to three bedroom homes, one bedroom homes are significantly
less likely to advertise a BER, while four and five bedroom homes are more likely. These
results hold for both the sales and lettings models.
For property sales we found that location affects the decision to include a BER: relative to
being located in West Dublin, properties located in Dublin city centre, south Dublin city,
south county Dublin, north county Dublin, Cork city, and counties Meath, Clare, Sligo and
Wexford are significantly more likely to list a BER. Coefficients on all other counties
were negative and significant, except for Co. Kildare which was found to be insignificant.
Likewise for rental homes, location matters: relative to properties in west Dublin,
properties in Dublin city centre, south Dublin city, north Dublin city, south county Dublin,
north county Dublin, Cork, Galway and Limerick cities, counties Meath, Kildare,
Wicklow, Carlow, Longford, Kerry, Clare, Galway, Sligo and Leitrim are more likely to
advertise BERs. Properties to let in Waterford city, and counties Offaly, Westmeath,
Kilkenny, Mayo, Roscommon and Monaghan are significantly less likely to list one.
17
BER advertising is increasing over time: in both the lettings and sales models the
coefficient on a continuous time variable was positive and significant. In the sales model
the probability that a property listed a BER cert increased by 2.2% per quarter; for the
lettings model the effect of time was even stronger at 3.5%. Finally, the coefficient on the
mandatory BER legislation variable, the instrument we are using in the selection equation,
is positive and highly significant in both models. For sales properties, the probability that a
property listed a BER certificate jumped by 53.8% on January 1 2009; again the effect is
even stronger for rental properties at 62.8%. This is an important result as it helps confirm
the validity of our instrument.
A subset of the results from the selection equation is presented below, the coefficients on
the county dummies are available in the appendix, Table A3.

18
Table 4: Selection equation
Dependent
variable:
BER
advertised
Sales Model
Coefficient
Std error
Dependent
variable:
BER
advertised
Lettings
Model
Coefficient
Std error
BER law 0.538*** 0.000 BER law 0.628*** 0.000
Dwelling type: Dwelling type:
Terrace 0.001 0.904 House -0.008 0.369
Semi-detached Reference Category Apartment Reference Category
Detached -0.005 0.684 Flat2 -0.272***
Apartment -0.020 0.282
Bungalow -0.007
0.619
Size: Size:
1 bedroom -0.072** 0.022 1 bedroom -0.084*** 0.000
2 bedroom -0.023 0.181 2 bedroom 0.025 0.134
4 bedroom 0.128*** 0.000 4 bedroom 0.089*** 0.000
5 bedroom 0.147***
0.000 5 bedroom
0.056
0.185
Bed/
bathroom:
Bed/
bathroom:
bb1m -0.054 0.725 bb1m 0.138** 0.048
bb2m 0.119*** 0.000 bb2m 0.100*** 0.000
bb32 0.176*** 0.000 bb32 0.082*** 0.000
bb3m 0.368*** 0.000 bb3m 0.201*** 0.000
bb41 -0.123*** 0.000 bb41 -0.106*** 0.000
bb4m 0.193*** 0.000 bb4m 0.149*** 0.000
bb51 -0.299*** 0.000 bb51 0.033 0.648
bb5m 0.148*** 0.000 bb5m 0.081**
0.030
New
development
0.178*** 0.000 Rent
allowance
0.148***
0.000
Time 0.022*** 0.000 Time 0.035*** 0.000
Constant -1.187*** 0.000 Constant -3.371*** 0.000
_n 397,258 _n 888,211 Notes: This table reports the estimation results for some of the variables used in the selection equation. Due
to the high volume of dummy variables used in the regression Table 4 above is a truncated version of the
regression results. The coefficients on the county dummies are presented in the Appendix, Table A3.
***, **, *: Significant at the 1%, 5% and 10% levels respectively
2 In the data there are no clear rules on how “flat” differs from “apartment” but typically “flat” is part of a
house, while “apartment” is purpose-built as an apartment
19
5.2 Effect of the BER on house prices and rents
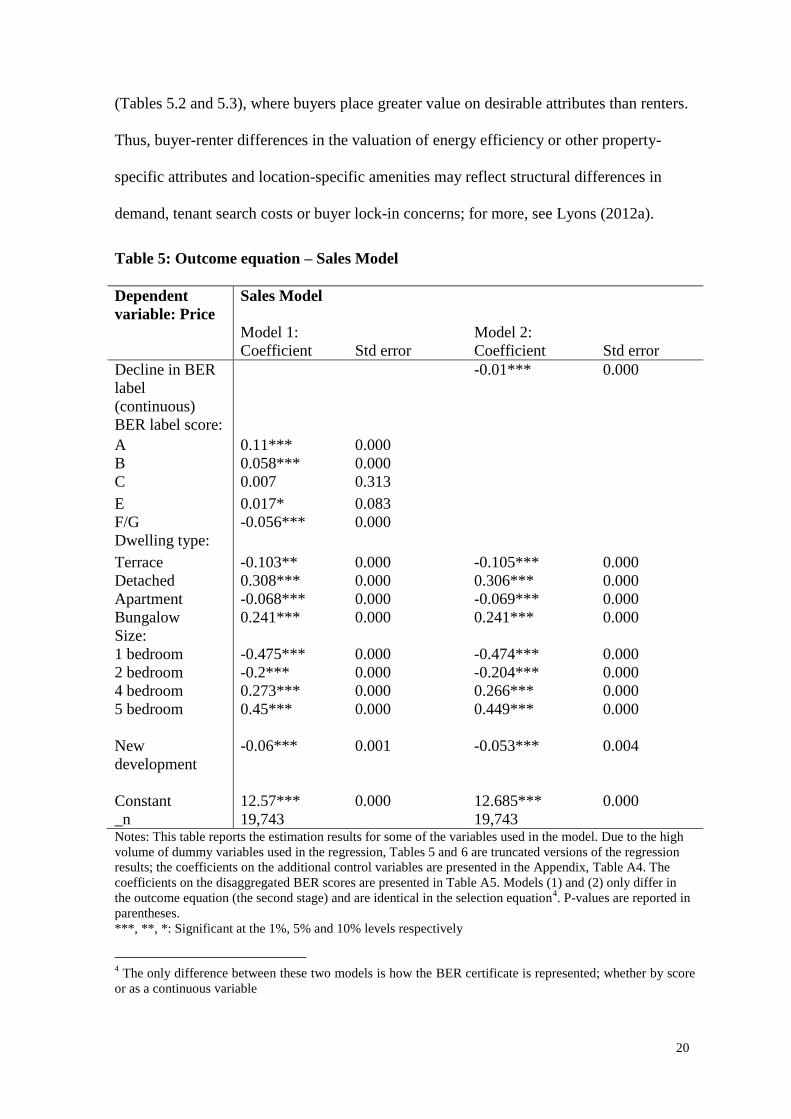
5.2.1 A positive energy rating has a positive effect on sale prices:
Our results show that, relative to obtaining a D energy rating, an A-rated property receives
a price premium of 11%, and a B rating increases the price by 5.8%. At the other end of
the scale, receiving an F or G rating reduces the price by 5.6%, ceteris paribus. If the BER
is measured as a 15-point scale from A1 to G, we find that each rating decline along the
BER scale is associated with a reduction in price of 1.0%.
5.2.2 A positive energy rating has a positive effect on rental prices:
We find that while the magnitude of the effect is weaker in the rental market, a positive
relationship still holds between energy ratings and rental prices. Relative to D-rated
properties, A-rated properties experience rental rates that are 1.9% higher, and counter-
intuitively, the premium is even higher for B-rated properties at 4.2%.3 E-rated properties
are penalised at a rate of 1.6% and F- or G-rated properties experience a price discount of
2.7%. Modelling the BER as a continuous variable we find that each decline in energy
efficiency along the BER scale is associated with a decline in rental price of 0.5%.
These results show that, while both buyers and renters value the energy efficiency of a
home, buyers place a higher value on it than renters. This is consistent with the results of
Eichholtz et al. (2010) who find that, for commercial properties, the premium in rental
rates for being “green” certified is between 7.9% and 10% (depending on the model
specification) but the premium in sales prices ranges from 15.8% to 16.8%.
Differences in discount rates between buyers and renters may mean that the mitigation
offered by energy efficiency against depreciation is given a greater value by buyers.
However, it is also present in attributes, such as four or five bedrooms, relative to three
3 This result may be driven by sample sizes, or a discrepancy between reported and actual BER certificates.
20
(Tables 5.2 and 5.3), where buyers place greater value on desirable attributes than renters.
Thus, buyer-renter differences in the valuation of energy efficiency or other property-
specific attributes and location-specific amenities may reflect structural differences in
demand, tenant search costs or buyer lock-in concerns; for more, see Lyons (2012a).
Table 5: Outcome equation – Sales Model
Dependent
variable: Price
Sales Model
Model 1:
Coefficient
Std error
Model 2:
Coefficient
Std error
Decline in BER
label
(continuous)
-0.01***
0.000
BER label score:
A 0.11*** 0.000
B 0.058*** 0.000
C 0.007 0.313
E 0.017* 0.083
F/G -0.056*** 0.000
Dwelling type:
Terrace -0.103** 0.000 -0.105*** 0.000
Detached 0.308*** 0.000 0.306*** 0.000
Apartment -0.068*** 0.000 -0.069*** 0.000
Bungalow 0.241*** 0.000 0.241*** 0.000
Size:
1 bedroom -0.475*** 0.000 -0.474*** 0.000
2 bedroom -0.2*** 0.000 -0.204*** 0.000
4 bedroom 0.273*** 0.000 0.266*** 0.000
5 bedroom
0.45***
0.000 0.449***
0.000
New
development
-0.06***
0.001 -0.053***
0.004
Constant 12.57*** 0.000 12.685*** 0.000
_n 19,743 19,743 Notes: This table reports the estimation results for some of the variables used in the model. Due to the high
volume of dummy variables used in the regression, Tables 5 and 6 are truncated versions of the regression
results; the coefficients on the additional control variables are presented in the Appendix, Table A4. The
coefficients on the disaggregated BER scores are presented in Table A5. Models (1) and (2) only differ in
the outcome equation (the second stage) and are identical in the selection equation4. P-values are reported in
parentheses.
***, **, *: Significant at the 1%, 5% and 10% levels respectively
4 The only difference between these two models is how the BER certificate is represented; whether by score
or as a continuous variable

21
Table 6: Outcome equation – Lettings Model
Dependent
variable: Price
Lettings Model
Model 1:
Coefficient
Std. Error
Model 2:
Coefficient
Std. error
Decline in BER
label
(continuous)
-0.005*** 0.000
BER label score:
A 0.019*** 0.003
B 0.042*** 0.000
C -0.003 0.514
E -0.016** 0.020
F/G -0.027*** 0.002
Dwelling type:
House -0.01** 0.028 -0.012** 0.016
Flat -0.194*** 0.000 -0.196*** 0.000
Size:
1 bedroom -0.322*** 0.000 -0.323*** 0.000
2 bedroom -0.154*** 0.000 -0.156*** 0.000
4 bedroom 0.128*** 0.000 0.126*** 0.000
5 bedroom
0.259*** 0.000 0.261*** 0.000
Constant 7.036*** 0.000 7.081*** 0.000
_n 20,825 20,825 Notes: See Table 5.
***, **, *: Significant at the 1%, 5% and 10% levels respectively
5.2.3. The effect of the energy rating is stronger where selling conditions are worse:
The same models were run on three different sub-samples, to analyse whether the
valuation of energy efficiency varied within the market, and in particular whether market
conditions matter to the value home buyers place on energy efficiency ratings. The
following subsamples were analysed:
1. 2009Q1-2010Q2 vs. 2010Q3-2012Q1: During the former period, there was an
average of 10,100 mortgages issued per quarter, according to Irish Banking
Federation statistics, compared to an average of 4,250 during the latter period.

22
Prices were on average 27% below peak levels of 2007 in the earlier period and
45% below in the latter period (IBF 2012, Daft.ie 2012).
2. Urban vs. rural: There are a number of reasons to believe that conditions during
this period were worse in rural property markets. According to the Department of
the Environment National Housing Survey 2011, there were almost 3,000
unfinished estates in Ireland by mid-2011. Just 354 were in Dublin, home to 1.3
million people (28% of Ireland’s population). The three Ulster counties of
Donegal, Cavan and Monaghan, home to fewer than 300,000 people, had 325
unfinished estates at the same period (Department of the Environment 2011). In
addition, demand for properties is likely to be stronger in urban markets due to
agglomeration forces and the concentration of new jobs growth in cities.
3. Property size (1/2 bed vs. 3-bed vs. 4-5 bed): In related research, Lyons (2012b)
finds clear evidence of a shift in price away from smaller properties (1-2 beds)
towards larger properties (3-4 beds), with the price premium of a four-bedroom
property over a two-bedroom properties, ceteris paribus, increasing from 45% to
57%. This suggests that conditions were likely to be tougher for those selling
smaller properties.
Comparing earlier and later periods, we find that the penalty for dropping each level on
the BER scale is larger when selling conditions are worse: for the period 2009-2010Q2 the
penalty is 1.5% whereas for 2010Q3-2012Q1 the penalty is 2.0%. The higher value
placed on energy efficiency in more illiquid markets could be reflective of tighter credit
constraints. In the later period, due to the lack of availability of finance to conduct
renovations on properties, it may be that buyers are looking for more energy efficient
properties, i.e.: properties which will not require further investment for renovation
purposes.

23
We find further evidence to support the hypothesis that energy efficiency matters more
where selling conditions are more difficult when comparing urban and rural markets. In
urban areas the price discount associated with each decline along the energy efficiency
scale is 1.2% whereas in rural areas the discount is almost double this at 2.3%.
Lastly, we find that energy efficiency ratings are more important the smaller the property.
The penalty for dropping down one grade on the energy efficiency scale is 2.3% in the
market for 1-2 bedroom homes, while for 3 bedroom and 4-5 bedroom homes the penalty
is lower at 1.7% and 1.6% respectively.
All three subsamples indicate that the effect of the BER on prices is generally stronger
where selling conditions are more difficult. As a final check on this, the same subsamples
were constructed for the lettings segment. Whereas market conditions in urban and rural
lettings markets and in markets across large and small rental properties more than likely
mirrored those of sales, there is a significant difference in the time subsamples. The
former period (2009Q1-2010Q2) saw rents fall on average by 3.3% per quarter. During the
latter period, rents were largely stable, falling by 0.3% on average (and rising marginally
on average in Dublin).
Crucially, the BER effect in the lettings market is stronger in the earlier period, as would
be expected if it is related to market conditions. In the earlier period, the effect is 0.8%,
compared to 0.6% in the later period. Lettings results by size subsamples are similar to
those for sales, however: the effect is largest for 1-2 bedroom properties (0.9%) and
smallest for 4-5 bedroom properties (0.4%).5 In urban lettings markets, the BER effect is
0.8%, compared to 0.6% in rural markets.
5 One potential explanation of the greater magnitude of the effect in prices and more generally of
buyer/renter differences in the valuation of attributes is that the nature of demand is different. In this case,
one might expect that home-buying families pay more attention to factors such as energy efficiency than
home-renting younger couples rent. The fact that in both sales and lettings segments the BER effect is

24
Table 7: Outcome equation – sub models
Dependent variable: Price Effect of a decline in BER label (continuous)
Sales Rentals
Sub model 1:
2009-2010Q2
-0.015***
-0.008***
vs.
2010Q3-2012Q1 -0.020*** -0.006***
Sub model 2:
Urban
-0.012***
-0.008***
vs.
Rural -0.023*** -0.006***
Sub model 3:
1-2 bed
-0.023***
-0.009***
vs.
3 bed -0.017*** -0.007***
vs.
4-5 bed -0.016*** -0.004*** Notes: This table reports the estimation results for only the outcome variables of interest. In Sub model 2,
urban refers to Dublin plus Cork, Galway and Limerick cities, whereas rural is the rest of the country.
***, **, *: Significant at the 1%, 5% and 10% levels respectively
6. Conclusions
According to the SEAI, energy efficiency certificates will “allow buyers and tenants to
take energy performance into consideration in their decision to purchase or rent a home”
(SEAI, from FAQs on BER certificates); in this paper we have confirmed that buyers and
tenants do place a positive and significant value on increased energy efficiency. We have
provided the first set of estimates for Ireland of the value of increased energy efficiency in
the residential sector. Based on previous research in this area, and on other hedonic
studies, we expected that property buyers would be willing to pay more for energy
efficiency than tenants; this result was confirmed in our estimates, A-rated properties
receive a sales price premium of 11% and a rental price premium of just under 2%.
However, we have not been able to identify whether this is due to structural differences in
stronger, not weaker, the smaller the property would imply that this is not the case and factors such as
market conditions, tenant search costs or buyer lock-in concerns are more important (Lyons, 2012a).

25
demand, tenant search costs or buyer lock-in concerns. These differences in the
capitalisation rates of energy efficient properties between owners and tenants are similar in
magnitude to those estimated by Eichholtz et al. (2010b) for the commercial property
market in the US.
There is scope for future research in this area. In particular, it would be useful to compare
the value of energy savings at higher BER levels as revealed in market transactions with
the hypothetical value from engineering studies. Market transactions may over- or under-
estimate the actual value of savings due to imperfect information or other market
imperfections, but engineering studies may also give a distorted view of the actual savings
because of omitted behavioural or environmental parameters. Comparing estimates could
yield improvements in both sources of information.
The ideal source for comparison would be a detailed engineering-based study of the cost
savings that could be realised by living in a more energy efficient property, calculated
separately for different property sizes, ages and types. This does not seem to be available
for Ireland at present. However, we can make a simple comparison using energy cost
averages published in SEAI, 2010. According to their estimates, for a typical 3 bedroom
semi-detached home the average running costs for principal energy use can range from
€300 per annum for an A2-rated home to €3,100 for a G-rated home (see Appendix, Table
A6). By plugging the estimates from our model back into the sales and rental prices, we
can compare the estimated cost savings with the rate at which energy efficiency is
capitalised into property values6. For a 3 bedroom property in west Dublin, the
engineering-based model says that moving from an F to a B1 rating would yield an
average cost savings of €2,040 but, for such a property, the sales price premium for
6 For simplicity these calculations assume that the energy savings are valued as a perpetuity, using a discount
rate of 5%

26
moving from an F to a B1 rating is only €1,617 (79% of the estimated cost savings) and
the rental premium is only €1,119 (55%). For a 4 bedroom property in Munster, moving
from an F to a B1 rating implies energy cost savings of €4,100, but the sales price
premium is only €2,640 (64%), and the rental premium is significantly lower at €563
(14%). These results imply that actual energy savings are not yet fully incorporated into
sales or rental price premiums, that engineering-based estimates overstate the actual
savings, or both. These results are for illustration purposes only, and it should be noted
that the cost saving estimates are based on averages for the relevant house types.
Other future work could utilise other datasets, for example, moves in Ireland to compile a
database of geo-coded property prices and BER certificates could facilitate a more precise
calculation of the parameters estimated in this paper. It would also allow researchers to
analyse how the parameters evolve as macroeconomic conditions change.
This paper can help inform policy in several ways. The first has to do with compliance
with BER legislation. The relatively small number of properties listing an energy rating
(20,825 for rentals and 19,743 for sales) relative to the total number of properties listed on
daft.ie for this period (888,211 rental and 397,258 sales advertisements) may indicate a
low level of compliance, particularly in the rental segment, with the legislation on the
mandatory labelling of properties offered for sale or rent. However, the recast Energy
Performance of Buildings Directive which will be brought into effect in 2013, and which
will make it compulsory for BER-assessed properties to list the energy rating at the point
of advertisement, should alleviate this problem.
A second policy issue relates to retrofitting. The Irish government is committed to the
implementation of Better Energy: the National Upgrade Programme (DCENR), which
aims to support the retrofitting of one million homes, businesses and public buildings. This
paper discusses the private benefits that can be gained from retrofits, and provides a

27
method of estimating the value of retrofits. There have been a numerous papers to date
analysing what is known as the energy efficiency gap (see for example Jaffe and Stavins,
1994 and Koopmans and te Velde, 2001). In a study of the energy efficiency gap in the
US, Allcott et al. (2012) find that while the size of the gap is small, it can vary
substantially across the population. The authors note that if the public is imperfectly
informed vis-à-vis energy efficiency, public awareness campaigns can be welfare
improving. In an Irish context, there may be benefits to informing the public of how
improvements in energy efficiency can lead to an increase in the value of housing assets.
However, to date little research has been published into the effectiveness of such
informational interventions in Ireland. An increasingly productive area for research
internationally that could usefully be applied in Ireland involves conducting randomised
controlled trials of proposed informational or retrofit programmes.
Acknowledgements
We are grateful for funding from the EPA Strive programme and the ESRI Energy Policy
Research Centre. The sponsors had no role in the design of the study; the collection,
analysis, and interpretation of data; the writing of the report; or the decision to submit the
paper for publication. Helpful comments were received from participants at the 2012
ESRI Environmental Economics Seminar and the ESRI UCC Energy Modelling Research
Seminar. The usual disclaimer applies.
References
Allcott, H., Greenstone, M., 2012. Is there an Energy Efficiency Gap? Journal of
Economic Perspectives. 26(1), 3-28.
Amecke, H., 2012. The impact of energy performance certificates: A survey of German
homeowners. Energy Policy. 46, 4-14.

28
Australian Bureau of Statistics, 2008. Energy efficiency rating and house price in the
ACT. Canberra: Department of the Environment, Water, Heritage and the Arts.
Banfi, S., Farsi, M., Filippini, M., Jakob, M., 2008. Willingness to pay for energy saving
measures in residential buildings. Energy Economics. 30(2), 503-516.
Brouen, D., Kok, N., 2011. On the economics of energy labels in the housing market.
Journal of Environmental Economics and Management. 62(2), 166-179.
Chegut, A., Eichholtz, P., Kok, N., 2011. The Value of Green Buildings: New Evidence
from the United Kingdom. Working paper. Available at:
www.sirp.se/getfile.ashx?cid=280784&cc=3&refid=34 (Accessed 8 June 2012)
Daft.ie, 2012, The Daft.ie House Price Report - An analysis of recent trends in the Irish
residential sales market, 2012 Q1. Available at: http://www.daft.ie/report (Accessed 7
June 2012)
Das, P., Tidwell, A., Ziobrowski, A., 2011. Dynamics of Green Rentals of Market Cycles:
Evidence from Commercial Office Properties in San Francisco and Washington DC.
Journal of Sustainable Real Estate. 3(1), 1-22.
Department of Energy, U.S., 2012. Buildings Energy Data Book, Table 1.1.3. Available
at: http://buildingsdatabook.eren.doe.gov/docs/xls_pdf/1.1.3.pdf (Accessed 7 June 2012)
Department of the Environment, Community & Local Government, 2011. National
Housing Development Survey 2011. Available at:
http://www.environ.ie/en/Publications/DevelopmentandHousing/Housing/HousingSurvey
2011/ (Accessed 30 May 2012)
Eichholtz, P., Kok, N., Quigley, J. M., 2010a. Doing Well by Doing Good? Green Office
Buildings. American Economic Review. 100(5), 2492-2509.

29
Eichholtz, P., Kok, N., Quigley, J. M., 2010b. The Economics of Green Building. Berkely
Program on Housing and Urban Policy, Working Paper No. W10-003. Available at:
http://escholarship.org/uc/item/3k16p2rj (Accessed 30 May 2012)
European Commission, 2011. A roadmap for moving to a competitive low carbon
economy in 2050. Communication from the Commission to the European Parliament, the
Council, the European Economic and Social Committee and the Committee of the
Regions. Available at:
http://eur-lex.europa.eu/LexUriServ/LexUriServ.do?uri=COM:2011:0112:FIN:EN:PDF
(Accessed: 7 June 2012)
European Communities, 2006. Energy Performance of Buildings Regulations 2006, S.I.
No. 666 of 2006. Dublin: The Stationary Office
European Communities, 2008. Energy Performance of Buildings (Amendment)
Regulations 2008, S.I. No. 229 of 2008. Dublin: The Stationary Office
The European Parliament and the Council of the European Union, 2010. Directive
2010/31/EU on the energy performance of buildings (recast), The Official Journal of the
European Union, 53, Legislation 153.
Fuerst, F., McAllister, P., 2011. The impact of Energy Performance Certificates on the
rental and capital values of commercial property assets. Energy Policy. 39(10), 6608-6614.
Fuerst, F., McAllister, P., 2011b. Green Noise or Green Value? Measuring the Effects of
Environmental Certification on Office Values. Real Estate Economics. 39(1), 45-69.
Greene, W. H., 2002. Econometric Analysis. 5th
edition. New Jersey: Prentice Hall.
Heckman, J. J., 1979. Sample selection bias as a specification error. Econometirca. 47(1),
153-161.

30
Irish Banking Federation, 2012. IBF/PwC Mortgage Market Profile. Available at:
http://www.ibf.ie/gns/publications/research/researchmortgagemarket.aspx (Accessed 8
June 2012)
Jaffe, A. B., Stavins, R. N., 1994. The energy efficiency gap: What does it mean? Energy
Policy. 22(10), 804-810.
Kok, N., Jennen, M., 2011. The impact of energy labels and accessibility on office rents.
Energy Policy. 46, 489-497
Koopmans, C. C., teVelde, D. W., 2001. Bridging the energy efficiency gap: using
bottom-up information in a top-down energy demand model. Energy Economics. 23(1),
57-75.
Lyons, R. C., 2012a. Inside a bubble and crash: Evidence from the valuation of amenities.
SSRN Working Paper 2007530.
Lyons, R. C., 2012b. East, West, Boom & Bust: The Spread of House Prices in Ireland,
2006-2011. SSRN Working Paper 2015276.
Reichardt, A., Fuerst, F., Rottke, N. B., Zietz, J., 2012. Sustainable Building Certification
and the Rent Premium: A Panel Data Approach. Journal of Real Estate Research. 34(1),
99-126.
Rosen, S. 1974. Hedonic Price and Implicit Markets: Product Differentiation in Pure
Competition. The Journal of Political Economy. 82(1), 34-55.
Sustainable Energy Authority of Ireland, 2010. BER information leaflet, Version 4
(09/2010).
Wiley, J. A, Benefield, J. D., Johnson, K. H., 2008. Green Design and the Market for
Commercial Office Space. Journal of Real Estate Finance and Economics. 41, 228-243.

31
Yoshida, J., Sugiura, A., 2010. Which "Greeness" is valued? Evidence from Green
Condominiums in Tokyo. 6th Annual AREUEA Conference Paper. Available at SSRN:
http://ssrn.com/abstract=1636426 (Accessed 8 June 2012)
Zheng, S., Wu, J., Kahn, M. E., Deng, Y., 2011. The Nascent Market for “Green” Real
Estate in Beijing. IRES Working Paper Series. IRES2011-013
32
Appendices
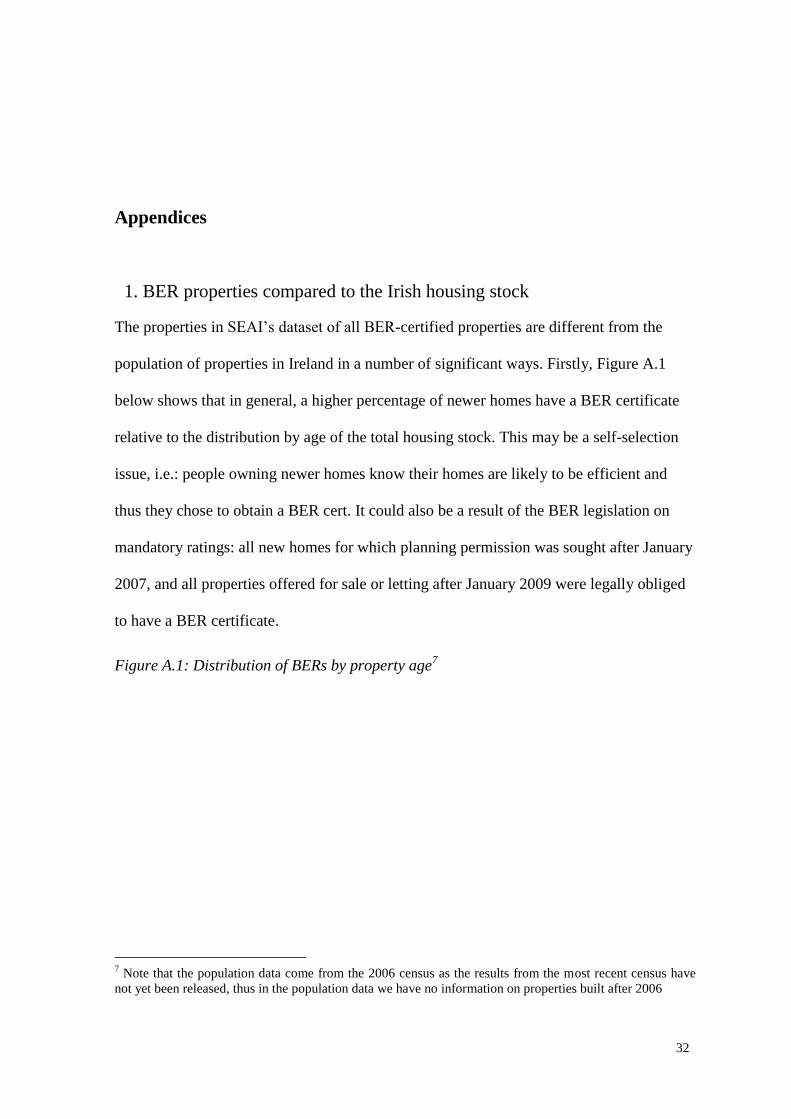
1. BER properties compared to the Irish housing stock
The properties in SEAI’s dataset of all BER-certified properties are different from the
population of properties in Ireland in a number of significant ways. Firstly, Figure A.1
below shows that in general, a higher percentage of newer homes have a BER certificate
relative to the distribution by age of the total housing stock. This may be a self-selection
issue, i.e.: people owning newer homes know their homes are likely to be efficient and
thus they chose to obtain a BER cert. It could also be a result of the BER legislation on
mandatory ratings: all new homes for which planning permission was sought after January
2007, and all properties offered for sale or letting after January 2009 were legally obliged
to have a BER certificate.
Figure A.1: Distribution of BERs by property age7
7 Note that the population data come from the 2006 census as the results from the most recent census have
not yet been released, thus in the population data we have no information on properties built after 2006
33
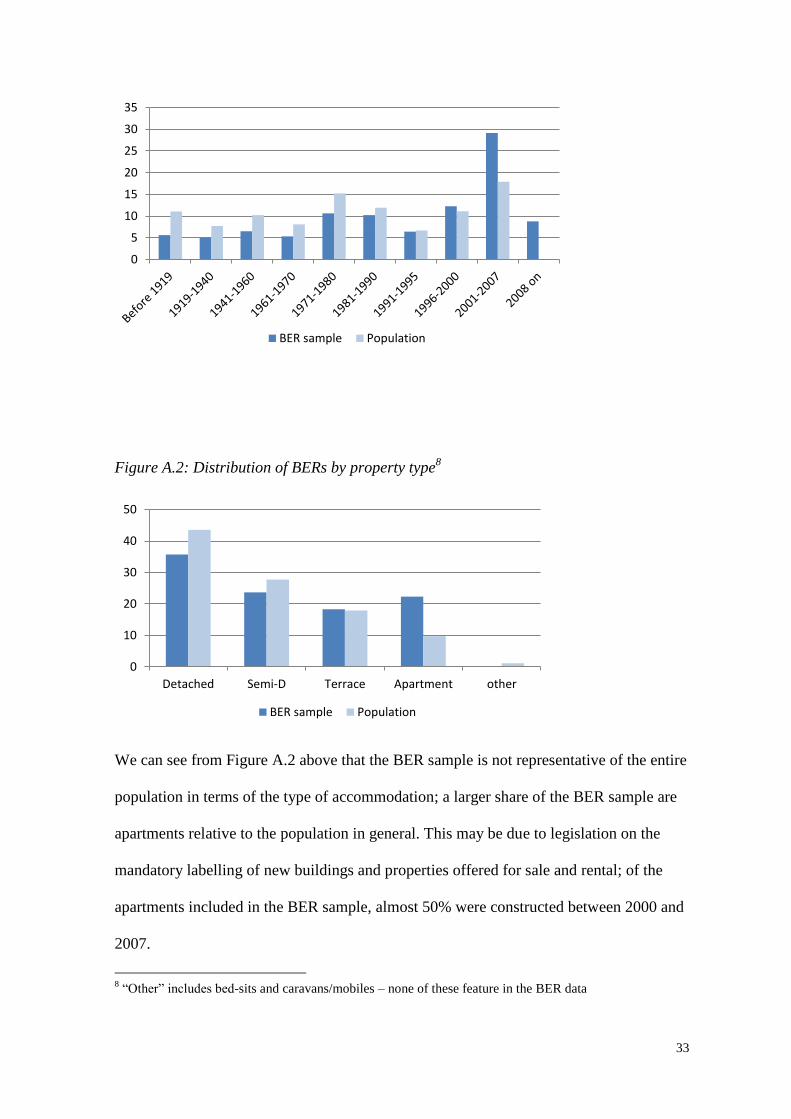
Figure A.2: Distribution of BERs by property type8
We can see from Figure A.2 above that the BER sample is not representative of the entire
population in terms of the type of accommodation; a larger share of the BER sample are
apartments relative to the population in general. This may be due to legislation on the
mandatory labelling of new buildings and properties offered for sale and rental; of the
apartments included in the BER sample, almost 50% were constructed between 2000 and
2007.
8 “Other” includes bed-sits and caravans/mobiles – none of these feature in the BER data
0
5
10
15
20
25
30
35
BER sample Population
0
10
20
30
40
50
Detached Semi-D Terrace Apartment other
BER sample Population

34
Table A1: Additional control variables used in the rentals model
garden Property has a garden
parking Property has a space for parking
alarm Property has an alarm
cable Property has cable television
washing_m Property has a washing machine
dryer Property has a dryer
dishwasher Property has a dishwasher
microwave Property has a microwave
pets Pets are allowed
access Property is wheelchair accessible
internet Property has internet
is_furnished Property is furnished
short_lease Property is available to let short term
long_lease Property is available to let long term
is_agent Property is being let by an agent
is_price_ch Observation is a property which is being re-listed at a different price
Table A2: Summary statistics – proportion of properties in the sample by county
Location: Sales – All
Properties Sales - With BER
Rental – All
Properties
Rental - With
BER
Dublin city centre 0.86% 1.35% 5.95% 5.69%
North Dublin city 5.15% 7.90% 9.40% 9.68%
South Dublin city 6.20% 15.18% 14.37% 12.92%
North county Dublin 3.23% 5.25% 3.96% 4.42%
South county Dublin 2.45% 6.84% 5.01% 7.53%
West Dublin 4.29% 6.66% 6.08% 4.43%
Cork city 3.68% 3.93% 7.09% 6.77%
Galway city 2.47% 1.43% 3.75% 7.36%
Limerick city 2.07% 1.05% 2.38% 2.30%
Waterford city 2.37% 0.59% 2.01% 0.88%
Co. Meath 3.98% 5.35% 3.26% 3.60%
Co. Kildare 4.19% 4.14% 5.54% 5.16%
Co. Wicklow 2.50% 2.31% 2.85% 3.54%
Co. Louth 3.55% 1.88% 2.79% 2.09%
Co. Longford 0.99% 0.83% 0.46% 0.45%
Co. Offaly 1.83% 0.95% 0.95% 0.35%
Co. Westmeath 2.28% 1.23% 2.01% 1.32%
Co. Laois 2.05% 0.91% 1.47% 1.11%
Co. Carlow 1.24% 0.70% 1.04% 3.21%
Co. Kilkenny 1.66% 1.05% 1.41% 0.72%

35
Co. Wexford 4.79% 5.55% 2.25% 1.85%
Co. Waterford 2.21% 0.93% 0.77% 0.54%
Co. Kerry 3.88% 2.22% 1.32% 1.18%
Co. Cork 7.00% 5.29% 4.43% 3.64%
Co. Clare 3.00% 4.07% 1.65% 2.04%
Co. Limerick 1.87% 0.72% 0.61% 0.54%
Co. Tipperary 3.12% 1.26% 1.23% 0.92%
Co. Galway 3.09% 1.81% 1.07% 1.26%
Co. Mayo 2.65% 0.84% 1.23% 0.84%
Co. Roscommon 2.28% 1.24% 0.54% 0.16%
Co. Sligo 1.44% 3.42% 0.87% 1.60%
Co. Leitrim 1.04% 0.46% 0.28% 0.26%
Co. Donegal 3.11% 1.07% 0.87% 0.86%
Co. Cavan 2.69% 1.15% 0.71% 0.54%
Co. Monaghan 0.78% 0.45% 0.40% 0.24%
Table A3. Selection equation – county dummies
Sales Model Lettings Model
Independent
variables:
Coefficient Independent
variables:
Coefficient Independent
variables:
Coefficient Independent
variables:
Coefficient
Dub. city
centre
0.077*
[0.087]
Co. Laois -0.292***
[0.000]
Dub. city
centre
0.268***
[0.000]
Co. Laois -0.029
[0.355]
N. Dublin
city
-0.162***
[0.000]
Co. Carlow -0.202***
[0.000]
N. Dublin
city
0.202***
[0.000]
Co. Carlow 0.63 ***
[0.000]
S. Dublin city 0.302***
[0.000]
Co.
Kilkenny
-0.178***
[0.000]
S. Dublin
city
0.172***
[0.000]
Co. Kilkenny -0.18***
[0.000]
N. Co. Dublin 0.192***
[0.000]
Co.
Wexford
0.136***
[0.000]
N. Co.
Dublin
0.181***
[0.000]
Co. Wexford -0.006
[0.813]
S. Co Dublin 0.232***
[0.000]
Co.
Waterford
-0.517***
[0.000]
S. Co
Dublin
0.386***
[0.000]
Co. Waterford -0.062
[0.134]
West Dublin Reference Co. Kerry -0.274***
[0.000]
West Dublin Reference Co. Kerry 0.073**
[0.017]
Cork city 0.089***
[0.000]
Co. Cork -0.115***
[0.000]
Cork city 0.148***
[0.000]
Co. Cork 0.014
[0.512]
Galway city -0.224***
[0.000]
Co. Clare 0.212***
[0.000]
Galway city 0.435***
[0.000]
Co. Clare 0.226***
[0.000]
Limerick city -0.283***
[0.000]
Co.
Limerick
-0.503***
[0.000]
Limerick
city
0.123***
[0.000]
Co. Limerick 0.04
[0.345]
Waterford
city
-0.564***
[0.000]
Co.
Tipperary
-0.357***
[0.000]
Waterford
city
-0.198***
[0.000]
Co. Tipperary -0.03
[0.374]

36
Co. Meath 0.148***
[0.000]
Co. Galway -0.296***
[0.000]
Co. Meath 0.146***
[0.000]
Co. Galway 0.171***
[0.000]
Co. Kildare 0.002
[0.941]
Co. Mayo -0.482***
[0.000]
Co. Kildare 0.086***
[0.000]
Co. Mayo -0.089
[0.008]
Co. Wicklow -0.11***
[0.000]
Co.
Roscommon
-0.214***
[0.000]
Co.
Wicklow
0.221***
[0.000]
Co.
Roscommon
-0.363 ***
[0.000]
Co. Louth -0.296***
[0.000]
Co. Sligo 0.506***
[0.000]
Co. Louth -0.006
[0.797]
Co. Sligo 0.402 ***
[0.000]
Co. Longford -0.169***
[0.000]
Co. Leitrim -0.354***
[0.000]
Co.
Longford
0.207 ***
[0.000]
Co. Leitrim 0.147**
[0.014]
Co. Offaly -0.267***
[0.000]
Co. Donegal -0.524***
[0.000]
Co. Offaly -0.251 ***
[0.000]
Co. Donegal 0.047
[0.185]
Co.
Westmeath
-0.221***
[0.000]
Co. Cavan -0.468***
[0.000]
Co.
Westmeath
-0.071**
[0.012]
Co. Cavan 0.028
[0.504]
Co.
Monaghan
-0.205***
[0.000]
Co. Monaghan -0.103*
[0.089]
Table A4. Outcome equation – additional control variables
Sales Model Lettings Model
Independent variables:
Coefficient Independent variables:
Coefficient Independent variables:
Coefficient Independent variables:
Coefficient
Q12008 0.225*** [0.000] Dub. city centre
0.315*** [0.000] Q12008 -0.009 [0.798] Pets allowed 0.016*** [0.000]
Q22008 0.175*** [0.000] N. Dublin city 0.273*** [0.000] Q22008 -0.034 [0.246] Dublin city centre
0.284*** [0.000]
Q32008 0.141*** [0.000] S. Dublin city 0.370*** [0.000] Q32008 -0.034 [0.166] N. Dublin city 0.121*** [0.000]
Q42008 0.077** [0.044] N. Co. Dublin 0.019 [0.314] Q42008 0.043** [0.027] S. Dublin city 0.25*** [0.000]
Q22009 -0.051*** [0.000] S. Co. Dublin 0.523*** [0.000] Q22009 -0.058*** [0.000] North Co. Dublin 0.018** [0.09]
Q32009 -0.088*** [0.000] Cork city -0.053*** [0.002] Q32009 -0.066*** [0.000] South Co. Dublin 0.272*** [0.000]
Q42009 -0.15*** [0.000] Galway city -0.149*** [0.000] Q42009 -0.11*** [0.000] Cork city -0.096*** [0.000]
Q12010 -0.153*** [0.000] Limerick city -0.244*** [0.000] Q12010 -0.133*** [0.000] Galway city -0.17*** [0.000]
Q22010 -0.182*** [0.000] Waterford city -0.348*** [0.000] Q22010 -0.142*** [0.000] Limerick city -0.333*** [0.000]
Q32010 -0.215*** [0.000] Co. Meath -0.227*** [0.000] Q32010 -0.143*** [0.000] Waterford city -0.351*** [0.000]
Q42010 -0.249*** [0.000] Co. Kildare -0.095*** [0.000] Q42010 -0.166*** [0.000] Co. Meath -0.317*** [0.000]
Q12011 -0.284*** [0.000] Co. Wicklow 0.031 [0.149] Q12011 -0.162*** [0.000] Co. Kildare -0.156*** [0.000]
Q22011 -0.308*** [0.000] Co. Louth -0.303*** [0.000] Q22011 -0.161*** [0.000] Co. Wicklow -0.04*** [0.001]
Q32011 -0.372*** [0.000] Co. Longford -0.623*** [0.000] Q32011 -0.153*** [0.000] Co. Louth -0.343*** [0.000]
Q42011 -0.433*** [0.000] Co. Offaly -0.369*** [0.000] Q42011 -0.176*** [0.000] Co. Longford -0.662*** [0.000]
Q12012 -0.455*** [0.000] Co. Westmeath -0.470*** [0.000] Q12012 -0.17*** [0.000] Co. Offaly -0.522*** [0.000]
Bed/ bath: Co. Laois -0.435*** [0.000] Bed/ bath: Co. Westmeath -0.486*** [0.000]
bb1m 0.353*** [0.001] Co. Carlow -0.341*** [0.000] bb1m 0.112*** [0.001] Co. Laois -0.543*** [0.000]
bb2m 0.128*** [0.001] Co. Kilkenny -0.369*** [0.000] bb2m 0.046*** [0.000] Co. Carlow -0.353*** [0.000]
bb32 0.09*** [0.001] Co. Wexford -0.401*** [0.000] bb32 0.042*** [0.000] Co. Kilkenny -0.387*** [0.000]

37
bb3m 0.118*** [0.001] Co. Waterford -0.307*** [0.000] bb3m 0.059*** [0.000] Co. Wexford -0.443*** [0.000]
bb41 -0.074*** [0.001] Co. Kerry -0.253*** [0.000] bb41 -0.033*** [0.008] Co. Waterford -0.441*** [0.000]
bb4m 0.053*** [0.001] Co. Cork -0.224*** [0.000] bb4m 0.049*** [0.000] Co. Kerry -0.487*** [0.000]
bb51 -0.194*** [0.001] Co. Clare -0.405*** [0.000] bb51 -0.047 [0.176] Co. Cork -0.378*** [0.000]
bb5m 0.086*** [0.001] Co. Limerick -0.355*** [0.000] bb5m 0.118*** [0.000] Co. Clare -0.504*** [0.000]
Co. Tipperary -0.406*** [0.000] Rent allow. -0.051*** [0.000] Co. Limerick -0.377*** [0.000]
Co. Galway -0.505*** [0.000] Garden9 0.026*** [0.000] Co. Tipperary -0.407*** [0.000]
Co. Mayo -0.538*** [0.000] Parking 0.042*** [0.000] Co. Galway -0.539*** [0.000]
Co.Roscommon -0.820*** [0.000] Alarm 0.035*** [0.000] Co. Mayo -0.486*** [0.000]
Co. Sligo -0.422*** [0.000] Cable TV 0.041*** [0.000] Co. Roscommon -0.559*** [0.000]
Co. Leitrim -0.702*** [0.000] Dish-washer
0.041*** [0.000] Co. Sligo -0.453*** [0.000]
Co. Donegal -0.598*** [0.000] Microwave 0.032*** [0.000] Co. Leitrim -0.708*** [0.000]
Co. Cavan -0.708*** [0.000] Furnished -0.121*** [0.000] Co. Donegal -0.525*** [0.000]
Co. Monaghan -0.535*** [0.000] Long term lease
0.094*** [0.000] Co. Cavan -0.69*** [0.000]
Let by agent
0.048*** [0.000] Co. Monaghan -0.43*** [0.000]
Is price change
-0.044*** [0.000]
9 Only those property amenities which were found to be significant are reported
38
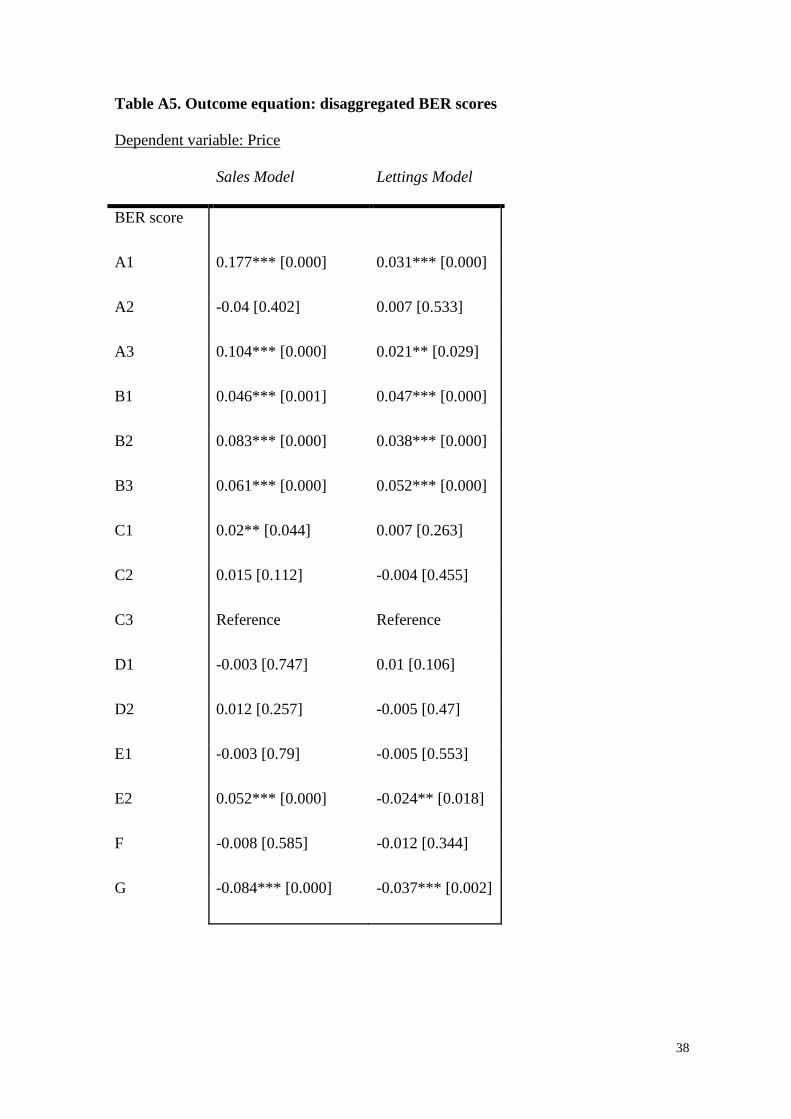
Table A5. Outcome equation: disaggregated BER scores
Dependent variable: Price
Sales Model Lettings Model
BER score
A1 0.177*** [0.000] 0.031*** [0.000]
A2 -0.04 [0.402] 0.007 [0.533]
A3 0.104*** [0.000] 0.021** [0.029]
B1 0.046*** [0.001] 0.047*** [0.000]
B2 0.083*** [0.000] 0.038*** [0.000]
B3 0.061*** [0.000] 0.052*** [0.000]
C1 0.02** [0.044] 0.007 [0.263]
C2 0.015 [0.112] -0.004 [0.455]
C3 Reference Reference
D1 -0.003 [0.747] 0.01 [0.106]
D2 0.012 [0.257] -0.005 [0.47]
E1 -0.003 [0.79] -0.005 [0.553]
E2 0.052*** [0.000] -0.024** [0.018]
F -0.008 [0.585] -0.012 [0.344]
G -0.084*** [0.000] -0.037*** [0.002]

39
Table A6. Estimated cost and CO₂ savings from SEAI
2 Bed Apartment
(75m²)
3 Bed Semi-D
(150m²)
4 Bed Detached
(200m²)
Tonnes Co₂ Cost Tonnes Co₂ Cost Tonnes Co₂ Cost
A2 0.8 €230 1.1 €300 2.2 €600
B1 1.2 €640 1.6 €460 3.3 €900
C1 2.3 €600 3.1 €900 6.2 €1,700
D1 3.7 €1,000 4.9 €1,400 9.8 €2,700
E1 5 €1,400 6.7 €1,800 13.3 €3,700
F 6.8 €1,900 9 €2,500 18.1 €5,000
G 8.5 €2,400 11.3 €3,100 22.6 €6,300
Note: the costs refer to the average running costs of heating a typical home to a standard
temperature and are based on an average of residential oil and gas prices for July 2010.
Source: SEAI BER information leaflet (Version 4, 09 / 2010).