The Use of Videoteletraining to Deliver Chief and Leading ...
80
Navy Personnel Research and Development Center San Diego, California 92152-7250 TR-95-8 August 1995 / The Use of Videoteletraining to Deliver Chief and Leading Petty Officer Navy Leadership Training: Evaluation and Summary C. Douglas Wetzel Henry Simpson George E. Seymour *" % 's' \J I 1 f Approved for public release; distribution is unlimited.
-
Upload
khangminh22 -
Category
Documents
-
view
0 -
download
0
Transcript of The Use of Videoteletraining to Deliver Chief and Leading ...
Navy Personnel Research and Development Center San Diego, California 92152-7250 TR-95-8 August 1995
/
The Use of Videoteletraining to Deliver Chief and Leading Petty Officer
Navy Leadership Training: Evaluation and Summary
C. Douglas Wetzel Henry Simpson
George E. Seymour
*" %'s' \J I 1 f
Approved for public release; distribution is unlimited.
NPRDC-TR-95-8 August 1995
The Use of Videoteletraining to Deliver Chief and Leading Petty Officer Navy Leadership Training:
Evaluation and Summary
C. Douglas Wetzel Henry Simpson
George E. Seymour
Reviewed by Nick Van Matre
Approved by J. C. McLachlan
Released by R M. Spishock
Captain, U.S. Navy Commanding Officer
and Murray W. Rowe
Technical Director
Accesion For
NTIS CRA&I DTIC TAB Unannounced Q Justification
By Distribution/
Availability Codes
Dist
m. Avail and/or
Special
Approved for public release; distribution is unlimited.
Navy Personnel Research and Development Center San Diego, California 92152-7250
REPORT DOCUMENTATION PAGE Form Approved OMB No. 0704-0188
Public reporting burden for this collection of information is estimated to average 1 hour per response, Including the time for reviewing instructions, searching existing data sources gathering and maintaining the data needed, and completing and reviewing the collection of information. Send comments regarding this burden estimate or any other aspect of this collection of information, including suggestions for reducing this burden, to Washington Headquarters Services, Directorate for Information Operations and Reports, 1215 Jefferson Davis Highway, Suite 1204, Arlington, VA 22202-4302, and to the Office of Management and Budget, Paperwork Reduction Project (0704-0188),
Washington, DC 20503.
1. AGENCY USE ONLY (Leave blank) 2. REPORT DATE August 1995
TITLE AND SUBTITLE The Use of Videoteletraining to Deliver Chief and Leading Petty Officer Navy Leadership Training: Evaluation and Summary
6. AUTHOR(S) C. Douglas Wetzel, Henry Simpson, George E. Seymour
7. PERFORMING ORGANIZATION NAME(S) AND ADDRESS(ES)
Navy Personnel Research and Development Center San Diego, CA 92152-7250
9. SPONSORING/MONITORING AGENCY NAME(S) AND ADDRESS(ES)
Chief of Naval Personnel (Pers-00H) Navy Annex Washington, DC 20350
3. REPORT TYPE AND DATE COVERED Interim
5. FUNDING NUMBERS
Program Element: 0603707N Project: 01772.ET112
8. PERFORMING ORGANIZATION REPORT NUMBER
NPRDC-TR-95-8
10. SPONSORING/MONITORING AGENCY REPORT NUMBER
11. SUPPLEMENTARY NOTES Functional Area: Training Research Product Line: Schoolhouse Training Effort: Distributed Training Technology
12a. DISTRIBUTION/AVAILABILITY STATEMENT
Approved for public release; distribution is unlimited. 12b. DISTRIBUTION CODE
13. ABSTRACT (Maximum 200 words)
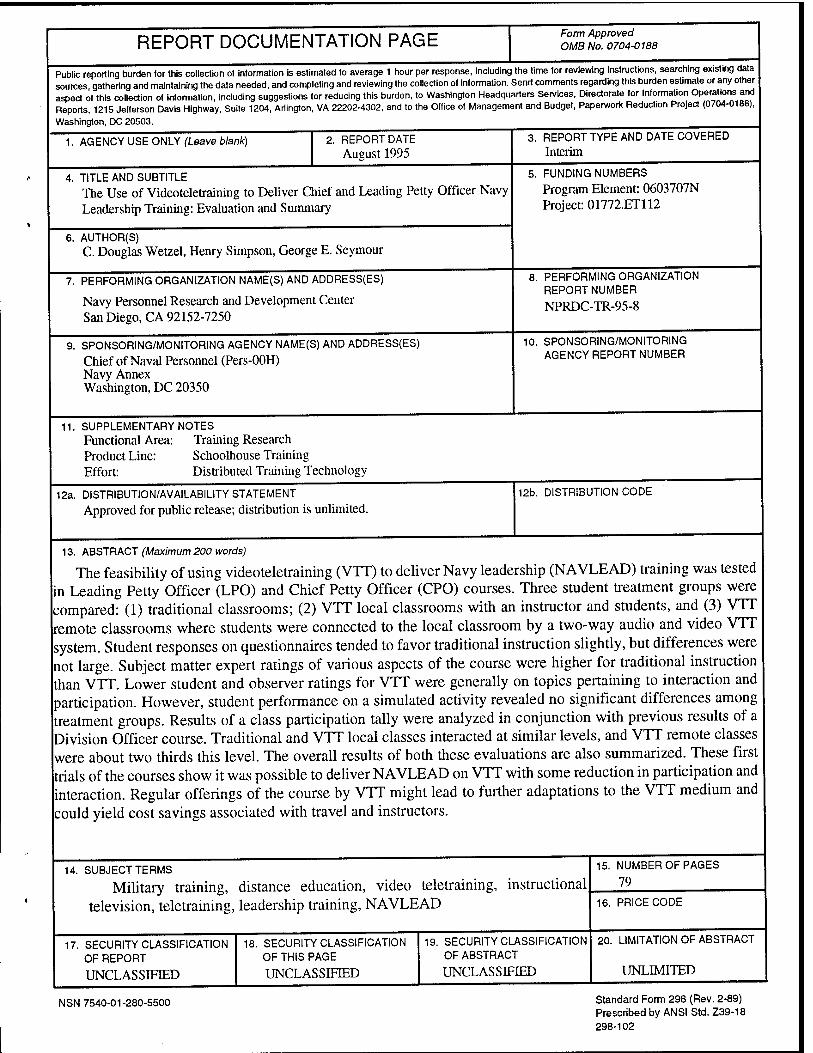
The feasibility of using videoteletraining (VTT) to deliver Navy leadership (NAVLEAD) training was tested in Leading Petty Officer (LPO) and Chief Petty Officer (CPO) courses. Three student treatment groups were compared: (1) traditional classrooms; (2) VTT local classrooms with an instructor and students, and (3) VTT remote classrooms where students were connected to the local classroom by a two-way audio and video VTT system. Student responses on questionnaires tended to favor traditional instruction slightly, but differences were not large. Subject matter expert ratings of various aspects of the course were higher for traditional instruction than VTT. Lower student and observer ratings for VTT were generally on topics pertaining to interaction and participation. However, student performance on a simulated activity revealed no significant differences among treatment groups. Results of a class participation tally were analyzed in conjunction with previous results of a Division Officer course. Traditional and VTT local classes interacted at similar levels, and VTT remote classes were about two thirds this level. The overall results of both these evaluations are also summarized. These first trials of the courses show it was possible to deliver NAVLEAD on VTT with some reduction in participation and interaction. Regular offerings of the course by VTT might lead to further adaptations to the VTT medium and could yield cost savings associated with travel and instructors.
14. SUBJECT TERMS
Military training, distance education, video teletraining, instructional television, teletraining, leadership training, NAVLEAD
17. SECURITY CLASSIFICATION OF REPORT
UNCLASSIFIED
18. SECURITY CLASSIFICATION OF THIS PAGE
UNCLASSIFIED
19. SECURITY CLASSIFICATION OF ABSTRACT
UNCLASSIFIED
15. NUMBER OF PAGES
79
16. PRICE CODE
20. LIMITATION OF ABSTRACT
UNLIMITED
NSN 7540-01-280-5500 Standard Form 298 (Rev. 2-89) Prescribed by ANSI Std. Z39-18 298-102
Foreword
This report describes research conducted as part of the Navy Personnel Research and Development Center's Distributed Training Technology (DTT) project. The DTT project is part of our Classroom and Afloat Training research program and falls under the Education and Training project (L1772) of the Navy's Manpower, Personnel, and Training Advanced Development Program Element (0603707N). The work was performed under the sponsorship of the Bureau of Naval Personnel. The research is evaluating technologies, training strategies, procedures, and management methods to extend videoteletraining (VTT) beyond traditional, lecture-based courses.
The research investigated the feasibility of using videoteletraining to deliver Navy leadership training. The findings have direct implications for the design of future distance education systems in the Navy and elsewhere.
The recommendations in this report are intended for use by the Chief of Naval Education and Training and Bureau of Naval Personnel in developing policy for the application of VTT in the Navy.
P. M. SPISHOCK MURRAY W. ROWE Captain, U.S. Navy Technical Director Commanding Officer
Acknowledgments
The research was conducted within the Chief of Naval Education and Training's Electronic Schoolhouse Network (CESN) classrooms in Damneck and Norfolk, Virginia; Newport, Rhode Island; Charleston, South Carolina; Mayport, Florida; and San Diego, California; and in the Navy Leadership (NAVLEAD) training classrooms in Little Creek, Virginia. The authors appreciate the assistance provided by the personnel in these commands that supported the research, the students who participated, and the NAVLEAD subject matter experts who observed classes and provided evaluation data. The authors are particularly indebted to Ms. Jean Ellis, CESN Project Manager; LT Russell Colbert, CESN VTT Officer; NAVLEAD instructors ATI Newsham, PN1 Lind, EW1 Melton, SMC Morgan, AMEC Axley, MMC Rogers, IMC Zekiel, EMC Johnson; and observers ETCS Houston, MM1 Laufenberger, RM2 Jones, ETC Granaas, RM1 Sorenson, FCCS Jaroszewski, DMC Bottos, AVCM Holetz, STGCS Huber, RMCS Brown, FTGC Grämlich, MMC Schlueter, AOC Sherman, ATI Czplinski, LCDR Goodman, PNCS David, STG1 Core, MM1 Miller, QM1 Caine, DSCS Henry, and ETCS Gail Brown. We also thank Betty Whitehill and Merle Vogel for performing data analyses.
Vll
Summary
Problem and Background
Many Navy personnel who must receive training are geographically separated from training resources. Videoteletraining (VTT) enables an instructor to teach multiple classes at different geographic locations. VTT has been shown to be an efficient and cost beneficial way to deliver training, and is now in operational use within the Navy's CNET Electronic Schoolhouse Network. Navy leadership training (NAVLEAD) involves high levels of interaction and represents a departure from the instructor-centered, lecture-based courses typically given by VTT. Given the strong demand for NAVLEAD training, significant travel or instructor costs could be avoided if such training could be delivered by VTT rather than in traditional classrooms.
Objective
The objective of the research was to test the feasibility of using videoteletraining to deliver NAVLEAD training for the Leading Petty Officer (LPO) and Chief Petty Officer (CPO) leadership courses. A secondary objective of this report is to summarize the combined results of the present work along with a similar previous evaluation of the Division Officer course.
Approach
Seven NAVLEAD classes were conducted with a total of 192 students. Three treatment groups were compared: (1) traditional instruction, (2) VTT local, and (3) VTT remote. Three classes were given in the traditional manner with instructors and students present in the same classroom (88 students). Four other classes were given by VTT with students distributed among local and remote sites. A total of 25 students were in VTT local classrooms with an instructor, and another 79 students were in remote VTT classrooms connected to the local classroom by a two- way audio and video VTT system.
The treatment groups were compared in terms of five outcome measures reflecting student evaluations of VTT, student evaluations on instructional topics, daily observer evaluations on several dimensions of the training, class participation, and student performance on a simulated classroom activity.
Results and Conclusions
Student responses on questionnaires tended to favor traditional instruction slightly, but differences were not large. There were no practical differences for ratings on VTT topics, although remote students were more likely to express the opinion that VTT reduced opportunities to interact. On instructional topics, the largest differences between groups in favor of traditional instruction tended to be on topics related to seeing and hearing students, teams, and instructors; or on topics related to interaction and participation. CPO students gave lower or more critical ratings overall than did LPO students. Subject matter expert ratings evaluating various dimensions of the training were significantly higher for traditional instruction than VTT. Some improvement over early days in the week occurred on items related to interaction. A common theme appearing in student and observer ratings was that VTT was given somewhat lower ratings than traditional
IX
instruction on those items pertaining to interaction and participation issues, although the ratings were above the mid point of the scale in the positive direction.
The tally of actual student initiated questions and comments showed the lowest level of interaction for VTT remote students, and a slightly higher level for VTT local than traditional students. An examination of the variability among individual sites revealed an interpretable pattern that resolved apparent inconsistencies between the present study and the previous study with Division Officer (DIVO) students. The pattern over all classes in both studies revealed a similar level of interaction for traditional and VTT local classes, while VTT remote classes were on average about two thirds this level.
Student performance on a simulated classroom activity was rated by observers near the end of the course at a point where it should have reflected some learning. There were no significant differences among traditional, local or remote students.
Overall, the LPO, CPO, and DIVO evaluations showed it was generally possible to deliver NAVLEAD by VTT given some reduction in participation. Interactivity was reduced in VTT classes in the perceptions of students and subject matter experts, and an objective interaction count was somewhat lower for remote site students. However, two measures reflecting learning during the course were generally unaffected. Little effect on student performance in the simulated activity was observed and student knowledge was identical among groups in the prior evaluation of DIVO students. Since all of these evaluations were first attempts to deliver NAVLEAD on VTT, it is possible that instructors could further develop techniques to adapt to the VTT medium were the course given regularly. A practical reason to offer the course by VTT would be the cost savings associated with instructors and travel, which are greater in high throughput courses of shorter duration.
Recommendations
1. The Chief of Naval Education and Training should consider the use of VTT for NAV- LEAD by weighing potential cost savings against the reduction in interactivity associated with using VTT for the training.
2. If the decision is made to conduct NAVLEAD instruction with VTT, the Chief of Naval Education and Training should test and refine ways to foster higher levels of instructor-student and student-student interaction.
Contents
Page
Introduction i
Problem 1 Objective 1 Background 1
Method 2
Research Plan 3 Research Objectives 3 Research Design and Independent Variable 3 Dependent Variables 3 Subjects 3 Data Collection Instruments 4 Data Collection 5
Preparation for VTT 6 Training Course Selection 6 Classroom Design Adaptations 6 Training Adaptations 8 Instructor Training 9
Results 9
VTT Student Questionnaire (Q.l) 9 Student Ratings 9 Multiple-Choice Questions 10 Comments 13
NAVLEAD Student Questionnaire (Q.2) 15 Student Ratings 15 Open-Ended Questions 19
Facilitator/Observer Questionnaire (Q.4) 22 Traditional vs. VTT 26 Day of Week 26
Performance Activities (Q.5) 27 Class Participation Tally (Q.6) 29
Discussion and Conclusions 32
Overview of Findings 32 Student Ratings 33 Observer Ratings 33 Interaction Tally • 33
XI
Page
Student Performance and Knowledge 34 Future VTT Courses 34
Recommendations 35
References 37
Appendix A--Data Collection Instructions A-O
Appendix B--VTT Student Questionnaire (Q.l) B-O
Appendix C--NAVLEAD Student Questionnaire (Q.2) C-o
Appendix D-Facilitator/Observer Questionnaire (Q.4) D-O
Appendix E--LPO Performance Activities (Q.5) E-o
Appendix F--CPO Performance Activities (Q.5) F-o
Appendix G-Class Participation Tally (Q.6) G-o
Appendix H--Additional Data Summary Tables H-o
Distribution List
Xll
List of Tables
Page
1. Class Types, Number of Students and Average Student Military Rank by Class 4
2. Statistical Comparisons for NAVLEAD Student Questionnaire (Q.2) 18
3. Analysis Results for NAVLEAD Facilitator/Observer Questionnaire (Q.4) 23
List of Figures
1. Student table layout in NAVLEAD classrooms: (a) traditional class, (b)VTT class 7
2. VTT Student Questionnaire responses (Q.l) 11
3. VTT Student Questionnaire (Q.l) responses to items 18 and 19 on how VTT affected opportunities to interact with the instructor or other students 12
4. Student preferences for method of instruction, location, and time on items 20, 2l,and 22 of VTT Student Questionnaire (Q.l) 13
5. VTT student preference and comments on taking another VTT course for the two parts of item 23 (Q.l) 14
6. NAVLEAD Student Questionnaire responses (Q.2) 16
7. Responses to item 28 on NAVLEAD Student Questionnaire (Q.2). ("What did you like the most about this course?") 21
8. Responses to item 29 on NAVLEAD Questionnaire (Q.2). ("What did you like the least about this course?") 21
9. Responses to item 30 on NAVLEAD Student Questionnaire (Q.2). ("Discuss any suggestions you have for improving the course.") 22
10. Facilitator/Observer Questionnaire (Q.4) ratings of course quality dimensions by group and day of week 24
11. LPO Performance Activities (Q.5) evaluator critique ratings for work center simulation team exercise 28
12. CPO Performance Activities (Q.5) evaluator critique ratings for Rice presentation 29
13. Level of student interaction as indicated by Class Participation Tally (Q.6) 31
14. Level of student interaction at individual sites for Class Participation Tally (Q.6) 32
xin
Introduction
Problem
Many Navy personnel who must receive training are geographically separated from training resources. An increasingly efficient approach to meeting this requirement is needed as the Navy downsizes and training resources become constrained. Videoteletraining (VTT) addresses this issue by enabling a single instructor to teach multiple classes at different geographic locations. Previous research and development has demonstrated that VTT can be an efficient and cost beneficial method to deliver training electronically to remote Navy personnel (Rupinski & Stoloff, 1990; Rupinski, 1991; Simpson, Pugh, & Parchman, 1990, 1991, 1992; Stoloff, 1991). Prior research on instructional television also indicates that student achievement is not affected and that any initial unfavorable attitudes lessen as a result of experience with the medium (Wetzel, Radtke, & Stern, 1993,1994). The Chief of Naval Education and Training (CNET) now has VTT in operational use in the CNET Electronic Schoolhouse Network (CESN). This VTT system utilizes an interactive two-way video and audio television system that allows distant remote site students to participate in the instruction originating from a local site where other students are co- located with the instructor.
VTT has generally been used for the delivery of lecture-based instruction. Even with current VTT technology, there is some reduction in the quality of the audio and video as compared to live instruction; e.g., it reduces the visibility of personnel at different classroom locations and also reduces the ability of instructors and students to interact as in a traditional classroom. These constraints make it more difficult to conduct training which is not instructor centered and which involves high levels of student participation, such as Navy leadership training (NAVLEAD). There is a continuing strong demand for NAVLEAD training. Significant travel or instructor costs could be avoided if such training could be delivered via VTT rather than in traditional classrooms.
Objective
The objective of the Distributed Training Technology (DTT) project is to evaluate technologies, training strategies, procedures, and management methods to extend VTT beyond traditional lecture-based courses. The research described in this report was conducted to test the feasibility of delivering NAVLEAD training via VTT.
Background
NAVLEAD training differs from traditional lecture-based instruction in several ways that pose unique challenges to VTT. The training involves a serious attempt to impart attitudes and values, as well as factual knowledge and skills. A combination of lecture, discussion, experiential learning, and team-building activities are employed. The sometimes intense learning environment is highly-interactive and requires students to make decisions, take positions, defend themselves before their peers, work as team members, and take responsibility for their own learning. The training is conducted by a team of instructors who make a determined effort to draw out students in order to facilitate instructor-student and student-student interaction. NAVLEAD instructors are called "facilitators" because they are present to facilitate a learning process in which the students themselves share knowledge and experiences and teach one another. They are trained to interpret
nonverbal cues such as body language and facial expressions and use them to assess student understanding and attitudes. The classroom is arranged so that instructors are able to stroll among tables in physical proximity to students. NAVLEAD training stresses team building, with students being organized in small groups that work together throughout the course as a unit. The team is assigned group problem-solving tasks and members work together in establishing roles and group hierarchy, denning and solving problems, and reporting out to the class. Successful teams are cohesive and group members work effectively together, often taking on a group identity.
These characteristics of NAVLEAD training raise several issues for an evaluation of the feasibility of delivering the training by VTT. The primary evaluation issue is whether the highly interactive instructional environment of the live classroom will be compromised by the lack of physical proximity of instructors and students trained by VTT. Additionally, can VTT be used to successfully conduct experiential learning activities in this environment, such as case studies, exercises, and simulations? Will student attitudes toward the learning experience be affected? Actual student behavior is ultimately an important concern, which the present evaluation assessed during a classroom performance activity. The research described in this report evaluated the feasibility of using VTT in terms of student attitudes toward VTT and the instruction itself, student performance during an activity, and daily observer ratings and tallies of interactions.
The present study is the second of two evaluations of NAVLEAD given by VTT. The first was conducted with the NAVLEAD Division Officer (DIVO) course where traditional, VTT local, and VTT remote students were compared (Simpson, Wetzel, & Pugh, 1995). That evaluation showed that it was technically feasible to successfully deliver the NAVLEAD course by VTT. A common theme appearing in student and observer ratings was that VTT was given somewhat lower ratings than traditional instruction on those rating items pertaining to interaction and participation issues, although the ratings were above the mid point of the scale in the positive direction. Interaction counts of student questions and comments were much higher for one of the two traditional classes than for VTT classes. However, a test of knowledge gained in the course revealed no differences among traditional, local or remote students. Taken together, the DIVO evaluation showed that it was possible to deliver NAVLEAD on VTT with a moderate reduction in participation and interaction that would not clearly rule out the use of VTT.
The present evaluation reports on a VTT trial with the enlisted Leading Petty Officer (LPO) and Chief Petty Officer (CPO) NAVLEAD courses. The evaluation plan was in most respects very similar to that of the DIVO evaluation. Beyond the courses themselves, the two evaluations used slightly different rating scales, no knowledge test was available in the present evaluation, and a performance activity was evaluated that could be not accomplished in the previous evaluation.
Method
The method of the study is described below in terms of the research plan, data collection instruments, and the preparation of the course for VTT.
Research Plan
The research plan is described below in terms of research objectives, research design and independent variable, dependent variables, subjects, data collection instruments, and data collection methods.
Research Objectives
The objective of the research was to test the feasibility of using VTT to deliver NAVLEAD training for the Leading Petty Officer and Chief Petty Officer, Navy Leader Development courses. Feasibility was defined in terms of several general criteria, including student perceptions of VTT and training quality, facilitator/observer perceptions of training quality, student performance, and class participation. The baseline for comparison was traditional live instruction. It was not expected that VTT would improve training in terms of the general criteria; parity with traditional instruction would validate the use of VTT. The research objective was addressed by determining the effects on dependent variables of student participation in traditional, live instruction compared to VTT instruction.
Research Design and Independent Variable
A single independent variable (type of instruction) with three states was used. This variable consisted of three treatment groups: (1) traditional classrooms; (2) VTT local classrooms with students and an instructor, and (3) VTT remote classrooms where students were connected to the local classroom by a two-way audio and video VTT system.
Dependent Variables
Dependent variables fell into five general classes: student perceptions of VTT quality, student perceptions of training quality, facilitator/observer perceptions of training quality, student performance, and class participation. Each of these variables was defined in terms of several related measures which were gathered with the five data collection instruments described below.
Subjects
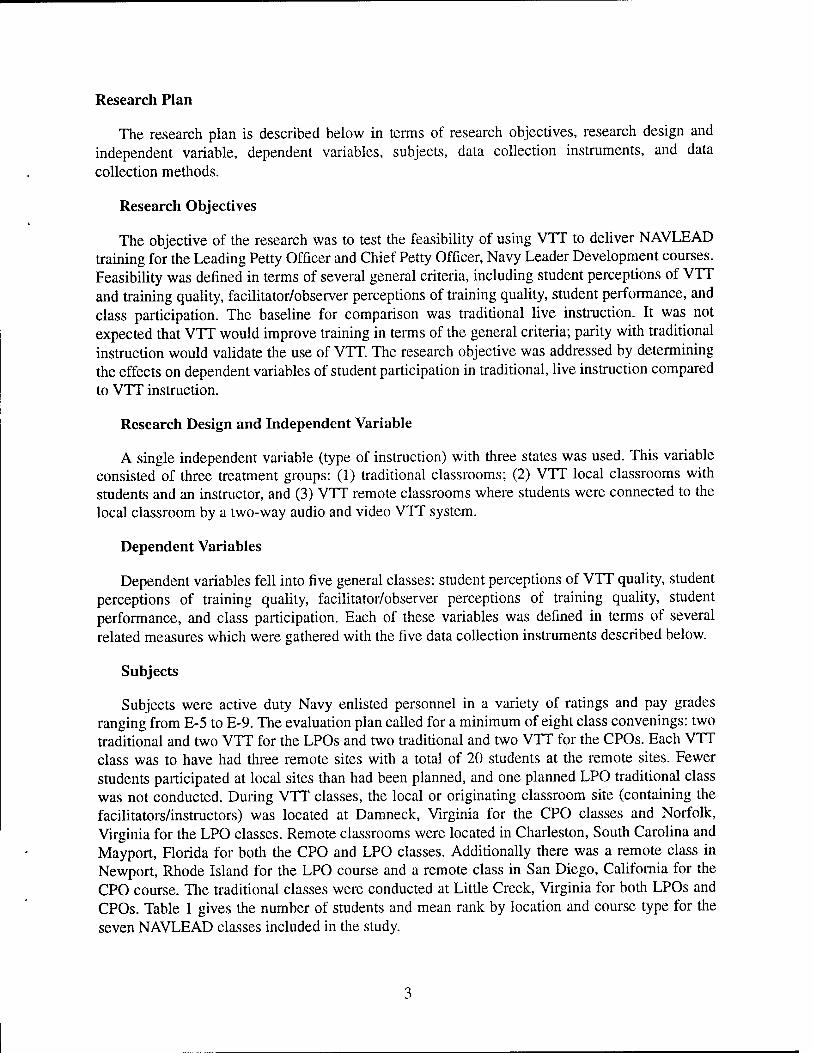
Subjects were active duty Navy enlisted personnel in a variety of ratings and pay grades ranging from E-5 to E-9. The evaluation plan called for a minimum of eight class convenings: two traditional and two VTT for the LPOs and two traditional and two VTT for the CPOs. Each VTT class was to have had three remote sites with a total of 20 students at the remote sites. Fewer students participated at local sites than had been planned, and one planned LPO traditional class was not conducted. During VTT classes, the local or originating classroom site (containing the facilitators/instructors) was located at Damneck, Virginia for the CPO classes and Norfolk, Virginia for the LPO classes. Remote classrooms were located in Charleston, South Carolina and Mayport, Florida for both the CPO and LPO classes. Additionally there was a remote class in Newport, Rhode Island for the LPO course and a remote class in San Diego, California for the CPO course. The traditional classes were conducted at Little Creek, Virginia for both LPOs and CPOs. Table 1 gives the number of students and mean rank by location and course type for the seven NAVLEAD classes included in the study.
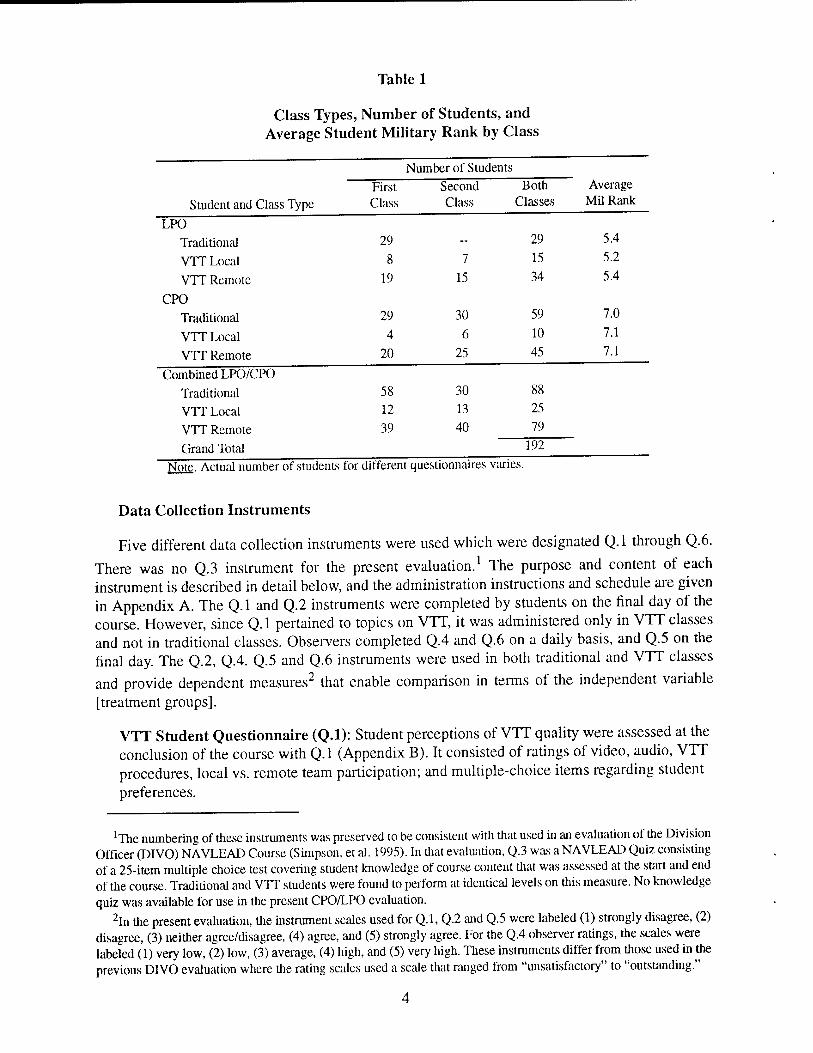
Table 1
Class Types, Number of Students, and Average Student Military Rank by Class
Number of Students
First Second Both Average
Student and Class Type Class Class Classes Mil Rank
LPO Traditional 29 -- 29 5.4
VTT Local 8 7 15 5.2
VTT Remote 19 15 34 5.4
CPO Traditional 29 30 59 7.0
VTT Local 4 6 10 7.1
VTT Remote 20 25 45 7.1
Combined LPO/CPO
Traditional 58 30 88
VTT Local 12 13 25
VTT Remote 39 40 79
Grand Total 192
Note. Actual number of students for different questionnaires varies.
Data Collection Instruments
Five different data collection instruments were used which were designated Q.l through Q.6.
There was no Q.3 instrument for the present evaluation.1 The purpose and content of each instrument is described in detail below, and the administration instructions and schedule are given in Appendix A. The Q.l and Q.2 instruments were completed by students on the final day of the course. However, since Q.l pertained to topics on VTT, it was administered only in VTT classes and not in traditional classes. Observers completed Q.4 and Q.6 on a daily basis, and Q.5 on the final day. The Q.2, Q.4. Q.5 and Q.6 instruments were used in both traditional and VTT classes
and provide dependent measures2 that enable comparison in terms of the independent variable [treatment groups].
VTT Student Questionnaire (Q.l): Student perceptions of VTT quality were assessed at the conclusion of the course with Q.l (Appendix B). It consisted of ratings of video, audio, VTT procedures, local vs. remote team participation; and multiple-choice items regarding student preferences.
lrThe numbering of these instruments was preserved to be consistent with that used in an evaluation of the Division Officer (DIVO) NAVLEAD Course (Simpson, et al. 1995). In that evaluation, Q.3 was a NAVLEAD Quiz consisting of a 25-item multiple choice test covering student knowledge of course content that was assessed at the start and end of die course. Traditional and VTT students were found to perform at identical levels on this measure. No knowledge quiz was available for use in the present CPO/LPO evaluation.
2In the present evaluation, the instrument scales used for Q.l, Q.2 and Q.5 were labeled (1) strongly disagree, (2) disagree, (3) neither agree/disagree, (4) agree, and (5) strongly agree. For the Q.4 observer ratings, the scales were labeled (1) very low, (2) low, (3) average, (4) high, and (5) very high. These instruments differ from those used in Üie previous DIVO evaluation where the rating scales used a scale that ranged from "unsatisfactory" to "outstanding."
NAVLED Student Questionnaire (Q.2): Student perceptions of training quality were assessed at the conclusion of the course with Q.2 (Appendix C). This questionnaire contained items concerned with ratings of facilitators, personnel visibility and audibility, written materi- als, learning activities, training aids, interaction/participation, overall evaluation; and three open-ended questions about student likes, dislikes, and suggestions.
Facilitator/Observer Questionnaire (Q.4): Facilitator or observer perceptions of training quality were assessed on a daily basis with Q.4 (Appendix D). It consisted of ratings on vari- ous dimensions of the course from the perspective of the facilitator or subject matter expert (SME) (e.g., effectiveness of presentations and exercises, success in meeting learning objec- tives, difficulty of conducting instruction, student interaction, student participation, degree of control, presentation quality, cohesiveness; space is provided for comments.
Performance Activities (Q.5): Two versions of Q.5 were used to assess student performance in completing a classroom performance activity. Ratings were made by facilitators, instruc- tors, or observers on several different dimensions immediately following each of four presen- tations that constituted the classroom activity being performed by students. In the case of LPO's this was lesson 5.4, Work Center Simulation Team Exercise: Skill Integration (evalu- ated with Q.5 in Appendix E). In the case of CPO's this was lesson 7.1, USS Rice Simulation (evaluated with Q.5 in Appendix F).
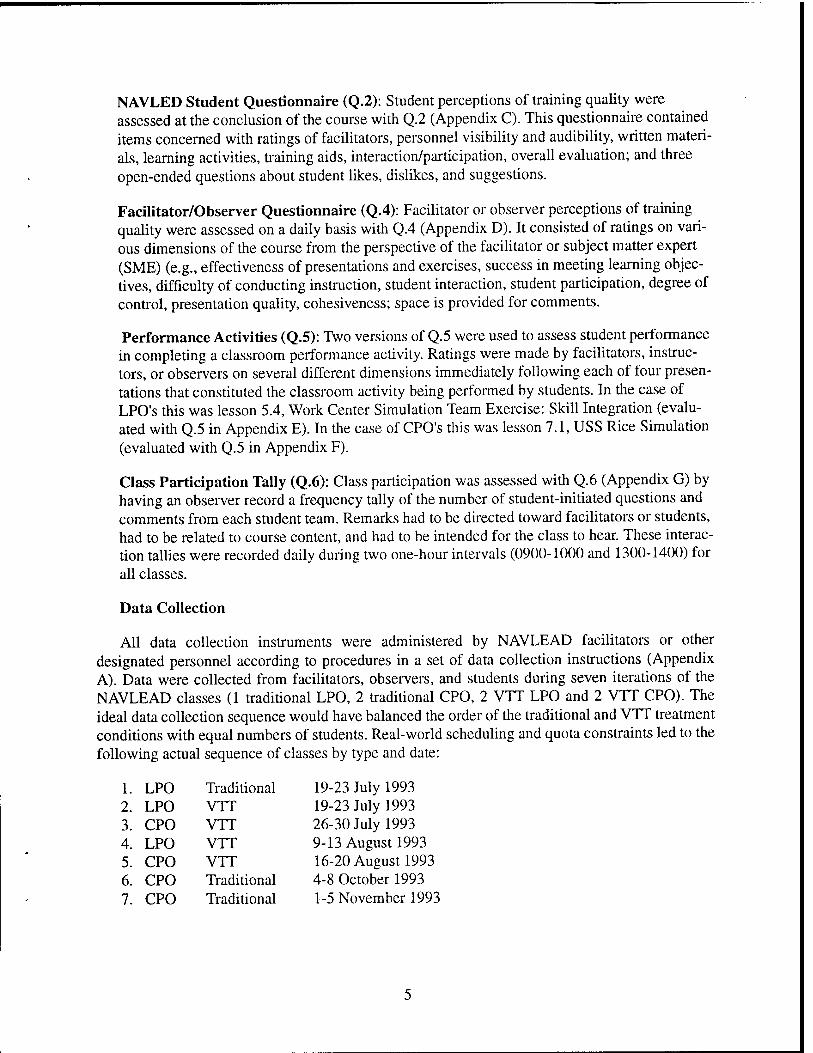
Class Participation Tally (Q.6): Class participation was assessed with Q.6 (Appendix G) by having an observer record a frequency tally of the number of student-initiated questions and comments from each student team. Remarks had to be directed toward facilitators or students, had to be related to course content, and had to be intended for the class to hear. These interac- tion tallies were recorded daily during two one-hour intervals (0900-1000 and 1300-1400) for all classes.
Data Collection
All data collection instruments were administered by NAVLEAD facilitators or other designated personnel according to procedures in a set of data collection instructions (Appendix A). Data were collected from facilitators, observers, and students during seven iterations of the NAVLEAD classes (1 traditional LPO, 2 traditional CPO, 2 VTT LPO and 2 VTT CPO). The ideal data collection sequence would have balanced the order of the traditional and VTT treatment conditions with equal numbers of students. Real-world scheduling and quota constraints led to the following actual sequence of classes by type and date:
1. LPO Traditional 19-23 July 1993 2. LPO VTT 19-23 July 1993 3. CPO VTT 26-30 July 1993 4. LPO VTT 9-13 August 1993 5. CPO VTT 16-20 August 1993 6. CPO Traditional 4-8 October 1993 7. CPO Traditional 1-5 November 1993
To assure comparability of traditional and VTT data, it would have been desirable to use the same facilitators and observers throughout all the class iterations. However, this was not always possible.
Preparation for VTT
Instruction delivered by VTT typically requires several adaptations of the training materials and classroom configuration, as well as instructor preparation for using the medium. An adaptation typically involves several iterations to refine the delivery of a course by VTT. A general guide to the conversion of courses to VTT is given in Simpson (1993). The methods specific to the NAVLEAD course are given below, which represent the first iteration in adapting NAVLEAD to VTT.
Training Course Selection
The research was conducted in the Navy Leader Development Program, Leading Petty Officer Course, CIN P-500-0034 and Navy Leadership Development Program, Chief Petty Officer's Course, CIN P-500-0036. For the LPO course the instructor guide was NAVEDTRA 38225-A, the student guide was NAVEDTRA 38224-A For the CPO course these were NAVEDTRA 38223-A and NAVEDTRA 38222-A, respectively.
As noted in the Introduction, NAVLEAD training stresses team building and involves a combination of lecture, discussion, experiential learning, and team-building activities. This occurs in an intense, highly-interactive learning environment that encourages students to share knowledge and experiences, and learn from one another. These courses are team taught by facilitators who consider perception and interpretation of student nonverbal cues to be highly important. The classroom physical layout permits the facilitators to stroll among tables in physical proximity to students. During lectures and discussion, facilitators use overhead transparencies, videotapes, posters, and various handouts. The student guides contain case studies, exercises, and simulations. The course does not include any formal testing.
These courses differ from previous courses we have studied because of their high level of interactivity (facilitator-student, student-student), use of experiential learning activities, use of nonverbal information, and stress on team building.
Classroom Design Adaptations
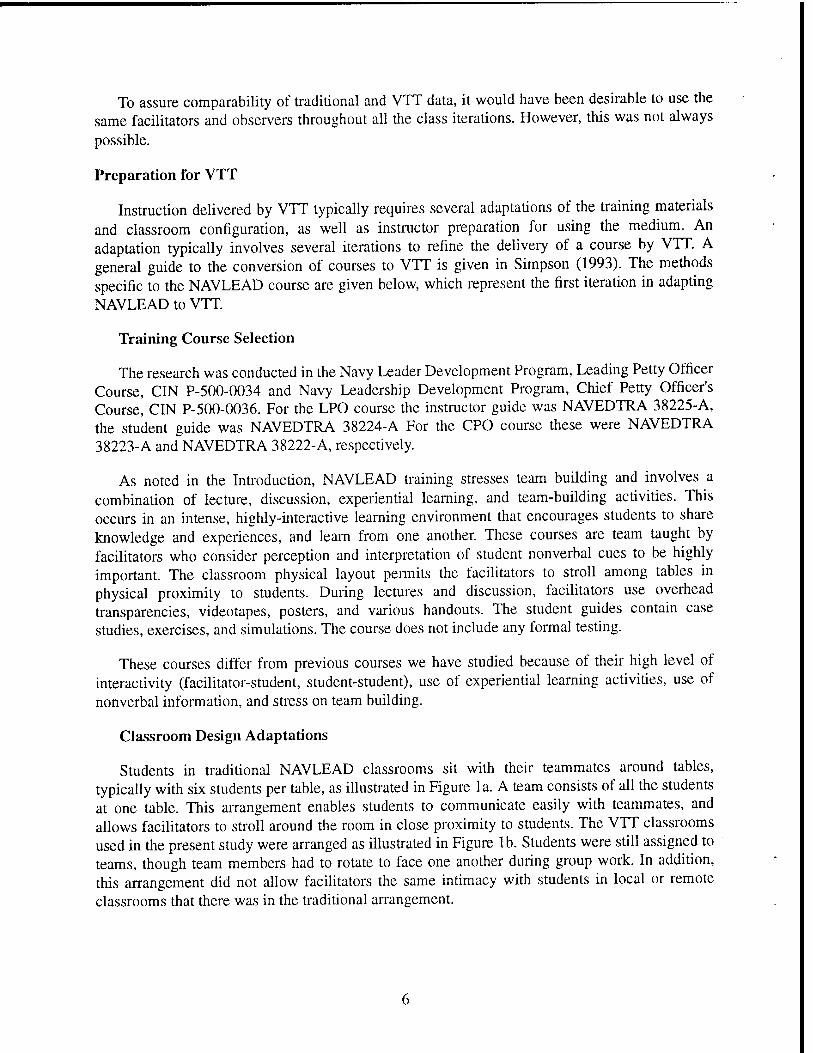
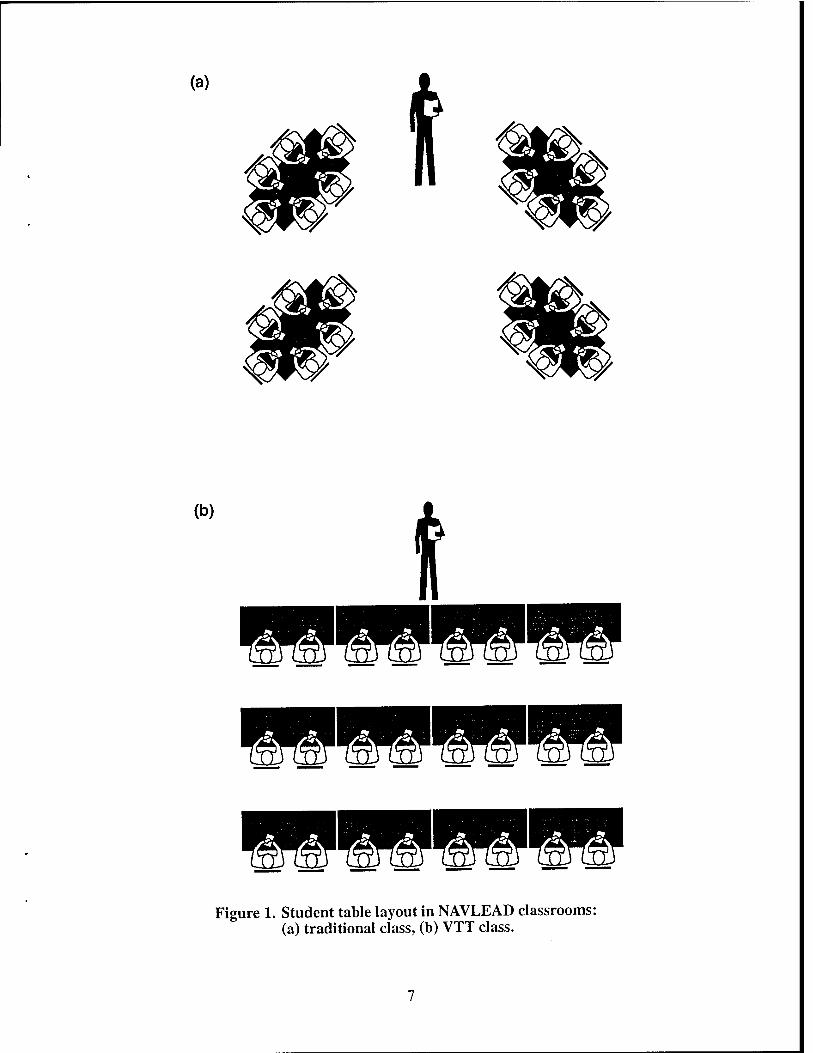
Students in traditional NAVLEAD classrooms sit with their teammates around tables, typically with six students per table, as illustrated in Figure la. A team consists of all the students at one table. This arrangement enables students to communicate easily with teammates, and allows facilitators to stroll around the room in close proximity to students. The VTT classrooms used in the present study were arranged as illustrated in Figure lb. Students were still assigned to teams, though team members had to rotate to face one another during group work. In addition, this arrangement did not allow facilitators the same intimacy with students in local or remote classrooms that there was in the traditional arrangement.
(a)
(b)
Figure 1. Student table layout in NAVLEAD classrooms: (a) traditional class, (b) VTT class.
The VTT classrooms were equipped with a fully interactive two-way video and audio VTT system. The local VTT classroom was equipped with an instructor camera, a student camera, an electronic presentation device, and a video easel camera. The instructor camera could be remotely controlled and was aimed at the instructor. The student camera was mounted at the front of the class and aimed to display a view of the students. The video easel camera was used to display material that might more commonly be displayed using an overhead projector. A camera operator/ technician in the originating classroom selected cameras or other video input devices and controlled other aspects of audio and video using a control panel and/or infrared remote controls.
Students in the local VTT classroom observed facilitators and students in that classroom directly but could see students in the remote classrooms only on a large TV monitor. Students in remote classrooms observed either facilitators or students in the local classroom on a TV monitor, depending upon which camera was selected. Generally the NAVLEAD instructor/facilitator was on the monitor until a student spoke. Then the camera pointing at the student speaking was selected. Selection was done by the operator/technician in the originating classroom.
Visual aids were presented on a TV monitor using one of two devices. The video easel camera could be used to display paper or transparencies. A General Paramedics Corporation VideoShow electronic slide presentation device could be used to display materials stored as computer files.
Training Adaptations
Training was adapted for VTT through a working collaboration between representatives of the CESN and the NAVLEAD school at Little Creek. No modifications were made to the content of lectures or class written materials. VTT and traditional class lengths were identical. However, the VTT classes differed in some ways from the traditional classes:
• Instructional transparencies were presented on TV monitors rather than projected on screens. Visuals or transparencies could be shown directly on the video easel camera or were converted for display on the computer-based presentation device.
• All posters were converted to paper hard copy form. Copies of the posters were provided to students instead of being posted on walls.
• Students were briefed regarding the network and encouraged to become medium con- scious, for example, by pressing a button on the microphone before speaking so that they could be heard by students at other sites.
• Facilitators limited their range of body movement to remain on camera, as well as their rate of motion to prevent image jerkiness associated with the rate of video transmission.
Facilitators made special efforts to maintain participation by students at remote sites, for example, by soliciting comments and directing questions at individuals.
• Facilitators used the video easel camera instead of a white board or flip charts for compil- ing classroom comments.
Instructor Training
Several different instructors (facilitators) delivered training during the study. Instructors team taught the classes. Instructors were familiarized with the audio and video equipment and practiced equipment operation and class procedures. The total training period per instructor was approximately two days, most of it devoted to practice teaching. None of the instructors were given or had previously received training in camera presence, articulation, graphics production, or other skills of TV professionals.
Results
Traditional, VTT local, and VTT remote treatment conditions are compared below for each of the five data collection instruments, Q.l, Q.2 and Q.4 through Q.6. The principal results reported here combined LPO and CPO students in the respective treatment groups, except for Q.5 where different critiques were used for LPOs and CPOs. The pattern of results for LPO and CPO students was generally similar and the rationale for combining the data was that the number of
students or data points in some treatment conditions was too small for separate analyses. Those instances where interesting LPO/CPO differences were obtained are noted below (summaries for the separate groups are given in Appendix H for the interested reader). The main observation resulting from comparing LPO and CPO students was that the ratings by CPO students were generally lower or were more critical of VTT than were those of LPO students.
VTT Student Questionnaire (Q.l)
Student attitudes were measured with a post-course questionnaire (Appendix B) which contained a series of statements to be rated, multiple-choice questions, and open-ended questions. Questionnaires were completed by a total 96 students participating in VTT class convenings. The results are presented in terms of comparisons between 24 students in local (originating) classrooms and 72 students in remote classrooms (there were 28 LPO and 44 CPO VTT remote students and only 15 LPO and 9 CPO VTT local students).
Student Ratings
The statements rated by students (items 1-17 in Appendix B) were grouped in three categories (video, audio, and VTT procedures). Statements were rated on a 5-point scale with a midpoint of 3 using the following scale values and labels: (1) strongly disagree, (2) disagree, (3) neither agree/ disagree, (4) agree, and (5) strongly agree.
3There are several instances where a treatment condition would be under-represented when LPO and CPO data are not combined. First, only one traditional LPO class was conducted instead of two. Second, a smaller than expected number of students appeared at VTT local sites (only 9 CPO and 15 LPO students completed Q.l and Q.2). Third, some sites did not collect or return all questionnaire measures. Although separate LPO and CPO summaries appear in Appendix H, it should be cautioned that statistics for the small number of VTT local students are less stable and subject to error.
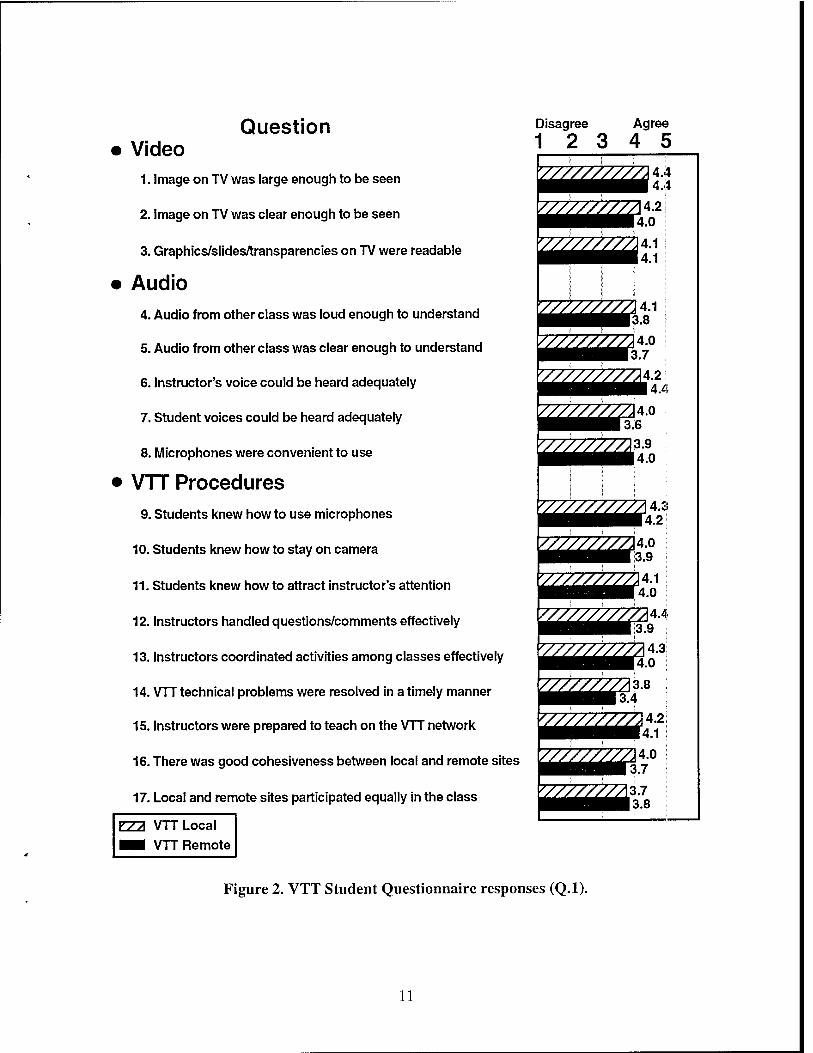
Figure 2 shows the mean ratings computed for VTT local and VTT remote classrooms, with LPO and CPO students combined for each type of classroom. Given that the average rating for each of the items was above the midpoint on the rating scale, most students gave positive ratings to the dimension being measured. Differences between local and remote classrooms were small and generally do not show interesting patterns. Students in both local and remote classrooms were, in general, positively disposed toward several different aspects of the VTT learning environment, a result that generally parallels previous VTT research (see Simpson et al., 1990, 1991, 1992). The ratings were slightly lower for the remote site on most but not all questions. Over all 17 questions, the average rating for the remote site (3.93) was slightly lower than for the local site (4.08), a difference of only 0.15. One-way analyses of variance (ANOVA) were conducted to determine the statistical significance of rating differences between local and remote classrooms. No statistically significant differences between were found between local and remote classrooms on any of the 17 questions for the combined LPO and CPO data. Similar results were also found in the evaluation of the Division Officer course, where only items 2 and 3 were significant, indicating slightly greater audiovisual problems for remote students (Simpson, et al, 1995).
Over all 17 items, the average rating given by CPO students (3.75) was consistently lower than that given by the LPO students (4.22), about .47 units lower for the CPOs on the five point scale (LPO and CPO subgroup results for Q.l are in Appendix H, Tables H-l and H-2). Were the LPO and CPO data to be considered separately, then again there would be no significant treatment group differences for any of the 17 questions for the LPO students. For CPO students, only three questions would be statistically significant: question 3 (F(l,51) = 4.54, p < .05) and question 6 (F(l,51) = 4.30, p < .05) where both would show that the local site provided lower ratings, and question 14 (F(l,50) = 4.39, p < .05) where the remote site provided a lower rating. Responses to these questions indicate that local CPO students experienced more problems in reading graphics and in hearing the instructors voice, while remote CPO students experienced more VTT technical problems. These differences do not appear to be systematic and probably reflect problems during certain class convenings.
Multiple-Choice Questions
Student perceptions of their opportunities to interact and their preference for a method of instruction were assessed with multiple-choice questions (items 18-22 in Appendix B). Items 18- 20 had three choices and items 21 and 22 had two. Percentages of response to each choice were calculated for local and remote classrooms, and Chi Square tests were used to compare response distributions by classroom.
Figure 3a shows student responses to question 18, which asked "How did the VTT method of instruction affect your opportunities to interact with the instructor?" VTT local students most often responded that their opportunities were unaffected or were greater. VTT remote students most often indicated fewer opportunities, followed by "no effect." Thus, fewer opportunities to interact were more likely to be reported by remote students (46%) than by local students (17%). A Chi Square test showed that the distribution of responses differed, being approximately at the
critical value for significance (x2(2) = 5.94, p = .05).
10
Question Video
1. Image on TV was large enough to be seen
2. Image on TV was clear enough to be seen
3. Graphics/slides/transparencies on TV were readable
Audio 4. Audio from other class was loud enough to understand
5. Audio from other class was clear enough to understand
6. Instructor's voice could be heard adequately
7. Student voices could be heard adequately
8. Microphones were convenient to use
VTT Procedures 9. Students knew how to use microphones
10. Students knew how to stay on camera
11. Students knew how to attract instructor's attention
12. Instructors handled questions/comments effectively
13. Instructors coordinated activities among classes effectively
14. VTT technical problems were resolved in a timely manner
15. Instructors were prepared to teach on the VTT network
16. There was good cohesiveness between local and remote sites
17. Local and remote sites participated equally in the class
Disagree Agree
12 3 4 5
EZ2 VTT Local
■■ VTT Remote
Figure 2. VTT Student Questionnaire responses (Q.l).
11
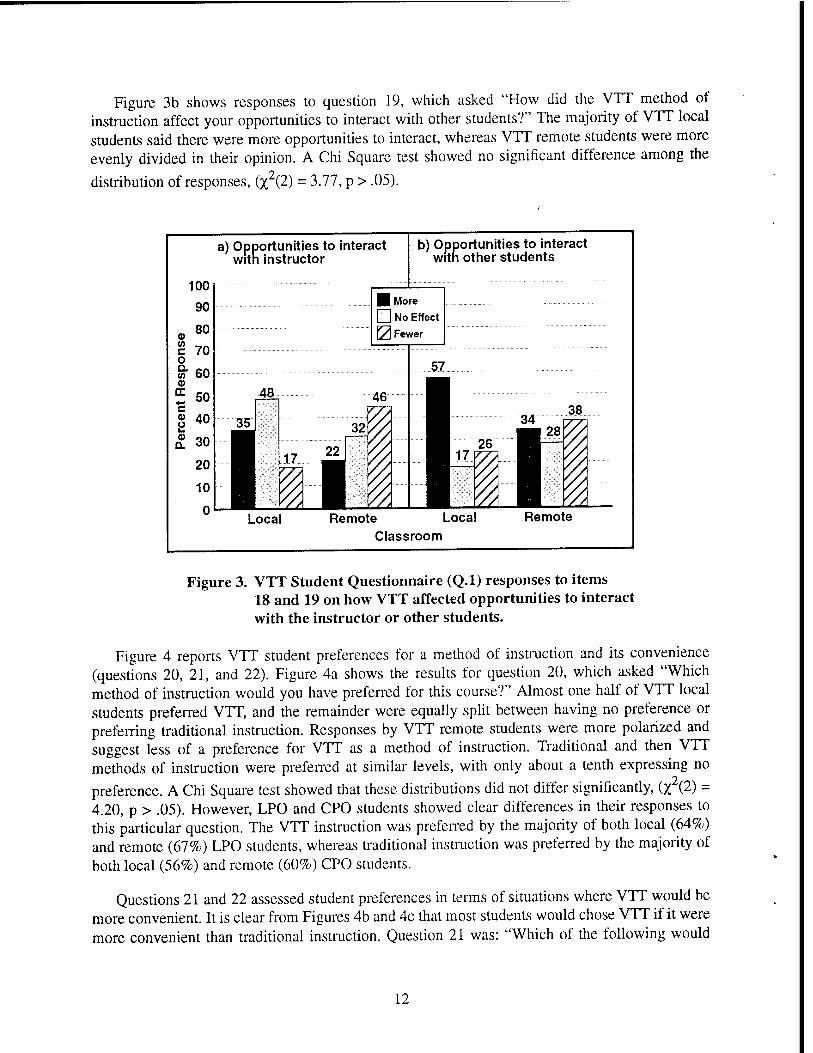
Figure 3b shows responses to question 19, which asked "How did the VTT method of instruction affect your opportunities to interact with other students?" The majority of VTT local students said there were more opportunities to interact, whereas VTT remote students were more evenly divided in their opinion. A Chi Square test showed no significant difference among the
distribution of responses, (% (2) = 3.77, p > .05).
a) Opportunities to interact with instructor
100
90
b) Opportunities to interact with other students
| More □ No Effect l/l Fewer
Loca Remote Loca Classroom
Remote
Figure 3. VTT Student Questionnaire (Q.l) responses to items 18 and 19 on how VTT affected opportunities to interact with the instructor or other students.
Figure 4 reports VTT student preferences for a method of instruction and its convenience (questions 20, 21, and 22). Figure 4a shows the results for question 20, which asked "Which method of instruction would you have preferred for this course?" Almost one half of VTT local students preferred VTT, and the remainder were equally split between having no preference or preferring traditional instruction. Responses by VTT remote students were more polarized and suggest less of a preference for VTT as a method of instruction. Traditional and then VTT methods of instruction were preferred at similar levels, with only about a tenth expressing no
preference. A Chi Square test showed that these distributions did not differ significantly, (% (2) = 4.20, p > .05). However, LPO and CPO students showed clear differences in their responses to this particular question. The VTT instruction was preferred by the majority of both local (64%) and remote (67%) LPO students, whereas traditional instruction was preferred by the majority of both local (56%) and remote (60%) CPO students.
Questions 21 and 22 assessed student preferences in terms of situations where VTT would be more convenient. It is clear from Figures 4b and 4c that most students would chose VTT if it were more convenient than traditional instruction. Question 21 was: "Which of the following would
12
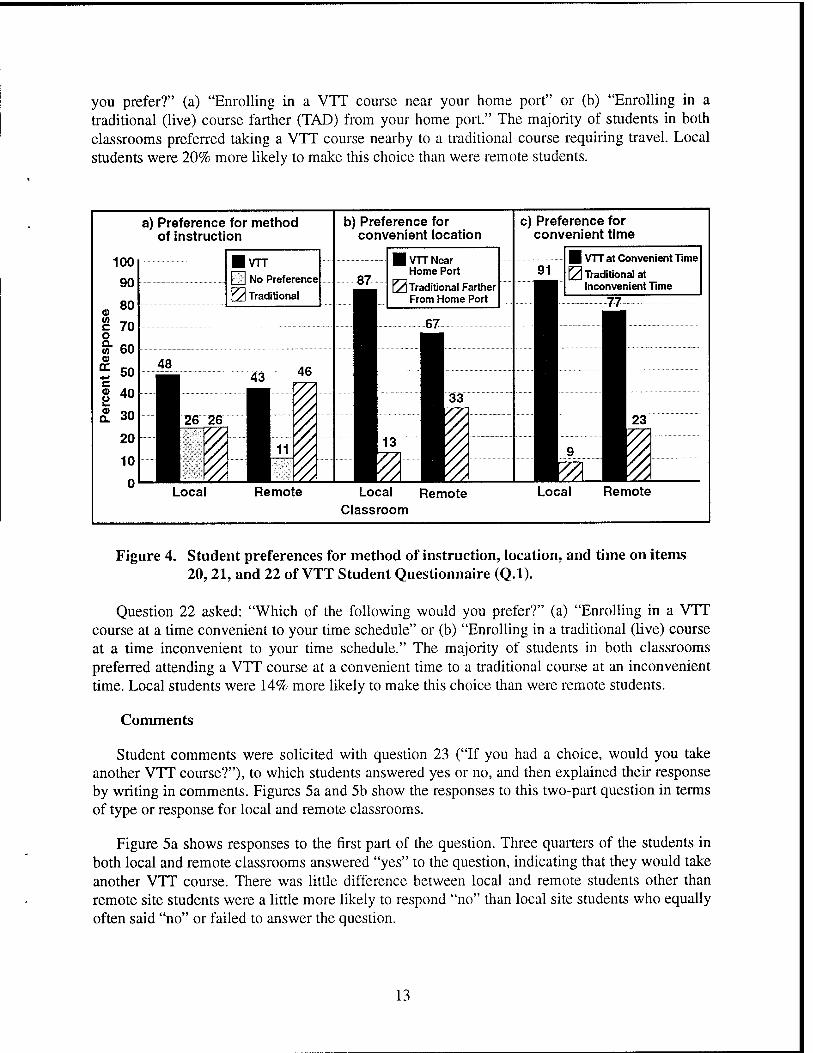
you prefer?" (a) "Enrolling in a VTT course near your home port" or (b) "Enrolling in a traditional (live) course farther (TAD) from your home port." The majority of students in both classrooms preferred taking a VTT course nearby to a traditional course requiring travel. Local students were 20% more likely to make this choice than were remote students.
a) Preference for method of instruction
IVTT LJ No Preference
YA Traditional
Loca Remote
b) Preference for convenient location
Local Remote Classroom
c) Preference for convenient time
| VTT at Convenient Time
M Traditional at Inconvenient Time
Local Remote
Figure 4. Student preferences for method of instruction, location, and time on items 20, 21, and 22 of VTT Student Questionnaire (Q.l).
Question 22 asked: "Which of the following would you prefer?" (a) "Enrolling in a VTT course at a time convenient to your time schedule" or (b) "Enrolling in a traditional (live) course at a time inconvenient to your time schedule." The majority of students in both classrooms preferred attending a VTT course at a convenient time to a traditional course at an inconvenient time. Local students were 14% more likely to make this choice than were remote students.
Comments
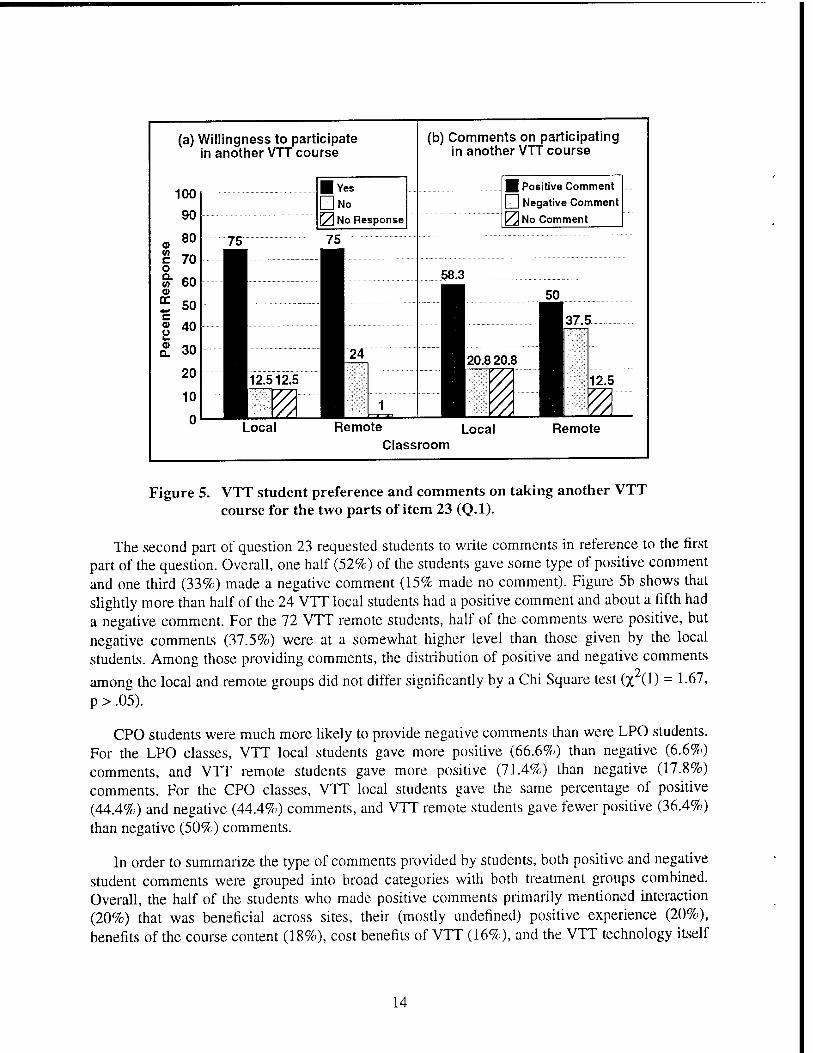
Student comments were solicited with question 23 ("If you had a choice, would you take another VTT course?"), to which students answered yes or no, and then explained their response by writing in comments. Figures 5a and 5b show the responses to this two-part question in terms of type or response for local and remote classrooms.
Figure 5a shows responses to the first part of the question. Three quarters of the students in both local and remote classrooms answered "yes" to the question, indicating that they would take another VTT course. There was little difference between local and remote students other than remote site students were a little more likely to respond "no" than local site students who equally often said "no" or failed to answer the question.
13
(a) Willingness to participate in another VTT course
m w c o CL </> 0) IT
100
90
80
70
60
"" 50
40 c m u
CL 30
20
10
0
■ Yes GNO 0No Response
Local
(b) Comments on participating in another VTT course
■ Positive Comment I I Negative Comment P^No Comment
Remote Local Remote Classroom
Figure 5. VTT student preference and comments on taking another VTT course for the two parts of item 23 (Q.l).
The second part of question 23 requested students to write comments in reference to the first part of the question. Overall, one half (52%) of the students gave some type of positive comment and one third (33%) made a negative comment (15% made no comment). Figure 5b shows that slightly more than half of the 24 VTT local students had a positive comment and about a fifth had a negative comment. For the 72 VTT remote students, half of the comments were positive, but negative comments (37.5%) were at a somewhat higher level than those given by the local students. Among those providing comments, the distribution of positive and negative comments
among the local and remote groups did not differ significantly by a Chi Square test {% (1) = 1.67, p > .05).
CPO students were much more likely to provide negative comments than were LPO students. For the LPO classes, VTT local students gave more positive (66.6%) than negative (6.6%) comments, and VTT remote students gave more positive (71.4%) than negative (17.8%) comments. For the CPO classes, VTT local students gave the same percentage of positive (44.4%) and negative (44.4%) comments, and VTT remote students gave fewer positive (36.4%) than negative (50%) comments.
In order to summarize the type of comments provided by students, both positive and negative student comments were grouped into broad categories with both treatment groups combined. Overall, the half of the students who made positive comments primarily mentioned interaction (20%) that was beneficial across sites, their (mostly undefined) positive experience (20%), benefits of the course content (18%), cost benefits of VTT (16%), and the VTT technology itself
14
(10%) (the remaining 16% fell in diverse categories). The third of the students who gave negative comments mentioned technology (34%) such as "down-time" or looking at a screen, criticism associated with the instructor (28%) such as preferences for face-to-face interaction, comments on the interaction being less effective or personal (19%), and dissatisfaction with course content (16%) suggesting VTT was not appropriate for the course.
NAVLEAD Student Questionnaire (Q.2)
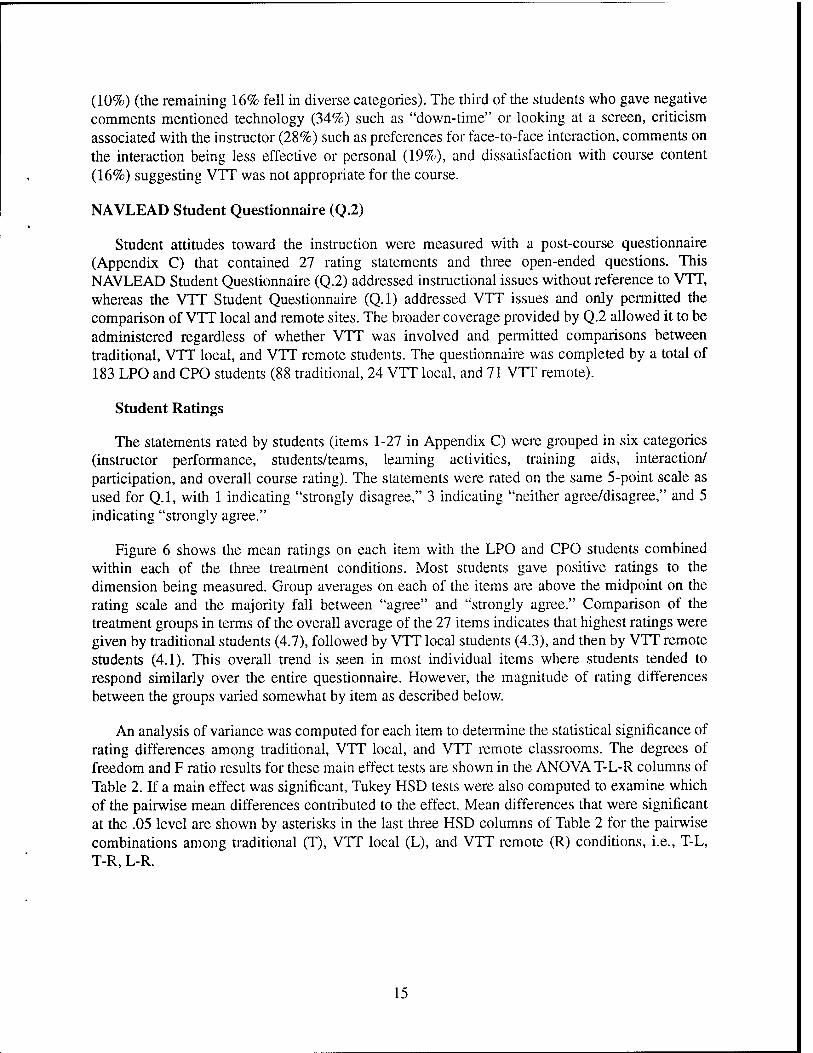
Student attitudes toward the instruction were measured with a post-course questionnaire (Appendix C) that contained 27 rating statements and three open-ended questions. This NAVLEAD Student Questionnaire (Q.2) addressed instructional issues without reference to VTT, whereas the VTT Student Questionnaire (Q.l) addressed VTT issues and only permitted the comparison of VTT local and remote sites. The broader coverage provided by Q.2 allowed it to be administered regardless of whether VTT was involved and permitted comparisons between traditional, VTT local, and VTT remote students. The questionnaire was completed by a total of 183 LPO and CPO students (88 traditional, 24 VTT local, and 71 VTT remote).
Student Ratings
The statements rated by students (items 1-27 in Appendix C) were grouped in six categories (instructor performance, students/teams, learning activities, training aids, interaction/ participation, and overall course rating). The statements were rated on the same 5-point scale as used for Q.l, with 1 indicating "strongly disagree," 3 indicating "neither agree/disagree," and 5 indicating "strongly agree."
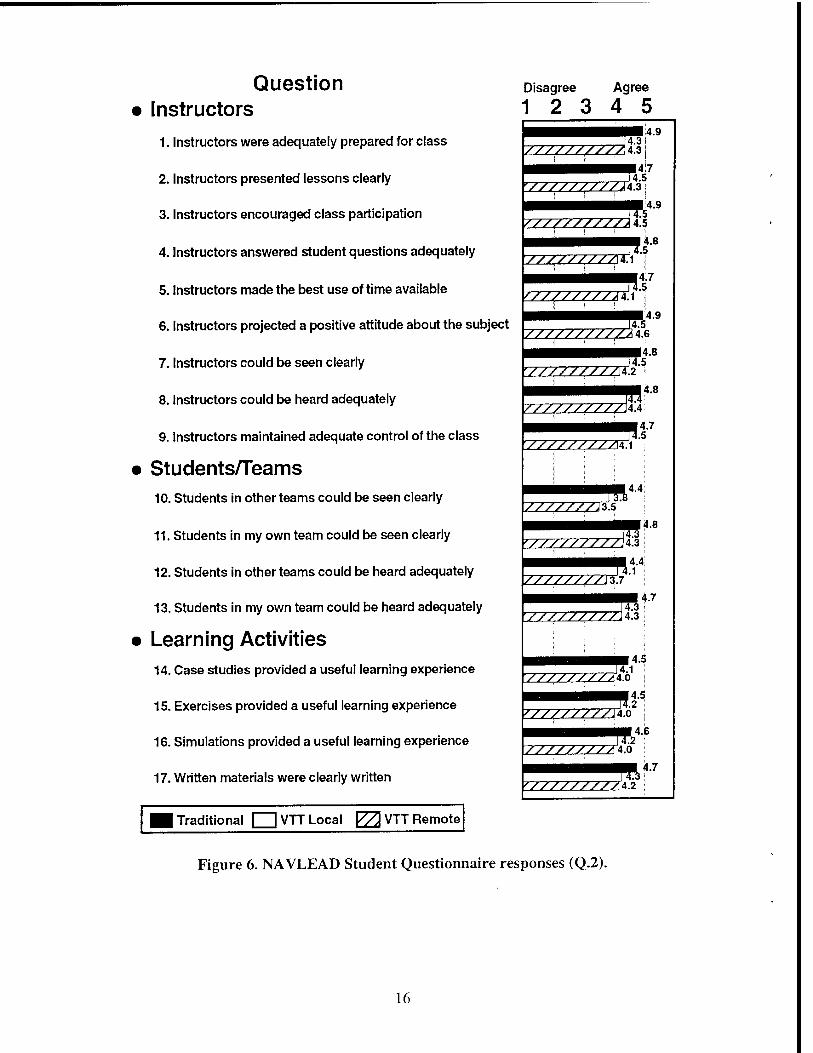
Figure 6 shows the mean ratings on each item with the LPO and CPO students combined within each of the three treatment conditions. Most students gave positive ratings to the dimension being measured. Group averages on each of the items are above the midpoint on the rating scale and the majority fall between "agree" and "strongly agree." Comparison of the treatment groups in terms of the overall average of the 27 items indicates that highest ratings were given by traditional students (4.7), followed by VTT local students (4.3), and then by VTT remote students (4.1). This overall trend is seen in most individual items where students tended to respond similarly over the entire questionnaire. However, the magnitude of rating differences between the groups varied somewhat by item as described below.
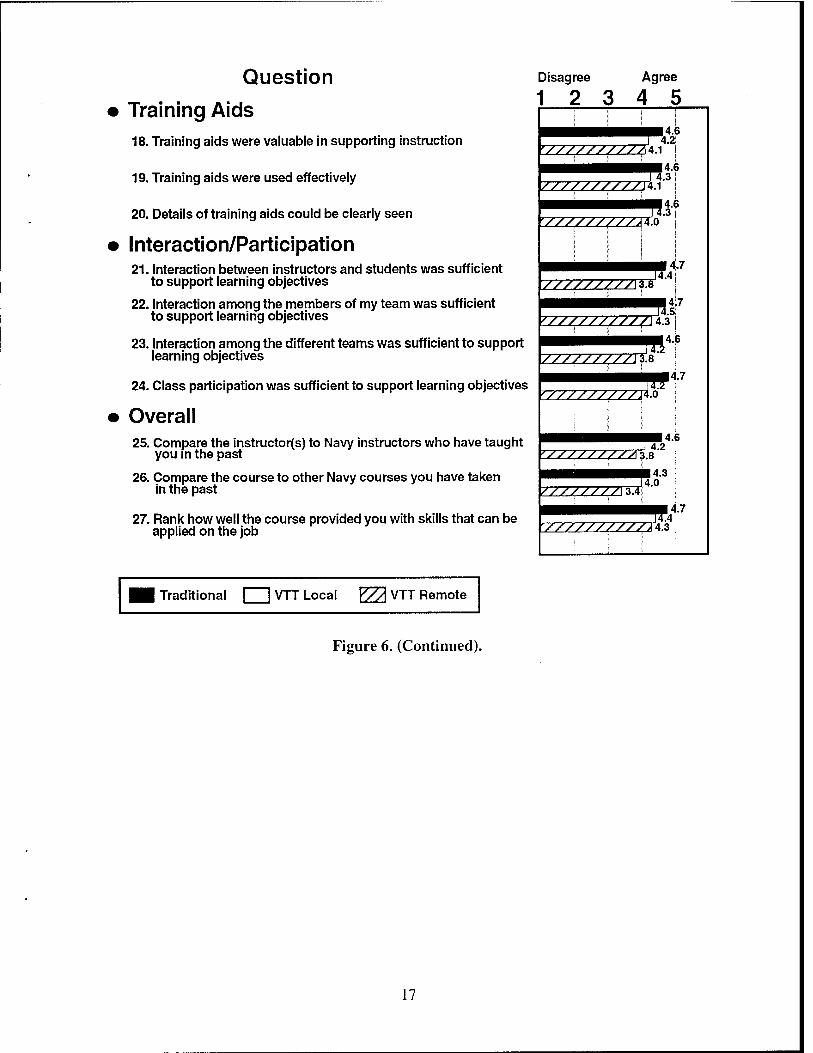
An analysis of variance was computed for each item to determine the statistical significance of rating differences among traditional, VTT local, and VTT remote classrooms. The degrees of freedom and F ratio results for these main effect tests are shown in the ANOVA T-L-R columns of Table 2. If a main effect was significant, Tukey HSD tests were also computed to examine which of the pairwise mean differences contributed to the effect. Mean differences that were significant at the .05 level are shown by asterisks in the last three HSD columns of Table 2 for the pairwise combinations among traditional (T), VTT local (L), and VTT remote (R) conditions, i.e., T-L, T-R, L-R.
15
Question • Instructors
1. Instructors were adequately prepared for class
2. Instructors presented lessons clearly
3. Instructors encouraged class participation
4. Instructors answered student questions adequately
5. Instructors made the best use of time available
6. Instructors projected a positive attitude about the subject
7. Instructors could be seen clearly
8. Instructors could be heard adequately
9. Instructors maintained adequate control of the class
• Students/Teams 10. Students in other teams could be seen clearly
11. Students in my own team could be seen clearly
12. Students in other teams could be heard adequately
13. Students in my own team could be heard adequately
• Learning Activities 14. Case studies provided a useful learning experience
15. Exercises provided a useful learning experience
16. Simulations provided a useful learning experience
17. Written materials were clearly written
Disagree Agree
12 3 4 5
ZZZZZZJZZZZ4.3
7ZZZZZZZZ3T1
Traditional □VTT Local VA VTT Remote
4.3 4.9
_4
ZZZZZZZZZT44d1
4.8
ZZZZZZZZZT4J f
I 4.5
[ZZZZZZZZZZ24.G _4.8
ZZZZZZZZZtfl'l
ZZZZZZZZZ4.2
Figure 6. NAVLEAD Student Questionnaire responses (Q.2).
16
Question
Training Aids 18. Training aids were valuable in supporting instruction
19. Training aids were used effectively
20. Details of training aids could be clearly seen
Interaction/Participation 21. Interaction between instructors and students was sufficient
to support learning objectives
22. Interaction among the members of my team was sufficient to support learning objectives
23. Interaction among the different teams was sufficient to support learning objectives
24. Class participation was sufficient to support learning objectives
Overall 25. Compare the instructor(s) to Navy instructors who have taught
you in the past
26. Compare the course to other Navy courses you have taken in the past
27. Rank how well the course provided you with skills that can be applied on the job
Disagree Agree
2 3 4 5
ZZZZZZZZZZ4.1
zzzzzzzzz^o ^■6
zzzzzzzzznr* 4.4
I.5| 7ZZZZZZZZZ£T4.3
zzzzzzzzzrts"
!ZZZZZZZZZJ*.o ffl 4.7
////////A%*
Traditional □ VTT Local YZÄ VTT Remote
Figure 6. (Continued).
17
Table 2
Statistical Comparisons for NAVLEAD Student Questionnaire (Q.2)
Question
ANOVA Mean Differences and
T-L-R Tukey HSD Compa
T-L T-R
risons
DF F L-R
2,180 11.57** 0.55* 0.54* -0.01
2,180 5.99** 0.26 0.41* 0.15
2,180 7 -^cs(s* 0.36 0.39* 0.03
2,180 13.25** 0.29 0.61* 0.32
2,180 11.06** 0.23 0.58* 0.35
ct 2,180 5.80** 0.38* 0.32* -0.06
2,180 8.96** 0.31 0.56* 0.25
2,180 7 25** 0.38 0.45* 0.07
2,180 10.95** 0.22 0.62* 0.40
2,178 14.29** 0.59* 0.84* 0.25
2,177 9 77** 0.54* 0.49* -0.05
2,176 9.48** 0.22 0.69* 0.47
2,176 <5 (59** 0.47* 0.39* -0.08
2,179 6.73** 0.38 0.51* 0.13
2,179 7.01** 0.32 0.50* 0.18
2,179 7 3g** 0.34 0.51* 0.17
2,179 5 49** 0.32 0.41* 0.09
2,178 10.65** 0.46* 0.57* 0.11
2,177 10.70** 0.32 0.55* 0.23
2,176 9.56** 0.23 0.56* 0.33
INSTRUCTORS
1. Instructors were adequately prepared for class
2. Instructors presented lessons clearly
3. Instructors encouraged class participation
4. Instructors answered student questions adequately
5. Instructors made the best use of time available
6. Instructors projected a positive attitude about the subject
7. Instructors could be seen clearly
8. Instructors could be heard adequately
9. Instructors maintained adequate control of the class
STUDENTS/TEAMS
10. Students in other teams could be seen clearly
11. Students in my own team could be seen clearly
12. Students in other teams could be heard adequately
13. Students in my own team could be heard adequately
LEARNING ACTIVITIES
14. Case studies provided a useful learning experience
15. Exercises provided a useful learning experience
16. Simulations provided a useful learning experience
17. Written materials were clearly written
TRAINING AIDS 18. Training aids were valuable in supporting instruction
19. Training aids were used effectively
20. Details of training aids could be clearly seen
INTERACTION/PARTICIPATION
21. Interaction between instructors and students was sufficient to support learning objectives 2,177 24.77** 0.35 0.98* 0.63*
22. Interaction among the members of my team was sufficient to support learning objectives 2,176 5.19** 0.26 0.40* 0.14
23. Interaction among the different team was sufficient to support learning objectives 2,177 15.50** 0.43 0.80* 0.37
24. Class participation was sufficient to support learning objectives 2,177 10.90** 0.44 0.62* 0.18
OVERALL 25. Compare the instructor(s) to Navy instructors
who have taught you in die past 2,178 12.92** 0.40 0.78* 0.38
26. Compare die course to other Navy courses you have taken in the past 2,178 12.28** 0.30 0.87* 0.57
27. Rank how well the course provided you with skills that can be applied on die job 2,178 3.95* 0.23 0.35* 0.12
Note. Scale is 1-5 for mean differences: T-L = Traditional-Local; T-R = Traditional-Remote; L-R = Local-Remote. *p<.05.
**p < .01 (Tukey HSD comparisons were judged significant at p < .05).
18
A significant overall ANOVA main effect was found on each of the 27 rating items for the combined LPO and CPO data. The Tukey HSD multiple comparison tests indicated that the primary source of these differences results from significantly higher ratings of the traditional group over the VTT remote group. Significant mean differences between traditional and VTT remote groups (T-R) appeared on all 27 items. Only six items showed significantly higher ratings for the traditional group over the VTT local group (T-L). Only one question showed a significantly higher rating for the VTT local group over the VTT remote group (L-R). In terms of mean differences over all 27 rating items combined, traditional classes are about 0.6 units higher than VTT remote and 0.4 units higher than VTT local classes, with die two VTT groups differing by about 0.2 units.
The largest mean differences (over 0.6 units) observed were for 10 comparisons concerned with several related clusters of topics. These concerned instructors answering questions and maintaining control of the class (items 4 and 9), being able to see and hear students in other teams (10 and 12), class participation and interaction with instructors or among teams (21, 23 and, 24), and overall comparisons to past instructors or courses (25 and 26).
The overall number of significant differences and the magnitude of the response pattern shown for the combined LPO/CPO data above tend to reflect that of die somewhat more numerous CPO subgroup. Inspection of the separate LPO and CPO response patterns revealed that most significant differences resulted from the CPO subgroup and very few from the LPO subgroup (subgroup results are given in Appendix H, Tables H-3, H-4, H-5). Had the subgroups been considered separately, 27 items would have been significant for CPOs, but only 8 for LPOs where the largest difference between means was only 0.57.
CPO students were somewhat more critical overall in their ratings than were LPO students. Over the 27 rating items, the average rating of CPOs (4.3) was about 0.3 units below that of the LPOs (4.6). The pattern of treatment group findings for these separate subgroups appears to differ somewhat in terms of the overall averages for all 27 items. For CPO students, the traditional group is about 0.7 units higher than either VTT local or VTT remote groups. For LPO students, the traditional group is about 0.2 units higher than VTT local and about 0.3 higher than VTT remote. Thus, the difference between VTT and traditional groups is much smaller for LPOs than for CPOs.
Several areas of commonality appear between the present results and the those from the prior study of DIVO students (Simpson, et al., 1995). In that study, 13 significant overall effects were found for items that primarily related to seeing and hearing students, teams, and instructors (items 7, 8,10-13); or items related to interaction and participation (items 21-24). The largest differences observed in the present study were also in similar topic areas. Both studies also found treatment group differences that were generally not large, and ratings to be toward the positive end of the scale.
Open-Ended Questions
Questions 28, 29, and 30 asked students what they like most about the course, what they liked least, and to provide any suggestions to improve the course, respectively. Response rates were calculated and the written responses to each open-ended question were exhaustively listed and
19
clustered into six broad categories described below in terras of percentages within each treatment group.
Over all treatment groups, students were somewhat more likely to respond about what they liked most (90%), than what they liked least (69%), or to suggest improvements (68%). This finding is similar to item 23 of the VTT Student Questionnaire (Q.l) where students were also more likely to respond with positive than negative comments on VTT. For the question on what they liked most, 92% of either traditional or VTT remote students responded, and 83% of the VTT local students responded. For the question on what they liked least, VTT remote students were more likely to respond (87%) than were traditional (59%) or VTT local (54%) students. Similarly, in providing suggestions for improvement, VTT remote students were again more likely to respond (90%) than were traditional (58%) or VTT local (42%) students. Thus, VTT remote students responded at the highest level on all three questions. Overall, LPO and CPO students were about equally likely to respond to the three questions.
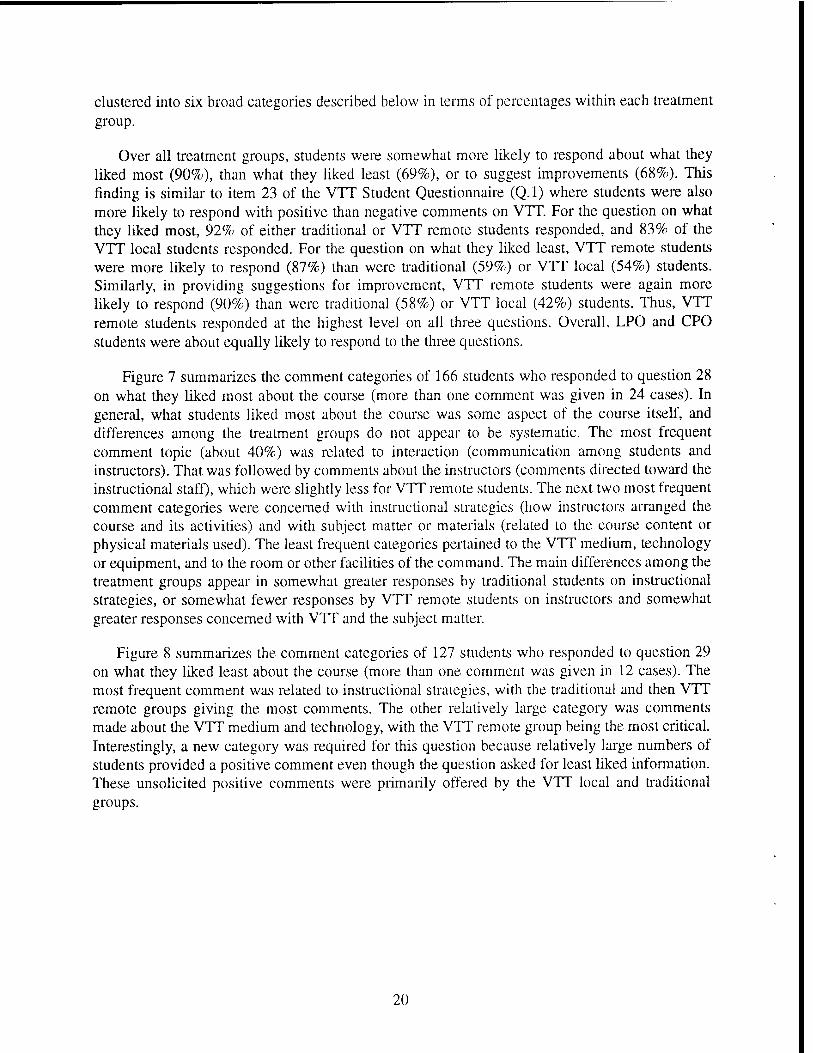
Figure 7 summarizes the comment categories of 166 students who responded to question 28 on what they liked most about the course (more than one comment was given in 24 cases). In general, what students liked most about the course was some aspect of the course itself, and differences among the treatment groups do not appear to be systematic. The most frequent comment topic (about 40%) was related to interaction (communication among students and instructors). That was followed by comments about the instructors (comments directed toward the instructional staff), which were slightly less for VTT remote students. The next two most frequent comment categories were concerned with instructional strategies (how instructors arranged the course and its activities) and with subject matter or materials (related to the course content or physical materials used). The least frequent categories pertained to the VTT medium, technology or equipment, and to the room or other facilities of the command. The main differences among the treatment groups appear in somewhat greater responses by traditional students on instructional strategies, or somewhat fewer responses by VTT remote students on instructors and somewhat greater responses concerned with VTT and the subject matter.
Figure 8 summarizes the comment categories of 127 students who responded to question 29 on what they liked least about the course (more than one comment was given in 12 cases). The most frequent comment was related to instructional strategies, with the traditional and then VTT remote groups giving the most comments. The other relatively large category was comments made about the VTT medium and technology, with the VTT remote group being the most critical. Interestingly, a new category was required for this question because relatively large numbers of students provided a positive comment even though the question asked for least liked information. These unsolicited positive comments were primarily offered by the VTT local and traditional groups.
20
Traditional Q VTT Local ^ VTT Remote
16
8
1 Interaction Instructional VTT & Subject Instructors Facilities No
strategies equipment matter/ Comment materials
Comments by Category
Figure 7. Responses to item 28 on NAVLEAD Student Questionnaire (Q.2). ("What did you like the most about this course?").
60
40 u
a.
20
-- — ''
2
16
9 -I
Traditional Q VTT Local ^ VTT Remote
Interaction Instructional VTT & Subject Instructors Facilities No Positive strategies equipment matter/ Comment Comment
materials
Comments by Category
Figure 8. Responses to item 29 on NAVLEAD Student Questionnaire (Q.2). ("What did you like the least about this course?").
21
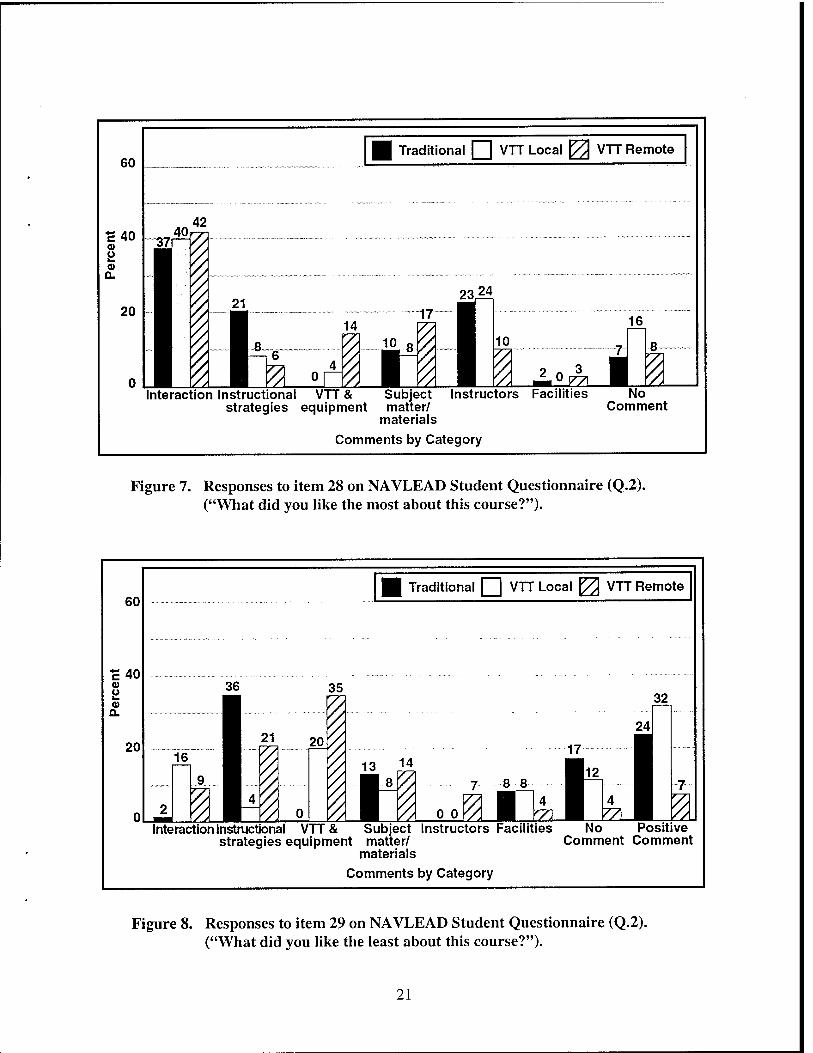
Figure 9 summarizes the comment categories of 125 students for question 30 on suggestions to improve the course (more than one comment was given in 12 cases). The pattern of responses paralleled those for question 29 wherein the two most frequent comment categories were VTT and instructional strategies. The VTT remote students offered the most suggestions pertaining to VTT, while the traditional and then VTT local students offered the most suggestions pertaining to instructional strategies. Again, about one fifth of the comments by VTT local and traditional students were nonspecific positive comments, such as having enjoyed the course.
60
£40 0) o
Q.
20
Traditional Q VTT Local 0 VTT Remote
Interaction Instructional VTT & Subject Instructors Facilities No Non- strategies equipment matter/ Comment specific
materials Positive Comment
Comments by Category
Figure 9. Responses to item 30 on NAVLEAD Student Questionnaire (Q.2). ("Discuss any suggestions you have for improving the course.").
Facilitator/Observer Questionnaire (Q.4)
Subject-matter expert perceptions of training quality were measured by having facilitators, observers, and instructors rate 14 different dimensions of the course using Q.4 (Appendix D). The ratings were completed daily at the end of a day, allowing progress on the different quality dimensions to be assessed over the week. VTT class observers, regardless of location, rated dimensions of both local and remote classes. The number of ratings actually obtained per day varied with the availability of raters and the applicability of a rating to the on-going activity in the class.
Three types of analyses were dictated by the form of the rating items. Five items allowed three-group comparisons between traditional, VTT local, and VTT remote conditions (items 5, 9, 11, 12, and 14). These five items provided two rating scale blanks to obtain separate ratings for VTT local and VTT remote sites (only one of these was answered for traditional classes). Eight items allowed two-group comparisons between the traditional and combined VTT local and remote conditions (items 1, 2, 3, 4, 6, 7, 8, and 10). One item allowed only the change over days
22
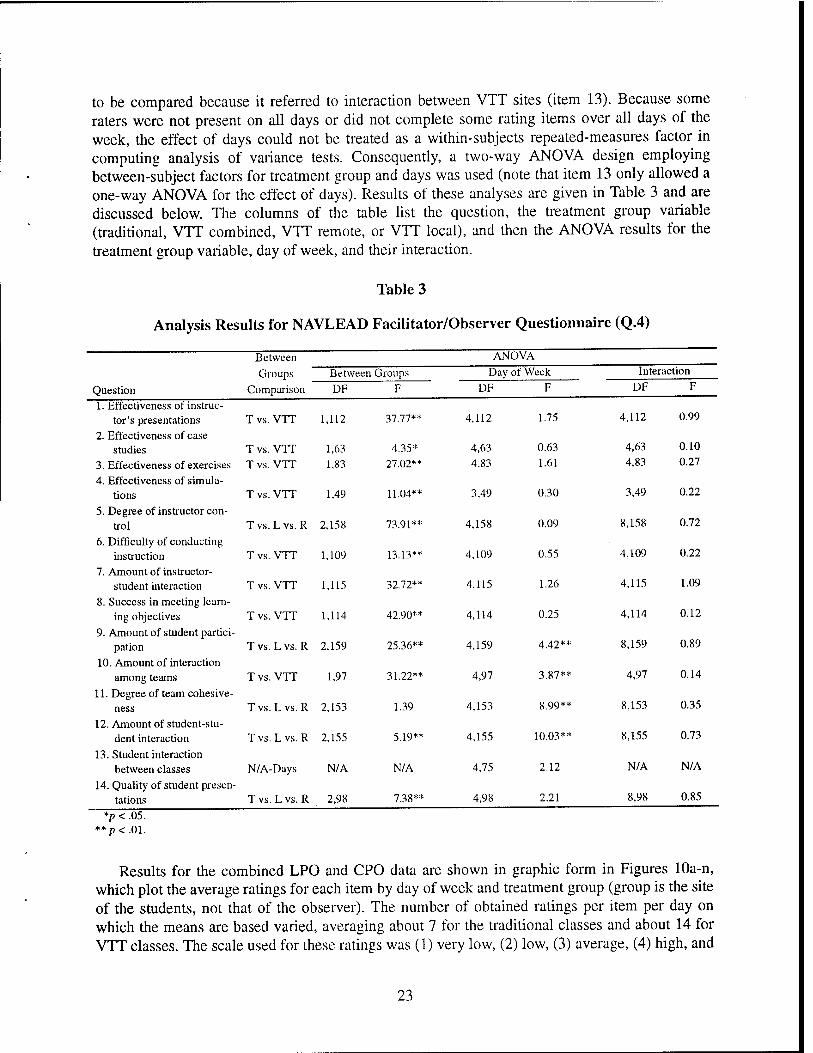
to be compared because it referred to interaction between VTT sites (item 13). Because some raters were not present on all days or did not complete some rating items over all days of the week, the effect of days could not be treated as a within-subjects repeated-measures factor in computing analysis of variance tests. Consequently, a two-way ANOVA design employing between-subject factors for treatment group and days was used (note that item 13 only allowed a one-way ANOVA for the effect of days). Results of these analyses are given in Table 3 and are discussed below. The columns of the table list the question, the treatment group variable (traditional, VTT combined, VTT remote, or VTT local), and then the ANOVA results for the treatment group variable, day of week, and their interaction.
Table 3
Analysis Results for NAVLEAD Facilitator/Observer Questionnaire (Q.4)
Between Groups
Comparison
ANOVA
Between Groups Day of Week Interaction
Question DF F DF F DF F
1. Effectiveness of instruc- tor's presentations T vs. VTT 1,112 37 77** 4,112 1.75 4,112 0.99
2. Effectiveness of case studies T vs. VTT 1,63 4.35* 4,63 0.63 4,63 0.10
3. Effectiveness of exercises T vs. VTT 1,83 27.02** 4,83 1.61 4,83 0.27
4. Effectiveness of simula- tions T vs. VTT 1,49 11.04** 3,49 0.30 3,49 0.22
5. Degree of instructor con- trol T vs. L vs. R 2,158 73.91** 4,158 0.09 8,158 0.72
6. Difficulty of conducting instruction T vs. VTT 1,109 13.13** 4,109 0.55 4,109 0.22
7. Amount of instructor- student interaction T vs. VTT 1,115 32 72** 4,115 1.26 4,115 1.09
8. Success in meeting learn- ing objectives T vs. VTT 1,114 42.90** 4,114 0.25 4,114 0.12
9. Amount of student partici- pation T vs. L vs. R 2,159 25.36** 4,159 4.42** 8,159 0.89
10. Amount of interaction among teams T vs. VTT 1,97 31.22** 4,97 3.87** 4,97 0.14
11. Degree of team cohesive- ness T vs. L vs. R 2,153 1.39 4,153 8.99** 8,153 0.35
12. Amount of student-stu- dent interaction T vs. L vs. R 2,155 5 19** 4,155 10.03** 8,155 0.73
13. Student interaction between classes N/A-Days N/A N/A 4,75 2.12 N/A N/A
14. Quality of student presen- tations T vs. L vs. R 2,98 7.38** 4,98 2.21 8,98 0.85
*p < .05. **p<.0l.
Results for the combined LPO and CPO data are shown in graphic form in Figures lOa-n, which plot the average ratings for each item by day of week and treatment group (group is the site of the students, not that of the observer). The number of obtained ratings per item per day on which the means are based varied, averaging about 7 for the traditional classes and about 14 for VTT classes. The scale used for these ratings was (1) very low, (2) low, (3) average, (4) high, and
23
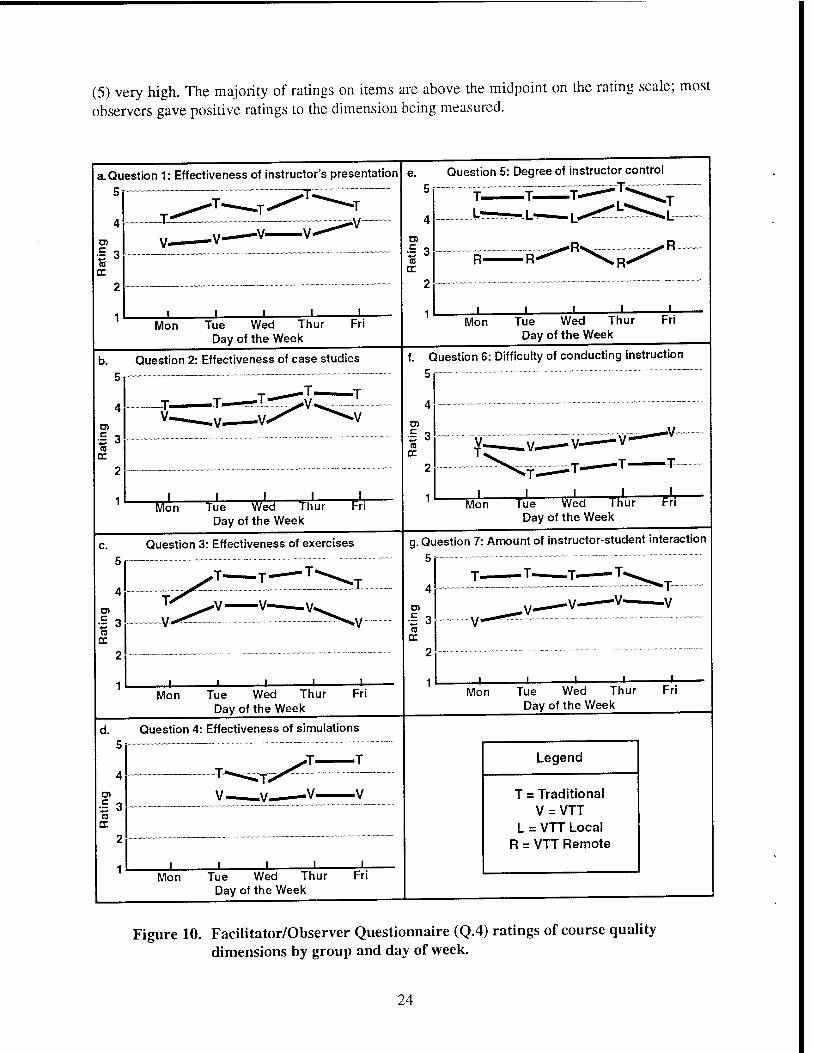
(5) very high. The majority of ratings on items are above the midpoint on the rating scale; most observers gave positive ratings to the dimension being measured.
a. Question 1: Effectiveness of instructor's presentation
5
4
o> £ 3 « EC
m tr
c.
-V-
-T -V"
Mon Tue Wed Thur Day of the Week
Fri
b. Question 2: Effectiveness of case studies
5
V- .1. -V-
■I' -V*
.T. »V.
-T
J_ Mon Tue Wed Thur FrT
Day of the Week
Question 3: Effectiveness of exercises
/T~ — T ■T^^.T
T-^-v- V-. "V^s^ w"™"^^«
- 1 1 1 1 1
Question 5: Degree of instructor control
Mon Tue Wed Thur Day of the Week
Fri
f. Question 6: Difficulty of conducting instruction
5
Mon "Tue Wed Thur Day of the Week
g. Question 7: Amount of instructor-student interaction
5
Mon Tue Wed Thur Fri Day of the Week
Question 4: Effectiveness of simulations
T^ ^—T
V _y_ -v/ u
iiii _l
Mon Tue Wed Thur Fri Day of the Week
Mon Tue Wed Thur Day of the Week
Legend
T = Traditional V = VTT
L = VTT Local R = VTT Remote
Figure 10. Facilitator/Observer Questionnaire (Q.4) ratings of course quality dimensions by group and day of week.
24
h. Question 8: Success in meeting learning objectives 5
c '■s 3 to
•V.
_L _L _L Mon Tue Wed Thur Fri
Day of the Week
i. Question 9: Amount of student participation 5
Mon Tue Wed Thur Day of the Week
Fri
Question 12: Amount of student interaction
Mon Tue Wed Thur Day of the Week
Fri
m. Question 13: Student interaction between classes 5
Mon Tue Wed Thur Fri Day of the Week
j. Question 10: Amount of interaction among teams 5
n. Question 14: Amount of instructor-student interaction
O)
I3 to cc
»T-
-V- .V •V
JL Mon Tue Wed Thur
Day of the Week Fri Mon Tue Wed Thur
Day of the Week Fri
Question 11: Degree of team cohesiveness
Mon Tue Wed Thur Day of the Week
Fri
Legend
T = Traditional V = VTT
L = VTT Local R = VTT Remote
Figure 10. (Continued).
25
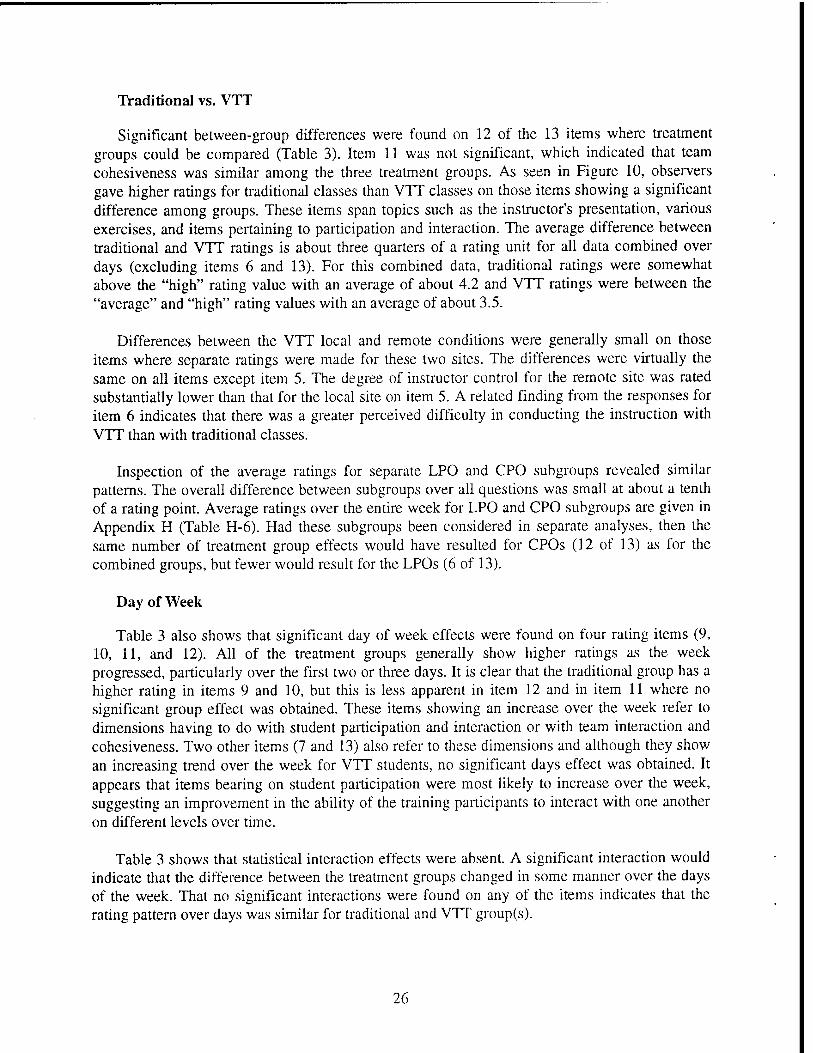
Traditional vs. VTT
Significant between-group differences were found on 12 of the 13 items where treatment groups could be compared (Table 3). Item 11 was not significant, which indicated that team cohesiveness was similar among the three treatment groups. As seen in Figure 10, observers gave higher ratings for traditional classes than VTT classes on those items showing a significant difference among groups. These items span topics such as the instructor's presentation, various exercises, and items pertaining to participation and interaction. The average difference between traditional and VTT ratings is about three quarters of a rating unit for all data combined over days (excluding items 6 and 13). For this combined data, traditional ratings were somewhat above the "high" rating value with an average of about 4.2 and VTT ratings were between the "average" and "high" rating values with an average of about 3.5.
Differences between the VTT local and remote conditions were generally small on those items where separate ratings were made for these two sites. The differences were virtually the same on all items except item 5. The degree of instructor control for the remote site was rated substantially lower than that for the local site on item 5. A related finding from the responses for item 6 indicates that there was a greater perceived difficulty in conducting the instruction with VTT than with traditional classes.
Inspection of the average ratings for separate LPO and CPO subgroups revealed similar patterns. The overall difference between subgroups over all questions was small at about a tenth of a rating point. Average ratings over the entire week for LPO and CPO subgroups are given in Appendix H (Table H-6). Had these subgroups been considered in separate analyses, then the same number of treatment group effects would have resulted for CPOs (12 of 13) as for the combined groups, but fewer would result for the LPOs (6 of 13).
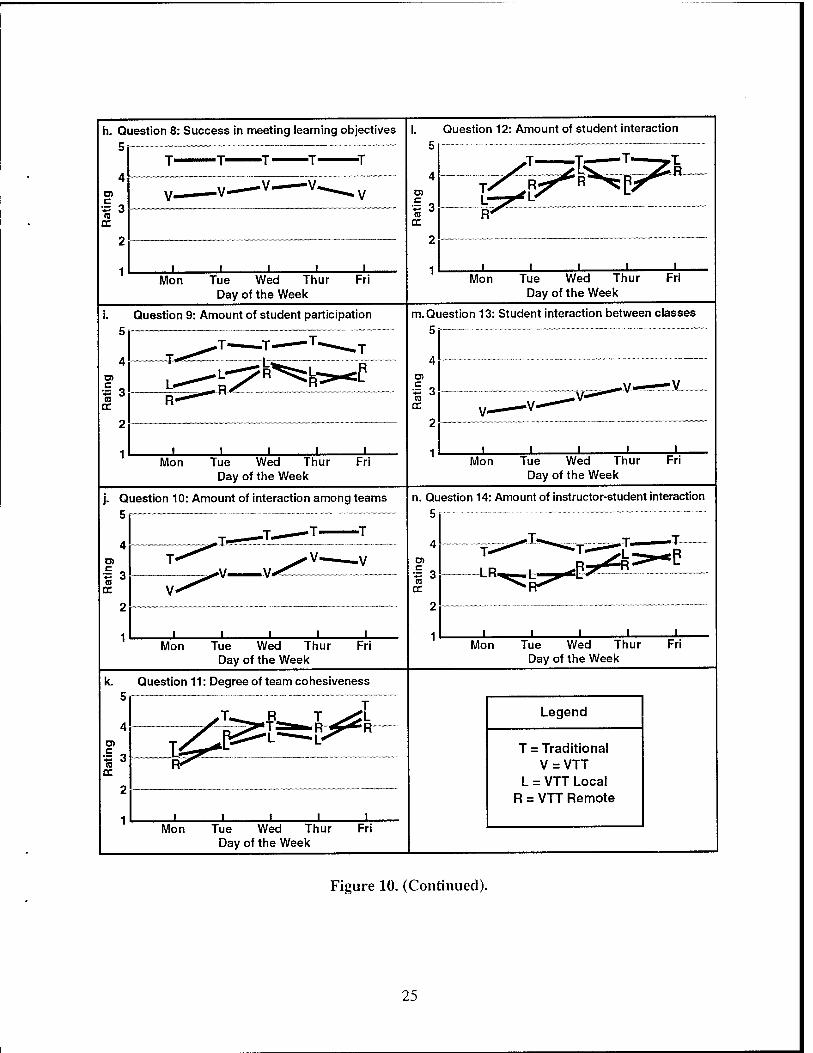
Day of Week
Table 3 also shows that significant day of week effects were found on four rating items (9, 10, 11, and 12). All of the treatment groups generally show higher ratings as the week progressed, particularly over the first two or three days. It is clear that the traditional group has a higher rating in items 9 and 10, but this is less apparent in item 12 and in item 11 where no significant group effect was obtained. These items showing an increase over the week refer to dimensions having to do with student participation and interaction or with team interaction and cohesiveness. Two other items (7 and 13) also refer to these dimensions and although they show an increasing trend over the week for VTT students, no significant days effect was obtained. It appears that items bearing on student participation were most likely to increase over the week, suggesting an improvement in the ability of the training participants to interact with one another on different levels over time.
Table 3 shows that statistical interaction effects were absent. A significant interaction would indicate that the difference between the treatment groups changed in some manner over the days of the week. That no significant interactions were found on any of the items indicates that the rating pattern over days was similar for traditional and VTT group(s).
26
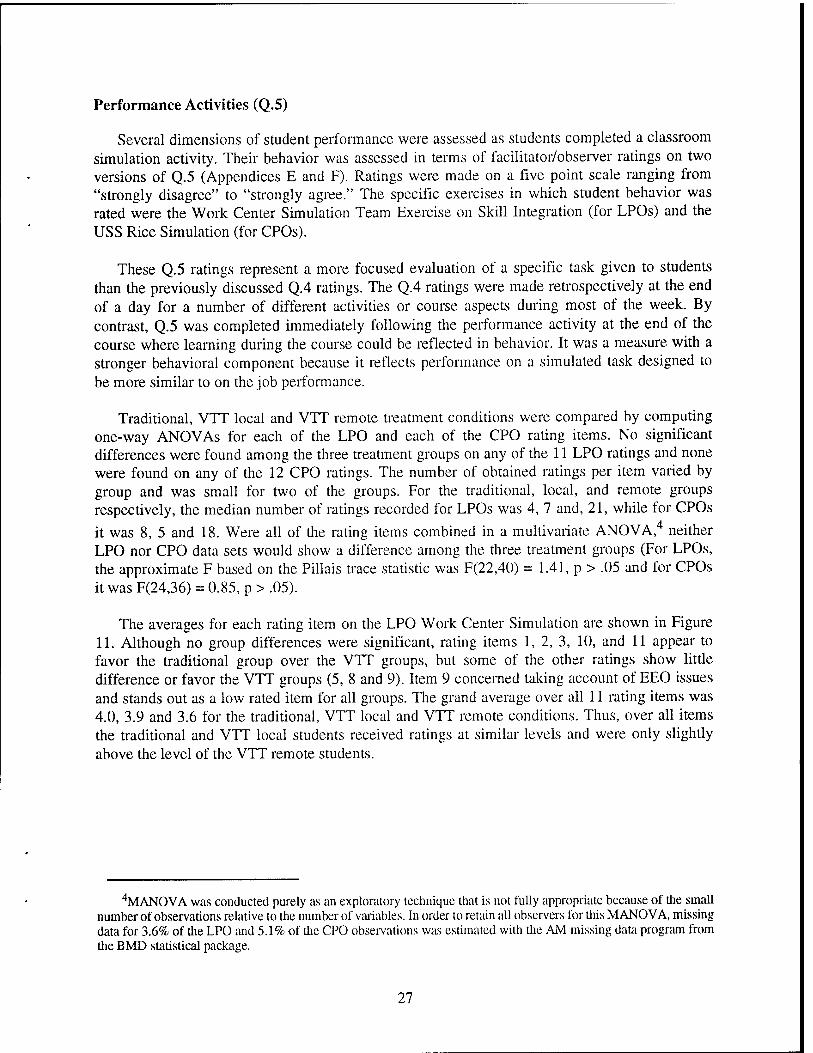
Performance Activities (Q.5)
Several dimensions of student performance were assessed as students completed a classroom simulation activity. Their behavior was assessed in terms of facilitator/observer ratings on two versions of Q.5 (Appendices E and F). Ratings were made on a five point scale ranging from "strongly disagree" to "strongly agree." The specific exercises in which student behavior was rated were the Work Center Simulation Team Exercise on Skill Integration (for LPOs) and the USS Rice Simulation (for CPOs).
These Q.5 ratings represent a more focused evaluation of a specific task given to students than the previously discussed Q.4 ratings. The Q.4 ratings were made retrospectively at the end of a day for a number of different activities or course aspects during most of the week. By contrast, Q.5 was completed immediately following the performance activity at the end of the course where learning during the course could be reflected in behavior. It was a measure with a stronger behavioral component because it reflects performance on a simulated task designed to be more similar to on the job performance.
Traditional, VTT local and VTT remote treatment conditions were compared by computing one-way ANOVAs for each of the LPO and each of the CPO rating items. No significant differences were found among the three treatment groups on any of the 11 LPO ratings and none were found on any of the 12 CPO ratings. The number of obtained ratings per item varied by group and was small for two of the groups. For the traditional, local, and remote groups respectively, the median number of ratings recorded for LPOs was 4, 7 and, 21, while for CPOs
it was 8, 5 and 18. Were all of the rating items combined in a multivariate ANOVA,4 neither LPO nor CPO data sets would show a difference among the three treatment groups (For LPOs, the approximate F based on the Pillais trace statistic was F(22,40) = 1.41, p > .05 and for CPOs it was F(24,36) = 0.85, p > .05).
The averages for each rating item on the LPO Work Center Simulation are shown in Figure 11. Although no group differences were significant, rating items 1, 2, 3, 10, and 11 appear to favor the traditional group over the VTT groups, but some of the other ratings show little difference or favor the VTT groups (5, 8 and 9). Item 9 concerned taking account of EEO issues and stands out as a low rated item for all groups. The grand average over all 11 rating items was 4.0, 3.9 and 3.6 for the traditional, VTT local and VTT remote conditions. Thus, over all items the traditional and VTT local students received ratings at similar levels and were only slightly above the level of the VTT remote students.
4MANOVA was conducted purely as an exploratory technique that is not fully appropriate because of the small number of observations relative to the number of variables. In order to retain all observers for this MANOVA, missing data for 3.6% of the LPO and 5.1% of die CPO observations was estimated with the AM missing data program from the BMD statistical package.
27
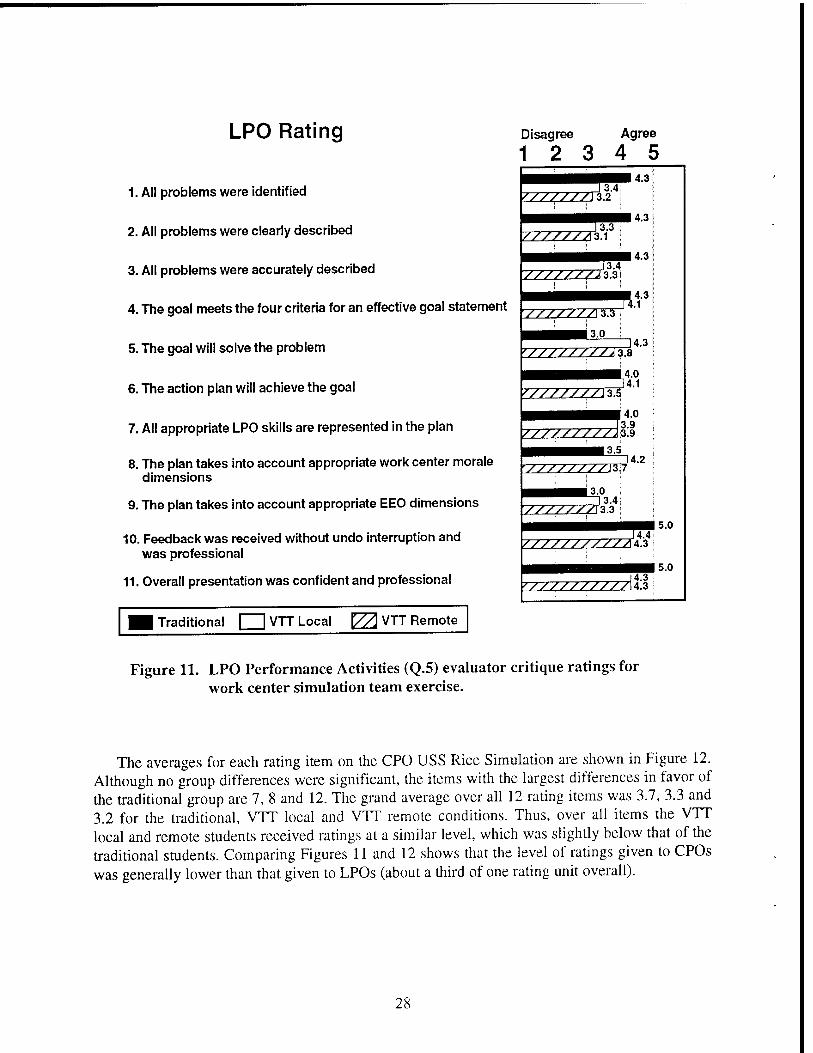
LPO Rating
1. All problems were identified
2. All problems were clearly described
3. All problems were accurately described
4. The goal meets the four criteria for an effective goal statement
5. The goal will solve the problem
6. The action plan will achieve the goal
7. All appropriate LPO skills are represented in the plan
8. The plan takes into account appropriate work center morale dimensions
9. The plan takes into account appropriate EEO dimensions
10. Feedback was received without undo interruption and was professional
11. Overall presentation was confident and professional
M Traditional | | VTT Local VA VTT Remote|
Disagree Agree
12 3 4 5
YzzzzzzrtkS
///////xt$\
IZZZZZZZX5S
zzzzzzzzz. | 4.0 3.9 3.9
S///////YU ]4.2 ;
3.0
ZZZZZZZT3.3 I 5.0
Figure 11. LPO Performance Activities (Q.5) evaluator critique ratings for work center simulation team exercise.
The averages for each rating item on the CPO USS Rice Simulation are shown in Figure 12. Although no group differences were significant, the items with the largest differences in favor of the traditional group are 7, 8 and 12. The grand average over all 12 rating items was 3.7, 3.3 and 3.2 for the traditional, VTT local and VTT remote conditions. Thus, over all items the VTT local and remote students received ratings at a similar level, which was slightly below that of the traditional students. Comparing Figures 11 and 12 shows that the level of ratings given to CPOs was generally lower than that given to LPOs (about a third of one rating unit overall).
28
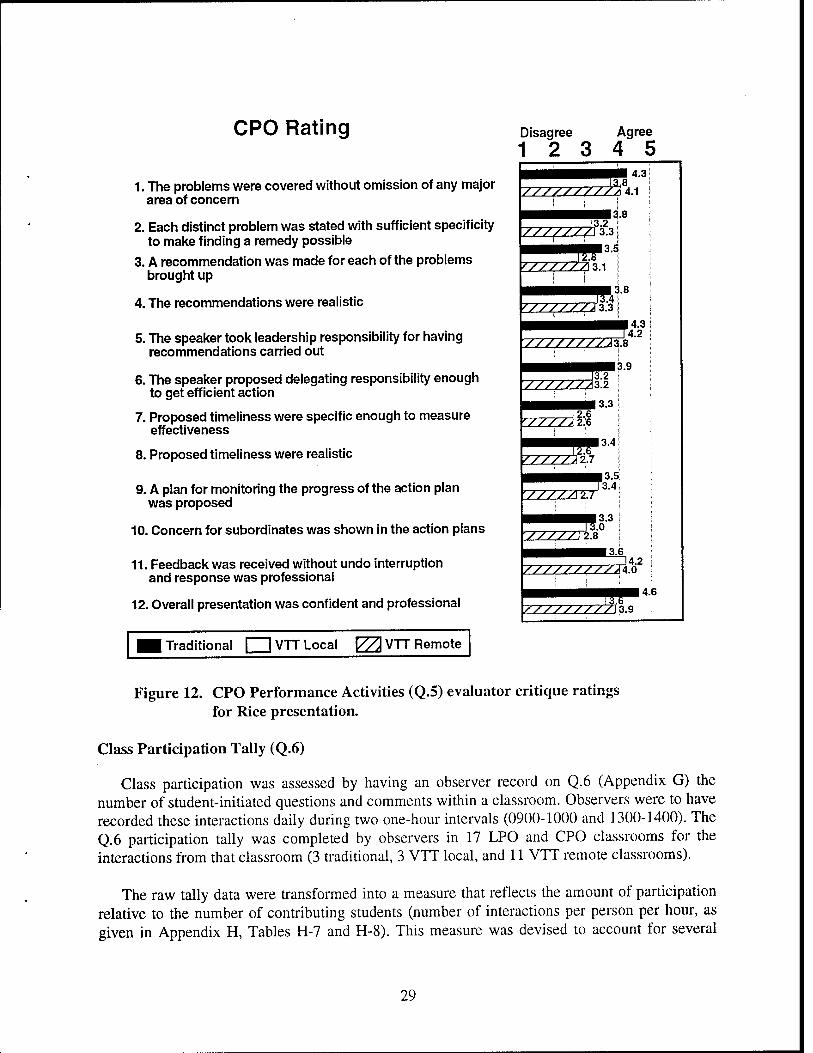
CPO Rating Disagree Agree
12 3 4 5
1. The problems were covered without omission of any major area of concern
2. Each distinct problem was stated with sufficient specificity to make finding a remedy possible
3. A recommendation was made for each of the problems brought up
4. The recommendations were realistic
5. The speaker took leadership responsibility for having recommendations carried out
6. The speaker proposed delegating responsibility enough to get efficient action
7. Proposed timeliness were specific enough to measure effectiveness
8. Proposed timeliness were realistic
9. A plan for monitoring the progress of the action plan was proposed
10. Concern for subordinates was shown in the action plans
11. Feedback was received without undo interruption and response was professional
12. Overall presentation was confident and professional
Traditional I IVTT Local V7\ VTT Remote
Figure 12. CPO Performance Activities (Q.5) evaluator critique ratings for Rice presentation.
Class Participation Tally (Q.6)
Class participation was assessed by having an observer record on Q.6 (Appendix G) the number of student-initiated questions and comments within a classroom. Observers were to have recorded these interactions daily during two one-hour intervals (0900-1000 and 1300-1400). The Q.6 participation tally was completed by observers in 17 LPO and CPO classrooms for the interactions from that classroom (3 traditional, 3 VTT local, and 11 VTT remote classrooms).
The raw tally data were transformed into a measure that reflects the amount of participation relative to the number of contributing students (number of interactions per person per hour, as given in Appendix H, Tables H-7 and H-8). This measure was devised to account for several
29
inequities that varied among the treatment conditions in terms of the number of students at a site, the number of sites, amount of recording time, and duplicated recording time among
simultaneous VTT sites.5 Tallies from the previous study of DIVO students (Simpson, et al, 1995) were also transformed. This allowed a direct comparison to the LPO/CPO data, which would not otherwise be comparable because the DIVO study reported per team basis interactions that were not possible to calculate with the present data. The interactions per student per hour measure was calculated for the treatment groups overall, for individual sites, and for each day at a site. Calculating this measure for each day at each site allowed a sufficient number of observations for testing significance by two-way analysis of variance with the three treatment groups as one factor and the five days of the course as the second factor.
The combined LPO and CPO interaction data are shown in the left hand bars of Figure 13. A higher level of interaction is shown by the VTT local group than by the traditional group, and the lowest level is shown by the VTT remote group. An ANOVA revealed that there were no significant differences among the three treatment groups, F(2,66) = 1.36, p > .05, among days of the week, F(4,66) = 0.18, p > .05, or for an interaction between days and groups, F(8,66) = 0.53, p > .05.
The middle bars shown in Figure 13 show the recalculated results for the DIVO classes previously studied by Simpson et al. (1995). The figure shows that the traditional group had a higher level of interaction than the VTT local group, and that the lowest level is found in the VTT remote group. The pattern shown with this new per-student, per-hour measure is similar to that reported by Simpson et al. using a per team measure. In that study, it was found that the high average level of the traditional group resulted from one of the two traditional classes responding at a very high level that was twice that of the other traditional class.
Although both the LPO/CPO and DIVO data in Figure 13 show fewer interactions for the remote group, the relative level of traditional and local groups was inconsistent for the two studies. This variability may result from the relatively small number of classes that comprise these subsets of the data. An alternative approach to drawing conclusions about the level of interactivity among these classrooms is to combine all data from both studies in one analysis, as well as to examine the pattern among the combined individual sites to understand these apparent discrepancies.
5The measure accounts for several inconsistencies and allows all available data to be used: a few observers recorded interactions for an entire classroom radier than for an individual team, some observers were unable to record all sessions during the week, and some sessions were in half hour rather than hour periods that required transformation into a per hour basis. The measure was calculated using "recording hours per site" to adjust for multiple class convenings and duplicated hours of recording during the same time periods over multiple VTT sites. LPO and CPO data were combined to obtain an adequate number of observations because data were not returned for one local and one remote classroom, and one traditional class was never conducted.
30
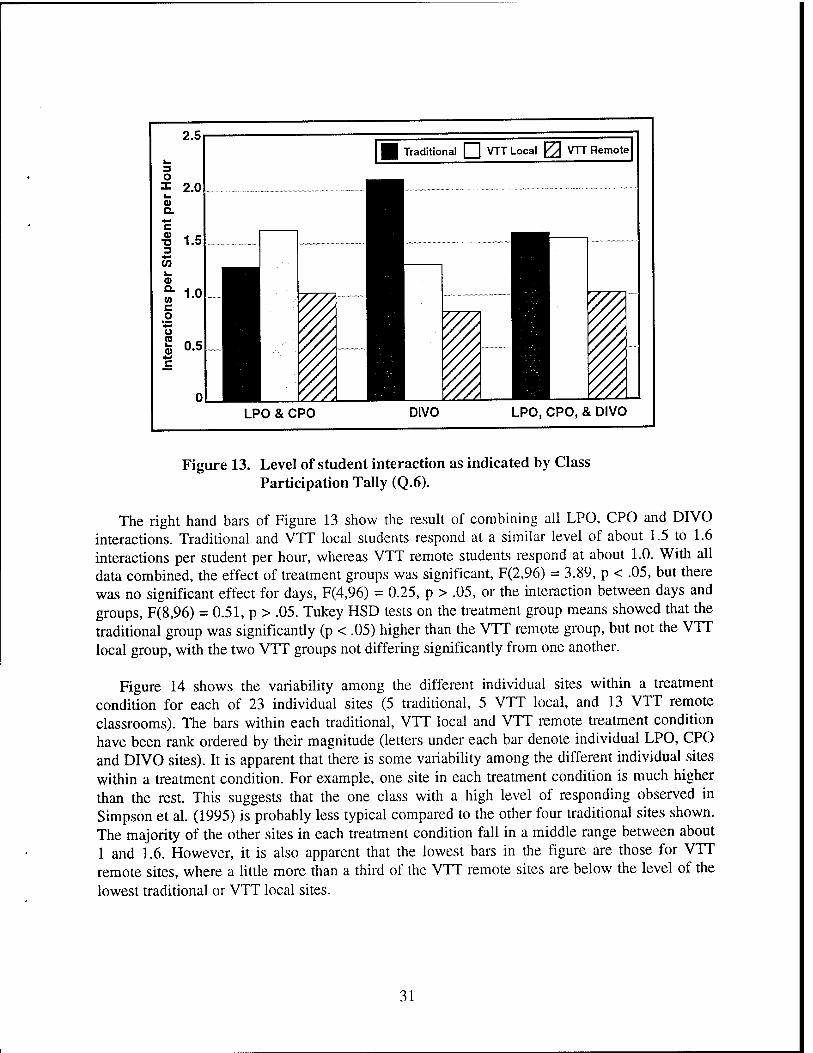
2.5
3 O I 2.0
a
TJ 1.5
(/}
<D a (0 c o u to o c
Traditional Q VTT Local ^ VTT Remote]
LPO & CPO DIVO LPO, CPO, & DIVO
Figure 13. Level of student interaction as indicated by Class Participation Tally (Q.6).
The right hand bars of Figure 13 show the result of combining all LPO, CPO and DIVO interactions. Traditional and VTT local students respond at a similar level of about 1.5 to 1.6 interactions per student per hour, whereas VTT remote students respond at about 1.0. With all data combined, the effect of treatment groups was significant, F(2,96) = 3.89, p < .05, but there was no significant effect for days, F(4,96) = 0.25, p > .05, or the interaction between days and groups, F(8,96) = 0.51, p > .05. Tukey HSD tests on the treatment group means showed that the traditional group was significantly (p < .05) higher than the VTT remote group, but not the VTT local group, with the two VTT groups not differing significantly from one another.
Figure 14 shows the variability among the different individual sites within a treatment condition for each of 23 individual sites (5 traditional, 5 VTT local, and 13 VTT remote classrooms). The bars within each traditional, VTT local and VTT remote treatment condition have been rank ordered by their magnitude (letters under each bar denote individual LPO, CPO and DIVO sites). It is apparent that there is some variability among the different individual sites within a treatment condition. For example, one site in each treatment condition is much higher than the rest. This suggests that the one class with a high level of responding observed in Simpson et al. (1995) is probably less typical compared to the other four traditional sites shown. The majority of the other sites in each treatment condition fall in a middle range between about 1 and 1.6. However, it is also apparent that the lowest bars in the figure are those for VTT remote sites, where a little more than a third of the VTT remote sites are below the level of the lowest traditional or VTT local sites.
31
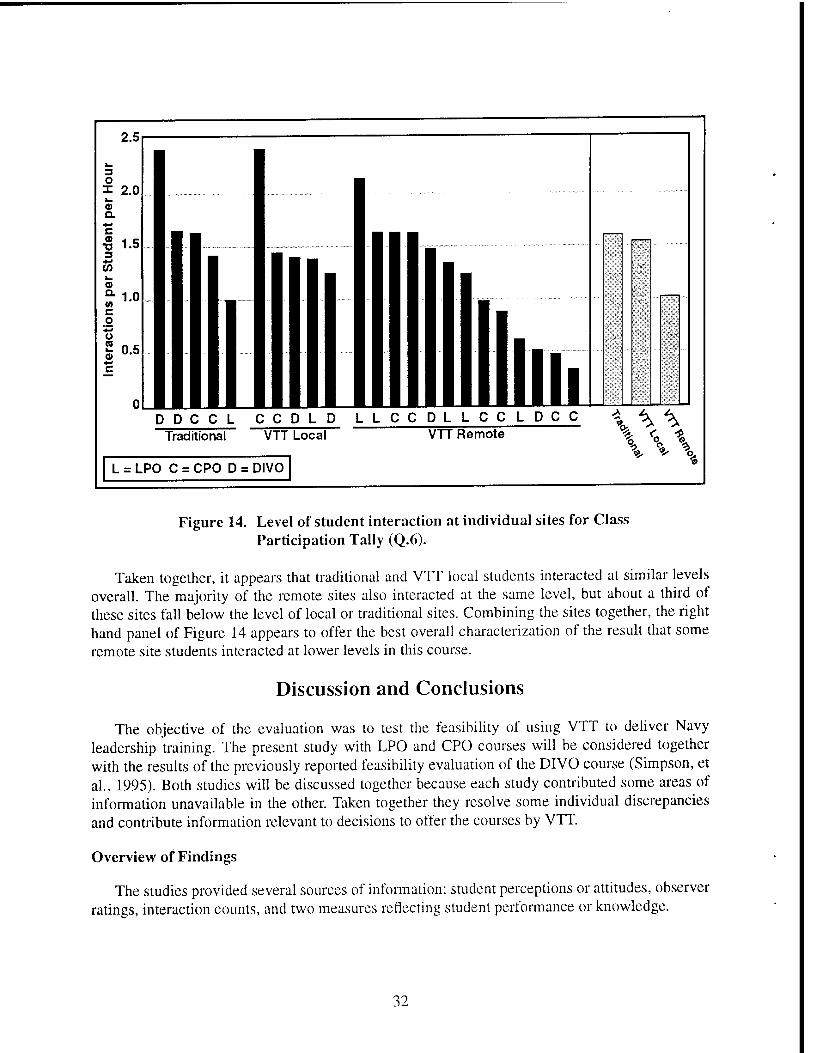
L = LPO C = CPO D = DIVO
Figure 14. Level of student interaction at individual sites for Class Participation Tally (Q.6).
Taken together, it appears that traditional and VTT local students interacted at similar levels overall. The majority of the remote sites also interacted at the same level, but about a third of these sites fall below the level of local or traditional sites. Combining the sites together, the right hand panel of Figure 14 appears to offer the best overall characterization of the result that some remote site students interacted at lower levels in this course.
Discussion and Conclusions
The objective of the evaluation was to test the feasibility of using VTT to deliver Navy leadership training. The present study with LPO and CPO courses will be considered together with the results of the previously reported feasibility evaluation of the DIVO course (Simpson, et al., 1995). Both studies will be discussed together because each study contributed some areas of information unavailable in the other. Taken together they resolve some individual discrepancies and contribute information relevant to decisions to offer the courses by VTT.
Overview of Findings
The studies provided several sources of information: student perceptions or attitudes, observer ratings, interaction counts, and two measures reflecting student performance or knowledge.
32
Student Ratings
Student responses tended to favor traditional instruction slightly on questionnaires Q. 1 and Q.2. Ratings were on the positive end of the scale, and differences among the treatment groups were generally small or modest.
Little difference between local and remote sites was observed in either study for ratings on the questionnaire concerned with VTT topics (Q.l). Audiovisual factors typical of findings for other types of courses were the only significant rating differences observed in one study. Students did, however, express the opinion that VTT reduced their opportunities to interact with the instructor, and although they were somewhat divided in their preference for VTT, they indicated they would take another VTT class.
The questionnaire concerned with insü-uctional issues (Q.2) revealed somewhat larger differences as a consequence of being given to a wider range of treatment conditions that included both VTT and traditional students. However, these differences were again modest, with the largest group differences appearing on topics that tended to be common to both LPO/CPO and DIVO studies. The largest differences between groups in favor of traditional instruction were primarily on topics related to seeing and hearing students, teams, and instructors; or on topics related to interaction and participation. Compared to the responses of DIVO students, larger treatment group differences were observed for the LPO/CPO combined data and these were primarily due to the CPO and not the LPO students. CPO students gave lower ratings overall, were generally more critical, and were less accepting of VTT.
Student responses to open ended questions were most often related to some aspect of the course content and interaction. Response rates were greater for what students liked than for what they disliked or for suggestions for improvement. In general, about half of the comments were positive and a third negative. Remote students were most likely to respond on open ended questions and were more likely to comment about VTT related problems.
Observer Ratings
Daily subject matter expert ratings of various dimensions of the training were generally the largest differences observed in both studies (on Q.4). These observers gave significantly higher ratings to traditional instruction than VTT, and the pattern was generally the same over the week so that VTT classes did not reach parity with traditional classes. Observers rated VTT lower with respect to effectiveness, interaction, and control over the class, and rated the difficulty of conducting the instruction as greater. There was a general tendency for interaction and participation to have been rated as increasing over the early part of the week. A recommended technique to foster such interaction is to get students actively using a VTT system early on the first day of a course.
Interaction Tally
The tally of student initiated questions and comments represents a behavioral measure of student interaction and participation that is more objective than the ratings above. There was some inconsistency in the patterns observed between the present study and that with DIVO
33
students. However, taking both studies together offered an interpretable pattern when the variability among classes was examined. The general pattern over all classes indicated a similar level of interaction for traditional and VTT local classes, while VTT remote classes were significantly lower at about two thirds this level. About a third of the individual VTT remote classes fell below the lowest level of local and traditional classes. Thus, some remote sites interacted at a somewhat lower level, and the observed data suggest that some variability should be expected from class to class and instructor to instructor.
Student Performance and Knowledge
Each of the two studies contributed a different measure that assessed an aspect of student performance or knowledge. These aspects were assessed near the end of the course where they would be expected to reflect student learning during the training.
In the present study, several dimensions of student performance during a classroom simulation activity were assessed in terms of facilitator/observer ratings (Q.5). No statistically significant differences were found among the three treatment groups on any of the ratings for either LPOs or CPOs. Over some items there was a trend for the VTT remote students to be rated somewhat lower. The results suggest that VTT had little effect on student performance on a specific task that was more behaviorally focused in nature than the other more general ratings made by observers at the end of each day.
Student knowledge was assessed in the Division Officer course with a multiple-choice quiz (Q.3) covering course content that was administered at the start and end of the course. Student knowledge of course content was unaffected by the delivery medium. Traditional, VTT local and VTT remote students were found to perform at identical levels on this measure.
Future VTT Courses
The feasibility of using VTT to deliver Navy leadership training has now been tested in two studies with three courses. Feasibility was demonstrated in the sense that the classes were conducted successfully, students received training and graduated, and there was no significant outcry about the way their training was being received. However, adapting the instruction to delivery by VTT may have led to some changes in areas that have been held to be important in the Navy leadership community: the intensity of a learning environment involving instructor-student and student-student interaction was lessened, the ability of instructors to circulate among teams and to perceive remote students' nonverbal cues was limited by the view offered through the VTT system, and some experiential learning experiences were more difficult to conduct with VTT. Based on the data from subject matter expert ratings and those pertaining to participation, some reduction in the interactivity of the NAVLEAD learning environment was suggested for VTT students as compared to those in traditional classrooms.
Do these findings and judgments mean that VTT should not be used for NAVLEAD instruction? On the one hand, the data reported here suggest some reduction in interactivity and perceived quality. On the other hand, it is not clear that the course has been compromised and several other considerations may play in the decision. Ultimately, weighing these factors and the decision to teach NAVLEAD is left to those who have direct oversight of the course, who pay for
34
it, and who use its graduates. Some of the other considerations to weigh in a decision to teach NAVLEAD by VTT are presented below.
First, some of the observed significant differences between traditional and VTT NAVLEAD classes mainly reflect subjective perceptions of reduced quality among ratings that were generally on the positive end of the scale. Among the more objective measures, the interaction count was nonetheless lower by about a third, but two instances reflecting learning were not affected. Those two measures which reflected actual student performance and student knowledge were not significantly different between traditional and VTT classes.
Second, all of the research reported here involved evaluations of the first attempts to deliver NAVLEAD instruction by VTT. Regular delivery of these courses by VTT would likely lead to some improvements as more experience is gained with VTT and instructors develop new techniques to foster interaction. Evolving new instructional strategies and instructor behaviors to encourage greater student participation could also be supplemented with new technologies to show better views of individuals between sites. Compared to when sites participate together as a whole class, the ability of facilitators to monitor the audio and video of activities involving multiple small groups at remote sites appears to be the greatest challenge in this course.
Third, practical reasons to consider VTT for these courses are a consequence of the ongoing drawdown and the need to reduce costs and make efficient use of instructor resources. Cost and efficiency benefits have resulted from use of the VTT system implemented in the CNET Electronic Schoolhouse Network (CESN). Use of the VTT system can favorably impact the cost of training by reducing the costs associated with travel, per diem, and instructors. Courses that are particularly beneficial in reducing travel costs are those with a high throughput and which are short in duration (a week or less). Cost savings for the NAVLEAD courses would require a site by site analysis, with the most likely instances being those remote sites currently being served by the CESN.
Recommendations
1. The Chief of Naval Education and Training should consider the use of VTT for NAV- LEAD by weighing potential cost savings against the reduction in interactivity associated with using VTT for the training.
2. If the decision is made to conduct NAVLEAD instruction with VTT, the Chief of Naval Education and Training should test and refine ways to foster higher levels of instructor-student and student-student interaction.
35
References
Rupinski, T. E. (1991). Analyses of video teletraining utilization, effectiveness, and acceptance. (Research Memorandum CRM 91-159). Alexandria, VA: Center for Naval Analysis.
Rupinski, T. E., & Stoloff, P. H. (1990). An evaluation of Navy video teletraining (VTT). (Research Memorandum CRM 90-36). Alexandria, VA: Center for Naval Analysis.
Simpson, H. (1993). Conversion of live instruction for videoteletraining: Training and classroom design considerations (NPRDC-TN-93-04). San Diego, CA: Navy Personnel Research and Development Center. (AD-A261 051)
Simpson, H., Pugh, H. L., & Parchman, S. W. (1990). A two-point videoteletraining system: Design, development, and evaluation (NPRDC-TR-90-05). San Diego, CA: Navy Personnel Research and Development Center. (AD-A226 734)
Simpson, H., Pugh, H. L., & Parchman, S. W. (1991). Empirical comparison of alternative video teletraining technologies (NPRDC-TR-92-3). San Diego, CA: Navy Personnel Research and Development Center. (AD-A242 200)
Simpson, H., Pugh, H. L., & Parchman, S. W. (1992). The use of videoteletraining to deliver hands- on training: Concept test and evaluation (NPRDC-TN-92-14). San Diego, CA: Navy Personnel Research and Development Center. (AD-A250 708)
Simpson, H., Wetzel, C. D., & Pugh, H. L. (1995). Delivery of Division Officer Navy Leadership Training by Videoteletraining: Initial Concept Test and Evaluation (NPRDC-TR-95-7). San Diego, CA: Navy Personnel Research and Development Center.
Stoloff, P. H. (1991). Cost-effectiveness of U.S. Navy Video Teletraining System Alternatives. (Research Memorandum CRM 91-165). Alexandria, VA: Center for Naval Analysis.
Wetzel, C. D., Radtke, P. H., & Stern, H. W. (1993, April). Review of the effectiveness of video media in instruction. (NPRDC Technical Report TR-93-4). San Diego, CA: Navy Personnel Research and Development Center. (AD-A264 228)
Wetzel, C. D., Radtke, P. H., & Stern, H. W (1994). Instructional Effectiveness of Video Media. Hillsdale, NJ: Lawrence Erlbaum Associates, Publishers.
37
Appendix A
Data Collection Instructions
A-0
Data Collection Instructions
Overview
The data collection coordinator is responsible for administering two data collection instruments:
1. VTT Student Questionnaire (Q.l)
2. NAVLEAD Student Questionnaire (Q.2)
The coordinator must also assure that facilitators and SME observers complete three data collection instruments:
1. Facilitator/Observer Questionnaire (Q.4)
2. LPO Work Center Simulation Team Exercise Presentation Critique (Q.5) or CPO Rice Presentation Critique (Q.5)
3. Class Participation Tally (Q.6)
The purpose, content, completion requirements, and time required for each of these instruments are described below.
Facilitators and observers should review each instrument to become familiar with instructions and content
Facilitators and observers should keep a personal log of "significant" events observed during training. The log should record the type of event, time, and comments for discus- sion during the course critique following the course.
Data Collection Instruments
VTT Student Questionnaire (Q.l)
Purpose: Assess student perceptions of VTT quality.
Content: Ratings of video, audio, VTT procedures, local vs. remote team partici- pation; and multiple-choice items regarding student preferences. Completed by: Students (VTT only)
When completed: At conclusion of training Time required: 5 min.
NAVLEAD Student Questionnaire (Q.2)
Purpose: Assess student perceptions of training quality.
Content: Ratings of facilitator, personnel visibility & audibility, written materials, learning activities, training aids, interaction/participation, overall evaluation; and open-ended questions about student likes, dislikes, and suggestions.
Completed by: Students (both traditional and VTT)
When completed: At conclusion of training
Time required: 10 min.
A-l
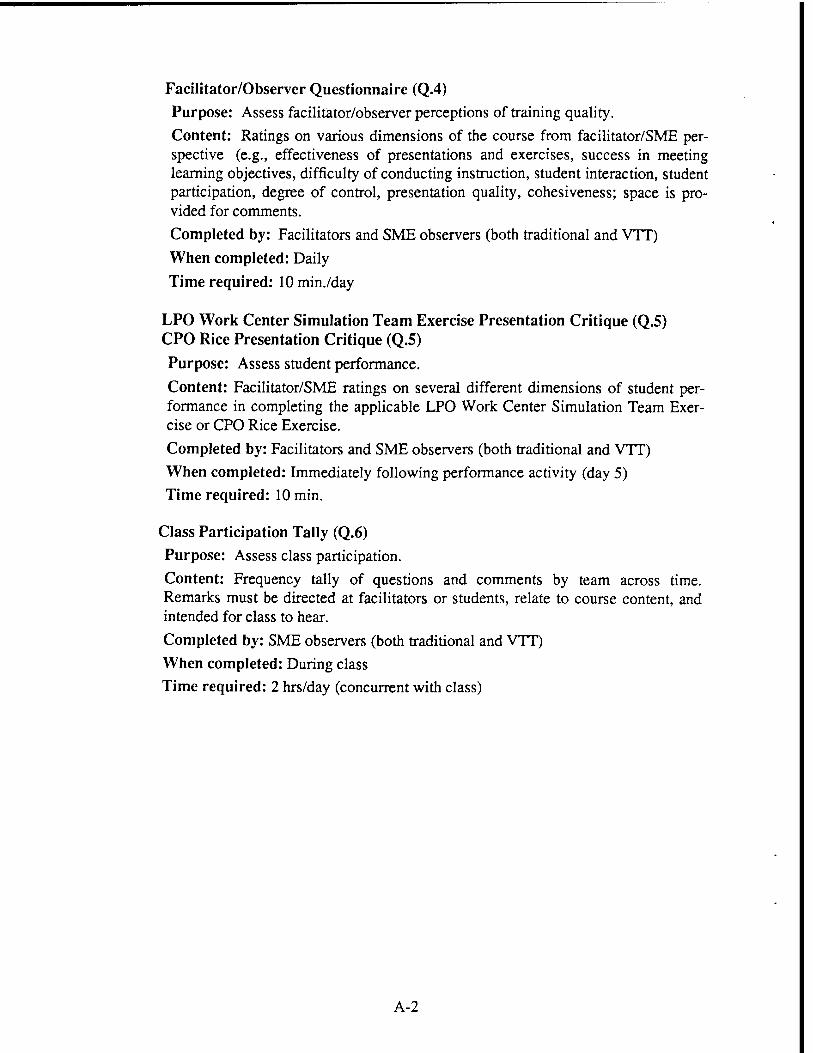
Facilitator/Observer Questionnaire (Q.4)
Purpose: Assess facilitator/observer perceptions of training quality.
Content: Ratings on various dimensions of the course from facilitator/SME per- spective (e.g., effectiveness of presentations and exercises, success in meeting learning objectives, difficulty of conducting instruction, student interaction, student participation, degree of control, presentation quality, cohesiveness; space is pro- vided for comments.
Completed by: Facilitators and SME observers (both traditional and VTT)
When completed: Daily
Time required: 10 min./day
LPO Work Center Simulation Team Exercise Presentation Critique (Q.5) CPO Rice Presentation Critique (Q.5)
Purpose: Assess student performance.
Content: Facilitator/SME ratings on several different dimensions of student per- formance in completing the applicable LPO Work Center Simulation Team Exer- cise or CPO Rice Exercise.
Completed by: Facilitators and SME observers (both traditional and VTT)
When completed: Immediately following performance activity (day 5)
Time required: 10 min.
Class Participation Tally (Q.6)
Purpose: Assess class participation.
Content: Frequency tally of questions and comments by team across time. Remarks must be directed at facilitators or students, relate to course content, and intended for class to hear.
Completed by: SME observers (both traditional and VTT)
When completed: During class
Time required: 2 hrs/day (concurrent with class)
A-2
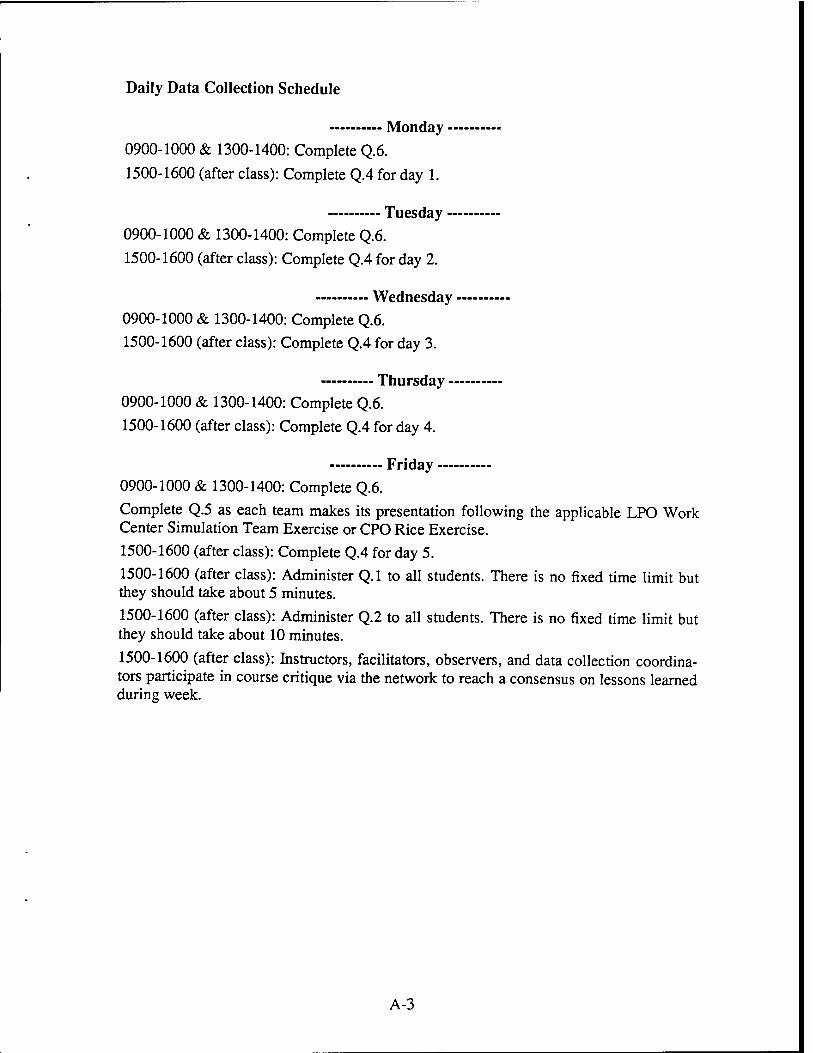
Daily Data Collection Schedule
Monday
0900-1000 & 1300-1400: Complete Q.6.
1500-1600 (after class): Complete Q.4 for day 1.
Tuesday
0900-1000 & 1300-1400: Complete Q.6.
1500-1600 (after class): Complete Q.4 for day 2.
Wednesday
0900-1000 & 1300-1400: Complete Q.6.
1500-1600 (after class): Complete Q.4 for day 3.
Thursday
0900-1000 & 1300-1400: Complete Q.6.
1500-1600 (after class): Complete Q.4 for day 4.
Friday
0900-1000 & 1300-1400: Complete Q.6.
Complete Q.5 as each team makes its presentation following the applicable LPO Work Center Simulation Team Exercise or CPO Rice Exercise.
1500-1600 (after class): Complete Q.4 for day 5.
1500-1600 (after class): Administer Q.l to all students. There is no fixed time limit but they should take about 5 minutes.
1500-1600 (after class): Administer Q.2 to all students. There is no fixed time limit but they should take about 10 minutes.
1500-1600 (after class): Instructors, facilitators, observers, and data collection coordina- tors participate in course critique via the network to reach a consensus on lessons learned during week.
A-3
Appendix B
VTT Student Questionnaire (Q.l)
B-0
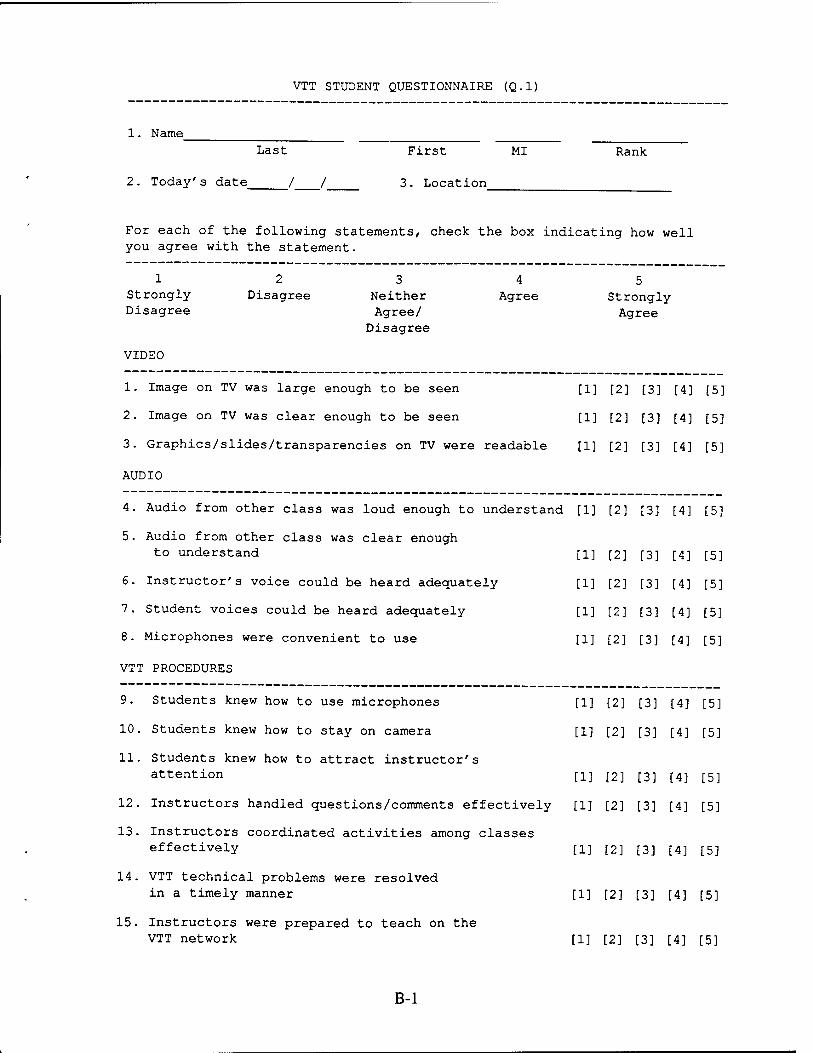
VTT STUDENT QUESTIONNAIRE (Q.l)
1. Name
Last First MI Rank
2. Today's date / / 3. Location
For each of the following statements, check the box indicating how well you agree with the statement.
12 3 4 5 Strongly Disagree Neither Agree Strongly Disagree Agree/ Agree
Disagree
VIDEO
1. Image on TV was large enough to be seen [1] [2] [3] [4] [5]
2. Image on TV was clear enough to be seen [1] [2] [3] [4] [5]
3. Graphics/slides/transparencies on TV were readable [1] [2] [3] [4] [5]
AUDIO
4. Audio from other class was loud enough to understand [1] [2] [3] [4] [5]
5. Audio from other class was clear enough to understand [1] [2] [3] [4] [5]
6. Instructor's voice could be heard adequately [1] [2] [3] [4] [5]
7. Student voices could be heard adequately [1] [2] [3] [4] [5]
8. Microphones were convenient to use [1] [2] [3] [4] [5]
VTT PROCEDURES
9. Students knew how to use microphones [1] [2] [3] [4] [5]
10. Students knew how to stay on camera [1] [2] [3] [4] [5]
11. Students knew how to attract instructor's attention [1] [2] [3] [4] [5]
12. Instructors handled questions/comments effectively [1] [2] [3] [4] [5]
13. Instructors coordinated activities among classes effectively [1] [2] [3] [4] [5]
14. VTT technical problems were resolved in a timely manner [1] [2] [3] [4] [5]
15. Instructors were prepared to teach on the VTT network [1] [2] [3] [4] [5]
B-l
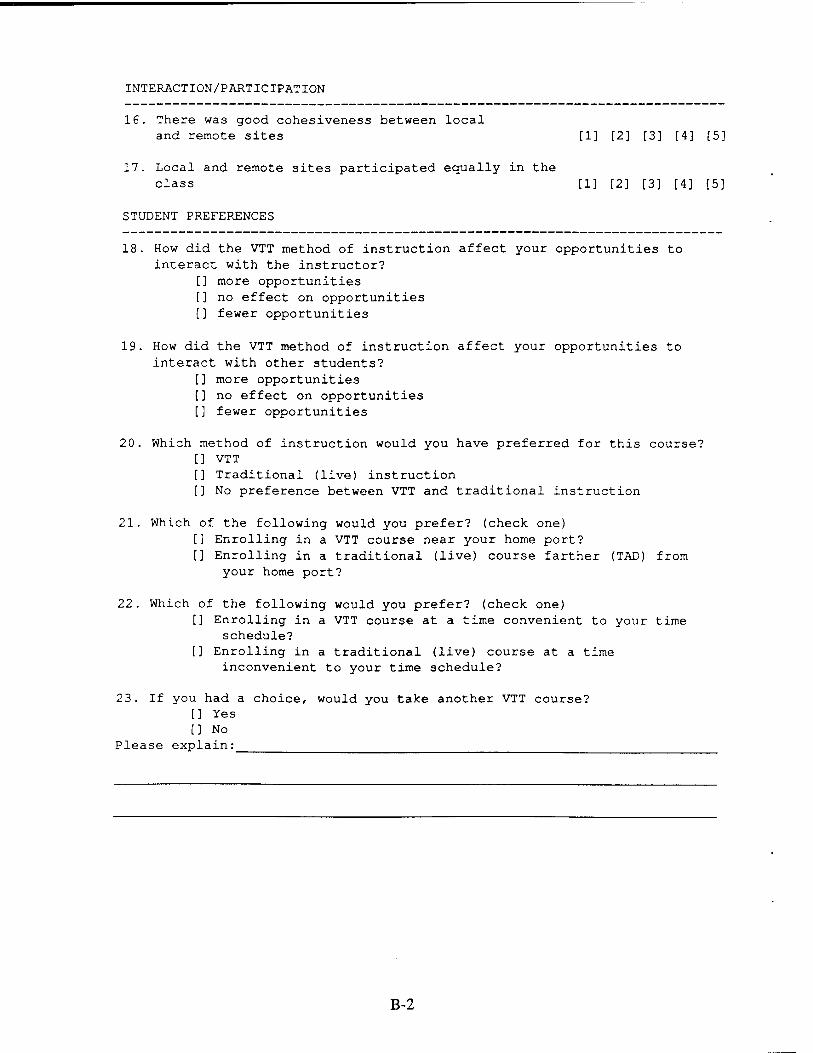
INTERACTION/PARTICIPATION
16. There was good cohesiveness between local and remote sites [1] [2] [3] [4] [5]
17. Local and remote sites participated equally in the class [1] [2] [3] [4] [5]
STUDENT PREFERENCES
18. How did the VTT method of instruction affect your opportunities to interact with the instructor?
[] more opportunities [] no effect on opportunities [] fewer opportunities
19. How did the VTT method of instruction affect your opportunities to interact with other students?
[] more opportunities [] no effect on opportunities [] fewer opportunities
20. Which method of instruction would you have preferred for this course? [] VTT [] Traditional (live) instruction [] No preference between VTT and traditional instruction
21. Which of the following would you prefer? (check one) [] Enrolling in a VTT course near your home port? [] Enrolling in a traditional (live) course farther (TAD) from
your home port?
22. Which of the following would you prefer? (check one) [] Enrolling in a VTT course at a time convenient to your time
schedule? [] Enrolling in a traditional (live) course at a time
inconvenient to your time schedule?
23. If you had a choice, would you take another VTT course? [] Yes [] No
Please explain:
B-2
Appendix C
NAVLEAD Student Questionnaire (Q.2)
c-o
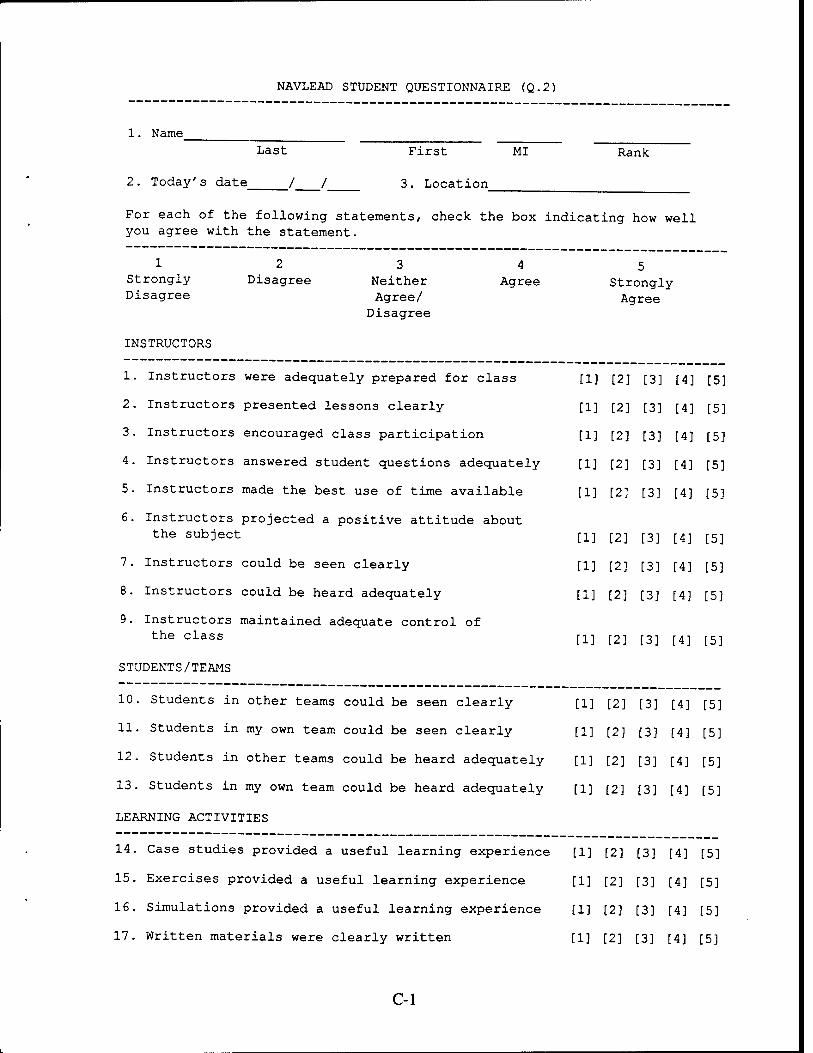
NAVLEAD STUDENT QUESTIONNAIRE (Q.2)
1. Name Last
2. Today's date / /
First
3. Location
MI Rank
For each of the following statements, check the box indicating how well you agree with the statement.
Strongly Disagree
INSTRUCTORS
Disagree Neither Agree/
Disagree
4 Agree Strongly
Agree
1. Instructors were adequately prepared for class
2. Instructors presented lessons clearly
3. Instructors encouraged class participation
4. Instructors answered student questions adequately
5. Instructors made the best use of time available
6. Instructors projected a positive attitude about the subject
7. Instructors could be seen clearly
8. Instructors could be heard adequately
9. Instructors maintained adequate control of the class
STUDENTS/TEAMS
[1] [2] [3] [4] [5]
[1] [2] [3] [4] [5]
[1] [2] [3] [4] [5]
[1] [2] [3] [4] [5]
[1] [2] [3] [4] [5]
[1] [2] [3] [4] [5]
[1] [2] [3] [4] [5]
[1] [2] [3] [4] [5]
[1] [2] [3] [4] [5]
10. Students in other teams could be seen clearly
11. Students in my own team could be seen clearly
12. Students in other teams could be heard adequately
13. Students in my own team could be heard adequately
LEARNING ACTIVITIES
[1] [2] [3] [4] [5]
[1] [2] [3] [4] [5]
[1] [2] [3] [4] [5]
[1] [2] [3] [4] [5]
14. Case studies provided a useful learning experience
15. Exercises provided a useful learning experience
16. Simulations provided a useful learning experience
17. Written materials were clearly written
[1] [2] [3] [4] [5]
[1] [2] [3] [4] [5]
[1] [2] [3] [4] [5]
[1] [2] [3] [4] [5]
C-l
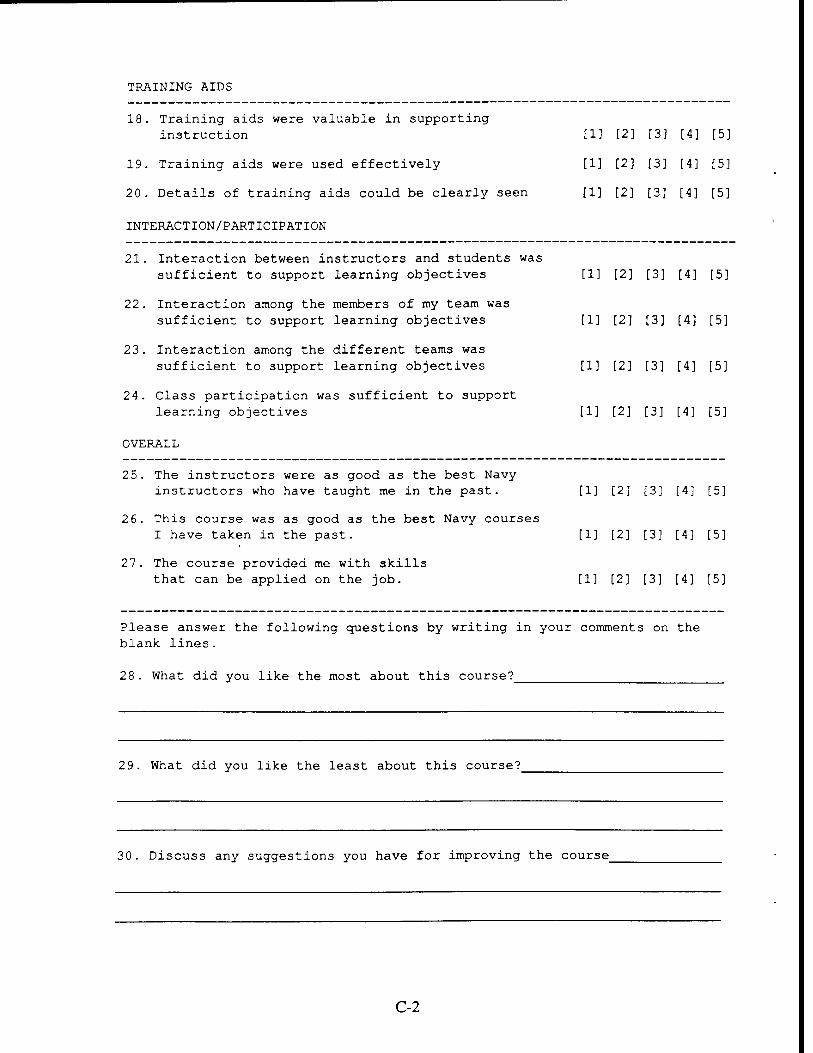
TRAINING AIDS
18. Training aids were valuable in supporting instruction [1] [2] [3] [4] [5]
19. Training aids were used effectively [1] [2] [3] [4] [5]
20. Details of training aids could be clearly seen [1] [2] [3] [4] [5]
INTERACTION/PARTICIPATION
21. Interaction between instructors and students was sufficient to support learning objectives [1] [2] [3] [4] [5]
22. Interaction among the members of my team was sufficient to support learning objectives [1] [2] [3] [4] [5]
23. Interaction among the different teams was sufficient to support learning objectives [1] [2] [3] [4] [5]
24. Class participation was sufficient to support learning objectives [1] [2] [3] [4] [5]
OVERALL
25. The instructors were as good as the best Navy instructors who have taught me in the past. [1] [2] [3] [4] [5]
26. This course was as good as the best Navy courses I have taken in the past. [1] [2] [3] [4] [5]
27. The course provided me with skills that can be applied on the job. [1] [2] [3] [4] [5]
Please answer the following questions by writing in your comments on the blank lines.
28. What did you like the most about this course?
29. What did you like the least about this course?_
30. Discuss any suggestions you have for improving the course_
C-2
Appendix D
Facilitator/Observer Questionnaire (Q.4)
D-0
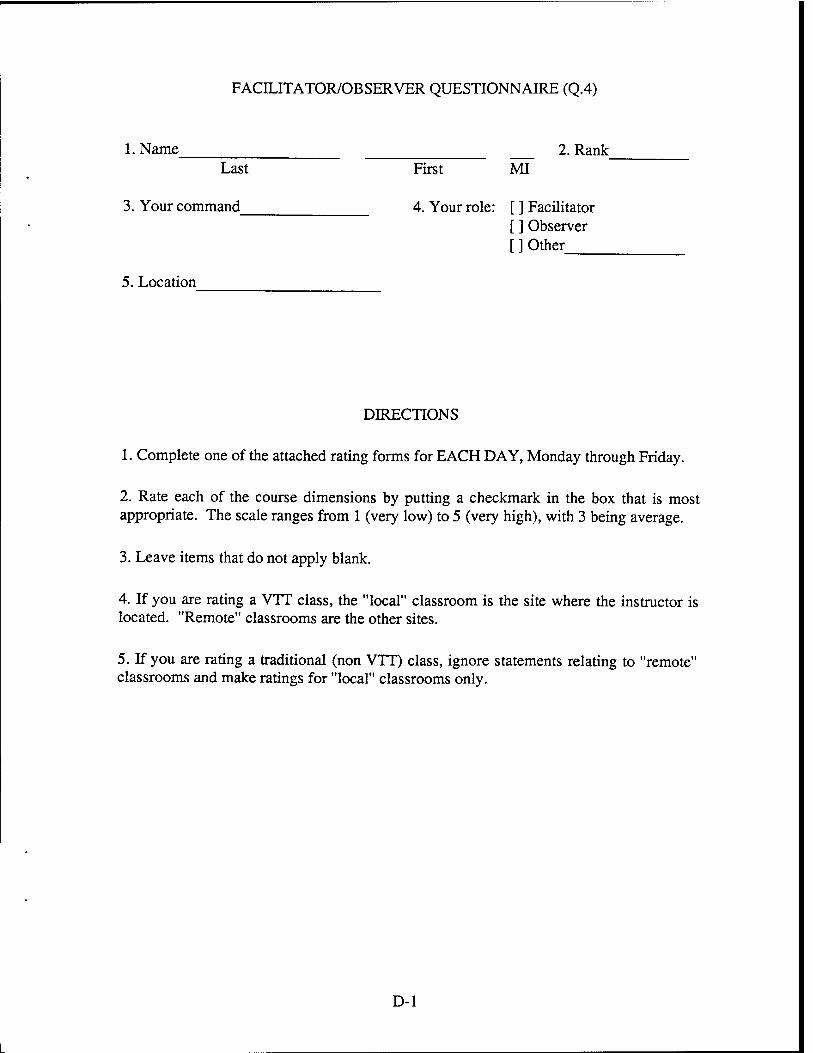
FACILITATOR/OBSERVER QUESTIONNAIRE (Q.4)
1. Name Last
2. Rank First MI
3. Your command 4. Your role: [ ] Facilitator [ ] Observer [ ] Other
5. Location
DIRECTIONS
1. Complete one of the attached rating forms for EACH DAY, Monday through Friday.
2. Rate each of the course dimensions by putting a checkmark in the box that is most appropriate. The scale ranges from 1 (very low) to 5 (very high), with 3 being average.
3. Leave items that do not apply blank.
4. If you are rating a VTT class, the "local" classroom is the site where the instructor is located. "Remote" classrooms are the other sites.
5. If you are rating a traditional (non VTT) class, ignore statements relating to "remote" classrooms and make ratings for "local" classrooms only.
D-l
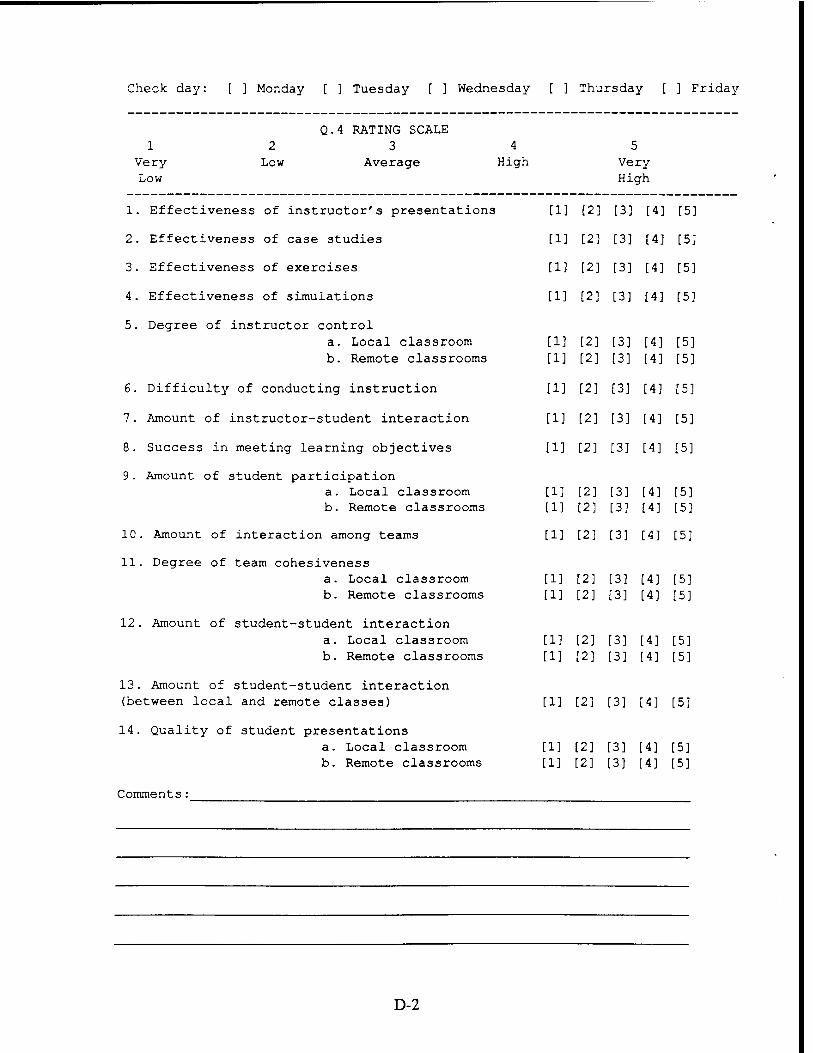
Check day: [ ] Monday [ ] Tuesday [ ] Wednesday [ ] Thursday [ ] Friday
1 Very Low
Q.4 RATING SCALE 2 3 4
Low Average High 5
Very High
1. Effectiveness of instructor's presentations
2. Effectiveness of case studies
3. Effectiveness of exercises
4. Effectiveness of simulations
5. Degree of instructor control a. Local classroom b. Remote classrooms
6. Difficulty of conducting instruction
7. Amount of instructor-student interaction
8. Success in meeting learning objectives
9. Amount of student participation a. Local classroom b. Remote classrooms
10. Amount of interaction among teams
11. Degree of team cohesiveness a. Local classroom b. Remote classrooms
12. Amount of student-student interaction a. Local classroom b. Remote classrooms
13. Amount of student-student interaction (between local and remote classes)
14. Quality of student presentations a. Local classroom b. Remote classrooms
Comments:
[1] [2] [3] [4] [5]
[1] [2] [3] [4] [5]
[1] [2] [3] [4] [5]
[1] [2] [3] [4] [5]
[1] [2] [3] [4] [5] [1] [2] [3] [4] [5]
[1] [2] [3] [4] [5]
[1] [2] [3] [4] [5]
[1] [2] [3] [4] [5]
[1] [2] [3] [4] [5] [1] t2] [3] [4] [5]
[1] [2] [3] [4] [5]
[1] [2] [3] [4] [5] [1] [2] [3] [4] [5]
[1] [2] [3] [4] [5] [1] [2] [3] [4] [5]
[1] [2] [3] [4] [5]
[1] [2] [3] [4] [5] [1] [2] [3] [4] [5]
D-2
Appendix E
LPO Performance Activities (Q.5)
E-0
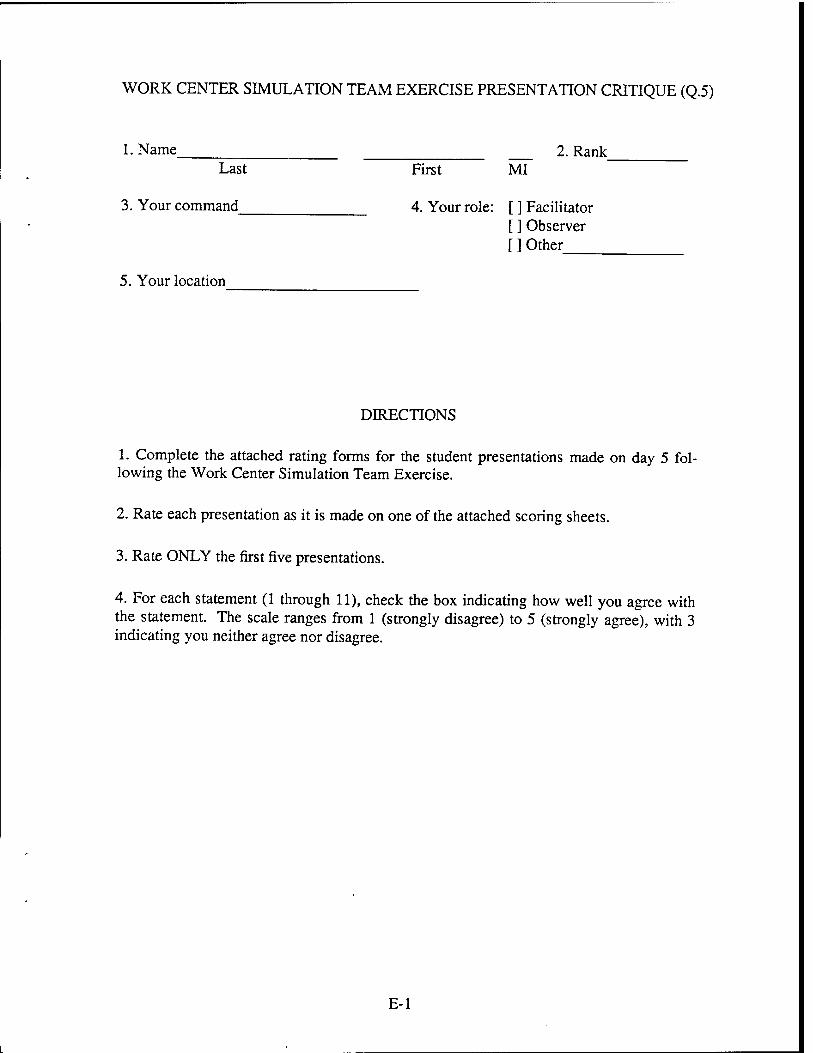
WORK CENTER SIMULATION TEAM EXERCISE PRESENTATION CRITIQUE (Q.5)
1. Name Last
2. Rank First MI
3. Your command 4. Your role: [ ] Facilitator [ ] Observer [ ] Other
5. Your location
DIRECTIONS
1. Complete the attached rating forms for the student presentations made on day 5 fol- lowing the Work Center Simulation Team Exercise.
2. Rate each presentation as it is made on one of the attached scoring sheets.
3. Rate ONLY the first five presentations.
4. For each statement (1 through 11), check the box indicating how well you agree with the statement. The scale ranges from 1 (strongly disagree) to 5 (strongly agree), with 3 indicating you neither agree nor disagree.
E-l
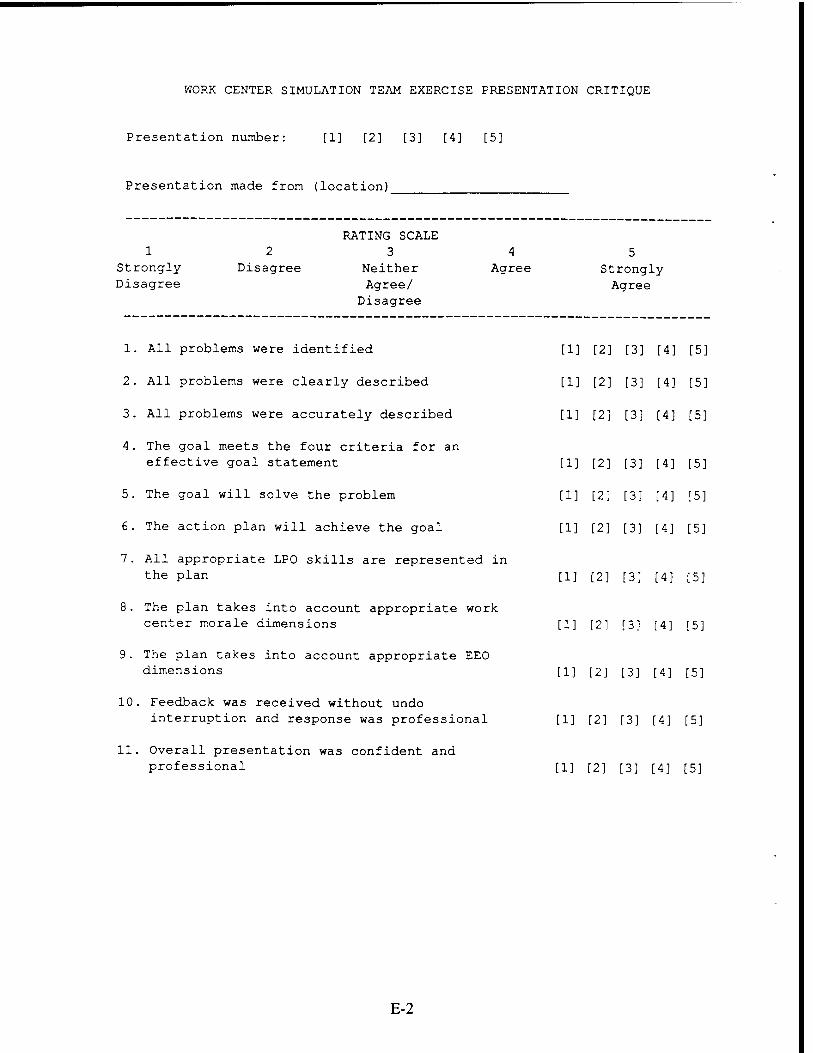
WORK CENTER SIMULATION TEAM EXERCISE PRESENTATION CRITIQUE
Presentation number: [1] [2] [3] [4] [5]
Presentation made from (location)
RATING SCALE 12 3 4 5
Strongly Disagree Neither Agree Strongly Disagree Agree/ Agree
Disagree
1. All problems were identified [1] [2] [3] [4] [5]
2. All problems were clearly described [1] [2] [3] [4] [5]
3. All problems were accurately described [1] [2] [3] [4] [5]
4. The goal meets the four criteria for an effective goal statement [1] [2] [3] [4] [5]
5. The goal will solve the problem [1] [2] [3] [4] [5]
6. The action plan will achieve the goal [1] [2] [3] [4] [5]
7. All appropriate LPO skills are represented in the plan [1] [2] [3] [4] [5]
8. The plan takes into account appropriate work center morale dimensions [1] [2] [3] [4] [5]
9. The plan takes into account appropriate EEO dimensions [1] [2] [3] [4] [5]
10. Feedback was received without undo interruption and response was professional [1] [2] [3] [4] [5]
11. Overall presentation was confident and professional [1] [2] [3] [4] [5]
E-2

Appendix F
CPO Performance Activities (Q.5)
F-0
L
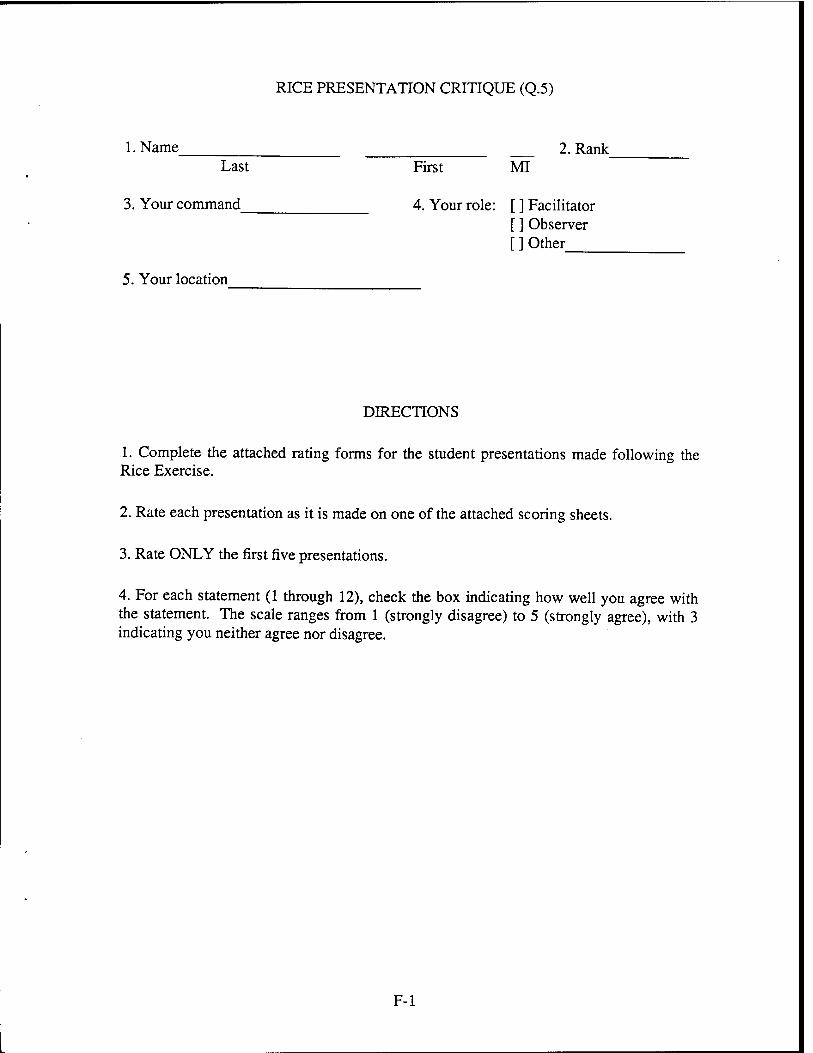
RICE PRESENTATION CRITIQUE (Q.5)
1. Name Last
2. Rank First MI
3. Your command 4. Your role: [ ] Facilitator [ ] Observer [ ] Other
5. Your location
DIRECTIONS
1. Complete the attached rating forms for the student presentations made following the Rice Exercise.
2. Rate each presentation as it is made on one of the attached scoring sheets.
3. Rate ONLY the first five presentations.
4. For each statement (1 through 12), check the box indicating how well you agree with the statement. The scale ranges from 1 (strongly disagree) to 5 (strongly agree), with 3 indicating you neither agree nor disagree.
F-l
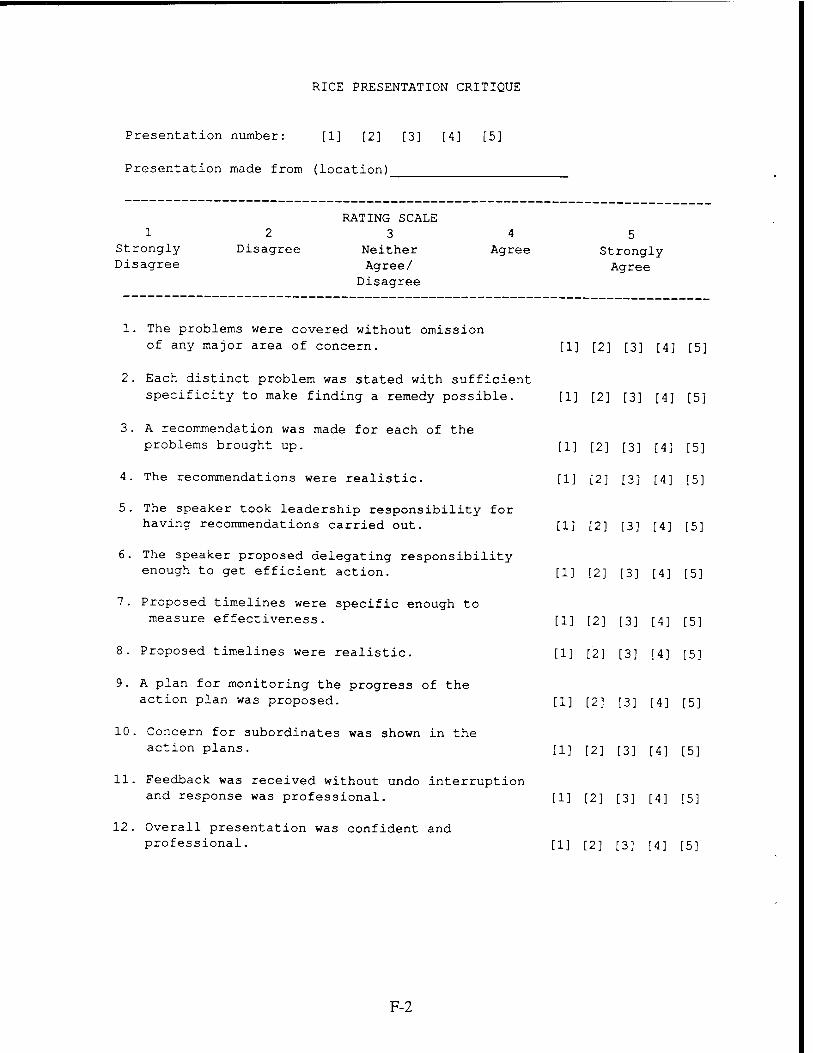
RICE PRESENTATION CRITIQUE
Presentation number: [1] [2] [3] [4] [5]
Presentation made from (location)
Strongly Disagree
Disagree
RATING SCALE 3
Neither Agree/
Disagree
4 Agree Strongly
Agree
1. The problems were covered without omission of any major area of concern.
2. Each distinct problem was stated with sufficient specificity to make finding a remedy possible.
3. A recommendation was made for each of the problems brought up.
4. The recommendations were realistic.
5. The speaker took leadership responsibility for having recommendations carried out.
6. The speaker proposed delegating responsibility enough to get efficient action.
7. Proposed timelines were specific enough to measure effectiveness.
8. Proposed timelines were realistic.
9. A plan for monitoring the progress of the action plan was proposed.
10. Concern for subordinates was shown in the action plans.
11. Feedback was received without undo interruption and response was professional.
12. Overall presentation was confident and professional.
[1] [2] [3] [4] [5]
[1] [2] [3] [4] [5]
[1] [2] [3] [4] [5]
[1] [2] [3] [4] [5]
[1] [2] [3] [4] [5]
[1] [2] [3] [4] [5]
[1] [2] [3] [4] [5]
[1] [2] [3] [4] [5]
[1] [2] [3] [4] [5]
[1] [2] [3] [4] [5]
[1] [2] [3] [4] [5]
[1] [2] [3] [4] [5]
F-2
Appendix G
Class Participation Tally (Q.6)
G-0
L
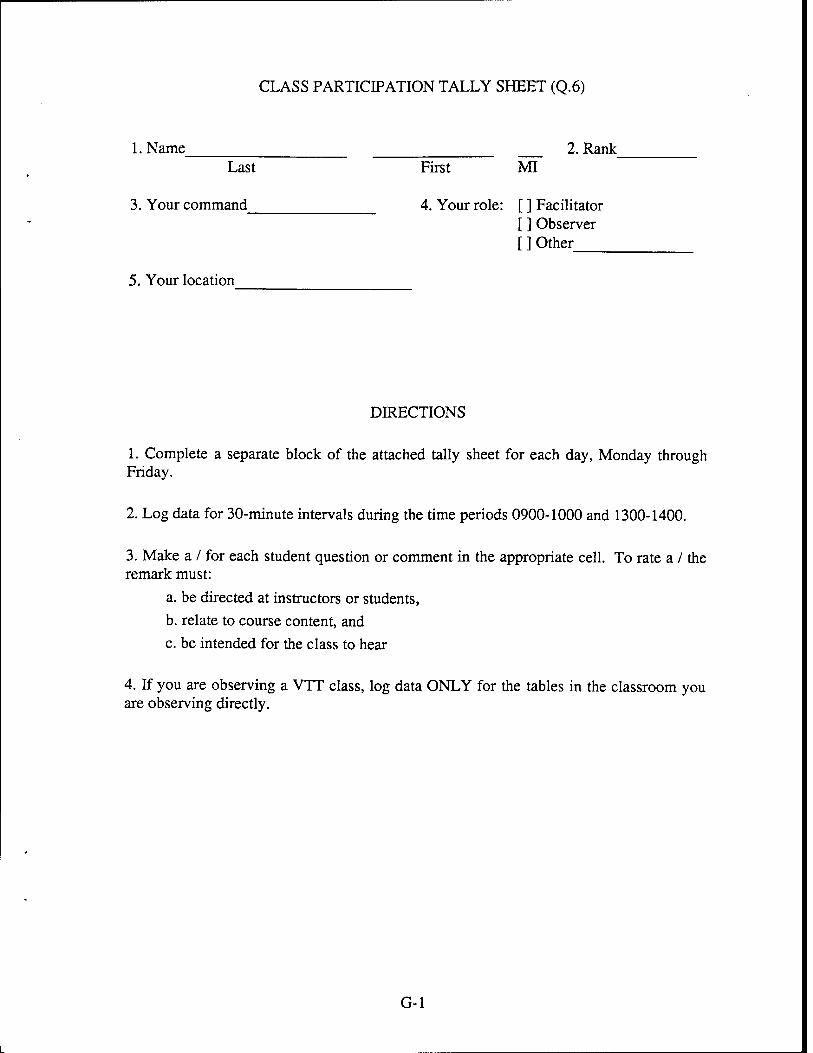
CLASS PARTICIPATION TALLY SHEET (Q.6)
l.Name Last
2. Rank First MI
3. Your command 4. Your role: [ ] Facilitator [ ] Observer [ ] Other
5. Your location
DIRECTIONS
1. Complete a separate block of the attached tally sheet for each day, Monday through Friday.
2. Log data for 30-minute intervals during the time periods 0900-1000 and 1300-1400.
3. Make a / for each student question or comment in the appropriate cell. To rate a / the remark must:
a. be directed at instructors or students,
b. relate to course content, and
c. be intended for the class to hear
4. If you are observing a VTT class, log data ONLY for the tables in the classroom you are observing directly.
G-l
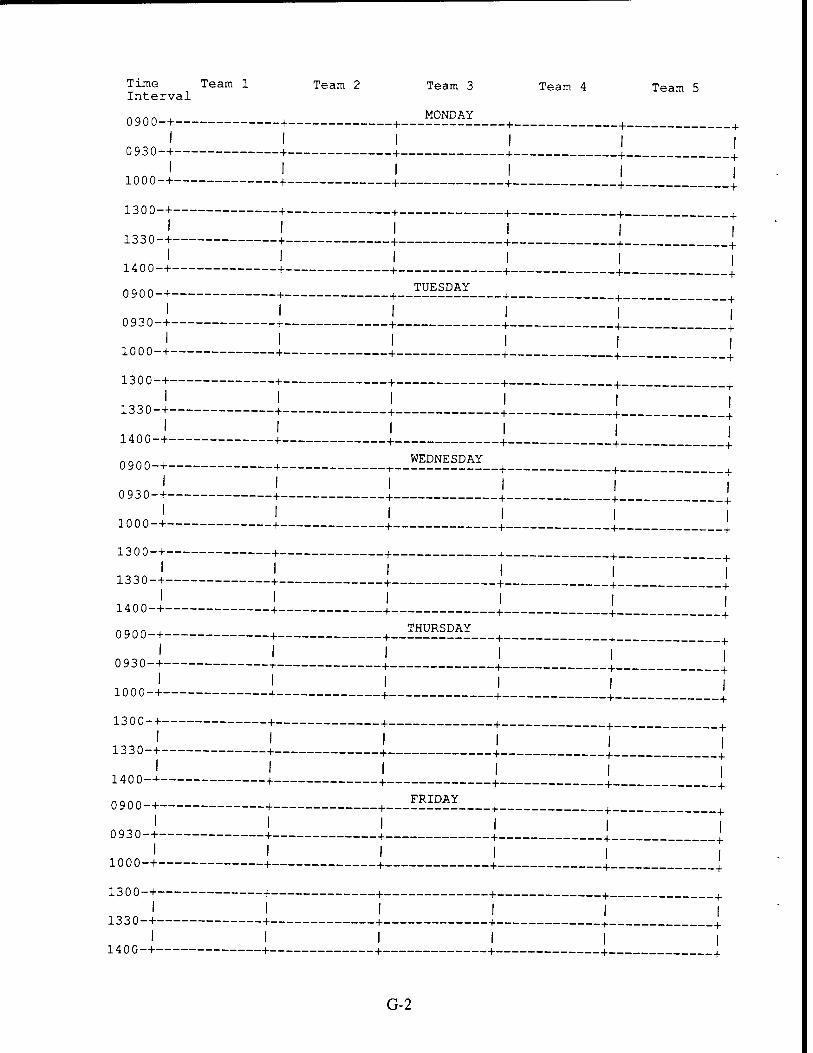
Time Team 1 Team 2 Team 3 Team 4 Team 5 Interval
0900-+ + +__J?™5£ + + I l l l l l
0 93 0-+ + + + + | 1 I I I I |
1300-+ + + + +
I I I I I | 1330-+ + + + + I
140 0-+ + +. .+ + +
o9oo-+ + +-_™?5™L___+ +__ l l l I I I
0 930-+ + + + + { 1 I I I I I 1000-+ + + + + I
1300-+ + + + + 1 I I I I I
1330-+ + + + + { 1 I I I I I
o9oo-+ + +_.ÜE^!5^__+ + 1 I I I I l
0 930-+ + + + + | 1 I I I I |
1300-+ + + + + 1 I I I I I
1400-+ + +. .+ + +
THURSDAY 0 900-+ + + + + 1 I I I I |
1 I I I I I
1300-+ + + + + +
1 I I I I |
I I I I I i 1400-+ +
0 90 0-+ + + + +.
.+ + + +
FRIDAY
1 I I I I I 1000-+ + + + + l
13 00-+ + + + + +
I I I I I I 1330-+ + + + + I
140 0-+ + +- .+ +
G-2

Appendix H
Additional Data Summary Tables
H-0
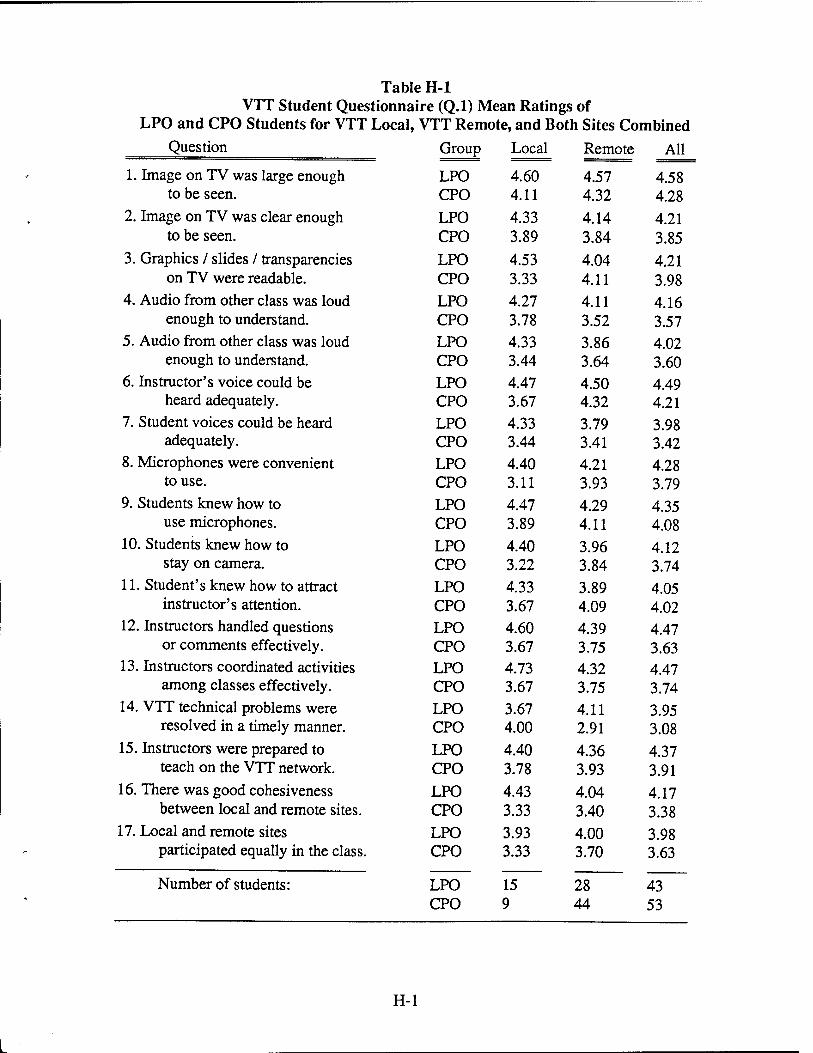
Table H-l VTT Student Questionnaire (Q.l) Mean Ratings of
LPO and CPO Students for VTT Local, VTT Remote, and Both Sites Combined Question Group
LPO
Local
4.60
Remote
4.57
All
1. Image on TV was large enough 4.58 to be seen. CPO 4.11 4.32 4.28
2. Image on TV was clear enough LPO 4.33 4.14 4.21 to be seen. CPO 3.89 3.84 3.85
3. Graphics / slides / transparencies LPO 4.53 4.04 4.21 on TV were readable. CPO 3.33 4.11 3.98
4. Audio from other class was loud LPO 4.27 4.11 4.16 enough to understand. CPO 3.78 3.52 3.57
5. Audio from other class was loud LPO 4.33 3.86 4.02 enough to understand. CPO 3.44 3.64 3.60
6. Instructor's voice could be LPO 4.47 4.50 4.49 heard adequately. CPO 3.67 4.32 4.21
7. Student voices could be heard LPO 4.33 3.79 3.98 adequately. CPO 3.44 3.41 3.42
8. Microphones were convenient LPO 4.40 4.21 4.28 to use. CPO 3.11 3.93 3.79
9. Students knew how to LPO 4.47 4.29 4.35 use microphones. CPO 3.89 4.11 4.08
10. Students knew how to LPO 4.40 3.96 4.12 stay on camera. CPO 3.22 3.84 3.74
11. Student's knew how to attract LPO 4.33 3.89 4.05 instructor's attention. CPO 3.67 4.09 4.02
12. Instructors handled questions LPO 4.60 4.39 4.47 or comments effectively. CPO 3.67 3.75 3.63
13. Instructors coordinated activities LPO 4.73 4.32 4.47 among classes effectively. CPO 3.67 3.75 3.74
14. VTT technical problems were LPO 3.67 4.11 3.95 resolved in a timely manner. CPO 4.00 2.91 3.08
15. Instructors were prepared to LPO 4.40 4.36 4.37 teach on the VTT network. CPO 3.78 3.93 3.91
16. There was good cohesiveness LPO 4.43 4.04 4.17 between local and remote sites. CPO 3.33 3.40 3.38
17. Local and remote sites LPO 3.93 4.00 3.98 participated equally in the class. CPO 3.33 3.70 3.63
Number of students: LPO 15 28 43 CPO 9 44 53
H-l
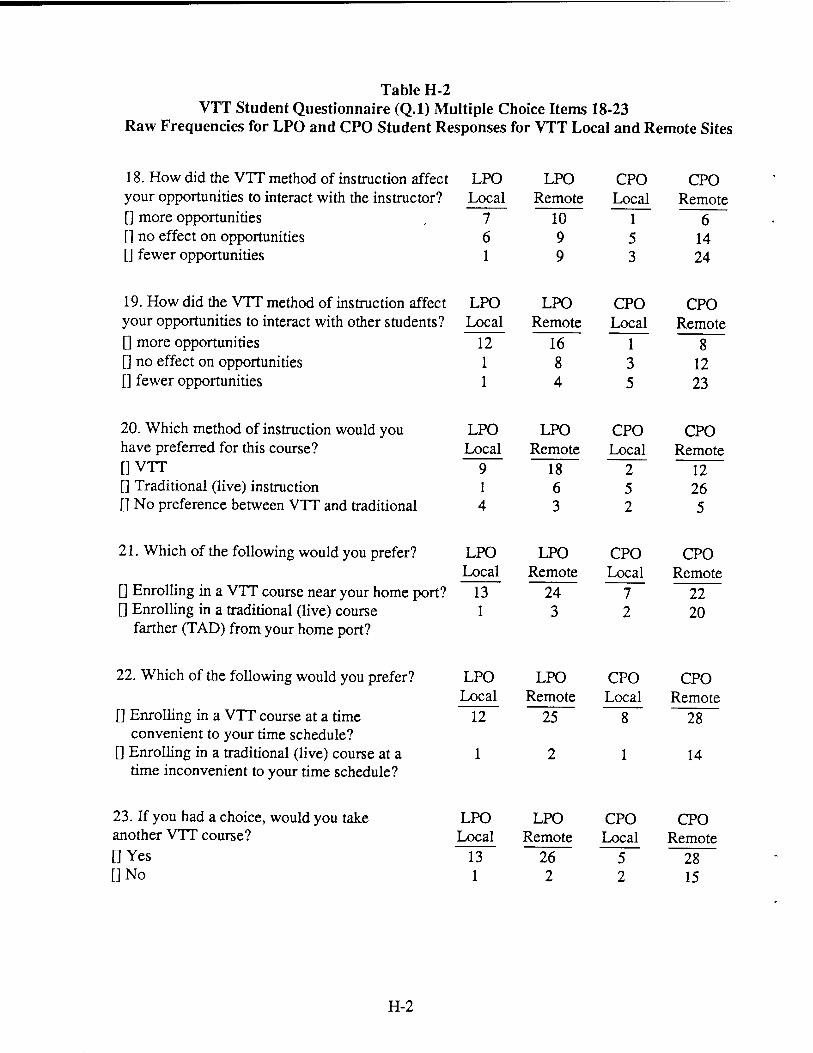
Table H-2 VTT Student Questionnaire (Q.l) Multiple Choice Items 18-23
Raw Frequencies for LPO and CPO Student Responses for VTT Local and Remote Sites
18. How did the VTT method of instruction affect your opportunities to interact with the instructor? [] more opportunities [] no effect on opportunities [] fewer opportunities
19. How did the VTT method of instruction affect your opportunities to interact with other students? [] more opportunities [] no effect on opportunities [] fewer opportunities
20. Which method of instruction would you have preferred for this course? [] VTT [] Traditional (live) instruction [] No preference between VTT and traditional
21. Which of the following would you prefer?
[] Enrolling in a VTT course near your home port? [] Enrolling in a traditional (live) course
farther (TAD) from your home port?
22. Which of the following would you prefer?
[] Enrolling in a VTT course at a time convenient to your time schedule?
[] Enrolling in a traditional (live) course at a time inconvenient to your time schedule?
LPO LPO CPO CPO Local Remote Local Remote
7 10 1 6 6 9 5 14 1 9 3 24
LPO LPO CPO CPO Local Remote Local Remote
12 16 1 8 1 8 3 12 1 4 5 23
LPO LPO CPO CPO Local Remote Local Remote
9 18 2 12 1 6 5 26 4 3 2 5
LPO LPO CPO CPO Local Remote Local Remote
13 24 7 22 1 3 2 20
LPO LPO CPO CPO Local Remote Local Remote
12 25 28
14
23. If you had a choice, would you take another VTT course? [] Yes □ No
LPO Local
13 1
LPO Remote
26 2
CPO Local
5 2
CPO Remote
28 15
H-2
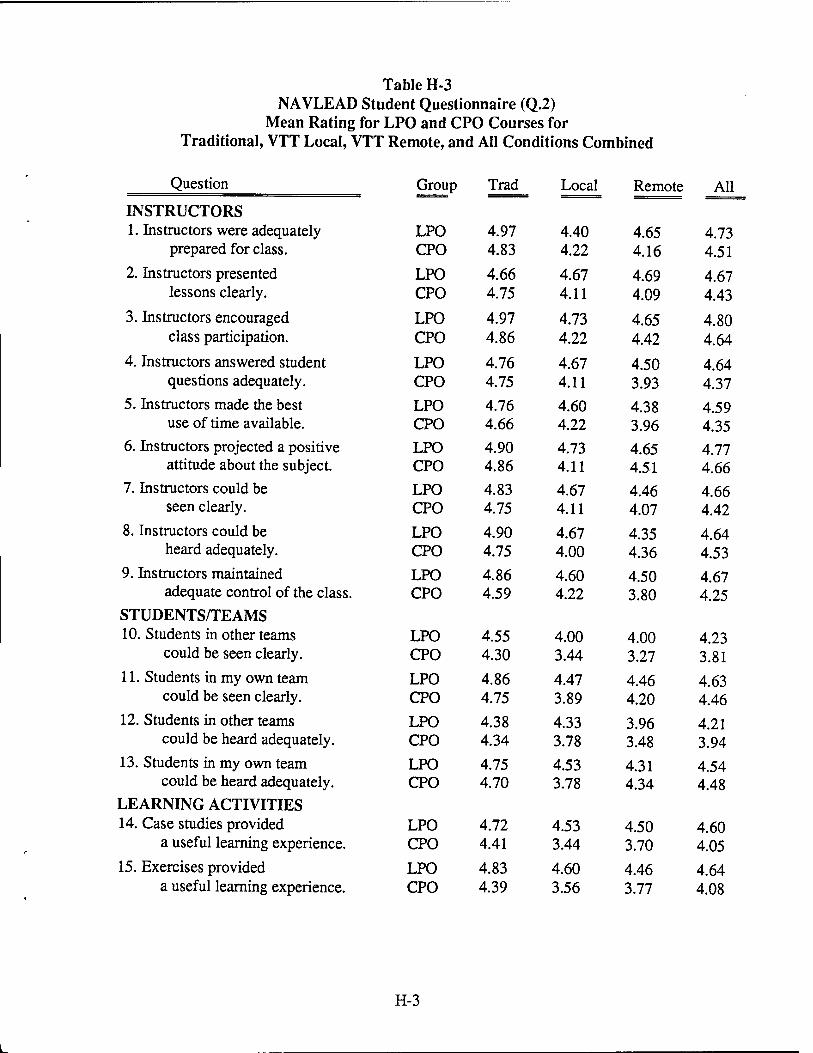
Table H-3 NAVLEAD Student Questionnaire (Q.2)
Mean Rating for LPO and CPO Courses for Traditional, VTT Local, VTT Remote, and AH Conditions Combined
Question
INSTRUCTORS 1. Instructors were adequately
prepared for class.
2. Instructors presented lessons clearly.
3. Instructors encouraged class participation.
4. Instructors answered student questions adequately.
5. Instructors made the best use of time available.
6. Instructors projected a positive attitude about the subject.
7. Instructors could be seen clearly.
8. Instructors could be heard adequately.
9. Instructors maintained adequate control of the class.
STUDENTS/TEAMS 10. Students in other teams
could be seen clearly.
11. Students in my own team could be seen clearly.
12. Students in other teams could be heard adequately.
13. Students in my own team could be heard adequately.
LEARNING ACTIVITIES 14. Case studies provided
a useful learning experience.
15. Exercises provided a useful learning experience.
Group Trad Local Remote All
LPO 4.97 4.40 4.65 4.73 CPO 4.83 4.22 4.16 4.51
LPO 4.66 4.67 4.69 4.67 CPO 4.75 4.11 4.09 4.43
LPO 4.97 4.73 4.65 4.80 CPO 4.86 4.22 4.42 4.64
LPO 4.76 4.67 4.50 4.64 CPO 4.75 4.11 3.93 4.37
LPO 4.76 4.60 4.38 4.59 CPO 4.66 4.22 3.96 4.35
LPO 4.90 4.73 4.65 4.77 CPO 4.86 4.11 4.51 4.66
LPO 4.83 4.67 4.46 4.66 CPO 4.75 4.11 4.07 4.42
LPO 4.90 4.67 4.35 4.64 CPO 4.75 4.00 4.36 4.53
LPO 4.86 4.60 4.50 4.67 CPO 4.59 4.22 3.80 4.25
LPO 4.55 4.00 4.00 4.23 CPO 4.30 3.44 3.27 3.81
LPO 4.86 4.47 4.46 4.63 CPO 4.75 3.89 4.20 4.46
LPO 4.38 4.33 3.96 4.21 CPO 4.34 3.78 3.48 3.94
LPO 4.75 4.53 4.31 4.54 CPO 4.70 3.78 4.34 4.48
LPO 4.72 4.53 4.50 4.60 CPO 4.41 3.44 3.70 4.05
LPO 4.83 4.60 4.46 4.64 CPO 4.39 3.56 3.77 4.08
H-3
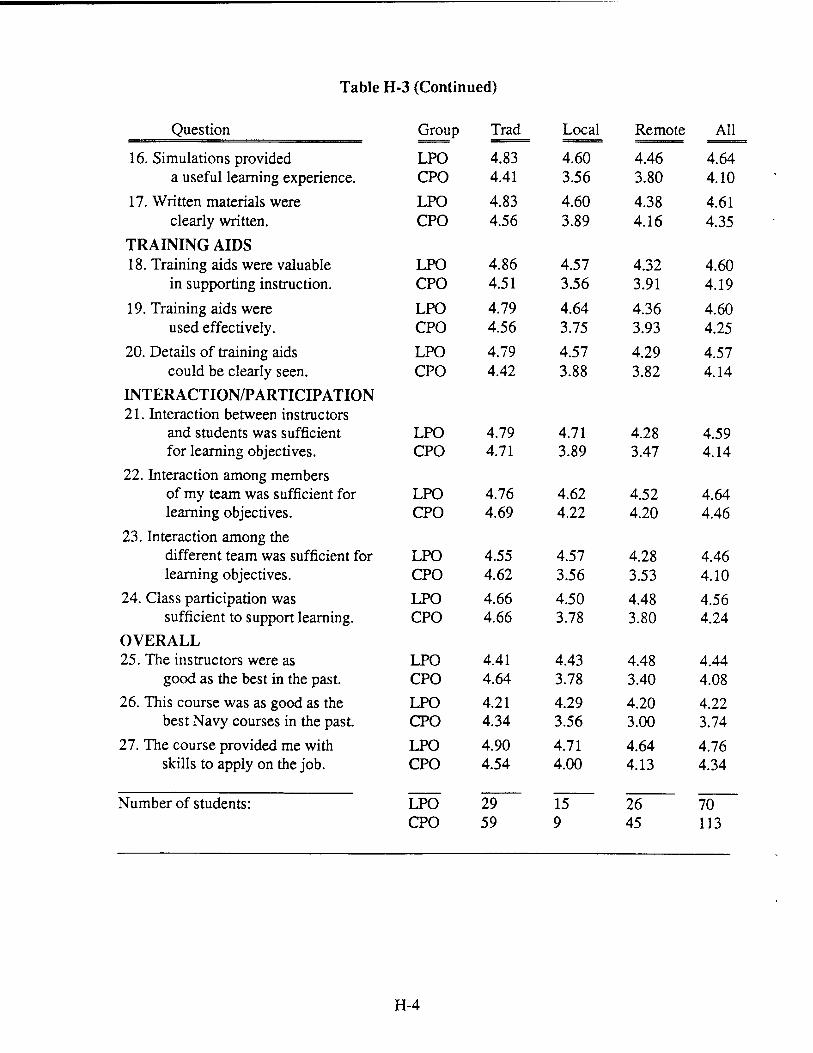
Table H-3 (Continued)
Question Group Trad Local Remote All
16. Simulations provided LPO 4.83 4.60 4.46 4.64 a useful learning experience. CPO 4.41 3.56 3.80 4.10
17. Written materials were LPO 4.83 4.60 4.38 4.61 clearly written. CPO 4.56 3.89 4.16 4.35
TRAINING AIDS 18. Training aids were valuable LPO 4.86 4.57 4.32 4.60
in supporting instruction. CPO 4.51 3.56 3.91 4.19
19. Training aids were LPO 4.79 4.64 4.36 4.60 used effectively. CPO 4.56 3.75 3.93 4.25
20. Details of training aids LPO 4.79 4.57 4.29 4.57 could be clearly seen. CPO 4.42 3.88 3.82 4.14
INTERACTION/PARTICIPATION 21. Interaction between instructors
and students was sufficient LPO 4.79 4.71 4.28 4.59 for learning objectives. CPO 4.71 3.89 3.47 4.14
22. Interaction among members of my team was sufficient for LPO 4.76 4.62 4.52 4.64 learning objectives. CPO 4.69 4.22 4.20 4.46
23. Interaction among the different team was sufficient for LPO 4.55 4.57 4.28 4.46 learning objectives. CPO 4.62 3.56 3.53 4.10
24. Class participation was LPO 4.66 4.50 4.48 4.56 sufficient to support learning. CPO 4.66 3.78 3.80 4.24
OVERALL 25. The instructors were as LPO 4.41 4.43 4.48 4.44
good as the best in the past. CPO 4.64 3.78 3.40 4.08
26. This course was as good as the LPO 4.21 4.29 4.20 4.22 best Navy courses in the past. CPO 4.34 3.56 3.00 3.74
27. The course provided me with LPO 4.90 4.71 4.64 4.76 skills to apply on the job. CPO
LPO
4.54 4.00 4.13 4.34
Number of students: 29 15 26 70 CPO 59 9 45 113
H-4
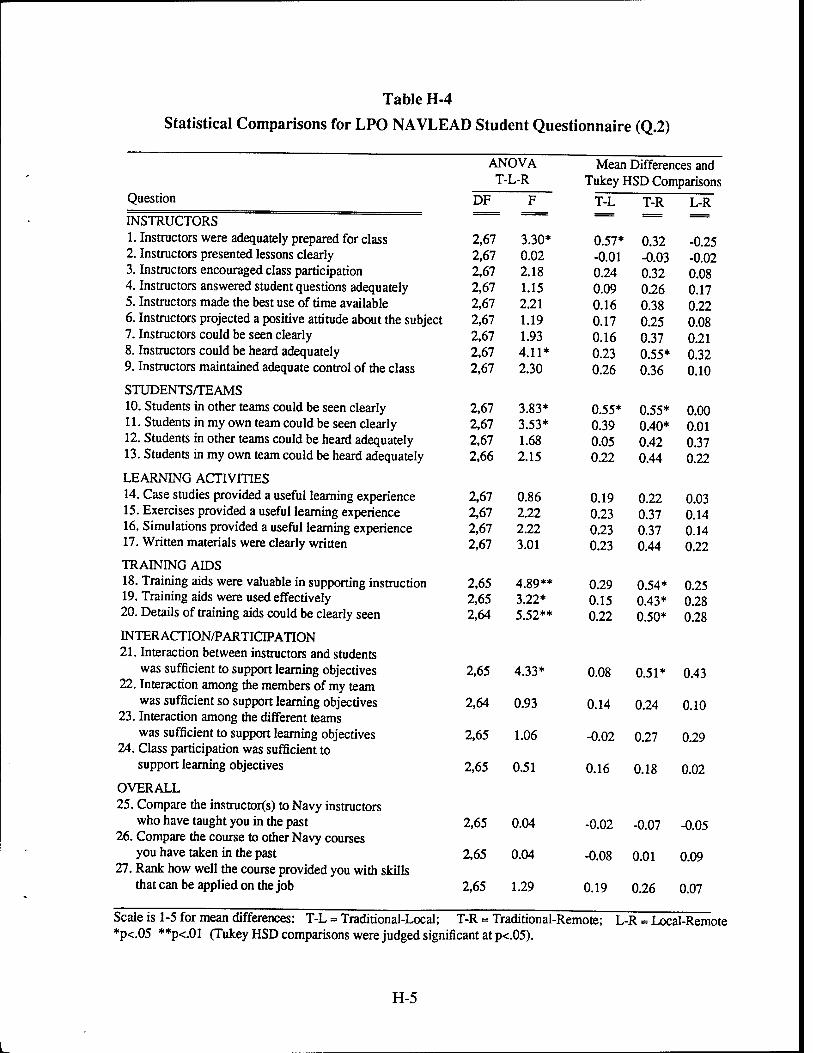
Table H-4
Statistical Comparisons for LPO NAVLEAD Student Questionnaire (Q.2)
ANOVA T-L-R
Question
INSTRUCTORS 1. Instructors were adequately prepared for class 2. Instructors presented lessons clearly 3. Instructors encouraged class participation 4. Instructors answered student questions adequately 5. Instructors made the best use of time available 6. Instructors projected a positive attitude about the subject 7. Instructors could be seen clearly 8. Instructors could be heard adequately 9. Instructors maintained adequate control of the class
STUDENTS/TEAMS 10. Students in other teams could be seen clearly 11. Students in my own team could be seen clearly 12. Students in other teams could be heard adequately 13. Students in my own team could be heard adequately
LEARNING ACTIVITIES 14. Case studies provided a useful learning experience 15. Exercises provided a useful learning experience 16. Simulations provided a useful learning experience 17. Written materials were clearly written
TRAINING AIDS 18. Training aids were valuable in supporting instruction 19. Training aids were used effectively 20. Details of training aids could be clearly seen
INTERACTION/PARTICIPATION 21. Interaction between instructors and students
was sufficient to support learning objectives 22. Interaction among the members of my team
was sufficient so support learning objectives 23. Interaction among the different teams
was sufficient to support learning objectives 24. Class participation was sufficient to
support learning objectives
OVERALL 25. Compare the instructor(s) to Navy instructors
who have taught you in the past 26. Compare the course to other Navy courses
you have taken in the past 27. Rank how well the course provided you with skills
that can be applied on the job
DF
2,67 2,67 2,67 2,67 2,67 2,67 2,67 2,67 2,67
2,67 2,67 2,67 2,66
2,67 2,67 2,67 2,67
2,65 2,65 2,64
3.30* 0.02 2.18 1.15 2.21 1.19 1.93 4.11* 2.30
3.83* 3.53* 1.68 2.15
0.86 2.22 2.22 3.01
4.89** 3.22* 5.52**
2,65 4.33*
2.64 0.93
2.65 1.06
2,65 0.51
2,65 0.04
2,65 0.04
2,65 1.29
0.32 -0.25 -0.03 -0.02 0.32 0.08 0.26 0.17 0.38 0.22 0.25 0.08 0.37 0.21 0.55* 0.32 0.36 0.10
Mean Differences and Tukey HSD Comparisons
fZ f^ UR
0.57* -0.01 0.24 0.09 0.16 0.17 0.16 0.23 0.26
0.55* 0.55* 0.00 0.39 0.40* 0.01 0.05 0.42 0.37 0.22 0.44 0.22
0.19 0.23 0.23 0.23
0.29 0.15 0.22
0.08 0.51* 0.43
0.14 0.24 0.10
-0.02 0.27 0.29
0.16 0.18 0.02
-0.02 -0.07 -0.05
-0.08 0.01 0.09
0.19 0.26 0.07
0.22 0.03 0.37 0.14 0.37 0.14 0.44 0.22
0.54* 0.25 0.43* 0.28 0.50* 0.28
Scale is 1-5 for mean differences: T-L = Traditional-Local; T-R = Traditional-Remote; L-R = Local-Remote *p<.05 **p<.01 (Tukey HSD comparisons were judged significant at p<.05).
H-5
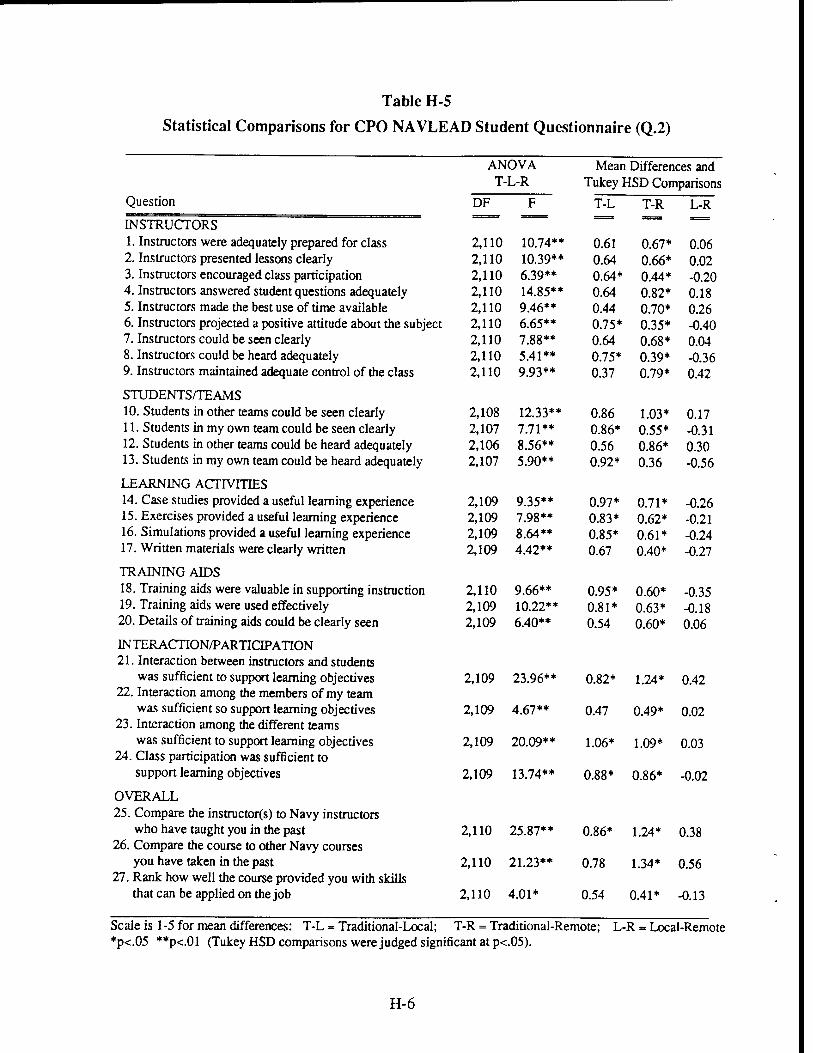
Table H-5
Statistical Comparisons for CPO NAVLEAD Student Questionnaire (Q.2)
ANOVA T-L-R
Mean Differences and Tukey HSD Comparisons
Question
INSTRUCTORS 1. Instructors were adequately prepared for class 2. Instructors presented lessons clearly 3. Instructors encouraged class participation 4. Instructors answered student questions adequately 5. Instructors made the best use of time available 6. Instructors projected a positive attitude about the subject 7. Instructors could be seen clearly 8. Instructors could be heard adequately 9. Instructors maintained adequate control of the class
STUDENTS/TEAMS 10. Students in other teams could be seen clearly 11. Students in my own team could be seen clearly 12. Students in other teams could be heard adequately 13. Students in my own team could be heard adequately
LEARNING ACTIVITIES 14. Case studies provided a useful learning experience 15. Exercises provided a useful learning experience 16. Simulations provided a useful learning experience 17. Written materials were clearly written
TRAINING AIDS 18. Training aids were valuable in supporting instruction 19. Training aids were used effectively 20. Details of training aids could be clearly seen
INTERACTION/PARTICIPATION 21. Interaction between instructors and students
was sufficient to support learning objectives 22. Interaction among the members of my team
was sufficient so support learning objectives 23. Interaction among the different teams
was sufficient to support learning objectives 24. Class participation was sufficient to
support learning objectives
OVERALL 25. Compare the instructor(s) to Navy instructors
who have taught you in the past 26. Compare the course to other Navy courses
you have taken in the past 27. Rank how well the course provided you with skills
that can be applied on the job
DF T-L T-R L-R
2,110 10.74** 0.61 0.67* 0.06 2,110 10.39** 0.64 0.66* 0.02 2,110 6.39** 0.64* 0.44* -0.20 2,110 14.85** 0.64 0.82* 0.18 2,110 9.46** 0.44 0.70* 0.26 2,110 6.65** 0.75* 0.35* -0.40 2,110 7.88** 0.64 0.68* 0.04 2,110 5.41** 0.75* 0.39* -0.36 2,110 9.93** 0.37 0.79* 0.42
2,108 12.33** 0.86 1.03* 0.17 2,107 7.71** 0.86* 0.55* -0.31 2,106 8.56** 0.56 0.86* 0.30 2,107 5.90** 0.92* 0.36 -0.56
2,109 9.35** 0.97* 0.71* -0.26 2,109 7.98** 0.83* 0.62* -0.21 2,109 8.64** 0.85* 0.61* -0.24 2,109 4.42** 0.67 0.40* -0.27
2,110 9.66** 0.95* 0.60* -0.35 2,109 10.22** 0.81* 0.63* -0.18 2,109 6.40** 0.54 0.60* 0.06
2,109 23.96** 0.82* 1.24* 0.42
2,109 4.67** 0.47 0.49* 0.02
2,109 20.09** 1.06* 1.09* 0.03
2,109 13.74** 0.88* 0.86* -0.02
2,110 25.87** 0.86* 1.24* 0.38
2,110 21.23** 0.78 1.34* 0.56
2,110 4.01* 0.54 0.41* -0.13
Scale is 1-5 for mean differences: T-L - Traditional-Local; T-R - Traditional-Remote; *p<.05 **p<.01 (Tukey HSD comparisons were judged significant at p<.05).
L-R - Local-Remote
H-6
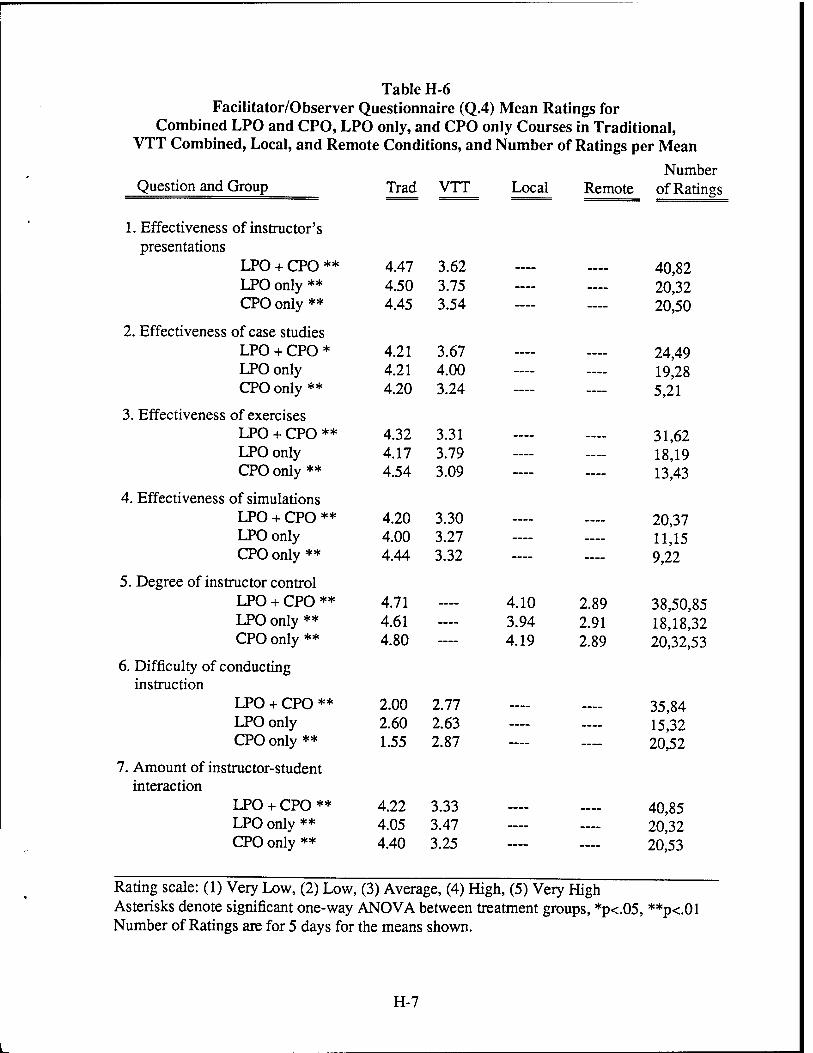
Table H-6 Facilitator/Observer Questionnaire (Q.4) Mean Ratings for
Combined LPO and CPO, LPO only, and CPO only Courses in Traditional, VTT Combined, Local, and Remote Conditions, and Number of Ratings per Mean
Number Question and Group Trad VTT Local Remote of Ratings
1. Effectiveness of instructor's presentations
LPO + CPO ** 4.47 LPO only ** 4.50 CPO only ** 4.45
2. Effectiveness of case studies LPO + CPO* 4.21 LPO only 4.21 CPO only ** 4.20
3. Effectiveness of exercises LPO + CPO ** 4.32 LPO only 4.17 CPO only ** 4.54
4. Effectiveness of simulations LPO + CPO ** 4.20 LPO only 4.00 CPO only ** 4.44
5. Degree of instructor control LPO + CPO** 4.71 LPO only ** 4.61 CPO only ** 4.80
6. Difficulty of conducting instruction
LPO + CPO ** 2.00 LPO only 2.60 CPO only** 1.55
7. Amount of instructor-student interaction
LPO + CPO ** 4.22 LPO only ** 4.05 CPO only ** 4.40
3.62 3.75 3.54
3.67 4.00 3.24
3.31 3.79 3.09
3.30 3.27 3.32
2.77 2.63 2.87
3.33 3.47 3.25
4.10 3.94 4.19
— 40,82 — 20,32
20,50
24,49 — 19,28 5,21
31,62 — 18,19 13,43
20,37 — 11,15 9,22
2.89 38,50,85 2.91 18,18,32 2.89 20,32,53
35,84 — 15,32 _ 20,52
40,85 — 20,32
20,53
Rating scale: (1) Very Low, (2) Low, (3) Average, (4) High, (5) Very High Asterisks denote significant one-way ANOVA between treatment groups, *p<.05, **p<.01 Number of Ratings are for 5 days for the means shown.
H-7
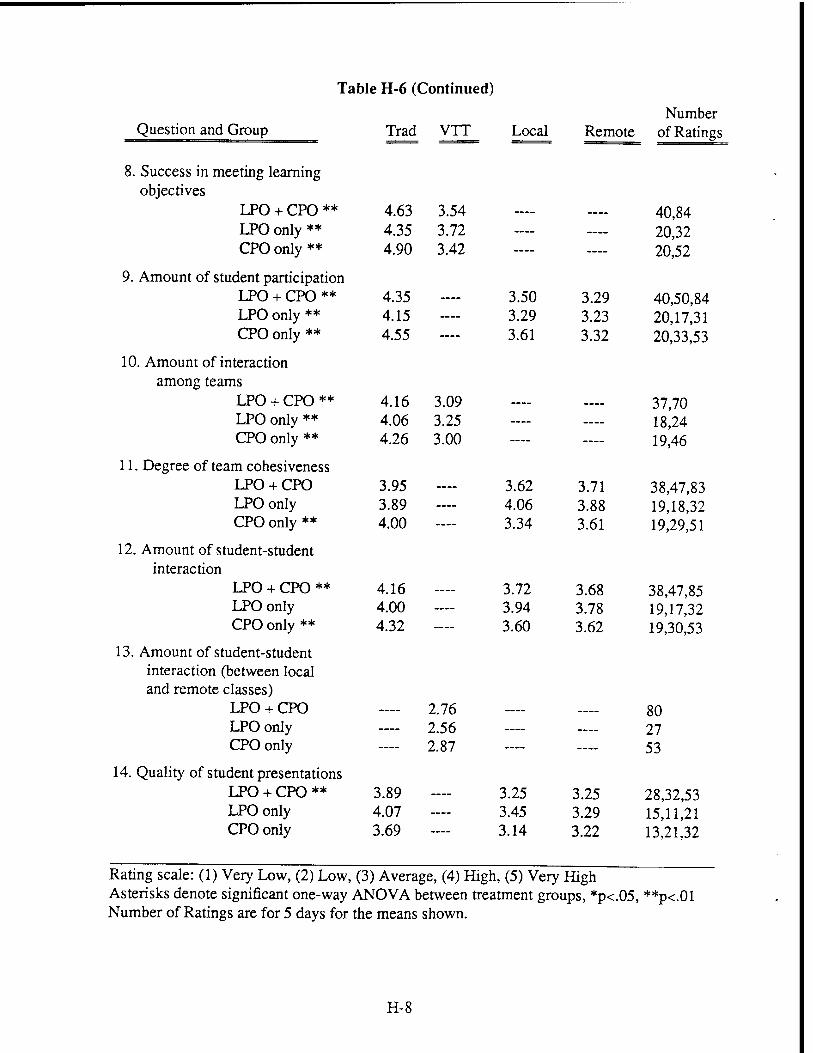
Question and Group
Table H-6 (Continued)
Trad VTT Local Number
Remote of Ratings
8. Success in meeting learning objectives
LPO + CPO ** 4.63 3.54 — — 40,84 LPO only ** 4.35 3.72 — — 20,32 CPO only ** 4.90 3.42 — — 20,52
9. Amount of student participation LPO + CPO ** 4.35 — 3.50 3.29 40,50,84 LPO only ** 4.15 — 3.29 3.23 20,17,31 CPO only ** 4.55 — 3.61 3.32 20,33,53
10. Amount of interaction among teams
LPO + CPO ** 4.16 3.09 — — 37,70 LPO only ** 4.06 3.25 — — 18,24 CPO only ** 4.26 3.00 — — 19,46
11. Degree of team cohesiveness LPO + CPO 3.95 — 3.62 3.71 38,47,83 LPO only 3.89 — 4.06 3.88 19,18,32 CPO only ** 4.00 — 3.34 3.61 19,29,51
12. Amount of student-student interaction
LPO + CPO ** 4.16 — 3.72 3.68 38,47,85 LPO only 4.00 — 3.94 3.78 19,17,32 CPO only ** 4.32 — 3.60 3.62 19,30,53
13. Amount of student-student interaction (between local and remote classes)
LPO + CPO — 2.76 — — 80 LPO only — 2.56 — — 27 CPO only — 2.87 — — 53
14. Quality of student presentations LPO + CPO ** 3.89 — 3.25 3.25 28,32,53 LPO only 4.07 — 3.45 3.29 15,11,21 CPO only 3.69 3.14 3.22 13,21,32
Rating scale: (1) Very Low, (2) Low, (3) Average, (4) High, (5) Very High Asterisks denote significant one-way ANOVA between treatment groups, *p<.05, **p<.01 Number of Ratings are for 5 days for the means shown.
H-8
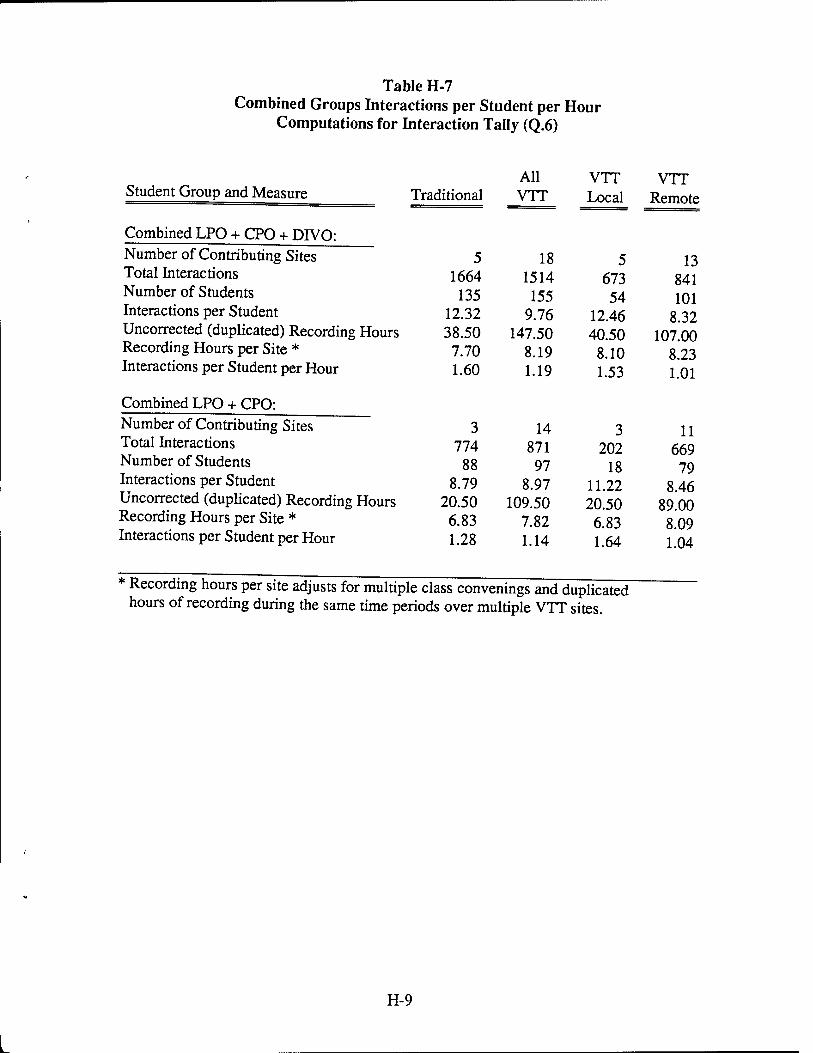
Table H-7 Combined Groups Interactions per Student per Hour
Computations for Interaction Tally (Q.6)
Student Group and Measure
Combined LPO + CPO + DIVO: Number of Contributing Sites Total Interactions Number of Students Interactions per Student Uncorrected (duplicated) Recording Hours Recording Hours per Site * Interactions per Student per Hour
Combined LPO + CPO: Number of Contributing Sites Total Interactions Number of Students Interactions per Student Uncorrected (duplicated) Recording Hours Recording Hours per Site * Interactions per Student per Hour
All VTT VTT Traditional VTT Local Remote
5 18 5 13 1664 1514 673 841
135 155 54 101 12.32 9.76 12.46 8.32 38.50 147.50 40.50 107.00 7.70 8.19 8.10 8.23 1.60 1.19 1.53 1.01
3 14 3 11 774 871 202 669
88 97 18 79 8.79 8.97 11.22 8.46
20.50 109.50 20.50 89.00 6.83 7.82 6.83 8.09 1.28 1.14 1.64 1.04
* Recording hours per site adjusts for multiple class convenings and duplicated hours of recording during the same time periods over multiple VTT sites.
H-9
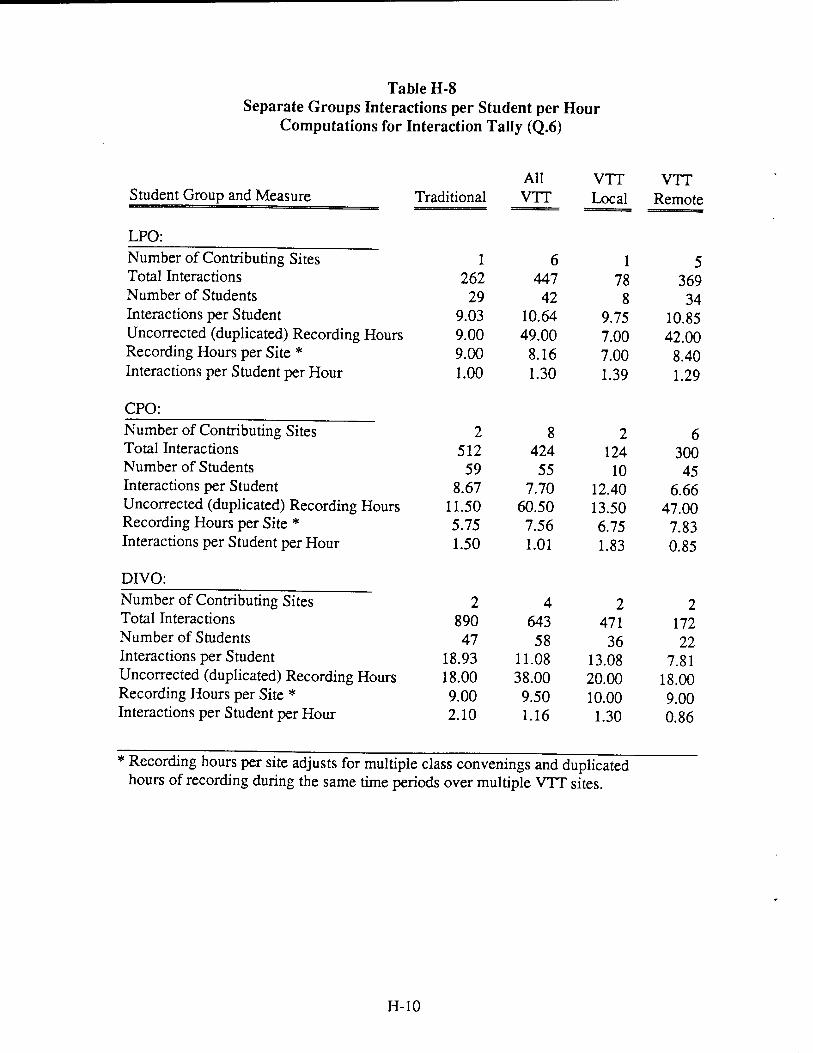
Table H-8 Separate Groups Interactions per Student per Hour
Computations for Interaction Tally (Q.6)
All VTT VTT Student Group and Measure Traditional VTT Local Remote
LPO: Number of Contributing Sites 1 6 1 5 Total Interactions 262 447 78 369 Number of Students 29 42 8 34 Interactions per Student 9.03 10.64 9.75 10.85 Uncorrected (duplicated) Recording Hours 9.00 49.00 7.00 42.00 Recording Hours per Site * 9.00 8.16 7.00 8.40 Interactions per Student per Hour 1.00 1.30 1.39 1.29
CPO: Number of Contributing Sites 2 8 2 6 Total Interactions 512 424 124 300 Number of Students 59 55 10 45 Interactions per Student 8.67 7.70 12.40 6.66 Uncorrected (duplicated) Recording Hours 11.50 60.50 13.50 47.00 Recording Hours per Site * 5.75 7.56 6.75 7.83 Interactions per Student per Hour 1.50 1.01 1.83 0.85
DIVO:
2 4 2 Number of Contributing Sites 2 Total Interactions 890 643 471 172 Number of Students 47 58 36 22 Interactions per Student 18.93 11.08 13.08 7.81 Uncorrected (duplicated) Recording Hours 18.00 38.00 20.00 18.00 Recording Hours per Site * 9.00 9.50 10.00 9.00 Interactions per Student per Hour 2.10 1.16 1.30 0.86
* Recording hours per site adjusts for multiple class convenings and duplicated hours of recording during the same time periods over multiple VTT sites.
H-10
Distribution List
Distribution: Chief of Naval Education and Training (Code 00Q) Chief of Naval Personnel (PERS-62), (PERS-OOH) Defense Technical Information Center (DTIC) (4)
Copy to: Commanding Officer, Fleet Training Center, San Diego (Code 021.2, VTT) Fleet Combat Training Center, Atlantic (Code N713, VTT) Director, Naval Leader Training Unit, Little Creek Director, Naval Leader Training Unit, Coronado