The Use of Risk Assessment to Decide the Control Strategy for Bluetongue in Italian Ruminant...
17
Risk Analysis, Vol. 24, No. 6, 2004 The Use of Risk Assessment to Decide the Control Strategy for Bluetongue in Italian Ruminant Populations Armando Giovannini, 1∗ Stuart MacDiarmid, 2 Paolo Calistri, 1 Annamaria Conte, 1 Lara Savini, 1 Donatella Nannini, 1 and Steve Weber 3 The affiliation. assessment and management of risks is a traditional part of veterinary medicine. In the past, veterinary services involved in this type of activity usually assessed risks qualita- tively. However, since the 1990s, quantitative methods have become increasingly important. The establishment of the World Trade Organization in 1994, and the promulgation of its Agree- ment on the Application of Sanitary and Phytosanitary Measures (the “SPS Agreement”) led to an increased application of import risk analysis and to significant improvements in the methodology of risk analysis as applied to international trade policy for animals and animal products. However, there was very little development of risk analysis in veterinary fields other than international trade and management of health risks to consumers of animal products and little has been published on its use in the choice and definition of control or prophylaxis strategies for animal diseases. This article describes a quantitative risk assessment, which was undertaken in Italy to help choose an appropriate national response strategy following an incursion of bluetongue, an infectious disease of sheep and goats. The results obtained in this study support the use of risk analysis as a tool to assist in choosing an appropriate animal disease management strategy. The use of risk analysis in the evaluation of disease manage- ment strategies also offers advantages in international trade. It makes easier the comparison of different strategies applied in the various countries, and thus facilitates the assessment of equivalence of the guarantees provided by different strategies. KEY WORDS: Bluetongue; control strategy; infectious disease; risk assessment; veterinary medicine 1. INTRODUCTION The assessment and management of risks is a tra- ditional part of veterinary medicine. In the past, vet- erinary services involved in this type of activity usually assessed risks qualitatively. However, since the 1990s, 1 Istituto Zooprofilattico Sperimentale dell’ Abruzzo e del Molise, Teramo, Italy. 2 New Zealand Food Safety Authority, Wellington, New Zealand. 3 USDA—Animal and Plant Health Inspection Service—Centers for Epidemiology & Animal Health—Center for Animal Disease Information and Analysis, Fort Collins, CO, USA. ∗ Address correspondence to Armando Giovannini, Istituto Zooprofilattico Sperimentale dell’ Abruzzo e del Molise, Via Campo Boario, 64100 Teramo, Italy. quantitative methods have become increasingly im- portant. The establishment of the World Trade Orga- nization in 1994, and the promulgation of its Agree- ment on the Application of Sanitary and Phytosanitary Measures (the “SPS Agreement”), (1) led to the formal recognition of the Office International des Epizooties (the world organization for animal health) (2) as being responsible for developing the standards and guide- lines for safe international trade in animals and animal products. The SPS Agreement states that sanitary or phy- tosanitary measures in international trade may be ap- plied only to the extent necessary to protect human, animal, or plant life or health and must be based on scientific principles. The agreement also identifies risk 1737 0272-4332/04/0100-1737$22.00/1 C 2004 Society for Risk Analysis
-
Upload
independent -
Category
Documents
-
view
0 -
download
0
Transcript of The Use of Risk Assessment to Decide the Control Strategy for Bluetongue in Italian Ruminant...
Risk Analysis, Vol. 24, No. 6, 2004
The Use of Risk Assessment to Decide the Control Strategyfor Bluetongue in Italian Ruminant Populations
Armando Giovannini,1∗ Stuart MacDiarmid,2 Paolo Calistri,1 Annamaria Conte,1 LaraSavini,1 Donatella Nannini,1 and Steve Weber3
The affiliation. assessment and management of risks is a traditional part of veterinary medicine.In the past, veterinary services involved in this type of activity usually assessed risks qualita-tively. However, since the 1990s, quantitative methods have become increasingly important.The establishment of the World Trade Organization in 1994, and the promulgation of its Agree-ment on the Application of Sanitary and Phytosanitary Measures (the “SPS Agreement”) ledto an increased application of import risk analysis and to significant improvements in themethodology of risk analysis as applied to international trade policy for animals and animalproducts. However, there was very little development of risk analysis in veterinary fields otherthan international trade and management of health risks to consumers of animal productsand little has been published on its use in the choice and definition of control or prophylaxisstrategies for animal diseases. This article describes a quantitative risk assessment, which wasundertaken in Italy to help choose an appropriate national response strategy following anincursion of bluetongue, an infectious disease of sheep and goats. The results obtained in thisstudy support the use of risk analysis as a tool to assist in choosing an appropriate animaldisease management strategy. The use of risk analysis in the evaluation of disease manage-ment strategies also offers advantages in international trade. It makes easier the comparisonof different strategies applied in the various countries, and thus facilitates the assessment ofequivalence of the guarantees provided by different strategies.
KEY WORDS: Bluetongue; control strategy; infectious disease; risk assessment; veterinary medicine
1. INTRODUCTION
The assessment and management of risks is a tra-ditional part of veterinary medicine. In the past, vet-erinary services involved in this type of activity usuallyassessed risks qualitatively. However, since the 1990s,
1 Istituto Zooprofilattico Sperimentale dell’ Abruzzo e del Molise,Teramo, Italy.
2 New Zealand Food Safety Authority, Wellington, New Zealand.3 USDA—Animal and Plant Health Inspection Service—Centers
for Epidemiology & Animal Health—Center for Animal DiseaseInformation and Analysis, Fort Collins, CO, USA.
∗ Address correspondence to Armando Giovannini, IstitutoZooprofilattico Sperimentale dell’ Abruzzo e del Molise, ViaCampo Boario, 64100 Teramo, Italy.
quantitative methods have become increasingly im-portant. The establishment of the World Trade Orga-nization in 1994, and the promulgation of its Agree-ment on the Application of Sanitary and PhytosanitaryMeasures (the “SPS Agreement”),(1) led to the formalrecognition of the Office International des Epizooties(the world organization for animal health)(2) as beingresponsible for developing the standards and guide-lines for safe international trade in animals and animalproducts.
The SPS Agreement states that sanitary or phy-tosanitary measures in international trade may be ap-plied only to the extent necessary to protect human,animal, or plant life or health and must be based onscientific principles. The agreement also identifies risk
1737 0272-4332/04/0100-1737$22.00/1 C© 2004 Society for Risk Analysis
1738 Giovannini et al.
analysis as the tool to ensure that scientific principlesare applied in the choice of measures to be applied ininternational trade.
The increased application of import risk analy-sis,(3) which followed the adoption of the SPS Agree-ment, led to significant improvements in the method-ology of risk analysis as applied to international tradepolicy for animals and animal products.(4) However,there was very little development of risk analysis inveterinary fields other than international trade andmanagement of health risks to consumers of animalproducts. Nevertheless, it is apparent that the tech-niques of quantitative risk assessment could have awide range of veterinary applications. Risk analy-sis is a tool for decision making in the face of un-certainty and provides numerical estimates of theprobabilities and consequences associated with par-ticular scenarios. Risk analysis allows a quantitativeevaluation and comparison of various scenarios rang-ing from no safeguards to combinations of varioussafeguards. It facilitates the communication of risksand their consequences to stakeholders and decision-makers and allows decisionmakers to choose appro-priate safeguards in a transparent fashion. However,little has been published on its use in the choiceand definition of control or prophylaxis strategies foranimal diseases.
This article describes a quantitative risk assess-ment, which was undertaken in Italy to help choosean appropriate national response strategy followingan incursion of bluetongue (BT), an infectious dis-ease of sheep and goats. BT appeared for the firsttime in Italy in August 2000, probably as a result ofthe wind-borne introduction of infected insect vectors(the most important of which is the midge Culicoidesimicola) from North Africa. The main epidemiologi-cal features of BT are summarized in Box 1.
The choice of the strategy was made after as-sessing the range and magnitude of consequencesof implementing or not implementing a vaccinationprogram of all susceptible domestic livestock (cattle,sheep, and goats) in the affected regions, or just thesheep and goats.
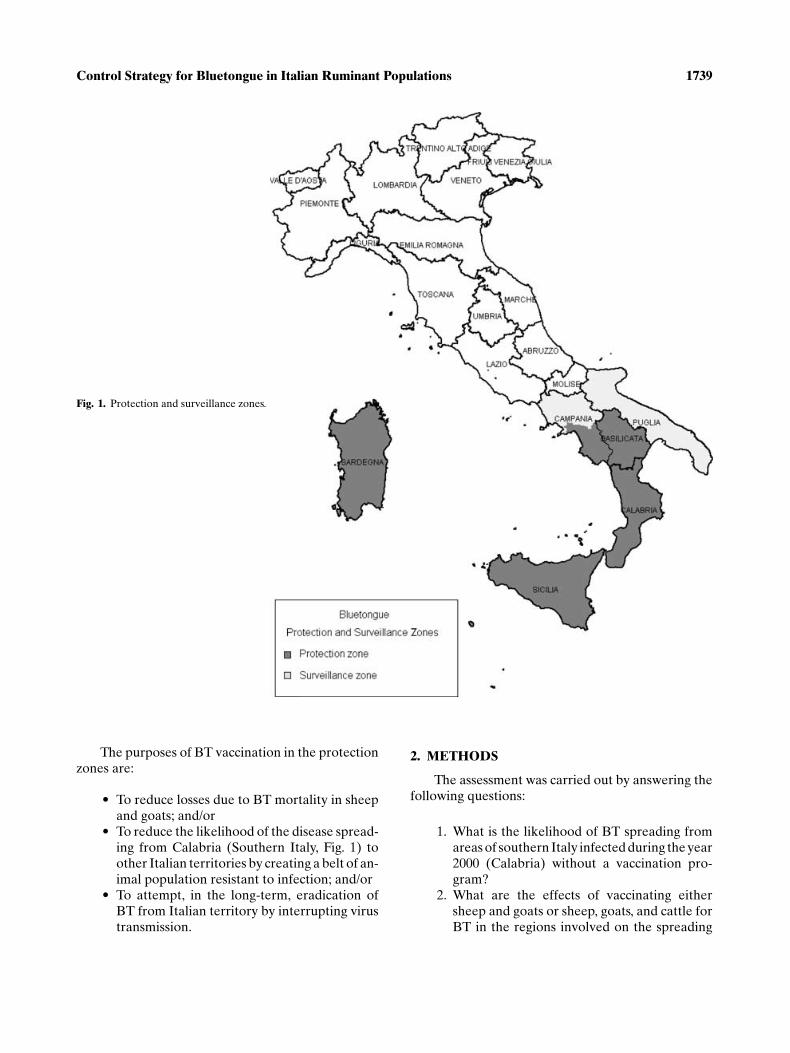
The relevant regions had already been definedin a European Commission Decision dated Febru-ary 9, 2001, which set BT protection and surveillancezones in the Community.(5) This decision declared allprovinces of Sardinia, Sicily, Calabria, and Basilicata,and one province of Campania, Salerno (Fig. 1) asprotection zones, within which a vaccination programshould be implemented.
BOX 1.
BT is an infectious disease of ruminants transmitted byinsect vectors and, although all ruminants are suscepti-ble to infection, clinical signs are seen mainly in sheepand goats.(10) The etiological agent is a virus, of which24 serotypes are known. Their pathogenicity is variableand immunity (naturally acquired after infection or in-duced by vaccination) against one serotype is often inef-fective in case of infection due to a different serotype.
In the past, BT was endemic in the eastern Mediterraneanbasin with sporadic spillover in Europe (Cyprus, Greece,Spain, and Portugal) that never led to an establishmentof the infection. In December 1999, BT was notified inTunisia, along the eastern coast of the country. New out-breaks appeared in the whole northern part of Tunisiaduring the summer of 2000.(17) During summer and au-tumn 2000, Italy experienced the largest bluetongue epi-demics in Europe. Three regions were involved (Sardinia,Sicily, and Calabria), inhabited by 54.7% of the entire Ital-ian sheep and goat population. In the early fall of 2000the disease has been also identified in Spanish Balearicislands and French island of Corsica.
BT virus is transmitted by midges (mosquito-like insects ofthe genus Culicoides), and the disease is generally con-sidered to be present, or potentially present, in a zone be-tween the 40◦ parallel North and the 35◦ parallel South,where climatic and environmental conditions are suitableto the vector’s life cycle. In reality, these limits are theoret-ical, since insects can spread beyond such boundaries un-der appropriate meteorological conditions.(10) Once in-fected by the vector, an unvaccinated animal undergoesa long viraemic period, lasting up to 45–60 days,(10) dur-ing which the virus can be transmitted to the midges, thusassuring survival of infection during the cold season. Non-infectious virus RNA can be detected for as long as 220days after infection. From an epidemiological point ofview, particular attention must be paid to bovine animals,which are presumed to be viral amplifiers, even thoughthey do not show any clinical signs of the disease.
Factors regulating vector presence have an influence on thedisease spread. Therefore, its pattern is strictly seasonal.The first cases of BT usually occur late in the summer,with the highest incidence at the end of that season; thedisease then tends to disappear at the beginning of winter,with night temperatures below 12◦C. Adult Culicoides areactive during night hours (from dusk to dawn) and biteanimals to feed on their blood. Insects become infected byfeeding on infected animals during viraemia and remaininfected for the rest of their lives. Virus vertical trans-mission (from one generation to another) in midges hasnot been proved. In order to reproduce, Culicoides needfresh water; eggs are laid in humid transitional areas atthe edge of water ponds. Here the insect goes through itsgrowth cycle (larva and pupa) and becomes an adult. Theadult midges are able to actively fly in an area of a fewhundred meters while wind can transport them for over300 km.
Control Strategy for Bluetongue in Italian Ruminant Populations 1739
Fig. 1. Protection and surveillance zones.
The purposes of BT vaccination in the protectionzones are:
� To reduce losses due to BT mortality in sheepand goats; and/or
� To reduce the likelihood of the disease spread-ing from Calabria (Southern Italy, Fig. 1) toother Italian territories by creating a belt of an-imal population resistant to infection; and/or
� To attempt, in the long-term, eradication ofBT from Italian territory by interrupting virustransmission.
2. METHODS
The assessment was carried out by answering thefollowing questions:
1. What is the likelihood of BT spreading fromareas of southern Italy infected during the year2000 (Calabria) without a vaccination pro-gram?
2. What are the effects of vaccinating eithersheep and goats or sheep, goats, and cattle forBT in the regions involved on the spreading
1740 Giovannini et al.
of the disease and on eradication of BT fromItaly?
The overall risk assessment was conducted on aqualitative basis by evaluating the likelihood of eachevent occurring, while some specific problems wereanalyzed also on a quantitative basis, by computermodels.
In the following sections, methods used to answereach question are described.
2.1. What is the Likelihood of BT Spreading fromInfected Areas of Southern Italy Withouta Vaccination Program?
In order to determine the likelihood of BTspreading, qualitative and quantitative risk assess-ments were conducted. In the quantitative assess-ment, the weekly infection probability in municipali-ties of Calabria was calculated.
The model’s input variables were chosen bya multiple logistic regression(6) performed on ge-ographical features of the municipalities analyzed(unpublished data). The study area analyzed in themultiple logistic regression was the whole of Sardiniaregion, the first and most widely affected Italian re-gion. Variables considered in the logistic regressionwere the mean height above sea level, cattle popula-tion density, and sheep and goat population density.The dependent variable was the presence or absenceof BT outbreaks in each municipality. The model in-cluding the mean height above sea level of the munic-ipal territory (variable affecting climatic conditionsand water stagnation due to the soil gradient; bothcharacters are important to the vector biology), andsheep and goat population density per square kilo-meter had a significant Hosmer and Lemeshow chi-square test and was used to build the deterministicmodel for the likelihood of BT spreading from in-fected areas.
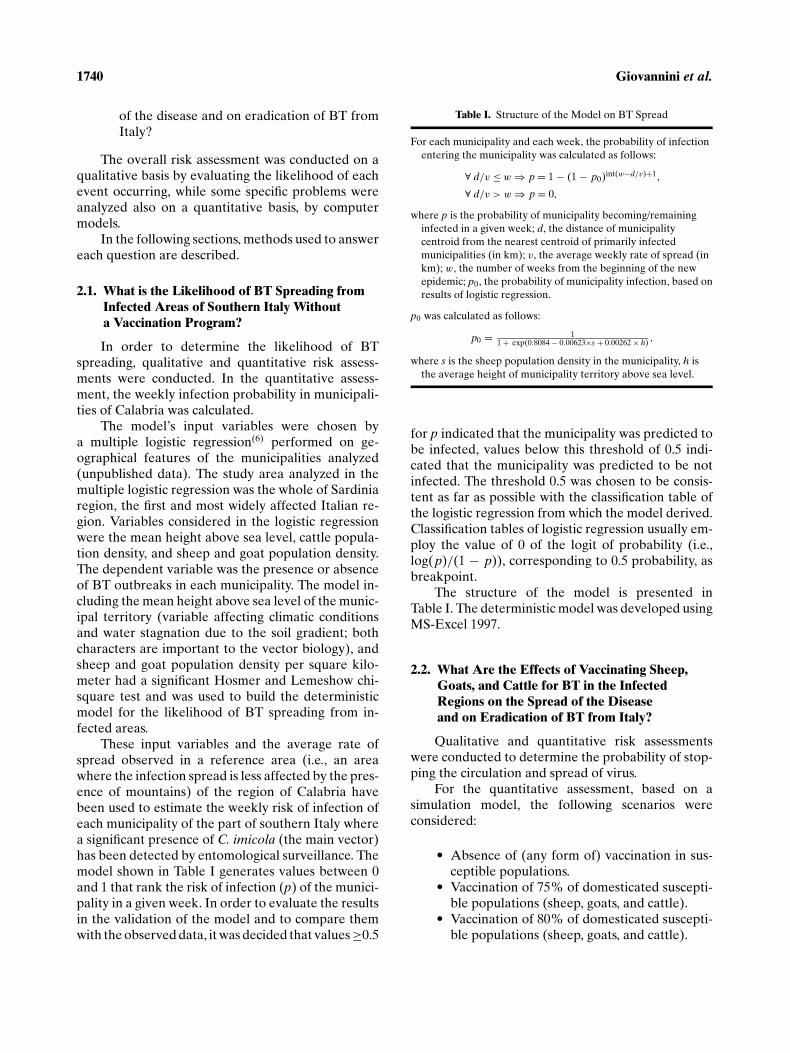
These input variables and the average rate ofspread observed in a reference area (i.e., an areawhere the infection spread is less affected by the pres-ence of mountains) of the region of Calabria havebeen used to estimate the weekly risk of infection ofeach municipality of the part of southern Italy wherea significant presence of C. imicola (the main vector)has been detected by entomological surveillance. Themodel shown in Table I generates values between 0and 1 that rank the risk of infection (p) of the munici-pality in a given week. In order to evaluate the resultsin the validation of the model and to compare themwith the observed data, it was decided that values ≥0.5
Table I. Structure of the Model on BT Spread
For each municipality and each week, the probability of infectionentering the municipality was calculated as follows:
∀ d/v ≤ w ⇒ p = 1 − (1 − p0)int(w−d/v)+1,
∀ d/v > w ⇒ p = 0,
where p is the probability of municipality becoming/remaininginfected in a given week; d, the distance of municipalitycentroid from the nearest centroid of primarily infectedmunicipalities (in km); v, the average weekly rate of spread (inkm); w, the number of weeks from the beginning of the newepidemic; p0, the probability of municipality infection, based onresults of logistic regression.
p0 was calculated as follows:
p0 = 11 + exp(0.8084 − 0.00623×s + 0.00262 × h) ,
where s is the sheep population density in the municipality, h isthe average height of municipality territory above sea level.
for p indicated that the municipality was predicted tobe infected, values below this threshold of 0.5 indi-cated that the municipality was predicted to be notinfected. The threshold 0.5 was chosen to be consis-tent as far as possible with the classification table ofthe logistic regression from which the model derived.Classification tables of logistic regression usually em-ploy the value of 0 of the logit of probability (i.e.,log(p)/(1 − p)), corresponding to 0.5 probability, asbreakpoint.
The structure of the model is presented inTable I. The deterministic model was developed usingMS-Excel 1997.
2.2. What Are the Effects of Vaccinating Sheep,Goats, and Cattle for BT in the InfectedRegions on the Spread of the Diseaseand on Eradication of BT from Italy?
Qualitative and quantitative risk assessmentswere conducted to determine the probability of stop-ping the circulation and spread of virus.
For the quantitative assessment, based on asimulation model, the following scenarios wereconsidered:
� Absence of (any form of) vaccination in sus-ceptible populations.
� Vaccination of 75% of domesticated suscepti-ble populations (sheep, goats, and cattle).
� Vaccination of 80% of domesticated suscepti-ble populations (sheep, goats, and cattle).
Control Strategy for Bluetongue in Italian Ruminant Populations 1741
� Vaccination of 85% of domesticated suscepti-ble populations (sheep, goats, and cattle).4
� Vaccination of 75% of sheep and goat popu-lation.
� Vaccination of 80% of sheep and goat popu-lation.
� Vaccination of 85% of sheep and goat popu-lation.
For each scenario, the probability of infectionspread was estimated by simulating the number ofsecondary cases expected after a month from the on-set of 1, 10, 50, 100, and 200 primary cases (animalsalready infected before the start of vaccination cam-paign or infected animals introduced in the area).
Input variables were:1. Susceptible population, equal to 8,010 ani-
mals, 14% of which are cattle and 86% ofwhich are sheep and goats (average number ofanimals in municipalities where the epidemicoccurred in 2000), minus the number of vacci-nated animals of each specific scenario.
2. Secondary attack rate for each primary caseduring the following month (equal to 0.166%,average detected in the year 2000 on all in-volved municipalities) in the absence of vac-cination. This is the main input variable tosimulate the expected number of secondarycases; therefore, the uncertainty in the esti-mate of the secondary attack rate may heavilyinfluence the predictions of the model. Nev-ertheless, the uncertainty was considered neg-ligible because the secondary attack rate wasestimated on the basis of the clinical surveil-lance performed on a total population of morethan 2,700,000 susceptible animals living in theinvolved municipalities, integrated by a sero-logical survey (aiming at the estimation of thesensitivity of the clinical surveillance) involv-ing a sample of animals in clinically infectedflocks, and a sample of the entire sheep, goats,and cattle populations, based on the randomtesting of three sheep or goats and three cat-tle/km2 (i.e., the overall testing of more than70,000 animals).
3. The decrease in vector capacity of C. imicolawhen a portion of the population is vacci-nated,(7,8) calculated as follows:
4 The range of vaccination coverage considered by the model(75–85%) is the one most frequently achieved by well-conductedmass vaccination campaigns in animal populations.
• the susceptibility of vaccinated populationis proportional to the decrease in the dura-tion of viraemia following the challenge ofvaccinated animals;
• the susceptibility of the unvaccinated popu-lation remains unchanged;
• therefore, the susceptibility to infection inthe entire population is proportional to:
�S ∝[
vv
vuV + 1 × (1 − V)
],
where S is the susceptibility of the entirepopulation; vv, the duration of viraemia invaccinated animals; vu, the duration of vi-raemia in unvaccinated animals; V is theproportion of vaccinated animals in thepopulation;
• since the effect of vaccination is to decreaseboth the probability of an infective vector toencounter susceptible animals and the prob-ability of uninfected vectors to encounter aninfected host, the final decrease in the vectorcapacity of midges is proportional to
�C ∝[
vv
vuV + 1 × (1 − V)
]2
.
Literature data concerning the duration of vi-raemia in unvaccinated animals are extremely vari-ous.(9,10) Therefore, data concerning the duration ofviraemia were taken from a research that comparedvaccinated and unvaccinated animals.(9) The chosenvalues were also the most conservative available be-cause they reported the lower published duration ofviraemia in unvaccinated animals. Therefore, the ra-tio vv/vu in the model was the least, making unlikelyan overestimation of the effectiveness of vaccination.The uncertainty in the ratio was considered using atruncated normal distribution with mean equal to themean number of days of viraemia in the vaccinatedand control groups, standard deviation equal to thestandard errors of the mean in the same two groups,and ranges equal to 0–60 for the unvaccinated animalsand 0-duration of viraemia in unvaccinated animalsfor the vaccinated group.
The structure of the model is described in Table II.The simulation model was developed using @Risk
software (Palisade Corporation, New York/London)version 3.5.2. Five thousand iterations were per-formed using a Latin hypercube sampling.
1742 Giovannini et al.
Table II. Structure of the Simulation Model on the Ability of Vaccination to Stop Spread of Infection
Variable Distribution Used Parameters of the Distribution Source
1. Total number of susceptible sheep, goats,and cattle
8,010Cattle = 14%Sheep and goats = 86%
Mean number of ruminantsin municipalities infectedduring year 2000,surveillance data
2. Number of primary cases 5 scenarios: 1, 10, 50, 100, 200primary cases
3. Mean number of days of viraemia invaccinated animals after challenge
Truncated normal µ = 0.375σ = 0.183Range 0–Variable 4
Ref. (9)
4. Mean number of days of viraemia innonvaccinated animals after challenge
Truncated normal µ = 6.5σ = 0.289Range 0–60
Ref. (9)
5. Proportion of vaccinated eligible population 3 scenarios: 0.75, 0.80, 0.856. Decrease in vector capacity of C. imicola
following vaccination[(Variable 3/Variable 4) ∗
(Variable 5) + 1 ∗ (1 − Variable 5)]2Ref. (7)Ref. (8)
7. Secondary attack rate in the absence ofvaccination
SAR = SCPAR × PC
where SAR is the secondary attack rate; SC,the number of secondary cases; PAR, thepopulation at risk; PC, the number ofprimary cases
0.00166 Surveillance data on year2000 epidemics
8. Number of expected secondary cases in theabsence of vaccination
Binomial n = Variable 1 − Variable 2p = 1 − (1 − Variable 7)Variable2
9. Number of expected secondary casesfollowing vaccination
Binomial n = Variable 1 − Variable 2p = 1 − (1 − Variable 7 ∗
Variable 6)Variable2
2.2.1. Validation of the Models
Since no vaccination against BT had been con-ducted in Europe when the models were designed,the only possible validation was that concerning theinfection spread model. The model was validated oninfection spread data from southern Italy and Sardiniain the year 2000. The data were used to forecast theweekly status of infection or noninfection of each mu-nicipality in the two regions and the forecasts werecompared with the observed data.
3. RESULTS
3.1. What is the Likelihood of BT Spreading fromInfected Areas of Southern Italy Without aVaccination Program?
3.1.1. Results of the Qualitative Assessment
Based on data collected so far from surveillanceprograms and from available scientific literature:
� C. imicola, the principal vector of BT, is alsopresent in the Italian territories north of thoseinfected in 2000 (Fig. 2).
� Climatic conditions and soil types north ofinfected areas are favorable for C. imicolabreeding.(11)
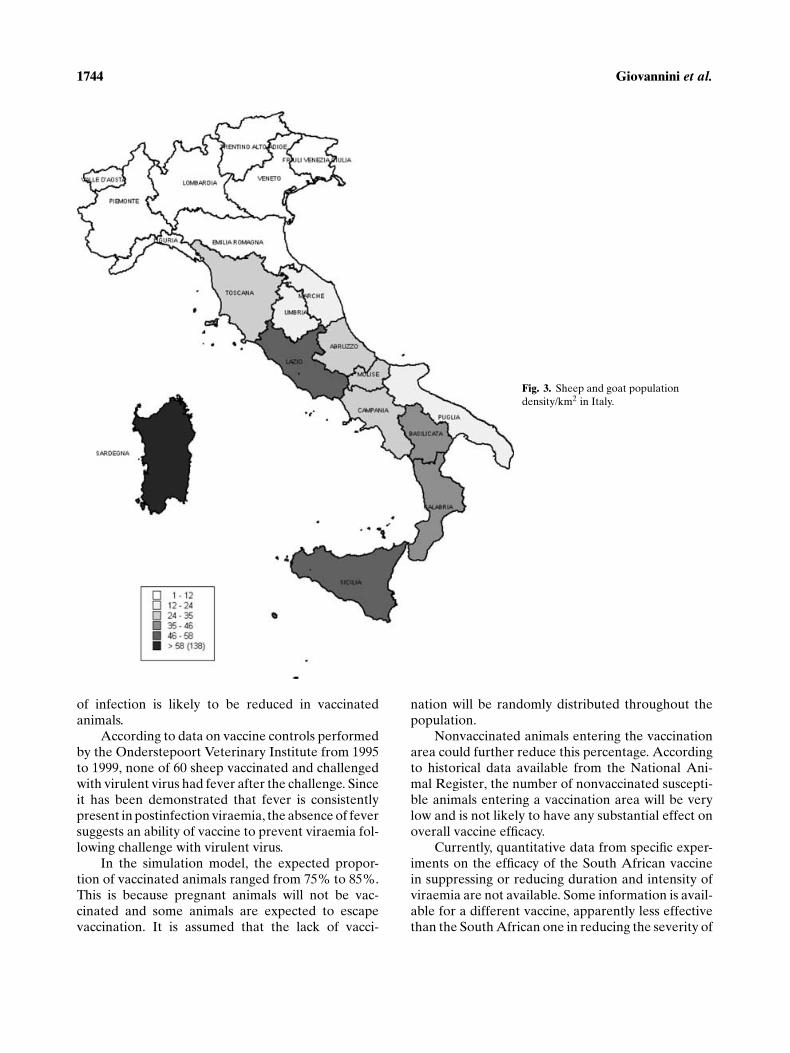
� Sufficient numbers of susceptible animals(sheep, goats, and cattle) are present northof infected areas for the epidemic to spread(Figs. 3 and 4).
� There is a source of BT virus present to initiatethe spread of the virus (the last diseased flockin southern Italy was detected on February 1,2001).
� There are no physical barriers to limit thespread of C. imicola.
Therefore, it can be assumed that, without a vacci-nation program, BT would spread from infected areasof southern Italy with a probability near 100%.
3.1.2. Results of Quantitative Assessment
According to the results of quantitative assess-ment (Fig. 5), without a vaccination program, the dis-ease could spread to the free regions of Italy within4–6 months of the beginning of any new epidemic,which might occur in 2001.

Control Strategy for Bluetongue in Italian Ruminant Populations 1743
Fig. 2. Distribution of C. imicola in Italy.
3.2. What Are the Effects of Vaccinating Sheep,Goats, and Cattle on the Spread andCirculation of BT Virus in Italy?
3.2.1. Results of Qualitative Assessment
The Onderstepoort Veterinary Institute, SouthAfrica, the manufacturer of the vaccine, claims a99.4% protection (P. Hunter, Onderstepoort Biolog-ical Products, personal communication) based on theratio:{
Total score of clinical signs invaccinated and challenged animals
}{
Total score of clinical signs innonvaccinated and challenged animals
}=99.4%.
This ratio measures the vaccine effectiveness inreducing economic losses due to mortality and de-creased productions caused by the disease.
Reduction of economic losses is not the onlypurpose of vaccination. By creating a BT-resistantpopulation belt, it aims also to reduce the prob-ability of spread of infection. It is also intendedto hasten eradication of the disease in the longerterm by interrupting the virus transmission cycle. Itmust be recognized that existing studies on the ef-ficacy of the South African vaccine are not entirelysufficient. Available data relate mainly to protec-tion against clinical disease, rather than to the ef-fects on intensity and duration of viraemia, whichare needed to evaluate the extent to which spread
1744 Giovannini et al.
Fig. 3. Sheep and goat populationdensity/km2 in Italy.
of infection is likely to be reduced in vaccinatedanimals.
According to data on vaccine controls performedby the Onderstepoort Veterinary Institute from 1995to 1999, none of 60 sheep vaccinated and challengedwith virulent virus had fever after the challenge. Sinceit has been demonstrated that fever is consistentlypresent in postinfection viraemia, the absence of feversuggests an ability of vaccine to prevent viraemia fol-lowing challenge with virulent virus.
In the simulation model, the expected propor-tion of vaccinated animals ranged from 75% to 85%.This is because pregnant animals will not be vac-cinated and some animals are expected to escapevaccination. It is assumed that the lack of vacci-
nation will be randomly distributed throughout thepopulation.
Nonvaccinated animals entering the vaccinationarea could further reduce this percentage. Accordingto historical data available from the National Ani-mal Register, the number of nonvaccinated suscepti-ble animals entering a vaccination area will be verylow and is not likely to have any substantial effect onoverall vaccine efficacy.
Currently, quantitative data from specific exper-iments on the efficacy of the South African vaccinein suppressing or reducing duration and intensity ofviraemia are not available. Some information is avail-able for a different vaccine, apparently less effectivethan the South African one in reducing the severity of

Control Strategy for Bluetongue in Italian Ruminant Populations 1745
Fig. 4. Cattle population density/km2 inItaly.
disease signs. This vaccine is reported as being able toreduce the duration of viraemia after challenge withwild virus to 5.8% of the average duration observed inunvaccinated sheep.(12) Therefore, it is assumed thatin field conditions, the level of viraemia suppressionfollowing natural infection would be equal to 94% inthe worst-case scenario.
Sheep, goats, and cattle are the only importanthosts in maintaining the disease. Once recovered,sheep, goats, and cattle are clear of the virus and areimmune to infections by the same serotype for at leastone year.(13) The expected reduction in the durationof viraemia should be able to significantly reduce thechances for the vector to become infected and spread
the infection. Therefore, following vaccination, a sig-nificant reduction of the incidence of infection isexpected.
3.2.2. Results of Quantitative Assessment
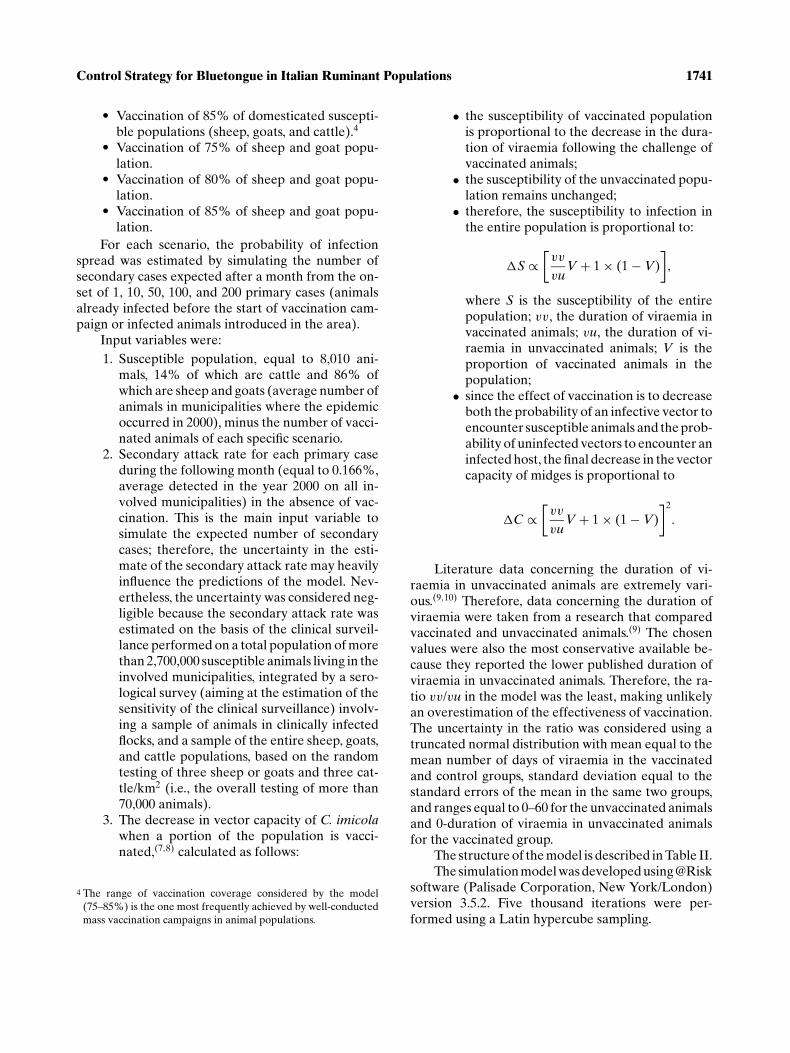
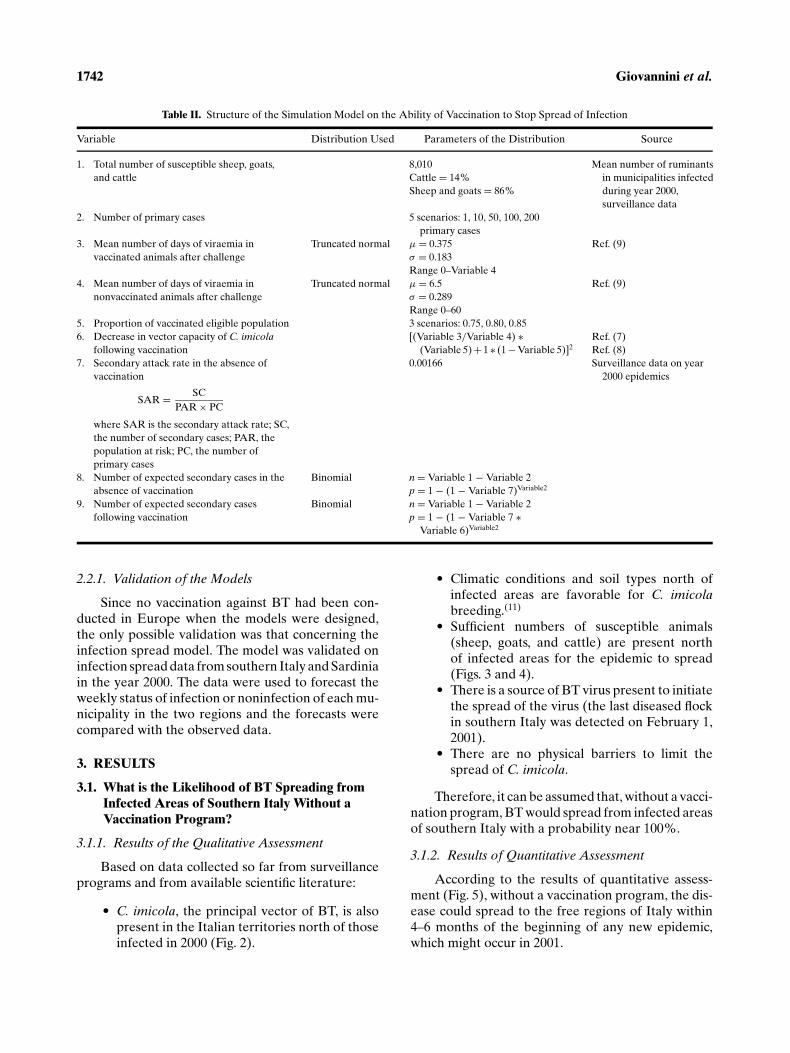
Simulation results, expressed as probability dis-tribution of expected secondary cases following 1 and200 primary cases after vaccination of sheep, goats,and cattle, are presented in Figs. 6 and 7. Results ob-tained with 10–100 primary cases were intermediatebetween these.
These figures show that, if at least 80% of thepopulation is effectively vaccinated, the probability

1746 Giovannini et al.
Fig. 5. Results of the spread modeling ofBT in the region of Calabria (southernItaly).
of a number of secondary cases greater than or equalto primary cases (endemic infection) is always verylow, regardless of the number of primary cases trig-gering the transmission. As a consequence, there isa high probability of having a decrease in the num-ber of cases over the time (and therefore the extinc-tion of the infection in the population) when herdimmunity involves at least 80% of the susceptiblepopulation. On the other hand, if the herd immunityinvolves only 75% of the population, the probabil-ity of infection extinction is lower (30% in case of asingle primary case and 35% in case of 200 primarycases).
Simulation results, expressed as probability dis-tribution of expected secondary cases following 1 and200 primary cases after vaccination of sheep and goatsonly, are presented in Figs. 8 and 9.
In these scenarios, the probability of a numberof secondary cases greater than or equal to primarycases (endemic infection) is always higher than aftervaccination of all ruminants. Moreover, in the case ofvaccination of sheep and goats only, even in the caseof immunization of 85% of the eligible population,the probability of a number of secondary cases ex-ceeding the primary ones is 40% when the infectionis triggered by one single primary case. This probabil-ity increases with the number of primary cases, up tomore than 65% when the infection is started by 200infected animals.
3.2.3. Validation of the Model
For the epidemic that occurred in the year 2000,the model of infection spread correctly forecast the
Control Strategy for Bluetongue in Italian Ruminant Populations 1747
Fig. 6. Number of secondary cases expected from 1 primary case—vaccination of cattle, sheep, and goats.
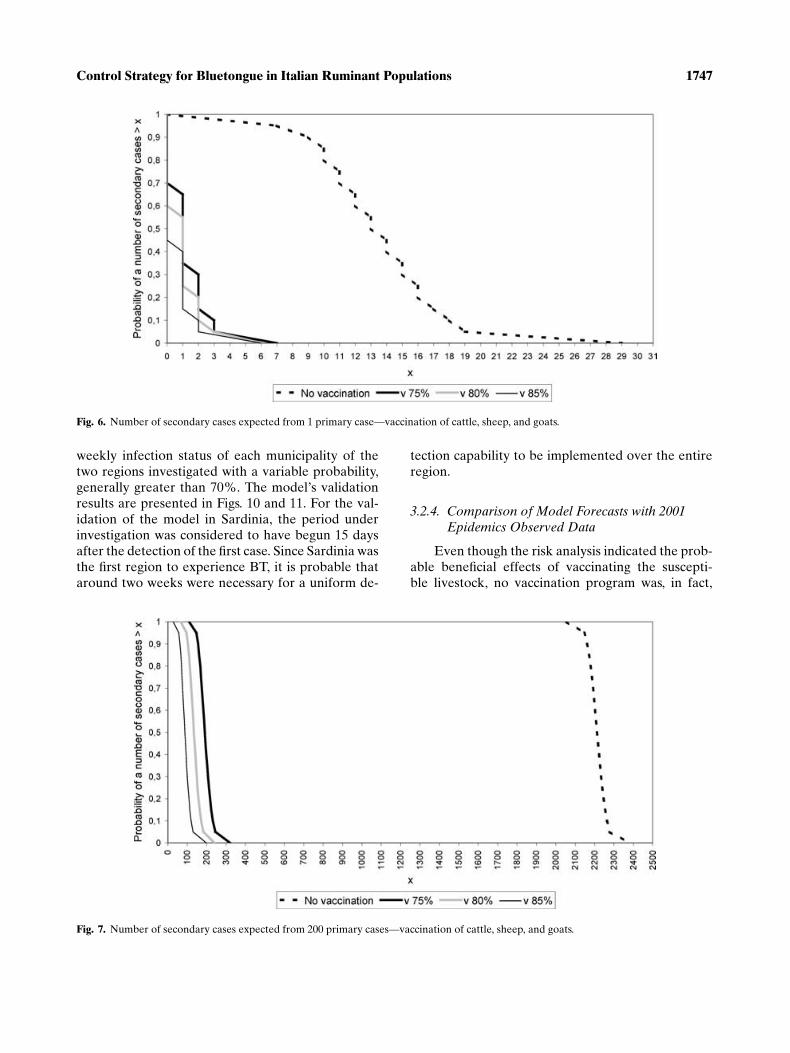
weekly infection status of each municipality of thetwo regions investigated with a variable probability,generally greater than 70%. The model’s validationresults are presented in Figs. 10 and 11. For the val-idation of the model in Sardinia, the period underinvestigation was considered to have begun 15 daysafter the detection of the first case. Since Sardinia wasthe first region to experience BT, it is probable thataround two weeks were necessary for a uniform de-
Fig. 7. Number of secondary cases expected from 200 primary cases—vaccination of cattle, sheep, and goats.
tection capability to be implemented over the entireregion.
3.2.4. Comparison of Model Forecasts with 2001Epidemics Observed Data
Even though the risk analysis indicated the prob-able beneficial effects of vaccinating the suscepti-ble livestock, no vaccination program was, in fact,

1748 Giovannini et al.
Fig. 8. Number of secondary cases expected from 1 primary case—vaccination of sheep and goats only.
implemented. Therefore, data collected during thesubsequent BT outbreak in 2001 allow further eval-uation of the validity of the model used to assess thelikelihood of spread from infected areas.
The first BT cases of the 2001 epidemic appearedin Calabria during June, along the Ionian coast. Theextension of the epidemic in the region, resulting frommovement of livestock, involved also the Tyrrhenian
Fig. 9. Number of secondary cases expected from 200 primary cases—vaccination of sheep and goats only.
coast, although the number of outbreaks and the timespan in which new cases appeared in the latter area re-mained significantly less than along the Ionian coast.In August 2001, the disease appeared also in the neigh-boring region, north of the area infected in the 2000epidemic. Therefore, the forecast of a spread of thedisease to free areas within 4–6 months from the be-ginning of a new epidemic was confirmed. The final

Control Strategy for Bluetongue in Italian Ruminant Populations 1749
Fig. 10. Results of the validation of thespread model using the data fromepidemic 2000 in southern Italy—percentmunicipalities correctly classified byweek from the start of the epidemic.
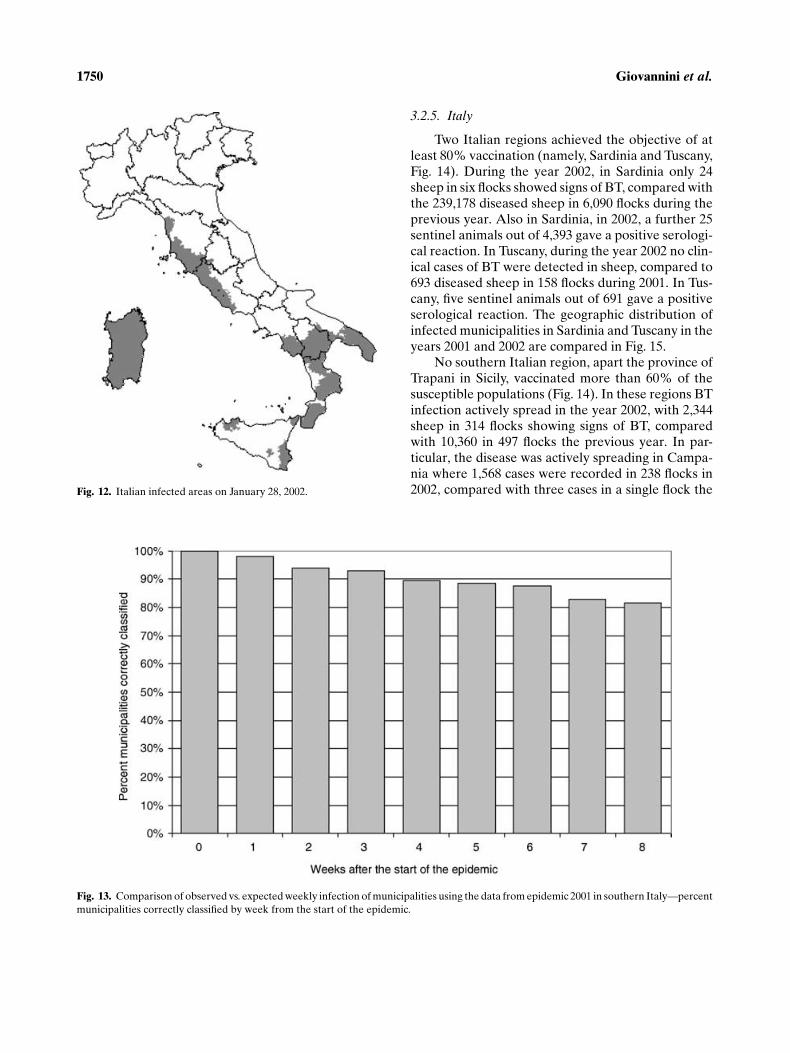
extension of BT in Italy on January 28, 2002 is shownin Fig. 12. Since the model was developed on the ba-sis of the 2000 epidemic, due to the serotype 2 of theBT virus and the 2001 epidemic in Calabria was dueto the serotype 9, less pathogenic than the serotype 2(morbidity was 0.38 and lethality was 0.37 times thevalues observed in 2000), the forecasting ability of themodel was rather poor. It was therefore hypothesizedthat, should the poor forecasting ability of the modelbe due only to the lower pathogenicity of serotype 9of the virus, the ranking by the model of the munici-palities in terms of their probability of infection wouldstill be correct, but shifted toward excessive values. Inorder to test this hypothesis, the threshold value of pwas increased. The threshold had to be changed to 0.8in order that the results of the model matched the ob-
Fig. 11. Results of the validation of thespread model using the data fromepidemic 2000 in Sardinia—percentmunicipalities correctly classified byweek from the start of the epidemic.
served results. The ability of the model to predict theweekly infection status of municipalities in Calabria,using the threshold value 0.8, is shown in Fig. 13.
The vaccination of susceptible animals started inSicily in October 2001 and in Sardinia in January 2002,while in the continental part of southern Italy vacci-nation campaigns started in February 2002, but thepercent of vaccinated animals was still low by au-tumn 2002 (Fig. 14). Data from Italian and other in-fected European regions that have vaccinated sheepand goat populations may give some indication of theability of vaccination to stop or limit the spread of thedisease. Other European regions that experienced aBT epidemic during the summer 2000 and that vacci-nated the sheep population were the Balearic Islandsof Majorca and Minorca, and Corsica (Table III).
1750 Giovannini et al.
Fig. 12. Italian infected areas on January 28, 2002.
Fig. 13. Comparison of observed vs. expected weekly infection of municipalities using the data from epidemic 2001 in southern Italy—percentmunicipalities correctly classified by week from the start of the epidemic.
3.2.5. Italy
Two Italian regions achieved the objective of atleast 80% vaccination (namely, Sardinia and Tuscany,Fig. 14). During the year 2002, in Sardinia only 24sheep in six flocks showed signs of BT, compared withthe 239,178 diseased sheep in 6,090 flocks during theprevious year. Also in Sardinia, in 2002, a further 25sentinel animals out of 4,393 gave a positive serologi-cal reaction. In Tuscany, during the year 2002 no clin-ical cases of BT were detected in sheep, compared to693 diseased sheep in 158 flocks during 2001. In Tus-cany, five sentinel animals out of 691 gave a positiveserological reaction. The geographic distribution ofinfected municipalities in Sardinia and Tuscany in theyears 2001 and 2002 are compared in Fig. 15.
No southern Italian region, apart the province ofTrapani in Sicily, vaccinated more than 60% of thesusceptible populations (Fig. 14). In these regions BTinfection actively spread in the year 2002, with 2,344sheep in 314 flocks showing signs of BT, comparedwith 10,360 in 497 flocks the previous year. In par-ticular, the disease was actively spreading in Campa-nia where 1,568 cases were recorded in 238 flocks in2002, compared with three cases in a single flock the

Control Strategy for Bluetongue in Italian Ruminant Populations 1751
Fig. 14. Percent vaccinated population by province on September30, 2002.
previous year. The infected municipalities in southernItaly in 2002 are shown in Fig. 16.
3.2.6. Balearic Islands
Two of the four islands, Majorca and Minorca,were involved in the summer 2000 epidemic. The firstcase of the disease was observed on September 29,and the total number of cases was 5,455. The suscep-
Table III. Results of Vaccination Campaigns Carried Outin the Balearic Islands and in Corsica
BalearicIslands Corsica
Sheep population 347,591 159,503Goat population 15,530Cattle population 31,403 NATotal number of susceptible animals
at the beginning of 2000 epidemic394,524 NA
Number of cases in 2000 epidemic 5,455 2,765Number of dead animals 1,991 259Number of slaughtered animals 7,706 2,632Total number of animals remaining
at the end of 2000 epidemic384,827 156,612
Number of vaccinated animals 301,202 102,000% vaccinated animals 78.3 65.1Number of cases in 2001 epidemic 0 13,141
NA = Not available.
tible animal population of the two islands is 394,524(347,591 sheep, 15,530 goats, and 31,403 cattle). A vac-cination campaign(14) was carried out and by January15, 2001 a total number of 301,202 sheep had been vac-cinated (78.3% of total susceptible population). Nofurther cases of disease were recorded during 2001.
3.2.7. Corsica
This island was involved in the summer 2000 epi-demic. The first case of BT was observed on October18, and the total number of recorded cases was 2,765.There are 129,900 sheep and goats on the island,(15)
but data on the cattle population were not availableto the authors. A vaccination campaign was carriedout and 102,000 sheep (65.1% of the sheep and goatpopulation) were vaccinated between December 15,2000 and April 30, 2001.(16) A new epidemic startedin Corsica in 2001, and a total number of 13,141 caseswas recorded between September 2001 and January2002.
4. DISCUSSION
A comparison of the results of the deterministicmodel with observed events in 2001 showed that themodel was able to predict correctly the time neededfor BT to spread from the area that was infected dur-ing the previous year. However, the model was unableto classify correctly the infection status of municipali-ties of southern Italy when used with the same thresh-old value used for the year 2000. This could be due toa number of reasons.
1. The numbers of vectors (Culicoides midges)in the year 2001 were significantly lower thannumbers recorded in 2000. This lower densityof vectors may have resulted in fewer oppor-tunities for transmission of infection in 2001.
2. The type of BT virus responsible for the 2001epidemic was BTV9 while in the previous epi-demic it was mainly BTV2. BTV9 is a lessvirulent strain than BTV2 and this may haveresulted in greater difficulty in detecting newcases.
3. Although the epidemic of 2000 was mainly dueto BTV2, a few cases of infection due to BTV9were detected in the final phases. A serologicalsurvey carried out at the end of the epidemicwave indicated that the infection due to BTV9was more widespread than anticipated on thebasis of the distribution of clinical disease at-tributable to BTV9. This largely unrecognized

1752 Giovannini et al.
Fig. 15. Infected municipalities in Sardinia and Tuscany in years 2001 and 2002.
Fig. 16. Infected municipalities insouthern Italy in 2002.

Control Strategy for Bluetongue in Italian Ruminant Populations 1753
presence of BTV9 in the previous yearmay have been responsible for a partialimmunological protection of the populationfrom the resurgence of the disease in 2001.
The ability of the model to predict the status ofmunicipalities after the threshold value was increasedshows that the model was nevertheless able to cor-rectly rank the municipalities based on their actualrisk of infection. This seems to indicate that the vari-ables chosen are relevant for the epidemiology of BTinfection and that, even if unable to produce an ex-act prediction of the spread of infection, the modelis able to indicate the level of risk to which each ter-ritory is exposed and, therefore, it could be a usefuldecision-making tool.
To provide adequate protection against BT, themodel predicted that at least 80% of susceptible live-stock must be immunized if vaccination is to be ef-fective. Results obtained following the 2002 vaccina-tion campaign in Italy are consistent with the model’spredictions. Data from the Balearic Islands and Cor-sica also seem to support the projections made by themodel. Although only sheep were vaccinated in bothareas, in the Balearic Islands, these greatly outnum-bered the cattle population and the total number ofvaccinated animals was near 80% of the total suscep-tible population (cattle, sheep, and goats). In contrast,in Corsica fewer than 70% of the total population ofsheep and goats were vaccinated. According to whatwas expected on the basis of the model’s predictions,disease seems to have disappeared from the BalearicIslands while a new epidemic occurred in Corsica in2001. No cases of BT were detected in Corsica duringthe year 2002, after a second vaccination campaign.
In conclusion, the results obtained in this studysupport the use of risk analysis as a tool to assist inchoosing an appropriate animal disease managementstrategy. The use of risk analysis in the evaluation ofdisease management strategies also offers advantagesin international trade. It makes easier the comparisonof different strategies applied in the various countries,and thus facilitates the assessment of equivalence ofthe guarantees provided by different strategies.
REFERENCES
1. World Trade Organization. (1994). Agreement on the Appli-cation of Sanitary and Phytosanitary Measures. Available athttp://www.wto.int/english/docs e/legal e/15-sps.pdf.
2. http://www.oie.int/eng/oie/en objectifs.htm.3. Office International des Epizooties. (1993). Risk analysis, an-
imal health and trade. Scientific and Technical Review, 12, 1–448.
4. Caporale, V., Giovannini, A., Calistri, P., & Conte, A. (1999).Import risk analysis: The experience of Italy. Scientific andTechnical Review, 18, 729–740.
5. European Union. (2001). Commission Decision of 9 Febru-ary 2001 establishing protection and surveillance zones in theCommunity in relation with bluetongue. 2001/138/EC. OfficialJournal L 050, 21/02/2001, pp. 17–19.
6. Hosmer, D. W., & Lemeshow, S. (1989). Applied Logistic Re-gression. New York: Wiley & Sons.
7. Frier, J. E. (1989). Estimation of vectorial capacity: Vectorabundance in relation to man. Bulletin of the Society of VectorEcology, 14, 41–46.
8. Gerry, A. C., Mullens, B. A., MacLachlan, N. J., & Mecham,J. O. (2001). Seasonal transmission of bluetongue virus byCulicoides sonorensis (Diptera:Ceratopogonidae) at a south-ern California dairy and evaluation of vectorial capacity as apredictor of bluetongue virus transmission. Journal of MedicalEntomology, 38, 197–209.
9. Roy, P., Bishop, D. H. L., LeBlois, H., & Erasmus, B. J. (1994).Long-lasting protection of sheep against bluetongue challengeafter vaccination with virus-like particles: Evidence for homol-ogous and partial eterologous protection. Vaccine, 12, 805–811.
10. OIE. (2003). Third International Symposium on Blue-tongue: Conclusions. Available at http://www.bluetonguesymposium.it/summary.htm.
11. Istituto Sperimentale di Studi del Suolo. Centro Nazionale diCartografia Pedologica. (2000). Soil Regions italiane. October2000. Available at http://www.issds.it/cncp/soilregionita.htm.
12. Roy, P., & Erasmus, B. J. (1992). Second generation candi-date vaccine for bluetongue disease. In T. E. Walton & B. I.Osburn (Eds.), Bluetongue, African Horse Sickness and Re-lated Orbiviruses. Proceedings of the Second InternationalSymposium (pp. 856–867). Boca Raton, FL: CRC Press.
13. OIE. (2000). Manual of Standards for Diagnostic Tests andVaccines, 4th ed. Available at http://www.oie.int/eng/normes/mmanual/A 00030.htm.
14. Report by the Spanish Government to the EU Standing Vet-erinary Committee.
15. Report: “Fievre catarrhale du mouton. Epizootie en Corse.Octobre 2000–Septembre 2001 (France).” Data providedduring the “Rencontre des services veterinaires BilateraleFrance-Italie.” Ajaccio, 25 September 2001.
16. Report of the “Rencontre des services veterinaires BilateraleFrance-Italie.” Ajaccio, 25 September 2001.
17. Calistri, P., Giovannini, A., Conte, A., Nannini, D., Santucci,U., Patta, C., Rolesu, S., & Caporale, V. (2003). Bluetongue inItaly—Part I. In Proceedings of the OIE Bluetongue Interna-tional Symposium. Taormina, 26–29 October.