The use of plants, including trees, to remediate oil ... - CORE
84
The use of plants, including trees, to remediate oil contaminated soils: a review and empirical study ...…….….Thesis submitted for a M.Sc. degree in Forest Ecology and Management University of Helsinki Dept. of Forest Sciences September 2012 Lijuan Yan
-
Upload
khangminh22 -
Category
Documents
-
view
0 -
download
0
Transcript of The use of plants, including trees, to remediate oil ... - CORE
The use of plants, including trees, to remediate oil
contaminated soils: a review and empirical study
...…….….Thesis submitted for a M.Sc. degree in Forest Ecology and Management
University of Helsinki
Dept. of Forest Sciences
September 2012
Lijuan Yan
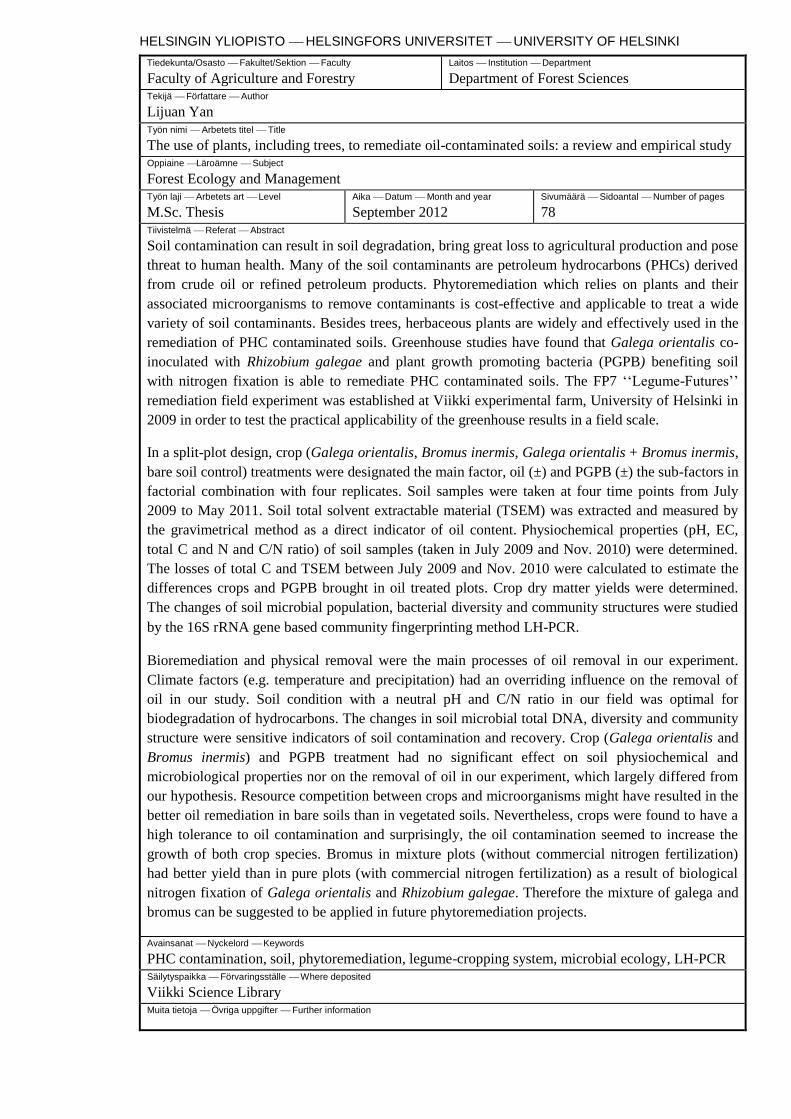
HELSINGIN YLIOPISTO HELSINGFORS UNIVERSITET UNIVERSITY OF HELSINKI
Tiedekunta/Osasto Fakultet/Sektion Faculty
Faculty of Agriculture and Forestry
Laitos Institution Department
Department of Forest Sciences Tekijä Författare Author
Lijuan Yan Työn nimi Arbetets titel Title
The use of plants, including trees, to remediate oil-contaminated soils: a review and empirical study Oppiaine Läroämne Subject
Forest Ecology and Management Työn laji Arbetets art Level
M.Sc. Thesis
Aika Datum Month and year
September 2012
Sivumäärä Sidoantal Number of pages
78 Tiivistelmä Referat Abstract
Soil contamination can result in soil degradation, bring great loss to agricultural production and pose
threat to human health. Many of the soil contaminants are petroleum hydrocarbons (PHCs) derived
from crude oil or refined petroleum products. Phytoremediation which relies on plants and their
associated microorganisms to remove contaminants is cost-effective and applicable to treat a wide
variety of soil contaminants. Besides trees, herbaceous plants are widely and effectively used in the
remediation of PHC contaminated soils. Greenhouse studies have found that Galega orientalis co-
inoculated with Rhizobium galegae and plant growth promoting bacteria (PGPB) benefiting soil
with nitrogen fixation is able to remediate PHC contaminated soils. The FP7 ‘‘Legume-Futures’’
remediation field experiment was established at Viikki experimental farm, University of Helsinki in
2009 in order to test the practical applicability of the greenhouse results in a field scale.
In a split-plot design, crop (Galega orientalis, Bromus inermis, Galega orientalis + Bromus inermis,
bare soil control) treatments were designated the main factor, oil (±) and PGPB (±) the sub-factors in
factorial combination with four replicates. Soil samples were taken at four time points from July
2009 to May 2011. Soil total solvent extractable material (TSEM) was extracted and measured by
the gravimetrical method as a direct indicator of oil content. Physiochemical properties (pH, EC,
total C and N and C/N ratio) of soil samples (taken in July 2009 and Nov. 2010) were determined.
The losses of total C and TSEM between July 2009 and Nov. 2010 were calculated to estimate the
differences crops and PGPB brought in oil treated plots. Crop dry matter yields were determined.
The changes of soil microbial population, bacterial diversity and community structures were studied
by the 16S rRNA gene based community fingerprinting method LH-PCR.
Bioremediation and physical removal were the main processes of oil removal in our experiment.
Climate factors (e.g. temperature and precipitation) had an overriding influence on the removal of
oil in our study. Soil condition with a neutral pH and C/N ratio in our field was optimal for
biodegradation of hydrocarbons. The changes in soil microbial total DNA, diversity and community
structure were sensitive indicators of soil contamination and recovery. Crop (Galega orientalis and
Bromus inermis) and PGPB treatment had no significant effect on soil physiochemical and
microbiological properties nor on the removal of oil in our experiment, which largely differed from
our hypothesis. Resource competition between crops and microorganisms might have resulted in the
better oil remediation in bare soils than in vegetated soils. Nevertheless, crops were found to have a
high tolerance to oil contamination and surprisingly, the oil contamination seemed to increase the
growth of both crop species. Bromus in mixture plots (without commercial nitrogen fertilization)
had better yield than in pure plots (with commercial nitrogen fertilization) as a result of biological
nitrogen fixation of Galega orientalis and Rhizobium galegae. Therefore the mixture of galega and
bromus can be suggested to be applied in future phytoremediation projects.
Avainsanat Nyckelord Keywords
PHC contamination, soil, phytoremediation, legume-cropping system, microbial ecology, LH-PCR Säilytyspaikka Förvaringsställe Where deposited
Viikki Science Library Muita tietoja Övriga uppgifter Further information

I
ACKNOWLEDGEMENTS
Without the help and support from my supervisors, colleagues and friends, I could
hardly finish my MSc. thesis, not alone the whole 3-year master study. Now I have
already been in the place I expected to come out, despite of the roundabout way in
the middle.
First of all, I am heartily grateful to Adjunct Professor Kristina Lindström, who
aroused my interest into the EU Legume-Futures project on the bioremediation of oil
contaminated soil. She has opened a new window for me, which is the use of
molecular tools to analyze what is happening in soils. She kindly provided me with
grant to support my MSc. lab work and facilitated me with everything concerning
working in the warmest N2 group. My deep gratitude also goes to my co-supervisors,
Adjunct Professor Fred Stoddard and Asko Simojoki in the Legume-Futures group,
for their valuable comments and advices on experiment implementation and data
analysis.
My warmest appreciation also goes to my thesis supervisor Mike Starr for his
thorough comments on my thesis and Professor Heljä-Sisko Helmisaari for having
taken me as a student in Forest Ecology and Management when I was facing the
major change problem. Without her, I could hardly think about graduation. I also
would like to thank her and Kim Yrjala for the thesis evaluation.
I would like to express my special thanks to Petri Penttinen, who directly supervised
me with all the microbiological analyses which I had not done before. I am thankful
for his valuable comments on thesis writing and the cherish friendship.
Last but not least, my deepest gratitude goes to my parents for their love to stimulate
me in the way of pursuing knowledge against all difficulties. Thank you all who have
ever supported me in any respect from the bottom of my heart.
Lijuan Yan
Helsinki, November 2012
II
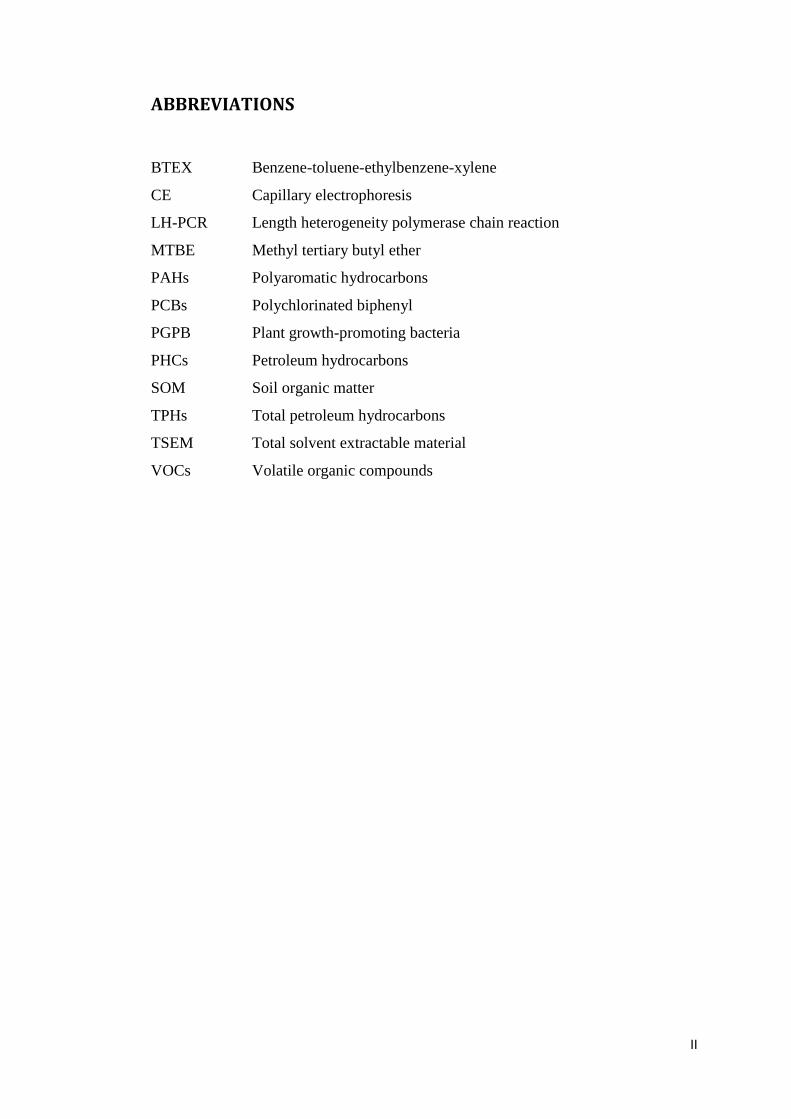
ABBREVIATIONS
BTEX Benzene-toluene-ethylbenzene-xylene
CE
LH-PCR
MTBE
PAHs
PCBs
PGPB
PHCs
Capillary electrophoresis
Length heterogeneity polymerase chain reaction
Methyl tertiary butyl ether
Polyaromatic hydrocarbons
Polychlorinated biphenyl
Plant growth-promoting bacteria
Petroleum hydrocarbons
SOM Soil organic matter
TPHs Total petroleum hydrocarbons
TSEM Total solvent extractable material
VOCs Volatile organic compounds
III
TABLE OF CONTENTS
ACKNOWLEDGEMENTS ........................................................................................................ I
ABBREVIATIONS .................................................................................................................... II
INTRODUCTION ................................................................................................................... 1
LITERATURE REVIEW ON PETROLEUM HYDRCARBON CONTAMINATION AND
ITS REMEDIATION METHODS ......................................................................................... 3
1. Petroleum hydrocarbon (PHC) contamination in soil .................................... 3
1.1 Introduction on oil and petroleum hydrocarbons ....................................................... 3
1.2 Impact of PHC chemicals on soil environment .......................................................... 3
1.3 Sources of PHC contamination .................................................................................. 5
1.4 Extent of land PHC contamination ............................................................................ 6
1.5 Fate of PHCs in soil ................................................................................................... 8
2 Methods of remediation of oil-contaminated soils .......................................... 11
2.1 Physical and chemical remediation .......................................................................... 11
2.2 Biological remediation ............................................................................................. 11
3 SUMMARY OF PHYTOREMEDIATION RESEARCH (INCLUDING
USE OF TREES) .................................................................................................. 15
3.1 Mechanisms of phytoremediation ............................................................................ 15
3.2 Species selection (including forest trees) in phytoremediation ................................ 20
EMPIRICAL STUDY – THE OIL-CONTAMINATED SOIL REMEDIATION FIELD
EXPERIMENT ..................................................................................................................... 31
4 Introduction about the soil remediation field experiment ............................. 31
4.1 Objectives of the experiment ................................................................................... 32
4.2 Hypotheses ............................................................................................................... 32
5 Materials and methods ...................................................................................... 34
5.1 Experimental field design ........................................................................................ 34
5.2 Selection of species .................................................................................................. 36
5.3 Field preparation and management .......................................................................... 36
5.4 Data collection ......................................................................................................... 38
5.5 Laboratory analyses ................................................................................................. 39
5.6 Statistical analysis .................................................................................................... 45
6 Results ................................................................................................................. 48
6.1 Soil physicochemical properties .............................................................................. 48
6.2 Oil content ................................................................................................................ 50
6.3 Plant chlorophyll content and dry matter yields ...................................................... 53

IV
6.4 Soil microbial dynamics........................................................................................... 54
7 Discussion ........................................................................................................... 60
7.1 Hydrocarbon contamination and soil physicochemical properties .......................... 60
7.2 Hydrocarbon contamination and crop growth .......................................................... 63
7.3 Hydrocarbon contamination and soil microorganisms ............................................ 65
8 General conclusions ........................................................................................... 68
REFERENCES ..................................................................................................................... 70
APPENDIX ........................................................................................................................... 78
1
INTRODUCTION
Soil is a fundamental and irreplaceable natural resource which provides a variety of
ecosystem services and is the essential link between the components air, bedrock,
water and biota that make up our environment. The components interact with each
other to constantly provide several goods (e.g., food, fuel and fiber) to support
organisms (DEFRA 2009).
More and more goods and services are being demanded from the land due to
population growth, resulting in increasing land degradation such as soil erosion,
landslides, organic matter decline, salinization and contamination. Contaminated
land is defined as sites having levels of contaminants present in the soil that pose a
significant possibility of harm to the ecosystem (DEFRA 2009). The European
Commission (2002; 2006a; 2006b) has identified soil contamination as one of eight
major threats to European soils. Soil contaminants include heavy metals, mineral
pollutants, monocyclic aromatic hydrocarbons, phenolic compounds, polycyclic
aromatic hydrocarbons (PAHs), chlorinated hydrocarbons, pesticides and other
pollutants such as mineral oils and gasoline (Beyer 1990). Contaminants can enter
the soil from points (local) and diffuse sources (DEFRA 2009). In Europe, 3.5
million sites are estimated to be potentially contaminated (European Commission
2006b). It is not easy to estimate the costs of the soil contamination in terms of
rehabilitating and restoring due to the lack of sufficient quantitative and qualitative
data, but studies have pointed out that soil contamination results in great costs to
society (European Commission 2006c).
Soil microbes as well as plants and biota are effective indicators to reflect the levels
of soil contamination. They are capable of degrading or retaining more than 99% of
all the types of soil pollutants (EA 2006) and preventing them from entering the
wider environment. However, when the amount of contaminants exceeds the
buffering capacity of a soil, it leads to a long-term negative impact on soil quality
and biodiversity, and also damages to its functions as a producer of fiber, fuel and
food. Once the contaminants enter the food chain, they can become a threat to human
health.
2
Growing awareness of the harm that pollutants do to the soil as well as to the whole
ecological chain has led to more research into how to clean up contaminated sites.
Due to the great diversity of pollutants, however, there is no common solution to
solve all types of soil contamination. Nevertheless, many of the pollutants mentioned
above are petroleum hydrocarbons (PHCs) that originate from crude oil or refined
petroleum products (EEA 2007). Therefore studies related to petroleum hydrocarbon
contamination of soil and its biological cleanup is of great importance.
This study consists of two parts. The first part is a literature review on the current
situation of petroleum hydrocarbon contamination and its remediation methods:
physical, chemical and biological methods. The emphasis is put on phytoremediation,
an effective method which relies on plants to remove contaminants from soil.
Successful cases of using trees in the remediation of petroleum hydrocarbon
contaminated soils are presented. The second part is an empirical field study focusing
on the use of two crop species, a legume (Galega orientalis) and a grass (Bromus
inermis), as well as plant growth promoting bacteria (PGPB) to remediate petroleum
hydrocarbon contaminated soil.
The overall objectives of this thesis were to study the environmental fate of
petroleum hydrocarbons in soil, introduce the phytoremediation mechanisms, test the
PHC remediation potential of two crops Galega orientalis and Bromus inermis in oil-
contaminated soils and detect the changes of soil bacteria population and community
structure under crop, oil and PGPB treatments through a split-plot design field
experiment.
3
LITERATURE REVIEW ON PETROLEUM HYDRCARBON
CONTAMINATION AND ITS REMEDIATION METHODS
1 Petroleum hydrocarbon (PHC) contamination in soil
1.1 Introduction on oil and petroleum hydrocarbons
Oil is defined as a broad range of hydrocarbon-based substances, which are of two
types: mineral oil such as different specific distillates of crude oil, and organic oil
such as animal fats and vegetable oils. Natural gas, crude oil, tars and asphalts are
types of petroleum hydrocarbons (Frick et al. 1999). The word "petroleum" means
"rock oil" or "oil from the earth" (USEPA 2011b). Petroleum widely used in our
daily life plays a vital role in our modern economy. We are dependent on it in many
ways as it provides great benefits to society. It is not only the main energy source for
heating, transportation and manufacturing, but also acts as a raw material for plastics
and synthetic rubber.
Petroleum hydrocarbons (PHCs) are used to describe mixtures of organic compounds
found in or derived from geological substances such as oil, bitumen and coal (CCME
2001a). They are composed of two categories: 1) gasoline range organics refers to
small chain alkanes (C6-C10), e.g. methane, ethane, propane, volatile aromatic
compounds (e.g. BTEX) and common oxygenates (e.g. MTBE and ethanol); and 2)
diesel range organics are the alkanes with longer chains (C10-C40) or non-
halogenated semi-volatile organic compounds and hydrophobic chemicals such as
PAHs (e.g. naphthalene, phenanthrene, anthracene, benzo[a]pyrene) (Kamath et al,
2007; Frick et al. 1999). The small chain alkanes, such as isopentane, always have
low boiling point between 60 and 170⁰C (Kamath et al. 2007).
1.2 Impact of PHC chemicals on soil environment
When PHCs are released into ecosystems, they are threatened in various ways.
According to U.S. Environmental Protection Agency (USEPA) (2007), “oil releases
threaten public health and safety by contaminating drinking water, causing fire and
explosion hazards, diminishing air and water quality, compromising agriculture,
destroying recreational areas, and wasting nonrenewable resources. Oil spills also
4
have a severe environmental impact on ecosystems by harming or killing wildlife
and plants, and destroying habitats and food”. They can influence on ecosystems
directly or indirectly.
Each type of petroleum hydrocarbon has its distinct physical and chemical properties
that affect the way of its spreading and breaking-down (USEPA 2011a). The degree
of harm that oil can do to an ecosystem and human life varies with the amount and
constitutions of the oil source spilled (e.g. gasoline vs. crude oil), site factors (e.g.
terrain, vegetation, soil texture and climate), time since release and management
(CCME 2008). Although the pollution is always caused by a mixture of
hydrocarbons, aromatic compounds tend to be more toxic than aliphatic compounds
(Epps 2006).
Even at low rates of contamination the residual hydrocarbons may cause serious
pertubations to the cellular metabolisms for plants (Chaineau et al. 2003). When
sorghum was grown in a high concentration of phenanthrene (e.g. 100 mg/kg), the
total amount of root-exuded compounds decreased by 78% due to the root damage
(Kawasaki et al. 2011). Therefore, food production and safety in the contaminated
area can hardly be guaranteed.
Once soil is polluted by PHCs, the recovery may take several years. For instance,
Wang et al. (2000) reported that four to five years was needed for the pasture to
restore the dominance of Aneurolopidium chinensis in oil drilling sites of chernozem
and Aeolian sand soils.
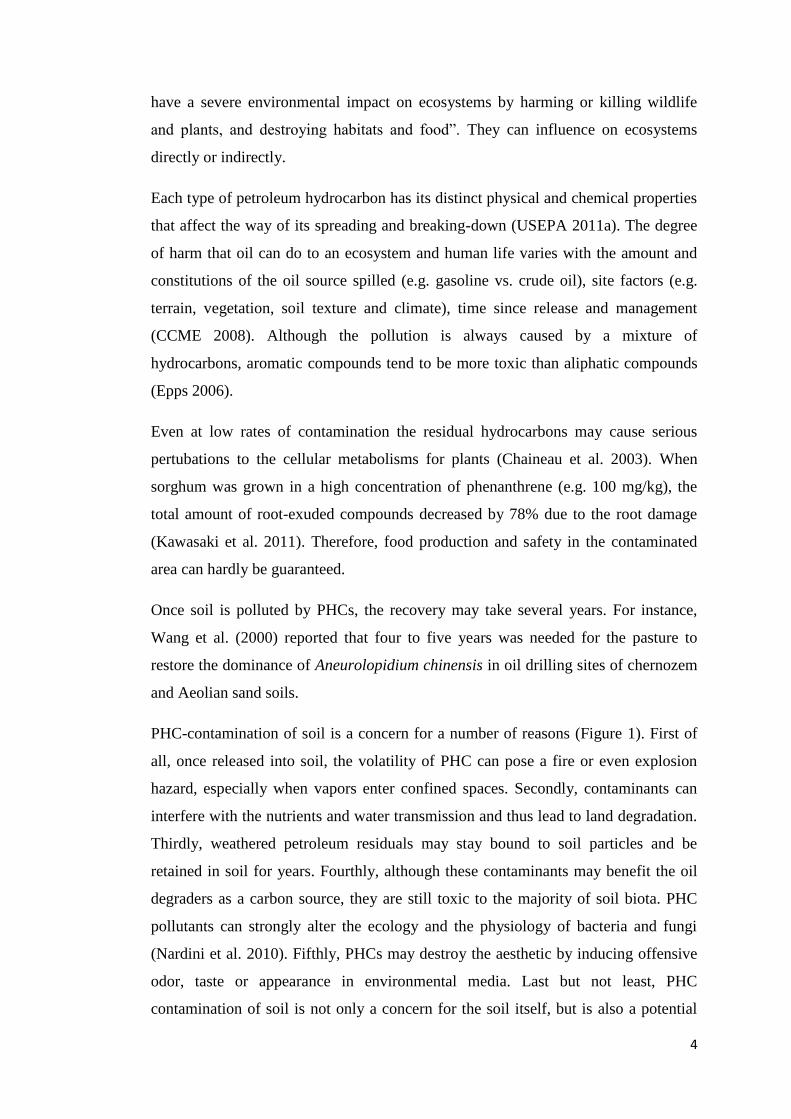
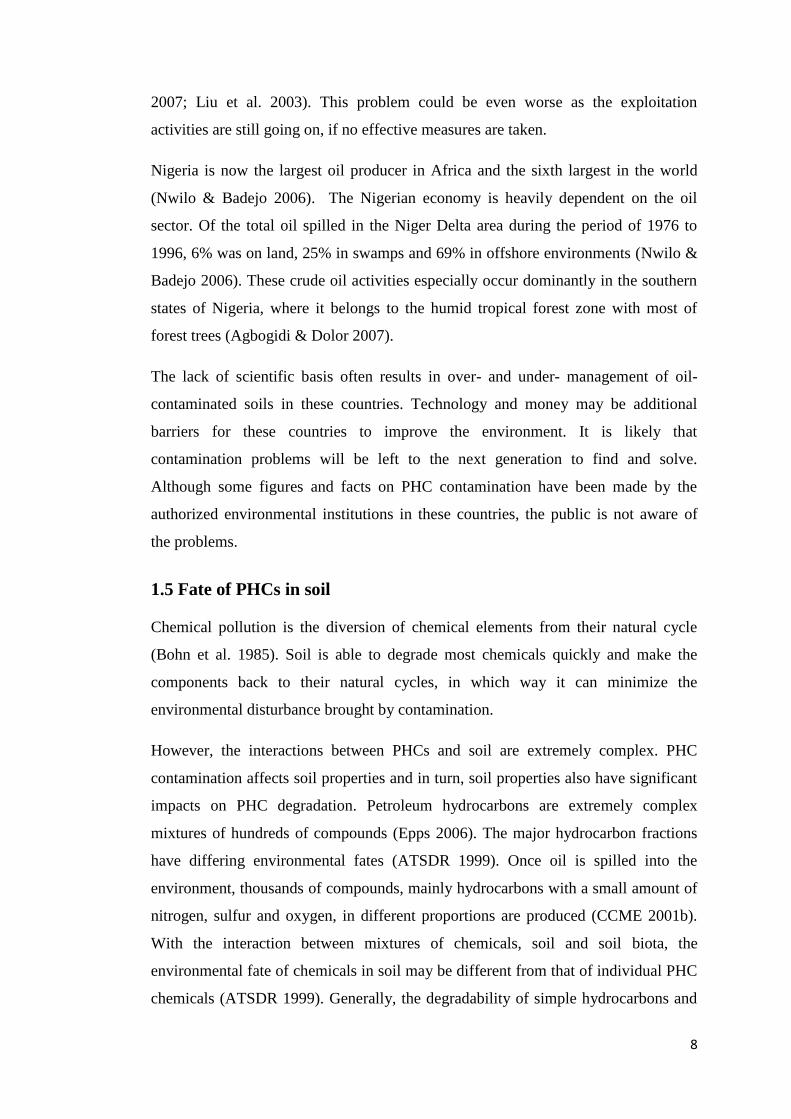
PHC-contamination of soil is a concern for a number of reasons (Figure 1). First of
all, once released into soil, the volatility of PHC can pose a fire or even explosion
hazard, especially when vapors enter confined spaces. Secondly, contaminants can
interfere with the nutrients and water transmission and thus lead to land degradation.
Thirdly, weathered petroleum residuals may stay bound to soil particles and be
retained in soil for years. Fourthly, although these contaminants may benefit the oil
degraders as a carbon source, they are still toxic to the majority of soil biota. PHC
pollutants can strongly alter the ecology and the physiology of bacteria and fungi
(Nardini et al. 2010). Fifthly, PHCs may destroy the aesthetic by inducing offensive
odor, taste or appearance in environmental media. Last but not least, PHC
contamination of soil is not only a concern for the soil itself, but is also a potential
5
threat to other ecosystems. If the PHC release is persistent in one place, it will
probably extend its impacts to adjacent areas as individual compounds continue to
separate and migrate away from the spill area via air or groundwater (ATSDR 1999).
PHCs and other chemicals can also find their way to drinking water and so pose a
threat to human health.
Figure 1. Concerns for PHC-contamination of soils, modified from Canada-wide
standards for petroleum hydrocarbons (PHC) in soil (CCME 2001a).
1.3 Sources of PHC contamination
With the development of the oil industry, it is difficult to avoid oil contamination of
soil through crude oil exploration, transportation, processing and consumption. Most
of the PHCs generated from crude oil or refined oil products released to the soil
environment are through anthropogenic accidents, as releases from industries or as
byproducts from commercial or private uses.
6
In different countries, the main sources and polluting activities may vary from each
other. However, industrial and commercial activities as well as the treatment and
disposal of waste are reported to be the most important sources of oil contamination
in Europe (EEA 2007). In Nordic countries where the climatic condition only can
support a few coniferous and broadleaf tree genera (Burton et al. 2003), petroleum
hydrocarbons still can find their way into the boreal ecosystem by surface spills or
leaks from pipelines or storage tanks (Robertson et al. 2007).
1.4 Extent of land PHC contamination
1.4.1 US, Canada and EU
The extent of PHC contaminated sites is most well-known in the developed world,
North America and Western Europe.
In the United States, oil spills caused by land-based facilities take up the bulk of the
whole spillage on land (Etkin 2001). From the production, storage, transport, and use
of oil, estimated 18,000 - 24,000 oil spills are reported annually in the United States
(USEPA 2007). These spills correspond to 10-25 million gallons of oil spilled
annually. Oil spills from pipelines are greater than spills from tankers and barges
since 1985 (Etkin 2001). However, the extent of petroleum hydrocarbon
contamination throughout the United States is often reflected by the numerous
‘’Superfund’’ sites that are abandoned hazardous waste sites and ‘’Leaking
Underground Storage Tanks (LUST)’’ sites that contain high concentrations of PHC
contamination (Kamath et al. 2007).
The Canadian Council of Ministers of the Environment (2001b) reported that
petroleum hydrocarbon is one of the most widespread types of soil contamination in
Canada. There are tens of thousands of contaminated sites across Canada, about 60%
of which involve PHC contamination (CCME 2001a; 2001b).
Due to the use of dangerous substances and lack of effective management practice in
the past, the whole Europe is faced with soil contamination problems as a result of
industrialization (European Commission 2006c). Heavy metals and mineral oil are
the main contaminants in soil (EEA 2007). However, the level and range of soil
contamination depend on local conditions and source of contaminants. The European
Environmental Agency (2007) has estimated that there are approximately 250 000
7
contaminated sites that require immediate remediation in the EEA member countries
and this number is growing. Although some measures have been taken, it may still
need several decades until they are totally cleaned up.
Legal frameworks have been made to identify and remediate soil contamination in
most developed countries. For example, Canada developed the Canada-Wide
Standard for Petroleum Hydrocarbons in Soil (PHC CWS) under the Harmonization
Sub-Agreement on Standards and was endorsed (with the exception of Quebec) in
May 2001 (CCME 2001a). Its supporting technical document (CCME 2008)
provides a consistent approach to managing PHC-contaminated sites across the
country.
1.4.2 Developing countries e.g. China and Nigeria
There is little awareness of oil contamination in the developing countries and the
challenge for soil remediation lies in the developing countries.
Soil contamination has been a problem for local authorities in China since the rapid
development of the economy from the last 40 years. Although more concern has
been given to heavy metal contamination, some 600, 000 tons of petroleum is
released into to the environment every year, resulting in the pollution of soil, ground
water and the sea (Lu et al. 2003). Oilfields, oil transmission stations, oil and
wastewater tanks, and oily sludge are the main sources of soil PHC contamination in
China (Liu et al. 2007).
Currently, there are more than 400 oil fields and oil gas fields under exploration and
development distributed in 25 provinces in China. These oil fields cover an area of
320, 000 km2, which is 3% of the whole territory of China. In the exploiting and
manufacturing process of petroleum products, it is estimated that there are 4.8
million hectares of land where the petroleum content exceeds the safety threshold for
crop growth (Liu et al. 2007).
Liu et al. (2003) showed that the average oil content in soils in Shengli oil field, the
second largest oil field in China, increased between 1986 and 2003. The oil content
in most of soils within 100 m distance of the four largest oilfields (Daqing, Shengli,
Jianghan and Jiangsu) was higher than the threshold value (500 mg/kg) (Liu et al.
8
2007; Liu et al. 2003). This problem could be even worse as the exploitation
activities are still going on, if no effective measures are taken.
Nigeria is now the largest oil producer in Africa and the sixth largest in the world
(Nwilo & Badejo 2006). The Nigerian economy is heavily dependent on the oil
sector. Of the total oil spilled in the Niger Delta area during the period of 1976 to
1996, 6% was on land, 25% in swamps and 69% in offshore environments (Nwilo &
Badejo 2006). These crude oil activities especially occur dominantly in the southern
states of Nigeria, where it belongs to the humid tropical forest zone with most of
forest trees (Agbogidi & Dolor 2007).
The lack of scientific basis often results in over- and under- management of oil-
contaminated soils in these countries. Technology and money may be additional
barriers for these countries to improve the environment. It is likely that
contamination problems will be left to the next generation to find and solve.
Although some figures and facts on PHC contamination have been made by the
authorized environmental institutions in these countries, the public is not aware of
the problems.
1.5 Fate of PHCs in soil
Chemical pollution is the diversion of chemical elements from their natural cycle
(Bohn et al. 1985). Soil is able to degrade most chemicals quickly and make the
components back to their natural cycles, in which way it can minimize the
environmental disturbance brought by contamination.
However, the interactions between PHCs and soil are extremely complex. PHC
contamination affects soil properties and in turn, soil properties also have significant
impacts on PHC degradation. Petroleum hydrocarbons are extremely complex
mixtures of hundreds of compounds (Epps 2006). The major hydrocarbon fractions
have differing environmental fates (ATSDR 1999). Once oil is spilled into the
environment, thousands of compounds, mainly hydrocarbons with a small amount of
nitrogen, sulfur and oxygen, in different proportions are produced (CCME 2001b).
With the interaction between mixtures of chemicals, soil and soil biota, the
environmental fate of chemicals in soil may be different from that of individual PHC
chemicals (ATSDR 1999). Generally, the degradability of simple hydrocarbons and
9
petroleum fuels decreases as molecular weight and degree of branching increase
(Shukla et al. 2010).
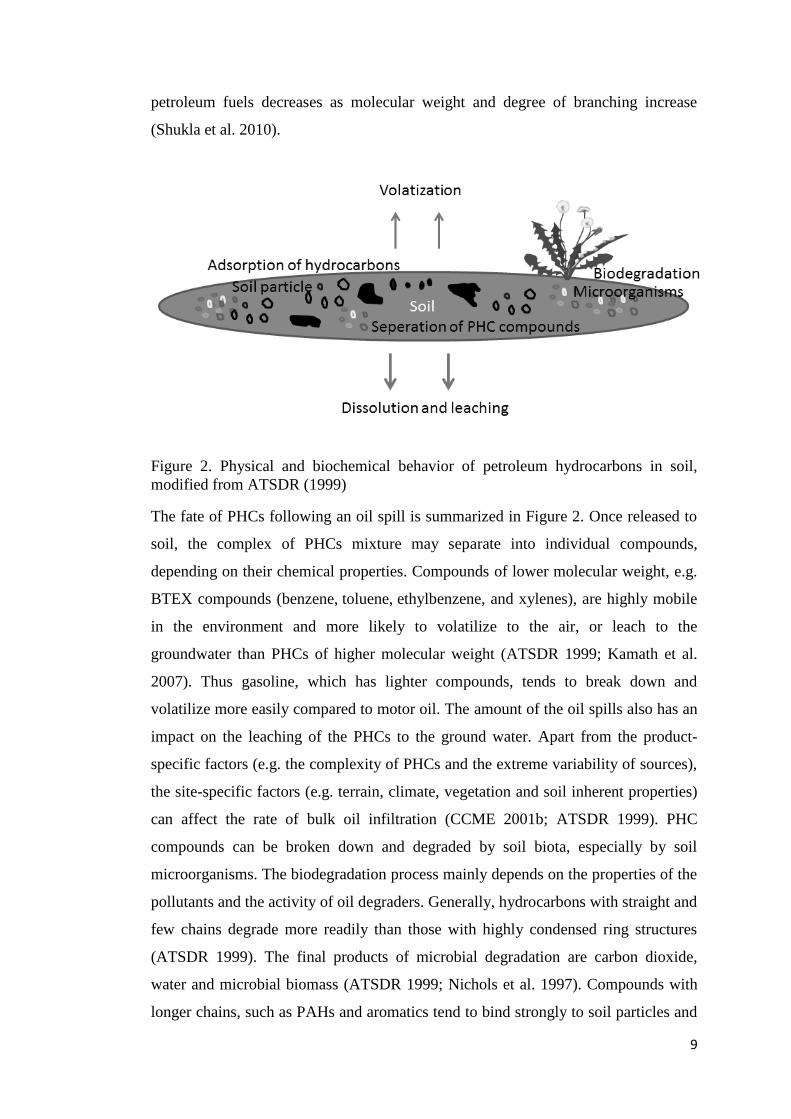
Figure 2. Physical and biochemical behavior of petroleum hydrocarbons in soil,
modified from ATSDR (1999)
The fate of PHCs following an oil spill is summarized in Figure 2. Once released to
soil, the complex of PHCs mixture may separate into individual compounds,
depending on their chemical properties. Compounds of lower molecular weight, e.g.
BTEX compounds (benzene, toluene, ethylbenzene, and xylenes), are highly mobile
in the environment and more likely to volatilize to the air, or leach to the
groundwater than PHCs of higher molecular weight (ATSDR 1999; Kamath et al.
2007). Thus gasoline, which has lighter compounds, tends to break down and
volatilize more easily compared to motor oil. The amount of the oil spills also has an
impact on the leaching of the PHCs to the ground water. Apart from the product-
specific factors (e.g. the complexity of PHCs and the extreme variability of sources),
the site-specific factors (e.g. terrain, climate, vegetation and soil inherent properties)
can affect the rate of bulk oil infiltration (CCME 2001b; ATSDR 1999). PHC
compounds can be broken down and degraded by soil biota, especially by soil
microorganisms. The biodegradation process mainly depends on the properties of the
pollutants and the activity of oil degraders. Generally, hydrocarbons with straight and
few chains degrade more readily than those with highly condensed ring structures
(ATSDR 1999). The final products of microbial degradation are carbon dioxide,
water and microbial biomass (ATSDR 1999; Nichols et al. 1997). Compounds with
longer chains, such as PAHs and aromatics tend to bind strongly to soil particles and
10
remain relative immobile at the location where they are spilled until they separate
into smaller fractions and are degraded by plants and microorganisms (ATSDR 1999;
Kamath et al 2007). Soil organic matter and clay particles play a vital role in the
binding of PHCs, reducing their bioavailability to microorganisms.
As microorganisms in soil are many and not easy to monitor and control, the
assessment and risk management are difficult. After a few decades of intensive
research, many cleanup methods have been developed. However, more trials and
methods are still needed since the nature of contamination varies in different sites
and countries.
11
2 Methods of remediation of oil-contaminated soils
Commission of the European Communities (2006) suggests ‘’Remediation shall
consist of actions on the soil aimed at the removal, control, containment or reduction
of contaminants so that the contaminated site, taking account of its current use and
approved future use, no longer poses any significant risk to human health or the
environment’’. The contaminants can be treated either in situ or ex situ. In situ
remediation requires treating the contaminated material in place, while ex situ
involves the physical removal of the soil and contaminants from the polluted site to
be treated elsewhere (Kapley & Purohi 2009; Boopathy 2000).
Conventional oil remediation methods can be broadly divided into physical, chemical
and biological methods, besides the natural attenuation (USEPA 2011a; Zhu et al.
2004).
2.1 Physical and chemical remediation
Mechanical and chemical methods are common traditional technologies used in
treating contaminated soils. Zhu et al. (2004) listed the commonly used mechanical
methods as follows: booming and skimming, manual removal (wiping), mechanical
removal, water flushing, sediment relocation and tilling. Chemical methods such as
the use of dispersants are most widely applied in oil-contaminated water bodies.
These physical and chemical methods relying on incineration, volatilization or
immobilization of pollutants are often adopted when the oil concentration is quite
high at the contaminated sites. The cost of removing 1 m3 soil from a 1-acre
contaminated site is estimated at 0.6-2.5 million USD (Mclntyre 2003). These
methods are often very effective to remove the original contaminants. However,
there is increasing debate about the use of these methods as they have the potential to
transfer the pollutants or produce secondary pollution as incineration residues which
might pose long-term threat to the environment (Zhu et al. 2004; Shukla et al. 2010).
2.2 Biological remediation
Biological remediation is often used in the moderate oil-contaminated soils.
Compared to the mechanical and chemical remediation, biological remediation is
regarded as a better remedial technology in soil contamination.
12
Defined as the elimination, attenuation or transformation of polluting or
contaminating substances by the use of biological processes, biological remediation
presents a potentially low-technology, cheaper option to physicochemical
technologies (Obuekwe & Al-Muttawa 2001; Shukla et al. 2010). Firstly, they are
more cost effective without much investment in labor. Secondly, the risk of causing
secondary pollution is lowered. Thirdly, they are applicable for treating a wide
variety of environmental contaminants. Last but not least, they can give an
aesthetical value by providing pleasant landscape by phytoremediation (Kamath et al.
2007).
There are four types of the biological tools that can be used in soil remediation: 1)
use of microorganisms (e.g. fungi or bacteria) to decompose the organic pollutants, 2)
use of plants, especially the fast growing plants with large biomass and 3) soil
animals (e.g. earthworms) to accumulate or stabilize the non-degradable
contaminants in their body or in the soil; 4) the combinative use of the above all
organisms or even the merge of both physicochemical and biological methods.
Here I will give an introduction on narrowly-defined bioremediation and
phytoremediation, however, the broad concepts of these two terms nowadays have
somehow overlapped or merged.
2.2.1 Bioremediation
Bioremediation is the use of biological agents, mainly microorganisms (e.g., yeast,
fungi or bacteria) or their enzymes to destroy or reduce the concentration of
hazardous wastes on a contaminated site (Kapley &Purohi 2009; Shukla et al. 2010;
Boopathy 2000). It has been widely used in organic and inorganic contaminated sites.
In the organic contaminated sites, microbes are able to use the contaminants as their
source of energy, resulting in the degradation of the contaminants.
Boopathy (2000) summarized three factors affecting bioremediation: 1) energy and
nutrient sources, 2) bio-activity of microorganisms and biochemistry of enzymes,
and 3) the bioavailability of a contaminant. The bioavailability of a pollutant in soil
depends on the mass transport towards the sites where degrader populations are
abundant, besides the solubility of the pollutant in soil (Wenzel 2009). For a
successful remediation, we should have the right microbes, e.g., bacteria or fungi,
which have the physiological and metabolic abilities to decompose the contaminants,
13
in the right place with the right environmental factors for degradation to occur. It is
also suggested that temperature and oxidation-reduction (redox potential) are
important parameters of bioremediation since most bioremediation systems run under
aerobic conditions (Shukla et al. 2010; USEPA 1994).This method which encourages
the biodegradation of hydrocarbons by providing oxygen and in necessary nutrients
to microorganisms into the soil unsaturated zone is called bioventing (Shukla et al.
2010).
Indigenous microbes are capable of adapting and responding rapidly to
contamination under favorable nutrient conditions and degrading the contamination
(ATSDR 1999; Margesin & Schinner 2001). Even in extreme conditions or
environments (e.g. deserts), microbes have been found capable of dealing with
hydrocarbon contamination (Margesin & Schinner 2001). The method of using
indigenous microorganisms to degrade soil contaminants is called biosparging and is
regarded most cost efficient and noninvasive (Shukla et al. 2010). Some bacteria
such as Pseudomonas (e.g. P. cepacea, P. fluorenscens and P. putida), Rhodococcus,
Acinetobacter, Mycobacterium, Arthrobacter, Acaligenes and Acidobacteria species
and some fungi such as Pencillium, Mucor and Aspergillus have been found able to
degrade hydrocarbons (Johnsen et al. 2005 & Ellis 1994).
2.2.2 Phytoremediation
Plants can well adapt to different environmental conditions and can also modify
conditions of the environment to some extent (Susarla et al. 2002). Phytoremediation
(phyto – Greek for plants) is a general term to describe the ways how plants can be
used to remove contaminants from soil and water (USEPA 1998; USDA 2000). More
specifically, phytoremediation is a term applied to a group of technologies that use
plants to reduce, remove, degrade or immobilize environmental toxins with the aim
of restoring a site to a condition useable for private or public applications (Peer et al.
2006). Phytoremediation has been widely applied to the remediation sites
contaminated by metals, pesticides, solvents, explosives, crude oil, PAHs and landfill
leachates (FRTR 2012). The advantages and constraints of phytoremediation are
shown in Table 1.
14
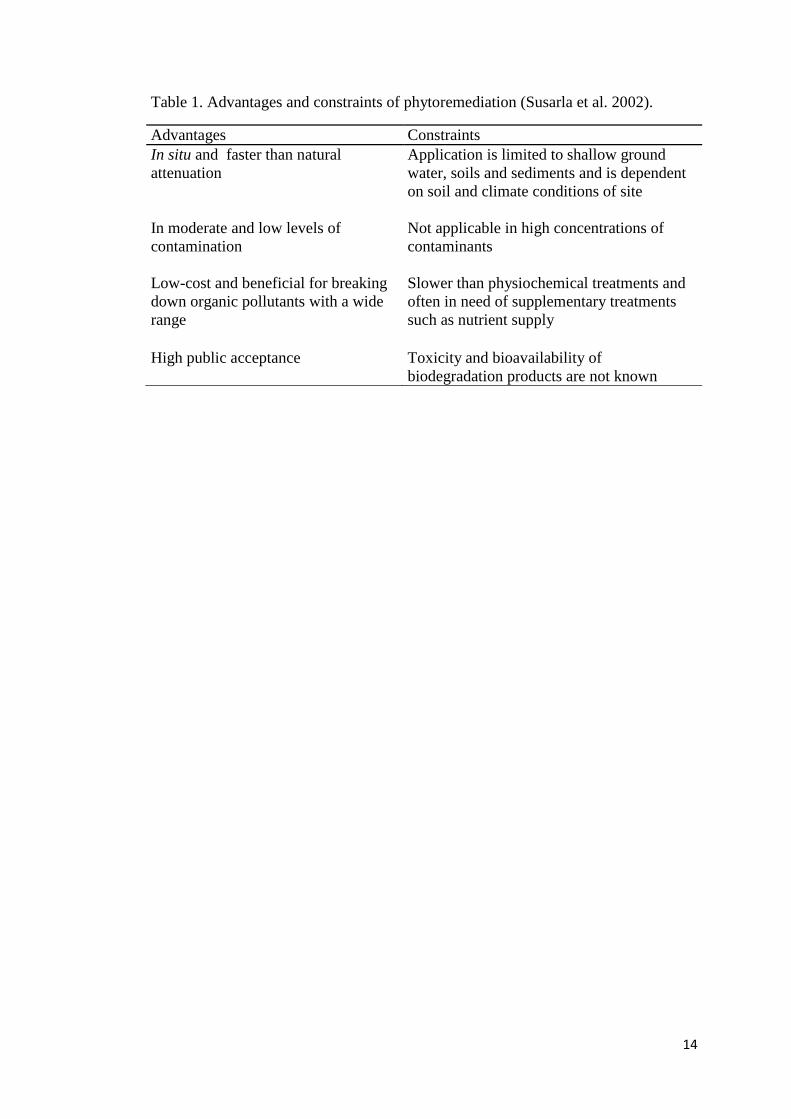
Table 1. Advantages and constraints of phytoremediation (Susarla et al. 2002).
Advantages Constraints
In situ and faster than natural
attenuation
Application is limited to shallow ground
water, soils and sediments and is dependent
on soil and climate conditions of site
In moderate and low levels of
contamination
Not applicable in high concentrations of
contaminants
Low-cost and beneficial for breaking
down organic pollutants with a wide
range
Slower than physiochemical treatments and
often in need of supplementary treatments
such as nutrient supply
High public acceptance
Toxicity and bioavailability of
biodegradation products are not known
15
3 SUMMARY OF PHYTOREMEDIATION RESEARCH (INCLUDING
USE OF TREES)
3.1 Mechanisms of phytoremediation
As mentioned, phytoremediation relies on the ability of plants to remove, degrade,
transform or stabilize contaminants within soil and groundwater through physical,
chemical and biological processes (Peer et al. 2006). Plants are also capable to
change the composition or the amount of root exudation as to stimulate
bioremediation by altering the microbial community structure, stimulating the
growth of microorganisms, or increasing microbial catabolic activities (Kawasaki et
al. 2011).
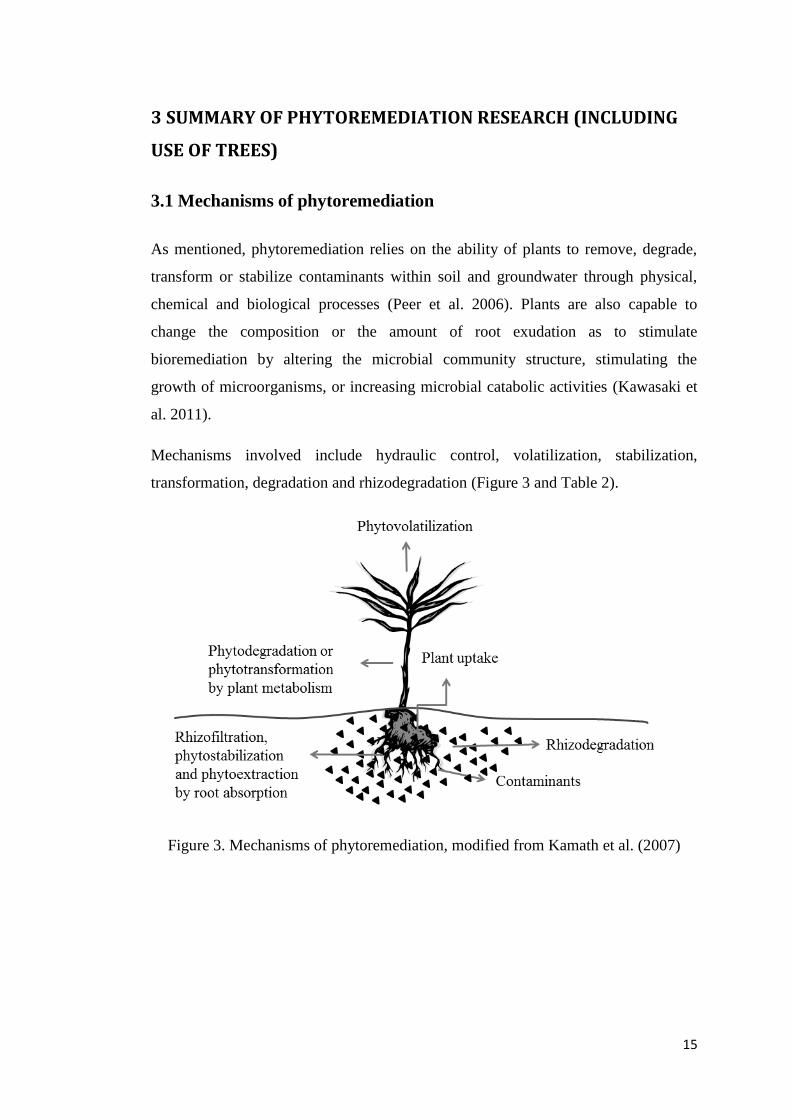
Mechanisms involved include hydraulic control, volatilization, stabilization,
transformation, degradation and rhizodegradation (Figure 3 and Table 2).
Figure 3. Mechanisms of phytoremediation, modified from Kamath et al. (2007)
16
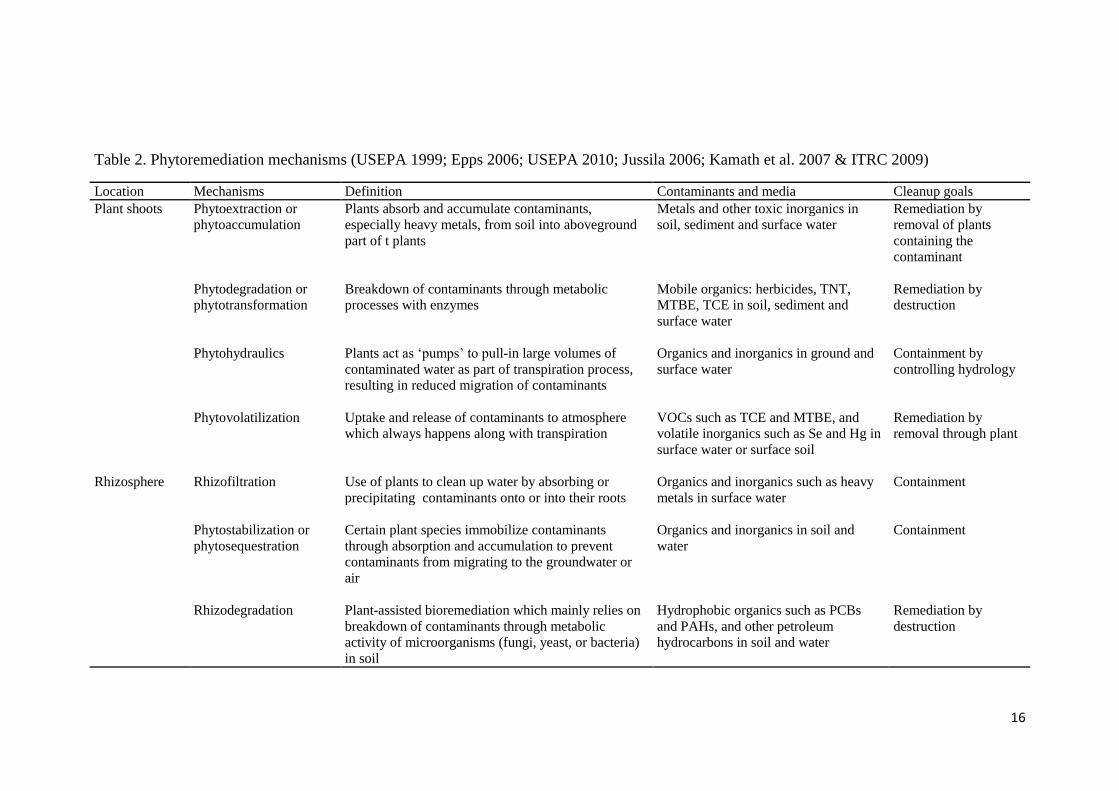
Table 2. Phytoremediation mechanisms (USEPA 1999; Epps 2006; USEPA 2010; Jussila 2006; Kamath et al. 2007 & ITRC 2009)
Location Mechanisms Definition Contaminants and media Cleanup goals
Plant shoots Phytoextraction or
phytoaccumulation
Plants absorb and accumulate contaminants,
especially heavy metals, from soil into aboveground
part of t plants
Metals and other toxic inorganics in
soil, sediment and surface water
Remediation by
removal of plants
containing the
contaminant
Phytodegradation or
phytotransformation
Breakdown of contaminants through metabolic
processes with enzymes
Mobile organics: herbicides, TNT,
MTBE, TCE in soil, sediment and
surface water
Remediation by
destruction
Phytohydraulics
Plants act as ‘pumps’ to pull-in large volumes of
contaminated water as part of transpiration process,
resulting in reduced migration of contaminants
Organics and inorganics in ground and
surface water
Containment by
controlling hydrology
Phytovolatilization
Uptake and release of contaminants to atmosphere
which always happens along with transpiration
VOCs such as TCE and MTBE, and
volatile inorganics such as Se and Hg in
surface water or surface soil
Remediation by
removal through plant
Rhizosphere
Rhizofiltration
Use of plants to clean up water by absorbing or
precipitating contaminants onto or into their roots
Organics and inorganics such as heavy
metals in surface water
Containment
Phytostabilization or
phytosequestration
Certain plant species immobilize contaminants
through absorption and accumulation to prevent
contaminants from migrating to the groundwater or
air
Organics and inorganics in soil and
water
Containment
Rhizodegradation
Plant-assisted bioremediation which mainly relies on
breakdown of contaminants through metabolic
activity of microorganisms (fungi, yeast, or bacteria)
in soil
Hydrophobic organics such as PCBs
and PAHs, and other petroleum
hydrocarbons in soil and water
Remediation by
destruction
17
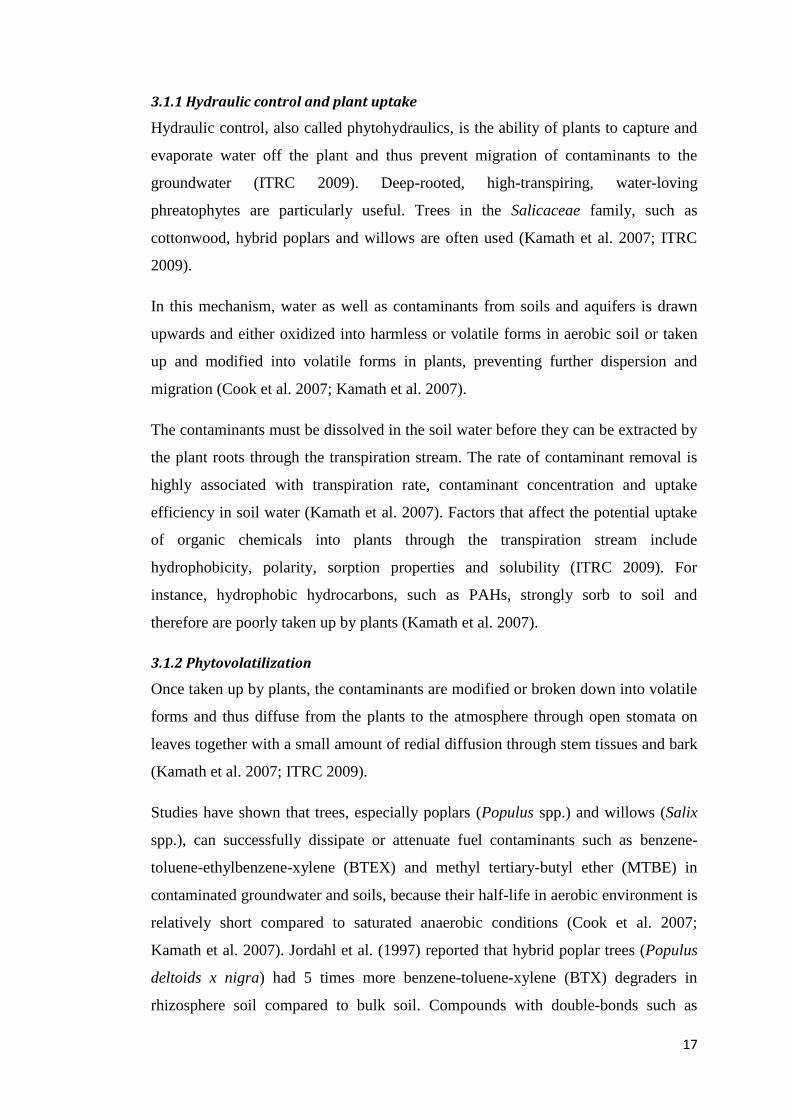
3.1.1 Hydraulic control and plant uptake
Hydraulic control, also called phytohydraulics, is the ability of plants to capture and
evaporate water off the plant and thus prevent migration of contaminants to the
groundwater (ITRC 2009). Deep-rooted, high-transpiring, water-loving
phreatophytes are particularly useful. Trees in the Salicaceae family, such as
cottonwood, hybrid poplars and willows are often used (Kamath et al. 2007; ITRC
2009).
In this mechanism, water as well as contaminants from soils and aquifers is drawn
upwards and either oxidized into harmless or volatile forms in aerobic soil or taken
up and modified into volatile forms in plants, preventing further dispersion and
migration (Cook et al. 2007; Kamath et al. 2007).
The contaminants must be dissolved in the soil water before they can be extracted by
the plant roots through the transpiration stream. The rate of contaminant removal is
highly associated with transpiration rate, contaminant concentration and uptake
efficiency in soil water (Kamath et al. 2007). Factors that affect the potential uptake
of organic chemicals into plants through the transpiration stream include
hydrophobicity, polarity, sorption properties and solubility (ITRC 2009). For
instance, hydrophobic hydrocarbons, such as PAHs, strongly sorb to soil and
therefore are poorly taken up by plants (Kamath et al. 2007).
3.1.2 Phytovolatilization
Once taken up by plants, the contaminants are modified or broken down into volatile
forms and thus diffuse from the plants to the atmosphere through open stomata on
leaves together with a small amount of redial diffusion through stem tissues and bark
(Kamath et al. 2007; ITRC 2009).
Studies have shown that trees, especially poplars (Populus spp.) and willows (Salix
spp.), can successfully dissipate or attenuate fuel contaminants such as benzene-
toluene-ethylbenzene-xylene (BTEX) and methyl tertiary-butyl ether (MTBE) in
contaminated groundwater and soils, because their half-life in aerobic environment is
relatively short compared to saturated anaerobic conditions (Cook et al. 2007;
Kamath et al. 2007). Jordahl et al. (1997) reported that hybrid poplar trees (Populus
deltoids x nigra) had 5 times more benzene-toluene-xylene (BTX) degraders in
rhizosphere soil compared to bulk soil. Compounds with double-bonds such as
18
trichloroethylene (TCE) and perchloroethylene (PCE) can also be rapidly oxidized in
the atmosphere by hydroxyl radicals following the emission from plant leaves
(Kamath et al. 2007).
Nevertheless, phytovolatilizaiton is not a terminal solution, especially under
circumstances when the air circulation is poor. Some volatile organic compounds
such as MTBE can exist in atmosphere for a long period of time (Kamath et al. 2007),
and pose a threat to the ecosystem as they do in soil and water. However, the
emission rate of VOCs from plant tissues is rather small and it is a potentially viable
remediation strategy for many VOCs.
3.1.3 Phytostabilization or phytosequestration
According to ITRC (2009), phytochemical complexation in the root zone, transport
protein inhibition and vacuolar storage in the root cells are the three mechanisms of
phytostablization, reducing the mobility of the contaminants and preventing
migration to soil, water, and air. Grasses, sedges, forage plants and reeds with high
transpiration rates are widely used in phytostabilization (Peer et al. 2006). Peer et al.
(2006) suggest that the combinations of hardy, perennial, dense rooted plants or deep
rooting trees (e.g. poplar, cottonwoods) have a particularly positive effect on the
remediation of soil contamination.
3.1.4 Phytotransformation and phytodegradation
Plants have a series of detoxification mechanisms that transform parent chemicals
into non-phytotoxic metabolites. Once taken up into plant system, contaminants are
detoxified through a number of reactions in three phases: conversion, conjugation
and compartmentation (Kamath et al. 2007).
Unlike microbes which metabolize organic contaminants to carbon dioxide and water,
phytodegradation relies on plant enzymes to metabolize or mineralize chemicals
completely into carbon dioxide and water (ITRC 2009). For example, dehalogenase,
an enzyme produced by hybrid poplars (Populus spp.), algae and parrot feather
(Myriophyllum aquaticum) is able to degrade organic compounds (e.g. dehalogenates
chlorinated solvents) (Susarla et al. 2002), which poses potential use of these plants
in remediating oil-contaminated soils.
19
3.1.5 Rhizoremediation
The rhizosphere is the zone around plant roots. It is mainly influenced by root
secretion and by the root-associated soil microorganisms. The term rhizoremediation
refers to the combined use of plants and rhizosphere microorganisms to improve the
bioremediation capacity of plants (Pajuelo et al. 2011). As a combination of two
methodologies (bioremediation and phytoremediation), rhizoremediation is called as
in situ plant-assisted bioremediation or generalized phytoremediation (Pajuelo et al.
2011).
Plant roots perform a vital role in this process. Roots favor microbial growth by
providing habitats, oxygen, nutrients and enzymes. Plant roots provide a large
surface area for microbes to colonize and allow them to move to deeper soil layers
(Anderson et al. 1993). Roots promote the contact of detoxifying microbes and soil
contaminants (Pajuelo et al. 2011). Roots also help with oxygen availability either
by transporting oxygen or by creating void spaces in the subsurface that allow for
greater oxygen diffusion from the atmosphere (Epps 2006), accelerating the
bioremediation process. ATSDR (1999) highlighted the importance of oxygen in
enhancing the biodegradation of PHCs whereas anaerobic conditions lead to
extremely low rates of PHC degradation. A higher microbial density (102–10
4 folds)
was observed in the surface soil than in deeper bulk soil or unplanted soil (Hinsinger
et al. 2005; Epps 2006). As much as 20% of carbon released by roots is into the
rhizosphere in an organic form, which serves as an energy source for microbes. Soil
organic matter (SOM) serves as a nutrient and energy reservoir. Higher SOM content
in the surface soil is always associated with higher microbial numbers, diversity and
bioactivity (Boopathy 2000). Roots also release ‘’allelopathic chemicals’’ or so-
called ‘’degradative enzymes’’, enhancing rhizodegradation of PHCs (Wenzel 2009).
The number or population of bio-degraders is an indicator of the remediation
potential microbes in the soil (Mikkonen 2008). Several studies have revealed that
organic pollutants generally increase bacteria populations in the rhizosphere soil by
‘’most-probable-number’’ (MPN) method, a technique used to estimate a microbial
population size based on a process-related attribute (Chaineau et al. 2003; Mikkonen
et al. 2011a; Chaudhary et al. 2012; Wallenius et al. 2012). In turn, a greater
microbial numbers benefit the plant growth by degrading soil pollutants. Chiapusio
et al. (2007), for example, demonstrated that the increase of red clover biomass and
20
its establishment in soils was due to the ability of rhizobium to adapt and metabolize
the chemicals.
Phytoremediation holds promise for the in situ treatment of PHC polluted soils. In
situ treatments may be more difficult to control than ex situ treatments, e.g. treating
the excavated soil from the refinery waste. Nevertheless, in situ remediation
treatments are widely used nowadays since they offer cost advantages and avoid
disruption to the contaminated site. The intensity of biodegradation is influenced by a
number of environmental factors: soil parameters (e.g. nutrients, oxygen, moisture
content and pH), contaminants characters (e.g. composition, concentration and
bioavailability), and contamination history of the environment (Margesin & Schinner
2001 & ATSDR 1999). How to control those factors to optimize the biological
activity in this process would be of great importance. The effectiveness of this
process also depends on the plant species used in phytoremediation process.
3.2 Species selection (including forest trees) in phytoremediation
3.2.1 Plant selection
Plant species for phytoremediation should be selected to ensure that the roots can
expand throughout the entire contaminated zone. A number of criteria for selecting
plants were identified for phytoremediation (Kamath et al. 2007). The selection of
plant species in principle has to follow the needs of the application, the contaminants
of concern and their potential to thrive on contaminated sites. Preferably they should
be native plants to avoid the introduction of invasive species. For instance, two
indigenous plants, kenaf (Hibiscus Cannabinus) and vetiver (Vetivera Zizanioides)
have proven to be very effective in cleaning crude oil contamination in Nigeria
(MERCK 2002).
Grasses, herbs, shrubs as well as deciduous and coniferous trees are candidate plant
species (Frick et al. 1999), depending on the local situation and the pollutants.
Legumes (e.g. alfalfa, clover, peas and reed canary grass), grasses (e.g. ryegrass,
wheatgrass and sunflowers) and trees (e.g. Populus sp., Salix sp., Cordia subcordata,
Thespesia populnea, Prosopis pallida and Scaevola serica) have been proven to be
tolerant of PHC contaminated soil (Frick et al. 1999; Kamath et al. 2007). Tolerance
21
is defined as the ability of a plant to grow in hydrocarbon contaminated soil but it
does not necessarily mean the plant is healthy (Frick et al. 1999).
1) Grasses in phytoremediation
Grasses, often planted with trees are widely used as a primary remediation species in
oil-contaminated sites as they provide tremendous fine roots in the surface soil. Grass
species are effective at binding and transforming hydrophobic contaminants such as
BTEX and PAHs due to large fine root biomass that can hold a higher microbial
population than other species of a comparable size (Kamath et al. 2007; Chiapusio et
al. 2007).
2) Legume – rhizobium symbiosis in phytoremediation
Nutrient deficiency, particularly that of nitrogen and phosphorus is common in
contaminated soils (Wenzel 2009). In addition, resource competition among soil
biota makes nutrients a limiting factor of bioremediation. Under extreme conditions,
especially when soil temperature or moisture content is low, N deficiency is
exacerbated due to poor nutrient transportation and restricted enzymes and microbial
activities (Wenzel 2009). Chaineau et al. (2003) suggested that adequate fertilization
and periodical tillage are helpful in PHC degradation as compared to untreated soil.
In their experiment, 70% to 81% of the initial PHCs were removed through
bioremediation in fertilized soils compared to 56% through natural attenuation
without nutrient addition.
However, excessive use of nitrogenous fertilizers can result in environment problems.
To avoid this problem, nitrogen fixing plants, such as legumes, can be used instead
(Miller & Cramer 2004). Rhizobia are able to penetrate the roots of leguminous
plants and form symbiotic associations, nodules, which are able to fix atmospheric
nitrogen into the plant as ammonia (Suominen et al. 2000). Azotobacter, azospirillum,
rhizobium, actinomycete, frankia, blue-green algae and anabaena are commonly used
N-fixing microorganisms in soils (Havlin et al. 2010). This capacity of biological N-
fixation is substantial, often exceeding 100 kg ha−1
y−1
(Vitosek et al. 2002). The
rhizobia have also been found to increase the uptake of K and P by plants
(Vershinina 2012).
The interaction between rhizobia and legume plants has been proved to be successful
in remediating PHC and heavy metal contaminated soils (Pajuelo et al. 2011).
22
Legumes such as alfalfa (Medicago sativa), Fescue (Vulpia myuros), rye (Elymus
sp.), clover (Trifolium sp.) and reed canary grass (Phalaris arundinacea) have been
successfully used to remediate contaminated sites, especially petrochemical waste
contaminated soils (Kamath et al. 2007; Chiapusio et al. 2007). The use of woody
legumes in tropical regions reflects their abundance there (Vitosek et al. 2002).
Legumes are also associated with different microbial populations. Like grass,
legumes can create an aerobic soil environment and stimulates microbial activity,
resulting in an enhancement in oxidation of organic chemical residues (Peer et al.
2006).
3) Trees and their hybrids in phytoremediation
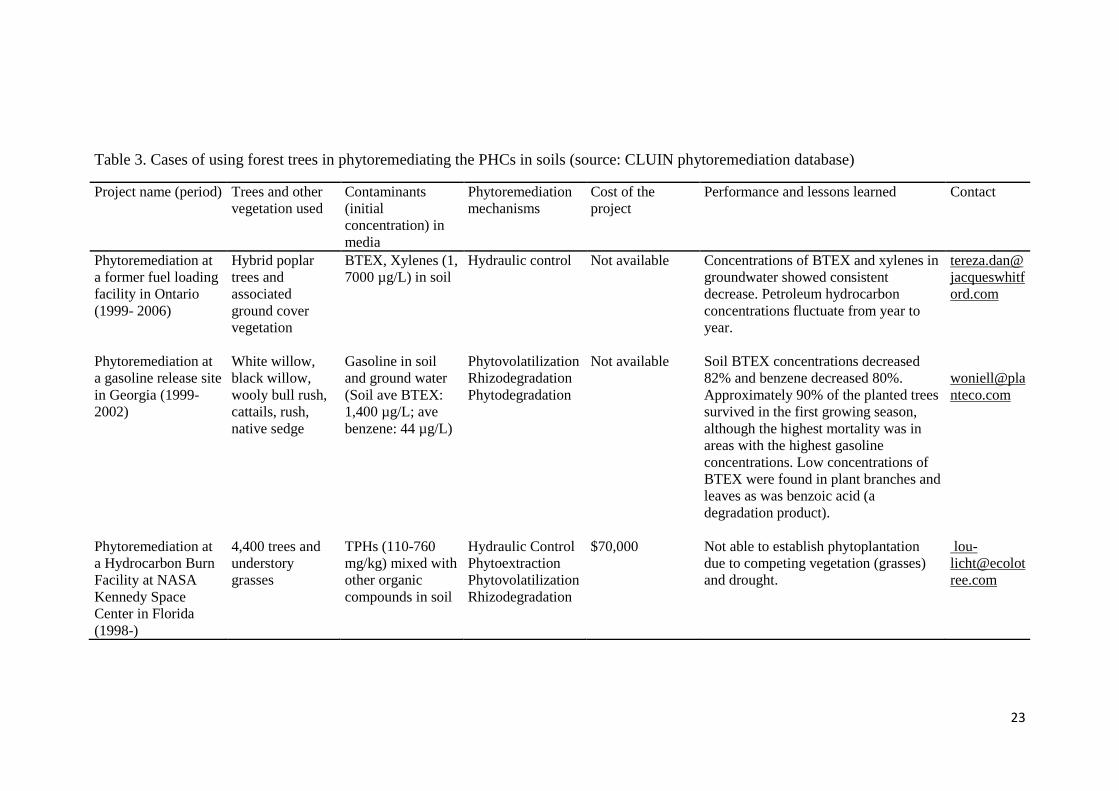
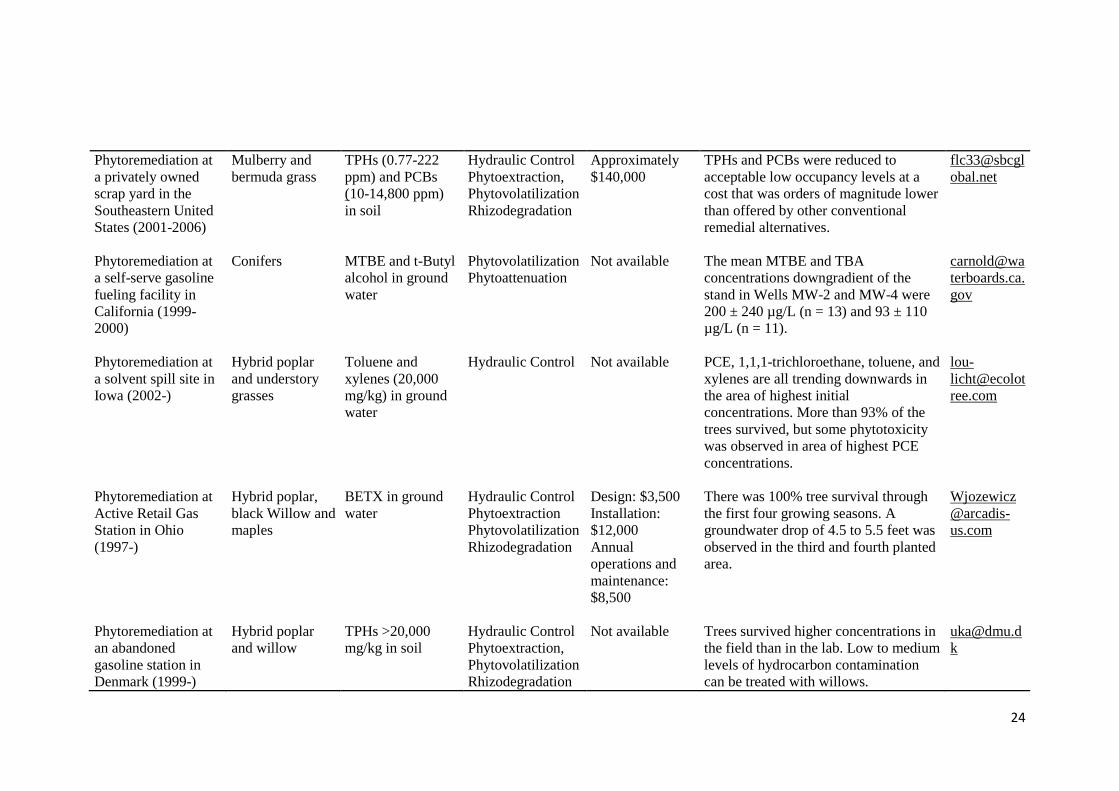
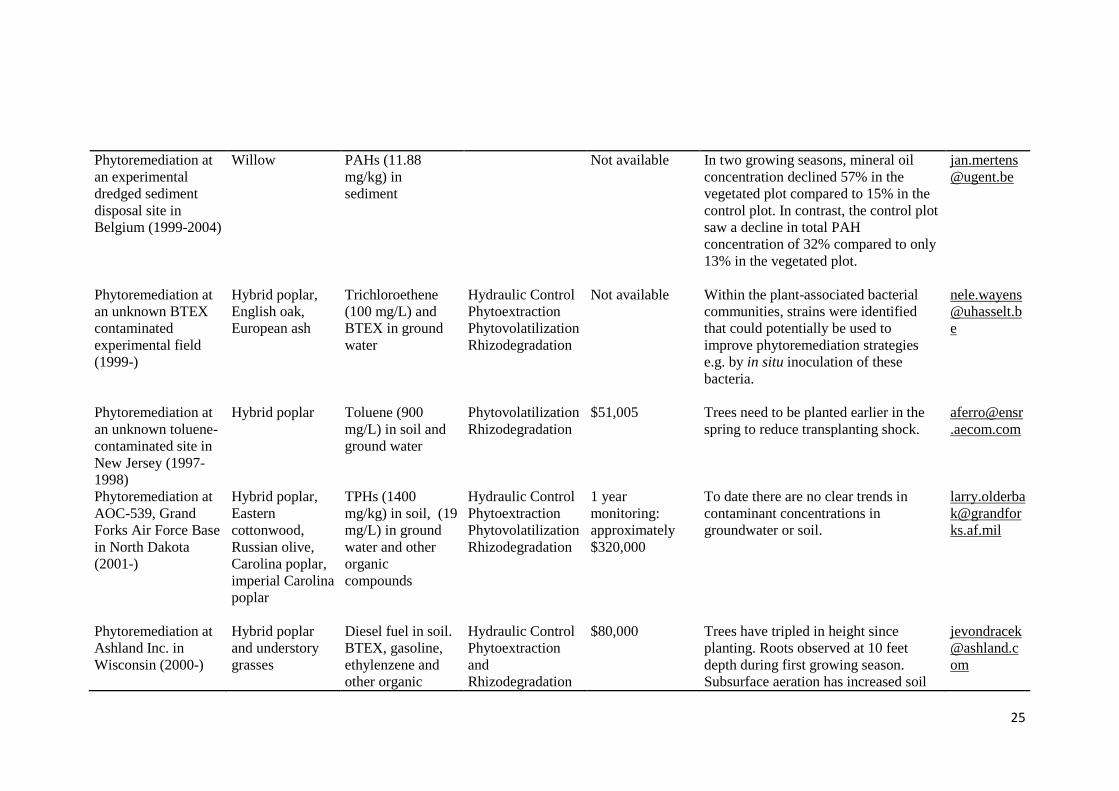
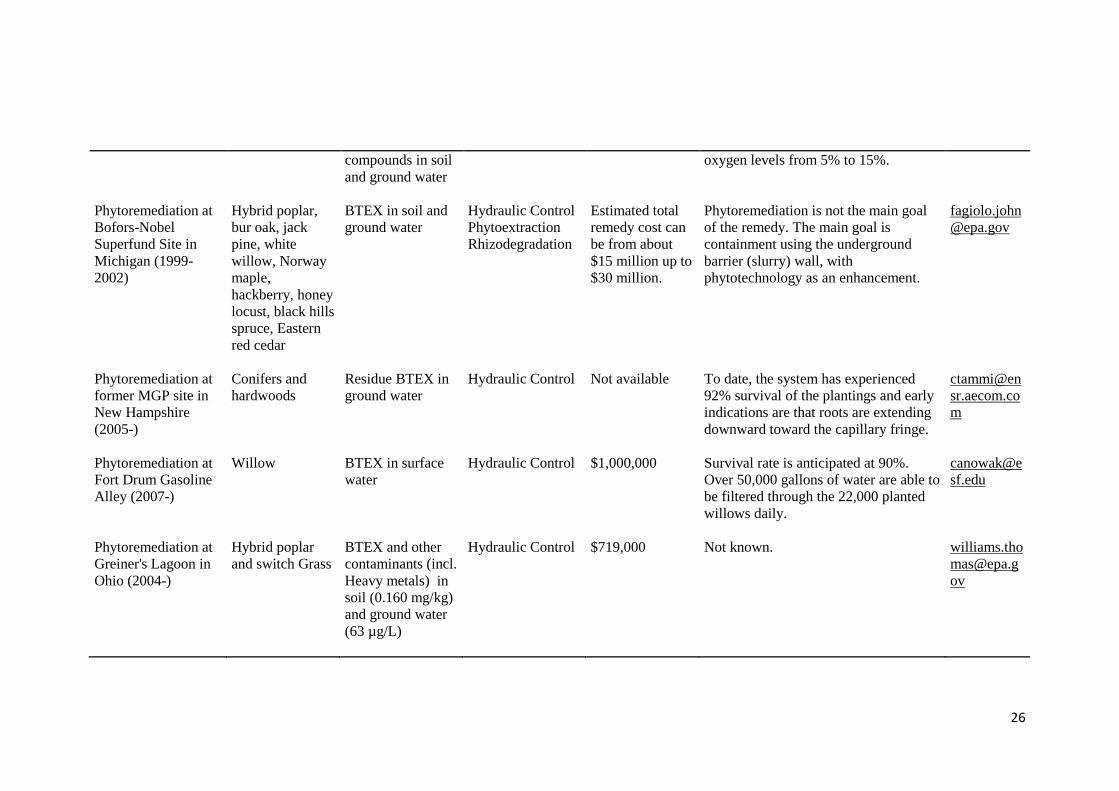
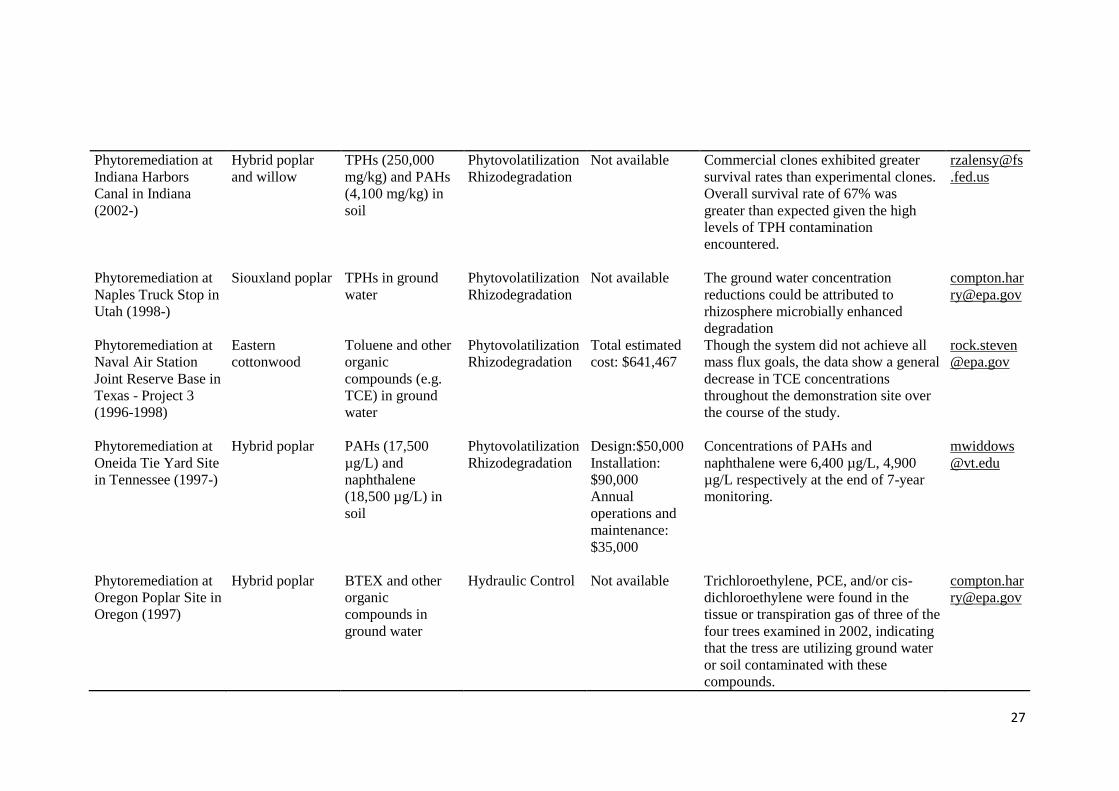
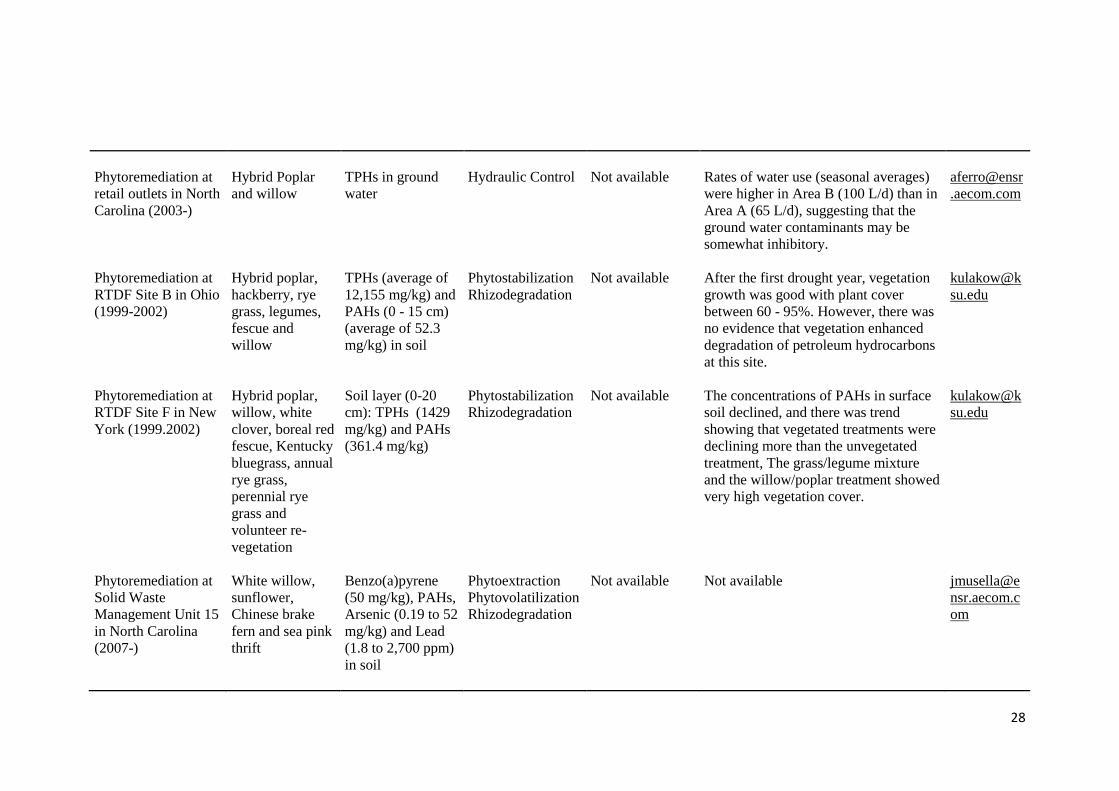
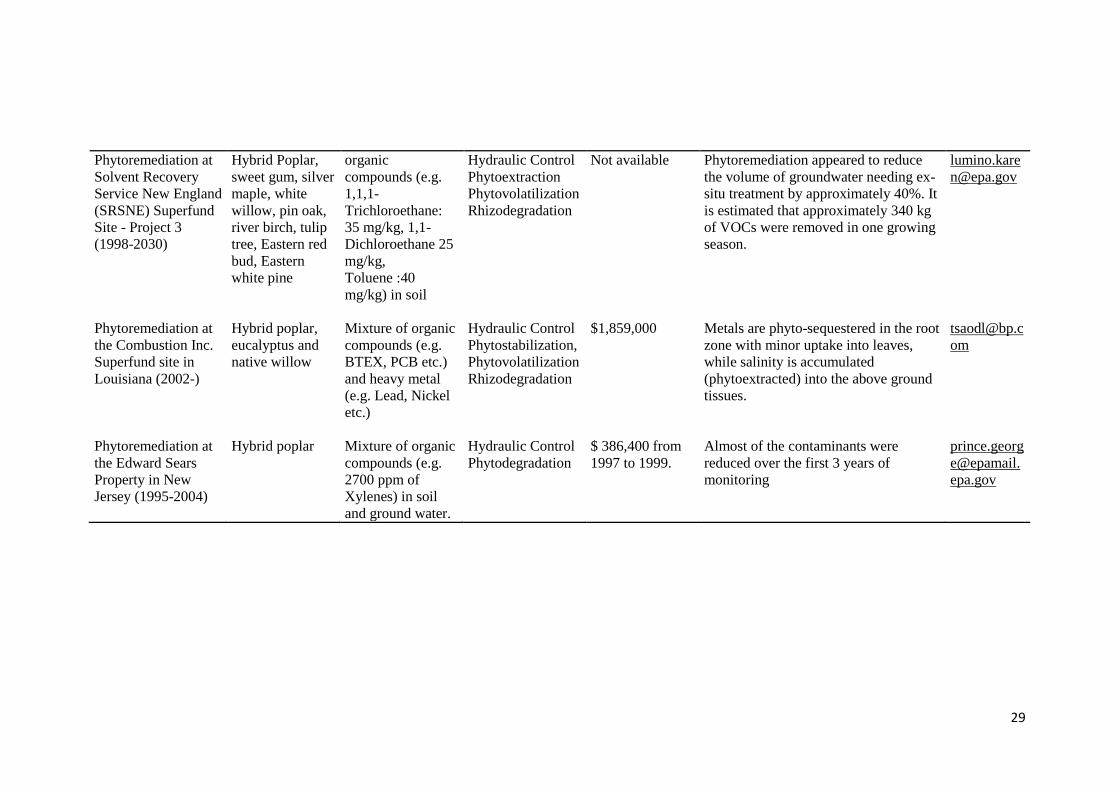
Trees are widely used in the remediation of PHC contaminated soils. As recorded in
the CLUIN phytoremediation database, most of the successful phytoremediation
projects were carried out using trees (Table 3).
Fast growing plant hybrids with desirable characteristics (e.g. resistant from diseases,
pests, contaminants, harsh climates and soil conditions) have been selected as
prospective candidates in phytoremediation (ITRC 2009). For instance, hybrid trees
such as from poplars and willows have been successfully and widely used in the
phytoremediation of both organic and inorganic polluted soils. However, attention
should be paid to avoid the risks of using genetically modified or engineered species
(ITRC 2009).
23
Table 3. Cases of using forest trees in phytoremediating the PHCs in soils (source: CLUIN phytoremediation database)
Project name (period) Trees and other
vegetation used
Contaminants
(initial
concentration) in
media
Phytoremediation
mechanisms
Cost of the
project
Performance and lessons learned Contact
Phytoremediation at
a former fuel loading
facility in Ontario
(1999- 2006)
Hybrid poplar
trees and
associated
ground cover
vegetation
BTEX, Xylenes (1,
7000 µg/L) in soil
Hydraulic control Not available Concentrations of BTEX and xylenes in
groundwater showed consistent
decrease. Petroleum hydrocarbon
concentrations fluctuate from year to
year.
tereza.dan@
jacqueswhitf
ord.com
Phytoremediation at
a gasoline release site
in Georgia (1999-
2002)
White willow,
black willow,
wooly bull rush,
cattails, rush,
native sedge
Gasoline in soil
and ground water
(Soil ave BTEX:
1,400 µg/L; ave
benzene: 44 µg/L)
Phytovolatilization
Rhizodegradation
Phytodegradation
Not available Soil BTEX concentrations decreased
82% and benzene decreased 80%.
Approximately 90% of the planted trees
survived in the first growing season,
although the highest mortality was in
areas with the highest gasoline
concentrations. Low concentrations of
BTEX were found in plant branches and
leaves as was benzoic acid (a
degradation product).
woniell@pla
nteco.com
Phytoremediation at
a Hydrocarbon Burn
Facility at NASA
Kennedy Space
Center in Florida
(1998-)
4,400 trees and
understory
grasses
TPHs (110-760
mg/kg) mixed with
other organic
compounds in soil
Hydraulic Control
Phytoextraction
Phytovolatilization
Rhizodegradation
$70,000 Not able to establish phytoplantation
due to competing vegetation (grasses)
and drought.
lou-
licht@ecolot
ree.com
24
Phytoremediation at
a privately owned
scrap yard in the
Southeastern United
States (2001-2006)
Mulberry and
bermuda grass
TPHs (0.77-222
ppm) and PCBs
(10-14,800 ppm)
in soil
Hydraulic Control
Phytoextraction,
Phytovolatilization
Rhizodegradation
Approximately
$140,000
TPHs and PCBs were reduced to
acceptable low occupancy levels at a
cost that was orders of magnitude lower
than offered by other conventional
remedial alternatives.
flc33@sbcgl
obal.net
Phytoremediation at
a self-serve gasoline
fueling facility in
California (1999-
2000)
Conifers MTBE and t-Butyl
alcohol in ground
water
Phytovolatilization
Phytoattenuation
Not available The mean MTBE and TBA
concentrations downgradient of the
stand in Wells MW-2 and MW-4 were
200 ± 240 µg/L (n = 13) and 93 ± 110
µg/L (n = 11).
carnold@wa
terboards.ca.
gov
Phytoremediation at
a solvent spill site in
Iowa (2002-)
Hybrid poplar
and understory
grasses
Toluene and
xylenes (20,000
mg/kg) in ground
water
Hydraulic Control Not available PCE, 1,1,1-trichloroethane, toluene, and
xylenes are all trending downwards in
the area of highest initial
concentrations. More than 93% of the
trees survived, but some phytotoxicity
was observed in area of highest PCE
concentrations.
lou-
licht@ecolot
ree.com
Phytoremediation at
Active Retail Gas
Station in Ohio
(1997-)
Hybrid poplar,
black Willow and
maples
BETX in ground
water
Hydraulic Control
Phytoextraction
Phytovolatilization
Rhizodegradation
Design: $3,500
Installation:
$12,000
Annual
operations and
maintenance:
$8,500
There was 100% tree survival through
the first four growing seasons. A
groundwater drop of 4.5 to 5.5 feet was
observed in the third and fourth planted
area.
Wjozewicz
@arcadis-
us.com
Phytoremediation at
an abandoned
gasoline station in
Denmark (1999-)
Hybrid poplar
and willow
TPHs >20,000
mg/kg in soil
Hydraulic Control
Phytoextraction,
Phytovolatilization
Rhizodegradation
Not available Trees survived higher concentrations in
the field than in the lab. Low to medium
levels of hydrocarbon contamination
can be treated with willows.
k
25
Phytoremediation at
an experimental
dredged sediment
disposal site in
Belgium (1999-2004)
Willow PAHs (11.88
mg/kg) in
sediment
Not available In two growing seasons, mineral oil
concentration declined 57% in the
vegetated plot compared to 15% in the
control plot. In contrast, the control plot
saw a decline in total PAH
concentration of 32% compared to only
13% in the vegetated plot.
jan.mertens
@ugent.be
Phytoremediation at
an unknown BTEX
contaminated
experimental field
(1999-)
Hybrid poplar,
English oak,
European ash
Trichloroethene
(100 mg/L) and
BTEX in ground
water
Hydraulic Control
Phytoextraction
Phytovolatilization
Rhizodegradation
Not available Within the plant-associated bacterial
communities, strains were identified
that could potentially be used to
improve phytoremediation strategies
e.g. by in situ inoculation of these
bacteria.
nele.wayens
@uhasselt.b
e
Phytoremediation at
an unknown toluene-
contaminated site in
New Jersey (1997-
1998)
Hybrid poplar Toluene (900
mg/L) in soil and
ground water
Phytovolatilization
Rhizodegradation
$51,005 Trees need to be planted earlier in the
spring to reduce transplanting shock.
aferro@ensr
.aecom.com
Phytoremediation at
AOC-539, Grand
Forks Air Force Base
in North Dakota
(2001-)
Hybrid poplar,
Eastern
cottonwood,
Russian olive,
Carolina poplar,
imperial Carolina
poplar
TPHs (1400
mg/kg) in soil, (19
mg/L) in ground
water and other
organic
compounds
Hydraulic Control
Phytoextraction
Phytovolatilization
Rhizodegradation
1 year
monitoring:
approximately
$320,000
To date there are no clear trends in
contaminant concentrations in
groundwater or soil.
larry.olderba
k@grandfor
ks.af.mil
Phytoremediation at
Ashland Inc. in
Wisconsin (2000-)
Hybrid poplar
and understory
grasses
Diesel fuel in soil.
BTEX, gasoline,
ethylenzene and
other organic
Hydraulic Control
Phytoextraction
and
Rhizodegradation
$80,000 Trees have tripled in height since
planting. Roots observed at 10 feet
depth during first growing season.
Subsurface aeration has increased soil
jevondracek
@ashland.c
om
26
compounds in soil
and ground water
oxygen levels from 5% to 15%.
Phytoremediation at
Bofors-Nobel
Superfund Site in
Michigan (1999-
2002)
Hybrid poplar,
bur oak, jack
pine, white
willow, Norway
maple,
hackberry, honey
locust, black hills
spruce, Eastern
red cedar
BTEX in soil and
ground water
Hydraulic Control
Phytoextraction
Rhizodegradation
Estimated total
remedy cost can
be from about
$15 million up to
$30 million.
Phytoremediation is not the main goal
of the remedy. The main goal is
containment using the underground
barrier (slurry) wall, with
phytotechnology as an enhancement.
fagiolo.john
@epa.gov
Phytoremediation at
former MGP site in
New Hampshire
(2005-)
Conifers and
hardwoods
Residue BTEX in
ground water
Hydraulic Control Not available To date, the system has experienced
92% survival of the plantings and early
indications are that roots are extending
downward toward the capillary fringe.
ctammi@en
sr.aecom.co
m
Phytoremediation at
Fort Drum Gasoline
Alley (2007-)
Willow BTEX in surface
water
Hydraulic Control $1,000,000 Survival rate is anticipated at 90%.
Over 50,000 gallons of water are able to
be filtered through the 22,000 planted
willows daily.
canowak@e
sf.edu
Phytoremediation at
Greiner's Lagoon in
Ohio (2004-)
Hybrid poplar
and switch Grass
BTEX and other
contaminants (incl.
Heavy metals) in
soil (0.160 mg/kg)
and ground water
(63 µg/L)
Hydraulic Control $719,000 Not known. williams.tho
ov
27
Phytoremediation at
Indiana Harbors
Canal in Indiana
(2002-)
Hybrid poplar
and willow
TPHs (250,000
mg/kg) and PAHs
(4,100 mg/kg) in
soil
Phytovolatilization
Rhizodegradation
Not available Commercial clones exhibited greater
survival rates than experimental clones.
Overall survival rate of 67% was
greater than expected given the high
levels of TPH contamination
encountered.
rzalensy@fs
.fed.us
Phytoremediation at
Naples Truck Stop in
Utah (1998-)
Siouxland poplar TPHs in ground
water
Phytovolatilization
Rhizodegradation
Not available The ground water concentration
reductions could be attributed to
rhizosphere microbially enhanced
degradation
compton.har
Phytoremediation at
Naval Air Station
Joint Reserve Base in
Texas - Project 3
(1996-1998)
Eastern
cottonwood
Toluene and other
organic
compounds (e.g.
TCE) in ground
water
Phytovolatilization
Rhizodegradation
Total estimated
cost: $641,467
Though the system did not achieve all
mass flux goals, the data show a general
decrease in TCE concentrations
throughout the demonstration site over
the course of the study.
rock.steven
@epa.gov
Phytoremediation at
Oneida Tie Yard Site
in Tennessee (1997-)
Hybrid poplar PAHs (17,500
µg/L) and
naphthalene
(18,500 µg/L) in
soil
Phytovolatilization
Rhizodegradation
Design:$50,000
Installation:
$90,000
Annual
operations and
maintenance:
$35,000
Concentrations of PAHs and
naphthalene were 6,400 µg/L, 4,900
µg/L respectively at the end of 7-year
monitoring.
mwiddows
@vt.edu
Phytoremediation at
Oregon Poplar Site in
Oregon (1997)
Hybrid poplar BTEX and other
organic
compounds in
ground water
Hydraulic Control Not available Trichloroethylene, PCE, and/or cis-
dichloroethylene were found in the
tissue or transpiration gas of three of the
four trees examined in 2002, indicating
that the tress are utilizing ground water
or soil contaminated with these
compounds.
compton.har
28
Phytoremediation at
retail outlets in North
Carolina (2003-)
Hybrid Poplar
and willow
TPHs in ground
water
Hydraulic Control Not available Rates of water use (seasonal averages)
were higher in Area B (100 L/d) than in
Area A (65 L/d), suggesting that the
ground water contaminants may be
somewhat inhibitory.
aferro@ensr
.aecom.com
Phytoremediation at
RTDF Site B in Ohio
(1999-2002)
Hybrid poplar,
hackberry, rye
grass, legumes,
fescue and
willow
TPHs (average of
12,155 mg/kg) and
PAHs (0 - 15 cm)
(average of 52.3
mg/kg) in soil
Phytostabilization
Rhizodegradation
Not available After the first drought year, vegetation
growth was good with plant cover
between 60 - 95%. However, there was
no evidence that vegetation enhanced
degradation of petroleum hydrocarbons
at this site.
kulakow@k
su.edu
Phytoremediation at
RTDF Site F in New
York (1999.2002)
Hybrid poplar,
willow, white
clover, boreal red
fescue, Kentucky
bluegrass, annual
rye grass,
perennial rye
grass and
volunteer re-
vegetation
Soil layer (0-20
cm): TPHs (1429
mg/kg) and PAHs
(361.4 mg/kg)
Phytostabilization
Rhizodegradation
Not available The concentrations of PAHs in surface
soil declined, and there was trend
showing that vegetated treatments were
declining more than the unvegetated
treatment, The grass/legume mixture
and the willow/poplar treatment showed
very high vegetation cover.
kulakow@k
su.edu
Phytoremediation at
Solid Waste
Management Unit 15
in North Carolina
(2007-)
White willow,
sunflower,
Chinese brake
fern and sea pink
thrift
Benzo(a)pyrene
(50 mg/kg), PAHs,
Arsenic (0.19 to 52
mg/kg) and Lead
(1.8 to 2,700 ppm)
in soil
Phytoextraction
Phytovolatilization
Rhizodegradation
Not available Not available jmusella@e
nsr.aecom.c
om
29
Phytoremediation at
Solvent Recovery
Service New England
(SRSNE) Superfund
Site - Project 3
(1998-2030)
Hybrid Poplar,
sweet gum, silver
maple, white
willow, pin oak,
river birch, tulip
tree, Eastern red
bud, Eastern
white pine
organic
compounds (e.g.
1,1,1-
Trichloroethane:
35 mg/kg, 1,1-
Dichloroethane 25
mg/kg,
Toluene :40
mg/kg) in soil
Hydraulic Control
Phytoextraction
Phytovolatilization
Rhizodegradation
Not available Phytoremediation appeared to reduce
the volume of groundwater needing ex-
situ treatment by approximately 40%. It
is estimated that approximately 340 kg
of VOCs were removed in one growing
season.
lumino.kare
Phytoremediation at
the Combustion Inc.
Superfund site in
Louisiana (2002-)
Hybrid poplar,
eucalyptus and
native willow
Mixture of organic
compounds (e.g.
BTEX, PCB etc.)
and heavy metal
(e.g. Lead, Nickel
etc.)
Hydraulic Control
Phytostabilization,
Phytovolatilization
Rhizodegradation
$1,859,000 Metals are phyto-sequestered in the root
zone with minor uptake into leaves,
while salinity is accumulated
(phytoextracted) into the above ground
tissues.
om
Phytoremediation at
the Edward Sears
Property in New
Jersey (1995-2004)
Hybrid poplar Mixture of organic
compounds (e.g.
2700 ppm of
Xylenes) in soil
and ground water.
Hydraulic Control
Phytodegradation
$ 386,400 from
1997 to 1999.
Almost of the contaminants were
reduced over the first 3 years of
monitoring
prince.georg
e@epamail.
epa.gov

30
3.2.2 Plant growth-promoting bacteria (PGPB)
Certain rhizosphere bacteria have important consequences for plant growth. They can
defend plants against pathogens, promote benefical plant-microbe symbioses,
increase nutrient uptake by solubilizing phosphate and fixing nitrogen, stimulate
plant growth by secreting phytohormone, exhibite antifungal activity, and induce
systemic resistance (Bhattacharyya & Jha 2011; Pajuelo et al. 2011). These bacteria
are called plant growth-promoting bacteria (PGPB).
PGPB such as Pseudomonas, Acinetobacter, Achromobacter, Flavobacterium,
Bacillus, Nocardia and Rhizobium species have been shown to increase plant yields
and SOM contents (Pajuelo et al. 2011). They have also been shown to enhance the
rhizoremediation of polluted soils (Vershinina 2012; Pajuelo et al. 2011;
Bhattacharyya & Jha 2011).
31
EMPIRICAL STUDY – THE OIL-CONTAMINATED SOIL
REMEDIATION FIELD EXPERIMENT
4 Introduction about the soil remediation field experiment
This soil remediation field experiment was a part of the EU supported FP7 project
‘‘Legume-Futures’’. This project is constituted by 18 research consortiums from 13
major EU countries, aiming to ‘‘develop and assess legume-supported cropping
systems that raise the economic and environmental performance of European
agriculture’’ (Legume-Futures 2012). It started on 1 March 2010 and is lasting for 4
years. There are currently 13 field experiment sites distributed in different agro-
environment zones in Europe (Legume-Futures 2012). Our soil remediation
experimental field in Viikki experimental farm of University of Helsinki is one of
them.
Fodder galega (Galega orientalis) (hereafter referred to as galega) is a perennial,
fast-growing forage legume (Lindstrom et al. 1985). It is also suitable for the low
temperature and acid soil conditions of northern regions (Lindstrom et al. 1985).
Fodder galega in mixture with grasses are able to economically provide continuous
and high forage production during summer season without additional N fertilization
(Adamovich 2002). One important property for fodder galega is that it can survive in
pure stands for 15 to 19 years without thinning compared to other legumes
(Adamovich 2002).
Only Rhizobium galegae is found to nodulate fodder galega (Lindström 1989).
Several greenhouse studies have demonstrated the potential use of Galega orientalis
(G. orientalis) and its microsymbiont Rhizobium galegae (R. galegae) for
rhizoremediation of oil-contaminated soils (Suominen et al. 2000; Cybulski et al.
2003; Lindström et al. 2003; Kaksonen et al. 2006; Jussila et al. 2006; Jussila et al.
2007; Mikkonen et al. 2011a). For example, Suominen et al. (2000) demonstrated
that galega, inoculated with its Rhizobium galegae, could withstand up to ten-fold
higher of toluate (a type of hydrocarbon) concentrations than non-inoculated plants.
Plant growth promoting bactera (e.g. Pseudomon strains) cannot only promote the
growth of G. orientalis, but also enhance the capacity of G. orientalis and its
microsymbiont R. galegae in rhizoremediation of oil-contaminated sites (Suominen
32
et al. 2000; Lindström et al. 2003; Kaksonen et al. 2006; Mikkonen et al. 2011a). For
instance, Lindström et al. (2003) isolated several oil degrading bacterial species from
galega rhizoshere and found that the ability to degrade m-toluate (3-methylbenzene)
in the presence of the gene xylE, which is an indication of toluene degradation, was
only detected within the genus Pseudomonas. Another research further indicated that
Pseudomonas could increase the numbers and diversity of cultivable bacteria in
G. orientalis rhizosphere in oil-contaminated soil (Kaksonen et al. 2006). A new
greenhouse experiment showed that co-inoculation of fodder galega with R. galega
HAMBI 540 and P. trivialis 3Re27 or with R. galegae HAMBI 540 and P.
extremorientalis TSAU20 could increase yields, nodulation and N content of fodder
galega, compared to plants inoculated with R. galegae HAMBI 540 alone
(Egamberdieva et al. 2010).
However, it is unknown whether the results from greenhouse experiments, where
conditions are controlled, can be transferred to the field. For example, the
productivity of galega-grass swards is significantly affected by sowing time, climate,
N fertilizers, and the frequency of cutting (Zolotarev 2010).
An extensive multi-year field experiment with crops (Bromus inermis and Galega
orientalis) under PGPB and oil contamination of 7000 ppm are designed in our
project in order to translate the results of greenhouse experiments into real
applicability.
4.1 Objectives of the experiment
The overall objectives of the empirical study was to 1) determine if Galega orientalis,
a legume, and Bromus inermis, a grass grown separately or in combination had a
significant effect on phytoremediation of oil-contaminated soil, 2) investigate the
effect of using plant growth promoting bacteria (PGPB) on plant growth and oil
remediation, and 3) study the recovery ability of soil under moderate oil
contamination by analyzing the differences in soil total DNA, soil bacterial diversity
and soil bacterial community structure with time in Nordic field condition.
4.2 Hypotheses
The main hypotheses of the experiment are as follows:

33
1) Crops would enhance oil removal compared to bare soil.
2) Crop performance on oil removal: galega + bromus > bromus > galega.
3) PGPB would enhance oil removal and dry matter yields of galega.
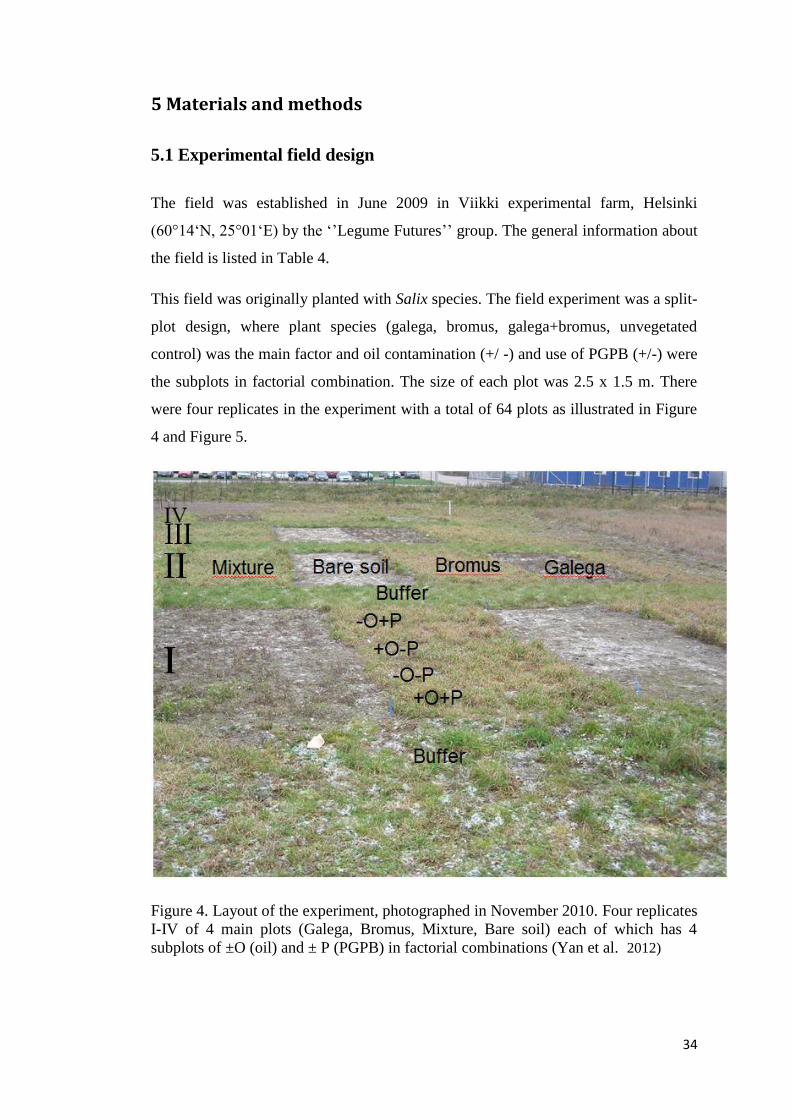
34
5 Materials and methods
5.1 Experimental field design
The field was established in June 2009 in Viikki experimental farm, Helsinki
(60°14‘N, 25°01‘E) by the ‘’Legume Futures’’ group. The general information about
the field is listed in Table 4.
This field was originally planted with Salix species. The field experiment was a split-
plot design, where plant species (galega, bromus, galega+bromus, unvegetated
control) was the main factor and oil contamination (+/ -) and use of PGPB (+/-) were
the subplots in factorial combination. The size of each plot was 2.5 x 1.5 m. There
were four replicates in the experiment with a total of 64 plots as illustrated in Figure
4 and Figure 5.
Figure 4. Layout of the experiment, photographed in November 2010. Four replicates
I-IV of 4 main plots (Galega, Bromus, Mixture, Bare soil) each of which has 4
subplots of ±O (oil) and ± P (PGPB) in factorial combinations (Yan et al. 2012)
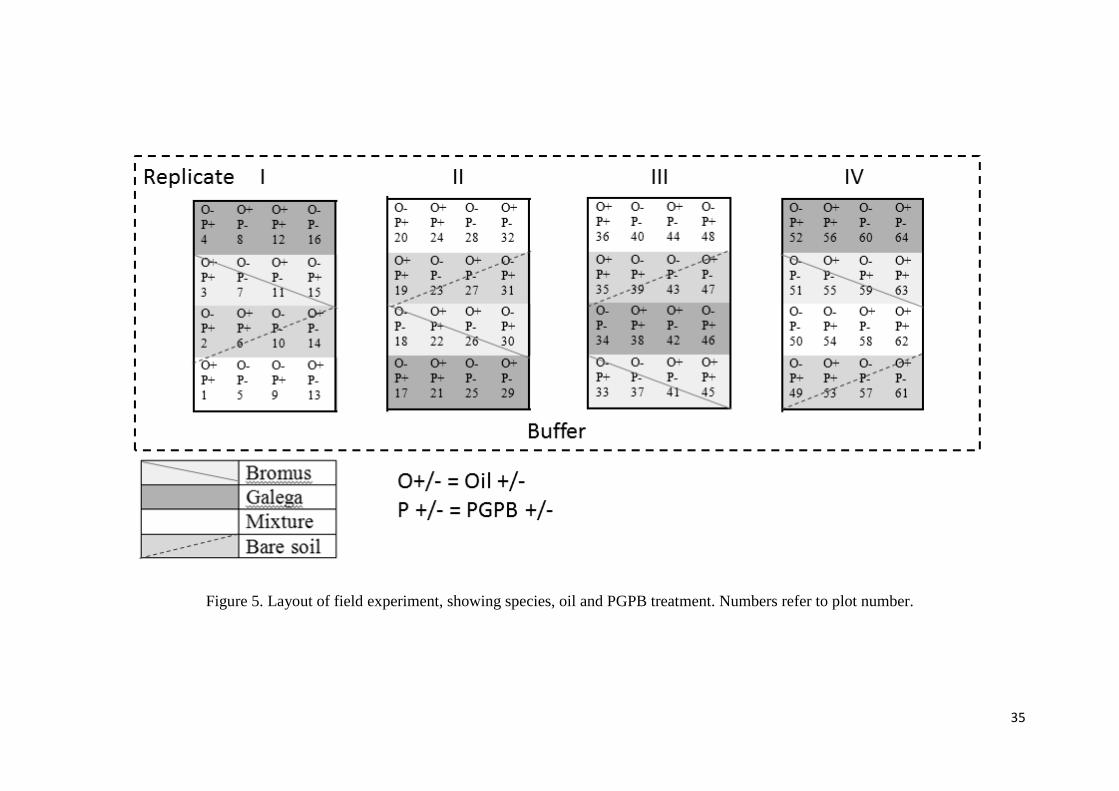
35
Figure 5. Layout of field experiment, showing species, oil and PGPB treatment. Numbers refer to plot number.
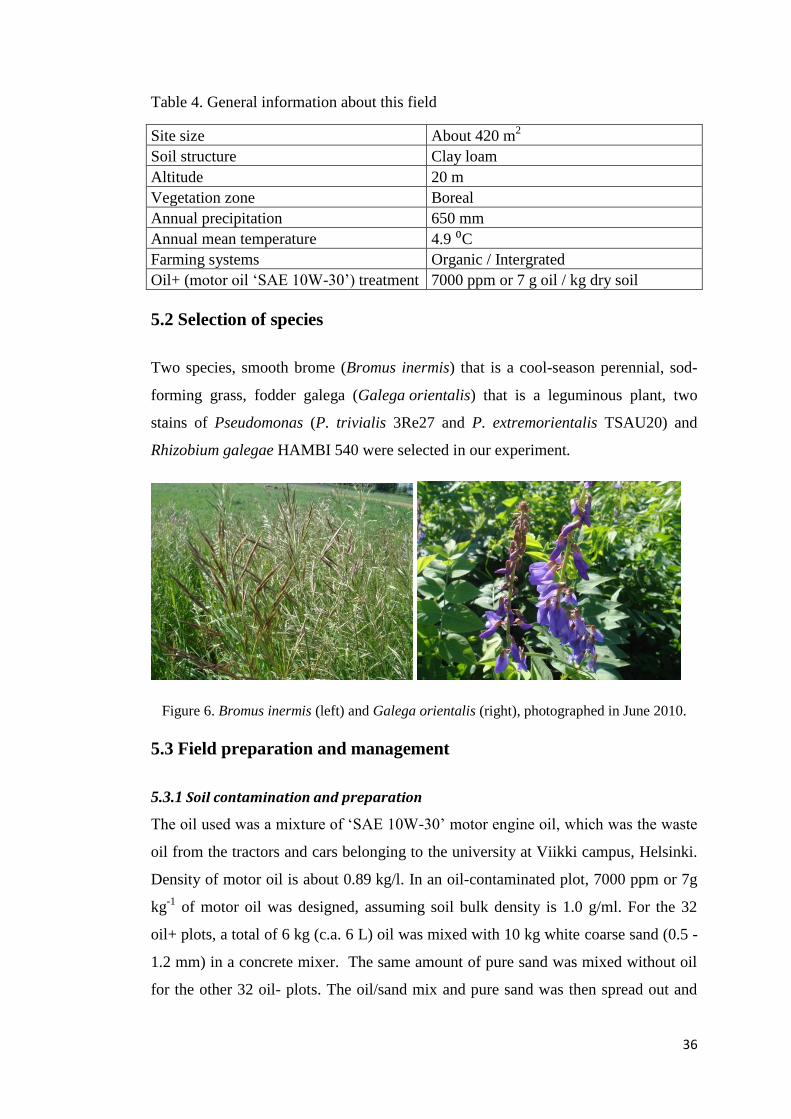
36
Table 4. General information about this field
Site size About 420 m2
Soil structure Clay loam
Altitude 20 m
Vegetation zone Boreal
Annual precipitation 650 mm
Annual mean temperature 4.9 ⁰C
Farming systems Organic / Intergrated
Oil+ (motor oil ‘SAE 10W-30’) treatment 7000 ppm or 7 g oil / kg dry soil
5.2 Selection of species
Two species, smooth brome (Bromus inermis) that is a cool-season perennial, sod-
forming grass, fodder galega (Galega orientalis) that is a leguminous plant, two
stains of Pseudomonas (P. trivialis 3Re27 and P. extremorientalis TSAU20) and
Rhizobium galegae HAMBI 540 were selected in our experiment.
Figure 6. Bromus inermis (left) and Galega orientalis (right), photographed in June 2010.
5.3 Field preparation and management
5.3.1 Soil contamination and preparation
The oil used was a mixture of ‘SAE 10W-30’ motor engine oil, which was the waste
oil from the tractors and cars belonging to the university at Viikki campus, Helsinki.
Density of motor oil is about 0.89 kg/l. In an oil-contaminated plot, 7000 ppm or 7g
kg-1
of motor oil was designed, assuming soil bulk density is 1.0 g/ml. For the 32
oil+ plots, a total of 6 kg (c.a. 6 L) oil was mixed with 10 kg white coarse sand (0.5 -
1.2 mm) in a concrete mixer. The same amount of pure sand was mixed without oil
for the other 32 oil- plots. The oil/sand mix and pure sand was then spread out and
37
mixed into the top 20 cm layer in respective plots with a rotary tilling device on June
17, 2009.
5.3.2 Co-inoculation of PGPB and R. Galegae on Galega orientalis
Befores sowing, commercial galega seeds (Naturcom Oy, Ruukki, Finland) were first
surface-sterilized and germinated on 1% water agar in the dark at 28 ⁰C. The two
strains of Pseudomonas, P. trivialis 3Re27 (Graz University of Technology, Graz,
Austria) and P. extremorientalis TSAU20 (National University of Uzbekistan,
Tashkent, Uzbekistan), were grown in King’s B (KB) broth and Rhizobium galegae
strain HAMBI 540 (University of Helsinki, Helsinki, Finland) in tryptone yeast (TY)
broth overnight. One ml and each culture was pelleted by centrifugation, washed and
suspended in PBS before diluted to an optical density of 0.1 at 620 nm. Cell
suspensions with three strains were mixed in a ratio of 1:1:1 and vortexed to obtain a
homogenous suspension. Germinated seeds were inoculated by placing them in the
bacterial suspension with sterile forceps and shaken gently for a few seconds. The
treatments were as follows: 1) seeds inoculated with R. galegae HAMBI 540 alone
and 2) seeds inoculated with the combination of R. galegae HAMBI 540, P. trivialis
3Re27 and P. extremorientalis TSAU20. The inoculated seeds were mixed with the
peat prior to sowing. Detailed procedures on co-inoculation can refer to
Egamberdieva et al. (2010).
5.3.3 Sowing
The inoculated seeds were sown by hand on surface and lightly covered with soil by
raking. First sowing was done on July 7, 2009. For pure plots, 25 kg/ha of galega and
35 kg/ha of bromus seeds were sown. For the mixture plots, 6 kg/ha of galega and 26
kg/ha of bromus seeds were sown. Due to a slow initial growth performance of
galega, an extra sowing of galega seeds was done in May 2010.
5.3.4 Weeds control and fertilization
This field was treated with herbicide (Glyphosate) before the establishment of the
field in June 2009 and Basagran® SG (165 gr/50L) in September 2009. Afterwards,
weeds were controlled manually once every month. Weeds in the border area were
not cleared as they can serve as buffer to prevent oil from surface spreading and
disturbances from neighbouring fields. 60 kg/ha N-fertilizer was given to the grass
plots in the summer of 2009 but none was given subsequently.
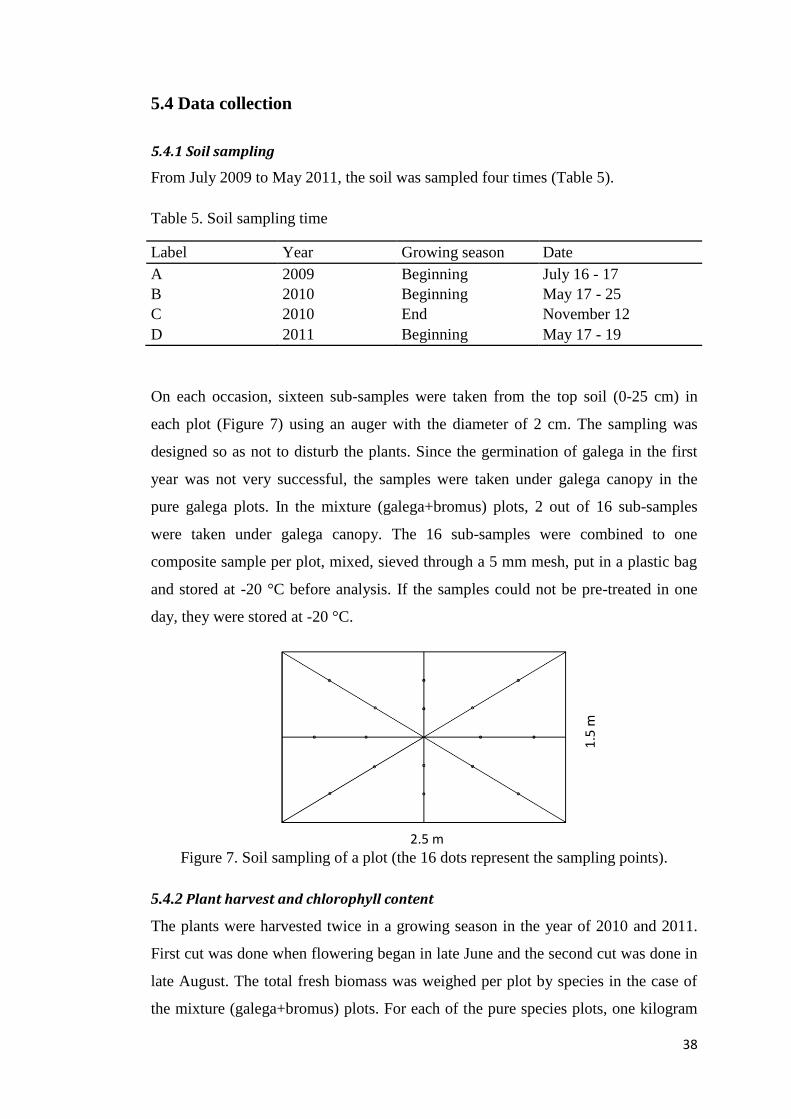
38
5.4 Data collection
5.4.1 Soil sampling
From July 2009 to May 2011, the soil was sampled four times (Table 5).
Table 5. Soil sampling time
Label Year Growing season Date
A 2009 Beginning July 16 - 17
B 2010 Beginning May 17 - 25
C 2010 End November 12
D 2011 Beginning May 17 - 19
On each occasion, sixteen sub-samples were taken from the top soil (0-25 cm) in
each plot (Figure 7) using an auger with the diameter of 2 cm. The sampling was
designed so as not to disturb the plants. Since the germination of galega in the first
year was not very successful, the samples were taken under galega canopy in the
pure galega plots. In the mixture (galega+bromus) plots, 2 out of 16 sub-samples
were taken under galega canopy. The 16 sub-samples were combined to one
composite sample per plot, mixed, sieved through a 5 mm mesh, put in a plastic bag
and stored at -20 °C before analysis. If the samples could not be pre-treated in one
day, they were stored at -20 °C.
Figure 7. Soil sampling of a plot (the 16 dots represent the sampling points).
5.4.2 Plant harvest and chlorophyll content
The plants were harvested twice in a growing season in the year of 2010 and 2011.
First cut was done when flowering began in late June and the second cut was done in
late August. The total fresh biomass was weighed per plot by species in the case of
the mixture (galega+bromus) plots. For each of the pure species plots, one kilogram
2.5 m
1.5
m
39
of fresh plant sample was taken for analyses. For the mixture plots, one kilogram of
bromus and 200 grams of galega were taken for analyses.
Before each harvest, chlorophyll content was measured using a SPAD 502
Chlorophyll Meter (MINOLTA CAMERA, Japan) once. The leaves selected for
measurement were healthy and unfolded ones located at the top of the plants. In the
pure species plots, 20 leaves per plot were selected. In the mixture plots, 20 bromus
leaves and at least 10 galega leaves were selected.
5.4.3 Meteorological data
According to the Finnish Meteorological Institute's statistics, there was a particularly
warm summer in 2010 in Finland with several temperature broken records (Hutila
2011). Summer mean temperature in 2010 was 1.87 ⁰C higher compared to that in
2009 (Table 6).
Table 6. Monthly average temperature (⁰C) in summer 2009 and 2010 reported by
Finnish Meteorological Institute in the observation in Kumpula campus
Month Year 2009 Year 2010
May 11.4 11.9
June 14.4 14.9
July 17.3 22.2
August 16.6 18.2
Mean 14.9 16.8
5.5 Laboratory analyses
5.5.1 Soil chemical analysis
Several soil properties were measured from the 128 soil samples taken in July 2009
and November 2010, including: dry matter weight, apparent bulk density, electrical
conductivity, pH in water, and total carbon and nitrogen. After thawing, the samples
were air-dried at room temperature (1 week), ground by hand and sieved (2 mm)
before analysis.
1) Dry matter content (DM)
The dry matter content (%) to an oven-dry basis was measured to convert bulk
density and total C and N contents. Crucibles were put to oven overnight at 105 ºC
40
before weighing the dry weight. About 1 g of air dried soil sample was weighed
before and after it was dried in a 105 ºC oven overnight together with crucibles. Dry
matter content is calculated as the formula below:
Dry matter content (d.m.) = (Wc+os – Wc) / Was * 100%, (1)
where Wc is the dry weight of the crucible, Wc+os is the total weight of the crucible
and soil after oven drying and Was is the weight of air dried soil.
2) Apparent bulk density
Apparent soil bulk density was determined using a special 10 ml measuring cup. The
cup was weighed before filling soil in. Then the cup was gently knocked with a ruler
for ten times to prevent compacting soil. The total weight of 10 ml pre-treated soil
sample and the measuring cup was recorded and the apparent bulk density was
calculated by the formula below:
Apparent bulk density = [(Wm+s – Wm) / d.m.] / Vm, (2)
Where Wm+s is the total weight of the measuring cup and soil, Wm is the weight of
the measuring cup and Vm is the volume of the measuring cup (10 ml).
3) Soil total C and N
Total carbon and nitrogen contents were determined using a Vario Max CN-analyzer.
For each determination, about 500 mg of pre-treated soil sample was weighed in a
special sample cup and then burned in an induction oven. The analyzer gives the
results as per cent C and N by weight. The values were then converted into dry
weight content by DM.
4) Electrical conductivity index and pH
Electrical conductivity (EC) and soil pH was measured in water suspension. EC was
measured from the solution part of the water-soil suspension. About 2 g pre-treated
soil sample was weighed into a 10 ml tube and then mixed with 5 ml deionized water,
suspended and left overnight. Electrical conductivity was first measured from the
upper solution of the water-soil suspension using a conductivity meter (MeterLab™
CDM210) the next morning. Soil pH was then measured by a pH-meter (SCHOTT
CG842) in the suspension after mixing with a glass rod.
41
5.5.2 Total solvent extractable material (TSEM) of oil
The total solvent extractable materials (TSEM) analysis provides a gross measure of
petroleum in the samples by gravimetric analysis (Mills et al. 1999). TSEM
extraction was done by Anni-Mari Pulkkinen (Department of applied chemistry,
University of Helsinki). The total solvent extractable materials (TSEM) were
extracted from thawed samples according to Jørgensen et al. (2005) modified from
the ISO 16703:2004 method. Soil samples (10 g) were extracted with 10 ml retention
time window solution (HPLC-pure heptane + 30 ml decane + 30 mg tetracontane)
and 20 ml acetone (HPLC-pure) by ultrasonication for 30 min. A blank sample
(without soil) was prepared in every extraction day. Organic phase was removed by
duplicate washing of the extract with deionized water at the ratio of 1:1, followed by
centrifuge (2500 rmp / 5 min). Finally the organic phase was dried with water
free Na2SO4 (c.a. 0.1 g).
TSEM was measured gravimetrically from the hydrocarbon extract (1 ml) evaporated
under N2 (+30 ⁰C) until dry. TSEM of the same kind of motor oil as used in the oil
treatment (Teboil Lubricants Classic Mineral Motor oil, moniaste SAE 10W-30, API
SF/CD) was also extracted and determined.
5.5.3 Soil DNA analysis
1) Soil DNA extraction
Soil microbial DNA was directly extracted from 0.50 g fresh soil sample which had
been stored in -20 °C freezer, with FastDNA SPIN kit for Soil (Qbiogene, USA),
according to the manufacturer’s instructions, except for the prolongation of the
lysing matrix tube centrifugation time (5 min) and the final elution volume (75 µL –
150 µL).
Altogether there are 256 DNA extracts, 64 for each sampling time. The yield and
quality of DNA extracts were checked on a 1 % agarose gel on 1 × TAE buffer.
2) Total DNA amount by fluorometric method
Double-stranded DNA can be bound to some fluorescent dyes, providing a
quantitative assay for DNA (Invitrogen 2010). The quantity of extracted DNA was
measured fluorometrically (PicoGreen dsDNA Quantification Reagent Kit;
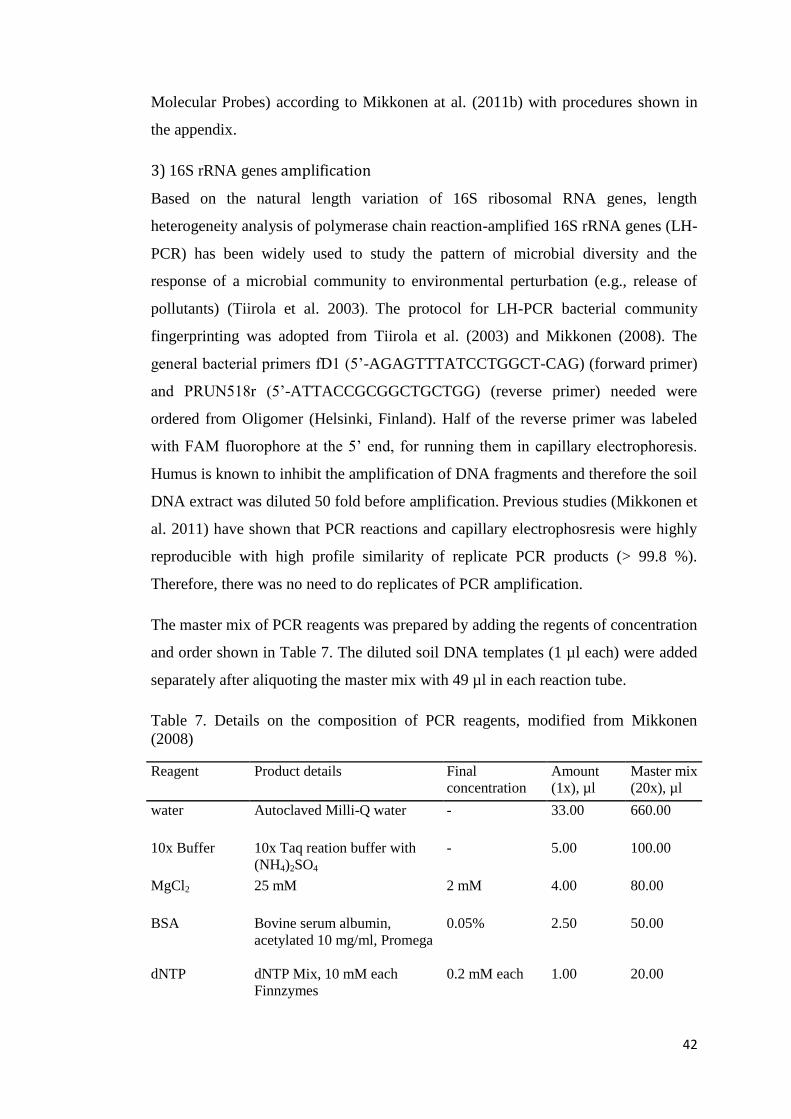
42
Molecular Probes) according to Mikkonen at al. (2011b) with procedures shown in
the appendix.
3) 16S rRNA genes amplification
Based on the natural length variation of 16S ribosomal RNA genes, length
heterogeneity analysis of polymerase chain reaction-amplified 16S rRNA genes (LH-
PCR) has been widely used to study the pattern of microbial diversity and the
response of a microbial community to environmental perturbation (e.g., release of
pollutants) (Tiirola et al. 2003). The protocol for LH-PCR bacterial community
fingerprinting was adopted from Tiirola et al. (2003) and Mikkonen (2008). The
general bacterial primers fD1 (5’-AGAGTTTATCCTGGCT-CAG) (forward primer)
and PRUN518r (5’-ATTACCGCGGCTGCTGG) (reverse primer) needed were
ordered from Oligomer (Helsinki, Finland). Half of the reverse primer was labeled
with FAM fluorophore at the 5’ end, for running them in capillary electrophoresis.
Humus is known to inhibit the amplification of DNA fragments and therefore the soil
DNA extract was diluted 50 fold before amplification. Previous studies (Mikkonen et
al. 2011) have shown that PCR reactions and capillary electrophosresis were highly
reproducible with high profile similarity of replicate PCR products (> 99.8 %).
Therefore, there was no need to do replicates of PCR amplification.
The master mix of PCR reagents was prepared by adding the regents of concentration
and order shown in Table 7. The diluted soil DNA templates (1 µl each) were added
separately after aliquoting the master mix with 49 µl in each reaction tube.
Table 7. Details on the composition of PCR reagents, modified from Mikkonen
(2008)
Reagent
Product details Final
concentration
Amount
(1x), µl
Master mix
(20x), µl
water Autoclaved Milli-Q water
- 33.00 660.00
10x Buffer 10x Taq reation buffer with
(NH4)2SO4
- 5.00 100.00
MgCl2 25 mM 2 mM 4.00 80.00
BSA Bovine serum albumin,
acetylated 10 mg/ml, Promega
0.05% 2.50 50.00
dNTP dNTP Mix, 10 mM each
Finnzymes
0.2 mM each 1.00 20.00
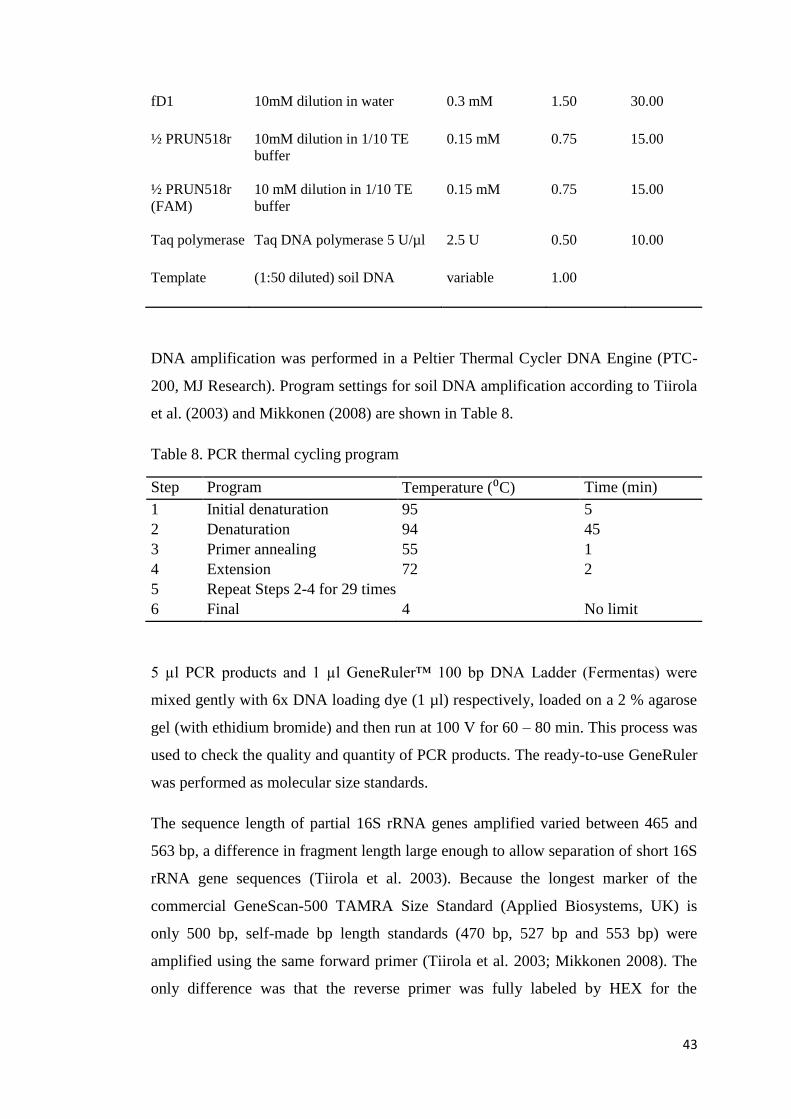
43
fD1 10mM dilution in water
0.3 mM 1.50 30.00
½ PRUN518r
10mM dilution in 1/10 TE
buffer
0.15 mM 0.75 15.00
½ PRUN518r
(FAM)
10 mM dilution in 1/10 TE
buffer
0.15 mM 0.75 15.00
Taq polymerase Taq DNA polymerase 5 U/µl
2.5 U 0.50 10.00
Template (1:50 diluted) soil DNA variable 1.00
DNA amplification was performed in a Peltier Thermal Cycler DNA Engine (PTC-
200, MJ Research). Program settings for soil DNA amplification according to Tiirola
et al. (2003) and Mikkonen (2008) are shown in Table 8.
Table 8. PCR thermal cycling program
Step Program Temperature (⁰C) Time (min)
1 Initial denaturation 95 5
2 Denaturation 94 45
3 Primer annealing 55 1
4 Extension 72 2
5 Repeat Steps 2-4 for 29 times
6 Final 4 No limit
5 µl PCR products and 1 µl GeneRuler™ 100 bp DNA Ladder (Fermentas) were
mixed gently with 6x DNA loading dye (1 µl) respectively, loaded on a 2 % agarose
gel (with ethidium bromide) and then run at 100 V for 60 – 80 min. This process was
used to check the quality and quantity of PCR products. The ready-to-use GeneRuler
was performed as molecular size standards.
The sequence length of partial 16S rRNA genes amplified varied between 465 and
563 bp, a difference in fragment length large enough to allow separation of short 16S
rRNA gene sequences (Tiirola et al. 2003). Because the longest marker of the
commercial GeneScan-500 TAMRA Size Standard (Applied Biosystems, UK) is
only 500 bp, self-made bp length standards (470 bp, 527 bp and 553 bp) were
amplified using the same forward primer (Tiirola et al. 2003; Mikkonen 2008). The
only difference was that the reverse primer was fully labeled by HEX for the
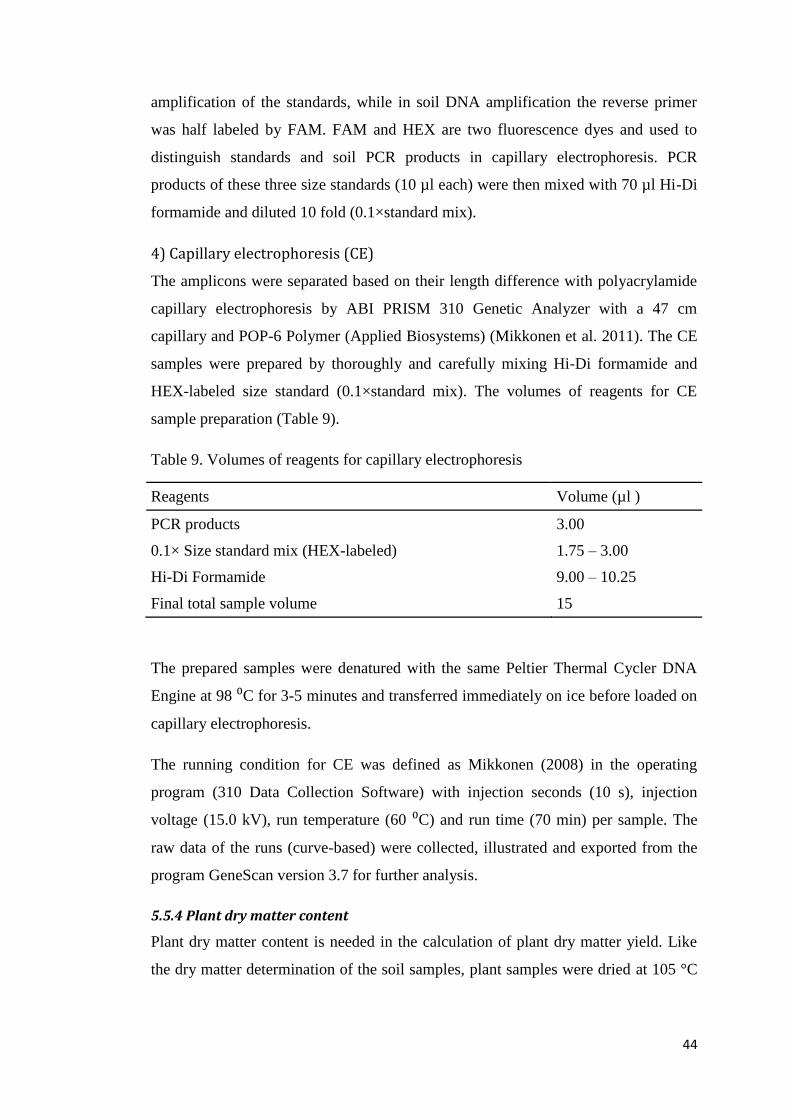
44
amplification of the standards, while in soil DNA amplification the reverse primer
was half labeled by FAM. FAM and HEX are two fluorescence dyes and used to
distinguish standards and soil PCR products in capillary electrophoresis. PCR
products of these three size standards (10 µl each) were then mixed with 70 µl Hi-Di
formamide and diluted 10 fold (0.1×standard mix).
4) Capillary electrophoresis (CE)
The amplicons were separated based on their length difference with polyacrylamide
capillary electrophoresis by ABI PRISM 310 Genetic Analyzer with a 47 cm
capillary and POP-6 Polymer (Applied Biosystems) (Mikkonen et al. 2011). The CE
samples were prepared by thoroughly and carefully mixing Hi-Di formamide and
HEX-labeled size standard (0.1×standard mix). The volumes of reagents for CE
sample preparation (Table 9).
Table 9. Volumes of reagents for capillary electrophoresis
Reagents Volume (µl )
PCR products 3.00
0.1× Size standard mix (HEX-labeled) 1.75 – 3.00
Hi-Di Formamide 9.00 – 10.25
Final total sample volume 15
The prepared samples were denatured with the same Peltier Thermal Cycler DNA
Engine at 98 ⁰C for 3-5 minutes and transferred immediately on ice before loaded on
capillary electrophoresis.
The running condition for CE was defined as Mikkonen (2008) in the operating
program (310 Data Collection Software) with injection seconds (10 s), injection
voltage (15.0 kV), run temperature (60 ⁰C) and run time (70 min) per sample. The
raw data of the runs (curve-based) were collected, illustrated and exported from the
program GeneScan version 3.7 for further analysis.
5.5.4 Plant dry matter content
Plant dry matter content is needed in the calculation of plant dry matter yield. Like
the dry matter determination of the soil samples, plant samples were dried at 105 °C
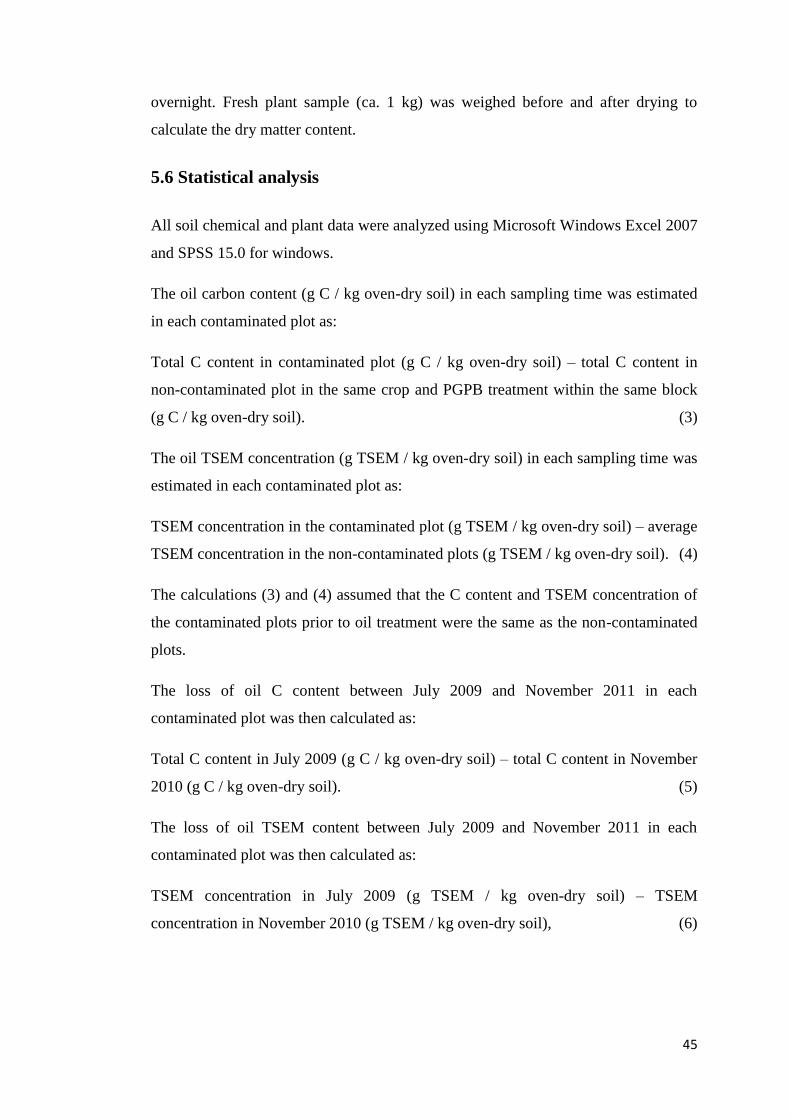
45
overnight. Fresh plant sample (ca. 1 kg) was weighed before and after drying to
calculate the dry matter content.
5.6 Statistical analysis
All soil chemical and plant data were analyzed using Microsoft Windows Excel 2007
and SPSS 15.0 for windows.
The oil carbon content (g C / kg oven-dry soil) in each sampling time was estimated
in each contaminated plot as:
Total C content in contaminated plot (g C / kg oven-dry soil) – total C content in
non-contaminated plot in the same crop and PGPB treatment within the same block
(g C / kg oven-dry soil). (3)
The oil TSEM concentration (g TSEM / kg oven-dry soil) in each sampling time was
estimated in each contaminated plot as:
TSEM concentration in the contaminated plot (g TSEM / kg oven-dry soil) – average
TSEM concentration in the non-contaminated plots (g TSEM / kg oven-dry soil). (4)
The calculations (3) and (4) assumed that the C content and TSEM concentration of
the contaminated plots prior to oil treatment were the same as the non-contaminated
plots.
The loss of oil C content between July 2009 and November 2011 in each
contaminated plot was then calculated as:
Total C content in July 2009 (g C / kg oven-dry soil) – total C content in November
2010 (g C / kg oven-dry soil). (5)
The loss of oil TSEM content between July 2009 and November 2011 in each
contaminated plot was then calculated as:
TSEM concentration in July 2009 (g TSEM / kg oven-dry soil) – TSEM
concentration in November 2010 (g TSEM / kg oven-dry soil), (6)
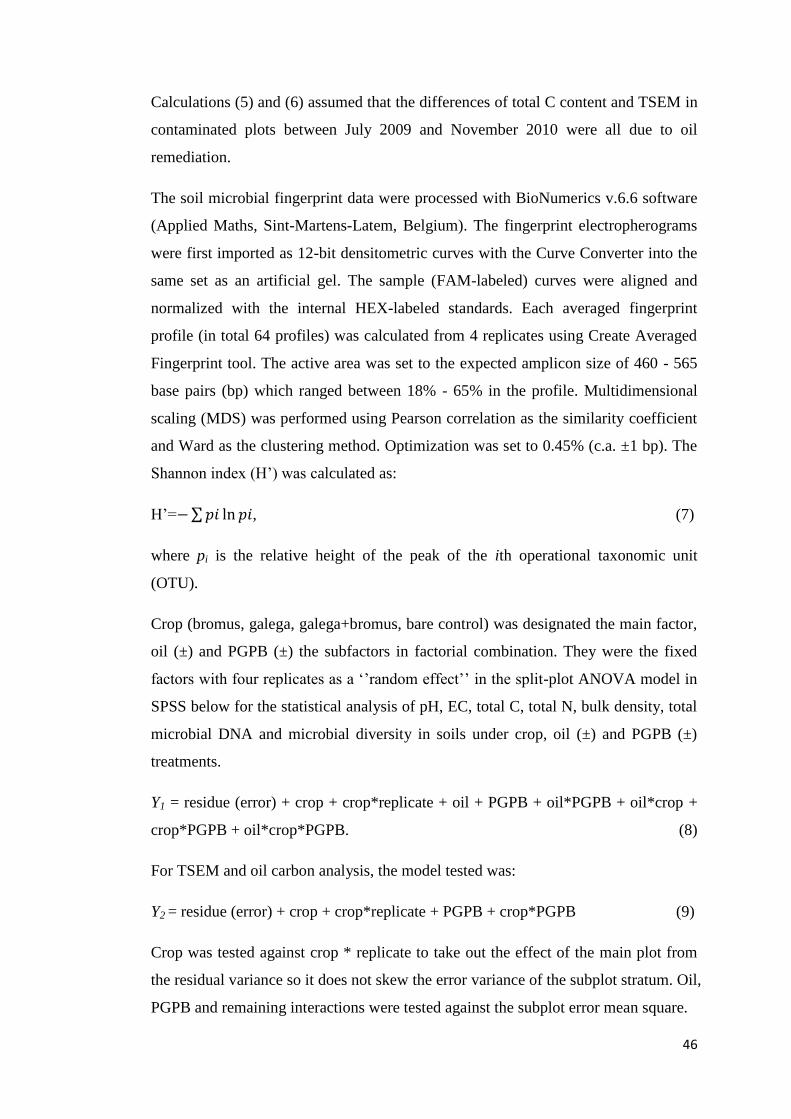
46
Calculations (5) and (6) assumed that the differences of total C content and TSEM in
contaminated plots between July 2009 and November 2010 were all due to oil
remediation.
The soil microbial fingerprint data were processed with BioNumerics v.6.6 software
(Applied Maths, Sint-Martens-Latem, Belgium). The fingerprint electropherograms
were first imported as 12-bit densitometric curves with the Curve Converter into the
same set as an artificial gel. The sample (FAM-labeled) curves were aligned and
normalized with the internal HEX-labeled standards. Each averaged fingerprint
profile (in total 64 profiles) was calculated from 4 replicates using Create Averaged
Fingerprint tool. The active area was set to the expected amplicon size of 460 - 565
base pairs (bp) which ranged between 18% - 65% in the profile. Multidimensional
scaling (MDS) was performed using Pearson correlation as the similarity coefficient
and Ward as the clustering method. Optimization was set to 0.45% (c.a. ±1 bp). The
Shannon index (H’) was calculated as:
H’= ∑ , (7)
where pi is the relative height of the peak of the ith operational taxonomic unit
(OTU).
Crop (bromus, galega, galega+bromus, bare control) was designated the main factor,
oil (±) and PGPB (±) the subfactors in factorial combination. They were the fixed
factors with four replicates as a ‘’random effect’’ in the split-plot ANOVA model in
SPSS below for the statistical analysis of pH, EC, total C, total N, bulk density, total
microbial DNA and microbial diversity in soils under crop, oil (±) and PGPB (±)
treatments.
Y1 = residue (error) + crop + crop*replicate + oil + PGPB + oil*PGPB + oil*crop +
crop*PGPB + oil*crop*PGPB. (8)
For TSEM and oil carbon analysis, the model tested was:
Y2 = residue (error) + crop + crop*replicate + PGPB + crop*PGPB (9)
Crop was tested against crop * replicate to take out the effect of the main plot from
the residual variance so it does not skew the error variance of the subplot stratum. Oil,
PGPB and remaining interactions were tested against the subplot error mean square.

47
Pearson correlation was used to test the correlation between the soil physiochemical
parameters. Two-way ANOVA was used to identify differences between treatments
in terms of pH, EC, C stocks, soil total DNA, Shannon diversity index and TSEM
content. All differences reported are significant at p ≤ 0.05.
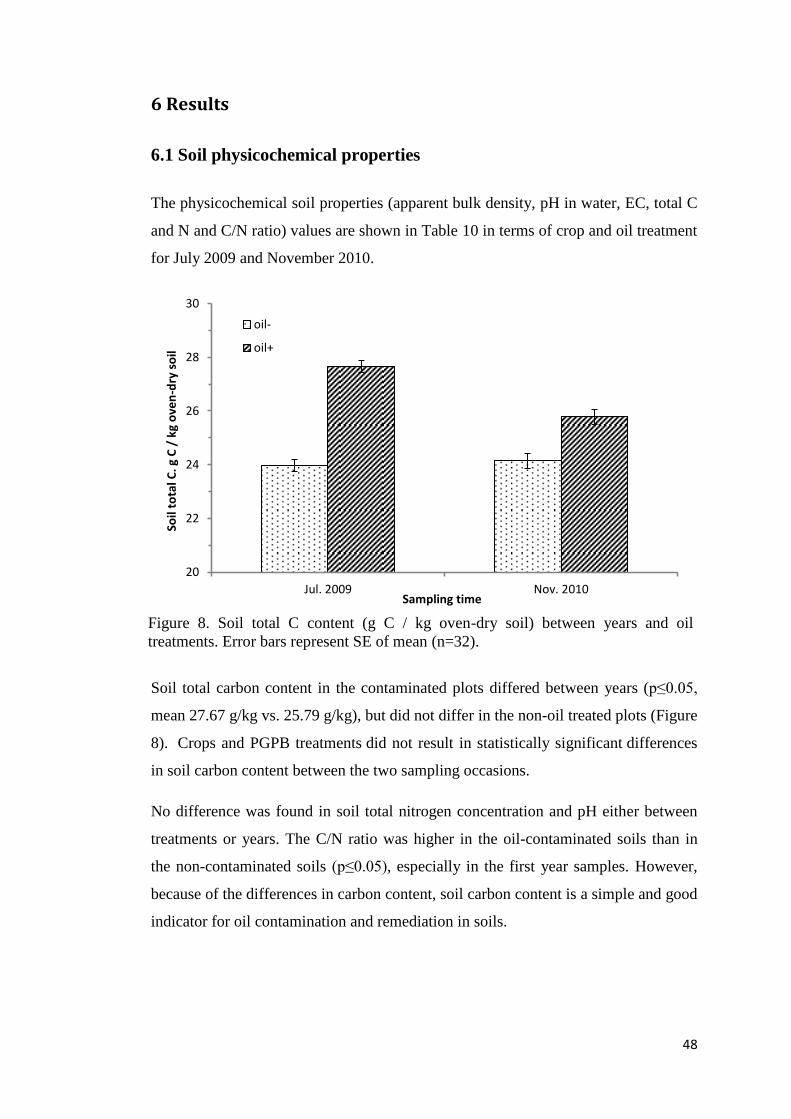
48
6 Results
6.1 Soil physicochemical properties
The physicochemical soil properties (apparent bulk density, pH in water, EC, total C
and N and C/N ratio) values are shown in Table 10 in terms of crop and oil treatment
for July 2009 and November 2010.
Soil total carbon content in the contaminated plots differed between years (p≤0.05,
mean 27.67 g/kg vs. 25.79 g/kg), but did not differ in the non-oil treated plots (Figure
8). Crops and PGPB treatments did not result in statistically significant differences
in soil carbon content between the two sampling occasions.
No difference was found in soil total nitrogen concentration and pH either between
treatments or years. The C/N ratio was higher in the oil-contaminated soils than in
the non-contaminated soils (p≤0.05), especially in the first year samples. However,
because of the differences in carbon content, soil carbon content is a simple and good
indicator for oil contamination and remediation in soils.
20
22
24
26
28
30
Jul. 2009 Nov. 2010
Soil
tota
l C. g
C /
kg
ove
n-d
ry s
oil
Sampling time
oil-
oil+
Figure 8. Soil total C content (g C / kg oven-dry soil) between years and oil
treatments. Error bars represent SE of mean (n=32).
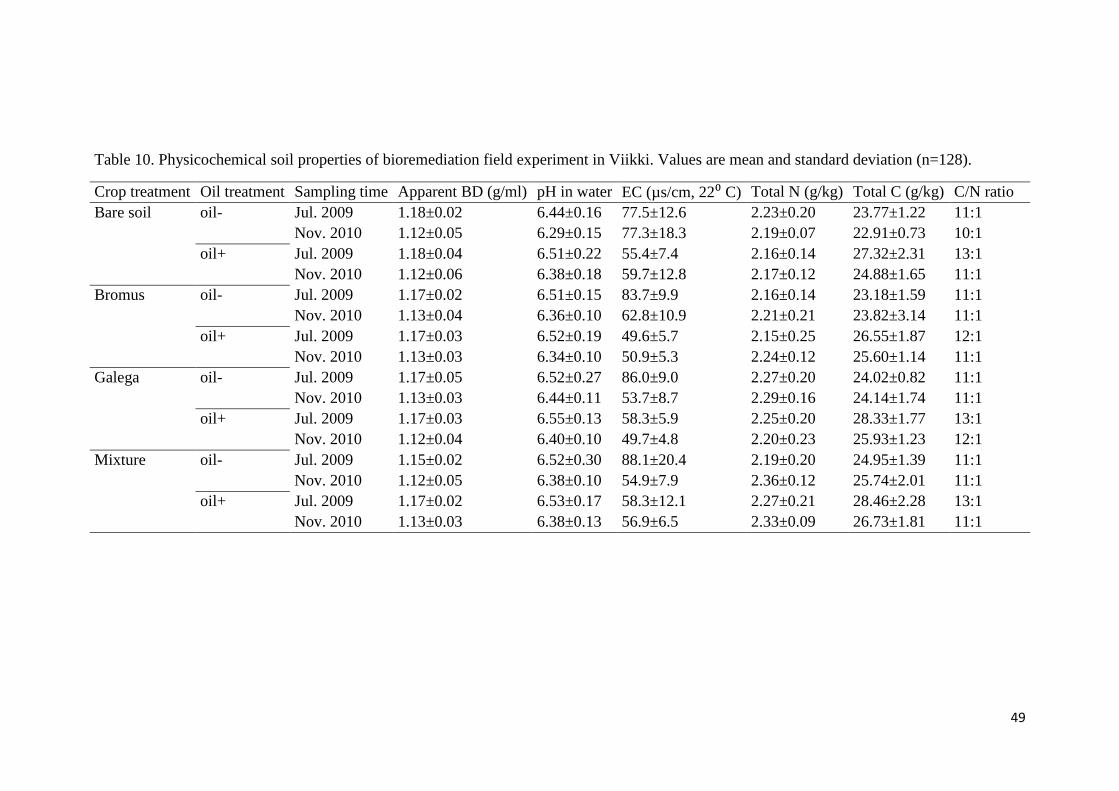
49
Table 10. Physicochemical soil properties of bioremediation field experiment in Viikki. Values are mean and standard deviation (n=128).
Crop treatment Oil treatment Sampling time Apparent BD (g/ml) pH in water EC (µs/cm, 22⁰ C) Total N (g/kg) Total C (g/kg) C/N ratio
Bare soil oil- Jul. 2009 1.18±0.02 6.44±0.16 77.5±12.6 2.23±0.20 23.77±1.22 11:1
Nov. 2010 1.12±0.05 6.29±0.15 77.3±18.3 2.19±0.07 22.91±0.73 10:1
oil+ Jul. 2009 1.18±0.04 6.51±0.22 55.4±7.4 2.16±0.14 27.32±2.31 13:1
Nov. 2010 1.12±0.06 6.38±0.18 59.7±12.8 2.17±0.12 24.88±1.65 11:1
Bromus oil- Jul. 2009 1.17±0.02 6.51±0.15 83.7±9.9 2.16±0.14 23.18±1.59 11:1
Nov. 2010 1.13±0.04 6.36±0.10 62.8±10.9 2.21±0.21 23.82±3.14 11:1
oil+ Jul. 2009 1.17±0.03 6.52±0.19 49.6±5.7 2.15±0.25 26.55±1.87 12:1
Nov. 2010 1.13±0.03 6.34±0.10 50.9±5.3 2.24±0.12 25.60±1.14 11:1
Galega oil- Jul. 2009 1.17±0.05 6.52±0.27 86.0±9.0 2.27±0.20 24.02±0.82 11:1
Nov. 2010 1.13±0.03 6.44±0.11 53.7±8.7 2.29±0.16 24.14±1.74 11:1
oil+ Jul. 2009 1.17±0.03 6.55±0.13 58.3±5.9 2.25±0.20 28.33±1.77 13:1
Nov. 2010 1.12±0.04 6.40±0.10 49.7±4.8 2.20±0.23 25.93±1.23 12:1
Mixture oil- Jul. 2009 1.15±0.02 6.52±0.30 88.1±20.4 2.19±0.20 24.95±1.39 11:1
Nov. 2010 1.12±0.05 6.38±0.10 54.9±7.9 2.36±0.12 25.74±2.01 11:1
oil+ Jul. 2009 1.17±0.02 6.53±0.17 58.3±12.1 2.27±0.21 28.46±2.28 13:1
Nov. 2010 1.13±0.03 6.38±0.13 56.9±6.5 2.33±0.09 26.73±1.81 11:1

50
Soil electrical conductivity was correlated with soil total C content in July 2009 (2-
tailed Pearson correlation, -0.474, p= 0.00). The EC values remained stable in oil
treated soils between two occasions, whereas in November 2010 the values
decreased (p≤0.05) in non-contaminated plots (Figure 9). The EC values were not
different between crop treatments in the first year (data not shown). In November
2010, EC values were highest (p≤0.05) in the non-contaminated bare plots and at the
same level in all the rest (Figure 10).
6.2 Oil content
The oil content of the soil was determined as the difference of 1) total solvent
extractable material (TSEM) and 2) carbon content between oil treated plots and the
corresponding non-oil treated plots. To test the TSEM method, TSEM of motor oil
(Teboil Lubricants Classic Mineral Motor oil, moniaste SAE 10W-30, API SF/CD)
was extracted and yielded 100 %.
The differences of TSEM concentration between oil-contaminated and non-
contaminated plots are due to the oil treatment (Figure 11). TSEM concentration in
non-contaminated plots remained stable (around 1.00 g TSEM / kg of oven-dry
basis). The average TSEM in oil-contaminated plots (n=32) decreased with time, e.g.,
by 47 % from July 2009 to May 2011. There was a high decrease rate (a steep
descent) in TSEM content in oil-contaminated plots in the growing season from May
2010 to November 2010. However, in May 2011 the oil was still not completely
remediated.. Crops (Galega, Bromus, and Mixture) did not influence TSEM values.
To our surprise, TSEM concentrations in bare soil were lower than in the vegetated
0
20
40
60
80
100
Jul. 2009 Nov. 2010
EC, µ
S/cm
Sampling time
oil- oil+
0
20
40
60
80
100
Bare soil Bromus Galega MixtureEC
, µS/
cm
Sampling time
oil- oil+
Figure 10. Soil electrical conductivity
(µs/cm) between oil and crop
treatments in Nov. 2010. Error bars
represent SE of mean (n=8).
Figure 9. Soil Electrical Conductivity
(µS/cm) between oil treatments in Jul.
2009 and Nov. 2010. Error bars
represent SE of mean (n=32).
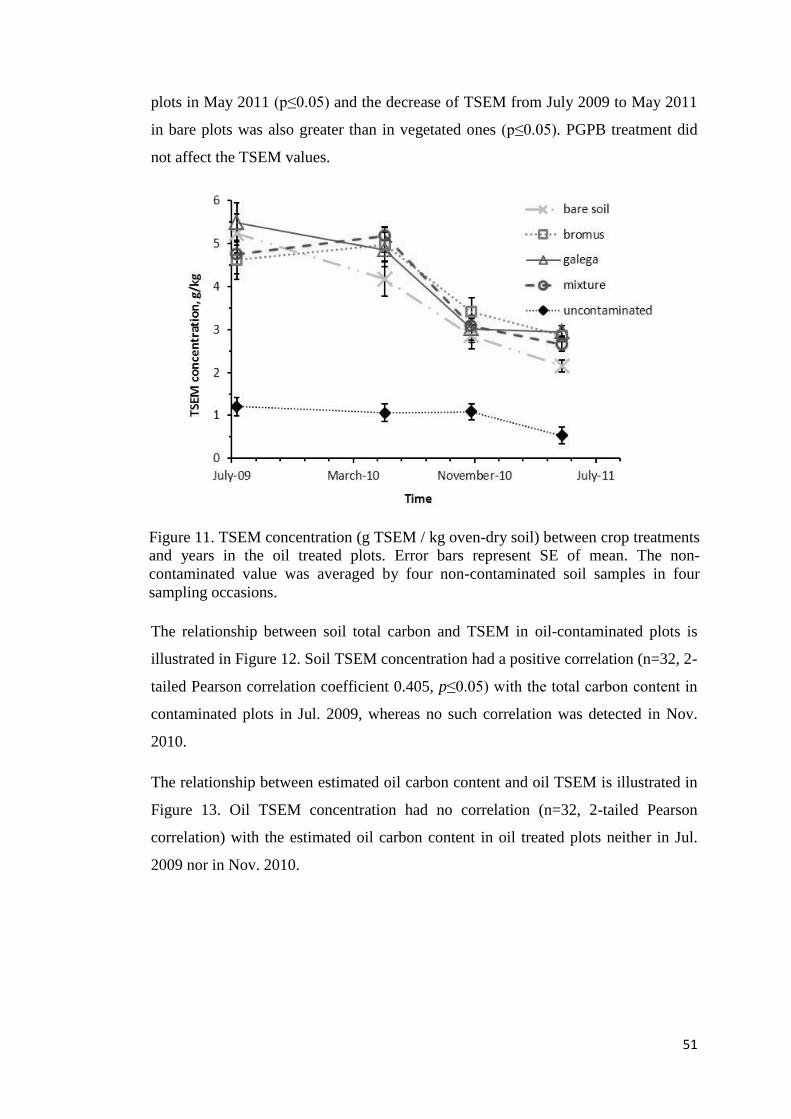
51
plots in May 2011 (p≤0.05) and the decrease of TSEM from July 2009 to May 2011
in bare plots was also greater than in vegetated ones (p≤0.05). PGPB treatment did
not affect the TSEM values.
The relationship between soil total carbon and TSEM in oil-contaminated plots is
illustrated in Figure 12. Soil TSEM concentration had a positive correlation (n=32, 2-
tailed Pearson correlation coefficient 0.405, p≤0.05) with the total carbon content in
contaminated plots in Jul. 2009, whereas no such correlation was detected in Nov.
2010.
The relationship between estimated oil carbon content and oil TSEM is illustrated in
Figure 13. Oil TSEM concentration had no correlation (n=32, 2-tailed Pearson
correlation) with the estimated oil carbon content in oil treated plots neither in Jul.
2009 nor in Nov. 2010.
Figure 11. TSEM concentration (g TSEM / kg oven-dry soil) between crop treatments
and years in the oil treated plots. Error bars represent SE of mean. The non-
contaminated value was averaged by four non-contaminated soil samples in four
sampling occasions.
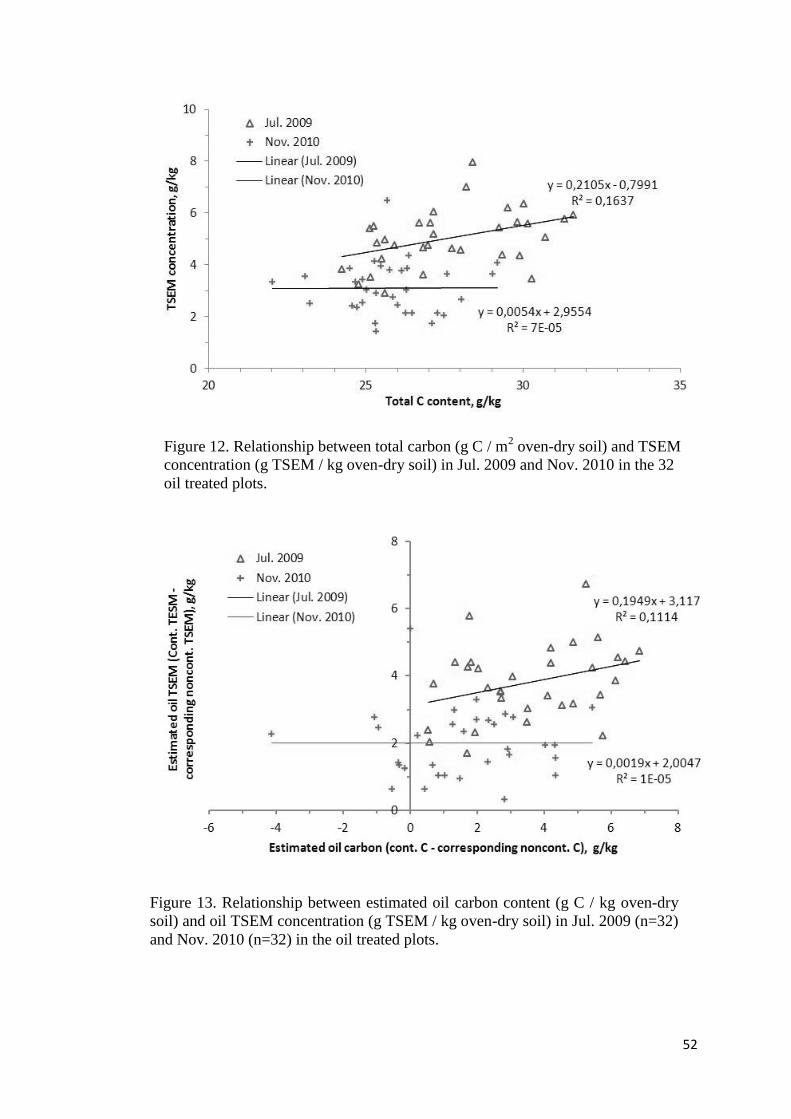
52
Figure 13. Relationship between estimated oil carbon content (g C / kg oven-dry
soil) and oil TSEM concentration (g TSEM / kg oven-dry soil) in Jul. 2009 (n=32)
and Nov. 2010 (n=32) in the oil treated plots.
Figure 12. Relationship between total carbon (g C / m2 oven-dry soil) and TSEM
concentration (g TSEM / kg oven-dry soil) in Jul. 2009 and Nov. 2010 in the 32
oil treated plots.
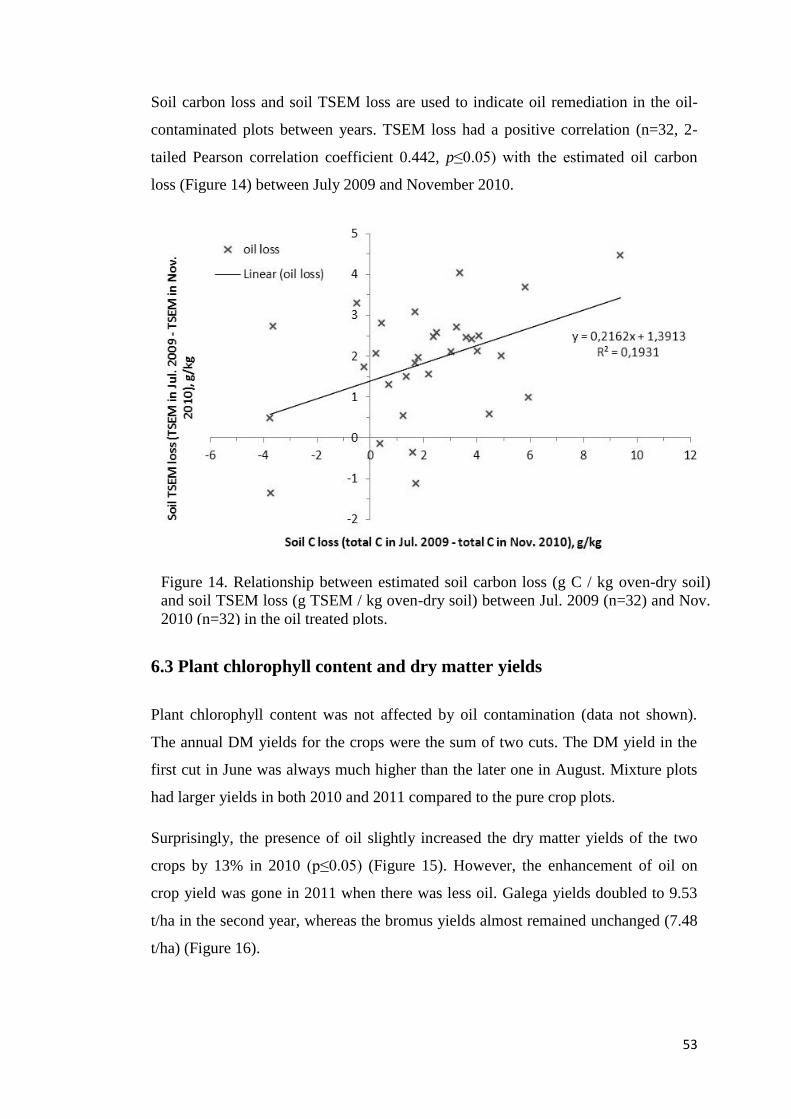
53
Soil carbon loss and soil TSEM loss are used to indicate oil remediation in the oil-
contaminated plots between years. TSEM loss had a positive correlation (n=32, 2-
tailed Pearson correlation coefficient 0.442, p≤0.05) with the estimated oil carbon
loss (Figure 14) between July 2009 and November 2010.
6.3 Plant chlorophyll content and dry matter yields
Plant chlorophyll content was not affected by oil contamination (data not shown).
The annual DM yields for the crops were the sum of two cuts. The DM yield in the
first cut in June was always much higher than the later one in August. Mixture plots
had larger yields in both 2010 and 2011 compared to the pure crop plots.
Surprisingly, the presence of oil slightly increased the dry matter yields of the two
crops by 13% in 2010 (p≤0.05) (Figure 15). However, the enhancement of oil on
crop yield was gone in 2011 when there was less oil. Galega yields doubled to 9.53
t/ha in the second year, whereas the bromus yields almost remained unchanged (7.48
t/ha) (Figure 16).
Figure 14. Relationship between estimated soil carbon loss (g C / kg oven-dry soil)
and soil TSEM loss (g TSEM / kg oven-dry soil) between Jul. 2009 (n=32) and Nov.
2010 (n=32) in the oil treated plots.
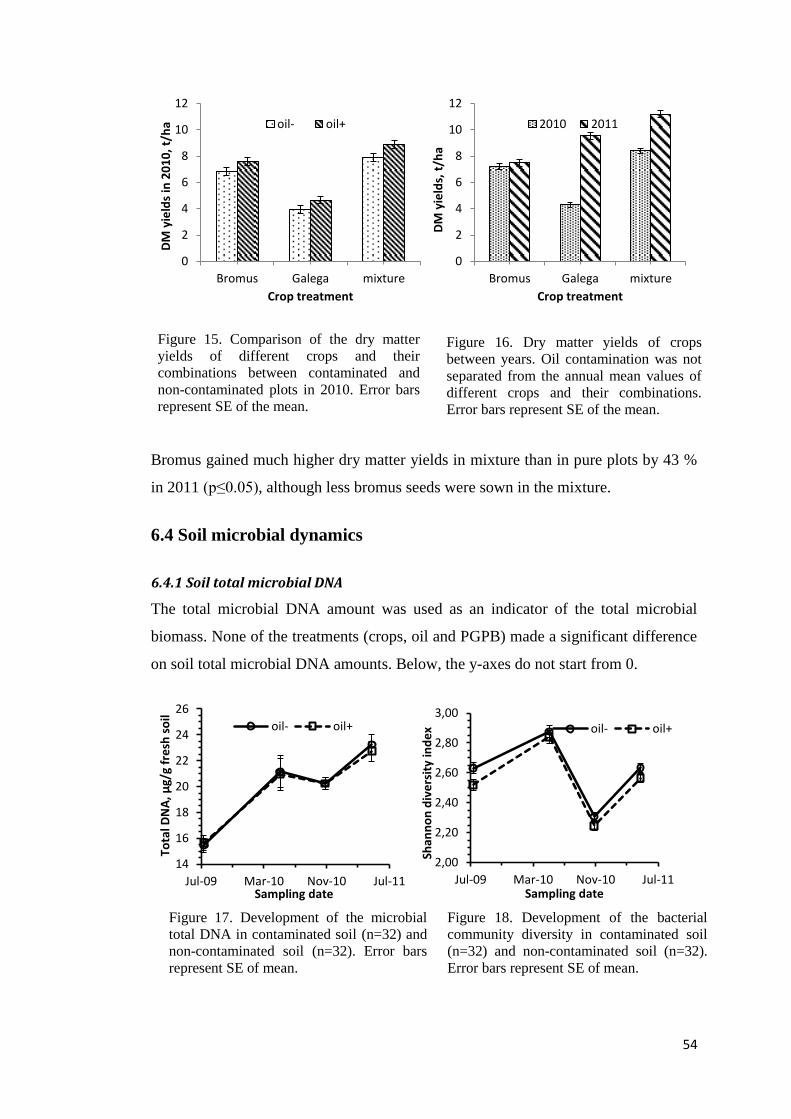
54
Bromus gained much higher dry matter yields in mixture than in pure plots by 43 %
in 2011 (p≤0.05), although less bromus seeds were sown in the mixture.
6.4 Soil microbial dynamics
6.4.1 Soil total microbial DNA
The total microbial DNA amount was used as an indicator of the total microbial
biomass. None of the treatments (crops, oil and PGPB) made a significant difference
on soil total microbial DNA amounts. Below, the y-axes do not start from 0.
0
2
4
6
8
10
12
Bromus Galega mixture
DM
yie
lds
in 2
01
0,
t/h
a
Crop treatment
oil- oil+
0
2
4
6
8
10
12
Bromus Galega mixture
DM
yie
lds,
t/h
a
Crop treatment
2010 2011
14
16
18
20
22
24
26
Jul-09 Mar-10 Nov-10 Jul-11
Tota
l DN
A,
µg/
g fr
esh
so
il
Sampling date
oil- oil+
2,00
2,20
2,40
2,60
2,80
3,00
Jul-09 Mar-10 Nov-10 Jul-11
Shan
no
n d
ive
rsit
y in
de
x
Sampling date
oil- oil+
Figure 17. Development of the microbial
total DNA in contaminated soil (n=32) and
non-contaminated soil (n=32). Error bars
represent SE of mean.
Figure 18. Development of the bacterial
community diversity in contaminated soil
(n=32) and non-contaminated soil (n=32).
Error bars represent SE of mean.
Figure 15. Comparison of the dry matter
yields of different crops and their
combinations between contaminated and
non-contaminated plots in 2010. Error bars
represent SE of the mean.
Figure 16. Dry matter yields of crops
between years. Oil contamination was not
separated from the annual mean values of
different crops and their combinations.
Error bars represent SE of the mean.
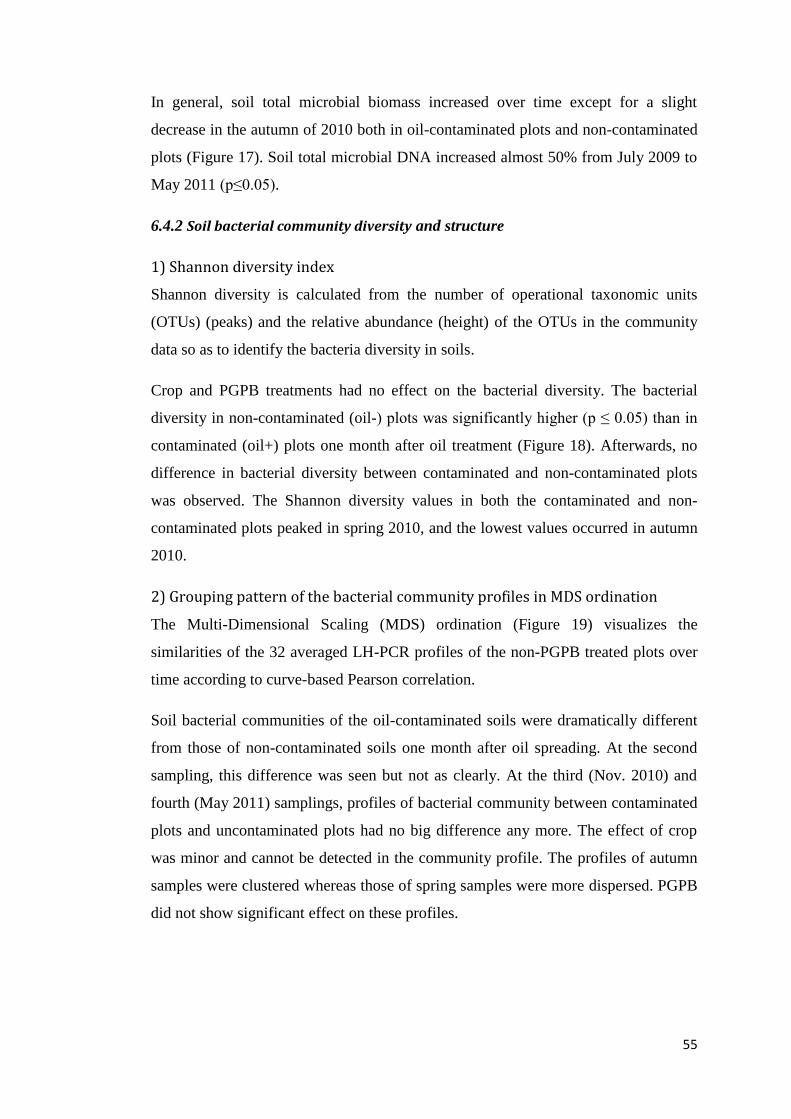
55
In general, soil total microbial biomass increased over time except for a slight
decrease in the autumn of 2010 both in oil-contaminated plots and non-contaminated
plots (Figure 17). Soil total microbial DNA increased almost 50% from July 2009 to
May 2011 (p≤0.05).
6.4.2 Soil bacterial community diversity and structure
1) Shannon diversity index
Shannon diversity is calculated from the number of operational taxonomic units
(OTUs) (peaks) and the relative abundance (height) of the OTUs in the community
data so as to identify the bacteria diversity in soils.
Crop and PGPB treatments had no effect on the bacterial diversity. The bacterial
diversity in non-contaminated (oil-) plots was significantly higher (p ≤ 0.05) than in
contaminated (oil+) plots one month after oil treatment (Figure 18). Afterwards, no
difference in bacterial diversity between contaminated and non-contaminated plots
was observed. The Shannon diversity values in both the contaminated and non-
contaminated plots peaked in spring 2010, and the lowest values occurred in autumn
2010.
2) Grouping pattern of the bacterial community profiles in MDS ordination
The Multi-Dimensional Scaling (MDS) ordination (Figure 19) visualizes the
similarities of the 32 averaged LH-PCR profiles of the non-PGPB treated plots over
time according to curve-based Pearson correlation.
Soil bacterial communities of the oil-contaminated soils were dramatically different
from those of non-contaminated soils one month after oil spreading. At the second
sampling, this difference was seen but not as clearly. At the third (Nov. 2010) and
fourth (May 2011) samplings, profiles of bacterial community between contaminated
plots and uncontaminated plots had no big difference any more. The effect of crop
was minor and cannot be detected in the community profile. The profiles of autumn
samples were clustered whereas those of spring samples were more dispersed. PGPB
did not show significant effect on these profiles.
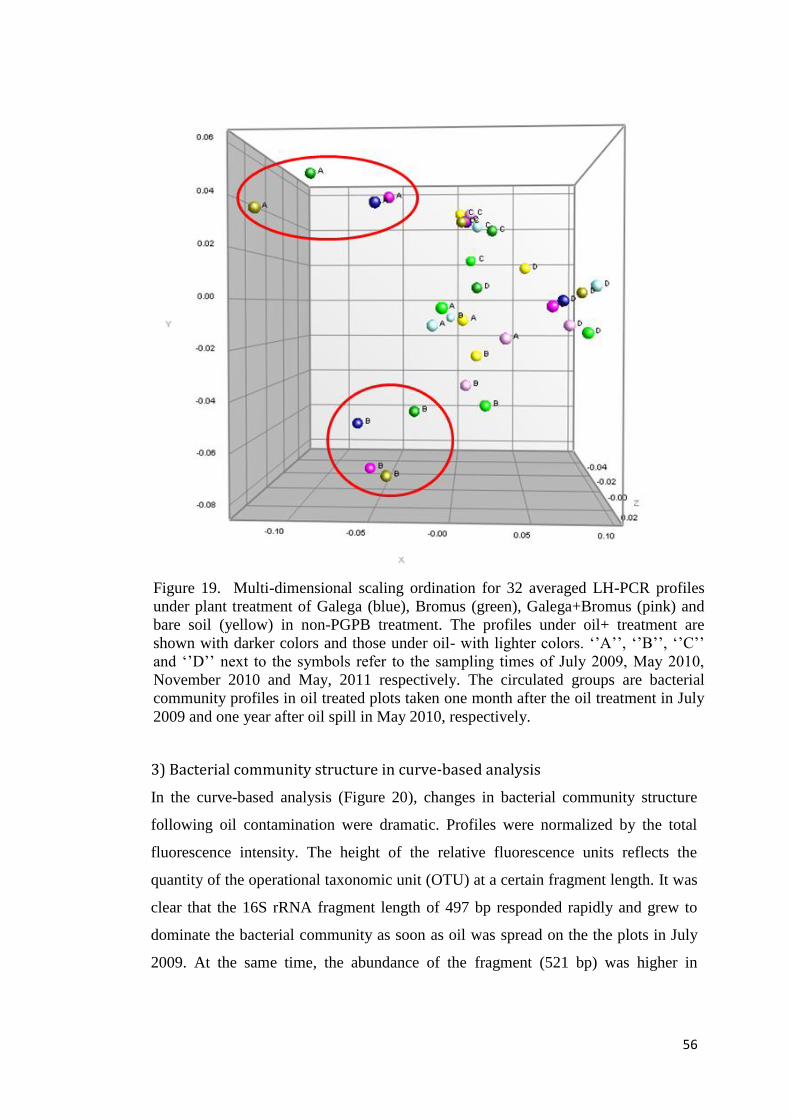
56
3) Bacterial community structure in curve-based analysis
In the curve-based analysis (Figure 20), changes in bacterial community structure
following oil contamination were dramatic. Profiles were normalized by the total
fluorescence intensity. The height of the relative fluorescence units reflects the
quantity of the operational taxonomic unit (OTU) at a certain fragment length. It was
clear that the 16S rRNA fragment length of 497 bp responded rapidly and grew to
dominate the bacterial community as soon as oil was spread on the the plots in July
2009. At the same time, the abundance of the fragment (521 bp) was higher in
Figure 19. Multi-dimensional scaling ordination for 32 averaged LH-PCR profiles
under plant treatment of Galega (blue), Bromus (green), Galega+Bromus (pink) and
bare soil (yellow) in non-PGPB treatment. The profiles under oil+ treatment are
shown with darker colors and those under oil- with lighter colors. ‘’A’’, ‘’B’’, ‘’C’’
and ‘’D’’ next to the symbols refer to the sampling times of July 2009, May 2010,
November 2010 and May, 2011 respectively. The circulated groups are bacterial
community profiles in oil treated plots taken one month after the oil treatment in July
2009 and one year after oil spill in May 2010, respectively.
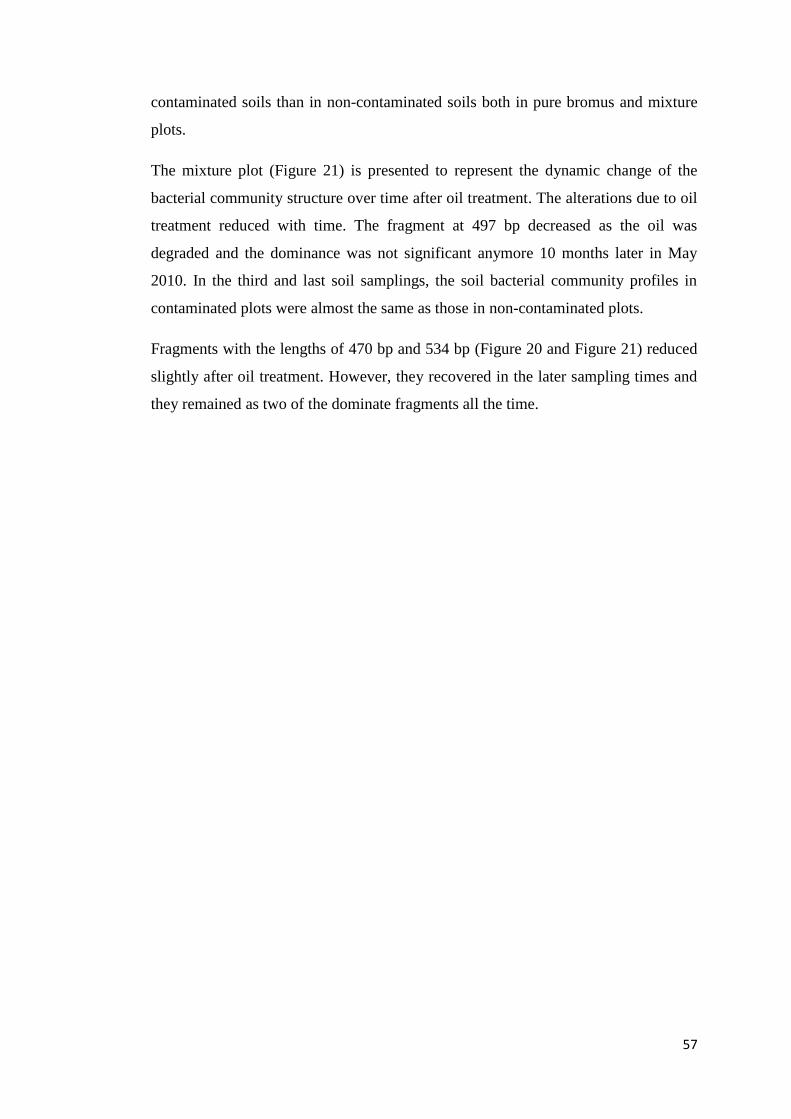
57
contaminated soils than in non-contaminated soils both in pure bromus and mixture
plots.
The mixture plot (Figure 21) is presented to represent the dynamic change of the
bacterial community structure over time after oil treatment. The alterations due to oil
treatment reduced with time. The fragment at 497 bp decreased as the oil was
degraded and the dominance was not significant anymore 10 months later in May
2010. In the third and last soil samplings, the soil bacterial community profiles in
contaminated plots were almost the same as those in non-contaminated plots.
Fragments with the lengths of 470 bp and 534 bp (Figure 20 and Figure 21) reduced
slightly after oil treatment. However, they recovered in the later sampling times and
they remained as two of the dominate fragments all the time.
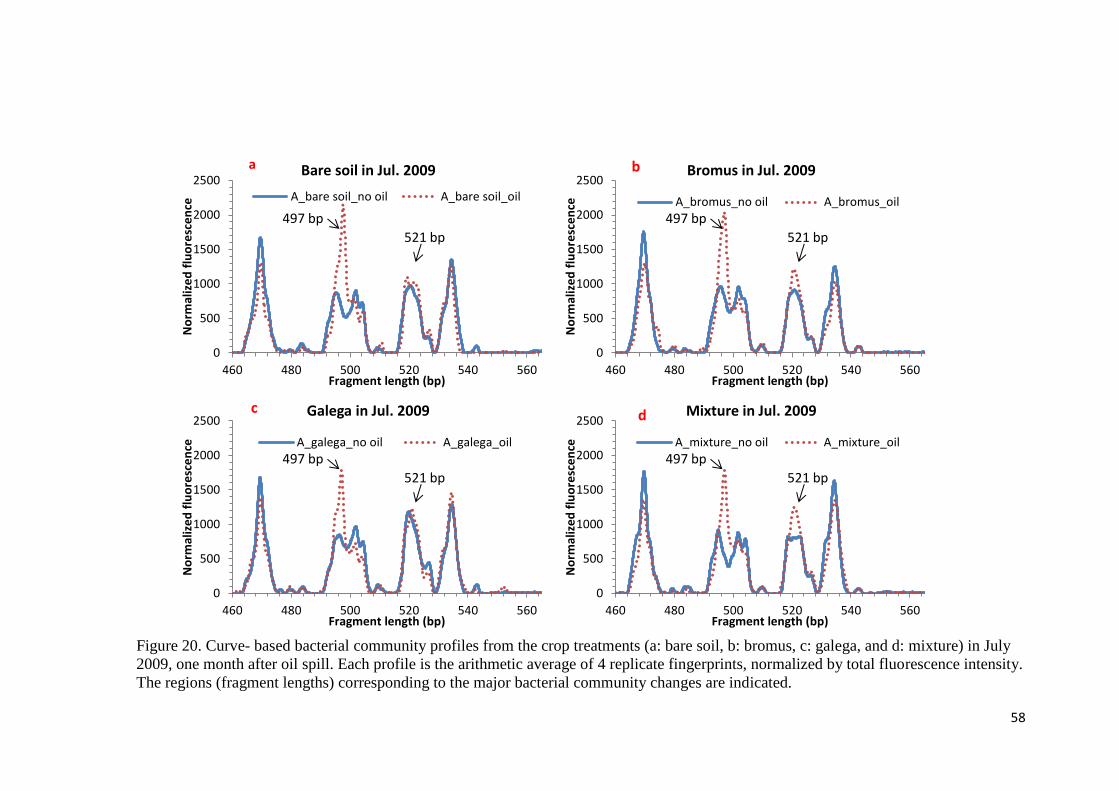
58
0
500
1000
1500
2000
2500
460 480 500 520 540 560
No
rmal
ize
d f
luo
resc
en
ce
Fragment length (bp)
Bare soil in Jul. 2009
A_bare soil_no oil A_bare soil_oil
497 bp
521 bp
a
0
500
1000
1500
2000
2500
460 480 500 520 540 560
No
rmal
ize
d f
luo
resc
en
ce
Fragment length (bp)
Bromus in Jul. 2009
A_bromus_no oil A_bromus_oil
497 bp
521 bp
0
500
1000
1500
2000
2500
460 480 500 520 540 560
No
rmal
ize
d f
luo
resc
en
ce
Fragment length (bp)
Galega in Jul. 2009
A_galega_no oil A_galega_oil
497 bp
521 bp
0
500
1000
1500
2000
2500
460 480 500 520 540 560
No
rmal
ize
d f
luo
resc
en
ce
Fragment length (bp)
Mixture in Jul. 2009
A_mixture_no oil A_mixture_oil
497 bp
521 bp
Figure 20. Curve- based bacterial community profiles from the crop treatments (a: bare soil, b: bromus, c: galega, and d: mixture) in July
2009, one month after oil spill. Each profile is the arithmetic average of 4 replicate fingerprints, normalized by total fluorescence intensity.
The regions (fragment lengths) corresponding to the major bacterial community changes are indicated.
b
c d
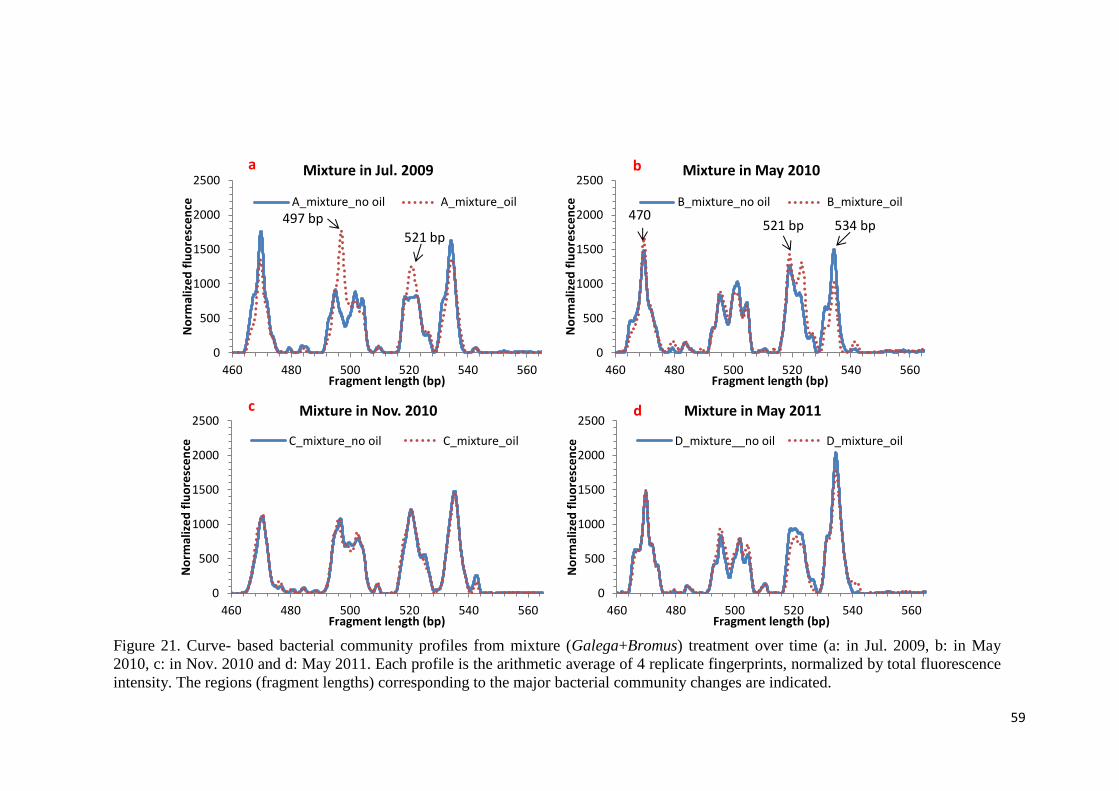
59
0
500
1000
1500
2000
2500
460 480 500 520 540 560
No
rmal
ize
d f
luo
resc
en
ce
Fragment length (bp)
Mixture in Jul. 2009
A_mixture_no oil A_mixture_oil
497 bp
521 bp
0
500
1000
1500
2000
2500
460 480 500 520 540 560
No
rmal
ize
d f
luo
resc
en
ce
Fragment length (bp)
Mixture in May 2010
B_mixture_no oil B_mixture_oil
0
500
1000
1500
2000
2500
460 480 500 520 540 560
No
rmal
ize
d f
luo
resc
en
ce
Fragment length (bp)
Mixture in Nov. 2010
C_mixture_no oil C_mixture_oil
0
500
1000
1500
2000
2500
460 480 500 520 540 560
No
rmal
ize
d f
luo
resc
en
ce
Fragment length (bp)
Mixture in May 2011
D_mixture__no oil D_mixture_oil
Figure 21. Curve- based bacterial community profiles from mixture (Galega+Bromus) treatment over time (a: in Jul. 2009, b: in May
2010, c: in Nov. 2010 and d: May 2011. Each profile is the arithmetic average of 4 replicate fingerprints, normalized by total fluorescence
intensity. The regions (fragment lengths) corresponding to the major bacterial community changes are indicated.
a b
c d
521 bp 470
bp 534 bp
60
7 Discussion
Soil is not only a nonrenewable natural resource, but also a living dynamic
ecosystem (FAO 2005). It takes extremely slow physicochemical and biological
processes for soil to be formed from rocks into binding particles and then aggregates
with the help of soil organisms (Banwart 2011). The health of a soil not only affects
the metabolic activities of plants and soil microorganisms, but also has a significant
impact on the human social and economic activities. Soil quality is highly dependent
on the interaction among soil physical, chemical, and biological properties (Dexter
2004). Soil properties can be affected by petroleum hydrocarbon contamination
(PHC) contamination and they in turn affect PHC remediation.
The total solvent extractable material (TSEM) yield in pure motor oil (Teboil
Lubricants Classic Mineral Motor oil, moniaste SAE 10W-30, API SF/CD) was
around 100 %, meaning that the method for TSEM extraction and determination was
working very well for this kind of motor oil. Soil samples are considered "clean",
when the oil concentration is below 1 g/kg.
7.1 Hydrocarbon contamination and soil physicochemical properties
The degree of hydrocarbon degradation is mainly affected by the characteristics of
the hydrocarbon in the contamination and only to a lesser extent by soil properties
(Aichberger et al. 2005). However, several soil properties (e.g. the soil texture,
content of soil organic matter, C/N, and pH) have been shown to be greatly involved
in hydrocarbon degradation in non-vegetated soils (Chiapusio et al. 2007).
7.1.1 Soil organic matter
Soil organic matter (SOM) is a reservoir of plant nutrients and carbon. Usually,
organic matter in soil originates from natural materials (e.g. plant or animal litters
that return to soil and microbial biomass. Soil may also contain man‐made chemicals
(e.g. pesticides, hydrocarbons, plastics and industrial by‐products) (Ward 2008; FAO
2005). SOM influences the bioavailability of nutrients as well as soil enzymes
produced by bacteria, fungi and plant roots (Chaudhary 2012).
Bioavailability is well explained as one of the most limiting factors in bioremediation
of persistent organic pollutants in soil (Wenzel 2009). Compared to the other soil
characteristics, soil organic matter is the major factor which affects the distribution
61
and bioavailability of petroleum hydrocarbons (Chaudhary 2012). Many studies
proved that there is a close relationship between soil organic matter and PHC
bioavailability to plants. SOM increased significantly after an oil contamination (Liu
et al. 2007). Bioavailability of PHCs in soil decreases as the soil organic matter
content increases; that is to say, when SOM accumulated for a certain amount after
an oil spill, phytoremediation of PHCs can be limited (Weissenfels et al. 1992).
The TSEM concentration is a direct indicator of oil content in oil-contaminated soil.
There is no doubt that TSEM loss had a significant positive correlation with the
estimated oil carbon loss between July 2009 and November 2010. One can easily get
the conclusion that the loss of TSEM and carbon were brought by the remediation of
PHCs in the oil treated soils. PHCs might have either physically left the soil matrix
or been converted into soil organic matter by heterotrophic microorganisms.
We observed a significantly positive correlation between TSEM concentration and
total carbon content one month after oil treatment. This correlation disappeared in
later sampling times, indicating that as oil content was reduced, the impact of oil
carbon on soil total carbon was smaller. However, the estimated oil TSEM did not
correlate with the estimated oil carbon content, indicating that it was not appropriate
to estimate oil carbon content by the difference of total carbon content between the
oil treated plots and the corresponding non-oil treated plots. Soil organic carbon
(without oil carbon), which constitutes the largest part of carbon content in the soil,
might have a different dynamics in oil treated and non-oil treated plots. Thus soil
organic carbon differed in content between oil treated and non-oil treated plots. The
negative values of estimated oil TSEM and oil carbon content in the samples from
Nov. 2010 could also well demonstrate this explanation.
7.1.2 Soil texture and structure
Chiapusio et al. (2007) investigated the importance of soil texture on the remediation
of PAHs and found that clay soil is the best for remediation of PAH contamination
because in clay soil PAHs and nutrients are more bioavailable and bioaccessible to
microorganisms. The clay loam soil in our field can therefore be expected to have
provided an optimal environment for microorganisms to degrade the oil
contamination.
62
7.1.3 Soil pH and electrical conductivity (EC)
Soil pH influences on plant growth, metal ion solubility, microbial activity and clay
dispersion (Haynes & Naidu 1998). The ideal pH range to promote biodegradation of
soil contamination is between 6 and 8, depending on the species of the degraders
(ATSDR 1999). In our study, soil pH was optimal (6.5) throughout the first two
years, providing a suitable environment for microbial PHC degradation. Oil
treatment made no difference to soil pH.
In our study, both oil and crop treatment significantly reduced soil electrical
conductivity. The EC values of the oil-contaminated plots remained stable between
July 2009 and November 2010, whereas the EC values reduced significantly in
November 2010, indicating that crops played a greater role in the change of soil
electrical conductivity than oil contamination in the second year.
7.1.4 Soil total N and C/N ratio
Since soil is a well-buffered system, soil total N, soluble K and effective P are not
largely influenced by PHCs (Liu et al. 2007). There was no significant difference in
soil total N concentration between oil-contaminated and non-contaminated plots in
our field experiment.
The addition of oil increased the C content and ratio of C/N of the soil. C/N ratios
less than 25:1 lead to mineralization and ratios greater than 30:1 lead to
immobilization (Xu & Johnson 1997). In order to stimulate and enhance the
biodegradation, 60 kg/ha N-fertilizer was given to the pure bromus field in 2009. The
C/N ratio in all plots was found to be lower than 25:1, increasing the availability of N
for microorganisms in the soil. The chlorophyll contents of the crops in all plots
(particularly in pure bromus plots) indicated that there was no N-deficiency in the
first two experimental years.
7.1.5 Climatic factors affecting soil moisture and temperature
The soil moisture content affects biodegradation of oils by the dissolution and
dispersive actions of the residual compounds and byproducts (Frankenberger 1992).
The volatilization of benzene, toluene, ethylbenzene and xylene (BTEX) from
gasoline-contaminated soils is enhanced by the decreasing soil moisture content
(Frankenberger 1992). Soil moisture also plays an important role in metabolic
63
activities of oil degrading microorganisms by affecting the availability of oxygen in
the soil (Adams et al. 2011).
All biological transformations are influenced by temperature (ATSDR 1999).
Biodegradation is reduced in winter when soil is frozen (Rike et al. 2003), but
microbial activity increases with temperature until the temperature rises to a level at
which the enzyme denaturation occurs (ATSDR 1999). The optimal temperature for
biodegradation ranges from 18 ºC to 30 ºC and the minimum rates are at 5 ºC or
lower (Frankenberger 1992). For oil degrading bacteria (e.g. Acinetobacter sp. LT4,
Pseudomonas sp. B2, BJ8, CY11, and Achromobacter sp.BJ5), degrading activities
are found optimal at 27 ⁰C (Huang et al. 2007). Temperature also affects the
volatility of lighter hydrocarbons (< C18). High summer temperatures tend to enhance
volatilization, especially when the soil begins to dry out (ATSDR 1999).
There was a steeper decrease in TSEM content from May to November in 2010. Low
moisture content and high temperature in the field are likely the crucial factors
responsible for the decrease. Soil sampling was difficult in 2010 as a result of
hardening of the soil at low moisture content. The high temperature in summer 2010
possibly not only accelerated the physical removal of oil through volatilization but
also enhanced soil microbial activity.
SOM is responsible for the brown and black color of soil. The mixture of soil and
organic compounds (e.g. oil) with darker color is most likely to raise soil temperature,
especially at the surface layer due to the higher capacity of adsorbing radiation by the
dark color (ATSDR 1999). As a result, bare soil adsorbed more radiation than
vegetated soil. The higher TSEM loss in bare contaminated soil than vegetated
contaminated soil from July 2009 to May 2011 may be explained by the greater
volatilization of the oil hydrocarbons in bare plots.
7.2 Hydrocarbon contamination and crop growth
Interactions between plants, soil and contaminants are rather complex. Plants are able
to remediate oil-contaminated soils by several mechanisms, including hydraulic
control, volatilization, stabilization, transformation, degradation and
rhizodegradation (Kamath et al. 2007).
64
Galega orientalis only reaches its highest stable annual dry matter yield and seed
yield in the second or third year after cultivation, due to a slow growth pattern (e.g.
low germination and growth rate) in the seedling year (Adamovich 2002 & Zolotarev
2010). Our results well proved this point. In the second year (2012), galega dry
matter yield doubled to 9.54 t/ha.
The roots of Bromus inermis develop within five days of germination (Global
Invasive Species Database 2010). DM yields in pure bromus plots did not change
between years and N-deficiency was not observed in these plots. Galega and rhizobia
symbiosis enhanced the growth of bromus, resulting in higher bromus DM yields in
the mixture plots (without N-fertilizer added) than in the pure bromus plots (with N-
fertilizer added) in 2011. This positive effect may most likely be contributed by the
nitrogen fixation of legumes and rhizobia symbiosis. In addition, rhizobia have been
proved to be associated with plant hormone (IAA) synthesis gene (nthAB) (Amadou
et al. 2008), which might benefit the growth of bromus in mixture plots. The yields
were highest in the mixture plots, which greatly reflected the benefits brought by the
legume-cropping system.
Galega orientalis and Bromus inermis were both tolerant to oil-contaminated soils at
the concentration of 7000 ppm. Surprisingly, oil contamination slightly increased the
dry matter yield of both crop species in the first year. The effect of oil on crop yields
was gone in the second year when the oil concentration was reduced.
The cultivation of the crops (galega and bromus) was hypothesized to have positive
impact on soil properties and microbial dynamics (e.g. soiltotal DNA, bacterial
diversity and bacterial community profiles) and therefore to enhance the remediation
on oil-contaminated soil. Nevertheless, oil loss was greater in bare soils than
vegetated soils. There are two possible causes for this result. The competition for
resources (e.g. nutrients and oxygen) between crops and soil microorganisms limited
the role crops played in oil remediation or the most easy-degradable PHCs might
have been removed from the soil surface by bioremediation and physical removal
before galega and bromus established their roots in the soil. Plant growth promoting
bacteria (PGPB) had no effect on plant growth probably due to the resource
competition with other organisms in soil or to climatic factors regulating plant
growth. There was no significant difference in oil (TSEM) concentration and total C
65
content between the two crop species and their combination, indicating that oil
reduction in our study was most likely caused by volatilization, leaching and
bioremediation, but not phytoremediation. The total solvent extractable materials
(TSEM) analysis does not distinguish between petroleum hydrocarbons and naturally
occurring compounds such as plant waxes and chlorophyll in the sample (Mills et al.
1999). It may partly explain why the TSEM concentration was always the lowest in
the bare plots, where there were no plant waxes and chlorophyll.
7.3 Hydrocarbon contamination and soil microorganisms
There are three categories of soil biota: soil flora (plants), soil fauna (animals) and
soil microorganisms (microbes) (McCauley 2005). Soil fauna act as a conditioner in
decomposing organic matter (e.g., plant debris) and promoting nutrient cycling in
soil and therefore soil fauna can be expected to help bioremediation in the soil (Yin
et al. 2010). Sinha et al. (2008) showed that earthworms are highly tolerant of
many chemical contaminants including PAHs and can purify the pollutants by bio-
accumulating them in their tissues. Earthworms were commonly observed in our
field.
Soil microorganisms are the main decomposers of organic matter in ecosystems.
Bacteria, molds, algae and fungi are common microorganisms in soil (Sullivan 1999).
The smallest and most numerous of the free-living microorganisms in the soil are
bacteria, which decompose plant debris and enhance plant nutrient up-take. Some
bacteria release nitrogen, sulfur, phosphorus and trace elements from organic matter
and some can even break down soil minerals and release potassium, phosphorus,
magnesium, calcium and iron (Sullivan 1999). Soil bacteria play a great role in the
bioremediation of contaminated soils. The bacterial diversity and community
structure highly are highly sensitive to the change of soil condition, especially to
pertubations such as soil contamination. Thus it is used as a tool to detect oil
contamination in our field experiment.
Bacteria in our field were highly resilient to oil contamination. The bacterial
diversity in the contaminated plots gradually returned to the original non-
contaminated state after two years from oil spreading. In curve-based analysis,
bacterial community structure in the contaminated soil developed in the same
direction as in the non-contaminated soil. Soil microbial biomass kept increasing
66
after oil treatment, indicating a good adaptation of soil microbes to PHC
contamination with exception to a seasonal slight decrease in the autumn 2010. A
larger microbial population indicates a faster remediation of organic contaminants in
soils. Oil treatment has been found to increase soil total microbial DNA content
(Mikkonen 2008). In our experiment, there was no statistical difference in soil total
microbial DNA between contaminated plots and non-contaminated plots.
Oil contamination was observed to decrease the bacterial diversity significantly in
the first few weeks after oil treatment. A 16S rRNA gene fragment at 497 bp was
very abundant at the beginning in contaminated soils, indicating a prompt growth of
a bacterium that is likely a PHC degrader. However, the quantity of this fragment
had decreased before the second sampling, when oil (TSEM) concentration in
contaminated soils was still high. This phenomenon might be brought by two reasons.
The easily degraded oil components had been degraded, and this bacterium with
fragment of 497 bp was not as efficient in degrading the rest oil components with
longer chains or oil contaminants might have been converted to some form of SOM
that was also extracted by our method in the second sampling. Bromus seemed to
enhance oil degrading activities of a bacterium with 16S rRNA gene fragment length
of 521 bp, resulting in a higher abundance in bromus plots. Besides the 497 and 521
bacteria described above, other bacteria with fragments of 470 bp and 534 bp also
appeared to endure oil contamination and to remain dominant in whole bacterial
community over time. They may therefore be promising for use in remediation of
oil-contaminated soils.
The clustering characteristics of bacterial community in the MDS analysis and the
overlap of bacterial community structure in the curve-based analysis indicated that
there was a clear seasonal change in total microbial DNA content and bacterial
diversity. Climatic factors (soil temperature and moisture) and soil C/N ratio are
prominent factors which can result in seasonal variation of soil microbial community
(Habekost et al. 2008). Change in soil temperature is probably the most important
factor to explain the seasonal change of microbial DNA content and bacterial
diversity in our experiment. Lower temperature limited the activities of enzymes and
bacteria in the autumn season, leading to a reduction in microbial DNA content. Soil
moisture affects the availability of oxygen in the soil, limiting the metabolic
activities of oil degrading microorganisms (Adams et al. 2011). Soil moisture was
67
higher in autumn in our field because of lower evapotranspiration, resulting in an
anaerobic soil environment. Activities of aerobic soil microorganisms were probably
restricted or inhibited in this season, resulting in the sharp decrease both in soil total
DNA and bacterial diversity. Most oil-degrading bacteria prefer aerobic conditions
(ATSDR 1999). Anaerobic soil conditions might also be responsible for the
clustering pattern of bacterial community structures between the oil-contaminated
plots and non-contaminated plots in the autumn 2010.
Generally, plant roots have less impact on bulk soil than rhizosphere soil in terms of
microbial growth and soil properties. The above analyses were all done on the basis
of bulk soil, instead of rhizosphere soil. It might explain why crops (galega and
bromus) did not make any difference on soil microbial population in our experiment.
68
8 General conclusions
It appears that bioremediation by soil microorganisms and physical removal
including volatilization and leaching were the main processes of oil reduction in our
experiment. Climate factors (e.g. temperature and precipitation) had an overriding
influence on the removal of oil and soil microbial activities in our study. Soil
condition in our field was optimal for biodegradation of hydrocarbons, having a
neutral pH and an optimal C/N ratio. Soil physiochemical properties were very well
buffered under oil treatment, expect for the sensitive parameters of electrical
conductivity and the total carbon content in the first year.
Compared to soil parameters, the changes in soil microbial population and
community are a more sensitive indicator of petroleum hydrocarbon contamination
and recovery. The soil bacterial communities showed a vast potential to recover from
oil contamination, even though the recovery was slower under field conditions as
compared to the greenhouse condition (Mikkonen et al. 2010). The seasonal change
of soil microorganisms was remarkable, which needs to be taken into account before
planning soil sampling.
Surprisingly, crops (Galega orientalis and Bromus inermis) and PGPB treatment had
no significant effect neither on soil physiochemical and microbiological properties
(microbial DNA content, bacterial diversity and bacterial community structure) nor
on the loss of oil in our experiment, which largely differed from our hypothesis.
Except for the climatic factors, resource competition between crops and
microorganisms might have resulted in the better oil remediation in bare soils than in
vegetated soils. Nevertheless, crops were found to have a high tolerance to oil
contamination and surprisingly, the oil contamination seemed to increase the growth
of both crop species. Bromus in mixture plots (without commercial nitrogen
fertilization) had better yield than in pure plots (with commercial nitrogen
fertilization) as a result of biological nitrogen fixation of Galega orientalis and
Rhizobium galegae. Therefore the mixture of galega and bromus can be suggested to
apply to future phytoremediation projects.
However, the oil contamination was not completely cleaned up till the last sampling
in May 2011. Long-term stimulation and monitoring on soil parameters, oil content,
crop growth and microbial community are still needed. In the future, sequencing will
69
be applied to identify the microbes and genes that were associated in PHC
remediation in our experiment.
As nitrogen is the most frequently deficient nutrient in most contaminated soils,
legume-cropping system is a good candidate in future phytoremediation projects with
considerable economic values. In the tropics, woody legumes which are abundant
there are going to benefit the removing of petroleum hydrocarbon contamination in
soils (Vitosek et al. 2002). Azotobacter, azospirillum, rhizobium, actinomycete,
frankia, blue-green algae and anabaena are the commonly used microorganisms
which can economically fix nitrogen in soils (Havlin et al. 2010). Provided with
proper management strategies for irrigation, fertilization, weed control (mowing,
mulching, or spraying) and pest control (ITRC 2009), N-fixing bacteria assisted crop
system is therefore ideal for the successful remediation of contaminated soils.
70
REFERENCES
Adamovich, M. 2002. Productivity and yield quality of fodder galega (Galega orientalis
Lam.) — Grass mixed swards. Plant nutrition. Developments in Plant and Soil Sciences 92
(12): 1008-1009.
Adams, R. H., Kikey, K., Francisco, J. G. & Erika, E. 2011. Comparison of moisture
management methods for the bioremediation of hydrocarbon contaminated soil. African
Journal of Biotechnology 10(3): 394-404.
Agbogidi, O. M. & Dolor D. E. (2007). An assessment of the growth of Irvingiagabonensis
(Aubry-Lecomte Ex O’ Rorte) Bail seedlings asinfluenced by crude oil contamination of soil.
Asian Journal of Plant Sciences 6(8):1287-1292.
Agency for Toxic Substances and Disease Registry (ATSDR) 1999. Toxicological profile for
total petroleum hydrocarbons (PHC). Atlanta, GA: U.S. Department of Health and Human
Services, Public Health Service. Available at:
http://www.atsdr.cdc.gov/ToxProfiles/tp123.pdf. Last visited: March 20, 2012.
Aichberger, H., Hasinger, M., Braun, R., Loibner, A. P. 2005. Potential preliminary test
methods to predict biodegradation performance of petroleum hydrocarbons in soil.
Biodegradation 16:115–125.
Amadou, C., Pascal, G., Mangenot, S., Glew, M., Bontemps, C., Capela, D., Carrère,
S., Cruveiller, S., Dossat, C., Lajus, A., Marchetti, M., Poinsot, V., Rouy, Z., Servin,
B., Saad, M., Schenowitz, C., Barbe, V., Batut, J., Médigue, C., Masson-Boivin, C. 2008.
Genome sequence of the beta-rhizobium Cupriavidus taiwanensis and comparative genomics
of rhizobia. Genome research 18(9): 1472-1483.
Anderson. T. A., Guthrie, E. A. & Walton, B.T. 1993. Bioremediation. Environmental
Science and Technology 27: 2630–2636.
Banwart, S. 2011. Save our soils. Nature 474: 151-152.
Beyer, W. N. 1990. Evaluating soil contamination. U.S. Fish and Wildlife Service,
Biological Report 90(2). 25 pp.
Bhattacharyya, P. N., Jha, D. K. 2011. Plant growth-promoting rhizobacteria (PGPR):
emergence in agriculture. World Journal of Microbiology and Biotechnology 28(4): 1327-
1350.
Bohn, H. L., Mcneal B. L. & O’Connor G.A. Soil chemistry Second Edition, 1985. A Wiley-
Interscience Publication, John Wiley & Sons, Inc.
Boopathy, R. 2000. Factors limiting bioremediation technologies. Bioresource Technology
74: 63-67.
Burton, P.J., Messier, C., Weetman, G. F., Prepas, E. E., Adamowicz, W. L. & Tittler, R.
2003. The current state of boreal forestry and the drive for change. In Towards Sustainable
Management of the Boreal forest. NRC press, Ottawa, Ont., Canada. pp. 1-40.
Canadian Council of Ministers of the Environment (CCME) 2001a. Canada-wide standards
for petroleum hydrocarbons (PHC) in soil. 8 pp. Available at:
http://www.ccme.ca/assets/pdf/phc_standard_1.0_e.pdf. Last visited: March 10, 2012.
Canadian Council of Ministers of the Environment (CCME) 2001b. Backgrounder -
Petroleum Hydrocarbons in Soil - Canada-Wide Standard. 2 pp. Available at:
http://www.ccme.ca/assets/pdf/phc_backgrounder_e.pdf. Last visited: March 29, 2012.
http://www.ncbi.nlm.nih.gov/pubmed?term=Cruveiller%20S%5BAuthor%5D&cauthor=true&cauthor_uid=18490699
71
Canadian Council of Ministers of the Environment (CCME) 2008. Canada-Wide Standard
for Petroleum Hydrocarbons (PHC) in Soil: Scientific Rationale Supporting Technical
Document Executive Summary. Available at:
http://www.ccme.ca/assets/pdf/phc_sr_std_es_1.0_e.pdf. Last visited: Febuary 12, 2012.
Chaineau, C. H., Yepremian, C., Vidalie, J. F., Ducreux, J. & Ballerini, D. 2003.
Bioremediation of a crude oil-polluted soil: biodegradation, leaching and toxicity assessment.
Water, Air, and Soil Pollution 144: 419-440.
Chaudhary, P. et al. 2012. Impact of PAH on biological health parameters of soils of an
Indian refinery and adjoining agricultural area—a case study. Environmental Monitoring and
Assessment 184: 1145–1156.
Chiapusio, G. et al. 2007. Phenanthrene toxicity and dissipation in rhizosphere of grassland
plants (Lolium perenne L. and Trifolium pratense L.) in three spiked soils. Plant Soil 294:
103–112.
CLUIN phytoremediation database. Available at: http://cluin.org/products/phyto/. Last
visited: August 20, 2012.
Commission of the European Communities 2006. Establishing a framework for the
protection of soil and amending directive 2004/35/EC. Directive of the European Parliament
and of the Council. Brussels. COM (2006) 232 final. Available at: http://eur-
lex.europa.eu/LexUriServ/LexUriServ.do?uri=COM:2006:0232:FIN:EN:PDF. Last visited:
August 26, 2012.
Cook, R. L., Landmeyer, J. E., Atkinson, B., Messier, J. P. & Nichols, E. G. 2010. Field note:
successful establishment of a phytoremediation system at a petroleum hydrocarbon
contaminated shallow aquifer: trends, trials, and tribulations. International Journal of
Phytoremediation, 12: 716-732.
Cybulski, Z., Dzuirla, E., Kaczorek, E. & Olszanowski, A. 2003. The influence of
emulsifiers on hydrocarbon biodegradation by Pseudomonadacea and Bacillacea strains.
Spill Science and Technology Bulletin, 8: 503 – 507.
Department for Environment, Food and Rural Affairs (DEFRA) of Unite Kingdom 2009.
Soil strategy for England supporting evidence paper. Available at:
http://archive.defra.gov.uk/environment/quality/land/soil/documents/evidence-paper.pdf.
Last visited: March 20, 2012.
Dexter, A. R. 2004. Soil physical quality: Part I. Theory, effects of soil texture, density, and
organic matter, and effects on root growth. Geoderma 120 (3-4): 201–214.
Egamberdieva, D., Berg G., Lindström, K & Räsänen, L.A. 2010. Co-inoculation of
Pseudomonas spp. with Rhizobium improves growth and symbiotic performance of fodder
galega (Galega orientalis Lam.). European Journal of Soil Biology 46: 169-272.
Ellis, B. 1994. Reclaiming Contaminated Land: In situ/Ex situ Bioremediation of Creosote-
and Petroleum Hydrocarbon- Contaminated Sites. Chapter 6. Bioremediation - Field
experience by CRC Press, Inc.
Environment Agency (EA) 2006. Soil quality indicators. IPSS Meeting, Leeds.
Epps, A. V. 2006. Phytoremediation of Petroleum Hydrocarbons. U.S. Environmental
Protection Agency. Available at: http://clu-in.org/download/studentpapers/A_Van_Epps-
Final.pdf. Last visited: December 2, 2011.
72
Etkin, D. S. 2001. Analysis of oil spill trends in the United States and worldwide.
International oil spill conference. Available at: http://www.environmental-
research.com/publications/pdf/spill_statistics/paper4.pdf. Last visited: January 20, 2012.
European Commission 2002. Communication of 16 April 2002 from the Commission to the
Council, the European Parliament, the Economic and Social Committee and the Committee
of the Regions: Towards a Thematic Strategy for Soil Protection. (COM 2002) 179 final.
Available at: http://europa.eu.International/scadplus/printversion/en//lvb/l28122.htm. Last
visited: May 12, 2012.
European Commission 2006a. Proposal for a Directive of the European Parliament and of
the Council establishing a framework for the soil protection of soil and amending Directive
2004/35/EC. COM (2006)232 Brussels, 22/09/2006; 30 pp. Available at: http://eur-
lex.europa.eu/LexUriServ/LexUriServ.do?uri=CELEX:52006PC0232:EN:NOT. Last visited:
March 20, 2012.
European Commission 2006b. Communication from the Commission to the Council, the
European Parliament, the European Economic and Social Committee and the Committee of
the regions: thematic strategy for soil protection. Available at: http://eur-
lex.europa.eu/LexUriServ/LexUriServ.do?uri=CELEX:52006SC1165:EN:NOT. Last visited:
May 24, 2012.
European Commission 2006c. Questions and answers on the Thematic Strategy on soil
protection, MEMO/06/341. Available at:
http://europa.eu/rapid/pressReleasesAction.do?reference=MEMO/06/341&format=HTML&
aged=0&language=EN&guiLanguage=en. Last visited: May 26, 2012.
European Environmental Agency (EEA) 2007. Progress in management of contaminated
sites (CSI 015) Available at: http://www.eea.europa.eu/data-and-maps/indicators/progress-
in-management-of-contaminated-sites/progress-in-management-of-contaminated-1. Last
visited: March 20, 2012.
Frankenberger, W. T. 1992. The need for laboratory feasibility study in bioremediation of
petroleum hydrocarbons. In: Calabrese E, Kostecki P, eds. Hydrocarbon contaminated soils
and groundwater, vol 2. Chelsea, MI: Lewis Publishers, 237-293.
Finnish Meteorological Institute (FMI) 2011. Helsinki Monthly Statistics. Available at:
http://www.helsinkiweather.info/monthly/statistics2010.html. Last visited: March 20, 2012.
Food and Agriculture Organization of the United Nations (FAO) 2005. The importance of
soil organic matter, Key to drought-resistant soil and sustained food and production. FAO
Soils Bulletin 80. ISSN 0253-2050 Available at: ftp://ftp.fao.org/agl/agll/docs/sb80e.pdf.
Last visited: April 24, 2012.
Frick, C. M., Farrell R. E. & Germida, J. J. 1999. Assessment of Phytoremediation as an In-
Situ Technique for Cleaning Oil-Contaminated Sites. Petroleum Technology Alliance of
Canada (PTAC) Calgary, AB.
Federal Remediation Technologies Roundtable (FRTR) 2012. Remediation Technologies
Screening Matrix and Reference Guide, Version 4.0. 4.3 Phytoremediation (In situ Soil
Remediation Technology). Available at: http://www.frtr.gov/matrix2/section4/4-3.html. Last
visited: January 18, 2012.
Global Invasive Species Database (2010). Bromus inermis (grass). Available at:
http://www.issg.org/database/species/ecology.asp?si=1223&fr=1&sts=&lang=EN. Last
visited: April 30, 2012.
73
Habekost, M., Eisenhauer, N., Scheu, S., Steinbeiss, S., Weigelt, A. & Gleixner, G. 2008.
Seasonal changes in the soil microbial community in a grassland plant diversity gradient four
years after establishment. Soil Biology & Biochemistry 40: 2588-2595.
Havlin, J. L., Beaton, J. D., Tisdale, S. L. & Nelson, W. L. 2010. Soil Fertility and Fertilizers
- an introduction to Nutrient Management, Seventh Edition. Published by Pearson Education,
Inc. ISBN-978-81-203-3017-7.
Haynes, R.J. & Naidu R. 1998. Influence of lime, fertilizer and manure applications on soil
organic matter content and soil physical conditions: a review. Nutr. Cycl. Agroecosyst, 51
(1998), pp. 123–137.
Hinsinger, P., Gobran, G. R., Gregory, P. J. & Wenzel, W. W. 2005. Rhizosphere geometry
and heterogeneity arising from root-mediated physical and chemical processes. New
Phytologist 168: 293–303.
Huang, L., Ye, S, Zhang, Y., Li, Y. O., Wang, X. & Ding, D. 2007. Microbial remediation
and optimization of oil polluted wetlands at Dalian Bay in China. Biomedical and
Environmental Sciences 10: 414-419.
Hutila, A. 2011. 2010 - a year of weather extremes in Finland. Finnish Meteorological
Institute. Available at: http://www.eurekalert.org/pub_releases/2011-01/fmi-2a010411.php.
Last visited: December 17, 2011.
Johnsen, A.R., Wick, L. Y. & Harms, H. 2005. Principles of microbial PAH degradation in
soil. Environmental Pollution 133:71–84.
International Tanker Owners Pollution Federation Limited (ITOPF) 2010. Oil tanker Spill
Statistics. Available at: http://www.itopf.com/information-services/data-and-
statistics/statistics/documents/StatsPack2010_000.pdf. Last visited: April 7, 2012.
Invitrogen 2010. Qubit® 2.0 Quick Reference Card. Qubit™ Assays. Available at:
http://www.invitrogen.com/etc/medialib/en/filelibrary/cell_tissue_analysis/Qubit-all-file-
types.Par.47595.File.dat/mp39808-Qubit-2-QRC.pdf. Last visited: December 28, 2011.
Interstate Technology & Regulatory Council (ITRC) 2009. Phytotechnology
Technical and Regulatory Guidance and Decision Trees, Revised. Phyto-3. Available at:
http://www.itrcweb.org/Documents/PHYTO-3.pdf. Last visited: December 29, 2011.
Jussila, M. M. 2006. Molecular Biomonitoring during Rhizoremediation of Oil-
Contaminated Soil. Academic Dissertation in Microbiology. Department of Applied
Chemistry and Microbiology, University of Helsinki
http://ethesis.helsinki.fi/julkaisut/maa/skemi/vk/jussila/molecula.pdf. Last visited: December
15, 2011.
Jordahl, J. L., Foster, L., Schnoor, J. L. & Alvarez, P. J. J. 1997. Effects of hybrid poplar
trees on microbial populations important to hazardous waste bioremediation. Environmental
Toxicology and Chemistry 16 (6):1318-1321.
Jørgensen, K., Järvinen, o., Sainio, P., Salminen, J. & Suortti A. M. 2005. Quantification of
soil contamination: hydrocarbons in te range C10-C40. In: Margesin, R., Schinner, F. (Eds.),
Manual of soil Analysis: Monitering and Assessing Soil Bioremediation. Springer, Berlin, pp.
103-109.
Jussila, M. M., Jurgens, G., Lindström, K. & Suominen, L. 2006. Genetic diversity of
culturable bacteria in oil-contaminated rhizosphere of Galega orientalis. Environmental
Pollution 139: 244–257.
74
Jussila, M. M., Zhao, J., Suominen, L. & Lindström, K. 2007. TOL plasmid transfer during
bacterial conjugation in vitro and rhizoremediation of oil compounds in vivo, Environmental
Pollution 146: 510-524.
Kaksonen, A. H., Jussila M. M., Lindström K. & Suominen, L., 2006. Rhizosphere effect of
Galeaga orientalis in oil-contaminated soil. Soil Biology and Biochemistry. 38:817-827.
Kamath, R., Rentz, J. A., Schnoor, J. L. & Alvarez P. J. J. 2007. Phytoremediation of
hydrocarbon-contaminated soils: principles and applications, Department of Civil and
Environmental Engineering, Seamans Center, University of Iowa, Iowa City, Iowa, U.S.A. –
52242.
Kapley, A. & Purohi, H. J. 2009. Genomic tools in bioremediation. Indian Journal of
Microbiology 49:108–113.
Kawasaki, A., Watson, E. R. & Kertesz, M. A. (2011). Indirect effects of polycyclic
aromatic hydrocarbon contamination on microbial communities in legume and grass
rhizosphere. Plant soil 1-14.
Legume-Futures official website 2012. Available at: http://www.legumefutures.eu/. Last
visited: August 24, 2012.
Lindström, K. 1989. Rhizobium galegae, a new species of legume root nodule bacteria.
International Journal of Systematic Bacteriology 39: 365-367.
Lindström, K. Jussila, M. M., Hintsa, H., Kaksonen, A., Mokelke, L., Mäkeläinen, K.,
Pitäjärvi, J., & Suominen, L. 2003. Potential of Galega-Rhizobium galegae system for
bioremediation of oil-contaminated soil. Food Technology and Biotechnology 41(1): 11-16.
Liu, Q., Liu, G. & Li, H. 2003. Comparison of the Statistical Distribution of Oil Content in
Soil in the Shengtuo Oil Field with that in the Gudong Oil Field. Chinese Journal of Soil
Science 34: 6.
Liu, W. X., Luo Y. M., Teng, Y., Li, Z. G. & Wu, L. H. 2007. The initial research on the
petroleum contamination in oilfileds and oily sludge in China. Soils 39 (2): 247-251.
Lu. X. J., Guo. S. H., Sun Q. & Liang C. H. 2003. The current situation and future of
remediation technologies in petroleum contaminated soil. Journal of Shenyang Agricultural
University 1: 63-67.
Margesin, R. & Schinner, F. 2001. Biodegradation and bioremediation of hydrocarbons in
extreme environments. Applied Microbiology and Biotechnology 56: 650–663.
McCauley, A. 2005. Soil and Water Management. Module 1: Basic Soil Properties. 4481-1.
Montana State University Extension service. Available at:
http://landresources.montana.edu/SWM/PDF/Final_proof_SW1.pdf. Last visited: April 7,
2012.
Mclntyre, T. 2003. Phytoremediaiton of heavey metals from soils. Advance Biochemical
Engineering Biotechnology 78:97-123.
MERCK 2002. "Indigenous Plants to the Rescue." Science in Africa. Available at:
http://www.scienceinafrica.co.za/2002/february/oil.htm. Last visited: January 15, 2012.
Mikkonen, A. 2008. Length heterogeneity PCR fingerprinting a technique to monitor
bacterial population dynamics during rhizoremediation of fuel oil-contaminated soil.
Master's thesis. University of Helsinki. Department of Applied Chemistry and Microbiology.
75
Mikkonen A., Kondo, E., Lappi, K., Wallenius, K., Lindström, K., Hartikainen, H. &
Suominen, L. 2011a. Contaminant and plant-derived changes in soil chemical and
microbiological indicators during fuel oil rhizoremediation with Galega orientalis. Geoderma
160: 336–346.
Mikkonen A., Lappi K., Wallenius K., Lindström K. & Suominen L. 2011b. Ecological
inference on bacterial succession using curve-based community fingerprint data analysis,
demonstrated with rhizoremediation experiment. FEMS Microbiology Ecology 78:604-616.
Miller A. J. & Cramer M. D. 2004. Root nitrogen acquisition and assimilation. Plant and Soil
274: 1–36.
Mills, M. A., Mcdonald, T. J., Bonner, J. S., Simon, M. A. & Autenrieth, R. L. 1999. Method
for quantifying the fate of petroleum in the environment. Chemosphere, 39 (14): 2563-2582.
Nardini, E., Kisand,V.& Lettieri, T. 2010. Microbial Biodiversity and Molecular Approach.
Aquatic microbial world and biodiversity: Molecular Approach to improve the knowledge.
JRC Scientific and Technical Report. European commission. Joint Research Center. Institute
for Environment and Sustainability. 49 pp.
Nichols, T. D. et al. 1997. Rhizosphere microbial populations in contaminated soils. Water,
Air, & Soil Pollution 95(1-4): 165-178.
Nwilo, P. C. & Badejo, O. T. 2006. Impacts and Management of Oil Spill Pollution Along
the Nigerian Coastal Areas. In Administering Marine Spaces: International Issues. A
Publication of FIG Commission 4 and 7 Group 4.3. International Federation of Surveyors.
Available at: http://www.fig.net/pub/figpub/pub36/chapters/chapter_8.pdf. Last visited:
March 25, 2012.
Obuekwe, C. O. & Al-Muttawa, E. M. 2001. Self-immobilized bacterial cultures with
potential for application as ready-to-use seeds for petroleum bioremediation. Biotechnology
Letters 23: 1025–1032.
Pajuelo, E. et al. 2011. Legume–Rhizobium Symbioses as a Tool for Bioremediation of
Heavy Metal Polluted Soils. Biomanagement of metal-contaminated soils. Environmental
Pollution 20: 95-123.
Peer, W. A., Baxter, I. R., Richards, E. L., Freeman, J. L. & Murphy, A. S. 2006.
Phytoremediation and Hyperaccumulator Plants. Chapter 7 in Molecular Biology of Metal
Homeostasis and Detoxification. Springer, Berlin. ISBN-10: 3-540-22175-1, p 299-340.
Rike, A. G., Haugen, K. B., Børresen, M., Engene, B. & Kolstad, P. 2003. In situ
biodegradation of petroleum hydrocarbons in frozen arctic soils. Cold Regions Science and
Technology 37: 97-120.
Robertson, S. J., McGill, W. B., Massicotte, H. B. & Rutherford, P. M. 2007. Petroleum
hydrocarbon contamination in boreal forest soils: a mycorrhizal ecosystems perspective.
Biological Reviews 82: 213-240.
Shukla, K. P. et al. 2010. Bioremediation: Developments, Current Practices and Perspectives.
Genetic Engineering and Biotechnology Journal, Volume 2010: GEBJ-3.
Sinha, R. K. et al. 2008. Converting wasteland into wonderland by earthworms—a low-cost
nature’s technology for soil remediation: a case study of vermiremediation of PAHs
contaminated soil. Environmentalist 28:466–475.

76
Suominen, L., Jussila, M. M., Mäkeläinen, K., Romantschuk, M. & Lindström, K. 2000.
Evaluation of the Galega-Rhizobium galegae system for the bioremediation of oil-
contaminated soil. Environmental pollution 107:239-244
Sullivan, P. 1999. Sustainable Soil Management, Soil System Guide. Appropriate
Technology Transfer for Rural Areas (ATTRA), Sustainable Soil Management, Soil System
Guide. Appropriate Technology Transfer for Rural Areas (ATTRA). Available at:
http://www.soilandhealth.org/01aglibrary/010117attrasoilmanual/010117attra.html. Last
visited: Febuary 28, 2012.
Susarla S. et al. 2002. Phytoremediation: An ecological solution to organic chemical
contamination. Ecological Engineering 18 (5): 647-658.
Tiirola, M. A., Suvilampi J. E., Kulomaa M.S. & Rintala J. A. 2003. Microbial diversity in a
thermophilic aerobic biofilm process: analysis by length heterogeneity PCR (LH-PCR).
Water Research 37: 2259–2268.
U. S. Environmental Protection Agency (USEPA) 1994. Chapter III Bioventing. Available at:
http://www.epa.gov/oust/pubs/tum_ch3.pdf. Last visited: January 26, 2011.
U. S. Environmental Protection Agency (USEPA) 1998. A citizen’s guide to
phytoremediation. EPA – 542-F- 98-011, Office of Solid Waste and Emergency Response.
Washington DC. 6pp.
U. S. Environmental protection agency (USEPA) 1999. Phytoremediation Resource Guide,
EPA 542-B-99-003, solid waste and emergency response (5102G). Available at: http://clu-
in.org/download/remed/phytoresgude.pdf. Last visited: January 16, 2012.
U. S. Environmental Protection Agency Office of Research and Development (USEPA)
2007. Developing innovative solutions for oil spill cleanup. Land Research Program.
Available at: http://www.epa.gov/research/npd/pdfs/lrp-factsheet_oil-spills.pdf. Last visited:
March 11, 2012.
U. S. Environmental Protection Agency (USEPA) 2010. Phytotechnologies for Site Cleanup.
EPA 542-F-10-009.
U. S. Environmental Protection Agency (USEPA) 2011a. The behavior of Effects of Oil
Spill in Aquatic Environments. Available at:
http://www.epa.gov/oem/docs/oil/edu/oilspill_book/chap1.pdf. Last visited: January 19,
2012.
U. S. Environmental Protection Agency (USEPA) 2011b. Oil: Crude and Petroleum Products.
2011b. Available at: http://www.eia.gov/energyexplained/index.cfm?page=oil_home. Last
visited: December 24, 2011.
U.S. Department of Agriculture (USDA) 2000. Conservation buffers work – economically
and environmentally. Program Aid 1615. Washington, D.C. 4pp.
Vershinina, Z. R. et al. 2012. Artificial colonization of non-symbiotic plants roots with the
use of lectins. Symbiosis 56(1): 23-33.
Vitosek, P. M. et al. 2002. Towards an ecological understanding of biological nitrogen
fixation. Biogeochemistry 57/58: 1–45.
Wallenius, K. et al. 2012. Simplified MPN method for enumeration of soil naphthalene
degraders using gaseous substrate. Biodegradation 23:47–55.
77
Wang H. T. & Luo J. 2000. Impact of the development of Songfangtun Oilfied on
Aneurolepidium Chinensis of Surrounding Pastures. Rural Eco-Environment 16(2):20-23.
Wenzel, W. W. 2009. Rhizosphere processes and management in plant-assisted
bioremediation (phytoremediation) of soils. Plant Soil 321:385–408.
Weissenfels, W. D., Klewer, H. J. & Langhoff, J. 1992. Adsorption of polycyclic aromatic
hydrocarbons (PAHs) by soil particles: Influence on biodegradability and biotoxicity.
Applied Microbiology and Biotechnology 36: 689-696.
Xu, J. G. & Johnson, R. L. 1997. Nitrogen dynamics in soils with different hydrocarbon
content planted to barley and field pea. Canadian Journal of Soil Sciences 77: 453-458.
Yan, L., Jääskeläinen, M., Penttinen, P., Puhakainen, T., Lindström, K., Simojoki, A. &
Stoddard, F. 2012. Field-scale evaluation of the oil remediation capacity of the legume
Galega orientalis. Legume-Futures year report poster.
Yin, X. et al. 2010. A review on the eco-geography of soil fauna in China. Journal of
Geographical Sciences 20(3): 333-346.
Zhu, X., Venosa, A. D. & Suidan, M. T. 2004. Literature review of the use of commercial
bioremediation agents for cleanup of oil-contaminated estuarine environments. EPA/600/R-
04/075. Available at: http://www.epa.gov/osweroe1/docs/oil/edu/litreviewbiormd.pdf. Last
visited: December 26, 2011.
Zolotarev, V. N. 2010. Agroecological estimate of sowing times of fodder galega for seeds
in the central region of Russia. Russian Agricultural Sciences 36 (6): 433–436.
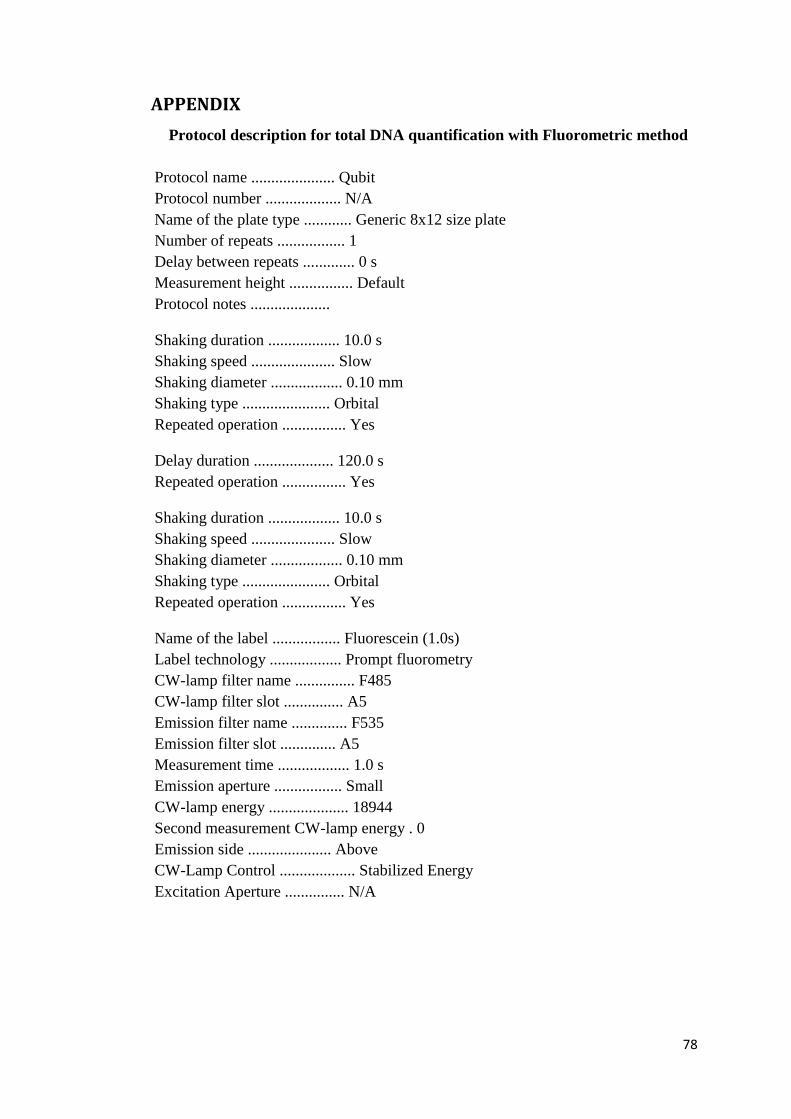
78
APPENDIX
Protocol description for total DNA quantification with Fluorometric method
Protocol name ..................... Qubit
Protocol number ................... N/A
Name of the plate type ............ Generic 8x12 size plate
Number of repeats ................. 1
Delay between repeats ............. 0 s
Measurement height ................ Default
Protocol notes ....................
Shaking duration .................. 10.0 s
Shaking speed ..................... Slow
Shaking diameter .................. 0.10 mm
Shaking type ...................... Orbital
Repeated operation ................ Yes
Delay duration .................... 120.0 s
Repeated operation ................ Yes
Shaking duration .................. 10.0 s
Shaking speed ..................... Slow
Shaking diameter .................. 0.10 mm
Shaking type ...................... Orbital
Repeated operation ................ Yes
Name of the label ................. Fluorescein (1.0s)
Label technology .................. Prompt fluorometry
CW-lamp filter name ............... F485
CW-lamp filter slot ............... A5
Emission filter name .............. F535
Emission filter slot .............. A5
Measurement time .................. 1.0 s
Emission aperture ................. Small
CW-lamp energy .................... 18944
Second measurement CW-lamp energy . 0
Emission side ..................... Above
CW-Lamp Control ................... Stabilized Energy
Excitation Aperture ............... N/A