The Use of Mini-and Micro-Models to Solve Some Type of Problems
9
Proceedings of 2013 IAHR Congress © 2013 Tsinghua University Press, Beijing ABSTRACT: The use of micro- or mini-models to solve some types of hydraulic problems is a subject that it is not entirely settled. It seems that for some type of problems these models can provide useful, economic and timely information. An introduction to this kind of models and two examples whose results were deemed useful are presented in this paper and some recommendations follow. First example: In spillway design the knowledge of the scouring processes downstream the flip bucket of a spillway is very important. A study on the scouring of the bed material downstream the flip bucket, with data from the Peñitas Dam (Mexico), was carried out for a non-distorted, movable bed mini-model with a length scale of 1:759 for three different discharges and seven different materials. The objective of the essays was to evaluate the predictive capacity of the mini-model and to propose and calibrate a formula to predict the geometry and maximum scour produced by the water. Experimental results show that the feasibility of this kind of models appears to be justified. The proposal is to use mini-models with scales of 1:500 to 1:1000 in tests with half-hour duration, as a substitute of the rather expensive and long duration tests that are presently used. Second example: In small ports or marines, it may be necessary to reduce the height of waves at a given zone to protect the boarding of passengers from small sailing vessels. In this case a mini- model can provide sufficient qualitative results to be able to propose the necessary improvements. The results of a National Polytechnic Institute study at Tangolunda Bay (Mexico) for a mini-model with horizontal and vertical scales of 1:150 and 1:100, respectively, are included. It can be concluded that the information obtained from mini-models, as the two presented here, in addition to their didactic value, provide at small cost useful information for spillway design and navigation problems. KEY WORDS: Hydraulic models, mini-models, micro-models. 1 INTRODUCTION The Use of Mini- and Micro-Models to Solve Some Type of Problems Gabriel Echávez Professor, School of Engineering, National Autonomous University of Mexico, Mexico. Email:[email protected] Gerardo Ruiz Professor, School of Engineering, National Autonomous University of Mexico, Mexico. Email:[email protected]
Transcript of The Use of Mini-and Micro-Models to Solve Some Type of Problems
Proceedings of 2013 IAHR Congress © 2013 Tsinghua University Press, Beijing
ABSTRACT: The use of micro- or mini-models to solve some types of hydraulicproblems is a subject that it is not entirely settled. It seems that for some typeof problems these models can provide useful, economic and timely information. Anintroduction to this kind of models and two examples whose results were deemeduseful are presented in this paper and some recommendations follow. First example:In spillway design the knowledge of the scouring processes downstream the flipbucket of a spillway is very important. A study on the scouring of the bed materialdownstream the flip bucket, with data from the Peñitas Dam (Mexico), was carriedout for a non-distorted, movable bed mini-model with a length scale of 1:759 forthree different discharges and seven different materials. The objective of theessays was to evaluate the predictive capacity of the mini-model and to propose andcalibrate a formula to predict the geometry and maximum scour produced by thewater. Experimental results show that the feasibility of this kind of modelsappears to be justified. The proposal is to use mini-models with scales of 1:500 to1:1000 in tests with half-hour duration, as a substitute of the rather expensiveand long duration tests that are presently used. Second example: In small ports ormarines, it may be necessary to reduce the height of waves at a given zone toprotect the boarding of passengers from small sailing vessels. In this case a mini-model can provide sufficient qualitative results to be able to propose thenecessary improvements. The results of a National Polytechnic Institute study atTangolunda Bay (Mexico) for a mini-model with horizontal and vertical scales of1:150 and 1:100, respectively, are included. It can be concluded that theinformation obtained from mini-models, as the two presented here, in addition totheir didactic value, provide at small cost useful information for spillway designand navigation problems.
KEY WORDS: Hydraulic models, mini-models, micro-models.
1 INTRODUCTION
The Use of Mini- and Micro-Models to Solve Some Type of Problems
Gabriel Echávez Professor, School of Engineering, National Autonomous University of Mexico, Mexico. Email:[email protected] Ruiz Professor, School of Engineering, National Autonomous University of Mexico, Mexico.Email:[email protected]
In the early nineties we tried scour essays at the end of the spillway for theAguamilpa Dam in the state of Jalisco (Mexico) with a 1:50 scale model. This typeof model entailed a high cost for the tests since the stabilization of the erosionrequired five hours, and the small amount of cementing, applied to the non-cohesivematerial to enable a steep topography, introduced a non-desirable effect. Thesereasons lead us to the idea of using a mini-model with no cementing which wouldinvolve less cost.
Years later, similar ideas were presented at the 2002 Conference of HydraulicMeasurements and Experimental Methods, Colorado, in interesting papers on the samesubject. As the use of micro- or mini-models for the solution of hydraulic problemsis a subject that is not entirely settled, this paper includes an introduction tothis kind of models and the proposed idea is that for some type of problems thesemodels can provide useful, economic and timely information.
2 BACKGROUND
Since the names of mini-models or micro-models is used rather indistinctly, asobserved by (Matsumoto et al., 2005), let us begin with the proposal stated in(Avila, 2010): it is to refer to them as mini-models when they have horizontalscales of between 500 and 1000, and as micro-models when they have horizontalscales greater than 1 000 and up to 20 000. The former can be used to model localor semi local problems and the latter to reproduce long stretches of rivers.
According to this classification the 17 cases included in the FORUM (Gainesand Maynord, 2001) can be divided into 16 micro-models and only one mini-model.The micro-models with horizontal scales of more than 1000 were generally usedin navigation problems or to represent long stretches of rivers. The larger one-a mini-model with a scale of 600- was applied to find a better bridge-abutmentprotection. This suggests that scales of between 500 and 1000, i.e. mini-models, can provide quantitative results. Furthermore, (Ettema and Muste,2002a,b) found that in a rather local problem -the study of dikes- a scale ofup to 500 gave results with an acceptable margin of error.
Maynord has commented that several observers have been critical of the useof micro-models, (Maynord, 2002, 2006). Falvey said in rather strong terms that“that is a disservice to the profession to imply that a micro-model can be usedfor serious engineering investigations”, (Falvey, 1999), while Yalin has statedin a letter to Maynord that “I regret that such a ‘model’ cannot be used forpredictive purposes.” Our impression is that because micro-models are so farremoved from any consideration of hydraulic similarity and dynamicalsimilitude, or from even the evolution of morphological similarities, their useshould be restricted to demonstration, education and communication only, asmentioned by Maynord (2006).
Mini-models, on the other hand, can be used for those problems which haveinsufficient information to justify a larger model or for which there is anurgency to solve and no resources to build a larger, more proper, hydraulicmodel, (Echávez, 1996). The next sections present two cases in which theinformation obtained from mini-models is considered appropriate.
2
3 EROSION DOWNSTREAM A FLIP BUCKET
Many spillways end with a flip bucket to move further away the scour, due tothe water impact, on the river-bed. The knowledge of this scouring process isimportant in spillway design. In this work the scouring of the bed materialdownstream the flip bucket is tested by means of a non-distorted, movable bed,mini-model for three different discharges and seven different materials. The essayswere performed to evaluate the predictive capacity of the mini-model and to proposeand calibrate a formula to predict the geometry and maximum scour produced by thewater.
3.1 Experimental Layout The experiments were carried out in a rectangular straight channel with a 0.61
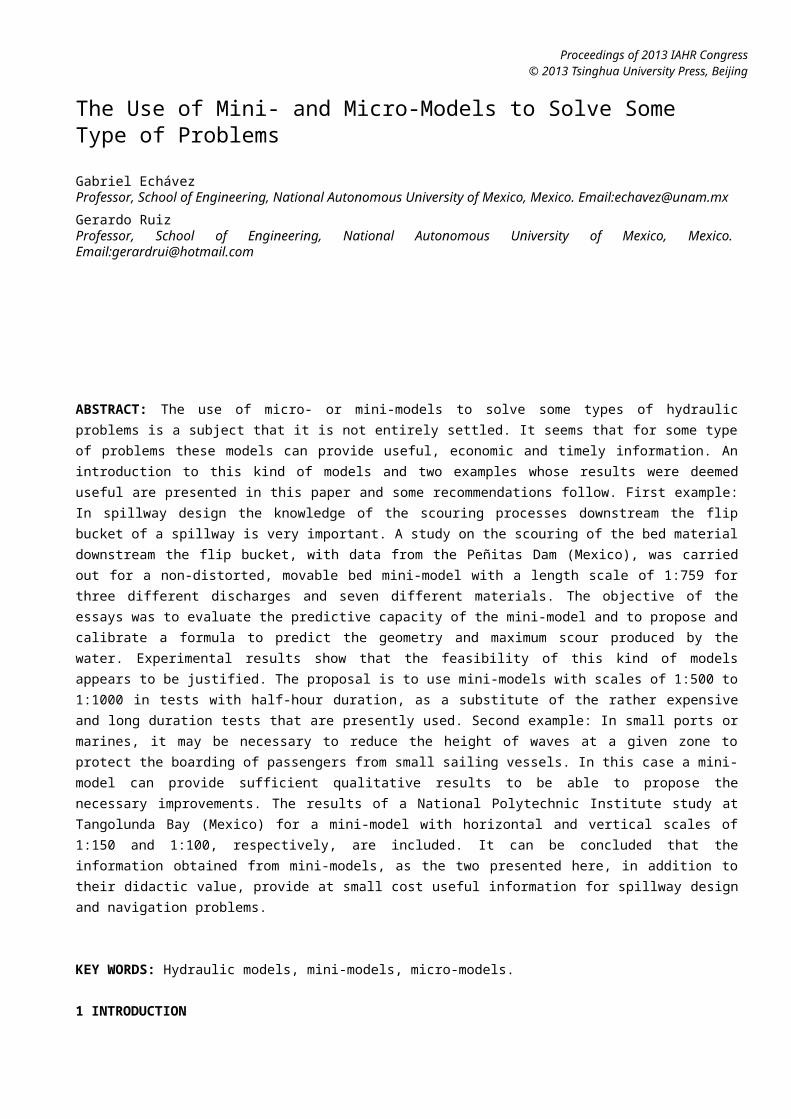
m width, in which a 0.092 m wide rectangular weir was followed by a 0.23 m longramp with a slope of 0.095, and had placed a small sky jump at its end. A box tohold the non-cohesive material, which was 0.21 m wide and 0.54 m long, wasinstalled downstream the small spillway, as can be seen in Figure 1.
Figure 1 Experimental setup
This geometry reproduced approximately the Peñitas Dam (Mexico) spillway with alength scale of 1:759.
3.2 Experimental Procedure
Each of the seven materials was tested with three discharges. In each essay,after introducing the non-cohesive material into the box, the selected dischargewas kept constant for 30 minutes which was sufficient time to stabilize theerosion. After draining the box the geometry of the profile was measured with alimnimeter in three longitudinal sections.
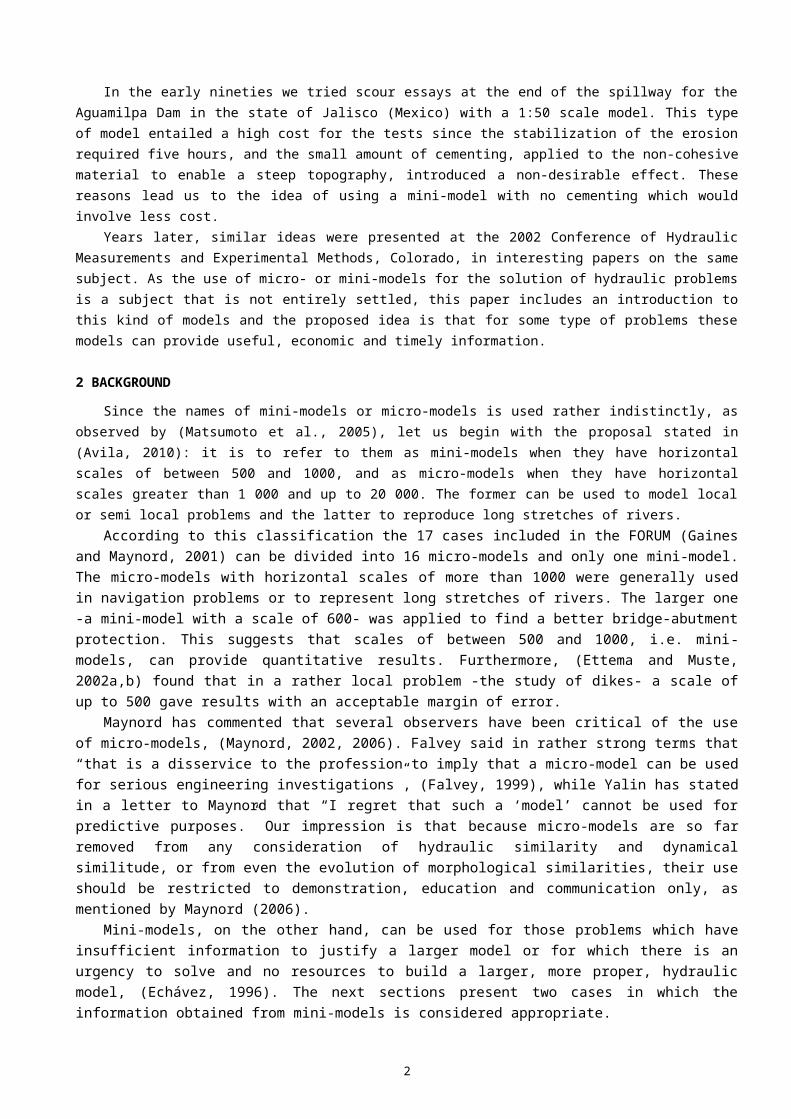
The grain size distributions of the material used are shown in Figure 2.
3
0.0100.1001.00010.000100.000
0
10
20
30
40
50
60
70
80
90
100
Test 1Test 2Test 3Test 4Test 5Test 6Test 7
Grain size particle (mm)
Perc
ent fi
ner (
%)
Figure 2 Grain size distribution of the material tested
These curves show that among the seven materials tested, there were practicallyonly two different diameters: five small with a D90 = 0.0045 m and two large with aD90 = 0.0080 m, on average. Their specific weight varied between 1.56 and 1.14g/cm3.
4 RESULTS
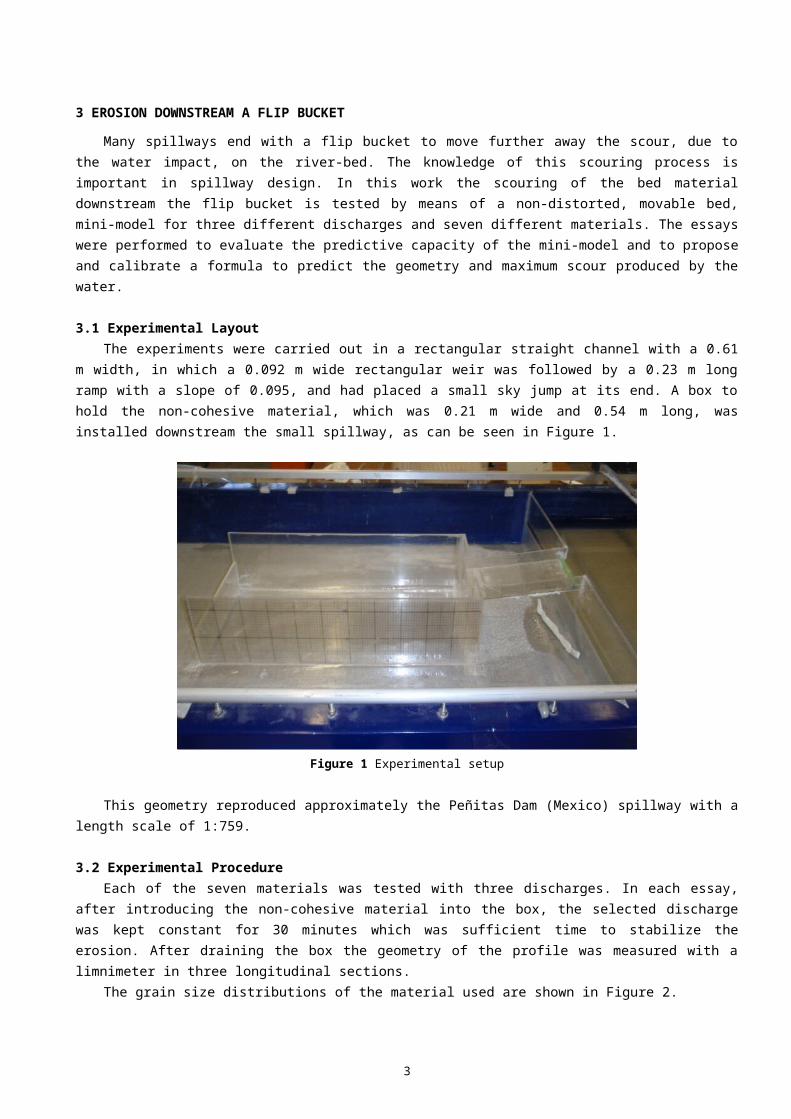
In Figure 3 a photograph of the scoured material after a completed essay isshown. And Figure 4 includes the scour profiles, along the center line, for theseven materials and the maximum discharge that were tested.
Figure 3 Scoured material after an essay is completed with the maximum discharge
4

00.03
0.06
0.09
0.12
0.15
0.18
0.21
0.24
0.27 0.
30.33
0.36
0.39
0.42
0.45
0.48
0.51
0.54
0
0.02
0.04
0.06
0.08
0.1
Original profileTest 1Test 2Test 3Test 4Test 5Test 6
Length (m)
Dept
h (m
)
Figure 4 Scour profiles along the center line for the maximum discharge
The main scour characteristics due to three discharges of the water jet, asmeasured by the mini-model with a scale of 1:759, are included in Table 1.
Table 1 Measurements given in prototype dimensionsQ
(m3/s)Ls(m)
Lc(m)
hp(m)
ts(m)
10,157 83.50 136.60 14.42 29.608,253 65.30 121.44 12.90 26.506,507 47.10 91.08 10.63 21.20
in which Ls is the distance from the lip of the bucket to the maximum scour depth;Lc is the distance from the lip of the bucket to the maximum over elevation; hp isthe over elevation; ts is the maximum scour depth.
4.1 Comparison with other results
1. In the early eighties a 1:80 model of the two channels of the Peñitas Damspillway was built. Three hour essays were performed with a 10,000 m3/s dischargeand three different materials: with D50 = 0.00056 m (sand), 0.0027 m (small gravel)and 0.0083 m (gravel), respectively.
The maximum scour depth (Faruque, et al. 2006), calculated by averaging thevalues found in each channel, was 30.00, 30.40 and 31.60 m, respectively. Thesefigures are quite close to the 29.6 m result of the mini-model for a similardischarge and an essay six times shorter. It is important to mention that theerosion profile in the case of the two essays with the smaller diameters wasdifferent than the one obtained in the mini-model. Only in the case of the essayswith the material of the larger diameter (gravel), the erosion profile of the twomodels with such different dimensions was similar.
2. A comparison was made with the procedure developed by (Aguirre, 1978) in an
5
experimental installation that was similar, but much larger, than the installationused in our example. It gave a similar equation to the one he expressed, when usingas constants those of the mini-model results.
(1)
(2)
in which Dm sediment characteristic size in m, g gravitational acceleration inm/s2, q unitary discharge in m2/s, ts maximum scour depth in m, u*c critical shearvelocity in m/s, Yb downstream flow depth in m, Z0 distance between spillwayoperation head and downstream flow depth in m, density of water, s density ofthe sediment.
NAVIGATION PROBLEMS
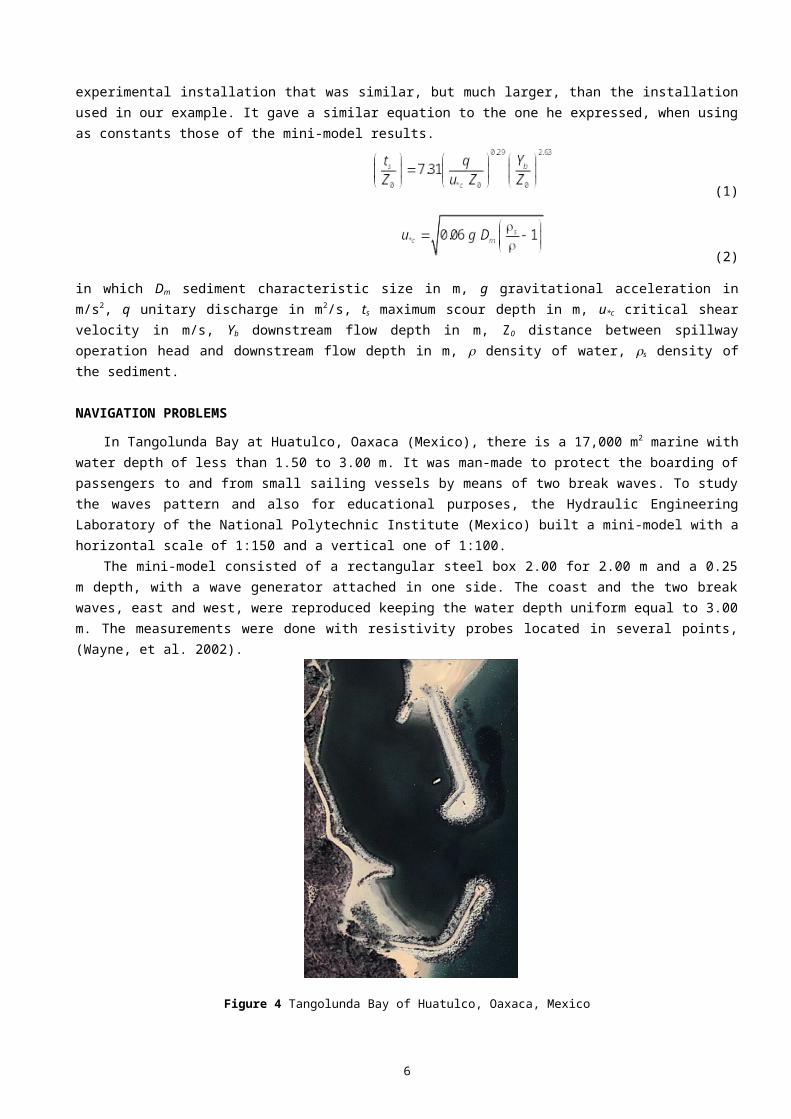
In Tangolunda Bay at Huatulco, Oaxaca (Mexico), there is a 17,000 m2 marine withwater depth of less than 1.50 to 3.00 m. It was man-made to protect the boarding ofpassengers to and from small sailing vessels by means of two break waves. To studythe waves pattern and also for educational purposes, the Hydraulic EngineeringLaboratory of the National Polytechnic Institute (Mexico) built a mini-model with ahorizontal scale of 1:150 and a vertical one of 1:100.
The mini-model consisted of a rectangular steel box 2.00 for 2.00 m and a 0.25m depth, with a wave generator attached in one side. The coast and the two breakwaves, east and west, were reproduced keeping the water depth uniform equal to 3.00m. The measurements were done with resistivity probes located in several points,(Wayne, et al. 2002).
Figure 4 Tangolunda Bay of Huatulco, Oaxaca, Mexico
6
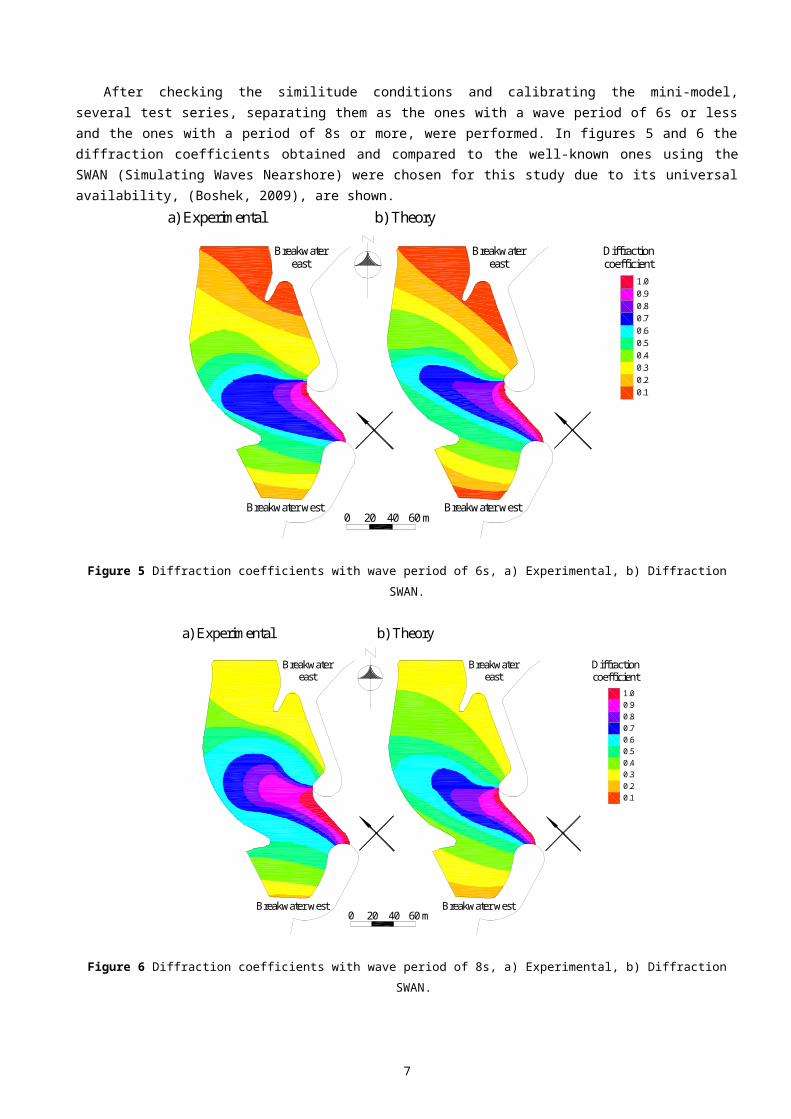
After checking the similitude conditions and calibrating the mini-model,several test series, separating them as the ones with a wave period of 6s or lessand the ones with a period of 8s or more, were performed. In figures 5 and 6 thediffraction coefficients obtained and compared to the well-known ones using theSWAN (Simulating Waves Nearshore) were chosen for this study due to its universalavailability, (Boshek, 2009), are shown.
Breakwater west
Breakwatereast
Breakwater west
Breakwatereast
1.00.90.80.70.60.50.40.30.20.1
Diffractioncoefficient
a) Experimental b) Theory
0 4020 60 m
Figure 5 Diffraction coefficients with wave period of 6s, a) Experimental, b) DiffractionSWAN.
1.00.90.80.70.60.50.40.30.20.1
a) Experimental b) Theory
Diffractioncoefficient
Breakwater west
Breakwatereast
Breakwater west
Breakwatereast
0 4020 60 m
Figure 6 Diffraction coefficients with wave period of 8s, a) Experimental, b) DiffractionSWAN.
7
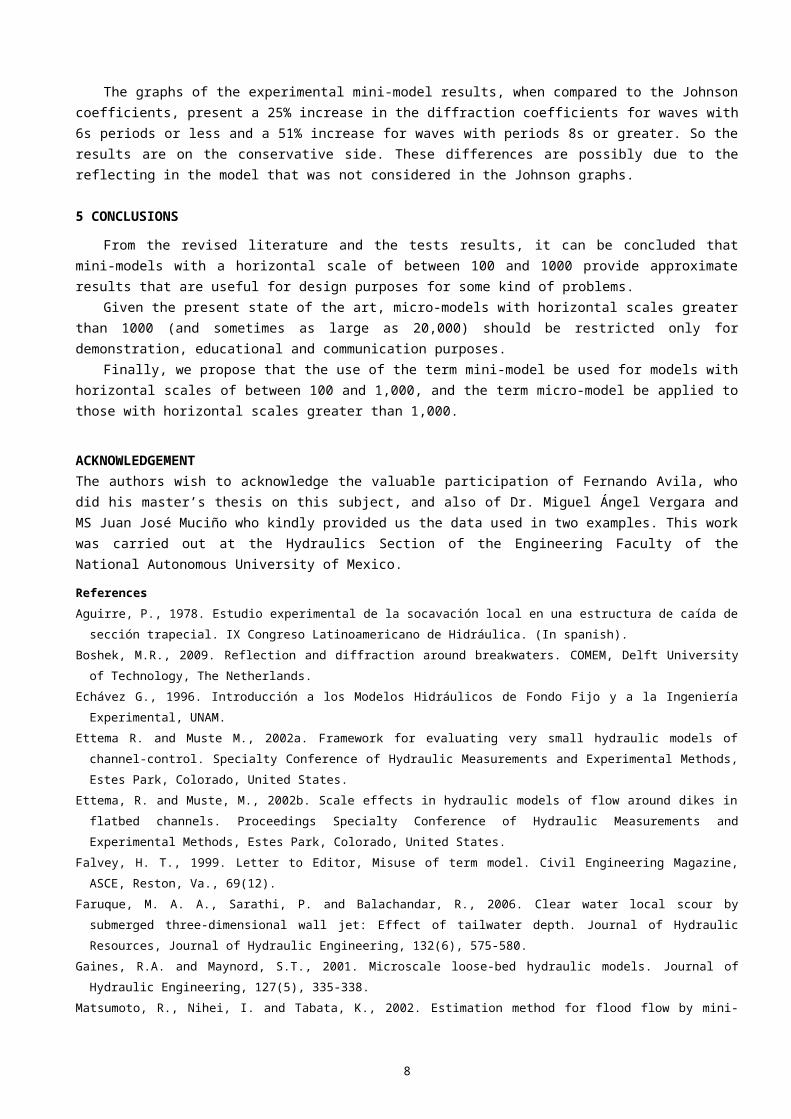
The graphs of the experimental mini-model results, when compared to the Johnsoncoefficients, present a 25% increase in the diffraction coefficients for waves with6s periods or less and a 51% increase for waves with periods 8s or greater. So theresults are on the conservative side. These differences are possibly due to thereflecting in the model that was not considered in the Johnson graphs.
5 CONCLUSIONS
From the revised literature and the tests results, it can be concluded thatmini-models with a horizontal scale of between 100 and 1000 provide approximateresults that are useful for design purposes for some kind of problems.
Given the present state of the art, micro-models with horizontal scales greaterthan 1000 (and sometimes as large as 20,000) should be restricted only fordemonstration, educational and communication purposes.
Finally, we propose that the use of the term mini-model be used for models withhorizontal scales of between 100 and 1,000, and the term micro-model be applied tothose with horizontal scales greater than 1,000.
ACKNOWLEDGEMENTThe authors wish to acknowledge the valuable participation of Fernando Avila, whodid his master’s thesis on this subject, and also of Dr. Miguel Ángel Vergara andMS Juan José Muciño who kindly provided us the data used in two examples. This workwas carried out at the Hydraulics Section of the Engineering Faculty of theNational Autonomous University of Mexico.
References Aguirre, P., 1978. Estudio experimental de la socavación local en una estructura de caída desección trapecial. IX Congreso Latinoamericano de Hidráulica. (In spanish).
Boshek, M.R., 2009. Reflection and diffraction around breakwaters. COMEM, Delft Universityof Technology, The Netherlands.
Echávez G., 1996. Introducción a los Modelos Hidráulicos de Fondo Fijo y a la IngenieríaExperimental, UNAM.
Ettema R. and Muste M., 2002a. Framework for evaluating very small hydraulic models ofchannel-control. Specialty Conference of Hydraulic Measurements and Experimental Methods,Estes Park, Colorado, United States.
Ettema, R. and Muste, M., 2002b. Scale effects in hydraulic models of flow around dikes inflatbed channels. Proceedings Specialty Conference of Hydraulic Measurements andExperimental Methods, Estes Park, Colorado, United States.
Falvey, H. T., 1999. Letter to Editor, Misuse of term model. Civil Engineering Magazine,ASCE, Reston, Va., 69(12).
Faruque, M. A. A., Sarathi, P. and Balachandar, R., 2006. Clear water local scour bysubmerged three-dimensional wall jet: Effect of tailwater depth. Journal of HydraulicResources, Journal of Hydraulic Engineering, 132(6), 575-580.
Gaines, R.A. and Maynord, S.T., 2001. Microscale loose-bed hydraulic models. Journal ofHydraulic Engineering, 127(5), 335-338.
Matsumoto, R., Nihei, I. and Tabata, K., 2002. Estimation method for flood flow by mini-
8

model. Proceedings Specialty Conference of Hydraulic Measurements and ExperimentalMethods, Estes Park, Colorado, United States.
Maynord, S.T., 2002. Comparison of surface velocities in micro-model and prototype.Proceedings Specialty Conference of Hydraulic Measurements and Experimental Methods, EstesPark, Colorado, United States.
Maynord, S.T., 2006. Evaluation of the micromodel: an extremely small scale movable bedmodel. Journal of Hydraulic Engineering, 132(4), 343-353.
Wayne, M., Gordon, D.C. and Gaines, R.A., 2002. Operation and calibration procedures formicro-models. Proceedings Specialty Conference of Hydraulic Measurements and ExperimentalMethods, Estes Park, Colorado, United States.
9