
The Use of Derivatives by Investment Managers and Implications for Portfolio Performance and Risk...
29
The Use of Derivatives by Investment Managers and Implications for Portfolio Performance and Risk n KINGSLEY FONG, DAVID R. GALLAGHER AND AARON NG School of Banking and Finance, The University of New South Wales, Australia ABSTRACT This study provides an empirical examination of derivative instruments used by institutional investors. Our analysis provides a unique insight into the role and benefits of derivative securities in active equity portfolio manage- ment. We contribute to the literature by using a database that comprises the periodic portfolio holdings and daily trades of institutional fund managers. The consequence of derivative use is analyzed using a number of performance and risk measures. Overall, we find the use of derivatives have a negligible impact on fund returns, and is primarily attributed to low levels of derivative exposure relative to total fund size. We also evaluate how derivatives are used by considering the trading strategies executed by active investment managers. Specifically, option trading patterns are consistent with the execution of momentum trading strategies. This study also documents that active investment managers prefer not to use options markets to engage in informed trading. I. INTRODUCTION Recent decades have witnessed a dramatic shift in the nature of risk in global financial markets and increased volatility of many asset classes. 1 As investors are continuously exposed to a broad range of dynamic risks, derivatives have become a valuable tool in the risk management practices of institutions. Despite the potential for derivative instruments to effectively manage the risks faced by institutions, public opinion concerning these securities suggests the general public view derivative securities as inherently dangerous (McGough 1995). Anecdotes such as Long-Term Capital Management (LTCM) in the US, Barings Bank in the UK, and the foreign exchange episode occurring at National n The authors gratefully acknowledge the helpful comments and suggestions from an anonymous referee, Bruce Grundy (the Editor), Anthony Asher, and seminar participants at the 2004 Australasian Finance and Banking Conference. 1 Campbell et al. (2001) document the upward trend in idiosyncratic volatility in equity markets. Gross (1997) also notes the increase in the volatility of US bond yields. r International Review of Finance Ltd. 2006. Published by Blackwell Publishing Ltd., 9600 Garsington Road, Oxford OX4 2DQ, UK and 350 Main Street, Malden, MA 02148, USA. International Review of Finance, 5:1–2, 2005: pp. 1–29
-
Upload
independent -
Category
Documents
-
view
0 -
download
0
Transcript of The Use of Derivatives by Investment Managers and Implications for Portfolio Performance and Risk...
The Use of Derivatives byInvestment Managers andImplications for Portfolio
Performance and Riskn
KINGSLEY FONG, DAVID R. GALLAGHER AND AARON NG
School of Banking and Finance, The University of New South Wales, Australia
ABSTRACT
This study provides an empirical examination of derivative instruments usedby institutional investors. Our analysis provides a unique insight into therole and benefits of derivative securities in active equity portfolio manage-ment. We contribute to the literature by using a database that comprises theperiodic portfolio holdings and daily trades of institutional fund managers.The consequence of derivative use is analyzed using a number ofperformance and risk measures. Overall, we find the use of derivatives havea negligible impact on fund returns, and is primarily attributed to low levelsof derivative exposure relative to total fund size. We also evaluate howderivatives are used by considering the trading strategies executed by activeinvestment managers. Specifically, option trading patterns are consistentwith the execution of momentum trading strategies. This study alsodocuments that active investment managers prefer not to use optionsmarkets to engage in informed trading.
I. INTRODUCTION
Recent decades have witnessed a dramatic shift in the nature of risk in globalfinancial markets and increased volatility of many asset classes.1 As investors arecontinuously exposed to a broad range of dynamic risks, derivatives havebecome a valuable tool in the risk management practices of institutions.
Despite the potential for derivative instruments to effectively manage therisks faced by institutions, public opinion concerning these securities suggeststhe general public view derivative securities as inherently dangerous (McGough1995). Anecdotes such as Long-Term Capital Management (LTCM) in the US,Barings Bank in the UK, and the foreign exchange episode occurring at National
n The authors gratefully acknowledge the helpful comments and suggestions from ananonymous referee, Bruce Grundy (the Editor), Anthony Asher, and seminar participants at the2004 Australasian Finance and Banking Conference.1 Campbell et al. (2001) document the upward trend in idiosyncratic volatility in equity markets.
Gross (1997) also notes the increase in the volatility of US bond yields.
r International Review of Finance Ltd. 2006. Published by Blackwell Publishing Ltd., 9600 Garsington Road,Oxford OX4 2DQ, UK and 350 Main Street, Malden, MA 02148, USA.
International Review of Finance, 5:1–2, 2005: pp. 1–29
Australia Bank in 2004, highlight the potential hazards of derivative use, andhave attracted the close attention of risk management executives, investors,governments, market regulators, as well as the media.
Regulators attempting to prevent corporate failure associated with deriva-tives usage have relied on mandated disclosure.2 In contrast, regulation ofderivative use in the Australian investment management industry has notrequired quantitative disclosure, but rather design features, implementation ofrisk management policies, and constraints placed on the use of derivatives.3 TheAustralian Prudential Regulation Authority (APRA) prescribes that derivativesmay not be used for speculative purposes, and managed funds cannot holduncovered positions in derivatives. Derivative use must also be conductedwithin the confines of the trust deed.4
Theoretical literature proposes that derivatives provide users with efficiencybenefits in the form of reduced transaction costs and improved risk control(Merton 1995). The extant literature on derivative usage focuses on corporatehedging rather than derivative use within the investment managementindustry.5 There are only a few studies which directly analyze the use ofderivatives by investment managers. Despite these alleged benefits, severalstudies from both the corporate and investment management literature havefound that the risk and return characteristics of derivative users are indeedsimilar to those of non-users. Specifically, Koski and Pontiff (1999) examinemutual fund return distributions of derivative users and non-users, and theyconclude that derivatives do not lead to significant differences in fundperformance or risk. Pinnuck (2004) shows that Australian equity managersutilize options to both increase or decrease exposure to underlying stocks heldin the fund. However, Pinnuck does not attempt to infer the motivation forderivative use by portfolio managers.
The primary contribution of this study is to better understand howderivatives are used by institutional investment managers. We study theexposure and the implicit strategies used by active equity managers inderivative trading.6 The empirical literature has been unable to characterizehow derivatives are used by investment managers.
This study benefits significantly from a unique and confidential dataset ofequity manager transactions and portfolio holdings. Prior studies examining US
2 Accounting regulators have formulated standards which require the disclosure of nominal
contract exposures and fair value of derivative instruments in financial accounting statements.
3 For a detailed discussion of risk management practices in the Australian investment manage-
ment industry, see Brown et al. (2005). The governance mechanism is most well known among
superannuation funds, which are required to maintain a Part B Risk Management Statement
(RMS) outlining their response to how risks are monitored.
4 APRA Circular (No. II.D.7).
5 Although the motivation to use derivatives as a part of a risk management strategy still exists
for investment managers, derivatives also represent a direct alternative to investment in
underlying asset markets.
6 See also Hentschel and Kothari (2001).
International Review of Finance
2 r International Review of Finance Ltd. 2006
funds have typically analyzed the portfolio holdings of investment managersobserved at quarter-end periods, where these data include only equity holdingsand not other instruments such as derivatives (Moskowitz 2000).7 In terms ofthe link between performance and derivatives use, Koski and Pontiff (1999)conduct telephone interviews to determine whether or not mutual funds arepermitted to trade derivatives. However, this binary approach is unable tocapture the size of derivative exposures held by funds. Although the data usedby Pinnuck (2004) include the month-end holdings of options, the sample didnot include data showing holdings of futures contracts. Our study offers asignificant improvement on Pinnuck (2004) given our database contains themonth-end portfolio holdings and daily trades of all securities, includingderivatives, and also investigates derivative use in considerably finer detail.
In evaluating the impact of derivatives on the returns of active equitymanagers, tests are used to measure the differences in the distributions across awide range of fund performance and risk measures (see Koski and Pontiff 1999).Consistent with the literature, we document few observable differences ineither performance or risk between derivative users and non-users. We attributethis result to the low level of derivative exposure relative to the total size of fundportfolios.
We next examine the propensity for active equity managers to transact inoptions on stocks exhibiting momentum by analyzing the proportion of optiontrades on stocks whose future price movements are expected to followmomentum patterns. Investment managers are shown to uniformly avoidtrading options on stocks with relatively poor past returns, whereas some fundsalso trade disproportionately more in options on stocks with relatively strongpast price performance. This provides empirical support that active investmentmanagers indeed use options to capture momentum returns.
Finally, we examine the information content of option trades by activeequity managers and document no abnormal price movements in the under-lying stocks over short-run event windows, both immediately prior andsubsequent to option trades. We interpret these findings as evidence thatinvestment managers do not execute informed trading in options markets.
The remainder of the paper is structured as follows. Section II summarizes therelevant extant literature and formulates the hypotheses that are addressed inthe paper. Section III outlines the empirical methodologies used in testing thehypotheses. Section IV presents the results and provides a discussion of the keyfindings. The final section concludes.
II. HYPOTHESES
Theoretical work suggests investment managers use derivatives to better exploitinformation, manage risk, and reduce transaction costs (Scholes 1981; Silber
7 The portfolio holdings of US institutional investors have been derived from 13F disclosure
forms reported on a quarterly basis to the Securities & Exchange Commission (SEC).
Use of Derivatives by Investment Managers and Implications
r International Review of Finance Ltd. 2006 3
1985; Stoll and Whaley 1985; Merton 1995). Koski and Pontiff (1999) predictthat on this basis, portfolios whose managers use derivatives, shoulddemonstrate improved performance relative to otherwise comparable portfoliosthat do not use derivatives. Although this prediction may not hold incompetitive market equilibrium, where marginal benefits and costs in tradingacross derivatives and underlying markets are arbitraged away,8 managers whodo not consider derivatives for policy reasons may miss out on opportunities toexploit intermarket disequilibrium.9 One opportunity that derivatives offer is tosell out-of-the-money covered call options at a favorable premium, and at thesame time generate cash flow for distribution. Lastly, managers may not tradederivatives because they focus on stocks with no derivatives. However, there arefew, if any, cheaper and faster alternatives for adjusting equity market exposurethan through trading index futures. In conclusion, the relationship betweenderivatives use and fund performance is an interesting empirical question.Following Koski and Pontiff (1999) we frame the first hypothesis as follows:
H1. The use of derivatives causes significant impacts on the performance andrisk of Australian investment managers.
The momentum strategy outlined by Jegadeesh and Titman (1993) consistsof buying recent past winner stocks and short-selling recent past loser stocks.Fong and Lee (2005), Demir et al. (2004), and Hurn and Pavlov (2003) verify theprofitability of this strategy in the Australian market. In this study, we examinethe extent to which a momentum strategy motivates fund managers to trade inderivative securities.
Previous studies have shown that mutual funds do engage in momentumstrategies in their equity stock holdings.10 Several factors in the Australianinstitutional environment make derivatives potentially more appropriate thanshares in implementing momentum strategies.
First, regulations and investment mandates often prevent fund managersfrom leveraging the portfolio or short-selling securities.11 Interestingly, Fongand Lee (2005) find that the momentum of loser stocks is an importantcontributor to overall momentum returns in Australia. However, the inability toshort-sell loser stocks represents a constraint for fund managers in taking fulladvantage of a momentum strategy. Although it can be argued that under-weighting loser stocks (relative to the benchmark index) is an adequatesubstitute for short-selling, purchasing put options of loser stocks provides anaggressive alternative to create an effective short position under short-sellingconstraints.
8 The authors thank the Editor for providing this equilibrium insight.
9 Exploiting intermarket disequilibrium is similar to exploiting short-term pricing inefficiency in
individual securities through stock picking.
10 See Grinblatt et al. (1995) and Carhart (1997).
11 For instance, the Superannuation Industry (Supervision) Act prohibits superannuation funds to
engage in leveraging and short selling. In addition, the mandates of the sample funds in this
study all prohibit short-selling, leveraging, and writing uncovered call options.
International Review of Finance
4 r International Review of Finance Ltd. 2006

Secondly, the leveraged exposure that options markets provide may be anefficient way for fund managers to establish positive exposure to winner stocks.
Thirdly, implementing a momentum strategy with derivatives can reduceexcessive realization of long-term accumulated capital gains. In comparison, amomentum strategy implemented in the cash market involves retaining onlyrecent past winners and losers in the portfolio, and this represents a relativelyhigh turnover strategy. Managers might be required to sell stocks that areclassified as losers over the past 12 months in using the momentum strategy,but these stocks might have been purchased 5 years ago with an accumulatedcapital gain of 100%. If these stocks are to be repurchased after a few months, itwould be better to use derivatives to implement the strategy and avoidunnecessary realization of capital gains.
We state our second hypothesis as follows:
H2. Active investment managers use options markets to implement momen-tum-based trading strategies.
Investment managers, through their skills in stock selection and markettiming, are theoretically able to generate and trade on their private informationto generate abnormal returns. Option contracts provide leverage, improvedtransaction cost benefits, and are potentially highly desirable instruments forinformed traders. However, there is no study that examines informed trading inindividual stock options. At the aggregate market level, prior studies find onlymixed evidence of informed trading in option markets.12 This study fills a gapin the literature on the role of derivative use in informed trading. We test thefollowing cross-market return implications of information trading by profes-sional traders:
H3. The option trades of active investment managers are associated withabnormal stock price performance.
III. EMPIRICAL METHODOLOGY
A. Data
We study Australian equity funds sourced from the Portfolio AnalyticsDatabase. This unique database, containing month-end portfolio holdingsand daily trading data, was formed on an invitation basis to the largestinvestment managers operating in Australia.13 The sample period for this studyis 1 January 1993 to 31 December 2003. Further details concerning theconstruction and composition of the database can be obtained from Brown etal. (2005), Gallagher and Looi (2006), and Foster et al. (2005). These studies also
12 Easley et al. (1998) show that option volumes lead stock prices, whereas Chakravarty et al.
(2004) provide evidence of price discovery in options markets.
13 The size of investment managers was measured by total funds under management.
Use of Derivatives by Investment Managers and Implications
r International Review of Finance Ltd. 2006 5
show that the sample of funds drawn from the database is not significantlydifferent from the universe of funds in terms of performance.
In addition to the managed fund data, daily stock price data and details ofdividends paid are collected from the SEATS system, sourced from the SecuritiesInstitute Research Centre of Asia-Pacific (SIRCA). The All Ordinaries Accumula-tion Index was used as the market proxy, whereas the Reserve Bank of Australiashort interest rate was used as the risk-free rate.
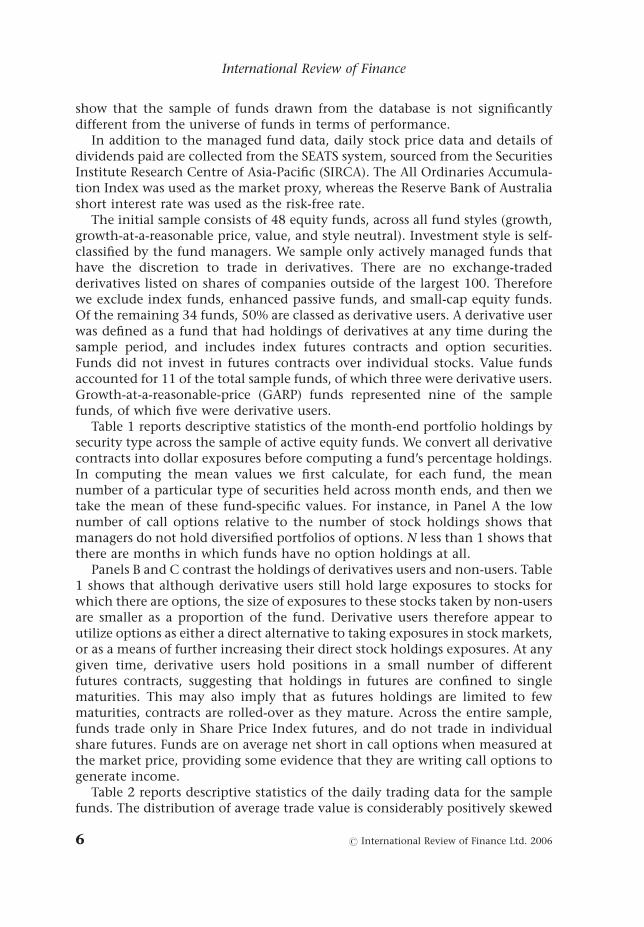
The initial sample consists of 48 equity funds, across all fund styles (growth,growth-at-a-reasonable price, value, and style neutral). Investment style is self-classified by the fund managers. We sample only actively managed funds thathave the discretion to trade in derivatives. There are no exchange-tradedderivatives listed on shares of companies outside of the largest 100. Thereforewe exclude index funds, enhanced passive funds, and small-cap equity funds.Of the remaining 34 funds, 50% are classed as derivative users. A derivative userwas defined as a fund that had holdings of derivatives at any time during thesample period, and includes index futures contracts and option securities.Funds did not invest in futures contracts over individual stocks. Value fundsaccounted for 11 of the total sample funds, of which three were derivative users.Growth-at-a-reasonable-price (GARP) funds represented nine of the samplefunds, of which five were derivative users.
Table 1 reports descriptive statistics of the month-end portfolio holdings bysecurity type across the sample of active equity funds. We convert all derivativecontracts into dollar exposures before computing a fund’s percentage holdings.In computing the mean values we first calculate, for each fund, the meannumber of a particular type of securities held across month ends, and then wetake the mean of these fund-specific values. For instance, in Panel A the lownumber of call options relative to the number of stock holdings shows thatmanagers do not hold diversified portfolios of options. N less than 1 shows thatthere are months in which funds have no option holdings at all.
Panels B and C contrast the holdings of derivatives users and non-users. Table1 shows that although derivative users still hold large exposures to stocks forwhich there are options, the size of exposures to these stocks taken by non-usersare smaller as a proportion of the fund. Derivative users therefore appear toutilize options as either a direct alternative to taking exposures in stock markets,or as a means of further increasing their direct stock holdings exposures. At anygiven time, derivative users hold positions in a small number of differentfutures contracts, suggesting that holdings in futures are confined to singlematurities. This may also imply that as futures holdings are limited to fewmaturities, contracts are rolled-over as they mature. Across the entire sample,funds trade only in Share Price Index futures, and do not trade in individualshare futures. Funds are on average net short in call options when measured atthe market price, providing some evidence that they are writing call options togenerate income.
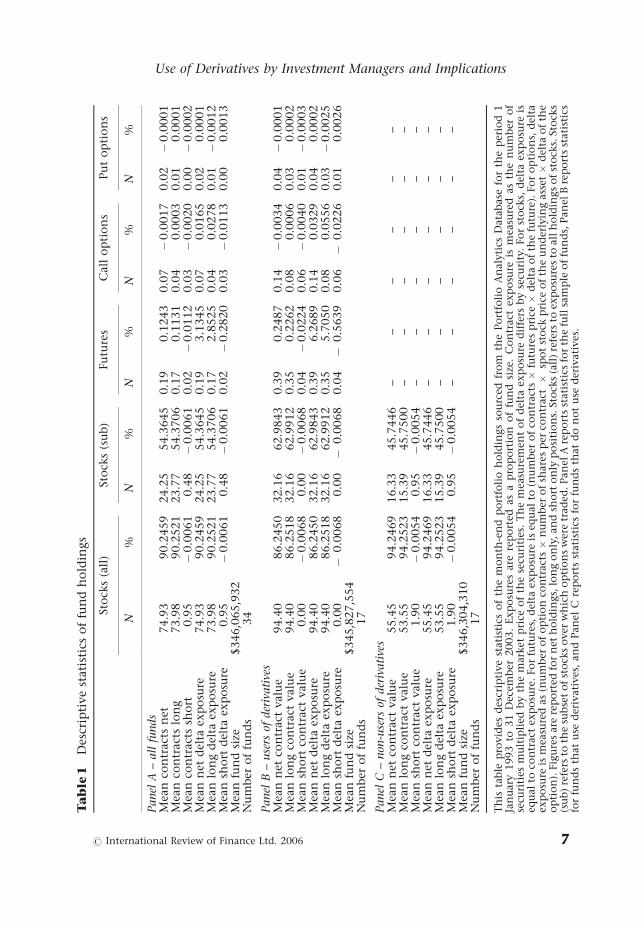
Table 2 reports descriptive statistics of the daily trading data for the samplefunds. The distribution of average trade value is considerably positively skewed
International Review of Finance
6 r International Review of Finance Ltd. 2006
Ta
ble
1D
escr
ipti
ve
stati
stic
so
ffu
nd
ho
ldin
gs
Sto
cks
(all
)St
ock
s(s
ub
)Fu
ture
sC
all
op
tio
ns
Pu
to
pti
on
s
N%
N%
N%
N%
N%
Panel
A–
all
funds
Mea
nco
ntr
act
sn
et74.9
390.2
459
24.2
554.3
645
0.1
90.1
243
0.0
7�
0.0
017
0.0
2�
0.0
001
Mea
nco
ntr
act
slo
ng
73.9
890.2
521
23.7
754.3
706
0.1
70.1
131
0.0
40.0
003
0.0
10.0
001
Mea
nco
ntr
act
ssh
ort
0.9
5�
0.0
061
0.4
8�
0.0
061
0.0
2�
0.0
112
0.0
3�
0.0
020
0.0
0�
0.0
002
Mea
nn
etd
elta
exp
osu
re74.9
390.2
459
24.2
554.3
645
0.1
93.1
345
0.0
70.0
165
0.0
20.0
001
Mea
nlo
ng
del
taex
po
sure
73.9
890.2
521
23.7
754.3
706
0.1
72.8
525
0.0
40.0
278
0.0
1�
0.0
012
Mea
nsh
ort
del
taex
po
sure
0.9
5�
0.0
061
0.4
8�
0.0
061
0.0
2�
0.2
820
0.0
3�
0.0
113
0.0
00.0
013
Mea
nfu
nd
size
$346,0
65,9
32
Nu
mb
ero
ffu
nd
s34
Panel
B–
use
rsof
der
ivati
ves
Mea
nn
etco
ntr
act
valu
e94.4
086.2
450
32.1
662.9
843
0.3
90.2
487
0.1
4�
0.0
034
0.0
4�
0.0
001
Mea
nlo
ng
con
tract
valu
e94.4
086.2
518
32.1
662.9
912
0.3
50.2
262
0.0
80.0
006
0.0
30.0
002
Mea
nsh
ort
con
tract
valu
e0.0
0�
0.0
068
0.0
0�
0.0
068
0.0
4�
0.0
224
0.0
6�
0.0
040
0.0
1�
0.0
003
Mea
nn
etd
elta
exp
osu
re94.4
086.2
450
32.1
662.9
843
0.3
96.2
689
0.1
40.0
329
0.0
40.0
002
Mea
nlo
ng
del
taex
po
sure
94.4
086.2
518
32.1
662.9
912
0.3
55.7
050
0.0
80.0
556
0.0
3�
0.0
025
Mea
nsh
ort
del
taex
po
sure
0.0
0�
0.0
068
0.0
0�
0.0
068
0.0
4�
0.5
639
0.0
6�
0.0
226
0.0
10.0
026
Mea
nfu
nd
size
$345,8
27,5
54
Nu
mb
ero
ffu
nd
s17
Panel
C–
non
-use
rsof
der
ivati
ves
Mea
nn
etco
ntr
act
valu
e55.4
594.2
469
16.3
345.7
446
––
––
––
Mea
nlo
ng
con
tract
valu
e53.5
594.2
523
15.3
945.7
500
––
––
––
Mea
nsh
ort
con
tract
valu
e1.9
0�
0.0
054
0.9
5�
0.0
054
––
––
––
Mea
nn
etd
elta
exp
osu
re55.4
594.2
469
16.3
345.7
446
––
––
––
Mea
nlo
ng
del
taex
po
sure
53.5
594.2
523
15.3
945.7
500
––
––
––
Mea
nsh
ort
del
taex
po
sure
1.9
0�
0.0
054
0.9
5�
0.0
054
––
––
––
Mea
nfu
nd
size
$346,3
04,3
10
Nu
mb
ero
ffu
nd
s17
Th
ista
ble
pro
vid
esd
escr
ipti
ve
stati
stic
so
fth
em
on
th-e
nd
po
rtfo
lio
ho
ldin
gs
sou
rced
fro
mth
ePo
rtfo
lio
An
aly
tics
Data
base
for
the
per
iod
1Ja
nu
ary
1993
to31
Dec
emb
er2003.
Exp
osu
res
are
rep
ort
edas
ap
rop
ort
ion
of
fun
dsi
ze.
Co
ntr
act
exp
osu
reis
mea
sure
das
the
nu
mb
ero
fse
curi
ties
mu
ltip
lied
by
the
mar
ket
pri
ceo
fth
ese
curi
ties
.T
he
mea
sure
men
to
fd
elta
exp
osu
red
iffe
rsb
yse
curi
ty.
Fo
rst
ock
s,d
elta
exp
osu
reis
equ
al
toco
ntr
act
exp
osu
re.
Fo
rfu
ture
s,d
elta
exp
osu
reis
equ
al
to(n
um
ber
of
con
trac
ts�
futu
res
pri
ce�
del
tao
fth
efu
ture
).Fo
ro
pti
on
s,d
elta
exp
osu
reis
mea
sure
das
(nu
mb
ero
fo
pti
on
con
trac
ts�
nu
mb
ero
fsh
are
sp
erco
ntr
act�
spo
tst
ock
pri
ceo
fth
eu
nd
erly
ing
ass
et�
del
tao
fth
eo
pti
on
).Fig
ure
sare
rep
ort
edfo
rn
eth
old
ings,
lon
go
nly
,an
dsh
ort
on
lyp
osi
tio
ns.
Sto
cks
(all
)re
fers
toex
po
sure
sto
all
ho
ldin
gs
of
sto
cks.
Sto
cks
(su
b)
refe
rsto
the
sub
set
of
sto
cks
over
wh
ich
op
tio
ns
wer
etr
ad
ed.Pan
elA
rep
ort
sst
ati
stic
sfo
rth
efu
llsa
mp
leo
ffu
nd
s,Pan
elB
rep
ort
sst
ati
stic
sfo
rfu
nd
sth
at
use
der
ivati
ves
,an
dPan
elC
rep
ort
sst
ati
stic
sfo
rfu
nd
sth
at
do
no
tu
sed
eriv
ati
ves
.
Use of Derivatives by Investment Managers and Implications
r International Review of Finance Ltd. 2006 7
across all securities. This suggests that managers occasionally trade insignificantly large parcels in stock, futures, and options markets. The numberof trades per month exhibits similar trends to the average trade value, beinghighly positively skewed, suggesting that funds experience months ofsignificantly large trading activity in stock, futures, and options markets. Thedistribution of time to maturity of derivatives is relatively symmetric. Degree ofmoneyness shows that option trades are relatively close-to-the-money; how-ever, the median call trade is slightly out-of-the-money and the median putoption trade is slightly in-the-money. The high standard deviation of money-ness for call options is consistent with the purchase of low-exercise-price-options (LEPOs), which have a high degree of moneyness (close to 100%). Inaddition, funds may be writing out-of-the-money call options, which have alow degree of moneyness, providing further evidence of selling call options togenerate income.
Table 2 Descriptive statistics of fund trades
Mean Std. dev. Median
Panel A – stocksAverage trade value ($) 564,667 2,405,018 185,429Number of trades per month 117 125 91Proportion of buy trades 57.01% 20.74% 55.56%
Panel B – futuresAverage trade value ($) 757,198 3,721,481 39,720Number of trades per month 33 54 19Proportion of buy trades 51.29% 24.39% 50.00%Time to maturity (days) 35.63 23.74 33.42
Panel C – call optionsAverage trade value ($) 85,648 188,579 26,200Number of trades per month 20 43 5Proportion of buy trades 41.66% 31.46% 43.10%Time to maturity (days) 75.43 53.21 68.24Degree of moneyness 3.95% 18.62% �1.20%
Panel D – put optionsAverage trade value ($) 29,694 42,989 17,834Number of trades per month 15 21 5Proportion of buy trades 44.76% 32.71% 45.86%Time to maturity (days) 83.24 68.72 73.42Degree of moneyness 2.92% 8.58% 2.97%
This table provides descriptive statistics of the daily trades sourced from the Portfolio AnalyticsDatabase for the period 1 January 1995 to 31 December 2002. For stocks and options, trade valuerefers to the number of securities traded � the price per security. For futures, trade value refers tothe number of contracts trade � the SPI futures value � $25. Degree of moneyness is measured asthe spot price of the underlying asset minus the strike price of the option, divided by the spotprice of the underlying asset.
International Review of Finance
8 r International Review of Finance Ltd. 2006
B. Research design
i. Distributional moments and risk metricsWe use a broad range of risk measures to capture distinct elements of risk. Thesemetrics include the variables examined by Koski and Pontiff (1999) andadditional variables as proposed by other studies.
Distributional parameters characterize the performance and risk of a fundrelative to the fund’s mean return. The first four moments of the fund returndistribution are examined.
Market model parameters are used as measurements of fund performanceand risk relative to market factors. The a and b of each fund are derived from asingle factor model, and idiosyncratic risk calculated as the standard deviationof the residuals.14 In addition, a market timing variable is included to capturethe ability of managers to utilize portfolio insurance to protect the portfolioagainst adverse market conditions.
Sortino (2001) stresses the importance of considering the risk of falling belowa ‘minimal acceptable return’ (MAR). A downside risk metric is included tocapture both the likelihood and magnitude of underperforming the relevantbenchmark return.15
ii. Classifying momentum tradesIn order to analyze the proportions of trades that follow momentum patterns,each trade must be classified as a momentum or non-momentum trade.Jegadeesh and Titman (1993) show that stocks exhibit persistent returns basedon past 3–12-month performance. Carhart (1997) shows that the persistence ofmutual fund performance is attributable to the 12-month momentum effect.This study defines momentum based on past 12-month performance. Recentstudies, such as Badrinath and Wahal (2002), continue to use momentumwindows ranging from 3 to 12 months. Demir et al. (2004) find significantmomentum effects in Australian equities over both short-term (1 week to 1month) horizon, and intermediate-term (3–12 month) horizon. Therefore, the12-month momentum effect should provide trading opportunities to invest-ment managers, where it may be appropriate to transact in options markets.
To derive momentum rankings, the constituents of the All Ordinaries Indexare taken at each month-end of the sample period. Taking these constituents ateach month-end captures the entry of new firms into the market, and removes
14 The single-factor model is estimated from the equation rt � rf,t 5 a 1 b(rMkt,t � rf,t) 1 et, where
rt is the return for month t, rf,t is the risk-free rate at the end of month t, and rMkt,t is the ex-post
return on the market during month t. A continuously compounded RBA cash rate is used to
proxy for the risk-free rate, and the logarithmic change in the All Ordinaries Index used as a
proxy for the market return.
15 Downside risk is defined by the equationPMAR�1 ðRt � MARtÞ2Pr
h i1=2, where Rt is the return of
the fund during month t, MARt is the minimal acceptable return for month t, and Pr is the
probability associated with observing that level of return. The MAR for each month is set at the
return on the All Ordinaries Accumulation Index.
Use of Derivatives by Investment Managers and Implications
r International Review of Finance Ltd. 2006 9
firms as they are delisted from the ASX. The 12-month buy-and-hold return iscalculated for each stock at each month-end date, which is then used as thebasis of ranking.
Two alternative classifications of momentum are defined. Jegadeesh andTitman (1993) construct a zero-cost trading strategy to profit from themomentum effect, which involves buying a portfolio of stocks consisting ofthe top decile firms based on past performance, and selling a portfolio of stocksconsisting of the bottom decile of firms. Therefore, stocks in the ‘loser’ portfolioare firstly defined as firms in the bottom decile of the performance ranking,whereas stocks in the ‘winner’ portfolio are defined as firms in the top decile ofthe performance ranking. As an alternative measure, the ‘loser’ portfolio is alsodefined as the bottom quintile of firms, and the ‘winner’ portfolio defined as thetop quintile of firms.
Individual options trades are then classified as either loser momentumtrades, winner momentum trades, or non-momentum trades. Loser momentumtrades are options on any underlying stock that fell within the loser portfolio asat the previous month-end date. Similarly, winner momentum trades are optiontrades on any underlying stock that fell within the winner portfolio as at theprevious month-end date. Non-momentum trades are all remaining trades thatwere not considered winner or loser trades.
The momentum strategy proposed by Jegadeesh and Titman (1993) profitsfrom upside exposure to the winner portfolio, and downside exposure to theloser portfolio. Options provide linear price exposure to either upside ordownside price movements. Furthermore, options may be both written orbought, providing opposite price exposures. Therefore, the sample of optiontransactions are separated by both call option and put option trades, and by buytrades and sell trades. This yields a total of four trade types. In addition to this,two trade types are defined in order to capture similar exposures gained bydifferent trade types:
1. delta increasing trades are transactions that profit from upside pricechanges in the underlying stock, and consist of call option buy tradesand put option sell trades; and
2. delta decreasing trades are transactions that profit from downside pricechanges in the underlying stock, and consist of call option sell tradesand put option buy trades.
The total number of option transactions for each trade type in the loser,winner, and non-momentum categories are calculated for each fund over theentire sample period. These totals form the basis of the tests of proportions. Foreach fund, the distribution of trades over the three categories is comparedagainst the expected number of trades in each category using a w2 goodness-of-fit test.
For the goodness-of-fit tests over decile-based momentum trades, theexpected number of trades in winner and loser categories are each equalto 10% of the total number of option trades, whereas the expected number of
International Review of Finance
10 r International Review of Finance Ltd. 2006
non-momentum trades is equal to 80% of total option trades. Similarly for thegoodness-of-fit tests over quintile-based momentum trades, the expectednumber of trades in winner and loser categories are each equal to 20% of thetotal number of option trades, whereas the expected number of non-momentum trades is equal to 60% of total option trades.
Tests of the nominal number of trades will not incorporate relativedifferences in trade size, and the level of exposure generated by each trade.For this reason, a measure of the value-weighted number of trades is introduced.This variable is calculated for each trade category as
Value � Weighted number of tradesi
¼ Total number of tradesi �Total exposure of tradesiPki¼1 Total exposure of tradesi
ð1Þ
The exposure of each trade is calculated as the equivalent ordinary shareexposure (see the Appendix). The w2 goodness-of-fit tests are then conducted, asdescribed, over the value-weighted number of trades.16
iii. Event study of option tradesThe literature approaches the use of options for informed trading at a marketlevel by comparing aggregate variables such as prices and volumes betweenstock and option markets. Much of this literature has utilized high-frequencyintraday data to establish lead/lag relationships between option and stockmarkets, finding mixed support for informed trading using options. Easley et al.(1998) show that price changes in stock markets lead option volumes with a lagof 20–30 min, whereas option volumes affect stock price changes more rapidly.Jarnecic (1999) shows that stock volumes on the ASX lead option volumes onthe ASX options market. Cairney and Swisher (2004) represent one of fewstudies which analyze informed trading in options markets on a lower-frequency basis, showing abnormal volume in Chicago Board OptionsExchange (CBOE) options for three days before earnings announcements.Importantly, prior studies have found evidence that mutual funds possessprivate information (Daniel et al. 1997; Wermers 2000). Therefore, this studyprovides an evaluation of the decision to disseminate private information inoptions markets as opposed to stock markets.
The information content of investment manager option trades is assessed byexamining the behavior of the share price of the underlying stock both beforeand after option transactions are executed. An event study methodology is used
16 In order to ensure that the w2 distribution adequately approximates the discrete sampling
distribution, the goodness-of-fit tests must conform to the rule of five. As a consequence, funds
with an insufficient number of trades were excluded from these tests (less than 50 trades for
decile-based tests, and less than 25 for quintile-based tests). Across all option trade types, eight
to nine funds were excluded from the decile-based tests, and between three and eight funds
were excluded from the quintile-based tests.
Use of Derivatives by Investment Managers and Implications
r International Review of Finance Ltd. 2006 11
to measure the significance of share price movements around an option tradeby an active investment manager.
Standard event study methodologies typically pool abnormal returns acrossall observed events, and test the hypothesis that the mean abnormal return isequal to zero (Kritzman 1994). This approach is inappropriate in this study forseveral reasons. Firstly, there are many factors influencing the decision byinvestment managers in choosing to transact in options markets, such asequitizing fund flows, attempting to add value through hedging, or byimplementing trading strategies based on public information.17 Thus, not alloption trades will be motivated by acting upon private information. Poolingoption trades will create significant noise in the event study model by includingtrades initiated for different motivations, and may distort the underlying shareprice impacts of option trades. Secondly, since options are short-term tradinginstruments, investment managers are likely to implement further trades toreverse initial trading positions. The timing of this reversal trade will beinfluenced by factors other than information motives, such as managing theloss of time value of the option exposure. This effect also prevents a pooledanalysis of investment manager option trades.
To implement the event study, abnormal returns are calculated from 10 daysbefore the option trade, to 10 days subsequent to the option transaction. Foreach event date, we estimate the standard deviation of returns as the squareroot of the sample variance of returns from t�100 to t�11, where t is the day ofthe option trade.
IV. RESULTS
A. Distributional moments and risk measures
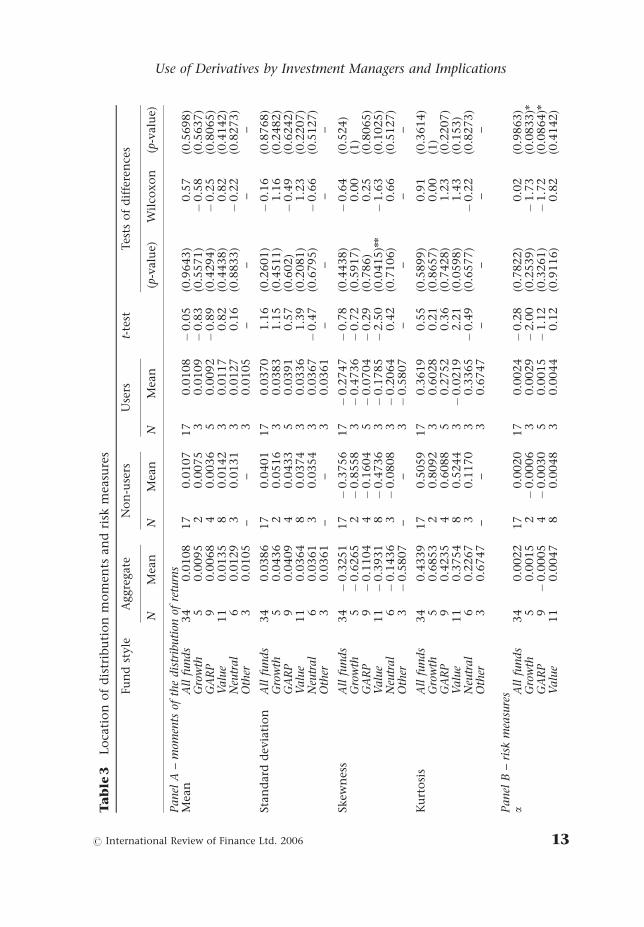
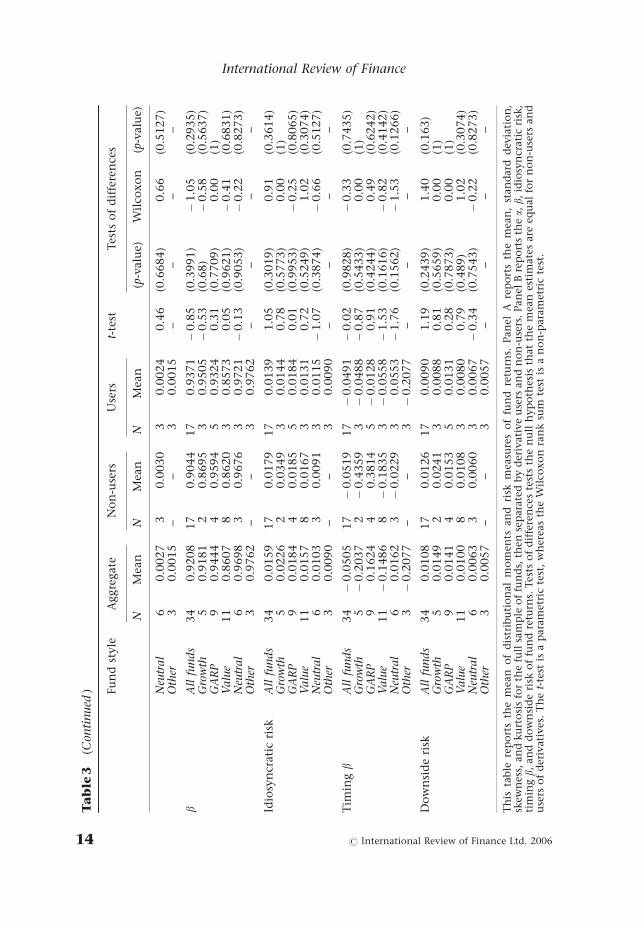
Table 3 presents the results for the difference in cross-sectional mean tests forthe distributional moments and risk measures. Panel A shows active equityfunds yield positive mean returns that are negatively skewed and leptokurtic.This is consistent with previous studies that have found similar non-normalityin the return distributions of equities and fixed income funds in Australian andinternational markets (Bird and Gallagher 2002). Across the entire sample offunds, derivative users do not display significantly higher mean returns, norsignificantly lower standard deviation, skewness and kurtosis. This observationholds across subsets of funds as well.
Panel B shows that on average, funds display positive a’s. Growth and GARPfunds that did not use derivatives are the only group to derive negative a’s.There is weak evidence indicating a difference in the mean a between derivativeusers and non-users for growth and GARP-style funds, with the Wilcoxon
17 Trading on the basis of public information will not result in any abnormal share price reaction
in the underlying stock. An example of a trading strategy based on public information is the
momentum strategy, where the trading decisions are formed solely on historical performance.
International Review of Finance
12 r International Review of Finance Ltd. 2006
Ta
ble
3Lo
cati
on
of
dis
trib
uti
on
mo
men
tsan
dri
skm
easu
res
Fu
nd
style
Aggre
gate
No
n-u
sers
Use
rst-
test
Tes
tso
fd
iffe
ren
ces
NM
ean
NM
ean
NM
ean
(p-v
alu
e)W
ilco
xo
n(p
-valu
e)
Panel
A–
mom
ents
ofth
edis
trib
uti
onof
retu
rns
Mea
nA
llfu
nds
34
0.0
108
17
0.0
107
17
0.0
108
�0.0
5(0
.9643)
0.5
7(0
.5698)
Gro
wth
50.0
095
20.0
075
30.0
109
�0.8
3(0
.5571)
�0.5
8(0
.5637)
GA
RP
90.0
068
40.0
036
50.0
092
�0.8
9(0
.4294)
�0.2
5(0
.8065)
Valu
e11
0.0
135
80.0
142
30.0
117
0.8
2(0
.4438)
0.8
2(0
.4142)
Neu
tral
60.0
129
30.0
131
30.0
127
0.1
6(0
.8833)
�0.2
2(0
.8273)
Oth
er3
0.0
105
––
30.0
105
––
––
Stan
dard
dev
iati
on
All
funds
34
0.0
386
17
0.0
401
17
0.0
370
1.1
6(0
.2601)
�0.1
6(0
.8768)
Gro
wth
50.0
436
20.0
516
30.0
383
1.1
5(0
.4511)
1.1
6(0
.2482)
GA
RP
90.0
409
40.0
433
50.0
391
0.5
7(0
.602)
�0.4
9(0
.6242)
Valu
e11
0.0
364
80.0
374
30.0
336
1.3
9(0
.2081)
1.2
3(0
.2207)
Neu
tral
60.0
361
30.0
354
30.0
367
�0.4
7(0
.6795)
�0.6
6(0
.5127)
Oth
er3
0.0
361
––
30.0
361
––
––
Skew
nes
sA
llfu
nds
34
�0.3
251
17
�0.3
756
17
�0.2
747
�0.7
8(0
.4438)
�0.6
4(0
.524)
Gro
wth
5�
0.6
265
2�
0.8
558
3�
0.4
736
�0.7
2(0
.5917)
0.0
0(1
)G
AR
P9
�0.1
104
4�
0.1
604
5�
0.0
704
�0.2
9(0
.786)
0.2
5(0
.8065)
Valu
e11
�0.3
931
8�
0.4
736
3�
0.1
785
�2.5
0(0
.0415)n
n�
1.6
3(0
.1025)
Neu
tral
6�
0.1
436
3�
0.0
808
3�
0.2
064
0.4
2(0
.7106)
0.6
6(0
.5127)
Oth
er3
�0.5
807
––
3�
0.5
807
––
––
Ku
rto
sis
All
funds
34
0.4
339
17
0.5
059
17
0.3
619
0.5
5(0
.5899)
0.9
1(0
.3614)
Gro
wth
50.6
853
20.8
092
30.6
028
0.2
1(0
.8657)
0.0
0(1
)G
AR
P9
0.4
235
40.6
088
50.2
752
0.3
6(0
.7428)
1.2
3(0
.2207)
Valu
e11
0.3
754
80.5
244
3�
0.0
219
2.2
1(0
.0598)
1.4
3(0
.153)
Neu
tral
60.2
267
30.1
170
30.3
365
�0.4
9(0
.6577)
�0.2
2(0
.8273)
Oth
er3
0.6
747
––
30.6
747
––
––
Panel
B–
risk
mea
sure
sa
All
funds
34
0.0
022
17
0.0
020
17
0.0
024
�0.2
8(0
.7822)
0.0
2(0
.9863)
Gro
wth
50.0
015
2�
0.0
006
30.0
029
�2.0
0(0
.2539)
�1.7
3(0
.0833)n
GA
RP
9�
0.0
005
4�
0.0
030
50.0
015
�1.1
2(0
.3261)
�1.7
2(0
.0864)n
Valu
e11
0.0
047
80.0
048
30.0
044
0.1
2(0
.9116)
0.8
2(0
.4142)
Use of Derivatives by Investment Managers and Implications
r International Review of Finance Ltd. 2006 13
Fu
nd
style
Aggre
gate
No
n-u
sers
Use
rst-
test
Tes
tso
fd
iffe
ren
ces
NM
ean
NM
ean
NM
ean
(p-v
alu
e)W
ilco
xo
n(p
-valu
e)
Neu
tral
60.0
027
30.0
030
30.0
024
0.4
6(0
.6684)
0.6
6(0
.5127)
Oth
er3
0.0
015
––
30.0
015
––
––
bA
llfu
nds
34
0.9
208
17
0.9
044
17
0.9
371
�0.8
5(0
.3991)
�1.0
5(0
.2935)
Gro
wth
50.9
181
20.8
695
30.9
505
�0.5
3(0
.68)
�0.5
8(0
.5637)
GA
RP
90.9
444
40.9
594
50.9
324
0.3
1(0
.7709)
0.0
0(1
)V
alu
e11
0.8
607
80.8
620
30.8
573
0.0
5(0
.9621)
�0.4
1(0
.6831)
Neu
tral
60.9
698
30.9
676
30.9
721
�0.1
3(0
.9053)
�0.2
2(0
.8273)
Oth
er3
0.9
762
––
30.9
762
––
––
Idio
syn
crati
cri
skA
llfu
nds
34
0.0
159
17
0.0
179
17
0.0
139
1.0
5(0
.3019)
0.9
1(0
.3614)
Gro
wth
50.0
226
20.0
349
30.0
144
0.7
8(0
.5773)
0.0
0(1
)G
AR
P9
0.0
184
40.0
185
50.0
184
0.0
1(0
.9953)
�0.2
5(0
.8065)
Valu
e11
0.0
157
80.0
167
30.0
131
0.7
2(0
.5249)
1.0
2(0
.3074)
Neu
tral
60.0
103
30.0
091
30.0
115
�1.0
7(0
.3874)
�0.6
6(0
.5127)
Oth
er3
0.0
090
––
30.0
090
––
––
Tim
ingb
All
funds
34
�0.0
505
17
�0.0
519
17
�0.0
491
�0.0
2(0
.9828)
�0.3
3(0
.7435)
Gro
wth
5�
0.2
037
2�
0.4
359
3�
0.0
488
�0.8
7(0
.5433)
0.0
0(1
)G
AR
P9
0.1
624
40.3
814
5�
0.0
128
0.9
1(0
.4244)
0.4
9(0
.6242)
Valu
e11
�0.1
486
8�
0.1
835
3�
0.0
558
�1.5
3(0
.1616)
�0.8
2(0
.4142)
Neu
tral
60.0
162
3�
0.0
229
30.0
553
�1.7
6(0
.1562)
�1.5
3(0
.1266)
Oth
er3
�0.2
077
––
3�
0.2
077
––
––
Do
wn
sid
eri
skA
llfu
nds
34
0.0
108
17
0.0
126
17
0.0
090
1.1
9(0
.2439)
1.4
0(0
.163)
Gro
wth
50.0
149
20.0
241
30.0
088
0.8
1(0
.5659)
0.0
0(1
)G
AR
P9
0.0
141
40.0
153
50.0
131
0.2
8(0
.7873)
0.0
0(1
)V
alu
e11
0.0
100
80.0
108
30.0
080
0.7
9(0
.489)
1.0
2(0
.3074)
Neu
tral
60.0
063
30.0
060
30.0
067
�0.3
4(0
.7543)
�0.2
2(0
.8273)
Oth
er3
0.0
057
––
30.0
057
––
––
Th
ista
ble
rep
ort
sth
em
ean
of
dis
trib
uti
on
al
mo
men
tsan
dri
skm
easu
res
of
fun
dre
turn
s.Pan
elA
rep
ort
sth
em
ean
,st
an
dard
dev
iati
on
,sk
ewn
ess,
an
dku
rto
sis
for
the
full
sam
ple
of
fun
ds,
then
sep
arate
db
yd
eriv
ati
ve
use
rsan
dn
on
-use
rs.Pan
elB
rep
ort
sth
ea,
b,id
iosy
ncr
ati
cri
sk,
tim
ingb,
an
dd
ow
nsi
de
risk
of
fun
dre
turn
s.Tes
tso
fd
iffe
ren
ces
test
sth
en
ull
hyp
oth
esis
that
the
mea
nes
tim
ate
sare
equ
alfo
rn
on
-use
rsan
du
sers
of
der
ivat
ives
.T
he
t-te
stis
ap
ara
met
ric
test
,w
her
eas
the
Wil
coxo
nra
nk
sum
test
isa
no
n-p
ara
met
ric
test
.
Ta
ble
3(C
onti
nued
)
International Review of Finance
14 r International Review of Finance Ltd. 2006
rank-sum test significant at the 10% level. Panel B also shows that there is nosignificant difference in other risk measures across derivative users and non-users.
Although the size of derivative exposures is small as a proportion of the totalportfolio, intra-month variation in derivative positions can potentially cause asignificant difference in portfolio risk and return between derivatives users andnon-users.18 The results in Table 3 show no systematic difference in the meansof distributional moments and risk measures between derivative users and non-users. This observation is consistent with the findings of Koski and Pontiff(1999).
B. Analyzing the proportions of option trades
Table 4 presents the results of the w2 goodness-of-fit tests over the equallyweighted proportion of option trades for stocks in momentum and non-momentum portfolios. Broadly, funds on average trade disproportionately lessfrequently in options over stocks in loser portfolios. There is evidence that somefunds trade more frequently in options over stocks in winner portfolios.
Panel A reports the empirical findings where momentum portfolios aredefined by upper and lower return deciles of the All Ordinaries Index. Across alloption trade types, there is evidence that active equity funds trade dispropor-tionately in option securities on momentum stocks. The w2 tests of goodness-of-fit (actual versus expected proportions) are found to be significant for asubstantial majority of funds across all option trade types. This shows that theobserved number of trades in each category are significantly different to theexpected number of trades. In particular, active equity managers avoid exposureto the loser portfolio, as shown by the shortfall in the observed proportion oftrades in this category below the expected proportion. The median proportionof trades in the loser portfolio is less than 2% for all trade types. For call optiontrades, the median proportion of option trades in the winner portfolio was lessthan the uniform expectation, suggesting that overall funds are also avoidingupward momentum exposure. However, the maximum proportion of buytrades in call options over the winner portfolio was 18.4%, signifying that somefunds use options to generate exposures to winner momentum stocks. Incontrast, the small proportion of put option trades over winner stocks showsthat these options are inappropriate in gaining upward momentum exposure.
Panel B presents the results of the momentum portfolios which are definedby upper and lower quintiles. These results provide stronger evidence thatactive equity funds trade disproportionately in options on stocks which exhibitmomentum characteristics. Similar to the decile-based ranking results, the w2
goodness-of-fit tests are significant for substantially all of the sample funds. Thisis largely due to funds trading lower proportions of options over loser stocks.
18 Mean futures exposure represents 6% of portfolio exposure to derivative users, with mean
options exposures contributing to less than 1% of portfolio exposure.
Use of Derivatives by Investment Managers and Implications
r International Review of Finance Ltd. 2006 15
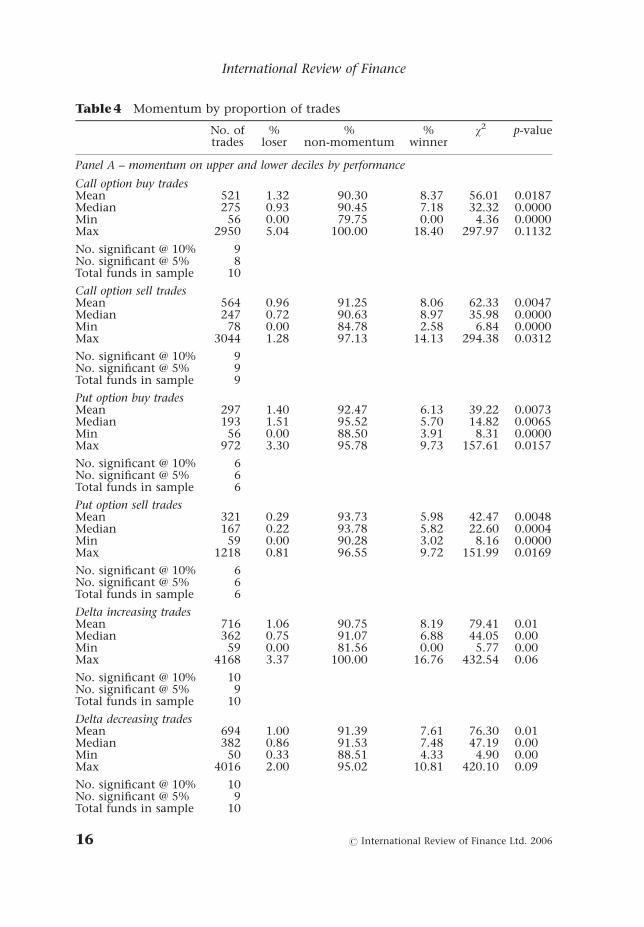
Table 4 Momentum by proportion of trades
No. oftrades
%loser
%non-momentum
%winner
w2 p-value
Panel A – momentum on upper and lower deciles by performance
Call option buy tradesMean 521 1.32 90.30 8.37 56.01 0.0187Median 275 0.93 90.45 7.18 32.32 0.0000Min 56 0.00 79.75 0.00 4.36 0.0000Max 2950 5.04 100.00 18.40 297.97 0.1132
No. significant @ 10% 9No. significant @ 5% 8Total funds in sample 10
Call option sell tradesMean 564 0.96 91.25 8.06 62.33 0.0047Median 247 0.72 90.63 8.97 35.98 0.0000Min 78 0.00 84.78 2.58 6.84 0.0000Max 3044 1.28 97.13 14.13 294.38 0.0312
No. significant @ 10% 9No. significant @ 5% 9Total funds in sample 9
Put option buy tradesMean 297 1.40 92.47 6.13 39.22 0.0073Median 193 1.51 95.52 5.70 14.82 0.0065Min 56 0.00 88.50 3.91 8.31 0.0000Max 972 3.30 95.78 9.73 157.61 0.0157
No. significant @ 10% 6No. significant @ 5% 6Total funds in sample 6
Put option sell tradesMean 321 0.29 93.73 5.98 42.47 0.0048Median 167 0.22 93.78 5.82 22.60 0.0004Min 59 0.00 90.28 3.02 8.16 0.0000Max 1218 0.81 96.55 9.72 151.99 0.0169
No. significant @ 10% 6No. significant @ 5% 6Total funds in sample 6
Delta increasing tradesMean 716 1.06 90.75 8.19 79.41 0.01Median 362 0.75 91.07 6.88 44.05 0.00Min 59 0.00 81.56 0.00 5.77 0.00Max 4168 3.37 100.00 16.76 432.54 0.06
No. significant @ 10% 10No. significant @ 5% 9Total funds in sample 10
Delta decreasing tradesMean 694 1.00 91.39 7.61 76.30 0.01Median 382 0.86 91.53 7.48 47.19 0.00Min 50 0.33 88.51 4.33 4.90 0.00Max 4016 2.00 95.02 10.81 420.10 0.09
No. significant @ 10% 10No. significant @ 5% 9Total funds in sample 10
International Review of Finance
16 r International Review of Finance Ltd. 2006
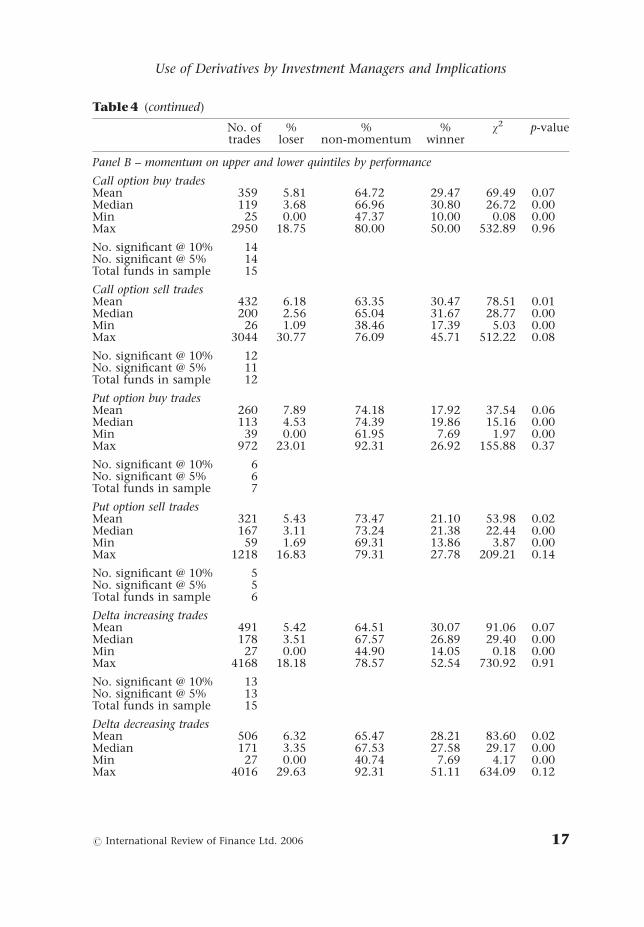
Table 4 (continued)
No. oftrades
%loser
%non-momentum
%winner
w2 p-value
Panel B – momentum on upper and lower quintiles by performance
Call option buy tradesMean 359 5.81 64.72 29.47 69.49 0.07Median 119 3.68 66.96 30.80 26.72 0.00Min 25 0.00 47.37 10.00 0.08 0.00Max 2950 18.75 80.00 50.00 532.89 0.96
No. significant @ 10% 14No. significant @ 5% 14Total funds in sample 15
Call option sell tradesMean 432 6.18 63.35 30.47 78.51 0.01Median 200 2.56 65.04 31.67 28.77 0.00Min 26 1.09 38.46 17.39 5.03 0.00Max 3044 30.77 76.09 45.71 512.22 0.08
No. significant @ 10% 12No. significant @ 5% 11Total funds in sample 12
Put option buy tradesMean 260 7.89 74.18 17.92 37.54 0.06Median 113 4.53 74.39 19.86 15.16 0.00Min 39 0.00 61.95 7.69 1.97 0.00Max 972 23.01 92.31 26.92 155.88 0.37
No. significant @ 10% 6No. significant @ 5% 6Total funds in sample 7
Put option sell tradesMean 321 5.43 73.47 21.10 53.98 0.02Median 167 3.11 73.24 21.38 22.44 0.00Min 59 1.69 69.31 13.86 3.87 0.00Max 1218 16.83 79.31 27.78 209.21 0.14
No. significant @ 10% 5No. significant @ 5% 5Total funds in sample 6
Delta increasing tradesMean 491 5.42 64.51 30.07 91.06 0.07Median 178 3.51 67.57 26.89 29.40 0.00Min 27 0.00 44.90 14.05 0.18 0.00Max 4168 18.18 78.57 52.54 730.92 0.91
No. significant @ 10% 13No. significant @ 5% 13Total funds in sample 15
Delta decreasing tradesMean 506 6.32 65.47 28.21 83.60 0.02Median 171 3.35 67.53 27.58 29.17 0.00Min 27 0.00 40.74 7.69 4.17 0.00Max 4016 29.63 92.31 51.11 634.09 0.12
Use of Derivatives by Investment Managers and Implications
r International Review of Finance Ltd. 2006 17
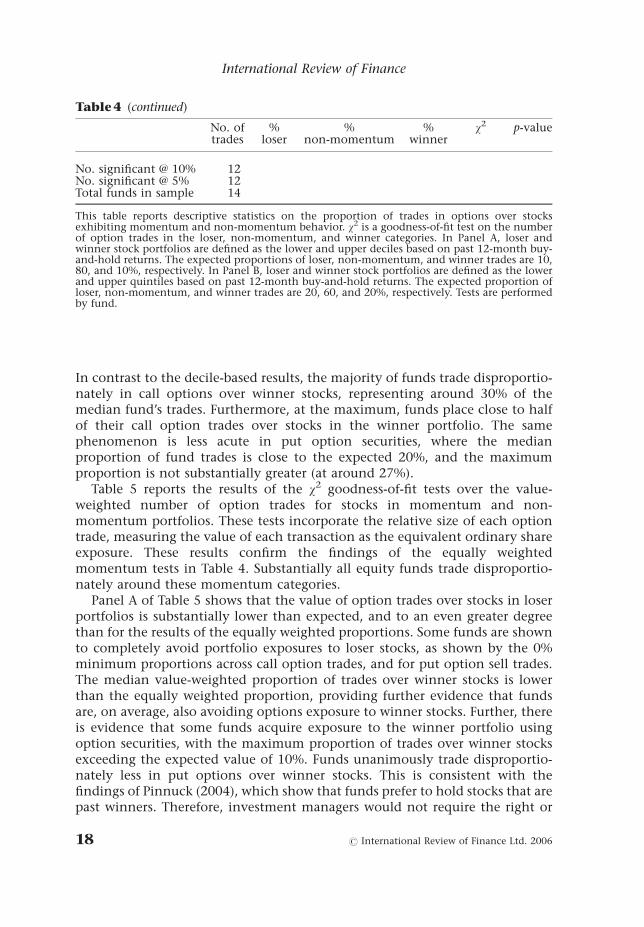
In contrast to the decile-based results, the majority of funds trade disproportio-nately in call options over winner stocks, representing around 30% of themedian fund’s trades. Furthermore, at the maximum, funds place close to halfof their call option trades over stocks in the winner portfolio. The samephenomenon is less acute in put option securities, where the medianproportion of fund trades is close to the expected 20%, and the maximumproportion is not substantially greater (at around 27%).
Table 5 reports the results of the w2 goodness-of-fit tests over the value-weighted number of option trades for stocks in momentum and non-momentum portfolios. These tests incorporate the relative size of each optiontrade, measuring the value of each transaction as the equivalent ordinary shareexposure. These results confirm the findings of the equally weightedmomentum tests in Table 4. Substantially all equity funds trade disproportio-nately around these momentum categories.
Panel A of Table 5 shows that the value of option trades over stocks in loserportfolios is substantially lower than expected, and to an even greater degreethan for the results of the equally weighted proportions. Some funds are shownto completely avoid portfolio exposures to loser stocks, as shown by the 0%minimum proportions across call option trades, and for put option sell trades.The median value-weighted proportion of trades over winner stocks is lowerthan the equally weighted proportion, providing further evidence that fundsare, on average, also avoiding options exposure to winner stocks. Further, thereis evidence that some funds acquire exposure to the winner portfolio usingoption securities, with the maximum proportion of trades over winner stocksexceeding the expected value of 10%. Funds unanimously trade disproportio-nately less in put options over winner stocks. This is consistent with thefindings of Pinnuck (2004), which show that funds prefer to hold stocks that arepast winners. Therefore, investment managers would not require the right or
Table 4 (continued)
No. oftrades
%loser
%non-momentum
%winner
w2 p-value
No. significant @ 10% 12No. significant @ 5% 12Total funds in sample 14
This table reports descriptive statistics on the proportion of trades in options over stocksexhibiting momentum and non-momentum behavior. w2 is a goodness-of-fit test on the numberof option trades in the loser, non-momentum, and winner categories. In Panel A, loser andwinner stock portfolios are defined as the lower and upper deciles based on past 12-month buy-and-hold returns. The expected proportions of loser, non-momentum, and winner trades are 10,80, and 10%, respectively. In Panel B, loser and winner stock portfolios are defined as the lowerand upper quintiles based on past 12-month buy-and-hold returns. The expected proportion ofloser, non-momentum, and winner trades are 20, 60, and 20%, respectively. Tests are performedby fund.
International Review of Finance
18 r International Review of Finance Ltd. 2006
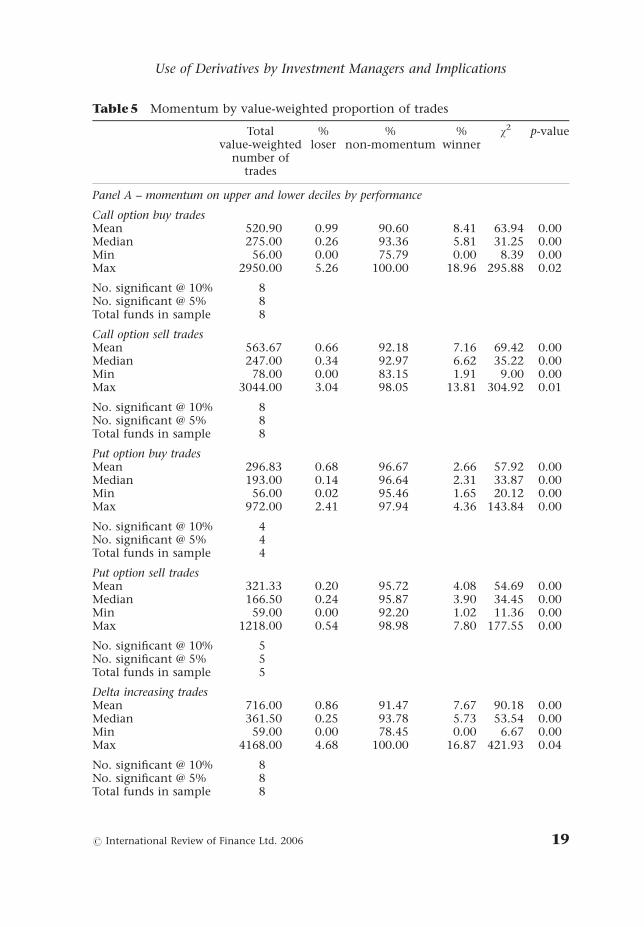
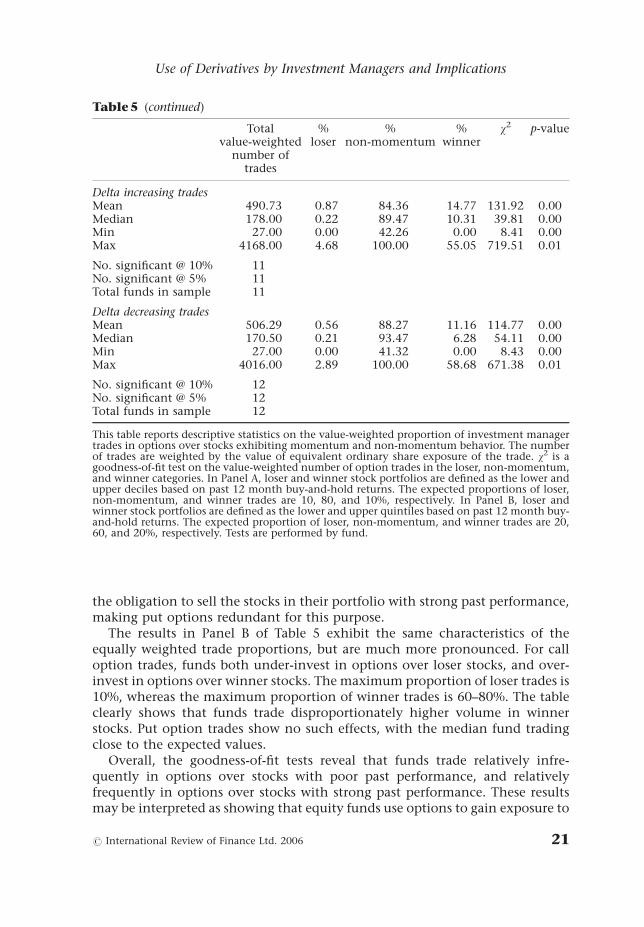
Table 5 Momentum by value-weighted proportion of trades
Totalvalue-weighted
number oftrades
%loser
%non-momentum
%winner
w2 p-value
Panel A – momentum on upper and lower deciles by performance
Call option buy tradesMean 520.90 0.99 90.60 8.41 63.94 0.00Median 275.00 0.26 93.36 5.81 31.25 0.00Min 56.00 0.00 75.79 0.00 8.39 0.00Max 2950.00 5.26 100.00 18.96 295.88 0.02
No. significant @ 10% 8No. significant @ 5% 8Total funds in sample 8
Call option sell tradesMean 563.67 0.66 92.18 7.16 69.42 0.00Median 247.00 0.34 92.97 6.62 35.22 0.00Min 78.00 0.00 83.15 1.91 9.00 0.00Max 3044.00 3.04 98.05 13.81 304.92 0.01
No. significant @ 10% 8No. significant @ 5% 8Total funds in sample 8
Put option buy tradesMean 296.83 0.68 96.67 2.66 57.92 0.00Median 193.00 0.14 96.64 2.31 33.87 0.00Min 56.00 0.02 95.46 1.65 20.12 0.00Max 972.00 2.41 97.94 4.36 143.84 0.00
No. significant @ 10% 4No. significant @ 5% 4Total funds in sample 4
Put option sell tradesMean 321.33 0.20 95.72 4.08 54.69 0.00Median 166.50 0.24 95.87 3.90 34.45 0.00Min 59.00 0.00 92.20 1.02 11.36 0.00Max 1218.00 0.54 98.98 7.80 177.55 0.00
No. significant @ 10% 5No. significant @ 5% 5Total funds in sample 5
Delta increasing tradesMean 716.00 0.86 91.47 7.67 90.18 0.00Median 361.50 0.25 93.78 5.73 53.54 0.00Min 59.00 0.00 78.45 0.00 6.67 0.00Max 4168.00 4.68 100.00 16.87 421.93 0.04
No. significant @ 10% 8No. significant @ 5% 8Total funds in sample 8
Use of Derivatives by Investment Managers and Implications
r International Review of Finance Ltd. 2006 19
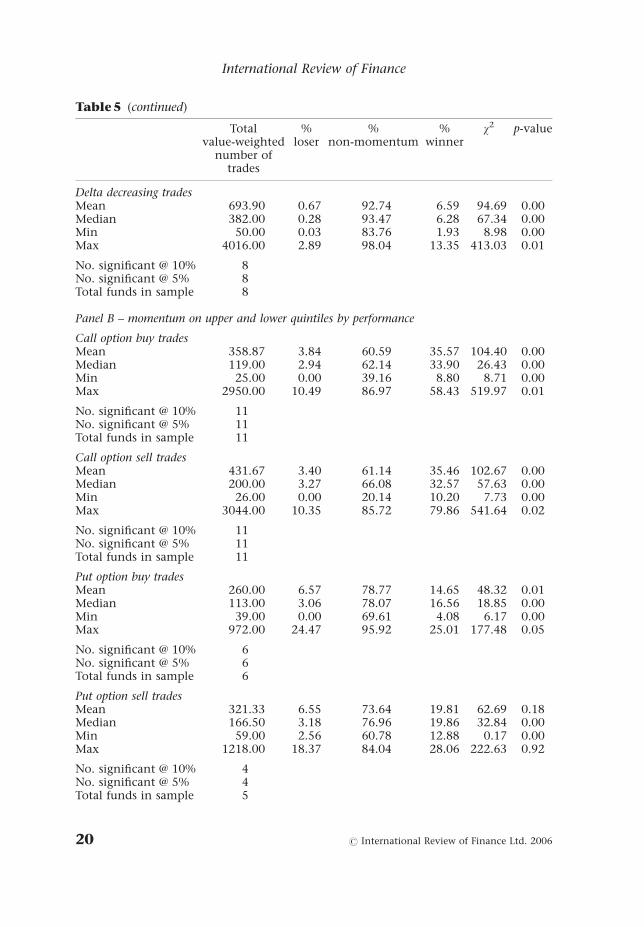
Table 5 (continued)
Totalvalue-weighted
number oftrades
%loser
%non-momentum
%winner
w2 p-value
Delta decreasing tradesMean 693.90 0.67 92.74 6.59 94.69 0.00Median 382.00 0.28 93.47 6.28 67.34 0.00Min 50.00 0.03 83.76 1.93 8.98 0.00Max 4016.00 2.89 98.04 13.35 413.03 0.01
No. significant @ 10% 8No. significant @ 5% 8Total funds in sample 8
Panel B – momentum on upper and lower quintiles by performance
Call option buy tradesMean 358.87 3.84 60.59 35.57 104.40 0.00Median 119.00 2.94 62.14 33.90 26.43 0.00Min 25.00 0.00 39.16 8.80 8.71 0.00Max 2950.00 10.49 86.97 58.43 519.97 0.01
No. significant @ 10% 11No. significant @ 5% 11Total funds in sample 11
Call option sell tradesMean 431.67 3.40 61.14 35.46 102.67 0.00Median 200.00 3.27 66.08 32.57 57.63 0.00Min 26.00 0.00 20.14 10.20 7.73 0.00Max 3044.00 10.35 85.72 79.86 541.64 0.02
No. significant @ 10% 11No. significant @ 5% 11Total funds in sample 11
Put option buy tradesMean 260.00 6.57 78.77 14.65 48.32 0.01Median 113.00 3.06 78.07 16.56 18.85 0.00Min 39.00 0.00 69.61 4.08 6.17 0.00Max 972.00 24.47 95.92 25.01 177.48 0.05
No. significant @ 10% 6No. significant @ 5% 6Total funds in sample 6
Put option sell tradesMean 321.33 6.55 73.64 19.81 62.69 0.18Median 166.50 3.18 76.96 19.86 32.84 0.00Min 59.00 2.56 60.78 12.88 0.17 0.00Max 1218.00 18.37 84.04 28.06 222.63 0.92
No. significant @ 10% 4No. significant @ 5% 4Total funds in sample 5
International Review of Finance
20 r International Review of Finance Ltd. 2006
the obligation to sell the stocks in their portfolio with strong past performance,making put options redundant for this purpose.
The results in Panel B of Table 5 exhibit the same characteristics of theequally weighted trade proportions, but are much more pronounced. For calloption trades, funds both under-invest in options over loser stocks, and over-invest in options over winner stocks. The maximum proportion of loser trades is10%, whereas the maximum proportion of winner trades is 60–80%. The tableclearly shows that funds trade disproportionately higher volume in winnerstocks. Put option trades show no such effects, with the median fund tradingclose to the expected values.
Overall, the goodness-of-fit tests reveal that funds trade relatively infre-quently in options over stocks with poor past performance, and relativelyfrequently in options over stocks with strong past performance. These resultsmay be interpreted as showing that equity funds use options to gain exposure to
Table 5 (continued)
Totalvalue-weighted
number oftrades
%loser
%non-momentum
%winner
w2 p-value
Delta increasing tradesMean 490.73 0.87 84.36 14.77 131.92 0.00Median 178.00 0.22 89.47 10.31 39.81 0.00Min 27.00 0.00 42.26 0.00 8.41 0.00Max 4168.00 4.68 100.00 55.05 719.51 0.01
No. significant @ 10% 11No. significant @ 5% 11Total funds in sample 11
Delta decreasing tradesMean 506.29 0.56 88.27 11.16 114.77 0.00Median 170.50 0.21 93.47 6.28 54.11 0.00Min 27.00 0.00 41.32 0.00 8.43 0.00Max 4016.00 2.89 100.00 58.68 671.38 0.01
No. significant @ 10% 12No. significant @ 5% 12Total funds in sample 12
This table reports descriptive statistics on the value-weighted proportion of investment managertrades in options over stocks exhibiting momentum and non-momentum behavior. The numberof trades are weighted by the value of equivalent ordinary share exposure of the trade. w2 is agoodness-of-fit test on the value-weighted number of option trades in the loser, non-momentum,and winner categories. In Panel A, loser and winner stock portfolios are defined as the lower andupper deciles based on past 12 month buy-and-hold returns. The expected proportions of loser,non-momentum, and winner trades are 10, 80, and 10%, respectively. In Panel B, loser andwinner stock portfolios are defined as the lower and upper quintiles based on past 12 month buy-and-hold returns. The expected proportion of loser, non-momentum, and winner trades are 20,60, and 20%, respectively. Tests are performed by fund.
Use of Derivatives by Investment Managers and Implications
r International Review of Finance Ltd. 2006 21
‘winner’ momentum stocks, and this is consistent with implementing amomentum trading strategy. However, investment manager trading behaviorin options does not show signs of the opposing side of the momentum strategythat prescribes taking short exposure in stocks with poor past performance.That is, the option trades of investment managers are consistent withpurchasing exposure to the winner portfolio, but do not simultaneously sellexposure to the loser portfolio.
Despite the existence of possible alternative explanations, the tests usedclearly identify a systematic trend that the options trades of investmentmanagers are cross-sectionally related to the past performance of the underlyingstock.
C. Event study of option trades
Table 6 presents the results of the event study examining the impact ofinvestment manager option trades on underlying stock returns. These resultsshow that the options trades of investment managers are not associated withabnormal share price reaction in the underlying stock. This suggests that themarket interprets little or no private information content in option trading.
The results shown in Table 6 are the percentiles of the t-statistics for thecumulative abnormal returns (CARs) in the underlying stock calculated for eachoption trade. If investment managers engage in informed trading in optionsmarkets, the information will quickly flow from the option price through to theprice of the underlying stock, driving abnormal stock returns around an optiontransaction. The results in Table 6 do not show such a reaction. To demonstratethat some proportion of option trades contain private information content, it isnecessary to show a significant CAR for a proportion of option tradessubstantially greater than the level of significance. We do not find suchempirical evidence across all option trade types.
At first instance, it appears that this result conflicts with some of the resultsfound in the prior literature (Easley et al. 1998; Chakravarty et al. 2004).Previous studies provide mixed support for the operation of informed trading inoptions markets. Although it should be noted that the issue of whetherinformed trading occurs in options markets is still unresolved, the bulk of thisresearch has been conducted on a market level. To our knowledge, this is thefirst study to investigate informed trading in options markets conductedspecifically by investment managers, and which utilizes a unique dataset ofdaily institutional trading data. Thus, although some degree of informedtrading may be performed using options, the results of this study suggest thatoverall, Australian investment managers do not transact in equity optionsmarkets as a key means of trading on private information.
The sign of CARs provides further insight into the trading behavior ofinvestment managers. For call option buy trades, the mean CARs are steadilydecreasing from 10 days prior until the day of the event. The abnormal shareprice return on the day of the call purchase is the largest negative mean return
International Review of Finance
22 r International Review of Finance Ltd. 2006
Table 6 Event study of informed trading
Percentile
Mean 1st 10th 25th 50th 75th 90th 99th
Panel A – call option buy tradesCAR [�10, �1] 0.14 �2.15nn �1.01 �0.40 0.12 0.72 1.33 2.42nn
CAR [�5, �1] 0.10 �2.25nn �1.05 �0.51 0.04 0.73 1.38 2.77nnn
CAR [�3, �1] 0.07 �2.42nn �1.10 �0.51 0.03 0.67 1.37 3.03nnn
CAR [�1, �1] 0.03 �2.34nn �1.05 �0.53 0.00 0.62 1.24 2.93nnn
CAR [0, 0] �0.11 �2.78nnn �1.31 �0.70 �0.08 0.55 1.27 2.79nnn
CAR [0, 2] �0.06 �2.69nnn �1.29 �0.65 �0.06 0.61 1.26 2.70nnn
CAR [0, 4] �0.05 �2.57nnn �1.14 �0.60 �0.02 0.54 1.22 2.63nnn
CAR [0, 9] �0.02 �2.41nn �1.09 �0.54 0.00 0.58 1.12 2.40nn
Panel B – call option sell tradesCAR [�10, �1] 0.12 �2.67nnn �1.04 �0.43 0.15 0.75 1.36 2.50nn
CAR [�5, �1] 0.10 �2.58nnn �1.08 �0.51 0.06 0.73 1.42 2.69nnn
CAR [�3, �1] 0.11 �2.64nnn �1.10 �0.51 0.07 0.75 1.43 2.98nnn
CAR [�1, �1] 0.09 �2.95nnn �1.10 �0.49 0.06 0.69 1.33 2.88nnn
CAR [0, 0] 0.19 �2.91nnn �1.16 �0.51 0.16 0.85 1.56 3.42nnn
CAR [0, 2] 0.07 �2.51nn �1.20 �0.58 0.06 0.71 1.36 2.88nnn
CAR [0, 4] 0.09 �2.34nn �1.02 �0.50 0.06 0.66 1.28 2.45nn
CAR [0, 9] 0.05 �2.39nn �1.08 �0.48 0.04 0.61 1.23 2.57nnn
Panel C – put option buy tradesCAR [�10, �1] 0.00 �2.62nnn �1.22 �0.53 0.05 0.59 1.18 2.21nn
CAR [�5, �1] �0.02 �3.20nnn �1.18 �0.59 0.03 0.57 1.16 2.37nn
CAR [� 3, � 1] �0.04 �3.14nnn �1.26 �0.60 �0.02 0.61 1.19 2.57nnn
CAR [�1, �1] 0.00 �3.41nnn �1.18 �0.52 0.02 0.57 1.23 2.76nn
CAR [0, 0] 0.19 �3.47nnn �1.05 �0.36 0.27 0.90 1.54 3.25nnn
CAR [0, 2] 0.18 �2.92nnn �1.01 �0.40 0.17 0.83 1.47 2.83nnn
CAR [0, 4] 0.10 �2.63nnn �0.94 �0.41 0.13 0.80 1.44 2.74nnn
CAR [0, 9] 0.06 �2.51nn �1.06 �0.43 0.10 0.71 1.25 2.52nn
Panel D – put option sell tradesCAR [�10, �1] �0.10 �2.85nnn �1.31 �0.66 �0.06 0.47 1.10 2.32nn
CAR [�5, �1] �0.11 �2.89nnn �1.25 �0.68 �0.10 0.47 1.06 2.43nn
CAR [�3, �1] �0.08 �3.01nnn �1.33 �0.66 �0.09 0.55 1.20 2.77nnn
CAR [�1, �1] �0.09 �3.52nnn �1.14 �0.63 �0.09 0.45 1.09 2.58nnn
CAR [0, 0] �0.12 �3.37nnn �1.39 �0.75 �0.19 0.54 1.24 3.19nnn
CAR [0, 2] �0.02 �2.92nnn �1.22 �0.62 �0.02 0.56 1.16 3.55nnn
CAR [0, 4] �0.01 �2.63nnn �1.16 �0.57 �0.02 0.50 1.22 2.86nnn
CAR [0, 9] 0.01 �2.61nnn �1.14 �0.51 0.01 0.59 1.15 2.60nnn
Panel E – delta increasing tradesCAR [�10, �1] 0.06 �2.40nn �1.13 � 0.48 0.06 0.65 1.27 2.40nn
CAR [�5, �1] 0.03 �2.48nn �1.12 � 0.57 0.00 0.63 1.28 2.68nnn
CAR [�3, �1] 0.03 �2.69nnn �1.14 � 0.55 � 0.01 0.62 1.32 2.95nnn
CAR [�1, �1] �0.01 �2.63nnn �1.08 � 0.56 � 0.04 0.58 1.20 2.83nnn
CAR [0, 0] �0.11 �2.84nnn �1.33 � 0.72 � 0.11 0.55 1.26 2.82nnn
CAR [0, 2] �0.05 �2.74nnn �1.27 � 0.64 � 0.05 0.59 1.21 2.80nnn
CAR [0, 4] �0.03 �2.61nnn �1.15 � 0.59 � 0.02 0.53 1.22 2.67nnn
CAR [0, 9] �0.01 �2.51nn �1.11 �0.53 0.00 0.58 1.13 2.47nn
nn 5 significant at the 5% level. nnn 5 significant at the 1% level.
This table reports the mean and percentiles of the t-statistics of the cumulative abnormal returns (CARs)of underlying stocks in event windows around investment manager option trades. For cumulativeabnormal returns, the numbers in the brackets represent the period of the event window. The firstnumber in the brackets is the day in which the event window begins, and the second number is theday in which the event window ends. These days are relative to an option trade event, set at day 0.
Use of Derivatives by Investment Managers and Implications
r International Review of Finance Ltd. 2006 23
around the period. The CARs steadily increase from the day after the trade. Thissuggests that funds may be able to locate profitable opportunities to purchasecall options during the days in which the share price has fallen. The behaviorafter the trade may suggest a stable correction in the market. Likewise, the meanabnormal return on the day of a call option sell trade is positive, and largest inthe days around the event. Investment managers may be selling call optionsfollowing a rise in the share price during the day, as it would be seen as lesslikely to rise further and into a loss position for the fund. The meancontemporaneous CAR for put option buy trades is positive, which would beconsistent with funds buying put options following a share price rise during theday on the expectation of a future share price fall. Put option sell trades show anopposite effect in the underlying share price, and is therefore consistent withselling put options in expectation of a future share price rise. Overall, thiscontrarian (liquidity provision) strategy in options trading better explains amanager’s motivation in participating in the options market than simply a purerisk management or informed trading explanation.19
V. CONCLUSION
This study uses a unique and confidential database comprising the monthlyholdings and daily trades of investment managers to study derivatives use byactive fund managers. It contributes to the literature in two ways. Firstly, itprovides evidence on the performance or risk effect of the derivatives use.Secondly, it investigates how derivatives are actually used by investmentmanagers.
Our results show no significant difference in both portfolio performance andrisk across derivative users and non-users. This finding is consistent with thecompetitive cross-market equilibrium outcome where the marginal benefit andcost of transacting in different markets are the same. The small size of aggregatederivative exposures relative to fund size also contribute to the limited impactof derivatives on fund portfolios.
We find evidence that investment managers trade disproportionately less inoptions on stocks with relatively poor past price performance. Some funds arealso found to trade heavily in options on stocks with relatively strong pastperformance. This observed option trading pattern is indicative of usingoptions to generate exposure to momentum stocks. In addition, the optionstrading behavior is consistent with prior research on fund manager preferencesfor momentum stocks (Grinblatt et al. 1995).
In studying the underlying stock price impact of institutional stock optionstrades, we find no abnormal price movements. The lack of market reactionsuggests that options are not used to execute informed trades. However, this
19 We leave further exploration of the motivation and impact of equity options use to future
research.
International Review of Finance
24 r International Review of Finance Ltd. 2006
result is consistent with managers using option trades, particularly call options,to capture short-term contrarian opportunities.
Aaron NgSchool of Banking and FinanceThe University of New South WalesSydney NSW [email protected]
REFERENCES
Badrinath, S. G., and S. Wahal (2002), ‘Momentum Trading by Institutions’, Journal ofFinance, 57, 2449–78.
Bird, R., and D. R. Gallagher (2002), ‘The Evaluation of Active Manager Returns in aNon-Symmetrical Environment’, Journal of Asset Management, 2, 303–24.
Brown, S. J., D. R. Gallagher, O. Steenbeek, and P. L. Swan (2005), ‘Double of Nothing:Patterns of Equity Fund Holdings and Transactions’, Working Paper, Stern School ofBusiness, New York University, USA.
Cairney, T., and J. Swisher (2004), ‘The Role of the Options Market in theDissemination of Private Information’, Journal of Business Finance & Accounting,31, 1015–41.
Campbell, J. Y., M. Lettau, B. G. Malkiel, and Y. Xu (2001), ‘Have Individual StocksBecome More Volatile? An Empirical Exploration of Idiosyncratic Risk’, Journal ofFinance, 56, 1–43.
Carhart, M. M. (1997), ‘On Persistence in Mutual Fund Performance’, Journal ofFinance, 52, 57–82.
Chakravarty, S., H. Gulen, and S. Mayhew (2004), ‘Informed Trading in Stock andOption Markets’, Journal of Finance, 59, 1235–57.
Cox, J. C., S. A. Ross, and M. Rubenstein (1979), ‘Option Pricing: A SimplifiedApproach’, Journal of Financial Economics, 7, 229–63.
Daniel, K., M. Grinblatt, S. Titman, and R. Wermers (1997), ‘Measuring MutualFund Performance with Characteristic-Based Benchmarks’, Journal of Finance, 52,1035–58.
Demir, I., J. Muthuswamy, and T. Walter (2004), ‘Momentum Returns in AustralianEquities: The Influences of Size, Risk, Liquidity and Return Computation’, Pacific-Basin Finance Journal, 12, 143–58.
Easley, D., M. O’Hara, and P. S. Srinivas (1998), ‘Option Volume and Stock Prices:Evidence on Where Informed Traders Trade’, Journal of Finance, 53, 431–65.
Fong, K., and A. Lee (2005), ‘Seasonality and Robustness of Momentum Returns inAustralia’, Working Paper, The University of New South Wales.
Foster, F. D., D. R. Gallagher, and A. Looi (2005), Institutional Trading and ShareReturns’, Working Paper, The University of New South Wales.
Gallagher, D. R., and A. Looi (2006), ‘Trading Behaviour and the Performance of DailyInstitutional Trades’, Accounting and Finance, 46, 125–48.
Geczy, C., B. A. Minton, and C. Schrand (1997), ‘Why Firms Use CurrencyDerivatives?’, Journal of Finance, 52, 1323–54.
Grinblatt, M., S. Titman, and R. Wermers (1995), ‘Momentum Investment Strategies,Portfolio Performance, and Herding: A Study of Mutual Fund Behaviour’, AmericanEconomic Review, 85, 1088–105.
Use of Derivatives by Investment Managers and Implications
r International Review of Finance Ltd. 2006 25
Gross, William H. (1997), Bill Gross on Investing. New York: John Wiley & Sons, Inc.Hentschel, L., and S. P. Kothari (2001), ‘Are Corporations Reducing or Taking
Risks with Derivatives?’, Journal of Financial and Quantitative Analysis, 36,93–118.
Hurn, S., and V. Pavlov (2003), ‘Momentum in Australian Stock Returns’, AustralianJournal of Management, 28, 141–55.
Jarnecic, E. (1999), ‘Trading Volume Lead/Lag Relations Between the ASX and ASXOptions Market: Implications for Market Microstructure’, Australian Journal ofManagement, 24, 77–94.
Jegadeesh, N., and S. Titman (1993), ‘Returns to Buying Winners and Selling Losers:Implications for Stock Market Efficiency’, Journal of Finance, 48, 65–91.
Koski, J. L., and J. Pontiff (1999), ‘How are Derivatives Used? Evidence from the MutualFund Industry’, Journal of Finance, 54, 791–816.
Kritzman, M. P. (1994), ‘About Event Studies’, Financial Analysts Journal, 50,17–20.
McGough, R. C. (1995), ‘SEC Seeks Aid in Devising Yardsticks for Funds’ Risk’, The WallStreet Journal, 29 March 1995, p. C1.
Merton, R. C. (1995), ‘Financial Innovation and the Management and Regulation ofFinancial Institutions’, Journal of Banking and Finance, 19, 461–81.
Moskowitz, T. J. (2000), ‘Discussion of Wermers. 2000’, Journal of Finance, 55,1695–703.
Pinnuck, M. (2004), ‘Stock Preferences and Derivative Activities of Australian FundManagers’, Accounting and Finance, 44, 97–120.
Scholes, M. S. (1981), ‘The Economics of Hedging and Spreading in Futures Markets’,Journal of Futures Markets, 1, 265–86.
Silber, W. L. (1985), ‘The Economic Role of Financial Futures’, in A. E. Peck (ed.),Futures Markets: Their Economic Role. American Enterprise Institute for Public PolicyResearch.
Sortino, F. A. (2001), ‘From Alpha to Omega’, in F. A. Sortino and S. E. Satchell (eds),Managing Downside Risk in Financial Markets. Butterworth–Heinemann.
Stoll, H. R., and R. E. Whaley (1985), ‘The New Option Markets’, in A. E. Peck (ed.),Futures Markets: Their Economic Role. American Enterprise Institute for Public PolicyResearch.
Wermers, R. (2000), ‘Mutual Fund Performance: An Empirical Decomposition intoStock-Picking Talent, Style, Transactions Costs and Expenses’, Journal of Finance, 55,1655–95.
APPENDIX – CALCULATION OF EQUIVALENT ORDINARY SHAREEXPOSURES
As derivative exposures contain leverage, the cost of the option does notrepresent the level of exposure to changes in the underlying stock price. Thus,measuring the level of exposure by the market price of the derivative securitieswill significantly underestimate the true level of exposure to the underlyingstock. Because of the availability of data from accounting disclosures, researchinto corporate derivative use has typically measured the level of exposure by thenotional principal of the contracts (see Geczy, Minton and Schrand 1997;Hentschel and Kothari 2001). Although this measure incorporates the leverageof derivative securities, it does not capture the price sensitivity relative to the
International Review of Finance
26 r International Review of Finance Ltd. 2006
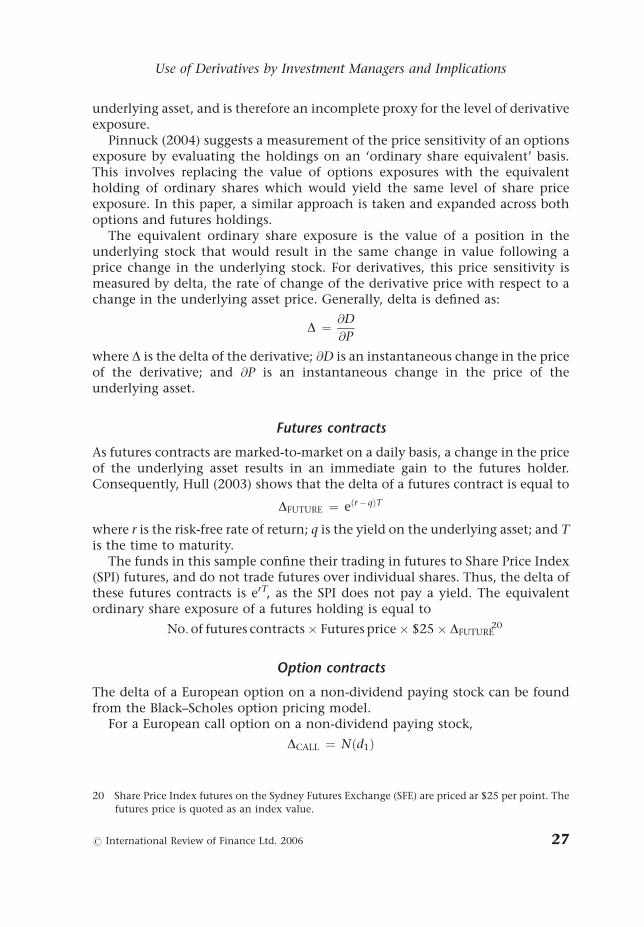
underlying asset, and is therefore an incomplete proxy for the level of derivativeexposure.
Pinnuck (2004) suggests a measurement of the price sensitivity of an optionsexposure by evaluating the holdings on an ‘ordinary share equivalent’ basis.This involves replacing the value of options exposures with the equivalentholding of ordinary shares which would yield the same level of share priceexposure. In this paper, a similar approach is taken and expanded across bothoptions and futures holdings.
The equivalent ordinary share exposure is the value of a position in theunderlying stock that would result in the same change in value following aprice change in the underlying stock. For derivatives, this price sensitivity ismeasured by delta, the rate of change of the derivative price with respect to achange in the underlying asset price. Generally, delta is defined as:
D ¼ @D
@P
where D is the delta of the derivative; @D is an instantaneous change in the priceof the derivative; and @P is an instantaneous change in the price of theunderlying asset.
Futures contracts
As futures contracts are marked-to-market on a daily basis, a change in the priceof the underlying asset results in an immediate gain to the futures holder.Consequently, Hull (2003) shows that the delta of a futures contract is equal to
DFUTURE ¼ eðr� qÞT
where r is the risk-free rate of return; q is the yield on the underlying asset; and Tis the time to maturity.
The funds in this sample confine their trading in futures to Share Price Index(SPI) futures, and do not trade futures over individual shares. Thus, the delta ofthese futures contracts is erT, as the SPI does not pay a yield. The equivalentordinary share exposure of a futures holding is equal to
No:of futures contracts� Futures price� $25� DFUTURE20
Option contracts
The delta of a European option on a non-dividend paying stock can be foundfrom the Black–Scholes option pricing model.
For a European call option on a non-dividend paying stock,
DCALL ¼ Nðd1Þ
20 Share Price Index futures on the Sydney Futures Exchange (SFE) are priced ar $25 per point. The
futures price is quoted as an index value.
Use of Derivatives by Investment Managers and Implications
r International Review of Finance Ltd. 2006 27
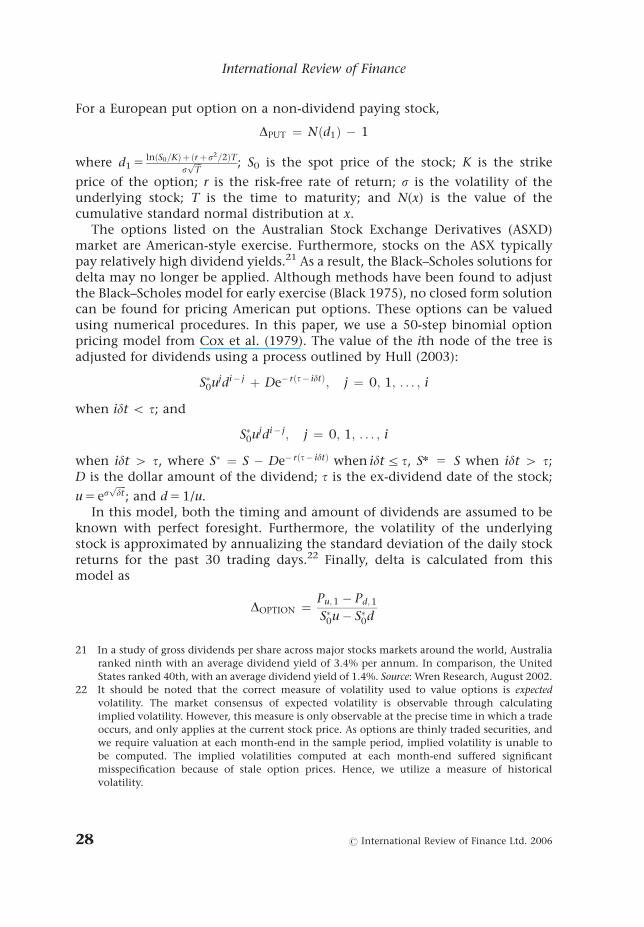
For a European put option on a non-dividend paying stock,
DPUT ¼ Nðd1Þ � 1
where d1 5lnðS0=KÞ þ ðrþs2=2ÞT
sffiffiffiTp ; S0 is the spot price of the stock; K is the strike
price of the option; r is the risk-free rate of return; s is the volatility of theunderlying stock; T is the time to maturity; and N(x) is the value of thecumulative standard normal distribution at x.
The options listed on the Australian Stock Exchange Derivatives (ASXD)market are American-style exercise. Furthermore, stocks on the ASX typicallypay relatively high dividend yields.21 As a result, the Black–Scholes solutions fordelta may no longer be applied. Although methods have been found to adjustthe Black–Scholes model for early exercise (Black 1975), no closed form solutioncan be found for pricing American put options. These options can be valuedusing numerical procedures. In this paper, we use a 50-step binomial optionpricing model from Cox et al. (1979). The value of the ith node of the tree isadjusted for dividends using a process outlined by Hull (2003):
S�0ujdi� j þ De� rðt� idtÞ; j ¼ 0; 1; . . . ; i
when idt o t; and
S�0ujdi� j; j ¼ 0; 1; . . . ; i
when idt 4 t, where S� ¼ S � De� rðt� idtÞ when idt r t, Sn 5 S when idt 4 t;D is the dollar amount of the dividend; t is the ex-dividend date of the stock;
u 5 esffiffiffiffidtp
; and d 5 1/u.In this model, both the timing and amount of dividends are assumed to be
known with perfect foresight. Furthermore, the volatility of the underlyingstock is approximated by annualizing the standard deviation of the daily stockreturns for the past 30 trading days.22 Finally, delta is calculated from thismodel as
DOPTION ¼Pu;1 � Pd;1
S�0u� S�0d
21 In a study of gross dividends per share across major stocks markets around the world, Australia
ranked ninth with an average dividend yield of 3.4% per annum. In comparison, the United
States ranked 40th, with an average dividend yield of 1.4%. Source: Wren Research, August 2002.
22 It should be noted that the correct measure of volatility used to value options is expected
volatility. The market consensus of expected volatility is observable through calculating
implied volatility. However, this measure is only observable at the precise time in which a trade
occurs, and only applies at the current stock price. As options are thinly traded securities, and
we require valuation at each month-end in the sample period, implied volatility is unable to
be computed. The implied volatilities computed at each month-end suffered significant
misspecification because of stale option prices. Hence, we utilize a measure of historical
volatility.
International Review of Finance
28 r International Review of Finance Ltd. 2006
where Pu,1 is the value of the option on the ‘up’ change of the first node, andPd,1 is the value of the option on the ‘down’ change of the first node.
The equivalent ordinary share exposure of an options position is thencalculated23 as
No:of options contracts�No:of shares per contract�Underlying stock price� DOPTION
Several issues must be noted regarding the appropriateness of using delta intransforming options exposures into equivalent ordinary share exposures.Firstly, delta measures the price sensitivity of the option price at the current spotstock price. The value of delta will change over time, and with changes in thespot stock price. Secondly, delta is an instantaneous measure of price sensitivity.The level of exposure computed by delta will only apply to small changes in thestock price.
23 Exchange-traded options on the ASXD are written over 1000 shares. However, this is adjusted in
the event of a capital distribution.
Use of Derivatives by Investment Managers and Implications
r International Review of Finance Ltd. 2006 29