The Usability Perception Scale (UPscale): A measure for evaluating feedback displays
10
Karlin, B. & Ford, R. (2013). The Usability Perception Scale (UPscale): A measure for evaluating feedback displays. In: Proceedings of the 2013 Human Computer Interaction (HCII) Conference. Las Vegas, NV: ACM. The Usability Perception Scale (UPscale): A measure for evaluating feedback displays Beth Karlin 1,* and Rebecca Ford 2,* 1 School of Social Ecology, University of California, Irvine, 202 Social Ecology I, Irvine, California, 92697-7075 [email protected] 2 Centre for Sustainability, University of Otago, PO Box 56, Dunedin, 9054, New Zealand [email protected] * Both authors contributed equally to this work. Abstract. This paper proposes and tests the Usability Perception Scale (UPscale), developed to evaluate the perceived usability of eco-feedback. This tool builds on previous system usability scales and includes sub-scales for ease of use and engagement. The scale was tested via an online survey of 1103 US residents. Factor analysis supported a two-factor solution, supporting subscales for ease of use and engagement. Reliability tests revealed high levels of internal consistency for the overall scale and both subscales. A test of criterion validity with behavioral intention found significant correlations with both subscales, suggesting that usability is a key mediator for behavior change. Finally, ANOVA results found differences between randomly assigned images, suggesting the scale has sufficient sensitivity for use in experimental research. Future research is suggested to test abbreviated versions as well as to further assess this scale with actual behavioral pilot studies. Keywords: evaluation, scale, energy, feedback, usability, user experience. 1 Introduction Residential energy use is a significant and rising contribution to carbon emissions and recent studies suggest potential savings up to 25% through conservation behavior [1], [2]. As the use of electricity in the home is “abstract, invisible, and untouchable” [3], the provision of information about energy use, also known as eco-feedback, has been hypothesized to serve a vital function in making this energy use visible and interpretable to the consumer. Decades of research support the effectiveness of eco- feedback [4], and advances in sensing and energy metering technology now allow the collection and provision of real-time data to consumers via a multitude of in-home and web- or mobile-based displays [5]. Despite this promise, eco-feedback products have not yet taken a strong hold in the marketplace and the results of empirical studies vary significantly, suggesting that the effectiveness of eco-feedback may depend on both what information is given to consumers and how it is presented [6].
Transcript of The Usability Perception Scale (UPscale): A measure for evaluating feedback displays
Karlin, B. & Ford, R. (2013). The Usability Perception Scale (UPscale): A measure for evaluating feedback displays. In: Proceedings of the 2013 Human Computer Interaction (HCII) Conference. Las Vegas, NV: ACM.
The Usability Perception Scale (UPscale): A measure for evaluating feedback displays
Beth Karlin1,* and Rebecca Ford2,*
1 School of Social Ecology, University of California, Irvine, 202 Social Ecology I, Irvine, California, 92697-7075
[email protected] 2 Centre for Sustainability, University of Otago,
PO Box 56, Dunedin, 9054, New Zealand [email protected]
* Both authors contributed equally to this work.
Abstract. This paper proposes and tests the Usability Perception Scale (UPscale), developed to evaluate the perceived usability of eco-feedback. This tool builds on previous system usability scales and includes sub-scales for ease of use and engagement. The scale was tested via an online survey of 1103 US residents. Factor analysis supported a two-factor solution, supporting subscales for ease of use and engagement. Reliability tests revealed high levels of internal consistency for the overall scale and both subscales. A test of criterion validity with behavioral intention found significant correlations with both subscales, suggesting that usability is a key mediator for behavior change. Finally, ANOVA results found differences between randomly assigned images, suggesting the scale has sufficient sensitivity for use in experimental research. Future research is suggested to test abbreviated versions as well as to further assess this scale with actual behavioral pilot studies.
Keywords: evaluation, scale, energy, feedback, usability, user experience.
1 Introduction
Residential energy use is a significant and rising contribution to carbon emissions and recent studies suggest potential savings up to 25% through conservation behavior [1], [2]. As the use of electricity in the home is “abstract, invisible, and untouchable” [3], the provision of information about energy use, also known as eco-feedback, has been hypothesized to serve a vital function in making this energy use visible and interpretable to the consumer. Decades of research support the effectiveness of eco-feedback [4], and advances in sensing and energy metering technology now allow the collection and provision of real-time data to consumers via a multitude of in-home and web- or mobile-based displays [5]. Despite this promise, eco-feedback products have not yet taken a strong hold in the marketplace and the results of empirical studies vary significantly, suggesting that the effectiveness of eco-feedback may depend on both what information is given to consumers and how it is presented [6].
Karlin, B. & Ford, R. (2013). The Usability Perception Scale (UPSCALE): A measure for evaluating feedback displays. Proceedings of HCII 2013. Las Vegas, NV: ACM.
As the goal of eco-feedback is reducing environmental impact, most field studies have relied on energy usage data (measured in kWh) as the dependent variable for evaluation [7], [8]. Although this is vital to assess overall effectiveness, additional information about the subjective experience of using eco-feedback could add significantly to our understanding about not only whether different types of feedback work, but how they work. At it’s core Human Computer Interaction (HCI) is focused on applying scientific methodology to further knowledge about how people interact with computers, and how computers may be designed so that they are “easy, efficient, error free – even enjoyable” [9]. As eco-feedback becomes increasingly pervasive, HCI is well placed to offer useful contributions to improve the evaluation and design of display interfaces. Measure such as preference, usability, and satisfaction, central to HCI, can yield useful insights for effective design [10], [11].
Although eco-feedback research dates back to the 1970s [6], its inclusion in the HCI literature is more recent, with over 90% of HCI papers on eco-feedback published since 2008 [7]. A review comparing environmental psychology and HCI approaches to eco-feedback [7] found that HCI studies have been primarily lab-based or qualitative with an emphasis on “understandability, aesthetic, and perceived usefulness”; the few field trials conducted were relatively brief (1-4 weeks) and used small samples (average 11 participants). On the other hand, research studies from psychology (as well as industry) have focused on field trials to assess behavioral outcomes of feedback compared to a control condition and/or pre-treatment baseline. The average sample size is 6,108 participants and average study length is 9 months [8]. Data collection in these studies is typically quantitative, with energy usage data as the most common variable collected. The review concludes that both approaches are valuable and suggest efforts toward greater integration [7].
One way to integrate these approaches is to include subjective measures of users’ experience and perceptions of eco-feedback displays into larger scale field trials, to understand their impact on behavioural outcomes. As qualitative data is cumbersome to collect and analyze for larger samples, the development of a quantitative instrument would be ideally suited. Past work in HCI has led to the development of multiple scales assessing the user experience of computer systems, but this work has yet to be applied within the eco-feedback literature.
In addition, it is vital that such an instrument be designed with specific intention. Although questions assessing a person’s gender or age may be fairly objective, questions about perceptions and attitudes are often subjective in nature and therefore care must be taken in question design. Psychometrics is a branch of psychology that addresses this issue through the development of methods for creating and assessing the quality of variables used to measure subjective human experience [12].
This paper introduces a new instrument, the Usability Perception Scale (UPscale), designed to measure users’ perceptions of eco-feedback displays. After reviewing past HCI research on usability, assessment, and limitations of current measures for eco-feedback evaluation, the UPscale is introduced and tested against four types of psychometric properties: factor structure, reliability, validity, and sensitivity. It concludes with suggestions for future research to both refine and use the UPscale in field studies.
2 Literature Review
A key function of HCI research is to assess the subjective user experience of computer systems, programs, and interfaces [9]. As such, a great deal of effort has been spent defining and determining the key characteristics of usability. Although the definition of usability is sometimes simplified to “ease of use”, a more comprehensive definition takes into account several characteristics related to user experience [13]. The ISO 9241 standard definition of usability is "the extent to which a product can be used by specified users to achieve specified goals with effectiveness, efficiency, and satisfaction in a specified context of use". Additional work has defined several characteristics of usability within the above definition. Although variations abound, a common definition of usability includes five key characteristics: effectiveness, efficiency, error tolerance, ease of use, and engagement [13].
Effectiveness, efficiency, and error tolerance all refer to the users’ ability to complete tasks with the system or interface. Effectiveness refers to overall ability to accomplish the task, efficiency refers to the speed an accuracy of completion, and error tolerance refers to the ability to minimize errors. They are typically measured objectively via usability studies in which subjects complete a task and metrics related to overall performance (effectiveness), time to completion (efficiency), and number of errors (error tolerance) are evaluated [14].
Ease of use refers to the ability of a user to learn and use a system or interface; it is sometimes broken into sub-characteristics of learnability and memorability [15]. Engagement refers to the whether a system or interface is pleasing and satisfying to use. As both ease of use and engagement are inherently subjective, self-report is the primary form of data collection for these characteristics. These two variables have been determined to be particularly important in predicting the degree to which people accept and use particular information technologies [11].
2.1 Usability Assessment in HCI
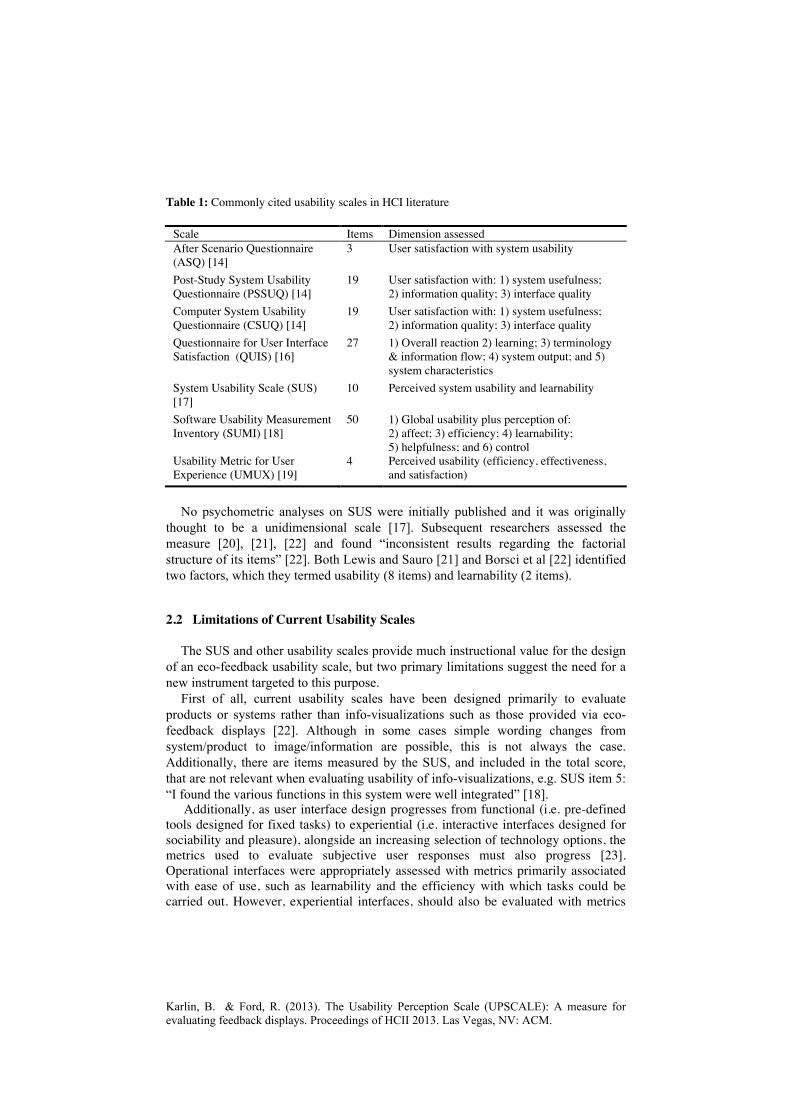
A number of survey instruments have been developed to evaluate the usability of a system or interface, assessing a number of characteristics related to usability, including perceived efficiency, learnability, and satisfaction. A list of these scales is presented in Table 1. These scales have been shown to predict similar responses for user satisfaction; the System Usability Scale (SUS) has been found to correlate with both the Software Usability Measurement Inventory (SUMI) (r=0.86) and the Usability Metric for User Experience (UMUX) (r=0.96) [19].
Among them, the System Usability Scale (SUS) is by far the most commonly cited and utilized scale in the HCI literature [20], [21]. It consists of 10 likert-scale items which ask respondents to agree or disagree with given statements on a 5-point scale. Odd-numbered items are worded positively and even-numbered items are worded negatively. SUS has proven popular and cost effective for evaluating usability across a wide variety of systems including cell phone equipment, modems, voice response systems, and websites [20]. It has been shown to outperform other scales at small sample sizes, has been found to be easy to administer and score, and is the only scale that addresses the whole system rather than a particular feature of the system [20].
Karlin, B. & Ford, R. (2013). The Usability Perception Scale (UPSCALE): A measure for evaluating feedback displays. Proceedings of HCII 2013. Las Vegas, NV: ACM.
Table 1: Commonly cited usability scales in HCI literature
Scale Items Dimension assessed After Scenario Questionnaire (ASQ) [14]
3 User satisfaction with system usability
Post-Study System Usability Questionnaire (PSSUQ) [14]
19 User satisfaction with: 1) system usefulness; 2) information quality; 3) interface quality
Computer System Usability Questionnaire (CSUQ) [14]
19 User satisfaction with: 1) system usefulness; 2) information quality; 3) interface quality
Questionnaire for User Interface Satisfaction (QUIS) [16]
27 1) Overall reaction 2) learning; 3) terminology & information flow; 4) system output; and 5) system characteristics
System Usability Scale (SUS) [17]
10 Perceived system usability and learnability
Software Usability Measurement Inventory (SUMI) [18]
50 1) Global usability plus perception of: 2) affect; 3) efficiency; 4) learnability; 5) helpfulness; and 6) control
Usability Metric for User Experience (UMUX) [19]
4 Perceived usability (efficiency, effectiveness, and satisfaction)
No psychometric analyses on SUS were initially published and it was originally
thought to be a unidimensional scale [17]. Subsequent researchers assessed the measure [20], [21], [22] and found “inconsistent results regarding the factorial structure of its items” [22]. Both Lewis and Sauro [21] and Borsci et al [22] identified two factors, which they termed usability (8 items) and learnability (2 items).
2.2 Limitations of Current Usability Scales
The SUS and other usability scales provide much instructional value for the design of an eco-feedback usability scale, but two primary limitations suggest the need for a new instrument targeted to this purpose.
First of all, current usability scales have been designed primarily to evaluate products or systems rather than info-visualizations such as those provided via eco-feedback displays [22]. Although in some cases simple wording changes from system/product to image/information are possible, this is not always the case. Additionally, there are items measured by the SUS, and included in the total score, that are not relevant when evaluating usability of info-visualizations, e.g. SUS item 5: “I found the various functions in this system were well integrated” [18].
Additionally, as user interface design progresses from functional (i.e. pre-defined tools designed for fixed tasks) to experiential (i.e. interactive interfaces designed for sociability and pleasure), alongside an increasing selection of technology options, the metrics used to evaluate subjective user responses must also progress [23]. Operational interfaces were appropriately assessed with metrics primarily associated with ease of use, such as learnability and the efficiency with which tasks could be carried out. However, experiential interfaces, should also be evaluated with metrics
that account for continued engagement, as a good interface design may result in increased time on task and this can’t be captured by ease of use metrics [23].
As such, no instrument has yet been developed that (1) addresses the unique needs of eco-feedback displays (as opposed to systems or products), and (2) incorporates psychometrically validated sub-scales for both the ease of use and engagement characteristics of usability. The current study is designed to meet this need.
3 Method
The present study introduces and tests the Usability Perception Scale (UPscale), which was designed to measure the user experience of eco-feedback displays. UPscale builds from previous system usability studies published in the HCI literature, but was designed to be different from the work reviewed above in that the UPscale questions were designed to: (1) measure information received from a feedback graph or other info-visualization and (2) incorporate and distinguish between hypothesizes subscales for ease of use and engagement.
3.1 Participants and Procedure
The scale was tested via an online experimental survey of 1103 US residents. Participants were recruited via Amazon Mechanical Turk and paid $0.31 for survey completion. After excluding incomplete responses as well as those who completed the survey in less than 5 minutes or answered a trick question incorrectly, 1103 responses remained for analysis. Table 2 presents summary data on demographic variables for the survey sample compared to U.S. Census data (2010).
Table 2: Demographic characteristics of the sample (n=1103) compared to US Census data
Demographic variables Sample Census Gender 47% Male 49% Male Average age* 31.3 Years 36.8 Years Race 78% White 79% White Average education* 14.6 Years 13.3 Years Average income** $52,940 $67,609
* Sample and census significantly different based on independent t-test (p < .01)
3.2 Measures
Data analyzed in this study were collected as part of a larger online survey, which was designed to address three major topics with the eco-feedback literature: (1) perception of graphical displays based on information density, (2) the role of message framing in behavioral intention, and (3) measuring subjective appraisal of user experience. The current paper presents results related to the third goal; measures examined in this study are described below.
Karlin, B. & Ford, R. (2013). The Usability Perception Scale (UPSCALE): A measure for evaluating feedback displays. Proceedings of HCII 2013. Las Vegas, NV: ACM.
UPscale. The Usability Perception Scale (UPscale) consists of eight likert-scale items, which ask respondents to agree or disagree with given statements on a 5-point scale. Odd-numbered items are worded positively and even-numbered items are worded negatively. It includes four questions designed to test for ease of use attributes, including complexity, interpretation, and learnability. An additional four questions test engagement attributes, which include relevance, usefulness, and intention to use. Questions included in the UPscale are listed in Table 3.
Table 3: Questions included in the UPscale
Ease of Use Questions: Engagement Questions: 1. I am able to get the information I need easily. 5. I gained information from this image
that will benefit my life. 2. I think the image is difficult to understand. 6. I do not find this image useful. 3. I feel very confident interpreting the
information in this image. 7. I think that I would like to use this
image frequently. 4. A person would need to learn a lot in order to
understand this image 8. I would not want to use this image.
Note: responses are scored on a Likert scale from “strongly agree” to “strongly disagree”
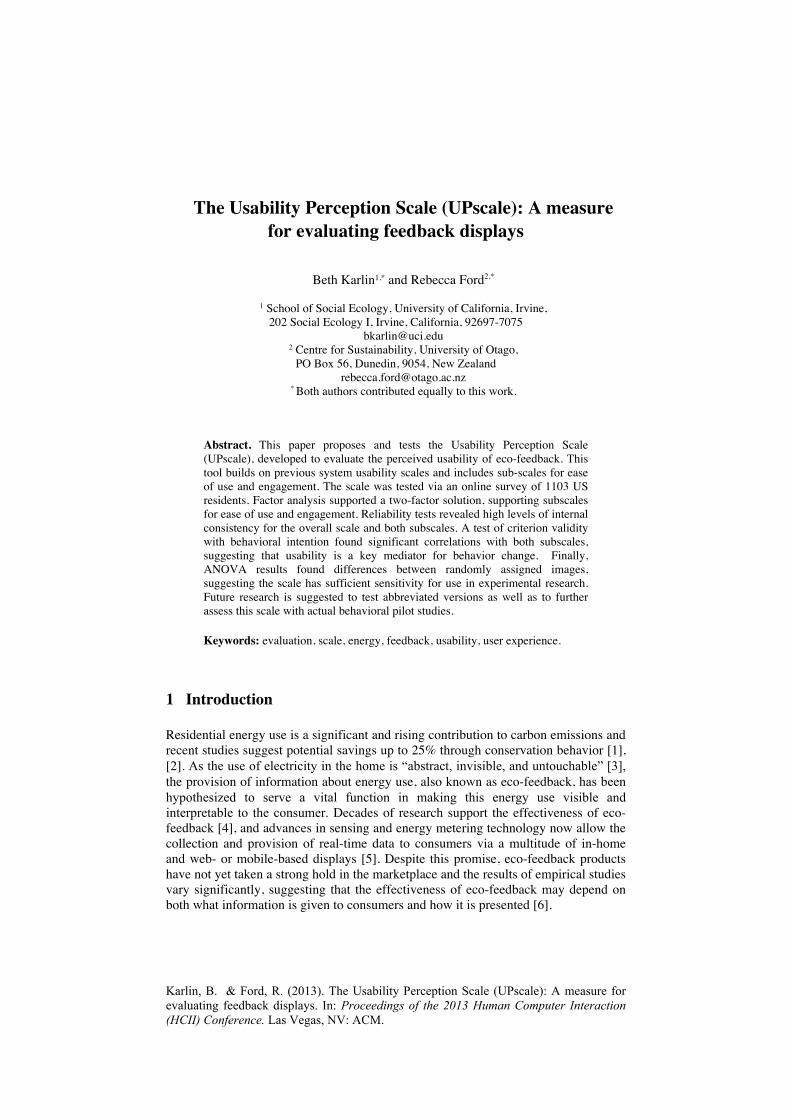
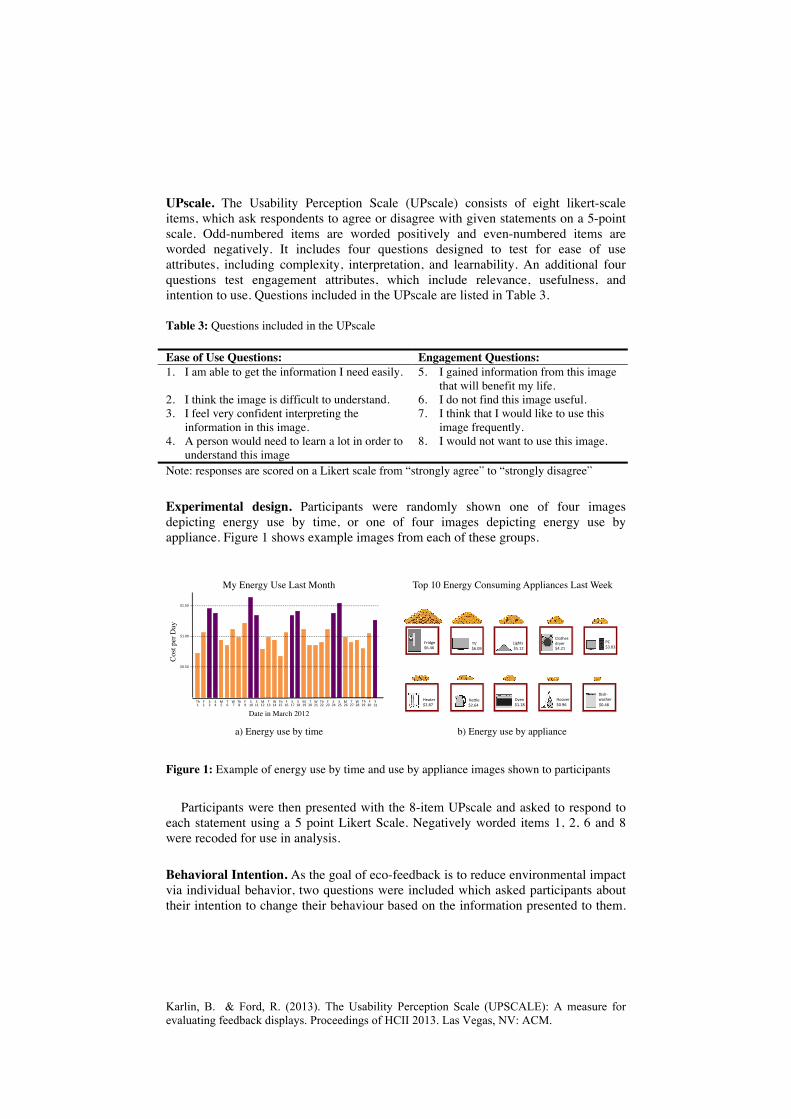
Experimental design. Participants were randomly shown one of four images depicting energy use by time, or one of four images depicting energy use by appliance. Figure 1 shows example images from each of these groups.
Cos
t per
Day!
1" 2" 3" 5"4" 6" 7" 8" 10"9" 11" 12" 13" 15"14" 16" 17" 18" 20"19" 21" 22" 23" 25"24" 26" 27" 28" 30"29"F"Th" S" S" M" T" W" F"Th" S" S" M" T" W"W" F"Th" S" S" M" T" W" F"Th" S" S" M" T"
Date in March 2012!
My Energy Use Last Month!
F"Th" S"31"
$0.50"
$1.00"
$1.50"
a) Energy use by time!
Fridge' PC'
Ke+le'
TV'Clothes'dryer'
$6.46' $5.12'$6.09' $4.21' $3.03'
Heater'DishA'washer'Oven'
Lights'
Hoover'$2.87' $1.18'$2.64' $0.96' $0.48'
Top 10 Energy Consuming Appliances Last Week!
b) Energy use by appliance!
Figure 1: Example of energy use by time and use by appliance images shown to participants
Participants were then presented with the 8-item UPscale and asked to respond to
each statement using a 5 point Likert Scale. Negatively worded items 1, 2, 6 and 8 were recoded for use in analysis.
Behavioral Intention. As the goal of eco-feedback is to reduce environmental impact via individual behavior, two questions were included which asked participants about their intention to change their behaviour based on the information presented to them.
These questions were intended to serve as a proxy for actual behaviour and were tested for criterion validity of the instrument.
Demographic Variables. Demographic questions were included to determine the representativeness of the sample and to test for the sensitivity of the instrument. Traditional demographic data included gender, age, race, income, and education. Since the study was concerned with pro-environmental behavior, a single item measuring environmentalism (Do you consider yourself to be an environmentalist?) was also included.
3.3 Analysis
Statistical analyses were conducted to test for four key aspects of psychometric quality commonly utilized in the HCI community: factor structure, reliability, validity and sensitivity [14].
Factor structure refers to naturally occurring groups of items that arise from multiple items. A scale may have just one or several factors, depending on the questions included. Factor structure is generally measured using factor analysis; factors include all the items with loading scores above a set point (generally .40).
Reliability refers to the internal consistency among the items within the scale. Once factors are established or confirmed, each factor, as well as the overall scale, is tested for reliability. Reliability is generally measured using Cronbach’s co-efficient a; if a is sufficiently high (> 0.70), items can be combined to produce a scale.
Validity refers to whether an instrument measures what it claims to measure. One of the main forms of validity, criterion validity, compares the scale to other indicators of a construct to assess any relationships. Validity is generally measured using Pearson correlation coefficient r.
Sensitivity refers to how much the scale varies based on different users or independent variables. Sensitivity is typically measured using t-tests for binary variables or analysis of variance (ANOVA) for categorical variables.
4 Results
4.1 Factor Structure
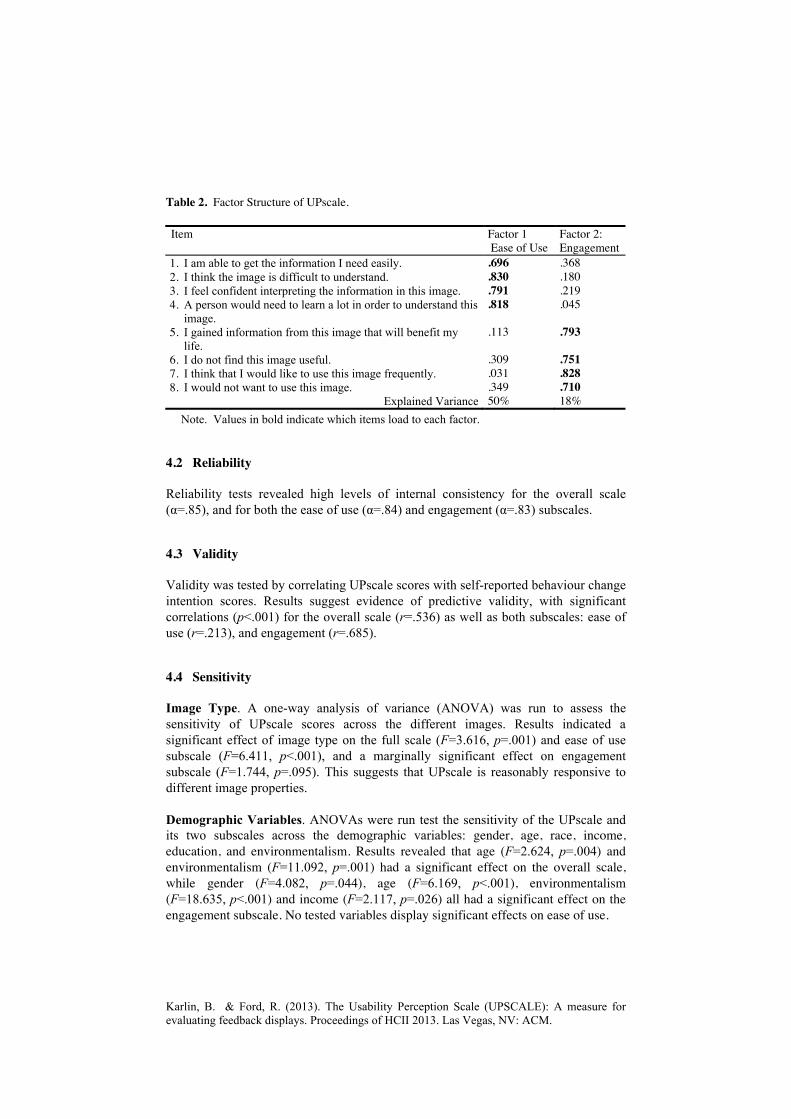
Factor Analysis on the eight UPscale items yielded a 2-component solution, which accounted for 68% of total variance (see Table 3). Items corresponding to ease of use clustered strongly as one component, and items corresponding to engagement as another component, with no cross-loading items. The sub-scales were both tested separately but no additional sub-factors emerged.
Karlin, B. & Ford, R. (2013). The Usability Perception Scale (UPSCALE): A measure for evaluating feedback displays. Proceedings of HCII 2013. Las Vegas, NV: ACM.
Table 2. Factor Structure of UPscale.
Item Factor 1 Ease of Use
Factor 2: Engagement
1. I am able to get the information I need easily. .696 .368 2. I think the image is difficult to understand. .830 .180 3. I feel confident interpreting the information in this image. .791 .219 4. A person would need to learn a lot in order to understand this
image. .818 .045
5. I gained information from this image that will benefit my life.
.113 .793
6. I do not find this image useful. .309 .751 7. I think that I would like to use this image frequently. .031 .828 8. I would not want to use this image. .349 .710
Explained Variance 50% 18% Note. Values in bold indicate which items load to each factor.
4.2 Reliability
Reliability tests revealed high levels of internal consistency for the overall scale (α=.85), and for both the ease of use (α=.84) and engagement (α=.83) subscales.
4.3 Validity
Validity was tested by correlating UPscale scores with self-reported behaviour change intention scores. Results suggest evidence of predictive validity, with significant correlations (p<.001) for the overall scale (r=.536) as well as both subscales: ease of use (r=.213), and engagement (r=.685).
4.4 Sensitivity
Image Type. A one-way analysis of variance (ANOVA) was run to assess the sensitivity of UPscale scores across the different images. Results indicated a significant effect of image type on the full scale (F=3.616, p=.001) and ease of use subscale (F=6.411, p<.001), and a marginally significant effect on engagement subscale (F=1.744, p=.095). This suggests that UPscale is reasonably responsive to different image properties. Demographic Variables. ANOVAs were run test the sensitivity of the UPscale and its two subscales across the demographic variables: gender, age, race, income, education, and environmentalism. Results revealed that age (F=2.624, p=.004) and environmentalism (F=11.092, p=.001) had a significant effect on the overall scale, while gender (F=4.082, p=.044), age (F=6.169, p<.001), environmentalism (F=18.635, p<.001) and income (F=2.117, p=.026) all had a significant effect on the engagement subscale. No tested variables display significant effects on ease of use.
5 Discussion
The UPscale, building on insights from existing usability measures, was developed to evaluate user perceptions of information visualizations such as those provided by eco-feedback displays. It incorporates and psychometrically evaluates questions relating to the ease of use (complexity, interpretability, and learnability) and engagement (relevance, usefulness, intention to use) characteristics of usability.
The psychometric properties of the UPscale point to its reliability and validity. Factor analysis supported the two theoretically derived subscales for ease of use and engagement. Both the overall scale as well as both subscales were found to be high in internal consistency, proving reliability. These two tests are vital for instrument validation, as they indicate that the questions can be summed and/or averaged into a single variable “item” for statistical analysis. As such, the UPscale can be used as a single eight-item scale, and the two four-item sub-scales for ease of use and engagement can also be used on their own.
The overall scale and both subscales also correlated with behavioral intention, suggesting criterion validity with energy savings. These results indicate that perceived ease of use and engagement may be key mediators of feedback effectiveness, though there are limitations with this method, as behavioural intention does not always accurately predict actual behaviour. Further research testing this hypothesis with actual behavior would be beneficial to explore this hypothesis more fully.
Finally, the UPscale was found to be sensitive to experimental manipulation, which suggests it can be used successfully to determine differences in usability among feedback types. As the scale was also sensitive to demographic variables (gender, age, income, environmentalism), it is highly recommended that they be included and controlled for in analysis to account for variability in subsequent findings.
As eco-feedback becomes more common, the need to ensure that it is useful and engaging to consumers is paramount. Programs like the U.S. Green Button Initiative [24], as well as the 200+ feedback products and services that have emerged on the market [25], are based on the idea that consumers will be engaged with and transformed by access to energy information. Attention to the usability of such eco-feedback displays is a key step toward this goal and the UPscale provides an instrument that can be used at scale in the hundreds of field trials planned in the coming months and years. Acknowledgments. Part of this research was supported by the Calit2 California Plug Load Research Center (CalPlug) at the University of California, Irvine. The authors thank Haley Herrera for assistance with survey development and implementation, and Nicole Sintov for valuable input on previous drafts.
References
1. Granade, H. C., Creyts, J., Derkach, A., Farese, P., Nyquist, S., Ostrowski, K.: Unlocking energy efficiency in the U.S. economy. Technical Report, McKinsey (2009)
Karlin, B. & Ford, R. (2013). The Usability Perception Scale (UPSCALE): A measure for evaluating feedback displays. Proceedings of HCII 2013. Las Vegas, NV: ACM.
2. Dietz, T., Gardner, G. T., Gilligan, J., Stern, P. C., Vandenbergh, M. P.: Household actions can provide a behavioral wedge to rapidly reduce US carbon emissions. Proceedings of the National Academy of Sciences. 106, 18452–-18456 (2009)
3. Fischer, C.: Feedback on household electricity consumption: A tool for saving energy? Energy Efficiency, 1, 79--104 (2008)
4. Darby, S.: A Review for Defra of the literature on metering, billing, and direct displays. Technical Report, Environmental Change Institute (2006)
5. Darby, S.: Smart metering: what potential for householder engagement? Building Research & Information, 38, 442--457 (2010)
6. Ehrhardt-Martinez, K., Donnelly, K.A., Laitner, J.A.: Advanced metering initiatives and residential feedback programs: a meta-review for household electricity-saving opportunities. Technical report, ACEEE (2010)
7. Froehlich, J., Findlater, L. Landay, J.: The Design of Eco-Feedback Technology. In: Proc. CHI'10. pp. 1999--2008. ACM Press (2010)
8. Karlin, B., Zinger, J.: Residential energy feedback: A meta-analysis and methodological review. Manuscript submitted for publication.
9. Card, S.K., Moran, T.P., Newell, A.: The Psychology of Human-Computer Interaction. Lawrence Erlbaum Associates (1983).
10. Toomim, M., Kriplean, T., Pörtner, C., Landay, J.A.: Utility of human-computer interactions: Toward a science of preference measurement. In: Proc. CHI'11. pp. 2275--2284. ACM Press (2011)
11. Davis, F. D.: Perceived usefulness, perceived ease of use, and user acceptance of information technology. MIS quarterly, 319--340 (1989)
12. Kline, P.: Handbook of Psychological Testing. Routledge, London (2000) 13. Quesenbery, W.: What Does Usability Mean: Looking Beyond ‘Ease of Use’. In
Proceedings of the 48th Annual Conference, Society for Technical Communication (2001) 14. Lewis, J. R.: IBM computer usability satisfaction questionnaires: Psychometric evaluation
and instructions for use. International Journal of Human-Computer Interaction, 7, 57–78 (1995)
15. Nielsen, J., Hackos, J. T.: Usability engineering. Academic press, San Diego (1993) 16. Chin, J.P., Diehl, V.A., Norman, K.L.: Development of an Instrument Measuring Human-
Computer User Satisfaction Interface. In: Proc. CHI ’88. pp. 213–-218. ACM Press (1988) 17. Brooke, J.: SUS - A quick and dirty usability scale. In: Jordan, Thomas, Weerdmeester,
McClelland, Eds. Usability evaluation in industry, 189, 189–194 (1996) 18. Kirakowski, J., Corbett, M.: SUMI: The software usability measurement inventory. British
journal of educational technology, 24, 210—212 (1993) 19. Finstad, K.: The Usability Metric for User Experience. Interacting with Computers, 22,
323–327 (2010) 20. Bangor, A., Kortum, P.T., Miller, J.T.: An Empirical Evaluation of the System Usability
Scale. International Journal of Human-Computer Interaction, 24, 574–594 (2008). 21. Lewis, J., & Sauro, J.: The factor structure of the system usability scale. Human Centered
Design, 94-103 (2009) 22. Borsci, S., Federici, S., Lauriola, M.: On the dimensionality of the System Usability Scale:
a test of alternative measurement models. Cognitive processing, 10, 193–7 (2009) 23. Angeli, A. De, Sutcliffe, A., Hartmann, J.: Interaction, Usability and Aesthetics: What
Influences Users’ Preferences? In: 8th ACM Conference on Designing Interactive Systems pp. 271–280 (2006)
24. Chopra, A.: Modeling a green energy challenge after a blue button. http://www.whitehouse.gov/blog/2011/09/15/modeling-green-energy-challenge-after-blue-button
25. Karlin, B., Ford, R. Squiers, C.: Energy Feedback: A Review and Taxonomy of Products and Technologies. Manuscript submitted for publication.