
The UncomforTable - CEDSJ
116
THE UNCOMFORTABLE NEXUS WATER, URBANIZATION AND CLIMATE CHANGE IN JAIPUR, INDIA July 2011
-
Upload
khangminh22 -
Category
Documents
-
view
0 -
download
0
Transcript of The UncomforTable - CEDSJ
The UncomforTable
nexUs Water, Urbanization and Climate Change
in JaipUr, india
July 2011
ii
IseT and ceDsJ (2011), The Uncomfortable nexus: Water, Urbanization and climate
change in Jaipur, India, IseT: boulder and ceDsJ: Jaipur, 105 pp.
© copyright 2011
Institute for social and environmental Transition & centre for environment and
Development studies, Jaipur
any part of this publication may be cited, copied, translated into other languages or
adapted to meet local needs without prior permission from IseT or ceDsJ so long as the
source is clearly cited.
This publication is made possible by the support of the United states national oceanic
and atmospheric administration (noaa). The research programme is supported through
noaa sectoral research applications Program (sarP) grant number na07oar4310372.
Views and opinions expressed within do not necessarily reflect the positions of noaa.
The findings, interpretations and conclusions expressed in this paper are those of the
authors alone.
first edition: 700
July 2011
Isbn: 978-0-9843616-1-8
Cover Photography by:
Yiqun Ding
Published by:
Institute for social and environmental Transition &
centre for environment and Development studies, Jaipur
Design & Print:
michelle fox, and systems Vision, new Delhi
iii
NOAA JAipur reseArch TeAm ANd Their iNsTiTuTiONs
ceNTre fOr eNvirONmeNT ANd develOpmeNT sTudies, JAipur (cedsJ)
m.s. rathore, ladulal sharma, n.P. singh
iNsTiTuTe fOr sOciAl ANd eNvirONmeNTAl TrANsiTiON (iseT)
sarah opitz-stapleton, shashikant chopde, Dilip singh, lea sabbag, marcus moench

iv
v
This book provides insights from a growing research programme exploring the inter-linked processes of migration, urban and peri-urbanization, water management and climate change in South Asia. The study builds off of previous research by the Centre for Environment and Development Studies, Jaipur (CEDSJ) and the Institute for Social and Environmental Transition (ISET). The current programme is financed by the U.S. National Oceanic and Atmospheric Administration (NOAA) through Sectoral Research Applications Program (SARP) grant number NA07OAR4310372 and we are grateful to NOAA for their support.
The core group of partners undertaking fieldwork, the modelling research and writing chapters included (in alphabetical order): Shashikant Chopde of ISET, Marcus Moench of ISET, Sarah Opitz-Stapleton of ISET, M.S. Rathore of CEDSJ, Ladulal Sharma of CEDSJ, Dilip Singh of ISET and N.P. Singh of CEDSJ. Lea Sabbag of ISET made substantive contributions to this book through editing, literature searches, climate data collection, and extensive cross-checking of key details. Laura Seraydarian of ISET assisted in the preliminary climate data collection. Ken MacClune of ISET provided significant advice and Karen MacClune (ISET) assisted with the initial WEAP model set-up.
Numerous organizations and individuals have contributed in a substantive way to previous research efforts and to the successful completion of this book. In India, many dedicated field staff and individuals in government and NGOs, as well as the local communities with whom they interacted, provided input. We also acknowledge the support of Jack Sieber (Stockholm Environment Institute) with the WEAP models. We gratefully acknowledge their input and support.
Systems Visions in New Delhi, was responsible for the printing of this report, in addition to layout and typesetting with assistance from Michelle Fox on behalf of ISET.
aCknoWledgements

vi
vii
Contents
conTenTs
Urbanization, Water scarcity and Climate Change:
A case from rajasthan with Global implications 1
introduction 1
methodologies 4
Key findings 5
study limitations 7
Urbanization, migration and Water demand 9
urbanization 9
push-pull factors 11
migration in Jaipur city survey results 13
impacts on Water demand in Jaipur city 23
the Water supply Context in Jaipur 25
Overview 25
policy landscape 26
Groundwater 28
surface Water supplies 29
Water supply situation in Jaipur 30
impact of climate variability on Water Availability in Jaipur 32
rainfall, Climate Change and Water supply in Jaipur 35
introduction 35
concepts in interpreting climate scenario information 37
climate science Definitions 37
Uncertainty in climate Projections 39
Banas river Basin historical climatology 42
rainfall projections for the Banas river Basin 44
Data sources 46
Downscaling methodology 48
rainfall Projections 2009-2040 50
climate change impacts on streamflow 54
rainfall-streamflow regression model 54
viii The UncomforTable nexUs
future streamflow sequences conditioned on climate change 56
summary 58
assessing options for Climate resilient Urban Water management:
Use of WeaP as a Tool 61
The context 61
The Weap model 62
setting up Weap for Jaipur 62
data for Weap modeling 64
Demand sites 65
Data for Demand Drivers 66
hydrology Data 67
Data for supply nodes 67
alternative scenarios through WeaP modeling 74
supply augmentation (sa) scenario 75
Demand management (Dm) scheme 76
combined Dm and sa scenario 77
summary 77
reflections on Jaipur’s Water Vulnerability and broader implications 81
elements of Jaipur’s current and future Water vulnerability 81
Implications for other Urban areas 85
bibliography 90
appendix 100

The UncomforTable nexUs
2 The UncomforTable nexUs Urbanization, Water scarcity and climate change The UncomforTable nexUs Urbanization, Water scarcity and climate change © Cleavers
The UncomforTable nexUs Urbanization, Water scarcity and climate change 1The UncomforTable nexUs Urbanization, Water scarcity and climate change
Chapter 1
Urbanization, Water sCarCity and Climate Change: A cAse frOm rAJAsThAN WiTh GlOBAl implicATiONs
iNTrOducTiON
The world is rapidly urbanizing. At a global level, over 50% of the world’s population already resides in cities and urban areas, which have become the primary engines of economic development (UN-HABITAT 2009). Migration into urban areas is high, as populations respond both to the opportunities they present and the pressures inherent in highly uncertain rural, agricultural livelihoods. Urbanization is often thought to be closely associated with poverty reduction and other positive social outcomes that range from higher living standards to technological innovation and women’s empowerment. By 2040, urban populations will exceed rural in all major world regions with the excep-tion of Eastern Africa.
Yet, how solid is the foundation upon which urbanization rests? In many parts of the world, the basic resources, such as water, required for burgeoning urban populations are increasingly polluted, in limited supply and facing intense competition from multiple users. Climate change is likely to substantially exacerbate the multiple challenges of providing adequate water resources to urban populations and protecting ecosystems. Fluctuating weather patterns — changes in temperature, precipitation and other climatic variables — could fundamentally affect the availability and quality of the water supplies that are central to the survival of urban areas. Many migrants from rural areas to urban areas are already pushed to leave their homes by depleted or degraded water resources and weather variability. As the frequency and intensity of climate
By 2040, urban
populations will
exceed rural in all
major world regions
with the exception
of Eastern Africa.
2 The UncomforTable nexUs Urbanization, Water scarcity and climate change The UncomforTable nexUs Urbanization, Water scarcity and climate change
related hazards, such as floods or droughts, changes, the rate of migration from rural to urban areas is likely to increase and further stretch the ability of urban areas to supply water to their populations (Bordalo and Savva-Bordalo 2007; Drechsel et al. 2007; Satterthwaite 2008). Furthermore, because transitions to urban livelihoods are pulsed and dynamic, urban water supply needs are difficult to project and many populations remain unserved by municipal systems. The problem is three fold:
1. To project and define the relationship between climatic and water resource condi-tions on one side and likely population pulses between urban, peri-urban and rural areas on the other side;
2. To ensure clean and safe water supplies are physically available that can meet the changing needs of migrants for domestic and livelihood uses; and
3. To deliver supplies to vulnerable (often transient) populations, particularly in areas that are not served by formal piped systems.
Addressing the above problem in a way that catalyzes attention and action requires approaches to research that actively engage key private, public and non-government actors. It also requires evaluation of current policies and projects governing the provi-sion of water supplies to migrant populations.
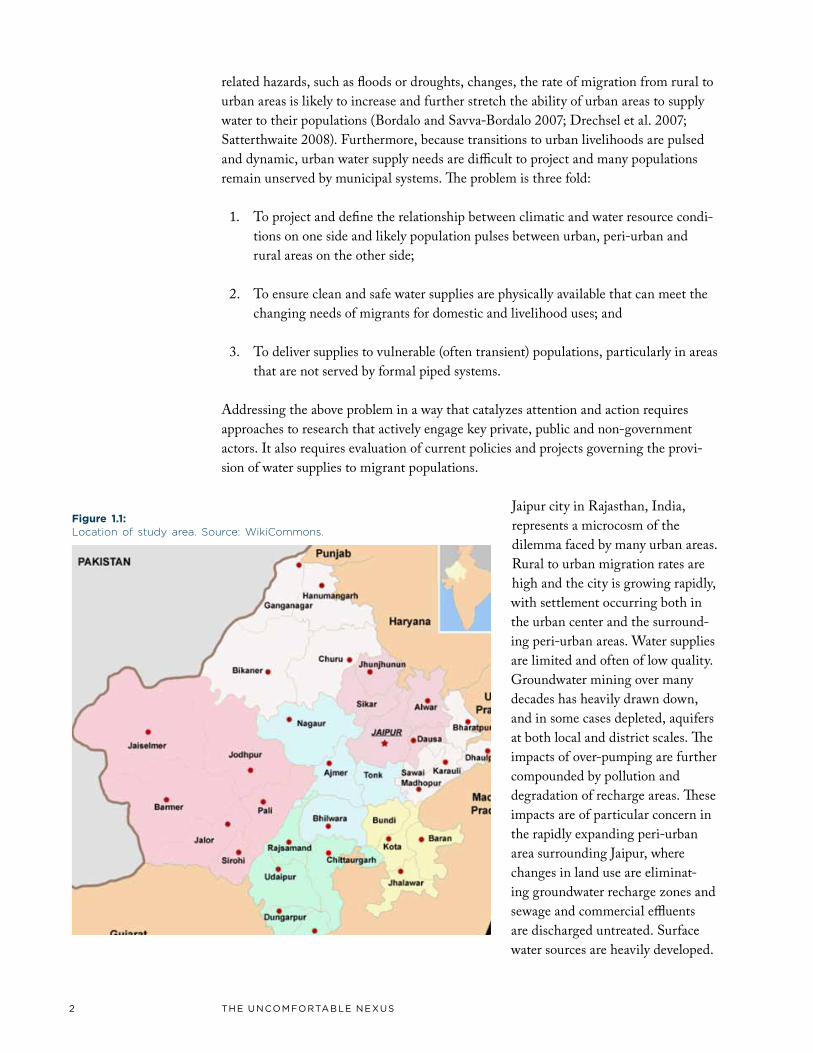
Jaipur city in Rajasthan, India, represents a microcosm of the dilemma faced by many urban areas. Rural to urban migration rates are high and the city is growing rapidly, with settlement occurring both in the urban center and the surround-ing peri-urban areas. Water supplies are limited and often of low quality. Groundwater mining over many decades has heavily drawn down, and in some cases depleted, aquifers at both local and district scales. The impacts of over-pumping are further compounded by pollution and degradation of recharge areas. These impacts are of particular concern in the rapidly expanding peri-urban area surrounding Jaipur, where changes in land use are eliminat-ing groundwater recharge zones and sewage and commercial effluents are discharged untreated. Surface water sources are heavily developed.
Figure 1.1: Location of study area. Source: WikiCommons.
The UncomforTable nexUs Urbanization, Water scarcity and climate change 3The UncomforTable nexUs Urbanization, Water scarcity and climate change
Bisalpur Dam, designed to become the principal source of Jaipur’s municipal water supply from 2010 onward, has only filled nine times since it became operational in 1994 (Department of Irrigation 2010).
Rainfall distribution is spatially uneven throughout the Banas River Basin, the river that feeds Bisalpur Dam, and is highly variable. Approximately 90% of the annual precipitation falls in July-September as the basin lies at the northwestern fringe of the South Asian Monsoon. The basin is bounded by the Aravalli Range on the west, which creates two rainfall zones in the area upstream of Bisalpur Dam. One zone receives an annual average of 805mm and the other only 614mm. Sequential drought years are common and some, such as 2000-2003 in which rainfall decreased almost 60%, are severe. The extreme recent drought events resulted in a marked flight from the rural areas to Jaipur city, and a significant drawdown in groundwater. Slight changes in the dynamics of the monsoon system as a result of climate change, whether through general shifts in the starting date, changes in overall rainfall amount and/or through rain events becoming less frequent but more intense, could have drastic implications for Jaipur’s water availability. Given Jaipur’s dependence on this one source for much of its water supply, any disruption could undermine one of the most essential resources required for any city to sustain itself – a secure source of water supply.
Jaipur’s potential vulnerability to climate change and rapid population growth typifies that of many cities. Cities are, as the latest UN-HABITAT report (2010) on urban areas emphasizes, engines of economic activity that contribute to poverty reduction, centers of population growth and potentially the foundation for many positive changes in human living conditions. The systems upon which cities depend, such as water, food, ecosystems, and energy systems, are complex and poorly understood. While cities have historically been among the most resilient of human institutions, as populations grow, competition over resources increases and the difficulty of projecting the effects of global processes ripples through systems, profound vulnerabilities may emerge. The State of the World’s Cities 2010/2011 (UN-HABITAT 2010) mentions climate change in passing in the text. In no place are the systems on which urban areas depend evaluated in any systematic manner. This is not intended as a criticism of the report. Instead, it reflects a much larger gap in understanding of the implications of climate change for urban areas that applies to most global knowledge centers.
The current project being implemented by ISET in partnership with CEDSJ (Centre for Environment and Development Studies, Jaipur, India) and supported by NOAA assesses the dynamic interaction between climate change, water resources and larger processes of socio-economic transition as represented by migration to and within Jaipur city. The case study of Jaipur city covered in this report should be read both as an analy-sis of the dynamic changes occurring in one specific location, and at the same time, as shedding light on issues that already are or will be faced by many cities globally. We investigated:
1. The dynamic interaction between climatic variability, groundwater overdraft and migrant inflows to the city of Jaipur; and
Rainfall distribution
is spatially uneven
throughout the Banas
River Basin, the river
that feeds Bisalpur
Dam, and is highly
variable.
4 The UncomforTable nexUs Urbanization, Water scarcity and climate change The UncomforTable nexUs Urbanization, Water scarcity and climate change
2. Options for managing water supply sources to meet the new domestic and commercial needs of immigrants under existing and projected climatic conditions.
Given these objectives, the report has two primary audiences. The first is local: the array of policy makers, academics, scientists, urban planners, community groups and others who are involved in shaping the future of cities such as Jaipur in Rajasthan. The second is global: those seeking to understand the interactions between climate change, migration and urbanization in order to improve urban resilience. Within these broad audiences, the report specifically focuses on the uses and limitations of avail-able scientific information on climate change, hydrology, and migration patterns. Acknowledgement of data realities is becoming increasingly crucial, as those working to build urban resilience must select strategies and policies based on the available infor-mation and their experience.
meThOdOlOGies
Methodologically, the report combines:
1. Background information on Jaipur and the evolving urbanization context based on secondary data and interviews with key actors;
2. Detailed surveys on migration across a number of villages and urban labor markets;
3. Statistical downscaling of climate change scenarios to produce future rainfall projections between 2009 – 2040; and
4. Modeling and analysis of Jaipur’s current and future water supply vulnerabil-ity through an integrated water resource software, the Water Evaluation and Planning (WEAP) software developed by the Stockholm Environment Institute (SEI).
A baseline characterization of Jaipur’s water supply context based on the above analysis was evaluated and used to develop potential future scenarios of water supply, demand and migration patterns. Plausible demand and supply-side scenarios were then devel-oped and tested in an integrated water resource model to evaluate their ability to provide water to Jaipur’s burgeoning population under various migration and climate change scenarios. These scenarios drew heavily on extensive prior research by one of the core project partners, the Centre for Environment and Development Studies Jaipur (CEDSJ).
The report is organized into three major sections. A detailed analysis of migration and settlement patterns in Jaipur’s urban and peri-urban areas is discussed first, to provide context to the overall water supply situation. This section concludes with a brief summary of the major implications of migration for Jaipur’s urbanization
Given data limitations
and high levels
of uncertainty
in projections of
climate and social
change, it is essential
to understand
the factors that
contribute resilience
to urban water
systems.
The UncomforTable nexUs Urbanization, Water scarcity and climate change 5The UncomforTable nexUs Urbanization, Water scarcity and climate change
process with particular focus on the implications for growth in peri-urban areas. The second section focuses heavily on climate change, precipitation downscaling and modeling of current and possible future water supply conditions. The process downscal-ing climate information is discussed first, followed by the water supply modeling. The chapter covering the water supply modeling also explores potential avenues for build-ing urban water supply resilience. The final chapter pulls together the implications of migration and climate change for the increasingly urbanized region surrounding Jaipur. It identifies knowledge gaps in themes related to Jaipur’s context and global contexts. By doing this research, we hope to provide key insights for both local and global audiences on critical next steps for understanding the vulnerability of cities and build-ing resilience as the processes of urbanization, hydrologic change and climate change proceed.
Key fiNdiNGs
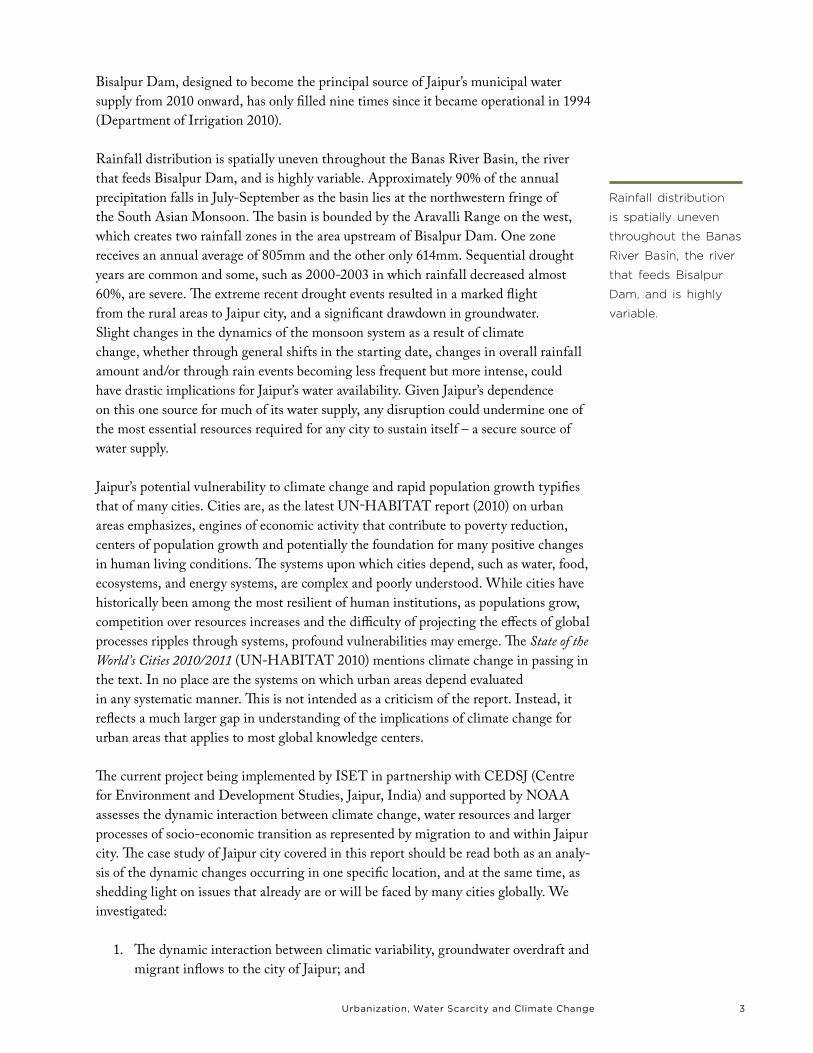
Analysis of Jaipur’s water supply system highlights the fundamental fragility of one of the basic systems upon which the future of the urban area and the livelihood and wellbeing of its residents depend. Both historical experiences and modeling results highlight the high possibility of sequential drought years in which the current water supply system would fail severely to meet the basic needs of urban residents. The ability to respond to this situation is heavily undermined by the unavailability, inaccessibility and lack of neutrality in key data sets. Official estimates of water supply availability in key facilities, such as the Bisalpur Dam, differ by as much as two orders of magnitude depending upon the data source. The uncertainties inherent in climate change projections makes it difficult, but not impossible, for key actors at the city level to adequately project water supply availability
Sand mining in the bed of the Banas River. © M.S. Rathore
6 The UncomforTable nexUs Urbanization, Water scarcity and climate change The UncomforTable nexUs Urbanization, Water scarcity and climate change
for burgeoning urban populations in the future. Reliable quantitative estimates of future streamflow are impossible to generate based on currently available data, and even if substantial improvements in data availability and neutrality could be assured, would remain limited due to uncertainties in climate, demographic changes, and livelihood shifts.
Given the limitations of available data and current scientific methods and knowledge to project change, research to understand the factors that contribute to resilience in urban water systems under uncertainty is essential. Jaipur’s water system has funda-
mental fragilities. High levels of dependence on a single surface water source, high loss rates in piped systems operated by the municipality, extensive pollution and degrada-tion of the ecosystems and aquifers that maintain local groundwater sources reduce the overall resilience of the water supply system to disruptions of any kind. Research by project partners has already demonstrated that migration from rural areas to Jaipur increases during droughts, further straining Jaipur’s water system. Avenues for building resilience need to be based on improved understanding of innovative options for:
1. Water supply diversification;
2. Improved efficiency in water supply delivery mechanisms;
3. Improved maintenance of the ecosystems and local watershed characteristics that enable capture and storage of water in locations where it falls;
4. Avoidance and control of pollution; and
5. Groundwater management.
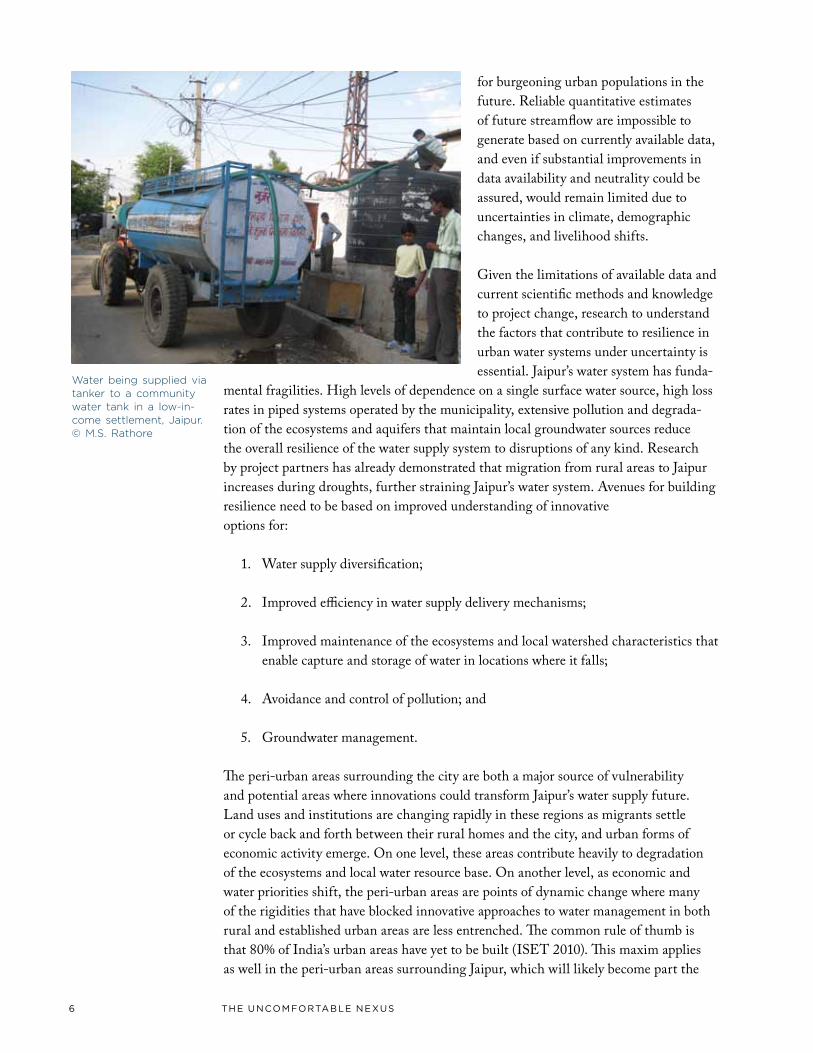
The peri-urban areas surrounding the city are both a major source of vulnerability and potential areas where innovations could transform Jaipur’s water supply future. Land uses and institutions are changing rapidly in these regions as migrants settle or cycle back and forth between their rural homes and the city, and urban forms of economic activity emerge. On one level, these areas contribute heavily to degradation of the ecosystems and local water resource base. On another level, as economic and water priorities shift, the peri-urban areas are points of dynamic change where many of the rigidities that have blocked innovative approaches to water management in both rural and established urban areas are less entrenched. The common rule of thumb is that 80% of India’s urban areas have yet to be built (ISET 2010). This maxim applies as well in the peri-urban areas surrounding Jaipur, which will likely become part the
Water being supplied via tanker to a community water tank in a low-in-come settlement, Jaipur. © M.S. Rathore
The UncomforTable nexUs Urbanization, Water scarcity and climate change 7The UncomforTable nexUs Urbanization, Water scarcity and climate change
The peri-urban areas
surrounding the city
are both a major
source of vulnerability
and potential areas
where innovations
could transform
Jaipur’s water supply
future.
future urban core. If key groundwater recharge areas can be protected in these areas, if innovative and efficient water supply systems can be established and if water quality can be protected, then Jaipur’s future as a city that is resilient to climate change and other disruptions may be possible to ensure. The future depends on the peri-urban regions and the opportunities for change that may be inherent in the transitions they are now undergoing. Understanding these opportunities and developing mechanisms to work with and take advantage of them is a fundamental challenge to building urban resilience.
sTudy limiTATiONs
No research initiative is able to examine all elements that are known to be criti-cal to the particular context being investigated. The critical piece of research missing from this project is a detailed investigation of the peri-urbanization and urbanization processes occurring in and around Jaipur city. The formal urban and industrial plans and informal processes by which the city, its services and provisions are expanding, were not able to be incorporated into this research effort, due to lack of data. CEDSJ is currently conducting more research on actual land use change patterns, loss of ecosys-tem services and provisions, trends in livelihood and economic development in the surrounding areas. These processes will greatly impact both future water demand and the strategies the city chooses to better manage supplies and demands. Given the lack of baseline data or a comprehensive snapshot of the peri-urban/urban development processes around data, we have relied on CEDSJ’s initial observations and government studies on Jaipur’s projected development to inform the research in this project.
Despite the lack of data in some areas, the data and observations we do have concretely demonstrate that Jaipur’s water supply is already extremely vulnerable and not very resilient to either shocks or slow-onset events – whether those are large pulses in migration or persistent, low-level drought. The study shows that even when consider-ing only two “simplified” stressors of migration and potential climate change, the city’s future water supply vulnerability will only increase unless demand and supply conserva-tion options are considered soon.
8 The UncomforTable nexUs© christian haugen
9Urbanization, migration and Water Demand
Chapter 2
Urbanization, migration and Water demand
urBANizATiON
Similar to the trends being observed around the world, India too is witnessing rapid growth in urban centers. In India, out of the total population of 1027 million as of 2001, approximately 742 million lived in rural areas and 285 million (27.8%) in urban areas. The decadal growth of populations in rural and urban areas between 1991-2001 was 17.9% and 31.2%, respectively (Gov. of India 2001). The rate of urban population growth far surpasses that of rural population growth and currently, almost a third of India’s population lives in urban areas. According to a recent study on Indian urban-ization, each year the urban population in India grows by more than 7 million people (MGI 2010). Furthermore, the trend in urbanization is expected to accelerate in coming decades as rural populations seek the better livelihood and lifestyle options that cities often afford. It is projected that by 2021 the number of cities with a population of more than one million will rise to 75 (in 2001 there were only 35) with nearly 40% of India’s population living in urban areas.
Cities in India are defined by the Indian Census as those urban centers having a population of more than 100,000, with cities of 1 million or more classified as “million plus cities”. Jaipur is the largest and the only million plus city in the State of Rajasthan. Among all of the megacities of India, Jaipur ranks 11th with a total population of 2.3 million (2001 Census). Regarded as one of the fastest growing cities in the country, it
10 The UncomforTable nexUs
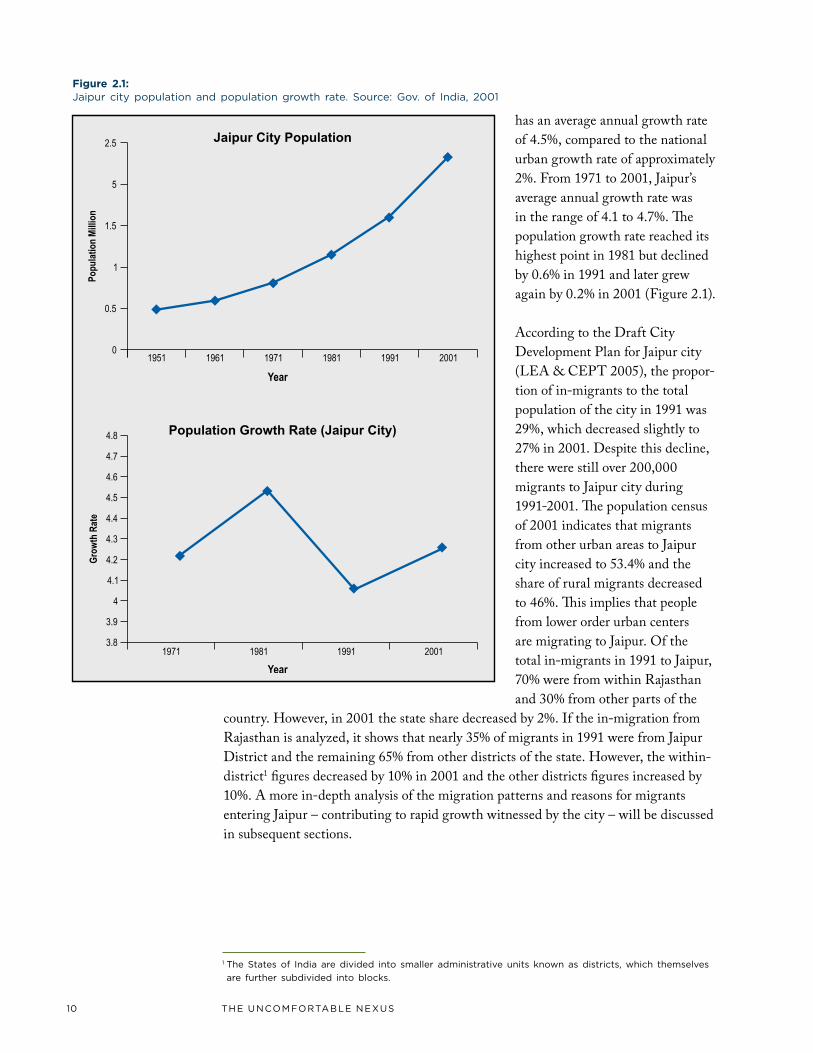
has an average annual growth rate of 4.5%, compared to the national urban growth rate of approximately 2%. From 1971 to 2001, Jaipur’s average annual growth rate was in the range of 4.1 to 4.7%. The population growth rate reached its highest point in 1981 but declined by 0.6% in 1991 and later grew again by 0.2% in 2001 (Figure 2.1).
According to the Draft City Development Plan for Jaipur city (LEA & CEPT 2005), the propor-tion of in-migrants to the total population of the city in 1991 was 29%, which decreased slightly to 27% in 2001. Despite this decline, there were still over 200,000 migrants to Jaipur city during 1991-2001. The population census of 2001 indicates that migrants from other urban areas to Jaipur city increased to 53.4% and the share of rural migrants decreased to 46%. This implies that people from lower order urban centers are migrating to Jaipur. Of the total in-migrants in 1991 to Jaipur, 70% were from within Rajasthan and 30% from other parts of the
country. However, in 2001 the state share decreased by 2%. If the in-migration from Rajasthan is analyzed, it shows that nearly 35% of migrants in 1991 were from Jaipur District and the remaining 65% from other districts of the state. However, the within-district1 figures decreased by 10% in 2001 and the other districts figures increased by 10%. A more in-depth analysis of the migration patterns and reasons for migrants entering Jaipur – contributing to rapid growth witnessed by the city – will be discussed in subsequent sections.
1 The states of India are divided into smaller administrative units known as districts, which themselves
are further subdivided into blocks.
Figure 2.1: Jaipur city population and population growth rate. source: Gov. of India, 2001
11Urbanization, migration and Water Demand
push-pull fAcTOrs
The circumstances under which people leave their homes and migrate are related to the structural causes of migration. There is a clear link between the number of displaced persons, the level of poverty and loss of ecosystem services in their home areas. Environmental pressures are often exacerbated by issues such as economic marginaliza-tion, insecurity, social upheaval and political mismanagement. Climate variability and change as underlying factors for migration should therefore always be seen in the light of these aggravating socio-economic factors. The cost to society of environmentally-induced displacements - especially if they are massive - can be large in both financial and human terms, because of the resultant social, political, and economic tensions.
There has been steady migration within India from rural to urban areas. Rural-to-urban migration has shown a gradual increase, with its share in total migration rising from 16.5% to 21.1% between 1971 and 2001. In addition, with respect to the distance of migration, of 1000 migrants in urban India, 722 come from the same state, 274 from the other states of the country and 3 from other countries (NSSO 2010). The 2001 Census shows that internal state migration increased rapidly during the 1990s. More than half of those that migrate do so within the same district and the incidence of migration decreases as distances become longer. Linguistic differences limit the degree of interstate migration, as do efforts by some states to limit job opportunities for migrants and give preference in public employment to long-time local residents. The National Sample Survey on Migration reports that more than three-fourths of migrant households were from within the same state (NSSO 2010).
Migration in India is mostly influenced by social structures and patterns of develop-ment. The landless poor, who mostly belong to lower castes, indigenous communities, and those from economically backward2 regions constitute the majority of migrants. With regard to the effect of pull factors to a particular destination, the prospect of better job opportunities is a major determinant of male migration. Low castes and minority groups tend toward pull-induced migration through social and famil-ial networks. Caste-kinship bonds and other kinds of village networks help rural job seekers to arrange urban-based jobs (Banerjee 1986).
Indian agriculture has become non-remunerative, leading to over 100,000 farmer suicides from 1996 to 2003 (Mishra 2007). This figure is the equivalent of a suicide of an Indian peasant every 32 minutes. The income differential between agricul-tural livelihoods and non-farm livelihoods is frequently a motivating factor in induc-ing people to move from low-income areas to relatively high-income areas (Harris and Todaro 1970). In the rural areas, sluggish agricultural growth and limited develop-ment of rural non-farm sectors raises the incidence of rural poverty, unemployment and underemployment. Given the fact that most high productivity activities are located in the urban areas, rural-urban income differentials, particularly for the poor and unemployed, are quite large. Thus, many migrate to the urban areas in search of jobs. Even when jobs in high productivity activities, such as skilled service, are limited in
Rural-to-urban
migration has shown
a gradual increase,
with its share in total
migration rising from
16.5% to 21.1% between
1971 and 2001.
2 “backward” is an official government connotation in India to describe areas that are underdeveloped
and economically poorer areas.
12 The UncomforTable nexUs
number relative to the demand, rural populations still flow to the urban areas in search of opportunities in the ‘informal sector.’ The loss of agricultural opportunities has led rural people from the downtrodden and backward communities and regions such as Bihar, Orissa, Uttar Pradesh to travel far distances seeking menial employment in the construction of roads, irrigation projects, commercial and residential complexes.
This trend of rising unemployment is compounded by the existence of regional imbal-ances - population pressures on land, inconsistency of infrastructure, industrial devel-opment, and modernization of agriculture - within the country, which have collectively accelerated the phenomenon of migration. These lead to a combination of pull and push factors influencing households’ decisions to migrate. While the rural poor are concen-trated in eastern India and in the rainfall-dependant parts of central and western India, which continue to have low agricultural productivity, the bulk of the jobs are actually being created in western and southern India. In particular, these developed areas have a greater demand for labor for specific seasonal activities like sowing and harvesting in the case of agricultural activities. As this demand often supersedes the availability of local labor, these developed regions offer a higher wage rate and/or greater number of days of employment. The demand for seasonal labor also exists in agro-industries (e.g. in rice mills or sugar factories) and in construction (canal construction, road, etc.) activities.
In the recent past, the economic scene in India has undergone a sea change due to globalization and liberalization processes initiated in 1990-91. There have been numer-ous debates as to whether the serious income disparities, agrarian distress, inadequate employment generation, and growth of the informal economy are due to these policies. Migration as a consequence of these economic reform policies is also debated. Despite a steadily growing economy, the pace at which job opportunities are created cannot meet the growing demand. There is substantial decline in employment elasticity (an increase in employment for every unit rise in gross domestic product) in almost all the
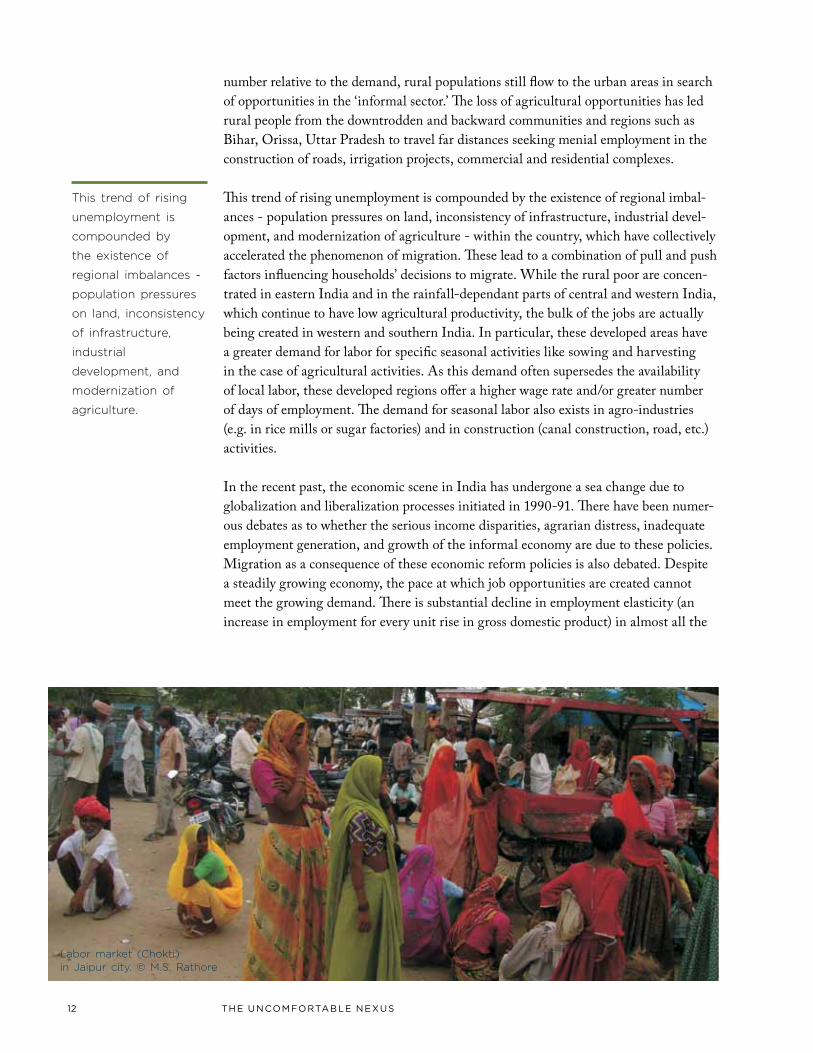
Labor market (Chokti) in Jaipur city. © M.S. Rathore
This trend of rising
unemployment is
compounded by
the existence of
regional imbalances -
population pressures
on land, inconsistency
of infrastructure,
industrial
development, and
modernization of
agriculture.
13Urbanization, migration and Water Demand
major productive sectors, except for trans-port and finance. In the agriculture sector, the employment elasticity has dropped to near zero.
While a large number of empirical studies on migration have been conducted on the basis of field surveys in urban destinations, the focus of researchers has primarily been on migrants and in some studies, non-migrants have been added for the sake of comparison (Oberai et al. 1989; Oberai and Singh 1983; Skeldon 1986; Deshingkar and Akter 2009). The factors by which urban migrants have been pulled or pushed are not often analyzed per se, although some of the important factors related to the livelihoods of migrants, such as urban labor markets and living conditions have been partially investigated. Also, the majority of the migration research so far has set the unit of analyses either at the national level or in local areas selected and demarcated by the research-ers. Research on migration at the intermedi-ate level, particularly district level analysis, is almost absent.
Fieldwork, research experience, reports and surveys indicate that the majority of the rural populations that migrate to the urban areas end
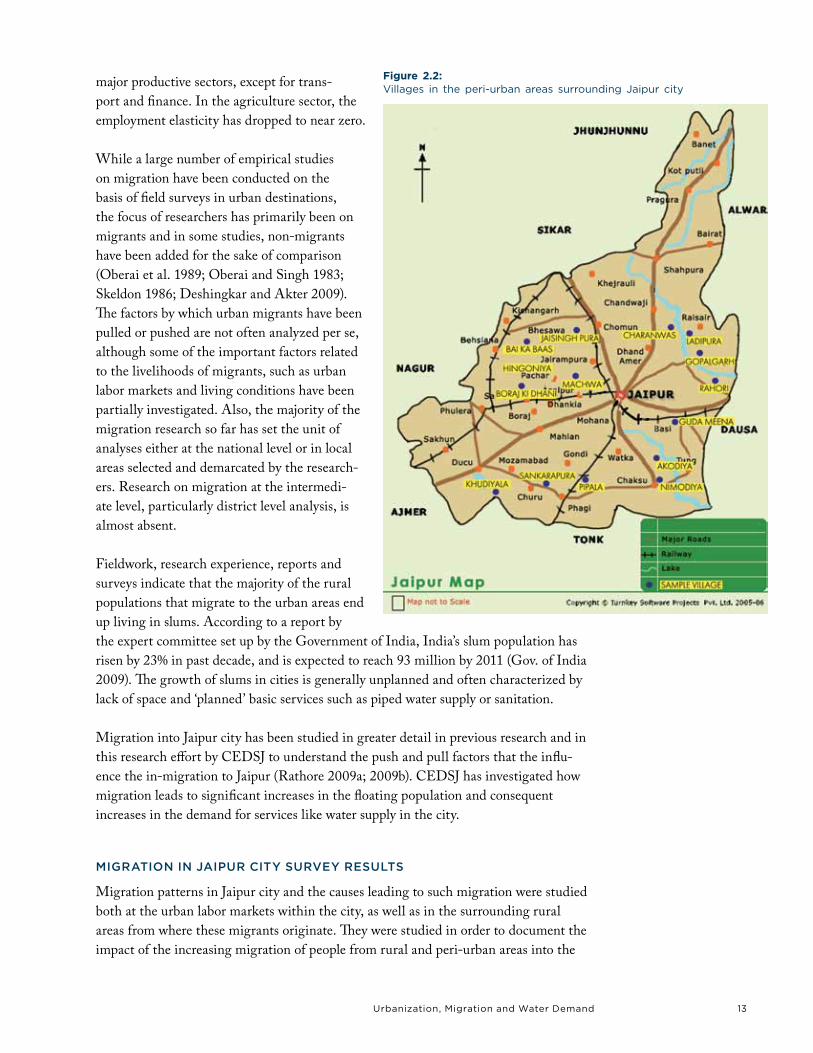
Figure 2.2:Villages in the peri-urban areas surrounding Jaipur city
up living in slums. According to a report by the expert committee set up by the Government of India, India’s slum population has risen by 23% in past decade, and is expected to reach 93 million by 2011 (Gov. of India 2009). The growth of slums in cities is generally unplanned and often characterized by lack of space and ‘planned’ basic services such as piped water supply or sanitation.
Migration into Jaipur city has been studied in greater detail in previous research and in this research effort by CEDSJ to understand the push and pull factors that the influ-ence the in-migration to Jaipur (Rathore 2009a; 2009b). CEDSJ has investigated how migration leads to significant increases in the floating population and consequent increases in the demand for services like water supply in the city.
miGrATiON iN JAipur ciTy survey resulTs
Migration patterns in Jaipur city and the causes leading to such migration were studied both at the urban labor markets within the city, as well as in the surrounding rural areas from where these migrants originate. They were studied in order to document the impact of the increasing migration of people from rural and peri-urban areas into the
14 The UncomforTable nexUs
city. The rural and peri-urban areas are suffering from degradation of basic environ-mental resources, particularly groundwater supplies. This has been documented as one of the reasons for migration to urban areas (Rathore 2006). Hence, a parallel study in villages surrounding the city was undertaken to understand the basic factors that induce people to migrate into Jaipur’s urban area. These studies were conducted using questionnaire surveys, interviews and focus group discussions.
The survey was organized in two phases. In the first phase a survey of labor markets in Jaipur city was conducted. In second phase, villages were selected in the peri-urban and rural areas from a 100 kilometer radius around Jaipur. This radius is the catchment area of labor arriving in the city. Two different set of questionnaires were designed for each phase of the survey and were pre-tested.
Labor Market Survey: In Jaipur city 46 labor markets were identified. These markets are locally known as ‘Chokti’ and they are scattered all over the city, mainly located along the main roads and rail routes entering the city. Every morning around 8am laborers (skilled and unskilled) assemble at these markets and wait for customers to hire them. The number of laborers in a Chokti varies from between 500 to 2500. The number also varies seasonally or on festival days. During the monsoon (June-Sept.) the number of laborers is lowest as demand for agricultural labor is high in the rural and peri-urban areas.
All the 46 markets were visited and out of these, 10 labor markets were purposefully selected based on geographical distributions covering all the entry points to the city. In every selected market, focus group discussions were organized and a sample of 10 labor-ers were selected for detailed interviews. The main topics covered in the urban survey included: the duration and frequency of migration, reasons for migration, quality of facilities and problems at the market – particularly about the provision of basic ameni-ties such as drinking water, sanitation, food and transportation. The analysis and results of this survey were used in the planning of the village surveys.
Village Surveys: The second survey was planned to study the rural and peri-urban areas, the changing environmental conditions and reasons of migration. The first survey revealed that laborers come from around 100 kilometer radius of Jaipur city. The survey also helped in identifying the direction and concentration of villages from where the majority of migrants to Jaipur originate. In each of the selected villages, focus group meetings were organized and a sample of 10 households with migrating members were randomly selected for detailed survey. The village surveys enabled documentation of environmental changes in each village, including the status of groundwater resources and whether water scarcity contributed to decisions to migrate. Village members were questioned about the frequency and duration of migration, their reasons for migrating and social and economic conditions in the village.
15Urbanization, migration and Water Demand
3 The labor markets in Jaipur city are locally known as chokti and they are scattered all over the
city, mainly located on the main roads and rail routes entering the city. every morning around 8 am,
laborers (skilled and unskilled) assemble at these markets and wait for customers to hire or select
them.
4 bPl or below Poverty line is an economic benchmark and poverty threshold used by the
Government of India to indicate economic disadvantage and to identify individuals and households
in need of government assistance and aid. It is determined using various parameters that vary from
state to state and within states.
urban labor market survey results
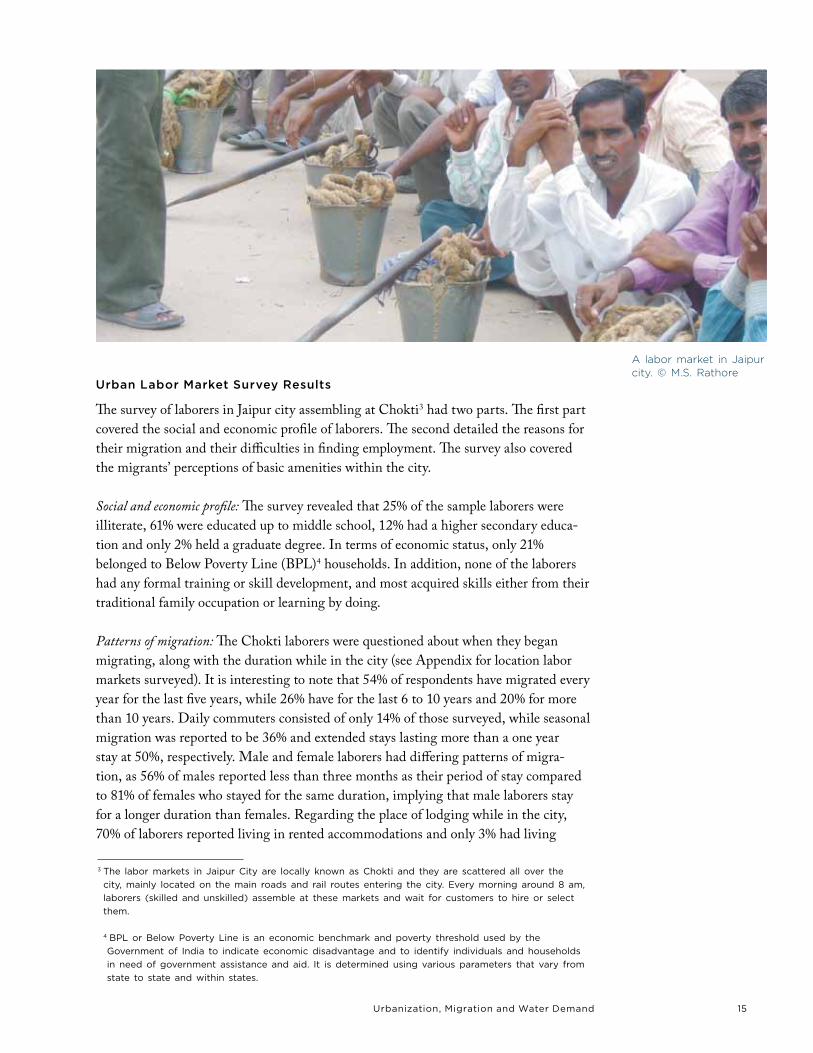
The survey of laborers in Jaipur city assembling at Chokti3 had two parts. The first part covered the social and economic profile of laborers. The second detailed the reasons for their migration and their difficulties in finding employment. The survey also covered the migrants’ perceptions of basic amenities within the city.
Social and economic profile: The survey revealed that 25% of the sample laborers were illiterate, 61% were educated up to middle school, 12% had a higher secondary educa-tion and only 2% held a graduate degree. In terms of economic status, only 21% belonged to Below Poverty Line (BPL)4 households. In addition, none of the laborers had any formal training or skill development, and most acquired skills either from their traditional family occupation or learning by doing.
Patterns of migration: The Chokti laborers were questioned about when they began migrating, along with the duration while in the city (see Appendix for location labor markets surveyed). It is interesting to note that 54% of respondents have migrated every year for the last five years, while 26% have for the last 6 to 10 years and 20% for more than 10 years. Daily commuters consisted of only 14% of those surveyed, while seasonal migration was reported to be 36% and extended stays lasting more than a one year stay at 50%, respectively. Male and female laborers had differing patterns of migra-tion, as 56% of males reported less than three months as their period of stay compared to 81% of females who stayed for the same duration, implying that male laborers stay for a longer duration than females. Regarding the place of lodging while in the city, 70% of laborers reported living in rented accommodations and only 3% had living
A labor market in Jaipur city. © M.S. Rathore
16 The UncomforTable nexUs
arrangements with their relatives. The payment for the rented accommodation varied between Rs. 500 to 1100 per month and 67% reported paying between Rs. 500 to 800 (at 2009 Rs. values). The laborers were also asked about their place of origin. It was observed that 36% of male and 71% of female laborers migrated from within the district and 55% of male and 26% of females were from other districts of Rajasthan. Only 9% of males and 3% of females reported to have come from other states.
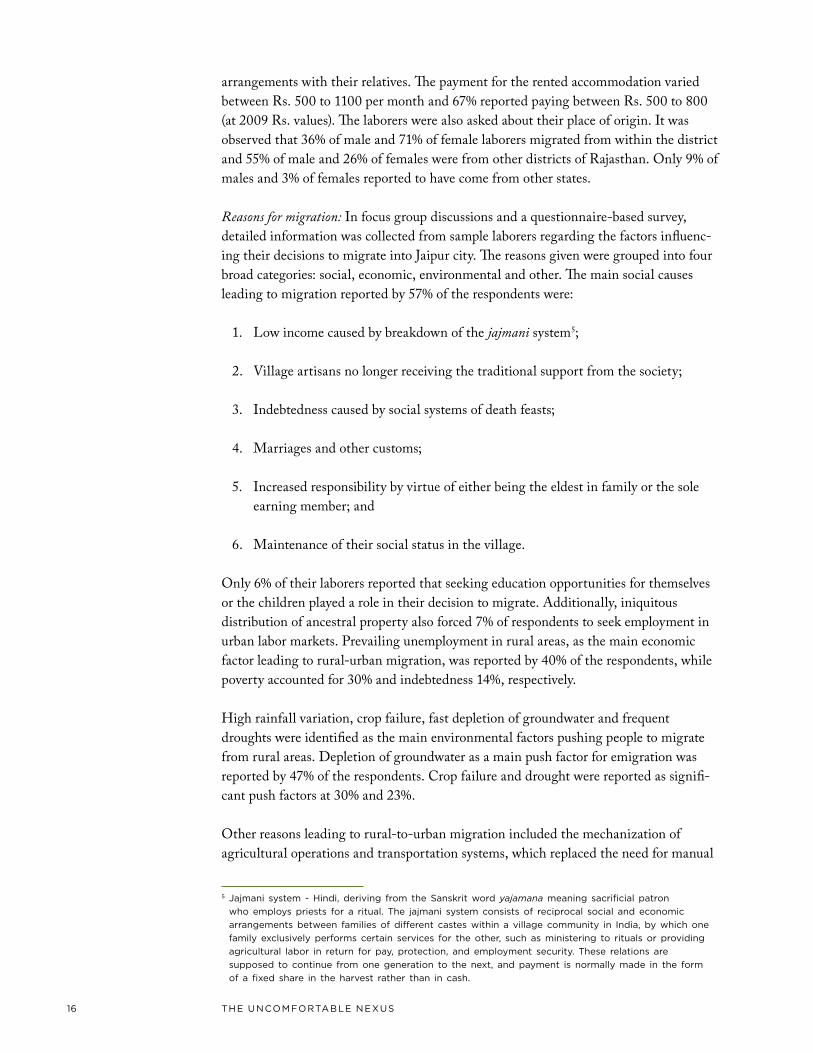
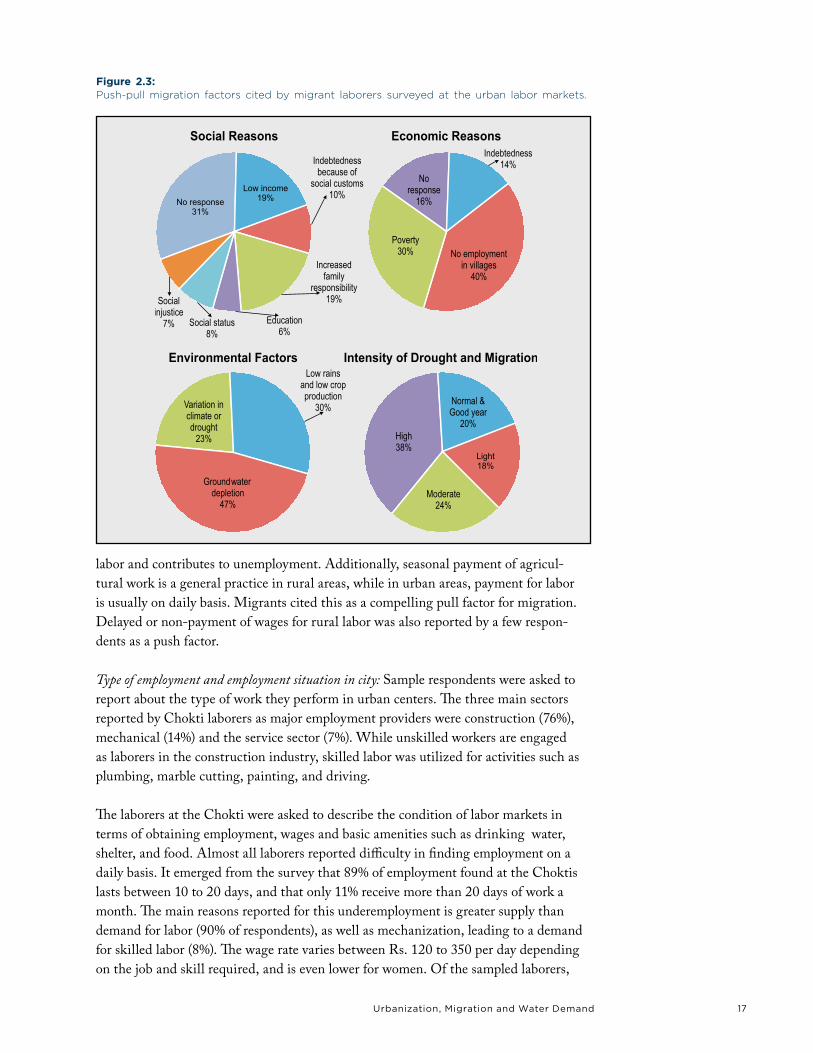
Reasons for migration: In focus group discussions and a questionnaire-based survey, detailed information was collected from sample laborers regarding the factors influenc-ing their decisions to migrate into Jaipur city. The reasons given were grouped into four broad categories: social, economic, environmental and other. The main social causes leading to migration reported by 57% of the respondents were:
1. Low income caused by breakdown of the jajmani system5;
2. Village artisans no longer receiving the traditional support from the society;
3. Indebtedness caused by social systems of death feasts;
4. Marriages and other customs;
5. Increased responsibility by virtue of either being the eldest in family or the sole earning member; and
6. Maintenance of their social status in the village.
Only 6% of their laborers reported that seeking education opportunities for themselves or the children played a role in their decision to migrate. Additionally, iniquitous distribution of ancestral property also forced 7% of respondents to seek employment in urban labor markets. Prevailing unemployment in rural areas, as the main economic factor leading to rural-urban migration, was reported by 40% of the respondents, while poverty accounted for 30% and indebtedness 14%, respectively.
High rainfall variation, crop failure, fast depletion of groundwater and frequent droughts were identified as the main environmental factors pushing people to migrate from rural areas. Depletion of groundwater as a main push factor for emigration was reported by 47% of the respondents. Crop failure and drought were reported as signifi-cant push factors at 30% and 23%.
Other reasons leading to rural-to-urban migration included the mechanization of agricultural operations and transportation systems, which replaced the need for manual
5 Jajmani system - hindi, deriving from the sanskrit word yajamana meaning sacrificial patron
who employs priests for a ritual. The jajmani system consists of reciprocal social and economic
arrangements between families of different castes within a village community in India, by which one
family exclusively performs certain services for the other, such as ministering to rituals or providing
agricultural labor in return for pay, protection, and employment security. These relations are
supposed to continue from one generation to the next, and payment is normally made in the form
of a fixed share in the harvest rather than in cash.
17Urbanization, migration and Water Demand
labor and contributes to unemployment. Additionally, seasonal payment of agricul-tural work is a general practice in rural areas, while in urban areas, payment for labor is usually on daily basis. Migrants cited this as a compelling pull factor for migration. Delayed or non-payment of wages for rural labor was also reported by a few respon-dents as a push factor.
Type of employment and employment situation in city: Sample respondents were asked to report about the type of work they perform in urban centers. The three main sectors reported by Chokti laborers as major employment providers were construction (76%), mechanical (14%) and the service sector (7%). While unskilled workers are engaged as laborers in the construction industry, skilled labor was utilized for activities such as plumbing, marble cutting, painting, and driving.
The laborers at the Chokti were asked to describe the condition of labor markets in terms of obtaining employment, wages and basic amenities such as drinking water, shelter, and food. Almost all laborers reported difficulty in finding employment on a daily basis. It emerged from the survey that 89% of employment found at the Choktis lasts between 10 to 20 days, and that only 11% receive more than 20 days of work a month. The main reasons reported for this underemployment is greater supply than demand for labor (90% of respondents), as well as mechanization, leading to a demand for skilled labor (8%). The wage rate varies between Rs. 120 to 350 per day depending on the job and skill required, and is even lower for women. Of the sampled laborers,
Figure 2.3: Push-pull migration factors cited by migrant laborers surveyed at the urban labor markets.
18 The UncomforTable nexUs
47% reported receiving wages between Rs. 120 to 150, 52% earned between Rs. 150 and 250 and only 1% were paid more than Rs. 250 per day. These wages amount to a monthly income ranging between Rs. 1800 and 6500.
With regard to the facilities at labor markets, 23% of the respondents were not satis-fied with the availability of water, food, shelter and other amenities. Both the quality and quantity of water supply was reported to be unsatisfactory. In addressing this, the Municipal Corporation6 of Jaipur has taken up an initiative to develop appropriate facilities at these markets and a few have already been upgraded.
part ii: village survey: rural-urban migration
The second part of the survey was conducted across 16 villages within a 100 km radius surrounding Jaipur. In the villages selected (see Appendix for selected villages), a
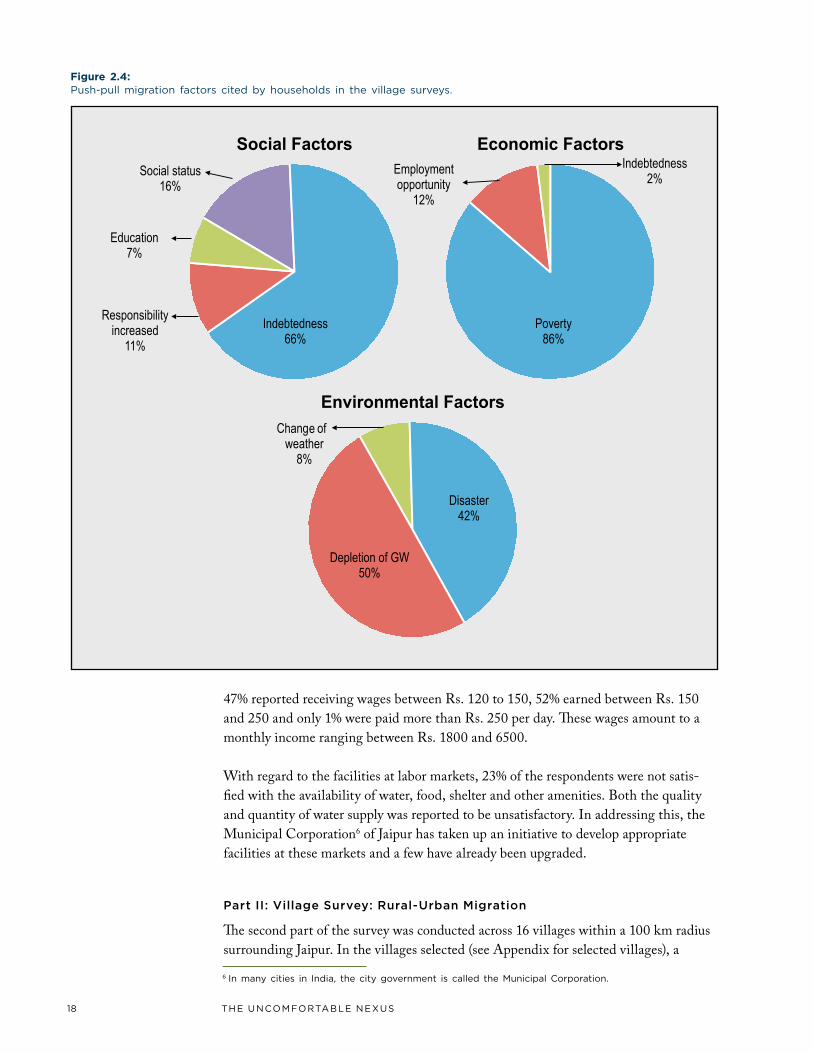
Figure 2.4: Push-pull migration factors cited by households in the village surveys.
6 In many cities in India, the city government is called the municipal corporation.
19Urbanization, migration and Water Demand
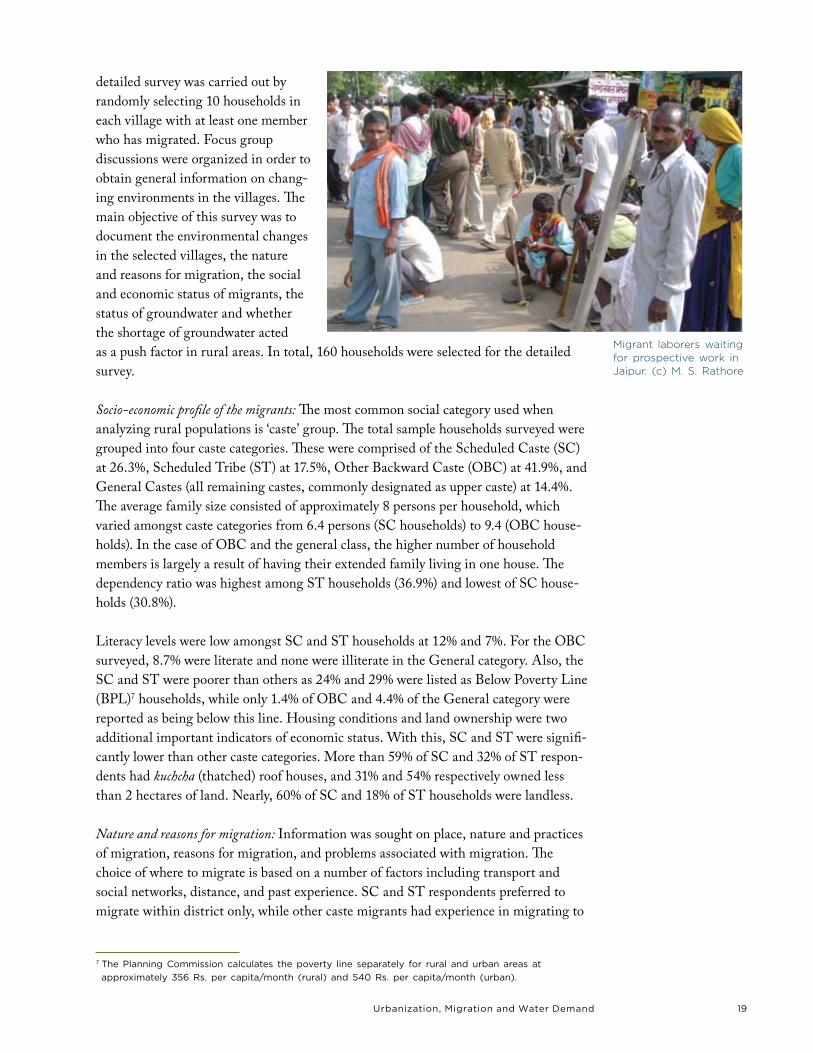
detailed survey was carried out by randomly selecting 10 households in each village with at least one member who has migrated. Focus group discussions were organized in order to obtain general information on chang-ing environments in the villages. The main objective of this survey was to document the environmental changes in the selected villages, the nature and reasons for migration, the social and economic status of migrants, the status of groundwater and whether the shortage of groundwater acted as a push factor in rural areas. In total, 160 households were selected for the detailed survey.
Socio-economic profile of the migrants: The most common social category used when analyzing rural populations is ‘caste’ group. The total sample households surveyed were grouped into four caste categories. These were comprised of the Scheduled Caste (SC) at 26.3%, Scheduled Tribe (ST) at 17.5%, Other Backward Caste (OBC) at 41.9%, and General Castes (all remaining castes, commonly designated as upper caste) at 14.4%. The average family size consisted of approximately 8 persons per household, which varied amongst caste categories from 6.4 persons (SC households) to 9.4 (OBC house-holds). In the case of OBC and the general class, the higher number of household members is largely a result of having their extended family living in one house. The dependency ratio was highest among ST households (36.9%) and lowest of SC house-holds (30.8%).
Literacy levels were low amongst SC and ST households at 12% and 7%. For the OBC surveyed, 8.7% were literate and none were illiterate in the General category. Also, the SC and ST were poorer than others as 24% and 29% were listed as Below Poverty Line (BPL)7 households, while only 1.4% of OBC and 4.4% of the General category were reported as being below this line. Housing conditions and land ownership were two additional important indicators of economic status. With this, SC and ST were signifi-cantly lower than other caste categories. More than 59% of SC and 32% of ST respon-dents had kuchcha (thatched) roof houses, and 31% and 54% respectively owned less than 2 hectares of land. Nearly, 60% of SC and 18% of ST households were landless.
Nature and reasons for migration: Information was sought on place, nature and practices of migration, reasons for migration, and problems associated with migration. The choice of where to migrate is based on a number of factors including transport and social networks, distance, and past experience. SC and ST respondents preferred to migrate within district only, while other caste migrants had experience in migrating to
7 The Planning commission calculates the poverty line separately for rural and urban areas at
approximately 356 rs. per capita/month (rural) and 540 rs. per capita/month (urban).
Migrant laborers waiting for prospective work in Jaipur. (c) M. S. Rathore
20 The UncomforTable nexUs
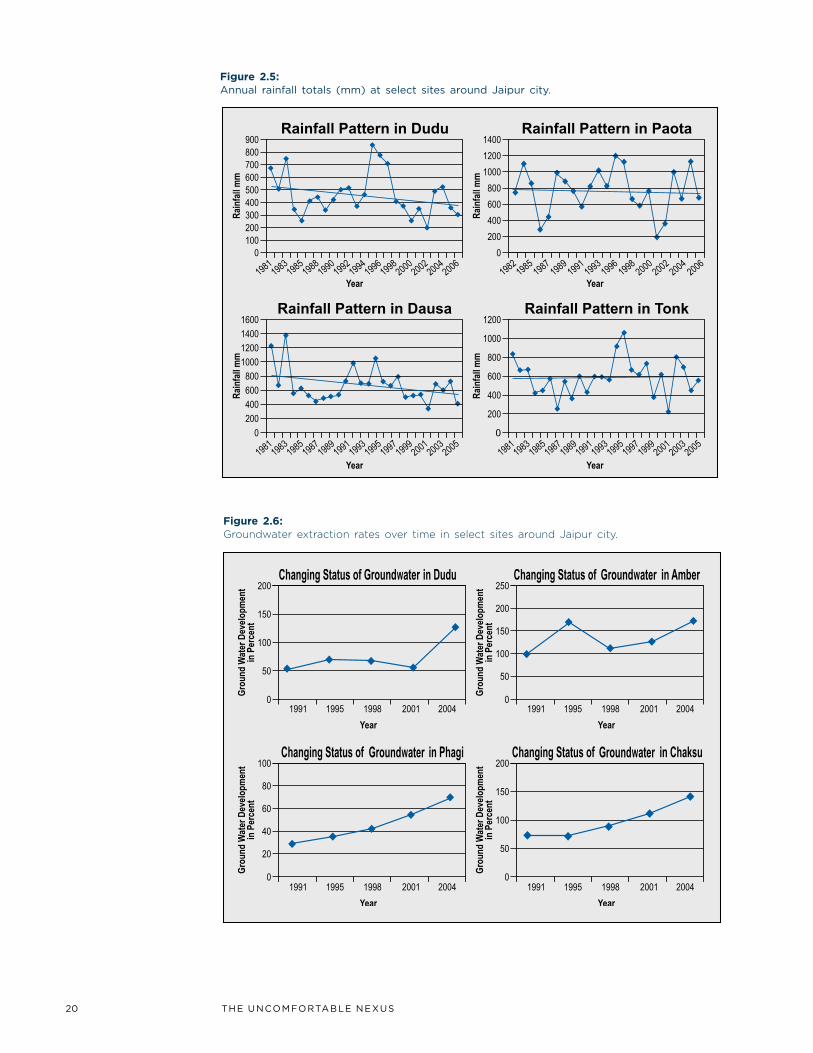
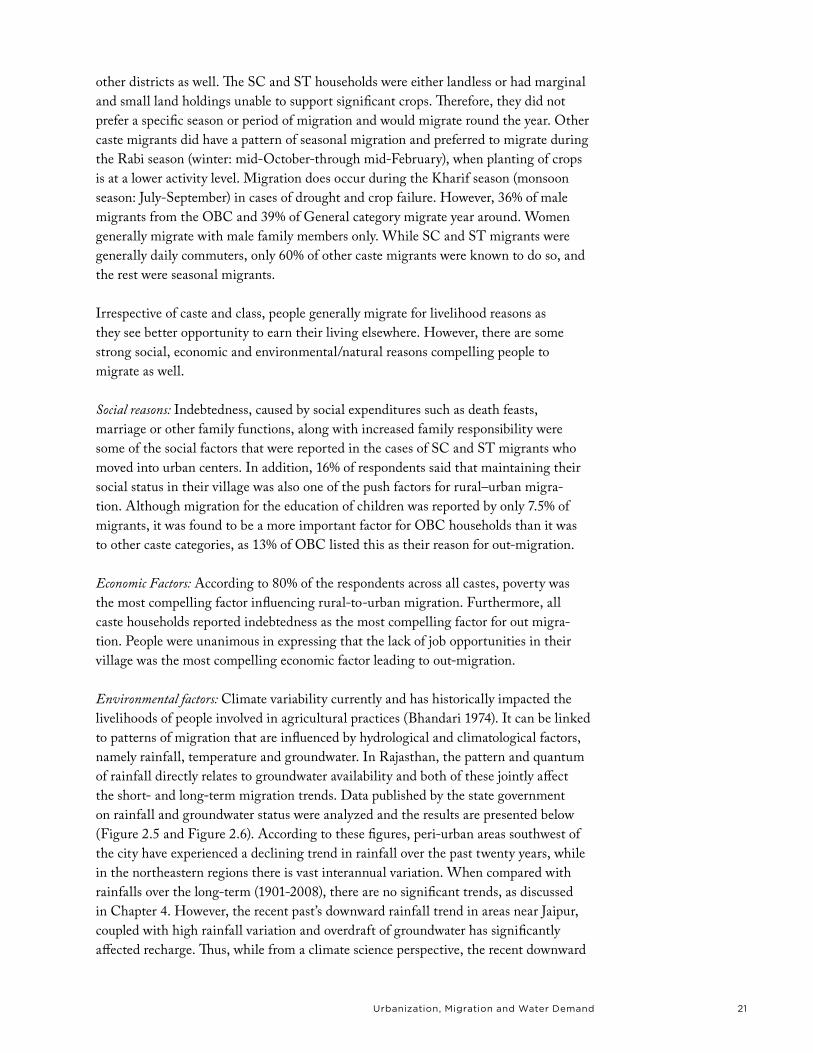
Figure 2.6:Groundwater extraction rates over time in select sites around Jaipur city.
Figure 2.5: annual rainfall totals (mm) at select sites around Jaipur city.
21Urbanization, migration and Water Demand
other districts as well. The SC and ST households were either landless or had marginal and small land holdings unable to support significant crops. Therefore, they did not prefer a specific season or period of migration and would migrate round the year. Other caste migrants did have a pattern of seasonal migration and preferred to migrate during the Rabi season (winter: mid-October-through mid-February), when planting of crops is at a lower activity level. Migration does occur during the Kharif season (monsoon season: July-September) in cases of drought and crop failure. However, 36% of male migrants from the OBC and 39% of General category migrate year around. Women generally migrate with male family members only. While SC and ST migrants were generally daily commuters, only 60% of other caste migrants were known to do so, and the rest were seasonal migrants.
Irrespective of caste and class, people generally migrate for livelihood reasons as they see better opportunity to earn their living elsewhere. However, there are some strong social, economic and environmental/natural reasons compelling people to migrate as well.
Social reasons: Indebtedness, caused by social expenditures such as death feasts, marriage or other family functions, along with increased family responsibility were some of the social factors that were reported in the cases of SC and ST migrants who moved into urban centers. In addition, 16% of respondents said that maintaining their social status in their village was also one of the push factors for rural–urban migra-tion. Although migration for the education of children was reported by only 7.5% of migrants, it was found to be a more important factor for OBC households than it was to other caste categories, as 13% of OBC listed this as their reason for out-migration.
Economic Factors: According to 80% of the respondents across all castes, poverty was the most compelling factor influencing rural-to-urban migration. Furthermore, all caste households reported indebtedness as the most compelling factor for out migra-tion. People were unanimous in expressing that the lack of job opportunities in their village was the most compelling economic factor leading to out-migration.
Environmental factors: Climate variability currently and has historically impacted the livelihoods of people involved in agricultural practices (Bhandari 1974). It can be linked to patterns of migration that are influenced by hydrological and climatological factors, namely rainfall, temperature and groundwater. In Rajasthan, the pattern and quantum of rainfall directly relates to groundwater availability and both of these jointly affect the short- and long-term migration trends. Data published by the state government on rainfall and groundwater status were analyzed and the results are presented below (Figure 2.5 and Figure 2.6). According to these figures, peri-urban areas southwest of the city have experienced a declining trend in rainfall over the past twenty years, while in the northeastern regions there is vast interannual variation. When compared with rainfalls over the long-term (1901-2008), there are no significant trends, as discussed in Chapter 4. However, the recent past’s downward rainfall trend in areas near Jaipur, coupled with high rainfall variation and overdraft of groundwater has significantly affected recharge. Thus, while from a climate science perspective, the recent downward
22 The UncomforTable nexUs
trend is within normal historical climate statistics for the area, from the people’s perspective, it is a significant trend and one that is stressing their ability to maintain rural livelihoods.
Water scarcity and its impact on the livelihood of rural populations was a separate question posed to all respondents and was also raised in the village focus group discus-sions. Approximately 91% of sample households expressed that the lack of irrigation water was the most significant push factor in rural-urban migration.
Groundwater depletion has further added to the plight of farmers. Arid and semi-arid areas are affected mostly because of high variability in rainfall and frequently occur-ring droughts. The groundwater situation in Rajasthan has become dire, as 75% of its groundwater blocks are over-exploited and marked as ‘Dark Zones’ 8 (Gov. of Rajasthan 2009; Rathore 2007). Because 60% of irrigated agriculture is dependent on groundwa-ter, the depletion of such sources has resulted in lower agricultural production, which has forced farmers to diversify and seek alternate employment. The future scope for increasing or even continuing irrigated farming is limited, further pushing migrating from rural areas.
The other set of figures (Figure 2.6) refers to groundwater exploitation in the study area (areas surrounding Jaipur city). It is evident from the figures that there is an increasing trend in groundwater withdrawal, or overexploitation at an increasing rate. This trend of groundwater] mining is mainly due to water use in peri-urban agriculture, especially to grow water intensive crops (vegetables) for selling to Jaipur city. In a few instances, groundwater was extracted and sold in tankers to settlements in the peri-urban areas.
Drinking water shortages do not currently play a significant role in forcing families to migrate, as only 4% of respondents expressed this as one of the factors. It was not the quantity of water available for household needs, but deteriorating quality of drinking water that was listed as an additional factor for migration. The presence of high concentrations of fluorides in groundwater is well known throughout the region and 20% of the respondents identified this as a major problem in their villages. The deepening of wells and tubewells further aggravates such groundwater quality conditions.
Problems of out-migrating populations: The migrants from rural areas facedproblems while leaving their homes for cities. Such factors included how to care for elderly parents, young children and livestock back in the villages, which altogether accounted for 87% of the respondents’ (of all caste categories) difficulties in migrating. In addition to social factors, the most common problems migrants faced when reaching the city were: lack of cash and suitable facilities (including drinking water and sanitation), and the lack of cheap and timely transportation facilities, which they need for commuting back to their respective villages.
8 “Dark Zone” is a legal designation prohibiting new borewell or groundwater extraction projects in an
area. existing wells are allowed to continue to pump.
23Urbanization, migration and Water Demand
impAcTs ON WATer demANd iN JAipur ciTy
One of the key observations from the study on migration patterns is that, in addition to the direct impacts of current climate variability on sources of water supply in terms of reduction or uncertainty in supply, the indirect impact is an increase in migra-tion to Jaipur’s urban and peri-urban areas resulting from a lack of irrigation water in rural and peri-urban areas. The survey results show that there are both push and pull factors influencing rural-urban migration. Aside from the lack of job opportunities in villages in the city’s hinterlands, other factors such as the scarcity of groundwater and droughts are significant push factors. Climate change, which may alter rainfall amounts and timing in the future, is likely to enhance the rate of out-migration from rural and peri-urban areas as 95% of the sample households expressed that scarcity of irriga-tion water was already a significant push factor. Social and economic factors also play a significant role in influencing migration out of rural areas. Increasing rural-urban inequity and wage differentials are the main pull factors for migration into urban areas. Approximately 80% of the respondents across all castes hold the view that poverty in rural areas was the most compelling reason for migration. Better employment oppor-tunities and higher wages bring nearly 10% of migrants into urban areas. Because the survey reveals that the number of long-term migrants is greater than that of daily commuters or seasonal migrants, Jaipur city’s water demand is likely to increase greatly in the future.
Presently, Jaipur city’s water supply is largely dependent on groundwater, which is depleting rapidly. The new surface water source, Bisalpur Dam, became operational in early 1994 and began serving Jaipur city in early 2010. The expansion of the city as a result of population growth will require an increase in domestic and commercial demand for water, which is expected to be around 28.3 million m3 per annum (Gov. of Rajasthan 2010). However, the state government also plans to supply drinking water to a number of cities, towns and villages – such as Ajmer, Beawar or Kishangarh – along. along Jaipur’s supply pipeline from the reservoir. In most villages, the drinking water supply is groundwater-based and is being overexploited for irrigation purposes, which is beginning to result in the failure of handpumps and tubewells. A large number of villages and towns regard Bisalpur as a potential source of water for them. Given this scenario, while the allocation for Jaipur from Bisalpur was fixed at 31.4 million m3 per year, the actual availability for Jaipur is debatable. Climate change will also affect the water availability in the dam and it is likely that future demand for water in Jaipur city may not be met in accordance with the plans (Rathore 2009).
Furthermore, Bisalpur Dam has a limited capacity with significant variations in availability (inflow) of water due to the recurrence of droughts in the state, changing rainfall patterns and significant surface and groundwater abstractions from the Banas River – the river that flows into Bisalpur. The risk for severe water stress and crisis becomes considerably higher when large populations are dependent on a single water source, especially when instances of consecutive droughts have been frequently observed in the state9. Therefore, it is necessary to search for alternative options in reducing the vulnerability of the dependent population.
9 for details see rathore, m. s. (2006), Droughts and the state failure: Unwilling to learn and
Unwilling to Distribute, Water Nepal 12(1/2): 261-280.
24 The UncomforTable nexUsThe UncomforTable nexUs
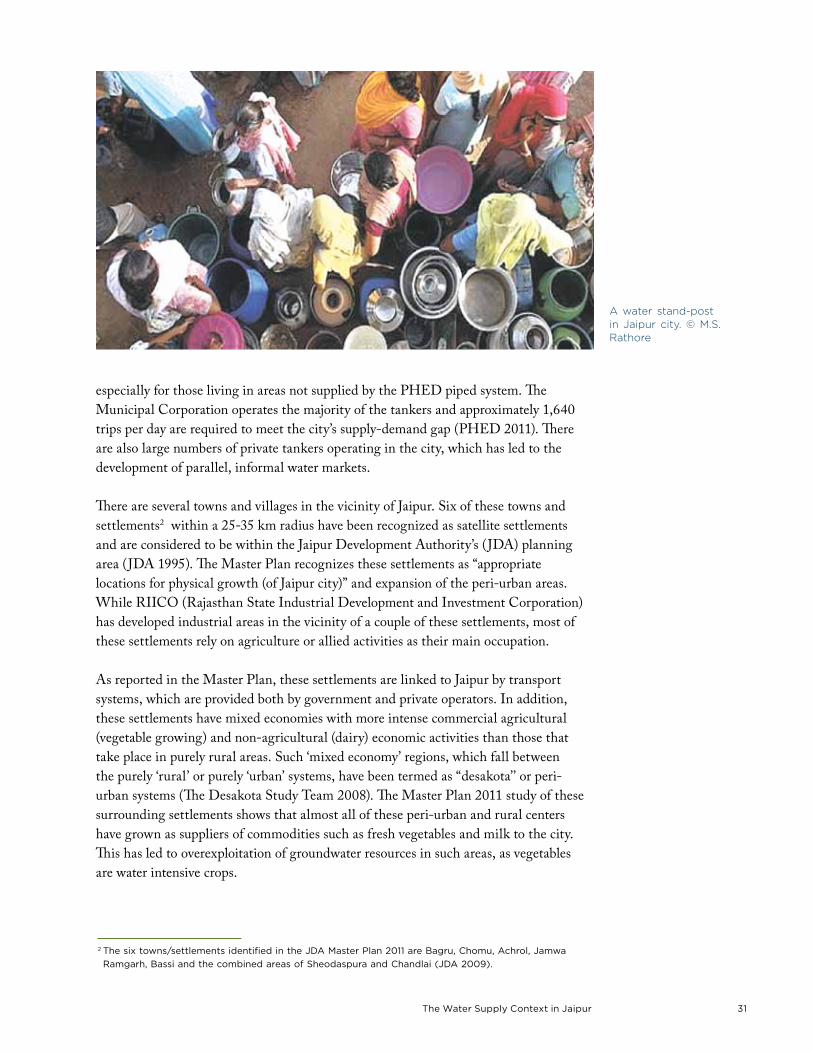
A water stand-post in Jaipur city. © M.S. Rathore
© Yiqun Ding
The UncomforTable nexUs 25The UncomforTable nexUs The Water supply context in Jaipur
Chapter 3
the Water sUpply Context in JaipUr
OvervieW
Rajasthan, the largest area state in the India, has always been a water deficit region. Consisting of 5.5% of India’s population, the state contains only about 1.16% of the country’s total surface water resources. Of the 142 desert blocks in the country, 85 are located in Rajasthan, which are areas of high water stress. The rainfall in the state is highly erratic with large variation in seasonal and year-to-year rainfall patterns. The average annual rainfall ranges from 100 mm in Jaisalmer District in the western Thar Desert, to 800 mm in Jhalawar District in the southeastern corner of the state. Groundwater conditions in the state have also deteriorated in the last two decades and reached alarmingly low levels. The degree of groundwater exploitation, which was only 35% exceedence of recharge rates in the year 1984, reached a level of 138% in 2008, and only 30 out of the 237 blocks are categorized as withdrawing water at safe rates in which recharge exceeds withdrawals (Gov. of Rajasthan 2009).
Rajasthan has faced frequent droughts and famine conditions in the past 50 years (Bhandari 1974). Groundwater is not available in many parts of the state, and in many cases, water is supplied to such areas through water tankers, trucks
Of the 142 desert blocks
in the country, 85 are
located in Rajasthan,
which are areas of high
water stress.
26 The UncomforTable nexUsThe UncomforTable nexUs
1 This was the water supply situation based upon the projected population as of July 2009.
and even trains. The per capita annual water availability in the state is about 780m31, despite the government target-minimum requirement of 1000m3 (Gov. of Rajasthan 2009).
The formal water supply for Jaipur city consists of both groundwater sources (tubewells), as well as surface sources. Before supplying the water, the Public Health and Engineering Department (PHED) chlorinates the water. Up until 2001, the only surface water resource for the city was Ramgarh Lake that catered to about 30% of the total requirement. In early 2010, the city began drawing a significant portion of its supply from Bisalpur Reservoir. The remaining balance of water demand is currently met by a network of private tubewells spread throughout the city. In some of the private colonies and cooperative societies, people have installed handpumps in order to meet their local demand. As per the City Development Plan for Jaipur (2005), the city had an adequate water supply with an availability corresponding to 126.5 liters per capita day (lpcd), serving almost 86.5% of the population. However, the main source of water – groundwater – is depleting rapidly as a result of growing population pressure and low recharge rates due to overexploitation and loss of recharge areas due to urban develop-ment. Water quality is also deteriorating due to disposal of sewerage using soak-pits, which leach into private groundwater supplies (LEA & CEPT 2005).
pOlicy lANdscApe
The Government of Rajasthan realizes the dismal situation of groundwater within the state and that there is a growing imbalance between demand and supply. The State Water Resources Planning Department announced a new state water policy in the 2010 that proposes a multi-sectoral approach to resource planning, development and management. The plan also gives equal priority to water conservation, augmentation of resources, awareness generation and a water-pricing regime that would enable better management and operation of water resources and supply schemes. The key elements of this policy are discussed below:
Planning for water resources
The policy indicates that the government would adopt an inclusive and multi-sectoral approach to water resources planning, development and management. All new resource planning would be done considering a river basin or its sub-basin as the basic unit. Furthermore, both urban and rural water supply schemes would be planned on the basis of ‘conjunctive’ use of ground and surface water resources.
management of resources
One of the key elements of this policy is a shift toward local community-based water management solutions as opposed to the earlier engineering-based solutions approach. The policy states that the communities will be empowered and held responsible for their own water management under the umbrella program of Integrated Water Resources Management. Formation of Water Users Groups (WUGs) and capacity
The UncomforTable nexUs 27The UncomforTable nexUs The Water supply context in Jaipur
building measures have been proposed in order to inculcate a sense of ownership on water resources and enhance participation in water management.
augmenting surface water sources
Given the paucity of surface water resources in the state, the policy places an empha-sis on augmentation through various measures. The policy recommends that traditional water harvesting structures be encouraged, in addition to the re-use of treated waste-water along with promoting rain and storm water harvesting. It further states that water use efficiency in irrigation could be enhanced by using means such as sprinklers or drip irrigation, so as to reduce water demand in agriculture, thus optimizing surface water utilization.
conservation of water resources
In order to conserve and enrich groundwater resources, the policy advises the reduction of groundwater withdrawal as much as possible by conserving water. It proposes that an evaluation of recharging potential groundwater resources should be undertaken for better planning. The policy further recommends an aquifer-wise planning of ground-water resources quite similar to the river basin approach for surface water planning.
Urban water conservation
Keeping in mind the rapid growth of urban centers, and consequently the increas-ing demand from these areas, the policy suggests several measures for conserving water. The policy suggests that all urban centers need to implement measures in order to reduce the unaccounted for water losses (UFWL), as these are quite high (44% for Jaipur city) and lead to losses in revenue. Early detection and prevention of leakages in the water supply network has been suggested as one of the remedial measures for improving water use efficiency in urban areas. The policy suggests provision of ceilings (maximum amounts that can be consumed) based on the consumption levels by differ-ent sets of consumers, coupled with a program to prevent unauthorized withdrawal in urban areas. Theoretically, these measures would lead to a more efficient and equitable distribution of this precious resource.
Pricing
The policy also states that a progressive pricing regime could be implemented in the effort to obtain full price recovery, including the operation and maintenance costs. This would be closely associated with an awareness generation campaign about water scarcity in the state so that people are willing to value the water they receive and pay for it, further reducing demand. The pricing of water would be based on one’s ability to pay, with people from lower income strata being charged less for water.
awareness generation
Looking at the inadequacy of the region’s water resources, the state planning depart-ment realizes that all of the above measures would have to have maximum participation from the various end-users to transition into a more sustainable water use situation. The policy recommends launching awareness generation campaigns highlighting the region’s water supply, as well as the need for water conservation by all users, across all sectors. It further states that there is a need to generate awareness towards practical wa-
The Government of
Rajasthan realizes the
dismal situation of
groundwater within
the state and that
there is a growing
imbalance between
demand and supply.
28 The UncomforTable nexUsThe UncomforTable nexUs
ter saving technologies and approaches for water conservation. Similarly, improvements in water use efficiency also need to be popularized amongst the people through various means, such as the re-use and recycling of wastewater.
GrOuNdWATer
Groundwater is the most important source of water in most parts of Rajasthan due to the lack of perennial surface water sources, except for the Chambal River. Approximately 90% of the drinking water supply schemes in Rajasthan focus on groundwater, and 60% of the agriculture sector demand is met through groundwa-ter. Groundwater availability varies across the state, both in quality and quantity, from satisfactory to very poor. Groundwater tables in various aquifers fluctuate because of recurring droughts in the state and the extreme rates of overdraft in many areas. Infiltration from rainfall is the most important source of groundwater recharge in Rajasthan. As the rainfall received by the state is scanty, there are very few perennial streams. Some of the aquifers in the western areas are confined bedrock aquifers and not easily recharged.
Groundwater resources in Rajasthan tend to have high concentrations of fluorides. In desert areas where groundwater is generally brackish, the water table has been drawn
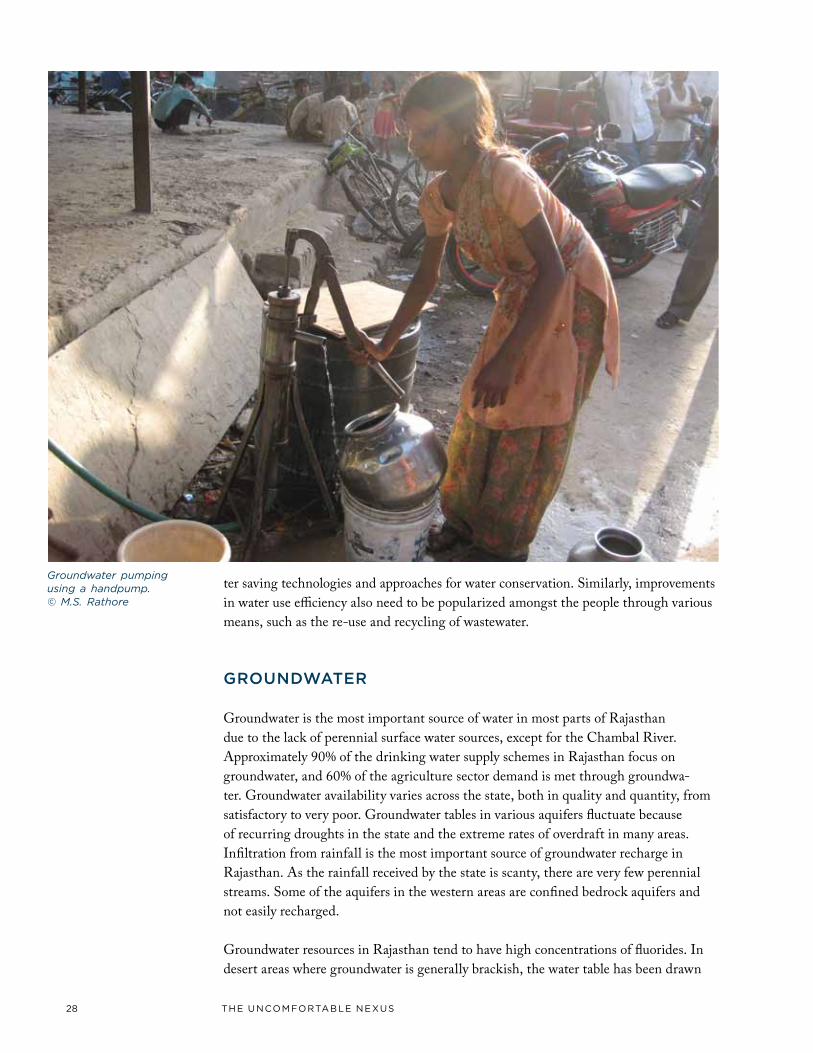
Groundwater pumping using a handpump. © M.S. Rathore
The UncomforTable nexUs 29The UncomforTable nexUs The Water supply context in Jaipur
down significantly, in some cases as much as 200 meters or more, further concentrating salts and fluorides in the remaining water. Efforts to reduce the high fluoride content in water have had limited success due to groundwater mining and poor recharge as a result of minimal rainfall and land use change.
Throughout Jaipur city, groundwater quality is variable, with some areas largely within permissible limits as per Indian Standard 10500, and concentrations of nitrates and fluorides exceeding limits in other locations. The widespread use of septic tanks throughout the city is possibly one factor contributing to the high concentration of nitrates in the groundwater. The wastewater from soak pits leaches into the ground and thus contaminates the groundwater strata (LEA & CEPT 2005). The drinking water standards do not provide provisions for monitoring or regulating bacteriological counts in water, only chemicals and metals (IS 10500). Thus, the extent of fecal contamination of tubewell drinking water in the city is not known, but the high presence of nitrates could be considered a proxy indicator. Households and businesses relying on private supplies or water tankers do not benefit from the disinfected water provided via the pipe network operated by the PHED. The watertable has been drawn down the most within the Walled City and Jhotwara Industrial Area. This could be attributed to the high population density in the Walled City, which is heavily dependent on groundwa-ter. The Jhotwara Industrial Area also faces the similar situation of deep groundwater tables due to drawdown in the aquifer by the surrounding neighborhoods.
surfAce WATer supplies
The total surface water available in the state is estimated to be 21.71 billion m3 (BCM), of which 16.05 BCM is economically usable. Roughly 72% of this viable potential has already been harnessed. In addition to this amount, an additional 17.89 BCM is avail-able through inter-state agreements with the neighboring states of Madhya Pradesh, Punjab and Gujarat. However, the total surface supply is not enough to meet the combined demands of the state’s drinking, agriculture and non-agriculture needs. The River Chambal, in the eastern part of the state, is the only perennial river in Rajasthan. In the western arid and semi-arid regions, surface water sources are almost non-existent (Gov. of Rajasthan 2009).
For Jaipur city, most of the surface water sources originate from nearby hills, which act as drainage channels for rainwater. The region is drained by a number of seasonal rivers, of which Banganga, Dhundh and Bandi are prominent. There is no perennial surface water source in the city. Amanishah Nallah and Dhund River are two seasonal streams that flow from north to south near the city. Ramgarh Lake, which was the main source of supply more than 30 years back, produces a negligible quantity today due to high silt loads reducing the lake’s capacity.
To reduce Jaipur’s current dependence on its groundwater resources, the Bisalpur-Jaipur Water Supply Project (BWSP) was designed to deliver water from the existing Bisalpur Dam headworks up to Balawala, located on the south edge of the city. The project
Throughout Jaipur
city, groundwater
quality is variable,
with some areas
largely within
permissible limits
as per Indian
Standard 10500, and
concentrations of
nitrates and fluorides
exceeding limits in
other locations.
30 The UncomforTable nexUsThe UncomforTable nexUs
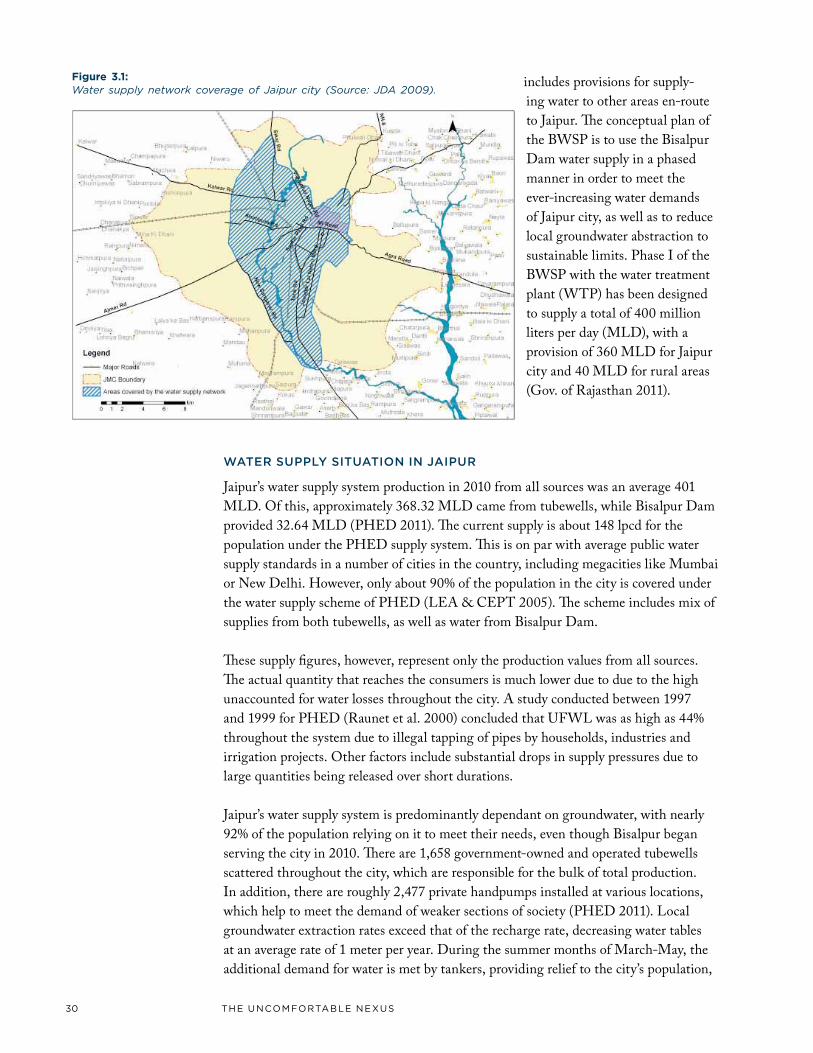
includes provisions for supply-ing water to other areas en-route to Jaipur. The conceptual plan of the BWSP is to use the Bisalpur Dam water supply in a phased manner in order to meet the ever-increasing water demands of Jaipur city, as well as to reduce local groundwater abstraction to sustainable limits. Phase I of the BWSP with the water treatment plant (WTP) has been designed to supply a total of 400 million liters per day (MLD), with a provision of 360 MLD for Jaipur city and 40 MLD for rural areas (Gov. of Rajasthan 2011).
WATer supply siTuATiON iN JAipur
Jaipur’s water supply system production in 2010 from all sources was an average 401 MLD. Of this, approximately 368.32 MLD came from tubewells, while Bisalpur Dam provided 32.64 MLD (PHED 2011). The current supply is about 148 lpcd for the population under the PHED supply system. This is on par with average public water supply standards in a number of cities in the country, including megacities like Mumbai or New Delhi. However, only about 90% of the population in the city is covered under the water supply scheme of PHED (LEA & CEPT 2005). The scheme includes mix of supplies from both tubewells, as well as water from Bisalpur Dam.
These supply figures, however, represent only the production values from all sources. The actual quantity that reaches the consumers is much lower due to due to the high unaccounted for water losses throughout the city. A study conducted between 1997 and 1999 for PHED (Raunet et al. 2000) concluded that UFWL was as high as 44% throughout the system due to illegal tapping of pipes by households, industries and irrigation projects. Other factors include substantial drops in supply pressures due to large quantities being released over short durations.
Jaipur’s water supply system is predominantly dependant on groundwater, with nearly 92% of the population relying on it to meet their needs, even though Bisalpur began serving the city in 2010. There are 1,658 government-owned and operated tubewells scattered throughout the city, which are responsible for the bulk of total production. In addition, there are roughly 2,477 private handpumps installed at various locations, which help to meet the demand of weaker sections of society (PHED 2011). Local groundwater extraction rates exceed that of the recharge rate, decreasing water tables at an average rate of 1 meter per year. During the summer months of March-May, the additional demand for water is met by tankers, providing relief to the city’s population,
Figure 3.1: Water supply network coverage of Jaipur city (Source: JDA 2009).
The UncomforTable nexUs 31The UncomforTable nexUs The Water supply context in Jaipur
2 The six towns/settlements identified in the JDa master Plan 2011 are bagru, chomu, achrol, Jamwa
ramgarh, bassi and the combined areas of sheodaspura and chandlai (JDa 2009).
especially for those living in areas not supplied by the PHED piped system. The Municipal Corporation operates the majority of the tankers and approximately 1,640 trips per day are required to meet the city’s supply-demand gap (PHED 2011). There are also large numbers of private tankers operating in the city, which has led to the development of parallel, informal water markets.
There are several towns and villages in the vicinity of Jaipur. Six of these towns and settlements2 within a 25-35 km radius have been recognized as satellite settlements and are considered to be within the Jaipur Development Authority’s (JDA) planning area (JDA 1995). The Master Plan recognizes these settlements as “appropriate locations for physical growth (of Jaipur city)” and expansion of the peri-urban areas. While RIICO (Rajasthan State Industrial Development and Investment Corporation) has developed industrial areas in the vicinity of a couple of these settlements, most of these settlements rely on agriculture or allied activities as their main occupation.
As reported in the Master Plan, these settlements are linked to Jaipur by transport systems, which are provided both by government and private operators. In addition, these settlements have mixed economies with more intense commercial agricultural (vegetable growing) and non-agricultural (dairy) economic activities than those that take place in purely rural areas. Such ‘mixed economy’ regions, which fall between the purely ‘rural’ or purely ‘urban’ systems, have been termed as “desakota’’ or peri-urban systems (The Desakota Study Team 2008). The Master Plan 2011 study of these surrounding settlements shows that almost all of these peri-urban and rural centers have grown as suppliers of commodities such as fresh vegetables and milk to the city. This has led to overexploitation of groundwater resources in such areas, as vegetables are water intensive crops.
A water stand-post in Jaipur city. © M.S. Rathore
32 The UncomforTable nexUsThe UncomforTable nexUs
The aforementioned study on rural-urban desakota systems (The Desakota Study Team 2008) argues that the desakota or peri-urban phenomenon can be defined by the closely interlinked, co-penetrating rural and urban livelihoods, communication, transport and economic systems. Given the close proximity of these settlements to Jaipur and the availability of cheap transport systems, many long-term migrants tend to live in such areas. Within peri-urban areas themselves, the intensification of economic and human activity, coupled with climate change phenomena, exerts signifi-cant stress on natural systems, especially water-based ecosystems and associated ecosys-tem services. Such stresses normally manifest as pollution and water demands from commercial, industrial and service industries, coupled with similar pressures from agricultural intensification. Under such conditions, the poor’s accessibility to essential services such as water is severely hampered. In addition, the emergence of intermediary informal market institutions to provide ecosystem services and goods has significant implications for their accessibility and affordability by the poor.
impAcT Of climATe vAriABiliTy ON WATer AvAilABiliTy iN JAipur
Current and historic rainfall variability is quite large and exerts both direct and indirect pressures on the water supply systems of Jaipur city. As discussed in the next chapters, the hydrology of the region is changing due to variations in climatic factors and in demand requirements. Groundwater availability is decreasing, made evident by a rapidly declining water table. Erratic rainfall further reduces the rate of groundwater recharge. There is evidence (refer to Chapters 2 and 4) of a downward trend in annual rainfall amounts in some areas near Jaipur over the past twenty years. This has directly affected groundwater recharge in Jaipur city and its surrounding areas, leading to increasing pressures on existing sources of water. Coupled with this is the reduced and uncertain availability of surface water from the sources such as lakes3 and rivers4. There are indications that climate change will have detrimental effects on the catchment area of this dam and the overall availability from the dam itself may not be met as planned. The future climate change scenarios and their implications for Jaipur city and its water supply are discussed in more detail in the next chapter.
Though the social structures and processes that create poverty and marginality are more important determinants of migration, environmental changes can be directly linked to aggravating poverty and marginality, as discussed in the previous chapter. Such changes in rural and peri-urban areas play a key role in factors influencing migra-tion into Jaipur city, which has led to increased pressure on the city water supply system.
3 ramgarh lake has almost dried up and is now producing insignificant amounts of water as opposed
to meeting about 30% of all water demands of the city a decade ago.
4 bisalpur Dam on banas river is supposed to provide significant amounts of water to the city. Yet
conflicting demands from other settlements is reducing the effective availability for Jaipur. even
though 2010 was a high rainfall year, with rajasthan receiving precipitation from the fronts that
brought significant flooding Pakistan, only minimal amounts of water were released from the dam to
the city.
Environmental
changes can be
linked to aggravating
poverty and
marginality in rural
and peri-urban areas
thus influencing
migration into Jaipur
city.

The UncomforTable nexUs 33The UncomforTable nexUs The Water supply context in Jaipur
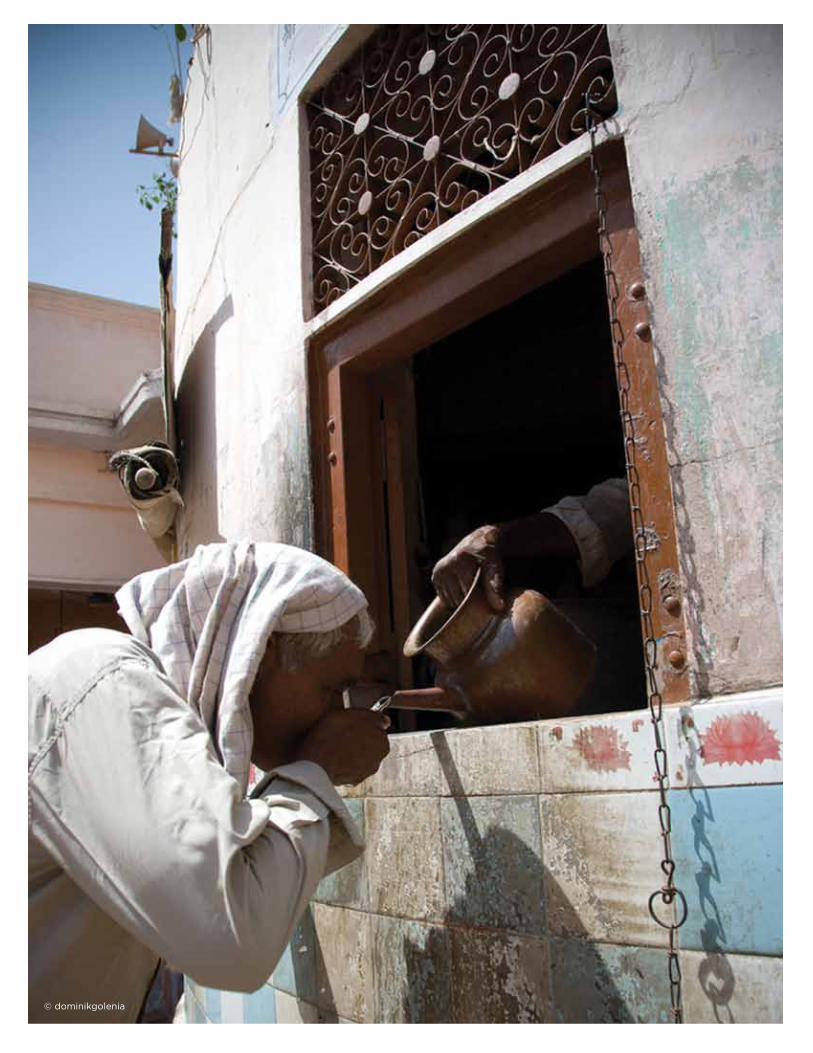
34 The UncomforTable nexUs rainfall, climate change and Water supply in JaipurThe UncomforTable nexUs © dominikgolenia
The UncomforTable nexUs 35rainfall, climate change and Water supply in JaipurThe UncomforTable nexUs
iNTrOducTiON
This chapter examines how rainfall patterns in the Banas River Basin might be altered in the near future (2010-2040) under various climate change scenarios and discusses the potential impacts of these changes on streamflow in the Banas River. Climate change scenarios on global and regional scales are generated by general circulation models (GCMs) and regional circulation models (RCMs). GCMs and RCMs are driven by different scenarios, known as the Special Report on Emissions Scenarios or SRES scenarios, of potential future greenhouse gas emissions based on popula-tion, energy choices and economic development. There are four primary SRES scenario families – A1, B1, A2 and B2 – developed by the Intergovernmental Panel on Climate Change (IPCC) that were each formulated from conditions in 2000 and then taken forward into the future under different growth pathways (Nakicenovic et al. 2000). Each SRES scenario is associated with varied levels of greenhouse gas emissions and rates of growth in those emissions through 2100. GCMs are driven by the scenarios in order to see how the planet’s climate might be impacted if certain greenhouse gas emission levels, population, energy and economic choices are made. In the most recent IPCC assessment (2007), most of the GCMs were driven by the emissions scenarios B1, A1B and A2 as shown in Figure 4.11.
Chapter 4
rainFall, Climate Change and Water sUpply in JaipUr
1 The latest set of Gcms are being driven by new emissions scenarios, called representative
concentration Pathways, that were developed with updated scientific knowledge, policy preferences
and observations of human behavior over the past decade. The new climate change projections will
be release in the fifth IPcc assessment in 2013.
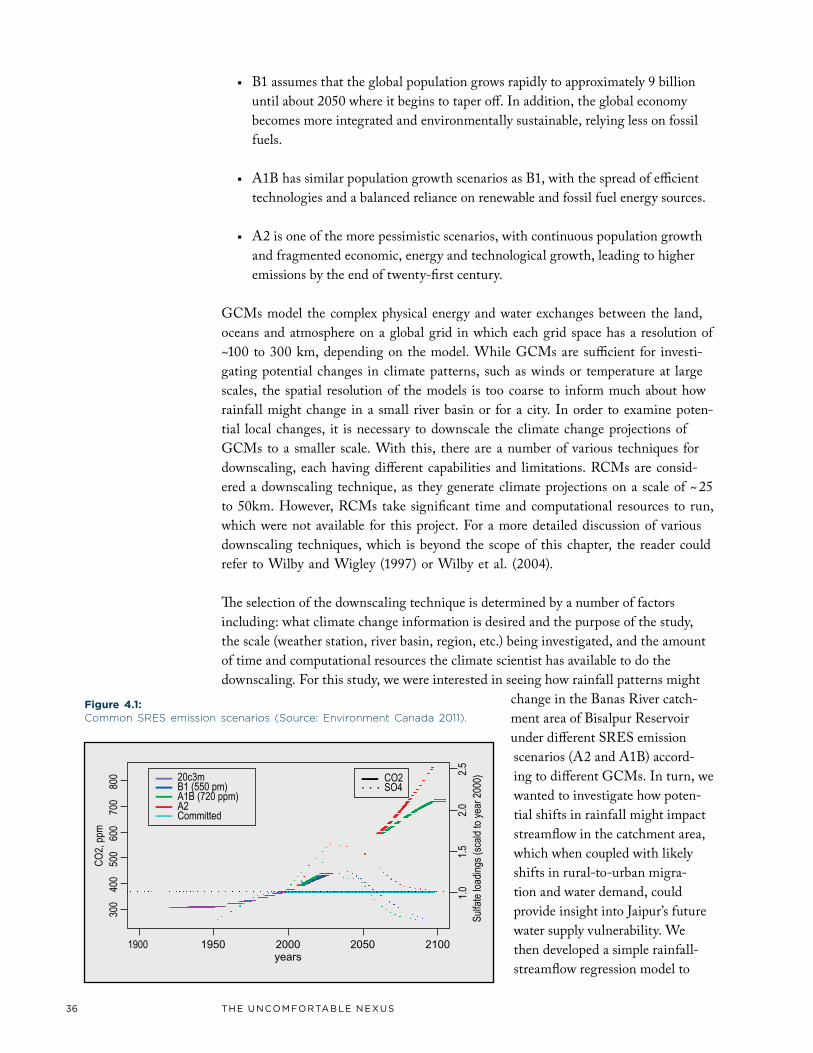
36 rainfall, climate change and Water supply in JaipurThe UncomforTable nexUs rainfall, climate change and Water supply in JaipurThe UncomforTable nexUs
■ B1 assumes that the global population grows rapidly to approximately 9 billion until about 2050 where it begins to taper off. In addition, the global economy becomes more integrated and environmentally sustainable, relying less on fossil fuels.
■ A1B has similar population growth scenarios as B1, with the spread of efficient technologies and a balanced reliance on renewable and fossil fuel energy sources.
■ A2 is one of the more pessimistic scenarios, with continuous population growth and fragmented economic, energy and technological growth, leading to higher emissions by the end of twenty-first century.
GCMs model the complex physical energy and water exchanges between the land, oceans and atmosphere on a global grid in which each grid space has a resolution of ~100 to 300 km, depending on the model. While GCMs are sufficient for investi-gating potential changes in climate patterns, such as winds or temperature at large scales, the spatial resolution of the models is too coarse to inform much about how rainfall might change in a small river basin or for a city. In order to examine poten-tial local changes, it is necessary to downscale the climate change projections of GCMs to a smaller scale. With this, there are a number of various techniques for downscaling, each having different capabilities and limitations. RCMs are consid-ered a downscaling technique, as they generate climate projections on a scale of ~ 25 to 50km. However, RCMs take significant time and computational resources to run, which were not available for this project. For a more detailed discussion of various downscaling techniques, which is beyond the scope of this chapter, the reader could refer to Wilby and Wigley (1997) or Wilby et al. (2004).
The selection of the downscaling technique is determined by a number of factors including: what climate change information is desired and the purpose of the study, the scale (weather station, river basin, region, etc.) being investigated, and the amount of time and computational resources the climate scientist has available to do the downscaling. For this study, we were interested in seeing how rainfall patterns might
change in the Banas River catch-ment area of Bisalpur Reservoir under different SRES emission scenarios (A2 and A1B) accord-ing to different GCMs. In turn, we wanted to investigate how poten-tial shifts in rainfall might impact streamflow in the catchment area, which when coupled with likely shifts in rural-to-urban migra-tion and water demand, could provide insight into Jaipur’s future water supply vulnerability. We then developed a simple rainfall-streamflow regression model to
Figure 4.1: Common SRES emission scenarios (Source: Environment Canada 2011).
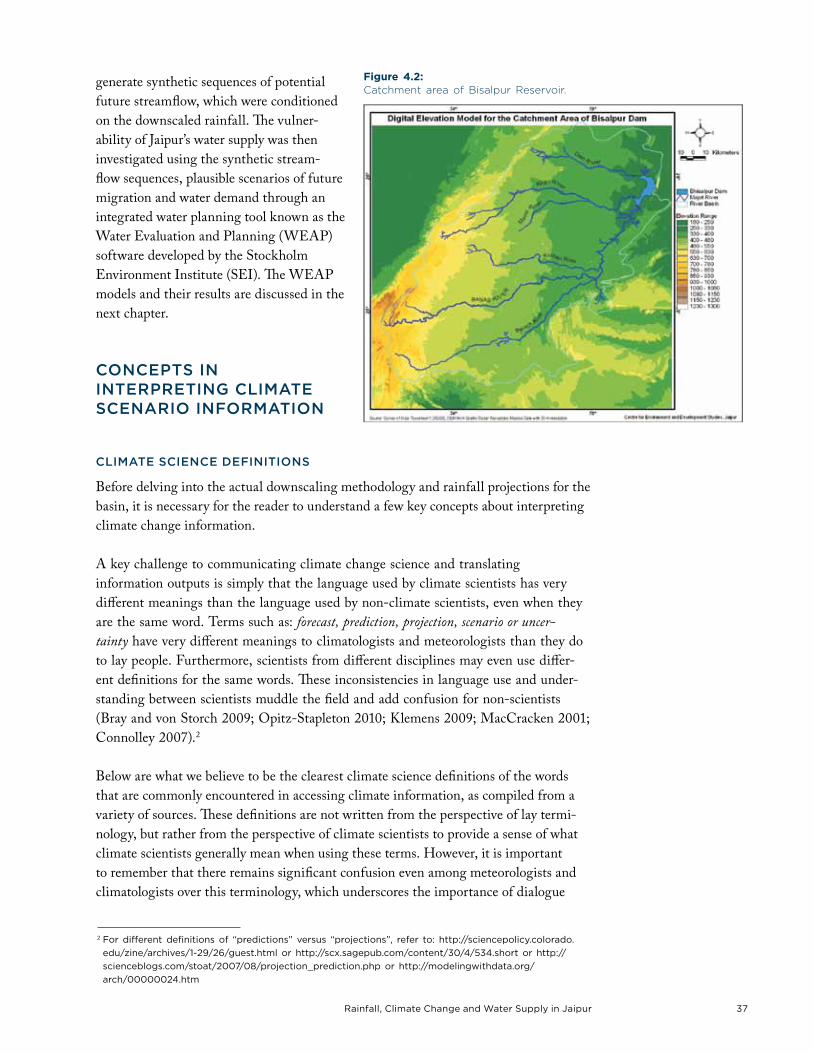
rainfall, climate change and Water supply in JaipurThe UncomforTable nexUs 37rainfall, climate change and Water supply in JaipurThe UncomforTable nexUs
Figure 4.2: Catchment area of Bisalpur Reservoir.
generate synthetic sequences of potential future streamflow, which were conditioned on the downscaled rainfall. The vulner-ability of Jaipur’s water supply was then investigated using the synthetic stream-flow sequences, plausible scenarios of future migration and water demand through an integrated water planning tool known as the Water Evaluation and Planning (WEAP) software developed by the Stockholm Environment Institute (SEI). The WEAP models and their results are discussed in the next chapter.
cONcepTs iN iNTerpreTiNG climATe sceNAriO iNfOrmATiON
climATe scieNce defiNiTiONs
Before delving into the actual downscaling methodology and rainfall projections for the basin, it is necessary for the reader to understand a few key concepts about interpreting climate change information.
A key challenge to communicating climate change science and translating information outputs is simply that the language used by climate scientists has very different meanings than the language used by non-climate scientists, even when they are the same word. Terms such as: forecast, prediction, projection, scenario or uncer-tainty have very different meanings to climatologists and meteorologists than they do to lay people. Furthermore, scientists from different disciplines may even use differ-ent definitions for the same words. These inconsistencies in language use and under-standing between scientists muddle the field and add confusion for non-scientists (Bray and von Storch 2009; Opitz-Stapleton 2010; Klemens 2009; MacCracken 2001; Connolley 2007).2
Below are what we believe to be the clearest climate science definitions of the words that are commonly encountered in accessing climate information, as compiled from a variety of sources. These definitions are not written from the perspective of lay termi-nology, but rather from the perspective of climate scientists to provide a sense of what climate scientists generally mean when using these terms. However, it is important to remember that there remains significant confusion even among meteorologists and climatologists over this terminology, which underscores the importance of dialogue
2 for different definitions of “predictions” versus “projections”, refer to: http://sciencepolicy.colorado.
edu/zine/archives/1-29/26/guest.html or http://scx.sagepub.com/content/30/4/534.short or http://
scienceblogs.com/stoat/2007/08/projection_prediction.php or http://modelingwithdata.org/
arch/00000024.htm
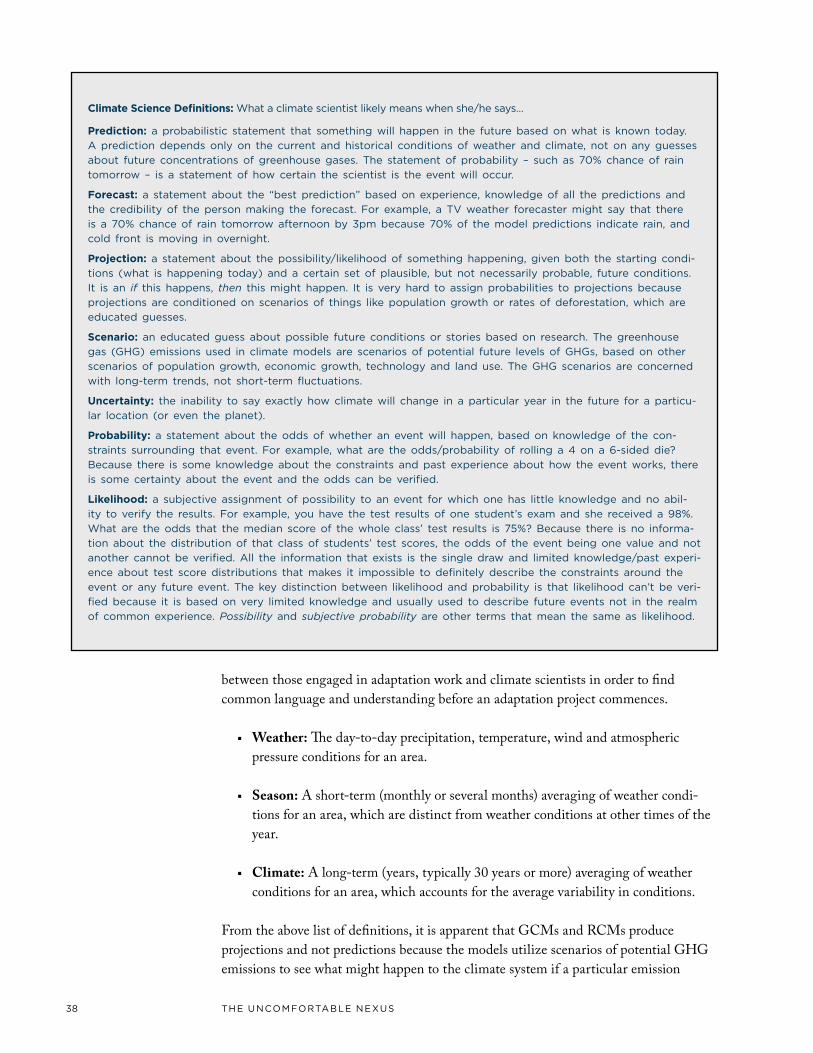
38 rainfall, climate change and Water supply in JaipurThe UncomforTable nexUs rainfall, climate change and Water supply in JaipurThe UncomforTable nexUs
Climate science definitions: What a climate scientist likely means when she/he says…
prediction: a probabilistic statement that something will happen in the future based on what is known today.
a prediction depends only on the current and historical conditions of weather and climate, not on any guesses
about future concentrations of greenhouse gases. The statement of probability – such as 70% chance of rain
tomorrow – is a statement of how certain the scientist is the event will occur.
Forecast: a statement about the “best prediction” based on experience, knowledge of all the predictions and
the credibility of the person making the forecast. for example, a TV weather forecaster might say that there
is a 70% chance of rain tomorrow afternoon by 3pm because 70% of the model predictions indicate rain, and
cold front is moving in overnight.
projection: a statement about the possibility/likelihood of something happening, given both the starting condi-
tions (what is happening today) and a certain set of plausible, but not necessarily probable, future conditions.
It is an if this happens, then this might happen. It is very hard to assign probabilities to projections because
projections are conditioned on scenarios of things like population growth or rates of deforestation, which are
educated guesses.
scenario: an educated guess about possible future conditions or stories based on research. The greenhouse
gas (GhG) emissions used in climate models are scenarios of potential future levels of GhGs, based on other
scenarios of population growth, economic growth, technology and land use. The GhG scenarios are concerned
with long-term trends, not short-term fluctuations.
Uncertainty: the inability to say exactly how climate will change in a particular year in the future for a particu-
lar location (or even the planet).
probability: a statement about the odds of whether an event will happen, based on knowledge of the con-
straints surrounding that event. for example, what are the odds/probability of rolling a 4 on a 6-sided die?
because there is some knowledge about the constraints and past experience about how the event works, there
is some certainty about the event and the odds can be verified.
likelihood: a subjective assignment of possibility to an event for which one has little knowledge and no abil-
ity to verify the results. for example, you have the test results of one student’s exam and she received a 98%.
What are the odds that the median score of the whole class’ test results is 75%? because there is no informa-
tion about the distribution of that class of students’ test scores, the odds of the event being one value and not
another cannot be verified. all the information that exists is the single draw and limited knowledge/past experi-
ence about test score distributions that makes it impossible to definitely describe the constraints around the
event or any future event. The key distinction between likelihood and probability is that likelihood can’t be veri-
fied because it is based on very limited knowledge and usually used to describe future events not in the realm
of common experience. Possibility and subjective probability are other terms that mean the same as likelihood.
between those engaged in adaptation work and climate scientists in order to find common language and understanding before an adaptation project commences.
■ Weather: The day-to-day precipitation, temperature, wind and atmospheric pressure conditions for an area.
■ Season: A short-term (monthly or several months) averaging of weather condi-tions for an area, which are distinct from weather conditions at other times of the year.
■ Climate: A long-term (years, typically 30 years or more) averaging of weather conditions for an area, which accounts for the average variability in conditions.
From the above list of definitions, it is apparent that GCMs and RCMs produce projections and not predictions because the models utilize scenarios of potential GHG emissions to see what might happen to the climate system if a particular emission
rainfall, climate change and Water supply in JaipurThe UncomforTable nexUs 39rainfall, climate change and Water supply in JaipurThe UncomforTable nexUs
scenario is used. The words “prediction” and “forecast” are most appropriately used with meteorology because weather models are conditioned on current and historical conditions, not on scenarios of possible futures. This is a very important distinction to communicate in climate adaptation work – because it means that probabilities cannot be assigned to any of the climate model outputs. At best, the likelihood or possibility of a particular projection occurring in the future can be discussed and must be based upon: 1) Knowledge about the model that produced the projection – its assumptions, how well it can replicate key features of the historical climate for the region of inter-est; 2) Which emission scenarios were used to make the projection(s); 3) The subjective degree of confidence in the projection, based on the decision-maker’s risk preferences; 4) The types of communication with the climate scientists who produced the informa-tion and their credibility; and, 5) The decision-maker’s understanding of the severity of the implications and impacts of that projection for the area, group of people, or time frame of interest (Kinzig et al. 2003; Gay and Estrada 2010; Dessai et al. 2009).
uNcerTAiNTy iN climATe prOJecTiONs
One of the most frequent requests from decision makers at all levels is for greater accuracy and precision in location-specific climate projections. Yet, because of a lack of high resolution projections for many locations and uncertainty in projections at any scale, it is impossible to predict exactly how much rain is likely to fall in a location in Gorakhpur, India on July 23, 2050 or exactly how the Asian Monsoon System will change in the future, due to the complex land-ocean-atmosphere dynamics that govern that system.
Climate change projections contain multiple sources of uncertainty. Some of the sources are:
■ Projections of human change, growth, and emissions: Modelers make simplified, educated assumptions regarding future energy pathways and development regimes whose effect on GHG emissions would alter both the foundational design and outcomes of many of the scenarios. Additionally, climate and integrated assess-ment models poorly incorporate human land use, especially for food, fuel, and forestry, and land use change even though these play significant roles in terres-trial-atmospheric interactions. Politics is another unpredictable factor that will greatly influence national and global energy choices. Understanding and trend-ing all these factors requires constant adjustment and integration into the scenar-ios used to drive climate models and integrated impact assessment models. The combination of so many assumptive scenarios of changing conditions and drivers of climate change compounds uncertainty throughout the modeling effort.
■ Climate models (or any model, for that matter) are only approximations of reality: Some of the climate physics - the interactions between the land, ocean, and atmosphere - are well understood, but others are not. The more we study the climate system, the more we are beginning to realize how complex it actually is and how much we have yet to learn. Even those interactions that are well under-stood are not necessarily easily represented in models because they are non-linear
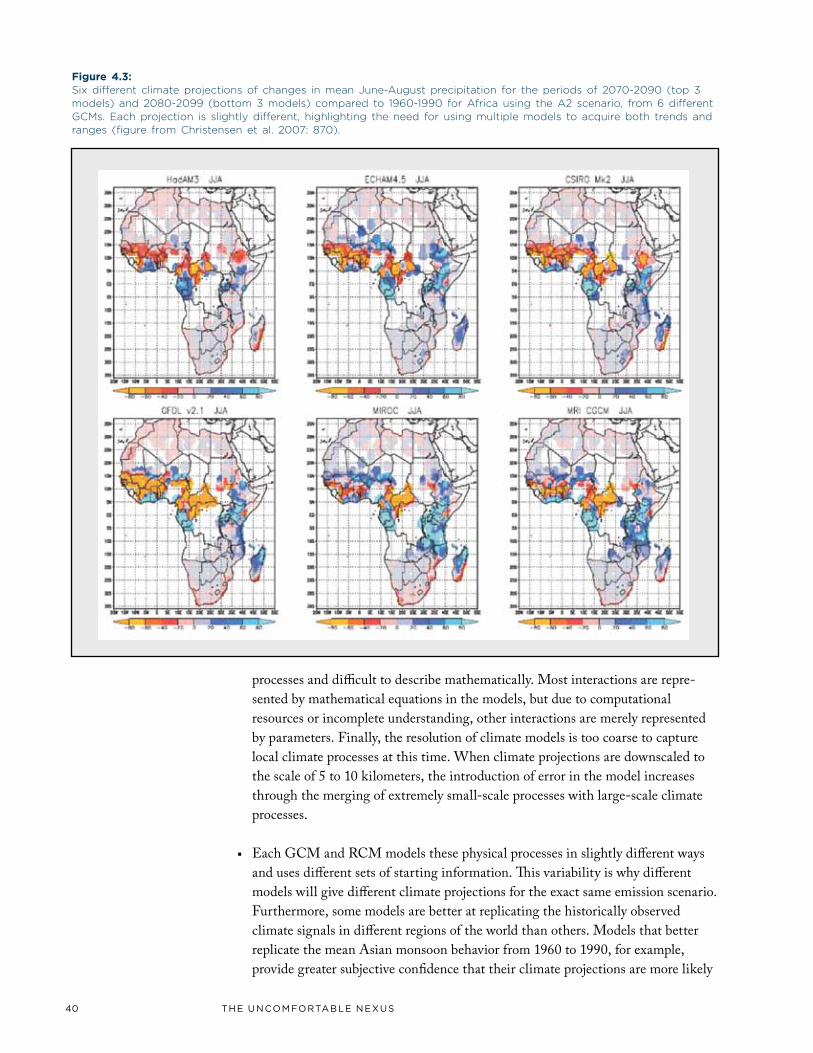
40 rainfall, climate change and Water supply in JaipurThe UncomforTable nexUs rainfall, climate change and Water supply in JaipurThe UncomforTable nexUs
Figure 4.3:Six different climate projections of changes in mean June-August precipitation for the periods of 2070-2090 (top 3 models) and 2080-2099 (bottom 3 models) compared to 1960-1990 for Africa using the A2 scenario, from 6 different GCMs. Each projection is slightly different, highlighting the need for using multiple models to acquire both trends and ranges (figure from Christensen et al. 2007: 870).
processes and difficult to describe mathematically. Most interactions are repre-sented by mathematical equations in the models, but due to computational resources or incomplete understanding, other interactions are merely represented by parameters. Finally, the resolution of climate models is too coarse to capture local climate processes at this time. When climate projections are downscaled to the scale of 5 to 10 kilometers, the introduction of error in the model increases through the merging of extremely small-scale processes with large-scale climate processes.
■ Each GCM and RCM models these physical processes in slightly different ways and uses different sets of starting information. This variability is why different models will give different climate projections for the exact same emission scenario. Furthermore, some models are better at replicating the historically observed climate signals in different regions of the world than others. Models that better replicate the mean Asian monsoon behavior from 1960 to 1990, for example, provide greater subjective confidence that their climate projections are more likely
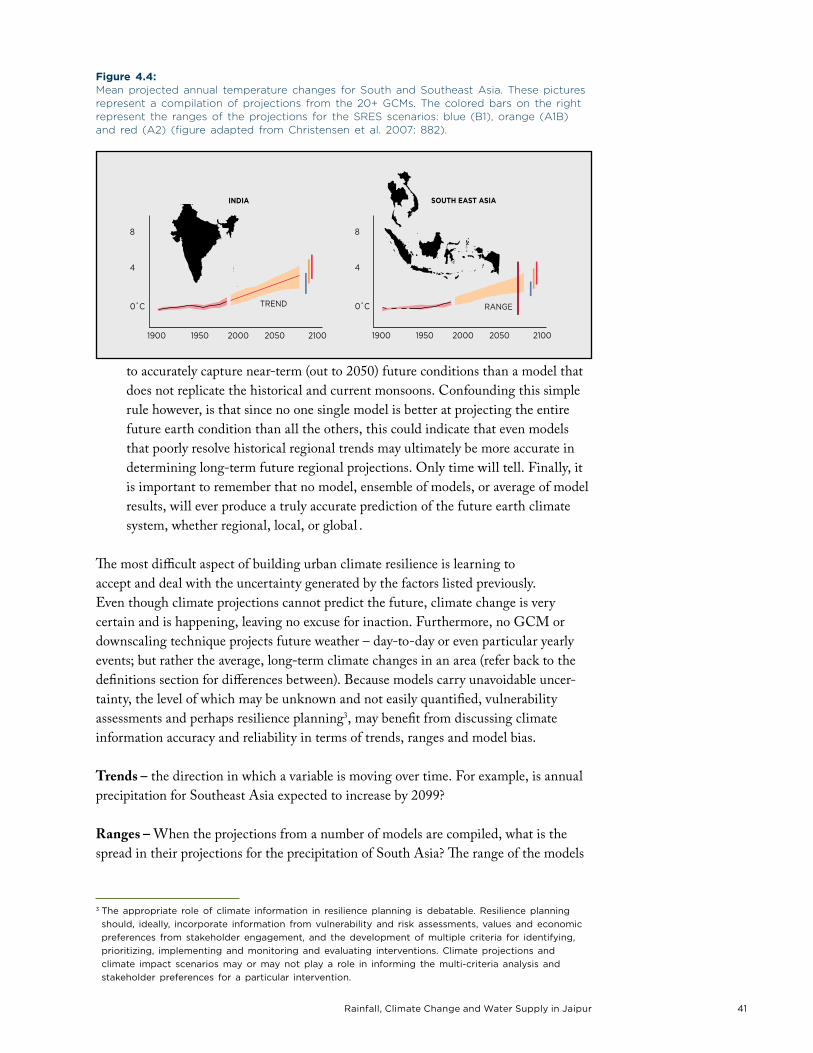
rainfall, climate change and Water supply in JaipurThe UncomforTable nexUs 41rainfall, climate change and Water supply in JaipurThe UncomforTable nexUs
to accurately capture near-term (out to 2050) future conditions than a model that does not replicate the historical and current monsoons. Confounding this simple rule however, is that since no one single model is better at projecting the entire future earth condition than all the others, this could indicate that even models that poorly resolve historical regional trends may ultimately be more accurate in determining long-term future regional projections. Only time will tell. Finally, it is important to remember that no model, ensemble of models, or average of model results, will ever produce a truly accurate prediction of the future earth climate system, whether regional, local, or global .
The most difficult aspect of building urban climate resilience is learning to accept and deal with the uncertainty generated by the factors listed previously. Even though climate projections cannot predict the future, climate change is very certain and is happening, leaving no excuse for inaction. Furthermore, no GCM or downscaling technique projects future weather – day-to-day or even particular yearly events; but rather the average, long-term climate changes in an area (refer back to the definitions section for differences between). Because models carry unavoidable uncer-tainty, the level of which may be unknown and not easily quantified, vulnerability assessments and perhaps resilience planning3, may benefit from discussing climate information accuracy and reliability in terms of trends, ranges and model bias.
Trends – the direction in which a variable is moving over time. For example, is annual precipitation for Southeast Asia expected to increase by 2099?
Ranges – When the projections from a number of models are compiled, what is the spread in their projections for the precipitation of South Asia? The range of the models
Figure 4.4:Mean projected annual temperature changes for South and Southeast Asia. These pictures represent a compilation of projections from the 20+ GCMs. The colored bars on the right represent the ranges of the projections for the SRES scenarios: blue (B1), orange (A1B) and red (A2) (figure adapted from Christensen et al. 2007: 882).
TREND
1900 1950 2000 2050 2100
8
4
0˚C
8
4
0˚C
1900 1950 2000 2050 2100
RANGE
INDIA SOUTH EAST ASIA
3 The appropriate role of climate information in resilience planning is debatable. resilience planning
should, ideally, incorporate information from vulnerability and risk assessments, values and economic
preferences from stakeholder engagement, and the development of multiple criteria for identifying,
prioritizing, implementing and monitoring and evaluating interventions. climate projections and
climate impact scenarios may or may not play a role in informing the multi-criteria analysis and
stakeholder preferences for a particular intervention.
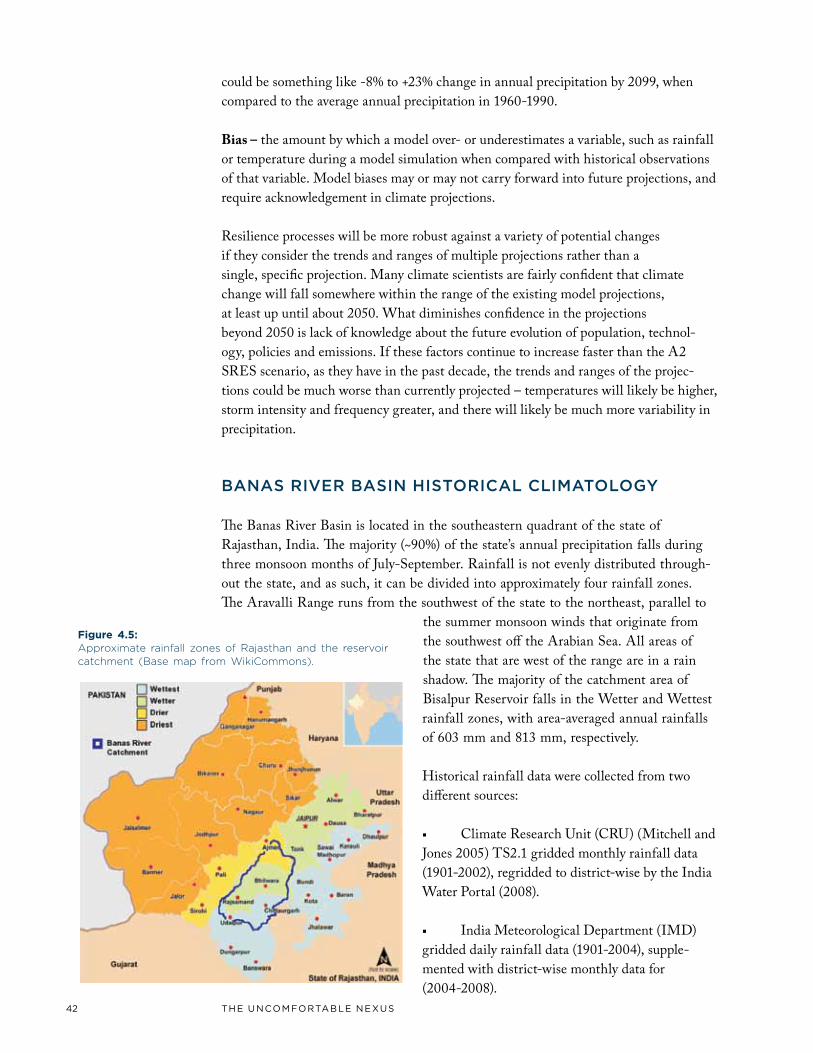
42 rainfall, climate change and Water supply in JaipurThe UncomforTable nexUs rainfall, climate change and Water supply in JaipurThe UncomforTable nexUs
Figure 4.5:Approximate rainfall zones of Rajasthan and the reservoir catchment (Base map from WikiCommons).
could be something like -8% to +23% change in annual precipitation by 2099, when compared to the average annual precipitation in 1960-1990.
Bias – the amount by which a model over- or underestimates a variable, such as rainfall or temperature during a model simulation when compared with historical observations of that variable. Model biases may or may not carry forward into future projections, and require acknowledgement in climate projections.
Resilience processes will be more robust against a variety of potential changes if they consider the trends and ranges of multiple projections rather than a single, specific projection. Many climate scientists are fairly confident that climate change will fall somewhere within the range of the existing model projections, at least up until about 2050. What diminishes confidence in the projections beyond 2050 is lack of knowledge about the future evolution of population, technol-ogy, policies and emissions. If these factors continue to increase faster than the A2 SRES scenario, as they have in the past decade, the trends and ranges of the projec-tions could be much worse than currently projected – temperatures will likely be higher, storm intensity and frequency greater, and there will likely be much more variability in precipitation.
BANAs river BAsiN hisTOricAl climATOlOGy
The Banas River Basin is located in the southeastern quadrant of the state of Rajasthan, India. The majority (~90%) of the state’s annual precipitation falls during three monsoon months of July-September. Rainfall is not evenly distributed through-out the state, and as such, it can be divided into approximately four rainfall zones. The Aravalli Range runs from the southwest of the state to the northeast, parallel to
the summer monsoon winds that originate from the southwest off the Arabian Sea. All areas of the state that are west of the range are in a rain shadow. The majority of the catchment area of Bisalpur Reservoir falls in the Wetter and Wettest rainfall zones, with area-averaged annual rainfalls of 603 mm and 813 mm, respectively.
Historical rainfall data were collected from two different sources:
■ Climate Research Unit (CRU) (Mitchell and Jones 2005) TS2.1 gridded monthly rainfall data (1901-2002), regridded to district-wise by the India Water Portal (2008).
■ India Meteorological Department (IMD) gridded daily rainfall data (1901-2004), supple-mented with district-wise monthly data for (2004-2008).
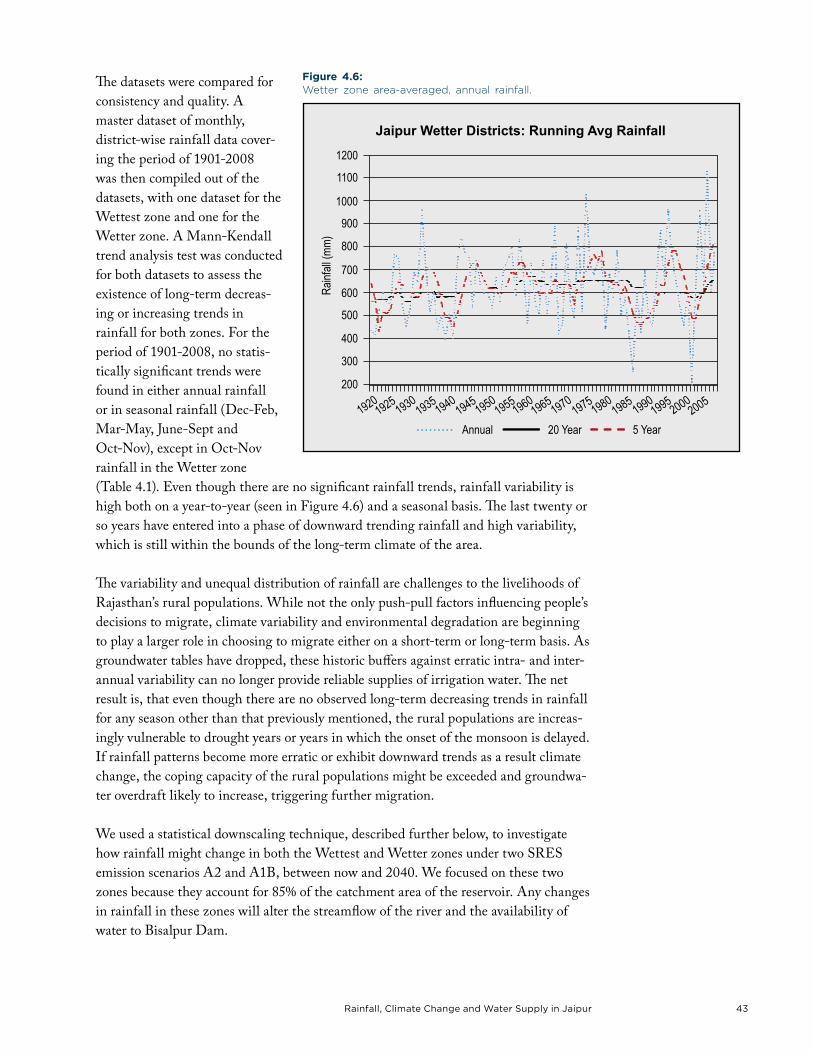
rainfall, climate change and Water supply in JaipurThe UncomforTable nexUs 43rainfall, climate change and Water supply in JaipurThe UncomforTable nexUs
The datasets were compared for consistency and quality. A master dataset of monthly, district-wise rainfall data cover-ing the period of 1901-2008 was then compiled out of the datasets, with one dataset for the Wettest zone and one for the Wetter zone. A Mann-Kendall trend analysis test was conducted for both datasets to assess the existence of long-term decreas-ing or increasing trends in rainfall for both zones. For the period of 1901-2008, no statis-tically significant trends were found in either annual rainfall or in seasonal rainfall (Dec-Feb, Mar-May, June-Sept and Oct-Nov), except in Oct-Nov rainfall in the Wetter zone (Table 4.1). Even though there are no significant rainfall trends, rainfall variability is high both on a year-to-year (seen in Figure 4.6) and a seasonal basis. The last twenty or so years have entered into a phase of downward trending rainfall and high variability, which is still within the bounds of the long-term climate of the area.
The variability and unequal distribution of rainfall are challenges to the livelihoods of Rajasthan’s rural populations. While not the only push-pull factors influencing people’s decisions to migrate, climate variability and environmental degradation are beginning to play a larger role in choosing to migrate either on a short-term or long-term basis. As groundwater tables have dropped, these historic buffers against erratic intra- and inter-annual variability can no longer provide reliable supplies of irrigation water. The net result is, that even though there are no observed long-term decreasing trends in rainfall for any season other than that previously mentioned, the rural populations are increas-ingly vulnerable to drought years or years in which the onset of the monsoon is delayed. If rainfall patterns become more erratic or exhibit downward trends as a result climate change, the coping capacity of the rural populations might be exceeded and groundwa-ter overdraft likely to increase, triggering further migration.
We used a statistical downscaling technique, described further below, to investigate how rainfall might change in both the Wettest and Wetter zones under two SRES emission scenarios A2 and A1B, between now and 2040. We focused on these two zones because they account for 85% of the catchment area of the reservoir. Any changes in rainfall in these zones will alter the streamflow of the river and the availability of water to Bisalpur Dam.
Figure 4.6: Wetter zone area-averaged, annual rainfall.
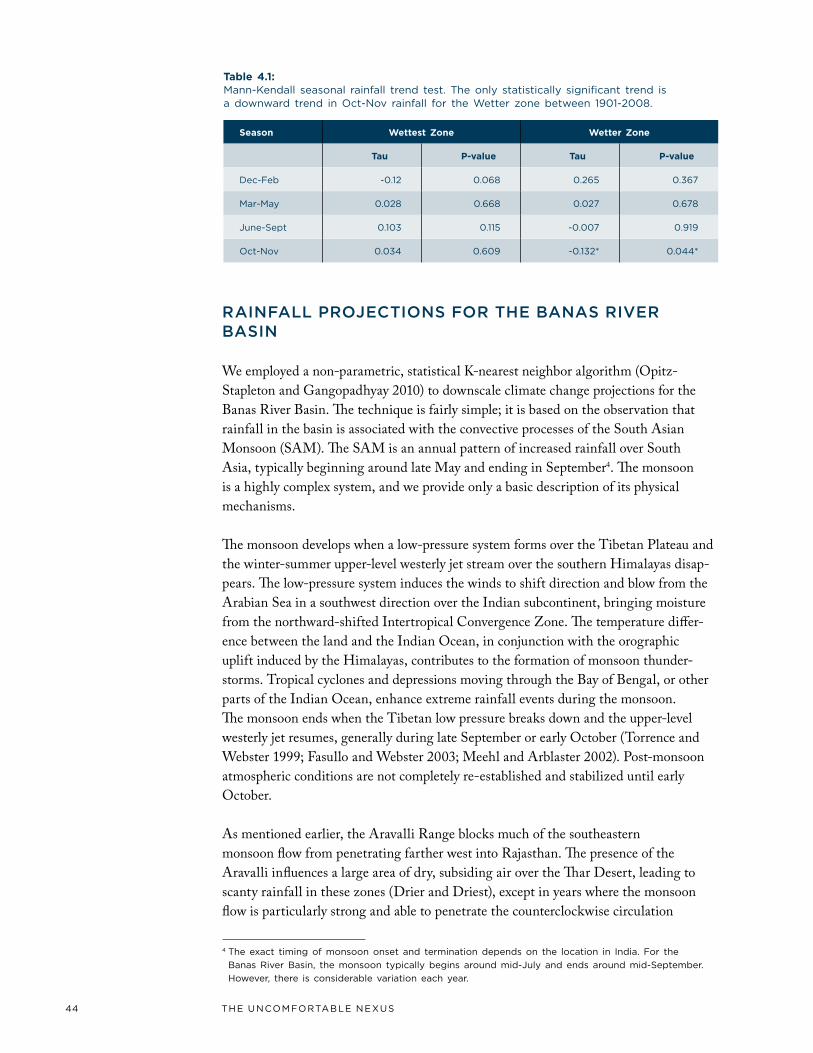
44 rainfall, climate change and Water supply in JaipurThe UncomforTable nexUs rainfall, climate change and Water supply in JaipurThe UncomforTable nexUs
rAiNfAll prOJecTiONs fOr The BANAs river BAsiN
We employed a non-parametric, statistical K-nearest neighbor algorithm (Opitz-Stapleton and Gangopadhyay 2010) to downscale climate change projections for the Banas River Basin. The technique is fairly simple; it is based on the observation that rainfall in the basin is associated with the convective processes of the South Asian Monsoon (SAM). The SAM is an annual pattern of increased rainfall over South Asia, typically beginning around late May and ending in September4. The monsoon is a highly complex system, and we provide only a basic description of its physical mechanisms.
The monsoon develops when a low-pressure system forms over the Tibetan Plateau and the winter-summer upper-level westerly jet stream over the southern Himalayas disap-pears. The low-pressure system induces the winds to shift direction and blow from the Arabian Sea in a southwest direction over the Indian subcontinent, bringing moisture from the northward-shifted Intertropical Convergence Zone. The temperature differ-ence between the land and the Indian Ocean, in conjunction with the orographic uplift induced by the Himalayas, contributes to the formation of monsoon thunder-storms. Tropical cyclones and depressions moving through the Bay of Bengal, or other parts of the Indian Ocean, enhance extreme rainfall events during the monsoon. The monsoon ends when the Tibetan low pressure breaks down and the upper-level westerly jet resumes, generally during late September or early October (Torrence and Webster 1999; Fasullo and Webster 2003; Meehl and Arblaster 2002). Post-monsoon atmospheric conditions are not completely re-established and stabilized until early October.
As mentioned earlier, the Aravalli Range blocks much of the southeastern monsoon flow from penetrating farther west into Rajasthan. The presence of the Aravalli influences a large area of dry, subsiding air over the Thar Desert, leading to scanty rainfall in these zones (Drier and Driest), except in years where the monsoon flow is particularly strong and able to penetrate the counterclockwise circulation
4 The exact timing of monsoon onset and termination depends on the location in India. for the
banas river basin, the monsoon typically begins around mid-July and ends around mid-september.
however, there is considerable variation each year.
season Wettest zone Wetter zone
tau p-value tau p-value
Dec-feb -0.12 0.068 0.265 0.367
mar-may 0.028 0.668 0.027 0.678
June-sept 0.103 0.115 -0.007 0.919
oct-nov 0.034 0.609 -0.132* 0.044*
table 4.1: mann-Kendall seasonal rainfall trend test. The only statistically significant trend is a downward trend in oct-nov rainfall for the Wetter zone between 1901-2008.
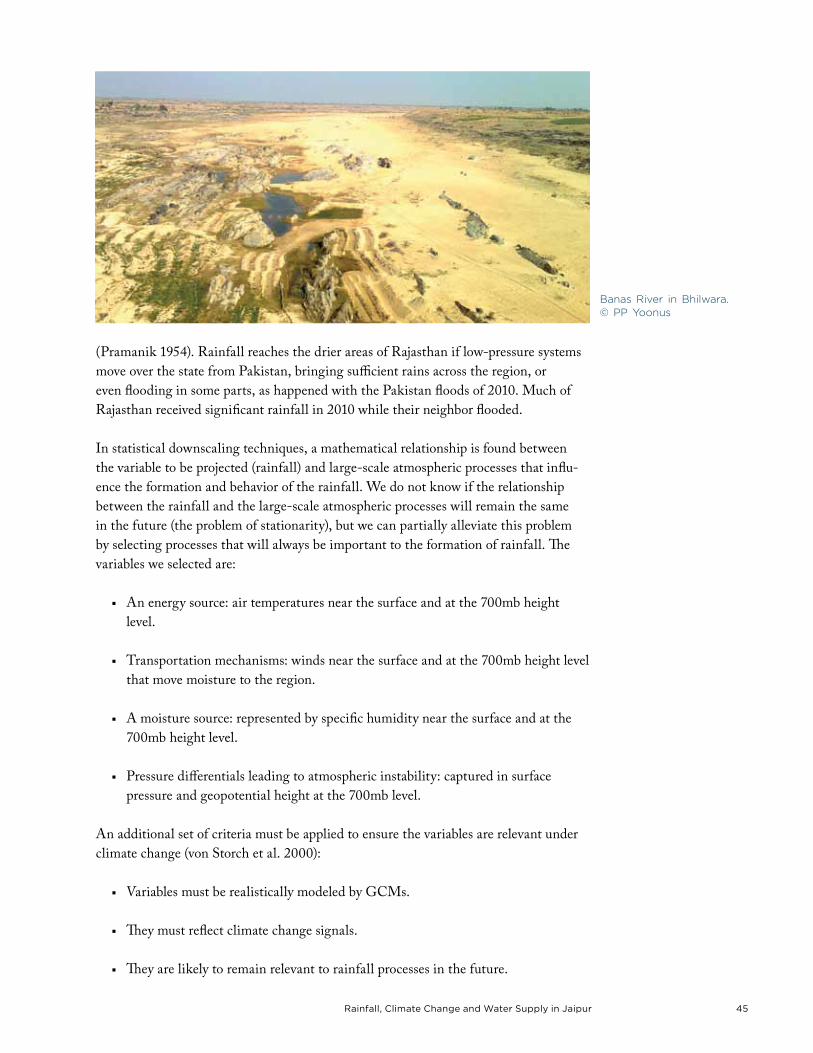
rainfall, climate change and Water supply in JaipurThe UncomforTable nexUs 45rainfall, climate change and Water supply in JaipurThe UncomforTable nexUs
(Pramanik 1954). Rainfall reaches the drier areas of Rajasthan if low-pressure systems move over the state from Pakistan, bringing sufficient rains across the region, or even flooding in some parts, as happened with the Pakistan floods of 2010. Much of Rajasthan received significant rainfall in 2010 while their neighbor flooded.
In statistical downscaling techniques, a mathematical relationship is found between the variable to be projected (rainfall) and large-scale atmospheric processes that influ-ence the formation and behavior of the rainfall. We do not know if the relationship between the rainfall and the large-scale atmospheric processes will remain the same in the future (the problem of stationarity), but we can partially alleviate this problem by selecting processes that will always be important to the formation of rainfall. The variables we selected are:
■ An energy source: air temperatures near the surface and at the 700mb height level.
■ Transportation mechanisms: winds near the surface and at the 700mb height level that move moisture to the region.
■ A moisture source: represented by specific humidity near the surface and at the 700mb height level.
■ Pressure differentials leading to atmospheric instability: captured in surface pressure and geopotential height at the 700mb level.
An additional set of criteria must be applied to ensure the variables are relevant under climate change (von Storch et al. 2000):
■ Variables must be realistically modeled by GCMs.
■ They must reflect climate change signals.
■ They are likely to remain relevant to rainfall processes in the future.
Banas River in Bhilwara. © PP Yoonus
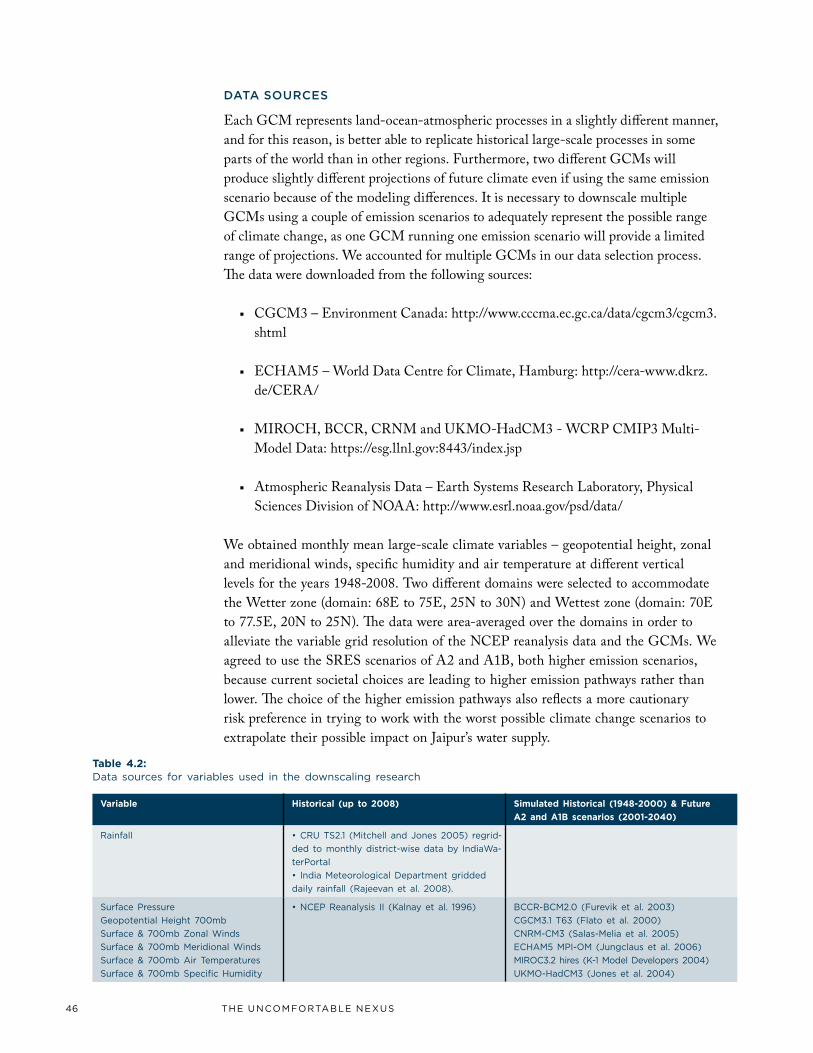
46 rainfall, climate change and Water supply in JaipurThe UncomforTable nexUs rainfall, climate change and Water supply in JaipurThe UncomforTable nexUs
dATA sOurces
Each GCM represents land-ocean-atmospheric processes in a slightly different manner, and for this reason, is better able to replicate historical large-scale processes in some parts of the world than in other regions. Furthermore, two different GCMs will produce slightly different projections of future climate even if using the same emission scenario because of the modeling differences. It is necessary to downscale multiple GCMs using a couple of emission scenarios to adequately represent the possible range of climate change, as one GCM running one emission scenario will provide a limited range of projections. We accounted for multiple GCMs in our data selection process. The data were downloaded from the following sources:
■ CGCM3 – Environment Canada: http://www.cccma.ec.gc.ca/data/cgcm3/cgcm3.shtml
■ ECHAM5 – World Data Centre for Climate, Hamburg: http://cera-www.dkrz.de/CERA/
■ MIROCH, BCCR, CRNM and UKMO-HadCM3 - WCRP CMIP3 Multi-Model Data: https://esg.llnl.gov:8443/index.jsp
■ Atmospheric Reanalysis Data – Earth Systems Research Laboratory, Physical Sciences Division of NOAA: http://www.esrl.noaa.gov/psd/data/
We obtained monthly mean large-scale climate variables – geopotential height, zonal and meridional winds, specific humidity and air temperature at different vertical levels for the years 1948-2008. Two different domains were selected to accommodate the Wetter zone (domain: 68E to 75E, 25N to 30N) and Wettest zone (domain: 70E to 77.5E, 20N to 25N). The data were area-averaged over the domains in order to alleviate the variable grid resolution of the NCEP reanalysis data and the GCMs. We agreed to use the SRES scenarios of A2 and A1B, both higher emission scenarios, because current societal choices are leading to higher emission pathways rather than lower. The choice of the higher emission pathways also reflects a more cautionary risk preference in trying to work with the worst possible climate change scenarios to extrapolate their possible impact on Jaipur’s water supply.
Variable historical (up to 2008) simulated historical (1948-2000) & Future
a2 and a1b scenarios (2001-2040)
rainfall • CRU TS2.1 (Mitchell and Jones 2005) regrid-
ded to monthly district-wise data by IndiaWa-
terPortal
• India Meteorological Department gridded
daily rainfall (rajeevan et al. 2008).
surface Pressure
Geopotential height 700mb
surface & 700mb Zonal Winds
surface & 700mb meridional Winds
surface & 700mb air Temperatures
surface & 700mb specific humidity
• NCEP Reanalysis II (Kalnay et al. 1996) bccr-bcm2.0 (furevik et al. 2003)
cGcm3.1 T63 (flato et al. 2000)
cnrm-cm3 (salas-melia et al. 2005)
echam5 mPI-om (Jungclaus et al. 2006)
mIroc3.2 hires (K-1 model Developers 2004)
UKmo-hadcm3 (Jones et al. 2004)
table 4.2: Data sources for variables used in the downscaling research
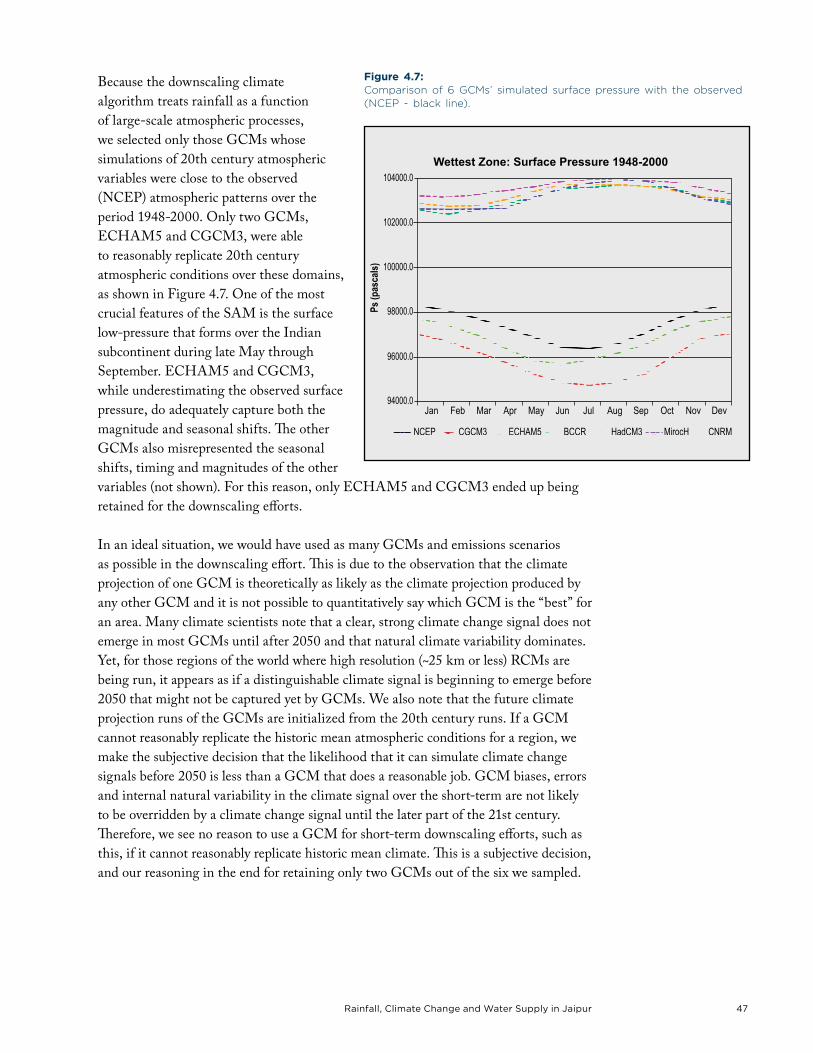
rainfall, climate change and Water supply in JaipurThe UncomforTable nexUs 47rainfall, climate change and Water supply in JaipurThe UncomforTable nexUs
Because the downscaling climate algorithm treats rainfall as a function of large-scale atmospheric processes, we selected only those GCMs whose simulations of 20th century atmospheric variables were close to the observed (NCEP) atmospheric patterns over the period 1948-2000. Only two GCMs, ECHAM5 and CGCM3, were able to reasonably replicate 20th century atmospheric conditions over these domains, as shown in Figure 4.7. One of the most crucial features of the SAM is the surface low-pressure that forms over the Indian subcontinent during late May through September. ECHAM5 and CGCM3, while underestimating the observed surface pressure, do adequately capture both the magnitude and seasonal shifts. The other GCMs also misrepresented the seasonal shifts, timing and magnitudes of the other variables (not shown). For this reason, only ECHAM5 and CGCM3 ended up being retained for the downscaling efforts.
In an ideal situation, we would have used as many GCMs and emissions scenarios as possible in the downscaling effort. This is due to the observation that the climate projection of one GCM is theoretically as likely as the climate projection produced by any other GCM and it is not possible to quantitatively say which GCM is the “best” for an area. Many climate scientists note that a clear, strong climate change signal does not emerge in most GCMs until after 2050 and that natural climate variability dominates. Yet, for those regions of the world where high resolution (~25 km or less) RCMs are being run, it appears as if a distinguishable climate signal is beginning to emerge before 2050 that might not be captured yet by GCMs. We also note that the future climate projection runs of the GCMs are initialized from the 20th century runs. If a GCM cannot reasonably replicate the historic mean atmospheric conditions for a region, we make the subjective decision that the likelihood that it can simulate climate change signals before 2050 is less than a GCM that does a reasonable job. GCM biases, errors and internal natural variability in the climate signal over the short-term are not likely to be overridden by a climate change signal until the later part of the 21st century. Therefore, we see no reason to use a GCM for short-term downscaling efforts, such as this, if it cannot reasonably replicate historic mean climate. This is a subjective decision, and our reasoning in the end for retaining only two GCMs out of the six we sampled.
Figure 4.7: Comparison of 6 GCMs’ simulated surface pressure with the observed (NCEP - black line).
48 rainfall, climate change and Water supply in JaipurThe UncomforTable nexUs rainfall, climate change and Water supply in JaipurThe UncomforTable nexUs
dOWNscAliNG meThOdOlOGy
In this section, we provide a simple description of the steps involved in our statisti-cal downscaling algorithm. For a technical description of the algorithm, the reader is advised to refer to Opitz-Stapleton and Gangopadhyay (2010).
step 1: confirm relationship between rainfall and large-scale
Atmospheric variables
The physical relationships between the large-scale climate indices and the basin rainfall were established using correlation analysis. While correlation does not imply causation, it is well established in meteorology that certain physical processes contrib-ute to the formation of thunderstorms and the monsoon. We performed correla-tion analysis between each month’s rainfall and various large-scale climate features at different height levels (geopotential height, specific humidity, air temperature, and meridional and zonal winds). A correlation was deemed to be significant at the 95th percentile in a two-tailed test. Each month was correlated separately as this allowed us to better capture the seasonal and intra-annual variability that are characteristic of rainfall patterns in the Wettest and Wetter zones. The correlations were tested for significance and the features that had the highest correlation with the month’s rainfall were identified and used to form the predictor set.
While historically the monsoon has been strongly correlated with snowfall amounts over the Tibetan Plateau and the El Niño Southern Oscillation (ENSO), these relationships are changing and it is not certain what the nature of the relationship will be in the future due to climate change. Furthermore, there is disagreement amongst the GCMs on the evolution of ENSO under differing climate change scenarios (Saji et al. 2006; de Szoeke and Xie 2008). Therefore, we decided not to use these large-scale climate indices in our modeling efforts.
step 2: verify model’s performance over historical period (1948-2000)
We employed a non-parametric, K-Nearest Neighbor (K-NN) downscaling algorithm. The algorithm was run in ensemble mode, in which multiple hindcasts were made for 1948-2000. Ensembles allow testing of how well the model is able to capture the long-term variability in rainfall and quantify the frequency of occurrence of different rainfall amounts. Since we have no way of testing the validity of the model’s projections in the future, we validated the model’s performance by how well it was able to replicate each month’s historical precipitation for 1948-2000. This is termed the model “testing period”.
During the testing period, the model was run in drop-one, cross-validation mode. There are several cross-validation schemes in common use in climate downscal-ing. In the particular variation we used, the model drops the month/year we wish to predict (say May 1980) from the overall dataset and tries to make the prediction for that month/year using only the remaining data. If the dataset of observed rainfall is of
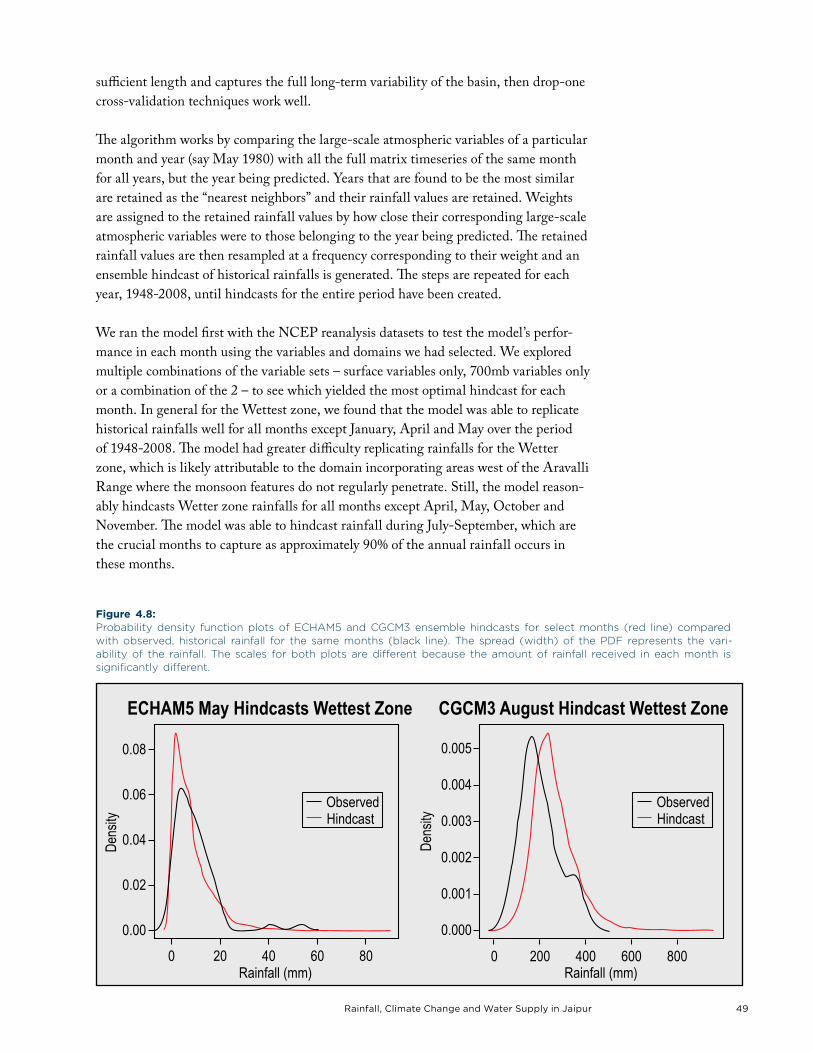
rainfall, climate change and Water supply in JaipurThe UncomforTable nexUs 49rainfall, climate change and Water supply in JaipurThe UncomforTable nexUs
sufficient length and captures the full long-term variability of the basin, then drop-one cross-validation techniques work well.
The algorithm works by comparing the large-scale atmospheric variables of a particular month and year (say May 1980) with all the full matrix timeseries of the same month for all years, but the year being predicted. Years that are found to be the most similar are retained as the “nearest neighbors” and their rainfall values are retained. Weights are assigned to the retained rainfall values by how close their corresponding large-scale atmospheric variables were to those belonging to the year being predicted. The retained rainfall values are then resampled at a frequency corresponding to their weight and an ensemble hindcast of historical rainfalls is generated. The steps are repeated for each year, 1948-2008, until hindcasts for the entire period have been created.
We ran the model first with the NCEP reanalysis datasets to test the model’s perfor-mance in each month using the variables and domains we had selected. We explored multiple combinations of the variable sets – surface variables only, 700mb variables only or a combination of the 2 – to see which yielded the most optimal hindcast for each month. In general for the Wettest zone, we found that the model was able to replicate historical rainfalls well for all months except January, April and May over the period of 1948-2008. The model had greater difficulty replicating rainfalls for the Wetter zone, which is likely attributable to the domain incorporating areas west of the Aravalli Range where the monsoon features do not regularly penetrate. Still, the model reason-ably hindcasts Wetter zone rainfalls for all months except April, May, October and November. The model was able to hindcast rainfall during July-September, which are the crucial months to capture as approximately 90% of the annual rainfall occurs in these months.
Figure 4.8: Probability density function plots of ECHAM5 and CGCM3 ensemble hindcasts for select months (red line) compared with observed, historical rainfall for the same months (black line). The spread (width) of the PDF represents the vari-ability of the rainfall. The scales for both plots are different because the amount of rainfall received in each month is significantly different.
50 rainfall, climate change and Water supply in JaipurThe UncomforTable nexUs rainfall, climate change and Water supply in JaipurThe UncomforTable nexUs
The ability of ECHAM5 and CGCM3 to replicate historical rainfalls was also tested. Large-scale atmospheric variables generated by these models using the 20th century emission levels were downloaded and used to run the model. The models that were run using the GCMs did not perform as well as those using NCEP reanalysis data, but still performed reasonably well, which lent confidence toward using these GCMs’ variable sets for developing climate change projections. In verifying the GCMs ability to hindcast, we were also able to test for biases (too wet or too dry) in the models and develop correction factors to adjust the bias. In general, the hindcasts generated with both GCMs captured the historical variability of each month and the median ensemble members were well correlated with the actual rainfall values (Figure 4.8).
step 3: Generate projections of future rainfall under climate change
The model steps for generating rainfall predictions for the years 2009-2040, condi-tioned on climate change scenarios, are slightly different from the above steps for the test period. The primary difference is that drop-one cross-validation is not used. When projecting rainfall for this period, the variable set of large-scale atmospheric features is formed from the output of ECHAM5 and CGCM3 under the SRES scenarios A2 and A1B. These variable sets are compared directly with the entire set of observed, large-scale atmospheric indices from the period of 1948-2008. The K-NN rainfalls in the historic set were found, weighted, and resampled to generate ensemble estimates of rainfall conditioned on the particular climate change scenario selected.
A total of 24 variable sets were used to generate rainfall projections for the Banas River Basin, 12 for the Wettest zone and 12 for the Wetter zone:
■ ECHAM5 ƌ A2: Surface variables, 700mb variables, combination of both ƌ A1B: Surface variables, 700mb variables, combination of both
■ CGCM3 ƌ A2: Surface variables, 700mb variables, combination of both ƌ A1B: Surface variables, 700mb variables, combination of both
Each model, running of one of the above variable sets, generated 40 ensemble members for each month. This yielded a total of 960 ensemble rainfall projections for each month. Analysis of the ensemble members across the 4 climate change scenarios – ECHAM5 A2 & A1B and CGCM3 A2 & A1B – allowed us to better capture the potential range of change and trend changes in rainfall than if we had used only a single GCM/emission scenario. However, it would be even better if we had been able to incorporate at least one or two more GCMs in the downscaling effort to increase our confidence that we are capturing a wider possible range of climate change for the area.
rAiNfAll prOJecTiONs 2009-2040
The Banas River Basin is semi-arid, experiences significant seasonal and interannual rainfall variability and supports a large number of irrigation withdrawals. Historically, the river flowed year around; however, since the late 1980s, the river has flowed only
Historically, the river
flowed year around;
however, since the
late 1980s, the river
has flowed only
during the monsoon
and post monsoon
seasons.
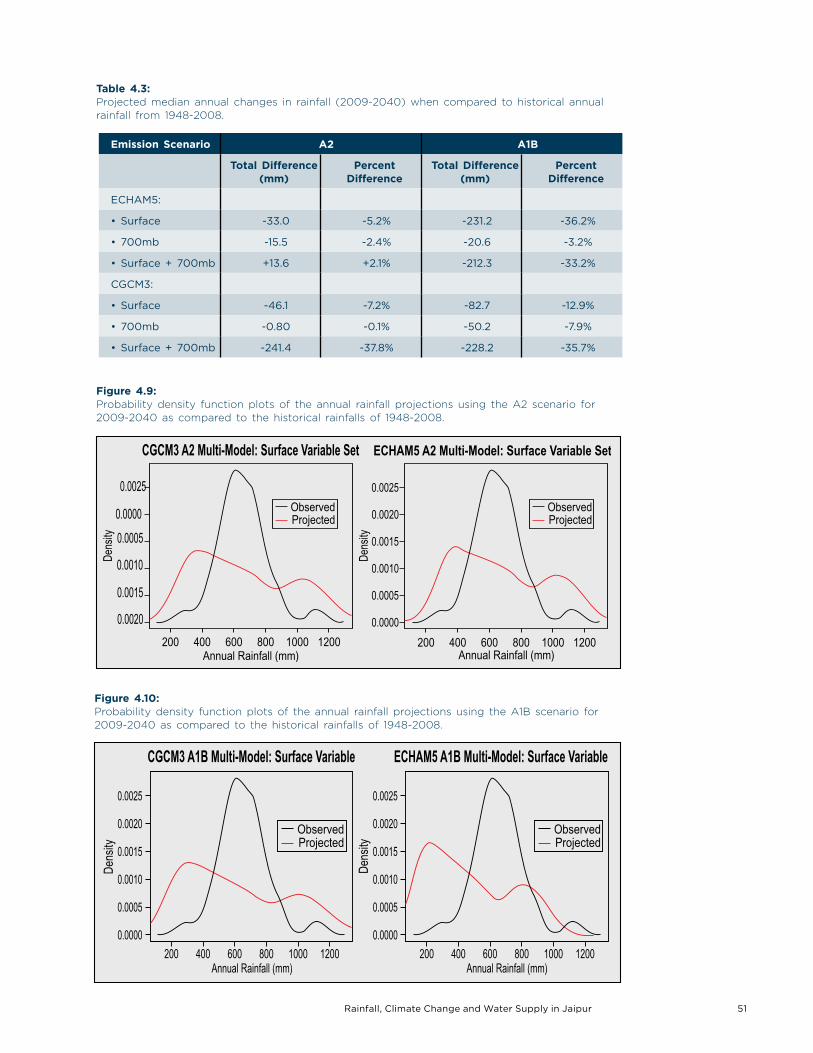
rainfall, climate change and Water supply in JaipurThe UncomforTable nexUs 51rainfall, climate change and Water supply in JaipurThe UncomforTable nexUs
Figure 4.9: Probability density function plots of the annual rainfall projections using the A2 scenario for 2009-2040 as compared to the historical rainfalls of 1948-2008.
Figure 4.10: Probability density function plots of the annual rainfall projections using the A1B scenario for 2009-2040 as compared to the historical rainfalls of 1948-2008.
emission scenario a2 a1b
total difference(mm)
percentdifference
total difference(mm)
percentdifference
echam5:
• Surface -33.0 -5.2% -231.2 -36.2%
• 700mb -15.5 -2.4% -20.6 -3.2%
• Surface + 700mb +13.6 +2.1% -212.3 -33.2%
cGcm3:
• Surface -46.1 -7.2% -82.7 -12.9%
• 700mb -0.80 -0.1% -50.2 -7.9%
• Surface + 700mb -241.4 -37.8% -228.2 -35.7%
table 4.3: Projected median annual changes in rainfall (2009-2040) when compared to historical annual rainfall from 1948-2008.
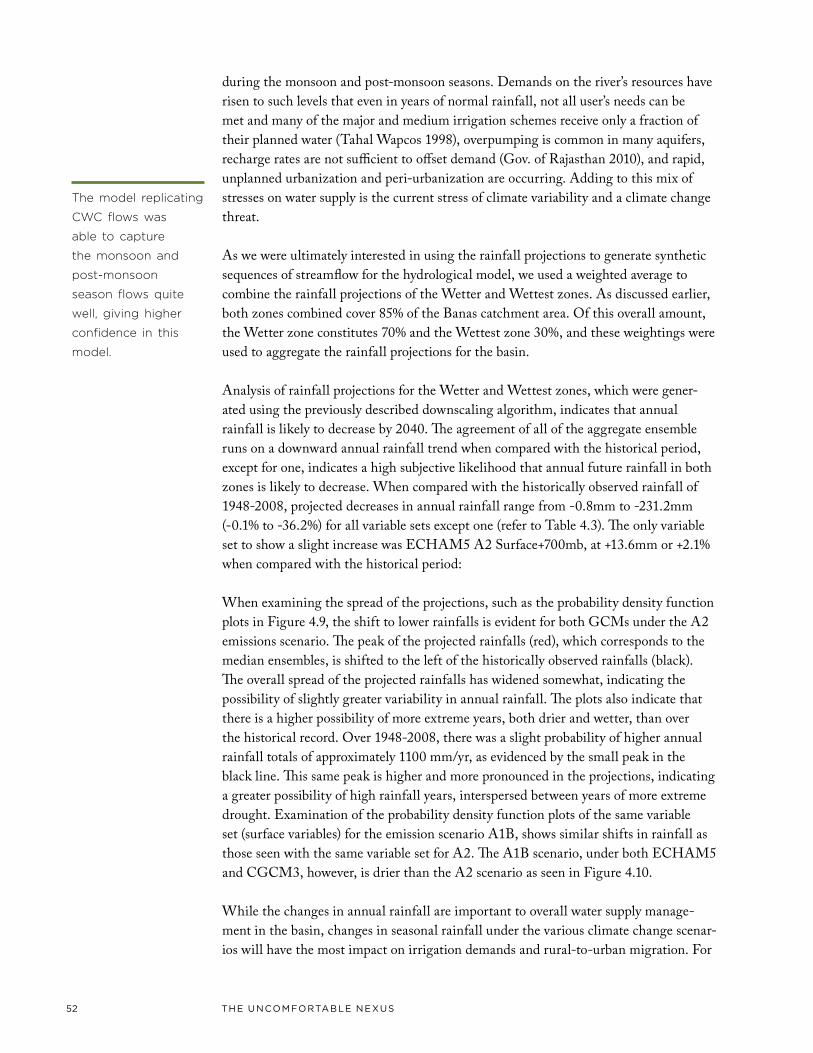
52 rainfall, climate change and Water supply in JaipurThe UncomforTable nexUs rainfall, climate change and Water supply in JaipurThe UncomforTable nexUs
during the monsoon and post-monsoon seasons. Demands on the river’s resources have risen to such levels that even in years of normal rainfall, not all user’s needs can be met and many of the major and medium irrigation schemes receive only a fraction of their planned water (Tahal Wapcos 1998), overpumping is common in many aquifers, recharge rates are not sufficient to offset demand (Gov. of Rajasthan 2010), and rapid, unplanned urbanization and peri-urbanization are occurring. Adding to this mix of stresses on water supply is the current stress of climate variability and a climate change threat.
As we were ultimately interested in using the rainfall projections to generate synthetic sequences of streamflow for the hydrological model, we used a weighted average to combine the rainfall projections of the Wetter and Wettest zones. As discussed earlier, both zones combined cover 85% of the Banas catchment area. Of this overall amount, the Wetter zone constitutes 70% and the Wettest zone 30%, and these weightings were used to aggregate the rainfall projections for the basin.
Analysis of rainfall projections for the Wetter and Wettest zones, which were gener-ated using the previously described downscaling algorithm, indicates that annual rainfall is likely to decrease by 2040. The agreement of all of the aggregate ensemble runs on a downward annual rainfall trend when compared with the historical period, except for one, indicates a high subjective likelihood that annual future rainfall in both zones is likely to decrease. When compared with the historically observed rainfall of 1948-2008, projected decreases in annual rainfall range from -0.8mm to -231.2mm (-0.1% to -36.2%) for all variable sets except one (refer to Table 4.3). The only variable set to show a slight increase was ECHAM5 A2 Surface+700mb, at +13.6mm or +2.1% when compared with the historical period:
When examining the spread of the projections, such as the probability density function plots in Figure 4.9, the shift to lower rainfalls is evident for both GCMs under the A2 emissions scenario. The peak of the projected rainfalls (red), which corresponds to the median ensembles, is shifted to the left of the historically observed rainfalls (black). The overall spread of the projected rainfalls has widened somewhat, indicating the possibility of slightly greater variability in annual rainfall. The plots also indicate that there is a higher possibility of more extreme years, both drier and wetter, than over the historical record. Over 1948-2008, there was a slight probability of higher annual rainfall totals of approximately 1100 mm/yr, as evidenced by the small peak in the black line. This same peak is higher and more pronounced in the projections, indicating a greater possibility of high rainfall years, interspersed between years of more extreme drought. Examination of the probability density function plots of the same variable set (surface variables) for the emission scenario A1B, shows similar shifts in rainfall as those seen with the same variable set for A2. The A1B scenario, under both ECHAM5 and CGCM3, however, is drier than the A2 scenario as seen in Figure 4.10.
While the changes in annual rainfall are important to overall water supply manage-ment in the basin, changes in seasonal rainfall under the various climate change scenar-ios will have the most impact on irrigation demands and rural-to-urban migration. For
The model replicating
CWC flows was
able to capture
the monsoon and
post-monsoon
season flows quite
well, giving higher
confidence in this
model.
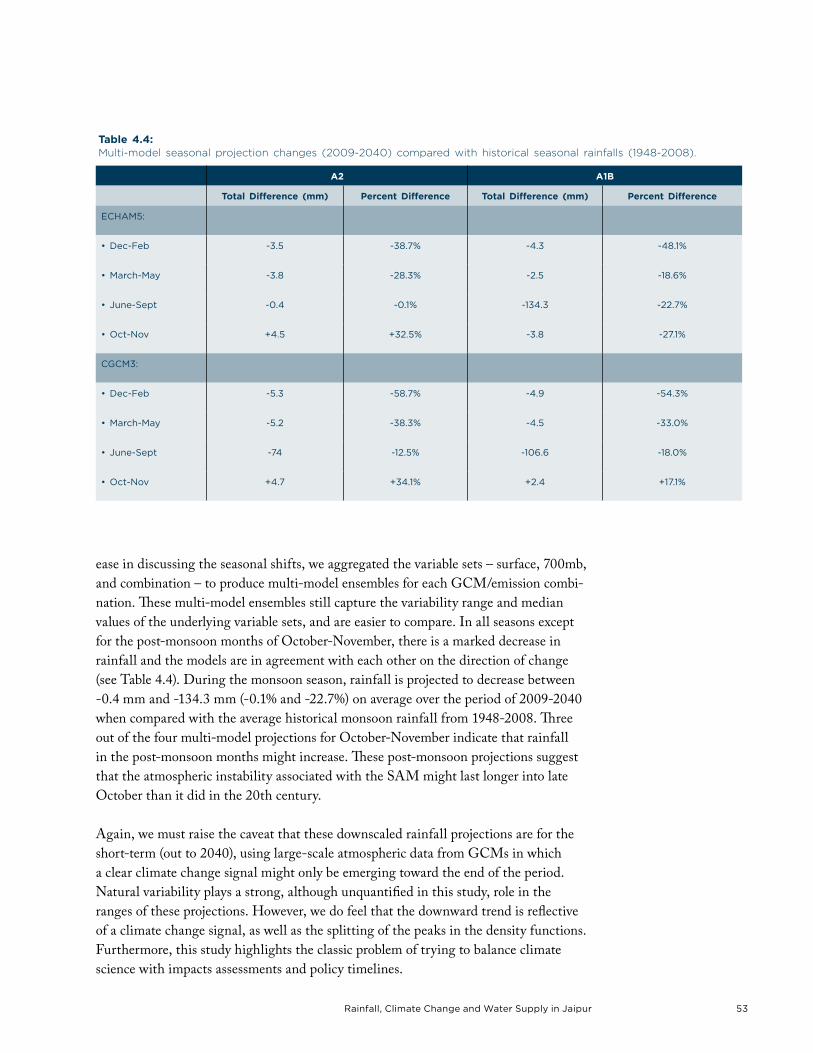
rainfall, climate change and Water supply in JaipurThe UncomforTable nexUs 53rainfall, climate change and Water supply in JaipurThe UncomforTable nexUs
ease in discussing the seasonal shifts, we aggregated the variable sets – surface, 700mb, and combination – to produce multi-model ensembles for each GCM/emission combi-nation. These multi-model ensembles still capture the variability range and median values of the underlying variable sets, and are easier to compare. In all seasons except for the post-monsoon months of October-November, there is a marked decrease in rainfall and the models are in agreement with each other on the direction of change (see Table 4.4). During the monsoon season, rainfall is projected to decrease between -0.4 mm and -134.3 mm (-0.1% and -22.7%) on average over the period of 2009-2040 when compared with the average historical monsoon rainfall from 1948-2008. Three out of the four multi-model projections for October-November indicate that rainfall in the post-monsoon months might increase. These post-monsoon projections suggest that the atmospheric instability associated with the SAM might last longer into late October than it did in the 20th century.
Again, we must raise the caveat that these downscaled rainfall projections are for the short-term (out to 2040), using large-scale atmospheric data from GCMs in which a clear climate change signal might only be emerging toward the end of the period. Natural variability plays a strong, although unquantified in this study, role in the ranges of these projections. However, we do feel that the downward trend is reflective of a climate change signal, as well as the splitting of the peaks in the density functions. Furthermore, this study highlights the classic problem of trying to balance climate science with impacts assessments and policy timelines.
a2 a1b
total difference (mm) percent difference total difference (mm) percent difference
echam5:
• Dec-Feb -3.5 -38.7% -4.3 -48.1%
• March-May -3.8 -28.3% -2.5 -18.6%
• June-Sept -0.4 -0.1% -134.3 -22.7%
• Oct-Nov +4.5 +32.5% -3.8 -27.1%
cGcm3:
• Dec-Feb -5.3 -58.7% -4.9 -54.3%
• March-May -5.2 -38.3% -4.5 -33.0%
• June-Sept -74 -12.5% -106.6 -18.0%
• Oct-Nov +4.7 +34.1% +2.4 +17.1%
table 4.4: Multi-model seasonal projection changes (2009-2040) compared with historical seasonal rainfalls (1948-2008).
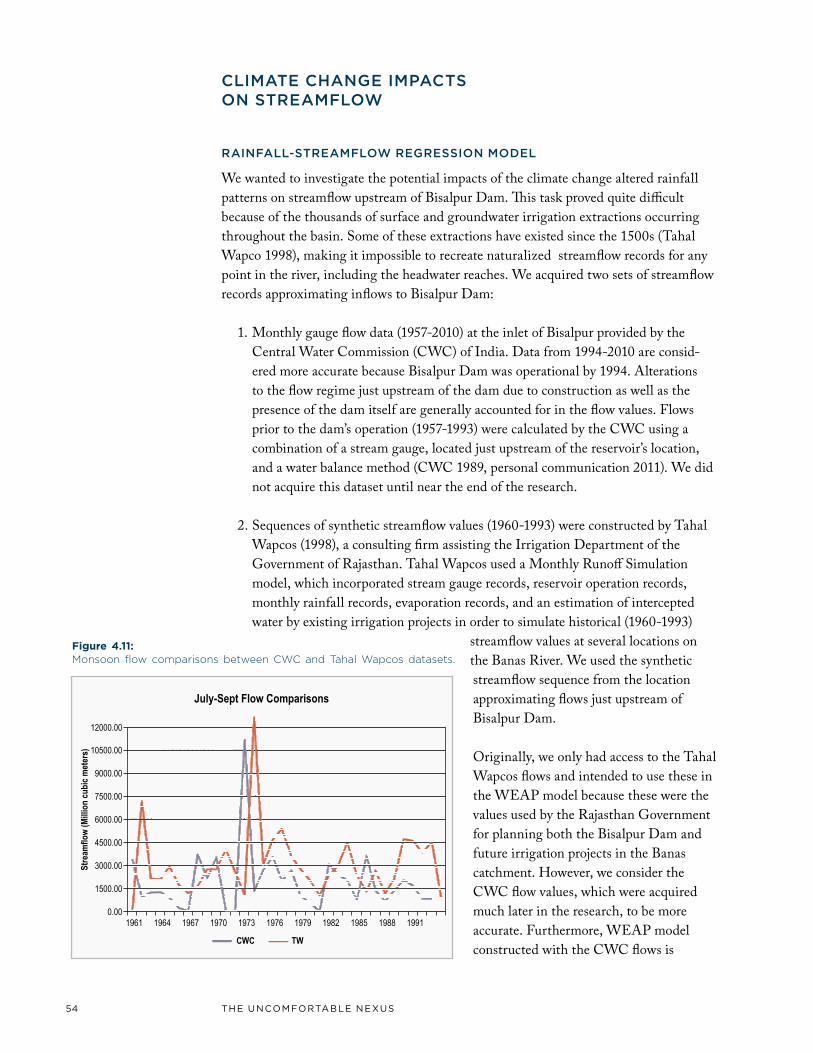
54 rainfall, climate change and Water supply in JaipurThe UncomforTable nexUs rainfall, climate change and Water supply in JaipurThe UncomforTable nexUs
climATe chANGe impAcTs ON sTreAmflOW
rAiNfAll-sTreAmflOW reGressiON mOdel
We wanted to investigate the potential impacts of the climate change altered rainfall patterns on streamflow upstream of Bisalpur Dam. This task proved quite difficult because of the thousands of surface and groundwater irrigation extractions occurring throughout the basin. Some of these extractions have existed since the 1500s (Tahal Wapco 1998), making it impossible to recreate naturalized streamflow records for any point in the river, including the headwater reaches. We acquired two sets of streamflow records approximating inflows to Bisalpur Dam:
1. Monthly gauge flow data (1957-2010) at the inlet of Bisalpur provided by the Central Water Commission (CWC) of India. Data from 1994-2010 are consid-ered more accurate because Bisalpur Dam was operational by 1994. Alterations to the flow regime just upstream of the dam due to construction as well as the presence of the dam itself are generally accounted for in the flow values. Flows prior to the dam’s operation (1957-1993) were calculated by the CWC using a combination of a stream gauge, located just upstream of the reservoir’s location, and a water balance method (CWC 1989, personal communication 2011). We did not acquire this dataset until near the end of the research.
2. Sequences of synthetic streamflow values (1960-1993) were constructed by Tahal Wapcos (1998), a consulting firm assisting the Irrigation Department of the Government of Rajasthan. Tahal Wapcos used a Monthly Runoff Simulation model, which incorporated stream gauge records, reservoir operation records, monthly rainfall records, evaporation records, and an estimation of intercepted water by existing irrigation projects in order to simulate historical (1960-1993)
streamflow values at several locations on the Banas River. We used the synthetic streamflow sequence from the location approximating flows just upstream of Bisalpur Dam.
Originally, we only had access to the Tahal Wapcos flows and intended to use these in the WEAP model because these were the values used by the Rajasthan Government for planning both the Bisalpur Dam and future irrigation projects in the Banas catchment. However, we consider the CWC flow values, which were acquired much later in the research, to be more accurate. Furthermore, WEAP model constructed with the CWC flows is
Figure 4.11: Monsoon flow comparisons between CWC and Tahal Wapcos datasets.
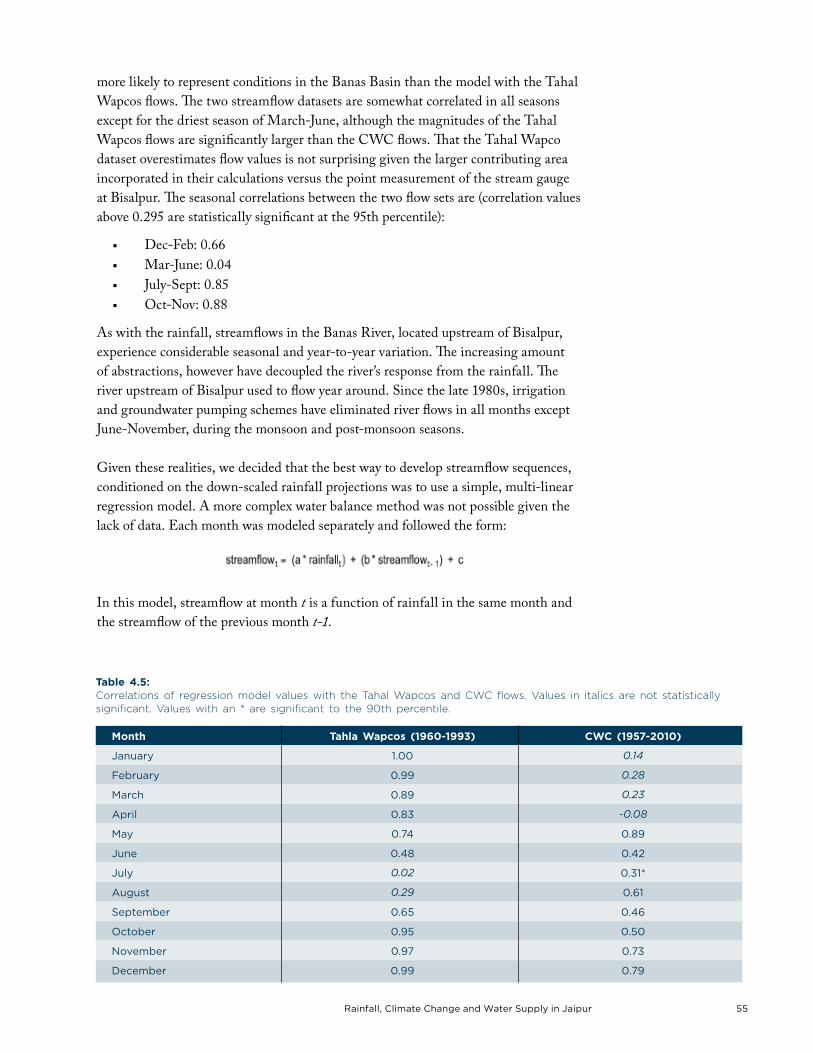
rainfall, climate change and Water supply in JaipurThe UncomforTable nexUs 55rainfall, climate change and Water supply in JaipurThe UncomforTable nexUs
more likely to represent conditions in the Banas Basin than the model with the Tahal Wapcos flows. The two streamflow datasets are somewhat correlated in all seasons except for the driest season of March-June, although the magnitudes of the Tahal Wapcos flows are significantly larger than the CWC flows. That the Tahal Wapco dataset overestimates flow values is not surprising given the larger contributing area incorporated in their calculations versus the point measurement of the stream gauge at Bisalpur. The seasonal correlations between the two flow sets are (correlation values above 0.295 are statistically significant at the 95th percentile):
■ Dec-Feb: 0.66 ■ Mar-June: 0.04 ■ July-Sept: 0.85 ■ Oct-Nov: 0.88
As with the rainfall, streamflows in the Banas River, located upstream of Bisalpur, experience considerable seasonal and year-to-year variation. The increasing amount of abstractions, however have decoupled the river’s response from the rainfall. The river upstream of Bisalpur used to flow year around. Since the late 1980s, irrigation and groundwater pumping schemes have eliminated river flows in all months except June-November, during the monsoon and post-monsoon seasons.
Given these realities, we decided that the best way to develop streamflow sequences, conditioned on the down-scaled rainfall projections was to use a simple, multi-linear regression model. A more complex water balance method was not possible given the lack of data. Each month was modeled separately and followed the form:
In this model, streamflow at month t is a function of rainfall in the same month and the streamflow of the previous month t-1.
month tahla Wapcos (1960-1993) CWC (1957-2010)
January 1.00 0.14
february 0.99 0.28
march 0.89 0.23
april 0.83 -0.08
may 0.74 0.89
June 0.48 0.42
July 0.02 0.31*
august 0.29 0.61
september 0.65 0.46
october 0.95 0.50
november 0.97 0.73
December 0.99 0.79
table 4.5: Correlations of regression model values with the Tahal Wapcos and CWC flows. Values in italics are not statistically significant. Values with an * are significant to the 90th percentile.
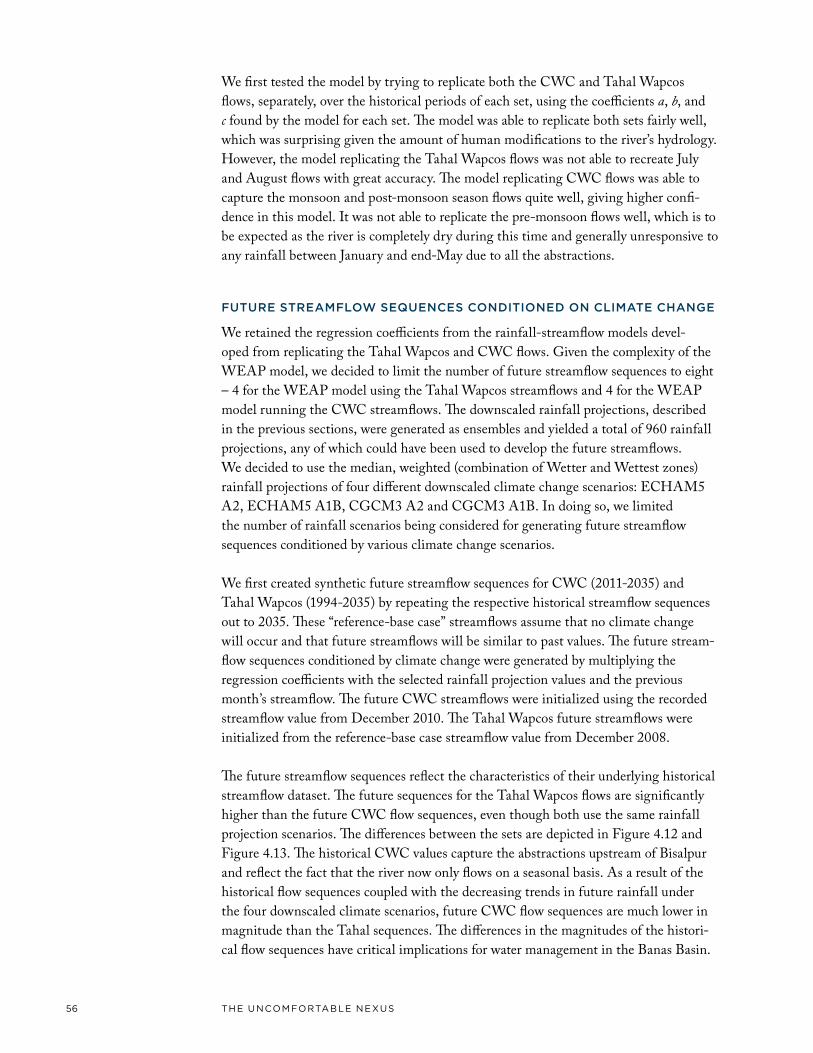
56 rainfall, climate change and Water supply in JaipurThe UncomforTable nexUs rainfall, climate change and Water supply in JaipurThe UncomforTable nexUs
We first tested the model by trying to replicate both the CWC and Tahal Wapcos flows, separately, over the historical periods of each set, using the coefficients a, b, and c found by the model for each set. The model was able to replicate both sets fairly well, which was surprising given the amount of human modifications to the river’s hydrology. However, the model replicating the Tahal Wapcos flows was not able to recreate July and August flows with great accuracy. The model replicating CWC flows was able to capture the monsoon and post-monsoon season flows quite well, giving higher confi-dence in this model. It was not able to replicate the pre-monsoon flows well, which is to be expected as the river is completely dry during this time and generally unresponsive to any rainfall between January and end-May due to all the abstractions.
fuTure sTreAmflOW sequeNces cONdiTiONed ON climATe chANGe
We retained the regression coefficients from the rainfall-streamflow models devel-oped from replicating the Tahal Wapcos and CWC flows. Given the complexity of the WEAP model, we decided to limit the number of future streamflow sequences to eight – 4 for the WEAP model using the Tahal Wapcos streamflows and 4 for the WEAP model running the CWC streamflows. The downscaled rainfall projections, described in the previous sections, were generated as ensembles and yielded a total of 960 rainfall projections, any of which could have been used to develop the future streamflows. We decided to use the median, weighted (combination of Wetter and Wettest zones) rainfall projections of four different downscaled climate change scenarios: ECHAM5 A2, ECHAM5 A1B, CGCM3 A2 and CGCM3 A1B. In doing so, we limited the number of rainfall scenarios being considered for generating future streamflow sequences conditioned by various climate change scenarios.
We first created synthetic future streamflow sequences for CWC (2011-2035) and Tahal Wapcos (1994-2035) by repeating the respective historical streamflow sequences out to 2035. These “reference-base case” streamflows assume that no climate change will occur and that future streamflows will be similar to past values. The future stream-flow sequences conditioned by climate change were generated by multiplying the regression coefficients with the selected rainfall projection values and the previous month’s streamflow. The future CWC streamflows were initialized using the recorded streamflow value from December 2010. The Tahal Wapcos future streamflows were initialized from the reference-base case streamflow value from December 2008.
The future streamflow sequences reflect the characteristics of their underlying historical streamflow dataset. The future sequences for the Tahal Wapcos flows are significantly higher than the future CWC flow sequences, even though both use the same rainfall projection scenarios. The differences between the sets are depicted in Figure 4.12 and Figure 4.13. The historical CWC values capture the abstractions upstream of Bisalpur and reflect the fact that the river now only flows on a seasonal basis. As a result of the historical flow sequences coupled with the decreasing trends in future rainfall under the four downscaled climate scenarios, future CWC flow sequences are much lower in magnitude than the Tahal sequences. The differences in the magnitudes of the histori-cal flow sequences have critical implications for water management in the Banas Basin.
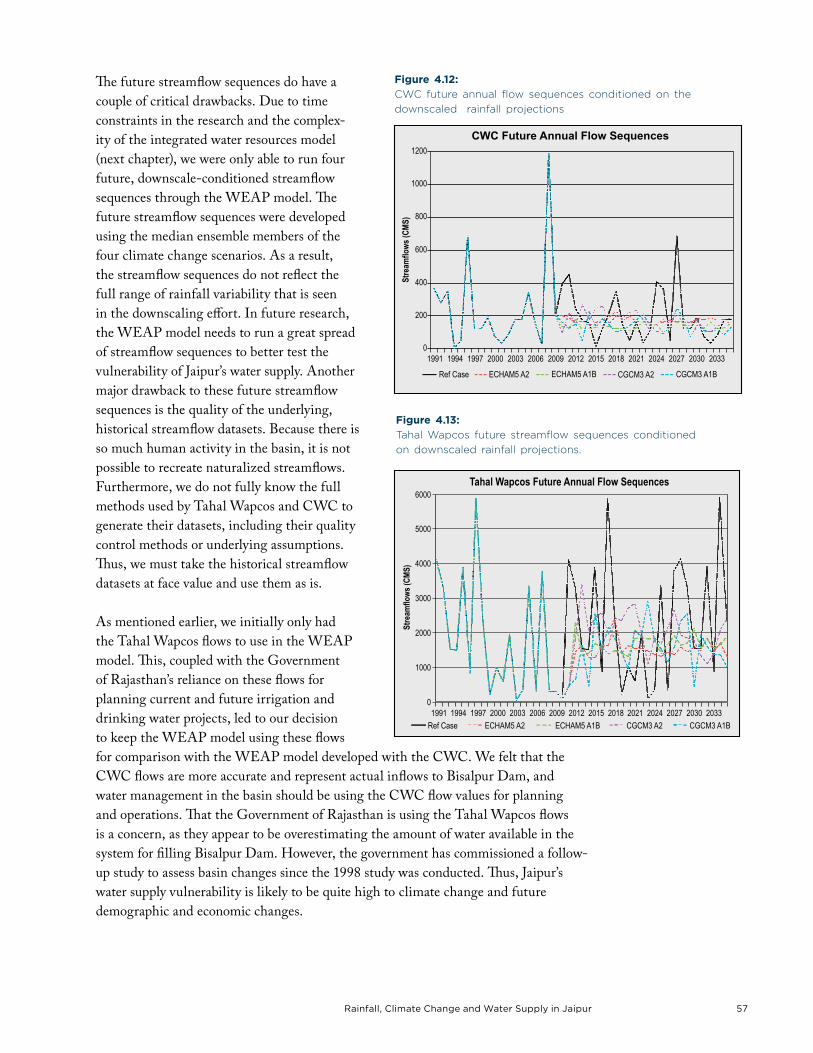
rainfall, climate change and Water supply in JaipurThe UncomforTable nexUs 57rainfall, climate change and Water supply in JaipurThe UncomforTable nexUs
The future streamflow sequences do have a couple of critical drawbacks. Due to time constraints in the research and the complex-ity of the integrated water resources model (next chapter), we were only able to run four future, downscale-conditioned streamflow sequences through the WEAP model. The future streamflow sequences were developed using the median ensemble members of the four climate change scenarios. As a result, the streamflow sequences do not reflect the full range of rainfall variability that is seen in the downscaling effort. In future research, the WEAP model needs to run a great spread of streamflow sequences to better test the vulnerability of Jaipur’s water supply. Another major drawback to these future streamflow sequences is the quality of the underlying, historical streamflow datasets. Because there is so much human activity in the basin, it is not possible to recreate naturalized streamflows. Furthermore, we do not fully know the full methods used by Tahal Wapcos and CWC to generate their datasets, including their quality control methods or underlying assumptions. Thus, we must take the historical streamflow datasets at face value and use them as is.
As mentioned earlier, we initially only had the Tahal Wapcos flows to use in the WEAP model. This, coupled with the Government of Rajasthan’s reliance on these flows for planning current and future irrigation and drinking water projects, led to our decision
Figure 4.12:
CWC future annual flow sequences conditioned on the
downscaled rainfall projections
Figure 4.13:
Tahal Wapcos future streamflow sequences conditioned
on downscaled rainfall projections.
to keep the WEAP model using these flows for comparison with the WEAP model developed with the CWC. We felt that the CWC flows are more accurate and represent actual inflows to Bisalpur Dam, and water management in the basin should be using the CWC flow values for planning and operations. That the Government of Rajasthan is using the Tahal Wapcos flows is a concern, as they appear to be overestimating the amount of water available in the system for filling Bisalpur Dam. However, the government has commissioned a follow-up study to assess basin changes since the 1998 study was conducted. Thus, Jaipur’s water supply vulnerability is likely to be quite high to climate change and future demographic and economic changes.
58 rainfall, climate change and Water supply in JaipurThe UncomforTable nexUs rainfall, climate change and Water supply in JaipurThe UncomforTable nexUs
summAry
Jaipur city in the State of Rajasthan is receiving the majority of its water supply from a sole surface source, Bisalpur Reservoir. The reservoir became operational in 1994 and the city began drawing water from it in 2010. However, due to high irrigation demand and groundwater overpumping in the reaches upstream of the dam, the Banas River only flows during the monsoon and post-monsoon seasons. As a result, the reservoir has only filled 9 times since 1994. Increasing demand, rural-to-urban migration as a coping response to drought years, and climate change, will greatly challenge the ability of the reservoir to meet Jaipur’s water supply needs.
We developed downscaled rainfall projections for two zones of the Banas River Basin that constitute the majority of the catchment area. Under all combinations of climate change scenarios, using output from two different GCMs, each running two different emissions scenarios A2 and A1B, median annual rainfall is likely to decrease by 2040. Rainfall is likely to decrease in all seasons except the post-monsoon season (October-November), but any rainfall increases in this season are not large enough to offset the decrease in other seasons, especially the monsoon season. We then generated synthetic sequences of future streamflow values, conditioned on the rainfall projections, to inves-tigate Jaipur’s water vulnerability in an integrated water resources planning model developed with the software tool WEAP. The WEAP models and the results of that modeling effort are discussed in the next chapter.

rainfall, climate change and Water supply in JaipurThe UncomforTable nexUs 59rainfall, climate change and Water supply in JaipurThe UncomforTable nexUs
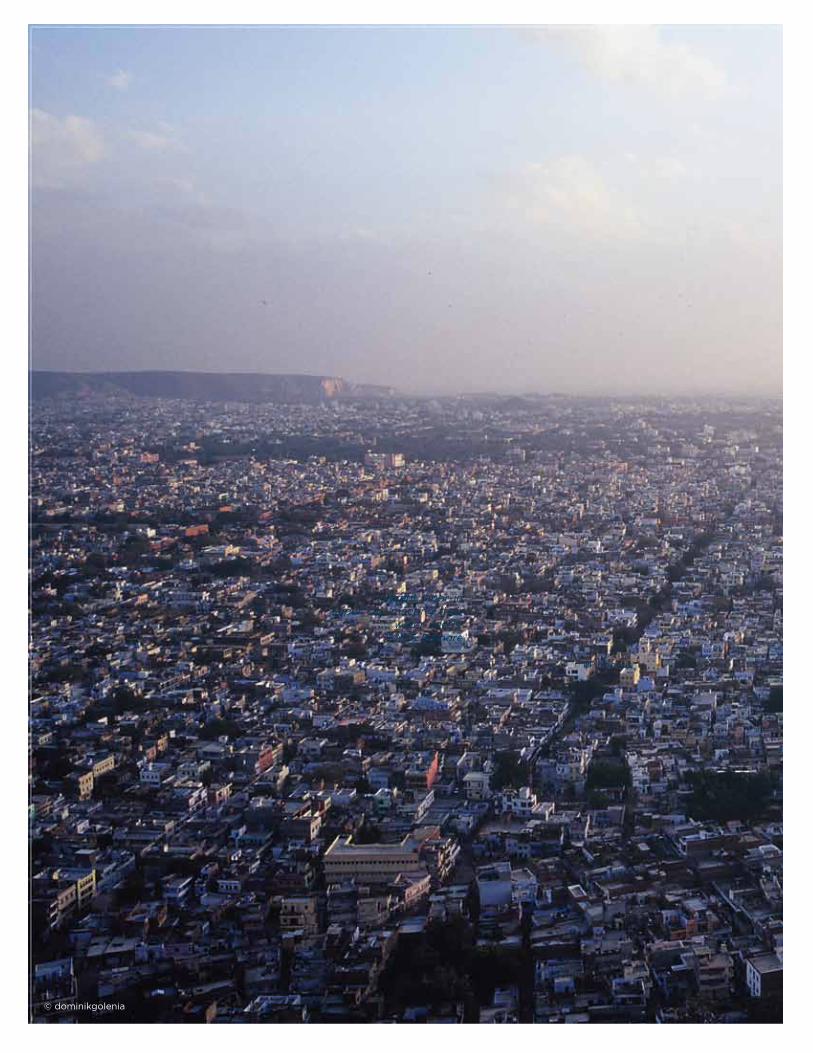
60 The UncomforTable nexUsThe UncomforTable nexUs
Migrant labor in Jaipur city meeting their
water needs. © M S Rathore
© PP Yoonus
© dominikgolenia
The UncomforTable nexUs 61assessing options for climate-resilient Urban Water managementThe UncomforTable nexUs
Chapter 5
assessing options For Climate resilient Urban Water management: Use of WeaP as a Tool
The cONTexT
Jaipur’s water supply, both current and future, was evaluated by modeling climate change impacts on streamflow, projected growth in demand, and migration rates through the Water Evaluation And Planning (WEAP) software, developed by the Stockholm Environment Institute (SEI). This chapter presents the WEAP models and their results.
Jaipur is the largest city of Rajasthan with a total population of 2.43 million, as per the 2001 census. Jaipur city’s population has been rapidly increasing at an annual average growth rate of 4.5%, compared to the national urban growth rate of 2%. The city is a major hub for migrant populations from around the state. After a decline in outflows from Ramgarh lake, Bisalpur Dam is the currently the principal surface water source for Jaipur city. Groundwater extraction continues to meet the gap between demand and supply from the reservoir. A number of industrial companies have sprung up around Jaipur, exerting pressure on the already fragile water resources in the area. Additionally, a number of rural areas surrounding Jaipur have transformed into peri-urban areas that also depend on Bisalpur Dam for their water supply.
The strength of WEAP
lies in its ability to
provide the user with
the flexibility to define
demand and supply on a
per use basis
62 The UncomforTable nexUsThe UncomforTable nexUs
The WeAp mOdel
The WEAP software tool is an integrated tool for water balance accounting. Specifically in the context of this project, the software was used to simulate Jaipur city’s water supply, as well as the surrounding irrigation projects and peri-urban nodes that place demand on Bisalpur Reservoir. In general, the software places demand side equations - water use patterns, efficiency of uses, and allocation priority - on equal footing with the supply side - streamflow, groundwater, reservoirs, etc. The strength of WEAP lies in its ability to provide the user with the flexibility to define demand and supply on a per use basis, and to define the drivers influencing these uses, such as scale and efficiency levels, population, water use technologies and allocation priorities. With its ease of use and modularity, WEAP helps evaluate and compare alternative water development and management strategies. The software can also be used to generate a database of water supply and demand systems. As a forecasting tool, it helps to project supplies and demand patterns and assess the implications of these on supply vulnerabil-ity. This dimension of WEAP is particularly useful when simulating climate change impacts on water resource systems. The primary way that WEAP was used in this research entailed the construction of two models:
1. A model developed using the Central Water Commission inflow values to Bisalpur Reservoir (described in Chapter 4).
2. A model developed using the synthetic streamflow sequences developed by Tahal Wapcos (described in Chapter 4).
Each of the models was initialized through the generation of a business-as-usual scenario, also known as a reference base case account, over a baseline period of 1991-2035. In the reference account, no climate change is assumed to occur and no water management options other than the current arrangements are considered. Projections of future supply and unmet demand, conditioned on the downscaled rainfall projections and water demand due to increase in floating population as a result of migration, were investigated in a number of scenarios developed for each model. The scenario development is described further below.
seTTiNG up WeAp fOr JAipur
For the purpose of modeling the reference base case, from which all other scenarios of future climate, migration and demand were developed, the base account for the year 1991 was developed using the data and parameters of that year with following key considerations:
■ The level of industrial, demographic and water resources development;
■ Water use efficiency in various sectors - industrial and domestic; and,
Bisalpur Reservoir
became operational
in 1994 and began
serving a number of
irrigation schemes,
but did not begin
supplying the city
until 2010.
The UncomforTable nexUs 63assessing options for climate-resilient Urban Water managementThe UncomforTable nexUs
■ The level of supplies, such as streamflows and storage characteristics of local groundwater sources and the planned and existing reservoirs (Ramgarh Lake, Bisalpur Dam and Isarda Dam).
The business-as-usual scenario (or reference account) was developed for 1992-2035 using the projected and planned growth rates and trends of population, industrial-ization and water resources development. The model was run on a monthly timestep. Bisalpur Reservoir became operational in 1994 and began serving a number of irriga-tion schemes, but did not begin supplying the city until 2010.
Future inflows to Bisalpur Dam were simulated through a simple rainfall-streamflow regression model, as described in Chapter 4. Flows for the reference case of 1992-2035 were generated by repeating the historical flow records of both Tahal Wapcos and CWC. Percent deviations of the historical, annual averaged timeseries of the two streamflow datasets were used to categorise years according to 5 Water Year types: Very Dry (<66% of long-term average), Dry (67% to 89%), Normal (90% to 110%), Wet (111% to 133%) and Very Wet (>133% of the long-term average). The sequences of the base case streamflows and climate change conditioned streamflows were then fed into the model as inflows to Bisalpur Dam. There is one crucial difference between the model using Tahal Wapcos flows and the CWC flows:
■ The Tahal Wapcos flows do not accurately account for all the demand abstrac-tions just upstream of Bisalpur Dam, and a demand node was created to draw down the streamflows to match the general pattern of the CWC flows – which is almost nonexistent in all months except for the monsoon and post-monsoon seasons.
A critical drawback for all of the streamflow sequences conditioned on climate change is that only four of the downscaled rainfall ensemble members could be used to generate the streamflow sequences. This means that the synthetic future streamflow sequences do not adequately capture the full range of possible variabil-ity in rainfall and the future streamflow variability is not as large as the historically observed variability. Thus, we must caution that the model scenarios and their outputs, discussed through the remainder of this chapter, should only be interpreted for their mean behavior and trend changes. They are not representative of the potential large range of change in rainfalls as indicated by the downscaling. However, the mean trend changes and their implications, as investigated in WEAP are sobering enough and provide a strong impetus for better management of water demand and supply in the Bisalpur catchment area.
The core approach of the models was to consider all demand sites (including both urban and rural domestic and industrial uses) in a contiguous geographical area spanning the blocks and districts that draw water from Bisalpur. This approach enabled the models to:
1. Assess changes in rural vs. Jaipur city’s urban water demand in the contiguous geographical area;
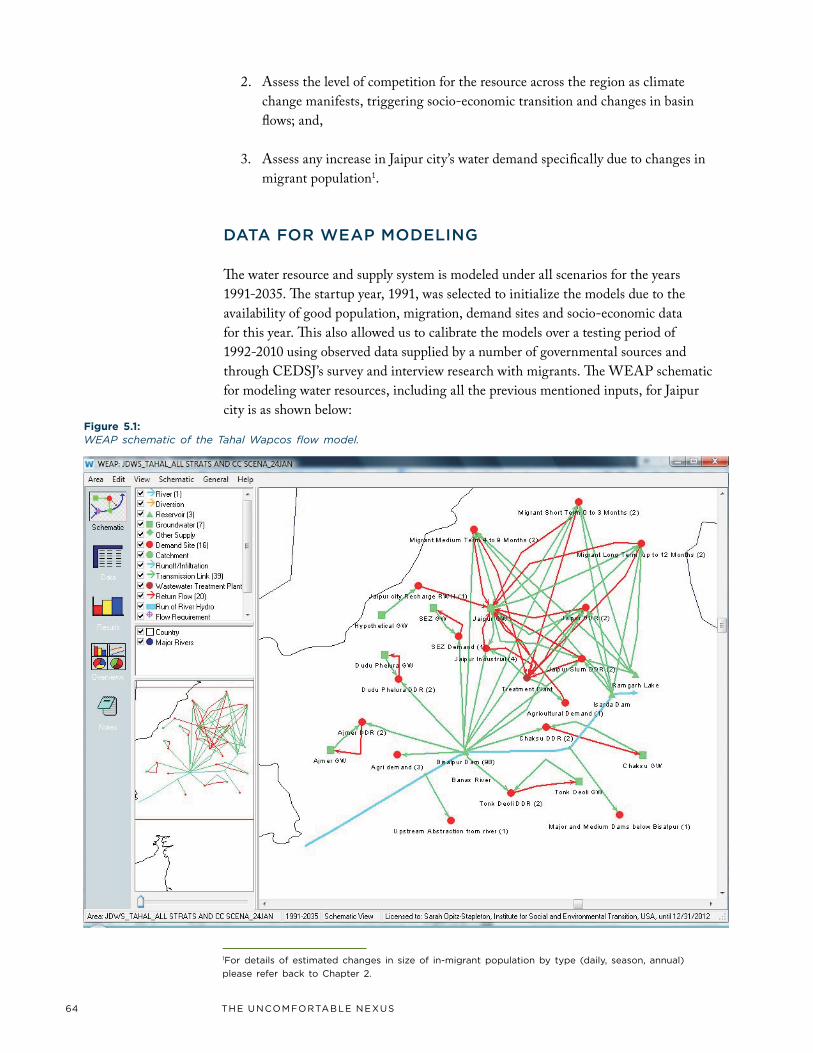
64 The UncomforTable nexUsThe UncomforTable nexUs
2. Assess the level of competition for the resource across the region as climate change manifests, triggering socio-economic transition and changes in basin flows; and,
3. Assess any increase in Jaipur city’s water demand specifically due to changes in migrant population1.
dATA fOr WeAp mOdeliNG
The water resource and supply system is modeled under all scenarios for the years 1991-2035. The startup year, 1991, was selected to initialize the models due to the availability of good population, migration, demand sites and socio-economic data for this year. This also allowed us to calibrate the models over a testing period of 1992-2010 using observed data supplied by a number of governmental sources and through CEDSJ’s survey and interview research with migrants. The WEAP schematic for modeling water resources, including all the previous mentioned inputs, for Jaipur city is as shown below:
1for details of estimated changes in size of in-migrant population by type (daily, season, annual)
please refer back to chapter 2.
Figure 5.1: WEAP schematic of the Tahal Wapcos flow model.
The UncomforTable nexUs 65assessing options for climate-resilient Urban Water managementThe UncomforTable nexUs
demANd siTes
As described earlier, there are already numerous demands being placed on Bisalpur Dam for irrigation, domestic and industrial needs. The ability of Bisalpur to actually serve as the primary source of drinking water for Jaipur city, and other settlements along the way, is challenged by these other demands that were placed on the reser-voir from the moment it became operational in 1994. Additionally, irrigation projects, groundwater pumping and sand mining in the Banas riverbed upstream of the reservoir essentially divert the river from the reservoir in all months except the monsoon and post-monsoon seasons. Because of this, any modeling attempts to assess Jaipur’s water supply vulnerability under current and future stressors must include all known water uses in the contiguous geographical area. We accounted for the following demand sites in the model:
■ Five domestic water demand sites for: ƌ Jaipur DDR: Covering the aggregate area of Jaipur, Amber, Sanganer,
and Phagi Tehsils; ƌ Dudu-Phulera DDR: Covering the aggregate area of Malpura, Dudu
and Sãmbhar Tehsils; ƌ Chaksu DDR: Covering the aggregate area of Todaraisingh, Peeplu,
Newai, and Chaksu Tehsils; ƌ Tonk Deoli DDR: Covering the aggregate area of Tonk, Deoli, and
Uniara Tehsils; ƌ Ajmer-Bewar DDR: Covering the aggregate area of Kekari, Sarwar,
Ajmer, Nasirabad, Bewar, and Kishangarh Tehsils; ■ Two industrial demand sites for recently developed SEZ and Jaipur industrial
area; ■ Two demand sites for Jaipur city - one excluding the slum population and one
covering the slum area demands; and ■ Three demand sites for the migrant population types - short-term migrants (up to
3 months duration stay), medium-term (up to 9 months) and long-term (up to 12 months).
Linking Demands and supplies: All of the demand nodes were linked to supply nodes (data sources and setup described below) through transmission links. Data on present and future capacities of transmission links from Bisalpur Dam and transmission losses were accounted for in the model (Gov. of Rajasthan 2006).
Return flow links: All demand sites have return flow after the water is used to supply nodes, such as the groundwater nodes and to the wastewater treatment plant node.
Wastewater treatment plant: All domestic demand nodes in Jaipur city, including Jaipur DDR, Jaipur slum DDR and the three migrant population nodes, were connected through return flow links to the wastewater treatment plant, which provides water to an agriculture demand site. The agriculture demand node is not active in the reference scenario. The data on the capacity of the wastewater treatment plant was taken from the information provided on the website http://www.ruidp.gov.in/project-cities/jaipur.htm.
The ability of Bisalpur
to actually serve as
the primary source
of drinking water for
Jaipur city, and other
settlements along the
way, is challenged by
these other demands
that were placed
on the reservoir
from the moment it
became operational
in 1994.
66 The UncomforTable nexUsThe UncomforTable nexUs
The inflows provided by CWC account for abstractions from the Banas River upstream of the dam; however, the Tahal Wapcos flows do not. Therefore, the model running the Tahal Wapco flows has an additional demand site upstream of the reservoir to calibrate inflows to the dam which should be zero in most months, as discussed earlier. This upstream demand site accounts for numerous major, medium and minor irriga-tion dams, approximately 27,513 anicuts and abstraction from the river, to supply water to an aggregate population of approximately 84,52,190 living in cities and villages upstream from the reservoir. The CWC WEAP model did not include this upstream demand node. There are also a number of major and minor irrigation dams downstream from the dam, which were aggregated as one demand site, “Major and Minor Irrigation Dams below Bisalpur”, and included in both the Tahal Wapcos and CWC models before the site of the proposed Isarda Reservoir.
All the catchment interception of flows by the irrigation demand nodes was only allowed in “Normal”, “Wet”, and “Very Wet” years. These upstream and downstream abstractions are not allowed to fill in “Dry” and “Very Dry” years, reflecting the obser-vations in the Tahal Wapcos reports that the headworks of many of the major and minor irrigation dams are unable to divert extremely low flows and thus not filling in drought years.
dATA fOr demANd drivers
Population for each Demand node: Population data at each of the five domestic demand sites was extracted from the 1991 and 2001 Census, as reported in the District Statistical Handbook (Gov. of Rajasthan 2006). As previously mentioned, the five drinking water demand nodes were created based on the supply of water from Bisalpur Dam to different rural and urban areas en route to Jaipur. The total population for each demand node was calculated by aggregating the population within the coverage area of the main or ancillary supply lines from the dam. In a few cases, the main line passes directly through an area. The current and projected growth and development rates of Jaipur city and the surrounding peri-urban areas was taken from the Jaipur Development Authority (JDA) Master Plans 2011 and 2025 (JDA 2009).
Slum Population: The number of people living in the slum areas was taken from the Census of India 1991 and 2001 reports (Gov. of Rajasthan 2010).
Migrant population: Data on migrant populations and their migration patterns (short-term, medium-term and long-term) came from the report entitled Migrant Worker in the Construction Sector-A Study in the Chowktis of Jaipur (PUCL 2002). The data also draws on the results of the special survey administered by CEDSJ under this project for Jaipur city during 2009-2010.
Livestock Population: Livestock data were taken from the Livestock Census (Gov. of Rajasthan 2003).
Growth rate of both human and livestock populations: was based on the decadal growth rate as projected by Census of India based on district wise decadal population
Jaipur city is actually
using 148 lpcd,
which exceeds the
government norms for
the city.
The UncomforTable nexUs 67assessing options for climate-resilient Urban Water managementThe UncomforTable nexUs
growth rates since 1951. The number of households and number of persons per house-holds were also taken from Census of India 2001 (Gov. of Rajasthan 2010).
Annual water use rate: The Government of Rajasthan norms for rural and urban water supply are listed as 80 liters per capita day (lpcd) for Jaipur, 60 lpcd for Ajmer, and all of the rural areas are listed as extracting 40 lpcd. As described in Chapter 3, Jaipur city is actually using 126.5 lpcd, which exceed the government norms for the city. Both of these sets values were taken from the Draft City Development Plan for Jaipur city (LEA & CEPT 2005).
Water supply Losses: The water distribution losses for Jaipur city were taken as 44 percent as reported in the Draft City Development Plan for Jaipur (LEA & CEPT 2005).
Priority: As per the national and new state water policy documents, drinking water is listed as the first priority when provisioning water, agriculture as the second prior-ity and industrial use as the third priority. Therefore, we also designated the drinking water nodes as top priority within the models and set the other uses to lower priorities, determining how the model allocated water to various users.
hydrOlOGy dATA
The sources of both the rainfall and inflow datasets are described in great detail in Chapter 4. The classification of the inflow datasets according to Water Year type is described previously in the current chapter.
dATA fOr supply NOdes
Surface water sources: Three surface water sources, namely Ramgarh Lake, Bisalpur Dam and Isarda Dam were considered in the models. The details on the data sources are as follows:
■ Local Reservoirs:
ƌ Ramgarh Lake: This was considered the prime surface water supply source for drinking water demand nodes until 2001, when it ceased to remain functional due to siltation (Gov. of Rajasthan 2007).
ƌ Bisalpur Dam: Information on the dam’s storage capacity, initial storage, and operations were taken from the report The Salient Features of Bisalpur Dam (Gov. of Rajasthan 2008). The information on net evaporation losses, loss to groundwater and the volume elevation curve were taken from the Bisalpur Project Report (Gov. of Rajasthan 1991).
ƌ Isarda Dam: Isarda Dam is a reservoir proposed for construction andexpected to become operational in 2020. In the absence of data, we assumed the proposed reservoir would have half the capacity of Bisalpur.
As per the national
and new state water
policy documents,
drinking water
is listed as the
first priority when
provisioning water,
agriculture as the
second priority
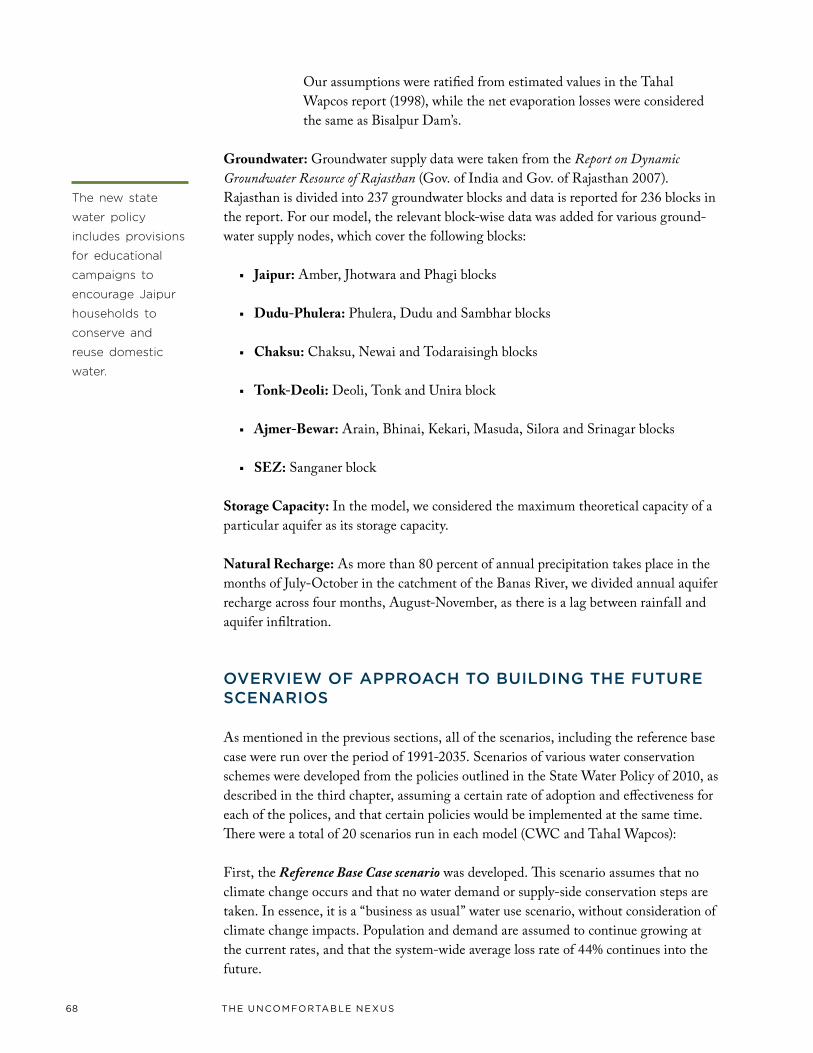
68 The UncomforTable nexUsThe UncomforTable nexUs
Our assumptions were ratified from estimated values in the Tahal Wapcos report (1998), while the net evaporation losses were considered the same as Bisalpur Dam’s.
Groundwater: Groundwater supply data were taken from the Report on Dynamic Groundwater Resource of Rajasthan (Gov. of India and Gov. of Rajasthan 2007). Rajasthan is divided into 237 groundwater blocks and data is reported for 236 blocks in the report. For our model, the relevant block-wise data was added for various ground-water supply nodes, which cover the following blocks:
■ Jaipur: Amber, Jhotwara and Phagi blocks
■ Dudu-Phulera: Phulera, Dudu and Sambhar blocks
■ Chaksu: Chaksu, Newai and Todaraisingh blocks
■ Tonk-Deoli: Deoli, Tonk and Unira block
■ Ajmer-Bewar: Arain, Bhinai, Kekari, Masuda, Silora and Srinagar blocks
■ SEZ: Sanganer block
Storage Capacity: In the model, we considered the maximum theoretical capacity of a particular aquifer as its storage capacity.
Natural Recharge: As more than 80 percent of annual precipitation takes place in the months of July-October in the catchment of the Banas River, we divided annual aquifer recharge across four months, August-November, as there is a lag between rainfall and aquifer infiltration.
OvervieW Of ApprOAch TO BuildiNG The fuTure sceNAriOs
As mentioned in the previous sections, all of the scenarios, including the reference base case were run over the period of 1991-2035. Scenarios of various water conservation schemes were developed from the policies outlined in the State Water Policy of 2010, as described in the third chapter, assuming a certain rate of adoption and effectiveness for each of the polices, and that certain policies would be implemented at the same time. There were a total of 20 scenarios run in each model (CWC and Tahal Wapcos):
First, the Reference Base Case scenario was developed. This scenario assumes that no climate change occurs and that no water demand or supply-side conservation steps are taken. In essence, it is a “business as usual” water use scenario, without consideration of climate change impacts. Population and demand are assumed to continue growing at the current rates, and that the system-wide average loss rate of 44% continues into the future.
The new state
water policy
includes provisions
for educational
campaigns to
encourage Jaipur
households to
conserve and
reuse domestic
water.
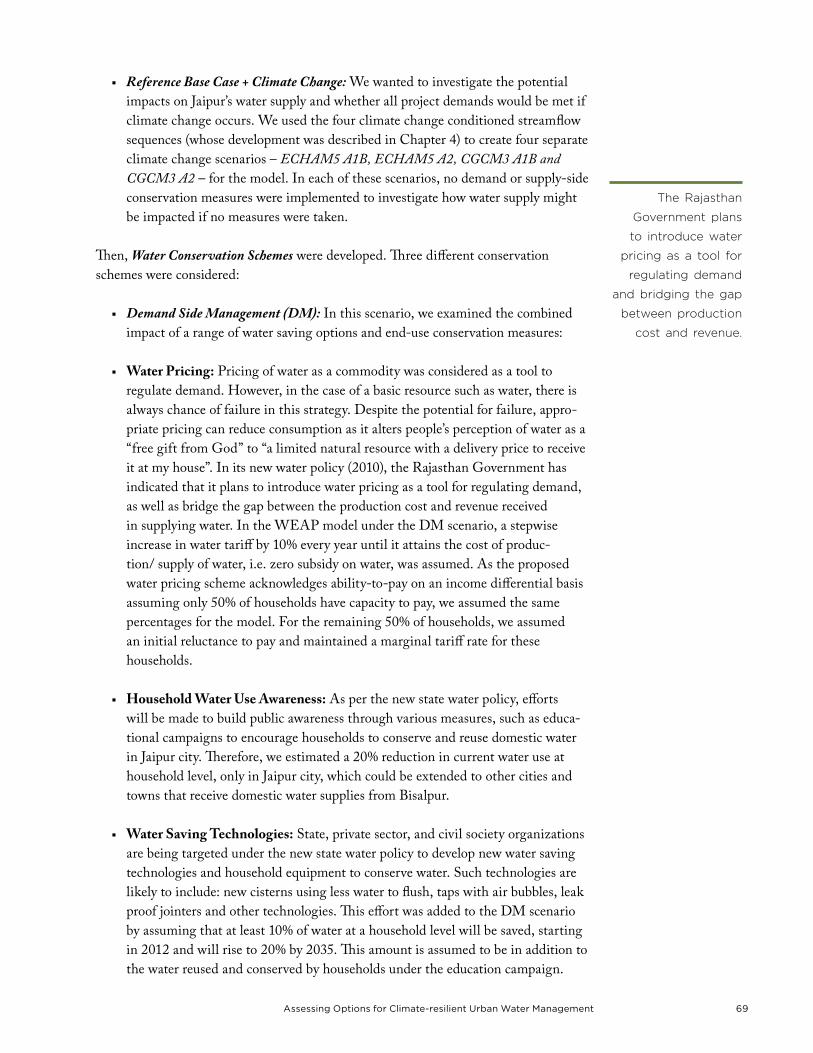
The UncomforTable nexUs 69assessing options for climate-resilient Urban Water managementThe UncomforTable nexUs
■ Reference Base Case + Climate Change: We wanted to investigate the potential impacts on Jaipur’s water supply and whether all project demands would be met if climate change occurs. We used the four climate change conditioned streamflow sequences (whose development was described in Chapter 4) to create four separate climate change scenarios – ECHAM5 A1B, ECHAM5 A2, CGCM3 A1B and CGCM3 A2 – for the model. In each of these scenarios, no demand or supply-side conservation measures were implemented to investigate how water supply might be impacted if no measures were taken.
Then, Water Conservation Schemes were developed. Three different conservation schemes were considered:
■ Demand Side Management (DM): In this scenario, we examined the combined impact of a range of water saving options and end-use conservation measures:
■ Water Pricing: Pricing of water as a commodity was considered as a tool to regulate demand. However, in the case of a basic resource such as water, there is always chance of failure in this strategy. Despite the potential for failure, appro-priate pricing can reduce consumption as it alters people’s perception of water as a “free gift from God” to “a limited natural resource with a delivery price to receive it at my house”. In its new water policy (2010), the Rajasthan Government has indicated that it plans to introduce water pricing as a tool for regulating demand, as well as bridge the gap between the production cost and revenue received in supplying water. In the WEAP model under the DM scenario, a stepwise increase in water tariff by 10% every year until it attains the cost of produc-tion/ supply of water, i.e. zero subsidy on water, was assumed. As the proposed water pricing scheme acknowledges ability-to-pay on an income differential basis assuming only 50% of households have capacity to pay, we assumed the same percentages for the model. For the remaining 50% of households, we assumed an initial reluctance to pay and maintained a marginal tariff rate for these households.
■ Household Water Use Awareness: As per the new state water policy, efforts will be made to build public awareness through various measures, such as educa-tional campaigns to encourage households to conserve and reuse domestic water in Jaipur city. Therefore, we estimated a 20% reduction in current water use at household level, only in Jaipur city, which could be extended to other cities and towns that receive domestic water supplies from Bisalpur.
■ Water Saving Technologies: State, private sector, and civil society organizations are being targeted under the new state water policy to develop new water saving technologies and household equipment to conserve water. Such technologies are likely to include: new cisterns using less water to flush, taps with air bubbles, leak proof jointers and other technologies. This effort was added to the DM scenario by assuming that at least 10% of water at a household level will be saved, starting in 2012 and will rise to 20% by 2035. This amount is assumed to be in addition to the water reused and conserved by households under the education campaign.
The Rajasthan
Government plans
to introduce water
pricing as a tool for
regulating demand
and bridging the gap
between production
cost and revenue.
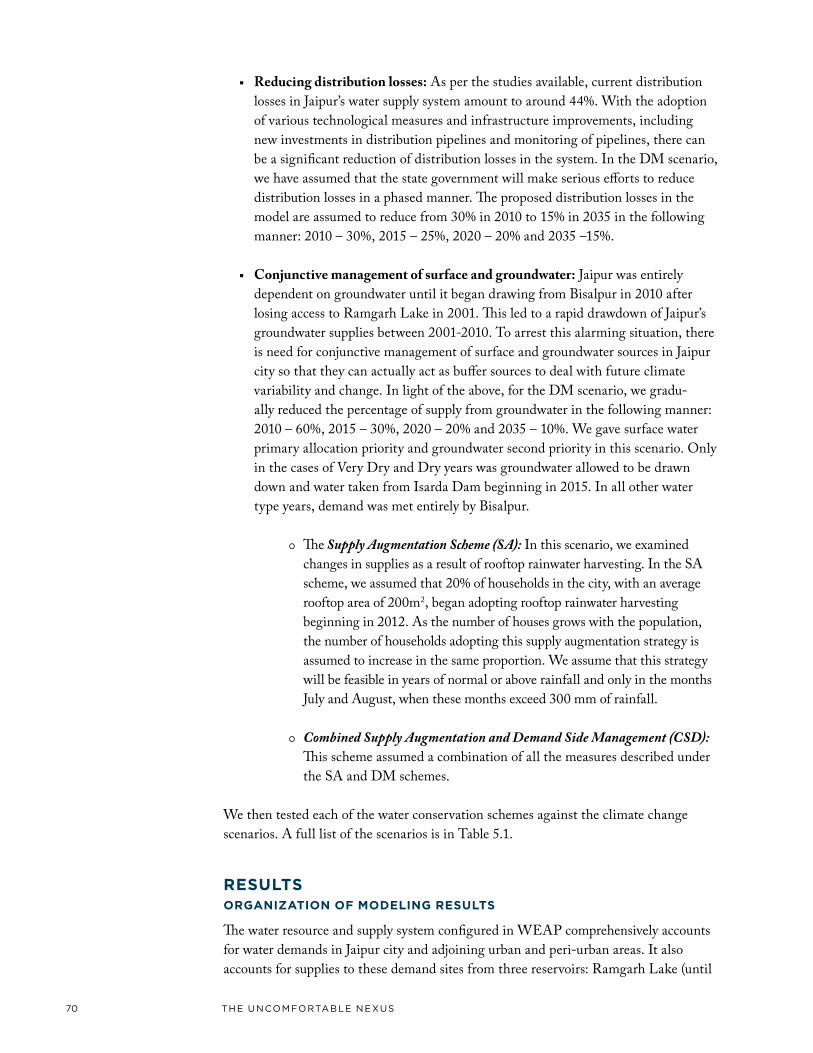
70 The UncomforTable nexUsThe UncomforTable nexUs
■ Reducing distribution losses: As per the studies available, current distribution losses in Jaipur’s water supply system amount to around 44%. With the adoption of various technological measures and infrastructure improvements, including new investments in distribution pipelines and monitoring of pipelines, there can be a significant reduction of distribution losses in the system. In the DM scenario, we have assumed that the state government will make serious efforts to reduce distribution losses in a phased manner. The proposed distribution losses in the model are assumed to reduce from 30% in 2010 to 15% in 2035 in the following manner: 2010 – 30%, 2015 – 25%, 2020 – 20% and 2035 –15%.
■ Conjunctive management of surface and groundwater: Jaipur was entirely dependent on groundwater until it began drawing from Bisalpur in 2010 after losing access to Ramgarh Lake in 2001. This led to a rapid drawdown of Jaipur’s groundwater supplies between 2001-2010. To arrest this alarming situation, there is need for conjunctive management of surface and groundwater sources in Jaipur city so that they can actually act as buffer sources to deal with future climate variability and change. In light of the above, for the DM scenario, we gradu-ally reduced the percentage of supply from groundwater in the following manner: 2010 – 60%, 2015 – 30%, 2020 – 20% and 2035 – 10%. We gave surface water primary allocation priority and groundwater second priority in this scenario. Only in the cases of Very Dry and Dry years was groundwater allowed to be drawn down and water taken from Isarda Dam beginning in 2015. In all other water type years, demand was met entirely by Bisalpur.
ƌ The Supply Augmentation Scheme (SA): In this scenario, we examined changes in supplies as a result of rooftop rainwater harvesting. In the SA scheme, we assumed that 20% of households in the city, with an average rooftop area of 200m2, began adopting rooftop rainwater harvesting beginning in 2012. As the number of houses grows with the population, the number of households adopting this supply augmentation strategy is assumed to increase in the same proportion. We assume that this strategy will be feasible in years of normal or above rainfall and only in the months July and August, when these months exceed 300 mm of rainfall.
ƌ Combined Supply Augmentation and Demand Side Management (CSD): This scheme assumed a combination of all the measures described under the SA and DM schemes.
We then tested each of the water conservation schemes against the climate change scenarios. A full list of the scenarios is in Table 5.1.
resUlts organization oF modeling resUlts
The water resource and supply system configured in WEAP comprehensively accounts for water demands in Jaipur city and adjoining urban and peri-urban areas. It also accounts for supplies to these demand sites from three reservoirs: Ramgarh Lake (until
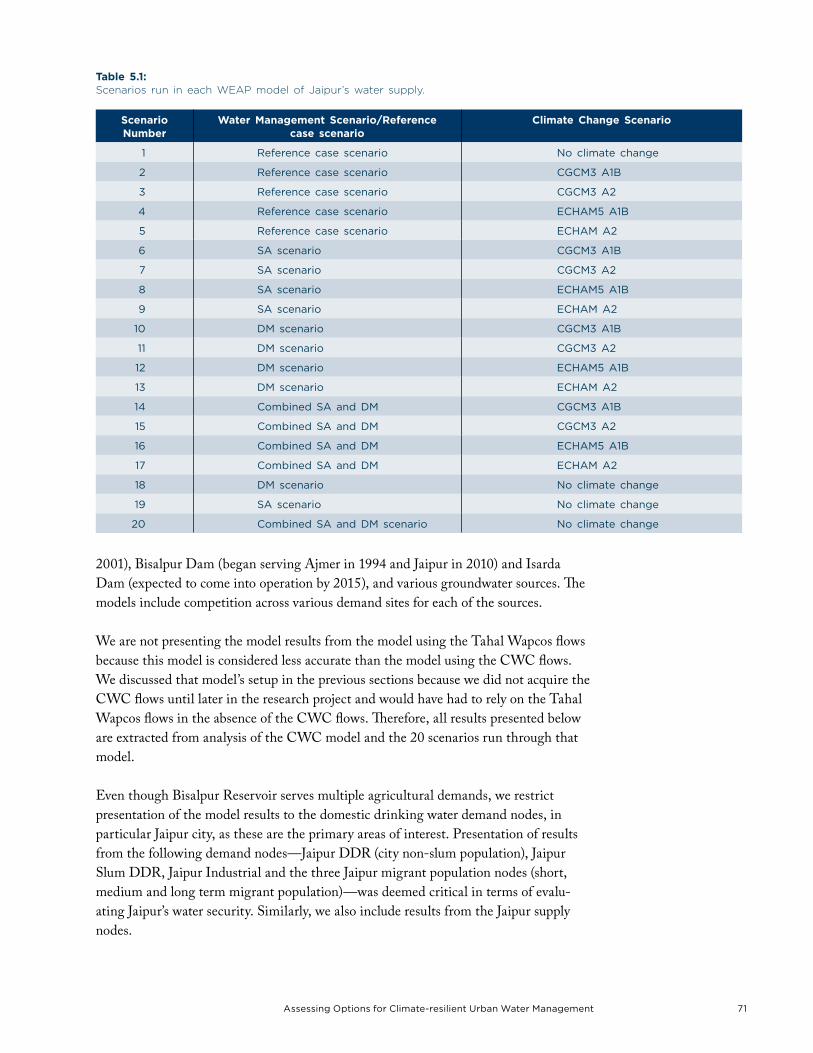
The UncomforTable nexUs 71assessing options for climate-resilient Urban Water managementThe UncomforTable nexUs
scenarionumber
Water management scenario/reference case scenario
Climate Change scenario
1 reference case scenario no climate change
2 reference case scenario cGcm3 a1b
3 reference case scenario cGcm3 a2
4 reference case scenario echam5 a1b
5 reference case scenario echam a2
6 sa scenario cGcm3 a1b
7 sa scenario cGcm3 a2
8 sa scenario echam5 a1b
9 sa scenario echam a2
10 Dm scenario cGcm3 a1b
11 Dm scenario cGcm3 a2
12 Dm scenario echam5 a1b
13 Dm scenario echam a2
14 combined sa and Dm cGcm3 a1b
15 combined sa and Dm cGcm3 a2
16 combined sa and Dm echam5 a1b
17 combined sa and Dm echam a2
18 Dm scenario no climate change
19 sa scenario no climate change
20 combined sa and Dm scenario no climate change
table 5.1: Scenarios run in each WEAP model of Jaipur’s water supply.
2001), Bisalpur Dam (began serving Ajmer in 1994 and Jaipur in 2010) and Isarda Dam (expected to come into operation by 2015), and various groundwater sources. The models include competition across various demand sites for each of the sources.
We are not presenting the model results from the model using the Tahal Wapcos flows because this model is considered less accurate than the model using the CWC flows. We discussed that model’s setup in the previous sections because we did not acquire the CWC flows until later in the research project and would have had to rely on the Tahal Wapcos flows in the absence of the CWC flows. Therefore, all results presented below are extracted from analysis of the CWC model and the 20 scenarios run through that model.
Even though Bisalpur Reservoir serves multiple agricultural demands, we restrict presentation of the model results to the domestic drinking water demand nodes, in particular Jaipur city, as these are the primary areas of interest. Presentation of results from the following demand nodes—Jaipur DDR (city non-slum population), Jaipur Slum DDR, Jaipur Industrial and the three Jaipur migrant population nodes (short, medium and long term migrant population)—was deemed critical in terms of evalu-ating Jaipur’s water security. Similarly, we also include results from the Jaipur supply nodes.
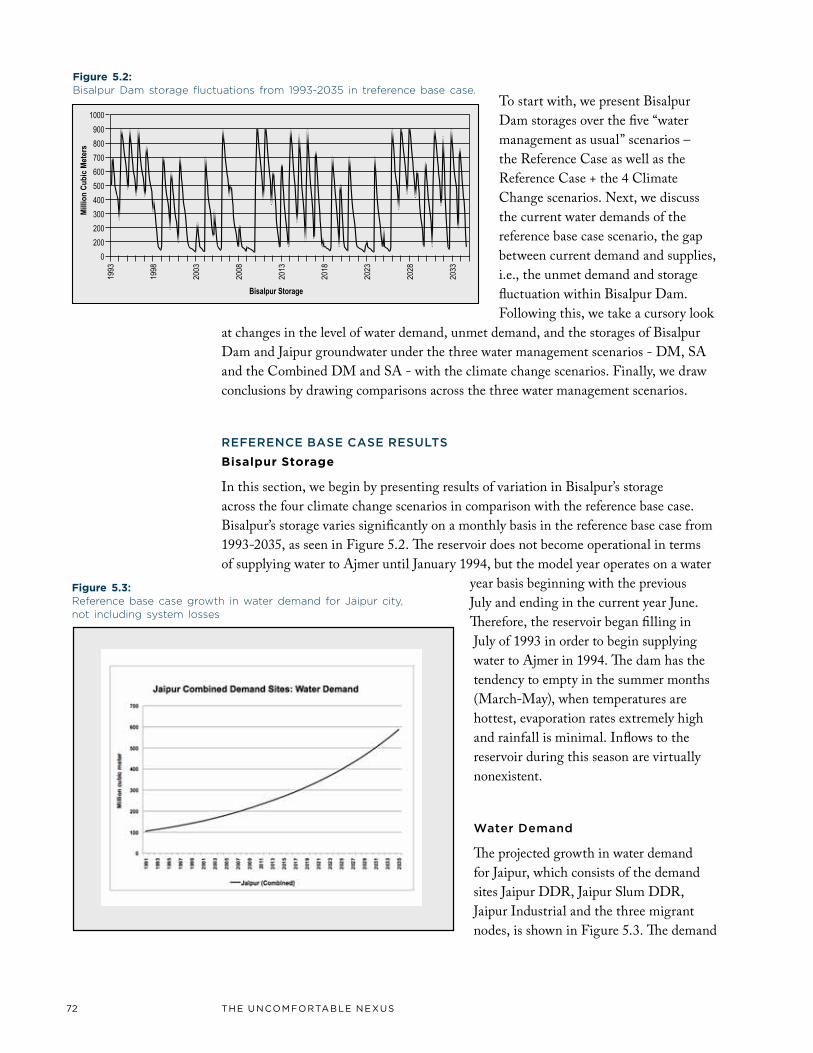
72 The UncomforTable nexUsThe UncomforTable nexUs
To start with, we present Bisalpur Dam storages over the five “water management as usual” scenarios – the Reference Case as well as the Reference Case + the 4 Climate Change scenarios. Next, we discuss the current water demands of the reference base case scenario, the gap between current demand and supplies, i.e., the unmet demand and storage fluctuation within Bisalpur Dam. Following this, we take a cursory look
at changes in the level of water demand, unmet demand, and the storages of Bisalpur Dam and Jaipur groundwater under the three water management scenarios - DM, SA and the Combined DM and SA - with the climate change scenarios. Finally, we draw conclusions by drawing comparisons across the three water management scenarios.
refereNce BAse cAse resulTs
bisalpur storage
In this section, we begin by presenting results of variation in Bisalpur’s storage across the four climate change scenarios in comparison with the reference base case. Bisalpur’s storage varies significantly on a monthly basis in the reference base case from 1993-2035, as seen in Figure 5.2. The reservoir does not become operational in terms of supplying water to Ajmer until January 1994, but the model year operates on a water
year basis beginning with the previous July and ending in the current year June. Therefore, the reservoir began filling in July of 1993 in order to begin supplying water to Ajmer in 1994. The dam has the tendency to empty in the summer months (March-May), when temperatures are hottest, evaporation rates extremely high and rainfall is minimal. Inflows to the reservoir during this season are virtually nonexistent.
Water demand
The projected growth in water demand for Jaipur, which consists of the demand sites Jaipur DDR, Jaipur Slum DDR, Jaipur Industrial and the three migrant nodes, is shown in Figure 5.3. The demand
Figure 5.2: Bisalpur Dam storage fluctuations from 1993-2035 in treference base case.
Figure 5.3: Reference base case growth in water demand for Jaipur city, not including system losses
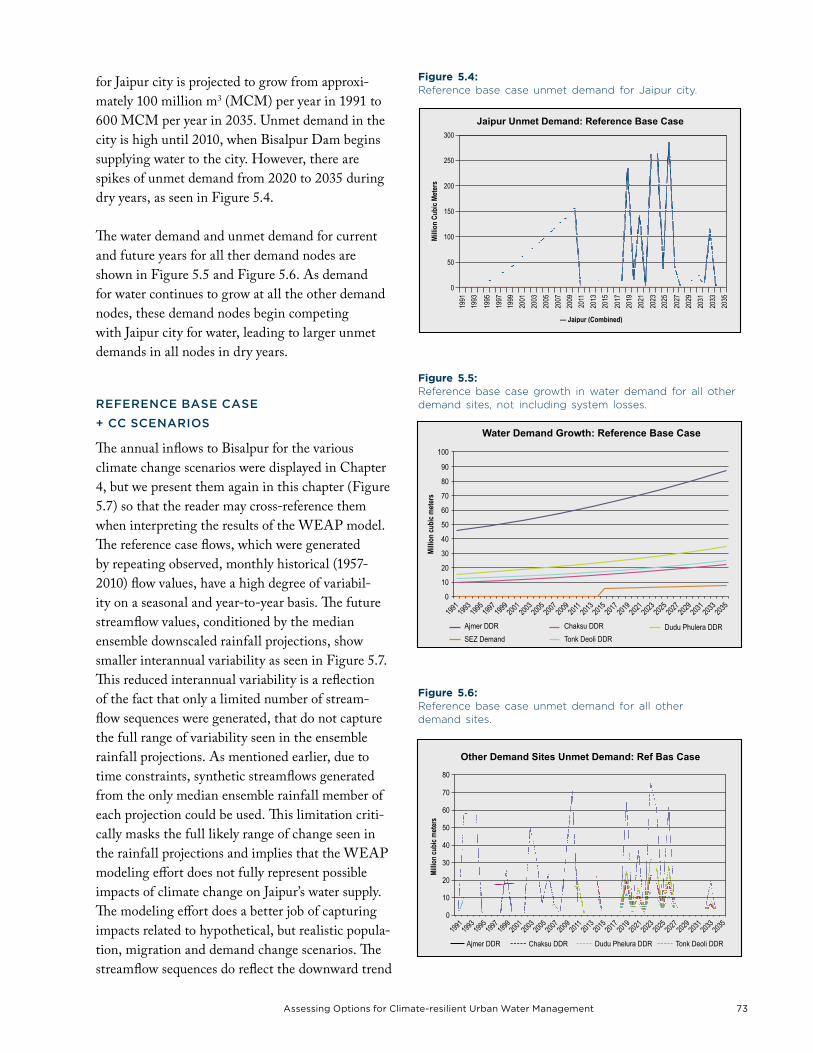
The UncomforTable nexUs 73assessing options for climate-resilient Urban Water managementThe UncomforTable nexUs
for Jaipur city is projected to grow from approxi-mately 100 million m3 (MCM) per year in 1991 to 600 MCM per year in 2035. Unmet demand in the city is high until 2010, when Bisalpur Dam begins supplying water to the city. However, there are spikes of unmet demand from 2020 to 2035 during dry years, as seen in Figure 5.4.
The water demand and unmet demand for current and future years for all ther demand nodes are shown in Figure 5.5 and Figure 5.6. As demand for water continues to grow at all the other demand nodes, these demand nodes begin competing with Jaipur city for water, leading to larger unmet demands in all nodes in dry years.
refereNce BAse cAse
+ cc sceNAriOs
The annual inflows to Bisalpur for the various climate change scenarios were displayed in Chapter 4, but we present them again in this chapter (Figure 5.7) so that the reader may cross-reference them when interpreting the results of the WEAP model. The reference case flows, which were generated by repeating observed, monthly historical (1957-2010) flow values, have a high degree of variabil-ity on a seasonal and year-to-year basis. The future streamflow values, conditioned by the median ensemble downscaled rainfall projections, show smaller interannual variability as seen in Figure 5.7. This reduced interannual variability is a reflection of the fact that only a limited number of stream-flow sequences were generated, that do not capture the full range of variability seen in the ensemble rainfall projections. As mentioned earlier, due to time constraints, synthetic streamflows generated from the only median ensemble rainfall member of each projection could be used. This limitation criti-cally masks the full likely range of change seen in the rainfall projections and implies that the WEAP modeling effort does not fully represent possible impacts of climate change on Jaipur’s water supply. The modeling effort does a better job of capturing impacts related to hypothetical, but realistic popula-tion, migration and demand change scenarios. The streamflow sequences do reflect the downward trend
Figure 5.6: Reference base case unmet demand for all other demand sites.
Figure 5.4: Reference base case unmet demand for Jaipur city.
Figure 5.5: Reference base case growth in water demand for all other demand sites, not including system losses.
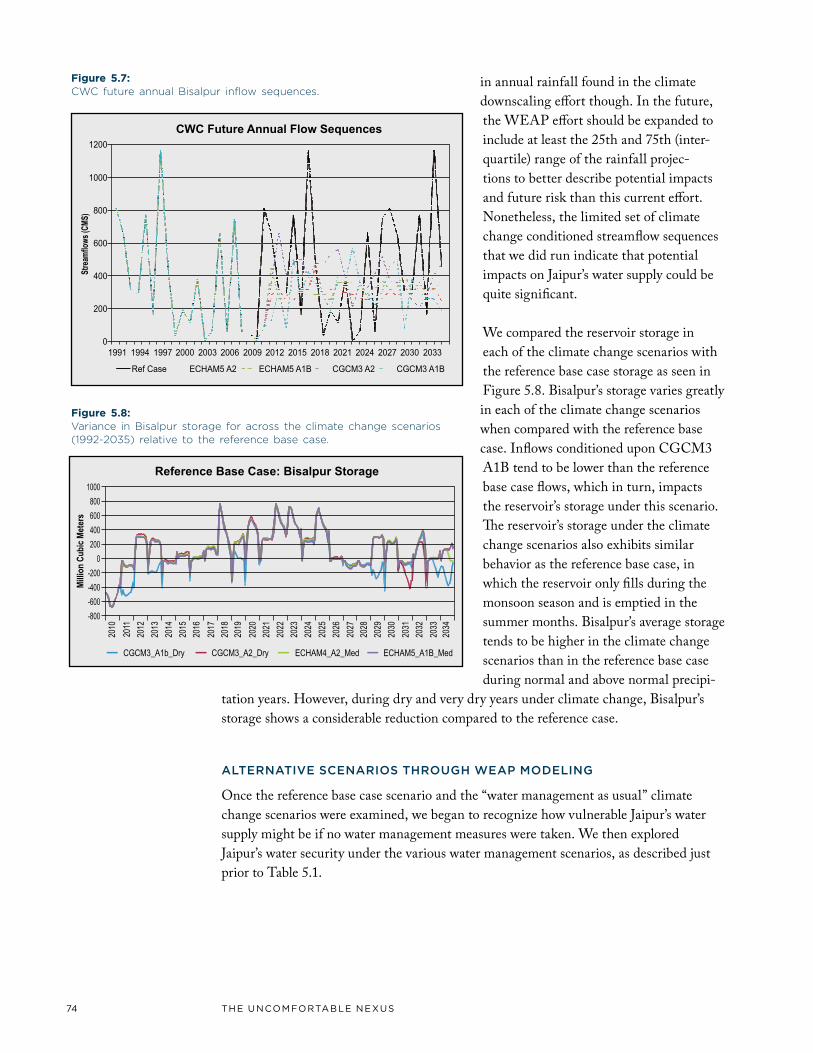
74 The UncomforTable nexUsThe UncomforTable nexUs
in annual rainfall found in the climate downscaling effort though. In the future, the WEAP effort should be expanded to include at least the 25th and 75th (inter-quartile) range of the rainfall projec-tions to better describe potential impacts and future risk than this current effort. Nonetheless, the limited set of climate change conditioned streamflow sequences that we did run indicate that potential impacts on Jaipur’s water supply could be quite significant.
We compared the reservoir storage in each of the climate change scenarios with the reference base case storage as seen in Figure 5.8. Bisalpur’s storage varies greatly in each of the climate change scenarios when compared with the reference base case. Inflows conditioned upon CGCM3 A1B tend to be lower than the reference base case flows, which in turn, impacts the reservoir’s storage under this scenario. The reservoir’s storage under the climate change scenarios also exhibits similar behavior as the reference base case, in which the reservoir only fills during the monsoon season and is emptied in the summer months. Bisalpur’s average storage tends to be higher in the climate change
Figure 5.8: Variance in Bisalpur storage for across the climate change scenarios (1992-2035) relative to the reference base case.
Figure 5.7: CWC future annual Bisalpur inflow sequences.
scenarios than in the reference base case during normal and above normal precipi-
tation years. However, during dry and very dry years under climate change, Bisalpur’s storage shows a considerable reduction compared to the reference case.
AlTerNATive sceNAriOs ThrOuGh WeAp mOdeliNG
Once the reference base case scenario and the “water management as usual” climate change scenarios were examined, we began to recognize how vulnerable Jaipur’s water supply might be if no water management measures were taken. We then explored Jaipur’s water security under the various water management scenarios, as described just prior to Table 5.1.
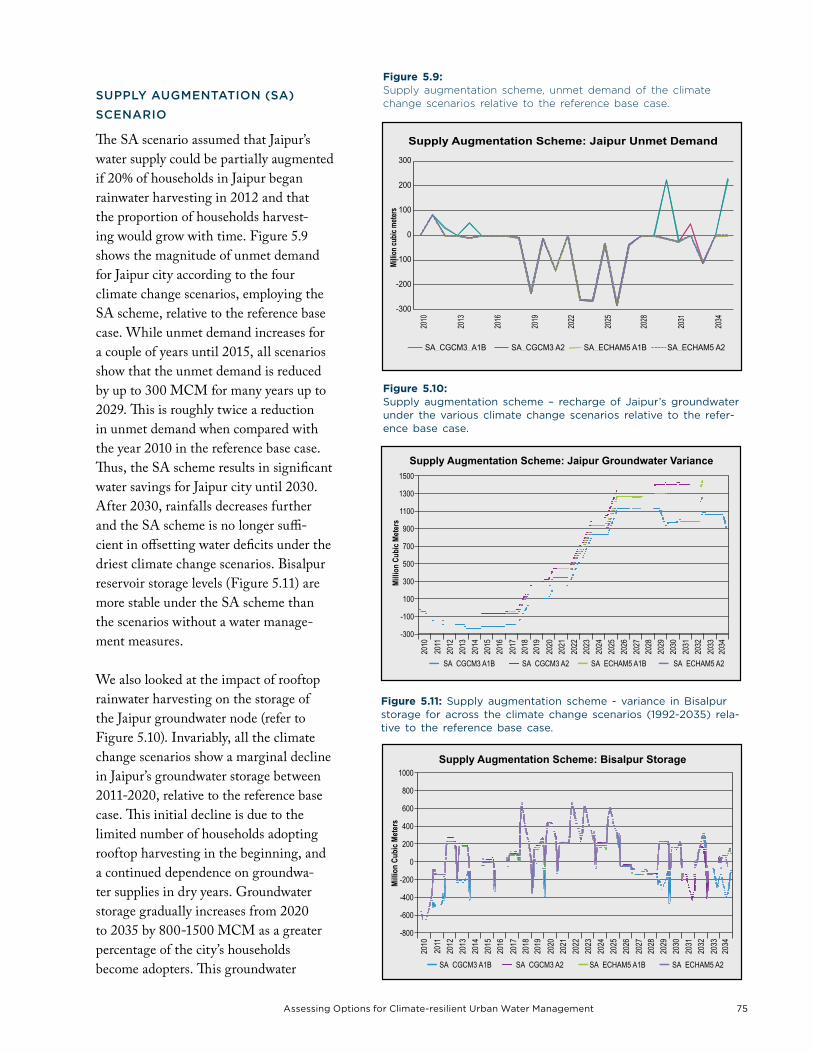
The UncomforTable nexUs 75assessing options for climate-resilient Urban Water managementThe UncomforTable nexUs
supply AuGmeNTATiON (sA)
sceNAriO
The SA scenario assumed that Jaipur’s water supply could be partially augmented if 20% of households in Jaipur began rainwater harvesting in 2012 and that the proportion of households harvest-ing would grow with time. Figure 5.9 shows the magnitude of unmet demand for Jaipur city according to the four climate change scenarios, employing the SA scheme, relative to the reference base case. While unmet demand increases for a couple of years until 2015, all scenarios show that the unmet demand is reduced by up to 300 MCM for many years up to 2029. This is roughly twice a reduction in unmet demand when compared with the year 2010 in the reference base case. Thus, the SA scheme results in significant water savings for Jaipur city until 2030. After 2030, rainfalls decreases further and the SA scheme is no longer suffi-cient in offsetting water deficits under the driest climate change scenarios. Bisalpur reservoir storage levels (Figure 5.11) are more stable under the SA scheme than the scenarios without a water manage-ment measures.
We also looked at the impact of rooftop rainwater harvesting on the storage of the Jaipur groundwater node (refer to Figure 5.10). Invariably, all the climate change scenarios show a marginal decline in Jaipur’s groundwater storage between 2011-2020, relative to the reference base case. This initial decline is due to the limited number of households adopting rooftop harvesting in the beginning, and a continued dependence on groundwa-ter supplies in dry years. Groundwater storage gradually increases from 2020 to 2035 by 800-1500 MCM as a greater percentage of the city’s households become adopters. This groundwater
Figure 5.9: Supply augmentation scheme, unmet demand of the climate change scenarios relative to the reference base case.
Figure 5.10: supply augmentation scheme – recharge of Jaipur’s groundwater under the various climate change scenarios relative to the refer-ence base case.
Figure 5.11: supply augmentation scheme - variance in bisalpur storage for across the climate change scenarios (1992-2035) rela-tive to the reference base case.
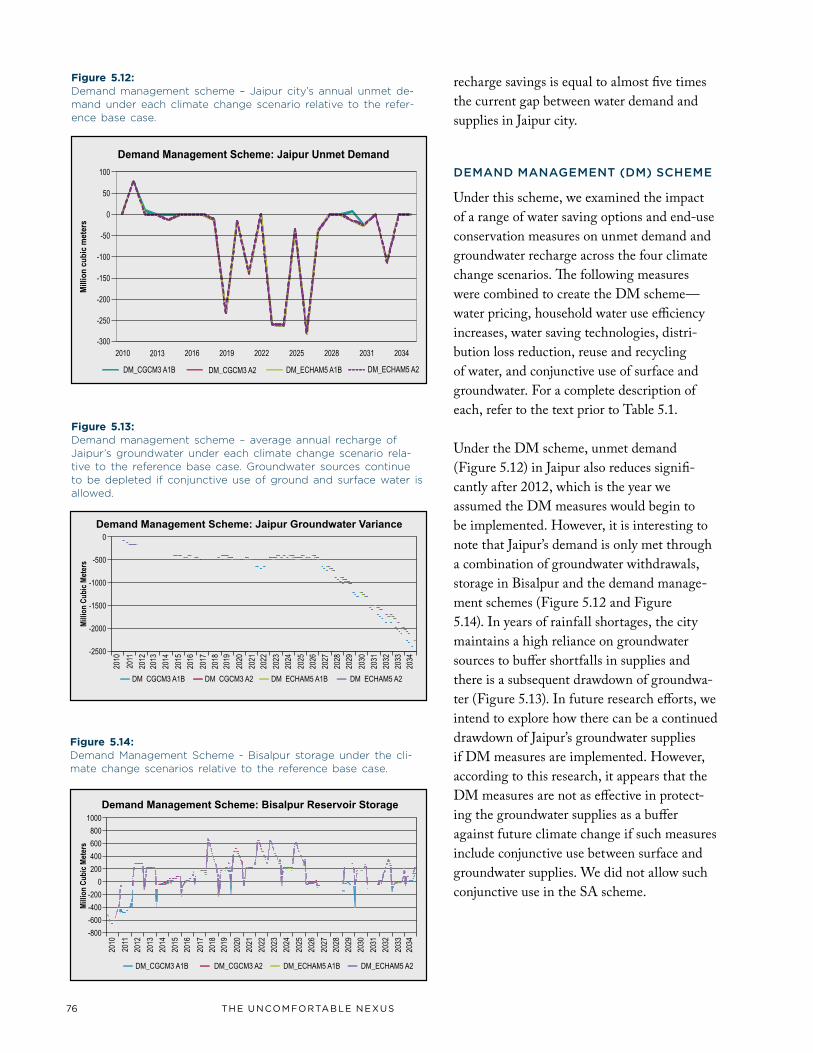
76 The UncomforTable nexUsThe UncomforTable nexUs
recharge savings is equal to almost five times the current gap between water demand and supplies in Jaipur city.
demANd mANAGemeNT (dm) scheme
Under this scheme, we examined the impact of a range of water saving options and end-use conservation measures on unmet demand and groundwater recharge across the four climate change scenarios. The following measures were combined to create the DM scheme—water pricing, household water use efficiency increases, water saving technologies, distri-bution loss reduction, reuse and recycling of water, and conjunctive use of surface and groundwater. For a complete description of each, refer to the text prior to Table 5.1.
Under the DM scheme, unmet demand (Figure 5.12) in Jaipur also reduces signifi-cantly after 2012, which is the year we assumed the DM measures would begin to be implemented. However, it is interesting to note that Jaipur’s demand is only met through a combination of groundwater withdrawals, storage in Bisalpur and the demand manage-ment schemes (Figure 5.12 and Figure 5.14). In years of rainfall shortages, the city maintains a high reliance on groundwater sources to buffer shortfalls in supplies and there is a subsequent drawdown of groundwa-ter (Figure 5.13). In future research efforts, we intend to explore how there can be a continued drawdown of Jaipur’s groundwater supplies if DM measures are implemented. However, according to this research, it appears that the DM measures are not as effective in protect-ing the groundwater supplies as a buffer against future climate change if such measures include conjunctive use between surface and groundwater supplies. We did not allow such conjunctive use in the SA scheme.
Figure 5.12: Demand management scheme – Jaipur city’s annual unmet de-mand under each climate change scenario relative to the refer-ence base case.
Figure 5.13: Demand management scheme – average annual recharge of Jaipur’s groundwater under each climate change scenario rela-tive to the reference base case. Groundwater sources continue to be depleted if conjunctive use of ground and surface water is allowed.
Figure 5.14: Demand Management Scheme - Bisalpur storage under the cli-mate change scenarios relative to the reference base case.
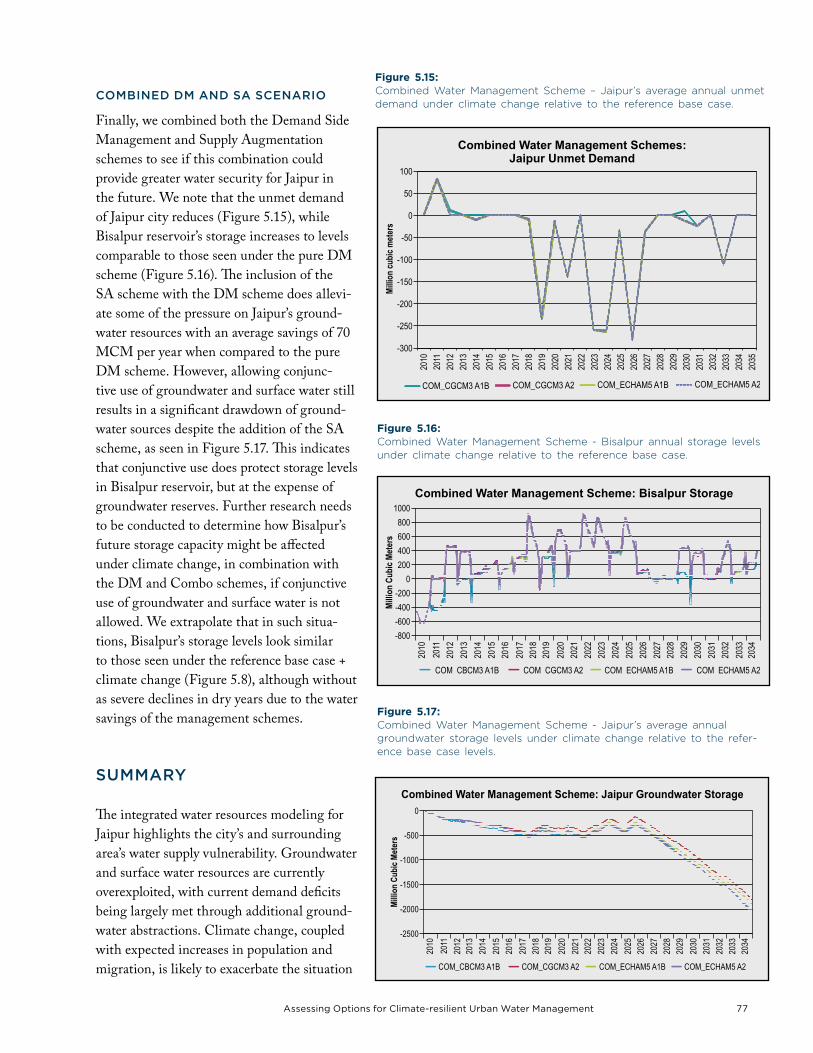
The UncomforTable nexUs 77assessing options for climate-resilient Urban Water managementThe UncomforTable nexUs
cOmBiNed dm ANd sA sceNAriO
Finally, we combined both the Demand Side Management and Supply Augmentation schemes to see if this combination could provide greater water security for Jaipur in the future. We note that the unmet demand of Jaipur city reduces (Figure 5.15), while Bisalpur reservoir’s storage increases to levels comparable to those seen under the pure DM scheme (Figure 5.16). The inclusion of the SA scheme with the DM scheme does allevi-ate some of the pressure on Jaipur’s ground-water resources with an average savings of 70 MCM per year when compared to the pure DM scheme. However, allowing conjunc-tive use of groundwater and surface water still results in a significant drawdown of ground-water sources despite the addition of the SA scheme, as seen in Figure 5.17. This indicates that conjunctive use does protect storage levels in Bisalpur reservoir, but at the expense of groundwater reserves. Further research needs to be conducted to determine how Bisalpur’s future storage capacity might be affected under climate change, in combination with the DM and Combo schemes, if conjunctive use of groundwater and surface water is not allowed. We extrapolate that in such situa-tions, Bisalpur’s storage levels look similar to those seen under the reference base case + climate change (Figure 5.8), although without as severe declines in dry years due to the water savings of the management schemes.
summAry
The integrated water resources modeling for Jaipur highlights the city’s and surrounding area’s water supply vulnerability. Groundwater and surface water resources are currently overexploited, with current demand deficits being largely met through additional ground-water abstractions. Climate change, coupled with expected increases in population and migration, is likely to exacerbate the situation
Figure 5.15: Combined Water Management Scheme – Jaipur’s average annual unmet demand under climate change relative to the reference base case.
Figure 5.16: Combined Water Management Scheme - Bisalpur annual storage levels under climate change relative to the reference base case.
Figure 5.17: Combined Water Management Scheme - Jaipur’s average annual groundwater storage levels under climate change relative to the refer-ence base case levels.
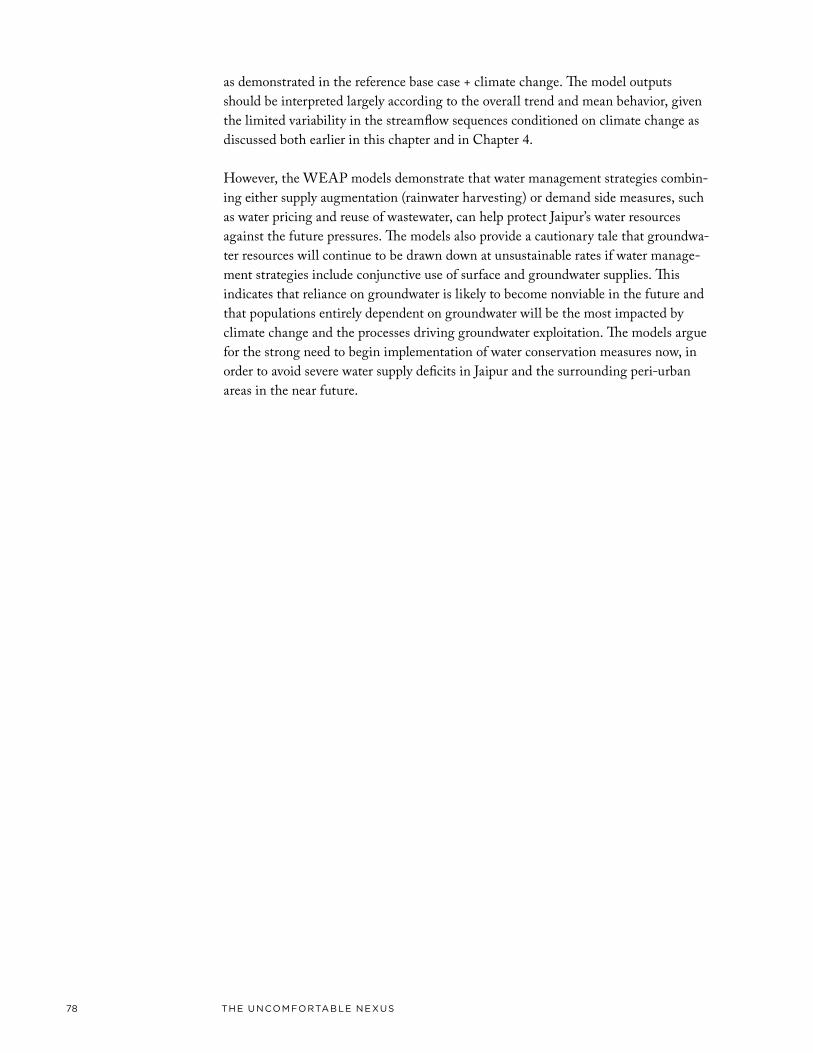
78 The UncomforTable nexUsThe UncomforTable nexUs
as demonstrated in the reference base case + climate change. The model outputs should be interpreted largely according to the overall trend and mean behavior, given the limited variability in the streamflow sequences conditioned on climate change as discussed both earlier in this chapter and in Chapter 4.
However, the WEAP models demonstrate that water management strategies combin-ing either supply augmentation (rainwater harvesting) or demand side measures, such as water pricing and reuse of wastewater, can help protect Jaipur’s water resources against the future pressures. The models also provide a cautionary tale that groundwa-ter resources will continue to be drawn down at unsustainable rates if water manage-ment strategies include conjunctive use of surface and groundwater supplies. This indicates that reliance on groundwater is likely to become nonviable in the future and that populations entirely dependent on groundwater will be the most impacted by climate change and the processes driving groundwater exploitation. The models argue for the strong need to begin implementation of water conservation measures now, in order to avoid severe water supply deficits in Jaipur and the surrounding peri-urban areas in the near future.

The UncomforTable nexUs 79assessing options for climate-resilient Urban Water managementThe UncomforTable nexUs
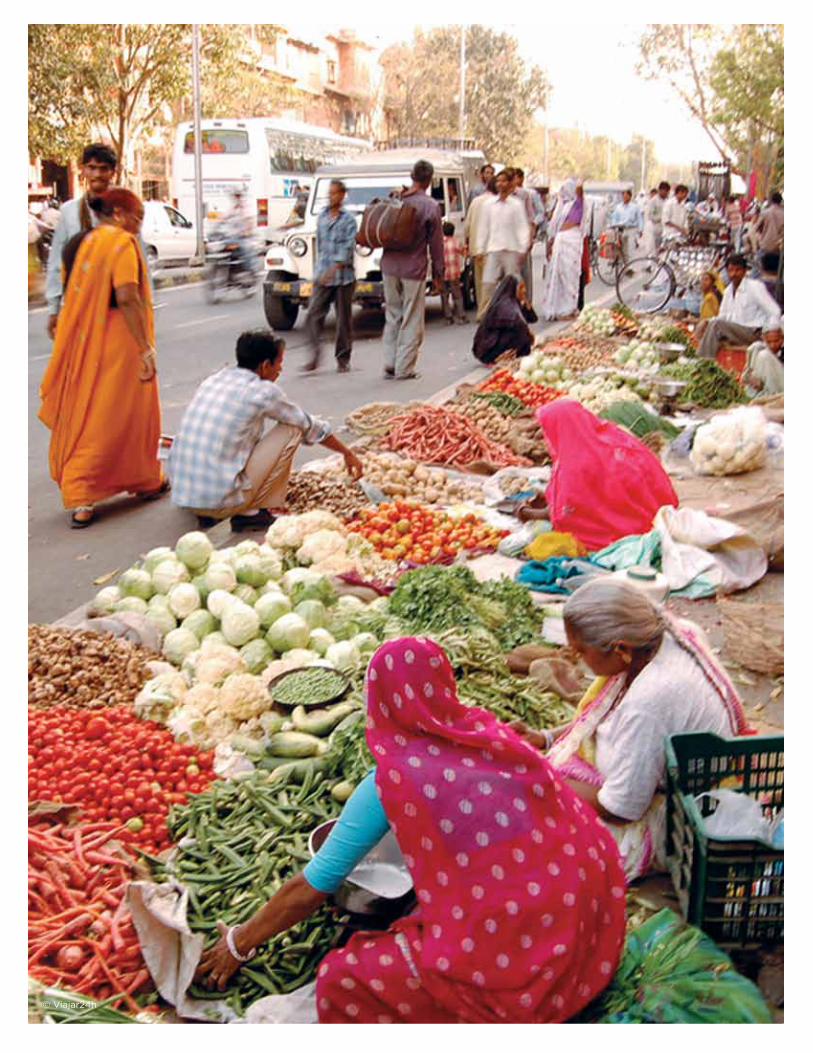
80 The UncomforTable nexUsThe UncomforTable nexUs © Viajar24h
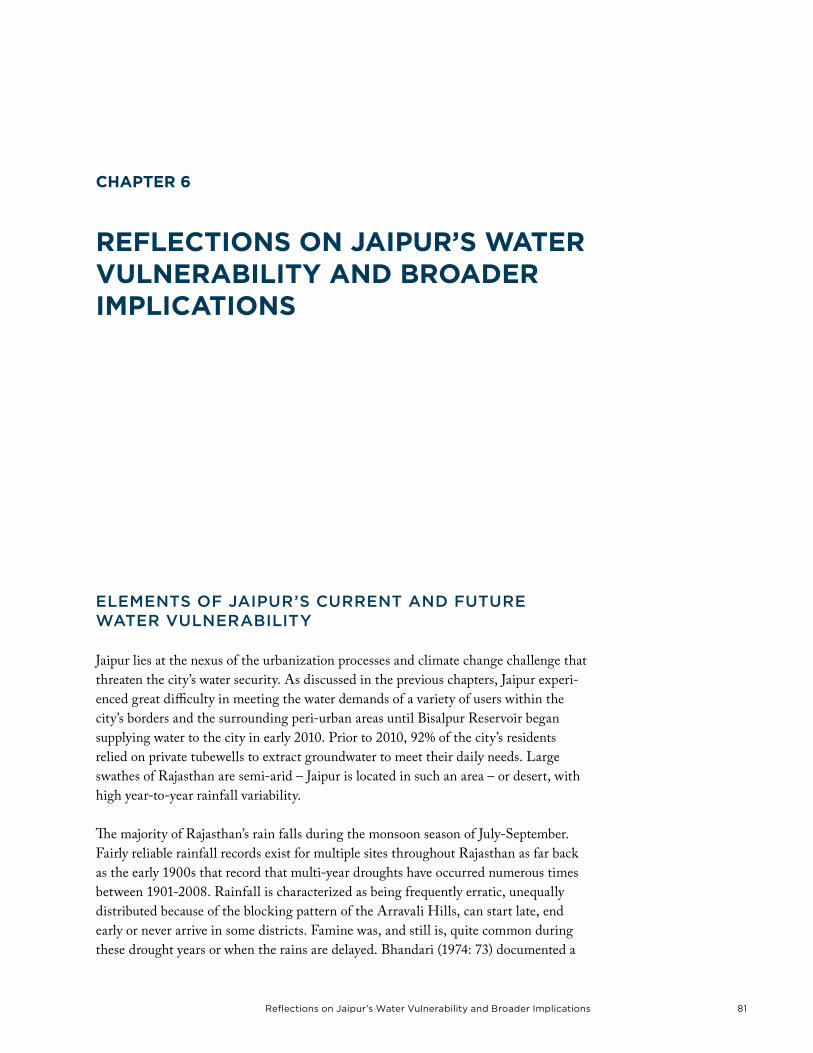
The UncomforTable nexUs 81reflections on Jaipur’s Water Vulnerability and broader ImplicationsThe UncomforTable nexUs
Chapter 6
reFleCtions on JaipUr’s Water VUlnerability and broader impliCations
elemeNTs Of JAipur’s curreNT ANd fuTure WATer vulNerABiliTy
Jaipur lies at the nexus of the urbanization processes and climate change challenge that threaten the city’s water security. As discussed in the previous chapters, Jaipur experi-enced great difficulty in meeting the water demands of a variety of users within the city’s borders and the surrounding peri-urban areas until Bisalpur Reservoir began supplying water to the city in early 2010. Prior to 2010, 92% of the city’s residents relied on private tubewells to extract groundwater to meet their daily needs. Large swathes of Rajasthan are semi-arid – Jaipur is located in such an area – or desert, with high year-to-year rainfall variability.
The majority of Rajasthan’s rain falls during the monsoon season of July-September. Fairly reliable rainfall records exist for multiple sites throughout Rajasthan as far back as the early 1900s that record that multi-year droughts have occurred numerous times between 1901-2008. Rainfall is characterized as being frequently erratic, unequally distributed because of the blocking pattern of the Arravali Hills, can start late, end early or never arrive in some districts. Famine was, and still is, quite common during these drought years or when the rains are delayed. Bhandari (1974: 73) documented a
82 The UncomforTable nexUsThe UncomforTable nexUs
Figure 6.1: Estimation of groundwater resources in Rajasthan as of 2001. Data for 2002, 2004 and 2009 are provisional. Source: Groundwater Department and Central Groundwater Board.
common saying throughout Rajasthan, “One lean year in three and one famine year in eight.”
Rural populations adopted a number of coping and adaptation measures for dealing with drought and famine conditions. People living in those areas that could support agricultural constructed complex canal and irriga-tion dam systems, some of which, like the Raj Samand Dam commissioned in 1676 (Tahal Wapcos 1998), are still functional today. Additional irrigation and water supply schemes are still being
constructed throughout the state, and involve water transfer agreements with neighbor-ing states. Some segments of populations living in the Thar Desert chose semi-migra-tory pastoralist lifestyles, raising livestock such as camels and goats which are more suited to the desert conditions, and moving the livestock as needed. Yet, even amongst those families engaged in pastoralism, not all family members took part in the activity. Instead, some chose to diversify family incomes as craftsmen or by taking part in the jajmani system (Geerlings 2001; Köhler-Rollefson et al. 1994; Rathore 2006).
Beyond adopting livelihood strategies suited to the harsh conditions of Rajasthan, people have traditionally relied on groundwater resources to serve as the primary source for irrigation and drinking water needs. The advent of electric and diesel pumps meant that groundwater could be extracted in much greater quantities and from much greater depths than in previous eras. However, rapid and extensive drawdown of groundwater resources resulted from the increased access that modern pumps brought. As a result, groundwater levels are critically low in 207 out of 237 blocks in the state and pumping rates far exceed natural recharge (Gov. of Rajasthan 2009). With this, it is apparent that a groundwater crisis is brewing in many districts of Rajasthan.
Another option that rural populations have traditionally employed for coping with drought is migration. However, environmental and climate factors are not the only factors pushing and pulling people from rural areas to the peri-urban and urban areas. As discussed in the second chapter, the perceived opportunities and constraints influ-encing the decision to migrate are complex and multifaceted. In the recent past, India’s rural population tended to migrate to areas of better opportunity that were in close proximity to their home villages and would not permanently settle in the new location (Deshingkar and Start 2003). As transportation networks have improved, as well as knowledge of better amenities and livelihood opportunities afforded by cities has spread, migration patterns have begun to change. Family and social networks are now well developed between rural/peri-urban/urban areas, further facilitating migration while allowing the migrants to be fluid in the distances traveled and duration of time away from the home village.
The UncomforTable nexUs 83reflections on Jaipur’s Water Vulnerability and broader ImplicationsThe UncomforTable nexUs
India and Rajasthan are rapidly urbanizing. While many migrants move within-district, a number of migrants are taking advantage of better transportation, communi-cation and social networks to migrate larger distances and stay longer periods of time. Jaipur city, the capital city of Rajasthan, is rapidly expanding in both its urban core and the surrounding peri-urban areas as rural populations from the surrounding districts respond to the combination of push-pull factors described in Chapter 2.
Life for the migrants, once they reach Jaipur, is not the easiest. Migrant workers complained during the interviews and surveys conducted by CEDSJ that day labor can be difficult to find. Additionally, the migrants indicated that the basic amenities in the city – affordable, quality housing and adequate, unpolluted drinking water – were not what they had hoped. A number of migrants are beginning to stay in Jaipur and the surrounding areas for longer periods of time, causing an expansion of the slum popula-tions, slum areas and the peri-urban areas.
As the city struggles to accommodate the growing populations, all inhabitants, not just the migrants, have difficulties acquiring enough high quality water. Ramgarh Lake, the previous surface water source, stopped serving the city in 2001 due to siltation and reduced reservoir capacity. Groundwater tables in the urban core and peri-urban areas began dropping precipitously under the combined pressures of: growing populations, loss of recharge areas due to conversion of land to buildings and roads, high climate variability, burgeoning industrial activity, peri-urban agriculture of high value, high water vegetable crops for the city and the loss of surface water supplies. Pollution from untreated sewage and industrial runoff is infiltrating water tables in certain areas of the city, rendering the local groundwater supply unsafe. People in these areas, if unserved by municipal water lines, have few choices other than to use the water as is or purchase water from tanker trucks. In short, Jaipur’s current water supply vulnerability is quite high.
Jaipur sought to ameliorate some of the pressure on its water supply and groundwa-ter sources by meeting a significant portion of current demand through water from Bisalpur Reservoir, which is fed by the Banas River. However, as documented in this research and in previous research by CEDSJ, significant abstractions both upstream and downstream of the dam on the Banas, and obligatory releases from the dam to other users, are creating significant competition over the water stored within Bisalpur. Abstractions from the Banas upstream of the dam mean that there is no inflow to the dam until the monsoon season, July-September, in most years. Since the dam became operational in 1994, it has filled only nine times. This past year, 2010, was a year of very high monsoon rainfall and flooding in neighboring Pakistan. Yet, the reservoir did not fill in this year and Jaipur did not receive its fully planned allocation of water.
With this chequered water supply history, Jaipur must now face the future. Migration and population growth rates are likely to continue growing, and as they do, there will be further expansion and growth in the peri-urban areas surrounding the city. Water demand and a drawdown of local groundwater resources are likely to increase as a result of population growth and industrial expansion. To this mix must be added the additional pressure of climate change.
A number of
migrants are taking
advantage of better
transportation,
communication and
social networks
to migrate larger
distances and stay
longer periods of
time.
84 The UncomforTable nexUsThe UncomforTable nexUs
While we cannot predict with absolute certainty how rainfall patterns might be altered by climate change in the near future (out to 2040), the downscaling efforts in this project using output from two GCMs – ECHAM5 and CGCM3 – under two emission scenarios – A1B and A2 – indicate the high likelihood that monsoon and annual rainfall might decrease. The rainfall projections generated from multiple GCMs are in agreement about the downward trend in rainfalls in all seasons except for the post-monsoon period of October-November. Also, all of the rainfall projec-tions indicate a greater tendency toward rainfall extremes, with a higher likelihood of drought years and a slightly higher chance of very wet monsoons, when compared with the historical period of 1948-2008. Seasonal rainfall patterns also appear to be shifting in the rainfall projections, with a greater proportion of the monsoon rainfall happening in August and September than in the past. This indicates the possibility of a delay in the onset of the monsoon from the beginning of July to mid/late July. Likewise, more rain is projected for October, signifying that the monsoon might last later than in the past.
Given this perfect storm of pressures on Jaipur’s water supply, how secure will it be in the near future? We sought to investigate this question using the data available to us about Jaipur’s water system. We found, through a combination of qualitative methods - interviews with migrants, and quantitative methods – statistical downscaling to gener-ate rainfall projections and an integrated water resources model, that Jaipur’s water supply is quite vulnerable in the future unless more sustainable water management measures are taken.
Under its new State Water Policy (2010), the Government of Rajasthan has begun acknowledging the challenges it faces in ensuring adequate drinking water, irrigation, and industrial water use to Jaipur and other areas of the state. A number of demand side and supply augmentation schemes are discussed in the new policy, as outlined in Chapter 2. While few hard targets of water savings are explicitly mentioned in the policy, we made assumptions about what measures are most likely to be implemented and the proportion of households in Jaipur that adopt such measures. Our assumptions, covered in Chapter 5, are quite optimistic, but we hope they are not unrealistic and begin to be implemented soon. Through the integrated water resources model devel-oped in WEAP, we demonstrated that various combinations of water management strategies could decrease Jaipur’s unmet demand and preserve Bisalpur’s storage in most years under the climate change scenarios. However, the model also provided a caution-ary note. If conjunctive use of groundwater and surface water supplies is considered as an option to maintaining Bisalpur’s storage, this will come at a price to groundwater supplies and result in a continued unsustainable drawdown of local watertables.
Thus, we recommend that the pros and cons of any proposed water management strat-egies be carefully investigated before being adopted. A number of the other demand sites, including Tonk, Ajmer, and others are in direct competition with Jaipur for water from Bisalpur Dam. Water taken to supply Jaipur is water taken from the other urban areas and villages served by the reservoir. Additionally, groundwater resources might continue to be mined unsustainably if there is not careful management of conjunc-tive uses. Water pricing schemes, in combination with public awareness campaigns,
Migration and
population growth
rates are likely to
continue growing
and there will be
further expansion
and growth in the
peri-urban areas
surrounding the city.
The demand on
local groundwater
resources are likely
to increase as a
result of population
growth and industrial
expansion.
The UncomforTable nexUs 85reflections on Jaipur’s Water Vulnerability and broader ImplicationsThe UncomforTable nexUs
are likely to reduce household demand. However, equity issues and the ability to pay for poor households and lower castes must be carefully considered so an undue burden is not placed on those who already struggle to make ends meet. Water transfers from neighboring states are currently being constructed or are in the planning stage, but at what point in the future will the neighboring states find that they are facing water shortages and that their ecosystems are being degraded, and refuse delivery of alloca-tions? Climate change impacts on water resources, such as the alteration of monsoon rainfall patterns, need to be considered in concert with household’s responses to the perceived changes, migration, environmental demands and processes of urbanization when selecting water management strategies.
implicATiONs fOr OTher urBAN AreAs
The challenges facing Jaipur – migration, rapid urbanization and peri-urbanization, degradation of surface and groundwater supplies and climate change, are not unique to this city. Other urban areas throughout the globe are struggling with similar challenges. Since 1900, urbanization processes have led to nearly 50 percent of the world’s population living in urban areas (Carpenter 2006; UN 2006). Urban population concentrations are expected to increase, with 56 percent of the population of less devel-oped countries living in urban areas by 2030. What does this “urbanization” mean? It does not necessarily entail people living in megacities. The most rapid growth in urban areas is in medium and small cities, and even market towns of less than a few thousand people (Cohen 2004). Additionally, urbanization trends are not entirely due to migra-tion, but also involve growth of existing populations and expansion of the urban area to encompass neighboring towns and villages.
The rapid expansion of urban areas and influx of migrant populations often occurs at a faster rate than formal urban managers can handle. As a result, slum areas and peri-urban areas tend to develop in an ad hoc and unplanned manner, in which residents are left to their own devices to procure basic amenities such as water or electricity. Additionally, the residents of such areas are often poor and marginalized, with low political capital and an urgent focus on employment. This poverty can exacerbate local environmental problems leading to unsustainable land and resource use (Adhikari 2003; WRI 2005). The poor are often dependent on local ecosystem services, such as groundwater, to meet their basic needs and supplement their income through activities such as peri-urban agriculture (Drechsel et al. 2006).
Even less understood is the growth of the peri-urban areas expanding around the urban core. Peri-urban areas are marked by transitional economies and livelihood endeavors ranging from traditional farming or peri-urban agriculture to non-farm activities like tanning or smithing. Proximity to urban areas, the growth of peri-urban areas and the expansion and improvement of transportation networks is creating new opportunities for livelihood diversification and demand for goods. Many in the peri-urban areas rely on ecosystem provisioning to provide the raw materials needed to meet their economic demands and those of the city. Nearby urban areas draw on natural resources to meet urbanization demands as well. Furthermore, the waste-streams and pollution generated
Climate change
impacts on water
resources, such as
the alteration of
monsoon rainfall
patterns, need to be
considered in concert
with household’s
responses to
the perceived
changes, migration,
environmental
demands and
processes of
urbanization need
to be considered
in concert when
selecting water
management
strategies.
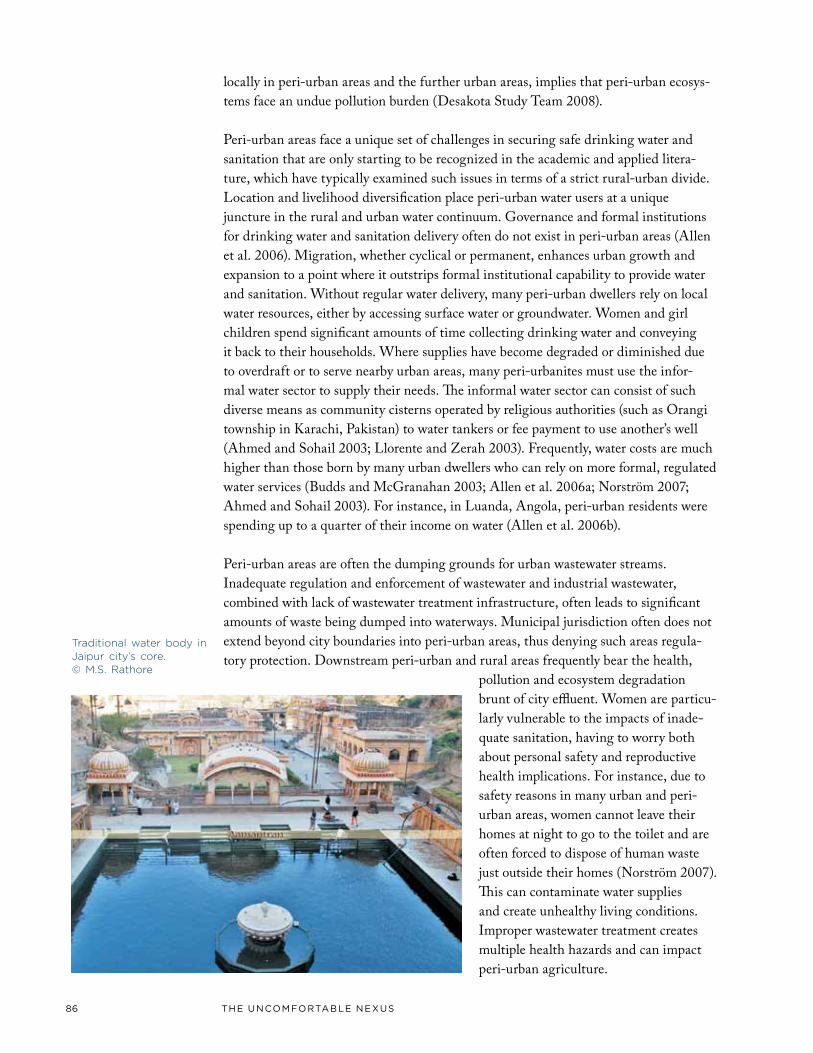
86 The UncomforTable nexUsThe UncomforTable nexUs
locally in peri-urban areas and the further urban areas, implies that peri-urban ecosys-tems face an undue pollution burden (Desakota Study Team 2008).
Peri-urban areas face a unique set of challenges in securing safe drinking water and sanitation that are only starting to be recognized in the academic and applied litera-ture, which have typically examined such issues in terms of a strict rural-urban divide. Location and livelihood diversification place peri-urban water users at a unique juncture in the rural and urban water continuum. Governance and formal institutions for drinking water and sanitation delivery often do not exist in peri-urban areas (Allen et al. 2006). Migration, whether cyclical or permanent, enhances urban growth and expansion to a point where it outstrips formal institutional capability to provide water and sanitation. Without regular water delivery, many peri-urban dwellers rely on local water resources, either by accessing surface water or groundwater. Women and girl children spend significant amounts of time collecting drinking water and conveying it back to their households. Where supplies have become degraded or diminished due to overdraft or to serve nearby urban areas, many peri-urbanites must use the infor-mal water sector to supply their needs. The informal water sector can consist of such diverse means as community cisterns operated by religious authorities (such as Orangi township in Karachi, Pakistan) to water tankers or fee payment to use another’s well (Ahmed and Sohail 2003; Llorente and Zerah 2003). Frequently, water costs are much higher than those born by many urban dwellers who can rely on more formal, regulated water services (Budds and McGranahan 2003; Allen et al. 2006a; Norström 2007; Ahmed and Sohail 2003). For instance, in Luanda, Angola, peri-urban residents were spending up to a quarter of their income on water (Allen et al. 2006b).
Peri-urban areas are often the dumping grounds for urban wastewater streams. Inadequate regulation and enforcement of wastewater and industrial wastewater, combined with lack of wastewater treatment infrastructure, often leads to significant amounts of waste being dumped into waterways. Municipal jurisdiction often does not extend beyond city boundaries into peri-urban areas, thus denying such areas regula-tory protection. Downstream peri-urban and rural areas frequently bear the health,
pollution and ecosystem degradation brunt of city effluent. Women are particu-larly vulnerable to the impacts of inade-quate sanitation, having to worry both about personal safety and reproductive health implications. For instance, due to safety reasons in many urban and peri-urban areas, women cannot leave their homes at night to go to the toilet and are often forced to dispose of human waste just outside their homes (Norström 2007). This can contaminate water supplies and create unhealthy living conditions. Improper wastewater treatment creates multiple health hazards and can impact peri-urban agriculture.
Traditional water body in Jaipur city’s core. © M.S. Rathore
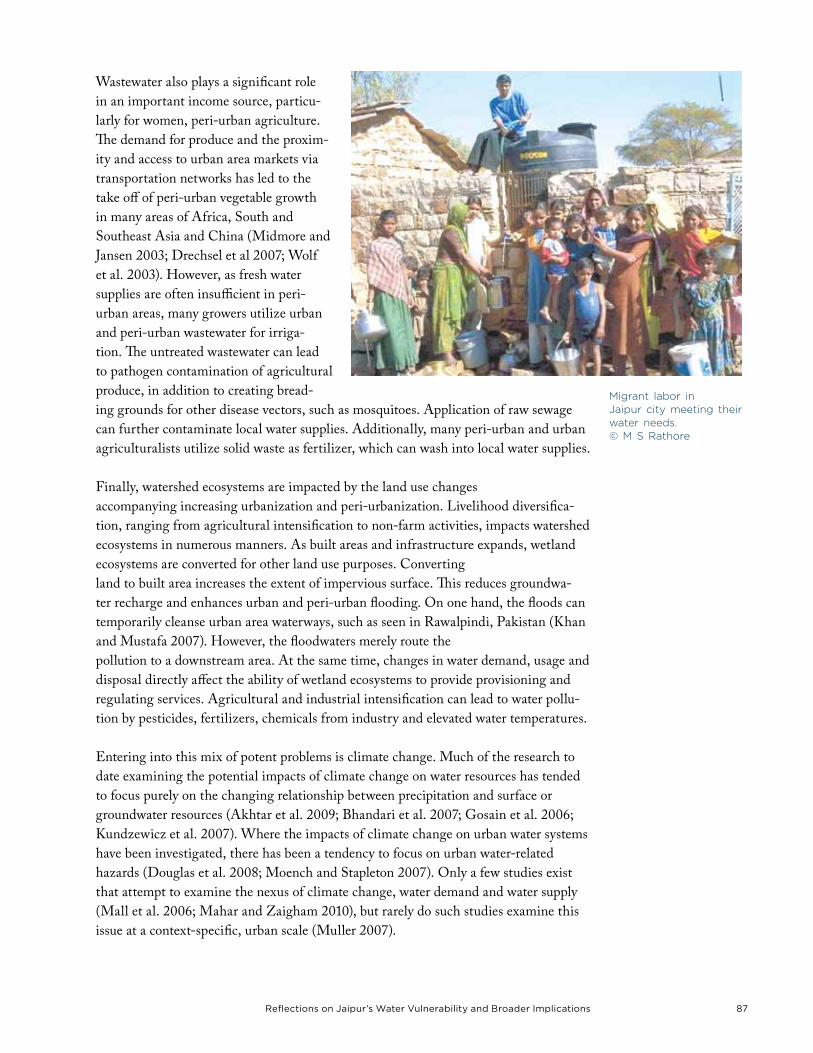
The UncomforTable nexUs 87reflections on Jaipur’s Water Vulnerability and broader ImplicationsThe UncomforTable nexUs
Wastewater also plays a significant role in an important income source, particu-larly for women, peri-urban agriculture. The demand for produce and the proxim-ity and access to urban area markets via transportation networks has led to the take off of peri-urban vegetable growth in many areas of Africa, South and Southeast Asia and China (Midmore and Jansen 2003; Drechsel et al 2007; Wolf et al. 2003). However, as fresh water supplies are often insufficient in peri-urban areas, many growers utilize urban and peri-urban wastewater for irriga-tion. The untreated wastewater can lead to pathogen contamination of agricultural produce, in addition to creating bread-ing grounds for other disease vectors, such as mosquitoes. Application of raw sewage can further contaminate local water supplies. Additionally, many peri-urban and urban agriculturalists utilize solid waste as fertilizer, which can wash into local water supplies.
Finally, watershed ecosystems are impacted by the land use changes accompanying increasing urbanization and peri-urbanization. Livelihood diversifica-tion, ranging from agricultural intensification to non-farm activities, impacts watershed ecosystems in numerous manners. As built areas and infrastructure expands, wetland ecosystems are converted for other land use purposes. Converting land to built area increases the extent of impervious surface. This reduces groundwa-ter recharge and enhances urban and peri-urban flooding. On one hand, the floods can temporarily cleanse urban area waterways, such as seen in Rawalpindi, Pakistan (Khan and Mustafa 2007). However, the floodwaters merely route the pollution to a downstream area. At the same time, changes in water demand, usage and disposal directly affect the ability of wetland ecosystems to provide provisioning and regulating services. Agricultural and industrial intensification can lead to water pollu-tion by pesticides, fertilizers, chemicals from industry and elevated water temperatures.
Entering into this mix of potent problems is climate change. Much of the research to date examining the potential impacts of climate change on water resources has tended to focus purely on the changing relationship between precipitation and surface or groundwater resources (Akhtar et al. 2009; Bhandari et al. 2007; Gosain et al. 2006; Kundzewicz et al. 2007). Where the impacts of climate change on urban water systems have been investigated, there has been a tendency to focus on urban water-related hazards (Douglas et al. 2008; Moench and Stapleton 2007). Only a few studies exist that attempt to examine the nexus of climate change, water demand and water supply (Mall et al. 2006; Mahar and Zaigham 2010), but rarely do such studies examine this issue at a context-specific, urban scale (Muller 2007).
Migrant labor in Jaipur city meeting their water needs. © M S Rathore
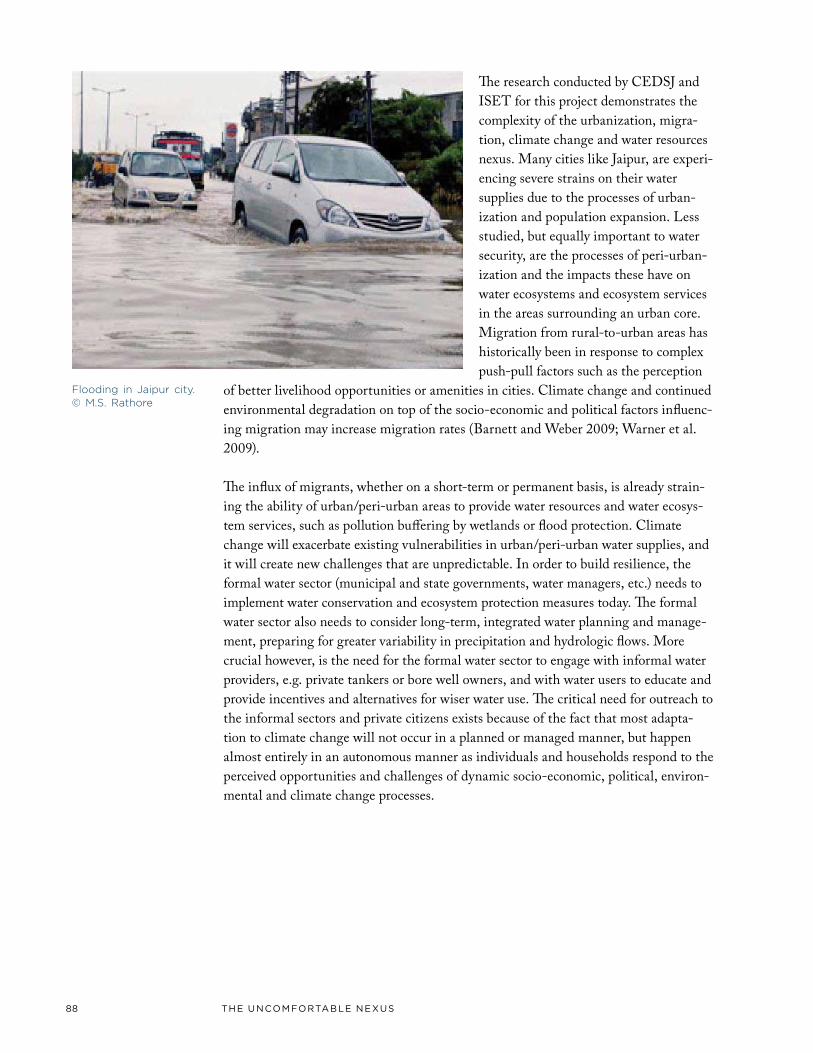
88 The UncomforTable nexUsThe UncomforTable nexUs
The research conducted by CEDSJ and ISET for this project demonstrates the complexity of the urbanization, migra-tion, climate change and water resources nexus. Many cities like Jaipur, are experi-encing severe strains on their water supplies due to the processes of urban-ization and population expansion. Less studied, but equally important to water security, are the processes of peri-urban-ization and the impacts these have on water ecosystems and ecosystem services in the areas surrounding an urban core. Migration from rural-to-urban areas has historically been in response to complex push-pull factors such as the perception
of better livelihood opportunities or amenities in cities. Climate change and continued environmental degradation on top of the socio-economic and political factors influenc-ing migration may increase migration rates (Barnett and Weber 2009; Warner et al. 2009).
The influx of migrants, whether on a short-term or permanent basis, is already strain-ing the ability of urban/peri-urban areas to provide water resources and water ecosys-tem services, such as pollution buffering by wetlands or flood protection. Climate change will exacerbate existing vulnerabilities in urban/peri-urban water supplies, and it will create new challenges that are unpredictable. In order to build resilience, the formal water sector (municipal and state governments, water managers, etc.) needs to implement water conservation and ecosystem protection measures today. The formal water sector also needs to consider long-term, integrated water planning and manage-ment, preparing for greater variability in precipitation and hydrologic flows. More crucial however, is the need for the formal water sector to engage with informal water providers, e.g. private tankers or bore well owners, and with water users to educate and provide incentives and alternatives for wiser water use. The critical need for outreach to the informal sectors and private citizens exists because of the fact that most adapta-tion to climate change will not occur in a planned or managed manner, but happen almost entirely in an autonomous manner as individuals and households respond to the perceived opportunities and challenges of dynamic socio-economic, political, environ-mental and climate change processes.
Flooding in Jaipur city. © M.S. Rathore

The UncomforTable nexUs 89reflections on Jaipur’s Water Vulnerability and broader ImplicationsThe UncomforTable nexUs
90 The UncomforTable nexUsThe UncomforTable nexUs
Adhikari, B. (2003), Property Rights and Natural Resources: Socio-Economic Heterogeneity and Distribution Implications of Common Property Resource Management, 54 pp, South Asian Network for Development and Environmental Economics: Kathmandu.
Ahmed, N. and M. Sohail (2003), Alternate water supply arrangements in peri-urban localities: awami (people’s) tanks in Orangi township, Karachi, Environment and Urbanization 15(2): 33-42.
Akhtar, M. et al. (2008), The impact of climate change on the water resources of Hindukush-Karakorum-Himalaya region under different glacier coverage scenarios, Journal of Hydrology 355(1-4): 148-163.
Allen, A. (2006), Understanding Environmental Change in the Context of Rural-Urban Interactions, in The Peri-Urban Interface: approaches to sustainable natural and human resource use, edited by D. McGregor et al., pp. 30-43, Earthscan: London.
Allen, A. et al. (2006), The peri-urban water poor: citizens or consumers?, Environment and Urbanization 18: 333-351.
bibliography
The UncomforTable nexUs 91bibliographyThe UncomforTable nexUs
Banerjee, B. (1986), Rural to Urban Migration and the Urban Labour Market:A Case Study of Delhi, 285 pp, Himalaya Publishing House: Bombay andNew Delhi.
Barnett, J. and M. Webber (2009), Accommodating Migration to Promote Adaptation to Climate Change, 63 pp, The Commission on Climate Change and Development.
Bhandari, M.M. (1974), Famine Foods in the Rajasthan Desert, Economic Botany 28: 73-81.
Bhandari, P.M. et al. (2007), Examining adaptation and mitigation opportunities in the context of the integrated watershed management programme of the Government of India, Mitigation and Adaptation Strategies to Global Change 12: 919-933.
Bordalo, A.A. and J. Savva-Bordalo (2007), The quest for safe drinking water: An example from Guinea-Bissau (West Africa), Water Research 41: 2978-2986.
Bray, D. and H. von Storch (2009), “Prediction” or “Projection”?: The Nomenclature of Climate Science, Science Communication 30: 534-543.
Budds, J. and G. McGranahan (2003), Are the debates on water privatization missing the point? Experiences from Africa, Asia and Latin America, Environment and Urbanization 15(2): 87-104.
Carpenter, S.R. et al. (2006), Scenarios for ecosystem services: An overview, Ecology and Society 11(1): 29-42.
Central Water Commission [CWC] (1989), Bisalpur Dam Project (Rajasthan): A Drinking Water Supply and Irrigation Scheme. Studies for Water Resources Assessment and Reservoir Sedimentation, Hydrology Studies Organisation:New Delhi.
_____ (2011), Personal communication for data acquisition.
Christensen, J.H., et al. (2007), Regional Climate Projections, in Climate Change 2007: The Physical Science Basis. Contribution of Working Group 1 to the Fourth Assessment Report of the Intergovernmental Panel on Climate Change, edited by S. Solomon et al., pp. 847-940, Cambridge University Press: Cambridge and New York.
Cohen, B. (2004), Urban growth in developing countries: A review of current trends and a caution regarding existing forecasts, World Development 32(1): 23-51.
Connolley, W.M. (2007), Projection/ Prediction. Retrieved October 4, 2010 from Science Blog: http://scienceblogs.com/stoat/2007/08/projection_prediction.php
Department of Irrigation, Bisalpur cell, Sechai Bhawan JLN Marg (2010), CEDSJ personal communication.
92 The UncomforTable nexUsThe UncomforTable nexUs
De Szoeke, S.P. and S.P. Xie (2008), The Tropical Eastern Pacific Seasonal Cycle: Assessment of Errors and Mechanisms in the IPCC AR4 Coupled Ocean-Atmosphere General Circulation Models, Journal of Climate 21: 2573-2590.
Desakota Study Team (2008), Re-imagining the Rural-Urban Continuum: Understanding the Role Ecosystem Services Play in the Livelihoods of the Poor in Desakota Regions undergo-ing Rapid Change, 124 pp, ISET and ISET-Nepal: Kathmandu.
Deshingkar, P. and D. Start (2003), Seasonal Migration for Livelihoods in India: Coping, Accumulation and Exclusion, 37 pp, Overseas Development Institute: London.
Deshingkar, P. and S. Akter (2009), Migration and Human Development in India, Human Development Research Paper 2009/13, 90 pp, United Nations Development Programme.
Dessai, S. et al. (2009), Do We Need Better Predictions to Adapt to a Changing Climate?, Eos 90(13): 111-112.
Douglas, I. et al. (2008), Unjust waters: climate change, flooding and the urban poor in Africa, Environment and Urbanization 20(1): 187-205.
Drechsel, P., et al. (2006), Informal irrigation in urban West Africa: An overview, 43 pp, International Water Management Institute: Colombo.
Drechsel, P., et al. (2007), Rural-Urban Food, Nutrient and Virtual Water Flows in Selected West African Cities, 39 pp, International Water Management Institute: Colombo.
Environment Canada (2010), CGCM3 Forcing: SRES Storylines and Scenario Families. Retrieved October 28, 2010 from: http://www.cccma.ec.gc.ca/data/cgcm3/cgcm3_forcing.shtml
Fasullo, J. and P.J. Webster (2003), A Hydrologic Definition of Indian Monsoon Onset and Withdrawal, Journal of Climate 16: 3200-3211.
Flato, G.M. et al. (2000), The Canadian Centre for Climate Modelling and Analysis of Global Coupled Model and its Climate, Climate Dynamics 16:451-467.
Furevik, T. et al. (2003), Description and evaluation of the Bergen Climate Model: ARPEGE coupled with MICOM, Climate Dynamics 21: 27–51.
Gay, C. and F. Estrada (2010), Objective probabilities about future climate are a matter of opinion, Climatic Change 99: 27-46.
Geerlings, E. (2001), Sheep husbandry and ethnoveterinary knowledge of Raika sheep pasto-ralists in Rajasthan, India, MSc thesis, 114 pp, Wageningen University: Wageningen.
The UncomforTable nexUs 93bibliographyThe UncomforTable nexUs
Gosain, A.K. et al. (2006), Climate change impact assessment on hydrology of Indian river basins, Current Science 90(3): 346-353.
Government of India (1991), Compiled from various district Census Handbooks for respective Districts, Directorate of Census Operations, Rajasthan India.
________ (2001), Basic Data Sheet, District-wise data compiled from Census 2001 Data. Retrieved December 3, 2010 from: http://www.censusindia.gov.in/2011-common/CensusDataSummary.html
________ (2009), Urban Poverty Report 2009, 327 pp, Ministry of Housing and Urban Poverty Alleviation, United Nations Development Programme, Oxford University Press: New Delhi.
________ (2011), Level of Urbanization. Retrieved January 15, 2011 from Ministry of Urban Development: http://www.urbanindia.nic.in/urbanscene/levelofurbanisation/urblevel.htm
Government of India and Government of Rajasthan (2009), Report on Dynamic Groundwater Resources of Rajasthan, 112 pp, Central Groundwater Board, Ministry of Water Resources. Retrieved December 4, 2010 from: http://cgwb.gov.in/gw_profiles/st_Rajasthan.htm
Government of Rajasthan (1991), Bisalpur Project Report Volume 1, pp. 5-20, Department of Water Resources, Jaipur.
________ (2003), Livestock Census. Retrieved January 15, 2011 from Department of Animal Husbandry: http://animalhusbandry.rajasthan.gov.in/livestock_census.asp
________ (2006), BWSP Final Bid Document June 2006\BWSP Volume 2, Employer’s Requirements (with addendum), pp 4-22, Department of Water Resources, Jaipur.
_______ (2006), District Statistical Handbook, Directorate of Economics and Statistics, Government of Rajasthan: Jaipur.
_______ (2007) “Artificial Groundwater Recharge for the City of Jaipur”, Public Health Engineering Department (PHED) of Department of Water Resources, Jaipur
_______ (2008) Salient Features, Bisalpur Drinking cum Irrigation Project (major), Rajasthan, Progress Report, Department of Water Resources, Jaipur.
_______ (2010), Data compiled from various unpublished reports Collected from the Department of Water Resources, Government of Rajasthan: Jaipur.
_______ (2010), State Water Policy, 21 pp, State Water Resources Planning Department: Jaipur.
94 The UncomforTable nexUsThe UncomforTable nexUs
_______ (2011), Bisalpur Water Supply. Retrieved January 15, 2011 from Rajasthan Urban Infrastructure Development Project: http://www.ruidp.gov.in/bisalpur-water-supply/bisalpur-water-supply.htm
Harris, J.R. and M.P. Todaro (1970), Migration, Unemployment and Development: ATwo Sector Analysis, The American Economic Review 60(1): 126-142.
ISET (2010), The Time Is Now: Sustainable and Climate Resilient Urban Development, Paper presented at International Workshop on Sustainable and Climate Resilient Urban Development, 54 pp, Institute for Social and Environmental Transition: Boulder.
JDA (1995), Master Development Plan-2011: Jaipur Region, 139 pp, Jaipur Development Authority: Jaipur.
JDA (2009), Draft Master Development Plan-2025: Jaipur Region. Retrieved March 21, 2011 from Jaipur Development Authority: http://121.242.213.11/JaipurJda/pdf/DraftMdp2025/RegionA4.pdf
Jones, C. et al. (2004), Systematic optimization and climate simulation of FAMOUS, a fast version of HADCM3, Hadley Centre Technical Note 60, 33pp, Exeter, UK.
Jungclaus, J.H. et al. (2006), Ocean circulation and tropical variability in the coupled model ECHAM5/MPI-OM, Journal of Climate 19: 3952-3972.
K-1 Model Developers (2004), K-1 Coupled GCM (MIROC) Description, 39 pp, Centre for Climate System Research, National Institute for Environmental Studies, Frontier Research Centre for Global Change.
Kalnay, E. et al. (1996), The NCEP/NCAR reanalysis 40-year project, Bulletin of the American Meteorological Society 77: 437-471.
Khan, F. and D. Mustafa (2007), Navigating the Contours of the Pakistani Hazardscapes: Disaster Experience versus Policy, in Working with the Winds of Change: Toward Strategies for Responding to the Risks Associated with Climate Change and other Hazards, edited by Moench, M. and A. Dixit, pp. 193-234, Pro Vention Consortium, ISET, ISET-Nepal: Kathmandu.
Kinzig, A. et al. (2003), Coping with Uncertainty: A Call for a New Science-Policy Forum, Ambio 32(5): 330-335.
Klemens, B. (2009), Probability v Likelihood, in Modeling with Data: Tools and Techniques for Scientific Computing, 470 pp, Princeton University Press: Princeton.
Köhler-Rollefson, I. (1994), Pastoralism in Western India from a Comparative Perspective: Some Comments, in A Collection of Papers from Rajasthan and Gujarat, pp. 3-5, Overseas Development Institute.
The UncomforTable nexUs 95bibliographyThe UncomforTable nexUs
Kundzewicz, Z., et al. (2007), Freshwater resources and their management, in Climate Change 2007: Impacts, Adaptation and Vulnerability. Contribution of Working Group II to the Fourth Assessment Report of the Intergovernmental Panel on Climate Change, edited by M.L. Parry, et al., pp. 173-210, Cambridge University Press: Cambridge.
Llorente, M. and M.H. Zerah (2003), The urban water sector: Formal versus Informal Suppliers in India, Urban India 22(1): 35-49.
Lea Associates South Asia Pvt. Ltd (LEA) and Centre for Environmental Planning and Management (CEPT) (2005), Draft City Development Plan: Preparation of City Development Plan for Jaipur under Jawaharlal Nehru Urban Renewal Mission, 427 pp, Government of Rajasthan: Jaipur.
MacCracken, M. (2001), Prediction versus Projection – Forecast versus Possibility, WeatherZine 26.
Mall, R.K. et al. (2006), Water resources and climate change: An Indian perspective, Current Science 90(12): 1610-1627.
Mahar, G.A. and N.A. Zaigham (2010), Identification of Climate Changes in the Lower Indus Basin, Sindh, Pakistan, Journal of Basis and Applied Sciences 6(2): 81-86.
Meehl, G.A. and J.M. Arblaster (2002), The Tropospheric Biennial Oscillation and Asian-Australian Monsoon Rainfall, Journal of Climate 15: 722-44.
MGI (2010), India’s urban awakening: Building inclusive cities, sustaining economic growth, 234 pp, McKinsey Global Institute.
Midmore, D.J. and H.G.P. Jansen (2003), Supplying vegetables to Asian cities: is there a case for peri-urban production?, Food Policy 28: 13-27.
Mitchell, T.D. and P.D. Jones (2005), An Improved Method of Constructing a Database of Monthly Climate Observations and Associated High-Resolution Grids, International Journal of Climatology 25: 693-712.
Moench, M. and S. Stapleton (2007), Water, Climate, Risk and Adaptation, 80 pp, Co-Operative Programme on Water and Climate and ISET: Delft, Nederland.
Muller, M. (2007), Adapting to climate change: water management for urban resil-ience, Environment and Urbanization 19(1): 99-113.
Nakicenovic, N. et al. (2000), IPCC Special Report Emissions Scenarios: Summary for Policy Makers, pp 27, Intergovernmental Panel on Climate Change.
96 The UncomforTable nexUsThe UncomforTable nexUs
National Sample Survey Organisation (2010), Migration in India, 2007-2008, Report No. 533, 429 pp, Ministry of Statistics and Programme Implementation, Government of India: New Delhi.
Norström, A. (2007), Water and Sanitation in Peri-Urban Areas, 16 pp, Swedish Water House: Stockholm.
Oberai, A.S. and H.K. Manmohan Singh (1983), Causes and Consequences of Internal Migration: A Study of Indian Punjab, 434 pp, Oxford University Press: New Delhi.
Oberai, A.S., et al. (1989), Determinants and Consequences of Internal Migration in India: Studies in Bihar, Kerala and Uttar Pradesh, 156 pp, Oxford University Press: New Delhi.
Opitz-Stapleton, S. and S. Gangopadhyay (2010), A non-parametric, statisti-cal downscaling algorithm applied to the Rohini River Basin, Nepal, Theoretical and Applied Climatology, DOI: 10.1007/s00704-010-0301-z.
Opitz-Stapleton, S. (2010), Informal survey of climatologists and meteorologists via the WAS*IS listserve and at the NCAR Junior Faculty Forum (unplublished).
People’s Union for Civil Liberty (2002), Migrant Worker in the Construction Sector- A Study in the Chowktis of Jaipur, 53-62 pp, Rajasthan Nirman Mazdoor Sangathan (Jaipur District Unit) and People’s Union for Civil Liberties, Rajasthan: Jaipur
PHED (2011), Personal communication for data acquisition.
Pramanik, S.K. (1954), Hydrology of the Rajasthan desert - rainfall, humidity and evaporation, in IAHS Assembléegénérale de Rome 1954, vol. III Comptesrendus et rapports de la commission des eaux de surface, pp. 223–236, IAHS Press: Wallingford.
Rajeevan, M. et al. (2008), Analysis of variability and trends of extreme rainfall events over India using 104 years of gridded daily rainfall data, Geophysical Research Letters, DOI: 10.1029/2008GL035143.
Rathore, M.S. (2006), Droughts and the State Failure: Unwilling to Learn and Unwilling to Distribute, Water Nepal 12(1/2): 261-280.
______ (2007), Natural Resource Use: Environmental Implications, in Rajasthan: The Quest for Sustainable Development, Vyas, V.S. et al [Eds.], pp 37-76, Academic Foundations and Institute for Development Studies, Jaipur.
______ (2009a), Climatic Variability and Rural-Urban Migration: A Study of Rural Migration to Jaipur city, in Shifting the Response Terrain, Opitz-Stapleton, S. et al. [Eds.], pp. 73-76, ISET and ISET-Nepal: Kathmandu.
The UncomforTable nexUs 97bibliographyThe UncomforTable nexUs
______ (2009b), Climatic Variability and Rural-Urban Migration: A Study of Uural Migration within Jaipur city, in Shifting the Response Terrain, Opitz-Stapleton, S. et al. [Eds.], pp. 77-80, ISET and ISET-N: Kathmandu.
Raunet, J.C. et al. (2000), Evaluation and reduction of losses and leakages in the water distribution system of the city of Jaipur, Seureca: India.
Saji, N.H et al. (2006), Tropical Indian Ocean Variability in the IPCC Twentieth-Century Climate Simulations, Journal of Climate 19: 4397-4417.
Salas-Mélia, D. et al. (2005), Description and validation of the CNRM-CM3 global coupled model, CNRM working note 103.
Satterthwaite, D. (2008), Climate Change and Urbanization: Effects and Implications for Urban Governance, 29 pp, United Nations Secretariat: New York.
Skeldon, R. (1986), On Migration Patterns in India during the 1970s, Population and Development Review 12(4): 759-779.
Tahal Wapcos (1998), Water Resources Planning for the State of Rajasthan: Banas River Basin Water Resources Planning, report prepared for the Government of Rajasthan.
Torrence, C. and P.J. Webster (1999), Interdecadal Changes in the ENSO-Monsoon System, Journal of Climate 12: 2679-2690.
UN-HABITAT (2009), Planning Sustainable Cities: Policy Directions, Global Report on Human Settlements 2009 (Abridged Edition), 98 pp, Earthscan: UK and USA.
UN-HABITAT (2010), State of the World’s Cities 2010/2011: Bridging the Urban Divide, 244 pp, Earthscan Publishers: London.
United Nations (2006), World Urbanization Prospects: The 2005 Revision, 210 pp, Department of Economic and Social Affairs: New York.
Von Storch, et al. (2000), Review of Empirical Downscaling Techniques, in Regional Climate Development under Global Warming, General Technical Report No. 4, Conference Proceedings, Torbjornrud, Norway.
Warner, K. et al. (2009), Climate change, environmental degradation and migration, Natural Hazards, DOI: 10.1007/s11069-009-9419-7.
Wikimedia Commons (2011), Divisions of Rajasthan. Retrieved April 4, 2009 from: http://en.wikipedia.org/wiki/File:Map_rajasthan_dist_7_div.png
Wilby, R.L. and T.M.L. Wigley (1997), Downscaling general circulation model output: a review of methods and limitations, Progress in Physical Geography 21: 530-548.
98 The UncomforTable nexUsThe UncomforTable nexUs
Wilby, R.L. et al. (2004), Guidelines for Use of Climate Scenarios Developed from Statistical Downscaling Methods, 27 pp, Intergovernmental Panel on Climate Change.
Wolf, J. et al. (2003), Urban and peri-urban agricultural production in Beijing munici-pality and its impact on water quality, Environment and Urbanization 15(2): 141-156.
WRI (2005), World Resources 2005: The Wealth of the Poor – Managing Ecosystems to Fight Poverty, 268 pp, United Nations Development Programme, United Nations Environment Programme, World Bank, World Resources Institute: Washington, DC.

The UncomforTable nexUs 99bibliographyThe UncomforTable nexUs
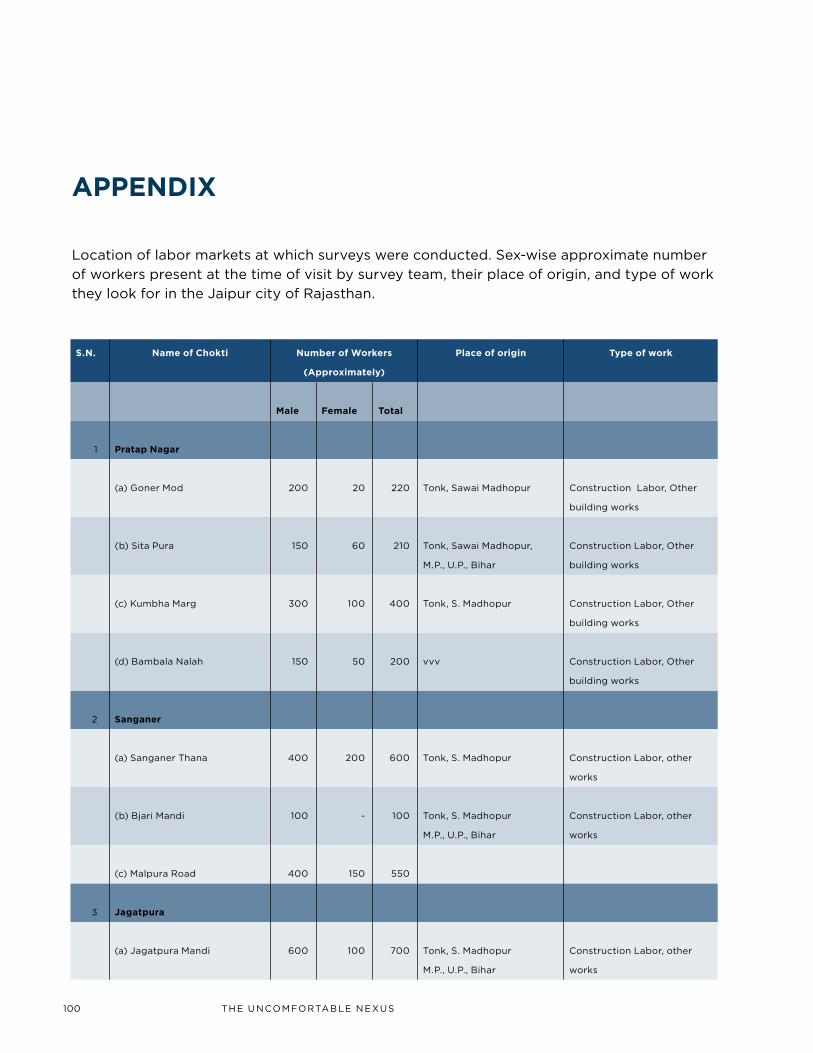
100 The UncomforTable nexUsThe UncomforTable nexUs
s.n. name of Chokti number of Workers
(approximately)
place of origin type of work
male Female total
1 pratap nagar
(a) Goner mod 200 20 220 Tonk, sawai madhopur construction labor, other
building works
(b) sita Pura 150 60 210 Tonk, sawai madhopur,
m.P., U.P., bihar
construction labor, other
building works
(c) Kumbha marg 300 100 400 Tonk, s. madhopur construction labor, other
building works
(d) bambala nalah 150 50 200 vvv construction labor, other
building works
2 sanganer
(a) sanganer Thana 400 200 600 Tonk, s. madhopur construction labor, other
works
(b) bjari mandi 100 - 100 Tonk, s. madhopur
m.P., U.P., bihar
construction labor, other
works
(c) malpura road 400 150 550
3 Jagatpura
(a) Jagatpura mandi 600 100 700 Tonk, s. madhopur
m.P., U.P., bihar
construction labor, other
works
location of labor markets at which surveys were conducted. sex-wise approximate number
of workers present at the time of visit by survey team, their place of origin, and type of work
they look for in the Jaipur city of rajasthan.
appendix
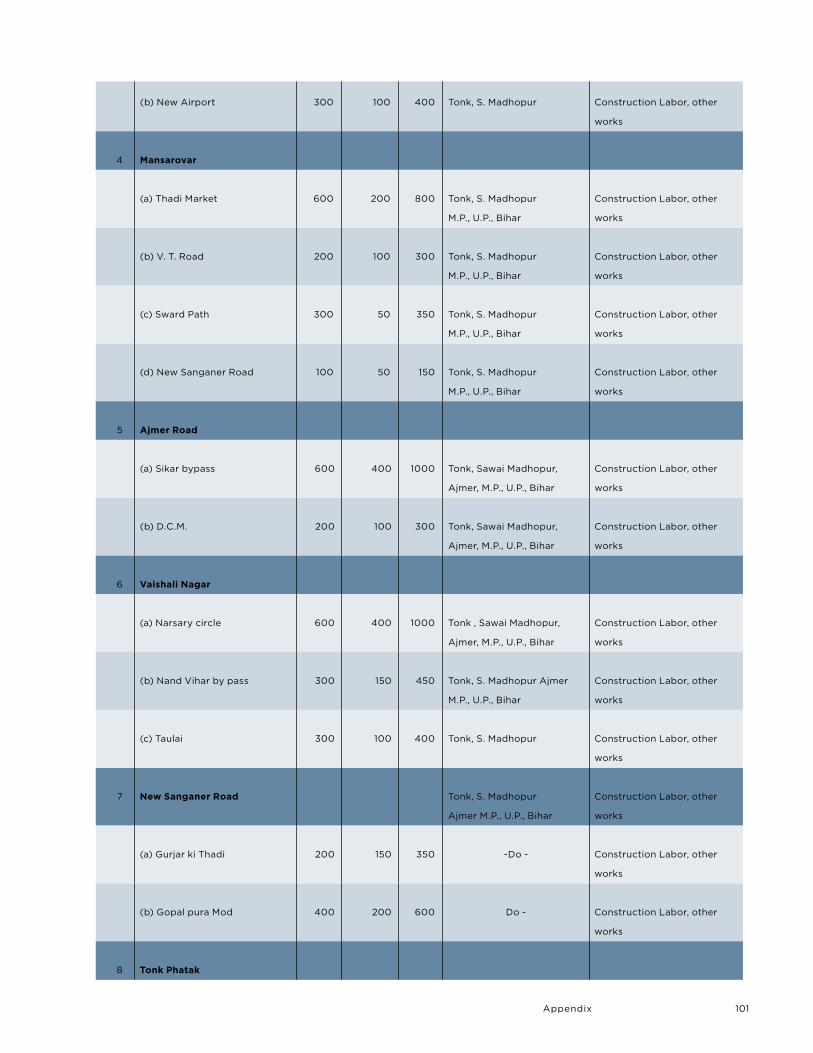
The UncomforTable nexUs 101appendixThe UncomforTable nexUs
(b) new airport 300 100 400 Tonk, s. madhopur construction labor, other
works
4 mansarovar
(a) Thadi market 600 200 800 Tonk, s. madhopur
m.P., U.P., bihar
construction labor, other
works
(b) V. T. road 200 100 300 Tonk, s. madhopur
m.P., U.P., bihar
construction labor, other
works
(c) sward Path 300 50 350 Tonk, s. madhopur
m.P., U.P., bihar
construction labor, other
works
(d) new sanganer road 100 50 150 Tonk, s. madhopur
m.P., U.P., bihar
construction labor, other
works
5 ajmer road
(a) sikar bypass 600 400 1000 Tonk, sawai madhopur,
ajmer, m.P., U.P., bihar
construction labor, other
works
(b) D.c.m. 200 100 300 Tonk, sawai madhopur,
ajmer, m.P., U.P., bihar
construction labor, other
works
6 Vaishali nagar
(a) narsary circle 600 400 1000 Tonk , sawai madhopur,
ajmer, m.P., U.P., bihar
construction labor, other
works
(b) nand Vihar by pass 300 150 450 Tonk, s. madhopur ajmer
m.P., U.P., bihar
construction labor, other
works
(c) Taulai 300 100 400 Tonk, s. madhopur construction labor, other
works
7 new sanganer road Tonk, s. madhopur
ajmer m.P., U.P., bihar
construction labor, other
works
(a) Gurjar ki Thadi 200 150 350 -Do - construction labor, other
works
(b) Gopal pura mod 400 200 600 Do - construction labor, other
works
8 tonk phatak
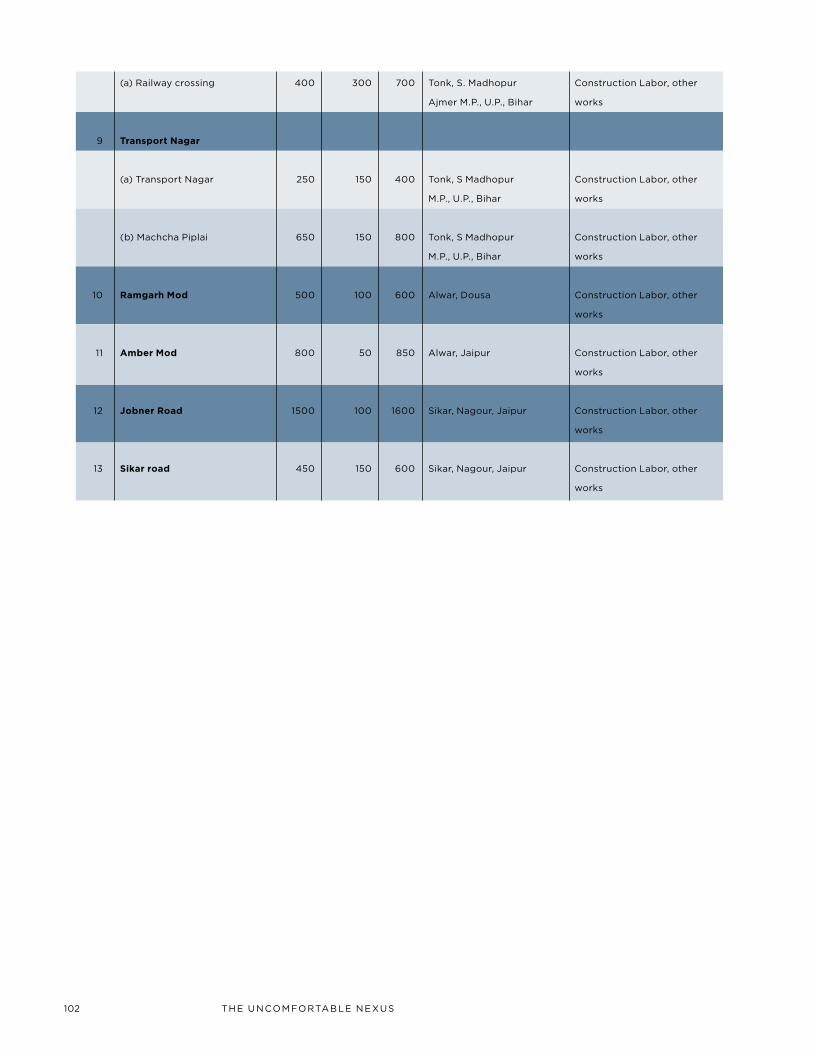
102 The UncomforTable nexUsThe UncomforTable nexUs
(a) railway crossing 400 300 700 Tonk, s. madhopur
ajmer m.P., U.P., bihar
construction labor, other
works
9 transport nagar
(a) Transport nagar 250 150 400 Tonk, s madhopur
m.P., U.P., bihar
construction labor, other
works
(b) machcha Piplai 650 150 800 Tonk, s madhopur
m.P., U.P., bihar
construction labor, other
works
10 ramgarh mod 500 100 600 alwar, Dousa construction labor, other
works
11 amber mod 800 50 850 alwar, Jaipur construction labor, other
works
12 Jobner road 1500 100 1600 sikar, nagour, Jaipur construction labor, other
works
13 sikar road 450 150 600 sikar, nagour, Jaipur construction labor, other
works
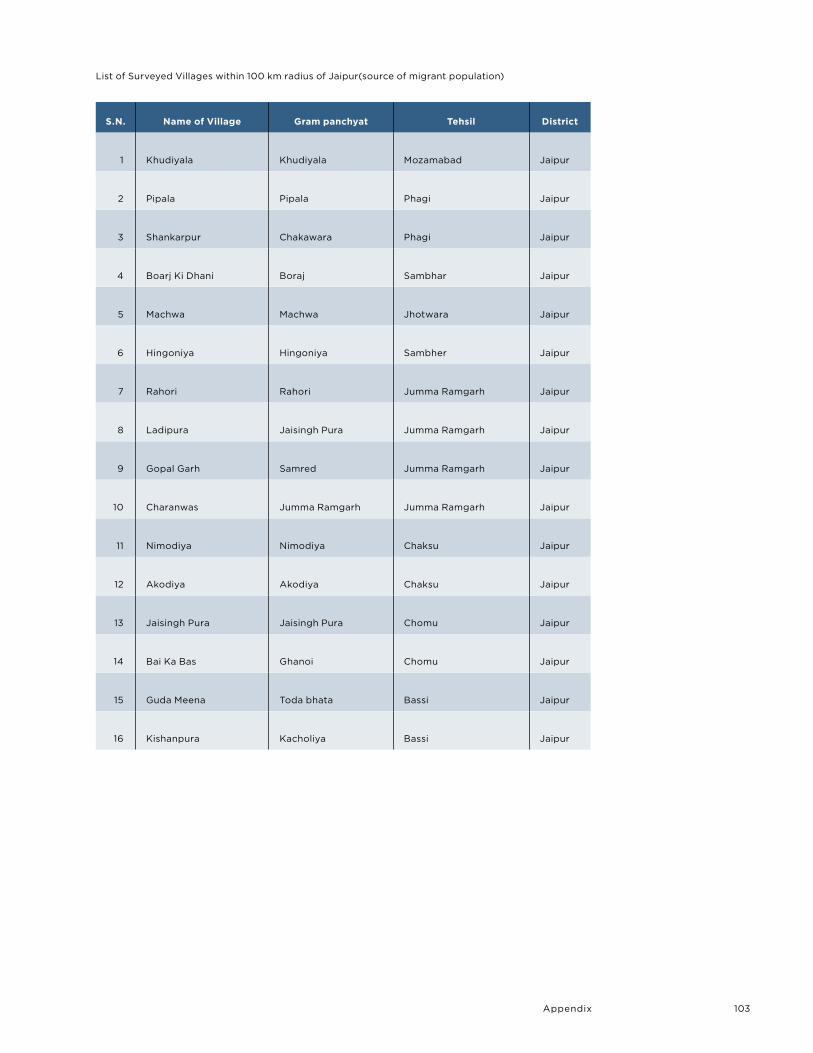
The UncomforTable nexUs 103appendixThe UncomforTable nexUs
s.n. name of Village gram panchyat tehsil district
1 Khudiyala Khudiyala mozamabad Jaipur
2 Pipala Pipala Phagi Jaipur
3 shankarpur chakawara Phagi Jaipur
4 boarj Ki Dhani boraj sambhar Jaipur
5 machwa machwa Jhotwara Jaipur
6 hingoniya hingoniya sambher Jaipur
7 rahori rahori Jumma ramgarh Jaipur
8 ladipura Jaisingh Pura Jumma ramgarh Jaipur
9 Gopal Garh samred Jumma ramgarh Jaipur
10 charanwas Jumma ramgarh Jumma ramgarh Jaipur
11 nimodiya nimodiya chaksu Jaipur
12 akodiya akodiya chaksu Jaipur
13 Jaisingh Pura Jaisingh Pura chomu Jaipur
14 bai Ka bas Ghanoi chomu Jaipur
15 Guda meena Toda bhata bassi Jaipur
16 Kishanpura Kacholiya bassi Jaipur
list of surveyed Villages within 100 km radius of Jaipur(source of migrant population)