The Type Icn SN 2021csp: Implications for the Origins of the ...
24
Cover page The Type Icn SN 2021csp: Implications for the Origins of the Fastest Supernovae and the Fates of Wolf-Rayet Stars Perley, Daniel A; Sollerman, Jesper; Schulze, Steve https://weizmann.esploro.exlibrisgroup.com/discovery/delivery/972WIS_INST:ResearchRepository/1296497990003596?l#1396756890003596 Perley, D. A., Sollerman, J., Schulze, S., Yao, Y., Fremling, C., Gal-Yam, A., … Zheng, W. (2022). The Type Icn SN 2021csp: Implications for the Origins of the Fastest Supernovae and the Fates of Wolf-Rayet Stars. The Astrophysical Journal, 927(2). https://doi.org/10.3847/1538-4357/ac478e Published Version: https://doi.org/10.3847/1538-4357/ac478e Document Version: Published (Version of record) downloaded on 2022/07/08 02:59:51 +0300 Research:Open CC BY V4.0 [email protected] https://weizmann.alma.exlibrisgroup.com/discovery/search?vid=972WIS_INST:ResearchRepository Please do not remove this page
-
Upload
khangminh22 -
Category
Documents
-
view
1 -
download
0
Transcript of The Type Icn SN 2021csp: Implications for the Origins of the ...
Cover page
The Type Icn SN 2021csp: Implications for theOrigins of the Fastest Supernovae and the Fatesof Wolf-Rayet StarsPerley, Daniel A; Sollerman, Jesper; Schulze, Stevehttps://weizmann.esploro.exlibrisgroup.com/discovery/delivery/972WIS_INST:ResearchRepository/1296497990003596?l#1396756890003596
Perley, D. A., Sollerman, J., Schulze, S., Yao, Y., Fremling, C., Gal-Yam, A., … Zheng, W. (2022). The Type IcnSN 2021csp: Implications for the Origins of the Fastest Supernovae and the Fates of Wolf-Rayet Stars. TheAstrophysical Journal, 927(2). https://doi.org/10.3847/1538-4357/ac478e
Published Version: https://doi.org/10.3847/1538-4357/ac478e
Document Version: Published (Version of record)
downloaded on 2022/07/08 02:59:51 +0300Research:OpenCC BY [email protected]://weizmann.alma.exlibrisgroup.com/discovery/search?vid=972WIS_INST:ResearchRepository
Please do not remove this page
The Type Icn SN 2021csp: Implications for the Origins of the Fastest Supernovae and theFates of Wolf–Rayet Stars
Daniel A. Perley1 , Jesper Sollerman2 , Steve Schulze3 , Yuhan Yao4 , Christoffer Fremling4 , Avishay Gal-Yam5 ,Anna Y. Q. Ho6,7 , Yi Yang5,6 , Erik C. Kool2 , Ido Irani5 , Lin Yan8 , Igor Andreoni4 , Dietrich Baade9 ,Eric C. Bellm10 , Thomas G. Brink6 , Ting-Wan Chen2 , Aleksandar Cikota11,12 , Michael W. Coughlin13 ,Aishwarya Dahiwale4, Richard Dekany8 , Dmitry A. Duev4 , Alexei V. Filippenko6,7 , Peter Hoeflich14 ,Mansi M. Kasliwal4 , S. R. Kulkarni4 , Ragnhild Lunnan2 , Frank J. Masci15 , Justyn R. Maund16 ,
Michael S. Medford6,12 , Reed Riddle8 , Philippe Rosnet17 , David L. Shupe15 , Nora Linn Strotjohann5 ,Anastasios Tzanidakis4 , and WeiKang Zheng6
1 Astrophysics Research Institute, Liverpool John Moores University, IC2, Liverpool Science Park, 146 Brownlow Hill, Liverpool L3 5RF, [email protected]
2 The Oskar Klein Centre, Department of Astronomy, Stockholm University, AlbaNova, SE-106 91 Stockholm, Sweden3 The Oskar Klein Centre, Department of Physics, Stockholm University, AlbaNova, SE-106 91 Stockholm, Sweden4 Division of Physics, Mathematics, and Astronomy, California Institute of Technology, Pasadena, CA 91125, USA
5 Department of Particle Physics and Astrophysics, Weizmann Institute of Science, 76100 Rehovot, Israel6 Department of Astronomy, University of California, Berkeley, CA 94720-3411, USA
7Miller Institute for Basic Research in Science, University of California, Berkeley, CA 94720, USA8 Caltech Optical Observatories, California Institute of Technology, Pasadena, CA 91125, USA
9 European Organisation for Astronomical Research in the Southern Hemisphere (ESO), Karl-Schwarzschild-Str. 2, D-85748 Garching b. München, Germany10 DIRAC Institute, Department of Astronomy, University of Washington, 3910 15th Avenue NE, Seattle, WA 98195, USA
11 European Organisation for Astronomical Research in the Southern Hemisphere (ESO), Vitacura Alonso de Córdova 3107 Vitacura, Casilla 19001 Santiago deChile, Chile
12 Physics Division, Lawrence Berkeley National Laboratory, 1 Cyclotron Road, Berkeley, CA 94720, USA13 School of Physics and Astronomy, University of Minnesota, Minneapolis, MN 55455, USA
14 Department of Physics, Florida State University, Tallahassee, FL 32306-4350, USA15 IPAC, California Institute of Technology, 1200 East California Boulevard, Pasadena, CA 91125, USA
16 Department of Physics and Astronomy, University of Sheffield, Hicks Building, Hounsfield Road, Sheffield S3 7RH, UK17 Université Clermont Auvergne, CNRS/IN2P3, LPC, F-63000 Clermont-Ferrand, France
Received 2021 August 6; revised 2021 November 15; accepted 2021 December 29; published 2022 March 15
Abstract
We present observations of SN 2021csp, the second example of a newly identified type of supernova (SN) hallmarkedby strong, narrow, P Cygni carbon features at early times (Type Icn). The SN appears as a fast and luminous bluetransient at early times, reaching a peak absolute magnitude of −20 within 3 days due to strong interaction between fastSN ejecta (v≈ 30,000 km s−1) and a massive, dense, fast-moving C/O wind shed by the WC-like progenitor monthsbefore explosion. The narrow-line features disappear from the spectrum 10–20 days after explosion and are replaced bya blue continuum dominated by broad Fe features, reminiscent of Type Ibn and IIn supernovae and indicative of weakerinteraction with more extended H/He-poor material. The transient then abruptly fades ∼60 days post-explosion wheninteraction ceases. Deep limits at later phases suggest minimal heavy-element nucleosynthesis, a low ejecta mass, orboth, and imply an origin distinct from that of classical Type Ic SNe. We place SN 2021csp in context with other fast-evolving interacting transients, and discuss various progenitor scenarios: an ultrastripped progenitor star, a pulsationalpair-instability eruption, or a jet-driven fallback SN from a Wolf–Rayet (W-R) star. The fallback scenario wouldnaturally explain the similarity between these events and radio-loud fast transients, and suggests a picture in which moststars massive enough to undergo a W-R phase collapse directly to black holes at the end of their lives.
Unified Astronomy Thesaurus concepts: Supernovae (1668); Core-collapse supernovae (304); Wolf–Rayet stars(1806); Stellar mass black holes (1611); Transient sources (1851)
Supporting material: data behind figure, machine-readable table
1. Introduction
Progenitor detections, hydrodynamic models, and basic ratecalculations all suggest that most single stars born with initialmasses of 8–20Me explode as red supergiants and produceType IIP supernovae (SNe; Smartt 2009), but the fates of more-massive stars (>25Me) remain an open question. Such starslose a significant fraction of their hydrogen (H) envelopes on
the main sequence via line-driven winds even as single stars(e.g., Vink et al. 2001), and they are also more likely toundergo strong binary interaction (Sana et al. 2012). In eithercase, a predicted consequence is that many such stars will bedeficient in H by the time of core collapse. Prior to explosion,these stars will appear as Wolf–Rayet (W-R) stars; theexplosion itself will then manifest as a supernova (SN) ofspectroscopic Type IIb, Ib, or Ic (a stripped-envelope SN; forreviews, see Filippenko 1997 and Gal-Yam 2017).This straightforward picture faces a number of challenges,
however. First, hydrodynamic models suggest that the massesejected by typical SNe Ib/c are only a few solar masses, much
The Astrophysical Journal, 927:180 (23pp), 2022 March 10 https://doi.org/10.3847/1538-4357/ac478e© 2022. The Author(s). Published by the American Astronomical Society.
Original content from this work may be used under the termsof the Creative Commons Attribution 4.0 licence. Any further
distribution of this work must maintain attribution to the author(s) and the titleof the work, journal citation and DOI.
1
https://crossmark.crossref.org/dialog/?doi=10.3847/1538-4357/ac478e&domain=pdf&date_stamp=2022-03-15
lower than predicted for exploding W-R stars (e.g., Dessartet al. 2012). Second, no W-R star has yet been identified at thesite of an SN in pre-explosion imaging: the handful of reportedSN Ib/c progenitor candidates are too optically luminous to beW-R stars (Cao et al. 2013; Eldridge & Maund 2016; Kilpatricket al. 2018, 2021; Van Dyk et al. 2018), and upper limits on theremainder are in marginal tension with the luminositydistribution of the Galactic W-R population (Eldridge et al.2013, although see Maund 2018 and Sander et al. 2019). Third,SNe Ib/c are too abundant (by a factor of ∼2) to originatesolely from the W-R population (Smith et al. 2011).
For these reasons, binary evolution involving pairs of lower-mass stars undergoing a common-envelope phase has increas-ingly been seen as the most likely pathway for explaining mostof the SN Ib/c population. If so, the final outcome of stellarevolution for more-massive stars (25Me) remains unclear.One possibility is that very massive stars do not explode at all,and instead collapse directly to black holes with minimalemission of electromagnetic radiation (O’Connor & Ott 2011;Sukhbold & Woosley 2014; Smartt 2015; Zapartas et al. 2021).This remains controversial. Some very massive stars probablyexplode while still in possession of their H envelope to produceSNe IIn (Gal-Yam et al. 2007; Gal-Yam & Leonard 2009;Smith et al. 2011; Mauerhan et al. 2013; Smith et al. 2014),although this does not resolve the question of the fates of thosemassive stars that do undergo a W-R phase. Some atypicalSNe Ib/c do appear to be consistent with massive W-Rprogenitors: specifically, about 25% of broad-lined SNe Ic(Ic-BL) show ejecta masses consistent with explosions of verymassive stars (Taddia et al. 2019), and the progenitors ofsuperluminous SNe are also likely to be quite massive (Gal-Yam et al. 2009; Nicholl et al. 2015; Jerkstrand et al. 2017;Blanchard et al. 2020).
Another rare stripped-envelope SN subtype that has beensuggested to be related to very massive stars is the class ofType Ibn SNe. The velocities inferred from the widths of thehallmark narrow helium (He) lines of these systems—attributedto dense circumstellar matter (CSM) surrounding the progenitorstar—are comparable to those seen in Local Group W-R stars,suggesting that W-R stars may indeed be their progenitors(Foley et al. 2007; Pastorello et al. 2008). However, the pre-explosion mass-loss rates inferred from observations ofSNe Ibn are much higher than those seen in normal W-Rwinds, implying that any W-R progenitor must enter a shortevolutionary phase of greatly enhanced mass loss prior to theexplosion.
The list of stripped-envelope SN subtypes continues toexpand. Gal-Yam et al. (2022) recently presented a detailedobservational study of SN 2019hgp, a fast and luminoustransient with no known literature precedent. Early-time spectraof this event are dominated by narrow lines with profilessimilar to those seen in SNe Ibn but originating from carbon(C), oxygen (O), and other alpha elements rather than He,defining a new class of “Type Icn” SNe that previously wasonly theoretical (Woosley 2017; Smith 2017a). In their analysisof this object, Gal-Yam et al. (2022) point out that thedistinction between SNe Ibn and SNe Icn closely mirrors that ofthe W-R spectroscopic subtypes (He/N-rich WN versus He-poor, C-rich WC stars). On this basis, they postulate thatSNe Ibn/Icn represent the true outcomes of the explosions ofW-R stars.
Gal-Yam et al. (2022) also note that the properties ofSN 2019hgp (fast-rising, hot, and luminous) show someresemblance to the population of rare, fast-evolving transientsidentified in photometric surveys (Drout et al. 2014; Arcaviet al. 2016; Tanaka et al. 2016; Pursiainen et al. 2018;Inserra 2019; Ho et al. 2021a), sometimes referred to as fastblue optical transients (FBOTs) or rapidly evolving transients(RETs), indicating a possible link with this previously poorlyexplored group of objects. However, SN 2019hgp would notitself have been classified as an FBOT/RET by the criteriatypically employed in earlier works.In this paper, we present observations of the second SN Icn
to be discovered, SN 2021csp. The properties of this object arequalitatively similar to those of SN 2019hgp but even moreextreme. SN 2021csp is faster and more luminous, and a farmore extensive observational campaign was possible. Theseobservations strengthen the basic model presented by Gal-Yamet al. (2022) but also allow us to further extend it, withimportant implications for the fates of very massive stars of alltypes. Indeed, we argue that the distinction between SNe Ibn/Icn and normal SNe Ib/Ic may involve not only the mass andevolutionary history of the progenitor, but also the nature of theunderlying explosion and the type of compact remnant that isleft behind.The paper is organized as follows. Section 2 presents the
discovery of SN 2021csp and our extensive observationalcampaign. We perform a more detailed analysis of the lightcurve, spectra, and host galaxy in Section 3 to infer some basicproperties of the explosion and pre-explosion system. InSection 4, we discuss the results of the analysis in the contextof the physical nature of the progenitor, its evolutionary state priorto explosion, and the nature of the explosion itself. Section 5discusses the implications of these results for progenitor models,and Section 6 summarizes our conclusions. We use a standardcosmological model with H0= 70 km s−1Mpc−1, ΩΛ= 0.7, andΩM= 0.3, corresponding to a distance modulus of μ= 37.91magat the redshift of SN 2021csp (z= 0.084; Section 2.3.1). UT datesare used throughout, and times of observations are referenced toan estimated explosion date of MJD 59254.5 (Section 3.1.1) andexpressed in the rest frame. Apparent magnitudes are reported inthe text in the AB system (Oke & Gunn 1983) without anextinction correction, but for analysis and in our figures we correctfor Galactic extinction assuming a reddening of E(B−V )=0.027mag (Schlafly & Finkbeiner 2011).
2. Observations
2.1. Palomar 48 Inch Discovery and Photometry
The Zwicky Transient Facility (ZTF; Bellm et al. 2019b;Graham et al. 2019) is a combined public and private time-domain optical sky survey, using a 47 deg2 field-of-viewcamera (Dekany et al. 2020) on the refurbished Samuel Oschin48 inch Schmidt telescope (P48) at Palomar Observatory. TheZTF observing and alert system are described in previousworks (Duev et al. 2019; Masci et al. 2019; Mahabal et al.2019; Patterson et al. 2019).SN 2021csp (internally designated ZTF21aakilyd) was first
detected in an i-band image obtained on 2021 February 11 (MJD59256.4766) as part of the ZTF high-cadence survey (Bellmet al. 2019a) and confirmed with a second observation in the gband the same night. The last nondetection was 2 days prior. Itwas identified as a candidate of interest the following morning
2
The Astrophysical Journal, 927:180 (23pp), 2022 March 10 Perley et al.
during daily scanning of our custom alert filter (Ho et al. 2020b;Perley et al. 2021b), owing to the fast rise (>2.5 mag in 2 days),blue colors (g− i=−1mag), and coincidence with an extendedobject (the host galaxy), motivating a substantial follow-upcampaign (Section 2.2–2.4).
We used the IPAC forced-photometry pipeline (Masci et al.2019) to obtain final P48 photometry and pre-explosion upperlimits, reported in Table 1. A long sequence of ultra-high-cadence imaging from 2021 February 18 (100 consecutive 30 sexposures, followed by another 26 consecutive 30 s exposures)has been averaged together into two measurements.
We also conducted a more extensive search of the pre-explosion P48 data (extending back to the start of the ZTFsurvey in 2018, 3 yr prior to the explosion time) to search forprecursor outbursts, following the procedure described byStrotjohann et al. (2021). No significant detections prior to theexplosion date were found, to typical (median) limits of ∼20.5 ,mag (−17.5 absolute magnitude) in 1 day bins or to ∼22, mag(−16 absolute magnitude) in bins up to 90 days in width.Previously observed outbursts prior to interacting SNe Ibn andSNe IIn have ranged in luminosity between −12.5 and−17 mag (Strotjohann et al. 2021), with only five previouslyreported cases of outbursts more luminous than −16 magamong 143 SNe of these types searched using this procedure.These limits therefore rule out only the most luminous potentialoutbursts.
2.2. Imaging
2.2.1. Liverpool Telescope
We obtained ugriz imaging using the Infrared/OpticalImager (IO:O) on the 2 m robotic Liverpool Telescope (LT;
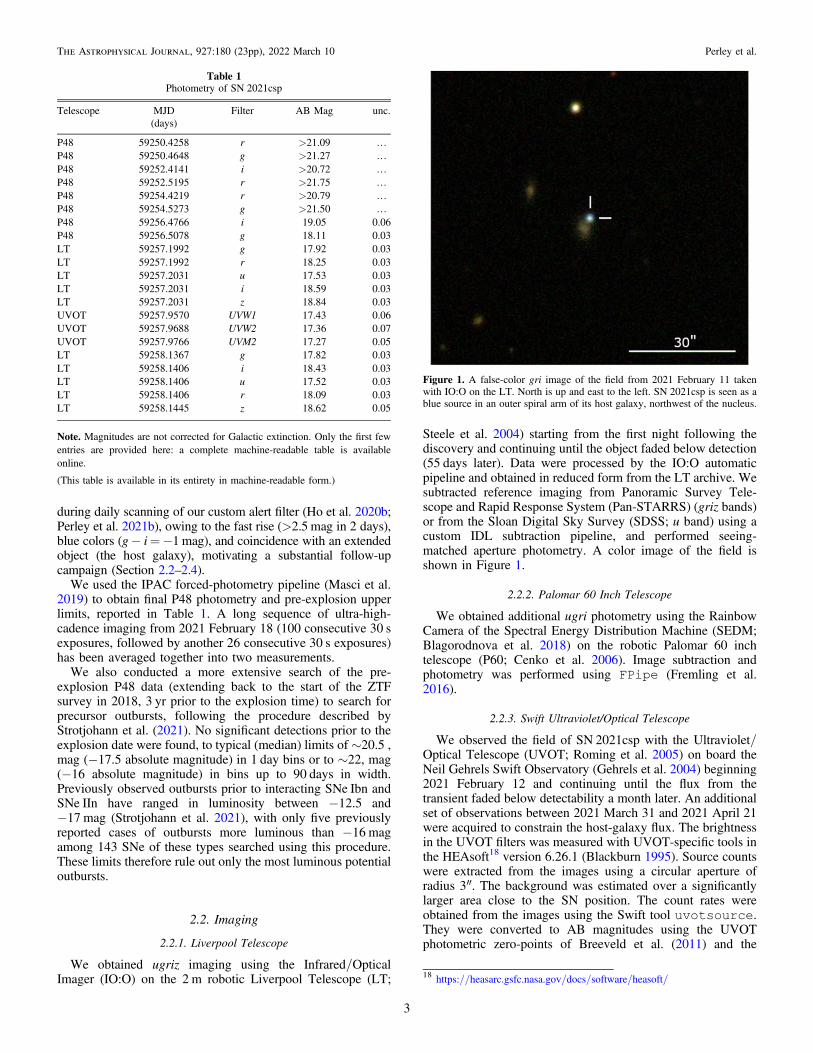
Steele et al. 2004) starting from the first night following thediscovery and continuing until the object faded below detection(55 days later). Data were processed by the IO:O automaticpipeline and obtained in reduced form from the LT archive. Wesubtracted reference imaging from Panoramic Survey Tele-scope and Rapid Response System (Pan-STARRS) (griz bands)or from the Sloan Digital Sky Survey (SDSS; u band) using acustom IDL subtraction pipeline, and performed seeing-matched aperture photometry. A color image of the field isshown in Figure 1.
2.2.2. Palomar 60 Inch Telescope
We obtained additional ugri photometry using the RainbowCamera of the Spectral Energy Distribution Machine (SEDM;Blagorodnova et al. 2018) on the robotic Palomar 60 inchtelescope (P60; Cenko et al. 2006). Image subtraction andphotometry was performed using FPipe (Fremling et al.2016).
2.2.3. Swift Ultraviolet/Optical Telescope
We observed the field of SN 2021csp with the Ultraviolet/Optical Telescope (UVOT; Roming et al. 2005) on board theNeil Gehrels Swift Observatory (Gehrels et al. 2004) beginning2021 February 12 and continuing until the flux from thetransient faded below detectability a month later. An additionalset of observations between 2021 March 31 and 2021 April 21were acquired to constrain the host-galaxy flux. The brightnessin the UVOT filters was measured with UVOT-specific tools inthe HEAsoft18 version 6.26.1 (Blackburn 1995). Source countswere extracted from the images using a circular aperture ofradius 3″. The background was estimated over a significantlylarger area close to the SN position. The count rates wereobtained from the images using the Swift tool uvotsource.They were converted to AB magnitudes using the UVOTphotometric zero-points of Breeveld et al. (2011) and the
Table 1Photometry of SN 2021csp
Telescope MJD Filter AB Mag unc.(days)
P48 59250.4258 r >21.09 KP48 59250.4648 g >21.27 KP48 59252.4141 i >20.72 KP48 59252.5195 r >21.75 KP48 59254.4219 r >20.79 KP48 59254.5273 g >21.50 KP48 59256.4766 i 19.05 0.06P48 59256.5078 g 18.11 0.03LT 59257.1992 g 17.92 0.03LT 59257.1992 r 18.25 0.03LT 59257.2031 u 17.53 0.03LT 59257.2031 i 18.59 0.03LT 59257.2031 z 18.84 0.03UVOT 59257.9570 UVW1 17.43 0.06UVOT 59257.9688 UVW2 17.36 0.07UVOT 59257.9766 UVM2 17.27 0.05LT 59258.1367 g 17.82 0.03LT 59258.1406 i 18.43 0.03LT 59258.1406 u 17.52 0.03LT 59258.1406 r 18.09 0.03LT 59258.1445 z 18.62 0.05
Note. Magnitudes are not corrected for Galactic extinction. Only the first fewentries are provided here: a complete machine-readable table is availableonline.
(This table is available in its entirety in machine-readable form.)
Figure 1. A false-color gri image of the field from 2021 February 11 takenwith IO:O on the LT. North is up and east to the left. SN 2021csp is seen as ablue source in an outer spiral arm of its host galaxy, northwest of the nucleus.
18 https://heasarc.gsfc.nasa.gov/docs/software/heasoft/
3
The Astrophysical Journal, 927:180 (23pp), 2022 March 10 Perley et al.
UVOT calibration files from 2020 September. To remove thehost emission from the transient light curves, we usedtemplates formed from our final observations in April andfrom archival UVOT observations of the field from 2012. Wemeasured the host contribution using the same source andbackground apertures, and subtracted this contribution from thetransient flux measurements.
2.2.4. Nordic Optical Telescope
We obtained five epochs of imaging with the Alhambra FaintObject Spectrograph and Camera (ALFOSC) on the 2.56 mNordic Optical Telescope (NOT). Observations were obtainedon 2021 April 03, 2021 April 18, 2021 April 20, 2021 May 7,and 2021 July 1. For the first two epochs, gri observations wereobtained; for the last three epochs only deep r-band observa-tions were acquired. All observations were taken under clearskies and subarcsecond seeing except the data from 2021 April18, which were affected by thin clouds and relatively poorseeing (∼1 3). Data were reduced with the Python packagePyNOT19 (v0.9.7).
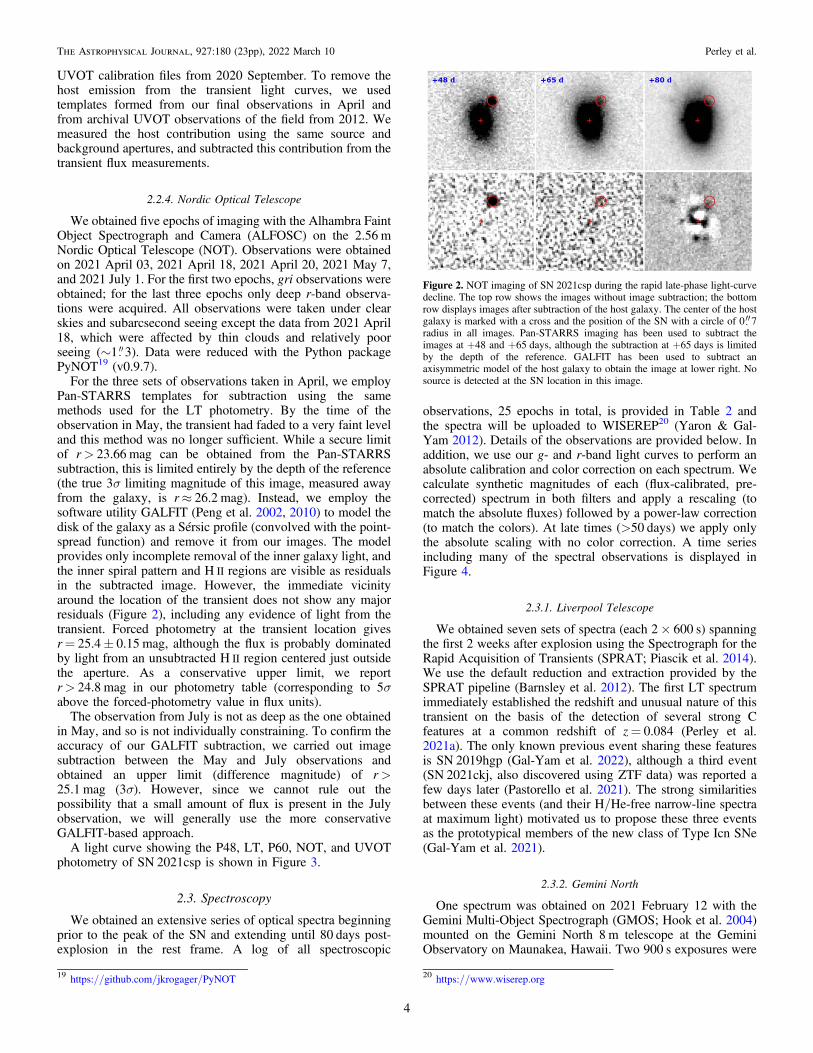
For the three sets of observations taken in April, we employPan-STARRS templates for subtraction using the samemethods used for the LT photometry. By the time of theobservation in May, the transient had faded to a very faint leveland this method was no longer sufficient. While a secure limitof r> 23.66 mag can be obtained from the Pan-STARRSsubtraction, this is limited entirely by the depth of the reference(the true 3σ limiting magnitude of this image, measured awayfrom the galaxy, is r≈ 26.2 mag). Instead, we employ thesoftware utility GALFIT (Peng et al. 2002, 2010) to model thedisk of the galaxy as a Sérsic profile (convolved with the point-spread function) and remove it from our images. The modelprovides only incomplete removal of the inner galaxy light, andthe inner spiral pattern and H II regions are visible as residualsin the subtracted image. However, the immediate vicinityaround the location of the transient does not show any majorresiduals (Figure 2), including any evidence of light from thetransient. Forced photometry at the transient location givesr= 25.4± 0.15 mag, although the flux is probably dominatedby light from an unsubtracted H II region centered just outsidethe aperture. As a conservative upper limit, we reportr> 24.8 mag in our photometry table (corresponding to 5σabove the forced-photometry value in flux units).
The observation from July is not as deep as the one obtainedin May, and so is not individually constraining. To confirm theaccuracy of our GALFIT subtraction, we carried out imagesubtraction between the May and July observations andobtained an upper limit (difference magnitude) of r>25.1 mag (3σ). However, since we cannot rule out thepossibility that a small amount of flux is present in the Julyobservation, we will generally use the more conservativeGALFIT-based approach.
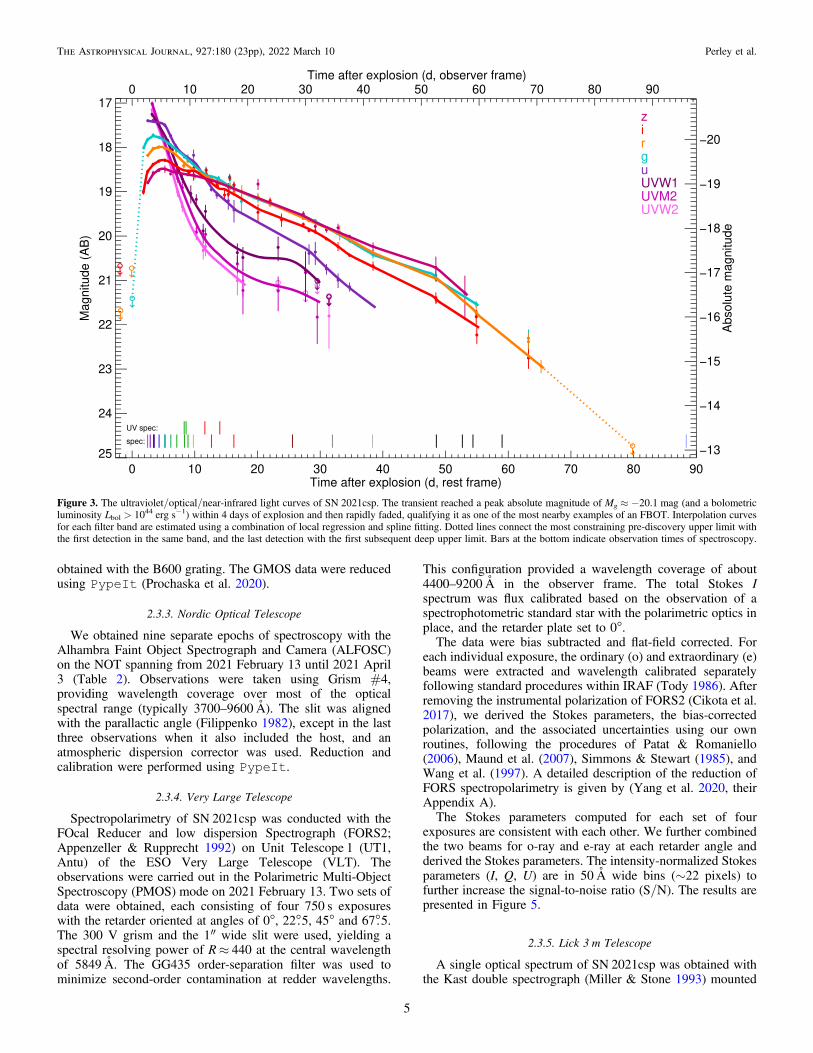
A light curve showing the P48, LT, P60, NOT, and UVOTphotometry of SN 2021csp is shown in Figure 3.
2.3. Spectroscopy
We obtained an extensive series of optical spectra beginningprior to the peak of the SN and extending until 80 days post-explosion in the rest frame. A log of all spectroscopic
observations, 25 epochs in total, is provided in Table 2 andthe spectra will be uploaded to WISEREP20 (Yaron & Gal-Yam 2012). Details of the observations are provided below. Inaddition, we use our g- and r-band light curves to perform anabsolute calibration and color correction on each spectrum. Wecalculate synthetic magnitudes of each (flux-calibrated, pre-corrected) spectrum in both filters and apply a rescaling (tomatch the absolute fluxes) followed by a power-law correction(to match the colors). At late times (>50 days) we apply onlythe absolute scaling with no color correction. A time seriesincluding many of the spectral observations is displayed inFigure 4.
2.3.1. Liverpool Telescope
We obtained seven sets of spectra (each 2× 600 s) spanningthe first 2 weeks after explosion using the Spectrograph for theRapid Acquisition of Transients (SPRAT; Piascik et al. 2014).We use the default reduction and extraction provided by theSPRAT pipeline (Barnsley et al. 2012). The first LT spectrumimmediately established the redshift and unusual nature of thistransient on the basis of the detection of several strong Cfeatures at a common redshift of z= 0.084 (Perley et al.2021a). The only known previous event sharing these featuresis SN 2019hgp (Gal-Yam et al. 2022), although a third event(SN 2021ckj, also discovered using ZTF data) was reported afew days later (Pastorello et al. 2021). The strong similaritiesbetween these events (and their H/He-free narrow-line spectraat maximum light) motivated us to propose these three eventsas the prototypical members of the new class of Type Icn SNe(Gal-Yam et al. 2021).
2.3.2. Gemini North
One spectrum was obtained on 2021 February 12 with theGemini Multi-Object Spectrograph (GMOS; Hook et al. 2004)mounted on the Gemini North 8 m telescope at the GeminiObservatory on Maunakea, Hawaii. Two 900 s exposures were
Figure 2. NOT imaging of SN 2021csp during the rapid late-phase light-curvedecline. The top row shows the images without image subtraction; the bottomrow displays images after subtraction of the host galaxy. The center of the hostgalaxy is marked with a cross and the position of the SN with a circle of 0 7radius in all images. Pan-STARRS imaging has been used to subtract theimages at +48 and +65 days, although the subtraction at +65 days is limitedby the depth of the reference. GALFIT has been used to subtract anaxisymmetric model of the host galaxy to obtain the image at lower right. Nosource is detected at the SN location in this image.
19 https://github.com/jkrogager/PyNOT 20 https://www.wiserep.org
4
The Astrophysical Journal, 927:180 (23pp), 2022 March 10 Perley et al.
obtained with the B600 grating. The GMOS data were reducedusing PypeIt (Prochaska et al. 2020).
2.3.3. Nordic Optical Telescope
We obtained nine separate epochs of spectroscopy with theAlhambra Faint Object Spectrograph and Camera (ALFOSC)on the NOT spanning from 2021 February 13 until 2021 April3 (Table 2). Observations were taken using Grism #4,providing wavelength coverage over most of the opticalspectral range (typically 3700–9600Å). The slit was alignedwith the parallactic angle (Filippenko 1982), except in the lastthree observations when it also included the host, and anatmospheric dispersion corrector was used. Reduction andcalibration were performed using PypeIt.
2.3.4. Very Large Telescope
Spectropolarimetry of SN 2021csp was conducted with theFOcal Reducer and low dispersion Spectrograph (FORS2;Appenzeller & Rupprecht 1992) on Unit Telescope 1 (UT1,Antu) of the ESO Very Large Telescope (VLT). Theobservations were carried out in the Polarimetric Multi-ObjectSpectroscopy (PMOS) mode on 2021 February 13. Two sets ofdata were obtained, each consisting of four 750 s exposureswith the retarder oriented at angles of 0°, 22°.5, 45° and 67°.5.The 300 V grism and the 1″ wide slit were used, yielding aspectral resolving power of R≈ 440 at the central wavelengthof 5849Å. The GG435 order-separation filter was used tominimize second-order contamination at redder wavelengths.
This configuration provided a wavelength coverage of about4400–9200Å in the observer frame. The total Stokes Ispectrum was flux calibrated based on the observation of aspectrophotometric standard star with the polarimetric optics inplace, and the retarder plate set to 0°.The data were bias subtracted and flat-field corrected. For
each individual exposure, the ordinary (o) and extraordinary (e)beams were extracted and wavelength calibrated separatelyfollowing standard procedures within IRAF (Tody 1986). Afterremoving the instrumental polarization of FORS2 (Cikota et al.2017), we derived the Stokes parameters, the bias-correctedpolarization, and the associated uncertainties using our ownroutines, following the procedures of Patat & Romaniello(2006), Maund et al. (2007), Simmons & Stewart (1985), andWang et al. (1997). A detailed description of the reduction ofFORS spectropolarimetry is given by (Yang et al. 2020, theirAppendix A).The Stokes parameters computed for each set of four
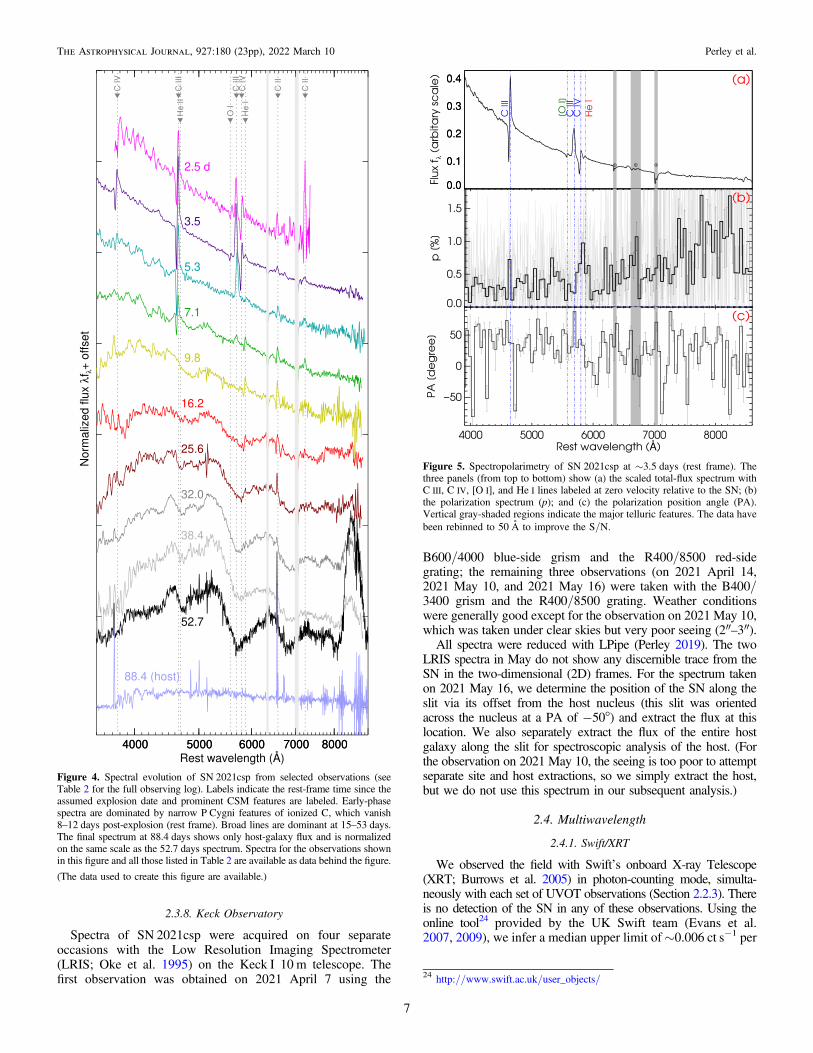
exposures are consistent with each other. We further combinedthe two beams for o-ray and e-ray at each retarder angle andderived the Stokes parameters. The intensity-normalized Stokesparameters (I, Q, U) are in 50Å wide bins (∼22 pixels) tofurther increase the signal-to-noise ratio (S/N). The results arepresented in Figure 5.
2.3.5. Lick 3 m Telescope
A single optical spectrum of SN 2021csp was obtained withthe Kast double spectrograph (Miller & Stone 1993) mounted
Figure 3. The ultraviolet/optical/near-infrared light curves of SN 2021csp. The transient reached a peak absolute magnitude of Mg ≈ −20.1 mag (and a bolometricluminosity Lbol > 1044 erg s−1) within 4 days of explosion and then rapidly faded, qualifying it as one of the most nearby examples of an FBOT. Interpolation curvesfor each filter band are estimated using a combination of local regression and spline fitting. Dotted lines connect the most constraining pre-discovery upper limit withthe first detection in the same band, and the last detection with the first subsequent deep upper limit. Bars at the bottom indicate observation times of spectroscopy.
5
The Astrophysical Journal, 927:180 (23pp), 2022 March 10 Perley et al.

on the 3 m Shane telescope at Lick Observatory. The spectrumwas taken at or near the parallactic angle (Filippenko 1982) tominimize slit losses caused by atmospheric dispersion. Datawere reduced following standard techniques for CCD proces-sing and spectrum extraction (Silverman et al. 2012) utilizingIRAF routines and custom Python and IDL codes.21 Low-orderpolynomial fits to arc-lamp spectra were used to calibrate thewavelength scale, and small adjustments derived from night-sky lines in the target frames were applied. Observations ofappropriate spectrophotometric standard stars were used to fluxcalibrate the spectra.
2.3.6. Hubble Space Telescope
We obtained two sets of observations of SN 2021csp withthe Hubble Space Telescope (HST), using both the CosmicOrigins Spectrograph (COS; Green et al. 2012) and the SpaceTelescope Imaging Spectrograph (STIS; Woodgate et al.1998).22 The COS observations employed the G140L grating
and the STIS observations used the G230L grating. The first setof observations was taken at 8.31 and 8.61 rest-frame days afterour assumed explosion time (for STIS and COS, respectively);the second set was taken at 11.61 days (STIS) and13.99 days (COS).We use the pipeline reductions from the HST archive. The
first STIS spectrum has an S/N about a factor of 10 lower thanexpected, likely due to a guiding problem. This problem is notseen in the second STIS exposure or with COS. The UVspectra are shown alongside optical spectra obtained at similartimes in Figure 6.
2.3.7. Palomar 200 inch Telescope
One spectrum of SN 2021csp was acquired with the DoubleBeam Spectrograph (DBSP; Oke & Gunn 1982) on the 5 mHale telescope at Palomar Observatory (P200). Observationswere taken on 2021 April 9, using the 600/4000 grating on theblue side and the 316/7150 grating on the red side. Data werereduced using the DBSP-DRP fully automated pipeline.23
Table 2Log of Spectroscopic Observations of SN 2021csp
Observation Date MJD Phase Facility Exp. Time Grism/Grating Slit Width Range(UTC) (days) (days) (s) (arcsec) (Å)
2021 Feb 12 04:23:54 59257.183 2.475 LT/SPRAT 2 × 600 Blue 1.8 4020–79942021 Feb 12 15:07:38 59257.630 2.888 Gemini/GMOS 2 × 900 B600 1.0 3641–68782021 Feb 13 05:36:01 59258.233 3.444 LT/SPRAT 2 × 600 Blue 1.8 4000–80002021 Feb 13 06:18:33 59258.263 3.471 NOT/ALFOSC 1800 Grism #4 1.0 3852–96812021 Feb 13 07:18:40 59258.305 3.510 VLT/FORS2 8 × 750 300V 1.0 4400–92002021 Feb 14 03:54:36 59259.163 4.302 LT/SPRAT 2 × 600 Blue 1.8 4000–80002021 Feb 15 03:30:05 59260.146 5.208 LT/SPRAT 2 × 600 Blue 1.8 4000–80002021 Feb 15 05:17:55 59260.221 5.277 NOT/ALFOSC 2 × 900 Grism #4 1.3 3501–96352021 Feb 16 04:40:52 59261.195 6.176 LT/SPRAT 2 × 600 Blue 1.8 4000–80002021 Feb 17 05:24:30 59262.225 7.127 NOT/ALFOSC 2 × 1800 Grism #4 1.3 3504–96352021 Feb 18 12:09:43 59263.507 8.309 HST/STIS 2100 G230L 0.2 1570–31802021 Feb 18 13:12:00 59263.550 8.349 Lick/Kast 1 × 3660 600/4310 2.0 3632–10,340
3 × 1200 300/75002021 Feb 18 20:05:29 59263.837 8.614 HST/COS 4243 G140L 3.0 1230–20502021 Feb 19 03:57:39 59264.165 8.916 LT/SPRAT 2 × 600 Blue 1.8 4000–80002021 Feb 20 02:16:36 59265.095 9.774 NOT/ALFOSC 2 × 1800 Grism #4 1.3 3501–96312021 Feb 22 01:58:28 59267.082 11.607 HST/STIS 2030 G230L 0.2 1570–31802021 Feb 23 05:15:11 59268.219 12.656 LT/SPRAT 2 × 600 Blue 1.8 4000–80002021 Feb 24 15:58:17 59269.665 13.990 HST/COS 4003 G140L 3.0 1230–20502021 Feb 27 02:19:35 59272.097 16.233 NOT/ALFOSC 2 × 1800 Grism #4 1.0 3753–96832021 Mar 09 05:19:36 59282.222 25.574 NOT/ALFOSC 2 × 1800 Grism #4 1.3 3752–96202021 Mar 16 03:18:45 59289.138 31.954 NOT/ALFOSC 3 × 1500 Grism #4 1.0 3701–96832021 Mar 23 01:48:34 59296.075 38.354 NOT/ALFOSC 3 × 1500 Grism #4 1.0 4001–96852021 Apr 03 02:42:56 59307.113 48.536 NOT/ALFOSC 3 × 1500 Grism #4 1.0 4003–96772021 Apr 07 14:32:41 59311.606 52.681 Keck/LRIS 850+750 B600/4000 1.0 3134–10,284
750+670 R400/85002021 Apr 09 10:28:48 59313.437 54.370 Palomar/DBSP 1200 B600 1.5 3400–10,000
1200 R3162021 Apr 14 11:32:20 59318.481 59.023 Keck/LRIS 450 B400/3400 1.0 3000–10,306
450 R400/85002021 May 10 10:56:35 59344.456 82.985 Keck/LRIS 3 × 900 B400/3400 1.0 3000–10,306
3 × 903 R400/85002021 May 16 07:52:14 59350.328 88.402 Keck/LRIS 3 × 900 B400/3400 1.0 3000–10,306
3 × 903 R400/8500
Note. The phase is calculated with respect to MJD 59254.5 (the estimated explosion date) and is given in the rest frame. The spectra tabulated here are available asdata-behind Figure 4.
21 https://github.com/ishivvers/TheKastShiv22 Program ID GO#16212 (PI: D. Perley). 23 https://github.com/finagle29/dbsp_drp
6
The Astrophysical Journal, 927:180 (23pp), 2022 March 10 Perley et al.
2.3.8. Keck Observatory
Spectra of SN 2021csp were acquired on four separateoccasions with the Low Resolution Imaging Spectrometer(LRIS; Oke et al. 1995) on the Keck I 10 m telescope. Thefirst observation was obtained on 2021 April 7 using the
B600/4000 blue-side grism and the R400/8500 red-sidegrating; the remaining three observations (on 2021 April 14,2021 May 10, and 2021 May 16) were taken with the B400/3400 grism and the R400/8500 grating. Weather conditionswere generally good except for the observation on 2021 May 10,which was taken under clear skies but very poor seeing (2″–3″).All spectra were reduced with LPipe (Perley 2019). The two
LRIS spectra in May do not show any discernible trace from theSN in the two-dimensional (2D) frames. For the spectrum takenon 2021 May 16, we determine the position of the SN along theslit via its offset from the host nucleus (this slit was orientedacross the nucleus at a PA of −50°) and extract the flux at thislocation. We also separately extract the flux of the entire hostgalaxy along the slit for spectroscopic analysis of the host. (Forthe observation on 2021 May 10, the seeing is too poor to attemptseparate site and host extractions, so we simply extract the host,but we do not use this spectrum in our subsequent analysis.)
2.4. Multiwavelength
2.4.1. Swift/XRT
We observed the field with Swiftʼs onboard X-ray Telescope(XRT; Burrows et al. 2005) in photon-counting mode, simulta-neously with each set of UVOT observations (Section 2.2.3). Thereis no detection of the SN in any of these observations. Using theonline tool24 provided by the UK Swift team (Evans et al.2007, 2009), we infer a median upper limit of∼0.006 ct s−1 per
Figure 4. Spectral evolution of SN 2021csp from selected observations (seeTable 2 for the full observing log). Labels indicate the rest-frame time since theassumed explosion date and prominent CSM features are labeled. Early-phasespectra are dominated by narrow P Cygni features of ionized C, which vanish8–12 days post-explosion (rest frame). Broad lines are dominant at 15–53 days.The final spectrum at 88.4 days shows only host-galaxy flux and is normalizedon the same scale as the 52.7 days spectrum. Spectra for the observations shownin this figure and all those listed in Table 2 are available as data behind the figure.
(The data used to create this figure are available.)
Figure 5. Spectropolarimetry of SN 2021csp at ∼3.5 days (rest frame). Thethree panels (from top to bottom) show (a) the scaled total-flux spectrum withC III, C IV, [O I], and He I lines labeled at zero velocity relative to the SN; (b)the polarization spectrum (p); and (c) the polarization position angle (PA).Vertical gray-shaded regions indicate the major telluric features. The data havebeen rebinned to 50 Å to improve the S/N.
24 http://www.swift.ac.uk/user_objects/
7
The Astrophysical Journal, 927:180 (23pp), 2022 March 10 Perley et al.
epoch at 3σ confidence. Stacking all data decreases the upperlimit to 0.0008 ct s−1. Assuming a Galactic neutral hydrogencolumn density of n(H)= 2.4× 1020 cm−2 (HI4PI Collabora-tion et al. 2016) and a power-law spectrum with a photonindex of 2, the count rates correspond to an unabsorbedflux limit of 2.2× 10⁻¹³ (for the median visit) and 3.1×10⁻¹⁴ erg cm−2 s−1 (for the stacked observation) in thebandpass 0.3–10 keV. At the distance of SN 2021csp, thiscorresponds to luminosity L< 3.8× 1042 erg s−1 and L<5.4× 1041 erg s−1 at 0.3–10 keV, respectively.
2.4.2. Very Large Array
We obtained three epochs of Very Large Array (VLA)observations of SN 2021csp: one each on 2021 February 17,2021 March 10, and 2021 July 1025 using the X-band receiver.The correlator was set up in 3 bit mode with frequency coveragefrom 8–12GHz. In each observation the phase calibrator wasJ1430+1043 and the flux calibrator was 3C286. Data werecalibrated using the automated pipeline available in the CommonAstronomy Software Applications (CASA; McMullin et al. 2007)and additional flagging was performed manually. Data wereimaged using the clean algorithm (Högbom 1974) with a cellsize 1/10 of the synthesized beam width, and a field size of thesmallest magic number (10× 2n) larger than the number of cellsneeded to cover the primary beam. The three observations allresulted in no detection of the counterpart, with rms values of 5, 5,and 7μJy for the February, March, and July observations(respectively). The equivalent 3σ limits on the source luminosity(Lν) are 2.6× 1027 erg s−1 Hz−1 at 7 and at 26 rest-frame dayspost-explosion, and 3.6× 1027 erg s−1 Hz−1 at 104 rest-frame dayspost-explosion.
2.4.3. High-energy Counterpart Search
We searched the Fermi Gamma-ray Burst Monitor (GBM)Burst Catalog (Narayana Bhat et al. 2016),26 the Fermi-GBM
Subthreshold Trigger list,27 the Swift Gamma-Ray Burst(GRB) Archive,28 the Interplanetary Network master list,29
and the Gamma-Ray Coordinates Network archives30 for aGRB between the last ZTF nondetection and the first ZTFdetection. The closest event was one Fermi burst(GRB 210210B) 16° away, but the association is unlikelygiven the size of the localization region. There was oneIceCube event in the relevant time interval, but owing to the10° separation we consider the association unlikely.
2.5. Host-galaxy Photometry
We retrieved science-ready coadded images from SDSSData Release 9 (Ahn et al. 2012), UKIRT Infrared Deep SkySurvey DR11Plus (Lawrence et al. 2007), and preprocessedWide-field Infrared Survey Explorer (WISE; Wright et al.2010) images from the unWISE archive (Lang 2014). TheunWISE images are based on the public WISE data and includeimages from the ongoing NEOWISE-Reactivation mission R3(Mainzer et al. 2014; Meisner et al. 2017). In addition to this,we use the UVOT observations that were obtained either beforethe explosion of SN 2021csp or after the SN had faded fromvisibility. The brightness in the UVOT filters was measuredwith UVOT-specific tools in HEAsoft. Source counts wereextracted from the images using a region of radius 10″. Thebackground was estimated using a circular region with a radiusof 33″ close to the SN position but not overlapping it. Countrates were obtained from the images using uvotsource.They were converted to AB magnitudes using the UVOTcalibration file from September 2020.We measured the brightness of the host using LAMBDAR
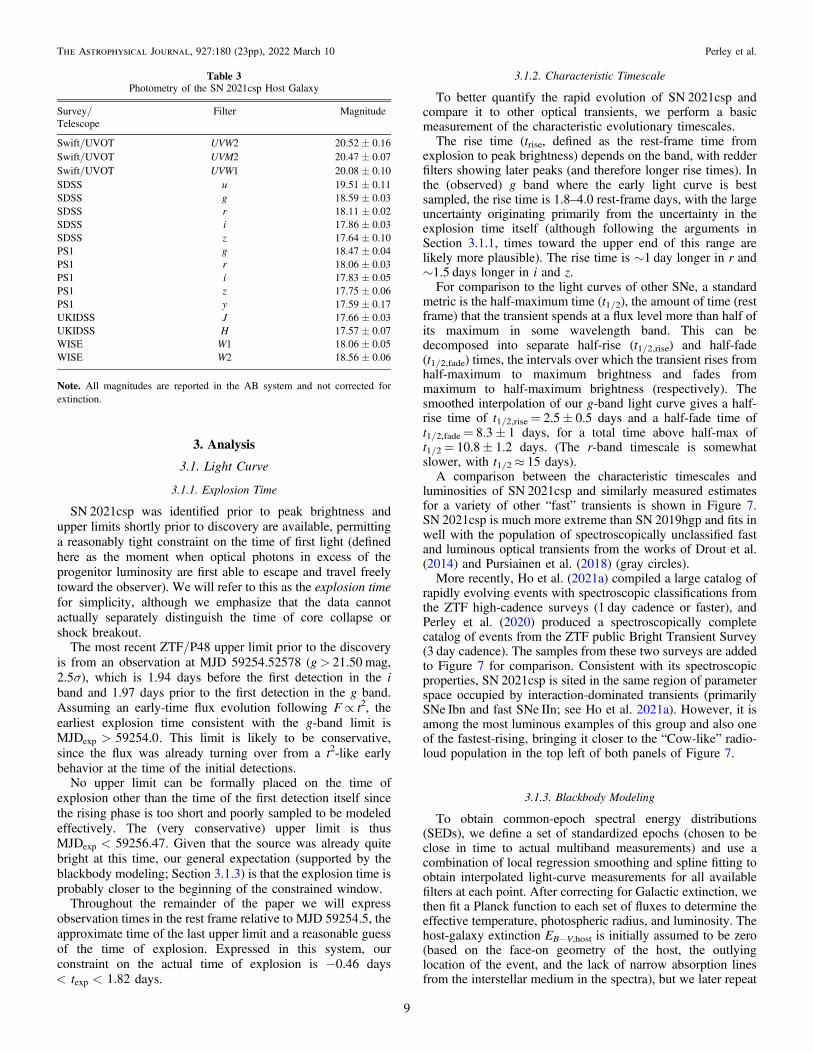
(Wright et al. 2016), uvotsource, and the methodsdescribed by Schulze et al. (2021). Table 3 provides themeasurements in the different bands.
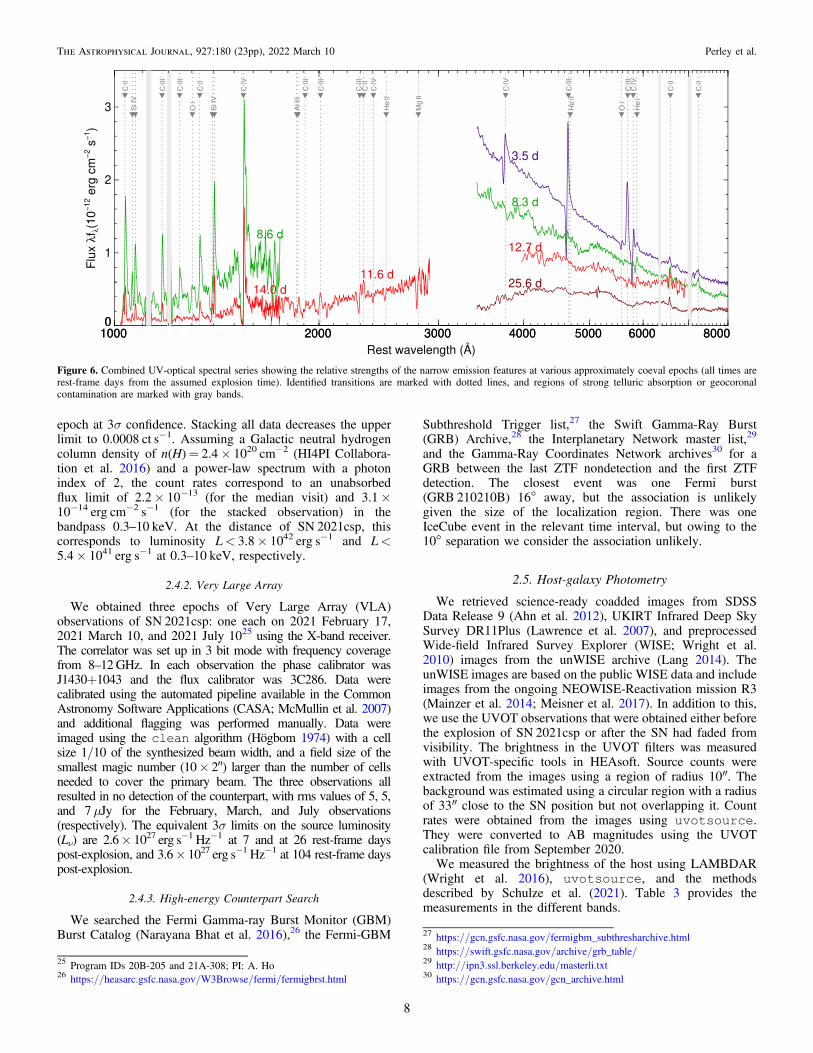
Figure 6. Combined UV-optical spectral series showing the relative strengths of the narrow emission features at various approximately coeval epochs (all times arerest-frame days from the assumed explosion time). Identified transitions are marked with dotted lines, and regions of strong telluric absorption or geocoronalcontamination are marked with gray bands.
25 Program IDs 20B-205 and 21A-308; PI: A. Ho26 https://heasarc.gsfc.nasa.gov/W3Browse/fermi/fermigbrst.html
27 https://gcn.gsfc.nasa.gov/fermigbm_subthresharchive.html28 https://swift.gsfc.nasa.gov/archive/grb_table/29 http://ipn3.ssl.berkeley.edu/masterli.txt30 https://gcn.gsfc.nasa.gov/gcn_archive.html
8
The Astrophysical Journal, 927:180 (23pp), 2022 March 10 Perley et al.
3. Analysis
3.1. Light Curve
3.1.1. Explosion Time
SN 2021csp was identified prior to peak brightness andupper limits shortly prior to discovery are available, permittinga reasonably tight constraint on the time of first light (definedhere as the moment when optical photons in excess of theprogenitor luminosity are first able to escape and travel freelytoward the observer). We will refer to this as the explosion timefor simplicity, although we emphasize that the data cannotactually separately distinguish the time of core collapse orshock breakout.
The most recent ZTF/P48 upper limit prior to the discoveryis from an observation at MJD 59254.52578 (g> 21.50 mag,2.5σ), which is 1.94 days before the first detection in the iband and 1.97 days prior to the first detection in the g band.Assuming an early-time flux evolution following F∝ t2, theearliest explosion time consistent with the g-band limit is
>MJD 59254.0exp . This limit is likely to be conservative,since the flux was already turning over from a t2-like earlybehavior at the time of the initial detections.
No upper limit can be formally placed on the time ofexplosion other than the time of the first detection itself sincethe rising phase is too short and poorly sampled to be modeledeffectively. The (very conservative) upper limit is thus
<MJD 59256.47exp . Given that the source was already quitebright at this time, our general expectation (supported by theblackbody modeling; Section 3.1.3) is that the explosion time isprobably closer to the beginning of the constrained window.
Throughout the remainder of the paper we will expressobservation times in the rest frame relative to MJD 59254.5, theapproximate time of the last upper limit and a reasonable guessof the time of explosion. Expressed in this system, ourconstraint on the actual time of explosion is −0.46 days< <t 1.82exp days.
3.1.2. Characteristic Timescale
To better quantify the rapid evolution of SN 2021csp andcompare it to other optical transients, we perform a basicmeasurement of the characteristic evolutionary timescales.The rise time (trise, defined as the rest-frame time from
explosion to peak brightness) depends on the band, with redderfilters showing later peaks (and therefore longer rise times). Inthe (observed) g band where the early light curve is bestsampled, the rise time is 1.8–4.0 rest-frame days, with the largeuncertainty originating primarily from the uncertainty in theexplosion time itself (although following the arguments inSection 3.1.1, times toward the upper end of this range arelikely more plausible). The rise time is ∼1 day longer in r and∼1.5 days longer in i and z.For comparison to the light curves of other SNe, a standard
metric is the half-maximum time (t1/2), the amount of time (restframe) that the transient spends at a flux level more than half ofits maximum in some wavelength band. This can bedecomposed into separate half-rise (t1/2,rise) and half-fade(t1/2,fade) times, the intervals over which the transient rises fromhalf-maximum to maximum brightness and fades frommaximum to half-maximum brightness (respectively). Thesmoothed interpolation of our g-band light curve gives a half-rise time of t1/2,rise= 2.5± 0.5 days and a half-fade time oft1/2,fade= 8.3± 1 days, for a total time above half-max oft1/2= 10.8± 1.2 days. (The r-band timescale is somewhatslower, with t1/2≈ 15 days).A comparison between the characteristic timescales and
luminosities of SN 2021csp and similarly measured estimatesfor a variety of other “fast” transients is shown in Figure 7.SN 2021csp is much more extreme than SN 2019hgp and fits inwell with the population of spectroscopically unclassified fastand luminous optical transients from the works of Drout et al.(2014) and Pursiainen et al. (2018) (gray circles).More recently, Ho et al. (2021a) compiled a large catalog of
rapidly evolving events with spectroscopic classifications fromthe ZTF high-cadence surveys (1 day cadence or faster), andPerley et al. (2020) produced a spectroscopically completecatalog of events from the ZTF public Bright Transient Survey(3 day cadence). The samples from these two surveys are addedto Figure 7 for comparison. Consistent with its spectroscopicproperties, SN 2021csp is sited in the same region of parameterspace occupied by interaction-dominated transients (primarilySNe Ibn and fast SNe IIn; see Ho et al. 2021a). However, it isamong the most luminous examples of this group and also oneof the fastest-rising, bringing it closer to the “Cow-like” radio-loud population in the top left of both panels of Figure 7.
3.1.3. Blackbody Modeling
To obtain common-epoch spectral energy distributions(SEDs), we define a set of standardized epochs (chosen to beclose in time to actual multiband measurements) and use acombination of local regression smoothing and spline fitting toobtain interpolated light-curve measurements for all availablefilters at each point. After correcting for Galactic extinction, wethen fit a Planck function to each set of fluxes to determine theeffective temperature, photospheric radius, and luminosity. Thehost-galaxy extinction EB−V,host is initially assumed to be zero(based on the face-on geometry of the host, the outlyinglocation of the event, and the lack of narrow absorption linesfrom the interstellar medium in the spectra), but we later repeat
Table 3Photometry of the SN 2021csp Host Galaxy
Survey/ Filter MagnitudeTelescope
Swift/UVOT UVW2 20.52 ± 0.16Swift/UVOT UVM2 20.47 ± 0.07Swift/UVOT UVW1 20.08 ± 0.10SDSS u 19.51 ± 0.11SDSS g 18.59 ± 0.03SDSS r 18.11 ± 0.02SDSS i 17.86 ± 0.03SDSS z 17.64 ± 0.10PS1 g 18.47 ± 0.04PS1 r 18.06 ± 0.03PS1 i 17.83 ± 0.05PS1 z 17.75 ± 0.06PS1 y 17.59 ± 0.17UKIDSS J 17.66 ± 0.03UKIDSS H 17.57 ± 0.07WISE W1 18.06 ± 0.05WISE W2 18.56 ± 0.06
Note. All magnitudes are reported in the AB system and not corrected forextinction.
9
The Astrophysical Journal, 927:180 (23pp), 2022 March 10 Perley et al.
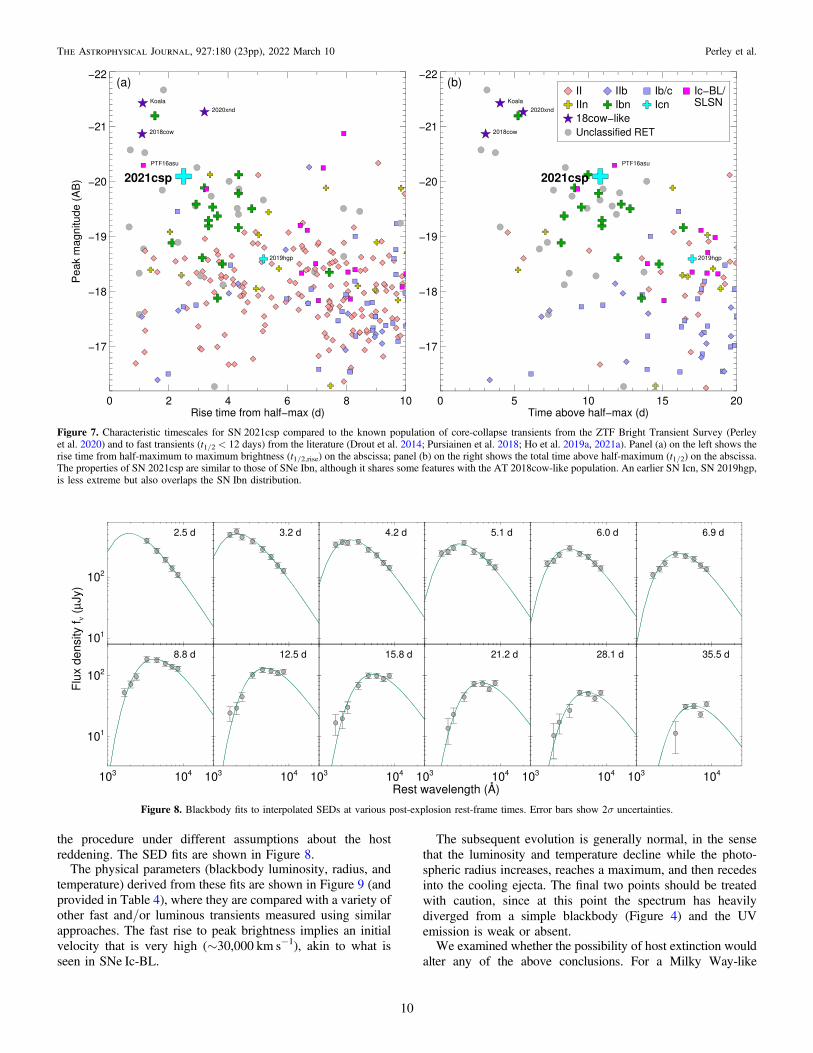
the procedure under different assumptions about the hostreddening. The SED fits are shown in Figure 8.
The physical parameters (blackbody luminosity, radius, andtemperature) derived from these fits are shown in Figure 9 (andprovided in Table 4), where they are compared with a variety ofother fast and/or luminous transients measured using similarapproaches. The fast rise to peak brightness implies an initialvelocity that is very high (∼30,000 km s−1), akin to what isseen in SNe Ic-BL.
The subsequent evolution is generally normal, in the sensethat the luminosity and temperature decline while the photo-spheric radius increases, reaches a maximum, and then recedesinto the cooling ejecta. The final two points should be treatedwith caution, since at this point the spectrum has heavilydiverged from a simple blackbody (Figure 4) and the UVemission is weak or absent.We examined whether the possibility of host extinction would
alter any of the above conclusions. For a Milky Way-like
Figure 7. Characteristic timescales for SN 2021csp compared to the known population of core-collapse transients from the ZTF Bright Transient Survey (Perleyet al. 2020) and to fast transients (t1/2 < 12 days) from the literature (Drout et al. 2014; Pursiainen et al. 2018; Ho et al. 2019a, 2021a). Panel (a) on the left shows therise time from half-maximum to maximum brightness (t1/2,rise) on the abscissa; panel (b) on the right shows the total time above half-maximum (t1/2) on the abscissa.The properties of SN 2021csp are similar to those of SNe Ibn, although it shares some features with the AT 2018cow-like population. An earlier SN Icn, SN 2019hgp,is less extreme but also overlaps the SN Ibn distribution.
Figure 8. Blackbody fits to interpolated SEDs at various post-explosion rest-frame times. Error bars show 2σ uncertainties.
10
The Astrophysical Journal, 927:180 (23pp), 2022 March 10 Perley et al.
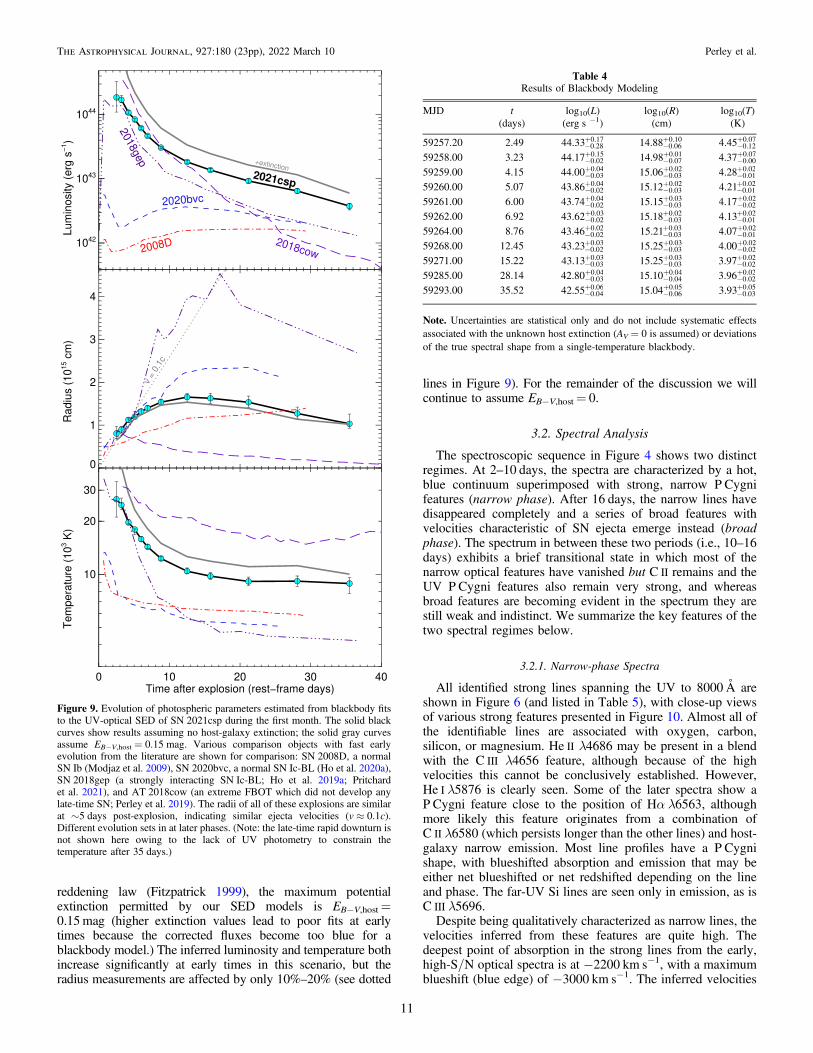
reddening law (Fitzpatrick 1999), the maximum potentialextinction permitted by our SED models is EB−V,host=0.15mag (higher extinction values lead to poor fits at earlytimes because the corrected fluxes become too blue for ablackbody model.) The inferred luminosity and temperature bothincrease significantly at early times in this scenario, but theradius measurements are affected by only 10%–20% (see dotted
lines in Figure 9). For the remainder of the discussion we willcontinue to assume EB−V,host= 0.
3.2. Spectral Analysis
The spectroscopic sequence in Figure 4 shows two distinctregimes. At 2–10 days, the spectra are characterized by a hot,blue continuum superimposed with strong, narrow P Cygnifeatures (narrow phase). After 16 days, the narrow lines havedisappeared completely and a series of broad features withvelocities characteristic of SN ejecta emerge instead (broadphase). The spectrum in between these two periods (i.e., 10–16days) exhibits a brief transitional state in which most of thenarrow optical features have vanished but C II remains and theUV P Cygni features also remain very strong, and whereasbroad features are becoming evident in the spectrum they arestill weak and indistinct. We summarize the key features of thetwo spectral regimes below.
3.2.1. Narrow-phase Spectra
All identified strong lines spanning the UV to 8000Å areshown in Figure 6 (and listed in Table 5), with close-up viewsof various strong features presented in Figure 10. Almost all ofthe identifiable lines are associated with oxygen, carbon,silicon, or magnesium. He II λ4686 may be present in a blendwith the C III λ4656 feature, although because of the highvelocities this cannot be conclusively established. However,He I λ5876 is clearly seen. Some of the later spectra show aP Cygni feature close to the position of Hα λ6563, althoughmore likely this feature originates from a combination ofC II λ6580 (which persists longer than the other lines) and host-galaxy narrow emission. Most line profiles have a P Cygnishape, with blueshifted absorption and emission that may beeither net blueshifted or net redshifted depending on the lineand phase. The far-UV Si lines are seen only in emission, as isC III λ5696.Despite being qualitatively characterized as narrow lines, the
velocities inferred from these features are quite high. Thedeepest point of absorption in the strong lines from the early,high-S/N optical spectra is at −2200 km s−1, with a maximumblueshift (blue edge) of −3000 km s−1. The inferred velocities
Figure 9. Evolution of photospheric parameters estimated from blackbody fitsto the UV-optical SED of SN 2021csp during the first month. The solid blackcurves show results assuming no host-galaxy extinction; the solid gray curvesassume EB−V,host = 0.15 mag. Various comparison objects with fast earlyevolution from the literature are shown for comparison: SN 2008D, a normalSN Ib (Modjaz et al. 2009), SN 2020bvc, a normal SN Ic-BL (Ho et al. 2020a),SN 2018gep (a strongly interacting SN Ic-BL; Ho et al. 2019a; Pritchardet al. 2021), and AT 2018cow (an extreme FBOT which did not develop anylate-time SN; Perley et al. 2019). The radii of all of these explosions are similarat ∼5 days post-explosion, indicating similar ejecta velocities (v ≈ 0.1c).Different evolution sets in at later phases. (Note: the late-time rapid downturn isnot shown here owing to the lack of UV photometry to constrain thetemperature after 35 days.)
Table 4Results of Blackbody Modeling
MJD t log10(L) log10(R) log10(T)(days) (erg s −1) (cm) (K)
59257.20 2.49 -+44.33 0.28
0.17-+14.88 0.06
0.10-+4.45 0.12
0.07
59258.00 3.23 -+44.17 0.02
0.15-+14.98 0.07
0.01-+4.37 0.00
0.07
59259.00 4.15 -+44.00 0.03
0.04-+15.06 0.03
0.02-+4.28 0.01
0.02
59260.00 5.07 -+43.86 0.02
0.04-+15.12 0.03
0.02-+4.21 0.01
0.02
59261.00 6.00 -+43.74 0.02
0.04-+15.15 0.03
0.03-+4.17 0.02
0.02
59262.00 6.92 -+43.62 0.02
0.03-+15.18 0.03
0.02-+4.13 0.01
0.02
59264.00 8.76 -+43.46 0.02
0.02-+15.21 0.03
0.03-+4.07 0.01
0.02
59268.00 12.45 -+43.23 0.02
0.03-+15.25 0.03
0.03-+4.00 0.02
0.02
59271.00 15.22 -+43.13 0.03
0.03-+15.25 0.03
0.03-+3.97 0.02
0.02
59285.00 28.14 -+42.80 0.03
0.04-+15.10 0.04
0.04-+3.96 0.02
0.02
59293.00 35.52 -+42.55 0.04
0.06-+15.04 0.06
0.05-+3.93 0.03
0.05
Note. Uncertainties are statistical only and do not include systematic effectsassociated with the unknown host extinction (AV = 0 is assumed) or deviationsof the true spectral shape from a single-temperature blackbody.
11
The Astrophysical Journal, 927:180 (23pp), 2022 March 10 Perley et al.

in the UV (where the transitions are much stronger) are evenhigher; the C IV λ1548 line shows almost-total absorption outto −2000 km s−1 but weaker absorption out to a maximumblueshift of approximately −4500 km s−1.
A comparison between the peak-light spectra of SN 2021csp,the prototypical Type Icn SN 2019hgp, and two SNe Ibn(SN 2019uo and SN 2010al) is displayed in Figure 11. Thespectrum of SN 2019uo is the classification spectrum from theTransient Name Server (Fremling et al. 2019); the spectrum ofSN 2010al is taken from Pastorello et al. (2015a). The spectrumof SN 2021csp strongly resembles that of SN 2019hgp,although it lacks some of the transitions seen in that SN(e.g., O III). The line widths in SN 2019hgp are somewhatbroader. The features in the SNe Ibn originate from differenttransitions (mainly He I) and are much weaker than those ofeither SN Icn, although the line profiles are qualitativelysimilar.
A comparison with two SNe Ibn in the UV (SN 2020nxt andSN 2010al; O. Fox et al. 2021, in preparation; Kirshner et al.2010) is provided in Figure 12. Some common transitions areapparent at these wavelengths, most notably the resonance linesof Si IV λ1402 and C IV λ1548, which have similar strengthsand profiles. The remaining features are quite different:SN 2021csp shows a number of carbon features absent inSNe Ibn, while the very strong doublet N V λλ 1238,1242 isseen in both SNe Ibn but is absent entirely in the Type IcnSN 2021csp. Also, while the characteristic velocities are
similar, the high-velocity component (4000 km s−1) in absorp-tion and emission seen in SN 2021csp is not clearly visible ineither of the SNe Ibn—although the issue is somewhatconfused by contamination with other features and the differentphases of the observations.
3.2.2. Broad-phase Spectra
The broad lines are somewhat indistinct at 10–15 days, butby 16 days the characteristic late-time spectrum has clearlyemerged. The flux is strongest in the blue, with maxima at4600, ∼5300, and ∼6400Å. The relative strength of thesefeatures increases gradually with time, but neither their shapesnor central wavelengths change much. A notable exception isthe Ca II near-infrared triplet at ∼8540Å: not apparent at allprior to ∼30 days, it rapidly rises to become the dominantemission feature in our final spectrum at 53 days. Themaximum velocity (at zero intensity) of this feature on theblueshifted side is ∼−10,000 km s−1, characteristic of nebular-phase stripped-envelope SNe.The identity of the remaining features is less clear. While the
late-phase spectra show some similarities to those of SNe Ic,the strong blue and near-UV continuum differs dramaticallyfrom the line-blanketed post-peak spectra of any normalmember of this class (including SNe Ic-BL). Instead, thecontinuum strongly resembles those of SNe Ibn at similarphases, although the narrow He I lines characteristic of SNe Ibnat these phases are absent. A comparison between SN 2021csp,SN 2019hgp, and two late-phase SNe Ibn (SN 2006jc fromPastorello et al. 2007 and SN 2020eyj from E. Kool et al. 2021,in preparation) is shown in Figure 13. The blue pseudoconti-nuum seen in SNe Ibn has been attributed to a forest of blendedFe II lines provided by fluorescence in the inner wind or post-shock gas (Foley et al. 2007; Chugai 2009; Smith et al. 2009;Pastorello et al. 2015b), and its presence here suggests thatstrong CSM interaction is continuing even after the narrowlines have faded.
3.3. Polarimetry
An upper limit on the interstellar polarization (ISP) inducedby dichroic extinction of Milky Way-like dust grains is givenby pISP< 9× EB−V (Serkowski et al. 1975). Therefore, we setan upper limit on the ISP from the Galactic component as0.24%. We assume a host AV= 0 mag (Section 3.1.3). Weevaluated a continuum polarization level of ∼0.3% bycomputing the error-weighted Stokes parameters in the opticalrange after excluding the prominent spectral features andtelluric ranges. Therefore, without a careful determination ofthe ISP from the SN host, we suggest that the continuumpolarization of the SN is less than ∼0.5%.There is no strong polarization signal associated with any of
the narrow-line features, although the wavelength bins in thevicinity of flash-ionized narrow P Cygni features of ionizedC III and C IV (labeled in Figure 5) do show a polarizationexcess of ∼0.4% above the continuum level at ∼5σsignificance, which may be an indicator of some (limited)asymmetry in the explosion and/or CSM.Assuming a limiting polarization of 0.5%, the axis ratio of
the photosphere can be limited to 1.3 assuming an ellipsoidalsurface with a Thomson optical depth of 5 and a radial CSMdensity profile of n(r)∝ r− n, with an index n in the range of3–5 (Höflich 1991).
Table 5Spectral Lines
Line Rest Wavelength(Å)
C II 1036Si IV 1062Si IV 1073C III 1175.7C III 1247.38O Ia 1302C IIa 1335Si IV 1393.76Si IV 1402.77C IV 1548Al III 1854.73Al III 1862.79C III 1908C III 2010.1C III 2296.87C II 2324C IV 2404.77He II 2511.4Mg II 2800C IV 3765C III 4658He II 4686O I 5577C IV 5801C III 5695.92He I 5876C II 6580C II 7234
Notes. Narrow (CSM) lines identified in the UV and optical spectra ofSN 2021csp and shown in Figures.a Uncertain line association.
12
The Astrophysical Journal, 927:180 (23pp), 2022 March 10 Perley et al.

Figure 10. Evolution of selected narrow-line features in the UV (left three columns) and optical (right four columns). Original spectra are plotted in black; a smoothingkernel has been applied to the colored curves. Line centers (assuming z = 0.084) are indicated as solid lines with other nearby (contaminating) transitions indicated asdotted lines. The C IV λ3765 and λ5801 features disappear from the optical spectra at ∼5 days; the C III λ4658 and λ5696 features disappear at ∼9 days. WeakC II λ6580 persists until later times, although it becomes contaminated by host-galaxy Hα emission and is difficult to recognize after 16 days. The UV features remainstrong until at least 14 days. (All times refer to rest frame elapsed time following the assumed explosion epoch.)
13
The Astrophysical Journal, 927:180 (23pp), 2022 March 10 Perley et al.

3.4. Radio Analysis
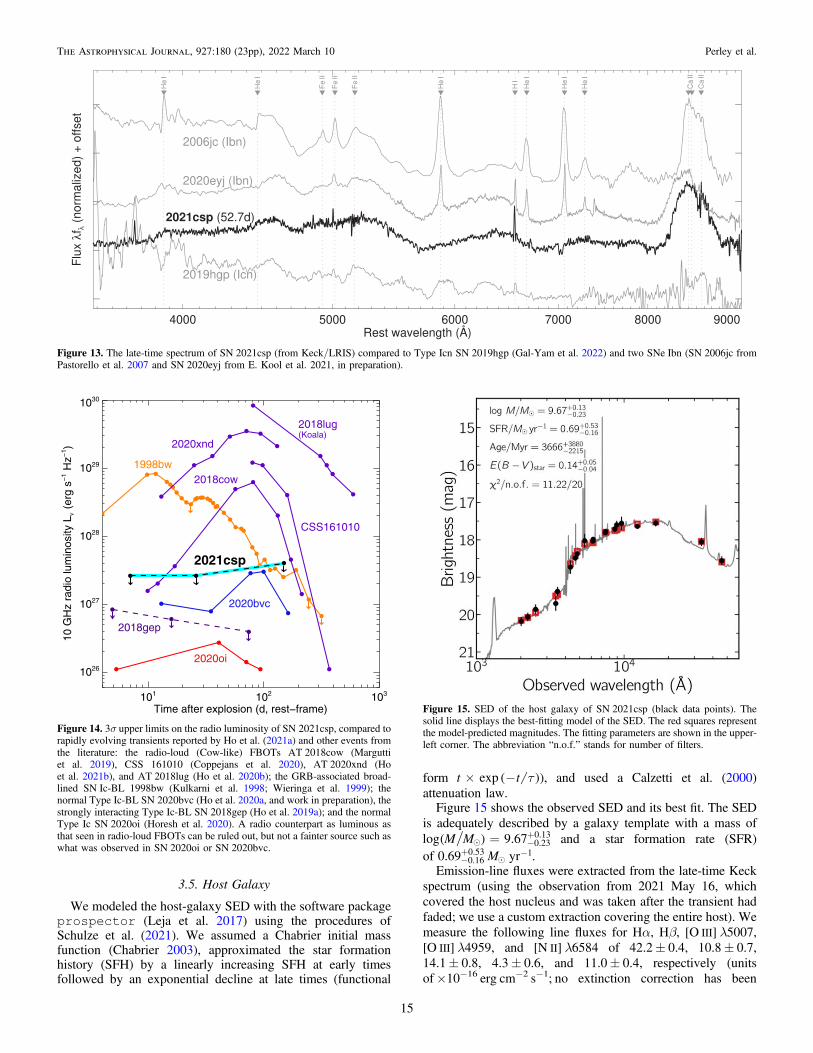
SN 2021csp was not detected in any of our radio observa-tions. The radio limits do not rule out a light curve similar tothat seen in ordinary SNe, but the luminosity limits derivedfrom the second and third measurements are significantly
below the light curves of AT 2018cow or AT 2020xnd atcomparable epochs (Ho et al. 2021a). A comparison betweenthe upper limits and some previous SN radio light curves isshown in Figure 14.
Figure 11. Peak-light spectra of SN 2021csp and SN 2019hgp (Type Icn) and of SN 2019uo and SN 2010al (Type Ibn). Both Type Ibn and Icn SNe show narrowP Cygni features in their early-time spectra, mostly from He for Ibn SNe and C for Icn SNe. The lines are much stronger in the SN Icn spectra.
Figure 12. UV spectra of SN 2021csp compared with those of two SNe Ibn. The early-time spectrum of SN 2021csp is compared to the Type Ibn SN 2020nxt (O. Foxet al. 2021, in preparation); the later spectrum is compared to the (later-phase) observation of the Type Ibn SN 2010al (Kirshner et al. 2010).
14
The Astrophysical Journal, 927:180 (23pp), 2022 March 10 Perley et al.
3.5. Host Galaxy
We modeled the host-galaxy SED with the software packageprospector (Leja et al. 2017) using the procedures ofSchulze et al. (2021). We assumed a Chabrier initial massfunction (Chabrier 2003), approximated the star formationhistory (SFH) by a linearly increasing SFH at early timesfollowed by an exponential decline at late times (functional
form t´ -t texp ( )), and used a Calzetti et al. (2000)attenuation law.Figure 15 shows the observed SED and its best fit. The SED
is adequately described by a galaxy template with a mass of= -
+M Mlog 9.67 0.23
0.13( ) and a star formation rate (SFR)of -
+ -M0.69 yr0.16
0.53 1.Emission-line fluxes were extracted from the late-time Keck
spectrum (using the observation from 2021 May 16, whichcovered the host nucleus and was taken after the transient hadfaded; we use a custom extraction covering the entire host). Wemeasure the following line fluxes for Hα, Hβ, [O III] λ5007,[O III] λ4959, and [N II] λ6584 of 42.2± 0.4, 10.8± 0.7,14.1± 0.8, 4.3± 0.6, and 11.0± 0.4, respectively (unitsof×10−16 erg cm−2 s−1; no extinction correction has been
Figure 13. The late-time spectrum of SN 2021csp (from Keck/LRIS) compared to Type Icn SN 2019hgp (Gal-Yam et al. 2022) and two SNe Ibn (SN 2006jc fromPastorello et al. 2007 and SN 2020eyj from E. Kool et al. 2021, in preparation).
Figure 14. 3σ upper limits on the radio luminosity of SN 2021csp, compared torapidly evolving transients reported by Ho et al. (2021a) and other events fromthe literature: the radio-loud (Cow-like) FBOTs AT 2018cow (Marguttiet al. 2019), CSS 161010 (Coppejans et al. 2020), AT 2020xnd (Hoet al. 2021b), and AT 2018lug (Ho et al. 2020b); the GRB-associated broad-lined SN Ic-BL 1998bw (Kulkarni et al. 1998; Wieringa et al. 1999); thenormal Type Ic-BL SN 2020bvc (Ho et al. 2020a, and work in preparation), thestrongly interacting Type Ic-BL SN 2018gep (Ho et al. 2019a); and the normalType Ic SN 2020oi (Horesh et al. 2020). A radio counterpart as luminous asthat seen in radio-loud FBOTs can be ruled out, but not a fainter source such aswhat was observed in SN 2020oi or SN 2020bvc.
Figure 15. SED of the host galaxy of SN 2021csp (black data points). Thesolid line displays the best-fitting model of the SED. The red squares representthe model-predicted magnitudes. The fitting parameters are shown in the upper-left corner. The abbreviation “n.o.f.” stands for number of filters.
15
The Astrophysical Journal, 927:180 (23pp), 2022 March 10 Perley et al.
applied). We estimate the metallicity at the galaxy center usingthe O3N2 indicator with the calibration reported by Marinoet al. (2013). The oxygen abundance of + =12 log O H( )
8.35 0.01 translates to a moderately low metallicity of(0.46± 0.01) Ze (assuming a solar oxygen abundance of 8.69;Asplund et al. 2009).
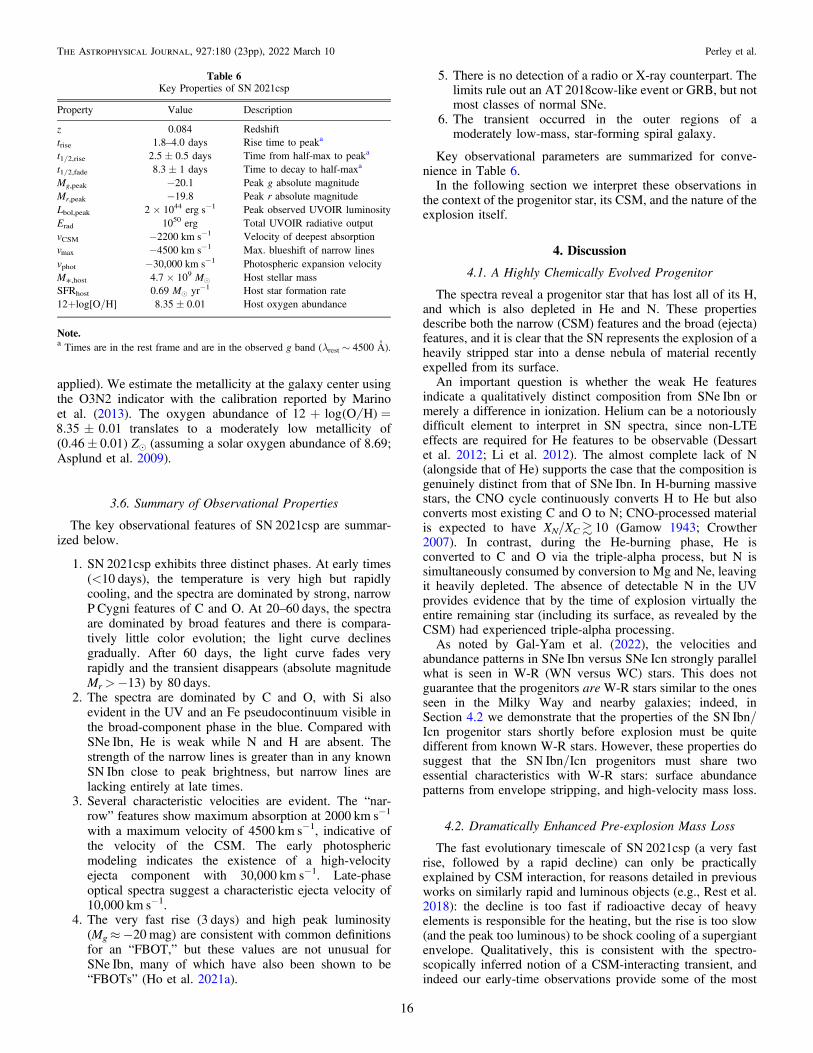
3.6. Summary of Observational Properties
The key observational features of SN 2021csp are summar-ized below.
1. SN 2021csp exhibits three distinct phases. At early times(<10 days), the temperature is very high but rapidlycooling, and the spectra are dominated by strong, narrowP Cygni features of C and O. At 20–60 days, the spectraare dominated by broad features and there is compara-tively little color evolution; the light curve declinesgradually. After 60 days, the light curve fades veryrapidly and the transient disappears (absolute magnitudeMr>−13) by 80 days.
2. The spectra are dominated by C and O, with Si alsoevident in the UV and an Fe pseudocontinuum visible inthe broad-component phase in the blue. Compared withSNe Ibn, He is weak while N and H are absent. Thestrength of the narrow lines is greater than in any knownSN Ibn close to peak brightness, but narrow lines arelacking entirely at late times.
3. Several characteristic velocities are evident. The “nar-row” features show maximum absorption at 2000 km s−1
with a maximum velocity of 4500 km s−1, indicative ofthe velocity of the CSM. The early photosphericmodeling indicates the existence of a high-velocityejecta component with 30,000 km s−1. Late-phaseoptical spectra suggest a characteristic ejecta velocity of10,000 km s−1.
4. The very fast rise (3 days) and high peak luminosity(Mg≈−20 mag) are consistent with common definitionsfor an “FBOT,” but these values are not unusual forSNe Ibn, many of which have also been shown to be“FBOTs” (Ho et al. 2021a).
5. There is no detection of a radio or X-ray counterpart. Thelimits rule out an AT 2018cow-like event or GRB, but notmost classes of normal SNe.
6. The transient occurred in the outer regions of amoderately low-mass, star-forming spiral galaxy.
Key observational parameters are summarized for conve-nience in Table 6.In the following section we interpret these observations in
the context of the progenitor star, its CSM, and the nature of theexplosion itself.
4. Discussion
4.1. A Highly Chemically Evolved Progenitor
The spectra reveal a progenitor star that has lost all of its H,and which is also depleted in He and N. These propertiesdescribe both the narrow (CSM) features and the broad (ejecta)features, and it is clear that the SN represents the explosion of aheavily stripped star into a dense nebula of material recentlyexpelled from its surface.An important question is whether the weak He features
indicate a qualitatively distinct composition from SNe Ibn ormerely a difference in ionization. Helium can be a notoriouslydifficult element to interpret in SN spectra, since non-LTEeffects are required for He features to be observable (Dessartet al. 2012; Li et al. 2012). The almost complete lack of N(alongside that of He) supports the case that the composition isgenuinely distinct from that of SNe Ibn. In H-burning massivestars, the CNO cycle continuously converts H to He but alsoconverts most existing C and O to N; CNO-processed materialis expected to have XN/XC 10 (Gamow 1943; Crowther2007). In contrast, during the He-burning phase, He isconverted to C and O via the triple-alpha process, but N issimultaneously consumed by conversion to Mg and Ne, leavingit heavily depleted. The absence of detectable N in the UVprovides evidence that by the time of explosion virtually theentire remaining star (including its surface, as revealed by theCSM) had experienced triple-alpha processing.As noted by Gal-Yam et al. (2022), the velocities and
abundance patterns in SNe Ibn versus SNe Icn strongly parallelwhat is seen in W-R (WN versus WC) stars. This does notguarantee that the progenitors are W-R stars similar to the onesseen in the Milky Way and nearby galaxies; indeed, inSection 4.2 we demonstrate that the properties of the SN Ibn/Icn progenitor stars shortly before explosion must be quitedifferent from known W-R stars. However, these properties dosuggest that the SN Ibn/Icn progenitors must share twoessential characteristics with W-R stars: surface abundancepatterns from envelope stripping, and high-velocity mass loss.
4.2. Dramatically Enhanced Pre-explosion Mass Loss
The fast evolutionary timescale of SN 2021csp (a very fastrise, followed by a rapid decline) can only be practicallyexplained by CSM interaction, for reasons detailed in previousworks on similarly rapid and luminous objects (e.g., Rest et al.2018): the decline is too fast if radioactive decay of heavyelements is responsible for the heating, but the rise is too slow(and the peak too luminous) to be shock cooling of a supergiantenvelope. Qualitatively, this is consistent with the spectro-scopically inferred notion of a CSM-interacting transient, andindeed our early-time observations provide some of the most
Table 6Key Properties of SN 2021csp
Property Value Description
z 0.084 Redshifttrise 1.8–4.0 days Rise time to peaka
t1/2,rise 2.5 ± 0.5 days Time from half-max to peaka
t1/2,fade 8.3 ± 1 days Time to decay to half-maxa
Mg,peak −20.1 Peak g absolute magnitudeMr,peak −19.8 Peak r absolute magnitudeLbol,peak 2 × 1044 erg s−1 Peak observed UVOIR luminosityErad 1050 erg Total UVOIR radiative outputvCSM −2200 km s−1 Velocity of deepest absorptionvmax −4500 km s−1 Max. blueshift of narrow linesvphot −30,000 km s−1 Photospheric expansion velocityM*,host 4.7 × 10⁹ Me Host stellar massSFRhost 0.69 Me yr−1 Host star formation rate12+log[O/H] 8.35 ± 0.01 Host oxygen abundance
Note.a Times are in the rest frame and are in the observed g band (λrest ∼ 4500 Å).
16
The Astrophysical Journal, 927:180 (23pp), 2022 March 10 Perley et al.
direct evidence yet that fast-rising blue transients (of allspectroscopic types) do indeed result from strong CSMinteraction. However, the properties of the CSM are quiteextreme for a W-R wind.
The SN reaches a peak luminosity of ∼2× 1044 erg s−1 on atimescale of only 3 days, and over the course of the first10 days (when interaction is the only viable source of energydeposition) the radiative energy release is ∼1050 erg. While thisis only a few percent of the kinetic-energy budget of a typicalSN, substantial CSM is required to decelerate the ejecta overthis timescale.
For an SN powered by CSM interaction, the pre-SN mass-loss rate can be related to the observed bolometric luminosityin a simple way assuming basic physical principles (seealso Smith 2017b). A star losing mass isotropically at aconstant velocity vCSM but potentially variable mass-lossrate M will produce a wind nebula with density profiler p= r M r v4 2
CSM( ) ( ). The SN shock then expands into thisnebula at a speed vej, sweeping up matter at a rate
r p= = dM dt v r v M v4ej2
ej CSM( ). In the SN shock frame,this matter is suddenly decelerated and its kinetic energy isconverted to heat; some fraction ò of this energy is thenreleased as thermal radiation. Thus, the luminosity is related tothe mass-loss rate as
= L Mv
v
1
2.bol
ej3
CSM ⎛
⎝⎜
⎞
⎠⎟
For a variable mass-loss rate, the SN luminosity at post-explosion time t probes the mass-loss rate at pre-explosiontime− t(vej/vCSM).
For SN 2021csp, we have vCSM≈ 2000 km s−1 (from early-time spectra), and vej≈ 30,000 km s−1 (from photosphericmodeling). For these parameters the mass-loss rate is
=-
-- M
LM0.24
10 erg s 0.1yr .
44 1
11
⎜ ⎟⎛⎝
⎞⎠
⎛⎝
⎞⎠
Thus, at a time mapping to the bolometric peak of the lightcurve (+3 days post-explosion, probing mass loss −45 dayspre-explosion), the equivalent mass-loss rate of the star musthave been close to 0.5Me yr−1. This is ∼4 orders of magnitudehigher than what is seen in typical W-R stars (e.g., Barlow et al.1981; Smith 2017a)—or, indeed, any stars other than luminousblue variables (LBVs) undergoing giant eruptions.
The narrow lines largely disappear by 16 days, although wehave reason to believe (Section 4.3) that interaction continuesto be the dominant power source of the light curve over theremainder of the evolution of the SN. Under the simplisticassumptions above, the mass-loss rate 1 yr prior to explosionwas ∼0.02Me yr−1 while 3 yr prior to explosion it was0.005Me yr−1, which is still a factor of 100 greater than fortypical W-R stars.
Based on this, we conclude that the dense and fast CSMindicated by our spectroscopy originates from a pre-explosiongiant eruption rather than a W-R wind. The very closeseparation in time between this eruption and the explosion(10−4 of the lifetime of the W-R phase) is unlikely to be acoincidence and suggests that the star was undergoing a periodof extreme instability, possibly brought on by late stages ofnuclear burning, as has been inferred indirectly from observa-tions of a variety of SNe (Yaron et al. 2017; Bruch et al. 2021;
Strotjohann et al. 2021) including at least one SN Ibn (Foleyet al. 2007; Pastorello et al. 2007).This is not in contradiction to the notion that a W-R star is
responsible for the explosion. The light curves and spectra ofSN 2021csp show that the interaction phase is very short-lived:once the zone of CSM originating from the pre-explosioneruption has been traversed by the shock, the interactionsignatures disappear and the optical luminosity plummets,consistent with the explosion expanding into a more tenuouswind from that point onward. This behavior is quite differentfrom that of SNe IIn (which typically continue to interact withCSM for years) but similar to that of all but a few SNe Ibn.
4.3. A Low Radioactive Mass
While the spectra become dominated by broad ejectafeatures from 15 days and the luminosity remains high forseveral weeks thereafter, it is notable that the spectra duringthis phase do not resemble those of normal SNe Ib/c: theidentifiable features are mostly in emission (not absorption) andthe “temperature” (a loose concept since the spectra no longerresemble a blackbody) remains high. Similar behavior is seenin SNe Ibn, and can be interpreted as the consequence of aninversion of the usual temperature geometry: ejecta are beingheated from the shock at the front (producing an emission-dominated spectrum), rather than from radioactive decay frombeneath (responsible for the more typical absorption-dominatedspectrum). The distinction from earlier phases is that the opticaldepth of the pre-shock material has dropped, and the photo-sphere has receded behind the shock (which may includeswept-up CSM material).This alone does not rule out the presence of radioactive
heating as well: out to 60 days SN 2021csp is still quiteluminous for an SN and it is easy to imagine a “typical” SN Ib/c explosion buried behind the optically thick shock photo-sphere—as is generally presupposed (although rarely demon-strated; Pastorello et al. 2015b) to exist in SNe Ibn. However,the late-time photometric limits provide strong constraints onradioactive heating.Ordinary (noninteracting, non-superluminous) stripped-
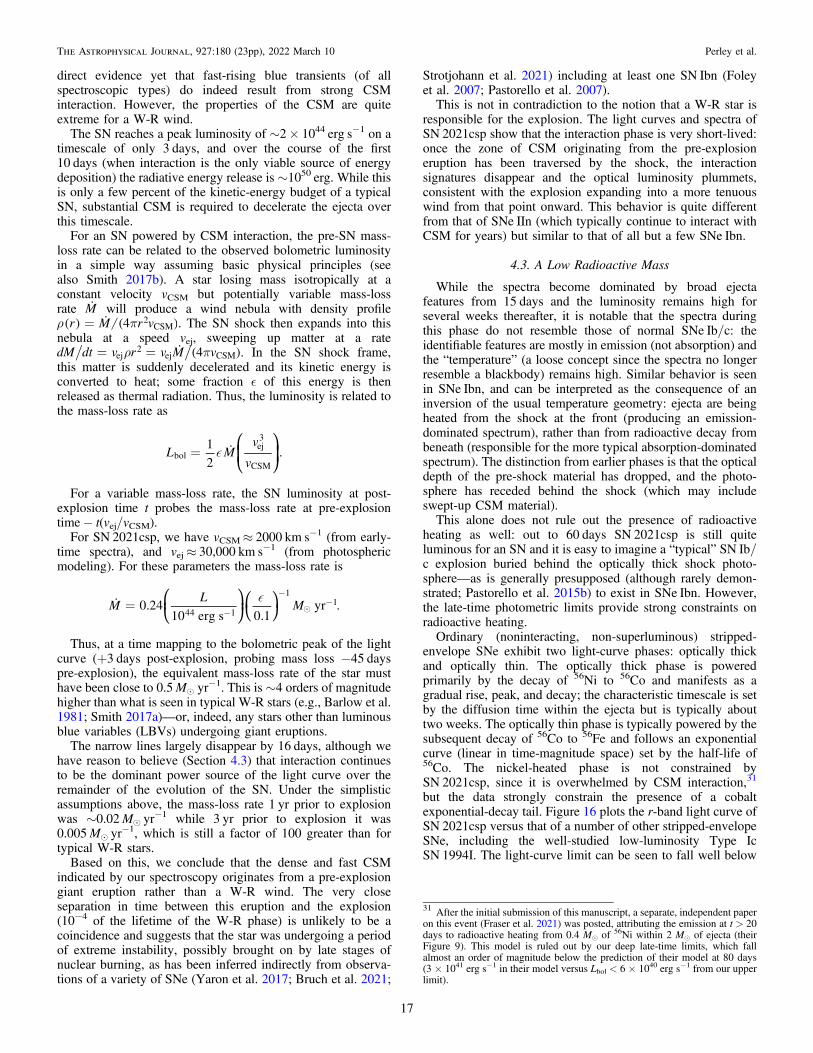
envelope SNe exhibit two light-curve phases: optically thickand optically thin. The optically thick phase is poweredprimarily by the decay of 56Ni to 56Co and manifests as agradual rise, peak, and decay; the characteristic timescale is setby the diffusion time within the ejecta but is typically abouttwo weeks. The optically thin phase is typically powered by thesubsequent decay of 56Co to 56Fe and follows an exponentialcurve (linear in time-magnitude space) set by the half-life of56Co. The nickel-heated phase is not constrained bySN 2021csp, since it is overwhelmed by CSM interaction,31
but the data strongly constrain the presence of a cobaltexponential-decay tail. Figure 16 plots the r-band light curve ofSN 2021csp versus that of a number of other stripped-envelopeSNe, including the well-studied low-luminosity Type IcSN 1994I. The light-curve limit can be seen to fall well below
31 After the initial submission of this manuscript, a separate, independent paperon this event (Fraser et al. 2021) was posted, attributing the emission at t > 20days to radioactive heating from 0.4 Me of 56Ni within 2 Me of ejecta (theirFigure 9). This model is ruled out by our deep late-time limits, which fallalmost an order of magnitude below the prediction of their model at 80 days(3 × 1041 erg s−1 in their model versus Lbol < 6 × 1040 erg s−1 from our upperlimit).
17
The Astrophysical Journal, 927:180 (23pp), 2022 March 10 Perley et al.
even SN 1994I at late times, demonstrating that SN 2021cspwas quite ineffective at producing cobalt (and therefore nickel).
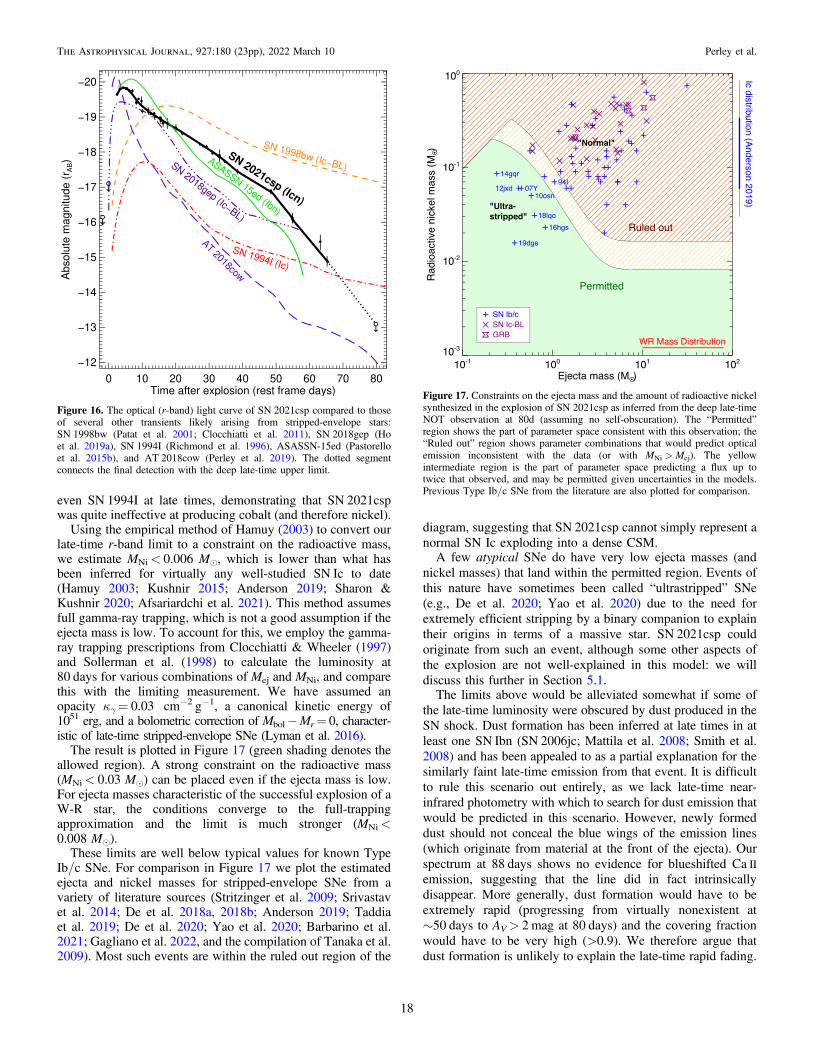
Using the empirical method of Hamuy (2003) to convert ourlate-time r-band limit to a constraint on the radioactive mass,we estimate MNi< 0.006 Me, which is lower than what hasbeen inferred for virtually any well-studied SN Ic to date(Hamuy 2003; Kushnir 2015; Anderson 2019; Sharon &Kushnir 2020; Afsariardchi et al. 2021). This method assumesfull gamma-ray trapping, which is not a good assumption if theejecta mass is low. To account for this, we employ the gamma-ray trapping prescriptions from Clocchiatti & Wheeler (1997)and Sollerman et al. (1998) to calculate the luminosity at80 days for various combinations of Mej and MNi, and comparethis with the limiting measurement. We have assumed anopacity κγ= 0.03 cm−2 g−1, a canonical kinetic energy of1051 erg, and a bolometric correction of Mbol−Mr= 0, character-istic of late-time stripped-envelope SNe (Lyman et al. 2016).
The result is plotted in Figure 17 (green shading denotes theallowed region). A strong constraint on the radioactive mass(MNi< 0.03 Me) can be placed even if the ejecta mass is low.For ejecta masses characteristic of the successful explosion of aW-R star, the conditions converge to the full-trappingapproximation and the limit is much stronger (MNi<0.008 Me).
These limits are well below typical values for known TypeIb/c SNe. For comparison in Figure 17 we plot the estimatedejecta and nickel masses for stripped-envelope SNe from avariety of literature sources (Stritzinger et al. 2009; Srivastavet al. 2014; De et al. 2018a, 2018b; Anderson 2019; Taddiaet al. 2019; De et al. 2020; Yao et al. 2020; Barbarino et al.2021; Gagliano et al. 2022, and the compilation of Tanaka et al.2009). Most such events are within the ruled out region of the
diagram, suggesting that SN 2021csp cannot simply represent anormal SN Ic exploding into a dense CSM.A few atypical SNe do have very low ejecta masses (and
nickel masses) that land within the permitted region. Events ofthis nature have sometimes been called “ultrastripped” SNe(e.g., De et al. 2020; Yao et al. 2020) due to the need forextremely efficient stripping by a binary companion to explaintheir origins in terms of a massive star. SN 2021csp couldoriginate from such an event, although some other aspects ofthe explosion are not well-explained in this model: we willdiscuss this further in Section 5.1.The limits above would be alleviated somewhat if some of
the late-time luminosity were obscured by dust produced in theSN shock. Dust formation has been inferred at late times in atleast one SN Ibn (SN 2006jc; Mattila et al. 2008; Smith et al.2008) and has been appealed to as a partial explanation for thesimilarly faint late-time emission from that event. It is difficultto rule this scenario out entirely, as we lack late-time near-infrared photometry with which to search for dust emission thatwould be predicted in this scenario. However, newly formeddust should not conceal the blue wings of the emission lines(which originate from material at the front of the ejecta). Ourspectrum at 88 days shows no evidence for blueshifted Ca IIemission, suggesting that the line did in fact intrinsicallydisappear. More generally, dust formation would have to beextremely rapid (progressing from virtually nonexistent at∼50 days to AV> 2 mag at 80 days) and the covering fractionwould have to be very high (>0.9). We therefore argue thatdust formation is unlikely to explain the late-time rapid fading.
Figure 16. The optical (r-band) light curve of SN 2021csp compared to thoseof several other transients likely arising from stripped-envelope stars:SN 1998bw (Patat et al. 2001; Clocchiatti et al. 2011), SN 2018gep (Hoet al. 2019a), SN 1994I (Richmond et al. 1996), ASASSN-15ed (Pastorelloet al. 2015b), and AT 2018cow (Perley et al. 2019). The dotted segmentconnects the final detection with the deep late-time upper limit.
Figure 17. Constraints on the ejecta mass and the amount of radioactive nickelsynthesized in the explosion of SN 2021csp as inferred from the deep late-timeNOT observation at 80d (assuming no self-obscuration). The “Permitted”region shows the part of parameter space consistent with this observation; the“Ruled out” region shows parameter combinations that would predict opticalemission inconsistent with the data (or with MNi > Mej). The yellowintermediate region is the part of parameter space predicting a flux up totwice that observed, and may be permitted given uncertainties in the models.Previous Type Ib/c SNe from the literature are also plotted for comparison.
18
The Astrophysical Journal, 927:180 (23pp), 2022 March 10 Perley et al.
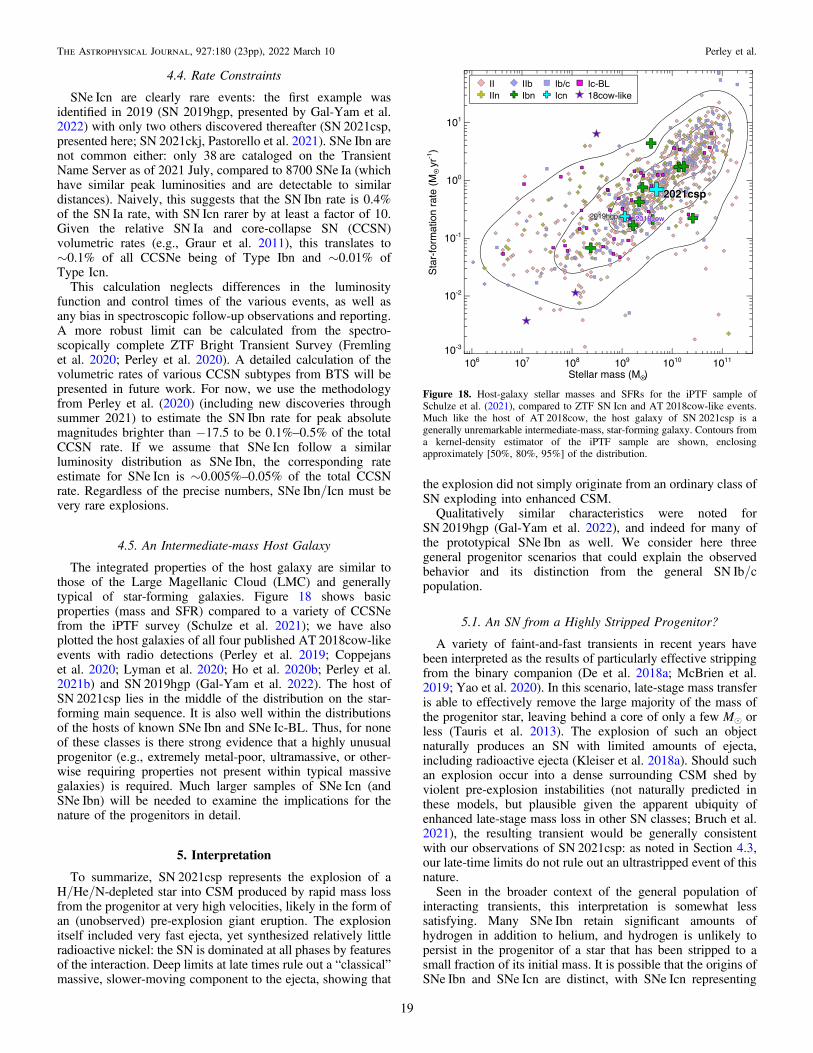
4.4. Rate Constraints
SNe Icn are clearly rare events: the first example wasidentified in 2019 (SN 2019hgp, presented by Gal-Yam et al.2022) with only two others discovered thereafter (SN 2021csp,presented here; SN 2021ckj, Pastorello et al. 2021). SNe Ibn arenot common either: only 38 are cataloged on the TransientName Server as of 2021 July, compared to 8700 SNe Ia (whichhave similar peak luminosities and are detectable to similardistances). Naively, this suggests that the SN Ibn rate is 0.4%of the SN Ia rate, with SN Icn rarer by at least a factor of 10.Given the relative SN Ia and core-collapse SN (CCSN)volumetric rates (e.g., Graur et al. 2011), this translates to∼0.1% of all CCSNe being of Type Ibn and ∼0.01% ofType Icn.
This calculation neglects differences in the luminosityfunction and control times of the various events, as well asany bias in spectroscopic follow-up observations and reporting.A more robust limit can be calculated from the spectro-scopically complete ZTF Bright Transient Survey (Fremlinget al. 2020; Perley et al. 2020). A detailed calculation of thevolumetric rates of various CCSN subtypes from BTS will bepresented in future work. For now, we use the methodologyfrom Perley et al. (2020) (including new discoveries throughsummer 2021) to estimate the SN Ibn rate for peak absolutemagnitudes brighter than −17.5 to be 0.1%–0.5% of the totalCCSN rate. If we assume that SNe Icn follow a similarluminosity distribution as SNe Ibn, the corresponding rateestimate for SNe Icn is ∼0.005%–0.05% of the total CCSNrate. Regardless of the precise numbers, SNe Ibn/Icn must bevery rare explosions.
4.5. An Intermediate-mass Host Galaxy
The integrated properties of the host galaxy are similar tothose of the Large Magellanic Cloud (LMC) and generallytypical of star-forming galaxies. Figure 18 shows basicproperties (mass and SFR) compared to a variety of CCSNefrom the iPTF survey (Schulze et al. 2021); we have alsoplotted the host galaxies of all four published AT 2018cow-likeevents with radio detections (Perley et al. 2019; Coppejanset al. 2020; Lyman et al. 2020; Ho et al. 2020b; Perley et al.2021b) and SN 2019hgp (Gal-Yam et al. 2022). The host ofSN 2021csp lies in the middle of the distribution on the star-forming main sequence. It is also well within the distributionsof the hosts of known SNe Ibn and SNe Ic-BL. Thus, for noneof these classes is there strong evidence that a highly unusualprogenitor (e.g., extremely metal-poor, ultramassive, or other-wise requiring properties not present within typical massivegalaxies) is required. Much larger samples of SNe Icn (andSNe Ibn) will be needed to examine the implications for thenature of the progenitors in detail.
5. Interpretation
To summarize, SN 2021csp represents the explosion of aH/He/N-depleted star into CSM produced by rapid mass lossfrom the progenitor at very high velocities, likely in the form ofan (unobserved) pre-explosion giant eruption. The explosionitself included very fast ejecta, yet synthesized relatively littleradioactive nickel: the SN is dominated at all phases by featuresof the interaction. Deep limits at late times rule out a “classical”massive, slower-moving component to the ejecta, showing that
the explosion did not simply originate from an ordinary class ofSN exploding into enhanced CSM.Qualitatively similar characteristics were noted for
SN 2019hgp (Gal-Yam et al. 2022), and indeed for many ofthe prototypical SNe Ibn as well. We consider here threegeneral progenitor scenarios that could explain the observedbehavior and its distinction from the general SN Ib/cpopulation.
5.1. An SN from a Highly Stripped Progenitor?
A variety of faint-and-fast transients in recent years havebeen interpreted as the results of particularly effective strippingfrom the binary companion (De et al. 2018a; McBrien et al.2019; Yao et al. 2020). In this scenario, late-stage mass transferis able to effectively remove the large majority of the mass ofthe progenitor star, leaving behind a core of only a few Me orless (Tauris et al. 2013). The explosion of such an objectnaturally produces an SN with limited amounts of ejecta,including radioactive ejecta (Kleiser et al. 2018a). Should suchan explosion occur into a dense surrounding CSM shed byviolent pre-explosion instabilities (not naturally predicted inthese models, but plausible given the apparent ubiquity ofenhanced late-stage mass loss in other SN classes; Bruch et al.2021), the resulting transient would be generally consistentwith our observations of SN 2021csp: as noted in Section 4.3,our late-time limits do not rule out an ultrastripped event of thisnature.Seen in the broader context of the general population of
interacting transients, this interpretation is somewhat lesssatisfying. Many SNe Ibn retain significant amounts ofhydrogen in addition to helium, and hydrogen is unlikely topersist in the progenitor of a star that has been stripped to asmall fraction of its initial mass. It is possible that the origins ofSNe Ibn and SNe Icn are distinct, with SNe Icn representing
Figure 18. Host-galaxy stellar masses and SFRs for the iPTF sample ofSchulze et al. (2021), compared to ZTF SN Icn and AT 2018cow-like events.Much like the host of AT 2018cow, the host galaxy of SN 2021csp is agenerally unremarkable intermediate-mass, star-forming galaxy. Contours froma kernel-density estimator of the iPTF sample are shown, enclosingapproximately [50%, 80%, 95%] of the distribution.
19
The Astrophysical Journal, 927:180 (23pp), 2022 March 10 Perley et al.
ultrastripped stars and SNe Ibn originating from a differentmechanism. However, if this is the case, the strong similaritiesbetween the Type Ibn and Type Icn classes (regardingtimescale, luminosity, CSM velocity, and late-time behavior)must be ascribed to coincidence. This, combined with thestrong similarities between the spectra of Type Ibn/Icn SNeand those of (high-mass) W-R stars, leads us to consider otherpotential interpretations.
5.2. A Pulsational Pair-instability Eruption?
Another potential explanation for the lack of a late-timeradioactive tail is a nonterminal eruption that expels only theouter envelope of the star, leaving the remainder intact. It isalready clear from the CSM properties that the star underwentan energetic eruption in the recent past. If the unstable state thatled to that prior eruption subsequently produced a second,higher-velocity eruption, the collision between the two shellscould produce a quite luminous transient. It is unlikely that anordinary, LBV-style eruption would be sufficient for this, but amore exotic progenitor might produce even more luminouseruptions. In particular, late-stage pulsational pair-instability(PPI) models have been shown to reasonably reproduce thelight curves of SNe Ibn (Woosley 2017; Karamehmetoglu et al.2021).
While the PPI eruption model cannot be strictly ruled out byany of our observations, we nevertheless disfavor this modelfor two reasons. First, the characteristic ejecta velocitiesassociated with pair-instability eruptions are quite low:hundreds to a few thousand kilometers per second, much lessthan what is inferred from the early photospheric expansionrate of SN 2021csp. Second, pair-instability SNe are generallyexpected to occur primarily or exclusively in extremely metal-poor environments (Langer et al. 2007; Leung et al. 2019) butthe host galaxies of known SNe Ibn/Icn do not appear to bestrongly atypical. However, this depends on the mass-lossprescription and there may be exceptions (Woosley 2017).
5.3. Jet Launching from a Failed Explosion of a W-R Star?
The third possibility is that the progenitor of SN 2021csp(and other SNe Ibn/Icn) really is a massive W-R star under-going core collapse, but the SN explosion was extraordina-rily weak.
In general, one would expect more-massive progenitors toproduce explosions that are both more luminous (owing to thelarger cores) and more slowly evolving (owing to the more-massive ejecta). There is some evidence that this is the caseamong normal SNe II with identified progenitors (Fraser et al.2011). However, this trend is unlikely to extend to the highestmasses: SN simulations suggest that above a certain mass theshock should stall, causing most or all of the star to collapse toform a black hole (O’Connor & Ott 2011; Woosley &Heger 2015). The lowest-luminosity SNe IIP have sometimesbeen attributed to marginally successful explosions sufferingfrom substantial fallback (Zampieri et al. 2003; Moriya et al.2010), and it is conceivable that SNe Ibn/Icn representequivalent members of the stripped-envelope population(Kleiser et al. 2018b).
The ejecta velocities inferred from the early-time modelingof SN 2021csp are extremely high, quite unlike what would beexpected from a marginally successful explosion. Theconcentration of kinetic energy in a small fraction of the
progenitor mass could be produced if the explosion is driven bya jet. There is ample precedent to expect jet formation fromW-R stars collapsing to form black holes: the original“collapsar” model for GRBs in which a rapidly rotatingcompact object accelerates ultrarelativistic jets is the mostfamous (Woosley 1993), but more modest jet energies andvelocities can be produced under less-extreme conditions(MacFadyen et al. 2001; Piran et al. 2019). The interactionbetween a low-energy jet (or jet cocoon) and a dense shell ofinner CSM could lead to a fast, but short-lived, interaction-driven transient of the type seen in SN 2021csp even as thebulk of the star collapses silently to a black hole.Spectropolarimetry (Section 2.3.4) does not suggest a highly
asymmetric photosphere, representing a potential problem forthis model. Similarly, highly luminous radio emission (anotherpossible jet-interaction signature) is ruled out by our VLAupper limits. However, the jet in this scenario is generallyweaker and slower than in known jet-driven explosions, withthe ejecta concealed behind the dense shocked CSM. Theremay also be other mechanisms (besides a fallback jet) by whicha massive star can produce an incomplete high-velocityexplosion.It should be emphasized that in this model (or in any model),
SNe Ibn/Icn cannot represent the typical deaths of W-R stars.Given the abundance of W-R stars in the Local Group (Hainichet al. 2014; Rosslowe & Crowther 2015) and a lifetime of106 yr in this phase (Smith 2014), the predicted W-R death rateis 3%–20% of the CCSN rate (Maoz & Badenes 2010), at leastan order of magnitude in excess of what we inferred inSection 4.4. This should not be surprising: the extremeproperties inferred from the early-phase observations ofSN 2021csp and similar events require particularly intensepre-explosion mass loss that may in practice be quite rare. Inthis scenario, the collapse of a high-mass star would generallyproduce only a relatively weak transient—consistent with thelack of good candidates for high-mass progenitors among thegeneral SN Ib/c population—but in rare instances (perhaps 1%of the time) the explosion encounters dense surrounding CSM,leading to a fast-evolving and luminous transient.It is interesting to note that the one class of successful SNe
for which modeling does suggest a significant contributionfrom high-mass progenitors (SNe Ic-BL; Taddia et al. 2019)has also been connected to jets and engines. The primarydifference is that the much more powerful jets in those eventsproduce more luminous transients and SN explosions and thusdo not require dense CSM to be visible. However, there isincreasing evidence that some SNe Ic-BL do interact withdense surrounding material as well (Corsi et al. 2014;Whitesides et al. 2017; Chen et al. 2018; Ho et al. 2020a),raising the possibility of a continuum of W-R collapsetransients, with the vast range in observable propertiesexplained by variations in the jet power, pre-explosion mass-loss history, and degree of progenitor stripping.If this is the correct model, it would shed light on the
even rarer, even faster-evolving transient population ofAT 2018cow-like transients, which show a number of simila-rities to SNe Ibn/Icn (Fox & Smith 2019). AT 2018cow and itsanalogs have also been hypothesized (Margutti et al. 2019;Perley et al. 2019) to originate from “failed” collapses based onsome of the arguments presented above: the luminous earlytransient implies a very fast-moving early component, yet late-time observations provide deep limits on nickel production
20
The Astrophysical Journal, 927:180 (23pp), 2022 March 10 Perley et al.

from the associated SN, demonstrating that they cannot simplyrepresent normal (or even rare) SNe exploding into anunusually dense medium. AT 2018cow-like transients showmajor differences from the SN Ibn/Icn population, including acomplete lack of early interaction signatures and a radio/X-ray“afterglow” that is more luminous than the limits on SNe Ibn/Icn by many orders of magnitude (Ho et al. 2019b, 2020b).This difference may be explicable in terms of the relativepower and velocity of the jet and the precise geometry of theCSM, or it may be more fundamental.
6. Conclusions
The Type Icn SN 2021csp is one of the most extreme knownexamples of an interaction-powered fast and luminous transientand also among the best observed. Its properties, alongsidethose of SN 2019hgp (the first SN Icn) and the generalpopulation of SNe Ibn, provide a challenge to the basic pictureof interaction-driven SNe as resulting from the explosions ofotherwise ordinary SNe into dense CSM. The expansion speedsinferred from modeling the rising light curve are much higherthan seen in ordinary stripped-envelope SNe, while the late-time flux is too faint for an explosion that produces significantejecta and/or leads to significant radioactive nucleosynthesis(absent rapid dust formation).
The properties of SN 2021csp and other interacting SNe canbe explained by a variety of potential models on an individualbasis: a moderately massive star highly stripped by a binarycompanion, or a nonterminal late-stage pair-instability eruptionfrom an extremely massive star. However, we argue that thecollective properties of this class are best explained under ascenario in which most SNe Ibn/Icn are produced by partiallysuccessful explosions following the collapse of massive W-Rstars. Specifically, we propose a model in which the directcollapse of a W-R star to a black hole launches a subrelativisticjet that interacts with dense CSM shed by the progenitor shortlybefore explosion. Given that other stripped-envelope SNe nowappear to originate from stars with masses too low to haveclassical W-R progenitors, this raises the possibility thatSNe Ibn/Icn, and engine-driven explosions like SNe Ic-BLand long-duration gamma-ray bursts, may actually representthe only currently observable manifestation of the collapse ofthe most massive stars.
Further studies will be necessary to robustly establishwhether this scenario is indeed the correct one. SN 2021csprepresents one of only two published SNe Icn, fewer than fivespectroscopically confirmed AT 2018cow-like events areknown, and even the SN Ibn population is only crudelymapped out (with sparingly few pre-maximum-brightnessdetections or deep late-time limits). Fortunately, with ZTFand a number of other wide-area surveys fully operating andwith increasing community interest in the fastest transients, thesample is destined to grow (albeit slowly) in the coming years.
The Legacy Survey of Space and Time (LSST; Ivezić et al.2019) with the Rubin Observatory will also play a vital role inthis effort. While the slow cadence of the primary survey ispoorly suited to the discovery of fast-evolving transients, thehost-galaxy photometric redshifts will make it much morestraightforward to distinguish luminous phenomena in high-cadence shallower surveys, providing important synergy withthe fast wide-field surveys of the future. Meanwhile, repeateddeep LSST imaging of nearby galaxies may be able to testwhether W-R stars disappear without a trace, better seek and
identify pre-explosion progenitor eruptions in future SNe Ibn/Icn (and other SNe), and search for low-luminosity transientsassociated with black hole fallback even in the absence ofstrong CSM interaction.
We thank Ori Fox, D. Alexander Kann, and the anonymousreferee for helpful comments and suggestions. Based onobservations obtained with the Samuel Oschin 48 inchtelescope and the 60 inch telescope at the Palomar Observatoryas part of the Zwicky Transient Facility project. ZTF issupported by the National Science Foundation (NSF) undergrant AST-2034437 and a collaboration including Caltech,IPAC, the Weizmann Institute for Science, the Oskar KleinCenter (OKC) at Stockholm University, the University ofMaryland, Deutsches Elektronen-Synchrotron and HumboldtUniversity, the TANGO Consortium of Taiwan, the Universityof Wisconsin at Milwaukee, Trinity College Dublin, LawrenceLivermore National Laboratories, and IN2P3, France. Opera-tions are conducted by COO, IPAC, and UW. The SEDMachine is based upon work supported by the NSF under grant1106171. The ZTF forced-photometry service was funded byHeising-Simons Foundation grant No. 12540303 (PI: M.Graham). The Liverpool Telescope is operated on the islandof La Palma by Liverpool John Moores University in theSpanish Observatorio del Roque de los Muchachos of theInstituto de Astrofisica de Canarias with financial support fromthe UK Science and Technology Facilities Council. Partlybased on observations made with the Nordic Optical Telescope,owned in collaboration by the University of Turku and AarhusUniversity, and operated jointly by Aarhus University, theUniversity of Turku, and the University of Oslo (respectivelyrepresenting Denmark, Finland, and Norway), the University ofIceland, and Stockholm University at the Observatorio delRoque de los Muchachos, La Palma, Spain, of the Instituto deAstrofisica de Canarias. These data were obtained withALFOSC, which is provided by the Instituto de Astrofisicade Andalucia (IAA) under a joint agreement with theUniversity of Copenhagen and NOT. Based in part onobservations collected at the European Organisation forAstronomical Research in the Southern Hemisphere underESO programs 106.21U2 and 106.216C. Some of the datapresented herein were obtained at the W. M. Keck Observatory,which is operated as a scientific partnership among theCalifornia Institute of Technology, the University of California,and NASA; the observatory was made possible by the generousfinancial support of the W. M. Keck Foundation. A majorupgrade of the Kast spectrograph on the Shane 3 m telescope atLick Observatory was made possible through generous giftsfrom the Heising-Simons Foundation as well as William andMarina Kast. Research at Lick Observatory is partiallysupported by a generous gift from Google. We thank the staffsof the various observatories where data were obtained for theirassistance.J.S., S.S., and E.K. acknowledge support from the G.R.E.A.
T. research environment funded by Vetenskapsrådet, theSwedish Research Council, under project #2016-06012. TheOKC’s participation in ZTF was made possible by the K.A.W.foundation. E.K. also acknowledges support from The Wenner-Gren Foundation. M.M.K. acknowledges generous supportfrom the David and Lucille Packard Foundation. P.R. hasreceived support from the from the European Research Council(ERC) under the European Union’s Horizon 2020 research and
21
The Astrophysical Journal, 927:180 (23pp), 2022 March 10 Perley et al.
innovation program (grant agreement 759194—USNAC). Theresearch of Y.Y. is supported through a Benoziyo PrizePostdoctoral Fellowship and a Bengier-Winslow-RobertsonFellowship. T.-W.C. acknowledges EU funding under MarieSkłodowska-Curie grant H2020-MSCA-IF-2018-842471. R.L.acknowledges support from a Marie Skłodowska-Curie Indi-vidual Fellowship within the Horizon 2020 European Union(EU) Framework Programme for Research and Innovation(H2020-MSCA-IF-2017-794467). The GROWTH Marshal(Kasliwal et al. 2019) development was supported by theGROWTH project funded by the NSF under grant 1545949.A.V.F.ʼs group is supported by the Christopher R. RedlichFund, the Miller Institute for Basic Research in Science (whereA.V.F. is a Miller Senior Fellow), and many individual donors.A.G.Y.s research is supported by the EU via ERC grant No.725161, the ISF GW excellence center, an IMOS spaceinfrastructure grant and BSF/Transformative and GIF grants,as well as The Benoziyo Endowment Fund for the Advance-ment of Science, the Deloro Institute for Advanced Research inSpace and Optics, The Veronika A. Rabl Physics DiscretionaryFund, Minerva, Yeda-Sela and the Schwartz/Reisman Colla-borative Science Program; A.G.Y. is the incumbent of the TheArlyn Imberman Professorial Chair.
IRAF is distributed by the National Optical AstronomyObservatories, which are operated by the Association ofUniversities for Research in Astronomy, Inc., under coopera-tive agreement with the NSF.
Facilities: HST(STIS, COS), Swift(XRT, UVOT),PO:1.2m(ZTF), PO:1.5m(SEDM), Hale(DBSP), LT(IO:O,SPRAT), VLA, Gemini:Gillett, NOT, VLT:Antu (FORS2),Shane (Kast), Keck:I (LRIS).
Software: IRAF (Tody 1986), HEASoft (Blackburn 1995),Pypeit (Prochaska et al. 2020), LPipe (Perley 2019), DBSP-DRP (Roberson 2021), PyNOT (Krogager 2021), Galfit (Penget al. 2002, 2010).
ORCID iDs
Daniel A. Perley https://orcid.org/0000-0001-8472-1996Jesper Sollerman https://orcid.org/0000-0003-1546-6615Steve Schulze https://orcid.org/0000-0001-6797-1889Yuhan Yao https://orcid.org/0000-0001-6747-8509Christoffer Fremling https://orcid.org/0000-0002-4223-103XAvishay Gal-Yam https://orcid.org/0000-0002-3653-5598Anna Y. Q. Ho https://orcid.org/0000-0002-9017-3567Yi Yang https://orcid.org/0000-0002-6535-8500Erik C. Kool https://orcid.org/0000-0002-7252-3877Ido Irani https://orcid.org/0000-0002-7996-8780Lin Yan https://orcid.org/0000-0003-1710-9339Igor Andreoni https://orcid.org/0000-0003-3768-7515Dietrich Baade https://orcid.org/0000-0003-1637-9679Eric C. Bellm https://orcid.org/0000-0001-8018-5348Thomas G. Brink https://orcid.org/0000-0001-5955-2502Ting-Wan Chen https://orcid.org/0000-0002-1066-6098Aleksandar Cikota https://orcid.org/0000-0001-7101-9831Michael W. Coughlin https://orcid.org/0000-0002-8262-2924Richard Dekany https://orcid.org/0000-0002-5884-7867Dmitry A. Duev https://orcid.org/0000-0001-5060-8733Alexei V. Filippenko https://orcid.org/0000-0003-3460-0103Peter Hoeflich https://orcid.org/0000-0002-4338-6586
Mansi M. Kasliwal https://orcid.org/0000-0002-5619-4938S. R. Kulkarni https://orcid.org/0000-0001-5390-8563Ragnhild Lunnan https://orcid.org/0000-0001-9454-4639Frank J. Masci https://orcid.org/0000-0002-8532-9395Justyn R. Maund https://orcid.org/0000-0003-0733-7215Michael S. Medford https://orcid.org/0000-0002-7226-0659Reed Riddle https://orcid.org/0000-0002-0387-370XPhilippe Rosnet https://orcid.org/0000-0002-6099-7565David L. Shupe https://orcid.org/0000-0003-4401-0430Nora Linn Strotjohann https://orcid.org/0000-0002-4667-6730Anastasios Tzanidakis https://orcid.org/0000-0003-0484-3331WeiKang Zheng https://orcid.org/0000-0002-2636-6508
References
Afsariardchi, N., Drout, M. R., Khatami, D. K., et al. 2021, ApJ, 918, 89Ahn, C. P., Alexandroff, R., Allende Prieto, C., et al. 2012, ApJS, 203, 21Anderson, J. P. 2019, A&A, 628, A7Appenzeller, I., & Rupprecht, G. 1992, Msngr, 67, 18Arcavi, I., Wolf, W. M., Howell, D. A., et al. 2016, ApJ, 819, 35Asplund, M., Grevesse, N., Sauval, A. J., & Scott, P. 2009, ARA&A, 47, 481Barbarino, C., Sollerman, J., Taddia, F., et al. 2021, A&A, 651, A81Barlow, M. J., Smith, L. J., & Willis, A. J. 1981, MNRAS, 196, 101Barnsley, R. M., Smith, R. J., & Steele, I. A. 2012, AN, 333, 101Bellm, E. C., Kulkarni, S. R., Barlow, T., et al. 2019a, PASP, 131, 068003Bellm, E. C., Kulkarni, S. R., Graham, M. J., et al. 2019b, PASP, 131, 018002Blackburn, J. K. 1995, in ASP Conf. Ser. 77, Astronomical Data Analysis
Software and Systems IV, ed. R. A. Shaw, H. E. Payne, & J. J. E. Hayes(San Francisco, CA: ASP), 367
Blagorodnova, N., Neill, J. D., Walters, R., et al. 2018, PASP, 130, 035003Blanchard, P. K., Berger, E., Nicholl, M., & Villar, V. A. 2020, ApJ, 897, 114Breeveld, A. A., Landsman, W., Holland, S. T., et al. 2011, in AIP Conf. Ser.
1358, Gamma Ray Bursts 2010, ed. J. E. McEnery, J. L. Racusin, &N. Gehrels (San Francisco, CA: ASP), 373
Bruch, R. J., Gal-Yam, A., Schulze, S., et al. 2021, ApJ, 912, 46Burrows, D. N., Hill, J. E., Nousek, J. A., et al. 2005, SSRv, 120, 165Calzetti, D., Armus, L., Bohlin, R. C., et al. 2000, ApJ, 533, 682Cao, Y., Kasliwal, M. M., Arcavi, I., et al. 2013, ApJL, 775, L7Cenko, S. B., Fox, D. B., Moon, D.-S., et al. 2006, PASP, 118, 1396Chabrier, G. 2003, PASP, 115, 763Chen, T.-W., Inserra, C., Fraser, M., et al. 2018, ApJL, 867, L31Chugai, N. N. 2009, MNRAS, 400, 866Cikota, A., Patat, F., Cikota, S., & Faran, T. 2017, MNRAS, 464, 4146Clocchiatti, A., Suntzeff, N. B., Covarrubias, R., & Candia, P. 2011, AJ,
141, 163Clocchiatti, A., & Wheeler, J. C. 1997, ApJ, 491, 375Coppejans, D. L., Margutti, R., Terreran, G., et al. 2020, ApJL, 895, L23Corsi, A., Ofek, E. O., Gal-Yam, A., et al. 2014, ApJ, 782, 42Crowther, P. A. 2007, ARA&A, 45, 177De, K., Kasliwal, M. M., Cantwell, T., et al. 2018b, ApJ, 866, 72De, K., Kasliwal, M. M., Ofek, E. O., et al. 2018a, Sci, 362, 201De, K., Kasliwal, M. M., Tzanidakis, A., et al. 2020, ApJ, 905, 58Dekany, R., Smith, R. M., Riddle, R., et al. 2020, PASP, 132, 038001Dessart, L., Hillier, D. J., Li, C., & Woosley, S. 2012, MNRAS, 424, 2139Drout, M. R., Chornock, R., Soderberg, A. M., et al. 2014, ApJ, 794, 23Duev, D. A., Mahabal, A., Masci, F. J., et al. 2019, MNRAS, 489, 3582Eldridge, J. J., Fraser, M., Smartt, S. J., Maund, J. R., & Crockett, R. M. 2013,
MNRAS, 436, 774Eldridge, J. J., & Maund, J. R. 2016, MNRAS, 461, L117Evans, P. A., Beardmore, A. P., Page, K. L., et al. 2007, A&A, 469, 379Evans, P. A., Beardmore, A. P., Page, K. L., et al. 2009, MNRAS, 397, 1177Filippenko, A. V. 1982, PASP, 94, 715Filippenko, A. V. 1997, ARA&A, 35, 309Fitzpatrick, E. L. 1999, PASP, 111, 63Foley, R. J., Smith, N., Ganeshalingam, M., et al. 2007, ApJL, 657, L105Fox, O. D., & Smith, N. 2019, MNRAS, 488, 3772Fraser, M., Ergon, M., Eldridge, J. J., et al. 2011, MNRAS, 417, 1417Fraser, M., Stritzinger, M. D., Brennan, S. J., et al. 2021, arXiv:2108.07278Fremling, C., Dugas, A., & Sharma, Y. 2019, TNSCR, 188, 1Fremling, C., Miller, A. A., Sharma, Y., et al. 2020, ApJ, 895, 32Fremling, C., Sollerman, J., Taddia, F., et al. 2016, A&A, 593, A68
22
The Astrophysical Journal, 927:180 (23pp), 2022 March 10 Perley et al.
Gagliano, A., Izzo, L., Kilpatrick, C. D., et al. 2022, ApJ, 924, 55Gal-Yam, A. 2017, in Observational and Physical Classification of
Supernovae, ed. A. W. Alsabti & P. Murdin (Cham: Springer), 195Gal-Yam, A., Bruch, R., Schulze, S., et al. 2022, Natur, 601, 201Gal-Yam, A., & Leonard, D. C. 2009, Natur, 458, 865Gal-Yam, A., Leonard, D. C., Fox, D. B., et al. 2007, ApJ, 656, 372Gal-Yam, A., Mazzali, P., Ofek, E. O., et al. 2009, Natur, 462, 624Gal-Yam, A., Yaron, O., Pastorello, A., et al. 2021, TNSAN, 76, 1Gamow, G. 1943, ApJ, 98, 500Gehrels, N., Chincarini, G., Giommi, P., et al. 2004, ApJ, 611, 1005Graham, M. J., Kulkarni, S. R., Bellm, E. C., et al. 2019, PASP, 131, 078001Graur, O., Poznanski, D., Maoz, D., et al. 2011, MNRAS, 417, 916Green, J. C., Froning, C. S., Osterman, S., et al. 2012, ApJ, 744, 60Hainich, R., Rühling, U., Todt, H., et al. 2014, A&A, 565, A27Hamuy, M. 2003, ApJ, 582, 905HI4PI Collaboration, Ben Bekhti, N., Flöer, L., et al. 2016, A&A, 594, A116Ho, A. Y. Q., Goldstein, D. A., Schulze, S., et al. 2019a, ApJ, 887, 169Ho, A. Y. Q., Kulkarni, S. R., Perley, D. A., et al. 2020a, ApJ, 902, 86Ho, A. Y. Q., Margalit, B., Bremer, M., et al. 2021b, arXiv:2110.05490Ho, A. Y. Q., Perley, D. A., Gal-Yam, A., et al. 2021a, arXiv:2105.08811Ho, A. Y. Q., Perley, D. A., Kulkarni, S. R., et al. 2020b, ApJ, 895, 49Ho, A. Y. Q., Phinney, E. S., Ravi, V., et al. 2019b, ApJ, 871, 73Höflich, P. 1991, A&A, 246, 481Högbom, J. A. 1974, A&AS, 15, 417Hook, I. M., Jørgensen, I., Allington-Smith, J. R., et al. 2004, PASP, 116, 425Horesh, A., Sfaradi, I., Ergon, M., et al. 2020, ApJ, 903, 132Inserra, C. 2019, NatAs, 3, 697Jerkstrand, A., Smartt, S. J., Inserra, C., et al. 2017, ApJ, 835, 13Ivezić, Ž., Kahn, S. M., Tyson, J. A., et al. 2019, ApJ, 873, 111Karamehmetoglu, E., Fransson, C., Sollerman, J., et al. 2021, A&A, 649, A163Kasliwal, M. M., Cannella, C., Bagdasaryan, A., et al. 2019, PASP, 131,
038003Kilpatrick, C. D., Drout, M. R., Auchettl, K., et al. 2021, MNRAS, 504, 2073Kilpatrick, C. D., Takaro, T., Foley, R. J., et al. 2018, MNRAS, 480, 2072Kirshner, R., Blondin, S., Chevalier, R., et al. 2010, ATel, 2513, 1Kleiser, I., Fuller, J., & Kasen, D. 2018a, MNRAS, 481, L141Kleiser, I. K. W., Kasen, D., & Duffell, P. C. 2018b, MNRAS, 475, 3152Krogager, J.-K. 2021, PyNOT, GitHub, https://github.com/jkrogager/PyNOTKulkarni, S. R., Frail, D. A., Wieringa, M. H., et al. 1998, Natur, 395, 663Kushnir, D. 2015, arXiv:1506.02655Lang, D. 2014, AJ, 147, 108Langer, N., Norman, C. A., de Koter, A., et al. 2007, A&A, 475, L19Lawrence, A., Warren, S. J., Almaini, O., et al. 2007, MNRAS, 379, 1599Leja, J., Johnson, B. D., Conroy, C., van Dokkum, P. G., & Byler, N. 2017,
ApJ, 837, 170Leung, S.-C., Nomoto, K., & Blinnikov, S. 2019, ApJ, 887, 72Li, C., Hillier, D. J., & Dessart, L. 2012, MNRAS, 426, 1671Lyman, J. D., Bersier, D., James, P. A., et al. 2016, MNRAS, 457, 328Lyman, J. D., Galbany, L., Sánchez, S. F., et al. 2020, MNRAS, 495, 992MacFadyen, A. I., Woosley, S. E., & Heger, A. 2001, ApJ, 550, 410Mahabal, A., Rebbapragada, U., Walters, R., et al. 2019, PASP, 131, 038002Mainzer, A., Bauer, J., Cutri, R. M., et al. 2014, ApJ, 792, 30Maoz, D., & Badenes, C. 2010, MNRAS, 407, 1314Margutti, R., Metzger, B. D., Chornock, R., et al. 2019, ApJ, 872, 18Marino, R. A., Rosales-Ortega, F. F., Sánchez, S. F., et al. 2013, A&A,
559, A114Masci, F. J., Laher, R. R., Rusholme, B., et al. 2019, PASP, 131, 018003Mattila, S., Meikle, W. P. S., Lundqvist, P., et al. 2008, MNRAS, 389, 141Mauerhan, J. C., Smith, N., Filippenko, A. V., et al. 2013, MNRAS, 430, 1801Maund, J. R. 2018, MNRAS, 476, 2629Maund, J. R., Wheeler, J. C., Patat, F., et al. 2007, MNRAS, 381, 201McBrien, O. R., Smartt, S. J., Chen, T.-W., et al. 2019, ApJL, 885, L23McMullin, J. P., Waters, B., Schiebel, D., Young, W., & Golap, K. 2007, in
ASP Conf. Ser. 376, Astronomical Data Analysis Software and SystemsXVI, ed. R. A. Shaw, F. Hill, & D. J. Bell (San Francisco, CA: ASP), 127
Meisner, A. M., Lang, D., & Schlegel, D. J. 2017, AJ, 153, 38Miller, J. S., & Stone, R. P. S. 1993, Lick Observatory Technical Report 66,
Univ. California, https://mthamilton.ucolick.org/techdocs/instruments/kast/Tech%20Report%2066%20KAST%20Miller%20Stone.pdf
Modjaz, M., Li, W., Butler, N., et al. 2009, ApJ, 702, 226Moriya, T., Tominaga, N., Tanaka, M., et al. 2010, ApJ, 719, 1445Narayana Bhat, P., Meegan, C. A., von Kienlin, A., et al. 2016, ApJS, 223, 28Nicholl, M., Smartt, S. J., Jerkstrand, A., et al. 2015, MNRAS, 452, 3869O’Connor, E., & Ott, C. D. 2011, ApJ, 730, 70Oke, J. B., Cohen, J. G., Carr, M., et al. 1995, PASP, 107, 375Oke, J. B., & Gunn, J. E. 1982, PASP, 94, 586
Oke, J. B., & Gunn, J. E. 1983, ApJ, 266, 713Pastorello, A., Benetti, S., Brown, P. J., et al. 2015a, MNRAS, 449, 1921Pastorello, A., Mattila, S., Zampieri, L., et al. 2008, MNRAS, 389, 113Pastorello, A., Prieto, J. L., Elias-Rosa, N., et al. 2015b, MNRAS, 453, 3649Pastorello, A., Smartt, S. J., Mattila, S., et al. 2007, Natur, 447, 829Pastorello, A., Vogl, C., Taubenberger, S., et al. 2021, TNSAN, 71, 1Patat, F., Cappellaro, E., Danziger, J., et al. 2001, ApJ, 555, 900Patat, F., & Romaniello, M. 2006, PASP, 118, 146Patterson, M. T., Bellm, E. C., Rusholme, B., et al. 2019, PASP, 131, 018001Peng, C. Y., Ho, L. C., Impey, C. D., & Rix, H.-W. 2002, AJ, 124, 266Peng, C. Y., Ho, L. C., Impey, C. D., & Rix, H.-W. 2010, AJ, 139, 2097Perley, D., Yao, Y., Schulze, S., et al. 2021a, TNSAN, 62, 1Perley, D. A. 2019, PASP, 131, 084503Perley, D. A., Fremling, C., Sollerman, J., et al. 2020, ApJ, 904, 35Perley, D. A., Ho, A. Y. Q., Yao, Y., et al. 2021b, MNRAS, 508, 5138Perley, D. A., Mazzali, P. A., Yan, L., et al. 2019, MNRAS, 484, 1031Piascik, A. S., Steele, I. A., Bates, S. D., et al. 2014, Proc. SPIE, 9147, 91478HPiran, T., Nakar, E., Mazzali, P., & Pian, E. 2019, ApJL, 871, L25Pritchard, T. A., Bensch, K., Modjaz, M., et al. 2021, ApJ, 915, 121Prochaska, J., Hennawi, J., Westfall, K., et al. 2020, JOSS, 5, 2308Pursiainen, M., Childress, M., Smith, M., et al. 2018, MNRAS, 481, 894Rest, A., Garnavich, P. M., Khatami, D., et al. 2018, NatAs, 2, 307Richmond, M. W., van Dyk, S. D., Ho, W., et al. 1996, AJ, 111, 327Roberson, M. 2021, DBSP-DRP, GitHub, https://github.com/finagle29/
dbsp_drpRoming, P. W. A., Kennedy, T. E., Mason, K. O., et al. 2005, SSRv, 120, 95Rosslowe, C. K., & Crowther, P. A. 2015, MNRAS, 447, 2322Sana, H., de Mink, S. E., de Koter, A., et al. 2012, Sci, 337, 444Sander, A. A. C., Hamann, W. R., Todt, H., et al. 2019, A&A, 621, A92Schlafly, E. F., & Finkbeiner, D. P. 2011, ApJ, 737, 103Schulze, S., Yaron, O., Sollerman, J., et al. 2021, ApJS, 255, 29Serkowski, K., Mathewson, D. S., & Ford, V. L. 1975, ApJ, 196, 261Sharon, A., & Kushnir, D. 2020, MNRAS, 496, 4517Silverman, J. M., Foley, R. J., Filippenko, A. V., et al. 2012, MNRAS,
425, 1789Simmons, J. F. L., & Stewart, B. G. 1985, A&A, 142, 100Smartt, S. J. 2009, ARA&A, 47, 63Smartt, S. J. 2015, PASA, 32, e016Smith, N. 2014, ARA&A, 52, 487Smith, N. 2017a, RSPTA, 375, 20160268Smith, N. 2017b, in Interacting Supernovae: Types IIn and Ibn, ed.
A. W. Alsabti & P. Murdin (Berlin: Springer), 403Smith, N., Foley, R. J., & Filippenko, A. V. 2008, ApJ, 680, 568Smith, N., Li, W., Filippenko, A. V., & Chornock, R. 2011, MNRAS,
412, 1522Smith, N., Mauerhan, J. C., & Prieto, J. L. 2014, MNRAS, 438, 1191Smith, N., Silverman, J. M., Chornock, R., et al. 2009, ApJ, 695, 1334Sollerman, J., Cumming, R. J., & Lundqvist, P. 1998, ApJ, 493, 933Srivastav, S., Anupama, G. C., & Sahu, D. K. 2014, MNRAS, 445, 1932Steele, I. A., Smith, R. J., Rees, P. C., et al. 2004, Proc. SPIE, 5489, 679Stritzinger, M., Mazzali, P., Phillips, M. M., et al. 2009, ApJ, 696, 713Strotjohann, N. L., Ofek, E. O., Gal-Yam, A., et al. 2021, ApJ, 907, 99Sukhbold, T., & Woosley, S. E. 2014, ApJ, 783, 10Taddia, F., Sollerman, J., Fremling, C., et al. 2019, A&A, 621, A71Tanaka, M., Tominaga, N., Morokuma, T., et al. 2016, ApJ, 819, 5Tanaka, M., Tominaga, N., Nomoto, K., et al. 2009, ApJ, 692, 1131Tauris, T. M., Langer, N., Moriya, T. J., et al. 2013, ApJL, 778, L23Tody, D. 1986, Proc. SPIE, 627, 733Van Dyk, S. D., Zheng, W., Brink, T. G., et al. 2018, ApJ, 860, 90Vink, J. S., de Koter, A., & Lamers, H. J. G. L. M. 2001, A&A, 369, 574Wang, L., Wheeler, J. C., & Höflich, P. 1997, ApJL, 476, L27Whitesides, L., Lunnan, R., Kasliwal, M. M., et al. 2017, ApJ, 851, 107Wieringa, M. H., Kulkarni, S. R., & Frail, D. A. 1999, A&AS, 138, 467Woodgate, B. E., Kimble, R. A., Bowers, C. W., et al. 1998, PASP, 110, 1183Woosley, S. E. 1993, ApJ, 405, 273Woosley, S. E. 2017, ApJ, 836, 244Woosley, S. E., & Heger, A. 2015, in The Deaths of Very Massive Stars, ed.
J. S. Vink, Vol. 412 (Berlin: Springer), 199Wright, A. H., Robotham, A. S. G., Bourne, N., et al. 2016, MNRAS, 460, 765Wright, E. L., Eisenhardt, P. R. M., Mainzer, A. K., et al. 2010, AJ, 140, 1868Yang, Y., Hoeflich, P., Baade, D., et al. 2020, ApJ, 902, 46Yao, Y., De, K., Kasliwal, M. M., et al. 2020, ApJ, 900, 46Yaron, O., & Gal-Yam, A. 2012, PASP, 124, 668Yaron, O., Perley, D. A., Gal-Yam, A., et al. 2017, NatPh, 13, 510Zampieri, L., Pastorello, A., Turatto, M., et al. 2003, MNRAS, 338, 711Zapartas, E., Renzo, M., Fragos, T., et al. 2021, A&A, 656, L19
23
The Astrophysical Journal, 927:180 (23pp), 2022 March 10 Perley et al.