The Transition from Primary to Secondary Education: Meritocracy and Ethnicity
17
European Sociological Review doi:10.1093/esr/jcn018 24:527-542, 2008. First published 6 Mar 2008; Eur. Sociol. Rev. Geert Driessen, Peter Sleegers and Frederik Smit The Transition from Primary to Secondary Education: Meritocracy and Ethnicity http://esr.oxfordjournals.org/cgi/content/full/24/4/527 available online at The full text of this article, along with updated information and services is References http://esr.oxfordjournals.org/cgi/content/full/24/4/527#BIBL This article cites 18 references, 2 of which can be accessed free at Reprints http://www.oxfordjournals.org/corporate_services/reprints.html Reprints of this article can be ordered at Email and RSS alerting http://esr.oxfordjournals.org Sign up for email alerts, and subscribe to this journal’s RSS feeds at image downloads PowerPoint® slide. Images from this journal can be downloaded with one click as a PowerPoint Journal information subscribe can be found at http://esr.oxfordjournals.org Additional information about European Sociological Review, including how to Published on behalf of Oxford University Press at Radboud University on 27 August 2008 http://esr.oxfordjournals.org Downloaded from
-
Upload
independent -
Category
Documents
-
view
6 -
download
0
Transcript of The Transition from Primary to Secondary Education: Meritocracy and Ethnicity

European Sociological Review
doi:10.1093/esr/jcn018 24:527-542, 2008. First published 6 Mar 2008; Eur. Sociol. Rev.
Geert Driessen, Peter Sleegers and Frederik Smit The Transition from Primary to Secondary Education: Meritocracy and Ethnicity
http://esr.oxfordjournals.org/cgi/content/full/24/4/527available online at The full text of this article, along with updated information and services is
References http://esr.oxfordjournals.org/cgi/content/full/24/4/527#BIBL
This article cites 18 references, 2 of which can be accessed free at
Reprints http://www.oxfordjournals.org/corporate_services/reprints.html
Reprints of this article can be ordered at
Email and RSS alertinghttp://esr.oxfordjournals.org Sign up for email alerts, and subscribe to this journal’s RSS feeds at
image downloadsPowerPoint®
slide. Images from this journal can be downloaded with one click as a PowerPoint
Journal informationsubscribe can be found at http://esr.oxfordjournals.org Additional information about European Sociological Review, including how to
Published on behalf of Oxford University Press
at Radboud University on 27 August 2008 http://esr.oxfordjournals.orgDownloaded from
The Transition from Primaryto Secondary Education:Meritocracy and EthnicityGeert Driessen, Peter Sleegers and Frederik Smit
The aim of this study was to better understand the influence of pupil background
characteristics (e.g. gender, SES, ethnicity), various cognitive, and non-cognitive
competencies (e.g. school performance, study attitude) and a number of class and
school characteristics (e.g. socio-ethnic class composition, degree of urbanization) on
the transition of children from primary to secondary education in the Netherlands.
In the final grade of Dutch primary school, pupils are advised with regard to the type
of secondary education considered most appropriate for them. Recent data from the
national large-scale PRIMA cohort study, which includes more than 8,000 pupils and
500 classes, were used to examine differences in the levels of recommendation provided.
The results showed the phenomenon of over-recommending or, in other words, groups of
pupils receiving an educational recommendation, which is higher than justified by their
school performance, to no longer exist. Pupil achievement appeared to be the most
important factor for the explanation of the level of recommendation, which clearly
provides support for the meritocratic principle.
Introduction
The majority of West European countries has experi-enced a massive influx of non-western immigrantssince the middle of the previous century. A sharedcharacteristic of many of these immigrants is that they
have received little or no education and are oftenilliterate, which holds for guest workers in particular(Koopmans and Stratham, 2000; EUMC, 2004). Over
the years, it has become apparent that the educationalposition of the children of such immigrants leavesmuch to be desired (Gillborn and Mirza, 2000;
Schnepf, 2004; OECD, 2006). Despite the attempts ofpolicymakers to combat the educational disadvantageof these groups, relatively little progress can be
detected and one certainly cannot speak of substantialimprovements in their social position (Karsten, 2006;Driessen and Dekkers, 2007).
Viewed from a meritocratic perspective, this situa-
tion is problematic as the occupation of a particular
social position should be determined only by the
talents, capacities, and efforts of the individual (i.e.
his or her ‘merits’). Competencies should thus play a
critical role in the social positions of people and not
factors such as gender, origin, or ethnicity. Research
nevertheless shows that pupils coming from lower
social milieus, which frequently include the children of
non-western immigrants, must demonstrate substan-
tially more ‘merit’ than children coming from more
privileged milieus to acquire comparable starting
positions in society (Breen and Goldthorpe, 2001;
Goldthorpe and Jackson, 2006). Politicians and policy-
makers in most western countries frequently assert that
one can speak of increased meritocratization, but the
results of empirical research raise some major doubts
about these assertions. Research into factors that
European Sociological Review VOLUME 24 NUMBER 4 2008 527–542 527
DOI:10.1093/esr/jcn018, available online at www.esr.oxfordjournals.org
Online publication 6 March 2008
� The Author 2008. Published by Oxford University Press. All rights reserved.For permissions, please e-mail: [email protected]
appear to influence the reduction of educationalinequality is, therefore, called for also to gain insightinto the mechanisms of intergenerational mobility.
In the present article, an important step in theschool careers of Dutch children, namely the transitionfrom primary to secondary school, was studied. Thetype of secondary education recommended by theprimary schools is of particular interest because thisrecommendation together with the final choice ofsecondary education determine the societal prospectsof the children to a large extent.
Within the framework of Dutch research on theestablishment of recommendations for secondaryeducation, the so-called phenomenon of ‘over-recommending’ for particularly minority children inthe Netherlands has been observed since the end of the1980s (Driessen, 1991). Given comparable achieve-ment, that is, minority children are actually givena higher educational recommendation than non-minority children. From a theoretical perspective,however, over-recommending represents a deviationfrom the meritocratic principle and thus constitutes aform of positive discrimination with alternativeexplanations nevertheless available for the deviation.In a broad interpretation of the meritocratic principle,both cognitive and non-cognitive competencies areused to determine educational recommendations. Thecharacterization of non-cognitive competencies may bequite broad, but various aspects of motivation andeffort are typically meant by the term ‘non-cognitivecompetencies’. In a narrow interpretation of themeritocratic principle, only cognitive competencies—that is, school test performance—are used to determineeducational recommendations (Tesser and Iedema,2001). According to the latter approach, the correla-tion between performance and educational recommen-dation should be 100 per cent (i.e. perfect). Accordingto the broad approach, this need not be the case asmotivation and effort (i.e. non-cognitive competencies)can also contribute either directly or indirectly toeducational recommendations and thus influence theassociation between cognitive competencies and educa-tional recommendations. And when the association ofcognitive (and possibly non-cognitive) competencieswith educational recommendations is not perfect,one can often speak of ‘over-recommending’. Theopposite of over-recommending, namely ‘under-recommending’, also exists. One can speak of under-recommending when lower types of educationare recommended than justified by the capacities ofthe pupil or pupils. In this context, over- and under-recommending always are relative phenomena and,therefore, depend on which group is taken as the norm
(Claassen and Mulder, 2003). It is nevertheless striking
that, in contrast to the phenomenon of under-
recommending and its consequences, the phenomenon
of over-recommending and its possible consequences
has received very little attention in the Netherlands
(Koeslag and Dronkers, 1994).When compared with the results of research
conducted on educational recommendations in the
1980s and 1990s, recent research shows substantial
decreases in the incidence of over-recommending for
minority pupils in the Netherlands (Claassen and
Mulder, 2003; Luyten and Bosker, 2004). In order to
determine the extent to which we can speak of a
change of trend, the most recent national data on the
educational advising of primary-school pupils were
analysed. In the present article, the results of these
analyses are described and thereby the state-of-the-art
with regard to the over-recommending of minority
pupils in the Netherlands and the question of
whether we can speak—or still speak—of such over-
recommending, i.e. positive discrimination.
The EducationalRecommendation
The Practice of Recommending
Dutch primary education (LO) is for 4- to 12-year-old
and consists of 8 grades. When the children are in the
final grade they are given a recommendation with
respect to the most suitable type of secondary
education. In the secondary education system today,
all pupils receive a basic secondary education during
the first year or two, which means a national common
core curriculum with only a difference in the level of
the subject matter. In actual practice, however, the
pupils are pre-sorted right from the beginning of
secondary school into separate tracks. With regard to
those tracks it is relevant to note that the Dutch
education structure has changed repeatedly during the
past decades; for purposes of clarity and comparability,
in this article we will use the old terms and
abbreviations for the different levels of secondary
education: individualized pre-vocational education
(IBO), pre-vocational education (VBO), junior general
secondary education (MAVO), senior general second-
ary education (HAVO), and pre-university education
(VWO). Depending on the level of secondary educa-
tion attended, pupils can progress to a middle-level
vocational or general education (MBO) or a higher
level education (HO: higher professional education or
university education) (MECS, 2005). On grounds of
528 DRIESSEN, SLEEGERS AND SMIT

efficiency, the current policy is intended to discouragethe stacking of educational programmes (e.g. MAVOfollowed by HAVO, HAVO followed by VWO).Because of the hierarchical nature of the Dutchschool system, therefore, it is crucial that the mostappropriate—in other words, highest—educationalrecommendation be provided for the transition fromprimary to secondary school at the end of primaryschool.
In practice, the recommendation includes threeelements, not only (i) cognitive competences (perfor-mance, test results), but also (ii) non-cognitive factorssuch as attitudes, motivation, and interests, and(iii) the teacher’s judgements with regard to thechild’s home situation (i.e. socio-ethnic milieu,which, e.g. forms the basis for the aspiration levelsset by the teacher). For admission to MAVO, HAVO,and VWO, i.e. the general, non-vocational types, pupilsmust be assessed to establish their suitability. Thecommonest method of assessment is for pupils to betested halfway through the final year of primary school,using tests developed centrally to gauge pupils’ level ofknowledge and understanding. The test employed forthis assessment by over 90 per cent of all primaryschools is the CITO (Central Institute of TestDevelopment) primary school leavers’ attainment test.
Under the auspices of the head of the school,primary schools advise parents as to the type ofsecondary education most suited to their child. Parentshave the right to choose a secondary school for theirchild, but the school decides whether or not to admitthe child. Secondary schools for MAVO, HAVO, andVWO may demand a minimum score on the CITOtest. To help schools and parents, CITO has con-structed standard tables in which the relation betweenspecific (ranges of) test scores and the recommenda-tion for the most suitable type of secondary school isindicated. In the case of IBO and VBO, schools are notobliged to consider in advance whether the child cancope with the course, but they may do so if they wish.
Various parties are thus involved in the formulationof an educational recommendation. The pupils them-selves have certain desires or preferences, just as theirparents. The teachers often weigh the level ofperformance against the socio-ethnic composition ofthe class during their formulation of recommendationsfor individual pupils. In addition, the admissionpolicies of secondary schools, the degree of communityurbanization (and related to this the availability ofschools and the socio-ethnic composition of theneighbourhood), and any agreements which havebeen made between school administrations withregard to the admission and distribution of pupils
within a region can all play a role. The advising of
pupils on the verge of entering secondary school is
thus a complicated process involving various forces,which can sometimes lead to undesired effects.
Information on decision processes of school directo-
rates is virtually absent, not only in the Netherlands
but also in other countries as well (West and Pennell,1998; Schnepf, 2002; Driessen, 2005).
Over-recommending, which is the central topic inthis study, has been associated with the ethnic minority
background of the child since the end of the 1980s. In
particular, Turkish and Moroccan pupils with the same
levels of performance as other pupils have been foundto be given a higher level of educational recommenda-
tion. In contrast to pupils advised in keeping with their
actual performance, over-recommended pupils start
with an immediate lag and over-recommending has,therefore, been placed in a negative light. According to
Tesser and Iedema (2001), such delays explain their
lower marks and higher rates of drop out fromsecondary school. Mulder (1993) nevertheless argues
that the less successful school careers of minority
pupils may be more a consequence of the selection of
an overly high type of secondary school than thereceipt of an overly high educational recommendation;
that is, an overly high type of secondary education may
be forced upon the pupil by parents who may certainly
have the pupil’s best interests in mind but do not havesufficient insight into what is needed for the pupil to
live up to such expectations (Van der Veen, 2001; Smit
et al., 2005). Many pupils who start out too high—thatis, higher than the educational recommendation
provided by the primary school—indeed end up
repeating a year. The choice of an overly high type
of secondary education can also lead to reducedmotivation and inferior performance. Van der Werf
and Kuyper (2004) have also observed in recent
research that schools are providing increasingly
higher recommendations—due in part to pressurefrom parents who apparently do not want their
children to end up in the lowest levels of secondary
education. Nevertheless, there are also signs that over-
recommending may not always turn out negatively.In hindsight, that is, over-recommending can be seen
to provide a clear challenge and stimulus for at least
some children to fulfil their ambitions or even surpassthese (Hustinx, 2002).
Explanations for Over-recommending
Alternative explanations for the ‘ethnic over-recommending’ observed within the Dutch situation
have been put forth. The explanations concern the levels
MERITOCRACY AND ETHNICITY 529

of the pupil, the class and the school, the broader context,
and the inter-relations between the different levels.
Pupil level
A frequently offered explanation for over-recommend-
ing is that teachers explicitly take the negative effects of
the children’s immigrant past into consideration.
Despite the poor Dutch language skills of some
pupils, for example, the teachers trust that the
intellectual capacities of the children are sufficient to
handle a higher type of secondary education. The
teachers thus allow educational potential to weigh
heavier than actual performance on a language test.
It is also conceivable that the teachers weigh such
non-cognitive aspects as motivation and effort heavier
in some cases as well. These pupils are thus given
the benefit of the doubt. It is also possible that teachers
are afraid of discriminating and, therefore, display
what can be considered politically correct behaviour.
There is, in fact, an increased mention of discrimina-
tion these days but then positive discrimination.
And within the framework of counteracting educa-
tional delays and particularly when the positive
discrimination has no negative effects for other
pupils, it may be relatively easy to accept (Driessen,
1991). Therefore, we expect that pupils from ethnic
minorities will receive a recommendation for second-
ary education that is higher than that of other groups
of pupils with the same cognitive and non-cognitive
competencies.
Class/school level
An alternative explanation for ethnic over-recommend-
ing concerns the cognitive composition of the class. It
is well-known that teacher judgements of individual
pupils can be influenced by the level of the other
children in the class or a so-called frog-pond effect
(Davis, 1966). Teachers thus, appear to rank order
their pupils for purposes of evaluation which means
that the slightly better children in a class with a
generally lower cognitive level will be more easily given
a higher recommendation than children showing
otherwise comparable performance, but in a class
with a generally higher cognitive level (Mulder
and Tesser, 1992; Brandsma and Doolaard, 1999).
The cognitive level of the class is associated, in turn,
with the social and ethnic composition of the pupil
population (Driessen, 2002). Minority children and
children from lower social-economic milieus perform
lower on average than native-Dutch children
and children from higher social-economic milieus.
To the extent that we can speak of a concentration
of minority children and/or children from a lowersocial-economic milieu within a single class, the levelof class performance will be lower and, as a directconsequence of the aforementioned frog-pond effect,over-recommending may be more likely to occur.From this, we thus expect that children in a class witha lower cognitive level will receive a recommendationfor secondary education that is higher than that ofpupils with similar cognitive and non-cognitivecompetencies in classes with a higher cognitive level.
Context level
Dronkers et al. (1998) found a higher incidence ofover-recommending in big cities even after variouspupil and school characteristics were taken intoconsideration. According to these authors, this can beattributed to the assertive lifestyle and competitiveclimate which characterize big cities and the pressurewhich these place on parents. Differences in advisingwith regard to secondary education choices can also betraced back to the small percentage of low educatednative-Dutch parents, the large percentage of minorityparents, and the predominance of non-denominationalschools in big cities. Following this line of reasoning,we expect that children in big cities will receive arecommendation for secondary education that ishigher than pupils with the same cognitive and non-cognitive competencies living in other parts of thecountry.
Recent Developments
While the aforementioned results suggest that ethnicover-recommending takes place in the Netherlands,the results of some more recent longitudinal analysesof educational advising in the Netherlands provide amore subtle picture. In fact, Claassen and Mulder(2003) report that the over-recommending observedin 1988 and 1992 reverted to under-recommending in2000. These results suggest a change of trend in theNetherlands. These recent findings also confirm resultsof research into educational advising in other WestEuropean countries such as Germany and Switzerlandwhere one can speak of to a certain extent comparablesecondary education system (Kristen, 2000; Schnepf,2002; Imdorf, 2003).1 Kristen (2000) found that Italianand Turkish children of guestworkers in Germany werereferred significantly more frequently than theirclassmates to the lowest form of secondary education,after the language and maths achievement of thechildren had been taken into account. In addition tothis negative ethnic effect at the level of the pupil,she also found a negative effect at the level of the
530 DRIESSEN, SLEEGERS AND SMIT

class: the more minority children in the class, the lowerthe educational recommendation. These results werenot confirmed, however, by another German researchconducted by Schnepf (2002) who used the maths,science, and reading tests from the Programme ofInternational Student Assessment (PISA) and theTrends in International Mathematics and ScienceStudy (TIMSS). Research by Imdorf (2003) hasshown under-recommending to also occur for thechildren of guestworkers in Switzerland, which also hasa tracked secondary education system. Given equalachievement, both boys and the children of guest-workers were generally referred to lower tracks thangirls and native-Swiss children, which indicates under-recommending.
One possible explanation for this reversal from over-to under-recommending in the Netherlands may lie inthe fact that big cities have made some proceduralagreements over the past few years to better attuneeducational recommendations to achievement (Tesserand Iedema, 2001). Some other factors may also be atwork, however. Lower levels of educational recom-mendation can also be expected to occur as teachersacquire greater experience with minority children andthus better insight into their capacities and prospects.The political climate has also changed considerably inthe Netherlands under the influence of the (highlycontroversial) politician Pim Fortuyn during the pastfew years and opened up public debate on topicswhich were previously taboo. In the discussion of amulti-cultural Dutch society, for example, the reserve,which was previously exercised with respect to theimposition of strict requirements and fears of beingaccused of discrimination have decreased markedly.Finally, it is also possible that schools are under greaterpressure to perform and, therefore, apply morestringent admission policies as a result of the market-ization of education and its accompanying develop-ments of accountability and competition (Teelkenet al., 2005).
In order to determine if the observed shift fromover-recommending to under-recommending in theNetherlands is still the case, the most recent nationaldata were analysed. In contrast to the analysesconducted previously, however, some new elementswere added to the present analyses. In addition tocognitive competencies, non-cognitive competenciesare now taken into account. In doing this, we haveadopted both a strict and a broad interpretation ofthe meritocratic principle. The focus of much of theresearch to date has been upon predominantlythe relations between pupil performance and educa-tional recommendation. In the present analyses,
the influences of various environmental factors
(e.g. the class, the school) are also taken into
consideration, therefore. New in this light is attention
to the cognitive level of the class as a whole. Relative to
previous studies, the content of the present study has
thus been broadened.
Methods
Samples
The data from the fifth measurement point for the
Dutch Primary Education (PRIMA) study from 2002
to 2003 were used for purposes of the present study.
PRIMA is a large-scale, national cohort study among
600 primary schools in the Netherlands (which is
almost 10 per cent of all Dutch primary schools).
The study includes 60,000 pupils from the Dutch
equivalent of kindergarten and grades 2, 4, and 6 with
sixth grade constituting the final year of primary
school in the Netherlands. Information on not only the
pupils but also parents, teachers, and school adminis-
trations has been included in the study. The total
PRIMA sample can be further subdivided into a
nationally representative sample of 420 primary
schools and a supplemental sample of 180 schools
with an over-representation of pupils from disadvan-
taged situations (Driessen et al., 2004; Van der Slik
et al., 2006). The first part of the present analyses
which was intended to gain insight into the distribu-
tions of the variables and bivariate associations
between the variables was conducted on the sixth
grade pupils from the representative sample. The
second part of the analyses which was intended
to get a better understanding of the multivariate
associations between the different variables was con-
ducted on the entire sample. The representative sample
used in the descriptive analyses contained 5,664 pupils
from 497 sixth grade classes. The total sample used in
the multivariate analyses contained 7,883 pupils from
519 sixth grade classes.
Measurement Instruments
The data were collected using different measurement
instruments. Background information on the pupils
and their parents was provided by the different school
administrations, and this information was then used
to calculate class averages. Different intelligence tests
and achievement tests were administered to the pupils.
The pupils were also asked to answer some
questions about the transition from primary to
MERITOCRACY AND ETHNICITY 531

secondary education. The schools reported the level of
educational recommendation provided for the pupils.
The teachers evaluated the pupils with regard to a
number of non-cognitive competencies. And informa-
tion on the background characteristics of the schools
was obtained from the databases of the Ministry of
Education.The final set of variables can be divided into four
blocks, namely cognitive competencies, non-cognitive
competencies, background characteristics of the pupils,
and background characteristics of the classes/schools.
In Tables 1 and 2, the different competencies and
characteristics are briefly described.The distributions for the pupil background char-
acteristics and the class/school background character-
istics within the representative sample are also
presented in Table 2.
Design of the Analyses
Analyses of variance were primarily used for the
descriptive analyses. To start with, the educational
recommendation was bivariately related to the various
cognitive and non-cognitive competencies. Thereafter,
educational recommendation and competencies were
analysed in relation to the characteristics of the pupils
and the characteristics of the classes/schools. Because
of the hierarchical nature of the Dutch school system
and the strong linear correlation between the pupils’
scores on ability tests such as the CITO primary school
leavers’ test and the recommendation for the most
suitable type of secondary school (see above), res-
earchers into Dutch school careers have always treated
educational recommendation as an interval variable
(Dronkers et al., 1998; Brandsma and Doolard, 1999).
Table 1 Operationalization of educational recommendation, cognitive competencies, and non-cognitivecompetencies
Educational recommendation Categories
Recommendation Categories: (1) IBO, (2) VBO, (3) MAVO,(4) HAVO, (5) VWO
Cognitive competencies Categories/scales
Intelligence Non-verbal intelligence test. Sum score for 34 itemsSchool career Categories: (1) delayed, (2) non-delayedLanguage performance Language test. Proficiency score based upon 64 itemsMaths performance Maths test. Proficiency score based upon 120 itemsReading performance Reading test. Proficiency score based upon 50 items
Non-cognitive competencies Categories/scalesEthnic breach (¼ linguistic—cultural
difference between the home andschool situations)a
Teacher judgement. Score based upon 3 items; for example:‘A language other than Dutch is spoken in this family’ (a¼ 0.89).Range: (1) definitely untrue – (5) definitely true
Home climate (¼ educationallysupportive home climate)a
Teacher judgement. Score based upon 4 items; for example:‘Learning and curiosity are encouraged in this family’ (a¼ 0.87).Range: (1) definitely untrue – (5) definitely true
Self-confidence Teacher judgement. Score based upon 3 items; for example:‘The pupil is anxious or afraid’ (a¼ 0.85). Range:(1) definitely untrue – (5) definitely true
Study attitude Teacher judgement. Score based upon 4 items; for example:‘Quickly thinks that he/she is done with work’ (a¼ 0.81).Range: (1) definitely untrue – (5) definitely true
Social behaviour Teacher judgement. Score based upon 4 items; for example:‘Is often cheeky’ (a¼ 0.83). Range: (1) definitely untrue –(5) definitely true
Addressable in Dutch Teacher judgement. Range: (1) very poor – (5) very goodEffort Pupil judgement. Score based upon 8 items; for example:
‘I work hard at school’ (a¼ 0.72). Range: (1) (almost)never – (4) (almost) always
aEthnic breach and home climate are not really non-cognitive pupil competencies but, rather circumstances. In connection with the readability
of the present text, they have nevertheless been subsumed under non-cognitive competencies.
532 DRIESSEN, SLEEGERS AND SMIT

We will follow this convention and treat recommenda-
tion, the dependent variable, as an interval variable.
Given the nested structure of the data, i.e. pupils
within classes, multi-level regression analyses were
conducted to analyse the multivariate associations
between the different variables (Rasbash et al., 2004).
More specifically, it was attempted to predict educa-
tional recommendation on the basis of the various
competencies and background characteristics.Given the large numbers of pupils and classes, the
usual levels of significance do not say much; associa-
tions may quickly reach significance but have little or
no relevance. For this reason, the emphasis in the
descriptive analyses was placed upon the strength of
the observed associations or the so-called eta coeffi-
cient. Cohen (1988) calls an association of 0.10 ‘weak’;
an association of 0.30 ‘medium’; and an association of
0.50 ‘strong.’ An eta of 0.15 (or 42 per cent explained
variance) is frequently taken to be the lower limit for
the relevance of an association (Bosker et al., 2001).
Results
Description of the Educational
Recommendations
In the upper part of Table 3, the percentages for the
different categories of educational recommendation are
shown. In the lower part of Table 3, the means and
standard deviations for educational recommendation
and a number of the cognitive and non-cognitivecompetencies are presented. The correlations (r) of thevarious competencies with educational recommenda-tion are also presented.
On average, the children studied here received amiddle-level (i.e. MAVO) educational recommenda-tion. More than 80 per cent of the pupils had a non-delayed school career; 20 per cent of the pupils hadstayed back a year or skipped a year on at least oneoccasion. One can speak of a moderately strongeducationally supportive home climate on average.The score for ethnic breach shows linguistic andcultural differences to only characterize the homeversus school environments to a limited extent. Onaverage, it was possible or very possible to address thepupils in Dutch. The amount of effort on the part ofthe pupils was generally judged to be good just as theirself-confidence and social behaviour; their studyattitudes were, according to the teachers, somewhatweaker. The final column in Table 3 shows moderateto strong associations between the various competen-cies and educational recommendation; cognitive com-petencies clearly correlated more strongly witheducational recommendation than non-cognitivecompetencies.
In the subsequent analyses, the associations betweeneducational recommendation, cognitive competencies,and non-cognitive competencies—on the one hand—and the background characteristics of the pupils,classes, and schools—on the other hand—wereexamined. Whether relevant differences (i.e. an
Table 2 Operationalization of pupil background characteristics and class/school background characteristics(with distributions for the representative sample presented in brackets)
Background characteristics of pupils Categories and distributions
Gender (1) boy (50%), (2) girl (50%)Parental education (1) LO (7%), (2) VBO (23%), (3) MBO (41%), (4) HO (29%)Ethnicity (1) native-Dutch (82%), (2) mixed native-Dutch and minority
(5%), (3) Surinamese and Antillean (2%), (4) Turkish [4%],(5) Moroccan (3%), (6) other ethnic background (4%)
Background characteristics of classes/schools Categories and distributionsPercentage native-Dutch disadvantaged
(¼low SES) pupils in the classMean¼ 18%; three categories used for the descriptive analyses:
(1) 0% (21%), (2) 1-24% (46%), (3)� 25% (33%).Percentage ethnic minority disadvantaged
pupils in the classMean¼ 13%; three categories used for the descriptive analyses:
(1) 0% (53%), (2) 1-24% (31%), (3)� 25% (16%).Cognitive level of the class (aggregated language
and maths scores; z-scores)Mean¼ 1.48; three categories used for the descriptive analyses:
(1) low (21%), (2) medium (36%), (3) high (43%).School denomination (1) Non-denominational [33%], (2) catholic [32%],
(3) protestant [28%], (4) other denomination [7%].Type of community (¼ degree of urbanization) (1) Four largest municipalities (Amsterdam, Rotterdam,
The Hague, Utrecht) (9%), (2) other large municipalities(11%), (3) modal (56%), (4) rural (24%).
MERITOCRACY AND ETHNICITY 533

eta� 0.15) occurred according to gender was first
examined. This generally appeared to not be the case:
The mean maths score for the boys was slightly higher
than that for the girls (120 versus 117; eta¼ 0.16); the
girls showed a slightly better study attitude than the
boys (3.6 versus 3.3; eta¼ 0.22); and the girls also
showed slightly more social behaviour than the boys
(3.8 versus 3.5; eta¼ 0.19).The differences with respect to the educa-
tional background of the parents are summarized in
Table 4.The results in the upper part of Table 4 confirm the
so-called reproduction thesis: 76 per cent of the
children of parents with only a primary education
(LO) and 70 per cent of the children of parents with
only a pre-vocational secondary education (VBO) were
found to receive a middle-level (MAVO) educational
recommendation at most; in contrast, 73 per cent of
the children of parents with a higher professional
or university education (HO) were given a relatively
high—if not the highest—level of educational recom-
mendation (HAVO or VWO) which places these
pupils—just as their parents before them—in a
position to pursue a higher level of post-secondary
education. In addition to this, there are moderately
strong to strong associations between the compe-
tencies of the pupils and parental level of education.
Table 3 Descriptive statistics for educationalrecommendation, cognitive competencies, andnon-cognitive competencies (percentages,means, standard deviations, and correlationswith educational recommendation)
Mean(%)
SD r�recommendation
RecommendationIBO (%) 6VBO (%) 17MAVO (%) 27HAVO (%) 26VWO (%) 25Average 3.5 1.2
Intelligence 26 4.2 0.43��
Non-delayed (%) 81 39.6 0.32��
Language performance 1,122 35.3 0.60��
Maths performance 118 8.9 0.73��
Reading performance 57 16.2 0.72��
Home climate 3.6 0.7 0.39��
Ethnic breach 1.7 0.9 �0.21��
Addressable in Dutch 4.5 0.5 0.29��
Effort 3.3 0.4 0.33��
Self-confidence 3.8 0.6 0.16��
Study attitude 3.4 0.7 0.37��
Social behaviour 3.7 0.6 0.17��
�P50.01, ��P50.001.
Table 4 Educational recommendation, cognitive competencies, and non-cognitive competencies accordingto parental level of education (means)
Parental level of educationLO VBO MBO HO Total eta
RecommendationIBO (%) 16 11 4 1 6 0.20��
VBO (%) 32 29 14 7 17 0.25��
MAVO (%) 28 30 31 20 27 0.11��
HAVO (%) 15 18 29 30 26 0.13��
VWO (%) 9 11 22 43 25 0.29��
Average 2.7 2.9 3.5 4.1 3.5 0.39��
Intelligence 25 25 27 28 26 0.22��
Non-delayed (%) 54 72 84 89 81 0.24��
Language performance 1,091 1,110 1,124 1,135 1,122 0.35��
Maths performance 113 115 118 122 118 0.32��
Reading performance 45 51 57 64 57 0.36��
Home climate 2.9 3.3 3.7 3.9 3.6 0.40��
Ethnic breach 3.5 1.9 1.6 1.5 1.7 0.56��
Addressable in Dutch 4.1 4.5 4.6 4.7 4.5 0.34��
Effort 3.3 3.3 3.3 3.4 3.3 0.10��
Self-confidence 3.8 3.8 3.8 3.8 3.8 0.04Study attitude 3.3 3.3 3.4 3.6 3.4 0.15��
Social behaviour 3.5 3.6 3.7 3.7 3.7 0.11��
�P50.01, ��P50.001.
534 DRIESSEN, SLEEGERS AND SMIT
The pupils varied very little with regard to such non-
cognitive capacities as effort, self-confidence, study
attitude, or social behaviour. It should be noted that
almost 50 per cent of the children of parents with only
a primary education (LO) had already experienced
educational delays while this was the case for only
about 10 per cent of the children of parents with a
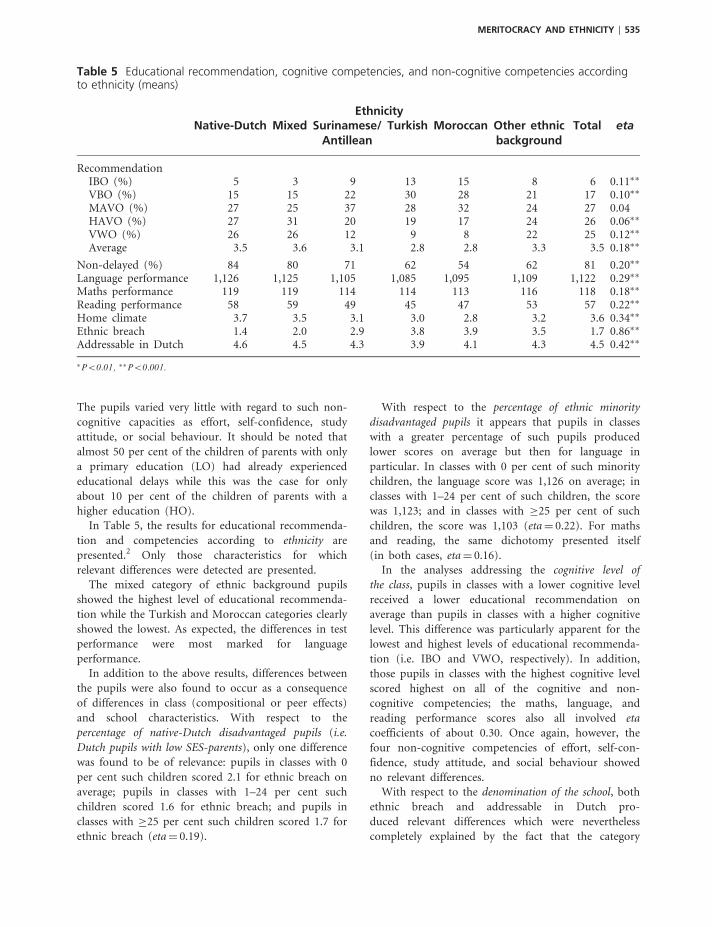
higher education (HO).In Table 5, the results for educational recommenda-
tion and competencies according to ethnicity are
presented.2 Only those characteristics for which
relevant differences were detected are presented.The mixed category of ethnic background pupils
showed the highest level of educational recommenda-
tion while the Turkish and Moroccan categories clearly
showed the lowest. As expected, the differences in test
performance were most marked for language
performance.In addition to the above results, differences between
the pupils were also found to occur as a consequence
of differences in class (compositional or peer effects)
and school characteristics. With respect to the
percentage of native-Dutch disadvantaged pupils (i.e.
Dutch pupils with low SES-parents), only one difference
was found to be of relevance: pupils in classes with 0
per cent such children scored 2.1 for ethnic breach on
average; pupils in classes with 1–24 per cent such
children scored 1.6 for ethnic breach; and pupils in
classes with �25 per cent such children scored 1.7 for
ethnic breach (eta¼ 0.19).
With respect to the percentage of ethnic minority
disadvantaged pupils it appears that pupils in classes
with a greater percentage of such pupils produced
lower scores on average but then for language in
particular. In classes with 0 per cent of such minority
children, the language score was 1,126 on average; in
classes with 1–24 per cent of such children, the score
was 1,123; and in classes with �25 per cent of such
children, the score was 1,103 (eta¼ 0.22). For maths
and reading, the same dichotomy presented itself
(in both cases, eta¼ 0.16).In the analyses addressing the cognitive level of
the class, pupils in classes with a lower cognitive level
received a lower educational recommendation on
average than pupils in classes with a higher cognitive
level. This difference was particularly apparent for the
lowest and highest levels of educational recommenda-
tion (i.e. IBO and VWO, respectively). In addition,
those pupils in classes with the highest cognitive level
scored highest on all of the cognitive and non-
cognitive competencies; the maths, language, and
reading performance scores also all involved eta
coefficients of about 0.30. Once again, however, the
four non-cognitive competencies of effort, self-con-
fidence, study attitude, and social behaviour showed
no relevant differences.With respect to the denomination of the school, both
ethnic breach and addressable in Dutch pro-
duced relevant differences which were nevertheless
completely explained by the fact that the category
Table 5 Educational recommendation, cognitive competencies, and non-cognitive competencies accordingto ethnicity (means)
EthnicityNative-Dutch Mixed Surinamese/
AntilleanTurkish Moroccan Other ethnic
backgroundTotal eta
RecommendationIBO (%) 5 3 9 13 15 8 6 0.11��
VBO (%) 15 15 22 30 28 21 17 0.10��
MAVO (%) 27 25 37 28 32 24 27 0.04HAVO (%) 27 31 20 19 17 24 26 0.06��
VWO (%) 26 26 12 9 8 22 25 0.12��
Average 3.5 3.6 3.1 2.8 2.8 3.3 3.5 0.18��
Non-delayed (%) 84 80 71 62 54 62 81 0.20��
Language performance 1,126 1,125 1,105 1,085 1,095 1,109 1,122 0.29��
Maths performance 119 119 114 114 113 116 118 0.18��
Reading performance 58 59 49 45 47 53 57 0.22��
Home climate 3.7 3.5 3.1 3.0 2.8 3.2 3.6 0.34��
Ethnic breach 1.4 2.0 2.9 3.8 3.9 3.5 1.7 0.86��
Addressable in Dutch 4.6 4.5 4.3 3.9 4.1 4.3 4.5 0.42��
�P50.01, ��P50.001.
MERITOCRACY AND ETHNICITY 535
‘other denomination’ included Islamic schools inaddition to other denomination schools. These schoolsare only attended by minority children, often entailmajor discrepancies between the home and school
cultures and often involve pupils whose parents speakpoor Dutch.
With respect to the type of community (i.e. degree ofurbanization), only a few relevant differences appeared.The pupils in the four biggest cities in theNetherlands—namely Amsterdam, Rotterdam, TheHague, and Utrecht—clearly score lower on languagealthough the difference is almost completely due to thelow cognitive level of the class. Relevant differences forhome climate, ethnic breach, and addressable in Dutchwere also apparent, but clearly explained by the higherpercentages of minority disadvantaged pupils in the bigcities.
Explanation of the Educational
Recommendations
A description of the different bivariate relationsbetween the competencies and characteristics examinedin this study was presented in the preceding. In thissection, the results are reported of the multivariateanalyses conducted using the multi-level program
MLwiN (Rasbash et al., 2004). The entire PRIMAsample was used in these analyses, which entails anoverrepresentation of schools with numerous minorityand native-Dutch disadvantaged pupils. Given that ourprimary concern was to identify critical relations andnot draw representative statements, we judged the totalPRIMA sample to be most suitable. Use of this samplealso guarantees sufficient cell numbers for the relativelysmaller groups.
Two issues will be considered in the following. Thefirst is the phenomenon of over-recommending ofcertain groups of pupils relative to other groups withcomparable competencies. The second issue is the
relative influences of the different competencies andcharacteristics on recommendations for secondaryeducation. As already mentioned, three alternativegrounds for over-recommendation have been sug-gested: ethnicity, cognitive level of the class, and typeof community. In order to determine the extent ofover-recommending on each of these grounds andwhether one can thus speak of different forms of over-recommending or not, separate multi-level regressionanalyses were undertaken. First, a basic model contain-ing one of the different grounds (i.e. ethnicity, classlevel, or type of community) was tested. Next, themodels with cognitive competencies, non-cognitivecompetencies, and various background characteristics
added stepwise were consecutively tested. The results ofthese analyses showed non-cognitive competencies toprovide virtually no extra explanatory power. Non-cognitive competencies were, therefore, not included inthe definitive models. We will, however, return to thesecompetencies in our final analyses.
In Table 6, the most important results with respectto over-recommending in relation to ethnicity arepresented. The table shows the unstandardized regres-sion coefficients that indicate the number of changepoints for educational recommendation when thepredictor variables change by one point. For predictorswith a wide range of scores, these coefficients can bevery small. To create some uniformity for purposes ofpresentation, the scores for language, maths, reading,intelligence, and percentage disadvantaged pupils weredivided by 10, therefore. The results thus reflect achange of educational recommendation per 10 pointsof change in the predictor. More concretely: acoefficient of 0.05 for language means a 0.05-pointhigher educational recommendation in relation to a10-point higher language score. For the dichotomousvariables, the reference category is also always indi-cated. The parameters of a given model are comparedwith the parameters of the preceding model, andthe results are presented in Table 6. At the bottom ofthe table, the percentages of variance explained at thelevels of the class and the pupil are also reported alongwith the percentage changes when the variouscompetencies and characteristics are added stepwiseto the model.
In the first step in the multi-level analyses, the so-called empty model (model 0) was estimated. Thismodel shows 14.4 per cent of the explained variance ineducational recommendation to relate to differencesbetween the classes and the remaining 85.6 per cent torelate to differences between the pupils. When the herecentral variable of ethnicity is added to the model toproduce a new model (model 1), minority pupils arefound to receive a lower educational recommendationthan native-Dutch pupils on average. For theMoroccan and Turkish pupils, the difference is asmuch as 0.70 along a scale of 1.0–5.0 and strong,therefore. When school performance is added to theprevious model to create model 2, the low average levelof educational recommendation for the minoritychildren is now explained by the low school perfor-mance of the children. After control for schoolperformance, that is, the differences between theminority and native-Dutch pupils virtually disappear.In model 3, other pupil background characteristics areadded to the previous model. The testing of this modelshows some minor over-recommending to now occur
536 DRIESSEN, SLEEGERS AND SMIT

for Moroccan and other ethnic background pupils on
average. When the composition of the class in terms of
the percentage of minority disadvantaged pupils and
percentage of native-Dutch disadvantaged pupils is
added to the previous model to create model 4, the
extra explanatory power of the two characteristics
(0.3 per cent) is virtually zero. This final model shows
the category of other ethnic background to continue to
make a difference although the effect does not amount
to much (i.e. is less than one-sixth of a standard
deviation). Over-recommending is also found to occur
for more intelligent pupils and the children of highly
educated parents while under-recommending occurs
for pupils with delayed school careers and boys. Once
again, however, the effects are very small.Comparable analyses were next conducted with
regard to over-recommending, but then with either
the cognitive level of the class or the type of
community added first to the model. Given the
strong resemblance of the results to the results for
ethnicity, we limit ourselves to the core of the analyses
here. With respect to the cognitive level of the class,
it was found that classes with a high cognitive level
received a higher level of educational recommendation
on average (coefficient of 1.00). This is related to the
higher school performance of the pupils in these
classes. After control for school performance, in fact,
one can actually speak of under-recommending in the
classes with a high cognitive level; pupils in high
achieving classes appear to be evaluated more strin-
gently. With regard to type of community, the four
largest and other large communities were given a
slightly lower educational recommendation on average
than smaller communities (coefficients of �0.39 and
�0.48, respectively). This is due to the lower school
performance of the pupils in the four largest and
other large communities: when school performance
is controlled for, the differences between the types
Table 6 Results of multi-level analyses over-recommending to ethnicity (unstandardized regressioncoefficients)
Model0 1 2 3 4
Regression coefficientsIntercept 3.3��
Ethnicity (reference ¼ native-Dutch):Mixed 0.00 0.05 0.06 0.05Surinamese/Antillean �0.50�� 0.09 0.11 0.09Turkish �0.66�� 0.00 0.10� 0.07Moroccan �0.70�� �0.03 0.12�� 0.09Other ethnic background �0.19�� 0.13�� 0.21�� 0.19��
Language performance 0.05�� 0.05�� 0.05��
Maths performance 0.66�� 0.63�� 0.63��
Reading performance 0.25�� 0.23�� 0.23��
Intelligence 0.08�� 0.08��
School career (reference¼ non-delayed) �0.21�� �0.21��
Gender (reference¼ girl) �0.09�� �0.09��
Parental education 0.10�� 0.10��
Native-Dutch disadvantaged pupils (%) �0.03��
Minority disadvantaged pupils (%) 0.01
Explained variances (%)Class level 14.4 29.6 58.8 60.3 62.1Pupils level 85.6 1.5 70.4 71.6 71.6Total 5.5 68.7 70.0 70.2þ Class level 29.2 1.5 1.8þ Pupils level 68.9 1.2 0.0þ Total 63.2 1.3 0.3
Model fit 25,028.9 24,794.8 15,555.2 15,226.4 15,208.2Improvement 46.8 3079.9 82.2 9.1Difference df 5 3 4 2
�P50.01, ��P50.001.
MERITOCRACY AND ETHNICITY 537

of communities with regard to level of educational
recommendation disappear. Neither over- nor under-
recommending are further found to occur in relation
to the background characteristics of the pupils or the
composition of the class.The focus of the preceding analyses was on the
phenomenon of over-recommending while a few
specific instances of under-recommending were also
examined. In the following, the relative weights of the
different categories of predictors of educational
recommendation will be considered in greater detail.
In doing this, the extent to which educational
recommendation can be predicted on the basis of
‘merits’ (e.g. talent, competencies, and effort) will be
examined along with the extent to which other factors
which do not relate directly to school performance
contribute to the variance in educational recommen-
dation. In such a manner, insight can be gained into
the degree to which one can speak of a meritocratic
system of education in the Netherlands. In an effort to
attain the most parsimonious models, the analyses
were again conducted in a number of steps.3 The final
results of the analyses are presented in Table 7.The three school performance measures were
entered first to create model 1 and all proved sig-
nificant. More than two-thirds (68.6 per cent) of the
variance in educational recommendation was predicted
by these three measures. In model 2, the other two
cognitive competencies were added. Given equal school
performance, those children who were more intelligent
Table 7 Results of the multi-level analyses of the relation between educational recommendation andcognitive competencies, background characteristics, and non-cognitive competencies [unstandardized andalso in model 4 (standardized) regression coefficients]
Model0 1 2 3 4
Regression coefficientsIntercept 3.3��
Language performance 0.05�� 0.05�� 0.05�� 0.04�� (0.13)Maths performance 0.66�� 0.62�� 0.63�� 0.58�� (0.43)Reading performance 0.25�� 0.24�� 0.23�� 0.21�� (0.27)Intelligence 0.11�� 0.08�� 0.07�� (0.03)School career (reference¼ non-delayed) �0.22�� �0.21�� �0.18�� (�0.06)Gender (reference¼ girl) �0.09�� �0.04� (�0.02)Parental education 0.10�� 0.08�� (0.06)Ethnicity (reference¼ native-Dutch):
Mixed 0.06 0.09� (0.02)Surinamese/Antillean 0.11 0.15�� (0.02)Turkish 0.10� 0.17�� (0.04)Moroccan 0.12�� 0.18�� (0.04)Other ethnic background 0.21�� 0.25�� (0.05)
Home climate 0.11�� (0.06)Addressable in Dutch 0.12�� (0.05)Effort 0.20�� (0.06)Self-confidence 0.04�� (0.02)Study attitude 0.10�� (0.06)Social behaviour �0.05�� (�0.03)
Explained variances (%)Class level 14.4 58.6 59.6 60.3 61.8Pupil level 85.6 70.3 71.0 71.6 73.1Total 68.6 69.4 70.0 71.5þ Class level 1.0 0.7 1.5þ Pupil level 0.7 0.6 1.5þ Total 0.8 0.6 1.5
Model fit 25,028.9 15,579.2 15,403.1 15,226.4 14,821.1Improvement 3149.9 88.1 25.2 67.6Difference df 3 2 7 6
�P50.01, ��P50.001.
538 DRIESSEN, SLEEGERS AND SMIT

and those pupils with a normal, non-delayed school
career were found to receive relatively higher educa-
tional recommendations. In model 3, various pupil
background characteristics were added. Given equal
school performance, intelligence, and school careers, it
was found that girls, children of highly educated
parents and minority children—including primarily
those with a Moroccan or other minority back-
ground—received a relatively higher educational
recommendation on average. These results suggest
that over-recommendation for some groups of ethnic
minority pupils (Moroccan, Turkish, and other
minority pupils) still takes place, although the effects
are very small. Finally, in model 4, the significant non-
cognitive competencies of the pupils were included.
Comparison of models 3 and 4 show these character-
istics to add virtually nothing to the model: pupils
from higher social milieus, pupils who are more
addressable in Dutch, pupils who show greater effort,
have better self-confidence, have a better study
attitude, and display less socially acceptable behaviour
are given a slightly higher educational recommendation
when compared with the other pupils. These results
show that also the non-cognitive competencies (moti-
vation, attitudes, and interests) of pupils affect
educational recommendation. Taken together, how-
ever, the six non-cognitive competences analysed
account for no more than 1.5 per cent of the explained
variance. In the final column of Table 7, the
standardized coefficients are presented. Inspection of
these coefficients indicates the relative weights of the
predictors. As can be seen, maths performance is
decisive for the level of educational recommendation
followed by reading and language performance.
Comparison of models 1 and 4 clearly shows the
dominant role of school performance in educational
advising. School performance explains more than two-
thirds of the variance in educational recommendation.
Those factors which might indicate a bias in the
educational advising of the school in the form of either
over- or under-recommending on the grounds of non-
performance related considerations jointly explained
less than 3 per cent of the total variance in educational
recommending.
Discussion
In the present contribution, the recommendations for
secondary education provided during the last year of
primary school in the Netherlands stood central. The
core question was whether or not we can still speak of
over-recommending (i.e. higher types of secondary
education being recommended for certain groupsof pupils than justified by their capacities). Over-recommending represents a deviation from themeritocratic principle and, in the present research, itwas studied from three perspectives (i.e. in terms ofethnicity, type of community, and cognitive level ofthe class).
With regard to the over-recommending of minoritypupils, the existence of the phenomenon has beendemonstrated on a number of occasions since the endof the 1980s (Driessen, 1991). The results of the presentanalyses show such ‘ethnic’ over-recommending tovirtually be a thing of the past: given equal schoolperformance, the different ethnic groups received com-parable educational recommendations although oneexception does exist, namely some minimal over-recommending for the category of ‘other minoritypupils’.
Dronkers et al. (1998) discovered a different form ofover-recommending in namely big cities and even afterthe influences of various pupil and school character-istics were taken into consideration. The cause of thiswas assumed to be the more assertive urban climatewhere teachers have less authority and parents exertmore pressure on teachers. The findings of the presentresearch do not provide support for this line ofreasoning. In fact, the somewhat lower level ofeducational recommendation on average in big citiescan be completely attributed to the relatively lowerschool performance of the pupils in the cities, and onecannot speak of over-recommending. It can also benoted in this light that there is no relation to thesocial-ethnic composition of the classes: the percent-ages of minority and native-Dutch disadvantagedpupils in the classes do not in any way explain thevariation in educational recommending.
When the composition of the class in terms of theaverage level of performance for language and maths areexamined, it is often assumed that the level of theeducational recommendation provided by the teachermay depend on the relative position of the pupil withinthe class. In a class with a predominantly low level ofperformance, slightly better pupils may be more easilygiven a higher educational recommendation than otherpupils (Driessen et al., 2003). The analyses conductedhere show the pupils in classes with a high cognitive levelto indeed receive higher educational recommendations,but this is clearly due to the higher levels of schoolperformance on the part of the individual pupils in theseclasses. When school performance is controlled for,moreover, one can actually speak of under-recommend-ing in the classes with a high cognitive level: The pupilsin such classes receive a relatively lower level of
MERITOCRACY AND ETHNICITY 539

educational recommendation after school performanceis taken into consideration—which is also counter to themeritocratic principle. As mentioned earlier, theseresults are in line with findings from German researchon the transition from primary to secondary education(Kristen, 2000).
In sum, the analyses conducted here show that, tothe extent that over-recommending still occurs, it doesnot relate to ethnicity, cognitive level of the class, ortype of community. This means that the phenomenonof ethnic over-recommending as it occurred in the1980s and 1990s in the Netherlands no longer occurs.This also implies that the three hypotheses orexpectations we formulated in the introduction ofthis article have to be rejected.
In addition to the occurrence of over-recommending, the meritocratic character of theeducational recommendations provided by primaryschools was also examined. The present findings showthe school performance of pupils to be decisive for theeducational recommendations provided. The othercognitive and non-cognitive competencies and social-ethnic background characteristics of the pupils con-sidered in the present study added little or nothing tothe predictive power of school performance. Thesefindings confirm the results of other Dutch research oneducational advising conducted by Luyten and Bosker(2004). These researchers also concluded that perfor-mance weighs more heavily than social-ethnic back-ground in the determination of educationalrecommendations. This means that pupils can com-pensate for a less favourable social-ethnic backgroundwith good school performance, but a favourable social-ethnic background cannot provide solace for inferiorschool performance.
The present results suggest that the associationbetween capacities and educational recommendationshas increased over the years and that, as a result ofthese increases, the already strong meritocratic calibreof Dutch educational advising has also increased. Ofinterest, is the question whether this finding alsoapplies to other European countries. Given the some-times contradictory results of European research oneducational matters, in part owing to differences ineducation systems, additional internationally compara-tive research is, therefore, needed (cf. Hanushek andWobmann, 2006). Such research can also shed morelight on limitations of Dutch studies on educationaladvising and the methods used. One relevant issue inthis context could be the possible bias of Dutch studiesdue to the standard treatment of the dependentvariable, educational recommendation, as an intervalvariable. With the results of such research, clearer
and better insight into the meritocratic calibre ofeducational recommendations in the Netherlands andelsewhere can thus be obtained.
Notes
1. In contrast to countries such as The Netherlands,
Germany, and Switzerland, where one can speak
of a selective education system, countries such as
the UK and the US have a more comprehensive
educational system and thus less tracking. The
choice of secondary education is also made
relatively late in the school careers of pupils in
the latter countries, which means that the
phenomenon of over-recommending is less likely
to present itself or may not occur at all.
2. The Antillean and Surinamese immigrants to the
Netherlands come from former colonies. As a
result of these ties, they are often already familiar
with the Dutch language and culture. The Turkish
and Moroccan immigrants consist of mostly
guestworkers arriving in the Netherlands in the
1960s and subsequent waves of immigration for
family formation or reunification purposes. One
characteristic shared by all these immigrants is
their low level of education. The remainder of the
immigrants to the Netherlands constitute a very
heterogeneous group with respect to language,
culture, and religion. The group includes guest
workers from other western countries and refugees
or asylum seekers from the Middle East, for
example.
3. We also tested, for example, two series of
interactions. First, the interactions between par-
ental education and ethnicity, on the one hand,
and the interactions between parental education
and school performance, on the other hand, were
evaluated. Whether the effects of parental educa-
tion on school recommendation differ across the
different ethnic groups or not can be examined in
such a manner. Following this, the remaining
interaction effects were added to the model,
namely: ethnicity� gender; parental educa-
tion� gender; gender� language, maths, and
reading performance; and ethnicity� language,
maths, and reading performance. Taken together,
these 32 interactions were found to explain not
more than an additional 0.6 per cent of
the variance in educational recommendation.
540 DRIESSEN, SLEEGERS AND SMIT
The pupil characteristic of ethnic breach played
no significant role and was, therefore, not
included in the final model.
Acknowledgements
The data used in the present analyses are from theDutch cohort study Primary Education (PRIMA).This cohort study was financially supported by theFoundation for Behavioural Sciences, which is part ofthe Dutch Organization for Scientific Research(NWO).
References
Bosker, R., Mulder, L. and Glas, C. (2001). Naareen nieuwe gewichtenregeling? Den Haag:Onderwijsraad.
Brandsma, H. and Doolaard, S. (1999). Differences ineffectiveness between primary schools and theirimpact on secondary school recommendation.School Effectiveness and School Improvement, 10,430–450.
Breen, R. and Goldthorpe, J. (2001). Class, mobilityand merit. The experience of two Britishbirth cohorts. European Sociological Review, 17,81–101.
Claassen, A. and Mulder, L. (2003). Leerlingen na deOverstap. Nijmegen: ITS.
Cohen, J. (1988). Statistical Power Analysis for theBehavioral Sciences. Hillsdale, NJ: Erlbaum.
Davis, J. (1966). The campus as a frog pond: anapplication of the theory of relative deprivation tocareer decisions of college men. American Journalof Sociology, 72, 17–31.
Driessen, G. (1991). Discrepanties tussenToetsresultaten en Doorstroomniveau. PositieveDiscriminatie bij de Overgang Basisonderwijs –Voortgezet Onderwijs? Pedagogische Studien, 68,27–35.
Driessen, G. (2002). School composition and achieve-ment in primary education: a large-scale multilevelapproach. Studies in Educational Evaluation, 28,347–368.
Driessen, G. (2005). De Totstandkoming van deAdviezen Voortgezet Onderwijs: Invloeden vanThuis en School. Pedagogiek, 25, 279–298.
Driessen, G. and Dekkers, H. (2007). Educationalinequality in the Netherlands: policy, practice,and effects. In Teese, R., Lamb, S. and Duru-Bellat, M. (Eds), International Studies inEducational Inequality, Theory and Policy.
Inequality: Educational Theory and Public Policy.Volume 3, Dordrecht: Springer, pp. 257–274.
Driessen, G., Doesborgh, J., Ledoux, G. and Van derVeen, I. et al. (2003). Sociale Integratie in hetPrimair Onderwijs. Nijmegen/Amsterdam: ITS/SCO-Kohnstamm Instituut.
Driessen, G., Van Langen, A. and Vierke, H. (2004).Basisonderwijs: Veldwerkverslag, Leerlinggegevensen Oudervragenlijsten. Basisrapportage PRIMA-cohortonderzoek. Vijfde Meting 2002-2003.Nijmegen: ITS.
Dronkers, J., Van Erp, M., Robijns, M. and Roeleveld, J.(1998). Krijgen Leerlingen in de Grote Steden enmet Name in Amsterdam te Hoge Adviezen?Tijdschrift voor Onderwijsresearch, 23, 17–30.
EUMC (2004). Migrants, Minorities and Education.Luxembourg: Office for Official Publications of theEuropean Communities.
Gillborn, D. and Mirza, H. (2000). EducationalInequality. Mapping Race, Class and Gender.London: Ofsted.
Goldthorpe, J. and Jackson, M. (2006). Education-basedMeritocracy: The Barriers to its Realisation, availablefrom 5www.equalsoc.org/paper_fetcher.aspx?id¼114 [accessed 5 December 2006].
Hanushek, E., Wobmann, and l., (2006). Doeseducational tracking affect performance and
inequality? Differences-in-differences evidenceacross countries. The Economic Journal, 116, 63–76.
Hustinx, P. (2002). School careers of pupils of ethnicminority background after the transition to sec-ondary education: is the ethnic factor alwaysnegative? Educational Research and Evaluation, 8,169–195.
Imdorf, C. (2003). Organisational Perspective on theTransition from Primary to Secondary School:
Tracking Decisions Depending on Gender andEthnicity in the Swiss Education System. PaperUNESCO Conference on Intercultural Education,Jyvaskyla, Finland, 15–18 June 2003.
Karsten, S. (2006). Policies for disadvantaged childrenunder scrunity: the Dutch Policy compared withpolicies in France, England, Flanders and the USA.Comparative Education, 42, 261–282.
Koeslag, M. and Dronkers, J. (1994). Overadvisering en
de Schoolloopbanen van Migrantenleerlingen enAutochtone Leerlingen in het VoortgezetOnderwijs. Tijdschrift voor Onderwijsresearch, 19,240–258.
Koopmans, R. and Statham, P. (Eds) (2000).Challenging Immigration and Ethnic RelationsPolitics: Comparative European Perspectives.New York: Oxford University Press.
MERITOCRACY AND ETHNICITY 541

Kristen, C. (2000). Ethnic Differences in EducationalPlacement: The Transition from Primary toSecondary Schooling. Mannheim: MZES.
Luyten, H. and Bosker, R. (2004). Hoe Meritocratischzijn Schooladviezen? Pedagogische Studien, 81,89–103.
MECS (2005). The Education System in the Netherlands2005. The Hague: Ministry of Education, Cultureand Science.
Mulder, L. (1993). De Invloed van het Advies op deSchoolloopbaan van de OVB-Doelgroepleerlingenin het Voortgezet Onderwijs. Pedagogische Studien,70, 242–251.
Mulder, L. and Tesser, P. (1992). De Schoolkeuze vanAllochtone Leerlingen. Nijmegen: ITS.
OECD (2006). Where Immigrant Students Succeed – AComparative Review of Performance andEngagement in PISA 2003. Paris: OECD.
Rasbash, J., Steele, F., Browne, W. and Prosser, B.(2004). A User’s Guide to MLwiN. Version 2.0.London: University of London.
Schnepf, S. (2002). A Sorting Hat that Fails? TheTransition from Primary to Secondary School inGermany. Innocenti Working Paper No. 92.Florence: UNICEF Innocenti Research Centre.
Schnepf, S. (2004). How Different are Immigrants?A Cross-Country and Cross-Survey Analysis ofEducational Achievement. IZA Discussion PaperNo. 1398. Bonn: IZA.
Smit, F., Driessen, G. and Doesborgh, J. (2005).Opvattingen van Allochtone Ouders over Onderwijs:tussen Wens en Realiteit. Nijmegen: ITS.
Teelken, C., Driessen, G. and Smit, F. (2005). Frictionsbetween formal education policy and actual schoolchoice: case studies in an international comparativeperspective. International Review of Education, 51,35–58.
Tesser, P. and Iedema, J. (2001). Rapportage
Minderheden 2001. Vorderingen op School. Den
Haag: SCP.Van der Slik, F., Driessen, G. and De Bot, K. (2006).
Ethnic and socioeconomic class composition and
language proficiency: a longitudinal multilevel
examination in Dutch elementary schools.
European Sociological Review, 22, 293–308.Van der Veen, I. (2001). Successful Turkish and
Moroccan Students in the Netherlands. Leuven/
Apeldoorn: Garant.Van der Werf, G. and Kuyper, H. (2004).
Brugklasdocenten Gaan Niet op de Hurken.
Didaktief, 34, 22–24.West, A. and Pennell, H. (1998). School
admissions: increasing equity, accountability and
transparency. British Journal of Educational Studies,
46, 188–200.
Authors’ Addresses
Geert Driessen (to whom correspondence should be
addressed), ITS, Radboud University Nijmegen,
PO Box 9048, 6500 KJ Nijmegen, The Netherlands.
Tel.: þ 24-3653545; Email: [email protected];
WWW: http://www.geertdriessen.nlPeter Sleegers, SCO-Kohnstamm Instituut, University
of Amsterdam, 1090 GE Amsterdam, The
Netherlands. Email: [email protected] Smit, ITS, Radboud University Nijmegen,
6500 KJ Nijmegen, The Netherlands. Email:
[email protected]; www.frederiksmit.com
Manuscript received: February 2007
542 DRIESSEN, SLEEGERS AND SMIT