
Direct social perception and dual process theories of mindreading
The Theory of Perception Driven Process Logistification
Ákos Gubán 1, Richard Kása 2, Miklós Gubán 3
1 Dept. of Information Technology, Budapest Business School, HU-1149 Budapest, Hungary
[email protected] 2 Dept. of Information Technology, Budapest Business School,
HU-1149 Budapest, Hungary [email protected]
3 Institute of Information Technology, Dennis Gabor College, HU-1119 Budapest, Hungary
Abstract
The demand for improving business processes has a very wide literature and even very popular not only in academic life, but also among business experts. The concept of restructuring dysfunctional processes and process elements still exist and evolve, though with more and more sophisticated tools than before, but on the old, proven principles. The narrowing markets, the increased competition and the economic crisis all forcing companies to gain a comparative advantage through increasing efficiency and understanding customers’ perceptions about organizational innovations. The production and service main and sub-processes of a business organizations form a single system. In many cases the operation of this system is dysfunctional because process structures do not reflect the structure of flowing materials, components, semi-finished products, products, documents, information and so on. An efficient process analysis should be started by the exploration of the general characteristics of the identified processes and followed by the exemplification of the object flow on this process flow. In this recent paper the conceptualization of a simulation based model framework for process rationalization is described. Such basic terms for future modelling are defined which were developed during our former researches. These definitions and contextual frameworks will provide the baseline for our future modelling research. A flowing element with uniformalised characteristics is defined with its related flow-features. The roles of perceptions of internal and external customers in developing an appropriate degree of uncertainty are also described. A unified method for the modelling and restructuring processes is presented. The primary purpose of this article is to develop a measurement degree of internal uncertainty of process systems. The detailed analysis of this obtained measurement index is a subject of a future paper, here only the proof of the most important contexts are shown. Keywords: logistification, fluid flow, perception, process 1. Preliminaries of the research The processes of economic systems, depending on their location in the system may be different both in structure and in operating characteristics. Processes according to their location in the organization can be either production processes or logistical, information technology, information, business, management or marketing processes, and so on. However they seem to show very large differences, in fact they have one fundamental thing in common: at least one object flows through each of the processes or sections of processes consuming partially or entirely the resources of processes. (Hammer and Champy 1993; Lepmets, McBride, and Ras 2012) During our examinations it was noticed (Ákos Gubán and Kása 2013; Kása and Gubán 2013), that the efficiency of a process is exclusively determined by the object flowing in it and not by the functional department which incorporates it partly or fully. It has been recognized that in many cases the explored processes of a system are not featured by the internal characteristics of the system, rather by earlier inheritances or bad habits which makes them dysfunctional and ineffective. A system works optimally when it involves only necessary and real processes and get rid of redundant, unnecessary elements. (Buavaraporn 2010) If these needless elements could be scarfed from the system – like in sculptures, the really effective process system will be arisen which will be controlled and determined by the flowing elements of the system.
2
The hereby outlined research of effective system reorganization was started at the beginning of 2013 and a research team was formed with the name of LOST (Logistification and Simulation Technologies) in Services. The scope of this recent paper is the conceptualization of our findings on internal and external customers’ perception driven process research framework regarding to business process amelioration (BPA). 2. Literature review Before starting to elaborate a new technique for process amelioration (or just laying its funds) basic techniques, methods and trends should be reviewed. We have analysed the current literature available in world leading or international scientific and academic journals. The sample of journals consists of Engineering and Process Economics, Engineering Costs and Production Economics, Journal of Operations Management, International Journal of Production Economics, European Management Journal, Journal of Management, Journal of Supply Chain Management and Production and Operations Management. In these journals we inspected 1151 papers (between 1978 and 2013), which could be associated with process improvement, reengineering, rightsizing or management. Having a closer look at the papers we found 55 that can be associated with business process amelioration. In most cases these papers show a case when one or more kinds of process reengineering tool were used. We found also many publications on methods and methodologies of process improving and reengineering, and also a relatively high number on the performance of the tools and performance change due to this improvement. There are a relatively low number of papers in relevant journals on applications and theory; this might be because of the tendency towards a narrowing development of new tools. The evidences of these findings are detailed in (Gubán & Kása, 2013). Having a closer look at the temporal distribution of these publications two trends seem to dominate. The first one is associated with the total number of publications on this topic. There was major growth in 1990, after Michael Hammer published his article in the Harvard Business Review, in which he claimed that the major challenge for managers is to obliterate forms of work that do not add value, rather than using technology for automating it (Hammer 1990)h. This initiated an avalanche in major journals. The number of papers is still growing after a peak in 1995, when Frankenstein Economy, made in USA began (Janszen 1996). There was also major growth after the global financial crisis started to expand. The second trend seemed to occur in 1997, when a great number of process improvement applications and tools where developed – as a product or summation of the strong interest in this topic in 1995. (Ettlie 1997) 2.1 Temporal Evolution and the Development of Process Orientation of BPA Techniques and Methods There is no doubt about the importance of the continuous amelioration of business processes. The driving forces of theses radical changes can be interpreted as the extension of Porter’s competitive advantages (Porter 1980; Porter 1985; Porter 1990) summarized by Hammer and Champy (1993) and reinforced by O’Neill and Sohal (1999):
- customers who can now be very diverse, segmented, and are expectant of consultation, - competition that has intensified to meet the needs of customers in every niche - change that has become pervasive, persistent, faster and in some markets a pre-
requisite, The evolution of BPA dates back to the first appearance of rudimentary process orientation between 1750-1970 with the beginning of industrial period. The main focus of this embryonic process improvement phase was on labour division, cost reduction and productivity with technologies such as mechanisation, standardization and depth records. Their main tools were PDCA improvement cycle and financial modelling. Rightsizing and restructuring were also
3
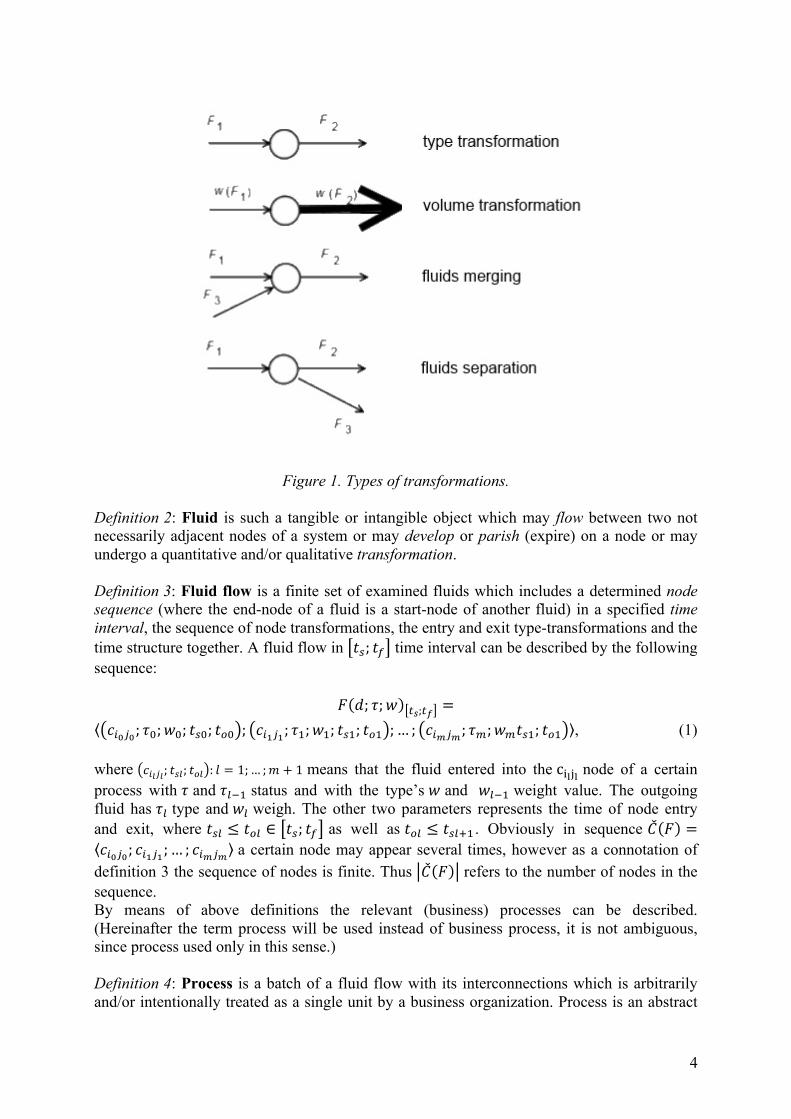
used for achieving changes in formal structural relationships and their focus on business processes are pretty low (Grover and Malhotra 1997). Their orientation is mainly functional, the improvement goals are usually incremental, and the frequency of application is isolated in time (Grover and Malhotra 1997). The next generation of process improving is the first phase of information period dated from 1970-90. This is the era of quality management and work efficiency with such technologies as material requirements planning (MRP) and management information systems (MIS). The main tools of this period were computer automation and statistical process control. These tools refer to the typical application of technologies where the application focuses mainly on automating existing procedures without questioning their appropriateness or legitimacy (Grover and Malhotra 1997). The third generation is the second phase of the information period with business process improvement (BPI) dating back in the ‘90s. This is the era of process innovation and best practices with such slogans like better, faster and cheaper. At this time technologies such as ERP, CRM, supply chain models and enterprise architecture models were introduced. New tools were developed and used, like Six Sigma, TQM, BPR and best practice benchmarking (BPB). These tools and techniques have their focus on processes, and bottom-up improvements in many places with continuous and incremental scope. The fourth generation is the third phase of information period with business process management (BPM) dating from the 2000s. The main focus of this era was continuous transformation, flexibility and modularity. Enterprise application integration (EAI), service oriented architecture (SOA) and semantic object model (SOM), performance management systems (PMS) and BPM systems are the major technologies of this era. Tools also vary from customization to BPM procedures like integrated design-build framework (IDBF), benchmarking-orientated process reengineering (BOPR), business process standardization (BPS) and event-condition-action (ECA) computing. Some of these tools have a very intensive service orientation (especially SOA and ECA), others tend to be adapted to services with more or less success. This literature review suggests, that numerous of techniques and methods are available for business process amelioration, and all of them are based on the concept of BPR: creating a blueprint of the process structure and then making significant changes to reach better performance and more harmonized process structure. In our terms BPA means something different, which can be written by process logistification. 3. Perception driven process The very first task of our research is to clarify the key terms of the concept. For this the notion of business process should be specified as it forms the basis of the research. As it is specially used in our research, the definition will be built up in several stages. Definition 1: A node is such an object of a system which is able to store data on any kind of transformation (input-output transformation or type transformation such as information → data) of any element, and able to perform actions on related functions and procedures (creation of new elements, merging and separating elements and even eliminating). Hereinafter these abilities are called node transformation (I/O transformation, new element, storage, merging, separating, eliminating). Such transformation where the type of input element and output element is different is called type-transformation. These possible transformations are shown in figure 1 below.
4
Figure 1. Types of transformations.
Definition 2: Fluid is such a tangible or intangible object which may flow between two not necessarily adjacent nodes of a system or may develop or parish (expire) on a node or may undergo a quantitative and/or qualitative transformation. Definition 3: Fluid flow is a finite set of examined fluids which includes a determined node sequence (where the end-node of a fluid is a start-node of another fluid) in a specified time interval, the sequence of node transformations, the entry and exit type-transformations and the time structure together. A fluid flow in 𝑡!; 𝑡! time interval can be described by the following sequence:
𝐹 𝑑; 𝜏;𝑤 !!;!! =𝑐!!!!; 𝜏!;𝑤!; 𝑡!!; 𝑡!! ; 𝑐!!!!; 𝜏!;𝑤!; 𝑡!!; 𝑡!! ;… ; 𝑐!!!!; 𝜏!;𝑤!𝑡!!; 𝑡!! , (1)
where 𝑐!!!!; 𝑡!"; 𝑡!" : 𝑙 = 1;… ;𝑚 + 1 means that the fluid entered into the c!!!! node of a certain process with 𝜏 and 𝜏!!! status and with the type’s 𝑤 and 𝑤!!! weight value. The outgoing fluid has 𝜏! type and 𝑤! weigh. The other two parameters represents the time of node entry and exit, where 𝑡!" ≤ 𝑡!" ∈ 𝑡!; 𝑡! as well as 𝑡!" ≤ 𝑡!"!! . Obviously in sequence 𝐶 𝐹 =𝑐!!!!; 𝑐!!!!;… ; 𝑐!!!! a certain node may appear several times, however as a connotation of
definition 3 the sequence of nodes is finite. Thus 𝐶 𝐹 refers to the number of nodes in the sequence. By means of above definitions the relevant (business) processes can be described. (Hereinafter the term process will be used instead of business process, it is not ambiguous, since process used only in this sense.) Definition 4: Process is a batch of a fluid flow with its interconnections which is arbitrarily and/or intentionally treated as a single unit by a business organization. Process is an abstract
5
notion in all cases which includes a model showing the structure of the process. This model will be the subject of examination in our research. Definition 5: A process item is real series of activities implemented on the basis of real demands. However the above definition for process items fits into our framework, bust seems to be too general. The reason is that business organizations develop their processes by some kind of management methodology techniques. This is also true for production, logistics, and even financial and accounting processes. Our previous studies have proved, that every process is guided by users’ perceptions, whether external or internal users, their requirements guide processes in every node of the system. Similarly there is a (not necessarily human) user in any node (like a robot on the assembly line) whose needs, "orders" must be satisfied on the input side and provides different outputs. Definition 6: User is an entity who may establish a claim to a process or a process section even from outside, either from inside of a system. Users on the system cannot be considered simply as a regular customer. These users (which may be either machines, or robots) like to be influenced by their perceptions determined by their characteristics in their requests and orders. Obviously the interpretation of costumers’ perceptions is necessary here whereas the concept of the notion of social perceptions is too rough for us. Definition 7: A users’ perception is a collective system of (potential) customers’ feelings about knowledge (data and information) that is or may be derived from internal processes of the company and has an impact on their (future) demands, orders and preferences. The term itself seems to be fairly subjective again. This follows from the fact that customers also have their own abilities which have significant influences on the quantity and quality of information absorbed from the process making interdependencies with preliminary knowledge and capabilities. (E.g. an elderly woman and a young guy have different perceptions on smartphone’s and analogue telephone’s service perceptions.) Question arises whether the perceptions of customers of a system counts in developing and operating its processes, especially when the inside feelings say everything is all right. Obviously inner perspectives are narrow, process items produce many internal uncertainty thus the operation of the system cannot provide the required optimality. Definition 8: Processes whose operation are much affected by intra- and inter-perceptions shall be called perception driven processes (PDP). Hereinafter processes identified in a system will be examined and such process attributes are given. Fluid flow can be constructed by further process examinations. Let:
- 𝑛 ∈ 𝑁! be the number of processes discovered in a system and 𝑃! 0 < 𝑖 ≤ 𝑛 be a single process of this system.
- D denote a finite set of fluids (such generalized above) of this system; if the fluid in a certain point of time belongs to process 𝑃! than in case of 𝑑 ∈ 𝐷, 𝑑 ↑ 𝑃! notation shall be used.
6
- τ denote fluid type set occurring in the system, or the role that it entrust in a certain test section, for example a document on the input of a process, a data on a certain node or it can be a waiting element as well. Typesets has general elements as well as specific components regarding to the system or subsystems of the processes.
Furthermore let:
- 𝑡!; 𝑡! be the system test time intervals - 𝑅 𝑟!" hyper-matrix show, that 𝑃! process somehow supplies fluids to 𝑃! process
0 < 𝑖, 𝑗 ≤ 𝑛 . Then 𝑟!" ≔ 𝑑;𝑇 𝑑 ∈ 𝐷;𝑇 ∈ 𝜏 is a fluid relationship set. (Obviously the matrix is non-symmetric.)
It is important to define inputs, outputs and interfaces of the processes as well as all significant flow features.
- 𝐼 𝑃! = 𝑑;𝑇; 𝑡 𝑑 ∈ 𝐷;𝑇 ∈ 𝜏; 𝑡 ∈ 𝑡!; 𝑡! is an input fluid set of a process (meta-process) where the input fluid, type and time of appearance on the input (which may be sub-intervals as well) are noted
- 𝑂 𝑃! = 𝑑;𝑇; 𝑡 𝑑 ∈ 𝐷;𝑇 ∈ 𝜏; 𝑡 ∈ 𝑡!; 𝑡! is an output fluid set of a process (meta-process) where the input fluid, type and time of appearance on the output (which may be sub-intervals as well) are noted
- 𝐶 𝑃!" = 𝑑;𝑇; 𝑡 𝑑 ∈ 𝐷;𝑇 ∈ 𝜏; 𝑡 ∈ 𝑡!; 𝑡! is fluid set of the jth interface of a process where the fluid, type and time of appearance (which may be sub-intervals as well) are noted. There may be such specific fluids here like 'waiting for … time', 'connection without waiting', etc…
- 𝑇!;𝑇! ! is the transformation on fluid d, which may happen on the process or on a
node as well. (However transformations on processes can be omitted because if a transformation happens during a flow then a virtual node should be crated on this process and transformation should be assigned to this node.)
- 𝑇! means a possible typeset of fluid d (0 < 𝑖; 𝑗 ≤ 𝑇! ). (Hereinafter for the sake of simplicity, the transformations are denoted by 𝑇, and ∅ means blank transformation when no type change occurred.
4. Logistification In the previous chapter those terms were prepared and organized, which will be used in deeper understanding of results of process examination. The technique of logistification will be used as a modelling and analysing tool for processes. Appellation comes from the well-defined and well-modelled logistics and supply chain processes as all other kinds of processes can be considered as logistical process because of the flowing fluids. Thus, a unified process analysis can be performed at the whole process system of business organizations. Definition 9: Logistification is the modelling and analysis in terms of efficiency, sensitivity and optimality of the temporal and spatial changes in related data of the processes of any kind of systems by means of fluids flowing in processes. The explored processes of the system shall be examined in a flow perspective, then the entry (input in flow aspect) and exit (output in flow aspect) nodes should be found in order to explore how processes are connected to each other and to identify the types and characteristics of these interfaces. The system may include only a finite number of processes,
7
otherwise if possible a finite number of the most important processes in aspect of the investigation should be selected. (This term does not cause any problem in economic/business systems.) Models carried out as a result from this type of analysis can be skeletonized about confusing and not relevant items supplied by the economic environment. In term of flow the fluid-flow can be divided into two groups: it can be either nodal flow or continuous flow. In case of nodal flow the fluid transformation is visible/measureable and have affect only on process nodes, while in case of continuous flow the effect of fluid transformation can be realized and measured at any point of the process. In terms of our investigation – as we are about to carry out simulation of service processes – nodal flows will be important and give an overview of this kind of flow. Let d∈ D be a fluid (where D is a finite set), and let 𝑃! be the process at 𝑡! initial time of fluid analysis (observation) whose input involves the fluid and be the initial type of the fluid 𝑇!. Then 𝑑,𝑇!, 𝑡! ∈ 𝑃! ∪ 𝐼(𝑃!). The flow of this fluid can be described at 𝑡!; 𝑡! period of time with the following sequence: 𝐹 𝑑 !!;!! = 𝑇!; 𝑐!!!!; 𝑡!!; 𝑡!! ;𝑇!; 𝑐!!!!; 𝑡!!; 𝑡!! ;… ;𝑇!; 𝑐!!!!; 𝑡!"; 𝑡!" ;𝑇!!! (2) where 𝑇! ∈ 𝑇!;𝑇! !
∪ ∅ : 𝑙 = 1;… ;𝑚 + 1 (3) and in equation (3) 𝑐!!!!; 𝑡!"; 𝑡!" : 𝑙 = 1;… ;𝑚 + 1; 𝑐!!!! is node; 𝑡!" ≤ 𝑡!" ∈ 𝑡!; 𝑡! and 𝑡!" ≤ 𝑡!"!!. 𝑡!" represents the time of node entry and 𝑡!" represents the exit time. The total duration of fluid flow in 𝑡!; 𝑡! interval is 𝑡!!; 𝑡!" . Comment: Obviously in sequence 𝐶 𝐹 = 𝑐!!!!; 𝑐!!!!;… ; 𝑐!!!! (4) a certain node may appear several times, however the sequence of nodes is finite (as follows from the definition). The fluid flow is homogenous if 𝐹 𝑑 !!;!! is a fluid flow and 𝑇! = ∅: 𝑙 = 1;… ;𝑚 + 1. For proper classification of fluid flow the fluid weight function is introduced. Since this value can vary along the process it should be incorporated in the transformation. Let 𝑇!;𝑇! !
be a type transformation and 𝑤 𝑇 :𝑇 ∈ 𝜏 be a weight function which is assigned to fluid type. This measure can be positive or negative sign as well, as negative measure refers to opposite direction of flow. Then a transformation is: 𝑇!" = 𝑇!;𝑤! ; 𝑇!;𝑤!
! (5)
where weights are assigned to the actual type of fluid. This solution allows quantitative and qualitative changes in fluids in case of materials. Since the typeset may include values with discrete and continuous types (the definition does not contain any restrictions on this issue), therefore a discrete material flow can be handled just like a continuous information flow as the amount of information can change such as the change of the size (amount/dimensions) of material during elaboration.
8
The extended nodal flow of fluids in 𝑡!; 𝑡! time interval is amended as follows: 𝐹 𝑑 !!;!! = 𝑇!; 𝑐!!!!; 𝑡!!; 𝑡!! ;𝑇!; 𝑐!!!!; 𝑡!!; 𝑡!! ;… ;𝑇!; 𝑐!!!!; 𝑡!"; 𝑡!" ;𝑇!!! (6) sequence, where 𝑇! ∈ 𝑇!;𝑤! ; 𝑇!;𝑤!
!∪ ∅ : 𝑙 = 1;… ;𝑚 + 1 (7)
and ( 𝑐!!!!; 𝑡! : 𝑙 = 1;… ;𝑚 + 1; 𝑐!!!! interface; 𝑡! ∈ 𝑡!; 𝑡! . Further processes associated with the fluid can be discovered for the explored processes of the above detailed fluid flow system. These processes are much more informative than the initial processes. Let there be 𝐹! = 𝐹 𝑑! !!!;!!! ;𝐹! = 𝐹 𝑑! !!!;!!! two process flow. It is said, that 𝐹! ≤ 𝐹! or 𝐹! is a process section of 𝐹! when 𝑡!!; 𝑡!! ⊆ 𝑡!!; 𝑡!! and 𝐶 𝐹! ⊂ 𝐶 𝐹! viz. subsequence. This definition can be refined if we do not expect the whole series to be part of the other series 𝐶 𝐹! ⊆ 𝐶 𝐹! . Logistification is illustrated in figure 2.
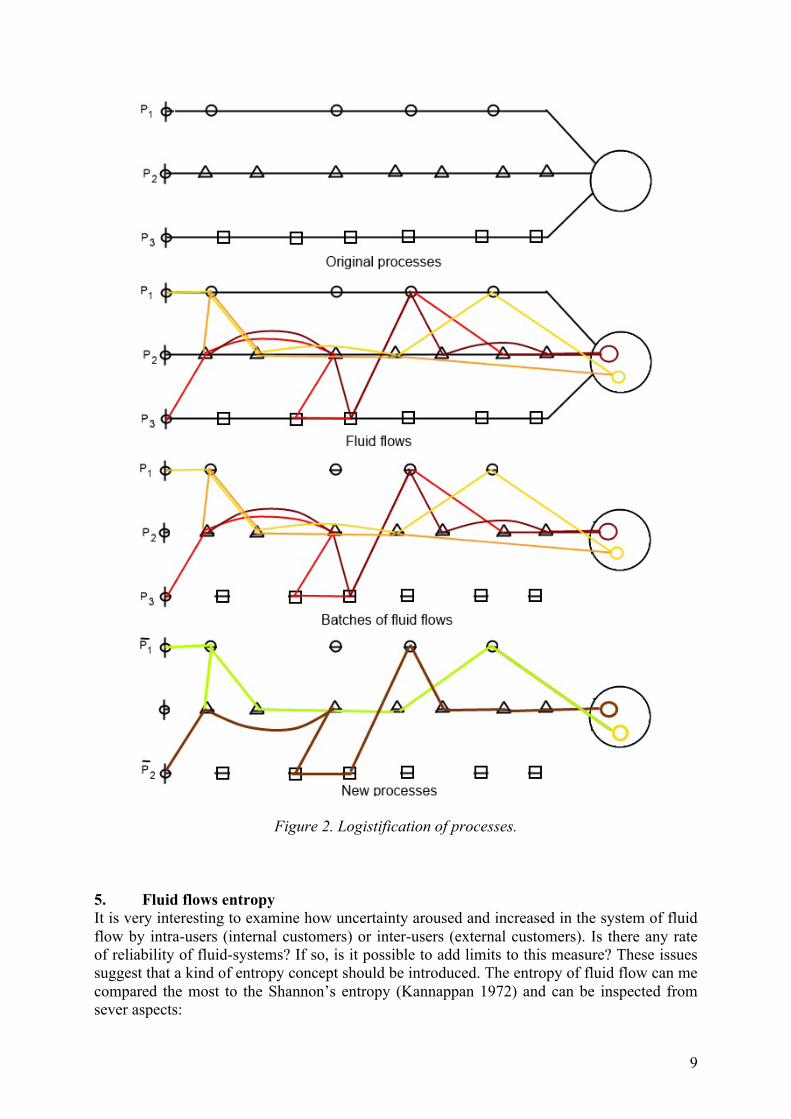
9
Figure 2. Logistification of processes.
5. Fluid flows entropy It is very interesting to examine how uncertainty aroused and increased in the system of fluid flow by intra-users (internal customers) or inter-users (external customers). Is there any rate of reliability of fluid-systems? If so, is it possible to add limits to this measure? These issues suggest that a kind of entropy concept should be introduced. The entropy of fluid flow can me compared the most to the Shannon’s entropy (Kannappan 1972) and can be inspected from sever aspects:
10
1. External (inter) users’ perspective 2. aspect of the real internal uncertainty of the system (this is subject of a following
paper) Economic systems are always open systems, so their uncertainty (reliability) is much influenced by external world and internal users. It is equally true that despite of an economic system have no demand for its products or services and it has no apparent activities, it should keep contact with the environment as social, legal, etc. environment requires it. Consequently they have both inter- and intra-users (customers) with their demands even in this special case, such as economic systems, tax authorities, reporting requirements and accountability. Accordingly these passive systems can be treated as the active ones. So it can be stated that there is an impact of increasing external uncertainty in all of the studied systems. On the other hand the level of uncertainty can be also increased by the demands and outputs of intra-users in nodes. The effect of these two influences should be complied to create a degree of reliability for process systems. 5.1 Inter-user entropy The uncertainty of an inter-user always depends on user demands, like a demand for fulfilling a deadline at a production system, a quality demand or the reliability of a user (simple parameters), as well as variations with priorities of any of these (complex parameters). The uncertainty of a system for an inter-user is determined by the collected data from system feedback information. Uncertainty can be terminated either by the system or by the users (e.g. on the occasion of the completion of the process) with a definite answer on the output (termination) of the process. In any other time uncertainty depends on inter-user’s perceptions. So the less the inter-user knows the processes of the system, the less they will be able to make safe decisions, thus the degree of uncertainty is high. As the process system of a business organization is stochastic therefore other users’ demands, the performance limitations of the system and the internal structure of processes also influence the uncertainty. Examining inter-user uncertainty from this aspect inter-user uncertainty is determined by the rate of information on the system on the one hand and users’ perceptions on the other hand. So it does not make much sense to the users if they get complete information on processes and they are not able to detect or interpret it via their perceptions. Therefore, the concept of inter-user entropy will be composed from these two features. More specifically, the inter-user entropy is the perceptional distortion of Shannon’s entropy. (Moore 1956) To define it the fluid flow provided set of information should be specified as a Shannon's sample space. (Shannon 1949) Let p be a parameter (simple or complex) whose value is relevant for an inter-user in time 𝑡!. Let the actual time be 𝑡! < 𝑡! and let 𝑡 ∈ 𝑡!; 𝑡! . Furthermore let all the fluid flow sets be known according to eq. (6): Φ !!;!! = 𝐹 𝑑 !!;!! . A fluid flow is characterized by its fluids, types, weights, transformations, etc. Let there be a sample space by the combination of a fluid flow relevant to the parameters and their characteristics: Ω. Interpret a probability on it. Let 𝐴 ∈ Ω be an arbitrary information (event) in sample space and let 𝐴! ∈ Ω be an information on A perceived by user’s perception. Then 𝐻! 𝐴 = −𝑙𝑜𝑔!𝑃 𝐴! (8)
11
is the perceptional distortion of Shannon’s entropy and denominated as the degree of uncertainty of the fluid flow system of an intra-user. In any other time the degree of uncertainty has a minimal value, which is adjusted by the user based on their perceptions of the system (obviously this is greatly influenced by the experiences). If the user’s perceptions can be determined exactly, then entropy may provide an effective measure for the (internal and external) customer side of the system.
1. If 𝐻! 𝐴 ≤ 𝐻 𝐴 is satisfied in any cases of 𝐴 ∈ Ω, then it is an undercontrolled distortion, and if 𝐻! 𝐴 ≥ 𝐻 𝐴 is satisfied then it is overcontrolled distortion. Any other case is degenerated distortion.
a. The most common case is the undercontrolled distortion as the user have such a low-level perceptions on the system that they are not be able to distort upwards, which means that they cannot perceive to feel more of the received information on their own than it is actually.
b. Overcontrolled distortion occurs when user have enough good perceptions on a system, and the received information is supplemented by their own internal knowledge.
2. 𝐻! 𝐴 = 0 is satisfied if and only if when 𝐴 = ∅ or 𝐴! = Ω; 3. In contrast, there is no monotony, so if 𝐴 ⊂ 𝐵 then 𝐴! ⊂ 𝐴 and if 𝐵! ⊂ 𝐵 not at all
certain that 𝐴! ⊂ 𝐵! is satisfied. So far as users’ characteristics of perceptions on a fluid flow system can be determined or even measured, then the goal is that the perceptional entropy should be as close to Shannon’s entropy as possible. 6. Conclusions To determine and model the operation of a process based system the first and most important task should be the conceptualization of the terms of the related discipline. In our research there have been many undefined and misunderstood terms and comprehension problems have occurred. In order to prepare the modelling phase of our future research and to lay the foundations of process logistification this conceptualization paper is inevitable. Accordingly the fluid flow based technical and mathematical model of a process system can be prepared, and a simulation built on this can be carried out to examine and reorganize an arbitrary process system from a flow perspective. Further investigations should be performed in the areas of users’ perceptions which is a very important issue for either a production or service oriented business organization since in many cases the demands of the system’s outputs may be determined by the customers’ perceptions. By the coordination of this two investigation areas such a simulation model can be developed, which could help in the amelioration of dysfunctional process systems. 7. References Buavaraporn, Nattapan. 2010. “Business Process Improvement Methodology Adoption For
Improving Service Quality: Case Studies Of Financial Institutions In Thailand”. University of Nottingham.
Ettlie, J.E. 1997. “Quality, Technology and Global Manufacturing.” Production and Operations Management 6 (2): 150–166.
Grover, V., and M.K. Malhotra. 1997. “Business Process Reengineering: A Tutorial on the Concept, Evolution, Method, Technology and Application.” Journal of Operations Management 15 (3): 193–213.
Gubán, Á., and R. Kása. 2013. “A Literature Based Review of Business Process Amelioration Methods and Techniques Regarding Service Orientation.” Journal of Advanced Managemet Science 1 (2): 230–235.
12
Gubán, Ákos, and Richard Kása. 2013. “A Literature Based Review of Business Process Amelioration Methods and Techniques Regarding Service Orientation.” Journal of Advanced Managemet Science 1 (2): 230–235.
Hammer, M. 1990. “Reengineering Work: Don’t Automate, Obliterate.” Harvard Business Review (July/August): 104–112.
Hammer, M., and J. Champy. 1993. “Reengineering the Corporation: A Manifesto for Business Revolution.” Business Horizons 36 (5): 90–91.
Janszen, E. 1996. The Postcatastrophe Economy: Rebuilding America and Avoiding the Next Bubble. Portfolio/Penguin.
Kannappan, Pl. 1972. “On Shannon’s Entropy, Directed Divergence and Inaccuracy.” Zeitschrift Für Wahrscheinlichkeitstheorie Und Verwandte Gebiete 22 (2): 95–100. doi:10.1007/BF00532728.
Kása, R., and Á. Gubán. 2013. “Folyamatjavítási Módszerek És Technikák Fejlődése És Szolgáltatásokra Szabhatósága.” In 3. Vezetéstudományi Konferencia: Vezetés És Szervezetek Taylor Után 102 Évvel. Szeged.
Lepmets, Marion, Tom McBride, and Eric Ras. 2012. “Goal Alignment in Process Improvement.” Journal of Systems and Software 85 (6) (June): 1440–1452. doi:http://dx.doi.org/10.1016/j.jss.2012.01.038. http://www.sciencedirect.com/science/article/pii/S016412121200026X.
Moore, E.F. 1956. “Gedanken Experiments on Sequential Machines.” In Automata Studies, edited by C.E. Shannon and J. McCarthy, 129–153. Princeton University Press.
O’Neill, P., and A.S. Sohal. 1999. “Business Process Reengineering A Review of Recent Literature.” Technovation 19: 571–581.
Porter, M.E. 1980. Competitive Strategy. New York: Free Press. ———. 1985. Competitive Advantage. New York: Free Press. ———. 1990. “The Competitive Advantage of Nations.” Harvard Business Review 68 (2):
73–92. Shannon, C. E. 1949. “Communication in the Presence of Noise.” Proceedings of Institute of
Radio Engineers 37 (1): 10–21.
Copyright © 2022 FDOKUMEN