The Survival of New Ventures in Dynamic versus Static Markets
28
D:\Papers\survival in dynamic markets4EARIE05.doc The Survival of New Ventures in Dynamic versus Static Markets † Andrew Burke University of Cranfield, UK and Max Planck Institute, Germany. Holger Görg University of Nottingham, Leverhulme Centre, UK. Aoife Hanley University of Nottingham (CRIS), UK. Draft March 2005 for EARIE 2005 Abstract The paper uses a unique dataset comprising a population of 179,306 new ventures who enter the UK market in 1998. The central hypothesis is that the survival function of new ventures has a different specification in dynamic compared to static markets. Estimation of a hazard function supports this hypothesis. In dynamic markets the survival of new ventures is increasing in industry concentration and decreasing in industry growth. The opposite is found to be true for static markets. The results shed new insights into the competitive dynamics of new ventures and also highlight some important effects for competition policy. JEL classification: L110, M130, 6110 Keywords: new firms, start-ups, survival, turbulence † Professor Andrew Burke, Economics, Strategy and Public Policy Group, Cranfield School of Management, Cranfield University, Cranfield, Bedford, MK43 OAL, United Kingdom. E-mail: [email protected] Acknowledgements: We are grateful for funding from NLF A2 RBL6 (Nottingham University). Also we owe thanks to Felix Ritchie and several staff members at the ONS for help with accessing the data. Note: This work contains statistical data from ONS which is Crown copyright and reproduced with the permission of the controller of HMSO and Queen's Printer for Scotland. The use of the ONS statistical data in this work does not imply the endorsement of the ONS in relation to the interpretation or analysis of the statistical data.
-
Upload
khangminh22 -
Category
Documents
-
view
5 -
download
0
Transcript of The Survival of New Ventures in Dynamic versus Static Markets
D:\Papers\survival in dynamic markets4EARIE05.doc
The Survival of New Ventures in Dynamic versus Static Markets †Andrew Burke University of Cranfield, UK and Max Planck Institute, Germany.
Holger Görg University of Nottingham, Leverhulme Centre, UK.
Aoife Hanley University of Nottingham (CRIS), UK.
Draft March 2005 for EARIE 2005
Abstract
The paper uses a unique dataset comprising a population of 179,306 new ventures who enter the
UK market in 1998. The central hypothesis is that the survival function of new ventures has a
different specification in dynamic compared to static markets. Estimation of a hazard function
supports this hypothesis. In dynamic markets the survival of new ventures is increasing in industry
concentration and decreasing in industry growth. The opposite is found to be true for static
markets. The results shed new insights into the competitive dynamics of new ventures and also
highlight some important effects for competition policy.
JEL classification: L110, M130, 6110
Keywords: new firms, start-ups, survival, turbulence
† Professor Andrew Burke, Economics, Strategy and Public Policy Group, Cranfield School of Management, Cranfield University, Cranfield, Bedford, MK43 OAL, United Kingdom. E-mail: [email protected] Acknowledgements: We are grateful for funding from NLF A2 RBL6 (Nottingham University). Also we owe thanks to Felix Ritchie and several staff members at the ONS for help with accessing the data. Note: This work contains statistical data from ONS which is Crown copyright and reproduced with the permission of the controller of HMSO and Queen's Printer for Scotland. The use of the ONS statistical data in this work does not imply the endorsement of the ONS in relation to the interpretation or analysis of the statistical data.
1
1. Introduction.
The aim of this paper is to investigate the determinants of the survival of new ventures in static and
dynamic markets. We define dynamic markets as markets where the rate of churn (firm entry plus
exit) of firms is high and where product and technological innovation are the main means through
which firms compete (see Audretsch 1995a, 1995b and Geroski, 1995). By contrast static markets
are characterised by a low churn rate and where price competition is more important. The main
motivation for the paper is the view that since the competitive model can be so different between
static and dynamic markets that in turn the specification of the survival function of new ventures
may too be different. In the paper we argue that industry concentration and industry sales growth
are likely to have opposite effects on the survival of new ventures in static compared to dynamic
markets. Thus, we argue that that it is not inappropriate to estimate a survival function based on
data which pools new ventures from static and dynamic markets.
In order to test this hypothesis we estimate hazard functions for new ventures using data from the
UK Office of National Statistics (ONS) comprising of the population of VAT registered business
from 1997-2002. We find that that the specification of the survival functions for new ventures in
static and dynamic markets is indeed different. Furthermore, we find that industry concentration
and industry growth do indeed have opposite effects on survival in dynamic compared to static
markets. Therefore, the existing empirical literature on the survival of new ventures hides an
important difference in the environment in which new ventures find themselves when entering a
dynamic compared to a static market. They indicate that the industry concentration and sales
growth will have significant differences on industry performance and evolution in static and
dynamic markets. The results are important for competition policy and support the view of
Audretsch, Baumol and Burke (2001) who argue that antitrust/competition policy, which
2
historically has been largely motivated by economic analysis of static markets, is often
inappropriate for dynamic markets. Our analysis highlights points consistent with this view but not
identified by these authors. In contrast to static markets, we find that that highly concentrated
dynamic markets are not impediments to new venture survival (sustainable entry) and by contrast
provide an easier environment for new ventures to survive. Thus, industry concentration is likely
to be less of a long term problem of the kind that warrants antitrust intervention in dynamic
industries as it actually promotes sustainable market entry. This is especially important as
Audretsch (1995a and 1995) notes that it is firm survival rather than market entry that is the big
challenge in terms of generating a future stock of viable entrants, as the variance in survival rates
across industries is greater than entry rates. Our analysis also indicates that new venture strategy is
likely to be different between static and dynamic markets due to contrasting opportunities and
threats for these ventures in these different competitive environments.
Geroski’s (1995) discussion of some of the stylized facts about entrants indicates that entry rates
vary across time rather than industries so that in the longer term no industry is more dynamic than
another. Likewise, high rates of entry are normally associated with high levels of innovation and
increases in efficiency. Thus, if these facts continue to hold then our study is more of a timing
than an industry issue i.e. stage of industry evolution. In other words, it is more of an investigation
of entering an industry when it is dynamic rather than static, as opposed to entering a dynamic
rather than a static industry. In a similar vein it is about entering when most other firms enter and
when the casualty rates (business failures) are high. Our analysis indicates that although dynamic
markets are more risky because of the high degree of uncertainty and risk, that nevertheless higher
the greater the presence of monopolistic (x-inefficient) incumbent firms the lower that risk will be.
In contrast static markets are less uncertain but monopolistic incumbents firms pose a significant
threat to survival.
3
The paper is structured as follows. In the next section we review the literature and set out the
propositions which support the view that the specification of a new venture survival function is
likely to be sufficiently different between static and dynamic markets in order to warrant separate
estimation in each type of market. This is followed in section 3 by a discussion of the data set. The
empirical analysis along with a summary concludes the paper.
2. The theoretical framework and hypotheses.
We draw on the work on firm entry and survival by Kihlstrom and Laffont (1979) and Evans and
Jovanovic (1989) Holtz-Eakin et al (1994) and allow for multiple entrepreneurs in a new venture so
that the economic profit (Y) from a new venture is defined as
Y = h – nW (1)
where h are expected accounting profits, n the number of entrepreneurs in the venture and W the
industry wage rate. Survival in any time period for any firm requires Y ≥ 0. Therefore, we assume
any firm enters and survives when this inequality holds. We accept the likelihood that new
ventures are not symmetric in terms of access to key resources (such as technology, human capital
and finance) and that entrants may also differ in terms of their degree of optimism regarding
survival. Accepting these as possibilities implies that the entry process may have very persistent
periods of high entry rates even when high failure rates are in also observation. Put differently, a
market may be persistently dynamic in terms of entry and exit as long as entrants think they are
unique and believe they can ‘beat the odds’ of survival currently in evidence. This is most likely to
occur at the early stages of new innovation diffusion when there is uncertainty regarding the
characteristics of winning firms and when there is also uncertainty regarding the characteristics of
4
actual and potential entrants. Thus, our theoretical disposition is sufficiently agnostic to
accommodate the empirical observation (e.g. Audretsch 1995a, 1995b and Mata et al 1995) that
explain high rates of entry and exit are normally associated with high levels of technological
change in an industry and that these high rates of churn may persist for some time i.e. high entry is
not necessarily a short lived process that continues until Y= 0.
Our primary focus is on the impact of monopoly power on the viability of new entrants. Therefore,
we assume that expected accounting profits are defined as
h = h(MES, S, C, G, W) (2)
where MES denotes minimum efficient scale, S is firm start-up size, C is industry concentration
and G is the industry sales growth). High minimum efficient scale indicates that entrants need to
be large in order to avoid a competitive disadvantage against incumbent firms. If there are
significant sunk costs for entrants then high MES can of itself present a disadvantage for new
entrants regardless of their start-up size so there is also justification for including MES on its own
also. Firm start-up size is often justified as a determinant of firm survival without recourse to MES
when there is uncertainty regarding entrepreneurs’ assessment of the prospects of survival. As
such, a higher start-up size should translate into higher predicted success probability or else these
investments would not be undertaken.
Hopenhayn’s (1992) model of the firm’s decision to exit confirms this intuition that size at start-up
enhances survival. He describes how larger firms which are exposed to a productivity shock
following entry are better equipped to deal with the shock than their poorer capitalised
counterparts. Hopenhayn’s model ties in with the intuition embedded in Gibrat’s law that greater
5
size implies a greater capability to capitalise on new opportunities. According to Sutton ‘the
probability that the next opportunity is taken up by any particular active firm is proportional to the
current size of the firm’ (Sutton, 1997, p.43). Analogously, in the ‘learning models’ first advanced
by Jovanovic (1982) and built upon by Pakes and Ericson (1998), hazard rates decline with firm
size because larger firms have a higher rational expectation of survival. Thus, we include firm size
at start-up S alongside MES in order to ascertain the impact of this factor. A significant body of the
empirical literature on the survival of new entrants in manufacturing industries has found a positive
effect of firms’ start-up size on survival1. Thus, it will be interesting to see how this results holds
up for our data which is mainly comprised of service industry firms and relates to a later time
period.
Industry concentration is associated with incumbent monopoly power and to this end can pose a
significant competitive threat for new entrants i.e. higher C reduces h. However, the sign on h’(C)
and hence on survival is in fact ambiguous. Mata et al (1995) note that h’(C) may in fact be
expected to be zero for the firms in our sample which are up to 3 years old.
“First, although numerous, new competitors are in general small. When they start, they typically compete with other small (and in most cases also new) firms rather than dispute the dominant firm’s market. Second, as a rule, their life is quite brief and, in most cases, entrants exit before they can really become a threat to market leaders. [Mata et al 1995 p 460]
However, other studies indicate that new entrants are frequently bringing new innovation to the
market and thus pose a threat to incumbent firms (for example, see Geroski 1995 and Audretsch,
1995a and 1995b). Depending on the nature of the new innovation high concentration could be
either a good or a bad thing for new entrants. The usual supposition is that even if entrants can use
1 Evans (1987), Hall (1987) and Audretsch (1991, 1995) have found a positive relationship between survival and firm start-up size for US manufacturing industries. Mata, Portugal and Guimaraes (1995) find similar evidence for Portuguese manufacturing.
6
innovation to enter a market their prospects would be better if they did not face competition from
incumbents with unique resources furnishing them with monopolistic power (see Audretsch 1991).
In this sense, we would expect h’(C) < 0. However, if we focus on the work of Leibenstein (1966)
then things can be quite different. If incumbents are vulnerable to the innovation of new entrants
and assuming that some level of monopolistic x-inefficiency (Leibenstein, 1966) has crept into
these firms then high concentration may pose a competitive cushion for entrants to enter a market
with out threat. In fact entry to a less concentrated industry with more efficient incumbents may
pose a much harder environment for entrants. Examples abound, the new ventures launched by
Richard Branson and his Virgin group of new ventures actually targeted highly concentrated
industries where incumbents were not used to competition and were slow to respond (DTI, 1996).
Likewise, the new entrants who introduced the ‘low cost travel’ innovation to the European airline
industry benefited from the fact that incumbents were monopolistic x-inefficient firms (such as
British Airways and Aer Lingus) who had relied on landing slots to block entry and had over time
become highly cost inefficient and moreover, were sufficiently inflexible to take a very long time to
bring their costs down to competitive levels. This provided crucial breathing space for once small
new entrants such as Ryanair and EasyJet to survive (and grow to become large firms). Thus, we
propose that in circumstances such as these that h’(C) < 0 is possible so that survival is promoted
by industry concentration.
Furthermore the key motivation for our paper is to argue that h’(C) < 0 is more likely to occur
when markets are dynamic and indeed that h’(C) > 0 is much more likely to occur when markets
are static. It is relevant that the distinction between static and dynamic markets largely seeks to
distinguish between different dominant forms of competition (see Audretsch, Baumol and Burke
2001). In particular, to differentiate situations where models of price competition dominate (static
7
markets) the competitive process from those where product and technological innovation play more
prominent roles (dynamic markets). As Geroski (1995) observes it is these latter markets which are
characterised by high level of firm entry and exit. Thus, in more static environments where new
entrants cannot shield themselves from price competition through product and technological
innovation (differentiation) the market power of incumbents associated with high industry
concentration is likely to pose a major threat to new entrants; implying h’(C) > 0 . By contrast, in
more dynamic settings where higher levels of innovation provide a means for entrants to
circumvent the competitive advantages of incumbents and where incumbents have become x-
inefficient high industry concentration may in fact boost the viability of entrants so that h’(C) < 0.
Thus, this possibility demands that the indirect text of equation (1) through a survival function
indicates that the impact of industry concentration on firm survival may have contrasting effects
depending on whether the market is dynamic and static. Therefore, it highlights that a pooled
estimation of survival comprising an independent variable measuring concentration across both
static and dynamic markets may yield misleading results as doing so in effect pools two very
different competitive regimes.
Proposition 1: The impact of industry concentration on the survival of new entrants is more
likely to be negative when markets are static and positive when markets are dynamic.
Therefore, in the analysis section of the paper we test to see if this proposition is upheld by
estimating competing models comprising pooled and split data by industry dynamism. However,
the motivation to split the data also emanates from consideration of the role of industry sales
growth on the survival of new ventures. In general, higher industry sales growth is normally
regarded as a positive force for new entrants as it allows them to secure market segments
overlooked by incumbents. Put differently, high industry sales growth may make incumbents lax

8
as they need to exert less effort in order to achieve their profit targets. However, the impact of
growth on entrants profits hinge crucially on the competitive process. In a shakeout environment
industry growth may be negatively associated with survival when economies of scale or network
externalities are important. In these cases high growth precipitates the shakeout process as faster
growing firms gain a competitive advantage over their rivals as their size increases and hence
reduces survival rates – so that h’(G) < 0 for most firms. By contrast, in a less turbulent situation
industry growth can provide a life line to otherwise uncompetitive entrants so that h’(G) >0. Thus,
we again find a motivation to split the data along the lines of market dynamism.
Proposition 2: The impact of industry sales growth on the survival of new entrants is more
likely to be positive when markets are static and negative when markets are dynamic.
In sum, our hypothesis is that the competitive model is quite different in static and dynamic
industries and that the impact of industry growth and concentration could have opposite effects on
the survival of new entrants. We test our propositions by dividing the data set in dynamic and
static industries and testing a survival function. We achieve this objective by estimating a firm’s
hazard function, hf (t) is defined as
hf (t) = h (t; xf) = h0 (t) exp (x’f β) (3)
where h0 (t) represents the baseline hazard function which describes the probability of failure
conditional on the firm having survived until time t following market entry, xf comprises a vector of
explanatory variables for the firm justified from equations 1 and 2 above, while f and β represent a
vector of regression parameters. When interpreting the regression output, hazard ratios of less than
1 imply that the firm’s survival chances are enhanced by increases in the covariate. Conversely,
9
hazard ratios greater than 1 show an adverse effect of the covariate on firm survival. We argue that
the (1) separate estimation of the hazard function for static and dynamic industries will prove a
superior fit and (2) that if this proves to be true propositions 1 and 2 are likely to hold.
Before moving on to the data and estimation we make some remarks about other control variables.
We note that because we examine the survival prospect of a cohort of UK firms (circa 179,306)
entering the market in 1998, the age of these firms remains invariant and therefore does not feature
in our analyses.
No duration analysis would be complete without reference to how the new entrants’ respective
industry sectors exhibit variation in survival likelihoods. In our analysis, we treat each 2-digit SIC
code as a separate stratum and allow the baseline hazard function to vary across these different
strata. Although we constrain the coefficients of the covariates to act in a homogeneous way, we
allow flexibility in this constraint by subsequently permitting the coefficients (or hazard ratios) to
vary according to whether the industry is denoted as dynamic or not (in the split regressions). This
latter part of the analysis represents an innovation from existing work in that no work so far has
allowed the covariates to vary across this dimension.2
We should further note that the standard errors estimated in our analyses are allowed to cluster by
individual firm by using the robust measure of variance in our estimations. In so doing, we
recognise that any firm can be expected to behave in a systematic way, and that errors across years
therefore, are correlated.
2 Although Segarra and Callejόn (2002) define turbulence as the summation of entry and exit rates, they opt to focus on entry rates in their estimations.

10
3. The Data and Descriptive Statistics
IDBR data
Our data is drawn from the Inter-Departmental Business Register (IDBR) database at the UK
Office for National Statistics. This register captures VAT registered businesses and as such
comprises about 98 percent of UK business activity.3 The advantage of using data from the register
is twofold. Firstly it is highly representative, given that it covers almost the population of UK firms
and does not suffer from biases induced by sampling. This latter point is especially important in
duration studies, where over-sampling of large firms in comparison to small firms underestimates
the real amount of movement in an economy, since entry and exit is mostly a small firm
phenomenon. Secondly, the register identifies businesses at the local unit level. Barnes and Martin
(2002) define this as the “individual site or workplace (factory, shop etc.) at which activity takes
place (P.37)”.
Single-plant firms
Higher levels of aggregation (enterprise level) used to uniquely identify firms within the UK
Annual Census of Production (drawn from mostly larger firms within the IDBR) has up to now
made it difficult for researchers to pinpoint whether the exit of an establishment from the data was
caused by the failure of all local units belonging to the enterprise. Alternatively, the exit of an
establishment could be induced by the failure of a large and important local unit which in turn
caused the whole enterprise to exit from the data. Notwithstanding the exit of the large and
important local unit, any sister units could have remained operational if they had been independent
entities rather than been part of an enterprise group. To put it simply: an examination of local units
is the simplest and most way to examine entry and exit when we need to directly attribute entry and
exit to the unit under examination.
3 See Barnes and Martin (2002) for an overview of this data.
11
Industry data from Annual Respondents’ Database (ARD)
Representativeness and research relevance come at a cost however: While the IDBR contains a
reasonably exhaustive listing of all firms from all sectors of the UK economy, knowledge about the
features of these local units is limited to sectoral and employment information. To remedy this
information shortfall, we import information at a sectoral level on productivity, wages and market
structure from the ARD survey. This lets us describe the composition of the sector in which our
local units operate and report inter alia industry concentration ratios.
Time Window and Censoring
We finally note that our data extends for a 6 year period, 1997 to 2002. However, this translates
into a relatively short year survival horizon for the cohort of firms who appear in the data for the
first time. Data for 1997 is essentially used as a criterion that allows us to identify new entrants
(present in 1998 but not in 1997) and data for 2002 allows us to identify real, uncensored exits
(present in 2001 but not in 2002). Accordingly, we limit our duration analysis to a 3 year time
window when we have accounted for left- and right-hand side censoring and represented failures
that arise in 1998 (entry year) as happening at the beginning of the following year.4 Fortunately,
given the high level of attrition of start-ups in the earliest phases of their operation (almost 50
percent failed within these 3 years), even within a relatively short time span we manage to capture a
high level of early stage exits. This pattern most likely arises from our ability to include low
quality, under-capitalised, start-ups when using the IDBR data. Given the comprehensive nature of
the data, we are confident that this data is representative.5
4 As is customary in survival analyses of this type with ‘simultaneous’ entry and exit 5 Our attrition rate for the 1998 cohort (1st three years), corresponds with other UK exit rates: 42 percent after 2 years cited by Scarpetta (2001) for the early 1990’s and 45 percent in Disney et al., (2003)for the period 1986 to 1991
12
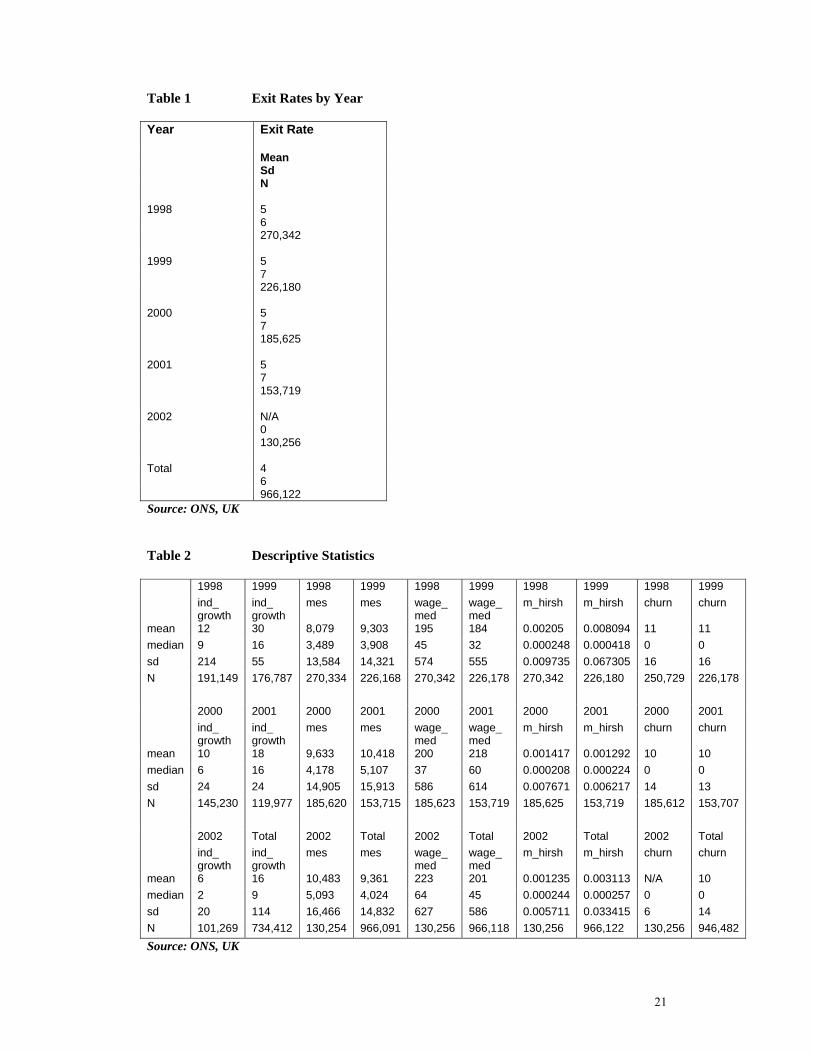
Since our analysis focuses on entry into and exit from industry sectors, we first report exit levels for
the cohort of UK firms entering into self-employment in 1998, tracking the number of exits from
1998 until 2001 (Table 1).6
[Table 1. here]
The average number of exits across all firms in the database is about 5 percent per year. This
means that only a minority of firms across the broad spectrum of UK industry will exit in any year.
As such, dynamism at a sectoral level is something that happens at the fringes of industry in
general, and an examination of all industry exits suggests a high amount of inertia.
This inertia seen across UK industry masks the dynamism that arises within cohorts of new
ventures, however. Accordingly, we would expect that annual exit rates within the grouping of
new ventures should be much higher, given the greater financial fragility and unproven track-record
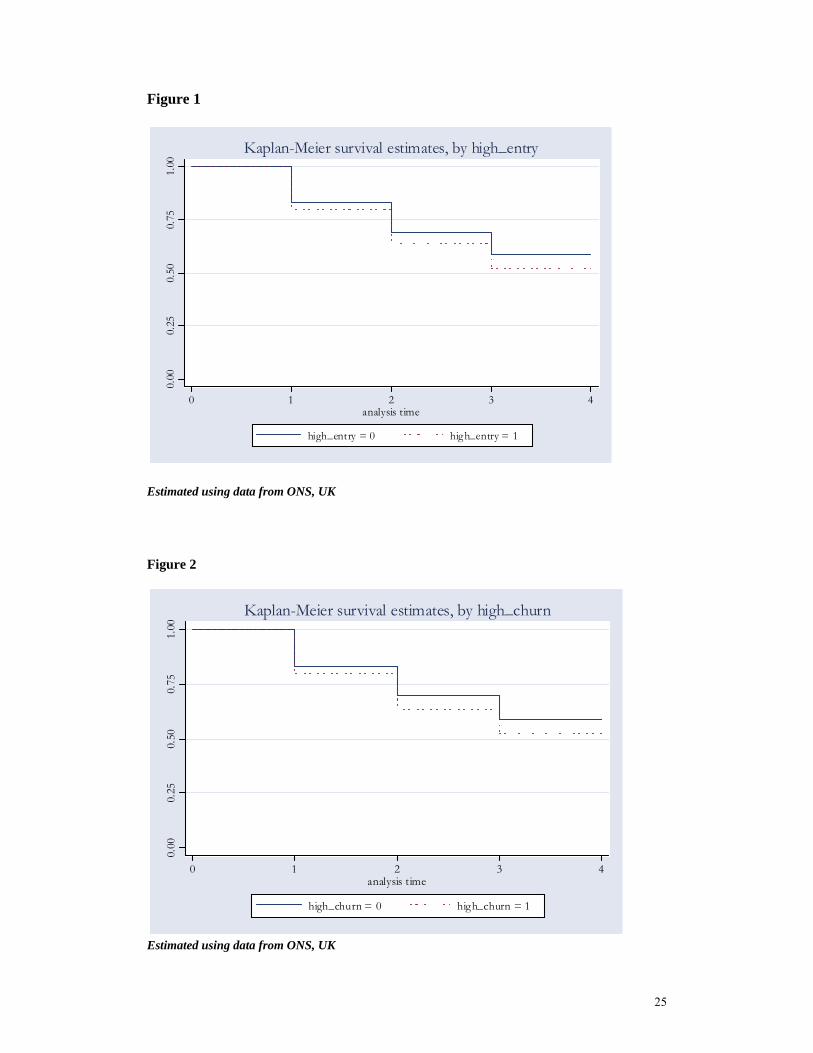
of new ventures. Figure 1 and Figure 2 trace the hazard rates for our 1998 cohort of UK firms as
Kaplan-Meier functions. Attrition is recorded for 3 analysis times (where the function ‘steps’) and
this corresponds to 1999, 2000 and 2001 respectively.7 We can see from the failure function that
almost 25 percent of entrants have failed in the year of entry, culminating in a rate of almost 50
percent for the third year of existence, a failure rate in line with other failure rates documented in
UK failure studies (Scarpetta, 2001; Disney et al., 2003). We moreover dichotomise our cohort
depending on whether sectoral entry rates at a sectoral level exceed median sectoral entry rates.
This allows us to capture possible differences in attrition according as firms enter markets
characterised by low and high levels of dynamism respectively.
6 We cannot calculate the value of exits for 2002 because firm’s survival is right censored at this date 7 A convention in duration analyses of this type is to treat all failures in the year of entry as having occurred at the beginning of the next year. Accordingly all failure times for entry at time t are treated as failures arising in t+1.
13
We see from Figure 1 that firms entering industries with above average entry rates with entry of at
least 11 percent (‘high_entry’ = 1) appear less likely to survive than their counterparts. This pattern
is reflected in the Kaplan-Meier function which formulates entry as a discrete variable.8 However,
we should note that the Kaplan-Meier does not take account of the auxiliary role of other covariates
in influencing survival and hence is merely illustrative.
[Figure 1 here]
Figure 2, on the other hand, reports the hazard rates for firms entering industries marked by high
levels of churn (summation of entry and exit rates), where ‘high_churn’ is set at the 75th percentile
(churn greater than and equal to 20 percent). Here we see that higher hazard rates are registered by
firms entering industries with higher churn rates, a pattern most likely induced by the dominance of
industry exit within the churn measure. This pattern is also borne out in the positive bivariate
correlation coefficient between the variable ‘churn’ and ‘fail’ in Appendix 1.
Table 2 shows the breakdown of the covariates used in our analysis While overall growth rates for
UK firms in the Annual Respondents’ Database (ARD) are shown to be volatile across the years,
the variables minimum efficient scale, ‘mes’ (average output of the leading 5 firms in the sector)
and median wage rates, ‘wage_med’ show less variation Our key variable measuring industry
dynamism, ‘churn’ is pretty invariant across the years and its median value of 0, brings out a point
made earlier that many industries at a 3-digit sectoral level do not demonstrate any activity at all. It
follows that at least half of all industries register 0 entry and exit and accordingly 0 churn rates.
8 We should note however, the negative correlation coefficient between failure and entry rates (Appendix 1) when firm entry rates are formulated as a continuous variable.
14
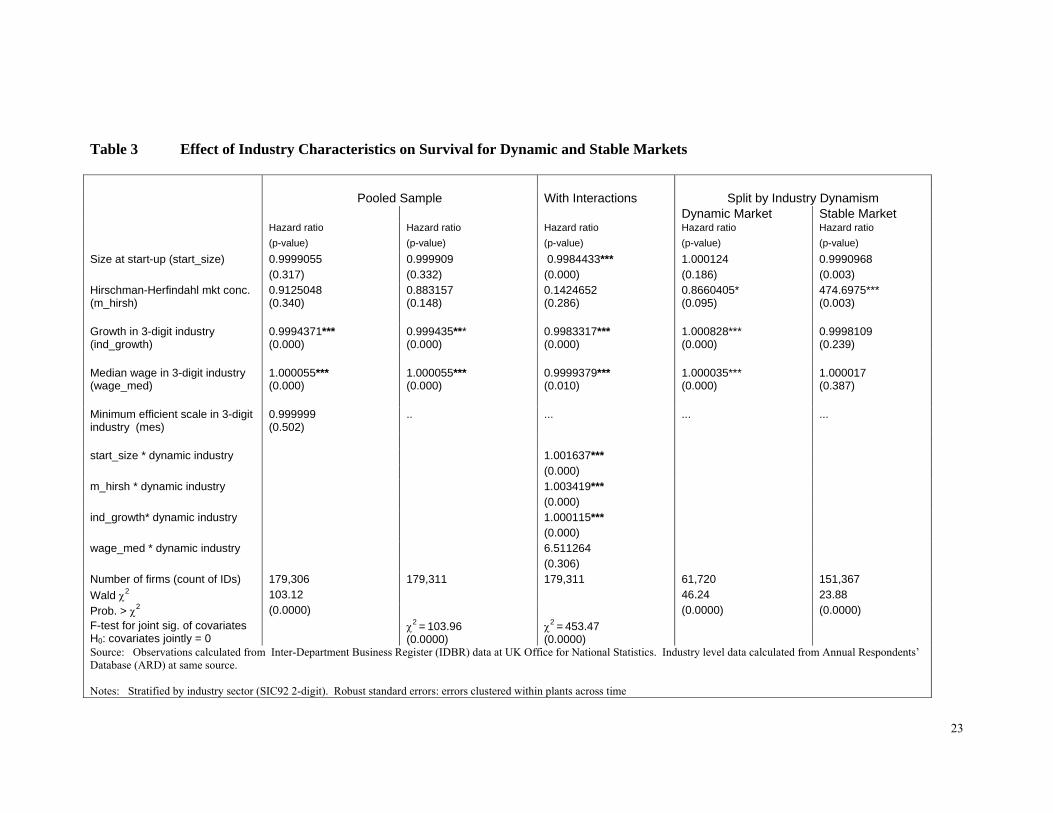
4. Analysis
Table 3 summarises the results of our Cox duration analysis which investigates the failure
likelihoods of firms in the 1998 cohort as a function of key industry concentration, growth, cost and
optimal output variables. We first analysed all firms in a pooled framework before going on to
explore possible interactions as markets exhibit higher or lower levels of dynamism.
Although the size of firm at the time of start-up and the level of industry concentration do not
appear to affect failure probabilities, the level of industry growth does. We find that firms entering
growing industries are less likely to fail and that this result is highly significant. This result appears
in line with the stylised facts of survival, where growing industries exhibit a higher capacity to
absorb new entrants (See Caves, 1998). We also note that higher cost industries, all things equal,
denoted by higher median wages are less advantageous to new entrants. Here new ventures
perform less strongly, as evidenced by their significantly higher failure rates. We do not find any
evidence of variation in survival across industries of varying optimal output levels (‘mes’).9
We reran the duration analysis having excluded the industry output level variable, ‘mes’ in order to
see whether the results remained robust to its omission. In line with what we expect given its
collinearity with the market concentration variable, ‘m_hirsh’, the significance of the latter
improves, although the signs and significance levels of the remaining variables remain unchanged.
Our next step was to check whether the coefficients on each of the controlling covariates are
sensitive to whether the industry into which new ventures entered was denoted as dynamic or
stable. Accordingly, we interact each of our covariates with the ‘churn’ dummy and note the
resulting F-test for this modification. Interestingly, start-up size and concentration, both of which
9 Due to the collinearity of this variable, ‘mes’ with our market concentration measure, ‘m_hirsh’ and insignificance in initial duration analyses, we omitted this variable from subsequent analyses.

15
showed no significance in the pooled regression show themselves highly sensitive to industry
dynamism, as evidenced by the high significance of their hazard ratios on the interactive term. The
χ2 value on the industry growth-dynamism interaction is also highly significant, and although the
interaction term for our cost interaction variable is insignificant, the overall F-test for joint
significance of the interaction terms suggests that we depart from the pooled framework and opt
instead for a split framework.
The final two columns document our results according to whether new entrants enter industries
characterised by churn of at least 20 percent (75 percentile and denoted as ‘high_churn’) or enter
more static industries. We see that the size of a new venture on starting up is only important in
enhancing survival when the industry is static. This result may suggest that new entrants in more
risky industries may have to ‘test the water’ and minimise sunk costs when entering a new market
in order to enable a quick withdrawal and that this strategy promotes their chances of survival.
Where risk of failure is lower, entrants can commit higher specialised resources to the new venture
and in so doing augment their survival chances.10
Growing industries are likely to be marked by high numbers of ‘pre-shakeout’ firms which have yet
to undergo the natural selection and the weeding out process that arises when demand slows down.
On the other hand, more mature industries are expected to be more concentrated, as firms
concentrate more on becoming low cost producers and put their efforts into competing on the basis
of price. Perhaps this dichotomy between concentration and growth underpins the difference in
survival prospects of new entrants in dynamic and less dynamic industries. New entrants into
10 This result may need to be examined further in the context of differential sunk costs, a possibility for future research
16
dynamic industries fare better when the industry is characterised by higher concentration and lower
growth while the reverse appears to hold true for new entrants into more stable markets.11
5. Conclusions
The paper constructed and used a unique dataset comprising a population 179,306 new ventures
who enter the UK market in 1998. The data spans a wide range of industries and is therefore, not
confined to manufacturing industries which so far have dominated empirical analyses of firm
survival. We observed that new ventures who enter markets with higher entry rates as well as
markets which are more dynamic (i.e. high churn rates of entry and exit) manifest lower survival
rates. The central hypothesis is that the survival function of new ventures has a different
specification in dynamic rather than static markets. Our estimation of a pooled and split (separated
into static and dynamic industries) sample hazard functions support this hypothesis. In dynamic
markets the survival of new ventures is increasing in industry concentration and decreasing in
industry growth. The opposite is found to be true for static markets. The results shed new insights
into the competitive dynamics of new ventures. In static markets new ventures face less risk and
uncertainty but greater competition from incumbents. In this environment industry growth
promotes new firm survival as it is likely to lesson the competition faced by incumbents and other
new ventures. By contrast in dynamic markets monopolistic incumbents actually boost the chances
of survival of new entrants by providing a vulnerable, or perhaps impudent, stock of x-inefficient
firms who are less relevant to the innovation-led competition which characterises dynamic markets.
Also by contrast industry growth in dynamic markets does not support new venture survival which
seems consistent with a view that such markets are subject to business shakeouts associated with
inherent economies of scale and/or network externalities. Market growth increases the importance
11 We qualify this observation by adding that although the p-value for industry growth in stable markets is insignificant, the hazard ratio is lower than 1 as expected.
17
of these scale effects and favour emerging winners among new entrants who already have acquired
scale advantages
Thus, while dynamic markets are more risky for new ventures than their static counterparts, our
analysis indicates that the source of the threat to survival for these businesses is very different. It
follows that the strategic priorities for new ventures differs between static and dynamic markets.
Being able to survive competition form incumbents is the key in static markets and as a result high
industry concentration poses a problem for new ventures. In dynamic markets market power of
incumbents appears less relevant. These firms are likely to exhibit the hallmarks of x-inefficiency
which allows smaller scale innovative ventures a double advantage but ultimately providing a boost
to firm survival. Thus, from a new venture strategy perspective, in dynamic markets they need to
think more about the capabilities of other new ventures while in static markets incumbents are pose
the main threat.
From a competition policy perspective, our analysis implies that industry concentration only poses
a threat to the viability of new firms in static markets. By contrast industry concentration actually
helps new ventures overcome other impediments to survival such as high risk in dynamic markets.
Thus, from an antitrust perspective, the paper provides some key empirical support to the central
hypothesis of Audretsch, Baumol and Burke (2001) who contend that competition policy frequently
needs to needs to be different in its form and conduct when moving from static and dynamic
markets.
18
References Agarwal, R. and M. Gort, Michael, 2002, ‘Firm and Product Life Cycles and Firm Survival’, American Economic Review, vol. 92, no. 2, May 2002, pp. 184-90 Audretsch, D., 1991, ‘New-Firm Survival and the Technological Regime’, The Review of Economics and Statistics, v73, n3, pp. 441-450 Audretsch, D.B. (1995a), Innovation and Industry Evolution, The MIT Press, Cambridge MA. Audretsch, D.B. (1995b), Innovation, growth and survival, International Journal of Industrial Organization, 13: 441-457. Audretsch, D.B., Baumol, W.J. and Burke, A.E. (2001), Competition policy in dynamic markets, International Journal of Industrial Organization, 19: 613-634. Audretsch, D.B., and Thurik, A. R. (2000), Capitalism and democracy inn the 21st Century: from the managed to the entrepreneurial economy, Journal of Evolutionary Economics, 10: 17-34. Audretsch, D.B., and Thurik, A. R. (2001), What is new about the new economy: sources of growth in the managed and entrepreneurial economies, Industrial and Corporate Change, 19: 795-821. Audretsch, D.B., and Thurik, A. R. (2004), A model of the entrepreneurial economy, International Journal of Entrepreneurship Education, 2: 143-166. Barnes, M. and R. Martin, 2002, “Business Data Linking: An Introduction”, Economic Trends, n581, April 2002, Office for National Statistics Caves, R., 1998, “Industrial Organization and New Findings on the Turnover and Mobility of Firms”, Journal of Economic Literature, v36, n4, pp.1947-1982 Geroski, P., 1995, “What do we know about entry?” International Journal of Industrial Organization, v13, pp.421-440 Görg, H. and E. Strobl, 2003, “Multinational Companies, Technology Spillovers and Plant Survival”, Scandinavian Journal of Economics, v105, n4, pp.581-595 Görg, H. and E. Strobl, 2003, “Footloose Multinationals”, The Manchester School, v71, n1, pp.1-19 Jovanovic, B., “Selection and Evolution of Industry”, Econometrica, v50, n7, pp.649-670 Segarra, and M. Callejon, 2002, ‘New Firms' Survival and Market Turbulence: New Evidence from Spain’, Review of Industrial Organization, vol. 20, no. 1, pp. 1-14
19
Audretsch, D., P. Houweling and R. Thurik, 2000, ‘Firm Survival in the Netherlands’, Review of Industrial Organization, v16, pp.1-11 Barnes, M. and R. Martin, 2002, “Business Data Linking: An Introduction”, Economic Trends, n581, April 2002, Office for National Statistics Caves, R., 1998, “Industrial Organization and New Findings on the Turnover and Mobility of Firms”, Journal of Economic Literature, v36, n4, pp.1947-1982 Disney, R., J. Haskel and Y. Heden, 2003, ‘Entry, Exit and Establishment Survival in UK Manufacturing’, Journal of Industrial Economics, v51, n1, pp. 91-112. Evans, D.S. and Jovanovic, B. (1989), 'An Estimated Model of Entrepreneurial Choice under Liquidity Constraints', Journal of Political Economy, vol. 97, August 1989, pp 808-827. Geroski, P., 1995, “What do we know about Entry?” International Journal of Industrial Organisation, v13, pp.421-440 Görg, H. and E. Strobl, 2003, “Multinational Companies, Technology Spillovers and Plant Survival”, Scandinavian Journal of Economics, v105, n4, pp.581-595 Görg, H. and E. Strobl, 2003, “Footloose Multinationals”, The Manchester School, v71, n1, pp.1-19 Holtz-Eakin, Douglas & Joulfaian, David & Rosen, Harvey S, 1994. "Sticking It Out: Entrepreneurial Survival and Liquidity Constraints," Journal of Political Economy, University of Chicago Press, vol. 102(1), pages 53-75. Hopenhayn, H., 1992, ‘Entry, Exit, and Firm Dynamics in Long Run Equilibrium’, Econometrica, v60, n5, September 1992, pp. 1127-50 Jovanovic, B., 1982, “Selection and Evolution of Industry”, Econometrica, v50, n7, pp.649-670 Kihlstrom, R.E., and Laffont, J-J. (1979), 'A General Equilibrium Theory of Firm Formation Based on Risk Aversion', Journal of Political Economy, vol 87, no 4: 719-748. Harvey Leibenstein (1966), "Allocative Efficiency and X-Efficiency," The American Economic Review, 56: 392-415. Mata, J., P. Portugal and P. Guimaraes, 1995, ‘The Survival of New Plants: Start-Up Conditions and Post-entry Evolution’, International Journal of Industrial Organization, v13, n4, pp. 459-81 Pakes, A. and R. Ericson, 1998, ‘Empirical Implications of Alternative Models of Firm Dynamics’, Journal of Economic Theory, v 79, n1, pp. 1-45 Scarpetta, S., 2001, OECD Economic Outlook, n69, June, Chapter 7, Paris

20
Segarra, A. and M. Callejόn, 2002, ‘New Firms' Survival and Market Turbulence: New Evidence from Spain’, Review of Industrial Organization, vol. 20, no. 1, pp. 1-14 Sutton, J., 1997, ‘Gibrat’s Legacy’, Journal of Economic Literature, v35, pp. 40-59
21
Table 1 Exit Rates by Year Year Exit Rate
Mean Sd N
1998 5 6 270,342
1999 5 7 226,180
2000 5 7 185,625
2001 5 7 153,719
2002 N/A 0 130,256
Total 4 6 966,122 Source: ONS, UK Table 2 Descriptive Statistics 1998 1999 1998 1999 1998 1999 1998 1999 1998 1999 ind_
growth ind_ growth
mes mes wage_ med
wage_ med
m_hirsh m_hirsh churn churn
mean 12 30 8,079 9,303 195 184 0.00205 0.008094 11 11 median 9 16 3,489 3,908 45 32 0.000248 0.000418 0 0 sd 214 55 13,584 14,321 574 555 0.009735 0.067305 16 16 N 191,149 176,787 270,334 226,168 270,342 226,178 270,342 226,180 250,729 226,178 2000 2001 2000 2001 2000 2001 2000 2001 2000 2001 ind_
growth ind_ growth
mes mes wage_ med
wage_ med
m_hirsh m_hirsh churn churn
mean 10 18 9,633 10,418 200 218 0.001417 0.001292 10 10 median 6 16 4,178 5,107 37 60 0.000208 0.000224 0 0 sd 24 24 14,905 15,913 586 614 0.007671 0.006217 14 13 N 145,230 119,977 185,620 153,715 185,623 153,719 185,625 153,719 185,612 153,707 2002 Total 2002 Total 2002 Total 2002 Total 2002 Total ind_
growth ind_ growth
mes mes wage_ med
wage_ med
m_hirsh m_hirsh churn churn
mean 6 16 10,483 9,361 223 201 0.001235 0.003113 N/A 10 median 2 9 5,093 4,024 64 45 0.000244 0.000257 0 0 sd 20 114 16,466 14,832 627 586 0.005711 0.033415 6 14 N 101,269 734,412 130,254 966,091 130,256 966,118 130,256 966,122 130,256 946,482 Source: ONS, UK

22
23
Table 3 Effect of Industry Characteristics on Survival for Dynamic and Stable Markets Pooled Sample With Interactions Split by Industry Dynamism Dynamic Market Stable Market Hazard ratio Hazard ratio Hazard ratio Hazard ratio Hazard ratio (p-value) (p-value) (p-value) (p-value) (p-value) Size at start-up (start_size) 0.9999055 0.999909 0.9984433*** 1.000124 0.9990968 (0.317) (0.332) (0.000) (0.186) (0.003) Hirschman-Herfindahl mkt conc. (m_hirsh)
0.9125048 (0.340)
0.883157 (0.148)
0.1424652 (0.286)
0.8660405* (0.095)
474.6975*** (0.003)
Growth in 3-digit industry (ind_growth)
0.9994371*** (0.000)
0.999435*** (0.000)
0.9983317*** (0.000)
1.000828*** (0.000)
0.9998109 (0.239)
Median wage in 3-digit industry (wage_med)
1.000055*** (0.000)
1.000055*** (0.000)
0.9999379*** (0.010)
1.000035*** (0.000)
1.000017 (0.387)
Minimum efficient scale in 3-digit industry (mes)
0.999999 (0.502)
.. ... ... ...
start_size * dynamic industry 1.001637*** (0.000) m_hirsh * dynamic industry 1.003419*** (0.000) ind_growth* dynamic industry 1.000115*** (0.000) wage_med * dynamic industry 6.511264 (0.306) Number of firms (count of IDs) 179,306 179,311 179,311 61,720 151,367 Wald χ2 103.12 46.24 23.88 Prob. > χ2 (0.0000) (0.0000) (0.0000) F-test for joint sig. of covariates H0: covariates jointly = 0
χ2 = 103.96 (0.0000)
χ2 = 453.47 (0.0000)
Source: Observations calculated from Inter-Department Business Register (IDBR) data at UK Office for National Statistics. Industry level data calculated from Annual Respondents’ Database (ARD) at same source. Notes: Stratified by industry sector (SIC92 2-digit). Robust standard errors: errors clustered within plants across time

24
Estimated using data from ONS, UK
25
Figure 1
0.00
0.25
0.50
0.75
1.00
0 1 2 3 4analysis time
high_entry = 0 high_entry = 1
Kaplan-Meier survival estimates, by high_entry
Estimated using data from ONS, UK
Figure 2
0.00
0.25
0.50
0.75
1.00
0 1 2 3 4analysis time
high_churn = 0 high_churn = 1
Kaplan-Meier survival estimates, by high_churn
Estimated using data from ONS, UK

26
27
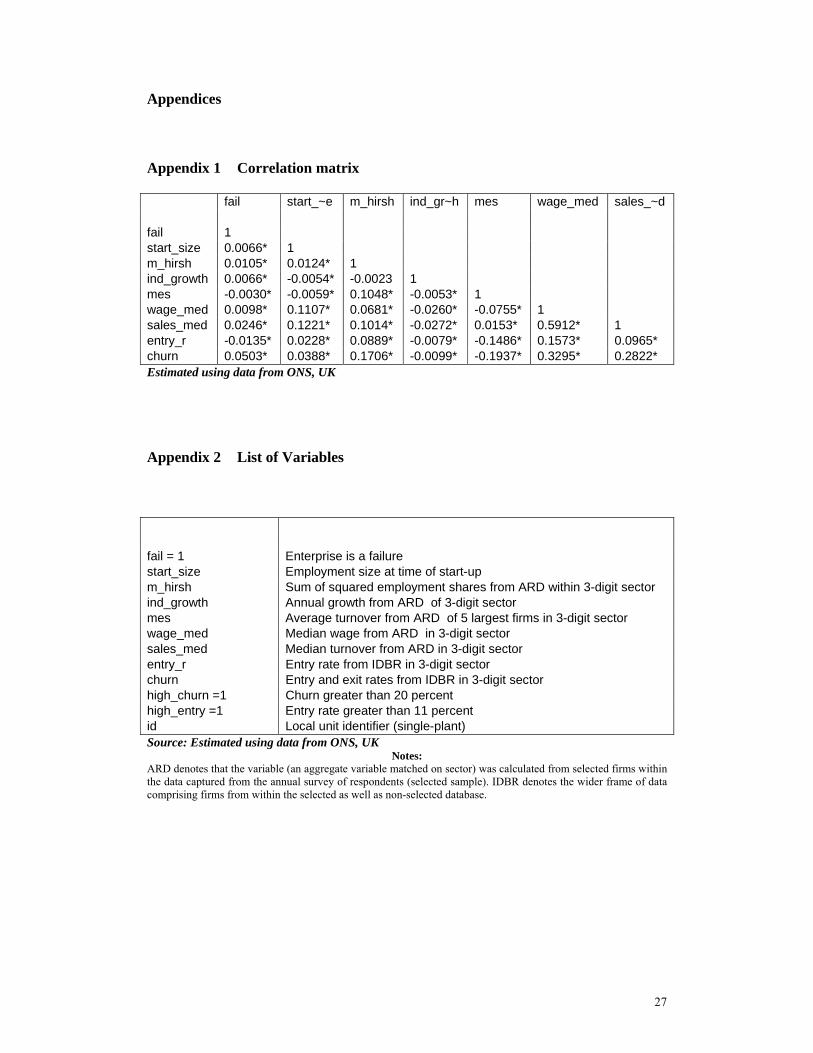
Appendices
Appendix 1 Correlation matrix
fail start_~e m_hirsh ind_gr~h mes wage_med sales_~d fail 1 start_size 0.0066* 1 m_hirsh 0.0105* 0.0124* 1 ind_growth 0.0066* -0.0054* -0.0023 1 mes -0.0030* -0.0059* 0.1048* -0.0053* 1 wage_med 0.0098* 0.1107* 0.0681* -0.0260* -0.0755* 1 sales_med 0.0246* 0.1221* 0.1014* -0.0272* 0.0153* 0.5912* 1 entry_r -0.0135* 0.0228* 0.0889* -0.0079* -0.1486* 0.1573* 0.0965* churn 0.0503* 0.0388* 0.1706* -0.0099* -0.1937* 0.3295* 0.2822* Estimated using data from ONS, UK
Appendix 2 List of Variables
fail = 1 Enterprise is a failure start_size Employment size at time of start-up m_hirsh Sum of squared employment shares from ARD within 3-digit sector ind_growth Annual growth from ARD of 3-digit sector mes Average turnover from ARD of 5 largest firms in 3-digit sector wage_med Median wage from ARD in 3-digit sector sales_med Median turnover from ARD in 3-digit sector entry_r Entry rate from IDBR in 3-digit sector churn Entry and exit rates from IDBR in 3-digit sector high_churn =1 Churn greater than 20 percent high_entry =1 Entry rate greater than 11 percent id Local unit identifier (single-plant) Source: Estimated using data from ONS, UK
Notes: ARD denotes that the variable (an aggregate variable matched on sector) was calculated from selected firms within the data captured from the annual survey of respondents (selected sample). IDBR denotes the wider frame of data comprising firms from within the selected as well as non-selected database.