How strongly can forest management influence soil carbon sequestration?
Upload
independentCategory
view
3download
0
Am. J. Hum. Genet. 72:1389–1400, 2003
1389
The Structure of Linkage Disequilibrium at the DBH Locus StronglyInfluences the Magnitude of Association between Diallelic Markersand Plasma Dopamine b-Hydroxylase ActivityCyrus P. Zabetian,1,3,* Sarah G. Buxbaum,4,† Robert C. Elston,4 Michael D. Kohnke,5George M. Anderson,2 Joel Gelernter,1,3 and Joseph F. Cubells1,3
1Department of Psychiatry and 2Child Study Center, Yale University School of Medicine, New Haven, CT; 3Department of Psychiatry,VA Connecticut Healthcare System, West Haven, CT; 4Department of Epidemiology and Biostatistics, Case Western Reserve University,Cleveland, OH; and 5University Hospital of Psychiatry and Psychotherapy, Tubingen University Hospital, Tubingen, Germany
There is currently a great deal of interest in using linkage disequilibrium (LD) mapping to locate both disease andquantitative-trait loci on a genomewide scale. Recent findings suggest that much of the human genome is organizedin discrete “blocks” of low haplotype diversity, but the utility of such blocks in identifying genes influencing complextraits is not yet known and must ultimately be tested empirically through use of real data. We recently identifieda putative functional polymorphism (51021CrT) in the 5′ upstream region of the DBH gene that accounted for35%–52% of the total phenotypic variance in plasma dopamine b-hydroxylase (DBH) activity in samples fromthree distinct populations. In the present study, we genotyped 11 diallelic markers at the DBH locus surrounding51021CrT in 386 unrelated individuals of European origin. We identified a single 10-kb block containing51021CrT, in which four haplotypes comprised 93% of the observed chromosomes. Only markers within theblock were highly associated with phenotype ( ), with one exception. In general, association with510P � 2.2 # 10phenotype was strongly correlated with the degree of LD between each marker and 51021CrT. Of four LDmeasures assessed, d2 was the best predictor of this relationship. Had one attempted to map quantitative-trait locifor plasma DBH activity on a genomewide basis without prior knowledge of candidate regions and not included(by chance) markers within this haplotype block, the DBH locus might have been missed entirely. These resultsprovide a direct example of the potential value of constructing a haplotype map of the human genome prior toembarking on large-scale association studies.
Introduction
Linkage disequilibrium (LD) mapping might prove to bemore powerful than linkage analysis in identifying genesunderlying complex traits (Risch 2000). Recent advancesin molecular and computational technology promise tomake genomewide LD mapping feasible in the near future.The growing public database (dbSNP Home Page) of ∼2.8million SNPs will be critical in this endeavor. The opti-mum choice of SNP marker densities, locations, and allelefrequencies must first be decided, however, and some au-thors have suggested that an LD map of the human ge-
Received November 13, 2002; accepted for publication March 14,2003; electronically published April 30, 2003.
Address for correspondence and reprints: Dr. Joseph F. Cubells, Psy-chiatry 116A2, VA Connecticut Healthcare System, 950 Campbell Av-enue, West Haven, CT 06516. E-mail: [email protected]
* Present affiliation: Department of Neurology, University of Wash-ington School of Medicine and Department of Neurology, VA PugetSound Health Care System, Seattle.
† Present affiliation: Department of Human Genetics, University ofPittsburgh, Pittsburgh.
� 2003 by The American Society of Human Genetics. All rights reserved.0002-9297/2003/7206-0004$15.00
nome be constructed to assist with the process (Daly etal. 2001). Several recent studies have emphasized the ne-cessity of such a tool, by demonstrating that the extentof LD throughout the genome is extremely variable evenat intragenic scales (Stephens et al. 2001; Tiret et al. 2002)and that the genome might be organized in discrete“blocks” of LD (Daly et al. 2001; Gabriel et al. 2002).By understanding the underlying block structure of LDin each region of interest, one might be able to assignmarker locations more efficiently and thus to minimizeinadequate or redundant coverage.
Whether such blocks of LD, defined statistically onthe basis of common SNPs, will be useful for detectingassociations with genes underlying complex traits ispresently unknown. For both quantitative and dichot-omous traits, this will depend on many factors, includ-ing the frequency and effect size for each trait allele,the measure used to define LD, and the sampling strat-egy employed (Risch 2000; Ardlie et al. 2002). Althoughseveral authors have attempted to address these issuesthrough use of computer simulations (Kruglyak 1999;Schork et al. 2000), the key factors need to be deter-mined empirically. Studies examining the effect of LD
1390 Am. J. Hum. Genet. 72:1389–1400, 2003
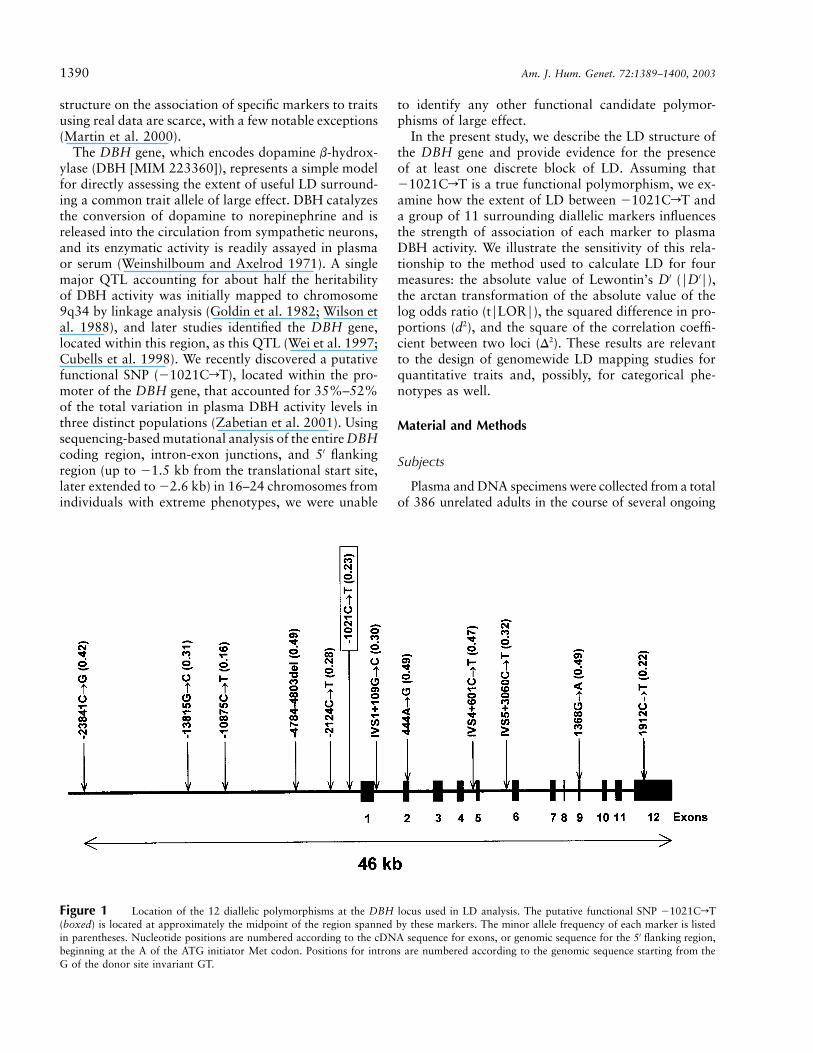
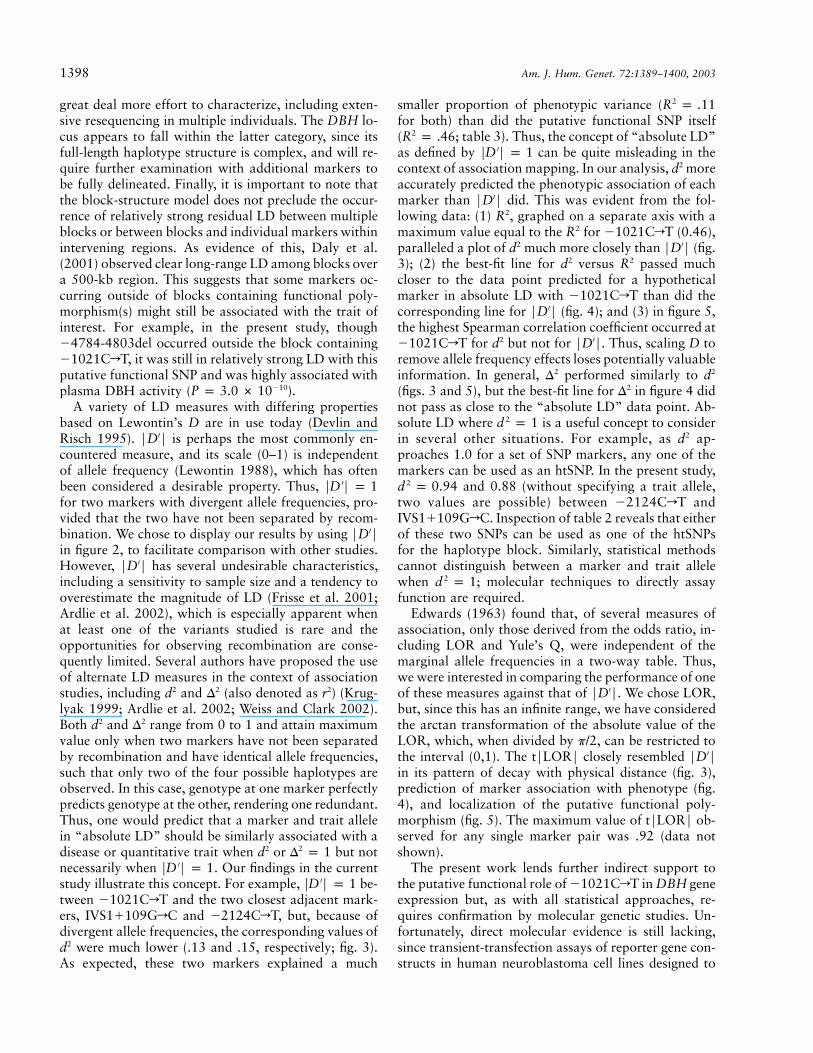
Figure 1 Location of the 12 diallelic polymorphisms at the DBH locus used in LD analysis. The putative functional SNP �1021CrT(boxed) is located at approximately the midpoint of the region spanned by these markers. The minor allele frequency of each marker is listedin parentheses. Nucleotide positions are numbered according to the cDNA sequence for exons, or genomic sequence for the 5′ flanking region,beginning at the A of the ATG initiator Met codon. Positions for introns are numbered according to the genomic sequence starting from theG of the donor site invariant GT.
structure on the association of specific markers to traitsusing real data are scarce, with a few notable exceptions(Martin et al. 2000).
The DBH gene, which encodes dopamine b-hydrox-ylase (DBH [MIM 223360]), represents a simple modelfor directly assessing the extent of useful LD surround-ing a common trait allele of large effect. DBH catalyzesthe conversion of dopamine to norepinephrine and isreleased into the circulation from sympathetic neurons,and its enzymatic activity is readily assayed in plasmaor serum (Weinshilboum and Axelrod 1971). A singlemajor QTL accounting for about half the heritabilityof DBH activity was initially mapped to chromosome9q34 by linkage analysis (Goldin et al. 1982; Wilson etal. 1988), and later studies identified the DBH gene,located within this region, as this QTL (Wei et al. 1997;Cubells et al. 1998). We recently discovered a putativefunctional SNP (�1021CrT), located within the pro-moter of the DBH gene, that accounted for 35%–52%of the total variation in plasma DBH activity levels inthree distinct populations (Zabetian et al. 2001). Usingsequencing-based mutational analysis of the entire DBHcoding region, intron-exon junctions, and 5′ flankingregion (up to �1.5 kb from the translational start site,later extended to �2.6 kb) in 16–24 chromosomes fromindividuals with extreme phenotypes, we were unable
to identify any other functional candidate polymor-phisms of large effect.
In the present study, we describe the LD structure ofthe DBH gene and provide evidence for the presenceof at least one discrete block of LD. Assuming that�1021CrT is a true functional polymorphism, we ex-amine how the extent of LD between �1021CrT anda group of 11 surrounding diallelic markers influencesthe strength of association of each marker to plasmaDBH activity. We illustrate the sensitivity of this rela-tionship to the method used to calculate LD for fourmeasures: the absolute value of Lewontin’s D′ (FD′F),the arctan transformation of the absolute value of thelog odds ratio (tFLORF), the squared difference in pro-portions (d2), and the square of the correlation coeffi-cient between two loci (D2). These results are relevantto the design of genomewide LD mapping studies forquantitative traits and, possibly, for categorical phe-notypes as well.
Material and Methods
Subjects
Plasma and DNA specimens were collected from a totalof 386 unrelated adults in the course of several ongoing
Zabetian et al.: LD and Association with Phenotype at DBH 1391
genetic studies, as described elsewhere (Zabetian et al.2001; Kohnke et al. 2002). In brief, 169 European Amer-icans and 217 individuals of German origin were recruitedfrom the northeastern United States and southwesternGermany, respectively. Ethnic groups were self-defined,and those of known mixed or other heritage (other thanmixed European) were excluded. The groups includedhealthy individuals and those with psychiatric and sub-stance-use disorders. As discussed elsewhere (Cubells etal. 1998), sampling from a variety of diagnostic groupsis unlikely to obscure fundamental genetic influences onplasma DBH activity.
Laboratory Methods
We selected a total of 12 diallelic markers for study atthe DBH locus, spanning 46 kb (fig. 1). These consistedof a 19–bp insertion/deletion (Nahmias et al. 1992) and11 SNPs derived from our previous study (Zabetian et al.2001) and dbSNP. The positions of the markers wereroughly symmetrically distributed around �1021CrTand included the entire DBH coding region and ∼23 kbof 5′ upstream sequence. We chose only common markerswith minor allele frequencies 10.15 and did not excludeany SNPs at CpG sites.
Genotypes were determined using RFLP techniques, bydigesting PCR products with the appropriate restrictionenzymes. PCR primers were designed with mismatches insome cases, to generate artificial restriction sites as needed.Digested PCR products were electrophoresed on ethidiumbromide–stained agarose gels, were photographed underUV transillumination, and were independently doublescored. The average rate of PCR nonamplification for allgenotype groups was 1.7%, and the maximum rate was3.1%. Results from representative samples of each ge-notype were confirmed by direct sequencing of PCR prod-ucts through use of an ABI Prism 377 DNA Sequencer.Further methodological details, PCR primer sequences,and source data for each marker are available upon re-quest from the authors.
DBH activity was assayed in plasma samples from allsubjects through use of a sensitive high-performance liq-uid chromatography–fluorometric method, as describedelsewhere (Cubells et al. 1998). Separation and mea-surement of the enzyme product, octopamine, in thepresence of a large excess of the substrate, tyramine, wasaccomplished with a detection limit of !1 pmol. All mea-surements were performed in duplicate, and average en-zyme activities are expressed in nanomoles/minute/mil-liliter plasma.
Statistical Analysis
We used the EH� program, version 1.11 (Zhao et al.2000) to estimate relative two-locus haplotype frequen-cies as given in the following table:
Locus 2Allele 1 Allele 2
Locus 1 Allele 1 a bAllele 2 c d
The 2LD program (Zapata et al. 2001) was then usedto calculate D′, D, and Dmax, where D′ is defined asD/Dmax, , andD p (ad) � (bc) D p min (a � b)(b �max
for andd),(c � d)(a � c) D 1 0 min (a � b)(a � c),(c �for (Lewontin 1964). The squared stan-d)(b � d) D ! 0
dardized difference in proportions was calculated usingthe formula , where locus 1 is2 2 2d p D /[(a � b)(c � d)]the trait locus (Nei and Li 1980). In figures 3 and 4,�1021CrT is considered the trait locus, whereas, in fig-ure 5, each marker was sequentially designated the traitlocus. The square of the correlation coefficient betweentwo loci is given by 2 2D p D /[(a � b)(c � d)(a � c)(b �
. The odds ratio was determined by first multiplyingd)]each of the relative haplotype frequencies in a fourfoldtable by 2n and then adding 0.5 haplotype counts to eachcell (Haldane 1955). This correction ensures nonzero val-ues in all cells. The odds ratio is then given by ad/bc,where a, b, c, and d are the corrected relative haplotypefrequencies, and natural logarithms were taken to obtainthe LOR. The arctan transformation of the wasFLORFthen divided by p/2 to obtain a measure whose maximumvalue is 1, which is abbreviated t . Multilocus hap-FLORFlotype frequencies were estimated by the expectation-maximization (EM) method using Arlequin, version2.000 (Schneider et al. 2000). Deviations from Hardy-Weinberg equilibrium (HWE) were assessed using theHWSIM program (Cubells et al. 1997; Kidd Lab Website). Since some of the analyses contained small numbersof observations in some cells, P values for all analyseswere estimated empirically through use of Monte Carlosimulations (10,000 iterations in each case) based on ob-served allele frequencies. Significance levels were esti-mated as the proportion of times the simulated distri-bution reached or exceeded the observed deviation fromHWE.
A square-root transformation of plasma DBH activitywas employed to stabilize the variance, as discussed else-where (Zabetian et al. 2001). Marker-phenotype asso-ciation was measured using multiple and simple linearregression with the GLM procedure in SAS. P valueswere calculated under the assumption of normality andhomoscedasticity of square-root DBH activity. Spear-man correlation coefficients (r) and the correspondingP values under the null hypothesis were calculatedr p 0using the FREQ procedure in SAS.
Results
None of the marker genotypes deviated significantlyfrom HWE after application of the appropriate Bonfer-
1392 Am. J. Hum. Genet. 72:1389–1400, 2003
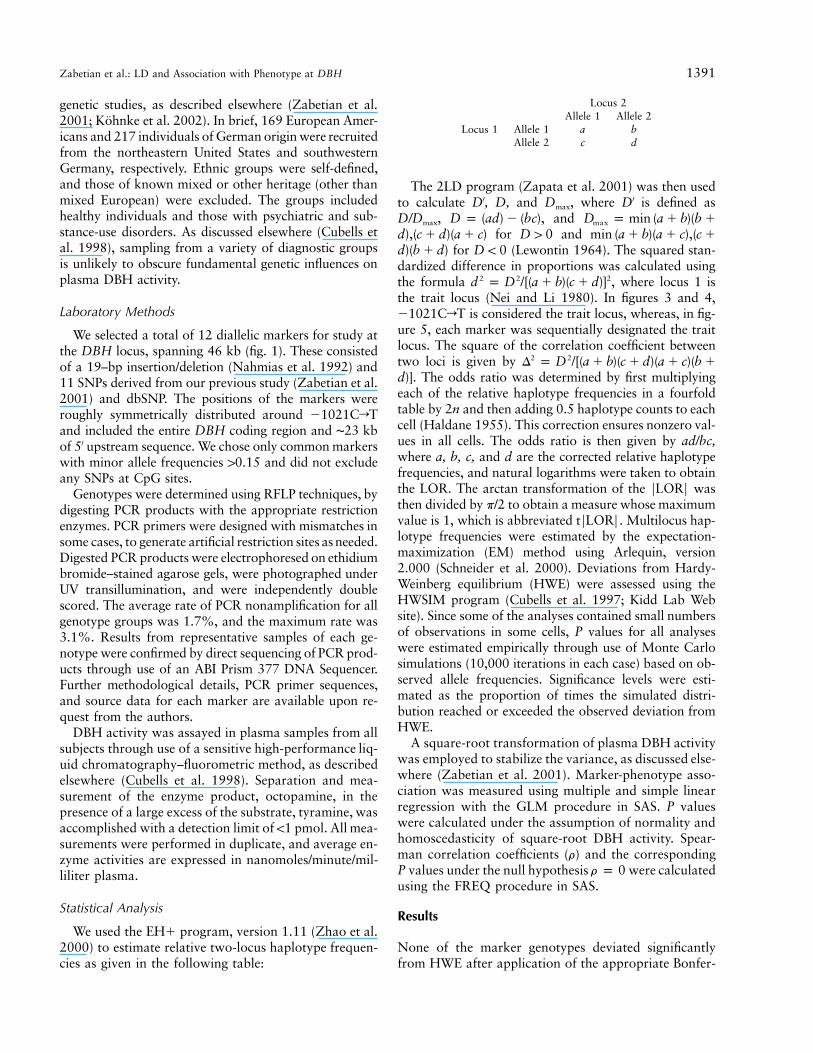
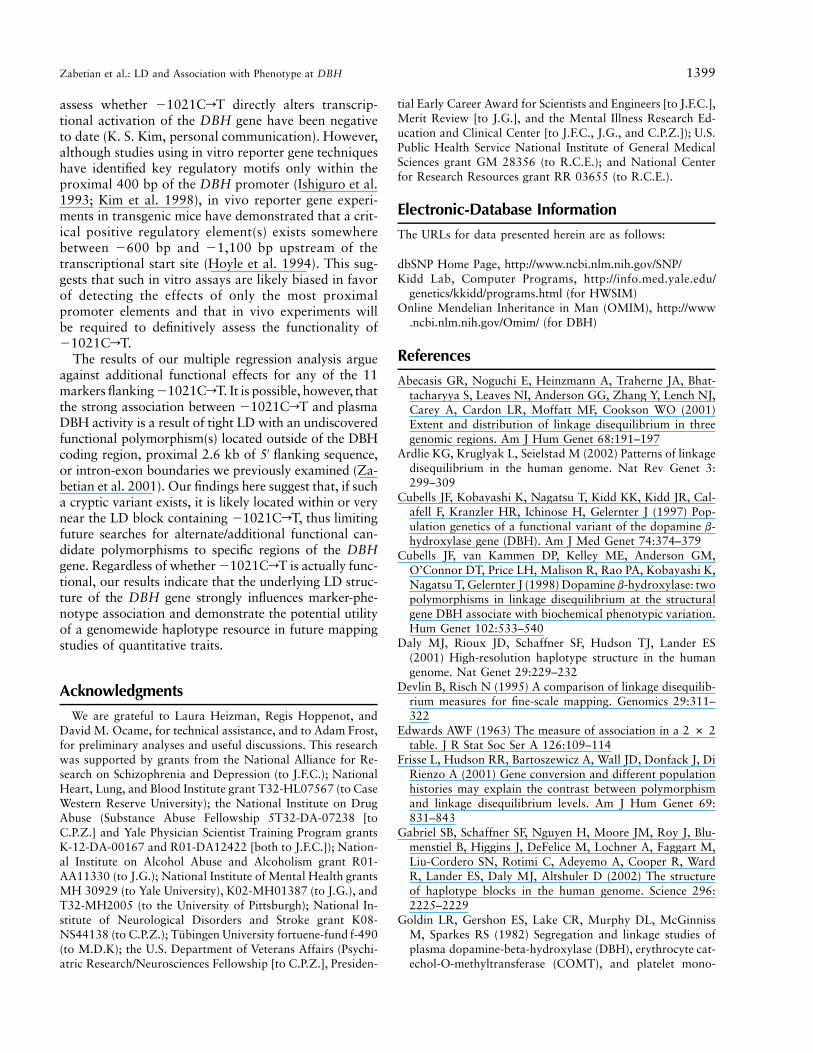
Figure 2 LD as measured by FD′F as a function of physical distance at the DBH locus for all pairs of markers (A) and the average ofall markers within sequential 5-kb intervals (B) (�SEM).
roni correction for multiple tests. A plot of intermarkerdistance versus LD as measured by FD′F, for all possiblepairwise combinations of markers, is displayed in figure2A. Over the 46-kb interval spanned by the marker set,a clear decay of LD with increasing physical distancewas evident, although the relationship for any singlepairwise comparison was quite variable. In figure 2B,the average value of FD′F for all markers within se-quential 5-kb intervals is plotted against distance. The“half-length” of LD, as defined by the distance overwhich the average value of FD′F falls below .5, was ∼10kb. No values of FD′F 10.5 were observed for anymarker pairs farther apart than 22 kb (fig. 2A).
Visual inspection of the square matrix of FD′F valuesrevealed a contiguous block of high values ( ′FD F 1
) for five sequential markers, suggesting the pres-.79ence of a block of LD with limited haplotype diversity
(table 1). These five markers, �2124CrT, �1021CrT,IVS1�109GrC, 444ArG, and IVS4�601CrT, spanneda 9.9-kb segment extending from the 5′ upstream area toroughly the first one-third of the genic region (fig. 1).Within this block, only 4 of the 32 possible haplotypeswere estimated to occur at a frequency 12%, and togetherthey accounted for an estimated 93% of the observedchromosomes (table 2). The ends of the block were welldelineated, since adding the adjacent marker in the 5′
(�4784-4803del) or 3′ (IVS5�3060CrT) direction in asix-locus analysis increased the number of observed hap-lotypes with a frequency 12% to seven and nine, re-spectively. Although �4784-4803del was in relativelystrong LD with �1021CrT ( ), located 3.8 kb′FD F p .81away, it was in weak LD with the two markers locatedat the 3′ end of the block (444ArG, ; and′FD F p .32IVS4�601CrT, ) and was thus excluded′FD F p .28
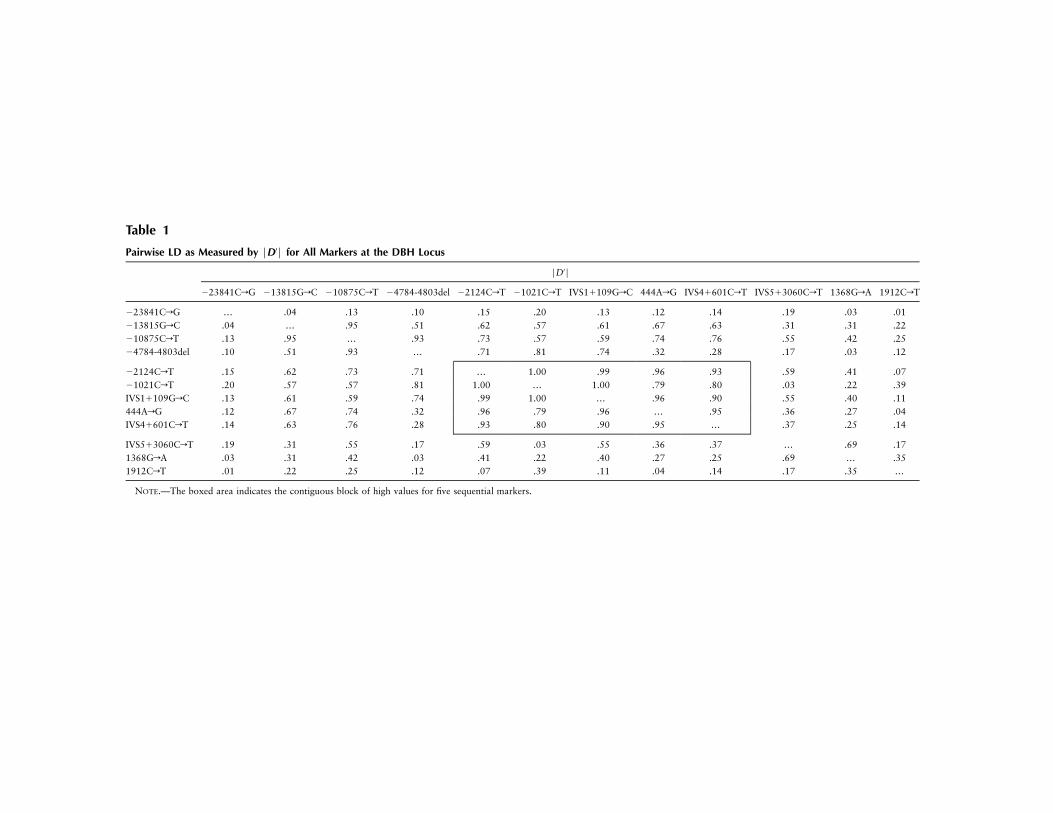
Table 1
Pairwise LD as Measured by FD′F for All Markers at the DBH Locus
FD′F
�23841CrG �13815GrC �10875CrT �4784-4803del �2124CrT �1021CrT IVS1�109GrC 444ArG IVS4�601CrT IVS5�3060CrT 1368GrA 1912CrT
�23841CrG … .04 .13 .10 .15 .20 .13 .12 .14 .19 .03 .01�13815GrC .04 … .95 .51 .62 .57 .61 .67 .63 .31 .31 .22�10875CrT .13 .95 … .93 .73 .57 .59 .74 .76 .55 .42 .25�4784-4803del .10 .51 .93 … .71 .81 .74 .32 .28 .17 .03 .12
�2124CrT .15 .62 .73 .71 … 1.00 .99 .96 .93 .59 .41 .07�1021CrT .20 .57 .57 .81 1.00 … 1.00 .79 .80 .03 .22 .39IVS1�109GrC .13 .61 .59 .74 .99 1.00 … .96 .90 .55 .40 .11444ArG .12 .67 .74 .32 .96 .79 .96 … .95 .36 .27 .04IVS4�601CrT .14 .63 .76 .28 .93 .80 .90 .95 … .37 .25 .14
IVS5�3060CrT .19 .31 .55 .17 .59 .03 .55 .36 .37 … .69 .171368GrA .03 .31 .42 .03 .41 .22 .40 .27 .25 .69 … .351912CrT .01 .22 .25 .12 .07 .39 .11 .04 .14 .17 .35 …
NOTE.—The boxed area indicates the contiguous block of high values for five sequential markers.
1394 Am. J. Hum. Genet. 72:1389–1400, 2003
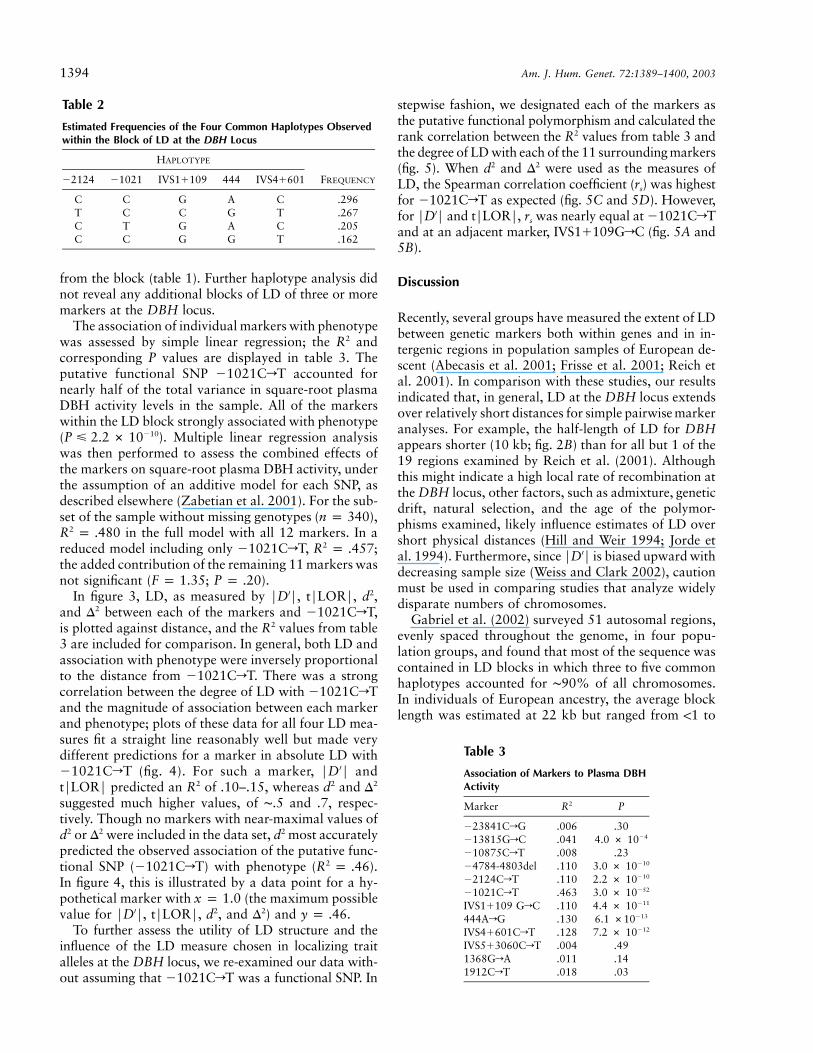
Table 2
Estimated Frequencies of the Four Common Haplotypes Observedwithin the Block of LD at the DBH Locus
HAPLOTYPE
FREQUENCY�2124 �1021 IVS1�109 444 IVS4�601
C C G A C .296T C C G T .267C T G A C .205C C G G T .162
Table 3
Association of Markers to Plasma DBHActivity
Marker R2 P
�23841CrG .006 .30�13815GrC .041 4.0 # 10�4
�10875CrT .008 .23�4784-4803del .110 3.0 # 10�10
�2124CrT .110 2.2 # 10�10
�1021CrT .463 3.0 # 10�52
IVS1�109 GrC .110 4.4 # 10�11
444ArG .130 6.1 #10�13
IVS4�601CrT .128 7.2 # 10�12
IVS5�3060CrT .004 .491368GrA .011 .141912CrT .018 .03
from the block (table 1). Further haplotype analysis didnot reveal any additional blocks of LD of three or moremarkers at the DBH locus.
The association of individual markers with phenotypewas assessed by simple linear regression; the R2 andcorresponding P values are displayed in table 3. Theputative functional SNP �1021CrT accounted fornearly half of the total variance in square-root plasmaDBH activity levels in the sample. All of the markerswithin the LD block strongly associated with phenotype( ). Multiple linear regression analysis�10P � 2.2 # 10was then performed to assess the combined effects ofthe markers on square-root plasma DBH activity, underthe assumption of an additive model for each SNP, asdescribed elsewhere (Zabetian et al. 2001). For the sub-set of the sample without missing genotypes ( ),n p 340
in the full model with all 12 markers. In a2R p .480reduced model including only �1021CrT, ;2R p .457the added contribution of the remaining 11 markers wasnot significant ( ; ).F p 1.35 P p .20
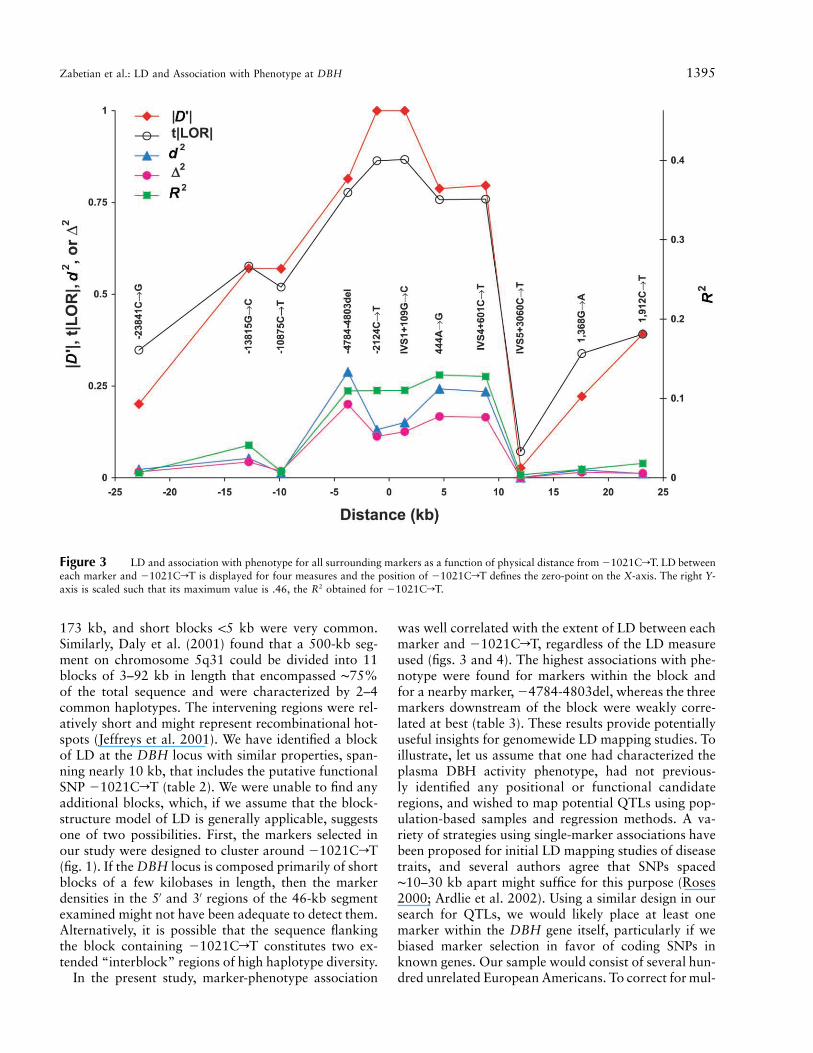
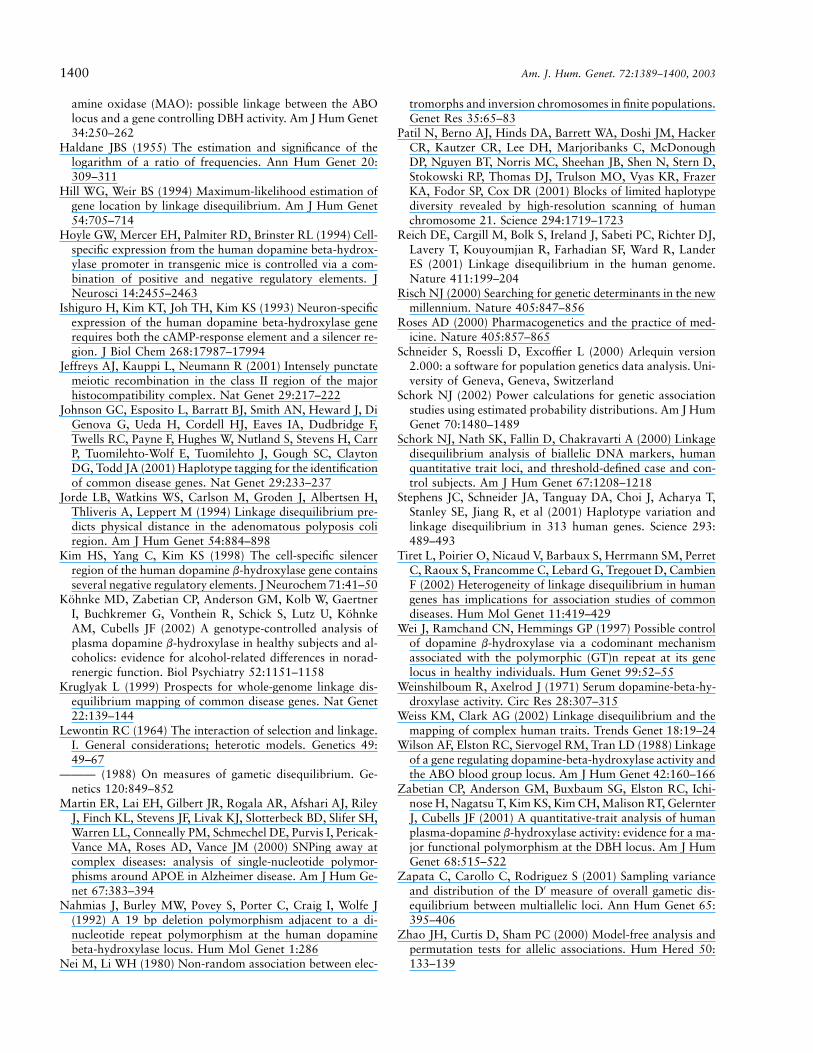
In figure 3, LD, as measured by FD′F, tFLORF, d2,and D2 between each of the markers and �1021CrT,is plotted against distance, and the R2 values from table3 are included for comparison. In general, both LD andassociation with phenotype were inversely proportionalto the distance from �1021CrT. There was a strongcorrelation between the degree of LD with �1021CrTand the magnitude of association between each markerand phenotype; plots of these data for all four LD mea-sures fit a straight line reasonably well but made verydifferent predictions for a marker in absolute LD with�1021CrT (fig. 4). For such a marker, FD′F andtFLORF predicted an R2 of .10–.15, whereas d2 and D2
suggested much higher values, of ∼.5 and .7, respec-tively. Though no markers with near-maximal values ofd2 or D2 were included in the data set, d2 most accuratelypredicted the observed association of the putative func-tional SNP (�1021CrT) with phenotype ( ).2R p .46In figure 4, this is illustrated by a data point for a hy-pothetical marker with (the maximum possiblex p 1.0value for FD′F, tFLORF, d2, and D2) and .y p .46
To further assess the utility of LD structure and theinfluence of the LD measure chosen in localizing traitalleles at the DBH locus, we re-examined our data with-out assuming that �1021CrT was a functional SNP. In
stepwise fashion, we designated each of the markers asthe putative functional polymorphism and calculated therank correlation between the R2 values from table 3 andthe degree of LD with each of the 11 surrounding markers(fig. 5). When d2 and D2 were used as the measures ofLD, the Spearman correlation coefficient (rs) was highestfor �1021CrT as expected (fig. 5C and 5D). However,for FD′F and tFLORF, rs was nearly equal at �1021CrTand at an adjacent marker, IVS1�109GrC (fig. 5A and5B).
Discussion
Recently, several groups have measured the extent of LDbetween genetic markers both within genes and in in-tergenic regions in population samples of European de-scent (Abecasis et al. 2001; Frisse et al. 2001; Reich etal. 2001). In comparison with these studies, our resultsindicated that, in general, LD at the DBH locus extendsover relatively short distances for simple pairwise markeranalyses. For example, the half-length of LD for DBHappears shorter (10 kb; fig. 2B) than for all but 1 of the19 regions examined by Reich et al. (2001). Althoughthis might indicate a high local rate of recombination atthe DBH locus, other factors, such as admixture, geneticdrift, natural selection, and the age of the polymor-phisms examined, likely influence estimates of LD overshort physical distances (Hill and Weir 1994; Jorde etal. 1994). Furthermore, since FD′F is biased upward withdecreasing sample size (Weiss and Clark 2002), cautionmust be used in comparing studies that analyze widelydisparate numbers of chromosomes.
Gabriel et al. (2002) surveyed 51 autosomal regions,evenly spaced throughout the genome, in four popu-lation groups, and found that most of the sequence wascontained in LD blocks in which three to five commonhaplotypes accounted for ∼90% of all chromosomes.In individuals of European ancestry, the average blocklength was estimated at 22 kb but ranged from !1 to
Zabetian et al.: LD and Association with Phenotype at DBH 1395
Figure 3 LD and association with phenotype for all surrounding markers as a function of physical distance from �1021CrT. LD betweeneach marker and �1021CrT is displayed for four measures and the position of �1021CrT defines the zero-point on the X-axis. The right Y-axis is scaled such that its maximum value is .46, the R2 obtained for �1021CrT.
173 kb, and short blocks !5 kb were very common.Similarly, Daly et al. (2001) found that a 500-kb seg-ment on chromosome 5q31 could be divided into 11blocks of 3–92 kb in length that encompassed ∼75%of the total sequence and were characterized by 2–4common haplotypes. The intervening regions were rel-atively short and might represent recombinational hot-spots (Jeffreys et al. 2001). We have identified a blockof LD at the DBH locus with similar properties, span-ning nearly 10 kb, that includes the putative functionalSNP �1021CrT (table 2). We were unable to find anyadditional blocks, which, if we assume that the block-structure model of LD is generally applicable, suggestsone of two possibilities. First, the markers selected inour study were designed to cluster around �1021CrT(fig. 1). If the DBH locus is composed primarily of shortblocks of a few kilobases in length, then the markerdensities in the 5′ and 3′ regions of the 46-kb segmentexamined might not have been adequate to detect them.Alternatively, it is possible that the sequence flankingthe block containing �1021CrT constitutes two ex-tended “interblock” regions of high haplotype diversity.
In the present study, marker-phenotype association
was well correlated with the extent of LD between eachmarker and �1021CrT, regardless of the LD measureused (figs. 3 and 4). The highest associations with phe-notype were found for markers within the block andfor a nearby marker, �4784-4803del, whereas the threemarkers downstream of the block were weakly corre-lated at best (table 3). These results provide potentiallyuseful insights for genomewide LD mapping studies. Toillustrate, let us assume that one had characterized theplasma DBH activity phenotype, had not previous-ly identified any positional or functional candidateregions, and wished to map potential QTLs using pop-ulation-based samples and regression methods. A va-riety of strategies using single-marker associations havebeen proposed for initial LD mapping studies of diseasetraits, and several authors agree that SNPs spaced∼10–30 kb apart might suffice for this purpose (Roses2000; Ardlie et al. 2002). Using a similar design in oursearch for QTLs, we would likely place at least onemarker within the DBH gene itself, particularly if webiased marker selection in favor of coding SNPs inknown genes. Our sample would consist of several hun-dred unrelated European Americans. To correct for mul-

1396 Am. J. Hum. Genet. 72:1389–1400, 2003
Figure 4 Comparison of the relationship between association with phenotype and LD to �1021CrT as measured by FD′F, tFLORF, d2,and D2. A data point for a hypothetical marker in absolute LD with the putative functional SNP (�1021CrT) is included for reference.
tiple testing using 100,000–300,000 SNPs, we wouldneed to apply a highly stringent significance level, onthe order of to (Schork�7 �8a p 2.5 # 10 8.3 # 102002). Would such an approach have identified theDBH locus as a potential QTL for plasma DBH activity,given these constraints? Probably so, if one or moremarkers had resided within the LD block surrounding�1021CrT (table 3). However, if all markers were lo-cated outside of the block, which could easily have oc-curred by chance, given the marker densities employed,the DBH locus might well have been missed. If a ge-nomewide mapping study based on SNP spacing alonefailed to detect the single major QTL for a trait of highheritability, how much more difficult might it be to de-tect QTLs for complex traits, each presumably of smalleffect? This underscores the potential utility of con-structing a genomewide haplotype map prior to under-taking such large-scale studies, as has been proposedelsewhere (Daly et al. 2001). Prior knowledge of hap-lotype structure at the DBH locus would have ensuredthe inclusion of markers representative of the block, andJohnson et al. (2001) have suggested formal methods
to select such “haplotype tagging” SNPs (htSNPs). In-spection of table 2 reveals that information from justthree of the five markers—for example, �2124CrT,�1021CrT, and 444ArG—effectively captures or tagsthe haplotype diversity of the entire block.
The block-structure model of LD is appealing becauseit suggests that a limited number of SNPs mightbe sufficient to adequately survey common variationwithin potential trait loci throughout the genome. How-ever, consensus criteria for the definition of haplotypeblocks have not yet been reached, and a variety of meth-ods have been used to define block structure (Daly etal. 2001; Patil et al. 2001; Gabriel et al. 2002). Someauthors have suggested that further SNP discovery andanalysis of underlying haplotypes be prioritized to areasin or around known genes (Johnson et al. 2001). Forgenes spanned by a single block of LD, as few as twoto five SNPs might be adequate to represent all of thecommon haplotypes, when existing resources such asdbSNP are used. At the other extreme, regions contain-ing multiple short-length blocks and/or long interveningsequences (recombination hotspots) might require a
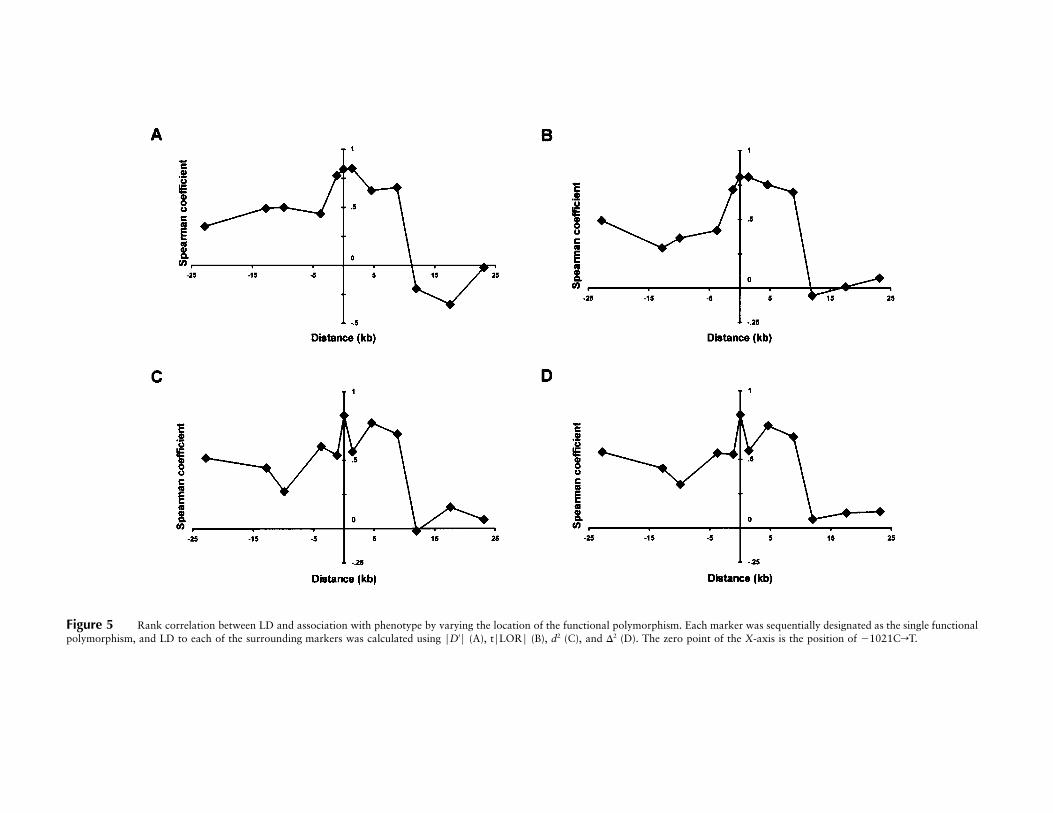
Figure 5 Rank correlation between LD and association with phenotype by varying the location of the functional polymorphism. Each marker was sequentially designated as the single functionalpolymorphism, and LD to each of the surrounding markers was calculated using FD′F (A), tFLORF (B), d2 (C), and D2 (D). The zero point of the X-axis is the position of �1021CrT.
1398 Am. J. Hum. Genet. 72:1389–1400, 2003
great deal more effort to characterize, including exten-sive resequencing in multiple individuals. The DBH lo-cus appears to fall within the latter category, since itsfull-length haplotype structure is complex, and will re-quire further examination with additional markers tobe fully delineated. Finally, it is important to note thatthe block-structure model does not preclude the occur-rence of relatively strong residual LD between multipleblocks or between blocks and individual markers withinintervening regions. As evidence of this, Daly et al.(2001) observed clear long-range LD among blocks overa 500-kb region. This suggests that some markers oc-curring outside of blocks containing functional poly-morphism(s) might still be associated with the trait ofinterest. For example, in the present study, though�4784-4803del occurred outside the block containing�1021CrT, it was still in relatively strong LD with thisputative functional SNP and was highly associated withplasma DBH activity ( ).�10P p 3.0 # 10
A variety of LD measures with differing propertiesbased on Lewontin’s D are in use today (Devlin andRisch 1995). FD′F is perhaps the most commonly en-countered measure, and its scale (0–1) is independentof allele frequency (Lewontin 1988), which has oftenbeen considered a desirable property. Thus, ′FD F p 1for two markers with divergent allele frequencies, pro-vided that the two have not been separated by recom-bination. We chose to display our results by using FD′Fin figure 2, to facilitate comparison with other studies.However, FD′F has several undesirable characteristics,including a sensitivity to sample size and a tendency tooverestimate the magnitude of LD (Frisse et al. 2001;Ardlie et al. 2002), which is especially apparent whenat least one of the variants studied is rare and theopportunities for observing recombination are conse-quently limited. Several authors have proposed the useof alternate LD measures in the context of associationstudies, including d2 and D2 (also denoted as r2) (Krug-lyak 1999; Ardlie et al. 2002; Weiss and Clark 2002).Both d2 and D2 range from 0 to 1 and attain maximumvalue only when two markers have not been separatedby recombination and have identical allele frequencies,such that only two of the four possible haplotypes areobserved. In this case, genotype at one marker perfectlypredicts genotype at the other, rendering one redundant.Thus, one would predict that a marker and trait allelein “absolute LD” should be similarly associated with adisease or quantitative trait when d2 or but not2D p 1necessarily when . Our findings in the current′FD F p 1study illustrate this concept. For example, be-′FD F p 1tween �1021CrT and the two closest adjacent mark-ers, IVS1�109GrC and �2124CrT, but, because ofdivergent allele frequencies, the corresponding values ofd2 were much lower (.13 and .15, respectively; fig. 3).As expected, these two markers explained a much
smaller proportion of phenotypic variance ( 2R p .11for both) than did the putative functional SNP itself( ; table 3). Thus, the concept of “absolute LD”2R p .46as defined by can be quite misleading in the′FD F p 1context of association mapping. In our analysis, d2 moreaccurately predicted the phenotypic association of eachmarker than FD′F did. This was evident from the fol-lowing data: (1) R2, graphed on a separate axis with amaximum value equal to the R2 for �1021CrT (0.46),paralleled a plot of d2 much more closely than FD′F (fig.3); (2) the best-fit line for d2 versus R2 passed muchcloser to the data point predicted for a hypotheticalmarker in absolute LD with �1021CrT than did thecorresponding line for FD′F (fig. 4); and (3) in figure 5,the highest Spearman correlation coefficient occurred at�1021CrT for d2 but not for FD′F. Thus, scaling D toremove allele frequency effects loses potentially valuableinformation. In general, D2 performed similarly to d2
(figs. 3 and 5), but the best-fit line for D2 in figure 4 didnot pass as close to the “absolute LD” data point. Ab-solute LD where is a useful concept to consider2d p 1in several other situations. For example, as d2 ap-proaches 1.0 for a set of SNP markers, any one of themarkers can be used as an htSNP. In the present study,
and 0.88 (without specifying a trait allele,2d p 0.94two values are possible) between �2124CrT andIVS1�109GrC. Inspection of table 2 reveals that eitherof these two SNPs can be used as one of the htSNPsfor the haplotype block. Similarly, statistical methodscannot distinguish between a marker and trait allelewhen ; molecular techniques to directly assay2d p 1function are required.
Edwards (1963) found that, of several measures ofassociation, only those derived from the odds ratio, in-cluding LOR and Yule’s Q, were independent of themarginal allele frequencies in a two-way table. Thus,we were interested in comparing the performance of oneof these measures against that of FD′F. We chose LOR,but, since this has an infinite range, we have consideredthe arctan transformation of the absolute value of theLOR, which, when divided by p/2, can be restricted tothe interval (0,1). The tFLORF closely resembled FD′Fin its pattern of decay with physical distance (fig. 3),prediction of marker association with phenotype (fig.4), and localization of the putative functional poly-morphism (fig. 5). The maximum value of tFLORF ob-served for any single marker pair was .92 (data notshown).
The present work lends further indirect support tothe putative functional role of �1021CrT in DBH geneexpression but, as with all statistical approaches, re-quires confirmation by molecular genetic studies. Un-fortunately, direct molecular evidence is still lacking,since transient-transfection assays of reporter gene con-structs in human neuroblastoma cell lines designed to
Zabetian et al.: LD and Association with Phenotype at DBH 1399
assess whether �1021CrT directly alters transcrip-tional activation of the DBH gene have been negativeto date (K. S. Kim, personal communication). However,although studies using in vitro reporter gene techniqueshave identified key regulatory motifs only within theproximal 400 bp of the DBH promoter (Ishiguro et al.1993; Kim et al. 1998), in vivo reporter gene experi-ments in transgenic mice have demonstrated that a crit-ical positive regulatory element(s) exists somewherebetween �600 bp and �1,100 bp upstream of thetranscriptional start site (Hoyle et al. 1994). This sug-gests that such in vitro assays are likely biased in favorof detecting the effects of only the most proximalpromoter elements and that in vivo experiments willbe required to definitively assess the functionality of�1021CrT.
The results of our multiple regression analysis argueagainst additional functional effects for any of the 11markers flanking �1021CrT. It is possible, however, thatthe strong association between �1021CrT and plasmaDBH activity is a result of tight LD with an undiscoveredfunctional polymorphism(s) located outside of the DBHcoding region, proximal 2.6 kb of 5′ flanking sequence,or intron-exon boundaries we previously examined (Za-betian et al. 2001). Our findings here suggest that, if sucha cryptic variant exists, it is likely located within or verynear the LD block containing �1021CrT, thus limitingfuture searches for alternate/additional functional can-didate polymorphisms to specific regions of the DBHgene. Regardless of whether �1021CrT is actually func-tional, our results indicate that the underlying LD struc-ture of the DBH gene strongly influences marker-phe-notype association and demonstrate the potential utilityof a genomewide haplotype resource in future mappingstudies of quantitative traits.
Acknowledgments
We are grateful to Laura Heizman, Regis Hoppenot, andDavid M. Ocame, for technical assistance, and to Adam Frost,for preliminary analyses and useful discussions. This researchwas supported by grants from the National Alliance for Re-search on Schizophrenia and Depression (to J.F.C.); NationalHeart, Lung, and Blood Institute grant T32-HL07567 (to CaseWestern Reserve University); the National Institute on DrugAbuse (Substance Abuse Fellowship 5T32-DA-07238 [toC.P.Z.] and Yale Physician Scientist Training Program grantsK-12-DA-00167 and R01-DA12422 [both to J.F.C.]); Nation-al Institute on Alcohol Abuse and Alcoholism grant R01-AA11330 (to J.G.); National Institute of Mental Health grantsMH 30929 (to Yale University), K02-MH01387 (to J.G.), andT32-MH2005 (to the University of Pittsburgh); National In-stitute of Neurological Disorders and Stroke grant K08-NS44138 (to C.P.Z.); Tubingen University fortuene-fund f-490(to M.D.K); the U.S. Department of Veterans Affairs (Psychi-atric Research/Neurosciences Fellowship [to C.P.Z.], Presiden-
tial Early Career Award for Scientists and Engineers [to J.F.C.],Merit Review [to J.G.], and the Mental Illness Research Ed-ucation and Clinical Center [to J.F.C., J.G., and C.P.Z.]); U.S.Public Health Service National Institute of General MedicalSciences grant GM 28356 (to R.C.E.); and National Centerfor Research Resources grant RR 03655 (to R.C.E.).
Electronic-Database Information
The URLs for data presented herein are as follows:
dbSNP Home Page, http://www.ncbi.nlm.nih.gov/SNP/Kidd Lab, Computer Programs, http://info.med.yale.edu/
genetics/kkidd/programs.html (for HWSIM)Online Mendelian Inheritance in Man (OMIM), http://www
.ncbi.nlm.nih.gov/Omim/ (for DBH)
References
Abecasis GR, Noguchi E, Heinzmann A, Traherne JA, Bhat-tacharyya S, Leaves NI, Anderson GG, Zhang Y, Lench NJ,Carey A, Cardon LR, Moffatt MF, Cookson WO (2001)Extent and distribution of linkage disequilibrium in threegenomic regions. Am J Hum Genet 68:191–197
Ardlie KG, Kruglyak L, Seielstad M (2002) Patterns of linkagedisequilibrium in the human genome. Nat Rev Genet 3:299–309
Cubells JF, Kobayashi K, Nagatsu T, Kidd KK, Kidd JR, Cal-afell F, Kranzler HR, Ichinose H, Gelernter J (1997) Pop-ulation genetics of a functional variant of the dopamine b-hydroxylase gene (DBH). Am J Med Genet 74:374–379
Cubells JF, van Kammen DP, Kelley ME, Anderson GM,O’Connor DT, Price LH, Malison R, Rao PA, Kobayashi K,Nagatsu T, Gelernter J (1998) Dopamine b-hydroxylase: twopolymorphisms in linkage disequilibrium at the structuralgene DBH associate with biochemical phenotypic variation.Hum Genet 102:533–540
Daly MJ, Rioux JD, Schaffner SF, Hudson TJ, Lander ES(2001) High-resolution haplotype structure in the humangenome. Nat Genet 29:229–232
Devlin B, Risch N (1995) A comparison of linkage disequilib-rium measures for fine-scale mapping. Genomics 29:311–322
Edwards AWF (1963) The measure of association in a 2 # 2table. J R Stat Soc Ser A 126:109–114
Frisse L, Hudson RR, Bartoszewicz A, Wall JD, Donfack J, DiRienzo A (2001) Gene conversion and different populationhistories may explain the contrast between polymorphismand linkage disequilibrium levels. Am J Hum Genet 69:831–843
Gabriel SB, Schaffner SF, Nguyen H, Moore JM, Roy J, Blu-menstiel B, Higgins J, DeFelice M, Lochner A, Faggart M,Liu-Cordero SN, Rotimi C, Adeyemo A, Cooper R, WardR, Lander ES, Daly MJ, Altshuler D (2002) The structureof haplotype blocks in the human genome. Science 296:2225–2229
Goldin LR, Gershon ES, Lake CR, Murphy DL, McGinnissM, Sparkes RS (1982) Segregation and linkage studies ofplasma dopamine-beta-hydroxylase (DBH), erythrocyte cat-echol-O-methyltransferase (COMT), and platelet mono-
1400 Am. J. Hum. Genet. 72:1389–1400, 2003
amine oxidase (MAO): possible linkage between the ABOlocus and a gene controlling DBH activity. Am J Hum Genet34:250–262
Haldane JBS (1955) The estimation and significance of thelogarithm of a ratio of frequencies. Ann Hum Genet 20:309–311
Hill WG, Weir BS (1994) Maximum-likelihood estimation ofgene location by linkage disequilibrium. Am J Hum Genet54:705–714
Hoyle GW, Mercer EH, Palmiter RD, Brinster RL (1994) Cell-specific expression from the human dopamine beta-hydrox-ylase promoter in transgenic mice is controlled via a com-bination of positive and negative regulatory elements. JNeurosci 14:2455–2463
Ishiguro H, Kim KT, Joh TH, Kim KS (1993) Neuron-specificexpression of the human dopamine beta-hydroxylase generequires both the cAMP-response element and a silencer re-gion. J Biol Chem 268:17987–17994
Jeffreys AJ, Kauppi L, Neumann R (2001) Intensely punctatemeiotic recombination in the class II region of the majorhistocompatibility complex. Nat Genet 29:217–222
Johnson GC, Esposito L, Barratt BJ, Smith AN, Heward J, DiGenova G, Ueda H, Cordell HJ, Eaves IA, Dudbridge F,Twells RC, Payne F, Hughes W, Nutland S, Stevens H, CarrP, Tuomilehto-Wolf E, Tuomilehto J, Gough SC, ClaytonDG, Todd JA (2001) Haplotype tagging for the identificationof common disease genes. Nat Genet 29:233–237
Jorde LB, Watkins WS, Carlson M, Groden J, Albertsen H,Thliveris A, Leppert M (1994) Linkage disequilibrium pre-dicts physical distance in the adenomatous polyposis coliregion. Am J Hum Genet 54:884–898
Kim HS, Yang C, Kim KS (1998) The cell-specific silencerregion of the human dopamine b-hydroxylase gene containsseveral negative regulatory elements. J Neurochem 71:41–50
Kohnke MD, Zabetian CP, Anderson GM, Kolb W, GaertnerI, Buchkremer G, Vonthein R, Schick S, Lutz U, KohnkeAM, Cubells JF (2002) A genotype-controlled analysis ofplasma dopamine b-hydroxylase in healthy subjects and al-coholics: evidence for alcohol-related differences in norad-renergic function. Biol Psychiatry 52:1151–1158
Kruglyak L (1999) Prospects for whole-genome linkage dis-equilibrium mapping of common disease genes. Nat Genet22:139–144
Lewontin RC (1964) The interaction of selection and linkage.I. General considerations; heterotic models. Genetics 49:49–67
——— (1988) On measures of gametic disequilibrium. Ge-netics 120:849–852
Martin ER, Lai EH, Gilbert JR, Rogala AR, Afshari AJ, RileyJ, Finch KL, Stevens JF, Livak KJ, Slotterbeck BD, Slifer SH,Warren LL, Conneally PM, Schmechel DE, Purvis I, Pericak-Vance MA, Roses AD, Vance JM (2000) SNPing away atcomplex diseases: analysis of single-nucleotide polymor-phisms around APOE in Alzheimer disease. Am J Hum Ge-net 67:383–394
Nahmias J, Burley MW, Povey S, Porter C, Craig I, Wolfe J(1992) A 19 bp deletion polymorphism adjacent to a di-nucleotide repeat polymorphism at the human dopaminebeta-hydroxylase locus. Hum Mol Genet 1:286
Nei M, Li WH (1980) Non-random association between elec-
tromorphs and inversion chromosomes in finite populations.Genet Res 35:65–83
Patil N, Berno AJ, Hinds DA, Barrett WA, Doshi JM, HackerCR, Kautzer CR, Lee DH, Marjoribanks C, McDonoughDP, Nguyen BT, Norris MC, Sheehan JB, Shen N, Stern D,Stokowski RP, Thomas DJ, Trulson MO, Vyas KR, FrazerKA, Fodor SP, Cox DR (2001) Blocks of limited haplotypediversity revealed by high-resolution scanning of humanchromosome 21. Science 294:1719–1723
Reich DE, Cargill M, Bolk S, Ireland J, Sabeti PC, Richter DJ,Lavery T, Kouyoumjian R, Farhadian SF, Ward R, LanderES (2001) Linkage disequilibrium in the human genome.Nature 411:199–204
Risch NJ (2000) Searching for genetic determinants in the newmillennium. Nature 405:847–856
Roses AD (2000) Pharmacogenetics and the practice of med-icine. Nature 405:857–865
Schneider S, Roessli D, Excoffier L (2000) Arlequin version2.000: a software for population genetics data analysis. Uni-versity of Geneva, Geneva, Switzerland
Schork NJ (2002) Power calculations for genetic associationstudies using estimated probability distributions. Am J HumGenet 70:1480–1489
Schork NJ, Nath SK, Fallin D, Chakravarti A (2000) Linkagedisequilibrium analysis of biallelic DNA markers, humanquantitative trait loci, and threshold-defined case and con-trol subjects. Am J Hum Genet 67:1208–1218
Stephens JC, Schneider JA, Tanguay DA, Choi J, Acharya T,Stanley SE, Jiang R, et al (2001) Haplotype variation andlinkage disequilibrium in 313 human genes. Science 293:489–493
Tiret L, Poirier O, Nicaud V, Barbaux S, Herrmann SM, PerretC, Raoux S, Francomme C, Lebard G, Tregouet D, CambienF (2002) Heterogeneity of linkage disequilibrium in humangenes has implications for association studies of commondiseases. Hum Mol Genet 11:419–429
Wei J, Ramchand CN, Hemmings GP (1997) Possible controlof dopamine b-hydroxylase via a codominant mechanismassociated with the polymorphic (GT)n repeat at its genelocus in healthy individuals. Hum Genet 99:52–55
Weinshilboum R, Axelrod J (1971) Serum dopamine-beta-hy-droxylase activity. Circ Res 28:307–315
Weiss KM, Clark AG (2002) Linkage disequilibrium and themapping of complex human traits. Trends Genet 18:19–24
Wilson AF, Elston RC, Siervogel RM, Tran LD (1988) Linkageof a gene regulating dopamine-beta-hydroxylase activity andthe ABO blood group locus. Am J Hum Genet 42:160–166
Zabetian CP, Anderson GM, Buxbaum SG, Elston RC, Ichi-nose H, Nagatsu T, Kim KS, Kim CH, Malison RT, GelernterJ, Cubells JF (2001) A quantitative-trait analysis of humanplasma-dopamine b-hydroxylase activity: evidence for a ma-jor functional polymorphism at the DBH locus. Am J HumGenet 68:515–522
Zapata C, Carollo C, Rodriguez S (2001) Sampling varianceand distribution of the D′ measure of overall gametic dis-equilibrium between multiallelic loci. Ann Hum Genet 65:395–406
Zhao JH, Curtis D, Sham PC (2000) Model-free analysis andpermutation tests for allelic associations. Hum Hered 50:133–139
Copyright © 2022 FDOKUMEN