THE STATUS OF TRADITIONAL SILVO-PASTORAL SYSTEMS IN MALAM JABBA VALLEY, N.W.F.P., PAKISTAN
165
THE STATUS OF TRADITIONAL SILVO-PASTORAL SYSTEMS IN MALAM JABBA VALLEY, N.W.F.P., PAKISTAN Diplomarbeit zur Erlangung des akademischen Grades Magistra rer.nat. an der Formal- und Naturwissenschaftlichen Fakultät der Universität Wien durchgeführt am Institut für Waldökologie der Universität für Bodenkultur eingereicht von Birgit Habermann Wien, November 1999
-
Upload
independent -
Category
Documents
-
view
3 -
download
0
Transcript of THE STATUS OF TRADITIONAL SILVO-PASTORAL SYSTEMS IN MALAM JABBA VALLEY, N.W.F.P., PAKISTAN
THE STATUS OF TRADITIONAL
SILVO-PASTORAL SYSTEMS IN MALAM
JABBA VALLEY, N.W.F.P., PAKISTAN
Diplomarbeit
zur Erlangung des akademischen Grades
Magistra rer.nat.
an der Formal- und Naturwissenschaftlichen Fakultät
der Universität Wien
durchgeführt am Institut für Waldökologie
der Universität für Bodenkultur
eingereicht von
Birgit Habermann
Wien, November 1999
ii
TO ALL FOREST DWELLERS.....
The forest is a peculiar organism of unlimited kindness and benevolence that
makes no demand for its sustenance and extends generously the products of its
life’ s activity; it affords protection to all beings, offering shade even to the
axeman who destroys it.
Lord Buddha
iii
ABSTRACT
The status of silvo-pastoral systems in Malam Jabba Valley, N.W.F.P., Pakistan was studied with the objective of demonstrating the complex interactions between the development of the human population of a former remote and inaccessible mountain area and the status of traditional agroforestrial landuse systems. Overpopulation and the consequent encroachment of settlements into the forested areas of Malam Jabba Valley have led to massive deforestation. Lack of fuelwood and timber cause excessive overuse of the remaining forested areas. The environmental damages have led to increased soil erosion and climatical changes. The assessment was carried through in a three-months field visit in two villages in the valley (Malam and Mangarkot). A forest survey was conducted to analyse the status of the remaining forested areas. Important stand parameter (dbh, total tree height, stand density) were measured and intensity of forest usage was classified. A survey on the socio-economic conditions was performed with RRA and PRA methods. The farmers were interviewed and encouraged to participate in a group discussion. Important issues discussed during this process were among others, availability of natural resources and constraints in agricultural and forest usage. The original forest type has altered towards a uniform stand of Pinus wallichiana (Secondary Blue Pine Forest). Stand density varies strongly within the forested area. Total tree height and mean dbh is almost the same in both surveyed forested areas. Volumes are generally high compared to the intensity of forest usage. Natural regeneration is only existent to a higher extent in protected forested areas. The understorey is characterised by low species diversity and occurrence of shrubs such as Indigofera heterantha, Plectranthus rugosus, Berberis lycium, Sarcococca saligna and Buxus papillosa. Quercus incana and Quercus dilatata occur only as degraded shrubs due to lopping and grazing. Therophytes and hemikryptophytes appear in high abundance but low diversity. Under the current conditions of intense forest usage to gain timber and fuelwood, and for grazing and cutting of grass on steeper slopes, the remaining forested areas of Malam and Mangarkot will rapidly decrease and become extinct in the near future. Due to the increase of population there is greater demand for land and increasing demand for forest produce. This high demand cannot be met with the present silvo-pastoral systems. Agrisilviculture with Ailanthus altissima and Robinia pseudoacacia is practised by some farmers in Malam Jabba Valley to replace the traditional system. These trees are the main substitutes for the indigenous trees to provide fuelwood, fodder and timber to a certain extent. In agrihorticulture pear, apple, peach, persimmon and apricot are cultivated together with conventional crops. These systems provide additional income and will replace subsistence farming that is no longer sufficient to sustain the farmers of Malam Jabba Valley.
iv
ACKNOWLEDGEMENTS
Dank und Anerkennung.... steht am Beginn einer Arbeit wie dieser mit voller Berechtigung, da nun mal eine Diplomarbeit keineswegs im Alleingang durchgeführt wird. So soll an dieser Stelle erwähnt werden, dass viele helfende Hände zum Abschluss und Gelingen dieser Arbeit beigetragen haben. Dank D.I. Friedrich Falch und seinem Studentenprojekt an der Technischen Universität Wien, an dem ich teilnahm, entstand die Idee zu dieser Diplomarbeit. Durch seine Unterstützung konnte die Feldarbeit so kurzfristig und unbürokratisch organisiert werden. An dieser Stelle muss auch die vorbildliche Betreuung durch die Österreichische Botschaft in Islamabad erwähnt werden, besonders durch Konsul Gernot Wiedner. Dankbar bin ich auch sehr für die bereitwillige Übernahme der Betreuung meiner Arbeit durch Univ. Prof. Dr. Gerhard Glatzel vom Institut für Waldökologie der Universität für Bodenkultur Wien. Dabei möchte ich mich auch herzlich bei den Mitarbeitern des Institutes bedanken, die mich als „Instituts- und Unifremde“ vorbehaltlos akzeptierten und mir bei Problemen immer weiterhalfen. Das führt mich zu Ass. Prof. Dr. Franz Andrae, der mir nicht nur „forstliche“ Anleitungen zu den Felderhebungen gab, sondern auch bei der Auswertung stets meine vielen Fragen beantwortete und mir aus so mancher rechnerischen Sackgasse heraushalf !
Special thanks.... to the people that helped me to accomplish the field work in Pakistan. There were so many helpful hands, but first of all I have to mention two people: Amir Zada, who accompanied us to the villages and helped us with the group interviews, who gave us advice in so many respects and who shared his tremendous knowledge in forestry and communal forest management with us. Thank you also for drinking so many cups of green tea with us! Sher Shah Syed, who is the most friendly and hospitable man I have ever met – without him the field work and the interviews in Malam would never have been possible. I also want to express my thankfulness to his wife and family, for allowing us to stay in the Hujra so many times. We want to thank the people in Mangarkot for being so friendly and patient with us and for their hospitality. Thanks also to Fazal Wahid who accompanied us during the interviews, and Amir Zada of Mangarkot who accompanied us during the field work. The co-operation with institutions and other foreign projects was also delightful and contributed to the success of this study: First of all I want to thank Munazza Khan from the PHP who accompanied me during the interviews with women in Malam and Mangarkot, and Keith Morris for the information on horticulture in Swat and Malam Jabba Valley. I also owe many thanks to the Social Forestry Project that provided information and lots of publications, and the Forest Management Centre in Peshawar, where the staff was unbelievably friendly and helpful, and I deeply appreciate the support and advice I received from the teachers and students of the Botany Department of the University in Peshawar and Prof. Taimur Khan of the Geography Department. All my thankfulness I want to express for the support of the Agricultural Extension Department Mingora, in particular from Mr. Fazal Maula, and the helpful information from the veterinarians of the Civil Veterinary Hospital Saidu Sharif (Mr. Javaid Iqbal and Mr. Ghulam Jabbar) and the Forest Department. Thinking of Saidu Sharif will always remind me of the Projecthouse and the staff, in particular Amir Sawab and his sons. Thanks also to our advisors in political and administrational issues, Syed Alamgir and Ali Akbar. In letzter Minute gerettet hat mich John Mee, der sich dankenswerterweise bereit erklärte, die mühsame Aufgabe des Korrekturlesens auf sich zu nehmen. Gerettet haben mich auch meine Freunde und mein Bruder Werner, die allesamt geduldige Zuhörer waren, wenn ich ein williges Ohr für meine Sorgen brauchte! Meine grösste Stütze und Hilfe war jedoch Karim, dank deiner Hilfsbereitschaft, deinem Verständnis für meine Arbeit und deinem unentgeltlichen und freiwilligen Einsatz als “field assistant” in Pakistan, als mein Beschützer und Helfer, konnte ich mir den Wunsch erfüllen, diese Diplomarbeit in einem islamischen Land durchzuführen! For a hungry man or a hungry woman, Truth has little meaning. He wants food. For a hungry man, God has no meaning...We have to find for them food, clothing, housing, education, health and so on – all absolute necessities
of life that every man should possess. When we have done all that we can philosophise and think of God.
Jawaharlal Nehru, first Prime Minister of India in 1947

v
LIST OF FIGURES, TABLES AND PHOTOGRAPHS
FIGURES
Fig. 1. 1: Map showing the project area of MAP in Malam Jabba Valley. Fig. 1. 2: Precipitation (mm) and mean annual temperature (M.A.T. in °C) of Saidu Sharif, Swat, for the years
1974 –1990. Fig. 1. 3: Diagram showing the altitudinal distribution of floral zones in Malam Jabba Valley. Fig. 1. 4: Landuse map of Malam Jabba Valley (only MAP project area). Fig. 1. 5: The agro-ecological zones in Malakand. Fig. 1. 6: Comparison of numbers of livestock by sources of feed in Swat District. Fig. 1. 7: The administrational structure of the Agricultural Extension in Malakand Division. Fig. 1. 8: Evolution of agricultural landuse in the mountains of Northern Pakistan Fig. 1. 9: Different agroforestrial systems in Swat Valley: Fig. 1. 10: Combination of Agroecosystem Analysis with other methods and tools Fig. 2. 1: Form of survey and analysis. Fig. 2. 2: In Malam (left) six transects were measured, in Mangarkot (right) only two. Fig. 2. 3: To determine the size of a sample plot, the area was calculated as a vertical projection. Fig. 2. 4: The transects were started at the lower forest line and continued in the direction of the ridge. Fig. 2. 5: Nomogram for calculation of SDI. Fig. 2. 6: Symbols and their respective categories used for natural resource village mapping. Fig. 3. 1: Population of Malam with regard to social groups. Fig. 3. 2: Average numbers of livestock per household in Malam. Fig. 3. 3: Comparison of the number of people per household and the available land (ha). Fig. 3. 4: Result of natural resource village mapping in Malam Fig. 3. 5: Seasonal diagram as told by the men in Malam. Fig. 3. 6: Seasonal diagram as told by the women in Malam. Fig. 3. 7: Priority ranking of products in Malam. Fig. 3. 8: Results of the evaluation of the MAP presented in an H-Form. Fig. 3. 9: Tree ranking according to preferences of farmers in Malam. Fig. 3. 10: Outcome of problem ranking with farmers in Malam during a group interview. Fig. 3. 11: Comparison of various plant groups with regard to dominance and abundance. Fig. 3. 12: Plant associations of all transects in Malam in comparison. Fig. 3. 13: Comparison of stand structures with regard to stand density (trees/ha) and dbh (cm). Fig. 3. 14: Remaining volumes (m³/ha) per dbh class (cm). Fig. 3. 15: Natural regeneration compared in all transects of Malam. Fig. 3. 16: Comparison of the number of stems and stumps. Fig. 3. 17: Intensity of forest usage in all transects of Malam in comparison. Fig. 3. 18: Percentage of coverage abundance of plant groups in transect I. Fig. 3. 19: Stand table in terms of dbh classes in transect I. Fig. 3. 20: Intensity of the different ways of forest usage in transect I. Fig. 3. 21: Percentage of coverage abundance of plant groups in transect II. Fig. 3. 22: Intensity of different ways of land/forest usage in transect II. Fig. 3. 23: Percentage of coverage abundance of plant groups in transect III. Fig. 3. 24: Stand table in terms of dbh classes in transect III. Fig. 3. 25: Intensity of different ways of forest usage in transect III. Fig. 3. 26: Percentage of coverage abundance of plant groups in transect IV. Fig. 3. 27: Stand table in terms of dbh classes in transect IV. Fig. 3. 28: Intensity of different ways of forest usage in transect IV. Fig. 3. 29: Percentage of coverage abundance of plant groups in transect V. Fig. 3. 30: Stand table in terms of dbh classes in transect V. Fig. 3. 31: Intensity of different ways of forest usage in transect V. Fig. 3. 32: Percentage of coverage abundance of plant groups in transect VI. Fig. 3. 33: Stand table in terms of dbh classes in transect VI. Fig. 3. 34: Intensity of different ways of forest usage in transect VI. Fig. 3. 35: The population of Mangarkot with regard to social groups. Fig. 3. 36: Average numbers of livestock per household in Mangarkot. Fig. 3. 37: Comparison of the number of people per household and the available land (ha). Fig. 3. 38: Result of natural resource village mapping in Mangarkot.
vi
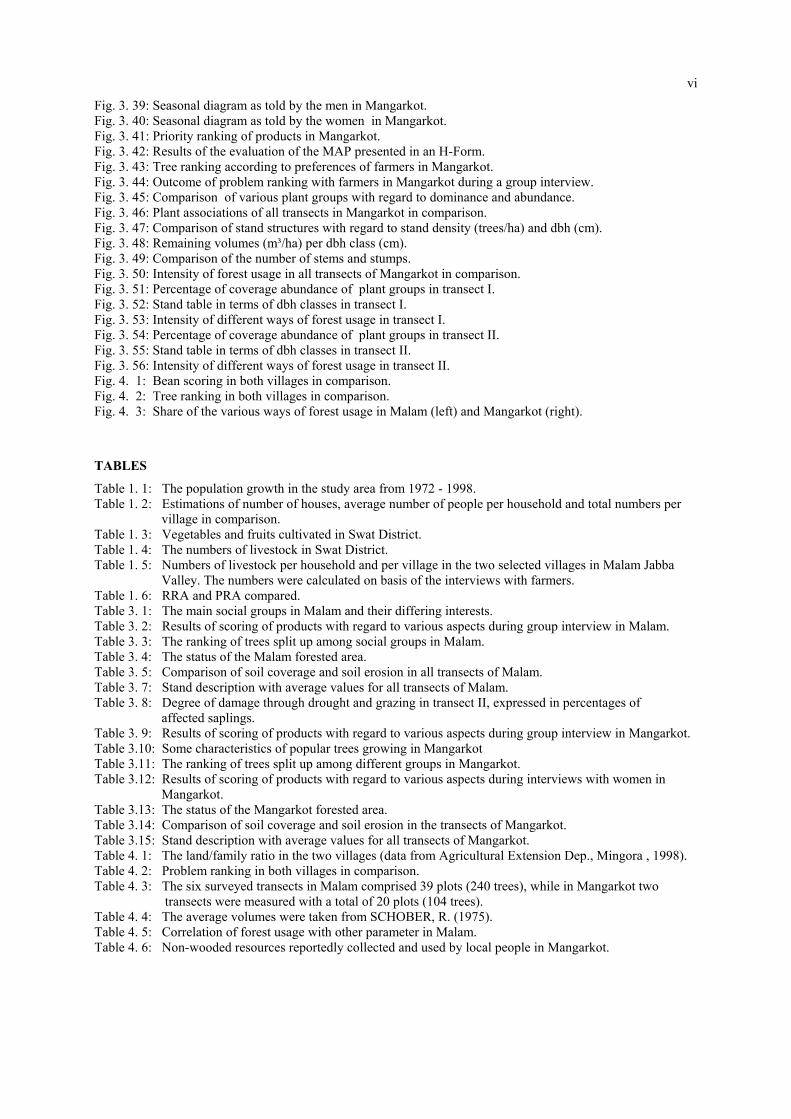
Fig. 3. 39: Seasonal diagram as told by the men in Mangarkot. Fig. 3. 40: Seasonal diagram as told by the women in Mangarkot. Fig. 3. 41: Priority ranking of products in Mangarkot. Fig. 3. 42: Results of the evaluation of the MAP presented in an H-Form. Fig. 3. 43: Tree ranking according to preferences of farmers in Mangarkot. Fig. 3. 44: Outcome of problem ranking with farmers in Mangarkot during a group interview. Fig. 3. 45: Comparison of various plant groups with regard to dominance and abundance. Fig. 3. 46: Plant associations of all transects in Mangarkot in comparison. Fig. 3. 47: Comparison of stand structures with regard to stand density (trees/ha) and dbh (cm). Fig. 3. 48: Remaining volumes (m³/ha) per dbh class (cm). Fig. 3. 49: Comparison of the number of stems and stumps. Fig. 3. 50: Intensity of forest usage in all transects of Mangarkot in comparison. Fig. 3. 51: Percentage of coverage abundance of plant groups in transect I. Fig. 3. 52: Stand table in terms of dbh classes in transect I. Fig. 3. 53: Intensity of different ways of forest usage in transect I. Fig. 3. 54: Percentage of coverage abundance of plant groups in transect II. Fig. 3. 55: Stand table in terms of dbh classes in transect II. Fig. 3. 56: Intensity of different ways of forest usage in transect II. Fig. 4. 1: Bean scoring in both villages in comparison. Fig. 4. 2: Tree ranking in both villages in comparison. Fig. 4. 3: Share of the various ways of forest usage in Malam (left) and Mangarkot (right).
TABLES
Table 1. 1: The population growth in the study area from 1972 - 1998. Table 1. 2: Estimations of number of houses, average number of people per household and total numbers per
village in comparison. Table 1. 3: Vegetables and fruits cultivated in Swat District. Table 1. 4: The numbers of livestock in Swat District. Table 1. 5: Numbers of livestock per household and per village in the two selected villages in Malam Jabba
Valley. The numbers were calculated on basis of the interviews with farmers. Table 1. 6: RRA and PRA compared. Table 3. 1: The main social groups in Malam and their differing interests. Table 3. 2: Results of scoring of products with regard to various aspects during group interview in Malam. Table 3. 3: The ranking of trees split up among social groups in Malam. Table 3. 4: The status of the Malam forested area. Table 3. 5: Comparison of soil coverage and soil erosion in all transects of Malam. Table 3. 7: Stand description with average values for all transects of Malam. Table 3. 8: Degree of damage through drought and grazing in transect II, expressed in percentages of
affected saplings. Table 3. 9: Results of scoring of products with regard to various aspects during group interview in Mangarkot. Table 3.10: Some characteristics of popular trees growing in Mangarkot Table 3.11: The ranking of trees split up among different groups in Mangarkot. Table 3.12: Results of scoring of products with regard to various aspects during interviews with women in
Mangarkot. Table 3.13: The status of the Mangarkot forested area. Table 3.14: Comparison of soil coverage and soil erosion in the transects of Mangarkot. Table 3.15: Stand description with average values for all transects of Mangarkot. Table 4. 1: The land/family ratio in the two villages (data from Agricultural Extension Dep., Mingora , 1998). Table 4. 2: Problem ranking in both villages in comparison. Table 4. 3: The six surveyed transects in Malam comprised 39 plots (240 trees), while in Mangarkot two
transects were measured with a total of 20 plots (104 trees). Table 4. 4: The average volumes were taken from SCHOBER, R. (1975). Table 4. 5: Correlation of forest usage with other parameter in Malam. Table 4. 6: Non-wooded resources reportedly collected and used by local people in Mangarkot.

vii
PHOTOGRAPHS
Photograph 1. 1: Ailanthus altissima on a field boundary in Malam as an example for agro-silvipastoral landuse. Photograph 1. 2: Agro-horticultural landuse near Mangarkot: Apple trees in a field after tomato harvest and
before wheat sowing (double cropping). Photograph 2. 1: Interviews with farmers: The farmer (right) talks with the translator (middle), while the author
(left) takes notes. Photograph 2. 2: Farmers in discussion with the facilitator (left) during group interviews in Malam. Photograph 2. 3: Village mapping in Malam: The farmers add symbols representing natural resources and crops
to a prepared sketch map of the village area. Photograph 2. 4: Bean scoring of products in agriculture and forestry. Photograph 2. 5: Ranking of problems written on coloured circles according to people’s priorities. Photograph 2. 6: Farmers in Malam at tree ranking with beans. Photograph 3. 1: Intensive lopping of trees is widely practised in the forested area in Malam. Photograph 3. 2: Splintering and other damage of bark is caused on purpose to weaken trees. Photograph 3. 3: After logging the stumps are burned down and used to gain torchwood until there is
nothing left. Photograph 3. 4: Timber and fuelwood stored near a farmhouse in Malam. Photograph 3. 5: Transect I in Malam: Turf-forming grasses dominate. The trees are severely lopped. Photograph 3. 6: Transect II in Malam: A tussock-steppe is developing in the protected area. Photograph 3. 7: Transect III in Malam: The understorey is poorly developed (Viburnum nervosum,
Quercus dilatata, Plectranthus rugosus etc.). Photograph 3. 8: Transect IV in Malam: This site is shady and humid, mosses and ferns dominate. Photograph 3. 9: Transect V in Malam: The slopes are very steep, but the forest is still comparatively pristine. Photograph 3.10: Transect VI in Malam: The forest is close to an afforestation site and therefore also protected.
The terraces reach up to the forest line and sometimes even encroach into the forested area. Photograph 3.11: Soil erosion in the forested area almost uproots pine trees. Photograph 3.12: A forest farmer’s settlement, situated closely to the forest. Photograph 3.13: Logging of intact, growing trees is illegal, but to take a “dying tree” is not against the law.
Often this process is artificially accelerated – e.g. by setting fire to a pine tree; the fire is eventually put out before it spreads.
Photograph 3.14: The terraces reach right up to the lower forest line and often expand into the existing forested area.
Photograph 3.15: Transect I in Mangarkot: The forest is used intensely for grazing, grass cutting, timber logging and lopping. Grasses are turf-forming and there are almost no woody perennials.
Photograph 3.16: Transect II in Mangarkot: There are both tufted grasses and turf –forming grasses represented in the transect. Stand density is high, but forest usage is about to become increasingly severe.
APPENDIX
Photograph 1: Typical milk buffalo in Malam. Photograph 2: Cattle searching for food (Mangarkot). Photograph 3: Sapling of P. wallichiana. Photograph 4: Sarcococca saligna. Photograph 5: Cedrus deodara. Photograph 6: Local fig in Mangarkot. Photograph 7: Local pear in Malam. Photograph 8: Persimmon fruits in Kashora. Fig. 1: Landuse map of Malam. Fig. 2: The status of the remaining forested area in Malam. Fig. 3: Landuse map of Mangarkot. Fig. 4: The status of the remaining forested area in Mangarkot.

viii
ABBREVIATIONS
AD Anno Domini – “in the year of the lord”
AEA Agroecosystem Analysis
ARSM Agricultural Research Station Mingora
BC Before Christ
CPR’s Common Property Resources
DFO Divisional Forest Officer
ERP Environmental Rehabilitation project
FMC Forest Management Centre
FSR Farming Systems Research
HKH Hindu-Kush-Himalayan Region
JFM Joint Forest Management
KIDP Kalam Integrated Development Project
MAP Malam Jabba Afforestation Project
MFVD Malakand Fruit and Vegetable Development Project
MMT Main Mantle Trust
MPTS Multipurpose trees
NGO Non-governmental Organisation
N.W.F.P. North Western Frontier Province
PA Participatory Appraisal
PATA Provincially Administered Tribal Area
PHP Project for Horticultural Promotion
PRA Participatory Rural Appraisal
Rps Pakistani Rupees
RRA Rapid Rural Appraisal
SDI Stand Density Index
SF Social Forestry
VDCs Village Development Committees
VLUP Village Land Use Plan
WID Women in Development

ix
CONVERSION TABLE
LINEAR MEASURE
1 mile 1,609 km
SQUARE MEASURES
1 acre 4047 m²
1000 m² 0,247 acres
1 ha 10 000 m²
10 000 m² 2,47 ha
1 kanal 505,88 m²
1000 m² 1,977 kanals
1 acre 8 kanals
1 ha 20 kanals
LOCAL AGRICULTURAL MEASURES
MOUNTS:
1 mount ~ 50 kg of grain (maize)
1 acre ~ 600 kg/ 12 mounts
1 ha ~ 30 mounts
CHEREB:
1 chereb ~ 250-300 kg maize grain
1 acre ~ 5-600kg/ 2 chereb
1 ha ~ 5 chereb
x
TABLE OF CONTENTS
ABSTRACT............................................................................................................................................................iii
ACKNOWLEDGEMENTS...................................................................................................................................iv
LIST OF FIGURES, TABLES AND PHOTOGRAPHS.....................................................................................v
ABBREVIATIONS..............................................................................................................................................viii
CONVERSION TABLE........................................................................................................................................ix
1 INTRODUCTION ............................................................................................................. 1
1.1 Objectives............................................................................................................................................... 1
1.2 The study area ....................................................................................................................................... 2 1.2.1 Natural prerequisites of the study area ............................................................................................ 2
1.2.1.1 Geography................................................................................................................................... 2 1.2.1.2 Geology, rock and soil ................................................................................................................ 2 1.2.1.3 Climate ........................................................................................................................................ 4 1.2.1.4 Vegetation ................................................................................................................................... 5
1.2.2 Social and cultural history............................................................................................................... 7 1.2.2.1 The History of Swat .................................................................................................................... 7 1.2.2.2 The Pathan Society...................................................................................................................... 7 1.2.2.3 The role of women in the Pathan society .................................................................................... 8 1.2.2.4 Population and development ....................................................................................................... 8
1.2.3 Landuse and Agriculture ............................................................................................................... 10 1.2.3.1 Development of land-tenure system in Swat:............................................................................ 10 1.2.3.2 Agricultural statistics and landuse in Swat valley: .................................................................... 12 1.2.3.3 Landuse in Malam Jabba Valley: .............................................................................................. 15 1.2.3.4 Livestock and pasturage ............................................................................................................ 17 1.2.3.5 Veterinary organisations ........................................................................................................... 19 1.2.3.6 Agricultural policies and Extension services ............................................................................ 20
1.3 Environment and development in the Himalayan region................................................................ 21 1.3.1 The Himalayan Dilemma .............................................................................................................. 21 1.3.2 Impact of Modernisation on Pakistan’s Hindukush-Himalaya...................................................... 22
1.4 Agroforestry in mountainous areas ................................................................................................... 24 1.4.1 Definition of Agroforestry ............................................................................................................ 24 1.4.2 Agroforestry systems..................................................................................................................... 25 1.4.3 Strategies in agroforestrial landuse in Swat Valley....................................................................... 26 1.4.4 Agroforestry in Malam Jabba:....................................................................................................... 27
1.5 Agroforestry and participation .......................................................................................................... 29 1.5.1 Participatory methods and tools for agroforestry applications ...................................................... 29 1.5.2 Integrating farmers in development .............................................................................................. 31
1.5.2.1 Participatory approach............................................................................................................... 31 1.5.2.2 Social forestry ........................................................................................................................... 32 1.5.2.3 Forest policies in the N.W.F.P. ................................................................................................. 32 1.5.2.4 Forest rights in the N.W.F.P...................................................................................................... 33 1.5.2.5 New forest policies for Malam Jabba........................................................................................ 34
xi
2 METHODS....................................................................................................................... 35
2.1 Generative phase ................................................................................................................................. 36 2.1.1 First assessment of agriculture and forestry .................................................................................. 36 2.1.2 Preparatory phase for second assessment...................................................................................... 36
2.2 Detailing phase .................................................................................................................................... 36 2.2.1 Introductory meetings and transect walk....................................................................................... 36 2.2.2 Investigation of landuse ................................................................................................................ 37
2.3 Assessment and correlation phase ..................................................................................................... 37 2.3.1 Methodology of forest survey ....................................................................................................... 37
2.3.1.1 Site description.......................................................................................................................... 39 2.3.1.2 Stand description....................................................................................................................... 39 2.3.1.3. SDI ............................................................................................................................................ 41 2.3.1.4 Regeneration ............................................................................................................................. 42 2.3.1.5 Forest usage............................................................................................................................... 43 2.3.1.6 Vegetational survey................................................................................................................... 43
2.3.2 Methodology of social survey ....................................................................................................... 44 2.3.2.1 Interviews with farmers............................................................................................................. 45 2.3.2.2 Group interviews....................................................................................................................... 45
2.3.3 Interviews with officials................................................................................................................ 47
3 RESULTS......................................................................................................................... 51
3.1 Malam .................................................................................................................................................. 51 3.1.1. Population, livestock and agricultural land .................................................................................. 51 3.1.2 Natural resources........................................................................................................................... 54
3.1.2.1 Description of the area .............................................................................................................. 54 3.1.2.2 Problematic aspects concerning natural resources in the village of Malam .............................. 55
3.1.3 Seasonal diagrams......................................................................................................................... 56 3.1.4 The importance of various products from agriculture and forestry for farmers in Malam............ 58 3.1.5 The main constraints in agriculture and forestry in the village of Malam..................................... 58 3.1.6 Priorities in agricultural policies ................................................................................................... 60 3.1.7 Priorities in forest policies............................................................................................................. 60 3.1.8 The main constraints in everyday life in the village of Malam ..................................................... 63
3.1.8.1 Interviews with farmers............................................................................................................. 63 3.1.8.2 Group interviews....................................................................................................................... 63
3.1.9 Situation of women in Malam....................................................................................................... 64 3.1.9.1 Social life .................................................................................................................................. 64 3.1.9.2 Agricultural issues..................................................................................................................... 64
3.1.3 Results of the forest survey ........................................................................................................... 65 3.1.3.1 Description of sites of the forest survey .................................................................................... 65 3.1.3.2 Soil and erosion......................................................................................................................... 66 3.1.3.3 Vegetation ................................................................................................................................. 66 3.1.3.4 Stand density ............................................................................................................................. 68 3.1.3.5 Regeneration ............................................................................................................................. 70 3.1.3.6 Stems and stumps...................................................................................................................... 70 3.1.3.7 Forest usage............................................................................................................................... 71 3.1.3.8 Malam: Transect I (Foreray) ..................................................................................................... 74 3.1.3.9 Malam: Transect II .................................................................................................................... 76 3.1.3.10 Malam: Transect III (Barida) .................................................................................................... 77 3.1.3.11 Malam: Transect IV .................................................................................................................. 80 3.1.3.12 Malam: Transect V.................................................................................................................... 82 3.1.3.13 Malam: Transect VI .................................................................................................................. 84
xii
3.2 Mangarkot ........................................................................................................................................... 88 3.2.1 Population, livestock and agricultural land ................................................................................... 88 3.2.2 Natural resources........................................................................................................................... 91
3.2.2.1 Description of the area .............................................................................................................. 90 3.2.2.2 Problematic aspects concerning natural resources in the village of Malam .............................. 90
3.2.3 Seasonal diagrams......................................................................................................................... 93 3.2.4 The importance of the various products from agriculture and forestry for the farmers ................ 95 3.2.5 The main constraints in agriculture and forestry in the village of Mangarkot............................... 96 3.2.6 Priorities in agricultural policies ................................................................................................... 97 3.2.7 Priorities in forest policies............................................................................................................. 97 3.2.8 The main constraints in everyday life in the village of Mangarkot ............................................. 100
3.2.8.1 Interviews with farmers........................................................................................................... 100 3.2.8.2 Group interviews..................................................................................................................... 100
3.2.9 Situation of women in Mangarkot............................................................................................... 101 3.2.9.1 Social life ................................................................................................................................ 101 3.2.9.2 Agricultural issues................................................................................................................... 101
3.2.10 Forest Survey .............................................................................................................................. 103 3.2.10.1 Description of the sites of the forest survey ........................................................................ 103 3.2.10.2 Soil and erosion................................................................................................................... 104 3.2.10.3 Vegetation ........................................................................................................................... 104 3.2.10.4 Stand density ....................................................................................................................... 106 3.2.10.5 Regeneration ....................................................................................................................... 108 3.2.10.6 Stems and stumps ................................................................................................................ 108 3.2.10.7 Forest usage......................................................................................................................... 109 3.2.10.8 Mangarkot: Transect I ......................................................................................................... 112 3.2.10.9 Mangarkot: Transect II..........................................................................................................114
4 DISCUSSION................................................................................................................. 117
4.1 The socio-economic situation............................................................................................................ 117 4.1.1 Interviews with farmers............................................................................................................... 118 4.1.2 Group interviews......................................................................................................................... 118
4.1.2.1 Village and natural resource mapping..................................................................................... 118 4.1.2.2 Problem ranking ...................................................................................................................... 118 4.1.2.3 Bean scoring............................................................................................................................ 121 4.1.2.4 Tree ranking ............................................................................................................................ 122
4.2 The status of the forested area ......................................................................................................... 123 4.2.1 Summary of the most important stand parameter........................................................................ 123 4.2.2 Natural regeneration and afforestation practices ......................................................................... 125 4.2.3 The extent of forest usage ........................................................................................................... 127 4.2.4 Vegetation resulting from intensive human impact in Malam Jabba Valley............................... 128 4.2.5 Wooded and non-wooded resources............................................................................................ 129 4.2.6 Agroforestrial landuse ................................................................................................................. 131
5 CONCLUSION .............................................................................................................. 132
APPENDIX...............................................................................................................................................................I
EXPLANATIONS..............................................................................................................................................XIV
LITERATURE...................................................................................................................................................XVI
CURRICULUM VITAE....................................................................................................................................XXI
1
1 INTRODUCTION
1.1 Objectives
This assessment aimed at demonstrating the complex interactions between the development of the human
population of a former remote and inaccessible mountainous area and the status of traditional agroforestrial
landuse systems, in particular the silvo-pastoral systems. The destruction of the forested areas has many
disastrous consequences (see 1.3) and threatens the villagers’ existence directly. Therefore the silvo-pastoral
systems were chosen as the main topic of this assessment.
In order to cover a broader aspect of these interactions both a social survey and a survey on the remaining
forested areas were carried through, concentrating on the following issues:
1. Population, livestock and agricultural land:
The survey included statistical data on the local population, the distribution and amount of livestock present
in the villages and the amount of available arable land. It provided the basis for understanding the social
structure, the situation of the women and the hierarchy in the villages.
2. Natural resources and landuse:
The importance of forest usage and other agroforestrial landuse practices for the local people were
investigated, as well as possible non-timber resources and the meaning and use of different tree species.
Important aspects were the changes in landuse during time, the consequences of misuse of natural resources
and the actual availability of such resources. The seasonal calendars and the respective importance of
products from agriculture and forestry were also included in the survey.
3. Forest survey:
The forest survey provided data on stand density, stand structure, remaining resources of timber, non-timber
products and non-wooded products from the forest. Species diversity, intensity and consequences of forest
usage were also compared. Based on these data a statement on the status of the forest structure and
resilience can be made.
4. Official policies and project work in the region:
The high number of foreign sponsored projects in the region made it necessary to include also this aspect in
the survey. Interviews and secondary literature were provided by several of these institutions, as well as of
governmental organisations such as the Agricultural Extension Department.
The results show the status of the silvo-pastoral systems in Malam Jabba Valley and the future perspectives of
the remaining forested areas. The social situation of the local people, as well as their initiatives and possibilities
for sustainable development are the framework for the future of the region and its inhabitants.
2
1.2 The study area
1.2.1 Natural prerequisites of the study area
1.2.1.1 Geography
The study area is situated in the Northwest of Pakistan (34° 90’N / 72°50’E) between the Himalayan and the
Hindu Kush foothills. The political province is the North Western Frontier Province (N.W.F.P.). Malam Jabba
Valley belongs to Swat District, a part of Malakand Division. The capital city of Swat District is Saidu Sharif -
together with its twin town Mingora it has 220 000 inhabitants. Malam Jabba Valley is situated about 8 km to the
Northeast of Saidu Sharif and diverges off Swat Valley at the village Manglaur. (INTEGRATED REGIONAL
DEVELOPMENT, 1998)
Along Swat River fertile land stretches widely. The hills along the valley used to be densely forested. The valley
is still picturesque in spite of severe changes in landscape due to increased settlement and deforestation during
the last decades.
In Malam Jabba Valley altitude varies from 990 m to 2880 m from the valley entrance to the highest peak of
Shagar Sar (INTEGRATED REGIONAL DEVELOPMENT, 1998). Starting from Ser the valley comprises of an
area of about 8540 ha (21 351 acres). The survey focuses on two villages, Malam and Mangarkot. (see fig.1.1)
The last census (1981) resulted in a population of 15 140 people. The outcome of an extrapolation of these data
with an assumed yearly population growth rate of 3% was already 24 000 people in 1998. (MALAM JABBA
AFFORESTATION PROJECT. PC-I, 1998)
There is one main asphalt road (35 km long) leading from Manglaur to Kuza Jabba. The Austrian Development
Co-operation assisted when it was constructed in the 70ies and 80ies. At the same time a skiing lift and a hotel
were built in Kuza Jabba (opened to the public in 1998). Most of the villages that are situated off the asphalt
road are connected to that road with jeep roads.
1.2.1.2 Geology, rock and soil
The area is characterised by a very complicated geological structure and a large number of different types of
rock:
Typical for Malam Jabba Valley are the phyllitic schists. Most of these rocks are between schists and phyllites.
They are predominantly composed of quartz and mica, with minor iron ore, graphite, etc. and sometimes
containing garnet. The rocks are usually dark grey with a micaceous sheen on the surface. (FMC PLANNING
REPORT,1998)
The valley is situated at the Main Mantle Thrust (MMT). The MMT divides the Indian Plate from the Kohistan
Island Arc. Earthquakes occur at regular intervals in the region, usually with a strength of 2-4 (Richter-scale), the
maximum is at about 6 (Richter-scale). (INTEGRATED REGIONAL DEVELOPMENT, 1998)
The silty clay loam and the moderately deep silt loam is the main soil material (Shangla-rockland complex),
always closely related to the parent rock. There are a wide variety of soil types in the area due to the multitude
of different parent rocks. (FMC PLANNING REPORT, 1998)

3
Fig. 1.1: Map showing the project area of MAP in Malam Jabba Valley (from MALAM JABBA AFFORESTATION PROJECT. PC-I, 1998).
MALAM
MANGARKOT
PROJECT BOUNDARY
JEEP ROAD
ASPHALT ROAD
CULTIVATED LAND
STREAMS
SETTLEMENTS
DISTRICT BOUNDARY

4
1.2.1.3 Climate
The climatic conditions in the area vary from sub-tropical (Barikot1), boreal (Miandam2) to moist-temperate
(Charbagh3). Fig. 1.2 shows climatic data of Saidu Sharif, where the only Meteorological Centre in the area is
located. (FMC PLANNING REPORT, 1998)
The sub-tropical, semi-arid climate of Saidu Sharif is comparable to that in the lower Malam Jabba. In the upper
Malam Jabba Valley the climate is temperate from 1500 to 2500 m and above 2500 m it is alpine. Precipitation
increases with altitude while evaporation decreases (compare WEIERS, S., 1995): The margin of the monsoon
shows an increase in precipitation to an altitude of 2500 m. Then it decreases and at about 3500 m it starts to
rise again. The upper regions of Malam Jabba valley are therefore classified as humid. There are usually two
rainy seasons per year: One lasts from January to April (Rabi-winter rainfall). The other rainy season occurs in
July/August (Kharif-summer rainfall) as a consequence of the monsoon influence from the southern subtropical
regions (Arabian Sea). From May to June there is a dry and sunny period, while December and January are
usually the most cloudy months. Reportedly this pattern varies often and there are both very dry summers and
summers with an extremely high precipitation. The climatic snow line is approximately 4600-4700 m (northern
slope) and 4800-5000 m (southern slope) respectively. The lower snow line in winter in Malam Jabba Valley is
1800 to 2000 m. (INTEGRATED REGIONAL DEVELOPMENT PROJECT , 1998)
9,5 13,6 19,5 24,6 28,6 28,7 27,1 24,8 20,2 14,4 9,9
103,4 180,4 99,4 64,3 31,5 146 142,2 56,7 54,8 30,9 56,4
J F M A M J J A S O N D
Fig. 1. 2 : Precipitation (mm) and mean annual temperature (M.A.T. in °C) of SaiduSharif, Swat, for the years 1974 –1990 (Source: FMC PLANNING REPORT, 1998;original source of data: Meteorological Centre Saidu Sharif).
PRECIPITATION (mm) 76,1
0
20
40
60
80
100
120
140
160
180
200
M.A.T.(°C) 8,2
1 The name refers to the whole planning unit according to the FMC PLANNING REPORT (1998), not only to the village. 2 see 1. 3 see 1.

5
1.2.1.4 Vegetation
According to WALTER, H. (1976) Pakistan’s flora and vegetation is influenced by the Irano-Turanian, the
Sudano-Zambesian and the Indian floral region. In the plain areas of Pakistan Saharo-Sindian and
Southmediterranean influences dominate. RAFIQ, R. A. (1996) claims in a study of Palas Valley, Kohistan (NE
of Swat Valley), that influences on vegetation and flora originate partly from the Sino-Japanese, the Irano-
Turanian and the Mediterranean floral region.
NW-Pakistan is included in ecotone VII and IV according to the classification of WALTER, H. et BRECKLE,
S.-W. (1991). Especially the mountainous areas of the Himalayan region are characterised through strongly
differing zones as a consequence of the chamber-like structures in this mountain ecosystem. HASERODT, K
(1989) explains that the vegetational changes in composition and altitudinal zones in Chitral Valley, Northern
Pakistan, are mainly depending on exposition. HUSSAIN, F., et al. (1997 b) proved in a study conducted in the
Dabargai hills, Swat, that south facing slopes had higher air and soil temperature than the north-east facing
slopes. With increasing altitude the differences in soil and air temperature as well as water holding capacity of
soil decreased again. Consequently the plant species and their communities similarly differed on south- and
north-east facing slopes.
HUSSAIN, F. published several phytosociological studies of Swat Valley in the 80ies and 90ies. In these he
documents consequences of intense human pressure during the last decades: Deforestation and overgrazing have
resulted in increased erosion and have changed the original vegetation (HUSSAIN, F. et al., 1997a). HUSSAIN,
F. et al. (1997a) cite several studies conducted in the N.W.F.P. stating that vegetation in the area has altered
mainly towards unpalatable species as a consequence of grazing of domestic animals. Deforestation and
overgrazing are the main ecological problems in the region (HUSSAIN, F. and ALEEM, S., 1989) and have
almost extinguished the primary subtropical vegetation of Swat. Degradation due to deforestation and over-
grazing has increased therophytes and soil erosion has hindered the regeneration of plants in the area
(HUSSAIN, F. et al., 1997 b).
The original subtropical vegetation ( see fig. 1.3) at lower elevations in Swat were Dry Subtropical Broad-leaved
Forests (as defined by CHAMPION, H.G., et al., 1965) with Olea cuspidata and Acacia modesta joined by
Pinus roxburghii at about 900 m (3000 ft), and Subtropical Pine Forests, Upper or Himalayan Chir Pine Forest
(P. roxburghii) at elevations from about 900 m to 1500 m (3000 ft to 5000 ft). P. roxburghii is usually joined by
Quercus incana and Olea cuspidata in this forest type.
With regard to ecological zones Malam Jabba Valley is situated in a transition zone from the subtropical to the
temperate zone (INTEGRATED REGIONAL DEVELOPMENT, 1998). The lower part of the valley is
characterised by the subtropical zone which is dominated by Dodonea viscosa. This indicates an ultimate stage
in degradation through excessive grass cutting and grazing. Occasionally P. roxburghii is scattered in and some
shrubby forms of Acacia modesta, Olea cuspitata, Quercus incana. More frequent other unpalatable species
occur, such as Monotheca buxifolia, Rhazya sp. and Withania sp., all unpalatable and growing along roadsides
and near villages. In higher altitudes Berberis lycium, Indigofera heterantha and Plectranthus rugosus dominate.
The transition zone from the subtropical to the temperate zone ranges from 1500 - 2000 m in Malam Jabba
Valley. In the temperate zone there are still remains of the coniferous forests that used to cover all the hillsides.
The primary forest type in this area and altitude is a Himalayan Moist Temperate Forest (according to

6
CHAMPION et al., 1965). It has been replaced by a degraded forest type classified as Secondary Blue Pine
forest (Pinus wallichiana) as a consequence of deforestation, overgrazing, terrace cultivation and erosion.
The original forest type is a mixed evergreen forest with Pinus wallichiana, Picea smithiana, Abies pindrow, and
the evergreen oaks Quercus incana and Quercus dilatata. This forest type still grows at higher elevations in
Malam Jabba, near Kuza Jabba (>2100m/6600 ft). Oaks are usually severely lopped and often appear as
degraded shrubs only.
From 1700 to 2100 m the main forest type is Secondary Blue Pine Forest (P. wallichiana). In the undergrowth
occasionally degraded forms of Qu. incana and Qu. dilatata occur. Shrubs such as Indigofera heterantha and
Sarcococca saligna withstand heavy grazing and intense use for cutting of grass and perennial herbs, as well as
lopping for fuelwood, debarking to gain torchwood and timber logging.
Fig. 1.3: Diagram showing the altitudinal distribution of floral zones in Malam Jabba Valley (modified after CHAMPION, H. G. et al., 1965):
HIMALAYAN MOIST TEMPERATE FORESTS:
UPPER ZONE: Abies pindrow, Qu. semecarpifolia Alnus sp.
LOWER ZONE: (Qu. dilatata) Abies pindrow Picea smithiana Pinus wallichiana Cedrus deodara (Qu. incana)
DECIDUOUS SHRUBS: Rubus, Viburnum, Lonicera, Indigofera, Desmodium.... EVERGREEN SHRUBS:Sarcococca, Daphne, Skimmia, Strobilanthes,...CLIMBERS: Rosa, Clematis, Hedera,..HERBACEOUS: Impatiens, Plectranthus,Senecio, Dipsacus, Heracleum,.....
Quercus semecarpifolia
Qu. dilatata
11 000 ft 10 000 ft 9 000 ft 8 000 ft 7 000 ft 6 000 ft 5 000 ft 4 000 ft 3 000 ft 2 000 ft 1 000 ft
Qu. incana
SUBTROPICAL BROADLEAVED FORESTS: Olea cuspidata, Acacia modesta, Pistacia integerrima, Punica sp.SHRUBS: Dodonea, Rhazya, Withania, thorny: Gymnosporia, Monotheca, Carissa, Zizyphus mauretania
SUBTROPICAL PINE FORESTS: P. roxburghii CLIMBERS: Clematis, Rosa, Smilax HERBACEOUS: Viola, Valeriana, Senecio,... SHRUBS: Upper Zone: Myrsine africana, Daphe, Rosa, Lonicera Throughout: Berberis, Indigofera, Rubus, Reinwardtia Lower Zone: Carissa, Dodonea, Woodfordia

7
1.2.2 Social and cultural history4
1.2.2.1 The History of Swat
In the 4th century BC Alexander the Great invaded Swat on his way to India. From the 2nd to the 9th century AD
it was the centre of the Buddhist Gandhara-culture. The following centuries were moulded by Hindu influence.
In the 16th century Yuzufzai Pathan conquered Swat Valley and subjugated the indigenous people. The Yuzufzai
represented only 20 % of the population (WARTHOL,W.,1980), but the right of landownership was entitled
only to them. The Vesh-system was introduced by the first Pathan intruders in the 16th century and was
maintained until 1926: The land was divided, and periodically redistributed (compare 1.2.3.1). Land was not
privately owned but was a common property of the Yuzufzai.
The British never directly interfered in Swat until 1895, when the succession to the throne in Chitral was
disputed. To prevent further instability in the region the British troops conquered the Malakand pass and entered
lower Swat. In the same year the Malakand Agency was created. In 1901 the N.W.F.P. was founded as a
province of its own.
In 1926 Miangul Abdul Wadud, the grandson of the Akund of Swat (Saidu Baba), united the tribes and founded
the state of Swat. He became thus the leader, the Wali of Swat. He co-operated with the British Government and
could maintain the independent state until 1948, when his son Miangul Jahan Zeb succeeded him as the next
Wali. In 1969 Miangul Jahan Zeb resigned and the Swat merged peacefully into the state of Pakistan.
1.2.2.2 The Pathan Society
The Yuzufzai not only subjugated the original mainly Dardic population of Swat, the former pagan (Kafir) or
Shiite population (Ismaili) were also converted to Islam (the Yuzufzai are Sunni Muslims). The Yuzufzai settled
mainly in the fertile valley bottom, consequently the indigenous population partly retreated to the high
mountainous areas (= Kohistani, meaning mountain people).
As BARTH, F., (1959) writes, the hierarchical system consists of categories called qoums, meaning people,
religious or ethnic group, caste. Membership in a qoum is determined patrilineal. The first rank in this caste-like
system is confined to Saints, second are already the Yuzufzai. Saints were allowed to own land privately. There
are four categories of Saints (WARTHOL,W., 1980, according to BELLEW, H.W., 1864):
1) Sayad (Syed, Sayyid): Descendants of the Prophet.
2) Pir: Descendants of a Pathan-Saint.
3) Mian: Like Pir, only that the Saint was no Yuzufzai descendant.
4) Sahibzada: Descendants of a Saint of minor importance.
The male heads of the families met at regular intervals in the Jirga, to discuss current issues and make decisions.
In case of a war or a crisis a leader was elected. As there was no ruling dynasty the tribes were constantly
involved in quarrels and tribal wars. Members of the Jirga were only the Yuzufzai. A control on social life was
4 Compare BARTH, F. (1956) , BARTH, F. (1959) and BARTH, F. (1995), BUSCHMANN, H. K. (1996), FAUTZ, B. (1963) and
WARTHOL, W. (1980).
8
guaranteed through the Pukhtunwali, a code of honour: The basic principles were hospitality, granting of
sanctuary, and obligation to blood feud in case of insult.
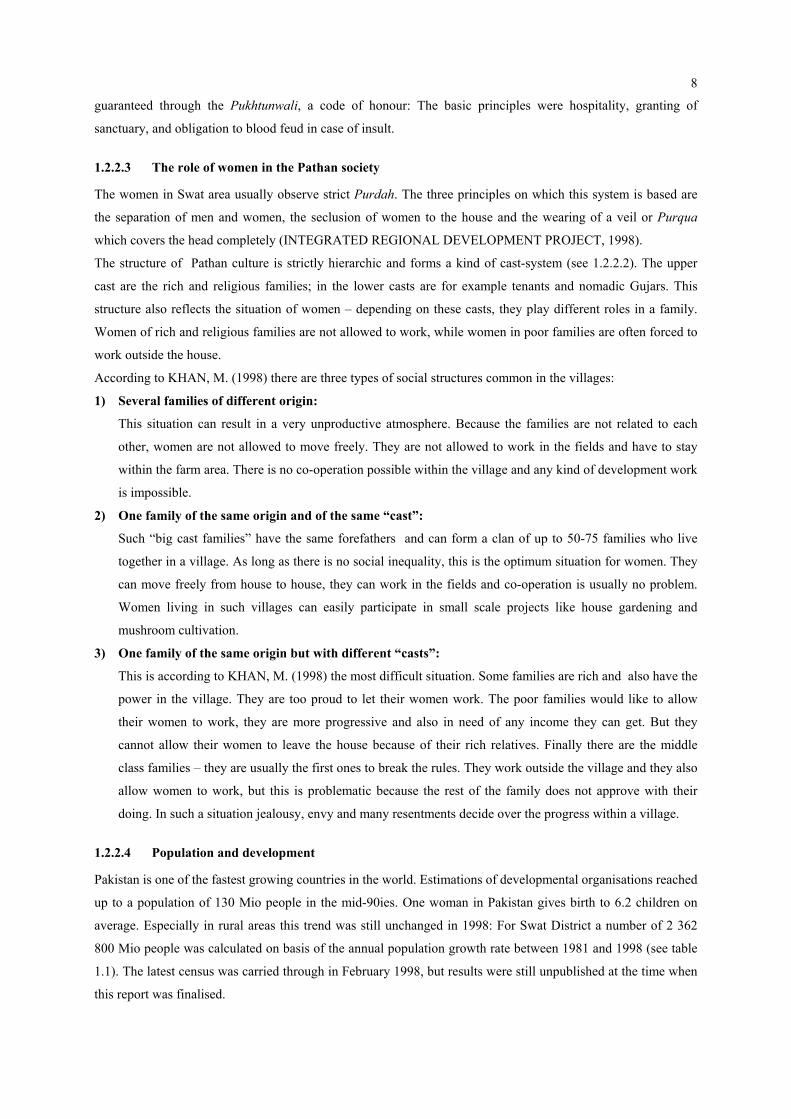
1.2.2.3 The role of women in the Pathan society
The women in Swat area usually observe strict Purdah. The three principles on which this system is based are
the separation of men and women, the seclusion of women to the house and the wearing of a veil or Purqua
which covers the head completely (INTEGRATED REGIONAL DEVELOPMENT PROJECT, 1998).
The structure of Pathan culture is strictly hierarchic and forms a kind of cast-system (see 1.2.2.2). The upper
cast are the rich and religious families; in the lower casts are for example tenants and nomadic Gujars. This
structure also reflects the situation of women – depending on these casts, they play different roles in a family.
Women of rich and religious families are not allowed to work, while women in poor families are often forced to
work outside the house.
According to KHAN, M. (1998) there are three types of social structures common in the villages:
1) Several families of different origin:
This situation can result in a very unproductive atmosphere. Because the families are not related to each
other, women are not allowed to move freely. They are not allowed to work in the fields and have to stay
within the farm area. There is no co-operation possible within the village and any kind of development work
is impossible.
2) One family of the same origin and of the same “cast”:
Such “big cast families” have the same forefathers and can form a clan of up to 50-75 families who live
together in a village. As long as there is no social inequality, this is the optimum situation for women. They
can move freely from house to house, they can work in the fields and co-operation is usually no problem.
Women living in such villages can easily participate in small scale projects like house gardening and
mushroom cultivation.
3) One family of the same origin but with different “casts”:
This is according to KHAN, M. (1998) the most difficult situation. Some families are rich and also have the
power in the village. They are too proud to let their women work. The poor families would like to allow
their women to work, they are more progressive and also in need of any income they can get. But they
cannot allow their women to leave the house because of their rich relatives. Finally there are the middle
class families – they are usually the first ones to break the rules. They work outside the village and they also
allow women to work, but this is problematic because the rest of the family does not approve with their
doing. In such a situation jealousy, envy and many resentments decide over the progress within a village.
1.2.2.4 Population and development
Pakistan is one of the fastest growing countries in the world. Estimations of developmental organisations reached
up to a population of 130 Mio people in the mid-90ies. One woman in Pakistan gives birth to 6.2 children on
average. Especially in rural areas this trend was still unchanged in 1998: For Swat District a number of 2 362
800 Mio people was calculated on basis of the annual population growth rate between 1981 and 1998 (see table
1.1). The latest census was carried through in February 1998, but results were still unpublished at the time when
this report was finalised.

9
Table 1.1: The population growth in the study area from 1972 - 1998.
1972 1981 1998 Population growth (annually)
N.W.F.P.5 8 388 551 11 061 328 17 688 000 2.8 %
Swat6 888 411 1 233 001 2 362 800 3.9 %
Malam Jabba7 n. a. 15 140 24 000 3 %
There were several differing estimations available on the number of houses and the number of people living in
the villages in Malam Jabba. Table 1.2 shows the numbers that were mentioned for Malam and Mangarkot, the
two villages that were included in the survey.
Table 1.2: Estimations of number of houses, average number of people per household and total numbers per village in comparison.
MALAM MANGARKOT
Number of
houses
Average per
household
Total
number
Number of
houses
Average per
household
Total
number
Population
census 1981
- - 1060 - - 560
Student Report
1998
200-250 10 19558 160 10 10339/2000
Agricultural
department 1998
368 6-7 2392 73 6-7 475
Estimations of
villagers
39310 10-15 11 4912 120-150 10-15 1562
Interviews with
farmers
393 10.7 4205 125 14 1750
In INTEGRATED REGIONAL DEVELOPMENT PROJECT (1998) the population census of 1981 was cited
and the actual population in 1998 in several villages of Malam Jabba Valley was estimated on basis of the annual
growth rate for Swat District. The number of houses and the average number of people per household were also
5 Data obtained from Agricultural Statistics of North-West Frontier Province for 1994-95 and INTEGRATED REGIONAL
DEVELOPMENT PROJECT, 1998. 6 see 5. 7 Data obtained from MALAM JABBA AFFORESTATION PROJECT. PC-I, 1998. 8 Projected to 1998 based on results of 1981 census, assuming an annual growth rate of 3.9 %. 9 as in 8. 10 This number was reportedly the result of the last census in 1998. 11 Reportedly the minimum number of people per household was 8 and the maximum 32 during the last census in 1998.

10
estimated on basis of field visits and interviews. The numbers given by the Agricultural Department and the
estimations of the villagers (see 3.1.8.1 and 3.2.8.1) were projected to the whole village. Calculations of the
average of all these various data lead to an estimated population of 2905 in Malam (482 ha arable land/200-250
ha forest) and 1260 in Mangarkot (235 ha arable land/80-100 ha forest).
1.2.3 Landuse and Agriculture
The most precise study on land use in Swat Valley dates back to 1963 and was carried out by FAUTZ, B.. At
that time landuse was still mainly characterised by the influence of the Pathan period (see 1.2.3.1). The valley
bottom was used for cultivation of rice and wheat, the slopes were terraced and used for maize production only.
Grains were grown on 95 % of the arable land in the early 60ies. Fruit and vegetable production as well was
sugar cane in Lower Swat were only timidly introduced at that time.
Malakand Fruit and Vegetable Development Project (MFVDP) collected much of the widespread knowledge on
landuse in Malakand Division. The Project for Horticultural Promotion (PHP) is the successor project of
MFVDP and aims to operate in the whole N.W.F.P. . Other landuse-related projects operating in the area are
Social Forestry (SF) and Environmental Rehabilitation Project (ERP).
Agricultural statistics documenting the changes from 1982 to 1995 could be obtained from the “Agricultural
Statistics of North-West Frontier Province for 1994-95. “ produced by the Agricultural Extension Department.
1.2.3.1 Development of land-tenure system in Swat:
Starting as early as the 16th century to 1927 (Pathan Period) only the Yuzufzai Pathan were allowed to own land
(compare Vesh-system, 1.2.2.1). The indigenous population of Swat was obliged to pay taxes and forced into
tenancy. (FAUTZ, B., 1963)
The Yuzufzai had settled in the most fertile areas (areas of double-harvest) and left the upper areas to the
Kohistani and Gujars, where only rainfed agriculture or pasturing were possible. While the Kohistani always had
firm settlements, the Gujars used to migrate annually. Many of them still migrate from the high mountainous
areas (summer settlement) to the plains of Peshawar valley (winter settlement) with their flocks of mainly sheep
and goat (transhumance). (TIETZE, W.)
The Pathan landlords split the whole Swat valley into Tapas. Within a tribe the clans used to rotate Daftars at
regular intervals (=Vesh-system). The clans exchanged the land among themselves to avoid injustice, because
naturally not all the land was of the same quality. The plots were assigned by casting lots. The Daftars comprised
of orchards, irrigated areas, rainfed areas as well as land for pasturage. The actual villagers (Astanadars) always
stayed at the same settlement. In 1926/27,when Swat became an official state with the Wali as a ruler, the system
was formally changed. (FAUTZ, B., 1963)
Informally the system was never really given up until this day and the majority of the landowners are still of
Pathan origin. In Malam Jabba Valley more than 60 % of the population is either landless or with small
landholdings and the farmers earn their living through share-cropping and off-farm labour (MALAM JABBA
AFFORESTATION PROJECT. PC-I, 1998.). The social structures started to break up after the abdication of the
last Wali (1949 – 1969), but the question of landownership still remains unsolved until today. In fact there is a
dispute over the entitlement to the land among several groups:

11
GOVERNMENT
The government claims to be the real owner of the land in consequence of the abdication of the ruler of Swat,
the last Wali, who was the former owner.
WALI FAMILY
The Wali and his family still claim the right of landownership in their former state.
LANDLORDS
Many people sold their land to the Wali, or the government, but then they claimed it back. Some say they bought
land from the Wali or received it as a donation for certain services. This is mostly the case among the members
of powerful Yuzufzai clans.
LOCAL PEOPLE
The local farmers have been cultivating the land for many years and regard it fully to be their own.
The disputes started as a consequence of a period of confusion following the abdication and merger into the state
of Pakistan. The following regularly changing governments and wide spread corruption made the promised
landreforms fail (see 1.2.3.6) and so this issue still remains unsolved and hinders further development in the area.
According to ZADA, A. (1998) there are different types of tenancy practised in the area. The status of the tenant
is very much depending on the landowner:
1) Sharecropping:
The tenant receives a 60 % share. 20 % are for his labour, 40 % is the share of the harvest that goes to the
tenant. Usually the tenant decides what to grow and he also finances all the inputs. If the owner provides all
the inputs, he takes 70 % and the tenant only 30%.
2) Leasing:
a) Bartering:
The tenant and the owner agree on the quantity of the share beforehand, e.g. 60 kg of the wheat will go
to the owner (fixed quantity instead of percentage). Payment is always in form of grain and not in cash.
The tenant has to supply all the input.
b) Cash system:
The lease is paid in cash. The amount is fixed beforehand and paid at harvest time.
In case of orchards, tenants receive a share of both the crop and the fruits. But very often the tenants receive only
the crop as fodder and just a minor share of the fruit harvest.
The tenants are in many cases also forced to work for the landlords. In a village in Malam Jabba Valley for
example, the tenants’ wives and daughters often work in the landlords’ households. They also take care of the
landlords’ animals, they milk the cows and produce yoghurt and butter. The men help with the field work, grass
cutting and if necessary with timber logging and house construction.
The rapid population growth forces people to move higher up in the mountainous areas. REPP, G. (1990) reports
of the much too high population density (150 – 200 inhabitants per km²) in the Shiwaliks, on the Southern
12
Himalayan periphery. In that area almost all of the hills are already deforested and the area faces severe
ecological problems such as massive soil erosion. This scenario might repeat itself in areas like Malam Jabba
Valley in the near future.
1.2.3.2 Agricultural statistics12 and landuse in Swat valley:
In Swat District there were a total of 92 993 farms in 1995. The total farm area comprised 302 549 ha, of which
76.6 % were cultivated land. The average size of a farm was 2.49 ha (cultivated land)13. 72 316 ha land were
under irrigation (23.9% of the total area). Irrigation was usually performed with canals (mainly private), lift
pumps, wells or tubewells. Improper handling of irrigation is often the cause for waterlogging and salinity,
especially in the plain areas of the valley bottom. Of the total area of 643 970 ha of Swat District only 22 % was
cultivated area. Among the uncultivated land there were 2.1% culturable waste land, 33.5 % forested areas and
64.4 % not arable land.
The last decades have brought many changes in landuse in Pakistan: In the N.W.F.P. there was a constant
increase of maize, wheat, onion, garlic from 1983/84 - 1994/95. Rice, barley, and potato have been reduced.
Yields per ha in kg have increased for most crops. No documentation was found on the increase of vegetable and
fruit production (see table 1.3). These gained importance only as late as the 70ies, after the abdication of the last
Wali of Swat and the consequent changes in landownership and landuse (see 1.2.3.1). Before that it was not
common to grow much else but wheat, maize and rice due to the complex land-tenure-system. In the hilly areas
an additional constraint is the lack of irrigation facilities. Here most of the land is only rainfed and allows only a
limited range of agricultural products. Fodder production plays an important role for the farmers in the hilly
areas, as livestock is essential for their survival. The Kharif-fodder is almost exclusively maize (11 564 ha of a
total area of 11 619 ha used for fodder production in summer) in Swat District, while Rabi-fodder is Shaftal
(6462 ha), barley (1 400 ha) , ray (15 ha) and others (4 430 ha) of a total area of 12 307 ha.
The use of fertilisers and pesticides is a privilege of the rich farmers - both are hardly available and very
expensive. The Agricultural Research Station Mingora (ARSM) operates a research program on biological
control, which might offer an important alternative to conventional pesticides in the future.
In Swat Valley there are traditionally three types of landuse (FAUTZ, B., 1963):
SCHORGERA (= riceland, permanently flooded land)
Double harvest is possible in the Schorgera; the Kharif crop is rice, while the Rabi crops are Shaftal on the land
next to the river and wheat in the area further away from the river.
WAT (= periodically irrigated land)
The Wat follows after the rice/wheat area in Swat Valley. In the sidevalleys this is the main type of land in the
valley bottom. Kharif crop is mainly maize, in winter (Rabi) wheat and barely are the main crops.
MAIRA (= dry land)
This term refers to the hillsides in lower and middle Swat Valley and the sidevalleys. Most of this land is in the
wheat zone (600-1200 m) or the maize-wheat zone (1200-2000 m). Above 2000 m originally only maize was
grown. Characteristically summer fallow was used as a pasture, mainly by Gujars.
12 The statistical data were taken from “Agricultural Statistics of North-West Frontier Province for 1994-95”.
13 The average value in the N.W.F.P. was 3.95 ha cultivated land per farm.
13
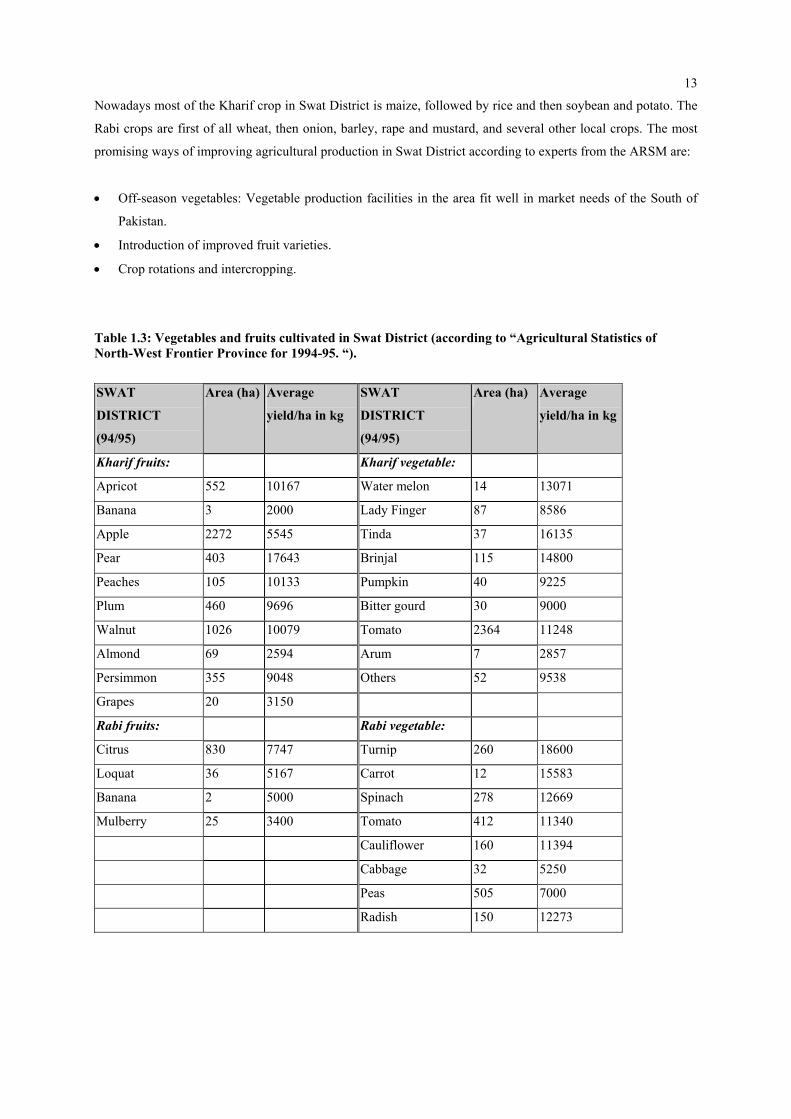
Nowadays most of the Kharif crop in Swat District is maize, followed by rice and then soybean and potato. The
Rabi crops are first of all wheat, then onion, barley, rape and mustard, and several other local crops. The most
promising ways of improving agricultural production in Swat District according to experts from the ARSM are:
• Off-season vegetables: Vegetable production facilities in the area fit well in market needs of the South of
Pakistan.
• Introduction of improved fruit varieties.
• Crop rotations and intercropping.
Table 1.3: Vegetables and fruits cultivated in Swat District (according to “Agricultural Statistics of North-West Frontier Province for 1994-95. “).
SWAT
DISTRICT
(94/95)
Area (ha) Average
yield/ha in kg
SWAT
DISTRICT
(94/95)
Area (ha) Average
yield/ha in kg
Kharif fruits: Kharif vegetable:
Apricot 552 10167 Water melon 14 13071
Banana 3 2000 Lady Finger 87 8586
Apple 2272 5545 Tinda 37 16135
Pear 403 17643 Brinjal 115 14800
Peaches 105 10133 Pumpkin 40 9225
Plum 460 9696 Bitter gourd 30 9000
Walnut 1026 10079 Tomato 2364 11248
Almond 69 2594 Arum 7 2857
Persimmon 355 9048 Others 52 9538
Grapes 20 3150
Rabi fruits: Rabi vegetable:
Citrus 830 7747 Turnip 260 18600
Loquat 36 5167 Carrot 12 15583
Banana 2 5000 Spinach 278 12669
Mulberry 25 3400 Tomato 412 11340
Cauliflower 160 11394
Cabbage 32 5250
Peas 505 7000
Radish 150 12273
14
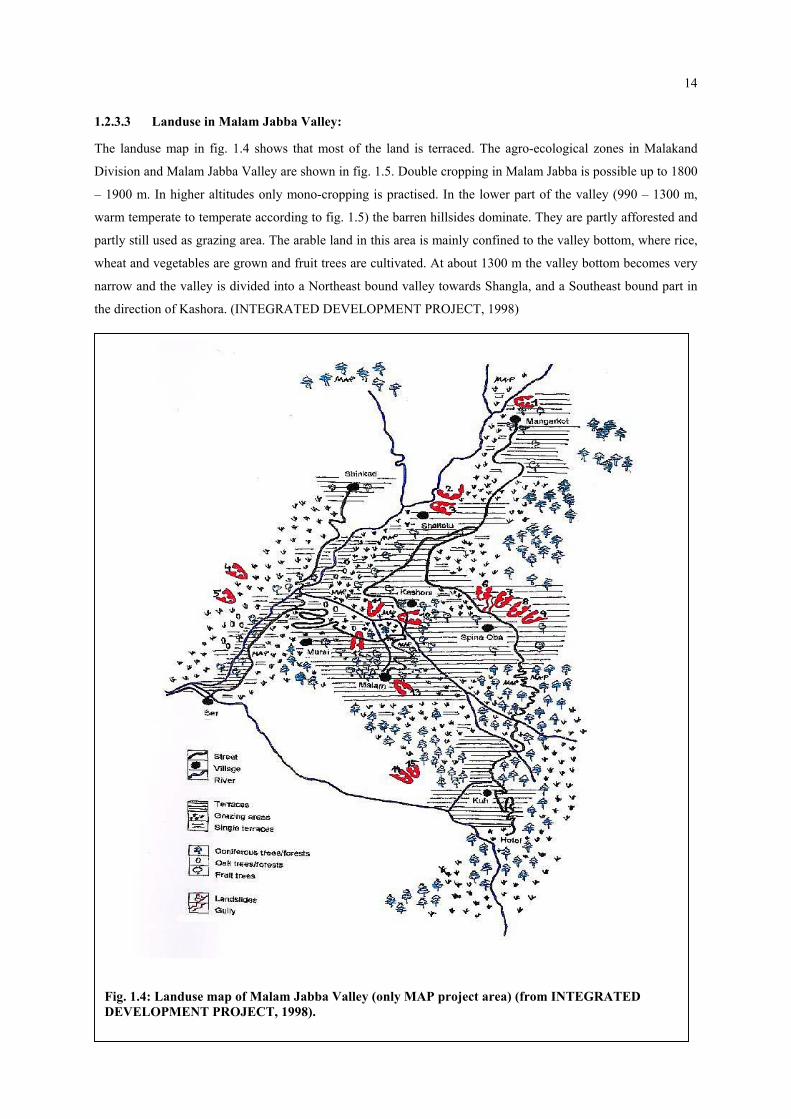
1.2.3.3 Landuse in Malam Jabba Valley:
The landuse map in fig. 1.4 shows that most of the land is terraced. The agro-ecological zones in Malakand
Division and Malam Jabba Valley are shown in fig. 1.5. Double cropping in Malam Jabba is possible up to 1800
– 1900 m. In higher altitudes only mono-cropping is practised. In the lower part of the valley (990 – 1300 m,
warm temperate to temperate according to fig. 1.5) the barren hillsides dominate. They are partly afforested and
partly still used as grazing area. The arable land in this area is mainly confined to the valley bottom, where rice,
wheat and vegetables are grown and fruit trees are cultivated. At about 1300 m the valley bottom becomes very
narrow and the valley is divided into a Northeast bound valley towards Shangla, and a Southeast bound part in
the direction of Kashora. (INTEGRATED DEVELOPMENT PROJECT, 1998)
Fig. 1.4: Landuse map of Malam Jabba Valley (only MAP project area) (from INTEGRATED DEVELOPMENT PROJECT, 1998).

15
Fig. 1.5: The agro-ecological zones in Malakand Division (modified after PATA, 1996).
SNOW
& ICE
ALPINE PASTURES
COLD TEMPERATE
COOL TEMPERATE
TEMPERATE
WARM TEMPERATE
SEMI-ARID-HUMID-
TROPICAL
1100 m
1500 m
3200 m
3000 m
2300 m
1900 m
LIMIT OF OLIVE
AND CITRUS
LIMIT OF ONION
LIMIT OF DOUBLE
CROPPING
Agric. limit as a
result of topography
Agric. limit as a
result of temperature
MONO CROPPING
GRAZING
TREE LIMIT
GRAZING
MALAM JABBA
VALLEY
( 990 - 2900 m )
600 m
450 m
6300 m
4700 m

16
Towards Shinkad (1500 m) there are only some terraced fields on the northern slopes, but very few on the
southern side where mainly barren hillsides remain (communal grazing land). The main crops in this part of the
valley are wheat, and maize in the rainfed areas. Vegetable and fruit production is rare.
In the direction of Kashora (1600 m) the slopes rise steeply and there are small terraces scattered all over the
hillsides. Fruit trees are scarce, only surrounding the village of Kashora are some orchards to be found. Near
Kashora a road branches off to Malam (1800 m) towards the Northwest and further up the hill another road
branches off to Mangarkot (1660 m) towards the Southeast. While Kashora and the villages in the direction of
Mangarkot are still in the area of double cropping and thus favourable for wheat, vegetables and fruit production,
Malam and all other villages further up have less favourable preconditions for such methods of landuse. The
lower parts of Malam still allow double cropping but higher than 1900 m only mono cropping is possible.
The village of Spin Obo (1900 m) lies above the lower snow line and usually receives some snow in winter. In
Kuh (2300 m) there is often a constant snow cover for two months. 2300 m is the first agricultural limit
according to fig.1.5. In the area of Kuh, the hills are very steep and farmers grow potato and maize with very
poor harvests. Massive soil erosion endangers many of the steeper denuded hills and landslides occur regularly.
The natural forests that covered the hillsides have been reduced to inaccessible, rugged terrain (MALAM
JABBA AFFORESTATION PROJECT. PC-I, 1998).
1.2.3.4 Livestock and pasturage
Livestock is usually kept only for domestic consumption. In Swat District there is even a lack of dairy products
according to the local veterinarians. Locally produced eggs, yoghurt and milk are valued as very high quality
products but are hardly found on the market. Numbers of livestock in Swat District and in particular in Malam
Jabba area are listed in table 1.4 and table 1.5.
Table 1.4: The numbers of livestock in Swat District (from LIVESTOCK CENSUS REPORT, 1996).
Livestock population in Swat District
Buffalo 100 372
Cattle 194 312
Goats 179 641
Sheep 59 713
Camels 78
Horses 2 394
Mules 1 979
Asses 13 828
Poultry 1 074 244
The Livestock Census (1996) named the most important breeds for Swat District, but the majority of the animals
could not be assigned to a specific race. Among the cattle breeds most common in Swat District are
Foreign/cross Breed, Lohani, Kankraj, Rojhan and Dhanni among the known breeds. The only breeds of sheep
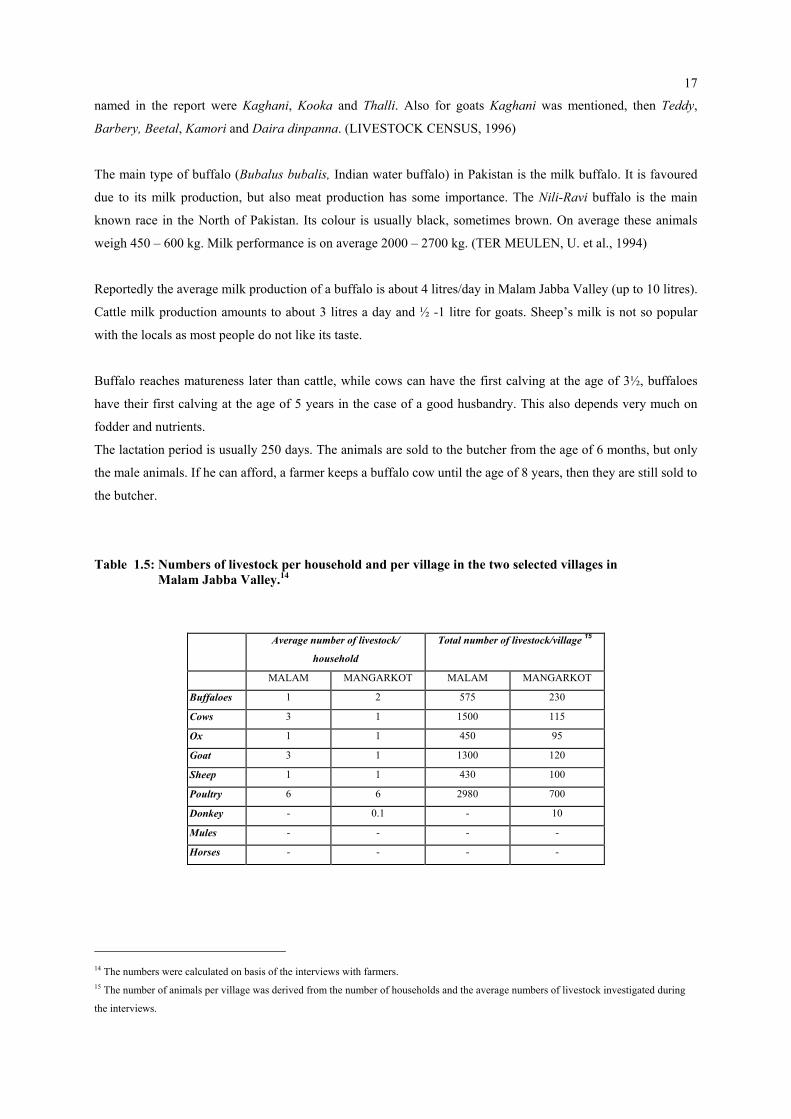
17
named in the report were Kaghani, Kooka and Thalli. Also for goats Kaghani was mentioned, then Teddy,
Barbery, Beetal, Kamori and Daira dinpanna. (LIVESTOCK CENSUS, 1996)
The main type of buffalo (Bubalus bubalis, Indian water buffalo) in Pakistan is the milk buffalo. It is favoured
due to its milk production, but also meat production has some importance. The Nili-Ravi buffalo is the main
known race in the North of Pakistan. Its colour is usually black, sometimes brown. On average these animals
weigh 450 – 600 kg. Milk performance is on average 2000 – 2700 kg. (TER MEULEN, U. et al., 1994)
Reportedly the average milk production of a buffalo is about 4 litres/day in Malam Jabba Valley (up to 10 litres).
Cattle milk production amounts to about 3 litres a day and ½ -1 litre for goats. Sheep’s milk is not so popular
with the locals as most people do not like its taste.
Buffalo reaches matureness later than cattle, while cows can have the first calving at the age of 3½, buffaloes
have their first calving at the age of 5 years in the case of a good husbandry. This also depends very much on
fodder and nutrients.
The lactation period is usually 250 days. The animals are sold to the butcher from the age of 6 months, but only
the male animals. If he can afford, a farmer keeps a buffalo cow until the age of 8 years, then they are still sold to
the butcher.
Table 1.5: Numbers of livestock per household and per village in the two selected villages in Malam Jabba Valley.14
Average number of livestock/
household
Total number of livestock/village 15
MALAM MANGARKOT MALAM MANGARKOT
Buffaloes 1 2 575 230
Cows 3 1 1500 115
Ox 1 1 450 95
Goat 3 1 1300 120
Sheep 1 1 430 100
Poultry 6 6 2980 700
Donkey - 0.1 - 10
Mules - - - -
Horses - - - -
14 The numbers were calculated on basis of the interviews with farmers. 15 The number of animals per village was derived from the number of households and the average numbers of livestock investigated during
the interviews.

18
Poultry keeping is widespread – in almost every household there are some hens kept for both eggs and meat.
Local poultry lay around 120 eggs/year according to veterinary officers. Around the cities especially in Punjab
there is also a great deal of poultry farming. In the whole Swat District around 100 000 chicken/month are
produced. (according to IQBAL, J., 1998 and JABBAR, GH., 1998)
0
20000
40000
60000
Total
Num
ber o
f ani
mal
s
Stall feeding Grazing Both stallfeeding and
grazing
CattleBuffaloesSheep and goats
Fig. 1.6: Comparison of numbers of livestock by sources of feed in Swat District . (LIVESTOCK CENSUS,1996)
Usually in Pakistan several flocks of sheep and goats are grazed together by a hired shepherd. He may also own
some sheep and goats himself. He takes the animals to graze on the road sides or to the canal banks, on stubbles
after crop harvest, on barren hillsides, .....For this he usually receives a 50 % share of the income. There are also
families and tribes who migrate with the flocks. (HASNAIN, H.U., 1985)
In May and June the nomads migrate through Swat Valley mainly with goats and sheep up to Upper Swat
(Kalam). In October/November they migrate south again to the plains, some of them also stay here for the
winter. In Malam Jabba only few nomads stay, but many cross the valley on their way back to the South.
The excessive over-use of rangelands in the area has led to many ecological problems. The barren hillsides are
highly prone to massive soil erosion and more and more under protection for afforestations. The remaining
forested area is also severely affected by over-grazing, and in many areas grazing is restricted to stop the process
of degradation and deforestation. Often grazing areas are transformed into agricultural lands. Animal husbandry
becomes more and more difficult for the people in Swat District and Malam Jabba Valley.
1.2.3.5 Veterinary organisations
In Saidu Sharif there is a Civil Veterinary Hospital where farmers can bring livestock in case they need medical
treatment. The hospital employs several veterinary officers who usually also have a private office or clinic. In
Malam Jabba there is one veterinary field worker stationed, the local contact person for the veterinarians and
distributor of veterinary medication for the farmers. As most of the farmers in the rural areas can normally not
afford the treatment, animals are sold when they are sick or unproductive. The most important diseases are
blackwater disease, foot and mouth disease, worms, liver flue and mental deficiencies.

19
According to IQBAL, J. (1998) the major constraints in animal husbandry in the area are:
- Lack of farmer education
- Lack of knowledge concerning livestock keeping and practices: No proper vaccination, de-worming, no
proper heat detection, no knowledge in artificial insemination etc.
- “Climatic” factors: Poor nutrition, poor management practices, lack of medical treatment,...
Suggestions for improvement aim at increasing efficiency in animal husbandry and at improving and introducing
facilities for artificial insemination and reproductive health services.
1.2.3.6 Agricultural policies and Extension services
To abolish the feudal tenancy system in Pakistan, several land reforms were carried through. Of these the biggest
one was in 1959, when 952 856 ha of land were redistributed. The landreforms in 1972 and 1977 were much
smaller. In total an area of 1 408 282 ha was redistributed to 288 000 beneficiaries. There is no limit to the
amount of land an individual or group can cultivate under tenancy, but the maximum size for individual
landholding is 116 ha in N.W.F.P. . Generally the number of farmers with small landholdings has increased,
mainly due to the subdivision of holdings by inheritance and due to population growth. Also middle-size
holdings have gained in numbers and area.
Land fragmentation is a serious problem. There are many reasons behind this, often there are simply no
alternative opportunities for work and income. Many farmers cannot live on the farm income and off-farm labour
has increased. These farmers even rent their lands out to middle and wealthy, upper class farmers. (KHAN,
M.H., 1994)
The Agricultural Extension seeks contact with the farmers (see fig. 1. 7). For the field work there are local field
assistants and field workers responsible. In Swat District there are 6 Tehsils: Mingora, Balikoot, Matta,
Khwazakhela, Kalam and Madyan. The next level, the Union Council is a kind of self-governmental type of
organisation. It includes around 3-3500 farmers each and has one field assistant and one field worker. A field
assistant has to attain a two-years certificate course in the Agricultural Training Institute Peshawar.
Fig. 1.7: The administrational structure of the Agricultural Extension in Malakand Division.
ASSISTANT DIRECTOR
Swat District
DIVISIONAL DIRECTOR
Malakand Division
Balikoot Mingora Khwazakhela Matta Madyan Kalam
AGRICULTURAL OFFICERS: 6 Tehsils
FIELD OFFICER + FIELD WORKER:
Each Tehsil (e.g. Mingora) includes several Councils(e.g. Charbagh)

20
The field officers are supposed to go to villages each month and give advise to solve farmers’ problems. But the
system does not work, there are not enough means of transport and the villages are difficult to reach. There has
been a lot of co-operation with foreign sponsored projects, e.g. Kalam Integrated Development Project (KIDP),
PATA, SF, .... Contact between research and extension usually functions well, but there is almost no exchange of
information between research and the farmers.
The three major constraints in agriculture in the area are (according to MAULA, F.,1998):
- Non-availability of subsidised agricultural inputs
- Non-availability of interest free credit
- Farm to market road
The major problems are agricultural inputs – loans, seed, fertilisers, pesticide,...There are always problems with
the availability, the products are never there when there is most need for them. In the year of the survey for
example there were no fertilisers available at the time of wheat sowing. Fertilisers were imported at the start of
the Rabi-season in Punjab, which was of course too late for the N.W.F.P. farmers. Another problem is that
farmers are very badly informed; in vegetable production it is popular to grow what was in short supply the year
before. For example 1997 everybody grew onion, in 1998 it was wheat, in 1999 it was onion again. In 1997 there
was a widespread onion disease (Downey Mildew) that caused big losses - many farmers asked for
compensations at that time, but again in 1999 the majority of the farmers planted onion. Another popular crop is
tomato which is often attacked by Late Blight. In spite of their rich traditional knowledge the farmers need
training concerning the newly introduced crops such as vegetables.
1.3 Environment and development in the Himalayan region
1.3.1 The Himalayan Dilemma
ECKHOLM, E. (1975) describes the “Tragedy in Shangri-La” as one example for the world-wide deterioration
of mountain environments: From the Himalayas flow the major rivers of the Indian subcontinent (Indus, Ganges,
Brahmaputra), thus representing the basis of life in the lowlands adjacent to Himalayan mountainous areas.
Population growth in the 20th century has lead to a “downward spiral of environmental degradation under the
condition of a high population density in the Himalayan region” (BANDYOPADHYAY, J.,1993).
Over-population forces the farmers to move higher to cultivate land. Either former grazing areas are turned into
arable land, or forests are cleared. The slopes are ever steeper and in fact “.....unfit for sustained farming even
with the astonishingly elaborate terracing practised there” (ECKHOLM, E., 1975). The increasing fuelwood
demand16, the need for timber for house constructions etc. leads to a further advance in deforestation. After some
time the hills surrounding the new settlements in the mountains are denuded and the trees disappear.
The consequent lack of fuelwood forces the villagers to use dung as fuel, which was previously applied as
manure in the fields (ECKHOLM, E., 1975). More people also means more livestock, but herd sizes have not
grown as rapidly as the cultivated land. Soil fertility cannot be preserved any longer, and the already existing
16 0.2 m³ was needed per capita in Pakistan in 1988-89 (ASIT K. BISWAS,1992).

21
fodder shortage gets worse. Grazing areas are extended into the forest and on former arable land. This hinders
natural regeneration and contributes to the advance of soil erosion. Landslides occur frequently thus destroying
life and land. The soil that is washed down the hills ends up in big rivers that carry a heavy silt load to the
lowlands. The two major environmental and economic problems evolving from this are according to ASIT K.
BISWAS (1992):
(1) A reduction in the designed lives of the reservoirs due to higher than expected rates of siltation and
(2) siltation of the river channels and deltas which may make navigation difficult and hazardous.
He further explains that “...the two most important reservoirs in Pakistan, Mangla and Tarabela, are losing their
storage capacities at annual rates of 48.27 and 167.75 million m³ respectively.” Consequently there is limited
possibility of expanding hydroelectric power at a larger scale in Pakistan.
Similar phenomena were documented by IVES, J.D. and MESSERLI, B. (1989): They were among the first to
discuss specific mountain characteristics. How complex the interactions in mountains ecosystems are, is
described in “The Himalayan Dilemma”:
“In any mountain subsistence-agricultural system, the demands on the forest are numerous and fairly self-
evident: fuelwood, undoubtedly, and construction timber, house shingles, timber for house and farm utensils,
and, of no less importance to the villages, fodder, thatch, and animal bedding. To these must be added medicinal
herbs, nuts, fruits, mushrooms, and a host of secondary products such as the use of Daphne spp. (Nepalese:
lokta) and Quercus semecarpifolia for the ash and fuel respectively, for paper making in Nepal. These demands
on the forest area augmented by the requirements for charcoal, commercial firewood for sale in the cities and
towns, and large commercial construction timber.”
They criticise, that often cause and effect have been confused within the context of the Himalayan problem. The
best intentions are no good if the wrong “cause” is treated. Numerous projects financing solar energy devices,
metal and ceramic wood-burning stoves, hydroelectricity projects, and wind generators are excellent evidence,
aimed only at providing alternative energy sources to save the remaining forests. According to them it is above
all the fuelwood depredation that has caught the attention of the international community – “...the wrong
problem (perceived or real, depending on the definition) has received undue priority.”. (IVES, J.D. and
MESSERLI, B., 1989)
Fuelwood shortage is thus an inevitable consequence of the pressing of the subsistent mountain farmers for more
agricultural land for production of food for every day life.
1.3.2 Impact of Modernisation on Pakistan’s Hindukush-Himalaya
The forest depredations in the Himalayan foothills took place as early as the last century. Another phase of
severe deforestation was after partition in 1947 when refugees from India settled in the area. The populations of
the Central and Eastern Hindukush were originally small, much differing in language, ethnicity, religion and
social organisation until the 1960ies. They were engaged in sedentary agriculture, agropastoralism,
transhumance and nomadism (see fig. 1.8). But foreign aid pouring into Afghanistan and Pakistan and political
changes within the countries changed the situation rapidly and life changed almost overnight. (ALLAN, N. J. R.,
1984a)

22
As ALLAN, N.J.R. (1984a) wrote, “Mountain villages moved from the fifteenth to the twentieth centuries in less
than a tenth of the time it took Northern European nations to reach a similar level of polity and technology.”
The influx of refugees from Afghanistan into Pakistan as a consequence of the war (Soviet occupation of
Afghanistan in 1979) had a deep impact on the N.W.F.P.: 3.5 Mio people fled to Pakistan within a few years.
These people originated from sparsely vegetated arid land, but were settled into forested areas. The consequence
was, besides fundamental changes of society, extensive environmental damage, most of it irreversible. (compare
ALLAN, N.J.R., 1987b)
se in the mountains of Northern Pakistan ( from ALLAN, N.J.R., 1986)
Fig. 1.8: Evolution of agricultural landu
.
According to ALLAN, N.J.R. (1984b) the surplus of Western donated food such as wheat gave farmers the
opportunity to grow higher-value crops and to develop crop rotations at that time. In the areas of Northern
Pakistan, influenced by the influx of refugees, growing patterns changed: In the watered areas vegetables were
added to the summer-season Kharif crop and potato to the Rabi crops. Intercropping of vegetables, crops and
fruit trees were introduced in areas like Swat Valley (see 1.4.3). In high mountainous areas such as Kalam and
Kaghan seed potatoes were produced for the lowland areas. ALLAN, N.J.R. (1987a) describes the changing
landuse patterns of Kalam, where the agropastoral system existed as a static system for centuries until it was
changed through the construction of a road for motorised travel to Kalam in 1965. The next strong impact took
place in 1969, when Swat became a part of Pakistan and the former anarchic social system of the Kohistan
society was changed and exposed to administration, and agricultural and forestry field extension officers. The
main consequences were the depletion of former communal property and deforestation, the step from subsistence
farming to cash cropping, changes in pasture strategies, in labour scheduling and mobilisation and finally of the

23
whole society. Additionally the area has become accessible to tourism marketing which has become
characteristic for Upper Swat, but detrimental for the local society. Profiteers are the hotel industries from the
lowlands.
“Esther Boserup suggests that more intensive technologies of agricultural production leading to land
intensification are the product of population pressure on limited resources. The absorption of massive supply of
labour and capital inputs available from the Afghan refugees indicates that in the foothills of North Pakistan
there is an elasticity of response which has permitted a rapid increase in agricultural production.” (ALLAN,
N.J.R. , 1984b)
In the meantime it has become questionable whether the Boserup model still applies, or if the carrying capacity
of this area is already reached through population pressure and intensification of landuse.
1.4 Agroforestry in mountainous areas
1.4.1 Definition of Agroforestry
Agroforestry is often identified with the term Taungya, a Burmese term of hill cultivation17. According to
SHINYA, T. (in: JORDAN, C.F. et al., 1992) there is much evidence of earlier use of such systems. Taungya is
in spite of many parallels a system of its own and not identical with typical agroforestry systems.
ALTIERI, M. A. and FARREL, J.G. (in ALTIERI, M. A., 1995) define agroforestry as “...the generic name used
to describe an old and widely practiced land use system in which trees are combined spatially and/ or
temporally with agricultural crops and/or animals. It combines elements of agriculture with elements of forestry
in sustainable production systems on the same piece of land.” According to them the maybe most widely
accepted definition was put up by the International Council for Research in Agroforestry (1982):
“Agroforestry denotes a sustainable land and crop management system that strives to increase yields on a
continuing basis by combining the production of woody forestry crops (including fruit and other tree crops) with
arable or field crops and/or animals simultaneously or sequentially on the same unit of land, and applying
management practices that are compatible with the cultural practices of the local population.”
NAIR, P.K.R. (in JARRIS, P. G. et al., 1991) explained that according to a global inventory (1982 – 1987)
“...the existence or adoption of an agroforestry system in a given area is determined primarily by the ecological
potential of the area, but the socio-economic factors determine the complexity of the system and the degree of
intensity of its management.” Important aspects of agroforestry are its suitability to marginal areas and low –
input systems (ALTIERI, M. A. and FARREL, J.G. in ALTIERI, M. A., 1995). This makes agroforestry
systems particularly attractive for mountainous areas. It is a compromise between extensive landuse, as it would
be possible with low population pressure, and intensive landuse, which has become a necessity under the current
demographic conditions (DENHOLM, J., 1991) of very high population densities, as is the case in the
mountainous areas of Pakistan.
17 “Taung” means hill, and “ya” means cultivation as practised in the hills of Burma (SHINYA T. in: JORDAN, C.F. et al. 1992). According
to EVANS, J. (1982) Taungya originated in Burma in the mid-1800s.

24
1.4.2 Agroforestry systems
ALTIERI, M. A. and FARREL, J.G. (in ALTIERI, M. A., 1995) group agroforestry systems as follows:
- Agrisilviculture systems: Concurrent or sequential production of agricultural crops and forest crops.
- Silvo-pastoral systems: Forests are used for the production of wood, food and fodder, as well as for the
rearing of domestic animals.
- Agro-silvo-pastoral systems: Landuse for concurrent production of agricultural and forest crops and for
rearing of domestic animals.
- Multipurpose forest tree production systems: Forest tree species are regenerated and managed not for wood
production only, but also for foliage and fruits for food/fodder.
Apart from these main types of agroforestry systems there are numerous other, more specific types (compare
NAIR, P.K.R. in: JARRIS, P. G. et al., 1991).
In the Hindu-Kush-Himalayan (HKH) Region the most common agroforestrial landuse practises are the agro-
silvo-pastoral systems. They combine both perennial and annual crops with animals or pasture. (DENHOLM, J.,
1991)
The role of the forest in these systems is determined by the following aspects (DENHOLM, J., 1991):
• The most significant strategy for maintaining soil fertility is through the transfer of nutrients from forests
and grazing lands via livestock. Biomass in form of grass and leaves is recycled in this way to produce
manure for the fields.
• Besides from tree and grass fodder, forests supply timber and fuel. In remote areas there is no substitute
available for fuel, and in some areas people even depend on the herbal medicines from the forest to cure
illness.
• Particularly farmers with small landholdings rely on the existence of Common Property Resources (CPR’s)
of forests and grazing lands. There are regulations at communal level to control the use of these CPR’s to
prevent over-use and exploitations through individuals or the whole community. As mentioned by FOX, J.
(1993), „...common-property-systems are not free-for-alls.“ There are usually ownership arrangements in
such communities, and resource degradation often originates in the destruction of local-level institutional
arrangements (FOX, J. , 1993).
• Through diversification in production existential risks of losses are weakened – the basis food supplies are
usually secured. Animals and/or products can still be sold for cash and through the mobility of livestock the
farmers are not entirely tied to local conditions.
The current conditions in the HKH have destroyed the balance in these traditional systems. The increasing
influence of state authorities and the consequent abolishment of local resource management rules have taken
place hand in hand with rapid population growth and uncontrolled settlement in mountainous areas: Increased
intensity of landuse is required, but on the other hand destructive for fragile mountain ecosystems.
1.4.3 Strategies in agroforestrial landuse in Swat Valley
In Middle Swat Valley agroforestry is common practice: Particularly in the Wat area there are often fruit trees in
intercropping with wheat, rape seed and mustard. The most common fruit trees are apricot, persimmon, apple,
pear (Tongu), peaches and plum. The main area for this type of agroforestry is from Mingora/Sangota to

25
Charbagh. On the other side of the river (Matta, Shakardarra) there are also fruit trees, but there is less
intercropping and more pasturage.
The trees are usually planted about three to five metres apart. Most of the trees are usually between four and
eight metres high. For the major part these orchards were planted 10-15 years ago. In the older orchards the
crown density is rather high - still Rabi crops grow rather well. This is due to the fact that the most productive
period for the trees is already over at the time when Rabi crops are sown (Oct./Nov). Rabi crops start their
growing period after the leaves have fallen and are harvested before the most productive period of the trees starts
(May/June). Once the trees are too old, they are gradually replaced with young saplings. The orchards are
usually protected from grazing through thorny hedgerows or even barbed wires. Sometimes the land is also used
as pasture.
I
Fig. 1.9. Different agroforestrial systems in Swat Valley (A= intercropping; B, C= plantations on field boundaries; D= Line planting; E= Scattered planting; F = Single tree planted on field; G, H= Hedgerow planting; I= Alley cropping) .
The most common ways of agroforestrial landuse are as follows ( see also fig. 1.9):
1. Intercropping: Fruit trees are planted in lines/rows with 3-5/3-5 m clearance; crops like wheat form the
undergrowth; these fields are mostly irrigated. (see fig. 1.9, A)
2. Plantations on boundaries: Fruit trees are also planted on boundaries in rows with 3-5 m clearance; this is
mostly the case on terraced ground, as there are usually large banks in-between the terraces. (see fig. 1.9,
B,C)

26
3. Scattered planting: Sometimes there are trees scattered around fields, either planted intentionally or
naturally growing. In the undergrowth there are crops such as wheat. These fields are often used for grazing
after harvest. (see fig. 1.9, E)
4. Line planting: There is only one line of trees planted per field, the rest of the field is used for crops only.
(see fig. 1.9, D)
5. Hedgerow planting: The trees used for hedgerows or alleys are normally not fruit trees but fast-growing
trees and so called multipurpose trees (MPTS). The most common species in the area are Populus sp,
Ailanthus ailanthissima, Robinia pseudoacacia and Melia azedarach; Alnus sp. and Salix sp. occur mainly
along watercourses, together with other mentioned species. Platanus orientalis occurs only seldom, and
preferably near villages. Populus sp. is also planted along the roadside with A. ailanthissima and R.
pseudoacacia.
Such hedgerows mark the field boundaries, especially with reference to different ownership. Also along
footpaths and along irrigation channels there are trees planted in rows or growing naturally. (see fig. 1.9,
G,H)
6. Alley cropping: Fruit trees are grown in regular rows, but crops are only grown in-between the rows not
within them . (see fig. 1.9, I)
1.4.4 Agroforestry in Malam Jabba:
In Malam Jabba Valley various ways of agroforestrial landuse are common:
Silvo-pastoral systems:
The traditionally most important systems are the silvo-pastoral systems. Timber, fuelwood, material for thatches
of houses, needles and leaves for animal bedding and fodder, torchwood, resin (from P. roxburghii only), etc. are
taken from the trees. The animals are brought to graze in the forests and on the steeper slopes grass is cut and
stored for the winter. In some areas mushrooms and medicinal plants are collected.
Agrisilviculture systems:
As a consequence of the high need for fuelwood and timber many farmers have started to plant trees themselves
on field boundaries and in particular on the banks of terraces. Especially near the houses there are often fast
growing trees planted such as A. ailanthissima, and R. pseudoacacia. Other popular trees are walnut, fig and
mulberry. (see photograph 1.1)
Agrihorticulture systems:
Some landowners with bigger landholdings have recently enhanced these ways of landuse. The fruit trees are
mainly apple, pear and persimmon. In the undergrowth there are either common crops such as wheat and maize,
and occasionally vegetables (tomatoes). (see photograph 1.2)
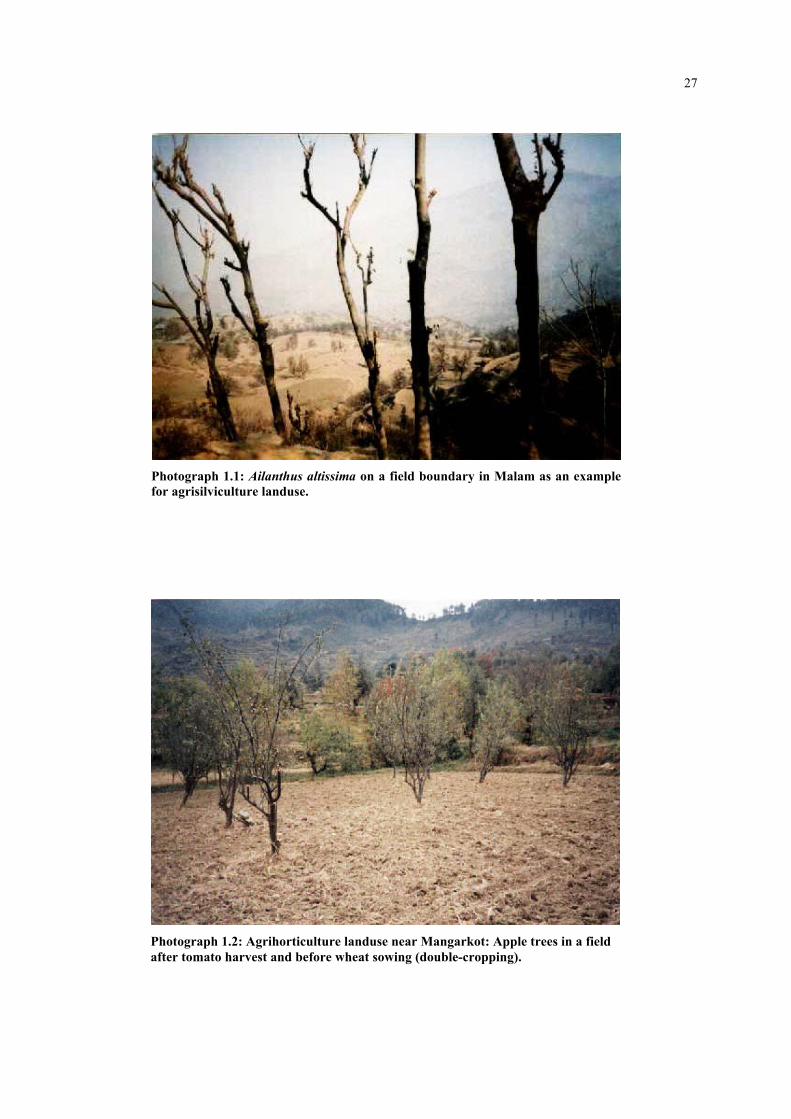
27
Photograph 1.1: Ailanthus altissima on a field boundary in Malam as an example for agrisilviculture landuse.
Photograph 1.2: Agrihorticulture landuse near Mangarkot: Apple trees in a field after tomato harvest and before wheat sowing (double-cropping).
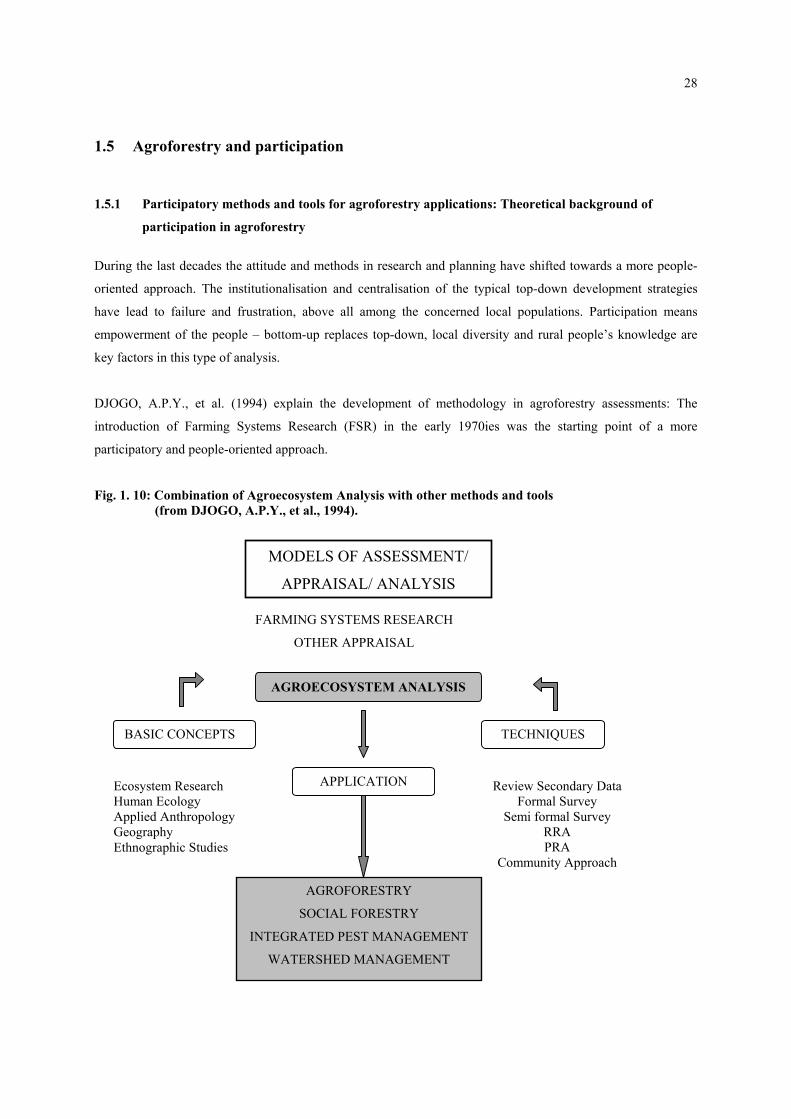
28
1.5 Agroforestry and participation
1.5.1 Participatory methods and tools for agroforestry applications: Theoretical background of
participation in agroforestry
During the last decades the attitude and methods in research and planning have shifted towards a more people-
oriented approach. The institutionalisation and centralisation of the typical top-down development strategies
have lead to failure and frustration, above all among the concerned local populations. Participation means
empowerment of the people – bottom-up replaces top-down, local diversity and rural people’s knowledge are
key factors in this type of analysis.
DJOGO, A.P.Y., et al. (1994) explain the development of methodology in agroforestry assessments: The
introduction of Farming Systems Research (FSR) in the early 1970ies was the starting point of a more
participatory and people-oriented approach.
Fig. 1. 10: Combination of Agroecosystem Analysis with other methods and tools (from DJOGO, A.P.Y., et al., 1994).
MODELS OF ASSESSMENT/
APPRAISAL/ ANALYSIS
FARMING SYSTEMS RESEARCH
OTHER APPRAISAL
AGROECOSYSTEM ANALYSIS
BASIC CONCEPTS TECHNIQUES
APPLICATION Ecosystem Research Human Ecology Applied Anthropology Geography Ethnographic Studies
AGROFORESTRY
SOCIAL FORESTRY
INTEGRATED PEST MANAGEMENT
WATERSHED MANAGEMENT
Review Secondary Data Formal Survey
Semi formal Survey RRA PRA
Community Approach

29
Agroecosystem analysis (AEA) was developed in Thailand from 1978 onwards by Gordon Conway and his
colleagues and at first spread through South Asia. In agroecosystem analysis the following methods are generally
applied: (CHAMBERS, R., 1992)
- Transects: Systematic walks and observation.
- Informal mapping: Sketch maps drawn on site.
- Diagramming: Seasonal calendars, flow and causal diagrams, bar charts, Venn or “chapati” diagrams.
- Innovation assessment: Scoring and ranking in different actions.
Multidisciplinary teams incorporating social scientists should help to transfer knowledge and technology from
research to farmers.
As CHAMBERS, R. (1992) points out, “The move here is away from extractive survey questionnaires and
towards participatory appraisal and analysis in which more and more the activities previously appropriated by
outsiders are instead carried out by local rural or urban people themselves.” CHAMBERS, R. (1992) also
explains the development from RRA to PRA: RRA evolved in the 1970s as a consequence of dissatisfaction with
the biases of rural development tourism, meaning the brief visits of urban-based experts in rural areas that often
failed to detect poverty and deprivation. Another reason was disillusion with the questionnaire surveys, that were
usually inaccurate and unreliable, taking a very long time to evaluate and failed to serve the purpose in the end.
But RRA is also a more cost-effective alternative to conventional methods. In the 1980s participation started to
become a familiar term in rural appraisal. While RRA means learning by outsiders, PRA enables local people to
analyse themselves and to plan and even take action. The differences between the two approaches are pointed
out in table 1.6, but in reality both RRA and PRA usually work hand in hand.
Table 1.6: RRA and PRA compared (according to CHAMBERS, R., 1994a).
RRA PRA
Period of major development Late 1970s, 1980s Late 1980s, 1990s
Major innovators based in Universities NGOs
Main users at first Aid agencies
Universities
NGOs
Key resource earlier undervalued Local people’s knowledge Local people’s analytical capabilities
Main innovations Methods
Team management
Behaviour
Experiential training
Predominant role Elicitive, Extractive Facilitating, Participatory
Ideal objectives Learning by outsiders Empowerment of local people
Longer term outcomes Plans, projects publications Sustainable local action and institutions
Participatory surveys should also include the use of secondary sources such as reports and maps of the area. It
can also be helpful to include decision-makers and officials in the survey, though local people’s experience and
knowledge is certainly the most reliable source. The influence of personal behaviour and attitudes should not be
under-estimated – certain information can be passed on through ways of dressing, talking and moving, which
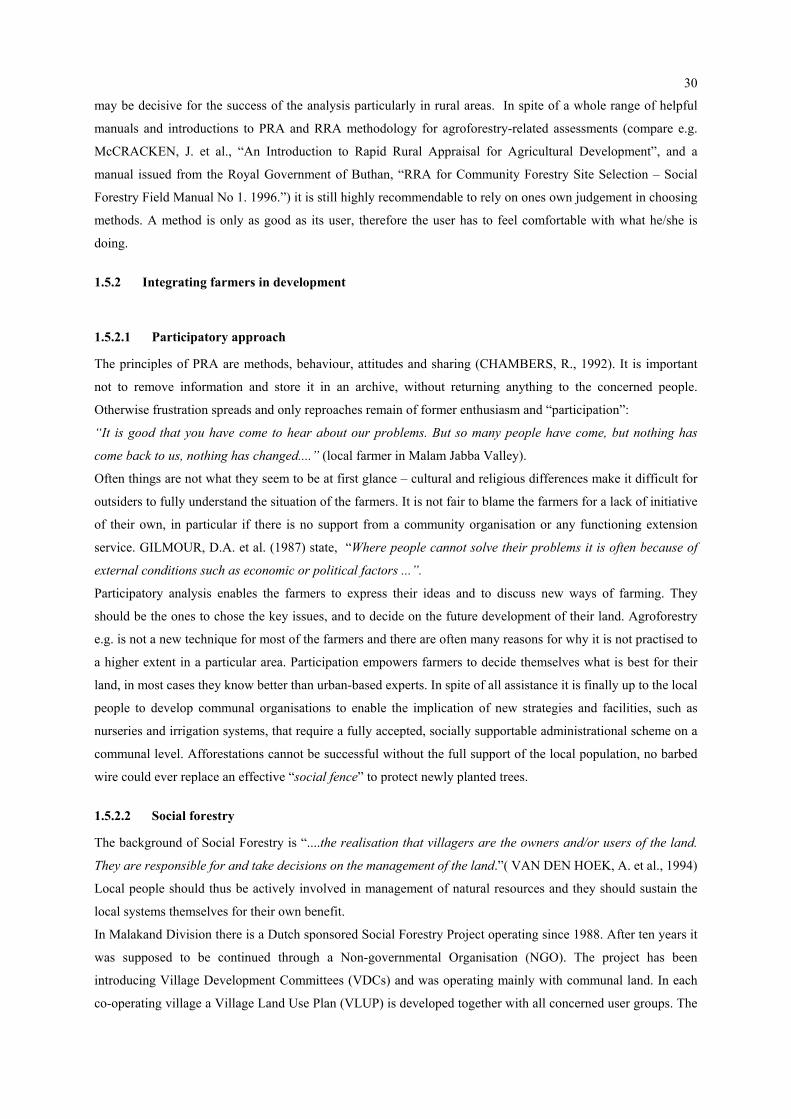
30
may be decisive for the success of the analysis particularly in rural areas. In spite of a whole range of helpful
manuals and introductions to PRA and RRA methodology for agroforestry-related assessments (compare e.g.
McCRACKEN, J. et al., “An Introduction to Rapid Rural Appraisal for Agricultural Development”, and a
manual issued from the Royal Government of Buthan, “RRA for Community Forestry Site Selection – Social
Forestry Field Manual No 1. 1996.”) it is still highly recommendable to rely on ones own judgement in choosing
methods. A method is only as good as its user, therefore the user has to feel comfortable with what he/she is
doing.
1.5.2 Integrating farmers in development
1.5.2.1 Participatory approach
The principles of PRA are methods, behaviour, attitudes and sharing (CHAMBERS, R., 1992). It is important
not to remove information and store it in an archive, without returning anything to the concerned people.
Otherwise frustration spreads and only reproaches remain of former enthusiasm and “participation”:
“It is good that you have come to hear about our problems. But so many people have come, but nothing has
come back to us, nothing has changed....” (local farmer in Malam Jabba Valley).
Often things are not what they seem to be at first glance – cultural and religious differences make it difficult for
outsiders to fully understand the situation of the farmers. It is not fair to blame the farmers for a lack of initiative
of their own, in particular if there is no support from a community organisation or any functioning extension
service. GILMOUR, D.A. et al. (1987) state, “Where people cannot solve their problems it is often because of
external conditions such as economic or political factors ...”.
Participatory analysis enables the farmers to express their ideas and to discuss new ways of farming. They
should be the ones to chose the key issues, and to decide on the future development of their land. Agroforestry
e.g. is not a new technique for most of the farmers and there are often many reasons for why it is not practised to
a higher extent in a particular area. Participation empowers farmers to decide themselves what is best for their
land, in most cases they know better than urban-based experts. In spite of all assistance it is finally up to the local
people to develop communal organisations to enable the implication of new strategies and facilities, such as
nurseries and irrigation systems, that require a fully accepted, socially supportable administrational scheme on a
communal level. Afforestations cannot be successful without the full support of the local population, no barbed
wire could ever replace an effective “social fence” to protect newly planted trees.
1.5.2.2 Social forestry
The background of Social Forestry is “....the realisation that villagers are the owners and/or users of the land.
They are responsible for and take decisions on the management of the land.”( VAN DEN HOEK, A. et al., 1994)
Local people should thus be actively involved in management of natural resources and they should sustain the
local systems themselves for their own benefit.
In Malakand Division there is a Dutch sponsored Social Forestry Project operating since 1988. After ten years it
was supposed to be continued through a Non-governmental Organisation (NGO). The project has been
introducing Village Development Committees (VDCs) and was operating mainly with communal land. In each
co-operating village a Village Land Use Plan (VLUP) is developed together with all concerned user groups. The
31
project area comprises Malakand and Dir. Plants were initially distributed free of charge, but in 1998 a fee was
introduced to establish a feeling of responsibility. Plants will still be given free to VDCs, but private farmers will
be charged. (HERING, H., 1998)
Investigations carried out during the project on the use and importance of trees for farmers showed significant
gender differences: Men and women prefer normally the same species, but they mention the trees in different
orders according to their different tasks. As collection of fuelwood and fodder is mainly women work, they are
more interested in species like Mulberry (Morus nigra, Morus alba) and Dodonea (Dodonea viscosa), while men
are responsible for the provision of timber, thus preferring trees like Chir Pine (Pinus roxburghii) and Walnut
(Iuglans regia). Women prefer tree species that produce fuelwood, fodder and fruit. (JOKY, F. and HERING,
H., 1996)
1.5.2.3 Forest policies in the N.W.F.P.
The forested area of Pakistan has decreased from 14 % to 5 % during the last 75 years (LÄNDERPROFIL
PAKISTAN, 1998). Deforestation in the N.W.F.P. is advancing at a very high speed: In the last 30 years there
was a decrease of 80 % - this tendency will slow down in the coming years, but in areas like Malam Jabba
Valley there will be hardly any forest left around 2010-2015 (ARCHER, G. ,1998).
From 1982 to 1994 the forested area in N.W.F.P. has however increased from 869 132 to 1 336 271 ha according
to government statistics. 33.5 % of the forested area of the N.W.F.P. in 1994/95 was in Swat District.
(Agricultural Statistics of North-West Frontier Province for 1994-95.)
There are some efforts by the government together with foreign sponsored projects to stop this tendency. The
more relevant projects for Malam Jabba Valley are listed below:
Forest Management Centre (FMC)
The FMC has its headquarters in Peshawar. It is a co-operation between the N.W.F.P. Forest Department and the
Interco-operation Switzerland. A survey on the remaining forested areas is currently carried through, also in
parts of Swat District. The aim is to investigate the forested area of the province and to determine the further use
of it. The survey covers availability of natural resources, but also social aspects and provides a broad variety of
data on the area, that will be very useful for future planning.
Malam Jabba Afforestation Project (MAP)
The MAP is based on an agreement between the Government of N.W.F.P. and the Autonomous Province of
Bolzano/Bozen Italy. The project is implemented by the Austrian Consultant Bureau Falch.
The implementation started in 1996/97. Two nurseries are operating in the valley to provide the villages with
plants for afforestations in former forested areas, that were often transformed into grazing land. The barren
hillsides of the valley will be afforested to stop erosion and to regain the valley’s former scenic beauty for
touristic purposes. The latter was initiated in the 1960ies to 80ies when a hotel and skiing lift were built in Kuza
Jabba, now at the end of the road leading up to the higher areas of Malam Jabba Valley. The initiative for this
co-operation between the Austrian and the Pakistani government goes back to an Austrian Ambassador to
Pakistan in the 60ies and aimed to found an Asian World Ski-centre in this poor and remote area of Pakistan.
The hotel and the lift were opened to the public only in 1998.
Many positive and negative side effects of this project have influenced life and development in Malam Jabba
Valley. The MAP is generally seen as a positive attempt and most of the people recognise the benefits of the

32
project for their communities, although a broader and more integrated approach for the project that is yet to come
but already planned is demanded by the local people.
Project for Horticultural Promotion (PHP)
This project was started as Malakand Fruit and Vegetable Development Project (MFVDP) in 1990 and extended
to the whole province in 1997/98. The project is a Swiss/Pakistani co-operation. The focus of the project is on
improvement of seed quality, provision of appropriate fruit trees in nurseries (rootstock improvement,
introduction of new varieties,...), biological control and assistance in product marketing. There are also programs
designed particularly for women. A farmer who decides to work for the project receives not only a lease for his
fields but also payment for the labour invested in the fields. This marks the change from traditional home
subsistence to cash economy. The products all go to the ARSM. Traditionally the farmers exchanged seeds
among themselves, some were renowned for their high quality seeds. The establishment of an organised seed
production in the area is targeted by the ARSM. For fruit trees the situation is similar. With better varieties the
trees will be carrying fruits much earlier and there will be less occurrence of diseases. (MORRIS, K.,1998)
In Malam Jabba Valley there is a Pilot Application Centre which was not in operation in 1998. The MFVDP is
widely known in the valley but not seen as a facility to improve farmer’s situation. The farmers complain that
there is no direct contact and that they do not benefit from the project. An attempted co-operation with MAP,
that plans to incorporate a horticultural component, could not be agreed upon due to the differing interests and
policies of the two projects.
1.5.2.4 Forest rights in the N.W.F.P.
Nowadays most of the forested area is under the jurisdiction of the Chief Forest Conservator of the N.W.F.P. ,
but villages in and around forests used to have certain CPR’s in the forest, which they still depend upon: They
are allowed to obtain forage, twigs and trees for construction of houses (and mosques), marriage timber for a
new house after marriage, grave timber, fuelwood, and food products.
The forest is destroyed mainly through felling and burning for creation of agricultural land to be planted with
wheat and maize. Excessive lopping for fuelwood and tapping of trees for resin to be sold on the market also
reduces the number of trees. Many trees are debarked to chest height to kill them for later use for house
construction, as it is forbidden to log a healthy, living tree but nothing objects to logging and using a dead tree.
Many unscrupulous Pakistanis have also gained large profits from the sale of illegal timber in the down-country
market. (compare ALLAN, N. J. R., 1987b and 3.1.3.7, 3.2.10.7)
In Malam Jabba the situation is similar – people debark trees to weaken them, they sometimes gain torchwood
from living trees, and set fire to the trees and stumps to kill them. The situation in the valley is even more critical
than elsewhere due to a ban on forest usage within a radius of 8 miles around the hotel in Kuza Jabba. The road,
that was originally constructed for the skiing tourists, now serves as an efficient transport route for this illegal
timber trade and has therefore enabled deforestation even in the higher areas of the valley. As the locals feel that
this forested area is no longer theirs, they do not feel responsible for it and have no interest in sustaining it. The
33
original structures of self-organisation and self-rule18 that existed formerly have dissolved and a lawless, mostly
unorganised village structure does not guarantee any control on a reasonable use of natural resources.
According to ZADA, A. (1998) there are three types of forest ownership in Pakistan:
(1) Protected forest: The forest is owned by the government, but the community can use the forest and is
entitled to a share of the timber sale.
(2) Reserve forest: All the profits go to the government, the communities cannot make claims any longer.
(3) Private forest: .The communities have all the CPR’s. This is a very rare case and applies only to about 6% of
the forests.
Due to feudalistic system in the Wali period ( compare 18) when the powerful village Malik made all important
decisions for the villagers the people are still not accustomed to the democratic idea of their own decision
making on village issues. The introduction of self-organisational structures like a VDC is not an easy task,
though welcomed by the majority of the villagers.
1.5.2.5 New forest policies for Malam Jabba
According to ZADA, A. (1998) the most important trees in the valley for afforestations are fruit trees i.e.
walnut, pear, persimmon, peaches, apricot and multipurpose fast-growing trees like R. pseudoacacia, A.
ailanthissima, Populus sp., Alnus sp.. Indigenous species such as Blue Pine, oak, olive etc. should also be
included in afforestations.
According to officials working for the Forest Department most local people are involved in illegal wood cutting,
although they admit that most of it is for domestic use i.e. fuelwood or timber. ZADA, A. (1998) describes in
one sentence the dilemma and conflict of the farmers in the valley:
“The local farmers have an excellent indigenous knowledge and experience and the only things they need are
initiative and confidence to accept changes.”
The three major constraints in forestry in the area are according to ZADA, A. (1998):
• Landownership disputes
• Very high population growth rate and low literacy rate
• Very weak infrastructure pertaining to basic needs
According to HAIDER KHAN, A. (1998) the conservation of forest itself is a major constraint in Malam Jabba.
It is difficult to get people involved in protection and the institutions do not keep the law themselves. He names
involvement of people in planning and utilisation of their natural resources as a very important objective, as well
as distribution of benefits and the demarcation of the natural forest from forest land/farm land. This demarcation
should be mutually agreed upon.
18 At the time before its merger into the state (1969) each village in Swat had a Malik, and a Jirga, where the villages elders would gather and
decide on communal issues (see 1.2.2.2). For the administration and distribution of water, timber and other valuable resources there were
responsible elders to concede the rights for use according to the respective schedules and systems.
34
ZADA, A. (1998) claims that the forest has to become communal property instead of state property. He favours
traditional management/participatory management or Joint Forest Management (JFM), meaning a co-operation
between the governmental Forest Department and the local VDCs.
“Optimal and sustainable use of natural resources should be ensured by imparting extensive training to the
local communities. To improve the socio-economic condition of local population the resource rich areas should
be given their due share in the national developmental plans. That means better living conditions for rural
people... and ....the sustainable management of natural resources /forest.” (ZADA, A., 1998)

35
2 METHODS
The first meetings and interviews took place during the first stay in Malam in February 1998 (INTEGRATED
REGIONAL DEVELOPMENT PROJECT, 1998). Based on the information gathered during this five week long
survey the two villages Malam and Mangarkot were selected for the current assessment. The field work took
place from October to the end of December 1998. This assessment aimed at evaluating the status of the
traditional silvo-pastoral systems in the valley. The form of the survey and analysis was chosen according to
ABEL, N. and PRINSLEY, R., in JARRIS, P. G. et al.,1991.
Fig. 2. 1: Form of survey and analysis (modified after ABEL, N. and PRINSLEY, R., in JARRIS, P. G. et al.,1991)
Interviews with men Statistical data, natural resources, problems &
priorities, seasonal diagrams, evaluation of MAP
Forest survey Status of the forested area,
vegetation, soil erosion, forest usage, regeneration,...
Interviews with officials
Forestry, agriculture, animal husbandry
Investigation of landuse: Field visits, outlining for further evaluation
Introductory meetings and transect walks
Meetings with key persons, farmers
Group interviews Natural resource mapping (village maps), ranking of
problems, scoring of products, tree ranking
DETAILING
PHASE
CORRELATION &
ASSESSMENT PHASE
Interviews with womenGroup discussions, semi-
structured interviews
GENERATIVE
PHASE
Assessment of agriculture & forestry
Semi-structured interviews with farmers, officials and project employees
Preparatory phase for second assessmentSelection of villages and methods of investigation, and
preparation of forest survey
36
2.1 Generative phase
2.1.1 First assessment of agriculture and forestry
During the first stay in Malam Jabba the following aspects were taken into account:
- Culture, traditions and religious life.
- Agricultural policies, landuse and growing patterns.
- Forest policies, the structures of MAP, and the attitude of villagers towards the forest.
Additionally ecological threats like soil erosion and water pollution were included in the study. All these aspects
were investigated through interviews with villagers, project employees and officials by an interdisciplinary
group of students. The results were analysed and summarised in a report (INTEGRATED REGIONAL
DEVELOPMENT PROJECT,1998).
2.1.2 Preparatory phase for second assessment
In order to carry through a more precise assessment of the traditional silvo-pastoral systems in Malam Jabba
Valley a further study was necessary. These systems were the basis of the long-term relationship between
villagers and the forest. The system got out of balance as a consequence of rapid population growth during the
last 50 years and profit-oriented, short-sighted forest policies.
Two villages were chosen for this survey. They are very different from one another, with regard to population,
climatic conditions and the degree of forest destruction:
• In Malam the social system is strictly hierarchic and feudalistic. There are some discussions on the
establishment of a VDC but still far from realisation. The village still has good reserves in terms of timber
availability, it has ample water supplies, and many parts of the village have high quality agricultural land.
• In Mangarkot there are already the beginnings of a somewhat more democratic social system in terms of a
VDC, that enables a larger part of the village population to participate in important decisions. The forested
area is diminishing and difficult to protect. Agricultural land of good quality and both irrigation and
drinking water are scarce in this area.
The village is situated on the opposite side of the valley to Malam ( see fig. 1.1) and has less than half the
population of Malam.
2.2 Detailing phase
2.2.1 Introductory meetings and transect walk
This survey was carried out in autumn 1998. In the beginning general information was gathered, in meetings
with farmers, and through transect walks. Transect walks in the forested area were performed together with the
MAP forester in Malam and Mangarkot. The agricultural areas were visited with local translators.

37
2.2.2 Investigation of landuse
Landuse maps were set up during walks through the area from below the villages to the tops of the hills. A
sketched map of landuse was drawn in each of the two villages. During several field visits the maps were
improved and corrected.
The village orchards were visited separately, together with the local translators. Further details on landuse were
investigated through informal talks with villagers and from interviews.
2.3 Assessment and correlation phase
2.3.1 Methodology of forest survey
The forested area in Malam Jabba Valley was difficult to survey due to its demanding terrain. The slopes are
very steep and there are many gullies running down the hills. Therefore forest inventory was not carried through
in a way that would have covered the entire forested area (e.g. grid net system), but with sample strips1 (as
recommended for such forested areas by ZÖHRER F.,1980 and ANDRAE, F. ,1998).
The bigger a sa
100-300 m² an
into ha and tota
The average n
bordering on e
fig. 2.2, 2.4).
The line was d
400 m). In one
1 The term “sample
Fig. 2. 2: In Malam (left) six transects were measured, in Mangarkot (right)only two.
mple area is, the lower is the coefficient of variation. Sample plots should cover an area of about
d should contain approximately 5-15 trees on average. The obtained results have to be projected
l values. (ZÖHRER, F.,1980)
umber of trees was expected to be very low, therefore sample plots of 400 m² (20 x 20 m),
ach other, were measured along a line from the lower forest line in the direction of the ridge (see
etermined with a compass. Due to the terrain the various transects were of different length (40 -
case (see 3.1.3.12) only one sample plot was measured.
strips” is correspondent to “transects”.

38
In order to mark the distance from the line, two thirty
metre tape measures were used. The respective
sample plot was marked with flagged sticks during
the inventory (see fig. 2.4). The twenty metre length
was measured as a vertical projection and the
additional distances were added according to
inclination (see fig.2.3).
Inclination was determined with a dendrometer
according to BLUME-LEISS. Fig. 2. 3: To determine the size of a sample plot, the area was calculated as a vertical projection.
The locations of sample strips were chosen during transect walks (see 2.2.1) through the forested area. The most
important criteria were as follows:
- The area had to be representative with regard to degrees of forest usage, stand density, ground vegetation
and terrain.
- Non-accessible areas were not regarded as representative.
- Altitude and exposition had to correspond among transects, in order to gain comparable results.
In Malam, transect I, III and VI started from the lower forest line. Only transect III reached to the ridge, in the
other cases the survey was stopped below it. Transect IV comprised of only two plots and transect V had only
one plot. Transect II was surveyed to represent an afforestation site.
In Mangarkot, transect I was started from the lower forest line. Transect II began in the middle of the forest and
was continued up to the ridge.
N-NW
20 m20 m
20 m
No 2
No 1TRANSECT
FOREST AREA
N-NW
Fig. 2.4: The transects were started at the lower forest line and continued in the direction of theridge. Each sample plot was 20 x 20 m of size and marked with flagged sticks.

39
2.3.1.1 Site description
For the forest inventory a prepared booking sheet (see APPENDIX) was filled in for each sample plot and a site
description was made for the respective forested area. According to the booking sheet a description of site
included sea level, exposition, inclination and terrain. The following types of terrain were taken into account:
1 Hollow 3 Lower slope – slope 5 Slope – Upper slope 7 Upper slope – Ridge
2 Lower slope 4 Slope 6 Upper slope 8 Ridge
The distances to nearby settlements and concerned villages were documented. For each transect a separate
sketched map was drawn to document all noticeable influence on the forest patch. Photographs were taken to
document the status of the forest and the degree of damage and use.
Soil was evaluated with regard to erosion damage, estimated soil depth and estimated soil coverage (in
percentages)2. Soil erosion and soil depth were classified as follows:
(1) No visible soil erosion (A) Very shallow soil
(2) Not much visible soil erosion (B) Rather shallow soil
(3) Visible soil erosion at a moderate extent (C) Soil is only sometimes shallow
(4) Visible soil erosion at a remarkable extent (D) Soil is rather deep
(5) Visible soil erosion at a very high extent (E) Very deep soil
2.3.1.2 Stand description
In each plot all stems and stumps were counted. The number of stems referred to all living trees. The stumps
were often hardly visible and so it is likely that not all of them, but only the ones resulting from felling during
the last five years, could be registered. The less damaged stumps were also counted with regard to the way of
tree felling (use of saws or axes) and destruction through fire. Proportions for transects with either more stumps,
more stems or equal amounts of both were calculated. The actual number of stems and stumps was projected into
numbers per ha.
410∗∗
=xa
nN
N number of stems/ha or stumps/ha
n number of stems/stumps per sample plot
a area of sample plot (400 m²)
x number of sample plots
The total height of trees (h) was measured with a dendrometer according to BLUME-LEISS. Total height refers
to the height of a tree at its highest growing point. Arithmetic mean height was calculated for all transects.
Calculation of the Mean or Average (according to PHILIP, M. S., 1994) :
2 In contrast to percentage of coverage abundance of vegetation this term refers to the total soil coverage and not to the share of specific plant
groups in an association surveyed on a sample plot.

40
∑=N
i
Nx
µ
N number of sampling units in the population
x i the value of the ith sampling unit
µ population mean value
( )∑=
− nitree
nh
h
−
h arithmetic mean tree height (m); h tree total height per tree (m)
i Transect number e.g. I or III n number of trees per transect i
Diameter at breast height (dbh, at 1.3 m height) of all living trees taller than 3 m was measured with a girth tape.
Adjusted to occurrence in the measured plots the following dbh classes were used:
<20 cm 20-30 cm 30-40 cm 40-50 cm 50-60 cm 60-70 cm >70 cm
The number of trees/ha (N) was put in relation with these dbh classes, as well as the corresponding volume (V)
and height (h).
42 π
∗= dbhGtree
( ) 410∗∗
= ∑x
itree
xaG
G
dbh diameter at breast height (1.3 m)
G tree basal area m²/tree; G basal area m²/ha
a area of sample plot (400 m²) i transect number e.g. I or III
x number of sample plots
A map was drawn for each plot showing the crown projection and distribution of stems and an average crown
width was estimated. Due to the large differences in crown shape and the consequently inaccurate values for
crown diameters these data were not further evaluated and excluded from the results, in particular as the
objectives of this study did not require further measurements of these parameter.
Volume was calculated for all dbh classes. For each transect the average volume per tree and the remaining
volumes (per ha) were determined.

41
coniferstreetreetree fhGV ∗∗=
410∗∗
∗= ∑
xtree
xanVV
f conifers 0.40 (form factor)
V tree volume per tree (m³); V total volume (m³/ha)
G tree basal area m²/tree; h tree total height per tree(m)
n number of trees per sample plot or per transect; a area of sample plot (400 m²)
x number of sample plots
2.3.1.3 SDI
REINEKE (1933) showed in the USA, that two fully
stocked pure stands without management had, independent
of age and site quality, exactly then the same number of
stems when the arithmetic mean diameter was equal. He
concluded that the number of stems belonging to a certain
arithmetic mean diameter was a good measure for the
determination of stand density. The curve of the maximum
number of stems at a known arithmetic mean diameter
shows, if drawn on double logarithmic paper, a straight line
with an ascent of –1.6 (independent of tree species).
DANIEL et al. (1979) converted the SDI (REINEKE
L.H.,1933) from English units into the metric system.
DANIEL, T. W. and STERBA, H., 1980 developed this
system further on and adapted it to European conditions. For
the metric system an arithmetic mean diameter of 25 cm was
chosen. Fig.2.5 shows how to determine this Stand Density
Index (SDI). The formula for SDI according to DANIEL, T.
W. and STERBA, H. (1980) is3 as follows:
3 The original formula were :
REINEKE (1933) : SDI = 10 (log N + 1.605 log dg –1.605)
DANIEL (1979): SDI = 1.0147 (10) log N + 1.605 log dg – 2.250
Fig.2. 5: Nomogram for calculation of SDI (from
DANIEL, T. W. and STERBA, H., 1980).
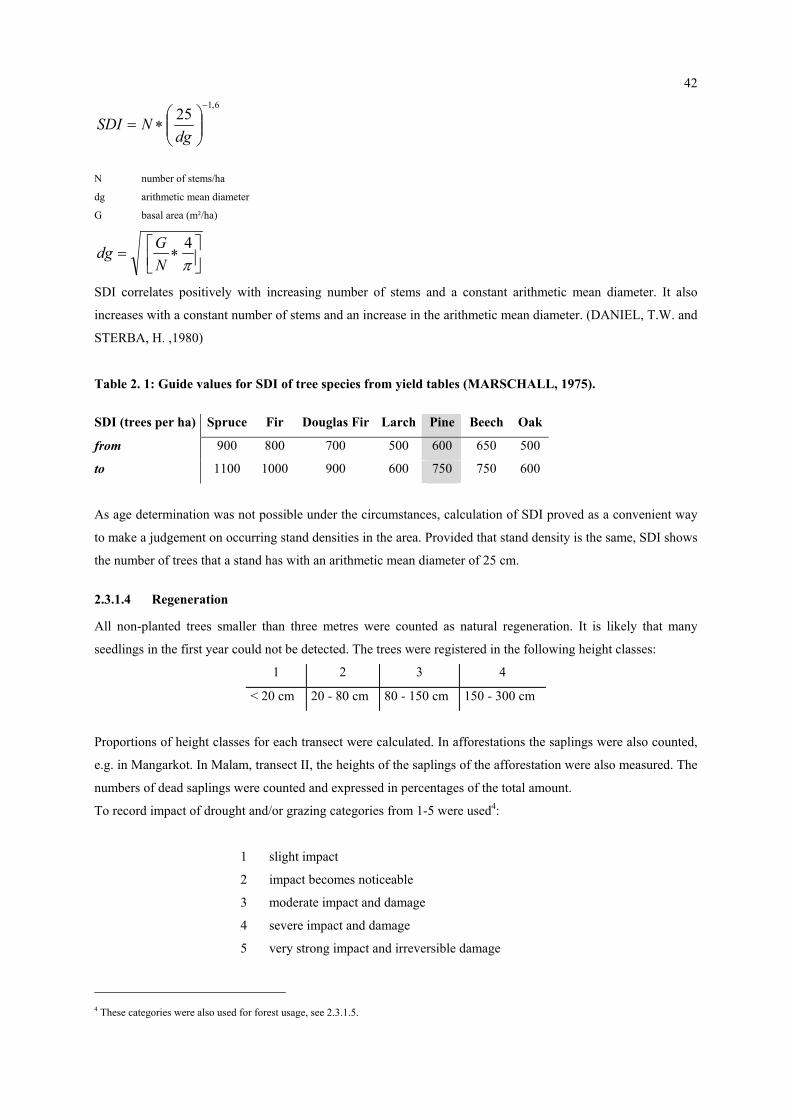
426,1
25−
∗=
dgNSDI
N number of stems/ha
dg arithmetic mean diameter
G basal area (m²/ha)
∗=
π4
NGdg
SDI correlates positively with increasing number of stems and a constant arithmetic mean diameter. It also
increases with a constant number of stems and an increase in the arithmetic mean diameter. (DANIEL, T.W. and
STERBA, H. ,1980)
Table 2. 1: Guide values for SDI of tree species from yield tables (MARSCHALL, 1975).
SDI (trees per ha) Spruce Fir Douglas Fir Larch Pine Beech Oak
from 900 800 700 500 600 650 500
to 1100 1000 900 600 750 750 600
As age determination was not possible under the circumstances, calculation of SDI proved as a convenient way
to make a judgement on occurring stand densities in the area. Provided that stand density is the same, SDI shows
the number of trees that a stand has with an arithmetic mean diameter of 25 cm.
2.3.1.4 Regeneration
All non-planted trees smaller than three metres were counted as natural regeneration. It is likely that many
seedlings in the first year could not be detected. The trees were registered in the following height classes:
1 2 3 4
< 20 cm 20 - 80 cm 80 - 150 cm 150 - 300 cm
Proportions of height classes for each transect were calculated. In afforestations the saplings were also counted,
e.g. in Mangarkot. In Malam, transect II, the heights of the saplings of the afforestation were also measured. The
numbers of dead saplings were counted and expressed in percentages of the total amount.
To record impact of drought and/or grazing categories from 1-5 were used4:
1 slight impact
2 impact becomes noticeable
3 moderate impact and damage
4 severe impact and damage
5 very strong impact and irreversible damage
4 These categories were also used for forest usage, see 2.3.1.5.
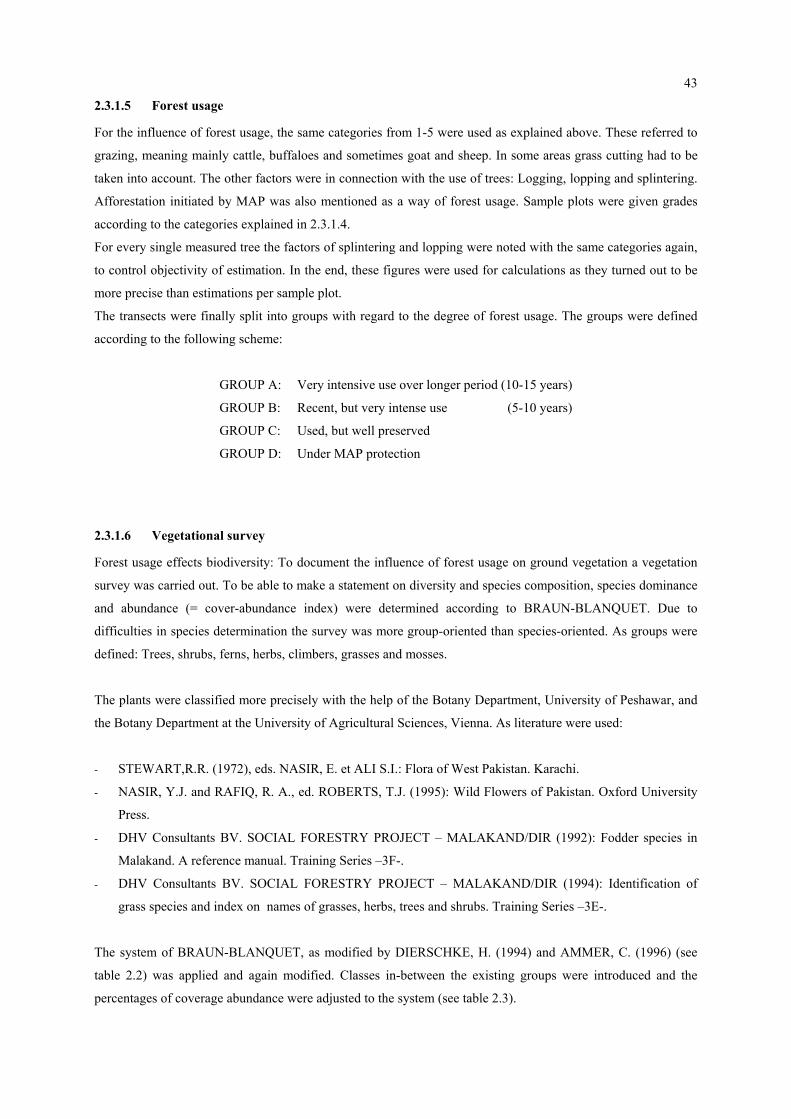
43
2.3.1.5 Forest usage
For the influence of forest usage, the same categories from 1-5 were used as explained above. These referred to
grazing, meaning mainly cattle, buffaloes and sometimes goat and sheep. In some areas grass cutting had to be
taken into account. The other factors were in connection with the use of trees: Logging, lopping and splintering.
Afforestation initiated by MAP was also mentioned as a way of forest usage. Sample plots were given grades
according to the categories explained in 2.3.1.4.
For every single measured tree the factors of splintering and lopping were noted with the same categories again,
to control objectivity of estimation. In the end, these figures were used for calculations as they turned out to be
more precise than estimations per sample plot.
The transects were finally split into groups with regard to the degree of forest usage. The groups were defined
according to the following scheme:
GROUP A: Very intensive use over longer period (10-15 years)
GROUP B: Recent, but very intense use (5-10 years)
GROUP C: Used, but well preserved
GROUP D: Under MAP protection
2.3.1.6 Vegetational survey
Forest usage effects biodiversity: To document the influence of forest usage on ground vegetation a vegetation
survey was carried out. To be able to make a statement on diversity and species composition, species dominance
and abundance (= cover-abundance index) were determined according to BRAUN-BLANQUET. Due to
difficulties in species determination the survey was more group-oriented than species-oriented. As groups were
defined: Trees, shrubs, ferns, herbs, climbers, grasses and mosses.
The plants were classified more precisely with the help of the Botany Department, University of Peshawar, and
the Botany Department at the University of Agricultural Sciences, Vienna. As literature were used:
- STEWART,R.R. (1972), eds. NASIR, E. et ALI S.I.: Flora of West Pakistan. Karachi.
- NASIR, Y.J. and RAFIQ, R. A., ed. ROBERTS, T.J. (1995): Wild Flowers of Pakistan. Oxford University
Press.
- DHV Consultants BV. SOCIAL FORESTRY PROJECT – MALAKAND/DIR (1992): Fodder species in
Malakand. A reference manual. Training Series –3F-.
- DHV Consultants BV. SOCIAL FORESTRY PROJECT – MALAKAND/DIR (1994): Identification of
grass species and index on names of grasses, herbs, trees and shrubs. Training Series –3E-.
The system of BRAUN-BLANQUET, as modified by DIERSCHKE, H. (1994) and AMMER, C. (1996) (see
table 2.2) was applied and again modified. Classes in-between the existing groups were introduced and the
percentages of coverage abundance were adjusted to the system (see table 2.3).
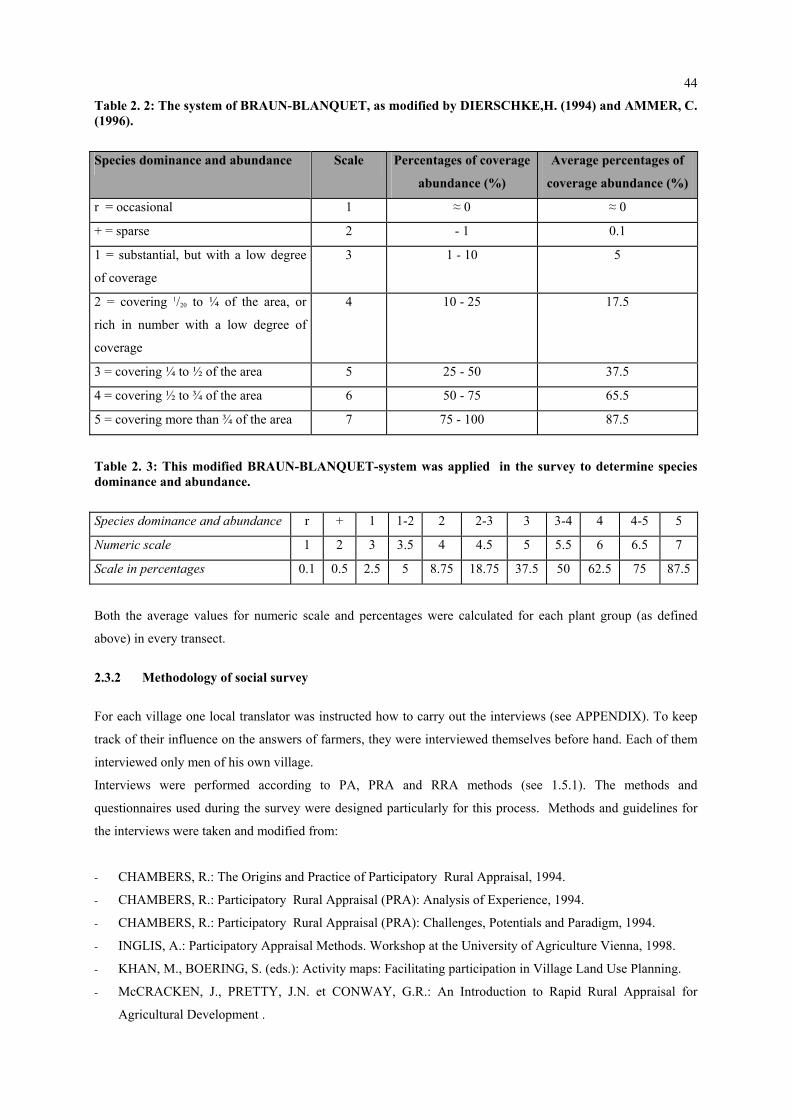
44
Table 2. 2: The system of BRAUN-BLANQUET, as modified by DIERSCHKE,H. (1994) and AMMER, C. (1996).
Species dominance and abundance Scale Percentages of coverage
abundance (%)
Average percentages of
coverage abundance (%)
r = occasional 1 ≈ 0 ≈ 0
+ = sparse 2 - 1 0.1
1 = substantial, but with a low degree
of coverage
3 1 - 10 5
2 = covering 1/20 to ¼ of the area, or
rich in number with a low degree of
coverage
4 10 - 25 17.5
3 = covering ¼ to ½ of the area 5 25 - 50 37.5
4 = covering ½ to ¾ of the area 6 50 - 75 65.5
5 = covering more than ¾ of the area 7 75 - 100 87.5
Table 2. 3: This modified BRAUN-BLANQUET-system was applied in the survey to determine species dominance and abundance.
Species dominance and abundance r + 1 1-2 2 2-3 3 3-4 4 4-5 5
Numeric scale 1 2 3 3.5 4 4.5 5 5.5 6 6.5 7
Scale in percentages 0.1 0.5 2.5 5 8.75 18.75 37.5 50 62.5 75 87.5
Both the average values for numeric scale and percentages were calculated for each plant group (as defined
above) in every transect.
2.3.2 Methodology of social survey
For each village one local translator was instructed how to carry out the interviews (see APPENDIX). To keep
track of their influence on the answers of farmers, they were interviewed themselves before hand. Each of them
interviewed only men of his own village.
Interviews were performed according to PA, PRA and RRA methods (see 1.5.1). The methods and
questionnaires used during the survey were designed particularly for this process. Methods and guidelines for
the interviews were taken and modified from:
- CHAMBERS, R.: The Origins and Practice of Participatory Rural Appraisal, 1994.
- CHAMBERS, R.: Participatory Rural Appraisal (PRA): Analysis of Experience, 1994.
- CHAMBERS, R.: Participatory Rural Appraisal (PRA): Challenges, Potentials and Paradigm, 1994.
- INGLIS, A.: Participatory Appraisal Methods. Workshop at the University of Agriculture Vienna, 1998.
- KHAN, M., BOERING, S. (eds.): Activity maps: Facilitating participation in Village Land Use Planning.
- McCRACKEN, J., PRETTY, J.N. et CONWAY, G.R.: An Introduction to Rapid Rural Appraisal for
Agricultural Development .

45
- PRETTY, J.: Participatory Learning for Sustainable Agriculture, 1995.
- RRA for Community Forestry Site Selection, Social Forestry Field Manual No 1, 1996.
- VAN DEN HOEK, A., WERTER, F.: Manual for Village Land Use Planning, 1994.
Due to cultural and traditional circumstances most of the information was gained by talking to men. Women
could only be interviewed on one occasion in Malam and again in Mangarkot. Together with a female translator
an attempt was made to understand the role of women in local society and to learn more about their constraints
and their priorities.
2.3.2.1 Interviews with farmers
At first all interviews were carried out with one farmer at a time or in small groups. The farmers were chosen at
random, with some regard to the ethnic/social group they belonged to. The farms were located in all parts of the
village area. In Malam fourteen farmers were interviewed and in Mangarkot thirteen.
The questionnaires were only used as a guideline during the interviews and to make notes (form of questionnaire
see APPENDIX). The farmers and translators themselves did not have to fill in questionnaires. Sometimes more
than one man answered the questions, but attention was always paid to the fact, that all should be part of the
same social group and about the same age, otherwise a separate interview was made. The questions covered the
following issues:
- Statistics: These questions provided information on social groups, age, land, livestock,....and aimed to
guarantee the representative aspect of the survey.
- Natural resources: Questions were asked to locate the main sources of water, fuelwood, grazing and to find
out about the annual crops.
- Problems and changes: The objective was also to learn about the main difficulties in livestock keeping,
cultivation of fruit trees, vegetables and crops, about people’s priorities concerning the forest and about
constraints in “daily use”, meaning the problems in everyday life. With regard to the role of the official side
(Agricultural Extension, Forest Department, foreign sponsored projects,..) local farmers were also asked
about their priorities for changes in forestry and agriculture.
- Seasonal diagrams: Setting up seasonal diagrams helps to understand what work the farmers have in the
different seasons of the year. A year was divided into four seasons (winter rain, summer drought, monsoon
period, winter drought). With regard to these seasons farmers were asked to tell about their work and about
the products they gain from their fields and from forests at different times of the year.
- Evaluation of the MAP: A so-called H-Form (see APPENDIX) was used to ask the farmers about their
opinion on the afforestation project and for possible improvements.
2.3.2.2 Group interviews
During the first interviews the farmers were informed, that a group interview would take place after the
completion of the interviews with individual farmers. The facilitator of these group discussions was the forester
of the MAP. He is not from the valley but he is respected by the farmers and also familiar with the problems of
the region. The group interview ran according to the following schedule :

46
1) Introduction:
It was very important to explain the role of the outsiders and make it clear that they have come to learn
from the locals. It was also explained what the gained knowledge would be used for.
2) Village maps:
To make the situation more relaxed, natural resource village mapping was started with. A prepared
village map5 was put on the ground (see photograph 2.3) and symbols (see fig.2.6) were used to show
the sources and the critical areas concerning the respective topic. This was also discussed with the basis
information about natural resources given by the farmers during interviews .
Fig. 2.6: Symbols and theirrespective categories used fornatural resource village mapping.
3) Problem ranking:
All problems mentioned by farmers during interviews were listed. The ones occurring more often were
written on circles in various colours. During the group discussion the men present were asked to rank
the named problems according to their priorities, at first in the categories very important, important, and
less important. Finally they ranked the circles within the categories (see photograph 2.5).
4) Bean scoring:
Using the results of previous interviews a list of main groups of products from agriculture and forestry
was made. For each row 10 beans were distributed, with at least one bean per field. The groups
fuelwood, timber, wheat, maize, vegetables, fruits, animals and fodder were given scores with regard to
various aspects: “Time consumption” meant whether farmers were spending a lot of time with this
product. “Labour” meant if that product required a lot of hard work. “Profits“ covered the economic
aspects of the various products, while ”importance” meant whether the farmers considered the products
to be very important for their farm and family. Finally the products had to be ranked again by giving
scores with the beans. Eight beans was the maximum and one the minimum (see photograph 2.2).
5 The village maps were roughly drawn on a large sheet of paper.

47
5) Tree species ranking:
A list with names and drawings of the 14 most important trees observed in the two villages was made
and presented during the group interview. Several farmers, representing various groups from the village,
were asked to rank the trees according to their own priorities by giving scores with beans. 14 was the
maximum amount and one was the minimum (see photograph 2.6).
2.3.3 Interviews with officials
Interviews and contact with officials familiar with the valley were also part of the survey. Experts on forestry
were asked questions with regard to forest policy in Malam Jabba (see APPENDIX). A former DFO (Divisional
Forest Officer) was interviewed and the responsible forest expert from MAP. The questions were relating to
forest products, preferred trees for afforestations, the constraints of forestry in the area, possible and desired
changes in forestry in the valley. An important part of all interviews was also to find out about the attitude of
officials towards the farmers.
Regarding agriculture, an interview was made with the Agricultural Officer of Mingora, who was also familiar
with the situation in Malam Jabba. The questions were about farmers and landownership, as well as major crops,
the main market and sustainability. The major constraints and desired changes in agriculture were also discussed.
Concerning livestock veterinarians operating in Malam Jabba were asked about their opinion on constraints in
animal husbandry, what should be changed in future, about the number of animals per village, lactation period,
first calving and milk production of buffaloes and cattle.

48
Photograph 2.1: Interviews with farmers: The farmer (right) talks with thetranslator (middle), while the author( left) takes notes.
Photograph 2.2: Farmers in discussion with the facilitator (left) during groupinterviews in Malam.
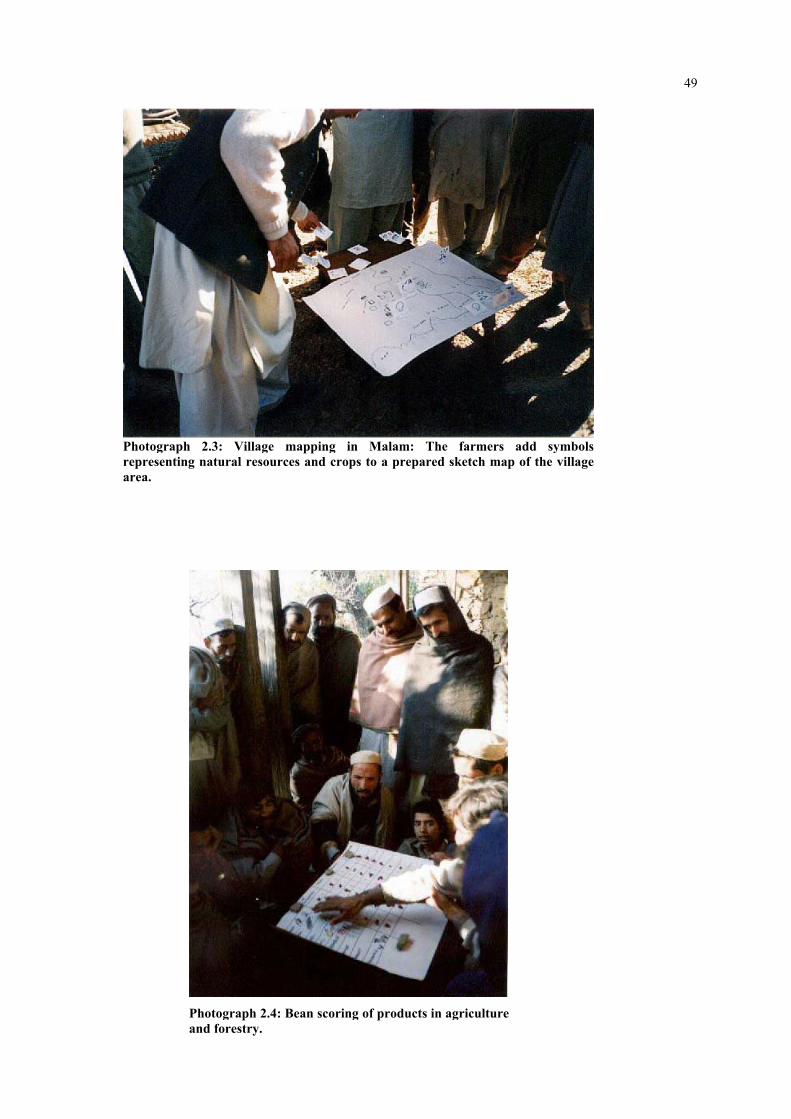
49
Photograph 2.3: Village mapping in Malam: The farmers add symbolsrepresenting natural resources and crops to a prepared sketch map of the villagearea.
Photograph 2.4: Bean scoring of products in agricultureand forestry.

50
Photograph 2.5: Ranking of problems written on coloured circles according topeople’s priorities.
Photograph 2.6: Farmers in Malam at tree ranking with beans.

51
3 RESULTS
3.1 Malam
3.1.1 Population, livestock and agricultural land
3%
1% 4%
92%
MullahMiagan
SirimarGujar
Fig. 3.1: Population of Malam with regard to social groups.
In Malam the social system is based on a cast-like
system (see fig. 3.1 and table 3.1). The most powerful
and wealthy family are the Miagan. They belong to
the Syed clan - members of this clan own most of the
land in Malam Jabba Valley and play a very important
role in social and political life in the whole area.
The Miagan in Malam own most of the land including
the forested area, but their entitlement to the land is
not legalised. The family has been holding on to its
landownership ever since the last Wali gave the land
to them (see 1.2.2.1 and 1.2.3.1).
During the last 15-20 years the population in the area has increased dramatically ( see 1.2.2.3). Originally only
the plateau surrounding the village was cultivated, but now numerous settlements are scattered around the former
forested area. The settlers are mainly poor Gujar families. Most of them are tenants of the Miagan. Some of the
Gujars are landowners, as well as some Pathan and other settlers. These small landowners are called Sirimar.
They bought land from the Miagan as social structures started to break up: Some of the traditional landowners
started to engage in other business during the last 10 years and consequently sold off some of their land.
0
1
2
3
4
5
6
7
Aver
age
num
ber o
f ani
mal
per
hou
seho
ld
Buffaloes Cows Ox Goat Sheep Poultry
TENANTSSIRIMARLANDLORDS
Fig. 3.2: Average numbers of livestock per household in Malam.
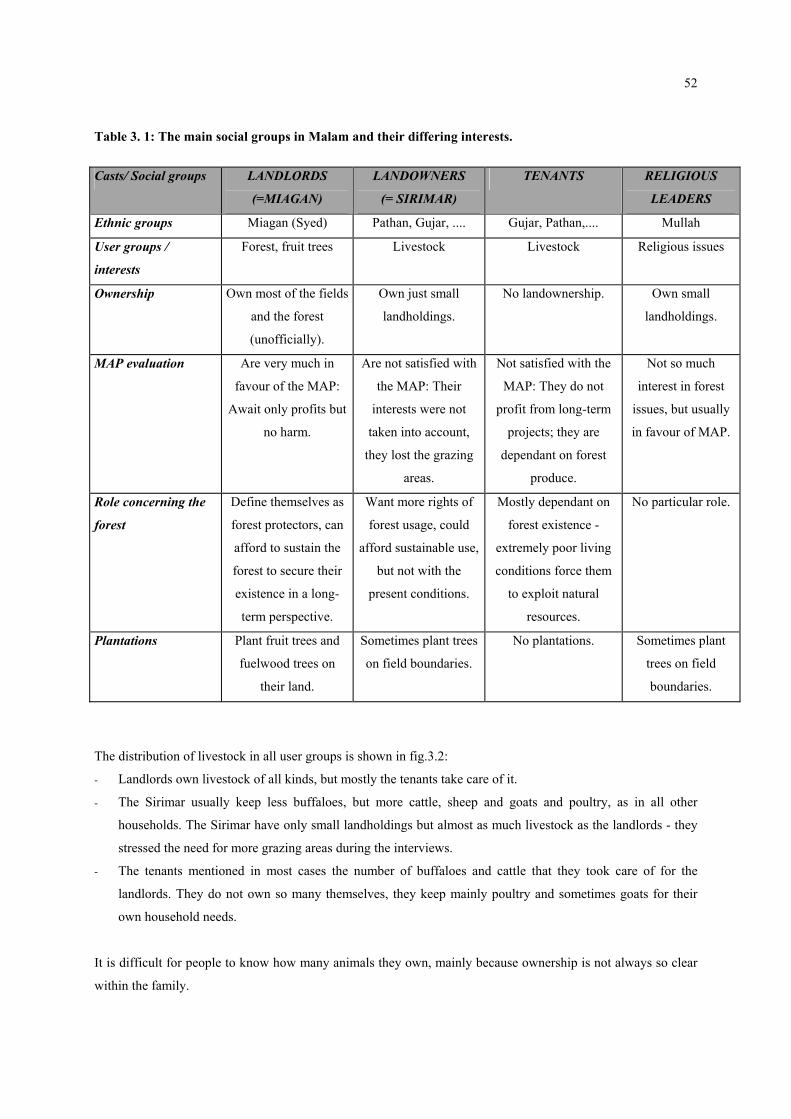
52
Table 3. 1: The main social groups in Malam and their differing interests.
Casts/ Social groups LANDLORDS
(=MIAGAN)
LANDOWNERS
(= SIRIMAR)
TENANTS RELIGIOUS
LEADERS
Ethnic groups Miagan (Syed) Pathan, Gujar, .... Gujar, Pathan,.... Mullah
User groups /
interests
Forest, fruit trees Livestock Livestock Religious issues
Ownership Own most of the fields
and the forest
(unofficially).
Own just small
landholdings.
No landownership. Own small
landholdings.
MAP evaluation Are very much in
favour of the MAP:
Await only profits but
no harm.
Are not satisfied with
the MAP: Their
interests were not
taken into account,
they lost the grazing
areas.
Not satisfied with the
MAP: They do not
profit from long-term
projects; they are
dependant on forest
produce.
Not so much
interest in forest
issues, but usually
in favour of MAP.
Role concerning the
forest
Define themselves as
forest protectors, can
afford to sustain the
forest to secure their
existence in a long-
term perspective.
Want more rights of
forest usage, could
afford sustainable use,
but not with the
present conditions.
Mostly dependant on
forest existence -
extremely poor living
conditions force them
to exploit natural
resources.
No particular role.
Plantations Plant fruit trees and
fuelwood trees on
their land.
Sometimes plant trees
on field boundaries.
No plantations. Sometimes plant
trees on field
boundaries.
The distribution of livestock in all user groups is shown in fig.3.2:
- Landlords own livestock of all kinds, but mostly the tenants take care of it.
- The Sirimar usually keep less buffaloes, but more cattle, sheep and goats and poultry, as in all other
households. The Sirimar have only small landholdings but almost as much livestock as the landlords - they
stressed the need for more grazing areas during the interviews.
- The tenants mentioned in most cases the number of buffaloes and cattle that they took care of for the
landlords. They do not own so many themselves, they keep mainly poultry and sometimes goats for their
own household needs.
It is difficult for people to know how many animals they own, mainly because ownership is not always so clear
within the family.

53
The average number of people in a household in Malam is 10.7:
Social group Persons/ household1
Landlords 11.0
Sirimar 12.5
Tenants 8.5
According to the local teacher the maximum number of people in one household during the latest census
(unpublished, 1998) was 32, the minimum was 8 persons in a single household. The census reportedly resulted
in a number of 393 households for Malam. The total share of various social groups is shown in fig. 3.1.
Fig.3.3 shows the distribution of the land in relation to the number of people per household. The estimated
number of people living in Malam is 2900. This is an average value calculated from all estimated numbers (see
1.2.2.3) and the results of the last published census (1981). The numbers given during the interviews would
result in about 4200 inhabitants. Most of the people are either tenants or farmers who own property. Many of the
small farmers or the tenants are engaged in off-farm labour. Almost in every family there is someone working in
the South of Pakistan or abroad (e.g. Saudi Arabia, Kuwait). Other professions practised in Malam are
shopkeeper, teacher, miller and hotel employee.
02468
1012141618
LANDLORDS SIRIMAR TENANTS
Num
ber o
f peo
ple/
land
(ha)
Land (ha)People/household
Fig. 3.3: Comparison of the number of people per householdand the available land (ha).
1 These are average values, calculated on basis of th statistical data resulting from the interviews with farmers.
e
54
3.1.2 Natural resources
3.1.2.1 Description of the area
Malam is connected to the main road near Kashora with a partly paved and partly unpaved road. This road is in a
very bad condition and no public transport is possible.
The village itself is situated on a plateau. Most of the slopes surrounding it are exposed to the N-NW. The area
surrounding the village is flat and well suited for agricultural landuse (see landuse map in APPENDIX). There
are orchards and fruit trees scattered on the banks of terraces. In this part of the village most of the fields are
irrigated and vegetables are grown in the fields. The fields in this area are usually 10-15 m wide and 30-80 m
long.
Further away from the village the situation worsens: The slopes rising to the N-NW of the plateau are very steep
and the terraced fields are much smaller. Length varies from 15-50 m, and the terraces are usually only 3-10 m
wide. There are hardly any trees on the embankments. Many small paths lead up to the houses that are scattered
on the hillsides near what remains of the forest. The soil is less suitable for agriculture here, and the fields are
very rocky. Most of the tenants live in this area.
Fig. 3.4: Result of natural resource village mapping in Malam. The map shows locations of themost important natural resources, the settlements of various ethnic/social groups, the location of different crops and important facilities mentioned during group interviews.
BANGO SER

55
Below the village some farmers have access to irrigation and there are many fruit trees on the embankments.
Most of these farmers are owners of small landholdings (Sirimar).
The main crops are wheat and maize. The following vegetables are grown in Malam: Onion, tomato, garlic,
beans, peas, pumpkin, cucumber, cabbage, cauliflower, spinach, radish, and others, providing the farmers have
access to irrigation. The main fruit is pear (local: tongu), but also apple, persimmon, apricot, walnut, and plum
are grown. The area is said to be suited for fruit growing - there are also many wild fruit trees to be found..
3.1.2.2 Problematic aspects concerning natural resources in the village of Malam
• Water
Only around 15-20 houses in the village have access to tap water. All other people have to fetch water from
springs and rivers. Usually the walking distance is not so far, but many of the springs do not provide sufficient
water. In case of a drought many springs run dry and water becomes scarce. Another problem is the pollution of
the unprotected springs: Often the drinking trough for cattle is nearby and animals pollute the water.
• Fuelwood
Most people named the area near Bango Ser (see fig.3.4) as the main source of fuelwood. The area is quite
remote and there is still ample supply of timber (see Transect IV and V), but it is alarming that almost the entire
village claims to obtain fuelwood and timber from there.
Most houses still have some forested area nearby, but these areas are already protected, if not by the MAP then
by the landlords who do not allow other villagers to use the forest.
• Pasturage
Some farmers leave the animals to graze in the fields near the village, and on the field boundaries. Most of the
cattle move to the Bandras in summer. This is an area near the skiing hotel. The Gujars look after the cattle here
and bring the milk and dairy produce to the farmers.
• Orchards and fields
There are several orchards in the village of Malam. Many trees are scattered on banks of terraces and on field
boundaries. Only the Miagan can afford to plant trees themselves, and that is the reason why the major part of
the fruit area is confined to their settlements in and around the village.
In the fields the majority of farmers/tenants grows only maize, and sometimes wheat. If irrigation is available
farmers also cultivate vegetables. In the village area few farmers try inter-cropping of fruit trees with wheat and
tomato.

56
3.1.3 Seasonal diagrams
MEN:
- As shown in fig. 3.5, the agricultural year begins with the preparation of fields. Soon after thaw maize and
potato are sown, followed by turnip and cucumber.
- In the dry summer season there is a great deal of work due to harvest of wheat and peas. The follower crop
is tomato.
- In September/October harvest starts again with tomato and fruits and then maize. At this time of year grass
is also cut and stored for the winter, as well as maize straw. Wheat, peas, onion and garlic are sown. Before
the snow arrives, fuelwood is collected and stored for the winter.
Men in Malam claim that the dry winter season is the most work intensive. Second they rank the dry summer
season. Least work they have during monsoon rain (July, August).
WOMEN:
As shown in fig. 3.6, Miagan women have a different seasonal calendar to Gujar women: Most of the Miagan
women’s work is domestic, preparing meals for men and food processing.
In contrast, the Gujar women also work outside their houses:
- They start the year with the preparation of fields. As soon as possible after the thaw, they again collect green
fodder for the animals.
- The most labour intensive period for them is the dry summer season: First the beds are prepared for the
planting of vegetables like cucumber, then in May, June wheat is harvested. The follower crops are maize
and in some fields tomatoes.
- During the monsoon period there is less work, but still women have to gather fuelwood and fodder every
day.
- At the end of the monsoon season harvest of fruits and tomato starts. Maize is harvested in October – the
maize has to be cleaned and the straw is stored for the winter. After the harvest wheat and peas are sown. In
January onion and garlic are planted.
- Before the snow arrives fuelwood has to be collected from the mountains. In winter the snow makes life
very difficult for poor people living on the hillsides and they often have to clear snow from house roofs. In
winter the Gujars also must take care of the Miagan’s cattle in stables and deliver milk and ghee to the
Miagan.
All year long leafy vegetables and sometimes mushrooms (in rainy seasons) are collected in the wild.
For women in Malam the dry summer season is the most labour intensive, followed by the dry winter season.
But especially the Gujar women claim that there is in fact a lot of work to be done in all seasons.

57
Fig. 3.5: The seasonal diagram as told by the men in Malam. Fig. 3.5: The seasonal diagram as told by the men in Malam.
Fig. 3.6: The seasonal diagram as told by the women in Malam. Fig. 3.6: The seasonal diagram as told by the women in Malam.
57
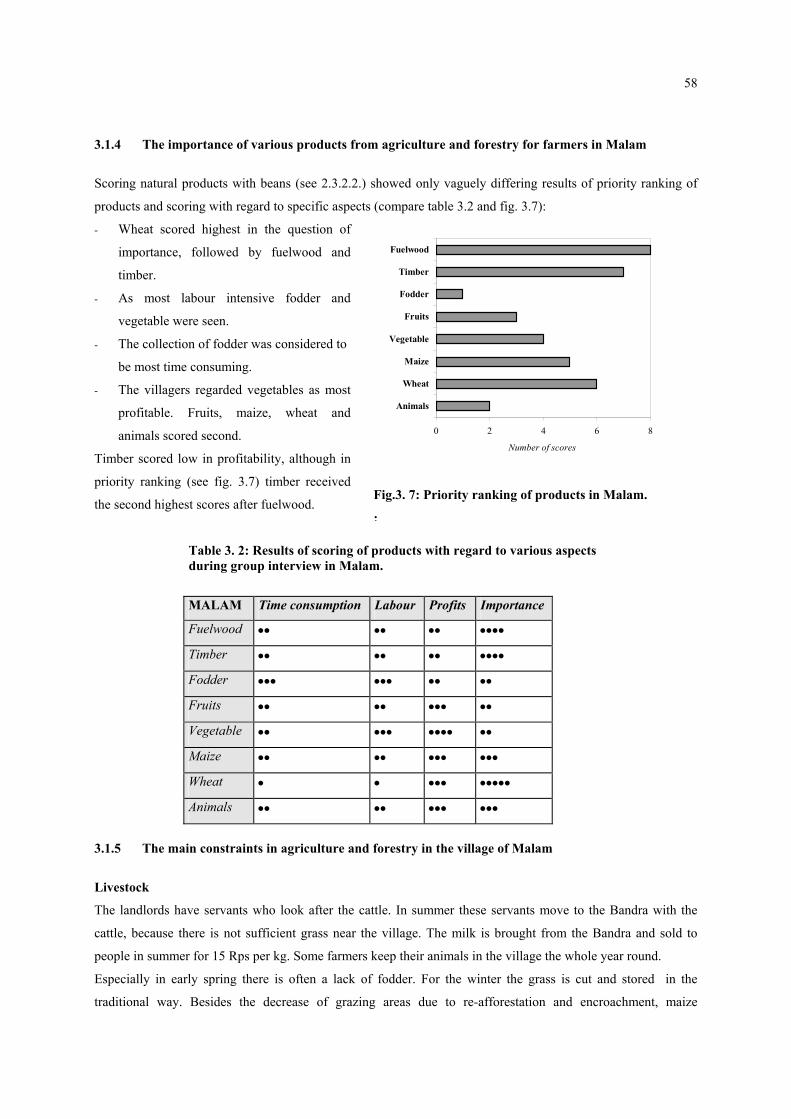
58
3.1.4 The importance of various products from agriculture and forestry for farmers in Malam
Scoring natural products with beans (see 2.3.2.2.) showed only vaguely differing results of priority ranking of
products and scoring with regard to specific aspects (compare table 3.2 and fig. 3.7):
- Wheat scored highest in the question of
importance, followed by fuelwood and
timber.
0 2 4 6
Animals
Wheat
Maize
Vegetable
Fruits
Fodder
Timber
Fuelwood
Number of scores
8
Fig.3. 7: Priority ranking of products in Malam.
:
- As most labour intensive fodder and
vegetable were seen.
- The collection of fodder was considered to
be most time consuming.
- The villagers regarded vegetables as most
profitable. Fruits, maize, wheat and
animals scored second.
Timber scored low in profitability, although in
priority ranking (see fig. 3.7) timber received
the second highest scores after fuelwood.
Table 3. 2: Results of scoring of products with regard to various aspects during group interview in Malam.
MALAM Time consumption Labour Profits Importance
Fuelwood •• •• •• ••••
Timber •• •• •• ••••
Fodder ••• ••• •• ••
Fruits •• •• ••• ••
Vegetable •• ••• •••• ••
Maize •• •• ••• •••
Wheat • • ••• •••••
Animals •• •• ••• •••
3.1.5 The main constraints in agriculture and forestry in the village of Malam
Livestock
The landlords have servants who look after the cattle. In summer these servants move to the Bandra with the
cattle, because there is not sufficient grass near the village. The milk is brought from the Bandra and sold to
people in summer for 15 Rps per kg. Some farmers keep their animals in the village the whole year round.
Especially in early spring there is often a lack of fodder. For the winter the grass is cut and stored in the
traditional way. Besides the decrease f grazing areas due to re-afforestation and encroachment, maize
o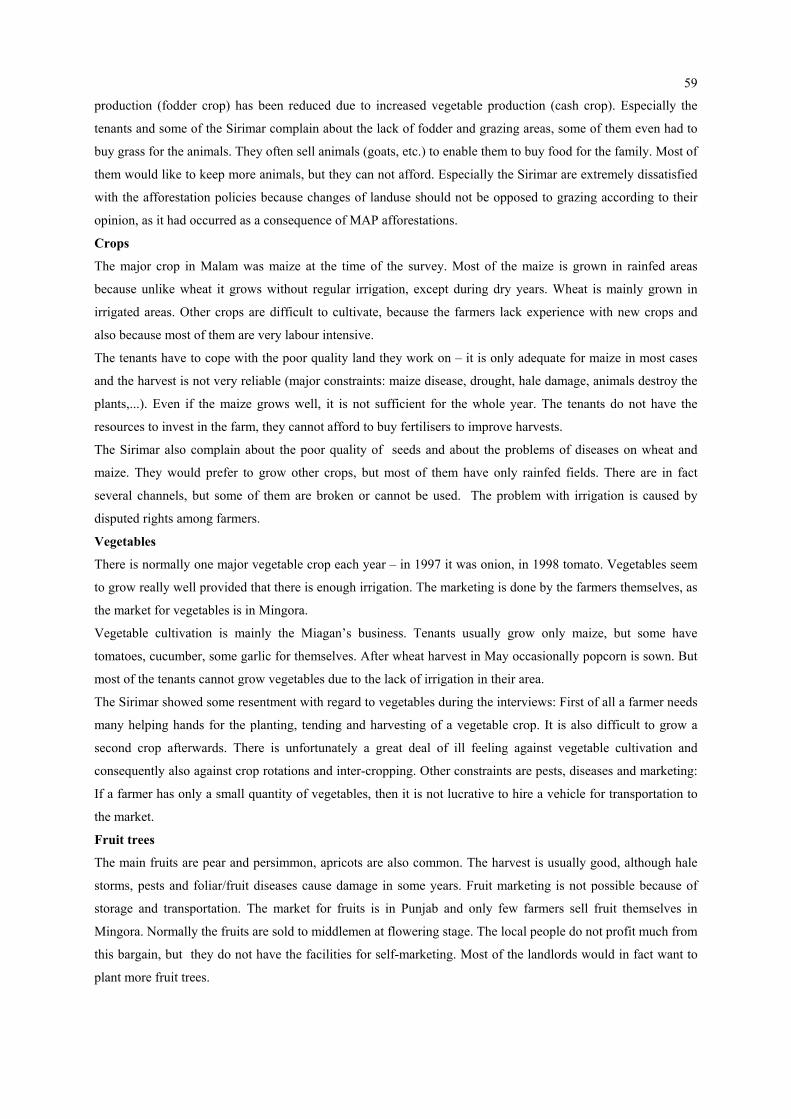
59
production (fodder crop) has been reduced due to increased vegetable production (cash crop). Especially the
tenants and some of the Sirimar complain about the lack of fodder and grazing areas, some of them even had to
buy grass for the animals. They often sell animals (goats, etc.) to enable them to buy food for the family. Most of
them would like to keep more animals, but they can not afford. Especially the Sirimar are extremely dissatisfied
with the afforestation policies because changes of landuse should not be opposed to grazing according to their
opinion, as it had occurred as a consequence of MAP afforestations.
Crops
The major crop in Malam was maize at the time of the survey. Most of the maize is grown in rainfed areas
because unlike wheat it grows without regular irrigation, except during dry years. Wheat is mainly grown in
irrigated areas. Other crops are difficult to cultivate, because the farmers lack experience with new crops and
also because most of them are very labour intensive.
The tenants have to cope with the poor quality land they work on – it is only adequate for maize in most cases
and the harvest is not very reliable (major constraints: maize disease, drought, hale damage, animals destroy the
plants,...). Even if the maize grows well, it is not sufficient for the whole year. The tenants do not have the
resources to invest in the farm, they cannot afford to buy fertilisers to improve harvests.
The Sirimar also complain about the poor quality of seeds and about the problems of diseases on wheat and
maize. They would prefer to grow other crops, but most of them have only rainfed fields. There are in fact
several channels, but some of them are broken or cannot be used. The problem with irrigation is caused by
disputed rights among farmers.
Vegetables
There is normally one major vegetable crop each year – in 1997 it was onion, in 1998 tomato. Vegetables seem
to grow really well provided that there is enough irrigation. The marketing is done by the farmers themselves, as
the market for vegetables is in Mingora.
Vegetable cultivation is mainly the Miagan’s business. Tenants usually grow only maize, but some have
tomatoes, cucumber, some garlic for themselves. After wheat harvest in May occasionally popcorn is sown. But
most of the tenants cannot grow vegetables due to the lack of irrigation in their area.
The Sirimar showed some resentment with regard to vegetables during the interviews: First of all a farmer needs
many helping hands for the planting, tending and harvesting of a vegetable crop. It is also difficult to grow a
second crop afterwards. There is unfortunately a great deal of ill feeling against vegetable cultivation and
consequently also against crop rotations and inter-cropping. Other constraints are pests, diseases and marketing:
If a farmer has only a small quantity of vegetables, then it is not lucrative to hire a vehicle for transportation to
the market.
Fruit trees
The main fruits are pear and persimmon, apricots are also common. The harvest is usually good, although hale
storms, pests and foliar/fruit diseases cause damage in some years. Fruit marketing is not possible because of
storage and transportation. The market for fruits is in Punjab and only few farmers sell fruit themselves in
Mingora. Normally the fruits are sold to middlemen at flowering stage. The local people do not profit much from
this bargain, but they do not have the facilities for self-marketing. Most of the landlords would in fact want to
plant more fruit trees.
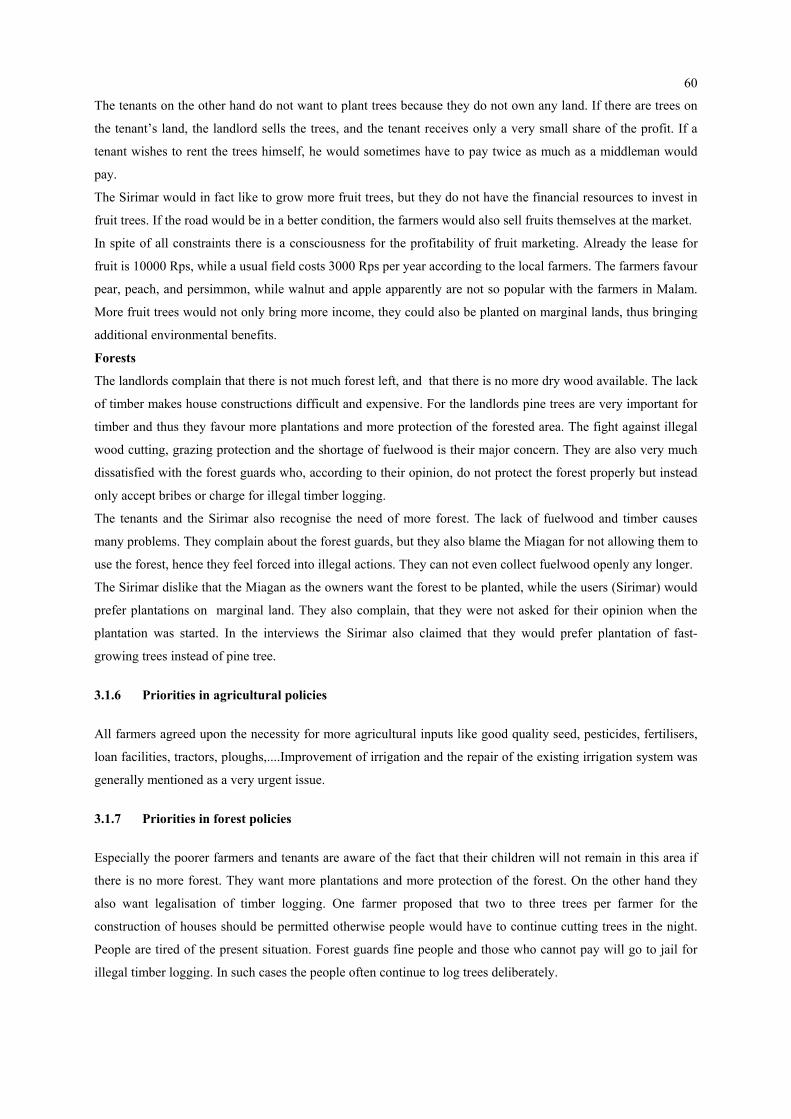
60
The tenants on the other hand do not want to plant trees because they do not own any land. If there are trees on
the tenant’s land, the landlord sells the trees, and the tenant receives only a very small share of the profit. If a
tenant wishes to rent the trees himself, he would sometimes have to pay twice as much as a middleman would
pay.
The Sirimar would in fact like to grow more fruit trees, but they do not have the financial resources to invest in
fruit trees. If the road would be in a better condition, the farmers would also sell fruits themselves at the market.
In spite of all constraints there is a consciousness for the profitability of fruit marketing. Already the lease for
fruit is 10000 Rps, while a usual field costs 3000 Rps per year according to the local farmers. The farmers favour
pear, peach, and persimmon, while walnut and apple apparently are not so popular with the farmers in Malam.
More fruit trees would not only bring more income, they could also be planted on marginal lands, thus bringing
additional environmental benefits.
Forests
The landlords complain that there is not much forest left, and that there is no more dry wood available. The lack
of timber makes house constructions difficult and expensive. For the landlords pine trees are very important for
timber and thus they favour more plantations and more protection of the forested area. The fight against illegal
wood cutting, grazing protection and the shortage of fuelwood is their major concern. They are also very much
dissatisfied with the forest guards who, according to their opinion, do not protect the forest properly but instead
only accept bribes or charge for illegal timber logging.
The tenants and the Sirimar also recognise the need of more forest. The lack of fuelwood and timber causes
many problems. They complain about the forest guards, but they also blame the Miagan for not allowing them to
use the forest, hence they feel forced into illegal actions. They can not even collect fuelwood openly any longer.
The Sirimar dislike that the Miagan as the owners want the forest to be planted, while the users (Sirimar) would
prefer plantations on marginal land. They also complain, that they were not asked for their opinion when the
plantation was started. In the interviews the Sirimar also claimed that they would prefer plantation of fast-
growing trees instead of pine tree.
3.1.6 Priorities in agricultural policies
All farmers agreed upon the necessity for more agricultural inputs like good quality seed, pesticides, fertilisers,
loan facilities, tractors, ploughs,....Improvement of irrigation and the repair of the existing irrigation system was
generally mentioned as a very urgent issue.
3.1.7 Priorities in forest policies
Especially the poorer farmers and tenants are aware of the fact that their children will not remain in this area if
there is no more forest. They want more plantations and more protection of the forest. On the other hand they
also want legalisation of timber logging. One farmer proposed that two to three trees per farmer for the
construction of houses should be permitted otherwise people would have to continue cutting trees in the night.
People are tired of the present situation. Forest guards fine people and those who cannot pay will go to jail for
illegal timber logging. In such cases the people often continue to log trees deliberately.
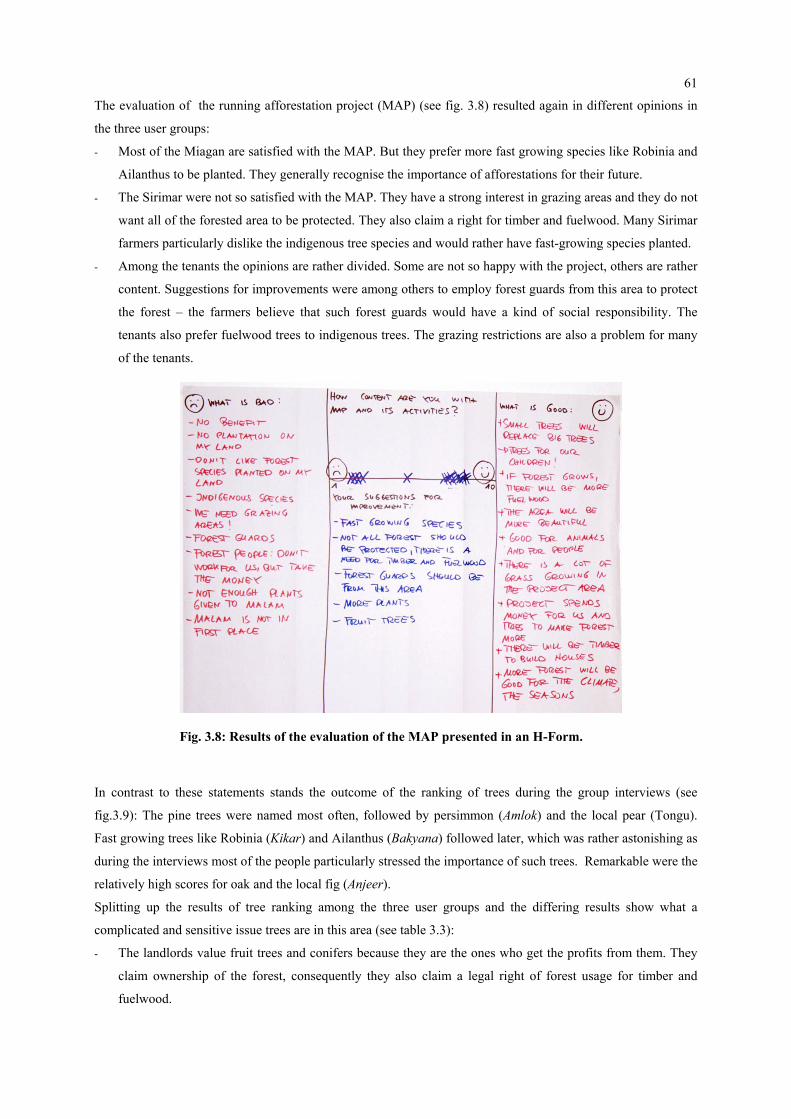
61
The evaluation of the running afforestation project (MAP) (see fig. 3.8) resulted again in different opinions in
the three user groups:
- Most of the Miagan are satisfied with the MAP. But they prefer more fast growing species like Robinia and
Ailanthus to be planted. They generally recognise the importance of afforestations for their future.
- The Sirimar were not so satisfied with the MAP. They have a strong interest in grazing areas and they do not
want all of the forested area to be protected. They also claim a right for timber and fuelwood. Many Sirimar
farmers particularly dislike the indigenous tree species and would rather have fast-growing species planted.
- Among the tenants the opinions are rather divided. Some are not so happy with the project, others are rather
content. Suggestions for improvements were among others to employ forest guards from this area to protect
the forest – the farmers believe that such forest guards would have a kind of social responsibility. The
tenants also prefer fuelwood trees to indigenous trees. The grazing restrictions are also a problem for many
of the tenants.
Fig. 3.8: Results of the evaluation of the MAP presented in an H-Form.
In contrast to these statements stands the outcome of the ranking of trees during the group interviews (see
fig.3.9): The pine trees were named most often, followed by persimmon (Amlok) and the local pear (Tongu).
Fast growing trees like Robinia (Kikar) and Ailanthus (Bakyana) followed later, which was rather astonishing as
during the interviews most of the people particularly stressed the importance of such trees. Remarkable were the
relatively high scores for oak and the local fig (Anjeer).
Splitting up the results of tree ranking among the three user groups and the differing results show what a
complicated and sensitive issue trees are in this area (see table 3.3):
- The landlords value fruit trees and conifers because they are the ones who get the profits from them. They
claim ownership of the forest, consequently they also claim a legal right of forest usage for timber and
fuelwood.
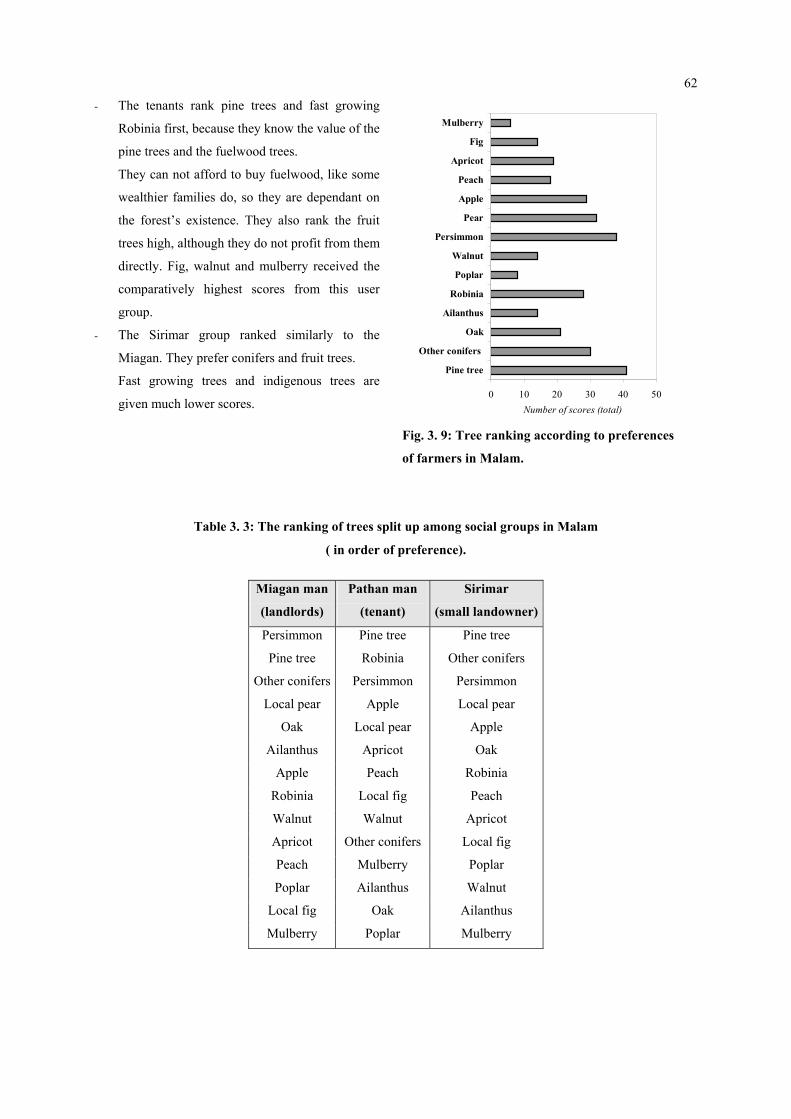
62
- The tenants rank pine trees and fast growing
Robinia first, because they know the value of the
pine trees and the fuelwood trees.
0 10 20 30 40 50
Pine tree
Other conifers
Oak
Ailanthus
Robinia
Poplar
Walnut
Persimmon
Pear
Apple
Peach
Apricot
Fig
Mulberry
Number of scores (total)
Fig. 3. 9: Tree ranking according to preferences
of farmers in Malam.
They can not afford to buy fuelwood, like some
wealthier families do, so they are dependant on
the forest’s existence. They also rank the fruit
trees high, although they do not profit from them
directly. Fig, walnut and mulberry received the
comparatively highest scores from this user
group.
- The Sirimar group ranked similarly to the
Miagan. They prefer conifers and fruit trees.
Fast growing trees and indigenous trees are
given much lower scores.
Table 3. 3: The ranking of trees split up among social groups in Malam
( in order of preference).
Miagan man
(landlords)
Pathan man
(tenant)
Sirimar
(small landowner)
Persimmon Pine tree Pine tree
Pine tree Robinia Other conifers
Other conifers Persimmon Persimmon
Local pear Apple Local pear
Oak Local pear Apple
Ailanthus Apricot Oak
Apple Peach Robinia
Robinia Local fig Peach
Walnut Walnut Apricot
Apricot Other conifers Local fig
Peach Mulberry Poplar
Poplar Ailanthus Walnut
Local fig Oak Ailanthus
Mulberry Poplar Mulberry

63
3.1.8 The main constraints in everyday life in the village of Malam
3.1.8.1 Interviews with farmers
Important problems for most people in Malam are drinking water supply and irrigation systems. A notable issue
is also the condition of the road. The hospital is also too far, there is only insufficient medical support.
The tenants mentioned the water supply, fuelwood, no job, road problem, no money for farming, the lack of
fertilisers, seeds, and fuelwood, and the bad condition of houses during the interviews. Most of them do not own
the house they live in, because they are too poor to build their own houses.
The Sirimar complained about water
supply, lack of fuelwood, electricity, the
bad condition of the road, poverty, lack of
dispensary, and the lack of functioning
irrigation facilities.
Fig. 3.10: Outcome of problem ranking with farmers in Malam during a group interview.
3.1.8.2 Group interviews
In the group discussion problems with
water supply were named first: In Malam
there are only part of the houses connected
to tap water and irrigation. Due to disputes
on the water issue, there is no further
development of irrigation systems and
water supply.
The bad condition of the very steep road
winding up to the village is another big
concern of the villagers – it is a hindering
factor in marketing and development.
Fuelwood, timber shortage and forest
rights are issues that farmers of all groups
considered to be important. Existential for
all farmers in Malam are also the following
topics: Seed quality, diseases on crops,
vegetable marketing and a lack of trees for
plantations. (see fig. 3.10)

64
3.1.9 Situation of women in Malam
3.1.9.1 Social life
In Malam the situation of women depends on the social group they belong to (see 3.1.1): The women of the
Miagan family are not allowed to work outside the house - they are not allowed to move out of the house either,
unless they have the permission of the male head of the family. They are only allowed to visit their relatives. If
they do leave the house, they must observe strict Purdah. Miagan women do housework like cooking, cleaning
the floor and they help with the cleaning of corn after harvest. The women from the tenants’ usually help with all
the housework, belonging to a lower cast, they are allowed to enter the landlords’ houses.
The Miagan women get married rather early, often at the age of eleven. Many girls are not even allowed to learn
to read and write. Consequently most women know little about their rights, for example about remarriage after
becoming a widow. Many of them are denied their right to remarry. A woman is also denied the right of chose
her husband, which means even if she would say no to a proposal made by her parents, it would remain without
consequence. Another consequence of the confinement of the women’s life to the house and family is the high
birth rate.
Despite of their isolated life the women are aware of environmental problems threatening their existence. Asked
about tree ranking they said they preferred fruit trees and fuelwood trees. In contrast to men the timber issue is
not so important to them2. They are also very interested in learning about food processing and storage.
The Gujar women are very hard working , they work as much as their men. For the gathering of fuelwood they
require three hours a day, although collecting fodder for animals is the major part of their daily work. In addition
to their own house and field work they also work for the Miagan: They take care of their cattle, they bring
fuelwood, bake bread, help with harvest work, etc. For taking care of the cattle they occasionally receive milk
and about 6000 Rps a year. In presence of the Miagan women the Gujars felt intimidated and did not speak
freely.
3.1.9.2 Agricultural issues
Maize and wheat are usually cleaned, dried and then stored in big wooden boxes. Important are also beans: The
women in Malam named red, black and white beans plus wild soy beans. All of them are dried and stored and
used for cooking; only the wild soy beans are used as additional fodder in winter. Tomatoes and onions are also
dried for conservation. The leafy vegetables that the Gujars collect are Shaftal and all kinds of digestible green
plants growing in the area. They are also dried and used for cooking either fresh or dried. Some Gujars also
collect mushrooms in the forests, but they have become very rare.
Gujar women named as their major constraints the fodder shortage in winter, fuelwood collection and cutting
grass for fodder, health, the hard work in the fields and with the cattle. It is also recognised that the diminution of
the forested area is a big problem. Like some of the men, the Gujar women blame the Miagan for this, because
they have sold many trees as timber for furniture themselves. Therefore they are not credible as forest protectors
in their eyes.
2 Compare also JOKY, F. AND HERING, H., 1996.
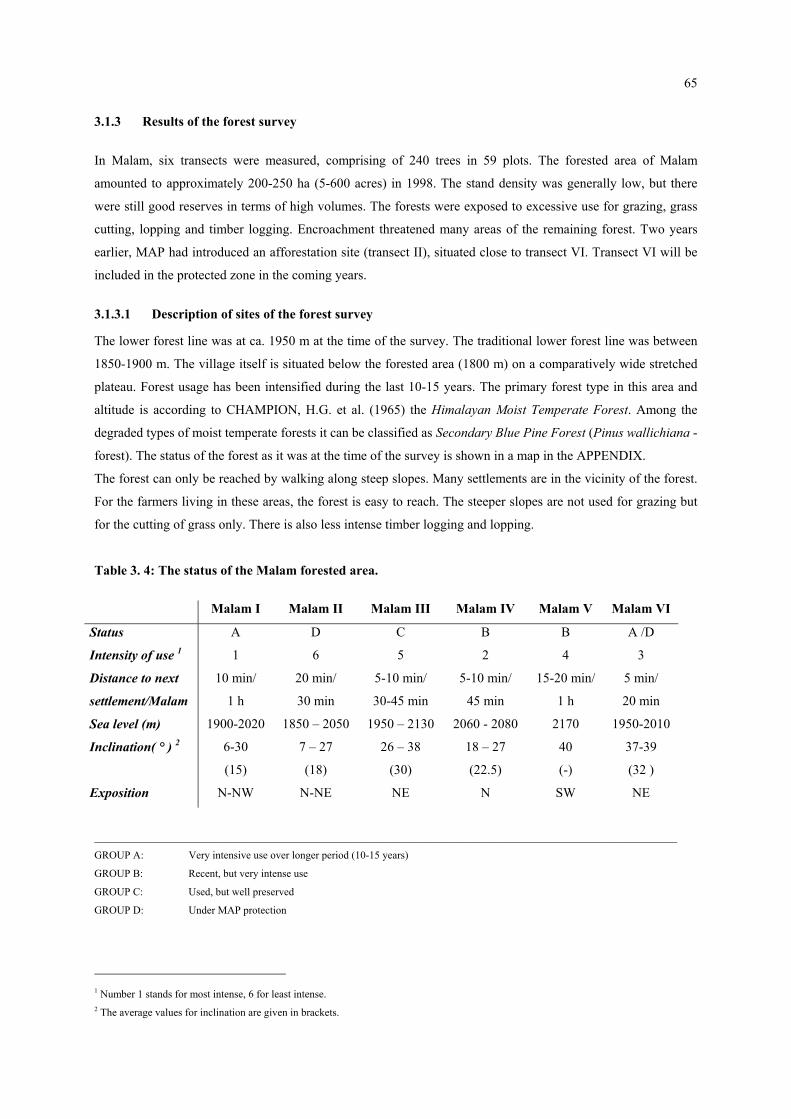
65
3.1.3 Results of the forest survey
In Malam, six transects were measured, comprising of 240 trees in 59 plots. The forested area of Malam
amounted to approximately 200-250 ha (5-600 acres) in 1998. The stand density was generally low, but there
were still good reserves in terms of high volumes. The forests were exposed to excessive use for grazing, grass
cutting, lopping and timber logging. Encroachment threatened many areas of the remaining forest. Two years
earlier, MAP had introduced an afforestation site (transect II), situated close to transect VI. Transect VI will be
included in the protected zone in the coming years.
3.1.3.1 Description of sites of the forest survey
The lower forest line was at ca. 1950 m at the time of the survey. The traditional lower forest line was between
1850-1900 m. The village itself is situated below the forested area (1800 m) on a comparatively wide stretched
plateau. Forest usage has been intensified during the last 10-15 years. The primary forest type in this area and
altitude is according to CHAMPION, H.G. et al. (1965) the Himalayan Moist Temperate Forest. Among the
degraded types of moist temperate forests it can be classified as Secondary Blue Pine Forest (Pinus wallichiana -
forest). The status of the forest as it was at the time of the survey is shown in a map in the APPENDIX.
The forest can only be reached by walking along steep slopes. Many settlements are in the vicinity of the forest.
For the farmers living in these areas, the forest is easy to reach. The steeper slopes are not used for grazing but
for the cutting of grass only. There is also less intense timber logging and lopping.
Table 3. 4: The status of the Malam forested area.
Malam I Malam II Malam III Malam IV Malam V Malam VI
Status A D C B B A /D
Intensity of use 1 1 6 5 2 4 3
Distance to next
settlement/Malam
10 min/
1 h
20 min/
30 min
5-10 min/
30-45 min
5-10 min/
45 min
15-20 min/
1 h
5 min/
20 min
Sea level (m) 1900-2020 1850 – 2050 1950 – 2130 2060 - 2080 2170 1950-2010
Inclination( ° ) 2 6-30
(15)
7 – 27
(18)
26 – 38
(30)
18 – 27
(22.5)
40
(-)
37-39
(32 )
Exposition N-NW N-NE NE N SW NE
_____________________________________________________________________________________________________________
GROUP A: Very intensive use over longer period (10-15 years)
GROUP B: Recent, but very intense use
GROUP C: Used, but well preserved
GROUP D: Under MAP protection
1 Number 1 stands for most intense, 6 for least intense. 2 The average values for inclination are given in brackets.

66
In table 3.4 all site-related and topographical parameters are listed. All transects except for Malam V are exposed
to the N. The hills surrounding the plateau of Malam are exposed to the N, NW or NE. The frequent monsoon
and early spring rains lead to a rather moist climate in the forest and as long as there is sufficient crown
coverage, it keeps the forest ground protected from strong radiation and high temperatures. Depending on these
conditions there is often a remarkable difference in vegetation within the forest (see 3.1.3.3).
3.1.3.2 Soil and erosion
Silty clay loam and moderately deep silt loam are the main soil materials in Malam Jabba Valley. (FMC
PLANNING REPORT, 1998). In the forested area soil coverage ranges from 30 – 95 % (see table 3.5). The least
soil coverage appears in areas of intense use, e.g. if there is a path leading through the forest or if canopy density
is low, with no more rich undergrowth existing. The soil is naturally rather shallow and often parent rock is
protruding. Intense forest usage enhances soil erosion additionally.
Table 3. 5: Comparison of soil coverage and soil erosion in all transects of Malam.
Malam I Malam II Malam III Malam IV Malam V Malam VI
Soil coverage 3
(%)
30 – 95
(65)
70 – 95
(86)
70 – 95
(82)
80 – 90
(85)
95
-
90 – 95
(94)
Soil erosion (5) (2) (3) (1) (2) (3)
Soil layer (B) (C) (A) (D) (B) (C)
_____________________________________________________________________________ (1) No visible soil erosion (A) Very shallow soil
(2) Not much visible soil erosion (B) Rather shallow soil
(3) Visible soil erosion at a moderate extent (C) Soil is only sometimes shallow
(4) Visible soil erosion at a remarkable extent (D) Soil is rather deep
(5) Visible soil erosion at a very high extent (E) Very deep soil
3.1.3.3 Vegetation
The percentages of coverage abundance range from 3 - 26 % per plant group in all transects (see fig 3.11). This
expresses how abundant the plant groups are represented on average in the whole surveyed forested area of
Malam. Fig. 3.12 shows how differing the six transects are with regard to dominance and abundance of various
plant groups.
TREE LAYER
The dominant tree in the Malam forests is Pinus wallichiana. Most of the trees are affected by intense usage
through lopping. Due to grazing and grass cutting, natural regeneration is low (see 3.1.3.5).
3 The average values for soil coverage are given in brackets.
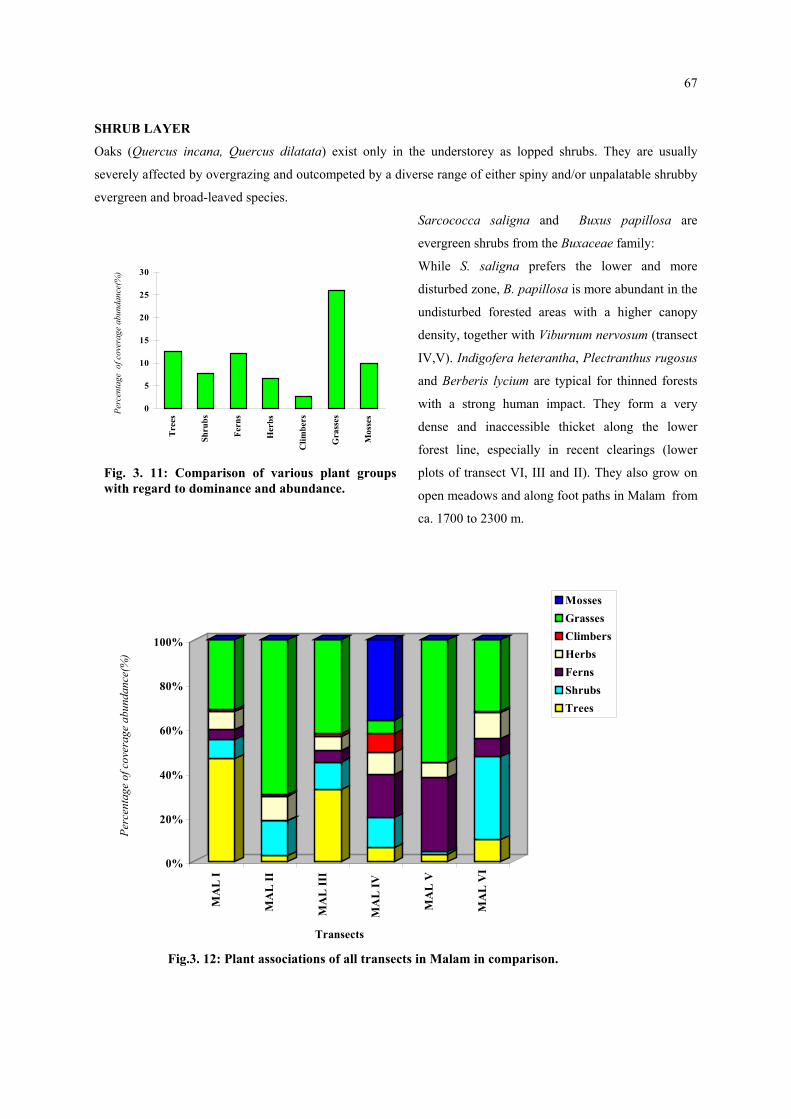
67
SHRUB LAYER
Oaks (Quercus incana, Quercus dilatata) exist only in the understorey as lopped shrubs. They are usually
severely affected by overgrazing and outcompeted by a diverse range of either spiny and/or unpalatable shrubby
evergreen and broad-leaved species.
Sarcococca saligna and Buxus papillosa are
evergreen shrubs from the Buxaceae family:
0
5
10
15
20
25
30
Tre
es
Shru
bs
Fern
s
Her
bs
Clim
bers
Gra
sses
Mos
sesPe
rcen
tage
of c
over
age
abun
danc
e(%
)
Fig. 3. 11: Comparison of various plant groupswith regard to dominance and abundance.
While S. saligna prefers the lower and more
disturbed zone, B. papillosa is more abundant in the
undisturbed forested areas with a higher canopy
density, together with Viburnum nervosum (transect
IV,V). Indigofera heterantha, Plectranthus rugosus
and Berberis lycium are typical for thinned forests
with a strong human impact. They form a very
dense and inaccessible thicket along the lower
forest line, especially in recent clearings (lower
plots of transect VI, III and II). They also grow on
open meadows and along foot paths in Malam from
ca. 1700 to 2300 m.
0%
20%
40%
60%
80%
100%
Perc
enta
ge o
f cov
erag
e ab
unda
nce(
%)
MA
L I
MA
L II
MA
L II
I
MA
L IV
MA
L V
MA
L V
I
Transects
MossesGrassesClimbersHerbsFernsShrubsTrees
Fig.3. 12: Plant associations of all transects in Malam in comparison.
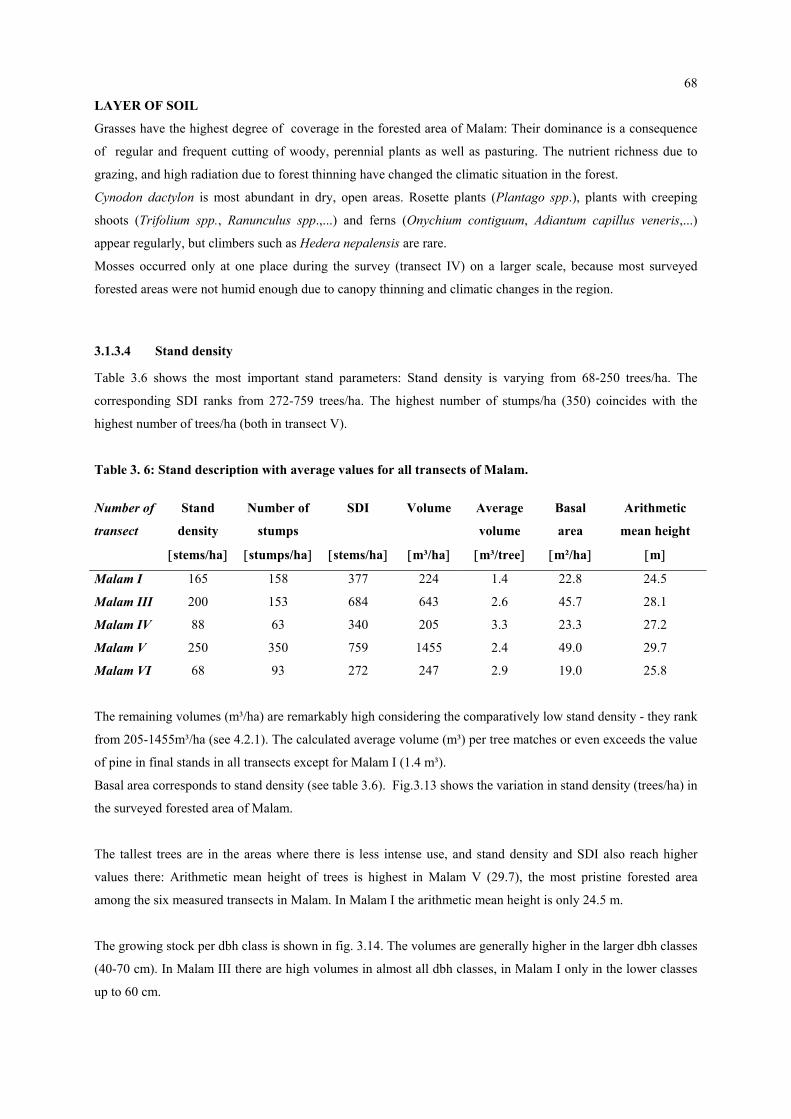
68
LAYER OF SOIL
Grasses have the highest degree of coverage in the forested area of Malam: Their dominance is a consequence
of regular and frequent cutting of woody, perennial plants as well as pasturing. The nutrient richness due to
grazing, and high radiation due to forest thinning have changed the climatic situation in the forest.
Cynodon dactylon is most abundant in dry, open areas. Rosette plants (Plantago spp.), plants with creeping
shoots (Trifolium spp., Ranunculus spp.,...) and ferns (Onychium contiguum, Adiantum capillus veneris,...)
appear regularly, but climbers such as Hedera nepalensis are rare.
Mosses occurred only at one place during the survey (transect IV) on a larger scale, because most surveyed
forested areas were not humid enough due to canopy thinning and climatic changes in the region.
3.1.3.4 Stand density
Table 3.6 shows the most important stand parameters: Stand density is varying from 68-250 trees/ha. The
corresponding SDI ranks from 272-759 trees/ha. The highest number of stumps/ha (350) coincides with the
highest number of trees/ha (both in transect V).
Table 3. 6: Stand description with average values for all transects of Malam.
Number of
transect
Stand
density
Number of
stumps
SDI Volume Average
volume
Basal
area
Arithmetic
mean height
[stems/ha] [stumps/ha] [stems/ha] [m³/ha] [m³/tree] [m²/ha] [m]
Malam I 165 158 377 224 1.4 22.8 24.5
Malam III 200 153 684 643 2.6 45.7 28.1
Malam IV 88 63 340 205 3.3 23.3 27.2
Malam V 250 350 759 1455 2.4 49.0 29.7
Malam VI 68 93 272 247 2.9 19.0 25.8
The remaining volumes (m³/ha) are remarkably high considering the comparatively low stand density - they rank
from 205-1455m³/ha (see 4.2.1). The calculated average volume (m³) per tree matches or even exceeds the value
of pine in final stands in all transects except for Malam I (1.4 m³).
Basal area corresponds to stand density (see table 3.6). Fig.3.13 shows the variation in stand density (trees/ha) in
the surveyed forested area of Malam.
The tallest trees are in the areas where there is less intense use, and stand density and SDI also reach higher
values there: Arithmetic mean height of trees is highest in Malam V (29.7), the most pristine forested area
among the six measured transects in Malam. In Malam I the arithmetic mean height is only 24.5 m.
The growing stock per dbh class is shown in fig. 3.14. The volumes are generally higher in the larger dbh classes
(40-70 cm). In Malam III there are high volumes in almost all dbh classes, in Malam I only in the lower classes
up to 60 cm.

69
0
40
80
120
160
200
Volu
me
(m³/h
a)
Fig. 3.1The claand >7
Fig. 3.1The claand >7
69
0
40
80
120
160
200
Volu
me
(m³/h
a)
0
40
80
120
160
<20 30 40 50 60 70 >70
dbh (cm)
N (n
umbe
r of t
rees
/ha)
MAL IMAL IIIMAL IVMAL VMAL VI
Fig. 3. 13: Comparison of stand structures with regard tostand density (trees/ha) and dbh (cm). The classes aresubdivided in groups from <20, 20-30, 30-40,....to 60-70and >70 cm.
0
40
80
120
160
<20 30 40 50 60 70 >70
dbh (cm)
N (n
umbe
r of t
rees
/ha)
MAL IMAL IIIMAL IVMAL VMAL VI
Fig. 3. 13: Comparison of stand structures with regard tostand density (trees/ha) and dbh (cm). The classes aresubdivided in groups from <20, 20-30, 30-40,....to 60-70and >70 cm.
<20 30 40 50 60 70 >70
dbh (cm)
MAL IMAL IIIMAL IVMAL VMAL VI
4: Growing stock in terms of volumes (m³/ha) per dbh class (cm) : sses are subdivided in groups from <20, 20-30, 30-40,.... to 60-70
0 cm.
4: Growing stock in terms of volumes (m³/ha) per dbh class (cm) : sses are subdivided in groups from <20, 20-30, 30-40,.... to 60-70
0 cm.
<20 30 40 50 60 70 >70
dbh (cm)
MAL IMAL IIIMAL IVMAL VMAL VI

70
3.1.3.5 Regeneration
All seedlings found were of Pinus wallichiana. The amount of natural regeneration was generally low in the
surveyed forested areas of Malam, with the exception of transect VI (see fig. 3.15). This was due to grazing
restrictions (transect VI is meant to be part of the MAP protection zone).
.
In transect V there was no
natural regeneration visible.
Here it was very difficult to
detect seedlings due to the
steepness of the slope. There
was also grazing to some
extent (mainly sheep and
goats). In all other transects
there was only little natural
regeneration, but it would
certainly increase rapidly if
grazing pressure would
3
S
e
f
F
b
t
t
p
o
M
4
t
l
A
a
a
T
e
s
0
50
100
150
200
250
300
MAL I MALIII
MALIV
MAL V MALVI
Transects
Num
ber o
f see
dlin
gs p
er h
a
<20 cm20 -80 cm80-150 cm>150 cm
Fig. 3.15: Natural regeneration compared in all transects of Malam
decrease (compare 3.1.3.11)..1.3.6 Stems and stumps
tumps from recent clearings are
asy to find, but if older than about
ive years, they are hardly visible.
ig. 3.16 shows the distribution
etween the number of stumps and
he number of living trees in the
ransects of Malam forest. In some
arts of the forest the stumps almost
utnumber the living trees. In
alam I there are more stumps in
0 % of the measured plots. Often
he numbers are equal between the
iving trees and the stumps.
0
20
40
60
80
100
Perc
enta
ges (
%)
MAL I MAL III MAL IV MAL V MAL VI
Transects
equal numbersmore stumpsmore stems
Fig. 3. 16: Comparison of the number of stems and stumps. dding the numbers of stumps to
ctual stand density, this would result in an average of 600 trees/ha in the S-exposed forested area and
pproximately 350 trees/ha on the N-exposed slopes.
he calculated SDI is 759 trees/ha for transect V (S-exposed) and 684 trees/ha for transect III (most intact N-
xposed transect). In many areas forest clearing had taken place to a higher extent at least five years before the
urvey was done and stumps or missing trees are no longer visible.
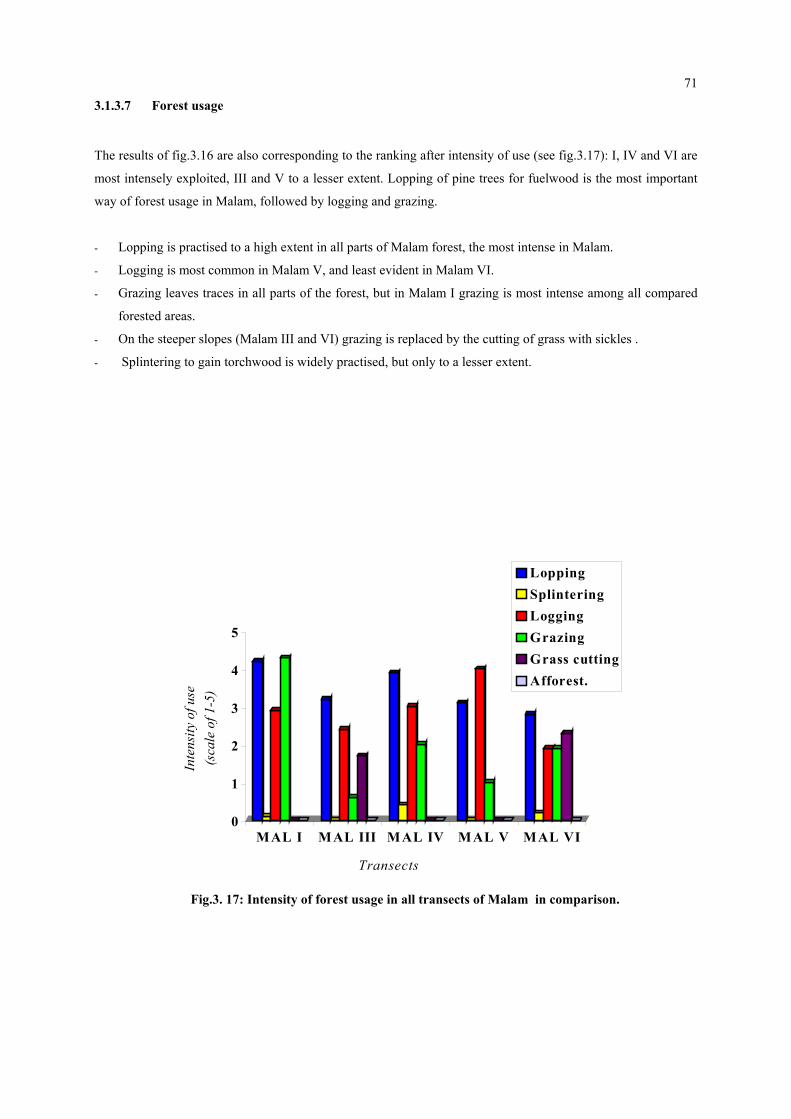
71
3.1.3.7 Forest usage
The results of fig.3.16 are also corresponding to the ranking after intensity of use (see fig.3.17): I, IV and VI are
most intensely exploited, III and V to a lesser extent. Lopping of pine trees for fuelwood is the most important
way of forest usage in Malam, followed by logging and grazing.
- Lopping is practised to a high extent in all parts of Malam forest, the most intense in Malam.
- Logging is most common in Malam V, and least evident in Malam VI.
- Grazing leaves traces in all parts of the forest, but in Malam I grazing is most intense among all compared
forested areas.
- On the steeper slopes (Malam III and VI) grazing is replaced by the cutting of grass with sickles .
- Splintering to gain torchwood is widely practised, but only to a lesser extent.
0
1
2
3
4
5
Inte
nsity
of u
se
(sca
le o
f 1-5
)
MAL I MAL III MAL IV MAL V MAL VI
Transects
LoppingSplinteringLoggingGrazingGrass cuttingAfforest.
Fig.3. 17: Intensity of forest usage in all transects of Malam in comparison.
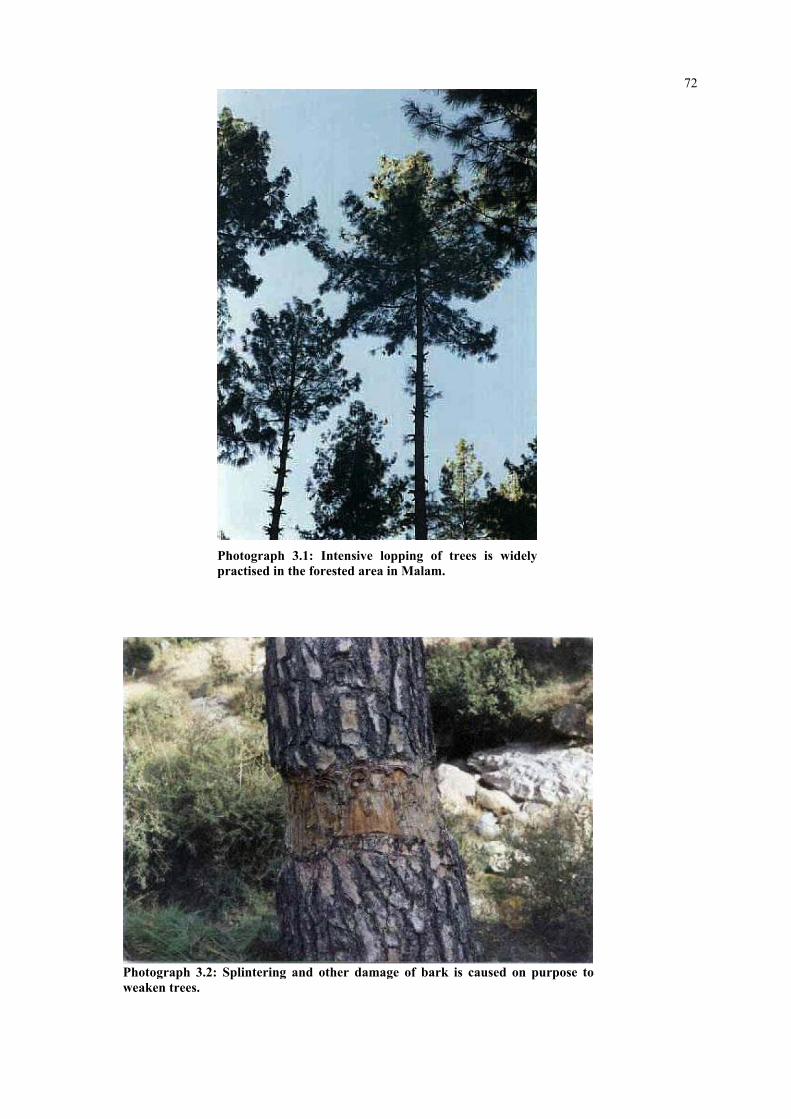
72
Photograph 3.2weaken trees.
Photograph 3.1: Intensive lopping of trees is widelypractised in the forested area in Malam.
: Splintering and other damage of bark is caused on purpose to

73
Photograph 3.3: After logging the stumps are burned down and used to gain torchwood until there is nothing left.
Photograph 3.4: Timber and fuelwood stored near a farmhouse in Malam.
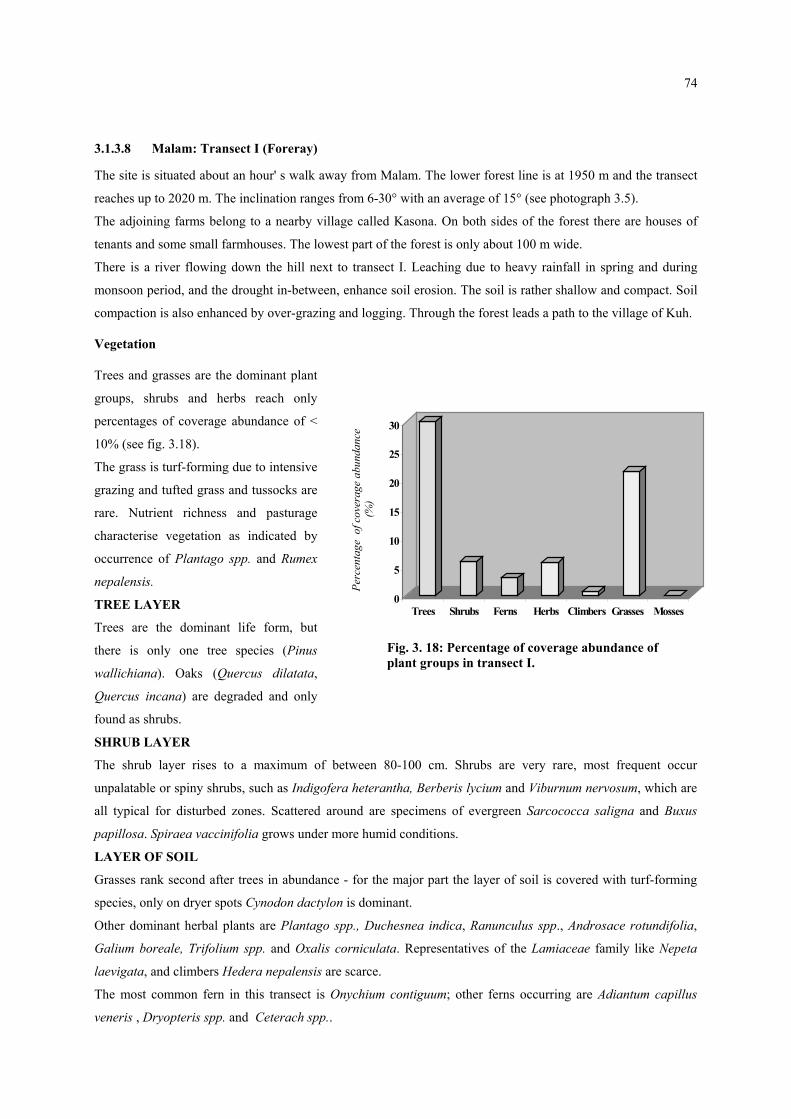
74
3.1.3.8 Malam: Transect I (Foreray)
The site is situated about an hour' s walk away from Malam. The lower forest line is at 1950 m and the transect
reaches up to 2020 m. The inclination ranges from 6-30° with an average of 15° (see photograph 3.5).
The adjoining farms belong to a nearby village called Kasona. On both sides of the forest there are houses of
tenants and some small farmhouses. The lowest part of the forest is only about 100 m wide.
There is a river flowing down the hill next to transect I. Leaching due to heavy rainfall in spring and during
monsoon period, and the drought in-between, enhance soil erosion. The soil is rather shallow and compact. Soil
compaction is also enhanced by over-grazing and logging. Through the forest leads a path to the village of Kuh.
Vegetation
0
5
10
15
20
25
30
Perc
enta
ge o
f cov
erag
e ab
unda
nce
(%)
Trees Shrubs Ferns Herbs Climbers Grasses Mosses
Fig. 3. 18: Percentage of coverage abundance of plant groups in transect I.
Trees and grasses are the dominant plant
groups, shrubs and herbs reach only
percentages of coverage abundance of <
10% (see fig. 3.18).
The grass is turf-forming due to intensive
grazing and tufted grass and tussocks are
rare. Nutrient richness and pasturage
characterise vegetation as indicated by
occurrence of Plantago spp. and Rumex
nepalensis.
TREE LAYER
Trees are the dominant life form, but
there is only one tree species (Pinus
wallichiana). Oaks (Quercus dilatata,
Quercus incana) are degraded and only
found as shrubs.
SHRUB LAYER
The shrub layer rises to a maximum of between 80-100 cm. Shrubs are very rare, most frequent occur
unpalatable or spiny shrubs, such as Indigofera heterantha, Berberis lycium and Viburnum nervosum, which are
all typical for disturbed zones. Scattered around are specimens of evergreen Sarcococca saligna and Buxus
papillosa. Spiraea vaccinifolia grows under more humid conditions.
LAYER OF SOIL
Grasses rank second after trees in abundance - for the major part the layer of soil is covered with turf-forming
species, only on dryer spots Cynodon dactylon is dominant.
Other dominant herbal plants are Plantago spp., Duchesnea indica, Ranunculus spp., Androsace rotundifolia,
Galium boreale, Trifolium spp. and Oxalis corniculata. Representatives of the Lamiaceae family like Nepeta
laevigata, and climbers Hedera nepalensis are scarce.
The most common fern in this transect is Onychium contiguum; other ferns occurring are Adiantum capillus
veneris , Dryopteris spp. and Ceterach spp..

75
Stand table
020406080
100
<20 30 40 50 60 70 >70
Dbh classes in cm
Num
ber o
f tre
es/h
a
Fig. 3. 19: Stand table in terms of dbh classes
in transect I.
Most of the trees are between 30-40 cm and 40-50 cm.
There are few small trees and few older trees. As the stand
table (see fig.3.19) shows, mainly the older and dominant
trees were removed. The stand is almost even-aged,
possibly due to a regeneration after fire.
There is some natural regeneration, but to a minor extent
(45 seedlings/ha), because grazing is too intensive in this
area and small seedlings hardly survive for more than a
year.
The trees reach an average height of 24.5 m and volume
per tree amounts to 1.4 m³/tree. The remaining trees are
intensely used for lopping and most of them have thinned
crowns.
Forest usage
Stand density amounts to 165
trees/ha (SDI 377 trees/ha) and 158
stumps/ha. In this transect 40% of
the plots have more stumps than
stems. The stand was used for
timber logging to a high extent (see
fig. 3.20). Many stumps are hardly
visible any longer. In some areas of
the forest the forest ground is very
rough and uneven – piles have
remained there as soil accumulation
of old root systems.
0
1
2
3
4
5
Intensity of use (1-5)
MAL I 4,2 0,1 2,9 4,3 0 0
Lop Spli Log Graz Grc Aff
Fig.3. 20: Intensity of different ways of forest usage intransect I.
The stumps of the logged trees are
hidden through covering with mud, and because of rinsing (water erosion) and soil compaction (grazing) they
emerge as piles from the forest ground.
For logging no saws are used in this area, only axes. 72% of all stumps show also signs of fire. People living
close to the forest gather fuelwood for their daily needs from the forest. They very often cut green branches from
the pine trees (lopping system). Splintering for torchwood is practised to a lower extent.
All the trees undergo lopping to a very high degree, crown length is usually no more than 3 - 4 m. Some of the
trees have only recently been taken for lopping, these trees still had a crown length up to 10 - 15 m at the time of
the survey.
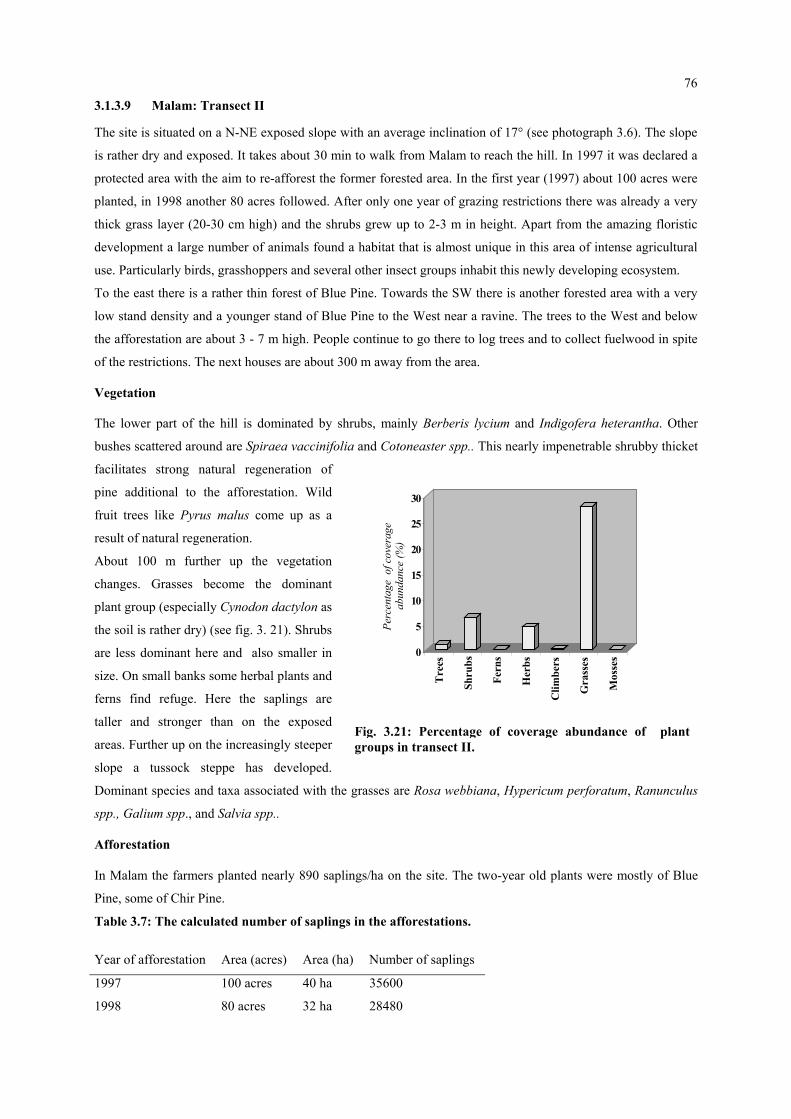
76
3.1.3.9 Malam: Transect II
The site is situated on a N-NE exposed slope with an average inclination of 17° (see photograph 3.6). The slope
is rather dry and exposed. It takes about 30 min to walk from Malam to reach the hill. In 1997 it was declared a
protected area with the aim to re-afforest the former forested area. In the first year (1997) about 100 acres were
planted, in 1998 another 80 acres followed. After only one year of grazing restrictions there was already a very
thick grass layer (20-30 cm high) and the shrubs grew up to 2-3 m in height. Apart from the amazing floristic
development a large number of animals found a habitat that is almost unique in this area of intense agricultural
use. Particularly birds, grasshoppers and several other insect groups inhabit this newly developing ecosystem.
To the east there is a rather thin forest of Blue Pine. Towards the SW there is another forested area with a very
low stand density and a younger stand of Blue Pine to the West near a ravine. The trees to the West and below
the afforestation are about 3 - 7 m high. People continue to go there to log trees and to collect fuelwood in spite
of the restrictions. The next houses are about 300 m away from the area.
Vegetation
0
5
10
15
20
25
30
Perc
enta
ge o
f cov
erag
e ab
unda
nce
(%)
Tre
es
Shru
bs
Fern
s
Her
bs
Clim
bers
Gra
sses
Mos
ses
Fig. 3.21: Percentage of coverage abundance of plantgroups in transect II.
The lower part of the hill is dominated by shrubs, mainly Berberis lycium and Indigofera heterantha. Other
bushes scattered around are Spiraea vaccinifolia and Cotoneaster spp.. This nearly impenetrable shrubby thicket
facilitates strong natural regeneration of
pine additional to the afforestation. Wild
fruit trees like Pyrus malus come up as a
result of natural regeneration.
About 100 m further up the vegetation
changes. Grasses become the dominant
plant group (especially Cynodon dactylon as
the soil is rather dry) (see fig. 3. 21). Shrubs
are less dominant here and also smaller in
size. On small banks some herbal plants and
ferns find refuge. Here the saplings are
taller and stronger than on the exposed
areas. Further up on the increasingly steeper
slope a tussock steppe has developed.
Dominant species and taxa associated with the grasses are Rosa webbiana, Hypericum perforatum, Ranunculus
spp., Galium spp., and Salvia spp..
Afforestation
In Malam the farmers planted nearly 890 saplings/ha on the site. The two-year old plants were mostly of Blue
Pine, some of Chir Pine.
Table 3.7: The calculated number of saplings in the afforestations.
Year of afforestation Area (acres) Area (ha) Number of saplings
1997 100 acres 40 ha 35600
1998 80 acres 32 ha 28480

77
The average height of a sapling was 29 cm. The tallest pine trees in the afforestation had reached 360 cm height.
There was also an amount of natural regeneration observed in the survey.
Intensity of use
At the time of the survey around 8 % of the
pits no longer contained any living saplings.
From the damaged plants 28 % were affected
from drought, around 4 % from pasturing (see
table 3. 8). On the whole there were hardly
any growing saplings to be found. It must be
taken into account that of the 890 saplings,
that were planted per ha, only around 20 %
will remain in the end.
0
1
2
3
4
Intensity of use (1-5)
MAL II 0,0 0,0 0,1 0,7 0,4 4,0
Lop Spli Log Graz Grc Aff
Fig. 3. 22: Intensity of different ways of land/forest usage intransect II.
As fig. 3. 22 shows, the protection of the area
seems to be widely accepted. There is hardly
any grazing and almost no grass cutting.
Table 3. 8: Degree of damage through drought and grazing in transect II, expressed in percentages of affected saplings.
Degree of damage4 Grazing Drought
No damage 95.9 % 71.9 %
(1) 1.5 % 9.4 %
(2) 2.1 % 11.1 %
(3) 0.4 % 4.2 %
(4) 0.1 % 1.7 %
(5) 0 % 1.7 %
Damage 4.1 % 28.1 %
Of the stems in this transect, 55% show signs of fire. For logging only axes are used. The number of stems
increases the further up to the ridge one goes: In the lower part of the transect a dense thicket of thorny bushes
makes it difficult to find stems, but normally trees are logged starting from the lower forest line. This explains
the lower number of stems there, while near the ridge the number of stems amounts to 11-18 per plot (350-450
stems/ha).
3.1.3.10 Malam: Transect III (Barida)
The site is situated on a very steep slope, inclination ranges from 26-30° (average 30°) (see photograph 3.7). The
transect reaches from 1950-2130 m. It is situated about 30 to 45 min way from Malam, but several farmhouses
were built next to the forest ending. Due to its steep slopes and difficult access it is still well preserved. There is
4 Categories according to 2.3.1.4.

78
only one major path leading through the lower part of the transect. Soil coverage averages to 82%, which is a
comparatively high value. Rocks are often protruding in the upper parts, which can be explained in the
geological history of the valley (see 1.2.1.2).
All the slopes surrounding the forest were cleared during the last 10-15 years to gain more land. On all sides of
the forest there are also recently cleared, already shrubby zones.
Vegetation
Most plant groups occur in low abundance. There are hardly any visible indicators of drought, although the site
is dry, but it is better shaded and not as exposed to radiation and heat. The major effect on ground vegetation
from a human side is grass cutting and cutting of woody perennials. The main components are therefore grasses,
followed by trees, less frequent appear shrubs, herbs and ferns (see fig.3.23).
Dominant in the shrubby zones surrounding the lower forest ending are Plectranthus rugosus and Berberis
lycium as the typical indicators of lower elevation, dryness and recent clearing. Scattered around are large trees
(Pinus wallichiana), that are mostly topped and severely lopped.
TREE LAYER
There is only one tree species (Pinus wallichiana), but it reaches high levels of abundance. Oaks (Qu. incana,
Qu. dilatata) are part of the shrub layer, they do not reach more than 100 cm height in this forested area.
SHRUB LAYER
In the part of the forest where only few pine trees are left, the shrub layer is extremely dense, forming a
transition zone to the clearings surrounding the forest. All dominant species are indicators for disturbed zones
and resistant to grazing pressure: Plectranthus rugosus, Berberis lycium and Indigofera heterantha. The shrubby
zone extends up to 1.5 - 2 m. Towards the ridge these species disappear totally in some plots and are replaced by
Spiraea vaccinifolia, Lonicera spp. and sometimes also Sarcococca saligna, a bush that indicates a more intact
forest type.
LAYER OF SOIL
0
5
10
15
20
25
30
Perc
enta
ge o
f cov
erag
e ab
unda
nce
(%)
Tre
es
Shru
bs
Fern
s
Her
bs
Clim
bers
Gra
sses
Mos
ses
Fig. 3. 23 : Percentage of coverage abundanceof plant groups in transect III.
Grasses are the dominant plant group in transect III:
These are mainly tufted grasses, while turf-forming
species are less common. Absence of Cynodon dactylon
in most parts of the forest indicates moist conditions.
Among the herbal plants Duchesnea indica, Viola spp.,
Androsace rotundifolia, Trifolium spp., Ranunculus spp.
and Potentilla spp. are dominant.
Climbers like Hedera nepalensis and Smilax sp. occur
seldom. The ferns Dryopteris spp. and Adiantum
capillus veneris occur rather frequent, other ferns are
rare.

79
Stand table
As the stand table (see fig.3. 24) shows, the stand is
almost even-aged. There are certain amounts of
trees with a larger dbh (40-50 and 50-60 cm),
therefore the stand has more or less the structure of
a forest after low thinning practices. It is also
possible that regeneration after fire is the reason for
this structure.
The stand has already been exposed to a long period
of usage and is therefore no longer renewing itself
(only 30 seedlings/ha), but for few exceptions (< 20
cm of size). The seedlings are unlikely to survive
more than one year due to grass cutting with sickles
which is a common and visible practice in this
forest. The arithmetic mean height of trees was
28.1 m.
Forest usage
Although logging for timber is practised frequently, there are still more stems than stumps in most of the plots
(89%). Stand density amounts to 200 trees /ha. Together with 153 stumps/ha this is a comparatively high value
(SDI 684 trees/ha).
Grass cutting is practised frequently in the forest. Grazing is a minor factor due to steep slopes, as the area is not
suitable for cows and buffaloes. Goats and sheep are less common in the area.
Lopping is practised at a comparatively low level. Sometimes crown length is still intact to 2/3 of the complete
length. Even less frequent is splintering for torchwood. Only few trees have a damaged bark (see fig. 3. 25).
0
1
2
3
4
5
Intensity of use
(1-5)
MAL III 3,2 0 2,4 0,6 1,7 0
Lop Spli Log Graz Grc Aff
Fig. 3. 25: Intensity of different ways of forest usage intransect III.
020406080
100
<20 30 40 50 60 70 >70
Dbh classes in cm
Num
ber o
f tre
es/h
aFig.3. 24: Stand table in terms of dbh classes intransect III.

80
3.1.3.11 Malam: Transect IV
The site is about ¾ h walk away from Malam and close to the plots there are only two houses. The area is very
difficult to reach and far away from the road and villages (see photograph 3.8).
The altitude is between 2060-2080 m. The site is situated in a ravine-like hollow, with a rather moist and cool
microclimate, exposed to the north. The soil is deep and there is almost no sign of soil erosion. There are small
paths leading through, but shrubs overshadow most of the area.
Also the ravine itself is the target of encroachment, which becomes obvious due to the high frequency of timber
logging. The forest is thinning on all sides, and the slope is rather steep and rocky. The average inclination on the
flatter part of the ravine is 22.5°, but on all sides slopes with an inclination of around 40° are visible. For this
reason the survey covers only two plots of this type of forest.
To the east there is a forest with rather thin undergrowth, moderately steep and used mostly for grazing and
lopping. To the west there is a very steep slope, with hardly any undergrowth and in spite of the steepness still
used for both lopping and logging. Grazing is practised to a lower extent here.
Vegetation
05
101520253035404550
Perc
enta
ge o
f cov
erag
e ab
unda
nce
(%)
Tre
es
Shru
bs
Fern
s
Her
bs
Clim
bers
Gra
sses
Mos
ses
The undergrowth is remarkably diverse
and indicating moist and shadowy
conditions. It clearly differs from all the
other transects of the survey. As fig. 3.26
shows, mosses are most abundant, ferns
are also common.
TREE LAYER
The only tree species occurring is Pinus
wallichiana.
SHRUB LAYER
The shrub layer is remarkably high (up to
3 m) and consists mainly of Viburnum
nervosum. Fig.3. 26: Percentage of coverage abundance of plant groups intransect IV. Other shrubs that occur frequently are
Sarcococca saligna and Indigofera
heterantha.
LAYER OF SOIL:
Ferns are dominant in this forest type: Onychium contiguum and Dryopteris spp. are the most common
representatives, but also Adiantum capillus veneris, Asplenium sp. and Ceterach spp. are dominant. Mosses are
widespread and cover rocks, stumps and ground. The bigger rocks are also overgrown with ferns and Bergenia
ciliata.
Among the herbaceous plants appear most frequently Oxalis corniculata, Stellaria media, Galium boreale,
Duchesnea indica, Valeriana spp., Androsace rotundifolia and Prunella vulgaris. Grasses occur less often and
are mainly turf-forming.
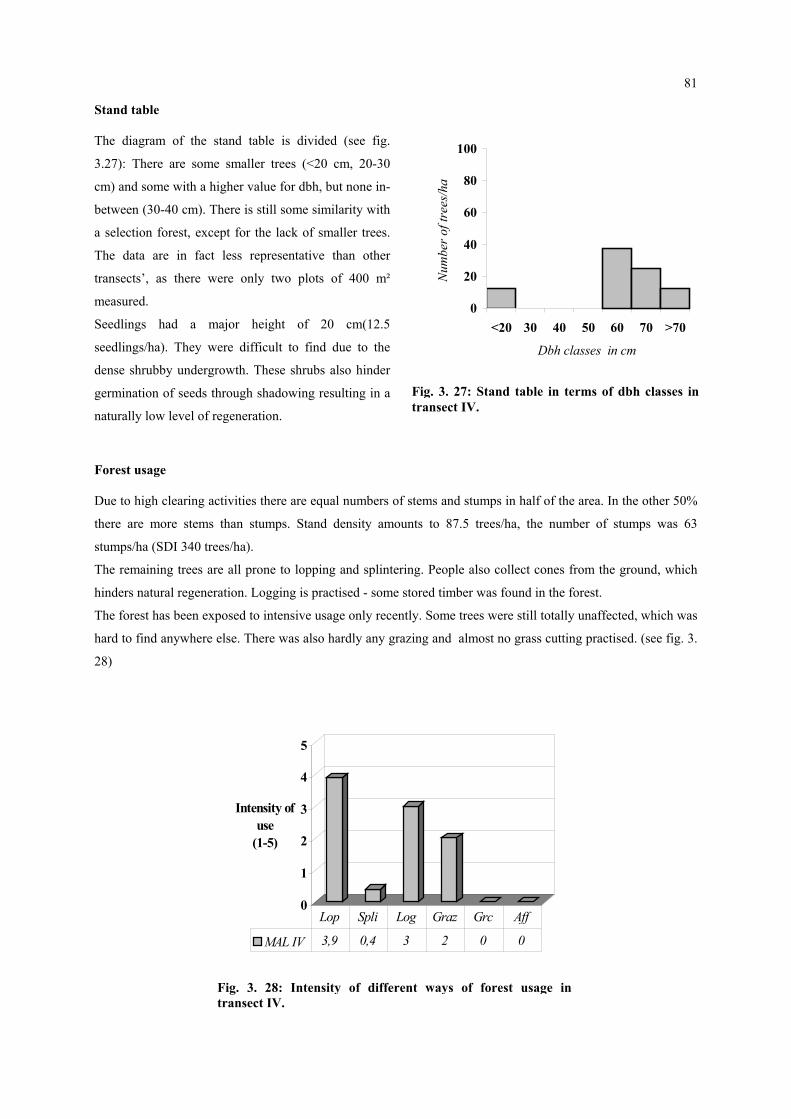
81
Stand table
The diagram of the stand table is divided (see fig.
3.27): There are some smaller trees (<20 cm, 20-30
cm) and some with a higher value for dbh, but none in-
between (30-40 cm). There is still some similarity with
a selection forest, except for the lack of smaller trees.
The data are in fact less representative than other
transects’, as there were only two plots of 400 m²
measured.
Seedlings had a major height of 20 cm(12.5
seedlings/ha). They were difficult to find due to the
dense shrubby undergrowth. These shrubs also hinder
germination of seeds through shadowing resulting in a
naturally low level of regeneration.
0
20
40
60
80
100
<20 30 40 50 60 70 >70
Dbh classes in cm
Num
ber o
f tre
es/h
a
Fig. 3. 27: Stand table in terms of dbh classes intransect IV.
Forest usage
Due to high clearing activities there are equal numbers of stems and stumps in half of the area. In the other 50%
there are more stems than stumps. Stand density amounts to 87.5 trees/ha, the number of stumps was 63
stumps/ha (SDI 340 trees/ha).
The remaining trees are all prone to lopping and splintering. People also collect cones from the ground, which
hinders natural regeneration. Logging is practised - some stored timber was found in the forest.
The forest has been exposed to intensive usage only recently. Some trees were still totally unaffected, which was
hard to find anywhere else. There was also hardly any grazing and almost no grass cutting practised. (see fig. 3.
28)
0
1
2
3
4
5
Intensity of use
(1-5)
MAL IV 3,9 0,4 3 2 0 0
Lop Spli Log Graz Grc Aff
Fig. 3. 28: Intensity of different ways of forest usage intransect IV.

82
3.1.3.12 Malam: Transect V
This plot was chosen as a representative of a more natural forest type with less intense use. The area is difficult
to reach and very steep (altitude 2170 m) (see photograph 3.9). Only one plot could be measured in this area.
Continuing from the ravine (transect IV) in the direction of Bango Ser there are densely forested slopes, with an
inclination of normally more than 40°. The area is about an hour away from Malam and there are no houses
within 15 min walking distance. The slopes are exposed from SW to NE, and altitude ranges from 2100-2200 m.
There is not much damage from soil erosion, as there is only one path leading through the forest and because of
its steepness there is not much cattle grazing in the area. The soil is rather shallow and sometimes the parent rock
is protruding. The respective measured plot was on a rather dry slope, leading down to a hollow, that has to be
crossed to reach Bango Ser.
Vegetation
In the forested area Pinus wallichiana is
the only dominant tree species.
Sometimes Quercus dilatata reaches 2-5
m height. The shrubby undergrowth is
represented by Viburnum nervosum,
Sarcococca saligna and Buxus papillosa.
In some hollows, under moist
conditions, Viburnum nervosum is
dominant, together with Adiantum
capillus veneris and Dryopteris spp..
On the slopes tufted grass appears, ferns
are also a dominant plant group here.
Remarkable abundance is also reached
by Duchesnea indica, Fragaria
nubicola, Viola spp., and several
Lamiaceae, as in plot V/1.
0
10
20
30
40
50Pe
rcen
tage
of c
over
age
abun
danc
e (%
)
Tre
es
Shru
bs
Fern
s
Her
bs
Clim
bers
Gra
sses
Mos
ses
Fig. 3. 29: Percentage of coverage abundance of plant groups intransect V.
PLOT V/1 (see fig. 3. 29):
TREE LAYER
The only occurring tree species is Pinus wallichiana, and is accompanied by small shrubby forms of Quercus
dilatata.
SHRUB LAYER
The shrub layer is very sparse, only a few specimen of Viburnum nervosum and Buxus papillosa are present.
LAYER OF SOIL
The most common are tufted grasses and tussocks. They profit from the conditions on the southern exposed
slope. Herbal plants occur only seldom in this forest type; ferns such as Dryopteris spp. and Adiantum capillus
veneris reach high abundance.
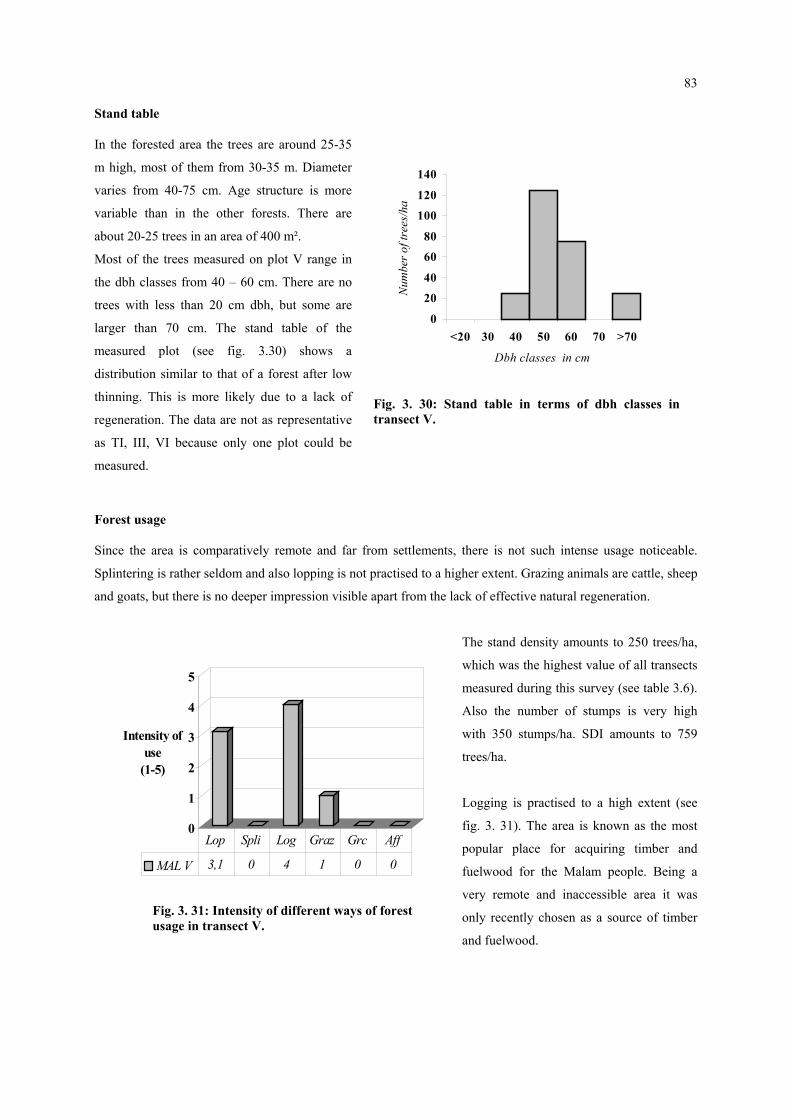
83
Stand table
In the forested area the trees are around 25-35
m high, most of them from 30-35 m. Diameter
varies from 40-75 cm. Age structure is more
variable than in the other forests. There are
about 20-25 trees in an area of 400 m².
Most of the trees measured on plot V range in
the dbh classes from 40 – 60 cm. There are no
trees with less than 20 cm dbh, but some are
larger than 70 cm. The stand table of the
measured plot (see fig. 3.30) shows a
distribution similar to that of a forest after low
thinning. This is more likely due to a lack of
regeneration. The data are not as representative
as TI, III, VI because only one plot could be
measured.
0
20
40
60
80
100
120
140
<20 30 40 50 60 70 >70
Dbh classes in cm
Num
ber o
f tre
es/h
a
Fig. 3. 30: Stand table in terms of dbh classes intransect V.
Forest usage
Since the area is comparatively remote and far from settlements, there is not such intense usage noticeable.
Splintering is rather seldom and also lopping is not practised to a higher extent. Grazing animals are cattle, sheep
and goats, but there is no deeper impression visible apart from the lack of effective natural regeneration.
The stand density amounts to 250 trees/ha,
which was the highest value of all transects
measured during this survey (see table 3.6).
Also the number of stumps is very high
with 350 stumps/ha. SDI amounts to 759
trees/ha.
Logging is practised to a high extent (see
fig. 3. 31). The area is known as the most
popular place for acquiring timber and
fuelwood for the Malam people. Being a
very remote and inaccessible area it was
only recently chosen as a source of timber
0
1
2
3
4
5
Intensity of use
(1-5)
MAL V 3,1 0 4 1 0 0
Lop Spli Log Graz Grc Aff
Fig. 3. 31: Intensity of different ways of forest usage in transect V.
and fuelwood.

84
3.1.3.13 Malam: Transect VI
This forested area is situated opposite to the afforestation area (see 3.1.3.9) of the MAP and planned to become
part of it in the coming years. This transect is within 20 min walking distance of Malam. In this forest is
remarkably high natural regeneration visible due to already existing grazing restrictions (see photograph 3.10).
Neighbouring the forest are farmhouses: People still use the forest as a source of fuelwood and timber, although
the extent of use is the least intense of all transects in Malam.
East of the transect there is a wooded area with a high stand density which is used for grazing and lopping to a
lesser extent. To the west, close to the afforestation, stretches a thinned area of trees evidently used for grazing
and lopping.
The transect extends from the lower forest line to approximately 60 m below the ridge (1950-2010 m), just
below a very steep slope (42°). Inclination ranges from 37-39° (average 32°). At the beginning of the transect
there is a very dense and almost impenetrable thicket of thorny and mostly unpalatable shrubs. Below the forest
there is a transitional zone where mainly shrubs and young pine trees grow. Only a few older pine trees remain.
Soil coverage ranges from 90-95 %. There are few areas of exposed rock due to geological formations in the
valley (see 1.2.1.2). The soil is occasionally shallow, and there is not a great deal of soil erosion. Some paths
lead through the forest.
Vegetation
Ground vegetation is variable due to human
interference. The lower part of the forest is
dominated by a shrubby zone with some
regeneration of Pinus wallichiana. The shrub
layer is dominated by Plectranthus rugosus
and Berberis lycium. The bushes are up to
1.5 m high.
Further up follows a patch where almost no
trees remain; pasturing is also practised here.
Finally closer to the ridge there is a more
intact forested area with a richer species
diversity. The undergrowth is still rather
poor, but similar to lower parts. Only
Indigofera heterantha appears more
frequently, Plectranthus rugosus is scarce.
(see fig.3. 32)
0
5
10
15
20
25
30
Perc
enta
ge o
f cov
erag
e ab
unda
nce
(%)
Tre
es
Shru
bs
Fern
s
Her
bs
Clim
bers
Gra
sses
Mos
ses
Fig. 3. 32: Percentage of coverage abundance of plant groups in transect VI.
TREE LAYER:
The only occurring tree species is Pinus wallichiana. Oaks are only represented as small shrubby forms
(Quercus dilatata, Quercus incana).
SHRUB LAYER:
Shrubs are most abundant in transect VI. Ever-green Sarcococca saligna, Cotoneaster spp. and the typical
shrubs of the disturbed zones Berberis lycium, Plectranthus rugosus and Indigofera heterantha have a very high
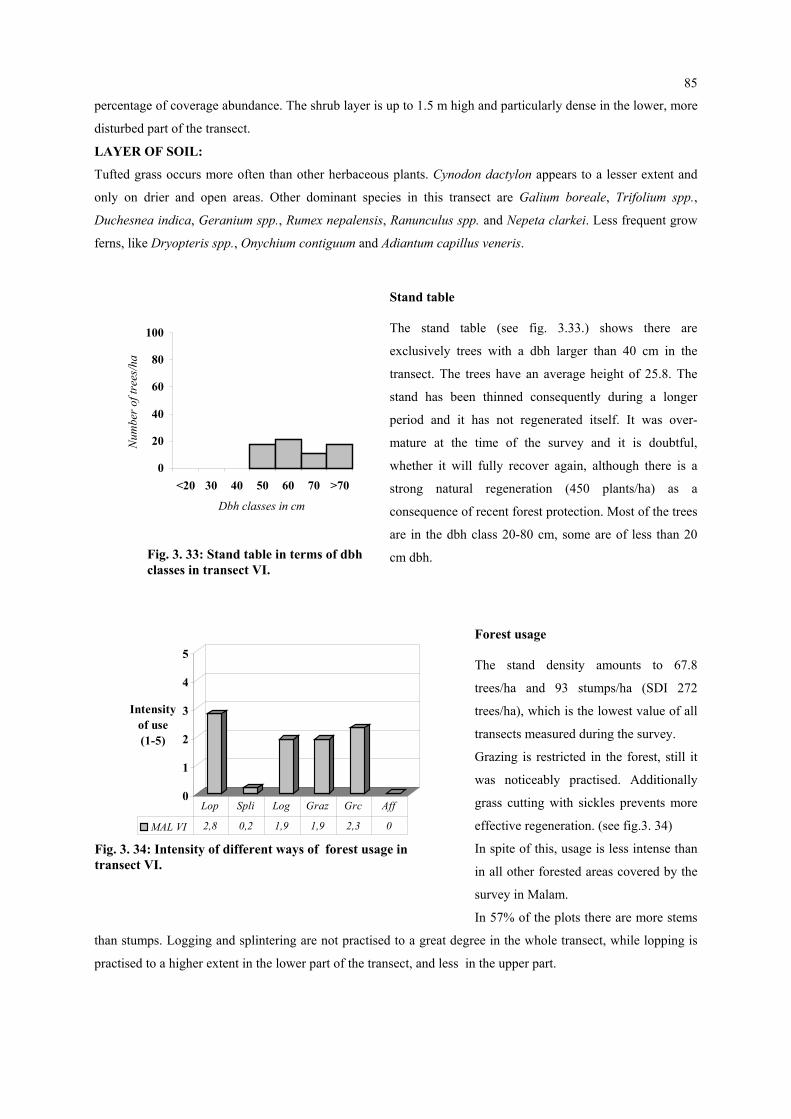
85
percentage of coverage abundance. The shrub layer is up to 1.5 m high and particularly dense in the lower, more
disturbed part of the transect.
LAYER OF SOIL:
Tufted grass occurs more often than other herbaceous plants. Cynodon dactylon appears to a lesser extent and
only on drier and open areas. Other dominant species in this transect are Galium boreale, Trifolium spp.,
Duchesnea indica, Geranium spp., Rumex nepalensis, Ranunculus spp. and Nepeta clarkei. Less frequent grow
ferns, like Dryopteris spp., Onychium contiguum and Adiantum capillus veneris.
Stand table
0
20
40
60
80
100
<20 30 40 50 60 70 >70
Dbh classes in cm
Num
ber o
f tre
es/h
a
Fig. 3. 33: Stand table in terms of dbhclasses in transect VI.
The stand table (see fig. 3.33.) shows there are
exclusively trees with a dbh larger than 40 cm in the
transect. The trees have an average height of 25.8. The
stand has been thinned consequently during a longer
period and it has not regenerated itself. It was over-
mature at the time of the survey and it is doubtful,
whether it will fully recover again, although there is a
strong natural regeneration (450 plants/ha) as a
consequence of recent forest protection. Most of the trees
are in the dbh class 20-80 cm, some are of less than 20
cm dbh.
Forest usage
0
1
2
3
4
5
Intensity of use (1-5)
MAL VI 2,8 0,2 1,9 1,9 2,3 0
Lop Spli Log Graz Grc Aff
Fig. 3. 34: Intensity of different ways of forest usage in transect VI.
The stand density amounts to 67.8
trees/ha and 93 stumps/ha (SDI 272
trees/ha), which is the lowest value of all
transects measured during the survey.
Grazing is restricted in the forest, still it
was noticeably practised. Additionally
grass cutting with sickles prevents more
effective regeneration. (see fig.3. 34)
In spite of this, usage is less intense than
in all other forested areas covered by the
survey in Malam.
In 57% of the plots there are more stems
than stumps. Logging and splintering are not practised to a great degree in the whole transect, while lopping is
practised to a higher extent in the lower part of the transect, and less in the upper part.

86
Photograph 3.5: Transect 1 in Malam:Turf-forming grasses dominate. The treesare severely lopped.
Photograph 3.7: Transect III in Malam: Th(Viburnum nervosum, Quercus dilatata, Plectran
Photograph 3.6: Transect II in Malam: A tussock-steppe is developing in the protected area.
e understorey is poorly developedthus rugosus etc.).
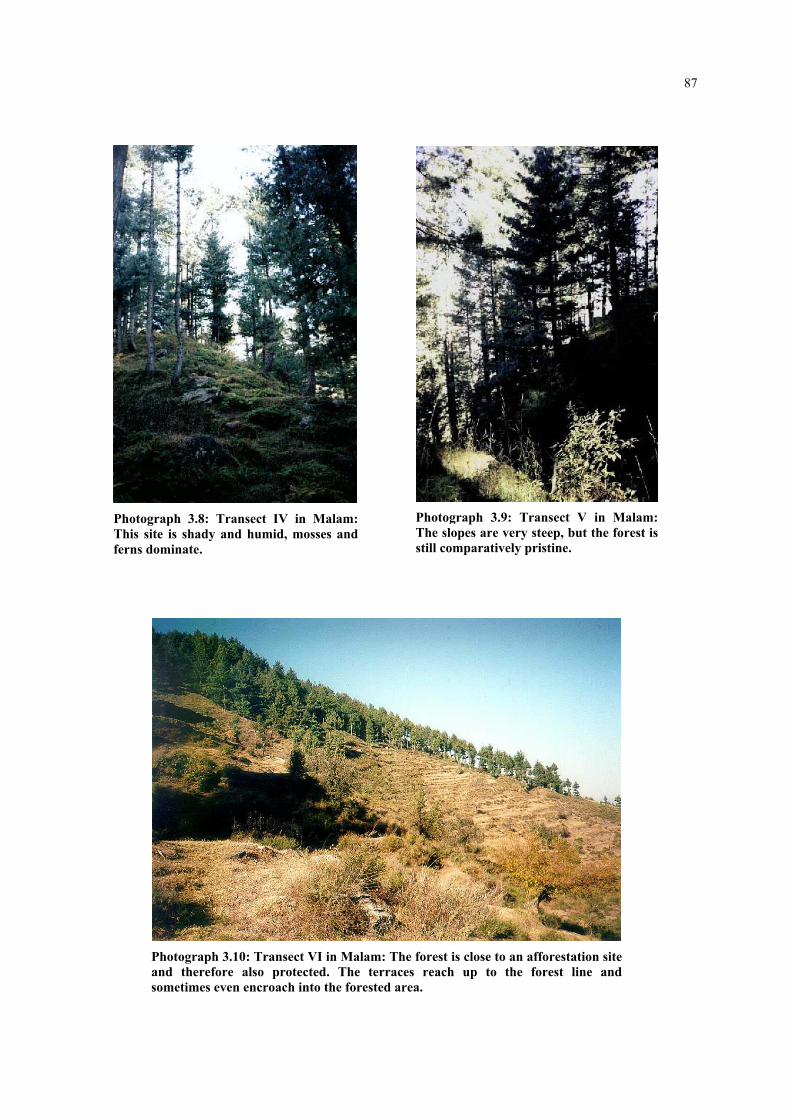
87
Photograph 3.8: Transect IV in Malam:This site is shady and humid, mosses andferns dominate.
Photograph 3.9: Transect V in Malam: The slopes are very steep, but the forest is still comparatively pristine.
Photograph 3.10: Transect VI in Malam: The forest is close to an afforestation siteand therefore also protected. The terraces reach up to the forest line andsometimes even encroach into the forested area.
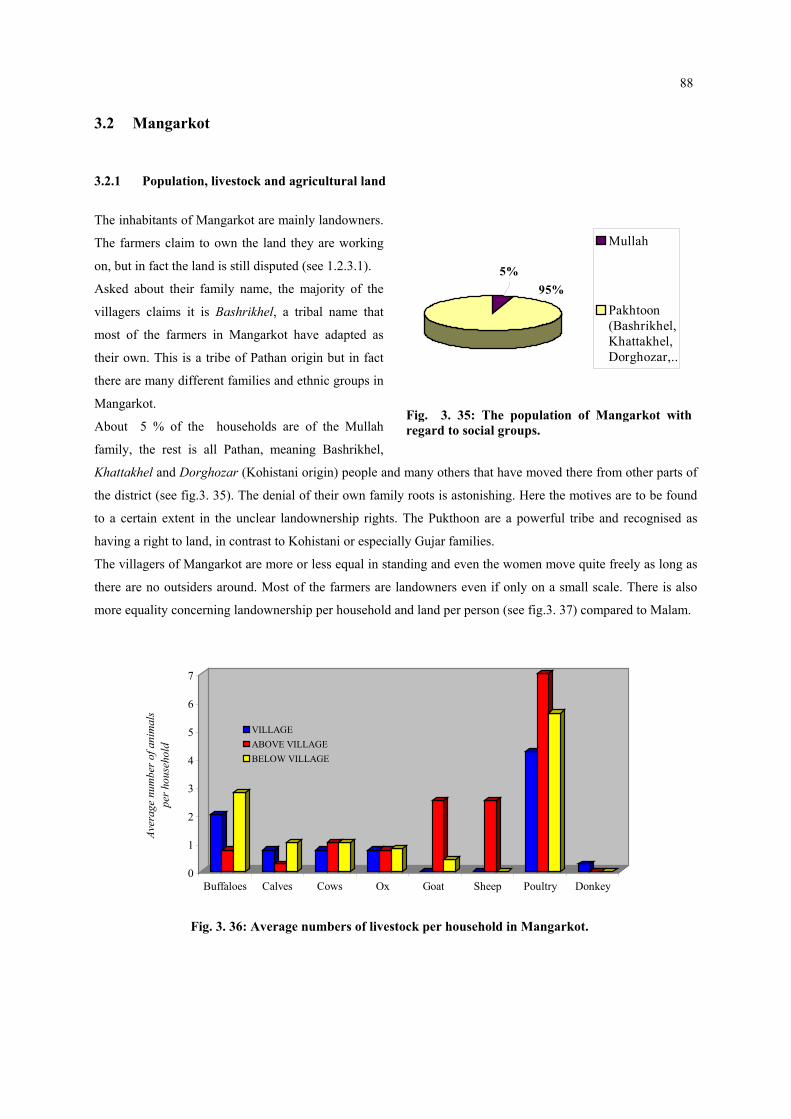
88
3.2 Mangarkot
3.2.1 Population, livestock and agricultural land
5%95%
Mullah
Pakhtoon(Bashrikhel,Khattakhel,Dorghozar,..
Fig. 3. 35: The population of Mangarkot with regard to social groups.
The inhabitants of Mangarkot are mainly landowners.
The farmers claim to own the land they are working
on, but in fact the land is still disputed (see 1.2.3.1).
Asked about their family name, the majority of the
villagers claims it is Bashrikhel, a tribal name that
most of the farmers in Mangarkot have adapted as
their own. This is a tribe of Pathan origin but in fact
there are many different families and ethnic groups in
Mangarkot.
About 5 % of the households are of the Mullah
family, the rest is all Pathan, meaning Bashrikhel,
Khattakhel and Dorghozar (Kohistani origin) people and many others that have moved there from other parts of
the district (see fig.3. 35). The denial of their own family roots is astonishing. Here the motives are to be found
to a certain extent in the unclear landownership rights. The Pukthoon are a powerful tribe and recognised as
having a right to land, in contrast to Kohistani or especially Gujar families.
The villagers of Mangarkot are more or less equal in standing and even the women move quite freely as long as
there are no outsiders around. Most of the farmers are landowners even if only on a small scale. There is also
more equality concerning landownership per household and land per person (see fig.3. 37) compared to Malam.
Buffaloes Calves Cows Ox Goat Sheep Poultry Donkey
GEGE
Fig. 3. 36: Average numbers of livestock per household in Mangarkot.
0
1
2
3
4
5
6
7
Aver
age
num
ber o
f ani
mal
s pe
r hou
seho
ld
VILLAGEABOVE VILLABELOW VILLA
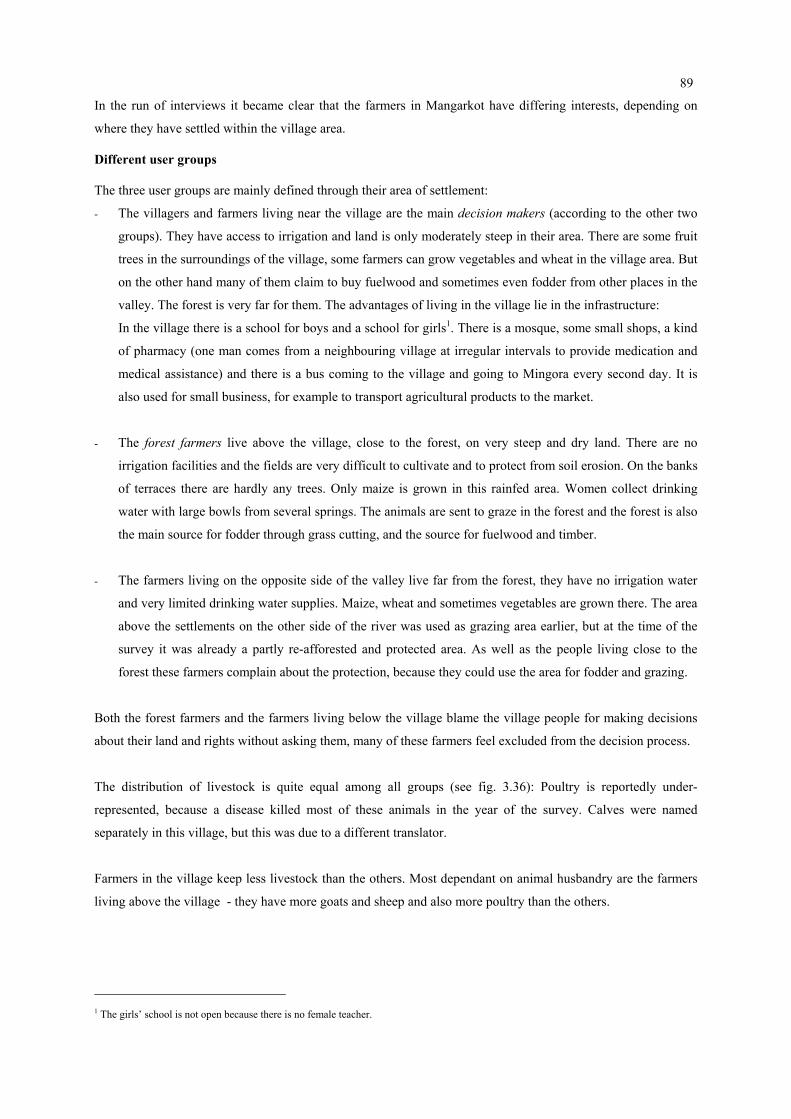
89
In the run of interviews it became clear that the farmers in Mangarkot have differing interests, depending on
where they have settled within the village area.
Different user groups
The three user groups are mainly defined through their area of settlement:
- The villagers and farmers living near the village are the main decision makers (according to the other two
groups). They have access to irrigation and land is only moderately steep in their area. There are some fruit
trees in the surroundings of the village, some farmers can grow vegetables and wheat in the village area. But
on the other hand many of them claim to buy fuelwood and sometimes even fodder from other places in the
valley. The forest is very far for them. The advantages of living in the village lie in the infrastructure:
In the village there is a school for boys and a school for girls1. There is a mosque, some small shops, a kind
of pharmacy (one man comes from a neighbouring village at irregular intervals to provide medication and
medical assistance) and there is a bus coming to the village and going to Mingora every second day. It is
also used for small business, for example to transport agricultural products to the market.
- The forest farmers live above the village, close to the forest, on very steep and dry land. There are no
irrigation facilities and the fields are very difficult to cultivate and to protect from soil erosion. On the banks
of terraces there are hardly any trees. Only maize is grown in this rainfed area. Women collect drinking
water with large bowls from several springs. The animals are sent to graze in the forest and the forest is also
the main source for fodder through grass cutting, and the source for fuelwood and timber.
- The farmers living on the opposite side of the valley live far from the forest, they have no irrigation water
and very limited drinking water supplies. Maize, wheat and sometimes vegetables are grown there. The area
above the settlements on the other side of the river was used as grazing area earlier, but at the time of the
survey it was already a partly re-afforested and protected area. As well as the people living close to the
forest these farmers complain about the protection, because they could use the area for fodder and grazing.
Both the forest farmers and the farmers living below the village blame the village people for making decisions
about their land and rights without asking them, many of these farmers feel excluded from the decision process.
The distribution of livestock is quite equal among all groups (see fig. 3.36): Poultry is reportedly under-
represented, because a disease killed most of these animals in the year of the survey. Calves were named
separately in this village, but this was due to a different translator.
Farmers in the village keep less livestock than the others. Most dependant on animal husbandry are the farmers
living above the village - they have more goats and sheep and also more poultry than the others.
1 The girls’ school is not open because there is no female teacher.
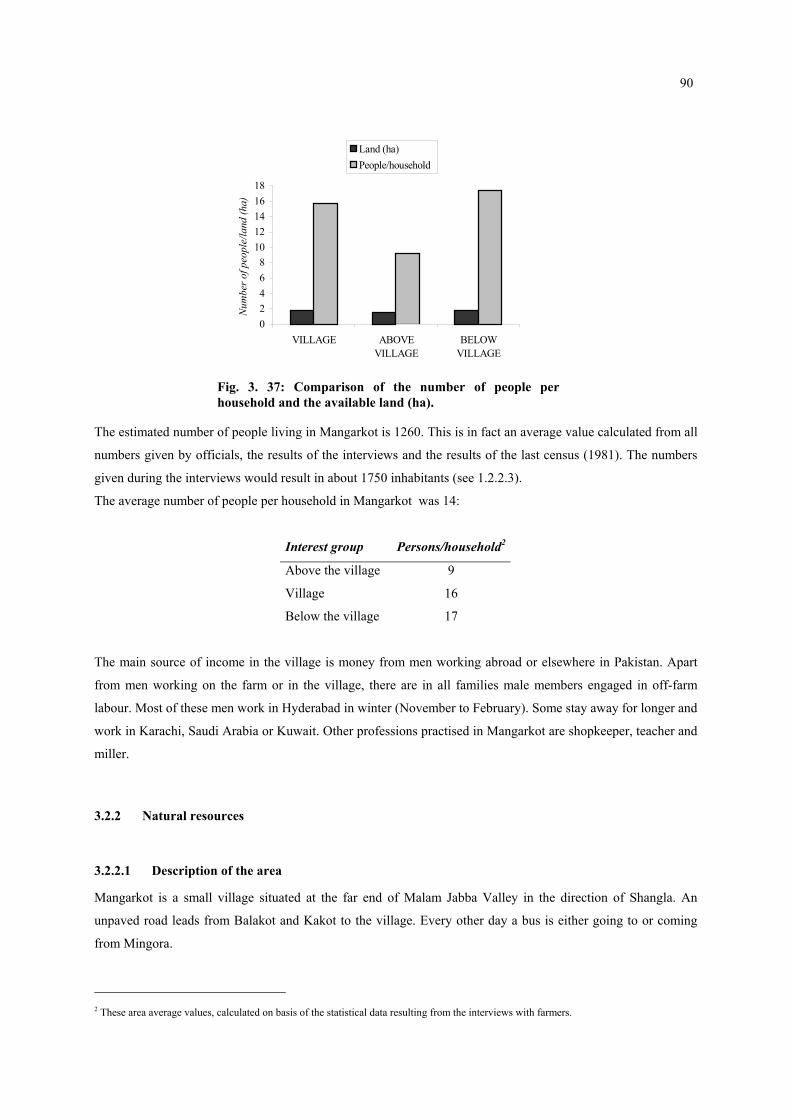
90
02468
1012141618
VILLAGE ABOVEVILLAGE
BELOWVILLAGE
Num
ber o
f peo
ple/
land
(ha)
Land (ha)People/household
Fig. 3. 37: Comparison of the number of people perhousehold and the available land (ha).
The estimated number of people living in Mangarkot is 1260. This is in fact an average value calculated from all
numbers given by officials, the results of the interviews and the results of the last census (1981). The numbers
given during the interviews would result in about 1750 inhabitants (see 1.2.2.3).
The average number of people per household in Mangarkot was 14:
Interest group Persons/household2
Above the village 9
Village 16
Below the village 17
The main source of income in the village is money from men working abroad or elsewhere in Pakistan. Apart
from men working on the farm or in the village, there are in all families male members engaged in off-farm
labour. Most of these men work in Hyderabad in winter (November to February). Some stay away for longer and
work in Karachi, Saudi Arabia or Kuwait. Other professions practised in Mangarkot are shopkeeper, teacher and
miller.
3.2.2 Natural resources
3.2.2.1 Description of the area
Mangarkot is a small village situated at the far end of Malam Jabba Valley in the direction of Shangla. An
unpaved road leads from Balakot and Kakot to the village. Every other day a bus is either going to or coming
from Mingora.
2 These area average values, calculated on basis of the statistical data resulting from the interviews with farmers.

91
The area above the village is very steep and the land is dry. Maize is the main crop there, because most of the
area is only rainfed (see landuse map in APPENDIX). Both water supply and irrigation are insufficient. There is
also a shortage of grazing areas and fodder. As the forest is diminishing dramatically there is no longer enough
fuelwood available. The terraced fields are usually about 5 m wide and 20 - 80 m long, but often they are even
smaller than that. Trees on field boundaries are scarce on the steep areas above the village and near the village
there are sometimes fruit trees on the banks of terraces. Farmers hardly ever plant trees because there is not
enough water. Another reason is that there are usually no trees of good quality available. Grazing with goats and
cows also destroys the young plants according to the farmers.
In higher areas there are many herbs growing. The surroundings of Mangarkot certainly present a good site for
medicinal plants. Reportedly some people collect them to sell, but no local people are involved in such business.
They only collect herbs for their own use. Near the forest there are also naturally growing trees like wild fruit
trees, mulberry, fig, and older pine trees that have survived from the old forest.
Fig. 3.38: Result of natural resource village mapping in Mangarkot. The map shows locationsof the most important natural resources, the settlements of various ethnic/social groups, thelocation of different crops and important facilities mentioned during group interviews.
Forest farmers
Village farmers
Farmers below
the village
Below 1700 m the land becomes less steep and more accessible. Around the village and along water courses
walnut occurs frequently, joined by willow tree, plane tree, ash, poplar, and others. There are often fruit trees and
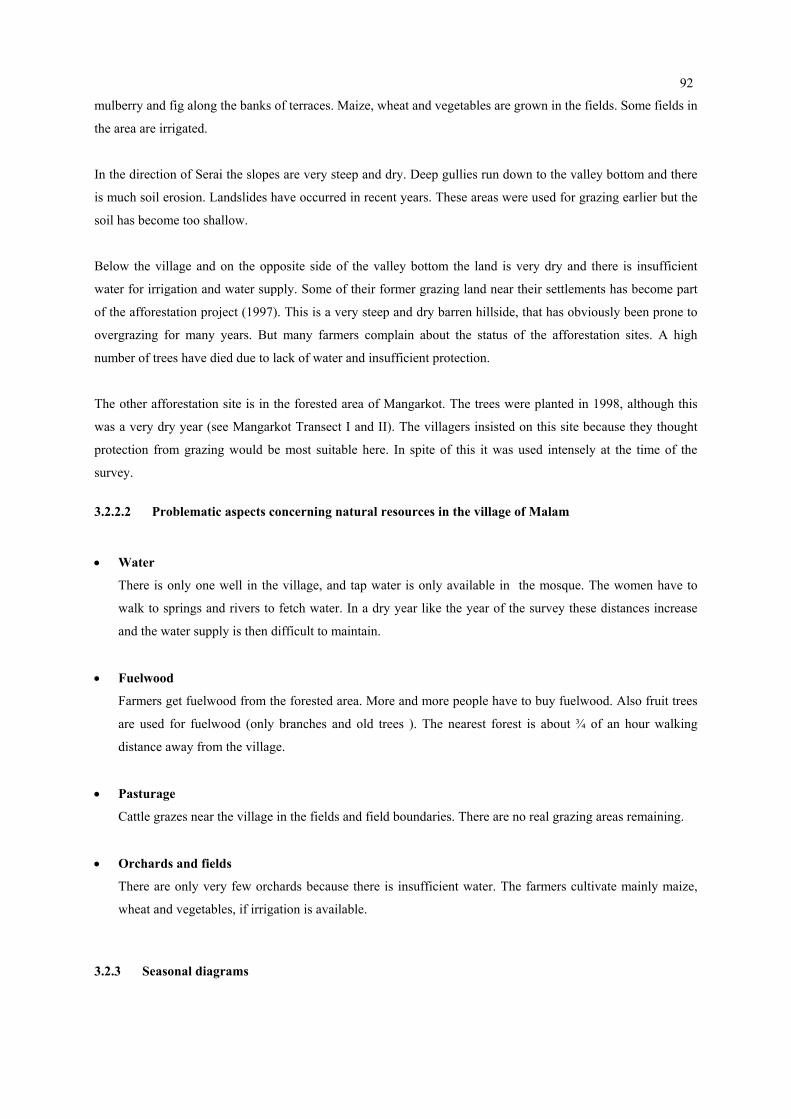
92
mulberry and fig along the banks of terraces. Maize, wheat and vegetables are grown in the fields. Some fields in
the area are irrigated.
In the direction of Serai the slopes are very steep and dry. Deep gullies run down to the valley bottom and there
is much soil erosion. Landslides have occurred in recent years. These areas were used for grazing earlier but the
soil has become too shallow.
Below the village and on the opposite side of the valley bottom the land is very dry and there is insufficient
water for irrigation and water supply. Some of their former grazing land near their settlements has become part
of the afforestation project (1997). This is a very steep and dry barren hillside, that has obviously been prone to
overgrazing for many years. But many farmers complain about the status of the afforestation sites. A high
number of trees have died due to lack of water and insufficient protection.
The other afforestation site is in the forested area of Mangarkot. The trees were planted in 1998, although this
was a very dry year (see Mangarkot Transect I and II). The villagers insisted on this site because they thought
protection from grazing would be most suitable here. In spite of this it was used intensely at the time of the
survey.
3.2.2.2 Problematic aspects concerning natural resources in the village of Malam
• Water
There is only one well in the village, and tap water is only available in the mosque. The women have to
walk to springs and rivers to fetch water. In a dry year like the year of the survey these distances increase
and the water supply is then difficult to maintain.
• Fuelwood
Farmers get fuelwood from the forested area. More and more people have to buy fuelwood. Also fruit trees
are used for fuelwood (only branches and old trees ). The nearest forest is about ¾ of an hour walking
distance away from the village.
• Pasturage
Cattle grazes near the village in the fields and field boundaries. There are no real grazing areas remaining.
• Orchards and fields
There are only very few orchards because there is insufficient water. The farmers cultivate mainly maize,
wheat and vegetables, if irrigation is available.
3.2.3 Seasonal diagrams

93
MEN:
- During spring rains the fields are prepared and then maize and potato are sown. In maize fields pumpkin is
occasionally sown.
- In May and June wheat and peas are harvested and then maize is sown as a follower crop, as well as
cucumber and tomato.
- During monsoon rains there is less work, only weeding and tending of crops and vegetables.
- In October harvest of maize and tomato starts. Afterwards wheat, peas or onion are sown. Before hand and
sometimes parallel grass is cut and stored for winter, like maize straw. Fuelwood and timber are collected
before the winter.
In Mangarkot men regard the dry summer season to be most work intensive, followed by the dry winter season.
Least work intensive is the rainy monsoon period. (see fig. 3. 39)
WOMEN:
All year round leafy vegetables are collected, in summer mushrooms and wild grapes and in autumn chestnuts
and walnuts. This is mainly women’s work (see fig. 3. 40).
- During spring rain women collect leafy vegetables, besides from their daily work, while the men have to
work in other areas and on other people’s fields (vegetable plantations,....).
- In May and June wheat is harvested, cleaned and stored, there is a lot of work at home, the fields have to be
prepared again and fuelwood and fodder has to be gathered.
- In summer they sometimes work for other people during fruit harvest season and they also take care of the
maize crop.
- In October women help with the maize harvest, grass cutting and storage for the winter as well as with
fuelwood collection.
Women in Mangarkot consider the dry summer season to be most work intensive (May/June), second they rank
the monsoon rainy season (July/August). The dry winter season is least work intensive for them.
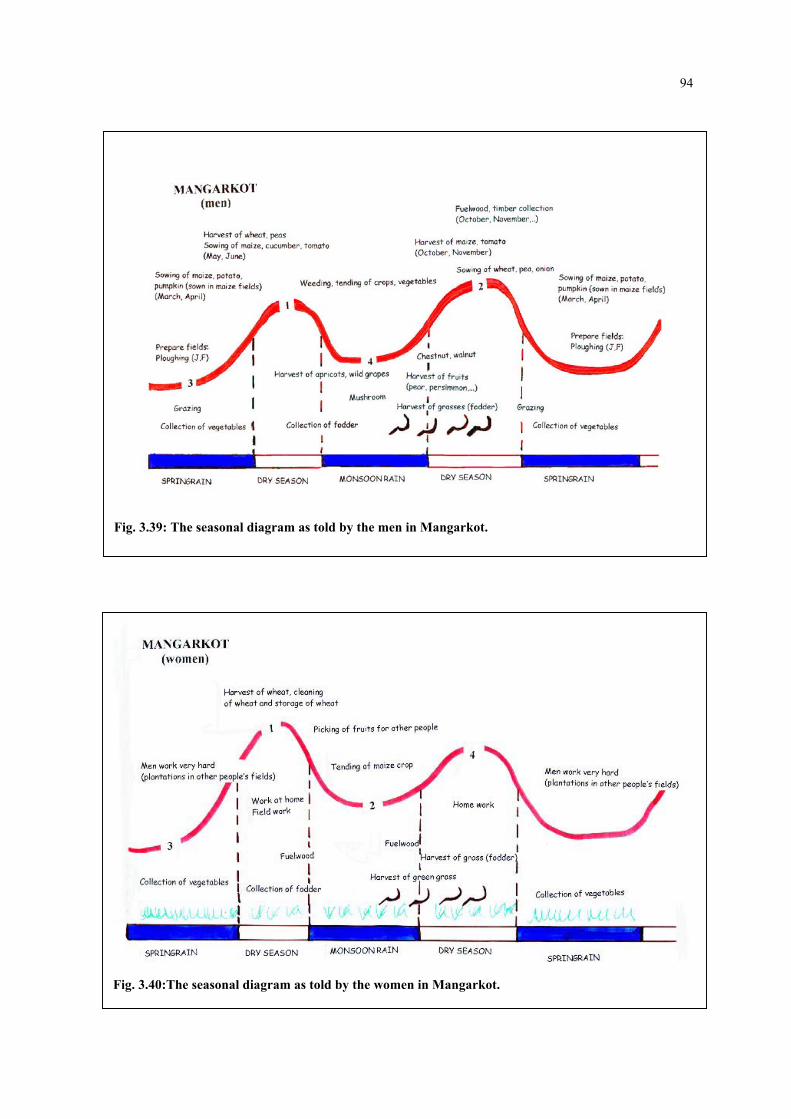
94
Fig. 3.40:The seasonal diagram as told by the women in Mangarkot.
Fig. 3.39: The seasonal diagram as told by the men in Mangarkot.

95
3.2.4 The importance of various products from agriculture and forestry for farmers in Mangarkot
The results of scoring (as described in 2.3.2.2) of
products from agriculture and forestry with beans
varied only marginally between priority ranking of
products and scoring with regard to specific aspects
(compare table 3.9 and fig. 3.41):
0 2 4 6 8
Animals
Wheat
Maize
Vegetable
Fruits
Fodder
Timber
Fuelwood
Number of scores
Fig. 3. 41: Priority ranking of products in Mangarkot.
- With regard to time consumption only wheat and
animals received higher scores.
- Vegetable production is seen as most labour
intensive, followed by fodder, maize and animal
husbandry.
- Vegetable production and maize are considered to
be very profitable. Wheat and fruits follow second.
- Asked about the importance of the products
fuelwood and timber were judged as most
important and vegetables as least important.
In Fig. 3.41 the ranking according to priorities is shown. By this way of scoring fodder and fuelwood scored
highest.
Table 3. 9: Results of scoring of products with regard to various aspects during group interview in Mangarkot.
MANGARKOT Time consumption Labour Profits Importance
Fuelwood •• •• •• ••••
Timber •• •• •• ••••
Fodder •• ••• •• •••
Fruits •• •• ••• •••
Vegetable • •••• •••• •
Maize • ••• •••• ••
Wheat ••• • ••• •••
Animals ••• ••• •• ••
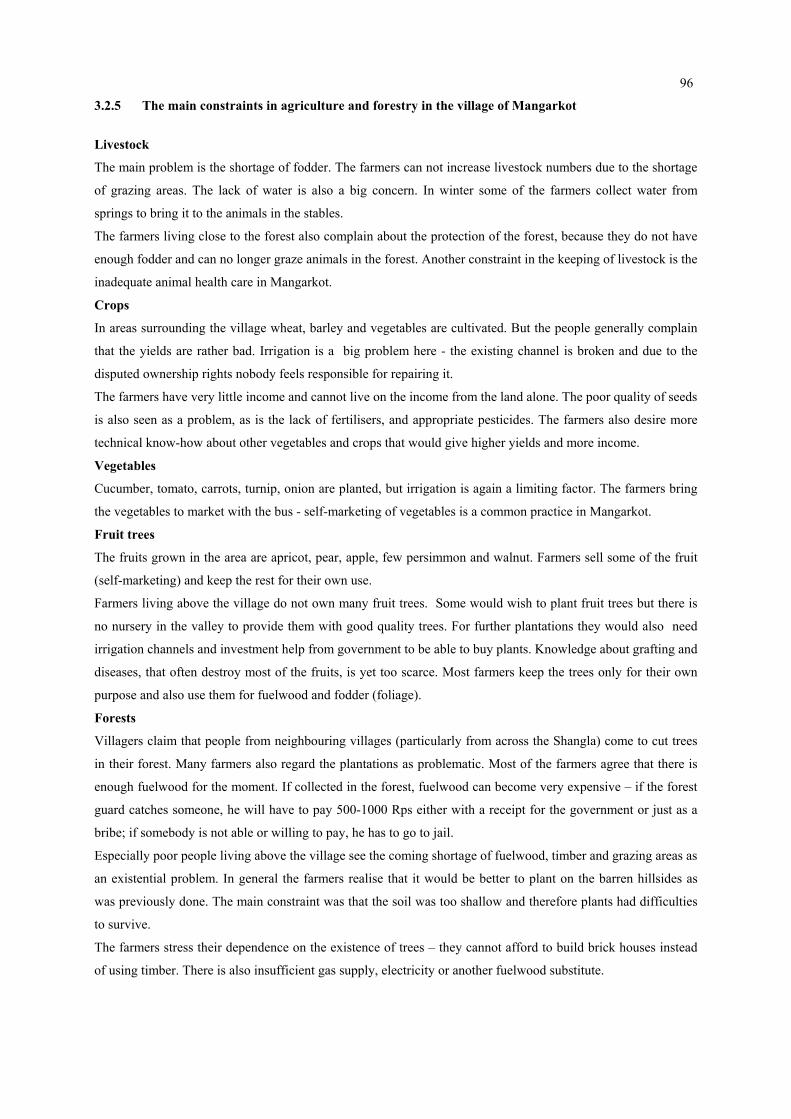
96
3.2.5 The main constraints in agriculture and forestry in the village of Mangarkot
Livestock
The main problem is the shortage of fodder. The farmers can not increase livestock numbers due to the shortage
of grazing areas. The lack of water is also a big concern. In winter some of the farmers collect water from
springs to bring it to the animals in the stables.
The farmers living close to the forest also complain about the protection of the forest, because they do not have
enough fodder and can no longer graze animals in the forest. Another constraint in the keeping of livestock is the
inadequate animal health care in Mangarkot.
Crops
In areas surrounding the village wheat, barley and vegetables are cultivated. But the people generally complain
that the yields are rather bad. Irrigation is a big problem here - the existing channel is broken and due to the
disputed ownership rights nobody feels responsible for repairing it.
The farmers have very little income and cannot live on the income from the land alone. The poor quality of seeds
is also seen as a problem, as is the lack of fertilisers, and appropriate pesticides. The farmers also desire more
technical know-how about other vegetables and crops that would give higher yields and more income.
Vegetables
Cucumber, tomato, carrots, turnip, onion are planted, but irrigation is again a limiting factor. The farmers bring
the vegetables to market with the bus - self-marketing of vegetables is a common practice in Mangarkot.
Fruit trees
The fruits grown in the area are apricot, pear, apple, few persimmon and walnut. Farmers sell some of the fruit
(self-marketing) and keep the rest for their own use.
Farmers living above the village do not own many fruit trees. Some would wish to plant fruit trees but there is
no nursery in the valley to provide them with good quality trees. For further plantations they would also need
irrigation channels and investment help from government to be able to buy plants. Knowledge about grafting and
diseases, that often destroy most of the fruits, is yet too scarce. Most farmers keep the trees only for their own
purpose and also use them for fuelwood and fodder (foliage).
Forests
Villagers claim that people from neighbouring villages (particularly from across the Shangla) come to cut trees
in their forest. Many farmers also regard the plantations as problematic. Most of the farmers agree that there is
enough fuelwood for the moment. If collected in the forest, fuelwood can become very expensive – if the forest
guard catches someone, he will have to pay 500-1000 Rps either with a receipt for the government or just as a
bribe; if somebody is not able or willing to pay, he has to go to jail.
Especially poor people living above the village see the coming shortage of fuelwood, timber and grazing areas as
an existential problem. In general the farmers realise that it would be better to plant on the barren hillsides as
was previously done. The main constraint was that the soil was too shallow and therefore plants had difficulties
to survive.
The farmers stress their dependence on the existence of trees – they cannot afford to build brick houses instead
of using timber. There is also insufficient gas supply, electricity or another fuelwood substitute.
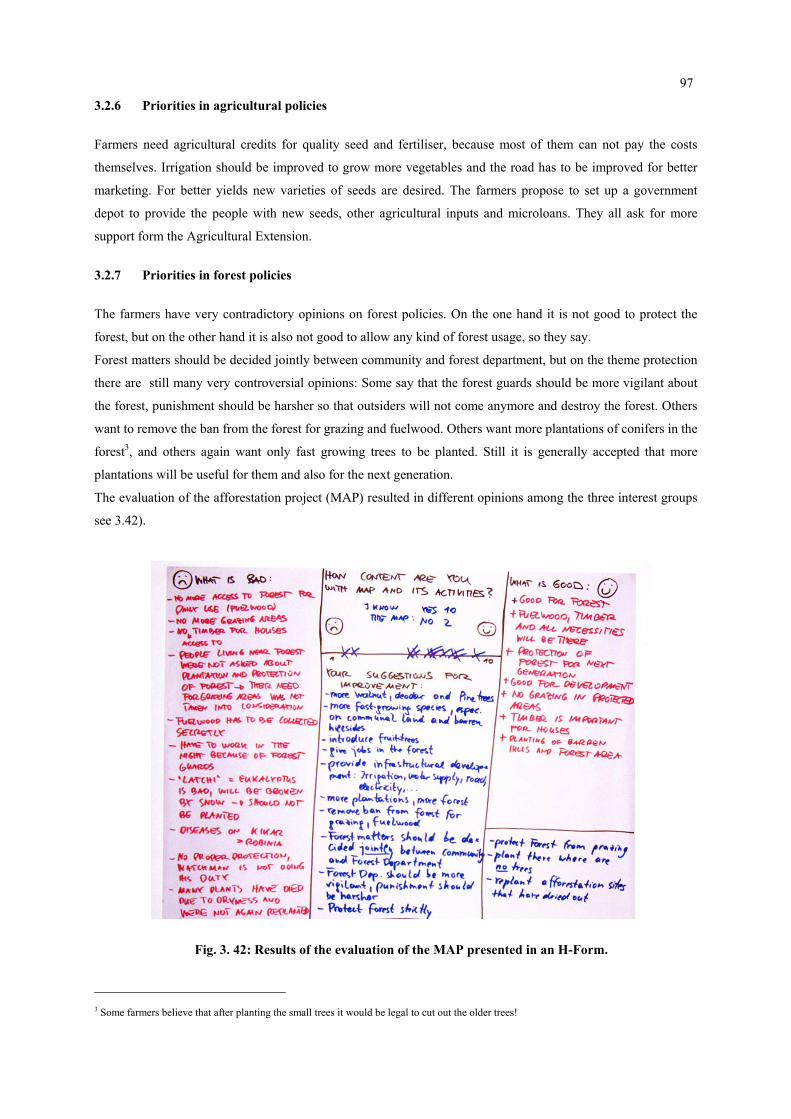
97
3.2.6 Priorities in agricultural policies
Farmers need agricultural credits for quality seed and fertiliser, because most of them can not pay the costs
themselves. Irrigation should be improved to grow more vegetables and the road has to be improved for better
marketing. For better yields new varieties of seeds are desired. The farmers propose to set up a government
depot to provide the people with new seeds, other agricultural inputs and microloans. They all ask for more
support form the Agricultural Extension.
3.2.7 Priorities in forest policies
The farmers have very contradictory opinions on forest policies. On the one hand it is not good to protect the
forest, but on the other hand it is also not good to allow any kind of forest usage, so they say.
Forest matters should be decided jointly between community and forest department, but on the theme protection
there are still many very controversial opinions: Some say that the forest guards should be more vigilant about
the forest, punishment should be harsher so that outsiders will not come anymore and destroy the forest. Others
want to remove the ban from the forest for grazing and fuelwood. Others want more plantations of conifers in the
forest3, and others again want only fast growing trees to be planted. Still it is generally accepted that more
plantations will be useful for them and also for the next generation.
The evaluation of the afforestation project (MAP) resulted in different opinions among the three interest groups
see 3.42).
3 Some farm
Fig. 3. 42: Results of the evaluation of the MAP presented in an H-Form.
ers believe that after planting the small trees it would be legal to cut out the older trees!

98
- Most of the farmers living in the village are more or less satisfied with the work of the MAP. The project
should also provide infrastructure development (improvement of road, irrigation, ...) according to some of
them. Fruit trees should also be introduced and provided, and other trees like Deodar (Cedrus deodara),
walnut should be planted. Some farmers mention the plantation of Eucalyptus sp. of a previous project with
disapprovement, because the trees were not suitable for the area.
- Farmers living above the village propose that the project should also provide fast growing trees and fruit
trees for agricultural land. The farmers complain about the protection and that they are no longer allowed to
gather fuelwood for daily use from the forest. These farmers are also not so satisfied with the project
because they felt excluded from the decision process. They claim that they were not asked their opinion
concerning the afforestation. Only people in the village agreed upon these plantations according to them.
They claim that for the villagers it was an easy decision because they were not dependant on cattle - they do
not live near the forest, they do not need area for grazing. The forest farmers on the other hand want the
right for their own use, they are much more dependant on the forest. It was their work to graze cattle and to
collect fuelwood from the forest.
- The farmers living below and opposite the village would rather have more walnut and fast growing species
planted on communal land and barren hillsides (Robinia, Ailanthus). Most of the other farmers were
involved in the decisions concerning the MAP and agreed with the protection of the former grazing areas.
They are aware of the need for more trees outside the old forest, they need fuelwood, but also timber to
improve their houses. They support the strict protection of the forest, but most of them believe that it would
be more reasonable to plant outside the forest and to replant dry afforestation sites.
The results of tree ranking are shown in see fig. 3.
43 and table 3.12:
0 10 20 30 40 50
Pine tree
Other conifers
Oak
Ailanthus
Robinia
Poplar
Walnut
Persimmon
Pear
Apple
Peach
Apricot
Fig
Mulberry
Number of scores (total)
Fig. 3. 43: Tree ranking according to preferences of farmers in Mangarkot.
Apple was named most often, followed by apricot
and then Robinia (kikar). It was argued that apple
would be easy to grow and fruits would bring a
good price. Persimmon, a well liked and abundant
fruit tree in the region, does not grow so well in
Mangarkot – people argue that it has a high water
requirement. People want new varieties of apple,
apricot and peach rather than the old, local
varieties.
Pine trees scored rather low, as did walnut and fig.
Still important seemed to be oak, peach and the
local pear (Tongu).
“Other conifers” ranked comparatively high. It
became apparent during the interviews that most
of the people knew about the value of Deodar
(Cedrus deodara), a conifer famous for its
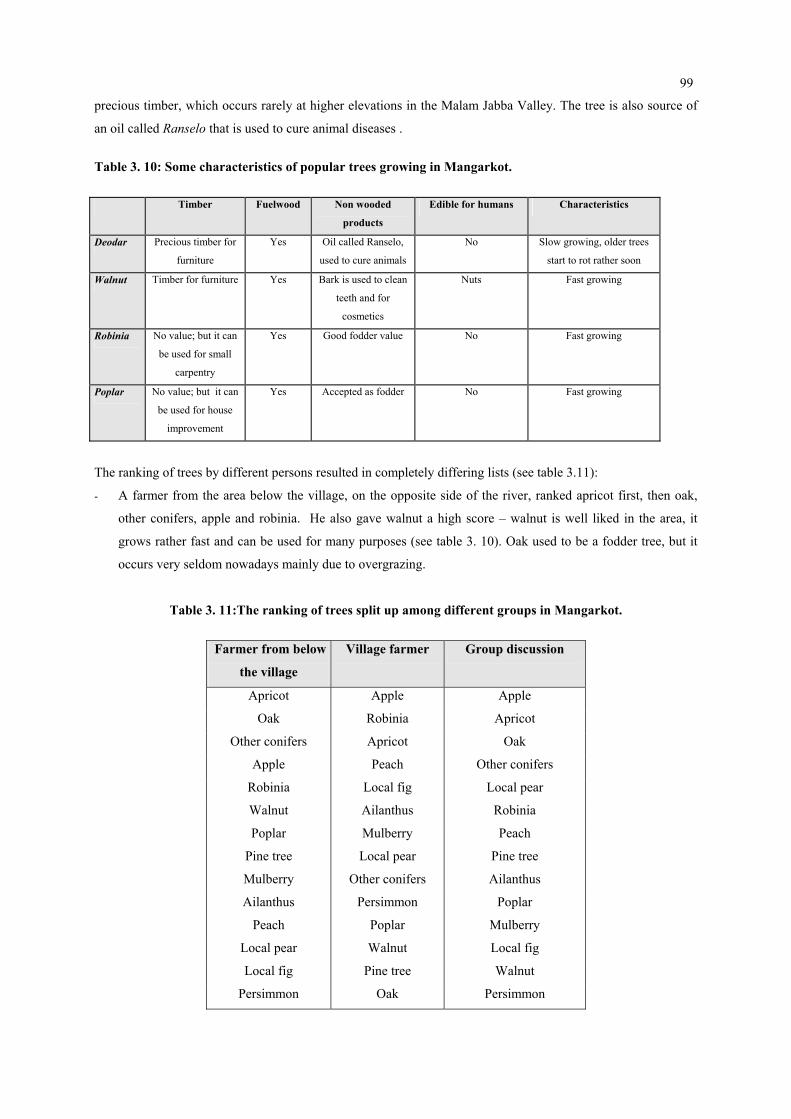
99
precious timber, which occurs rarely at higher elevations in the Malam Jabba Valley. The tree is also source of
an oil called Ranselo that is used to cure animal diseases .
Table 3. 10: Some characteristics of popular trees growing in Mangarkot. Timber Fuelwood Non wooded
products
Edible for humans Characteristics
Deodar Precious timber for
furniture
Yes Oil called Ranselo,
used to cure animals
No Slow growing, older trees
start to rot rather soon
Walnut Timber for furniture Yes Bark is used to clean
teeth and for
cosmetics
Nuts Fast growing
Robinia No value; but it can
be used for small
carpentry
Yes Good fodder value No Fast growing
Poplar No value; but it can
be used for house
improvement
Yes Accepted as fodder No Fast growing
The ranking of trees by different persons resulted in completely differing lists (see table 3.11):
- A farmer from the area below the village, on the opposite side of the river, ranked apricot first, then oak,
other conifers, apple and robinia. He also gave walnut a high score – walnut is well liked in the area, it
grows rather fast and can be used for many purposes (see table 3. 10). Oak used to be a fodder tree, but it
occurs very seldom nowadays mainly due to overgrazing.
Table 3. 11:The ranking of trees split up among different groups in Mangarkot.
Farmer from below
the village
Village farmer Group discussion
Apricot Apple Apple
Oak Robinia Apricot
Other conifers Apricot Oak
Apple Peach Other conifers
Robinia Local fig Local pear
Walnut Ailanthus Robinia
Poplar Mulberry Peach
Pine tree Local pear Pine tree
Mulberry Other conifers Ailanthus
Ailanthus Persimmon Poplar
Peach Poplar Mulberry
Local pear Walnut Local fig
Local fig Pine tree Walnut
Persimmon Oak Persimmon

100
- A farmer living in the village gave apple the highest score, then Robinia and again fruit trees (apricot,
peach). Conifers and pine trees ranked low, but mulberry and fig ranked rather high. Again there was a
high consciousness concerning the need for fruit trees and fuelwood substitutes.
- A group discussion finally led to the following result: Apple and apricot scored highest, followed by oak
and conifers. The farmers of Mangarkot are very much aware of what trees they have a use for. The user
groups were not so opposed, since the extinction of the pine forest is already within sight, most people are
already focusing on alternatives in one or an other way.
3.2.8 The main constraints in everyday life in the village of Mangarkot
3.2.8.1 Interviews with farmers
The people living in Mangarkot complain about the poor condition of the road, the irrigation channel,
insufficient drinking water supply and the lack of improvement of the educational system. There are no jobs in
the villages, and the farmers can only work as tenants for rich landowners or migrate. The inadequate health care
and the lack of food supply are also criticised. The entitlement to land is also seen as a big problem - the farmers
have “owned” and used land for a long time, but they don’t have the legal ownership of the land.
3.2.8.2 Group interviews
Fig. 3. 44: Outcome of problem ranking with farmers in Mangarkot during a group interview.
The farmers name irrigation as the most
important problem during the group
interviews (see fig. 3.44), but asked for the
reason why nobody started to construct
simple irrigation channels, as there is in a
typical year plenty of water available, they
argued that they did not want to invest
money and work due to the unclear
ownership.
Due to the destruction of the forest there is
hardly any timber left for house
construction, and to take it from the forest
is illegal. Very often houses have to be
rebuilt, they are not very stable and
therefore prone to damage during the
monsoon period and also from snow
during the winter.
People also complain about the lack of
work in the area – in almost every
household there is someone working
outside the valley. There is also
insufficient health care in the village.
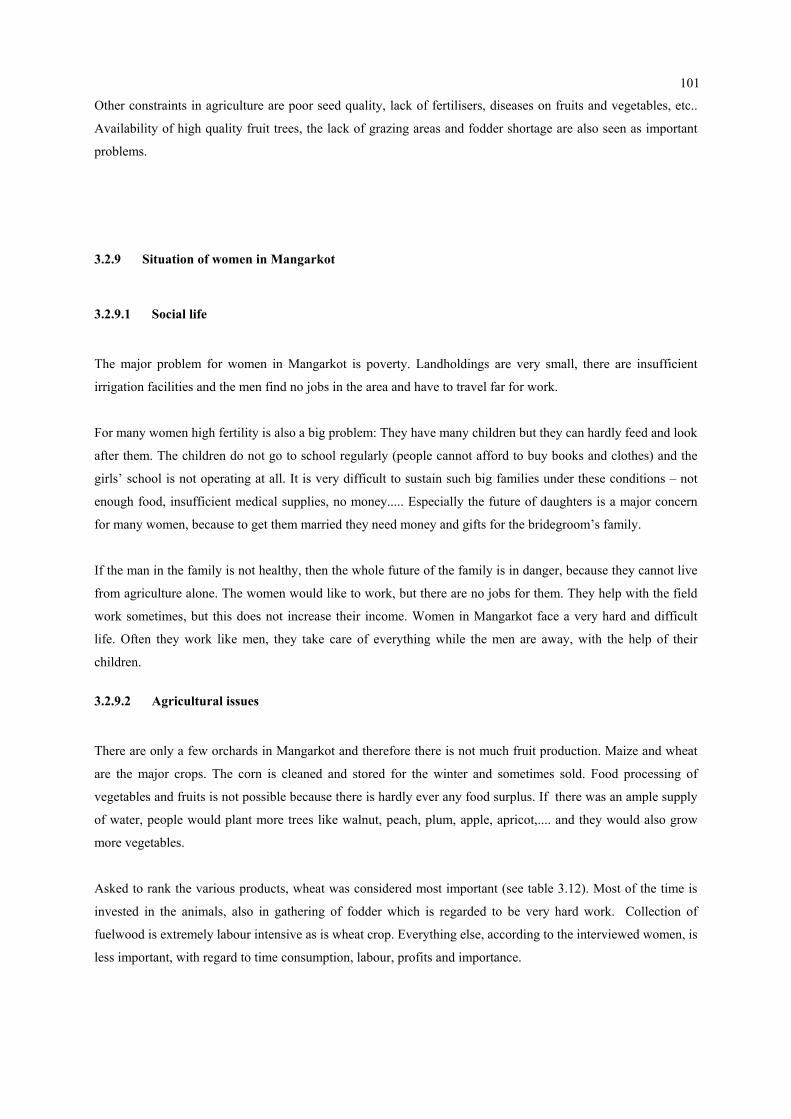
101
Other constraints in agriculture are poor seed quality, lack of fertilisers, diseases on fruits and vegetables, etc..
Availability of high quality fruit trees, the lack of grazing areas and fodder shortage are also seen as important
problems.
3.2.9 Situation of women in Mangarkot
3.2.9.1 Social life
The major problem for women in Mangarkot is poverty. Landholdings are very small, there are insufficient
irrigation facilities and the men find no jobs in the area and have to travel far for work.
For many women high fertility is also a big problem: They have many children but they can hardly feed and look
after them. The children do not go to school regularly (people cannot afford to buy books and clothes) and the
girls’ school is not operating at all. It is very difficult to sustain such big families under these conditions – not
enough food, insufficient medical supplies, no money..... Especially the future of daughters is a major concern
for many women, because to get them married they need money and gifts for the bridegroom’s family.
If the man in the family is not healthy, then the whole future of the family is in danger, because they cannot live
from agriculture alone. The women would like to work, but there are no jobs for them. They help with the field
work sometimes, but this does not increase their income. Women in Mangarkot face a very hard and difficult
life. Often they work like men, they take care of everything while the men are away, with the help of their
children.
3.2.9.2 Agricultural issues
There are only a few orchards in Mangarkot and therefore there is not much fruit production. Maize and wheat
are the major crops. The corn is cleaned and stored for the winter and sometimes sold. Food processing of
vegetables and fruits is not possible because there is hardly ever any food surplus. If there was an ample supply
of water, people would plant more trees like walnut, peach, plum, apple, apricot,.... and they would also grow
more vegetables.
Asked to rank the various products, wheat was considered most important (see table 3.12). Most of the time is
invested in the animals, also in gathering of fodder which is regarded to be very hard work. Collection of
fuelwood is extremely labour intensive as is wheat crop. Everything else, according to the interviewed women, is
less important, with regard to time consumption, labour, profits and importance.

102
Table 3. 12: Results of scoring of products with regard to various aspects during interviews with women in Mangarkot.
Time consumption Labour Profits Importance
Fuelwood •• •••• • •••
Timber men work!! - - -
Fodder ••• ••••••• - -
Fruits very little! - - -
Vegetable very little! - - -
Maize only 5 days work - - -
Wheat ••• ••• - ••••
Animals •••••• •••• - -
The main constraints according to women:
- Water scarcity:
Water supply was especially in the year of the survey a big problem – after four months without any rain
women had to walk up to 40 minutes to the next spring to get water. There is only one well in the village
and it is very unreliable. Because there are hardly any irrigated fields, cultivation of fruit trees and
vegetables is difficult.
- Fuelwood shortage:
To gather fuelwood people had to walk a long way. If the men were not at home the young children would
have to go and collect fuelwood and fodder.
- Uncertain harvests:
Due to the lack of irrigation systems and the local climate, harvest is very much depending on precipitation
and varies from year to year.
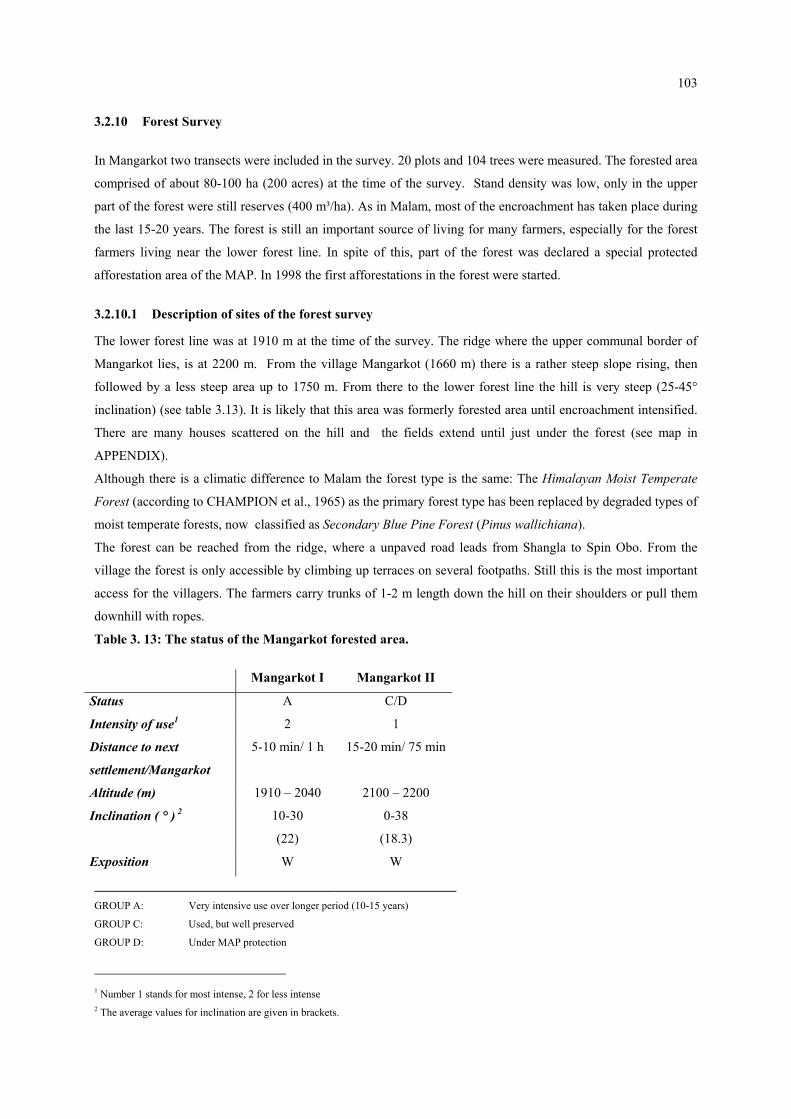
103
3.2.10 Forest Survey
In Mangarkot two transects were included in the survey. 20 plots and 104 trees were measured. The forested area
comprised of about 80-100 ha (200 acres) at the time of the survey. Stand density was low, only in the upper
part of the forest were still reserves (400 m³/ha). As in Malam, most of the encroachment has taken place during
the last 15-20 years. The forest is still an important source of living for many farmers, especially for the forest
farmers living near the lower forest line. In spite of this, part of the forest was declared a special protected
afforestation area of the MAP. In 1998 the first afforestations in the forest were started.
3.2.10.1 Description of sites of the forest survey
The lower forest line was at 1910 m at the time of the survey. The ridge where the upper communal border of
Mangarkot lies, is at 2200 m. From the village Mangarkot (1660 m) there is a rather steep slope rising, then
followed by a less steep area up to 1750 m. From there to the lower forest line the hill is very steep (25-45°
inclination) (see table 3.13). It is likely that this area was formerly forested area until encroachment intensified.
There are many houses scattered on the hill and the fields extend until just under the forest (see map in
APPENDIX).
Although there is a climatic difference to Malam the forest type is the same: The Himalayan Moist Temperate
Forest (according to CHAMPION et al., 1965) as the primary forest type has been replaced by degraded types of
moist temperate forests, now classified as Secondary Blue Pine Forest (Pinus wallichiana).
The forest can be reached from the ridge, where a unpaved road leads from Shangla to Spin Obo. From the
village the forest is only accessible by climbing up terraces on several footpaths. Still this is the most important
access for the villagers. The farmers carry trunks of 1-2 m length down the hill on their shoulders or pull them
downhill with ropes.
Table 3. 13: The status of the Mangarkot forested area.
Mangarkot I Mangarkot II
Status A C/D
Intensity of use1 2 1
Distance to next
settlement/Mangarkot
5-10 min/ 1 h 15-20 min/ 75 min
Altitude (m) 1910 – 2040 2100 – 2200
Inclination ( ° ) 2 10-30
(22)
0-38
(18.3)
Exposition W W
______________________________________________________ GROUP A: Very intensive use over longer period (10-15 years)
GROUP C: Used, but well preserved
GROUP D: Under MAP protection
1 Number 1 stands for most intense, 2 for less intense 2 The average values for inclination are given in brackets.
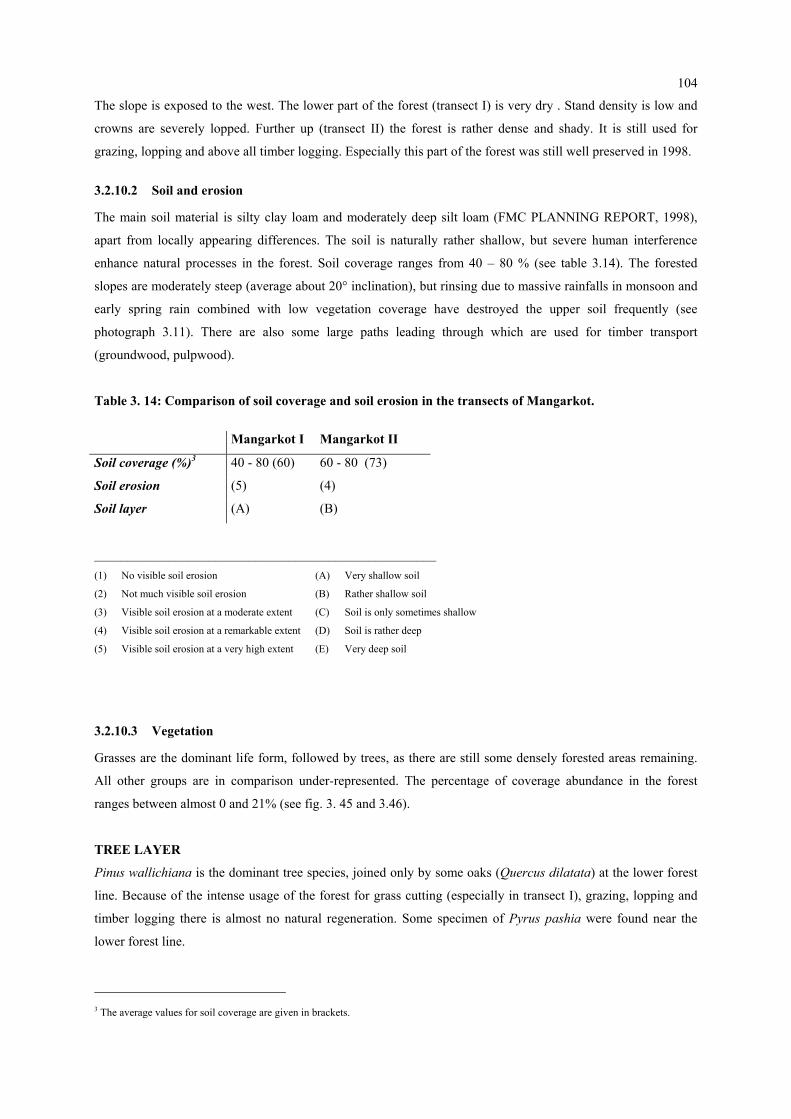
104
The slope is exposed to the west. The lower part of the forest (transect I) is very dry . Stand density is low and
crowns are severely lopped. Further up (transect II) the forest is rather dense and shady. It is still used for
grazing, lopping and above all timber logging. Especially this part of the forest was still well preserved in 1998.
3.2.10.2 Soil and erosion
The main soil material is silty clay loam and moderately deep silt loam (FMC PLANNING REPORT, 1998),
apart from locally appearing differences. The soil is naturally rather shallow, but severe human interference
enhance natural processes in the forest. Soil coverage ranges from 40 – 80 % (see table 3.14). The forested
slopes are moderately steep (average about 20° inclination), but rinsing due to massive rainfalls in monsoon and
early spring rain combined with low vegetation coverage have destroyed the upper soil frequently (see
photograph 3.11). There are also some large paths leading through which are used for timber transport
(groundwood, pulpwood).
Table 3. 14: Comparison of soil coverage and soil erosion in the transects of Mangarkot.
Mangarkot I Mangarkot II
Soil coverage (%)3 40 - 80 (60) 60 - 80 (73)
Soil erosion (5) (4)
Soil layer (A) (B)
___________________________________________________ (1) No visible soil erosion (A) Very shallow soil
(2) Not much visible soil erosion (B) Rather shallow soil
(3) Visible soil erosion at a moderate extent (C) Soil is only sometimes shallow
(4) Visible soil erosion at a remarkable extent (D) Soil is rather deep
(5) Visible soil erosion at a very high extent (E) Very deep soil
3.2.10.3 Vegetation
Grasses are the dominant life form, followed by trees, as there are still some densely forested areas remaining.
All other groups are in comparison under-represented. The percentage of coverage abundance in the forest
ranges between almost 0 and 21% (see fig. 3. 45 and 3.46).
TREE LAYER
Pinus wallichiana is the dominant tree species, joined only by some oaks (Quercus dilatata) at the lower forest
line. Because of the intense usage of the forest for grass cutting (especially in transect I), grazing, lopping and
timber logging there is almost no natural regeneration. Some specimen of Pyrus pashia were found near the
lower forest line.
3 The average values for soil coverage are given in brackets.
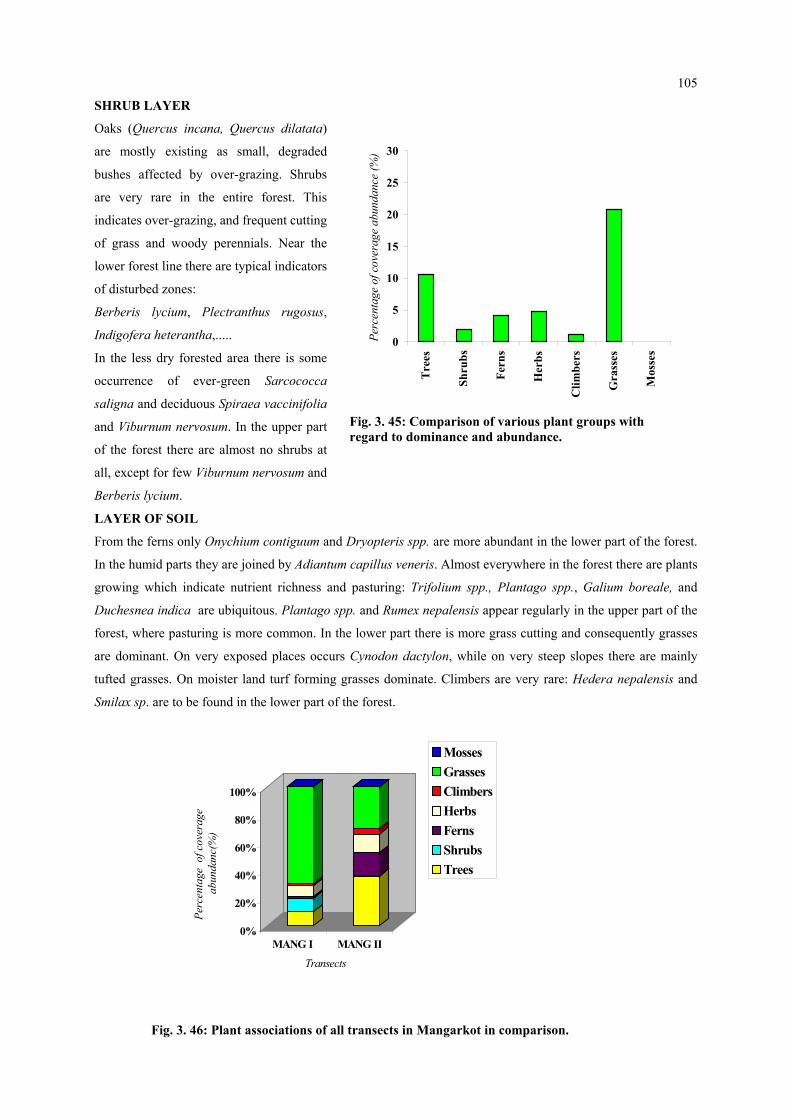
105
SHRUB LAYER
Oaks (Quercus incana, Quercus dilatata)
are mostly existing as small, degraded
bushes affected by over-grazing. Shrubs
are very rare in the entire forest. This
indicates over-grazing, and frequent cutting
of grass and woody perennials. Near the
lower forest line there are typical indicators
of disturbed zones:
Mos
ses
Berberis lycium, Plectranthus rugosus,
Indigofera heterantha,.....
In the less dry forested area there is some
occurrence of ever-green Sarcococca
saligna and deciduous Spiraea vaccinifolia
and Viburnum nervosum. In the upper part
of the forest there are almost no shrubs at
all, except for few Viburnum nervosum and
Berberis lycium.
LAYER OF SOIL
From the ferns only Onychium contiguum and Dryopteris spp. are more abundant in the lower part of the forest.
In the humid parts they are joined by Adiantum capillus veneris. Almost everywhere in the forest there are plants
growing which indicate nutrient richness and pasturing: Trifolium spp., Plantago spp., Galium boreale, and
Duchesnea indica are ubiquitous. Plantago spp. and Rumex nepalensis appear regularly in the upper part of the
forest, where pasturing is more common. In the lower part there is more grass cutting and consequently grasses
are dominant. On very exposed places occurs Cynodon dactylon, while on very steep slopes there are mainly
tufted grasses. On moister land turf forming grasses dominate. Climbers are very rare: Hedera nepalensis and
Smilax sp. are to be found in the lower part of the forest.
0%
20%
40%
60%
80%
100%
Perc
enta
ge o
f cov
erag
e ab
unda
nc(%
)
MANG I MANG II
Transects
MossesGrassesClimbersHerbsFernsShrubsTrees
Fig. 3. 46: Plant associations of all transects in Mangarkot in comparison.
0
5
10
15
20
25
30
Tre
es
Shru
bs
Fern
s
Her
bs
Clim
bers
Gra
sses
Perc
enta
ge o
f cov
erag
e ab
unda
nce
(%)
Fig. 3. 45: Comparison of various plant groups withregard to dominance and abundance.
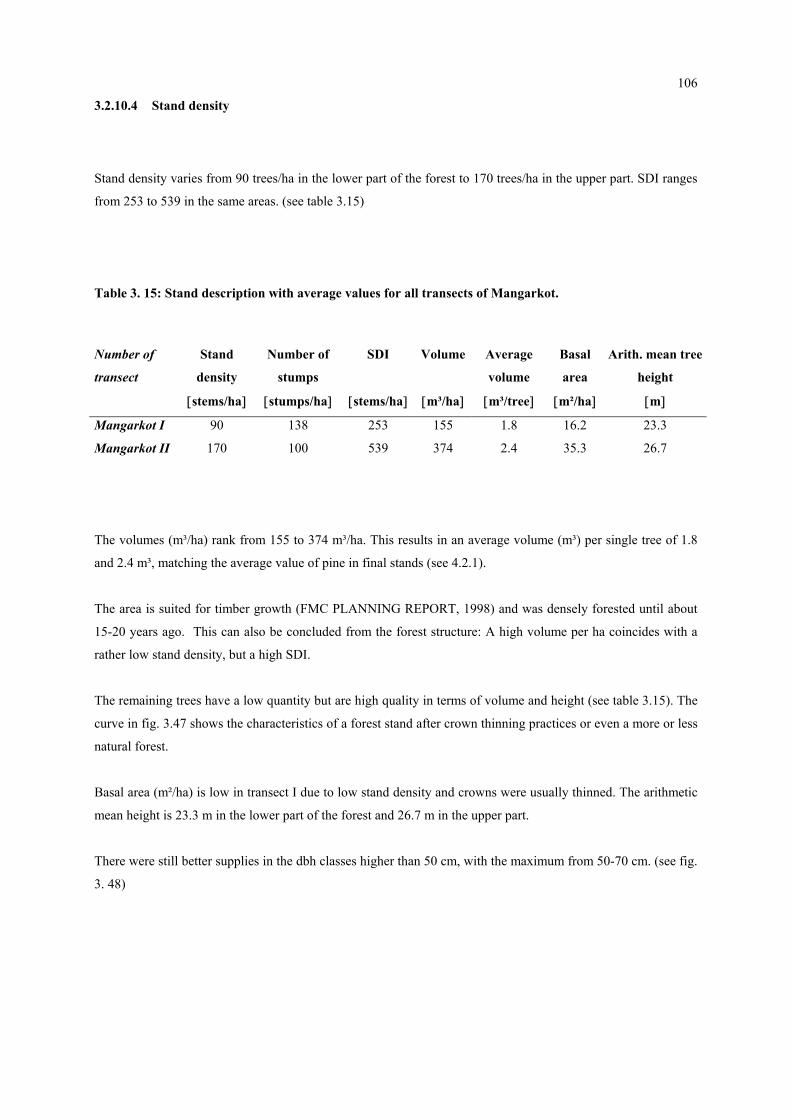
106
3.2.10.4 Stand density
Stand density varies from 90 trees/ha in the lower part of the forest to 170 trees/ha in the upper part. SDI ranges
from 253 to 539 in the same areas. (see table 3.15)
Table 3. 15: Stand description with average values for all transects of Mangarkot.
Number of
transect
Stand
density
Number of
stumps
SDI Volume Average
volume
Basal
area
Arith. mean tree
height
[stems/ha] [stumps/ha] [stems/ha] [m³/ha] [m³/tree] [m²/ha] [m]
Mangarkot I 90 138 253 155 1.8 16.2 23.3
Mangarkot II 170 100 539 374 2.4 35.3 26.7
The volumes (m³/ha) rank from 155 to 374 m³/ha. This results in an average volume (m³) per single tree of 1.8
and 2.4 m³, matching the average value of pine in final stands (see 4.2.1).
The area is suited for timber growth (FMC PLANNING REPORT, 1998) and was densely forested until about
15-20 years ago. This can also be concluded from the forest structure: A high volume per ha coincides with a
rather low stand density, but a high SDI.
The remaining trees have a low quantity but are high quality in terms of volume and height (see table 3.15). The
curve in fig. 3.47 shows the characteristics of a forest stand after crown thinning practices or even a more or less
natural forest.
Basal area (m²/ha) is low in transect I due to low stand density and crowns were usually thinned. The arithmetic
mean height is 23.3 m in the lower part of the forest and 26.7 m in the upper part.
There were still better supplies in the dbh classes higher than 50 cm, with the maximum from 50-70 cm. (see fig.
3. 48)

107
0
10
20
30
40
50
60
<20 30 40 50 60 70 >70
dbh (cm)
N (n
umbe
r of t
rees
/ha)
MANG IMANG II
Fig. 3. 47: Comparison of stand structures with regardto stand density (trees/ha) and dbh (cm). The classesare subdivided in groups from <20, 20-30, 30-40,....to60-70 and >70 cm.
0
40
80
120
160
<20 30 40 50 60 70 >70
dbh (cm)
Volu
me
(m³/h
a)
MANG IMANG II
Fig. 3. 48: Remaining volumes (m³/ha) per dbh class (cm):The classes are subdivided in groups from <20, 20-30, 30-40,....to 60-70 and >70 cm.
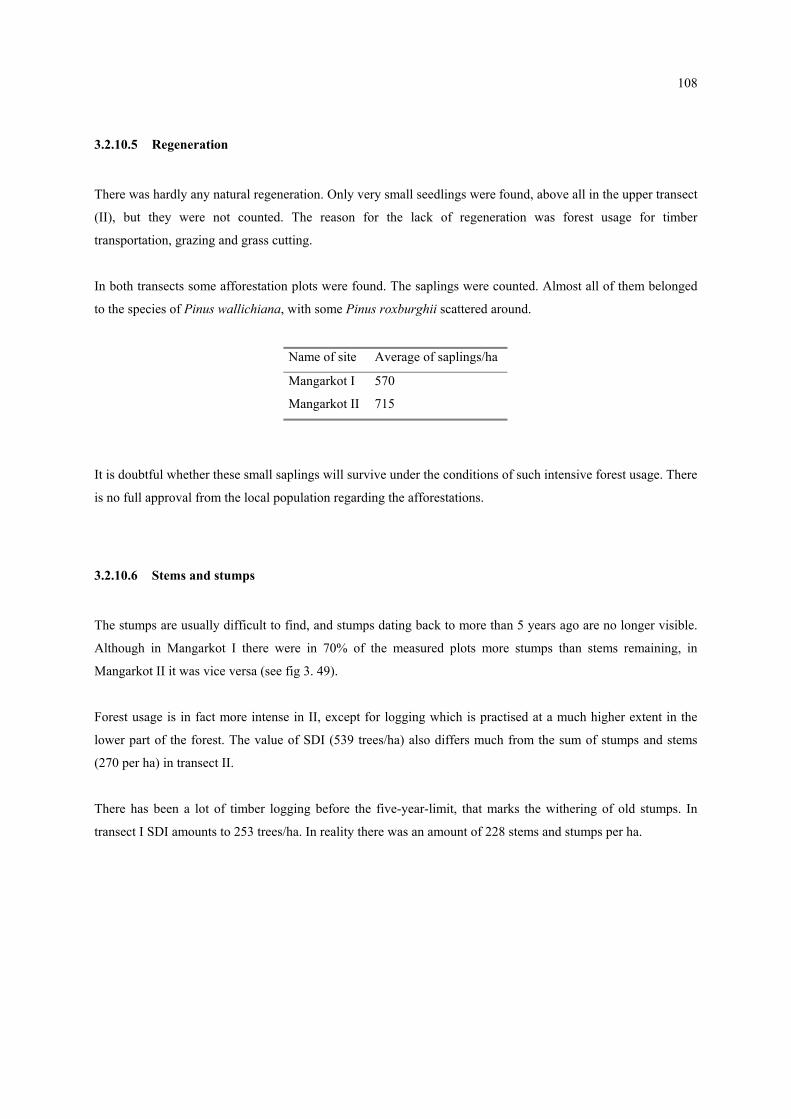
108
3.2.10.5 Regeneration
There was hardly any natural regeneration. Only very small seedlings were found, above all in the upper transect
(II), but they were not counted. The reason for the lack of regeneration was forest usage for timber
transportation, grazing and grass cutting.
In both transects some afforestation plots were found. The saplings were counted. Almost all of them belonged
to the species of Pinus wallichiana, with some Pinus roxburghii scattered around.
Name of site Average of saplings/ha
Mangarkot I 570
Mangarkot II 715
It is doubtful whether these small saplings will survive under the conditions of such intensive forest usage. There
is no full approval from the local population regarding the afforestations.
3.2.10.6 Stems and stumps
The stumps are usually difficult to find, and stumps dating back to more than 5 years ago are no longer visible.
Although in Mangarkot I there were in 70% of the measured plots more stumps than stems remaining, in
Mangarkot II it was vice versa (see fig 3. 49).
Forest usage is in fact more intense in II, except for logging which is practised at a much higher extent in the
lower part of the forest. The value of SDI (539 trees/ha) also differs much from the sum of stumps and stems
(270 per ha) in transect II.
There has been a lot of timber logging before the five-year-limit, that marks the withering of old stumps. In
transect I SDI amounts to 253 trees/ha. In reality there was an amount of 228 stems and stumps per ha.
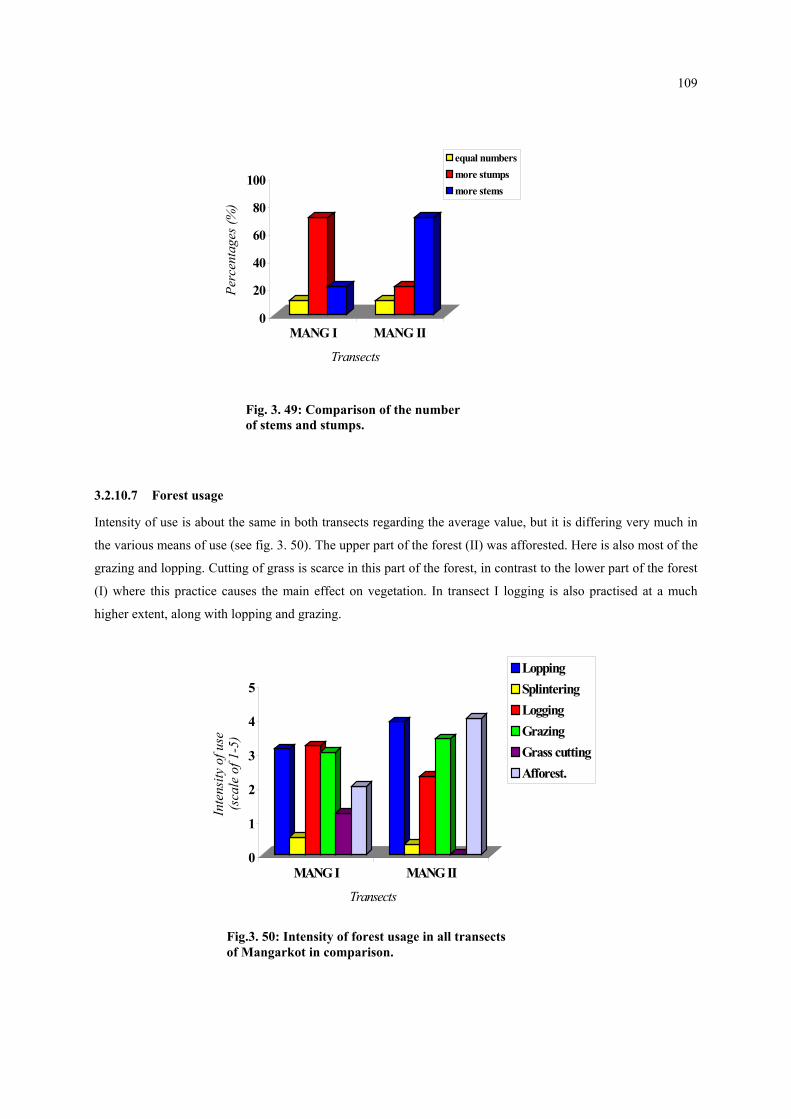
109
ual numbersore stumpsore stems
3.2.10.7 Forest
Intensity of use is
the various means
grazing and loppin
(I) where this pra
higher extent, alon
0
20
40
60
80
100
Perc
enta
ges (
%)
MANG I MANG II
Transects
eqmm
Fig. 3. 49: Comparison of the number of stems and stumps.
usage
about the same in both transects regarding the average value, but it is differing very much in
of use (see fig. 3. 50). The upper part of the forest (II) was afforested. Here is also most of the
g. Cutting of grass is scarce in this part of the forest, in contrast to the lower part of the forest
ctice causes the main effect on vegetation. In transect I logging is also practised at a much
g with lopping and grazing.
0
1
2
3
4
5
Inte
nsity
of u
se
(sca
le o
f 1-5
)
MANG I MANG II
Transects
LoppingSplinteringLoggingGrazingGrass cuttingAfforest.
Fig.3. 50: Intensity of forest usage in all transects of Mangarkot in comparison.
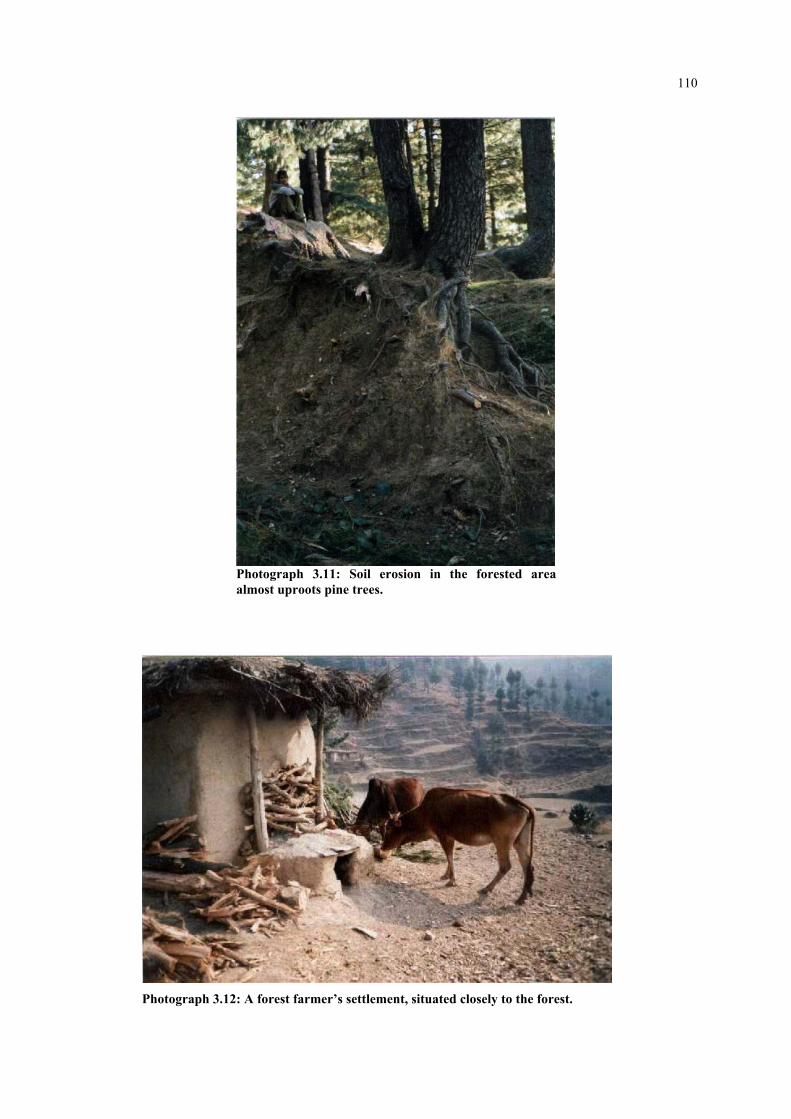
110
Photograph 3.11: Soil erosion in the forested areaalmost uproots pine trees.
Photograph 3.12: A forest farmer’s settlement, situated closely to the forest.

111
Photograph 3.13: Logging of intact, vital trees is illegal,but to take a “dying tree” is not against the law. Oftenthis process is artificially accelerated – e.g. by setting fire to a pine tree; the fire is usually put out before itspreads.
Photograph 3.14: The terraces reach right up to the lower forest line and often expand into the existing forested area.

112
3.2.10.8 Mangarkot: Transect I
The site is situated about an hour's walk away from Mangarkot on a very steep, western exposed slope (see
photograph 3. 15). The average inclination in the transect is 22°. The transect reaches from 1900 - 2040 m. To
the south the slope declines into a ravine like hollow. This slope is very steep (40-45°), but it is still used for
grazing and lopping.
Transect I begins only about 60 m away from the last farmhouse below the forest. There are only few trees left
there, only a little bit further up the lower forest line there are more trees and additionally more undergrowth,
also richer in diversity.
Beginning with plot Nr.6 the MAP afforestation starts. The year 1998, when the afforestation was started, was
very dry. Following the last plot of this transect there is a flat area with a very strong soil compaction and not
much ground vegetation. This area was not very representative and was therefore not further investigated. The
survey was continued approximately 400 m further up the hill with transect II.
Vegetation
TREE LAYER
Pinus wallichiana is the dominant tree species, accompanied by some oaks and specimen of Pyrus pashia near
the lower forest line. But oaks (Quercus incana, Quercus dilatata) existed mostly as small, degraded bushes
affected by over-grazing. There are relatively few trees in transect I. (see fig. 3. 51)
0
5
10
15
20
25
30
Perc
enta
ge o
f cov
erag
e ab
unda
nce
(%)
Tre
es
Shru
bs
Fern
s
Her
bs
Clim
bers
Gra
sses
Mos
ses
Fig.3. 51: Percentage of coverage abundance of plant groups in transect I.
SHRUB LAYER
Shrubs have a very low percentage of coverage
abundance due to over-grazing and frequent grass
cutting. All woody perennials are cut regularly.
Near the lower forest line there are typical
indicators of disturbed zones: Berberis lycium,
Plectranthus rugosus, Indigofera heterantha,.....In
the less dry forested area there are examples of
ever-green Sarcococca saligna and Cotoneaster
spp., as well as deciduous Spiraea vaccinifolia and
Viburnum nervosum.
LAYER OF SOIL
Grasses are the dominant life form, mainly as tufted grass. On drier aspects Cynodon dactylon dominates.
Among the herbs are pasture-tolerant Trifolium spp., Chenopodium album and Plantago spp., together with
Galium boreale, Duchesnea indica and Androsace rotundifolia. Nepeta clarkei, Nepeta laevigata and
Clinopodium umbrosum are abundant representatives of the Lamiaceae family.

113
Less common are moisture containing Oxalis corniculata, Rumex nepalensis and ferns - only Onychium
contiguum and Dryopteris spp. occurred in abundance in the lower part of the forest. Climbers like Hedera
nepalensis and Smilax sp. appear rather seldom.
Stand table
0
20
40
60
80
100
<20 30 40 50 60 70 >70
Dbh classes in cm
Num
ber o
f tre
es/h
a
Fig. 3. 52: Stand table in terms of dbh classesin transect I.
The stand table diagram (see fig. 3.52) shows a low
number of trees/ha (90). Most of the dbh are in the
classes 30-40 and 40-50 cm, while smaller and larger
dbh are largely underrepresented. The structure is similar
to that known after crown thinning, which would
indicate that mainly dominant, older trees were taken
out.
Natural regeneration could not be verified since recent
grass cutting destroyed the seedlings that possibly
existed earlier.
In the upper part of the transect saplings were planted.
These plantations amount to 22.8 plants per 400 m² on
average which would result in 570 plants/ha.
Although it is unlikely, that more than 20 % will survive for a year, especially in a dry one like the year of the
survey. Also grazing, grass cutting and logging affect the plantations.
Forest usage
0
1
2
3
4
5
Intensity of use (1-5)
MANG I 3,1 0,5 3,2 3 1,2 2
Lop Spli Log Graz Grc Aff
Fig.3. 52: Intensity of different ways of forest usage in transect I.
In 70% of the plots there are more stumps than
stems counted. The further up one goes the more
stumps could be found.
Stand density is already very low with 90 trees/ha
and 138 stumps/ha (SDI 253 trees/ha). Both
logging and lopping are still practised to a very
high extent. Saws were frequently used to log
trees in this forest.
There is a certain amount of pasturage, but the
major interference is the cutting of grass and
woody perennials. (see fig. 3.52)

114
3.2.10.9 Mangarkot: Transect II
Transect II is exposed to the west. The average inclination is 18.3°, varying from very steep to exceptionally flat
areas (see photograph 3.16). The walking distance to Mangarkot is about 1 hour and 15 minutes. The transect
starts about 400 m above transect I and ends below the unpaved road from Shangla to Spin Obo. The altitude
ranges from 2100-2200 m. On top of the hill, near the ridge, the forest ends.
The forest is used for lopping, grazing and logging but it is still well preserved. There are also many seedlings
(one year old) growing on the forest ground (ca. 5 cm high), but no other trees of less than 20 m height. In this
transect many saplings were found but they were unlikely to survive on long term basis.
Vegetation
TREE LAYER
0
5
10
15
20
25
30
Perc
enta
ge o
f cov
erag
e ab
unda
nce
(%)
Tre
es
Shru
bs
Fern
s
Her
bs
Clim
bers
Gra
sses
Mos
ses
Fig.3. 54: Percentage of coverage abundance of plant groups in transect II.
Pinus wallichiana is the dominant tree
species, occurring with the highest
abundance among all plant groups in this
transect (see fig. 3.54).
Oaks (Quercus incana, Quercus dilatata)
exist mainly as small, degraded bushes.
SHRUB LAYER
In transect II there are almost no shrubs at
all, except for some Viburnum nervosum and
Berberis lycium, joined by very few
specimen of Indigofera heterantha and
Cotoneaster spp..
LAYER OF SOIL
Grasses rank second in average coverage percentages after trees, next are ferns followed by herbal plants. The
dominant grasses are turf-forming grassed, the next most prolific is Cynodon dactylon.
In transect II indicators of pasturing and nutrient richness are plentiful, like Trifolium spp., Plantago spp., and
Rumex nepalensis. The latter appears very often, also together with Duchesnea indica, Galium boreale,
Geranium spp., Ranunculus spp. and Androsace rotundifolia. The Lamiaceae family is represented with
Prunella vulgaris, Nepeta laevigata, Nepeta clarkei, Clinopodium umbrosum.
Ferns are more common in this transect, above all Onychium contiguum followed by Dryopteris spp. and
Adiantum capillus veneris, while climbers are scarce.
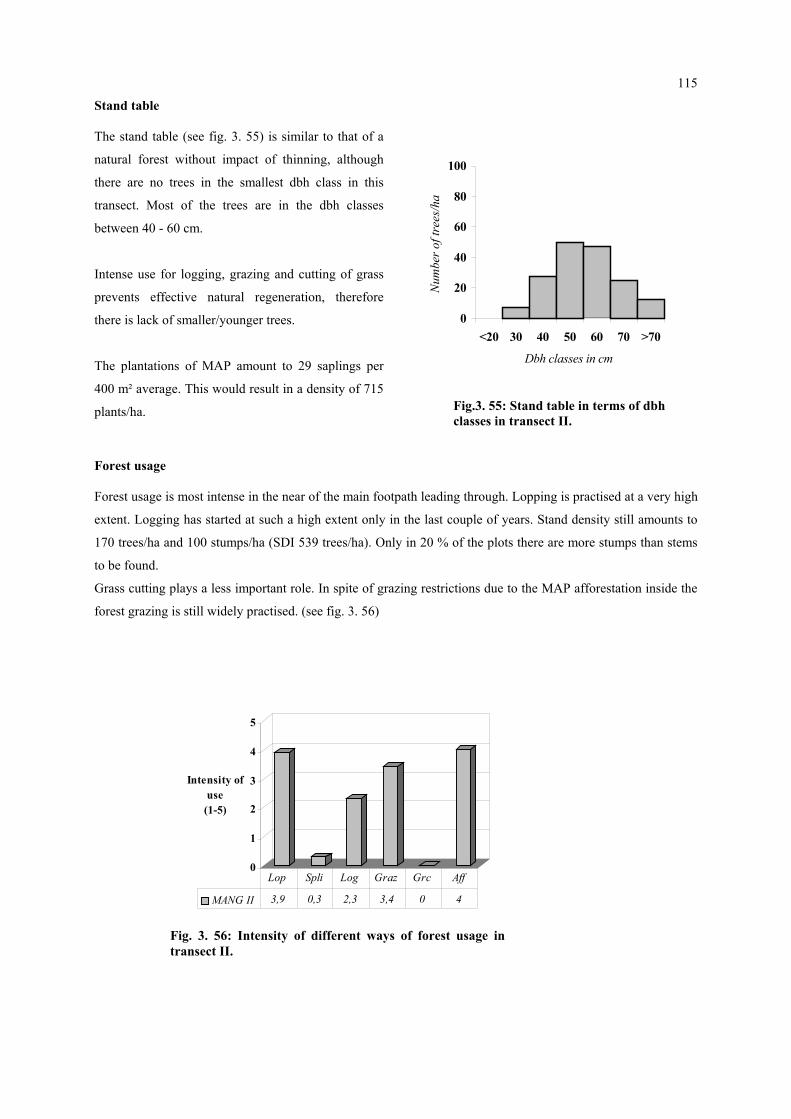
115
Stand table
The stand table (see fig. 3. 55) is similar to that of a
natural forest without impact of thinning, although
there are no trees in the smallest dbh class in this
transect. Most of the trees are in the dbh classes
between 40 - 60 cm.
Intense use for logging, grazing and cutting of grass
prevents effective natural regeneration, therefore
there is lack of smaller/younger trees.
The plantations of MAP amount to 29 saplings per
400 m² average. This would result in a density of 715
plants/ha.
Forest usage
Forest usage is most intense in the near of the main footp
extent. Logging has started at such a high extent only in
170 trees/ha and 100 stumps/ha (SDI 539 trees/ha). Only
to be found.
Grass cutting plays a less important role. In spite of graz
forest grazing is still widely practised. (see fig. 3. 56)
0
1
2
3
4
5
Intensity of use
(1-5)
MANG II 3,9 0,3 2,3 3,4
Lop Spli Log Graz
Fig. 3. 56: Intensity of different ways transect II.
0
20
40
60
80
100
<20 30 40 50 60 70 >70
Dbh classes in cm
Num
ber o
f tre
es/h
a
Fig.3. 55: Stand table in terms of dbh classes in transect II.
ath leading through. Lopping is practised at a very high
the last couple of years. Stand density still amounts to
in 20 % of the plots there are more stumps than stems
ing restrictions due to the MAP afforestation inside the
0 4
Grc Aff
of forest usage in

116
Photograph 3.15: Transect I in Mangarkot: The forest is intensely used forgrazing, grass cutting, timber logging and lopping. Grasses are turf-forming andthere are almost no woody perennials.
Photograph 3.15: Transect I in Mangarkot: The forest is intensely used forgrazing, grass cutting, timber logging and lopping. Grasses are turf-forming andthere are almost no woody perennials.
116
Photograph 3.16: Transect II in Mangarkot: There are both tufted grasses andturf –forming grasses represented in the transect. Stand density is high, but forestusage is about to become increasingly severe.
Photograph 3.16: Transect II in Mangarkot: There are both tufted grasses andturf –forming grasses represented in the transect. Stand density is high, but forestusage is about to become increasingly severe.
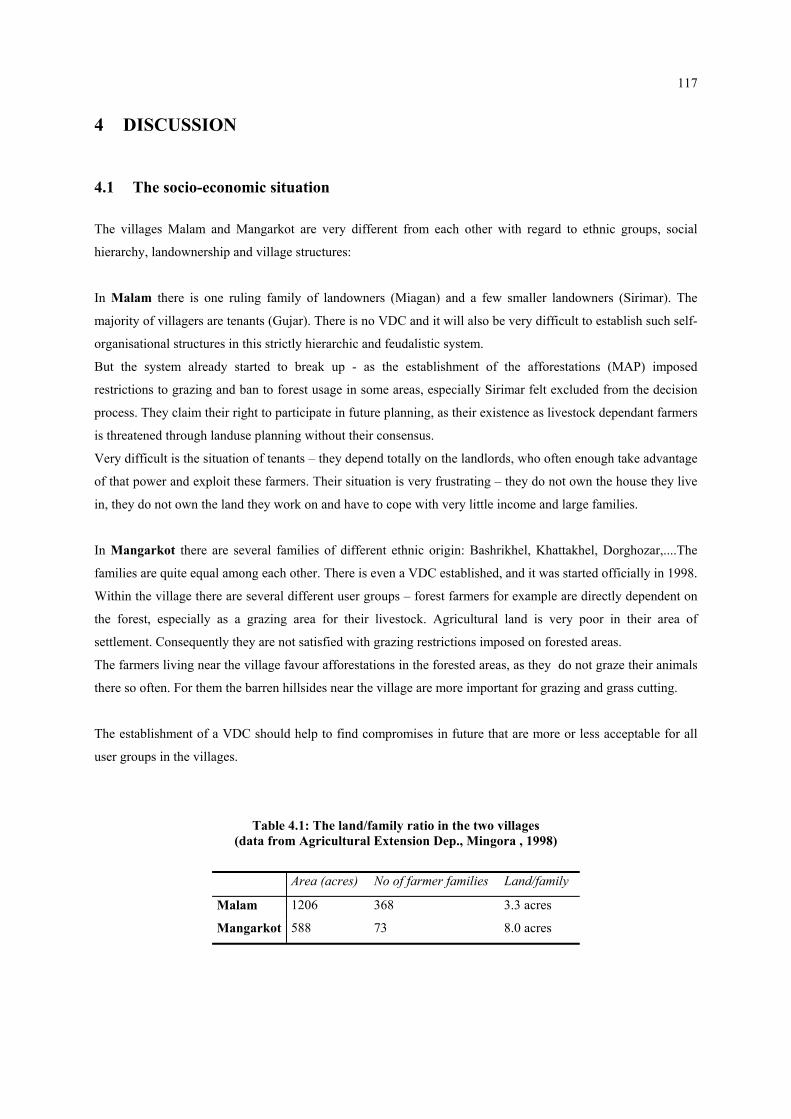
117
4 DISCUSSION
4.1 The socio-economic situation
The villages Malam and Mangarkot are very different from each other with regard to ethnic groups, social
hierarchy, landownership and village structures:
In Malam there is one ruling family of landowners (Miagan) and a few smaller landowners (Sirimar). The
majority of villagers are tenants (Gujar). There is no VDC and it will also be very difficult to establish such self-
organisational structures in this strictly hierarchic and feudalistic system.
But the system already started to break up - as the establishment of the afforestations (MAP) imposed
restrictions to grazing and ban to forest usage in some areas, especially Sirimar felt excluded from the decision
process. They claim their right to participate in future planning, as their existence as livestock dependant farmers
is threatened through landuse planning without their consensus.
Very difficult is the situation of tenants – they depend totally on the landlords, who often enough take advantage
of that power and exploit these farmers. Their situation is very frustrating – they do not own the house they live
in, they do not own the land they work on and have to cope with very little income and large families.
In Mangarkot there are several families of different ethnic origin: Bashrikhel, Khattakhel, Dorghozar,....The
families are quite equal among each other. There is even a VDC established, and it was started officially in 1998.
Within the village there are several different user groups – forest farmers for example are directly dependent on
the forest, especially as a grazing area for their livestock. Agricultural land is very poor in their area of
settlement. Consequently they are not satisfied with grazing restrictions imposed on forested areas.
The farmers living near the village favour afforestations in the forested areas, as they do not graze their animals
there so often. For them the barren hillsides near the village are more important for grazing and grass cutting.
The establishment of a VDC should help to find compromises in future that are more or less acceptable for all
user groups in the villages.
Table 4.1: The land/family ratio in the two villages (data from Agricultural Extension Dep., Mingora , 1998)
Area (acres) No of farmer families Land/family
Malam 1206 368 3.3 acres
Mangarkot 588 73 8.0 acres
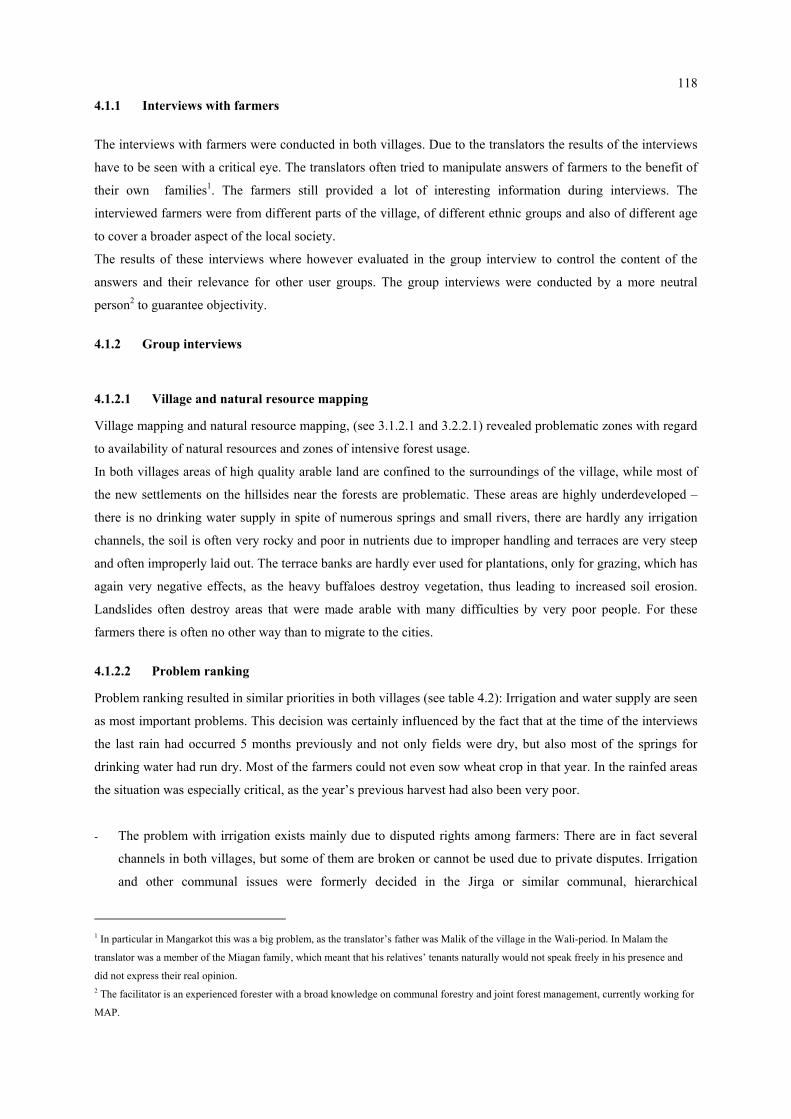
118
4.1.1 Interviews with farmers
The interviews with farmers were conducted in both villages. Due to the translators the results of the interviews
have to be seen with a critical eye. The translators often tried to manipulate answers of farmers to the benefit of
their own families1. The farmers still provided a lot of interesting information during interviews. The
interviewed farmers were from different parts of the village, of different ethnic groups and also of different age
to cover a broader aspect of the local society.
The results of these interviews where however evaluated in the group interview to control the content of the
answers and their relevance for other user groups. The group interviews were conducted by a more neutral
person2 to guarantee objectivity.
4.1.2 Group interviews
4.1.2.1 Village and natural resource mapping
Village mapping and natural resource mapping, (see 3.1.2.1 and 3.2.2.1) revealed problematic zones with regard
to availability of natural resources and zones of intensive forest usage.
In both villages areas of high quality arable land are confined to the surroundings of the village, while most of
the new settlements on the hillsides near the forests are problematic. These areas are highly underdeveloped –
there is no drinking water supply in spite of numerous springs and small rivers, there are hardly any irrigation
channels, the soil is often very rocky and poor in nutrients due to improper handling and terraces are very steep
and often improperly laid out. The terrace banks are hardly ever used for plantations, only for grazing, which has
again very negative effects, as the heavy buffaloes destroy vegetation, thus leading to increased soil erosion.
Landslides often destroy areas that were made arable with many difficulties by very poor people. For these
farmers there is often no other way than to migrate to the cities.
4.1.2.2 Problem ranking
Problem ranking resulted in similar priorities in both villages (see table 4.2): Irrigation and water supply are seen
as most important problems. This decision was certainly influenced by the fact that at the time of the interviews
the last rain had occurred 5 months previously and not only fields were dry, but also most of the springs for
drinking water had run dry. Most of the farmers could not even sow wheat crop in that year. In the rainfed areas
the situation was especially critical, as the year’s previous harvest had also been very poor.
- The problem with irrigation exists mainly due to disputed rights among farmers: There are in fact several
channels in both villages, but some of them are broken or cannot be used due to private disputes. Irrigation
and other communal issues were formerly decided in the Jirga or similar communal, hierarchical
1 In particular in Mangarkot this was a big problem, as the translator’s father was Malik of the village in the Wali-period. In Malam the
translator was a member of the Miagan family, which meant that his relatives’ tenants naturally would not speak freely in his presence and
did not express their real opinion. 2 The facilitator is an experienced forester with a broad knowledge on communal forestry and joint forest management, currently working for
MAP.
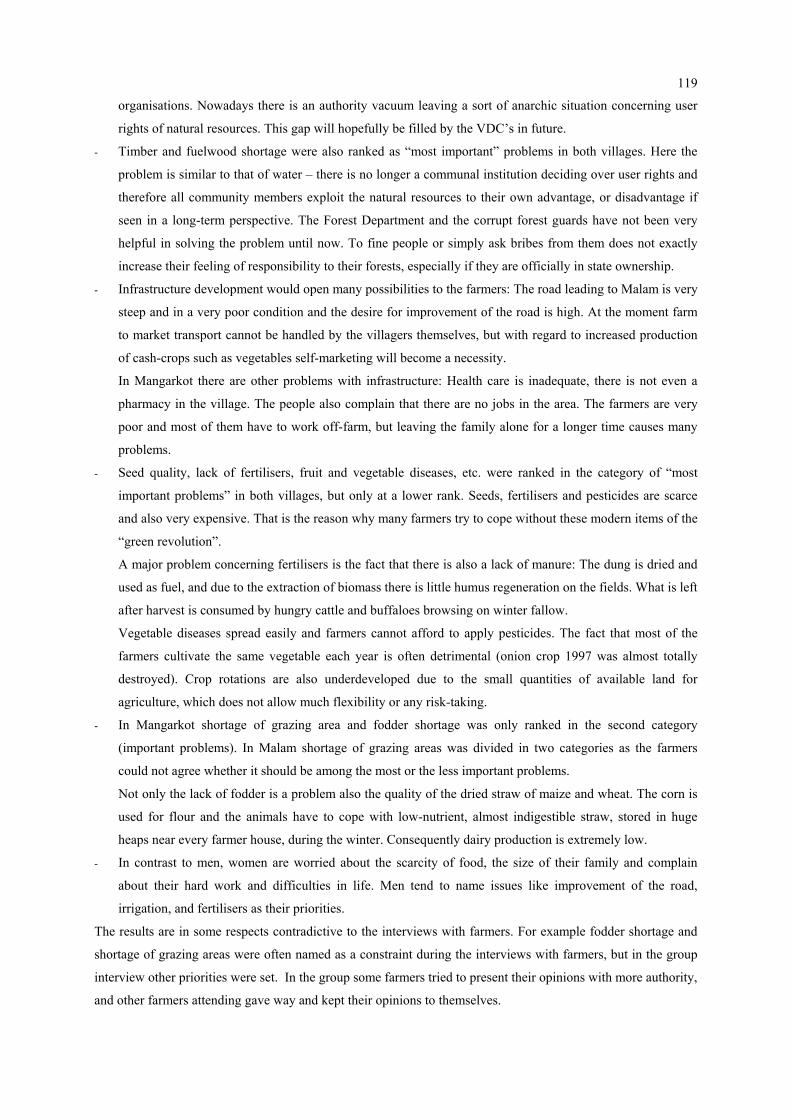
119
organisations. Nowadays there is an authority vacuum leaving a sort of anarchic situation concerning user
rights of natural resources. This gap will hopefully be filled by the VDC’s in future.
- Timber and fuelwood shortage were also ranked as “most important” problems in both villages. Here the
problem is similar to that of water – there is no longer a communal institution deciding over user rights and
therefore all community members exploit the natural resources to their own advantage, or disadvantage if
seen in a long-term perspective. The Forest Department and the corrupt forest guards have not been very
helpful in solving the problem until now. To fine people or simply ask bribes from them does not exactly
increase their feeling of responsibility to their forests, especially if they are officially in state ownership.
- Infrastructure development would open many possibilities to the farmers: The road leading to Malam is very
steep and in a very poor condition and the desire for improvement of the road is high. At the moment farm
to market transport cannot be handled by the villagers themselves, but with regard to increased production
of cash-crops such as vegetables self-marketing will become a necessity.
In Mangarkot there are other problems with infrastructure: Health care is inadequate, there is not even a
pharmacy in the village. The people also complain that there are no jobs in the area. The farmers are very
poor and most of them have to work off-farm, but leaving the family alone for a longer time causes many
problems.
- Seed quality, lack of fertilisers, fruit and vegetable diseases, etc. were ranked in the category of “most
important problems” in both villages, but only at a lower rank. Seeds, fertilisers and pesticides are scarce
and also very expensive. That is the reason why many farmers try to cope without these modern items of the
“green revolution”.
A major problem concerning fertilisers is the fact that there is also a lack of manure: The dung is dried and
used as fuel, and due to the extraction of biomass there is little humus regeneration on the fields. What is left
after harvest is consumed by hungry cattle and buffaloes browsing on winter fallow.
Vegetable diseases spread easily and farmers cannot afford to apply pesticides. The fact that most of the
farmers cultivate the same vegetable each year is often detrimental (onion crop 1997 was almost totally
destroyed). Crop rotations are also underdeveloped due to the small quantities of available land for
agriculture, which does not allow much flexibility or any risk-taking.
- In Mangarkot shortage of grazing area and fodder shortage was only ranked in the second category
(important problems). In Malam shortage of grazing areas was divided in two categories as the farmers
could not agree whether it should be among the most or the less important problems.
Not only the lack of fodder is a problem also the quality of the dried straw of maize and wheat. The corn is
used for flour and the animals have to cope with low-nutrient, almost indigestible straw, stored in huge
heaps near every farmer house, during the winter. Consequently dairy production is extremely low.
- In contrast to men, women are worried about the scarcity of food, the size of their family and complain
about their hard work and difficulties in life. Men tend to name issues like improvement of the road,
irrigation, and fertilisers as their priorities.
The results are in some respects contradictive to the interviews with farmers. For example fodder shortage and
shortage of grazing areas were often named as a constraint during the interviews with farmers, but in the group
interview other priorities were set. In the group some farmers tried to present their opinions with more authority,
and other farmers attending gave way and kept their opinions to themselves.

120
Table 4.2: Problem ranking in both villages in comparison.
MALAM
MANGARKOT
Most important
problem
Important
problem
Less important
problem
Most important
problem
Important
problem
Less important
problem
WATER SUPPLY
LACK OF
FERTILISERS
SHORTAGE OF
GRAZING
AREAS
IRRIGATION VEGETABLES AND
FRUIT MARKETING
AND TRANSPORT
ELECTRICITY
IRRIGATION FRUIT STORAGE
AND MARKETING
WATER SUPPLY
AVAILABILITY OF
GOOD FRUIT TREES
ROAD
FODDER SHORTAGE TIMBER
SHORTAGE
SHORTAGE OF
GRAZING AREAS
FUELWOOD
NO JOBS NEAR
THE VILLAGE
FODDER SHORTAGE
TIMBER
SHORTAGE
HEALTH CARE
FOREST RIGHTS
ROAD
SEED QUALITY
LACK OF
FERTILISERS
DISEASES
(ON FRUITS AND
VEGETABLES)
FUELWOOD
VEGETABLES
AND MARKETING
SEED QUALITY
TREES FOR
PLANTATIONS
DISEASES
(ON FRUITS AND
VEGETABLES)
SHORTAGE OF
GRAZING AREAS
PROTECTED
AREAS (FOREST)
ANIMAL HEALTH
CARE
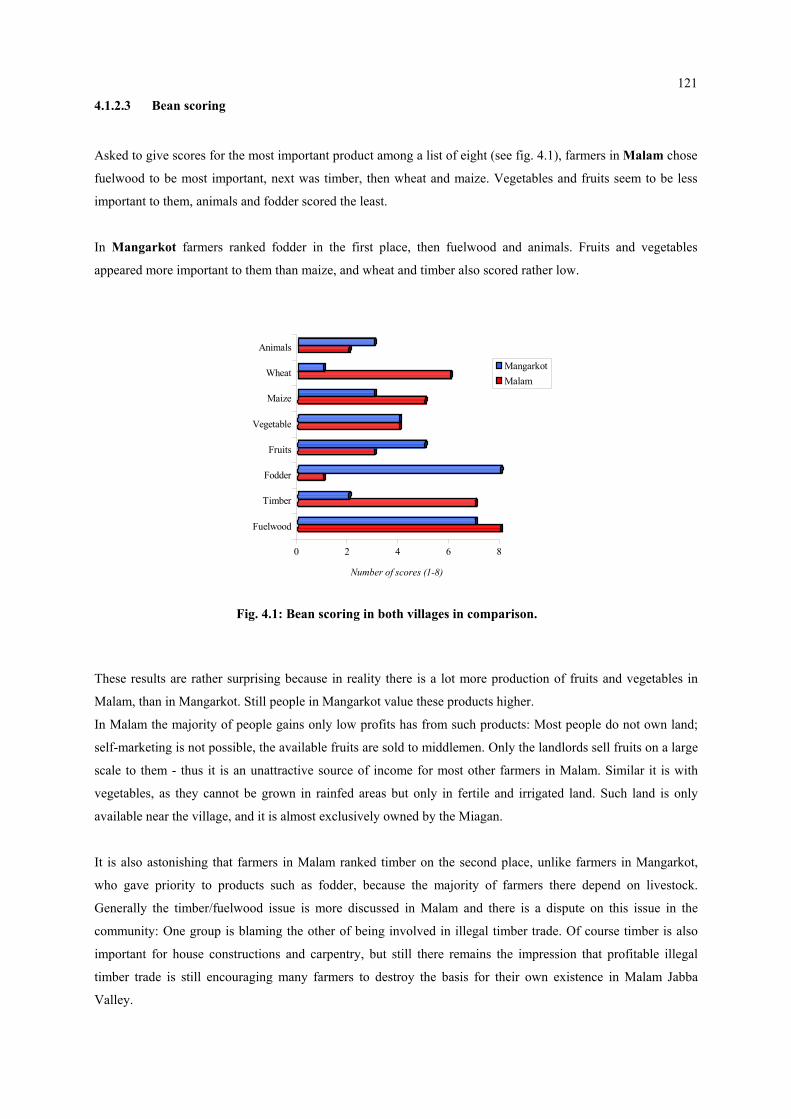
121
4.1.2.3 Bean scoring
Asked to give scores for the most important product among a list of eight (see fig. 4.1), farmers in Malam chose
fuelwood to be most important, next was timber, then wheat and maize. Vegetables and fruits seem to be less
important to them, animals and fodder scored the least.
In Mangarkot farmers ranked fodder in the first place, then fuelwood and animals. Fruits and vegetables
appeared more important to them than maize, and wheat and timber also scored rather low.
These results are rather s
Malam, than in Mangarko
In Malam the majority o
self-marketing is not poss
scale to them - thus it is
vegetables, as they cann
available near the village
It is also astonishing tha
who gave priority to pr
Generally the timber/fue
community: One group i
important for house con
timber trade is still enco
Valley.
0 2 4 6 8
Number of scores (1-8)
Fuelwood
Timber
Fodder
Fruits
Vegetable
Maize
Wheat
Animals
MangarkotMalam
Fig. 4.1: Bean scoring in both villages in comparison.
urprising because in reality there is a lot more production of fruits and vegetables in
t. Still people in Mangarkot value these products higher.
f people gains only low profits has from such products: Most people do not own land;
ible, the available fruits are sold to middlemen. Only the landlords sell fruits on a large
an unattractive source of income for most other farmers in Malam. Similar it is with
ot be grown in rainfed areas but only in fertile and irrigated land. Such land is only
, and it is almost exclusively owned by the Miagan.
t farmers in Malam ranked timber on the second place, unlike farmers in Mangarkot,
oducts such as fodder, because the majority of farmers there depend on livestock.
lwood issue is more discussed in Malam and there is a dispute on this issue in the
s blaming the other of being involved in illegal timber trade. Of course timber is also
structions and carpentry, but still there remains the impression that profitable illegal
uraging many farmers to destroy the basis for their own existence in Malam Jabba
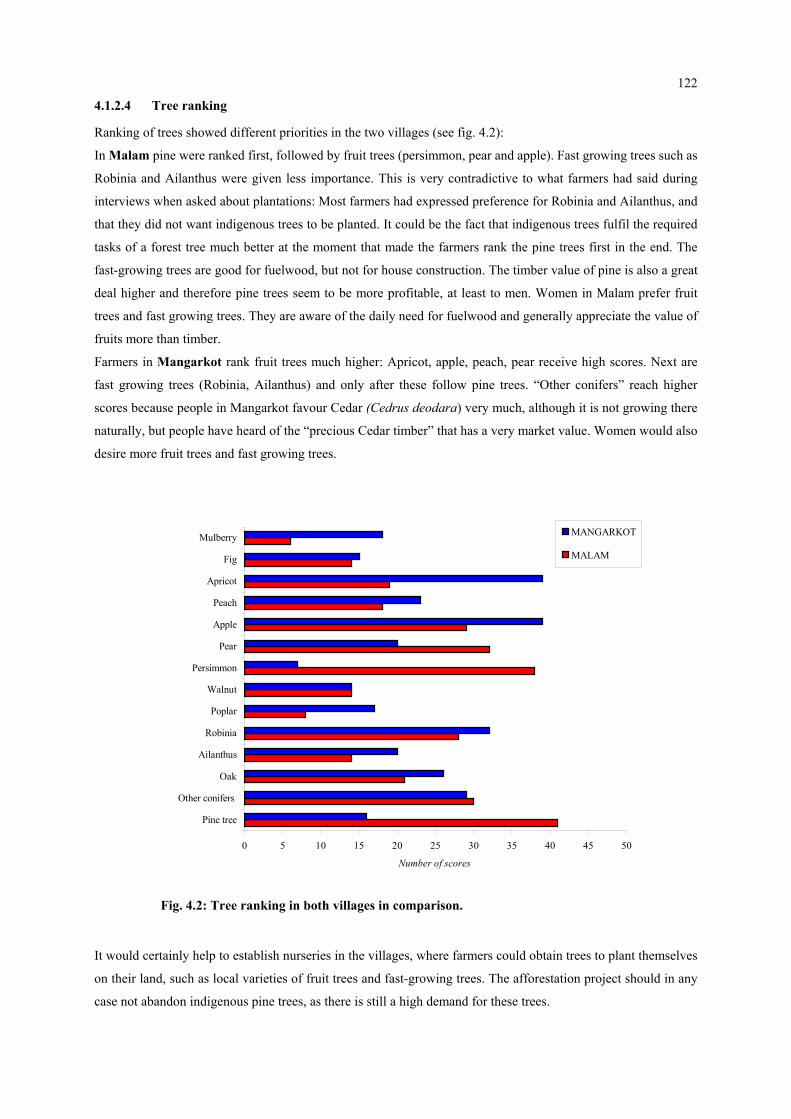
122
4.1.2.4 Tree ranking
Ranking of trees showed different priorities in the two villages (see fig. 4.2):
In Malam pine were ranked first, followed by fruit trees (persimmon, pear and apple). Fast growing trees such as
Robinia and Ailanthus were given less importance. This is very contradictive to what farmers had said during
interviews when asked about plantations: Most farmers had expressed preference for Robinia and Ailanthus, and
that they did not want indigenous trees to be planted. It could be the fact that indigenous trees fulfil the required
tasks of a forest tree much better at the moment that made the farmers rank the pine trees first in the end. The
fast-growing trees are good for fuelwood, but not for house construction. The timber value of pine is also a great
deal higher and therefore pine trees seem to be more profitable, at least to men. Women in Malam prefer fruit
trees and fast growing trees. They are aware of the daily need for fuelwood and generally appreciate the value of
fruits more than timber.
Farmers in Mangarkot rank fruit trees much higher: Apricot, apple, peach, pear receive high scores. Next are
fast growing trees (Robinia, Ailanthus) and only after these follow pine trees. “Other conifers” reach higher
scores because people in Mangarkot favour Cedar (Cedrus deodara) very much, although it is not growing there
naturally, but people have heard of the “precious Cedar timber” that has a very market value. Women would also
desire more fruit trees and fast growing trees.
0 5 10 15 20 25 30 35 40 45 50
Pine tree
Other conifers
Oak
Ailanthus
Robinia
Poplar
Walnut
Persimmon
Pear
Apple
Peach
Apricot
Fig
Mulberry
Number of scores
MANGARKOT
MALAM
Fig. 4.2: Tree ranking in both villages in comparison.
It would certainly help to establish nurseries in the villages, where farmers could obtain trees to plant themselves
on their land, such as local varieties of fruit trees and fast-growing trees. The afforestation project should in any
case not abandon indigenous pine trees, as there is still a high demand for these trees.
123
4.2 The status of the forested area
4.2.1 Summary of the most important stand parameter
Pinus wallichiana is the dominant tree in the forested area in both surveyed villages. Table 4.1 shows minimum,
maximum and average values measured for all trees in transects of Malam and Mangarkot. Standard error (Se)
and standard deviation (Sd ) were calculated for the most important stand features.
The surveyed area shows remarkable differences in stand density and volumes within the respective forested
areas. Basal area, dbh, arithmetic mean height and species dominance and abundance vary in a much smaller
range.
Table 4.3: The six surveyed transects in Malam comprised 39 plots (240 trees), while in Mangarkot two transects were measured with a total of 20 plots (104 trees).
MALAM MANGARKOT
Min
Max Average
S d
S e
Min
Max
Average
S d
S e
Stand density
[stems/ha]
25 300 153.8 78.9 12.6 50 275 130.0 64.7 14.5
Number of stumps
[stumps/ha]
25 425 144.9 92.9 14.9 0 225 118.8 55.5 12.4
SDI
[stems/ha]
120 843 436.9 206.4 33.1 107 934 395.8 212.9 47.6
Volume
[m³/ha]
35 1455 366.4 309.1 49.5 47 671 264.8 157.6 35.2
Basal area
[m²/ha]
7 57 28.1 13.7 2.2 6 65 25.8 14.5 3.3
Dbh
[cm]
33.5 73 48.9 9.8 1.57 38 72 49.3 8.2 1.8
Arithmetic mean
tree height
[m]
21 32 25.8 2.5 0.4 16 30 25.0 3.4 0.8
Species dominance
and abundance
(scale 1-5)
2 4 2.5 0.5 0.1 1 3 2.5 0.6 0.1
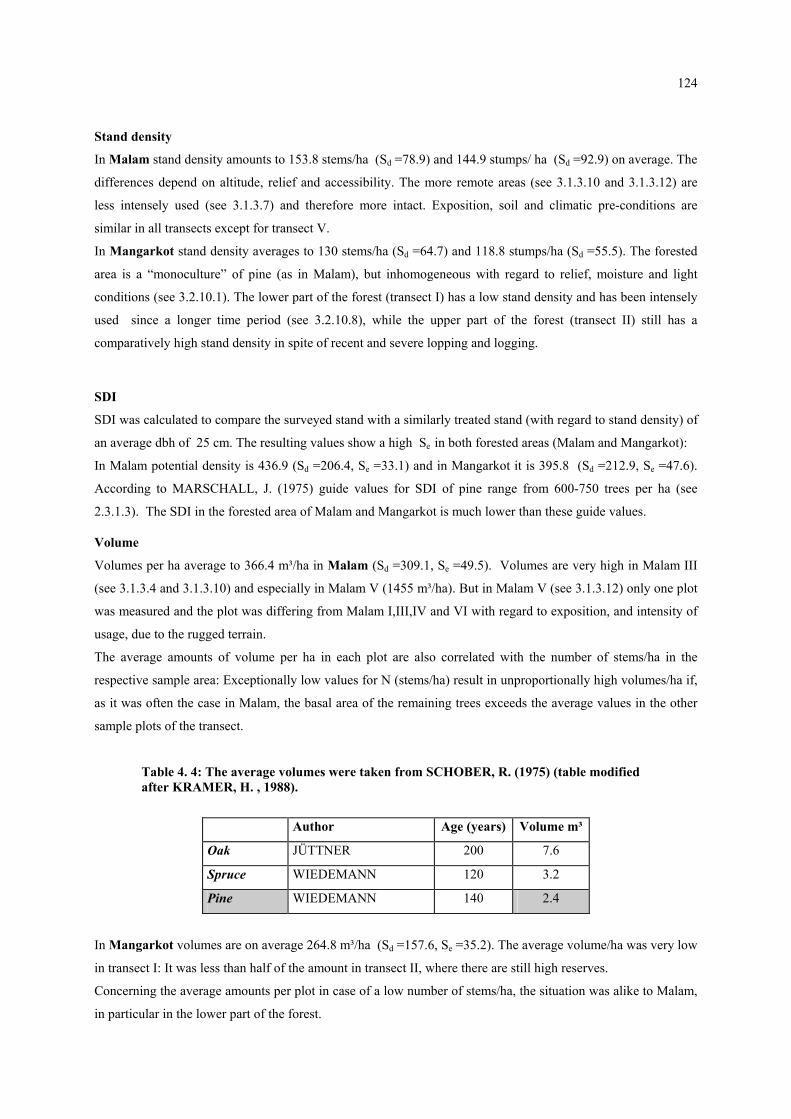
124
Stand density
In Malam stand density amounts to 153.8 stems/ha (Sd =78.9) and 144.9 stumps/ ha (Sd =92.9) on average. The
differences depend on altitude, relief and accessibility. The more remote areas (see 3.1.3.10 and 3.1.3.12) are
less intensely used (see 3.1.3.7) and therefore more intact. Exposition, soil and climatic pre-conditions are
similar in all transects except for transect V.
In Mangarkot stand density averages to 130 stems/ha (Sd =64.7) and 118.8 stumps/ha (Sd =55.5). The forested
area is a “monoculture” of pine (as in Malam), but inhomogeneous with regard to relief, moisture and light
conditions (see 3.2.10.1). The lower part of the forest (transect I) has a low stand density and has been intensely
used since a longer time period (see 3.2.10.8), while the upper part of the forest (transect II) still has a
comparatively high stand density in spite of recent and severe lopping and logging.
SDI
SDI was calculated to compare the surveyed stand with a similarly treated stand (with regard to stand density) of
an average dbh of 25 cm. The resulting values show a high Se in both forested areas (Malam and Mangarkot):
In Malam potential density is 436.9 (Sd =206.4, Se =33.1) and in Mangarkot it is 395.8 (Sd =212.9, Se =47.6).
According to MARSCHALL, J. (1975) guide values for SDI of pine range from 600-750 trees per ha (see
2.3.1.3). The SDI in the forested area of Malam and Mangarkot is much lower than these guide values.
Volume
Volumes per ha average to 366.4 m³/ha in Malam (Sd =309.1, Se =49.5). Volumes are very high in Malam III
(see 3.1.3.4 and 3.1.3.10) and especially in Malam V (1455 m³/ha). But in Malam V (see 3.1.3.12) only one plot
was measured and the plot was differing from Malam I,III,IV and VI with regard to exposition, and intensity of
usage, due to the rugged terrain.
The average amounts of volume per ha in each plot are also correlated with the number of stems/ha in the
respective sample area: Exceptionally low values for N (stems/ha) result in unproportionally high volumes/ha if,
as it was often the case in Malam, the basal area of the remaining trees exceeds the average values in the other
sample plots of the transect.
Table 4. 4: The average volumes were taken from SCHOBER, R. (1975) (table modified after KRAMER, H. , 1988).
Author Age (years) Volume m³
Oak JÜTTNER 200 7.6
Spruce WIEDEMANN 120 3.2
Pine WIEDEMANN 140 2.4
In Mangarkot volumes are on average 264.8 m³/ha (Sd =157.6, Se =35.2). The average volume/ha was very low
in transect I: It was less than half of the amount in transect II, where there are still high reserves.
Concerning the average amounts per plot in case of a low number of stems/ha, the situation was alike to Malam,
in particular in the lower part of the forest.

125
KRAMER, H. (1988) mentions that the volume of forest trees depends mainly on locality, Wuchsraum and age
of a tree. The collection of yield tables of SCHOBER, R. (1975) contains average volumes for the most
important European trees. In the first yield class (I. Ertragsklasse) and under strong thinning trees of final stands
reach average volumes as shown in table 4.2.
The calculated average volume (m³) per single tree matches or even exceeds the value of pine (2.4m³) in all
transects except for Malam I (1.4 m³) (see 3.1.3.4) and Mangarkot I (1.8 m³) (see 3.2.10.1). This reflects the past
management of stands, when no conventional forest management was practised, but single trees were mainly
logged for fuelwood and house construction.
KLEINE, M. (1990) also mentions that intensive management of the high hill conifer forests in Northern
Pakistan started only in the early 80ies: “Mainly the single tree selection system without proper measures to
enhance natural regeneration, the lack of systematic stand management and traditional felling and extraction
methods (scantlings) led to undesirable conditions of these forests.” As such he lists overmaturity of the stands,
poor stocking and therefore low productivity and considerable loss of valuable timber in terms of quantity and
quality.
SOERIANEGARA, I. and LEMMENS, R.H.M.J. (1993) describe the attributes of Pinus L. with special regard
to pines of South-East Asia. According to them, pine is a good general-purpose timber, although in
woodworking and finishing aspects its resinous nature requires special attention. The wood is medium-weight
and moderately hard. Pine timber is only moderately durable and often prone to termite attack. It is also
susceptible to blue stain, ambrosia beetles and dry-wood borers.
“Pines are much planted trees because of their fast growth, ability to grow on comparatively poor soils and at
high altitudes, and because of the detailed information available on their silviculture. The quality of the wood is,
however, often very poor. “ (SOERIANEGARA, I. and LEMMENS, R.H.M.J., 1993)
VIDAKOVIC, M. (1991) describes P. wallichiana in particular: This pine is up to 50 m high, the crown is
broadly pyramidal. Needles are in fascicles of 5. P. wallichiana is native to the Himalaya. It often forms pure
stands, and is known as a fast growing and very frost hardy tree that grows preferably on fresh and rich soils.
4.2.2 Natural regeneration and afforestation practices
Pines are pioneers and their natural range is extended by colonisation following disturbances such as fire. They
are light demanding and habitually grow in pure stands. Successful natural regeneration is only possible where a
relatively large amount of sunlight reaches the ground. (SOERIANEGARA, I. and LEMMENS, R.H.M.J., 1993)
In the surveyed forested area was enough sunlight reaching the forest ground due to low canopy density (except
for transect IV, see 3.1.3.11). Stand density and canopy density influence microclimate on forest ground. The
amount of radiation reaching forest ground through the canopy, influences mixture, density and growth of
seedlings (AMMER, C., 1996).
In the case of Malam and Mangarkot forest usage is far too intense for any efficient regeneration: Over-grazing,
frequent cutting of grass and woody perennials, logging and consequent timber transport (as in Mangarkot, see
126
3.2.10.1) destroy seedlings and small trees. If forest usage decreases, then natural regeneration will rapidly
increase, as it has already happened in Malam VI (see 3.1.3.13).
The afforestation in Malam II (see 3.1.3.9) is situated on a slope not far from the village. In 1997 and 1998 about
180 acres in total were afforested. The amount of 890 plants/ha3 appears to be extremely low, considering that
LÜPKE, B. (1995) recommends 3000-5000 plants/ha in afforestations of pine under European conditions
(however, nothing objects to lower the density to 1000-2000 plants/ha according to him). KHAN, M. and
KLEINE, M. (1990) write after a two-years study on natural regeneration of Chir Pine (P. roxburghii),” The
increase in the number of plants which are taller than 20 cm also reached a level of about 10 000 plants/ha after
two years which is sufficient to build up future stands of suitable stocking.” A study on seedling mortality
revealed that a height of 20 cm is sufficient for the survival of seedlings – in the afforestation of Malam 24 % of
the seedlings were smaller than 20 cm, and 57 % between 20-30 cm.
To make afforestations more efficient it would be important to have a full acceptance from the farmers’ side in
the first place, additionally the following aspects should be taken into account:
- Density should be increased to at least 2000 plants/ha. Reportedly there have been drop-out rates of about
80% in the first two years of the afforestations. Considering an average amount of about 800-1000 plants/ha
in the afforestations this would only leave a number of 160-200 plants/ha after only two years.
- In any case the sites have to be replanted regularly – besides the practical effect, there is also some
psychological side-effect if the site is not neglected but in a “hopeful” condition. If there are only dead
saplings left, there will be no more reason for protection.
- Protection should be organised by the villagers themselves, to create a sort of social responsibility and a
“social fence” protecting the afforestations.
- Besides an increase in density, it also seems reasonable to start afforestations with plants of at least 20 cm
height. Especially in dry years and if grazing was not fully given up yet in the concerned area, smaller plants
have less chance to survive.
The afforestations in the forested area in Mangarkot were chosen because some villagers asked for it, but it is
doubtful whether it will be successful: It is situated in the middle of the forest where restricted grazing would
enhance natural regeneration sufficiently (see Malam transect VI). Density is rather low, only 570 – 715
plants/ha, and many saplings were planted in ditches, along the path and on other unsuitable areas, which again
makes their destruction most likely.
Due to afforestation attempts two introduced species have reached an enormous spread - Robinia pseudoacacia
(originates from North America) and Ailanthus altissima (originates from China). Already after five years first
harvesting is possible and thus the trees are widely accepted and preferred to slow-growing indigenous species.
The trees are avoided by grazing animals because they are slightly poisonous and because of thorns (Robinia
only). Still foliage is used as fodder, thus replacing oaks that used to be a common fodder source before.
3 This value is a result of the survey on afforestation, see 3.1.3.9).

127
4.2.3 The extent of forest usage
The intense use of forested areas for grazing, cutting of woody perennials and grasses are the reasons for slow
and insufficient establishment of natural regeneration. Changes in nutrient circulation due to pasturage influence
vegetation and alter the original flora.
Lopping and splintering to gain torchwood weakens trees in the long run, and are frequently practised for this
purpose.
Single tree selection is a common practice, nevertheless forest soil is often destroyed through logging and the
consequent downhill transport of poles.
Grass cutting
9%Afforest.
0%
Splintering2%Logging
31%
Grazing21%
Lopping37%
Lopping27%
Splintering3%
Afforest.22%
Grass cutting
4%
Grazing24%
Logging20%
Fig. 4.3: Share of the various ways of forest usage in Malam( left) and Mangarkot (right).
Fig. 4.3 shows the importance of the different ways of forest usage in the two surveyed villages: In both forested
areas lopping and logging have the severest impact on forest structure and are practised almost everywhere.
Grazing is a common practice on the slopes with a lesser inclination, while grass cutting is confined to the
steeper forested areas. Splintering is not practised to a larger extent. There are no afforestations in the forested
areas of Malam, only in Mangarkot the forest is partly afforested (see 4.2.2).
Table 4.5 shows the correlation between various parameter and forest usage:
• Inclination is significantly correlated with forest usage: The steeper the slopes are the less intense is forest
usage. Only cutting of grass is practised more often and therefore positively correlated with increasing
inclination in Malam.
• Natural regeneration in the forested area of Malam is significantly correlated with grass cutting, as in higher
areas there is less impact on forest ground and almost no pasturage. Lopping has a negative impact on
regeneration, as many trees are so severely lopped that seed production is reduced drastically.
• Species dominance and abundance is positively correlated with altitude, inclination and soil coverage on the
0.01 level. Forest usage has a negative impact – grazing reduces species dominance and abundance of
vegetation and severe lopping reduces canopy density: Sunlight reaches the forest ground and it often turns
very dry, thus negatively influencing typical forest plants.
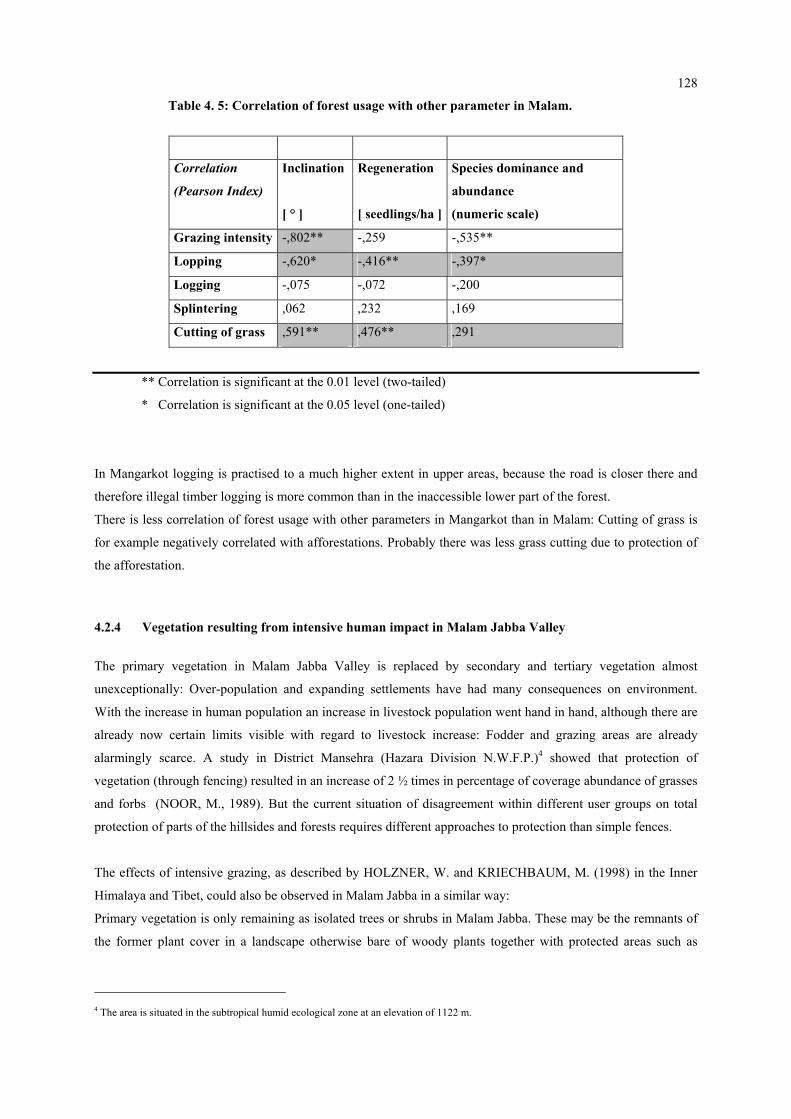
128
Table 4. 5: Correlation of forest usage with other parameter in Malam.
Correlation
(Pearson Index)
Inclination
[ ° ]
Regeneration
[ seedlings/ha ]
Species dominance and
abundance
(numeric scale)
Grazing intensity -,802** -,259 -,535**
Lopping -,620* -,416** -,397*
Logging -,075 -,072 -,200
Splintering ,062 ,232 ,169
Cutting of grass ,591** ,476** ,291
** Correlation is significant at the 0.01 level (two-tailed)
* Correlation is significant at the 0.05 level (one-tailed)
In Mangarkot logging is practised to a much higher extent in upper areas, because the road is closer there and
therefore illegal timber logging is more common than in the inaccessible lower part of the forest.
There is less correlation of forest usage with other parameters in Mangarkot than in Malam: Cutting of grass is
for example negatively correlated with afforestations. Probably there was less grass cutting due to protection of
the afforestation.
4.2.4 Vegetation resulting from intensive human impact in Malam Jabba Valley
The primary vegetation in Malam Jabba Valley is replaced by secondary and tertiary vegetation almost
unexceptionally: Over-population and expanding settlements have had many consequences on environment.
With the increase in human population an increase in livestock population went hand in hand, although there are
already now certain limits visible with regard to livestock increase: Fodder and grazing areas are already
alarmingly scarce. A study in District Mansehra (Hazara Division N.W.F.P.)4 showed that protection of
vegetation (through fencing) resulted in an increase of 2 ½ times in percentage of coverage abundance of grasses
and forbs (NOOR, M., 1989). But the current situation of disagreement within different user groups on total
protection of parts of the hillsides and forests requires different approaches to protection than simple fences.
The effects of intensive grazing, as described by HOLZNER, W. and KRIECHBAUM, M. (1998) in the Inner
Himalaya and Tibet, could also be observed in Malam Jabba in a similar way:
Primary vegetation is only remaining as isolated trees or shrubs in Malam Jabba. These may be the remnants of
the former plant cover in a landscape otherwise bare of woody plants together with protected areas such as
4 The area is situated in the subtropical humid ecological zone at an elevation of 1122 m.
129
graveyards. On graveyards oaks and the indigenous olive tree (Olea cuspidata) can be found, which is otherwise
almost extinct in Malam Jabba.
Inaccessible areas, that have been scarcely or not at all visited for various reasons, often give an impression of
how landscape and vegetation look like without strong human influences. In Malam Jabba this phenomenon is
confined to areas of higher altitude and rugged terrain.
In vegetation unpalatable plants are predominant: Unpalatable species increase due to their competitive
advantage. In contrast to unprotected plants they are “armed” with mechanical means of defence such as hard
tissues and spiny organs. Other plants prefer chemical protection devices such as bitter or acrid compounds,
ethereal oils or poisonous substances. (HOLZNER, W. and KRIECHBAUM, M., 1998)
Unpalatable shrubs occurring in Malam Jabba are for example Dodonea viscosa (bitter taste, hard tissues) in
lower areas on barren hillsides, and Berberis lycium (spiny, poisonous fruits) in the forested areas. Indigofera
heterantha, Plectranthus rugosus, Sarcococca saligna and Buxus papillosa are also mostly avoided by grazing
animals.
Spreading of pioneer plants over the whole landscape indicates a high grazing pressure according to HOLZNER,
W. and KRIECHBAUM, M. (1998). Plants that are specialised to colonise on open soils invade if vegetation is
destroyed and soil lies bare. Characteristic pioneers are annual plants (poor root system) or biennial growth
(often producing a rosette of leaves pressed to the soil). HUSSAIN , F. et al. (1997a) conducted a survey in Swat
District and observed a high abundance of therophytes and nanophanerophytes indicating “...that the habitat is
disturbed, a condition which has resulted through human activities such as deforestation, over grazing and
uprooting.”
In Malam Jabba species diversity is generally low – only one tree species grows in the surveyed area (P.
wallichiana), eight different shrubby species (phanerophytes and chamaephytes), some ferns and few different
grasses (hemikryptophytes and therophytes) in high abundance. Herbal plants are mainly hemikryptophytes
(rosette plants or with creeping shoots) and chamaephytes.
4.2.5 Wooded and non-wooded resources
Forests offer people much more than timber and fuelwood. Especially in areas like the HKH there used to be a
wide range of non-wooded products that people gained from the forest:
Trees
Besides from fodder and sometimes fruits, trees offer a wide range of possible benefits for farmers. The
indigenous pine trees are utilised for house construction, thatching, simple furniture and fuelwood. Other
valuable resources are:
- P. wallichiana: SAHNI, K. C. (1998) reports of a sweet liquid known as honey-dew that is secreted by
aphids infesting leaves of P. wallichiana and is eaten by the Himalayan people.
- P. roxburghii produces resin of commercial importance.
- Walnut (Iuglans regia) is very popular with farmers; it is renowned for its valuable timber, use for
fuelwood, edible nuts, and its fast growth is also appreciated. Its bark is used for teeth and also as cosmetic.
- Cedar (Cedrus deodara) is not only known for its precious timber, but also for “Ranselo”, an oily liquid that
is used to cure animals.
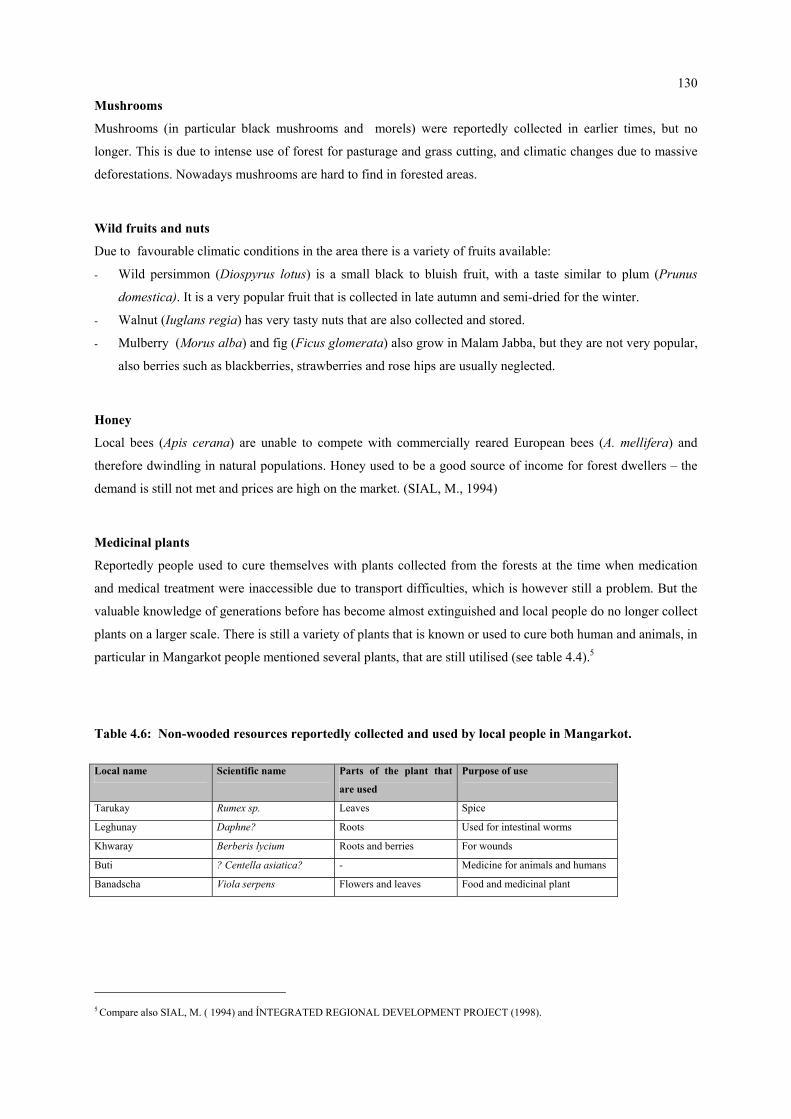
130
Mushrooms
Mushrooms (in particular black mushrooms and morels) were reportedly collected in earlier times, but no
longer. This is due to intense use of forest for pasturage and grass cutting, and climatic changes due to massive
deforestations. Nowadays mushrooms are hard to find in forested areas.
Wild fruits and nuts
Due to favourable climatic conditions in the area there is a variety of fruits available:
- Wild persimmon (Diospyrus lotus) is a small black to bluish fruit, with a taste similar to plum (Prunus
domestica). It is a very popular fruit that is collected in late autumn and semi-dried for the winter.
- Walnut (Iuglans regia) has very tasty nuts that are also collected and stored.
- Mulberry (Morus alba) and fig (Ficus glomerata) also grow in Malam Jabba, but they are not very popular,
also berries such as blackberries, strawberries and rose hips are usually neglected.
Honey
Local bees (Apis cerana) are unable to compete with commercially reared European bees (A. mellifera) and
therefore dwindling in natural populations. Honey used to be a good source of income for forest dwellers – the
demand is still not met and prices are high on the market. (SIAL, M., 1994)
Medicinal plants
Reportedly people used to cure themselves with plants collected from the forests at the time when medication
and medical treatment were inaccessible due to transport difficulties, which is however still a problem. But the
valuable knowledge of generations before has become almost extinguished and local people do no longer collect
plants on a larger scale. There is still a variety of plants that is known or used to cure both human and animals, in
particular in Mangarkot people mentioned several plants, that are still utilised (see table 4.4).5
Table 4.6: Non-wooded resources reportedly collected and used by local people in Mangarkot. Local name Scientific name Parts of the plant that
are used
Purpose of use
Tarukay Rumex sp. Leaves Spice
Leghunay Daphne? Roots Used for intestinal worms
Khwaray Berberis lycium Roots and berries For wounds
Buti ? Centella asiatica? - Medicine for animals and humans
Banadscha Viola serpens Flowers and leaves Food and medicinal plant
5 Compare also SIAL, M. ( 1994) and ÍNTEGRATED REGIONAL DEVELOPMENT PROJECT (1998).

131
4.2.6 Agroforestrial landuse
Some farmers in Malam Jabba Valley have already started to specialise on agrisilvicultural and agrihorticultural
landuse systems: Both can be applied on marginal lands and embankments of terraces thus preventing soil
erosion to some extent. Intercropping is possible and improves agricultural income. The shadow of trees protects
crops in the dry and hot months of May and June, and during the rainy seasons trees prevent surface soil erosion
with their root systems.
Agrisilviculture
This way of landuse should help to meet the increasing demand for fuelwood and construction timber, as well as
material for thatching and fodder for animal husbandry. Possible trees are fast growing trees such as Ailanthus
altissima, Robinia pseudoacacia, Populus sp. and Melia azedarach. Indigenous species such as oaks and pines
are also suitable for such plantations. They are slow-growing compared to the trees mentioned above and
therefore less appreciated. But local farmers are still more familiar with these than with newly introduced tree
species such as Ailanthus and Robinia.
Agrihorticulture
Horticulture in intercropping offers a wide range of possibilities to improve landuse and to increase household
income: Apple, pear, peach, persimmon and apricot are the most common fruit trees in the area. Wheat, rape
seed, maize and vegetables can be cultivated in intercropping. Pasturage is also possible.
Fodder and fuelwood can also be gained to some extent from fruit trees. Fruits can be sold on the market or kept
for household use. This would also mean a benefit for women in particular as their role in food processing and
storage would consequently gain importance.

132
5 CONCLUSION
The silvo-pastoral systems in Malam Jabba Valley are characterised through excessive over-use of natural
resources. The rapid population growth in this century has lead to hillside agriculture in former forested areas
and to numerous settlements expanding into forested areas.
Over-grazing, grass cutting and intense forest usage for timber and fuelwood have altered the natural vegetation.
Pinus wallichiana is the only tree species still occurring in the surveyed forests between 1700-2200 m altitude.
Species diversity is generally low. Therophytes and hemikryptophytes grow in high abundance together with
several nano-phanerophytes.
The original advantages of the systems are no longer existing, the variety of products that the forests formerly
offered, are now restricted to timber and fuelwood.
Stand density in the forested area ranges from 25 to 300 trees/ha, the number of stumps indicating logging
intensity reaches from 25-425 per ha. The trees are on average 25-26 m high and arithmetic mean dbh is
approximately 50 cm.
Volumes average to 265 (Mangarkot) and 366 (Malam) m³/ha. Although natural regeneration is fast and
effective once established, it remains questionable whether the forests, that are now over-mature and over-used,
can fully recover again.
Under the current socio-economic conditions it is also doubtful whether the required consensus for total
protection can be reached in the near future, as many farmers are still depending on silvo-pastoral systems. The
limited availability of natural resources and the lack of communal management deprives the local people more
and more of the fundaments of their lives. To avoid social erosion in form of migration to the cities alternative
ways of agroforestry have to be supported and developed.
Agrihorticulture and agrisilviculture are already practised to some extent by farmers in Malam Jabba Valley –
they are most likely to replace the traditional silvo-pastoral systems in future.

I
APPENDIX
Photograph 1: Typical milk buffalo in Malam.
Photograph 2: Cattle searching for food (Mangarkot).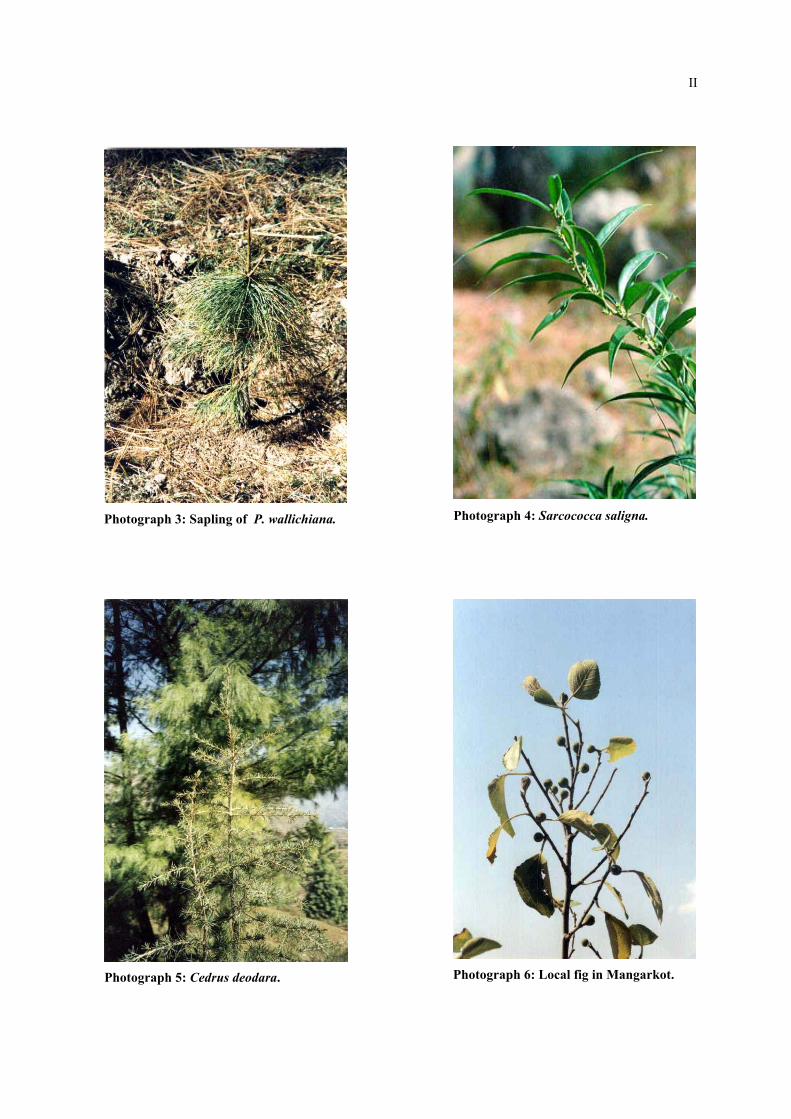
II
Photograph 3: Sapling of P. wallichiana.
Photograph 4: Sarcococca saligna.
Photograph 5: Cedrus deodara.
Photograph 6: Local fig in Mangarkot.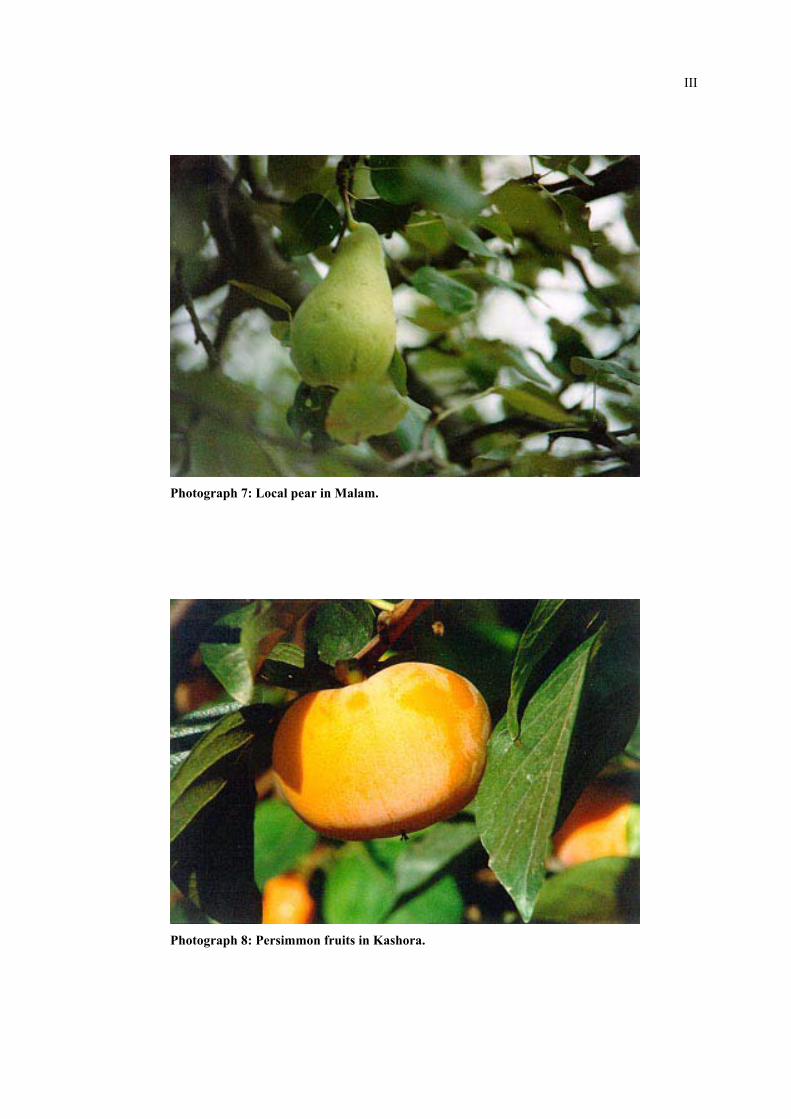
III
Photograph 8: Persimmon fruits in Kashora.
Photograph 7: Local pear in Malam.
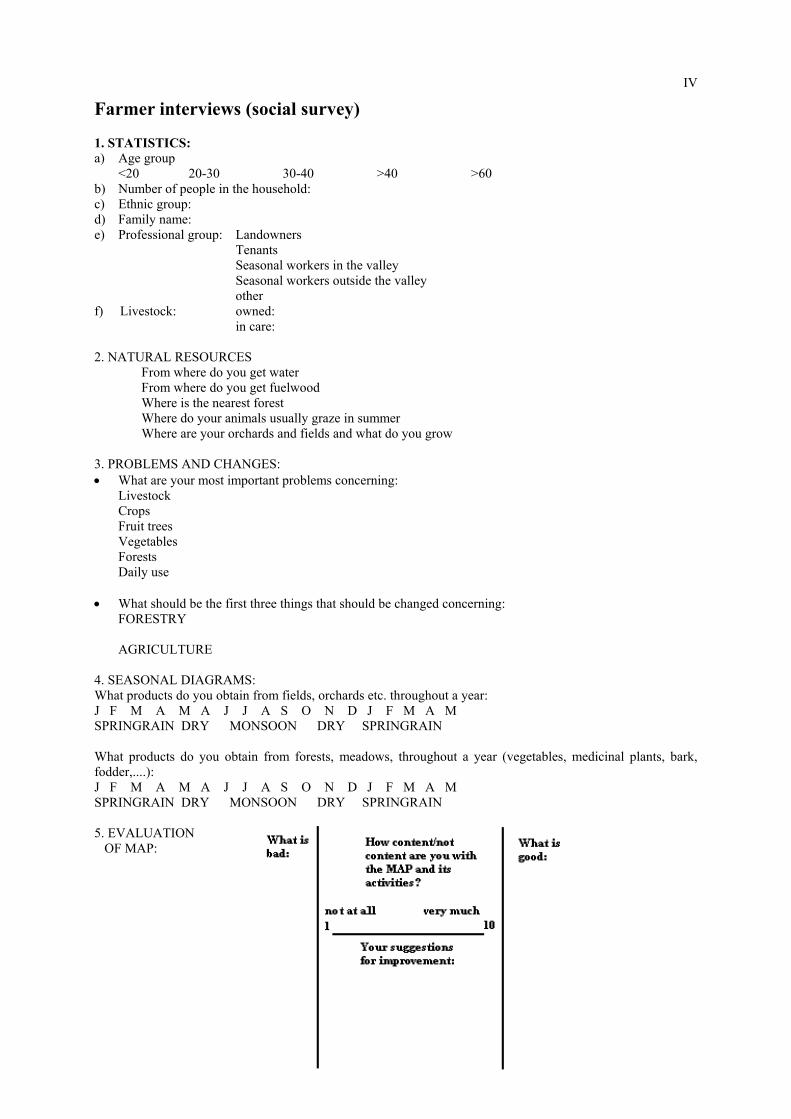
IV
Farmer interviews (social survey)
1. STATISTICS: a) Age group
<20 20-30 30-40 >40 >60 b) Number of people in the household: c) Ethnic group: d) Family name: e) Professional group: Landowners
Tenants Seasonal workers in the valley Seasonal workers outside the valley other
f) Livestock: owned: in care:
2. NATURAL RESOURCES
From where do you get water From where do you get fuelwood Where is the nearest forest Where do your animals usually graze in summer Where are your orchards and fields and what do you grow
3. PROBLEMS AND CHANGES: • What are your most important problems concerning:
Livestock Crops Fruit trees Vegetables Forests Daily use
• What should be the first three things that should be changed concerning:
FORESTRY AGRICULTURE
4. SEASONAL DIAGRAMS: What products do you obtain from fields, orchards etc. throughout a year: J F M A M A J J A S O N D J F M A M SPRINGRAIN DRY MONSOON DRY SPRINGRAIN What products do you obtain from forests, meadows, throughout a year (vegetables, medicinal plants, bark, fodder,....): J F M A M A J J A S O N D J F M A M SPRINGRAIN DRY MO SOON DRY SPRINGRAIN 5. EVALUATION OF MAP:
N
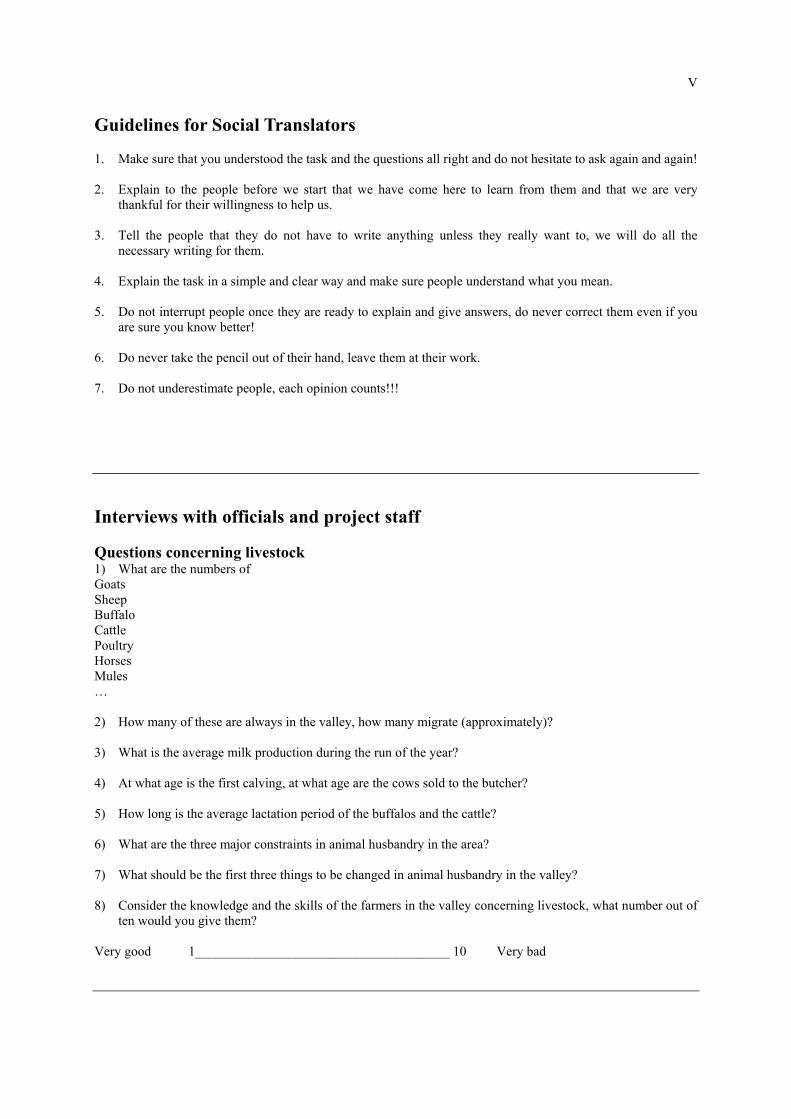
V
Guidelines for Social Translators
1. Make sure that you understood the task and the questions all right and do not hesitate to ask again and again! 2. Explain to the people before we start that we have come here to learn from them and that we are very
thankful for their willingness to help us. 3. Tell the people that they do not have to write anything unless they really want to, we will do all the
necessary writing for them. 4. Explain the task in a simple and clear way and make sure people understand what you mean. 5. Do not interrupt people once they are ready to explain and give answers, do never correct them even if you
are sure you know better! 6. Do never take the pencil out of their hand, leave them at their work. 7. Do not underestimate people, each opinion counts!!!
Interviews with officials and project staff
Questions concerning livestock 1) What are the numbers of Goats Sheep Buffalo Cattle Poultry Horses Mules … 2) How many of these are always in the valley, how many migrate (approximately)? 3) What is the average milk production during the run of the year? 4) At what age is the first calving, at what age are the cows sold to the butcher? 5) How long is the average lactation period of the buffalos and the cattle? 6) What are the three major constraints in animal husbandry in the area? 7) What should be the first three things to be changed in animal husbandry in the valley? 8) Consider the knowledge and the skills of the farmers in the valley concerning livestock, what number out of
ten would you give them? Very good 1______________________________________ 10 Very bad

VI
Questions concerning forestry
1) Which trees are most important in the valley (ranked by importance according to your opinion) with regard to afforestations?
2) What are the most important products people obtain from the forests according to your opinion? 3) How many local people out of 10 do you think are involved in illegal wood cutting? 4) What are the three major constraints in forestry in the area? 5) What should be the first three things to be changed concerning forestry in the valley? 6) Consider the knowledge and the skills of the farmers in the valley concerning trees and forestry, what
number out of ten would you give them?
Very good 1______________________________________ 10 Very bad
Questions concerning agriculture
1) What are the numbers of farmers in the valley? 2) How many of these are … • Landowners • Tenants • Workers on farms (seasonal workers - Gujars) 3) What is the average area of land per farmer/ tenant? 4) What are the major crops at the moment (including vegetables) and what were the major crops before? 5) Where is the main market for the farmers? 6) How many family members does a farm sustain in the area according to your opinion? 7) What are the three major constraints in agriculture in the area? 8) What should be the first three things to be changed in agriculture in the valley? 9) Consider the knowledge and the skills of the farmers in the valley concerning agriculture, what number out
of ten would you give them? Very good 1______________________________________ 10 Very bad

Transect walk
Key persons
Field survey
Semi-structured interviews
Natural resource mapping
Tree ranking
Problem ranking
Bean scoring (product scoring)
Seasonal diagram
Interviews with officials
H-Form
Non-timber resources ×
× × × ×
Timber-resources × ×
× ×
Importance of trees × × ×
× ×
Agricultural products (fruits, vegetables, crops) × ×
× × × × ×
Non-agricultural products/non-wooded products ×
× × × × ×
Grazing, livestock, fodder sources × × × × ×
× ×
Number of farmers, farm sizes, ethnic groups
× ×
×
Forest use × × ×
× ×
Afforestation, plantations × × × ×
× ×
Importance of forest products
× ×
Changes in land use × × ×
× ×
Major problems in the area
× ×
× ×
Which changes are most desired/important
× ×
× × ×
Evaluation of MAP × × × ×
× × × Evaluation of institutional work (extension services, projects,...)
× × ×
Birgit
VII
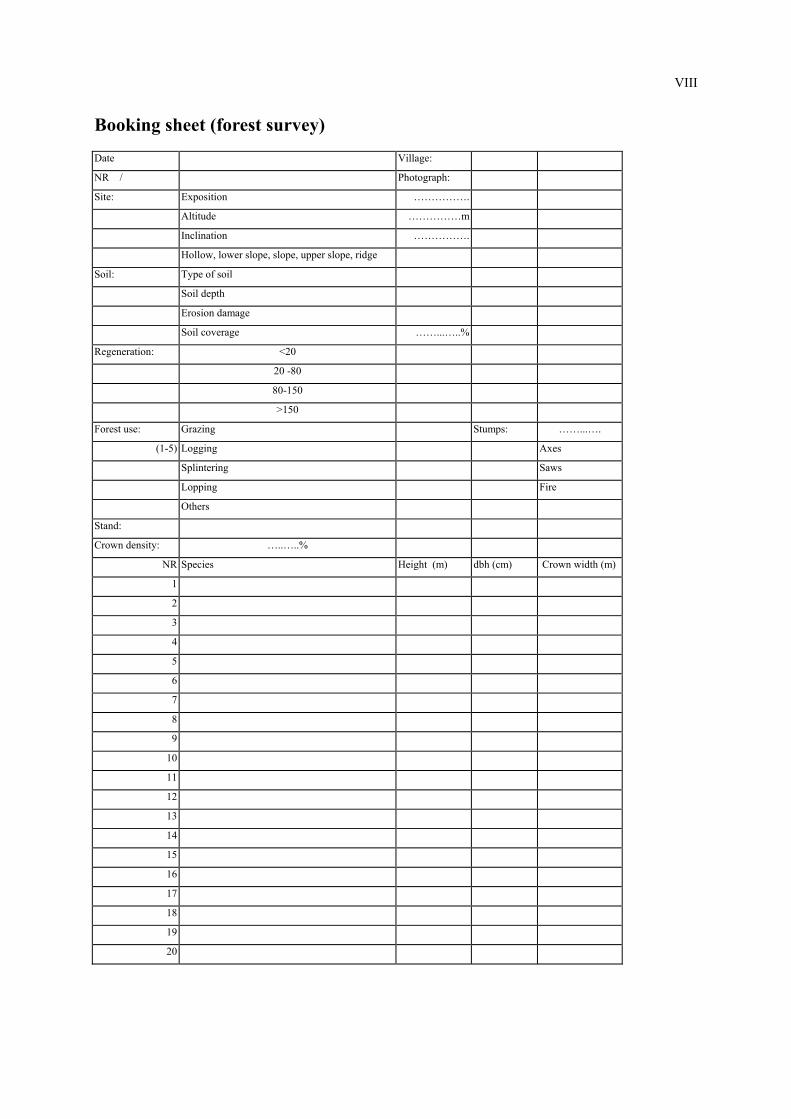
VIII
Booking sheet (forest survey)
Date Village:
NR / Photograph:
Site: Exposition …………….
Altitude ……………m
Inclination …………….
Hollow, lower slope, slope, upper slope, ridge
Soil: Type of soil
Soil depth
Erosion damage
Soil coverage ……...…..%
Regeneration: <20
20 -80
80-150
>150
Forest use: Grazing Stumps: ……...….
(1-5) Logging Axes
Splintering Saws
Lopping Fire
Others
Stand:
Crown density: …..…..%
NR Species Height (m) dbh (cm) Crown width (m)
1
2
3
4
5
6
7
8
9
10
11
12
13
14
15
16
17
18
19
20
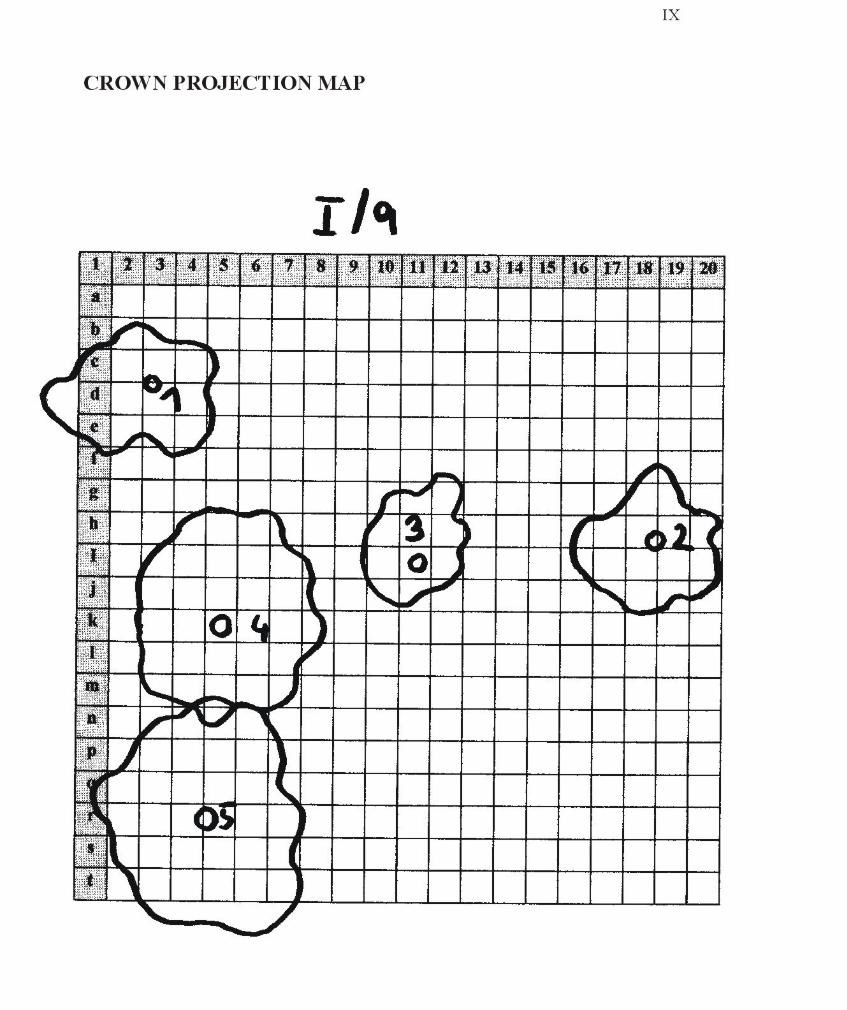

X
Fig. 1: Landuse map of Malam.

XI
Fig. 2: The status of the remaining forested area in Malam.
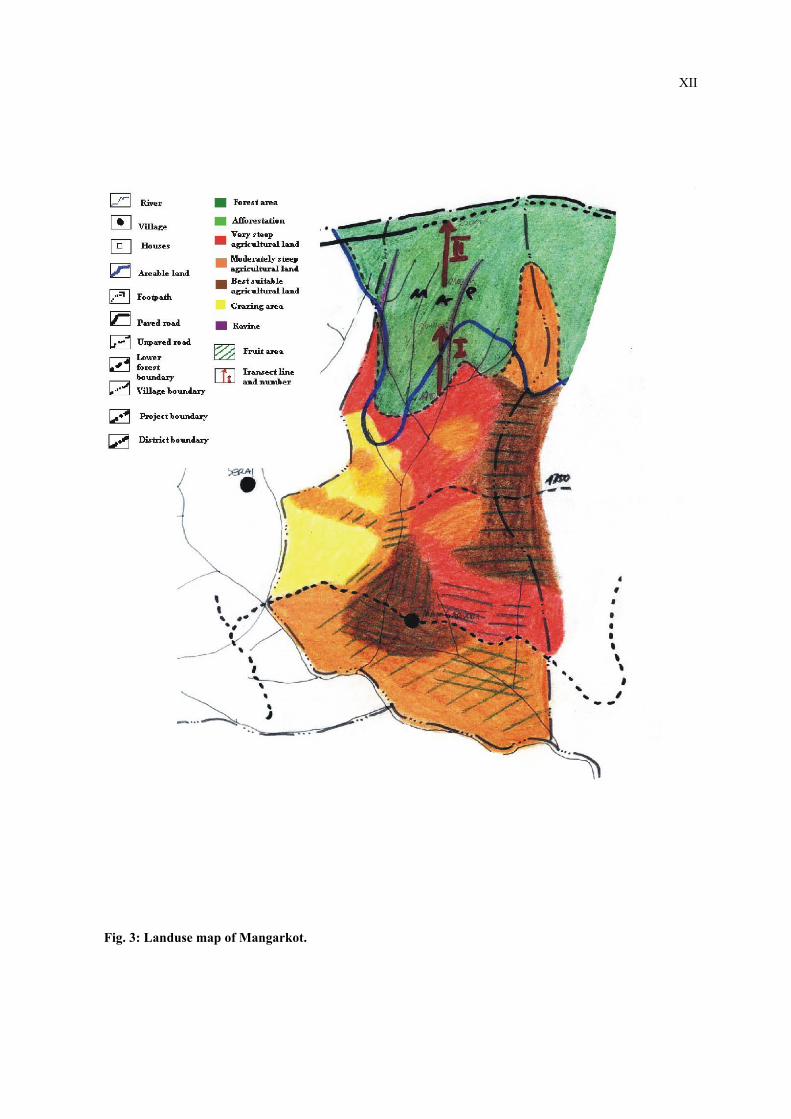
XII
Fig. 3: Landuse map of Mangarkot.

XIII
Fig. 4: The status of the remaining forested area in Mangarkot.

XIV
EXPLANATIONS
Akund of Swat also: Saidu Baba; famous Saint who lived in Saidu Sharif in the 19th century;
grandfather of the first Wali of Swat
Amlok persimmon
Anjeer local fig
Astanadars permanent settlers in the villages belonging to the Daftars
Bakyana Ailanthus althissima
Banadscha Viola serpens
Bandra grazing areas in summer, used by the villagers of Malam
Barida name of a forest in Malam
Bashrikhel Pathan tribe
Buti medicinal plant, used for animals and humans
Dardic referring to ethnic groups and languages of Dardic/Indian descent
Daftar land owned by one clan
Deodar Cedrus deodara
Dodonea Dodonea viscosa
Dorghozar family name of Kohistani origin
Foreray name of a forest in Malam
Ghee clarified butter
Gujar nomads and shepherds, migrating and also settling in Swat Valley
Hujra guest house
Ismaili Shiite sect, widespread in Kashmir, in particular in Hunza Valley
Jirga assembly of the male family heads
Kafir pagans
Kail Blue Pine (Pinus wallichiana)
Kharif summer crop
Khattakhel Pathan tribe
Khwaray Berberis lycium
Kikar Robinia pseudoacacia
Kohistani mountain people; the term refers to the indigenous population of Swat before the
Pathan invasion in the 16th century; live mainly in Upper Swat and the higher
mountain areas
Leghunay medicinal plant; roots are used for intestinal worms
Maira dry land in hillsides
Malik a kind of mayor, presiding over a village/community
Miagan family name – Miagan are Syed (descendants of the Prophet and therefore Saints)
Miangul Abdul Wadud first Wali of Swat
Miangul Jahan Zeb last Wali of Swat
XV
Mullah preside over the community and organise prayers
Pathan ethnic group inhabiting parts of Afghanistan and Pakistan
Pir descendant of a Pathan-Saint
Pukhtunwali code of honour controlling social life in Pathan society
Purdha system for the protection of women, based on seclusion of women to the house,
separation of men and women and wearing of a veil or Purqua
Purqua a veil that covers the head completely
Qoum caste-like category in hierarchical system in Pathan society
Ranselo oil, gained from Cedrus deodara; reportedly used to cure animal diseases.
Schorgera riceland, permanently flooded land
Sirimar farmers of different ethnic origin who own small landholdings in Malam
Syed descendants of the Prophet and therefore Saints
Shaftal clover; fodder plant
Rabi winter crop
Tappa area owned by a tribe in Swat Valley
Tarukay medicinal plants leaves are used as a spice (Rumex estata?)
Tehsil administrational unit of the Agricultural Extension (e.g. Mingora) in
Malakand Division
Toor oak (Quercus dilatata)
Tongu local pear in Malam Jabba Valley
Vesh system of re-distribution of communal property within the Yuzufzai clans in
Swat Valley
Wali title of the king of Swat
Wat periodically irrigated land
Yuzufzai Pathan tribe; conquered Swat in the 16th century

XVI
LITERATURE
ABEL, N., PRINSLEY, R.(1991): Rapid Appraisal for Agroforestry Research and Extension – The Shurugwi experience. In: JARRIS, P.G. et al. (eds): Agroforestry: Principles and Practice. Dep. of Forestry and Natural Resources Univ. of Edinburgh, UK. Agricultural Statistics of North-West Frontier Province for 1994-95. Agriculture Statistics Wing. (Agriculture (Ext.) Department), N.W.F.P. Peshawar, 1995. AMMER, C. (1996): Konkurrenz um Licht – zur Entwicklung der Naturverjüngung im Bergmischwald. Forstliche Forschungsberichte München. ANDRAE, F. (1998), Ass. Prof. D.I. Dr. nat.tech., Inst. für Waldwachstumsforschung, University of Agriculture Vienna. ALLAN, N.J.R. (1984a): Ecological Effects of Land Intensification in the Central and Eastern Hindukush. In: Groetzbach, E. and Rinschede, G. (eds.): Beiträge zur Vergleichenden Kulturgeographie der Hochgebirge. F. Pustet, Regensberg, pp.193-212. ALLAN, N.J.R. (1984b): Changing Crop Complexes in the North Pakistan Foothills. In: Geography, No.304, Vol. 69, Part 3, June 1984. ALLAN, N.J.R. (1986): Deforestation et agropastoralisme dans le Pakistan du Nord. In: Revue de Geographie Alpine, t. LXXIV, 1986-4. ALLAN, N.J.R. (1987a): Ecotechnology and Modernisation in Pakistan Mountain Agriculture. In: Western Himalaya: Environment, Problems and Developement, Vol.2, pp. 771-789; edited by Pangtey, Y.P.S. and Joshi, S.C., Nainaital, India, Gyanodya Prakashan. ALLAN, N.J.R. (1987b): Impact of Afghan Refugees on the Vegetation Resources of Pakistan’s Hindukush-Himalaya. In: Mountain Research and Development, Vol.7, No.3, 1987, pp.200-204. ALTIERI, M. A. (1995): Agroecology – The Science of Sustainable Agriculture, Westview Press, Boulder, Colorado. ALTIERI, M. A. and FARREL, J.G. (1995): Agroforestry Systems. In: ALTIERI, M. A. (1995): Agroecology – The Science of Sustainable Agriculture, Westview Press, Boulder, Colorado. ARCHER, G. (1998), Forest Management Centre, Peshawar. Forestry and GIS Adviser (Interco-operation Switzerland – Forest Department NWFP), personal communication. ASIT K. BISWAS (1992): Forest Management, Environment and Development in South Asia. In: Contemporary South Asia, 1(2), 249 – 258. BANDYOPADHYAY, J. (1993): Understanding Environment-Poverty Relationship in the fragile Himalayan region. An Introductory Framework. In: ICIMOD – Development of poor mountain areas. Ed. Mahesh Banskota and Pitamber Sharma, Proceedings of an International Forum, Beijing, March 22-27,1993. BARTH, F. (1995): The Last Wali of Swat. An Autobiography as told to Fredrik Barth. Bangkok. BARTH, F. (1959): Political Leadership among Swat Pathans. LSE Monograph No 19, Athlon Press, London 1959, repr. 1975. BARTH, F. (1956): Ecologic Relationships of Ethnic Groups in Swat, North Pakistan. In: American Anthropologist, Vol. 58, pp.1079-1089.

XVII
BERGEL, D. (1986): Douglasien - Ertragstafel für Nordwestdeutschland 1985, In: AFJZ, 157,49-58 BRAUN-BLANQUET, J. (1951): Pflanzensoziologie - Grundzüge der Vegetationskunde. Springer-Verlag. BUSCHMANN, H. K. (1996): Pakistan. Reiseführer mit Landeskunde. Mai’s Weltführer 25. CHAMBERS, R.(1992): Rural Appraisal: Rapid, Relaxed and Participatory. IDS Discussion Paper 311. CHAMBERS, R. (1994a ): The Origins and Practice of Participatory Rural Appraisal. in: World Development, Vol.22, No.7, pp. 953-969. CHAMBERS, R.( 1994b): Participatory Rural Appraisal (PRA): Analysis of Experience. In: World Development, Vol.22,No.9, pp. 1253-1268. CHAMBERS, R. (1994c): Participatory Rural Appraisal (PRA): Challenges, Potentials and Paradigm. In: World Development, Vol.22, No.10, pp. 1437-1454. CHAMPION, H.G., SETH, S.K., KHATTAK, G.M. (1965): Forest Types of Pakistan. DANIEL, T. W., MEYN, R.L., MOORE, R.R. (1979): REINEKES Stand Density Index in Tabular Form in English and Metric Units with its Applications. Res. Rep. 37. Utah Agricultural Experiment Station. DANIEL, T. W., STERBA, H. (1980): Zur Ansprache der Bestandesdichte. Sonderdruck aus “Allgemeine Forstzeitung”, Folge 6, Juni 1980. DENHOLM, J. (1991): Agroforestry in Mountain Areas of the Hindu Kush-Himalayan Region. ICIMOD Occasional Paper No.17., Kathmandu, Nepal. DHV Consultants BV. SOCIAL FORESTRY PROJECT – MALAKAND/DIR. Fodder species in Malakand. A reference manual. Training Series –3F-, 1992. DHV Consultants BV. SOCIAL FORESTRY PROJECT – MALAKAND/DIR. Identification of grass species and index on names of grasses, herbs, trees and shrubs. Training Series –3E-, 1994. DIERSCHKE, H. (1994): Pflanzensoziologie. Grundlagen und Methoden. Stuttgart, Ulmer Verlag. DJOGO, A.P.Y., et al. (eds.) (1994): Participatory methods and tools for agroforestry application in Asia-Pacific. Based on the Regional Training Workshop of Technical and Extension Level Agroforestry Trainers in Asia-Pacific. Asia-Pacific Agroforestry Network, Field Document NO.3, 14-27 November 1993, Khon Kaen, Thailand. ECKHOLM, E. (1975): The Deterioration of Mountain Environments. In: Science 189:189. EVANS, J. (1982): Plantation Forestry in the Tropics. Clarendon Press, Oxford. FAUTZ, B. (1963): Sozialstruktur und Bodennutzung in der Kulturlandschaft des Swat (NW-Himalaya). Gießen. FMC PLANNING REPORT(1998): Preliminary Report, unpublished. FOX, J. (1993): The Tragedy of the Open Access. United Nations University Press GILMOUR, D.A., KING, G.C., FISHER, R.J. (1987): Action Research into Socio-Economic Aspects of Forest Management. In: Role of Forest Research in solving Socio-Economic Problems in the Himalaya Region. P.F.I. , Peshawar. HAIDER KHAN, A. (1998), former Divisional Forest Officer, in 1998 working for Social Forestry Project (The Netherlands), personal communication. HASERODT, K. (1989): Hochgebirgsräume Nordpakistans. Beiträge und Materialien zur Regionalen Geographie, Heft 2, Uni Berlin.

XVIII
HASNAIN, H.U.(1985): Sheep and goats in Pakistan. Rome, FAO. HERING, H. (1998), Social Forestry Project (The Netherlands) ), personal communication. HOLZNER, W. and KRIECHBAUM, M. (1998): Man’s Impact on the Vegetation and Landscape in the Inner Himalaya and Tibet. In: Sediments of Time – Environment and Society in Chinese History. ed. Mark Elvin and Liu Ts’ui-jung; Cambridge University Press. HUSSAIN, F., ALEEM, S. (1989): Phytosociology of Vanishing Subtropical Vegetation of Swat with special reference to Dogut Hills, I. Winter Aspect. In: Sci. Khyber, 2 (1):27-36, 1989. HUSSAIN, F., ILYAS, M., TAKATSUKI, S.(1997a ): Plant Communities of Girbanr Hills, Swat District, Northwestern Pakistan. Reprinted from: Ecological Review. Vol.23, No.4, March 1997, pp. 247-260. HUSSAIN, F., KHALIQ, A., ILAHI, I. (1997b): Effect of Altitude, Aspect and Biotic Factors on the Plant Diversity of Dabargai hills, Swat, Pakistan. Reprinted from: Biodiversity of Pakistan. ed. by MUFTI, S.A. et al., Pakistan museum of Natural History Islamabad and Florida Museum of Natural History Gainesville. INGLIS, A. (1998), Participatory Appraisal Methods. Seminar at the University of Agriculture Vienna. Institute for Organic Farming (no publication). INTEGRATED REGIONAL DEVELOPMENT PROJECT (1998): Project Report, Technical University of Vienna, Institute of Public Finance and Infrastructure Policy. IQBAL, J. (1998), Veterinary Officer, Civil Veterinary Hospital Saidu Sharif, Swat, personal communication. IVES, J.D. , MESSERLI, B.(1989): The Himalayan Dilemma. London. JABBAR,G. (1998), Veterinary Officer, Civil Veterinary Hospital Saidu Sharif, Swat, personal communication. JARRIS, P.G. et al. (eds) (1991): Agroforestry: Principles and Practice. Dep. of Forestry and Natural Resources Univ. of Edinburgh, UK JOKY,F. and HERING, H. (1996): The Use and Importance of Trees for Farmers. Social Forestry Project Malakand/Dir, Saidu Sharif, Pakistan. Working Paper No.24. JORDAN, C.F., GAJASENI, J. and WATANABE, H. (eds.), 1992. Taungya: Forest Plantations with Agriculture in Southeast Asia. Wallingford, C.A.B. International. JÜTTNER, O. (1955) Eichen-Ertragstafel. In: SCHOBER, R. (1975): Ertragstafeln wichtiger Baumarten. Frankfurt/M. KHAN, Mahmood H. (1994): The Structural Adjustment Process and Agricultural Change in Pakistan in the 1980s and 1990s. In: The Pakistan Development Review 33: 4 Part I (Winter 1994) pp. 533-591. KHAN, Munazza (1998), Women in Development Co-ordinator at MFVDP, Mingora, personal communication. KHAN, M., BOERING, S. (eds): Activity maps: Facilitating participation in Village Land Use Planning (VLUP). Social Forestry Project Malakand-Dir, N.W.F.P., Forest Department. Technical Paper No.21. KHAN, M. and KLEINE, M. (1990): Study on Natural Regeneration of Chir Pine (Pinus roxburghii roxb.). In: The Pakistan Journal of Forestry. January 1990. Peshawar. KLEINE, M. (1990): Growth features of Blue Pine (Pinus wallichiana) in Northern Pakistan. Deutsche Gesellschaft für Technische Zusammenarbeit (GTZ), Eschborn. KRAMER, H. (1988): Waldwachstumslehre. Verlag Paul Parey
XIX
LÄNDERPROFIL PAKISTAN(1998): Politik, Gesellschaft, Wirtschaft. Österreichische Forschung für Entwicklungshilfe (ÖFSE), 1998. LIVESTOCK CENSUS 1996. Agricultural Census Organization. Statistics Division, Gov. of Pakistan, Gulberg, Lahore, 1998. LÜPKE, B.v. (1995): Waldbauliche Fragen der Kiefernwirtschaft. Kolloquium aus Anlaß des 100jährigen Geburtstages von Adolf Olberg. Schriften aus der Forstlichen Fakultät der Universtität Göttingen und der Nidersächsischen Forstlichen Versuchsanstalt. Band 119. Frankfurt am Main. MALAM JABBA AFFORESTATION PROJECT. PC-I (1998). DI Falch Consultants Austria, NWFP Forest Department Peshawar. Afforestation and Land Stabilization in Malam Jabba Resort. MARSCHALL, J.(1975): Hilfstafeln für die Forsteinrichtung. Oesterr. Agrarverlag, Wien. MAULA, F. (1998), Agricultural Officer Mingora, Agricultural Extension Department, personal communication. McCRACKEN, J. , PRETTY, J.N., CONWAY, G.R.: An Introduction to Rapid Rural Appraisal for Agricultural Development. IIED. Sustainable Agriculture Programme. MORRIS, K. (1998), Horticultural Advisor at MFVDP, Mingora, personal communication. NAIR, P.K.R. (1991): State-of-the-art of agroforestry systems. In: JARRIS, P.G. et al. (eds): Agroforestry: Principles and Practice. Dep. of Forestry and Natural Resources Univ. of Edinburgh, UK. NASIR,Y.J., RAFIQ, R.A. (1995): Wild Flowers of Pakistan. Oxford University Press. NASIR, E., ALI S.I. (eds.), by STEWART,R.R. (1972): Flora of West Pakistan. Karachi. NOOR , M. (1989): Vegetation Changes due to Closure at Jaba Sheep Farm. In: The Pakistan Journal of Forestry, October 1989. PATA (1996): Project Report, Peshawar. PHILIP, M. S. (1994): Measuring Trees and Forests. CAB International. PRETTY, J.N. (1995): Participatory Learning for Sustainable Agriculture. In: World Development, Vol.23,No.8, pp.1247-1263,1995. RAFIQ, R. A. (1996): Taxonomical, Chorological and Phytosociological Studies on the Vegetation of Palas Valley. Dissertation. Dep. of Ecology and Conservation Biology (Prof. Dr. Georg Grabherr) and Botany Department, Natural History Museum (Dr. H. Riedl). Vienna. REINEKE, L.H.(1933): Perfecting a stand density index for evenaged forests. In: J. Agric. Res. 46, pp. 627-638. REPP, G. (1990): Das Beispiel von Bangla Desh und Pakistan. In: Die Bevölkerungsentwicklung und ihre Auswirkungen auf die Umwelt. Schriftleitung: Herbert Fuchs. Österreichische Akademie der Wissenschaften. RRA for Community Forestry Site Selection – Social Forestry Field Manual No 1. 1996. Social Forestry & Extension Section – Forestry Division Service – Ministry of Agriculture, Royal Gov. of Buthan with support from FAO/UNDP. SAHNI, K. C. (1998): The Book of Indian Trees. Bombay Natural History Society. Oxford University Press. Mumbai. SCHOBER,R. (1975): Ertragstafeln wichtiger Baumarten. Frankfurt/M. SHINYA, T. (1992): Origins of Taungya. In: JORDAN, C.F., GAJASENI, J. and WATANABE, H. (eds.), Taungya: Forest Plantations with Agriculture in Southeast Asia. Wallingford, C.A.B. International.

XX
SIAL, M. I. ( 1994): Non-Wood Forest Products: Pakistan. In: DURST, P.B., WARD, U. and KASHIO, M. (eds), Non-wood Forest Products in Asia, RAPA Publication 1994/28. FAO, Rome. SOERIANEGARA, I. and LEMMENS, R.H.M.J. (eds) (1993): Plant Resources of South-East Asia No 5 (1). Timber Trees: Major Commercial Timbers. Wageningen. STEWART, R.R. (1982): Flora of Pakistan. History and Exploration of Plants in Pakistan and Adjoining Areas. TER MEULEN, U., NOTHELLE, G., EL-HARITH,E.A. (1994): Ansätze zur Verbesserung der Milchbüffel-fütterung in Pakistan. In: Der Tropenlandwirt, Zeitschrift für die Landwirtschaft in den Tropen und Subtropen, 95. Jahrgang, April 1994, pp. 145 –156. TIETZE, Wolf (ed.): Westermann – Lexikon der Geographie. Weinheim, Zweiburgen -Verlag. VAN DEN HOEK, A., WERTER, F. (1994): Manual for Village Land Use Planning. Training Series 5A. Social Forestry Project Malakand-Dir, N.W.F.P. Forest Department. Islamabad, Pakistan. VIDAKOVIC, M. (1991): Conifers. Morphology and Variation. Translated from Croatian to English by Maja Soljan. WALTER, H. (1976): Die ökologischen Systeme der Kontinente. Gustav Fischer Verlag. WALTER, H., BRECKLE, S.W. (1991): Ökologie der Erde. Band 4. Gemäßigte und arktische Zonen außerhalb Euro-Nordasiens. Gustav Fischer. UTB. S.181ff. WARTHOL, W. (1980): Der Basar von Mingora. Dissertation Universität Wien. WEIERS, S. (1995): Zur Klimatologie des NW-Karakorums und angrenzender Gebiete. Bonner Geographische Abhandlungen. Bonn. WIEDEMANN, E. (1936/42): Fichten-Ertragstafeln. In: SCHOBER,R. (1975): Ertragstafeln wichtiger Baumarten. Frankfurt/M. WIEDEMANN E. (1943a): Kiefern - Ertragstafeln. In: SCHOBER,R. (1975): Ertragstafeln wichtiger Baumarten. Frankfurt/M. ZADA, A. (1998), Forest Officer MAP, Saidu Sharif, personal communication. ZÖHRER, F. (1980): Forstinventur. Ein Leitfaden für Studium und Praxis. Verlag Paul Parey Hamburg und Berlin.

XXI
CURRICULUM VITAE
Habermann Birgit
DATE OF BIRTH: 1.9. 1974
PLACE OF BIRTH: Amstetten, Austria
1980 - 1984 Primary School (Hürm, Lower Austria)
1984 - 1992 Grammar School (Stiftsgymnasium Melk, Lower Austria)
1992 - 1995 University of Vienna: Study of Biology/Ecology
1995 - 1996 ERASMUS - Exchange Program at the University of Lund , Sweden (Ecology)
1996 – 1999 University of Vienna: Study of Biology/Ecology
1997/98 Integrated Regional Development Project in Developing
Countries, a case study in Malam Jabba Valley, N.W.F.P.,
Pakistan – Technical University of Vienna
1998/99 Thesis/Diplomarbeit
“The Status of Traditional Silvo-pastoral Systems in Malam
Jabba Valley, N.W.F.P., Pakistan”


![[Material Bahan Bangunan Rumah] Malam Penganugerahan Indocement Award 2012](https://static.fdokumen.com/doc/165x107/631ae0ed68e6f36d03044193/material-bahan-bangunan-rumah-malam-penganugerahan-indocement-award-2012.jpg)