The State Report Card for No Child Left Behind - Iowa ...
126
The State Report Card for No Child Left Behind Iowa Department of Education September 2014
-
Upload
khangminh22 -
Category
Documents
-
view
0 -
download
0
Transcript of The State Report Card for No Child Left Behind - Iowa ...

The
State Report
Card
for
No Child
Left Behind
Iowa Department
of Education
September 2014


State Report Card 2014 i
Iowa Department of Education 2014
State Board of Education Charles C. Edwards, Jr., President, Des Moines Michael L. Knedler, Vice President, Council
Bluffs Brooke Axiotis, Des Moines Michael Bearden, Gladbrook Diane Crookham-Johnston, Oskaloosa Angela English, Dyersville Rosie Hussey, Clear Lake William May, Spirit Lake Mary Ellen Miller, Mason City and Corydon Hannah Rens, Student Member, Sioux City
Administration Brad Buck, Director and Executive Officer of the
State Board of Education
Division of Learning and Results
David Tilly, Deputy Director and Administrator Bureau of Information and Analysis Services Jay Pennington, Chief Dianne Chadwick, Administrative Consultant Xiaoping Wang, Administrative Consultant Tom Deeter, Lead Consultant Marlene Dorenkamp, Consultant Fang Fang, Consultant Bureau of School Improvement Amy J. Williamson, Chief Janell Brandhorst, Administrative Consultant Meredith MacQuigg, Consultant
It is the policy of the Iowa Department of Education not to discriminate on the basis of race, creed, color, sexual orientation, gender identity, national origin, sex, disability, religion, age, political party affiliation, or actual or potential parental, family or marital status in its programs, activities, or employment practices as required by the Iowa Code sections 216.9 and 256.10(2), Titles VI and VII of the Civil Rights Act of 1964 (42 U.S.C. § 2000d and 2000e), the Equal Pay Act of 1973 (29 U.S.C. § 206, et seq.), Title IX (Educational Amendments, 20 U.S.C.§§ 1681 – 1688), Section 504 (Rehabilitation Act of 1973, 29 U.S.C. § 794), and the Americans with Disabilities Act (42 U.S.C. § 12101, et seq.). If you have questions or complaints related to compliance with this policy by the Iowa Department of Education, please contact the legal counsel for the Iowa Department of Education, Grimes State Office Building, 400 E. 14th Street, Des Moines, IA 50319-0146, telephone number: 515-281-5295, or the Director of the Office for Civil Rights, U.S. Department of Education, Citigroup Center, 500 W. Madison Street, Suite 1475, Chicago, IL 60661-4544, telephone number: 312-730-1560, FAX number: 312-730-1576, TDD number: 877-521-2172, email: [email protected].
The State Report Card
for No Child Left Behind

ii State Report Card 2014

State Report Card 2014 iii
September 2014
Dear Iowans:
As a lifelong Iowa resident, I have viewed education in our state
as a student, a teacher, a father, a school administrator and as
the state schools chief.
In each of these roles, I’ve seen a common thread: Iowans care
very deeply about our schools. We love to watch a child’s eyes
light up when she truly grasps a new concept. We understand a
great education has the power to open doors for students. And
we’re serious about getting better.
The information provided here in the 2014 State Report Card for No Child Left Behind tells part
of the story of how Iowa students are progressing in school. Our goal is to continuously improve
our schools and prepare every student for success after high school.
Measuring student achievement is essential in our work to achieve those goals. It’s also at the
heart of state accountability systems required by the federal education law known as No Child
Left Behind.
The data in this report include assessment results, attendance rates, high school graduation
rates and teacher qualifications. Educators and students across the state continue to work very
hard to meet targets set by the No Child Left Behind law, and they deserve our support.
I encourage you to take time to review this report. Staying informed helps all of us work together
in the best interests of Iowa’s students.
Respectfully,
Brad A. Buck
Director
Iowa Department of Education
iv State Report Card 2014
Acknowledgments The authors of the State Report Card for No Child Left Behind wish to thank the staff of the Iowa Department of Education who contributed to the production of this report especially Staci Hupp. A thank you is also extended to Dr. Steve Dunbar and Dr. Catherine Welch of Iowa Testing Programs.

State Report Card 2014 v
Contents Introduction .............................................................................................................................. 1
Annual Measurable Objectives ................................................................................................. 3
Student Participation Rates ...................................................................................................... 5
Assessment Results for Students with Disabilities ................................................................... 7 Student Performance ................................................................................................................ 9 Reading ................................................................................................................................. 9 Mathematics ....................................................................................................................... 23 Science ................................................................................................................................ 37 National Assessment of Educational Progress ........................................................................ 49
High School Graduates and Graduation Rates ........................................................................ 53
Average Daily Attendance ....................................................................................................... 57
Highly Qualified Teachers ....................................................................................................... 59
Districts and Schools in Need of Assistance ............................................................................ 63

vi State Report Card 2014

State Report Card 2014 1
Introduction The No Child Left Behind Act (NCLB) of 2001 requires each state to provide an annual report card to inform stakeholders and the public about the progress of students and schools on indicators of student achievement and other information that relates to student success. The State Report Card for No Child Left Behind provides state-level data to serve as a comparison for schools and districts as they consider and implement improvement efforts to increase the success for all Iowa students. The State Report Card contains the critical elements of accountability under NCLB as specified in the No Child Left Behind Act 1111(h)(1)(C)(i). These are listed below:
The comparison between the percent of public school students in each group scoring at the proficient level on the Iowa Assessment (IA) with Iowa’s Annual Measurable Objectives (AMO) as required in the Adequate Yearly Progress (AYP) formula. The AMO results represent the performance of students that enrolled in Iowa public schools for a full academic year in grades 3 through 8 and 11.
The percent of public school students, by group, who participated in the Iowa Assessment or the Iowa Alternate Assessment (IAA) in grades 3 through 8 and 11.
The participation rates and assessment results for students with disabilities in grades 3 through 8 and 11 in reading and mathematics.
The percent of students scoring at each achievement level on the Iowa Assessment or IAA for grades 3 through 8 and 11. The results are for all students in public schools.
Trends in student achievement for reading and mathematics for all students in grades 4, 8 and 11 and for science for all students in grades 5, 8 and 11.
The most recent results of National Assessment of Educational Progress (NAEP) for Iowa grades 4 and 8 in reading and mathematics.
Other academic indicators including the public school statewide attendance rates for kindergarten through grade 8 and graduation rates for public high schools.
The percentage of classes not taught by highly qualified teachers (HQT) in the aggregate and disaggregated by high-poverty and low-poverty schools and by school level and academic area.
AYP status for each district is included. Districts that did not make adequate yearly progress for two consecutive years under NCLB are identified as districts in need of assistance. Districts remain identified until they have made AYP for two consecutive years.
AYP status for each school is included. Schools that did not make adequate yearly progress for two consecutive years under NCLB, section 1116, are identified as schools in need of assistance. Schools remain identified until they have made AYP for two consecutive years.

2 State Report Card 2014
State Report Card 2014 3
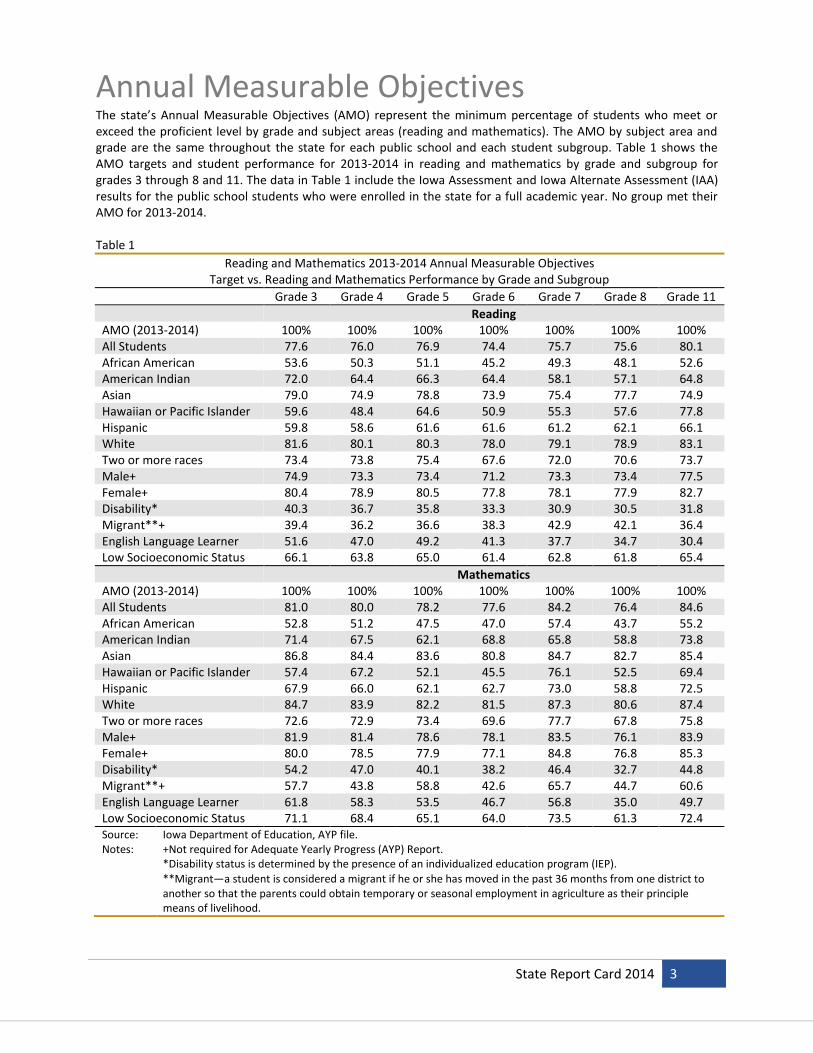
Annual Measurable Objectives The state’s Annual Measurable Objectives (AMO) represent the minimum percentage of students who meet or exceed the proficient level by grade and subject areas (reading and mathematics). The AMO by subject area and grade are the same throughout the state for each public school and each student subgroup. Table 1 shows the AMO targets and student performance for 2013-2014 in reading and mathematics by grade and subgroup for grades 3 through 8 and 11. The data in Table 1 include the Iowa Assessment and Iowa Alternate Assessment (IAA) results for the public school students who were enrolled in the state for a full academic year. No group met their AMO for 2013-2014. Table 1
Reading and Mathematics 2013-2014 Annual Measurable Objectives Target vs. Reading and Mathematics Performance by Grade and Subgroup
Grade 3 Grade 4 Grade 5 Grade 6 Grade 7 Grade 8 Grade 11
Reading AMO (2013-2014) 100% 100% 100% 100% 100% 100% 100% All Students 77.6 76.0 76.9 74.4 75.7 75.6 80.1 African American 53.6 50.3 51.1 45.2 49.3 48.1 52.6 American Indian 72.0 64.4 66.3 64.4 58.1 57.1 64.8 Asian 79.0 74.9 78.8 73.9 75.4 77.7 74.9 Hawaiian or Pacific Islander 59.6 48.4 64.6 50.9 55.3 57.6 77.8 Hispanic 59.8 58.6 61.6 61.6 61.2 62.1 66.1 White 81.6 80.1 80.3 78.0 79.1 78.9 83.1 Two or more races 73.4 73.8 75.4 67.6 72.0 70.6 73.7 Male+ 74.9 73.3 73.4 71.2 73.3 73.4 77.5 Female+ 80.4 78.9 80.5 77.8 78.1 77.9 82.7 Disability* 40.3 36.7 35.8 33.3 30.9 30.5 31.8 Migrant**+ 39.4 36.2 36.6 38.3 42.9 42.1 36.4 English Language Learner 51.6 47.0 49.2 41.3 37.7 34.7 30.4 Low Socioeconomic Status 66.1 63.8 65.0 61.4 62.8 61.8 65.4
Mathematics AMO (2013-2014) 100% 100% 100% 100% 100% 100% 100% All Students 81.0 80.0 78.2 77.6 84.2 76.4 84.6 African American 52.8 51.2 47.5 47.0 57.4 43.7 55.2 American Indian 71.4 67.5 62.1 68.8 65.8 58.8 73.8 Asian 86.8 84.4 83.6 80.8 84.7 82.7 85.4 Hawaiian or Pacific Islander 57.4 67.2 52.1 45.5 76.1 52.5 69.4 Hispanic 67.9 66.0 62.1 62.7 73.0 58.8 72.5 White 84.7 83.9 82.2 81.5 87.3 80.6 87.4 Two or more races 72.6 72.9 73.4 69.6 77.7 67.8 75.8 Male+ 81.9 81.4 78.6 78.1 83.5 76.1 83.9 Female+ 80.0 78.5 77.9 77.1 84.8 76.8 85.3 Disability* 54.2 47.0 40.1 38.2 46.4 32.7 44.8 Migrant**+ 57.7 43.8 58.8 42.6 65.7 44.7 60.6 English Language Learner 61.8 58.3 53.5 46.7 56.8 35.0 49.7 Low Socioeconomic Status 71.1 68.4 65.1 64.0 73.5 61.3 72.4 Source: Iowa Department of Education, AYP file. Notes: +Not required for Adequate Yearly Progress (AYP) Report.
*Disability status is determined by the presence of an individualized education program (IEP).
**Migrant—a student is considered a migrant if he or she has moved in the past 36 months from one district to another so that the parents could obtain temporary or seasonal employment in agriculture as their principle means of livelihood.

4 State Report Card 2014

State Report Card 2014 5
Student Participation Rates
The Iowa Department of Education collects assessment participation rates for reading and mathematics students in grades 3 through 8 and 11 and for science in grades 5, 8 and 11 through the Adequate Yearly Progress (AYP) annual report from all public schools and districts. Participation rates include all students regardless of full academic year enrollment status. Table 2 presents the 2013-2014 state level assessment participation rates for reading, mathematics and science by grade and subgroup. Table 2
Reading, Mathematics and Science 2013-2014 Participation Rates by Grade and Subgroup
Grade 3 Grade 4 Grade 5 Grade 6 Grade 7 Grade 8 Grade 11
Reading
All Students 99.6 99.7 99.6 99.6 99.4 99.3 98.0 African American 99.6 99.5 99.3 99.0 98.7 97.6 94.8 American Indian 100.0 99.3 100.0 99.2 100.0 98.0 96.0 Asian 99.8 99.3 99.5 99.7 99.9 99.5 99.3 Hawaiian or Pacific Islander 98.5 100.0 100.0 98.7 100.0 100.0 93.8 Hispanic 99.7 99.2 99.8 99.5 99.1 99.1 96.8 White 99.6 99.8 99.6 99.6 99.5 99.4 98.3 Two or more races 99.7 99.8 99.5 99.3 98.8 99.1 97.8 Male+ 99.6 99.6 99.6 99.5 99.2 99.0 978.8 Female+ 99.7 99.8 99.6 99.7 99.6 99.5 98.2 Disability* 99.0 99.0 99.0 98.5 97.3 97.1 95.1 Migrant**+ 100.0 98.4 100.0 97.3 98.2 100.0 90.7 English Language Learner 99.7 98.8 99.7 99.3 99.3 99.6 97.6 Low Socioeconomic Status 99.5 99.5 99.5 99.3 99.1 98.8 96.7
Mathematics All Students 99.7 99.4 99.1 99.0 98.8 97.4 94.4 African American 100.0 99.3 99.3 98.6 100.0 98.0 96.0 American Indian 99.7 99.3 99.8 99.8 99.9 99.5 99.1 Asian 98.5 100.0 100.0 98.8 100.0 100.0 91.8 Hawaiian or Pacific Islander 99.7 99.8 99.8 99.6 99.4 99.2 97.0 Hispanic 99.8 99.8 99.7 99.7 99.5 99.4 98.3 White 99.8 99.8 99.4 99.2 99.2 99.0 97.9 Two or more races 99.7 99.7 99.6 99.5 99.3 99.0 97.8 Male+ 99.8 99.8 99.6 99.7 99.6 99.5 98.1 Female+ 99.0 99.0 99.1 98.5 97.6 97.0 95.1 Disability* 100.0 100.0 100.0 98.7 98.3 100.0 98.0 Migrant**+ 99.7 99.6 99.6 99.4 99.5 99.6 97.4 English Language Learner 99.6 99.6 99.5 99.4 99.2 98.8 96.5 Low Socioeconomic Status 99.7 99.4 99.1 99.0 98.8 97.4 94.4

6 State Report Card 2014
Table 2 (continued)
Reading, Mathematics and Science 2013-2014
Participation Rates by Grade and Subgroup
Grade 5 Grade 8 Grade 11
Science
All Students 99.5 99.0 97.8
African American 98.4 97.5 94.6
American Indian 99.3 97.3 96.0
Asian 99.8 99.5 99.3
Hawaiian or Pacific Islander 100.0 100.0 91.8
Hispanic 99.6 99.1 96.6
White 99.6 99.1 98.2
Two or more races 98.6 98.9 97.3
Male+ 99.5 98.7 97.7
Female+ 99.5 99.3 98.0
Disability* 98.7 96.9 94.8
Migrant**+ 100.0 98.3 90.6
English Language Learner 99.6 99.3 97.3
Low Socioeconomic Status 99.3 98.7 96.4 Source: Iowa Department of Education, AYP file.
Notes: +Not required for Adequate Yearly Progress (AYP) Report.
*Disability status is determined by the presence of an individualized education program (IEP).
**Migrant—a student is considered a migrant if he or she has moved in the past 36 months from one district to another so that the parents could obtain temporary or seasonal employment in agriculture as their principle means of livelihood.
State Report Card 2014 7
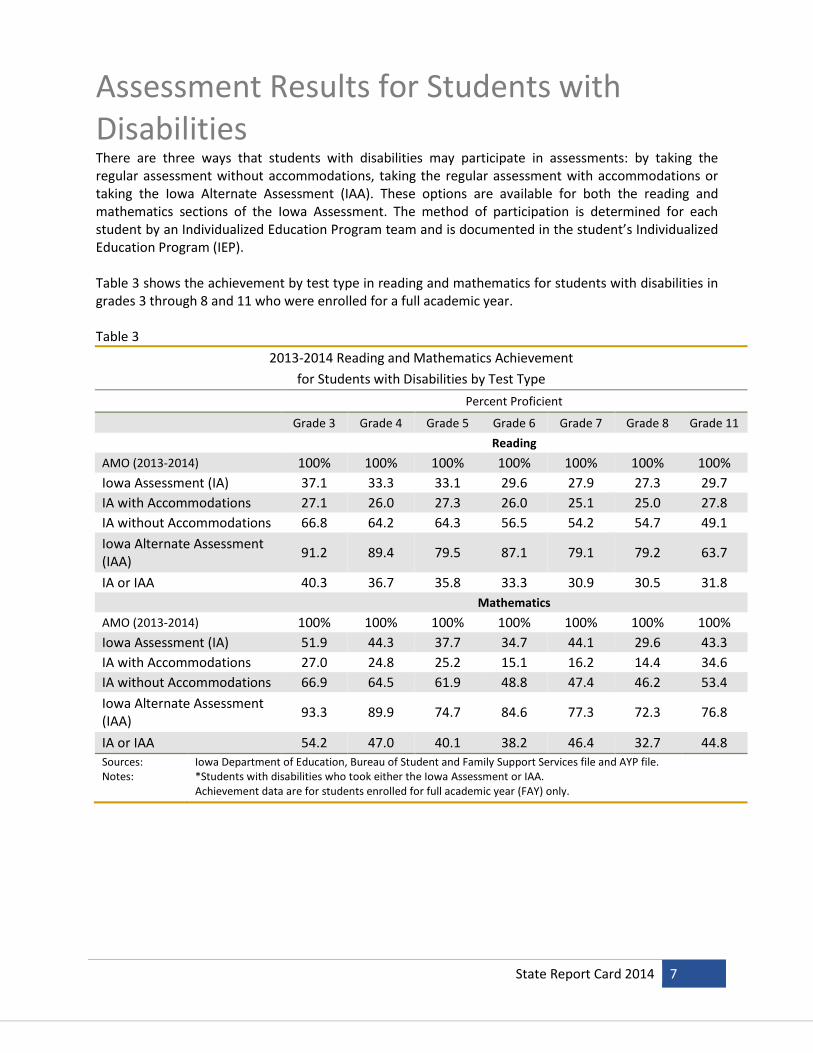
Assessment Results for Students with Disabilities There are three ways that students with disabilities may participate in assessments: by taking the regular assessment without accommodations, taking the regular assessment with accommodations or taking the Iowa Alternate Assessment (IAA). These options are available for both the reading and mathematics sections of the Iowa Assessment. The method of participation is determined for each student by an Individualized Education Program team and is documented in the student’s Individualized Education Program (IEP). Table 3 shows the achievement by test type in reading and mathematics for students with disabilities in grades 3 through 8 and 11 who were enrolled for a full academic year. Table 3
2013-2014 Reading and Mathematics Achievement
for Students with Disabilities by Test Type
Percent Proficient
Grade 3 Grade 4 Grade 5 Grade 6 Grade 7 Grade 8 Grade 11
Reading
AMO (2013-2014) 100% 100% 100% 100% 100% 100% 100%
Iowa Assessment (IA) 37.1 33.3 33.1 29.6 27.9 27.3 29.7
IA with Accommodations 27.1 26.0 27.3 26.0 25.1 25.0 27.8
IA without Accommodations 66.8 64.2 64.3 56.5 54.2 54.7 49.1
Iowa Alternate Assessment (IAA)
91.2 89.4 79.5 87.1 79.1 79.2 63.7
IA or IAA 40.3 36.7 35.8 33.3 30.9 30.5 31.8
Mathematics
AMO (2013-2014) 100% 100% 100% 100% 100% 100% 100%
Iowa Assessment (IA) 51.9 44.3 37.7 34.7 44.1 29.6 43.3
IA with Accommodations 27.0 24.8 25.2 15.1 16.2 14.4 34.6
IA without Accommodations 66.9 64.5 61.9 48.8 47.4 46.2 53.4
Iowa Alternate Assessment (IAA)
93.3 89.9 74.7 84.6 77.3 72.3 76.8
IA or IAA 54.2 47.0 40.1 38.2 46.4 32.7 44.8 Sources: Iowa Department of Education, Bureau of Student and Family Support Services file and AYP file. Notes: *Students with disabilities who took either the Iowa Assessment or IAA.
Achievement data are for students enrolled for full academic year (FAY) only.

8 State Report Card 2014
Table 4 shows a range of 95.1 to 99.1 percent of students with disabilities in grades 3 through 8 and 11 who participated in reading and mathematics assessments. The majority of students with IEPs participated in the Iowa Assessment (with or without accommodations) with approximately five percent of Iowa’s students with disabilities participating in the IAA for reading and mathematics. Less than one percent of all students took the IAA.
Table 4
2013-2014 Reading and Mathematics Participation Rates for Students with Disabilities by Test Type
Number and Percent of Students
Grade 3 Grade 4 Grade 5 Grade 6 Grade 7 Grade 8 Grade 11 Reading FAY Iowa Assessment (IA) 3,778 4,073 4,142 4,065 3,874 3,977 3,211 FAY Iowa Assessment (IA) with Accommodations
2,823 3,293 3,497 3,592 3,505 3,666 2,932
FAY Iowa Assessment (IA) without Accommodations
955 780 645 473 369 311 279
FAY Iowa Alternate Assessment (IAA)
238 265 258 279 244 259 212
FAY IA or IAA 4,016 4,338 4,400 4,344 4,118 4,236 3,423 Total IA or IAA (FAY and non-FAY)
4,751 5,030 4,999 4,964 4,764 4,877 3,948
Total Enrollment for Students with Disabilities
4,800 5,079 5,049 5,041 4,896 5,022 4,151
Participation Rates for Students with Disabilities
99.0 99.0 99.0 98.5 97.3 97.1 95.1
Mathematics FAY Iowa Assessment (IA) 3,642 4,079 4,256 4,107 3,860 3,971 3,214 FAY Iowa Assessment (IA) with Accommodations
2,723 3,292 3,589 3,626 3,487 3,661 2,933
FAY Iowa Assessment (IA) without Accommodations
919 787 667 481 373 310 281
FAY Iowa Alternate Assessment (IAA)
231 257 248 275 240 261 210
FAY ITP or IAA 3,873 4,336 4,504 4,382 4,100 4,232 3,424 Total ITP or IAA (FAY and non-FAY)
4,576 5,029 5,113 5,004 4,744 4,868 3,946
Total Enrollment for Students with Disabilities
4,620 5,079 5,161 5,078 4,862 5,020 4,150
Participation Rates for Students with Disabilities
99.0 99.0 99.1 98.5 97.6 97.0 95.1
Sources: Iowa Department of Education, Bureau of Student and Family Support Services file and AYP file. Notes: FAY indicates full academic year.

State Report Card 2014 9
Student Performance One of the requirements for The State Report Card for No Child Left Behind is to show public school students scoring at each achievement level on the Iowa Assessment and Iowa Alternative Assessment (IAA) for grades 3 through 8 and 11 in reading and mathematics and grades 5, 8 and 11 in science. All students, full academic year (FAY) and non-full academic year, are included in this chapter. Achievement data are reported by levels—Low, Intermediate, and High.
The Achievement Levels Report for the Iowa Assessment is provided to Iowa schools to help describe the level of performance of student groups and monitor the progress of groups over time. For each of the three main achievement levels—Low, Intermediate and High—descriptors are included in the report to identify what the typical student in each level is able to do. The Iowa Department of Education (DE) has combined the Intermediate and High performance levels to define a single achievement level called “Proficient” as a student performance indicator.
Comparisons of results from one grade to another are not appropriate because the corresponding descriptions of performance are not exactly the same from grade to grade. For example, “Low” in reading comprehension does not mean exactly the same thing at grade 4 and at grade 11.
Comparisons from one subject area to another are not appropriate because the corresponding descriptions of performance are different from subject to subject. For example, “Low” in grade 4 reading comprehension does not mean the same thing as “Low” in grade 4 mathematics.
Separate tables show achievement level performance for students by gender, racial/ethnic, disability, socioeconomic, primary language, and migrant subgroups. These subgroups vary in size from year to year. The subgroup data should not be averaged to obtain an overall value that matches the data for the total grade group.
The Iowa Alternate Assessment measures what students know and can do at their grade level in reading and mathematics when compared to Iowa’s Alternate Achievement Standards and is designed for students with the most significant cognitive disabilities. There are three levels of proficiency for the IAA: Basic (non-proficient), Proficient, and Advanced (proficient and advanced are combined to form “Proficient” for AYP).
Reading Table 5 shows student performance by achievement level for 2013-2014. Figures 1 to 21 show the reading trends for all public school students in grades 4, 8 and 11 and by subgroups.

10 State Report Card 2014
Table 5
Reading Performance by Achievement Level 2013-2014 Percent of Students
Proficient High Intermediate Low
Grade 3
All Students 76.6% 20.9% 55.6% 23.4% African American 52.3 7.1 45.2 47.7 American Indian 69.7 13.6 56.1 30.3 Asian 77.3 25.0 52.3 22.7 Hawaiian or Pacific Islander 54.6 10.6 43.9 45.5 Hispanic 58.9 8.4 50.4 41.1 White 81.0 23.8 57.2 19.0 Two or more races 72.1 15.8 56.3 27.9 Male+ 73.9 18.9 55.0 26.1 Female+ 79.4 23.1 56.3 20.6 Disability* 39.6 8.3 31.4 60.4 Migrant**+ 38.8 3.8 35.0 61.3 English Language Learner 50.4 3.8 46.6 49.6 Low Socioeconomic Status 65.0 11.5 53.6 35.0 Grade 4 All Students 75.2% 27.2% 48.0% 24.8% African American 49.6 9.3 40.3 50.4 American Indian 63.3 13.7 49.6 36.7 Asian 73.2 30.7 42.4 26.8 Hawaiian or Pacific Islander 50.7 6.9 43.8 49.3 Hispanic 57.7 13.7 44.0 42.3 White 79.6 30.4 49.2 20.5 Two or more races 73.8 25.1 48.7 26.2 Male+ 72.4 24.5 47.8 27.6 Female+ 78.2 30.0 48.1 21.9 Disability* 36.2 8.8 27.4 63.8 Migrant**+ 37.0 3.7 33.3 63.0 English Language Learner 45.3 6.2 39.1 54.7 Low Socioeconomic Status 63.1 16.4 46.7 36.9
Grade 5
All Students 76.2% 28.1% 48.0% 23.8% African American 50.3 9.9 40.4 49.7 American Indian 66.9 19.4 47.6 33.1 Asian 77.0 32.3 44.7 23.1 Hawaiian or Pacific Islander 58.7 12.7 46.0 41.3 Hispanic 61.0 13.6 47.4 39.0 White 79.8 31.1 48.7 20.2 Two or more races 74.0 26.2 47.8 26.0 Male+ 72.5 24.4 48.1 27.5 Female+ 80.0 32.0 48.0 20.0 Disability* 35.4 7.7 27.7 64.6 Migrant**+ 31.9 2.1 29.8 68.1 English Language Learner 46.7 5.0 41.7 53.3 Low Socioeconomic Status 64.2 16.5 47.7 35.8

State Report Card 2014 11
Table 5 (continued)
Reading Performance by Achievement Level 2013-2014 Percent of Students
Proficient High Intermediate Low Grade 6 All Students 73.6% 24.4% 49.2% 26.4% African American 44.4 7.9 36.5 55.6 American Indian 64.2 17.9 46.3 35.8 Asian 73.0 28.0 45.0 27.0 Hawaiian or Pacific Islander 46.1 5.3 40.8 54.0 Hispanic 60.7 12.9 47.8 39.3 White 77.5 27.1 50.4 22.5 Two or more races 65.6 18.9 46.7 34.4 Male+ 70.4 21.8 48.7 29.6 Female+ 76.9 27.2 49.7 23.1 Disability* 33.1 5.4 27.7 66.9 Migrant**+ 41.3 6.4 34.9 58.7 English Language Learner 39.7 3.8 35.9 60.3 Low Socioeconomic Status 60.6 13.2 47.4 39.4 Grade 7 All Students 74.7% 19.7% 55.1% 25.3% African American 47.3 5.8 41.6 52.7 American Indian 59.2 10.2 49.0 40.8 Asian 73.5 26.6 46.9 26.5 Hawaiian or Pacific Islander 50.0 12.5 37.5 50.0 Hispanic 59.8 9.2 50.6 40.2 White 78.6 21.7 56.8 21.4 Two or more races 71.2 18.7 52.4 28.8 Male+ 72.4 18.9 53.5 27.6 Female+ 77.2 20.6 56.6 22.8 Disability* 30.4 3.7 26.8 69.6 Migrant**+ 42.0 6.0 36.0 58.0 English Language Learner 35.3 1.9 33.3 64.8 Low Socioeconomic Status 61.7 10.0 51.7 38.3
Grade 8
All Students 74.5% 22.4% 52.1% 25.5% African American 46.2 6.5 39.7 53.8 American Indian 55.6 8.3 47.2 44.4 Asian 74.9 31.3 43.6 25.1 Hawaiian or Pacific Islander 53.3 14.3 39.0 46.8 Hispanic 60.6 10.7 49.9 39.4 White 78.2 24.7 53.6 21.8 Two or more races 70.4 20.5 49.9 29.6 Male+ 72.2 21.7 50.5 27.8 Female+ 76.9 23.1 53.8 23.1 Disability* 30.0 3.4 26.6 70.0 Migrant**+ 44.0 6.0 38.0 56.0 English Language Learner 31.7 1.2 30.6 68.3 Low Socioeconomic Status 60.6 11.7 48.9 39.4

12 State Report Card 2014
Table 5 (continued)
Reading Performance by Achievement Level 2013-2014 Percent of Students
Proficient High Intermediate Low
Grade 11
All Students 78.8% 11.9% 66.9% 21.2% African American 49.8 3.5 46.2 50.3 American Indian 66.9 6.3 60.6 33.1 Asian 71.6 13.1 58.5 28.4 Hawaiian or Pacific Islander 77.8 4.4 73.3 22.2 Hispanic 64.2 4.2 60.0 35.8 White 82.3 13.1 69.2 17.7 Two or more races 72.6 10.0 62.6 27.4 Male+ 76.2 12.1 64.1 23.8 Female+ 81.5 11.6 69.9 18.5 Disability* 31.8 3.2 28.6 68.2 Migrant**+ 40.5 0.0 40.5 59.5 English Language Learner 28.6 0.6 28.0 71.4 Low Socioeconomic Status 63.9 5.4 58.5 36.1 Source: Iowa Department of Education, AYP file. Notes: +Not required for Adequate Yearly Progress Report.
*Disability status is determined by the presence of an individualized education program. **Migrant—a student is considered a migrant if he or she has moved in the past 36 months from one district to another so that the parents could obtain temporary or seasonal employment in agriculture as their principle means of livelihood. The Iowa Department of Education has combined the Intermediate and High achievement levels to define a single achievement level called Proficient. Figures for High, Intermediate, and Low may not total 100 percent due to rounding.
Figure 1
Percent of Iowa Fourth Grade Students Proficient
in Reading 2012-2013 and 2013-2014
Source: Iowa Department of Education, AYP file. Note: The data include results from the Iowa Assessments and the IAA.
74.8 75.2
0.0
10.0
20.0
30.0
40.0
50.0
60.0
70.0
80.0
90.0
100.0
2012-2013 2013-2014
Pe
rce
nt
School Year

State Report Card 2014 13
Figure 2
Percent of Iowa Fourth Grade Students Proficient
in Reading by Gender 2012-2013 and 2013-2014
Source: Iowa Department of Education, AYP file. Note: The data include results from the Iowa Assessments and the IAA.
Figure 3
Percent of Iowa Fourth Grade Students Proficient
in Reading by Race/Ethnicity 2012-2013 and 2013-2014
Source: Iowa Department of Education, AYP file. Note: The data include results from the Iowa Assessments and the IAA.
72.4 72.477.3 78.2
0.0
10.0
20.0
30.0
40.0
50.0
60.0
70.0
80.0
90.0
100.0
2012-2013 2013-2014
Pe
rce
nt
School Year
Male Female
47.9
60.4
75.0
54.1
57.4
79.0
70.4
49.6
63.3
73.2
50.7
57.7
79.6
73.8
African American
American Indian
Asian
Hawaiian or Pacific Islander
Hispanic
White
Two or more races
2012-2013
2013-2014

14 State Report Card 2014
Figure 4
Percent of Iowa Fourth Grade Students Proficient
in Reading by Socioeconomic Status* 2012-2013 and 2013-2014
Source: Iowa Department of Education, AYP file. Note: The data include results from the Iowa Assessments and the IAA.
*Socioeconomic status is determined by the eligibility for free or reduced price meals.
Figure 5
Percent of Iowa Fourth Grade Students Proficient
in Reading by Disability Status 2012-2013 and 2013-2014
Source: Iowa Department of Education, AYP file. Note: The data include results from the Iowa Assessments and the IAA.
*Disability status is determined by the presence of an individualized education program (IEP).
62.3 63.1
84.2 84.5
0.0
10.0
20.0
30.0
40.0
50.0
60.0
70.0
80.0
90.0
100.0
2012-2013 2013-2014
Pe
rce
nt
School Year
Eligible for Free or Reduced Price Meals Not Eligible for Free or Reduced Price Meals
35.4 36.2
81.0 81.3
0.0
10.0
20.0
30.0
40.0
50.0
60.0
70.0
80.0
90.0
100.0
2012-2013 2013-2014
Pe
rce
nt
School Year
Disability No Disability

State Report Card 2014 15
Figure 6
Percent of Iowa Fourth Grade Students Proficient
in Reading by Primary Language Status* 2012-2013 and 2013-2014
Source: Iowa Department of Education, AYP file. Note: The data include results from the Iowa Assessments and the IAA.
*Primary language status classified by English and English language learner and determined according to the following definition: English language learner refers to a student who has a language other than English and the proficiency in English is such that the probability of the student’s academic success in an English-only classroom is below that of an academically successful peer with an English language background.
Figure 7
Percent of Iowa Fourth Grade Students Proficient
in Reading by Migrant Status* 2012-2013 and 2013-2014
Source: Iowa Department of Education, AYP file. Note: The data include results from the Iowa Assessments and the IAA.
*Migrant status is defined as migrant or non-migrant as follows: Migrant: a student is considered a migrant if he or she has moved in the past 36 months from one district to another so that the parents could obtain temporary or seasonal employment in agriculture as their principle means of livelihood.
47.6 45.3
76.6 77.4
0.0
10.0
20.0
30.0
40.0
50.0
60.0
70.0
80.0
90.0
100.0
2012-2013 2013-2014
Pe
rce
nt
School Year
English Language Learner Not English Language Learner
41.637.0
74.9 75.2
0.0
10.0
20.0
30.0
40.0
50.0
60.0
70.0
80.0
90.0
100.0
2012-2013 2013-2014
Pe
rce
nt
School Year
Migrant Not Migrant

16 State Report Card 2014
Figure 8
Percent of Iowa Eighth Grade Students Proficient
in Reading 2012-2013 and 2013-2014
Source: Iowa Department of Education, AYP file. Note: The data include results from the Iowa Assessments and the IAA.
Figure 9
Percent of Iowa Eighth Grade Students Proficient
in Reading by Gender 2012-2013 and 2013-2014
Source: Iowa Department of Education, AYP file. Note: The data include results from the Iowa Assessments and the IAA.
65.2
74.5
0.0
10.0
20.0
30.0
40.0
50.0
60.0
70.0
80.0
90.0
100.0
2012-2013 2013-2014
Pe
rce
nt
School Year
62.6
72.268.0
76.9
0.0
10.0
20.0
30.0
40.0
50.0
60.0
70.0
80.0
90.0
100.0
2012-2013 2013-2014
Pe
rce
nt
School Year
Male Female

State Report Card 2014 17
Figure 10
Percent of Iowa Eighth Grade Students Proficient
in Reading by Race/Ethnicity 2012-2013 and 2013-2014
Source: Iowa Department of Education, AYP file. Note: The data include results from the Iowa Assessments and the IAA.
Figure 11
Percent of Iowa Eighth Grade Students Proficient
in Reading by Socioeconomic Status* 2012-2013 and 2013-2014
Source: Iowa Department of Education, AYP file. Note: The data include results from the Iowa Assessments and the IAA.
*Socioeconomic status is determined by the eligibility for free or reduced price meals.
37.4
41.9
66.3
50.8
45.8
69.4
57.4
46.2
55.6
74.9
53.3
60.6
78.2
70.4
African American
American Indian
Asian
Hawaiian or Pacific Islander
Hispanic
White
Two or more races
2012-2013
2013-2014
49.3
60.6
75.483.6
0.0
10.0
20.0
30.0
40.0
50.0
60.0
70.0
80.0
90.0
100.0
2012-2013 2013-2014
Pe
rce
nt
School Year
Eligible for Free or Reduced Price Meals
Not Eligible for Free or Reduced Price Meals

18 State Report Card 2014
Figure 12
Percent of Iowa Eighth Grade Students Proficient
in Reading by Disability Status 2012-2013 and 2013-2014
Source: Iowa Department of Education, AYP file. Note: The data include results from the Iowa Assessments and the IAA.
*Disability status is determined by the presence of an individualized education program (IEP).
Figure 13
Percent of Iowa Eighth Grade Students Proficient
in Reading by Primary Language Status* 2012-2013 and 2013-2014
Source: Iowa Department of Education, AYP file. Note: The data include results from the Iowa Assessments and the IAA.
*Primary language status classified by English and English language learner and determined according to the following definition: English language learner refers to a student who has a language other than English and the proficiency in English is such that the probability of the student’s academic success in an English-only classroom is below that of an academically successful peer with an English language background.
19.8
30.0
73.1
81.3
0.0
10.0
20.0
30.0
40.0
50.0
60.0
70.0
80.0
90.0
100.0
2012-2013 2013-2014
Pe
rce
nt
School Year
Disability No Disability
18.4
31.7
66.7
76.2
0.0
10.0
20.0
30.0
40.0
50.0
60.0
70.0
80.0
90.0
100.0
2012-2013 2013-2014
Pe
rce
nt
School Year
English Language Learner Not English Language Learner

State Report Card 2014 19
Figure 14
Percent of Iowa Eighth Grade Students Proficient
in Reading by Migrant Status* 2012-2013 and 2013-2014
Source: Iowa Department of Education, AYP file. Note: The data include results from the Iowa Assessments and the IAA.
*Migrant status is defined as migrant or non-migrant as follows: Migrant: a student is considered a migrant if he or she has moved in the past 36 months from one district to another so that the parents could obtain temporary or seasonal employment in agriculture as their principle means of livelihood.
Figure 15
Percent of Iowa Eleventh Grade Students Proficient
in Reading 2012-2013 and 2013-2014
Source: Iowa Department of Education, AYP file. Note: The data include results from the Iowa Assessments and the IAA.
22.6
44.0
65.3
74.5
0.0
10.0
20.0
30.0
40.0
50.0
60.0
70.0
80.0
90.0
100.0
2012-2013 2013-2014
Pe
rce
nt
School Year
Migrant Not Migrant
81.978.8
0.0
10.0
20.0
30.0
40.0
50.0
60.0
70.0
80.0
90.0
100.0
2012-2013 2013-2014
Pe
rce
nt
School Year

20 State Report Card 2014
Figure 16
Percent of Iowa Eleventh Grade Students Proficient
in Reading by Gender 2012-2013 and 2013-2014
Source: Iowa Department of Education, AYP file. Note: The data include results from the Iowa Assessments and the IAA.
Figure 17
Percent of Iowa Eleventh Grade Students Proficient
in Reading by Race/Ethnicity 2012-2013 and 2013-2014
Source: Iowa Department of Education, AYP file. Note: The data include results from the Iowa Assessments and the IAA.
78.1 76.2
86.081.5
0.0
10.0
20.0
30.0
40.0
50.0
60.0
70.0
80.0
90.0
100.0
2012-2013 2013-2014
Pe
rce
nt
School Year
Male Female
58.3
74.2
75.7
62.8
69.7
84.6
78.5
49.8
66.9
71.6
77.8
64.2
82.3
72.6
African American
American Indian
Asian
Hawaiian or Pacific Islander
Hispanic
White
Two or more races
2012-2013
2013-2014

State Report Card 2014 21
Figure 18
Percent of Iowa Eleventh Grade Students Proficient
in Reading by Socioeconomic Status* 2012-2013 and 2013-2014
Source: Iowa Department of Education, AYP file. Note: The data include results from the Iowa Assessments and the IAA.
*Socioeconomic status is determined by the eligibility for free or reduced price meals.
Figure 19
Percent of Iowa Eleventh Grade Students Proficient
in Reading by Disability Status 2012-2013 and 2013-2014
Source: Iowa Department of Education, AYP file. Note: The data include results from the Iowa Assessments and the IAA.
*Disability status is determined by the presence of an individualized education program (IEP).
69.063.9
88.3 86.2
0.0
10.0
20.0
30.0
40.0
50.0
60.0
70.0
80.0
90.0
100.0
2012-2013 2013-2014
Pe
rce
nt
School Year
Eligible for Free or Reduced Price Meals
Not Eligible for Free or Reduced Price Meals
37.831.8
87.784.8
0.0
10.0
20.0
30.0
40.0
50.0
60.0
70.0
80.0
90.0
100.0
2012-2013 2013-2014
Pe
rce
nt
School Year
Disability No Disability

22 State Report Card 2014
Figure 20
Percent of Iowa Eleventh Grade Students Proficient
in Reading by Primary Language Status* 2012-2013 and 2013-2014
Source: Iowa Department of Education, AYP file. Note: The data include results from the Iowa Assessments and the IAA.
*Primary language status classified by English and English language learner and determined according to the following definition: English language learner refers to a student who has a language other than English and the proficiency in English is such that the probability of the student’s academic success in an English-only classroom is below that of an academically successful peer with an English language background.
Figure 21
Percent of Iowa Eleventh Grade Students Proficient
in Reading by Migrant Status* 2012-2013 and 2013-2014
Source: Iowa Department of Education, AYP file. Note: The data include results from the Iowa Assessments and the IAA.
*Migrant status is defined as migrant or non-migrant as follows: Migrant: a student is considered a migrant if he or she has moved in the past 36 months from one district to another so that the parents could obtain temporary or seasonal employment in agriculture as their principle means of livelihood.
34.028.6
83.280.1
0.0
10.0
20.0
30.0
40.0
50.0
60.0
70.0
80.0
90.0
100.0
2012-2013 2013-2014
Pe
rce
nt
School Year
English Language Learner Not English Language Learner
39.3 40.5
82.078.8
0.0
10.0
20.0
30.0
40.0
50.0
60.0
70.0
80.0
90.0
100.0
2012-2013 2013-2014
Pe
rce
nt
School Year
Migrant Not Migrant
State Report Card 2014 23
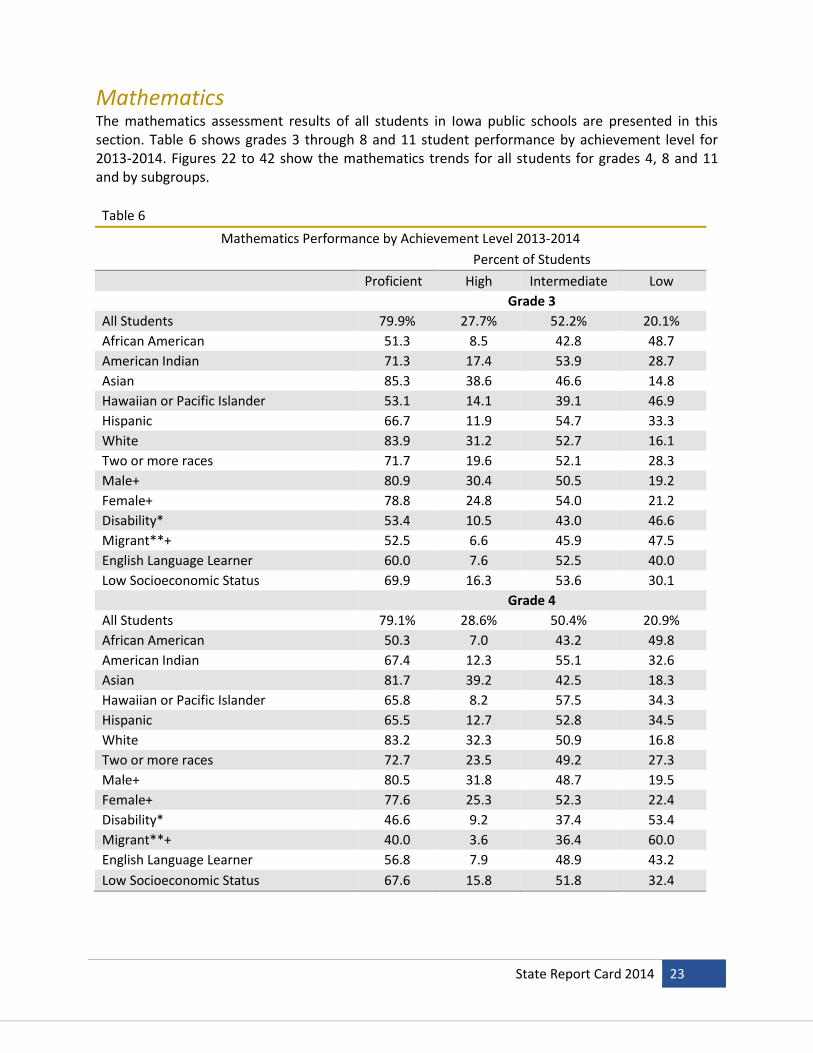
Mathematics The mathematics assessment results of all students in Iowa public schools are presented in this section. Table 6 shows grades 3 through 8 and 11 student performance by achievement level for 2013-2014. Figures 22 to 42 show the mathematics trends for all students for grades 4, 8 and 11 and by subgroups.
Table 6
Mathematics Performance by Achievement Level 2013-2014
Percent of Students
Proficient High Intermediate Low
Grade 3
All Students 79.9% 27.7% 52.2% 20.1%
African American 51.3 8.5 42.8 48.7
American Indian 71.3 17.4 53.9 28.7
Asian 85.3 38.6 46.6 14.8
Hawaiian or Pacific Islander 53.1 14.1 39.1 46.9
Hispanic 66.7 11.9 54.7 33.3
White 83.9 31.2 52.7 16.1
Two or more races 71.7 19.6 52.1 28.3
Male+ 80.9 30.4 50.5 19.2
Female+ 78.8 24.8 54.0 21.2
Disability* 53.4 10.5 43.0 46.6
Migrant**+ 52.5 6.6 45.9 47.5
English Language Learner 60.0 7.6 52.5 40.0
Low Socioeconomic Status 69.9 16.3 53.6 30.1
Grade 4
All Students 79.1% 28.6% 50.4% 20.9%
African American 50.3 7.0 43.2 49.8
American Indian 67.4 12.3 55.1 32.6
Asian 81.7 39.2 42.5 18.3
Hawaiian or Pacific Islander 65.8 8.2 57.5 34.3
Hispanic 65.5 12.7 52.8 34.5
White 83.2 32.3 50.9 16.8
Two or more races 72.7 23.5 49.2 27.3
Male+ 80.5 31.8 48.7 19.5
Female+ 77.6 25.3 52.3 22.4
Disability* 46.6 9.2 37.4 53.4
Migrant**+ 40.0 3.6 36.4 60.0
English Language Learner 56.8 7.9 48.9 43.2
Low Socioeconomic Status 67.6 15.8 51.8 32.4
24 State Report Card 2014
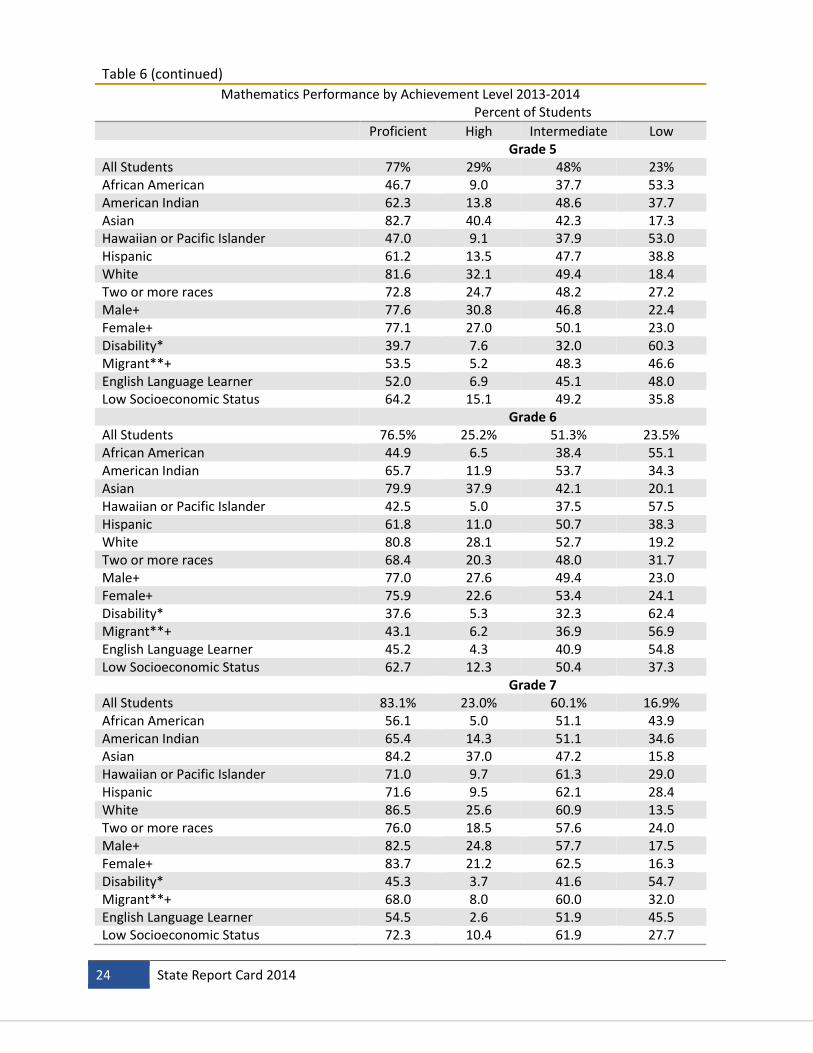
Table 6 (continued)
Mathematics Performance by Achievement Level 2013-2014 Percent of Students
Proficient High Intermediate Low Grade 5 All Students 77% 29% 48% 23% African American 46.7 9.0 37.7 53.3 American Indian 62.3 13.8 48.6 37.7 Asian 82.7 40.4 42.3 17.3 Hawaiian or Pacific Islander 47.0 9.1 37.9 53.0 Hispanic 61.2 13.5 47.7 38.8 White 81.6 32.1 49.4 18.4 Two or more races 72.8 24.7 48.2 27.2 Male+ 77.6 30.8 46.8 22.4 Female+ 77.1 27.0 50.1 23.0 Disability* 39.7 7.6 32.0 60.3 Migrant**+ 53.5 5.2 48.3 46.6 English Language Learner 52.0 6.9 45.1 48.0 Low Socioeconomic Status 64.2 15.1 49.2 35.8 Grade 6 All Students 76.5% 25.2% 51.3% 23.5% African American 44.9 6.5 38.4 55.1 American Indian 65.7 11.9 53.7 34.3 Asian 79.9 37.9 42.1 20.1 Hawaiian or Pacific Islander 42.5 5.0 37.5 57.5 Hispanic 61.8 11.0 50.7 38.3 White 80.8 28.1 52.7 19.2 Two or more races 68.4 20.3 48.0 31.7 Male+ 77.0 27.6 49.4 23.0 Female+ 75.9 22.6 53.4 24.1 Disability* 37.6 5.3 32.3 62.4 Migrant**+ 43.1 6.2 36.9 56.9 English Language Learner 45.2 4.3 40.9 54.8 Low Socioeconomic Status 62.7 12.3 50.4 37.3
Grade 7
All Students 83.1% 23.0% 60.1% 16.9% African American 56.1 5.0 51.1 43.9 American Indian 65.4 14.3 51.1 34.6 Asian 84.2 37.0 47.2 15.8 Hawaiian or Pacific Islander 71.0 9.7 61.3 29.0 Hispanic 71.6 9.5 62.1 28.4 White 86.5 25.6 60.9 13.5 Two or more races 76.0 18.5 57.6 24.0 Male+ 82.5 24.8 57.7 17.5 Female+ 83.7 21.2 62.5 16.3 Disability* 45.3 3.7 41.6 54.7 Migrant**+ 68.0 8.0 60.0 32.0 English Language Learner 54.5 2.6 51.9 45.5 Low Socioeconomic Status 72.3 10.4 61.9 27.7

State Report Card 2014 25
Table 6 (continued)
Mathematics Performance by Achievement Level 2013-2014 Percent of Students
Proficient High Intermediate Low
Grade 8
All Students 75.0% 22.0% 53.0% 25.0% African American 42.4 4.4 38.0 57.6 American Indian 58.3 6.9 51.4 41.7 Asian 80.5 35.0 45.4 19.5 Hawaiian or Pacific Islander 48.1 9.1 39.0 52.0 Hispanic 57.2 8.8 48.4 42.8 White 79.6 24.7 54.9 20.5 Two or more races 66.8 16.2 50.7 33.2 Male+ 74.6 23.2 51.4 25.4 Female+ 75.5 20.8 54.7 24.5 Disability* 31.7 3.4 28.3 68.3 Migrant**+ 48.0 2.0 46.0 52.0 English Language Learner 33.7 1.9 31.9 66.3 Low Socioeconomic Status 59.9 9.4 50.5 40.1 Grade 11 All Students 83.4% 22.0% 61.4% 16.6% African American 53.6 4.3 49.3 46.4 American Indian 73.9 9.9 64.1 26.1 Asian 83.8 30.0 53.8 16.2 Hawaiian or Pacific Islander 71.1 13.3 57.8 28.9 Hispanic 70.8 6.6 64.2 29.2 White 86.5 24.6 62.0 13.5 Two or more races 74.8 13.0 61.8 25.2 Male+ 82.6 23.6 59.0 17.4 Female+ 84.1 20.3 63.9 15.9 Disability* 44.1 1.5 42.7 55.9 Migrant**+ 52.4 2.4 50.0 47.6 English Language Learner 47.4 2.3 45.1 52.6 Low Socioeconomic Status 70.9 8.2 62.7 29.1 Source: Iowa Department of Education, AYP file.
Notes:
+Not required for Adequate Yearly Progress Report. *Disability status is determined by the presence of an individualized education program. **Migrant—a student is considered a migrant if he or she has moved in the past 36 months from one district to another so that the parents could obtain temporary or seasonal employment in agriculture as their principle means of livelihood. The Iowa Department of Education has combined the Intermediate and High achievement levels to define a single achievement level called Proficient. Figures for High, Intermediate, and Low may not total 100 percent due to rounding.
26 State Report Card 2014
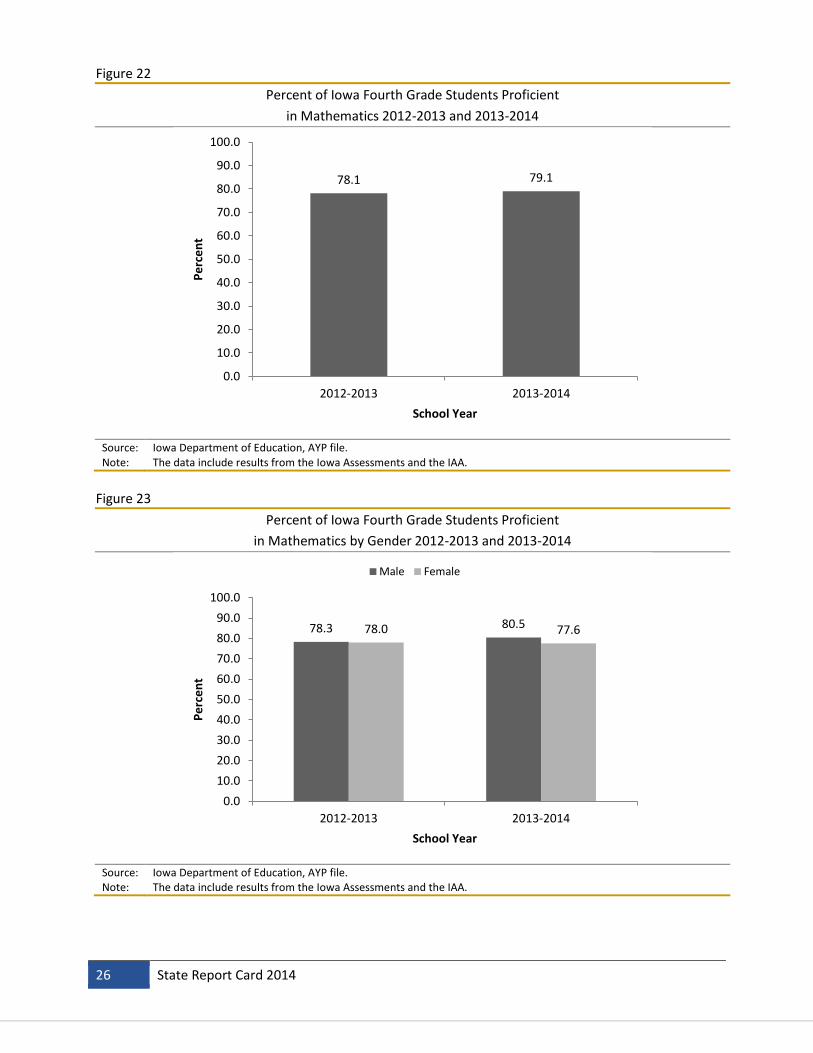
Figure 22
Percent of Iowa Fourth Grade Students Proficient
in Mathematics 2012-2013 and 2013-2014
Source: Iowa Department of Education, AYP file. Note: The data include results from the Iowa Assessments and the IAA.
Figure 23
Percent of Iowa Fourth Grade Students Proficient
in Mathematics by Gender 2012-2013 and 2013-2014
Source: Iowa Department of Education, AYP file. Note: The data include results from the Iowa Assessments and the IAA.
78.1 79.1
0.0
10.0
20.0
30.0
40.0
50.0
60.0
70.0
80.0
90.0
100.0
2012-2013 2013-2014
Pe
rce
nt
School Year
78.3 80.578.0 77.6
0.0
10.0
20.0
30.0
40.0
50.0
60.0
70.0
80.0
90.0
100.0
2012-2013 2013-2014
Pe
rce
nt
School Year
Male Female

State Report Card 2014 27
Figure 24
Percent of Iowa Fourth Grade Students Proficient
in Mathematics by Race/Ethnicity 2012-2013 and 2013-2014
Source: Iowa Department of Education, AYP file. Note: The data include results from the Iowa Assessments and the IAA.
Figure 25
Percent of Iowa Fourth Grade Students Proficient
in Mathematics by Socioeconomic Status* 2012-2013 and 2013-2014
Source: Iowa Department of Education, AYP file. Note: The data include results from the Iowa Assessments and the IAA.
*Socioeconomic status is determined by the eligibility for free or reduced price meals.
49.0
65.0
84.3
63.9
66.1
81.7
72.6
50.3
67.4
81.7
65.8
65.5
83.2
72.7
African American
American Indian
Asian
Hawaiian or Pacific Islander
Hispanic
White
Two or more races
2012-2013
2013-2014
67.1 67.6
86.4 87.9
0.0
10.0
20.0
30.0
40.0
50.0
60.0
70.0
80.0
90.0
100.0
2012-2013 2013-2014
Pe
rce
nt
School Year
Eligible for Free or Reduced Price Meals
Not Eligible for Free or Reduced Price Meals
28 State Report Card 2014
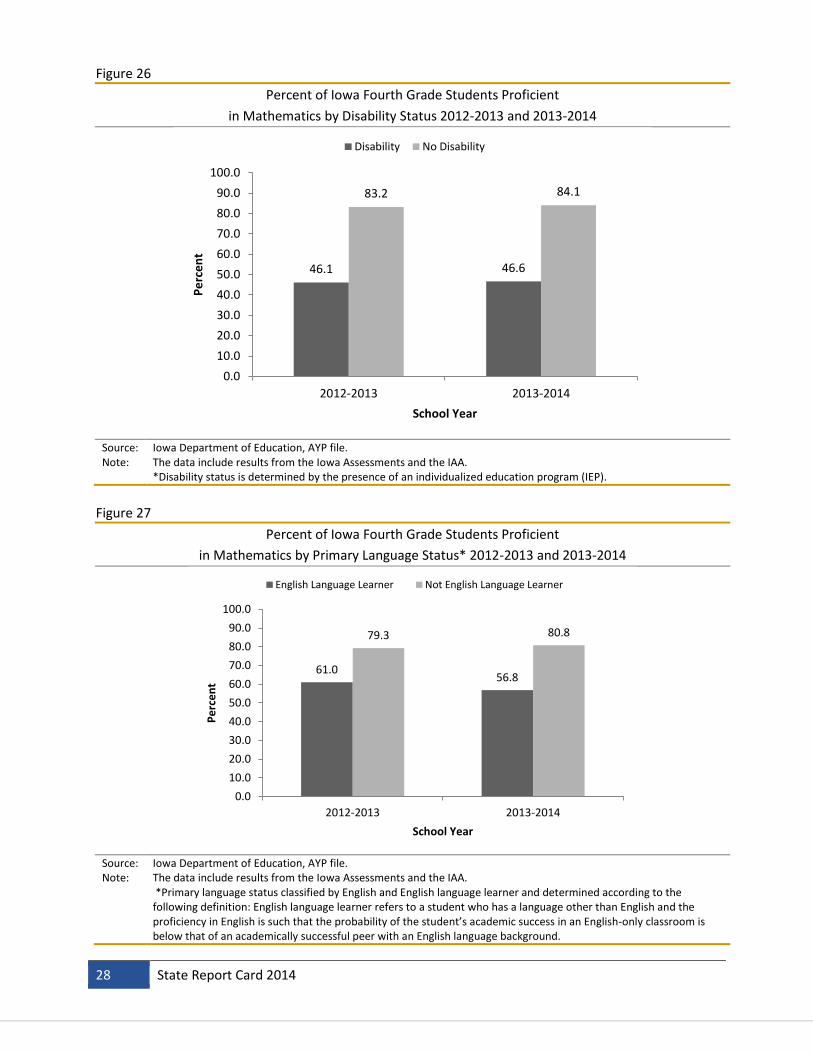
Figure 26
Percent of Iowa Fourth Grade Students Proficient
in Mathematics by Disability Status 2012-2013 and 2013-2014
Source: Iowa Department of Education, AYP file. Note: The data include results from the Iowa Assessments and the IAA.
*Disability status is determined by the presence of an individualized education program (IEP).
Figure 27
Percent of Iowa Fourth Grade Students Proficient
in Mathematics by Primary Language Status* 2012-2013 and 2013-2014
Source: Iowa Department of Education, AYP file. Note: The data include results from the Iowa Assessments and the IAA.
*Primary language status classified by English and English language learner and determined according to the following definition: English language learner refers to a student who has a language other than English and the proficiency in English is such that the probability of the student’s academic success in an English-only classroom is below that of an academically successful peer with an English language background.
46.1 46.6
83.2 84.1
0.0
10.0
20.0
30.0
40.0
50.0
60.0
70.0
80.0
90.0
100.0
2012-2013 2013-2014
Pe
rce
nt
School Year
Disability No Disability
61.056.8
79.3 80.8
0.0
10.0
20.0
30.0
40.0
50.0
60.0
70.0
80.0
90.0
100.0
2012-2013 2013-2014
Pe
rce
nt
School Year
English Language Learner Not English Language Learner

State Report Card 2014 29
Figure 28
Percent of Iowa Fourth Grade Students Proficient
in Mathematics by Migrant Status* 2012-2013 and 2013-2014
Source: Iowa Department of Education, AYP file. Note: The data include results from the Iowa Assessments and the IAA.
*Migrant status is defined as migrant or non-migrant as follows: Migrant: a student is considered a migrant if he or she has moved in the past 36 months from one district to another so that the parents could obtain temporary or seasonal employment in agriculture as their principle means of livelihood.
Figure 29
Percent of Iowa Eighth Grade Students Proficient
in Mathematics 2012-2013 and 2013-2014
Source: Iowa Department of Education, AYP file. Note: The data include results from the Iowa Assessments and the IAA.
63.6
40.0
78.2 79.1
0.0
10.0
20.0
30.0
40.0
50.0
60.0
70.0
80.0
90.0
100.0
2012-2013 2013-2014
Pe
rce
nt
School Year
Migrant Not Migrant
73.3 75.0
0.0
10.0
20.0
30.0
40.0
50.0
60.0
70.0
80.0
90.0
100.0
2012-2013 2013-2014
Pe
rce
nt
School Year

30 State Report Card 2014
Figure 30
Percent of Iowa Eighth Grade Students Proficient
in Mathematics by Gender 2012-2013 and 2013-2014
Source: Iowa Department of Education, AYP file. Note: The data include results from the Iowa Assessments and the IAA.
Figure 31
Percent of Iowa Eighth Grade Students Proficient
in Mathematics by Race/Ethnicity 2012-2013 and 2013-2014
Source: Iowa Department of Education, AYP file. Note: The data include results from the Iowa Assessments and the IAA.
72.6 74.674.1 75.5
0.0
10.0
20.0
30.0
40.0
50.0
60.0
70.0
80.0
90.0
100.0
2012-2013 2013-2014
Pe
rce
nt
School Year
Male Female
41.8
48.7
80.6
53.1
55.1
77.6
62.8
42.4
58.3
80.5
48.1
57.2
79.6
66.8
African American
American Indian
Asian
Hawaiian or Pacific Islander
Hispanic
White
Two or more races
2012-2013
2013-2014

State Report Card 2014 31
Figure 32
Percent of Iowa Eighth Grade Students Proficient
in Mathematics by Socioeconomic Status* 2012-2013 and 2013-2014
Source: Iowa Department of Education, AYP file. Note: The data include results from the Iowa Assessments and the IAA.
*Socioeconomic status is determined by the eligibility for free or reduced price meals.
Figure 33
Percent of Iowa Eighth Grade Students Proficient
in Mathematics by Disability Status 2012-2013 and 2013-2014
Source: Iowa Department of Education, AYP file. Note: The data include results from the Iowa Assessments and the IAA.
*Disability status is determined by the presence of an individualized education program (IEP).
57.7 59.9
83.3 85.0
0.0
10.0
20.0
30.0
40.0
50.0
60.0
70.0
80.0
90.0
100.0
2012-2013 2013-2014
Pe
rce
nt
School Year
Eligible for Free or Reduced Price Meals
Not Eligible for Free or Reduced Price Meals
27.831.7
80.3 81.6
0.0
10.0
20.0
30.0
40.0
50.0
60.0
70.0
80.0
90.0
100.0
2012-2013 2013-2014
Pe
rce
nt
School Year
Disability No Disability

32 State Report Card 2014
Figure 34
Percent of Iowa Eighth Grade Students Proficient
in Mathematics by Primary Language Status* 2012-2013 and 2013-2014
Source: Iowa Department of Education, AYP file. Note: The data include results from the Iowa Assessments and the IAA.
*Primary language status classified by English and English language learner and determined according to the following definition: English language learner refers to a student who has a language other than English and the proficiency in English is such that the probability of the student’s academic success in an English-only classroom is below that of an academically successful peer with an English language background.
Figure 35
Percent of Iowa Eighth Grade Students Proficient
in Mathematics by Migrant Status* 2012-2013 and 2013-2014
Source: Iowa Department of Education, AYP file. Note: The data include results from the Iowa Assessments and the IAA.
*Migrant status is defined as migrant or non-migrant as follows: Migrant: a student is considered a migrant if he or she has moved in the past 36 months from one district to another so that the parents could obtain temporary or seasonal employment in agriculture as their principle means of livelihood.
33.8 33.7
74.6 76.7
0.0
10.0
20.0
30.0
40.0
50.0
60.0
70.0
80.0
90.0
100.0
2012-2013 2013-2014
Pe
rce
nt
School Year
English Language Learner Not English Language Learner
34.9
48.0
73.4 75.1
0.0
10.0
20.0
30.0
40.0
50.0
60.0
70.0
80.0
90.0
100.0
2012-2013 2013-2014
Pe
rce
nt
School Year
Migrant Not Migrant

State Report Card 2014 33
Figure 36
Percent of Iowa Eleventh Grade Students Proficient
in Mathematics 2012-2013 and 2013-2014
Source: Iowa Department of Education, AYP file. Note: The data include results from the Iowa Assessments and the IAA.
Figure 37
Percent of Iowa Eleventh Grade Students Proficient
in Mathematics by Gender 2012-2013 and 2013-2014
Source: Iowa Department of Education, AYP file. Note: The data include results from the Iowa Assessments and the IAA.
80.7 83.4
0.0
10.0
20.0
30.0
40.0
50.0
60.0
70.0
80.0
90.0
100.0
2012-2013 2013-2014
Pe
rce
nt
School Year
80.6 82.680.9 84.1
0.0
10.0
20.0
30.0
40.0
50.0
60.0
70.0
80.0
90.0
100.0
2012-2013 2013-2014
Pe
rce
nt
School Year
Male Female

34 State Report Card 2014
Figure 38
Percent of Iowa Eleventh Grade Students Proficient
in Mathematics by Race/Ethnicity 2012-2013 and 2013-2014
Source: Iowa Department of Education, AYP file. Note: The data include results from the Iowa Assessments and the IAA.
Figure 39
Percent of Iowa Eleventh Grade Students Proficient
in Mathematics by Socioeconomic Status* 2012-2013 and 2013-2014
Source: Iowa Department of Education, AYP file. Note: The data include results from the Iowa Assessments and the IAA.
*Socioeconomic status is determined by the eligibility for free or reduced price meals.
52.4
60.5
79.4
55.8
65.6
84.1
71.1
53.6
73.9
83.8
71.1
70.8
86.5
74.8
African American
American Indian
Asian
Hawaiian or Pacific Islander
Hispanic
White
Two or more races
2012-2013
2013-2014
66.470.9
87.8 89.5
0.0
10.0
20.0
30.0
40.0
50.0
60.0
70.0
80.0
90.0
100.0
2012-2013 2013-2014
Pe
rce
nt
School Year
Eligible for Free or Reduced Price Meals
Not Eligible for Free or Reduced Price Meals

State Report Card 2014 35
Figure 40
Percent of Iowa Eleventh Grade Students Proficient
in Mathematics by Disability Status 2012-2013 and 2013-2014
Source: Iowa Department of Education, AYP file. Note: The data include results from the Iowa Assessments and the IAA.
*Disability status is determined by the presence of an individualized education program (IEP).
Figure 41
Percent of Iowa Eleventh Grade Students Proficient
in Mathematics by Primary Language Status* 2012-2013 and 2013-2014
Source: Iowa Department of Education, AYP file. Note: The data include results from the Iowa Assessments and the IAA.
*Primary language status classified by English and English language learner and determined according to the following definition: English language learner refers to a student who has a language other than English and the proficiency in English is such that the probability of the student’s academic success in an English-only classroom is below that of an academically successful peer with an English language background.
43.7 44.1
85.588.4
0.0
10.0
20.0
30.0
40.0
50.0
60.0
70.0
80.0
90.0
100.0
2012-2013 2013-2014
Pe
rce
nt
School Year
Disability No Disability
40.547.4
81.7 84.3
0.0
10.0
20.0
30.0
40.0
50.0
60.0
70.0
80.0
90.0
100.0
2012-2013 2013-2014
Pe
rce
nt
School Year
English Language Learner Not English Language Learner

36 State Report Card 2014
Figure 48
Percent of Iowa Eleventh Grade Students Proficient
in Mathematics by Migrant Status* 2012-2013 and 2013-2014
Source: Iowa Department of Education, AYP file. Note: The data include results from the Iowa Assessments and the IAA.
*Migrant status is defined as migrant or non-migrant as follows: Migrant: a student is considered a migrant if he or she has moved in the past 36 months from one district to another so that the parents could obtain temporary or seasonal employment in agriculture as their principle means of livelihood.
49.252.4
80.9 83.4
0.0
10.0
20.0
30.0
40.0
50.0
60.0
70.0
80.0
90.0
100.0
2012-2013 2013-2014
Pe
rce
nt
School Year
Migrant Not Migrant
State Report Card 2014 37
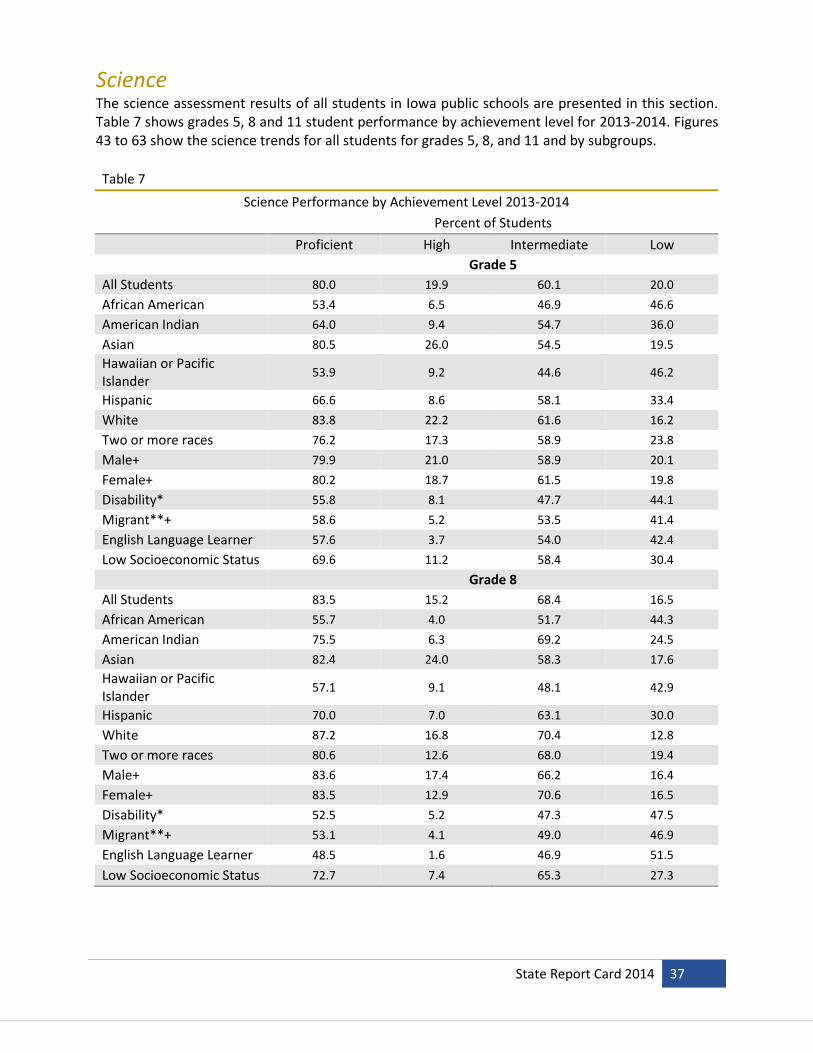
Science The science assessment results of all students in Iowa public schools are presented in this section. Table 7 shows grades 5, 8 and 11 student performance by achievement level for 2013-2014. Figures 43 to 63 show the science trends for all students for grades 5, 8, and 11 and by subgroups.
Table 7
Science Performance by Achievement Level 2013-2014
Percent of Students
Proficient High Intermediate Low
Grade 5
All Students 80.0 19.9 60.1 20.0
African American 53.4 6.5 46.9 46.6
American Indian 64.0 9.4 54.7 36.0
Asian 80.5 26.0 54.5 19.5
Hawaiian or Pacific Islander
53.9 9.2 44.6 46.2
Hispanic 66.6 8.6 58.1 33.4
White 83.8 22.2 61.6 16.2
Two or more races 76.2 17.3 58.9 23.8
Male+ 79.9 21.0 58.9 20.1
Female+ 80.2 18.7 61.5 19.8
Disability* 55.8 8.1 47.7 44.1
Migrant**+ 58.6 5.2 53.5 41.4
English Language Learner 57.6 3.7 54.0 42.4
Low Socioeconomic Status 69.6 11.2 58.4 30.4
Grade 8
All Students 83.5 15.2 68.4 16.5
African American 55.7 4.0 51.7 44.3
American Indian 75.5 6.3 69.2 24.5
Asian 82.4 24.0 58.3 17.6
Hawaiian or Pacific Islander
57.1 9.1 48.1 42.9
Hispanic 70.0 7.0 63.1 30.0
White 87.2 16.8 70.4 12.8
Two or more races 80.6 12.6 68.0 19.4
Male+ 83.6 17.4 66.2 16.4
Female+ 83.5 12.9 70.6 16.5
Disability* 52.5 5.2 47.3 47.5
Migrant**+ 53.1 4.1 49.0 46.9
English Language Learner 48.5 1.6 46.9 51.5
Low Socioeconomic Status 72.7 7.4 65.3 27.3

38 State Report Card 2014
Table 7 (continued)
Science Performance by Achievement Level 2013-2014 Percent of Students
Proficient High Intermediate Low Grade 11 All Students 79.1 21.2 58.0 20.9
African American 47.8 4.9 42.9 52.2
American Indian 66.0 7.8 58.2 34.0
Asian 76.0 23.0 53.0 24.0
Hawaiian or Pacific Islander
73.3 15.6 57.8 26.7
Hispanic 64.9 8.0 56.9 35.1
White 82.7 23.6 59.1 17.3
Two or more races 70.5 15.1 55.4 29.5
Male+ 78.0 23.4 54.6 22.0
Female+ 80.4 18.9 61.5 19.6
Disability* 40.1 5.1 35.1 59.9
Migrant**+ 53.7 4.9 48.8 46.3
English Language Learner 36.8 1.5 35.3 63.2
Low Socioeconomic Status 65.1 9.7 55.4 34.9 Source: Iowa Department of Education, AYP file.
Notes:
+Not required for Adequate Yearly Progress Report. *Disability status is determined by the presence of an individualized education program. **Migrant—a student is considered a migrant if he or she has moved in the past 36 months from one district to another so that the parents could obtain temporary or seasonal employment in agriculture as their principle means of livelihood. The Iowa Department of Education has combined the Intermediate and High achievement levels to define a single achievement level called Proficient. Figures for High, Intermediate, and Low may not total 100 percent due to rounding.
Figure 43
Percent of Iowa Fifth Grade Students Proficient
in Science 2012-2013 and 2013-2014
Source: Iowa Department of Education, AYP file. Note: The data include results from the Iowa Assessments and the IAA.
77.5 80.0
0.0
10.0
20.0
30.0
40.0
50.0
60.0
70.0
80.0
90.0
100.0
2012-2013 2013-2014
Pe
rce
nt
School Year
State Report Card 2014 39
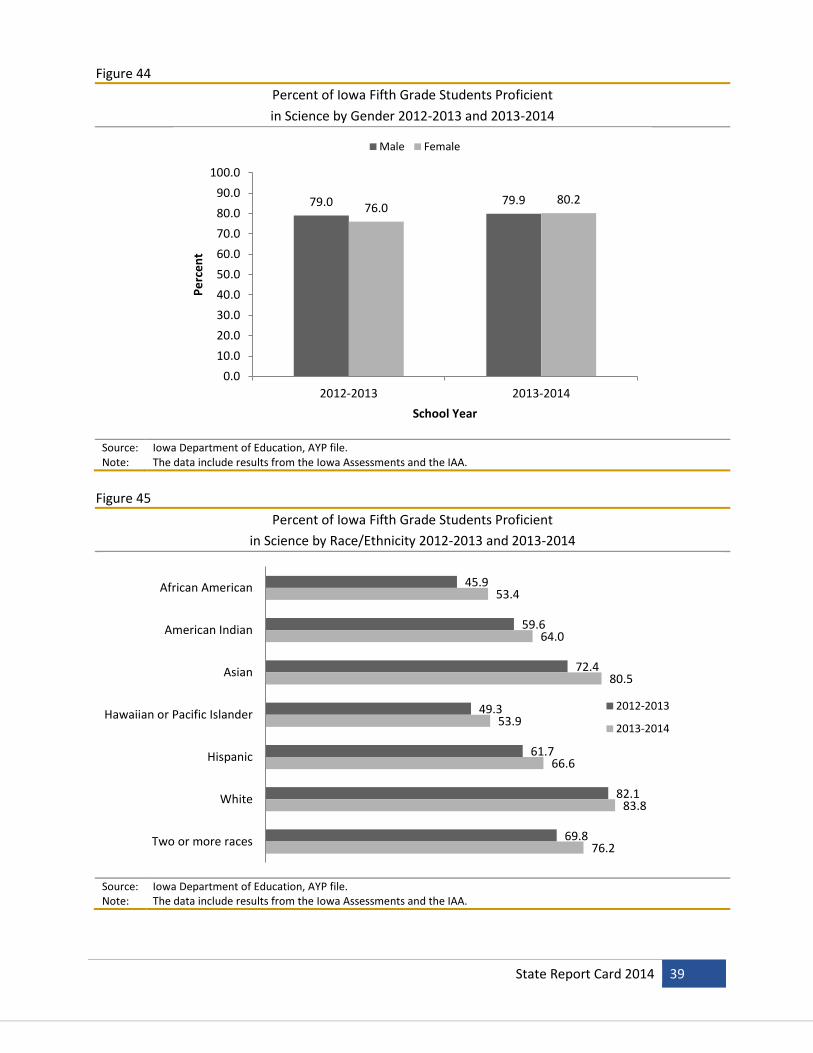
Figure 44
Percent of Iowa Fifth Grade Students Proficient
in Science by Gender 2012-2013 and 2013-2014
Source: Iowa Department of Education, AYP file. Note: The data include results from the Iowa Assessments and the IAA.
Figure 45
Percent of Iowa Fifth Grade Students Proficient
in Science by Race/Ethnicity 2012-2013 and 2013-2014
Source: Iowa Department of Education, AYP file. Note: The data include results from the Iowa Assessments and the IAA.
79.0 79.976.0
80.2
0.0
10.0
20.0
30.0
40.0
50.0
60.0
70.0
80.0
90.0
100.0
2012-2013 2013-2014
Pe
rce
nt
School Year
Male Female
45.9
59.6
72.4
49.3
61.7
82.1
69.8
53.4
64.0
80.5
53.9
66.6
83.8
76.2
African American
American Indian
Asian
Hawaiian or Pacific Islander
Hispanic
White
Two or more races
2012-2013
2013-2014

40 State Report Card 2014
Figure 46
Percent of Iowa Fifth Grade Students Proficient
in Science by Socioeconomic Status* 2012-2013 and 2013-2014
Source: Iowa Department of Education, AYP file. Note: The data include results from the Iowa Assessments and the IAA.
*Socioeconomic status is determined by the eligibility for free or reduced price meals.
Figure 47
Percent of Iowa Fifth Grade Students Proficient
in Science by Disability Status 2012-2013 and 2013-2014
Source: Iowa Department of Education, AYP file. Note: The data include results from the Iowa Assessments and the IAA.
*Disability status is determined by the presence of an individualized education program (IEP).
65.6 69.6
86.4 87.7
0.0
20.0
40.0
60.0
80.0
100.0
2012-2013 2013-2014
Pe
rce
nt
School Year
Eligible for Free or Reduced Price Meals
Not Eligible for Free or Reduced Price Meals
50.355.8
82.0 83.9
0.0
10.0
20.0
30.0
40.0
50.0
60.0
70.0
80.0
90.0
100.0
2012-2013 2013-2014
Pe
rce
nt
School Year
Disability No Disability

State Report Card 2014 41
Figure 48
Percent of Iowa Fifth Grade Students Proficient
in Science by Primary Language Status* 2012-2013 and 2013-2014
Source: Iowa Department of Education, AYP file. Note: The data include results from the Iowa Assessments and the IAA.
*Primary language status classified by English and English language learner and determined according to the following definition: English language learner refers to a student who has a language other than English and the proficiency in English is such that the probability of the student’s academic success in an English-only classroom is below that of an academically successful peer with an English language background.
Figure 49
Percent of Iowa Fifth Grade Students Proficient
in Science by Migrant Status* 2012-2013 and 2013-2014
Source: Iowa Department of Education, AYP file. Note: The data include results from the Iowa Assessments and the IAA.
*Migrant status is defined as migrant or non-migrant as follows: Migrant: a student is considered a migrant if he or she has moved in the past 36 months from one district to another so that the parents could obtain temporary or seasonal employment in agriculture as their principle means of livelihood.
47.8
57.6
79.4 81.5
0.0
10.0
20.0
30.0
40.0
50.0
60.0
70.0
80.0
90.0
100.0
2012-2013 2013-2014
Pe
rce
nt
School Year
English Language Learner Not English Language Learner
45.6
58.6
77.6 80.0
0.0
10.0
20.0
30.0
40.0
50.0
60.0
70.0
80.0
90.0
100.0
2012-2013 2013-2014
Pe
rce
nt
School Year
Migrant Not Migrant

42 State Report Card 2014
Figure 50
Percent of Iowa Eighth Grade Students Proficient
in Science 2012-2013 and 2013-2014
Source: Iowa Department of Education, AYP file. Note: The data include results from the Iowa Assessments and the IAA.
Figure 51
Percent of Iowa Eighth Grade Students Proficient
in Science by Gender 2012-2013 and 2013-2014
Source: Iowa Department of Education, AYP file. Note: The data include results from the Iowa Assessments and the IAA.
75.0
83.5
0.0
10.0
20.0
30.0
40.0
50.0
60.0
70.0
80.0
90.0
100.0
2012-2013 2013-2014
Pe
rce
nt
School Year
76.383.6
73.5
83.5
0.0
10.0
20.0
30.0
40.0
50.0
60.0
70.0
80.0
90.0
100.0
2012-2013 2013-2014
Pe
rce
nt
School Year
Male Female

State Report Card 2014 43
Figure 52
Percent of Iowa Eighth Grade Students Proficient
in Science by Race/Ethnicity 2012-2013 and 2013-2014
Source: Iowa Department of Education, AYP file. Note: The data include results from the Iowa Assessments and the IAA.
Figure 53
Percent of Iowa Eighth Grade Students Proficient
in Science by Socioeconomic Status* 2012-2013 and 2013-2014
Source: Iowa Department of Education, AYP file. Note: The data include results from the Iowa Assessments and the IAA.
*Socioeconomic status is determined by the eligibility for free or reduced price meals.
43.4
56.1
76.0
54.7
57.5
79.2
67.0
55.7
75.5
82.4
57.1
70.0
87.2
80.6
African American
American Indian
Asian
Hawaiian or Pacific Islander
Hispanic
White
Two or more races
2012-2013
2013-2014
61.5
72.7
83.690.6
0.0
10.0
20.0
30.0
40.0
50.0
60.0
70.0
80.0
90.0
100.0
2012-2013 2013-2014
Pe
rce
nt
School Year
Eligible for Free or Reduced Price Meals
Not Eligible for Free or Reduced Price Meals

44 State Report Card 2014
Figure 54
Percent of Iowa Eighth Grade Students Proficient
in Science by Disability Status 2012-2013 and 2013-2014
Source: Iowa Department of Education, AYP file. Note: The data include results from the Iowa Assessments and the IAA.
*Disability status is determined by the presence of an individualized education program (IEP).
Figure 55
Percent of Iowa Eighth Grade Students Proficient
in Science by Primary Language Status* 2012-2013 and 2013-2014
Source: Iowa Department of Education, AYP file. Note: The data include results from the Iowa Assessments and the IAA.
*Primary language status classified by English and English language learner and determined according to the following definition: English language learner refers to a student who has a language other than English and the proficiency in English is such that the probability of the student’s academic success in an English-only classroom is below that of an academically successful peer with an English language background.
39.5
52.5
80.3
88.3
0.0
10.0
20.0
30.0
40.0
50.0
60.0
70.0
80.0
90.0
100.0
2012-2013 2013-2014
Pe
rce
nt
School Year
Disability No Disability
34.3
48.5
76.3
84.9
0.0
10.0
20.0
30.0
40.0
50.0
60.0
70.0
80.0
90.0
100.0
2012-2013 2013-2014
Pe
rce
nt
School Year
English Language Learner Not English Language Learner
State Report Card 2014 45
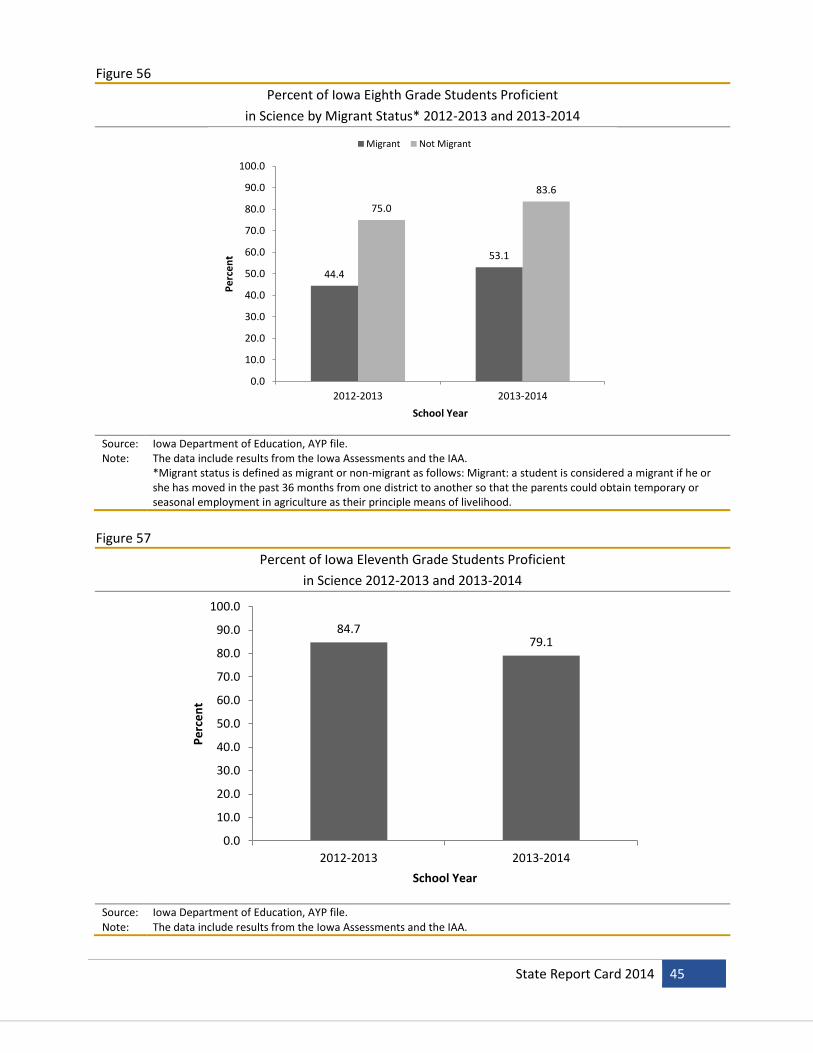
Figure 56
Percent of Iowa Eighth Grade Students Proficient
in Science by Migrant Status* 2012-2013 and 2013-2014
Source: Iowa Department of Education, AYP file. Note: The data include results from the Iowa Assessments and the IAA.
*Migrant status is defined as migrant or non-migrant as follows: Migrant: a student is considered a migrant if he or she has moved in the past 36 months from one district to another so that the parents could obtain temporary or seasonal employment in agriculture as their principle means of livelihood.
Figure 57
Percent of Iowa Eleventh Grade Students Proficient
in Science 2012-2013 and 2013-2014
Source: Iowa Department of Education, AYP file. Note: The data include results from the Iowa Assessments and the IAA.
44.4
53.1
75.0
83.6
0.0
10.0
20.0
30.0
40.0
50.0
60.0
70.0
80.0
90.0
100.0
2012-2013 2013-2014
Pe
rce
nt
School Year
Migrant Not Migrant
84.779.1
0.0
10.0
20.0
30.0
40.0
50.0
60.0
70.0
80.0
90.0
100.0
2012-2013 2013-2014
Pe
rce
nt
School Year

46 State Report Card 2014
Figure 58
Percent of Iowa Eleventh Grade Students Proficient
in Science by Gender 2012-2013 and 2013-2014
Source: Iowa Department of Education, AYP file. Note: The data include results from the Iowa Assessments and the IAA.
Figure 59
Percent of Iowa Eleventh Grade Students Proficient
in Science by Race/Ethnicity 2012-2013 and 2013-2014
Source: Iowa Department of Education, AYP file. Note: The data include results from the Iowa Assessments and the IAA.
83.078.0
86.580.4
0.0
10.0
20.0
30.0
40.0
50.0
60.0
70.0
80.0
90.0
100.0
2012-2013 2013-2014
Pe
rce
nt
School Year
Male Female
58.1
76.2
80.8
64.3
71.9
87.6
79.5
47.8
66.0
76.0
73.3
64.9
82.7
70.5
African American
American Indian
Asian
Hawaiian or Pacific Islander
Hispanic
White
Two or more races
2012-2013
2013-2014

State Report Card 2014 47
Figure 60
Percent of Iowa Eleventh Grade Students Proficient
in Science by Socioeconomic Status* 2012-2013 and 2013-2014
Source: Iowa Department of Education, AYP file. Note: The data include results from the Iowa Assessments and the IAA.
*Socioeconomic status is determined by the eligibility for free or reduced price meals.
Figure 61
Percent of Iowa Eleventh Grade Students Proficient
in Science by Disability Status 2012-2013 and 2013-2014
Source: Iowa Department of Education, AYP file. Note: The data include results from the Iowa Assessments and the IAA.
*Disability status is determined by the presence of an individualized education program (IEP).
73.465.1
90.286.1
0.0
10.0
20.0
30.0
40.0
50.0
60.0
70.0
80.0
90.0
100.0
2012-2013 2013-2014
Pe
rce
nt
School Year
Eligible for Free or Reduced Price Meals
Not Eligible for Free or Reduced Price Meals
51.2
40.1
90.084.1
0.0
10.0
20.0
30.0
40.0
50.0
60.0
70.0
80.0
90.0
100.0
2012-2013 2013-2014
Pe
rce
nt
School Year
Disability No Disability
48 State Report Card 2014
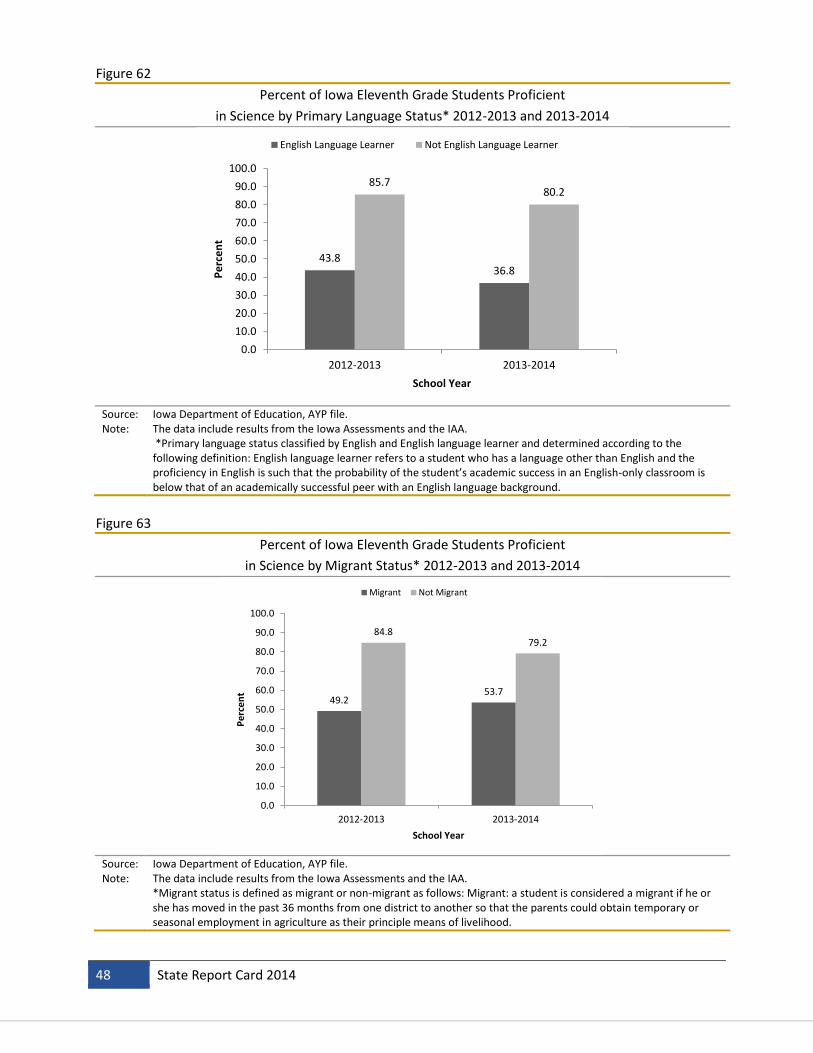
Figure 62
Percent of Iowa Eleventh Grade Students Proficient
in Science by Primary Language Status* 2012-2013 and 2013-2014
Source: Iowa Department of Education, AYP file. Note: The data include results from the Iowa Assessments and the IAA.
*Primary language status classified by English and English language learner and determined according to the following definition: English language learner refers to a student who has a language other than English and the proficiency in English is such that the probability of the student’s academic success in an English-only classroom is below that of an academically successful peer with an English language background.
Figure 63
Percent of Iowa Eleventh Grade Students Proficient
in Science by Migrant Status* 2012-2013 and 2013-2014
Source: Iowa Department of Education, AYP file. Note: The data include results from the Iowa Assessments and the IAA.
*Migrant status is defined as migrant or non-migrant as follows: Migrant: a student is considered a migrant if he or she has moved in the past 36 months from one district to another so that the parents could obtain temporary or seasonal employment in agriculture as their principle means of livelihood.
43.836.8
85.780.2
0.0
10.0
20.0
30.0
40.0
50.0
60.0
70.0
80.0
90.0
100.0
2012-2013 2013-2014
Pe
rce
nt
School Year
English Language Learner Not English Language Learner
49.253.7
84.879.2
0.0
10.0
20.0
30.0
40.0
50.0
60.0
70.0
80.0
90.0
100.0
2012-2013 2013-2014
Pe
rce
nt
School Year
Migrant Not Migrant

State Report Card 2014 49
National Assessment of Educational Progress The National Assessment of Educational Progress (NAEP) is the only nationally representative, continuing assessment of what students in the United States know and can accomplish in various subject areas. Since NAEP assessments are administered uniformly using the same sets of test booklets across the nation, NAEP results serve as a common metric for all states and selected urban districts. The assessment stays essentially the same from year to year, with only carefully documented changes. This permits NAEP to provide a clear picture of student academic progress over time. The following tables show the most recent results of NAEP for Iowa in reading and mathematics that were available at the time this document was released. Additional information on NAEP can be found at: http://nationsreportcard.gov/. NAEP mathematics and reading results for grades four and eight are reported on a 0–500 scale. Because NAEP scales are developed independently for each subject and for each content area within a subject, the scores cannot be compared across subjects. In addition to the scale scores and based on recommendations from policymakers, educators, and members of the general public, specific achievement levels are set for each subject area and grade. Achievement levels are performance standards showing what students should know and be able to do. They provide another perspective with which to interpret student performance. NAEP results are reported as percentages of students performing at the Basic, Proficient, and Advanced levels.
Basic denotes partial mastery of prerequisite knowledge and skills that are fundamental for proficient work at a given grade.
Proficient represents solid academic performance. Students reaching this level have demonstrated competency over challenging subject matter.
Advanced represents superior performance. Note that the cut point for the Basic level on NAEP is the best comparison to the Proficient level on the Iowa Assessments. Table 8
Inclusion Rates: Percent Included in the NAEP 2013 Assessment
Jurisdiction Grade 4 Reading
Grade 4 Mathematics
Grade 8 Reading
Grade 8 Mathematics
Students with Disabilities Iowa 93.4% 95.9% 91.1% 94.2% Nation 83.3% 89.8% 84.0% 89.1%
English Language Learners Iowa 95.6% 96.4% 91.6% 98.5%
Nation 91.8% 95.8% 89.6% 92.6%
Source: U.S. Department of Education, Institute of Education Sciences, National Center for Education Statistics, National Assessment of Educational Progress (NAEP), 2013 Assessment.

50 State Report Card 2014
Table 9
NAEP Reading 2013, Grade 4, Percent of Students at Each Achievement Level for Iowa and the Nation
Iowa Nation Below
Basic Basic Proficient Advanced Below
Basic Basic Proficient Advanced
All Students 28% 34% 29% 9% 33% 33% 26% 8%
African American
56% 30% 12% 2% 50% 32% 15% 2%
American Indian - - - - 48% 30% 18% 4%
Asian 30% 32% 25% 12% 19% 28% 34% 18%
Hispanic 43% 35% 18% 4% 48% 33% 17% 3%
Pacific Islander - - - - 44% 31% 19% 5%
White 25% 34% 32% 10% 21% 34% 33% 11%
Two or more races
32% 33% 26% 9% 29% 32% 28% 10%
Low SES 44% 32% 20% 4% 47% 34% 17% 3%
Not Low SES 18% 35% 35% 12% 17% 32% 37% 14%
Source: U.S. Department of Education, Institute of Education Sciences, National Center for Education Statistics, National Assessment of Educational Progress (NAEP), 2013 Assessment.
Notes: - Reporting standards not met (insufficient sample size to report). Detail may not sum to 100% because of rounding. Some apparent differences between estimates may not be statistically significant.
Table 10
NAEP Reading 2013, Grade 8, Percent of Students at Each Achievement Level for Iowa and the Nation
Iowa Nation
Below Basic
Basic Proficient Advanced Below Basic
Basic Proficient Advanced
All Students 19% 44% 34% 3% 23% 42% 31% 4%
African American 40% 45% 14% 1% 40% 44% 15% 1%
American Indian - - - - 37% 44% 18% 1%
Asian 19% 41% 34% 6% 14% 34% 42% 10%
Hispanic 31% 48% 20% 1% 33% 46% 20% 1%
Pacific Islander - - - - 31% 42% 25% 1%
White 16% 44% 36% 3% 15% 41% 39% 5%
Two or more races 27% 37% 31% 5% 21% 41% 33% 5%
Low SES 30% 49% 21% 1% 34% 46% 19% 1%
Not Low SES 12% 42% 42% 4% 13% 39% 42% 6%
Source: U.S. Department of Education, Institute of Education Sciences, National Center for Education Statistics, National Assessment of Educational Progress (NAEP), 2013 Assessment.
Notes: - Reporting standards not met (insufficient sample size to report). Detail may not sum to 100% because of rounding. Some apparent differences between estimates may not be statistically significant.
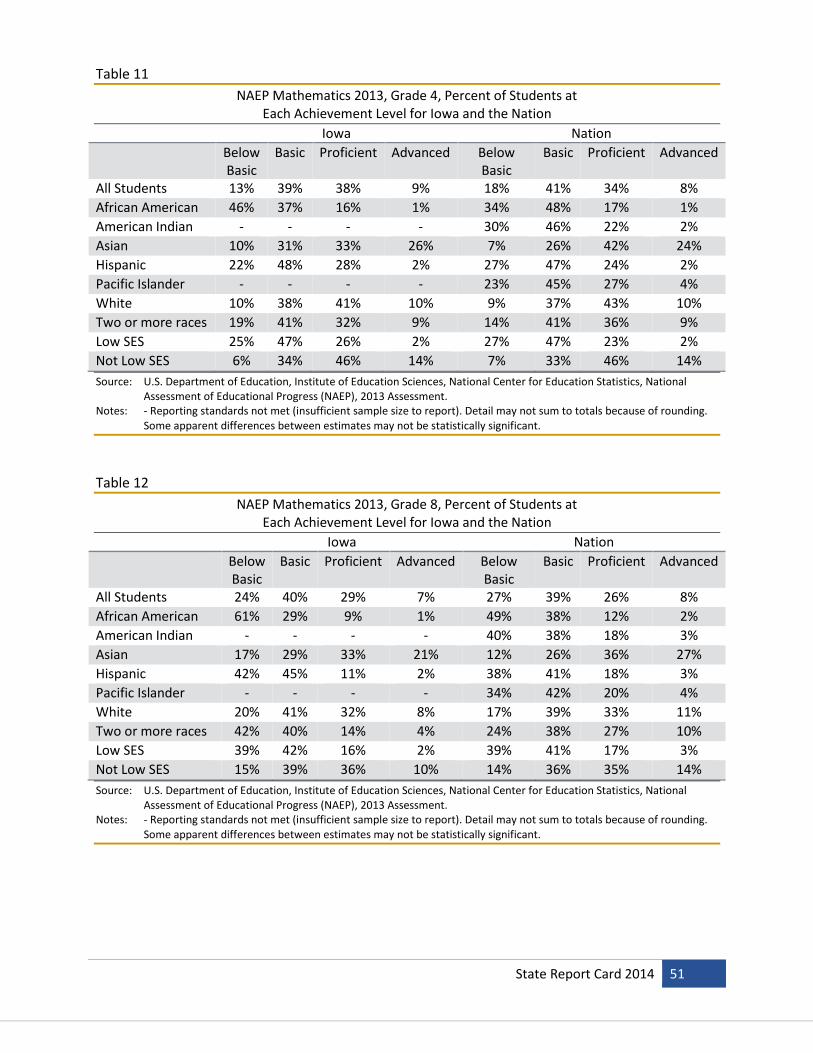
State Report Card 2014 51
Table 11
NAEP Mathematics 2013, Grade 4, Percent of Students at Each Achievement Level for Iowa and the Nation
Iowa Nation
Below Basic
Basic Proficient Advanced Below Basic
Basic Proficient Advanced
All Students 13% 39% 38% 9% 18% 41% 34% 8%
African American 46% 37% 16% 1% 34% 48% 17% 1%
American Indian - - - - 30% 46% 22% 2%
Asian 10% 31% 33% 26% 7% 26% 42% 24%
Hispanic 22% 48% 28% 2% 27% 47% 24% 2%
Pacific Islander - - - - 23% 45% 27% 4%
White 10% 38% 41% 10% 9% 37% 43% 10%
Two or more races 19% 41% 32% 9% 14% 41% 36% 9%
Low SES 25% 47% 26% 2% 27% 47% 23% 2%
Not Low SES 6% 34% 46% 14% 7% 33% 46% 14%
Source: U.S. Department of Education, Institute of Education Sciences, National Center for Education Statistics, National Assessment of Educational Progress (NAEP), 2013 Assessment.
Notes: - Reporting standards not met (insufficient sample size to report). Detail may not sum to totals because of rounding. Some apparent differences between estimates may not be statistically significant.
Table 12
NAEP Mathematics 2013, Grade 8, Percent of Students at Each Achievement Level for Iowa and the Nation
Iowa Nation
Below Basic
Basic Proficient Advanced Below Basic
Basic Proficient Advanced
All Students 24% 40% 29% 7% 27% 39% 26% 8%
African American 61% 29% 9% 1% 49% 38% 12% 2%
American Indian - - - - 40% 38% 18% 3%
Asian 17% 29% 33% 21% 12% 26% 36% 27%
Hispanic 42% 45% 11% 2% 38% 41% 18% 3%
Pacific Islander - - - - 34% 42% 20% 4%
White 20% 41% 32% 8% 17% 39% 33% 11%
Two or more races 42% 40% 14% 4% 24% 38% 27% 10%
Low SES 39% 42% 16% 2% 39% 41% 17% 3%
Not Low SES 15% 39% 36% 10% 14% 36% 35% 14%
Source: U.S. Department of Education, Institute of Education Sciences, National Center for Education Statistics, National Assessment of Educational Progress (NAEP), 2013 Assessment.
Notes: - Reporting standards not met (insufficient sample size to report). Detail may not sum to totals because of rounding. Some apparent differences between estimates may not be statistically significant.

52 State Report Card 2014

State Report Card 2014 53
High School Graduates and Graduation Rates This section reports nine years of trend data on number of high school graduates in Iowa public schools and displays a four-year cohort graduation rate trend for graduating classes of 2012 and 2013. In addition, a five-year cohort graduation rate is reported for the graduating classes of 2011 and 2012.
High School Graduates A public high school completer can receive high school diploma or a certificate. The NCLB Act defines the regular diploma recipients as high school graduates. Other completers, students who have finished the high school program but did not earn a diploma, are not high school graduates based on the Iowa Consolidated State Application Accountability Workbook. Figure 64 shows the number of regular diploma recipients by school year from 2004-2005 to 2012-2013. The counts in this figure include the students who earn a regular diploma in four years and the students who receive regular diplomas in less or more than four years. Figure 64
Number of Iowa Public High School Graduates 2004-2005 to 2012-2013
Source: Iowa Department of Education, Bureau of Information and Analysis, SRI files.
High School Graduation Rates With the statewide identification system and Student Reporting in Iowa (SRI, originally called EASIER) data, Iowa can follow the same group of students over several years and implement the first-time freshman cohort rates (students who repeated their 9th grade year were not included in the cohort). The four-year cohort graduation rate is calculated for the class of 2013 by dividing the
33,547 33,693 34,140
34,573 33,926
34,462 33,853
33,231 32,547
20,000
22,000
24,000
26,000
28,000
30,000
32,000
34,000
36,000
2004-05 2005-06 2006-07 2007-08 2008-09 2009-10 2010-11 2011-12 2012-13
Nu
mb
er o
f G
rad
uat
es
School Year

54 State Report Card 2014
number of students in the cohort (numerator) who graduate with a regular high school diploma in four years or less by the number of first-time 9th graders enrolled in the fall of 2009 minus the number of students who transferred out plus the total number of students who transferred in. Iowa Four-Year Cohort Graduation Rate = (FG + TIG) / (F + TI - TO) For the graduating class of 2013
FG = First-time 9th grade students in fall of 2009 and graduated in 2013 or earlier TIG = Students who transferred in grades 9 to 12 and graduated in 2013 or sooner F = First-time 9th grade students in fall of 2009 TI = Transferred in the first-time 9th graders’ cohort in grades 9 to 12 TO = Transfer out (including emigrates and deceased)
First-time freshmen and transferred-in students include: resident students attending a public school in the district; non-resident students open-enrolled in, whole-grade sharing in, or tuition in; and foreign students on Visa. Those excluded are: home-schooled and nonpublic schooled students; public school students enrolled in another district but taking courses on a part-time basis; and foreign exchange students. Students receiving regular diplomas are included as graduates in the numerator. Early graduates are included in the original cohort. All students who take longer to graduate (including students with IEPs) are included in the denominator but not in the numerator for the four-year rate. Figure 65
Iowa Public High School Four-Year Cohort Graduation Rate for the Graduating Classes of 2009 to 2013
Source: Iowa Department of Education, Bureau of Information and Analysis, SRI files.
The five-year cohort graduation rate is calculated using a similar methodology as the four-year cohort rate. The five-year cohort graduation rate for the class of 2011 is calculated by dividing the number of students in the cohort (numerator) who graduate with a regular high school diploma in five years or less (by the 2012-2013 school year) by the number of first-time 9th graders enrolled in the fall of 2008 minus the number of students who transferred out (between 2008 and 2012) plus the total number of students who transferred in (between 2008 and 2012). The five-year cohort
87.3% 88.8% 88.3% 89.3% 89.7%
50%
55%
60%
65%
70%
75%
80%
85%
90%
95%
100%
2009 2010 2011 2012 2013
Per
cen
t
Graduating Class
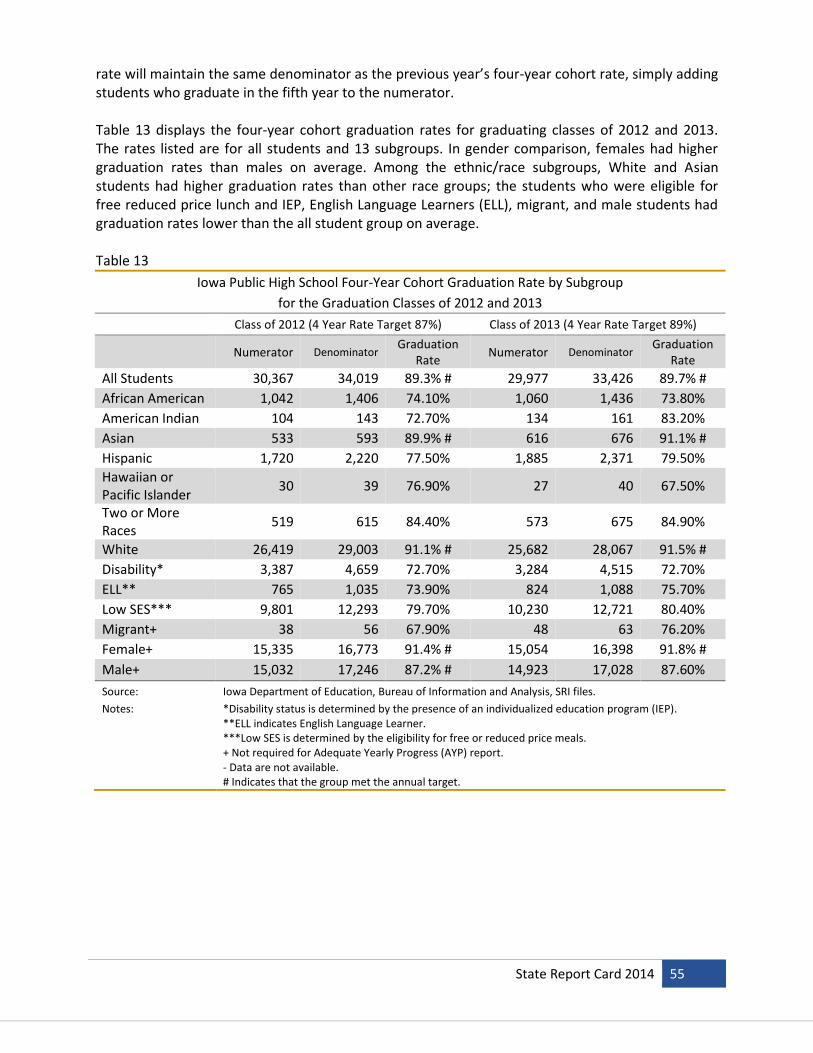
State Report Card 2014 55
rate will maintain the same denominator as the previous year’s four-year cohort rate, simply adding students who graduate in the fifth year to the numerator. Table 13 displays the four-year cohort graduation rates for graduating classes of 2012 and 2013. The rates listed are for all students and 13 subgroups. In gender comparison, females had higher graduation rates than males on average. Among the ethnic/race subgroups, White and Asian students had higher graduation rates than other race groups; the students who were eligible for free reduced price lunch and IEP, English Language Learners (ELL), migrant, and male students had graduation rates lower than the all student group on average. Table 13
Iowa Public High School Four-Year Cohort Graduation Rate by Subgroup
for the Graduation Classes of 2012 and 2013
Class of 2012 (4 Year Rate Target 87%) Class of 2013 (4 Year Rate Target 89%)
Numerator Denominator
Graduation Rate
Numerator Denominator Graduation
Rate
All Students 30,367 34,019 89.3% # 29,977 33,426 89.7% #
African American 1,042 1,406 74.10% 1,060 1,436 73.80%
American Indian 104 143 72.70% 134 161 83.20%
Asian 533 593 89.9% # 616 676 91.1% #
Hispanic 1,720 2,220 77.50% 1,885 2,371 79.50%
Hawaiian or Pacific Islander
30 39 76.90% 27 40 67.50%
Two or More Races
519 615 84.40% 573 675 84.90%
White 26,419 29,003 91.1% # 25,682 28,067 91.5% #
Disability* 3,387 4,659 72.70% 3,284 4,515 72.70%
ELL** 765 1,035 73.90% 824 1,088 75.70%
Low SES*** 9,801 12,293 79.70% 10,230 12,721 80.40%
Migrant+ 38 56 67.90% 48 63 76.20%
Female+ 15,335 16,773 91.4% # 15,054 16,398 91.8% #
Male+ 15,032 17,246 87.2% # 14,923 17,028 87.60%
Source: Iowa Department of Education, Bureau of Information and Analysis, SRI files.
Notes: *Disability status is determined by the presence of an individualized education program (IEP). **ELL indicates English Language Learner. ***Low SES is determined by the eligibility for free or reduced price meals. + Not required for Adequate Yearly Progress (AYP) report. - Data are not available. # Indicates that the group met the annual target.

56 State Report Card 2014
The five-year cohort graduation rates for the graduating class of 2011 and 2012 are displayed in Table 14. Table 14
Iowa Public High School Five-Year Cohort Graduation Rate
by Subgroup for the Graduation Classes of 2011 and 2012
Class of 2011 (5 Year Rate Target 87%) Class of 2012 (5 Year Rate Target 89%)
Numerator Denominator
Graduation Rate
Numerator Denominator Graduation
Rate
All Students 32,624 35,676 91.4% # 31,348 34,019 92.1% #
African American 1,223 1,543 79.30% 1,119 1,406 79.60%
American Indian 127 154 82.50% 115 143 80.40%
Asian 577 627 92.0% # 554 593 93.4% #
Hispanic 1,800 2,186 82.30% 1,856 2,220 83.60%
Hawaiian or Pacific Islander
33 38 86.80% 31 39 79.50%
Two or More Races 463 538 86.10% 541 615 88.00%
White 28,401 30,590 92.8% # 27,132 29,003 93.5% #
Disability* 4,273 5,296 80.70% 3,837 4,659 82.40%
ELL** 800 999 80.10% 858 1,035 82.90%
Low SES*** 10,575 12,646 83.60% 10,429 12,293 84.80%
Migrant+ 133 166 80.10% 41 56 73.20%
Female+ 16,203 17,417 93.0% # 15,720 16,773 93.7% #
Male+ 16,421 18,259 89.9% # 15,628 17,246 90.6% #
Source: Iowa Department of Education, Bureau of Information and Analysis, SRI files.
Notes: *Disability status is determined by the presence of an individualized education program (IEP). **ELL indicates English Language Learner. ***Low SES is determined by the eligibility for free or reduced price meals. + Not required for Adequate Yearly Progress (AYP) report. - Data are not available. # Indicates that the group met the annual target.

State Report Card 2014 57
Average Daily Attendance The average daily attendance (ADA) rate for kindergarten to grade eight is one of the additional academic indicators for the NCLB accountability system. Iowa’s average daily attendance is defined as the aggregate days of student attendance (days present) in a school or school district divided by the aggregate days of enrollment. The 2012-2013 aggregate K-8 ADA rate for Iowa public schools was 95.9 percent, a decrease of 0.2 percent over last year’s rate. Figure 66 shows the ADA trend for Iowa public schools for the past eight school years.
Figure 66
Iowa Public School Grades K-8 Average Daily Attendance Rate
2005-2006 to 2012-2013
Source: Iowa Department of Education, SRI file.
95.8 95.8 95.9 95.8 95.5 95.696.1 95.9
80
85
90
95
100
2005-06 2006-07 2007-08 2008-09 2009-10 2010-11 2011-12 2012-13
Per
cen
t
School Year
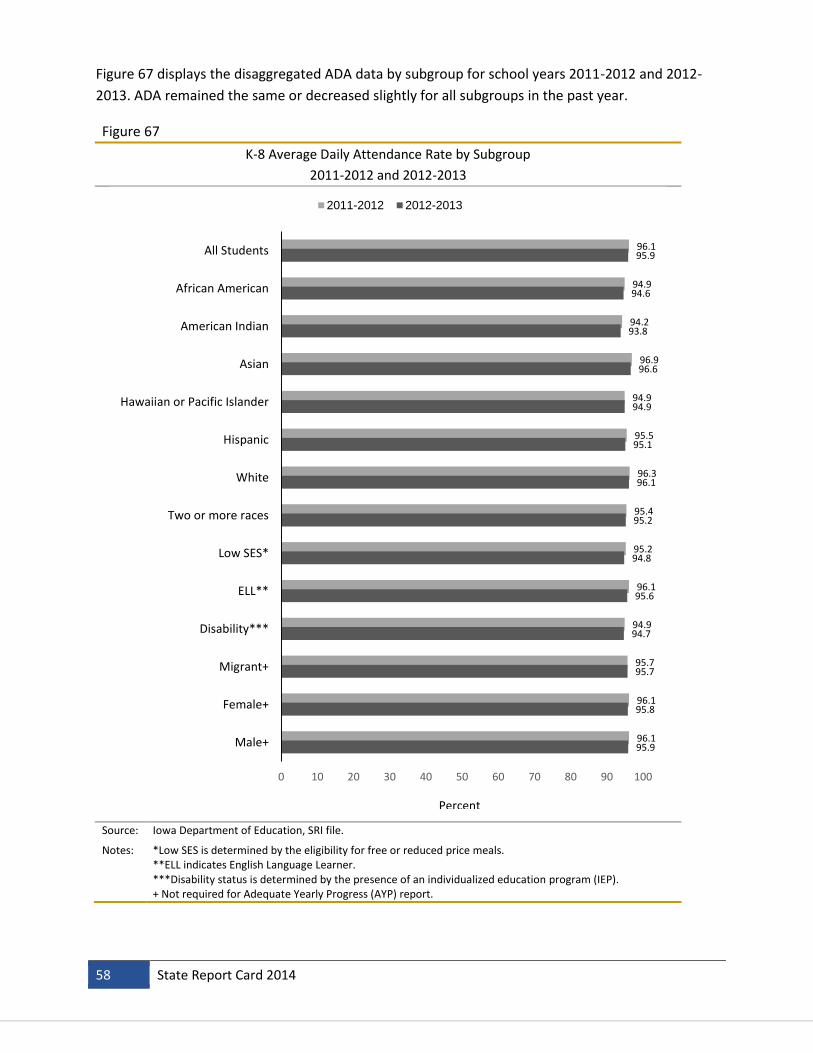
58 State Report Card 2014
Figure 67 displays the disaggregated ADA data by subgroup for school years 2011-2012 and 2012-
2013. ADA remained the same or decreased slightly for all subgroups in the past year.
Figure 67
K-8 Average Daily Attendance Rate by Subgroup
2011-2012 and 2012-2013
Source: Iowa Department of Education, SRI file.
Notes: *Low SES is determined by the eligibility for free or reduced price meals. **ELL indicates English Language Learner. ***Disability status is determined by the presence of an individualized education program (IEP). + Not required for Adequate Yearly Progress (AYP) report.
96.1
94.9
94.2
96.9
94.9
95.5
96.3
95.4
95.2
96.1
94.9
95.7
96.1
96.1
95.9
94.6
93.8
96.6
94.9
95.1
96.1
95.2
94.8
95.6
94.7
95.7
95.8
95.9
0 10 20 30 40 50 60 70 80 90 100
All Students
African American
American Indian
Asian
Hawaiian or Pacific Islander
Hispanic
White
Two or more races
Low SES*
ELL**
Disability***
Migrant+
Female+
Male+
2011-2012 2012-2013
Percent

State Report Card 2014 59
Highly Qualified Teachers The No Child Left Behind (NCLB) Act requires states to provide the characteristics of teachers in high and low poverty schools in their annual state report card. The Act defines high and low poverty schools as those in the top (high) and bottom (low) quartiles of schools in poverty. The Iowa Department of Education uses the percentage of students eligible for free or reduced-price lunch by school to determine the poverty quartiles. Table 15 shows the comparison of teacher characteristics between high and low poverty public schools in 2012-2013. Table 16 shows the same comparison between high and low poverty public schools by school level. Highly Qualified Teacher (HQT) assignment indicates a match between assignment and endorsement areas. There were a larger percentage of the teachers with advanced degrees in high poverty schools than in low poverty schools. On average, the teachers in high poverty schools were older and had more district experience compared to the teachers in low poverty schools. Highly qualified teacher data by academic area are presented in Tables 17 to 19. Table 18 further breaks down not HQT sections by school level and Table 19 breaks down the not HQT sections by school poverty status. For academic areas shown, all twelve areas had below 0.1 percent of sections that are not taught by Highly Qualified Teachers. Table 15
Highly Qualified Teacher (HQT) Data for 2013-14
All Schools by Poverty Status
High Poverty Low Poverty All Schools
# Sections in Selected Areas 39,914 43,502 149,202
# Sections in Selected Areas Not Taught by HQT 7 5 12
% Sections in Selected Areas Not Taught by HQT 0.02% 0.01% 0.01%
# Full-Time Teachers 9,906 9,093 33,300
# Advanced Degrees 3,410 3,404 10,938
% Advanced Degrees 34.4% 37.4% 32.8%
# Bachelor Degrees 6,496 5,689 22,362
Avg. District Experience 10.2 10.0 10.6
Avg. Total Experience 12.9 13.8 13.9
Avg. Age
40.9 40.4 41.2
Avg. Salary $51,946 $53,855 $52,015
# Students Served 136,577 138,332 474,220
Source: Iowa Department of Education, Teacher Licensure Files and Basic Educational Data Survey, Staff and Enrollment Files.
Notes: District office and AEA teachers and students are NOT included.
High/low poverty based on top and bottom 25 percent of schools in terms of percent of their students eligible for free/reduced price lunch.
The selected academic areas include English, reading/language arts, mathematics, science, foreign language, civic/government, economics, arts, history, geography, elementary (K-8), and special education.
Teachers with assignments in middle school (or junior high) and high school are reported in both elementary and secondary levels.
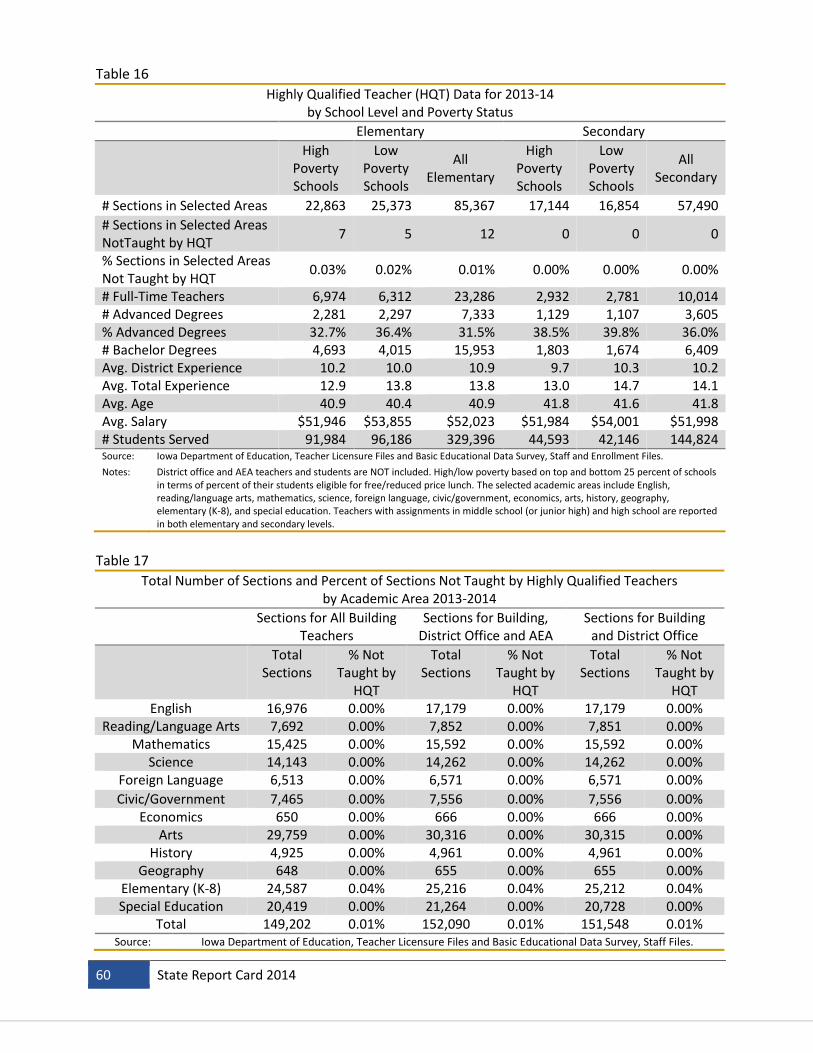
60 State Report Card 2014
Table 16
Highly Qualified Teacher (HQT) Data for 2013-14 by School Level and Poverty Status
Elementary Secondary
High Poverty Schools
Low Poverty Schools
All Elementary
High Poverty Schools
Low Poverty Schools
All Secondary
# Sections in Selected Areas 22,863 25,373 85,367 17,144 16,854 57,490
# Sections in Selected Areas NotTaught by HQT
7 5 12 0 0 0
% Sections in Selected Areas Not Taught by HQT
0.03% 0.02% 0.01% 0.00% 0.00% 0.00%
# Full-Time Teachers 6,974 6,312 23,286 2,932 2,781 10,014 # Advanced Degrees 2,281 2,297 7,333 1,129 1,107 3,605 % Advanced Degrees 32.7% 36.4% 31.5% 38.5% 39.8% 36.0% # Bachelor Degrees 4,693 4,015 15,953 1,803 1,674 6,409 Avg. District Experience 10.2 10.0 10.9 9.7 10.3 10.2 Avg. Total Experience 12.9 13.8 13.8 13.0 14.7 14.1 Avg. Age 40.9 40.4 40.9 41.8 41.6 41.8 Avg. Salary $51,946 $53,855 $52,023 $51,984 $54,001 $51,998 # Students Served 91,984 96,186 329,396 44,593 42,146 144,824 Source: Iowa Department of Education, Teacher Licensure Files and Basic Educational Data Survey, Staff and Enrollment Files.
Notes: District office and AEA teachers and students are NOT included. High/low poverty based on top and bottom 25 percent of schools in terms of percent of their students eligible for free/reduced price lunch. The selected academic areas include English, reading/language arts, mathematics, science, foreign language, civic/government, economics, arts, history, geography, elementary (K-8), and special education. Teachers with assignments in middle school (or junior high) and high school are reported in both elementary and secondary levels.
Table 17
Total Number of Sections and Percent of Sections Not Taught by Highly Qualified Teachers by Academic Area 2013-2014
Sections for All Building Teachers
Sections for Building, District Office and AEA
Sections for Building and District Office
Total Sections
% Not Taught by
HQT
Total Sections
% Not Taught by
HQT
Total Sections
% Not Taught by
HQT English 16,976 0.00% 17,179 0.00% 17,179 0.00%
Reading/Language Arts 7,692 0.00% 7,852 0.00% 7,851 0.00% Mathematics 15,425 0.00% 15,592 0.00% 15,592 0.00%
Science 14,143 0.00% 14,262 0.00% 14,262 0.00% Foreign Language 6,513 0.00% 6,571 0.00% 6,571 0.00%
Civic/Government 7,465 0.00% 7,556 0.00% 7,556 0.00% Economics 650 0.00% 666 0.00% 666 0.00%
Arts 29,759 0.00% 30,316 0.00% 30,315 0.00% History 4,925 0.00% 4,961 0.00% 4,961 0.00%
Geography 648 0.00% 655 0.00% 655 0.00% Elementary (K-8) 24,587 0.04% 25,216 0.04% 25,212 0.04% Special Education 20,419 0.00% 21,264 0.00% 20,728 0.00%
Total 149,202 0.01% 152,090 0.01% 151,548 0.01% Source: Iowa Department of Education, Teacher Licensure Files and Basic Educational Data Survey, Staff Files.

State Report Card 2014 61
Table 18
Total Number of Sections and Percent of Sections Not Taught by Highly Qualified Teachers by Academic Area and School Level 2013-2014
Sections for All Building
Teachers Sections for Elementary Building (K-8) Teachers
Sections for Secondary Building (9-12) Teachers
Total
Sections
% Not Taught by
HQT
Total Sections
% Not Taught by
HQT
Total Sections
% Not Taught by
HQT English 16,976 0.00% 5,586 0.00% 10,356 0.00% Reading/Language Arts 7,692 0.00% 6,992 0.00% 545 0.00% Mathematics 15,425 0.00% 5,509 0.00% 9,029 0.00% Science 14,143 0.00% 4,676 0.00% 8,607 0.00% Foreign Language 6,513 0.00% 1,128 0.00% 4,985 0.00% Civic/Government 7,465 0.00% 4,518 0.00% 2,545 0.00% Economics 650 0.00% - 0.00% 650 0.00% Arts 29,759 0.00% 21,436 0.00% 7,092 0.00% History 4,925 0.00% - 0.00% 4,925 0.00% Geography 648 0.00% - 0.00% 648 0.00% Elementary (K-8) 24,587 0.04% 24,587 0.04% - 0.00% Special Education 20,419 0.00% 11,501 0.01% 8,442 0.00% Total 149,202 0.01% 85,933 0.01% 57,824 0.00% Source: Iowa Department of Education, Teacher Licensure Files and Basic Educational Data Survey, Staff and Enrollment Files. Notes: Secondary indicates regular and alternative school grade 9-12 and elementary indicates grade level K-8. District office and
AEA teachers are NOT included.
Table 19
Total Number of Sections and Percent of Sections Not Taught by Highly Qualified Teachers by Academic Area and Poverty Status 2013-2014
Sections for All Building
Teachers Sections for High Poverty Teachers
Sections for Low Poverty Building Teachers
Total Sections
% Not Taught by
HQT
Total Sections
% Not Taught by
HQT
Total Sections
% Not Taught by
HQT
English 16,976 0.00% 4,477 0.00% 4,893 0.00% Reading/Language Arts 7,692 0.00% 2,338 0.00% 1,559 0.00% Mathematics 15,425 0.00% 4,108 0.00% 4,364 0.00% Science 14,143 0.00% 2,411 0.00% 2,580 0.00% Foreign Language 6,513 0.00% 1,480 0.00% 2,105 0.00% Civic/Government 7,465 0.00% 1,870 0.00% 2,174 0.00% Economics 650 0.00% 195 0.00% 174 0.00% Arts 29,759 0.00% 7,915 0.00% 8,592 0.00% History 4,925 0.00% 1,429 0.00% 1,331 0.00% Geography 648 0.00% 156 0.00% 187 0.00% Elementary (K-8) 24,587 0.04% 6,520 0.11% 7,055 0.06% Special Education 20,419 0.00% 2,683 0.00% 5,466 0.02% Total 149,202 0.01% 35,582 0.02% 40,480 0.01% Source: Iowa Department of Education, Teacher Licensure Files and Basic Educational Data Survey, Staff and Enrollment Files. Notes: High/low poverty based on top and bottom 25 percent of schools in terms of percent of their students eligible for free/reduced
price lunch. District office and AEA teachers are NOT included.

62 State Report Card 2014
Table 20
Number and Percent of Teachers with
Emergency/Provisional Licenses 2013-2014
Number of Teachers Percent of Teachers
All Schools 0 0.00%
Elementary Schools 0 0.00%
Secondary Schools 0 0.00%
High Poverty Schools 0 0.00%
Low Poverty Schools 0 0.00%
Source: Iowa Department of Education, Teacher Licensure Files and Basic Educational Data Survey, Staff Files. Notes: High/low poverty based on top and bottom 25 percent of schools in terms of percent of their students
eligible for free/reduced price lunch.

State Report Card 2014 63
Districts and Schools in Need of Assistance
Under the No Child Left Behind Act of 2001 (NCLB), public school districts and public schools must report
the academic progress of all students in grades three through eight and eleven. Student academic
progress is reported by subgroups and their test participation rates in the subject areas of reading and
mathematics. Public elementary and middle school average daily attendance (ADA) rates and public high
school graduation rates are the other academic indicators (OAI) for public districts and schools.
If a district does not meet the Adequate Yearly Progress (AYP) state participation goals or state Annual
Measurable Objectives (AMO) proficiency targets in either the “all students” group or any one of the
subgroups within the required grade spans (3-5 elementary, 6-8 middle, and 11 high) in the same
subject area (reading or mathematics) for two consecutive years, it shall be identified as a district in
need of assistance (DINA). A district can also be classified as DINA if it misses both ADA and graduation
rate for two consecutive years. To be removed from DINA status, a district must meet AYP for two
consecutive years.
If a school does not meet the AYP state participation goals or state AMO in reading or mathematics in
either the “all students” group or any one of the subgroups for two consecutive years, it shall be
designated as a school in need of assistance (SINA). A school level decision is based on all of the AYP
grades housed at each attendance center. A school can also be classified as SINA if it does not meet the
ADA or graduation rate for two consecutive years. To be removed from SINA status, a school must meet
AYP for two consecutive years.
Based on 2013-2014 performance, 45 of 345 (13.0 percent) public school districts were identified as a
district in need of assistance (DINA) for the 2014-2015 school year. Forty-one districts were identified as
a district in need of assistance for the previous (2012-2013) school year.
Of the 1,356 Iowa public schools that provided services to students in grades K to 12 for which AYP
decisions were made, a total of 737 public schools (54.4 percent) were identified as a school in need of
assistance (SINA). This is an increase of 7.2 percent from the 47.2 percent of public schools identified as
a school in need of assistance for the 2012-2013 school year.
Table 21 shows the list of the districts in need of assistance and Table 22 shows the list of schools in
need of assistance. For this report, the AYP status of all districts and schools is displayed. Ratings include
SINA-X (denoting the number of years in improvement status), Delay (meeting AYP for one year;
meeting the following year would cause removal from the improvement list), Watch (missing AYP for
one year; missing the following year would change designation to SINA status), Removed (from Watch
status for making AYP after missing AYP; or from SINA status for making AYP for two consecutive years
after being designated as SINA), or MET (making AYP through at least one of eight steps in the
determination process).

64 State Report Card 2014
Table 21
AYP Status for Districts for the 2014-15 School Year Based on Previous School Year's Performance
District Math
Proficiency Reading
Proficiency
Other Academic Indicator
Adair-Casey Comm School District MET MET MET
Adel DeSoto Minburn Comm School District MET MET MET
AGWSR Comm School District MET MET MET
A-H-S-T Comm School District MET MET MET
Akron Westfield Comm School District MET MET MET
Albert City-Truesdale Comm School District MET MET MET
Albia Comm School District Watch DINA-1 MET
Alburnett Comm School District MET MET MET
Alden Comm School District* Watch MET MET
Algona Comm School District Removed-
Watch Delay-1 MET
Allamakee Comm School District MET MET MET
Alta Comm School District MET MET MET
Ames Comm School District Watch Watch MET
Anamosa Comm School District MET MET MET
Andrew Comm School District MET Removed-
Watch MET
Ankeny Comm School District MET Watch MET
Aplington-Parkersburg Comm School District MET Watch MET
Armstrong-Ringsted Comm School District MET MET MET
Ar-We-Va Comm School District MET MET MET
Atlantic Comm School District Removed-
Watch Removed-
Watch MET
Audubon Comm School District MET MET MET
Aurelia Comm School District Removed-
Watch Removed-
Watch MET
Ballard Comm School District MET MET MET
Battle Creek-Ida Grove Comm School District MET Watch MET
Baxter Comm School District MET MET MET
BCLUW Comm School District MET MET MET
Bedford Comm School District MET MET MET
Belle Plaine Comm School District MET MET MET
Bellevue Comm School District MET MET MET
Belmond-Klemme Comm School District MET MET MET
Bennett Comm School District MET MET MET
Benton Comm School District MET MET MET
Bettendorf Comm School District* MET Watch MET

State Report Card 2014 65
Table 21 (continued)
AYP Status for Districts for the 2014-15 School Year Based on Previous School Year's Performance
District Math
Proficiency Reading
Proficiency
Other Academic Indicator
Bondurant-Farrar Comm School District MET MET MET
Boone Comm School District Removed-
Watch MET MET
Boyden-Hull Comm School District MET MET MET
Boyer Valley Comm School District MET MET MET
Brooklyn-Guernsey-Malcom Comm School District
MET MET MET
Burlington Comm School District DINA-4 DINA-3 MET
CAL Comm School District MET MET MET
Calamus-Wheatland Comm School District MET MET MET
CAM Comm School District MET MET MET
Camanche Comm School District DINA-1 Removed-
Watch MET
Cardinal Comm School District Watch Watch MET
Carlisle Comm School District MET MET MET
Carroll Comm School District MET MET MET
Cedar Falls Comm School District Delay-1 Removed-
Watch MET
Cedar Rapids Comm School District DINA-7 DINA-9 MET
Center Point-Urbana Comm School District MET MET MET
Centerville Comm School District MET MET MET
Central City Comm School District MET MET MET
Central Clinton Comm School District MET MET MET
Central Comm School District MET MET MET
Central Decatur Comm School District MET MET MET
Central Lee Comm School District MET MET MET
Central Lyon Comm School District MET MET MET
Central Springs Comm School District MET MET MET
Chariton Comm School District DINA-1 Watch MET
Charles City Comm School District MET MET MET
Charter Oak-Ute Comm School District MET MET MET
Cherokee Comm School District MET MET MET
Clarinda Comm School District MET MET MET
Clarion-Goldfield Comm School District MET Watch MET
Clarke Comm School District Removed-
Watch Watch MET

66 State Report Card 2014
Table 21 (continued)
AYP Status for Districts for the 2014-15 School Year Based on Previous School Year's Performance
District Math
Proficiency Reading
Proficiency
Other Academic Indicator
Clarksville Comm School District MET MET MET
Clay Central-Everly Comm School District MET MET MET
Clayton Ridge Comm School District Removed-
Watch MET MET
Clear Creek Amana Comm School District Watch MET MET
Clear Lake Comm School District Watch MET MET
Clearfield Comm School District MET MET MET
Clinton Comm School District DINA-5 DINA-7 Watch
Colfax-Mingo Comm School District MET Removed-
Watch MET
College Comm School District MET DINA-2 MET
Collins-Maxwell Comm School District MET Removed-
Watch MET
Colo-Nesco Comm School District MET MET MET
Columbus Comm School District Delay-2 Delay-1 MET
Coon Rapids-Bayard Comm School District MET MET MET
Corning Comm School District MET MET MET
Corwith-Wesley Comm School District MET MET MET
Council Bluffs Comm School District DINA-8 DINA-9 MET
Creston Comm School District MET MET MET
Dallas Center-Grimes Comm School District MET MET MET
Danville Comm School District* MET MET MET
Davenport Comm School District DINA-9 DINA-10 Watch
Davis County Comm School District* MET Watch MET
Decorah Community School District MET MET MET
Delwood Comm School District MET MET MET
Denison Comm School District* MET DINA-4 MET
Denver Comm School District MET MET MET
Des Moines Independent Comm School District DINA-6 DINA-8 Watch
Diagonal Comm School District MET MET MET
Dike-New Hartford Comm School District* MET MET MET
Dows Comm School District MET MET MET
Dubuque Comm School District DINA-5 DINA-5 MET
Dunkerton Comm School District MET MET MET
Durant Comm School District Removed-
Watch MET MET
Eagle Grove Comm School District Removed-
Watch Removed-
Watch MET

State Report Card 2014 67
Table 21 (continued)
AYP Status for Districts for the 2014-15 School Year Based on Previous School Year's Performance
District Math
Proficiency Reading
Proficiency
Other Academic Indicator
Earlham Comm School District MET Watch MET
East Buchanan Comm School District MET MET MET
East Greene Comm School District MET Removed-
Watch MET
East Marshall Comm School District MET Watch MET
East Mills School District Watch MET MET
East Sac Comm School District MET MET MET
East Union Comm School District MET MET MET
Eastern Allamakee Comm School District MET MET MET
Easton Valley Comm School District MET Removed-
Watch MET
Eddyville-Blakesburg-Fremont Comm School District
Removed-Watch
MET MET
Edgewood-Colesburg Comm School District Removed-
Watch MET MET
Eldora-New Providence Comm School District MET Watch MET
Elk Horn-Kimballton Comm School District MET MET MET
Emmetsburg Comm School District MET Removed-
Watch MET
English Valleys Comm School District MET MET MET
Essex Comm School District* MET MET MET
Estherville Lincoln Central Com Sch Dist DINA-3 Delay-2 MET
Exira Comm School District MET MET MET
Fairfield Comm School District Watch Removed-
Watch MET
Farragut Comm School District MET MET MET
Forest City Comm School District MET MET MET
Fort Dodge Comm School District DINA-5 DINA-10 MET
Fort Madison Comm School District Removed-
Watch Removed-
Watch MET
Fredericksburg Comm School District MET MET MET
Fremont-Mills Comm School District MET Watch MET
Galva-Holstein Comm School District MET MET MET
Garner-Hayfield Comm School District MET MET MET
George-Little Rock Comm School District MET MET MET
Gilbert Comm School District MET MET MET
Gilmore City-Bradgate Comm School District MET MET MET
Gladbrook-Reinbeck Comm School District MET MET MET

68 State Report Card 2014
Table 21 (continued)
AYP Status for Districts for the 2014-15 School Year Based on Previous School Year's Performance
District Math
Proficiency Reading
Proficiency
Other Academic Indicator
Glenwood Comm School District Delay-1 MET MET
Glidden-Ralston Comm School District MET MET MET
GMG Comm School District MET MET MET
Graettinger Comm School District MET MET MET
Grinnell-Newburg Comm School District Removed-
Watch MET MET
Griswold Comm School District MET MET MET
Grundy Center Comm School District MET MET MET
Guthrie Center Comm School District MET MET MET
Hamburg Comm School District MET Delay-1 MET
Hampton-Dumont Comm School District* DINA-1 MET MET
Harlan Comm School District MET MET MET
Harmony Comm School District MET MET MET
Harris-Lake Park Comm School District MET MET MET
Hartley-Melvin-Sanborn Comm School District MET MET MET
Highland Comm School District MET MET MET
Hinton Comm School District MET MET MET
H-L-V Comm School District MET MET MET
Howard-Winneshiek Comm School District MET Removed-
Watch MET
Hubbard-Radcliffe Comm School District Removed-
Watch Delay-1 MET
Hudson Comm School District MET MET MET
Humboldt Comm School District MET MET MET
IKM Comm School District MET Removed-
Watch MET
Independence Comm School District MET MET MET
Indianola Comm School District MET MET MET
Interstate 35 Comm School District MET MET MET
Iowa City Comm School District DINA-8 DINA-8 MET
Iowa Falls Comm School District* MET MET MET
Iowa Valley Comm School District MET Removed-
Watch MET
Janesville Consolidated School District MET MET MET
Jefferson-Scranton Comm School District MET Watch MET
Jesup Comm School District MET MET MET
Johnston Comm School District DINA-2 DINA-1 MET
Keokuk Comm School District DINA-1 Delay-1 MET
Keota Comm School District MET MET MET

State Report Card 2014 69
Table 21 (continued)
AYP Status for Districts for the 2014-15 School Year Based on Previous School Year's Performance
District Math
Proficiency Reading
Proficiency
Other Academic Indicator
Kingsley-Pierson Comm School District MET MET MET
Knoxville Comm School District DINA-1 Delay-1 MET
Lake Mills Comm School District MET MET MET
Lamoni Comm School District MET MET MET
Laurens-Marathon Comm School District MET MET MET
Lawton-Bronson Comm School District MET MET MET
Le Mars Comm School District* MET MET MET
Lenox Comm School District MET MET MET
Lewis Central Comm School District DINA-2 DINA-4 MET
Linn-Mar Comm School District* MET MET MET
Lisbon Comm School District MET MET MET
Logan-Magnolia Comm School District MET MET MET
Lone Tree Comm School District MET MET MET
Louisa-Muscatine Comm School District Watch MET MET
LuVerne Comm School District MET MET MET
Lynnville-Sully Comm School District MET MET MET
Madrid Comm School District MET MET MET
Manson Northwest Webster Comm School District
MET MET MET
Maple Valley Anthon-Oto Comm School District* MET MET MET
Maquoketa Comm School District DINA-2 MET MET
Maquoketa Valley Comm School District MET MET MET
Marcus-Meriden-Cleghorn Comm School District MET MET MET
Marion Independent School District MET Watch MET
Marshalltown Comm School District DINA-8 DINA-6 MET
Martensdale-St Marys Comm School District MET MET MET
Mason City Comm School District Delay-3 Delay-5 MET
Mediapolis Comm School District MET MET MET
Melcher-Dallas Comm School District MET MET MET
MFL MarMac Comm School District Removed-
Watch MET MET
Midland Comm School District MET Watch MET
Mid-Prairie Comm School District MET MET MET
Missouri Valley Comm School District Removed-
Watch MET MET
MOC-Floyd Valley Comm School District MET MET MET
Montezuma Comm School District MET MET MET
Monticello Comm School District MET MET MET
Moravia Comm School District MET MET MET

70 State Report Card 2014
Table 21 (continued)
AYP Status for Districts for the 2014-15 School Year Based on Previous School Year's Performance
District Math
Proficiency Reading
Proficiency
Other Academic Indicator
Mormon Trail Comm School District MET MET MET
Morning Sun Comm School District MET MET MET
Moulton-Udell Comm School District MET MET MET
Mount Ayr Comm School District MET MET MET
Mount Pleasant Comm School District Delay-4 Delay-1 MET
Mount Vernon Comm School District MET MET MET
Murray Comm School District MET MET MET
Muscatine Comm School District DINA-1 DINA-5 Watch
Nashua-Plainfield Comm School District MET MET MET
Nevada Comm School District MET Watch MET
New Hampton Comm School District MET MET MET
New London Comm School District MET MET MET
Newell-Fonda Comm School District MET MET MET
Newton Comm School District DINA-4 Removed-
DINA MET
Nodaway Valley Comm School District MET Removed-
Watch MET
North Butler Comm School District MET MET MET
North Cedar Comm School District Watch MET MET
North Fayette Comm School District MET MET MET
North Iowa Comm School District MET Removed-
Watch MET
North Kossuth Comm School District Removed-
Watch Removed-
Watch MET
North Linn Comm School District MET MET MET
North Mahaska Comm School District* MET MET MET
North Polk Comm School District MET MET MET
North Scott Comm School District Removed-
Watch Delay-1 MET
North Tama County Comm School District MET MET MET
North Winneshiek Comm School District MET MET MET
Northeast Comm School District MET MET MET
Northeast Hamilton Comm School District MET MET MET
Northwood-Kensett Comm School District MET MET MET
Norwalk Comm School District MET Watch MET
Odebolt-Arthur Comm School District Watch Watch MET
Oelwein Comm School District Delay-1 DINA-1 MET
Ogden Comm School District MET MET MET

State Report Card 2014 71
Table 21 (continued)
AYP Status for Districts for the 2014-15 School Year Based on Previous School Year's Performance
District Math
Proficiency Reading
Proficiency
Other Academic Indicator
Okoboji Comm School District MET MET MET
Olin Consolidated School District MET MET MET
Orient-Macksburg Comm School District MET MET MET
Osage Comm School District MET MET MET
Oskaloosa Comm School District Removed-
DINA Delay-2 MET
Ottumwa Comm School District DINA-6 DINA-8 MET
Panorama Comm School District MET MET MET
Paton-Churdan Comm School District MET MET MET
PCM Comm School District MET MET MET
Pekin Comm School District MET MET MET
Pella Comm School District MET MET MET
Perry Comm School District Removed-
DINA Removed-
Watch MET
Pleasant Valley Comm School District MET MET MET
Pleasantville Comm School District MET MET MET
Pocahontas Area Comm School District MET MET MET
Postville Comm School District Watch MET MET
Prairie Valley Comm School District MET MET MET
Prescott Comm School District MET MET MET
Red Oak Comm School District MET MET MET
Remsen-Union Comm School District MET MET MET
Riceville Comm School District MET MET MET
River Valley Comm School District MET MET MET
Riverside Comm School District MET MET MET
Rock Valley Comm School District MET Removed-
Watch MET
Rockwell City-Lytton Comm School District MET MET MET
Roland-Story Comm School District MET MET MET
Rudd-Rockford-Marble Rk Comm School District MET MET MET
Ruthven-Ayrshire Comm School District MET Watch MET
Saydel Comm School District Removed-
Watch Removed-
Watch MET
Schaller-Crestland Comm School District MET MET MET
Schleswig Comm School District Removed-
Watch MET MET
Sentral Comm School District Watch Watch MET
Sergeant Bluff-Luton Comm School District MET MET MET
Seymour Comm School District MET MET MET

72 State Report Card 2014
Table 21 (continued)
AYP Status for Districts for the 2014-15 School Year Based on Previous School Year's Performance
District Math
Proficiency Reading
Proficiency
Other Academic Indicator
Sheldon Comm School District MET MET MET
Shenandoah Comm School District Removed-
Watch MET MET
Sibley-Ocheyedan Comm School District MET MET MET
Sidney Comm School District MET MET MET
Sigourney Comm School District MET MET MET
Sioux Center Comm School District MET MET MET
Sioux Central Comm School District MET MET MET
Sioux City Comm School District DINA-8 DINA-8 MET
Solon Comm School District MET MET MET
South Hamilton Comm School District MET MET MET
South O'Brien Comm School District MET MET MET
South Page Comm School District MET MET MET
South Tama County Comm School District DINA-5 DINA-2 MET
South Winneshiek Comm School District MET MET MET
Southeast Polk Comm School District* Watch Watch MET
Southeast Warren Comm School District MET MET MET
Southeast Webster Grand Comm School District MET MET MET
Southern Cal Comm School District Watch Watch MET
Spencer Comm School District Watch MET MET
Spirit Lake Comm School District MET MET MET
Springville Comm School District MET MET MET
St Ansgar Comm School District MET MET MET
Stanton Comm School District MET MET MET
Starmont Comm School District* MET MET MET
Storm Lake Comm School District Delay-3 Delay-1 MET
Stratford Comm School District MET MET MET
Sumner Comm School District MET Watch MET
Tipton Comm School District MET MET MET
Treynor Comm School District MET MET MET
Tri-Center Comm School District MET MET MET
Tri-County Comm School District MET MET MET
Tripoli Comm School District MET MET MET
Turkey Valley Comm School District MET MET MET
Twin Cedars Comm School District MET MET MET
Twin Rivers Comm School District MET MET MET
Underwood Comm School District MET MET MET
Union Comm School District MET Delay-1 MET

State Report Card 2014 73
Table 21 (continued)
AYP Status for Districts for the 2014-15 School Year Based on Previous School Year's Performance
District Math
Proficiency Reading
Proficiency
Other Academic Indicator
United Comm School District MET MET MET
Urbandale Comm School District Removed-
Watch DINA-1 MET
Valley Comm School District MET MET MET
Van Buren Comm School District Removed-
Watch MET MET
Van Meter Comm School District MET MET MET
Ventura Comm School District MET MET MET
Villisca Comm School District Watch MET MET
Vinton-Shellsburg Comm School District MET Removed-
Watch MET
Waco Comm School District MET MET MET
Walnut Comm School District MET MET MET
Wapello Comm School District MET MET MET
Wapsie Valley Comm School District MET MET MET
Washington Comm School District MET DINA-1 MET
Waterloo Comm School District DINA-9 DINA-9 MET
Waukee Comm School District MET MET MET
Waverly-Shell Rock Comm School District MET MET MET
Wayne Comm School District MET MET MET
Webster City Comm School District Removed-
Watch Removed-
Watch MET
West Bend-Mallard Comm School District MET MET MET
West Branch Comm School District MET MET MET
West Burlington Ind School District MET MET MET
West Central Comm School District MET MET MET
West Central Valley Comm School District MET MET MET
West Delaware County Comm School District MET MET MET
West Des Moines Comm School District DINA-5 DINA-5 MET
West Fork Comm School District MET MET MET
West Hancock Comm School District MET MET MET
West Harrison Comm School District MET MET MET
West Liberty Comm School District Delay-1 Delay-1 MET
West Lyon Comm School District MET MET MET
West Marshall Comm School District MET MET MET
West Monona Comm School District MET MET MET
West Sioux Comm School District MET MET MET

74 State Report Card 2014
Table 21 (continued)
AYP Status for Districts for the 2014-15 School Year Based on Previous School Year's Performance
District Math
Proficiency Reading
Proficiency
Other Academic Indicator
Western Dubuque Comm School District MET Removed-
Watch MET
Westwood Comm School District MET MET MET
Whiting Comm School District MET MET MET
Williamsburg Comm School District MET MET MET
Wilton Comm School District MET Removed-
Watch MET
Winfield-Mt Union Comm School District MET MET MET
Winterset Comm School District MET MET MET
Woodbine Comm School District MET MET MET
Woodbury Central Comm School District MET MET MET
Woodward-Granger Comm School District MET MET MET
*Status frozen at 2013-14 level due to testing with the Smarter Balanced Assessment.

State Report Card 2014 75
Table 22
AYP Status for Schools for the 2014-15 School Year Based on Previous School Year's Performance
District School Math
Participation Reading
Participation Math
Proficiency Reading
Proficiency Other
Indicator
Adair-Casey Adair-Casey ES MET MET MET Removed-
Watch MET
Adair-Casey Adair-Casey Jr-Sr HS
MET MET Watch SINA-1 MET
Adel DeSoto Minburn Adel ES MET MET MET Watch MET
Adel DeSoto Minburn ADM HS MET MET MET MET MET
Adel DeSoto Minburn ADM MS MET MET Delay-2 Delay-1 MET
Adel DeSoto Minburn DeSoto Int MET MET Delay-1 SINA-2 MET
AGWSR AGWSR ES MET MET MET Watch MET
AGWSR AGWSR HS MET MET MET MET MET
AGWSR AGWSR MS MET MET Watch Removed-
SINA MET
A-H-S-T A-H-S-T ES MET MET Delay-1 SINA-2 MET
A-H-S-T A-H-S-T HS MET MET Watch Watch MET
Akron Westfield Akron Westfield ES
MET MET Watch Watch MET
Akron Westfield Akron Westfield HS
MET MET MET MET MET
Akron Westfield Akron Westfield MS
MET MET SINA-1 Removed-
Watch MET
Albert City-Truesdale Albert City-Truesdale ES
MET MET MET Watch MET
Albia Albia HS MET MET SINA-1 SINA-1 MET
Albia Albia MS MET MET Watch SINA-2 MET
Albia Grant MET MET SINA-1 SINA-1 MET
Albia Lincoln MET MET SINA-2 SINA-1 MET
Alburnett Alburnett ES MET MET MET MET MET
Alburnett Alburnett HS MET MET MET MET MET
Alburnett Alburnett MS MET MET Watch Watch MET
Alden Alden ES* MET MET SINA-1 MET MET
Algona Algona HS Removed-
Watch Delay-1
Removed-Watch
Delay-1 MET
Algona Algona MS MET MET Delay-1 Delay-3 MET
Algona Bertha Godfrey ES
MET MET Removed-
Watch Removed-
Watch MET
Algona Bryant ES MET MET Removed-
Watch Removed-
Watch MET
Algona Lucia Wallace ES MET MET Delay-1 SINA-1 MET
Allamakee Allamakee JHS MET MET Watch Removed-
Watch MET
Allamakee East Campus ES MET MET Delay-1 Removed-
Watch MET
Allamakee Waterville ES MET MET MET Watch MET
Allamakee Waukon HS MET MET MET Watch MET
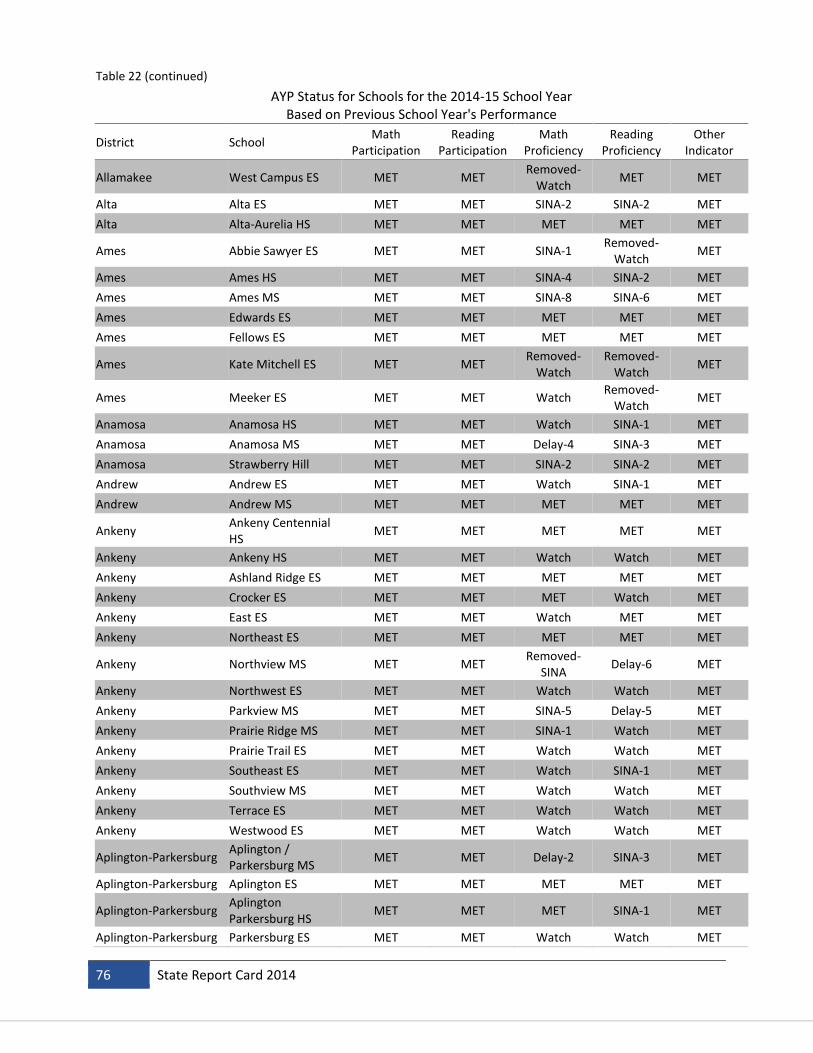
76 State Report Card 2014
Table 22 (continued)
AYP Status for Schools for the 2014-15 School Year Based on Previous School Year's Performance
District School Math
Participation Reading
Participation Math
Proficiency Reading
Proficiency Other
Indicator
Allamakee West Campus ES MET MET Removed-
Watch MET MET
Alta Alta ES MET MET SINA-2 SINA-2 MET
Alta Alta-Aurelia HS MET MET MET MET MET
Ames Abbie Sawyer ES MET MET SINA-1 Removed-
Watch MET
Ames Ames HS MET MET SINA-4 SINA-2 MET
Ames Ames MS MET MET SINA-8 SINA-6 MET
Ames Edwards ES MET MET MET MET MET
Ames Fellows ES MET MET MET MET MET
Ames Kate Mitchell ES MET MET Removed-
Watch Removed-
Watch MET
Ames Meeker ES MET MET Watch Removed-
Watch MET
Anamosa Anamosa HS MET MET Watch SINA-1 MET
Anamosa Anamosa MS MET MET Delay-4 SINA-3 MET
Anamosa Strawberry Hill MET MET SINA-2 SINA-2 MET
Andrew Andrew ES MET MET Watch SINA-1 MET
Andrew Andrew MS MET MET MET MET MET
Ankeny Ankeny Centennial HS
MET MET MET MET MET
Ankeny Ankeny HS MET MET Watch Watch MET
Ankeny Ashland Ridge ES MET MET MET MET MET
Ankeny Crocker ES MET MET MET Watch MET
Ankeny East ES MET MET Watch MET MET
Ankeny Northeast ES MET MET MET MET MET
Ankeny Northview MS MET MET Removed-
SINA Delay-6 MET
Ankeny Northwest ES MET MET Watch Watch MET
Ankeny Parkview MS MET MET SINA-5 Delay-5 MET
Ankeny Prairie Ridge MS MET MET SINA-1 Watch MET
Ankeny Prairie Trail ES MET MET Watch Watch MET
Ankeny Southeast ES MET MET Watch SINA-1 MET
Ankeny Southview MS MET MET Watch Watch MET
Ankeny Terrace ES MET MET Watch Watch MET
Ankeny Westwood ES MET MET Watch Watch MET
Aplington-Parkersburg Aplington / Parkersburg MS
MET MET Delay-2 SINA-3 MET
Aplington-Parkersburg Aplington ES MET MET MET MET MET
Aplington-Parkersburg Aplington Parkersburg HS
MET MET MET SINA-1 MET
Aplington-Parkersburg Parkersburg ES MET MET Watch Watch MET

State Report Card 2014 77
Table 22 (continued)
AYP Status for Schools for the 2014-15 School Year Based on Previous School Year's Performance
District School Math
Participation Reading
Participation Math
Proficiency Reading
Proficiency Other
Indicator
Armstrong-Ringsted North Union HS MET MET MET SINA-2 MET
Ar-We-Va Ar-We-Va ES MET MET Removed-
Watch Removed-
Watch MET
Ar-We-Va Westside Jr-Sr HS MET MET MET MET MET
Atlantic Atlantic HS MET MET Delay-2 SINA-1 MET
Atlantic Atlantic MS MET MET Delay-3 SINA-5 MET
Atlantic Schuler ES MET MET SINA-2 SINA-2 MET
Atlantic Washington ES* MET MET Watch Watch MET
Audubon Audubon ES MET MET Watch Watch MET
Audubon Audubon MS-HS MET MET Watch SINA-2 MET
Aurelia Aurelia ES MET MET SINA-1 Removed-
Watch MET
Aurelia Aurelia MS MET MET Removed-
Watch Removed-
Watch MET
Ballard Ballard HS MET MET MET Watch MET
Ballard Ballard MS MET MET Removed-
Watch Delay-1 MET
Ballard East ES MET MET SINA-2 SINA-2 MET
Ballard West ES MET MET Removed-
Watch SINA-1 MET
Battle Creek-Ida Grove Battle Creek-Ida Grove HS
MET MET MET Watch MET
Battle Creek-Ida Grove BCIG ES MET MET Watch Watch MET
Baxter Baxter ES MET MET Delay-1 MET MET
Baxter Baxter HS MET MET Removed-
Watch Delay-1 MET
BCLUW BCLUW ES MET MET MET Watch MET
BCLUW BCLUW HS MET MET MET Watch MET
BCLUW BCLUW MS MET MET MET MET MET
Bedford Bedford ES MET MET MET Removed-
Watch MET
Bedford Bedford HS MET MET Removed-
Watch Removed-
Watch MET
Belle Plaine Belle Plaine Jr-Sr HS MET MET SINA-1 SINA-2 MET
Belle Plaine Longfellow ES MET MET SINA-2 Delay-1 MET
Bellevue Bellevue ES MET MET MET SINA-1 MET
Bellevue Bellevue HS MET MET Watch Removed-
SINA MET
Belmond-Klemme Belmond-Klemme Jr-Sr HS
MET MET Delay-1 Delay-1 MET
Belmond-Klemme Belmond-Klemme Alternative
MET MET MET Removed-
Watch MET
Belmond-Klemme Richard O. Jacobson ES
MET MET Watch SINA-5 MET

78 State Report Card 2014
Table 22 (continued)
AYP Status for Schools for the 2014-15 School Year Based on Previous School Year's Performance
District School Math
Participation Reading
Participation Math
Proficiency Reading
Proficiency Other
Indicator
Bennett Bennett ES MET MET MET MET MET
Benton Atkins ES MET MET MET MET MET
Benton Benton HS MET MET MET Watch MET
Benton Benton MS MET MET SINA-2 Delay-1 MET
Benton Keystone ES MET MET MET Removed-
Watch MET
Benton Norway ES MET MET Delay-3 Delay-1 MET
Benton Van Horne ES MET MET MET Removed-
Watch MET
Bettendorf Bettendorf HS Removed-
Watch Removed-
Watch SINA-4 SINA-4 MET
Bettendorf Bettendorf MS MET MET SINA-9 Delay-7 MET
Bettendorf Grant Wood ES* MET MET Watch MET MET
Bettendorf Herbert Hoover ES* MET MET MET MET MET
Bettendorf Mark Twain ES* MET MET MET MET MET
Bettendorf Neil Armstrong ES* MET MET MET SINA-1 MET
Bettendorf Paul Norton ES* MET MET MET MET MET
Bettendorf Thomas Jefferson ES*
MET MET MET MET MET
Bondurant-Farrar Anderson ES MET MET SINA-3 Watch MET
Bondurant-Farrar Bondurant - Farrar MS
MET MET SINA-2 Removed-
SINA MET
Bondurant-Farrar Bondurant-Farrar HS
MET MET Removed-
Watch Removed-
Watch MET
Boone Boone HS MET MET SINA-1 SINA-1 MET
Boone Boone MS MET MET Delay-4 Removed-
SINA MET
Boone Franklin ES MET MET Delay-4 Delay-1 MET
Boone Futures MET MET Removed-
Watch MET MET
Boone Lincoln ES MET MET Removed-
Watch Removed-
Watch MET
Boone Page ES MET MET Removed-
Watch Removed-
Watch MET
Boyden-Hull Boyden-Hull ES MET MET Watch Watch MET
Boyden-Hull Boyden-Hull HS MET MET Watch SINA-2 MET
Boyer Valley Boyer Valley ES MET MET Watch SINA-2 MET
Boyer Valley Boyer Valley MS-HS MET MET Delay-3 SINA-3 MET
Brooklyn-Guernsey-Malcom
Brooklyn-Guernsey-Malcom ES
MET MET MET Removed-
Watch MET
Brooklyn-Guernsey-Malcom
Brooklyn-Guernsey-Malcom Jr-Sr HS
MET MET Watch SINA-3 MET
Burlington Aldo Leopold MS MET MET SINA-6 Delay-3 MET

State Report Card 2014 79
Table 22 (continued)
AYP Status for Schools for the 2014-15 School Year Based on Previous School Year's Performance
District School Math
Participation Reading
Participation Math
Proficiency Reading
Proficiency Other
Indicator
Burlington Black Hawk ES MET MET SINA-1 SINA-1 MET
Burlington Burlington HS MET MET SINA-7 SINA-9 MET
Burlington Burlington Alternative
Watch Watch Delay-3 Delay-2 MET
Burlington Corse ES MET MET SINA-1 SINA-1 MET
Burlington Edward Stone MS MET MET SINA-6 SINA-6 MET
Burlington James Wilson Grimes
MET MET SINA-1 SINA-1 MET
Burlington North Hill ES MET MET Watch Removed-
SINA MET
Burlington Sunnyside ES MET MET SINA-4 Removed-
SINA MET
CAL CAL HS MET MET Removed-
Watch Delay-3 MET
CAL CAL ES MET MET Delay-1 Delay-1 MET
Calamus-Wheatland Calamus-Wheatland ES
MET MET MET Removed-
Watch MET
Calamus-Wheatland Calamus-Wheatland Sec
MET MET MET Watch MET
CAM CAM HS MET MET MET MET MET
CAM CAM MS MET MET SINA-2 SINA-2 MET
CAM CAM North ES MET MET MET MET MET
CAM CAM South ES MET MET MET MET MET
CAM Iowa Connections Academy ES
MET MET MET MET MET
CAM Iowa Connections Academy HS
MET MET MET Watch MET
CAM Iowa Connections Academy MS
MET MET MET MET MET
Camanche Camanche ES MET MET SINA-1 SINA-1 MET
Camanche Camanche HS MET MET SINA-1 SINA-1 Removed-
Watch
Camanche Camanche MS MET MET SINA-5 Delay-5 MET
Cardinal Cardinal ES MET MET SINA-1 SINA-2 MET
Cardinal Cardinal MS-HS MET MET SINA-5 SINA-5 MET
Carlisle Carlisle ES MET MET Watch Watch MET
Carlisle Carlisle HS MET MET MET Watch MET
Carlisle Carlisle MS MET MET Delay-3 Delay-1 MET
Carlisle Hartford Upper ES MET MET Watch SINA-3 MET
Carroll Adams ES MET MET Removed-
Watch Removed-
Watch MET
Carroll Carroll HS MET MET MET Watch MET
Carroll Carroll MS MET MET SINA-2 SINA-2 MET

80 State Report Card 2014
Table 22 (continued)
AYP Status for Schools for the 2014-15 School Year Based on Previous School Year's Performance
District School Math
Participation Reading
Participation Math
Proficiency Reading
Proficiency Other
Indicator
Carroll Fairview ES MET MET MET MET MET
Cedar Falls Cedar Falls HS MET MET Delay-4 Delay-5 MET
Cedar Falls Cedar Heights ES MET MET Watch MET MET
Cedar Falls Helen A Hansen ES MET MET MET Removed-
SINA MET
Cedar Falls Holmes JHS MET MET Delay-5 SINA-7 MET
Cedar Falls Lincoln ES MET MET Watch MET MET
Cedar Falls North Cedar ES MET MET Delay-1 Delay-1 MET
Cedar Falls Orchard Hill ES MET MET MET Delay-1 MET
Cedar Falls Peet JHS MET MET MET SINA-6 MET
Cedar Falls River Hills MET MET MET MET MET
Cedar Falls Southdale ES MET MET MET SINA-2 MET
Cedar Rapids Arthur ES MET MET Watch Watch MET
Cedar Rapids Cleveland ES MET MET Delay-2 SINA-5 MET
Cedar Rapids Coolidge ES MET MET MET Watch MET
Cedar Rapids Erskine ES MET MET Watch SINA-2 MET
Cedar Rapids Franklin MS MET MET SINA-6 SINA-9 MET
Cedar Rapids Garfield ES MET MET SINA-3 Delay-4 MET
Cedar Rapids George Washington HS
MET MET SINA-8 SINA-8 MET
Cedar Rapids Grant ES MET MET SINA-5 SINA-5 MET
Cedar Rapids Grant Wood ES MET MET SINA-2 Delay-4 MET
Cedar Rapids Harding MS MET MET SINA-6 SINA-5 MET
Cedar Rapids Harrison ES MET MET SINA-1 SINA-6 MET
Cedar Rapids Hiawatha ES MET MET Watch SINA-5 MET
Cedar Rapids Hoover ES MET MET SINA-2 SINA-2 MET
Cedar Rapids Jackson ES MET MET Watch MET MET
Cedar Rapids John F Kennedy HS MET MET SINA-2 SINA-6 MET
Cedar Rapids Johnson ES MET MET SINA-7 SINA-7 MET
Cedar Rapids Kenwood ES MET MET Watch Removed-
Watch MET
Cedar Rapids Madison ES MET MET SINA-4 SINA-4 MET
Cedar Rapids McKinley MS MET MET SINA-6 Delay-9 MET
Cedar Rapids Metro HS Delay-9 Delay-9 SINA-6 Watch MET
Cedar Rapids Nixon ES MET MET Watch SINA-1 MET
Cedar Rapids Pierce ES MET MET SINA-1 SINA-1 MET
Cedar Rapids Roosevelt MS MET MET SINA-9 SINA-9 MET
Cedar Rapids Taft MS MET MET Removed-
SINA Delay-6 MET
Cedar Rapids Taylor ES MET MET Delay-1 MET MET
Cedar Rapids Thomas Jefferson HS MET MET SINA-7 SINA-8 MET
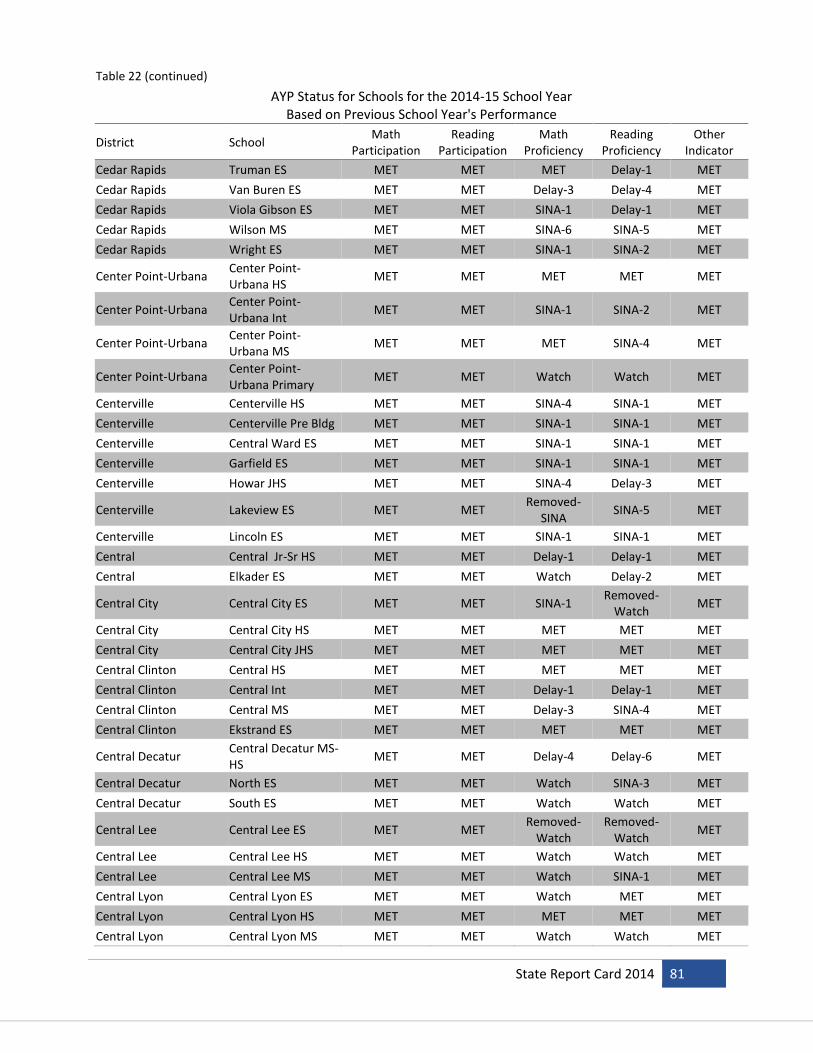
State Report Card 2014 81
Table 22 (continued)
AYP Status for Schools for the 2014-15 School Year Based on Previous School Year's Performance
District School Math
Participation Reading
Participation Math
Proficiency Reading
Proficiency Other
Indicator
Cedar Rapids Truman ES MET MET MET Delay-1 MET
Cedar Rapids Van Buren ES MET MET Delay-3 Delay-4 MET
Cedar Rapids Viola Gibson ES MET MET SINA-1 Delay-1 MET
Cedar Rapids Wilson MS MET MET SINA-6 SINA-5 MET
Cedar Rapids Wright ES MET MET SINA-1 SINA-2 MET
Center Point-Urbana Center Point-Urbana HS
MET MET MET MET MET
Center Point-Urbana Center Point-Urbana Int
MET MET SINA-1 SINA-2 MET
Center Point-Urbana Center Point-Urbana MS
MET MET MET SINA-4 MET
Center Point-Urbana Center Point-Urbana Primary
MET MET Watch Watch MET
Centerville Centerville HS MET MET SINA-4 SINA-1 MET
Centerville Centerville Pre Bldg MET MET SINA-1 SINA-1 MET
Centerville Central Ward ES MET MET SINA-1 SINA-1 MET
Centerville Garfield ES MET MET SINA-1 SINA-1 MET
Centerville Howar JHS MET MET SINA-4 Delay-3 MET
Centerville Lakeview ES MET MET Removed-
SINA SINA-5 MET
Centerville Lincoln ES MET MET SINA-1 SINA-1 MET
Central Central Jr-Sr HS MET MET Delay-1 Delay-1 MET
Central Elkader ES MET MET Watch Delay-2 MET
Central City Central City ES MET MET SINA-1 Removed-
Watch MET
Central City Central City HS MET MET MET MET MET
Central City Central City JHS MET MET MET MET MET
Central Clinton Central HS MET MET MET MET MET
Central Clinton Central Int MET MET Delay-1 Delay-1 MET
Central Clinton Central MS MET MET Delay-3 SINA-4 MET
Central Clinton Ekstrand ES MET MET MET MET MET
Central Decatur Central Decatur MS-HS
MET MET Delay-4 Delay-6 MET
Central Decatur North ES MET MET Watch SINA-3 MET
Central Decatur South ES MET MET Watch Watch MET
Central Lee Central Lee ES MET MET Removed-
Watch Removed-
Watch MET
Central Lee Central Lee HS MET MET Watch Watch MET
Central Lee Central Lee MS MET MET Watch SINA-1 MET
Central Lyon Central Lyon ES MET MET Watch MET MET
Central Lyon Central Lyon HS MET MET MET MET MET
Central Lyon Central Lyon MS MET MET Watch Watch MET

82 State Report Card 2014
Table 22 (continued)
AYP Status for Schools for the 2014-15 School Year Based on Previous School Year's Performance
District School Math
Participation Reading
Participation Math
Proficiency Reading
Proficiency Other
Indicator
Central Springs Central Springs ES Manly
MET MET MET MET MET
Central Springs Central Springs ES Nora Springs
MET MET MET Watch MET
Central Springs Central Springs HS MET MET MET MET MET
Central Springs Central Springs MS MET MET Delay-1 Delay-1 MET
Chariton Chariton HS MET MET SINA-1 SINA-1 MET
Chariton Chariton MS MET MET SINA-4 SINA-4 MET
Chariton Columbus ES MET MET Removed-
Watch Removed-
Watch MET
Chariton Van Allen ES MET MET SINA-6 SINA-3 MET
Charles City Carrie Lane HS MET MET MET MET MET
Charles City Charles City HS MET MET Watch SINA-1 MET
Charles City Charles City MS MET MET Delay-5 SINA-5 MET
Charles City Lincoln ES MET MET SINA-1 Removed-
Watch MET
Charles City Washington ES MET MET SINA-2 Watch MET
Charter Oak-Ute Charter Oak-Ute ES MET MET SINA-1 Delay-2 MET
Charter Oak-Ute Charter Oak-Ute HS MET MET MET MET MET
Charter Oak-Ute Charter Oak-Ute JHS MET MET SINA-1 Delay-2 MET
Cherokee Cherokee MS MET MET SINA-4 SINA-4 MET
Cherokee Little Sioux Success MET MET MET MET MET
Cherokee Roosevelt ES MET MET Removed-
Watch SINA-1 MET
Cherokee Washington HS MET MET MET MET MET
Clarinda Clarinda HS MET MET Watch Watch MET
Clarinda Clarinda MS MET MET Removed-
SINA Delay-3 MET
Clarinda Garfield ES MET MET SINA-1 Watch MET
Clarion-Goldfield Clarion ES MET MET Watch Watch MET
Clarion-Goldfield Clarion-Goldfield HS MET MET MET Watch MET
Clarion-Goldfield Clarion-Goldfield MS
MET MET SINA-1 SINA-3 MET
Clarke Clarke ES Removed-
Watch Removed-
Watch SINA-4 SINA-4 MET
Clarke Clarke HS MET MET Removed-
Watch SINA-2 MET
Clarke Clarke MS MET MET SINA-1 SINA-2 MET
Clarksville Clarksville ES MET MET Watch MET MET
Clarksville Clarksville HS MET MET Removed-
Watch Delay-1 MET
Clay Central-Everly Clay Central-Everly ES Royal
MET MET MET Watch MET

State Report Card 2014 83
Table 22 (continued)
AYP Status for Schools for the 2014-15 School Year Based on Previous School Year's Performance
District School Math
Participation Reading
Participation Math
Proficiency Reading
Proficiency Other
Indicator
Clay Central-Everly Clay Central-Everly Jr-Sr HS
MET MET MET Watch MET
Clayton Ridge Clayton Ridge ES MET MET Delay-1 MET MET
Clayton Ridge Clayton Ridge HS MET MET SINA-1 Watch MET
Clayton Ridge Clayton Ridge MS MET MET Delay-2 Delay-1 MET
Clayton Ridge Iowa Virtual Academy
MET MET Watch Watch MET
Clear Creek Amana Amana ES MET MET SINA-1 Watch MET
Clear Creek Amana Clear Creek Amana HS
MET MET Watch Watch MET
Clear Creek Amana Clear Creek Amana MS
MET MET SINA-6 Delay-3 MET
Clear Creek Amana Clear Creek ES MET MET SINA-1 Watch MET
Clear Creek Amana North Bend ES MET MET Removed-
Watch SINA-2 MET
Clear Lake Clear Creek ES MET MET SINA-2 SINA-2 MET
Clear Lake Clear Lake HS MET MET Watch SINA-2 MET
Clear Lake Clear Lake MS MET MET SINA-2 Removed-
SINA MET
Clearfield Clearfield ES MET MET MET MET MET
Clinton Bluff ES MET MET SINA-2 SINA-4 MET
Clinton Clinton HS MET Watch SINA-1 SINA-5 SINA-1
Clinton Eagle Heights ES MET MET Removed-
SINA SINA-3 MET
Clinton Jefferson ES MET MET Removed-
Watch SINA-5 MET
Clinton Lyons MS MET MET Delay-4 Delay-4 MET
Clinton Washington MS MET MET Delay-4 Delay-4 Removed-
Watch
Clinton Whittier ES MET MET MET MET MET
Colfax-Mingo Colfax-Mingo ES MET MET Removed-
Watch SINA-1 MET
Colfax-Mingo Colfax-Mingo HS MET MET SINA-1 SINA-1 MET
College Prairie Creek MET MET SINA-4 SINA-4 MET
College Prairie Crest ES MET MET Delay-1 SINA-1 MET
College Prairie Edge MET MET MET Delay-1 MET
College Prairie Heights ES MET MET Removed-
Watch SINA-3 MET
College Prairie HS MET MET Removed-
SINA SINA-9 MET
College Prairie Point MET MET SINA-4 SINA-4 MET
College Prairie Ridge ES MET MET Removed-
Watch MET MET
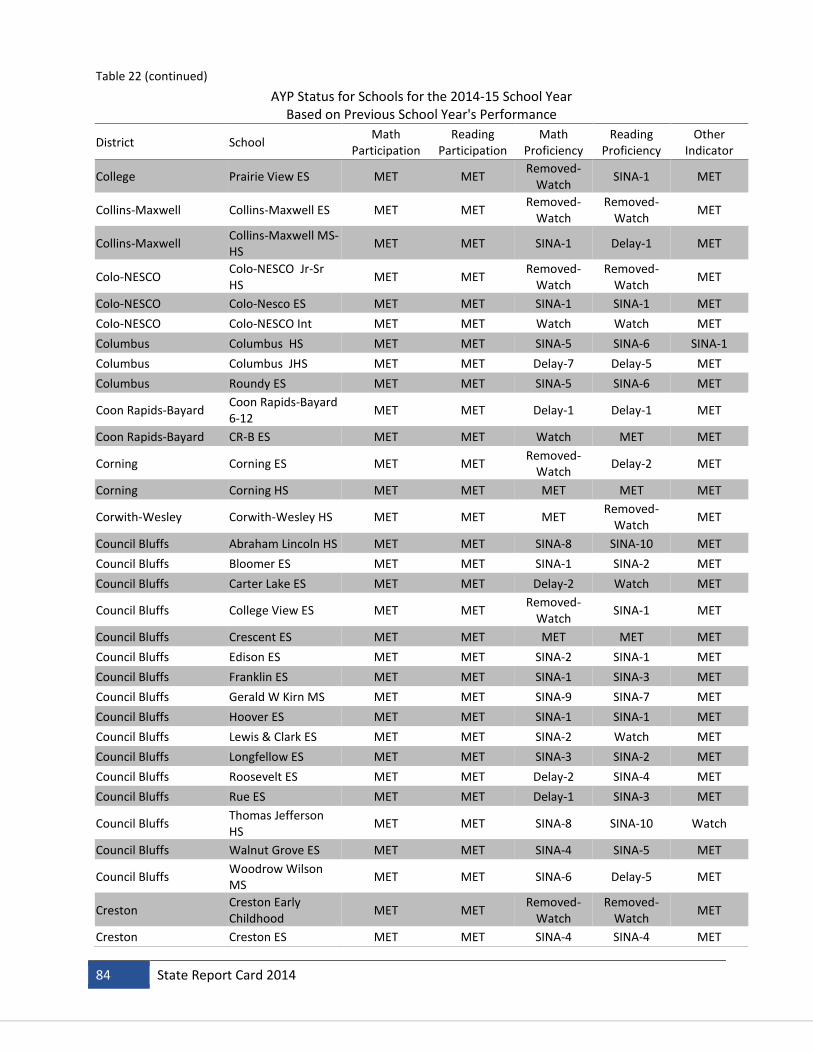
84 State Report Card 2014
Table 22 (continued)
AYP Status for Schools for the 2014-15 School Year Based on Previous School Year's Performance
District School Math
Participation Reading
Participation Math
Proficiency Reading
Proficiency Other
Indicator
College Prairie View ES MET MET Removed-
Watch SINA-1 MET
Collins-Maxwell Collins-Maxwell ES MET MET Removed-
Watch Removed-
Watch MET
Collins-Maxwell Collins-Maxwell MS-HS
MET MET SINA-1 Delay-1 MET
Colo-NESCO Colo-NESCO Jr-Sr HS
MET MET Removed-
Watch Removed-
Watch MET
Colo-NESCO Colo-Nesco ES MET MET SINA-1 SINA-1 MET
Colo-NESCO Colo-NESCO Int MET MET Watch Watch MET
Columbus Columbus HS MET MET SINA-5 SINA-6 SINA-1
Columbus Columbus JHS MET MET Delay-7 Delay-5 MET
Columbus Roundy ES MET MET SINA-5 SINA-6 MET
Coon Rapids-Bayard Coon Rapids-Bayard 6-12
MET MET Delay-1 Delay-1 MET
Coon Rapids-Bayard CR-B ES MET MET Watch MET MET
Corning Corning ES MET MET Removed-
Watch Delay-2 MET
Corning Corning HS MET MET MET MET MET
Corwith-Wesley Corwith-Wesley HS MET MET MET Removed-
Watch MET
Council Bluffs Abraham Lincoln HS MET MET SINA-8 SINA-10 MET
Council Bluffs Bloomer ES MET MET SINA-1 SINA-2 MET
Council Bluffs Carter Lake ES MET MET Delay-2 Watch MET
Council Bluffs College View ES MET MET Removed-
Watch SINA-1 MET
Council Bluffs Crescent ES MET MET MET MET MET
Council Bluffs Edison ES MET MET SINA-2 SINA-1 MET
Council Bluffs Franklin ES MET MET SINA-1 SINA-3 MET
Council Bluffs Gerald W Kirn MS MET MET SINA-9 SINA-7 MET
Council Bluffs Hoover ES MET MET SINA-1 SINA-1 MET
Council Bluffs Lewis & Clark ES MET MET SINA-2 Watch MET
Council Bluffs Longfellow ES MET MET SINA-3 SINA-2 MET
Council Bluffs Roosevelt ES MET MET Delay-2 SINA-4 MET
Council Bluffs Rue ES MET MET Delay-1 SINA-3 MET
Council Bluffs Thomas Jefferson HS
MET MET SINA-8 SINA-10 Watch
Council Bluffs Walnut Grove ES MET MET SINA-4 SINA-5 MET
Council Bluffs Woodrow Wilson MS
MET MET SINA-6 Delay-5 MET
Creston Creston Early Childhood
MET MET Removed-
Watch Removed-
Watch MET
Creston Creston ES MET MET SINA-4 SINA-4 MET

State Report Card 2014 85
Table 22 (continued)
AYP Status for Schools for the 2014-15 School Year Based on Previous School Year's Performance
District School Math
Participation Reading
Participation Math
Proficiency Reading
Proficiency Other
Indicator
Creston Creston HS MET MET SINA-4 Watch MET
Creston Creston MS MET MET Delay-4 Delay-4 MET
Dallas Center-Grimes Dallas Center ES MET MET Watch Watch MET
Dallas Center-Grimes Dallas Center-Grimes HS
MET MET Watch MET MET
Dallas Center-Grimes Dallas Center-Grimes MS
MET MET Removed-
SINA SINA-2 MET
Dallas Center-Grimes DC-G Meadows MET MET SINA-1 SINA-1 MET
Dallas Center-Grimes North Ridge ES MET MET MET Removed-
Watch MET
Dallas Center-Grimes South Prairie ES MET MET MET MET MET
Danville Danville ES* MET MET Delay-1 SINA-1 MET
Danville Danville Jr-Sr HS MET MET MET SINA-3 MET
Davenport Adams ES MET MET Delay-2 Delay-1 MET
Davenport Blue Grass ES MET MET Watch Watch MET
Davenport Buchanan ES MET MET SINA-3 SINA-4 Watch
Davenport Buffalo ES MET MET MET SINA-2 MET
Davenport Central HS MET MET SINA-7 SINA-9 Watch
Davenport Eisenhower ES MET MET SINA-1 Watch MET
Davenport Fillmore ES MET MET SINA-5 SINA-5 MET
Davenport Frank L Smart Intermediate
MET MET SINA-6 SINA-6 Watch
Davenport Garfield ES MET MET SINA-1 SINA-2 MET
Davenport Harrison ES MET MET SINA-1 SINA-3 MET
Davenport Harry S Truman MET MET SINA-2 SINA-2 MET
Davenport Hayes ES MET MET SINA-2 SINA-2 MET
Davenport Jackson ES MET MET SINA-3 SINA-4 MET
Davenport JB Young ES MET MET SINA-5 Delay-4 Removed-
Watch
Davenport JB Young Intermediate
MET MET SINA-6 SINA-6 SINA-3
Davenport Jefferson ES MET MET SINA-6 Delay-5 MET
Davenport Kimberly Center for Alt
MET MET MET MET MET
Davenport Kimberly East Watch Watch SINA-6 SINA-8 Watch
Davenport Madison ES Removed-
Watch Removed-
Watch SINA-4 SINA-4 SINA-1
Davenport McKinley ES MET MET Delay-2 SINA-2 MET
Davenport Monroe ES MET MET SINA-6 SINA-6 Watch
Davenport North HS MET MET SINA-10 SINA-10 MET
Davenport Sudlow Intermediate
MET MET SINA-8 SINA-10 MET
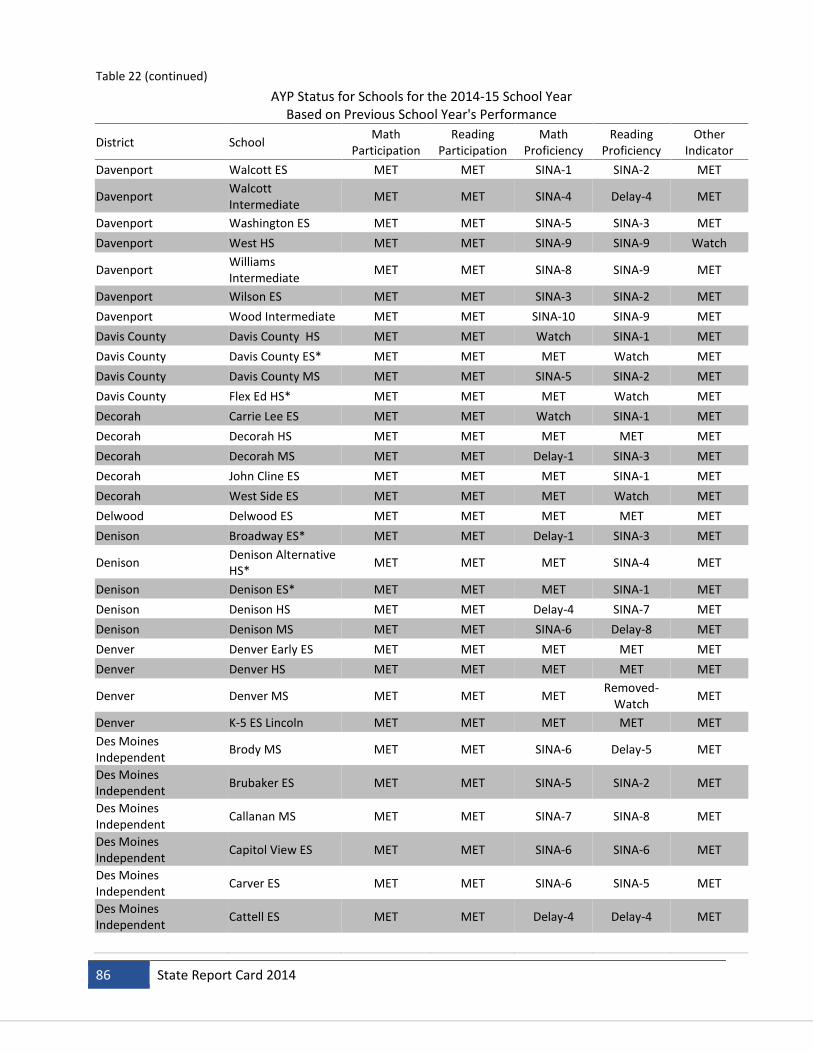
86 State Report Card 2014
Table 22 (continued)
AYP Status for Schools for the 2014-15 School Year Based on Previous School Year's Performance
District School Math
Participation Reading
Participation Math
Proficiency Reading
Proficiency Other
Indicator
Davenport Walcott ES MET MET SINA-1 SINA-2 MET
Davenport Walcott Intermediate
MET MET SINA-4 Delay-4 MET
Davenport Washington ES MET MET SINA-5 SINA-3 MET
Davenport West HS MET MET SINA-9 SINA-9 Watch
Davenport Williams Intermediate
MET MET SINA-8 SINA-9 MET
Davenport Wilson ES MET MET SINA-3 SINA-2 MET
Davenport Wood Intermediate MET MET SINA-10 SINA-9 MET
Davis County Davis County HS MET MET Watch SINA-1 MET
Davis County Davis County ES* MET MET MET Watch MET
Davis County Davis County MS MET MET SINA-5 SINA-2 MET
Davis County Flex Ed HS* MET MET MET Watch MET
Decorah Carrie Lee ES MET MET Watch SINA-1 MET
Decorah Decorah HS MET MET MET MET MET
Decorah Decorah MS MET MET Delay-1 SINA-3 MET
Decorah John Cline ES MET MET MET SINA-1 MET
Decorah West Side ES MET MET MET Watch MET
Delwood Delwood ES MET MET MET MET MET
Denison Broadway ES* MET MET Delay-1 SINA-3 MET
Denison Denison Alternative HS*
MET MET MET SINA-4 MET
Denison Denison ES* MET MET MET SINA-1 MET
Denison Denison HS MET MET Delay-4 SINA-7 MET
Denison Denison MS MET MET SINA-6 Delay-8 MET
Denver Denver Early ES MET MET MET MET MET
Denver Denver HS MET MET MET MET MET
Denver Denver MS MET MET MET Removed-
Watch MET
Denver K-5 ES Lincoln MET MET MET MET MET
Des Moines Independent
Brody MS MET MET SINA-6 Delay-5 MET
Des Moines Independent
Brubaker ES MET MET SINA-5 SINA-2 MET
Des Moines Independent
Callanan MS MET MET SINA-7 SINA-8 MET
Des Moines Independent
Capitol View ES MET MET SINA-6 SINA-6 MET
Des Moines Independent
Carver ES MET MET SINA-6 SINA-5 MET
Des Moines Independent
Cattell ES MET MET Delay-4 Delay-4 MET

State Report Card 2014 87
Table 22 (continued)
AYP Status for Schools for the 2014-15 School Year Based on Previous School Year's Performance
District School Math
Participation Reading
Participation Math
Proficiency Reading
Proficiency Other
Indicator
Des Moines Independent
Cowles ES MET MET Watch MET MET
Des Moines Independent
Downtown MET MET MET MET MET
Des Moines Independent
East HS SINA-1 SINA-1 SINA-9 SINA-9 MET
Des Moines Independent
Edmunds Fine Arts Academy
MET MET Delay-3 SINA-5 MET
Des Moines Independent
Findley ES MET MET Removed-
SINA SINA-5 MET
Des Moines Independent
Garton ES MET MET SINA-5 SINA-5 MET
Des Moines Independent
Gateway Secondary MET MET SINA-2 SINA-2 MET
Des Moines Independent
Goodrell MS MET MET SINA-8 Delay-6 MET
Des Moines Independent
Greenwood ES MET MET SINA-3 SINA-5 MET
Des Moines Independent
Hanawalt ES MET MET SINA-1 Watch MET
Des Moines Independent
Harding MS MET MET SINA-3 SINA-3 Watch
Des Moines Independent
Hiatt MS MET MET SINA-9 SINA-9 SINA-1
Des Moines Independent
Hillis ES MET MET Delay-5 SINA-2 MET
Des Moines Independent
Hoover HS MET MET SINA-9 SINA-8 MET
Des Moines Independent
Howe ES MET MET Delay-5 Delay-4 MET
Des Moines Independent
Hoyt MS MET MET SINA-5 SINA-9 Delay-1
Des Moines Independent
Hubbell ES MET MET SINA-3 SINA-4 MET
Des Moines Independent
Jackson ES MET MET SINA-4 SINA-7 MET
Des Moines Independent
Jefferson ES MET MET MET MET MET
Des Moines Independent
King ES MET MET SINA-8 SINA-4 Watch
Des Moines Independent
Lincoln HS MET MET SINA-9 SINA-9 MET
Des Moines Independent
Lovejoy ES MET MET SINA-4 SINA-6 MET
Des Moines Independent
Madison ES MET MET SINA-4 SINA-6 MET

88 State Report Card 2014
Table 22 (continued)
AYP Status for Schools for the 2014-15 School Year Based on Previous School Year's Performance
District School Math
Participation Reading
Participation Math
Proficiency Reading
Proficiency Other
Indicator
Des Moines Independent
McCombs MS MET MET SINA-11 SINA-6 SINA-1
Des Moines Independent
McKinley ES MET MET SINA-6 SINA-6 MET
Des Moines Independent
Meredith MS MET MET SINA-11 SINA-11 MET
Des Moines Independent
Merrill MS MET MET SINA-8 Delay-10 MET
Des Moines Independent
Monroe ES MET MET SINA-6` SINA-7 MET
Des Moines Independent
Morris ES MET MET SINA-5 SINA-6 MET
Des Moines Independent
Moulton ES MET MET SINA-7 SINA-7 Watch
Des Moines Independent
North HS MET MET SINA-6 SINA-5 Watch
Des Moines Independent
Oak Park MET MET SINA-4 Watch MET
Des Moines Independent
Park Ave ES MET MET SINA-5 SINA-2 MET
Des Moines Independent
Perkins ES MET MET Delay-2 Removed-
SINA MET
Des Moines Independent
Phillips ES MET MET SINA-1 Watch MET
Des Moines Independent
Pleasant Hill ES MET MET Watch Watch MET
Des Moines Independent
River Woods ES MET MET SINA-5 SINA-5 MET
Des Moines Independent
Roosevelt HS MET MET SINA-7 SINA-8 MET
Des Moines Independent
Ruby Van Meter MET MET Watch MET MET
Des Moines Independent
Samuelson ES MET MET SINA-5 Delay-4 MET
Des Moines Independent
Scavo Alternative HS
Removed-SINA Removed-SINA SINA-6 SINA-6 SINA-4
Des Moines Independent
Smouse Opportunity
MET MET SINA-1 SINA-1 SINA-1
Des Moines Independent
South Union ES MET MET SINA-7 SINA-8 MET
Des Moines Independent
Stowe ES MET MET SINA-4 SINA-5 MET
Des Moines Independent
Studebaker ES MET MET SINA-2 SINA-3 MET
Des Moines Independent
Walnut Street MET MET MET Watch MET
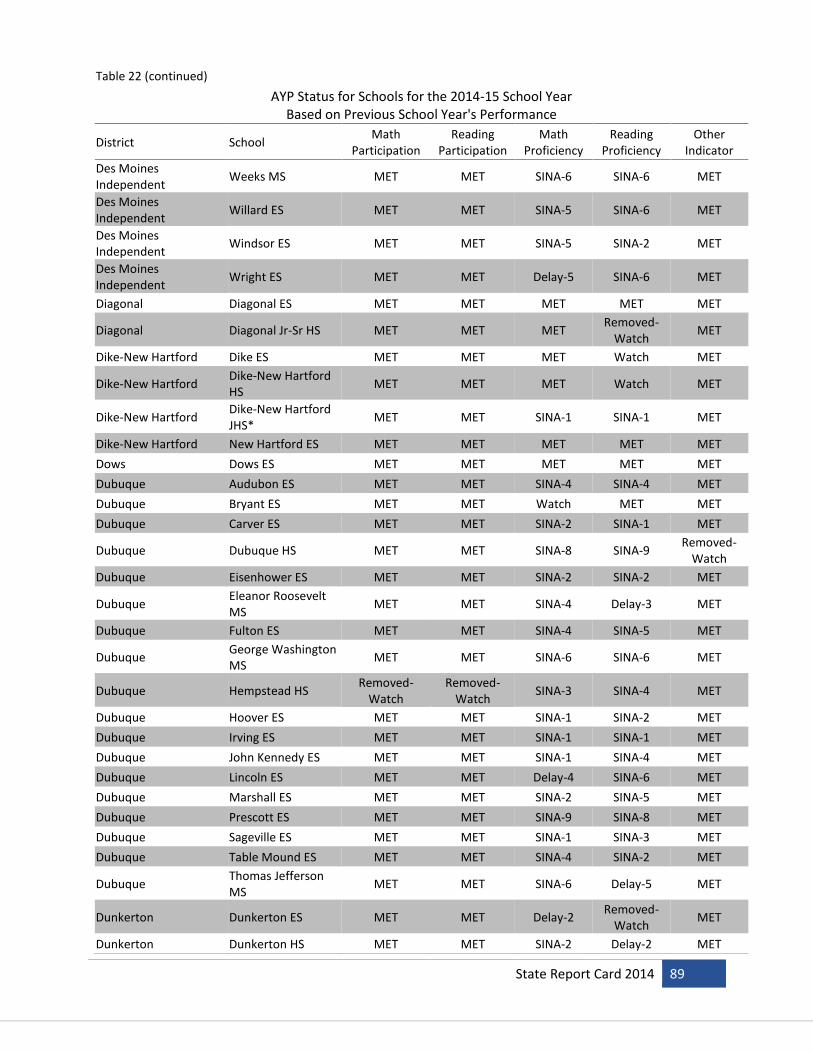
State Report Card 2014 89
Table 22 (continued)
AYP Status for Schools for the 2014-15 School Year Based on Previous School Year's Performance
District School Math
Participation Reading
Participation Math
Proficiency Reading
Proficiency Other
Indicator
Des Moines Independent
Weeks MS MET MET SINA-6 SINA-6 MET
Des Moines Independent
Willard ES MET MET SINA-5 SINA-6 MET
Des Moines Independent
Windsor ES MET MET SINA-5 SINA-2 MET
Des Moines Independent
Wright ES MET MET Delay-5 SINA-6 MET
Diagonal Diagonal ES MET MET MET MET MET
Diagonal Diagonal Jr-Sr HS MET MET MET Removed-
Watch MET
Dike-New Hartford Dike ES MET MET MET Watch MET
Dike-New Hartford Dike-New Hartford HS
MET MET MET Watch MET
Dike-New Hartford Dike-New Hartford JHS*
MET MET SINA-1 SINA-1 MET
Dike-New Hartford New Hartford ES MET MET MET MET MET
Dows Dows ES MET MET MET MET MET
Dubuque Audubon ES MET MET SINA-4 SINA-4 MET
Dubuque Bryant ES MET MET Watch MET MET
Dubuque Carver ES MET MET SINA-2 SINA-1 MET
Dubuque Dubuque HS MET MET SINA-8 SINA-9 Removed-
Watch
Dubuque Eisenhower ES MET MET SINA-2 SINA-2 MET
Dubuque Eleanor Roosevelt MS
MET MET SINA-4 Delay-3 MET
Dubuque Fulton ES MET MET SINA-4 SINA-5 MET
Dubuque George Washington MS
MET MET SINA-6 SINA-6 MET
Dubuque Hempstead HS Removed-
Watch Removed-
Watch SINA-3 SINA-4 MET
Dubuque Hoover ES MET MET SINA-1 SINA-2 MET
Dubuque Irving ES MET MET SINA-1 SINA-1 MET
Dubuque John Kennedy ES MET MET SINA-1 SINA-4 MET
Dubuque Lincoln ES MET MET Delay-4 SINA-6 MET
Dubuque Marshall ES MET MET SINA-2 SINA-5 MET
Dubuque Prescott ES MET MET SINA-9 SINA-8 MET
Dubuque Sageville ES MET MET SINA-1 SINA-3 MET
Dubuque Table Mound ES MET MET SINA-4 SINA-2 MET
Dubuque Thomas Jefferson MS
MET MET SINA-6 Delay-5 MET
Dunkerton Dunkerton ES MET MET Delay-2 Removed-
Watch MET
Dunkerton Dunkerton HS MET MET SINA-2 Delay-2 MET
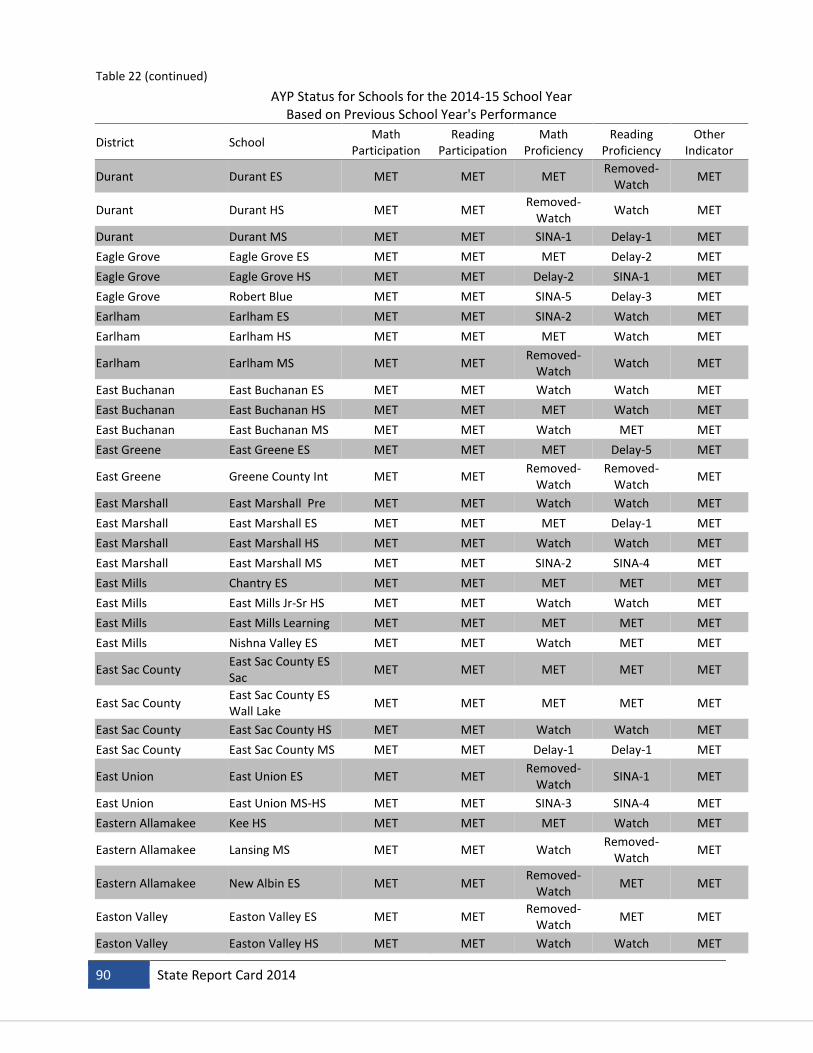
90 State Report Card 2014
Table 22 (continued)
AYP Status for Schools for the 2014-15 School Year Based on Previous School Year's Performance
District School Math
Participation Reading
Participation Math
Proficiency Reading
Proficiency Other
Indicator
Durant Durant ES MET MET MET Removed-
Watch MET
Durant Durant HS MET MET Removed-
Watch Watch MET
Durant Durant MS MET MET SINA-1 Delay-1 MET
Eagle Grove Eagle Grove ES MET MET MET Delay-2 MET
Eagle Grove Eagle Grove HS MET MET Delay-2 SINA-1 MET
Eagle Grove Robert Blue MET MET SINA-5 Delay-3 MET
Earlham Earlham ES MET MET SINA-2 Watch MET
Earlham Earlham HS MET MET MET Watch MET
Earlham Earlham MS MET MET Removed-
Watch Watch MET
East Buchanan East Buchanan ES MET MET Watch Watch MET
East Buchanan East Buchanan HS MET MET MET Watch MET
East Buchanan East Buchanan MS MET MET Watch MET MET
East Greene East Greene ES MET MET MET Delay-5 MET
East Greene Greene County Int MET MET Removed-
Watch Removed-
Watch MET
East Marshall East Marshall Pre MET MET Watch Watch MET
East Marshall East Marshall ES MET MET MET Delay-1 MET
East Marshall East Marshall HS MET MET Watch Watch MET
East Marshall East Marshall MS MET MET SINA-2 SINA-4 MET
East Mills Chantry ES MET MET MET MET MET
East Mills East Mills Jr-Sr HS MET MET Watch Watch MET
East Mills East Mills Learning MET MET MET MET MET
East Mills Nishna Valley ES MET MET Watch MET MET
East Sac County East Sac County ES Sac
MET MET MET MET MET
East Sac County East Sac County ES Wall Lake
MET MET MET MET MET
East Sac County East Sac County HS MET MET Watch Watch MET
East Sac County East Sac County MS MET MET Delay-1 Delay-1 MET
East Union East Union ES MET MET Removed-
Watch SINA-1 MET
East Union East Union MS-HS MET MET SINA-3 SINA-4 MET
Eastern Allamakee Kee HS MET MET MET Watch MET
Eastern Allamakee Lansing MS MET MET Watch Removed-
Watch MET
Eastern Allamakee New Albin ES MET MET Removed-
Watch MET MET
Easton Valley Easton Valley ES MET MET Removed-
Watch MET MET
Easton Valley Easton Valley HS MET MET Watch Watch MET

State Report Card 2014 91
Table 22 (continued)
AYP Status for Schools for the 2014-15 School Year Based on Previous School Year's Performance
District School Math
Participation Reading
Participation Math
Proficiency Reading
Proficiency Other
Indicator
Eddyville-Blakesburg-Fremont
Blakesburg ES MET MET Watch Removed-
Watch MET
Eddyville-Blakesburg-Fremont
Eddyville ES MET MET Removed-
Watch MET MET
Eddyville-Blakesburg-Fremont
Eddyville-Blakesburg- Fremont Jr-Sr HS
MET MET Removed-
SINA Delay-2 MET
Eddyville-Blakesburg-Fremont
Fremont ES MET MET Watch Watch MET
Edgewood-Colesburg Edgewood-Colesburg ES
MET MET Removed-
Watch SINA-2 MET
Edgewood-Colesburg Edgewood-Colesburg HS
MET MET Delay-4 SINA-4 MET
Eldora-New Providence Eldora-New Providence ES
MET MET MET Watch MET
Eldora-New Providence Eldora-New Providence HS
MET MET Watch Watch MET
Elk Horn-Kimballton Elk Horn-Kimballton ES
MET MET MET MET MET
Elk Horn-Kimballton Elk Horn-Kimballton HS
MET MET MET Watch MET
Emmetsburg Emmetsburg HS MET MET MET MET MET
Emmetsburg Emmetsburg MS MET MET SINA-2 Delay-3 MET
Emmetsburg West ES MET MET Watch SINA-1 MET
English Valleys English Valleys ES MET MET SINA-2 Watch MET
English Valleys English Valleys Jr-Sr HS
MET MET Removed-
Watch SINA-2 MET
Essex Essex ES* MET MET MET MET MET
Essex Essex Jr-Sr HS* MET MET MET MET MET
Estherville Lincoln Central
Demoney ES MET MET Watch SINA-1 MET
Estherville Lincoln Central
Estherville Lincoln Central HS
MET MET SINA-4 Delay-2 MET
Estherville Lincoln Central
Estherville Lincoln Central MS
MET MET SINA-6 SINA-7 MET
Estherville Lincoln Central
Roosevelt ES MET MET SINA-2 SINA-2 MET
Exira Exira/EHK MS MET MET Watch Delay-1 MET
Fairfield Fairfield HS MET MET SINA-2 SINA-1 MET
Fairfield Fairfield MS MET MET SINA-6 Delay-4 MET
Fairfield Libertyville ES MET MET Removed-
Watch Watch MET
Fairfield Pence ES MET MET SINA-1 SINA-3 MET
Fairfield Washington ES MET MET MET MET MET
Farragut Farragut ES MET MET Watch MET MET
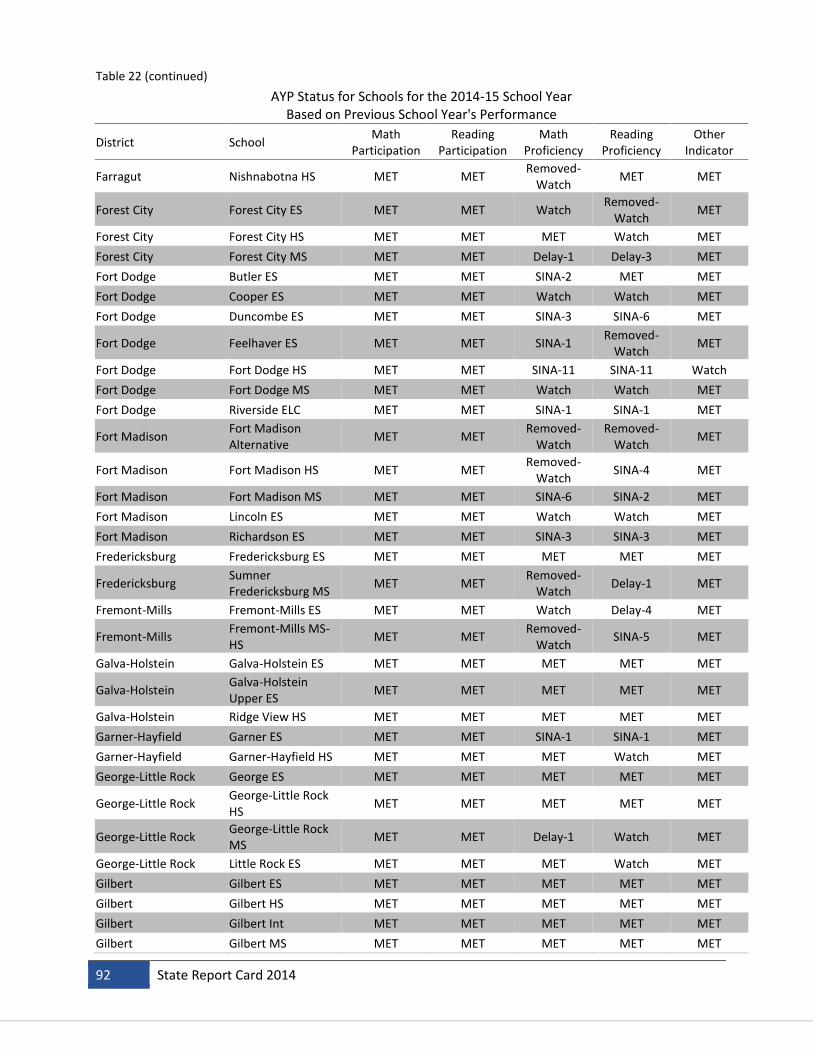
92 State Report Card 2014
Table 22 (continued)
AYP Status for Schools for the 2014-15 School Year Based on Previous School Year's Performance
District School Math
Participation Reading
Participation Math
Proficiency Reading
Proficiency Other
Indicator
Farragut Nishnabotna HS MET MET Removed-
Watch MET MET
Forest City Forest City ES MET MET Watch Removed-
Watch MET
Forest City Forest City HS MET MET MET Watch MET
Forest City Forest City MS MET MET Delay-1 Delay-3 MET
Fort Dodge Butler ES MET MET SINA-2 MET MET
Fort Dodge Cooper ES MET MET Watch Watch MET
Fort Dodge Duncombe ES MET MET SINA-3 SINA-6 MET
Fort Dodge Feelhaver ES MET MET SINA-1 Removed-
Watch MET
Fort Dodge Fort Dodge HS MET MET SINA-11 SINA-11 Watch
Fort Dodge Fort Dodge MS MET MET Watch Watch MET
Fort Dodge Riverside ELC MET MET SINA-1 SINA-1 MET
Fort Madison Fort Madison Alternative
MET MET Removed-
Watch Removed-
Watch MET
Fort Madison Fort Madison HS MET MET Removed-
Watch SINA-4 MET
Fort Madison Fort Madison MS MET MET SINA-6 SINA-2 MET
Fort Madison Lincoln ES MET MET Watch Watch MET
Fort Madison Richardson ES MET MET SINA-3 SINA-3 MET
Fredericksburg Fredericksburg ES MET MET MET MET MET
Fredericksburg Sumner Fredericksburg MS
MET MET Removed-
Watch Delay-1 MET
Fremont-Mills Fremont-Mills ES MET MET Watch Delay-4 MET
Fremont-Mills Fremont-Mills MS-HS
MET MET Removed-
Watch SINA-5 MET
Galva-Holstein Galva-Holstein ES MET MET MET MET MET
Galva-Holstein Galva-Holstein Upper ES
MET MET MET MET MET
Galva-Holstein Ridge View HS MET MET MET MET MET
Garner-Hayfield Garner ES MET MET SINA-1 SINA-1 MET
Garner-Hayfield Garner-Hayfield HS MET MET MET Watch MET
George-Little Rock George ES MET MET MET MET MET
George-Little Rock George-Little Rock HS
MET MET MET MET MET
George-Little Rock George-Little Rock MS
MET MET Delay-1 Watch MET
George-Little Rock Little Rock ES MET MET MET Watch MET
Gilbert Gilbert ES MET MET MET MET MET
Gilbert Gilbert HS MET MET MET MET MET
Gilbert Gilbert Int MET MET MET MET MET
Gilbert Gilbert MS MET MET MET MET MET

State Report Card 2014 93
Table 22 (continued)
AYP Status for Schools for the 2014-15 School Year Based on Previous School Year's Performance
District School Math
Participation Reading
Participation Math
Proficiency Reading
Proficiency Other
Indicator
Gilmore City-Bradgate Gilmore City ES MET MET SINA-1 Watch MET
Gladbrook-Reinbeck Gladbrook ES MET MET MET MET MET
Gladbrook-Reinbeck Gladbrook-Reinbeck HS
MET MET MET Removed-
Watch MET
Gladbrook-Reinbeck Gladbrook-Reinbeck MS
MET MET Removed-
SINA Delay-4 MET
Gladbrook-Reinbeck Reinbeck ES MET MET Delay-1 MET MET
Glenwood Glenwood HS MET MET SINA-2 Watch MET
Glenwood Glenwood MS MET MET SINA-6 Delay-3 MET
Glenwood Northeast ES MET MET MET Watch MET
Glenwood West ES MET MET Delay-1 Watch MET
Glidden-Ralston Glidden-Ralston ES MET MET MET MET MET
Glidden-Ralston Glidden-Ralston Jr-Sr HS
MET MET Removed-
Watch Removed-
Watch MET
GMG GMG ES MET MET Removed-
Watch SINA-2 MET
GMG GMG Secondary MET MET MET Watch MET
Graettinger-Terril Graettinger-Terril ES MET MET Removed-
Watch SINA-1 MET
Graettinger-Terril Graettinger-Terril HS
MET MET MET MET MET
Graettinger-Terril Graettinger-Terril MS
MET MET Removed-
Watch Delay-2 MET
Grinnell-Newburg Bailey Park ES MET MET MET MET MET
Grinnell-Newburg Davis ES MET MET MET Delay-3 MET
Grinnell-Newburg Fairview ES MET MET MET MET MET
Grinnell-Newburg Grinnell HS MET MET Watch MET MET
Grinnell-Newburg Grinnell MS MET MET SINA-4 Removed-
SINA MET
Griswold Elliott ES MET MET MET Watch MET
Griswold Griswold MS-HS MET MET Removed-
Watch Removed-
Watch MET
Griswold Lewis ES MET MET MET MET MET
Grundy Center Grundy Center ES MET MET Watch Watch MET
Grundy Center Grundy Center HS MET MET MET MET MET
Grundy Center Grundy Center MS MET MET MET Removed-
Watch MET
Guthrie Center Guthrie Center ES MET MET Watch Watch MET
Guthrie Center Guthrie Center HS MET MET MET MET MET
Guthrie Center Guthrie Center JHS MET MET Removed-
Watch Removed-
Watch MET
Hamburg Marnie Simons ES MET MET SINA-3 SINA-2 MET

94 State Report Card 2014
Table 22 (continued)
AYP Status for Schools for the 2014-15 School Year Based on Previous School Year's Performance
District School Math
Participation Reading
Participation Math
Proficiency Reading
Proficiency Other
Indicator
Hamburg Nishnabotna MS MET MET Removed-
Watch Delay-1 MET
Hampton-Dumont Hampton-Dumont HS
MET MET Delay-1 Watch MET
Hampton-Dumont Hampton-Dumont MS*
MET MET SINA-3 SINA-7 MET
Hampton-Dumont North Side ES MET MET Watch Watch MET
Hampton-Dumont South Side ES MET MET Watch SINA-3 MET
Harlan Harlan HS MET MET MET MET MET
Harlan Harlan MS MET MET SINA-1 SINA-1 MET
Harlan Harlan Comm Int MET MET SINA-2 SINA-2 MET
Harlan Harlan Comm. Primary
MET MET Watch SINA-1 MET
Harmony Harmony ES MET MET Delay-1 SINA-1 MET
Harmony Harmony Jr. Sr. High MET MET Delay-1 SINA-3 MET
Harris-Lake Park Harris-Lake Park ES MET MET MET MET MET
Harris-Lake Park Harris-Lake Park HS MET MET MET Watch MET
Hartley-Melvin-Sanborn Hartley-Melvin-Sanborn ES
MET MET MET Watch MET
Hartley-Melvin-Sanborn Hartley-Melvin-Sanborn HS
MET MET MET MET MET
Hartley-Melvin-Sanborn Hartley-Melvin-Sanborn MS
MET MET Watch Delay-2 MET
Highland Ainsworth ES MET MET Watch Delay-1 MET
Highland Highland HS MET MET MET MET MET
Highland Highland MS MET MET Delay-1 Removed-
SINA MET
Highland Riverside ES MET MET Watch SINA-3 MET
Hinton Hinton ES MET MET SINA-1 SINA-1 MET
Hinton Hinton HS MET MET Watch Watch MET
Hinton Hinton MS MET MET Removed-
Watch Delay-1 MET
H-L-V H-L-V ES MET MET MET Watch MET
H-L-V H-L-V Jr-Sr HS MET MET MET SINA-2 MET
Howard-Winneshiek Cresco Early Childhood Development
MET MET Watch Watch MET
Howard-Winneshiek Cresco JHS MET MET SINA-2 Delay-4 MET
Howard-Winneshiek Crestwood ES MET MET Removed-
Watch SINA-4 MET
Howard-Winneshiek Crestwood HS MET MET MET SINA-1 MET
Howard-Winneshiek Elma ES MET MET Watch SINA-1 MET
Howard-Winneshiek Lime Springs ES MET MET MET Watch MET

State Report Card 2014 95
Table 22 (continued)
AYP Status for Schools for the 2014-15 School Year Based on Previous School Year's Performance
District School Math
Participation Reading
Participation Math
Proficiency Reading
Proficiency Other
Indicator
Hubbard-Radcliffe Hubbard-Radcliffe ES
MET MET Removed-
Watch Delay-1 MET
Hubbard-Radcliffe South Hardin MS MET MET SINA-2 Delay-1 MET
Hudson Hudson ES MET MET MET Watch MET
Hudson Hudson HS MET MET MET MET MET
Hudson Hudson MS MET MET SINA-2 Delay-1 MET
Humboldt Clyde D Mease ES MET MET MET MET MET
Humboldt Humboldt HS MET MET MET MET MET
Humboldt Humboldt MS MET MET Watch SINA-2 MET
Humboldt Taft ES MET MET MET Removed-
Watch MET
IKM-Manning IKM-Manning HS MET MET Removed-
Watch Removed-
Watch MET
IKM-Manning IKM-Manning MS MET MET SINA-1 Delay-1 MET
IKM-Manning Irwin ES MET MET Removed-
Watch Removed-
Watch MET
IKM-Manning Manning ES MET MET Watch MET MET
Independence East ES MET MET MET Watch MET
Independence Independence Jr-Sr HS
MET MET Watch SINA-2 MET
Independence West ES MET MET Watch SINA-3 MET
Indianola Emerson ES MET MET Delay-2 Watch MET
Indianola Indianola HS MET MET MET MET MET
Indianola Indianola MS MET MET Delay-4 SINA-4 MET
Indianola Irving ES MET MET MET Watch MET
Indianola Whittier ES MET MET MET Watch MET
Indianola Wilder ES MET MET Removed-
SINA Removed-
Watch MET
Interstate 35 Interstate 35 ES MET MET SINA-1 MET MET
Interstate 35 Interstate 35 Secondary
MET MET Watch Watch MET
Iowa City Bohumil Shimek ES MET MET MET Watch MET
Iowa City Buford Garner ES MET MET SINA-2 SINA-2 MET
Iowa City Central ES MET MET SINA-4 Delay-3 MET
Iowa City Elizabeth Tate Alt. HS
MET MET SINA-8 SINA-8 MET
Iowa City Ernest Horn ES MET MET Watch Watch MET
Iowa City Grant Wood ES MET MET SINA-6 SINA-6 MET
Iowa City Helen Lemme ES MET MET SINA-3 Delay-3 MET
Iowa City Herbert Hoover ES MET MET SINA-1 SINA-2 MET
Iowa City Hills ES MET MET Delay-2 SINA-2 MET
Iowa City Horace Mann ES MET MET SINA-1 SINA-1 MET
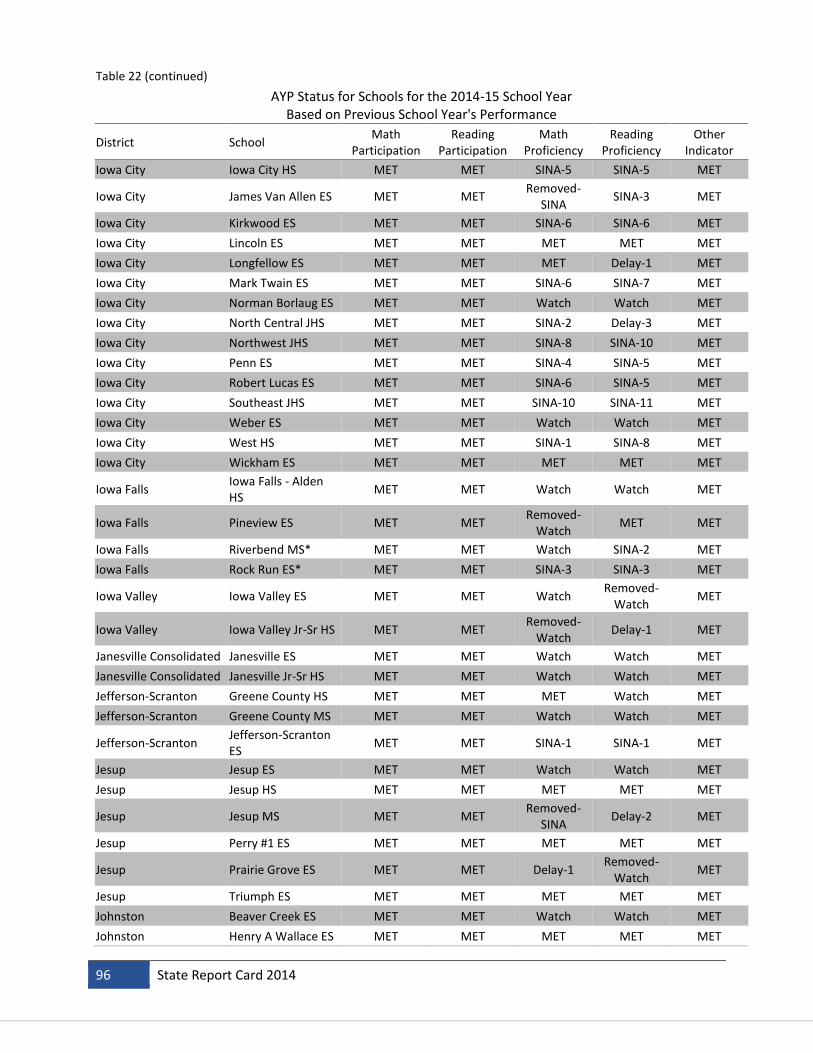
96 State Report Card 2014
Table 22 (continued)
AYP Status for Schools for the 2014-15 School Year Based on Previous School Year's Performance
District School Math
Participation Reading
Participation Math
Proficiency Reading
Proficiency Other
Indicator
Iowa City Iowa City HS MET MET SINA-5 SINA-5 MET
Iowa City James Van Allen ES MET MET Removed-
SINA SINA-3 MET
Iowa City Kirkwood ES MET MET SINA-6 SINA-6 MET
Iowa City Lincoln ES MET MET MET MET MET
Iowa City Longfellow ES MET MET MET Delay-1 MET
Iowa City Mark Twain ES MET MET SINA-6 SINA-7 MET
Iowa City Norman Borlaug ES MET MET Watch Watch MET
Iowa City North Central JHS MET MET SINA-2 Delay-3 MET
Iowa City Northwest JHS MET MET SINA-8 SINA-10 MET
Iowa City Penn ES MET MET SINA-4 SINA-5 MET
Iowa City Robert Lucas ES MET MET SINA-6 SINA-5 MET
Iowa City Southeast JHS MET MET SINA-10 SINA-11 MET
Iowa City Weber ES MET MET Watch Watch MET
Iowa City West HS MET MET SINA-1 SINA-8 MET
Iowa City Wickham ES MET MET MET MET MET
Iowa Falls Iowa Falls - Alden HS
MET MET Watch Watch MET
Iowa Falls Pineview ES MET MET Removed-
Watch MET MET
Iowa Falls Riverbend MS* MET MET Watch SINA-2 MET
Iowa Falls Rock Run ES* MET MET SINA-3 SINA-3 MET
Iowa Valley Iowa Valley ES MET MET Watch Removed-
Watch MET
Iowa Valley Iowa Valley Jr-Sr HS MET MET Removed-
Watch Delay-1 MET
Janesville Consolidated Janesville ES MET MET Watch Watch MET
Janesville Consolidated Janesville Jr-Sr HS MET MET Watch Watch MET
Jefferson-Scranton Greene County HS MET MET MET Watch MET
Jefferson-Scranton Greene County MS MET MET Watch Watch MET
Jefferson-Scranton Jefferson-Scranton ES
MET MET SINA-1 SINA-1 MET
Jesup Jesup ES MET MET Watch Watch MET
Jesup Jesup HS MET MET MET MET MET
Jesup Jesup MS MET MET Removed-
SINA Delay-2 MET
Jesup Perry #1 ES MET MET MET MET MET
Jesup Prairie Grove ES MET MET Delay-1 Removed-
Watch MET
Jesup Triumph ES MET MET MET MET MET
Johnston Beaver Creek ES MET MET Watch Watch MET
Johnston Henry A Wallace ES MET MET MET MET MET
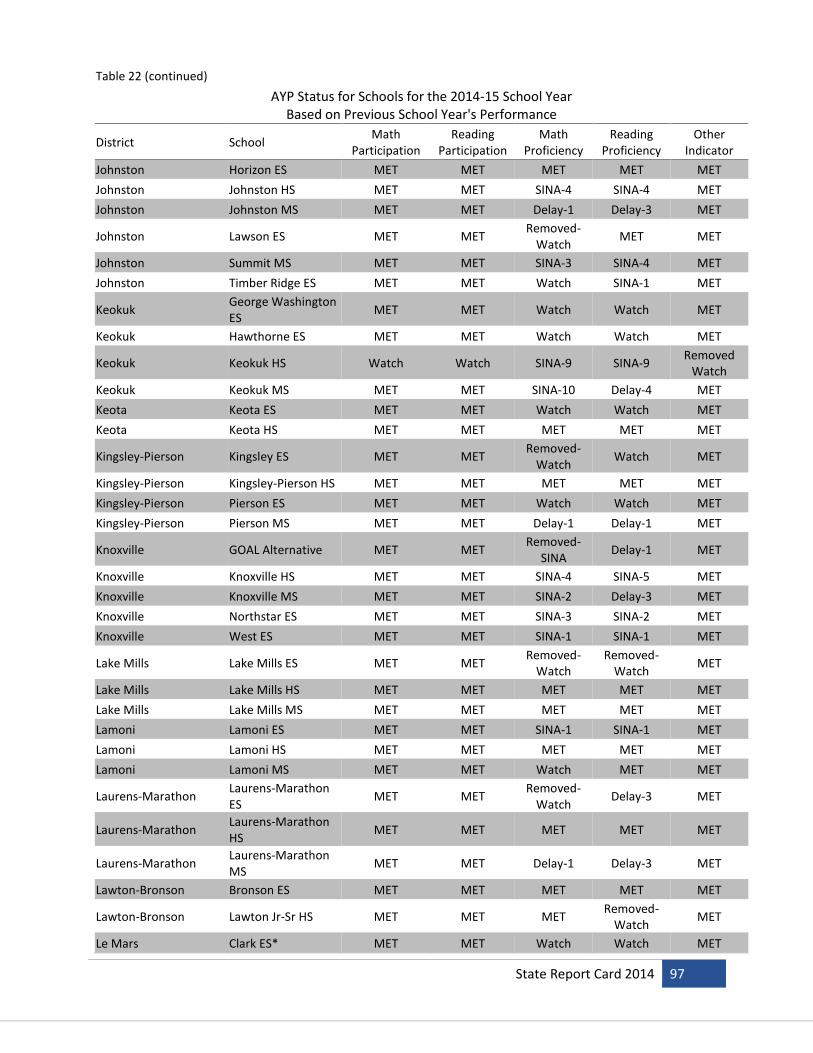
State Report Card 2014 97
Table 22 (continued)
AYP Status for Schools for the 2014-15 School Year Based on Previous School Year's Performance
District School Math
Participation Reading
Participation Math
Proficiency Reading
Proficiency Other
Indicator
Johnston Horizon ES MET MET MET MET MET
Johnston Johnston HS MET MET SINA-4 SINA-4 MET
Johnston Johnston MS MET MET Delay-1 Delay-3 MET
Johnston Lawson ES MET MET Removed-
Watch MET MET
Johnston Summit MS MET MET SINA-3 SINA-4 MET
Johnston Timber Ridge ES MET MET Watch SINA-1 MET
Keokuk George Washington ES
MET MET Watch Watch MET
Keokuk Hawthorne ES MET MET Watch Watch MET
Keokuk Keokuk HS Watch Watch SINA-9 SINA-9 Removed
Watch
Keokuk Keokuk MS MET MET SINA-10 Delay-4 MET
Keota Keota ES MET MET Watch Watch MET
Keota Keota HS MET MET MET MET MET
Kingsley-Pierson Kingsley ES MET MET Removed-
Watch Watch MET
Kingsley-Pierson Kingsley-Pierson HS MET MET MET MET MET
Kingsley-Pierson Pierson ES MET MET Watch Watch MET
Kingsley-Pierson Pierson MS MET MET Delay-1 Delay-1 MET
Knoxville GOAL Alternative MET MET Removed-
SINA Delay-1 MET
Knoxville Knoxville HS MET MET SINA-4 SINA-5 MET
Knoxville Knoxville MS MET MET SINA-2 Delay-3 MET
Knoxville Northstar ES MET MET SINA-3 SINA-2 MET
Knoxville West ES MET MET SINA-1 SINA-1 MET
Lake Mills Lake Mills ES MET MET Removed-
Watch Removed-
Watch MET
Lake Mills Lake Mills HS MET MET MET MET MET
Lake Mills Lake Mills MS MET MET MET MET MET
Lamoni Lamoni ES MET MET SINA-1 SINA-1 MET
Lamoni Lamoni HS MET MET MET MET MET
Lamoni Lamoni MS MET MET Watch MET MET
Laurens-Marathon Laurens-Marathon ES
MET MET Removed-
Watch Delay-3 MET
Laurens-Marathon Laurens-Marathon HS
MET MET MET MET MET
Laurens-Marathon Laurens-Marathon MS
MET MET Delay-1 Delay-3 MET
Lawton-Bronson Bronson ES MET MET MET MET MET
Lawton-Bronson Lawton Jr-Sr HS MET MET MET Removed-
Watch MET
Le Mars Clark ES* MET MET Watch Watch MET

98 State Report Card 2014
Table 22 (continued)
AYP Status for Schools for the 2014-15 School Year Based on Previous School Year's Performance
District School Math
Participation Reading
Participation Math
Proficiency Reading
Proficiency Other
Indicator
Le Mars Franklin ES* MET MET MET MET MET
Le Mars Individualized Learning
MET MET MET MET MET
Le Mars Kluckhohn ES* MET MET MET MET MET
Le Mars Le Mars HS MET MET MET Removed-
Watch MET
Le Mars Le Mars MS MET MET SINA-4 SINA-1 MET
Lenox Lenox ES MET MET MET Watch MET
Lenox Lenox HS MET MET MET MET MET
Lewis Central E A Kreft Primary MET MET SINA-1 SINA-1 MET
Lewis Central Lewis Central HS MET MET SINA-4 SINA-1 MET
Lewis Central Lewis Central MS MET MET SINA-6 SINA-8 MET
Lewis Central Titan Hill Int MET MET SINA-6 SINA-6 MET
Linn-Mar Bowman Woods ES* MET MET MET MET MET
Linn-Mar Echo Hill ES* MET MET MET MET MET
Linn-Mar Excelsior MS MET MET SINA-5 Delay-4 MET
Linn-Mar Indian Creek ES* MET MET MET MET MET
Linn-Mar Linn Grove ES* MET MET MET Watch MET
Linn-Mar Linn-Mar HS MET MET MET MET MET
Linn-Mar Novak ES* MET MET MET Watch MET
Linn-Mar Oak Ridge MET MET SINA-5 SINA-5 MET
Linn-Mar Westfield ES* MET MET MET MET MET
Linn-Mar Wilkins ES* MET MET MET Watch MET
Lisbon Lisbon ES MET MET Removed-
Watch Watch MET
Lisbon Lisbon HS MET MET MET Removed-
Watch MET
Lisbon Lisbon MS MET MET Removed-
Watch MET MET
Logan-Magnolia Logan-Magnolia ES MET MET MET Watch MET
Logan-Magnolia Logan-Magnolia Jr-Sr HS
MET MET Watch Watch MET
Lone Tree Lone Tree ES MET MET SINA-1 Removed-
Watch MET
Lone Tree Lone Tree Jr-Sr HS MET MET SINA-2 SINA-2 MET
Louisa-Muscatine Louisa-Muscatine ES MET MET Watch SINA-2 MET
Louisa-Muscatine Louisa-Muscatine HS
MET MET SINA-4 SINA-1 Watch
Louisa-Muscatine Louisa-Muscatine JHS
MET MET SINA-3 SINA-2 MET
LuVerne LuVerne ES MET MET Watch Watch MET
Lynnville-Sully Lynnville-Sully ES MET MET Watch Watch MET

State Report Card 2014 99
Table 22 (continued)
AYP Status for Schools for the 2014-15 School Year Based on Previous School Year's Performance
District School Math
Participation Reading
Participation Math
Proficiency Reading
Proficiency Other
Indicator
Lynnville-Sully Lynnville-Sully HS MET MET MET MET MET
Lynnville-Sully Lynnville-Sully MS MET MET MET MET MET
Madrid Madrid ES MET MET Removed-
Watch Watch MET
Madrid Madrid HS MET MET MET MET MET
Madrid Madrid JHS MET MET MET Watch MET
Manson Northwest Webster
Manson Northwest Webster ES-Barnum
MET MET Watch Removed-
Watch MET
Manson Northwest Webster
Manson Northwest Webster Jr-Sr HS
MET MET Watch SINA-1 MET
Maple Valley-Anthon Oto
Anthon ES* MET MET MET MET NA
Maple Valley-Anthon Oto
Maple Valley-Anthon Oto HS
MET MET MET MET MET
Maple Valley-Anthon Oto
Mapleton ES* MET MET MET MET MET
Maple Valley-Anthon Oto
MVAO MS* MET MET SINA-2 SINA-2 NA
Maquoketa Briggs ES MET MET SINA-5 SINA-5 MET
Maquoketa Cardinal ES MET MET Watch Watch MET
Maquoketa Maquoketa HS MET MET SINA-2 SINA-2 MET
Maquoketa Maquoketa MS MET MET SINA-7 Delay-7 MET
Maquoketa Valley Delhi ES MET MET Watch Watch MET
Maquoketa Valley Earlville ES MET MET MET MET MET
Maquoketa Valley Johnston ES MET MET MET MET MET
Maquoketa Valley Maquoketa Valley HS
MET MET MET MET MET
Maquoketa Valley Maquoketa Valley MS
MET MET Removed-
Watch MET MET
Marcus-Meriden-Cleghorn
Marcus-Meriden-Cleghorn Jr-Sr HS
MET MET MET Removed-
Watch MET
Marcus-Meriden-Cleghorn
Marcus-Meriden-Cleghorn East ES
MET MET MET Removed-
Watch MET
Marcus-Meriden-Cleghorn
Marcus-Meriden-Cleghorn Primary
MET MET MET MET MET
Marion Independent Emerson ES MET MET SINA-1 SINA-1 MET
Marion Independent Francis Marion Int MET MET Delay-1 SINA-2 MET
Marion Independent Marion HS MET MET MET Watch MET
Marion Independent Starry ES MET MET SINA-1 SINA-1 MET
Marion Independent Vernon MS MET MET SINA-3 SINA-3 MET
Marshalltown Anson ES MET MET SINA-1 SINA-5 MET
Marshalltown B R Miller MS MET MET SINA-9 SINA-8 SINA-1
Marshalltown Fisher ES MET MET SINA-3 SINA-4 MET

100 State Report Card 2014
Table 22 (continued)
AYP Status for Schools for the 2014-15 School Year Based on Previous School Year's Performance
District School Math
Participation Reading
Participation Math
Proficiency Reading
Proficiency Other
Indicator
Marshalltown Franklin ES Sch MET MET SINA-1 SINA-2 MET
Marshalltown J C Hoglan ES MET MET Watch SINA-3 MET
Marshalltown Lenihan Int MET MET SINA-6 SINA-6 MET
Marshalltown Marshalltown HS MET MET SINA-9 SINA-10 MET
Marshalltown Rogers ES MET Watch SINA-3 SINA-5 MET
Marshalltown Woodbury ES MET MET Removed-
Watch SINA-3 MET
Martensdale-St Marys Martensdale ES MET MET MET MET MET
Martensdale-St Marys Martensdale-St Marys Jr-Sr HS
MET MET Removed-
Watch Watch MET
Mason City Alternative Removed-
Watch Removed-
Watch Delay-3 Delay-5
Removed-Watch
Mason City Harding ES MET MET SINA-2 SINA-5 MET
Mason City Hoover ES MET MET Watch Removed-
SINA MET
Mason City Jefferson ES MET MET Delay-1 SINA-1 MET
Mason City John Adams MS MET MET Delay-5 Delay-5 MET
Mason City Lincoln Intermediate
MET MET SINA-3 SINA-3 Removed-
Watch
Mason City Mason City HS MET MET SINA-1 SINA-7 MET
Mason City Roosevelt ES MET MET SINA-5 SINA-4 MET
Mediapolis Mediapolis ES MET MET Watch Removed-
Watch MET
Mediapolis Mediapolis HS MET MET MET MET MET
Mediapolis MS MET MET MET SINA-2 MET
Melcher-Dallas Melcher-Dallas ES MET MET Watch Watch MET
Melcher-Dallas Melcher-Dallas HS MET MET MET MET MET
Melcher-Dallas Melcher-Dallas JHS MET MET Watch Removed-
Watch MET
MFL MarMac McGregor Int MET MET SINA-1 SINA-2 MET
MFL MarMac MFL MarMac ES MET MET MET Removed-
Watch MET
MFL MarMac MFL Marmac HS MET MET Removed-
Watch MET MET
MFL MarMac MFL MarMac MS MET MET Delay-1 Delay-1 MET
Midland Midland ES MET MET SINA-2 SINA-2 MET
Midland Midland MS-HS MET MET SINA-1 SINA-4 MET
Mid-Prairie Alterntive Learning Cent
MET MET MET MET MET
Mid-Prairie Kalona ES MET MET SINA-1 SINA-2 MET
Mid-Prairie Mid-Prairie HS MET MET MET MET MET
Mid-Prairie Mid-Prairie MS MET MET Removed-
Watch Delay-5 MET

State Report Card 2014 101
Table 22 (continued)
AYP Status for Schools for the 2014-15 School Year Based on Previous School Year's Performance
District School Math
Participation Reading
Participation Math
Proficiency Reading
Proficiency Other
Indicator
Mid-Prairie Washington Township ES
MET MET MET Watch MET
Mid-Prairie Wellman ES MET MET Watch SINA-1 MET
Missouri Valley Missouri Valley Early Learning
MET MET Watch Watch MET
Missouri Valley Missouri Valley ES MET MET SINA-1 SINA-2 MET
Missouri Valley Missouri Valley HS MET MET Removed-
Watch Watch MET
Missouri Valley Missouri Valley MS MET MET Delay-3 Delay-1 MET
MOC-Floyd Valley Hospers ES MET MET Watch MET MET
MOC-Floyd Valley MOC-Floyd Valley HS
MET MET MET MET MET
MOC-Floyd Valley MOC-Floyd Valley MS
MET MET Delay-1 Delay-2 MET
MOC-Floyd Valley Orange City ES MET MET SINA-1 MET MET
Montezuma Montezuma ES MET MET SINA-3 Delay-2 MET
Montezuma Montezuma HS MET MET MET MET MET
Montezuma Montezuma JHS MET MET MET Delay-1 MET
Monticello Carpenter ES MET MET SINA-2 Watch MET
Monticello Monticello HS MET MET MET MET MET
Monticello Monticello MS MET MET Delay-1 Delay-3 MET
Monticello Shannon ES MET MET SINA-1 Watch MET
Moravia Moravia ES MET MET Delay-1 Delay-1 MET
Moravia Moravia HS MET MET Removed-
Watch Delay-1 MET
Mormon Trail Mormon Trail ES MET MET SINA-5 SINA-5 MET
Mormon Trail Mormon Trail Jr-Sr HS
MET MET Removed-
SINA SINA-2 MET
Morning Sun Morning Sun ES MET MET MET MET MET
Moulton-Udell Moulton ES MET MET Watch Watch MET
Moulton-Udell Moulton-Udell HS MET MET MET Removed-
Watch MET
Mount Ayr Mount Ayr ES MET MET MET Removed-
Watch MET
Mount Ayr Mount Ayr HS MET MET MET Delay-3 MET
Mount Pleasant Harlan ES MET MET SINA-1 Delay-1 MET
Mount Pleasant Lincoln ES MET MET Watch Removed-
Watch MET
Mount Pleasant Mount Pleasant HS MET MET Delay-4 Delay-1 MET
Mount Pleasant Mount Pleasant MS MET MET SINA-5 Delay-5 MET
Mount Pleasant Salem ES MET MET MET MET MET
Mount Pleasant Van Allen ES MET MET Delay-2 Delay-3 MET

102 State Report Card 2014
Table 22 (continued)
AYP Status for Schools for the 2014-15 School Year Based on Previous School Year's Performance
District School Math
Participation Reading
Participation Math
Proficiency Reading
Proficiency Other
Indicator
Mount Pleasant Wisdom Quest Education
MET MET Delay-4 Delay-1 MET
Mount Vernon Mount Vernon HS MET MET MET MET MET
Mount Vernon Mount Vernon MS MET MET Delay-1 Delay-1 MET
Mount Vernon Washington ES MET MET Removed-
Watch Watch MET
Murray Murray Murray Jr-Sr HS
MET MET MET MET MET
Murray Murray ES MET MET SINA-1 Watch MET
Muscatine Central MS MET MET SINA-5 Delay-5 MET
Muscatine Colorado ES* MET MET MET Watch MET
Muscatine Franklin ES* MET MET SINA-1 Watch MET
Muscatine Grant ES MET MET Watch MET MET
Muscatine Jefferson ES* MET MET Watch Watch MET
Muscatine Madison ES MET MET Watch Watch MET
Muscatine McKinley ES MET MET Watch Watch MET
Muscatine Mulberry ES MET MET MET MET MET
Muscatine Muscatine HS MET MET SINA-8 SINA-9 SINA-1
Muscatine Washington ES* MET MET SINA-1 SINA-1 MET
Muscatine West MS MET MET SINA-9 SINA-6 SINA-1
Nashua-Plainfield Nashua-Plainfield ES MET MET MET SINA-1 MET
Nashua-Plainfield Nashua-Plainfield Int
MET MET Watch Watch MET
Nashua-Plainfield Nashua-Plainfield Jr-Sr HS
MET MET Watch Watch MET
Nevada Central ES MET MET SINA-1 Watch MET
Nevada Nevada HS MET MET MET Watch MET
Nevada Nevada MS MET MET SINA-3 SINA-6 MET
New Hampton Education Options MET MET MET MET MET
New Hampton New Hampton ES MET MET Watch Removed-
Watch MET
New Hampton New Hampton HS MET MET MET Watch MET
New Hampton New Hampton MS MET MET Delay-1 Delay-1 MET
New London Clark ES MET MET MET Watch MET
New London New London Jr-Sr HS
MET MET Removed-
Watch Removed-
SINA MET
Newell-Fonda Newell-Fonda HS MET MET MET MET MET
Newell-Fonda Newell-Fonda Lower ES
MET MET Watch Watch MET
Newell-Fonda Newell-Fonda MS MET MET Removed-
Watch Delay-2 MET
Newell-Fonda Newell-Fonda Upper ES. ES
MET MET MET Watch MET
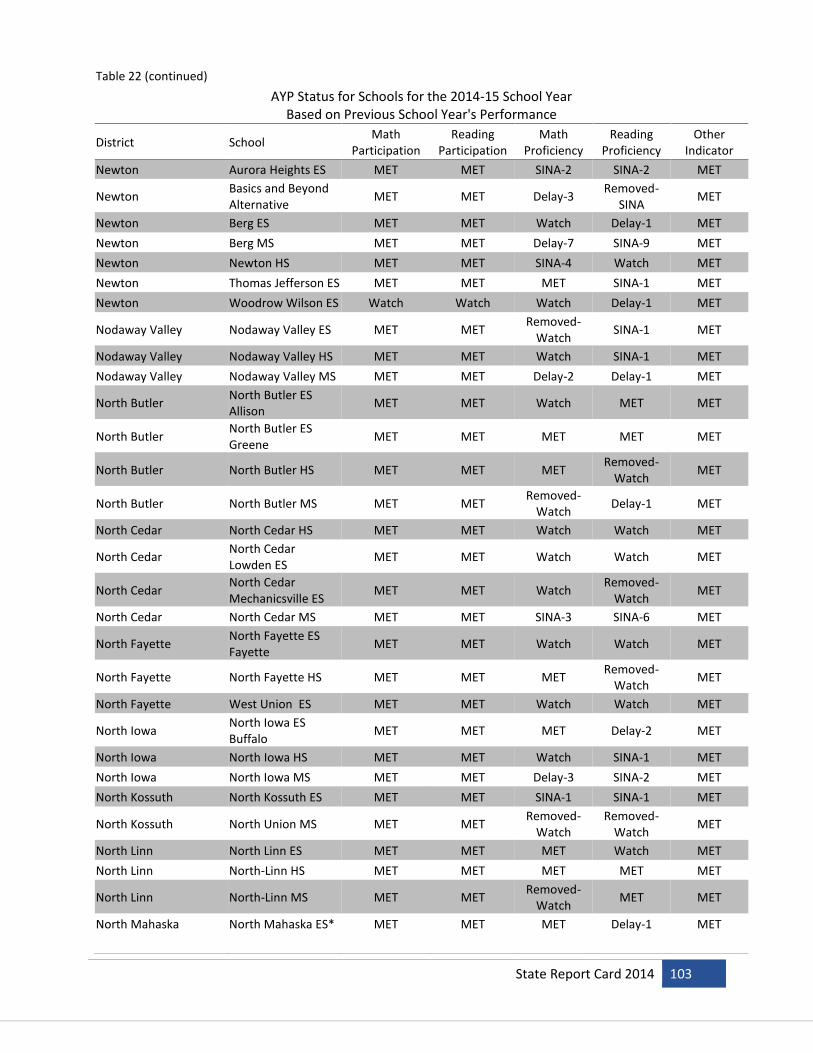
State Report Card 2014 103
Table 22 (continued)
AYP Status for Schools for the 2014-15 School Year Based on Previous School Year's Performance
District School Math
Participation Reading
Participation Math
Proficiency Reading
Proficiency Other
Indicator
Newton Aurora Heights ES MET MET SINA-2 SINA-2 MET
Newton Basics and Beyond Alternative
MET MET Delay-3 Removed-
SINA MET
Newton Berg ES MET MET Watch Delay-1 MET
Newton Berg MS MET MET Delay-7 SINA-9 MET
Newton Newton HS MET MET SINA-4 Watch MET
Newton Thomas Jefferson ES MET MET MET SINA-1 MET
Newton Woodrow Wilson ES Watch Watch Watch Delay-1 MET
Nodaway Valley Nodaway Valley ES MET MET Removed-
Watch SINA-1 MET
Nodaway Valley Nodaway Valley HS MET MET Watch SINA-1 MET
Nodaway Valley Nodaway Valley MS MET MET Delay-2 Delay-1 MET
North Butler North Butler ES Allison
MET MET Watch MET MET
North Butler North Butler ES Greene
MET MET MET MET MET
North Butler North Butler HS MET MET MET Removed-
Watch MET
North Butler North Butler MS MET MET Removed-
Watch Delay-1 MET
North Cedar North Cedar HS MET MET Watch Watch MET
North Cedar North Cedar Lowden ES
MET MET Watch Watch MET
North Cedar North Cedar Mechanicsville ES
MET MET Watch Removed-
Watch MET
North Cedar North Cedar MS MET MET SINA-3 SINA-6 MET
North Fayette North Fayette ES Fayette
MET MET Watch Watch MET
North Fayette North Fayette HS MET MET MET Removed-
Watch MET
North Fayette West Union ES MET MET Watch Watch MET
North Iowa North Iowa ES Buffalo
MET MET MET Delay-2 MET
North Iowa North Iowa HS MET MET Watch SINA-1 MET
North Iowa North Iowa MS MET MET Delay-3 SINA-2 MET
North Kossuth North Kossuth ES MET MET SINA-1 SINA-1 MET
North Kossuth North Union MS MET MET Removed-
Watch Removed-
Watch MET
North Linn North Linn ES MET MET MET Watch MET
North Linn North-Linn HS MET MET MET MET MET
North Linn North-Linn MS MET MET Removed-
Watch MET MET
North Mahaska North Mahaska ES* MET MET MET Delay-1 MET

104 State Report Card 2014
Table 22 (continued)
AYP Status for Schools for the 2014-15 School Year Based on Previous School Year's Performance
District School Math
Participation Reading
Participation Math
Proficiency Reading
Proficiency Other
Indicator
North Mahaska North Mahaska Jr-Sr HS*
MET MET Watch Watch MET
North Polk North Polk Central ES
MET MET Delay-1 Removed-
Watch MET
North Polk North Polk HS MET MET MET MET MET
North Polk North Polk MS MET MET MET MET MET
North Polk North Polk West ES MET MET Removed-
Watch MET MET
North Scott Alan Shepard ES MET MET MET MET MET
North Scott Edward White ES MET MET Watch MET MET
North Scott John Glenn ES MET MET MET SINA-1 MET
North Scott Neil Armstrong ES MET MET Removed-
Watch SINA-1 MET
North Scott North Scott HS MET MET Delay-5 SINA-6 MET
North Scott North Scott JHS MET MET SINA-5 Delay-1 MET
North Scott Virgil Grissom ES MET MET MET Watch MET
North Tama County North Tama ES MET MET MET SINA-1 MET
North Tama County North Tama HS MET MET Removed-
Watch Delay-1 MET
North Winneshiek North Winneshiek ES
MET MET MET MET MET
North Winneshiek North Winneshiek MS
MET MET MET MET MET
Northeast Northeast ES MET MET MET MET MET
Northeast Northeast MS-HS MET MET MET Removed-
Watch MET
Northeast Hamilton Northeast Hamilton ES
MET MET Watch MET MET
Northeast Hamilton Northeast Hamilton HS
MET MET MET MET MET
Northeast Hamilton Northeast Hamilton MS
MET MET Watch Delay-1 MET
Northwood-Kensett Northwood-Kensett ES
Removed-Watch
Removed-Watch
Removed-Watch
SINA-1 MET
Northwood-Kensett Northwood-Kensett Jr-Sr HS
MET MET MET Removed-
Watch MET
Norwalk Lakewood ES MET MET SINA-2 SINA-3 MET
Norwalk Norwalk HS MET MET MET Watch MET
Norwalk Norwalk MS MET MET Removed-
Watch SINA-5 MET
Norwalk Oviatt ES MET MET Watch Watch MET
Odebolt-Arthur OA-BCIG MS MET MET Watch SINA-2 MET
Odebolt-Arthur Odebolt-Arthur ES MET MET Watch Watch MET

State Report Card 2014 105
Table 22 (continued)
AYP Status for Schools for the 2014-15 School Year Based on Previous School Year's Performance
District School Math
Participation Reading
Participation Math
Proficiency Reading
Proficiency Other
Indicator
Oelwein Little Husky Learning
MET MET Removed-
Watch Removed-
Watch MET
Oelwein Oelwein HS MET MET Delay-3 Watch MET
Oelwein Oelwein MS MET MET SINA-4 SINA-5 Removed-
Watch
Oelwein Parkside ES MET MET Removed-
Watch Removed-
Watch MET
Oelwein Wings Park ES MET MET SINA-4 SINA-4 MET
Ogden Howe ES MET MET MET MET MET
Ogden Ogden HS MET MET MET MET MET
Ogden Ogden MS MET MET Removed-
Watch MET MET
Okoboji Okoboji ES MET MET MET MET MET
Okoboji Okoboji HS MET MET Watch Watch MET
Okoboji Okoboji MS MET MET SINA-3 Removed-
SINA MET
Olin Consolidated Olin ES MET MET MET Removed-
Watch MET
Orient-Macksburg Orient ES MET MET Removed-
Watch Removed-
Watch MET
Orient-Macksburg Orient-Macksburg HS
MET MET MET Removed-
Watch MET
Osage Lincoln ES MET MET Removed-
Watch MET MET
Osage Osage HS MET MET MET MET MET
Osage Osage MS MET MET Delay-1 Delay-1 MET
Oskaloosa Oskaloosa ES MET MET Delay-3 Delay-3 MET
Oskaloosa Oskaloosa HS MET MET SINA-6 SINA-6 MET
Oskaloosa Oskaloosa MS MET MET SINA-9 SINA-6 MET
Oskaloosa Webster MET MET SINA-1 SINA-1 MET
Ottumwa Agassiz ES MET MET MET MET MET
Ottumwa Eisenhower ES MET MET MET Removed-
Watch MET
Ottumwa Evans MS MET MET SINA-9 SINA-8 MET
Ottumwa Horace Mann ES MET MET Watch Watch MET
Ottumwa James ES MET MET SINA-3 Removed-
SINA MET
Ottumwa Liberty ES MET MET MET MET MET
Ottumwa Ottumwa HS MET MET SINA-10 SINA-11 Removed-
Watch
Ottumwa Wildwood ES MET MET MET MET MET
Ottumwa Wilson ES MET MET Watch SINA-4 MET
Panorama Panorama ES MET MET Delay-1 Delay-1 MET

106 State Report Card 2014
Table 22 (continued)
AYP Status for Schools for the 2014-15 School Year Based on Previous School Year's Performance
District School Math
Participation Reading
Participation Math
Proficiency Reading
Proficiency Other
Indicator
Panorama Panorama HS MET MET MET MET MET
Panorama Panorama MS MET MET Watch MET MET
Paton-Churdan Paton-Churdan ES MET MET MET MET MET
Paton-Churdan Paton-Churdan Jr-Sr HS
MET MET Removed-
Watch Delay-1 MET
PCM Monroe ES MET MET Watch MET MET
PCM PCM HS MET MET Watch Watch MET
PCM PCM MS MET MET Removed-
Watch Delay-1 MET
PCM Prairie City ES MET MET Watch MET MET
Pekin Pekin HS MET MET Removed-
Watch Watch MET
Pekin Pekin ES MET MET MET MET MET
Pekin Pekin MS MET MET Removed-
Watch Delay-1 MET
Pella Jefferson Intermediate
MET MET SINA-3 SINA-4 MET
Pella Lincoln ES MET MET MET MET MET
Pella Madison ES MET MET Watch MET MET
Pella Pella HS MET MET MET MET MET
Pella Pella MS MET MET SINA-3 Delay-2 MET
Perry Perry ES MET MET SINA-6 Delay-7 Removed-
Watch
Perry Perry HS MET MET Removed-
SINA SINA-9 MET
Perry Perry MS MET MET Delay-4 Delay-7 MET
Pleasant Valley Bridgeview ES MET MET Removed-
Watch Removed-
Watch MET
Pleasant Valley Cody ES MET MET Watch Watch MET
Pleasant Valley Hopewell ES MET MET MET Watch MET
Pleasant Valley Pleasant Valley HS MET MET MET Watch MET
Pleasant Valley Pleasant Valley Junior HS
MET MET SINA-5 Delay-6 MET
Pleasant Valley Pleasant View ES MET MET MET Watch MET
Pleasant Valley Riverdale Heights ES MET MET MET Delay-2 MET
Pleasantville Pleasantville ES MET MET Watch Watch MET
Pleasantville Pleasantville HS MET MET MET SINA-1 MET
Pleasantville Pleasantville MS MET MET SINA-1 SINA-1 MET
Pocahontas Area Pocahontal Area Pomeroy ES
MET MET Watch Watch MET
Pocahontas Area Pocahontas Area ES MET MET MET MET MET
Pocahontas Area Pocahontas Area MS-HS
MET MET Watch SINA-1 MET

State Report Card 2014 107
Table 22 (continued)
AYP Status for Schools for the 2014-15 School Year Based on Previous School Year's Performance
District School Math
Participation Reading
Participation Math
Proficiency Reading
Proficiency Other
Indicator
Pocahontas Area Pocahontas Area Regional Learning
MET MET MET MET MET
Postville Cora B Darling ES/MS
MET MET SINA-5 SINA-3 MET
Postville John R Mott HS MET MET Watch SINA-1 MET
Prairie Valley Prairie Valley ES MET MET Removed-
Watch Removed-
Watch MET
Prairie Valley Prairie Valley HS MET MET SINA-2 SINA-3 MET
Prescott Prescott ES MET MET MET MET MET
Red Oak Inman Primary MET MET MET Delay-1 MET
Red Oak Red Oak HS MET MET Removed-
Watch MET MET
Red Oak Red Oak MS MET MET SINA-5 SINA-5 MET
Red Oak Washington Int MET MET Watch SINA-3 MET
Remsen-Union Remsen-Union ES MET MET Watch Watch MET
Remsen-Union Remsen-Union HS MET MET MET MET MET
Remsen-Union Remsen-Union MS MET MET MET Watch MET
Riceville Riceville ES MET MET MET Watch MET
Riceville Riceville HS MET MET SINA-2 SINA-5 MET
River Valley River Valley ES MET MET Removed-
Watch SINA-1 MET
River Valley River Valley Junior- HS
MET MET SINA-1 SINA-1 MET
Riverside Riverside HS MET MET Watch Watch MET
Riverside Riverside Int MET MET Watch Watch MET
Riverside Riverside ES MET MET Removed-
Watch MET MET
Rock Valley Rock Valley ES MET MET SINA-2 Removed-
Watch MET
Rock Valley Rock Valley Jr-Sr HS MET MET SINA-1 Delay-2 MET
Rockwell City-Lytton SCC MS MET MET Delay-1 Delay-1 MET
Rockwell City-Lytton SCC Rockwell City ES MET MET MET MET MET
Roland-Story Roland-Story ES MET MET Watch MET MET
Roland-Story Roland-Story HS MET MET MET MET MET
Roland-Story Roland-Story MS MET MET Removed-
Watch SINA-1 MET
Rudd-Rockford-Marble Rk
Rockford Jr-Sr HS MET MET Removed-
Watch SINA-2 MET
Rudd-Rockford-Marble Rk
RRMR ES MET MET SINA-2 Removed-
SINA MET
Ruthven-Ayrshire Ruthven-Ayrshire ES MET MET MET SINA-1 MET
Ruthven-Ayrshire Ruthven-Ayrshire HS
MET MET Watch SINA-2 MET

108 State Report Card 2014
Table 22 (continued)
AYP Status for Schools for the 2014-15 School Year Based on Previous School Year's Performance
District School Math
Participation Reading
Participation Math
Proficiency Reading
Proficiency Other
Indicator
Saydel Cornell ES MET MET SINA-3 SINA-2 MET
Saydel Saydel HS Watch MET Removed-
Watch Removed-
Watch MET
Saydel Woodside MS MET MET Delay-7 Delay-4 MET
Schaller-Crestland Ridge View MS MET MET Delay-1 Delay-1 MET
Schaller-Crestland Schaller-Crestland ES
MET MET Watch Watch MET
Schleswig Schleswig ES MET MET MET Watch MET
Schleswig Schleswig MS MET MET Removed-
Watch MET MET
Sentral North Union ES - Sentral Campus
MET MET Watch Watch MET
Sergeant Bluff-Luton Sergeant Bluff-Luton ES
MET MET SINA-2 Watch MET
Sergeant Bluff-Luton Sergeant Bluff-Luton HS
MET MET MET MET MET
Sergeant Bluff-Luton Sergeant Bluff-Luton MS
MET MET SINA-2 Delay-3 MET
Sergeant Bluff-Luton Sergeant Bluff-Luton Primary
MET MET MET MET MET
Seymour Seymour ES MET MET Watch Watch MET
Seymour Seymour HS MET MET MET Removed-
Watch MET
Sheldon East ES MET MET MET Watch MET
Sheldon Sheldon HS MET MET Watch Watch MET
Sheldon Sheldon MS MET MET Watch SINA-2 MET
Shenandoah Shenandoah ES MET MET Delay-1 Removed-
Watch MET
Shenandoah Shenandoah HS Removed-
Watch Removed-
Watch Removed-
Watch SINA-1 MET
Shenandoah Shenandoah MS MET MET SINA-2 Watch MET
Sibley-Ocheyedan Sibley Ocheyedan ES
MET MET MET SINA-2 MET
Sibley-Ocheyedan Sibley-Ocheyedan HS
MET MET MET Watch MET
Sibley-Ocheyedan Sibley-Ocheyedan MS
MET MET Delay-1 Delay-3 MET
Sidney Sidney ES MET MET Watch Watch MET
Sidney Sidney HS MET MET Removed-
Watch Delay-1 MET
Sigourney Sigourney ES MET MET Delay-1 SINA-2 MET
Sigourney Sigourney Jr-Sr HS MET MET Watch SINA-1 MET
Sioux Center Kinsey ES MET MET Watch SINA-1 MET
Sioux Center Sioux Center HS MET MET MET MET MET
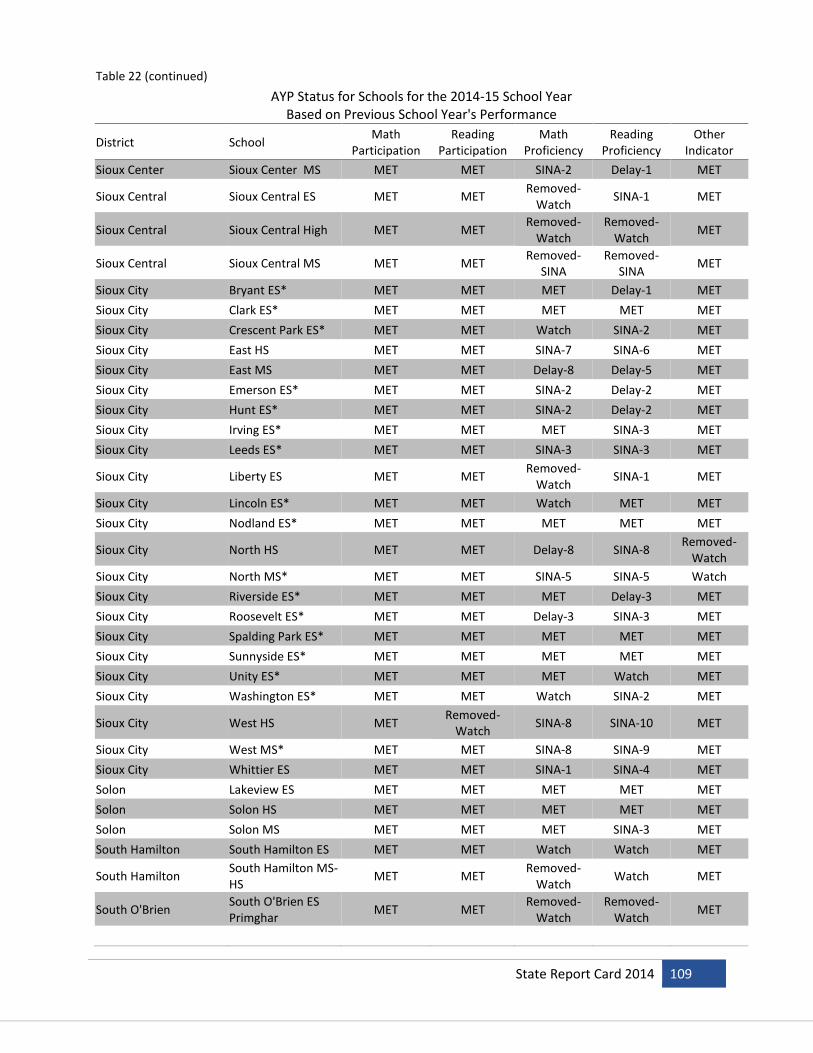
State Report Card 2014 109
Table 22 (continued)
AYP Status for Schools for the 2014-15 School Year Based on Previous School Year's Performance
District School Math
Participation Reading
Participation Math
Proficiency Reading
Proficiency Other
Indicator
Sioux Center Sioux Center MS MET MET SINA-2 Delay-1 MET
Sioux Central Sioux Central ES MET MET Removed-
Watch SINA-1 MET
Sioux Central Sioux Central High MET MET Removed-
Watch Removed-
Watch MET
Sioux Central Sioux Central MS MET MET Removed-
SINA Removed-
SINA MET
Sioux City Bryant ES* MET MET MET Delay-1 MET
Sioux City Clark ES* MET MET MET MET MET
Sioux City Crescent Park ES* MET MET Watch SINA-2 MET
Sioux City East HS MET MET SINA-7 SINA-6 MET
Sioux City East MS MET MET Delay-8 Delay-5 MET
Sioux City Emerson ES* MET MET SINA-2 Delay-2 MET
Sioux City Hunt ES* MET MET SINA-2 Delay-2 MET
Sioux City Irving ES* MET MET MET SINA-3 MET
Sioux City Leeds ES* MET MET SINA-3 SINA-3 MET
Sioux City Liberty ES MET MET Removed-
Watch SINA-1 MET
Sioux City Lincoln ES* MET MET Watch MET MET
Sioux City Nodland ES* MET MET MET MET MET
Sioux City North HS MET MET Delay-8 SINA-8 Removed-
Watch
Sioux City North MS* MET MET SINA-5 SINA-5 Watch
Sioux City Riverside ES* MET MET MET Delay-3 MET
Sioux City Roosevelt ES* MET MET Delay-3 SINA-3 MET
Sioux City Spalding Park ES* MET MET MET MET MET
Sioux City Sunnyside ES* MET MET MET MET MET
Sioux City Unity ES* MET MET MET Watch MET
Sioux City Washington ES* MET MET Watch SINA-2 MET
Sioux City West HS MET Removed-
Watch SINA-8 SINA-10 MET
Sioux City West MS* MET MET SINA-8 SINA-9 MET
Sioux City Whittier ES MET MET SINA-1 SINA-4 MET
Solon Lakeview ES MET MET MET MET MET
Solon Solon HS MET MET MET MET MET
Solon Solon MS MET MET MET SINA-3 MET
South Hamilton South Hamilton ES MET MET Watch Watch MET
South Hamilton South Hamilton MS-HS
MET MET Removed-
Watch Watch MET
South O'Brien South O'Brien ES Primghar
MET MET Removed-
Watch Removed-
Watch MET

110 State Report Card 2014
Table 22 (continued)
AYP Status for Schools for the 2014-15 School Year Based on Previous School Year's Performance
District School Math
Participation Reading
Participation Math
Proficiency Reading
Proficiency Other
Indicator
South O'Brien South O'Brien Secondary
MET MET MET Removed-
Watch MET
South Page South Page ES MET MET Delay-1 Watch MET
South Page South Page HS Watch Watch SINA-2 SINA-2 MET
South Tama County South Tama County ES
MET MET SINA-7 SINA-6 MET
South Tama County South Tama County HS
MET MET SINA-5 SINA-1 MET
South Tama County South Tama County MS
MET MET SINA-6 SINA-6 MET
South Winneshiek South Winneshiek ES
MET MET MET Delay-1 MET
South Winneshiek South Winneshiek HS
MET MET MET MET MET
South Winneshiek South Winneshiek MS
MET MET Removed-
Watch Watch MET
Southeast Polk Altoona ES* MET MET MET SINA-1 MET
Southeast Polk Centennial ES* MET MET SINA-1 Watch MET
Southeast Polk Clay ES* MET MET MET MET MET
Southeast Polk Delaware ES* MET MET Watch SINA-1 MET
Southeast Polk Four Mile ES* MET MET MET Watch MET
Southeast Polk Mitchellville ES* Watch Watch MET MET MET
Southeast Polk Runnells ES* MET MET MET MET MET
Southeast Polk Southeast Polk HS Removed-
Watch MET Delay-4 SINA-5 MET
Southeast Polk Southeast Polk JHS MET MET SINA-6 SINA-9 MET
Southeast Polk Spring Creek - 6th Grade
MET MET Delay-2 Delay-2 MET
Southeast Polk Willowbrook ES* MET MET MET MET MET
Southeast Warren Southeast Warren Intermediate
MET MET Watch Removed-
Watch MET
Southeast Warren Southeast Warren Jr-Sr HS
MET MET Watch Removed-
Watch MET
Southeast Warren Southeast Warren Primary
MET MET MET MET MET
Southeast Webster Grand
Dayton MET MET MET Watch MET
Southeast Webster Grand
Grand ES MET MET Watch Watch MET
Southeast Webster Grand
Southeast Webster JHS
MET MET Removed-
Watch MET MET
Southeast Webster Grand
Southeast Webster-Grand HS
MET MET Removed-
Watch MET MET
Southern Cal SCC HS MET MET Watch Watch MET
Spencer Fairview Park ES MET MET Watch Watch MET

State Report Card 2014 111
Table 22 (continued)
AYP Status for Schools for the 2014-15 School Year Based on Previous School Year's Performance
District School Math
Participation Reading
Participation Math
Proficiency Reading
Proficiency Other
Indicator
Spencer Johnson ES MET MET Watch Watch MET
Spencer Lincoln ES MET MET Watch Watch MET
Spencer Spencer HS MET MET Watch Watch MET
Spencer Spencer MS MET MET SINA-2 Delay-7 MET
Spirit Lake Spirit Lake ES MET MET Watch SINA-1 MET
Spirit Lake Spirit Lake HS MET MET MET MET MET
Spirit Lake Spirit Lake MS MET MET SINA-4 SINA-2 MET
Springville Springville ES MET MET Watch Watch MET
Springville Springville Secondary
MET MET Watch SINA-2 MET
St Ansgar St Ansgar ES MET MET MET Watch MET
St Ansgar St Ansgar HS MET MET MET Watch MET
St Ansgar St. Ansgar MS MET MET MET Delay-1 MET
Stanton Stanton ES MET MET MET MET MET
Stanton Stanton HS MET MET Watch Watch MET
Starmont Starmont ES* MET MET MET MET MET
Starmont Starmont HS MET MET MET MET MET
Starmont Starmont MS MET MET Watch Delay-1 MET
Storm Lake East Early Childhood Ctr
MET MET SINA-1 SINA-1 MET
Storm Lake Storm Lake ES MET MET SINA-2 SINA-2 MET
Storm Lake Storm Lake HS MET Removed-
Watch SINA-7 SINA-9 Watch
Storm Lake Storm Lake MS MET MET Delay-4 SINA-10 MET
Stratford Stratford ES MET MET MET Watch MET
Sumner Durant ES MET MET Watch Watch MET
Sumner Sumner-Fredericksburg HS
MET MET MET Watch MET
Tipton Tipton ES MET MET SINA-1 Delay-1 MET
Tipton Tipton HS MET MET Watch Watch MET
Tipton Tipton MS MET MET Delay-3 Delay-2 MET
Treynor Treynor ES MET MET MET Watch MET
Treynor Treynor HS MET MET MET MET MET
Treynor Treynor MS MET MET Removed-
Watch MET MET
Tri-Center Tri-Center ES MET MET Watch Removed-
Watch MET
Tri-Center Tri-Center HS MET MET MET MET MET
Tri-Center Tri-Center MS MET MET Watch Watch MET
Tri-County Tri-County ES MET MET Watch Removed-
SINA MET

112 State Report Card 2014
Table 22 (continued)
AYP Status for Schools for the 2014-15 School Year Based on Previous School Year's Performance
District School Math
Participation Reading
Participation Math
Proficiency Reading
Proficiency Other
Indicator
Tri-County Tri-County HS MET MET MET Removed-
SINA MET
Tri-County Tri-County JHS MET MET MET Removed-
Watch MET
Tripoli Tripoli ES MET MET Watch SINA-2 MET
Tripoli Tripoli Middle/Sr HS MET MET Removed-
Watch Delay-1 MET
Turkey Valley Turkey Valley ES MET MET MET Watch MET
Turkey Valley Turkey Valley Jr-Sr HS
MET MET MET Removed-
Watch MET
Twin Cedars Twin Cedars ES MET MET MET Delay-1 MET
Twin Cedars Twin Cedars Jr-Sr HS MET MET Removed-
Watch SINA-1 MET
Twin Rivers Twin Rivers ES MET MET MET MET MET
Underwood Underwood ES MET MET MET MET MET
Underwood Underwood HS MET MET MET MET MET
Underwood Underwood MS MET MET Removed-
Watch Removed-
Watch MET
Union Dysart-Geneseo ES MET MET Watch Watch MET
Union La Porte City ES MET MET MET SINA-2 MET
Union Union HS MET MET MET Delay-3 MET
Union Union MS MET MET SINA-3 SINA-5 MET
United United North MET MET MET MET MET
United United South MET MET Watch MET MET
Urbandale Jensen ES MET MET Watch Watch MET
Urbandale Karen Acres ES MET MET Removed-
Watch SINA-3 MET
Urbandale Olmsted ES MET MET Removed-
Watch Removed-
Watch MET
Urbandale Rolling Green ES MET MET MET MET MET
Urbandale Urbandale HS MET MET SINA-1 SINA-1 MET
Urbandale Urbandale MS MET MET Delay-5 SINA-6 MET
Urbandale Valerius ES MET MET MET MET MET
Urbandale Webster ES MET MET MET MET MET
Valley North Fayette-Valley MS
MET MET Watch Watch MET
Valley Valley ES MET MET Removed-
SINA Watch MET
Van Buren Van Buren ES MET MET Delay-1 Delay-1 MET
Van Buren Van Buren HS MET MET Removed-
Watch Removed-
Watch MET
Van Meter Van Meter ES MET MET Watch Watch MET
Van Meter Van Meter Jr-Sr HS MET MET MET MET MET

State Report Card 2014 113
Table 22 (continued)
AYP Status for Schools for the 2014-15 School Year Based on Previous School Year's Performance
District School Math
Participation Reading
Participation Math
Proficiency Reading
Proficiency Other
Indicator
Ventura Ventura ES MET MET Removed-
Watch MET MET
Ventura Ventura MS MET MET Watch Watch MET
Villisca Southwest Valley MS
MET MET Watch Watch MET
Villisca Sylvia Enarson ES MET MET Watch Delay-1 MET
Vinton-Shellsburg Shellsburg ES MET MET Removed-
Watch Delay-4 MET
Vinton-Shellsburg Tilford ES MET MET Delay-1 Watch MET
Vinton-Shellsburg Vinton-Shellsburg HS
MET MET SINA-4 SINA-6 MET
Vinton-Shellsburg Vinton-Shellsburg MS
MET MET SINA-5 SINA-7 Removed-
Watch
Waco Waco ES MET MET SINA-1 Delay-2 MET
Waco WACO HS MET MET Removed-
Watch Delay-1 MET
Walnut Walnut ES MET MET MET MET MET
Walnut Walnut HS MET MET MET MET MET
Walnut Walnut MS MET MET MET Watch MET
Wapello Wapello ES MET MET Delay-1 Delay-1 MET
Wapello Wapello HS MET MET MET Delay-1 MET
Wapello Wapello JHS MET MET SINA-2 Delay-4 MET
Wapsie Valley Fairbank ES MET MET MET Watch MET
Wapsie Valley Readlyn ES MET MET Watch MET MET
Wapsie Valley Rural ES #1 MET MET MET Removed-
SINA MET
Wapsie Valley Rural ES #2 MET MET Removed-
Watch Delay-2 MET
Wapsie Valley Rural ES #3 MET MET MET MET MET
Wapsie Valley Rural ES #4 MET MET MET MET MET
Wapsie Valley Wapsie Valley HS MET MET MET SINA-2 MET
Washington Lincoln Upper ES MET MET Delay-5 SINA-2 MET
Washington Stewart ES MET MET Delay-4 SINA-1 MET
Washington Washington HS MET MET MET SINA-1 MET
Washington Washington MS MET MET Delay-1 SINA-4 MET
Waterloo Bunger MS MET MET Delay-5 SINA-6 MET
Waterloo Central MS MET MET SINA-10 SINA-10 Watch
Waterloo Cunningham MET MET SINA-6 SINA-4 Removed-
Watch
Waterloo East HS MET Watch SINA-10 SINA-6 MET
Waterloo Expo Alternative Learning
SINA-2 SINA-1 SINA-7 Delay-7 MET
Waterloo Fred Becker ES MET MET SINA-6 SINA-6 MET
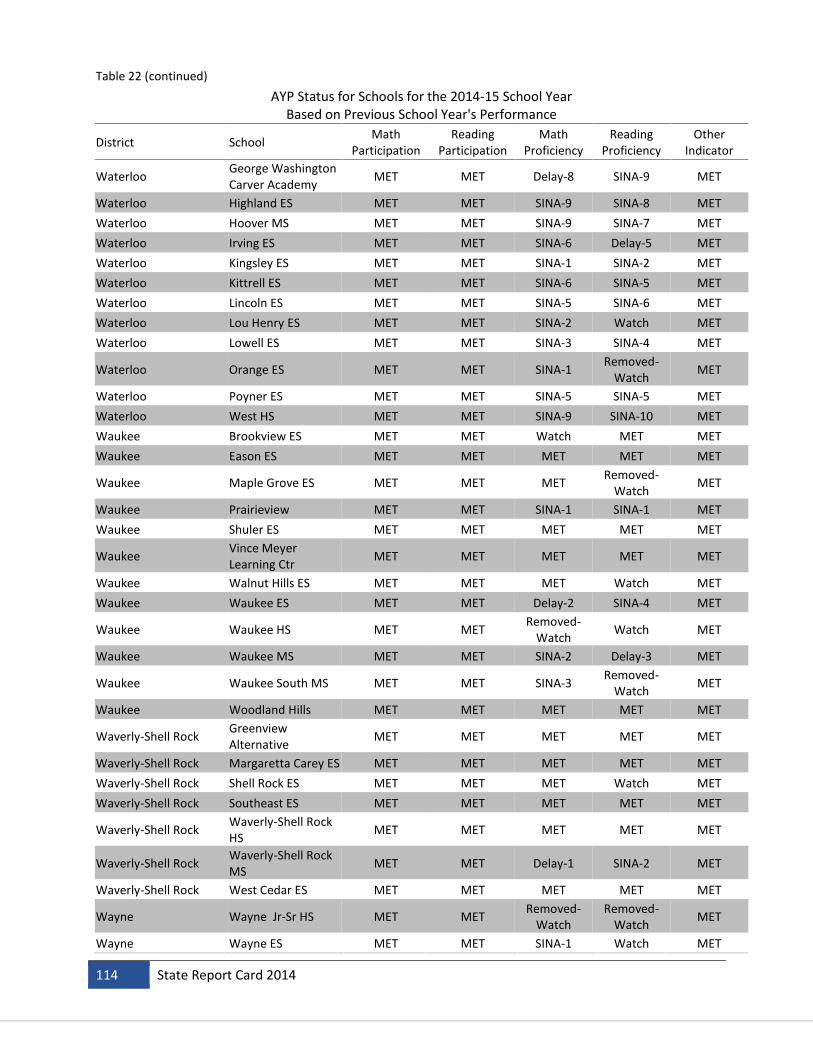
114 State Report Card 2014
Table 22 (continued)
AYP Status for Schools for the 2014-15 School Year Based on Previous School Year's Performance
District School Math
Participation Reading
Participation Math
Proficiency Reading
Proficiency Other
Indicator
Waterloo George Washington Carver Academy
MET MET Delay-8 SINA-9 MET
Waterloo Highland ES MET MET SINA-9 SINA-8 MET
Waterloo Hoover MS MET MET SINA-9 SINA-7 MET
Waterloo Irving ES MET MET SINA-6 Delay-5 MET
Waterloo Kingsley ES MET MET SINA-1 SINA-2 MET
Waterloo Kittrell ES MET MET SINA-6 SINA-5 MET
Waterloo Lincoln ES MET MET SINA-5 SINA-6 MET
Waterloo Lou Henry ES MET MET SINA-2 Watch MET
Waterloo Lowell ES MET MET SINA-3 SINA-4 MET
Waterloo Orange ES MET MET SINA-1 Removed-
Watch MET
Waterloo Poyner ES MET MET SINA-5 SINA-5 MET
Waterloo West HS MET MET SINA-9 SINA-10 MET
Waukee Brookview ES MET MET Watch MET MET
Waukee Eason ES MET MET MET MET MET
Waukee Maple Grove ES MET MET MET Removed-
Watch MET
Waukee Prairieview MET MET SINA-1 SINA-1 MET
Waukee Shuler ES MET MET MET MET MET
Waukee Vince Meyer Learning Ctr
MET MET MET MET MET
Waukee Walnut Hills ES MET MET MET Watch MET
Waukee Waukee ES MET MET Delay-2 SINA-4 MET
Waukee Waukee HS MET MET Removed-
Watch Watch MET
Waukee Waukee MS MET MET SINA-2 Delay-3 MET
Waukee Waukee South MS MET MET SINA-3 Removed-
Watch MET
Waukee Woodland Hills MET MET MET MET MET
Waverly-Shell Rock Greenview Alternative
MET MET MET MET MET
Waverly-Shell Rock Margaretta Carey ES MET MET MET MET MET
Waverly-Shell Rock Shell Rock ES MET MET MET Watch MET
Waverly-Shell Rock Southeast ES MET MET MET MET MET
Waverly-Shell Rock Waverly-Shell Rock HS
MET MET MET MET MET
Waverly-Shell Rock Waverly-Shell Rock MS
MET MET Delay-1 SINA-2 MET
Waverly-Shell Rock West Cedar ES MET MET MET MET MET
Wayne Wayne Jr-Sr HS MET MET Removed-
Watch Removed-
Watch MET
Wayne Wayne ES MET MET SINA-1 Watch MET

State Report Card 2014 115
Table 22 (continued)
AYP Status for Schools for the 2014-15 School Year Based on Previous School Year's Performance
District School Math
Participation Reading
Participation Math
Proficiency Reading
Proficiency Other
Indicator
Webster City Hamilton Regional HS HS
MET MET MET MET MET
Webster City Pleasant View ES MET MET MET Watch MET
Webster City Sunset Heights ES MET MET Watch Watch MET
Webster City Webster City HS MET MET Removed-
Watch SINA-2 MET
Webster City Webster City MS MET MET SINA-1 SINA-4 MET
West Bend-Mallard Mallard ES MET MET MET Watch MET
West Bend-Mallard West Bend-Mallard HS
MET MET MET MET MET
West Bend-Mallard West Bend-Mallard MS
MET MET Watch Watch MET
West Branch Hoover ES MET MET SINA-2 Delay-1 MET
West Branch West Branch HS MET MET MET MET MET
West Branch West Branch MS MET MET SINA-1 SINA-2 MET
West Burlington Ind West Burlington ES MET MET Watch SINA-2 MET
West Burlington Ind West Burlington HS MET MET MET MET MET
West Burlington Ind West Burlington JHS MET MET Delay-2 Delay-1 MET
West Central West Central K - 8 MET MET MET Removed-
Watch MET
West Central West Central Sr HS MET MET MET MET MET
West Central Valley Dexter ES MET MET MET MET MET
West Central Valley Stuart ES MET MET Removed-
Watch Watch MET
West Central Valley West Central Valley HS
MET MET Removed-
Watch MET MET
West Central Valley West Central Valley MS
MET MET SINA-5 MET MET
West Delaware County Lambert ES MET MET SINA-1 SINA-1 MET
West Delaware County West Delaware HS MET MET MET MET MET
West Delaware County West Delaware MS MET MET SINA-3 Removed-
SINA MET
West Des Moines Clive ES MET MET SINA-4 Delay-1 MET
West Des Moines Crestview ES MET MET SINA-4 SINA-4 MET
West Des Moines Crossroads Park ES MET MET Delay-3 SINA-4 MET
West Des Moines Fairmeadows ES MET MET SINA-1 SINA-2 MET
West Des Moines Hillside ES MET MET Removed-
SINA Delay-5 MET
West Des Moines Indian Hills JHS MET MET SINA-5 SINA-7 MET
West Des Moines Jordan Creek ES MET MET Watch Watch MET
West Des Moines Phenix ES Early Childhood
MET MET SINA-1 SINA-2 MET
West Des Moines Stilwell JHS MET MET SINA-3 Delay-4 MET
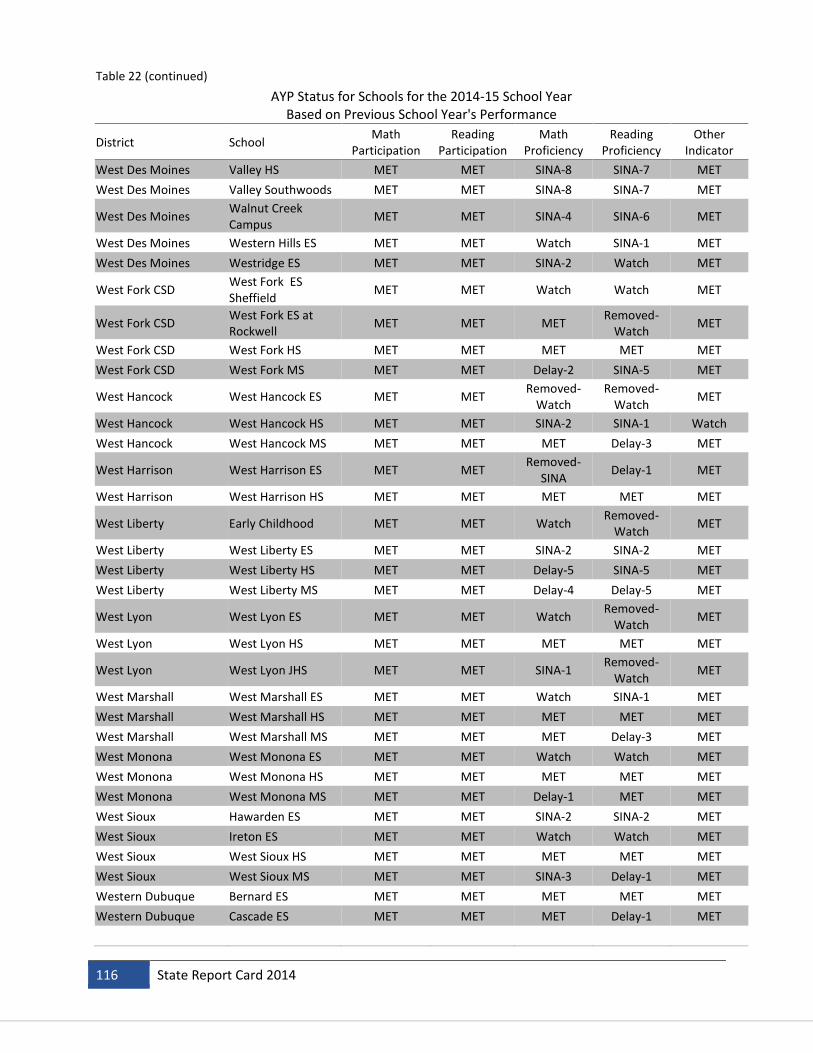
116 State Report Card 2014
Table 22 (continued)
AYP Status for Schools for the 2014-15 School Year Based on Previous School Year's Performance
District School Math
Participation Reading
Participation Math
Proficiency Reading
Proficiency Other
Indicator
West Des Moines Valley HS MET MET SINA-8 SINA-7 MET
West Des Moines Valley Southwoods MET MET SINA-8 SINA-7 MET
West Des Moines Walnut Creek Campus
MET MET SINA-4 SINA-6 MET
West Des Moines Western Hills ES MET MET Watch SINA-1 MET
West Des Moines Westridge ES MET MET SINA-2 Watch MET
West Fork CSD West Fork ES Sheffield
MET MET Watch Watch MET
West Fork CSD West Fork ES at Rockwell
MET MET MET Removed-
Watch MET
West Fork CSD West Fork HS MET MET MET MET MET
West Fork CSD West Fork MS MET MET Delay-2 SINA-5 MET
West Hancock West Hancock ES MET MET Removed-
Watch Removed-
Watch MET
West Hancock West Hancock HS MET MET SINA-2 SINA-1 Watch
West Hancock West Hancock MS MET MET MET Delay-3 MET
West Harrison West Harrison ES MET MET Removed-
SINA Delay-1 MET
West Harrison West Harrison HS MET MET MET MET MET
West Liberty Early Childhood MET MET Watch Removed-
Watch MET
West Liberty West Liberty ES MET MET SINA-2 SINA-2 MET
West Liberty West Liberty HS MET MET Delay-5 SINA-5 MET
West Liberty West Liberty MS MET MET Delay-4 Delay-5 MET
West Lyon West Lyon ES MET MET Watch Removed-
Watch MET
West Lyon West Lyon HS MET MET MET MET MET
West Lyon West Lyon JHS MET MET SINA-1 Removed-
Watch MET
West Marshall West Marshall ES MET MET Watch SINA-1 MET
West Marshall West Marshall HS MET MET MET MET MET
West Marshall West Marshall MS MET MET MET Delay-3 MET
West Monona West Monona ES MET MET Watch Watch MET
West Monona West Monona HS MET MET MET MET MET
West Monona West Monona MS MET MET Delay-1 MET MET
West Sioux Hawarden ES MET MET SINA-2 SINA-2 MET
West Sioux Ireton ES MET MET Watch Watch MET
West Sioux West Sioux HS MET MET MET MET MET
West Sioux West Sioux MS MET MET SINA-3 Delay-1 MET
Western Dubuque Bernard ES MET MET MET MET MET
Western Dubuque Cascade ES MET MET MET Delay-1 MET

State Report Card 2014 117
Table 22 (continued)
AYP Status for Schools for the 2014-15 School Year Based on Previous School Year's Performance
District School Math
Participation Reading
Participation Math
Proficiency Reading
Proficiency Other
Indicator
Western Dubuque Cascade Jr-Sr HS MET MET MET Removed-
Watch MET
Western Dubuque Drexler Middle- Int MET MET Removed-
Watch Delay-3 MET
Western Dubuque Dyersville ES MET MET MET Removed-
Watch MET
Western Dubuque Epworth ES MET MET MET MET MET
Western Dubuque Farley ES MET MET MET MET MET
Western Dubuque Peosta ES MET MET MET Watch MET
Western Dubuque Western Dubuque HS
MET MET Watch SINA-1 MET
Westwood Westwood ES MET MET Watch SINA-1 MET
Westwood Westwood HS MET MET Removed-
Watch Delay-3 MET
Whiting Whiting ES MET MET MET MET MET
Whiting Whiting HS MET MET Removed-
Watch SINA-1 MET
Williamsburg Mary Welsh ES MET MET SINA-1 SINA-1 MET
Williamsburg Williamsburg Jr-Sr HS
MET MET SINA-1 Removed-
Watch MET
Wilton Wilton ES MET MET SINA-2 SINA-2 MET
Wilton Wilton Jr-Sr HS MET MET Removed-
Watch Removed-
SINA MET
Winfield-Mt Union Winfield ES MET MET Watch Watch MET
Winfield-Mt Union Winfield-Mt Union Jr-Sr HS
MET MET Removed-
Watch SINA-1 MET
Winterset Winterset Bridges MET MET MET MET MET
Winterset Winterset ES MET MET Removed-
Watch Removed-
Watch MET
Winterset Winterset HS MET MET MET Watch MET
Winterset Winterset JHS MET MET MET SINA-4 MET
Winterset Winterset MS MET MET Delay-2 Delay-1 MET
Woodbine Woodbine ES MET MET SINA-1 Removed-
Watch MET
Woodbine Woodbine HS MET MET Removed-
Watch Removed-
Watch MET
Woodbury Central Moville ES MET MET Watch Watch MET
Woodbury Central Woodbury Central HS
MET MET MET MET MET
Woodbury Central Woodbury Central MS
MET MET Removed-
Watch MET MET
Woodward-Granger Woodward-Granger ES
MET MET MET Removed-
Watch MET
Woodward-Granger Woodward-Granger Grandwood
MET MET MET MET MET

118 State Report Card 2014
Table 22 (continued)
AYP Status for Schools for the 2014-15 School Year Based on Previous School Year's Performance
District School Math
Participation Reading
Participation Math
Proficiency Reading
Proficiency Other
Indicator
Woodward-Granger Woodward-Granger HS
MET MET Watch Watch MET
Woodward-Granger Woodward-Granger MS
MET MET Removed-
Watch Removed-
Watch MET
*Status frozen at 2013-14 level due to testing with the Smarter Balanced Assessment.