The Sociophonetic and Acoustic Vowel Dynamics of Michigan’s Upper Peninsula English
245
The Sociophonetic and Acoustic Vowel Dynamics of Michigan’s Upper Peninsula English Wil A. Rankinen Submitted to the faculty of the University Graduate School in partial fulfillment of the requirements for the degree Doctor of Philosophy in the Department of Linguistics Indiana University August 2014 (Updated Last: August 17, 2014 )
Transcript of The Sociophonetic and Acoustic Vowel Dynamics of Michigan’s Upper Peninsula English
The Sociophonetic andAcoustic Vowel Dynamics
of Michigan’s Upper Peninsula English
Wil A. Rankinen
Submitted to the faculty of the University Graduate School
in partial fulfillment of the requirements for the degree
Doctor of Philosophy
in the Department of Linguistics
Indiana University
August 2014(Updated Last: August 17, 2014 )
Title: The Sociophoneticand Acoustic Vowel Dynamicsof Michigan’s Upper Peninsula English
Submitted by: Wil Rankinen9342 Nixon Road (Signature of Candidate)Grand Ledge, MI 48837
Date of Submission: July 18th, 2014Expected Date of Completion: August 15th, 2014
Ph.D. Thesis Committee Members:
Kenneth de Jong (chair), Professor of LinguisticsIndiana University, Bloomington, Indiana (Signature of Chair)
Stuart Davis, Professor of LinguisticsIndiana University, Bloomington, Indiana (Signature of Reader)
Julie Auger, Professor of LinguisticsIndiana University, Bloomington, Indiana (Signature of Reader)
Dennis Preston, Professor of Linguistics (outside member)Oklahoma State University, Stillwater, Oklahoma (Signature of Reader)
Pia Paivo, Professor of Linguistics (CEUS minor member)University of Copenhagen, Denmark (Signature of Reader)
ii
Copyright c© 2014
Wil A. Rankinen
iii
Dedication
This dissertation is dedicated to Michael and Jill Rankinen;two parents that gave the world to their sons and inspired them to do more.
We do what we do because of you.
iv
Acknowledgements
To Dr. Kenneth De Jong, my chair, advisor, colleague and friend, thank you forbeing my pillar of support throughout the entire process and guiding me throughthe many challenges I encountered. Dr. Dennis Preston, thank you for inspiring meto become a linguist early in my career and continually being there to advise andsupport me in my growth and the development of the thesis. Thanks must be givento Dr. Julie Auger, Dr. Stuart Davis, and Dr. Pia Paivo, all of whom contributed tothe development of the thesis in its present form. Aaron Albin (ABD), as a colleagueand dear friend, thank you for your expertise and guidance in the co-development ofthe procedural methods of formant extraction used in the thesis. To my loving wifeand son, Leah Rankinen and Eli Sheridan, your patience, support and love was feltevery step of the way. To my parents, I would not be where I am today without thesacrifices that you have made, the upbringing you have provided and the support youhave given. Thanks must also be given to others that have offered their support atvarious stages of the research: Dr. Clancy Clements, Dr. Kristopher Ebarb, Dr. SusanE. Wagner, Dr. Karthik Durvasula and yet others that remain unnamed. Finally, theresearch would not have been possible without the kindness and willingness of thosethat voluntarily shared their time and experiences with me during the summers of2007 and 2008 in Michigan’s Marquette County.
v
Abstract
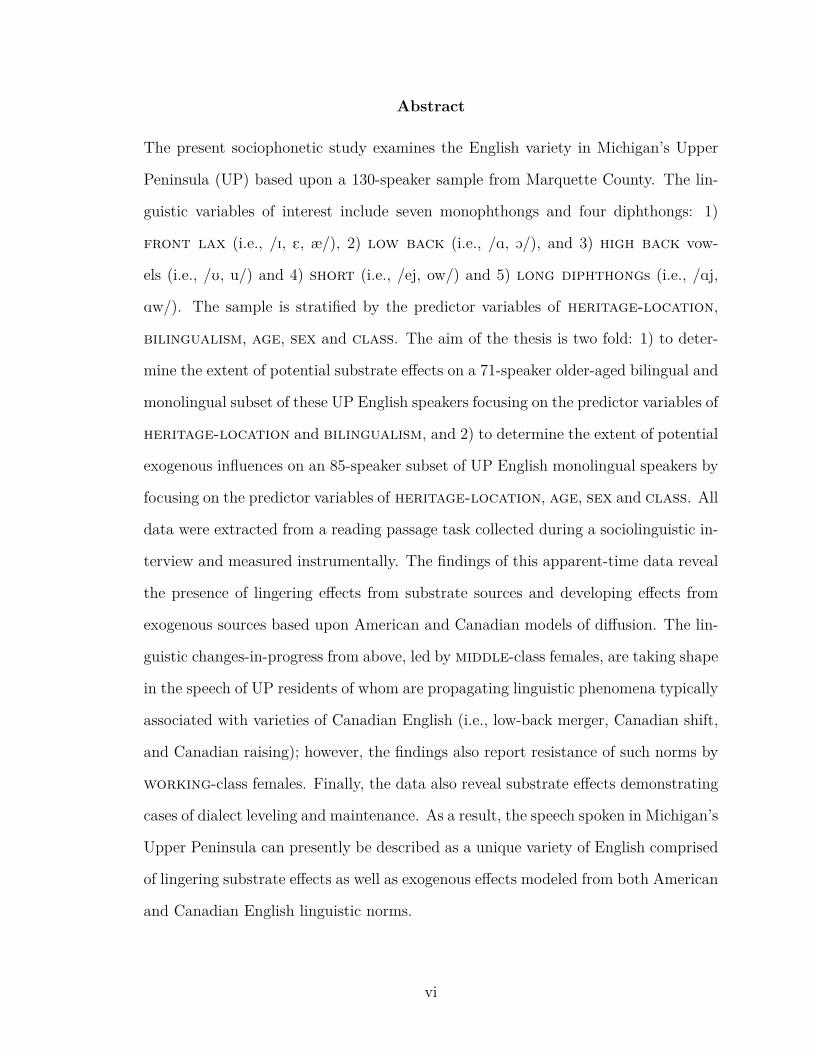
The present sociophonetic study examines the English variety in Michigan’s Upper
Peninsula (UP) based upon a 130-speaker sample from Marquette County. The lin-
guistic variables of interest include seven monophthongs and four diphthongs: 1)
front lax (i.e., /I, E, æ/), 2) low back (i.e., /A, O/), and 3) high back vow-
els (i.e., /U, u/) and 4) short (i.e., /ej, ow/) and 5) long diphthongs (i.e., /Aj,
Aw/). The sample is stratified by the predictor variables of heritage-location,
bilingualism, age, sex and class. The aim of the thesis is two fold: 1) to deter-
mine the extent of potential substrate effects on a 71-speaker older-aged bilingual and
monolingual subset of these UP English speakers focusing on the predictor variables of
heritage-location and bilingualism, and 2) to determine the extent of potential
exogenous influences on an 85-speaker subset of UP English monolingual speakers by
focusing on the predictor variables of heritage-location, age, sex and class. All
data were extracted from a reading passage task collected during a sociolinguistic in-
terview and measured instrumentally. The findings of this apparent-time data reveal
the presence of lingering effects from substrate sources and developing effects from
exogenous sources based upon American and Canadian models of diffusion. The lin-
guistic changes-in-progress from above, led by middle-class females, are taking shape
in the speech of UP residents of whom are propagating linguistic phenomena typically
associated with varieties of Canadian English (i.e., low-back merger, Canadian shift,
and Canadian raising); however, the findings also report resistance of such norms by
working-class females. Finally, the data also reveal substrate effects demonstrating
cases of dialect leveling and maintenance. As a result, the speech spoken in Michigan’s
Upper Peninsula can presently be described as a unique variety of English comprised
of lingering substrate effects as well as exogenous effects modeled from both American
and Canadian English linguistic norms.
vi
Ph.D. Thesis Committee Members:
Kenneth de Jong (chair), Professor of Linguistics
Indiana University, Bloomington, Indiana (Signature of Chair)
Stuart Davis, Professor of Linguistics
Indiana University, Bloomington, Indiana (Signature of Reader)
Julie Auger, Professor of Linguistics
Indiana University, Bloomington, Indiana (Signature of Reader)
Dennis Preston, Professor of Linguistics (outside member)
Oklahoma State University, Stillwater, Oklahoma (Signature of Reader)
Pia Paivo, Professor of Linguistics (CEUS minor member)
University of Copenhagen, Denmark (Signature of Reader)
vii
Table of ContentsPage
Tables xi
Figures xii
1 Introduction 11.1 Research Questions . . . . . . . . . . . . . . . . . . . . . . . . . . . . 31.2 Potential Outcomes . . . . . . . . . . . . . . . . . . . . . . . . . . . . 51.3 Outline of Thesis . . . . . . . . . . . . . . . . . . . . . . . . . . . . . 8
2 Background 102.1 Michigan’s Upper Peninsula as a Region . . . . . . . . . . . . . . . . 11
2.1.1 Geological Position and Landscape . . . . . . . . . . . . . . . 112.1.2 Development of the Highway System . . . . . . . . . . . . . . 122.1.3 Socio-cultural Relevance of Immigration and Acculturation . . 15
2.2 Previous Linguistic Research in the Region . . . . . . . . . . . . . . . 202.2.1 American English in Michigan’s Upper Peninsula . . . . . . . 202.2.2 Substrate Systems in the Upper Midwest . . . . . . . . . . . . 222.2.3 American English in the Upper Midwest . . . . . . . . . . . . 232.2.4 American English in the Lower Midwest . . . . . . . . . . . . 232.2.5 Canadian English in Ontario and Elsewhere in Canada . . . . 26
3 Methods 303.1 The Sets of Linguistic Variables . . . . . . . . . . . . . . . . . . . . . 30
3.1.1 The Front Lax /I/, /E/, /æ/ Vowels . . . . . . . . . . . . . . . 313.1.2 The Low Back /A/ and /O/ Vowels . . . . . . . . . . . . . . . 323.1.3 The High Back /U/ and /u/ Vowels . . . . . . . . . . . . . . . 333.1.4 The Short Diphthongs /ej/ and /ow/ Vowels . . . . . . . . . . 343.1.5 The Long Diphthongs /Aj/and /Aw/Vowels . . . . . . . . . . . 35
3.2 The Speakers and Predictor Variables . . . . . . . . . . . . . . . . . . 363.2.1 heritage-location as a Predictor Variable . . . . . . . . . . 373.2.2 heritage-location and bilingualism . . . . . . . . . . . . 413.2.3 heritage-location, age, sex and class . . . . . . . . . . 42
4 Procedures 444.1 Speech Stimuli . . . . . . . . . . . . . . . . . . . . . . . . . . . . . . 454.2 Formant-Extraction of Vowel Trajectories . . . . . . . . . . . . . . . . 47
4.2.1 Previous Extraction Procedures . . . . . . . . . . . . . . . . . 484.2.2 A Proposed Formant Extraction Method . . . . . . . . . . . . 50
viii
4.2.3 Pair-wise Comparions of Formant Extraction Procedures . . . 554.3 Speaker Normalization of Vowel Data . . . . . . . . . . . . . . . . . . 614.4 Statistical Analysis . . . . . . . . . . . . . . . . . . . . . . . . . . . . 64
5 Results I:Heritage-Location and Bilingualism 675.1 The Vowel System of Older-aged Speakers . . . . . . . . . . . . . . . 685.2 The Factor of Heritage-Location . . . . . . . . . . . . . . . . . . . . . 80
5.2.1 The Analysis of the Front Lax Vowels . . . . . . . . . . . . . . 815.2.2 The Analysis of the Low Back Vowels . . . . . . . . . . . . . . 855.2.3 The Analysis of the High Back Vowels . . . . . . . . . . . . . 885.2.4 The Analysis of the Short Diphthongs . . . . . . . . . . . . . 915.2.5 The Analysis of the Long Diphthongs . . . . . . . . . . . . . . 92
5.3 The Factor of Bilingualism . . . . . . . . . . . . . . . . . . . . . . . . 945.3.1 The Analysis of the Front Lax Vowels . . . . . . . . . . . . . . 955.3.2 The Analysis of the Low Back Vowels . . . . . . . . . . . . . . 975.3.3 The Analysis of the High Back Vowels . . . . . . . . . . . . . 975.3.4 The Analysis of the Short and Long Diphthongs . . . . . . . . 99
5.4 The Interaction of Heritage-Location and Bilingualism . . . . . . . . 1015.4.1 Homogeneity and Structural Differences . . . . . . . . . . . . 1035.4.2 Heterogeneity of east-side Finns’ bilingualism groups . . . 107
5.5 Summary . . . . . . . . . . . . . . . . . . . . . . . . . . . . . . . . . 112
6 Results II:Heritage-Location, Age, Sex and Class 1136.1 The Vowel System of Monolingual Speakers . . . . . . . . . . . . . . 1146.2 Front Lax, Low Back and High Back Vowels as Sets of Ling. Variables 124
6.2.1 Structural Differences and Heritage-Location . . . . . . . . . . 1246.2.2 Front Lax Vowels by Heritage-Location and Age . . . . . . . . 1276.2.3 Low Front Lax Vowel by Heritage-Location and Sex . . . . . . 1316.2.4 Front Lax Vowels by Heritage-Location, Age and Sex . . . . . 1336.2.5 Low Front Lax Vowel by Heritage-Location and Class . . . . . 1406.2.6 Low Front Lax Vowel by Heritage-Location, Sex and Class . . 142
6.3 Short and Long Diphthongs as Sets of Ling. Variables . . . . . . . . . 1486.3.1 Main Effects of Age and Heritage-Location . . . . . . . . . . . 1506.3.2 Raised Variants of [Aj] and [Aw] as Changes-in-Progress . . . . 155
6.4 Summary . . . . . . . . . . . . . . . . . . . . . . . . . . . . . . . . . 162
7 Discussion 1637.1 Substrate Influences as a Process of Transmission . . . . . . . . . . . 166
7.1.1 Ethnic-heritage and Change from Below . . . . . . . . . . . . 1677.2 Exogenous Influences as a Processes of Diffusion . . . . . . . . . . . . 171
7.2.1 Dialect Leveling among Older-aged UP Speakers . . . . . . . . 1727.2.2 Linguistic Diffusion among Monolingual UP Speakers . . . . . 1757.2.3 Sources of Diffusion as Linguistic Models of Innovation . . . . 187
ix

8 Further Research andFuture Directions 1948.1 Limitations and Continuation of the Present Research . . . . . . . . . 1958.2 Beyond the Present Research . . . . . . . . . . . . . . . . . . . . . . 1978.3 Concluding Remarks . . . . . . . . . . . . . . . . . . . . . . . . . . . 200
Glossary 204
Acronyms 213
Bibliography 215
x
Tables
Table 2.1 US Census statistics of total populations by Upper Peninsula(UP) county and ethnic-heritage . . . . . . . . . . . . . . . . . . . . . 18
Table 3.1 Sets of linguistic variables and their variants . . . . . . . . . . . 31Table 3.2 Front lax sets of ling. variables and variants . . . . . . . . . . . 31Table 3.3 Low-back sets of ling. variables and variants . . . . . . . . . . . 32Table 3.4 High-back sets of ling. variables and variants . . . . . . . . . . 33Table 3.5 Short diphthongal sets of ling. variables and variants . . . . . . 34Table 3.6 Long diphthongal sets of ling. variables and variants . . . . . . 35Table 3.7 Sample demographics of heritage and location . . . . . . . . . . 41Table 3.8 Sample demographics of heritage-location and bilingualism . . 41Table 3.9 Sample demographics of heritage-location, age, sex, and class . 42
Table 4.1 The phonetic inventory of 13 American English vowels in the “ABad Day for Ducks” passage. . . . . . . . . . . . . . . . . . . . . . . . 46
Table 4.2 Statistical tests and use . . . . . . . . . . . . . . . . . . . . . . 65
Table 5.1 The coefficient of variation (CoV) of the front lax vowels asa factor of heritage-location . . . . . . . . . . . . . . . . . . . . . 84
Table 5.2 The coefficient of variation (CoV) of the low back vowels as afactor of heritage-location . . . . . . . . . . . . . . . . . . . . . . 88
Table 5.3 Means, Euclidean distances (EDs), and pearson’s product-momentcorrelations for the nuclei and offglides of the short diphthong [ow]as a factor of heritage-location . . . . . . . . . . . . . . . . . . . 92
Table 5.4 Means, EDs, and pearson’s product-moment correlations for thenuclei and offglides of the short diphthong [ow] as a factor of bilin-gualism . . . . . . . . . . . . . . . . . . . . . . . . . . . . . . . . . . 99
Table 5.5 Multivariate analyses of variance of each monophthong and diph-thong and the interaction between heritage-location and bilin-gualism . . . . . . . . . . . . . . . . . . . . . . . . . . . . . . . . . . 102
Table 7.1 Principles of linguistic stability and change . . . . . . . . . . . 178Table 7.2 The phonetic patterns and sociolinguistics trends of the front
lax, low back, and long diphthong linguistic variables amongthe 85 monolingual English UP speakers . . . . . . . . . . . . . . . . 180
Table 8.3 Token words from the “Bad Day for Ducks” reading passage . . 203
xi

Figures
Figure 2.1 Michigan’s Upper Peninsula . . . . . . . . . . . . . . . . . . . 11Figure 2.2 US41/M28 Highway Corridor in Michigan’s Marquette County 12Figure 2.3 Michigan’s Marquette County, Townships & us41/m28 Corridor 13Figure 2.4 Pre-NCVS Michigan English (females) . . . . . . . . . . . . . 25Figure 2.5 Pre-NCVS Michigan English (males) . . . . . . . . . . . . . . 25Figure 2.6 Schematic of the Canadian Shift and the Low-Back Merger . . 27
Figure 3.1 Participants’ geolocation by heritage . . . . . . . . . . . . . . 38Figure 3.2 The longitudinal dimension and west/east threshold . . . . . . 39Figure 3.3 West– to east–siders by heritage groups . . . . . . . . . . . . . 40
Figure 4.1 Single-pivot stylization model for a monophthong . . . . . . . 52Figure 4.2 Dual-pivot stylization model for a diphthong . . . . . . . . . . 52Figure 4.3 The correlation coefficient values (r2) of pair-wise comparisons
between the formant extraction methods . . . . . . . . . . . . . . . . 57Figure 4.4 The pair-wise comparisons for monophthongs’ F1 and F2 mea-
surements . . . . . . . . . . . . . . . . . . . . . . . . . . . . . . . . . 58Figure 4.5 The pair-wise comparisons for diphthongs’ F1 and F2 measure-
ments for nuclei . . . . . . . . . . . . . . . . . . . . . . . . . . . . . 59Figure 4.6 The pair-wise comparisons for diphthongs’ F1 and F2 measure-
ments for offglides . . . . . . . . . . . . . . . . . . . . . . . . . . . . 59Figure 4.7 Unnormalized monophthongs . . . . . . . . . . . . . . . . . . 62Figure 4.8 Normalized monophthongs . . . . . . . . . . . . . . . . . . . . 62Figure 4.9 Unnormalized and normalized diphthongal nucleus data . . . . 63Figure 4.10 Unnormalized and normalized diphthongal offglide data . . . . 63
Figure 5.1 The grand F1 and F2 means of monophthongs and diphthongsfor the older-aged speakers in Michigan’s UP vowel corpus (n=71) . . 69
Figure 5.2 The global distribution of monophthongs’ F1 and F2 . . . . . 72Figure 5.3 The global distribution of diphthongs’ F1 and F2 . . . . . . . 72Figure 5.4 The distribution density of the [A . . . . . . . . . . . . . . . . 73Figure 5.5 The distribution density of the [AjT] and [AjC] nuclei . . . . . 74Figure 5.6 The nucleus of [AjT] compared to the [æ] vowel . . . . . . . . 75Figure 5.7 The nucleus of [AjT] compared to the [A/O] vowel . . . . . . . 75Figure 5.8 The nucleus of the [AwT] diphthong compared to the [A/O] vowel 76Figure 5.9 The nucleus of the [AwT] diphthong compared to the [2] vowel 76Figure 5.10 The relationship of euclidian distance and duration for diphthongs 78
xii
Figure 5.11 Means of monophthongs and the predictor variable of heritage-location . . . . . . . . . . . . . . . . . . . . . . . . . . . . . . . . . 80
Figure 5.12 Means of diphthongs and the predictor variable of heritage-location . . . . . . . . . . . . . . . . . . . . . . . . . . . . . . . . . 80
Figure 5.13 The grand means of the front lax vowels for the heritage-location groups . . . . . . . . . . . . . . . . . . . . . . . . . . . . . 82
Figure 5.14 The distribution of the front lax vowels for each heritage-location group . . . . . . . . . . . . . . . . . . . . . . . . . . . . . 83
Figure 5.15 The distribution of the low back vowels for the heritage-location groups . . . . . . . . . . . . . . . . . . . . . . . . . . . . . 86
Figure 5.16 The grand means of the high and mid back vowels for theheritage-location groups . . . . . . . . . . . . . . . . . . . . . . . 89
Figure 5.17 Means of monophthongs and the predictor variable of bilin-gualism . . . . . . . . . . . . . . . . . . . . . . . . . . . . . . . . . . 94
Figure 5.18 Means of diphthongs and the predictor variable of bilingualism 94Figure 5.19 The means of the front lax vowels for the bilingualism
groups . . . . . . . . . . . . . . . . . . . . . . . . . . . . . . . . . . . 96Figure 5.20 The means of the high back vowels for the bilingualism groups 98Figure 5.21 Means of monophthongs and the predictor variables of heritage-
location and bilingualism . . . . . . . . . . . . . . . . . . . . . . 104Figure 5.22 Means of diphthongs and the predictor variables of heritage-
location and bilingualism . . . . . . . . . . . . . . . . . . . . . . 106Figure 5.23 Means of monophthongs and diphthongs for the east-side Finns
and the predictor variable of bilingualism . . . . . . . . . . . . . . 108
Figure 6.1 The grand F1 and F2 means of monophthongs and diphthongsfor the monolingual speakers in Michigan’s UP vowel corpus (n=85) . 115
Figure 6.2 F1 differences from the center point of the global vowel space . 117Figure 6.3 F2 differences from the center point of the global vowel space . 117Figure 6.4 The presence of the low-back merger of the [A] and [O] vowels . 118Figure 6.5 The relationship of Euclidian distance and duration for diphthongs119Figure 6.6 The distribution density of the [AjT] and [AjC] nuclei (ellipses
based on .95 confidence-interval) . . . . . . . . . . . . . . . . . . . . . . . 121Figure 6.7 The nucleus of the [Aj] diphthong compared to the [æ] vowel . 122Figure 6.8 The nucleus of the [Aj] diphthong compared to the [A/O] vowel 122Figure 6.9 The nucleus of the [Aw] diphthong compared to the [A/O] vowel 123Figure 6.10 The nucleus of the [Aw] diphthong compared to the [2] vowel . 123Figure 6.11 The monophthongs’ F1/ F2 means for heritage-location
groups . . . . . . . . . . . . . . . . . . . . . . . . . . . . . . . . . . . 125Figure 6.12 The front lax vowels for heritage-location and age groups128Figure 6.13 The [æ] and low-back vowels for heritage-location and sex
groups . . . . . . . . . . . . . . . . . . . . . . . . . . . . . . . . . . . 132Figure 6.14 The front lax vowels for the east-side Finnish female and
male age groups . . . . . . . . . . . . . . . . . . . . . . . . . . . . . 134
xiii

Figure 6.15 The front lax vowels for the east-side Italian female andmale age groups . . . . . . . . . . . . . . . . . . . . . . . . . . . . . 136
Figure 6.16 The front lax vowels for the west-side Finnish female andmale age groups . . . . . . . . . . . . . . . . . . . . . . . . . . . . . 138
Figure 6.17 The [æ] and low-back vowels for heritage-location andclass groups . . . . . . . . . . . . . . . . . . . . . . . . . . . . . . . 141
Figure 6.18 The [æ] vowels for the east-side Finnish working-class andmiddle-class age groups . . . . . . . . . . . . . . . . . . . . . . . . . 143
Figure 6.19 The [æ] vowels for the east-side Italian working-class andmiddle-class age groups . . . . . . . . . . . . . . . . . . . . . . . . . 144
Figure 6.20 The [æ] vowels for the west-side Finnish working-class andmiddle-class age groups . . . . . . . . . . . . . . . . . . . . . . . . . 146
Figure 6.21 F1 difference of the long diphthongs’ nuclei and the low-backmerger as a factor of either heritage-location or age . . . . . . . 150
Figure 6.22 F1 difference of the long diphthongs’ nuclei and the low-backmerger as an interaction heritage-location and age . . . . . . . . 153
Figure 6.23 F1 difference of the long diphthongs’ nuclei and the low-backmerger as a factor of age and sex . . . . . . . . . . . . . . . . . . . 156
Figure 6.24 F1 difference of the long diphthongs’ nuclei and the low-backmerger as a factor of age and class . . . . . . . . . . . . . . . . . . 157
Figure 6.25 F1 difference of the long diphthongs’ nuclei and the low-backmerger as a three-way interaction age, sex and class . . . . . . . . 159
xiv

CHAPTER 1
INTRODUCTION
The Upper Midwest, post-European settlement and occupation, is a region character-
ized with a rich and diverse history, which includes communities with vibrant cultures
centered around both urban-rural and rural lifestyles and varying cultural practices.
However diverse, the areas within this region uniquely share similar geological forces
shaping the topographical formation of its geography, economic sources of indus-
trial development shaping its infrastructure and means of commerce, and historical
patterns of migration and settlement shaping its communal practices and local iden-
tities. With the seminal work of Labov et al.’s The Atlas of North American English
(ANAE), the areas within the Upper Midwest (i.e. known also as the North Central
region) have recently been shown to also share many phonological linguistic variables,
and as a geolinguistic region, it notably differs from other neighboring regions (Labov
et al. 2006, 141):
“The Central region ranges from Montana to Michigan along the U.S.-
Canadian border, including the communities of Billings, Bismark, Minot,
Fargo, Duluth, and Marquette. It does not participate actively in the
sound changes in progress . . . [that define the neighboring regions] . . . It
is distinguished from the North by the presence of [the low back merger].
It is distinguished from Canada by the absence of the Canadian Shift. It
is distinguished from Canada and the West by a very limited fronting of
/uw/ after non-coronals. . . ”
1
Rankinen, W. CHAPTER 1. INTRODUCTION
A geolinguistic region is a geographical area within which the speech community
or communities exhibits a preference for a definable set of linguistic variants (e.g.,
phonological, syntactic) and characterizes the linguistic speech patterns of residents
living in this geographical area. Since the Upper Midwest is characterized as hav-
ing a “mixed-bag” of phonological and phonetic variables that typify the speech of
those communities within this region, it can be characterized as a geolinguistic region
juxtaposed between the neighboring regional varieties of the North and Canadian
English. Labov et al. (2006)’s use of the term “residual region” indicates two under-
lying assumptions, both of which refer to the potential impact that these neighboring
American English varieties may have on this region. This region may be under 1)
potential competing pressures of neighboring regional varieties (i.e., regions with a
defined set of linguistic variables) and 2) a potential change-in-progress toward the
adoption of a preferred set of phonological variables.1 Since these assumptions go
beyond the scope of the seminal work of Labov et al. (2006), the authors offer them
with the expectation that future empirical support would be required; that is, they
sought to stimulate future investigations that are not only area-focused in design but
also examine the internal linguistic and social constraints operating and affecting so-
ciolinguistic language change at the more local level (Konopka and Pierrehumbert
2014).
The present sociophonetic and phonological study is an acoustic investigation of
vowels and the sociolinguistic variation that exists in the speech of rural Upper Mid-
west immigrant-American communities located in Marquette County in Michigan’s
Upper Peninsula (UP). This thesis investigates eleven linguistic variables of which
seven are phonologically regarded as monophthongs (i.e., /I/, /E/, /æ/, /A/, /O/,
/U/, /u/) and the other four as diphthongs (i.e., /ej/, /ow/, /Aj/, /Aw/); in this the-1Of course, Labov et al. (2006) report no change-in-progress in the case of the Canadian shift;
however, the claim made is questionable since it was based on data obtained from very few speakers.
(Table of Contents) 2 Ph.D Thesis 2014
Rankinen, W. CHAPTER 1. INTRODUCTION
sis, these linguistic variables will be grouped into five sets: front lax (i.e., /I, E, æ/),
low back (i.e., /A, O/) and high back (i.e., /U, u/) vowels and short (i.e., /ej, ow/)
and long diphthongs (i.e., /Aj, Aw/). Each set of linguistic variables will be exam-
ined in relation to the five predictor variables of heritage-location, bilingual-
ism, age, sex and class. The sociolinguistic factors of heritage-location and
bilingualism are included to examine the potential substrate influences of ethnic-
heritage and ethnic-language usage in shaping the American English language variety
in Michigan’s UP (Labov 2008).2 Additionally, the speech communities in this re-
gion also find themselves in a unique position for the potential adoption of new local
norms from two opposing and neighboring regional English varieties (e.g., Canadian
English as reported in Boberg (2008) and American English; the latter is charac-
terized either by the post-Northern Cities Vowel Shift (NCVS) in the Inland North
as reported in Labov et al. (2006) or by the pre-NCVS in Michigan as reported in
Peterson and Barney (1952)). The factors of age, sex and class are sociolinguistic
variables that are used in the apparent-time construct of the thesis to determine if
changes-in-progress are taking shape in this speech community, and if so, to reveal
the types of change (i.e., change from above or below) and the sociolingustic trends
of such changes (Labov 2001).
1.1 Research Questions
This thesis has two main research questions:
1. What is the extent of potential substrate influences on the linguistic variables
in question with specific reference to the predictor variables of heritage-2Labov states when using the term “substrate”, sociolinguists are typically “. . . speaking of a
community effect - that is, a change in the language that is the result of a very large number ofbilingual speakers transferring some part of the L2 effect to large numbers of their descendants. . . ”(2008, 316).
(Table of Contents) 3 Ph.D Thesis 2014
Rankinen, W. CHAPTER 1. INTRODUCTION
location and bilingualism? This question can be broken into three sub-
sequent parts: 1) how have the phonological and phonetic characteristics of the
five sets of English vowel qualities and their overall constellation and individ-
ual distribution in the vowel space been affected in the speech of UP speakers
in regards to ethnic ancestry and exposure to immigrant-heritage communities
throughout Marquette County, 2) what linguistic differences or similarities ex-
ist for these linguistic variables when comparing UP bilingual speakers and UP
monolingual English speakers, and 3) how do these bilingualism groups differ
as a factor of heritage-location.
2. With regards to potential exogenous influences on UP vowels, to what extent are
the social groups according to the predictor variables of heritage-location,
age, sex and class differing from one another in the use of variants typically
associated with regional varieties? For example, is the distribution of the /æ/
in the speech of UP speakers showing similar patterns typically associated with
either the significant raising of [æ] characterized by the NCVS or the lowering
and retraction of [æ] characterized by the Canadian shift? This research ques-
tion is not restricted to a single linguistic variable but to all considered in this
thesis, and as such, this question essentially seeks to understand if, for certain
groups of linguistic variables, particular social groups are: 1) converging toward
the regional or substrate variants (e.g., a change-in-progress led by comparing
age groups in an apparent-time construct), 2) diverging away from substrate
variants (e.g., due to social pressures), or 3) remaining stable with relatively
equal use of potential variants.
(Table of Contents) 4 Ph.D Thesis 2014
Rankinen, W. CHAPTER 1. INTRODUCTION
1.2 Potential Outcomes
In regards to the first research question, there are several possible outcomes. As
this study examines two Finnish-heritage groups and one Italian-heritage group (i.e.,
further split by locale),3 as well as, two bilingual groups and one monolingual group
(i.e., further split by language-dominance),4 the investigation seeks to tease apart
the predictor variables of heritage-location and bilingualism to see if substrate
influences exist and to what degree they are present in the English variety spoken
by UP speakers across the Marquette County. The potential outcomes of this first
research question are spelled out below:
1. When comparing subject groups for heritage-location and bilingualism,
most linguistic variables, if not all of them, might show little to no statistical dif-
ference or correlation between linguistic and predictor variables. This outcome
may be indicative of the potential fact that, while perhaps a lingering substrate
influence might have been present at one time, such an influence is no longer
present in the English spoken by either monolingual or bilingual speakers for
this particular speech community. Additionally, the lack of linguistic differences
for heritage-location would indicate that such communities are much more
internally focused than what previous research suggests (Rankinen 2013b; Rem-
linger 2006; Simon 2005). Such an outcome in the data would validate the claim
that the once heterogeneous communities seem to have become more homoge-3The heritage-location variable is split into three levels because, while the Finns are located
throughout the county in both rural and urban areas, the Italians are largely found in only the moreurbanized, eastern areas of the county; see Chapter 3 for a thorough discussion of this predictorvariable.
4The bilingualism variable is split into three levels and restricted to older-aged speakers, sincein this community, there are older-aged UP residents with limited to no knowledge of their heritagelanguage, while the older-aged bilinguals in the community can be further divided in terms of whenEnglish was acquired as either their dominant language spoken in the home during early childhoodor learned only after entering grade school; see Chapter 3 for a thorough discussion of this predictorvariable.
(Table of Contents) 5 Ph.D Thesis 2014
Rankinen, W. CHAPTER 1. INTRODUCTION
neous, having integrated amongst themselves enough to homogenize even their
phonological vowel system; a type of linguistic phenomenon typically shown to
be largely below the speaker’s awareness (Konopka and Pierrehumbert 2014).
2. When comparing subject groups for heritage-location and bilingualism,
several linguistic variables might show statistical differences or correlations be-
tween linguistic and predictor variables, which may indicate a lingering, rather
than strong, substrate influence. This outcome may be indicative of the fact
that there still exists a certain amount of second language effects, from an
immigrant-heritage language, on the English variety spoken in Michigan’s UP.
Such an outcome in the data would validate the claim that heritage-location
within this speech community is: a) a valid and salient predictor category and
b) is potentially losing ground to dialect leveling pressures (i.e., the replacement
of substrate linguistic variables for more local norms shared by the larger speech
community).
3. When comparing subject groups for heritage-location and bilingualism,
several sets of linguistic variables might show statistical differences or correla-
tions between linguistic and predictor variables, which indicate a strong sub-
strate influence. This outcome may be indicative of the fact that there currently
exists a strong amount of second language effects on the English variety spo-
ken in Michigan’s UP. Such an outcome in the data would validate the claim
then that heritage-location within this speech community is a) a valid and
strongly salient predictor variable and b) is not likely succumbing to pressures
resulting in dialect leveling.
Regarding the second research question posed by this thesis, there are some other
possible outcomes as well. This study examines to see if the UP speakers as a speech
community, as characterized by the four predictor variables (i.e., excluding bilin-
(Table of Contents) 6 Ph.D Thesis 2014

Rankinen, W. CHAPTER 1. INTRODUCTION
gualism), are aligning with particular sets of linguistic variables associated with one
neighboring regional English variety or another. The investigation seeks to test if
exogenous influences exist and to what degree they are present in the English variety
spoken by UP speakers. The following potential outcomes are detailed below:
1. When comparing subject groups for heritage-location, age, sex and class,
there might not be any linguistic variables that show statistical differences or
correlations between the linguistic and predictor variables, which may indicate
the stability of the set of linguistic variables. Furthermore, this outcome would
suggest this speech community is relatively close-knit and homogenous, and
thus, may indicate a tendency toward being more resistant to potential exoge-
nous pressures.
2. When comparing subject groups for heritage-location, age, sex and class,
there might only be a few linguistic variables that show statistical differences or
correlations between the linguistic and predictor variables. This outcome may
indicate a preference toward the use or disuse of canonically salient regional vari-
ant(s) of particular variable(s). This might be indicative of a beginning stage
for a change-in-progress, where the use of new non-local norms in the commu-
nity is correlated with the factor of age (e.g. the raising of /æ/, fronting of
/A/ and lowering of /O/ among only the younger-aged speakers). In such
cases of change, the sociolinguistic trend of the change may be indicated by the
predictor variables of sex and class; in accordance with the general principles
of linguistic change supported by previous sociolinguistic research, women and
socioeconomic groups located in the middle of the social hierarchy of a speech
community have been shown to lead the use of the innovative variants (Labov
2001). While some groups may exhibit a preference for exogenous models of
diffusion at the beginning stages of a change-in-progress, there may be varying
(Table of Contents) 7 Ph.D Thesis 2014
Rankinen, W. CHAPTER 1. INTRODUCTION
degrees of resistance to such exogenous influences by particular groups within
the community due to various orientations toward local norms.
3. When comparing subject groups for heritage-location, age, sex and class,
there might be many linguistic variables showing statistical differences or corre-
lations between the linguistic and predictor variables. This would be indicative
of a strong preference toward the use or disuse of the variants of a particular
set of variables associated with a canonically salient regional variety (e.g., the
Canadian shift, low-back merger, /u/ fronting, and Canadian raising). If pre-
dictor variables of the heritage-location and age reveal differential effects,
this may indicate linguistic changes-in-progress or the propagation of innovative
variants by particular groups based upon ethnic-heritage or locale. Furthermore,
the predictor variables of sex and class will like indicate which of the social
groups are the most extreme users of the innovative linguistic forms and help
reveal the nature of the linguistic change-in-progress.
1.3 Outline of Thesis
Including the present chapter, this thesis is organized into eight chapters. The next
chapter, Chapter 2, examines the background of various fields of literature pertain-
ing to the socio-cultural development of the communities in Michigan’s Marquette
County, and in Michigan’s UP more generally, and the linguistic literature pertaining
to English varieties within and neighboring the Upper Midwest. Chapters 3 and 4
report on the methods and procedures used in the thesis. Chapter 5 presents the first
analysis of thesis investigating the predictor variables of heritage-location and
bilingualism in regards to the five sets of linguistic variables of interest. Chapter 6
presents the second analysis of these sets of linguistic variables restricted to the pre-
dictor variables of heritage-location, age, sex and class. Chapter 7 presents
(Table of Contents) 8 Ph.D Thesis 2014
Rankinen, W. CHAPTER 1. INTRODUCTION
the discussion of the findings reported in Chapters 5 and 6. The final chapter, Chap-
ter 8, concludes with a discussion of the contributions and limitations of the present
research, the continuation of this research and potential threads of future research.
(Table of Contents) 9 Ph.D Thesis 2014

CHAPTER 2
SOCIO-CULTURAL AND LINGUISTIC BACKGROUND
The Upper Peninsula (UP) of Michigan sits in a uniquely remote region of the United
States, juxtaposed between Wisconsin and three of the Great Lakes. It has a fasci-
nating history of economic and population growth and decline over the past hundred
and seventy years (1840s-2010s). As it is with many other mining and lumber com-
munities across the United States, the rise of this region’s economy and population
was due to the discovery of valuable natural resources (e.g., iron ore, copper) and
the industrialization of the mining and lumber sectors. The subsequent decline of
the economy, largely due to the depletion of these natural resources, and cultural
factors affecting succeeding generations (e.g., out-migration due to unemployment,
use of English over heritage languages, inter-marriage of ethnic heritage groups), has
ultimately had a dramatic effect on the development of the speech communities found
within the peninsula. The speech communities within the UP are under-documented;
however, this region’s unique socio-historical and -cultural situation has garnered
some attention from several sociologists, historians and several linguists in the past
five decades. In this section, I will provide brief expositions on the following: a)
Michigan’s UP history regarding the formation and development of its economy, cul-
ture and communities, and b) previous linguistic research in the UP English variety
and neighboring regional varieties.
10
Rankinen, W. CHAPTER 2. BACKGROUND
2.1 Michigan’s Upper Peninsula as a Region
2.1.1 Geological Position and Landscape
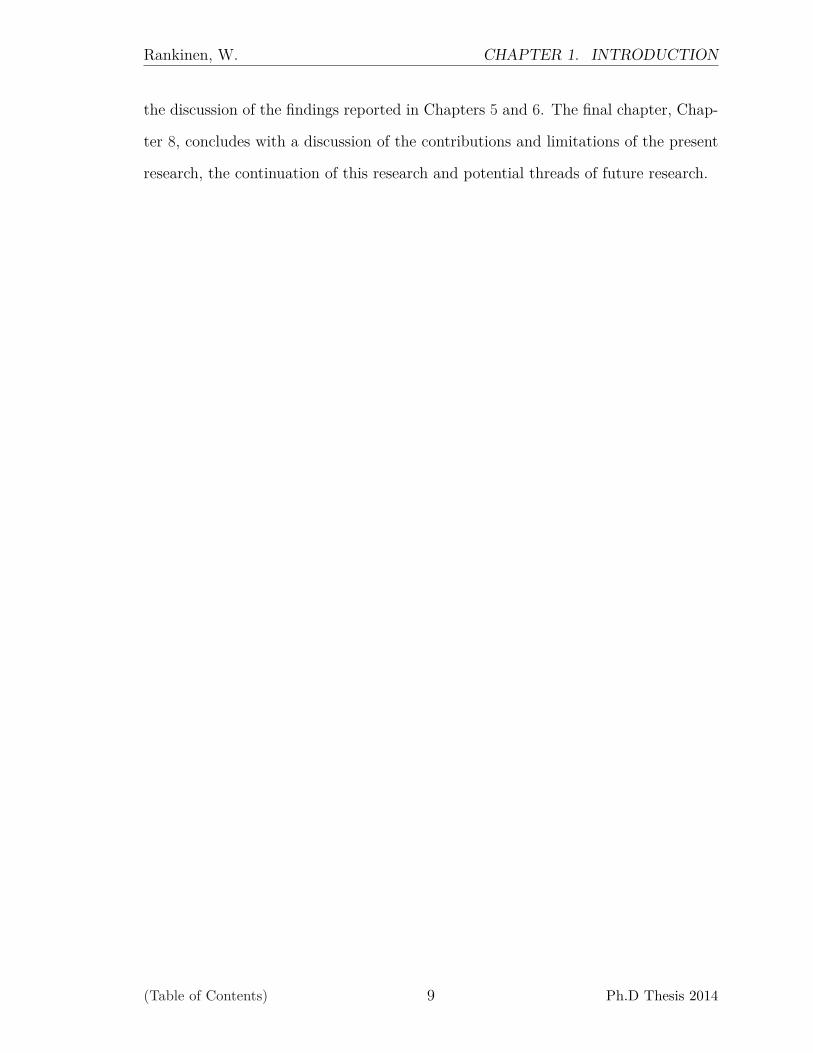
The distinctive profile of Michigan’s northern peninsula is a result of major glacial
shifts and processes that carved the geological landscape of the Great Lakes. Figure
2.1 displays Michigan’s UP in its adjacent geographical setting. Michigan’s northern-
most state border is shared with Wisconsin. Michigan’s UP juts out eastward and is
surrounded by three of the Great Lakes: Lake Superior to the north, Lake Michigan
to the south and Lake Huron to the west. At the northeastern tip of the peninsula,
the St. Mary’s River connects Lake Superior and Lake Huron. Similarly, the five-mile
wide waterway connecting Lake Huron and Lake Michigan is known as the Mackinac
Strait.
Figure 2.1: Michigan’s Upper PeninsulaPrior to the 1950s and 1960s, the
only way to gain access to Michigan’s
UP from the east was by waterway, rail-
way or air from Lower Michigan or On-
tario, Canada. As a result, most railway
and roadway traffic utilized Wisconsin-
bound routes. Nevertheless, shipping
lanes through the St. Mary’s River or
Mackinac Strait waterways have been
largely utilized by domestic and interna-
tional shipping traffic in the transporta-
tion of natural resources and manufactured goods to or from Duluth, Copper Harbor
or Marquette; a railroad bridge was built in 1880 to span the St. Mary’s River as
a land-transportational route between the northern peninsula and Ontario, Canada
(Table of Contents) 11 Ph.D Thesis 2014
Rankinen, W. CHAPTER 2. BACKGROUND
(MDOT 2014a). In addition to shipping lanes and railways, ferries were utilized as a
way to transport passengers and automobiles from either Lower Michigan or Ontario
Canada to Michigan’s UP (or vice versa). While waterways and railways are still uti-
lized today, the Mackinac Bridge built in 1957 and the International Bridge built in
1962 replaced the need for ferries and opened major thoroughfares for both domestic
and commercialized traffic (MDOT 2014b).
2.1.2 Development of the Highway System
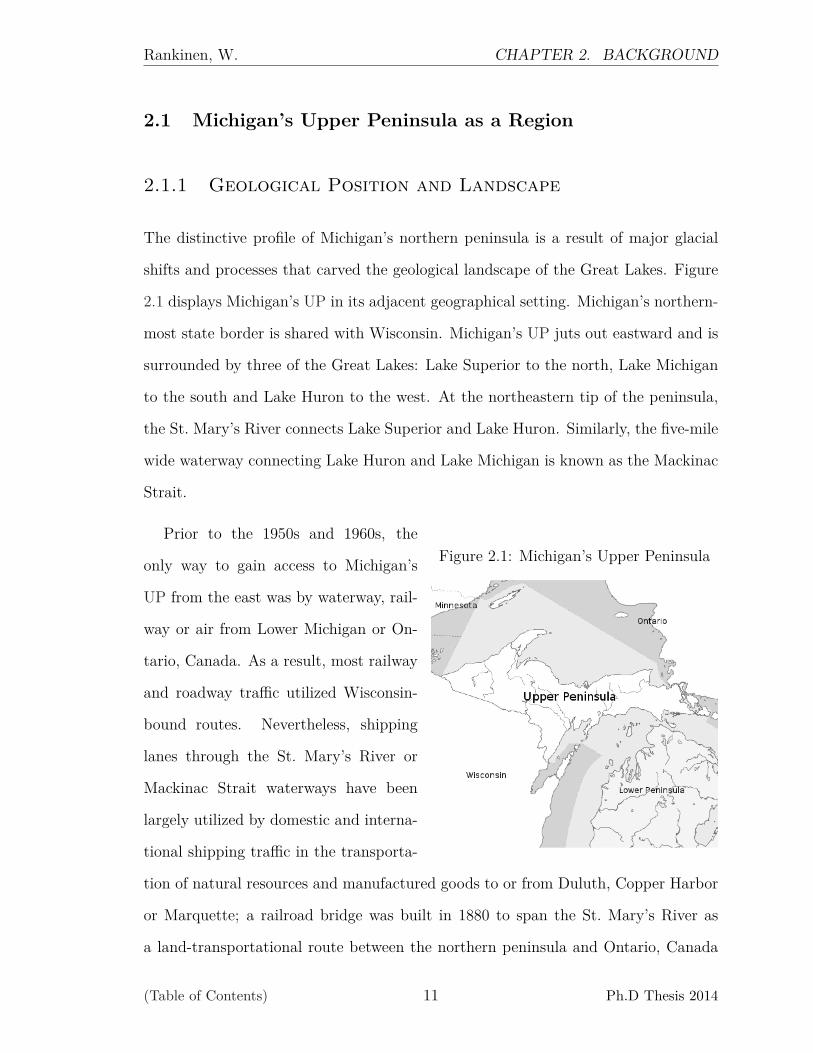
Figure 2.2: US41/M28 Highway Corridorin Michigan’s Marquette County
The town of Marquette is not only the largest urban center in the county (i.e.,
approximately 26,000), it is the largest urban center in the entire northern peninsula
of Michigan (US Census Bureau 2000).1 Local residents of Marquette County, living
outside of the city limits of Marquette, may travel forty-five miles or more (i.e., one-
way) to go shopping at the local mall (e.g., Westwood Mall) or department stores
(e.g., Wal-mart, Shopko), dine at local restaurants (e.g., Casa Calabria), or hang out
in the many parks and recreational sights along Lake Superior’s shoreline (e.g., ore1Sault St. Marie, Escanaba and Iron Mountain are the only other urban centers within the UP
that break the 10,000 mark for total population (US Census Bureau 2000).
(Table of Contents) 12 Ph.D Thesis 2014

Rankinen, W. CHAPTER 2. BACKGROUND
docks, parks). Many Marquette County residents, who work in Marquette, actually
live in other areas of the county in such towns as Negaunee or Ishpeming and in the
more rural townships as Ely, Humboldt, Michigamme and Republic. The majority
of these commuting locals take the US-41/M-28 Highway, which in fact, is a vital
traffic corridor from western to eastern Marquette County (i.e., from Michigamme
to Marquette). Figure 2.2 shows that the two highways, US-41 and M-28, span the
entire northern peninsula from the northern to the southern tip and from the western
to the eastern tip.
Figure 2.3: Michigan’s Marquette County,Townships and US-41/M-28 Corridor
In Figure 2.3, the merging of US-41 and M-28 in Marquette County is regarded
as the US-41/M-28 highway corridor. This corridor is a major route for both local
and non-local traffic to and from the prominent social centers in the county (i.e.,
(Table of Contents) 13 Ph.D Thesis 2014
Rankinen, W. CHAPTER 2. BACKGROUND
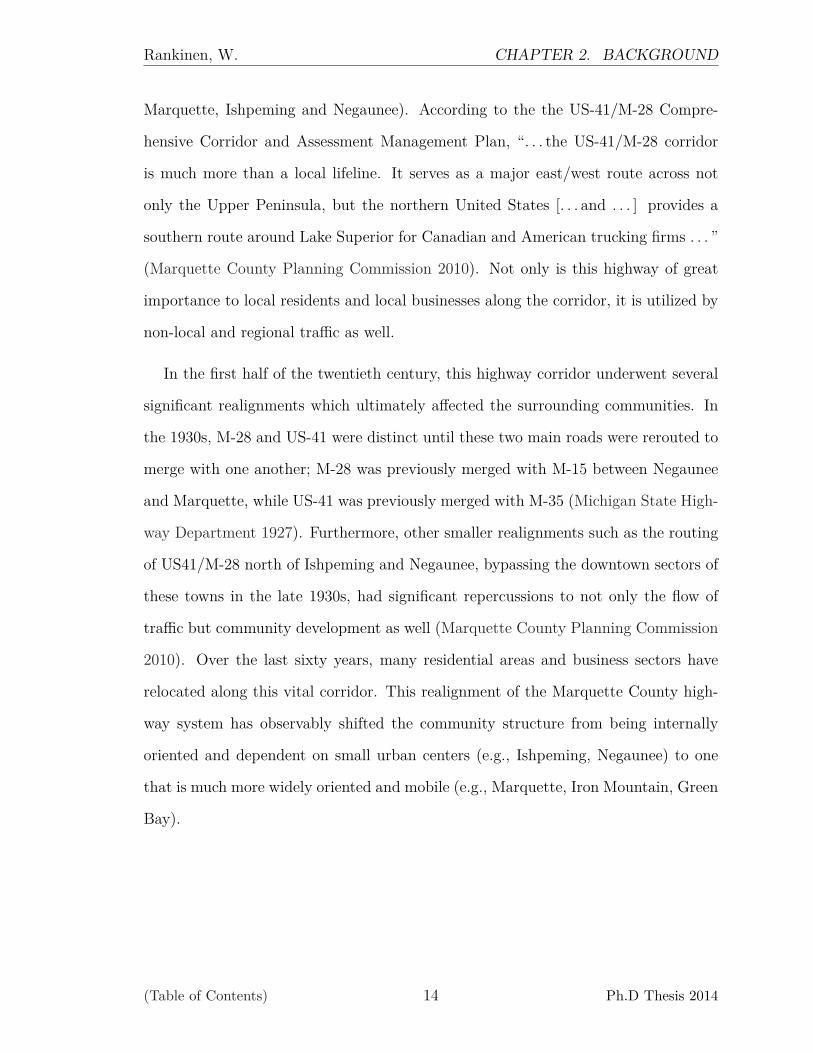
Marquette, Ishpeming and Negaunee). According to the the US-41/M-28 Compre-
hensive Corridor and Assessment Management Plan, “. . . the US-41/M-28 corridor
is much more than a local lifeline. It serves as a major east/west route across not
only the Upper Peninsula, but the northern United States [. . . and . . . ] provides a
southern route around Lake Superior for Canadian and American trucking firms . . . ”
(Marquette County Planning Commission 2010). Not only is this highway of great
importance to local residents and local businesses along the corridor, it is utilized by
non-local and regional traffic as well.
In the first half of the twentieth century, this highway corridor underwent several
significant realignments which ultimately affected the surrounding communities. In
the 1930s, M-28 and US-41 were distinct until these two main roads were rerouted to
merge with one another; M-28 was previously merged with M-15 between Negaunee
and Marquette, while US-41 was previously merged with M-35 (Michigan State High-
way Department 1927). Furthermore, other smaller realignments such as the routing
of US41/M-28 north of Ishpeming and Negaunee, bypassing the downtown sectors of
these towns in the late 1930s, had significant repercussions to not only the flow of
traffic but community development as well (Marquette County Planning Commission
2010). Over the last sixty years, many residential areas and business sectors have
relocated along this vital corridor. This realignment of the Marquette County high-
way system has observably shifted the community structure from being internally
oriented and dependent on small urban centers (e.g., Ishpeming, Negaunee) to one
that is much more widely oriented and mobile (e.g., Marquette, Iron Mountain, Green
Bay).
(Table of Contents) 14 Ph.D Thesis 2014

Rankinen, W. CHAPTER 2. BACKGROUND
2.1.3 Socio-cultural Relevance of
Immigration and Acculturation
The Upper Midwest, specifically northern Minnesota, Wisconsin and Michigan, has
historically been influenced by diverse immigration patterns. Michigan’s UP is by no
means an exception. Immigrants from European and Scandinavian countries began
settling in this northern peninsula around the mid-19th century, gradually tapering off
during the next hundred years. Multi-ethnic immigrant communities began cropping
up around mines and lumber camps after the discovery of valuable natural resources
such as copper and iron ore. Immigration has greatly affected the formation of UP
culture and history.
Ethnicity is an important concept, which is distinct from traditional social cat-
egories of age, sex and socioeconomic status, and will be an important factor to
consider throughout this thesis. This term here will refer strictly to the ancestral
heritage of speakers and may be referred to as ethnic-heritage (i.e., shortened to just
‘heritage” and discussed in greater detail in Chapter 3); more than a strict defini-
tion, Isajiwa (1985) points out the importance of operationalizing this extralinguistic
variable in order to better understand and index ethnolinguistic behavior. Further-
more, when referring to ethnic-heritage, this term remains distinct from — albeit
related to — the much more documented extralinguistic category of race which is
often addressed during the discussion of African-American English (Labov 1966) and
Latino-American English (Eckert 2008). Racial categories often denote social, cul-
tural and ancestral ties of a group of speakers and have been shown to be a more
sociolinguistically salient predictor variable, in comparison to ethnic-heritage, for doc-
umenting language variation and change (Labov 2008, 317; Boberg 2004, 540). Nev-
ertheless, subtle ethnolinguistic differences have been shown to exist among Irish,
Jewish and Italian Canadian communities in Montreal (Boberg 2004) and in Amer-
(Table of Contents) 15 Ph.D Thesis 2014
Rankinen, W. CHAPTER 2. BACKGROUND
ican communities located in Boston (Laferriere 1979), among Germans, Polish and
Italians immigrants in Buffalo (Carlock and Wolck 1981), and among speakers with
Italian and Jewish ancestry in New York City (Labov 2001); in contrast, of course,
there has been many other studies that have shown little to no trace of these dif-
ferences (Haugen 1969; Purnell et al. 2005). An ethnolect is regarded as a unique,
native variety of a language (e.g., English), which is spoken by the successive gener-
ations of immigrants and these speakers tend to acquire English at an early age even
when the immigrant-heritage language is spoken in the home; moreover, the English
variety “. . . often preserves unique features that distinguish them from the speech of
the wider community . . . (Boberg 2004, 539). This thesis offers a unique opportunity
to build upon the prior ethnolect literature that has examined Italian ancestry by
contrasting a comparable group of Italian-heritage UP speakers with a less common
studied ethnolect — one spoken by Finnish-Americans — in the Upper Midwest.
The Finnish-immigrant population has had the strongest influence on UP society,
as well as many other areas of the Upper Midwest. Although late in immigrating to
the region, a vast number of Finns settled in the peninsula in two waves from the
1880s to the 1920s (Kero 1969, 2014). In Marquette County, the Finnish were the
largest immigrant group in the towns of Marquette, Negaunee, Ishpeming, and other
neighboring towns of Palmer, Republic, and Michigamme. These immigrants formed
communities on the outskirts of the rural mining towns; Palmer, a small town located
south of the larger town of Negaunee, is an example of such a community that was
comprised mostly of residents claiming Finnish-heritage at approximately 90 percent
by the late 1960s (Holmio 2001). The Finns maintained public use of their language,
which, in addition to the size of the community, aided in the maintenance of the
Finnish language. The fact that the Finns owned businesses, held Finnish church
services, and ran Finnish newspapers up until the mid-20th century exhibits the
prevailing use of the Finnish language. (For a more thorough discussion of Finnish-
(Table of Contents) 16 Ph.D Thesis 2014
Rankinen, W. CHAPTER 2. BACKGROUND
American immigration history and impact on the community in Michigan’s Upper
Peninsula, please see Rankinen 2014).
Similar to the Finns, Italian immigrants began to make an appearance in the UP
during the 1880s and 1890s (Rudnicki 1987). By the turn of the century, the Italian
immigrant population was one of the largest ethnic groups in the iron mining towns of
Ishpeming and Negaunee. Many Italians began businesses in these developing towns
and formed large immigrant-heritage communities — often second in population size
only to the Finns (Sturgul 1987). Though a much smaller immigrant-American group
than the Finns, the Italian-American community is an excellent comparative group
to that of the Finnish-American community in the Marquette County. Even today,
both heritage-communities have actively participated in acknowledging their cultural
identity. The Italian and Finnish heritage pride is clearly and vibrantly celebrated
annually during the UP Finn Festival and Italian Festival.
The highest percentage of Finnish-Americans are geographically located primarily
in the western half of Michigan’s Upper Peninsula as described by Rankinen (2014)
using 2009-2013 US Bureau Census’ data. Italian-Americans, in contrast, tended to
settle in the more central regions of the peninsula, which includes the counties of
Dickinson, Delta and Marquette. Most importantly, Marquette County reports sig-
nificant populations of those claiming either Finnish- or Italian-heritage as their first,
and potentially their most salient, ethnic-heritage. Focusing on Marquette County,
many of the residents claiming Italian ancestry are located primarily in the city limits
and townships of Ishpeming and Negaunee, while those claiming Finnish ancestry are
more dispersed throughout the county and located in the much more rural townships
of Champion, Republic and Michigamme (US Census Bureau 2000). Table 2.1 below
reports on US census data of total populations and first ancestry reported (i.e., based
on the 2005-2009 estimates).2
2The 2005-2009 estimates were included in this table because 1) all subjects were interviewed
(Table of Contents) 17 Ph.D Thesis 2014
Rankinen, W. CHAPTER 2. BACKGROUND
Table 2.1: US Census Bureau statistics of total population byUP county (i.e., based on 2005-2009 Census estimates) and Ethnic-heritage (i.e., those
claiming Finnish (FA) and Italian (IA) as their first ethnic-heritage)
Counties inMichigan’s
UP
TotalPopulation
(TP) &Percentages
[for each UPcounty]
TP &Percentagesof FinnishAncestry[for each UP
county]
Percentagesof
FinnishAncestry
[relative to UP’sTP of FA]
TP &Percentages
of ItalianAncestry[for each UP
county]
PercentagesofItalian
Ancestry[relative to UP’s
TP of IA]
Houghton 35,214(1.4%)
11,062(31.4%)
30.1% 1,555(4.%)
9.8%
Marquette 65,298(21.1%)
11,014(16.9%)
29.9% 4,374(6.7%)
27.4%
Gogebic 16,193(5.2%)
2,523(15.6%)
6.9% 1,304(8.1%)
8.2%
Delta 37,413(12.1%)
2,033(5.4%)
5.5% 941(2.5%)
5.9%
Ontonagon 6,907(2.2%)
1,737(25.1%)
4.7% 141(2.0%)
0.9%
Baraga 8,650(2.8%)
1,713(19.8%)
4.7% 160(1.8%)
1.0%
Dickinson 27,003(8.7%)
1,461(5.4%)
4.0% 3,136(11.6%)
19.7%
Iron 11,923(3.9%)
1,188(10.0%)
3.2% 1,261(10.6%)
7.9%
Chippewa 38,700(12.5%)
1,097(2.8%)
3.0% 1,672(4.3%)
10.5%
Alger 9,512(3.1%)
1,036(10.9%)
2.8% 220(2.3%)
1.4%
Keweenaw 2,224(0.7%)
943(42.4%)
2.6% 69(3.1%)
0.4%
Menominee 24,230(7.8%)
378(1.6%)
1.0% 590(2.4%)
3.7%
Luce 6,645(2.1%)
247(3.7%)
0.7% 128(1.9%)
0.8%
Mackinac 10,871(3.5%)
241(2.2%)
0.7% 206(1.9%)
1.3%
Schoolcraft 8,413(2.7%)
120(1.4%)
0.3% 184(2.2%)
1.2%
Total 309,196 36,793 15,941
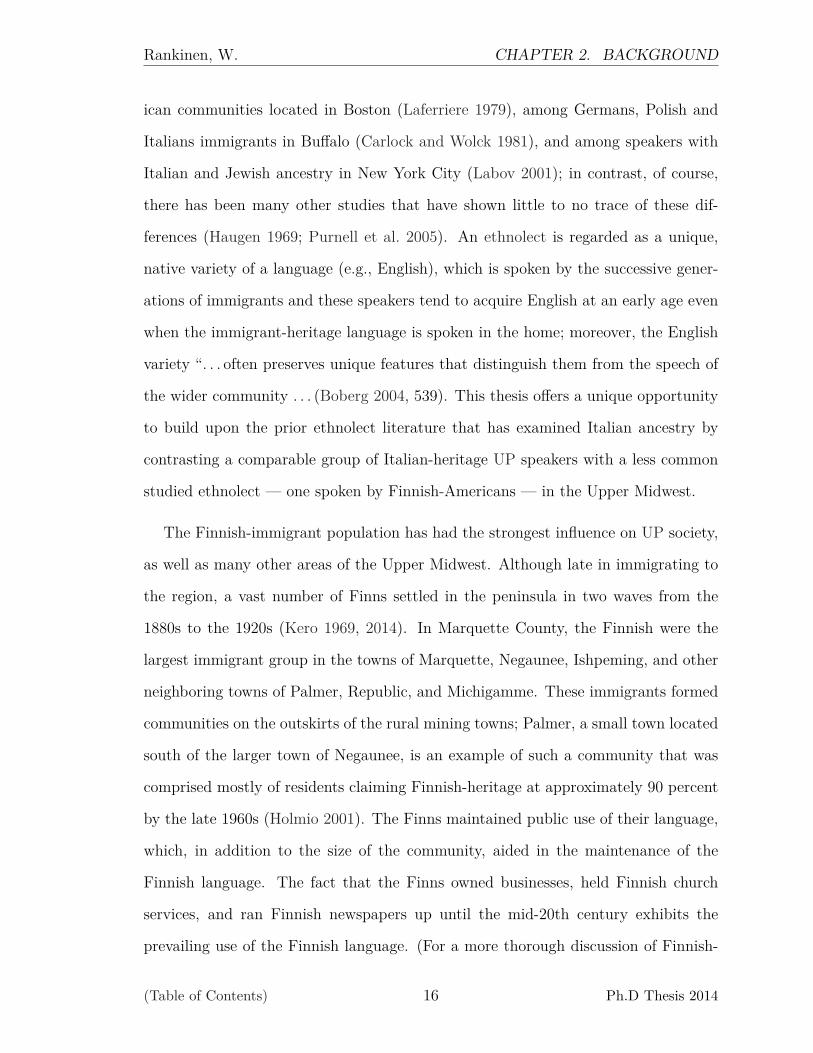
The counties in the far left column in Table 2.1 are in a descending order ac-
cording to the highest total population and percentages of Finnish ancestry relative
to each county’s total population. Of Marquette County’s total population (i.e.,
approximately 65,300 residents), 16.9% report Finnish as their first ethnic-heritage
(i.e., 11,014 residents), while 6.7% report Italian (i.e., 1,555 residents). Combining
all of the counties ethnic-heritage populations for the two groups, an estimate of
36,800 residents claim Finnish ancestry as their first ethnic-heritage of which 29.9%
of them reside within Marquette County; in contrast, 27.4% claiming Italian as their
during the summers of 2007 and 2008, and therefore, it potentially reflects more accurately the sam-pled population at the time of data collection, and 2) the 2005-2008 estimates provides comparableresults with the 2009-2013 estimates reported in Rankinen (2014).
(Table of Contents) 18 Ph.D Thesis 2014
Rankinen, W. CHAPTER 2. BACKGROUND
first ethnic-heritage reside in the Marquette County. While there are more residents
claiming Finnish-heritage in Marquette County, the two ethnic-heritage groups are
comparable relative to the total populations of each ethnic-heritage group for the
entire northern peninsula. While there are other European and non-European ances-
tral groups that exist in Marquette County (e.g., German, Swedish, French Canadian,
etc.), Finnish and Italian as ethnic-heritage groups are not only instantiated by their
population size - but also, as ethnic-heritage groups, they are among the few that
still vibrantly celebrate their ancestry at local festivals which legitimizes their sense
of identity within and among the local communities (Rankinen 2014; Remlinger 2006).
In addition to population size, the language that is used in the home is also an
important topic to consider with regards to Michigan’s Marquette County. According
to the 2009-2013 statistics reported in Rankinen (2014, 10), “. . . Of the 88.3% claim-
ing to be native-born residents of the county, the US Census reports only 2.4% of the
residents claim to speak another language in the home (i.e., other than English) and
only 1.1% of those residents claim to speak a language other than either an Indo-
European or an Asian and Pacific Island language; based on that small percentage of
potential Finnish [and Italian] bilinguals, 0.54% are estimated to be 65 years or older,
0.40% are estimated to be between 65 and 18 years old, and only 0.13% are estimated
to be between 17 and 5 years old” (US Census Bureau 2000). This is supported by
the 2005-2009 US Census estimates that approximately 94.7% of Marquette County’s
population are monolingual English speakers. Although the Finnish and Italian lan-
guages are still retained among a minority of the first and second-generation speakers
in these communities, Michigan’s UP should be regarded today as being a predomi-
nately monolingual English speaking community. However, this is not to say that the
present-day monolingual English speakers have escaped the influence of their cultural
or linguistic ethnic-heritage. In fact, the UP community is claimed to be distinct
in their cultural-identity and language from other neighboring regional communi-
(Table of Contents) 19 Ph.D Thesis 2014

Rankinen, W. CHAPTER 2. BACKGROUND
ties such as Canada and Lower Michigan. While Marquette County, and the Upper
Peninsula more generally, may not be unique in being a monolingual-oriented speech
community - it is however an excellent location to examine the potential lingering
substrate influences of two distinctly different ethnic-heritage groups on an American
variety of English spoken by both bilingual and monolingual speakers.
2.2 Previous Linguistic Research in the Region
2.2.1 American English in Michigan’s Upper Peninsula
Recent linguistic qualitative research has focused primarily on ethnographic concerns
(e.g., enregisterment, local identity, and regional and local perceptions (Remlinger
2006, 2007, 2009; Simon 2005). Similarly, the quantitative linguistic research exam-
ining this northern peninsula has been limited to only a handful of studies. Those
studies containing UP subjects have referred to them as either a rural community on
the marginal limits of the study or as a contrastive group; as a result of not focusing
on the linguistic characterization of the English language variety spoken in Michigan’s
UP, such studies have held subject pools of relatively small sample size and none of
them have examined the internal diffusion of a linguistic variable by investigating the
speech patterns of groups of speakers and comparing those patterns across social cat-
egories (Labov et al. 2006; Rakerd and Plichta 2010). There are three exceptions to
this claim: 1) an earlier dialectal research study conducted by Steward A. Kingsbury
and Zacharias Thundyil for the North Central atlas in the Linguistic Altas Project
(1945-1975), 2) an earlier dialect survey focusing on Finnish-heritage influence on
English conducted by Anita Adamson, and 3) a more recent sociophonetic study that
investigates the potential substrate and neighboring regional influences on the vowel
system of sixty-nine Michigan UP Finnish-Americans (Rankinen 2014).
(Table of Contents) 20 Ph.D Thesis 2014
Rankinen, W. CHAPTER 2. BACKGROUND
While the North Central atlas in the Linguistic Atlas Project (1945-1975) origi-
nally did not include speakers from Michigan’s Upper Peninsula, contributions from
Stewart A. Kingsbury, Zacharias Thundyil, and Joseph Peterson mark the earliest lin-
guistic investigation in the region (Allen and Underwood 1977, 179). This preliminary
dialectical work, initially presented by Peterson and Thundyil in 1971 at Michigan’s
Linguistic Society conference, reported on a wide-range of survey data that included
phonological, lexical and grammatical items; the survey sought to obtain residents
from each of the fifteen counties located in the peninsula (1971).
Peterson and Thundyil were not alone at making a debut of UP dialect research
in 1971. Anita Adamson, at the same Michigan Linguistic Society annual conference
that year, also presented on UP dialect survey data that she collected for a graduate
term paper. Unlike the wide-scope project done by Peterson and Thundyil, Adam-
son’s survey focused specifically on the speech of UP Finnish-heritage speakers from
the local dialect area in and around the town of Marquette, Michigan (1971). Three
generational groups (i.e., Finnish immigrants who migrated in the 1930s and 1940s,
first-generation UP residents whose parents were immigrants, and second-generation
UP residents whose grandparents were immigrants) were compared with a control
group (i.e., non-Finnish-heritage residents from Marquette with a diverse range of
occupational, social and economic categories) (1971, 6). Based on phonemic tran-
scription of single-word pronunciation of lexical items, Adamson concluded that the
second generation Finnish-heritage speakers pattern more similarly to the Finnish
immigrants than to those of the first generation. This claim is weakened, however,
due to the small number of subjects claiming to be immigrants in her study. While
the results and conclusions may be questioned, this study serves as the first attempt
toward examining generational effects of Finnish-heritage in the speech among Michi-
gan’s UP speakers, as well as, the first linguistic study to investigate the speech specific
to Michigan’s Marquette County.
(Table of Contents) 21 Ph.D Thesis 2014

Rankinen, W. CHAPTER 2. BACKGROUND
Results from my previous sociophonetic vowel system study (Rankinen 2014),
which examined sixty-nine Finnish-heritage UP English speakers from Michigan’s
Marquette County, suggests that there is a change-in-progress toward a set of linguis-
tic variables associated or shared with that of Canadian English speakers; this shift
is most pronounced in the vowels of younger-aged speakers compared to that of the
older- or middle-aged speakers. More specifically, the lowering and retraction of the
front lax vowels in conjunction with the presence of the low-back merger stands as
apparent-time evidence to support that the Canadian shift is being adopted by the
younger monolingual, and not the older bilingual, UP speakers.3
2.2.2 Substrate Systems in the Upper Midwest
The two substrate systems of interest are Finnish and Italian, both of which are
distinct from one another in terms of phonological inventory and system configuration.
The Finnish vowel system includes eight short and long vowel phonemes (i.e., /i/, /y/,
/e/, /ø/, /æ/, /A/, /o/, /u/), which forms a trapezoidal configuration (Wiik 1965);
limited dialect variation exists for Finnish vowels (Suomi et al. 2008). In contrast, the
Italian system is conservatively characterized as having seven vowel phonemes (i.e.,
/i/, /e/, /E/, /A/, /O/, /o/, /u/) and form a triangular configuration (Bertinetto and
Loporcaro 2005); however, there can be as many as eight and as low as five vowel
qualities, particularly among southern Italian dialects (Flege et al. 1999, 2976). The
triangular configuration of the Italian vowel system is structurally distinct compared
to the trapezoidal configuration of the Finnish and English systems (Flege et al. 1999,
1580; Escudero et al. 2014, 2978).3The middle-aged monolinguals’ front lax vowels (e.g., the /I/, /E/ and /æ/ vowels) are in-
between the older- and younger-aged counterparts.
(Table of Contents) 22 Ph.D Thesis 2014
Rankinen, W. CHAPTER 2. BACKGROUND
2.2.3 American English in the Upper Midwest
The vowel system characteristics in the American English speech communities located
in the western parts of the Upper Midwest also need to be addressed due to this area’s
proximity with Michigan’s UP, which together, comprise of the larger “transitional
region” as defined by Labov et al. (2006). As such, it is generally regarded as having
the low-back merger and slight /uw/-fronting but not the Canadian shift. In addition
to these sets of linguistic variables that indicate a variety, recent sociophonetic work
in the region report evidence of a monophthongized /ow/ variant preferred among
more rural communities in the Minnesota and Wisconsin areas (Allen 1973; Nguyen
2011; Rose 2006). However, the use of the monophthongized /ow/ variant is often
stigmatized and disfavored by those preferring the use of the standard diphthongal
variant (Nguyen 2011); further research is required to confirm such a claim and to
provide a more comprehensive account of this variable in general (e.g., larger sample
size of both urban and rural speech communities).
2.2.4 American English in the Lower Midwest
The geolinguistic region known as the “Inland North” is typically characterized by the
internal acoustic relationships between the vowels participating in the Northern Cities
Vowel Shift (NCVS) (Gordon 2000b; Konopka and Pierrehumbert 2014; Labov et al.
2006). The presence of EQ, ED and UD criteria in the vowel system of a speaker, as
characterized by Labov, is defined as being a fully shifted NCVS system: 1) the EQ
criteria stipulates that the relative position of the /æ/ and the /E/ must reverse so
that /æ/ is both higher and fronter than the /E/ vowel; 2) the ED criteria stipulates
that the /2/ is further back than the /A/ vowel; 3) the UD criteria stipulates that
the /E/ and the /æ/ vowels must be <375Hz in the F2 dimension from one another
(Table of Contents) 23 Ph.D Thesis 2014
Rankinen, W. CHAPTER 2. BACKGROUND
(Labov et al. 2006, 200-204). The Inland North, as defined by the full adoption of the
NCVS, is a region that spans from Bufflalo, New York to Milwaukee, Wisconsin. The
propagation of the set of linguistic variables associated with the NCVS tend to diffuse
from one urban center to another, after which they have the potential to disperse to
more rural regions (Labov 2011, 139).
Since the /A/ and the /O/ vowels are participating in the NCVS (i.e., fronting
relative to their canonical acoustic positions), they do remain phonologically distinct
from one another in the Inland North. Furthermore, the /ow/ vowel is characterized
as a typical short diphthong, and there is limited /uw/-fronting (i.e., <1500 Hz in
F2 value when following a coronal consonant and <1200 Hz when following a non-
coronal); this is reported in the speech of speakers located in the western part of
the Inland North and the North Central regions (Labov et al. 2006, 154-155). The
presence of /aw/-fronting (i.e., <1550 Hz) and the centralization of /aj/ (i.e., when
followed by a voiceless consonant) are also reported to be present in the region; the
latter one exists in areas such as Detroit and New York (Eckert 1996; Keyser 1963;
Labov et al. 2006).
Currently, the NCVS is not likely an influencing factor on the speech of UP English
speakers as reported by Rakerd and Plichta (2010). In their study, they compared
the vowel spaces of one speaker from Michigan’s UP and one speaker from Michi-
gan’s Lower Peninsula (LP). Based on this perceptual study, the two speakers were
recognized as having observably different systems. The relative position of the LP
speaker’s vowels were distinct from the UP speaker. The /æ/ vowel was in a low
position for the UP speaker, while the /æ/ and /E/ vowels for the LP speaker have
switched positions (i.e., Labov et al’s “EQ” factor stating that /æ/ is both more front
and higher than the /E/ vowel). The cot-caught merger existed in the vowel space of
the UP speaker. In contrast, this low-back vowel merger was not present in the LP
(Table of Contents) 24 Ph.D Thesis 2014
Rankinen, W. CHAPTER 2. BACKGROUND
speaker vowel space (i.e., as is characteristic of systems participating in the NCVS).
Note also that the LP speaker’s /E/ and /A/ vowels were relatively close in their F2
space, which is a general characteristic that is not shared with the UP speaker; this is
the “ED” criterion for the NCVS, which states that the /E/ vowel is less than 375Hz
further front than the /A/ vowel (Labov et al. 2006). At the present time of Rak-
erd and Plichta (2010)’s study, the NCVS is shown not to be a factor on Michigan’s
UP vowel system; however, future studies in the next few decades should revisit the
development of the NCVS in this region.
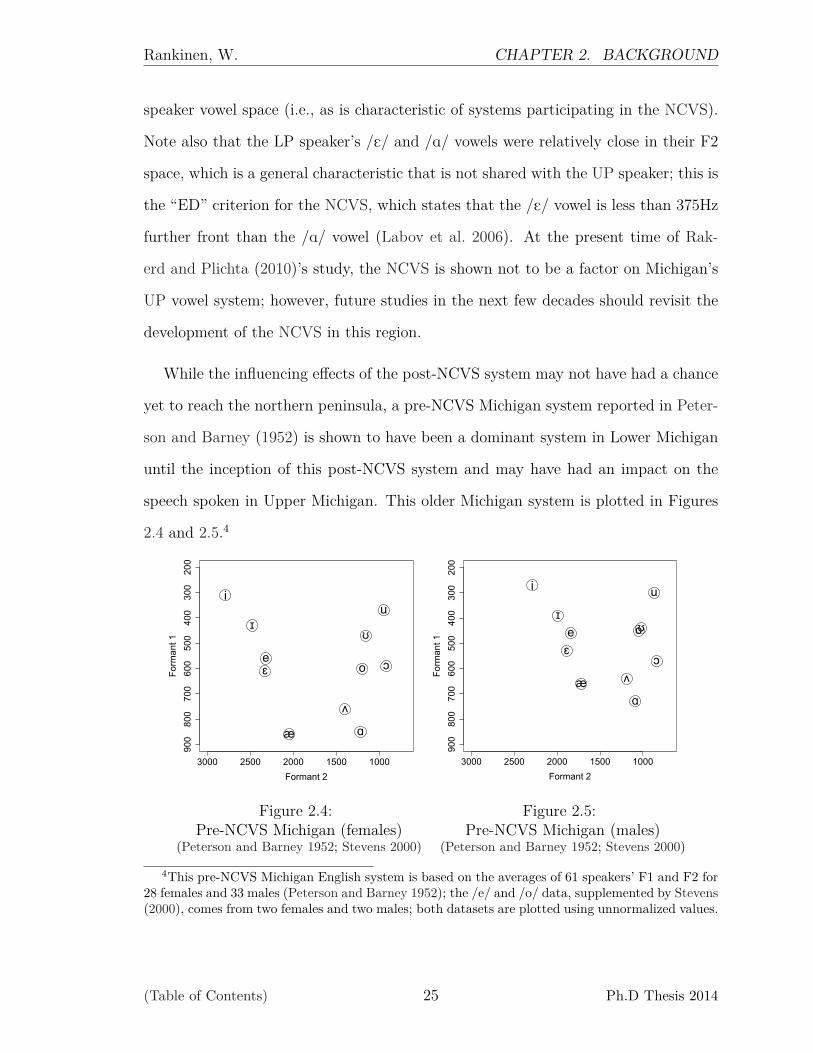
While the influencing effects of the post-NCVS system may not have had a chance
yet to reach the northern peninsula, a pre-NCVS Michigan system reported in Peter-
son and Barney (1952) is shown to have been a dominant system in Lower Michigan
until the inception of this post-NCVS system and may have had an impact on the
speech spoken in Upper Michigan. This older Michigan system is plotted in Figures
2.4 and 2.5.4
3000 2500 2000 1500 1000
900
800
700
600
500
400
300
200
Formant 2
Form
ant 1
i
ɪ
eɛ
æ ɑ
ʌ
ɔo
ʊ
u
Figure 2.4:Pre-NCVS Michigan (females)
(Peterson and Barney 1952; Stevens 2000)
3000 2500 2000 1500 1000
900
800
700
600
500
400
300
200
Formant 2
Form
ant 1
i
ɪeɛ
æɑ
ʌɔ
oʊ
u
Figure 2.5:Pre-NCVS Michigan (males)
(Peterson and Barney 1952; Stevens 2000)
4This pre-NCVS Michigan English system is based on the averages of 61 speakers’ F1 and F2 for28 females and 33 males (Peterson and Barney 1952); the /e/ and /o/ data, supplemented by Stevens(2000), comes from two females and two males; both datasets are plotted using unnormalized values.
(Table of Contents) 25 Ph.D Thesis 2014
Rankinen, W. CHAPTER 2. BACKGROUND
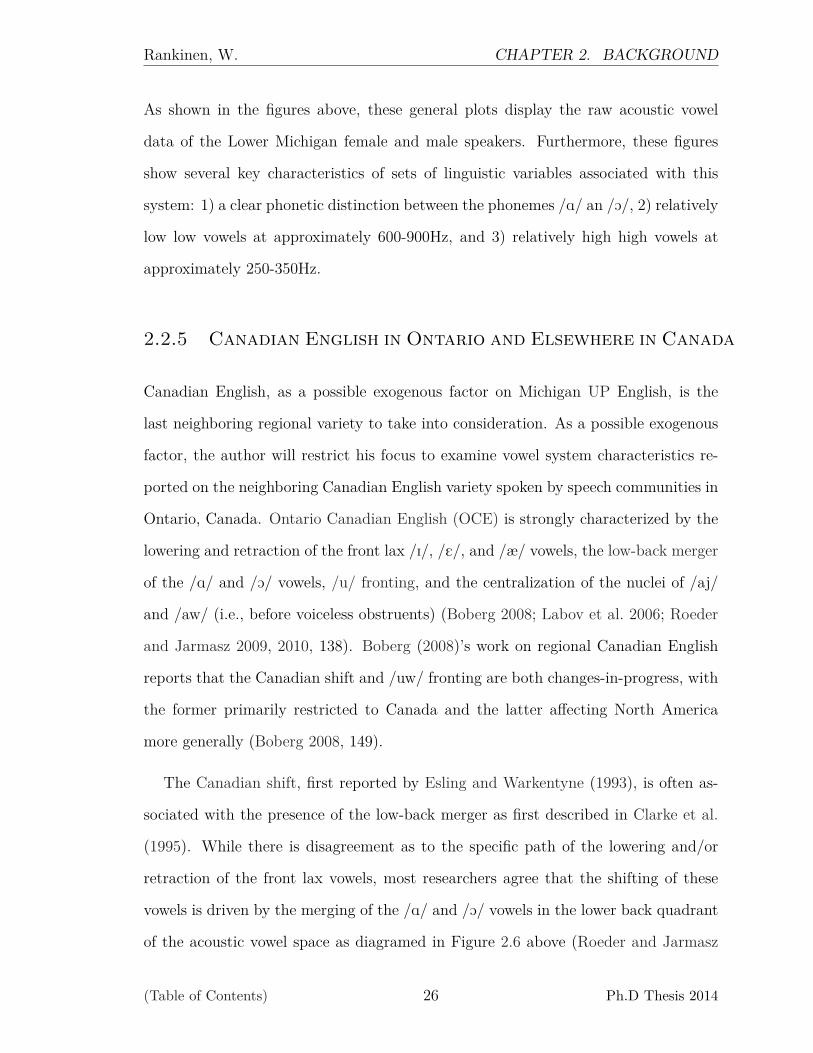
As shown in the figures above, these general plots display the raw acoustic vowel
data of the Lower Michigan female and male speakers. Furthermore, these figures
show several key characteristics of sets of linguistic variables associated with this
system: 1) a clear phonetic distinction between the phonemes /A/ an /O/, 2) relatively
low low vowels at approximately 600-900Hz, and 3) relatively high high vowels at
approximately 250-350Hz.
2.2.5 Canadian English in Ontario and Elsewhere in Canada
Canadian English, as a possible exogenous factor on Michigan UP English, is the
last neighboring regional variety to take into consideration. As a possible exogenous
factor, the author will restrict his focus to examine vowel system characteristics re-
ported on the neighboring Canadian English variety spoken by speech communities in
Ontario, Canada. Ontario Canadian English (OCE) is strongly characterized by the
lowering and retraction of the front lax /I/, /E/, and /æ/ vowels, the low-back merger
of the /A/ and /O/ vowels, /u/ fronting, and the centralization of the nuclei of /aj/
and /aw/ (i.e., before voiceless obstruents) (Boberg 2008; Labov et al. 2006; Roeder
and Jarmasz 2009, 2010, 138). Boberg (2008)’s work on regional Canadian English
reports that the Canadian shift and /uw/ fronting are both changes-in-progress, with
the former primarily restricted to Canada and the latter affecting North America
more generally (Boberg 2008, 149).
The Canadian shift, first reported by Esling and Warkentyne (1993), is often as-
sociated with the presence of the low-back merger as first described in Clarke et al.
(1995). While there is disagreement as to the specific path of the lowering and/or
retraction of the front lax vowels, most researchers agree that the shifting of these
vowels is driven by the merging of the /A/ and /O/ vowels in the lower back quadrant
of the acoustic vowel space as diagramed in Figure 2.6 above (Roeder and Jarmasz
(Table of Contents) 26 Ph.D Thesis 2014

Rankinen, W. CHAPTER 2. BACKGROUND
Figure 2.6:Schematic of the Canadian Shift and
the Low-Back Merger(Based upon a similar one developed
by Roeder and Jarmasz (2009))
(Table of Contents) 27 Ph.D Thesis 2014
Rankinen, W. CHAPTER 2. BACKGROUND
2009). This shift is shown to be occurring in much smaller and more rural speech
communities of OCE (De Decker and Mackenzie 2000). In other areas of Canada
(e.g., in such urban centers as Winnipeg and Montreal), the Canadian shift and the
low-back merger are also both shown to be present (Boberg 2005; Hagiwara 2006;
Labov et al. 2006).
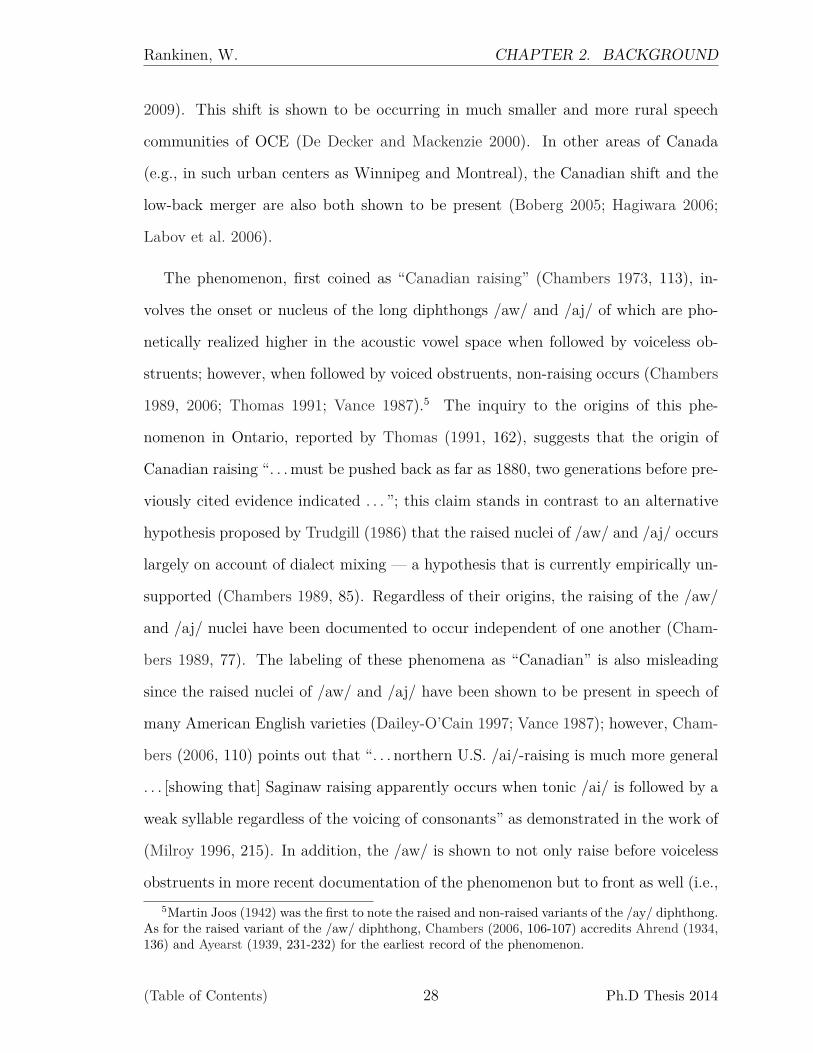
The phenomenon, first coined as “Canadian raising” (Chambers 1973, 113), in-
volves the onset or nucleus of the long diphthongs /aw/ and /aj/ of which are pho-
netically realized higher in the acoustic vowel space when followed by voiceless ob-
struents; however, when followed by voiced obstruents, non-raising occurs (Chambers
1989, 2006; Thomas 1991; Vance 1987).5 The inquiry to the origins of this phe-
nomenon in Ontario, reported by Thomas (1991, 162), suggests that the origin of
Canadian raising “. . . must be pushed back as far as 1880, two generations before pre-
viously cited evidence indicated . . . ”; this claim stands in contrast to an alternative
hypothesis proposed by Trudgill (1986) that the raised nuclei of /aw/ and /aj/ occurs
largely on account of dialect mixing — a hypothesis that is currently empirically un-
supported (Chambers 1989, 85). Regardless of their origins, the raising of the /aw/
and /aj/ nuclei have been documented to occur independent of one another (Cham-
bers 1989, 77). The labeling of these phenomena as “Canadian” is also misleading
since the raised nuclei of /aw/ and /aj/ have been shown to be present in speech of
many American English varieties (Dailey-O’Cain 1997; Vance 1987); however, Cham-
bers (2006, 110) points out that “. . . northern U.S. /ai/-raising is much more general
. . . [showing that] Saginaw raising apparently occurs when tonic /ai/ is followed by a
weak syllable regardless of the voicing of consonants” as demonstrated in the work of
(Milroy 1996, 215). In addition, the /aw/ is shown to not only raise before voiceless
obstruents in more recent documentation of the phenomenon but to front as well (i.e.,5Martin Joos (1942) was the first to note the raised and non-raised variants of the /ay/ diphthong.
As for the raised variant of the /aw/ diphthong, Chambers (2006, 106-107) accredits Ahrend (1934,136) and Ayearst (1939, 231-232) for the earliest record of the phenomenon.
(Table of Contents) 28 Ph.D Thesis 2014

Rankinen, W. CHAPTER 2. BACKGROUND
known as “/aw/-fronting”) (Easson 1997, 61; Rosenfelder 2005; Chambers 2006, 117);
this tends to be led by females and seems to be slowing down as a change-in-progress
in Canadian English more generally (Chambers 2006, 115). The low-back merger, the
Canadian shift, the Canadian raising and /aw/-fronting are all distinctive linguistic
phenomenon that characterize the English variety referred to in this thesis as Ontario
Canadian English.
In the next chapter, we will turn to the description and implementation of the
thesis’ methods and procedures.
(Table of Contents) 29 Ph.D Thesis 2014

CHAPTER 3
METHODS
3.1 The Sets of Linguistic Variables
This thesis examines five sets of linguistic variables, comprised of seven monoph-
thongal variables and four diphthongal variables. The first set of linguistic variables
(front lax vowels), participating in the Canadian shift or the California shift, in-
volves the three front lax /I/, /E/ and /æ/ vowels as in bit, bet and bat. The second
set of linguistic variables (low back vowels), typically regarded as the low-back
merger, involves the two low back /A/ and /O/ vowels as in cot and caught. The third
set of linguistic variables (high back vowels) involves the high back /U/ and /u/
vowels as in put and boot. The fourth set of linguistic variables (short diphthong
vowels) involves the /ej/ and /ow/ vowels as in bait and boat. The fifth set of linguis-
tic variables (long diphthong vowels) involves the /Aj/and /Aw/vowels bite and
bout. The subsequent sub-sections are organized by the sets of linguistic variables as
shown in Table 3.1, where potential variants of each linguistic variable (i.e., analyzed
separately) for each set of linguistic variables are described in detail.
30
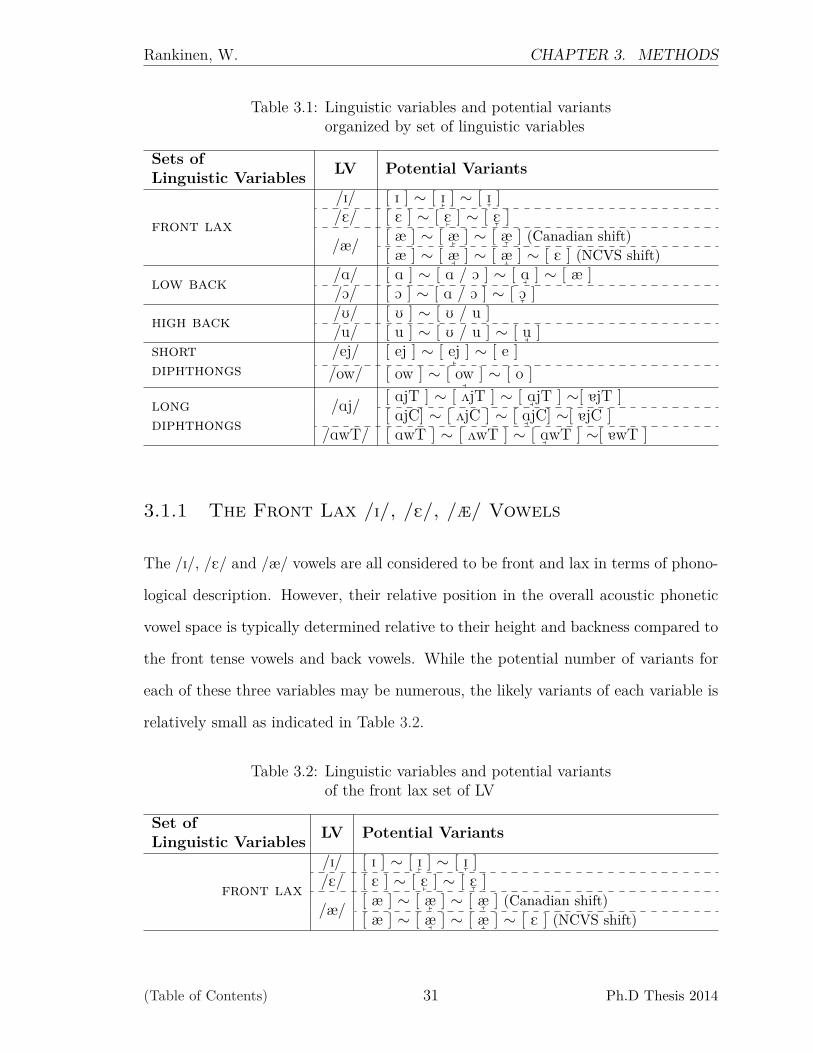
Rankinen, W. CHAPTER 3. METHODS
Table 3.1: Linguistic variables and potential variantsorganized by set of linguistic variables
Sets ofLinguistic Variables LV Potential Variants
front lax
/I/ [ I ] ∼ [ Iffl ] ∼ [ Ifl ]/E/ [ E ] ∼ [ Effl ] ∼ [ Efl ]
/æ/ [ æ ] ∼ [ æffl ] ∼ [ æfl ] (Canadian shift)[ æ ] ∼ [ æffi ] ∼ [ æfi ] ∼ [ E ] (NCVS shift)
low back /A/ [ A ] ∼ [ A / O ] ∼ [ Affi ] ∼ [ æ ]/O/ [ O ] ∼ [ A / O ] ∼ [ Ofl ]
high back /U/ [ U ] ∼ [ U / u ]/u/ [ u ] ∼ [ U / u ] ∼ [ uffi ]
shortdiphthongs
/ej/ [ ej ] ∼ [ ej ]ffl∼ [ e ]
/ow/ [ ow ] ∼ [ ow ]ffi∼ [ o ]
longdiphthongs
/Aj/ [ AjT ] ∼ [ 2jT ] ∼ [ AffijT ] ∼[ 5jT ][ AjC] ∼ [ 2jC ] ∼ [ AffijC] ∼[ 5jC ]
/AwT/ [ AwT ] ∼ [ 2wT ] ∼ [ AffiwT ] ∼[ 5wT ]
3.1.1 The Front Lax /I/, /E/, /æ/ Vowels
The /I/, /E/ and /æ/ vowels are all considered to be front and lax in terms of phono-
logical description. However, their relative position in the overall acoustic phonetic
vowel space is typically determined relative to their height and backness compared to
the front tense vowels and back vowels. While the potential number of variants for
each of these three variables may be numerous, the likely variants of each variable is
relatively small as indicated in Table 3.2.
Table 3.2: Linguistic variables and potential variantsof the front lax set of LV
Set ofLinguistic Variables LV Potential Variants
front lax
/I/ [ I ] ∼ [ Iffl ] ∼ [ Ifl ]/E/ [ E ] ∼ [ Effl ] ∼ [ Efl ]
/æ/ [ æ ] ∼ [ æffl ] ∼ [ æfl ] (Canadian shift)[ æ ] ∼ [ æffi ] ∼ [ æfi ] ∼ [ E ] (NCVS shift)
(Table of Contents) 31 Ph.D Thesis 2014
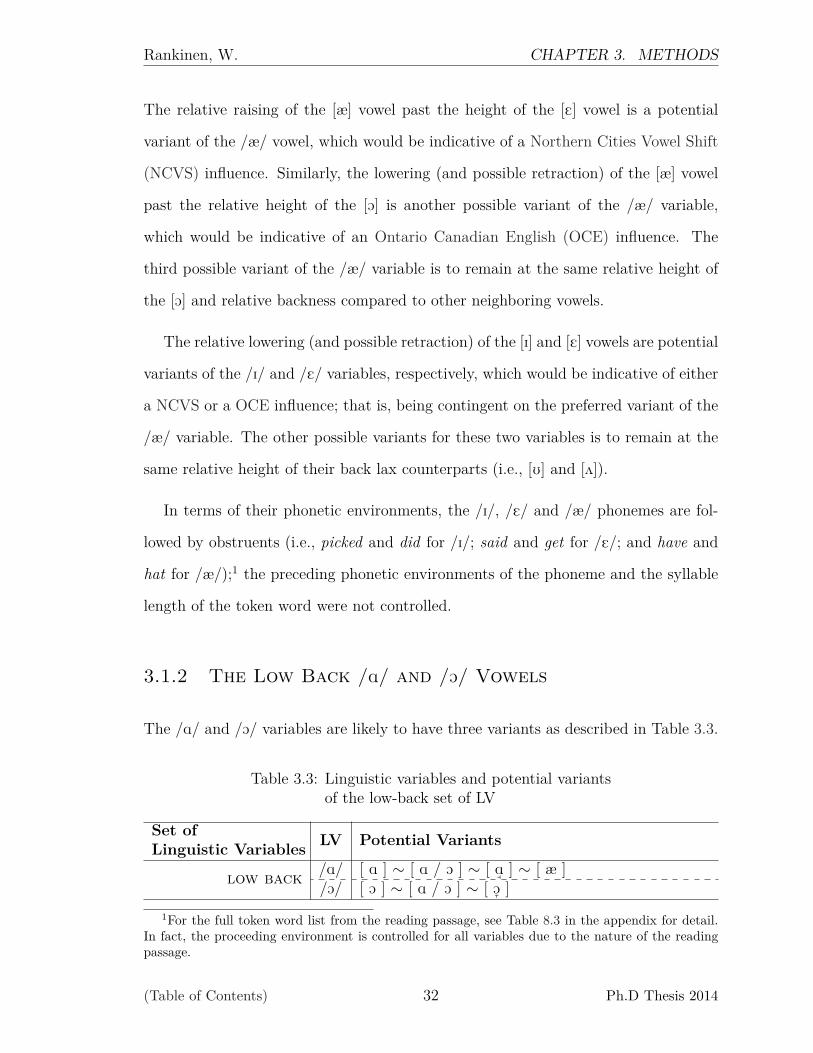
Rankinen, W. CHAPTER 3. METHODS
The relative raising of the [æ] vowel past the height of the [E] vowel is a potential
variant of the /æ/ vowel, which would be indicative of a Northern Cities Vowel Shift
(NCVS) influence. Similarly, the lowering (and possible retraction) of the [æ] vowel
past the relative height of the [O] is another possible variant of the /æ/ variable,
which would be indicative of an Ontario Canadian English (OCE) influence. The
third possible variant of the /æ/ variable is to remain at the same relative height of
the [O] and relative backness compared to other neighboring vowels.
The relative lowering (and possible retraction) of the [I] and [E] vowels are potential
variants of the /I/ and /E/ variables, respectively, which would be indicative of either
a NCVS or a OCE influence; that is, being contingent on the preferred variant of the
/æ/ variable. The other possible variants for these two variables is to remain at the
same relative height of their back lax counterparts (i.e., [U] and [2]).
In terms of their phonetic environments, the /I/, /E/ and /æ/ phonemes are fol-
lowed by obstruents (i.e., picked and did for /I/; said and get for /E/; and have and
hat for /æ/);1 the preceding phonetic environments of the phoneme and the syllable
length of the token word were not controlled.
3.1.2 The Low Back /A/ and /O/ Vowels
The /A/ and /O/ variables are likely to have three variants as described in Table 3.3.
Table 3.3: Linguistic variables and potential variantsof the low-back set of LV
Set ofLinguistic Variables LV Potential Variants
low back /A/ [ A ] ∼ [ A / O ] ∼ [ Affi ] ∼ [ æ ]/O/ [ O ] ∼ [ A / O ] ∼ [ Ofl ]
1For the full token word list from the reading passage, see Table 8.3 in the appendix for detail.In fact, the proceeding environment is controlled for all variables due to the nature of the readingpassage.
(Table of Contents) 32 Ph.D Thesis 2014

Rankinen, W. CHAPTER 3. METHODS
The [A] vowel can: a) retract relative to the vowel space (i.e., crowding the neighboring
acoustic space of the [O] vowel), b) advance relative to the vowel space (i.e., utilizing
the low central or low front vowel space if available), or c) remain in the relative
position of the low back vowel space. The [O] vowel can: a) lower to the low-back
vowel space (i.e., utilizing the empty acoustic space left by the [A] vowel), b) lower
relative to the vowel space (i.e., begin crowding the acoustic space already utilized
by the [A] vowel), or c) remain in the relative position distinct from the low back
vowel space. The phonetic environments of [A] and [O] were restricted to being either
followed by a consonant or located at syllable-final position (e.g., Bob for /A/ and
saw for /O/; see Table 8.3 in the appendix for details).
3.1.3 The High Back /U/ and /u/ Vowels
In Table 3.4 below, the /U/ and the /u/ variables have three likely variants.
Table 3.4: Linguistic variables and potential variantsof the high-back set of LV
Set ofLinguistic Variables LV Potential Variants
high back /U/ [ U ] ∼ [ U / u ] ∼ [ Uffi ]/u/ [ u ] ∼ [ U / u ] ∼ [ uffi ]
The [u] vowel can: a) advance relative to the vowel space (i.e., utilizing the empty
high central area of the acoustic vowel space), b) slightly advance and/or lower to
merge with its high back lax counterpart, or c) remain in the relative high back
position distinct from its lax counterpart. The [U] vowel can: a) advance relative to
the vowel space (i.e., patterning with the advancement of the [u] variant), b) retract
and/or raise relative to the vowel space (i.e., crowding the acoustic space already
utilized by the [u] vowel and potentially merge with the [u] vowel) or c) remain in
(Table of Contents) 33 Ph.D Thesis 2014
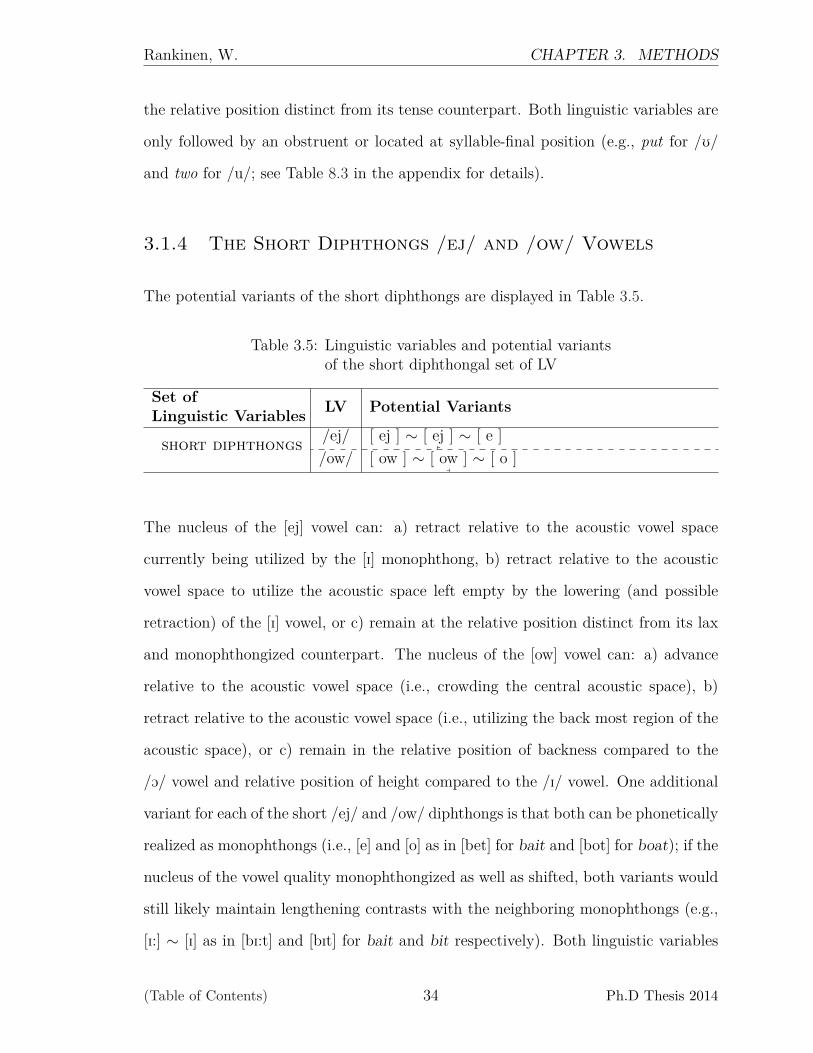
Rankinen, W. CHAPTER 3. METHODS
the relative position distinct from its tense counterpart. Both linguistic variables are
only followed by an obstruent or located at syllable-final position (e.g., put for /U/
and two for /u/; see Table 8.3 in the appendix for details).
3.1.4 The Short Diphthongs /ej/ and /ow/ Vowels
The potential variants of the short diphthongs are displayed in Table 3.5.
Table 3.5: Linguistic variables and potential variantsof the short diphthongal set of LV
Set ofLinguistic Variables LV Potential Variants
short diphthongs /ej/ [ ej ] ∼ [ ej ]ffl∼ [ e ]
/ow/ [ ow ] ∼ [ ow ]ffi∼ [ o ]
The nucleus of the [ej] vowel can: a) retract relative to the acoustic vowel space
currently being utilized by the [I] monophthong, b) retract relative to the acoustic
vowel space to utilize the acoustic space left empty by the lowering (and possible
retraction) of the [I] vowel, or c) remain at the relative position distinct from its lax
and monophthongized counterpart. The nucleus of the [ow] vowel can: a) advance
relative to the acoustic vowel space (i.e., crowding the central acoustic space), b)
retract relative to the acoustic vowel space (i.e., utilizing the back most region of the
acoustic space), or c) remain in the relative position of backness compared to the
/O/ vowel and relative position of height compared to the /I/ vowel. One additional
variant for each of the short /ej/ and /ow/ diphthongs is that both can be phonetically
realized as monophthongs (i.e., [e] and [o] as in [bet] for bait and [bot] for boat); if the
nucleus of the vowel quality monophthongized as well as shifted, both variants would
still likely maintain lengthening contrasts with the neighboring monophthongs (e.g.,
[I:] ∼ [I] as in [bI:t] and [bIt] for bait and bit respectively). Both linguistic variables
(Table of Contents) 34 Ph.D Thesis 2014

Rankinen, W. CHAPTER 3. METHODS
are only followed by an obstruent or located at syllable-final position (e.g., chased for
/ej/ and go for /ow/; see Table 8.3 in the appendix for details).
3.1.5 The Long Diphthongs /Aj/and /Aw/Vowels
The long /Aj/and /Aw/diphthongs are the last variables, and their respective variants,
to consider for this section. It is important to note first that /aj/ and /aw/ are both
constrained in their following phonetic environments in that they are only followed
by an obstruent. Furthermore, /aw/ is only followed by a voiceless segment (e.g.
house, out, (a)bout), while /aj/ is followed by both a voiced and voiceless obstruent
(e.g., slices, tried); whenever /Aj/ and /Aw/ are followed by a voiceless obstruent, the
phonetic realization will be presented with a “T”, and whenever /Aj/ is followed by a
voiced obstruent, the phonetic realization will be represented with a “C” as displayed
in Table 3.6 below.
Table 3.6: Linguistic variables and potential variantsof the long diphthongal set of LV
Set ofLinguistic Variables LV Potential Variants
long diphthongs /Aj/ [ AjT ] ∼ [ 2jT ] ∼ [ AffijT ] ∼[ 5jT ][ AjC] ∼ [ 2jC ] ∼ [ AffijC] ∼[ 5jC ]
/Aw/ [ AwT ] ∼ [ 2wT ] ∼ [ AffiwT ] ∼[ 5wT ]
The nuclei of the [AjT] and [AjC] diphthongs can: a) raise relative to the acoustic vowel
space and crowd the acoustic space already utilized by the /2/ vowel, b) advance
relative to the acoustic vowel space and utilize the low central acoustic space, c) raise
to the height of the /2/ and advance to the central vowel space, or d) remain in
the relative position of the /A/ monophthong. Similarly, the nucleus of the [AwT]
diphthong can: a) raise relative to the acoustic vowel space and crowd the acoustic
space already utilized by the /2/ vowel, b) advance relative to the acoustic vowel
(Table of Contents) 35 Ph.D Thesis 2014

Rankinen, W. CHAPTER 3. METHODS
space and utilize the low central acoustic space, c) raise to the height of the /2/ and
advance to the central vowel space, or d) remain in the relative position of the /A/
monophthong.2
3.2 The Speakers and Predictor Variables
This study includes a total of 130 participants, all of which are native to Michigan’s
Marquette County. Speech data obtained from each participant were collected during
the summers of 2007 and 2008. While the bilingual subset of this corpus is split
based on whether participants spoke their heritage language (i.e., Finnish or Italian)
or English first during their early childhood, both bilinguals and monolinguals alike
speak the American English variety spoken in the Upper Peninsula (UP) as their first,
second or only language. Additionally, each participant must have had at least one
grandparent who claimed full ancestry of either Finnish or Italian ethnic-heritage. In
addition to being native to the region of study, all participants spent the majority
of their lives in Michigan’s UP; “majority” means that they spent no more than five
years away from the peninsula. In the following subsections, a full description of the
heritage-location, bilingualism, age, sex and class predictor variables will
be provided.
The original corpus design was based on a stratified random sampling technique.
The predictor variables that stratify this original corpus included heritage, bilin-
gualism, age, sex, class. However, the present thesis will examine the predictor
variable of heritage (i.e., Finnish- or Italian-heritage) as it correlates with the pre-
dictor variable of location (i.e., the geolocation of participants based on residency).2While it is possible that these diphthongs could monophthongize, it is not likely due to their
distinctive trajectory and durational patterns for marking lexical contrasts and a lack of any neigh-boring regional variety that has the monophthongization variants of these long diphthongs (i.e.,American English in Pittsburgh or the U.S. South would be the closest regional varieties, but bothare unlikely to have any influence on UP English).
(Table of Contents) 36 Ph.D Thesis 2014
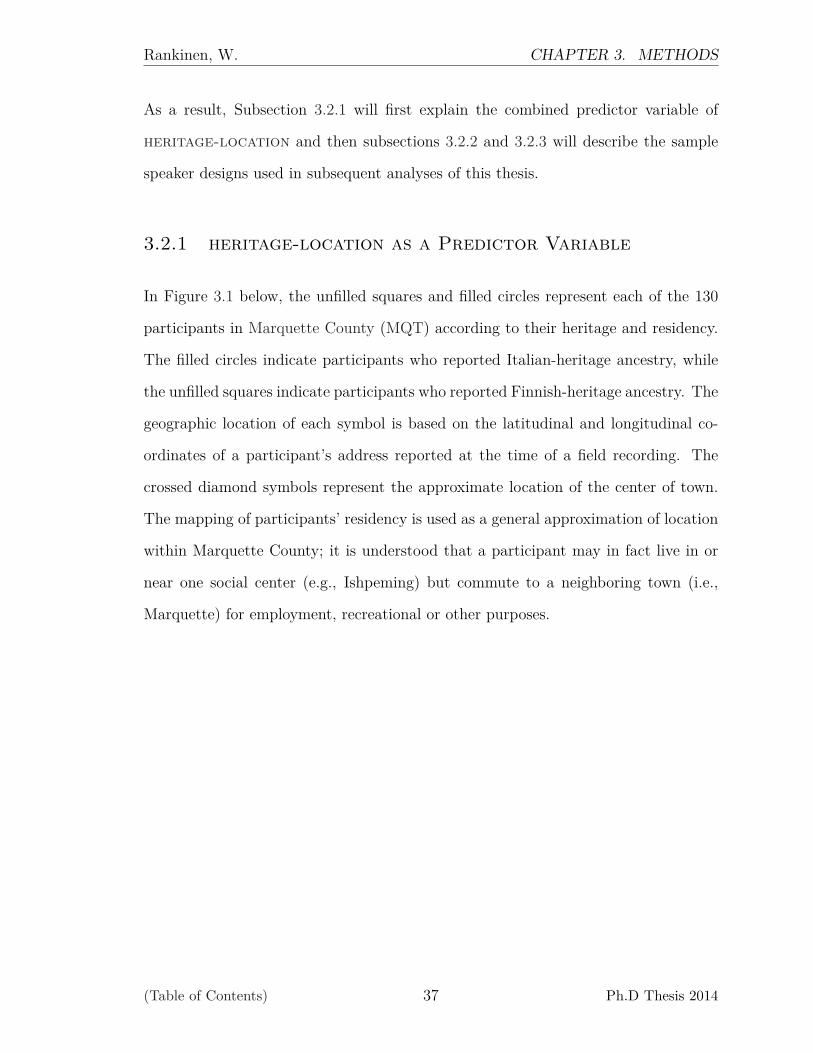
Rankinen, W. CHAPTER 3. METHODS
As a result, Subsection 3.2.1 will first explain the combined predictor variable of
heritage-location and then subsections 3.2.2 and 3.2.3 will describe the sample
speaker designs used in subsequent analyses of this thesis.
3.2.1 heritage-location as a Predictor Variable
In Figure 3.1 below, the unfilled squares and filled circles represent each of the 130
participants in Marquette County (MQT) according to their heritage and residency.
The filled circles indicate participants who reported Italian-heritage ancestry, while
the unfilled squares indicate participants who reported Finnish-heritage ancestry. The
geographic location of each symbol is based on the latitudinal and longitudinal co-
ordinates of a participant’s address reported at the time of a field recording. The
crossed diamond symbols represent the approximate location of the center of town.
The mapping of participants’ residency is used as a general approximation of location
within Marquette County; it is understood that a participant may in fact live in or
near one social center (e.g., Ishpeming) but commute to a neighboring town (i.e.,
Marquette) for employment, recreational or other purposes.
(Table of Contents) 37 Ph.D Thesis 2014
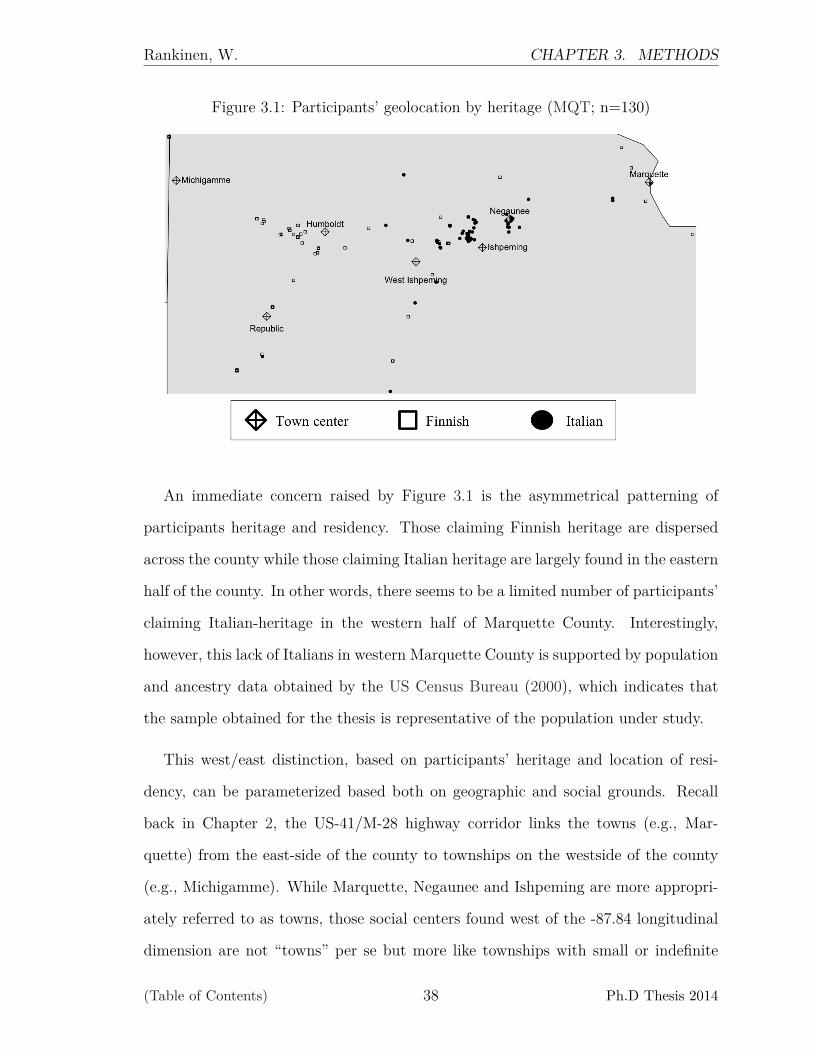
Rankinen, W. CHAPTER 3. METHODS
Figure 3.1: Participants’ geolocation by heritage (MQT; n=130)
An immediate concern raised by Figure 3.1 is the asymmetrical patterning of
participants heritage and residency. Those claiming Finnish heritage are dispersed
across the county while those claiming Italian heritage are largely found in the eastern
half of the county. In other words, there seems to be a limited number of participants’
claiming Italian-heritage in the western half of Marquette County. Interestingly,
however, this lack of Italians in western Marquette County is supported by population
and ancestry data obtained by the US Census Bureau (2000), which indicates that
the sample obtained for the thesis is representative of the population under study.
This west/east distinction, based on participants’ heritage and location of resi-
dency, can be parameterized based both on geographic and social grounds. Recall
back in Chapter 2, the US-41/M-28 highway corridor links the towns (e.g., Mar-
quette) from the east-side of the county to townships on the westside of the county
(e.g., Michigamme). While Marquette, Negaunee and Ishpeming are more appropri-
ately referred to as towns, those social centers found west of the -87.84 longitudinal
dimension are not “towns” per se but more like townships with small or indefinite
(Table of Contents) 38 Ph.D Thesis 2014
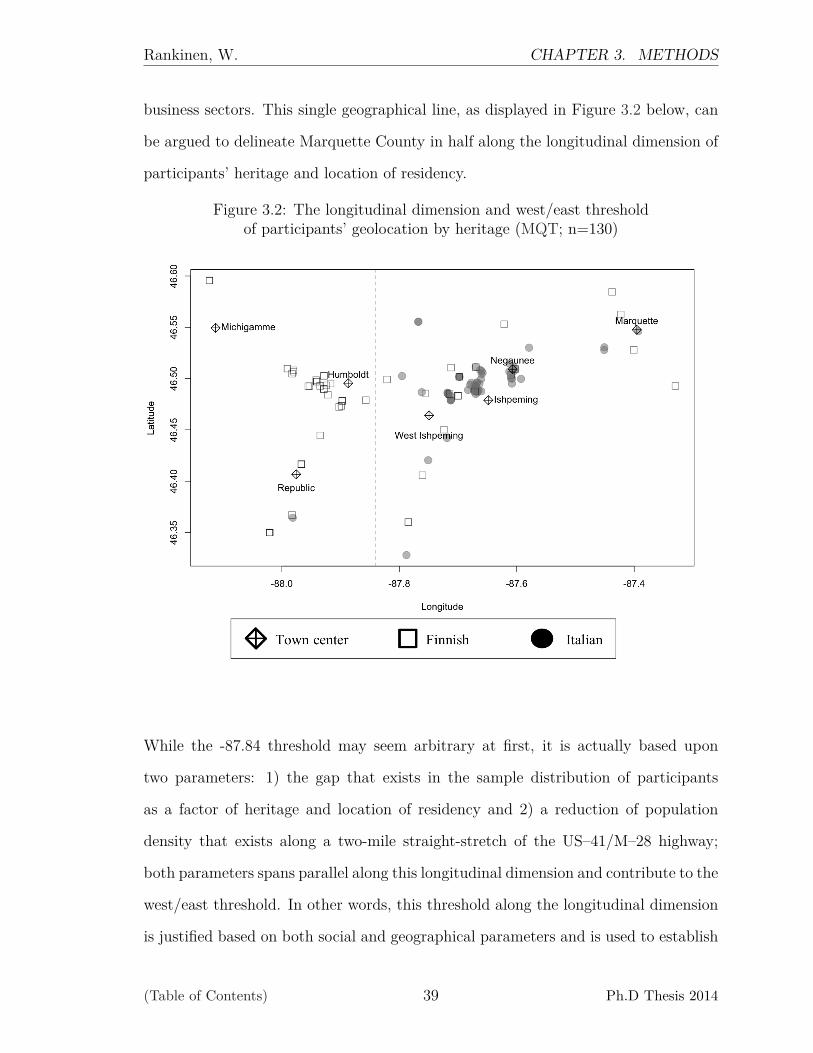
Rankinen, W. CHAPTER 3. METHODS
business sectors. This single geographical line, as displayed in Figure 3.2 below, can
be argued to delineate Marquette County in half along the longitudinal dimension of
participants’ heritage and location of residency.
Figure 3.2: The longitudinal dimension and west/east thresholdof participants’ geolocation by heritage (MQT; n=130)
While the -87.84 threshold may seem arbitrary at first, it is actually based upon
two parameters: 1) the gap that exists in the sample distribution of participants
as a factor of heritage and location of residency and 2) a reduction of population
density that exists along a two-mile straight-stretch of the US–41/M–28 highway;
both parameters spans parallel along this longitudinal dimension and contribute to the
west/east threshold. In other words, this threshold along the longitudinal dimension
is justified based on both social and geographical parameters and is used to establish
(Table of Contents) 39 Ph.D Thesis 2014
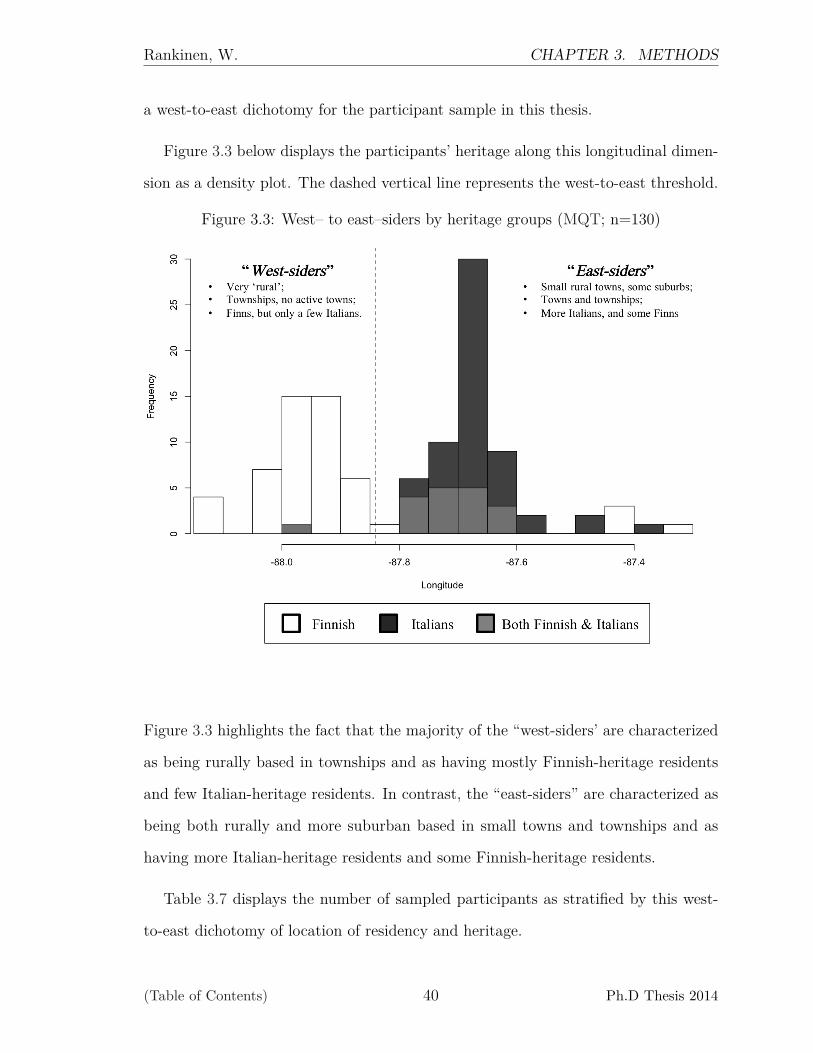
Rankinen, W. CHAPTER 3. METHODS
a west-to-east dichotomy for the participant sample in this thesis.
Figure 3.3 below displays the participants’ heritage along this longitudinal dimen-
sion as a density plot. The dashed vertical line represents the west-to-east threshold.
Figure 3.3: West– to east–siders by heritage groups (MQT; n=130)
Figure 3.3 highlights the fact that the majority of the “west-siders’ are characterized
as being rurally based in townships and as having mostly Finnish-heritage residents
and few Italian-heritage residents. In contrast, the “east-siders” are characterized as
being both rurally and more suburban based in small towns and townships and as
having more Italian-heritage residents and some Finnish-heritage residents.
Table 3.7 displays the number of sampled participants as stratified by this west-
to-east dichotomy of location of residency and heritage.
(Table of Contents) 40 Ph.D Thesis 2014
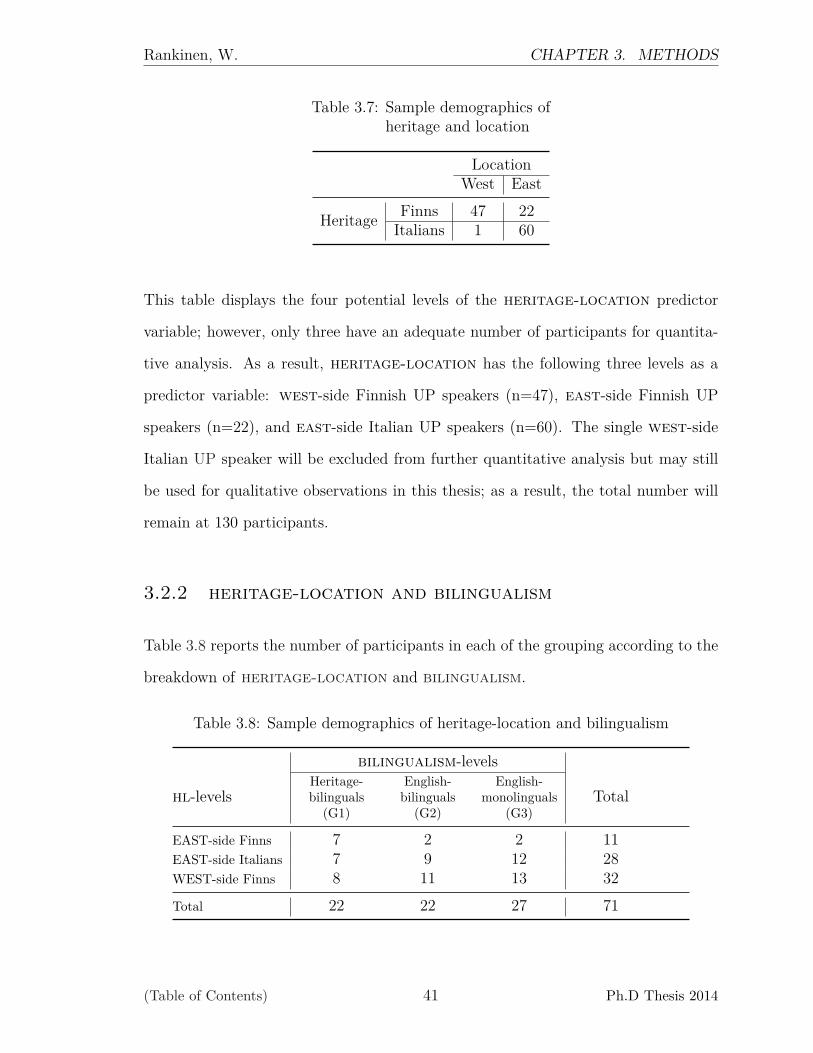
Rankinen, W. CHAPTER 3. METHODS
Table 3.7: Sample demographics ofheritage and location
LocationWest East
Heritage Finns 47 22Italians 1 60
This table displays the four potential levels of the heritage-location predictor
variable; however, only three have an adequate number of participants for quantita-
tive analysis. As a result, heritage-location has the following three levels as a
predictor variable: west-side Finnish UP speakers (n=47), east-side Finnish UP
speakers (n=22), and east-side Italian UP speakers (n=60). The single west-side
Italian UP speaker will be excluded from further quantitative analysis but may still
be used for qualitative observations in this thesis; as a result, the total number will
remain at 130 participants.
3.2.2 heritage-location and bilingualism
Table 3.8 reports the number of participants in each of the grouping according to the
breakdown of heritage-location and bilingualism.
Table 3.8: Sample demographics of heritage-location and bilingualism
bilingualism-levels
hl-levelsHeritage-bilinguals
(G1)
English-bilinguals
(G2)
English-monolinguals
(G3)Total
EAST-side Finns 7 2 2 11EAST-side Italians 7 9 12 28WEST-side Finns 8 11 13 32Total 22 22 27 71
(Table of Contents) 41 Ph.D Thesis 2014
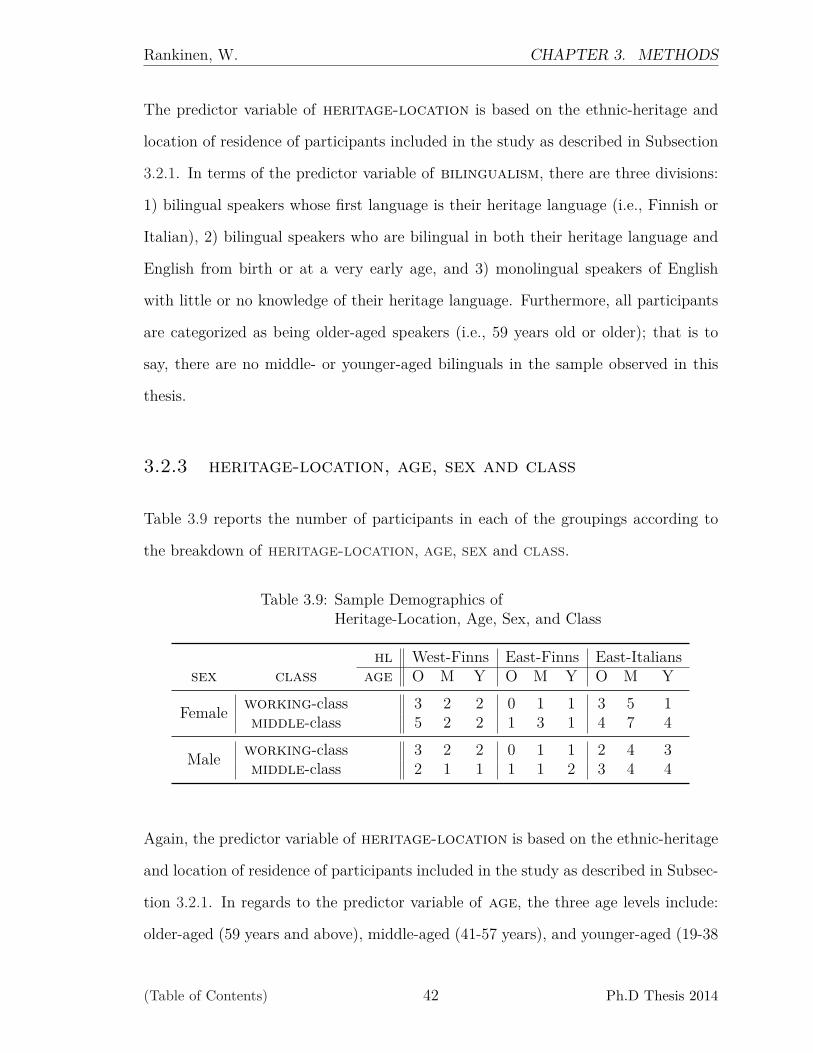
Rankinen, W. CHAPTER 3. METHODS
The predictor variable of heritage-location is based on the ethnic-heritage and
location of residence of participants included in the study as described in Subsection
3.2.1. In terms of the predictor variable of bilingualism, there are three divisions:
1) bilingual speakers whose first language is their heritage language (i.e., Finnish or
Italian), 2) bilingual speakers who are bilingual in both their heritage language and
English from birth or at a very early age, and 3) monolingual speakers of English
with little or no knowledge of their heritage language. Furthermore, all participants
are categorized as being older-aged speakers (i.e., 59 years old or older); that is to
say, there are no middle- or younger-aged bilinguals in the sample observed in this
thesis.
3.2.3 heritage-location, age, sex and class
Table 3.9 reports the number of participants in each of the groupings according to
the breakdown of heritage-location, age, sex and class.
Table 3.9: Sample Demographics ofHeritage-Location, Age, Sex, and Class
hl West-Finns East-Finns East-Italianssex class age O M Y O M Y O M Y
Female working-class 3 2 2 0 1 1 3 5 1middle-class 5 2 2 1 3 1 4 7 4
Male working-class 3 2 2 0 1 1 2 4 3middle-class 2 1 1 1 1 2 3 4 4
Again, the predictor variable of heritage-location is based on the ethnic-heritage
and location of residence of participants included in the study as described in Subsec-
tion 3.2.1. In regards to the predictor variable of age, the three age levels include:
older-aged (59 years and above), middle-aged (41-57 years), and younger-aged (19-38
(Table of Contents) 42 Ph.D Thesis 2014
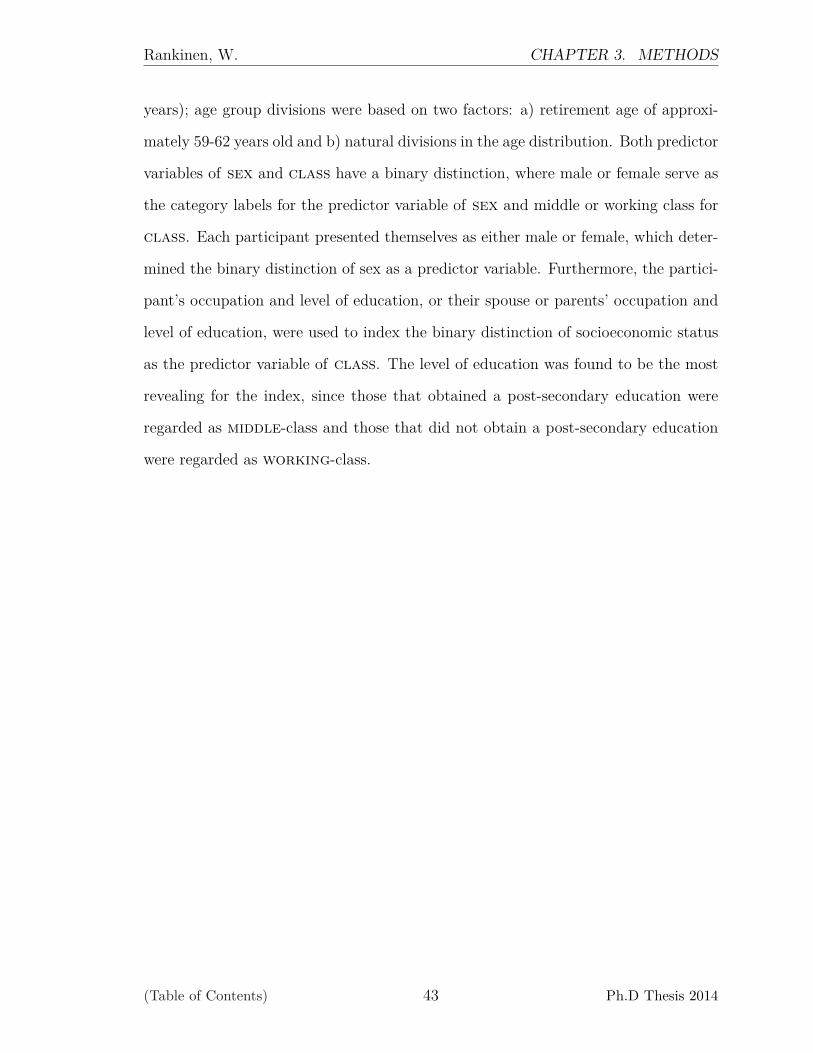
Rankinen, W. CHAPTER 3. METHODS
years); age group divisions were based on two factors: a) retirement age of approxi-
mately 59-62 years old and b) natural divisions in the age distribution. Both predictor
variables of sex and class have a binary distinction, where male or female serve as
the category labels for the predictor variable of sex and middle or working class for
class. Each participant presented themselves as either male or female, which deter-
mined the binary distinction of sex as a predictor variable. Furthermore, the partici-
pant’s occupation and level of education, or their spouse or parents’ occupation and
level of education, were used to index the binary distinction of socioeconomic status
as the predictor variable of class. The level of education was found to be the most
revealing for the index, since those that obtained a post-secondary education were
regarded as middle-class and those that did not obtain a post-secondary education
were regarded as working-class.
(Table of Contents) 43 Ph.D Thesis 2014
CHAPTER 4
PROCEDURES
This chapter examines the specific procedures used in the collection, extraction, nor-
malization and analysis of vowel data. Section 4.1 describes the speech stimuli; all
data is obtained from a reading passage. The extraction and handling of data are
critical stages of any sociophonetic study, and as such, the present chapter will give a
thorough explanation of the models behind the formant extraction and the normal-
ization procedures used in this thesis. Section 4.2 describes the formant extraction
procedure used in this thesis, which is referred to as the pivot method and is non-
traditional in nature; to give validity to its use, this alternative formant extraction
procedure undergoes a three pair-wise comparison with two additional traditional
methods (i.e., manual method and fixed method for formant extraction). Sec-
tion 4.3 describes the normalization procedure used, which follows a version of Labov’s
Atlas of North American English (ANAE) algorithm (i.e., uses a data internal grand
mean and is speaker-, vowel- and formant-extrinsic in nature). Finally, Section 4.4
briefly describes the statistical tests used to determine correlations of the formant
and durational measurements of vowels and the predictor variables under investiga-
tion (e.g., MANOVA, ANOVA, independent and dependent Student’s t-Tests, CoV).0The novel formant extraction procedure described in this chapter and used in the obtainment
of vowel formant data presented in the thesis is a result of collaborative work between Aaron Albinand Wil Rankinen (Albin and Rankinen 2012; Rankinen 2013a).
44

Rankinen, W. CHAPTER 4. PROCEDURES
4.1 Speech Stimuli
All data were collected from fieldwork recordings during the summers of 2007 and
2008. The present author is the sole fieldworker for all interviews. As a native to
Michigan’s Upper Peninsula (UP), the author had access to a variety of community
networks in Michigan’s Marquette County. The author knew the speakers personally
for several of the interviews, however most often he was introduced as a “friend of a
friend”. The environment varied for each interview, though considerable effort was
made to conduct the interview in a quiet and familiar setting, often at the speaker’s
home or cabin. Every opportunity was taken to try to find participants of various
social networks and backgrounds in the community, while at the same time, continue
to meet the stratified requirements of the study’s judgement sampling design.
Each recording contains a sociolinguistic interview and the reading of a passage
and a wordlist. The interview section consists of background questions and casual
conversation. There are considerable stylistic differences from speaker to speaker;
the shorter interviews lasted approximately fifteen minutes, while longer ones took as
long as sixty minutes. The sociolinguistic interview typically takes on an interview-
ing style (i.e., elicitation/reply structure) but speakers did often go into extended
monologues to describe a particular situation or personal experience (Labov et al.
2006; Milroy 1987). The reading passage and word list text, respective of each task,
were both displayed on a Dell Latitude D430 laptop in large font using Microsoft’s
PowerPoint R© software. The reason for this was twofold: 1) to maintain consistency
across the interviews, and 2) to aid in speakers’ convenience of reading the provided
text sequentially and in manageable parts.
The Bad Day for Ducks reading passage, created by Dr. Dennis Preston and pre-
sented as Appendix A on page 203, consists of four paragraphs with 110 tokens located
(Table of Contents) 45 Ph.D Thesis 2014
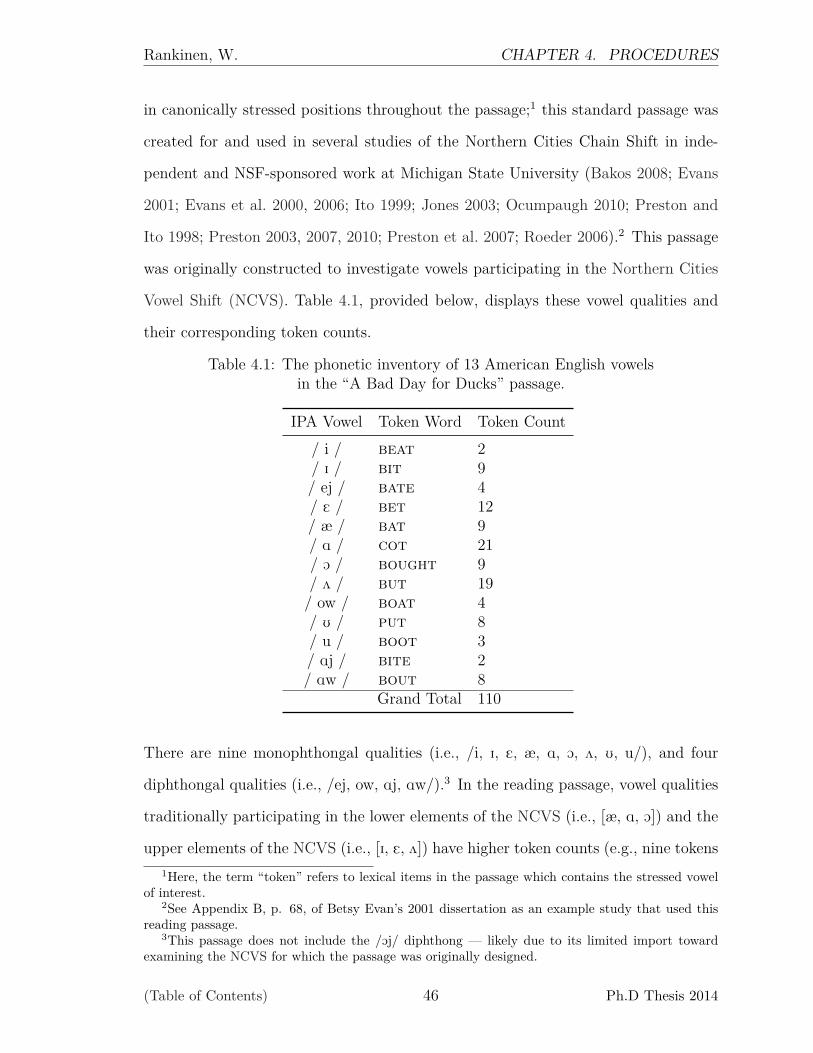
Rankinen, W. CHAPTER 4. PROCEDURES
in canonically stressed positions throughout the passage;1 this standard passage was
created for and used in several studies of the Northern Cities Chain Shift in inde-
pendent and NSF-sponsored work at Michigan State University (Bakos 2008; Evans
2001; Evans et al. 2000, 2006; Ito 1999; Jones 2003; Ocumpaugh 2010; Preston and
Ito 1998; Preston 2003, 2007, 2010; Preston et al. 2007; Roeder 2006).2 This passage
was originally constructed to investigate vowels participating in the Northern Cities
Vowel Shift (NCVS). Table 4.1, provided below, displays these vowel qualities and
their corresponding token counts.
Table 4.1: The phonetic inventory of 13 American English vowelsin the “A Bad Day for Ducks” passage.
IPA Vowel Token Word Token Count/ i / beat 2/ I / bit 9/ ej / bate 4/ E / bet 12/ æ / bat 9/ A / cot 21/ O / bought 9/ 2 / but 19/ ow / boat 4/ U / put 8/ u / boot 3/ Aj / bite 2/ Aw / bout 8
Grand Total 110
There are nine monophthongal qualities (i.e., /i, I, E, æ, A, O, 2, U, u/), and four
diphthongal qualities (i.e., /ej, ow, Aj, Aw/).3 In the reading passage, vowel qualities
traditionally participating in the lower elements of the NCVS (i.e., [æ, A, O]) and the
upper elements of the NCVS (i.e., [I, E, 2]) have higher token counts (e.g., nine tokens1Here, the term “token” refers to lexical items in the passage which contains the stressed vowel
of interest.2See Appendix B, p. 68, of Betsy Evan’s 2001 dissertation as an example study that used this
reading passage.3This passage does not include the /Oj/ diphthong — likely due to its limited import toward
examining the NCVS for which the passage was originally designed.
(Table of Contents) 46 Ph.D Thesis 2014

Rankinen, W. CHAPTER 4. PROCEDURES
or above) than those that do not (Gordon 2000b, 53). As a consequence of using this
passage, there are several vowel qualities that have low token counts (i.e., [i, u, Aj]
have two or three tokens).4
This thesis limits its focus to the reading passage data.5 The reading passage
contains various consonantal environments, all of which are in a stressed syllable
position. The passage contains a total of 110 observed vowel tokens. The potential
token count, therefore, is 14,520; a potential vowel token count of 110 in the reading
passage multiplied by 130 passages.
All interviews were digitally recorded on a Macintosh Macbook OS X version
10.5.5 laptop using a MC51B Lavalier microphone and a USB-Pre digital device. The
speech analysis software Praat, developed by Boersma (2001), was used to record all
respondents (i.e., version 5.0 was used to record speakers, while version 5.1 and 5.2
were used to extract formant measurements; versions are free to download at: http:
//www.fon.hum.uva.nl/praat/download_win.html). All recordings were initially
captured at 44.1 kHz and saved as individual WAV files for later data handling and
eventual analysis.
4.2 Formant-Extraction of Vowel Trajectories
Vowel qualities are not static but transient and dynamic acoustic events. Phono-
logically, vowels are traditionally categorized as either being a monophthong or a
diphthong in American English. The distinction between a monophthong and a diph-
thong resides in the trajectory pattern of the acoustic quality of the speech event.4At the time of field recordings, the use of this passage could be justified since little was known
about the participation of UP speakers in the NCVS.5While the thesis restricts its focus to just the reading passage data, the wordlist contains a
total of 111 observed vowel tokens and yields a potentially comparable 14,652 token count (i.e., incomparison to the 14,520 tokens in the reading passage).
(Table of Contents) 47 Ph.D Thesis 2014

Rankinen, W. CHAPTER 4. PROCEDURES
Under the gestural model, the production of a vowel is inextricably linked to a tar-
get or targets and the gestural timing of sound sequences needed to reach a target
and transition to the next (Browman and Goldstein 1985, 1990).6 A monophthongal
quality is characterized as a vowel with an acoustic trajectory toward a single target,
while a diphthongal quality is characterized as a vowel with an acoustic trajectory
toward two sequentially occurring targets.
4.2.1 Previous Extraction Procedures
For the phonetic analysis of vowels, there is an ongoing debate as to the best practice
for efficiently extracting the linguistically important information as well as accurately
capturing any socially or extralinguistically relevant information of a vowel quality
(i.e., predictor variables). As noted by Neary and Assemann (1986), phoneticians
need to distinguish between three types of auditory-acoustic relations:7 1) tradition-
ally phonological monophthongs (e.g., /I/, /E/, /æ/), 2) traditionally phonological
diphthongs (e.g., /Aj/ and /Aw/), and 3) environmentally conditioned phonetic diph-
thongs (e.g., [Eg], [æg]). Socio-phoneticians need to address to additional auditory-
acoustic relations: 4) socially conditioned phonetic monophthongs (e.g., [A:] for /Aw/
in Southern U.S. varieties) and 5) socially conditioned phonetic diphthongs.
Two main extraction models exist, based upon what information within the vowel’s6For example, the word [bæn] as in “ban” has three phonetic units. Each of the three sounds
are phonetically realized relative to one another and must be dynamically produced in regards todifferences in the articulatory timing of plan gestural movements. For each of the speech sounds, thegestural timing and sequencing of the articulators is actually comprised of a series of targets for eachsound segment. Thus, gestural movements need to be planned concurrently as well as sequentiallyin order to produce a three sound-segment event. The transition from one segment to the otheralso requires that the gestures overlap (i.e., to transiently and dynamically co-exist, often referredto as the consonantal effect of a neighboring consonant at beginning or at ending of a particularvowel). Ultimately, the gestural timing of these sound segments, as well as the transitions fromone to the other, is directly correlated with the acoustic properties embedded within the acousticphonetic signal of the speech event.
7Auditory-acoustic relations (i.e., a termed used by (Nearey and Assmann 1986)) refers to theproduction-perception mapping of how the acoustic signal is produced and how it is perceived bythe speaker/listener.
(Table of Contents) 48 Ph.D Thesis 2014

Rankinen, W. CHAPTER 4. PROCEDURES
trajectory is regarded as being important. The first model conceptualizes vowels as
non-dynamic and static entities; for monophthongal qualities, single-point measure-
ments are taken at the center of a vowels’ duration (e.g., see Peterson and Barney
(1952)). The second model views a vowel as a dynamic but linear entity, where two- or
multi-point measurements are taken at pre-established locations (i.e., fixed-positions)
relative to the vowel’s duration (e.g., see Browman and Goldstein (1990); Labov et al.
(2006); Lindblom (1986)). The latter model has two standard approaches for extract-
ing multiple points: a) the formant extraction measurements of a vowel are taken at
pre-established points, relative to the vowel’s duration (e.g., if three points are desired,
then measurements are taken at the 33rd, 50th and 66th percentile relative to the du-
ration of each vowel token) (Labov et al. 2006); b) first, pre-established “cut-offs” of a
vowels’s on- / offglides are established and removed (i.e., the rationale for this removal
is that this portion of a vowel’s quality contains undesired consonantal effects), then
the formant extraction measurements of a vowel are taken at pre-established points
similar to the first standard approach. For example, 20-percent at the beginning and
20-percent at the end of the vowel,8 relative to its duration, would be removed and
discarded, then the remaining duration of the vowel (i.e., approximately 60-percent)
would be divided into a set number of points where either measurements are extracted
there or bins of measurements are taken as averages of multiple measurement points
(MacDonald et al. 2011).9
Critically, these approaches base the measurement values either on arbitrarily fixed
points or averages for predetermined ranges of measurements. These approaches as-
sume that two similar vowel tokens (i.e., those that are of the same quality and8Technically speaking, identifying the first and last 20 percent of a vowel’s duration is a kind of
binning in and of itself; however, the important distinction is that this information is completelyremoved.
9Of course, there are other models that can be used for formant extraction as well; for exampleone that determines the point of measurement in a vowel’s trajectory based upon the maximal F1or point of inflection in F2 (Boberg 2004).
(Table of Contents) 49 Ph.D Thesis 2014
Rankinen, W. CHAPTER 4. PROCEDURES
have phonetically similar conditioning environments as in “pit” and “bit”) and two
dissimilar vowel tokens (i.e., those that are of different quality and have phonetically
dissimilar conditioning environments as in “big” and “poke”) have inherently the same
dynamic trajectory patterns, since all measurements using either approach for this
standard extraction model superimposes either “fixed” points or “average measure-
ment ranges” and are contingent only on the relative duration of each vowel token.
These approaches assume that a vowel’s duration is independent from the formant
measurements extracted from the vowel; in other words, it is assumed that a long
or a short vowel is not affected or influenced by the trajectory of it’s quality. This
assumption, however, does not account for cases such as undershoot, where the vowel
target is missed because there is not enough duration to do so. The present section
describes an alternative way to model vowels’ targets and proposes a novel formant
extraction method — one that addresses said concerns and is used in the attainment
of the acoustic vowel data for this thesis.
4.2.2 A Proposed Formant Extraction Method
This proposed formant extraction method is in accordance with the conceptualiza-
tion of a vowel as being both a dynamic and linear entity. Furthermore, it assumes
that vowel trajectories are acoustically dynamic entities because of the articulatory
dynamics needed to reach a particular target; to produce an acoustic quality, this re-
quires a series of co-occurring gestural movements. This proposed formant extraction
method uses both manual and automated procedures to extract the measurements
from each vowel quality, and more specifically, it can be broken into three stages and
will be described in terms of this thesis.
The first stage of the procedure for this formant extraction method is to mark
the beginning and ending of each vowel token. This part of the procedure is the
(Table of Contents) 50 Ph.D Thesis 2014
Rankinen, W. CHAPTER 4. PROCEDURES
most time-intensive, since for this thesis each vowel throughout the passage for all
participants needed to be manually marked in the acoustic phonetic software of Praat.
After all the boundaries of every vowel in a reading passage are marked for an
individual participant, a set of Praat scripts are then used to extract the various pieces
of information associated with the time points along a vowel’s duration for all 110
vowel tokens in the passage. The second stage of the procedure involves the automated
extraction of various pieces of information associated with each time point at every
1ms along each individual vowel’s trajectory. A master text file is generated, where
measurements at 1ms-intervals are sequentially stored for each vowel and saved for
each speaker. For each millisecond of each vowel token, the timestamp, the frequency
value of F1/F2/F3, and the bandwidth of F1/F2/F3 are saved.
Once data is collected, the final stage of the formant extraction process is applied.
Stylization is the process of taking a large number of samples from the signal and
reducing it down to a much smaller number of representative vectorized points in such
a way that it still closely resembles the original raw signal. The automated application
of stylization models are used to determine where along the vowel’s trajectory is the
best “fitted”. Two separate stylization models must be applied to find the best fitted
target(s) of each individual vowel trajectory: 1) a single-pivot stylization model is used
to determine the target of a monophthongal quality, and 2) a dual-pivot stylization
model is used to determine the target of a diphthongal quality. Thus, this procedure
assumes that vowel qualities are of two types, monophthongs and diphthongs. These
two vowel categories correspond to either one or two targets that are represented
in the acoustic space of a vowel’s trajectory of F1 and F2; the “expected” value
(i.e., monophthong or diphthong), given the specific vowel of interest (e.g., [ow] as in
“boat”), is used to determine this aspect of the model. The use of such stylization
models for dynamic structures is not new, and in fact is based on one common method
(Table of Contents) 51 Ph.D Thesis 2014
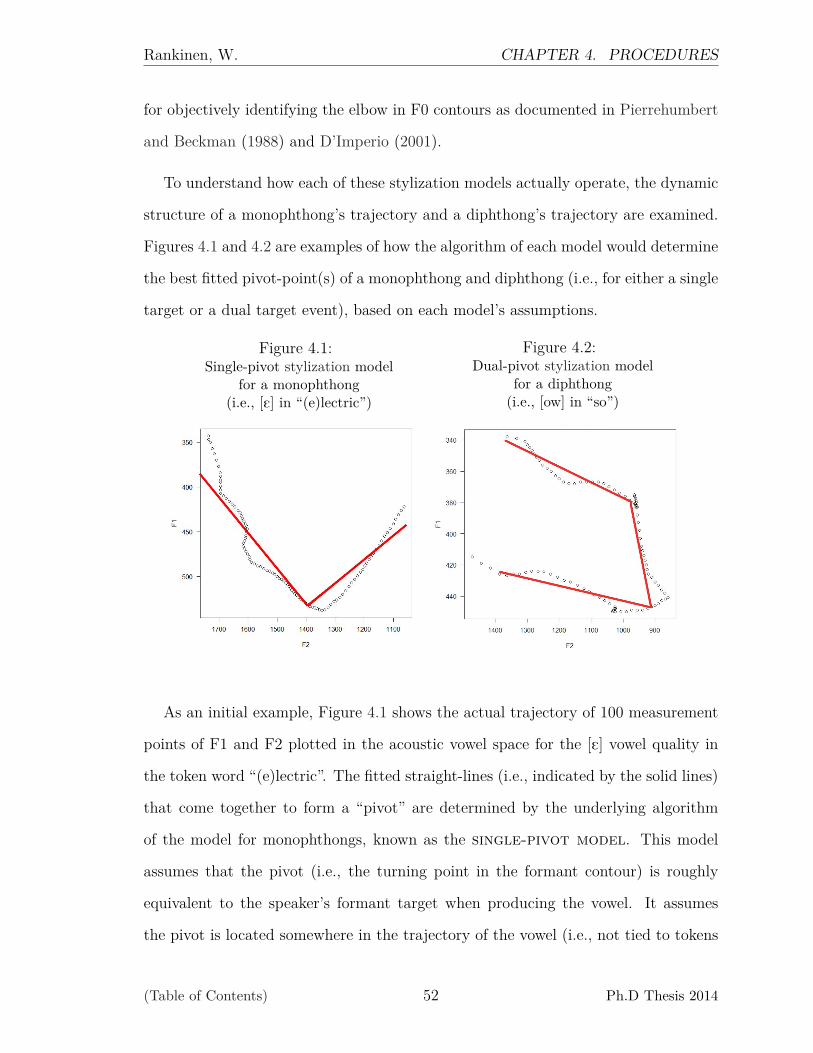
Rankinen, W. CHAPTER 4. PROCEDURES
for objectively identifying the elbow in F0 contours as documented in Pierrehumbert
and Beckman (1988) and D’Imperio (2001).
To understand how each of these stylization models actually operate, the dynamic
structure of a monophthong’s trajectory and a diphthong’s trajectory are examined.
Figures 4.1 and 4.2 are examples of how the algorithm of each model would determine
the best fitted pivot-point(s) of a monophthong and diphthong (i.e., for either a single
target or a dual target event), based on each model’s assumptions.
Figure 4.1:Single-pivot stylization model
for a monophthong(i.e., [E] in “(e)lectric”)
Figure 4.2:Dual-pivot stylization model
for a diphthong(i.e., [ow] in “so”)
As an initial example, Figure 4.1 shows the actual trajectory of 100 measurement
points of F1 and F2 plotted in the acoustic vowel space for the [E] vowel quality in
the token word “(e)lectric”. The fitted straight-lines (i.e., indicated by the solid lines)
that come together to form a “pivot” are determined by the underlying algorithm
of the model for monophthongs, known as the single-pivot model. This model
assumes that the pivot (i.e., the turning point in the formant contour) is roughly
equivalent to the speaker’s formant target when producing the vowel. It assumes
the pivot is located somewhere in the trajectory of the vowel (i.e., not tied to tokens
(Table of Contents) 52 Ph.D Thesis 2014
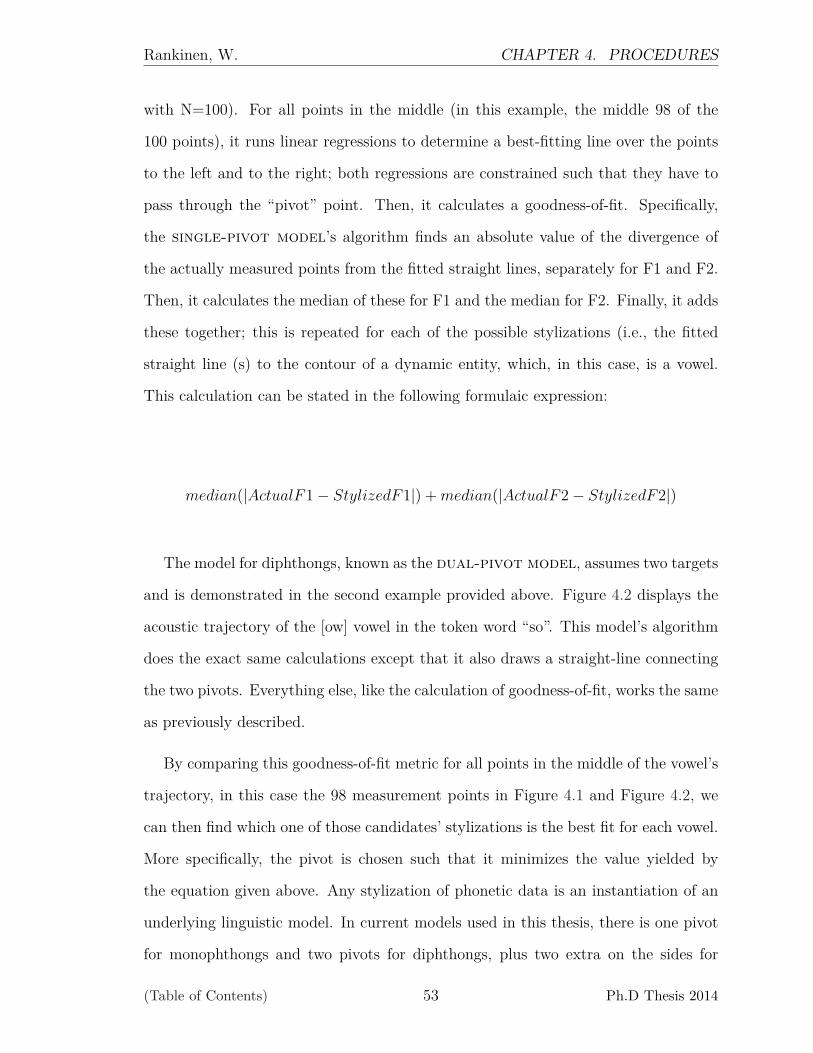
Rankinen, W. CHAPTER 4. PROCEDURES
with N=100). For all points in the middle (in this example, the middle 98 of the
100 points), it runs linear regressions to determine a best-fitting line over the points
to the left and to the right; both regressions are constrained such that they have to
pass through the “pivot” point. Then, it calculates a goodness-of-fit. Specifically,
the single-pivot model’s algorithm finds an absolute value of the divergence of
the actually measured points from the fitted straight lines, separately for F1 and F2.
Then, it calculates the median of these for F1 and the median for F2. Finally, it adds
these together; this is repeated for each of the possible stylizations (i.e., the fitted
straight line (s) to the contour of a dynamic entity, which, in this case, is a vowel.
This calculation can be stated in the following formulaic expression:
median(|ActualF1− StylizedF1|) + median(|ActualF2− StylizedF2|)
The model for diphthongs, known as the dual-pivot model, assumes two targets
and is demonstrated in the second example provided above. Figure 4.2 displays the
acoustic trajectory of the [ow] vowel in the token word “so”. This model’s algorithm
does the exact same calculations except that it also draws a straight-line connecting
the two pivots. Everything else, like the calculation of goodness-of-fit, works the same
as previously described.
By comparing this goodness-of-fit metric for all points in the middle of the vowel’s
trajectory, in this case the 98 measurement points in Figure 4.1 and Figure 4.2, we
can then find which one of those candidates’ stylizations is the best fit for each vowel.
More specifically, the pivot is chosen such that it minimizes the value yielded by
the equation given above. Any stylization of phonetic data is an instantiation of an
underlying linguistic model. In current models used in this thesis, there is one pivot
for monophthongs and two pivots for diphthongs, plus two extra on the sides for
(Table of Contents) 53 Ph.D Thesis 2014
Rankinen, W. CHAPTER 4. PROCEDURES
consonantal effects. The “better” model is one that has unused residual information,
due to the stylization process, which is essentially just random noise; conversely, a
“bad” model would be one that throws away linguistically-relevant information.
For either model, the goodness-of-fit metric determines which pivot point(s) is
chosen, and that pivot-point is then used as the measurement(s) for sociophonetic
analysis. If a stylization systematically diverges from the original trajectory of the
vowel, this will yield enormous residuals over a large stretch of the contour and a
large value for the goodness-of-fit; for the above equation, such a stylization would
be disfavored and not be used to determine the pivots for the analysis.
Essentially, this proposed formant extraction method uses a more efficient (i.e.,
and perhaps more objective) means of determining a meaningful measurement(s)
based on phonetic assumptions about the linguistic phenomenon in question.10 This
method uses all the data of a vowel quality’s trajectory to determine the best-fitted
measurement relative to each vowel token. While trying to be objective in nature, it
remains a question as to the validity of the present method in terms of comparability
with the more traditional methods of formant extraction. As a result, three pair-wise
comparisons are provided in the following section, namely the formant measurements
obtained using two traditional formant extraction procedures and this proposed pro-
cedure.11
10One always has to be careful about proclaiming “objectiveness”, because while the algorithmis fully automatic, the assumptions in the underlying model are determined subjectively (e.g. thenumber of pivots to use for a given token, the details of the goodness-of-fit equation, etc.).
11It is important to note that one weakness of this proposed method is that an a priori classificationof a vowel token’s quality (i.e., a vowel token’s status as either a monophthong or a diphthong) isrequired in order to determine which of the two pivot-based models is applied; at present, however,this weakness is shared with traditional formant extraction procedures as well.
(Table of Contents) 54 Ph.D Thesis 2014

Rankinen, W. CHAPTER 4. PROCEDURES
4.2.3 Pair-wise Comparions of
Formant Extraction Procedures
In this subsection, three vowel datasets are extracted from the same corpus and three
vowel measurement datasets, all from the same reading passage task, are examined
in three pair-wise comparisons; the critical difference between these datasets is the
procedure used to extract the formant measurements. The three formant extraction
procedures are: 1) a manual method, 2) a fixed method, and 3) the proposed
pivot method. Since the procedural extraction of formant measurements using the
third method has already been discussed, the first two methods will be described in
detail below.
The formant measurements obtained from the manual method are reported in
Rankinen (2013b, 2014). Formant measurements are obtained at two temporal points
relative to a vowel’s duration (i.e., irrespective of the vowel being a monophthong or a
diphthong). A vowel is first visually inspected via waveform and accompanying spec-
trographic representation to determine the beginning and ending of the vowel. Then,
two points are manually selected at approximately the 33rd and the 66th percentile
relative to the vowel’s duration, and the formant measurements are then extracted
at each point. While the selection of the two points is based on approximate “fixed”
points relative to a vowel’s duration, they may be manually adjusted to the right or
left in order to obtain F1 or F2 bandwidths below 300Hz values; F1 and F2 band-
widths greater than 200Hz have been shown to increase perceptual distortions in
actual communicative situations and may negatively affect the validity of production
data (Klatt 1982, 1279; Thomas 2011, 47).
Both the fixed method and the pivot method originate from the same dataset
of raw measurements. While the pivot method uses stylization models to select
(Table of Contents) 55 Ph.D Thesis 2014
Rankinen, W. CHAPTER 4. PROCEDURES
the best “fitted” one or two pivot points, this fixed method obtains its formant
measurements based on absolute “fixed” points at the 33rd and the 66th percentile
relative to the vowel’s duration with no manual adjustment.
For both the fixed method and the manual method, formant measurements
are based on two temporal points relative to a vowel’s duration. In order to compare
the monophthong formant estimate of these two different procedures with the pivot
method, the first and second measurements of a monophthong are averaged together.
This follows the assumption that monophthongs have a single target and yields a
value that can be directly compared with that of the pivot method. Formant
measurements for diphthongs remain unaffected since all three formant extraction
procedures select two temporal points of a diphthong (i.e., relative to its duration).
Essentially, all three procedures are able to model vowels with one or two targets but
differ in the criteria used to select the measurements representing those targets.
In Figure 4.3 below, the correlation coefficient values (i.e., using Pearson’s product-
moment correlation) are displayed for the eighteen pair-wise comparisons between the
three procedures, two formants (i.e., F1 and F2), and three possible targets (i.e., the
first and only target for a monophthong, the first of two targets for a diphthong, and
the second of two targets for a diphthong). As reported in Figure 4.3, the correlation
coefficients are very high (i.e., r2 = .83 – .97, all p-values < .001), with between
83% and 97% of the variation being explained for every one of the eighteen pair-wise
comparisons! As such, the three procedures’ formant measurements can be stated as
being highly correlated with one another.
(Table of Contents) 56 Ph.D Thesis 2014
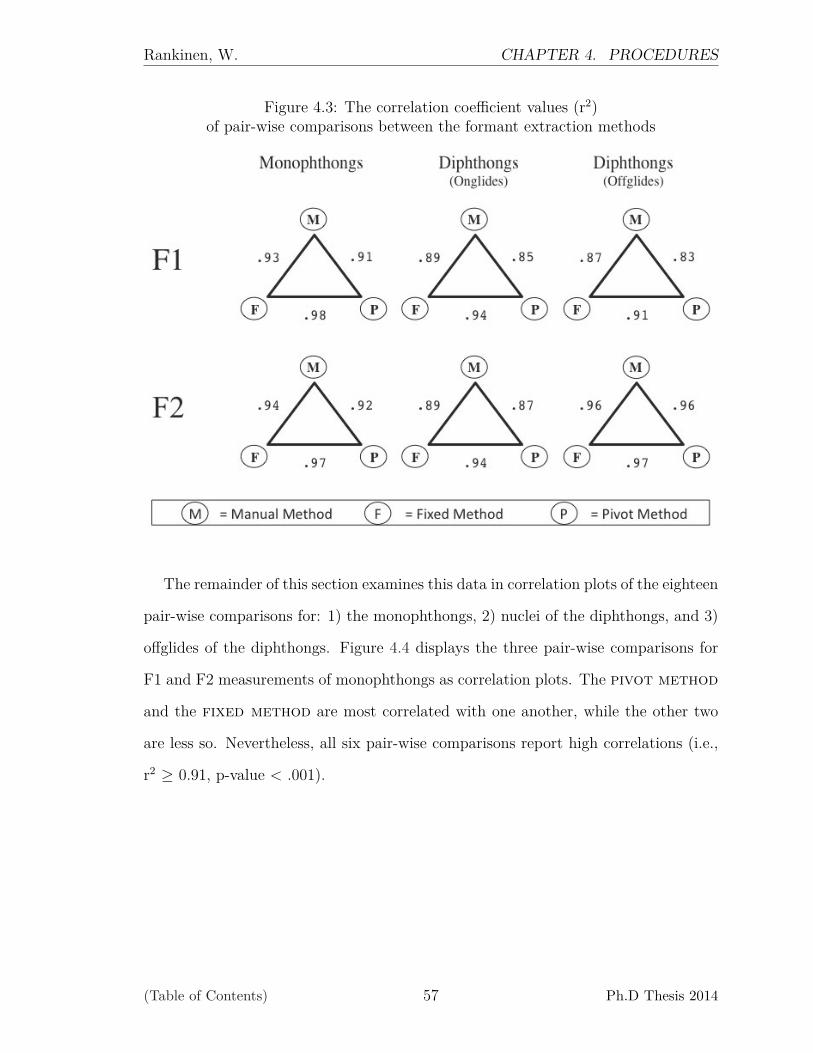
Rankinen, W. CHAPTER 4. PROCEDURES
Figure 4.3: The correlation coefficient values (r2)of pair-wise comparisons between the formant extraction methods
The remainder of this section examines this data in correlation plots of the eighteen
pair-wise comparisons for: 1) the monophthongs, 2) nuclei of the diphthongs, and 3)
offglides of the diphthongs. Figure 4.4 displays the three pair-wise comparisons for
F1 and F2 measurements of monophthongs as correlation plots. The pivot method
and the fixed method are most correlated with one another, while the other two
are less so. Nevertheless, all six pair-wise comparisons report high correlations (i.e.,
r2 ≥ 0.91, p-value < .001).
(Table of Contents) 57 Ph.D Thesis 2014
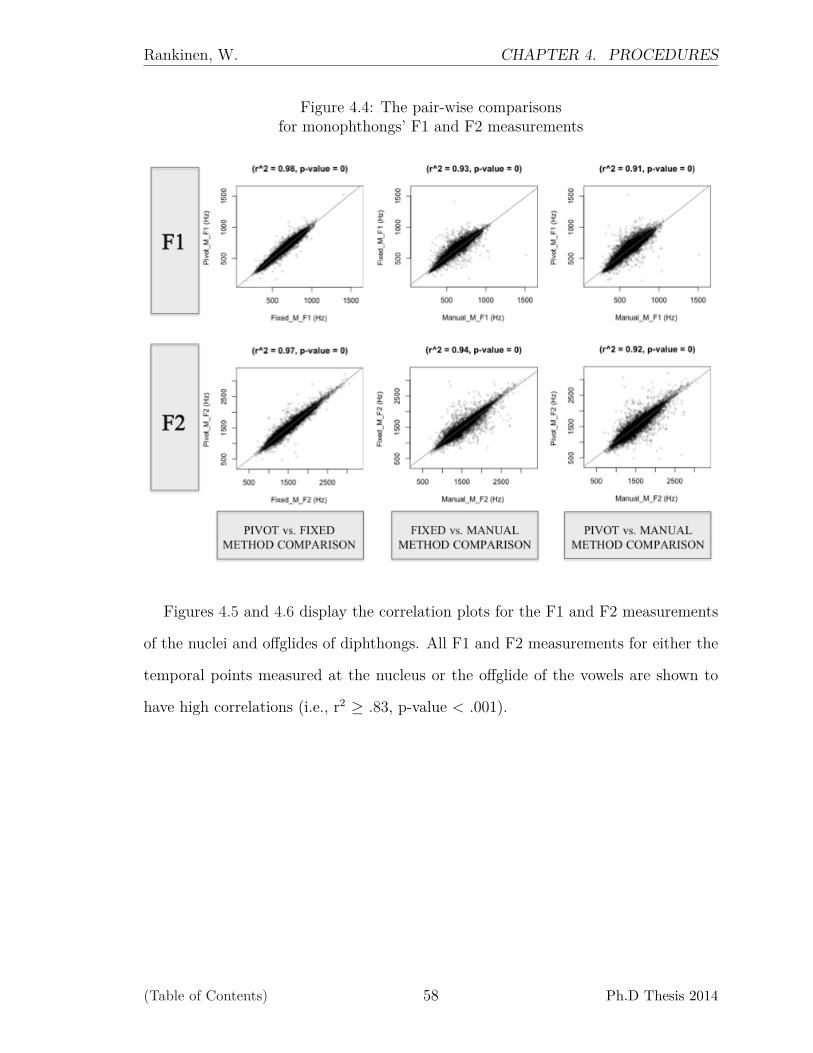
Rankinen, W. CHAPTER 4. PROCEDURES
Figure 4.4: The pair-wise comparisonsfor monophthongs’ F1 and F2 measurements
Figures 4.5 and 4.6 display the correlation plots for the F1 and F2 measurements
of the nuclei and offglides of diphthongs. All F1 and F2 measurements for either the
temporal points measured at the nucleus or the offglide of the vowels are shown to
have high correlations (i.e., r2 ≥ .83, p-value < .001).
(Table of Contents) 58 Ph.D Thesis 2014

Rankinen, W. CHAPTER 4. PROCEDURES
Figure 4.5: The pair-wise comparisonsfor diphthongs’ F1 and F2 measurements for nuclei
Figure 4.6: The pair-wise comparisonsfor diphthongs’ F1 and F2 measurements for offglides
(Table of Contents) 59 Ph.D Thesis 2014
Rankinen, W. CHAPTER 4. PROCEDURES
In general, the three pair-wise comparisons of the formant measurements show
high correlations (i.e., with correlation coefficients greater than .83). However, when
the pair-wise comparisons are contrasted with one another we see that certain com-
parisons have higher correlations than others. The pivot method and the man-
ual method pair-wise comparison have the lowest correlations, while the pivot
method and the fixed method pair-wise comparison has the highest. In the latter
case, the formant estimates show the strongest relationship with one another be-
cause they are mainly automated and are derived from the same raw dataset. In
contrast, the manual method differs from the pivot method in the same ways
that the fixed method does but with two additional differences. First, the manual
method manually selects formant measurements at the approximate 33rd and 66th
percentile, however, there can be potential deviations made on account of inspection
of the speech analyst. Second, a different set of formant tracking parameters may
have been used when obtaining formant measurements for the manual method as
opposed to the other two (e.g., for a given vowel, Praat might have been set to track
four or six formants instead of five).
In summary, this section validates the use of this novel pivot method. This
formant extraction method applies stylization models to objectively determine the
“best” fitted point(s), or pivot(s), along a vowel’s trajectory (i.e., based on if the vowel
is assumed to have a single or a dual target). When compared to more traditional
formant extraction methods, the pivot method’s formant measurements are shown
to be significantly correlated. Backed by this statistical support, this method will be
used for all formant estimates presented in the remainder of the present thesis.
(Table of Contents) 60 Ph.D Thesis 2014
Rankinen, W. CHAPTER 4. PROCEDURES
4.3 Speaker Normalization of Vowel Data
Normalization is performed in order to factor out known anatomical differences due
to vocal-tract size effects, which impact the size and shape of the vowel space (Hillen-
brand et al. 1995; Peterson and Barney 1952). All data for this thesis are normalized
using a version of the algorithm used by the phonological Atlas of North American
English (ANAE) (Labov et al. 2006, 39-40). This method’s algorithm handles the
data at three different levels:
1. speaker-extrinsic: all speakers’ data are pooled together in the algorithm
(i.e., as opposed to being individually applied speaker-by-speaker);
2. vowel-extrinsic: all vowels’ data are treated simultaneously in the algorithm
(i.e., as opposed to looping through each vowel and applying the algorithm to
each separately); and
3. formant-extrinsic: all data for all formants are combined in the algorithm
(i.e., as opposed to isolating F1 data from F2 data).
Following Labov et al. (2006)’s algorithm, measurements are normalized using the
norm.labov() function in the statistical and graphing language R (i.e. see the R-
project website: www.R-project.org) (Boersma 2001). To serve as a metric for
interpreting the formant values, a single grand mean was calculated for the particu-
lar set of speakers included in the dataset for this thesis and not from an externally
derived grand mean (i.e., the Telsur G value as discussed by Thomas and Kendall
(2007) at the NORM website: http://ncslaap.lib.ncsu.edu/tools/norm/). Ad-
ditionally, this method computes a scaling factor for each individual speaker in order
to modify each individual’s vowel space to scale to Hertz-like values. This metric has
been proven to be the best transformation for reducing anatomical variation while
maintaining phonological and sociolinguistic variation (Adank et al. 2004; Clopper
(Table of Contents) 61 Ph.D Thesis 2014
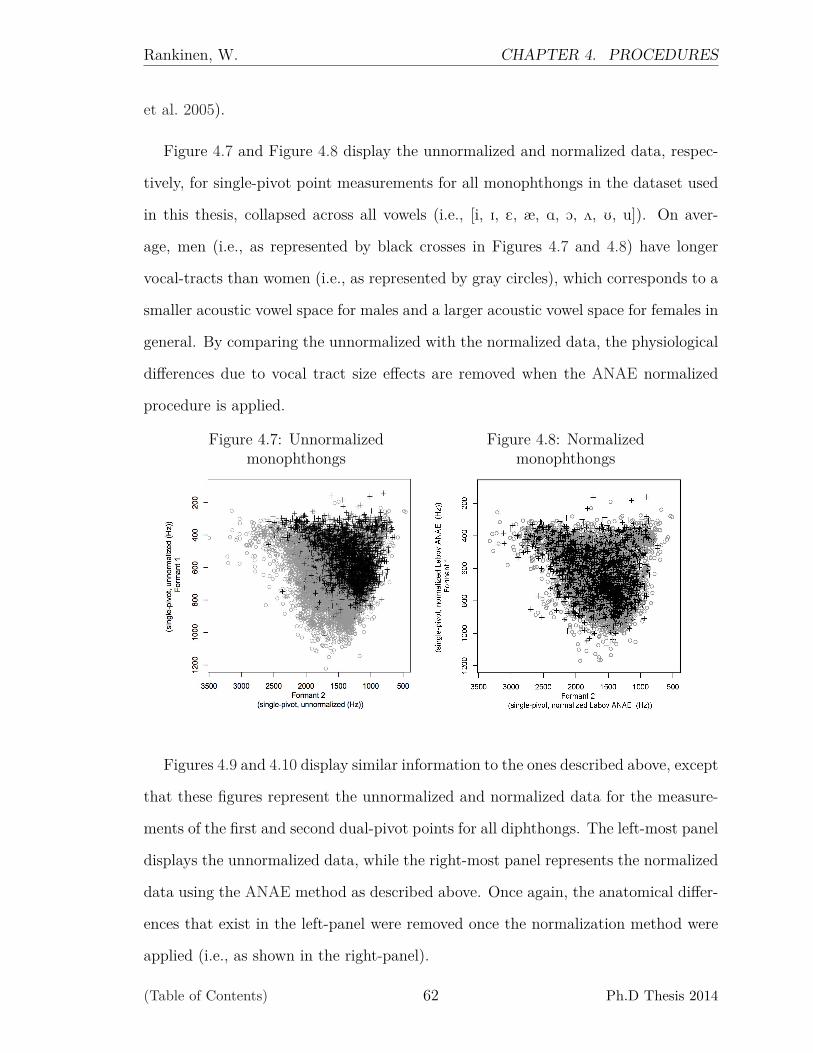
Rankinen, W. CHAPTER 4. PROCEDURES
et al. 2005).
Figure 4.7 and Figure 4.8 display the unnormalized and normalized data, respec-
tively, for single-pivot point measurements for all monophthongs in the dataset used
in this thesis, collapsed across all vowels (i.e., [i, I, E, æ, A, O, 2, U, u]). On aver-
age, men (i.e., as represented by black crosses in Figures 4.7 and 4.8) have longer
vocal-tracts than women (i.e., as represented by gray circles), which corresponds to a
smaller acoustic vowel space for males and a larger acoustic vowel space for females in
general. By comparing the unnormalized with the normalized data, the physiological
differences due to vocal tract size effects are removed when the ANAE normalized
procedure is applied.
Figure 4.7: Unnormalizedmonophthongs
Figure 4.8: Normalizedmonophthongs
Figures 4.9 and 4.10 display similar information to the ones described above, except
that these figures represent the unnormalized and normalized data for the measure-
ments of the first and second dual-pivot points for all diphthongs. The left-most panel
displays the unnormalized data, while the right-most panel represents the normalized
data using the ANAE method as described above. Once again, the anatomical differ-
ences that exist in the left-panel were removed once the normalization method were
applied (i.e., as shown in the right-panel).
(Table of Contents) 62 Ph.D Thesis 2014
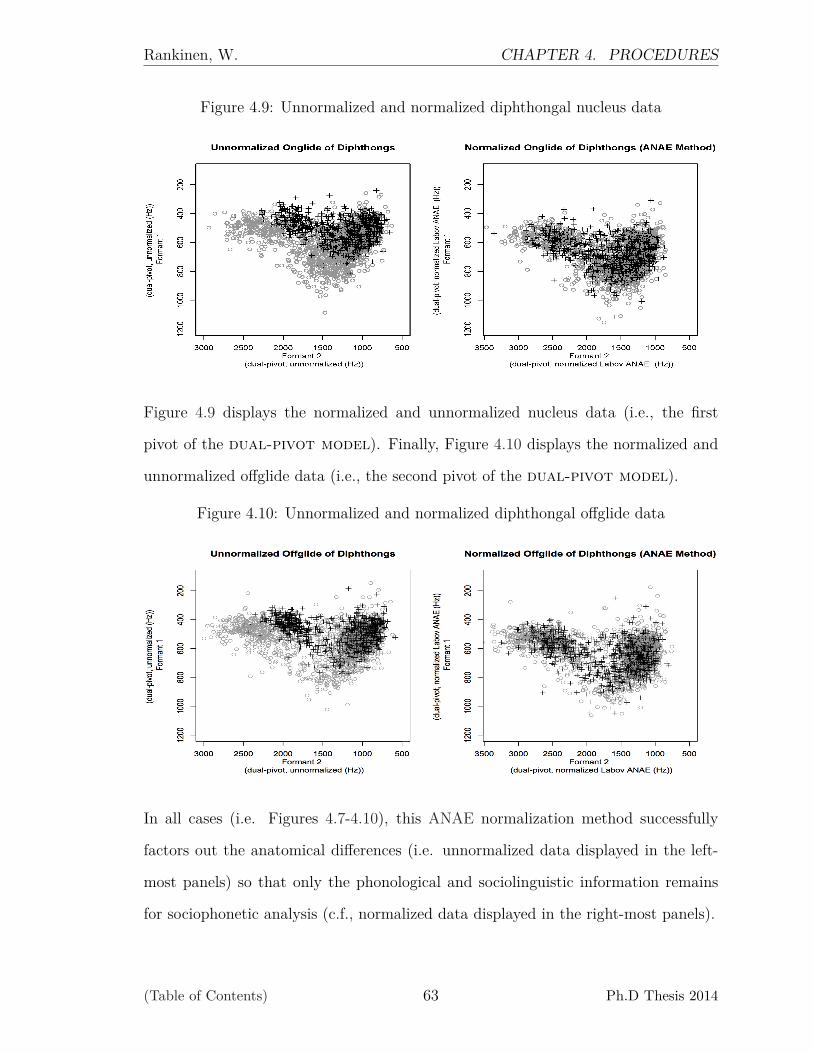
Rankinen, W. CHAPTER 4. PROCEDURES
Figure 4.9: Unnormalized and normalized diphthongal nucleus data
Figure 4.9 displays the normalized and unnormalized nucleus data (i.e., the first
pivot of the dual-pivot model). Finally, Figure 4.10 displays the normalized and
unnormalized offglide data (i.e., the second pivot of the dual-pivot model).
Figure 4.10: Unnormalized and normalized diphthongal offglide data
In all cases (i.e. Figures 4.7-4.10), this ANAE normalization method successfully
factors out the anatomical differences (i.e. unnormalized data displayed in the left-
most panels) so that only the phonological and sociolinguistic information remains
for sociophonetic analysis (c.f., normalized data displayed in the right-most panels).
(Table of Contents) 63 Ph.D Thesis 2014
Rankinen, W. CHAPTER 4. PROCEDURES
4.4 Statistical Analysis
Prior to and after normalization, individual speakers’ vowel spaces are checked for
outliers or possible data-entry errors. This dataset is then submitted to a series of
statistical test procedures according to the particular questions posed in this thesis.
Each of the linguistic variables considered is examined separately, unless otherwise
stated. Five main statistical tests are frequently used throughout the subsequent
chapters, and as a result, Table 4.2 provides a summary of those tests.
Since the main thrust of the thesis investigates the independent variables of heritage-
location, bilingualism, age, sex and class for both monophthongs and diph-
thongs, multivariate analysis of variance (MANOVA) and univariate analysis of vari-
ance (ANOVA) will be used to determine if significant differences exist between the
mean values of F1 and/or F2 and at least two independent variables for any given
main effect or interaction of effects; besides F1 or F2, Euclidean distances (EDs) and
duration may also be used as dependent variables for ANOVAs. A Student’s t-Test
is also used but typically only as a post-hoc analysis of a particular case where two
means of a single dependent variable are compared; unpaired t-Tests will be used
in cases where the two means are independent from one another (e.g., mean of two
distinct vowel categories), while paired t-Tests will be used when the means are de-
pendent (e.g., the mean of a vowel’s nucleus compared to the mean of that same
vowel’s offglide).
(Table of Contents) 64 Ph.D Thesis 2014
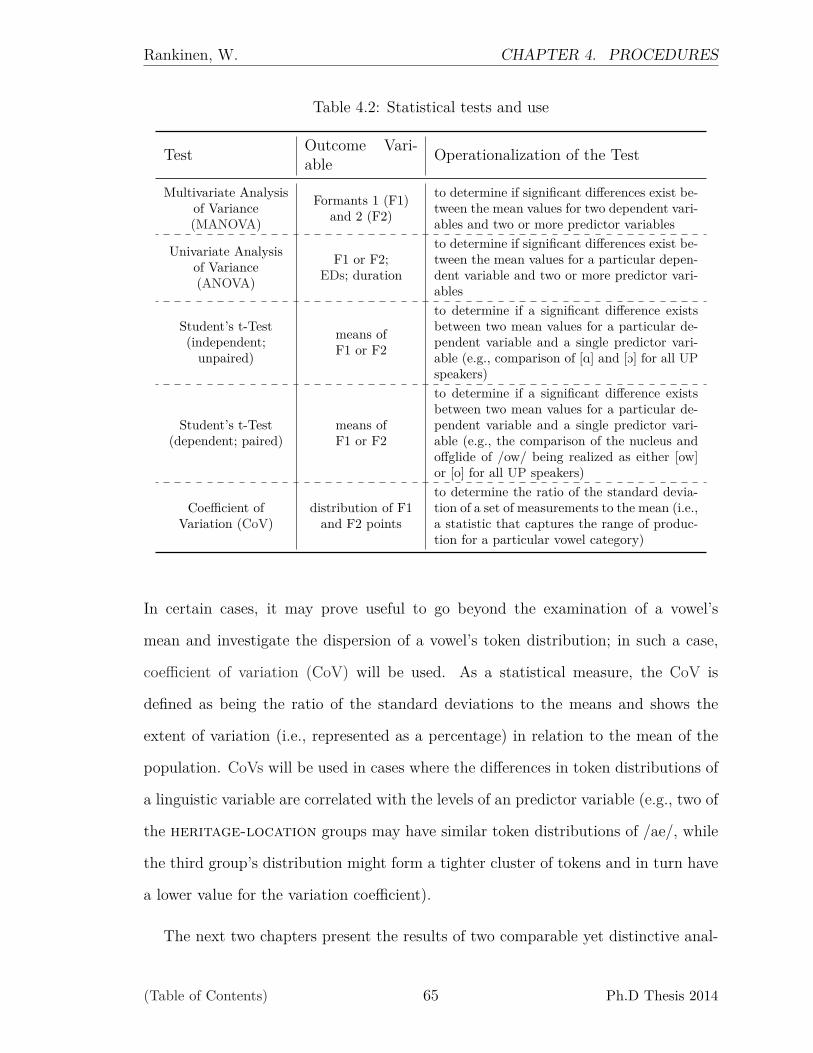
Rankinen, W. CHAPTER 4. PROCEDURES
Table 4.2: Statistical tests and use
Test Outcome Vari-able Operationalization of the Test
Multivariate Analysisof Variance(MANOVA)
Formants 1 (F1)and 2 (F2)
to determine if significant differences exist be-tween the mean values for two dependent vari-ables and two or more predictor variables
Univariate Analysisof Variance(ANOVA)
F1 or F2;EDs; duration
to determine if significant differences exist be-tween the mean values for a particular depen-dent variable and two or more predictor vari-ables
Student’s t-Test(independent;
unpaired)
means ofF1 or F2
to determine if a significant difference existsbetween two mean values for a particular de-pendent variable and a single predictor vari-able (e.g., comparison of [A] and [O] for all UPspeakers)
Student’s t-Test(dependent; paired)
means ofF1 or F2
to determine if a significant difference existsbetween two mean values for a particular de-pendent variable and a single predictor vari-able (e.g., the comparison of the nucleus andoffglide of /ow/ being realized as either [ow]or [o] for all UP speakers)
Coefficient ofVariation (CoV)
distribution of F1and F2 points
to determine the ratio of the standard devia-tion of a set of measurements to the mean (i.e.,a statistic that captures the range of produc-tion for a particular vowel category)
In certain cases, it may prove useful to go beyond the examination of a vowel’s
mean and investigate the dispersion of a vowel’s token distribution; in such a case,
coefficient of variation (CoV) will be used. As a statistical measure, the CoV is
defined as being the ratio of the standard deviations to the means and shows the
extent of variation (i.e., represented as a percentage) in relation to the mean of the
population. CoVs will be used in cases where the differences in token distributions of
a linguistic variable are correlated with the levels of an predictor variable (e.g., two of
the heritage-location groups may have similar token distributions of /ae/, while
the third group’s distribution might form a tighter cluster of tokens and in turn have
a lower value for the variation coefficient).
The next two chapters present the results of two comparable yet distinctive anal-
(Table of Contents) 65 Ph.D Thesis 2014
Rankinen, W. CHAPTER 4. PROCEDURES
yses based on a shared 130-speaker sample of a rural immigrant-American English
speech community in Michigan’s UP. The first analysis of Chapter 5 examines front
lax, low back, high back, and short and long diphthongs to determine if they
correlate with the extralinguistic factors of heritage-location and bilingualism
for a 71-speaker sample of older-aged UP speakers. In Chapter 6, the second analysis
examines these five sets of linguistic variables in the speech of an 85-speaker sam-
ple of monolingual English UP speakers stratified across heritage-location, age,
sex and class. Together these analyses seek to reveal the sociolinguistically relevant
correlates of interspeaker variation that exists within this speech community.
(Table of Contents) 66 Ph.D Thesis 2014
CHAPTER 5
RESULTS I:
HERITAGE-LOCATION AND BILINGUALISM
This chapter examines F1, F2 and duration response variables for the five sets of
front lax, low back, high back, short diphthong and long diphthong lin-
guistic variables produced by seventy-one older-aged Upper Peninsula (UP) speakers.
The analyses of this chapter takes into account the predictor variables of heritage-
location and bilingualism.1 As described in Chapter 3, these predictor vari-
ables are restricted to the older-aged speakers whom are grouped by the defined lev-
els of heritage-location (i.e., east-side Finns, east-side Italians or west-side
Finns) and bilingualism (i.e., Heritage-bilinguals, English-bilinguals or English-
monolinguals). Therefore, only results from this 71-speaker subset of the larger corpus
will be reported in this chapter.2
This chapter reports on four specific analyses of the data: 1) an analysis of the
overall structure of the older-aged UP speakers’ vowel system, 2) an analysis of
heritage-location as a main effect, 3) an analysis of bilingualism as a main
effect, and 4) an analysis of the heritage-location and bilingualism as an in-1Multivariate analyses investigating the three-way interactions of sex and class with either
heritage-location or bilingualism were performed but failed to report differences betweengroups for the linguistic variables considered; two-way interactions were also performed and didyield cases where significance differences existed but no interpretable patterns could be made. Fur-thermore, the structure of the sampled population and stratified corpus would not allow for afour-way comparison of heritage-location, bilingualism, sex and class. As a result, only thetwo predictor variables of heritage-location and bilingualism are considered in this chapter(i.e., as main effects and as a two-way interaction).
2The breakdown of the demographics for this subset is located in Table 3.8 on page 41.
67

Rankinen, W.CHAPTER 5. RESULTS I:
HERITAGE-LOCATION AND BILINGUALISM
teraction. Section 5.1 first investigates the individual placement of vowels within the
structural configuration as a global system for these seventy-one older-aged speakers.
This section prepares the reader for the next two sections by justifying a focused
analysis of each main effect for the front lax, low back, short diphthong
and long diphthong sets of linguistic variables. Section 5.2 takes into account
the predictor variable of heritage-location when examining these linguistic vari-
ables, while Section 5.3 focuses on the predictor variable of bilingualism. The final
section, Section 5.4, examines the interaction of these two factors. This chapter ul-
timately seeks to uncover if substrate characteristics are present in the vowel spaces
of these older-aged UP speakers, and if such characteristics are correlated with either
heritage-location or bilingualism as main effects or as an interaction of these
two predictor variables.
5.1 The Vowel System of Older-aged Speakers
The first analysis of this chapter investigates the individual vowel placement and
overall configuration of the seventy-one older-aged bilingual and monolingual UP
speakers’ vowel spaces as a vowel system. The grand averages of the first and second
formant values have been calculated for each of the nine monophthongs and four
diphthongs, and each vowel is plotted in the acoustic vowel space as a global system
in Figure 5.1.
(Table of Contents) 68 Ph.D Thesis 2014
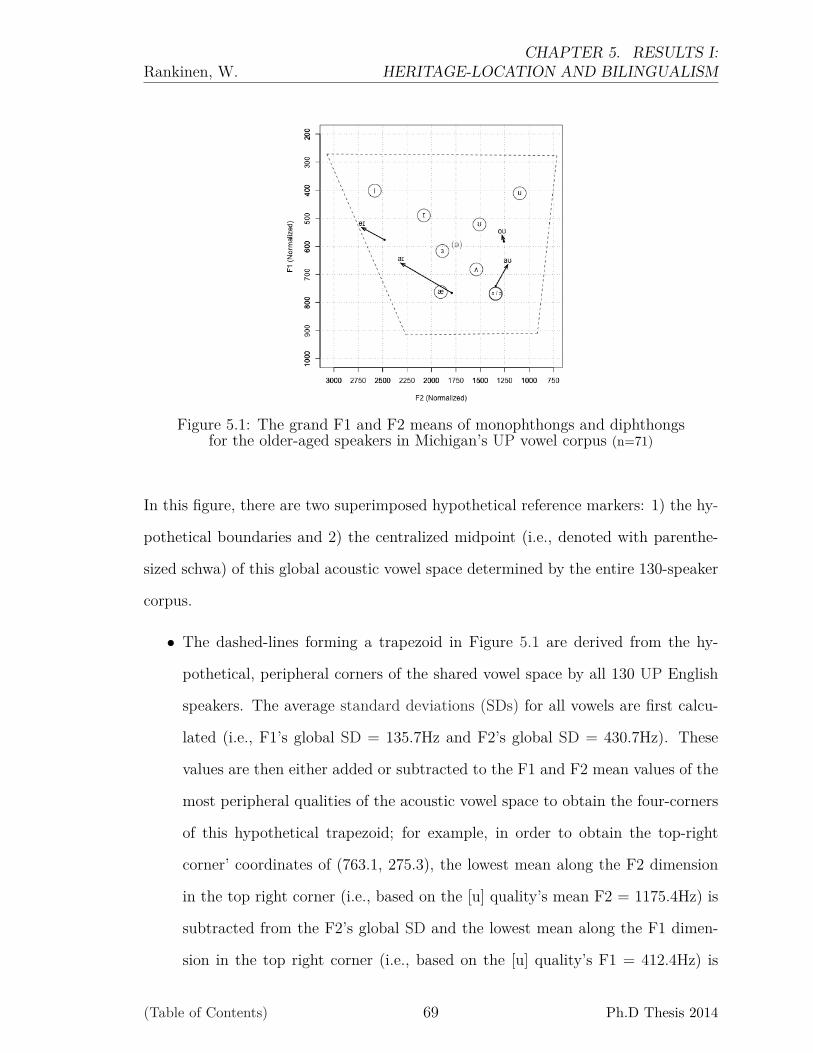
Rankinen, W.CHAPTER 5. RESULTS I:
HERITAGE-LOCATION AND BILINGUALISM
Figure 5.1: The grand F1 and F2 means of monophthongs and diphthongsfor the older-aged speakers in Michigan’s UP vowel corpus (n=71)
In this figure, there are two superimposed hypothetical reference markers: 1) the hy-
pothetical boundaries and 2) the centralized midpoint (i.e., denoted with parenthe-
sized schwa) of this global acoustic vowel space determined by the entire 130-speaker
corpus.
• The dashed-lines forming a trapezoid in Figure 5.1 are derived from the hy-
pothetical, peripheral corners of the shared vowel space by all 130 UP English
speakers. The average standard deviations (SDs) for all vowels are first calcu-
lated (i.e., F1’s global SD = 135.7Hz and F2’s global SD = 430.7Hz). These
values are then either added or subtracted to the F1 and F2 mean values of the
most peripheral qualities of the acoustic vowel space to obtain the four-corners
of this hypothetical trapezoid; for example, in order to obtain the top-right
corner’ coordinates of (763.1, 275.3), the lowest mean along the F2 dimension
in the top right corner (i.e., based on the [u] quality’s mean F2 = 1175.4Hz) is
subtracted from the F2’s global SD and the lowest mean along the F1 dimen-
sion in the top right corner (i.e., based on the [u] quality’s F1 = 412.4Hz) is
(Table of Contents) 69 Ph.D Thesis 2014
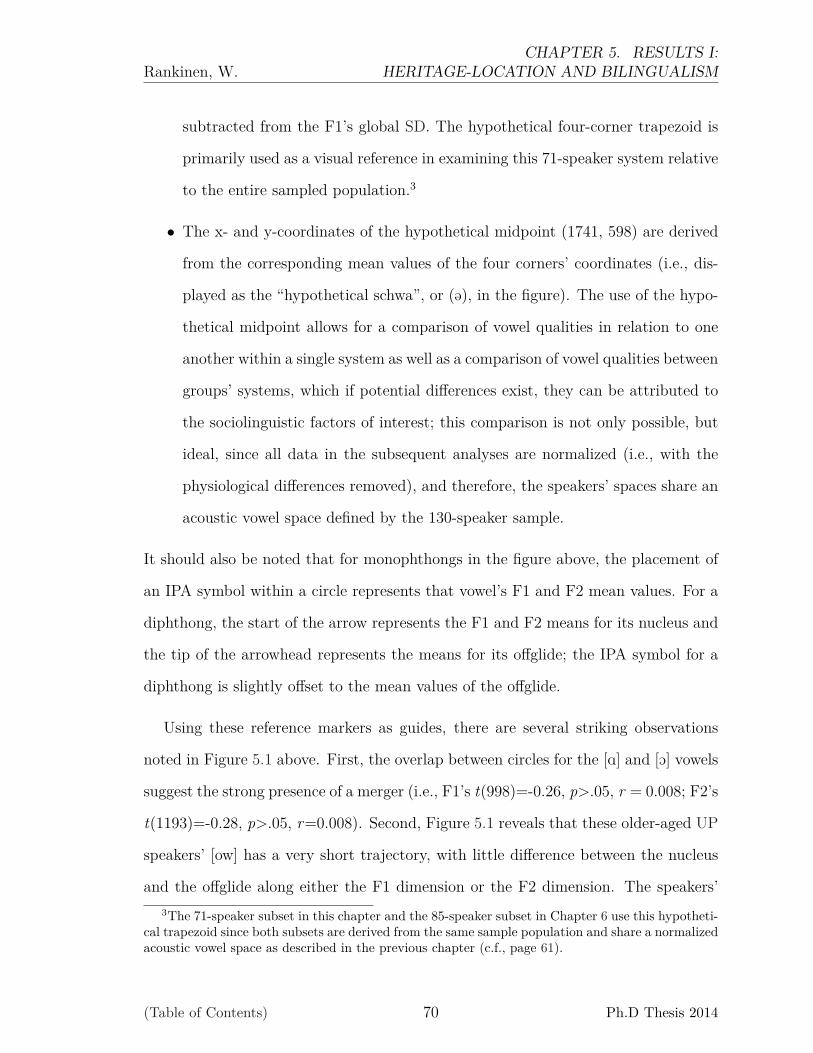
Rankinen, W.CHAPTER 5. RESULTS I:
HERITAGE-LOCATION AND BILINGUALISM
subtracted from the F1’s global SD. The hypothetical four-corner trapezoid is
primarily used as a visual reference in examining this 71-speaker system relative
to the entire sampled population.3
• The x- and y-coordinates of the hypothetical midpoint (1741, 598) are derived
from the corresponding mean values of the four corners’ coordinates (i.e., dis-
played as the “hypothetical schwa”, or (@), in the figure). The use of the hypo-
thetical midpoint allows for a comparison of vowel qualities in relation to one
another within a single system as well as a comparison of vowel qualities between
groups’ systems, which if potential differences exist, they can be attributed to
the sociolinguistic factors of interest; this comparison is not only possible, but
ideal, since all data in the subsequent analyses are normalized (i.e., with the
physiological differences removed), and therefore, the speakers’ spaces share an
acoustic vowel space defined by the 130-speaker sample.
It should also be noted that for monophthongs in the figure above, the placement of
an IPA symbol within a circle represents that vowel’s F1 and F2 mean values. For a
diphthong, the start of the arrow represents the F1 and F2 means for its nucleus and
the tip of the arrowhead represents the means for its offglide; the IPA symbol for a
diphthong is slightly offset to the mean values of the offglide.
Using these reference markers as guides, there are several striking observations
noted in Figure 5.1 above. First, the overlap between circles for the [A] and [O] vowels
suggest the strong presence of a merger (i.e., F1’s t(998)=-0.26, p>.05, r = 0.008; F2’s
t(1193)=-0.28, p>.05, r=0.008). Second, Figure 5.1 reveals that these older-aged UP
speakers’ [ow] has a very short trajectory, with little difference between the nucleus
and the offglide along either the F1 dimension or the F2 dimension. The speakers’3The 71-speaker subset in this chapter and the 85-speaker subset in Chapter 6 use this hypotheti-
cal trapezoid since both subsets are derived from the same sample population and share a normalizedacoustic vowel space as described in the previous chapter (c.f., page 61).
(Table of Contents) 70 Ph.D Thesis 2014

Rankinen, W.CHAPTER 5. RESULTS I:
HERITAGE-LOCATION AND BILINGUALISM
nucleus of [ow] is approximately the same as the offglide (i.e., the F1 and F2’s mean
differences between the nucleus and the offglide is 21.2Hz and 18.5Hz respectively);
the difference for F2 is not significant (i.e., t(214)=-1.71, p>0.05, r = 0.12), while the
F1 does report a significant difference (i.e., t(214)=6.49, p<0.001, r=0.41). The third
and fourth striking characteristics refer to the nucleus of the long diphthongs and
their proximity with their neighboring monophthongs. The [Aj] vowel is considerably
forward in terms of this shared vowel space with an F2 mean of 1787Hz compared
to the [æ] vowel’s F2 mean of 1907Hz and the [A/O] vowels’ F2 means of 1341Hz and
1343Hz respectively. In contrast the [Aw] is higher rather than more forward in the
vowel space, with an F1 mean of 742Hz compared to the [2] vowel’s F1 mean of 683Hz
and the [A/O] vowels’ shared F1 mean of 769Hz. Although Figure 5.1 provides four
striking characteristics, this plot is limited in that it does not account for the token
distribution of each vowel or the relationship of a vowel to another in the acoustic
vowel space.
As an accompaniment to the previous figure, Figures 5.2 and 5.3 display the global
distribution as well as the grand means of each monophthong and each diphthongs’
nucleus and offglide.
(Table of Contents) 71 Ph.D Thesis 2014
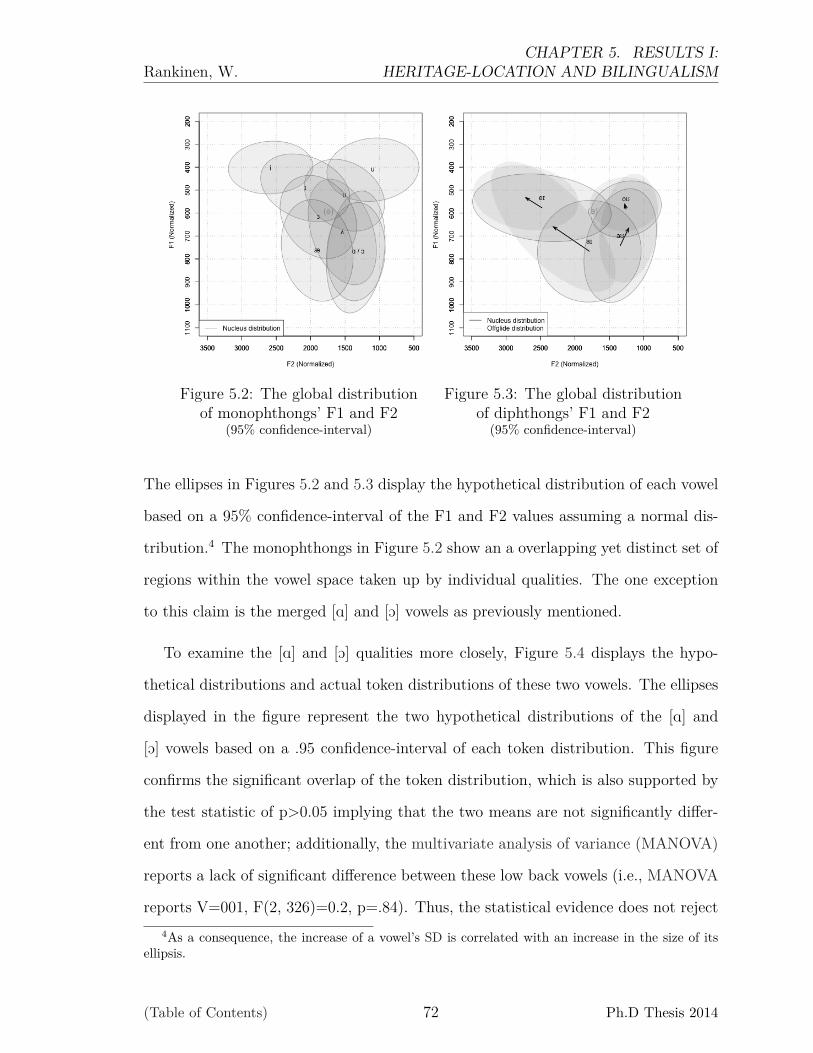
Rankinen, W.CHAPTER 5. RESULTS I:
HERITAGE-LOCATION AND BILINGUALISM
Figure 5.2: The global distributionof monophthongs’ F1 and F2
(95% confidence-interval)
Figure 5.3: The global distributionof diphthongs’ F1 and F2
(95% confidence-interval)
The ellipses in Figures 5.2 and 5.3 display the hypothetical distribution of each vowel
based on a 95% confidence-interval of the F1 and F2 values assuming a normal dis-
tribution.4 The monophthongs in Figure 5.2 show an a overlapping yet distinct set of
regions within the vowel space taken up by individual qualities. The one exception
to this claim is the merged [A] and [O] vowels as previously mentioned.
To examine the [A] and [O] qualities more closely, Figure 5.4 displays the hypo-
thetical distributions and actual token distributions of these two vowels. The ellipses
displayed in the figure represent the two hypothetical distributions of the [A] and
[O] vowels based on a .95 confidence-interval of each token distribution. This figure
confirms the significant overlap of the token distribution, which is also supported by
the test statistic of p>0.05 implying that the two means are not significantly differ-
ent from one another; additionally, the multivariate analysis of variance (MANOVA)
reports a lack of significant difference between these low back vowels (i.e., MANOVA
reports V=001, F(2, 326)=0.2, p=.84). Thus, the statistical evidence does not reject4As a consequence, the increase of a vowel’s SD is correlated with an increase in the size of its
ellipsis.
(Table of Contents) 72 Ph.D Thesis 2014

Rankinen, W.CHAPTER 5. RESULTS I:
HERITAGE-LOCATION AND BILINGUALISM
the claim that the [O] and the [A] are merged within the general UP system. It will
be interesting to see if the merger is maintained at subsequent levels of analysis for
heritage-location and bilingualism in this chapter.
Figure 5.4: and [O] merger ]The distribution density
of the [A] and [O] merger(ellipses based on .95 confidence-interval)
Turning back to the diphthongs in Figure 5.3, the two types of ellipses (i.e., solid
vs. dotted) represent the nucleus distribution and the offglide distribution of the
short diphthongs and long diphthongs. Each of the four diphthongs are pat-
terning very differently in comparison to one another in that their respective nuclei
are utilizing distinct regions of the vowel space. Even the nuclei of the [Aw] and [Aj]
diphthongs are significantly different from one another in the F1 and F2 dimension
(i.e., univariate analysis of variance (ANOVA) of F2 reports F(2, 698)=401, p<.001,
while ANOVA of F1 reports F(2, 6.83), p<0.01; MANOVA reports V=0.367, F(2,
697)=202, p<0.001).
In this thesis, the question remains as to if the following environments condition
the raised and non-raised variants of the long diphthongs’ nuclei, [Aj] and [Aw].
(Table of Contents) 73 Ph.D Thesis 2014

Rankinen, W.CHAPTER 5. RESULTS I:
HERITAGE-LOCATION AND BILINGUALISM
However, this question can only be partially answered, since the [Aj] vowel is followed
by both voiced and voiceless obstruents while the latter is only followed by voiceless
obstruents in the reading passage dataset. As a result, first we will examine the
nucleus of /Aj/ to see if it is conditioned based on the following environment for the
two tokens “tried” for [AjC] and “slices” [AjT].
Figure 5.5: The distribution density ofthe [AjT] and [AjC] nuclei
Figure 5.5 displays the means and to-
ken distribution of the phonetical real-
ization of the nucleus of /Aj/ in a pre-
voiced context (i.e., [AjC] as in the case
of “tried”) and a pre-voiceless context
(i.e., [AjT] as in the case of “slices”).5
The pre-voiceless tokens of /Aj/ are on
average raised more than the pre-voiced
ones. The pre-voiced and -voiceless envi-
ronments of the /Aj/ observationally and
statistically are conditioning the raised
and non-raised variants; a MANOVA re-
ports statistical significance with a 66.2Hz difference along the F1 dimension (i.e.,
MANOVA reports V=0.167, F(2, 139)=13.9, p<0.001). A greater than 60Hz differ-
ence between the variants of /Aj/ in pre-voiced and pre-voiceless contexts is shown to
be a diagnostic for determining the presence of Canadian raising in the seminal work
of Labov et al. (2006, 222).
If the nuclei of the two long diphthongs are distinctive from one another along
the F2 and F1 dimension, are they also distinctive from neighboring vowel qualities
(e.g., [æ], [A/O], [2])? In order to answer this question, both the nuclei of the pre-
voiceless /Aj/ and /Aw/ vowels will be examined in relation to their neighboring5The ellipses are based on .95 confidence-interval.
(Table of Contents) 74 Ph.D Thesis 2014
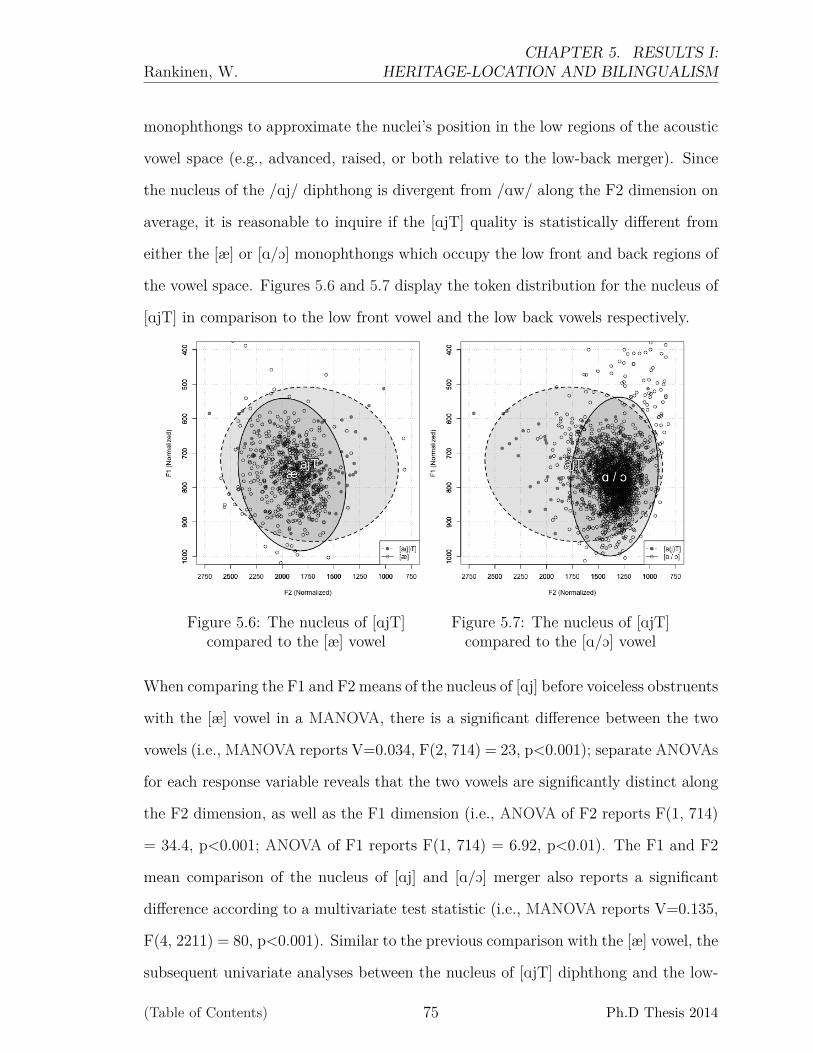
Rankinen, W.CHAPTER 5. RESULTS I:
HERITAGE-LOCATION AND BILINGUALISM
monophthongs to approximate the nuclei’s position in the low regions of the acoustic
vowel space (e.g., advanced, raised, or both relative to the low-back merger). Since
the nucleus of the /Aj/ diphthong is divergent from /Aw/ along the F2 dimension on
average, it is reasonable to inquire if the [AjT] quality is statistically different from
either the [æ] or [A/O] monophthongs which occupy the low front and back regions of
the vowel space. Figures 5.6 and 5.7 display the token distribution for the nucleus of
[AjT] in comparison to the low front vowel and the low back vowels respectively.
Figure 5.6: The nucleus of [AjT]compared to the [æ] vowel
Figure 5.7: The nucleus of [AjT]compared to the [A/O] vowel
When comparing the F1 and F2 means of the nucleus of [Aj] before voiceless obstruents
with the [æ] vowel in a MANOVA, there is a significant difference between the two
vowels (i.e., MANOVA reports V=0.034, F(2, 714) = 23, p<0.001); separate ANOVAs
for each response variable reveals that the two vowels are significantly distinct along
the F2 dimension, as well as the F1 dimension (i.e., ANOVA of F2 reports F(1, 714)
= 34.4, p<0.001; ANOVA of F1 reports F(1, 714) = 6.92, p<0.01). The F1 and F2
mean comparison of the nucleus of [Aj] and [A/O] merger also reports a significant
difference according to a multivariate test statistic (i.e., MANOVA reports V=0.135,
F(4, 2211) = 80, p<0.001). Similar to the previous comparison with the [æ] vowel, the
subsequent univariate analyses between the nucleus of [AjT] diphthong and the low-
(Table of Contents) 75 Ph.D Thesis 2014

Rankinen, W.CHAPTER 5. RESULTS I:
HERITAGE-LOCATION AND BILINGUALISM
back merger reveal that the vowels are significantly distinct along the F2 dimension
and the F1 dimension (i.e., ANOVA of F2 reports F(2, 2211) = 160.3, p<0.001;
ANOVA of F1 reports F(2, 2211) = 4.94, p<0.01).
Since the nuclei of the /Aj/ and the /Aw/ are phonetically distinct along the
F2 dimension, what is [AwT]’s relationship with the neighboring vowels in the low
back quadrant of this global vowel space? With the focus on the nucleus of the
[AwT] diphthong, Figures 5.8 and 5.9 display the token distribution of the nucleus
of this diphthong with the token distribution of the [A/O] vowels and the [2] vowel
respectively.
Figure 5.8: The nucleus of the [AwT]diphthong compared to the [A/O] vowel
Figure 5.9: The nucleus of the [AwT]diphthong compared to the [2] vowel
The multivariate analysis of variance for [AwT] before voiceless obstruents and the
low-back merger reveals a significant difference (i.e., MANOVA report V=0.013, F(4,
2710) = 9, p<0.01); subsequent ANOVAs report significant differences between these
qualities along the F1 dimension but not the F2 dimension (i.e., ANOVA of F1 reports
F(2, 2710) = 17.7, p<0.001; ANOVA of F2 reports F(2, 2710) = 0.074, p>0.05). The
nucleus of [AwT] and the [2] vowel are also significantly distinctive from one another
(i.e., MANOVA reports V=0.19, F(2, 1925) = 229, p<0.001); along both the F1 and
(Table of Contents) 76 Ph.D Thesis 2014
Rankinen, W.CHAPTER 5. RESULTS I:
HERITAGE-LOCATION AND BILINGUALISM
F2 dimensions, the nucleus of the diphthong is distinctive from the [2] monophthong
(i.e., ANOVA of F1 reports F(1, 1925) = 152.7, p<0.001; ANOVA of F2 reports F(1,
1925) = 369.3, p<0.001). These test statistics indicate that the nucleus of the [AwT]
diphthong is raised in the older-aged UP speakers’ system; that is, it is distinctive
from both the [A/O] and [2] vowels that are the low-back merger but below the [2]
monophthong. In general, the nucleus of the [AwT] diphthong can be described as
being both raised above the low-back merger but not advanced in the acoustic vowel
space, while the nucleus of the [AjT] diphthong is both advanced and raised relative
to the merger.
When examining diphthongs, the response variables of Euclidean distance (ED)
and duration should also be taken into account. Figure 5.10 displays the relationship
of ED and duration for the diphthongal qualities of [ej, ow, AwT, AjT, AjC], with
labels located at the centralized loci of the five ellipses. The ED is the distance
from the nucleus (i.e., first-pivot point) to the offglide (i.e., second pivot-point) of a
diphthong’s trajectory, while a diphthong’s duration begins at the vocalic onset and
ends at the vocalic offset of the vowel.
(Table of Contents) 77 Ph.D Thesis 2014
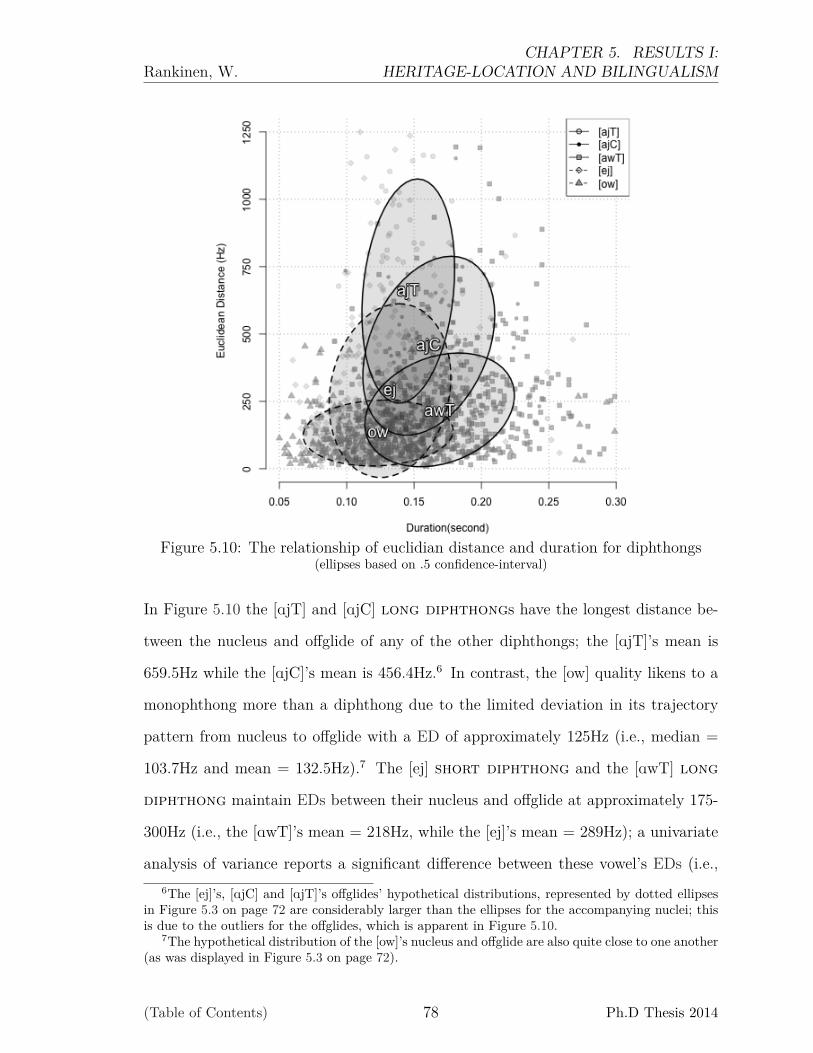
Rankinen, W.CHAPTER 5. RESULTS I:
HERITAGE-LOCATION AND BILINGUALISM
Figure 5.10: The relationship of euclidian distance and duration for diphthongs(ellipses based on .5 confidence-interval)
In Figure 5.10 the [AjT] and [AjC] long diphthongs have the longest distance be-
tween the nucleus and offglide of any of the other diphthongs; the [AjT]’s mean is
659.5Hz while the [AjC]’s mean is 456.4Hz.6 In contrast, the [ow] quality likens to a
monophthong more than a diphthong due to the limited deviation in its trajectory
pattern from nucleus to offglide with a ED of approximately 125Hz (i.e., median =
103.7Hz and mean = 132.5Hz).7 The [ej] short diphthong and the [AwT] long
diphthong maintain EDs between their nucleus and offglide at approximately 175-
300Hz (i.e., the [AwT]’s mean = 218Hz, while the [ej]’s mean = 289Hz); a univariate
analysis of variance reports a significant difference between these vowel’s EDs (i.e.,6The [ej]’s, [AjC] and [AjT]’s offglides’ hypothetical distributions, represented by dotted ellipses
in Figure 5.3 on page 72 are considerably larger than the ellipses for the accompanying nuclei; thisis due to the outliers for the offglides, which is apparent in Figure 5.10.
7The hypothetical distribution of the [ow]’s nucleus and offglide are also quite close to one another(as was displayed in Figure 5.3 on page 72).
(Table of Contents) 78 Ph.D Thesis 2014

Rankinen, W.CHAPTER 5. RESULTS I:
HERITAGE-LOCATION AND BILINGUALISM
ANOVA of ED reports F(3, 1207) = 120.5, p<0.001). If the EDs for /Aj/ is ex-
cluded, the univariate analysis of variance for the nucleus of [ow], [AwT] and [ej]
reveal that they are all statistically different from one another (i.e., ANOVA of ED
reports F(2,1067) = 38.81, p<0.001).
In terms of total duration, as shown in Figure 5.10 as well, the short diph-
thongs and long diphthongs are patterning very similarly with their respective
counterparts. The duration means for [ej] and [ow] are ≈ 132ms and 123ms (i.e.,
ANOVA of duration reports F(1, 499)=5.28, p<0.05), and the duration means for
[AjT], [AjC] and [AwT] are ≈ 156ms, 161ms and 169ms respectively (i.e., ANOVA of
duration reports F(1, 708)=13.45, p<0.001). All diphthongs are distinctly different
in terms of duration; however, the /Aw/ and /Aj/ diphthongs are clearly longer than
the /ej/ and /ow/ diphthong which maintains the traditional long-short distinction.
The duration measurements for these older-aged UP speakers’ diphthongs follow the
traditional distinction between short diphthongs and long diphthongs, while
the ED measurements do not. The short ED and the significant correlation between
the short diphthong /ow/ indicates its quality resembles a monophthong rather
than a diphthong (i.e., this suggest that “boat” might be pronounced more like [bot],
instead of [boUt], by an older-aged UP speaker in this speech community).
This section reveals that the global system of these older-aged UP speakers has
several salient characteristics: 1) the presence of a low-back merger, 2) the monoph-
thongized [ow] vowel 3) fronting of the /Aj/ nucleus (but not the /Aw/ nucleus), and
4) raising of both the [AjT] and the [AwT] nuclei above the low-back merger. Now that
an overall description of the older-aged UP speakers’ system has been provided, the
remainder of this chapter will focus on the interspeaker variation of the linguistic vari-
ables of interest as they correlate with the predictor variables of heritage-location
and bilingualism and the interaction between them.
(Table of Contents) 79 Ph.D Thesis 2014
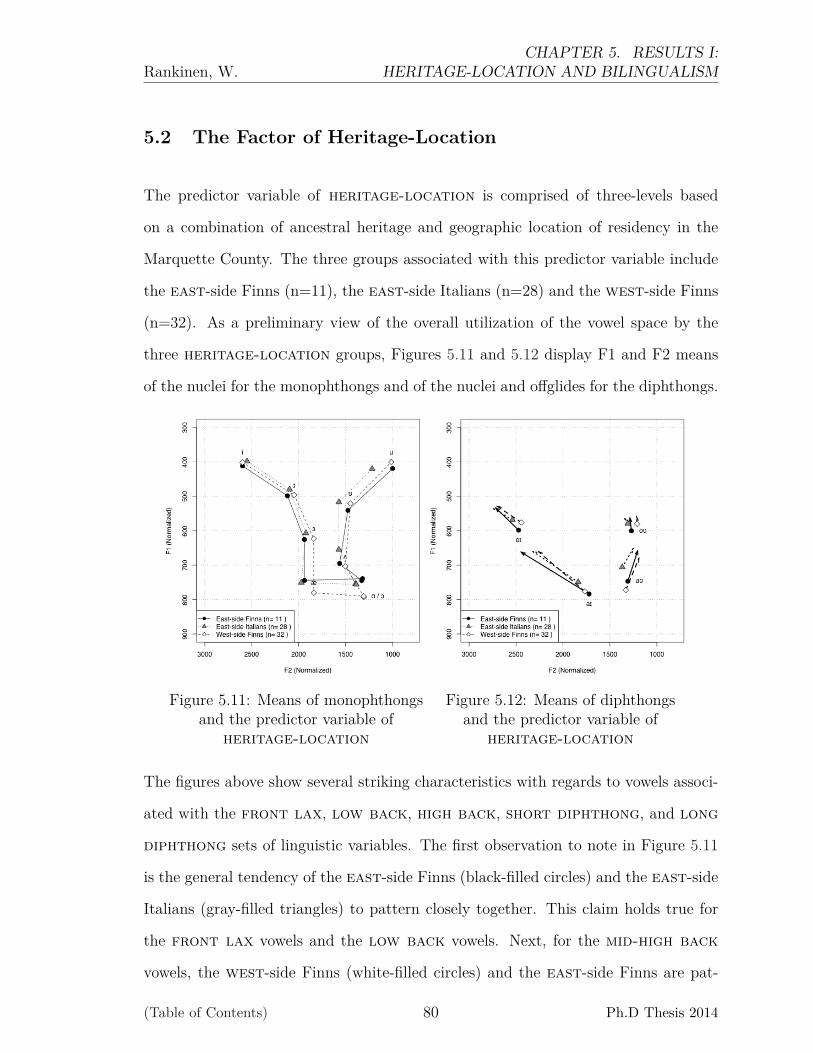
Rankinen, W.CHAPTER 5. RESULTS I:
HERITAGE-LOCATION AND BILINGUALISM
5.2 The Factor of Heritage-Location
The predictor variable of heritage-location is comprised of three-levels based
on a combination of ancestral heritage and geographic location of residency in the
Marquette County. The three groups associated with this predictor variable include
the east-side Finns (n=11), the east-side Italians (n=28) and the west-side Finns
(n=32). As a preliminary view of the overall utilization of the vowel space by the
three heritage-location groups, Figures 5.11 and 5.12 display F1 and F2 means
of the nuclei for the monophthongs and of the nuclei and offglides for the diphthongs.
Figure 5.11: Means of monophthongsand the predictor variable of
heritage-location
Figure 5.12: Means of diphthongsand the predictor variable of
heritage-location
The figures above show several striking characteristics with regards to vowels associ-
ated with the front lax, low back, high back, short diphthong, and long
diphthong sets of linguistic variables. The first observation to note in Figure 5.11
is the general tendency of the east-side Finns (black-filled circles) and the east-side
Italians (gray-filled triangles) to pattern closely together. This claim holds true for
the front lax vowels and the low back vowels. Next, for the mid-high back
vowels, the west-side Finns (white-filled circles) and the east-side Finns are pat-
(Table of Contents) 80 Ph.D Thesis 2014

Rankinen, W.CHAPTER 5. RESULTS I:
HERITAGE-LOCATION AND BILINGUALISM
terning together, while the east-side Italians’ vowels are higher and further forward
in the acoustic space. In Figure 5.12, the first observation to note is the trend for
the east-side Italians to pattern differently from either the east-side Finns or the
west-side Finns for the nucleus of the [Aj], [Aw] and [ow] diphthongs; in other words,
the [Aj]’s nucleus is further forward, the [Aw] is higher and the [ow] is further forward
and higher for the east-side Italians compared to these other two groups. When com-
paring the [ow] vowel’s nuclei and the offglides for the heritage-location groups,
the east-side Italians’ [ow] is completely monophthongized while the other two have
observable, albeit short, trajectories.
The remainder of this section presents each observation discussed above in turn,
and for each subsection, a thorough analysis will be provided of the heritage-
location groups relative to each linguistic set of variables of interest. As such,
Subsections 5.2.1, 5.2.2 and 5.2.3 first examine the effects of heritage-location
on the vowels characterized by the front lax, high back and low back sets of lin-
guistic variables respectively. Subsections 5.2.4 and 5.2.5 then investigate the short
diphthongs and long diphthongs in relation to the main effect of heritage-
location.
5.2.1 The Analysis of the Front Lax Vowels
The structural difference between the heritage-location groups for the front
lax vowels is visually striking and displayed in Figure 5.13. The [I] vowel is sta-
tistically significant for the factor of heritage-location according to both a mul-
tivariate (i.e., MANOVA reports V=0.03, F(2, 632)=4.72, p<0.001) and univariate
analyses of variance (i.e., ANOVA of F1 reports F(2, 632) = 6.13, p<0.01; ANOVA of
F2 reports F(2, 632) = 3.74, p<0.05). Similarly, the [E] vowel does show significance
(i.e., MANOVA reports V=0.05, F(2, 847) = 10.13, p<0.001, while the ANOVA of F2
(Table of Contents) 81 Ph.D Thesis 2014

Rankinen, W.CHAPTER 5. RESULTS I:
HERITAGE-LOCATION AND BILINGUALISM
Figure 5.13: The grand means ofthe front lax vowels for
the heritage-location groups
reports F(2, 847) = 5.4, p<0.01; ANOVA of F1 reports F(2, 847) = 16.50, p<0.001).
Finally, the heritage-location groups are significantly different from one another
when examining the [æ] vowel using multivariate and univariate analyses of variance;
the MANOVA statistic reports a high significance (i.e., MANOVA reports V=0.10,
F(2, 634) = 17.26, p<0.001), which corresponds to the univariate analyses of vari-
ance for F1 (i.e., ANOVA of F1 reports F(2, 634) = 9.70, p<0.001) and F2 (i.e.,
ANOVA of F2 reports F(2, 634) = 29.6, p<0.001). The results indicate that the
east-side Finns and the east-side Italians are patterning closely to one another; in
other words, the west-side Finns’ front lax vowels are more retracted than the
other two heritage-location groups as a factor of location.
In order to examine more closely the claim that location of residency seems to have
an effect on front lax vowels, Figure 5.14 displays the hypothetical distribution
and actual token distribution of the three vowels independently for each heritage-
location group.
(Table of Contents) 82 Ph.D Thesis 2014

Rankinen, W.CHAPTER 5. RESULTS I:
HERITAGE-LOCATION AND BILINGUALISM
(a) East-side Finns (n=11) (b) East-side Italians (n=28)
(c) West-side Finns (n=32)
Figure 5.14: The distribution of the front lax vowelsfor each heritage-location group
(Based on a .95 confidence-interval)
In this figure there are three subplots for each heritage-location group, each of
which displays the hypothetical distribution and the actual distribution of the [I], [E]
and [æ] tokens.8 The [I] vowels have a similar token distribution for all three subfig-
ures; this is supported by the multivariate and univariate statistics which reported
non-significant differences. In contrast, both the [E] and [æ] distributions are quite8The latter is based on a .95 confidence-interval and represented by ellipses.
(Table of Contents) 83 Ph.D Thesis 2014
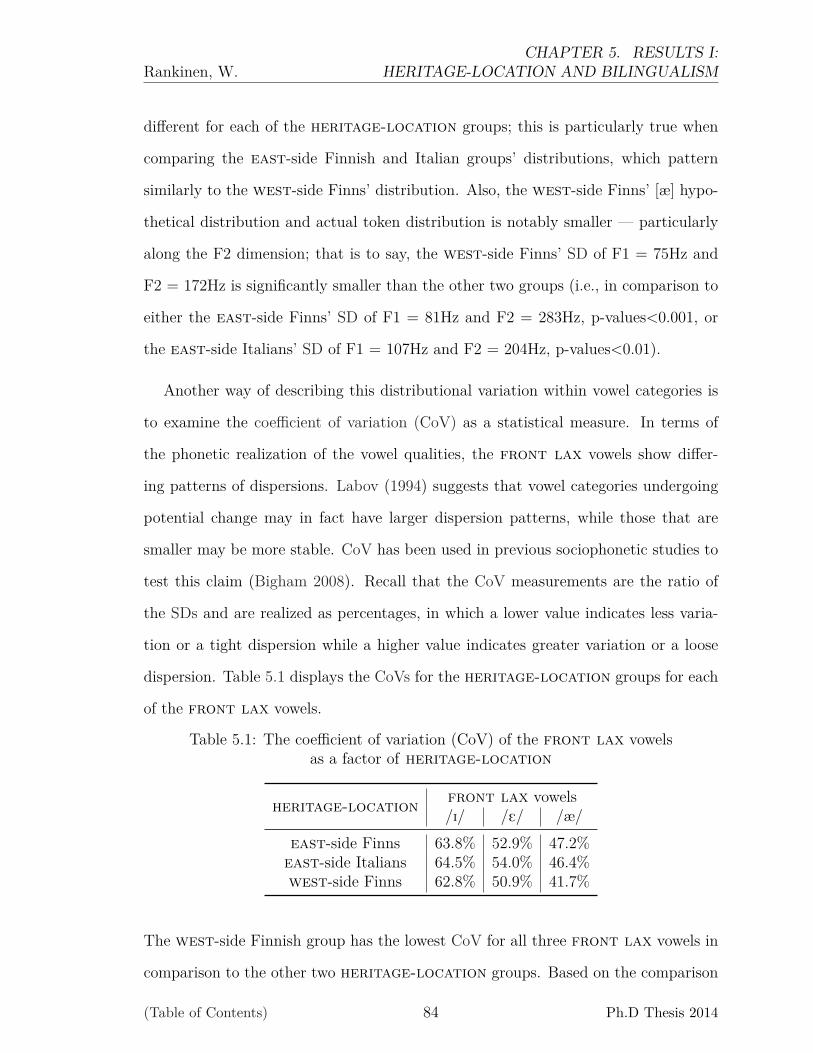
Rankinen, W.CHAPTER 5. RESULTS I:
HERITAGE-LOCATION AND BILINGUALISM
different for each of the heritage-location groups; this is particularly true when
comparing the east-side Finnish and Italian groups’ distributions, which pattern
similarly to the west-side Finns’ distribution. Also, the west-side Finns’ [æ] hypo-
thetical distribution and actual token distribution is notably smaller — particularly
along the F2 dimension; that is to say, the west-side Finns’ SD of F1 = 75Hz and
F2 = 172Hz is significantly smaller than the other two groups (i.e., in comparison to
either the east-side Finns’ SD of F1 = 81Hz and F2 = 283Hz, p-values<0.001, or
the east-side Italians’ SD of F1 = 107Hz and F2 = 204Hz, p-values<0.01).
Another way of describing this distributional variation within vowel categories is
to examine the coefficient of variation (CoV) as a statistical measure. In terms of
the phonetic realization of the vowel qualities, the front lax vowels show differ-
ing patterns of dispersions. Labov (1994) suggests that vowel categories undergoing
potential change may in fact have larger dispersion patterns, while those that are
smaller may be more stable. CoV has been used in previous sociophonetic studies to
test this claim (Bigham 2008). Recall that the CoV measurements are the ratio of
the SDs and are realized as percentages, in which a lower value indicates less varia-
tion or a tight dispersion while a higher value indicates greater variation or a loose
dispersion. Table 5.1 displays the CoVs for the heritage-location groups for each
of the front lax vowels.
Table 5.1: The coefficient of variation (CoV) of the front lax vowelsas a factor of heritage-location
heritage-location front lax vowels/I/ /E/ /æ/
east-side Finns 63.8% 52.9% 47.2%east-side Italians 64.5% 54.0% 46.4%west-side Finns 62.8% 50.9% 41.7%
The west-side Finnish group has the lowest CoV for all three front lax vowels in
comparison to the other two heritage-location groups. Based on the comparison
(Table of Contents) 84 Ph.D Thesis 2014
Rankinen, W.CHAPTER 5. RESULTS I:
HERITAGE-LOCATION AND BILINGUALISM
of means and SDs, along with the comparison of coefficients of variation, the present
analysis shows that heritage-location has a clear effect on the front lax vowels;
that is to say, the more urban-based east-side groups are patterning together but
are distinctly different from the more rurally-based west-side Finns.
5.2.2 The Analysis of the Low Back Vowels
In Section 5.1, the low-back merger had been shown to be present among the older-
aged UP speakers’ system, and as a result, subsequent questions arise from this obser-
vation as it relates to the factor of heritage-location. First, are these heritage-
location groups participating in the merger? If so, then are these groups’ partici-
pation different or similar with respect to one another?
(Table of Contents) 85 Ph.D Thesis 2014
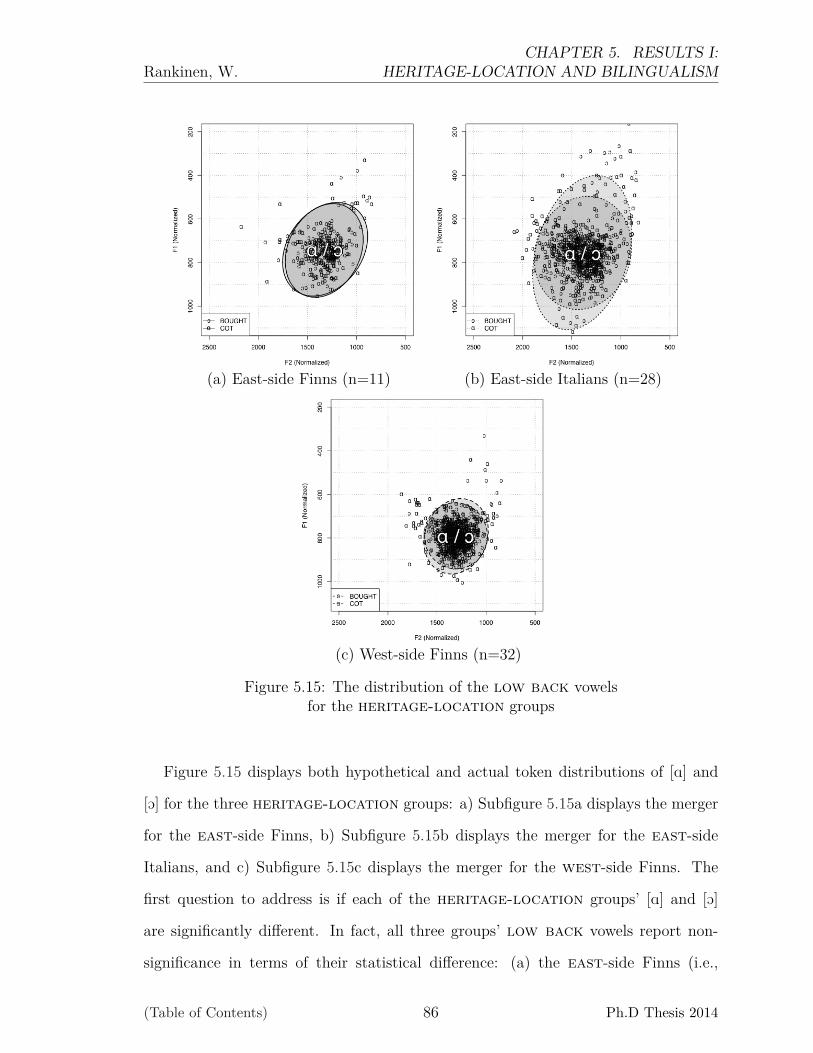
Rankinen, W.CHAPTER 5. RESULTS I:
HERITAGE-LOCATION AND BILINGUALISM
(a) East-side Finns (n=11) (b) East-side Italians (n=28)
(c) West-side Finns (n=32)
Figure 5.15: The distribution of the low back vowelsfor the heritage-location groups
Figure 5.15 displays both hypothetical and actual token distributions of [A] and
[O] for the three heritage-location groups: a) Subfigure 5.15a displays the merger
for the east-side Finns, b) Subfigure 5.15b displays the merger for the east-side
Italians, and c) Subfigure 5.15c displays the merger for the west-side Finns. The
first question to address is if each of the heritage-location groups’ [A] and [O]
are significantly different. In fact, all three groups’ low back vowels report non-
significance in terms of their statistical difference: (a) the east-side Finns (i.e.,
(Table of Contents) 86 Ph.D Thesis 2014
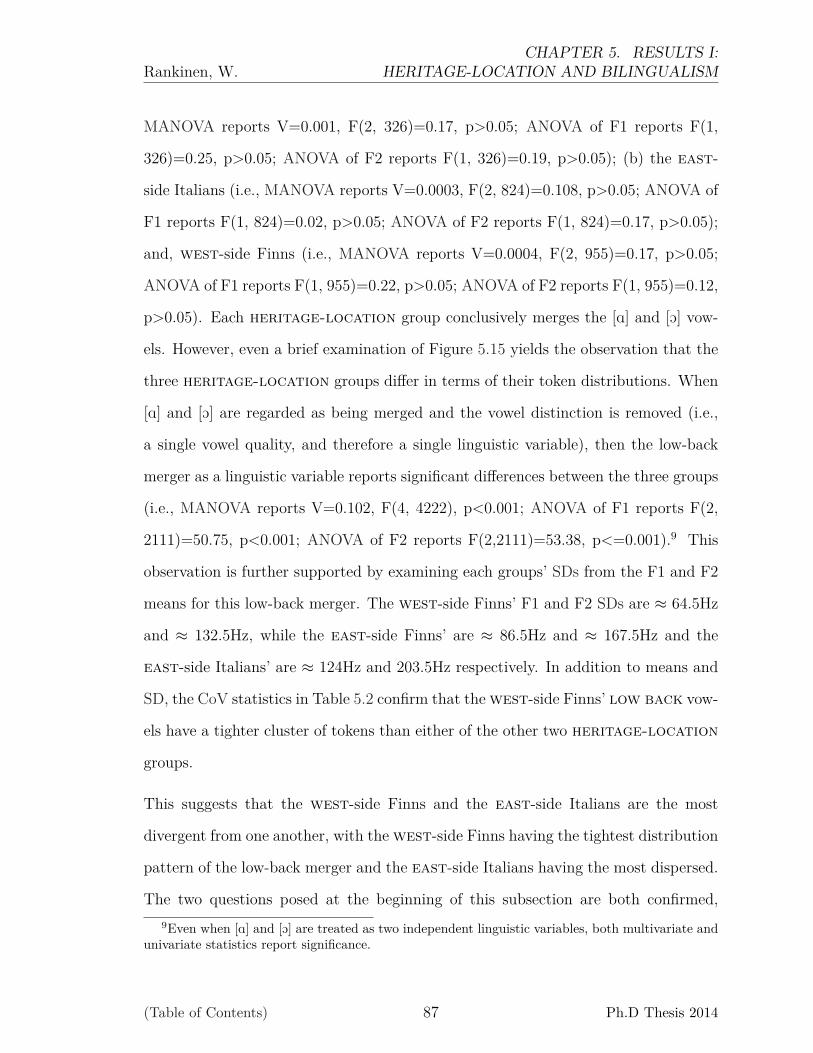
Rankinen, W.CHAPTER 5. RESULTS I:
HERITAGE-LOCATION AND BILINGUALISM
MANOVA reports V=0.001, F(2, 326)=0.17, p>0.05; ANOVA of F1 reports F(1,
326)=0.25, p>0.05; ANOVA of F2 reports F(1, 326)=0.19, p>0.05); (b) the east-
side Italians (i.e., MANOVA reports V=0.0003, F(2, 824)=0.108, p>0.05; ANOVA of
F1 reports F(1, 824)=0.02, p>0.05; ANOVA of F2 reports F(1, 824)=0.17, p>0.05);
and, west-side Finns (i.e., MANOVA reports V=0.0004, F(2, 955)=0.17, p>0.05;
ANOVA of F1 reports F(1, 955)=0.22, p>0.05; ANOVA of F2 reports F(1, 955)=0.12,
p>0.05). Each heritage-location group conclusively merges the [A] and [O] vow-
els. However, even a brief examination of Figure 5.15 yields the observation that the
three heritage-location groups differ in terms of their token distributions. When
[A] and [O] are regarded as being merged and the vowel distinction is removed (i.e.,
a single vowel quality, and therefore a single linguistic variable), then the low-back
merger as a linguistic variable reports significant differences between the three groups
(i.e., MANOVA reports V=0.102, F(4, 4222), p<0.001; ANOVA of F1 reports F(2,
2111)=50.75, p<0.001; ANOVA of F2 reports F(2,2111)=53.38, p<=0.001).9 This
observation is further supported by examining each groups’ SDs from the F1 and F2
means for this low-back merger. The west-side Finns’ F1 and F2 SDs are ≈ 64.5Hz
and ≈ 132.5Hz, while the east-side Finns’ are ≈ 86.5Hz and ≈ 167.5Hz and the
east-side Italians’ are ≈ 124Hz and 203.5Hz respectively. In addition to means and
SD, the CoV statistics in Table 5.2 confirm that the west-side Finns’ low back vow-
els have a tighter cluster of tokens than either of the other two heritage-location
groups.
This suggests that the west-side Finns and the east-side Italians are the most
divergent from one another, with the west-side Finns having the tightest distribution
pattern of the low-back merger and the east-side Italians having the most dispersed.
The two questions posed at the beginning of this subsection are both confirmed,9Even when [A] and [O] are treated as two independent linguistic variables, both multivariate and
univariate statistics report significance.
(Table of Contents) 87 Ph.D Thesis 2014
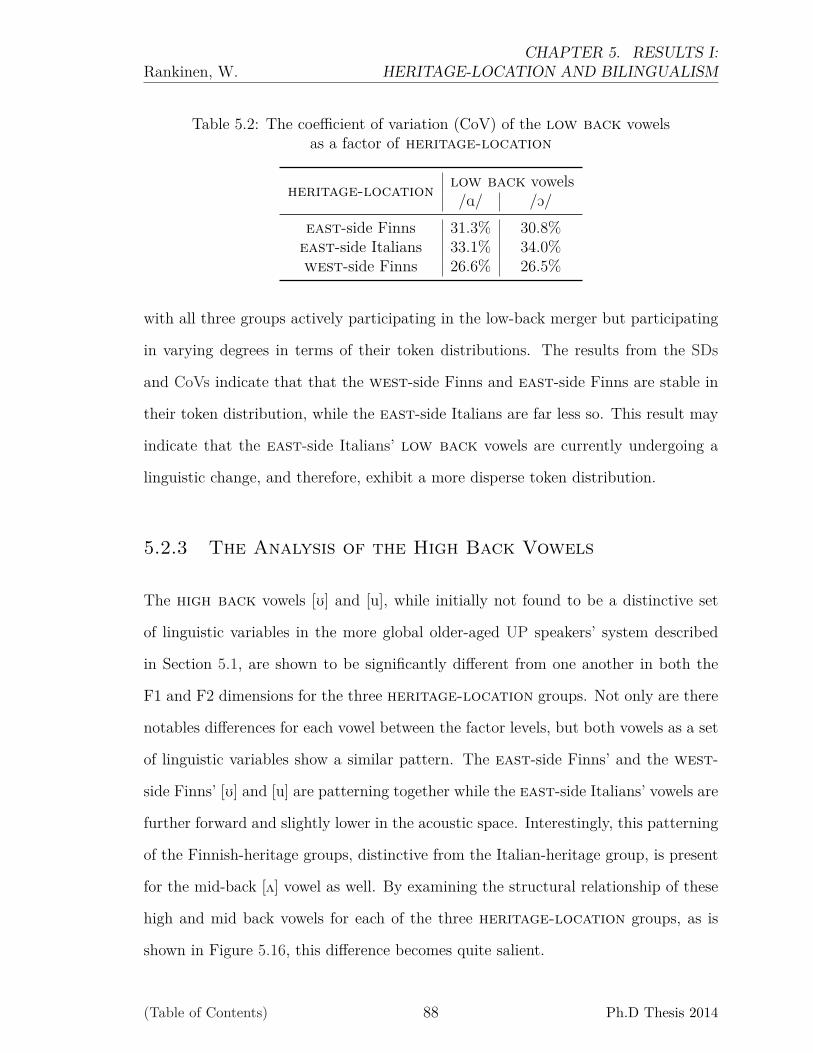
Rankinen, W.CHAPTER 5. RESULTS I:
HERITAGE-LOCATION AND BILINGUALISM
Table 5.2: The coefficient of variation (CoV) of the low back vowelsas a factor of heritage-location
heritage-location low back vowels/A/ /O/
east-side Finns 31.3% 30.8%east-side Italians 33.1% 34.0%west-side Finns 26.6% 26.5%
with all three groups actively participating in the low-back merger but participating
in varying degrees in terms of their token distributions. The results from the SDs
and CoVs indicate that that the west-side Finns and east-side Finns are stable in
their token distribution, while the east-side Italians are far less so. This result may
indicate that the east-side Italians’ low back vowels are currently undergoing a
linguistic change, and therefore, exhibit a more disperse token distribution.
5.2.3 The Analysis of the High Back Vowels
The high back vowels [U] and [u], while initially not found to be a distinctive set
of linguistic variables in the more global older-aged UP speakers’ system described
in Section 5.1, are shown to be significantly different from one another in both the
F1 and F2 dimensions for the three heritage-location groups. Not only are there
notables differences for each vowel between the factor levels, but both vowels as a set
of linguistic variables show a similar pattern. The east-side Finns’ and the west-
side Finns’ [U] and [u] are patterning together while the east-side Italians’ vowels are
further forward and slightly lower in the acoustic space. Interestingly, this patterning
of the Finnish-heritage groups, distinctive from the Italian-heritage group, is present
for the mid-back [2] vowel as well. By examining the structural relationship of these
high and mid back vowels for each of the three heritage-location groups, as is
shown in Figure 5.16, this difference becomes quite salient.
(Table of Contents) 88 Ph.D Thesis 2014
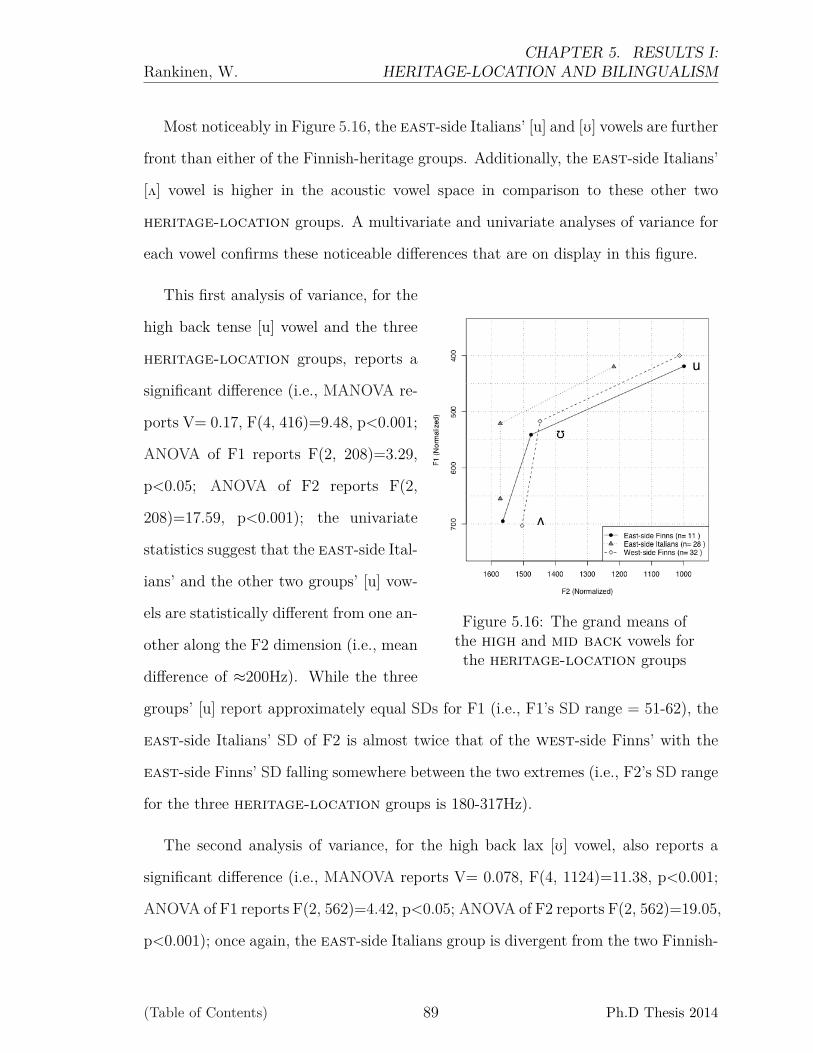
Rankinen, W.CHAPTER 5. RESULTS I:
HERITAGE-LOCATION AND BILINGUALISM
Most noticeably in Figure 5.16, the east-side Italians’ [u] and [U] vowels are further
front than either of the Finnish-heritage groups. Additionally, the east-side Italians’
[2] vowel is higher in the acoustic vowel space in comparison to these other two
heritage-location groups. A multivariate and univariate analyses of variance for
each vowel confirms these noticeable differences that are on display in this figure.
Figure 5.16: The grand means ofthe high and mid back vowels forthe heritage-location groups
This first analysis of variance, for the
high back tense [u] vowel and the three
heritage-location groups, reports a
significant difference (i.e., MANOVA re-
ports V= 0.17, F(4, 416)=9.48, p<0.001;
ANOVA of F1 reports F(2, 208)=3.29,
p<0.05; ANOVA of F2 reports F(2,
208)=17.59, p<0.001); the univariate
statistics suggest that the east-side Ital-
ians’ and the other two groups’ [u] vow-
els are statistically different from one an-
other along the F2 dimension (i.e., mean
difference of ≈200Hz). While the three
groups’ [u] report approximately equal SDs for F1 (i.e., F1’s SD range = 51-62), the
east-side Italians’ SD of F2 is almost twice that of the west-side Finns’ with the
east-side Finns’ SD falling somewhere between the two extremes (i.e., F2’s SD range
for the three heritage-location groups is 180-317Hz).
The second analysis of variance, for the high back lax [U] vowel, also reports a
significant difference (i.e., MANOVA reports V= 0.078, F(4, 1124)=11.38, p<0.001;
ANOVA of F1 reports F(2, 562)=4.42, p<0.05; ANOVA of F2 reports F(2, 562)=19.05,
p<0.001); once again, the east-side Italians group is divergent from the two Finnish-
(Table of Contents) 89 Ph.D Thesis 2014

Rankinen, W.CHAPTER 5. RESULTS I:
HERITAGE-LOCATION AND BILINGUALISM
heritage groups along the F2 dimension (i.e., with a mean difference of ≈ 100-125Hz);
whereas, the SDs of F1 and F2 for all three groups are approximately the same (i.e.,
SD<40Hz).
The last analysis of variance to examine is the mid back [2] vowel and the three
heritage-location groups, of which both the multivariate and univariate analyses
report significant differences (i.e., MANOVA reports V= 0.069, F(4, 2672)=24.05,
p<0.001; ANOVA of F1 reports F(2, 1336)=41.21, p<0.001; ANOVA of F2 reports
F(2,1336)=18.43, p<0.001). While the east-side Italians’ [2] vowel is significantly
divergent from that of the west-side Finns’ vowel along both the F1 and F2 di-
mension, the east-side Finns’ [2] is only significantly different from the east-side
Italians’ vowel along the F1 dimension (i.e., ANOVA of F1 reports F(1, 732)=25.35,
p<0.001) and from the west-side Finns’ vowel along the F2 dimension (i.e., ANOVA
of F2 reports F(1, 812)=17.65, p<0.001). The east-side Finns are patterning with
the other Finnish heritage-location group along the F1 dimension for the high
back vowels, but these east-side Finns are also patterning with the other east-side
heritage-location group along the F2 dimension.
The results from Sections 5.2.1, 5.2.2 and 5.2.3 exhibit several phonetic patterns
worth summarizing at this juncture. First, the Finnish heritage-location groups
pattern together for the low back and high back vowels, exhibiting a systematic
and structural difference from that of the east-side Italians. When the east-side
Finns do pattern differently from the west-side Finns and similar to the east-side
Italian group (e.g., front lax vowels), this groups’ token distribution is observa-
tionally dispersed and unstable (i.e., a phonetic pattern of a vowel quality typically
associated with a change-in-progress). If this is a change-in-progress, such a hypoth-
esis would account for why the east-side Finns’ and east-side Italians’ front lax
vowels exhibit the dispersed and unstable token distributions, while west-side Finns
(Table of Contents) 90 Ph.D Thesis 2014
Rankinen, W.CHAPTER 5. RESULTS I:
HERITAGE-LOCATION AND BILINGUALISM
do not — the front lax vowels of the older-aged east-side heritage-location
groups’ are undergoing a change (i.e, converging toward one another), while the
front lax vowels of the more rurally located west-side heritage-location group
is not (i.e., remaining distinctive from the east-side counterparts). Under this hy-
pothesis, the systematic and structural difference of the low back and high back
vowels that is exhibited between the heritage groups may also extend to the front
lax vowels. The west-side Finns maintain a structural difference with the east-
side Italians for each of the three front lax linguistic variables; in contrast, the
east-side Finnish group’s front lax vowels are mirroring that of its east-side
counterpart, which is indicative of dialect leveling as a factor of location and a
diffusion process of linguistic change.
5.2.4 The Analysis of the Short Diphthongs
This section seeks to reveal if the short diphthong /ow/ is monophthongized for
each heritage-location group, and if so, to determine the relationship and pattern
in comparison to one another and neighboring vowels. To determine if monophthon-
galization is present for the three heritage-location groups requires a comparison
between the nucleus of the [ow] vowel with its offglide counterpart for each level of
the heritage-location factor. In Table 5.3 below, the EDs and Pearson’s product-
moment correlations reveal that a high correlation between the nucleus and offglide
of [ow] vowel quality is correlated with the heritage-location factor.
Only one of the three heritage-location groups reports r2 correlation coeffi-
cients’ above .60 for both F1 and F2, with the west-side Finns reporting an ED
of 108.2Hz, which is approximately 40Hz shorter than the other two groups (i.e.,
ANOVA reports F(2, 209)=5.67, p<0.01). The results suggest that the west-side
Finns ’ nuclei and offglides of the [ow] quality are closely aligned, and therefore, the
(Table of Contents) 91 Ph.D Thesis 2014
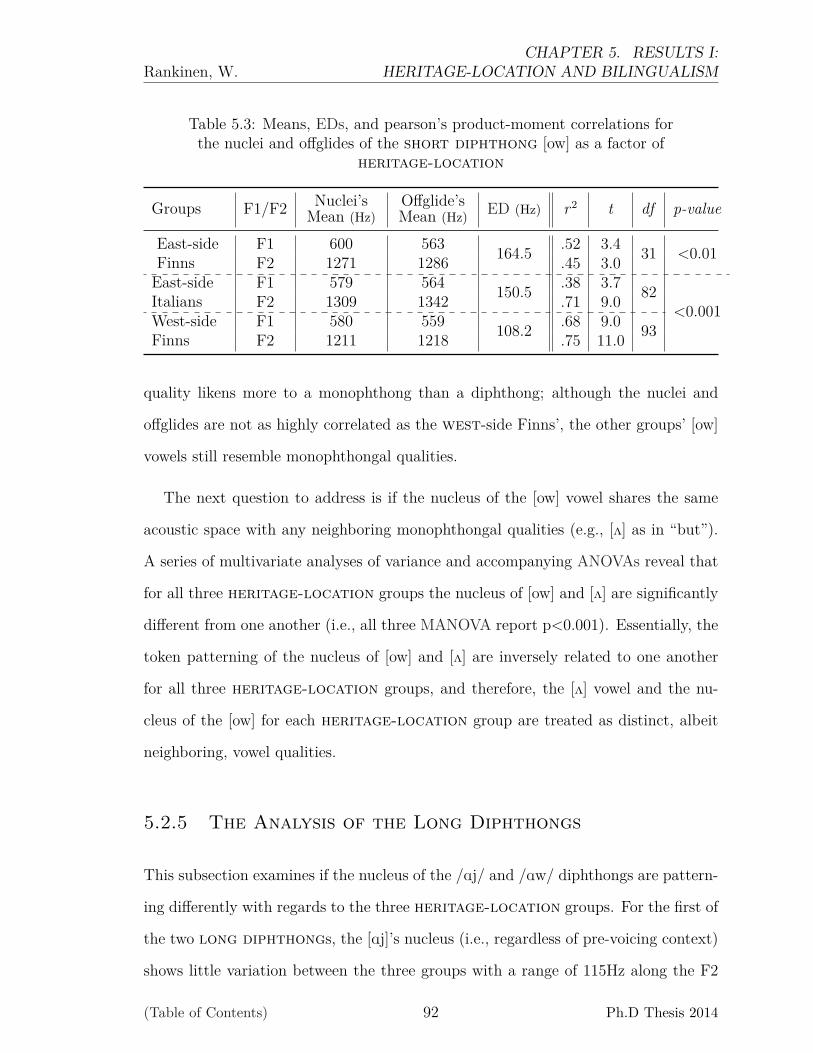
Rankinen, W.CHAPTER 5. RESULTS I:
HERITAGE-LOCATION AND BILINGUALISM
Table 5.3: Means, EDs, and pearson’s product-moment correlations forthe nuclei and offglides of the short diphthong [ow] as a factor of
heritage-location
Groups F1/F2 Nuclei’sMean (Hz)
Offglide’sMean (Hz) ED (Hz) r2 t df p-value
East-sideFinns
F1 600 563 164.5 .52 3.4 31 <0.01F2 1271 1286 .45 3.0East-sideItalians
F1 579 564 150.5 .38 3.7 82<0.001F2 1309 1342 .71 9.0
West-sideFinns
F1 580 559 108.2 .68 9.0 93F2 1211 1218 .75 11.0
quality likens more to a monophthong than a diphthong; although the nuclei and
offglides are not as highly correlated as the west-side Finns’, the other groups’ [ow]
vowels still resemble monophthongal qualities.
The next question to address is if the nucleus of the [ow] vowel shares the same
acoustic space with any neighboring monophthongal qualities (e.g., [2] as in “but”).
A series of multivariate analyses of variance and accompanying ANOVAs reveal that
for all three heritage-location groups the nucleus of [ow] and [2] are significantly
different from one another (i.e., all three MANOVA report p<0.001). Essentially, the
token patterning of the nucleus of [ow] and [2] are inversely related to one another
for all three heritage-location groups, and therefore, the [2] vowel and the nu-
cleus of the [ow] for each heritage-location group are treated as distinct, albeit
neighboring, vowel qualities.
5.2.5 The Analysis of the Long Diphthongs
This subsection examines if the nucleus of the /Aj/ and /Aw/ diphthongs are pattern-
ing differently with regards to the three heritage-location groups. For the first of
the two long diphthongs, the [Aj]’s nucleus (i.e., regardless of pre-voicing context)
shows little variation between the three groups with a range of 115Hz along the F2
(Table of Contents) 92 Ph.D Thesis 2014

Rankinen, W.CHAPTER 5. RESULTS I:
HERITAGE-LOCATION AND BILINGUALISM
dimension and a range of 35Hz along the F1 dimension. Multivariate and univariate
analyses both report a non-significant difference for the nucleus of [Aj] (i.e., MANOVA
report V=0.047, F(4, 272)=1.65, p>0.05; ANOVA of F1 reports F(2, 136)=1.79,
p>0.05; ANOVA of F2 reports F(2, 136)=1.42, p>0.05); the lack of significant dif-
ference along the F2 dimension is a result of a small token count.10 In contrast, the
nucleus of [Aw] does report a significant difference (i.e., MANOVA report V=0.13,
F(4, 1116) = 18.75, p<0.001; ANOVA of F1 reports F(2, 558) = 27.8, p<0.001;
ANOVA of F2 reports F(2, 558) = 3.07, p<0.05). Although the Finnish-heritage
groups pattern similarly with each other, the nucleus of the east-side Italians’ [Aw]
is ≈ 60Hz higher in the acoustic space. Furthermore, these east-side Italians have
a [Aw] nucleus that is 50Hz higher than the neighboring vowels participating in the
low-back merger (i.e., t(385.061)=6.12, p<0.001). The west-side Finns’ nucleus of
[Aw] is only 18Hz higher yet it is still marginally significant in its difference (i.e.,
t(315.696)=2.89, p<0.01), while the east-side Finns report a non-significant differ-
ence between their low-back merger and their neighboring [Aw] nucleus. In terms
of long diphthongs and the heritage-location effect, two main claims can be
stated: 1) only the east-side Italians are described as having the raised variant for
the [Aw]’s nucleus (i.e., <775Hz), and 2) all three heritage-location groups are
patterning similarly in terms of overall fronting for the [Aj]’s nucleus (i.e., >1720Hz).
10Multivariate analysis of the [AjT], in pre-voiceless contexts, reveals a marginal significant dif-ference between heritage-location groupings (i.e., F(4, 66)=2.54, p<0.05); however, follow-upunivariate analysis reveals no difference along either the F1 or F2 dimension independently.
(Table of Contents) 93 Ph.D Thesis 2014
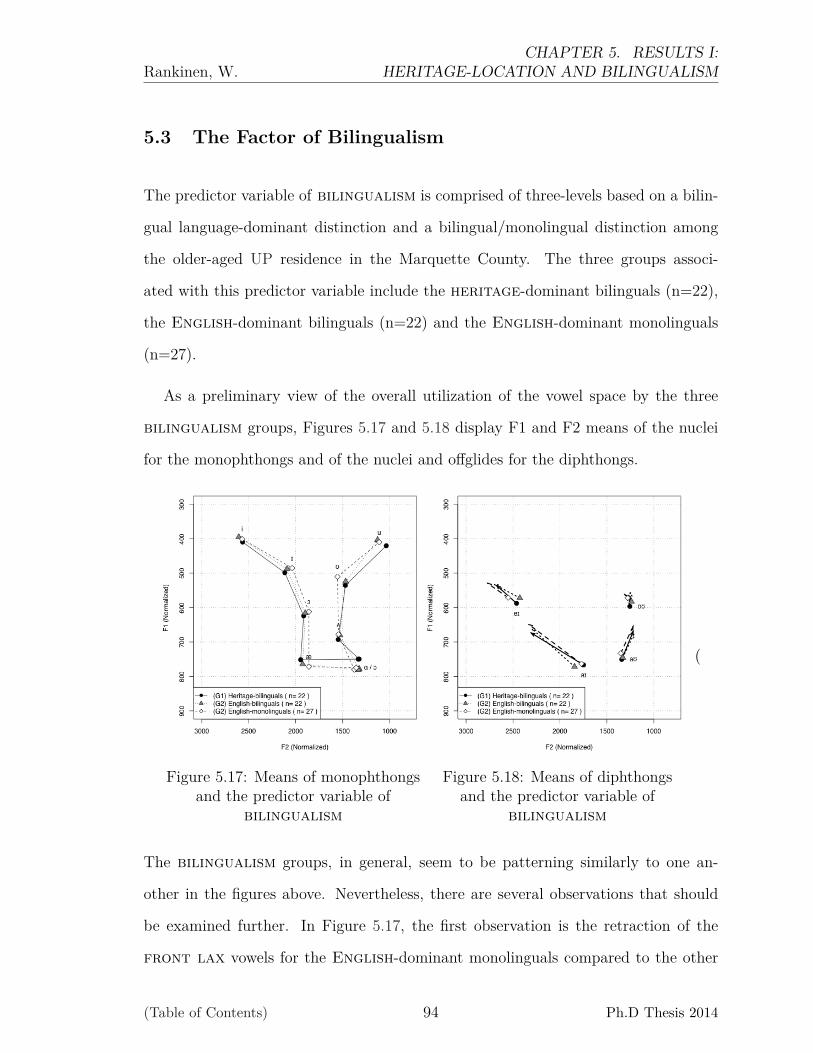
Rankinen, W.CHAPTER 5. RESULTS I:
HERITAGE-LOCATION AND BILINGUALISM
5.3 The Factor of Bilingualism
The predictor variable of bilingualism is comprised of three-levels based on a bilin-
gual language-dominant distinction and a bilingual/monolingual distinction among
the older-aged UP residence in the Marquette County. The three groups associ-
ated with this predictor variable include the heritage-dominant bilinguals (n=22),
the English-dominant bilinguals (n=22) and the English-dominant monolinguals
(n=27).
As a preliminary view of the overall utilization of the vowel space by the three
bilingualism groups, Figures 5.17 and 5.18 display F1 and F2 means of the nuclei
for the monophthongs and of the nuclei and offglides for the diphthongs.
Figure 5.17: Means of monophthongsand the predictor variable of
bilingualism
Figure 5.18: Means of diphthongsand the predictor variable of
bilingualism
(
The bilingualism groups, in general, seem to be patterning similarly to one an-
other in the figures above. Nevertheless, there are several observations that should
be examined further. In Figure 5.17, the first observation is the retraction of the
front lax vowels for the English-dominant monolinguals compared to the other
(Table of Contents) 94 Ph.D Thesis 2014
Rankinen, W.CHAPTER 5. RESULTS I:
HERITAGE-LOCATION AND BILINGUALISM
two groups. Second, the advancement of the high back vowels is present in the En-
glish-dominant monolinguals’ and English-dominant bilinguals’ systems but not in
the heritage-dominant bilinguals’ system. Third, all three bilingualism groups
exhibit the low-back merger, but the English-dominant monolinguals’ and English-
dominant bilinguals’ low-back mergers are lower in the acoustic space compared to
that of the heritage-dominant bilinguals’ system. Turning to Figure 5.18, the fourth
observation to note is the overall uniformity of nuclei and trajectory patterns of the
short diphthong among each of the three bilingualism groups; in particular,
the [ow] nuclei and offglides are patterning closely to one another which suggests a
monophthong-like quality for all three bilingualism groups. The final observation
to note is the uniform patterning of the overall trajectories of the long diphthong
vowels, and as a result, the nuclei of these long diphthongs are utilizing the F1
and F2 dimensions differently (i.e., following the description given in Section 5.1 on
pages 75 and 76). This present section will investigate each of these initial observa-
tions described above to see if the linguistic variables of interest are correlated with
the predictor variable of bilingualism (i.e., regardless of ethnic-heritage language
effects).11
5.3.1 The Analysis of the Front Lax Vowels
This section investigates the potential retraction of the front lax vowels as they cor-
relate with the factor of bilingualism. In Figure 5.19, the solid-lines and black-filled
circles, dotted-lines and gray-filled triangles, and the dashed-lines and white-filled cir-
cles represent the front lax [I], [E] and [æ] means for heritage-dominant bilinguals,
English-dominant bilinguals and English-dominant monolinguals respectively.11It is important to note that the Finnish- and Italian-heritage speakers are pooled together for
each of the three bilingualism groups during this section of the analysis; such an analysis is doneto examine if substrate effects can be associated with one or more of the groupings for the maineffect of bilingualism.
(Table of Contents) 95 Ph.D Thesis 2014

Rankinen, W.CHAPTER 5. RESULTS I:
HERITAGE-LOCATION AND BILINGUALISM
Figure 5.19: The means of the front lax vowels for the bilingualism groups
Three separate multivariate analyses of variance, examining the factor of bilin-
gualism for each of the three front lax vowels, report statistical significant dif-
ferences; however, subsequent univariate analyses of variance reveal that such sig-
nificant differences exist only along the F2 dimension. For all three front lax
vowels, the heritage-dominant bilinguals and the English-dominant monolinguals
have the greatest mean difference along the F2 dimension. For the high front lax [I]
vowel, these two groups’ F2 difference is 78.5Hz (i.e., MANOVA reports V=0.034,
F(4, 632)=5.50, p<0.001; ANOVA of F1 reports F(2, 632)=2.96, p>0.05; ANOVA
of F2 reports F(2, 632)=5.18, p<0.01). For the mid front lax [E] vowel, heritage-
dominant bilinguals’ and the English-dominant monolinguals’ F2 difference is 56Hz
(i.e., MANOVA reports V=0.020, F(4, 847)=4.20, p<0.01; ANOVA of F1 reports F(2,
847)=1.94, p<0.05; ANOVA of F2 reports F(2, 847)=4.72, p<0.01). For the low front
lax [æ] vowel, the F2 difference between these two groups is 88Hz (i.e., MANOVA
reports V=0.037, F(4, 634)=6.03, p<0.001; ANOVA of F1 reports F(2, 634)=2.73,
p>0.05; ANOVA of F2 reports F(2, 634)=10.63, p<0.001). This result indicates that
the English-dominant monolinguals’ front lax vowels are more retracted in the
(Table of Contents) 96 Ph.D Thesis 2014

Rankinen, W.CHAPTER 5. RESULTS I:
HERITAGE-LOCATION AND BILINGUALISM
acoustic vowel space compared to the other two bilingualism groups.
5.3.2 The Analysis of the Low Back Vowels
The low-back merger is present for each of the three bilingualism groups; all multi-
variate and univariate analyses of variance fail to report significant differences between
the [A] and the [O] vowels respective of each individual bilingualism group (i.e., all
three MANOVAs and six subsequent ANOVAs report p>0.05). However, the ques-
tion remains as to if there is a difference between the three bilingualism groups
with respect to the low-back merger (i.e., treating the [A] and [O] as a single lin-
guistic variable). The differences between the three bilingualism groups’ low-back
merger is statistically significant (i.e., MANOVA reports V=0.028, F(4, 1155)=8.32,
p<0.001; ANOVA of F1 reports F(2, 1155)=12.34, p<0.001; ANOVA of F2 reports
F(2, 1155)=12.34, p<0.01). In other words, the difference of ≈30Hz along the F1 di-
mension for the English-dominant bilinguals and English-dominant monolinguals
(i.e., 776-779Hz) compared to the heritage-dominant bilinguals (749Hz) is statis-
tically significant in its difference. In all other comparisons, these three groups are
patterning very similarly with regards to the [A] and [O] vowels relative to one another
in the low back quadrant of the acoustic vowel space.
5.3.3 The Analysis of the High Back Vowels
This section investigates the high back vowels to see if differences exist between the
three bilingualism groups. In Figure 5.20, the solid-lines and black-filled circles,
dotted-lines and gray-filled triangles, and the dashed-lines and white-filled circles
represent the high back [u], [U] and [2] means for the heritage-dominant bilin-
guals, English-dominant bilinguals and English-dominant monolinguals respec-
(Table of Contents) 97 Ph.D Thesis 2014

Rankinen, W.CHAPTER 5. RESULTS I:
HERITAGE-LOCATION AND BILINGUALISM
Figure 5.20: The means of the high back vowels for the bilingualism groups
tively. Both the high back vowels and mid back vowel are patterning differently
with regards to the three bilingualism groups. For the mid back lax [2] vowel,
only the 16Hz difference between the heritage-dominant bilinguals and English-
dominant monolinguals along the F1 dimension reports a significant difference (i.e.,
MANOVA reports V=0.019, F(4, 725)=3.45, p<0.01; ANOVA of F2 reports F(2,
725)=4.38, p<0.05; ANOVA of F2 reports F(2, 725)=1.06, p>0.05). For the high
back lax [U] vowel, the 26Hz difference between the heritage-dominant bilinguals
and English-dominant bilinguals along the F1 dimension and the 86Hz difference be-
tween heritage-dominant bilinguals and English-dominant monolinguals along the
F2 dimension reveals a significant difference (i.e., MANOVA reports V=0.049, F(4,
562)=7.07, p<0.001; ANOVA of F1 reports F(2, 562)=7.90, p<0.001; ANOVA of F2
reports F(2, 562)=9.39, p<0.001). For the high back tense [u] vowel, multivariate and
univariate analysis of variance report non-significance even though there is a 92Hz
difference between heritage-dominant bilinguals and English-dominant bilinguals
along the F2 dimension (i.e., MANOVA reports V=0.039, F(4, 208)=2.08, p>0.05;
ANOVA of F1 reports F(2, 208)=1.50, p>0.05; ANOVA of F2 reports F(2, 208)=2.23,
p>0.05); however, a t-test reports a marginally significant difference along the F2 di-
(Table of Contents) 98 Ph.D Thesis 2014
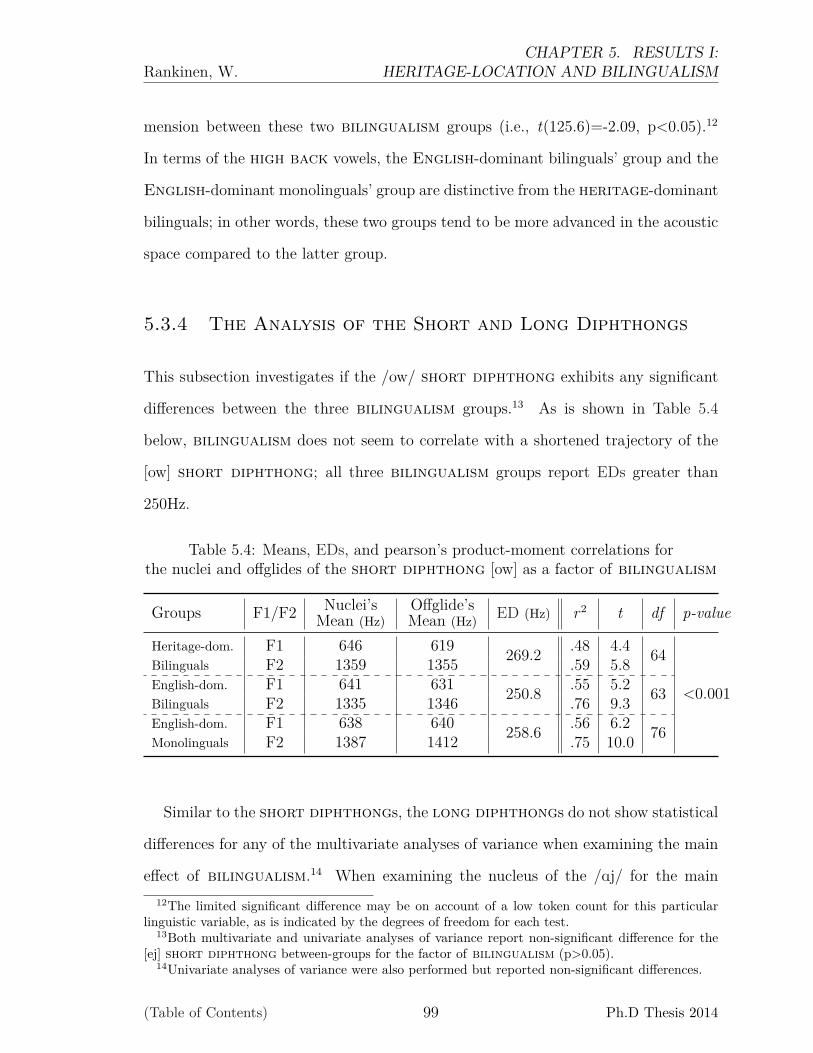
Rankinen, W.CHAPTER 5. RESULTS I:
HERITAGE-LOCATION AND BILINGUALISM
mension between these two bilingualism groups (i.e., t(125.6)=-2.09, p<0.05).12
In terms of the high back vowels, the English-dominant bilinguals’ group and the
English-dominant monolinguals’ group are distinctive from the heritage-dominant
bilinguals; in other words, these two groups tend to be more advanced in the acoustic
space compared to the latter group.
5.3.4 The Analysis of the Short and Long Diphthongs
This subsection investigates if the /ow/ short diphthong exhibits any significant
differences between the three bilingualism groups.13 As is shown in Table 5.4
below, bilingualism does not seem to correlate with a shortened trajectory of the
[ow] short diphthong; all three bilingualism groups report EDs greater than
250Hz.
Table 5.4: Means, EDs, and pearson’s product-moment correlations forthe nuclei and offglides of the short diphthong [ow] as a factor of bilingualism
Groups F1/F2 Nuclei’sMean (Hz)
Offglide’sMean (Hz) ED (Hz) r2 t df p-value
Heritage-dom.Bilinguals
F1 646 619 269.2 .48 4.4 64
<0.001
F2 1359 1355 .59 5.8English-dom.Bilinguals
F1 641 631 250.8 .55 5.2 63F2 1335 1346 .76 9.3English-dom.Monolinguals
F1 638 640 258.6 .56 6.2 76F2 1387 1412 .75 10.0
Similar to the short diphthongs, the long diphthongs do not show statistical
differences for any of the multivariate analyses of variance when examining the main
effect of bilingualism.14 When examining the nucleus of the /Aj/ for the main12The limited significant difference may be on account of a low token count for this particular
linguistic variable, as is indicated by the degrees of freedom for each test.13Both multivariate and univariate analyses of variance report non-significant difference for the
[ej] short diphthong between-groups for the factor of bilingualism (p>0.05).14Univariate analyses of variance were also performed but reported non-significant differences.
(Table of Contents) 99 Ph.D Thesis 2014
Rankinen, W.CHAPTER 5. RESULTS I:
HERITAGE-LOCATION AND BILINGUALISM
effect of bilingualism, the multivariate analysis reports non-significant differences
(i.e., MANOVA reports V=0.019, F(4, 136)=0.63, p>0.05). Similarly, the /Aw/ long
diphthong’s multivariate analysis of variance also reports non-significant differences
(i.e., MANOVA reports V=0.009, F(4, 558)=1.30, p>0.05). The results indicate the
main effect of bilingualism to not be a salient sociolinguistic factor on its own. As
a result, the next section will examine the interaction of heritage-location and
bilingualism.
(Table of Contents) 100 Ph.D Thesis 2014

Rankinen, W.CHAPTER 5. RESULTS I:
HERITAGE-LOCATION AND BILINGUALISM
5.4 The Interaction of Heritage-Location and Bilingualism
As shown in Sections 5.2 and 5.3, the predictor variables of heritage-location
and bilingualism differ in how each factor affects the older-aged UP speakers’
vowel spaces; that is to say, differences and similarities between groups’ systems
reveal trends and characteristics unique to the community along the sociolinguistic
categories of heritage-location and bilingualism. The factor of heritage-
location revealed more systematic differences between its groups than bilingual-
ism. Nevertheless, this final section of Chapter 5 describes such characteristics as-
sociated with each of the systems as defined by the interaction of these two factors;
since each predictor variable has three levels, there are a total of nine systems that
will be discussed in this section: east-side Finnish heritage-dominant bilinguals
(n=7), east-side Finnish English-dominant bilinguals (n=2), east-side Finnish
English-dominant monolinguals (n=2), east-side Italian heritage-dominant bilin-
guals (n=7), east-side Italian English-dominant bilinguals (n=9), east-side Italian
English-dominant monolinguals (n=12), west-side Finnish heritage-dominant
bilinguals (n=8), west-side Finnish English-dominant bilinguals (n=11), and west-
side Finnish English-dominant monolinguals (n=13).
An initial series of multivariate analyses of variance of F1 and F2 reveal that all
but one of the monophthongs and two out of the four diphthongs shows statistically
significant differences for the interaction of heritage-location and bilingualism.
Table 5.5, organized by the five sets of linguistic variables, reports MANOVA Pillai
statistic, F-value and accompanying degrees of freedom, and the p-value for each
vowels’ outcome variables of F1 and F2.15
15For diphthongal qualities, the tests’ results reported in Table 5.5 are based on only the nucleus.
(Table of Contents) 101 Ph.D Thesis 2014

Rankinen, W.CHAPTER 5. RESULTS I:
HERITAGE-LOCATION AND BILINGUALISM
Table 5.5: Multivariate analyses of variance of each monophthong and diphthongand the interaction between heritage-location and bilingualism
Set of LV IPA Vowel Pillai (V) F-value (df) p-value
front lax[ I ] BIT 0.109 4.53 (16, 626) p<0.001***[ E ] BET 0.100 5.47 (16, 841) p<0.001***[ æ ] BAT 0.186 8.04 (16, 628) p<0.001***
low back [ A ] COT 0.155 15.5 (16, 1472) p<0.001***[ O ] BOUGHT 0.182 7.80 (16, 624) p<0.001***
high back [ U ] PUT 0.161 6.06 (16, 556) p<0.001***[ u ] BOOT 0.205 2.88 (16, 202) p<0.001***
shortdiphthongs
[ ej ] BAIT 0.083 1.48 (16, 273) p>0.05[ ow ] BOAT 0.107 1.92 (16, 273) p<0.05*
longdiphthongs
[ Aj ] BITE 0.089 0.76 (16, 130) p>0.05[ Aw ] BOUGH 0.176 6.65 (16, 552) p<0.001***
Others [ i ] BEAT 0.082 0.71 (16, 133) p>0.05[ 2 ] BUT 0.089 7.71 (16, 1330) p<0.001***
( Significant levels: * <0.05 ; ** <0.01 ; *** <0.001 )
Based on the variation observed between groups for each predictor variable in the pre-
vious sections, it is not surprising to find that almost all of the monophthongs show a
significant difference from one another for the interaction of predictor variables (i.e.,
with the exception of the high front tense [i] vowel which reports a p-value above
0.05). In addition, the nuclei of the short and long diphthongs report significant
differences for only the back counterparts; in other words, the [ej] and [Aj] nuclei
both report non-significant differences, while the [ow] and [Aw] nuclei report differ-
ences between the interacting groups. Since the nucleus of the long diphthongs
may in fact be contingent on the phonological conditioning environments of voiced
and voiceless obstruents, a follow-up analysis was done to account for the pre-voicing
context of the following obstruent. A three-factor analysis of context, heritage-
location and bilingualism for the [Aj] nucleus reveals that only Context as a
main effect is shown to be statistically significant along both the F1 and F2 dimension
(Table of Contents) 102 Ph.D Thesis 2014
Rankinen, W.CHAPTER 5. RESULTS I:
HERITAGE-LOCATION AND BILINGUALISM
(i.e., MANOVA reports V=0.053, F(2, 121)=13.13, p<0.001; ANOVA of F1 reports
F(2, 121)=21.12, p<0.001 and ANOVA of F2 reports F(1, 121)=5.37, p<05);16 all
other main effects and interactions reveal non-significant differences. While significant
differences are reported in Table 5.5, the question remains as to the nature of the vari-
ation between groups, and can such variation be attributed to heritage-location,
bilingualism, or a combination of the two factors?
5.4.1 Homogeneity and Structural Differences
A definite relationship exists for the particular groups involved in the interaction of
heritage-location and bilingualism. In fact, most of the interspeaker varia-
tion can be accounted for by comparing the bilingualism groups relative to each
heritage-location group. The subsequent figures show that east-side Italians
and west-side Finns are structurally very different from one another, but at the
same time, they are also the most stable in terms of their respective bilingualism
groups. In contrast, the east-side Finns are characterized as being structurally in-
between the two other heritage-location groups, and its bilingualism groups
are shown to be most divergent from one another (i.e., thus, accounting for much of
the variation described in Table 5.5 above). Additionally, the raised-variant of long
diphthongs are most prevalent in the speech of east-side Italians and English-
dominant monolinguals speakers.
Focusing on the structural differences between the east-side Italians and the
west-side Finns first, Figure 5.21 displays the plots of the bilingualism groups’
monophthongs for each of the two heritage-location groups.16Accompanying t-tests, comparing the means of [AjC] when followed by a voiced obstruent and
[AjT] when followed by a voiceless obstruent, report significance as well, with a 116.5Hz differencealong the F2 dimension and a 67Hz difference along the F1 dimension.
(Table of Contents) 103 Ph.D Thesis 2014
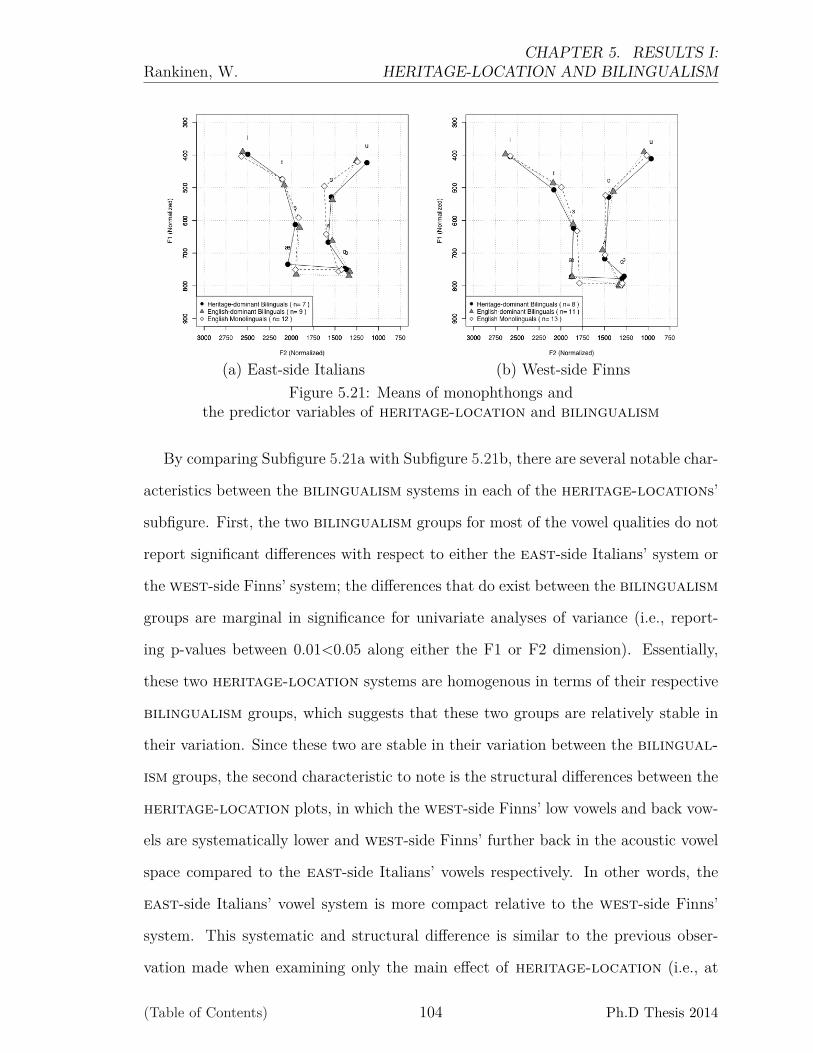
Rankinen, W.CHAPTER 5. RESULTS I:
HERITAGE-LOCATION AND BILINGUALISM
(a) East-side Italians (b) West-side FinnsFigure 5.21: Means of monophthongs and
the predictor variables of heritage-location and bilingualism
By comparing Subfigure 5.21a with Subfigure 5.21b, there are several notable char-
acteristics between the bilingualism systems in each of the heritage-locations’
subfigure. First, the two bilingualism groups for most of the vowel qualities do not
report significant differences with respect to either the east-side Italians’ system or
the west-side Finns’ system; the differences that do exist between the bilingualism
groups are marginal in significance for univariate analyses of variance (i.e., report-
ing p-values between 0.01<0.05 along either the F1 or F2 dimension). Essentially,
these two heritage-location systems are homogenous in terms of their respective
bilingualism groups, which suggests that these two groups are relatively stable in
their variation. Since these two are stable in their variation between the bilingual-
ism groups, the second characteristic to note is the structural differences between the
heritage-location plots, in which the west-side Finns’ low vowels and back vow-
els are systematically lower and west-side Finns’ further back in the acoustic vowel
space compared to the east-side Italians’ vowels respectively. In other words, the
east-side Italians’ vowel system is more compact relative to the west-side Finns’
system. This systematic and structural difference is similar to the previous obser-
vation made when examining only the main effect of heritage-location (i.e., at
(Table of Contents) 104 Ph.D Thesis 2014
Rankinen, W.CHAPTER 5. RESULTS I:
HERITAGE-LOCATION AND BILINGUALISM
the conclusion of Subsection 5.2.3 on page 90), and it is further supported by similar
results reported in Rankinen (2013c)’s analysis of the same corpus using the manual
method of formant extraction; this previous analysis of the data examined the two-
level factor of heritage.17 Furthermore, the observationally compact UP Italians-
heritage system stands in contrast to wordlist data reported in Boberg (2004)’s work
on Italian-, Jewish-, and Irish-heritage English speakers in Montreal, Canada. In
this study, the Italian-heritage vowel system was described as having much lower
low vowels than either of the two other heritage systems (Boberg 2004, 552).18 A
reasonable question that one might ask is: why are the UP east-side Italians’ low
vowels so much higher in the acoustic space compared to the west-side Finns (i.e., ≈
50Hz difference)? This is likely an L1 effect due to phonological differences between
the Finnish and Italian phonemic vowel inventory and phonetic configuration of each
system.19 In fact, this observation is not restricted to the monophthongal qualities
but applies to the diphthongs as well.
The east-side Italians’ and west-side Finns’ diphthongs also show similar cases
of the homogenous variation between the bilingualism groups and the structural
differences between heritage-location groups. Subfigures 5.22a and 5.22b display
the nuclei and offglides of the bilingualism groups in the east-side Italians’ and
the west-side Finns’ system respectively.17At the time of the analysis, subjects’ residency within the county was not taken into considera-
tion.18While the overall F1 difference between heritage groups is largely attributed to Italians tendancy
to open their mouths more when speaking than other any of the other groups as reported in Boberg(2004), the major differences between the Italian Montreal English and Italian UP English systemscan be attributed to the nature of the tasks (i.e., a wordlist versus a reading passage); the formertypically yields a more peripherally spaced system of vowels compared to data obtained from areading passage (Rankinen 2014).
19A thorough discussion of this hypothesis is provided in Chapter 7, Subsection 7.1.1, on page167.
(Table of Contents) 105 Ph.D Thesis 2014

Rankinen, W.CHAPTER 5. RESULTS I:
HERITAGE-LOCATION AND BILINGUALISM
(a) East-side Italians (b) West-side FinnsFigure 5.22: Means of diphthongs and
the predictor variables of heritage-location and bilingualism
In the figures above, all bilingualism groups for the east-side Italians and west-
side Finns exhibit a preference for the raised variant of the [AjT] and [AwT] nuclei,
since they are level relative to one another in terms of the F1 dimension and raised
above the [AjC] variable along the F2 dimension (i.e., [Aj] when followed by a voiced
obstruent); independent t-tests confirm that the 93Hz F1 mean difference and the
52Hz F1 mean difference between the [AjT] and [AjC] vowels, regardless of bilin-
gualism, are distinctive from one another for both the east-side Italian (p<0.001)
and west-side Finnish bilingualism groups (p<0.05).20 Second, a comparison of
the short diphthong reveals no significant differences across the bilingualism
groups; while monophthongal in trajectory, the [ow]’s nucleus remains distinctive
from the neighboring [2] vowel in quality for both the east-side Italians and west-
side Finns. Third, limited variation exists in all other cases of analyses of variance for
either the east-side Italians’ or the west-side Finns’ bilingualism groups’ short
or long diphthongs. Once again, this supports the claim that these two heritage-
location groups are remarkably homogenous (i.e., independent of each heritage20Note that a three-factor multivariate analysis of context, heritage-location, and bilin-
gualism revealed no significant differences between bilingualism groups for the [AjT] and [AjC]comparison.
(Table of Contents) 106 Ph.D Thesis 2014
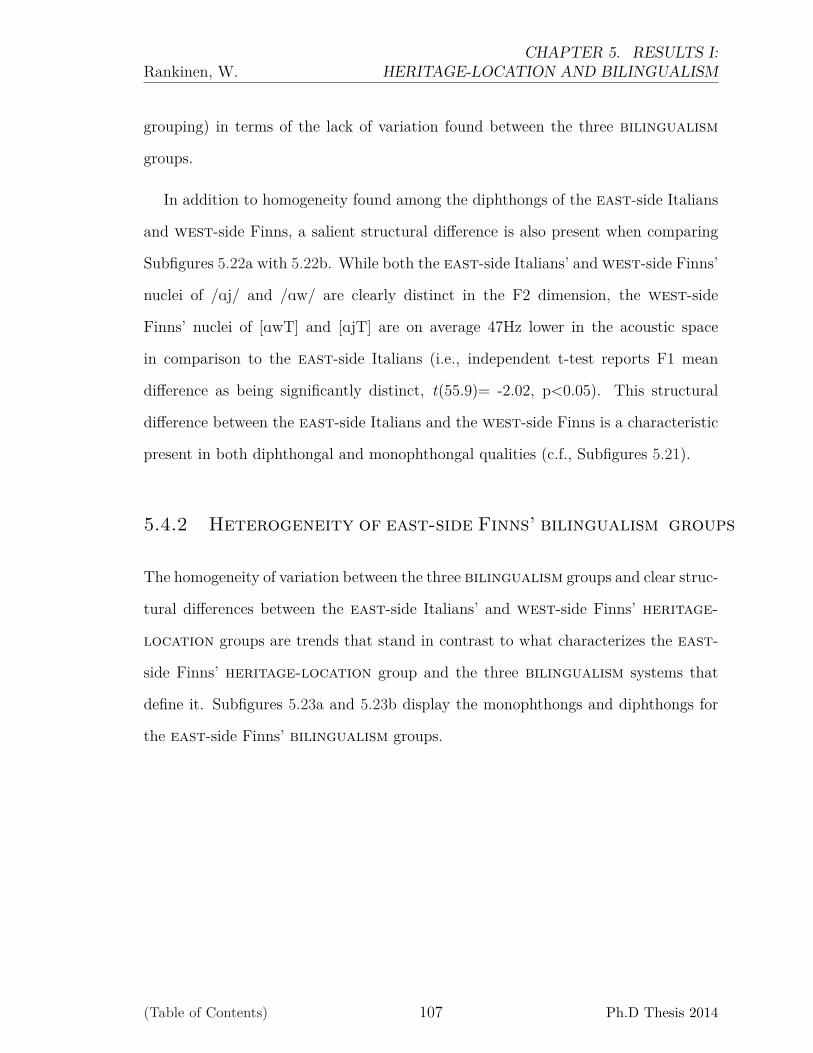
Rankinen, W.CHAPTER 5. RESULTS I:
HERITAGE-LOCATION AND BILINGUALISM
grouping) in terms of the lack of variation found between the three bilingualism
groups.
In addition to homogeneity found among the diphthongs of the east-side Italians
and west-side Finns, a salient structural difference is also present when comparing
Subfigures 5.22a with 5.22b. While both the east-side Italians’ and west-side Finns’
nuclei of /Aj/ and /Aw/ are clearly distinct in the F2 dimension, the west-side
Finns’ nuclei of [AwT] and [AjT] are on average 47Hz lower in the acoustic space
in comparison to the east-side Italians (i.e., independent t-test reports F1 mean
difference as being significantly distinct, t(55.9)= -2.02, p<0.05). This structural
difference between the east-side Italians and the west-side Finns is a characteristic
present in both diphthongal and monophthongal qualities (c.f., Subfigures 5.21).
5.4.2 Heterogeneity of east-side Finns’ bilingualism groups
The homogeneity of variation between the three bilingualism groups and clear struc-
tural differences between the east-side Italians’ and west-side Finns’ heritage-
location groups are trends that stand in contrast to what characterizes the east-
side Finns’ heritage-location group and the three bilingualism systems that
define it. Subfigures 5.23a and 5.23b display the monophthongs and diphthongs for
the east-side Finns’ bilingualism groups.
(Table of Contents) 107 Ph.D Thesis 2014
Rankinen, W.CHAPTER 5. RESULTS I:
HERITAGE-LOCATION AND BILINGUALISM
(a) East-side Finns(monophthongs)
(b) East-side Finns(diphthongs)
Figure 5.23: Means of monophthongs and diphthongsfor the east-side Finns and the predictor variable of bilingualism
In the subfigures above, several striking observations are present regarding systematic
variation occurring between the bilingualism groups for these east-side Finns: 1)
the retraction of front vowels, 2) the lowering of the English-dominant monolin-
guals’ low back vowels compared to the other two groups, and 3) the tendency to
raise the nucleus of the [Aw] and raise and retract the nucleus of the [AjT] for the
heritage-dominant bilinguals and English-dominant monolinguals.
The front lax vowels in Subfigure 5.23 have a significant amount of variation be-
tween the bilingualism groups; in fact, this observation is confirmed with statistical
support from both multivariate and univariate analyses of variance. For the high front
lax [I] vowel, the English-dominant monolinguals’vowel is significantly distinctive
from the other two groups along the F1 and F2 dimensions (i.e., MANOVA reports
V= 0.33, F(4, 96)=9.33, p<0.001; ANOVA of F1 reports F(2, 96)=5.84, p<0.01;
ANOVA of F2 reports F(2, 96)=6.37, p<0.01). For the mid front lax [E] vowel, once
again the English-dominant monolinguals’ vowel is significantly divergent, but this
time, it is only distinct along the F2 dimension (i.e., MANOVA reports V=0.185, F(4,
128)=6.53, p<0.001; ANOVA of F1 reports F(2, 128)=2.97, p>0.05; ANOVA of F2
(Table of Contents) 108 Ph.D Thesis 2014

Rankinen, W.CHAPTER 5. RESULTS I:
HERITAGE-LOCATION AND BILINGUALISM
reports F(2, 128)=9.02, p<0.001). Similar to the [E] vowel, the English-dominant
monolinguals’ low front lax [æ] vowel is significantly divergent from the other two
groups along only the F2 dimension (i.e., MANOVA reports V=0.165, F(4, 96)=4.31,
p<0.01; ANOVA of F1 reports F(2, 96)=1.31, p>0.05; ANOVA of F2 reports F(2,
96)=9.14, p<0.001). All three of the front lax vowels show significant differences
along the F2 dimension. If the back vowels are used as a baseline for the bilin-
gualism groups (i.e., which show limited vowel-internal variation between groups),
the English-dominant monolinguals’ front vowels are retracting to the central vowel
space relative to their back counterparts — the same degree of retraction cannot be
claimed for either English-dominant bilinguals or heritage-dominant bilinguals.
All groups exhibit the low-back merger, but it seems that the English-dominant
monolinguals are once again divergent from the other two bilingualism groups.
The [A] and [O] vowels are statistically significant along the F1 dimension only (i.e.,
MANOVA reports V=0.156, F(4, 323)=13.68, p<0.001; ANOVA of F1 reports F(2,
323)=26.64, p<0.001; ANOVA of F2 reports F(2, 323)=2.35, p>0.05). However,
while the English-dominant monolinguals’ low-back merger appears to be lower in
the acoustic vowel space compared to their [æ] vowel, this difference is not found to
be statistically significant (i.e., ANOVA of F1 reports F(4, 419)=2.24, p>0.05).
Turning to the nuclei of the long diphthongs, the east-side Finnish her-
itage-dominant bilinguals’ and English-dominant monolinguals’ [Aj] are much more
retracted in the acoustic vowel space than previously seen in other figures. In fact,
the English-dominant monolinguals’ [AjT] and [AwT] are approximately the same
in both the F1 and F2 dimension. Furthermore, it looks like the two subjects that
make up the English-dominant bilinguals’ group do not show evidence for the raised
variant of either /Aj/ or /Aw/. Unfortunately, little can be concluded about the diph-
thongal variation for the east-side Finns on account of limited token counts for
(Table of Contents) 109 Ph.D Thesis 2014
Rankinen, W.CHAPTER 5. RESULTS I:
HERITAGE-LOCATION AND BILINGUALISM
these seven heritage-dominant bilinguals, two English-dominant bilinguals and
two English-dominant monolinguals.
Nevertheless, the east-side Finns’ group shares several characteristics with the
west-side Finns but not with the east-side Italians. First, the east-side Finns’
system has relatively retracted back vowels (i.e., the [u] vowel is located approximately
at the 1000Hz boundary along the F2 dimension, while the [U] and [2] are both
<1500Hz); in contrast, the east-side Italians’ systems’ mid and high back vowels
have means >1500Hz. Second, the east-side Finns’ have relatively higher low vowels
which is a characteristic that they share with the east-side Italians’ system (i.e., at ≈
750Hz) rather than the west-side Finns’s system (i.e., at ≈ 790Hz). The exception
to this observation is the east-side Finnish English-dominant monolinguals who
report unusually low F1 values of approximately 810Hz.
The front and low back vowels show a considerable amount of interspeaker
variation, and as a result, structural comparisons are difficult to determine; however,
much of this variation is caused by the English-dominant monolinguals’ group. If
this east-side Finnish English-dominant monolinguals’ group is temporary sup-
pressed, the comparison of east-side Finnish heritage-dominant bilinguals and
English-dominant bilinguals to the east-side Italians’ and the west-side Finns’
groups reveals that these two bilingual groups are actually patterning more like the
east-side Italians than the west-side Finns. This observation initially might be
surprising, but it actually makes a lot of intuitive sense and follows the series of ob-
servations seen thus far in this chapter. Since both of these groups are older-aged
bilinguals living on the east-side of the county of Marquette, it is very likely these
east-side Finns have had more opportunities to share communities of practice (e.g.,
work environments, social events, community gathering) with the east-side Italians
than with the west-side Finns. This falls in line with the previous hypothesis and
(Table of Contents) 110 Ph.D Thesis 2014
Rankinen, W.CHAPTER 5. RESULTS I:
HERITAGE-LOCATION AND BILINGUALISM
assumes that a dialect leveling process has or is currently taking place which has
influenced the east-side Finns to accommodate to the linguistic norms of the more
urban east-side speech communities, characterized by the east-side Italians in the
Marquette County.
What is happening with the east-side Finnish English-dominant monolinguals
then? The significant retraction of the front vowels but low low back vowels re-
quires an additional hypothesis. These English-dominant monolinguals might be
retracting their front vowels and lowering their low back vowels as a way of
indexing their heritage identity in the linguistic marketplace (Bourdieu 1991; Mil-
roy 1987), which if true, is most distinctive among the west-side Finns in terms
of the retracted front lax and the low low back vowels. While one’s genetic
ancestry alone has never been shown to be the single motivating factor in linguistic
change (Boberg 2004), these older-aged English-dominant monolinguals are per-
haps interacting with their west-side counterparts in cultural, albeit English-driven,
activities and functions held within the community (e.g., Lutheran church services,
Finnish-heritage community centers, cultural festivals celebrating Finnish heritage).
It is not uncommon for third generation ethnic-heritage groups to be drawn closer to
their ancestral ties in comparison to first or second generations, whom tend to avoid
such ties particularly due to social pressures to conform to American cultural and
linguistic practices — including but not limited to the prescribed use of American
English (Labov 2008; Loukinen 1980; Simon 2005). The two proposed hypotheses
would account for: 1) why the bilingualism systems of east-side Finns shares
characteristics with both the east-side Italians’ and west-side Finns’ systems and
2) why the east-side Italians’ and west-side Finns’ systems are structurally distinct,
yet with respect to their heritage-location grouping, their bilingualism systems
remain relatively homogenous.
(Table of Contents) 111 Ph.D Thesis 2014
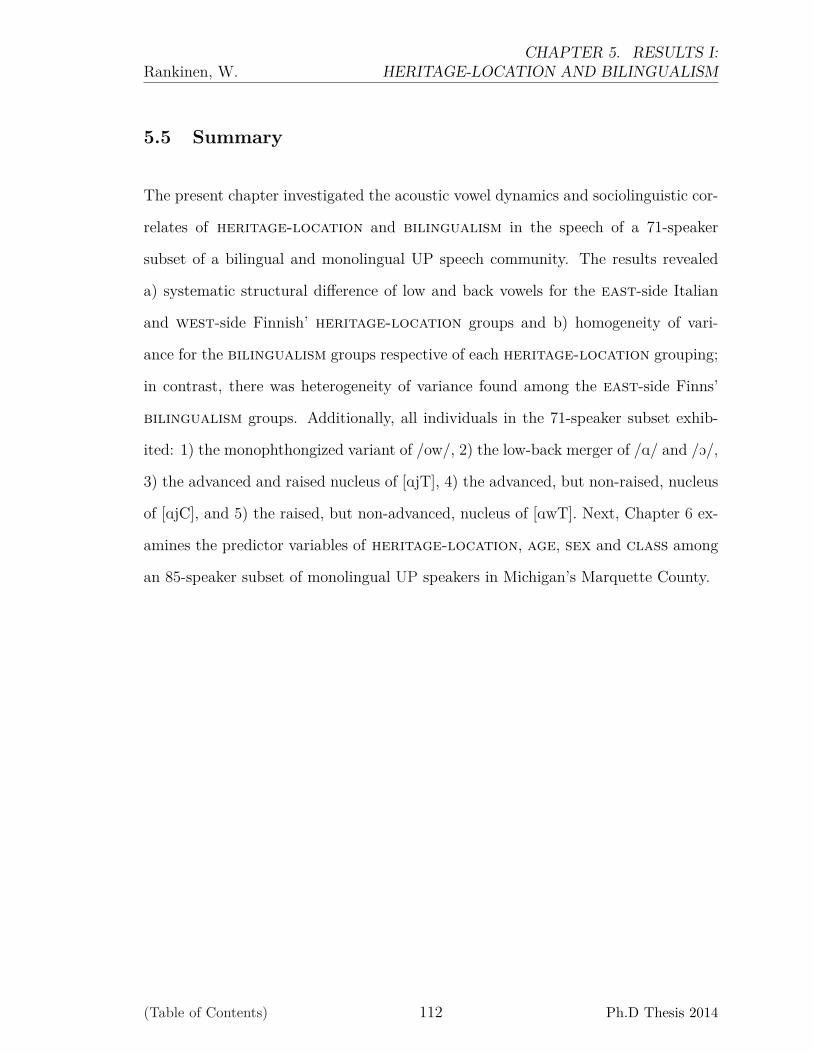
Rankinen, W.CHAPTER 5. RESULTS I:
HERITAGE-LOCATION AND BILINGUALISM
5.5 Summary
The present chapter investigated the acoustic vowel dynamics and sociolinguistic cor-
relates of heritage-location and bilingualism in the speech of a 71-speaker
subset of a bilingual and monolingual UP speech community. The results revealed
a) systematic structural difference of low and back vowels for the east-side Italian
and west-side Finnish’ heritage-location groups and b) homogeneity of vari-
ance for the bilingualism groups respective of each heritage-location grouping;
in contrast, there was heterogeneity of variance found among the east-side Finns’
bilingualism groups. Additionally, all individuals in the 71-speaker subset exhib-
ited: 1) the monophthongized variant of /ow/, 2) the low-back merger of /A/ and /O/,
3) the advanced and raised nucleus of [AjT], 4) the advanced, but non-raised, nucleus
of [AjC], and 5) the raised, but non-advanced, nucleus of [AwT]. Next, Chapter 6 ex-
amines the predictor variables of heritage-location, age, sex and class among
an 85-speaker subset of monolingual UP speakers in Michigan’s Marquette County.
(Table of Contents) 112 Ph.D Thesis 2014

CHAPTER 6
RESULTS II:
HERITAGE-LOCATION, AGE, SEX AND CLASS
The present chapter examines the response variables of F1, F2 and duration for the
front lax, low back and high back vowels and the short and long diph-
thongs as sets of linguistic variables produced by eighty-five monolingual English
speakers from Michigan’s Upper Peninsula (UP). The analyses of this chapter takes
into account the predictor variables of heritage-location, age, sex, and class.
As described in Chapter 3, these predictor variables are restricted to the monolingual
speakers in the Upper Peninsula (UP) vowel corpus, which are grouped by the defined
levels of heritage-location (i.e., east-side Finns, east-side Italians or west-side
Finns), age (i.e., older-, middle-, or younger-aged), sex (i.e., male or female) and
class (i.e., working- or middle-class). As such, only results from this 85-speaker
subset of the larger 130-speaker corpus will be reported in this chapter.1
This chapter reports on three specific threads of analyses. The first thread in-
vestigates the overall structure of the monolingual UP speakers’ vowel system. The
second thread examines the nine monophthongs (i.e., /i, I, E, æ, A, O, 2 U u/), with a
particular focus placed on the front lax and low back sets of linguistic variables.
The third thread focuses on the four diphthongs (i.e., /ej, ow, Aj, Aw/), with partic-
ular attention on the long diphthongs as linguistic variables. All three sections
seek to determine if substrate or exogenous influences correlate with the predictor1The breakdown of the demographics for this subset is located in Table 3.9 on page 42.
113

Rankinen, W.CHAPTER 6. RESULTS II:
HERITAGE-LOCATION, AGE, SEX AND CLASS
variables of heritage-location, age, sex and class. Accordingly, Section 6.1
first investigates the individual placement of vowels within the structural configura-
tion as a global system for these eighty-five monolingual English speakers. Section
6.2 examines how monophthongs as linguistic variables correlate with the predictor
variables under investigation, while Section 6.3 examines the diphthongs. This chap-
ter ultimately seeks to uncover if either substrate or exogenous characteristics are
present in the vowel spaces of these monolingual UP English speakers, and if such
characteristics are correlated with the predictor variables of heritage-location,
age, sex and class to account for such interspeaker variation.
6.1 The Vowel System of Monolingual Speakers
The first analysis of this chapter seeks to investigate the individual vowel placement
and overall configuration of the eighty-five monolingual UP English speakers’ vowel
spaces as a global vowel system. The present analysis mirrors the one reported in
Section 5.1 for the 75-speaker subset of the older-aged bilingual and monolingual
UP speakers; although this section will demonstrate that similarities exist, more
importantly, there exists subtle differences between these two subsets of the sampled
UP speech community. In this chapter, the interspeaker variation of the linguistic
variables within a set and for sets of variables are shown to be following similar
phonetic and sociolinguistic patterns, and as such, the predictor variables are used
to probe the social patterning of this variation. Ultimately, the observations in this
section motivate the subsequent analyses to examine sets of linguistic variables as
linguistic indicators to account for the social patterning in the speech of this sampled
UP speech community.2
2The use of the term “linguistic indicator” refers to linguistic variants that correlate with differentsociolinguistic groupings but do not necessarily show signs of stylistic conditioning (Labov 1972, 178-180); in contrast, variants that show stylistic effects are typically regarded as “linguistic markers”and those that are overtly stigmatized are “linguistic stereotypes”. While this thesis does not address
(Table of Contents) 114 Ph.D Thesis 2014

Rankinen, W.CHAPTER 6. RESULTS II:
HERITAGE-LOCATION, AGE, SEX AND CLASS
The grand averages of the first and second formant values have been calculated
for each of the nine monophthongs and four diphthongs, and each vowel is plotted in
the acoustic vowel space as a global system in Figure 6.1.
Figure 6.1: The grand F1 and F2 means of monophthongs and diphthongsfor the monolingual speakers in Michigan’s UP vowel corpus (n=85)
In this figure, which is similar to Figure 5.1, there are two superimposed hypothetical
reference markers: 1) the hypothetical boundaries and 2) the centralized midpoint
of this global acoustic vowel space as determined by the entire 130-speaker corpus.
Using these reference markers as guides (c.f., Chapter 5), there are several striking
observations noted in Figure 6.1 above. The first observation is in regards to the
front lax vowels which are retracted and lowered in the acoustic vowel space in
relation to the hypothetical schwa and the other mid and low back vowels; the [æ]
vowel is lower in the F1 dimension in comparison to either the [A] or the [O] vowel as
is indicated by the upward slant of the base of the hypothetical trapezoid — this is a
characteristic that was not present among the seventy-one older-aged speakers’ system
described in Chapter 5. The second observation to note in the global monolingualalternative speech styles other than speech obtained from a reading passage task, Rankinen (2013b)does report limited stylistic effects for the front lax and low back vowels when comparing wordlistand reading passage tasks.
(Table of Contents) 115 Ph.D Thesis 2014
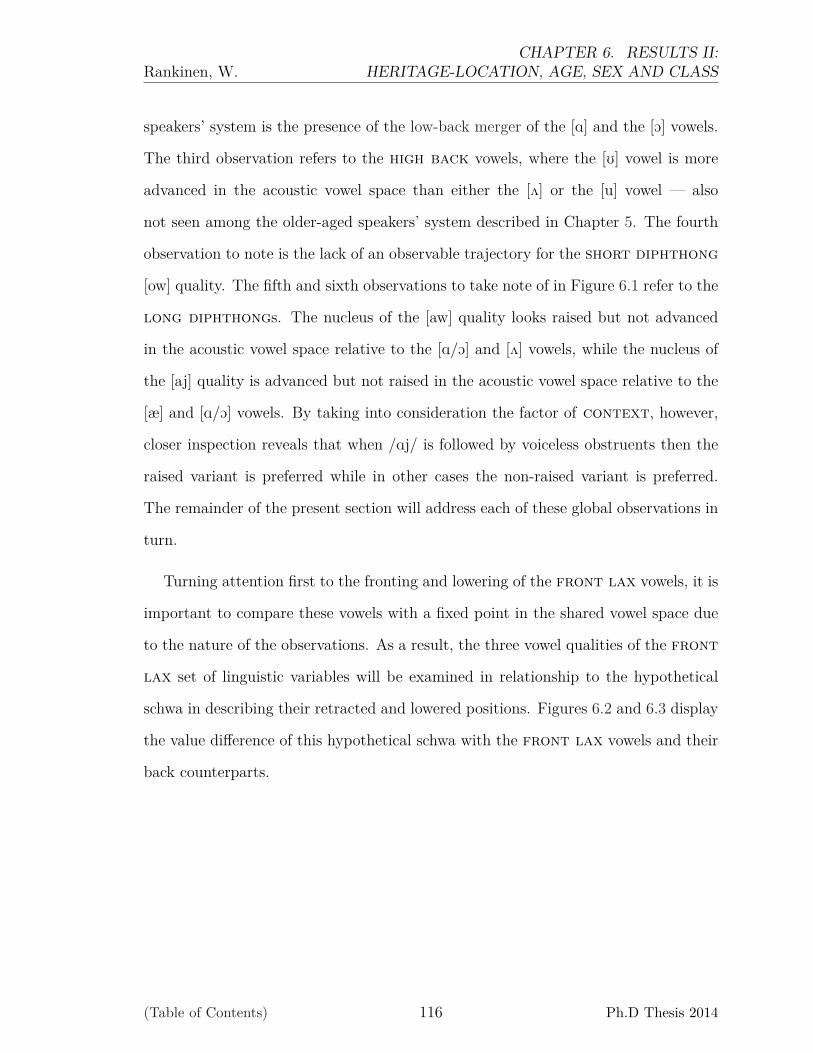
Rankinen, W.CHAPTER 6. RESULTS II:
HERITAGE-LOCATION, AGE, SEX AND CLASS
speakers’ system is the presence of the low-back merger of the [A] and the [O] vowels.
The third observation refers to the high back vowels, where the [U] vowel is more
advanced in the acoustic vowel space than either the [2] or the [u] vowel — also
not seen among the older-aged speakers’ system described in Chapter 5. The fourth
observation to note is the lack of an observable trajectory for the short diphthong
[ow] quality. The fifth and sixth observations to take note of in Figure 6.1 refer to the
long diphthongs. The nucleus of the [aw] quality looks raised but not advanced
in the acoustic vowel space relative to the [A/O] and [2] vowels, while the nucleus of
the [aj] quality is advanced but not raised in the acoustic vowel space relative to the
[æ] and [A/O] vowels. By taking into consideration the factor of context, however,
closer inspection reveals that when /Aj/ is followed by voiceless obstruents then the
raised variant is preferred while in other cases the non-raised variant is preferred.
The remainder of the present section will address each of these global observations in
turn.
Turning attention first to the fronting and lowering of the front lax vowels, it is
important to compare these vowels with a fixed point in the shared vowel space due
to the nature of the observations. As a result, the three vowel qualities of the front
lax set of linguistic variables will be examined in relationship to the hypothetical
schwa in describing their retracted and lowered positions. Figures 6.2 and 6.3 display
the value difference of this hypothetical schwa with the front lax vowels and their
back counterparts.
(Table of Contents) 116 Ph.D Thesis 2014
Rankinen, W.CHAPTER 6. RESULTS II:
HERITAGE-LOCATION, AGE, SEX AND CLASS
Figure 6.2: F1 differences from thecenter point of the global vowel space
Figure 6.3: F2 differences from thecenter point of the global vowel space
The figures above display the [I], [E] and [æ] vowels with respect to the central vowel
space (i.e., the midpoint is represented by a solid black line in each figure) and
in comparison to other vowels’ distribution for both the F1 dimension and the F2
dimension respectively. In Figure 6.2, the mid front lax [E] vowel is ≈ 43Hz below the
hypothetical schwa and the high back lax [U] vowel is ≈ 61Hz above it. In contrast,
the [I] and [2] vowels are respectively |95.3|Hz and |104.6|Hz from the midpoint, and
the [æ] and [A/O] are respectively |195.6|Hz and |190|Hz from the midpoint. In Figure
6.3, the mid and low front lax vowels are clearly fronted relative to the midpoint
along the F2 dimension with a difference of |23.9|Hz for the [æ] vowel and a difference
of |54.5|Hz for the the [E] vowel; in contrast, all other vowels report difference values
above |193.5|Hz (e.g., [U] = -193.5Hz, [I] = 225.4Hz). These results suggest that the
mid and low front lax vowels are observably retracted in the vowel space in relation
to the midpoint and neighboring vowels. This chapter will determine if the retraction
and lowering of these front lax vowels correlate with any of the predictor variables.
Similar to Chapter 5, the merging of the [A] and [O] vowels into a single quality
seems to be a distinctive set of linguistic variables in the monolingual UP English
(Table of Contents) 117 Ph.D Thesis 2014
Rankinen, W.CHAPTER 6. RESULTS II:
HERITAGE-LOCATION, AGE, SEX AND CLASS
speakers’ vowel system as well.
Figure 6.4: The presence of the low-back merger of the [A] and [O] vowels
In Figure 6.4, the hypothetical distributions (i.e., based on .95 confidence-intervals)
and actual token distributions of the [A] and [O] display the relationship that these
vowels have with one another in the low back quadrant of the acoustic vowel space.
Although the [A] and [O] vowels are shown to represent a non-significant difference in a
multivariate test of variance (i.e., MANOVA reports V=0.002, F(2, 2530)=3, p>0.05),
subsequent univariate analyses of variance suggest that the two vowels are marginally
distinct along the F2 dimension with a difference of only 16.77Hz (i.e., ANOVA of F1
reports F(1, 2530)=0.03, p>0.05; ANOVA of F2 reports F(1, 2530)=5.72, p<0.01);
while small, perhaps this marginal difference is a result of systematic variation be-
tween groups’ systems correlated with one or more of the predictor variables.
The third observation to address is the monophthongalization of the /ow/ vowel
quality, which is traditionally regarded as a short diphthong in other American
English varieties. If Euclidean distance (ED) and duration are taken into consider-
ation as well, the distance between the nuclei and the offglide of the [ow] quality is
distinctly shorter than any of the other diphthongal qualities; however, duration does
(Table of Contents) 118 Ph.D Thesis 2014
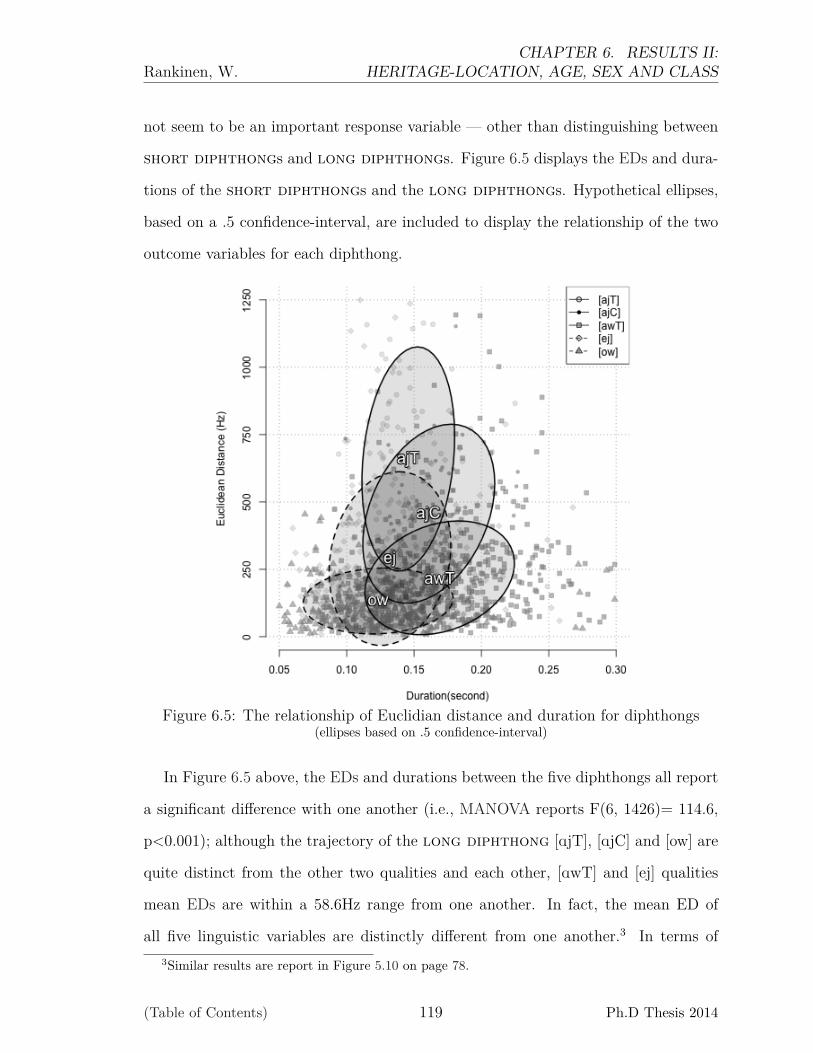
Rankinen, W.CHAPTER 6. RESULTS II:
HERITAGE-LOCATION, AGE, SEX AND CLASS
not seem to be an important response variable — other than distinguishing between
short diphthongs and long diphthongs. Figure 6.5 displays the EDs and dura-
tions of the short diphthongs and the long diphthongs. Hypothetical ellipses,
based on a .5 confidence-interval, are included to display the relationship of the two
outcome variables for each diphthong.
Figure 6.5: The relationship of Euclidian distance and duration for diphthongs(ellipses based on .5 confidence-interval)
In Figure 6.5 above, the EDs and durations between the five diphthongs all report
a significant difference with one another (i.e., MANOVA reports F(6, 1426)= 114.6,
p<0.001); although the trajectory of the long diphthong [AjT], [AjC] and [ow] are
quite distinct from the other two qualities and each other, [AwT] and [ej] qualities
mean EDs are within a 58.6Hz range from one another. In fact, the mean ED of
all five linguistic variables are distinctly different from one another.3 In terms of3Similar results are report in Figure 5.10 on page 78.
(Table of Contents) 119 Ph.D Thesis 2014

Rankinen, W.CHAPTER 6. RESULTS II:
HERITAGE-LOCATION, AGE, SEX AND CLASS
duration for Figure 6.5, the short and long distinction is maintained between the
short diphthongs and long diphthongs; a univariate analysis of variance for
[ej], [AjT] and [AjC] reports a significant difference (i.e., ANOVA of duration reports
F(1, 501)=29.8, p<0.001), while [ej] and [ow] report a non-significant difference (i.e.,
ANOVA of duration reports F(1, 589)=2.774, p>0.05). These results suggest that
the diphthongs are patterning differently from one another in terms of both ED
and duration. That is to say, the response variable of duration confirms the major
distinction of short diphthongs from long diphthongs, while EDs and overall
acoustic quality help to distinguish these diphthongs from one another.
The fourth observation refers to the nuclei of the /Aj/ and /Aw/ long diph-
thongs. A question arises as to if these monolingual English speakers show a prefer-
ence for either the raised or the non-raised variants of the long diphthongs’ nuclei
based on the following phonetic conditioning environment. As described in Chapter
5, only the /Aj/ vowel is followed by both voiced and voiceless obstruents while the
/Aw/ vowel is only followed by voiceless obstruents in the reading passage dataset.
As a result, first the nuclei of /Aj/ will be examined to reveal if it is conditioned
based on the following environment for the two tokens “tried” (i.e., [AjC], pre-voiced
context) and “slices” (i.e., [AjT], pre-voiceless context).
Figure 6.6 displays the means and token distribution of the phonetical realization
of the nuclei of /Aj/ when followed by both voiced obstruents (i.e., [AjC] as in the case
of “tried”) and voiceless obstruents (i.e., [AjT] as in the case of “slices”). The pre-
voicing environment of /Aj/ seems to be observationally and statistically conditioning
the raised and non-raised variants; a MANOVA reports statistical significance with
a 67.2Hz difference along the F1 dimension (i.e., V=0.23, F(2, 164)=24.4, p<0.001).
As previously discussed in Chapter 5, a >60Hz difference was used as a diagnostic
parameter for indicating the presence of Canadian raising (Labov et al. 2006, 222),
(Table of Contents) 120 Ph.D Thesis 2014

Rankinen, W.CHAPTER 6. RESULTS II:
HERITAGE-LOCATION, AGE, SEX AND CLASS
Figure 6.6: The distribution densityof the [AjT] and [AjC] nuclei
(ellipses based on .95 confidence-interval)
and as such, it is reasonable to suggest that based on this diagnostic parameter [AjT]
is clearly raised for this 85-speaker sample of monolingual UP speakers.
The question still remains as to if the nuclei of either of the long diphthongs
share its space with neighboring vowel qualities more generally, regardless of con-
text. Turning first to the nucleus of the [Aj] long diphthong, Figures 6.7 and 6.8
display its hypothetical and actual token distribution in relation to the [æ] and [A/O]
vowels.
(Table of Contents) 121 Ph.D Thesis 2014
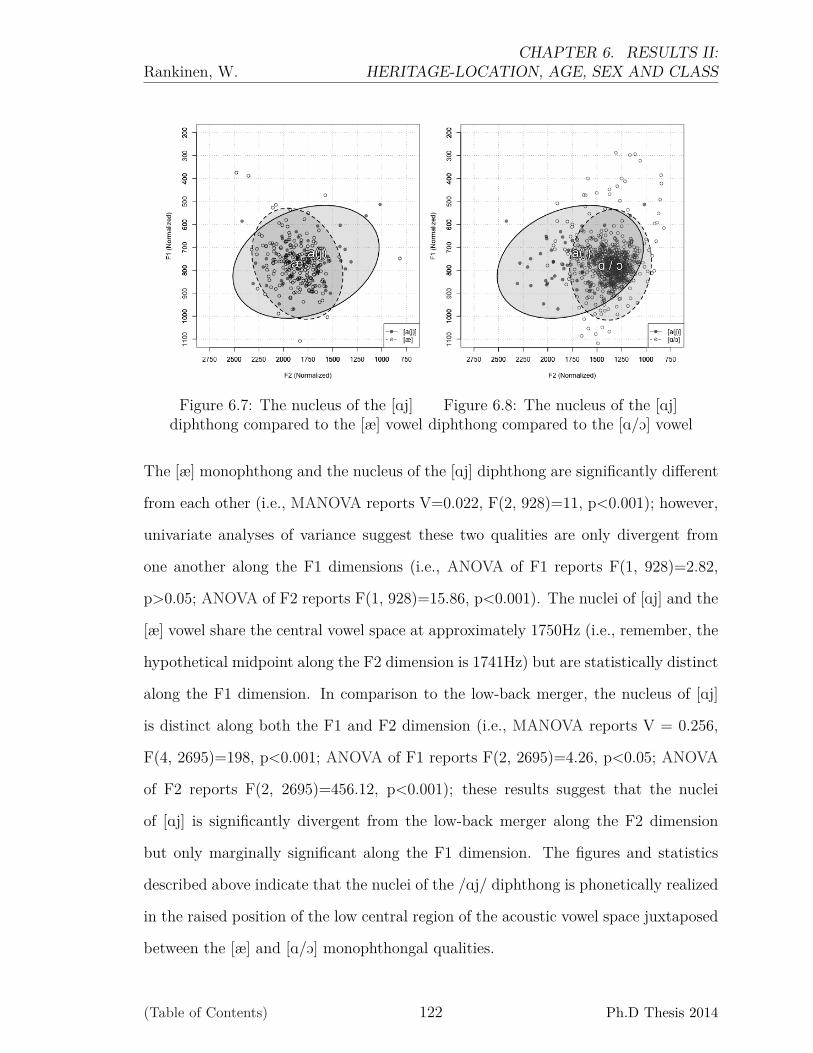
Rankinen, W.CHAPTER 6. RESULTS II:
HERITAGE-LOCATION, AGE, SEX AND CLASS
Figure 6.7: The nucleus of the [Aj]diphthong compared to the [æ] vowel
Figure 6.8: The nucleus of the [Aj]diphthong compared to the [A/O] vowel
The [æ] monophthong and the nucleus of the [Aj] diphthong are significantly different
from each other (i.e., MANOVA reports V=0.022, F(2, 928)=11, p<0.001); however,
univariate analyses of variance suggest these two qualities are only divergent from
one another along the F1 dimensions (i.e., ANOVA of F1 reports F(1, 928)=2.82,
p>0.05; ANOVA of F2 reports F(1, 928)=15.86, p<0.001). The nuclei of [Aj] and the
[æ] vowel share the central vowel space at approximately 1750Hz (i.e., remember, the
hypothetical midpoint along the F2 dimension is 1741Hz) but are statistically distinct
along the F1 dimension. In comparison to the low-back merger, the nucleus of [Aj]
is distinct along both the F1 and F2 dimension (i.e., MANOVA reports V = 0.256,
F(4, 2695)=198, p<0.001; ANOVA of F1 reports F(2, 2695)=4.26, p<0.05; ANOVA
of F2 reports F(2, 2695)=456.12, p<0.001); these results suggest that the nuclei
of [Aj] is significantly divergent from the low-back merger along the F2 dimension
but only marginally significant along the F1 dimension. The figures and statistics
described above indicate that the nuclei of the /Aj/ diphthong is phonetically realized
in the raised position of the low central region of the acoustic vowel space juxtaposed
between the [æ] and [A/O] monophthongal qualities.
(Table of Contents) 122 Ph.D Thesis 2014

Rankinen, W.CHAPTER 6. RESULTS II:
HERITAGE-LOCATION, AGE, SEX AND CLASS
The nucleus of the [Aw] long diphthong is observably distinct from the neigh-
boring [A/O] and [2] monothongs on display in Figures 6.9 and 6.10 below.
Figure 6.9: The nucleus of the [Aw]diphthong compared to the [A/O] vowel
Figure 6.10: The nucleus of the [Aw]diphthong compared to the [2] vowel
The low-back merger is distinctly different from the nucleus of the [Aw] diphthong
in terms of the F1 but not the F2 dimension (i.e., MANOVA reports V=0.041, F(4,
3202)=33, p<0.001); this is confirmed in accompanying univariate analyses of vari-
ance with an F1 difference of 43Hz (i.e., ANOVA of F1 reports F(2, 3202)=64.33,
p<0.001; ANOVA of F2 reports F(2, 3202)=2.34, p>0.05). In contrast, the nucleus
of [Aw] is distinctly different from the [2] monophthong along both the F1 and F2
dimension (i.e., MANOVA reports V=0.172, F(2, 2269)=236, p<0.001; ANOVA of
F1 reports F(1, 2269)=179.17, p<0.001; ANOVA of F2 reports F(1, 2269)=309.47,
p<0.001). Both nuclei of the long diphthongs exhibit evidence of raising in the
acoustic vowel space in relation to these neighboring monophthongs as indicated by
their statistical differences along the F1 dimension. Moreover, the /Aj/ variable re-
gardless of context exhibits fronting, while the /Aw/ exhibits non-fronting.
This initial section has given a general overview of the four salient characteristics
that define this 85-speaker monolingual UP English vowel system: 1) the front lax
(Table of Contents) 123 Ph.D Thesis 2014
Rankinen, W.CHAPTER 6. RESULTS II:
HERITAGE-LOCATION, AGE, SEX AND CLASS
vowels exhibit lowering and retracting, 2) the low back vowels exhibit a phonological
merger, 3) the [ow] short diphthong presents as a monophthongized variant, and
4) the nuclei of /Aw/ and /Aj/ exhibit varying degrees of raising and fronting. The
subsequent sections will examine the sociolinguistic variation of the front lax, low
back and long diphthong linguistic variables as they correlate with the factor or
interaction of factors of heritage-location, age, sex and class.
6.2 Front Lax, Low Back and High Back Vowels as
Sets of Linguistic Variables
The present section investigates nine monophthongs in this 85-speaker system as they
correlate with predictor variables of heritage-location, age, sex and class. As
such, this section will examine the front lax, low back and high back linguistic
variables to account for interspeaker variation and to attribute such variation to the
differences between groups and the defined social categories describing them. The
main predictor variable of interest is heritage-location, and the reason for this is
two-fold: 1) if structural similarities are shared between the Finnish-heritage groups
but not with the one Italian-heritage group, then this would indicate a potential
lingering substrate influence on these speakers’ systems; 2) if structural differences
exist between the two Finnish-heritage groups but structural similarities are shared
between the two east-side heritage groups, then this would indicate either the po-
tential encroachment of an exogenous influence in the more urban location or novel
influences from the town locale itself. Thus, the factors of age, sex, and class in
this section serve as interacting factors with the main factor of heritage-location.
6.2.1 Structural Differences and Heritage-Location
(Table of Contents) 124 Ph.D Thesis 2014

Rankinen, W.CHAPTER 6. RESULTS II:
HERITAGE-LOCATION, AGE, SEX AND CLASS
Figure 6.11: The monophthongs’ F1/ F2means for heritage-location groups
Subsection 6.2.1 examines the structural
similarities and differences that exist be-
tween the three heritage-location
groups’ systems. The grand F1 and F2
means of the nine monophthongs (i.e., [ i,
I, E, æ, A, O, 2, U, u ]) for each heritage-
location group are displayed as three
distinct systems in Figure 6.11 to the
right. The solid-lines and black filled cir-
cles represent the east-side Finns’ sys-
tem, the dotted-lines and gray filled tri-
angles represent the east-side Italians’ system, and the dashed-lines and white filled
diamonds represent the west-side Finns’ system.
In this figure, there are three observations to note — two of which refer to the
shared patterning of the Finnish-heritage groups (i.e., dissimilar to the east-side
Italians’ group), while the other refers to the difference between all three heritage-
location groups. The first two observations refer to the structural similarities that
exist between the east-side Finns’ and west-side Finns’ high back and low back
vowels along the F2 dimension, which is observably different from those of the east-
side Italians. In fact, the two Finnish-heritage groups’ [u] means are not signifi-
cantly different from one another, t(66.931)=0.745, p>0.05. In order to compare
the Finnish-heritage groups’ and the east-side Italians’ group mean of [u], the two
Finnish-heritage groups’ [u] means are pooled together and compared with the other
Italian-heritage group; an ANOVA and a independent t-test confirm that the differ-
ence of 145.59Hz is significant (i.e., F2’s ANOVA of the two heritage groups’ [u]
mean reports F(1, 253)=18.11, p<001, and an F2’s t(224.73)= -4.319, p<0.001). Sim-
ilarly, the two Finnish-heritage groups’ [U] pattern together along the F2 dimension
(Table of Contents) 125 Ph.D Thesis 2014

Rankinen, W.CHAPTER 6. RESULTS II:
HERITAGE-LOCATION, AGE, SEX AND CLASS
as well, with t(190.33)=-0.119, >0.05. The east-side Italians’ [U] vowel is signifi-
cantly different along the F2 dimension in comparison to these two Finnish-heritage
groups with an F2 difference of 66.4Hz (i.e., F2’s ANOVA reports F(1, 677)=16.51,
p<0.001, and an independent t-test reports t(673.49)=-4.064, p<0.001). The two
Finnish-heritage groups’ high back vowels are systematically more retracted in the
acoustic vowel space than the east-side Italians’ systems.
These two Finnish-heritage groups are patterning similarly with regards to one
another, and differently from the east-side Italians, in terms of the low back vow-
els, albeit along only the F1 dimension. All three heritage-location groups are
participating in the low-back merger with <10Hz F1 difference and <20Hz F2 dif-
ference between the mean values of the [A] and [O] vowels respective of each groups’
system (i.e., t-tests for F1 and F2 report p>0.05). This invariance between the low
back vowels allows for the pooling of the [A] and [O] values when comparing across
heritage-location groups. As with the high back vowels, the Finnish-heritage
groups’ low-back merger seem to be patterning closely together and both multivariate
and univariate analysis of variance confirming this observation (i.e., MANOVA re-
ports V= 0.0016, F(2, 1225)=0.994, p>0.05; F1’s ANOVA reports F(1, 1225)=0.313,
p>0.05; F2’s ANOVA reports F(1, 1225)=1.621, p>0.05). These Finnish-heritage
groups’ low-back merger is significantly different from that of the east-side Italians,
with a 19.6Hz difference along the F1 dimension and a 50.8Hz difference along the
F2 dimension (i.e, MAOVA reports V=0.040, F(2, 2530), p<0.001; F1’s ANOVA re-
ports F(1, 2530)=33.94, p<0.001; F2’s ANOVA reports F(1, 2530)=67.851, p<0.001).
The east-side Finns’ and the west-side Finns’ low back and high back vow-
els are structurally similar to one another but their difference from the east-side
Italians’ subsystem is not as observationally distinct as shown among heritage-
location groups for the older-aged bilingual and monolinguals UP speakers (c.f.,
Figure 5.11). This suggests that while a lingering substrate influence is still shared
(Table of Contents) 126 Ph.D Thesis 2014
Rankinen, W.CHAPTER 6. RESULTS II:
HERITAGE-LOCATION, AGE, SEX AND CLASS
by these heritage-location groups, the difference may be diminishing in the speech
of successive generations.
The last notable distinction between these three heritage-location groups
in Figure 6.11 cannot be attributed to potential substrate influences. The front
lax vowels in Figure 6.11 show a striking difference between the three heritage-
location groups in that each group is quite distinct in both the F1 and F2 dimension.
Unlike the cases of the low back or the high back vowels, the east-side Finns’
front lax vowels are distinct from either of these two groups regardless of shared
heritage or location of residency. The remainder of this section will investigate the
lowering and retraction of the [I], [E], and [æ] vowels as these linguistic variables in-
teract with heritage-location and either age, sex, class or a combination of
these factors.
6.2.2 Front Lax Vowels by Heritage-Location and Age
The first interaction to examine for front lax vowels is heritage-location and
age.
(Table of Contents) 127 Ph.D Thesis 2014
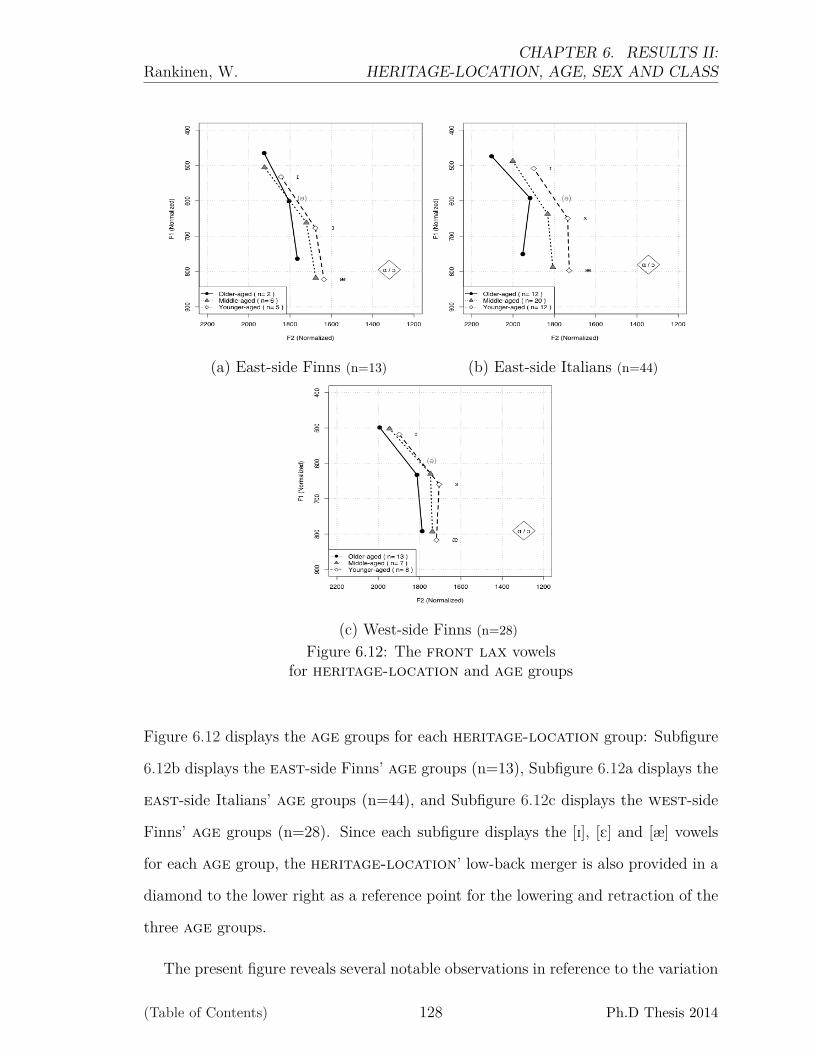
Rankinen, W.CHAPTER 6. RESULTS II:
HERITAGE-LOCATION, AGE, SEX AND CLASS
(a) East-side Finns (n=13) (b) East-side Italians (n=44)
(c) West-side Finns (n=28)Figure 6.12: The front lax vowels
for heritage-location and age groups
Figure 6.12 displays the age groups for each heritage-location group: Subfigure
6.12b displays the east-side Finns’ age groups (n=13), Subfigure 6.12a displays the
east-side Italians’ age groups (n=44), and Subfigure 6.12c displays the west-side
Finns’ age groups (n=28). Since each subfigure displays the [I], [E] and [æ] vowels
for each age group, the heritage-location’ low-back merger is also provided in a
diamond to the lower right as a reference point for the lowering and retraction of the
three age groups.
The present figure reveals several notable observations in reference to the variation
(Table of Contents) 128 Ph.D Thesis 2014
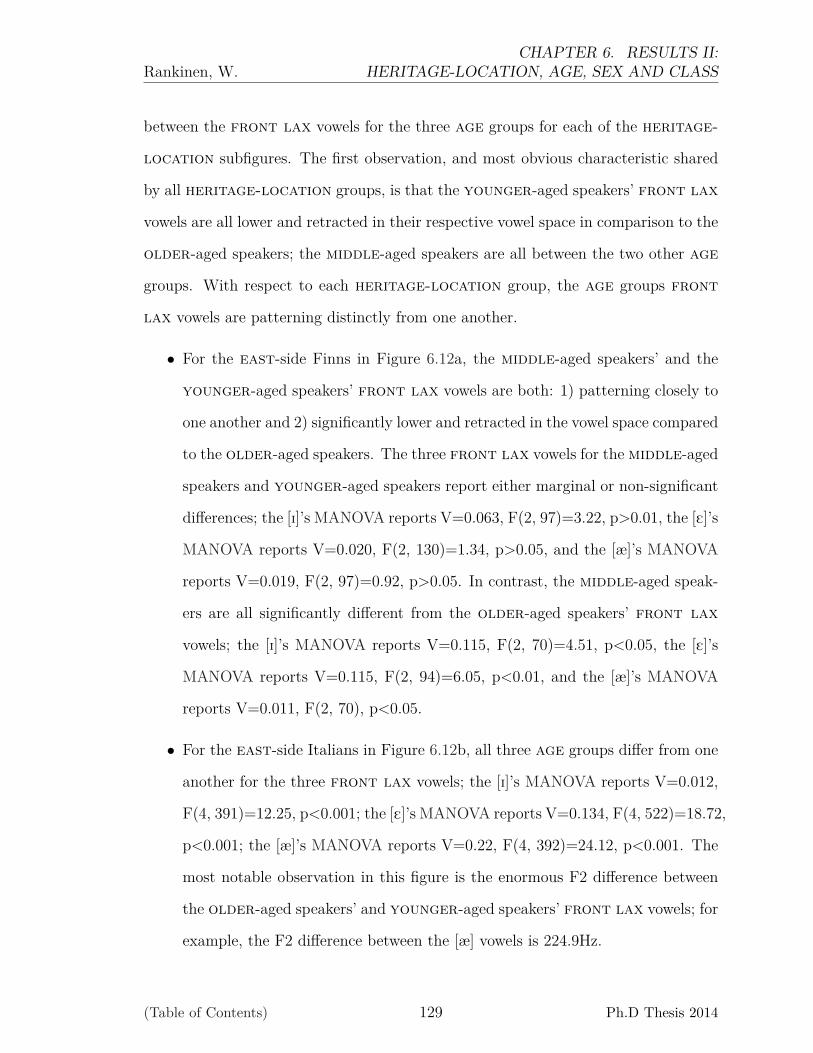
Rankinen, W.CHAPTER 6. RESULTS II:
HERITAGE-LOCATION, AGE, SEX AND CLASS
between the front lax vowels for the three age groups for each of the heritage-
location subfigures. The first observation, and most obvious characteristic shared
by all heritage-location groups, is that the younger-aged speakers’ front lax
vowels are all lower and retracted in their respective vowel space in comparison to the
older-aged speakers; the middle-aged speakers are all between the two other age
groups. With respect to each heritage-location group, the age groups front
lax vowels are patterning distinctly from one another.
• For the east-side Finns in Figure 6.12a, the middle-aged speakers’ and the
younger-aged speakers’ front lax vowels are both: 1) patterning closely to
one another and 2) significantly lower and retracted in the vowel space compared
to the older-aged speakers. The three front lax vowels for the middle-aged
speakers and younger-aged speakers report either marginal or non-significant
differences; the [I]’s MANOVA reports V=0.063, F(2, 97)=3.22, p>0.01, the [E]’s
MANOVA reports V=0.020, F(2, 130)=1.34, p>0.05, and the [æ]’s MANOVA
reports V=0.019, F(2, 97)=0.92, p>0.05. In contrast, the middle-aged speak-
ers are all significantly different from the older-aged speakers’ front lax
vowels; the [I]’s MANOVA reports V=0.115, F(2, 70)=4.51, p<0.05, the [E]’s
MANOVA reports V=0.115, F(2, 94)=6.05, p<0.01, and the [æ]’s MANOVA
reports V=0.011, F(2, 70), p<0.05.
• For the east-side Italians in Figure 6.12b, all three age groups differ from one
another for the three front lax vowels; the [I]’s MANOVA reports V=0.012,
F(4, 391)=12.25, p<0.001; the [E]’s MANOVA reports V=0.134, F(4, 522)=18.72,
p<0.001; the [æ]’s MANOVA reports V=0.22, F(4, 392)=24.12, p<0.001. The
most notable observation in this figure is the enormous F2 difference between
the older-aged speakers’ and younger-aged speakers’ front lax vowels; for
example, the F2 difference between the [æ] vowels is 224.9Hz.
(Table of Contents) 129 Ph.D Thesis 2014
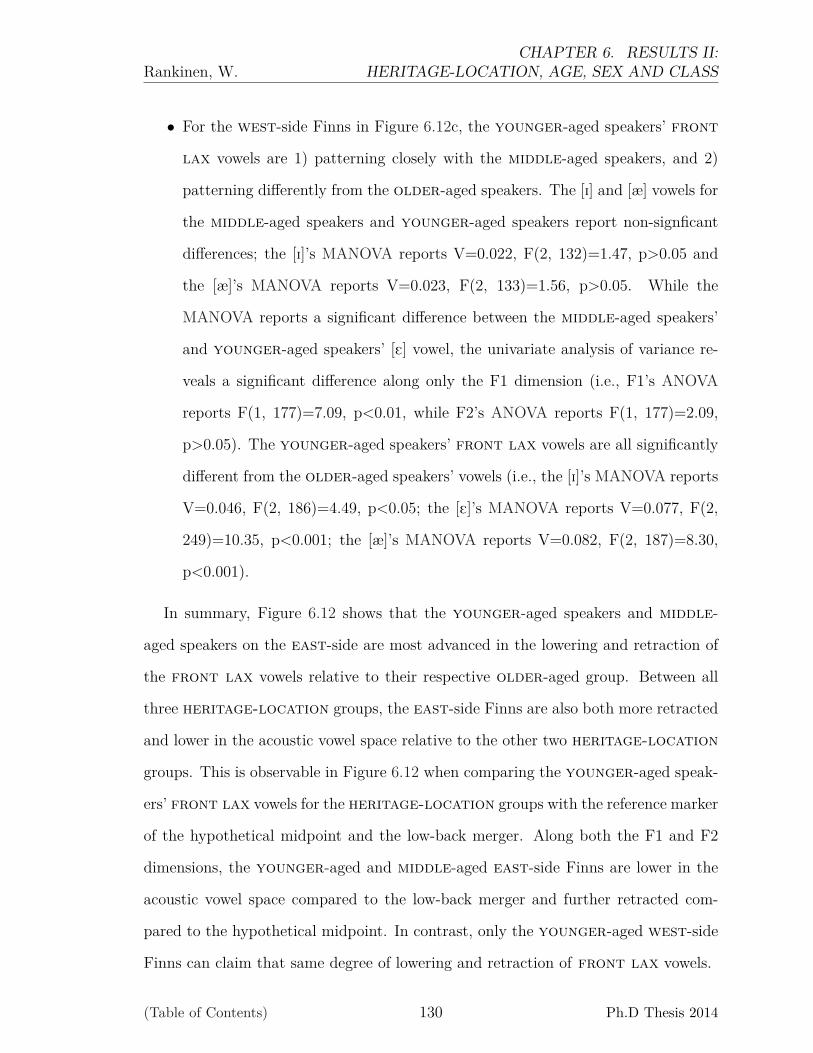
Rankinen, W.CHAPTER 6. RESULTS II:
HERITAGE-LOCATION, AGE, SEX AND CLASS
• For the west-side Finns in Figure 6.12c, the younger-aged speakers’ front
lax vowels are 1) patterning closely with the middle-aged speakers, and 2)
patterning differently from the older-aged speakers. The [I] and [æ] vowels for
the middle-aged speakers and younger-aged speakers report non-signficant
differences; the [I]’s MANOVA reports V=0.022, F(2, 132)=1.47, p>0.05 and
the [æ]’s MANOVA reports V=0.023, F(2, 133)=1.56, p>0.05. While the
MANOVA reports a significant difference between the middle-aged speakers’
and younger-aged speakers’ [E] vowel, the univariate analysis of variance re-
veals a significant difference along only the F1 dimension (i.e., F1’s ANOVA
reports F(1, 177)=7.09, p<0.01, while F2’s ANOVA reports F(1, 177)=2.09,
p>0.05). The younger-aged speakers’ front lax vowels are all significantly
different from the older-aged speakers’ vowels (i.e., the [I]’s MANOVA reports
V=0.046, F(2, 186)=4.49, p<0.05; the [E]’s MANOVA reports V=0.077, F(2,
249)=10.35, p<0.001; the [æ]’s MANOVA reports V=0.082, F(2, 187)=8.30,
p<0.001).
In summary, Figure 6.12 shows that the younger-aged speakers and middle-
aged speakers on the east-side are most advanced in the lowering and retraction of
the front lax vowels relative to their respective older-aged group. Between all
three heritage-location groups, the east-side Finns are also both more retracted
and lower in the acoustic vowel space relative to the other two heritage-location
groups. This is observable in Figure 6.12 when comparing the younger-aged speak-
ers’ front lax vowels for the heritage-location groups with the reference marker
of the hypothetical midpoint and the low-back merger. Along both the F1 and F2
dimensions, the younger-aged and middle-aged east-side Finns are lower in the
acoustic vowel space compared to the low-back merger and further retracted com-
pared to the hypothetical midpoint. In contrast, only the younger-aged west-side
Finns can claim that same degree of lowering and retraction of front lax vowels.
(Table of Contents) 130 Ph.D Thesis 2014
Rankinen, W.CHAPTER 6. RESULTS II:
HERITAGE-LOCATION, AGE, SEX AND CLASS
The critical linguistic variable participating in this lowering and retraction of
front lax vowels is the front lax /æ/ vowel. As a result, the subsequent subsection
will investigate the /æ/ vowel to examine the degree of lowering and retraction for
the interaction of heritage-location and sex.
6.2.3 Low Front Lax Vowel by Heritage-Location and Sex
The second interaction to examine for front lax vowels is heritage-location and
sex. However, this subsection will restrict its focus on the low front lax /æ/ vowel as
it exhibits the most significant differential effects between groups of the three front
lax linguistic variables and can be compared to the relative height of the low-back
merger. Subfigure 6.13a displays the east-side Finns’ sex groups (n=13), Subfigure
6.13b displays the east-side Italians’ sex groups (n=44), and Subfigure 6.13c displays
the west-side Finns’ sex groups (n=28).
The present figure reveals several striking characteristics with regards to how the
males’ and females’ [æ] vowels are patterning as a factor of heritage-location.
There are three general observations:
• The females in all three heritage-location groups are more advanced in
the lowering of the [æ] vowel compared to their male counterparts, particu-
larly among the west-side Finns. Of the three heritage-location groups,
only the west-side Finnish males and females exhibit a statistically signifi-
cant difference (i.e., F1’s ANOVA reports F(1, 250)=39.50, p<0.001), while the
other two groups’ [æ] vowel, when comparing males against females, report non-
significant differences. Even though not always statistically significant, females
are observably lower in the F1 dimension for each heritage-location group.
(Table of Contents) 131 Ph.D Thesis 2014

Rankinen, W.CHAPTER 6. RESULTS II:
HERITAGE-LOCATION, AGE, SEX AND CLASS
(a) East-side Finns (n=13) (b) East-side Italians (n=44)
(c) West-side Finns (n=28)
Figure 6.13: The [æ] and low-back vowelsfor heritage-location and sex groups
• In terms of male speakers, only the east-side Finns exhibit lowering and re-
traction of the [æ] vowel (i.e., F1’s ANOVA reports F(2, 192)=3.05, p<0.05).
This is a striking characteristic because it seems only the east-side Finns, for
both male and female speakers, are actively participating in the lowering and
retraction of the [æ] vowel. In contrast, neither of the males nor females for the
east-side Italians and only the females for the west-side Finns exhibit a F1
difference with their respective low-back merger.
• The east-side Finnish females exhibit the lowest and most retraction of the
(Table of Contents) 132 Ph.D Thesis 2014
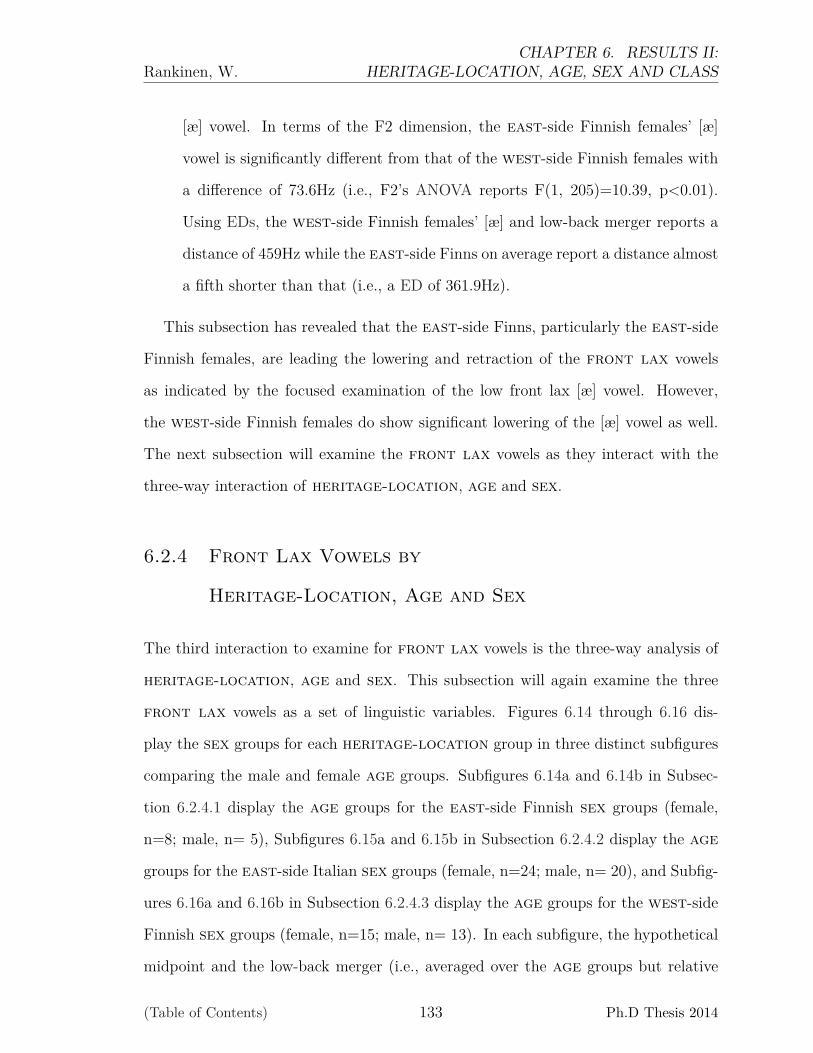
Rankinen, W.CHAPTER 6. RESULTS II:
HERITAGE-LOCATION, AGE, SEX AND CLASS
[æ] vowel. In terms of the F2 dimension, the east-side Finnish females’ [æ]
vowel is significantly different from that of the west-side Finnish females with
a difference of 73.6Hz (i.e., F2’s ANOVA reports F(1, 205)=10.39, p<0.01).
Using EDs, the west-side Finnish females’ [æ] and low-back merger reports a
distance of 459Hz while the east-side Finns on average report a distance almost
a fifth shorter than that (i.e., a ED of 361.9Hz).
This subsection has revealed that the east-side Finns, particularly the east-side
Finnish females, are leading the lowering and retraction of the front lax vowels
as indicated by the focused examination of the low front lax [æ] vowel. However,
the west-side Finnish females do show significant lowering of the [æ] vowel as well.
The next subsection will examine the front lax vowels as they interact with the
three-way interaction of heritage-location, age and sex.
6.2.4 Front Lax Vowels by
Heritage-Location, Age and Sex
The third interaction to examine for front lax vowels is the three-way analysis of
heritage-location, age and sex. This subsection will again examine the three
front lax vowels as a set of linguistic variables. Figures 6.14 through 6.16 dis-
play the sex groups for each heritage-location group in three distinct subfigures
comparing the male and female age groups. Subfigures 6.14a and 6.14b in Subsec-
tion 6.2.4.1 display the age groups for the east-side Finnish sex groups (female,
n=8; male, n= 5), Subfigures 6.15a and 6.15b in Subsection 6.2.4.2 display the age
groups for the east-side Italian sex groups (female, n=24; male, n= 20), and Subfig-
ures 6.16a and 6.16b in Subsection 6.2.4.3 display the age groups for the west-side
Finnish sex groups (female, n=15; male, n= 13). In each subfigure, the hypothetical
midpoint and the low-back merger (i.e., averaged over the age groups but relative
(Table of Contents) 133 Ph.D Thesis 2014
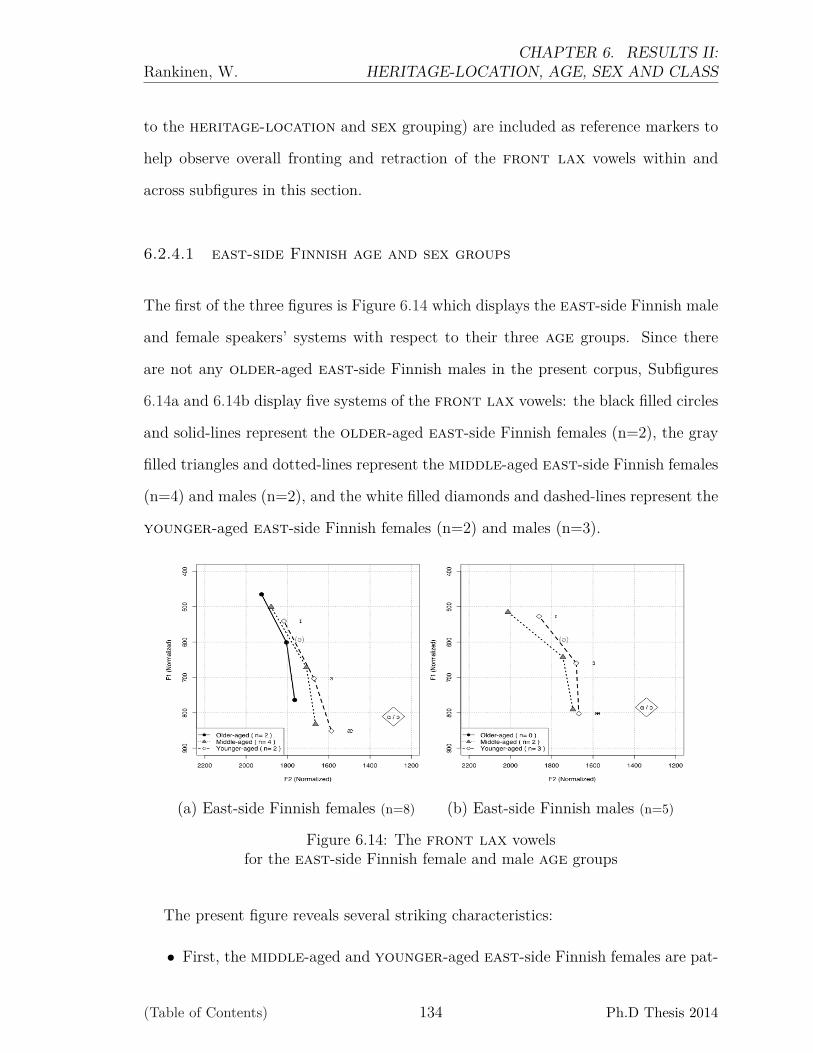
Rankinen, W.CHAPTER 6. RESULTS II:
HERITAGE-LOCATION, AGE, SEX AND CLASS
to the heritage-location and sex grouping) are included as reference markers to
help observe overall fronting and retraction of the front lax vowels within and
across subfigures in this section.
6.2.4.1 east-side Finnish age and sex groups
The first of the three figures is Figure 6.14 which displays the east-side Finnish male
and female speakers’ systems with respect to their three age groups. Since there
are not any older-aged east-side Finnish males in the present corpus, Subfigures
6.14a and 6.14b display five systems of the front lax vowels: the black filled circles
and solid-lines represent the older-aged east-side Finnish females (n=2), the gray
filled triangles and dotted-lines represent the middle-aged east-side Finnish females
(n=4) and males (n=2), and the white filled diamonds and dashed-lines represent the
younger-aged east-side Finnish females (n=2) and males (n=3).
(a) East-side Finnish females (n=8) (b) East-side Finnish males (n=5)
Figure 6.14: The front lax vowelsfor the east-side Finnish female and male age groups
The present figure reveals several striking characteristics:
• First, the middle-aged and younger-aged east-side Finnish females are pat-
(Table of Contents) 134 Ph.D Thesis 2014

Rankinen, W.CHAPTER 6. RESULTS II:
HERITAGE-LOCATION, AGE, SEX AND CLASS
terning similarly to one another. In terms of front lax vowels for the younger-
aged and middle-aged east-side Finnish females, the high front [I] vowel is the
only one that reports a significant difference — albeit along only the F1 dimen-
sion (i.e., MANOVA reports V=0.095, F(2, 52)=2.67, p>0.05; F1’s ANOVA
reports F(1, 52)=5.436, p<0.05, with a 40Hz difference; F2’s ANOVA reports
F(1, 52)=0.067, p>0.05).
• Second, the older-aged east-side Finnish females are both observationally
and statistically distinct from both the middle-aged and younger-aged coun-
terparts in Figure 6.15a for mid and low front lax vowels; this is confirmed
when comparing the middle-aged and older-aged east-side Finnish females
in a multivariate analysis of variance (i.e., the [E] vowel’s MANOVA reports
V=0.168, F(2, 70)=6.96, p<0.01; the [æ] vowel’s MANOVA reports V=0.160,
F(2, 52)=4.87, p<0.01).
• Third, the middle-aged and younger-aged east-side Finnish males are also
patterning similarly to one another. Only the [I] vowel reports any statistical
difference between these two groups (i.e., MANOVA reports V=0.184, F(2,
43)=4.73, p<0.05; F1’s ANOVA reports F(1, 43)=0.52, p>0.05; F2’s ANOVA
reports F(1, 43)=9.26, p<0.01, with a difference of 150.7Hz).
• Fourth, the younger-aged and middle-aged east-side Finnish males and
younger-aged and middle-aged east-side Finnish females’ [E] and [æ] vow-
els are distinct from each other (i.e., [E]’s MANOVA reports V= 0.055, F(2,
128)=3.67, p<0.05; [æ]’s MANOVA reports V=0.095, F(2, 95)=4.91, p<0.01);
this was also reported in the focused analysis of the [æ] vowel in Subsection
6.2.3.
These results confirm that the younger-aged and the middle-aged east-side Finns
pattern together, but Figure 6.14 reveals that the sex factor is also very important
(Table of Contents) 135 Ph.D Thesis 2014
Rankinen, W.CHAPTER 6. RESULTS II:
HERITAGE-LOCATION, AGE, SEX AND CLASS
by showing that the younger-aged and middle-aged east-side Finnish females
and the younger-aged and middle-aged east-side Finnish males are patterning
differently from one another. The figure and subsequent results indicate that the [æ]
and [E] vowels are the lowest and most retracted in the speech of younger-aged and
middle-aged east-side Finnish females, closely followed by, but distinct from, the
younger-aged and middle-aged east-side Finnish males.
6.2.4.2 east-side Italian age and sex groups
The second of the three figures is Figure 6.15 which displays the east-side Italian
male and female speakers’ systems with respect to their three age groups. Subfigures
6.15a and 6.15b display six systems of the front lax vowels: the black filled circles
and solid-lines represent the older-aged east-side Italian females (n=7) and males
(n=5), the gray filled triangles and dotted-lines represent the middle-aged east-side
Italian females (n=12) and males (n=8), and the white filled diamonds and dashed-
lines represent the younger-aged east-side Italian females (n=5) and males (n=7).
(a) east-side Italians females (n=24) (b) east-side Italians males (n=20)
Figure 6.15: The front lax vowelsfor the east-side Italian female and male age groups
Figure 6.15 reveals several notable differences between the age and sex groups
(Table of Contents) 136 Ph.D Thesis 2014
Rankinen, W.CHAPTER 6. RESULTS II:
HERITAGE-LOCATION, AGE, SEX AND CLASS
for the east-side Italians:
• First, all three age groups for the east-side Italian females are significantly
different from one another. Furthermore, the middle-aged and younger-
aged east-side Italian females are statistically distinct from each other for
each of the front lax vowels (i.e., [I]’s MANOVA reports V=0.133, F(2,
151)=11.46, p<0.001, with a ED of 171Hz; [E]’s MANOVA reports V=0.106,
F(2, 199)=11.70, p<0.001, with a ED of 145.7Hz; [æ]’s MANOVA reports
V=0.144, F(2, 151)=12.57, p<0.001, with a ED of 138.6Hz). This result is
different from that found among the east-side Finns in Subsection 6.2.4.1,
since the middle-aged and younger-aged east-side Italian females are not
patterning together — though they are both lower and more retracted than
their older-aged counterpart.
• Second, the middle-aged and younger-aged east-side Italian males are pat-
terning together (i.e., [I]’s MANOVA reports V=0.009, F(2, 133)=0.60, p>0.05,
with a ED of 40.8Hz; [E]’s MANOVA reports V=0.020, F(2, 178)=1.69, p>0.05,
with a ED of 55.6Hz; [æ]’s MANOVA reports V=0.020, F(2, 133)=1.36, p>0.05,
with a ED of 41.3Hz).
• Third, the middle-aged and younger-aged east-side Italian males are pat-
terning with the middle-aged east-side Italian females for the mid and low
front lax vowels (e.g., [æ]’s MANOVA reports V=0.008, F(2, 241)=1.02,
p>0.05).
The results in this subsection indicate that younger-aged east-side Italian females
are the ones most advanced in the lowering and retraction of the front lax vowels.
Furthermore, the younger-aged east-side Italian males and middle-aged east-side
Italian males and females are patterning together; that is to say, they are distinct from
their older-aged counterparts but yet not participating as actively in the lowering
(Table of Contents) 137 Ph.D Thesis 2014
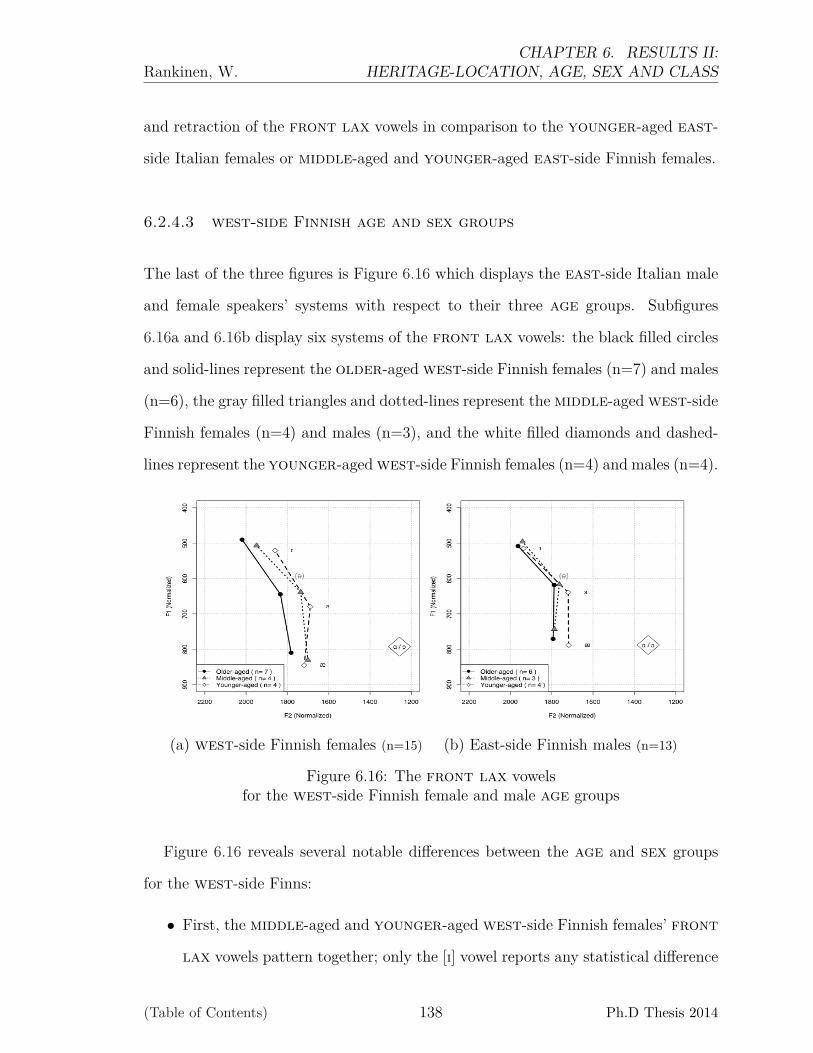
Rankinen, W.CHAPTER 6. RESULTS II:
HERITAGE-LOCATION, AGE, SEX AND CLASS
and retraction of the front lax vowels in comparison to the younger-aged east-
side Italian females or middle-aged and younger-aged east-side Finnish females.
6.2.4.3 west-side Finnish age and sex groups
The last of the three figures is Figure 6.16 which displays the east-side Italian male
and female speakers’ systems with respect to their three age groups. Subfigures
6.16a and 6.16b display six systems of the front lax vowels: the black filled circles
and solid-lines represent the older-aged west-side Finnish females (n=7) and males
(n=6), the gray filled triangles and dotted-lines represent the middle-aged west-side
Finnish females (n=4) and males (n=3), and the white filled diamonds and dashed-
lines represent the younger-aged west-side Finnish females (n=4) and males (n=4).
(a) west-side Finnish females (n=15) (b) East-side Finnish males (n=13)
Figure 6.16: The front lax vowelsfor the west-side Finnish female and male age groups
Figure 6.16 reveals several notable differences between the age and sex groups
for the west-side Finns:
• First, the middle-aged and younger-aged west-side Finnish females’ front
lax vowels pattern together; only the [I] vowel reports any statistical difference
(Table of Contents) 138 Ph.D Thesis 2014
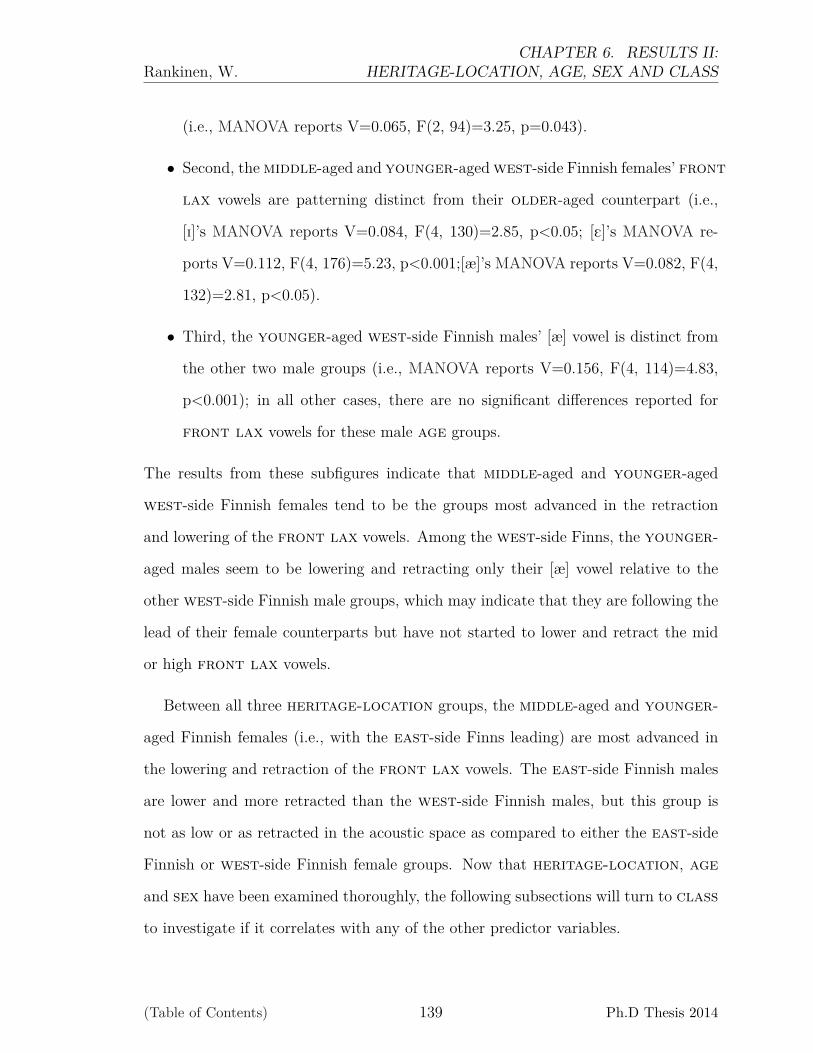
Rankinen, W.CHAPTER 6. RESULTS II:
HERITAGE-LOCATION, AGE, SEX AND CLASS
(i.e., MANOVA reports V=0.065, F(2, 94)=3.25, p=0.043).
• Second, the middle-aged and younger-aged west-side Finnish females’ front
lax vowels are patterning distinct from their older-aged counterpart (i.e.,
[I]’s MANOVA reports V=0.084, F(4, 130)=2.85, p<0.05; [E]’s MANOVA re-
ports V=0.112, F(4, 176)=5.23, p<0.001;[æ]’s MANOVA reports V=0.082, F(4,
132)=2.81, p<0.05).
• Third, the younger-aged west-side Finnish males’ [æ] vowel is distinct from
the other two male groups (i.e., MANOVA reports V=0.156, F(4, 114)=4.83,
p<0.001); in all other cases, there are no significant differences reported for
front lax vowels for these male age groups.
The results from these subfigures indicate that middle-aged and younger-aged
west-side Finnish females tend to be the groups most advanced in the retraction
and lowering of the front lax vowels. Among the west-side Finns, the younger-
aged males seem to be lowering and retracting only their [æ] vowel relative to the
other west-side Finnish male groups, which may indicate that they are following the
lead of their female counterparts but have not started to lower and retract the mid
or high front lax vowels.
Between all three heritage-location groups, the middle-aged and younger-
aged Finnish females (i.e., with the east-side Finns leading) are most advanced in
the lowering and retraction of the front lax vowels. The east-side Finnish males
are lower and more retracted than the west-side Finnish males, but this group is
not as low or as retracted in the acoustic space as compared to either the east-side
Finnish or west-side Finnish female groups. Now that heritage-location, age
and sex have been examined thoroughly, the following subsections will turn to class
to investigate if it correlates with any of the other predictor variables.
(Table of Contents) 139 Ph.D Thesis 2014
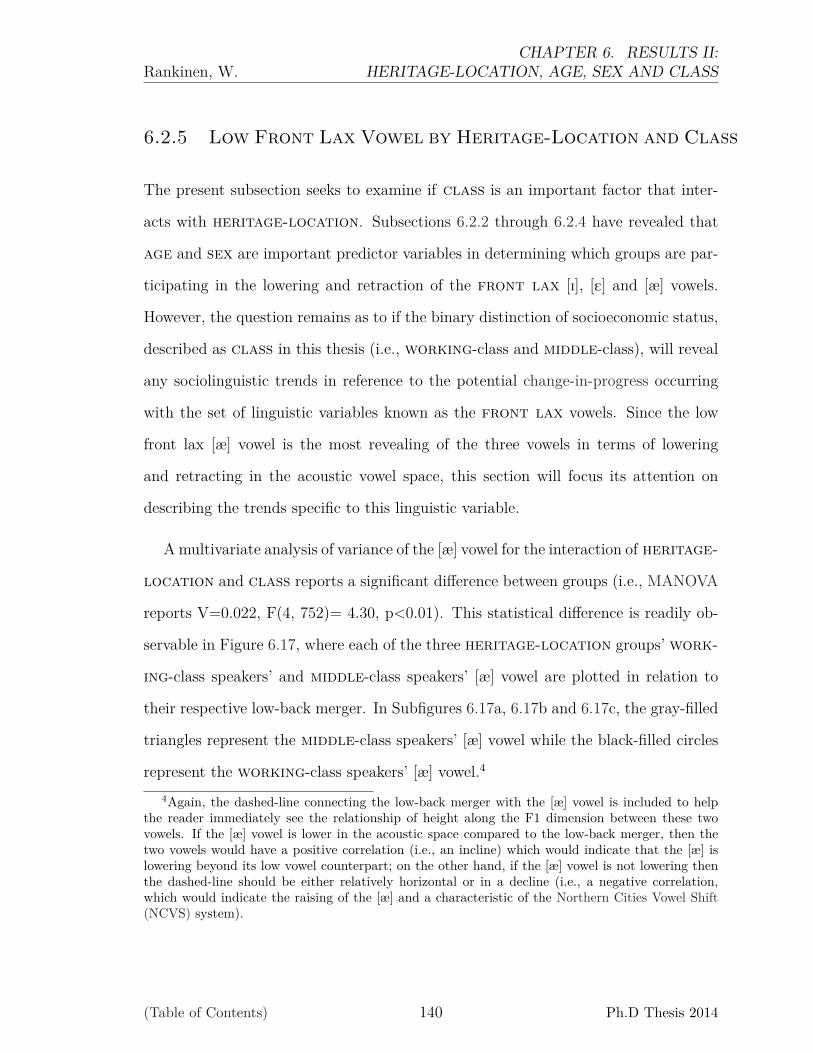
Rankinen, W.CHAPTER 6. RESULTS II:
HERITAGE-LOCATION, AGE, SEX AND CLASS
6.2.5 Low Front Lax Vowel by Heritage-Location and Class
The present subsection seeks to examine if class is an important factor that inter-
acts with heritage-location. Subsections 6.2.2 through 6.2.4 have revealed that
age and sex are important predictor variables in determining which groups are par-
ticipating in the lowering and retraction of the front lax [I], [E] and [æ] vowels.
However, the question remains as to if the binary distinction of socioeconomic status,
described as class in this thesis (i.e., working-class and middle-class), will reveal
any sociolinguistic trends in reference to the potential change-in-progress occurring
with the set of linguistic variables known as the front lax vowels. Since the low
front lax [æ] vowel is the most revealing of the three vowels in terms of lowering
and retracting in the acoustic vowel space, this section will focus its attention on
describing the trends specific to this linguistic variable.
A multivariate analysis of variance of the [æ] vowel for the interaction of heritage-
location and class reports a significant difference between groups (i.e., MANOVA
reports V=0.022, F(4, 752)= 4.30, p<0.01). This statistical difference is readily ob-
servable in Figure 6.17, where each of the three heritage-location groups’ work-
ing-class speakers’ and middle-class speakers’ [æ] vowel are plotted in relation to
their respective low-back merger. In Subfigures 6.17a, 6.17b and 6.17c, the gray-filled
triangles represent the middle-class speakers’ [æ] vowel while the black-filled circles
represent the working-class speakers’ [æ] vowel.4
4Again, the dashed-line connecting the low-back merger with the [æ] vowel is included to helpthe reader immediately see the relationship of height along the F1 dimension between these twovowels. If the [æ] vowel is lower in the acoustic space compared to the low-back merger, then thetwo vowels would have a positive correlation (i.e., an incline) which would indicate that the [æ] islowering beyond its low vowel counterpart; on the other hand, if the [æ] vowel is not lowering thenthe dashed-line should be either relatively horizontal or in a decline (i.e., a negative correlation,which would indicate the raising of the [æ] and a characteristic of the Northern Cities Vowel Shift(NCVS) system).
(Table of Contents) 140 Ph.D Thesis 2014
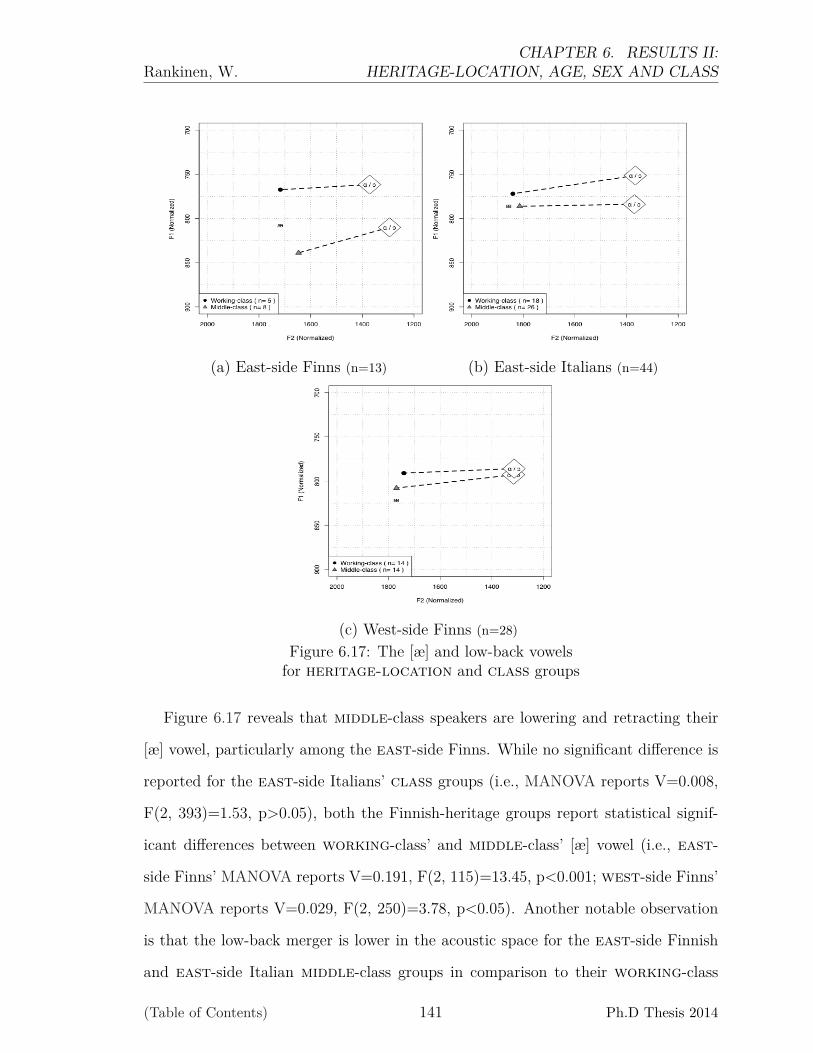
Rankinen, W.CHAPTER 6. RESULTS II:
HERITAGE-LOCATION, AGE, SEX AND CLASS
(a) East-side Finns (n=13) (b) East-side Italians (n=44)
(c) West-side Finns (n=28)Figure 6.17: The [æ] and low-back vowels
for heritage-location and class groups
Figure 6.17 reveals that middle-class speakers are lowering and retracting their
[æ] vowel, particularly among the east-side Finns. While no significant difference is
reported for the east-side Italians’ class groups (i.e., MANOVA reports V=0.008,
F(2, 393)=1.53, p>0.05), both the Finnish-heritage groups report statistical signif-
icant differences between working-class’ and middle-class’ [æ] vowel (i.e., east-
side Finns’ MANOVA reports V=0.191, F(2, 115)=13.45, p<0.001; west-side Finns’
MANOVA reports V=0.029, F(2, 250)=3.78, p<0.05). Another notable observation
is that the low-back merger is lower in the acoustic space for the east-side Finnish
and east-side Italian middle-class groups in comparison to their working-class
(Table of Contents) 141 Ph.D Thesis 2014
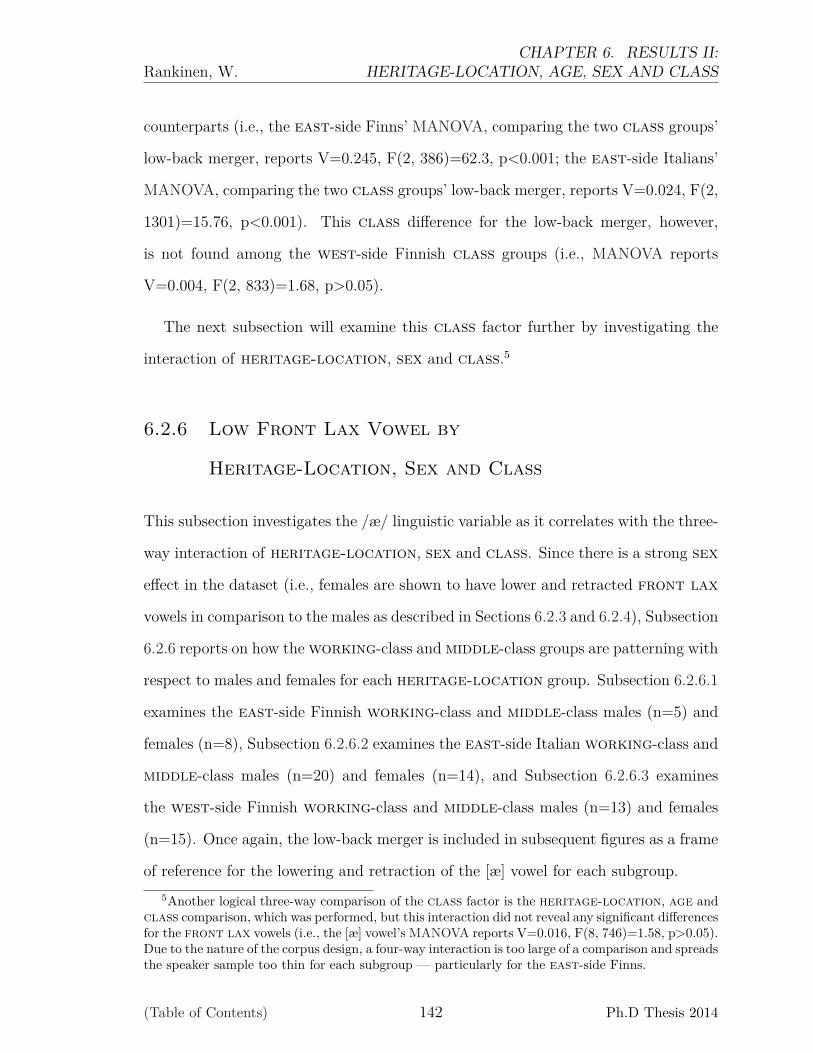
Rankinen, W.CHAPTER 6. RESULTS II:
HERITAGE-LOCATION, AGE, SEX AND CLASS
counterparts (i.e., the east-side Finns’ MANOVA, comparing the two class groups’
low-back merger, reports V=0.245, F(2, 386)=62.3, p<0.001; the east-side Italians’
MANOVA, comparing the two class groups’ low-back merger, reports V=0.024, F(2,
1301)=15.76, p<0.001). This class difference for the low-back merger, however,
is not found among the west-side Finnish class groups (i.e., MANOVA reports
V=0.004, F(2, 833)=1.68, p>0.05).
The next subsection will examine this class factor further by investigating the
interaction of heritage-location, sex and class.5
6.2.6 Low Front Lax Vowel by
Heritage-Location, Sex and Class
This subsection investigates the /æ/ linguistic variable as it correlates with the three-
way interaction of heritage-location, sex and class. Since there is a strong sex
effect in the dataset (i.e., females are shown to have lower and retracted front lax
vowels in comparison to the males as described in Sections 6.2.3 and 6.2.4), Subsection
6.2.6 reports on how the working-class and middle-class groups are patterning with
respect to males and females for each heritage-location group. Subsection 6.2.6.1
examines the east-side Finnish working-class and middle-class males (n=5) and
females (n=8), Subsection 6.2.6.2 examines the east-side Italian working-class and
middle-class males (n=20) and females (n=14), and Subsection 6.2.6.3 examines
the west-side Finnish working-class and middle-class males (n=13) and females
(n=15). Once again, the low-back merger is included in subsequent figures as a frame
of reference for the lowering and retraction of the [æ] vowel for each subgroup.5Another logical three-way comparison of the class factor is the heritage-location, age and
class comparison, which was performed, but this interaction did not reveal any significant differencesfor the front lax vowels (i.e., the [æ] vowel’s MANOVA reports V=0.016, F(8, 746)=1.58, p>0.05).Due to the nature of the corpus design, a four-way interaction is too large of a comparison and spreadsthe speaker sample too thin for each subgroup — particularly for the east-side Finns.
(Table of Contents) 142 Ph.D Thesis 2014
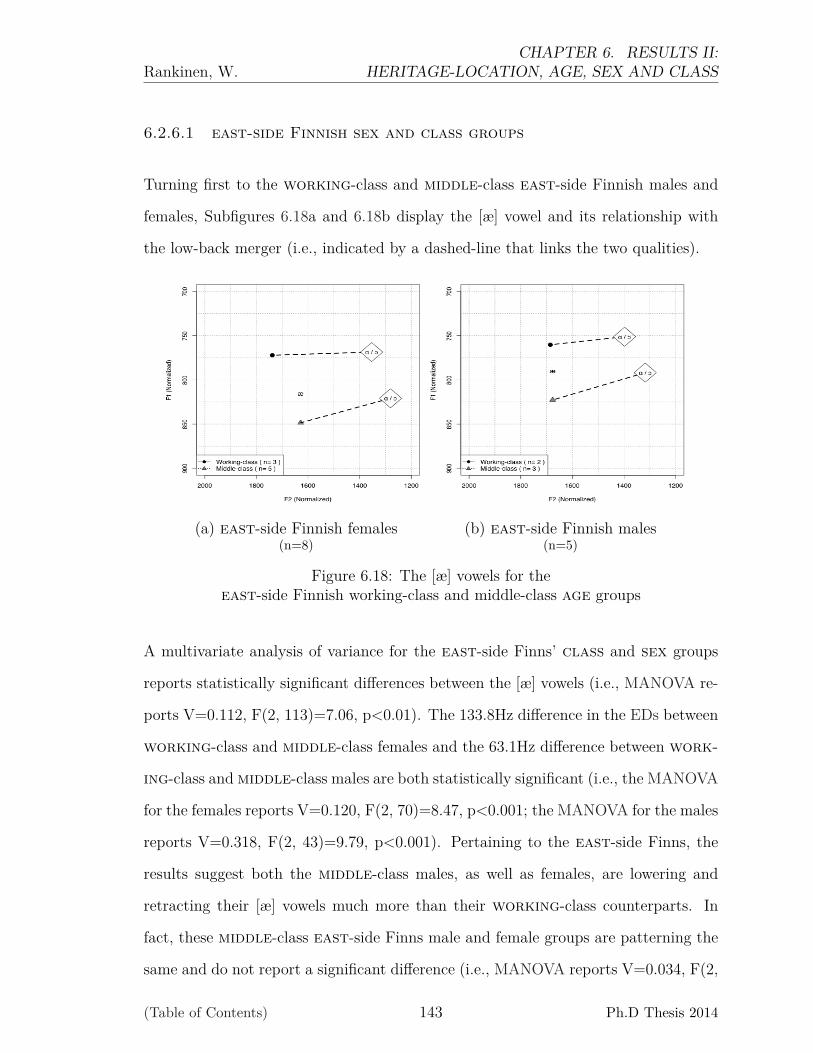
Rankinen, W.CHAPTER 6. RESULTS II:
HERITAGE-LOCATION, AGE, SEX AND CLASS
6.2.6.1 east-side Finnish sex and class groups
Turning first to the working-class and middle-class east-side Finnish males and
females, Subfigures 6.18a and 6.18b display the [æ] vowel and its relationship with
the low-back merger (i.e., indicated by a dashed-line that links the two qualities).
(a) east-side Finnish females(n=8)
(b) east-side Finnish males(n=5)
Figure 6.18: The [æ] vowels for theeast-side Finnish working-class and middle-class age groups
A multivariate analysis of variance for the east-side Finns’ class and sex groups
reports statistically significant differences between the [æ] vowels (i.e., MANOVA re-
ports V=0.112, F(2, 113)=7.06, p<0.01). The 133.8Hz difference in the EDs between
working-class and middle-class females and the 63.1Hz difference between work-
ing-class and middle-class males are both statistically significant (i.e., the MANOVA
for the females reports V=0.120, F(2, 70)=8.47, p<0.001; the MANOVA for the males
reports V=0.318, F(2, 43)=9.79, p<0.001). Pertaining to the east-side Finns, the
results suggest both the middle-class males, as well as females, are lowering and
retracting their [æ] vowels much more than their working-class counterparts. In
fact, these middle-class east-side Finns male and female groups are patterning the
same and do not report a significant difference (i.e., MANOVA reports V=0.034, F(2,
(Table of Contents) 143 Ph.D Thesis 2014
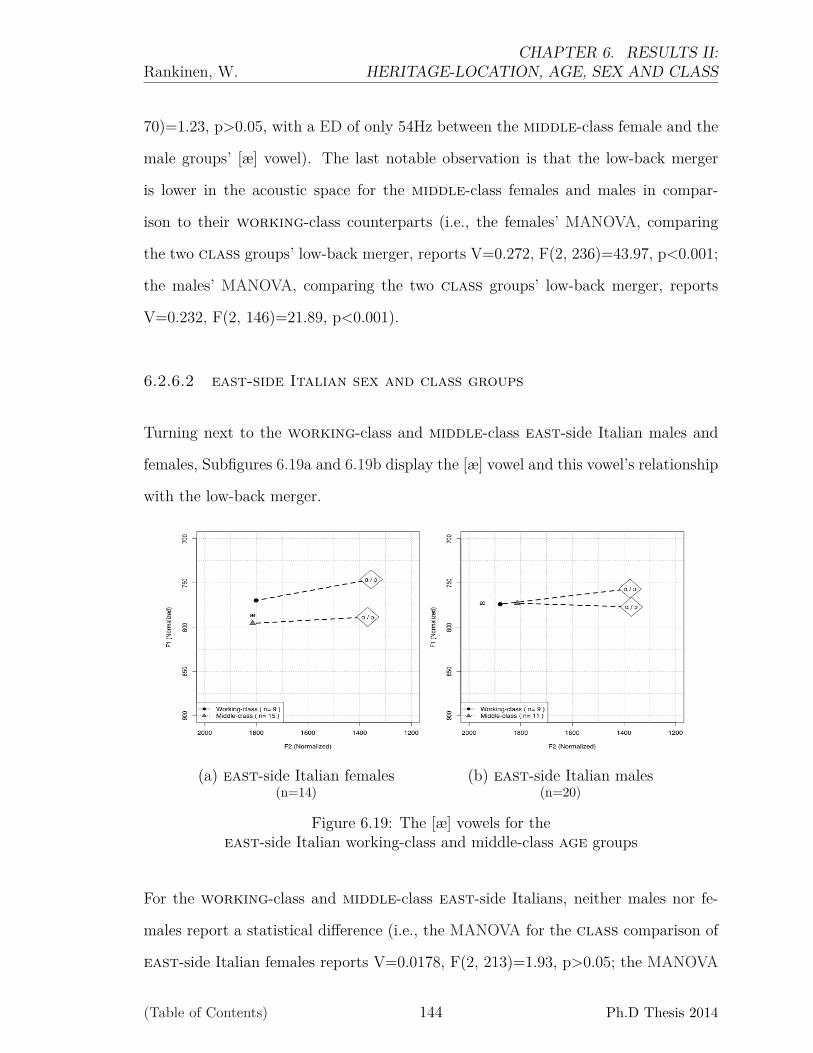
Rankinen, W.CHAPTER 6. RESULTS II:
HERITAGE-LOCATION, AGE, SEX AND CLASS
70)=1.23, p>0.05, with a ED of only 54Hz between the middle-class female and the
male groups’ [æ] vowel). The last notable observation is that the low-back merger
is lower in the acoustic space for the middle-class females and males in compar-
ison to their working-class counterparts (i.e., the females’ MANOVA, comparing
the two class groups’ low-back merger, reports V=0.272, F(2, 236)=43.97, p<0.001;
the males’ MANOVA, comparing the two class groups’ low-back merger, reports
V=0.232, F(2, 146)=21.89, p<0.001).
6.2.6.2 east-side Italian sex and class groups
Turning next to the working-class and middle-class east-side Italian males and
females, Subfigures 6.19a and 6.19b display the [æ] vowel and this vowel’s relationship
with the low-back merger.
(a) east-side Italian females(n=14)
(b) east-side Italian males(n=20)
Figure 6.19: The [æ] vowels for theeast-side Italian working-class and middle-class age groups
For the working-class and middle-class east-side Italians, neither males nor fe-
males report a statistical difference (i.e., the MANOVA for the class comparison of
east-side Italian females reports V=0.0178, F(2, 213)=1.93, p>0.05; the MANOVA
(Table of Contents) 144 Ph.D Thesis 2014

Rankinen, W.CHAPTER 6. RESULTS II:
HERITAGE-LOCATION, AGE, SEX AND CLASS
for the class comparison of east-side Italian males reports V=0.028, F(2, 178)=2.56,
p>0.05). However, a two-way comparison of these east-side Italian class and sex
groups does report a significant difference indicating the presence of a class distinc-
tion (i.e., MANOVA reports V=0.024, F(2, 391)=4.77, p<0.01). The results from
the east-side Italians suggests that once again, not only are the females leading the
males in the lowering and retraction of their front lax [æ] vowel, but also that mid-
dle-class females lead working-class females (i.e., similar to the east-side Finnish
results presented in the previous subsection). Unlike the east-side Finnish males,
however, the east-side Italian males regardless of class do not exhibit the lowering
and retraction of the [æ] vowel. The last notable observation is that the low-back
merger is lower in the acoustic space for the middle-class females and males in com-
parison to their working-class counterparts (i.e., the females’ MANOVA, comparing
the two class groups’ low-back merger, reports V=0.030, F(2, 711)=10.93, p<0.001;
the males’ MANOVA, comparing the two class groups’ low-back merger, reports
V=0.016, F(2, 586)=4.72, p<0.01); this tendency for the middle-class groups to
have lower low-back mergers in comparison to the working-class is one shared by
both east-side Finns and Italians.
6.2.6.3 west-side Finnish sex and class groups
Turning finally to the working- and middle-class west-side Finnish males and
females, Subfigures 6.20a and 6.20b display the [æ] vowel and the low-back merger.
(Table of Contents) 145 Ph.D Thesis 2014
Rankinen, W.CHAPTER 6. RESULTS II:
HERITAGE-LOCATION, AGE, SEX AND CLASS
(a) west-side Finnish females(n=15)
(b) west-side males(n=13)
Figure 6.20: The [æ] vowels for thewest-side Finnish working-class and middle-class age groups
The results in Subfigures 6.20 reveal a few striking characteristics of the four work-
ing-class and middle-class west-side Finnish male and female groups in regards
to the front lax [æ] vowel. Unlike the other heritage-location groups, the
west-side Finns do not exhibit a class difference in regards to this linguistic vari-
able (i.e., the MANOVA for the class comparison of west-side Finnish females
reports V=0.013, F(2, 133)=0.85, p>0.05; the MANOVA for the class comparison
of west-side Finnish males reports V=0.047, F(2, 115)=2.78, p>0.05). The other
notable observation is that both the working-class and the middle-class west-side
Finnish females are lowering and retracting their front lax [æ] vowel yet their male
counterparts do not (i.e., MANOVA reports V=0.153, F(2, 250)=16.97, p<0.001).
The last notable observation is that the low-back merger is lower in the acoustic
space for the middle-class males in comparison to their working-class counterpart
(i.e., the males’ MANOVA, comparing the two class groups’ low-back merger, re-
ports V=0.035, F(2, 384)=6.99, p<0.01); the same class distinction of the low-back
merger is not true for the females (i.e., MANOVA reports V=0.007, F(2, 445)=1.47,
p>0.05).
(Table of Contents) 146 Ph.D Thesis 2014

Rankinen, W.CHAPTER 6. RESULTS II:
HERITAGE-LOCATION, AGE, SEX AND CLASS
This section has shown in detail that the lowering and retraction of [I], [E] and [æ]
are linguistic indicators that share both phonetic and sociolinguistic patterns; that is
to say, the most extreme cases of lowering and retraction of these linguistic variables
is found in the speech of the younger-aged east-side Finnish middle-class females.
The results indicate that the lowering and retraction of the front lax vowels may
in fact be seen as a prestigious variant used by women and the middle-class groups
(Labov 2001).6 In addition, the lowering of the low back variants may be co-
occurring with the lowering and retraction of the [æ] variant. The next section of
the present chapter will investigate the predictor variables of heritage-location,
age, sex and class as they pertain to the short and long diphthongs.
6A thorough discussion of this finding will be provided in the next chapter (c.f., Section 7.2.2.1).
(Table of Contents) 147 Ph.D Thesis 2014

Rankinen, W.CHAPTER 6. RESULTS II:
HERITAGE-LOCATION, AGE, SEX AND CLASS
6.3 Short and Long Diphthongs as
Sets of Linguistic Variables
This section focuses primarily on the long diphthongs as linguistic variables of
interest; this is largely due to the fact that very little interspeaker variation exists
for either the /ej/ or /ow/ short diphthongs, which indicates that the variants of
these linguistic variables are stable within the sample of this UP speech community
(e.g., monophthongalization of /ow/). In contrast, the nuclei of long diphthongs
are quite distinct from one another and have been shown to be interacting in different
ways with the low and mid regions of the acoustic vowel space, and in the case of /Aj/,
correlated with the linguistic predictor variable of context. The primary question
of this section is to inquire if the nuclei of these long diphthongs are raising and
advancing in the acoustic vowel space when compared to the low-back merger.7
As was shown in Section 6.1, the /Aj/ is the only long diphthong that exhibits
the advancement to the low central region of the acoustic vowel space; further analyses
reveal both long diphthongs to be relatively invariant linguistic variables along the
F2 dimension (i.e., showing limited to no interspeaker variation between groups). This
suggests that the advancement of [Aj] (i.e., fronting of [Aj]) and this non-advancement
of [Aw] (i.e., non-fronting of [Aw]) are relatively stable characteristics of these linguis-
tic variables within this UP speech community. As a result, this section examines
strictly the F1 dimension, using the F1 differences between each nucleus of a long
diphthong and the low-back merger in order to determine if raising is occurring be-
tween groups according the the predictor variables of interest in an analysis. For each
group based on a predictor variable or an interaction of predictor variables, a group
F1 mean difference is calculated. This group F1 mean difference is used to examine7It is important to note that as described in Chapter 3 these long diphthongs are constrained
in terms of their following phonetic environment in that [AjT] and [AwT] are both followed by avoiceless obstruent, while the [AjC] is followed by a voiced obstruent.
(Table of Contents) 148 Ph.D Thesis 2014
Rankinen, W.CHAPTER 6. RESULTS II:
HERITAGE-LOCATION, AGE, SEX AND CLASS
the degree to which the nucleus of a long diphthong deviates from the low-back
merger. This difference is calculated by taking the mean F1 value of the [A] and [O]
vowels and subtracting it from the mean F1 value of the long diphthong’ nucleus in
order to obtain the mean F1 difference. Due to the nature the F1 dimension, a raised
nucleus would have a negative value and a non-raised nucleus would have a positive
value (or approximate zero). For example, in calculating the mean F1 difference of
the [Aw] vowel for the east-side Finnish, east-side Italian and west-side Finnish
groups in a heritage-location factor analysis, each group’s mean F1 value of the
[Aw] nucleus is subtracted from the group’s corresponding low-back mean value to
arrive at single F1 difference; this is done for each heritage-location group. For
this specific analysis, a between-group comparison is then used to examine if these
heritage-location groups exhibit interspeaker variation in terms of the raised or
non-raised variant of the /Aw/ diphthong (and potentially, the subsequent analysis
of /Aj/ might reveal if the [AjT] and [AjC] are being raised as well).
In this final section of the chapter, two focused questions guide the present analysis:
1. Are the nuclei of the [AwT], [AjT] and [AjC] long diphthongs raised in the
acoustic vowel space (i.e., raised and distinct from the height of the low-back
merger)?
2. Does interspeaker variation exist for either of the long diphthongs, and if
so, does it correlate with the predictor variables of heritage-location, age,
sex or class?
Subsection 6.3.1 examines the F1 difference of the long diphthongs’ nuclei for
the main effects of age and heritage-location and then examines the two-way
interaction of these factors. Subsection 6.3.2 focuses on the factor of age and its
two-way and three-way interactions with the sex and class factors.
(Table of Contents) 149 Ph.D Thesis 2014
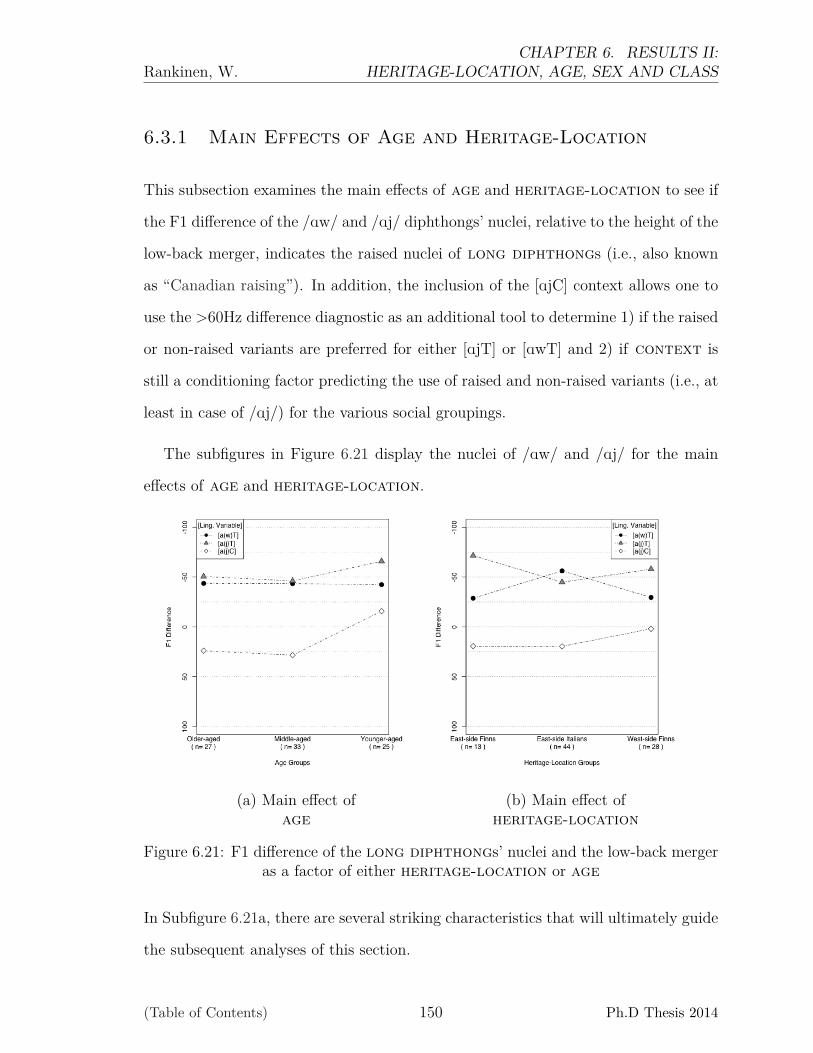
Rankinen, W.CHAPTER 6. RESULTS II:
HERITAGE-LOCATION, AGE, SEX AND CLASS
6.3.1 Main Effects of Age and Heritage-Location
This subsection examines the main effects of age and heritage-location to see if
the F1 difference of the /Aw/ and /Aj/ diphthongs’ nuclei, relative to the height of the
low-back merger, indicates the raised nuclei of long diphthongs (i.e., also known
as “Canadian raising”). In addition, the inclusion of the [AjC] context allows one to
use the >60Hz difference diagnostic as an additional tool to determine 1) if the raised
or non-raised variants are preferred for either [AjT] or [AwT] and 2) if context is
still a conditioning factor predicting the use of raised and non-raised variants (i.e., at
least in case of /Aj/) for the various social groupings.
The subfigures in Figure 6.21 display the nuclei of /Aw/ and /Aj/ for the main
effects of age and heritage-location.
(a) Main effect ofage
(b) Main effect ofheritage-location
Figure 6.21: F1 difference of the long diphthongs’ nuclei and the low-back mergeras a factor of either heritage-location or age
In Subfigure 6.21a, there are several striking characteristics that will ultimately guide
the subsequent analyses of this section.
(Table of Contents) 150 Ph.D Thesis 2014

Rankinen, W.CHAPTER 6. RESULTS II:
HERITAGE-LOCATION, AGE, SEX AND CLASS
• The nuclei of the [AwT] long diphthong is invariantly raised across the age
groups at approximately 40Hz or more (i.e., a F1 difference of -40 to -45Hz)
above the low-back merger (i.e., ANOVA reports a non-significant difference,
F(2, 670)=0.01, p>0.05).
• The nuclei of the /Aj/, for [AjC] and [AjT] long diphthongs, also exhibit
limited interspeaker variation as a factor of age, with univariate analyses of
variance reporting non-significance across the age groups (i.e., [AT]’s ANOVA
reports F(2, 80)=0.507, p>0.05; [AC]’s ANOVA reports F(2, 80)=2.79, p>0.05.
However with respect of each age grouping, the [AjC] and [AjT] are found to be
statistically distinct for the older-aged (i.e., ANOVA reports F(2, 260)=5.02,
p<0.01) and middle-aged groups (i.e., ANOVA reports F(2, 323)=7.94, p<0.001)
but not for younger-aged groups (i.e., ANOVA reports F(2, 247)=2.89, p>0.05).
Additionally, an independent t-test comparing the middle-aged group’s [AjC]
mean with the younger-aged group’s [AjC] mean does report a significant
difference, t(54.6)=2.46, p<0.05.
The results from this figure indicate that the main effect of age is an important
factor for the raised variant of the /Aj/ and /Aw/ nuclei as linguistic variables. In
contrast, it also suggests that the [AjC] and [AjT] nuclei are clearly conditioned by
the following phonetic segment as being voiced or voiceless. While the pre-voicing
context is invariably conditioning the raised and non-raised variants for the older-
aged and middle-aged groups, it may not be as important of a predictive variable for
the younger-aged group since all of the nuclei are raised, regardless of the following
segment.
The F1 difference data in Subfigures 6.21b, for the three groups as a factor of
heritage-location, also exhibit some striking trends for the /Aw/ and /Aj/ nuclei
as linguistic variables.
(Table of Contents) 151 Ph.D Thesis 2014
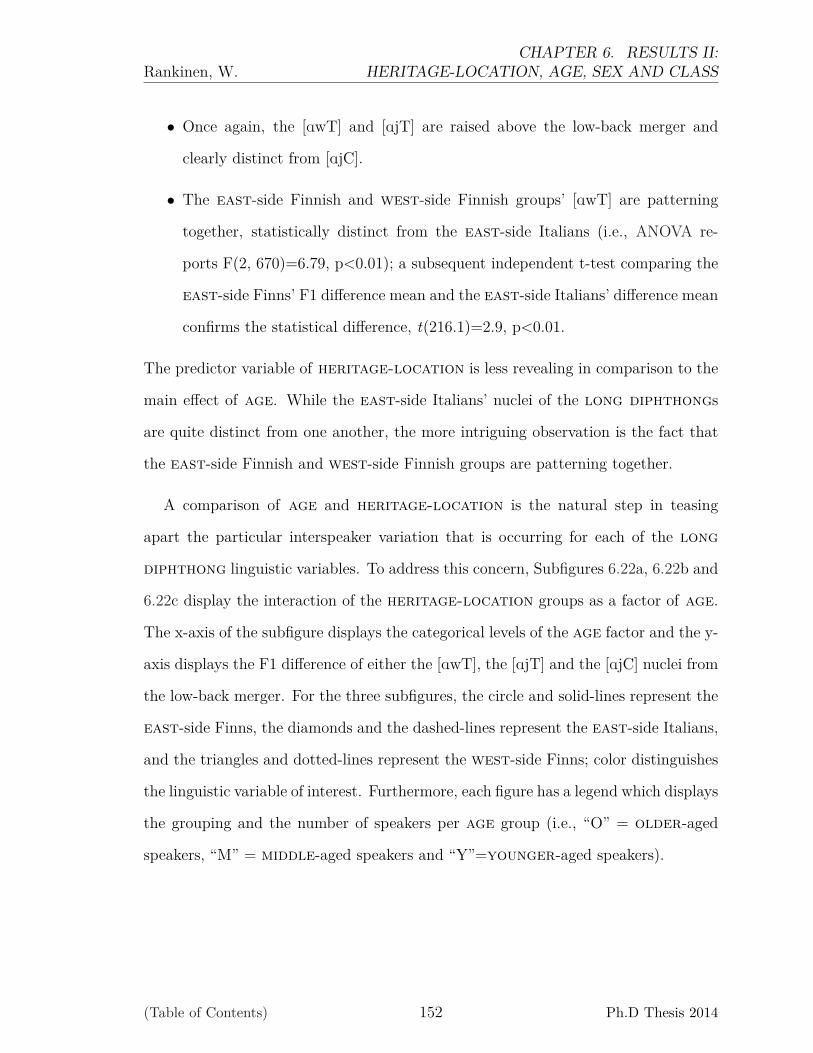
Rankinen, W.CHAPTER 6. RESULTS II:
HERITAGE-LOCATION, AGE, SEX AND CLASS
• Once again, the [AwT] and [AjT] are raised above the low-back merger and
clearly distinct from [AjC].
• The east-side Finnish and west-side Finnish groups’ [AwT] are patterning
together, statistically distinct from the east-side Italians (i.e., ANOVA re-
ports F(2, 670)=6.79, p<0.01); a subsequent independent t-test comparing the
east-side Finns’ F1 difference mean and the east-side Italians’ difference mean
confirms the statistical difference, t(216.1)=2.9, p<0.01.
The predictor variable of heritage-location is less revealing in comparison to the
main effect of age. While the east-side Italians’ nuclei of the long diphthongs
are quite distinct from one another, the more intriguing observation is the fact that
the east-side Finnish and west-side Finnish groups are patterning together.
A comparison of age and heritage-location is the natural step in teasing
apart the particular interspeaker variation that is occurring for each of the long
diphthong linguistic variables. To address this concern, Subfigures 6.22a, 6.22b and
6.22c display the interaction of the heritage-location groups as a factor of age.
The x-axis of the subfigure displays the categorical levels of the age factor and the y-
axis displays the F1 difference of either the [AwT], the [AjT] and the [AjC] nuclei from
the low-back merger. For the three subfigures, the circle and solid-lines represent the
east-side Finns, the diamonds and the dashed-lines represent the east-side Italians,
and the triangles and dotted-lines represent the west-side Finns; color distinguishes
the linguistic variable of interest. Furthermore, each figure has a legend which displays
the grouping and the number of speakers per age group (i.e., “O” = older-aged
speakers, “M” = middle-aged speakers and “Y”=younger-aged speakers).
(Table of Contents) 152 Ph.D Thesis 2014
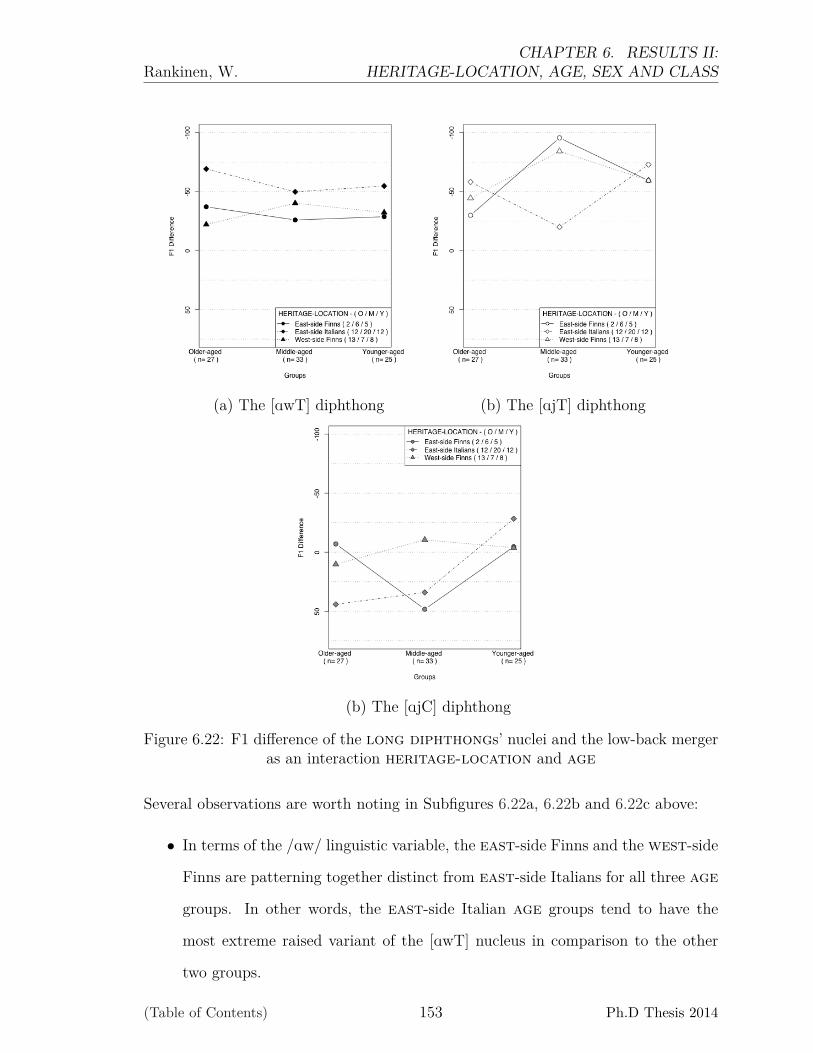
Rankinen, W.CHAPTER 6. RESULTS II:
HERITAGE-LOCATION, AGE, SEX AND CLASS
(a) The [AwT] diphthong (b) The [AjT] diphthong
(b) The [AjC] diphthong
Figure 6.22: F1 difference of the long diphthongs’ nuclei and the low-back mergeras an interaction heritage-location and age
Several observations are worth noting in Subfigures 6.22a, 6.22b and 6.22c above:
• In terms of the /Aw/ linguistic variable, the east-side Finns and the west-side
Finns are patterning together distinct from east-side Italians for all three age
groups. In other words, the east-side Italian age groups tend to have the
most extreme raised variant of the [AwT] nucleus in comparison to the other
two groups.
(Table of Contents) 153 Ph.D Thesis 2014
Rankinen, W.CHAPTER 6. RESULTS II:
HERITAGE-LOCATION, AGE, SEX AND CLASS
• In terms of the /Aj/ linguistic variable when followed by a voiceless obstruent,
all three heritage-location groups are patterning together respective of the
older-aged and younger-aged groupings. However, middle-aged east-side
Italians are patterning very differently from the middle-aged Finnish-heritage
groups (i.e., ANOVA reports F(2, 29)=4.42, p<0.05).
• In contrast, the nucleus of the pre-voiced /Aj/ linguistic variable is typically
not raised relative to the low-back merger; at least, the [AjC] and the low-back
merger fail to report statistically significant differences for any of the heritage-
location groups for each age grouping (i.e., a series of univariate analyses all
reveal p>0.05). Observationally, however, all three younger-aged heritage-
location groups are raising their [AjC] to height of the low-back merger; the
same cannot be said for the older-aged or middle-aged groupings.
The age factor is the most revealing of the two factors in terms of indicating
a trend toward the use or non-use of the raised variant of either the /Aw/ or the
/Aj/ linguistic variable. Moreover, the slightly raised variant of the [AjC] among the
younger-aged heritage-location group does indicate a trend toward the loss
of an allophonic distinction between the raised and non-raised variants according
to the voicing contrast of the following phonetic environment. Additionally, while
there does seem to be some other interspeaker variation on account of heritage-
location, further investigation of this factor’s interaction with the three predictor
variables reveals limited to no interpretable results other than the main effect reported
in Figure 6.21 or the two-way interaction of age and heritage-location reported
in Figure 6.22.
The results in Subsection 6.3.1 confirm that [AwT] and [AjT] are higher in the
acoustic space (i.e., raised above the low-back merger) regardless of age and heritage-
location, while the [AjC] is only raised among the younger-aged speakers. Because
(Table of Contents) 154 Ph.D Thesis 2014
Rankinen, W.CHAPTER 6. RESULTS II:
HERITAGE-LOCATION, AGE, SEX AND CLASS
of the importance of age, the subsequent subsections will now focus on the predictor
variable of age and this factor’s interaction with sex and class in order to account
for the interspeaker variation that exists in the raising of the [AwT], [AjT] and [AjC]
long diphthongs.
6.3.2 Raised Variants of [Aj] and [Aw] as Changes-in-Progress
In the previous section all speakers were shown to be raising both the nuclei of /Aw/
and /Aj/ when followed by a voiceless obstruent, while the younger-aged speakers
were the only group that exhibited evidence for the raised variant of the [AjC] nucleus
(i.e., to the height of the low-back merger, yet still below that of the [AjT] and [AwT]
nuclei). As a result, the present section examines the interaction of age and sex and
the interaction of age and class to see if these raised variants are associated with
any particular sex or class group among these younger-aged speakers. Turning
first to the interaction of age and sex, Figure 6.23 displays the F1 difference for the
male and female speakers’ [AwT], [AjT], and [AjC] nuclei on the y-axis and the three
age groups on the x-axis. Color indexes each linguistic variable, line type indexes
each sex group, and symbol type indexes each unique grouping. Furthermore, this
figure has a legend which displays the linguistic variable of interest, the sex groupings
and the number of speakers per sex group (i.e., “O” = older-aged speakers, “M”
= middle-aged speakers and “Y”=younger-aged speakers).
It is clear from Figure 6.23 that the raised variants of /Aw/ and /Aj/ are strongly
preferred when followed by a voiceless obstruent for all three age groupings regardless
of gender. Comparing the nuclei of [AwT] to the low-back merger, the raised variant
of both male and females across the age groupings are all located between 34Hz and
48.5Hz above the low-back merger. Similarly, the male and female speakers’ [AjT]
nuclei are also raised, but are even more so, with a range mean difference between
(Table of Contents) 155 Ph.D Thesis 2014
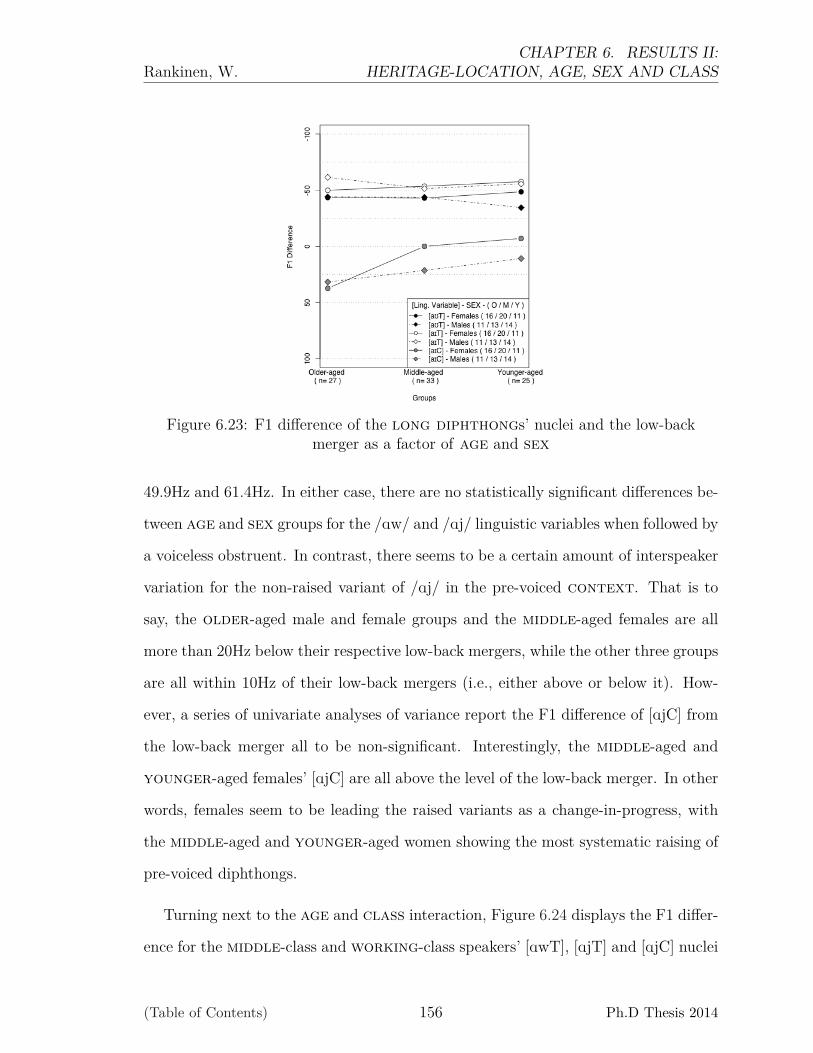
Rankinen, W.CHAPTER 6. RESULTS II:
HERITAGE-LOCATION, AGE, SEX AND CLASS
Figure 6.23: F1 difference of the long diphthongs’ nuclei and the low-backmerger as a factor of age and sex
49.9Hz and 61.4Hz. In either case, there are no statistically significant differences be-
tween age and sex groups for the /Aw/ and /Aj/ linguistic variables when followed by
a voiceless obstruent. In contrast, there seems to be a certain amount of interspeaker
variation for the non-raised variant of /Aj/ in the pre-voiced context. That is to
say, the older-aged male and female groups and the middle-aged females are all
more than 20Hz below their respective low-back mergers, while the other three groups
are all within 10Hz of their low-back mergers (i.e., either above or below it). How-
ever, a series of univariate analyses of variance report the F1 difference of [AjC] from
the low-back merger all to be non-significant. Interestingly, the middle-aged and
younger-aged females’ [AjC] are all above the level of the low-back merger. In other
words, females seem to be leading the raised variants as a change-in-progress, with
the middle-aged and younger-aged women showing the most systematic raising of
pre-voiced diphthongs.
Turning next to the age and class interaction, Figure 6.24 displays the F1 differ-
ence for the middle-class and working-class speakers’ [AwT], [AjT] and [AjC] nuclei
(Table of Contents) 156 Ph.D Thesis 2014
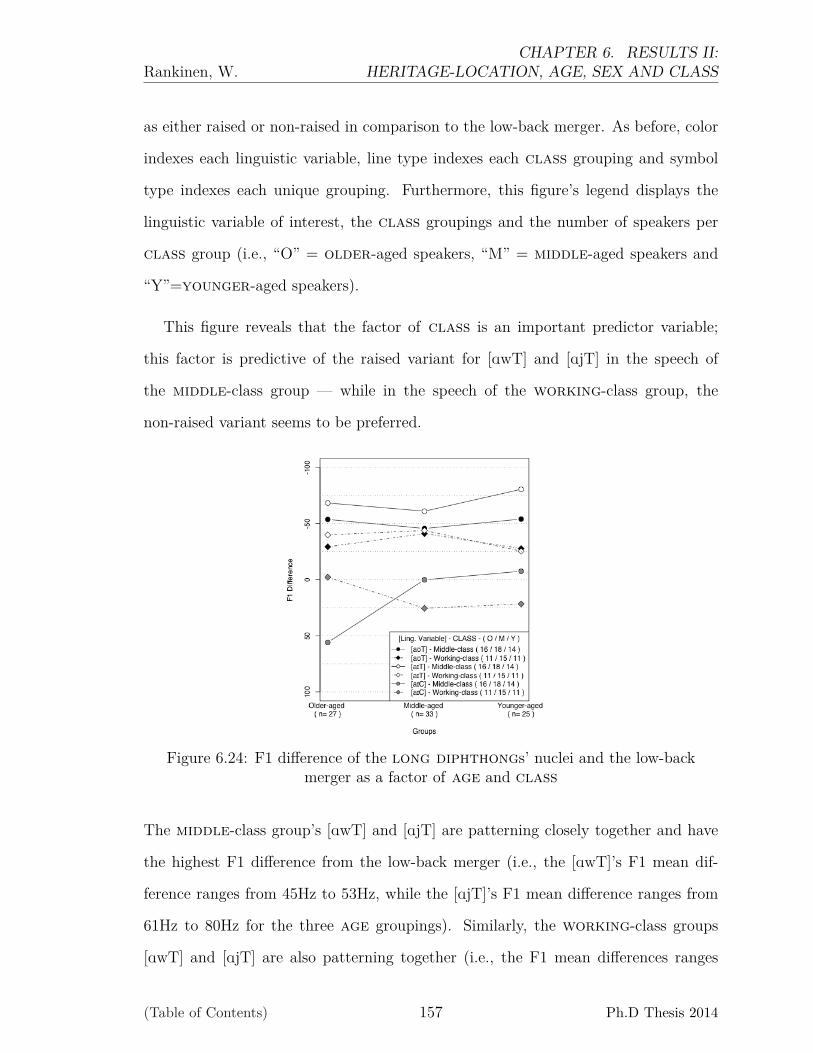
Rankinen, W.CHAPTER 6. RESULTS II:
HERITAGE-LOCATION, AGE, SEX AND CLASS
as either raised or non-raised in comparison to the low-back merger. As before, color
indexes each linguistic variable, line type indexes each class grouping and symbol
type indexes each unique grouping. Furthermore, this figure’s legend displays the
linguistic variable of interest, the class groupings and the number of speakers per
class group (i.e., “O” = older-aged speakers, “M” = middle-aged speakers and
“Y”=younger-aged speakers).
This figure reveals that the factor of class is an important predictor variable;
this factor is predictive of the raised variant for [AwT] and [AjT] in the speech of
the middle-class group — while in the speech of the working-class group, the
non-raised variant seems to be preferred.
Figure 6.24: F1 difference of the long diphthongs’ nuclei and the low-backmerger as a factor of age and class
The middle-class group’s [AwT] and [AjT] are patterning closely together and have
the highest F1 difference from the low-back merger (i.e., the [AwT]’s F1 mean dif-
ference ranges from 45Hz to 53Hz, while the [AjT]’s F1 mean difference ranges from
61Hz to 80Hz for the three age groupings). Similarly, the working-class groups
[AwT] and [AjT] are also patterning together (i.e., the F1 mean differences ranges
(Table of Contents) 157 Ph.D Thesis 2014
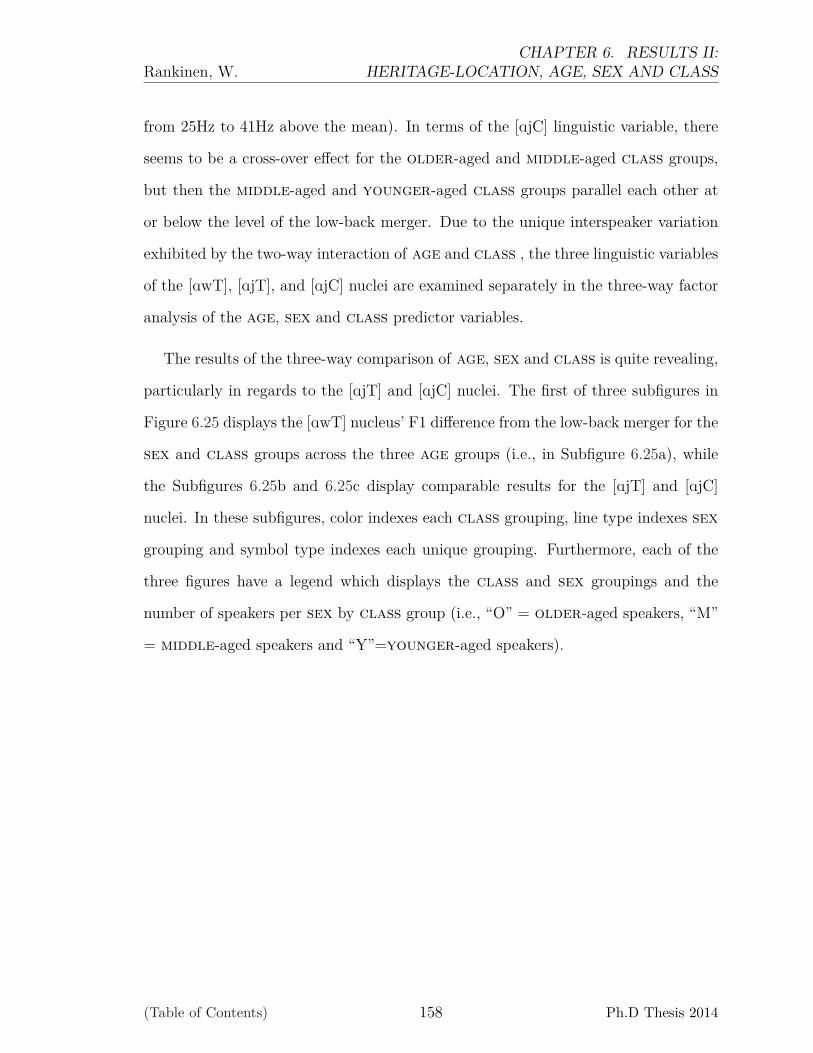
Rankinen, W.CHAPTER 6. RESULTS II:
HERITAGE-LOCATION, AGE, SEX AND CLASS
from 25Hz to 41Hz above the mean). In terms of the [AjC] linguistic variable, there
seems to be a cross-over effect for the older-aged and middle-aged class groups,
but then the middle-aged and younger-aged class groups parallel each other at
or below the level of the low-back merger. Due to the unique interspeaker variation
exhibited by the two-way interaction of age and class , the three linguistic variables
of the [AwT], [AjT], and [AjC] nuclei are examined separately in the three-way factor
analysis of the age, sex and class predictor variables.
The results of the three-way comparison of age, sex and class is quite revealing,
particularly in regards to the [AjT] and [AjC] nuclei. The first of three subfigures in
Figure 6.25 displays the [AwT] nucleus’ F1 difference from the low-back merger for the
sex and class groups across the three age groups (i.e., in Subfigure 6.25a), while
the Subfigures 6.25b and 6.25c display comparable results for the [AjT] and [AjC]
nuclei. In these subfigures, color indexes each class grouping, line type indexes sex
grouping and symbol type indexes each unique grouping. Furthermore, each of the
three figures have a legend which displays the class and sex groupings and the
number of speakers per sex by class group (i.e., “O” = older-aged speakers, “M”
= middle-aged speakers and “Y”=younger-aged speakers).
(Table of Contents) 158 Ph.D Thesis 2014
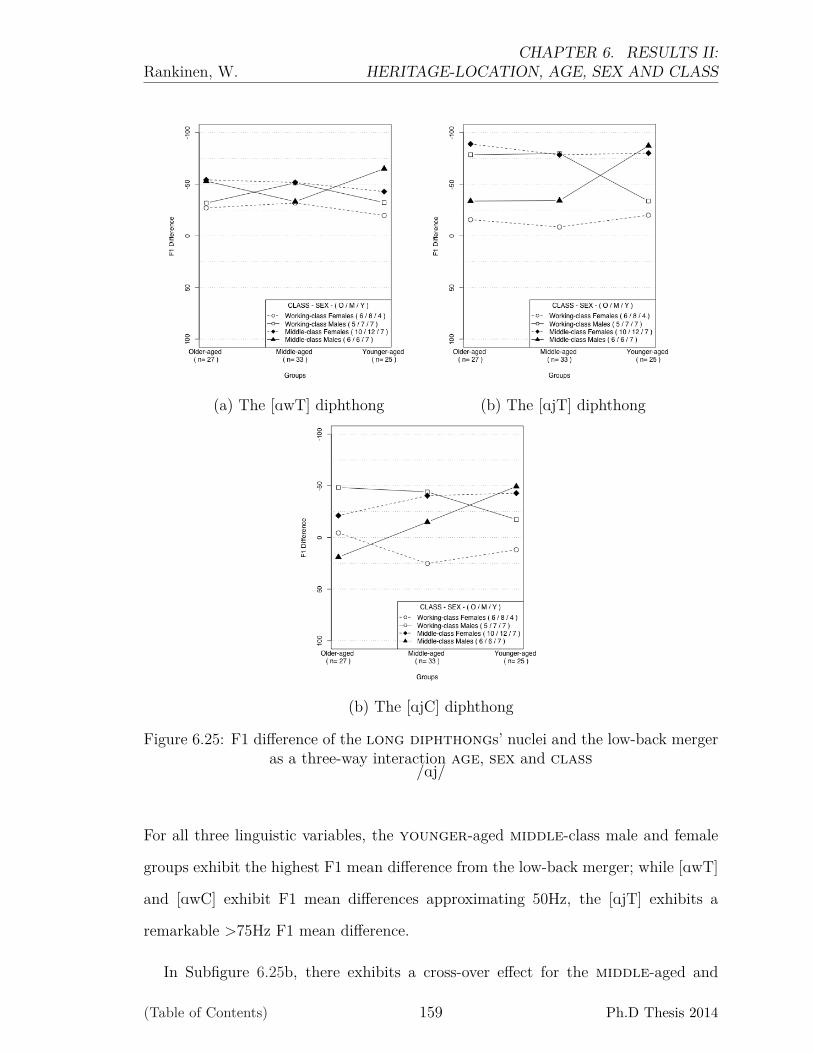
Rankinen, W.CHAPTER 6. RESULTS II:
HERITAGE-LOCATION, AGE, SEX AND CLASS
(a) The [AwT] diphthong (b) The [AjT] diphthong
(b) The [AjC] diphthong
Figure 6.25: F1 difference of the long diphthongs’ nuclei and the low-back mergeras a three-way interaction age, sex and class
/Aj/
For all three linguistic variables, the younger-aged middle-class male and female
groups exhibit the highest F1 mean difference from the low-back merger; while [AwT]
and [AwC] exhibit F1 mean differences approximating 50Hz, the [AjT] exhibits a
remarkable >75Hz F1 mean difference.
In Subfigure 6.25b, there exhibits a cross-over effect for the middle-aged and
(Table of Contents) 159 Ph.D Thesis 2014

Rankinen, W.CHAPTER 6. RESULTS II:
HERITAGE-LOCATION, AGE, SEX AND CLASS
younger-aged middle-class and working-class male groups; however, in contrast,
their female counterparts remain stable across the age groups. The raised variant
of /Aj/ and /Aw/ before voiceless obstruents in words like [2wt] for out and [f2jt] for
fight is often regarded with significant amount of stigma, and is seen as a linguistic
stereotype of Canadian speech (Chambers 1989, 76); however, it also can have local
or covert prestige (Chambers 1989; Rosenfelder 2005; Chambers 2006; Tagliamonte
2012, 33). The results from Subfigure 6.25 may indicate the presence of prestige in
the use of the raised and non-raised variants of [AjT] as a factor of class, as well as,
sex in Michigan’s UP speech community. Females tend to be the leaders of particular
innovative forms from above (i.e., external to the system) for linguistic changes-in-
progress (Labov 2001, 274; Tagliamonte 2012, 57). In the case of the raised variant of
[AjT] in this UP speech data, middle-class females are stable in their preference for
the raised variant while their male counterparts only become equal in this preference
among the younger-aged speakers. Similarly, the non-raised variant of [AjT] is
categorically used by the working-class females, and only among the younger-aged
males is there a tendency for this non-raised variant. The fact that the younger-aged
middle-class males disfavor the non-raised variant for the raised variant suggest that
there is a certain amount of prestige, albeit unconscious, for the raised variant. In
contrast, the younger-aged working-class males do the opposite and shift toward
the non-raised variant aligning with working-class females; potentially, the non-
raised variant is perceived with prestige among the working-class speakers.
Turning to Subfigure 6.25c, there exists clear trends for the raised and non-raised
variants of the [AjC] linguistic variable as an interaction of age, sex and class.
The working-class male and female groups display a positive correlation toward the
preference of the non-raised variant as a factor of age (i.e., as age decreases, the
preference of the raise variant increases). In stark contrast, there exists a negative
correlation toward the preference of the raised variant as a factor of age by the
(Table of Contents) 160 Ph.D Thesis 2014

Rankinen, W.CHAPTER 6. RESULTS II:
HERITAGE-LOCATION, AGE, SEX AND CLASS
middle-class male and female groups (i.e., as age decreases, so does the preference
of the raised variant). This preference for the raised variant for [AjC] may be due
to hypercorrection and an over application of Canadian raising or it may be indica-
tive of an exogenous influence from neighboring regional American English varieties
(Milroy 1996; Dailey-O’Cain 1997; Chambers 2006, 110). Nevertheless, the results
here suggest that any raised variant of the /Aj/ regardless of the following phonetic
segment holds prestige among the middle-class groups — particularly among the
younger-aged speakers, and led by the females. The non-raised variant, in contrast,
may be garnering similar prestige but among the working-class groups and led by
the females.
This subsection has shown that the raised variant of the [AwT] nucleus is a rela-
tively stable linguistic variable (i.e., with limited interspeaker variation). Addition-
ally, the results from this subsection have also shown that all three factors, age, sex
and class, are important for understanding the interspeaker variation that is found
for the [AjT] and [AjC] nuclei. The younger-aged group’s use of the raised variants
of the [AjT] and [AjC] are led distinctly by the younger-aged middle-class females.
In contrast, the working-class females are shown to be the leaders of the non-raised
variants of these linguistic variables. The clear preference toward the raised and
non-raised variants, particularly among these younger-aged sex and class groups,
suggest that a certain amount of prestige is associated with their usage; in fact, the
middle-class and working-class females are shown to be the avid users of their
respective variant as a factor of age, which further supports the claim that these
linguistic variables are changes-in-progress and hold prestige, albeit unconsciously.
(Table of Contents) 161 Ph.D Thesis 2014

Rankinen, W.CHAPTER 6. RESULTS II:
HERITAGE-LOCATION, AGE, SEX AND CLASS
6.4 Summary
The present chapter examined the acoustic vowel dynamics and sociolinguistic cor-
relates in the speech of an 85-speaker subset of an English monolingual UP speech
community. The results revealed that the raised variant of the [Aw] nucleus and the
low-back merger were stable linguistic variables. Furthermore, five linguistic vari-
ables were shown to be changes-in-progress, which included the raised variant of the
/Aj/ nuclei in pre-voiced and -voiceless contexts and the lowering and retraction of
the front lax vowels (i.e., according to the apparent-time data); all five linguistic
variables were led by younger-aged middle-class female speakers. Taken together,
these findings stand as substantial evidence indicative of an exogenous Canadian in-
fluence on the speech of this UP speech community (i.e., exhibiting both the Canadian
shift of /I, E, æ/ and Canadian raising of [AwT, AjT]). Additionally, while lingering
substrate characteristics still remain in the speech of UP speakers (e.g., monophthon-
galization of [ow], the structural differences of the high back and low back vowels
as a factor of heritage), it seems that the UP speech community is shifting — albeit
unconsciously — toward new norms based upon exogenous regional influences.
(Table of Contents) 162 Ph.D Thesis 2014
CHAPTER 7
DISCUSSION
The present thesis examines the acoustic vowel qualities of five sets of linguistic vari-
ables (i.e., the front lax, low back, high back monophthongs and the short
and long diphthongs) to determine if they vary with the sociolinguistic predic-
tor variables of heritage-location, bilingualism, age, sex, and class in the
speech of bilingual and monolingual Finnish- and Italian-heritage English speakers
from Michigan’s Upper Peninsula (UP). The 71-speaker subset of the 130-speaker
corpus was the first of two analyses (c.f., Chapter 5) to determine if these sets of
linguistic variables vary with the heritage-location and bilingualism factors
among older-aged Upper Peninsula (UP) English speakers. The second analysis ex-
amined an 85-speaker subset of monolingual UP English speakers (c.f., Chapter 6)
to determine if these sets of linguistic variables varied with heritage-location, as
well as the more traditional sociolinguistic variables of age, sex, and class. The two
analyses revealed several vowel system characteristics of UP speech that will be ar-
gued in this chapter as developing from or have developed from both system-internal
and system-external sources of linguistic change.
As such, this chapter will be closely examining the processes of transmission and
diffusion as they pertain to the salient systematic patterns of the acoustic vowel qual-
ities exhibiting sociolinguistic trends in the speech of Michigan’s Upper Peninsula
English speakers from Marquette County. Similar to the seminal sociophonetic vowel
work done in the communities of New York City (Labov 1966), Philadephia (Labov
163

Rankinen, W. CHAPTER 7. DISCUSSION
2001), Winnapeg (Hagiwara 2006), Toronto (Hoffman and Walker 2010), Montreal
(Boberg 2004, 2005), and many other areas across North America (e.g., Boberg (2008);
Labov et al. (2006)), the results presented in previous chapters are based upon a de-
finable and stratified sample of a rural UP speech community which exhibit highly
structured and salient sociolinguistic patterns. In order to investigate and account
for the processes of transmission and diffusion of linguistic change, a sociolinguistic
investigation must hold true to two underlying assumptions: 1) the sampled com-
munity is well-defined and 2) there are highly structured characteristics and trends
within the speech of the sampled community (Labov 2007, 348). While keeping in
step with the seminal sociophonetic and sociolinguistic studies previously mentioned
along these lines, the thesis does offer a unique opportunity for examining transmis-
sion and diffusion as processes of change by focusing on a predominately rural and
under documented English variety.1
Transmission and diffusion as processes of linguistic change first need to be defined.
Labov (2007, 346) states that “[t]he continuity of dialects and languages across time
is the result of the ability of children to replicate faithfully the form of the older gen-
eration’s language . . . [and] . . . is the normal type of internal language change, termed
change from below or change from within the system . . . ,” which is the critical means
of defining the process of transmission. Successive generations reproduce the struc-
tured patterns of a language variety by faithfully transmitting the linguistic and
social constraints modeled by the older, adult forms (Labov 1994, 2007). However,
such a “faithful” transmission is often affected by other factors that stimulates inter-
nal change between groups (e.g., inherit ages, language-dominance, ethnic-heritage).
While this may lead to further divergence over time between these factor-groups, it
may lead to the maintenance and the strengthening of linguistic and social continuity1In the past decade, how these processes propagate throughout communities from urban to more
rural communities has grown in interest among sociolinguists (Gordon 2000b).
(Table of Contents) 164 Ph.D Thesis 2014
Rankinen, W. CHAPTER 7. DISCUSSION
within a particular group as well (Gordon 2000a). Structured patterns have shown
to exist, albeit subtle, in the phonetic characteristics of ethnic-heritage groups (i.e.,
based on family heritage or ancestry) in several studies that acknowledge structural
differences between groups to be in part due to the processes of transmission and
change from below (Boberg 2004; Horvath 1985; Horvath and Sankoff 1987; Labov
2001, 2008).
Diffusion as a process of linguistic change, on the other hand, is the propagation
of exogenous norms within a community; that is, innovative forms which have origi-
nated from outside the speech community and are used as a model for diffusing the
new local norms. Since this change originates from outside the community, it is re-
ferred to as change from above (Labov 1966), and it typically results from “contact
between communities” and the “transfer of features from one to another” (Labov
2007, 347; Tagliamonte 2012, 59). However, when a particular feature or set of lin-
guistic variables diffuse from one community to another, the structural patterns of a
linguistic phenomenon may weakened and be lost overtime, which “ . . . implicates the
constraints on variation as key indicators of mechanisms of change . . . ” (Tagliamonte
2012, 59). Diffusion critically differs from transmission in that the linguistic innova-
tion will diffuse from community to community by the way of adult speech, whereas
children are a means in which structural innovations are transmitted from generation
to generation with in a community.
Section 7.1 will discuss the linguistic variables that are undergoing system-internal
sources of change on account of transmission of linguistic innovations generated within
and propagated throughout the UP speech community. Section 7.2 will discuss the
linguistic variables that are undergoing system-external sources of change as a result
of dialect leveling toward older linguistic models for propagation and geographical
diffusion of newer linguistic models for propagation within this UP speech community.
(Table of Contents) 165 Ph.D Thesis 2014
Rankinen, W. CHAPTER 7. DISCUSSION
7.1 Substrate Influences as a Process of Transmission
In the analyses of the older-aged bilingualism and heritage-location UP speak-
ers’ vowel data reported in Chapter 5, heritage-location groups are shown to
exhibit salient structural differences (i.e., the Italian-heritage system’s low vowels
were higher and the back vowels were further advanced in the acoustic vowel space
compared to either of the two Finnish-heritage systems). In contrast, the interac-
tion of heritage-location and bilingualism revealed the bilingualism groups
for east-side Italians and west-side Finns (i.e., respective of heritage-location
grouping) were homogeneous in terms of their vowel configuration and structure. In
addition to the clear divergence in the overall shape of the vowel system which is
correlated with ethnic-heritage, there is evidence to suggest that dialect leveling has
homogenized any marked or salient differences; such a hypothesis accounts for the
lack of variation that exists between the bilingualism groups. However, it seems not
all groups are conforming to local norms among these older-aged UP speakers —
the east-side Finnish English-dominant monolinguals are shown to be adopting
forms different from their peers. While it is unclear if the retraction of the front
vowels and the lowering of the low back vowels among the older-aged east-side
Finnish English-dominant monolinguals are linguistic innovations originating within
the speech community or outside of it, there is strong evidence in support of system-
atic and structural differences between heritage groups and homogeneity between
bilingualism groups. Subsection 7.1.1 will discuss the role of ethnic-heritage and
the plausibility of these structural differences as result of a change from within the
UP speech community.
(Table of Contents) 166 Ph.D Thesis 2014
Rankinen, W. CHAPTER 7. DISCUSSION
7.1.1 Ethnic-heritage and Change from Below
Ethnic-heritage, or heritage as operationalized in this thesis, takes into account the
ancestral heritage of a speaker’s background; the strict criteria that a speaker must
be able to claim at least one grandparent as having full ancestry of either Finnish or
Italian-heritage is used because, like many other regions of the Upper Midwest, most
direct immigrants that arrived prior to the 1920s are no longer living, which leaves only
first, second, third, fourth and even fifth generation ethnic-heritage speakers to make
up the speech community (Loukinen 1980, 1997; Rudnicki 1987; Sturgul 1987). While
the first, second and third generation immigrant-Americans are the oldest groups and
tend to comprise the vast majority of the bilinguals, successive generations span a
wider age range and are predominately monolingual English speakers. Furthermore,
a decrease in in-group marriages based on ethnic-heritage and an increase of out-
migration from the peninsula to find employment are two factors that have led to a
gradual decline in the number of those that could claim Finnish or Italian as their
primary ancestry (Loukinen 1997; Rudnicki 1987). In other words, many UP residents
today are of mixed ethnicity (i.e., predominately a mixture of German, Cornish,
Scandinavian, Finnish, Italian and/or other ancestral heritages), marry outside of
their primary ethnicity, and leave their UP communities in order to find employment,
complete post-secondary education, or a combination of the two.2
Ethnic-heritage is still an important factor to consider because it plays a criti-
cal role in defining the cultures and the group identities of the various communities
located in Michigan’s UP. It should be noted that this is not the only way of opera-
tionalizing and categorizing the factor of ethnic-heritage. Hoffman and Walker argue2As a result, it can be quite difficult to find younger-aged UP residents that can claim full or
even half ethnic ancestry of Finnish or Italian. Nevertheless, it would be interesting for furtherresearch to index this predicator variable by the degree of ethnic-heritage (e.g., quarter, half or fullethnic-heritage) and/or the degree of orientation toward one’s ethnic-heritage.
(Table of Contents) 167 Ph.D Thesis 2014

Rankinen, W. CHAPTER 7. DISCUSSION
that “. . . ethnic categorization of a speaker cannot rely (solely) on external measure-
ments, but also must take account of the individual’s’ perceptions of their ethnicity”
(2010, 41). Although the present thesis does not use a participant’s perception of
his/her ethnicity as a means of indexing ethnic-heritage,3 the vast majority of the
sociolinguistic interviews revealed that having either Finnish or Italian ancestry was
a distinct, if not the most salient marker of their identity — usually second only to
the identity marker of being native to Michigan’s Upper Peninsula. Similar markers
of identity are reported in the perception and identity using ethnolinguistic meth-
ods in Wisconsin and the Upper Peninsula (Remlinger et al. 2009; Remlinger 2006,
2009). In fact, it is likely that this strong sense of group identity, determined by one’s
ethnic-heritage and the community of practice shared by speakers, is a catalyst for
the propagation of the structural differences reported among the speech of older-aged
UP Finnish- and Italian-Americans.
The question remains, however, as to why the two immigrant-heritage vowel sub-
systems are systematically distinct for the low and back vowels? This finding cannot
be attributed to a faulty normalization algorithm (i.e., which should have eliminated
all biological/anatomical variation due to vocal tract size effects). If this were the
case, the low and back vowels would have systematic and structured variation occur-
ring orthogonal to the origin (i.e., both F1 and F2 would be affected) and thus be
indicative of lingering anatomical variation. However, this does not align with the
data; instead, the /2/ and /O/ vowels show systematic variation along only the F1 but
not the F2 dimension, while /U/ and /u/ vowels show systematic variation only along
the F2 but not the F1 dimension. The alternative possibility is that this is actually
a lingering substrate influence of Finnish and Italian as an L1 effect, first propagated
by bilingual speakers but now transmitted by monolingual English speakers as well.3See Hoffman and Walker (2010) for further details on how they used the perception of their
speakers’ ethnicity to index ethnic-heritage as a sociolinguistic predictor variable.
(Table of Contents) 168 Ph.D Thesis 2014

Rankinen, W. CHAPTER 7. DISCUSSION
If this alternative hypothesis is to gain any currency, a discussion of each language’s
phonological system needs to be addressed.
The Finnish language has a relatively complex and symmetrical vowel system with
eight vowel qualities (i.e., /i/, /y/, /e/, /ø/, /æ/, /A/, /o/, /u/); additionally, this
system has a complex arrangement of long and short vowel quality distinctions (Wiik
1965). This arrangement of eight phonemes, thus, exhibits a full trapezoidal vowel
configuration as a system, which exists in all varieties of the Finnish language (Suomi
et al. 2008, 22).4 In contrast, the Italian system can be conservatively stated as having
seven vowel phonemes (i.e., /i/, /e/, /E/, /A/, /O/, /o/, /u/), which form a triangular
configuration as a vowel system (Bertinetto and Loporcaro 2005, 136).5 While the
specific region in Italy from which these UP Italian-heritage speakers came from is
not conclusively known,6 the Italian systems in general have fewer vowel qualities and
a different vowel system configuration in comparison to either the Finnish or English
system (Flege et al. 1999, 1580; Escudero et al. 2014, 2978).
American English has a relatively large and complex vowel system with a diverse
phonemic vowel inventory. The structural difference in the L1 vowel systems of these
early Finnish- and Italian-immigrants may have transferred as an L1 influence during
the acquisition of English (i.e., transition from either the Finnish trapezoidal system
or the Italian triangular system to a much larger American English trapezoidal sys-
tem). The subsequent transmission of this structural difference may have persisted
in the speech of successive generations of immigrant-Americans. Finnish immigrants
are likely to have been able to closely approximate the English system since they4Some phonetic variation does occur with the /æ/, /A/ and /o/ phonemes across dialects (Kuro-
nen 2000; Suomi et al. 2008).5However, there can be as many as eight and as low as five vowel qualities, particularly among
southern Italian dialects (Flege et al. 1999, 2976).6Between 1876-1900, Italians migrating to the Keweenaw Peninsula (i.e., a region northwest of
Michigan’s Marquette County) were primarily from northern regions of Italy; however, Italians thatimmigrated to the region in later decades were primarily from the southern regions of Italy (Menghini2004, 1).
(Table of Contents) 169 Ph.D Thesis 2014
Rankinen, W. CHAPTER 7. DISCUSSION
are both trapezoidal in shape, while the higher low vowels and retracted back vow-
els of the Italian-heritage English system may be due to the Italian’s system being
a smaller and triangular in configuration. However, under this hypothesis, the two
ethnic-heritage English systems over time must have become more and more similar
with only slight lingering traces of the structural differences remaining. Labov notes
that children tend to avoid the “accented” speech of their caregivers and tend “not to
acquire the foreign accent of their parents” (2008, 316-317). The Italian-immigrants
and their children would have tried to eliminate any salient structural differences,
leaving behind only the lingering structural difference of the back and low vowels.
For the UP Finnish- and Italian-heritage speakers today, this structural difference
between the two systems is likely below the conscious awareness of the speech com-
munity. If this hypothesis is true, the structural difference may linger yet within the
community for some time as a relic of a substrate influence — eventually, however,
this structural difference may weaken to the point of being lost completely within this
speech community (Boberg 2012; Labov 2008).7
In contrast, the monophthongization of /ow/ as a substrate phenomenon does not
show any sign of weakening in the UP speech. As previously shown, Finnish and
Italian are languages that have the phoneme /o/ and are both regarded as having
monophthongal qualities; in English, this is not the case. The phonetic realization
of the American /ow/ is typically regarded as an upgliding diphthong (e.g., [oU] or
[ou]). However, western areas of the Upper Midwest (i.e., speech communities heav-
ily influenced by German and Scandinavian languages) have reported monopthongal
variants of /ow/ (Allen 1973; Nguyen 2011; Rose 2006), and such findings have been
argued to be a substratum effect (Allen 1973). Based on an ethnographic investiga-
tion of a rural town in Wisconsin, Rose (2006) found that the two variants of /ow/7This may give way to dialect leveling or incoming exogenous models of linguistic innovation
currently being adopted by the younger portions of the population.
(Table of Contents) 170 Ph.D Thesis 2014
Rankinen, W. CHAPTER 7. DISCUSSION
was correlated with sex and the social distinctions of occupation and education; while
the monophthongization of /ow/ was regarded as the default form in the community
(i.e., used by the men and those in professional occupations). Females were the only
ones to use the upgliding variant which might indicate an incoming form from outside
the community (Labov 2001; Rose 2006). In the Marquette County, however, there
does not seem to be any indication that the upgliding variant of /ow/ is taking hold
among UP speakers (i.e., besides heritage-location, all other sociolinguistic fac-
tors do not exhibit correlation with the Euclidean distance (ED), between the nucleus
and offglide of the /ow/ linguistic variable, as reported in Chapters 5 and 6). The
interspeaker variation of /ow/ that does exist in the UP speech is slight and corre-
lates with location rather than heritage; although the east-sided residents have
longer EDs in comparison to their west-side counterparts, it is important to note
that all exhibit EDs resembling a monophthongal quality rather than a diphthongal
one.8
Both the structural difference of the back and low vowels and the monophthongiza-
tion of /ow/ are substrate effects from both the L1 of Finnish and Italian transmitted
by successive generations. However, unlike the back and low vowels in UP speech,
the monophthongized variant of /ow/ does not show any sign of weakening, and in
fact, it can be regarded as a relatively stable linguistic variable within this speech
community.
7.2 Exogenous Influences as a Processes of Diffusion
The two main analyses performed in this thesis reveal two processes of diffusion: 1)
a process of dialect leveling toward American English norms in the speech of the8While the /ej/ short diphthong maintains it’s diphthongal quality, it’s uncharacteristically
short trajectory may also be on account of this substratum effect; however, further research isrequired to test this hypothesis.
(Table of Contents) 171 Ph.D Thesis 2014
Rankinen, W. CHAPTER 7. DISCUSSION
older-aged speakers as a factor of bilingualism, and 2) the more recent process of
geographic diffusion of Canadian English norms among the middle- and younger-
aged monolinguals as a factor of sex and class. The leveling of dialect variation
refers to the disuse of “marked variants” by speakers as a way of homogenizing, or
mutually converging, the speech of a particular community (Trudgill 1986, 98; Taglia-
monte 2012). Geographical diffusion refers to the wave-model of diffusion in which
the spread of linguistic forms propagate from urban centers to other urban centers
with rural areas adopting the innovative forms endmost (Kerswill 2002, 188). The
two processes of diffusion are distinct, yet they both involve the propagation of a
linguistic change through the speech community based on some exogenous influence.
Both types of diffusion are concurrently shaping the English language variety spoken
in Michigan’s Marquette County. Subsection 7.2.1 will examine the process of diffu-
sion as it relates to dialect leveling, while Subsection 7.2.2 will examine geographic
diffusion of new linguistic forms which are being adopted within this UP speech com-
munity.
7.2.1 Dialect Leveling among Older-aged UP Speakers
With the exception of the east-side Finnish English-dominant monolinguals,9 there
is strong evidence of dialect leveling among the bilingualism groups respective of
each heritage grouping. The process of dialect leveling involves the homogeniza-
tion of salient linguistic forms within the speech community by purging any “marked”
linguistic phenomena which are regarded as “unusual or in the minority” (Trudgill
1986, 98). Using the heritage-location factor, which examines both geographic9The divergence of the east-side Finnish English-dominant monolinguals and the other two
bilingualism groups in Figure 5.23 may be due to: (1) low speaker count and therefore be subjectto individual speaker’s idiosyncrasies, or (2) change-in-progress led by these two speakers. The firstof the two is the most likely scenario since the two speakers are patterning similarly but differ intheir sex and background and have widely different ages.
(Table of Contents) 172 Ph.D Thesis 2014
Rankinen, W. CHAPTER 7. DISCUSSION
residency within the county and the ethnic-heritage of the speaker, the results from
the older-aged 71-speaker subset did not find differences between the east-side Ital-
ians’ and west-side Finns’ monophthongs — that is to say, this lack of variation in
the speech of Marquette County residents from the east-side to the west-side of the
county and for both heritage groups indicates dialect leveling.
To account for the leveling process of dialect variation, the process of speech ac-
commodation needs to be considered (i.e., the “convergence” of mutually intelligible
dialects) (Kerswill 2002; Trudgill 1986). Explaining the community-wide phenomenon
of dialect leveling with the speaker-by-speaker interaction of speech accommodation
requires a unique situation. In order for dialect leveling to take root, speakers of
mutually intelligible yet distinct dialects in a particular community must come to-
gether in the linguistic marketplace to participate in “short-term accommodation”
acts, which over time, these continued accommodations will lead to “long-term ac-
commodation” acts — essentially, leveling any salient dialect differences (Sankoff and
Laberge 1978; Trudgill 1986; Kerswill 2002, 188).
Overt social pressure to “Americanize” (i.e., to give up immigrant-heritage prac-
tices) was also a strong linguistic motivator not only for immigrants to acquire English
but to encourage their children and grandchildren to master it. This was the situation
for many UP communities in the first half of the twentieth century, where established
and developing rural mining towns comprised of diverse ethnic-heritage communities
experienced an increase in contact between ethnolects coupled with pressure to con-
form to American culture (Leinonen 2014; Simon 2005). The situation was primed
for the development of dialect leveling to take shape among these early UP speech
communities.
Where the greatest amount of variation would be expected (i.e., between the her-
itage-dominant bilinguals’ system and the English-dominant monolinguals’ sys-
(Table of Contents) 173 Ph.D Thesis 2014
Rankinen, W. CHAPTER 7. DISCUSSION
tem), there exists very little difference for either heritage-location group.10 If
there were any marked L1 substrate vowel features, those features were likely purged
by the children and grandchildren of UP immigrants as a way to avoid being per-
ceived within the community as having foreign-accented speech (Labov 2008). The
vast majority of the speakers in the older-aged 71-speaker sample were born after
1920,11 and as such, these older-aged speakers comprise of the second and third gen-
eration, and even some first generation, Finnish- and Italian-Americans. Among the
first, second and third generation immigrant-American children, there was immense
pressure to speak the English language in the Upper Peninsula during the late nine-
teenth and early 20th century, even though many immigrant enclaves existed where
ethnic-heritage languages were heard or read outside the home (i.e., at church services,
public events and social gatherings, and in ethnic-oriented newspapers). However, by
the mid-1950s and 1960s, English replaced Finnish or Italian at venues where they
once were used; for example, church services held in Finnish or Italian were deliv-
ered in English instead, and many of the non-English newspapers gradually shifted
to English only or went out of print entirely (Holmio 2001; Kostiainen 2014; Simon
2005). Many of the heritage-dominant bilinguals and English-dominant bilinguals
reported during the sociolinguistic interview that they had a strong aversion toward
the use of their heritage language outside the home, preferring to use English when
at school and among their peers.12
The external source of pressure on the older-aged speakers in the 20th century
to use English rather than their heritage language, it seems, was only the first step10Of course, the structural difference, previously noted regarding the back and low vowels, exists
between these two groups, but differences between the bilingualism groups do not exist respectiveof each heritage-location grouping (c.f., Subfigure 5.21).
11Four speakers were born earlier: 1918, 1919, 1914, and 1908; the oldest subject in the 130-speaker corpus was 100 years old at the time of recording and she was a child of Finnish-immigrantparents.
12Most subjects reported that when given the option to use either the heritage language or Englishamong friends, English was strongly preferred; for many of the English-dominant bilinguals, andsome of the heritage-dominant bilinguals, English was even preferred in the home.
(Table of Contents) 174 Ph.D Thesis 2014
Rankinen, W. CHAPTER 7. DISCUSSION
toward conforming to the linguistic models of “Americanization.” The homogeniza-
tion of monophthongs for the bilingualism groups stands as strong evidence for
dialect leveling, and it seems, the next step was taken toward the elimination of any
phonetically salient vowel distinctions in their speech.13 Thus, it can be said that
the older-aged speakers (i.e., successive generations of immigrants) have favored to
incrementally adjust their speech toward homogenized, non-salient local norms. This
finding is not surprising since many other sociolinguistics studies have shown that
immigrant-heritage languages have limited effects on the continued development of
ethnolects in the United States and Canada due to the exogenous pressure on chil-
dren to conform toward “non-accented” speech (Shuy et al. 1967; Woods 1979; Labov
2001; Labov et al. 2006; Labov 2008, 317, Boberg 2012).
7.2.2 Linguistic Diffusion among Monolingual UP Speakers
The other type of diffusion refers to the propagation of external linguistic norms
spreading from one urban center to another with the rural regions last to be affected
by the linguistic change; this is known as geographical diffusion (Kerswill 2002; Taglia-
monte 2012). The population size of a social center and neighboring social centers
relative to one another may be used in order to indicate where linguistic norms begin
and how they propagate thereafter (Trudgill 1974). Based on the Geographic Areas
Reference Manual (1994), the Census Bureau has consistently defined an urbanized
area as having population density of 50,000 or more (LaMacchia et al. 1994). The
largest city in Michigan’s Upper Peninsula reports a population less than half that
size (i.e., the city of Marquette in Marquette County reports approximately 21,500
residents based on 2010-2013 population estimates). In order to get a sense of the
geographic and demographic landscape surrounding this relatively small UP rural-13Of course, there could be other linguistic phenomena that still mark their speech as being
“accented.”
(Table of Contents) 175 Ph.D Thesis 2014

Rankinen, W. CHAPTER 7. DISCUSSION
urban center and how it might be seen as a conduit for the propagation of exogenous
linguistic forms, a comparison of proximity and population size of other urban centers
to Marquette is needed.14
The next nearest urban center to Marquette is Sault St. Marie, Ontario. This
urban center is considerably larger in population size with 79,800 residents (Statistics
Canada 2011) and neighbors the second largest urban center in Michigan’s Upper
Peninsula (i.e., Sault St. Marie, Michigan, which reports a population size of approx-
imately 14,000 residents). The towns of Marquette and Sault St. Marie are only 165
miles from one another along the M-28 route from central UP to the north-eastern
most tip of the peninsula. Directly across the St. Marie’s River, connected by the
International Bridge, is Sault St. Marie, Ontario. The next closest urban center
to Marquette is Green Bay, Wisconsin, with a distance of 176 miles and a popu-
lation size of approximately 105,000 residents. Additionally, Appleton is only 209
miles away from Marquette and reports a population size of approximately 73,000
residents. From a strict hierarchical model of diffusion (Trudgill 1974), one would
suspect that linguistic norms of the largest neighboring urban centers to have more
influence on the linguistic practices of speakers living in and around the rural-urban
center of Marquette.15 However, other factors have been shown to play a vital role
in directing, redirecting and stopping the propagation of linguistic forms including
geological barriers (e.g., mountain ranges, rivers, lakes), social barriers (e.g., racial
isolation of neighborhoods in major urban centers), and in some cases, even geopolit-
ical borders may serve as linguistic barriers of diffusion if linguistic forms mark social
affiliations and identities (Boberg 2000; Labov 1972; Labov et al. 2006).
While approximately the same distance from the much larger social centers of Wis-14Marquette will be referred to as a “rural-urban” center due to its limited population size but
unique status as a central social hub in Michigan’s Upper Peninsula.15In other cases, the complete reverse occurs where the propagation of linguistic norms begins in
more rural areas and expands outwards toward more urbanized areas (Bailey et al. 1993).
(Table of Contents) 176 Ph.D Thesis 2014
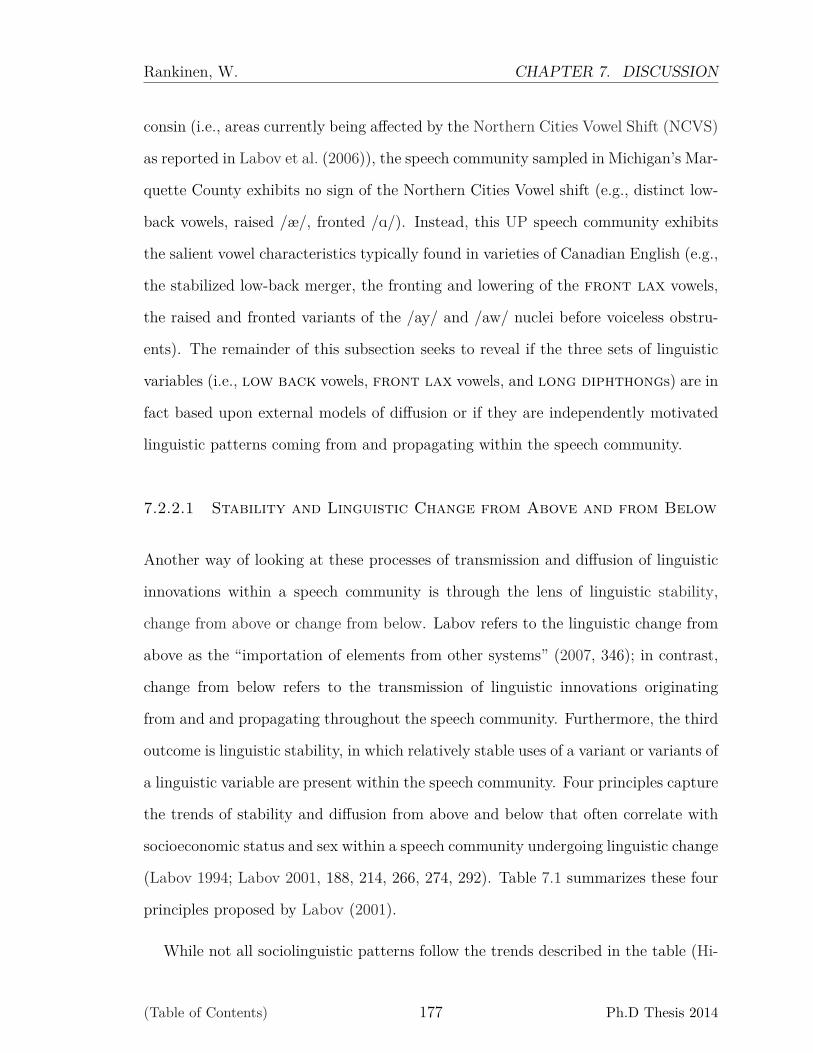
Rankinen, W. CHAPTER 7. DISCUSSION
consin (i.e., areas currently being affected by the Northern Cities Vowel Shift (NCVS)
as reported in Labov et al. (2006)), the speech community sampled in Michigan’s Mar-
quette County exhibits no sign of the Northern Cities Vowel shift (e.g., distinct low-
back vowels, raised /æ/, fronted /A/). Instead, this UP speech community exhibits
the salient vowel characteristics typically found in varieties of Canadian English (e.g.,
the stabilized low-back merger, the fronting and lowering of the front lax vowels,
the raised and fronted variants of the /ay/ and /aw/ nuclei before voiceless obstru-
ents). The remainder of this subsection seeks to reveal if the three sets of linguistic
variables (i.e., low back vowels, front lax vowels, and long diphthongs) are in
fact based upon external models of diffusion or if they are independently motivated
linguistic patterns coming from and propagating within the speech community.
7.2.2.1 Stability and Linguistic Change from Above and from Below
Another way of looking at these processes of transmission and diffusion of linguistic
innovations within a speech community is through the lens of linguistic stability,
change from above or change from below. Labov refers to the linguistic change from
above as the “importation of elements from other systems” (2007, 346); in contrast,
change from below refers to the transmission of linguistic innovations originating
from and and propagating throughout the speech community. Furthermore, the third
outcome is linguistic stability, in which relatively stable uses of a variant or variants of
a linguistic variable are present within the speech community. Four principles capture
the trends of stability and diffusion from above and below that often correlate with
socioeconomic status and sex within a speech community undergoing linguistic change
(Labov 1994; Labov 2001, 188, 214, 266, 274, 292). Table 7.1 summarizes these four
principles proposed by Labov (2001).
While not all sociolinguistic patterns follow the trends described in the table (Hi-
(Table of Contents) 177 Ph.D Thesis 2014
Rankinen, W. CHAPTER 7. DISCUSSION
Table 7.1: Principles of linguistic stability and change (Labov 2001)
Principles Type of Change Description(1) change from below Originates from and lead by central interior social groups.(2) stability Women tend to adopt prestigious variants, and disfavor
stigmatized variants, more than men.(3) change from above Women tend to adopt prestigious variants more than
men.(4) change from below Women tend to adopt prestigious variants more than
men.
biya 1988; Morales 1986), these trends do seem to describe the findings for the vast
majority of the sociolinguistic studies since Labov’s seminal works in Martha’s Vine-
yard, New York and Philadephia and equally important works thereafter (Labov 1966,
1972, 2001; Trudgill 1972; Mees 1987; Milroy et al. 1994; Tagliamonte 2012, 62-63).
Such studies, as well as many others, report findings that correlate with these two
important predicator variables of socioeconomic status and sex, which gives currency
to these principles of linguistic stability and change. For most linguistic variables, one
of the competing variants typically acquires some sort of prestige (Sturtevant 1947;
Labov 1972, 3); that is, speakers denote value toward the usage of an innovative form
based upon a perceived standard or variety, and the variant’s usage is often associ-
ated with upward mobility (Trudgill 1972, 179-180). In terms of linguistic innovations
that originate within a speech community (i.e., change from below; Principle 1), it
is the middle socioeconomic groups in the social hierarchy (i.e., working and middle
class) that tend to be the leaders of the propagation due to their orientation toward
advancing in the social hierarchy. For the second, third and fourth principles, women
tend to adopt prestigious forms at a faster rate than men, regardless if a linguis-
tic variable is stable or if it is changing from above or below; again, this has to do
with social mobility since women tend to be more upwardly mobile, and so, they use
language (i.e., through the use of “linguistic extremes”) to gain access to a higher
socioeconomic group (Eckert 2000, 192; Labov 2001, 291). As such, prestigious vari-
(Table of Contents) 178 Ph.D Thesis 2014

Rankinen, W. CHAPTER 7. DISCUSSION
ants tend to be used more often by working- or middle-class females than by working-
or middle-class males, with men tending to lag a full generation behind the women
in the linguistic transmission or diffusion of an innovative form (Labov 2001, 501).
Labov claims that women in the working or lower-middle class groups, as upwardly
mobile and motivated non-conformists, tend to possess “. . . the particular ability to
confront established norms and the motivation to defy them . . . ” (2001, 516).
What is the situation regarding the linguistic stability and change among women
and class groups in Michigan’s Upper Peninsula with regards to the monolingual UP
English speech community? Based on the analysis of Chapter 6, the sets of linguistic
variables can be described in terms of the phonetic patterning of variants and the
sociolinguistic trends to which those patterns correspond as displayed in Table 7.2.
In order to summarize the results of the various linguistic variables reported in the
previous chapter and to get an overall sense of the acoustic vowel characteristics of
UP English, this table displays the main sets of linguistic variables that capture the
important phonetic patterns and their correlation with major sociolinguistic trends.
The sets of linguistic variables are organized by type of linguistic change and each
will be discussed in turn.
(Table of Contents) 179 Ph.D Thesis 2014
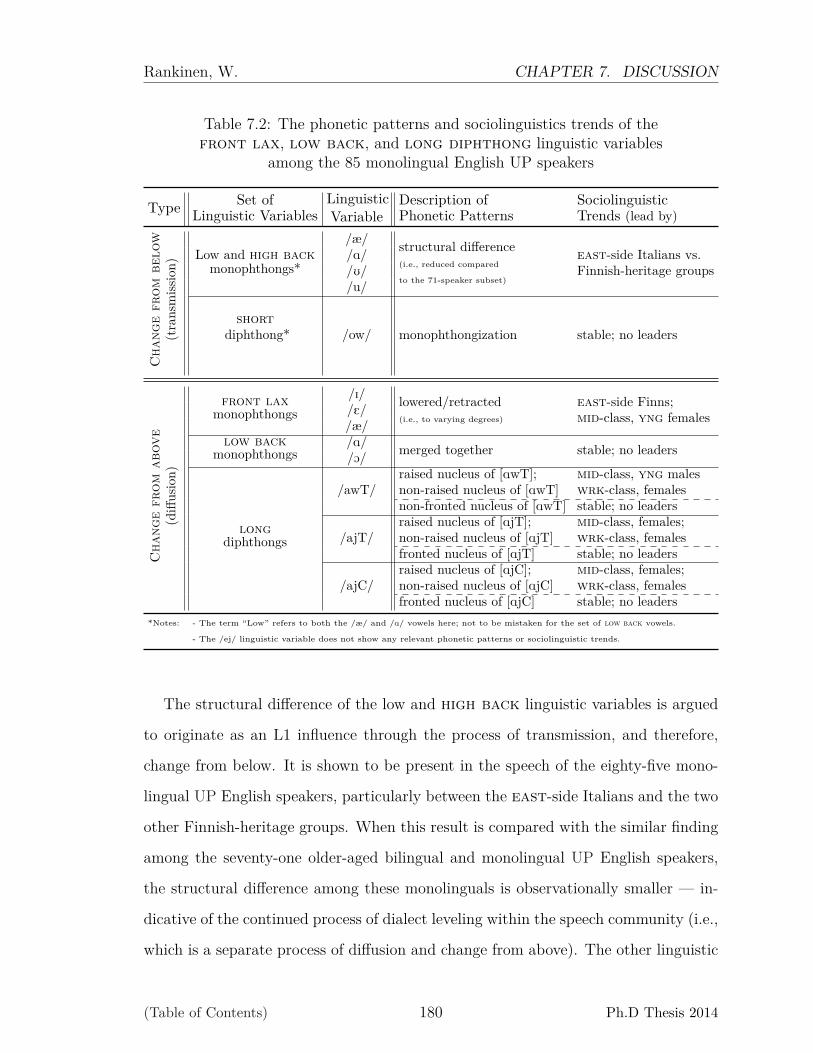
Rankinen, W. CHAPTER 7. DISCUSSION
Table 7.2: The phonetic patterns and sociolinguistics trends of thefront lax, low back, and long diphthong linguistic variables
among the 85 monolingual English UP speakers
Type Set ofLinguistic Variables
LinguisticVariable
Description ofPhonetic Patterns
SociolinguisticTrends (lead by)
Cha
nge
from
belo
w(t
rans
miss
ion)
Low and high backmonophthongs*
/æ/ structural difference(i.e., reduced compared
to the 71-speaker subset)
east-side Italians vs.Finnish-heritage groups
/A//U//u/
shortdiphthong* /ow/ monophthongization stable; no leaders
Cha
nge
from
abov
e(d
iffus
ion)
front laxmonophthongs
/I/ lowered/retracted(i.e., to varying degrees)
east-side Finns;mid-class, yng females/E/
/æ/low back
monophthongs/A/ merged together stable; no leaders/O/
longdiphthongs
/awT/raised nucleus of [AwT];non-raised nucleus of [AwT]
mid-class, yng maleswrk-class, females
non-fronted nucleus of [AwT] stable; no leaders
/ajT/raised nucleus of [AjT];non-raised nucleus of [AjT]
mid-class, females;wrk-class, females
fronted nucleus of [AjT] stable; no leaders
/ajC/raised nucleus of [AjC];non-raised nucleus of [AjC]
mid-class, females;wrk-class, females
fronted nucleus of [AjC] stable; no leaders*Notes: - The term “Low” refers to both the /æ/ and /A/ vowels here; not to be mistaken for the set of low back vowels.
- The /ej/ linguistic variable does not show any relevant phonetic patterns or sociolinguistic trends.
The structural difference of the low and high back linguistic variables is argued
to originate as an L1 influence through the process of transmission, and therefore,
change from below. It is shown to be present in the speech of the eighty-five mono-
lingual UP English speakers, particularly between the east-side Italians and the two
other Finnish-heritage groups. When this result is compared with the similar finding
among the seventy-one older-aged bilingual and monolingual UP English speakers,
the structural difference among these monolinguals is observationally smaller — in-
dicative of the continued process of dialect leveling within the speech community (i.e.,
which is a separate process of diffusion and change from above). The other linguistic
(Table of Contents) 180 Ph.D Thesis 2014

Rankinen, W. CHAPTER 7. DISCUSSION
variable of interest that is argued to be a change from below is the monophthongiza-
tion of the /ow/ short diphthong; while originating from an L1 influence through
the process of transmission, this monophthongized variant is clearly preferred and
regarded as a stable linguistic variable in the UP speech community (i.e., regardless
of age or bilingualism).
The linguistic variables undergoing changes from above, the front lax and low
back vowels and the long diphthongs, will now be considered. The front lax
vowels all exhibit various degrees of lowering and retraction as a factor of age, with
the most extreme in the speech of middle-class younger-aged east-side Finnish
females followed by their male counterparts and the middle-class younger-aged
east-side Italian females. The fact that younger-aged speakers are significantly
more advanced in the lowering and retraction of the front lax vowels in comparison
to the middle-aged speakers (i.e., both which are more advanced than the older-
aged speakers) indicates a change-in-progress, and one that is argued to be from
above as an exogenous influence. The first piece of evidence is indicative of change
from above, where incoming variants are led by the upwardly oriented social groups
(i.e., by middle-class speakers and by females). The second piece of evidence is
that males are lagging behind the females as a factor of heritage (Labov 2001),
where the most extreme cases of fronting and retraction are reported in the speech
of both the east-side Finnish females and males. In contrast, the same degree of
fronting/retraction is only reported in the speech the east-side Italian females and
not the males. The last piece of evidence that this is a change from above comes
from the fact that the fronting and retraction of the front lax vowels is present,
but just not as extreme, in the speech of the more rurally located west-side Finnish
females and not at all among their male counterparts. This is the sociolinguistic
pattern that would emerge according to the process of geolinguistic diffusion where
linguistic extremes originate in the speech of those residing in the more urbanized
areas of the county (i.e., east-side) and then dispersing to less urbanized areas (i.e.
(Table of Contents) 181 Ph.D Thesis 2014
Rankinen, W. CHAPTER 7. DISCUSSION
first appearing among the west-side middle-class women). Middle-class women are
the clear leaders in the diffusion of the fronted and retracted variants of the front
lax vowels, and because other groups are following their lead it is likely that these
variants garner prestige — albeit unconscious — in this UP speech community. One
hypothesis as to why heritage is shown to be an important factor is that the east-
side Finns, as a larger and historically more dispersed ethnic-heritage group, are
more in tune with the innovative forms that surround the rural-urban social centers
in the county. In contrast, the east-side Italians as an ethnic-heritage group have
always been established in these rural-social centers and still form close-knit internally
focused groups (i.e., at least among the east-side Italian males, since they presently
do not exhibit the use of the prestigious variant while the east-side Finnish males
clearly do).
Clarke, Elms, and Youssef claim that the lowering and the retraction of the front
lax vowels, as a set of linguistic variables defining the Canadian shift, is a chain shift
started by the formation of a merger in the low back quadrant of the acoustic vowel
space (1995, 212). If indeed the lowering and retraction of the front lax vowels
are a geolinguistic diffusion process and change from above currently underway in
the speech of UP residents (i.e., using neighboring varieties of Canadian English as
linguistic models), then this presupposes that the merging of /A/ and /O/ must have
taken place prior to the elements of the Canadian shift, and thus be further along, in
the speech of the UP community. In fact, this is exactly what is found in the data
for this thesis. Not only are the low-back vowels fully merged in the speech of the
eighty-five UP English monolinguals, but they are merged in the speech of the older-
aged bilinguals as well. While there is not any evidence of a sex effect for the low
back linguistic variables (i.e., which might indicate prestige following Labov’s second
principle of linguistic change), a clear preference of the merged variants indicates
linguistic stability. The strong presence of the low-back merger coupled with evidence
of a change-in-progress for front lax vowels support the argument that exogenous
(Table of Contents) 182 Ph.D Thesis 2014
Rankinen, W. CHAPTER 7. DISCUSSION
influences from Canada are currently shaping the vowel characteristics of the UP
speech community in Marquette County.
The long diphthongs (i.e., the nuclei of /AwT/, /AjT/ and /AjC/) also report
evidence of stability along the F2 dimension and changes-in-progress along the F1
dimension as linguistic change from above; however, the situation is a bit more com-
plex than previously seen with the front lax and low back vowels. The fronting
of these variants in UP speech show the opposite pattern of what would be expected
if they were to follow the tendencies of neighboring varieties of Canadian English.
In Toronto Canadian English, /Aw/-fronting is shown to be occurring as a change-
in-progress (Easson 1997), and in all Canadian English varieties, there is not any
evidence of /Aj/-fronting. In contrast, the UP speech data reports a clear prefer-
ence for the non-fronted variant of the /Aw/ nucleus and for the fronted variant for
the /Aj/ variant. While this is true, the /Aj/ in a pre-voiceless context (i.e., [AjT])
tends to be less fronted, lower in duration, and further away from its offglide than
when followed by a voiced obstruent (i.e., [AjC]). All three characteristics follow the
tendency of patterns of Canadian raising mitigating the process of undershoot com-
mon among English diphthongs (Lindblom 1963; Gottfried et al. 1993; Moreton and
Thomas 2007, 41-42). Currently, it is unclear if the significant fronting of the /Aj/
nucleus is a linguistic innovation due to transmission or diffusion (i.e., approximating
the acoustic position more like [æ] rather than the centralized position of [a] or the
back position of [A]); however, the observational “asymmetric assimilation” pattern
between the [AjT] and [AjC] along the F2 dimension is characteristic of an exogenous
influence modeled from Canadian norms (Moreton and Thomas 2007, 42).
Turning to the F1 dimension, the raised variants of these three linguistic variables
are clearly most advanced among middle-class female speakers, while the non-raised
variants are more advanced among the working-class females. Each of the three
linguistic variables are exhibiting unique phonetic patterns that correspond to socio-
(Table of Contents) 183 Ph.D Thesis 2014
Rankinen, W. CHAPTER 7. DISCUSSION
linguistic trends as described below:
• The raised nucleus of [AwT] at first seems relatively stable with younger-aged
middle-class males leading; however, all other younger-aged groups have
slightly lower variants than these middle-class males. Even the younger-aged
middle-class females are patterning more closely with the other working-class
groups and all exhibit lower instances of the raised variant in comparison to ei-
ther their middle-aged or older-aged counterparts. This may indicate that
the raised variant of [AwT] is losing prestige within the community, and instead
the non-raised variant may be gaining prestige as an indicator of local norms
led by the working-class. Under this hypothesis, such a newly developing
sociolinguistic trend would account for why the younger-aged middle-class
males are patterning distinctly different from the other groups (i.e., they actu-
ally lag behind, as would be expected following principles of linguistic change).
Such an interpretation would suggest a change from above toward local norms
originating within the speech community and diffusing from working-class
groups. Additionally, this also suggests that there may be some degree of con-
scious awareness and stigmatization in the use of the raised variant of the [AwT]
nucleus. This would not be surprising since other researchers that have exam-
ined this phenomenon in other English varieties report higher instances of overt
awareness of the raised variant of /Aw/ in words like about sounding more like
a boat (Chambers 1989, 2006; Vance 1987). Interestingly, the same degree of
conscious awareness through overt commentary by speakers is not reported for
the raised variant of the /Aj/ nucleus.
• The raised and non-raised variants of the [AjT] nuclei are relatively stable for the
middle-class females and working-class females respectively; in other words,
middle-class females categorically prefer the raised variant while the work-
ing-class females categorically prefer the non-raised variant. The categorical
(Table of Contents) 184 Ph.D Thesis 2014
Rankinen, W. CHAPTER 7. DISCUSSION
usage of each variant by the female class groups indicates a certain amount
of prestige associated with each variant. The non-raised variant is associated
with prestigious local norms led by the working-class females, while the raised
variant is associated with prestigious exogenous norms led by the middle-class
females. This is further supported by evidence of cross-over effects showing that
the younger-aged middle-class males are aligning with their female coun-
terparts and the younger-aged working-class males are aligning with their
female counterparts. Once again, the males lag behind the change-in-progress
led by the females respective of each class grouping.
• The non-raised variant of the /AjC/ nucleus would align with the strict phono-
logical conditioning environment associated with Canadian raising in varieties
of Canadian English while the raised variant would be more akin to other vari-
eties of American English (Chambers 2006). The raised variant would suggest
the loss of phonetic context as an important conditioning factor for this lin-
guistic variable. In the speech of UP residents, it seems that the raised variant
of the [AjC] nucleus is favored by the middle-class groups and disfavored by
the working-class groups as a factor of age, suggesting a change-in-progress.
Once again, in both cases the females are leading with males lagging a gen-
eration behind as a factor of age and class. Similar to the sociolinguistic
trends exhibited with the /AjT/ linguistic variable, the middle-class females
and males are converging toward the use of the raised variant as a factor of
age for the /AjC/ nucleus; the same is true for the working-class females and
males, except their convergence is toward the non-raised variant.
With regards to the /Aj/ nucleus (i.e., either /AjT/ or /AjC/), there is at least two,
perhaps as many as three, changes-in-progress taking place within UP speech com-
munity (i.e., middle-aged and younger-aged women lead the use of the innovative
forms, while men tend to lag a generation behind). The first refers to the raised vari-
(Table of Contents) 185 Ph.D Thesis 2014
Rankinen, W. CHAPTER 7. DISCUSSION
ants of /AjT/ or /AjC/ which are restricted to the middle-class group and likely due
to change from above (i.e., served by linguistic models for diffusion by neighboring
varieties of Canadian English). The preference for non-raised variants of /AjT/ or
/AjC/ is restricted to the working-class group, which may indicate either: 1) a sep-
arate change-in-progress as a change from below (i.e., the “faithful” transmission of
local norms by successive generations) or 2) a change from above (i.e., as a response
against the exogenous norms propagated by the middle-class females). The other
change-in-progress refers to the non-raised variant of the /AwT/ nucleus and is led
by the working-class group in the use of the non-raised variant.16
The front lax and low back vowels and long diphthongs as sets of lin-
guistic variables provide a cohesive, albeit complex, account of the acoustic vowel
characteristics and sociolinguistic trends present in the speech of the predominately
monolingual English speaking community in Michigan’s Upper Peninsula. There is
strong evidence to indicate a change-in-progress using the apparent-time construct
presented in this thesis. The front lax and low back vowels and long diph-
thongs all exhibit interspeaker variation as a factor of age — but is this a case
of generational change or age-grading? The sociolinguistic patterns examined in this
thesis do not exhibit the curvilinear pattern typically associated with age-grading,17
and the linguistic variables themselves are of the type to be below social awareness
(Labov 1994, 111-112).18 A curvilinear pattern as a result of age-grading would be
indicative of a higher usage of standard forms among the middle-aged group since
these speakers are active participants in the linguistic marketplace of the workplace
(i.e., where conservative forms are preferred). This contrasts with the typically less
conservative speech of speakers in their early twenties or speakers past retirement age16It is perhaps too early in the development of this change to venture any additional claims.17A curvilinear pattern is a sociolinguistic pattern typically found when middle-aged groups
pattern systematically differently (i.e., toward more conservative or “standard” variants) from theirolder and younger peers, and as such, the data usually takes the form of a U-shaped pattern, or itsinverse, as a factor of age.
18The exception to this claim is the raised variant of the /Aw/ nucleus.
(Table of Contents) 186 Ph.D Thesis 2014
Rankinen, W. CHAPTER 7. DISCUSSION
(Tagliamonte 2012).19 However, the sociolinguistic trends in the UP data exhibit ei-
ther linear patterns of linguistic change of an innovative form with the younger-aged
speakers using the linguistic extreme or linguistic stability of variants for a linguistic
variable regardless of the age factor.
At this point of the discussion, the main concern to sort out is the origin of the
linguistic change that is taking hold of the younger-aged UP speakers in Michigan’s
Marquette County. Any one of the linguistic variables, or even a single set of linguistic
variables, discussed in this subsection may not have been strong enough evidence to
suggest the origin of the changes-in-progress. However, the accumulation of evidence
from three sets of linguistic variables exhibiting similar sociolinguistic trends presents
a strong case that these innovative forms led primarily by middle-class females are
diffusing across the UP speech community based upon linguistic models of diffusion
associated with varieties of Canadian English. The source of this exogenous influence
likely stems from neighboring urban centers such as those located in the eastern
regions of the Upper Peninsula and Ontario. The last subsection will discuss the two
sources of diffusion that have taken place and are currently present in this UP speech
community.
7.2.3 Sources of Diffusion as
Linguistic Models of Innovation
The communities in Michigan’s Upper Peninsula have undergone significant changes
in the last hundred years. This subsection will offer two sources for propagation
of linguistic change based upon: 1) American English perceived standards among
older generations (i.e., first, second and third-generation immigrant-Americans) and
2) Canadian English norms among the younger generations.19However, real-time data is needed to conclusively distinguish authentic change-in-progress across
generations and age-grading (Labov 2001, 163).
(Table of Contents) 187 Ph.D Thesis 2014

Rankinen, W. CHAPTER 7. DISCUSSION
7.2.3.1 Americanization as a Model
for the Propagation of Linguistic Change
Early communities in Michigan’s UP were comprised of a diverse mix of ethnic-
immigrant groups that likely led to the beginning stages of dialect formation. The
remote rural mining towns that describe many of the early communities in the penin-
sula created situations of “relatively intense interpersonal communication” whereby
these ethnic-heritage groups spoke a heterogeneous set of English varieties (Kerswill
and Trudgill 2005, 196). According to Kerswill and Trudgill’s work on dialect for-
mation, the subsequent stages that are likely to have occurred to form today’s UP
speech community began with the mixing of input dialects from different origins (i.e.,
English spoken by Finnish, Italian, Cornish, Irish and many other immigrant groups),
followed by the process of dialect leveling (i.e., the perjuring of salient linguistic phe-
nomena) and finally the process of reallocation (i.e., the retainment of non-salient
linguistic phenomena) (2005, 197-199). The evidence of dialect leveling and lingering
substrate effects among the seventy-one older-aged bilinguals and monolinguals in the
present corpus (i.e., the homogeneity of monophthongs as a factor of bilingualism,
the structural difference of low and back vowels, the monophthongization of /ow/)
corresponds with the second and third stages of dialect formation, where leveling and
reallocating of linguistic phenomena begin to define the speech community. As a re-
sult, the UP speech communities by the mid-20th century were beginning to become
a predominately monolingual English speaking community modeled after American
English norms with lingering substrate effects. Dialect leveling toward American En-
glish norms was fueled by the strong presence of “Americanization” propaganda that
persisted in the UP during this time in order to acculturate and shape the identity
of immigrants’ children and grandchildren toward American cultural and linguistic
practices (Leinonen 2014; Simon 2005) — it included, but was not limited to, the
prescribed use of American English.
(Table of Contents) 188 Ph.D Thesis 2014
Rankinen, W. CHAPTER 7. DISCUSSION
7.2.3.2 Canadian English as a Model
for the Propagation of Linguistic Change
This source of diffusion through dialect leveling toward American English norms, is
not the only linguistic model in this UP speech community. The more recent linguis-
tic model for diffusion is based upon the innovative forms associated with varieties
of Canadian English (i.e., the low-back merger, the Canadian shift, raising of the
/Aw/ and /Aj/ nuclei before voiceless obstruents), which is supported by the evidence
that these innovative forms are being adopted and propagated by the middle-class
women and are then followed by other adjacent social groups within this speech com-
munity. However, the situation is complicated further by contrasting evidence from
the linguistic variables of /Aw/ and /Aj/ nuclei, where working-class females seem
to resist the innovative forms associated with the Canadian English model. Further-
more, middle-class groups tend to prefer the use of the raised variant of the /Aj/
nucleus regardless of the phonological conditioning environment (i.e., raising the nu-
cleus when followed by either a voiced or voiceless obstruent). Similar cases in other
varieties of American English have reported a weakening of constraints for the linguis-
tic phenomenon of Canadian raising, which is not present in varieties of Canadian
English (Vance 1987; Rosenfelder 2005; Chambers 2006). It is due to this asym-
metrical relationship that Rosenfelder suggests that “[w]ith respect to the [spread of
the] phenomenon of raising, it would then be Canada that is influencing the United
States, and not vice versa . . . ” (2005, 97). This implies that American varieties’ fail
to retain the particular constraint of obstruent voicing during the diffusion process of
this linguistic phenomenon (i.e., adoption and propagation of the innovative variant).
It is interesting to note that while this seems to be the case in Michigan’s UP speech,
other areas of Michigan reporting instances of Canadian raising still maintain the
conditioning environment (Dailey-O’Cain 1997). Evidence of /Aj/-fronting and the
non-fronting of /Aw/ in UP English also stands in opposition to the Canadian model
(Table of Contents) 189 Ph.D Thesis 2014
Rankinen, W. CHAPTER 7. DISCUSSION
of diffusion, since the reverse is found in Ontario and other varieties of Canadian
English (Chambers 2006; Easson 1997). Nevertheless, the evidence in support of the
Canadian English model of diffusion affecting the speech of the contemporary UP
speech community outweighs any other competing claims of an exogenous influence
(e.g., effects from the pre- or post-NCVS system).20
Based upon the present discussion, the Canadian model of diffusion is being spread
by the younger-aged middle-class females within this UP speech community —
however, the question that still remains is: how have these speakers gained access
to the Canadian model in order to propagate the innovative forms in the first place?
Recent migration patterns based on the 2006-2010 US Census estimates of Mar-
quette County suggest that the community itself is relatively stable with less than
4% of the population having moved to the area from a different county within the
same state, less than 1% having moved from a different state and less than one per-
cent having moved from abroad (US Census Bureau 2000). Furthermore, a recent
Canadian-immigrant presence is virtually non-existent (i.e., less than 0.05% based
upon a older 2000 summary Census, which corresponds to more recent estimates).
If models of linguistic change are not being brought in to the speech community by
permanent residents with Canadian origins, two non-mutually exclusive hypotheses
must be posed to account for this preference for Canadian norms: 1) temporary mi-
gration patterns of linguistic carriers to and from the speech community, and 2) a
positive orientation toward Canada as a source of shared local identity.
The International Bridge linking the city of Sault St. Marie in Ontario and the town
of Sault St. Marie in Michigan represent a vital link between the U.S. and Canada
allowing for the flow of commercial truck crossing and the exchange of foreign and
domestic traffic. Since the 1980s, the vast majority of the bridge traffic has consisted20In addition to these phonological and phonetic traits shared with Canadian English, the UP
speech is characterized as having lexical and pragmatic linguistic variables typically associated withCanadian speech (e.g., “toque” for winter cap, the ubiquitous “eh” as a pragmatic marker); suchlinguistic variables can be heard among older-aged, as well as, younger-aged UP residents.
(Table of Contents) 190 Ph.D Thesis 2014
Rankinen, W. CHAPTER 7. DISCUSSION
of local automobiles conducting local trips across the U.S.-Canada border for employ-
ment or recreational purposes between the two social centers. In terms of commercial
truck traffic across the bridge, over half of the traffic was restricted to routes between
Michigan and Canada, as opposed to routes with other U.S. states (MDOT 2014c).
Due to Marquette County’s central location in the peninsula, a significant amount of
Canadian truck traffic must pass through the central and western UP in order to get
to western Canada and Wisconsin “. . . with local and tourism traffic” (MDOT 2007,
87). As a result, the M-28 and US-41 corridors hold statewide significance linking
Sault St. Marie, MI, with Marquette, Ishpeming and Negaunee as well as other towns
in the Keweenaw Peninsula such as Houghton and Hancock. While commercial truck
traffic emanating from Canada is reported, there currently is not any evidence to
suggest that either the strong presence of tourists originating from Canada exists in
Marquette or a consistent stream of tourism traffic exists between Canada, Sault St.
Marie and Marquette. As a result, the temporary migration of people between the
U.S.-Canadian border by itself (i.e., based upon tourism or commercial truck traffic)
is unlikely to account for why Canadian models of diffusion are taking root in the
Marquette County’s speech community.21
Upper Peninsula residents are consciously aware that their speech is perceived as
“accented” or at least different from non-UP residents. During the sociolinguistic in-
terviews, participants were asked if they have ever left the peninsula, and if so, where
did they travel? Many participants took this opportunity to reminisce about short
vacations taken and would even talk at length about their travels. One such partici-
pant, in her reminiscing about a trip to California taken with her husband, claimed
that “. . . there were some people that even thought we’re Canadians . . . ‘cause of the
way we talk . . . ” (east-side Finnish middle-class Female; 42); similar reports of21An additional source of temporary migration between the UP and Canada may be linked to
the recreational sport of hockey (i.e., for both men and women) and other activities such as fishing,hunting and camping; however, the number of UP residents making the seasonal trips into Canadais presently unknown.
(Table of Contents) 191 Ph.D Thesis 2014

Rankinen, W. CHAPTER 7. DISCUSSION
linguistic associations between UP and Canada are also reported in other work con-
ducted in the peninsula (Remlinger 2009, 118). This participant was by no means an
exception to the hundred and thirty individuals interviewed, as many of the partici-
pants showed social awareness that their speech is often marked with “Canadianisms”
by non-UP residents. Though when pressed, most could not describe what “Canadi-
anism” entailed, and those that could, usually leaned on lexical borrowings such as
“toque” or “chook” (i.e., for winter cap) or the pragmatic marker of “eh”. Other
participants talked about the recreational activities that they perceived the UP and
Canada to have in common, such as fishing, hunting, hockey, snowmobiling and spend-
ing time out at a rustic cabin or cottage.22 The shared linguistic and non-linguistic
identity markers that link the UP with Canada have also been documented in the
enthnolinguistic research done in the Keweenaw Peninsula (Remlinger 2006, 2009).
However, Remlinger points out that UP residents, or “Yoopers”, have a clear sense of
an “authentic” local identity and a uniqueness of linguistic variables that define their
dialect (2009, 119). The acknowledgement and use of these linguistic markers and
other non-linguistic acts to express an individual’s identity is known as the process
of enregisterment (Milroy 2000, 2004; Silverstein 1998). Furthermore, neighboring re-
gional identities are often contrasted against their own local identity by UP residents
through the use of epithets as a way of strengthening this “Yooper” local identity.23
For example, outsiders originating from Michigan’s Lower Peninsula are known as
“Trolls” since they live below or south of the Mackinac Bridge, while outsiders orig-
inating from Wisconsin are known as “Cheeseheads”.24 UP residents tend to project
a positive association with Canada by associating the two regions as having similar22This is also referred to as camp (noun) in the Upper Peninsula, which is wholly different from
to camp (verb) which is reserved for the act of camping.23Historically, “Yooper” was initially a term of abuse for UP residents propagated by outsiders;
several older-aged participants that were interviewed still held a significant amount of abhorrencein the use of this term. However, over time the term was recasted as a term of endearment andis used by locals to mark their sense of local pride; many younger-aged UP residents now holdonly a positive connotation in its usage. As of May 2014, Merriam-Webster’s Collegiate Dictionaryrecognized the term yooper (Merriam-Webster, Inc. 2014).
24Canadians are referred to as “Canocks” following the Americanism by much of the U.S.
(Table of Contents) 192 Ph.D Thesis 2014

Rankinen, W. CHAPTER 7. DISCUSSION
sets of cultural practices and linguistic markers, they also have developed a strong
sense of pride that is continually shaping the local identity and linguistic practices in
opposition to external influences.
The source of the Canadian model of diffusion, led by the middle-class females
and propagated by adjacent social groups, is argued to be a response of shared cultural
and social ties between the Canadian and UP identities, additionally supported by a
limited amount of short-term limited migration of groups to and from the neighboring
geographic regions. Under this hypothesis, the resistance of Canadian-like variants
in the speech of the working-class females is a result of their strict adherence to
the registered linguistic norms of local UP speech that presently define the “Yooper”
local identity. Similar results in the maintenance of local norms were also found
in Belfast (Milroy 1987), where local linguistic norms were present in the speech of
individuals forming strong networks typically associated with working-class groups.
In contrast, weak networks exhibited a tendency toward exogenous linguistic norms
and were associated with non-working-class groups (Milroy and Milroy 1992, 17).
Such a situation is taking place in Michigan’s UP, where the middle-class speakers
form weak networks that are influenced by an more recent external model of linguis-
tic diffusion (i.e., particularly among the younger generations). The working-class
speakers form close-knit, internally focused social networks, and as a result, they are
presently able to resist more recent innovative linguistic forms. These working-class
speakers maintain the local linguistic norms defined by lingering substrate effects and
older linguistic forms modeled after American English norms. For the majority of the
linguistic variables considered in this thesis, the working-class groups have success-
fully resisted the linguistic Canadianisms which are led by their class counterpart;
the exception to this claim is the presence of the low-back merger. Further research is
required to conclusively determine if these linguistic Canadianisms will be propagated
throughout the speech community, relegated to a particular social group, or resisted
and replaced by defined local linguistic norms.
(Table of Contents) 193 Ph.D Thesis 2014
CHAPTER 8
FURTHER RESEARCH AND
FUTURE DIRECTIONS
The present thesis stands as a significant contribution to the field’s understanding
of the sociophonetic characteristics in the speech variety of English spoken in Michi-
gan’s Upper Peninsula (UP). Furthermore, it documents aspects of previously under-
documented ethnic-heritage groups and the ethnolects that define them in this speech
community (Boberg 2012; Labov 2008). Finally, it instantiates previous linguistic
findings (Labov et al. 2006; Rakerd and Plichta 2010; Remlinger 2009), while offering
new insights into the potential changes-in-progress taking shape within this rural UP
speech community, and potentially, raises new questions as to the state of linguis-
tic change for these substrate and exogenous linguistic forms in other areas of the
peninsula and neighboring regions of the Upper Midwest.
The present chapter seeks to discuss the limitations faced by the thesis, supple-
mentary avenues for on-going research, and alternative directions open to future veins
of research. As such, Section 8.1 will discuss the restrictions and barriers faced by
the present thesis. Section 8.2 will discuss the prospect of future research. Section
8.3 will conclude by connecting the discussion and the findings back to the larger
questions posed at the onset of the thesis.
194
Rankinen, W.CHAPTER 8. FURTHER RESEARCH AND
FUTURE DIRECTIONS
8.1 Limitations and Continuation of the Present Research
This sociophonetic study deviates from traditional introspective analysis of vowels,
and instead relies heavily upon instrumental methods in the acoustic analysis of
the phenomenon similar to other recent sociophonetic research (Labov et al. 2006;
Rakerd and Plichta 2010; Rosenfelder 2005). Due to the continuous nature of formant
structures and the traditional practices of formant extraction, the development and
use of an alternative extraction procedure to objectively and efficiently measure the
acoustic measurements was a decisive choice at the onset of the project, and one
that may have made the results better for it (Albin and Rankinen 2012); previous
results using the manual method did not reveal sex or class effects (Rankinen
2014), which is likely a result of the formant extraction difference.1 Furthermore,
the sociolinguistic materials developed for data collection and analysis of only the
reading data naturally affected the trajectory and shape of this thesis. This subsection
acknowledges other known limitations faced by the thesis and their correlations with
these higher-order decisions.
1. Limited Token Count: One limitation include the uneven and sparse token
count of the linguistic variables, which was a result of several factors. The main
factor contributing to this limitation stemmed from the task material itself. As
previously mentioned in Chapter 4, the reading passage was originally developed
to investigate post-NCVS speech communities located in Lower Michigan and
other similar areas (Evans 2001). As a result, the reading passage contained
higher token count of vowels participating in the Northern Cities Vowel Shift
(NCVS) (e.g., /I, E, æ, A, O/) and fewer tokens of vowels not participating in
the shift (e.g., /i, u , Aj, Aw/). At the time of field recording (i.e., 2007-2008),
the UP’s participation in the NCVS was still unknown (i.e., until the work1Further research is required to empirically and more rigorously compare this proposed method
to others.
(Table of Contents) 195 Ph.D Thesis 2014

Rankinen, W.CHAPTER 8. FURTHER RESEARCH AND
FUTURE DIRECTIONS
of Rakerd and Plichta in 2010). The sociolinguistic interviews included the
interview task and the reading passage task, which were also accompanied by a
token-balanced wordlist task. However, previous sociophonetic analysis of the
data from the reading passage and wordlist task types using traditional formant
extraction procedures (c.f., Rankinen (2013b, 2014)) revealed that the wordlist
task tended to elicit highly conservative styles of speech, and as such, it was more
likely to conceal innovative and less prestigious forms (Labov 2001; Tagliamonte
2012). The author’s concerns with traditional extraction methods and the desire
to implement the alternative formant extraction procedure coupled with time-
constraints placed upon the thesis, a rationale was motivated to extract data
from the reading passage recordings instead of the wordlist recordings. As a
result, the limited token-count, particularly in the case of the /Aj/ and /Aw/
long diphthongs, is a concern due to lexical effects whereby “. . . any lexical
item of sufficient frequency may skew the overall distributions in the data set
. . . ” (Tagliamonte 2012, 91). Therefore, the complexity exhibited by the long
diphthongs may be due in part to this effect, and therefore, a more focused
analysis of these linguistic variables are required to confirm the claims made in
the present thesis;2 however, all other linguistic variables report sufficient token
counts and lexical variability.
2. Linguistic Constraints: The focus of the thesis was to investigate the so-
ciolinguistic correlates of the linguistic variables of vowels in the speech of a
sampled community. With this in mind, another limitation that had to be ne-
gotiated was the linguistic constraints on these linguistic variables of interest.
While several important linguistic constraints were considered when constrain-
ing the data (e.g., vowels always in stressed position, vowels never occur in
a pre-liquid context, long diphthongs occur in pre-voiceless and pre-voiced
contexts), other linguistic constraints were not controlled (e.g., place of articu-2A similar case can be made for the high front and back vowels (i.e., /i/ and /u/).
(Table of Contents) 196 Ph.D Thesis 2014
Rankinen, W.CHAPTER 8. FURTHER RESEARCH AND
FUTURE DIRECTIONS
lation). The tightening of linguistic constraints in more focused analyses may
prove insightful in teasing apart the phonological and phonetic behavior of UP
vowels (c.f., Boberg (2004)). In terms of the present research, such analyses
could be done in the conservative speech of the wordlist task and the casual
speech of the sociolinguistic interviews.
3. Other Task Types: A natural next step for this research would be to extract
and process the available data from wordlist and interview tasks in order to
compare it with the data obtained from the reading passage task. Such an
analysis of speech styles may further our understanding of prestige and how
these innovative forms are being used in the UP speech community (Labov
1966, 1994, 2001).
The disclosure of these concerns or limitations in the research may serve to be useful
for future researchers in navigating potential considerations in similar studies. Fur-
thermore, it should be noted that such concerns do not offset the significance of the
findings reported in the present thesis.
8.2 Beyond the Present Research
The findings of this thesis, that both lingering substrate and developing exogenous
effects are present in the speech patterns of UP speakers, answer the main questions
posed at the onset of the study. These findings also promise to generate additional
questions that will likely stimulate decades of future research related but not restricted
to the documentation of the variety of UP English, the sociolinguistic effects of ethnic-
immigrant groups and the social dynamics involved with the propagation of linguistic
norms in rural speech communities. These three veins of research are by no means
exhaustive but stand as logical directions of inquiry for future research.
1. Salient Linguistic Variables: The speech in Michigan’s Upper Peninsula
(Table of Contents) 197 Ph.D Thesis 2014
Rankinen, W.CHAPTER 8. FURTHER RESEARCH AND
FUTURE DIRECTIONS
is a unique linguistic variety of English, exhibiting unique linguistic indicators
and markers beyond that of vowel characteristics. In other areas of phonetics
and phonology, the gemination of consonants and lengthening effects and the
lenition of interdental fricative effects are just two non-vocalic threads of lin-
guistic research deserving empirical attention (Remlinger et al. 2009; Remlinger
2007). There are also many unique linguistic phenomena in the UP variety
spanning the breadth of linguistic inquiry such as the lexical borrowings from
substrate and exogenous sources, the morpho-syntactic processes of preposi-
tional omission (e.g, “We go (to) Shopko”), and the unique pragmatic usages of
the ubiquitous “eh” (Rankinen 2013c; Remlinger 2007).
2. Ethnic-heritage Groups: This thesis also contributes toward the growing
body of literature on ethnolects, which seek to document and account for the
subtle nuances of substrate effects of ethnic-heritage groups within the speech
community and the resilience or degrade of those effects against competing
linguistic norms (Boberg 2012; Labov 2008). The UP Finnish- and Italian-
Americans served as excellent contrastive ethnic-heritage groups to observe
these potential outcomes in a speech community. Some substrate effects were
shown to be waining, while others were much more resilient to linguistic change
from above from competing exogenous sources (i.e., modeled from linguistic
norms of American and Canadian English). Furthermore, ethnic-heritage was
shown to be an important sociolinguistic factor correlated with innovative lin-
guistic forms (i.e., besides sex and class, the east-side Finns were shown
be at the vanguard of most linguistic changes in this UP speech community).
The results of the present thesis in conjunction with the findings from pre-
vious ethnolinguistic-oriented research should continue to motivate the field
toward the investigation of other less-documented ethnic-heritage communities
including but not limited to: a) indigenous-heritage groups of North America
(Dannenberg 1999; Labov 1963; Wolfram 1984), b) European-heritage groups
(Table of Contents) 198 Ph.D Thesis 2014
Rankinen, W.CHAPTER 8. FURTHER RESEARCH AND
FUTURE DIRECTIONS
(Boberg 2004; Carlock and Wolck 1981; Haugen 1969; Laferriere 1979; Purnell
et al. 2005), and c) Asian-heritage groups (Lo and Reyes 2004).3
3. Rural Speech Communities: The rigorous examination of the sociolinguis-
tic characteristics of a rural speech community presented in this thesis also
contributes to the field’s expanding knowledge of the propagation of linguistic
norms in face of competing substrate and regional influences. As reported by
previous sociolinguistic work on rural speech communities (Dannenberg 1999,
2002; Labov 1963; Rose 2006), sociolinguistic correlates can be used to account
for exogenous effects indicative of changes-in-progress within less populated and
more rural-orientated speech communities in addition to more populated and
urban-orientated speech communities (Gordon 2000b; Labov 1966; Rosenfelder
2005; Trudgill 1972). However, further research should examine regional-wide
linguistic change across rural communities with similar histories and shared cul-
tural and community identities. The Upper Midwest is an excellent example of
an under-documented region, particularly among the rural speech communities
along the Wisconson-Michigan state border; novel research such as this might
offer a bridge of insight into the linguistic similarities and differences of English
varieties in Wisconsin (Purnell et al. 2013) and Michigan’s Upper Peninsula
(Remlinger 2009).
3Other more documented ethnic-heritage/racial groups include communities of African-originLabov (1972); Wolfram (1969, 1974) or Latino-origin (Eckert 2008; Fought 2003; Konopka andPierrehumbert 2014).
(Table of Contents) 199 Ph.D Thesis 2014
Rankinen, W.CHAPTER 8. FURTHER RESEARCH AND
FUTURE DIRECTIONS
8.3 Concluding Remarks
This thesis investigated the five sets of linguistic variables of front lax (i.e., /I/,
/E/, /æ/), low back (i.e., /A/, /O/), high back (i.e., /U/, /u/), short diph-
thongs (i.e., /ej/, /ow/) and long diphthongs (i.e., /Aj/, /Aw/) and the predic-
tor variables of heritage-location, bilingualism, age, sex and class in order
to account for substrate and exogenous influences in the speech of ethnic-heritage
groups from Michigan’s Upper Peninsula. This research began with two over-arching
questions, both of which were stated at the onset of this thesis and ultimately guided
its subsequent analyses and discussion of findings.
The first question of the thesis sought to uncover the potential substrate effects
of ethnic-heritage groupings of Finnish- and Italian-Americans in the speech variety
of Michigan’s Upper Peninsula by examining the predictor variables of heritage-
location and bilingualism. The findings revealed the strong presence of individual
and structural phonetic patterns attributed to substrate effects in the speech of the
seventy-one older-aged UP bilinguals and monolinguals (i.e., the west-side Finns
and east-side Italians’ structural difference of the low vowels and the high back
vowels, as well as, the monophthongization of /ow/). However, among this subset of
speakers, there was considerable evidence of linguistic homogeneity across the bilin-
gualism groups indicating the strong presence of dialect leveling. The source of
this homogeneity is likely due to social pressures to conform toward perceived norms
based upon an American English model derived from local varieties.
The second question of the thesis sought to reveal if exogenous sources of linguistic
change were present within the predominately monolingual UP speech community by
examining the predictor variable of heritage-location and the more traditional
sociolinguistic variables of age, sex and class. Strong evidence from three sets
of linguistic variables support the claim that changes-in-progress are taking place
(Table of Contents) 200 Ph.D Thesis 2014
Rankinen, W.CHAPTER 8. FURTHER RESEARCH AND
FUTURE DIRECTIONS
within the UP speech variety, modeled from Canadian English linguistic norms (i.e.,
the low-back merger, Canadian shift, Canadian raising) and led by upwardly mobile
middle-class women. heritage and location were also found to be correlated with
these linguistic extremes, particularly among east-side Finns. However, not all UP
residents were found to be participating in these Canadianisms, and in some cases,
trends away from such forms were shown to be led by working-class females. These
findings suggest the resistance of Canada English models of linguistic change and
the orientation toward more local norms. In addition to the presence of exogenous
influences, there remain lingering effects of the substratum in the speech of these
monolinguals across the age range. While the structural differences on account of L1
vowel configurations were shown to be diminishing in the speech of the age groups
(i.e., continued processes of dialect leveling), the monophthongized variant of /ow/
displayed no sign of weakening in the speech of UP residents.
The speech spoken in Michigan’s Upper Peninsula is a unique variety of English
comprised of lingering substrate effects as well as exogenous effects modeled from
both American and Canadian English linguistic norms. The findings of this thesis
shed light on the eastern regions of the “residual zone” defining the Upper Midwest
in the seminal work of Labov, Ash, and Boberg (2006, 144), indicating the strong
presence of a linguistic encroachment of Canadian English norms into this northern
peninsula. At present, however, it remains unclear if these linguistic norms will
continue to propagate throughout Michigan’s Upper Peninsula (and to other areas
of the Upper Midwest), or if they will be challenged by local or neighboring regional
linguistic norms.
(Table of Contents) 201 Ph.D Thesis 2014
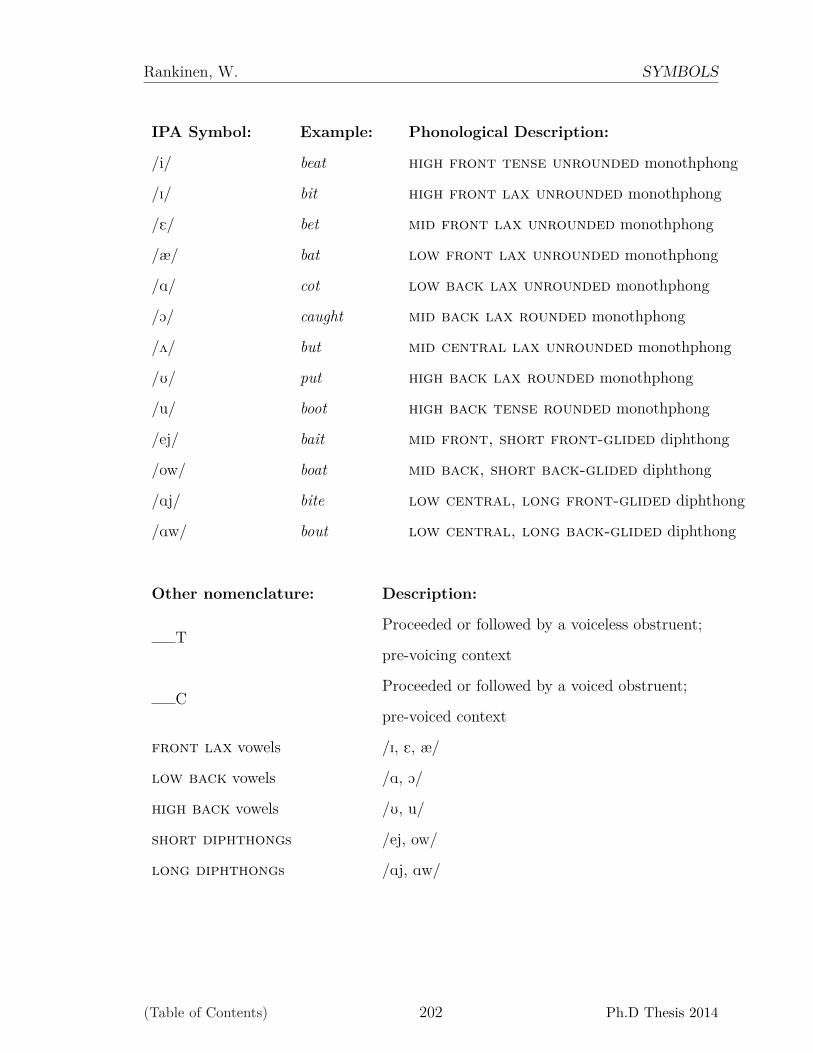
Rankinen, W. SYMBOLS
IPA Symbol: Example: Phonological Description:
/i/ beat high front tense unrounded monothphong
/I/ bit high front lax unrounded monothphong
/E/ bet mid front lax unrounded monothphong
/æ/ bat low front lax unrounded monothphong
/A/ cot low back lax unrounded monothphong
/O/ caught mid back lax rounded monothphong
/2/ but mid central lax unrounded monothphong
/U/ put high back lax rounded monothphong
/u/ boot high back tense rounded monothphong
/ej/ bait mid front, short front-glided diphthong
/ow/ boat mid back, short back-glided diphthong
/Aj/ bite low central, long front-glided diphthong
/Aw/ bout low central, long back-glided diphthong
Other nomenclature: Description:
TProceeded or followed by a voiceless obstruent;
pre-voicing context
CProceeded or followed by a voiced obstruent;
pre-voiced context
front lax vowels /I, E, æ/
low back vowels /A, O/
high back vowels /U, u/
short diphthongs /ej, ow/
long diphthongs /Aj, Aw/
(Table of Contents) 202 Ph.D Thesis 2014
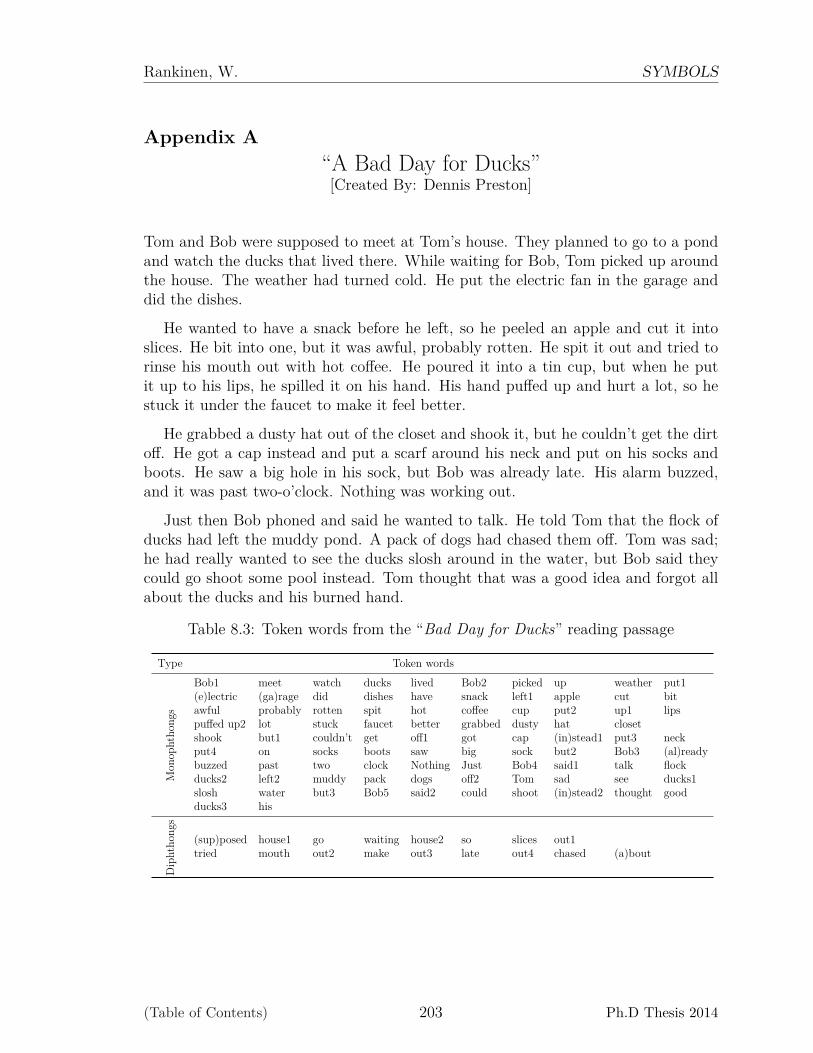
Rankinen, W. SYMBOLS
Appendix A“A Bad Day for Ducks”[Created By: Dennis Preston]
Tom and Bob were supposed to meet at Tom’s house. They planned to go to a pondand watch the ducks that lived there. While waiting for Bob, Tom picked up aroundthe house. The weather had turned cold. He put the electric fan in the garage anddid the dishes.
He wanted to have a snack before he left, so he peeled an apple and cut it intoslices. He bit into one, but it was awful, probably rotten. He spit it out and tried torinse his mouth out with hot coffee. He poured it into a tin cup, but when he putit up to his lips, he spilled it on his hand. His hand puffed up and hurt a lot, so hestuck it under the faucet to make it feel better.
He grabbed a dusty hat out of the closet and shook it, but he couldn’t get the dirtoff. He got a cap instead and put a scarf around his neck and put on his socks andboots. He saw a big hole in his sock, but Bob was already late. His alarm buzzed,and it was past two-o’clock. Nothing was working out.
Just then Bob phoned and said he wanted to talk. He told Tom that the flock ofducks had left the muddy pond. A pack of dogs had chased them off. Tom was sad;he had really wanted to see the ducks slosh around in the water, but Bob said theycould go shoot some pool instead. Tom thought that was a good idea and forgot allabout the ducks and his burned hand.
Table 8.3: Token words from the “Bad Day for Ducks” reading passage
Type Token words
Mon
opht
hong
s
Bob1 meet watch ducks lived Bob2 picked up weather put1(e)lectric (ga)rage did dishes have snack left1 apple cut bitawful probably rotten spit hot coffee cup put2 up1 lipspuffed up2 lot stuck faucet better grabbed dusty hat closetshook but1 couldn’t get off1 got cap (in)stead1 put3 neckput4 on socks boots saw big sock but2 Bob3 (al)readybuzzed past two clock Nothing Just Bob4 said1 talk flockducks2 left2 muddy pack dogs off2 Tom sad see ducks1slosh water but3 Bob5 said2 could shoot (in)stead2 thought goodducks3 his
Dip
htho
ngs
(sup)posed house1 go waiting house2 so slices out1tried mouth out2 make out3 late out4 chased (a)bout
(Table of Contents) 203 Ph.D Thesis 2014
Glossary
/u/ fronting
a phonological vowel process, whereby the [u] quality significantly advances to
the front of the acoustic vowel space; typically associated with other Canadian
features (e.g., Canadian shift, Canadian raising, low-back merger). 8, 24, 203,
204, 207
age
an operationalized term referring to the age of the speaker; three levels are
considered in the thesis: 1) older-aged (58-100), 2) middle-aged (41-57), and
3) younger-aged (19-38). 3, 34, 40, 62, 111, 161, 198
age-grading
a type of language change where the middle-aged speakers (i.e., regardless of
generational differences) use more conservative, or standard, forms due to so-
cial pressures placed upon them in the linguistic marketplace, while older- and
younger-aged speakers tend to display higher usage of non-conservative forms;
this type of change will exhibit a curvilinear pattern in apparent-time and real-
time data. 184, 203, 205
ANOVA
univariate analysis of variance; a statistical method in which the variation in a
set of observations is divided into distinct components using a single predictor
variable. 62, 63, 71, 73–75, 77, 79, 80, 85, 87–91, 94–96, 101, 106, 107, 116, 118,
120, 121, 123, 124, 128–131, 133, 149, 150, 152
204

Rankinen, W. Glossary
apparent-time
a type of data collection following a synchronic approach to language change,
where data is collected at a single point in time from a group of subjects span-
ning a relatively wide age-range; in an apparent-time construct used in the
study of language change in progress, systematic variation across age groupings
or generational groups are assumed to mirror the diachronic developments in a
language (i.e., unless evidence to the contrary is found, such as age-grading).
21, 160, 183, 202
auditory-acoustic relations
a term that refers to the production-perception mapping of how the acoustic
signal is produced and how it is perceived by the speaker/listener. 46
bilingualism
an operationalized term referring to a) a speaker’s use of English and/or an
immigrant-heritage language and b) the language-dominance of each language
(i.e., spoken at an early age and used outside the home, even in adulthood);
three levels are considered in the thesis: 1) heritage-dominant bilinguals, 2)
English-dominant bilinguals and 3) English-dominant monolinguals. 3, 34, 39,
62, 65, 161, 198
California shift
an acoustic vowel shift characterized by the lowering and retracting of the front
lax vowels (i.e., [I, E, æ]); see also the Canadian shift. 28, 204
Canadian raising
an phonological vowel process, whereby the onglides of /Aj/ and /Aw/ centralize
to /2j/ and /2w/ when followed by a voiceless consonant; typically associated
with other Canadian features Canadian shift, low-back merger, /u/ fronting).
(Table of Contents) 205 Ph.D Thesis 2014

Rankinen, W. Glossary
8, 26, 148, 160, 202, 204, 207
Canadian shift
an acoustic vowel shift characterized by the lowering and retracting of the front
lax vowels (i.e., [I, E, æ]); typically associated with other Canadian features
(e.g., Canadian raising, low-back merger, /u/ fronting); see also the California
shift. 4, 8, 21, 25, 28, 160, 202, 203, 207
change from above
a process of linguistic change, where innovative forms originate from outside the
speech community; see diffusion. 163, 175, 196, 205, 208
change from below
a process of linguistic change, where innovative forms originate from within the
speech community; see transmission. 163, 175, 208, 209
change-in-progress
a linguistic process (e.g., phonological, syntactic), where a subset of the pop-
ulation, and not the entire population, is participating/propagating the use of
an innovative form. 2, 7, 88, 138
class
an operationalized term referring to the socioeconomic status of the speaker
indexed by the presence of post-secondary education (i.e., which often correlated
with “white” / “blue” collar distinctions in occupation); as a result, two levels
are considered in the thesis: 1) working-class and 2) middle-class. 3, 34, 40,
62, 111, 161, 198
curvilinear pattern
a sociolinguistic pattern of a linguistic variable’s usage as a factor of age, where
the middle-aged subjects are patterning distinctly different from either the
(Table of Contents) 206 Ph.D Thesis 2014
Rankinen, W. Glossary
older- or younger-aged subjects (i.e., forming a U-shape pattern or its inverse);
this pattern is usually associated with age-grading. 184, 202
dialect leveling
a process of language change where salient or marked variants of linguistic vari-
ables are disfavored and disused over time, whereby language varieties become
less distinctive from one another (i.e., the variation between them potentially
become non–existent). 6, 89, 109, 163, 198
diffusion
a type of linguistic propagation, where linguistic forms disperse throughout
and outside the speech community resulting from contact between the speech
communities; typically associated with change from above. 161, 204
ethnolect
a unique, native variety of English spoken by immigrant-heritage speakers, who
were exposed to English at an early age; retains unique linguistic features that
can be attributed to the non-native variety or substrate language. 15, 171, 192
exogenous influence
linguistic pressures external to a speech community that affect the linguistic
speech pattern of subgroups within the particular speech community. 111, 166,
170
feature
1) a sociolinguistic term referring to a set of linguistic variables that exhibit
similar phonetic patterns and sociolinguistic trends as a set of linguistic indica-
tors, markers or stereotypes (e.g., Canadian shift of /I, E, æ/); 2) a phonological
term referring to a binary characteristic of a phoneme’s feature structure (e.g.,
[+/- voice]). 163, 171, 202–205, 207
(Table of Contents) 207 Ph.D Thesis 2014

Rankinen, W. Glossary
fixed method
a method of formant extraction where the temporal measurements are selected
at “fixed” positions based upon pre-determined locations along the vowel’s du-
ration (e.g., exactly the 33rd and the 66th percentile of the vocalic duration).
42, 53
generational change
a type of language change where the use of an innovative form is associated
with a particular generation or age group. 184
geolinguistic region
a geographical area within which the speech community or communities exhibit
preference for a definable set of linguistic variants (e.g., phonological, syntac-
tic) and characterizes the linguistic speech patterns of residents living in this
geographical area. 1, 2
heritage
an operationalized term referring to the ancestral heritage of a speaker, who has
at least one grandparent that can claim full ancestry of an immigrant-heritage;
also referred to as ethnic-heritage. 34, 164, 199, 206
heritage-location
an operationalized term referring to the ancestral heritage and place of resideny
of a speaker; see heritage and location. 3, 34, 35, 39, 40, 62, 65, 111, 161, 198
interspeaker variation
a type of variation referring to the linguistic differences that exist between
speaker or groups of speakers (e.g., generational change, age-grading, lifespan
change); this type of variation is usually contrasted with intraspeaker variation,
(Table of Contents) 208 Ph.D Thesis 2014
Rankinen, W. Glossary
which refers to the linguistic differences that exist within an individual speaker
(e.g., style shifting). 77, 108, 112, 169
linguistic indicator
a variant of a linguistic variable that correlates with different sociolinguistic
groups but does not show signs of stylistic conditioning; typically below the
conscious awareness of speakers. 112
linguistic marker
a variant of a linguistic variable that correlates with different sociolinguistic
groups and does show signs of stylistic conditioning, but it may not be above
the conscious awareness of speakers. 112
linguistic stereotype
a variant of a linguistic variable that correlates with different sociolinguistic
groups, shows signs of stylistic conditioning, and holds stigma (i.e., being above
the conscious awareness of speakers). 112
location
an operationalized term referring to the place of residency of a speaker, based
upon the geo-coordinates of the subject at the time of field recording. 34, 199,
206
low-back merger
an acoustic vowel merger characterized by merging of the [A] and [O] vowels; typ-
ically associated with other Canadian features (e.g., Canadian shift, Canadian
raising, /u/ fronting). 8, 21, 24, 28, 114, 202–204
MANOVA
multivariate analysis of variance; a statistical method in which the variation in
a set of observations is divided into distinct components using two predictor
(Table of Contents) 209 Ph.D Thesis 2014

Rankinen, W. Glossary
variables. 63, 70–74, 79, 80, 85, 87, 88, 90, 91, 94–96, 98, 99, 101, 106, 107,
116–118, 120, 121, 124, 127, 128, 133, 135, 137–144
manual method
a method of formant extraction where the temporal measurements are manually
selected based upon an approximate location along the vowel’s duration (e.g.,
approximately the 33rd and the 66th percentile of the vocalic duration). 42, 53
out-migration
The migration out of a particular region due to various social and economical
reasons. 9
pivot method
a method of formant extraction where the temporal measurements are selected
at non-fixed positions based upon the “best” fitted vectorized point(s) in a
stylization model; the point with the lowest residuals is selected for formant
extraction. 42, 53
prestige
a term referring to the conscious or unconscious value placed on the use of an
innovative form, typically based upon a perceived standard or variety; covert,
local prestige refers to value places on variants that are propagated as change
from below, while overt, non-local prestige refers to value placed on variants
that are propagated as change from above. 158, 176
real-time
a type of data collection following a diachronic approach to language change,
where data is collected at multiple points in time to investigate language change
in progress. 202
(Table of Contents) 210 Ph.D Thesis 2014
Rankinen, W. Glossary
sex
an operationalized term referring to the self-reported sex of the speaker (i.e.,
male or female); this term does not refer to gender identity or sexual orientation.
3, 34, 40, 62, 111, 161, 198
stability
a process of linguistic change, where innovative forms of a linguistic variable
remain stable in a speech community. 175
strong network
a type of social network which is comprised of strong ties and involves inter-
action between close friends and family, socially and geographically immobile
individuals, and limited connections between groups; such a network typically
leads to agreement, resulting in the strengthening of a close-knit network struc-
ture. 190
stylization
a process of taking a large number of samples from the signal and reducing it
down to a much smaller number of representative vectorized points in such a
way that it still closely resembles the original raw signal. 49, 50, 208
substrate influence
linguistic pressures internal to a speech community that affect the linguistic
speech pattern of subgroups within the particular community. 110, 122
transmission
a type of linguistic propagation, where linguistic forms are transmitted “faith-
fully” by successive generations within a speech community (i.e., by children);
typically associated with change from below. 161, 204
weak network
(Table of Contents) 211 Ph.D Thesis 2014

Rankinen, W. Glossary
a type of social network which is comprised of weak ties and involves causal
interaction between acquaintances, socially and geographically mobile individ-
uals, and diverse connections between groups; such a network typically leads to
change and conflict, resulting in the weakening of a close-knit network structure.
190
(Table of Contents) 212 Ph.D Thesis 2014

Acronyms
ANAE
Atlas of North American English. 1, 42, 59–61
ANOVA
univariate analysis of variance. 42, 62, 71
CoV
coefficient of variation. 42, 63, 82, 85, 86
ED
Euclidean distance. x, 62, 63, 75–77, 89, 90, 97, 116–118, 131, 135, 141, 142,
169
LP
Lower Peninsula. 23
MANOVA
multivariate analysis of variance. 42, 62, 70
MQT
Marquette County. 35–38
NCVS
Northern Cities Vowel Shift. 3, 4, 22, 23, 30, 44, 45, 138, 174, 193
213
Rankinen, W. Acronyms
OCE
Ontario Canadian English. 24, 30
SD
standard deviation. 67, 68, 70, 82, 83, 85–88
UP
Upper Peninsula. x, xi, 2–11, 14–16, 18–21, 23, 24, 34, 39, 43, 45, 46, 63–68,
71, 75, 77, 83, 86, 92, 99, 103, 110–112, 115, 119, 121, 124, 146, 158, 160–171,
173, 174, 177–180, 182–190, 192, 193, 195, 196, 198, 199
(Table of Contents) 214 Ph.D Thesis 2014
Bibliography
Adamson, A. (1971). A Dialect Survey Involving Persons of Finnish Descent. In
Papers from Michigan Linguistic Society Meeting, Volume 1. Central Michigan
University.
Adank, P., R. Smits, and R. van Hout (2004). A Comparison of Vowel Normalization
Procedures for Language Variation Research. The Journal of the Acoustical Society
of America 116 (5), 3099–3107.
Ahrend, E. R. (1934). Ontario Speech. American Speech 9, 136–139.
Albin, A. and W. Rankinen (2012, October). Hierarchical Bayesian Modeling of Vowel
Formant Data. Poster presentation at the 164th Meeting of the Acoustical Society
of America.
Allen, H. and G. Underwood (1977). Regional dialects, 1945-1974. American
Speech 52 (3/4), 163–261.
Allen, H. B. (1973). The Linguistic Atlas of the Upper Midwest. University of Min-
nesota Press.
Ayearst, M. (1939). A Note on Canadian Speech. American Speech 14, 231–233.
Bailey, G., T. Wikle, J. Tillery, and L. Sand (1993). Some Patterns of Linguistic
Diffusion. Language Variation and Change 5, 359–390.
Bakos, J. (2008). An examination of the adaptation of the northern cities chain shift
215
Rankinen, W. BIBLIOGRAPHY
by lebanese immigrants in dearborn. Master’s thesis, Michigan State University,
East Lansing, Michigan.
Bertinetto, P. M. and M. Loporcaro (2005). The sound pattern of standard italian,
as compared with the varieties spoken in florence, milan and rome. Journal of the
International Phonetic Association 35 (02), 131–151.
Bigham, D. S. (2008, August). Dialect Contact and Accommodation among Emerging
Adults in a University Setting. Ph. D. thesis, University of Texas, Austin, Texas.
Boberg, C. (2000). Geolinguistic Diffusion and the U.S.-Canada Border. Language
Variation and Change 12, 1–24.
Boberg, C. (2004). Ethnic Patterns in the Phonetics of Montreal English. Journal of
Sociolinguistics 8 (4), 538–568.
Boberg, C. (2005, 7). The Canadian Shift in Montreal. Language Variation and
Change 17, 133–154.
Boberg, C. (2008). Regional Phonetic Differentiation in Standard Canadian English.
Journal of English Linguistics 36 (2), 129–154.
Boberg, C. (2012). Ethnic Dialects in North American English. In T. Nevalainen
and E. C. Traugott (Eds.), The Oxford Handbook of the History of English, Oxford
Handbooks in Linguistics, Chapter 42, pp. 538–548. Oxford University Press.
Boersma, P. (2001). Praat, a System for Doing Phonetics by Computer. Glot Inter-
national 5 (9/10), 341–345.
Bourdieu, P. (1991). Language and Symbolic Power. Cambridge, MA: Harvard Uni-
versity Press.
Browman, C. P. and L. Goldstein (1985). Dynamic Modeling of Phonetic Structure.
In V. Fromkin (Ed.), Phonetic Linguistics, pp. 35–53. New York: Academic Press.
(Table of Contents) 216 Ph.D Thesis 2014
Rankinen, W. BIBLIOGRAPHY
Browman, C. P. and L. Goldstein (1990). Gestural Specification Using Dynamically-
defined Articulatory Structures. Journal of Phonetics 18, 299–320.
Carlock, E. and W. Wolck (1981). A Method for Isolating Diagnostic Linguistic
Variables: The Buffalo ethnolects experiment. In D. Sankoff and H. Cedergren
(Eds.), Variation Omnibus, Current inquiry into language linguistics, pp. 17–24.
Carbondale, USA: Linguistic Research.
Chambers, J. K. (1973). Canadian Raising. The Canadian Journal of Linguistics 18,
118–135.
Chambers, J. K. (1989, Spring). Canadian Raising: Blocking, Fronting, etc. American
Speech 64 (1), 75–88.
Chambers, J. K. (2006, July). Canadian Raising Retrospect and Prospect. The
Canadian Journal of Linguistics 51 (2/3), 105–118.
Clarke, S., F. Elms, and A. Youssef (1995, 7). The Third Dialect of English: Some
Canadian evidence. Language Variation and Change 7, 209–228.
Clopper, C. G., D. B. Pisoni, and K. de Jong (2005). Acoustic Characteristics of the
Vowel Systems of Six Regional Varieties of American English. The Journal of the
Acoustical Society of America 118 (3), 1661–1676.
Dailey-O’Cain, J. (1997). Canadian Raising in a Midwestern U.S. City. Language
Variation and Change 9, 107–120.
Dannenberg, C. (1999). Sociolinguistic Constructs of Ethnic Identity: The syntactic
delineation of Lumbee English. Ph. D. thesis, University of North Carolina, Chapel
Hill.
Dannenberg, C. (2002). Sociolinguistic Constructs of Ethnic Identity: The syntactic
(Table of Contents) 217 Ph.D Thesis 2014
Rankinen, W. BIBLIOGRAPHY
delineation of Native American English, Volume 87 of American Dialect Society.
Durham, NC: Duke University Press.
De Decker, P. and S. Mackenzie (2000). Slept Through the Ice: A further look at lax
vowel lowering in Canadian English. Toronto Working Papers in Linguistics 18,
1–11.
D’Imperio, M. (2001). The Role of Perception in Defining Tonal Targets and their
Alignment. Ph. D. thesis, The Ohio State University, Columbus.
Easson, G. (1997). Out and About in Toronto: (aw)-Fronting in real time and ap-
parent time. Master Thesis.
Eckert, P. (1996). (ay) Goes to the City: Reminiscences of Marth’s Vineyard. In D. S.
John Baugh, Gregroy Guy (Ed.), Festschrift for William Labov. John Benjamins.
Eckert, P. (2000). Language Variation at Social Practices. Oxford and Malden:
Blackwell Publishing Ltd/Inc.
Eckert, P. (2008). Where Do Ethnolects Stop? Internation Journal of Bilingual-
ism 12, 25–42.
Escudero, P., B. Sisinni, and M. Grimaldi (2014, March). The Effect of Vowel Inven-
tory and Acoustic Properties in Salento Italian learners of Southern British English
Vowels. Journal of Acoustical Society of America 135 (3), 1577–1584.
Esling, J. H. and H. J. Warkentyne (1993). Retracting of /æ/ in Vancouver English.
In S. Clarke (Ed.), Focus on Canada, pp. 229–246. John Benjamins Publishing
Company.
Evans, B. (2001). Dialect Contact and the Northern Cities Shift in Ypsilanti, Michi-
gan. Michigan State University. Department of Linguistics, Germanic, Slavic, Asian
and African.
(Table of Contents) 218 Ph.D Thesis 2014
Rankinen, W. BIBLIOGRAPHY
Evans, B. E., R. Ito, J. Jones, and D. R. Preston (2000). Change on top of change:
Social and regional accommodation to the northern cities chain shift. In H. Ben-
nis, H. Ryckboer, and J.Stroop (Eds.), De Toekomst van de Variatielinguıstiek (a
special issue of Taal en Tongval to honor Dr. Jo Daan on her ninetieth birthday),
Volume 52, pp. 61–86.
Evans, B. E., R. Ito, J. Jones, and D. R. Preston. (2006). How to get to be one kind
of midwesterner: Accommodation to the northern cities chain shift. In T. Murray
and B. L. Simon (Eds.), Language variation and change in the American Midland,
pp. 179–197. Amsterdam: John Benjamins Publishing Company.
Flege, J. E., I. R. A. MacKay, and D. Meador (1999, November). Native Italian
Speakers’ Perception and Production of English Vowels. Journal of Acoustical
Society of America 106 (5), 2973–2987.
Fought, C. (2003). Chicano English in Context. New York: Macmillan.
Gordon, M. J. (2000a). Phonological Correlates of Ethnic Identity: Evidence of
divergence? American Speech 75 (2), 115.
Gordon, M. J. (2000b). Small-Town Values and Big-City Vowels: A Study of the
Northern Cities Shift in Michigan. Publication of the American Dialect Society
(Book 84). Duke University Press Books.
Gottfried, M., J. D. Miller, and D. J. Meyer (1993). Three Approaches to the Clas-
sification of American English Diphthongs. Journal of Phonetics 21, 205–229.
Hagiwara, R. (2006). Vowel Production in Winnipeg. Canadian Journal of Linguis-
tics 51 (2), 127–141.
Haugen, E. I. (1969). The Norwegian Language in America: A Study in Bilingual
Behavior. Bloomington: Indiana University Press.
(Table of Contents) 219 Ph.D Thesis 2014

Rankinen, W. BIBLIOGRAPHY
Hibiya, J. (1988). Social Stratificaiton of Tokyo Japanese. Ph. D. thesis, University
of Pennsylvania, Philadelphia.
Hillenbrand, J., L. A. Getty, M. J. Clark, and K. Wheeler (1995, May). Acoustic
Characteristics of American English Vowels. Journal of the Acoustical Society of
America 97 (5), 3099–3111.
Hoffman, M. F. and J. A. Walker (2010, 3). Ethnolects and the City: Ethnic orienta-
tion and linguistic variation in Toronto English. Language Variation and Change 22,
37–67.
Holmio, A. (2001). History of the Finns in Michigan. Great Lakes books. Wayne
State University Press.
Horvath, B. (1985). Variation in Australian English. Cambridge University Press.
Horvath, B. and D. Sankoff (1987). Delimiting the Sydney Speech Community. Lan-
guage in Society 16, 179–204.
Isajiwa, W. W. (1985). Definitions of Ethnicity. In R. Bienvenue and J. Goldstein
(Eds.), Ethnicity and Ethnic Relations in Canada: A book of readings, pp. 5–17.
Butterworths.
Ito, R. (1999). Diffusion of urban sound change in rural Michigan: A case of the
Northern Cities Shift. Ph. D. thesis, Michigan State University, East Lansing,
Michigan.
Jones, J. (2003). African Americans in Lansing and the Northern Cities Vowel Shift.
Ph. D. thesis, Michigan State University, East Lansing, Michigan.
Joos, M. (1942). A Phonological Dilemma in Canadian English. Language 18, 141–
144.
Kero, R. (1969). The Background of Finnish Emigration. In R. J. Jalkanen (Ed.), The
(Table of Contents) 220 Ph.D Thesis 2014
Rankinen, W. BIBLIOGRAPHY
Finns in North America: A social symposium, pp. 55–62. East Lansing: Michigan
State University Press for Suomi College.
Kero, R. (2014). Migration from Finland to North America. In Finns in the United
States: A History of Settlement, Dissent, and Integration, pp. 41–54. Michigan
State University Press.
Kerswill, P. (2002). Models of Linguistic Change and Diffusion: New evidence from
dialect levelling in British English. Reading Working Papers in Linguistics 6, 187–
216.
Kerswill, P. and P. Trudgill (2005). The Birth of New Dialects. In P. Auer,
F. Hinskens, and P. Kerswill (Eds.), Convergence and divergence in European lan-
guages, pp. 196–220. Cambridge University Press.
Keyser, S. J. (1963). Review of The Pronunciation of English in the Atlantic States:
Based upon the Collections of the Linguistic Atlas of the Eastern United States.
Language 39 (2), 303–316.
Klatt, D. H. (1982, May). Prediction of Perceived Phonetic Distance from Critical-
band Spectra: A first step. In Acoustics, Speech, and Signal Processing, IEEE
International Conference on ICASSP 1982, Volume 7, pp. 1278–1281.
Konopka, K. and J. Pierrehumbert (2014). Vowel dynamics of mexican heritage
english: Language contact and phonetic change in a chicago community. [Online
article: http://faculty.wcas.northwestern.edu/˜jbp/publications.html].
Kostiainen, A. (2014). Papers and Publications. In Finns in the United States:
A History of Settlement, Dissent, and Integration, pp. 205–220. Michigan State
University Press.
Kuronen, M. (2000). Vokaluttalets akustik i sverigesvenska, finlandssvenska och finska.
Jyvaskyla: Jyvaskyla University Printing House.
(Table of Contents) 221 Ph.D Thesis 2014
Rankinen, W. BIBLIOGRAPHY
Labov, W. (1963). The Social Motivation of a Sound Change. Word 19, 273–309.
Labov, W. (1966). The Social Stratification of English in New York City. Washington,
D.C.: Center for Applied Linguistics.
Labov, W. (1972). Sociolinguistic Patterns. Philadelphia: University of Philadelphia
Press.
Labov, W. (1994). Principles of Linguistic Change: Internal Factors. Oxford: Basil
Blackwell.
Labov, W. (2001). Principles of Linguistic Change, Social Factors. Language in
Society. Wiley.
Labov, W. (2007, June). Transmission and Diffusion. Language 83 (2), 344–387.
Labov, W. (2008). Mysteries of the Substrate. In M. Meyerhoff and N. Nagy (Eds.),
Social Lives in Language - Sociolinguistics and multilingual speech communities:
Celebrating the work of Gillian Sankoff, pp. 315–326. John Benjamins Publishing
Company.
Labov, W. (2011). Principles of Linguistic Change: Cognitive and Cultural Factors.
Principles of Linguistic Change. Wiley.
Labov, W., S. Ash, and C. Boberg (2006). The Atlas of North American English:
Phonetics, Phonology, and Sound Change : a Multimedia Reference Tool. Number
v. 1 in The Atlas of North American English: Phonetics, Phonology, and Sound
Change : a Multimedia Reference Tool. Mouton de Gruyter.
Laferriere, M. (1979). Ethnicity in Phonological Variation and Change. Lan-
guage 55 (3), pp. 603–617.
LaMacchia, R. A., R. W. Marx, and J. Sobel (1994). The Urban and Rural Classifi-
cations. U.S. Department of Commerce.
(Table of Contents) 222 Ph.D Thesis 2014
Rankinen, W. BIBLIOGRAPHY
Leinonen, J. (2014). One Culture, Two Cultures? Families of Finns in the United
States in the Twentieth Century. In Finns in the United States: A History of
Settlement, Dissent, and Integration, pp. 285–296. Michigan State University Press.
Lindblom, B. (1963). Spectrographic Study of Vowel Reduction. Journal of Acoustical
Society of America 35, 1773–1781.
Lindblom, B. (1986). Phonetic Universals in Vowel Systems. In J. J. Ohala and J. J.
Jaear (Eds.), Experimental Phonology, pp. 13–43. Academic Press.
Lo, A. and A. Reyes (2004). Language, Identity and Relationality in Asian Pacific
America: An introduction. Pragmatics 14, 115–125.
Loukinen, M. (1980). Sociolinguistic Structure of Finnish America. In R. Padilla
(Ed.), Theory in Bilingual Education, Ethnoperspectives in Bilingual Education
Research Series. Department of Foreign Languages and Bilingual Studies, Bilingual
Programs, Eastern Michigan University.
Loukinen, M. (1997). Cultural Tracks: Finnish Americans in Michigan’s Upper Penin-
sula. In M. Marsden and R. Magnaghi (Eds.), A Sense of Place, Michigan’s Up-
per Peninsula: Essays in Honor of the Career of William Vandament, pp. 15–34.
Northern Michigan University Press.
MacDonald, E. N., D. W. Purcell, and K. G. Munhall (2011). Probing the Indepen-
dence of Formant Control using Altered Auditory Feedback. The Journal of the
Acoustical Society of America 129 (2), 955–965.
Marquette County Planning Commission (2010). US-41/M-28 Access Management
Plan. Online at http://www.co.marquette.mi.us/departments/planning/AM_
Plan.php#.Ut1y9PYo4cU.
MDOT (2007). Economic Regions Corridor Summary. State Long-Range Transporta-
tion Plan II, The Michigan Department of Transportation.
(Table of Contents) 223 Ph.D Thesis 2014
Rankinen, W. BIBLIOGRAPHY
MDOT (2014a). International bridge: Bridge history. http://www.michigan.gov/
mdot/0,4616,7-151-9618_48384-23856--,00.html.
MDOT (2014b). Mackinac bridge: History. http://www.michigan.gov/mdot/0,
4616,7-151-9618_11016-25527--,00.html.
MDOT (2014c). Traffic trends. http://www.michigan.gov/mdot/0,4616,
7-151-9618_48384-30295--,00.html.
Mees, I. (1987). Glottal Stops as a Prestigious Feature of Cardiff English. English
Word-Wide 8, 25–39.
Menghini, C. (2004). Examining patterns of Italian immigration to Michigan’s
Houghton County, 1860-1930. Ph. D. thesis, Michigan Technological University,
Houghon, Michigan.
Merriam-Webster, Inc. (2014). Merriam-Webster’s Collegiate Dictionary (11th ed.).
Merriam-Webster, Inc.
Michigan State Highway Department (1927). Official highway service map. Cateog-
raphy by MSHD.
Milroy, J. (1996). Variation in /ai/ in Northern British English, with comments on
Canadian Raising. University of Pennsylvania Working Papers in Linguistics 3 (1),
213–221.
Milroy, J., L. Milroy, S. Hartley, and D. Walshaw (1994). Glottal Stops and Tyneside
Glottalization: Competing patterns of variation and change in British English.
Language Variation and Change 6 (3), 327–357.
Milroy, L. (1987). Studying Language in the Community: The fieldworker and the
social network. In Language and Social Networks, Language in Society. Wiley.
Milroy, L. (2000). Britain and the United States: Two nations divided by the same
(Table of Contents) 224 Ph.D Thesis 2014

Rankinen, W. BIBLIOGRAPHY
language (and different language ideologies). Journal of Linguistic Anthropology 10,
56–89.
Milroy, L. (2004). Language Ideologies and Linguistic Change. In C. Fought (Ed.),
Sociolinguistic Variation: Critical Reflections, New York, pp. 161–177. Oxford Uni-
versity Press.
Milroy, L. and J. Milroy (1992). Social Network and Social Class: Toward an inte-
grated sociolinguistic model. Language in Society 21 (1), 1–26.
Morales, H. L. (1986). Velarization of -/N/ in Purerto Rican Spanish. In D. Sankoff
(Ed.), Diversity and Diachrony, pp. 105–113. Philadelphia: John Benjamins Pub-
lishing Company.
Moreton, E. and E. Thomas (2007). Origins of Canadian Raising in Voiceless-coda
Effects: A cas study in phonologization. In J. Cole and J. I. Hualde (Eds.), Papers in
Laboratory Phonology 9, Phonology and Phonetics, pp. 37–64. Berlin: De Gruyter
Mouton.
Nearey, T. and P. Assmann (1986). Modeling the Role of Inherent Spectral Change
in Vowel Identification. The Journal of the Acoustical Society of America 80, 1297.
Nguyen, E. (2011, October). The Urban/Rural Distinction and so much More:
Monophthongal (ow) in Minnesota. Paper presented at the 40th Annual Meet-
ing for New Ways of Analyzing Variation.
Ocumpaugh, J. (2010). Regional variation in Chicano English: Incipient dialect for-
mation among L1 and L2 speakers in Benton Harbor. Ph. D. thesis, Michigan State
University, East Lansing, Michigan.
Peterson, G. E. and H. L. Barney (1952). Control Methods Used in a Study of the
Vowels. The Journal of the Acoustical Society of America 24 (2), 175–184.
(Table of Contents) 225 Ph.D Thesis 2014
Rankinen, W. BIBLIOGRAPHY
Peterson, J. and Z. Thundyil (1971). A Computerized Questionnaire for the Dialectal
Survey of the Upper Peninsula of Michigan. Papers from the Michigan Linguistic
Society Meeting.
Pierrehumbert, J. and M. Beckman (1988). Japanese tone structure. Linguistic in-
quiry monographs. Mit Press.
Preston, D. and R. Ito (1998). Identity, discourse, and language variation. Journal
of Language and Social Psychology 17 (4), 465–483.
Preston, D. R. (2003). Systemic accommodation. In D. Britain and J. Cheshire
(Eds.), Social Dialectology, (IMPACT: Studies in Language and Society 18), pp.
39–58. John Benjamins Publishing Company.
Preston, D. R. (2007). Why can’t you understand your own language? In P. Reich,
W. J. Sullivan, A. R. Lommel, and T. Griffen (Eds.), LACUS Forum XXXIII:
Variation, pp. 5–18. Houston: Linguistic Association of Canada and the United
States.
Preston, D. R. (2010). Belle’s body just caught the fit gnat. In D. R. Preston and
N. Niedzielski (Eds.), A reader in sociophonetics, pp. 241–252. Berlin: De Gruyter
Mouton.
Preston, D. R., B. Plichta, and B. Rakerd (2007). It’s too hat in here? the perception
of ncs a-fronting. Linguistica Atlantica 27-28, 92–95.
Purnell, T., E. Raimy, and J. Salmons (2013). Wisconsin Talk: Linguistic Diversity
in the Badger State (1st ed.). Languages and Folklore of Upper Midwest. University
of Wisconsin Press.
Purnell, T., J. Salmons, and D. Tepeli (2005). German Substrate Effects in Wisconsin
English: Evidence for final fortition. American Speech 80 (2), 135 – 164.
(Table of Contents) 226 Ph.D Thesis 2014
Rankinen, W. BIBLIOGRAPHY
Rakerd, B. and B. Plichta (2010). More on Michigan Listeners’ Perception of /A/-
fronting. American Speech 85 (4), 431 – 449.
Rankinen, W. (2013a, April). Location and Heritage Effects: On the vowel charac-
teristics among monolingual English speakers from Michigan’s Upper Peninsula.
Rankinen, W. (2013b, November). Michigan’s upper peninsula vowel system: Acous-
tic vowel characteristics of finnish-american communities. Submitted to Language
Variation and Change.
Rankinen, W. (2013c). Where’d the Preposition Go? A perceptual-based account
of locative prepositional deletion for younger raters in Michigan’s Upper Peninsula
Where’d the preposition go? A perceptual-based account of locative prepositional
deletion for younger raters in Michigan’s Upper Peninsula. Qualifying Paper II
submitted to the Department of Linguistics.
Rankinen, W. (2014, June). A Michigan Upper Peninsula Vowel System: Finnish-
American communities in Marquette County. Accepted for publication in American
Speech on 05/20/2014.
Remlinger, K., J. Salmons, and L. Von Schneidemesser (2009, June). Revised Percep-
tions: Changing dialect perceptions in Wisconsin and Michigan’s Upper Peninsula.
American Speech 84 (2), 176–191.
Remlinger, K. A. (2006). What It Means to Be a Yooper: Identity, language attitudes
and variation in Michigan’s Keweenaw Peninsula. In M. Filppula (Ed.), Topics in
Dialectal Variation: Selection of Papers from the Eleventh International Conference
on Methods in Dialectology, Studies in languages. University of Joensuu.
Remlinger, K. A. (2007). The Intertwined Histories of Identity and Dialect in Michi-
gan’s Copper Country. In A. Hoagland, E. Nordberg, and T. Reynolds (Eds.), New
Perspectives on Michigan’s Copper Country. Quincy Mine Hoist Association.
(Table of Contents) 227 Ph.D Thesis 2014

Rankinen, W. BIBLIOGRAPHY
Remlinger, K. A. (2009). Everyone Up Here: Enregisterment and identity in Michi-
gan’s Keweenaw Peninsula. American Speech 84 (2), 118 – 137.
Roeder, R. (2006). Accommodation to the Northern Cities Shift among Mexican
Americans in Lansing. Ph. D. thesis, Michigan State University, East Lansing,
Michigan.
Roeder, R. and L. G. Jarmasz (2009). The Lax Vowel Subsystem in Canadian English
Revisited. Toronto Working Papers in Linguistics 31, 1–12.
Roeder, R. and L.-G. Jarmasz (2010). The Canadian Shift in Toronto. Canadian
Journal of Linguistics 55 (3), 387 – 404.
Rose, M. (2006). Language, Place and Identity in Later Life. Ph. D. thesis, Stanford
University, Standford.
Rosenfelder, I. (2005). Canadian raising in victoria, b.c.: An acoustic anaylsis. Ms,
University of Heidelberg.
Rudnicki, R. (1987). Patterns of italian immigrant settlement. In R. Vecoli (Ed.),
Italian Immigrants in Rural and Small Town America, Number 9-17 in Fourteenth
Annual Conference of the American Italian Historical Association. University of
Minnesota Press.
Sankoff, D. and S. Laberge (1978). The Linguistic Market and the Statistical Ex-
planation of Variability. In D. Sankoff (Ed.), Linguistic Variation: Models and
Methods, pp. 239–250. New York: Academic Press.
Shuy, R., W. Wolfram, and W. Riley (1967). A Study of Social Dialects in Detroit.
Final Report, Project 6-1347, Office of Education, Washington, D.C.
Silverstein, M. (1998). Contemporary Transformations of Local Linguistic Commu-
nities. Annual Review of Anthropology 27, 401–426.
(Table of Contents) 228 Ph.D Thesis 2014
Rankinen, W. BIBLIOGRAPHY
Simon, B. (2005). Dago, Finlander, and Cousin Jack: Ethnicity and identity on
Michigan’s Upper Peninsula. In B. Joseph, C. Preston, and D. Preston (Eds.),
Language Diversity in Michigan and Ohio: Towards Two State Linguistic Profiles.
Caravan Books.
Statistics Canada (2011). Focus on geography series, 2011 census: Census
agglomeration of sault ste. marie, ontario. http://www12.statcan.gc.
ca/census-recensement/2011/as-sa/fogs-spg/Facts-cma-eng.cfm?LANG=
Eng&GK=CMA&GC=590.
Stevens, K. (2000). Acoustic Phonetics. Current Studies in Linguistics Series. MIT
Press.
Sturgul, P. A. (1987). Italians on the gogebic iron range. In R. Vecoli (Ed.), Italian
Immigrants in Rural and Small Town America, Fourteenth Annual Conference of
the American Italian Historical Association, pp. 170–178. University of Minnesota
Press.
Sturtevant, E. (1947). An introduction to linguistic science. New Haven: Yale Uni-
versity Press.
Suomi, K., J. Toivanen, and R. Ylitalo (2008). Finnish Sound Structure: Phonetics,
Phonology, Phonotactics, and Prosody. STUDIA HUMANIORA OULUENSIA 9.
Oulu University Press.
Tagliamonte, S. A. (2012). Variationist Sociolingustics: Change, Observation, Inter-
pretation. Wiley-Blackwell.
Thomas, E. (1991). The Origin of Canadian Raising in Ontario. The Canadian
Journal of Linguistics 36 (2), 147–170.
Thomas, E. (2011). Sociophonetics: An Introduction. Palgrave Macmillan.
(Table of Contents) 229 Ph.D Thesis 2014

Rankinen, W. BIBLIOGRAPHY
Thomas, E. R. and T. Kendall (2007). NORM: The vowel normalization and plotting
suite. [Software Resource: http://ncslaap.lib.ncsu.edu/tools/norm/].
Trudgill, P. (1972). Sex, Covert Prestige, and Linguistic Change in Urban British
English. Language in Society 1 (2), 179–195.
Trudgill, P. (1974). Linguistic Change and Diffusion: Description and explanation in
sociolinguistic dialect geography. Language in Society 3, 215–246.
Trudgill, P. (1986). Dialects in Contact. New York: Basil Blackwell.
US Census Bureau (2000). American FactFinder. http://factfinder2.census.
gov/faces/nav/jsf/pages/index.xhtml.
Vance, T. J. (1987, Autumn). ”Canadian Raising” in Some Dialects of the Northern
United States. American Speech 62 (3), 195–2010.
Wiik, K. (1965). Finnish and English Vowels: A Comparison with special reference
to the learning problems met by native speakers of Finnish learning English. Turun
Yliopiston julkaisuja. Sarja B osa 94. Turun Yliopisto.
Wolfram, W. (1969). A Sociolinguistic Description of Detroit Negro Speech. Center
for Applied Linguistics.
Wolfram, W. (1974). Sociolinguistic Aspects of Assimilation: Purerto Rican English
in New York. Center for Applied Linguistics.
Wolfram, W. (1984). Unmarked Tense in American Indian English. American
Speech 59, 31–50.
Woods, H. (1979). A Socio-dialectology Survey of the Englsih Spoken in Ottawa: A
study of sociological and stylistic variation in Canadian English. Ph. D. thesis,
University of British Columbia, Vancouver.
(Table of Contents) 230 Ph.D Thesis 2014