The social and ecological significance of Hervey Bay Queensland for eastern Australian humpback...
268
Southern Cross University ePublications@SCU eses 2012 e social and ecological significance of Hervey Bay Queensland for eastern Australian humpback whales (Megaptera novaeangliae) Trish Franklin Southern Cross University ePublications@SCU is an electronic repository administered by Southern Cross University Library. Its goal is to capture and preserve the intellectual output of Southern Cross University authors and researchers, and to increase visibility and impact through open access to researchers around the world. For further information please contact [email protected]. Publication details Franklin, T 2012, 'e social and ecological significance of Hervey Bay Queensland for eastern Australian humpback whales (Megaptera novaeangliae)', PhD thesis, Southern Cross University, Lismore, NSW. Copyright T Franklin 2012
Transcript of The social and ecological significance of Hervey Bay Queensland for eastern Australian humpback...

Southern Cross UniversityePublications@SCU
Theses
2012
The social and ecological significance of HerveyBay Queensland for eastern Australian humpbackwhales (Megaptera novaeangliae)Trish FranklinSouthern Cross University
ePublications@SCU is an electronic repository administered by Southern Cross University Library. Its goal is to capture and preserve the intellectualoutput of Southern Cross University authors and researchers, and to increase visibility and impact through open access to researchers around theworld. For further information please contact [email protected].
Publication detailsFranklin, T 2012, 'The social and ecological significance of Hervey Bay Queensland for eastern Australian humpback whales(Megaptera novaeangliae)', PhD thesis, Southern Cross University, Lismore, NSW.Copyright T Franklin 2012
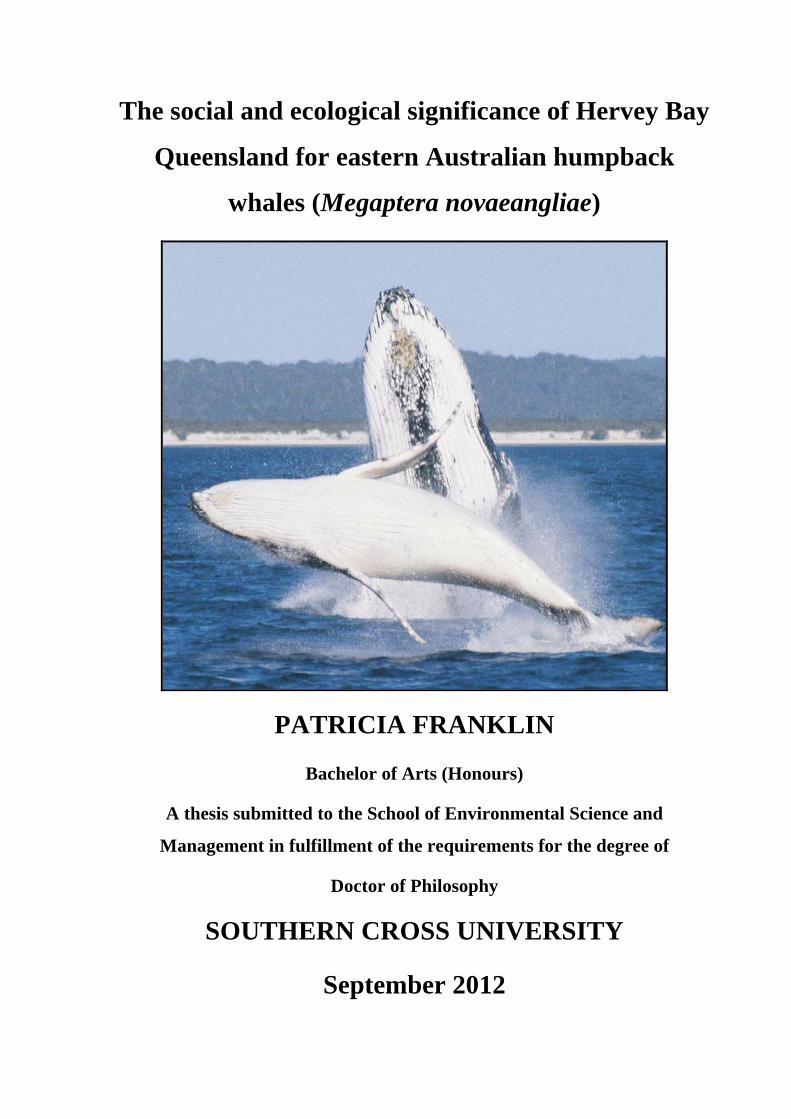
The social and ecological significance of Hervey Bay
Queensland for eastern Australian humpback
whales (Megaptera novaeangliae)
PATRICIA FRANKLIN
Bachelor of Arts (Honours)
A thesis submitted to the School of Environmental Science and
Management in fulfillment of the requirements for the degree of
Doctor of Philosophy
SOUTHERN CROSS UNIVERSITY
September 2012

II
DECLARATION
I certify that the work presented in this thesis is, to the best of my knowledge and belief,
original, except as acknowledged in the text, and that the material has not been submitted,
either in a whole or in part, for a degree at this or any other university.
I acknowledge that I have read and understood the University’s rules, requirements,
procedures and policy relating to my higher degree research award and to my thesis. I certify
that I have complied with the rules, requirements, procedures and policy of the University (as
they may be from time to time).
Print Name…………………………………………………….
Signature……………………………………………………….
Date……………………………………………………………….

III
ABSTRACT
This study provides the first detailed research on the seasonal pod characteristics, seasonal
social behaviour and temporal segregation of different reproductive and maturational classes
of humpback whales in Hervey Bay (Queensland, Australia). Vessel-based surveys for this
study were conducted for 9 weeks in 1992 and for 10 weeks each year between 1993 and
2009. A total of 4,506 humpback whale pods were recorded in Hervey Bay between 1992 and
2005, and photo-identification data were obtained for 2,821 individually identified humpback
whales in Hervey Bay during the period 1992 to 2009. The data obtained during these surveys
were used to analyse and model the variability, both within and between seasons, of pod
characteristics, social behaviour in terms of pod associations, competitive groups and non-
agonistic social behaviour pods. The data were also used to investigate temporal segregation
of different classes of humpback whales. The overall aim of this research was to investigate
the importance of Hervey Bay for particular classes of humpback whales, and to assess
whether social factors influenced seasonal pod characteristics, social behaviour and temporal
segregation.
Pods of humpback whales in Hervey Bay ranged in size from one to nine individuals. Pairs
(1,344, 29.8%) were the most frequent pod type, followed by mother-calf alone (1,249,
27.7%), trios (759, 16.8%), singletons (717, 15.9%), and 4+ whales (437, 9.7%). Of the 4,506
pods, calves were present in 1,804 (40%), and 487 (10.8%) had one or more escorts present.
Of the 1,804 pods observed with calves present, 1,251 (69.4%) were mothers alone with their
calves. The size and composition of pods in Hervey Bay varied significantly as the season
progressed. Pods with calves present were rarely sighted early in the season but dominated
later in the season. A significant increase was recorded over years in the frequency of groups
of 3+ whales, which may be related to social and behavioural changes as the eastern
Australian population expands. The increasing proportion of socially active and interacting
immature and mature males and females as the population increases, combined with the
density and movement of humpback whale aggregations within and around Hervey Bay, may
be contributing to the formation of larger groups over years.
While under observation 22.7% of pods or singletons associated with other whales to form
larger newly associated pods, which ranged in size from 2 to 14 whales. The rate of formation
of newly associated pods was significantly higher in the first four weeks of the season

IV
compared with the last six weeks of the season. Non-agonistic social behaviour was also
observed more frequently earlier in the season when immature and mature males and females
predominated and pods with calves were rarely observed. In contrast, competitive groups
were observed more frequently later in the season when mother-calf pods predominated and
increased significantly towards the end of the season as pod size and composition changed.
Competitive groups and non-agonistic social behaviour were more frequently observed in
both larger and newly associated pods. Competitive behaviour was observed in 249 (6.3%) of
pods, whereas non-agonistic social behaviour was observed in 465 (11.8%) of pods.
Using long-term observations of 361 individual whales identified photographically between
1992 and 2009, the study investigated the temporal segregation of different reproductive and
maturational classes of humpback whales in Hervey Bay. Mature non-lactating females
occurred mainly during August. Lactating females occurred in September and October with
peak density occurring in late September, an average of thirty-two days after that for mature
non-lactating females. There was no significant difference in the peak density and
observations by day within season of immature males and females and mature non-lactating
females. There were very few mature males observed in August, with the main concentrations
occurring in September and October; the occurrence of this class overlapped with that of non-
lactating females but more so with lactating females. Furthermore, the data suggest that both
non-lactating and lactating females interact with immature and maturing males and females to
a greater extent than previously reported, and show that social factors influence pod dynamics
and behaviour of humpback whales in Hervey Bay. The observed temporal segregation
pattern of humpback whales in Hervey Bay is fully consistent with the results reported by
Dawbin (1966, 1997) from whaling catches made between the 1930s and 1960s. The results
indicate that temporal segregation is a constant and cohesive feature of the social organisation
of migrating humpback whales, which provides a predictable social framework for individuals
moving through various maturational and reproductive stages as they age.
Hervey Bay is neither a terminal destination nor a calving or breeding area but rather a
stopover early in the southern migration. This research has shown that Hervey Bay is an
important habitat for different maturational and reproductive classes of whales. This is
particularly true for females and their calves later in the season; for non-lactating and early
pregnant females together with immature males and females early in the season; and for
mature males seeking to maximize mating opportunities in mid- to late season. However,
human activities including increased boat traffic, pollution, aquaculture development and

V
habitat degradation are increasing rapidly in Hervey Bay, coinciding with the increasing
humpback whale population. Therefore, it is important that long-term monitoring of this
population and its use of the Hervey Bay habitat continues into the future. It is also vital that
the effects of human activities are monitored and managed effectively to ensure the long-term
viability of Hervey Bay as a habitat important to the social development and reproductive
success of these eastern Australian humpback whales.

VI
ACKNOWLEDGEMENTS
I wish to thank my co-supervisor Dr. Phillip J. Clapham for sharing his expert knowledge of
humpback whales and his guidance, generosity and patience, which remained constant
throughout this project. His editing and comments were ever ruthless and brilliant and it was a
joy to work with him.
A giant thank you to my supervisor Professor Peter Harrison, PhD for his thorough editing
and constructive comments, which helped greatly in simplifying and clarifying the contents of
this project. Thank you for your time and effort, I deeply appreciate it.
To Emeritus Professor Peter Baverstock, I would like to thank him for his foresight in
recognising the importance of the long-term study undertaken in Hervey Bay, and his
encouragement, support and counsel to ensure that the data contributed to the body of
knowledge on humpback whales.
Without the expertise in statistical method and analyses given generously by Dr. Lyndon
Brooks to this project, we may never have delved into the depths of humpback whale pod
characteristics, social behaviour and migratory temporal segregation. Thank you Lyndon.
Thanks to Greg Luker and Margaret Rolfe, Southern Cross University for assistance with
figures.
I wish to thank three anonymous reviewers who contributed to the pod characteristics paper
and thank you to Dr. Daryl Boness, Dr. Adam Pack and two anonymous reviewers whose
comments contributed to the social behaviour manuscript and three anonymous reviewers
who contributed to the temporal segregation manuscript.
The long-term study of humpback whales in Hervey Bay is supported by The Oceania Project
and in part by an Australian Research Council Linkage grant with the Southern Cross
University Whale Research Group and the International Fund for Animal Welfare (IFAW)
and also a research grant from Queensland Parks and Wildlife Service. Thank you also to Dr.
Tim Stevens for assistance in the implementation of the long-term study in Hervey Bay, and
to Dr. Peter Corkeron whose research in Hervey Bay provided a foundation and focus for this
study.
A special thank you to the Research Assistants who supported the study throughout this last
eighteen years: Jason Brokken, Peter Skennerton, Alyssa Muller, Bachelor of Applied

VII
Science, Jason Cole, Kylie Stower, Laura Pitt, from the University of Queensland (Gatton
College); Brooke Butler, Dr. Daniel Burns, Olive Andrews, Jacqui Bullard, Lee Taylor, Greg
Gorman from Southern Cross University; Shannon MacKay from Deakin University;
Amanda Sheehan Bachelor of Science from Griffiths University; Jennifer McGee, Master of
Science, from University of Wales; Jackie Reed, Bachelor of Science from La Trobe
University; Kaite Krause-Davies, Bachelor of Science, from Hull University UK; Corrine
Goyetche, Bachelor of Science, Saint Francis Xavier University, Nova Scotia, Canada and
Master of Marine Science, University of New England, NSW and Kim Fabian from Germany.
Thank you also to Dr. Gregory Baxter, Senior Lecturer, Wildlife Management and Ecology,
University of Queensland (Gatton College) for organising and supervising the students who
participated in The Oceania Project’s Expeditions as Research Assistants.
A special thank you to Allan Perry, Principal of Hervey Bay Senior College and APEX
Hervey Bay for supporting and organising high school students to participate in The Oceania
Youth Project. Thanks also to John Swartzrock and his Youthcare team who supported and
organised young people to have a once in a lifetime experience on ‘Svanen’ (a square-rigged
vessel) and The Oceania Project’s first research vessel.
Thank you to Lyn Woolley, Chris Martin, Ben Love, Olive Andrews and Sasha Meaton and
their organisation Kids On The Ocean (KOTO) for supporting students from the Byron Bay,
Northern Rivers area in community fundraising to participate in TOP’s expeditions.
Thank you to Sue Mason, marine studies teacher, and students from the Knox school Senior
College for their participation in the expeditions and support with the environmental and
research tasks onboard.
Thank you to the Owners, Captains, Staff and Crew of the Hervey Bay Whale Watch Fleet for
their support and encouragement over the years. I would also like to thank the Management
and Staff of Queensland Parks and Wildlife, Department of Environment and Resource
Management in Maryborough, Hervey Bay and Brisbane for their support and assistance over
the years.
A great big thank you to all who supported and financially contributed to The Oceania
Project’s Internship program and their assistance with the study. A special thank you to Paul
Hodda, Chairman of the Australian Whale Conservation Society for his support, friendship
and the many marine presentations he gave aboard the expedition. Also a very special thanks

VIII
to Mark Cornish for his financial, professional and moral support and friendship during
thirteen consecutive years of participation in the expeditions.
I deeply acknowledge the love and constant support of my soul mate and partner, Wally
Franklin. I acknowledge his total dedication in organising the annual expeditions, the onboard
environmental projects, his excellent video work and recording of many hours of whale song.
I could not have taken the thousands of photographs of humpback whales needed for this
study without his excellent Captaincy when manoeuvring the expedition vessel from pod to
pod of humpback whales. His care for the safety of all on board was and is outstanding.
I am also forever grateful to our sons, Paul, Mark and Stephen, who had to tolerate a mature
student mother during their early childhood and over the following years. All three of them
have been serving Directors of The Oceania Project since 1988, along with Norah Stevenson,
Paul’s partner. Thank you to Stephen Franklin for his brilliant graphic designs and work on
The Oceania Project’s website. Thank you to Mark Francis Franklin for his professional
expertise as an Audio Engineer, for the creation of the digital database and production of
humpback whale DVDs and whale song CD, as well as the management and maintenance of
The Oceania Project’s YouTube channels and Facebook pages. Thanks to our grandsons
Matthew and Noë, Stephen’s partner Karina Hahn and our granddaughter Sophia for all their
love and support.
Finally I wish to thank the eastern Australian humpback whales for capturing my attention
and motivating me to learn more about them over the last twenty years. I trust that they will
be able to continue to live in harmony with their ocean environment for many generations into
the future.

IX
TABLE OF CONTENTS
DECLARATION………………………………………………………………………....…..II
ABSTRACT…………………………………………………………………...……..………III
ACKNOWLEDGEMENTS……………………………………………………………….....VI
TABLE OF CONTENTS……………………………………………………………..……...IX
LIST OF FIGURES………………………………………………………………......….…XVI
LIST OF TABLES…………………………………………………………………..…....XVIII
CHAPTER 1: GENERAL INTRODUCTION……………………………………….……..1
1.1 HUMPBACK WHALES (Megaptera novaeangliae, Borowski 1781)..........................1
1.2 TAXONOMY AND MORPHOLOGY……………………..........................................1
1.2.1 Taxonomy………………………………………………………….……..……1
1.2.2 Species Morphology…………………………………………....….……..……2
1.3 LIFE HISTORY…………………………………………………………………...…..4
1.3.1 Birth, growth and maturity…………………………………………….………4
1.3.2 Diet and foraging behaviour…………………………………….………..........8
1.3.3 Threats and potential anthropogenic impacts...................................................9
1.4 DISTRIBUTION AND MIGRATORY PATTERNS………………………………..10
1.4.1 Asynchronous timing of migrations…………………………….......………..10
1.4.2 Ancient lineages and maternally directed fidelity……………….…………...11
1.4.3 Northern Hemisphere: feeding, breeding and migration..................................12
1.4.3.1 North Atlantic Ocean............................................................................12
1.4.3.2 North Pacific Ocean..............................................................................13
1.4.3.3 Northern Indian Ocean..........................................................................15
1.4.4 Southern Hemisphere: breeding, feeding and migration..................................16

X
1.4.4.1 Southern Hemisphere Populations…………………………….……...16
1.4.4.2 South America, southeastern Pacific (Breeding G; feeding AREA 1).17
1.4.4.3 South America: Southwestern Atlantic Ocean (Breeding A, feeding
AREA ll)…………………………………………………...…………18
1.4.4.4 West Africa: Southeastern Atlantic Ocean (Breeding B; Feeding AREA
ll, lll) )……………………………………………………...…………19
1.4.4.5 East Africa, southwestern Indian Ocean (Breeding C; feeding AREA
lll) )…………………………………………………....………………20
1.4.4.6 Western Australia, southeastern Indian Ocean (Breeding D; feeding
AREA lV and V)…………………..……………….…………………20
1.4.4.7 South Pacific Islands (Oceania) (Breeding E2, E3 and F1, F2; feeding
V, VI and 1) ……………………………………………...……..……21
1.5 EASTERN AUSTRALIAN HUMPBACK WHALES..................………….……..….23
1.5.1 Population structure, migration and migratory interchange............................23
1.5.2 Breeding grounds and northern coastal migratory cycle.................................23
1.5.3 Antarctic feeding areas....................................................................................25
1.5.4 Trends in abundance of eastern Australian humpback whales.......................25
1.6 HERVEY BAY, QUEENSLAND AUSTRALIA........……………………….………26
1.7 FOCUS OF THESIS AND RESEACH OBJECTIVES……………………….………29
1.8 THESIS FORMAT…………………………………………………………………….31
CHAPTER 2: STUDY BACKGROUND AND METHODOLOGY…………..…………33
2.1 THE OCEANIA PROJECT’S HERVEY BAY HUMPBACK WHALE STUDY……33
2.2 STUDY SITE AND SURVEY TIMING………………………………..…………….34
XI
2.3 VESSEL-BASED SURVEYS…………………………………………………………35
2.4 OBSERVATIONS, PHOTO-IDENTIFICATION AND OTHER DATA………...…..36
2.5 PHOTOGRAPHIC MATCHING SYSTEM AND DATA ANALYSIS………...……39
CHAPTER 3: SEASONAL CHANGES IN POD CHARACTERISTICS OF EASTERN
AUSTRALIAN HUMPBACK WHALES (Megaptera novaeangliae), (HERVEY BAY
1992-2005)……………………………………………………………………………………48
3.1 ABSTRACT…………………………………………………………….……………49
3.2 INTRODUCTION…………………………………………………….…………..….50
3.3 METHODS…………………………………………………………….….………….52
3.3.1 Definitions........................................................................................................52
3.3.2 Surveys.............................................................................................................53
3.4 STATISTICAL ANALYSIS........................................................................................54
3.5 RESULTS.....................................................................................................................54
3.5.1 Effort and observations.....................................................................................54
3.5.2 Pod sizes in Hervey Bay 1992-2005.................................................................57
3.5.3 Observations of Pods with Calves and Escorts Present in Hervey Bay 1992–
2005…………………………………………………………………………..58
3.5.4 Trends in Pod Size and Composition in Hervey Bay 1992–2005……………59
3.5.5 The Effect of the Presence or Absence of Calves on Seasonal Variation in Pod
Size and Composition…………..……………………………………….……60
3.5.6 Statistical Model………………………………………………………….…..62
3.6 DISCUSSION………………………………………………………………….…….66
3.6.1 Increase of Larger Pods in Hervey Bay over Years…………………….……66
3.6.2 Seasonal Change in Pod Characteristics Early to Mid-Season………….…...68
3.6.3 Presence of Calves Affect Pod Composition after Mid-Season……………..69
3.6.4 Hervey Bay as a Habitat for Mothers with Calves…………………….……..70

XII
3.7 CONCLUSION………………………………………………………………….…..72
3.8 LITERATURE CITED………………………………………………………………..72
CHAPTER 4: SEASONAL CHANGES IN SOCIAL BEHAVIOUR OF EASTERN
AUSTRALIAN HUMPBACK WHALES (Megaptera novaeangliae) DURING THE
SOUTHERN MIGRATORY STOPOVER IN HERVEY BAY, QUEENSLAND, 1992-
2005………………………………………………………………………………….……….79
4.1 ABSTRACT………………………………………………………………………….80
4.2 INTRODUCTION………………………………………………………………...….81
4.3 METHODS……………………………………………………………………..…….86
4.3.1 Study area and timing of surveys......................................................................86
4.3.2 Definitions…………………………………………………………………….86
4.3.3 Fieldwork surveys……………………………………………………….……89
4.3.4 Observations, photo-identifications and data analysis......................................90
4.3.5 Statistical analysis.............................................................................................92
4.4 RESULTS……………………………………………………………………....…….93
4.4.1 Effort and observations………………………………………………….……93
4.4.2 Data set…………………………….…………………………………….……94
4.4.3 Newly associated pods……………………………….………………….……94
4.4.4 Competitive groups, non-agonistic social behaviour and other behaviour.......96
4.4.5 Avoidance and repulsion behaviour................................................................102
4.4.6 Competitive groups and non-agonistic social behaviour pods within
season………………………………………………………………………..103
4.4.7 Sex-identified males and females in competitive groups and non-
agonistic social behaviour pods......................................................................104
4.4.8 Statistical analysis and modelling...................................................................106
4.4.8.1 Newly associated pods........................................................................106

XIII
4.4.8.2 Competitive groups.............................................................................108
4.4.8.3 Non-agonistic social behaviour pods..................................................111
4.5. DISCUSSION………………………………………………………………....…….114
4.5.1 Seasonal variation in newly associated pods……………………….....…….114
4.5.2 Social interactions among lactating females and other conspecifics………..117
4.5.3 Competitive behaviour occurs throughout the season…………………..…..118
4.5.4 Hervey Bay: a resource for males seeking to maximise mating
opportunities……………………………………………….……………......120
4.5.5 Non-agonistic social behaviour predominates in early to mid-season….......121
4.5.6 Relative proportions of non-agonistic and competitive behaviour………....123
4.5.7 Hervey Bay: a unique stopover early in the southern migration………..….124
4.6 CONCLUSION……………….……………………………….......................…….126
4.7 LITERATURE CITED……………….……………………...........................……..126
CHAPTER 5: TEMPORAL SEGREGATION AND BEHAVIOUR OF
REPRODUCTIVE AND MATURATIONAL CLASSES OF INDIVIDUALLY
IDENTIFIED HUMPBACK WHALES (Megaptera novaeangliae), IN HERVEY BAY,
QUEENSLAND, 1992-2009.................................................................................................134
5.1 ABSTRACT...............................................................................................................135
5.2 INTRODUCTION......................................................................................................136
5.3 METHODS AND DATA............................................ ..............................................137
5.3.1 Study area, fieldwork and photo-id data.........................................................137
5.3.2 Definitions.......................................................................................................139
5.3.3 Statistical analysis ..........................................................................................142
5.4 RESULTS...................................................................................................................143
5.4.1 Individually identified whales and observation database...............................143

XIV
5.4.2 Reproductive category of selected females based on long-term resighting
histories..........................................................................................................145
5.4.3 Statistical analysis..........................................................................................147
5.4.4 Statistical model.............................................................................................150
5.4.5 Results of multilevel model...........................................................................151
5.4.6 Analysis of residency.....................................................................................154
5.4.7 Statistical model of observed residency.........................................................155
5.4.8 Extended residency........................................................................................157
5.4.9 Timing and changes in maturational and reproductive status
of known-age whales.....................................................................................160
5.5. DISCUSSION...........................................................................................................164
5.5.1 Temporal segregation: a stable inherent feature of migrating humpback
whales............................................................................................................164
5.5.2 Reproductive status of mature females changes early in the southern `
migration............................................................................................................................167
5.5.3 Immature males and females travel in the company of mature non-
lactating females............................................................................................168
5.5.4 Migratory timings of known-age individuals varies with changes
maturational and reproductive status.............................................................169
5.5.5 Migratory timing of mature males allows for the changes the reproductive
status of mature females.................................................................................171
5.5.6 Hervey Bay: a preferential stopover for females early in the
southern migration? .......................................................................................173
5.5.7 Temporal segregation provides a predictable social framework as individuals
move through different maturational and reproductive stages.......................175
5.6 LITERATURE CITED...............................................................................................178

XV
CHAPTER 6: THESIS SYNTHESIS, SUMMARY OF GENERAL CONCLUSION
AND CONSERVATION ISSUES.......................................................................................187
6.1 GLOBAL RESEARCH CONTEXT...........................................................................187
6.2 SYNTHESIS AND GENERAL CONCLUSION.......................................................190
6.2.1 Hervey Bay as a stopover is different from traditional breeding grounds......190
6.2.2 Seasonal changes in social behaviour.............................................................191
6.2.3 Timing and social behaviour of classes of humpback whales utilising Hervey
Bay..................................................................................................................191
6.2.4 Temporal segregation of reproductive and maturational classes...................193
6.2.5 Female bias and differential migration of males and females in Hervey
Bay.................................................................................................................195
6.2.6 Temporal segregation a consistent and coherent feature of social
organisation....................................................................................................195
6.2.7 Increase in abundance may have density dependent effects on humpback
whales in Hervey Bay..................................................................................196
6.2.8 Benefits outweigh costs for humpback whales utilising Hervey Bay............198
6.3 FUTURE RESEARCH...............................................................................................198
6.4 CONSERVATION ISSUES.......................................................................................199
CHAPTER 7: LITERATURE CITED IN GENERAL INTRODUCTION (CHAPTER 1)
AND CHAPTERS 2 and 6....................................................................................................201
CHAPTER 8: APPENDIX: SUMMARY OF RELEVANT AUTHORED AND CO-
AUTHORED PUBLICATIONS..........................................................................................244

XVI
List of Figures
Figure 1.1: Southern Hemisphere breeding grounds (A to G) and feeding areas (I to
VI).............................................................................................................................................17
Figure 1.5.4.1: Estimates of yearly abundance of eastern Australian humpback whales.........26
Figure 1.6.1 The location of Hervey Bay on the eastern coast of Australia and its
geographic relationship to the putative overwintering and breeding grounds within the inter-
reef lagoon of the Great Barrier Reef is shown in the left side map. The migratory pathways
into and out of Hervey Bay (B and D); the area where the humpback whales aggregate (C)
and the main north south migratory pathway (A) are shown in the right side map.................28
Figure 2.1: The location of Hervey Bay on the eastern coast of Australia and the study area
showing the Hervey Bay Marine Park boundaries……………………………………...……34
Figure 2.2: GPS locations of sightings of humpback whales observed in Hervey Bay
during the months of August, September and October over the years 1992-2005..................37
Figure 2.3: A selection of 24 fluke photographs illustrating how the ACDC code in the
filename facilitates visual display to facilitate photo-identification matching.........................42
Figure 3.1: (A) Weekly survey and observation hours 1992–2005, (B) weekly observations
of humpback whale pods and whales 1992–2005, (C) humpback whales and pods observed
per hour in survey periods 1992–2005 with Loess growth curves……………………...……56
Figure 3.2: Observed proportions: (A) pods with calves present by year, (B) pods with
calves present by week within year, (C) all whales in pod (calves included): pod size by year,
(D) all whales in pod (calves included): pod size by week within year……………………...59
Figure 3.3: Estimated probabilities of 1, 2, or 3+ adults: (A) by year, (B) by week within
year for pods with no calves present, and (C) by week within year for pods with calves
present…………………………………………………………………………….……..……64
Figure 4.1: Observed proportions: (A) newly associated pods by year, (B) newly
associated pods by week within year, (C) pods by number of whales in pods (newly
associated; No, Yes).………………………………………………………………………..107
Figure 4.2: Estimated probabilities of observing competitive groups: (A) by newly
associated pods (No, Yes); (B) by number of whales (excluding calves); and (C) by week
within year………………………………………………………………………………..…110

XVII
Figure 4.3: Estimated probabilities of observing non-agonistic social behaviour: (A) by
year; (B) by week within year; (C) by number of whales (excluding calves), in newly
associated pods (No, Yes)……………………………………….…………………….....….113
Figure 5.1: Observations by day within season, of individually identified whales by sex,
age, reproductive and maturational sub-classes: (a) Males (known mature, not with lactating
females); (b) Males (known mature, with lactating females); (c) Males (unknown maturity,
not with lactating females); (d) Females (lactating); (e) Females (non-lactating); (f) Calves
(males and females); (g) Males, females and unknown sex (1-6 years) and (h) Males and
females (7+ years).……………………………………….…………………............….....…148
Figure 5.5.1.1: Temporal segregation of specified categories of humpback whales from
Dawbin (1966, Fig 4, p 158) and Franklin (Table 5.5 and 5.6 above). Migration from tropical
waters (left) and from Antarctic waters (right) by days after passage of earliest migrating
humpback whales, showing mean value for each category...................................................166

XVIII
List of Tables
Table 2.1: Array of Coded Discrete Characteristics (ACDC) applied to ventral fluke
image filenames for photo-id matching of intra and inter-season resightings of individual
humpback whales and the protocol used for the ACDC code assignment and order in
filename.....................................................................................................................................41
Table 2.2: Number and % of flukes by primary ACDC categories in 1992-2009 fluke
catalogue...................................................................................................................................45
Table 2.3: Summary of fieldwork, observations and data: Hervey Bay from 1992 to
2009..........................................................................................................................................46
Table 3.1: Number of whales in pods (N) in Hervey Bay, between 1992-2005...............57
Table 3.2: Number of whales in pods (N) by no calves present and calves present…….57
Table 3.3: Pods with calves/escorts present (by number & percentage)...........................58
Table 3.4: Number of pods by week within year for size categories (1, 2, 3, 4+), for: (a)
Number of adults (in pods with no calves present); (b) All whales (in pods with calves
present) and (c) Number of adults (in pods with calves present). Relevant percentages are
reported below columns………………………………………………………………………61
Table 3.5: Ordered multinomial logistic regression model for the proportions of size
categories 1,2,3+ adults (calves excluded from count): fixed effects parameter estimates, their
standard errors and p-values.....................................................................................................63
Table 4.1: Size (excluding calves1) of newly associated pods (2, 3, 4, 5+); by number of
pods associating (2, 3, 4, 5), size (excluding calves1) of initial pod under observation (1, 2, 3,
4+), split by pods with no calves present and pods with calves present (by number of pods
with sub-totals and percentage)................................................................................................95
Table 4.2: Competitive groups, non-agonistic social behaviour and other behaviour in
pods (n) (by number and percentage) and duration of observations (by hours with minimum,
maximum, median and mean with standard deviation)...........................................................97
Table 4.3: Competitive groups (CG), non-agonistic social behaviour (NASB) and other
behaviour (OB) in all pods, pods with no calves present and pods with calves present, split by
newly associated pods (NAP) and pods that did not associate with other pods (PDNA) (n) (by
numbers and percentage).........................................................................................................99

XIX
Table 4.4: Competitive groups (CG), non-agonistic social behaviour (NASB) and other
behaviour (OB) by number of adults (excluding calves1) in pod (1, 2, 3+), in all pods, pods
with no calves present and pods with calves present, split by newly associated pods (NAP)
and pods that did not associate while under observation (PDNA) (n) (by number and
percentage)..............................................................................................................................101
Table 4.5: Number of pods, week within year by pods (n), newly associated pods (NAP),
competitive groups (CG) and the subset of pods used in analysis, non-agonistic social
behaviour (NASB) and the subset of pods used in analysis...................................................103
Table 4.6: Sex-identified males and females in competitive groups and non-agonistic
social behaviour pods by method of sex-identification, number of males (n), number females
(n) with percentages and totals...............................................................................................105
Table 5.1: Summary of fieldwork, observations and data, Hervey Bay from 1992 to
2009............................................. ...........................................................................................139
Table 5.2: Classification of 361 individually identified humpback whales by sex,
reproductive status and known-age. .......................................................................................144
Table 5.3: Number of observations of individually identified whales (a, b, c and d) by
sex, and method of sex-identification, reproductive category and maturational status; and
known-age whales (e) by maturational status, age-class (i, ii, iii, iv) and sex........................145
Table 5.4: Occurrences of more specific reproductive categories of 111 individually
identified females derived from adjacent year resightings.....................................................146
Table 5.5: Sub-class results and statistics........................................................................147
Table 5.6: Multilevel model estimated means (Peak Density), their standard errors and
95% confidence interval for each class...................................................................................152
Table 5.7: Results of the ten planned pairwise comparison tests between selected sexual,
reproductive and maturational classes based on estimated marginal means..........................153
Table 5.8: Number of observations of individuals (N) per year, and the geometric and
arithmetic means and standard deviations of observed residency times.................................155
Table.5.9: Number of observations of individuals (N) by sex and reproductive state, and
the geometric and arithmetic means and standard deviations of observed residency times...155

XX
Table.5.10: Estimated geometric means of the distributions of observed residency times of
individuals...............................................................................................................................156
Table.5.11: Females with sightings spanning ten or more days........................................158
Table.5.12: Males with sightings spanning ten or more days............................................159
Table.5.13: Timing and changes of maturational and reproductive status of known-age
male: observation number (Obs), date of sighting, age, number of pods, pod size, number of
calves present, number of known females present, behaviour in pod, pod composition and
notes, with times in brackets...................................................................................................161
Table.5.14: Timing and changes of maturational and reproductive status of known-age
females: observation number (Obs), date of sighting, age, number of pods, pod size, number
of calves present, number of known females present, behaviour in pod, pod composition and
notes, with times in brackets...................................................................................................163

1
Chapter 1
General Introduction
1.1 HUMPBACK WHALES (Megaptera novaeangliae, Borowski 1781)
Humpback whales are found in all oceans of the world and are a large baleen whale
distinguished by long pectoral fins, distinctive tubercles on the rostrum and unique ventral
surface pigmentation patterns and unique serrations on the trailing edge of the tail flukes
(True 1904, Katona and Whitehead 1981, Clapham and Mead 1999). They are noted for their
exuberant surface behaviours and are the focus of a global whale-watching industry (Clapham
2000, O’Conner et al. 2009).
1.2 TAXONOMY AND MORPHOLOGY
1.2.1 Taxonomy
Humpback whales belong to the Order Cetacea (now included in Order Cetartiodactyla),
Suborder Mysticeti Family Balaenopteridae (Clapham and Mead 1999). Historically the
species was described as several different populations, which were considered to vary in size
and pigmentation. However the variations among populations described did not warrant
subspecies differentiation, as the general agreement was that they were all referable to the
same species (True 1904, Clapham and Mead 1999). Megaptera novaeangliae was first
described from a specimen on the coast of New England by Borowski (1781) and remains the
current and accepted taxonomic classification of humpback whales; the genus is considered
mono-typic (Clapham and Mead 1999).

2
1.2.2 Species Morphology
True (1904), noted that the morphological feature that distinguishes Megaptera novaeangliae
from other balaenopterids and any other cetacean, is the large pectoral fins measuring one
third of their body length. The anterior surface of the pectoral fins have a number of large
protuberances unlike the anterior edge in any other species of Cetacea, and in contrast to the
medial ridge of other balaenopterids, rounded tubercles are present on the upper and lower
jaws and rostrum (True 1904, Clapham and Mead 1999). The morphology of the pectoral fins
and the placement of the leading edge tubercles are reported to have a hydrodynamic form
and function that provides enhanced lift at high angles of attack for high maneuverability
associated with feeding behaviour (Whitehead 1981, Fish and Battle 1995, Miklosovic et al.
2004). The colouration of the dorsal surface is black and the ventral surface varies from all
black to all white (Rosenbaum et al. 1995, Clapham and Mead 1999).
In some populations the white ventral surface of some humpback whales can extend
considerably up the flanks towards the dorsal fin (Kaufman et al. 1987). The black and white
patterns on the ventral surface of the tail flukes also vary in combinations of the two
pigmentations and together with the characteristic serrated posterior margin of the flukes,
each caudal fin is individually distinctive (Katona and Whitehead 1981). The utilisation of
those individual pigmentation patterns and the ventral fluke serrations has been the basis of
many long-term studies of identified individual humpback whales (Clapham and Mead 1999).
The dorsal fin is also highly variable in shape and ranges from low-set and rounded to high-
set and falcate (Katona and Whitehead 1981, Clapham and Mayo 1990).
As in all balaenopterids, the ventral grooves expand during feeding, allowing considerable
enlargement of the mouth cavity. The baleen plates, which function as a filtering curtain, are
mainly black except along the front 30.5 cm where they are partly white on the anterior (True

3
1904). Compared to all other baleen whales the humpback whales have relatively few throat
grooves, 14 to 22, which are approximately 10 to 13 cm wide, while all other rorqual whales
have 38 to 100 throat grooves (True 1904, Clapham and Mead 1999).
The most distinctive characteristic distinguishing female humpback whales from males is the
presence of a hemispherical lobe at the posterior terminus of the genital slit, which is absent
in males (True 1904, Glockner 1983).
Chittleborough (1965) analysed the mean lengths of 2,031 male and 1,605 female humpback
whales and reported that for physically mature males and females the mean lengths were 13.0
m and 13.9 m, respectively; 9.9 m and 9.7 m for males and females at the age of one year; and
11.8 m and 11.9 m in length at the average age of sexual maturity. He also reported that the
mean body length of females is approximately 1-1.5 m longer than males.
Of the many body lengths data recorded from commercial whaling sources, True (1904)
reported that the largest humpback whale male was 16.2 m and the largest female was 15.7 m.
In comparison, the whaling stations at Moss Landing and Trinidad, California, between 1919
and 1926 reported that the largest individual humpback whales were 17.4 m for males and
18.6 m for females (Clapham et.al. 1997); however, it is not clear whether these were
measured in a straight line from the tip of the rostrum to the notch of the flukes, or using a
curvilinear method along the body (which gives an inaccurate and larger measurement). The
largest humpback whales among several thousand measured by Chittleborough (1965) from
Antarctic and Australian catches, were 14.3 m for males and 15.5 m for females. Clapham
and Mead (1999, p.2) cautioned that “although the extreme values of sizes appear
questionable it must be remembered that many subsequent measurements were recorded from
heavily exploited populations from which the largest individuals had been removed, and that
4
while humpback whales of 17 to 18 m long seem unlikely, it is conceivable that pristine
populations could contain a few individuals of this size.”
1.3 LIFE HISTORY
1.3.1 Birth, growth and maturity
Humpback whale calves are born after a gestation of between 11 and 12 months
(Chittleborough 1958a, Clapham 2000) and although there have been some twin fetuses
recorded from whaling carcasses (Chittleborough 1958a, 1965; Slijper 1962; Mikhalev;
1997), there are no reliable records of a humpback whale giving birth to twins. Although no
birth event has been observed in this species the abundance of females with young calves in
sub-tropical and tropical waters during the winter makes it clear that the majority of calves are
born in low latitudes (Matthews 1937, Chittleborough 1965, Clapham 2000). Weaning is
approximately at age 10-12 months and independent feeding can occur at six months, with a
few calves remaining with their mothers at some point during the second winter
(Chittleborough 1958a; Baker and Herman 1984b; Clapham and Mayo 1987, 1990; Glockner-
Ferrari and Ferrari 1990; Baraff and Weinrich 1993; Clapham 1993).
The peak birth month in the Southern Hemisphere, as determined from fetal birth length, is
early August (Matthews 1937; Chittleborough 1958a, 1965). Studies in the breeding grounds
in the Northern Hemisphere suggest that the peak birth month is February (Herman and
Antinoja 1977, Whitehead 1981). The mean length of calves at birth is between 13 and 15 feet
(3.96 to 4.57 m) (Clapham et al. 1999). Calves are precocious: they may begin the migration
to the mother’s high-latitude feeding grounds when only a few weeks old and probably learn

5
from their mothers the migratory routes to the feeding areas and back to the breeding grounds
(Clapham and Mayo 1987, Clapham 2000).
In the Northern Hemisphere, calving intervals were found to be between one and five years,
although two to three years appear to be most common (Wiley and Clapham 1993, Barlow
and Clapham 1997, Steiger and Calambokidis 2000). In the Southern Hemisphere, most
information on humpback population characteristics and life history was obtained from
whaling data from the early 1900s to the 1960s (Clapham and Baker 2008). Reported average
annual birthing rates from whaling data of 0.37 (Western Australia: Chittleborough 1965) are
comparable to the measure of ‘calves per mature female per year’ reported from some long-
term studies, including 0.37 for Alaska (Baker et al. 1987); 0.41 for the Gulf of Maine
(Clapham and Mayo 1990, Clapham 2000) and 0.48 for the Hawaiian Islands (Herman et al.
2011). Post-partum ovulation has been reported (Chittleborough 1965) and inter-birth
intervals of a single year have occasionally been recorded (Clapham and Mayo 1987,
Glockner-Ferrari and Ferrari 1990, which may be a consequence of early calf mortality or the
fitness of the female (Lockyer 1984, Clapham and Mayo 1987, Gabriele et al. 2001. The
annual survival rate of calves in the Southern Hemisphere is unknown (Fleming and Jackson
2011).
In the North Atlantic Gulf of Maine feeding grounds and the North Pacific Hawaiian Islands
breeding grounds, adult mortality of humpback whales has been estimated to range between
0.049 and 0.037 (Barlow and Clapham 1997, Mizroch et al. 2004). In Hervey Bay, eastern
Australia in the Southern Hemisphere, adult survival of humpback whales has been estimated
at 0.966 (95% CI: 0.87 to 1.00 (Chaloupka et al. 1999).
The life expectancy of humpback whales is difficult to estimate because whaling removed
most ‘old’ whales from the population (Clapham 2000). Ages of humpback whales were
6
originally calculated by counting the laminations (light and dark layers) that accumulate in
earplugs (waxy accretions that form in the auditory canal) (Chittleborough 1959b, 1965) as
one growth layer (GLG). Chittleborough (1959a) also used an alternative method of age
determination using the growth of cortical layers in the baleen plates. However this latter
method was found to be unreliable (Chittleborough 1959a, Robins 1960, Best 2006, 2011).
Earplug readings provided an earplug age estimate of two GLG’s accrued per annum for
humpback whales (Chittleborough 1959b, Robins 1960). Using this method Chittleborough
(1965), reported that the oldest whale he examined off western Australia was 48 years old. A
review of the original GLG counts and available age calibration evidence from corpora lutea
(a structure that develops in an ovary) concluded that one GLG is accrued annually, rather
than two (Best 2006, 2011). Consequently this finding doubles the estimated time to sexual
maturity of humpback whales from age 5 to 11 years from that population at that time and
suggests the likelihood that the Chittleborough 48 year old whale may have been 96 years of
age (Chittleborough 1959b, 1965; Clapham 1992; Gabriele et al. 2007a). However,
longitudinal identification studies have reported differing data on sexual maturity for some
populations. In the Gulf of Maine, Clapham (1992) reported sexual maturity at five years of
age based on individually identified whales, while in southeastern Alaska Gabriele et al.
(2007) reported ages at first calving at an average 11.8 years. The variance in these results
remains unresolved (Best 2011).
Sexual maturity is defined by the presence of sperm in the testes of males or the occurrence of
ovulation in females (Chittleborough 1954, 1955a, and b). Whaling biologists determined
sexual maturity in male and female humpback whales from the histological examination of
whaling carcasses. In particular they examined the weight and diameter of the testes in males
and compared the increase of testis size with body length and maturity. To determine whether
a female humpback whale was sexually mature, whale biologists undertook histological

7
examination of the ovaries and the ovarian cycle, mammary glands and foetuses (Matthews
1937, Omura 1953, Chittleborough 1954, 1955a, and b, Nishiwaki 1959). Physical maturity
of humpback whales is based on their body lengths and is generally defined by the complete
epiphysial fusion of a cap at the bone of joints in the vertebrae (Chittleborough 1955b).
During the winter months in both the Northern and Southern Hemisphere humpback whales
migrate to tropical and sub-tropical breeding areas where they aggregate in large numbers to
mate or give birth (Clapham 2000). Parental care of calves is provided exclusively by females
(Clapham 2000) who seek shallow water in which to give birth and possibly to minimize
harassment from mature males (Smultea 1994, Craig and Herman 2000). Because female
humpbacks are widely dispersed in the breeding areas males cannot monopolize groups of
females or defend resource-based territories (Clapham 1996, 2000). Consequently, males
compete for single rather than multiple females, which involves intrasexual aggression among
males in competitive groups (Darling et al. 1983, 2006; Tyack and Whitehead 1983, Baker
and Herman 1984b, Clapham et al. 1992, 1993; Clapham 2000, Herman et al. 2008). Males
also organize themselves through communal singing displays (Darling et al. 2006), and are
involved in escorting or guarding females (Darling and Berube 2001). A male biased sex ratio
has been reported in breeding grounds (Herman et al. 2011). Humpback whales are
considered to be polygamous and promiscuous with females observed with multiple males,
and males observed with multiple females (Baker 1985, Clapham and Palsboll 1997, Clapham
2000). However, the mating system of humpback whales is still not fully understood (Herman
and Tavolga 1980, Clapham 1996, Cerchio et al. 2005, Darling et al. 2006).

8
1.3.2 Diet and foraging behaviour
Humpback whales feed on dense patches of euphausiids (krill) and small schooling fish
(Clapham 2000). Known prey organisms include Euphausia, Thysanoessa, or
Meganyctiphanes krill (Ingebrigtsen 1929, Matthews 1937, Mackintosh 1942, Nemoto 1959,
Slijper 1962, Nowacek et al. 2011); Clupea herring (Hain et al. 1982, Baker et al. 1985,
Clapham et al. 1997, Sharpe and Dill 1997, Overholtz and Link 2007); Scomber mackerel
(Geraci et al. 1989, Mikhalev 1997); Ammodytes sand lance (Overholtz and Nicolas 1979;
Hain et al. 1982; Auster et al. 1986; Payne et al. 1986, 1990; Friedlaender 2009); Mallotus
capelin (Matthews 1937, Clapham et al. 1997, Witteveen et al. 2008); Sardinops sardine
(Clapham et al. 1997, Mikhalev 1997, Schweigert et al. 2007); and Engraulis anchovy
(Kieckhefer 1992, Clapham et al. 1997).
Humpback whales are described as ‘gulp feeders’; they engulf a single mouthful of prey at a
time (Watkins and Schevill 1979, Hain et al. 1982, Clapham 2000). Feeding behaviours
include swimming/lunging and bubble netting (Jurasz and Jurasz 1979, Hain et al. 1982,
Goldbogen et al. 2008). Humpback whales either forage alone, in pairs or sometimes in
cooperative groups (Whitehead 1983, Baker and Herman 1984a, Perry et al. 1990, Straley
1990, Baker et al. 1992, Clapham 1993, Clapham 2000). However, major differences have
been reported in feeding techniques used by humpback whales in different oceans (Clapham
2000). It has been suggested that certain feeding behaviours are spread through the population
by cultural transmission (Weinrich et al. 1992) and that feeding behaviours change
simultaneously with changes in prey behaviour (Friedlaender et al. 2009).

9
1.3.3 Threats and potential anthropogenic impacts
By the mid-20th century most humpback whale populations were in rapid decline and were in
danger of becoming severely depleted by the onslaught of modern whaling. Clapham and
Baker (2008) reported that between 1904 and 1983 197,000 humpback whales were taken in
the Southern Hemisphere. Extensive illegal and unreported catches of humpback whales by
the Soviet whaling occurred between 1947 and 1973, leading to the collapse of regulated
shore-based whaling on the east coast of Australia and New Zealand (Clapham and Baker
2008, Clapham et al. 2009). In 1963 humpback whales were declared to be protected in the
Southern Hemisphere, and by 1986 when a global moratorium on commercial whaling came
into force most populations of humpback whales were exhibiting signs of increasing
abundance. However the threat remains of unregulated special permit whaling in the Antarctic
(Clapham et al. 2003). The proposal in 2005 by Japan to take a self-declared quota of 50
humpback whales annually starting in the 2007 season onwards, although not acted upon, is
still a potential threat to Antarctic humpback whales (Nishiwaki et al. 2007).
Humpback whales are under threat from a range of issues (see recent review in Fleming and
Jackson 2011). Major threats to humpback whales in the Northern and Southern Hemisphere
include vessel strikes resulting in mortality, injury and strandings (Laist et al. 2001, Lammers
et al. 2003, Gabriele et al. 2007b, Van Waerebeek et al. 2007, Douglas et al. 2008, Glass et
al. 2009, Marcondes and Engel 2009, Strahan 2009, Braulik et al. 2010, Carrillo and Ritter
2010, Silber et al. 2010, Pace 2011); entanglement in fishing gear (Johnson et al. 2005, Glass
et al. 2009, Kiszka et al. 2009, Neilson 2009, Robbins et al. 2009, Strahan 2009, Robbins
2010, Cassoff et al 2011, Meyer et al. 2011); marine debris, which could be linked to
strandings (Williams et al. 2011, Baulch and Perry 2012); contaminants (Geraci et al. 1989,
Aguilar et al. 2002, Elfes et al. 2010) and anthropogenic sound (Frankel and Clark 2000,

10
2002; McCauley et al. 2000; Johnson and Tyack 2003; Wright et al. 2007; Van Parijs et al.
2009).
Seismic surveys for oil and gas exploration worldwide and its potential impact on marine
mammals from acoustic noise, have been widely investigated and monitored (McCauley et al.
2000, Engel et al. 2004, Cerchio et al. 2010). Further potential impacts on humpback whale
populations include the effects of climate change on the ocean environment and its marine
food web (Orr et al. 2005, Kurihara 2008, Moore and Huntington 2008, Nicol et al. 2008,
Wootton et al. 2008, Doney et al. 2009, Simmonds and Eliott 2009, Alter et al. 2010); whale
watching (Corkeron et al. 1995, O’Connor et al. 2009, Weinrich and Corbelli 2009, Schaffar
and Garrigue 2010, Franklin et al. 2011); and natural mortality from killer whale attacks on
humpback whales, particularly calves (Naessig and Lanyon 2004, Steiger et al. 2008).
1.4 DISTRIBUTION AND MIGRATORY PATTERNS
1.4.1 Asynchronous timing of migrations
Humpback whales are cosmopolitan and are found in all oceans of the world. They migrate
over long distances up to 16,000 km each year between summer feeding areas in temperate or
near-polar waters and winter breeding grounds in tropical and near-tropical waters (Baker et
al. 1990, Rasmussen et al. 2007). The Northern and Southern Hemisphere humpback whales
are asynchronous in the seasonal timing of their migrations between low-latitude tropical
breeding grounds and high-latitude feeding areas (Omura 1953; Dawbin 1956, 1966;
Chittleborough 1965; Baker et al. 1990; Clapham 2000).

11
Spatial overlap between Southern and Northern Hemispheres by southern humpback whales
occurs in Central America and the Gulf of Guinea, West Africa (Acevedo and Smultea 1995,
Van Waerebeek 2003, Stevick et al. 2004, Best 2008). Rasmussen et al. (2007) suggested
that the spatial overlap of Southern Hemisphere whales across the equator into Northern
Hemisphere waters may be related to water temperatures for breeding.
1.4.2 Ancient lineages and maternally directed fidelity
There are three major worldwide oceanic divisions of humpback whale populations based on
genetic differentiation: North Atlantic, North Pacific, and Southern Hemisphere populations
(Baker et al. 1993, Baker and Medrano-Gonzalez 2002). Baker et al. (1990) reported a
marked segregation of mitochondrial DNA haplotypes among subpopulations of humpback
whales on different feeding and wintering grounds of the North Pacific and western North
Atlantic oceans as well as between the two oceans. They interpreted this segregation to be the
consequence of maternally directed fidelity to migratory destinations. Baker et al. (1993)
suggested that the existing humpback whale lineages are of ancient origin. Photo-
identification of individual humpback whales over long periods of time has documented
maternally directed fidelity to feeding destinations (Martin et al. 1984, Clapham and Mayo
1987, Katona and Beard 1990, Clapham et al. 1993, Palsboll et al. 1997). There have been
few reports of exchange between distant feeding grounds, with neighbouring feeding grounds
being more frequent sites for exchange (Katona and Beard 1990, Stevick et al. 2006).

12
1.4.3 Northern Hemisphere: feeding, breeding and migration
In the Northern Hemisphere humpback whale populations are widely dispersed in two major
ocean basins, the North Atlantic Ocean and the North Pacific Ocean and there is a single
population in the North Indian Ocean (Clapham 2000, Fleming and Jackson 2011).
1.4.3.1 North Atlantic Ocean
In the North Atlantic ocean the feeding areas are located in the Gulf of Maine (Clapham and
Mayo 1987, 1990; Katona and Beard 1990; Weinrich 1991; Clapham 1993; Clapham et al.
1993; Palsboll et al. 1995, 1997; Smith et al. 1999; Stevick et al. 2003, 2006; Clark and
Clapham 2004; Robbins 2007); the Gulf of St Lawrence, Newfoundland and Labrador in
Canada and West Greenland in the western North Atlantic (Whitehead 1983; Katona and
Beard 1990; Palsboll et al. 1995, 1997; Smith et al. 1999; Stevick et al. 2003, 2006); and in
the eastern North Atlantic in Iceland including the Jan Mayen and Bear Islands and the
Barents Sea off northern Norway (Ingebrigtsen 1929; Martin et al. 1984; Katona and Beard
1990; Palsboll et al. 1995, 1997; Smith et al. 1999; Stevick et al. 1999b, 2003, 2006).
Humpback whales feeding in the western and eastern Atlantic migrate annually to primary
winter breeding grounds in the West Indies (Ingebrigtsen 1929; Balcomb and Nichols 1982;
Whitehead and Moore 1982; Martin et al. 1984; Mattila and Clapham 1989; Mattila et al.
1989, 1994; Palsboll et al. 1995, 1997; Stevick et al. 1998, 1999a, 2003; Smith et al. 1999;
Charif et al. 2001; Reeves et al. 2001).
Stone et al. (1987) reported that Bermuda is a mid-ocean habitat and stopover for western
North Atlantic humpback whales en route to, and from, the West Indies breeding grounds.
They also reported evidence suggesting that feeding occurs in the deep waters off Bermuda
during the stopover.

13
1.4.3.2 North Pacific Ocean
Feeding areas in the North Pacific Ocean range from Russia in the western North Pacific to
Alaska in the north-eastern Pacific and California in the eastern Pacific (Clapham 2000,
Calambokidis et al. 2008, Fleming and Jackson 2011).
The most westerly summer feeding areas in the North Pacific were found in Russian waters in
the Gulf of Anadyr, the east side of Kamchatka, the Commander Islands, the Kuril Islands and
the western end of the Aleutian Islands (Baker et al. 2008, Calambokidis et al. 2008). Dense
feeding aggregations occur across the Alaskan region with specific feeding locations
identified in the eastern Aleutian Islands, the Bering Sea, the western and northern Gulf of
Alaska and southeastern Alaska (Baker et al. 1985, 1990, 1992, 1994, 1998a, 2008; Perry et
al. 1990; Calambokidis et al. 1996, 2008). The most easterly feeding areas in the North
Pacific are along the North American coastline at northern and southern British Columbia off
Canada, and northern Washington, Oregon and California off the west coast of the United
States (Baker et al. 1994, 1998a, 2008; Calambokidis et al. 1996, 2000, 2008; Darling et al.
1996).
Humpback whales feeding across the North Pacific migrate annually between at least five
primary over-wintering breeding regions, Asia, Hawaii, offshore Mexico, mainland
Mexico/Central America (Calambokidis et al. 2008). The specific breeding grounds in these
regions are: Asia including the waters off the northern Philippines and Taiwan, Okinawa and
the Ryukyu Islands near Japan and the Ogasawara and Mariana Islands (Nishiwaki 1959;
Baker et al. 1998a, 2008; Calambokidis et al. 2008); the main Hawaiian Islands including
Kauai, Oahu, Penguin Bank, Molokai, Maui and the Big Island (Herman and Antinoja 1977;
Baker and Herman 1981; Glockner and Venus 1983; Baker et al. 1994, 1998b, 2008;
Calambokidis et al. 2008; Herman et al. 2011); and Mexican waters including the mainland

14
Pacific coast, the southern Baja Peninsula, offshore in the Revillagigedo Archipelago and
Central America (Baker et al. 1994, 1998b, 2008; Urban et al. 1999; Calambokidis et al.
2000, 2008; Rasmussen et al. 2004, 2012; May-Collado et al. 2005; Oviedo and Solis 2008;
Rasmussen 2008). The principal breeding ground for the North Pacific humpback whales is
the Hawaiian Islands (Calambokidis et al. 2008, Herman et al. 2011).
In addition, the low proportion of photographic matches between the Bering Sea and the
currently known breeding areas strongly suggests the existence of another, as-yet-
undiscovered breeding ground for North Pacific humpback whales (Calambokidis et al.
2008).
Calambokidis et al. (2008) reported that the linkages between feeding areas and breeding
grounds in the North Pacific are complex with a high degree of maternally directed fidelity to
both feeding areas and breeding grounds. Hawaii and the Revillagigedos are the principal
breeding grounds for higher latitude feeding areas of the eastern Aleutians, Bering Sea, Gulf
of Alaska, southeastern Alaska, northern and southern British Columbia, and northern
Washington (Baker et al. 1985, 1990, 1994, 1998a, 2008; Calambokidis et al. 2008).
Humpback whales feeding in Russian waters in the eastern Pacific migrate annually to Asian
breeding grounds (Baker et al. 2008, Calambokidis et al. 2008), while humpbacks feeding off
the Washington Oregon Californian coast primarily migrate to Mexican and Central
American breeding grounds (Baker et al. 1990, 1994, 1998a, 2008; Calambokidis et al. 2000,
2008; Rasmussen et al. 2012). Darling et al. (1996) reported a humpback whale migrating
between British Columbia and Japan.
Interchange between the principal wintering regions across seasons (Asia, Hawaii and
Mexico) is relatively low, and interchange between the two feeding groups (one group
offshore of California and Oregon and another feeding group offshore of northern

15
Washington and southern British Columbia) is relatively uncommon (Calambokidis et al.
2008).
Calambokidis et al. (2008) reported low levels of interchange between western Pacific
feeding and breeding areas in Russian and Asian waters and the central and eastern North
Pacific, and interchange between the breeding regions of Asia, Hawaii and Mexico were also
relatively low. The movements of humpback whales between the two breeding grounds of
Japan and Hawaii have been reported (Darling and Cerchio 1993, Salden et al. 1999).
1.4.3.3 Northern Indian Ocean
In the Northern Indian Ocean a single isolated humpback whale population is located in the
waters of the Gulf of Oman and the Arabian Sea off Oman on the Arabian Peninsula (Reeves
et al. 1991, Mikhalev 1997, Minton 2004, Rosenbaum et al. 2009, Minton et al. 2011).
Mikhalev (1997) reported that examination of individual whales taken from this population
during Soviet whaling in the mid-nineteen sixties showed significant differences from
Antarctic humpback whales and provided strong evidence that the population was both
feeding and breeding in Arabian waters year-round. The isolation of this population was
subsequently confirmed by both photo-identification and genetic analysis (Minton 2004,
Rosenbaum et al. 2009, Minton et al. 2011). This small (< 100 individuals, Minton et al.
2011) unique non-migratory population is endangered and threatened by anthropogenic
impacts (Baldwin et al. 2010, Braulik et al. 2010, Corkeron et al. 2011, Minton et al. 2011).
Corkeron et al. (2011) suggested that spatial models of sparse data could inform conservation
planning for mitigating impacts on the endangered Arabian Sea population of humpback
whales.
16
1.4.4 Southern Hemisphere: breeding, feeding and migration
1.4.4.1 Southern Hemisphere Populations
Kellogg (1929) reported six populations of humpback whales in the Southern Hemisphere;
two populations in each of the Southern Atlantic, Indian and Pacific Oceans. Based on recent
information of humpback whale populations in the Southern Hemisphere the International
Whaling Commission (IWC) has identified seven breeding populations categorised as A to G
(IWC 2006, Fig 1.1): A, is Brazil in the southwestern Atlantic; B, is West Africa in the
southeastern Atlantic; C, is East Africa in the southwestern Indian Ocean; D, is western
Australia in the southeastern Indian Ocean; (E1), is eastern Australia in the southwestern
Pacific Ocean; E2 and E3, are in southwestern Oceania; and F, is in central Oceania. Finally,
G is in the southeastern Pacific off South America (IWC 2006, Fig 1.1).
The IWC adopted six Management Areas for feeding areas in Antarctica (IWC 2006, Fig 1.1):
Area I, below western South America; Area II, below eastern South America; Area III, below
Africa; Area IV, below central Indian Ocean and Western Australia; Area V, below eastern
Australia and western Pacific and VI, below the central Pacific.

17
Figure 1.1. Southern Hemisphere breeding grounds (A to G) and feeding areas (I to
VI). The areas and sub-areas identified reflect approximate, rather than exact boundaries. A
dotted line represents a hypothetical connection, thin lines represent a small number of
documented connections between areas using Discovery tags, photo-identification, genetics or
satellite tracked whales and thick lines represent a large number of documented connections
between areas from resights using Discovery tags, photo-identification, genetics or satellite
tracked whales (source, IWC 2006).
1.4.4.2 South America, southeastern Pacific (Breeding G; feeding Area I)
The most northerly breeding grounds for Southern Hemisphere humpback whales migrating
from the Antarctic feeding areas are located above the equator (see 1.3.1 above, overlap
between Northern and Southern Hemisphere humpback whales) in waters off Central
America and the northwest South American continent at: Costa Rica (Acevedo and Smultea
1995; Rasmussen et al. 2000, 2004, 2007, 2012; May-Collado et al. 2005; Acevedo et al.
2007, 2008a, 2008b; Florez-Gonzalez et al. 2007); Panama (Acevedo et al. 2007, 2008a;

18
Florez-Gonzalez et al. 2007; Rasmussen et al. 2008, 2012) and Colombia (Florez-Gonzalez
1991, Caballero et al. 2001, Olavarria et al. 2006a, Florez-Gonzalez et al. 2007, Acevedo et
al. 2008a).
Further south below the equator, breeding aggregations of humpback whales are located in the
waters off Ecuador (Felix and Haase 1997, 2001a, 2001b; Scheidat et al. 2000; Felix et al.
2006a, 2007, 2009a, 2009b; Olavarria et al. 2006a; Florez-Gonzalez et al. 2007; Castro et al.
2008, 2011), Galapagos Islands (Felix et al. 2006b), and the northern coast of Peru (Ramirez
1988, Florez-Gonzalez et al. 2007).
Humpback whales breeding in Central America and off the northwestern coast of South
America migrate annually to feeding areas in the Magellan Strait, Chile and the western
Antarctic Peninsula (Caballero et al. 2001; Acevedo et al. 2006, 2008a, 2008b; Florez-
Gonzalez et al. 2007). Photo-identification and genetic data suggest that humpback whales
breeding in Central America predominantly feed in the Magellan Strait, while humpback
whales breeding off the northwestern coast of South America feed off the western Antarctic
Peninsula (Olavarria et al. 2006a, Acevedo et al. 2008b).
1.4.4.3 South America: Southwestern Atlantic Ocean (Breeding A, feeding Area II)
The primary breeding ground for humpback whales in the southwestern Atlantic is located
along the coastline of Brazil ranging from the waters off Natal in northeast Brazil, the waters
off Rio de Janeiro in the south, with the main concentrations in the Abrolhos Archipelago
(Martins et al. 2001; Zerbini et al. 2004, 2006; Darling and Sousa-Lima 2005; Rosenbaum et
al. 2006, 2009; Engel et al. 2008; Rossi-Santos et al. 2008; Andriolo et al. 2010; Cypriano-
Souza et al. 2010; Wedekin et al. 2010a, 2010b) (Fig 1.1).

19
Humpback whales breeding off the Brazilian coast migrate annually to feeding areas located
in offshore waters of the South Sandwich Islands, the western Antarctic Peninsula and
possibly South Georgia (Zerbini et al. 2006, Engel et al. 2008, Engel and Martin 2009) (Fig
1.1).
1.4.4.4 West Africa: Southeastern Atlantic Ocean (Breeding B; Feeding Area II and III)
Humpback whale breeding grounds in the waters off West Africa are located in the Gulf of
Guinea (breeding stock B1, IWC 2006) in the waters of the Bight of Benin, Togo, the Sao
Tome and Principe Archipelago and Pagalu to the north (Aguilar 1985; Van Waerebeek 2003;
Rosenbaum and Mate 2006; Picanco et al. 2009), and further south in the waters off Gabon,
Congo and Angola (Walsh et al. 2000; Rosenbaum et al. 2004, 2009; Darling and Sousa-
Lima 2005; Pomilla and Rosebaum 2006; Rosenbaum and Collins 2006; Rosenbaum and
Mate 2006; Weir 2007; Cerchio et al. 2010). Recent genetic studies indicate that humpback
whales migrating off Namibia and west South Africa are from a separate breeding sub-
population (breeding stock B2, IWC 2006), the location of which has yet to be identified
(Barendse et al. 2006, 2011; Rosenbaum and Mate 2006; Rosenbaum et al. 2009). Macleod
and Bennet (2007) reported humpback whales in the waters of St Helena Island in the
southeastern Atlantic.
Feeding areas for humpback whales breeding on the western coast of Africa have been
identified south of the Walvis Ridge off Namibia and the waters of Saldanha Bay southwest
Africa (Best et al. 1995; Barendse et al. 2006, 2011). It has also been suggested that West
African humpback whales migrate to the areas in waters off Bouvet Island, southwest of
Africa (Rosenbaum and Mate 2006, Engel and Martin 2009).

20
1.4.4.5 East Africa, southwestern Indian Ocean (Breeding C; feeding Area III)
There are three separate breeding aggregations of humpback whales in waters off East Africa:
Seychelles Tanzania Mozambique (C1, IWC 2006), (Reeves et al. 1991, Best et al. 1998,
Hermans and Pistorious 2008, Rosenbaum et al. 2009, Findlay et al. 2011); Comoros Islands
Mayotte Island and islands and reef of the Mozambique Channel (C2, IWC 2006), (Best et al.
1998; Ersts et al. 2006, 2011; Kiska et al. 2007; Rosenbaum et al. 2009; Findlay et al. 2011)
and the coastal waters of Madagascar (C3, IWC 2006), (Wray and Martin 1983; Rosenbaum
et al. 2009; Best et al. 1998; Ersts et al. 2003, 2006, 2011; Pomilla and Rosenbaum 2006;
Murray et al. 2009). Humpback whales have also been observed in the migratory corridor off
Cape Vidal, northern Natal (Findlay and Best 2006).
Best et al. (1998) suggested that humpback whales migrating from East Africa to Antarctic
feeding grounds travel along three proposed routes: one southeast along the eastern coastline
of southern Africa; a second south from the Mozambique Channel and a third southwards
from southern Madagascar. The summer feeding distribution of east African humpback
whales is unknown. The putative feeding areas may be in Antarctic waters of Area III
between 50 E and 600 E (IWC 2006, Tynan 1998, Fig. 1.1).
1.4.4.6 Western Australia, southeastern Indian Ocean (Breeding D; feeding
Area IV and V)
The most northerly aggregation of humpback whales off the western Australian coast is at
Camden Sound, in the Kimberley Region (150S to 180S), which has also been identified as a
major calving area (Bannister and Hedley 2001, Jenner et al. 2001). During the southern
migration, resting areas have been reported at Exmouth Gulf (210S) and Shark Bay (250S)
(Bannister, 1994, Bannister and Hedley 2001, Jenner et al. 2001).

21
Chittleborough (1959a, 1965) reported whaling catches in the migratory corridor off Point
Cloates (220S), Carnarvon (250S) and in the waters off Albany (350S). The migratory corridor
also includes the Dampier Archipelago (200S) and the Perth Basin (330S) (Jenner and Jenner
1994, Jenner et al. 2001).
The summer feeding areas for western Australian humpback whales are in Antarctic waters
above 560S and between 800E and 1100E (Area IV, IWC 2006, Fig 1.1) (Rayner 1940;
Chittleborough 1959a, 1965; Gill and Burton 1995; Matsuoka et al. 2006; Franklin et al.
2008). Discovery Mark data and recent satellite tag data suggest some mixing of western
Australian and eastern Australian humpback whales during summer feeding in Area IV
(Chittleborough 1965, Gales et al. 2009).
1.4.4.7 South Pacific Islands (Oceania) (Breeding E2, E3 and F1, F2;
feeding Area V, VI and I)
Four breeding populations have been identified in tropical waters in the South Pacific Ocean;
two are in the western Pacific designated E2 and E3 and two in the central Pacific F1 and F2
(IWC 2006, Fig.1.1).
Breeding locations for E2 are in the waters off New Caledonia (18-23°S, 163-169°E) and
Vanuatu (170S, 1680E) (Garrigue and Gill 1994; Garrigue et al. 2004, 2010; Baker et al.
2006; South Pacific Whale Research Consortium 2009). Breeding locations for E3 are in the
waters off Fiji (18°S, 178°E) (Paton and Clapham 2002, South Pacific Whale Research
Consortium 2009); Samoa and American Samoa (13°S, 173-170°W) (Baker et al. 2006, Noad
et al. 2006, Robbins and Mattila 2006, South Pacific Whale Research Consortium 2009,
Carretta et al. 2010) and Tonga (15-23°S, 173-177°W) (Abernethy et al. 1992, Baker et al.
2006, Olavarria et al. 2007, South Pacific Whale Research Consortium 2009).

22
In the central South Pacific breeding area F1 is located in the waters of the Cook Islands (8-
23°S, 156-167°W) (Hauser et al. 2000, Baker et al. 2006, Hauser and Clapham 2006, South
Pacific Whale Research Consortium 2009; Hauser et al. 2010) and F2 is located in the waters
of French Polynesia (8-27°S, 134-155°W) (Poole 2002, 2006; Gannier 2004; Baker et al.
2006; Carretta et al. 2010; South Pacific Whale Research Consortium 2009). Hauser and
Clapham (2006) report that although the observations of humpback whales in the Cook
Islands have the primary characteristics of a breeding area the low density of whales and the
absence of inter-annual resightings suggest that it may not be a central breeding location but
rather a migratory corridor. This is also supported by satellite tagging from the area (Hauser et
al. 2010).
Discovery Marks, photo-identification data and genetic data have established low levels of
interchange among breeding locations consistent with E2, E3, F1 and F2 being breeding sub-
populations (Chittleborough 1959b; Dawbin 1964; Constantine et al. 2007; Olavarria et al.
2007; Garrigue et al. 2000, 2011a; Franklin et al. in press-b).
Humpback whales migrating from the western Pacific (E2 and E3) to Antarctic feeding areas
travel through New Zealand waters and disperse widely to feeding areas in Antarctic Area V
(Dawbin and Falla 1949; Dawbin 1956, 1966; Steel et al. 2008; Gales et al. 2009; Franklin et.
al. in press-a, b). Hauser et al. (2010) using a satellite-monitored track reported a single
humpback whale travelling from the Cook Islands (F1) to eastern Area VI off Antarctica.
Steel et al. (2008) reported a genotype match between Tonga (E2) and Antarctic Area VI.
Movements of a few humpback whales have been reported between American Samoa (E2)
and French Polynesia (F2) and feeding Area I near the Antarctic Peninsula (Robbins et al.
2008, Albertson-Gibb et al. 2009).

23
1.5 EASTERN AUSTRALIAN HUMPBACK WHALES
1.5.1 Population structure, migration and migratory interchange
The International Whaling Commission (1WC), consider eastern Australian humpback whales
to be a relatively discrete breeding stock termed E1, which forms part of the IWC’s Antarctic
Area V management area (1300 E-1700 W) (IWC 2006, Olavarria et al. 2006b). Eastern
Australian humpback whales migrate annually between semi-tropical and tropical
overwintering and breeding grounds along the northeast coast of Queensland Australia and
high latitude feeding areas in Antarctic Area V (Chittleborough 1965, Dawbin 1966, Franklin
et al. 2012).
Discovery Marks, photo-identification, genetic and acoustic data have revealed low levels of
interchange between eastern Australia, western Australia and western Oceania populations
consistent with eastern Australia being a separate breeding population (Chittleborough 1965;
Dawbin 1966; Garrigue et al. 2000, 2011b; Noad et al. 2000; Olavarria et al. 2006b;
Anderson et al. 2010; Franklin et al. in press-b).
1.5.2 Breeding grounds and northern coastal migratory cycle
The inter-reef lagoon of the Great Barrier Reef, between 160S and 230S is considered to be the
primary overwintering and breeding ground of eastern Australian humpback whales
(Simmons and Marsh 1986, Paterson 1991, Chaloupka and Osmond 1999, Smith et al. 2012).
There are no recent published data on the aggregations of humpback whales in the eastern
Australian breeding grounds.
Based on resighting intervals of humpback whales at Byron Bay (280 37’S) and Ballina (280
52’S) in New South Wales and Hervey Bay (250 00’S) in Queensland, it has been calculated
that the average residency time of eastern Australian humpback whales in the breeding

24
grounds is 4 weeks and that the travel time from Byron Bay to the southern end of the
putative breeding ground (210S) and the return journey to Ballina is 5 weeks. On average
eastern Australian humpback whales spend a total of 9 weeks on the northern migratory cycle
(Burns et al. in press).
During the peak of the northward migration in June and July (Paterson 1991), humpback
whales returning from the Antarctic summer feeding areas approach the southeastern
coastline of Australia at various latitudes and are deflected to the northeast until they reach
Cape Byron (Dawbin and Falla 1949, Dawbin 1966, Paton et al. 2011). After passing the
most easterly point of Australia at Byron Bay (280S) the migratory stream moves up along the
coastline past Point Lookout (270S) and north to the east of Fraser Island and Hervey Bay
(250S, Fig. 1.6.1 below) (Paterson 1991, Noad et al. 2008). On the northward migration
humpback whales do not enter Hervey Bay (Paterson 1991, Corkeron et al. 1994). The
migration stream passes Breaksea Spit to the northeast of Hervey Bay (240S) and then inclines
to the northwest dispersing widely within the inter-reef lagoon of the Great Barrier Reef
(Simmons and Marsh 1986, Paterson 1991, Chaloupka and Osmond 1999, Smith et al. 2012).
The southward migration from the breeding grounds commences in late July and continues
until late October (Dawbin 1966, Paterson 1991). The main southward migratory corridor is
to the east of Fraser Island and Hervey Bay (Fig. 1.6.1) (Paterson 1991) and the migratory
stream continues south past Point Lookout (270S), Byron Bay (280S) and Eden (370S)
(Paterson 1991, Gales et al. 2009). Gales et al. (2009) using satellite-monitored tracks
deployed off Eden reported that some eastern Australian humpbacks migrated eastwards
towards New Zealand, and some migrated due south past the east coast of Australia and
Tasmania, while a single humpback whale moved through Bass Strait southwest towards
Antarctic Area IV.

25
1.5.3 Antarctic feeding areas
Eastern Australian humpback whales predominantly feed in Antarctic Area V (Dawbin and
Falla 1949, Dawbin 1966, Bryden 1985, Gales et al. 2009, Anderson et al. 2010, Franklin et
al. 2012), however there is some evidence that the feeding range of some individuals extends
westward into Area IV (Chittleborough, 1965, Gales et al. 2009).
1.5.4 Trends in abundance of eastern Australian humpback whales
Recent modeling suggests that the eastern Australian humpback whale population prior to the
last period of commercial whaling was estimated to be 22, 093 (95% PPI, 20,062-26,673)
(Jackson et al. 2009). Commercial coastal and Antarctic pelagic whaling together with illegal
Soviet whaling from the mid-1940s to the early 1970s devastated the eastern Australian
humpback whale population (Clapham et al. 2009). In 1963 when the IWC declared complete
protection for southern ocean humpback whales it was estimated there were possibly fewer
than 200 survivors of the eastern Australian humpback whale population (Paterson et al.
1994, Jackson et al. 2009). In the thirty years from 1962 to 1992 the eastern Australian
humpback whale population was estimated to have only increased to 1,900 (95% CI 1,650-
2,150, Paterson et al. 1994). During the 18 years of this study the eastern Australian
humpback whale population is estimated to have increased to 13,098 whales at an average
rate of over 10% per annum (Noad et al. 2004, 2011; Jackson et al. 2009). The estimates of
yearly abundance of the eastern Australian humpback whale population from 1991 to 2009
are presented in Figure 1.5.4.1.

26
Figure 1.5.4.1. Estimates of yearly abundance of eastern Australian humpback whales
(Data provided by Dr M. Noad, University of Queensland: the 1991 estimate is from Paterson
et al. 1994; the 1996 estimate is from Bryden et al. 1996; the 2000 estimate is from an
unpublished report by Brown et al. 2000 which was partly reported in Brown et al. 2003; the
2004 estimate is an updated but unpublished estimate of the estimate reported in Noad et al.
2011; The other years are interpolated, while those post 2004 are based on the relative
abundance surveys and the 2004 data published in Noad et al. 2004). Chaloupka et al. 1999
suggested that from 30% to 50% of eastern Australian humpback whales enter Hervey Bay
during the southern migration.
1.6 HERVEY BAY, QUEENSLAND AUSTRALIA
Hervey Bay is located at 250S, 1530E on the eastern coast of Queensland (Fig.1.6.1), 20 south
of the southern end of the putative overwintering and breeding grounds for eastern Australian
humpback whales (Simmons and Marsh 1986, Paterson 1991, Chaloupka and Osmond 1999).

27
Paterson (1991) reported that the pattern of the southern migration differed from the northern
migration. On the northern migration humpback whales bypass Hervey Bay (Fig. 1.6.1,
migratory pathway A), whereas on the southern migration large numbers of humpback whales
make a diversion from the primary migratory pathway and pass inside Breaksea Spit to enter
Hervey Bay (Fig.1.6.1, migratory pathway B) (Paterson 1991). Aerial surveys undertaken in
1988 to 1990 confirmed that southbound humpback whales enter Hervey Bay from the north
and aggregate in shallow waters close to the western shore of Fraser Island in the eastern part
of the Bay (Fig. 1.6.1,B and C) (Corkeron 1994). On departure from Hervey Bay humpback
whales need to travel westward to clear Ferguson Spit, which runs west of Rooney Point,
before turning northwards to clear Breaksea Spit (Fig. 1.6.1, D), prior to turning east and
joining the main southern migratory pathway (Fig. 1.6.1, A).
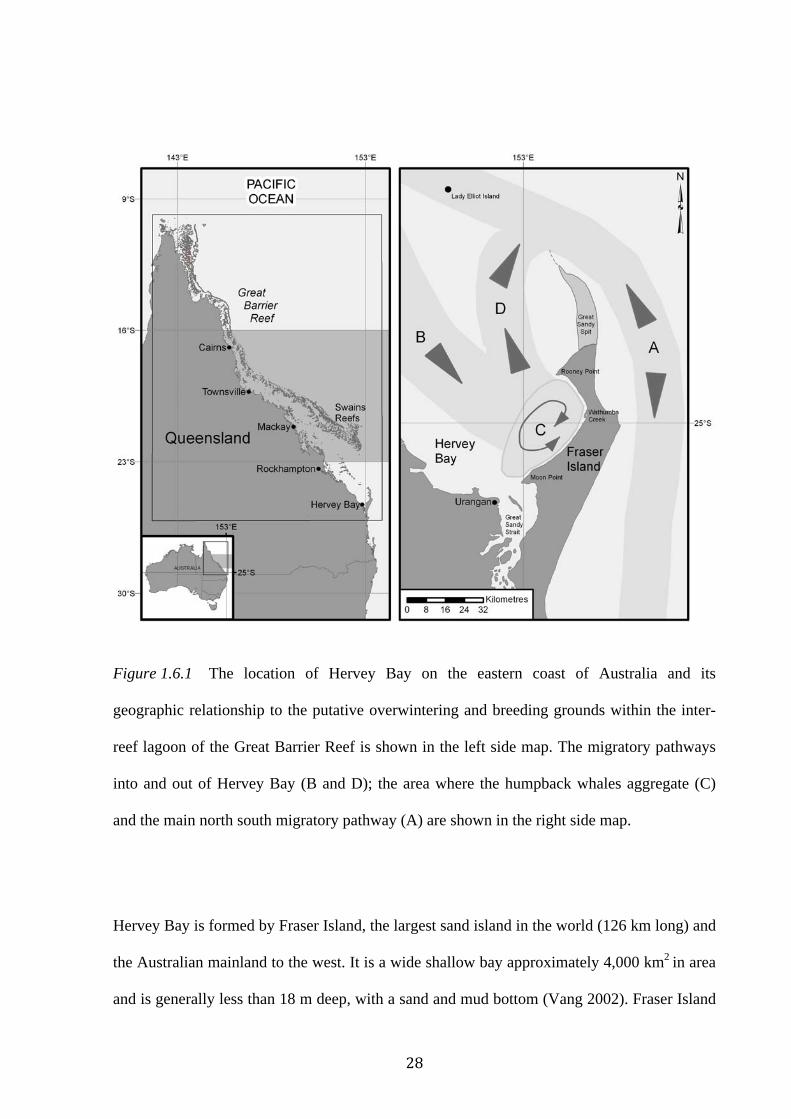
28
Figure 1.6.1 The location of Hervey Bay on the eastern coast of Australia and its
geographic relationship to the putative overwintering and breeding grounds within the inter-
reef lagoon of the Great Barrier Reef is shown in the left side map. The migratory pathways
into and out of Hervey Bay (B and D); the area where the humpback whales aggregate (C)
and the main north south migratory pathway (A) are shown in the right side map.
Hervey Bay is formed by Fraser Island, the largest sand island in the world (126 km long) and
the Australian mainland to the west. It is a wide shallow bay approximately 4,000 km2 in area
and is generally less than 18 m deep, with a sand and mud bottom (Vang 2002). Fraser Island

29
lies along a northeasterly axis and its northern end bridges the continental shelf. The most
southerly islands of the Great Barrier Reef are directly north of Hervey Bay at a distance of
between 111 and 222 km (Fig. 1.6.1).
Early research during the late 1980s and early 1990s involving aerial surveys and boat-based
photo-identification reported that humpback whales visited and resided in Hervey Bay for
short periods of time (Corkeron 1994). It was also estimated that large numbers of humpback
whales, representing between 30 to 50% of the eastern Australian population, visited Hervey
Bay annually (Chaloupka et al. 1999). This research established Hervey Bay as a stopover for
eastern Australian humpback whales. Specifically the research investigated pod sizes,
temporal variation in classes of humpback whales, residency and pod behaviour (Corkeron et
al. 1994, 1995). Corkeron et al. (1994) reported short residency times that were similar to the
Northern Hemisphere breeding grounds in the West Indies and suggested that the non-random
clustering of humpback whales aggregating in Hervey Bay might be related to social factors.
However, there were no data indicating that Hervey Bay was of importance to any particular
class of humpback whale (Corkeron et al. 1994).
1.7 FOCUS OF THESIS AND RESEARCH OBJECTIVES
Why do humpback whales make a diversion from the main migratory pathway? Paterson
(1991, p. 337) suggested that; “The geographic relationship of Breaksea Spit and Fraser
Island to the mainland may explain in part why humpback whales enter Hervey Bay.” It is
clear from earlier studies in Hervey Bay that to answer the fundamental question of what is
the function of Hervey Bay in the migration of humpback whales, further data were required.
30
In order to fully understand the function of Hervey Bay in the migration of eastern Australian
humpback whales, the thesis will address several underlying and related questions: what
classes of humpback whales are using the bay?; is Hervey Bay important to any particular
class of humpback whale?; are there any changes in pod sizes and composition over years and
within season?; what behaviours are occurring in Hervey Bay over years and within season
and are these behaviours different from other overwintering and breeding grounds and if so,
why?; what can the observed behaviours tell us about the function of Hervey Bay in the
migration?; is there temporal segregation of the reproductive and maturational classes of
humpback whales entering Hervey Bay, and if so, how does this compare to the temporal
segregation in the migration reported by Dawbin (1966, 1997)?; what can observed behaviour
and the temporal segregation of classes of humpback whales in Hervey Bay tell us about the
social organisation of humpbacks whales?; is the trend in abundance of the eastern Australian
humpback whales population likely to have density/dependent affects for humpback whales
visiting Hervey Bay?
The aim of this research was to investigate the ecological and social significance of Hervey
Bay, Queensland for eastern Australian humpback whales.
The specific research objectives were:
♦ To investigate the seasonal changes in humpback whale pod characteristics within
and between seasons;
♦ To investigate the seasonal social behaviour of humpback whales during the
southern migratory stopover in Hervey Bay, in terms of pod associations,
competitive behaviour and non-agonistic social behaviour within and between
seasons;

31
♦ To investigate and analyse the temporal segregation and behaviour of reproductive
and maturational classes of known individual humpback whales in Hervey Bay,
within and between seasons, and to consider the implications for social
organisation.
1.8 THESIS FORMAT
This thesis presents chapters on the main research theme, which is the ecological and social
significance of Hervey Bay for the eastern Australian humpback whales. Chapter 1 provides a
general introduction to the biology and ecology of humpback whales. Chapter 2 describes the
general methodology including: the background to The Oceania Project’s Hervey Bay
humpback whale study; the study site and survey timing; vessel-based surveys; observation,
photo-identification and other data; and photographic data analysis. Chapter 3 is based on a
published paper (Franklin et al. 2011), which investigates the pod characteristics of different
classes of humpback whales entering Hervey Bay throughout the winter season. Chapter 4 is a
manuscript in preparation and investigates the seasonal social behaviour of different classes of
humpback whales, and considers the influence of the different classes of whales on the
occurrence of observed behaviours. Chapter 5 is a manuscript in preparation: the chapter
examines the context of Hervey Bay in terms of the migration of eastern Australian humpback
whales between their putative breeding ground in the Great Barrier Reef and their summer
feeding areas in the Antarctic. The chapter also examines the migratory movement, timing
and residency of the different maturational and reproductive classes of whales and the
behaviour of known-age individuals. The findings are compared with the pioneering work of
Dr. William Dawbin on the temporal segregation of humpback whales during the period of
commercial whaling in the 20th century. There is some overlap (and therefore unavoidable

32
repetition) in methodology between Chapters 2, 3, 4 and 5 because they are formatted as
papers for publication or submission. Chapter 6 provides a synthesis and general conclusion
of the thesis and examines conservation issues for humpback whales in Hervey Bay.

33
Chapter 2
Study Background and Methodology
2.1 THE OCEANIA PROJECT’S HERVEY BAY HUMPBACK WHALE STUDY
The Oceania Project (TOP) was established by Trish and Wally Franklin in 1988 as a not–for-
profit research and education organisation, with a primary focus on humpback whale research
in Hervey Bay, southeast Queensland. In 1989, a six-week vessel-based expedition was
completed as a pilot study to assess the feasibility of conducting a long-term study of
humpback whales in Hervey Bay.
Earlier research on humpback whales in Hervey Bay by Dr Peter Corkeron for the
Queensland National Parks and Wildlife Service (QNPWS), reported in Corkeron (1993) and
Corkeron et al. (1994), concluded that there were insufficient data available to determine the
importance of Hervey Bay for any class of humpback whales. To obtain the data required to
address the issue of the importance of Hervey Bay for eastern Australian humpback whales,
Corkeron (1993) recommended a dedicated long-term systematic vessel-based photo-
identification survey be undertaken. This provided the rationale for the study design and the
focus for TOP’s Hervey Bay humpback whale research study, and the focus of this thesis on
the social behaviour and social organisation of humpback whales in Hervey Bay.
A QNPWS research permit was approved in early 1991, and fieldwork protocols for the study
were trialed and reviewed with the assistance of Dr. Tim Stevens of QNPWS in Hervey Bay
during August to October 1991. Research undertaken in Hervey Bay between 1992 and
2009 was conducted under research permits issued by the QNPWS (permit numbers
MP2006/020 and WISP03749806).

34
2.2 STUDY SITE AND SURVEY TIMING
Hervey Bay, formed by Fraser Island and the Australian mainland, is located at 250S,
1530E on the eastern coast of Queensland (Fig. 2.1). It is a wide, shallow bay
approximately 4,000 km2 in area and is generally less than 18 m deep, with a sand and
mud bottom (Vang 2002). Fraser Island is 126 km long; it lies along a northeasterly axis
and its northern end bridges the continental shelf. The most southerly islands of the
Great Barrier Reef are directly north of Hervey Bay at a distance of between 111 and
222 km (Fig. 2.1).
Figure 2.1. The location of Hervey Bay on the eastern coast of Australia and its
geographic relationship to the reefs and inter-reef lagoon of the Great Barrier Reef is shown
in the left side map. The primary overwintering and breeding ground for eastern Australian
humpback whales is believed to be off the Queensland coast within the Great Barrier Reef
inter-reef lagoon between 160S and 230S (shaded) (Simmons and Marsh 1986, Paterson 1991,
35
Chaloupka and Osmond 1999). The study area and the Hervey Bay Marine Park boundaries
are shown on the eastern side of Hervey Bay.
Paterson (1991) reported that the annual southern migration from the Great Barrier Reef
began in late July, with humpback whales moving into and out of Hervey Bay from early
August to mid-October. Additional information from the Queensland Environment Protection
Agency (QEPA) and the whale-watching industry confirmed the presence of humpback
whales in the bay from the first week of August to mid-October between 1987 and 1991.
Accordingly, a 10 week survey commencing on the first Sunday after 5 August each season
was chosen to provide a representative sample of the seasonal occurrence of humpback
whales in Hervey Bay.
2.3 VESSEL-BASED SURVEYS
Vessel-based surveys for this study were conducted for 9 weeks in 1992 and for 10 weeks
each year between 1993 and 2009, commencing on the first Sunday after the 5th of August
until mid-October. The study area (Fig. 2.1) is approximately 27.8 km from Urangan Boat
Harbour, Hervey Bay. Fieldwork was planned for six days each week, leaving Urangan
harbour at 0800 each Sunday and returning at 1500 the following Friday. Planned daily
operations were from 0930 to 1700 on Sunday, 0700 to 1700 Monday to Thursday, and from
0700 to 1330 on Friday, to allow for return travel to Urangan harbour.
Four different motorized vessels were utilised as dedicated research platforms from 1992 to
2009: two were mono-hulls and two were catamarans, ranging in length from 11 to 27 m.
When searching for humpback whale pods the normal range of operational speed of the four
research vessels was 12.9-18.5 km h. When searching for pods GPS locations (waypoints in

36
degrees of latitude and longitude) were recorded every hour on the hour. Upon
commencement of observations of a pod the rate of travel of the research vessel was adjusted
to match the speed of the pod.
2.4 OBSERVATIONS, PHOTO-IDENTIFICATION AND OTHER DATA
Observations and photo-identification began on the first sighted pod or singleton, with no a
priori selection of any particular pod class. If no pod or singleton was in sight, either a
random direction of travel was commenced until a pod or singleton was sighted or, if
information about the location of pods or singletons was available from one of the local
commercial whale-watching vessels, travel was commenced towards that location. If a pod or
singleton was sighted en route it was selected for observation.
Photography of the ventral fluke patterns, shape and size of dorsal fins and lateral body
markings were obtained to allow identification of individual humpback whales (Katona et al.
1979, Katona and Whitehead 1981). Photographs were taken with Canon EOS cameras, using
a 100-300mm lens. A marker shot of Fraser Island was taken prior to commencement of
photography on a pod and after completion of photography on a pod. In addition if a
photograph of a dorsal fin was followed immediately by a fluke photograph of the same
individual whale a marker shot (of the ship’s railings) was taken to verify that the preceding
series of photographs were of the same individual whale.

37
Figure 2.2 GPS locations of sightings of humpback whales observed in Hervey Bay
during the months of August, September and October over the years 1992-2005.
Data collected during the observation of each pod included: date, time, depth and GPS
location at commencement of observation, every fifteen minutes during observation and at the
completion of the observation. As well, the following data were recorded: pod identification
code; the observed number of individuals in the pod; pod composition; associations and
disassociations of pods and surface behaviours (continuous sampling; Altmann, 1974).
Information on sex-identification was obtained where possible. Sex-identification was
determined by the observation of the genital area and the presence of a hemispherical lobe
posterior to the genital slit in the case of females and its absence in the case of males (True
1904, Glockner 1983). Furthermore, sex can also be inferred from social roles: an adult
individual accompanying a calf consistently and providing nurturing behaviours towards the
calf can be inferred to be female (Tyack and Whitehead 1983). Similarly, escorts and singers
have been found to be male (Glockner and Venus 1983, Tyack and Whitehead 1983, Baker
and Herman 1984a, Clapham 2000). With few exceptions, Nuclear Animals in competitive
groups have been found to be female (Darling et al. 1983; Tyack and Whitehead 1983; Baker
38
and Herman 1984b; Clapham et al. 1992, 1993; Clapham 2000; Darling et al. 2006). Chu and
Nieukirk (1988) reported that individual humpback whales with distinct vertical and
horizontal dorsal fin scars, resulting from competitive activity could be inferred as males.
These marks were only used in conjunction with the resighting histories and the observed
social roles to infer an individual as a male.
Members of the research team constantly scanned 3600 for any pods approaching the pod
under observation. All pod and observation data were recorded daily in field notes and
entered into a FileMaker Pro database each evening.
In addition to pod and observation data, daily weather and environmental readings were
recorded. These included wind speed and direction, sea state (Beaufort scale), cloud cover and
precipitation. Also daily readings of sea temperature, salinity and turbidity were recorded and
systematic water samples were obtained for chlorophyll a analysis within the Hervey Bay
humpback whale habitat. As well, sloughed-skin samples were opportunistically collected for
genetic analyses.
The principal investigators were supported each season by Research Assistants who were
predominantly undergraduate students or graduates participating in environmental or marine
science degrees at Southern Cross University and other Australian and overseas Universities.
Research Assistants rostered and supervised Interns, who volunteered on a weekly basis, to
assist with fieldwork aboard the expedition. Interns were rostered on morning and afternoon
shifts for photo-identification note taking, GPS readings, weather and environmental readings,
water sampling, sloughed-skin collection and daily data entry.

39
2.5 PHOTOGRAPHIC MATCHING SYSTEM AND DATA ANALYSIS
After completion of fieldwork, photography for each pod was examined, and photographs
were organised into ventral flukes, dorsal fins and lateral body markings for each individual
humpback whale in the pod utilising Adobe Photoshop CS software. Photographs that
provided useful information of individuals in each pod were archived as high-resolution JPEG
files at a standard ratio of 1536 pixels by 1024 pixels at 300 dpi. The selected photographs
were analysed in conjunction with the field notes on observations of pod composition,
behaviours observed and sex-identification information.
The best ventral fluke photographs of individual humpback whales were assessed for
photographic quality and individual information. Annual fluke catalogues for the years 1992
to 2009 were compiled and analysed for intra- and inter-season resights of individual
humpback whales using a propriety matching system based on categorisation of flukes
utilising an array of coded discrete characteristics (ACDC), applied to the file name of each
fluke photograph (Table 2.1 and 2.2, Figure 2.3). The ACDC categories were based on
individually unique and stable patterns of black and white pigmentation on the underside of
the tail flukes (Katona et al. 1979, Katona and Whitehead 1981). The ACDC characteristics
selected for the system (Table 2.1) were derived from a visual analysis of 28,000 fluke
photographs taken between 1992 and 2003. The system allowed each fluke to be allocated to
contiguous stratified categories using the ACDC codes in the image filename for visual
display and organisation to facilitate photographic analyses and matching (Figure 2.3). A
standard protocol was utilised for the allocation of ACDC codes to the filename of each fluke
image (Table 2.1). When matching a fluke against the fluke catalogue it was pairwise
matched with other photographs within its ACDC colour and pattern category and then if not
matched it was then subsequently compared with photographs within adjacent categories. As

40
the majority of flukes were predominantly all white (63.5%, Table 2.2) the shape and
colouration of the trailing edge and notch were important characteristics in the matching
process (Carlson et al. 1990, Mizroch et al. 1990, Blackmer et al. 2000, Friday et al. 2000).
Because pigmentation patterns and marks of individual flukes may change over years
(Carlson et al. 1990), utilising a consistent protocol in the assignment of ACDC
characteristics minimised mismatch errors. If for example a resighting of a particular
individual showed a change in marks, the ACDC filename reflects the change in that year.
Photographic analysis outcomes together with original field data were incorporated into a
single FileMaker Pro relational database.
The ACDC characteristic codes selected for the system and protocol used to assign ACDC
codes are reported in Table 2.1. Examples of how ACDC categories display in photo-
identification analysis software are presented in Figure 2.3.

41
Table 2.1 Array of Coded Discrete Characteristics (ACDC) applied to ventral fluke image filenames for photo-id matching of intra and inter-season resightings of individual humpback whales and the protocol used for the ACDC code assignment and order in filename. Code Description Protocol used for code assignment (a) (A) Primary Characteristics: Step I BB Black Border BC Black Centre
View and examine the ventral fluke photo from posterior to anterior across the horizontal plane for primary characteristics.
BK Black Step II TE Trailing edge NT Notch (B) Secondary Characteristics:
Compare to examples (Fig 2.2) and assigned primary code or codes. If BB & BC both present BB precedes BC. If BB, BC or BK not present, TE, will be the sole primary code. Separate each four digits of code by a hyphen.
Step III BS Black Stem DM Damaged RK Rake Marks
View and examine the ventral fluke photo from posterior to anterior across the horizontal plane for secondary characteristics.
CR Curled Step IV WP White Patch BP Black Patch
Compare to examples (Fig 2.2) and assign secondary codes from posterior to anterior for characteristics present. Separate each four digits of code by a hyphen.
(C) Tertiary Characteristics: Step V SM Scratch Marks DT Dots
View and examine the ventral fluke photo posterior to anterior across the horizontal plane for any tertiary characteristics present.
RG Rings Step VI
Compare to examples (Fig 2.2) and assign tertiary codes posterior to anterior for characteristics present. If SM, DT and/or RG occur on in the same horizontal plane SM precedes DT and, DT precedes RG in the code array. Separate each four digits of code by a hyphen.
(a] The examples (Figure 2.3 below) illustrate the stratification of categories from the
applied ACDC codes in each fluke photograph filename.

42

43

44
Figure 2.3 A selection of 24 fluke photographs illustrating how the ACDC code in the
filename facilitates visual display to facilitate photo-identification matching. Each filename is

45
composed of the assigned ACDC codes, year photograph was taken and photo-id archive
number of the fluke photograph.
The Hervey Bay fluke catalogue for the period 1992 to 2009 was fully reconciled within and
between seasons using the ACDC fluke matching system and consisted of 2,821 individual
humpback whales. The number and percentage of flukes in each of the primary ACDC
categories is reported in Table 2.2.
Life histories of individual humpback whales based on resightings over two or more years
were compiled from observations recorded in the annual fluke catalogues. A total of 578 life
histories were obtained with resightings of individually identified whales ranging over a
period of eighteen years. A summary of fieldwork, observations and data in Hervey Bay from
1992 to 2009 is presented in Table 2.3.
Table 2.2 Number and % of flukes by primary ACDC categories in 1992-2009 fluke
catalogue.
Primary ACDC categories (1) Number of Flukes %
BBBC/BBDM/BBNT/BBRK (Black Borders plus) 51 1.8
BCBP/BCDM/BCCR/BCNT/BCRK (Black Centres plus) 214 7.6
BKDM/BKNT/BKRK/BKWP (Black plus) 86 3.0
TEBB (Trailing Edge, Black Border) 311 11.0
TEBP/TECR (Trailing Edge, Black Patch or Curled) 9 0.3
TEDM (Trailing Edge, Damaged) 93 3.3
TEHL (Trailing Edge, Holes) 52 1.8
TENT-1 (Trailing Edge (Thick), Notch) 372 13.2
TENT-2 (Trailing Edge (Medium), Notch) 722 25.6
TENT-3 (Trailing Edge (Fine), Notch) 696 24.7
TERK (Trailing Edge, Raked) 215 7.6
Total Flukes 1992-2009 2821 100.00

46
(1) The primary ACDC category is made-up of the first four digits of code in the filename,
except for the TENT categories (See Table 2.1 above). The TENT category is further
categorised based on the thickness of black pigmentation along the trailing edge of the fluke
as 1 (Thick, but less than BB), 2 (Medium), 3 (Fine). All TENT flukes are predominantly
white pigmentation.
Table 2.3. Summary of fieldwork, observations and data: Hervey Bay from 1992 to 2009.
Effort and observations Data
Fieldwork Observations Yearly Catalogues Cumulative
Year First day Last day Field days Pods (n)
Whales (n)
Flukes (n)
Resighting histories
Resighting histories
1992 10th Aug 9th Oct 42 189 387 4 4 4
1993 6th Aug 15th Oct 53 229 442 5 3 7
1994 7th Aug 14th Oct 50 163 380 47 36 43
1995 6th Aug 13th Oct 51 172 374 47 27 70
1996 4th Aug 11th Oct 48 185 410 70 26 96
1997 1st Aug 17th Oct 64 300 693 140 52 148
1998 9th Aug 16th Oct 58 410 934 190 56 204
1999 28th Jul 15th Oct 63 399 929 210 43 247
2000 6th Aug 13th Oct 58 380 815 206 50 297
2001 12th Aug 19th Oct 57 432 954 234 43 340
2002 11th Aug 17th Oct 59 409 968 268 56 396
2003 10th Aug 17th Oct 56 390 928 270 42 438
2004 5th Aug 15th Oct 60 419 952 303 49 487
2005 30th Jul 14th Oct 61 448 1,050 376 43 530
2006 3rd Aug 13th Oct 58 420 984 341 23 553
2007 30th Jul 11th Oct 60 399 945 297 14 567
2008 7th Aug 17th Oct 61 508 1,283 407 11 578
2009 6th Aug 16th Oct 55 396 901 317 0 578
Totals 1,014 6,248 14,329 3,732 578
As noted in Chapter 1, the primary data chapters for this thesis (Chapters 3, 4 and 5) are based
on a published paper and two manuscripts formatted as papers for submission, that provide

47
further relevant details of the methods and analyses; hence there is some unavoidable
repetition in the relevant Method section of each of those Chapters.

48
Chapter 3
Seasonal changes in pod characteristics of eastern
Australian humpback whales (Megaptera
novaeangliae), Hervey Bay 1992-2005
This chapter was published in Marine Mammal Science. It was submitted on the 6th
November 2009 and accepted on 14th July 2010.
The publication citation is:
Franklin, T., W. Franklin, L. Brooks, P. Harrison, P. Baverstock and P. Clapham.
2011. Seasonal changes in pod characteristics of eastern Australian humpback whales
(Megaptera novaeangliae), Hervey Bay 1992-2005. Marine Mammal Science, 27(3):
E134–E152 (July 2011) ©2010 by the Society for Marine Mammalogy. DOI:
10.1111/j.1748-7692.2010.00430.x.)
Declaration of Authorship:
Conception of the study: TF (70%), WF (30%)
Survey Design: TF (70%), WF (30%)
Data collection: TF (80%), WF (20%)
Data analysis: TF (80%), WF (20%)
Statistical analysis: TF (10%), WF (10%), LB (80%)
Interpretation of data: TF (60%), WF (10%), PH (10%) PC (10%), LB (10%)
Writing of manuscript: TF (70%), WF (20%), PH, PC, LB, PB (10%)

49
3.1 ABSTRACT
This study investigated the characteristics and composition of 4,506 humpback whale pods
observed in Hervey Bay between 1992 and 2005. These data were used to analyse and model
the variability of pod size and composition, and to assess the importance of Hervey Bay for
particular classes of humpback whales. Pods ranged in size from one to nine individuals. Pairs
were the most frequent pod type (1,344, 29.8%), followed by mother-calf alone (1,249,
27.7%), trios (759, 16.8%), singletons (717, 15.9%), and 4+ whales (437, 9.7%). Of the 4,506
pods, calves were present in 40%, and 10.8% of all pods had one or more escorts present. Of
the 1,804 pods observed with calves present, 1,251 (69.4%) were mothers alone with their
calves. The size and composition of pods in the study area varied significantly as the season
progressed. Pods with calves present were rarely recorded early in the season but dominated
later in the season. A significant increase over years in larger groups may be related to social
and behavioural changes as the population expands. The data indicate that Hervey Bay is
important to immature males and females early in the season, to mature males and females in
mid-season, and to mother-calf pairs (either alone or with escorts) in mid-to-late season.

50
3.2 INTRODUCTION Humpback whales (Megaptera novaeangliae) are found in all oceans of the world and
maintain an annual migratory cycle from low-latitude winter breeding grounds to high-
latitude summer feeding areas in both the Northern and Southern Hemispheres
(Chittleborough 1965, Dawbin 1966, Baker et al. 1986, Clapham 2000). Winter assemblages
of humpback whales occur in tropical and subtropical waters either around islands or along
continental coastlines (Dawbin 1956). Relatively shallow and sheltered warm-water areas
appear to be a preferred habitat for calving females (Dawbin 1966, Whitehead and Moore
1982, Smultea 1994, Clapham 2000, Craig and Herman 2000, Ersts and Rosenbaum 2003).
Eastern Australian humpback whales commence the southern migration from the breeding
grounds to their Antarctic feeding areas in July each year and return at some point by June the
following year (Dawbin 1966). Chittleborough (1965) suggested that there is no particular
latitude along the eastern coast of Australia where migration ceases and breeding activities
commence.
One of many places that are used by humpback whales during the winter is Hervey Bay in
Queensland; this is slightly west of the main northward migratory stream and 2◦ south of the
Great Barrier Reef lagoon. Humpback whales do not enter Hervey Bay on their northward
migration that peaks during June and July. The migration stream passes Breaksea Spit to the
northeast of Hervey Bay and then inclines to the northwest, with whales dispersing widely
between the outer Great Barrier Reef and the Australian coast (Paterson 1991).
Previous studies suggested that the large inter-reef lagoon of the Great Barrier Reef, between
16◦S and 23◦S, represents the primary overwintering and breeding grounds of eastern
Australian humpback whales (Simmons and Marsh 1986, Paterson 1991, Chaloupka and

51
Osmond 1999). There are no recent published data on aggregations of humpback whales north
of Hervey Bay.
On the southward migration, large numbers of humpback whales make a slight diversion from
the southern migratory pathway and pass inside Breaksea Spit to enter Hervey Bay (Paterson
1991). It has been suggested that the proportion of eastern Australian (E1 breeding ground)
humpbacks entering Hervey Bay is 30%–50% (Chaloupka et al. 1999). Humpback whales
move into Hervey Bay from late July and during August, September, and October. They enter
and leave from the north and aggregate in shallow water close to the western shore of Fraser
Island in the eastern part of the bay (Corkeron et al. 1994). Aerial surveys have shown that
pods are not randomly distributed but tend to aggregate in clusters (Corkeron 1993). Mother
and calf pods are the final cohort to migrate southwards (Dawbin 1966, 1997) and enter
Hervey Bay during September and October (Corkeron 1995, Corkeron and Brown 1995). On
leaving the area, humpback whales initially travel north, rounding Breaksea Spit to the east
before rejoining the southward migratory stream (Corkeron 1993, Corkeron et al. 1994).
Calves are frequently observed in Hervey Bay, singers are heard, and competitive groups are
observed in the bay (Corkeron 1993, Corkeron et al. 1994); the latter involve intrasexual
competition among males for access to females (Clapham 2000). Previous studies of
humpback whales in Hervey Bay in the late 1980s and early 1990s examined migratory
movement, distribution, pod size, residency, relative abundance (Corkeron 1993, Corkeron et
al. 1994), behavioural response to whale watching vessels (Corkeron 1995, Corkeron and
Brown 1995), seasonal abundance trends, and survival probabilities (Chaloupka et al. 1999).
Corkeron et al. (1994) suggested that the nonrandom clustering of humpback whales
aggregating in Hervey Bay might be related to social factors. However, there were no data
indicating that Hervey Bay was of importance to any particular class of humpback whale
(Corkeron et al. 1994).

52
This study investigates the sizes and composition (classes of whales) of 4,506 humpback
whale pods observed in Hervey Bay between 1992 and 2005. The primary objective of the
study was to investigate and analyse pod size and composition over years and within season,
and to use these data to assess the importance of Hervey Bay for particular classes of
humpback whales.
3.3 METHODS
3.3.1 Definitions
Pod: Refers to either a lone whale (singleton) 1 or two or more humpback whales swimming
side-by-side within one–two body lengths of each other, generally moving in the same
direction and coordinating their speed of travel (Whitehead 1983, Clapham 1993, Corkeron et
al. 1994). Although in some species, for example, Orcinus orca, the term pod is used to
describe stable groups, our use of the term “pod” does not imply stable groups.
Adult—For the purpose of this study, the term “adult” is used in the results and modeling, to
describe the number of whales in a pod that were not calves. The term “adult” is therefore
used for convenience to identify all non-calves but does not imply sexual maturity. A
proportion of the whales here classified as adults are likely to be immature whales and they
are not identified separately as such in this paper.
Calf: An individual whale was considered to be a calf if it appeared to be less than half the
length of a particular adult with whom it maintained a constant and close relationship. In most
observations, no other whale was seen coming between a mother and calf (Tyack and
Whitehead 1983). The adult in the dyad was assumed to be the mother.
1 Although a single whale is not a pod, the term singleton is used for convenience for the purpose of these
analyses

53
Escort: Is defined as a whale accompanying a mother and her calf (Herman and Antinoja
1977). Escorts have been generally found to be male and may be mature males waiting for a
postpartum estrous mating opportunity ((Herman and Antinoja 1977, Glockner and Venus
1983, Tyack and Whitehead 1983, Baker and Herman 1984, Clapham 2000).
3.3.2 Surveys
Vessel surveys for this study were conducted for nine weeks in 1992 and for ten weeks each
year between 1993 and 2005, commencing on the first Sunday after 5 August until mid-
October. The study area (Fig. 2.1) is approximately 27.8 km from Urangan Boat Harbour,
Hervey Bay. Fieldwork was planned for 6 d each week, leaving Urangan harbour at 0800
each Sunday and returning at 1500 the following Friday. Planned daily operations were from
0930 to 1700 on Sunday, 0700 to 1700 Monday to Thursday, and from 0700 to 1330 on
Friday.
Four different motorised vessels were utilised as dedicated research platforms between 1992
and 2005: two were mono-hulls and two were catamarans, ranging in length from 11 to 27 m.
When searching for humpback whale pods, the normal range of operational speed of the four
research vessels was 12.9–18.5 km/h. Upon commencement of observations, the rate of travel
of the research vessel was adjusted to match the speed of the pod.
Pods were chosen for observation on a “first pod available” basis with no a priori selection of
any particular pod class. On arrival in the study area, or prior to departing an overnight
anchorage within the study area, the nearest pod in sight was selected. If no pod was in sight,
either a random direction of travel was commenced until a pod was sighted or, if information
about the location of pods was available from one of the local commercial whale-watching
vessels, travel was commenced toward that location. If a pod was sighted en-route, it was
selected for observation.

54
The pod was used as the basic observational unit in analysis for the 4,506 pods observed. The
hours spent weekly on survey and observing whales, the weekly total numbers of pods and
whales observed, and the mean hourly rates of observation of pods and whales over weeks
were documented prior to analysis of the size and composition of pods.
3.4 STATISTICAL ANALYSIS
To examine the variation in pod size and composition, the whole sample frequencies and
percentages of pod sizes (all whales), and pod sizes categorised by no calves present, versus
calves present are reported. The proportions of pods for the classes, calves and escorts in
terms of the number of calves and the number of escorts present are reported. For the
variation over years and within season, the proportion of pods with a calf present and the
proportion of all whales in the pod size categories (1, 2, 3, 4+ whales) are reported.
For further analysis, the frequencies by week (1–10) of the pod size categories 1, 2, 3, 4+
adults of pods in which a calf was present or not present, and the frequencies by week (1–10)
of the pod size category 1, 2, 3, 4+ of all whales in pods with calves present are reported.
A multinomial logistic regression model was developed to estimate variation in the proportion
of pods of 1, 2, 3+ adults over years, and over weeks within year of pods in which a calf was
present or not present.
3.5 RESULTS
3.5.1 Effort and observations
A total of 139 six-day survey periods (Sunday–Friday) were conducted in the Hervey Bay
study area between 1992 and 2005 (Fig. 2.1). Data were obtained on 770 of the planned 834

55
survey days. Total survey time was 6,160 h and observations of humpback whale pods were
conducted for a total of 2,760 h.
Observations were made and data collected on a total of 10,179 humpback whales in 4,506
pods during the 139 6-day survey periods. Six-day survey and observation hours, and
numbers of pods and whales observed in each survey period, are plotted in Figure 3.1A and
B. Figure 3.1C shows the hourly rates of pods and whales observed. A Loess curve
(Cleveland 1979) was added to Figure 3.1C to show the growth of mean observation rates
over time.

56
0 20 40 60 80 100 120 140
010
2030
4050
60
Numb
er(a) Survey hours
Observation hours
0 20 40 60 80 100 120 140
050
100
150
200
Numb
er
(b) Whales
Pods
0 20 40 60 80 100 120 140
0.0
1.0
2.0
3.0
Numb
er p
er h
our (c) Whales per hour
Pods per hour
Weeks
Figure 3.1. (A) Weekly survey and observation hours 1992–2005, (B) weekly
observations of humpback whale pods and whales 1992–2005, (C) humpback whales and
pods observed per hour in survey periods 1992–2005 with Loess growth curves.

57
3.5.2 Pod sizes in Hervey Bay 1992-2005
The frequencies and percentages of pod sizes for the whole sample are summarised in Table
3.1, and divided into two categories by “no calves present, or calves present” in Table 3.2.
Table 3.1. Number of whales in pods (N) in Hervey Bay, between 1992-2005.
All whales (calves included) Number of whales in pods
N % 1 717 15.9 2 2,593 57.5 3 759 16.8 4 281 6.2 5 96 2.1 6 38 0.8 7 12 0.3 8 7 0.2 9 3 0.1 Total 4,506 100.0
Pods ranged in size from 1 to 9 individual whales (mean = 2.26, SD = 0.10). Pods with two
whales present were the most frequently observed pod size (57.5%) followed by trios
(16.8%), and singletons (15.9%). Only 9.7% of pods were composed of four or more whales
(Table 3.1).
Table 3.2. Number of whales in pods (N) by no calves present and calves present
Pods with no calves present Pods with calves present Number of whales in pods N % N %
1 717 26.5 0 0
2 1,344 49.7 1,249 69.2
3 393 14.5 366 20.3
4+ 248 9.2 189 10.5
Total 2,702 100.0 1,804 100.0

58
Of the 4,506 pods, 2,702 (59.96%) had no calves present and 1,804 (40.04%) had calves
present (Table 3.2). Of the 2,593 pods with two whales in the whole sample (Table 3.1), 1,344
(51.8%, Table 3.2) were made up of two adults, and 1,249 (48.2%, Table 3.2) were composed
of mothers alone with their calves. In pods with no calves present, 23.7% had three or more
whales and in pods with calves present, 30.8% of pods had three or more whales present.
3.5.3 Observations of Pods with Calves and Escorts Present in Hervey Bay 1992–2005
The number of pods observed with calves present, and the number of pods with escorts
present by number and percentage for the whole sample are summarised in Table 3.3. Of the
4,506 pods, 1,804 (40%) had one or more calves present; 38.2% had one calf present, 1.6%
two, and 0.2% included three calves. One or more escorts were recorded in 10.8% of the
4,506 pods.
Table 3.3. Pods with calves/escorts present (by number & percentage).
Calves (Number of pods) Escorts (Number of pods) Number of calves/ Escorts present N % N % None present 2,702 60.0 4,019 89.2
1 1,721 38.2 371 8.2
2 75 1.6 71 1.6
3 8 0.2 37 0.8
4 4 0.1
5 3 0.1
6 1 0.0
Total 4,506 100.0 4,506 100.0
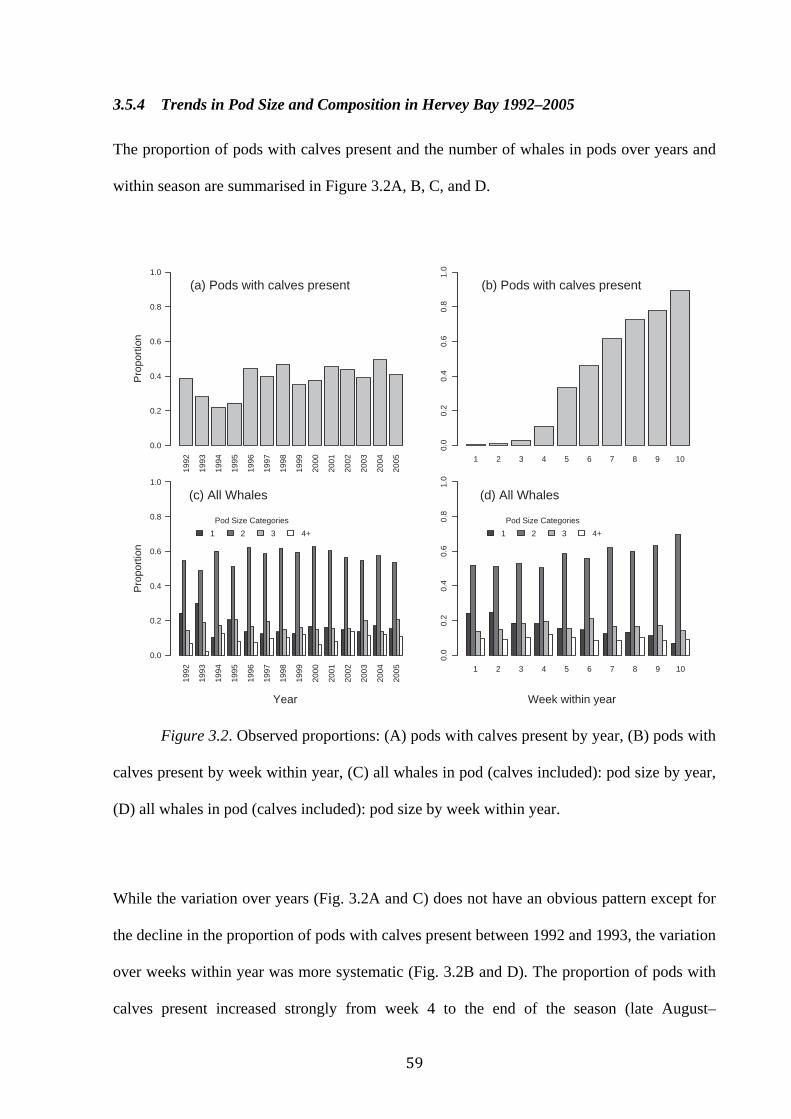
59
3.5.4 Trends in Pod Size and Composition in Hervey Bay 1992–2005
The proportion of pods with calves present and the number of whales in pods over years and
within season are summarised in Figure 3.2A, B, C, and D.
1992
1993
1994
1995
1996
1997
1998
1999
2000
2001
2002
2003
2004
2005
Prop
ortio
n
0.0
0.2
0.4
0.6
0.8
1.0(a) Pods with calves present
1 2 3 4 5 6 7 8 9 100.
00.
20.
40.
60.
81.
0
(b) Pods with calves present
1992
1993
1994
1995
1996
1997
1998
1999
2000
2001
2002
2003
2004
2005
Prop
ortio
n
0.0
0.2
0.4
0.6
0.8
1.0(c) All Whales
Pod Size Categories1 2 3 4+
1 2 3 4 5 6 7 8 9 10
0.0
0.2
0.4
0.6
0.8
1.0
(d) All WhalesPod Size Categories
1 2 3 4+
Year Week within year
Figure 3.2. Observed proportions: (A) pods with calves present by year, (B) pods with
calves present by week within year, (C) all whales in pod (calves included): pod size by year,
(D) all whales in pod (calves included): pod size by week within year.
While the variation over years (Fig. 3.2A and C) does not have an obvious pattern except for
the decline in the proportion of pods with calves present between 1992 and 1993, the variation
over weeks within year was more systematic (Fig. 3.2B and D). The proportion of pods with
calves present increased strongly from week 4 to the end of the season (late August–

60
September, to mid-October; Fig. 3.2B).
For all whales (Fig. 3.2C and D), pods with two whales consisted of either two adults, or a
mother alone with her calf (Table 3.2). For all whales, the number of pods with two whales
present—expressed as a proportion of all pods—increased with time during the season, while
the proportion representing singleton pods decreased. The proportion of all pods represented
by larger pods (3 and 4+ whales) increased from week 1 to about week 6 (early August to
mid-September) and decreased thereafter (Fig. 3.2D).
3.5.5 The Effect of the Presence or Absence of Calves on Seasonal Variation in Pod Size
and Composition
Singletons as a proportion of all pods were highest in the first four weeks when pods with
calves were rarely seen; however, in the same period there were still more pairs than
singletons (Fig. 3.2D). The proportion of pods with a calf present increased in the second half
of the season, along with a rapid increase in the proportion of mothers alone with their calves
(Fig. 3.2B and D).
To analyse and compare the size and composition of pods with calves present and pods with
no calves present, we adopted the approach used by Mobley and Herman (1985) of counting
and analysing the number of adults in pods. Table 3.4 summarises the pod data by week
within year, categorised by the number of adults in pods with no calves present, all whales in
pods with calves present, and the number of adults in pods with calves present.

61
Table 3.4. Number of pods by week within year for size categories (1, 2, 3, 4+), for: (a)
Number of adults (in pods with no calves present); (b) All whales (in pods with calves
present) and (c) Number of adults (in pods with calves present). Relevant percentages are
reported below columns.
1 For the number of adults (Table 3.4c), if one adult is present it was a mother alone with her
calf, 2 adults can either be 2 mothers together, or a mother with an escort. Similarly, if 3
adults are present, they can be a combination of up to 3 mothers (2 mothers with 1 escort, or 1
mother with 2 escorts), while 4+ can be a combination of up to 3 mothers and escorts.
2 There were two observations of a mother with two calves present in this week in different
years, which accounts for the differences in this row between ‘All whales, in pods with calves
present’ and ‘Number of adults, in pods with calves present’.
(a) Number of adults (b) All whales in pods with
no calves present in pods with
calves present
(c) Number of adults in pods with
calves present1 Week \ Size 1 2 3 4+ Total 2 3 4+ Total 1 2 3 4+ Total
1 89 190 50 36 365 0 1 0 1 0 1 0 0 1
2 110 223 66 41 440 4 0 0 4 4 0 0 0 4
3 86 239 80 42 447 6 5 5 16 6 5 4 1 16
4 87 209 77 51 424 31 16 5 52 31 16 3 2 52
5 72 169 40 28 309 102 32 19 153 102 33 11 7 153
6 64 117 42 15 238 129 50 23 202 129 55 9 9 202
7 64 102 15 17 198 2172 71 28 316 2192 81 13 3 316
8 67 53 10 8 138 248 73 44 365 248 84 22 11 365
9 52 31 11 8 102 260 67 32 359 260 84 7 8 359
10 26 11 2 2 41 252 51 33 336 252 63 13 8 336
Total 717 1,344 393 248 2,702 1,249 366 189 1,804 1,251 422 82 49 1,804
% of Total 26.5 49.7 14.5 9.2 100 69.4 23.4 4.5 2.7 100

62
Of the 1,804 pods observed with calves present (Table 3.4c), 1,251 (69.4%) included one
adult, i.e. mothers alone with their calves, 23.4% had two adults, and 7.2% had three or more
adults. Where no calves were present (Table 3.4a, 2,702 pods), pairs were the dominant pod
type (49.7%); singletons (26.5%) and 23.7% had 3 or more adults.
Of singleton pods (Table 3.4a), 51.9% occurred in the first four weeks of the season when
pods with a calf present were rarely seen. Similarly, 64.1% of adult pairs and 69.1% of 3 and
4+ pods with no calves present occurred in the first four weeks of the season. In contrast,
during the last four weeks of the season, when the majority of pods had calves present, the
occurrence of singleton pods was 29.1%, adult pairs 14.7%, and 3 and 4+ adults, 11.4%
(Table 3.4a).
3.5.6 Statistical Model
A statistical model was designed to examine the number of adults in pods over years, and
over weeks within season, and to compare the number of adults in pods in which a calf was
present or not present. The pod sizes were summarised to the categories 1, 2, 3+ adults for
this analysis. These categories were chosen to simplify the model, and to ensure that there
were reasonable numbers in the cells of the design while capturing the main features of the
data.
An ordered multinomial logistic regression model (Hosmer and Lemeshow 2000) was fitted
to the data using MLwiN V2.02 software (Rasbash et al. 2005) to assess the joint effects of
year, week within year, and presence of a calf on the probabilities of occurrence of 1, 2, 3+
adults. It was necessary to aggregate the first three weeks within years in order to fit the
presence of the calf by week within year interaction effect because so few calves were

63
observed early in the seasons. A linear effect for year and a quadratic effect for week within
year were employed to smooth and describe the systematic pattern in the data.
Table 3.5 summarises the parameter estimates, their standard errors and P-values from an
ordered multinomial logistic regression model for the proportions of size categories 1, 2, 3+
adults as a function of year (linear), week within year (quadratic), absence or presence of calf,
and the interaction of week within year by presence of calf.
Table 3.5. Ordered multinomial logistic regression model for the proportions of size
categories 1,2,3+ adults (calves excluded from count): fixed effects parameter estimates, their
standard errors and p-values.
1 γ3j = π3j ; γ2j = π3j + π2j ; γ1j = 1. Logit (γ2j) Logit (γ3j)
Parameter Estimate SE 3p Estimate SE 3p 2 Intercept 0.942 0.105 <0.0001 -1.601 0.129 <0.0001
Year 0.007 0.009 0.436 0.044 0.012 <0.0002
Week -0.231 0.024 <0.0001 -0.138 0.032 <0.0001
Week x Week -0.048 0.012 <0.0001 -0.020 0.015 0.182
Calf -1.646 0.110 <0.0001 -1.136 0.155 <0.0001
Week x Calf 0.161 0.056 0.004 -0.069 0.078 0.376
Week x Week x Calf 0.038 0.020 0.058 0.046 0.029 0.112
1 Model: responseij = ordered multinomial (podj, πij), where πij = probability of i (1,2,3+)
adults (calves excluded from count), and reference category = 1 adult.
2 Year referred to 1992, Week centred at Week 6, Calf referred to ‘calf not present’
3 Two-tailed p-values based on z = Estimate/SE.
The estimates reported in Table 3.5 were based on a parameterisation using the size category
of one adult as the reference category. The column labeled Logit (2j) compares (on the natural

64
logarithm scale) the probability of encountering two or more adults relative to a single adult,
and the column labeled Logit (3j) compares the probability of encountering three or more
adults relative to a single adult.
The P-values in Table 3.5 indicate that there were significant effects for variation in relative
pod size probabilities by year (linear), week within year (quadratic), presence of calf in a pod,
and the interaction of week within year by presence of calf.
The model parameter estimates reported in Table 3.5 were used to calculate the estimated
probabilities of the three response categories, 1, 2, 3+ adults by year, week within year, and
absence or presence of calf. The estimated probabilities of 1, 2, or 3+ adults are plotted by
year in Figure 3.3A, by week for pods with no calf present in Figure 3.3B, and by week for
pods with calves present in Figure 3.3C.
1992
1993
1994
1995
1996
1997
1998
1999
2000
2001
2002
2003
2004
2005
Estim
ated
Pro
babil
ity0.
00.
20.
40.
60.
81.
0
(a) All Pods Number of adults
1 2 3+
1,2,3 4 5 6 7 8 9 10
0.0
0.2
0.4
0.6
0.8
1.0
(b) Pods with no calves presentNumber of adults
1 2 3+
1,2,3 4 5 6 7 8 9 10
0.0
0.2
0.4
0.6
0.8
1.0
(c) Pods with calves present Number of adults
1 2 3+
Year Week Week
Figure 3.3. Estimated probabilities of relative proportions of 1, 2, or 3+ adults in pods:
(A) by year, (B) by week within year for pods with no calves present, and (C) by week within
year for pods with calves present. (Note: In Fig. 3.3C the single adult category represents
mothers alone with their calves and the 2 and 3+ categories are adults accompanying a calf or
calves).

65
The effects estimated by the model are more readily interpreted from the size category
probabilities in Figure 3.3A, B, and C than from the Logit scale estimates in Table 3.5.
The proportion of 3+ adults increased significantly over years relative to the proportion of one
adult and of either one or two adults. The increase in the proportion of 3+ adults over years
(increased from 23% to 31%) corresponded with a greater relative decrease in the proportion
of two adults (decreased from 57% to 47%) than in the proportion of one adult (decreased
from 23% to 21%) (Fig. 3.3A).
To the extent that the relative size probabilities changed over weeks, those changes differed
significantly between pods where a calf was present and pods where a calf was not present
(Table 3.5). A comparison of Figure 3.3B with Figure 3.3C shows that there was much
greater variation over weeks in the number of adults where a calf was not present than the
number of adults where calves were present.
For pods where a calf was not present (Fig. 3.3B), the proportion of singleton pods increased
rapidly from about week 4 (late August) (increased from 23% to 68%) with an accompanying
decrease in the proportions of larger pods (pods with two adults decreased from 57% to 24%
and pods with 3+ adults decreased from 20% to 8%). Where a calf was present (Fig. 3.3C),
the proportion of pods that included only the mother increased (from 64% to 76%) while the
proportions of larger pods decreased over weeks (pods with two adults went from 23% to
20% via a peak of 27% in mid-September, and pods with 3+ adults decreased from 13% to
4%).
The proportion of pods where calves were present increased sharply from about week 4 (late
August), so that by week 10 (mid-October) about 90% of all pods included calves (Fig. 3.3B).
Consequently, the rapid increase in the proportion of singleton pods over weeks (Fig. 3.3B)

66
occurred in the context of an ever-decreasing proportion of the total number of pods that did
not include a mother and calf (Table 3.4a).
3.6 DISCUSSION
3.6.1 Increase of Larger Pods in Hervey Bay over Years
In the Southern Hemisphere, at least seven populations of humpback whales are recognised
(IWC 2006). Eastern Australian humpback whales are considered by the International
Whaling Commission (IWC) to be a relatively discrete breeding stock termed E1, and form
part of the IWC’s Antarctic Area V management area (130◦E– 170◦W) (IWC 2006, Olavarrıa
et al. 2006). Recent modelling suggests that, prior to the last period of commercial and illegal
whaling (Clapham and Zerbini 2006, Clapham et al. 2009), the eastern Australian and
Oceania humpback whale population may have ranged from 40,595 to 44,476 (95% CI
36,642–66,129, Jackson et al. 2006). In 1963, when the IWC declared complete protection for
Southern Ocean humpback whales, it was estimated that there may have been fewer than 100
survivors in the eastern Australian population (Paterson et al. 1994). During the 30 yr from
1962 to 1992, the eastern Australian humpback whale population was estimated to have only
increased to 1,900 whales (95% CI 1,650–2,150, Paterson et al. 1994). During the 14 yr of
this study, 1992–2005, the eastern Australian humpback whale population is estimated to
have increased to 7,024 (95% CI 5,163–9,685; Paton et al. 2012).
Accordingly, the numbers of humpback whales available to enter Hervey Bay during the
study period increased by a factor of approximately 3.7. The increase in the population of
eastern Australian humpback whales in Hervey Bay may be one of the factors contributing to
the significant increase (Table 3.5) over years of larger groups (pods with 3+ adults, Fig.

67
3.3A) compared to pods of one or two adults. Hence, as the population increased, larger
groups became more common.
The increase in the number of pods observed over the study period (Fig. 3.1C) is consistent
with the growth in the population, which is likely to have generated a skewed distribution in
the population toward younger whales. Humpback whale males and females may reach sexual
and social maturity as early as 5 yr (Chittleborough 1965, Clapham 1992), although a recent
study suggests it could be 10 or more years in some populations (Gabriele et al. 2007).
Consequently, male and female humpback whales in the early stages of sexual and social
development may also have contributed to the significant growth in pods with 3+ adults (Fig.
3.3A) over years in Hervey Bay.
Dawbin (1956, 1966) suggested that humpback whales require some period in suitable
semitropical coastal waters for normal breeding behaviour, and that maximum aggregations
can be expected to occur toward the northern part of the migration closest to the breeding
grounds. Hervey Bay is near the putative breeding ground of eastern Australian humpback
whales located in the Great Barrier Reef lagoon (Simmons and Marsh 1986, Paterson 1991,
Chaloupka and Osmond 1999). They do not migrate directly through Hervey Bay, but divert
from the main migratory pathway to move into and out of the bay from the north. Humpback
whales in Hervey Bay aggregate in non-random clusters on the eastern side of the Bay
(Corkeron et al. 1994). Therefore, due to the density and movements around the bay by
humpback whales, there is an increased likelihood of interactions (aggregation and
disaggregation) among pods, which may also contribute to the formation of larger groups or
to the probability of encountering recently aggregated pods.
There were significant changes in the pod characteristics of humpback whales utilising
Hervey Bay from the beginning to the end of the study, notably the increase in larger groups.
Given that this population is known to have increased in size from about 1,900 to 7,000

68
whales (Paterson et al. 1994; Paton et al. 2012) during the period 1992–2005, these changes
may be indicative of social and behavioural changes that occur as a population expands. If so,
it may be useful to review similar long-term data from other areas hosting recovering
populations (notably Hawaii and the West Indies), to search for similar changes in pod
characteristics and social behaviour as populations expand over extended study periods.
Studies from Hawaii have reported that the range of humpback whales has expanded as the
population increased (Mobley et al. 1999, Johnston et al. 2007), and that whales regularly
move between islands separated by 40 of longitude (Cerchio et al. 1998).
3.6.2 Seasonal Change in Pod Characteristics Early to Mid-Season
Dawbin (1966, 1997) reported that females in early pregnancy and resting non- lactating
females were among the first to commence the southern migration and that they preceded
lactating females by about a month. Furthermore, they were either accompanied or closely
succeeded by immature males and females. Mature males and females follow immature males
and females but also precede lactating females with calves and escorts. The timing and
presence of the sexual and maturational classes as described by Dawbin (1966, 1997) is likely
to contribute to the higher proportion and number of pairs in Hervey Bay during August.
In the early part of the season, when calves were rarely present, the highest proportion and
numbers of pods were pairs (Fig. 3.3B, Table 3.4a). Recent genetic studies of humpback
whales in breeding grounds off the coast of South Africa and Brazil reported that most pairs
consist of male–female dyads (Pomilla and Rosenbaum 2006, Cypriano-Souza et al. 2010).
Brown and Corkeron (1995) also reported that male–female associations represented the
greatest proportion of pairs observed during the southern migration along the eastern coast of
Australia.

69
Compared to pairs, there were relatively fewer singletons in the early part of the season (Fig.
3.3B). The proportion and number of singletons were higher during the first two weeks of
August, compared to the last two weeks of August and the first week of September (Fig.
3.2D, Table 3.4a). Clapham (1994) showed that, in the southern Gulf of Maine, immature
male and female humpback whales spent relatively more time alone in their early years, with
solitary time diminishing as they approached sexual and social maturity. Specifically, he
found that males were alone in 55.8% of observations at the age of one, but in only 26.8% of
sightings by the age of six. The comparable figures for lone females were 49.9% at age 1 yr to
20.5% at 6 yr. Male and female humpback whales in the early stages of maturity are likely to
contribute to the proportion of singletons observed in August.
3.6.3 Presence of Calves Affect Pod Composition after Mid-Season
Modeling of the systematic variability of observed pod size and composition within season in
Hervey Bay revealed the significant influence of pods with calves present on pod size and
composition in mid-to-late season (Fig. 3.3C, Table 3.4c).
Adult pairs and mothers alone with their calves were the most frequent pod size and type
observed in Hervey Bay, with mothers alone with their calves accounting for just under half
of such pods (Table 3.1, 3.2). However, the composition of pods with two whales present
changed significantly over the season (Fig. 3.3B and C) as the mothers with calves moved
into the bay from mid-season onwards and dominated the latter half of the season (Fig. 3.2B),
coinciding with a rapid decrease of adult pairs (Fig. 3.3B). Mothers were alone with their calf
in 69.4% of observations of pods with calves present, (Table 3.4c), and the proportion of lone
mother-calf pods in Hervey Bay was greater than has been reported for other regions (Hawaii:

70
Mobley and Herman 1985, Herman and Antinoja 1977; West Indies: Mattila and Clapham
1989, Mattila et al. 1994).
Mobley and Herman (1985) found that when they excluded calves from the count, the overall
distributions of pod sizes were very similar. In contrast in Hervey Bay, there were significant
differences in pod sizes in pods with and without a calf, when the calf was excluded from the
count (Fig. 3.3B and C). One of the major differences between the Hervey Bay and Hawaiian
studies was that the modal size for pods having a calf present was three, mother-calf and
escort (Herman and Antinoja 1977, Herman et al. 1980, Glockner and Venus 1983). By
contrast, in Hervey Bay in pods with calves present the modal size was two, because of the
significantly higher proportion of mothers alone with their calf (Table 3.4c).
When mothers were not alone with their calves, they were either accompanied by an escort or
escorts, or were mixing with other females with calves (Table 3.3, 3.4c). It has been reported
that mother and calf pods rarely associate with other mother-calf pods in winter breeding
grounds (Herman and Antinoja 1977, Baker and Herman 1984, Mobley and Herman 1985). In
contrast in Hervey Bay, although the proportion of pods with more than one calf present is
low, interaction between mother-calf pods does occur. Possibly by mid-to-late season in
Hervey Bay, when the calves are more mature and mother-calf bonds are well established,
mothers may be more comfortable mixing with other mother-calf pods (see below).
3.6.4 Hervey Bay as a Habitat for Mothers with Calves
Forty percent of all pods observed in Hervey Bay had one or more calves present (Table 3),
and there were more mother-calf pods observed in Hervey Bay compared to earlier reports in
other regions (Hawaii: Herman and Antinoja 1977, Mobley and Herman 1985, West Indies:
Mattila and Clapham 1989, Mattila et al. 1994).
Hervey Bay is slightly off the migratory pathway and south of the putative breeding ground

71
and may provide mothers and calves with a suitable and convenient location for maternal care
in the early stages of the southern migration. Mothers of humpback calves exclusively provide
maternal care in the form of food, protection, and preparation for their calves’ first migration
to high-latitude feeding areas (Clapham 2000). It has been suggested that females with calves
prefer shallower waters close to shore to minimise predation by sharks and/or to avoid
harassment by males (Whitehead and Moore 1982, Glockner and Venus 1983, Mattila and
Clapham 1989, Smultea 1994), or as a function of social organisation (Ersts and Rosenbaum
2003).
It has also been suggested that escorts may serve a protective function, and that it may be
advantageous for mothers with calves to travel with an escort during migration (Herman and
Antinoja 1977, Brown and Corkeron 1995). A recent study reported that females with a calf
may tolerate a single escort as a “bodyguard” strategy to avoid harassment by other males
(Cartwright and Sullivan 2009). However, the low proportion of escorts observed in Hervey
Bay may provide a further advantage to mothers in that they have the opportunity of spending
most of their time alone with their calves without having to take into account the presence of
male escorts, or of being harassed by male escorts.
The first calves observed in Hervey Bay occurred in late August. Therefore, calves
accompanied by mothers may be between a few weeks to 2 months of age (Chittleborough
1953, 1958). Consequently, Hervey Bay does not appear to be a calving ground, but rather a
suitable stopover for mothers to engage in maternal activity with older calves during the early
stages of their southern migration.

72
3.7 CONCLUSIONS
Hervey Bay is south of the putative breeding grounds and is a habitat utilised by eastern
Australian humpback whales during the early stages of the southern migration. These data on
pod characteristics of humpback whales in Hervey Bay indicate that the shallow, sheltered
waters of the eastern bay provide an important habitat for mothers and calves, as a temporary
stopover during their initial southern migration to Antarctic feeding areas. In addition, Hervey
Bay provides a suitable and important habitat for other classes of humpback whales primarily
during the early part of the migratory season, specifically immature males and females in
early August and mature males and females in late August. The significant seasonal changes
in pod characteristics of humpback whales in Hervey Bay appear to be related to the different
sexual and maturational classes of humpback whales using the bay.
3.8 LITERATURE CITED
Baker, C. S., and L. M. Herman. 1984. Aggressive behavior between humpback whales
(Megaptera novaeangliae) wintering in Hawaiian waters. Canadian Journal of
Zoology 62:1922-1937.
Baker, C. S., L. M. Herman, A. Perry, W. S. Lawton, J. M. Straley, A. A. Wolman, G. D.
Kaufman, H. E. Winn, J. D. Hall, J. M. Reinke and J. Ostman. 1986. Migratory
movement and population structure of humpback whales (Megaptera novaeangliae) in
the central and eastern North Pacific. Marine Ecology - Progress Series 31:105-119.
Brown, M., and P. Corkeron. 1995. Pod characteristics of migrating humpback whales
(Megaptera novaeangliae) off the east Australian coast. Behaviour 132 (Part 3-4):163-
179.
Cartwright, R., and M. Sullivan. 2009. Associations with multiple male groups increase the

73
energy expenditure of humpback whale (Megaptera novaeangliae) female and calf
pairs on the breeding grounds. Behaviour 146:1573-1600.
Cerchio, S., C. M. Gabriele, T. F. Norris and L. M. Herman. 1998. Movements of humpback
whales between Kauai and Hawaii: implications for population structure and
abundance estimation in the Hawaiian Islands. Marine Ecology Progress Series 175:
13-22.
Chaloupka, M., and M. Osmond. 1999. Spatial and Seasonal Distribution of Humpback
Whales in the Great Barrier Reef Region. in Life in the Slow Lane: Ecology and
Conservation of Long-Lived Marine Animals. Edited by John A. Musick. American
Fisheries Society Symposium 23. American Fisheries Society:89–106.
Chaloupka, M., M. Osmond and G. Kaufman. 1999. Estimating seasonal abundance trends
and survival probabilities of humpback whales in Hervey Bay (east coast Australia).
Marine Ecology - Progress Series 184:291-301.
Chittleborough, R. G. 1953. Aerial observations on the Humpback Whale, Megaptera nodosa
(Bonnaterre), with notes on other species. Australian Journal of Marine and
Freshwater Research 4(2):219-228.
Chittleborough, R. G. 1958. The Breeding Cycle of the female Humpback Whale, Megaptera
nodosa, (Bonnaterre). Australian Journal of Marine and Freshwater Research 9(1):1-
20.
Chittleborough, R. G. 1965. Dynamics of two populations of the humpback whale, Megaptera
novaeangliae (Borowski). Australian Journal of Marine and Freshwater Research
16:33-128.
Clapham, P. J. 1992. Age at attainment of sexual maturity in humpback whales (Megaptera
novaeangliae). Canadian Journal of Zoology 70:1470-1472.
Clapham, P. J. 1993. Social organization of humpback whales on a North Atlantic feeding

74
ground. Symposia of the Zoological Society, London 66:131-145.
Clapham, P. J. 1994. Maturational changes in patterns of association in male and female
humpback whales, (Megaptera novaeangliae). Journal of Zoology 234 (Part 2):265-
274.
Clapham, P. J. 2000. The humpback whale - Seasonal feeding and breeding in a baleen whale.
in Cetacean Societies: Field Studies of Dolphins and Whales. Mann, J., Conner, R. C.,
Tyack, P. L and Whitehead, H, eds. University of Chicago Press. Chicago and
London:173-196.
Clapham, P., and A. Zerbini. 2006. Is social aggregation driving high rates of increase in
some Southern Hemisphere humpback whale populations? Paper SC/58/SH3
presented to the IWC Scientific Committee, 2006: 11 pp. [Available from the Office
of the IWC Secretariat]
Clapham, P., Y. Mikhalev, W. Franklin, D. Paton, C. S. Baker, Y. V. Ivashchenko and R. L.
Brownell Jr. 2009. Catches of Humpback Whales by the Soviet Union and Other
Nations in the Southern Ocean, 1947-1973. Marine Fisheries Review 71(1):39-43.
Cleveland, W. S. 1979. Robust locally weighted regression and smoothing scatterplots.
Journal of the American Statistical Association 74:828-836.
Corkeron, P. J. 1993. Aerial Survey Methodology for Hervey Bay Marine Park Queensland -
A Review. Report to the Queensland Department of Environment and Heritage:1-33.
Corkeron, P. J. 1995. Humpback whales (Megaptera novaeangliae) in Hervey Bay,
Queensland: behaviour and responses to whale-watching vessels. Canadian Journal of
Zoology 73(7):1290-1299.
Corkeron, P. J., and M. Brown. 1995. Humpback whales (Megaptera novaeangliae) in
Hervey Bay, Queensland. Impact of whalewatching & the utilisation of the bay by
whales: 17 pp. Scientific Aspects of Managing Whale Watching, Italy, March-April

75
1995 - Workshop Report IFAW UK.
Corkeron, P. J., M. Brown, R. W. Slade and M. M. Bryden. 1994. Humpback Whales,
Megaptera novaeangliae (Cetacea: Balaenopteridae), in Hervey Bay, Queensland.
Wildlife Research 21(3):293-305.
Craig, A. S., and L. M. Herman. 2000. Habitat preferences of female humpback whales
(Megaptera novaeangliae) in the Hawaiian Islands are associated with reproductive
status. Marine Ecology Progress Series 193: 213-216.
Cypriano-Souza, A. L., G. P. Fernandez, C. A. V. Lima-Rosa, M. H. Engel and S. L. Bonatto.
2010. Microsatellite Genetic Characterization of the Humpback Whale (Megaptera
novaeangliae) Breeding Ground off Brazil (Breeding Stock A). Journal of Heredity
2010: 101 (2): 189-200.
Dawbin, W. H. 1956. The migrations of humpback whales which pass the New Zealand coast.
Transactions of the Royal Society of New Zealand 84 (Part 1):147-196.
Dawbin, W. H. 1966. The seasonal migratory cycle of humpback whales. in Whales, Dolphins
and Porpoises. Edited by K. S. Norris. University of California Press. Berkeley,
California:145-170.
Dawbin, W. H. 1997. Temporal segregation of humpback whales during migration in
southern hemisphere waters. Memoirs of the Queensland Museum 42(1):105-138.
Ersts, P. J., and Rosenbaum, C. 2003. Habitat preference reflects social organisation of
humpback whales (Megaptera novaeangliae) on a wintering ground. Journal of
Zoology, London 260:337-345.
Gabriele, C. M., J. M. Straley and J. L. Neilsen. 2007. Age at first calving of female
humpback whales in Southeastern Alaska. in Proceedings of the Fourth Glacier Bay
Science Symposium, October 26–28, 2004: U.S. Geological Survey Scientific
Investigations. Piatt, J.F. and Gende, S.M eds. Report 2007-5047:159-162.
76
Glockner, D. A., and S. C. Venus. 1983. Identification, growth rate and behavior of humpback
whale (Megaptera novaeangliae) cows and calves in the waters off Maui, Hawaii,
1977-1979. in Communication and behavior of whales. Payne, R. S ed. Westview
Press. Boulder, CO:223-258.
Herman, L. M., and R. C. Antinoja. 1977. Humpback whales in Hawaiian breeding waters:
population and pod characteristics. Scientific Reports of the Whales Research Institute
29:59-85.
Herman, L. M., P. H. Forestell and R. C. Antinoja. 1980. The 1976/77 migration of humpback
whales into Hawaiian: composite description. Final Report to the U.S. Marine
Mammal Commission, Report # MMC-77/19. Published by the National Technical
Information Service PBSO-162332, Arlington, Virginia: 55 pp.
Hosmer, D. W., and S. Lemeshow. 2000. Applied Logistic Regression, 2nd Edition. Wiley,
New York. New York.
IWC 2006. Report of the Workshop on the Comprehensive Assessment of Southern
Hemisphere Humpback Whales. IWC Scientific Committee 2006 SC/58/Rep5: 77 pp.
[Available from the office of the IWC Secretariat].
Jackson, J. A., A. Zerbini, P. Clapham, C. Garrigue, N. Hauser, M. Poole and C. S. Baker.
2006. A Bayesian assessment of humpback whales on breeding grounds of Eastern
Australia and Oceania (IWC Stocks E, E1, E2 and F). Paper SC/A06/HW52 presented
to the IWC Scientific Committee, 2006: 17 pp. [Available from the office of the IWC
Secretariat].
Johnston, D., M. Chapla, L. Williams and D. Mattila. 2007. Identification of humpback whale
Megaptera novaeangliae wintering habitat in the Northwestern Hawaiian Islands using
spatial habitat modeling. Endangered Species Research 3: 249-257.
Mattila, D. K., and P. J. Clapham. 1989. Humpback whales, Megaptera novaeangliae, and

77
other cetaceans on the Virgin Bank and in the northern Leeward Islands, 1985 and
1986. Canadian Journal of Zoology 67:2201-2211.
Mattila, D. K., P. J. Clapham, O. Vasquez and R. S. Bowman. 1994. Occurrence, population
composition, and habitat use of humpback whales in Samana Bay, Dominican
Republic. Canadian Journal of Zoology 72(11):1898-1907.
Mobley, J. R., and L. M. Herman. 1985. Transience of social affiliations among humpback
whales in Hawaiian breeding waters. Canadian Journal of Zoology 63:762-772.
Mobley, J. R. Jr., G. B. Bauer and L. M. Herman. 1999. Changes over a ten-year interval in
the distribution and relative abundance of humpback whales (Megaptera novaeangliae)
wintering in Hawaiian waters. Aquatic Mammals 25: 63-72.
Olavarría, C., M. Anderson, D. Paton, D. Burns, M. Brasseur, C. Garrigue, N. Hauser, M.
Poole, S. Caballero, L. Florez-Gonzalez and C. S. Baker. 2006. Eastern Australia
Humpback whale genetic diversity and their relationship with Breeding Stocks D, E, F
and G. IWC Scientific Committee SC/58/SH25. 6 pp. [Available from the office of the
IWC Secretariat].
Paterson, R. A. 1991. The migration of Humpback Whales (Megaptera novaeangliae) in east
Australian waters. Memoirs of the Queensland Museum 30(2):333-341.
Paterson, R. A., P. Paterson and D. H. Cato. 1994. The status of Humpback whales
Megaptera novaeangliae in East Australia thirty years after whaling. Biological
Conservation 70(2):135-142.
Paton, D. A., L. Brooks, D. Burns, T. Franklin, W. Franklin, P. Harrison and P. Baverstock.
2012. Abundance of east coast Australian humpback whales (Megaptera
novaeangliae) in 2005 estimated using multi-point sampling and capture-recapture
analysis. Journal of Cetacean Research and Management, (Special Issue) 3: 253-259.
Pomilla, C., and H. C. Rosenbaum. 2006. Estimates of relatedness in groups of humpback

78
whales (Megaptera novaeangliae) on two wintering grounds off the Southern
Hemisphere. Molecular Ecology 15:2541-2555.
Rasbash, J., W. Browne, M. Healy, B. Cameron and C. Charlton. 2005. MLwiN Version 2.02.
Multilevel Models Project. Institute of Education.
http://www.cmm.bristol.ac.uk/MLwiN/.
Simmons, M. L., and H. E. Marsh. 1986. Sightings of humpback whales in Great Barrier Reef
waters. Scientific Reports of the Whales Research Institute 37:31-46.
Smultea, M. A. 1994. Segregation by humpback whale (Megaptera novaeangliae) cows with
a calf in coastal habitat near the island of Hawaii. Canadian Journal of Zoology
72(5):805-811.
Tyack, P., and H. Whitehead. 1983. Male competition in large groups of wintering humpback
whales. Behaviour 83(1/2):132-154.
Vang, L. 2002. Distribution, abundance and biology of Group V humpback whales
(Megaptera novaeangliae): A review. The State of Queensland Environmental
Protection Agency, Conservation Management Report, August 2002: 20 pp.
Whitehead, H. 1983. Structure and stability of humpback whale groups off Newfoundland.
Journal of Cetacean Research and Management. 61:1391-1397.
Whitehead, H., and M. J. Moore. 1982. Distribution and movements of West Indian
humpback whales in winter. Journal of Cetacean Research and Management
(60):2203-2211.

79
Chapter 4
Seasonal changes in social behaviour of eastern
Australian humpback whales (Megaptera
novaeangliae) during the southern migratory
stopover in Hervey Bay, Queensland, 1992-2005

80
4.1 ABSTRACT
This study investigated the social behaviour of humpback whales in 3,949 pods observed in
Hervey Bay (Queensland, Australia) between 1992 and 2005. The 3,949 pods consisted of
3,484 pods that did not change size while under observation and 465 newly associated pods
that ranged in size from 2 to 14 whales. The rate of formation of newly associated pods was
significantly higher in the first four weeks of the season compared with later in the season. Of
the 3,949 pods competitive behaviour was observed in 216 (5.5%) pods, non-agonistic social
behaviour was observed in 432 (10.9%) pods, both competitive behaviour and non-agonistic
social behaviour were observed in 33 pods (0.8%), while other behaviour was observed in
3,268 (82.8%) pods. Non-agonistic social behaviour was observed more frequently earlier in
the season and rarely occurred in pods with calves present. In contrast, competitive groups
were observed more frequently later in the season when mother-calf pods predominated. The
frequency of competitive groups increased significantly towards the end of the season as pod
size and composition changed. Competitive groups and non-agonistic social behaviour were
more frequently observed in both larger and newly associated pods. Seasonal changes in
social behaviour appear to be associated with the timing of different maturational and
reproductive classes using Hervey Bay as a stopover during their southern migration with an
increasing proportion of mothers and calves later in the season.
Key words: humpback whales, Megaptera novaeangliae, Hervey Bay, Australia, social
behaviour, competitive groups, non-agonistic social behaviour

81
4.2 INTRODUCTION
Hervey Bay (Queensland 250S, 1530E) is located south of the putative breeding ground of
eastern Australia humpback whales and is neither a calving ground nor a terminal destination
(Franklin et al. 2011). Previous studies suggested that the large inter-reef lagoon of the Great
Barrier Reef, between 160S and 230S, represents the primary overwintering and breeding
ground of eastern Australian humpback whales (Simmons and Marsh 1986, Paterson et al.
1981, Chaloupka and Osmond 1999). Humpback whales on their northern migration do not
enter Hervey Bay, but on their southward migration, large numbers of humpback whales
make a slight diversion from the southern migratory pathway and pass inside Breaksea Spit to
enter Hervey Bay (Paterson 1991). Between 30% and 50% of eastern Australian humpback
whales enter Hervey Bay during the southern migration (Chaloupka et al. 1999). They
aggregate in shallow waters close to the western shore of Fraser Island in the eastern part of
the bay, and enter and leave Hervey Bay from the north (Corkeron et al. 1994, Franklin et al.
2011). As an accessible stopover early in the southern migration from their winter breeding
grounds to their Antarctic feeding areas, Hervey Bay offers a unique opportunity to study the
social behaviour of humpback whales during their migration, in contrast to the social
groupings and dynamics reported from traditional breeding grounds and feeding areas in other
studies.
Franklin et al. (2011) studied pod characteristics of humpback whales in Hervey Bay between
1992 and 2005, and reported that there was a significant increase over these years in the
numbers of pods of 3+ whales and this was related to population growth and density. Adult
pairs were the most frequent pod type, followed by mothers alone with their calves (Franklin
et al. 2011). They found that the size and composition of pods in Hervey Bay varied
significantly as the season progressed (Franklin et al. 2011). Pods with calves present were
rarely recorded during the first four weeks of the season but dominated for the last six weeks

82
of the season (Franklin et al. 2011). The pod data were consistent with the timing of
reproductive and maturational classes reported by Dawbin (1966, 1997) suggesting that the
predominant age/sex structure of whales in Hervey Bay during the first two weeks of the
season were immature males and females, followed by mature males and females during mid
season, and mothers with calves (either alone or with escorts) during September through to
mid-October (Dawbin 1966, 1997; Franklin et al. 2011). Franklin et al. (2011) reported
significant differences in pod size and composition compared to the Hawaiian and West
Indies breeding grounds (Herman and Antinoja 1977, Herman et al. 1980, Mobley and
Herman 1985, Mattila et al. 1989, 1994), and suggested this may be related to Hervey Bay
being a migratory stopover early in the southern migration.
Social organisation and behaviour of humpback whales has been well documented in the
Northern Hemisphere in both the feeding areas and breeding grounds (Clapham 1993, 2000;
Craig et al. 2002; Darling et al. 2006; Herman et al. 2011). Studies have investigated group
size and examined the factors influencing the formation and dynamics of groups. There is
general agreement that beyond the mother-calf association, which lasts for 11 to 12 months
(Chittleborough 1958, Clapham 2000), the social organisation of humpback whales is
characterised by small unstable groups, involving brief associations lasting for periods of a
few hours or less, with some associations lasting over several days or (rarely) over longer
periods (Herman and Antinoja 1977, Tyack and Whitehead 1983, Baker and Herman 1984a,
Mobley and Herman 1985, Mattila et al. 1994, Clapham 2000).
Humpback whales of both sexes and all maturational classes from calves to adults, engage in
a range of surface behaviours and activities observed frequently in both high and low latitudes
(see review in Clapham 2000). There are certain group classes observed at breeding grounds
that appear to be related to mating. These include competitive groups (Tyack and Whitehead,
1983; Baker and Herman, 1984b; Clapham et al. 1992; Spitz et al. 2002; Herman et al. 2008;

83
Pack et al. 2009), mother-calf escort groups (Clapham 2000, Craig et al. 2002), and male-
female dyads (Pack et al. 2012). Large fast-moving groups of humpback whales involved in
high levels of aggressive behaviour were first described by Tyack and Whitehead (1983) and
Baker and Herman (1984a), who suggested that the groups consisted of mature males
competing for access to a single female. This hypothesis that competitive groups contained a
single female and competing males was later largely confirmed using molecular techniques
(Clapham et al. 1992). Individual humpback whales in the company of mother-calf pairs on
the breeding grounds were also proved to be male and supported the evidence that a
proportion of females may become pregnant while lactating (Chittleborough 1958, 1965;
Clapham 2000, Craig et al. 2002). A recent study of the body lengths of male-female dyads
showed that many were mature-sized and that mature-sized females preferred associating with
large mature-sized males (Pack et al. 2012). However, mating has never been observed in this
species (Clapham 2000, Pack et al. 2002, Herman et al. 2008) and the mating system is still
not fully understood (Herman and Tavolga 1980, Clapham 1996, Cerchio et al. 2005, Darling
et al. 2006). Helweg and Herman (1994) reported that humpback whales in breeding grounds
may spend up to 90% of their time underwater. Because it is often difficult to study
humpback whales underwater for extended periods (Herman et al. 2008) researchers often
rely on surface observations to describe social behaviour and organisation. Consequently the
study of humpback whale surface behaviours is important in understanding individual and
group social behaviour and social organisation.
Competitive behaviours have predominantly been reported occurring within competitive
groups, which typically consist of a single female (with or without a calf) and two or more
male escorts competing for access to her (Tyack and Whitehead 1983, Baker and Herman
1984b, Clapham et al. 1992). Competitive groups primarily occur at winter breeding grounds
and may involve a series of aggressive and sometimes escalating agonistic behaviours (Baker

84
and Herman 1984b). The roles of both male and female humpback whales within competitive
groups, the sex composition of groups, and the role of escorts, in terms of their maturational
status, stamina and experience, have been investigated and described in the breeding grounds
of the Northern Hemisphere (Darling et al. 1983; Tyack and Whitehead 1983; Baker and
Herman 1984b; Clapham et al. 1992; Clapham 2000; Pack et al. 2002, 2009; Spitz et al.
2002) and in the Southern Hemisphere (Brown and Corkeron 1995). Reports of agonistic
behaviour outside of competitive groups are rare (Tyack and Whitehead 1983, Clapham et al.
1992, Clapham 1996, Darling and Berube 2001).
Humpback whale surface behaviours that have no obvious competitive component have been
reported in several studies; the behaviours include, pectoral fin slapping, rolling over ventral
side up, head-rising, spy-hopping, pectoral fin extensions, fluke extensions and breaching. It
has been suggested that these behaviours may be associated with courtship and mating in
humpback whales (Dawbin 1956, Tyack 1981, Tyack and Whitehead 1983, Herman and
Antinoja 1977). Tyack and Whitehead (1983 p.137) reported that “In Hawaii some groups of
more than three adults appeared to lack the Nuclear Animal, Principal Escort structure...and...
whales in these groups seemed to tolerate the approach of any other member of the group.
Surfacings were much more relaxed in these groups, unlike the lunging surfacings seen in
more active groups. Furthermore, the very rapid rate of travel which characterizes large active
groups did not occur.” Herman and Antinoja (1977) reported slow-moving milling groups
involved in spatially undirected activity occurring within a small area. Herman et al. (2008)
described underwater behaviours by female humpback whales that may be acting in a non-
agonistic solicitous manner towards males.
Non-agonistic male-male interactions have been reported during the winter migrations and at
breeding grounds. Clapham et al. (1992) speculated that the existence of apparently mutually
non-agonistic male-male coalitions in the Northern Hemisphere breeding grounds may be an

85
indicator that these humpback males cooperate in their effort to secure access to a female.
Darling et al. (2006) reported in a recent study of singers that in Hawaii singer/joiner male-
male dyads occurred and that overall 80% of male-male relations were considered non-
agonistic in nature. They suggested that singer/joiner relations may provide mutual assistance
in mating when joining competitive groups. They also speculated that non-agonistic social
behaviour might be more prevalent in humpback whale social organisation than had been
previously reported.
The social behaviour of eastern Australian humpback whales has been studied during the
northern and southern seasonal migration from and to the Antarctic feeding areas. Brown and
Corkeron (1995) reported that during migration group formation and behaviour were
influenced by social factors and that most male-male interactions were characterised by non-
agonistic and occasionally cooperative interactions. Valsecchi et al. (2002) studied the social
structure of migrating humpback whales off eastern Australia and reported that with the
exception of the mother-calf relationship, there was an absence of kin-relatedness within
small groups.
Corkeron et al. (1994) suggested that the non-random distribution of pods of humpback
whales aggregating in Hervey Bay might be related to social factors, but there were no data
indicating that the bay was of importance to any particular class of humpback whale. The
seasonal social behaviour of humpback whales in Hervey Bay has not been previously
described and no study to date has systematically investigated non-agonistic social behaviour
in pods within season and over years.
This study summarises behavioural observations of humpback whales in 3,949 pods recorded
during the fourteen-year period 1992 to 2005. The primary objective was to investigate the
seasonal social behaviour of humpback whales in Hervey Bay. Specifically, the study
investigated the occurrence of pod associations, competitive groups and non-agonistic social

86
behaviour pods within and among seasons. These data were used to investigate and analyse
competitive behaviour and non-agonistic social behaviour and to discuss whether the timing
of occurrence of different maturational classes influences the seasonal social behaviour of
humpback whales in Hervey Bay.
4.3 METHODS
4.3.1 Study area and timing of surveys
Hervey Bay is located at 250S, 1530E on the eastern coast of Queensland and is formed by
Fraser Island and the Australian mainland, (Fig. 2.1 above). It is a wide shallow bay with a
sand and mud bottom, approximately 4,000 km2 in area, and is generally less than 18 m deep,
(Vang 2002). Fraser Island is 126 km long; it lies along a northeasterly axis and its northern
end bridges the continental shelf. Directly north of Hervey Bay, at a distance of between 111
and 222 km, are the most southerly islands of the Great Barrier Reef (Fig. 2.1 above).
The southern migration from the Great Barrier Reef begins in late July, with humpback
whales moving into and out of Hervey Bay from early August to mid-October (Paterson 1991,
Corkeron et al. 1994, Franklin et al. 2011). Accordingly, a 10-week survey commencing on
the first Sunday after the 5th of August each season was chosen to provide a representative
sample of the seasonal flow of humpback whales in Hervey Bay.
4.3.2 Definitions
Singleton: a lone humpback whale.

87
Pod: two or more humpback whales swimming side by side within one to two body lengths of
each other, generally moving in the same direction and coordinating their speed of travel
(Whitehead 1983, Clapham 1993, Corkeron et al. 1994). Although in some species for
example Orcinus orca, the term pod is used to describe stable groups, our use of the term
‘pod’ does not imply stability.
Initial pod: this is a group of whales (or a singleton) as first encountered, prior to any change
in pod size. If the initial singleton or pod joins, or is joined by, one or more singleton or pod it
is referred to as a newly associated pod:
Calf: an individual whale was considered to be a calf if it appeared to be less than half the
length of a particular adult with which it maintained a constant and close relationship. In most
observations, no other whale was seen coming between a mother and her calf (Tyack and
Whitehead 1983). The adult in the dyad was assumed to be the mother. Yearlings were
distinguished from calves visually by an experienced observer to be unambiguously small
relative to adults but too large to be calves of the year (Clapham et al. 1999, Craig et al.
2003).
Escort: is defined as a whale accompanying a mother with calf. The term ‘escort’, was first
used by Herman and Antinoja (1977). Escorts have been found to be male and may be mature
males waiting for a post-partum estrous mating opportunity (Glockner and Venus 1983,
Tyack and Whitehead 1983, Baker and Herman 1984a, Clapham 2000).
Competitive Group: a group of three or more whales exhibiting competitive behaviour, and
which usually consists of a single female and a variable number of males (Clapham et al.
1992, 1993; Clapham 2000). Roles within the competitive group are defined as follows: a
Nuclear Animal refers to a whale that is centrally located within the group, and is usually
passive. A Principal Escort is a whale that is spatially closest to the Nuclear whale in the

88
group, and appears to fend off approaches to the Nuclear whale by other participants (Tyack
and Whitehead 1983). A Challenger is any whale observed to make such an approach. The
interaction between the Principal Escort and any challenger may involve a series of escalating
aggressive behaviours increasing in intensity (Baker and Herman 1984b). A Secondary Escort
is any participant in the group that is neither the Nuclear Animal nor the Principal Escort and
is not observed in a Challenger role. A competitive group may contain a female with or
without a calf. Behaviours observed in competitive groups may include high-speed chasing,
strong loud exhalations, head lunging, inflated head lunging, blocking, linear bubble
streaming and side tail thrashes (Darling et al. 1983, Tyack and Whitehead 1983, Baker and
Herman 1984b, Clapham 2000, Darling et al. 2006).
Non-Agonistic Social Behaviour: this occurs in pods consisting of at least two whales
(excluding a mother alone with her calf). The surface behaviours concerned involve spatially
undirected activity occurring within a small area (Herman and Antinoja 1977), and calm
interactions where no high-energy actions, aggression or competitive behaviours are observed
(Darling et al. 2006). The behaviours include: pectoral fin slapping, pectoral fin extensions,
head rising, spy-hops and fluke-extensions, rolling over ventral side up, milling, all involving
slow coordinated movements (Herman and Antinoja 1977, Tyack 1981, Tyack and Whitehead
1983).
Other Behaviour: occurs in pods that are neither competitive groups nor non-agonistic social
behaviour pods and include surface travelling, resting or surface activity, for example
breaching, lobtailing or singing and in the case of mother-calf pods maternal activities, either
alone or with an escort.
Sex-identification: sex can be determined by the observation of the genital area and the
presence of a hemispherical lobe posterior to the genital slit in the case of females and its
absence in the case of males (True 1904, Glockner 1983). Furthermore, sex can also be

89
inferred from social roles: an individual accompanying a calf consistently and providing
nurturing behaviors towards the calf can be inferred to be female (Tyack and Whitehead
1983). Similarly, escorts and singers have been found to be male (Glockner and Venus 1983,
Tyack and Whitehead 1983, Baker and Herman 1984a, Clapham 2000). Chu and Nieukirk
(1988) reported that individual humpback whales with distinct vertical and horizontal dorsal
fin scars, resulting from competitive activity could be inferred as males. These marks were
only used in conjunction with the resighting histories and the observed social roles to infer an
individual as a male. With few exceptions, Nuclear Animals in competitive groups have been
found to be female (Darling et al. 1983; Tyack and Whitehead 1983; Baker and Herman
1984b; Clapham et al. 1992, 1993; Clapham 2000; Darling et al. 2006).
4.3.3 Fieldwork surveys
Vessel surveys for this study were conducted for nine weeks in 1992 and for ten weeks each
year between 1993 and 2005. The study area (Fig. 4.1) is approximately 27.8 km from
Urangan Boat Harbour, Hervey Bay. Fieldwork was planned for 6 d each week, leaving
Urangan harbor at 0800 each Sunday and returning at 1500 the following Friday. Planned
daily operations were from 0930 to 1700 on Sunday, 0700 to 1700 Monday to Thursday, and
from 0700 to 1330 on Friday.
Four different motorised vessels were utilised as dedicated research platforms: two were
mono-hulls and two were catamarans, ranging in length from 11 to 27 m. When searching for
humpback whales the normal range of operational speed of the four research vessels was
12.9-18.5 km/h (7-10 kts). During commencement of observations, the rate of travel of the
research vessel was adjusted to match the speed of the pod or singleton. Observations were
conducted from the upper deck or flying bridge of each vessel, which provided a clear
vantage point for 5 or more nautical miles.

90
4.3.4 Observations, photo-identification and data analysis
Observations and photo-identification began on the first sighted pod or singleton, with no a
priori selection of any particular pod class. If no pod or singleton was in sight, either a
random direction of travel was commenced until a pod or singleton was sighted or, if
information about the location of pods or singletons was available from one of the local
commercial whale-watching vessels, travel was commenced towards that location. If a pod or
singleton was sighted en route it was selected for observation.
Photography of the ventral fluke patterns, shape and size of dorsal fins and lateral body
markings were obtained to allow identification of individual humpback whales (Katona et al.
1979, Katona and Whitehead 1981). Data collected during the observation of each pod
included: date, time and GPS location at commencement every 15m during the observation
and at completion of the observation. In addition the following information was recorded for
each pod; a pod identification code, the observed number of individuals in the pod, pod
composition, and surface behaviours (continuous sampling; Altmann, 1974). Information on
sex-identification was obtained where possible in accordance with the definitions above. The
duration of observation was maintained until the composition and size of each pod was
determined and the surface behaviours occurring were recorded.
Upon commencement of observation of the initial pod a member of the observation team
continually scanned for and reported on other pods within a radius of a kilometre. If one or
more of those pods were tracking towards the initial pod, or if the initial pod was tracking
towards them then the duration of observation was extended to observe and record
associations as they occurred. The details of each associating pod, including time, GPS
location, size, composition and surface behaviours, were recorded. Each newly associated pod
was designated as either a consecutive association (e.g. a mother-calf pod attracts one escort
at time 1, then another at time 2, then another at time 3, and so forth making five associations

91
in an observation period) or as a simultaneous association (e.g. three singletons approaching
each other and associating simultaneously). Disassociations were also recorded, however, as
the focus of this study was pod associations, competitive groups and non-agonistic social
behaviour pods the rate of changes in membership of pods were not analysed.
All data were recorded daily in field notes and entered into a FileMaker Pro database each
evening. Photography for each pod was analysed in conjunction with the field notes on
observations of pod composition, behaviours observed and sex-identification information.
Ventral fluke photographs of individual humpback whales were assessed for photographic
quality using an established photo-identification quality protocol (Calambokidis et al. 2001).
Annual fluke catalogues for the years 1992 to 2005 were compiled and analysed for intra- and
inter-season resights of individual humpback whales using a propriety matching system based
on categorisation of flukes utilising an array of coded discrete characteristics (ACDC),
applied to the file name of each fluke photograph (see Chapter 2 for further details). The
ACDC categories were based on individually unique and stable patterns of black and white
pigmentation on the underside of the tail flukes (Katona et al. 1979, Katona and Whitehead
1981). The system allowed each fluke to be allocated to contiguous stratified categories for
visual display and organisation during photographic analyses. When matching a fluke against
the fluke catalogue it was compared with other photographs within its colour and pattern
category and then if not matched it was then subsequently compared with photographs within
adjacent categories. Photographic analysis outcomes together with original field data were
incorporated into a single FileMaker Pro relational database.
For the purposes of analysis in this study, pods were categorised into pods that did not
associate while under observation and pods that did associate while under observation
forming newly associated pods. All logged information on surface behaviours and
composition for each pod was reviewed and each pod in the data set was then further

92
categorised, on the basis of surface behaviours occurring, as a competitive group, non-
agonistic social behaviour pod or other behaviour pod in accordance with the definitions
described above.
4.3.5 Statistical analysis
The pod or singleton was used as the basic observational unit in analyses. The pods used in
the analyses were the initial pods that did not change size while under observation, and the
newly associated pods that did change size while under observation. The size of the newly
associated pods by number of pods associating and size of the initial pod were reported. The
duration of observations of competitive groups, non-agonistic social behaviour pods and other
behaviour pods were reported.
The frequencies of competitive groups, non-agonistic social behaviour pods and other
behaviour pods, split by pods with no calves present and pods with calves present, by newly
associated pods and pods that did not associate while under observation, and by number of
adults in pods (1, 2, and 3+) were reported.
As the focus of this study was competitive behaviour and non-agonistic social behaviour the
analysis was undertaken on the subset of pods that met the definition (see above) of a
competitive group (i.e. pods that included at least three whales of which at least 2 were non-
mothers); and pods that met the definition (see above) of a non-agonistic social behaviour pod
(i.e. pods that included at least two whales, excluding a mother alone with her calf).
The data on competitive groups, non-agonistic social behaviour pods and newly associated
pods, by week within season (1-10), together with the sub-set of pods used in statistical
analysis and modelling were reported. Finally sex-identified males and females in competitive
groups and non-agonistic social behaviour pods were reported. However, as sex could not be
unambiguously identified for all individuals, the data were not used in analysis.

93
Variation in the proportion of newly associated pods by year, by week within year (1-10), by
calf present or not present, and by pod size were assessed using chi-square analyses.
The variation in the proportion of competitive groups and non-agonistic social behaviour pods
(independent analyses) by year, by week within year, by pods that did not associate while
under observation and newly associated pods, and by pods with no calves present and pods
with calves present were examined.
Chi-square analyses were used to document the univariate associations between the
occurrence of competitive groups and newly associated pods, year, week within year, number
of whales (excluding calves) and presence of a calf in the pod prior to fitting a binary logistic
regression model to assess the joint effects of the above factors on the probability of
occurrence of competitive groups.
Similarly, chi-square analyses were used to document the univariate associations between the
occurrence of non-agonistic social behaviour pods and newly associated pods, year, week
within year, number of whales (excluding calves) and presence of calf in the pod prior to
fitting a binary logistic regression model to assess the joint effects of the above factors on the
probability of occurrence of non-agonistic social behaviour pods.
4.4 RESULTS
4.4.1 Effort and observations
A total of 139 6-day survey periods (Sunday to Friday) were conducted in the Hervey Bay
study area (Fig. 4.1) between 1992 and 2005. Data were obtained on 770 of the planned 834
survey days. Total survey time was 6,160 hr and observations of humpback whale pods were
conducted for a total of 2,760 hr.

94
Observations were made and data collected on 4,506 pods. The hours spent weekly on survey
and observing whales, the weekly total numbers of pods and individual whales observed, and
the mean hourly rates of observation of pods and individuals over weeks are reported in
Franklin et al. (2011).
4.4.2 Data set
Of the 4,506 pods, 3,484 (77.3%) were pods that did not associate while under observation
and the other 1,022 (22.7%) were pods that did associate while under observation and were
involved in associations of from 2 to 5 pods, forming 465 newly associated pods (Table 1).
The data set of 3,949 pods used for analysis in this study is made up of the 3,484 (88.2%)
pods that did not associate and the 465 (11.8%) newly associated pods.
4.4.3 Newly associated pods
Newly associated pods, formed by the consecutive or simultaneous association of up to 5
pods during the period of observation, with calves present versus those without calves present
are reported in Table 4.1.
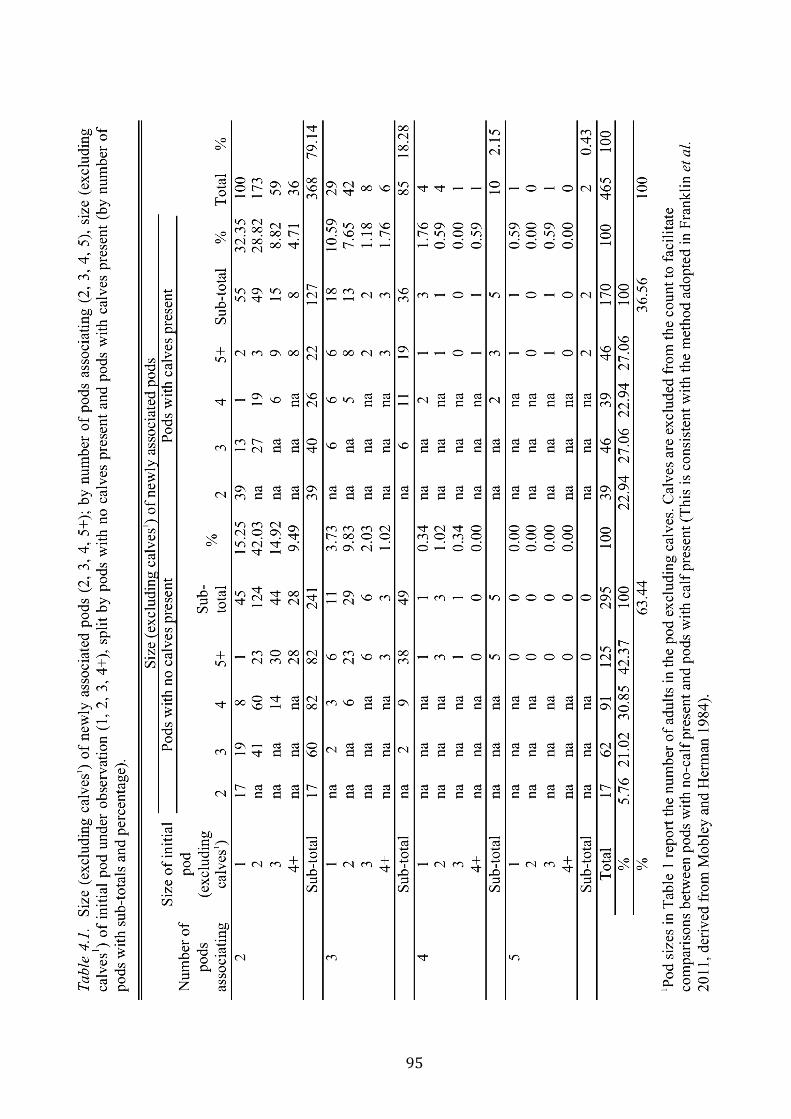
95

96
Of the 465 newly associated pods, 368 (79.1%) consisted of two pods (or singletons)
associating, 85 (18.3%) of three pods associating, 10 (2.2 %) of four pods associating and 2
(0.4%) of five pods associating. Of the 465 newly associated pods, 295 (63.4%) had no calf
present, and 170 pods (36.6%) had a calf or calves present.
Of the 465 newly associated pods, 341 (73.3%) were consecutive associations and 124
(26.7%) were simultaneous associations. There were 171 (36.8%) of the 465 newly associated
pods in which disassociations were recorded.
4.4.4 Competitive groups, non-agonistic social behaviour and other behaviour
The frequencies and the duration of observations of competitive groups, non-agonistic social
behaviour pods and pods displaying other behaviours are reported in Table 4.2.

97

98
The frequencies and proportions of competitive groups, non-agonistic social behaviour pods
and pods displaying other behaviours are reported in Table 4.3 for: all pods, pods with no
calves present, pods with calves present, and by newly associated pods and pods that did not
associate.

99

100
The duration of observation of pods that did not associate while under observation ranged
from 0.02 h to 3.72 hr (median = 0.45 h, mean = 0.56 h, SD = 0.48 h, n = 3,484). The duration
of observation of newly associated pods ranged from 0.02 h to 5.07 hr (median = 0.83 h,
mean = 0.97 h, SD = 0.58 h, n = 465).
Competitive groups, non-agonistic social behaviour pods and pods that displayed both
competitive and non-agonistic social behaviour, were observed with greater frequency in
newly associated pods than in pods that did not associate while under observation (25.8% to
2.7%, 25.6% to 9.0% and 4.3% to 0.4% respectively). In contrast, pods displaying other
behaviour occurred with greater frequency in pods that did not associate while under
observation (87.9%, 3,062 of 3,484) than in newly associated pods (44.3%, 206 of 465).
Of the data set of 3,949 pods, 1,721 pods (43.6%) had calves present while 2,228 pods
(56.4%) had no calves present. Competitive groups, non-agonistic social behaviour pods and
pods that displayed both competitive and non-agonistic social behaviour were observed with
greater frequency in pods with no calves present than in pods with calves present (6.1% to
4.6%, 17.7% to 2.1% and 1.2% to 0.4% respectively). Conversely, in pods displaying other
behaviour 92.8% (1,597 of 1,721) were pods with calves present and 75.0% (1,671 of 2,228)
were pods with no calves present.
The frequencies and proportions of competitive groups, non-agonistic social behaviour pods
and pods displaying other behaviour by size of pod (excluding calves), for all pods, pods with
no calves present and pods with calves present, by newly associated pods and pods that did
not associate while under observation are reported in Table 4.4.

101

102
Competitive groups, non-agonistic social behaviour pods, pods which displayed both
competitive and non-agonistic social behaviour, and pods displaying other behaviour occurred
with greater frequency in newly associated pods of 3+ adults, compared with pods that did not
associate with other pods of the same size (25.8% to 2.8%, 22.8% to 4.3%, 4.3% to 0.4% and
35.1% to 9.1% respectively). In contrast, in pods of two adults, non-agonistic social behaviour
and other behaviour occurred less frequently in newly associated pods than in pods that did
not associate with other pods (2.8% to 4.7% and 9.2% to 33.6% respectively).
Of the 3,949 pods, 1,010 (25.6%) had two adults present, and consisted of 158 pairs involved
in non-agonistic social behaviour, and 852 were pairs that displayed other behaviour. Pods of
one adult consisted of singletons (24.3%, 469 of 1,933) and mothers alone with their calf
(64.3%, 1,107 of 1,721) and these pods displayed other behaviour.
4.4.5 Avoidance and repulsion behaviour
There were instances in the ‘other behaviour’ category (Table 4.2) of agonistic behaviour that
did not meet the definitions of a competitive group. In 28 pods (0.71% of 3,949 pods), a
mother repulsed or avoided the advances of an escort (Pack et al. 2002). All except one of
these pods were trios, consisting of mother-calf and escort; the other pod was a mother in the
company of two small calves repulsing an aggressive approach by an escort. Between 1992
and 2005 there were only two sightings of a mother with two calves in Hervey Bay (Franklin
et al. 2011). Of the 28 pods, 22 (78.6 %) involved avoidance by the mother of the escort and 6
pods (21.4%) involved active repulsion of the escort by the mother.
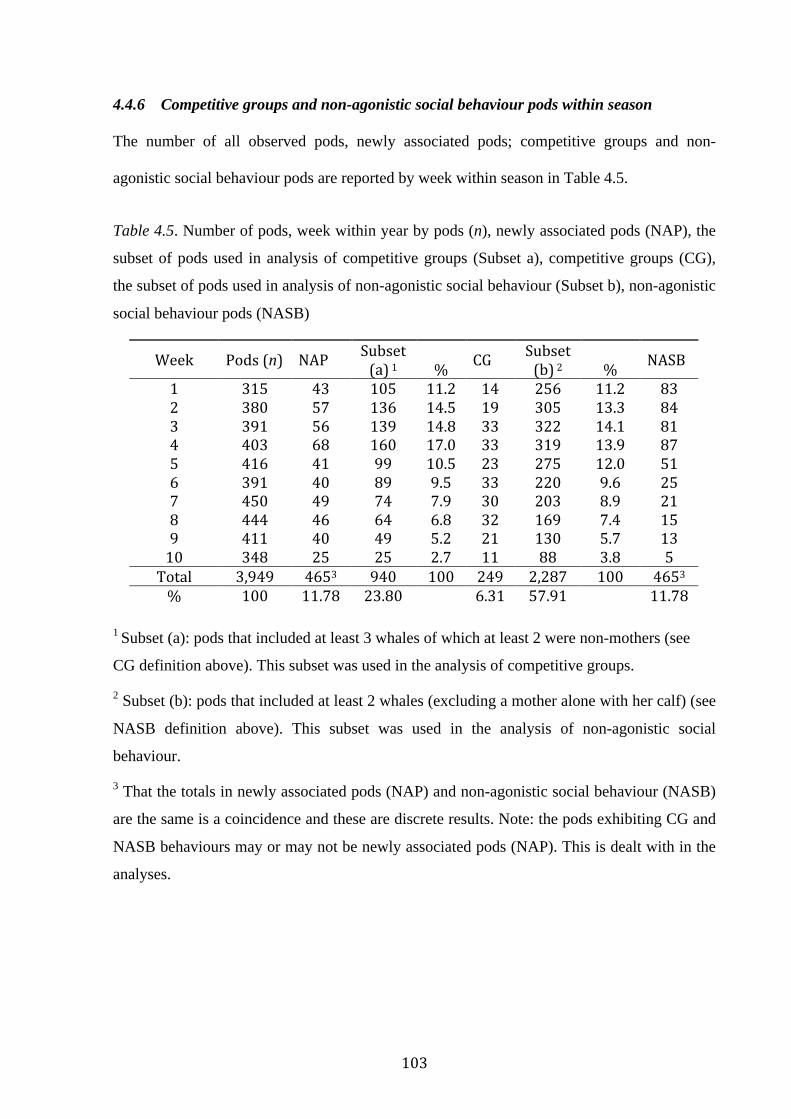
103
4.4.6 Competitive groups and non-agonistic social behaviour pods within season
The number of all observed pods, newly associated pods; competitive groups and non-
agonistic social behaviour pods are reported by week within season in Table 4.5.
Table 4.5. Number of pods, week within year by pods (n), newly associated pods (NAP), the
subset of pods used in analysis of competitive groups (Subset a), competitive groups (CG),
the subset of pods used in analysis of non-agonistic social behaviour (Subset b), non-agonistic
social behaviour pods (NASB)
Week Pods (n) NAP Subset (a) 1
% CG Subset
(b) 2 % NASB
1 315 43 105 11.2 14 256 11.2 83 2 380 57 136 14.5 19 305 13.3 84 3 391 56 139 14.8 33 322 14.1 81 4 403 68 160 17.0 33 319 13.9 87 5 416 41 99 10.5 23 275 12.0 51 6 391 40 89 9.5 33 220 9.6 25 7 450 49 74 7.9 30 203 8.9 21 8 444 46 64 6.8 32 169 7.4 15 9 411 40 49 5.2 21 130 5.7 13 10 348 25 25 2.7 11 88 3.8 5 Total 3,949 4653 940 100 249 2,287 100 4653 % 100 11.78 23.80 6.31 57.91 11.78
1 Subset (a): pods that included at least 3 whales of which at least 2 were non-mothers (see
CG definition above). This subset was used in the analysis of competitive groups.
2 Subset (b): pods that included at least 2 whales (excluding a mother alone with her calf) (see
NASB definition above). This subset was used in the analysis of non-agonistic social
behaviour.
3 That the totals in newly associated pods (NAP) and non-agonistic social behaviour (NASB)
are the same is a coincidence and these are discrete results. Note: the pods exhibiting CG and
NASB behaviours may or may not be newly associated pods (NAP). This is dealt with in the
analyses.

104
The lowest proportion of competitive groups occurred in the first two weeks of the season (33
of 249 pods, 13.3%) when calves were rarely seen (5 of 810 pods, 0.62%; Franklin et al.
2011), and during the last two weeks (32 of 249 pods, 12.9%) when the majority of pods had
calves present (695 of 838 pods, 82.9%; Franklin et al. 2011). In contrast, the highest
proportion of non-agonistic social behaviour pods (335 pods, 72.0%) occurred during the first
four weeks when calves were rarely seen (73 of 1,749 pods, 4.2%; Franklin et al. 2011), and
the lowest proportion of non-agonistic social behaviour pods (54 pods, 11.6%) occurred
during the last four weeks when the majority of pods had calves present (1,376 of 1,855 pods,
74.2%; Franklin et al. 2011).
4.4.7 Sex-identified males and females in competitive groups and non-agonistic
social behaviour pods
Sex could not be unambiguously identified for all individuals. The frequency and proportion
of individuals whose sex could be identified (see Sex-identification in Definitions 4.3.2 and
4.3.4 above) in competitive groups and non-agonistic social behaviour pods by method of
sex-identification are reported in Table 4.6.

105
Tabl
e 4.
6. S
ex-id
entif
ied
mal
es a
nd fe
mal
es in
com
petit
ive
grou
ps a
nd n
on-a
goni
stic
soci
al b
ehav
ior p
ods b
y m
etho
d of
sex-
iden
tific
atio
n, n
umbe
r of m
ales
(n),
num
ber f
emal
es (n
) with
per
cent
ages
and
tota
ls
C
ompe
titiv
e gr
oups
(n =
249
) N
on-a
goni
stic
soci
al b
ehav
ior p
ods (
n =
285)
M
etho
d of
sex-
iden
tific
atio
n M
ales
(n)
%
Fe
mal
es (n
) %
M
ales
(n)
%
Fem
ales
(n)
%
Phot
ogra
phy
of g
enita
l are
a 16
1.
8 29
10
.8
65
20.8
95
37
.2
Fiel
d ob
serv
atio
n of
gen
ital a
rea
4 0.
4 6
2.2
15
4.8
30
11.8
In
divi
dual
resi
ghtin
g hi
stor
ies
113
12.6
73
27
.2
56
17.9
82
32
.2
Fem
ales
(mot
her w
ith c
alf)
0
0.0
43
16.1
0
0.0
33
12.9
In
ferr
ed n
ucle
ar fe
mal
es
0 0.
0 11
7 43
.7
0 0.
0 15
5.
9 In
ferr
ed m
ales
(esc
ort,
sing
er)
767
85.2
0
0.0
177
56.5
0
0.0
Tota
ls
900
100
268
100
313
100
255
100
1

106
If we assume that all behavioural roles are sex-specific, including the nuclear ‘females’ in a
competitive group, the sex of all individuals in all 249 competitive groups (Table 4.5) was
either determined or inferred, with a ratio of 900 males to 268 females (3.36:1) (Table 4.6).
Of the 465 non-agonistic social behaviour pods (Table 4.5) there were 285 pods (61.3%) in
which some individuals were sex-identified and 180 pods (38.7%) in which no individuals
were sex-identified. In the 285 pods in which the sex of some individuals was identified, there
was a ratio of 313 to 255 (1.23:1) sex-identified males to females (Table 4.6). Of the 180
pods, in which no individuals were sex-identified, 87 (48.3%) were pairs and 93 (51.7%) were
pods of 3+ whales.
Of these 285 pods in which some individuals were sex-identified, there were 22 (7.7%) pods
of pairs and 4 (1.4%) pods of 3+ whales in which all individuals were sex-identified. Of the
22 pairs, 18 (81.8%) consisted of a male and female, 2 (9.1%) consisted of 2 males, and 2
(9.1%) consisted of 2 females. Of the 4 pods of 3+ whales, 2 (50%) consisted of 1 male and 2
females, 1 (25%) consisted of 2 males and 1 female and 1 (25%) consisted of 1 male and 3
females.
4.4.8 Statistical analysis and modelling
4.4.8.1 Newly associated pods
The proportion of newly associated pods in Hervey Bay varied from 5.0% to 14.4% over the
years, and from 16.9% to 7.2% over the weeks within year (Figure 4.1A, 4.1B respectively).
Although there was no systematic pattern to the variation over years, the proportion of newly
associated pods over weeks within year was significantly greater in the first 4 weeks of the
season than the last six weeks of the season (15.0%, 9.8%; Fisher’s exact test, P < 0.001).
This result is consistent with the significant differences in pod characteristics early in the
season compared to later in the season reported in Franklin et al. (2011).

107
Figure 4.1. Observed proportions: (A) newly associated pods by year, (B) newly
associated pods by week within year, (C) pods by number of whales in pods for newly
associated pods (NAP) and pods that did not associate while under observation (PDNA).

108
Newly associated pods on average, as expected, were significantly larger than pods that did
not associate with other whales while under observation (Mann-Whitney test, P < 0.001).
Newly associated pods ranged in size from 2 to 14 whales (mode = 4, median = 5, mean =
4.9, SD = 1.85, n = 465) while pods that did not associate with other whales while under
observation, ranged from 1 to 9 whales (mode = 2, median = 2, mean = 2.3, SD = 0.98, =
3,484) (Fig. 4.1C, Table 4.3).
The proportion of pods with calves present increased rapidly from week 4 to the end of the
season (3.6% to 92.8%, Franklin et al. 2011). Pods that included a calf were less likely to
associate than pods that did not include a calf (9.9%: 13.2%, χ2 = 10.57, df=1, P < 0.001), and
when pods that included a calf did associate, they were much more likely to join with pods
that also included a calf than with pods that did not include a calf (70.4%: 29.6%; χ2 = 16.33,
df=1, P < 0.001).
4.4.8.2 Competitive groups
As competitive groups and newly associated pods were closely related (see below), the
following analyses were conducted on the data set in Table 4.5, which included the data on
newly associated pods and pods that did not associate while under observation. Of the 3,949
pods in the data set, 940 (23.8%, Subset (a), Table 4.5) were pods that included at least 3
whales, of which at least 2 were non-mothers; it is this subset that was analysed. Competitive
behaviour was observed in 249 (26.5%) of these 940 pods.
The factors; newly associated pod, year, presence of calf, number of whales in pod (excluding
calves), and week within year were each assessed for effects on the probability of observing
competitive groups. Competitive groups were:

109
1. Observed in a greater proportion of newly associated pods (140/376 = 37.2%) than in
pods that did not associate while under observation (109/564 = 19.3%) (χ2 = 37.15, df
= 1, P < 0.001);
2. Not significantly variable over years (χ2 = 13.55, df = 13, P = 0.406);
3. Significantly more frequent in pods with calves present (87/191 = 45.5%) than in pods
with no calf or calves present (162/749 = 21.6%), (χ2 = 44.72, df = 1, P < 0.001);
4. Observed to significantly increase in frequency with the number of whales in the pod
(excluding calves) (70/425 = 16.5%, 72/270 = 26.7% and 107/245 = 43.7% for 3, 4
and 5+ whales respectively, χ2 = 59.07, df = 2, P < 0.001);
5. Observed to significantly increase in frequency over weeks within year (from ~12% to
~45%), χ2 = 65.66, df = 9, P < 0.001).
However, these univariate effects were not independent. Consequently, a binary logistic
regression model was fitted to assess the joint effects of newly associated pods (yes, no),
presence of calf (present, not present), number of whales (excluding calves) (3, 4, 5+) and
week within year (1, 2, …, 10) on the probability of observing competitive groups.
Together the four main effects accounted for a significant proportion of variation in the rate of
observation of competitive groups (χ2 = 137.23, df = 13, P < 0.001). However, the marginal
Wald tests showed the calf effect to be non-significant in the context of the other effects
(Wald = 2.993, df = 1, P = 0.084). The non-significance of the calf effect was largely due to
the strength of the association between the increasing proportion of calf pods and week within
season.
An attempt to fit interaction effects required considerable collapsing of categories and failed
to produce useful results. Consequently, the selected model included only the 3 main effects

110
for newly associated pods, number of whales (excluding calves) and week within year (χ2 =
134.26, df = 12, P < 0.001, Cox and Snell RSQ = 0.133, Nagelkerke RSQ = 0.194).
While not reported here the individual parameter estimates were used to calculate the
estimated probabilities of observing competitive groups by the explanatory factor levels.
The mean probabilities of observing competitive groups by newly associated pods (yes, no),
number of whales (excluding calves) (3, 4, 5+) and for week within year are plotted in Figure
4.2.
No Yes
0.0
0.1
0.2
0.3
0.4
0.5
0.6
3 4 5+
0.0
0.1
0.2
0.3
0.4
0.5
0.6
1 2 3 4 5 6 7 8 9 109
0.0
0.1
0.2
0.3
0.4
0.5
0.6
(B) Number of whales(A) Newly associated pods (C) Week within year
Estim
ated
pro
babil
ity
A B C
Figure 4.2. Estimated probabilities of observing competitive groups: (A) by newly
associated pods (No, Yes); (B) by number of whales (excluding calves); and (C) by week
within year.
That the effects of increasing pod size and newly associated pods are jointly significant
indicates that the rate of competitive groups is greater in newly associated pods than in pods

111
that did not associate with other whales, and is not simply a function of the increase in pod
size following the formation of a newly associated pod. As shown in Figure 4.2B, larger pods
were more likely to be competitive, with a larger increase in the frequency of competitive
groups between 4 and 5+ whales than between 3 and 4 whales. However, as shown in Figure
4.2A, if those pods have just associated, there is an approximately 17% increase in the
frequency of competitive groups compared to (i.e., over and above) pods of the same sizes
that did not associate with other whales while under observation.
The calf effect was likely non-significant in the context of the other effects because the
presence of calf and week within year were very strongly associated (χ2 = 349.76, df = 9, P <
0.001).
4.4.8.3 Non-agonistic social behaviour pods
As non-agonistic social behaviour and newly associated pods were closely related (see
below), the following analyses were conducted on the data set in Table 4.5, which included
the data on newly associated pods and pods that did not associate with other whales while
under observation. Of the 3,949 pods in the data set, 2,287 (57.9%, Subset (b), Table 4.5)
included at least 2 whales (excluding a mother alone with her calf), and it was this subset that
was analysed.
Non-agonistic social behaviour was observed in 465 (20.3%) of the 2,287 pods. The
following factors were each assessed for effects on the probability of observing non-agonistic
social behaviour: newly associated pod, year, presence of calf, number of whales in pod
(excluding calves), and week within year. Non-agonistic social behaviour was:

112
1. Observed with greater frequency in newly associated pods (139/435 = 32.0%) than in
pods that did not associate with other whales (326/1,852 = 17.6%), (χ2 = 44.79, df = 1,
P < 0.001);
2. Significantly variable over years (χ2 = 44.79, df = 13, P < 0.001);
3. Observed significantly more often in pods with no calf present (421/1,759 = 23.9%)
than in pods with a calf or calves present (44/528 = 8.3%) (χ2 = 61.02, df = 1, P <
0.001);
4. Observed to significantly increase in frequency with the number of whales in the pod
(excluding calves) (176/1,319 = 13.3%, 125/446 = 28.0%, 76/276 = 27.5%, 88/246 =
35.8% in pods with 2, 3, 4 and 5+ whales respectively, χ2 = 101.12, df = 3, P < 0.001);
5. Significantly variable by week within year (χ2 = 104.88, df = 9, P < 0.001).
However, these univariate effects were not independent. Consequently, a binary logistic
regression model was fitted to assess the joint effects of newly associated pods (yes, no),
presence of calf (present, not present), year, week within year and number of whales
(excluding calves) (2, 3, 4, 5+) on the probability of observing non-agonistic social behaviour.
The five main effects were fitted as a block, which accounted for a significant proportion of
variation (χ2 = 321.41, df = 27, P < 0.001). Adding the two-way interaction effects
individually to the model showed that only the newly associated pods by number of whales in
the pod interaction effect was significant.
The selected model included the five main effects and the newly associated pods by number
of whales (excluding calves) interaction effect (χ2 = 334.59, df = 30, P < 0.001, Cox and Snell
RSQ = 0.136, Nagelkerke RSQ = 0.214, marginal Wald tests for all effects with P ≤0.002).

113
The parameter estimates and their standard errors are not reported here, although the
parameter estimates were used to calculate the estimated probabilities of observing non-
agonistic social behaviour by the factors in the model.
The estimated probability of observing non-agonistic social behaviour by year, week within
year and by number of whales (excluding calves), in newly associated pods (No, Yes) are
plotted in Figure 4.3.
1992
1993
1994
1995
1996
1997
1998
1999
2000
2001
2002
2003
2004
2005
0.00.1
0.20.3
0.40.5
1 2 3 4 5 6 7 8 9 10
0.00.1
0.20.3
0.40.5
2 3 4 5+
0.00.1
0.20.3
0.40.5
Newly associated podsNo Yes
(C) Number of whales(B) Week within year (A) Year
Estim
ated
pro
babil
ity
A B C
Figure 4.3. Estimated probabilities of observing non-agonistic social behaviour: (A)
by year; (B) by week within year; (C) by number of whales (excluding calves), in newly
associated pods (No, Yes).
The variation over years in the probability of observing non-agonistic social behaviour (Fig.
4.3A) includes a rapid decline over the period 1992 to 1995 followed by a sudden increase in
1996. This is followed by a decline to 2001 and an increase after that to 2005.

114
The probability of observing non-agonistic social behaviour declined from the beginning of
the season, and rapidly after about week 5 (Fig. 4.3B). Although the effect of the presence of
a calf in a pod is not shown in Figure 4.3A, 4.3B or 4.3C, there was a significant main effect
in the model with the rate of occurrence of non-agonistic social behaviour being significantly
lower in pods that included calves (8.3% with calves, 23.9% without calves). That both the
presence of calf and week within year effects were significant in the model indicates that the
calf effect is not simply due to the rapidly increasing proportion of pods that included calves
later in the season (3.6% to 92.8%, Franklin et al. 2011): i.e., the calf effect is over and above
the decline in the rate of non-agonistic social behaviour shown in Figure 4.3B.
The probability of observing non-agonistic social behaviour increased with the number of
whales (excluding calves) in the pod, and was higher for pods of 2 whales (excluding calves)
that were newly associated, than for pods of 2 whales that did not associate with other whales
while under observation (Fig. 4.3C). This difference largely accounts for the pod size effect.
Thus, the effect of newly associated pods is largely confined to the difference between newly
associated pods of 2 (2 singletons associating) rather than newly associated pods of larger
size.
4.5. DISCUSSION
4.5.1 Seasonal variation in newly associated pods
While there was no systematic pattern in the frequency of newly associated pods over years,
the rate of formation of newly associated pods within season was significantly higher during
the first four weeks of the season compared to the last six weeks of the season (Fig. 4.1A and
B). Furthermore, in pods, which met the definition of non-agonistic social behaviour (Subset
(b), Table 4.5) non-agonistic social behaviour was observed more frequently early in the

115
season when calves were rarely present. In contrast, in pods, which met the definition of
competitive group behaviour (Subset (a), Table 4.5) competitive groups were observed more
frequently later in the season when mother-calf pods predominated. These results, together
with the significant differences in pod characteristics and composition within season reported
in Franklin et al. (2011), suggest that there are biological differences in the classes of
humpback whales present in Hervey Bay in the first four weeks of the season compared to the
last six weeks of the season.
Dawbin (1966, 1997) reported that the first sexual and maturational classes to commence the
southern migration were newly pregnant females with resting non-lactating females, closely
succeeded by immature males and females, preceding mature males and females. The highest
proportion and numbers of pods in Hervey Bay during the first four weeks of the season were
pairs (Franklin et al. 2011). Genetic studies of humpback whales in breeding grounds off the
coast of South Africa and Brazil reported that most pairs consist of male-female dyads
(Pomilla and Rosenbaum 2006, Cypriano-Souza et al. 2010). Herman et al. (2011) reported
that the majority of dyads in the Hawaiian wintering grounds were composed of male-female
pairs. Brown and Corkeron (1995) also reported that male-female associations represented the
greatest proportion of pairs observed during the southern migration along the east coast of
Australia and reported only two female-female pairs out of a sample size of twenty-seven
pairs. Pack et al. (2012) investigated body size-assortative pairing of humpback whales in the
Hawaiian breeding grounds and reported that male-female pairs predominated, followed by
male-male pairs with four female-female pairs out of 258 pairs sampled. In the Gulf of Maine
feeding ground (Clapham 1993) reported male-female pairs predominated and that 5.4% of
pair pods (372 of 6,829) were female-female pairs. In this study 81.9% pair pods (18 of 22) in
which sex was identified, were male-female, two pairs were male-male and two female-
female.

116
Franklin et al. (2011) reported that 51.9% of singleton pods occurred in the first four weeks of
the season when calves were rarely seen. Furthermore, they reported that 69.1% of 3 and 4+
larger pods with no calves present also occurred in the first four weeks of the season. Overall,
in Hervey Bay singletons and pairs predominated in the formation of newly associated pods
(Table 4.1). The social interactions occurring among singletons early in the season is reflected
in the markedly higher probability of observing two singletons forming pairs in newly
associated pods involved in non-agonistic social behaviour (Fig. 4.1C). Therefore, the
presence of socially active immature males and females, and mature males and females either
as singletons or pairs and in larger pods are likely to contribute to the higher rate of newly
associated pods during the first four weeks of the season.
Dawbin (1966, 1997) reported that lactating females followed the migration of early pregnant
and resting females south by about a month. In Hervey Bay the mother-calf class represents
the largest proportion of pod types from September onwards, with the proportion of mother-
calf pods in relation to other pod types increasing rapidly towards the end of the season, and
with mothers spending 69.4% of their time alone with their calves (Franklin et al. 2011). The
predominance of mother-calf pods and the time they spend alone with their calves is likely to
contribute to the significantly lower rates of newly associated pods during the last six weeks
of the season. Furthermore, the departure early in the season of immature and non-lactating
mature females, may also contribute to a lower rate of associations in the latter half of the
season.
The joint significance of both pod size and newly associated pods reported in this study
indicate that there was a significant increase in the probability of observing competitive
groups and non-agonistic social behaviour pods in newly associated pods, over and above the
increase in pod size alone. Previous studies have reported increased surface activity with pod
size (Herman 1978, Tyack 1982, Tyack and Whitehead 1983) with the exception of Silber

117
(1986), who reported a negative correlation between group size and surface activity. In
Hervey Bay some of the larger pods that were not seen to associate while under observation,
may have only recently associated and already lost members through disassociations.
4.5.2 Social interactions among lactating females and other conspecifics
Clapham (2000) summarised the sparse reports of female-female associations in the Northern
Hemisphere feeding and breeding grounds and reported that lactating females appear to avoid
each other in all areas. Clapham and Mayo (1987) reported that in Massachusetts Bay groups
containing more than a single calf were rare in summer. Weinrich (1991) reported that adult
females involved in cooperative feeding were the most consistent members of stable foraging
groups in the Gulf of Maine and appeared more frequently in stable groups when pregnant.
While in southeastern Alaska, Baker (1985) and Perry et al. (1990) reported non-competitive
foraging groups of humpback whales consisting of either all males, all females or both sexes,
which were on occasion cooperative. Although there were dense aggregations of lactating
females in Hervey Bay during the second half of the season, for the most part they remained
alone with their calves (Franklin et al. 2011), and were involved in limited interactions with
other conspecifics. However, when pods that included a calf did associate, they were
significantly more likely to associate with pods in which a calf or calves were present.
Franklin et al. (2011) suggested that Hervey Bay was a suitable stopover for mothers to
engage in maternal activity with older calves during the early stages of the southern
migration.
When lactating females were observed interacting with other conspecifics, they were
predominantly involved in non-agonistic social interactions with only a small proportion
involved in pods displaying agonistic behaviour such as competitive groups or mother-calf
escort pods involving repulsion or avoidance of an escort (Table 4.2, 4.3 and 4.4). Lactating

118
females in Hervey Bay are predominantly involved in non-agonistic social interactions rather
than agonistic competitive social interactions.
4.5.3 Competitive behaviour occurs throughout the season
Competitive groups involve intrasexual competition among males for access to sexually
mature females who may be in estrous (Darling et al. 1983, Tyack and Whitehead 1983,
Baker and Herman 1984b, Clapham et al. 1992, Clapham 2000). However, Clapham (1996
p.37) qualifies the above definition because the onset and duration of oestrous in humpback
females is not known and that the Principal Escort in a competitive group may well be
“...competing for a female in the hope of subsequently mating with her, or is practising the
post-copulatory mate guarding behaviour...and that some competitive groups...consisted
entirely of males...that he...tentatively interpreted as dominance sorting.” Herman et al.
(2011) reported a male-biased sex ratio in the Hawaiian breeding grounds and suggested that
newly pregnant females leave the breeding grounds earlier while males tend to linger; thus as
the season progresses females become a limited resource for which males compete.
Only a low proportion of pods in Hervey Bay were competitive groups (6.3%, Table 4.5). The
probability of observing competitive groups in Hervey Bay was at its lowest during the first
two weeks of the season and increased significantly throughout the season. Franklin et al.
(2011) reported that pod characteristics early in the season in Hervey Bay were consistent
with the presence of immature males and females (also see Fig. 5.1, Chapter 5). Dawbin
(1966, 1997) reported that immature males and females were accompanied by non-lactating
females, either resting or newly pregnant are the first classes of humpback whales to travel
south. It has been suggested that females may either be newly pregnant or in a temporary
condition preceding ovulation (Chittleborough 1954, Nishiwaki 1959, Craig et al. 2003).
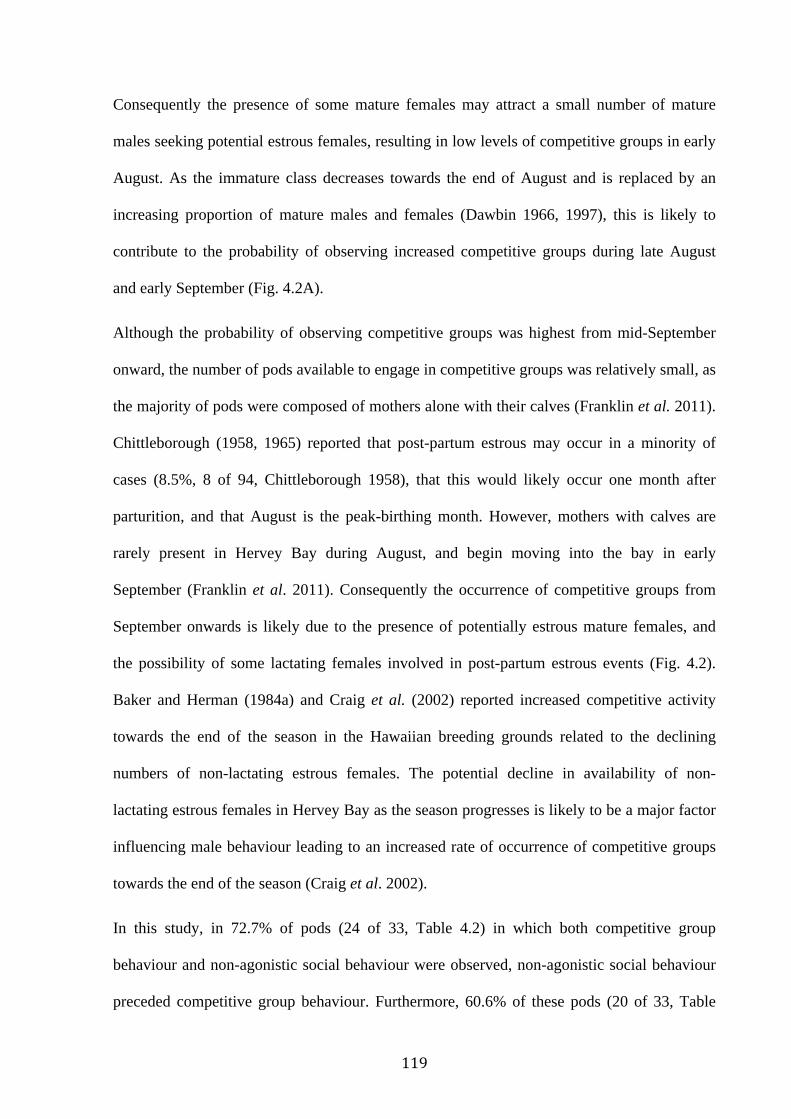
119
Consequently the presence of some mature females may attract a small number of mature
males seeking potential estrous females, resulting in low levels of competitive groups in early
August. As the immature class decreases towards the end of August and is replaced by an
increasing proportion of mature males and females (Dawbin 1966, 1997), this is likely to
contribute to the probability of observing increased competitive groups during late August
and early September (Fig. 4.2A).
Although the probability of observing competitive groups was highest from mid-September
onward, the number of pods available to engage in competitive groups was relatively small, as
the majority of pods were composed of mothers alone with their calves (Franklin et al. 2011).
Chittleborough (1958, 1965) reported that post-partum estrous may occur in a minority of
cases (8.5%, 8 of 94, Chittleborough 1958), that this would likely occur one month after
parturition, and that August is the peak-birthing month. However, mothers with calves are
rarely present in Hervey Bay during August, and begin moving into the bay in early
September (Franklin et al. 2011). Consequently the occurrence of competitive groups from
September onwards is likely due to the presence of potentially estrous mature females, and
the possibility of some lactating females involved in post-partum estrous events (Fig. 4.2).
Baker and Herman (1984a) and Craig et al. (2002) reported increased competitive activity
towards the end of the season in the Hawaiian breeding grounds related to the declining
numbers of non-lactating estrous females. The potential decline in availability of non-
lactating estrous females in Hervey Bay as the season progresses is likely to be a major factor
influencing male behaviour leading to an increased rate of occurrence of competitive groups
towards the end of the season (Craig et al. 2002).
In this study, in 72.7% of pods (24 of 33, Table 4.2) in which both competitive group
behaviour and non-agonistic social behaviour were observed, non-agonistic social behaviour
preceded competitive group behaviour. Furthermore, 60.6% of these pods (20 of 33, Table
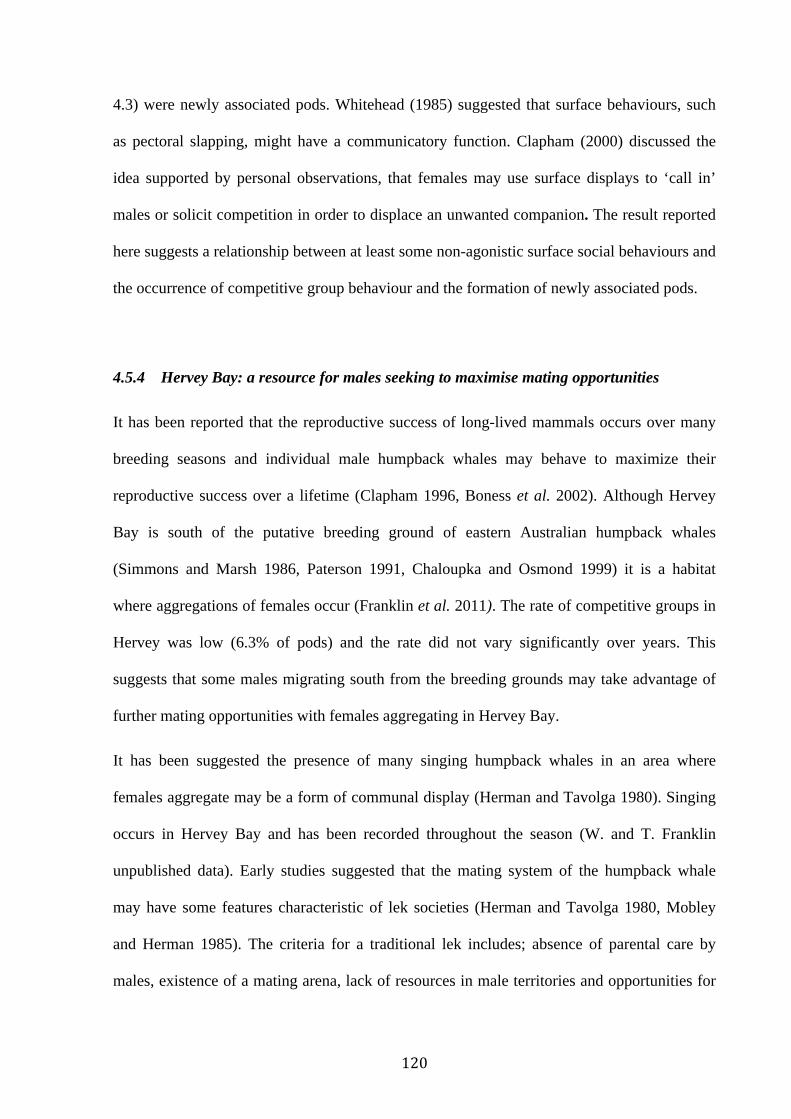
120
4.3) were newly associated pods. Whitehead (1985) suggested that surface behaviours, such
as pectoral slapping, might have a communicatory function. Clapham (2000) discussed the
idea supported by personal observations, that females may use surface displays to ‘call in’
males or solicit competition in order to displace an unwanted companion. The result reported
here suggests a relationship between at least some non-agonistic surface social behaviours and
the occurrence of competitive group behaviour and the formation of newly associated pods.
4.5.4 Hervey Bay: a resource for males seeking to maximise mating opportunities
It has been reported that the reproductive success of long-lived mammals occurs over many
breeding seasons and individual male humpback whales may behave to maximize their
reproductive success over a lifetime (Clapham 1996, Boness et al. 2002). Although Hervey
Bay is south of the putative breeding ground of eastern Australian humpback whales
(Simmons and Marsh 1986, Paterson 1991, Chaloupka and Osmond 1999) it is a habitat
where aggregations of females occur (Franklin et al. 2011). The rate of competitive groups in
Hervey was low (6.3% of pods) and the rate did not vary significantly over years. This
suggests that some males migrating south from the breeding grounds may take advantage of
further mating opportunities with females aggregating in Hervey Bay.
It has been suggested the presence of many singing humpback whales in an area where
females aggregate may be a form of communal display (Herman and Tavolga 1980). Singing
occurs in Hervey Bay and has been recorded throughout the season (W. and T. Franklin
unpublished data). Early studies suggested that the mating system of the humpback whale
may have some features characteristic of lek societies (Herman and Tavolga 1980, Mobley
and Herman 1985). The criteria for a traditional lek includes; absence of parental care by
males, existence of a mating arena, lack of resources in male territories and opportunities for

121
females to select males (Clapham 1996). However, Clapham (1996) noted that the humpback
mating system had all the characteristics of a ‘classical lek’ except for the rigid spatial
structuring of male territories, and suggested the term ‘floating lek’. Emlen and Oring (1977,
p. 219) suggested that “If female movements or concentrations are predictable, encounter
rates would be high for males that position themselves in these areas..”. The predictability of
the presence of non-lactating females in Hervey Bay early to mid-season and lactating
females from mid-season onwards, may represent a feature of a ‘floating lek’, which provides
an annual resource for males seeking to maximize the number of potential mates.
4.5.5 Non-agonistic social behaviour predominates in early to mid-season
There was significant variability in the occurrence of non-agonistic social behaviour pods
both over years and within season. Franklin et al. (2011) reported a significant growth in pods
with 3+ whales over years in Hervey Bay. They suggested that as the population increased
larger groups became more common, and was likely to have generated a skewed distribution
in the population towards younger whales. The proportion of eastern Australian humpback
whales entering Hervey Bay may range from 30% to 50% (Chaloupka et al. 1999). Therefore
the variability of non-agonistic social behaviour over years may be related to the relative
proportions of age, sex and maturational classes of humpback whales entering Hervey Bay in
any given year.
As noted above, in the early part of the season the highest proportion and numbers of pods
were pairs, followed by singletons (Franklin et al. 2011) and were related to the presence of
immature males and females early in the season and mature males and females mid-season
(Dawbin 1966, 1997). In the North Atlantic, Clapham (1994) reported that juveniles (which
he defined as sexually immature whales less than five years old) exhibit increasing sociality

122
with age, and that as they attain sexual maturity around the age of five years their social
development parallels reproductive or courtship-related behaviour of mature adults.
In this study the probability of observing non-agonistic social behaviour pods predominantly
occurred during the first four weeks of the season, and increased with the number of whales in
the pod. Corkeron et al. (1994) reported from aerial surveys conducted in Hervey Bay that
pods were not randomly distributed, but tended to aggregate in clusters, which may be related
to social factors. Franklin et al. (2011) suggested that because whales enter and leave Hervey
Bay from the north, the density and movements of whales increased the likelihood of
interactions among pods, contributing to the formation of larger pods or to the probability of
encountering recently aggregated pods. Consequently, the higher levels of non-agonistic
social behaviour pods observed during the first four weeks of the season is likely to be related
to the social interactions among immature males and females early in the season, and mature
males and females in mid-season.
Compared to pods involved in non-agonistic social behaviour (11.8%), the majority of pods in
Hervey Bay were involved in other behaviour (82.8%). Unlike competitive groups, both non-
agonistic social behaviour pods and other behaviour pods have no obvious competitive
component. A possible negative bias could arise from incorrectly classifying non-agonistic
social behaviour pods as other behaviour pods. However, there is little likelihood for non-
agonistic social behaviour pods to be classified in other behaviour as other behaviour pods are
predominantly involved in surface travelling, resting and occasional surface behaviours (e.g.
lob-tailing and breaching). Whereas, non-agonistic social behaviour pods involve observation
of a clearly defined set of surface social behaviours, occurring in a small spatial area (see
Definitions 4.3.2 above).
Hervey Bay offers a convenient habitat early in the southern migration for social activity
among individuals within the above maturational classes. In non-agonistic social behaviour

123
pods immature males and females are more likely to be involved in social interactions related
to the establishment of social bonds and juvenile development (Clapham 1994). In non-
agonistic social behaviour pods mature males and females are more likely to be involved in
courtship-related behaviour. The social behaviour of both classes may be reflected in the
higher frequency of non-agonistic social behaviour pods in newly associated pods and as pod
size increases (Fig. 4.3).
4.5.6 Relative proportions of non-agonistic and competitive behaviour
Competitive group behaviour has been well documented in the Northern Hemisphere (Darling
et al. 1983, Tyack and Whitehead 1983, Baker and Herman 1984b, Clapham et al. 1992,
Clapham 2000) and in the Southern Hemisphere (Brown and Corkeron 1995). Darling et al.
(2006) noted that competitive behaviour is more conspicuous than cooperative relationships,
which are more difficult to identify and confirm. Non-agonistic and cooperative behaviour
has been reported in various earlier studies (Herman and Antinoja 1977, Tyack and
Whitehead 1983, Clapham et al. 1992, Brown and Corkeron 1995). Darling et al. (2006)
suggested that non-agonistic behaviour may be more prevalent in humpback whale
interactions than has previously been reported, and that while competitive and non-agonistic
relations do occur, the relative proportion of each type of behaviour in a humpback population
is not known.
This study provides a measure of the relative proportion of competitive group behaviour
(6.3%, Table 4.5) and non-agonistic social behaviour (11.8%, Table 4.5) of humpback whales
in Hervey Bay. Overall, competitive behaviour (7.0%) occurred in competitive groups (6.3%,
Table 4.5), with a small proportion of repulsion or avoidance behaviour by mothers towards
escorts (0.7%). It should be noted that 82.8% of pods (Table 4.2) in Hervey Bay were
involved in ‘other behaviour’, in which neither competitive behaviour nor non-agonistic

124
social behaviour was observed. Therefore, further detailed study on these other behaviours is
needed, to understand the complex social behaviour of humpback whales.
4.5.7 Hervey Bay: a unique stopover early in the southern migration The results of this study and Franklin et al. (2011) indicate that the social behaviour and pod
characteristics of humpback whales utilising Hervey Bay differ in important aspects
compared with studies in the Northern Hemisphere breeding grounds of Hawaii and the West
Indies. Hervey Bay is located south of the putative Great Barrier Reef breeding ground for
eastern Australian humpback whales, and Franklin et al. (2011) concluded that it is neither a
calving ground nor a terminal destination. In contrast to the Northern Hemisphere breeding
grounds, for example Hawaii, where there is no easily accessible stopover between the
breeding grounds and the feeding grounds in Southeastern Alaska, Hervey Bay provides a
unique opportunity to study the behaviour and pod dynamics of a humpback whale population
after leaving the activities on the breeding ground and while preparing for the migration to
their feeding areas in Antarctica.
Herman et al. (2011) reported a male-biased sex ratio in the Hawaiian breeding grounds of
1.82:1 males to females. They reviewed the literature on male-biased sex ratios reported in
other winter breeding grounds in both the Northern and Southern Hemisphere, and discussed
the issue of whether the male-bias was a sampling artefact, or whether it reflected a
differential migration to the winter grounds such that fewer females than males migrate or
complete the migration. They found no conclusive evidence for sampling artefact or
differential migration in the reported male-biased sex ratio and suggested that newly pregnant
females may leave the breeding grounds earlier while males tend to linger. Craig et al. (2002)
suggested that in Hawaii male humpback whales preferentially associate with mature females
without a calf, and towards the end of the season expend more energy in competition over

125
females without a calf than females with a calf. Furthermore, they found that the probability
of females with a calf being accompanied by one or more escorts increased towards the end of
the season. Thus in Hawaii the modal size of pods with a calf present was three (Herman and
Antinoja 1977, Herman et al. 1980, Glockner and Venus 1983, Herman et al. 2011). In
contrast, in Hervey Bay the last six weeks of the season is dominated by mother-calf pods and
in contrast to Hawaii, the modal size of pods with calves present was two, which was related
to mothers spending most of their time alone with their calf (Franklin et al. 2011).
Pairs were the predominant pod size during the first four weeks of the season in Hervey Bay
(51.4%, 861 of 1,676; Franklin et al. (2011). In this study there was male-female parity in
pairs in which both individuals were sex-identified. In Hervey Bay non-agonistic social
behaviour pods predominantly occurred during the first four weeks of the season and have a
ratio of sex-identified whales near parity (Table 4.6) but represented only 11.8% of pods
(Table 4.5). In contrast, competitive groups have a ratio of sex-identified whales of just over
3:1 males to females, but represented only 6.3% of pods (Table 4.5). However, during the last
six weeks of the season in Hervey Bay almost half of all pods consist of a mother alone with
her calf (47.8%, 1,107 of 2,315; Table 4.4). Taken together, the above results are potentially
indicative of an overall female sex-bias in Hervey Bay. Furthermore in a recent study of 361
individually identified humpback whales in Hervey Bay, the ratio of sex-identified or inferred
females to males was 2.94:1 females to males (reported in Chapter 5.4, below). Therefore, in
contrast to the Hawaiian breeding grounds, it is suggested that Hervey Bay may be a
preferential habitat for females involving differential migration of females and males early in
the southern migration.

126
4.6 CONCLUSION
The changes in seasonal social behaviour reported in this study, involving newly associated
pods, competitive groups, and non-agonistic social behaviour pods, are consistent with the
seasonal occurrence and timing of particular maturational and reproductive classes of
humpback whales in Hervey Bay. Non-agonistic social behaviour occurs mainly during the
first four weeks of the season when immature and mature males and females are present and
pods with calves are rarely sighted. Very few pods with calves engaged in non-agonistic
social behaviour. Competitive groups increased towards the end of the season as the
availability of mature females without calves diminished and the proportion of pods including
mothers with calves increased rapidly. Overall, non-agonistic social behaviour was more
prevalent than competitive behaviour. Both non-agonistic social behaviour and competitive
group behaviour were more common in larger groups and newly associated pods. The data are
consistent with social factors, related to the presence of differing maturational and
reproductive classes, influencing the seasonal social behaviour of humpback whales in
Hervey Bay.
4.7 LITERATURE CITED
Altmann, J. 1974. Observational study of behavior: Sampling methods. Behaviour 49: 227-
267.
Baker, C. S., and L. M. Herman. 1984a. Seasonal contrasts in the social behavior of
humpback whales. Cetus 5.
Baker, C. S., and L. M. Herman. 1984b. Aggressive behavior between humpback whales
(Megaptera novaeangliae) wintering in Hawaiian waters. Canadian Journal of
Zoology 62: 1922-1937.

127
Baker, C. S. 1985. The population structure and social organization of humpback whales
(Megaptera novaeangliae) in the central and eastern North Pacific. Ph.D. Dissertation,
University Microfilms International, Ann Arbor, University of Hawaii.
Boness, D. J., P. J. Clapham and S. L. Mesnick. 2002. Life history and reproductive
strategies. Marine Mammal Biology: An Evolutionary Approach: 278-324.
Brown, M., and P. Corkeron. 1995. Pod characteristics of migrating humpback whales
(Megaptera novaeangliae) off the east Australian coast. Behaviour 132 (Part 3-4):
163-179.
Cerchio, S., J.K. Jacobsen, D.M. Cholewiak, E.A. Falcone and D.A. Merriwether. 2005.
Paternity in humpback whales, Megaptera novaeangliae: assessing polygyny and
skew in male reproductive success. Animal Behaviour 70: 267-277.
Chaloupka, M., and M. Osmond. 1999. Spatial and Seasonal Distribution of Humpback
Whales in the Great Barrier Reef Region. in Life in the Slow Lane: Ecology and
Conservation of Long-Lived Marine Animals. Edited by John A. Musick. American
Fisheries Society Symposium 23. American Fisheries Society: 89–106.
Chaloupka, M., M. Osmond and G. Kaufman. 1999. Estimating seasonal abundance trends
and survival probabilities of humpback whales in Hervey Bay (east coast Australia).
Marine Ecology Progress Series 184: 291–301.
Chittleborough, R. G. 1954. Studies on the Ovaries of the Humpback Whale, Megaptera
nodosa (Bonnaterre), on the Western Australian coast. Australian Journal of Marine
and Freshwater Research 5: 35-63.
Chittleborough, R. G. 1958. The Breeding Cycle of the female Humpback Whale, Megaptera
nodosa, (Bonnaterre). Australian Journal of Marine and Freshwater Research 9(1): 1-
20.
Chittleborough, R. G. 1965. Dynamics of two populations of the humpback whale, Megaptera
128
novaeangliae (Borowski). Australian Journal of Marine and Freshwater Research 16:
33-128.
Chu, K. and S. Nieukirk. 1988. Dorsal fin scars as indicators of age, sex, and social status in
humpback whales (Megaptera novaeangliae). Canadian Journal of Zoology 66: 416-
420.
Clapham, P. J. and C. A. Mayo. 1987. Reproduction and recruitment of individually identified
humpback whales, Megaptera novaeangliae, observed in Massachusetts Bay 1979-
1985. Canadian Journal of Zoology 65: 2853-2863.
Clapham, P. J., P. J. Palsboll, D. K. Mattila and O. Vasquez. 1992. Composition and
dynamics of humpback whale competitive groups in the West Indies. Behaviour 122:
182-194.
Clapham, P. J., D. K. Mattila and P. J. Palsboll. 1993. High-latitude-area composition of
humpback whale competitive groups in samana bay - further evidence for panmixis in
the north Atlantic population. Canadian Journal of Zoology 71(5): 1065-1066.
Clapham, P. J. 1993. Social organization of humpback whales on a North Atlantic feeding
ground. Symposia of the Zoological Society, London 66: 131-145.
Clapham, P. J. 1994. Maturational changes in patterns of association in male and female
humpback whales, (Megaptera novaeangliae). Journal of Zoology 234 (Part 2): 265-
274.
Clapham, P. J. 1996. The social and reproductive biology of humpback whales - an ecological
perspective. Mammal Review 26(1): 27-49.
Clapham, P. J. 2000. The humpback whale - Seasonal feeding and breeding in a baleen whale.
in Cetacean Societies: Field Studies of Dolphins and Whales. Mann, J., Conner, R. C.,
Tyack, P. L and Whitehead, H, eds. University of Chicago Press. Chicago and
London: 173-196.

129
Corkeron, P. J., M. Brown, R. W. Slade and M. M. Bryden. 1994. Humpback Whales,
Megaptera novaeangliae (Cetacea: Balaenopteridae), in Hervey Bay, Queensland.
Wildlife Research 21(3): 293-305.
Craig, A. S., and L. M. Herman and A. A. Pack. 2002. Male mate choice and male-male
competition coexist in the humpback whale (Megaptera novaeangliae). Canadian
Journal of Zoology - Revue Canadienne de Zoologie 80: 745-755.
Craig, A. S., L. M. Herman, C. M. Gabriele and A. A. Pack. 2003. Migratory Timing of
Humpback Whales (Megaptera novaeangliae) in the Central North Pacific Varies with
Age, Sex and Reproductive Status. Behaviour 140: 981-1001.
Cypriano-Souza, A. L., G. P. Fernandez, C. A. V. Lima-Rosa, M. H. Engel and S. L. Bonatto.
2010. Microsatellite Genetic Characterization of the Humpback Whale (Megaptera
novaeangliae) Breeding Ground off Brazil (Breeding Stock A). Journal of Heredity
2010: 101 (2): 189-200.
Darling, J. D., K. M. Gibson and J. K. Silber. 1983. Observations on the abundance and
behavior of humpback whales (Megaptera novaeangliae) off West Maui Hawaii 1977-
1979. in R. Payne (Ed.) Communication and behavior of whales. Westview Press,
Boulder, Co.: 201-222.
Darling, J. D. and Berube, M. 2001. Interactions of singing humpback whales with other
males. Marine Mammal Science, 17: 570–584.
Darling, J. D., M. E. Jones and C. P. Nicklin. 2006. Humpback whale songs: Do they organize
males during the breeding season? Behaviour 143: 1051-1101.
Dawbin, W. H. 1956. The migrations of humpback whales which pass the New Zealand coast.
Transactions of the Royal Society of New Zealand 84 (Part 1): 147-196.
Dawbin, W. H. 1966. The seasonal migratory cycle of humpback whales. in Whales, Dolphins
and Porpoises. Edited by K. S. Norris. University of California Press. Berkeley,

130
California: 145-170.
Dawbin, W. H. 1997. Temporal segregation of humpback whales during migration in
southern hemisphere waters. Memoirs of the Queensland Museum 42(1): 105-138.
Emlen, T. and Oring, L.W. (1977) Ecology, sexual selection, and the evolution of mating
systems. Science 197, 215.
Franklin, T., Franklin, W., Brooks, L., Harrison, P., Baverstock, P. and Clapham, P. (2011),
Seasonal changes in pod characteristics of eastern Australian humpback whales
(Megaptera novaeangliae), Hervey Bay 1992–2005. Marine Mammal Science, 27:
E134–E152. doi: 10.1111/j.1748-7692.2010.00430.x
Glockner, D. A. 1983. Determining the sex of humpback whales (Megaptera novaeangliae) in
their natural environment. In: Payne, R. S (ed.) Communication and Behavior of
Whales, AAAS Selected Symposia Series. Westview Press. Boulder, CO: 447–464.
Glockner, D. A., and S. C. Venus. 1983. Identification, growth rate and behavior of humpback
whale (Megaptera novaeangliae) cows and calves in the waters off Maui, Hawaii,
1977-1979. in Communication and behavior of whales. Payne, R. S (ed). Westview
Press. Boulder, CO: 223-258.
Helweg, D.A., and L.M. Herman. 1994. Diurnal patterns of behaviour and group membership
of humpback whales (Megaptera novaeangliae) wintering in Hawaiian waters.
Ethology. 98: 298-311.
Herman, L. M., and R. C. Antinoja. 1977. Humpback whales in Hawaiian breeding waters:
population and pod characteristics. Scientific Reports of the Whales Research Institute
29: 59-85.
Herman, L. M. 1978. Humpback whales in Hawaiian breeding waters: behaviors. Marine
Mammal Commission Report No. 77/03. NTIS PB-280. Edited by K. S. Norris and R.
R. Reeves: 79pp.

131
Herman, L.M. and W.N. Tavolga. 1980. The communication systems of cetaceans. In:
Cetacean Behavior: Mechanisms and Functions, ed. L.M. Herman. pp. 149-209. NY:
Wiley Interscience.
Herman, L.M., Forestell, P.H. and C. Antinoja, R. (1980) The 1976/77 migration of humpback
whales into Hawaiian: Composite description. Final Report to the U.S. Marine Mammal
Commission, Report # MMC-77/19. National Technical Information Service PBSO-162332,
Arlington, 55 pp.
Herman, E.Y.K., L.M Herman, A.A. Pack, G.J. Marshall, C.M. Shepard, and M. Bakhtiari.
(2008). When whales collide: CRITTERCAM offers insight into the competitive
behavior of humpback whales on their Hawaiian wintering grounds. Marine
Technology Society Journal 41(4): 35-43.
Herman, L. M., Pack, A. A., Rose, K., Craig, A., Herman, E. Y. K., Hakala, S. and Milette, A.
2011, Resightings of humpback whales in Hawaiian waters over spans of 10–32 years:
Site fidelity, sex ratios, calving rates, female demographics, and the dynamics of
social and behavioral roles of individuals. Marine Mammal Science, 27: 736–768.
doi: 10.1111/j.1748-7692.2010.00441.x
Mattila, D. K., P. J. Clapham, S. K. Katona and G. S. Stone. 1989. Population composition of
humpback whales, Megaptera novaeangliae, on Silver Bank, 1984. Canadian Journal
of Zoology 67: 281-285.
Mattila, D. K., P. J. Clapham, O. Vasquez and R. S. Bowman. 1994. Occurrence, population
composition, and habitat use of humpback whales in Samana Bay, Dominican
Republic. Canadian Journal of Zoology 72(11): 1898-1907.
Mobley, J. R., and L. M. Herman. 1985. Transience of social affiliations among humpback
whales in Hawaiian breeding waters. Canadian Journal of Zoology 63: 762-772.
Nishiwaki, M. 1959. Humpback whales in Ryukuan waters. Science Reports of the Whale
Research Institute, Tokyo 14: 49-87.

132
Pack, A. A., L. M. Herman, A. S. Craig, S. S. Spitz and M. H. Deakos. 2002. Penis extrusions
by humpback whales (Megaptera novaeangliae). Aquatic Mammals. 28: 131-146.
Pack, A. A., L. M. Herman, S. S. Spitz, S. Hakala, M. H. Deakos and E. Y. K. Herman. 2009.
Male humpback whales in the Hawaiian breeding grounds preferentially associate
with larger females. Animal Behaviour 77: 653-662.
Pack, A.A., Herman, L.M., Spitz, S.S., Craig, A.S., Hakala, S., Deakos, M.H., Herman,
E.Y.K., Milette, A.J., Carroll, E., Levitt, S. and Lowe, C. (2012) Size-assortative
pairing and discrimination of potential mates by humpback whales in the Hawaiian
breeding grounds. Animal Behaviour 84, 983-993.
Paterson, R. A. 1991. The migration of Humpback Whales (Megaptera novaeangliae) in east
Australian waters. Memoirs of the Queensland Museum 30(2): 333-341.
Perry, A., C. S. Baker and M. H. Herman. 1990. Population characteristics of individually
identified humpback whales in the central and eastern North Pacific: A summary and
critique. Report of the International Whaling Commission: 307-317.
Pomilla, C., and H. C. Rosenbaum. 2006. Estimates of relatedness in groups of humpback
whales (Megaptera novaeangliae) on two wintering grounds off the Southern
Hemisphere. Molecular Ecology 15: 2541-2555.
Silber, G.K. 1986. The relationship of social vocalization to surface behavior and aggression
in the Hawaiian humpback whale (Megaptera novaeangliae). Canadian Journal of
Zoology 64: 2075-2080.
Simmons, M. L., and H. E. Marsh. 1986. Sightings of humpback whales in Great Barrier Reef
waters. Scientific Reports of the Whales Research Institute 37: 31-46.
Spitz, S. S., L. M. Herman, A. A. Pack and M. H. Deakos. 2002. The relation of body size of
male humpback whales to their social roles on the Hawaiian winter grounds. Canadian
Journal of Zoology 80: 1938-1947.
True, F. W. 1904. The whalebone whales of the western North Atlantic compared with those

133
occurring in European waters; with some observations on the species of the North
Pacific. Smithsonian Institution Press, Washington, District of Columbia 33: 1-318.
Tyack, P. 1981. Interactions between singing Hawaiian humpback whales and conspecifics
nearby. Behavioural Ecology and Sociobiology. 13: 49-55.
Tyack, P. 1982. Humpback whales respond to the sounds of their neighbors. Ph.D. thesis, The
Rockefeller University, New York.
Tyack, P., and H. Whitehead. 1983. Male competition in large groups of wintering humpback
whales. Behaviour 83(1/2): 132-154.
Valsecchi, E., P. Hale, P. Corkeron and W. Amos. 2002. Social structure in migrating
humpback whales (Megaptera novaeangliae). Molecular Ecology 11: 507-518.
Vang, L. 2002. Distribution, abundance and biology of Group V humpback whales
(Megaptera novaeangliae): A review. The State of Queensland Environmental
Protection Agency, Conservation Management Report, August 2002: 20 pp.
Weinrich, M. T. 1991. Stable social associations among humpback whales (Megaptera
novaeangliae ) in the southern Gulf of Maine. Canadian Journal of Zoology 69: 3012-
3019.
Whitehead, H. 1983. Structure and stability of humpback whale groups off Newfoundland.
Canadian Journal of Zoology 61: 1391-1397.
Whitehead, H. 1985. Humpback whale breaching. Investigations on Cetacea 17: 117-155.

134
Chapter 5
Temporal segregation and behaviour of reproductive
and maturational classes of individually identified
humpback whales (Megaptera novaeangliae) in
Hervey Bay, 1992-2009

135
5.1 ABSTRACT
This study investigated the temporal segregation and behaviour of different reproductive and
maturational classes of humpback whales in Hervey Bay eastern Australia, using observations
from long-term resighting histories of 361 individual whales identified photographically
between 1992 and 2009. Mature non-lactating females occurred mainly during August.
Lactating females occurred in September and October with peak density occurring in late
September, thirty-two days after that for mature non-lactating females. There was no
significant difference in the peak density and observations by day within season of immature
males and females and mature non-lactating females. There were very few mature males
observed in August, with the main concentrations occurring in September and October; the
occurrence of this class partly overlapped with that of non-lactating females but to a greater
extent with lactating females. The data suggest that both non-lactating and lactating females
interact with immature and maturing males and females to a greater extent than previously
reported. Hervey Bay appears to be a preferential southbound stopover habitat for females on
their southern migration from their winter breeding grounds. The observed temporal
segregation pattern of humpback whales in Hervey Bay is consistent with the results reported
by Dawbin (1966, 1997) from whaling catches made between the 1930s and 1960s. The
results suggest that temporal segregation is a constant and cohesive feature of the social
organisation of migrating humpback whales, which provides a predictable social framework
for individuals moving through various maturational and reproductive stages.

136
5.2 INTRODUCTION
Baleen whales show temporal segregation of migration by age, sex and reproductive class
(Nishiwaki 1959; Chittleborough 1965; Dawbin 1966, 1997, Swartz 1986). Dawbin (1997)
undertook the most extensive investigation of such segregation in humpback whales during
their migrations between summer feeding grounds and winter breeding areas in the Southern
Hemisphere. Dawbin’s data were obtained from 65,600 humpback whale catches in pre- and
post-war whaling periods, ranging from the early 1930s to the early 1960s. Samples were
obtained at coastal whaling locations and Antarctic pelagic waters between 10S and 660S and
he reported no significant differences in trends of the timing of occurrence of the classes of
whales examined within each of the separate tropical breeding grounds.
These whaling data were based on only one sighting record per individual at the time of the
individual’s death and consequently provided no information of individual behaviour over
time and not all behaviour classes could be differentiated in that analysis. Furthermore, those
data were collected at a time when the humpback whale populations were in rapid decline
(Jackson et al. 2006, Clapham et al. 2009) and it is not clear if the patterns observed were
influenced by this decline. More recent collaborative studies have utilised resighting histories
of individuals to investigate estimates of abundance and rates of increase for the North
Atlantic humpback whale population (Stevick et al. 2003). Resighting histories have also
been used to study migratory timing and segregation of particular age, sex and reproductive
classes of humpback whales during their migrations in the central North Pacific (Craig et al.
2003), and the resightings and social behaviour of individual humpback whales in the
Hawaiian Islands were used to determine relative sight fidelity of males and females, apparent
and operational sex-ratios, calving rates, females demographics and the diversity of the
social/behavioural roles of males and females (Herman et al. 2011). Consequently, the use of
137
long-term resighting histories of known individuals provides an opportunity to investigate
social behaviour within the context of temporal segregation.
It has been suggested that between 30% and 50% of eastern Australian humpback whales
enter Hervey Bay in any one year (Chaloupka et al. 1999). Hervey Bay (Queensland, 250S,
1530E) is located south of the putative breeding ground of eastern Australian humpback
whales within the lagoon of the Great Barrier Reef (Simmons and Marsh 1986, Paterson
1991, Chaloupka and Osmond 1999). Humpback whales do not enter Hervey Bay during the
northern migration, but do so on their southern migration (Corkeron et al. 1994, Brown and
Corkeron 1995, Franklin et al. 2011). Hervey Bay is neither a calving ground nor a terminal
destination, but rather a migratory stopover for a portion of the population early in the
southern migration (Franklin et al. 2011).
Significant changes in seasonal pod characteristics and seasonal social behaviour in Hervey
Bay have been reported that are consistent with, and related to, the presence of different
maturational and reproductive classes of humpback whales during the season (Franklin et al.
2011, Chapters 3 and 4 above).
Long-term resighting histories of 361 individually identified humpback whales were used to
investigate the temporal segregation and behaviour of age, sex, reproductive and maturational
classes of humpback whales travelling through Hervey Bay to compare these patterns to those
reported from the whaling period, and to discuss the social behaviour of humpback whales in
the context of temporal segregation.
5.3 METHODS AND DATA
5.3.1 Study area, fieldwork and photo-id data

138
Vessel-based photo-identification of humpback whale pods was conducted in Hervey Bay
(Queensland, 250S, 1530E) from early August until mid-October each year between 1992 and
2009 (see Chapter 2.2 and Fig. 2.1 above). Fieldwork was conducted for 181 weeks, 1,014
operational days in the field and 8,122 hours of observations (Table 5.1).
Photography of the ventral fluke patterns, shape and size of dorsal fins and lateral body
markings were obtained to allow identification of individual humpback whales (Katona et al.
1979, Katona and Whitehead 1981). Data collected during the observation of each pod
included: date, time of commencement and completion of observation, pod identification
code, the observed number of individuals in the pod, pod composition, pod behaviours
(continuous sampling; Altmann, 1974), associations of pods and type of encounter.
Information on sex-identification was obtained where possible.
Photography for each pod was analysed in conjunction with the field notes on observations of
pod composition and behaviour (for detailed description of method, see Chapter 2.5).
Resighting histories of individual humpback whales based on resightings over two or more
years were compiled from observations recorded in the yearly fluke catalogues. A total of 578
individual histories were obtained with resightings ranging over a period of eighteen years
(Table 5.1).
Each initial sighting and subsequent resightings of the 578 individual whales, within and
between seasons, was examined in conjunction with photo-identification and observation
notes. Information on pod composition, pod behaviour, individual behaviour and sex were
reviewed to determine whether or not each initial sighting and subsequent resightings could
be used to classify each whale with respect to sex, age, reproductive and maturational classes
in accordance with the definitions below.

139
Table 5.1. Summary of fieldwork, observations and data: Hervey Bay from 1992 to 2009.
Effort and observations Data
Fieldwork Observations Yearly Catalogues Cumulative
Year First day Last day Field days Pods (n)
Whales (n)
Sightings of
individuals (n)
Sighting histories
commenced Sighting histories
1992 10th Aug 9th Oct 42 189 387 4 4 4
1993 6th Aug 15th Oct 53 229 442 5 3 7
1994 7th Aug 14th Oct 50 163 380 47 36 43
1995 6th Aug 13th Oct 51 172 374 47 27 70
1996 4th Aug 11th Oct 48 185 410 70 26 96
1997 1st Aug 17th Oct 64 300 693 140 52 148
1998 9th Aug 16th Oct 58 410 934 190 56 204
1999 28th Jul 15th Oct 63 399 929 210 43 247
2000 6th Aug 13th Oct 58 380 815 206 50 297
2001 12th Aug 19th Oct 57 432 954 234 43 340
2002 11th Aug 17th Oct 59 409 968 268 56 396
2003 10th Aug 17th Oct 56 390 928 270 42 438
2004 5th Aug 15th Oct 60 419 952 303 49 487
2005 30th Jul 14th Oct 61 448 1,050 376 43 530
2006 3rd Aug 13th Oct 58 420 984 341 23 553
2007 30th Jul 11th Oct 60 399 945 297 14 567
2008 7th Aug 17th Oct 61 508 1,283 407 11 578
2009 6th Aug 16th Oct 55 396 901 317 0 578
Totals 1,014 6,248 14,329 3,732 578
5.3.2 Definitions
Male sex identification: was determined by either unequivocal observation and or
photography of their genital area, or the whale was inferred as a male when observed in the
social role of escort to a lactating female (see definition below), a singer, a Principal Escort or
a Challenging Escort in a competitive group (Tyack 1981, Glockner and Venus 1983, Baker
et al 1984b, Clapham et al. 1992, Herman et al. 2011). The presence of extensive vertical and

140
horizontal scratch marks on the left and right lateral body, were also used in conjunction with
the behavioural observations, to infer that an individual was a male (Chu and Nieukirk 1988).
Males observed both as escorts, and not in the role of escorts: males were identified as
escorts when observed accompanying a female with calf and were classified ‘with lactating
female’. When the same males were observed either within or between seasons in pods with
no calves present they were classified as ‘not with lactating females’.
Male maturational status - mature or unknown maturity: males were presumed to be
socially and sexually mature if the time between first sighting and subsequent resightings
exceeded six-years and were therefore classified as ‘mature’ (Chittleborough 1965, Clapham
1992, Gabriele et al. 2007 see Chapter 1.3.1 above for a detailed discussion on age
determination at sexual maturity). If the time between first sighting and subsequent
resightings of a male was less than six-years they were classified ‘maturity unknown’. The
rationale in using one to six years to infer immaturity relies on the Chittleborough (1965) and
Clapham (1992) results which report humpback whale sexual maturity at an average age of
five years in both the northern and southern hemisphere and provides a conservative estimate
of age at sexual maturity.
Female sex identification: was determined by either unequivocal observation and or
photography of their genital area and the presence of a hemispherical lobe posterior to the
genital slit (True 1904, Glockner 1983), or the whale was inferred as female when observed in
a constant and close relationship with a calf (Tyack and Whitehead 1983, Clapham et al.
1999, Herman et al. 2011).
Females lactating and non-lactating: females observed in a constant and close relationship
with a calf (Tyack and Whitehead 1983, Clapham et al. 1999, Herman et al. 2011) were
inferred to be lactating. When the same females were observed in other seasons in pods with

141
no calves present they were classified as ‘non-lactating’. If individual females were observed
only in pods in a constant and close relationship with a calf throughout their resighting-
histories, they were classified as ‘only lactating’. If individual females were observed only in
pods with no calves present throughout their resighting-histories and were sex-identified by
genital observation, they were classified as ‘only non-lactating’.
Females maturational status - mature or unknown maturity: females classified as ‘lactating’
were presumed to be both socially and sexually mature and classified as ‘mature’. Females
classified as ‘only non-lactating’ were presumed to be socially and sexually mature and
classified as ‘mature’ if the time between first sighting and subsequent resightings exceeded
six-years (Chittleborough 1955b, 1965; Clapham 1992; Best 2006, 2011: see rationale above).
If the time between first sighting and subsequent resightings was less than six-years they were
classified as ‘maturity unknown’.
Known-age whales: were individually identified whales first observed as calves or yearlings.
Yearlings were identified visually by an experienced observer, to be unambiguously small
relative to adults but too large to be calves of the year (Clapham et al. 1999, Craig et al.
2003).
Known-age whales were classified as male or female from genital observations or classified
as sex unknown. They were then further categorised into four age categories: sightings as
calves (male, female or unknown sex); sightings as yearlings, (male, female or unknown sex);
sightings as 2 to 6 year olds (male, female or unknown sex); and sightings from year seven
onwards, 7+ years (male and female). Sightings of known-age individual whales (males,
females and unknown sex) first sighted as calves, yearlings, or from 2 to 6 years were
categorised at ‘immature’ and sightings of the same whales that exceeded six years, or if they
were females observed lactating, were categorised as ‘mature’.

142
Peak density: is the model-estimated mean day within season of each of the sex, age,
reproductive and maturational classes analysed in this study.
5.3.3 Statistical analysis
Analysis and modelling were undertaken on the observations of individually identified
humpback whales that, from long-term resighting histories over two or more years, could be
assigned to specific sub-classes of sex, age, reproductive category and/or maturational status.
Data on the number of observations of the individually identified whales by sex, method of
sex-identification, reproductive category and maturational status were reported. Additionally
further information on more specific reproductive categories of a sub-set of individually
identified females was also provided from adjacent year sightings. This information was not
used in analysis or modelling but to inform the discussion of the results of the analysis and
modelling of the sub-classes that were analysed.
The data were organised into eight sub-classes of interest for statistical analysis with the
response variable of primary interest being day within season of each sighting. Statistics for
each sub-class were reported and the observations by sub-class presented graphically.
To further investigate the above results a multilevel linear model, with day within season as
the response variable, was fitted to seven of the sub-classes of whales as a fixed factor, and
whale and observation of whale as nested random factors. Separate variances were fitted for
the seven sub-classes in the random effects part of the model. Estimates were obtained by the
Markov Chain Monte Carlo method. The model estimated mean day within season (Peak
Density) for each of the seven sub-classes was reported.

143
To examine the mean day within season between the sub-classes, ten pairwise comparisons
were undertaken and the results of the comparison tests between the selected sex,
reproductive and maturational classes based on estimated marginal means were reported.
As the likelihood of encountering an individual whale in Hervey Bay may be related to their
length of stay, an analysis of residency was also undertaken. The data for analysis of
residency were organised as one record per year for each individual whale. Each record
included the sex of the individual, whether it was lactating if female, and the dates of the first
and last observations within each year the individual was observed. The number of
observations, the geometric and arithmetic means and standard deviations of the observed
residency times were reported by year and by sex and reproductive state.
A linear mixed effects model was fitted to the natural log of observed residency times with
individual and year within individual as random factors, and with year and the sex and
reproductive state categories as fixed effects and the estimated geometric means of the
distributions of observed residency times of individuals by sex and reproductive state were
reported. Data on the extended residency of those females and males spanning ten or more
days were also reported.
Finally to inform the discussion of the results of the analysis and modelling of the sex, age,
reproductive and maturational sub-classes, data on the long-term resighting histories and
social interactions among different sub-classes of three known-age humpback whales were
reported.
5.4 RESULTS
5.4.1 Individually identified whales and observation database

144
Of the 578 individually identified whales with known resighting histories, 361 could be
assigned to reproductive and known-age classes as described in the definitions above (Table
5.2). The ratio of sex-identified or inferred females to males was 2.94:1 females to males. The
2,131 observations of these whales were the database used in the analysis in this study and are
summarised in Table 5.3.
Table 5.2. Classification of 361 individually identified humpback whales by sex, reproductive
status and known-age, from resighting histories over two or more years
Classification of individually identified whales Number (a) Males observed both in the role of escorts, and the same males not in the role of escorts 77 (b) Females observed lactating and the same females observed non-lactating 126 (c) Females observed only lactating 96 (d) Females observed only non-lactating 30 (e) Known-age whales: first observed as calves or yearlings
I. Males II. Females III. Unknown sex
12 10 10
Total number of individually identified whales 361

145
Table 5.3. Number of observations of individually identified whales (a, b, c and d) by
sex, and method of sex-identification, reproductive category and maturational status; and
known-age whales (e) by maturational status, age-class (i, ii, iii, iv) and sex.
Class Category or Sex Immature
Mature
Maturity unknown
Total Obs
(a) Males observed as escorts, and the same males observed not in the role of escorts (n=77) Males: genital observation Not with lactating females 0 11 12 23 Males: inferred Not with lactating females 0 126 98 224 Males: genital observation With lactating females 0 7 0 7 Males: inferred With lactating females 0 185 0 185
Total observations of males 329 110 439 (b) Females observed lactating and the same females observed non-lactating (n=126) Females: genital observation Lactating na 109 na 109 Females: inferred Lactating na 490 na 490 Females: genital observation Non-lactating na 60 na 60 Females: inferred Non-lactating na 203 na 203 Sub-total na 862 na 862 (c) Females observed only lactating (n=96) Females: inferred Lactating na 544 na 544 Sub-total na 544 na 544 (d) Females observed only non-lactating (n=30) Females: genital observation Non-lactating na 2 110 112 Sub-total na 2 110 112
Total observations of females 1,408 110 1,518 (e) Known-age (male female or unknown sex): first observed as calves or yearlings (n=32) (i) Calves: male 14 na na 14 female 12 na na 12 Unknown sex 5 na na 5 (ii) Yearlings: male 33 na na 33 female 20 na na 20 unknown sex 9 na na 9 (iii) 2-6 years: male 17 na na 17 female 14 na na 14 Unknown sex 12 na na 12 (iv) 7+ years: male na 23 na 23 female na 12 na 12
Unknown sex na 3 na 3 Total observations of known-age whales 136 38 na 174
Total observations of individually identified whales 136 1,775 220 2,131
5.4.2 Reproductive category of selected females based on long-term resighting histories
Of the 252 individually identified females in the database, 111 (44.0%) had adjacent year
resightings and were able to be assigned to more specific reproductive categories, which are

146
reported in Table 5.4. These more specific reproductive categories were not used in the
statistical analysis and modeling below. The results are used when discussing the reproductive
sub-classes of females lactating and non-lactating.
Table 5.4. Occurrences of more specific reproductive categories of 111 individually
identified females derived from adjacent year resightings. Occurrences means how many
times were the reproductive categories observed.
Class Specific reproductive category Whales Occurrences (b) Females both lactating and not lactating (n = 126, Table 5.3)
Non-lactating, resting 16 18 Non-lactating, early pregnant 36 44 Non-lactating, either resting or early pregnant 21 22 Lactating and post-partum estrous pregnant 17 26
(c) Females only lactating (n = 96, Table 5.3)
Lactating and post-partum estrous pregnant 19 24
(d) Females only non-lactating (n = 30, Table 5.3) Non-lactating, either resting or early pregnant 2 2 Totals 111 136
There were 62 occurrences of resting or early pregnant females; 49 (79.0%) in August, 12
(19.3%) in September and 1 (1.6%) in early October. There were 24 occurrences of either
resting or early pregnant females; 12 (50.0%) in August, 9 (37.5%) in September and 3
(12.5%) in early October.
There were 50 occurrences of lactating and post-partum pregnant females (i.e. mature females
simultaneously lactating and pregnant). Twenty-four individuals had one post-partum
pregnant occurrence, 10 had two and, 2 had three. Of the 50 post-partum pregnant
occurrences; 39 (78.0%) were observed during September and 11 (22.0%) were observed
during October.

147
5.4.3 Statistical analysis
The database of observations in Table 5.3 were rearranged for statistical analysis (Table 5.5),
with the response variable of primary interest being the day within season (Day 1 = August 1
… October 19 = Day 80) of each sighting.
The results and statistics for each sub-class are summarised in Table 5.5 and the observations
by day within season of sex, age, reproductive and maturational sub-classes are summarised
in Figure 5.1, below.
Table 5.5. Sub-class results and statistics
Sex, age, reproductive and maturational sub-classes
Whales
(n)
Obs (n)
First day
Last day
Median
Mean
SD
(a) Males (mature, not with lactating females) 41 137 6 76 50.0 49.4 14.28
(b) Males (mature, with lactating females) 73 192 19 77 57.0 56.7 12.32
(c) Males (unknown maturity, not with lactating females) 41 110 6 76 36.0 34.3 16.55
(d) Females (lactating) 222 1,143 13 80 57.0 56.8 12.77
(e) Females (non-lactating) 156 375 3 73 24.0 26.3 13.68
(f) Calves (males and females) 7 31 37 77 67.0 64.7 10.12
(g) Males, females & unknown (1-6 years)
32 105 1 62 22.0 25.3 13.84
(h) Males & females (7+ years) 14 38 18 64 51.5 45.4 14.83

148
Figure 5.1. Observations by day within season, of individually identified whales by
sex, age, reproductive and maturational sub-classes: (a) Males (mature, not with lactating
females;); (b) Males (mature, with lactating females); (c) Males (unknown maturity, not with
lactating females); (d) Females (lactating); (e) Females (non-lactating); (f) Calves (males and
females); (g) Males, females and unknown sex (1-6 years) and (h) Males and females (7+
years).

149
Note (i): In Figure 5.1 above, sub-class (a) and (b) represent observations of the same
individually identified males.
Note (ii): Of the individually identified females in sub-class (d) and (e), 126 are individuals
that were observed both lactating and non-lactating (see Table 5.3).
Note (iii): Sub-class (f), (g) and (h) represent observations of the same known-age
individually identified whales.
Observations of mature males not with lactating females (Fig. 5.1a) were less common during
August and peaked during September. As expected, observations of those same males when
with lactating females (Fig. 5.1b) occurred mainly in September and early October, with very
few observations in August. Males left Hervey Bay approximately 3 to 4 days before the last
of the lactating females (Fig 5.1a, 5.1b and 5.1d, Table 5.5). Observations of males of
unknown maturity not with lactating females occurred from early August through September
and into early October (Fig. 5.1c). The extended observation period of this class suggests that
it may be composed of both immature and mature whales. Observations of lactating females
(Fig. 5.1d) occurred mainly in September and October and this class of whales was rarely
observed in August. Observations of non-lactating females occurred predominantly in August
with decreasing observations during September and very few observations in October (Fig.
5.1e). Although there is some temporal overlap of observations of lactating females (Fig.
5.1d) and non-lactating females (Fig. 5.1e) in September and less in October, there is a clear
segregation and clumping of these two classes over the season.
The observations presented in Fig. 5.1f, 5.1g and 5.1h are of the same known-age individuals.
The data show that calves returned to Hervey Bay as immature whales in August (Fig. 5.1f
and 5.1g). Observations of immature whales (Fig. 5.1g) occurred in August and early
September coinciding with the presence of the non-lactating females (Fig. 5.1e), whereas

150
those same immature individual whales when observed as calves, as expected, coincided with
the observations of lactating females (Fig. 5.1d and 5.1f). As mature whales (7+ years) they
were observed in late August through to late September (Fig. 5.1h).
5.4.4 Statistical model
To further investigate the results presented in Table 5.5 and the patterns illustrated in Figure
5.1 above, a multilevel linear model, with day within season as the response variable, was
fitted with the seven sub-classes of whales (calves excluded as necessarily accompanying the
lactating females, Figure 5.1d and 5.1f) as a fixed factor, and whale and observation of whale
as nested random factors, using MLwiN V2.25 (Rasbash et al. 2012). Separate variances were
fitted for the seven sub-classes in the random effects part of the model. Estimates were
obtained by the Markov Chain Monte Carlo method (MCMC 5,000 iterations burn in,
200,000 iterations monitoring chain length; Browne 2012).
To examine the differences in mean day within season between the sub-classes ten
comparisons were planned:
(1) Females (non-lactating) v. females (lactating)
(2) Females (lactating) v. males, females and unknown sex (1-6 years)
(3) Males (mature, not with lactating females) v. females (non-lactating)
(4) Males (mature, with lactating females) v. females (non-lactating)
(5) Males (mature, not with lactating females) v. males (maturity unknown, not with lactating
females)
(6) Males (mature, with lactating females) v. males (maturity unknown, not with lactating
females)

151
(7) Males, females and unknown sex (1-6 years) v. males and females (7+ years)
(8) Males (mature, with lactating females) v. females (lactating)
(9) Females (non-lactating) v. males, females and unknown sex (1-6 years of age)
(10) Males (mature, not with lactating females) v. males and females (7+ years).
The first 7 of these comparisons were expected to yield significant mean differences, while
the last 3 were not. Tests of significance for the comparisons employed Wald Chi-square tests
using 1 degree of freedom (Browne 2012). Each comparison was tested against a Bonferroni-
adjusted p-value of 0.005 to yield an overall alpha level of 0.05 for the ten tests.
5.4.5 Results of multilevel model
In the multilevel model for mean day within season, the data were modeled as a sample of
observations on each of a sample of whales. There were significant differences between the
sex, age, reproductive and maturational classes (Fig. 1). As predicted the first seven planned
comparisons were all highly statistically significant and the last three were not (Table 5.7),
with the 7 significant tests meeting the Bonferroni-adjusted p-value of 0.005 significance
level, while the 3 non-significant tests had p > 0.106 unadjusted. The model-estimated mean
day within season (peak density of sub-class) are reported in Table 5.6 and the results of the
planned comparison tests are reported in Table 5.7.

152
Table 5.6. Model estimated mean day within season (Peak Density) with 95% confidence
interval for each class
Sex, age, reproductive and maturational class Mean L95%CI U95%CI Males (mature, not with lactating females) 51.10 48.37 53.82 Males (mature, with lactating females) 56.65 54.35 58.87 Males (unknown maturity, not with lactating females) 37.54 33.62 41.47 Females (lactating) 57.81 56.30 59.32 Females (non-lactating) 25.61 23.70 27.53 Males, females & unknown (1-6 years) 25.58 21.81 29.35 Males and females (7+ years) 45.86 40.13 51.58
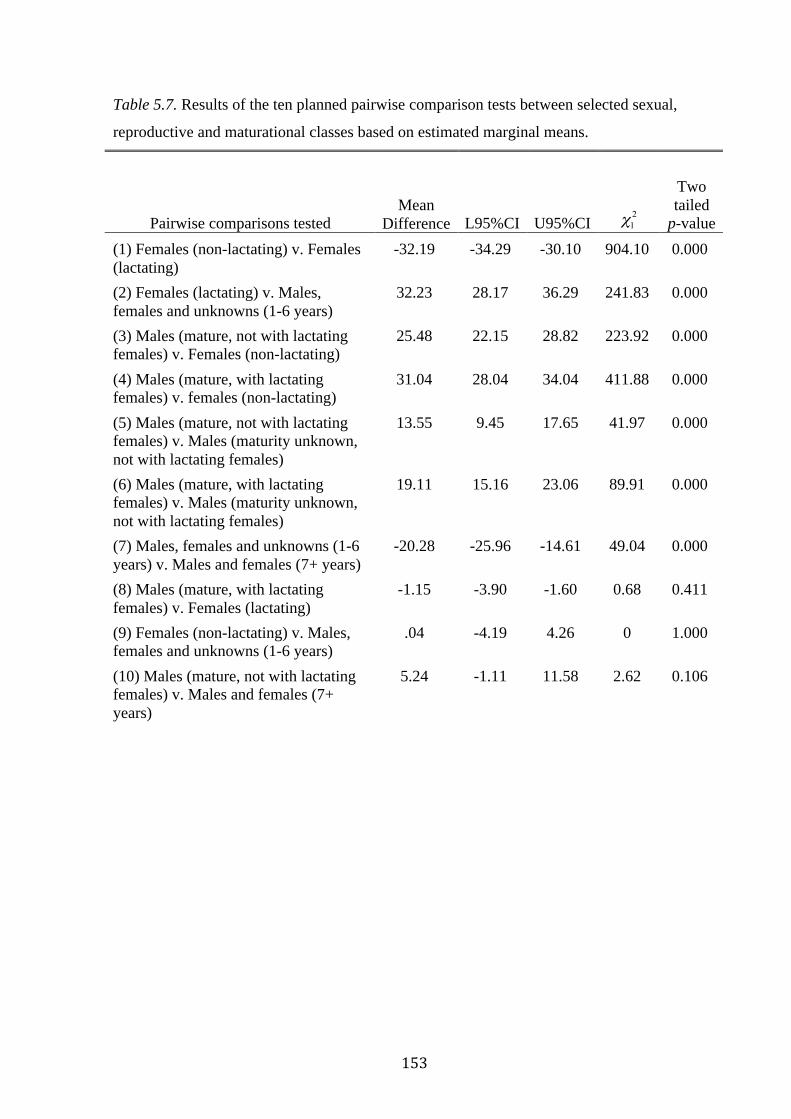
153
Table 5.7. Results of the ten planned pairwise comparison tests between selected sexual,
reproductive and maturational classes based on estimated marginal means.
Pairwise comparisons tested Mean
Difference L95%CI U95%CI
Two tailed
p-value (1) Females (non-lactating) v. Females (lactating)
-32.19 -34.29 -30.10 904.10 0.000
(2) Females (lactating) v. Males, females and unknowns (1-6 years)
32.23 28.17 36.29 241.83 0.000
(3) Males (mature, not with lactating females) v. Females (non-lactating)
25.48 22.15 28.82 223.92 0.000
(4) Males (mature, with lactating females) v. females (non-lactating)
31.04 28.04 34.04 411.88 0.000
(5) Males (mature, not with lactating females) v. Males (maturity unknown, not with lactating females)
13.55 9.45 17.65 41.97 0.000
(6) Males (mature, with lactating females) v. Males (maturity unknown, not with lactating females)
19.11 15.16 23.06 89.91 0.000
(7) Males, females and unknowns (1-6 years) v. Males and females (7+ years)
-20.28 -25.96 -14.61 49.04 0.000
(8) Males (mature, with lactating females) v. Females (lactating)
-1.15 -3.90 -1.60 0.68 0.411
(9) Females (non-lactating) v. Males, females and unknowns (1-6 years)
.04 -4.19 4.26 0 1.000
(10) Males (mature, not with lactating females) v. Males and females (7+ years)
5.24 -1.11 11.58 2.62 0.106
154
The data presented in Figure 5.1 indicate that males (mature with lactating females) (Fig.
5.1b) leave the bay earlier than the females in the final week of the season.
5.4.6 Analysis of residency
As the likelihood of encountering an individual whale in Hervey Bay may be related to their
length of stay, an analysis of residency was undertaken. The data for analysis of residency
were organised as one record per year for each individual whale. Each record included the sex
of the individual, whether it was lactating if female, and the dates of the first and last
observations within each year the individual was observed. Because there were fewer
observations in the years 1992 to 1995, the 1,098 observations from 1996 to 2009 were the
data selected for analysis of residency.
The distribution of observed residency times by observation (last date sighted – first date
sighted + 1) included many 1-day intervals (66.5%) and was extremely right skewed. These
data were transformed to their natural logarithms for further analysis. While the distribution
of log intervals also included 66.5% of zero values and remained right-skewed, the
distribution of residuals from the fitted model was much more symmetric, and with 1,098
observation values was considered as indicating that a normal model for the sampling
distribution of the log values was appropriate. Back-transformation of an estimated mean log
value yields an estimate of the geometric mean. As a descriptive statistic for a skewed
distribution, the geometric mean is less influenced by extreme values than the arithmetic
mean and closer to the median, and is a more ‘reasonable’ indicator of the location (central
tendency) of the distribution.
The number of observations, the geometric and arithmetic means and standard deviations of
the observed residency times are reported by year in Table 5.8, and by sex and reproductive
state in Table 5.9. A trend of reduction over years was observed in the geometric means of

155
observed residency times summarized in Table 5.8, and Table 5.9 shows the geometric means
reducing in the order, females lactating, males and females not lactating.
Table 5.8. Number of observations of individuals (N) per year, and the geometric and
arithmetic means and standard deviations of observed residency times (Days)
Year N Geometric Mean Mean Std. Deviation 1996 35 2.20 4.26 5.420 1997 55 2.14 3.71 6.379 1998 82 2.10 3.95 5.715 1999 78 1.47 1.97 2.156 2000 74 1.80 3.12 4.370 2001 85 2.15 4.36 6.654 2002 98 1.89 3.92 7.577 2003 87 1.65 3.06 4.996 2004 97 2.03 4.05 6.184 2005 88 1.62 2.55 3.273 2006 76 1.44 2.25 3.250 2007 81 1.54 2.20 2.581 2008 92 1.25 1.55 2.221 2009 70 1.53 2.67 4.406 Total 1,098 1.73 3.08 5.020
Table 5.9. Number of observations of individuals (N) by sex and reproductive state,
and the geometric and arithmetic means and standard deviations of observed residency
times (Days)
Sex and reproductive state N Geometric Mean Mean Std. Deviation Females, not lactating 265 1.29 1.63 1.824 Females, lactating 543 2.02 3.47 4.452 Males 290 1.67 3.66 7.271 Total 1,098 1.73 3.08 5.020
5.4.7 Statistical model of observed residency
A linear mixed effects model was fitted to the natural log of observed residency times with
individual and year within individual as random factors, and with year and the sex and
reproductive state categories as fixed effects. The model was initially fitted with year (1996-
2009) as a categorical variable and subsequently as a linear function of the year number (1-

156
14) as a continuous variable. The Satterthwaite (1946) method was employed to adjust the
degrees of freedom for the F tests of fixed effects, and the Bonferroni (see Abdi 2007) method
was used to adjust for multiple pairwise comparison tests.
A plot of the estimated log observed residency times by year (1996-2009; not shown)
displayed a quite linear declining trend and we report the model with year fitted as a linear
function of the year number (1-14). Tests of the fixed effects found both year number (F =
32.24, df = 1, 1093.7, p < 0.001) and the sex and reproductive state categories (F = 29.35, df
= 2, 587.93, p < 0.001) to be significant predictors. Bonferroni-adjusted multiple pairwise
comparison tests found the lactating female class mean to be significantly greater than both
the non-lactating female class mean (p<0.001) and the male class mean (p=0.011), and the
male class mean to be significantly greater than the non-lactating female class mean
(p<0.001).
The coefficient for year number showed a reduction of 0.04 (SE = 0.007) log observed
residency time per year. The estimated mean log observed residency times (SE) for the sex
and reproductive categories at year 5 (2000) were: 0.469 (0.069) days for non-lactating
females, 0.981 (0.067) days for lactating females and 0.777 (0.075) days for males. Back-
transformation yielded estimated geometric means of the distributions of observed residency
times of individuals in 1996, 2000 and 2009 and are reported in Table 5.10.
Table 5.10. Estimated geometric means of the distributions of observed
residency times of individuals.
Sex and reproductive state / year 1996 2000 2009 Females, not lactating 1.88 1.60 1.11 Females, lactating 3.13 2.67 1.86 Males 2.56 2.18 1.51

157
The trend over years was estimated as a linear function on the log days scale and
consequently displays a regular form. The estimates presented in Table 5.10 are provided to
show the estimated residency times on the natural scale (days) for the beginning, middle and
end of the continuous function for each of the three classes; females not lactating, female,
lactating, and males.
5.4.8 Extended residency
Of the 361 resighted individual whales, there were 50 cases of extended residency observed
that spanned 10 or more days. Twenty-five of these were females with calf, 3 were females
without calf, and 22 were males. The sightings, including the span in days from the first day
sighted to the last day sighted, and the longest interval in days between any two sightings, are
summarised in Tables 5.11 and 5.12.

158
Table 5.11. Females with sightings spanning ten or more days
UID Sex Year No of days
sighted First
sighting Last
sighting
Span from first to last sighting
(Days)
Longest Interval between two
sightings (Days)
221 Female 2003 2 21/08/03 07/09/03 18 16 337 Female 1998 2 21/08/98 30/08/98 10 8 871 Female 2001 2 07/09/01 16/09/01 10 8
7 Female/calf 1998 6 16/09/98 25/09/98 10 3 7 Female/calf 2003 3 25/09/03 16/10/03 22 19 7 Female/calf 2006 4 15/09/06 24/09/06 10 3
157 Female/calf 2007 4 16/09/07 25/09/07 10 4 160 Female/calf 1996 4 16/09/96 02/10/96 17 13 160 Female/calf 2003 2 28/09/03 12/10/03 15 12 277 Female/calf 2005 2 07/09/05 19/09/05 13 11 279 Female/calf 1997 3 30/09/97 16/10/97 17 14 292 Female/calf 2005 4 23/08/05 02/09/05 11 4 362 Female/calf 2004 2 17/09/04 28/09/04 12 10 394 Female/calf 2001 3 09/09/01 23/09/01 15 11 396 Female/calf 2000 2 15/09/00 26/09/00 12 10 414 Female/calf 1998 4 24/09/98 08/10/98 15 10 425 Female/calf 2000 3 11/09/00 25/09/00 15 10 425 Female/calf 2004 3 16/09/04 27/09/04 12 5 440 Female/calf 2004 5 24/09/04 04/10/04 11 4 573 Female/calf 2001 7 10/09/01 26/09/01 17 7 633 Female/calf 2007 5 09/09/07 20/09/07 12 6 654 Female/calf 2006 4 03/10/06 12/10/06 10 5 879 Female/calf 2001 2 19/09/01 02/10/01 14 12 998 Female/calf 2002 4 27/08/02 10/09/02 15 6
1101 Female/calf 2006 7 14/09/06 29/09/06 16 4 1101 Female/calf 2008 2 10/09/08 30/09/08 21 19 1105 Female/calf 2002 2 24/09/02 04/10/02 11 9 1272 Female/calf 2003 2 05/09/03 15/09/03 11 9
The range of the time period between first and last day of sighting for females in Hervey Bay
was 10 to 22 days and the range of the longest interval between any two sightings was 3 to 19
days. The median span from the first to the last sighting of females was 12.5 days (Mean 13.6,
Median 12.5, SD = 3.4) while the median interval between any two sightings was 9 days
(Mean 9.0, Median 9.0, SD = 4.5).

159
Table 5.12. Males with sightings spanning ten or more days
UID Sex Year No of days
sighted First
sighting Last
sighting
Span from first to last sighting
(Days)
Longest Interval between two sightings
(Days) 40 Male 1997 3 10/08/97 21/09/97 43 37 43 Male 2003 3 11/09/03 23/09/03 13 10
471 Male 2005 5 12/09/05 25/09/05 14 6 74 Male 1998 2 26/08/98 04/09/98 10 8
106 Male 2001 8 12/09/01 09/10/01 28 8 161 Male 1996 4 16/09/96 02/10/96 17 12 161 Male 2004 4 21/09/04 03/10/04 13 6 175 Male 1997 2 05/08/97 08/09/97 35 33 228 Male 1997 3 13/08/97 03/09/97 22 18 352 Male 2005 3 31/08/05 15/09/05 16 13 420 Male 1998 3 07/09/98 05/10/98 29 20 531 Male 2001 2 10/09/01 21/09/01 12 10 586 Male 2001 7 31/08/01 25/09/01 26 9 586 Male 2002 9 15/08/02 04/10/02 51 25 586 Male 2004 2 26/08/04 13/09/04 19 17 701 Male 2000 2 15/09/00 03/10/00 19 17 715 Male 2001 6 05/09/01 30/09/01 26 12 715 Male 2009 4 17/09/09 01/10/09 15 11 825 Male 2002 2 12/08/02 05/09/02 25 23 882 Male 2002 5 13/08/02 24/09/02 43 23 916 Male 2004 2 17/09/04 15/10/04 29 27
1314 Male 2004 3 14/09/04 05/10/04 22 18
The range of the time period between first and last day of sighting for males was 10 to 51
days and the range of the longest interval between any two sightings was from 6 to 37 days.
The median span from first to last sighting of males was 22 days (Mean 24.0, Median 22.0,
SD = 11.1) while the median longest interval between any two sightings was 15 days (Mean
16.5, Median 15.0, SD = 8.7).
160
5.4.9 Timing and changes in maturational and reproductive status of known-age whales
To illustrate the timing and changes in maturational and reproductive status of known-age
whales (Table 5.3e; Figure 5.1f, g and h) and the type of social interactions with other classes
of whales (Fig. 5.1) in which they were engaged, the resighting history of a known-age male
from a calf to an eleven year old, UID-176; a known-age female from a calf to a six year old,
UID-1193, and a known-age female from a yearling to a seven year old, UID-1100, are
summarised in Tables 5.13 and 5.14.

161

162
Maturational status: male UID-176 (Calf)
The male (catalogue number UID-176) was resighted on eight occasions as a calf during
September and October. On five of these resightings he was alone with his mother. The other
three resightings involved associations with multiple mother-calf pods (Table 5.13). The
timings are consistent with the presence of lactating females in Hervey Bay (Fig. 5.1d).
Maturational status: male UID-176 (1-6 years)
As an immature male UID-176 was observed in mid- to late-August associating with
numerous immature and mature whales over a period ranging from a yearling to three years
old, and was involved in non-agonistic social behaviour pods. At the age of five and six, male
UID-176 was resighted in three competitive groups and one non-agonistic social behaviour
pod (Table 5.13).
Maturational status: male UID-176 (7+ years)
As a seven and eight year old, UID-176 returned to Hervey Bay in late September
predominantly in pods with calves present and was only resighted in two competitive groups
as a secondary escort. He displayed no aggressive behaviour towards the presence of
immature escorts in mother-calf pods. He was heard singing as an eight year old.
In 2005 as a nine year old, UID-176 was resighted in Hervey Bay in mid-August and was
observed on two occasions in the company of the same mature female in non-agonistic social
behaviour pods. As a ten and eleven year old, he was again observed in the bay in mid-
September in pods with a calf present. In the last observation of UID-176 as an eleven-year
old in 2007, he was observed escorting the same known mother UID-422 with a new calf, that
he had been an escort to as an eight year old in 2004 (Table 5.13).

163
Tabl
e 5.
14. T
imin
g an
d ch
ange
s of
mat
urat
iona
l and
repr
oduc
tive
stat
us o
f kno
wn-
age
fem
ales
: obs
erva
tion
num
ber (
Obs
), da
te o
f sig
htin
g, a
ge, n
umbe
r of p
ods,
pod
siz
e, n
umbe
r of c
alve
s
pres
ent,
num
ber o
f kno
wn
fem
ales
pre
sent
, beh
avio
r in
pod,
pod
com
posi
tion
and
note
s, w
ith ti
mes
in b
rack
ets.
Obs
D
ate
Age
P
ods
Siz
e C
alve
s Fe
mal
es
Beh
avio
r1 P
od c
ompo
sitio
n an
d no
tes
(tim
e)
Kno
wn
age
fem
ale
(Uni
vers
al-ID
: 119
3. M
nem
onic
nam
e: 'H
odda
', fro
m c
alf t
o se
ven
year
old
) 1
9-O
ct-0
2 C
alf
1 2
1 1
Oth
er
Alo
ne w
ith m
othe
r (11
30).!
2 9-
Oct
-02
Cal
f 1
2 1
1 O
ther
A
lone
with
mot
her (
1308
).!3
10-O
ct-0
2 C
alf
1 2
1 1
Oth
er
Alo
ne w
ith m
othe
r (15
44).!
4 15
-Oct
-02
Cal
f 1
3 1
1 O
ther
C
alf a
nd m
othe
r with
esc
ort (
0916
).!5
16-O
ct-0
2 C
alf
1 2
1 1
Oth
er
Alo
ne w
ith m
othe
r (10
58).!
6 27
-Aug
-03
Yea
rling
1
3 0
1 O
ther
W
ith tw
o m
atur
e w
hale
s.!
7 9-
Aug
-04
Two
2 5
0 1
Non
-ago
nist
ic s
ocia
l W
ith a
yea
rling
and
a m
atur
e w
hale
, the
n as
soci
ated
with
tw
o m
atur
es. !
8 23
-Aug
-06
Four
3
4 0
1 O
ther
In
a p
air w
ith a
n im
mat
ure,
whi
ch d
isas
soci
ated
. The
n a
sing
er/jo
iner
pai
r ass
ocia
ted.
!9
26-A
ug-0
8 S
ix
2 11
0
2 N
on-a
goni
stic
soc
ial
In a
pod
of f
our w
ith tw
o m
atur
es a
nd o
ne im
mat
ure
(080
5),
whi
ch a
ssoc
iate
d w
ith a
pod
of s
even
mat
ures
(081
8). !
10
26-A
ug-0
8 S
ix
1 5
0 1
Oth
er
In a
pod
of f
ive
with
four
mat
ures
(113
4).!
11
26-A
ug-0
8 S
ix
1 11
0
1 N
on-a
goni
stic
soc
ial
In a
pod
of e
leve
n m
atur
es (1
409)
.!12
27
-Aug
-08
Six
2
5 0
1 O
ther
In
a p
od o
f thr
ee w
ith o
ne m
atur
e an
d on
e im
mat
ure,
whi
ch
asso
ciat
ed w
ith a
pai
r of i
mm
atur
es (1
308)
. !K
now
n ag
e fe
mal
e (U
nive
rsal
-ID: 1
100.
Mne
mon
ic n
ame:
'Klin
a', f
rom
yea
rling
to s
even
yea
r old
) 1
3-S
ep-0
2 Y
earli
ng
2 3
0 1
Non
-ago
nist
ic s
ocia
l In
itial
ly a
sin
glet
on (0
757)
pec
tora
l sla
ppin
g an
d ro
lling
ove
r be
lly u
p, th
en a
ssoc
iate
d w
ith a
mat
ure
pair.
2
3-S
ep-0
2 Y
earli
ng
1 2
0 1
Non
-ago
nist
ic s
ocia
l In
pai
r with
a m
atur
e w
hale
(102
2).
3 3-
Sep
-02
Yea
rling
1
5 0
1 N
on-a
goni
stic
soc
ial
With
ano
ther
imm
atur
e an
d tw
o m
atur
es (1
150)
. 4
10-A
ug-0
3 Tw
o 1
3 0
2 N
on-a
goni
stic
soc
ial
With
two
mat
ures
(135
5) o
ne w
as a
kno
wn
mat
ure
fem
ale
obse
rved
with
cal
f in
2004
.
5 11
-Aug
-03
Two
1 4
0 2
Non
-ago
nist
ic s
ocia
l W
ith o
ne m
atur
e fe
mal
e an
d tw
o im
mat
ures
(073
0).
6 27
-Aug
-04
Thre
e 1
5 0
1 N
on-a
goni
stic
soc
ial
With
four
mat
ures
(081
5) u
nkno
wn
gend
er.
7 25
-Sep
-06
Five
2
3 1
1 O
ther
In
itial
ly a
lone
with
her
cal
f (10
32) a
yea
rling
ass
ocia
ted,
then
la
ter r
epul
sed
afte
r per
form
ing
a st
rong
sid
e-lo
btai
l nea
r the
ca
lf.
8 26
-Sep
-08
Sev
en
1 2
1 1
Oth
er
Alo
ne w
ith h
er c
alf (
0651
). 9
26-S
ep-0
8 S
even
2
4 2
2 O
ther
A
ssoc
iate
d w
ith a
noth
er m
othe
r and
cal
f.
1 S
ee C
hapt
er 4
for r
epor
t on
soci
al b
ehav
ior i
n H
erve
y B
ay

164
Maturational status: female UID-1193 (Calf)
The female UID-1193 was resighted in October on five occasions as a calf. On four of these
resightings she was alone with her mother and on one resighting a single escort was present
(Table 5.14).
Maturational status: female UID-1193 (1-6 years)
As a yearling to two year old, UID-1193 was resighted on two occasions during August
associating with immature and mature whales and involved in one non-agonistic social
behaviour pod. From the age of four to six years, UID-1193 was resighted on five occasions
in late August, associating with mature whales.
Maturational and reproductive status: female UID-1100 (1-6 years & 7+ years)
Female UID 1100 as a yearling to three year old was resighted on six occasions from early
August to early September associating with immature and mature whales in non-agonistic
social behaviour pods (Table 5.14). However, at the age of five years old UID-1100 was
resighted in late September initially alone with a new calf and then with a yearling escort,
which she later repulsed. Finally as a seven-year old UID-1100, was resighted once again
with a new calf. She was initially alone with her calf and later associated with another
mother-calf pair (Table 5.14).
5.5 DISCUSSION
5.5.1 Temporal segregation: a stable inherent feature of migrating humpback whales
In this study using individually identified live whales temporal segregation in Hervey Bay
was found to be consistent with the temporal segregation pattern reported by Dawbin (1996,
1997) utilising whaling data. Non-lactating females, either resting or newly pregnant, were

165
first to arrive accompanied by immature males and females. Mature males followed about 10
days later preceding the arrival of mature lactating females by about 6 days. The interval in
Hervey Bay, between non-lactating females leading the migration and lactating females at the
end of the migration was 32.2 days (Table 5.7 above). Dawbin (1966, 1997) reported that,
except for females who changed their timing in the migration related to their reproductive
status, there were no significant differences in the timing and temporal segregation of the
different sex, age, reproductive and maturational classes in each of the breeding areas and at
the localities in his study, based on samples from the early 1930s to the early 1960s. On the
southbound migration Dawbin (1966, 1997) reported that the first class of humpback whales
to travel south were resting and newly pregnant females together with immature males and
females, who preceded mature males by about 10 days. Mothers with calves followed these
classes 6 days later and the interval between the passage of non-lactating females and
lactating females was hypothesised to be approximately one month.
The southbound data on temporal segregation presented in Dawbin (1966, Fig 4, p.158)
involved a very small and biased sample (1,881 whales) compared to the northbound data
(22,275 whales) (Fig. 5.5.1.1). Dawbin reported that the southbound data were difficult to
interpret, because there were no southward whaling data from Cook Strait; that eastern
Australian whaling operations had already filled their quotas and ceased operations before the
beginning of the southward migration; and that there were a lack of data on the direction of
travel of overlapping late northward and early southward migrating whales. Dawbin also
reported from the uncorrected catch data, that during the southward migration mixed females
occur first, followed by immature whales, mature males and females in early lactation 3, 13,
and 19 days later respectively (Fig. 5.5.1.1), and suggested for the above reasons that these
intervals should be increased. Furthermore, Dawbin (1966) hypothesised that “If the true
interval before the arrival of immature whales is of the same order as for the northbound

166
whales (twelve days), then there is close agreement between the timing southward and the
timing northward, and the interval between the passage of mixed and pregnant females and
that of lactating females is approximately one month.” The evidence presented from the
sample analysed in this study (361 whales, Table 5 and 6) confirms Dawbin’s hypothesis that
the interval between the southbound categories of mature mixed females and lactating females
is approximately one month (Figure 5.5.1.1).
Figure 5.5.1.1 Temporal segregation of specified categories of humpback whales from
Dawbin (1966, Fig 4, p 158) and Franklin (Table 5.5 and 5.6 above). Migration from tropical
waters (left) and from Antarctic waters (right) by days after passage of earliest migrating
humpback whales, showing mean value for each category.
In 1963, when the IWC declared complete protection for Southern Ocean humpback whales,
it was estimated that there may have been fewer than 100 survivors in the eastern Australian
population (Paterson et al. 1994). During the thirty years from 1962 to 1992, the eastern
167
Australian humpback whale population was estimated to have increased to only 1,900 whales
(95% CI, 1,650-2,150, Paterson et al. 1994). By 2005 the population was estimated to have
increased to just over 7,000 humpback whales (Noad et al. 2006, Paton et al. 2011). Using a
growth rate of 10.6% per annum (Noad et al. 2006), it is estimated that by 2009 the eastern
Australian humpback whale population may have increased to approximately 10,500
humpback whales. Thus, following a period of intensive and rapid depletion during the 1930s
to the 1960s and after approximately forty-seven years of partial recovery, the population
continues to exhibit the migratory temporal segregation intervals as reported by Dawbin.
Consequently, the timing and segregation of the age, sex, reproductive and maturational
classes of humpback whales during the annual migrations may result from underlying
evolutionary pressures and are likely to be an inherent and constant feature of the social
organisation of humpback whales.
5.5.2 Reproductive status of mature females changes early in the southern migration
In this study observations of mature non-lactating females in Hervey Bay predominantly
occurred during August, with fewer observations in September and very few in early October
(Table 5.5 and Fig. 5.1e). The peak density of this class occurred in late August (day within
season 25.6, Table 5.6). Long-term adjacent year resightings of known individual females
revealed that there were some newly pregnant and resting females among the mature non-
lactating females (Table 5.4). Consequently a proportion of the previously northbound late-
lactating females changed reproductive status, becoming the newly pregnant and resting
females among the mature non-lactating females at the vanguard of the southern migration
Dawbin (1997) had difficulty determining the timing and reproductive status (resting or newly
pregnant) of mature females early in the southern migration because of sampling limitations.
He reported that most of the Southern Hemisphere shore-based commercial whaling was

168
concentrated on northbound whales, also that it was difficult to distinguish between
northbound and southbound females during the cross-over period in August and that detection
of early small foetuses was hindered by the brief examination time available at many shore
stations.
Craig et al. (2003) questioned the classification of resting females in Dawbin (1997) and
suggested that many of the mature females classified as ‘resting’ were likely to be newly
pregnant females. Chittleborough (1954) and Nishiwaki (1959) considered ‘resting’ to be a
temporary condition preceding ovulation. Chittleborough (1954) further reported that during
June on the northern migration off western Australia, 70% of mature females with ovaries in a
resting state were in the late stages of lactation, and by mid-July the proportion of resting
females ready to ovulate reached a maximum, with a secondary increase in early August.
5.5.3 Immature males and females travel in the company of mature non-lactating females
In this study, immature males and females observed from 1 to 6 years old were predominantly
observed during August, with fewer observed during September and very few observed in
early October (Figure 5.1g) with the peak density occurring in late August (day within season
25.6, Table 5.6). There were no significant differences in the mean day of observations within
season (peak density) of immature males and females compared to mature non-lactating
females (Tables 5.6 and 5.7; Fig. 5.1e and 5.1g).
Franklin et al. (2011) reported significant differences in pod characteristics during August in
Hervey Bay compared to later in the season. Pairs were the predominant pod size early in the
season with the highest proportion of singletons occurring throughout August. There was a
significantly higher rate of pod associations during August in Hervey Bay, with significantly
more non-agonistic social behaviour occurring throughout August compared with later in the

169
season (see Chapter 4 above). Pods with calves present were rarely sighted during August and
both the pod characteristics and behaviour of humpback whales in Hervey Bay were
consistent with the presence of immature males and females early in August and mature males
and females in late August (Franklin et al. 2011, Chapter 4 above). The data presented in this
study suggests that immature males and females while migrating through Hervey Bay are
embedded among a phalanx of mature non-lactating females, which is clearly illustrated in the
resighting histories of a known age male and two known age females presented in Tables 5.13
and 5.14 above. These immature whales are interacting not only with immature male and
female whales but are also interacting with mature non-lactating females during their
concurrent passage through Hervey Bay mainly in August and some in early September (Fig.
5.1 and Table 5.7).
5.5.4 Migratory timing of known-age individuals varies with changes in maturational and
reproductive status
Male and female humpback whales may reach sexual and social maturity as early as five
years (Clapham 1992), although a recent study suggests it could be ten or more years in some
populations (Gabriele et al. 2007, Best 2011). The reproductive success of long-lived
mammals normally occurs over many breeding seasons and therefore individual male
humpback whales may behave to maximise their reproductive success over their lifetime
(Clapham 1996, Boness et al. 2002). Clapham (1992) suggested that many male humpback
whales may not be able to reproduce until they are large enough or experienced enough to
successfully compete with other males.
The social interactions and timing of observations of male UID-176 (Table 5.13) are
consistent with the temporal segregation of maturational and reproductive classes reported by

170
Dawbin (1997) and with the results presented in this study. As a calf, (UID-176) was
resighted in Hervey Bay over a period of sixteen days, from mid-September until the
beginning of October. From a yearling to six year old he was observed in the bay during
August among and interacting with immature and mature whales, and as a seven, eight, ten
and eleven year old he was observed in the bay in September among and interacting with
lactating females. As a nine year old he was present in the bay in mid-August with a mature
female. Up to the age of eleven years there was no evidence of male UID-176 participating in
competitive groups as a primary escort or as a challenging escort. The resighting history of
male UID-176 (Table 5.13) is consistent with Clapham’s (1992) suggestion that male
humpback whales require time and experience before successfully competing with other
mature males.
The resighting histories of females UID-1193 and UID-1100 are also consistent with the
timing and segregation of classes presented in this study (Fig. 5.1). As a calf female UID-
1193 was resighted in Hervey Bay over a period of eight days from the 9th to the 16th of
October among lactating females. On four of the five resightings in October, she was alone
with her mother. From a yearling to a six year old she was resighted in Hervey Bay on seven
occasions during August interacting with immature and mature whales predominantly in
larger non-agonistic social behaviour pods (Table 5.14)
As a yearling to a three-year old female UID-1100 was also observed in Hervey Bay among
and interacting with immature and mature whales in August, and was predominantly involved
in larger non-agonistic social behaviour pods. In contrast to UID-1193, at the age of five and
seven years UID-1100 was observed with a new calf in each year, among and associating with
lactating females in late-September (Table 5.13). The transition of UID-1100 from an
immature to a mature lactating female is consistent with the timing and segregation of
lactating females entering Hervey Bay during September and October.

171
5.5.5 Migratory timing of mature males allows for the changes in the reproductive status
of mature females
In this study there were very few observations of known mature males during August with the
main concentrations of mature males occurring in September and October. The peak density
of known mature males not with lactating females was in mid-September (day within season
51.1, Table 5.6 and Fig. 5.1a) and the peak density of the same known mature males with
lactating females was in late-September (day within season 56.7, Table 5.6 and Fig. 5.1b).
Dawbin (1997) reported that mature males commence their northern migration an average of
20 days after the late-lactating females with weaning calves, followed by the mature resting
females three days later, with the late-pregnant females being the last to leave on average 32
days after the late-lactating females and 11 days after the mature males. Chittleborough
(1954, 1958) reported that the ovulatory period for mature female humpback whales ranged
from June to November. He noted that the maximum frequency of ovulations occurred in late
July with considerable numbers of ovulations in August and September and that by the peak
period of ovulations in late July and August most calves from the previous season would have
been weaned. Chittleborough (1955a) also reported that spermatogenesis in mature male
humpback whales peaks in late-July and August, with lower rates in September coinciding
with the ovulatory cycle of mature female humpback whales. It would appear that the
migratory timing of the mature males leaves enough time for the late-lactating females to
complete the weaning of their last season’s calves and allows for the change in reproductive
status of those females as they approach the breeding grounds in late July. Thus, the mature
males would be well positioned for mating opportunities in the breeding grounds north of
Hervey Bay, prior to the arrival of the mature non-lactating resting females. The data
presented in this study suggest that most mature males are likely to be located further north in
the breeding grounds during August and gradually move south, with some moving through

172
Hervey Bay, following the non-lactating mature females in late August and early September,
and with their peak density being slightly ahead of the lactating females.
As reported in Chapter 4 above, in Hervey Bay there was a low probability of observing
competitive groups during the first two weeks of August; the rate with which such groups
were observed increased during the last two weeks of August and the first week of September.
However, there was a high probability of observing competitive groups during the rest of
September through to mid-October. Consistent with those results, in this study there were
very few observations of mature males during August with the main concentrations of mature
males occurring in September and October.
In this study, lactating females were observed in Hervey Bay from day 13 (mid-August) to
day 80 (mid-October) within season, with peak density occurring at day 57.8 (late-September)
within season (Table 5.6). Whilst the peak densities in Hervey Bay of lactating and non-
lactating females are separated by on average 32.2 days, there is a clear overlap of these two
classes during September (Figure 5.1d and e). Parturition in humpback whales occurs from
June to November with the peak birthing month being August (Chittleborough 1954, 1965).
Franklin et al. (2011) reported that lactating females begin arriving in Hervey Bay by late
August and the proportion of pods with a calf present escalates steeply from late August
(3.6%) through to mid-October (92.8%). In Hervey Bay lactating females spend an average of
69.4% of their time alone with their calves (Franklin et al. 2011) and when they do associate
with other whales they are significantly more likely to associate with other mother-calf pods
(see Chapter 4 above). Although the primary focus of lactating females is maternal care in
Hervey Bay, the attraction for mature males in Hervey Bay is the possibility of mating
opportunities with post-partum estrous lactating females.

173
In this study, mature males observed for ten or more days were resighted over longer intervals
than mature females and the longest interval between sightings was almost twice that of
mature females. Burns et al. (in press), reported that mature males during the southern
migration off Ballina, northern NSW were resighted over longer intervals than females and
suggested that some males may circle northward to maximise mating opportunities. The
longer intervals between resightings of mature males may indicate that some mature males
circle northwards from and to Hervey Bay in search of estrous females.
There are very few mature males in Hervey Bay during August when some mature non-
lactating females are present. The main concentrations of mature males coincides with the
presence of mature non-lactating females in September but more so with the lactating females
in September and October. In this study, utilising long-term adjacent year resightings of
known individual females there were 36 lactating females involved in 50 post-partum estrous
pregnancies, i.e. they had calves two years in a row (Table 5.4). Although mature males
remain concurrent with the lactating females they leave the bay ahead of the last lactating
females in the final week of the season.
5.5.6 Hervey Bay: a preferential stopover for females early in the southern migration?
Based on the selected sample of 361 individual resighting histories (262 females and 89
males), this study reports a ratio of 2.94:1 sex-identified or inferred females to males. The
constant annual effort of observation and photography during this study, which involved no a
priori selection of individuals or pods, coupled with the data on mean residency times,
suggest that the reported ratio of sex-identified or inferred females to males is indicative of a
real female sex-bias in Hervey Bay. The male-biased sex ratio reported in breeding grounds
(reviewed by Herman et al. (2011)) and the male-biased sex ratio in the migratory corridor off
eastern Australia (Brown et al. 1995) may be indicative of greater mating opportunities for

174
males in the eastern Australian breeding grounds to the north of Hervey Bay and along the
main southerly migratory corridor, compared with habitats in Hervey Bay.
Heterogeneity of capture probabilities of different reproductive and maturational classes of
humpback whales, particularly females with calves and mature males, may result in some
unintentional sampling biases. As well, the decreasing residency in Hervey Bay over years
may reflect decreasing capture probabilities as the population recovers. Therefore, further
studies of heterogeneity of capture probabilities of selected maturational and reproductive
classes of humpback whales is needed in order to identify and quantify any potential sampling
biases and likely error rates.
Adult humpback whales may use deeper water to facilitate breeding behaviour, whereas
females with calves use shallower water to avoid harassment from sexually active males who
may cause injury to calves (Smultea 1994, Ersts and Rosenbaum 2003). The diving depths of
individuals in competitive groups are reported to range between 10 m to 298 m (Herman et al.
2008) and Hervey Bay is on average less than 18 m deep (Vang 2002). Hervey Bay is a
stopover early in the southern migration, with low levels of competitive behaviour (6.3% of
pods, see Chapter 4 above) and only 10.8% of pods had escorts present (Franklin et al. 2011).
Therefore, Hervey Bay provides mothers with older calves a suitable sheltered and convenient
habitat for maternal care in the early stages of the southern migration (Franklin et al. 2011).
In this study few known mature males were observed in August, and immature males and
females together with mature females were observed early in the season with peak density
occurring in late August (Fig. 5.1a, e and g). In contrast, mothers with calves, who spend
69.4% of the time alone with their calves in Hervey Bay, dominated the last six-weeks of the
season (Franklin et al. 2011). Consequently, the ratio of sex-identified or inferred females to
males reported in this study indicates that Hervey Bay is a preferential habitat selected by
southbound non-lactating females accompanying both immature males and females early in

175
the season, and by lactating females with older calves later in the season. These results
suggest that there are subtle but ecologically significant differential migration patterns and
routes of females, a higher proportion of which enter Hervey Bay, compared to the majority
of males that remain along the coastline migratory corridor during this stage of the migration
off eastern Australia.
5.5.7 Temporal segregation provides a predictable social framework as individuals move
through different maturational and reproductive stages
Boness et al. (2002) suggested that the yearlong period of gestation and the high rate of foetal
growth in mysticetes together with highly seasonal breeding may result from the need for
reproductive timing to coincide with annual patterns of prey availability. Alternatively,
predator avoidance in high latitudes has been hypothesised as a factor influencing winter
migrations to low-latitude breeding grounds (Corkeron and Connor 1999). However, in
response to this hypothesis, Clapham (2001) speculated that for “humpback whale calves,
energy conserved in low-latitude warm waters during the first months of life...may translate
into larger size in adulthood and may in turn result in higher reproductive success.” Dawbin
(1956, 1966) examined the factors influencing migratory timing and pathways of humpback
whales in the Southern Ocean and concluded that the primary factors were feeding behaviour
in Antarctica and breeding behaviour in temperate tropical coastal waters.
There is general agreement that beyond the mother-calf association, which lasts for 11 to 12
months, the social organisation of humpback whales is characterised by small unstable
groups, involving brief associations lasting for periods of a few hours or less, with some
associations lasting over several days or (rarely) over longer periods (Herman and Antinoja
1977, Tyack and Whitehead 1983, Baker and Herman 1984a, Mobley and Herman 1985,

176
Mattila et al. 1994, Clapham 2000). Valsecchi et al. (2002) reported that with the exception of
the mother-calf relationship, there was an absence of kin-relatedness within small groups of
humpback whales. They suggested that if any social organisation does exist in the humpback
whale population it is formed transiently when needed, rather than being a constant feature of
the population.
Several genetic and photo-identification studies have documented evidence of maternally
directed fidelity to migratory destinations (Martin et al. 1984, Clapham and Mayo 1987,
Baker et al. 1990, Katona and Beard 1990, Clapham et al. 1993, Palsboll et al. 1997). Ersts
and Rosenbaum (2003) suggested that patterns of habitat preference on wintering grounds,
particularly those of mothers with calves appear to be guided by social organisation.
The coherent annual structure of temporally segregated maturational and reproductive classes
of humpback whales is consistent with maternally directed fidelity to winter breeding grounds
and summer feeding areas. The mature non-lactating females are at the vanguard and the
mature lactating females at the rearguard of the southern migration, while in contrast on the
northern migration, the late-lactating females with weaning calves lead the migration and the
pregnant females are the last to leave the Antarctic feeding areas (Dawbin 1997). Moreover
the peak densities of non-lactating females and lactating females are separated by 32 days
during both the southern migration from the breeding grounds and northern migration from
the feeding areas. It is interesting to note that the immature males and females follow closely
behind the mature females at the vanguard of both the southern and northern migrations.
Mothers returning with weaning calves on the northern migration lead their yearlings to the
opposite end of the migration and leave them with the immature cohort in the early part of the
southern migration. Similarly, mature males fit in with the migratory timing and reproductive
status of mature females and also remain in the same position in both the southern and
northern migration.

177
Clutton-Brock (1989) reported that several studies of species where non-breeding adults or
sub-adults assist in rearing the young show that the survival of juveniles increases in relation
to the number of adults that help to rear them. Furthermore, he suggested that the reasons for
female clumping in mammals such as ungulates and other groups may be totally unrelated to
reproduction and pointed out that the benefits of clumping may include information exchange,
efficiency by observational learning or cultural transmission of learned habits. The use of
long-term resighting histories of known individuals in this study revealed the timing and
behaviour of the different age, sex, reproduction and maturational classes across the season in
Hervey Bay. In particular the data suggest that known immature males and females were
accompanied by and interacted with known non-lactating mature females from early to mid-
season (see resighting histories in Table 5.13 and 5.14, and Fig. 5.1e and g). It is reported in
Chapter 4 above, that whilst lactating females were primarily involved in maternal activities
alone with their calves, when they did socialise they were significantly more likely to interact
with other mother-calf pods. This study confirms that temporal segregation and behaviour by
age, sex and reproductive classes during the annual migrations is a constant inherent feature
of the social organisation of humpback whales and also shows that the social interactions of
singletons and unstable groups occurred within the broader context of a stable predictable and
orderly migratory procession.

178
5.6 LITERATURE CITED
Abdi, H (2007). "Bonferroni and Šidák corrections for multiple comparisons". In N.J. Salkind
(ed.). Encyclopedia of Measurement and Statistics. Thousand Oaks, CA: Sage.
Altmann, J. 1974. Observational study of behavior: Sampling methods. Behaviour 49: 227-
267.
Baker, C. S. and L. M. Herman. 1984a. Seasonal contrasts in the social behavior of humpback
whales. Cetus 5.
Baker, C. S. and L. M. Herman. 1984b. Aggressive behaviour between humpback whales
(Megaptera novaeangliae) wintering in Hawaiian waters. Canadian Journal of
Zoology 62: 1922-1937.
Baker, C. S., S. R. Palumbi, R. H. Lambertsen, M. T. Weinrich, J. Calambokidis and S. J. O
Brien. 1990. Influence of Seasonal Migration on Geographic Distribution of
Mitochondrial DNA Haplotypes in Humpback Whales. Nature 344: 238-240.
Best, P. B. 2006. A note on the age at sexual maturity of humpback whales. Paper
SC/A06/HW5 submitted to the International Whaling Commission workshop on the
comprehensive assessment of southern hemisphere humpback whales, Tasmania, 4-7
April 2006. 6 pp.
Best, P.B. (2011) A note on the age at sexual maturity of humpback whales. Journal of
cetacean Research and Management (Special Issue 3), 71-73.
Boness, D. J., P. J. Clapham and S. L. Mesnick. 2002. Life history and reproductive
strategies. Marine Mammal Biology: An Evolutionary Approach. Pages: 278-324.
Brown, M. and P. Corkeron. 1995. Pod characteristics of migrating humpback whales
(Megaptera novaeangliae) off the east Australian coast. Behaviour 132: 163-179.
Brown, M. R., P. J. Corkeron, P. T. Hale, K. W. Schultz and M. M. Bryden. 1995. Evidence
for a sex-segregated migration in the humpback whale (Megaptera novaeangliae).

179
Proceedings of the Royal Society of London - Series B: Biological Sciences 259: 229-
234.
Browne, W.J. 2012. MCMC Estimation in MLwiN, v2.25. Centre for Multilevel Modelling,
University of Bristol
Burns, D. 2010. Population characteristics and migratory movements of humpback whales
(Megaptera novaeangliae) identified on their southern migration past Ballina, eastern
Australia. Southern Cross University. PhD Thesis: pp 265.
Burns, D., Brooks, L., Harrison, P., Franklin, T., Franklin, W., Paton, D. and Clapham, P. (in
press) Migratory movements of individual humpback whales photographed off the
eastern coast of Australia. Marine Mammal Science.
Chaloupka, M. and M. Osmond. 1999. Spatial and Seasonal Distribution of Humpback
Whales in the Great Barrier Reef Region. Life in the Slow Lane: Ecology and
Conservation of Long-Lived Marine Animals Edited by John A. Musick. American
Fisheries Society Symposium 23: 89–106.
Chaloupka, M., M. Osmond and G. Kaufman. 1999. Estimating seasonal abundance trends
and survival probabilities of humpback whales in Hervey Bay (east coast Australia).
Marine Ecology Progress Series 184: 291-301.
Chittleborough, R. G. 1954. Studies on the Ovaries of the Humpback Whale, Megaptera
nodosa (Bonnaterre), on the Western Australian coast. Australian Journal of Marine
and Freshwater Research 5: 35-63.
Chittleborough, R. G. 1955a. Aspects of reproduction in the Male Humpback whale,
Megaptera nodosa (Bonnaterre). Australian Journal of Marine and Freshwater
Research 6: 1-29.
Chittleborough, R. G. 1955b. Puberty, Physical Maturity, and relative growth of the female
Humpback whale, Megaptera nodosa (Bonnaterre), on the Western Australian Coast.
Australian Journal of Marine and Freshwater Research: 315-327.

180
Chittleborough, R. G. 1958. Breeding cycle of the female humpback whale, Megaptera
nodosa. Australian Journal of Marine and Freshwater Research: 219-226.
Chittleborough, R. G. 1965. Dynamics of two populations of the humpback whale, Megaptera
novaeangliae (Borowski). Australian Journal of Marine and Freshwater Research 16:
33-128.
Chu, K. and S. Nieukirk. 1988. Dorsal fin scars as indicators of age, sex, and social status in
humpback whales (Megaptera novaeangliae). Canadian Journal of Zoology 66: 416-
420.
Clapham, P. J. 1992. Age at attainment of sexual maturity in humpback whales. Canadian
Journal of Zoology 70: 1470-1472.
Clapham, P. J. 1996. The social and reproductive biology of humpback whales - an ecological
perspective. Mammal Review 26: 27-49.
Clapham, P. J. 2000. The humpback whale - Seasonal feeding and breeding in a baleen whale.
Pages 173-196 in Cetacean Societies: Field Studies Of Dolphins And Whales.
Clapham, P. 2001. Why do baleen whales migrate? A response to Corkeron and Connor.
Marine Mammal Science 17: 432-436.
Clapham, P. J., L. S. Baraff, C. A. Carlson, M. A. Christian, D. K. Mattila, C. A. Mayo, M. A.
Murphy and S. Pittman. 1993. Seasonal occurrence and annual return of humpback
whales, Megaptera novaeangliae, in the Southern Gulf of Maine. Canadian Journal of
Zoology 71: 440-443.
Clapham, P. J., P. J. Palsboll, D. K. Mattila and V. Oswaldo. 1992. Composition and
dynamics of humpback whale competitive groups in the West Indies. Behaviour 122:
182-194.
Clapham, P. J. and C. A. Mayo. 1987. Reproduction and recruitment of individually identified
humpback whales, Megaptera novaeangliae, observed in Massachusetts Bay 1979-
181
1985. Canadian Journal of Zoology 65: 2853-2863.
Clapham, P., Y. Mikhalev, W. Franklin, D. Paton, S. Baker, Y. V. Ivashchenko and R. L. J.
Brownell. 2009. Catches of Humpback Whales by the Soviet Union and Other Nations
in the Southern Ocean, 1947-1973. Marine Fisheries Review 71: 39-43.
Clapham, P. J., S. E. Wetmore, T. D. Smith and J. G. Mead. 1999. Length at birth and at
independence in humpback whales. Journal of Cetacean Research and Management:
141-146.
Clutton-Brock, T. H. 1989. Mammalian mating systems. Proceedings of the Royal Society of
London B: 339-372.
Corkeron, P. J., M. Brown, R. W. Slade and M. M. Bryden. 1994. Humpback Whales,
Megaptera novaeangliae (Cetacea: Balaenopteridae), in Hervey Bay, Queensland.
Wildlife Research 21: 293-305.
Corkeron, P. J. and R. C. Connor. 1999. Why do baleen whales migrate? Marine Mammal
Science 15: 1228-1245.
Craig, A. S., L. M. Herman, C. M. Gabriele and A. A. Pack. 2003. Migratory Timing of
Humpback Whales (Megaptera novaeangliae) in the Central North Pacific Varies with
Age, Sex and Reproductive Status. Behaviour 140: 981-1001.
Dawbin, W. H. 1956. The migrations of humpback whales which pass the New Zealand coast.
Transactions of the Royal Society of New Zealand 84: 147-196.
Dawbin, W. H. 1966. The seasonal migratory cycle of humpback whales. Pages 145-170 in K.
S. NORRIS ed. Whales, Dolphins and Porpoises. University of California Press,
Berkeley, California.
Dawbin, W. H. 1997. Temporal segregation of humpback whales during migration in
southern hemisphere waters. Memoirs of the Queensland Museum 42: 105-138.
Ersts, P. J. and H. C. Rosenbaum. 2003. Habitat preference reflects social organization of

182
humpback whales (Megaptera novaeangliae) on a wintering ground. Journal of
Zoology 260: 337-345.
Franklin, T., W. Franklin, L. Brooks, P. Harrison, P. Baverstock and P. Clapham. 2011.
Seasonal changes in pod characteristics of eastern Australian humpback whales
(Megaptera novaeangliae), Hervey Bay 1992-2005. Marine Mammal Science, 27(3):
E134–E152 (July 2011) ©2010 by the Society for Marine Mammalogy. DOI:
10.1111/j.1748-7692.2010.00430.x.
Gabriele, C. M., J. M. Straley and J. L. Neilsen. 2007. Age at first calving of female
humpback whales in Southeastern Alaska. Pages 159-162 in J. F. Piatt And S. M.
Gende Eds. Proceedings of the Fourth Glacier Bay Science Symposium, October 26–
28, 2004: U.S. Geological Survey Scientific Investigations. Proceedings of the Fourth
Glacier Bay Science Symposium.
Glockner, D. 1983. Determining the sex of humpback whales (Megaptera novaeangliae) in
their natural environment. Pages 447-464 in R. Payne ed. Communication and
behaviour of whales. Westview Press Inc, Boulder, Colorado.
Glockner, D. A. and S. C. Venus. 1983. Identification, growth rate and behavior of humpback
whale (Megaptera novaeangliae) cows and calves in the waters off Maui, Hawaii,
1977-1979. Pages 223-258 in R. S. Payne Ed. Communication and behavior of
whales. Westview Press, Boulder, CO.
Herman, L. M. and R. C. Antinoja. 1977. Humpback whales in Hawaiian breeding waters:
population and pod characteristics. Scientific Reports of the Whales Research Institute
29: 59-85.
Herman, E. Y. K., L. M. Herman, A. A. Pack, G. Marshall, C. M. Shepard and M. Bakhtiari.
2008. When whales collide: Crittercam offers insights into the competitive behavior of
humpback whales on their Hawaiian wintering grounds. Marine Technology Society

183
Journal 41: 35-43.
Herman, L. M., A. A. Pack, K. Rose, A. Craig, E. Y. K. Herman, S. Hakala and A. Milette.
2011. Resightings of humpback whales in Hawaiian waters over spans of 10–32 years:
Site fidelity, sex ratios, calving rates, female demographics, and the dynamics of
social and behavioral roles of individuals. Marine Mammal Science. 27: 736–768. doi:
710.1111/j.1748-7692.2010.00441.x.
Jackson, J. A., A. Zerbini, P. Clapham, C. Garrigue, N. Hauser, M. Poole and C. S. Baker.
2006. A Bayesian assessment of humpback whales on breeding grounds of Eastern
Australia and Oceania (IWC Stocks E, E1, E2 and F). 17 pp. Paper SC/A06/HW52
presented to the IWC Scientific Committee. International Whaling Commission,
Cambridge, U.K. (Unpublished). [Available from the office of this Journal].
Katona, S. K., B. Baxter, O. Brazier, S. Kraus, J. Perkins and H. Whitehead. 1979.
Identification of Humpback whales by fluke photographs. Pages 33-44 in H. E. Winn
And B. L. Olla eds. Behaviour of marine animals - current perspectives in research.
Plenum Press, New York.
Katona, S. K. and H. P. Whitehead. 1981. Identifying Humpback whales using their natural
markings. Polar Record 20: 439-444.
Katona, S. K. and J. A. Beard. 1990. Population size, migrations and feeding aggregations of
the Humpback whale (Megaptera novaeangliae) in the Western North Atlantic Ocean.
Report of the International Whaling Commission. Special Issue 12: 295-305.
Martin, A. R., S. K. Katona, D. Matilla, D. Hembree and T. D. Waters. 1984. Migration of
humpback whales between the Caribbean and Iceland. Journal of Mammalogy 65:
330-333.
Mattila, D. K., P. J. Clapham, O. Vasquez and R. S. Bowman. 1994. Occurrence, population
composition, and habitat use of humpback whales in samana bay, Dominican

184
Republic. Canadian Journal of Zoology 72: 1898-1907.
Mobley, J. R. and L. M. Herman. 1985. Transience of social affiliations among humpback
whales in Hawaiian breeding waters. Canadian Journal of Zoology 63: 762-772.
Nishiwaki, M. 1959. Humpback whales in Ryukyuan waters. The Scientific Reports of the
Whales Research Institute 14: 49-87.
Noad, M. J., D. H. Cato and D. Paton. 2006. Absolute and relative abundance estimates of
Australian east coast humpback whales (Megaptera novaeangliae). SC/A06/HW27.
Paper submitted to the International Whaling Commission sub- committee for the
assessment of Southern Hemisphere humpback whales, Hobart, April 2006.
Palsbøll, P. J., J. Allen, M. Berube, P. J. Clapham, T. P. Feddersen, P. S. Hammond, R. R.
Hudson, H. Jorgensen, S. Katona, A. H. Larsen, F. Larsen, J. Lien, D. K. Mattila, J.
Sigurjonsson, R. Sears, T. Smith, R. Sponer, P. Stevick and N. Oien. 1997. Genetic
tagging of humpback whales. Nature 388: 767-769.
Paterson, R., P. Paterson and D. H. Cato. 1994. The status of Humpback whales Megaptera
novaeangliae in East Australia thirty years after whaling. Biological Conservation 70:
135-142.
Paterson, R. A. 1991. The migration of Humpback Whales Megaptera novaeangliae in east
Australian waters. Memoirs of the Queensland Museum 30: 333-341.
Paton, D. A., L. Brooks, D. Burns, T. Franklin, W. Franklin, P. Harrison and P. Baverstock.
2011. First abundance estimate of east coast Australian humpback whales (Megaptera
novaeangliae) utilising mark-recapture analysis and multi-point sampling. Journal of
Cetacean Research and Management, (Special Edition) 3:235-259.
Rasbash, Jon., William Browne, Michael Healy, Bruce Cameron and Christopher Charlton.
2012. MLwiN V2.25, Center for Multilevel Modelling, University of Bristol, UK.
Satterthwaite, F. E. 1946, "An Approximate Distribution of Estimates of Variance

185
Components.", Biometrics Bulletin 2: 110–114.
Simmons, M. L. and H. E. Marsh. 1986. Sightings of humpback whales in Great Barrier Reef
waters. Scientific Reports of the Whales Research Institute 37: 31-46.
Smultea, M. A. 1994. Segregation by humpback whale (Megaptera novaeangliae) cows with
a calf in coastal habitat near the island of Hawaii. Canadian Journal of Zoology 72:
805-811.
Stevick, P. T., J. Allen, M. Bérubé, P. J. Clapham, S. K. Katona, F. Larsen, J. Lien, D. K.
Mattila, P. J. Palsbøll, J. Robbins, J. Sigurjónsson, T. D. Smith, N. Øien and P. S.
Hammond. 2003. Segregation of migration by feeding ground origin in North Atlantic
humpback whales (Megaptera novaeangliae). Journal of Zoology, London 259: 231-
237.
Swartz, S. L. 1986. Demography, migrations, and behavior of gray whales Eschrichtius
robustus (Lilljeborg, 1861) in San Ignacio Lagoon, Baja California Sur, Mexico and in
their winter range. Doctor of Philosophy in Biology, University of California, Santa
Cruz.
True, F. W. 1904. The whalebone whales of the western North Atlantic compared with those
occurring in European waters; with some observations on the species of the North
Pacific. Smithsonian Institution Press, Washington, District of Columbia 33: 1-318.
Tyack, P. 1981. Interactions between singing Hawaiian humpback whales and conspecifics
nearby. Behavioural Ecology and Sociobiology. 8: 105-116.
Tyack, P. and H. Whitehead. 1983. Male competition in large groups of wintering humpback
whales. Behaviour 83: 132-154.
Valsecchi, E., P. Hale, P. Corkeron and W. Amos. 2002. Social structure in migrating
humpback whales (Megaptera novaeangliae). Molecular Ecology 11: 507-518.

186
Vang, L. 2002. Distribution, abundance and biology of Group V humpback whales Megaptera
novaeangliae: A review. The State of Queensland Environmental Protection Agency,
Conservation Management Report, August 2

187
Chapter 6
Thesis synthesis, summary of general conclusions
and conservation issues
6.1 GLOBAL RESEARCH CONTEXT
The study of humpback whales prior to the 1970s was largely a by-product of, and focussed
by, commercial whaling and the establishment of the International Whaling Commission
(IWC) in 1946. From the mid-1940s to the mid-1970s commercial whaling was extensively
conducted in the Northern Hemisphere in the North Pacific and in the Southern Hemisphere at
coastal whaling stations in temperate waters and aboard pelagic whaling factory ships in
Antarctic waters (True 1904; Mathews 1937; Mackintosh 1942; Nishiwaki 1959;
Chittleborough 1965; Dawbin and Falla 1949; Dawbin 1956; 1966). Data from these and
other studies yielded extensive information on humpback whale morphology, physiology,
reproduction, diet, distribution and movements (Chittleborough, 1954; 1955a; 1955b; 1958a,
1958b; 1959a; 1959b; Dawbin 1964, 1997; Chapter 1 above).
From the 1970s the emergence worldwide of non-lethal techniques including photo-
identification, genetics, satellite tagging and acoustics stimulated extensive individual and
collaborative studies of the ecology of humpback whales in tropical breeding grounds as well
as in temperate and polar feeding areas. These studies extended scientific knowledge of
humpback whale populations in all ocean basins and the linkages within and between feeding
areas and breeding grounds as well as social behaviour and social organisation (see Chapter
1.4 for a summary of these studies). This research phase culminated in two major ocean-

188
basin-wide studies involving extensive collaborations, which were undertaken in the Northern
Hemisphere: Years of the North Atlantic Humpback Whale (YONAH) (Smith et al. 1999)
and Structure of Populations, Levels of Abundance and Status of Humpback Whales in the
North Pacific; (SPLASH) (Calambokidis et al. 2008). In the Southern Hemisphere the South
Pacific Whale Research Consortium (SPWRC) has coordinated research over the last decade
on humpback whale breeding grounds across the South Pacific and linkages with eastern
Australia and Antarctic feeding grounds (Garrigue et al. 2007, 2011a and b; Franklin et al.
2012.
Studies undertaken during the period of lethal whaling of humpback whales in Australia
provided a foundation for subsequent non-lethal methods of investigation of humpback
whales on both the western and eastern coastlines of Australia. However the data obtained on
individual humpback whales provided only one record of each whale, at the time of its death.
The Australian coastlines provide excellent opportunities for long-term research on humpback
whales throughout much of their annual migration and breeding periods. This context was
noted by Dawbin (1956 p. 190) who made the observation that “The great length of the east
Australian coastline situated in the tropics…provides a much more extended area of coastal
conditions suitable for breeding humpbacks than is available near Pacific Islands…and that
many more humpback whales pass close to this coastline than occur near any of the Pacific
Islands.”
During their annual migration between winter breeding grounds and summer feeding areas
eastern Australian humpback whales traverse the full length of the continental shelf from 120
S (northeastern Queensland, Chaloupka and Osmond 1999) to approximately 430 S (southeast
Tasmania, Gales et al. 2009). South of the putative tropical breeding ground (160 to 230 S),
eastern Australian humpback whales travel offshore past Stradbroke Island, (270 S, Brown
and Corkeron 1995, Noad et al. 2011), Byron Bay and Ballina (290 S, Paton et al. 2011), and

189
Eden (370 S, Gales et al. 2009). It has been noted that humpback whales, after leaving the
putative breeding ground in northeastern Queensland, continue to display social behaviours
along the eastern coastline of Australia (Brown and Corkeron 1995).
During their southern migration some humpback whales divert west of the primary coastal
migratory pathway and enter and leave Hervey Bay from the north (250 S, Paterson 1991,
Franklin et al. 2011, Fig 1.6.1 above). Research conducted in Hervey Bay prior to this study
established that humpback whales aggregate on the eastern side of Hervey Bay during the
southern migration (Corkeron 1993, Corkeron et al. 1994). The research outlined above
provides the context for this present study, which aimed to address the question ‘What is the
social and ecological significance of Hervey Bay for eastern Australian humpback whales?’
To address this question long-term observations and photo-identification of humpback whales
were undertaken involving constant effort across the season during the southern migration
(see Figure 3.1, Chapter 3). The extensive data obtained (see Chapter 2), were used to
investigate pod characteristics and composition (Chapter 3), social behaviour (Chapter 4), and
temporal segregation of reproductive and maturational classes of humpback whales (Chapter
5). These investigations revealed that Hervey Bay is utilised by different maturational and
reproductive classes of humpback whales as the season progresses, that it is a unique stopover
in the early part of the southern migration and that it provides an important habitat for some
eastern Australian humpback whales. The study also provided important insights into the
social behaviour and social organisation of humpback whales in Hervey Bay. These general
conclusions are synthesised in section 6.2 below.

190
6.2 SYNTHESIS AND GENERAL CONCLUSIONS
6.2.1 Hervey Bay as a stopover is different from traditional breeding grounds
Humpback whales migrate annually over long distances between summer feeding areas in
near-polar waters and winter breeding grounds in tropical and near-tropical waters (Baker et
al. 1990, Rasmussen et al. 2007). In the northern hemisphere traditional breeding grounds are
located between 160 and 230.north in the offshore waters near the West Indies and Hawaiian
Islands (Whitehead and Moore 1982, Baker and Herman 1981), while in eastern Australia the
breeding grounds for humpback whales are considered to be between 160 and 230 south
(Smith et al. 2012). Hervey Bay is located at 250, south of the putative breeding grounds and
is an accessible stopover utilised by certain classes of humpback whales early in the southern
migration prior to leaving for feeding areas in Antarctica (Figure 1.6.1, Chapter 3).
The present study shows that there are differences in social behaviour in Hervey Bay
compared to breeding grounds in the Northern Hemisphere (Chapter 4). The proportion of
lone mother-calf pods in Hervey Bay (Table 3.2) was greater than has been reported for other
regions (Hawaii: Mobley and Herman 1985, Herman and Antinoja 1977; West Indies: Mattila
and Clapham 1989, Mattila et al. 1994). One of the major differences between the Hervey
Bay and Hawaiian studies was that the modal size for pods having a calf present was three,
mother-calf and escort (Herman and Antinoja 1977, Herman et al. 1980, Glockner and Venus
1983). By contrast, in Hervey Bay in pods with calves present the modal size was two,
because of the significantly higher proportion of mothers alone with their calf (Table 3.4c).
This difference in pod size and composition may be related to Hawaii being a breeding
destination whereas Hervey Bay is a migratory stopover early in the southern migration for
mothers with older calves (Franklin et al. 2011, Chapter 3 above). It has been suggested that
adult humpback whales may use deeper water to facilitate breeding behaviour, whereas

191
females with calves use shallower water to avoid harassment from sexually active males who
may cause injury to calves (Smultea 1994, Ersts and Rosenbaum 2003). Hervey Bay is on
average less than 18 m deep (Vang 2002) and there were low levels of competitive behaviour
and few escorts recorded (see Chapter 4 and Franklin et al. 2011), hence Hervey Bay is not a
traditional breeding ground.
6.2.2 Seasonal changes in social behaviour
This study shows that the seasonal social behaviour of humpback whales is intimately linked
not only with pod characteristics but also with the seasonal changes of different classes of
whales moving through Hervey Bay on their southern migration (Chapter 3). Data on pod
characteristics demonstrate a significant increase of pods of 3 plus whales over years (Fig.
3.3a), coinciding with a trend of rapidly increasing abundance (Noad et al. 2011, Paton et al.
2011) and partial recovery of the eastern Australian population. Observations by Dawbin
(1956) of humpback whales displaying social behaviour in coastal waters and in semi-tropical
waters prompted him to suggest that humpback whales probably require some period in
coastal waters for breeding behaviour. Dawbin (1956, p. 191) concluded that “an intensive
study of environmental conditions and humpback behaviour in the breeding areas may well
prove to be more productive in furthering an understanding of their migratory movements
than any similar study of humpbacks on passage or in the feeding grounds.”
6.2.3 Timing and social behaviour of classes of humpback whales utilising Hervey Bay
The seasonal pod characteristics and social behaviour of humpback whales in Hervey Bay
show significant differences in the first four weeks of the season compared to the last six
weeks of the season (Chapter 3 and 4). Pairs and singletons were the predominant pod size

192
during the first four weeks, while pods with calves were rarely sighted. Non-agonistic social
behaviour occurred mainly during the first four weeks. Pod characteristics and behaviour in
the first four weeks are related to the presence of immature and mature males and females
involved in social interactions.
Mothers with calves predominated during the last six weeks of the season with the proportion
of pods with a calf present escalating rapidly towards the end of the season (Fig. 3.2b).
Overall, there were low levels of competitive behaviour with the highest frequency of
competitive behaviour occurring towards the end of the season (Fig. 4.2c).
It has been reported that mother and calf pods rarely associate with other mother-calf pods in
winter breeding grounds (Herman and Antinoja 1977, Baker and Herman 1984a, Mobley and
Herman 1985). In contrast in Hervey Bay, although the proportion of pods with more than
one calf present is low, interaction between mother-calf pods does occur. By mid-to-late
season in Hervey Bay, when the calves are more mature and mother-calf bonds are well
established, mothers may be more comfortable mixing with other mother-calf pods. When
mothers were not alone with their calves, they were either accompanied by an escort or
escorts, or were mixing with other females with calves (Table 3.3, 3.4c). However, it would
appear that mothers with calves in Hervey Bay are mainly left alone, which gives them ample
time for maternal activities involving training, nurturing and feeding their calves. In addition,
mothers were often observed resting on the surface of the water with their calves and were
mostly left alone by male humpback whales, and by whale-watching tour operators, that
mainly seek out active pods.

193
6.2.4 Temporal segregation of reproductive and maturational classes
Using long-term and adjacent year resighting histories of individually identified humpback
whales; this study was able to compare the differing reproductive status and timing of mature
non-lactating females throughout the season in Hervey Bay (Chapter 5). Known mature non-
lactating females occurred in August with peak density occurring in late August and fewer in
September and very few in early October. The study data also showed that there was no
significant difference in the peak density and observations by day within season of immature
males and females compared to mature non-lactating females (Table 5.7). Detailed
observations of timing and behaviour of three particular individuals showed that immature
males and females interact with non-lactating, resting or newly pregnant females (Tables 5.13
and 5.14). Known non-lactating females also overlap with lactating females in September,
with peak density occurring in late September, on average thirty-two days later than the
mature non-lactating females (Table 5.7).
Burns (2010) reported the regularity of timing of particular known individual humpback
whales during their migration past Ballina northern NSW over years and raised the question
as to which other individual whales they may be likely to encounter over years. In contrast to
mature females who change their position in the migration sequence according to their
reproductive status, mature males do not change the timing of their occurrence in the
migratory procession (Dawbin 1966, 1997). Therefore there may be a higher probability of
migrating mature males encountering individuals that they have encountered in previous
years.
Few known mature males are observed in August in Hervey Bay, with the main
concentrations in September and October (Fig. 5.1). The peak density of known mature males
when they were not in the company of lactating females occurred in mid-September, a week

194
earlier than the peak density in late September of known mature males observed with lactating
females (Fig. 5.1, Table 5.7).
It is interesting to note that male UID-176 changed his residency timing in Hervey Bay as he
matured, but was resighted with a known mother with calf UID-422 on 26th September 2004
and again with the same mother on 23rd September 2007 (Table 5.13). Therefore, within the
context of the temporal segregation and behaviour of humpback whales, further research and
investigation is needed to provide insight into the question of whether or not there are long-
term repeated associations between known individuals.
6.2.5 Female bias and differential migration of males and females in Hervey Bay
A female-biased sex ratio of 2.94:1 sex-identified or inferred females to males is evident from
the 361 individual resighting histories in this study (Chapter 5). This contrasts strongly, with
the male-biased sex ratio reported in the migratory corridor off eastern Australia (Brown et al.
1995) and the male-biased sex ratio reported in the breeding grounds in Hawaii and other
regions globally (reviewed by Herman et al. 2011). Coupled with the data on mean residency
times (Chapter 5), this strongly suggests that the reported ratio of sex-identified or inferred
females to males in Hervey Bay is a real phenomenon. However, heterogeneity of capture
probabilities of different reproductive and maturational classes of humpback whales,
particularly females with calves and mature males, may result in some unintentional sampling
biases. Furthermore, the decreasing residency in Hervey Bay over years may reflect
decreasing capture probabilities as the population recovers. Therefore, further studies of
heterogeneity of capture probabilities of selected maturational and reproductive classes of
humpback whales are needed in order to identify and quantify any potential sampling biases
and error rates.

195
In their global review of humpback whales, Fleming and Jackson (2011) reported a number of
resting areas and potential resting areas for humpback whales en route to terminal
destinations. Bannister and Hedley (2001) and Jenner et al. (2001) reported that during the
southern migration south from the breeding area in the Kimberley region on the western
Australian coastline, humpback whales use Exmouth Gulf and Shark Bay as resting nursery
regions. Further research is needed in these areas to determine whether differential migratory
routes occur for particular classes of whales, such as mother with calves, immature males and
females, and mature males seeking potential mating opportunities away from the direct
migratory coastlines.
6.2.6 Temporal segregation a consistent and coherent feature of social organisation
The timing and spacing of different reproductive and maturational classes of humpback
whales in Hervey Bay (Chapter 5) is fully consistent with the temporal segregation reported
by Dawbin (1966, 1997). The data suggest that mature non-lactating and lactating females
interact with, and are involved in, the social development of immature and maturing males
and females (Tables 5.13 and 5.14). Hervey Bay provides a safe environment for resting
mothers and calves; it is an area where immature male and female humpback whales can
develop their social skills and potentially learn from and interact with mature females. In
addition, the predictability of females in different maturational and reproductive stages
frequenting the bay throughout the season provides mature males with potential mating
opportunities across the migratory season in Hervey Bay. Burns et al. (in press) suggested that
some males during the southern migration off Ballina northern NSW may circle back to
maximise mating opportunities. The residency data presented in this study, showing that some
males visit Hervey Bay early and subsequently return later in the season (Table 5.12), suggest
that a similar motive may underlie these occurrence patterns.
196
This study suggests that temporal segregation is a constant and cohesive feature of the social
organisation of migrating humpback whales, which provides a predictable social framework
for individuals moving through various maturational and reproductive stages as they age.
6.2.7 Increase in abundance may have density dependent effects on humpback whales in
Hervey Bay
Over the period of this study the eastern Australian humpback whale population has shown a
near linear trajectory increase in abundance from approximately 2,000 in 1992 (Paterson et al.
1994) to approximately 13,000 in 2009 (Noad et al. 2004, 2011; Fig.1.5.4.1). Consequently,
the possible density dependent effects on humpback whales visiting Hervey Bay should be
considered. In this study it is suggested that the significant increase over years in groups of 3+
whales (Fig. 3.3) may be related to the increasing proportion of socially active and interacting
immature and mature males and females, aggregating in the bay. Furthermore, the
significantly higher rate of pod associations (Fig. 4.1b) during the first four weeks of the
season and the relatively higher frequency of non-agonistic social behaviour early in the
season (Fig. 4.3b) may be related to the density and movement into and out of Hervey Bay of
an increasing proportion of immature and mature males and females over years. Finally, the
rapid increase of mothers alone with their calves in the latter half of the season and the fact
that when mothers with calves associate they are significantly more likely to associate with
other mother calf pods (see 4.4.8.1 above) may be related to the increasing density of mother
calf pods in Hervey Bay.

197
6.2.8 Benefits outweigh costs for humpback whales utilising Hervey Bay
Hervey Bay is not a traditional breeding ground. It is neither a calving area nor a terminal
destination. After spending time in the breeding grounds to the north of Hervey Bay some
humpback whales make a diversion from the primary migratory pathway and enter Hervey
Bay (Fig. 1.6.1 above). There are substantial physiological pressures on humpback whales to
initiate the migration towards summer feeding areas (Locker 1984). Consequently, the costs
in energy in diverting from the primary migratory pathway and spending time in Hervey Bay
must be outweighed by the benefits from time spent in Hervey Bay. There are potential risks
for humpback whales entering and leaving Hervey Bay. Humpback whales have to negotiate
extensive sand-spits and contend with strong tidal conditions in shallow waters moving into
and out of the bay (Fig. 1.6.1 above).
In contrast to the wide dispersal of humpback whales throughout the breeding area to the
north (Simmons and Marsh 1986, Paterson 1991, Chaloupka and Osmond 1999, Smith et al.
2012), in Hervey Bay dense aggregations of whales occur in a limited and relatively shallow
area (Fig.1.6.1 above). Mature females that are either resting or in the early stage of
pregnancy accompany and interact with immature males and females in pairs and larger
groups and may benefit from socialising opportunities during the first half of the season.
Mature males and females involved in both non-agonistic social behaviour and competitive
groups provide opportunities for social bonding and possibly breeding. Mothers with older
calves have the opportunity to rest in Hervey Bay after the initial birthing period, but also
benefit from the opportunities for maternal and social activities with low levels of interference
from mature males.
The long migration between their feeding areas in Antarctica and their breeding ground
within the Great Barrier Reef appears to be a maternally directed learned experience. There is
a rhythm and order, which binds the whole group in an annual orchestrated movement

198
(Chapter 5). Mothers with weaning calves lead the northern migration closely followed by the
immature males and females then by the mature males and females and finally the last to
leave the Antarctic feeding areas are the expectant mothers (Fig. 5.5.1.1.). While on the
southern migration from the breeding ground in the Great Barrier Reef, resting and newly
pregnant mature females lead the way south followed closely by the immature males and
females, then the mature males and females, while the last to leave Hervey Bay are the
mothers with this season’s calves (Fig. 5.1, and Fig. 5.5.1.1). Thus the mature females are at
the vanguard and rearguard of the migration both northwards and southwards.
Hervey Bay’s place in the annual rhythm of the orchestrated migratory movement of eastern
Australian humpback whales appears to be a ‘Cavanbah’, a safe annual social meeting place
(see: http://arakwal.com.au/cavanbah/).
6.3 FUTURE RESEARCH
The long-term dataset of resighting histories of individual males and females used in this
study provides opportunities to investigate further questions on the social behaviour of
humpback whales. These include; Do breeding females form long-term relationships?
Similarly do mature males form long-term relationships? Are there any long-term patterns in
the timing of resightings and site fidelity of individual mature males utilising Hervey Bay?
Do mature male escorts entering Hervey Bay exhibit other social functions beyond escorting
lactating females? To what degree do mature males socially interact with immature males?
Future research of long-term capture histories of individually identified humpback whales
using robust design modelling could provide estimates of probability of entry and survival by
week within season and over years, together with estimates of abundance within season and

199
over years, site fidelity, residency, as well as birthing rates. These estimates could contribute
to better understanding of density dependent effects in Hervey Bay.
The availability of GIS data in conjunction with long-term sightings provides the basis for
investigating the spatial utilisation of the Hervey Bay habitat by both individual and classes of
humpback whales and to address the following questions. Have there been any changes over
years in the spatial utilisation of the bay by classes of humpback whales? Do particular
classes of humpback whales exhibit differences in the spatial utilisation of the Hervey Bay
habitat? Has the increasing population of humpback whales using the bay influenced spatial
utilisation? Can changes in spatial use of the bay over the long-term provide the basis for a
predictive model of future use of the bay by the eastern Australian humpback whales?
6.4 CONSERVATION ISSUES
Humpback whales in Queensland waters are protected under the Nature Conservation Act
1992 and are listed as ‘Vulnerable’ in the Nature Conservation (Wildlife) Regulation 2006.
Eastern Hervey Bay was the first site to be specifically declared for the protection of
humpback whales within a single ‘general use zone’ designated as a ‘Whale Management and
Monitoring Area’ within the Hervey Bay Marine Park declared in 1989. Since 1997
humpback whales have been managed under the Nature Conservation (Whales and Dolphins)
Conservation Plan 1997 (Vang 2000). The Great Sandy Marine Park was established in 2004
incorporating the former Hervey Bay Marine Park. Current regulations related to commercial
and recreational whale-watching within a designated whale management and monitoring area
are set out in the Marine Parks (Great Sandy) zoning plan 2006. These regulations provide for
movement of commercial and recreational vessels in close proximity to whales and provisions
for the protection of whales within the Marine Park.

200
Hervey Bay and Fraser Island are also the focus of an international and domestic tourism
industry and a commercial and recreational fishing and boating industry. Furthermore, there is
an established and expanding aquaculture industry. Human activities within the Hervey Bay
region are increasing, coinciding with the rapidly expanding humpback whale population
along eastern Australia. Therefore, it is likely that interactions between humpback whales and
human activities are going to increase substantially in future, which will require careful
management to ensure that Hervey Bay continues to provide a suitable habitat for these
whales.
During August and September, Hervey Bay is clearly an important habitat for mature non-
lactating females (newly pregnant and resting), as well as for immature males and females.
Later in the season it is an important stopover for lactating females involved in maternal care
with older calves. Therefore, it is imperative to ensure the long-term viability of Hervey Bay
as a habitat important to the reproductive success of these eastern Australian humpback
whales. There is clearly the possibility of future increased anthropogenic disturbances of the
migrating humpback whales and their habitat in Hervey Bay from increased boat traffic,
pollution, aquaculture development and habitat degradation. Therefore it is important that
long-term monitoring of this habitat and its use by different classes of migrating humpback
whales is continued into the future.
Moreover, it is essential that an integrated environmental research, monitoring and
management plan be created for Hervey Bay. Such a plan should include an adaptive
management framework to mitigate impacts from increased human activities, as well as
provisions for monitoring the interactions and effects of these activities on humpback whales.
The monitoring data should then be regularly reviewed to evaluate and adapt the planning
processes, in order to better manage human activities in this important whale habitat for the
future.

201
Chapter 7
Literature cited in General Introduction
(Chapter 1), and in Chapters 2 and 6 Abernethy, R. B., C. S. Baker and M. W. Cawthorn. 1992. Abundance and genetic identity of
Humpback Whales (Megaptera novaeangliae) in the Southwest Pacific. Paper
SC/44/O20 presented to the IWC Scientific Committee, May 1992 (unpublished). 46pp.
[Available from the office of this Journal].
Acevedo, A. and M. A. Smultea. 1995. First records of humpback whales including calves at
Golfo Dulce and Isla Del Coco, Costa Rico, suggesting geographical overlap of
northern and southern hemisphere populations. Marine Mammal Science. 11: 554-560.
Acevedo, J., J. Allen, C. Castro, F. Félix, K. Rasmussen, L. Flórez-González, A. Aguayo-
Lobo, E. Secchi, M. Llano, F. Garita, P. Forestell, B. Haase, J. Capella, L. Dalla Rosa,
D. Ferrina, J. Plana, I. C. Tobón, G. Kaufman, P. Flak, M. Scheidat and L. A. Pastene.
2008a. Migratory destination of humpback whales from the Eastern South Pacific
population as revealed by photo identification analysis. Paper SC/60/SH20 presented
to the IWC Scientific Committee, May 2008 (unpublished). 8pp. [Available from the
office of this Journal].
Acevedo, J., R. Hucke-Gaete, E. Secchi, J. Allen, A. Aguayo-Lobo, L. Dalla Rosa, D. Haro
and L. A. Pastene. 2008b. Photo-identification analysis of humpback whales from
three high latitude localities of the Eastern South Pacific Population (Stock G). Paper
SC/60/SH27 presented to the IWC Scientific Committee, May 2008 (unpublished). 5pp.
[Available from the office of this Journal].
Acevedo, J., K. Rasmussen, F. Felix, C. Castro, M. Llano, E. Secchi, M. T. Saborio, A.
202
Aguayo-Lobo, B. Haase, M. Scheidat, L. Dalla-Rosa, C. Olavarria, P. Forestell, P.
Acuna, G. Kaufman and L. A. Pastene. 2007. Migratory destinations of humpback
whales from the Magellan Strait feeding ground, Southeast Pacific. Marine Mammal
Science 23: 453-463.
Acevedo, J. A., A. Aguayo-Lobo and L. A. Pastene. 2006. Site fidelity of humpback whales
(Megaptera novaeangliae Borowski, 1781), to the Magellan Strait feeding ground.
[Filopatría de la ballena jorobada (Megaptera novaeangliae Borowski, 1781), al área
de alimentacíon del estrecho de Mafallanes]. Revista de Biologia Marina y
Oceaografia 41: 11-19.
Aguilar, A. 1985. Aboriginal Whaling off Pagalu (Equatorial Guinea). Report of the
International Whaling Commission 35: 385-386.
Aguilar, A., A. Borrell and P. J. H. Reijnders. 2002. Geographical and temporal variation in
levels of organochlorine contaminants in marine mammals. Marine Environmental
Research 53: 425-452.
Albertson-Gibb, R., J. Acevedo, C. Olavarría, A. Aguayo-Lobo, M. M. Poole and C. S. Baker.
2009. Photo-identification comparison of humpback whales from the Antarctic
Peninsula/ Strait of Magellan and French Polynesia (Breeding Stock F). Paper
SC/61/SH13 presented to the IWC Scientific Committee, May 2009 (unpublished). 7pp.
[Available from the office of this Journal].
Alter, E. S., M. P. Simmonds and J. R. Brandon. 2010. Forecasting the consequences of
climate-driven shifts in human behavior on cetaceans. Marine Policy 34: 943-954.
Altmann, J. 1974. Observational study of behavior: Sampling methods. Behaviour 49: 227-
267.
Anderson, M., D. Steel, W. Franklin, T. Franklin, D. Paton, D. Burns, P. Harrison, P. R.
Baverstock, C. Garrigue, C. Olavarria, M. M. Poole, N. Hauser, R. Constantine, D.
203
Thiele, P. Clapham, M. Donoghue and C. S. Baker. 2010. Microsatellite genotype
matches of eastern Australian humpback whales to Area V feeding and breeding
grounds. Paper SC/62/SH7 presented to the Scientific Committee of the International
Whaling Commission. 11pp. (unpublished). [available from the office of this Journal].
Andriolo, A., P. G. Kinas, M. H. Engel, C. C. Albuquerque Martins and A. M. Rufino. 2010.
Humpback whales within the Brazilian breeding ground: distribution and population
size estimate. Endangered Species Research 11: 233-243.
Auster, P. J. and L. L. Stewart. 1986. Species Profiles: Life Histories and Environmental
Requirements of Coastal Fishes and Invertebrates (North Atlantic): SAND LANCE.
National coastal Ecosystems Team Research and Development Fish and Wildlife
Service. U.S. Department o f the I n t e r i o r Washington, D.C. 20240. Biological
Report 82 (11.66) TR EL-82-4: 1-21.
Baker, C. S. 1985. The population structure and social organization of humpback whales
(Megaptera novaeangliae) in the central and eastern North Pacific. Ph.D. Dissertation,
University Microfilms International, Ann Arbor, University of Hawaii.
Baker, C. S., D. Steel, J. Calambokidis, J. Barlow, A.M. Burdin, P.J. Clapham, E.A. Falcone,
J.K.B. Ford, C.M. Gabriele, U. Gozález-Peral, R. Leduc, D. Mattila, T.J. Quinn, L.
Rojas-Bracho, J.M. Straley, B.L. Taylor, J. Urbán-R., M. Vant, P. Wade, D. Weller,
B.H. Witteveen, K. Wynne and M. Yamaguchi. 2008. geneSPLASH: An initial,
ocean-wide survey of mitochondrial (mt) DNA diversity and population structure
among humpback whales in the North Pacific. Final report for Contract 2006-0093-
008 to the National Fish and Wildlife Foundation. (See also SPLASH summary at
Cetacean Conservation Genetics Lab of the Marine Mammal Institute at OSU).
Baker, C. S., L. Florezgonzalez, B. Abernethy, H. C. Rosenbaum, R. X. Slade, J. Capella and
J. L. Bannister. 1998b. Mitochondrial dna variation and maternal gene flow among

204
humpback whales of the southern hemisphere. Marine Mammal Science 14: 721-737.
Baker, C. S., C. Garrigue, R. Constantine, B. Madon, M. Poole, N. Hauser, P. Clapham, M.
Donoghue, K. Russell, T. O'Callahan, D. Paton and D. Mattila. 2006. Abundance of
humpbacks in Oceania (South Pacific) 1999 to 2004. Paper SC/A06/HW51 submitted
to the IWC Southern Hemisphere Humpback Workshop, Hobart, April 2006.
Baker, C. S. and L. M. Herman. 1981. Migration and local movement of humpback whales
(Megaptera novaeangliae) through Hawaiian Waters. Canadian Journal of Zoology 59:
460-446.
Baker, C. S. and L. M. Herman. 1984a. Seasonal contrasts in the social behavior of humpback
whales. Cetus 5.
Baker, C. S. and L. M. Herman. 1984b. Aggressive behaviour between humpback whales
(Megaptera novaeangliae) wintering in Hawaiian waters. Canadian Journal of
Zoology 62: 1922-1937.
Baker, C. S. and L. Medrano-Gonzalez. 2002. World-wide distribution and diversity of
humpback whale mitochondrial DNA lineages. Pages 84-89 in C. J. PFEIFFER ed.
Molecular and cell biology of Marine Mammals. Krieger Publishing Company,
Malabar, FL.
Baker, C. S., L. Medrano-Gonzalez, J. Calambokidis, A. Perry, F. Pichler, H. Rosenbaum, J.
M. Straley, J. Urban-Ramirez, M. Yamaguchi and O. Vonziegesar. 1998a. Population
structure of nuclear and mitochondrial DNA variation among humpback whales in the
North Pacific. Molecular Ecology 7: 695-707.
Baker, C. S., S. R. Palumbi, R. H. Lambertsen, M. T. Weinrich, J. Calambokidis and S. J. O
Brien. 1990. Influence of Seasonal Migration on Geographic Distribution of
Mitochondrial DNA Haplotypes in Humpback Whales. Nature 344: 238-240.
Baker, C. S., A. Perry, J. L. Bannister, M. T. Weinrich, R. B. Abernethy, J. Calambokidis, J.

205
Lien, R. H. Lambertsen, J. U. Ramirez, O. Vasquez, P. J. Clapham, A. Alling, S. J.
Obrien and S. R. Palumbi. 1993. Abundant mitochondrial DNA variation and world-
wide population structure in humpback whales. Proceedings of the National Academy
of Sciences of the United States of America 90: 8239-8243.
Baker, C. S., A. Perry and L. M. Herman. 1987. Reproductive histories of female humpback
whales Megaptera novaeangliae in the North Pacific. Marine Ecology Progress Series
41: 103-114.
Baker, C. S., R. W. Slade, J. L. Bannister, R. B. Abernethy, M. T. Weinrich, J. Lien, J. Urban,
P. Corkeron, J. Calmabokidis, O. Vasquez and S. R. Palumbi. 1994. Hierarchical
structure of mitochondrial dna gene flow among humpback whales (Megaptera
novaeangliae), world-wide. Molecular Ecology 3: 313-327.
Baker, S. C., J. M. Straley and A. Perry. 1992. Population characteristics of individually
identified humpback whales in southeastern Alaska: Summer and fall 1986. Fishery
Bulletin U.S.: 429-447.
Balcomb, K. C. and G. Nichols. 1982. Humpback whale censuses in the West Indies. Paper
SC/33/PS17 presented to the IWC Scientific Committee, May 1982 (unpublished).
[Available from the office of this Journal].
Baldwin, R., T. Collins and G. Minton. 2010. Arabian Sea humpback whales: canaries for the
Northern Indian Ocean. Paper SC/62/SH20 presented to the IWC the Scientific. 5pp.
(unpublished). [Available from the office of this Journal].
Bannister, J. L. 1994. Continued increase in Group IV humpbacks off Western Australia
SC/44/SHB15. Report of the International Whaling Commission 44: 309-310
Bannister, J. L. and S. L. Hedley. 2001. Southern Hemisphere Group IV humpback whales:
their status from recent aerial survey. Memoirs of the Queensland Museum 47: 587-
598.

206
Baraff, L. and M. T. Weinrich. 1993. Separation of humpback whale mothers and calves on a
feeding ground in early autumn. Marine Mammal Science 9: 431-434.
Barendse, J., P. B. Best and M. Thornton. 2006. Preliminary results of photo-identification of
humpback whales on the west coast of South Africa. Pages 14pp. Paper SC/A06/HW4
submitted to the IWC southern hemisphere humpback workshop, Hobart, April 2006.
Barendse, J., S. H. Elwen, P. B. Best and R. Leeney. 2011. A preliminary comparison of
humpback whale tail fluke images from west South Africa and Namibia. Paper
SC/63/SH21 presented to the Scientific Committee of the International Whaling
commission. (unpublished). 15pp. [Paper available from the Office of this Journal].
Barlow, J. and P. J. Clapham. 1997. A new birth-interval approach to estimating demographic
parameters of humpback whales. Ecology 78: 535-546.
Baulch, S. and C. Perry. 2012. A sea of plastic: Evaluating the impacts of marine debris on
cetaceans. Paper SC/64/E10 presented to the Scientific Committee of the International
Whaling Commission. 24pp. (unpublished). [available from the office of this Journal].
Best, P. B. 2006. A note on the age at sexual maturity of humpback whales. Paper
SC/A06/HW5 submitted to the International Whaling Commission workshop on the
comprehensive assessment of southern hemisphere humpback whales, Tasmania, 4-7
April 2006. 6 pp.
Best, P. B. 2008. Nineteenth-century evidence for the Golfo de Panama as a migratory
destination for southern humpback whales, including the first mention of singing.
Marine Mammal Science 24: 737-742.
Best, P.B. (2011) A note on the age at sexual maturity of humpback whales. Journal of
cetacean Research and Management (Special Issue 3), 71-73.
Best, P. B., K. P. Findlay, K. Sekiguchi, V. M. Peddemors, B. Rakotonirina, A. Rossouw and
D. Gove. 1998. Winter distribution and possible migration routes of humpback whales
207
Megaptera novaeangliae in the southwest Indian Ocean. Marine Ecology Progress
Series 162: 287-299.
Best, P. B., K. Sekiguchi and K. P. Findlay. 1995. A suspended migration of humpback
whales (Megaptera novaeangliae) on the west coast of south africa. Marine Ecology
Progress Series 118: 1-12.
Blackmer, A. L., Anderson, S. K., and Weinrich, M. T. 2000. Temporal variability in features
used to photo-identify humpback whales (Megaptera novaeangliae). Marine Mammal
Science 16: 338-354.
Braulik, G. T., Ranjbar, S. Owfi, F., Aminrad, T., Dakhteh, S.M.H., Kamrani, E., and
Mohsenizadeh, F. 2010. Marine Mammal Records from Iranian Waters of the Persian
Gulf and Gulf of Oman. Journal of Cetacean Research and Management 11: 49-63.
Brown, M. and P. Corkeron. 1995. Pod characteristics of migrating humpback whales
(megaptera novaeangliae) off the east australian coast. Behaviour 132: 163-179.
Brown, M. R., P. J. Corkeron, P. T. Hale, K. W. Schultz and M. M. Bryden. 1995. Evidence
for a sex-segregated migration in the humpback whale (megaptera novaeangliae).
Proceedings of the Royal Society of London - Series B: Biological Sciences 259: 229-
234.
Bryden, M. M. 1985. Studies of humpback whales Megaptera novaeangliae, Area V. Pages
115-123 in J. K. Ling and M. M. Bryden eds. Studies of Sea Mammals in South
Latitudes. South Australian Museum, Adelaide, Australia.
Bryden, M.M., Brown, M.R., Field, M.S., Clarke, E.D. and Butterworth, D.S. 1996. Survey of
humpback whales (Megaptera novaeangliae) off eastern Australia. Canberra.
Burns, D. 2010. Population characteristics and migratory movements of humpback whales
(Megaptera novaeangliae) identified on their southern migration past Ballina, eastern
Australia. Southern Cross University. PhD Thesis: pp 265.

208
Burns, D., L. Brooks, P. Harrison, T. Franklin, W. Franklin, D. Paton and P. Clapham. (in
press). Migratory movements of individual humpback whales photographed off the
eastern coast of Australia. Marine Mammal Science.
Caballero, S., H. Hamilton, C. Jaramillo, J. Capella, L. Flórez-González, C. Olavarría, H.
Rosenbaum, F. Guhl and C. S. Baker. 2001. Genetic Characterization of the
Colombian Pacific Coast Humpback Whale population using RAPD and
mitochondrial DNA sequences. Memoirs of the Queensland Museum 47: 459-464.
Calambokidis, J., E.A. Falcone, T.J. Quinn, A.M. Burdin, P.J. Clapham, J.K.B. Ford, C.M.
Gabriele, R. Leduc, D. Mattila, L. Rojas-Bracho, J.M. Straley, B.L. Taylor, J. UrbaN
R., D. Weller, B.H. Witteveen, M. Yamaguchi, A. Bendlin, D. Camacho, K. Flynn, A.
Havron, A. J. Huggins and N. Maloney. 2008. SPLASH: Structure of Populations,
Levels of Abundance and Status of Humpback Whales in the North Pacific. Final
report for Contract AB133F-03-RP-00078 U.S. Dept of Commerce Western
Administrative Center, Seattle, Washington.
Calambokidis, J., G. H. Steiger, J. R. Evenson, K. R. Flynn, K. C. Balcomb, D. E. Claridge, P.
Bloedel, J. M. Straley, C. S. Baker, O. Vonziegesar, M. E. Dahlheim, J. M. Waite, J.
D. Darling, G. Ellis and G. A. Green. 1996. Interchange and isolation of humpback
whales off california and other north pacific feeding grounds. Marine Mammal
Science 12: 215-226.
Calambokidis, J., G. H. Steiger, K. Rasmussen, J. Urban, K. C. Balcomb, P. L. De Guevara,
M. Salinas, J. K. Jacobsen, C. S. Baker, L. M. Herman, S. Cerchio and J. D. Darling.
2000. Migratory destinations of humpback whales that feed off California, Oregon and
Washington. Marine Ecology Progress Series 192: 295-304.
Carillo, M. and F. Ritter. 2010. Increasing numbers of ship strikes in the Canary Islands:
proposals for immediate action to reduce risk of vessel-whale collisions. Journal of
209
Cetacean Research and Management 11: 131-138.
Carlson, C. A., C. A. Mayo and W. Whitehead. 1990. Changes in the ventral fluke pattern of
the humpback whale (Megaptera novaeangliae), and its effects on matching;
Evaluation of its significance to photo-identification research. Report of the
International Whaling Commission: 105-111.
Carretta, J. V., K. A. Forney, M. S. Lowry, J. Barlow, J. Baker, D. Johnston, B. Hanson, R. L.
J. Brownell, J. Robbins, D. K. Mattila, K. Ralls, M. M. Muto, D. Lynch and L.
Carswell. 2010. US Pacific Marine Mammal Stock Assessments: 2009. National
Marine Fisheries Service. US Department of Commerce.
Cassoff, R. M., K. M. Moore, W. A. Mclellan, S. G. Barco, D. S. Rotstein and M. J. Moore.
2011. Lethal entanglement in baleen whales. Diseases of Aquatic Organisms 96: 175-
185.
Castro, C., B. Alcorta, J. Allen, C. Cáceres, P. Forestell, G. Kaufman, D. Mattila, A. S.
Pacheco, J. Robbins, L. Santillán, M. Scheidat, S. Silva and A. Tagarino. 2011.
Comparison of the humpback whale catalogues between Ecuador, Peru and american
Samoa. Evidence of the enlargement of the breeding stock G to Peru. Paper
SC/63/SH19 presented to the Scientific Committee of the International Whaling
commission. 5pp. (unpublished). [available from the office of this Journal].
Castro, C., P. Forestell, G. Kaufman, M. Scheidat, Q. Gibson and D. Ferina. 2008. Photo-
identification of Humpback whales, Megaptera novaeangliae, in the Puerto Lopez part
of Machalilla National Park in the Ecuadorian Coast - South America: 1996 - 2007.
Paper SC/60/SH22 presented to the Scientific Committee of the International Whaling
commission. (unpublished). 10pp. [Paper available from the Office of this Journal].
Cerchio, S., T. Collins, S. Strindberg, C. Bennett and H. Rosenbaum. 2010. Humpback whale
singing activity off northern Angola: an indication of the migratory cycle, breeding

210
habitat and impact of seismic surveys on singer number in Breeding Stock B1. Paper
SC/62/SH12 presented to the Scientific Committee of the International Whaling
Commission. 21pp. (unpublished). [available from the office of this Journal].
Cerchio, S., J. K. Jacobsen, D. M. Cholewiak, E. A. Falcone and D. A. Merriwether. 2005.
Paternity in humpback whales, Megaptera novaeangliae: assessing polygyny and skew
in male reproductive success. Animal Behaviour 70: 267-277.
Chaloupka, M. and M. Osmond. 1999. Spatial and Seasonal Distribution of Humpback
Whales in the Great Barrier Reef Region. Life in the Slow Lane: Ecology and
Conservation of Long-Lived Marine Animals Edited by John A. Musick. American
Fisheries Society Symposium 23: 89–106.
Chaloupka, M., M. Osmond and G. Kaufman. 1999. Estimating seasonal abundance trends
and survival probabilities of humpback whales in Hervey Bay (east coast Australia).
Marine Ecology Progress Series 184: 291-301.
Charif, R. A., P. J. Clapham and C. W. Clark. 2001. Acoustic detections of singing humpback
whales in deep waters off the British Isles. Marine Mammal Science 17: 751-768.
Chittleborough, R. G. 1954. Studies on the Ovaries of the Humpback Whale, Megaptera
nodosa (Bonnaterre), on the Western Australian coast. Australian Journal of Marine
and Freshwater Research 5: 35-63.
Chittleborough, R. G. 1955a. Aspects of reproduction in the Male Humpback whale,
Megaptera nodosa (Bonnaterre). Australian Journal of Marine and Freshwater
Research 6: 1-29.
Chittleborough, R. G. 1955b. Puberty, Physical Maturity, and relative growth of the female
Humpback whale, Megaptera nodosa (Bonnaterre), on the Western Australian Coast.
Australian Journal of Marine and Freshwater Research: 315-327.
Chittleborough, R. G. 1958a. The Breeding Cycle of the female Humpback Whale,

211
Megaptera nodosa, (Bonnaterre). Australian Journal of Marine and Freshwater
Research 9: 1-18.
Chittleborough, R. G. 1958b. An analysis of recent catches of humpback whales from the
stocks in Groups IV and V - Prepared for the International Commission on Whaling.
Norsk Hvalfangst-Tidende (Norwegian whaling gazette) 47: 109-137.
Chittleborough, R. G. 1959a. Determination of age in the Humpback Whale, Megaptera
nodosa (Bonnaterre). Australian Journal of Marine and Freshwater Research 10: 125-
143.
Chittleborough, R. G. 1959b. Australian marking of humpback whales. Norsk Hvalfangst-
Tidende (Norwegian whaling gazette) 48: 47-55.
Chittleborough, R. G. 1965. Dynamics of two populations of the humpback whale, Megaptera
novaeangliae (Borowski). Australian Journal of Marine and Freshwater Research 16:
33-128.
Clapham, P. J. 1993. Social organization of humpback whales on a North Atlantic feeding
ground. Symposia of the Zoological Society, London 66: 131-145.
Clapham, P. J. 1996. The social and reproductive biology of humpback whales - an ecological
perspective. Mammal Review 26: 27-49.
Clapham, P. J. 2000. The humpback whale - Seasonal feeding and breeding in a baleen whale.
Pages 173-196. Cetacean Societies: Field Studies Of Dolphins And Whales. Pg.
Clapham, P. and C. S. Baker. 2008. Modern whaling. In: Perrin, W.F., Würsig, B. and
Thewissen, J.G.M. (eds.) Encyclopedia of Marine Mammals, pp. 1239-1243. Academic
Press, San Diego.
Clapham, P. J., L. S. Baraff, C. A. Carlson, M. A. Christian, D. K. Mattila, C. A. Mayo, M. A.
Murphy and S. Pittman. 1993. Seasonal occurrence and annual return of humpback
whales, Megaptera novaeangliae, in the Southern Gulf of Maine. Canadian Journal of

212
Zoology 71: 440-443.
Clapham, P. J., P. Berggren, S. Childerhouse, A. Nancy, Friday, T. Kasuya, L. Kell, K.-H.
Kock, S. Manzanilla-Naim, G. N. D. Sciara, W. F. Perrin, A. J. Read, R. R. Reeves, E.
Rogan, L. Rojas-Bracho, T. D. Smith, M. Stachowitsch, B. L. Taylor, D. Thiele, P. R.
Wade and R. L. B. Jr. 2003. Whaling as Science. BioScience 53: 210-212.
Clapham, P. J., S. Leatherwood, I. Szczepaniak and R. L. Brownell. 1997. Catches of
humpback and other whales from shore stations at moss landing and trinidad,
california, 1919-1926. Marine Mammal Science 13: 368-394.
Clapham, P. J. and C. A. Mayo. 1987. Reproduction and recruitment of individually identified
humpback whales, Megaptera novaeangliae, observed in Massachusetts Bay 1979-
1985. Canadian Journal of Zoology 65: 2853-2863.
Clapham, P. J. and C. A. Mayo. 1990. Reproduction of humpback whales (Megaptera
novaeangliae) observed in the Gulf of Maine. Report of the International Whaling
Commission: 171-175.
Clapham, P., Y. Mikhalev, W. Franklin, D. Paton, S. Baker, Y. V. Ivashchenko and R. L. J.
Brownell. 2009. Catches of Humpback Whales by the Soviet Union and Other Nations
in the Southern Ocean, 1947-1973. Marine Fisheries Review 71: 39-43.
Clapham, P. J. and J. G. Mead. 1999. Megaptera novaeangliae. Mammalian Species 604: 1-9.
Clapham, P. J., P. J. Palsboll, D. K. Mattila and O. Vasquez. 1992. Composition and
dynamics of humpback whale competitive groups in the West Indies. Behaviour 122:
182-194.
Clapham, P. J. and P. J. Palsboll. 1997. Molecular analysis of paternity shows promiscuous
mating in female humpback whales (megaptera novaeangliae, borowski). Proceedings
of the Royal Society of London - Series B: Biological Sciences 264: 95-98.
Clapham, P. J., S. E. Wetmore, T. D. Smith and J. G. Mead. 1999. Length at birth and at

213
independence in humpback whales. Journal of Cetacean Research and Management
1: 141-146.
Clark, C. W. and P. J. Clapham. 2004. Acoustic monitoring on a humpback whale (Megaptera
novaeangliae) feeding ground shows continual singing into late spring. Proceedings of
the Royal Society of London Series B-Biological Sciences 271: 1051-1057.
Constantine, R., K. Russell, N. Gibbs, S. Childerhouse and C. S. Baker. 2007. Photo-
identification of humpback whales (Megaptera novaeangliae) in New Zealand waters
and their migratory connections to breeding grounds of oceania. Marine Mammal
Science 23: 715-720.
Corkeron, P. 1993. Aerial Survey Methodology for Hervey Bay Marine Park Queensland - A
Review. Report to the Queensland Department of Environment and Heritage: 1-33.
Corkeron, P. J. 1995. Humpback whales (Megaptera novaeangliae) in Hervey Bay,
Queensland: behaviour and responses to whale-watching vessels. Canadian Journal
of Zoology 73: 1290-1299.
Corkeron, P. J., M. Brown, R. W. Slade and M. M. Bryden. 1994. Humpback Whales,
Megaptera novaeangliae (Cetacea: Balaenopteridae), in Hervey Bay, Queensland.
Wildlife Research 21: 293-305.
Corkeron, P. J., G. Minton, T. Collins, K. Findlay, A. Willson and R. Baldwin. 2011. Spatial
models of sparse data to inform cetacean conservation planning: an example from
Oman. Endangered Species Research 15: 39-52.
Craig, A.S. and Herman, L.M. (2000) Habitat preferences of female humpback whales
Megaptera novaeangliae in the Hawaiian Islands are associated with reproductive
status. Marine Ecology Progress Series 193, 209-216.
Cypriano-Souza, A. L., G. P. Fernandez, C. A. V. Lima-Rosa, M. H. Engel and S. L. Bonatto.
2010. Microsatellite Genetic Characterization of the Humpback Whale (Megaptera

214
novaeangliae) Breeding Ground off Brazil (Breeding Stock A). Journal of Heredity
101: 189-200.
Darling, J. D. and Berube, M. 2001. Interactions of singing humpback whales with other
males. Marine Mammal Science, 17: 570–584.
Darling, J. D., J. Calambokidis, K. C. Balcomb, P. Bloedel, K. R. Flynn, A. Mochizuki, K.
Mori, F. Sato, H. Suganuma and M. Yamaguchi. 1996. Movement of a humpback
whale (Megaptera novaeangliae) from Japan to British Columbia and return. Marine
Mammal Science 12: 281-287.
Darling, J. D. and S. Cerchio. 1993. Movement of a humpback whale (Megaptera
novaeangliae) between Japan and Hawaii. Marine Mammal Science 9: 84-89.
Darling, J. D., K. M. Gibson and J. K. Silber. 1983. Observations on the abundance and
behavior of humpback whales (Megaptera novaeangliae) off West Maui Hawaii 1977-
1979. in R. Payne (Ed.) Communication and behavior of whales. Westview Press,
Boulder, Co.: 201-222.
Darling, J. D., M. E. Jones and C. P. Nicklin. 2006. Humpback whale songs: Do they organize
males during the breeding season? Behaviour 143: 1051-1101.
Darling, J. D. and R. S. Sousa-Lima. 2005. Songs indicate interaction between humpback
whale (Megaptera novaeangliae) populations in the western and eastern South
Atlantic Ocean. Marine Mammal Science 21: 557-566.
Dawbin, W. H. 1956. The migrations of humpback whales which pass the New Zealand coast.
Transactions of the Royal Society of New Zealand 84: 147-196.
Dawbin, W. H. 1964. Movements of humpback whales marked in the southwest Pacific
Ocean 1952 to 1962. Norsk Hvalfangst-Tidende (Norwegian whaling gazette) 53: 68-
78.
Dawbin, W. H. 1966. The seasonal migratory cycle of humpback whales. Pages 145-170 in K.

215
S. NORRIS ed. Whales, Dolphins and Porpoises. University of California Press,
Berkeley, California.
Dawbin, W. H. 1997. Temporal segregation of humpback whales during migration in
southern hemisphere waters. Memoirs of the Queensland Museum 42: 105-138.
Dawbin, W. H. and R. A. Falla. 1949. A contribution to the study of the humpback whale
based on observations at New Zealand shore stations. Pages 373-382. 7th Pacific
Science Congress.
Doney, S. C., V. J. Fabry, R. A. Feely and J. A. Kleypas. 2009. Ocean Acidification: The
Other CO2 Problem. Annual Review of Marine Science 1: 169-192.
Douglas, A. B., J. Calambokidis, S. Raverty, S. J. Jeffries, D. M. Lambourn and S. A.
Norman. 2008. Incidence of ship strikes of large whales in Washington State. Journal
of the Marine Biological Association of the United Kingdom 88: 1121-1132.
Cambridge University Press. Retrieved from
http://www.journals.cambridge.org/abstract_S0025315408000295.
Elfes, C. T., G. R. Vanblaricom, D. Boyd, J. Calambokidis, P. J. Clapham, R. W. Pearce, J.
Robbins, J. C. Salinas, J. M. Straley, P. R. Wade and M. M. Krahn. 2010. Geographic
variation of persistent organic pollutant levels in humpback whale (Megaptera
novaeangliae) feeding areas of the North Pacific and North Atlantic. Environmental
Toxicology and Chemistry 29: 824-834.
Engel, M. H., N. J. R. Fagundes, H. C. Rosenbaum, M. S. Leslie, P. H. Ott, R. Schmitt, E.
Secchi, L. Dalla Rosa and S. L. Bonatto. 2008. Mitochondrial DNA diversity of the
Southwestern Atlantic humpback whale (Megaptera novaeangliae) breeding area off
Brazil, and the potential connections to Antarctic feeding areas. Conservation
Genetics 9: 1253-1262.
Engel, M. H., M. C. C. Marcondes, C. C. A. Martins, F. O. Luna, R. P. Lima and A. Campos.

216
2004. Are seismic surveys responsible for cetacean strandings? An unusual mortality
of adult Humpback Whales in Abrolhos Bank, Northeastern coast of Brazil.
Engel, M. H. and A. R. Martin. 2009. Feeding grounds of the western South Atlantic
humpback whale population. Marine Mammal Science 25: 964-969.
Ersts, P. J., J. Kiszka, M. Vély and H. C. Rosenbaum. 2011. Density, group composition and
encounter rates of humpback whales (Megaptera novaeangliae) in the eastern
Comoros archipelago [C2]. Journal of Cetacean Research and Management (Special
Issue 3): 175-182.
Ersts, P. J., C. Pomilla, H. C. Rosenbaum, J. Kiszka and M. Vély. 2006. Humpback whales
identified in the territorial waters of Mayotte [C2] and matches to eastern Madagascar
[C3]. Pages 7pp. Paper SC/A06/HW12 submitted to the IWC southern hemisphere
humpback workshop, Hobart, April 2006. 7pp.
Ersts, P. J. and H. C. Rosenbaum. 2003. Habitat preference reflects social organization of
humpback whales (Megaptera novaeangliae) on a wintering ground. Journal of
Zoology 260: 337-345.
Félix, F., S. Caballero and C. Olavarria 2009a. Genetic diversity and population structure of
humpback whales (Megaptera novaeangliae) from Ecuador based on mitochondrial
DNA analyses. Paper SC/59/SH11 presented to the 61 Scientific Committee of the
International Whaling Commission, June 2009, Madeira, Portugal.
Felix, F., S. Caballero and C. Olavarría. 2007. A preliminary assessment of the genetic
diversity in humpback whales (Megaptera novaeangliae) from Ecuador and population
differentian with other southern hemisphere breeding grounds and feeding areas Paper
SC/59/SH11 presented to the Scientific Committee of the International Whaling
commission. (unpublished). 11pp. [Paper available from the Office of this Journal].
Félix, F., C. Castro, B. Haase, P. Forestell, J. J. Álava and M. Scheidat. 2006a. Estimates of

217
the Southeastern Pacific humpback whale stock with mark-recapture models in
Ecuador. 7pp. Paper SC/A06/HW13 submitted to the IWC southern hemisphere
humpback workshop, Hobart, April 2006.
Félix, F. and B. Haase. 2001a. A note on humpback whales off the coast of Ecuador during
the 1997 'El Niño' event. Journal of Cetacean Research and Management 3: 59-64.
Félix, F. and B. Haase. 2001b. The humpback whale off The Coast of Ecuador, population
parameters and behavior. Revista de Biología Marina y Oceanografía 36: 61-74.
Félix, F., B. Haase, J. W. Davis, D. Chiluiza and P. Amador. 1997. A Note on Recent
Strandings and Bycatches of Sperm Whales (Physeter macrocephalus) and Humpback
Whales (Megaptera novaeangliae) in Ecuador. Report of the International Whaling
Commission 47: 917-919.
Félix, F., D. M. Palacios, S. Caballero, B. Haase and J. Falconi. 2006b. The 2005 Galápagos
Humpback Whale Expedition: A first attempt to assess and characterize the population
in the Archipelago. Paper SC/A06/HW15 submitted to the IWC Southern Hemisphere
Humpback Workshop, Hobart, April 2006.
Félix, F., K. Rasmussen, F. Garita, B. Haase and A. Simonis. 2009b. Movements of
Humpback Whales between Ecuador and Central America, Wintering Area of the
Breeding Stock G. Paper SC/61/SH18 presented to the IWC Scientific Committee,
May 2009 (unpublished). 7pp. [Available from the office of this Journal].
Findlay, K. and P. B. Best. 2006. The migrations of humpback whales past Cape Vidal, South
Africa, and a preliminary estimate of the population increase rate. 36pp. Paper
SC/A06/HW16 submitted to the IWC southern hemisphere humpback workshop,
Hobart, April 2006.
Findlay, K., M. Meyer, S. Elwen, D. Kotze, R. Johnson, P. Truter, C. Uamusse, S. Sitoe, C.
Wilke, S. Kerwath, S. Swanson, L. Staverees and J. V. D. Derwesthuizen. 2011.

218
Distribution and abundance of humpback whales, Megaptera novaeangliae, off the
coast of Mozambique, 2003. Journal of Cetacean Research and Management (Special
Issue 3): 163-174.
Fish, F. E. and J. M. Battle. 1995. Hydrodynamic design of the humpback whale flipper.
Journal of Morphology 225: 51-60.
Fleming, A. and J. Jackson. 2011. Global Review of Humpback Whales (Megaptera
novaeangliae) NOAA-TM-NMFS-SWFSC-474. NOAA Technical Memorandum NMFS.
Florez-Gonzalez, L. 1991. Humpback whales Megaptera novaeangliae in the Gorgona Island,
Colombia Pacific breeding waters: population and pod characteristics. Mem. Qld. Mus.
30: 291-295.
Flórez-González, L., I. Avila, J. Capella Alzueta, P. Falk, F. Félix, J. Gibbons, H. M.
Guzmán, B. Hasse, J. C. Herrera, V. Peña, L. Santillán, I. C. Tobón and K. Van
Waerbeek. 2007. Estrategia para la conservación de la ballena jorobada del Pacífico
Sudeste. Pages 106. Limeamientos de un plan de acción regional e iniciativas
nacionales. Fundación Yubarta, Cali, Colombia.
Frankel, A. S. and C. W. Clark. 2000. Behavioral responses of humpback whales (Megaptera
novaeangliae) to full-scale ATOC signals. Journal of the Acoustical Society of
America 108: 1930-1937.
Frankel, A. S. and C. W. Clark. 2002. Atoc and other factors affecting the distribution and
abundance of humpback whales (Megaptera novaeangliae) off the north shore of
Kauai. Marine Mammal Science 18: 644-662.
Franklin, T., W. Franklin, L. Brooks, P. Harrison, P. Baverstock and P. Clapham. 2011.
Seasonal changes in pod characteristics of eastern Australian humpback whales
(Megaptera novaeangliae), Hervey Bay 1992-2005. Marine Mammal Science, 27(3):
E134–E152 (July 2011) ©2010 by the Society for Marine Mammalogy. DOI:

219
10.1111/j.1748-7692.2010.00430.x.
Franklin, W., Franklin, T., Brooks, L., Gibbs, N., Childerhouse, S., Smith, F., Burns, D.,
Paton, D., Garrigue, C., Constantine, R., Poole, M.M., Hauser, N., Donoghue, M.,
Russell, K., Mattila, D.K., Robbins, J., Oosterman, A., Leaper, R., Harrison, P., Baker,
S.C. and Clapham, P. (2012) Antarctic waters (Area V) near the Balleny Islands are a
summer feeding area for some Eastern Australian (E (i) breeding group) Humpback
whales (Megaptera novaeangliae). Journal of Cetacean Research and Management 12,
321-327.
Franklin, W., T. Franklin, L. Brooks, C. Jenner, M. Jenner, L. Gonçalves, R. Leaper, L.
Brooks and P. Clapham. 2008. Photo-identification comparison of humpback whale
(Megaptera novaeangliae) flukes from Antarctic Area IV with Western and Eastern
Australian fluke catalogues Paper SC/60/SH1 presented to the International Whaling
Commission Scientific Committee. (unpublished) 13pp. [available from the office of
this Journal].
Franklin, W., T. Franklin, N. Gibbs, S. Childerhouse, C. Garrigue, R. Constantine, L. Brooks,
D. Burns, D. Paton, M. M. Poole, N. Hauser, M. Donoghue, K. Russell, D. K. Mattila,
J. Robbins, M. Anderson, C. Olavarria, J. Jackson, M. Noad, P. Harrison, P.
Baverstock, R. Leaper, S. C. Baker and P. Clapham. (In press-b). Photo-identification
confirms that humpback whales (Megaptera novaeangliae) from eastern Australia
migrate past New Zealand but indicates low levels of interchange with breeding
grounds of Oceania. Journal of Cetacean Research and Management.
Friday, N., T. D. Smith, P. T. Stevick and J. Allen. 2000. Measurement of photographic
quality and individual distinctiveness for the photographic identification of humpback
whales, Megaptera novaeangliae. Marine Mammal Science 16: 355-374.
Friedlaender, A. S., E. L. Hazen, D. P. Nowacek, P. N. Halpin, C. Ware, M. T. Weinrich, T.

220
Hurst and D. Wiley. 2009. Diel changes in humpback whale Megaptera novaeangliae
feeding behavior in response to sand lance Ammodytes spp. behavior and distribution.
Marine Ecology Progress Series 395: 91-100.
Gabriele, C.M., Straley, J.M., Mizroch, S.A., Baker, C.S., Craig, A.S., Herman, L.M.,
Glockner-Ferrari, D., Ferrari, M.J., Cerchio, S., von Ziegesar, O., Darling, J.,
McSweeney, D., Quinn, T.J. and Jacobsen, J.K. (2001) Estimating the mortality rate of
humpback whale calves in the central North Pacific Ocean. Canadian Journal of
Zoology - Revue Canadienne de Zoologie 79, 589-600.
Gabriele, C. M., A. S. Jensen, J. Neilsen and J. M. Straley. 2007b. Preliminary Summary of
Reported Whale-Vessel Collisions in Alaskan Waters: 1978-2006. Paper SC/59/BC/_
presented to the Scientific Committee of the International Whaling Commission. 5pp.
(unpublished). [available from the office of this Journal].
Gabriele, C. M., J. M. Straley and J. L. Neilson. 2007a. Age at first calving of female
humpback whales in Southeastern Alaska. Marine Mammal Science 23: 226-239.
Gales, N., M. Double, S. Robinson, C. Jenner, M. Jenner, E. Kink, J. Gedamke, D. Paton and
B. Raymond. 2009. Satellite tracking of southbound East Australian humpback whales
(Megaptera novaeangliae): challenging the feast or famine model for migrating
whales. Paper SC/61/SH17 presented to the Scientific Committee of the International
Whaling Commission. (unpublished) 12pp. Available from the office of this Journal.
Gannier, A. 2004. The Large-Scale Distribution of Humpback Whales (Megaptera
novaeangliae) Wintering in French Polynesia During 1997-2002. Aquatic Mammals
30: 227-236.
Garrigue, C., R. Constantine, M. Poole, N. Hauser, P. Clapham, M. Donoghue, K. Russell, D.
Paton, D. K. Mattila, J. Robbins and C. S. Baker. 2011a. Movement of individual
humpback whales between wintering grounds of Oceania (South Pacific), 1999 to
221
2004. Journal of Cetacean Research and Management (Special Issue 3): 275-282.
Garrigue, C., P. Forestell, J. Greaves, P. Gill, P. Naessig and C. S. Baker. 2000. Migratory
movement of humpback whales (Megaptera novaeangliae) between New Caledonia,
East Australia and New Zealand. J. Cetacean Res. Manage. 2: 111-115.
Garrigue, C., Franklin, T., Russell, K., burns, D., Poole, M., Paton, D., Hauser, N., Oremus,
M., Constantine, R., Childerhouse, S., Mattila, D., Gibbs, N., Franklin, W., Robbins,
J., Clapham, P. and Baker, C.S. (2007) First assessment of interchange of humpback
whales between Oceania and the east coast of Australia. IWC Scientific Committee,
SC/59/SH15, 2007. .
Garrigue, C., T. Franklin, R. Constantine, K. Russell, D. Burns, M. Poole, D. Paton, N.
Hauser, M. Oremus, S. Childerhouse, D. Mattila, N. Gibbs, W. Franklin, J. Robbins,
P. Clapham and C. S. Baker. 2011b. First assessment of interchange of humpback
whales between Oceania and the east coast of Australia. Journal of Cetacean Research
and Management (Special Issue) 3: 269-274.
Garrigue, C. and P. C. Gill. 1994. Observations of humpback whales megaptera-novaeangliae
in new caledonian waters during 1991-1993. Biological Conservation 70: 211-218.
Garrigue, C., K. Russell and R. Dodemont. 2004. A preliminary survey of humpback whales
and other cetaceans in Vanuatu, South-West Pacific: a contribution from the South
Pacific Whale Research Consortium. Paper SC/56/SH18 presented to the IWC
Scientific Committee, May 2004 (unpublished). .
Garrigue, C., A. N. Zerbini, Y. Geyer, M. P. Heide-Jorgensen, W. Hanaoka and P. Clapham.
2010. Movements of satellite-monitored humpback whales from New Caledonia.
Journal of Mammalogy 91: 109-115.
Geraci, J. R., D. A. Anderson, R. J. Timperi, D. J. St. Aubin, G. A. Early, J. H. Prescott and
C. A. Mayo. 1989. Humpback whales (Megaptera novaeangliae) fatally poisoned by

222
dinoflagellate toxin. Can. J. Fish. Aquat. Sci. 46: 1895-1898.
Gill, P. C. and C. L. K. Burton. 1995. Photographic resight of a humpback whale between
western australia and antarctic area iv. Marine Mammal Science 11: 96-100.
Glass, A. H., T. V. N. Cole and M. Garron. 2009. Mortality and serious injury determinations
for baleen whale stocks along the United States eastern seaboard and adjacent
Canadian Maritimes, 2003-2007 (2nd Edition). Northeast Fisheries Science Center.
Doc. 09-04. 19pp. http://nefsc.noaa.gov/publications/crd/crd0904/.
Glockner, D. 1983. Determining the sex of humpback whales (Megaptera novaeangliae) in
their natural environment. Pages 447-464 in R. Payne ed. Communication and
behaviour of whales. Westview Press Inc, Boulder, Colorado.
Glockner, D. A. and S. C. Venus. 1983. Identification, growth rate and behavior of humpback
whale (Megaptera novaeangliae) cows and calves in the waters off Maui, Hawaii,
1977-1979. Pages 223-258 in R. S. Payne ed. Communication and behavior of whales.
Westview Press, Boulder, CO.
Glockner-Ferrari, D. and M. Ferrari. 1990. Reproduction in the humpback Whale (megaptera
novaeangliae) in hawaiian waters, 1975-1988: the Life History, Reproductive Rates
and Behaviour of Known Individuals Identified through surface and underwater
Photography. SC/A88/ID30. Report of the International Whaling Commission (Special
Issue 12): 161-169.
Goldbogen, J. A., J. Calambokidis, D. A. Croll, J. T. Harvey, K. M. Newton, E. M. Oleson, G.
Schorr and R. E. Shadwick. 2008. Foraging behavior of humpback whales: kinematic
and respiratory patterns suggest a high cost for a lunge. Journal of Experimental
Biology 211: 3712-3719.
Hain, J. H. W., G. Carter, S. Kraus, C. Mayo and H. Winn. 1982. Feeding behavior of the
humpback whales in the Western North Atlantic. Fish . Bull. U.S. 80: 259-268.

223
Hauser, N. and P. J. Clapham. 2006. Occurrence and habitat use of humpback whales in the
Cook Islands. Paper SC/A06/HW49 submitted to the IWC Southern Hemisphere
Humpback Workshop, Hobart, April 2006.
Hauser, N., H. Peckham and P. Clapham. 2000. Humpback whales in the Southern Cook
Islands, South Pacific. J. Cetacean Res. Manage. 2: 159-164.
Hauser, N., A. N. Zerbini, Y. Geyer, M.-P. Heide-Jørgensen and P. Clapham. 2010.
Movements of satellite-monitored humpback whales, Megaptera novaeangliae, from
the Cook Islands. Marine Mammal Science 26: 679-685.
Herman, E.Y.K., L.M Herman, A.A. Pack, G.J. Marshall, C.M. Shepard, and M. Bakhtiari.
(2008). When whales collide: CRITTERCAM offers insight into the competitive
behavior of humpback whales on their Hawaiian wintering grounds. Marine
Technology Society Journal 41(4): 35-43.
Herman, L. M. and R. C. Antinoja. 1977. Humpback whales in Hawaiian breeding waters:
population and pod characteristics. Scientific Reports of the Whales Research Institute
29: 59-85.
Herman, L. M., A. A. Pack, K. Rose, A. Craig, E. Y. K. Herman, S. Hakala and A. Milette.
2011. Resightings of humpback whales in Hawaiian waters over spans of 10-32 years:
Site fidelity, sex ratios, calving rates, female demographics, and the dynamics of
social and behavioral roles of individuals. Marine Mammal Science 27: 736-768.
Herman, L. M. and W. N. Tavolga. 1980. The communication systems of cetaceans. In:
Cetacean Behavior: Mechanisms and Functions, ed. L.M. Herman. pp 149-209. NY:
Wiley Interscience. .
Hermans, A. and P. A. Pistorius. 2008. Marine Mammal Diversity in the Remote Waters of
Aldabra Atoll, Southern Seychelles. Atoll Research Bulletin 564: 1-7.
Ingebrigtsen, A. 1929. Whales caught in the North Atlantic and other seas. Rapp. P.-V. Reun.

224
Cons. Perm. Int. Explor. Mer 56: 1-26.
IWC. 2006. Report of the Workshop on the Comprehensive Assessment of Southern
Hemisphere Humpback Whales. IWC Scientific Committee 2006 SC/58/Rep5.
International Whaling Commission, Cambridge, U.K. 77 pp.
Jackson, J.A., Zerbini, A., Clapham, P., Constantine, R., Garrigue, C., Hauser, N., Poole,
M.M. and Baker, C.S. (2009) Progress on a two-stock catch allocation model for
reconstructing population histories of east Australia and Oceania (Updated from
Jackson et al. SC/60/SH14.). Paper SC/F09/SH8 presented to the Scientific Committee
of the International Whaling commission. (unpulished) 13pp. [Available from the
office of this Journal].
Jenner, K. C. S. and M.-N. Jenner. 1994. A preliminary population estimate of the group IV
breeding stock of humpback whales off Western Australia. Rep. Int. Whal. Commn 44:
303-308.
Jenner, K. C. S., M.-N. Jenner and K. A. Mccabe. 2001. Geographical and temporal
movements of humpback whales in Western Australian waters. APPEA Journal: 749-
765.
Johnson, A., G. Salvador, J. Kenney, J. Robbins, S. Kraus, S. Landry and P. Clapham. 2005.
Fishing gear involved in entanglements of right and Humpback whales. Marine
Mammal Science 21: 635-645.
Johnson, M. P. and P. L. Tyack. 2003. A Digital Acoustic Recording Tag for Measuring the
Response of Wild Marine Mammals to Sound. IEEE Journal of Oceanic Engineering
28.
Jurasz, C. M. and V. P. Jurasz. 1979. Feeding modes of the humpback whale, Megaptera
novaeangliae, in Southeast Alaska. Sci. Rep. Whales Res. Inst. 31: 69-83.
Katona, S. K., B. Baxter, O. Brazier, S. Kraus, J. Perkins and H. Whitehead. 1979.

225
Identification of Humpback whales by fluke photographs. Pages 33-44 in H. E. Winn
and B. L. Olla eds. Behaviour of marine animals - current perspectives in research.
Plenum Press, New York.
Katona, S. K. and J. A. Beard. 1990. Population size, migrations and feeding aggregations of
the Humpback whale (Megaptera novaeangliae) in the Western North Atlantic Ocean.
Report of the International Whaling Commission. Special Issue 12: 295-305.
Katona, S. K. and H. P. Whitehead. 1981. Identifying Humpback whales using their natural
markings. Polar Record 20: 439-444.
Kaufman, G. D., M. A. Smultea and P. Forestell. 1987. Use of lateral body pigmentation
patterns for photographic identification of East Australian (Area V) humpback whales.
Cetus. The Journal of Whales, Dolphins and Porpoises 7: 5-13.
Kellogg, R. 1929. What is known of the migration of some of the whalebone whales.
Smithsonian Institution Annual Report 1928: 467-494.
Kieckhefer, T. R. 1992. Feeding Ecology of Humpback Whales in Continental Shelf Waters
near Cordell Bank, California. Masters thesis, San Jose State University. Available at
http://aquaticcommons.org/2665/2/Kieckhefer_MS_Thesis_OCR.pdf (Accessed 17th
May 2012).
Kiszka, J., P. J. Ersts and V. Ridoux. 2007. Cetacean diversity around the Mozambique
Channel Island of Mayotte (Comoros archipelago). Journal of Cetacean Research and
Management 9: 105-109.
Kiszka, J., C. Muir, C. Poonian, T. M. Cox, O. A. Amir, J. Bourjea, Y. Razafindrakoto, N.
Wambitji and N. Bristol. 2009. Marine Mammal Bycatch in the Southwest Indian
Ocean: Review and Need for a Comprehensive Status Assessment. Western Indian
Ocean Journal of Marine Science 7: 119-136.
Kurihara, H. 2008. Effects of CO2-driven ocean acidification on the early developmental

226
stages of invertebrates. Marine Ecology Progress Series 373: 275-284.
Laist, D. W., A. R. Knowlton, J. G. Mead, A. S. Collet and M. Podesta. 2001. Collisions
between ships and whales. Marine Mammal Science 17: 35-75.
Lammers, M. O., A. A. Pack and L. Davis. 2003. Historical Evidence of Whale/Vessel
Collisions in Hawaiian Waters (1975 – Present). OSI Technical Report 2003-01
Prepared for: NOAA’s Hawaiian Islands Humpback Whale National Marine
Sanctuary.
Lockyer, C. (1984) Review of Baleen Whale Reproduction and Implications for Management.
Report of the International Whaling Commission. Special Issue 6.
Mackintosh, N. A. 1942. The southern stocks of whalebone whales. Discovery Reports XXII:
197-300.
Macleod, C. and E. Bennett. 2007. Pan-tropical spotted dolphins (Stenella attenuata) and
other cetaceans around St Helena in the tropical south-eastern Atlantic. Journal of the
Marine Biological Association of the UK 87: 339-344.
Marcondes, M. C. C. and M. H. Engel. 2009. Ship strikes with humpback whales in Brazil.
Paper SC/61/BC$ presented to the Scientific Committee of the International Whaling
Commission. 7pp. (unpublished). [available from the office of this Journal].
Martin, A. R., S. K. Katona, D. Matilla, D. Hembree and T. D. Waters. 1984. Migration of
humpback whales between the Caribbean and Iceland. Journal of Mammalogy 65:
330-333.
Martins, C. C. A., M. E. Morete, M. H. Engel, A. C. Freitas, E. R. Secchi and P. G. Kinas.
2001. Aspects of habitat use patterns of humpback whales in the Abrolhos Bank,
Brazil, breeding ground. Memoirs of the Queensland Museum 47: 563-570.
Matsuoka, K., T. Hakamada, H. Kiwada, H. Murase and S. Nishiwaki. 2006. Distribution and
abundance estimates of blue whales in the Antarctic Areas IIIE, IV, V and VIW

227
(35°E-145°W) based on JARPA data. Paper SC/58/SH7 presented to the Scientific
Committee of the International Whaling Commission. 9pp. (unpublished). Available
from the office of this journal.
Matthews, L. H. 1937. The Humpback whale, Megaptera nodosa. University Press,
Cambridge.
Mattila, D. K. and P. J. Clapham. 1989. Humpback whales, megaptera novaeangliae, and
other cetaceans on the Virgin Bank and in the northern Leeward Islands, 1985 and
1986. Canadian Journal of Zoology 67: 2201-2211.
Mattila, D. K., P. J. Clapham, S. K. Katona and G. S. Stone. 1989. Population composition of
humpback whales, Megaptera novaeangliae, on Silver Bank, 1984. Canadian Journal
of Zoology 67: 281-285.
Mattila, D. K., P. J. Clapham, O. Vasquez and R. S. Bowman. 1994. Occurrence, population
composition, and habitat use of humpback whales in samana bay, dominican republic.
Canadian Journal of Zoology 72: 1898-1907.
May-Collado, L., T. Gerrodette, J. Calambokidis, K. Rasmussen and I. Sereg. 2005. Patterns
of cetacean sighting distribution in the Pacific Exclusive Economic Zone of Costa
Rica based on data collected from 1979-2001. Revista de Biologia Tropical 53: 249-
263.
McCauley, R. D., J. Fewtrell, A. J. Duncan, C. Jenner, M.-N. Jenner, J. D. Penrose, R. I. T.
Prince, A. A. Murdoch and K. Mccabe. 2000. Marine Seismic Surveys— A Study Of
Environmental Implications. The Australian Petroleum Production and Exploration
Association (APPEA) Journal: 692-708.
Meyer, M. A., P. B. Best, M. D. Anderson-Reade, G. Cliff, S. F. J. Dudley and S. P. Kirkman.
2011. Trends and interventions in large whale entanglement along the South African
coast. African Journal of Marine Science 33: 429-439.

228
Mikhalev, Y. A. 1997. Humpback whales Megaptera novaeangliae in the Arabian Sea.
Marine Ecology Progress Series 149: 13-21.
Miklosovic, D. S., M. M. Murray, L. E. Howle and F. E. Fish. 2004. Leading-edge tubercles
delay stall on humpback whale (Megaptera novaeangliae) flippers. Physics of Fluids
16: L39-L42.
Minton, G. 2004. Ecology and Conservation of Cetaceans in Oman with particular reference
to humpback whales, Megaptera novaeangliae (Borowski 1781). D.Phil. D.Phil.,
University of London, Millport 250 pp.
Minton, G., T. Collins, K. Findlay, P. Ersts, H. Rosenbaum, P. Berggren and R. Baldwin.
2011. Seasonal Distribution, abundance, habitat use and population identity of
humpback whales in Oman. Journal of Cetacean Research and Management (Special
Issue 3): 185-198.
Mizroch, S. A., J. A. Beard and M. Lynde. 1990. Computer assisted photo-identification of
humpback whales. Report of the International Whaling Commission, SC/A88/ID11:
63-70
Mizroch, S. A., L. M. Herman, J. M. Straley, D. A. Glockner-Ferrari, C. Jurasz, J. Darling, S.
Cerchio, C. M. Gabriele, D. R. Salden and O. Von Ziegesar. 2004. Estimating the
adult survival rate of Central North Pacific humpback whales (Megaptera
novaeangliae). J. Mamm. 85: 963-972.
Mobley, J. R. and L. M. Herman. 1985. Transience of social affiliations among humpback
whales in Hawaiian breeding waters. Canadian Journal of Zoology 63: 762-772.
Moore, S. E. and H. P. Huntington. 2008. Arctic Marine Mammals and climate change:
impacts and resilience. Ecological Applications 18: S157-S165.
Murray, A., S. Cerchio, R. Mccauley, C. S. Jenner, Y. Razafindrakoto, D. Coughran, S.
Mckay and H. Rosenbaum. 2009. Comparison of humpback whale (Megaptera

229
novaeangliae) songs in the southern Indian Ocean indicates limited exchange between
populations wintering off Madagascar and Western Australia. Paper SC/61/SH9
presented to the Scientific Committee of the International Whaling Commission. 20pp.
(unpublished. [available from the office of this journal].
Naessig, P. J. and J. M. Lanyon. 2004. Levels and probable origin of predatory scarring on
humpback whales (Megaptera novaeangliae) in east Australian waters. Wildlife
Research 31: 163-170.
Neilson, J. L., J. M. Straley, C. M. Gabriele and S. Hills. 2009. Non-lethal entanglement of
humpback whales (Megaptera novaeangliae) in fishing gear in northern Southeast
Alaska. Journal of Biogeography 36: 452-464.
Nemoto, T. 1959. Food of the baleen whales with reference to whales movements. Scientific
Reports to the Whales Research Institute 14: 149-290.
Nicol, S., A. Worby and R. Leaper. 2008. Changes in the Antarctic sea ice ecosystem:
potential effects on krill and baleen whales. Marine and Freshwater Research 59:
361-382.
Nishiwaki, M. 1959. Humpback whales in Ryukyuan waters. The Scientific Reports of the
Whales Research Institute 14: 49-87.
Nishiwaki, S., T. Ogawa, K. Matsuoka, T. Mogoe, H. Kiwada, K. Konishi, N. Kanda, T.
Yoshida, A. Wada, M. Mori, T. Osawa, S. Kumagai, T. Oshima, K. Kimura, I.
Yoshimura, T. Sasaki, M. Aki, Y. Matsushita, H. Ito, S. Sudo and G. Nakamura. 2007.
Cruise Report of the Second Phase of the Japanese Whale Research Program under
Special Permit in the Antarctic (JARPA II) in 2006/2007- Feasibility Study. Paper
SC/59/O4 presented to the IWC Scientific Committee, May 2007 (unpublished). 23pp.
[Available from the office of this Journal].
Noad, M. J., D. H. Cato, M. M. Bryden, M. N. Jenner and K. C. S. Jenner. 2000. Cultural
230
revolution in whale songs. Nature 408: 537-537.
Noad, M. J., R. A. Dunlop, D. Paton and D. H. Cato. 2008. An update of the east Australian
humpback whale population (E1) rate of increase. Paper SC/59/SH31 presented to
the IWC Scientific Committee, May 2008 (unpublished). 13pp. [Available from the
office of this Journal].
Noad, M. J., R. A. Dunlop, D. Paton and H. Kniest. 2011. Abundance estimates of the east
Australian humpback whale population: 2010 survey and update. Paper SC/63/SH22
presented to the IWC Scientific Committee, June 2011, Tromsø, Norway
(unpublished). 12pp. [Paper available from the Office of this Journal].
Noad, M.J., Dunlop, R.A., Paton, D. and Cato, D.H. 2011. Absolute and relative abundance
estimates of Australian east coast humpback whales (Megaptera novaeangliae).
Journal of Cetacean Research and Management (Special Issue) 3, 243-‐252.
Noad, M. J., D. A. Paton, N. J. Gibbs and S. J. Childerhouse. 2006. A combined visual and
acoustic survey of humpback whales and other cetaceans of Samoa. 15pp. Paper
SC/A06/HW28 submitted to the IWC Southern Hemisphere Humpback Workshop,
Hobart, April 2006. (unpublished). Available from the office of this Journal.
Nowacek, D. P., A. S. Friedlaender, P. N. Halpin, E. L. Hazen, D. W. Johnston, A. J. Read, B.
Espinasse, M. Zhou and Y. Zhu. 2011. Super-Aggregations of Krill and Humpback
Whales in Wilhelmina Bay, Antarctic Peninsula. PLoS ONE 6: e19173.
O'Connor, S., R. Campbell, H. Cortez and T. Knowles. 2009. Whale watching Worldwide:
Tourism numbers, expenditures and expanding economic benefits. Pages 295. A
special report from the International Fund for Animal Welfare prepared by Economists
At Large, Yarmouth, MA, USA.
Olavarría, C., A. Aguayo, J. Acevedo, L. Medrano, D. Thiele and S. C. Baker. 2006a. Genetic
differentiation between two feeding areas of the Eastern South Pacific humpback

231
whale population: Update on SC/57/SH3. Paper SC/A06/HW29 submitted to the IWC
southern hemisphere humpback workshop, Hobart, April 2006. 7pp.
Olavarria, C., M. Anderson, D. Paton, D. Burns, M. Brasseur, C. Garrigue, N. Hauser, M.
Poole, S. Caballero, L. Florez-Gonzalez and C. S. Baker. 2006b. Eastern Australia
humpback whale genetic diversity and their relationship with Breeding Stocks D, E, F
and G. IWC Scientific Committee SC/58/SH25. International Whaling Commission,
Cambridge, U.K. 6 pp.
Olavarria, C., C. S. Baker, C. Garrigue, M. Poole, N. Hauser, S. Caballero, L. Florez-
Gonzalez, M. Brasseur, J. Bannister, J. Capella, P. Clapham, R. Dodemont, M.
Donoghue, C. Jenner, M. N. Jenner, D. Moro, M. Oremus, D. Paton, H. Rosenbaum
and K. Russell. 2007. Population structure of South Pacific humpback whales and the
origin of the eastern Polynesian breeding grounds. Marine Ecology-Progress Series
330: 257-268.
Omura, H. 1953. Biological study on Humpback whales in the Antarctic whaling areas IV and
V. Scientific Report of Whale Research Institute 8: 81-102.
Orr, J. C., V. J. Fabry, O. Aumont, L. Bopp, S. C. Doney, R. A. Feely, A. Gnanadesikan, N.
Gruber, A. Ishida, F. Joos, R. M. Key, K. Lindsay, E. Maier-Reimer, R. Matear, P.
Monfray, A. Mouchet, R. G. Najjar, G.-K. Plattner, K. B. Rodgers, C. L. Sabine, J. L.
Sarmiento, R. Schlitzer, R. D. Slater, I. J. Totterdell, M.-F. Weirig, Y. Yamanaka and
A. Yool. 2005. Anthropogenic ocean acidification over the twenty-first century and its
impact on calcifying organisms. Nature 437: 681-686.
Overholtz, W. J. and J. S. Link. 2007. Consumption impacts by marine mammals, fish, and
seabirds on the Gulf of Maine‚Georges Bank Atlantic herring (Clupea harengus)
complex during the years 1977‚2002. ICES Journal of Marine Science: Journal du
Conseil 64: 83-96.
232
Overholtz, W. J. and J. R. Nicolas. 1979. Apparent feeding by the fin whale, Balaenoptera
physalus, and humpback whale, Megaptera novaeangliae, on the American sand lance,
Ammodytes americanus, in the northwest Atlantic. . Fishery Bulletin (Wash DC) 77:
285-287.
Oviedo, L. and M. Solis. 2008. Underwater topography determines critical breeding habitat
for humpback whales near Osa Peninsula, Costa Rica: implications for Marine
Protected Areas. Revista de Biolog Tropical 56: 591-602.
Pace, R. M. 2011. Frequency of Whale and Vessel Collisions on the US Eastern Seaboard:
Ten Years Prior and Two Years Post Ship Strike Rule. Northeast Fisheries Science
Center. Reference Document 11-15. 18pp.
Palsbøll, P. J., J. Allen, M. Berube, P. J. Clapham, T. P. Feddersen, P. S. Hammond, R. R.
Hudson, H. Jorgensen, S. Katona, A. H. Larsen, F. Larsen, J. Lien, D. K. Mattila, J.
Sigurjonsson, R. Sears, T. Smith, R. Sponer, P. Stevick and N. Oien. 1997. Genetic
tagging of humpback whales. Nature 388: 767-769.
Palsbøll, P. J., P. J. Clapham, D. K. Mattila, F. Larsen, R. Sears, H. R. Siegismund, J.
Sigurjonsson, O. Vasquez and P. Arctander. 1995. Distribution of mtDNA haplotypes
in north atlantic humpback whales - the influence of behaviour on population
structure. Marine Ecology-Progress Series 116: 1-10.
Paterson, R. A. 1991. The migration of Humpback Whales Megaptera novaeangliae in east
Australian waters. Memoirs of the Queensland Museum 30: 333-341.
Paton, D. A., L. Brooks, D. Burns, T. Franklin, W. Franklin, P. Harrison and P. Baverstock.
2011. First abundance estimate of east coast Australian humpback whales (Megaptera
novaeangliae) utilising mark-recapture analysis and multi-point sampling. Journal of
Cetacean Research and Management (Special Issue) 3: 253-259.
Paton, D. A. and P. J. Clapham. 2002. Preliminary analysis of humpback whale sighting

233
survey data collected in Fiji, 1956-1958. Paper SC/54/SH7 presented to the IWC
Scientific Committee, May 2002. 6 pp. (unpublished). [Available from the office of
this Journal].
Payne, P. M., J. R. Nicolas, L. O'brien and K. D. Powers. 1986. The distribution of the
humpback whale, Megaptera novaeangliae, on Georges Bank and in the Gulf of
Maine in relation to densities of the sand eel, Ammodytes americanus. Fishery Bulletin
84: 271-277.
Payne, P. N., D. Wiley, S. Young, S. Pittman, P. J. Clapham and J. W. Jossi. 1990. Recent
fluctuations in the abundance of baleen whales in the southern Gulf of Maine in
relation to changes in prey abundance. Fish. Bull. U.S. 88: 687-696.
Perry, A., C. S. Baker and M. H. Herman. 1990. Population characteristics of individually
identified humpback whales in the central and eastern North Pacific: A summary and
critique. Report of the International Whaling Commission: 307-317.
Picanço, C., I. Carvalho and C. Brito. 2009. Occurrence and distribution of cetaceans in Sao
Tome and Principe tropical archipelago and their relation to environmental variables.
Journal of the Marine Biological Association of the United Kingdom 89: 1071-1076.
Pomilla, C. and H. C. Rosenbaum. 2006. Estimates of relatedness in groups of humpback
whales (Megaptera novaeangliae) on two wintering grounds of the Southern
Hemisphere. Molecular Ecology 15: 2541-2555.
Poole, M. M. 2002. Occurrence of Humpback Whales (Megaptera novaeangliae) in French
Polynesia 1988-2001. Paper SC/54/H14 presented to the IWC Scientific Committee,
May 2002 (unpublished). 16pp. Available from the office of this Journal.
Poole, M. M. 2006. An update on the Occurrence of Humpback Whales in French Polynesia.
Paper SC/A06/HW60 submitted to the IWC Southern Hemisphere Humpback
Workshop, Hobart, April 2006.

234
Ramírez, P. 1988. La ballena jorobada Megaptera novaeangliae en la costa norte del Perú:
Períodos 1965-1965 y 1975-1985. Boletín de Lima 56: 91-96.
Rasmussen, K. 2008. Humpback whale surveys off the Pacific coast of Panama during the
2007 austral winter season. Paper SC/60/SH12 presented to the IWC Scientific
Committee, May 2008 (unpublished). 7pp. [Available from the office of this Journal].
Rasmussen, K., J. Calambokidis and G. H. Steiger. 2000. Humpback whales and other marine
mammals off Costa Rica, 1996-2000. Pages 16p. +tables and figures. Cascadia
Research, Olympia, WA.
Rasmussen, K., J. Calambokidis and G. H. Steiger. 2004. Humpback whales and other marine
mammals off Costa Rica and surrounding waters, 1996-2003. . Oceanic Society
Expeditions.
Rasmussen, K., J. Calambokidis and G. H. Steiger. 2012. Distribution and migratory
destinations of humpback whales off the Pacific coast of Central America during the
boreal winters of 1996–2003. Marine Mammal Science 28: E267-E279.
Rasmussen, K., D. M. Palacios, J. Calambokidis, M. T. Saborio, L. Dalla Rosa, E. R. Secchi,
G. H. Steiger, J. M. Allen and G. S. Stone. 2007. Southern Hemisphere humpback
whales wintering off Central America: insights from water temperature into the
longest mammalian migration. Biology Letters 3: 302-305.
Rayner, G. W. 1940. Whale marking: Progress and results to December 1939. Disc. Rep. 19:
245-284.
Reeves, R. R. 2001. Overview of catch history, historic abundance and distribution of right
whales in the western North Atlantic and in Cintra Bay, West Africa. Journal of
Cetacean Research and Management: 187-185.
Reeves, R. R., S. Leatherwood and V. Papastavrou. 1991. Possible stock affinities of
humpback whales in the northern Indian Ocean. Pages 259-269 in S. Leatherwood and

235
G. P. Donovan eds. United Nations Environment Programme, Nairobi, Kenya.
Robbins, J. 2007. Structure and dynamics of the Gulf of Maine Humpback Whale Population.
PhD. University of St Andrews, Scotland. Available at http://research-repository.st-
andrews.ac.uk/bitstream/10023/328/1/Robbins_2007.pdf (Accessed 17th May 2012).
Robbins, J. 2010. A review of the frequency and impact of entanglement on Gulf of Maine
humpback whales. Paper IWC/A10/E3 presented to IWC workshop on welfare issues
associated with the entanglement of large whales. 9pp. (unpublished). [Available from
the office of this Journal].
Robbins, J., L. Dalla Rosa, J. M. Allen, D. K. Mattila and E. R. Secchi. 2008. Humpback
whale photo-identification reveals exchange between American Samoa and the
Antarctic Peninsula, and a new mammalian distance record. Paper SC/60/SH5
presented to the IWC Scientific Committee, May 2008 (unpublished). 4pp. [Available
from the office of this Journal].
Robbins, J., S. Landry and D. K. Mattila. 2009. Estimating entanglement mortality from scar-
based studies. Paper SC/61/BC3 presented to the IWC Scientific Committee, May
2009 (unpublished). 4pp. [Available from the office of this Journal].
Robbins, J. and D. K. Mattila. 2006. Summary of humpback whale research at American
Samoa, 2003-2005. Paper SC/58/SH5 presented to the IWC Scientific Committee,
May 2006 (unpublished). 4pp. [Available from the office of this Journal].
Robins, J. P. 1960. Age Studies in the Female Humpback Whale, Megaptera nodosa
(Bonnaterre), in East Australian Waters. Marine and Freshwater Research 11: 1-13.
Rosenbaum, H. and T. Collins. 2006. The Ecology, Population Characteristics and
Conservation Efforts for Humpback whales (Megaptera novaeangliae) on their
Wintering Grounds in the Coastal Waters of Gabon. Bulletin of the Biological Society
of Washington 12: 219-228.
236
Rosenbaum, H. C., P. J. Clapham, J. Allen, M. Nicolejenner, C. Jenner, L. Florezgonzalez, J.
Urban, P. Ladron, K. Mori, M. Yamaguchi and C. S. Baker. 1995. Geographic
variation in ventral fluke pigmentation of humpback whale megaptera novaeangliae
populations worldwide. Marine Ecology Progress Series 124: 1-7.
Rosenbaum, H. C. and B. Mate. 2006. From North of the Equator to the Antarctic: Unique
and unexpected movements for humpback whales off the coast of West Africa and
throughout the eastern South Atlantic Ocean. Paper SC/A06/HW42 submitted to the
IWC southern hemisphere humpback workshop, Hobart, April 2006. 2pp.
Rosenbaum, H. C., C. Pomilla, M. Mendez, M. S. Leslie, P. B. Best, K. P. Findlay, G.
Minton, P. J. Ersts, T. Collins, M. H. Engel, S. L. Bonatto, D. P. G. H. Kotze, M.
Meyer, J. Barendse, M. Thornton, Y. Razafindrakoto, S. Ngouessono, M. Vely and J.
Kiszka. 2009. Population Structure of Humpback Whales from Their Breeding
Grounds in the South Atlantic and Indian Oceans. PLoS ONE 4: e7318.
Rosenbaum, H. C., C. Pomilla, C. Olavarría, C. S. Baker, M. C. Leslie, M. C. Mendez, S.
Caballero, M. Brasseur, J. Bannister, P. B. Best, S. Bonatto, T. Collins, M. H. Engel,
P. J. Ersts, K. P. Findlay, L. Floréz-González, C. Garrigue, N. Hauser, C. Jenner, M.
Meyer, G. Minton, M. Poole and Y. Razafindrakoto. 2006. A first and preliminary
analysis of mtDNA sequences from humpback whales for breeding stocks A-G and X.
Paper SC/A06/HW59 submitted to the IWC southern hemisphere humpback workshop,
Hobart, April 2006.
Rosenbaum, H. C., S. Strindberg and P. J. Ersts. 2004. Initial estimates of abundance and
distribution of humpback whales on their wintering grounds of Gabon (southeastern
Atlantic Ocean, Area B) based on aerial surveys. Pages 12pp. Paper SC/56/SH2
presented to the IWC Scientific Committee, May 2004 (unpublished). [Available from
the office of this Journal].

237
Rossi-Santos, M. R., E. S. Neto, C. G. Baracho, S. R. Cipolotti, E. Marcovaldi and M. H.
Engel. 2008. Occurrence and distribution of humpback whales (Megaptera
novaeangliae) on the north coast of the State of Bahia, Brazil, 2000-2006. Ices Journal
of Marine Science 65: 667-673.
Salden, D.R., Herman, L.M., Yamaguchi, M. and Sato, F. (1999) Multiple visits of individual
humpback whales (Megaptera novaeangliae) between the Hawaiian and Japanese
winter grounds. Canadian Journal of Zoology - Revue Canadienne de Zoologie 77,
504-508.
Schaffar, A., C. Garrigue and R. Constantine. 2010. Exposure of humpback whales to
unregulated whale-watching activities in their main reproductive area in New
Caledonia. Journal of Cetacean Research and Management 11: 147-152.
Scheidat, M., C. Castro, J. Denkinger, J. Gonzalez and D. Adelung. 2000. A breeding area for
humpback whales (Megaptera novaeangliae) off Ecuador. Journal of Cetacean
Research and Management 2: 165-171.
Schweigert, J., B. Mccarter, T. Therriault, L. Flostrand, C. Hrabok, P. Winchell and D.
Johannessen. 2007. Appendix H: pelagic fishes. In: Canadian Technical Report of
Fisheries and Aquatic Sciences 2667. ECOSYSTEM OVERVIEW: PACIFIC NORTH
COAST INTEGRATED MANAGEMENT AREA (PNCIMA) Edited by: B.G. Lucas, S.
Verrin, and R. Brown. 39pp.
Sharpe, F. A. and L. M. Dill. 1997. The behavior of pacific herring schools in response to
artificial humpback whale bubbles. Canadian Journal of Zoology - Revue Canadienne
de Zoologie 75: 725-730.
Silber, G. K., J. Slutsky and S. Bettridgea. 2010. Hydrodynamics of a ship/whale collision.
Journal of Experimental Marine Biology and Ecology 391: 10–19.
Simmonds, M. P. and W. J. Eliott. 2009. Climate change and cetaceans: concerns and recent

238
developments. Journal of the Marine Biological Association of the United Kingdom
89: 203-210.
Simmons, M. L. and H. E. Marsh. 1986. Sightings of humpback whales in Great Barrier Reef
waters. Scientific Reports of the Whales Research Institute 37: 31-46.
Slijper, E. J. 1962. Whales. Hutchinson of London, London.
Smith, T. D., J. Allen, P. J. Clapham, P. S. Hammond, S. Katona, F. Larsen, J. Lien, D.
Mattila, P. J. Palsboll, J. Sigurjonsson, P. T. Stevick and N. Oien. 1999. An ocean-
basin-wide mark-recapture study of the North Atlantic humpback whale (Megaptera
novaeangliae). Marine Mammal Science 15: 1-32.
Smith, J. N., H. S. Grantham, N. Gales, M. C. Double, M. J. Noad and D. Paton. 2012.
Identification of humpback whale breeding and calving habitat in the Great Barrier
Reef. Marine Ecology Progress Series 447: 259-272.
Smultea, M. A. 1994. Segregation by humpback whale (megaptera novaeangliae) cows with a
calf in coastal habitat near the island of hawaii. Canadian Journal of Zoology 72: 805-
811.
South Pacific Whale Research Consortium. 2009. Report of the Annual Meeting of the South
Pacific Whale Research Consortium. Paper SC/61/SH15 presented to the IWC
Scientific Committee, May 2009 (unpublished). 15pp. [Available from the office of this
Journal].
Steel, D., C. Garrigue, M. Poole, N. Hauser, C. Olavarría, L. Florez-Gonzalez, R.
Constantine, S. Caballero, D. Thiele, D. Paton, P. Clapham, M. Donoghue and C. S.
Baker. 2008. Migratory connections between humpback whales from South Pacific
breeding grounds and Antarctic feeding areas based on genotype matching.
SC/60/SH13. Santiago, Chile.
Steiger, G. H. and J. Calambokidis. 2000. Reproductive rates of humpback whales off

239
California. Marine Mammal Science 16: 220-239.
Steiger, G. H., J. Calambokidis, J. M. Straley, L. M. Herman, S. Cerchio, D. R. Salden, J.
Urbán, J. K. Jacobsen, O. V. Ziegesar, K. C. Balcomb, C. M. Gabriele, M. E.
Dahlheim, S. Uchida, J. K. B. Ford, P. L. D. Guevara, M. Yamaguchi and J. Barlow.
2008. Geographic variation in killer whale attacks on humpback whales in the North
Pacific: implications for predation pressure. Endangered Species Research 4: 247-256.
Stevick, P. T., A. Aguayo, J. Allen, I. C. Avila, J. Capella, C. Castro, K. Chater, L. Dalla
Rosa, M. H. Engel, F. Félix, L. Flórez-González, A. Freitas, B. Haase, M. Llano, L.
Lodi, E. Munoz, C. Olavarría, E. Secchi, M. Scheidat and S. Siciliano. 2004.
Migrations of individually identified humpback whales between the Antarctic
Peninsula and South America. Journal of Cetacean Research and Management 6:
109-113.
Stevick, P. T., J. Allen, M. Bérubé, P. J. Clapham, S. K. Katona, F. Larsen, J. Lien, D. K.
Mattila, P. J. Palsbøll, J. Robbins, J. Sigurjónsson, T. D. Smith, N. Øien and P. S.
Hammond. 2003. Segregation of migration by feeding ground origin in North Atlantic
humpback whales (Megaptera novaeangliae). Journal of Zoology, London 259: 231-
237.
Stevick, P. T., J. Allen, P. J. Clapham, S. K. Katona, F. Larsen, J. Lien, D. K. Mattila, P. J.
Palsbøll, R. Sears, J. Sigurjónsson, T. D. Smith, G. Vikingsson, N. A. Øien and P. S.
Hammond. 2006. Population spatial structuring on the feeding grounds in North
Atlantic humpback whales (Megaptera novaeangliae). Journal of Zoology 270:244–
255. doi: 210.1111/j.1469-7998.2006.00128.x.
Stevick, P. T., C. A. Carlson and K. C. Balcomb. 1999a. A note on the migratory destinations
of humpback whales from the eastern Caribbean. Journal of Cetacean Research and
Management 1: 251-254.

240
Stevick, P. T., N. Øien and D. K. Mattila. 1998. Migration of a humpback whale (Megaptera
novaeangliae) between Norway and the West Indies. Marine Mammal Science 14:
162-166.
Stevick, P. T., N. Øien and D. K. Mattila. 1999b. Migratory destinations of humpback whales
from Norwegian and adjacent waters: evidence for stock identity. J. Cetacean Res.
Manage. 1: 147-152.
Stone, G. S., S. K. Katona and E. B. Tucker. 1987. History, migration and present status of
humpback whales, Megaptera novaeangliae, at Bermuda. Biological Conservation 42:
133-145.
Strahan, R. M. 2009. A New Paradigm for Conservation of Great Whales in the Urban Sea of
the United States -- Species in Need of a "Green Night". Boston College
Environmental Affairs Law Review 36: 431-481.
http://lawdigitalcommons.bc.edu/ealr/vol436/iss432/437.
Straley, J. M. 1990. Fall and winter occurrence of humpback whales (Megaptera
novaeangliae) in southeastern Alaska. Report of the International Whaling
Commission: 319-323.
True, F. W. 1904. The whalebone whales of the western North Atlantic compared with those
occurring in European waters; with some observations on the species of the North
Pacific. Smithsonian Institution Press, Washington, District of Columbia 33: 1-318.
Tyack, P., and H. Whitehead. 1983. Male competition in large groups of wintering humpback
whales. Behaviour 83(1/2):132-154.
Tynan, C. T. 1998. Ecological importance of the Southern Boundary of the Antarctic
circumpolar current. Nature 392: 708-710.
Urbán R., J., C. Alvarez F., M. Salinas Z., J. Jacobsen, K. C. Balcomb Iii, A. Jaramillo L., L.
D. G. P. and A. Aguayo L. 1999. Population size of humpback whale, Megaptera

241
novaeangliae, in waters off the Pacific coast of Mexico. Fishery Bulletin 97: 1017-
1024.
Van Parijs, S. M., C. W. Clark, R. S. Sousa-Lima, S. E. Parks, S. Rankin, D. Risch and I. C.
Van Opzeeland. 2009. Management and research applications of real-time and
archival passive acoustic sensors over varying temporal and spatial scales. Marine
Ecology Progress Series 395: 21-36.
Van Waerebeek, K. 2003. A newly discovered population of humpback whales in the
Northern Gulf of Guinea. CMS Bulletin 18: 6-7.
Van Waerebeek, K., A. N. Baker, F. Félix, J. Gedamke, M. Iñiguez, G. P. Sanino, E. Secchi,
D. Sutaria, A. V. Helden and Y. Wang. 2007. Vessel collisions with small cetaceans
worldwide and with large whales in the Southern Hemisphere, an initial assessment.
Latin american journal of aquatic research 6: 43-69.
Vang, L. 2002. Distribution, abundance and biology of Group V humpback whales Megaptera
novaeangliae: A review. The State of Queensland Environmental Protection Agency,
Conservation Management Report, August 2002.
Walsh, P. D., J. M. Fay, S. Gulick and G. P. Sounguet. 2000. Humpback whale activity near
Cap Lopez, Gabon. Journal of Cetacean Research and Management 2: 63-67.
Watkins, W. A. and W. E. SchevillL. 1979. Aerial Observation of Feeding Behavior in Four
Baleen Whales: Eubalaena glacialis, Balaenoptera borealis, Megaptera novaeangliae,
and Balaenoptera physalus. Journal of Mammalogy 60: 155-163.
Wedekin, L. L., M. H. Engel, A. Azevedo, P. G. Kinas, A. Andriolo and P. C. Simões-Lopes.
2010a. Density and abundance of the humpback whale in the Brazilian breeding
ground (stock A): aerial survey, 2008. Paper SC/62?SH28 presented to the Scientific
committee of the International Whaling Commission. (unpublished). [available from
the office of this journal].

242
Wedekin, L. L., M. C. Neves, M. C. C. Marcondes, C. Baracho, M. R. Rossi-Santos, M. H.
Engel and P. C. Simões-Lopes. 2010b. Site fidelity and movements of humpback
whales (Megaptera novaeangliae) on the Brazilian breeding ground, southwestern
Atlantic. Marine Mammal Science 26: 787-802.
Weinrich, M. and C. Corbelli. 2009. Does whale watching in Southern New England impact
humpback whale (Megaptera novaeangliae) calf production or calf survival?
Biological Conservation 142: 2931-2940.
Weinrich, M. T. 1991. Stable social associations among humpback whales (Megaptera
novaeangliae ) in the southern Gulf of Maine. Canadian Journal of Zoology 69: 3012-
3019.
Weinrich, M. T., M. R. Schilling and C. R. Belt. 1992. Evidence for acquisition of a novel
feeding behavior: lobtail feeding in humpback whales, Megaptera novaeangliae.
Animal Behaviour 44: 1059-1072.
Weir, C. R. 2007. Occurrence and distribution of cetaceans off northern Angola, 2004/05.
Journal of Cetacean Research and Management 9: 225-239.
Whitehead, H. 1983. Structure and stability of humpback whale groups off Newfoundland.
Canadian Journal of Zoology 61: 1391-1397.
Whitehead, H. and M. J. Moore. 1982. Distribution and Movements of West Indian
Humpback Whales in Winter. Canadian Journal of Zoology, 60: 2203-2211.
Whitehead, H. P. 1981. The behaviour and ecology of the humpback whale in the Northwest
Atlantic. Ph.D. dissertation, Cambridge University, Cambridge, England.
Williams, R., E. Ashe and P. D. O’hara. 2011. Marine mammals and debris in coastal
waters of British Columbia, Canada. Marine Pollution Bulletin 62: 1303-1316.
Wiley, D. N. and P. J. Clapham. 1993. Does maternal condition affect the sex ratio of
offspring in humpback whales. Animal Behaviour 46: 321-324.

243
Witteveen, B. H., R. J. Foy, K. M. Wynne and Y. Tremblay. 2008. Investigation of foraging
habits and prey selection by humpback whales (Megaptera novaeangliae) using
acoustic tags and concurrent fish surveys. Marine Mammal Science 24: 516-534.
Wootton, J. T., C. A. Pfister and J. D. Forester. 2008. Dynamic patterns and ecological
impacts of declining ocean pH in a high-resolution multi-year dataset. Proceedings of
the National Academy of Sciences.
Wray, P. and K. R. Martin. 1980. Historical whaling records from the Western Indian Ocean.
Report of the International Whaling Commission (Special Issue) 5: 213-241.
Wright, A. J., N. A. Soto, A. L. Baldwin, M. Bateson, C. M. Beale, C. Clark, T. Deak, E. F.
Edwards, A. Fern√°Ndez, A. Godinho, L. T. Hatch, A. Kakuschke, D. Lusseau, D.
Martineau, M. L. Romero, L. S. Weilgart, B. A. Wintle, G. Notarbartolo-Di-Sciara and
V. Martin. 2007. Do Marine Mammals Experience Stress Related to Anthropogenic
Noise? International Journal of Comparative Psychology 20.
Zerbini, A. N., A. Andriolo, J. M. Da Rocha, P. C. Simões-Lopes, S. Siciliano, J. L. Pizzorno,
J. M. Waite, D. P. Demaster and G. R. Vanblaricom. 2004. Winter distribution and
abundance of humpback whales (Megaptera novaeangliae) off Northeastern Brazil. J.
Cetacean Res. Manage. 6: 101-107.
Zerbini, A. N., A. Andriolo, M. P. Heide-Jorgensen, J. L. Pizzorno, Y. G. Maia, G. R.
Vanblaricom, D. P. Demaster, P. C. Simoes-Lopes, S. Moreira and C. Bethlem. 2006.
Satellite-monitored movements of humpback whales Megaptera novaeangliae in the
southwest Atlantic Ocean. Marine Ecology-Progress Series 313: 295-304.

244
Chapter 8
Appendix:
Summary of relevant
Authored and Co-authored publications
Franklin, T., W. Franklin, L. Brooks, P. Harrison, P. Baverstock and P. Clapham. 2011.
Seasonal changes in pod characteristics of eastern Australian humpback whales
(Megaptera novaeangliae), Hervey Bay 1992-2005. Marine Mammal Science, 27(3):
E134–E152 (July 2011) ©2010 by the Society for Marine Mammalogy. DOI:
10.1111/j.1748-7692.2010.00430.x.
Franklin, T. and D. Burns. 2005. A Southern Right Whale, (Eubalaena Australis), In Hervey
Bay, Qld and Ballina, N NSW. Memoirs of the Queensland Museum 51 (2): 308.
Franklin, W., Franklin, T., Brooks, L., Gibbs, N., Childerhouse, S., Smith, F., Burns, D.,
Paton, D., Garrigue, C., Constantine, R., Poole, M.M., Hauser, N., Donoghue, M.,
Russell, K., Mattila, D.K., Robbins, J., Oosterman, A., Leaper, R., Harrison, P., Baker,
S.C. and Clapham, P. (2012) Antarctic waters (Area V) near the Balleny Islands are a
summer feeding area for some Eastern Australian (E (i) breeding group) Humpback
whales (Megaptera novaeangliae). Journal of Cetacean Research and Management 12,
321-327.
Franklin, W., T. Franklin, N. Gibbs, S. Childerhouse, C. Garrigue, R. Constantine, L. Brooks,
D. Burns, D. Paton, M. M. Poole, N. Hauser, M. Donoghue, K. Russell, D. K. Mattila,
J. Robbins, M. Anderson, C. Olavarria, J. Jackson, M. Noad, P. Harrison, P.
Baverstock, R. Leaper, S. C. Baker and P. Clapham. (In pressb). Photo-identification

245
confirms that humpback whales (Megaptera novaeangliae) from eastern Australia
migrate past New Zealand but indicates low levels of interchange with breeding
grounds of Oceania. Journal of Cetacean Research and Management.
Franklin, W., T. Franklin, L. Brooks, C. Jenner, M. Jenner, L. Goncalves, R. Leaper, L.
Brooks and P. Clapham. 2008. Photo-identification comparison of humpback whale
(Megaptera novaeangliae) flukes from Antarctic Area IV with Western and Eastern
Australian fluke catalogues Paper SC/60/SH1 presented to the International Whaling
Commission Scientific Committee. (Unpublished) 13pp. [Available from the office of
this Journal].
Anderson, M., D. Steel, W. Franklin, T. Franklin, D. Paton, D. Burns, P. Harrison, P.
Baverstock, C. Garrigue, P. Baverstock, C. Olavarria, M. Poole, N. Hauser, R.
Constantine, D. Theile, P. Clapham, M. Donoghue and S. Baker. 2010. Microsatellite
genotype matches of eastern Australian humpback whales to Area V feeding and
breeding grounds. Paper SC/62/SH7 presented to the Scientific Committee of the
International Whaling Commission, Agadir, Morocco, 30th May - 11th June
2010.11pp. (Unpublished). [Available from the office of this Journal]
Burns, D., L. Brooks, P. Harrison, T. Franklin, W. Franklin, D. Paton and P. Clapham. in
press. Migratory movements of individual humpback whales photographed off the
eastern coast of Australia. Marine Mammal Science.
Garrigue, C., T. Franklin, R. Constantine, K. Russell, D. Burns, M. Poole, D. Paton, N.
Hauser, M. Oremus, S. Childerhouse, D. Mattila, N. Gibbs, W. Franklin, J. Robbins,
P. Clapham and C. S. Baker. 2011. First assessment of interchange of humpback
whales between Oceania and the east coast of Australia. Journal of Cetacean Research
and Management (Special Issue) 3: 269-274.

246
Jackson, J. A., M. Anderson, D. S. Steel, L. Brooks, P. Baverstock, D. Burns, P. Clapham, R.
Constantine, W. Franklin, T. Franklin, C. Garrigue, N. Hauser, D. Paton, M. M. Poole
and S. C. Baker. 2012. Multistate measurements of genotype interchange between East
Australia and Oceania (IWC breeding sub-stocks E1, E2, E3 and F2) between 1999
and 2004. Paper SC/64/SH22 presented to the Scientific Committee of the
International Whaling Commission. 16pp. (Unpublished). [Available from the office of
this journal].
Gregory Kaufman, Douglas Coughran, Judy M. Allen, Daniel Burns, Chris Burton, Cristina
Castro, Simon Childerhouse, Rochelle Constantine, Trish Franklin, Wally Franklin,
Paul Forestell, Rosemary Gales, Claire Garrigue, Nadine Gibbs, Curt Jenner, David
Paton, Michael Noad, Jooke Robbins, Elisabeth Slooten, Franz Smith and P. Stevick.
2011. Photographic Evidence of Interchange Between East Australia (BS E-1) and
West Australia (BS – D) Humpback Whale Breeding Populations. Paper SC63/SH11
presented to the Scientific Committee of the International Whaling Commission. 16pp.
(Unpublished). [Available from the office of this Journal].
Paton, D. A., L. Brooks, D. Burns, T. Franklin, W. Franklin, P. Harrison and P. Baverstock.
2011. First abundance estimate of east coast Australian humpback whales (Megaptera
novaeangliae) utilising mark-recapture analysis and multi-point sampling. Journal of
Cetacean Research and Management (Special Issue) 3: 253-259.
Rochelle Constantine, Judy Allen, Peta Beeman, Daniel Burns, Simon Childerhouse, Michael
C. Double, Paul Ensor, Trish Franklin, Wally Franklin, Nick Gales, Claire Garrigue,
Emma Gates, Nadine Gibbs, Amanda Hutsel, Curt Jenner, Micheline Jenner, Greg
Kaufman, Anne Macie, David K. Mattila, Adrian Oosterman, David Paton, Jooke
Robbins, Peter Stevick, Natalie Schmitt, Alden Tagarino and K. Thompson. 2011.
Comprehensive photo-identification matching of Antarctic Area V humpback whales.

247
Paper SC/63/SH16 presented to IWC Scientific Committee. 11pp.(unpublished).
[Available from the office of this Journal].
Steel, D., N. Schmitt, M. Anderson, D. Burns, S. Childerhouse, R. Constantine, T. Franklin,
W. Franklin, N. Gales, C. Garrigue, N. Gibb, N. Hauser, D.Mattila, C. Olavarria, D.
Paton, M. Poole, J. Robbins, J. Ward, P. Harrison, P. Baverstock, M. Double and C. S.
Baker. 2011. Initial genotype matching of humpback whales from the 2010
Australia/New Zealand Antarctic Whale Expedition (Area V) to Australia and the
South Pacific. Paper SC/63/SH10 presented to the Scientific Committee of the
International Whaling Commission. 8pp. (Unpublished). [Available from the office of
this Journal].