The Sawan Gas Field - CORE
58
This is an Open Access document downloaded from ORCA, Cardiff University's institutional repository: http://orca.cf.ac.uk/102849/ This is the author’s version of a work that was submitted to / accepted for publication. Citation for final published version: Anwer, M. Hafiz, Alves, Tiago MArcos, Aamir,, A. and Zubair, 2017. Effects of sand-shale anisotropy on amplitude variation with angle (AVA) modelling: The Sawan Gas Field (Pakistan) as a key case-study for South Asia's sedimentary basins. Journal of Asian Earth Sciences 147 , pp. 516- 531. 10.1016/j.jseaes.2017.07.047 file Publishers page: https://doi.org/10.1016/j.jseaes.2017.07.047 <https://doi.org/10.1016/j.jseaes.2017.07.047> Please note: Changes made as a result of publishing processes such as copy-editing, formatting and page numbers may not be reflected in this version. For the definitive version of this publication, please refer to the published source. You are advised to consult the publisher’s version if you wish to cite this paper. This version is being made available in accordance with publisher policies. See http://orca.cf.ac.uk/policies.html for usage policies. Copyright and moral rights for publications made available in ORCA are retained by the copyright holders.
-
Upload
khangminh22 -
Category
Documents
-
view
0 -
download
0
Transcript of The Sawan Gas Field - CORE

This is an Open Access document downloaded from ORCA Cardiff Universitys institutional
repository httporcacfacuk102849
This is the authorrsquos version of a work that was submitted to accepted for publication
Citation for final published version
Anwer M Hafiz Alves Tiago MArcos Aamir A and Zubair 2017 Effects of sand-shale
anisotropy on amplitude variation with angle (AVA) modelling The Sawan Gas Field (Pakistan) as
a key case-study for South Asias sedimentary basins Journal of Asian Earth Sciences 147 pp 516-
531 101016jjseaes201707047 file
Publishers page httpsdoiorg101016jjseaes201707047
lthttpsdoiorg101016jjseaes201707047gt
Please note
Changes made as a result of publishing processes such as copy-editing formatting and page
numbers may not be reflected in this version For the definitive version of this publication please
refer to the published source You are advised to consult the publisherrsquos version if you wish to cite
this paper
This version is being made available in accordance with publisher policies See
httporcacfacukpolicieshtml for usage policies Copyright and moral rights for publications
made available in ORCA are retained by the copyright holders
1
Effects of sand-shale anisotropy on amplitude variation with angle (AVA ) 1
modelling The Sawan Gas Field (Pakistan) as a key case-study for South 2
Asias sedimentary basins 3
Hafiz Mubbasher Anwer1 Tiago M Alves2 Aamir Ali1 Zubair 3 4
1Department of Earth Sciences Quaid-i-Azam University Islamabad 45320 Pakistan 5
23D Seismic Lab School of Earth and Ocean Sciences Cardiff University Main Building-Park 6
Place Cardiff CF10 1JZ United Kingdom 7
3Software Integrated Solutions Schlumberger Pakistan 8
Corresponding author 9
10
Abstract 11
Amplitude variation with angle (AVA) is a technique widely used in the characterisation of 12
hydrocarbon reservoirs and assumes the Earthrsquos crust to be an isotropic medium Yet seismic 13
anisotropy is known to have first-order effects on seismic AVA responses when investigating 14
subsurface prospects This work analyses the effects of anisotropic strata on AVA responses 15
using the Lower Goru Formation middle Indus basin (Pakistan) as a case-study In the study 16
area shale intervals are interbedded with reservoir sands of the Sawan gas field Shales in this 17
gas field form laminae or are dispersed within reservoir sands making the Lower Goru 18
Formation an example of a vertically transversely isotropic (VTI) medium In this work we 19
calculate the effective (saturated) mechanical properties of the Lower Goru Formation based on 20
rock physics templates the Backus (1962) average typically designed for layered media 21
combined with the empirical relations of Brown and Korringa (1975) and Wood (1955) The 22
input data used in our rock physics modelling is based on a detailed petrophysical analysis of 23
well data Using the saturated effective mechanical properties of the Lower Goru Formation we 24
2
generate angle-dependent reflection coefficient curves (and seismic AVA responses) based on 25
exact and approximate solutions for both isotropic and anisotropic reservoir scenarios Our 26
results suggest that the effects of lithological anisotropy are more pronounced in places with 27
thick shale beds within reservoir sands Conversely angle-dependent reflection curves and 28
seismic AVA responses based on isotropic or anisotropic cases give similar solutions in the 29
presence of thin shale beds As a corollary of this work we present a Bayesian inversion method 30
for the estimation of porosity in VTI media 31
32
Keywords South Asia VTI medium Ruumlgerrsquos approximation PP reflection coefficients 33
Anisotropic AVA Modelling Bayesian inversion 34
35
1 Introduction 36
37
Modern techniques based on the systematic analysis of amplitude variations of seismic 38
waves with changing distance between source and receiver (AVO) or with angle of incidence 39
(AVA) are widely used in the petroleum industry to a) detect subsurface gas b) identify 40
lithological variations and c) analyse subsurface fluid volumes and compositions (Floridia and 41
Teles 1998 Grechka 1998 Margesson and Sondergeld 1999 Feng and Bancroft 2006 42
Almutlaq and Margrave 2010 Chao et al 2012) Seismic AVA is of particular interest as its 43
use is based on the realisation that variations in amplitude at varying incident angles result from 44
contrasts in lithology and fluid content in rocks above and below a layer boundary (Zhang and 45
Brown 2001) Seismic AVA modelling is systematically carried out in reservoir studies by 46
considering the Earth as an isotropic medium However all sedimentary rocks exhibit anisotropic 47
behaviour at different scales (Xu et al 2005) It has been known for a long time that anisotropy 48
resulting from shaley beds and lenses within sandy successions can affect seismic AVA 49
responses when investigating sand-shale reservoirs (Banik 1987 Wright 1987 Kim et al 1993 50
3
Thomsen 1995 Blangy 1994 Ball 1995 Grechka 1998 Besheli et al 2005 Brajanovski et 51
al 2009 Chao et al 2012 Nourollah et al 2015) By ignoring the effects of anisotropy during 52
AVA modelling interpreters may complete erroneous characterisations of productive reservoir 53
intervals (Besheli et al 2005) Importantly erroneous quantification of volumes and reservoir 54
distribution(s) should arise when analysing the petroleum potential of sedimentary basins in 55
South Asia and other parts of the world where stratified reservoir sequences of shale and silt 56
contain significant amounts of lsquotight oilrsquo and lsquotight gasrsquo (εcGlade et al 2012 Katz and Lin 57
2014 English et al 2015 Rodriguez et al 2016) 58
In recent decades stratigraphic sequences of thin-layered sands and shales have become 59
key exploration targets for which seismic anisotropy methods (also referred to as long-60
wavelength anisotropy) are useful and broadly successful in their characterisation (Crampin et 61
al 1984 Sayers 2013 Sone and Zoback 2013 Das and Zoback 2013) Shale layers within a 62
horizontally-bedded sand matrix behave elastically as transversely isotropic (TI) media ie they 63
have similar wave properties in two perpendicular directions but are significantly different in a 64
third orthogonal direction (Sone and Zoback 2013) In these same sequences vertical axes of 65
symmetry are often described as vertically transversely isotropic (VTI) media (da Silva et al 66
2016 Li et al 2016) 67
The anisotropic behaviour of VTI media is usually quantified by using Thomsens 68
anisotropic parameters (Thomsen 1986) in which denotes the fractional difference 69
between the horizontal and vertical P-wave velocities describes the variation in P-wave 70
velocity with phase angle for near-vertical propagation and denotes the fractional difference 71
between the horizontal and vertical SH-wave velocity (Ruumlger 2002) The empirical forms of 72 are provided by Ruumlger (2002) as 73
74
55
5566
2C
CC (1) 75
4
33
3311
2C
CC (2) 76
and 77
)(2
)()(
553333
25533
25513
CCC
CCCC
(3) 78
79
Here C represents the stiffness and its indices denote standard constants for VTI media In 80
essence elastic anisotropy in VTI media can be characterised by five independent elastic 81
constants which can be expressed in two notations a) in terms of stiffness constants 82
(C C C C amp C ) or b) in terms of vertical velocities (VP and V and Thomsenrsquos 83
anisotropic parameters ( (Tsvankin 1997a 1997b) These five independent elastic 84
constants are very difficult to apply to AVA analyses and most of these latter are developed by 85
assuming a non-VTI medium 86
Several researchers have attempted to estimate seismic anisotropy and incorporate it into 87
AVA -based methods using seismic VSP well logs and core data (Blangy 1992 Leaney 1993 88
Blangy 1994 Margesson and Sondergeld 1999 Besheli et al 2005 Luo et al 2005 Wang et 89
al 2006 Brajanovski et al 2009 Goodway et al 2010 Wang 2011) but seldom for 90
hydrocarbon-rich basins in South Asia However in the Indian subcontinent (including Pakistan 91
and bordering countries) important tight oil and gas reservoirs have been found in the hinterland 92
basins that surround the Himalayan and Baluchistan mountain ranges The Indus basin is 93
currently the main focus of oil and gas exploration and production in Pakistan (Alam et al 2014 94
Asim et al 2015) (Figure 1a) In this basin as in other hydrocarbon-productive regions of South 95
and Southeast Asia the successful use of AVA techniques in reservoir characterisation is 96
critically dependent upon the careful estimation of the anisotropic parameters of sedimentary 97
rocks (Zaigham and Mallick 2000 Chengzao et al 2012 Zhu et al 2012 Jinhu et al 2014) 98
5
In this work we use well log data from the Sawan gas field (Figure 1b) middle Indus basin 99
(Pakistan) to focus on the Cretaceous Lower Goru C-sand reservoir which is interbedded with 100
shales We use reservoir properties estimated from borehole data as key data inputs to our rock 101
physics models and to later carry out anisotropic and isotropic AVA analyses Rock physics 102
models are often used to link seismic data to reservoir properties (Avseth et al 2005) Seismic-103
based estimates of reservoir properties can be uncertain but the inclusion of rock physics models 104
in exploration workflows is nevertheless capable of reducing the level of uncertainty by 105
decreasing the number of unknown parameters in AVA analyses In other words rock physics 106
modelling represents a type of regularization within the context of seismic inversion (Ali and 107
Jakobsen 2011a 2011b) 108
The aim of this work is to analyse the effects of anisotropy generated by interbedded shales 109
within the reservoir sands and its implications to AVA -based reservoir studies In parallel we 110
investigate how accurate are seismic AVA methods for both exact (Zoeppritz 1919 Daley and 111
Horn 1977) and approximate (Ruumlger 1998 2002) solutions for PP-reflection coefficients within 112
the context of isotropic and anisotropic cases 113
114
2 Geological setting 115
116
The Sawan gas field lies in the middle Indus basin in the eastern border of Pakistan (Zaigham 117
and Mallick 2000) The study area is bounded by the Sargodha High to the north and by the 118
Jacobabad and Mari-Kandkot Highs to the south (Figure 1a) The Indian Shield bounds the 119
eastern side of the study area whereas the Kirthar and Suleiman fold-and-thrust belts mark its 120
western boundary (Kadri 1995 Afzal et al 2009) Regional geological data indicate that the 121
structural evolution of the Sawan gas field was closely controlled by three post-rift tectonic 122
events a) Late Cretaceous uplift and erosion b) NWndashtrending thick-skinned wrench faulting and 123
c) Late Tertiary to present-day tectonic uplift of the Jacobabad and Khairpur Highs (Ahmad et 124
6
al 2004 Afzal et al 2009 Azeem et al 2016) These latter structural highs played an important 125
role in the formation of structural and stratigraphic traps not only in the Sawan area but also in 126
multiple oil and gas fields in the region (Ahmad et al 2004 Fink et al 2004 Berger et al 127
2009) 128
Cretaceous black shales in the Sembar Formation are the proven source rock in the middle 129
and lower Indus basins which were mainly filled with shale and minor amounts of black 130
siltstone sandstone and nodular argillaceous limestone (Quadri and Shuaib 1986 Kadri 1995) 131
The thickness of the Sembar Formation ranges from 0 m to more than 260 m (Iqbal and Shah 132
1980) The Sembar Formation is deeply buried and matures thermally towards the western edge 133
of the Indus basin It becomes shallower and less mature towards its eastern edge (Wandrey et 134
al 2004) In the study area the tectonic uplift recorded by the Khairpur High controlled the 135
depositional patterns of the main reservoir unit (Goru Formation) reservoir sands in proximal 136
depositional systems are positioned in structurally deep areas whereas non-reservoir distal shales 137
are positioned up-dip to form major structural traps (Azeem et al 2016 Berger et al 2009) The 138
depositional environment of the Lower Goru Member which comprises the main reservoir 139
interval above the Sembar Formation was marine and reflects deposition at the western (passive) 140
margin of the Indian plate 141
The Sembar Formation is therefore overlain by the Lower Goru Member of the Goru 142
Formation ie the proven reservoir interval in the Sawan gas field (Fig 2) The upper part of the 143
Lower Goru Member is chiefly composed of shales whereas its lower part comprises medium 144
to coarse-grained sandstones with thin layers of shale and limestone The lower portion of the 145
reservoir interval can be subdivided into distinct sand intervals A B C and D (Krois et al 1998) 146
(Figure 2) The deposition of these sand intervals took place in deltaic shallow-marine 147
environments during sea-level lowstands when medium to coarse-grained sediment was 148
deposited on top of the distal (shale and siltstone) strata of previous highstand systems tracts 149
(HSTs) (Berger et al 2009 Azeem et al 2016) 150
7
Petrographically intervals A and B can be classified as quartz-rich arenites (Berger et al 151
2009) The C interval includes significant amounts of partially altered volcanic rock fragments 152
and pore lining iron chlorite cement Thus the sands of interval C can be classified as sublithic 153
to lithic arenites (McPhee and Enzendorfer 2004 Berger et al 2009 Azeem et al 2016) Sands 154
in the B and C intervals comprise the main gas reservoirs in the study area (Munir et al 2011) 155
showing high porosity (ie around 16 ) and permeability at depths between 3000ndash3500 m 156
(Azeem et al 2016) These two reservoir intervals of the Lower Goru Member are draped by 157
transgressive shales and siltstones of the Upper Goru Member which acts as a regional seal in 158
the middle and lower Indus basins (Berger et al 2009) 159
160
3 Dataset and methods 161
162
Data from three exploration wells (Sawan-01 Sawan-3B and Sawan-06) are used in this 163
study to analyse the acoustic effects of the lithologic anisotropy created by interbedded shales in 164
the C-sand reservoir The rationale behind selecting the Sawan gas field as a case study results 165
from the fact that it is located in the tectonically stable part of the Thar Platform in the middle 166
Indus basin It also shows marked alternations of sands and shales being a typical example of a 167
VTI medium 168
The workflow adopted in this work is shown in Figure 3 In a first instance we analysed 169
sand-shale distribution patterns in the main reservoir intervals using the methodology proposed 170
by Thomas and Stieber (1975) In a second stage rock physics modelling was undertaken using 171
the Backus (1962) approach for dry composite porous media (sand-shale) used together with the 172
relationships of Brown and Korringa (1975) and Wood (1955) These latter relationships allowed 173
us to incorporate fluid effects on the mechanical properties of strata The aim of the second stage 174
of our analysis was to obtain (saturated) effective elastic properties for the Lower Goru reservoir 175
8
intervals (see also Jakobsen et al 2003a 2003b Ali and Jakobsen 2011a 2011b Ali et al 176
2016) 177
In a third stage exact solutions of P-wave reflection coefficients derived from Zoeppritz 178
(1919) solutions for isotropic media and Daley and Hornrsquos (1977) solutions for VTI media were 179
used to generate angle dependent reflection coefficients and seismic AVA data from the top of 180
the reservoir for both isotropic and anisotropic cases In parallel the Ruumlgerrsquos approximation 181
(Ruumlger 1998 2002) was used for angle dependent reflection coefficients and seismic AVA data 182
from the top of the reservoir for both isotropic and anisotropic cases over the Sawan reservoir 183
intervals Finally a Bayesian inversion scheme was utilised to investigate the implications of 184
isotropic and anisotropic AVA solutions on the estimation of porosity throughout the reservoir 185
186
31 Sand-Shale distribution analysis 187
188
To understand shale distribution within reservoir sands is an integral part of forward 189
modelling using rock physics templates (Ali et al 2016) Prior to developing the appropriate 190
rock physics model for AVA modelling sand-shale distribution analyses are necessary to 191
identify the type of shale(s) distributed within reservoir sands (Ali et al 2016) This step 192
improves confidence in the interpretation of sand-shale reservoirs because it helps interpreters to 193
decide which geophysical approach is appropriate for a particular reservoir (Kurniawan 2005) 194
The distribution of shale within reservoir sands has a pronounced effect on reservoir production 195
performance due to decreasing porosity values and variable saturations that derive from the 196
presence of shales (Sames and Adrea 2001 Ali et al 2016) Hence sand-shale distribution 197
analyses require robust stratigraphic correlations based on gamma-ray log data (Figure 4) 198
Gamma-ray curves are particularly helpful in the identification of shales within reservoir sand 199
and for detailed petrophysical analyses and correlations The petrophysical interpretation of wells 200
9
(Sawan-01 Sawan-3B and Sawan-06) was carried out to determine key reservoir properties such 201
as P-wave velocity (Vp) S-wave velocity (Vs) porosity (ϕ) density (ρ) volume of shale (Vsh) 202
and water saturation (Sw) for the C-sand of the Lower Goru Member (Figures 5-7) The details 203
of estimated reservoir parameters are given in Tables 1-3 204
The parameters commonly required in sand-shale distribution analyses are volume of shale 205
porosity and water saturation with the volume of shale being a critical parameter that controls 206
the two latter (Saxena et al 2006) Once these parameters are estimated the Thomas-Stieber 207
(1975) method in Figure 8 can be used to estimate shale distribution patterns (Saxena et al 208
2006) The Thomas-Stieber (1975) method estimates shale distribution utilizing a cross-plot with 209
volume of shale along the X-axis and total porosity along the Y-axis The position of data points 210
on the cross-plot allows the identification of the type(s) of shale distribution within sands 211
Usually shales are distributed through four different ways within sands a) as laminae b) 212
through structures (faults joints) c) dispersed in sands and d) as any combinations of the three 213
latter ways (Clavaud et al 2005 Sams and Andrea 2001) The results from sand-shale analyses 214
undertaken for the three studied wells suggest that in our study area laminar and dispersed shales 215
are distributed within reservoir sands (Figures 9-11) 216
217
32 Forward Modelling 218
219
The nonlinear forward problem is defined as 220
221
= G (4) 222
223
In Equation (4) is a vector of observable quantities (angle-dependent reflection coefficients 224
or seismic AVA data) and is a vector of model parameters required to be estimated over the 225
10
model space ie isin The operator is a forward modelling operator used for generating 226
synthetic angle-dependent reflection coefficients or seismic AVA data via rock physics and 227
seismic modelling In the subsequent section we will discuss the rock physics modelling for a 228
layered medium 229
230
321 Rock Physics modelling 231
232
Rock physics models are important to correlate variations in reservoir properties (lithology 233
porosity permeability pore fluid etc) with changes in the velocities (Vp Vs) and density (ρ) 234
observed on well data (Uden et al 2004) Rock physics models act as a bridge between 235
geological properties (reservoir parameters) and geophysical data by upscaling the reservoir 236
variables related to lithology shale content and fluid parameters (Bachrach 2006 Avseth et al 237
2005) Rock physics also provide a realistic and systematic basis for seismic-attribute generation 238
and interpretation (Avseth et al 2005) In clastic reservoirs shales are often found to behave 239
elastically as transversely isotropic media with a vertical axis of symmetry (Jakobsen and 240
Johansen 1999 2000) In forward models rock physics models are used to calculate effective 241
elastic properties from petrophysical properties estimated from wireline-log data 242
Results of shale distribution analyses within the Sawan gas field reservoir sands show that 243
laminar and dispersed shale types are distributed in the host medium Such a medium can be 244
modelled using anisotropic rock physics (Ali et al 2016 Ali et al 2015 Jakobsen et al 2003 245
Sayers and Rickett 1997 Sayers 1998 Backus 1962) In this study we follow the approach 246
given by Backus (1962) which was typically designed for a layered medium (see Appendix-A) 247
The fluid effects are incorporated via the Gassmann model for isotropic cases and via the Brown 248
and Korringa (1975) model for anisotropic cases in conjunction with the Wood (1955) model 249
for homogenous saturations (Appendix-B) 250
11
251
322 Seismic amplitude variation with angle (AVA ) modelling 252
253
Seismic AVA modelling is considered to be the most effective technique for reservoir 254
characterisation In practice AVA studies are the method most widely used for gas detection 255
lithology identification and fluid parameter analyses (Feng and Bancroft 2006) Seismic 256
response of variations in effective elastic properties obtained through rock physics tools for sand-257
shale layers can be modelled using synthetic seismic AVA data From the effective elastic 258
properties as calculated above angle-dependent reflection coefficients and seismic AVA data 259
can be generated using the exact Zoeppritz (1919) formulation for isotropic media and the Daley 260
and Hornrsquos (1977) exact methods for anisotropic (VTI) media We also tested the Ruumlger (2002) 261
approximation for the generation of reflection coefficients for both isotropic and VTI media The 262
rationale behind only selecting Ruumlgerrsquos approximation for isotropic and VTI media is that the 263
Ruumlgerrsquos technique is only linearised in terms of small contrasts in medium parameters without 264
having any additional assumption on Poissonrsquos or VpVs ratios (Ruumlger 2002) 265
266
3221 P-wave reflection coefficient for isotropic media 267
268
The exact Zoeppritz (1919) empirical relation (see Equation 5) allows us to calculate the PP-269
wave reflection coefficients () of a rock as a function of the incidence angle from the top of 270
an isotropic medium which can be represented as a system of linear equations given as (Pujol 271
2003) 272 = (5) 273
Where 274
275
12
A =
[ minus prime prime sin cos prime minus prime minus prime prime prime prime prime prime primeminus minus prime prime minus prime prime prime ]
(6) 276
= [ ] (7) 277
and = [ ] (8) 278
279
The unknown vector can be obtained by 280
281 = minus (9) 282
283
In these equations α ρ e and f are the P-wave velocity S-wave velocity density P-wave 284
transmission angle and SVndashwave transmission angle of the upper half space Conversely αacute acute 285
ρacute eacute and facute are the P-wave velocity S-wave velocity density and P-wave reflection angle and 286
SVndashwave reflection angle of the lower half space 287
288
3222 Formulation of PP-wave reflection coefficients for VTI media 289
290
The exact algebraic solution for reflectiontransmission coefficients of plane incident 291
P-waves in a VTI medium developed by Daley and Horn (1977) is used in this work The 292
concise form of the exact solution of P-wave reflection coefficients for a VTI medium 293
in matrix form is given below (Graebner 1992 Ruumlger 2002) 294
= (10) 295
13
where = [minus minus ] (11) 296
and = [
] (12) 297
By using Cramerrsquos rule the solution for unknown vector can be expressed in its analytic form 298
as 299
= M [ ] (13) 300
The values of matrices M and are given by Ruumlger (2002) Graebner (1992) and Daley and Horn 301
(1977) 302
303
3223 Approximations for P-wave reflection coefficients 304
305
We also investigate the accuracy of Ruumlgerrsquos (2002) approximation for both isotropic and VTI 306
media with the exact solutions given by Zeoppritzrsquos (1919) and Daley and Hornrsquos (1977) 307
Ruumlgerrsquos approximation for isotropic media is given below (Ruumlger 2002) 308
309
RPPi = ΔZZ + ΔVPVP minus VSVP ΔGG sin + ΔVPVP sin tan (14) 310
311
14
Where Z is the P-wave impedance G is the shear wave modulus VP is the vertical P-wave 312
velocity and V is the vertical shear-wave velocity The character delta (Δ stands for contrasts 313
across an interface (ΔZ = Z minus Z ) and the bar over a symbol represents its average (Z = Z +Z) 314
Subscript 1 corresponds to the upper layer and subscript 2 denotes the lower layer Ruumlgerrsquos 315
approximation for the generation of reflection coefficients as a function of incidence angle () 316
in the case of VTI media (Ruumlger 2002) is written as 317
318
RPPV i = ΔZZ + ΔVPVP minus VSVP ΔGG + Δ sin i + ΔVPVP + Δɛ sin i tan i (15) 319
320
The additional terms ɛ and are Thomsenrsquos (1985 1996) anisotropy parameters for VTI 321
media 322
323
33 Inverse modelling 324
325
In Bayesian settings the solution of the inverse problem is given by the posterior probability 326
distribution q() applied over the model space M In essence q() carries all the 327
information about the model originating from the likelihood L and a priori probability 328
density function p Bayesrsquo theorem allows to relate q() with L and p given 329
as (Aster et al 2005) 330
331 q() L p (16) 332
333
Here is the sign of proportionality The solution of the posterior distribution can be written 334
in a compact form as (Aster et al 2005 Tarantola 2005) 335
15
336 q() = N eminus (17) 337
338
where N is the normalization constant The functional form of the objective function J 339
required to be minimised in the case of Gaussian statistics and an uninformative prior 340
distribution is given by Aster at al (2005) as 341
342
J = minsum (G )iminus iσi= (18) 343
344
Here σ is the standard deviation of the measured seismic data The rationale behind assuming 345
an uninformative prior distribution is that we do not intend to constrain our inversion scheme by 346
incorporating a priori information (obtained mostly from logcorelaboratory data) about the 347
model parameters There are different methods available for the evaluation of q() most of 348
which are described in Ali et al (2011a 2011b and 2015) 349
350
4 Numerical results and discussion 351
352
In this work we analyse the effects created by sand-shale anisotropy on AVA response with 353
the help of rock physics modelling In parallel we present a comparison of exact and approximate 354
AVA solutions for isotropic and anisotropic scenarios Before applying rock physics modelling 355
to layered media it is very important to identify the type of shale distribution within reservoir 356
sands eg laminar structural dispersed and so on For this same purpose we followed the 357
approach presented in Section 31 for the C-sand reservoir unit (Lower Goru Member) drilled by 358
16
wells Sawan-01 Sawan-3B and Sawan-06 Reservoir properties are estimated through 359
petrophysical analyses of well log data acquired in the Sawan field and results are presented in 360
Figures 5-7 and in Tables 1-2 361
The analysis of shale distribution suggests that the C-sand comprises laminated and dispersed 362
shale types (Figures 8-11) Thus the Lower Goru C-sand may be a potential candidate to be 363
characterised as a VTI medium rather than isotropic Laminar shales in the C-sand reservoir 364
comprise thin layers of allogenic clays and do not control effective porosity water saturation or 365
the horizontal permeability of rock However they significantly change vertical permeability 366
(Kurniawan 2005) Each lamina differs in thickness in a way that the amounts of sand silt and 367
clay in the layer are repeated as depositional sequences (or cycles) under dual flow regimes that 368
denote contrasts in energy level 369
The saturated effective elastic properties for isotropic and VTI media are obtained using the 370
methodology discussed in section 32 The input to our rock physics modelling in the form of 371
elastic and reservoir properties of the Lower Goru C-sand intra-reservoir shale layers and 372
overburden strata is extracted from the petrophysical analyses summarised in Table 3 The 373
elastic properties of solid mineral (quartz) and fluid (water and gas) required to generate AVA 374
data are given in Table 4 375
For the generation of isotropic angle-dependent reflection coefficient curves are used the exact 376
solution of Zeoppritz (1919) for isotropic media and Daley and Hornrsquos (1977) solution for VTI 377
media Ruumlgerrsquos (2002) approximation is also used for both isotropic and VTI media to investigate 378
the accuracy of exact and approximate solution of P-wave reflection coefficients as a function of 379
incidence angle 380
The angle dependent reflection coefficient (RC) curves are key to explain the main results in 381
this work We demonstrate in Figs 12-14 that the intercept (normal incidence ie zero offset P-382
wave reflectivity) and slope of the curve (gradient) indicate how the amplitude of RC changes 383
with angleoffset The gradient of each RC curve is almost the same but there are small 384
17
differences in the magnitude of angle-dependent PP-reflection coefficients when comparing the 385
isotropic and anisotropic cases (Figures 12-14) If we examine variations in RC based upon 386
isotropy and anisotropy it is obvious that in the Sawan-01 well only small differences can be 387
observed between isotropic and anisotropic RC curves (Figure 12) This clearly demonstrates 388
that strata drilled in Sawan-01 have a weak anisotropy ( = 00β14 = 00γ06 = 00186) In 389
Sawan-3B there are insignificant variations between isotropic and anisotropic RC curves (Figure 390
13) Finally for Sawan-06 there is a significant variation in RC curves when comparing the 391
isotropic and anisotropic cases (Figure 14) More importantly if we relate these variations in RC 392
curves with varying shale content we can conclude that the wells with comparatively thick shale 393
layers show substantial variations between their isotropic and anisotropic RC curves The best 394
example is naturally the RC response documented in well Sawan-06 (Figure 14 see also thick 395
shale content marked in yellow in Figure 4) 396
We observe that AVA data is moderately sensitive to the anisotropy of the medium In 397
essence our results confirm that little or no effects created by anisotropy upon reflection curves 398
are diagnostic of very weakly anisotropic media Significantly as shales are strongly anisotropic 399
and heterogeneous (Kumar et al 2012) exploration well(s) that encountered thick shale layers 400
in the study area show clear variations between the behaviour of isotropic and anisotropic angle 401
dependent PP-reflection coefficients (Figure 14) Based on data from the three interpreted wells 402
(Sawan-01 Sawan-3B and Sawan-06) shale anisotropy increases proportionally to shale content 403
and the effect of this same shale anisotropy upon reflection curves becomes more pronounced 404
As such it is advisable to predict anisotropy in a medium during AVA studies especially when 405
thick allogenic shale layers are present in reservoir successions 406
The investigation of Ruumlger (2002) approximationrsquos accuracy for both isotropic and VTI media 407
reveal that the predicted magnitude of reflection coefficients is significantly different in all the 408
three studied wells at large offsets Also the gradient predicted by the Ruumlger (2002) 409
approximation is high when compared to the exact solutions 410
18
For seismic AVA response in isotropic and VTI media angle-dependent reflection 411
coefficients are convolved with the source (Ricker) wavelet (Figures 15-17) It can be observed 412
from our approach that the amplitude of synthetic AVA gathers show a decreasing trend with 413
increasing angle of incidence The difference between exact and approximate solutions is more 414
pronounced in the magnitude of predicted seismic AVA amplitude values (Figures 15-17) 415
The AVA response of VTI media is sensitive to contrasts in Thomsenrsquos anisotropic 416
parameters and across the interface (Blangy 1994 Margesson and Sondergeld 1999) As 417
also identified by Daley and Horn (1977) generally P-P reflections indicate that the smaller the 418
contrast in isotropic properties (VP Vs ρ) and the larger the contrast in (variation in P-wave 419
velocity with phase angle for near vertical propagation) across a reflection interface the greater 420
are the effects of anisotropy on AVA signatures Contrasts in are most important under small-421
to-medium angles of incidence as previously reported in Banik (1987) whereas contrasts in 422
(fractional difference between the horizontal and vertical P-wave velocities) can have a strong 423
influence on amplitudes for the larger angles of incidence (21o) commonly used in exploration 424
seismic data The increasing trend in gradients is more pronounced at far offsets (21o to 40o) 425
revealing an increasing sensitivity in terms of anisotropy and isotropy with increasing offset 426
angles 427
The AVA modelling also proves a strong relationship between porosity and reflection 428
coefficient for all offset ranges Therefore in order to check the accuracy of exact and 429
approximate solutions for P-wave reflection coefficients in AVA inversion we tried to recover 430
true reservoir porosity distribution (with 20 uncertainty) under the Bayesian settings discussed 431
in Section 6 For this purpose a correlated Gaussian field was generated representing the true 432
porosity (Buland and Omre 2003) distribution throughout the reservoir within 100times100 grid 433
blocks (Figure 18) Later a AVA modelling approach (exactapproximate VTI or 434
exactapproximate isotropic) was performed using a maximum-a-posteriori (MAP) solution The 435
19
results suggest that the exact VTI solution recovers the porosity trends with much more accuracy 436
when compared to all other solutions under significant noise conditions (Figure 18) 437
438
5 Conclusions 439
In industry seismic AVAAVO techniques are being increasingly used for amplitude-based 440
reservoir characterisation but frequently assume that subsurface media are isotropic Seismic 441
anisotropy is known to have a first order effect on AVA modelling but this effect is often ignored 442
during AVA studies providing significant errors when describing reservoir intervals In this 443
work we analyse the effects of anisotropy on AVA modelling and inversion for a sand-shale 444
reservoir in the Sawan gas field Pakistan The main conclusions of this work are as follows 445
446
a) AVA modelling shows that anisotropy effects are more pronounced in stratigraphic 447
intervals where interbedded shales are relatively thick within reservoir sand (Sawan-06 well) 448
The exactapproximate isotropic or VTI solutions show smaller variations in the presence of thin 449
interbedded shale layers within reservoir sands 450
b) The exact solution for VTI media provided by Daley and Hornrsquos (1977) is one with the 451
highest potential for performing AVA inversion in sand-shale media with weak to strong 452
anisotropy We have demonstrated this fact by completing a numerical synthetic experiment for 453
recovering porosity distributions through the Lower Goru reservoir 454
c) The choice of approximate solution(s) for AVA modelling is crucial in any workflow since 455
in most cases there is a significant difference in the predictions of magnitude of reflection 456
coefficients and gradient of the reflection curves resulting from distinct approximate solutions 457
As suggested by our own AVA modelling results the Ruumlgerrsquos approximation is significantly 458
different to other techniques when considering the magnitude and gradient of reflection curves 459
This fact can create additional uncertainty to the use of AVA inversion techniques in the 460
characterisation of shale-sand reservoirs 461
20
462
Acknowledgments 463
Dr Aamir Ali (Advisor) and Hafiz Mubasher Anwer (PhD Scholar) would like to thank the 464
Higher Education Commission (HEC) of Pakistan for providing the necessary funding needed to 465
complete this research work The authors are also pleased to the Director General Petroleum 466
Concessions (DGPC) Ministry of Petroleum and Natural Resources Government of Pakistan 467
and joint venture partners of Sawan gas field for providing data and other required material to 468
complete this work TA thanks Cardiff University for their support to a visiting staff scheme set 469
with HMA Reviewers and Editor M Faure are acknowledged for their constructive feedback 470
471
References 472
Afzal J Kuffner T Rahman A Ibrahim M 2009 Seismic and well-log based sequence 473
stratigraphy of the early Cretaceous δower Goru ldquoCrdquo sand of the Sawan gas field middle Indus 474
Platform Pakistan Annual Technical Conference Islamabad 475
Ahmad N Fink P Sturrock S Mahmood T Ibrahim M 2004 Sequence stratigraphy as 476
predictive tool in Lower Goru fairway Lower Middle Indus Platform Pakistan PAPG-SPE 477
ATC 85-105 478
Alam I Azhar AM Khan MW 2014 Frontal structural style of the Khisor Range northwest 479
of Bilot Implications for hydrocarbon potential of the north-western Punjab foredeep Pakistan 480
Journal of Himalayan Earth Sciences Volume 47 Issue No 1 87-98 481
Ali A Anwer HM Hussain M 2015 A comparisonal study in the context of seismic fracture 482
characterization based on effective stiffness and compliance methods Arab J of Geosci DOI 483
101007s12517-014-1478-8 484
21
Ali A Jakobsen M 2011a On the accuracy of Ruumlgers approximation for reflection 485
coefficients in HTI media implications for the determination of fracture density and orientation 486
from seismic AVAZ data Journal of Geophysics and Engineering issue No 8 372-393 487
Ali A Jakobsen M 2011b Seismic characterization of reservoirs with multiple fractures sets 488
using velocity and attenuation anisotropy data Journal of Applied Geophysics Issue No75 590-489
602 490
Ali A Shahraini A Jakobsen M 2011 Improved characterization of fault zones by 491
quantitative integration of seismic and production data Journal of Geophysicsamp Eng Issue 8 492
259ndash274 493
Ali A Zubair Hussain M Rehman K Toqeer M 2016 Effect of Shale Distribution on 494
Hydrocarbon Sands Integrated with Anisotropic Rock Physics for AVA Modelling A Case 495
Study Acta Geophysica vol 64 issue No 4 1139-1163 496
Almutlaq MH Margrave GF 2010 Tutorial AVO inversion CREWES Research Report 497
Vol 22 1-23 498
Asim S Zhu P Qureshi SN Naseer MT 2015 A case study of Precambrian to Eocene 499
sedimentsrsquo hydrocarbon potential assessment in Central Indus Basin of Pakistan Arabian Journal 500
of Geosciences ISSN 1866-7511 DOI 101007s12517-015-1988-z 501
Aster RC Borchers B Thurber CH 2005 Parameter Estimation and Inverse Problems 502
ISBN 0-12-065604-3 Elsevier Academic Press Amsterdam 503
Avseth P Mukerji T Mavko G 2005 Quantitative seismic interpretation Applying rock 504
physics tools to reduce interpretation risk ISBN 0-13-978-0-521-81601-7 Cambridge 505
University Press UK 506
22
Azeem T Yanchun W Khalid P Xueqing L Yuan F Lifang C 2016 An application of 507
seismic attributes analysis for mapping of gas bearing sand zones in the Sawan gas field Pakistan 508
Acta Geod Geophys DOI 101007s40328-015-0155-z 509
Bachrach R 2006 Joint estimation of porosity and saturation using stochastic rock-physics 510
modelling Geophysics 71(5) 53ndash63 511
Backus GE1962 Long-wave elastic anisotropy produced by horizontal layering J 512
Geophysics Res issue No67 4427-4440 513
Ball G 1995 Estimation of anisotropy and anisotropic 3-D Prestack depth migration offshore 514
Zaire Geophysics issue No 60 1495-1513 515
Banik N C 1987 An effective anisotropy parameter in transversely isotropic media 516
Geophysics 52(12) 1654-1664 517
Berger A Gier S Krois P 2009 Porosity-preserving chlorite cements in shallow-marine 518
volcaniclastic sandstones evidence of the Sawan gas field Pakistan AAPG Bull 93(5) 595-615 519
Besheli S A Urosevic M Li R 2005 The effect of seismic anisotropy on reservoir 520
characterization SEG Annual Meeting Houston USA 521
Blangy JP1992 Anisotropy and AVO in TI media an overview Joint SEG In EAEG summer 522
research workshop Expanded Abstracts Vol 60 l-605 523
Blangy JP1994 AVO in transversely isotropic media-An overview Geophysics Vol 59 No5 524
775-781 525
Brajanovski M Nadri D Gurevich B Bona A 2009 Stress induced anisotropy in sandstone 526
reservoir and shale overburden - AVO modeling International Geophysical Conference and 527
23
Exposition Beijing China 24ndash27 April 194-194 ISBN 978-1-56080-284-6 doi 528
10119013603719 529
Brown RJS Korringa J 1975 On the dependence of elastic properties of a porous rock on 530
the compressibility of the pore fluid Geophysics 40 608ndash616 531
Buland A Omre H 2003 Joint AVO inversion-wavelet estimation and noise level estimation 532
using a spatially coupled and hierarchical Bayesian Model Geophysical Prospecting 51 531-533
550 534
Chao G Cadore T Deplante C Gratzer O 2012 Detailed AVA analysis of a class IIp 535
reservoir in presence of VTI shale anisotropy A case study from offshore West Africa SEG 536
Annual Meeting Las Vegas DOI101190segam2012-12801 537
Chengzao J Min Z Yongfeng Z 2012 Unconventional Hydrocarbon Resources in China 538
and the Prospect of Exploration and Development Petroleum Exploration and Development v 539
392 129-136 540
Clavaud JB Nelson R Guru UK Wang H 2005 Field example of enhanced hydrocarbon 541
estimation in thinly laminated formation with a triaxial array induction tool A laminated sand-542
shale analysis with anisotropic shale SPWLA 46th Annual Logging Symposium 26-29 June 543
New Orleans USA 544
Crampin S Chesnokov EM Hipkin RG 1984 Seismic Anisotropy- the state of the art II 545
Geophysics J Int issue 76(1) 1-16 546
Da Silva NV Ratcliffe A Vinje V Conroy G 2016 A new parameter set for anisotropic 547
multiparameter full-waveform inversion and application to a North Sea dataset Geophysics Vol 548
81 issue No 4 U25ndashU38 549
24
Daley PF Horn F 1977 Reflection and transmission coefficients for transversely isotropic 550
media Bull Seis Soc Am issue No 67 661-675 551
Das I Zoback MD 2013 Long-period long-duration seismic events during hydraulic 552
stimulation of shale and tight-gas reservoirs Part 1 Waveform characteristics Geophysics Vol 553
78 No 6 KS97-KS108 554
English JM Lunn GA Ferreira L Yacu G 2015 Geologic evolution of the Iraqi Zagros 555
and its influence on the distribution of hydrocarbons in the Kurdistan region AAPG Bulletin 556
V99 No2 231-272 DOI 10130606271413205 557
Feng H Bancroft JC 2006 AVO principles processing and inversion CREWES Research 558
Report Vol 18 1-19 559
Fink P Schuh M Ahmad N Koehazy R 2004 Can the American Securities and Exchange 560
Commission and the central limit theorem ever become friends A practical proposal for 561
reconciliation from OεVrsquos Sawan Reserves Estimation exercise PAPGSPE Annual Technical 562
Conference 8-9 October Islamabad Pakistan 563
Floridia C Teles NT 1998 Effects of anisotropy in the AVO analysis SEG Technical 564
Program Expanded Abstracts 212-215 doi10119011820378 565
Gassmann F 1951 Uumlber die Elastizitaumlt poroumlser MedienViertelNaturforschGes Zuumlrich 96 1-566
23 567
Goodway B Perez M Varsek J Abaco C 2010 Seismic petrophysics and isotropic-568
anisotropic AVO methods for unconventional gas exploration The Leading Edge 29(12) 1500-569
1508 Doi 10119013525367 570
25
Graebner M 1992 Plane-wave reflection and transmission coefficients for a transversely 571
isotropic solid Geophysics 57(11) 1512-1519 doi10119011443219 572
Grechka V1998 AVO analysis in finely layered azimuthally anisotropic media SEG Technical 573
Program Expanded Abstracts 1649-1652 doi 10119011820238 574
Iqbal MWA Shah SMI 1980 A guide to the stratigraphy of Pakistan Geological Survey 575
of Pakistan Records Geol Surv Pak Quetta 53-34 576
Jakobsen M Johansen TA 1999 A test of ANNIE based on ultrasonic measurements on a 577
shale J Seis Explorissue No 8 77-89 578
Jakobsen M Hudson JA Johansen TA 2003a T-matrix approach to shale acoustics 579
Geophysical Journal International Issue No154 533-558 580
Jakobsen M Johansen TA 2000 Anisotropic approximations for mud rocks A seismic 581
laboratory study Geophys 65 1711-1725 582
Jakobsen M Johansen TA McCann C 2003b The acoustic signature of fluid flow in 583
complex porous media Journal of Applied Geophysics 54 219-246 584
Jinhu D He L Desheng M Jinhua F Yuhua W Zhou T 2014Discussion on effective 585
development techniques for continental tight oil in China Petroleum Exploration and 586
Development Volume 41 Issue 2 217-224 587
Kadri IB 1995 Petroleum geology of Pakistan Pakistan Petroleum Limited Graphic 588
Publishers Karachi 589
Katz B Lin F 2014 Lacustrine Basin unconventional Resource Plays Key differences 590
Marine and Petroleum Geology Volume 56 255-265 591
26
Kim KY Wrolstad KH Aminzadeh F 1993 Effects of Transverse Isotropy on P-wave 592
AVO for gas sands Geophysics 58 883-888 593
Krois P Mahmood T Milan G 1998 Miano field Pakistan a case history of model driven 594
exploration Proceedings of the Pakistan Petroleum Convention Pakistan Association of 595
Petroleum Geologists Islamabad 111-131 596
Kumar D Hoversten GM 2012 Geophysical model response in a shale gas 9th Biennial 597
international conference amp Exposition on Petroleum Geophysics Hyderabad India 598
Kurniawan F 2005 Shaly Sand Interpretation Using CEC-Dependent Petrophysical 599
Parameters MS Dissertation Louisiana State University and Agricultural and Mechanical 600
College 601
Leaney WS 1993 AVO and anisotropy from logs and walkaways Exploration Geophysics 602
24 623-630 603
Li V Tsvankin I Alkhalifah T 2016 Analysis of RTM extended images for VTI media 604
Geophysics Vol 81 NO3 S139ndashS150 DOI 101190GEO2015-03841 605
Luo X Lin Y Wu L Yao F 2005 Estimation of anisotropy parameters in VTI Media from 606
surface P-wave seismic data and VSP in Tarim Basin China SEG Annual Meeting Houston 607
178-181 608
Margesson RW Sondergeld CH 1999 Anisotropy and amplitude versus offset a case 609
history from the West of Shetlands Proceedings of the 5th Conference 635-643 Petroleum 610
Geology 86 Ltd Published by the Geological Society London 611
Mavko G Mukerji T Dvorkin J 2009 The Rock Physics Handbook Tools for Seismic 612
Analysis in Porous Media Cambridge University Press UK 613
27
McGlade C Speirs J Sorrell S 2012 A review of regional and global estimates of 614
unconventional gas resources A report to the Energy Security Unit of the Joint Research Centre 615
of the European Commission 616
McPhee CA Enzendorfer CK 2004 Sand management solutions for high-rate gas wells 617
Sawan field SPE Sindh 618
Munir K Iqbal MA Farid A Shabih SM 2011 Mapping the productive sands of Lower 619
Goru Formation by using seismic stratigraphy and rock physical studies in Sawan area southern 620
Pakistan a case study Journal of Petroleum Exploration amp Production Technology issue No1 621
33-42 doi101007s13202-011-0003-9 622
Nourollah H Urosevic M Keetley J 2015 Seal potential of shale sequences through seismic 623
anisotropy Case study from Exmouth Sub-basin Australia Society of Exploration 624
Geophysicists Vol 3 Issue No 4 T257-T267 625
Pujol J 2003 Elastic Wave Propagation and Generation in Seismology ISBN 0-521-52046-0 626
Cambridge University Press UK 160-161 627
Quadri VN Shuaib M1986 Hydrocarbon prospects of Southern Indus Basin AAPG 628
Bulletin v 70 pp730ndash747 629
Rodriguez K Hodgson N Hewitt A 2016 The future of oil exploration First Break Vol 34 630
issue No 2 95-101 631
Ruumlger A 2002 Reflection Coefficients and Azimuthal AVO Analysis in Anisotropic Media 632
Geophysical Monograph Series No 10 Society of Exploration Geophysics 633
Ruumlger A1998 Variation of P-wave reflectivity with offset and azimuth in anisotropic media 634
Geophysics issue Nno63 935-947 635
28
Sams MS Andrea M 2001 The effect of clay distribution on the elastic properties of 636
sandstones Geophysical Prospecting 49128-150 637
Saxena K Tyagi A Klimentos T Morriss C Mathew A 2006 Evaluating Deepwater Thin-638
Bedded Reservoirs with the RT Scanner Petromin Kaula Lumpur 639
Sayers CM 2013 Rock Physics for Reservoir Exploration Characterisation and Monitoring 640
Geophysical Prospecting 61 251ndash253 doi 1011111365-247812034 641
Sayers CM 1998 Long-wave seismic anisotropy of heterogeneous reservoirs Geophysical J 642
Int 132 667-673 643
Sayers CM Rickett JE 1997 Azimuthal variation in AVO response for fractured gas sands 644
Geophysical Prospecting 45 165-182 645
Shahraini A Ali A Jakobsen M 2011 Seismic history matching in fractured reservoirs using 646
a consistent stiffness-permeability model Focus on the effects of fracture aperture Geophysical 647
Prospecting 59 492-505 648
Sone H Zoback MD 2013 Mechanical properties of shale-gas reservoir rocks Part 2 Ductile 649
creep brittle strength and their relation to the elastic modulus Geophysics Vol 78 No 5 650
D393-D402 651
Tarantola A 2005 Inverse Problem Theory and Methods for Model Parameter Estimation 652
Society for Industrial and Applied Mathematics USA 653
Thomas EC Stieber SJ 1975 The distribution of shale in sandstones and its effect on 654
porosity SPWLA 16th Annual Logging Symp 4-7 June1975 655
29
Thomsen L 1995 Elasticity anisotropy due to aligned cracks in porous rock Geophysical 656
Prospecting 43 805-829 657
Thomsen L1986 Weak elastic anisotropy Geophysics51(10) 1954-1966 658
Tsvankin I 1997a Anisotropic parameters and P-wave velocity for orthorhombic media 659
Geophysics 62 1292ndash1309 660
Tsvankin I 1997b Reflection move out and parameter estimation for horizontal transverse 661
isotropy Geophysics issue No62 614-629 662
Tyagi AK Guha R Voleti D Saxena K 2009 Challenges in The Reservoir 663
Characterization of a Laminated Sand Shale Sequence 2nd SPWLA-India Symposium 664
November 19-20 665
Uden R Dvorkin J Walls J Carr M 2004 Lithology substitution in a sandshale sequence 666
ASEG 17th Geophysical Conference and Exhibition Sydney 667
Wandrey CJ Law BE Shah HA 2004 Sembar GoruGhazij composite total petroleum 668
system Indus and Sulaiman-Kirthar geologic Provinces Pakistan and India US Geological 669
Survey USA Geological Survey Bulletin 670
Wang L Dai H Li XY 2006 Estimating anisotropic parameters from PS converted-wave 671
data a case study British Geological Survey Xianyi Sun Petro China Daqing Oil Field 672
Wang Y 2011 Seismic anisotropy estimated from P-wave arrival times in cross hole 673
measurements Geophysical Journal International 184 1311-1316 674
Wood AW 1955 A Textbook of Sounds New York McMillan Co USA 675
30
Wright J 1987 The effects of transverse isotropy on reflection amplitude versus offset 676
Geophysics 52 564-567 677
Xu S Wu X Huang X Yin H 2005 Evaluation of Anisotropic Rock Properties in 678
Sedimentary Rocks from well log Offshore Technology Conference Houston TX USA 679
Zaigham NA Mallick KA 2000 Prospect of hydrocarbon associated with fossil-rift 680
structures of the southern Indus basin Pakistan AAPG Bull 84(11) 1833-1848 681
Zhang H Brown RJ 2001 A review of AVO analysis CREWES Research Report Volume 682
13 337-378 683
Zhu Y Xu S Payne M Martinez A Liu E Harris C Bandyopadhyay K 2012 684
Improved Rock-Physics Model for Shale Gas Reservoirs SEG Technical Program Expanded 685
Abstracts 1-5doi 101190segam2012-09271 686
Zoeppritz KE 1919 On the reflection and propagation of seismic waves Goumlttinger 687
Nachrichten 1(5) 66-84 688
689
31
690
Figure 1a Regional map showing the regional structural setting of Pakistan and the location of 691
multiple sedimentary basins in this country The location of Sawan gas field is highlighted by 692
the black circle 693
FORE LAND FOLD-THRUST BELT
THRUST FRONT OF FOLD BELT
PLATE BOUNDARIESTHRUSTS
OPHIOLITIES
MAJOR BACKTHRUST
LEGEND
62deg 64deg 68deg 70deg 72deg66deg 74deg 76deg
62deg 72deg64deg 68deg 70deg66deg 74deg
24deg
26deg
28deg
30deg
32deg
34deg
36deg
24deg
26deg
28 deg
30deg
32deg
34deg
36deg
32
694
Figure-1b Local map showing the boundaries of the Sawan gas field and the relative location 695
of exploration wells in the study area 696
33
697
Figure 2 Generalised stratigraphy of the Sawan gas field highlighting the presence of multiple 698
lithological units including the Lower Goru C-sand interval and shaley intervals within and 699
adjacent to these reservoir sands This C-sand interval comprises the principal gas-producing 700
reservoir of the Sawan field (Azeem et al 2015) 701
702
34
703 Figure 3 Work Flow diagram showing the methodology adopted to compare isotropic and 704
anisotropic AVA modelling 705
706
35
707
Figure 4 Well-log correlations for the Lower Goru C-sand and shale intervals in the three exploration wells used in AVA modelling 708
36
709
Figure 5 Results of petrophysical analyses for the estimation of reservoir properties of sand-710
shale intervals in the Sawan-01 well 711
712
37
713
Figure 6 Results of petrophysical analyses for the estimation of reservoir properties of sand-714
shale intervals in the Sawan-3B well 715
38
716
Figure 7 Results of petrophysical analyses for the estimation of reservoir properties of sand-717
shale intervals in the Sawan-06 well 718
39
719
Figure 8 Shale distribution model proposed by Thomas and Strieber (1975) (figure modified 720
from Tyagi et al 2009) In this diagram ℎ is the volume of shale is the total 721
porosity is the maximum porosity and ℎ is the porosity in shales 722
723
40
724
725
Figure 9 Cross-plots between volume of shale (X-axis) and total porosity (Y-axis) Based 726
upon the position of data points shale distribution was characterised within the C-sand 727
reservoir in the Sawan-01 well 728
729
Sawan-01
41
730
Figure 10 Cross-plots between volume of shale (X-axis) and total porosity (Y-axis) Based 731
upon the position of data points shale distribution was characterised within the C-sand 732
reservoir in the Sawan-3B well 733
Sawan-3B
42
734
Figure 11 Cross-plots between volume of shale (X-axis) and total porosity (Y-axis) Based 735
upon the position of data points shale distribution was characterised within the C-sand 736
reservoir in the Sawan-06 well 737
Sawan-06
43
738
Figure 12 Angle-dependent reflection coefficient data generated through the exact and 739
approximate solutions of PP-wave for isotropic and anisotropic (VTI) media at the top of C-740
sand reservoir (Sawan-01 well) 741
742
44
743
Figure 13 Angle-dependent reflection coefficient data generated through the exact and 744
approximate solutions of PP-wave for isotropic and anisotropic (VTI) media at the top of C-745
sand reservoir (Sawan-3B well) 746
747
45
748
Figure 14 Angle-dependent reflection coefficient data generated through the exact and 749
approximate solutions of PP-wave for isotropic and anisotropic (VTI) media at the top of C-750
sand reservoir (Sawan-06 well) 751
752
46
753
Figure 15 Seismic AVA response for the Lower Goru C-sand Sawan-01 well 754
755
47
756
Figure 16 Seismic AVA response for the Lower Goru C-sand Sawan-3B well 757
758
48
759
Figure 17 Seismic AVA response for the Lower Goru C-sand Sawan-06 well 760
761
49
762
Figure 18 Maps highlighting the inversion with 20 uncertainty for true porosity distribution 763
(top) generated via a correlated Gaussian field distribution throughout the reservoir interval at 764
100times100 grid blocks These porosity plots were compiled via maximum a posteriori solution 765
under Bayesian settings utilising the rock physical properties of C-sand reservoir interval 766
(3268-3432 m) with exact and approximate solutions of PP-reflection coefficients for the 767
isotropic and anisotropic (VTI) cases Inversion results show that Daley amp Hornrsquos (1977) exact 768
solution for VTI (left in 2nd row) returns porosity trends that are accurately aligned with the 769
true porosity distribution of the reservoir 770
771
50
Reservoir Properties Sawan-01 Sawan-3B Sawan-06
Depth Range (m) 3268-3432 3398-3592 3227-3312
Gross Thickness (m) 164 184 85
Net Reservoir Thickness (m) 80 126 36
Net Pay Thickness (m) 24 58 20
Avg Porosity () 15 14 12
Avg Volume of Shale () 28 22 34
Average Water Saturation () 46 40 45
Table 1 Reservoir properties of the Sawan wells used in this study 772
773
51
Cut-off GRlt=75 API 01lt=NPHIlt=045 Swlt=50
Rock Thickness (m) Yes No No
Net Reservoir Thickness
(m) Yes Yes No
Net Pay Thickness (m) Yes Yes Yes
Table 2 Details of cut-off values used in the calculation of reservoir properties in Table 1 774
775
52
Well Formation Vp(α) Vs(β) Density(ρ) Porosity(ɸ)
Sawan-01 Sand 4165 4112 232 015
Shale 2668 2170 267 008
Overburden 28745 23675 254
Sawan-3B Sand 4251 2562 244 013
Shale 4487 2628 260 010
Overburden 4258 2547 262
Sawan-06 Sand 4148628 25790 251 013
Shale 4462847 17410 261 0085
Overburden 4322960 25200 257
Table 3 Mechanical properties of reservoir sand intra-reservoir shale layers and overburden 776
used in the calculation of reflection coefficients 777
778
53
Material Shear modulus
(GPa)
Bulk modulus
(GPa)
Density
(gcm3)
Solid Mineral
(Quartz)
44 37 265
Gas 00 0025 0065
Fluid (waterbrine) 00 22 1035
779
Table 4 Values of elastic moduli and densities for solid mineral and fluid used in our rock physics
modelling
54
Appendix-A 780
Backus Averaging Approach 781
The effective stiffness is anisotropic for a stratified medium composed of transversely 782
isotropic layers in the limit of long-wavelength and represented by the Backus (1962) matrix 783
below (Mavko et al 2009) 784
M
D
D
CFF
FAB
FBA
00000
00000
00000
000
000
000
BAM 2
1 (A-I) 785
whereA B C D and F are the five independent elastic constants 786
[ie C C C C ampC ] In terms of P- and S-wave velocities (PV and SV ) and densities 787
( ) the five independent elastic constants can be written as 788
112
2
2
2
2
22 2114
P
P
S
P
SS V
V
V
V
VVA (A-II )789
112
2
2
2
2
22 21
212
P
P
S
P
SS V
V
V
V
VVB (A-III )790
112 PVC (A-IV) 791
112 SVD (A-V) 792
112
2
2
2
21 P
P
S VV
VF (A-VI) 793
55
2SVM (A-VII) 794
The brackets indicate averages of the enclosed properties weighted by their volumetric 795
proportions Once the five independent constants are obtained the Thomsen anisotropy 796
parameters for VTI can be obtained using the relationships given by Thomsen (1986 1995) 797
= minus (A-VII) 798
= minus (A-VIII) 799
= + minus minusminus (A-IX) 800
In order to calculate the effect of fluid saturation on the effective properties of a sand-shale 801
layered medium we have used the Gassmann (1951) equation for isotropic media and the 802
relationships of Brown and Korringa (1975) for anisotropic (VTI) media (Ali et al 2011 803
Shahraini et al 2011) 804
805
56
Appendix-B 806
1 Gassmann (1951) fluid substitution model for isotropic media 807
As the dry composite sand-shale medium was assumed as isotropic in this work we used the 808
low frequency Gassmann (1951) model (Equation B-I) applicable to well-connected porous 809
media under isobaric conditions We used this latter model in order to incorporate fluid 810
effects into the effective mechanical properties calculated in our own models Equation (B-I) 811
defines a relationship between saturated bulk modulus bulk modulus of the skeleton of the 812
rock bulk modulus of mineral comprising rock matrix fluid bulk modulus and porosity A 813
typical form of the Gassmann (1951) equation is as follows 814
815
= + minus( frasl )ɸ + minusɸ minus (B-I) 816
Here lsquo rsquo is the saturated rock bulk modulus lsquo rsquo is the frame or dry bulk modulus 817
lsquo rsquo is the grain bulk modulus lsquo rsquo corresponds to the fluid bulk moduli and lsquoɸrsquo is 818
the porosity 819
820
2 Brown and Korringa (1975) relations for fluid effects of an anisotropic medium 821
(VTI) 822
823
In order to calculate the effect of fluid saturation on the effective properties of a sand-shale 824
interval assuming it as VTI medium we have used the anisotropic relations of Brown and 825
Korringa (1975) which can be written in the symbolic or matrix notation as (Ali et al 2011) 826
827
57
lowast = lowast + (lowastminus)∶ ⨂ ∶ (lowastminus) ∙∙ minus kfrasl minus ∙(lowastminus)∙ (B-II ) 828
Hereotimes denotes the dyadic product is the compliance tensor of the solid mineral 829
component (properties of mineral quartz were used in the case of sand-shale model) lowast is the 830
effective compliance tensor for the dry sand-shale medium and S is the effective compliance 831
tensor for the saturated sand-shale medium In Equation (B-II ) φ is the total porosity and 832
is the (symmetric) identity matrix for second-rank tensors 833
In the case of a composite porous medium that is partially saturated with oil gas and water 834 K may be regarded as the bulk modulus of an effective fluid given by Wood - also known as 835
the Reuss average (Mavko et al 2009) 836
837 = ww + oo + (B-III ) 838
where 839
840 Sw + S + S = (B-IV) 841
Here Sw S and S represent the saturation for water oil and gas and Kw K and K 842
represent the bulk modulus for water oil and gas 843
2
generate angle-dependent reflection coefficient curves (and seismic AVA responses) based on 25
exact and approximate solutions for both isotropic and anisotropic reservoir scenarios Our 26
results suggest that the effects of lithological anisotropy are more pronounced in places with 27
thick shale beds within reservoir sands Conversely angle-dependent reflection curves and 28
seismic AVA responses based on isotropic or anisotropic cases give similar solutions in the 29
presence of thin shale beds As a corollary of this work we present a Bayesian inversion method 30
for the estimation of porosity in VTI media 31
32
Keywords South Asia VTI medium Ruumlgerrsquos approximation PP reflection coefficients 33
Anisotropic AVA Modelling Bayesian inversion 34
35
1 Introduction 36
37
Modern techniques based on the systematic analysis of amplitude variations of seismic 38
waves with changing distance between source and receiver (AVO) or with angle of incidence 39
(AVA) are widely used in the petroleum industry to a) detect subsurface gas b) identify 40
lithological variations and c) analyse subsurface fluid volumes and compositions (Floridia and 41
Teles 1998 Grechka 1998 Margesson and Sondergeld 1999 Feng and Bancroft 2006 42
Almutlaq and Margrave 2010 Chao et al 2012) Seismic AVA is of particular interest as its 43
use is based on the realisation that variations in amplitude at varying incident angles result from 44
contrasts in lithology and fluid content in rocks above and below a layer boundary (Zhang and 45
Brown 2001) Seismic AVA modelling is systematically carried out in reservoir studies by 46
considering the Earth as an isotropic medium However all sedimentary rocks exhibit anisotropic 47
behaviour at different scales (Xu et al 2005) It has been known for a long time that anisotropy 48
resulting from shaley beds and lenses within sandy successions can affect seismic AVA 49
responses when investigating sand-shale reservoirs (Banik 1987 Wright 1987 Kim et al 1993 50
3
Thomsen 1995 Blangy 1994 Ball 1995 Grechka 1998 Besheli et al 2005 Brajanovski et 51
al 2009 Chao et al 2012 Nourollah et al 2015) By ignoring the effects of anisotropy during 52
AVA modelling interpreters may complete erroneous characterisations of productive reservoir 53
intervals (Besheli et al 2005) Importantly erroneous quantification of volumes and reservoir 54
distribution(s) should arise when analysing the petroleum potential of sedimentary basins in 55
South Asia and other parts of the world where stratified reservoir sequences of shale and silt 56
contain significant amounts of lsquotight oilrsquo and lsquotight gasrsquo (εcGlade et al 2012 Katz and Lin 57
2014 English et al 2015 Rodriguez et al 2016) 58
In recent decades stratigraphic sequences of thin-layered sands and shales have become 59
key exploration targets for which seismic anisotropy methods (also referred to as long-60
wavelength anisotropy) are useful and broadly successful in their characterisation (Crampin et 61
al 1984 Sayers 2013 Sone and Zoback 2013 Das and Zoback 2013) Shale layers within a 62
horizontally-bedded sand matrix behave elastically as transversely isotropic (TI) media ie they 63
have similar wave properties in two perpendicular directions but are significantly different in a 64
third orthogonal direction (Sone and Zoback 2013) In these same sequences vertical axes of 65
symmetry are often described as vertically transversely isotropic (VTI) media (da Silva et al 66
2016 Li et al 2016) 67
The anisotropic behaviour of VTI media is usually quantified by using Thomsens 68
anisotropic parameters (Thomsen 1986) in which denotes the fractional difference 69
between the horizontal and vertical P-wave velocities describes the variation in P-wave 70
velocity with phase angle for near-vertical propagation and denotes the fractional difference 71
between the horizontal and vertical SH-wave velocity (Ruumlger 2002) The empirical forms of 72 are provided by Ruumlger (2002) as 73
74
55
5566
2C
CC (1) 75
4
33
3311
2C
CC (2) 76
and 77
)(2
)()(
553333
25533
25513
CCC
CCCC
(3) 78
79
Here C represents the stiffness and its indices denote standard constants for VTI media In 80
essence elastic anisotropy in VTI media can be characterised by five independent elastic 81
constants which can be expressed in two notations a) in terms of stiffness constants 82
(C C C C amp C ) or b) in terms of vertical velocities (VP and V and Thomsenrsquos 83
anisotropic parameters ( (Tsvankin 1997a 1997b) These five independent elastic 84
constants are very difficult to apply to AVA analyses and most of these latter are developed by 85
assuming a non-VTI medium 86
Several researchers have attempted to estimate seismic anisotropy and incorporate it into 87
AVA -based methods using seismic VSP well logs and core data (Blangy 1992 Leaney 1993 88
Blangy 1994 Margesson and Sondergeld 1999 Besheli et al 2005 Luo et al 2005 Wang et 89
al 2006 Brajanovski et al 2009 Goodway et al 2010 Wang 2011) but seldom for 90
hydrocarbon-rich basins in South Asia However in the Indian subcontinent (including Pakistan 91
and bordering countries) important tight oil and gas reservoirs have been found in the hinterland 92
basins that surround the Himalayan and Baluchistan mountain ranges The Indus basin is 93
currently the main focus of oil and gas exploration and production in Pakistan (Alam et al 2014 94
Asim et al 2015) (Figure 1a) In this basin as in other hydrocarbon-productive regions of South 95
and Southeast Asia the successful use of AVA techniques in reservoir characterisation is 96
critically dependent upon the careful estimation of the anisotropic parameters of sedimentary 97
rocks (Zaigham and Mallick 2000 Chengzao et al 2012 Zhu et al 2012 Jinhu et al 2014) 98
5
In this work we use well log data from the Sawan gas field (Figure 1b) middle Indus basin 99
(Pakistan) to focus on the Cretaceous Lower Goru C-sand reservoir which is interbedded with 100
shales We use reservoir properties estimated from borehole data as key data inputs to our rock 101
physics models and to later carry out anisotropic and isotropic AVA analyses Rock physics 102
models are often used to link seismic data to reservoir properties (Avseth et al 2005) Seismic-103
based estimates of reservoir properties can be uncertain but the inclusion of rock physics models 104
in exploration workflows is nevertheless capable of reducing the level of uncertainty by 105
decreasing the number of unknown parameters in AVA analyses In other words rock physics 106
modelling represents a type of regularization within the context of seismic inversion (Ali and 107
Jakobsen 2011a 2011b) 108
The aim of this work is to analyse the effects of anisotropy generated by interbedded shales 109
within the reservoir sands and its implications to AVA -based reservoir studies In parallel we 110
investigate how accurate are seismic AVA methods for both exact (Zoeppritz 1919 Daley and 111
Horn 1977) and approximate (Ruumlger 1998 2002) solutions for PP-reflection coefficients within 112
the context of isotropic and anisotropic cases 113
114
2 Geological setting 115
116
The Sawan gas field lies in the middle Indus basin in the eastern border of Pakistan (Zaigham 117
and Mallick 2000) The study area is bounded by the Sargodha High to the north and by the 118
Jacobabad and Mari-Kandkot Highs to the south (Figure 1a) The Indian Shield bounds the 119
eastern side of the study area whereas the Kirthar and Suleiman fold-and-thrust belts mark its 120
western boundary (Kadri 1995 Afzal et al 2009) Regional geological data indicate that the 121
structural evolution of the Sawan gas field was closely controlled by three post-rift tectonic 122
events a) Late Cretaceous uplift and erosion b) NWndashtrending thick-skinned wrench faulting and 123
c) Late Tertiary to present-day tectonic uplift of the Jacobabad and Khairpur Highs (Ahmad et 124
6
al 2004 Afzal et al 2009 Azeem et al 2016) These latter structural highs played an important 125
role in the formation of structural and stratigraphic traps not only in the Sawan area but also in 126
multiple oil and gas fields in the region (Ahmad et al 2004 Fink et al 2004 Berger et al 127
2009) 128
Cretaceous black shales in the Sembar Formation are the proven source rock in the middle 129
and lower Indus basins which were mainly filled with shale and minor amounts of black 130
siltstone sandstone and nodular argillaceous limestone (Quadri and Shuaib 1986 Kadri 1995) 131
The thickness of the Sembar Formation ranges from 0 m to more than 260 m (Iqbal and Shah 132
1980) The Sembar Formation is deeply buried and matures thermally towards the western edge 133
of the Indus basin It becomes shallower and less mature towards its eastern edge (Wandrey et 134
al 2004) In the study area the tectonic uplift recorded by the Khairpur High controlled the 135
depositional patterns of the main reservoir unit (Goru Formation) reservoir sands in proximal 136
depositional systems are positioned in structurally deep areas whereas non-reservoir distal shales 137
are positioned up-dip to form major structural traps (Azeem et al 2016 Berger et al 2009) The 138
depositional environment of the Lower Goru Member which comprises the main reservoir 139
interval above the Sembar Formation was marine and reflects deposition at the western (passive) 140
margin of the Indian plate 141
The Sembar Formation is therefore overlain by the Lower Goru Member of the Goru 142
Formation ie the proven reservoir interval in the Sawan gas field (Fig 2) The upper part of the 143
Lower Goru Member is chiefly composed of shales whereas its lower part comprises medium 144
to coarse-grained sandstones with thin layers of shale and limestone The lower portion of the 145
reservoir interval can be subdivided into distinct sand intervals A B C and D (Krois et al 1998) 146
(Figure 2) The deposition of these sand intervals took place in deltaic shallow-marine 147
environments during sea-level lowstands when medium to coarse-grained sediment was 148
deposited on top of the distal (shale and siltstone) strata of previous highstand systems tracts 149
(HSTs) (Berger et al 2009 Azeem et al 2016) 150
7
Petrographically intervals A and B can be classified as quartz-rich arenites (Berger et al 151
2009) The C interval includes significant amounts of partially altered volcanic rock fragments 152
and pore lining iron chlorite cement Thus the sands of interval C can be classified as sublithic 153
to lithic arenites (McPhee and Enzendorfer 2004 Berger et al 2009 Azeem et al 2016) Sands 154
in the B and C intervals comprise the main gas reservoirs in the study area (Munir et al 2011) 155
showing high porosity (ie around 16 ) and permeability at depths between 3000ndash3500 m 156
(Azeem et al 2016) These two reservoir intervals of the Lower Goru Member are draped by 157
transgressive shales and siltstones of the Upper Goru Member which acts as a regional seal in 158
the middle and lower Indus basins (Berger et al 2009) 159
160
3 Dataset and methods 161
162
Data from three exploration wells (Sawan-01 Sawan-3B and Sawan-06) are used in this 163
study to analyse the acoustic effects of the lithologic anisotropy created by interbedded shales in 164
the C-sand reservoir The rationale behind selecting the Sawan gas field as a case study results 165
from the fact that it is located in the tectonically stable part of the Thar Platform in the middle 166
Indus basin It also shows marked alternations of sands and shales being a typical example of a 167
VTI medium 168
The workflow adopted in this work is shown in Figure 3 In a first instance we analysed 169
sand-shale distribution patterns in the main reservoir intervals using the methodology proposed 170
by Thomas and Stieber (1975) In a second stage rock physics modelling was undertaken using 171
the Backus (1962) approach for dry composite porous media (sand-shale) used together with the 172
relationships of Brown and Korringa (1975) and Wood (1955) These latter relationships allowed 173
us to incorporate fluid effects on the mechanical properties of strata The aim of the second stage 174
of our analysis was to obtain (saturated) effective elastic properties for the Lower Goru reservoir 175
8
intervals (see also Jakobsen et al 2003a 2003b Ali and Jakobsen 2011a 2011b Ali et al 176
2016) 177
In a third stage exact solutions of P-wave reflection coefficients derived from Zoeppritz 178
(1919) solutions for isotropic media and Daley and Hornrsquos (1977) solutions for VTI media were 179
used to generate angle dependent reflection coefficients and seismic AVA data from the top of 180
the reservoir for both isotropic and anisotropic cases In parallel the Ruumlgerrsquos approximation 181
(Ruumlger 1998 2002) was used for angle dependent reflection coefficients and seismic AVA data 182
from the top of the reservoir for both isotropic and anisotropic cases over the Sawan reservoir 183
intervals Finally a Bayesian inversion scheme was utilised to investigate the implications of 184
isotropic and anisotropic AVA solutions on the estimation of porosity throughout the reservoir 185
186
31 Sand-Shale distribution analysis 187
188
To understand shale distribution within reservoir sands is an integral part of forward 189
modelling using rock physics templates (Ali et al 2016) Prior to developing the appropriate 190
rock physics model for AVA modelling sand-shale distribution analyses are necessary to 191
identify the type of shale(s) distributed within reservoir sands (Ali et al 2016) This step 192
improves confidence in the interpretation of sand-shale reservoirs because it helps interpreters to 193
decide which geophysical approach is appropriate for a particular reservoir (Kurniawan 2005) 194
The distribution of shale within reservoir sands has a pronounced effect on reservoir production 195
performance due to decreasing porosity values and variable saturations that derive from the 196
presence of shales (Sames and Adrea 2001 Ali et al 2016) Hence sand-shale distribution 197
analyses require robust stratigraphic correlations based on gamma-ray log data (Figure 4) 198
Gamma-ray curves are particularly helpful in the identification of shales within reservoir sand 199
and for detailed petrophysical analyses and correlations The petrophysical interpretation of wells 200
9
(Sawan-01 Sawan-3B and Sawan-06) was carried out to determine key reservoir properties such 201
as P-wave velocity (Vp) S-wave velocity (Vs) porosity (ϕ) density (ρ) volume of shale (Vsh) 202
and water saturation (Sw) for the C-sand of the Lower Goru Member (Figures 5-7) The details 203
of estimated reservoir parameters are given in Tables 1-3 204
The parameters commonly required in sand-shale distribution analyses are volume of shale 205
porosity and water saturation with the volume of shale being a critical parameter that controls 206
the two latter (Saxena et al 2006) Once these parameters are estimated the Thomas-Stieber 207
(1975) method in Figure 8 can be used to estimate shale distribution patterns (Saxena et al 208
2006) The Thomas-Stieber (1975) method estimates shale distribution utilizing a cross-plot with 209
volume of shale along the X-axis and total porosity along the Y-axis The position of data points 210
on the cross-plot allows the identification of the type(s) of shale distribution within sands 211
Usually shales are distributed through four different ways within sands a) as laminae b) 212
through structures (faults joints) c) dispersed in sands and d) as any combinations of the three 213
latter ways (Clavaud et al 2005 Sams and Andrea 2001) The results from sand-shale analyses 214
undertaken for the three studied wells suggest that in our study area laminar and dispersed shales 215
are distributed within reservoir sands (Figures 9-11) 216
217
32 Forward Modelling 218
219
The nonlinear forward problem is defined as 220
221
= G (4) 222
223
In Equation (4) is a vector of observable quantities (angle-dependent reflection coefficients 224
or seismic AVA data) and is a vector of model parameters required to be estimated over the 225
10
model space ie isin The operator is a forward modelling operator used for generating 226
synthetic angle-dependent reflection coefficients or seismic AVA data via rock physics and 227
seismic modelling In the subsequent section we will discuss the rock physics modelling for a 228
layered medium 229
230
321 Rock Physics modelling 231
232
Rock physics models are important to correlate variations in reservoir properties (lithology 233
porosity permeability pore fluid etc) with changes in the velocities (Vp Vs) and density (ρ) 234
observed on well data (Uden et al 2004) Rock physics models act as a bridge between 235
geological properties (reservoir parameters) and geophysical data by upscaling the reservoir 236
variables related to lithology shale content and fluid parameters (Bachrach 2006 Avseth et al 237
2005) Rock physics also provide a realistic and systematic basis for seismic-attribute generation 238
and interpretation (Avseth et al 2005) In clastic reservoirs shales are often found to behave 239
elastically as transversely isotropic media with a vertical axis of symmetry (Jakobsen and 240
Johansen 1999 2000) In forward models rock physics models are used to calculate effective 241
elastic properties from petrophysical properties estimated from wireline-log data 242
Results of shale distribution analyses within the Sawan gas field reservoir sands show that 243
laminar and dispersed shale types are distributed in the host medium Such a medium can be 244
modelled using anisotropic rock physics (Ali et al 2016 Ali et al 2015 Jakobsen et al 2003 245
Sayers and Rickett 1997 Sayers 1998 Backus 1962) In this study we follow the approach 246
given by Backus (1962) which was typically designed for a layered medium (see Appendix-A) 247
The fluid effects are incorporated via the Gassmann model for isotropic cases and via the Brown 248
and Korringa (1975) model for anisotropic cases in conjunction with the Wood (1955) model 249
for homogenous saturations (Appendix-B) 250
11
251
322 Seismic amplitude variation with angle (AVA ) modelling 252
253
Seismic AVA modelling is considered to be the most effective technique for reservoir 254
characterisation In practice AVA studies are the method most widely used for gas detection 255
lithology identification and fluid parameter analyses (Feng and Bancroft 2006) Seismic 256
response of variations in effective elastic properties obtained through rock physics tools for sand-257
shale layers can be modelled using synthetic seismic AVA data From the effective elastic 258
properties as calculated above angle-dependent reflection coefficients and seismic AVA data 259
can be generated using the exact Zoeppritz (1919) formulation for isotropic media and the Daley 260
and Hornrsquos (1977) exact methods for anisotropic (VTI) media We also tested the Ruumlger (2002) 261
approximation for the generation of reflection coefficients for both isotropic and VTI media The 262
rationale behind only selecting Ruumlgerrsquos approximation for isotropic and VTI media is that the 263
Ruumlgerrsquos technique is only linearised in terms of small contrasts in medium parameters without 264
having any additional assumption on Poissonrsquos or VpVs ratios (Ruumlger 2002) 265
266
3221 P-wave reflection coefficient for isotropic media 267
268
The exact Zoeppritz (1919) empirical relation (see Equation 5) allows us to calculate the PP-269
wave reflection coefficients () of a rock as a function of the incidence angle from the top of 270
an isotropic medium which can be represented as a system of linear equations given as (Pujol 271
2003) 272 = (5) 273
Where 274
275
12
A =
[ minus prime prime sin cos prime minus prime minus prime prime prime prime prime prime primeminus minus prime prime minus prime prime prime ]
(6) 276
= [ ] (7) 277
and = [ ] (8) 278
279
The unknown vector can be obtained by 280
281 = minus (9) 282
283
In these equations α ρ e and f are the P-wave velocity S-wave velocity density P-wave 284
transmission angle and SVndashwave transmission angle of the upper half space Conversely αacute acute 285
ρacute eacute and facute are the P-wave velocity S-wave velocity density and P-wave reflection angle and 286
SVndashwave reflection angle of the lower half space 287
288
3222 Formulation of PP-wave reflection coefficients for VTI media 289
290
The exact algebraic solution for reflectiontransmission coefficients of plane incident 291
P-waves in a VTI medium developed by Daley and Horn (1977) is used in this work The 292
concise form of the exact solution of P-wave reflection coefficients for a VTI medium 293
in matrix form is given below (Graebner 1992 Ruumlger 2002) 294
= (10) 295
13
where = [minus minus ] (11) 296
and = [
] (12) 297
By using Cramerrsquos rule the solution for unknown vector can be expressed in its analytic form 298
as 299
= M [ ] (13) 300
The values of matrices M and are given by Ruumlger (2002) Graebner (1992) and Daley and Horn 301
(1977) 302
303
3223 Approximations for P-wave reflection coefficients 304
305
We also investigate the accuracy of Ruumlgerrsquos (2002) approximation for both isotropic and VTI 306
media with the exact solutions given by Zeoppritzrsquos (1919) and Daley and Hornrsquos (1977) 307
Ruumlgerrsquos approximation for isotropic media is given below (Ruumlger 2002) 308
309
RPPi = ΔZZ + ΔVPVP minus VSVP ΔGG sin + ΔVPVP sin tan (14) 310
311
14
Where Z is the P-wave impedance G is the shear wave modulus VP is the vertical P-wave 312
velocity and V is the vertical shear-wave velocity The character delta (Δ stands for contrasts 313
across an interface (ΔZ = Z minus Z ) and the bar over a symbol represents its average (Z = Z +Z) 314
Subscript 1 corresponds to the upper layer and subscript 2 denotes the lower layer Ruumlgerrsquos 315
approximation for the generation of reflection coefficients as a function of incidence angle () 316
in the case of VTI media (Ruumlger 2002) is written as 317
318
RPPV i = ΔZZ + ΔVPVP minus VSVP ΔGG + Δ sin i + ΔVPVP + Δɛ sin i tan i (15) 319
320
The additional terms ɛ and are Thomsenrsquos (1985 1996) anisotropy parameters for VTI 321
media 322
323
33 Inverse modelling 324
325
In Bayesian settings the solution of the inverse problem is given by the posterior probability 326
distribution q() applied over the model space M In essence q() carries all the 327
information about the model originating from the likelihood L and a priori probability 328
density function p Bayesrsquo theorem allows to relate q() with L and p given 329
as (Aster et al 2005) 330
331 q() L p (16) 332
333
Here is the sign of proportionality The solution of the posterior distribution can be written 334
in a compact form as (Aster et al 2005 Tarantola 2005) 335
15
336 q() = N eminus (17) 337
338
where N is the normalization constant The functional form of the objective function J 339
required to be minimised in the case of Gaussian statistics and an uninformative prior 340
distribution is given by Aster at al (2005) as 341
342
J = minsum (G )iminus iσi= (18) 343
344
Here σ is the standard deviation of the measured seismic data The rationale behind assuming 345
an uninformative prior distribution is that we do not intend to constrain our inversion scheme by 346
incorporating a priori information (obtained mostly from logcorelaboratory data) about the 347
model parameters There are different methods available for the evaluation of q() most of 348
which are described in Ali et al (2011a 2011b and 2015) 349
350
4 Numerical results and discussion 351
352
In this work we analyse the effects created by sand-shale anisotropy on AVA response with 353
the help of rock physics modelling In parallel we present a comparison of exact and approximate 354
AVA solutions for isotropic and anisotropic scenarios Before applying rock physics modelling 355
to layered media it is very important to identify the type of shale distribution within reservoir 356
sands eg laminar structural dispersed and so on For this same purpose we followed the 357
approach presented in Section 31 for the C-sand reservoir unit (Lower Goru Member) drilled by 358
16
wells Sawan-01 Sawan-3B and Sawan-06 Reservoir properties are estimated through 359
petrophysical analyses of well log data acquired in the Sawan field and results are presented in 360
Figures 5-7 and in Tables 1-2 361
The analysis of shale distribution suggests that the C-sand comprises laminated and dispersed 362
shale types (Figures 8-11) Thus the Lower Goru C-sand may be a potential candidate to be 363
characterised as a VTI medium rather than isotropic Laminar shales in the C-sand reservoir 364
comprise thin layers of allogenic clays and do not control effective porosity water saturation or 365
the horizontal permeability of rock However they significantly change vertical permeability 366
(Kurniawan 2005) Each lamina differs in thickness in a way that the amounts of sand silt and 367
clay in the layer are repeated as depositional sequences (or cycles) under dual flow regimes that 368
denote contrasts in energy level 369
The saturated effective elastic properties for isotropic and VTI media are obtained using the 370
methodology discussed in section 32 The input to our rock physics modelling in the form of 371
elastic and reservoir properties of the Lower Goru C-sand intra-reservoir shale layers and 372
overburden strata is extracted from the petrophysical analyses summarised in Table 3 The 373
elastic properties of solid mineral (quartz) and fluid (water and gas) required to generate AVA 374
data are given in Table 4 375
For the generation of isotropic angle-dependent reflection coefficient curves are used the exact 376
solution of Zeoppritz (1919) for isotropic media and Daley and Hornrsquos (1977) solution for VTI 377
media Ruumlgerrsquos (2002) approximation is also used for both isotropic and VTI media to investigate 378
the accuracy of exact and approximate solution of P-wave reflection coefficients as a function of 379
incidence angle 380
The angle dependent reflection coefficient (RC) curves are key to explain the main results in 381
this work We demonstrate in Figs 12-14 that the intercept (normal incidence ie zero offset P-382
wave reflectivity) and slope of the curve (gradient) indicate how the amplitude of RC changes 383
with angleoffset The gradient of each RC curve is almost the same but there are small 384
17
differences in the magnitude of angle-dependent PP-reflection coefficients when comparing the 385
isotropic and anisotropic cases (Figures 12-14) If we examine variations in RC based upon 386
isotropy and anisotropy it is obvious that in the Sawan-01 well only small differences can be 387
observed between isotropic and anisotropic RC curves (Figure 12) This clearly demonstrates 388
that strata drilled in Sawan-01 have a weak anisotropy ( = 00β14 = 00γ06 = 00186) In 389
Sawan-3B there are insignificant variations between isotropic and anisotropic RC curves (Figure 390
13) Finally for Sawan-06 there is a significant variation in RC curves when comparing the 391
isotropic and anisotropic cases (Figure 14) More importantly if we relate these variations in RC 392
curves with varying shale content we can conclude that the wells with comparatively thick shale 393
layers show substantial variations between their isotropic and anisotropic RC curves The best 394
example is naturally the RC response documented in well Sawan-06 (Figure 14 see also thick 395
shale content marked in yellow in Figure 4) 396
We observe that AVA data is moderately sensitive to the anisotropy of the medium In 397
essence our results confirm that little or no effects created by anisotropy upon reflection curves 398
are diagnostic of very weakly anisotropic media Significantly as shales are strongly anisotropic 399
and heterogeneous (Kumar et al 2012) exploration well(s) that encountered thick shale layers 400
in the study area show clear variations between the behaviour of isotropic and anisotropic angle 401
dependent PP-reflection coefficients (Figure 14) Based on data from the three interpreted wells 402
(Sawan-01 Sawan-3B and Sawan-06) shale anisotropy increases proportionally to shale content 403
and the effect of this same shale anisotropy upon reflection curves becomes more pronounced 404
As such it is advisable to predict anisotropy in a medium during AVA studies especially when 405
thick allogenic shale layers are present in reservoir successions 406
The investigation of Ruumlger (2002) approximationrsquos accuracy for both isotropic and VTI media 407
reveal that the predicted magnitude of reflection coefficients is significantly different in all the 408
three studied wells at large offsets Also the gradient predicted by the Ruumlger (2002) 409
approximation is high when compared to the exact solutions 410
18
For seismic AVA response in isotropic and VTI media angle-dependent reflection 411
coefficients are convolved with the source (Ricker) wavelet (Figures 15-17) It can be observed 412
from our approach that the amplitude of synthetic AVA gathers show a decreasing trend with 413
increasing angle of incidence The difference between exact and approximate solutions is more 414
pronounced in the magnitude of predicted seismic AVA amplitude values (Figures 15-17) 415
The AVA response of VTI media is sensitive to contrasts in Thomsenrsquos anisotropic 416
parameters and across the interface (Blangy 1994 Margesson and Sondergeld 1999) As 417
also identified by Daley and Horn (1977) generally P-P reflections indicate that the smaller the 418
contrast in isotropic properties (VP Vs ρ) and the larger the contrast in (variation in P-wave 419
velocity with phase angle for near vertical propagation) across a reflection interface the greater 420
are the effects of anisotropy on AVA signatures Contrasts in are most important under small-421
to-medium angles of incidence as previously reported in Banik (1987) whereas contrasts in 422
(fractional difference between the horizontal and vertical P-wave velocities) can have a strong 423
influence on amplitudes for the larger angles of incidence (21o) commonly used in exploration 424
seismic data The increasing trend in gradients is more pronounced at far offsets (21o to 40o) 425
revealing an increasing sensitivity in terms of anisotropy and isotropy with increasing offset 426
angles 427
The AVA modelling also proves a strong relationship between porosity and reflection 428
coefficient for all offset ranges Therefore in order to check the accuracy of exact and 429
approximate solutions for P-wave reflection coefficients in AVA inversion we tried to recover 430
true reservoir porosity distribution (with 20 uncertainty) under the Bayesian settings discussed 431
in Section 6 For this purpose a correlated Gaussian field was generated representing the true 432
porosity (Buland and Omre 2003) distribution throughout the reservoir within 100times100 grid 433
blocks (Figure 18) Later a AVA modelling approach (exactapproximate VTI or 434
exactapproximate isotropic) was performed using a maximum-a-posteriori (MAP) solution The 435
19
results suggest that the exact VTI solution recovers the porosity trends with much more accuracy 436
when compared to all other solutions under significant noise conditions (Figure 18) 437
438
5 Conclusions 439
In industry seismic AVAAVO techniques are being increasingly used for amplitude-based 440
reservoir characterisation but frequently assume that subsurface media are isotropic Seismic 441
anisotropy is known to have a first order effect on AVA modelling but this effect is often ignored 442
during AVA studies providing significant errors when describing reservoir intervals In this 443
work we analyse the effects of anisotropy on AVA modelling and inversion for a sand-shale 444
reservoir in the Sawan gas field Pakistan The main conclusions of this work are as follows 445
446
a) AVA modelling shows that anisotropy effects are more pronounced in stratigraphic 447
intervals where interbedded shales are relatively thick within reservoir sand (Sawan-06 well) 448
The exactapproximate isotropic or VTI solutions show smaller variations in the presence of thin 449
interbedded shale layers within reservoir sands 450
b) The exact solution for VTI media provided by Daley and Hornrsquos (1977) is one with the 451
highest potential for performing AVA inversion in sand-shale media with weak to strong 452
anisotropy We have demonstrated this fact by completing a numerical synthetic experiment for 453
recovering porosity distributions through the Lower Goru reservoir 454
c) The choice of approximate solution(s) for AVA modelling is crucial in any workflow since 455
in most cases there is a significant difference in the predictions of magnitude of reflection 456
coefficients and gradient of the reflection curves resulting from distinct approximate solutions 457
As suggested by our own AVA modelling results the Ruumlgerrsquos approximation is significantly 458
different to other techniques when considering the magnitude and gradient of reflection curves 459
This fact can create additional uncertainty to the use of AVA inversion techniques in the 460
characterisation of shale-sand reservoirs 461
20
462
Acknowledgments 463
Dr Aamir Ali (Advisor) and Hafiz Mubasher Anwer (PhD Scholar) would like to thank the 464
Higher Education Commission (HEC) of Pakistan for providing the necessary funding needed to 465
complete this research work The authors are also pleased to the Director General Petroleum 466
Concessions (DGPC) Ministry of Petroleum and Natural Resources Government of Pakistan 467
and joint venture partners of Sawan gas field for providing data and other required material to 468
complete this work TA thanks Cardiff University for their support to a visiting staff scheme set 469
with HMA Reviewers and Editor M Faure are acknowledged for their constructive feedback 470
471
References 472
Afzal J Kuffner T Rahman A Ibrahim M 2009 Seismic and well-log based sequence 473
stratigraphy of the early Cretaceous δower Goru ldquoCrdquo sand of the Sawan gas field middle Indus 474
Platform Pakistan Annual Technical Conference Islamabad 475
Ahmad N Fink P Sturrock S Mahmood T Ibrahim M 2004 Sequence stratigraphy as 476
predictive tool in Lower Goru fairway Lower Middle Indus Platform Pakistan PAPG-SPE 477
ATC 85-105 478
Alam I Azhar AM Khan MW 2014 Frontal structural style of the Khisor Range northwest 479
of Bilot Implications for hydrocarbon potential of the north-western Punjab foredeep Pakistan 480
Journal of Himalayan Earth Sciences Volume 47 Issue No 1 87-98 481
Ali A Anwer HM Hussain M 2015 A comparisonal study in the context of seismic fracture 482
characterization based on effective stiffness and compliance methods Arab J of Geosci DOI 483
101007s12517-014-1478-8 484
21
Ali A Jakobsen M 2011a On the accuracy of Ruumlgers approximation for reflection 485
coefficients in HTI media implications for the determination of fracture density and orientation 486
from seismic AVAZ data Journal of Geophysics and Engineering issue No 8 372-393 487
Ali A Jakobsen M 2011b Seismic characterization of reservoirs with multiple fractures sets 488
using velocity and attenuation anisotropy data Journal of Applied Geophysics Issue No75 590-489
602 490
Ali A Shahraini A Jakobsen M 2011 Improved characterization of fault zones by 491
quantitative integration of seismic and production data Journal of Geophysicsamp Eng Issue 8 492
259ndash274 493
Ali A Zubair Hussain M Rehman K Toqeer M 2016 Effect of Shale Distribution on 494
Hydrocarbon Sands Integrated with Anisotropic Rock Physics for AVA Modelling A Case 495
Study Acta Geophysica vol 64 issue No 4 1139-1163 496
Almutlaq MH Margrave GF 2010 Tutorial AVO inversion CREWES Research Report 497
Vol 22 1-23 498
Asim S Zhu P Qureshi SN Naseer MT 2015 A case study of Precambrian to Eocene 499
sedimentsrsquo hydrocarbon potential assessment in Central Indus Basin of Pakistan Arabian Journal 500
of Geosciences ISSN 1866-7511 DOI 101007s12517-015-1988-z 501
Aster RC Borchers B Thurber CH 2005 Parameter Estimation and Inverse Problems 502
ISBN 0-12-065604-3 Elsevier Academic Press Amsterdam 503
Avseth P Mukerji T Mavko G 2005 Quantitative seismic interpretation Applying rock 504
physics tools to reduce interpretation risk ISBN 0-13-978-0-521-81601-7 Cambridge 505
University Press UK 506
22
Azeem T Yanchun W Khalid P Xueqing L Yuan F Lifang C 2016 An application of 507
seismic attributes analysis for mapping of gas bearing sand zones in the Sawan gas field Pakistan 508
Acta Geod Geophys DOI 101007s40328-015-0155-z 509
Bachrach R 2006 Joint estimation of porosity and saturation using stochastic rock-physics 510
modelling Geophysics 71(5) 53ndash63 511
Backus GE1962 Long-wave elastic anisotropy produced by horizontal layering J 512
Geophysics Res issue No67 4427-4440 513
Ball G 1995 Estimation of anisotropy and anisotropic 3-D Prestack depth migration offshore 514
Zaire Geophysics issue No 60 1495-1513 515
Banik N C 1987 An effective anisotropy parameter in transversely isotropic media 516
Geophysics 52(12) 1654-1664 517
Berger A Gier S Krois P 2009 Porosity-preserving chlorite cements in shallow-marine 518
volcaniclastic sandstones evidence of the Sawan gas field Pakistan AAPG Bull 93(5) 595-615 519
Besheli S A Urosevic M Li R 2005 The effect of seismic anisotropy on reservoir 520
characterization SEG Annual Meeting Houston USA 521
Blangy JP1992 Anisotropy and AVO in TI media an overview Joint SEG In EAEG summer 522
research workshop Expanded Abstracts Vol 60 l-605 523
Blangy JP1994 AVO in transversely isotropic media-An overview Geophysics Vol 59 No5 524
775-781 525
Brajanovski M Nadri D Gurevich B Bona A 2009 Stress induced anisotropy in sandstone 526
reservoir and shale overburden - AVO modeling International Geophysical Conference and 527
23
Exposition Beijing China 24ndash27 April 194-194 ISBN 978-1-56080-284-6 doi 528
10119013603719 529
Brown RJS Korringa J 1975 On the dependence of elastic properties of a porous rock on 530
the compressibility of the pore fluid Geophysics 40 608ndash616 531
Buland A Omre H 2003 Joint AVO inversion-wavelet estimation and noise level estimation 532
using a spatially coupled and hierarchical Bayesian Model Geophysical Prospecting 51 531-533
550 534
Chao G Cadore T Deplante C Gratzer O 2012 Detailed AVA analysis of a class IIp 535
reservoir in presence of VTI shale anisotropy A case study from offshore West Africa SEG 536
Annual Meeting Las Vegas DOI101190segam2012-12801 537
Chengzao J Min Z Yongfeng Z 2012 Unconventional Hydrocarbon Resources in China 538
and the Prospect of Exploration and Development Petroleum Exploration and Development v 539
392 129-136 540
Clavaud JB Nelson R Guru UK Wang H 2005 Field example of enhanced hydrocarbon 541
estimation in thinly laminated formation with a triaxial array induction tool A laminated sand-542
shale analysis with anisotropic shale SPWLA 46th Annual Logging Symposium 26-29 June 543
New Orleans USA 544
Crampin S Chesnokov EM Hipkin RG 1984 Seismic Anisotropy- the state of the art II 545
Geophysics J Int issue 76(1) 1-16 546
Da Silva NV Ratcliffe A Vinje V Conroy G 2016 A new parameter set for anisotropic 547
multiparameter full-waveform inversion and application to a North Sea dataset Geophysics Vol 548
81 issue No 4 U25ndashU38 549
24
Daley PF Horn F 1977 Reflection and transmission coefficients for transversely isotropic 550
media Bull Seis Soc Am issue No 67 661-675 551
Das I Zoback MD 2013 Long-period long-duration seismic events during hydraulic 552
stimulation of shale and tight-gas reservoirs Part 1 Waveform characteristics Geophysics Vol 553
78 No 6 KS97-KS108 554
English JM Lunn GA Ferreira L Yacu G 2015 Geologic evolution of the Iraqi Zagros 555
and its influence on the distribution of hydrocarbons in the Kurdistan region AAPG Bulletin 556
V99 No2 231-272 DOI 10130606271413205 557
Feng H Bancroft JC 2006 AVO principles processing and inversion CREWES Research 558
Report Vol 18 1-19 559
Fink P Schuh M Ahmad N Koehazy R 2004 Can the American Securities and Exchange 560
Commission and the central limit theorem ever become friends A practical proposal for 561
reconciliation from OεVrsquos Sawan Reserves Estimation exercise PAPGSPE Annual Technical 562
Conference 8-9 October Islamabad Pakistan 563
Floridia C Teles NT 1998 Effects of anisotropy in the AVO analysis SEG Technical 564
Program Expanded Abstracts 212-215 doi10119011820378 565
Gassmann F 1951 Uumlber die Elastizitaumlt poroumlser MedienViertelNaturforschGes Zuumlrich 96 1-566
23 567
Goodway B Perez M Varsek J Abaco C 2010 Seismic petrophysics and isotropic-568
anisotropic AVO methods for unconventional gas exploration The Leading Edge 29(12) 1500-569
1508 Doi 10119013525367 570
25
Graebner M 1992 Plane-wave reflection and transmission coefficients for a transversely 571
isotropic solid Geophysics 57(11) 1512-1519 doi10119011443219 572
Grechka V1998 AVO analysis in finely layered azimuthally anisotropic media SEG Technical 573
Program Expanded Abstracts 1649-1652 doi 10119011820238 574
Iqbal MWA Shah SMI 1980 A guide to the stratigraphy of Pakistan Geological Survey 575
of Pakistan Records Geol Surv Pak Quetta 53-34 576
Jakobsen M Johansen TA 1999 A test of ANNIE based on ultrasonic measurements on a 577
shale J Seis Explorissue No 8 77-89 578
Jakobsen M Hudson JA Johansen TA 2003a T-matrix approach to shale acoustics 579
Geophysical Journal International Issue No154 533-558 580
Jakobsen M Johansen TA 2000 Anisotropic approximations for mud rocks A seismic 581
laboratory study Geophys 65 1711-1725 582
Jakobsen M Johansen TA McCann C 2003b The acoustic signature of fluid flow in 583
complex porous media Journal of Applied Geophysics 54 219-246 584
Jinhu D He L Desheng M Jinhua F Yuhua W Zhou T 2014Discussion on effective 585
development techniques for continental tight oil in China Petroleum Exploration and 586
Development Volume 41 Issue 2 217-224 587
Kadri IB 1995 Petroleum geology of Pakistan Pakistan Petroleum Limited Graphic 588
Publishers Karachi 589
Katz B Lin F 2014 Lacustrine Basin unconventional Resource Plays Key differences 590
Marine and Petroleum Geology Volume 56 255-265 591
26
Kim KY Wrolstad KH Aminzadeh F 1993 Effects of Transverse Isotropy on P-wave 592
AVO for gas sands Geophysics 58 883-888 593
Krois P Mahmood T Milan G 1998 Miano field Pakistan a case history of model driven 594
exploration Proceedings of the Pakistan Petroleum Convention Pakistan Association of 595
Petroleum Geologists Islamabad 111-131 596
Kumar D Hoversten GM 2012 Geophysical model response in a shale gas 9th Biennial 597
international conference amp Exposition on Petroleum Geophysics Hyderabad India 598
Kurniawan F 2005 Shaly Sand Interpretation Using CEC-Dependent Petrophysical 599
Parameters MS Dissertation Louisiana State University and Agricultural and Mechanical 600
College 601
Leaney WS 1993 AVO and anisotropy from logs and walkaways Exploration Geophysics 602
24 623-630 603
Li V Tsvankin I Alkhalifah T 2016 Analysis of RTM extended images for VTI media 604
Geophysics Vol 81 NO3 S139ndashS150 DOI 101190GEO2015-03841 605
Luo X Lin Y Wu L Yao F 2005 Estimation of anisotropy parameters in VTI Media from 606
surface P-wave seismic data and VSP in Tarim Basin China SEG Annual Meeting Houston 607
178-181 608
Margesson RW Sondergeld CH 1999 Anisotropy and amplitude versus offset a case 609
history from the West of Shetlands Proceedings of the 5th Conference 635-643 Petroleum 610
Geology 86 Ltd Published by the Geological Society London 611
Mavko G Mukerji T Dvorkin J 2009 The Rock Physics Handbook Tools for Seismic 612
Analysis in Porous Media Cambridge University Press UK 613
27
McGlade C Speirs J Sorrell S 2012 A review of regional and global estimates of 614
unconventional gas resources A report to the Energy Security Unit of the Joint Research Centre 615
of the European Commission 616
McPhee CA Enzendorfer CK 2004 Sand management solutions for high-rate gas wells 617
Sawan field SPE Sindh 618
Munir K Iqbal MA Farid A Shabih SM 2011 Mapping the productive sands of Lower 619
Goru Formation by using seismic stratigraphy and rock physical studies in Sawan area southern 620
Pakistan a case study Journal of Petroleum Exploration amp Production Technology issue No1 621
33-42 doi101007s13202-011-0003-9 622
Nourollah H Urosevic M Keetley J 2015 Seal potential of shale sequences through seismic 623
anisotropy Case study from Exmouth Sub-basin Australia Society of Exploration 624
Geophysicists Vol 3 Issue No 4 T257-T267 625
Pujol J 2003 Elastic Wave Propagation and Generation in Seismology ISBN 0-521-52046-0 626
Cambridge University Press UK 160-161 627
Quadri VN Shuaib M1986 Hydrocarbon prospects of Southern Indus Basin AAPG 628
Bulletin v 70 pp730ndash747 629
Rodriguez K Hodgson N Hewitt A 2016 The future of oil exploration First Break Vol 34 630
issue No 2 95-101 631
Ruumlger A 2002 Reflection Coefficients and Azimuthal AVO Analysis in Anisotropic Media 632
Geophysical Monograph Series No 10 Society of Exploration Geophysics 633
Ruumlger A1998 Variation of P-wave reflectivity with offset and azimuth in anisotropic media 634
Geophysics issue Nno63 935-947 635
28
Sams MS Andrea M 2001 The effect of clay distribution on the elastic properties of 636
sandstones Geophysical Prospecting 49128-150 637
Saxena K Tyagi A Klimentos T Morriss C Mathew A 2006 Evaluating Deepwater Thin-638
Bedded Reservoirs with the RT Scanner Petromin Kaula Lumpur 639
Sayers CM 2013 Rock Physics for Reservoir Exploration Characterisation and Monitoring 640
Geophysical Prospecting 61 251ndash253 doi 1011111365-247812034 641
Sayers CM 1998 Long-wave seismic anisotropy of heterogeneous reservoirs Geophysical J 642
Int 132 667-673 643
Sayers CM Rickett JE 1997 Azimuthal variation in AVO response for fractured gas sands 644
Geophysical Prospecting 45 165-182 645
Shahraini A Ali A Jakobsen M 2011 Seismic history matching in fractured reservoirs using 646
a consistent stiffness-permeability model Focus on the effects of fracture aperture Geophysical 647
Prospecting 59 492-505 648
Sone H Zoback MD 2013 Mechanical properties of shale-gas reservoir rocks Part 2 Ductile 649
creep brittle strength and their relation to the elastic modulus Geophysics Vol 78 No 5 650
D393-D402 651
Tarantola A 2005 Inverse Problem Theory and Methods for Model Parameter Estimation 652
Society for Industrial and Applied Mathematics USA 653
Thomas EC Stieber SJ 1975 The distribution of shale in sandstones and its effect on 654
porosity SPWLA 16th Annual Logging Symp 4-7 June1975 655
29
Thomsen L 1995 Elasticity anisotropy due to aligned cracks in porous rock Geophysical 656
Prospecting 43 805-829 657
Thomsen L1986 Weak elastic anisotropy Geophysics51(10) 1954-1966 658
Tsvankin I 1997a Anisotropic parameters and P-wave velocity for orthorhombic media 659
Geophysics 62 1292ndash1309 660
Tsvankin I 1997b Reflection move out and parameter estimation for horizontal transverse 661
isotropy Geophysics issue No62 614-629 662
Tyagi AK Guha R Voleti D Saxena K 2009 Challenges in The Reservoir 663
Characterization of a Laminated Sand Shale Sequence 2nd SPWLA-India Symposium 664
November 19-20 665
Uden R Dvorkin J Walls J Carr M 2004 Lithology substitution in a sandshale sequence 666
ASEG 17th Geophysical Conference and Exhibition Sydney 667
Wandrey CJ Law BE Shah HA 2004 Sembar GoruGhazij composite total petroleum 668
system Indus and Sulaiman-Kirthar geologic Provinces Pakistan and India US Geological 669
Survey USA Geological Survey Bulletin 670
Wang L Dai H Li XY 2006 Estimating anisotropic parameters from PS converted-wave 671
data a case study British Geological Survey Xianyi Sun Petro China Daqing Oil Field 672
Wang Y 2011 Seismic anisotropy estimated from P-wave arrival times in cross hole 673
measurements Geophysical Journal International 184 1311-1316 674
Wood AW 1955 A Textbook of Sounds New York McMillan Co USA 675
30
Wright J 1987 The effects of transverse isotropy on reflection amplitude versus offset 676
Geophysics 52 564-567 677
Xu S Wu X Huang X Yin H 2005 Evaluation of Anisotropic Rock Properties in 678
Sedimentary Rocks from well log Offshore Technology Conference Houston TX USA 679
Zaigham NA Mallick KA 2000 Prospect of hydrocarbon associated with fossil-rift 680
structures of the southern Indus basin Pakistan AAPG Bull 84(11) 1833-1848 681
Zhang H Brown RJ 2001 A review of AVO analysis CREWES Research Report Volume 682
13 337-378 683
Zhu Y Xu S Payne M Martinez A Liu E Harris C Bandyopadhyay K 2012 684
Improved Rock-Physics Model for Shale Gas Reservoirs SEG Technical Program Expanded 685
Abstracts 1-5doi 101190segam2012-09271 686
Zoeppritz KE 1919 On the reflection and propagation of seismic waves Goumlttinger 687
Nachrichten 1(5) 66-84 688
689
31
690
Figure 1a Regional map showing the regional structural setting of Pakistan and the location of 691
multiple sedimentary basins in this country The location of Sawan gas field is highlighted by 692
the black circle 693
FORE LAND FOLD-THRUST BELT
THRUST FRONT OF FOLD BELT
PLATE BOUNDARIESTHRUSTS
OPHIOLITIES
MAJOR BACKTHRUST
LEGEND
62deg 64deg 68deg 70deg 72deg66deg 74deg 76deg
62deg 72deg64deg 68deg 70deg66deg 74deg
24deg
26deg
28deg
30deg
32deg
34deg
36deg
24deg
26deg
28 deg
30deg
32deg
34deg
36deg
32
694
Figure-1b Local map showing the boundaries of the Sawan gas field and the relative location 695
of exploration wells in the study area 696
33
697
Figure 2 Generalised stratigraphy of the Sawan gas field highlighting the presence of multiple 698
lithological units including the Lower Goru C-sand interval and shaley intervals within and 699
adjacent to these reservoir sands This C-sand interval comprises the principal gas-producing 700
reservoir of the Sawan field (Azeem et al 2015) 701
702
34
703 Figure 3 Work Flow diagram showing the methodology adopted to compare isotropic and 704
anisotropic AVA modelling 705
706
35
707
Figure 4 Well-log correlations for the Lower Goru C-sand and shale intervals in the three exploration wells used in AVA modelling 708
36
709
Figure 5 Results of petrophysical analyses for the estimation of reservoir properties of sand-710
shale intervals in the Sawan-01 well 711
712
37
713
Figure 6 Results of petrophysical analyses for the estimation of reservoir properties of sand-714
shale intervals in the Sawan-3B well 715
38
716
Figure 7 Results of petrophysical analyses for the estimation of reservoir properties of sand-717
shale intervals in the Sawan-06 well 718
39
719
Figure 8 Shale distribution model proposed by Thomas and Strieber (1975) (figure modified 720
from Tyagi et al 2009) In this diagram ℎ is the volume of shale is the total 721
porosity is the maximum porosity and ℎ is the porosity in shales 722
723
40
724
725
Figure 9 Cross-plots between volume of shale (X-axis) and total porosity (Y-axis) Based 726
upon the position of data points shale distribution was characterised within the C-sand 727
reservoir in the Sawan-01 well 728
729
Sawan-01
41
730
Figure 10 Cross-plots between volume of shale (X-axis) and total porosity (Y-axis) Based 731
upon the position of data points shale distribution was characterised within the C-sand 732
reservoir in the Sawan-3B well 733
Sawan-3B
42
734
Figure 11 Cross-plots between volume of shale (X-axis) and total porosity (Y-axis) Based 735
upon the position of data points shale distribution was characterised within the C-sand 736
reservoir in the Sawan-06 well 737
Sawan-06
43
738
Figure 12 Angle-dependent reflection coefficient data generated through the exact and 739
approximate solutions of PP-wave for isotropic and anisotropic (VTI) media at the top of C-740
sand reservoir (Sawan-01 well) 741
742
44
743
Figure 13 Angle-dependent reflection coefficient data generated through the exact and 744
approximate solutions of PP-wave for isotropic and anisotropic (VTI) media at the top of C-745
sand reservoir (Sawan-3B well) 746
747
45
748
Figure 14 Angle-dependent reflection coefficient data generated through the exact and 749
approximate solutions of PP-wave for isotropic and anisotropic (VTI) media at the top of C-750
sand reservoir (Sawan-06 well) 751
752
46
753
Figure 15 Seismic AVA response for the Lower Goru C-sand Sawan-01 well 754
755
47
756
Figure 16 Seismic AVA response for the Lower Goru C-sand Sawan-3B well 757
758
48
759
Figure 17 Seismic AVA response for the Lower Goru C-sand Sawan-06 well 760
761
49
762
Figure 18 Maps highlighting the inversion with 20 uncertainty for true porosity distribution 763
(top) generated via a correlated Gaussian field distribution throughout the reservoir interval at 764
100times100 grid blocks These porosity plots were compiled via maximum a posteriori solution 765
under Bayesian settings utilising the rock physical properties of C-sand reservoir interval 766
(3268-3432 m) with exact and approximate solutions of PP-reflection coefficients for the 767
isotropic and anisotropic (VTI) cases Inversion results show that Daley amp Hornrsquos (1977) exact 768
solution for VTI (left in 2nd row) returns porosity trends that are accurately aligned with the 769
true porosity distribution of the reservoir 770
771
50
Reservoir Properties Sawan-01 Sawan-3B Sawan-06
Depth Range (m) 3268-3432 3398-3592 3227-3312
Gross Thickness (m) 164 184 85
Net Reservoir Thickness (m) 80 126 36
Net Pay Thickness (m) 24 58 20
Avg Porosity () 15 14 12
Avg Volume of Shale () 28 22 34
Average Water Saturation () 46 40 45
Table 1 Reservoir properties of the Sawan wells used in this study 772
773
51
Cut-off GRlt=75 API 01lt=NPHIlt=045 Swlt=50
Rock Thickness (m) Yes No No
Net Reservoir Thickness
(m) Yes Yes No
Net Pay Thickness (m) Yes Yes Yes
Table 2 Details of cut-off values used in the calculation of reservoir properties in Table 1 774
775
52
Well Formation Vp(α) Vs(β) Density(ρ) Porosity(ɸ)
Sawan-01 Sand 4165 4112 232 015
Shale 2668 2170 267 008
Overburden 28745 23675 254
Sawan-3B Sand 4251 2562 244 013
Shale 4487 2628 260 010
Overburden 4258 2547 262
Sawan-06 Sand 4148628 25790 251 013
Shale 4462847 17410 261 0085
Overburden 4322960 25200 257
Table 3 Mechanical properties of reservoir sand intra-reservoir shale layers and overburden 776
used in the calculation of reflection coefficients 777
778
53
Material Shear modulus
(GPa)
Bulk modulus
(GPa)
Density
(gcm3)
Solid Mineral
(Quartz)
44 37 265
Gas 00 0025 0065
Fluid (waterbrine) 00 22 1035
779
Table 4 Values of elastic moduli and densities for solid mineral and fluid used in our rock physics
modelling
54
Appendix-A 780
Backus Averaging Approach 781
The effective stiffness is anisotropic for a stratified medium composed of transversely 782
isotropic layers in the limit of long-wavelength and represented by the Backus (1962) matrix 783
below (Mavko et al 2009) 784
M
D
D
CFF
FAB
FBA
00000
00000
00000
000
000
000
BAM 2
1 (A-I) 785
whereA B C D and F are the five independent elastic constants 786
[ie C C C C ampC ] In terms of P- and S-wave velocities (PV and SV ) and densities 787
( ) the five independent elastic constants can be written as 788
112
2
2
2
2
22 2114
P
P
S
P
SS V
V
V
V
VVA (A-II )789
112
2
2
2
2
22 21
212
P
P
S
P
SS V
V
V
V
VVB (A-III )790
112 PVC (A-IV) 791
112 SVD (A-V) 792
112
2
2
2
21 P
P
S VV
VF (A-VI) 793
55
2SVM (A-VII) 794
The brackets indicate averages of the enclosed properties weighted by their volumetric 795
proportions Once the five independent constants are obtained the Thomsen anisotropy 796
parameters for VTI can be obtained using the relationships given by Thomsen (1986 1995) 797
= minus (A-VII) 798
= minus (A-VIII) 799
= + minus minusminus (A-IX) 800
In order to calculate the effect of fluid saturation on the effective properties of a sand-shale 801
layered medium we have used the Gassmann (1951) equation for isotropic media and the 802
relationships of Brown and Korringa (1975) for anisotropic (VTI) media (Ali et al 2011 803
Shahraini et al 2011) 804
805
56
Appendix-B 806
1 Gassmann (1951) fluid substitution model for isotropic media 807
As the dry composite sand-shale medium was assumed as isotropic in this work we used the 808
low frequency Gassmann (1951) model (Equation B-I) applicable to well-connected porous 809
media under isobaric conditions We used this latter model in order to incorporate fluid 810
effects into the effective mechanical properties calculated in our own models Equation (B-I) 811
defines a relationship between saturated bulk modulus bulk modulus of the skeleton of the 812
rock bulk modulus of mineral comprising rock matrix fluid bulk modulus and porosity A 813
typical form of the Gassmann (1951) equation is as follows 814
815
= + minus( frasl )ɸ + minusɸ minus (B-I) 816
Here lsquo rsquo is the saturated rock bulk modulus lsquo rsquo is the frame or dry bulk modulus 817
lsquo rsquo is the grain bulk modulus lsquo rsquo corresponds to the fluid bulk moduli and lsquoɸrsquo is 818
the porosity 819
820
2 Brown and Korringa (1975) relations for fluid effects of an anisotropic medium 821
(VTI) 822
823
In order to calculate the effect of fluid saturation on the effective properties of a sand-shale 824
interval assuming it as VTI medium we have used the anisotropic relations of Brown and 825
Korringa (1975) which can be written in the symbolic or matrix notation as (Ali et al 2011) 826
827
57
lowast = lowast + (lowastminus)∶ ⨂ ∶ (lowastminus) ∙∙ minus kfrasl minus ∙(lowastminus)∙ (B-II ) 828
Hereotimes denotes the dyadic product is the compliance tensor of the solid mineral 829
component (properties of mineral quartz were used in the case of sand-shale model) lowast is the 830
effective compliance tensor for the dry sand-shale medium and S is the effective compliance 831
tensor for the saturated sand-shale medium In Equation (B-II ) φ is the total porosity and 832
is the (symmetric) identity matrix for second-rank tensors 833
In the case of a composite porous medium that is partially saturated with oil gas and water 834 K may be regarded as the bulk modulus of an effective fluid given by Wood - also known as 835
the Reuss average (Mavko et al 2009) 836
837 = ww + oo + (B-III ) 838
where 839
840 Sw + S + S = (B-IV) 841
Here Sw S and S represent the saturation for water oil and gas and Kw K and K 842
represent the bulk modulus for water oil and gas 843
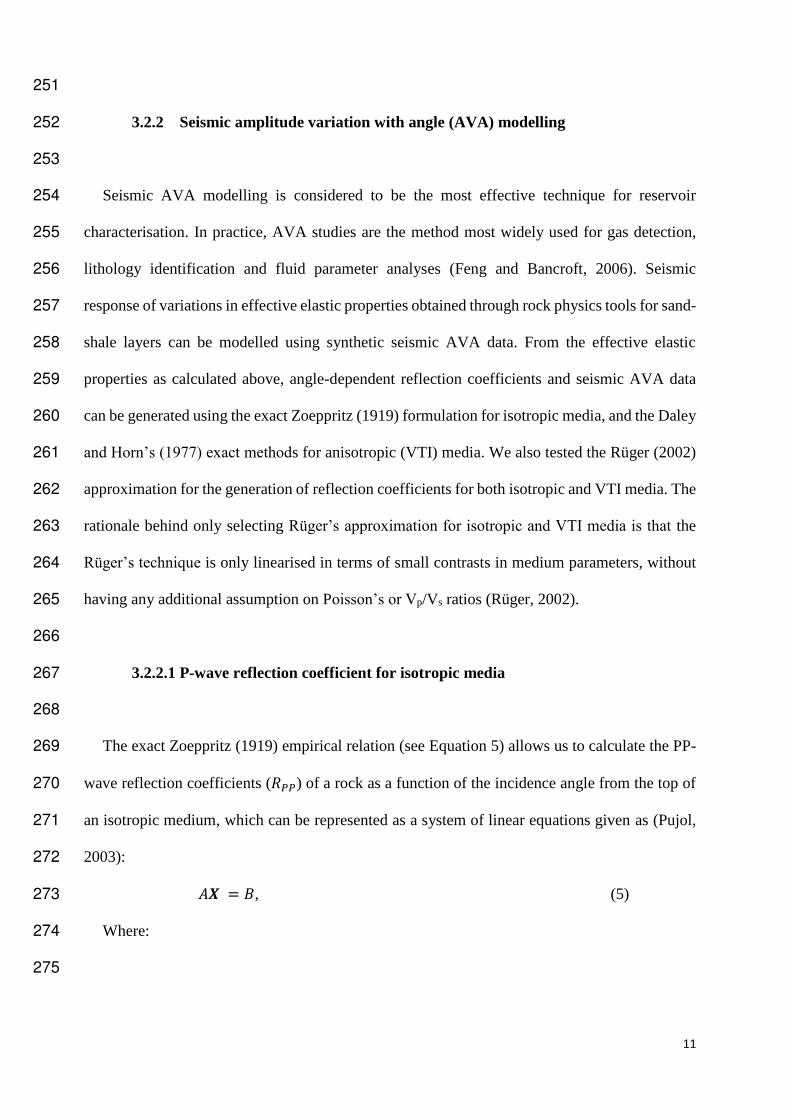
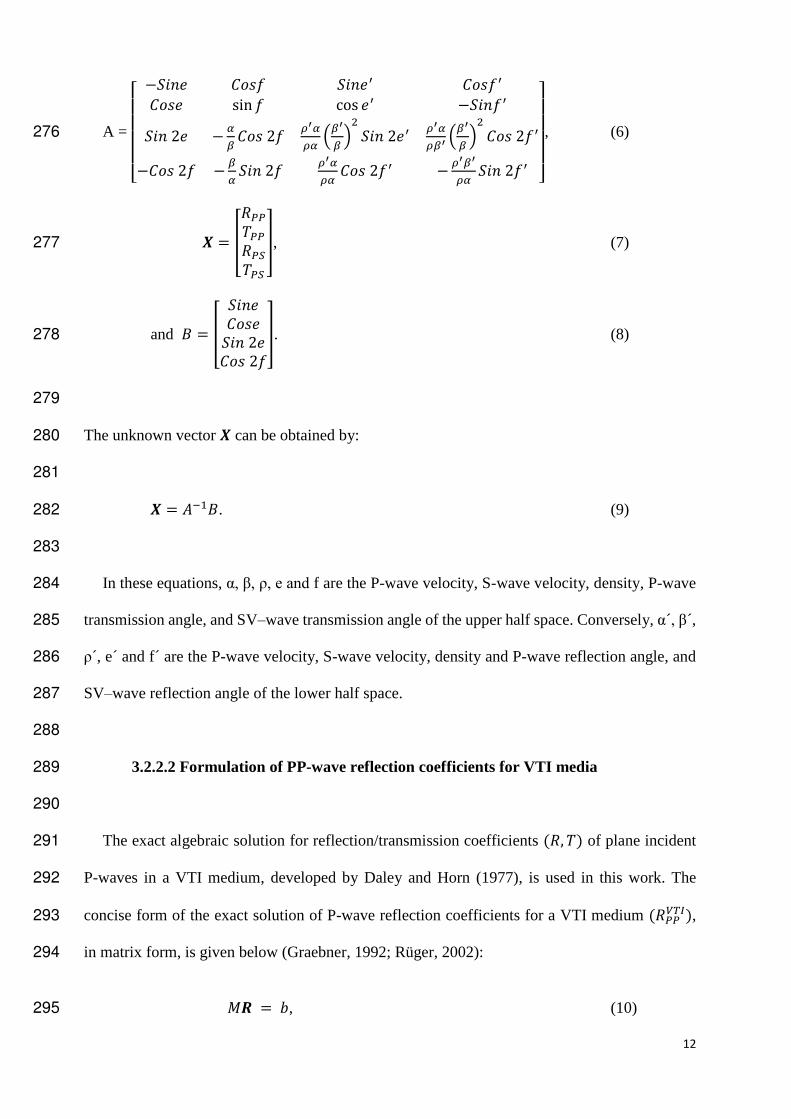
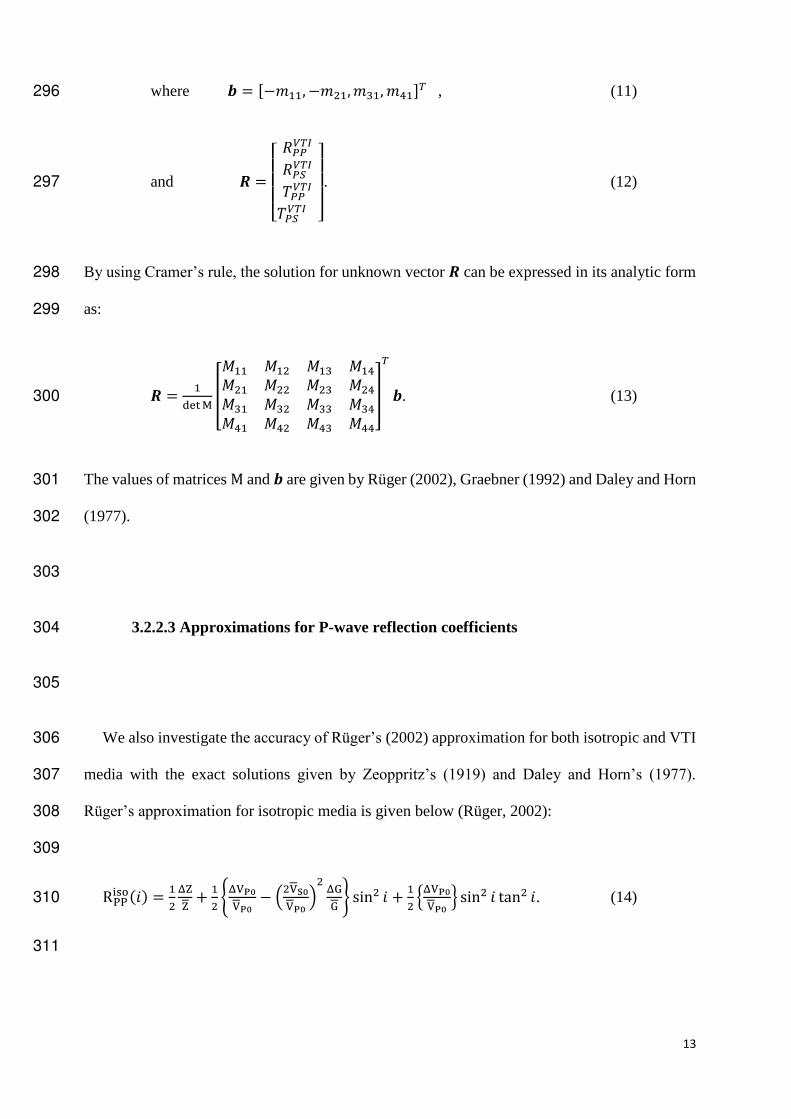
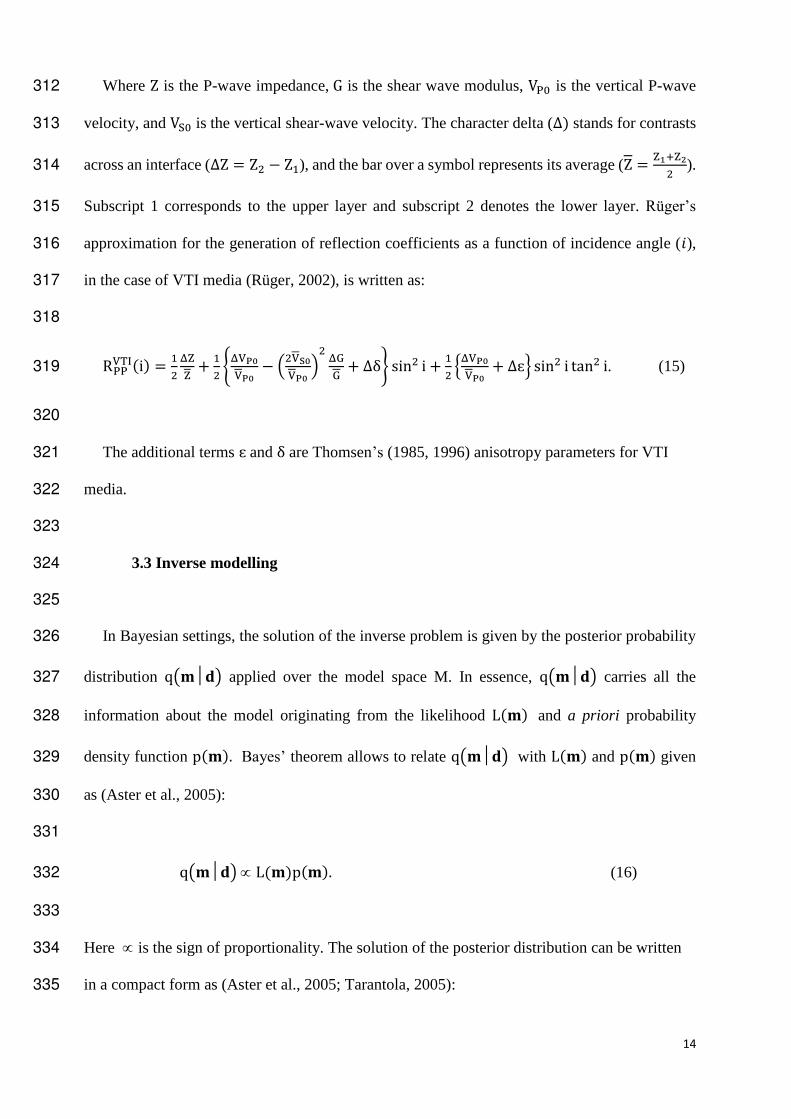
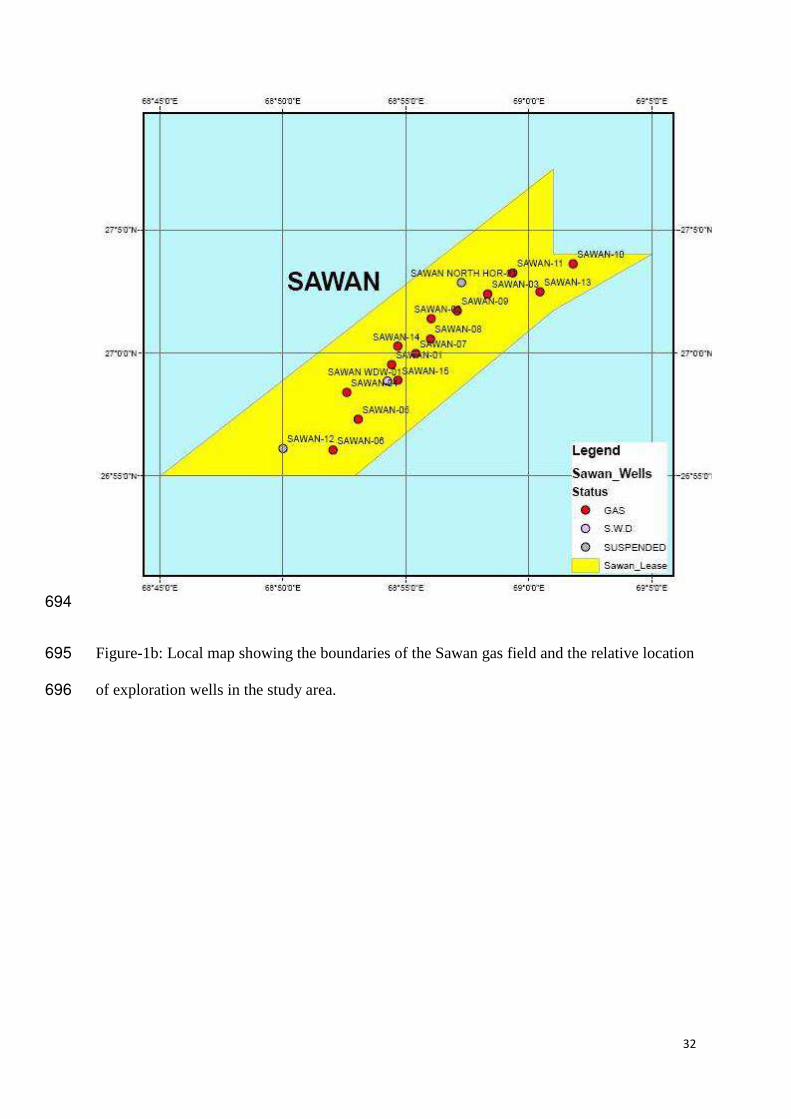
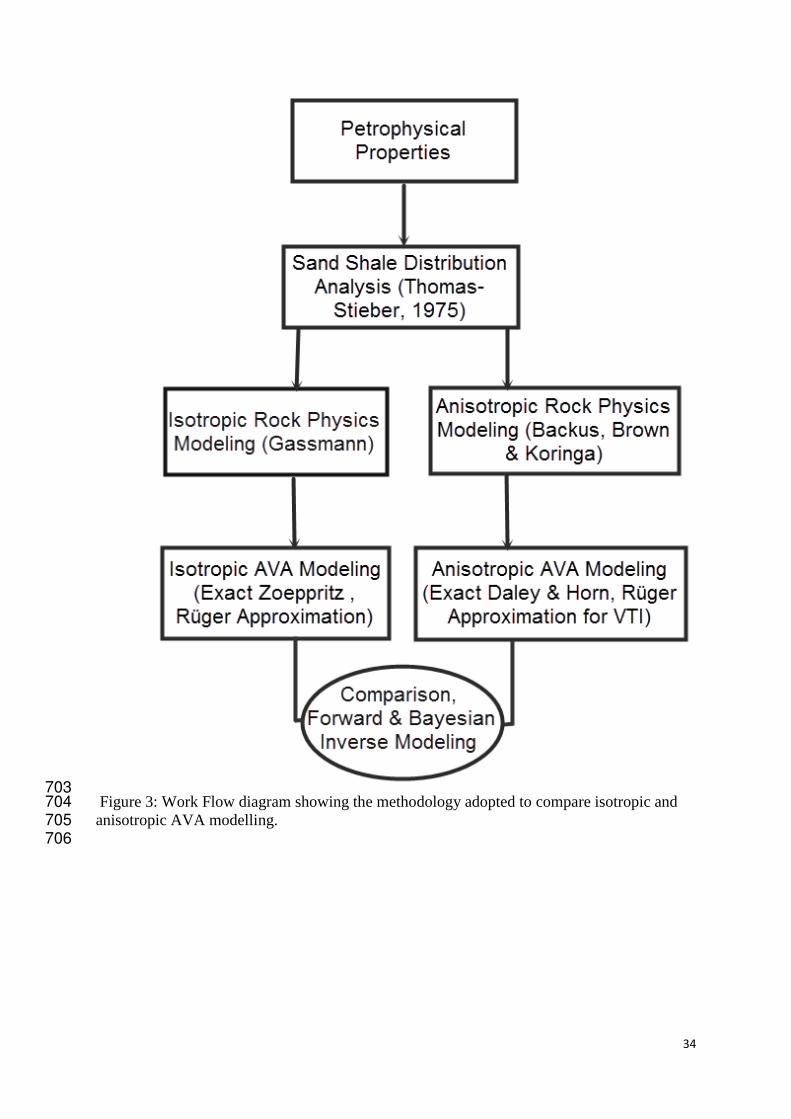
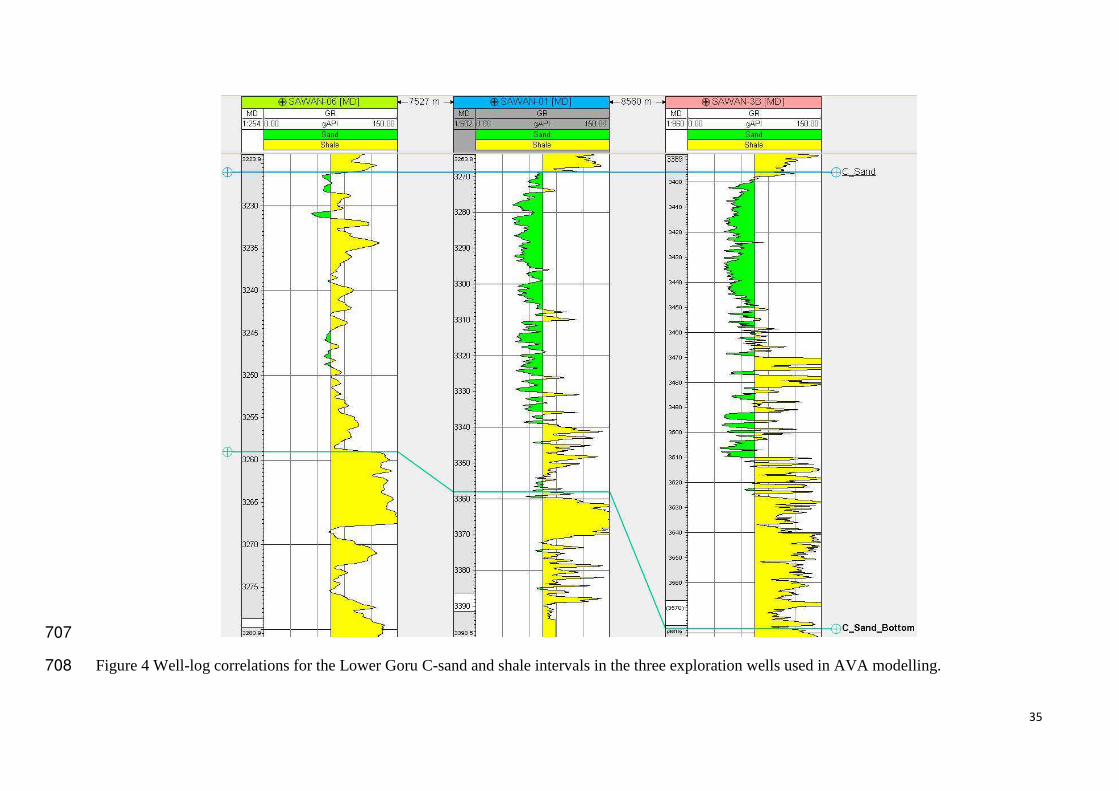
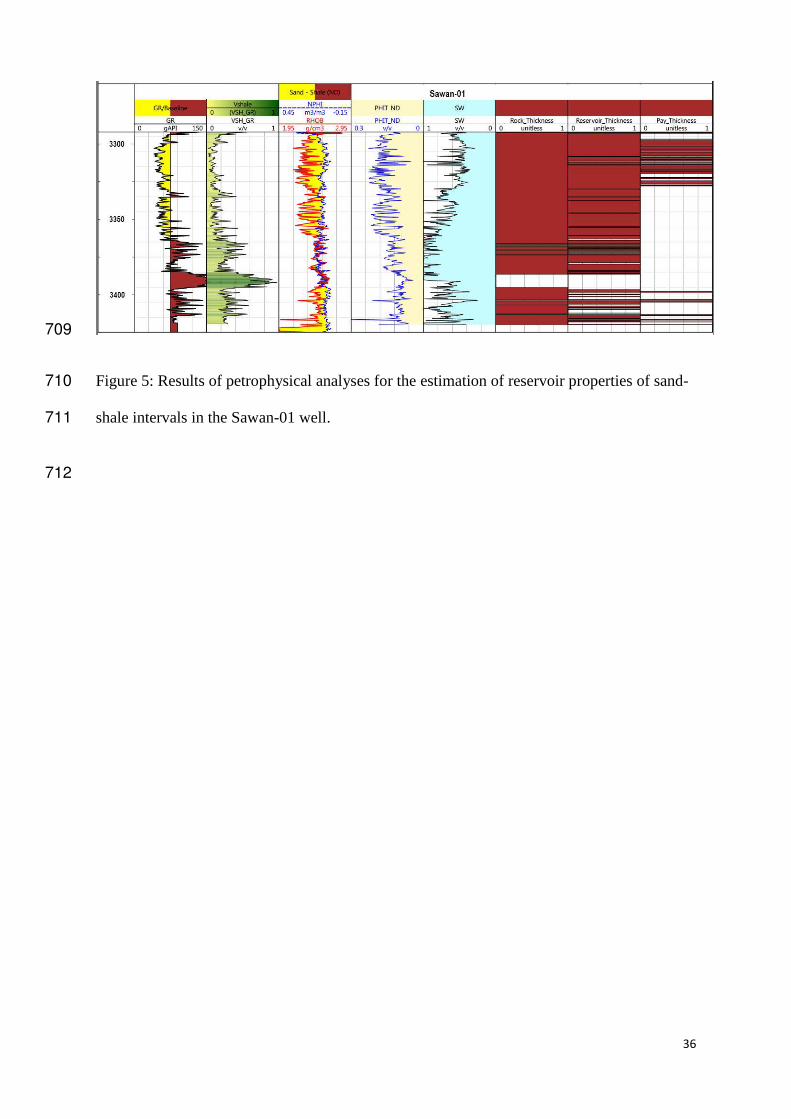
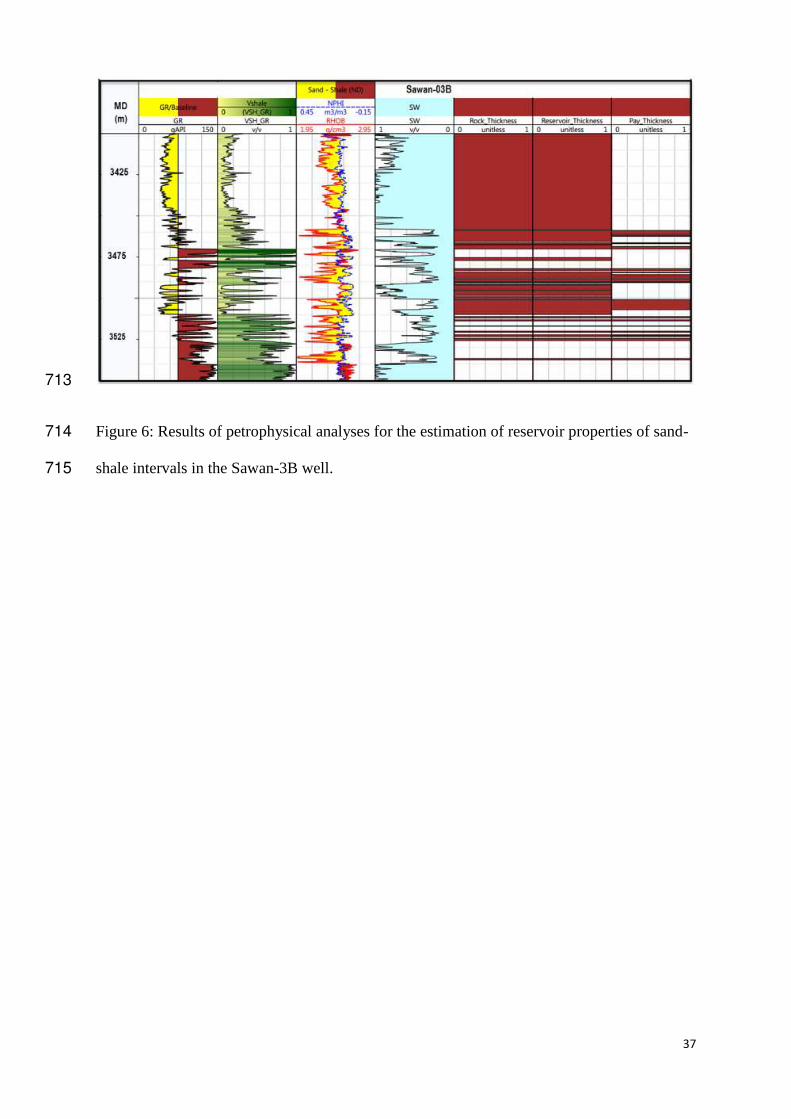
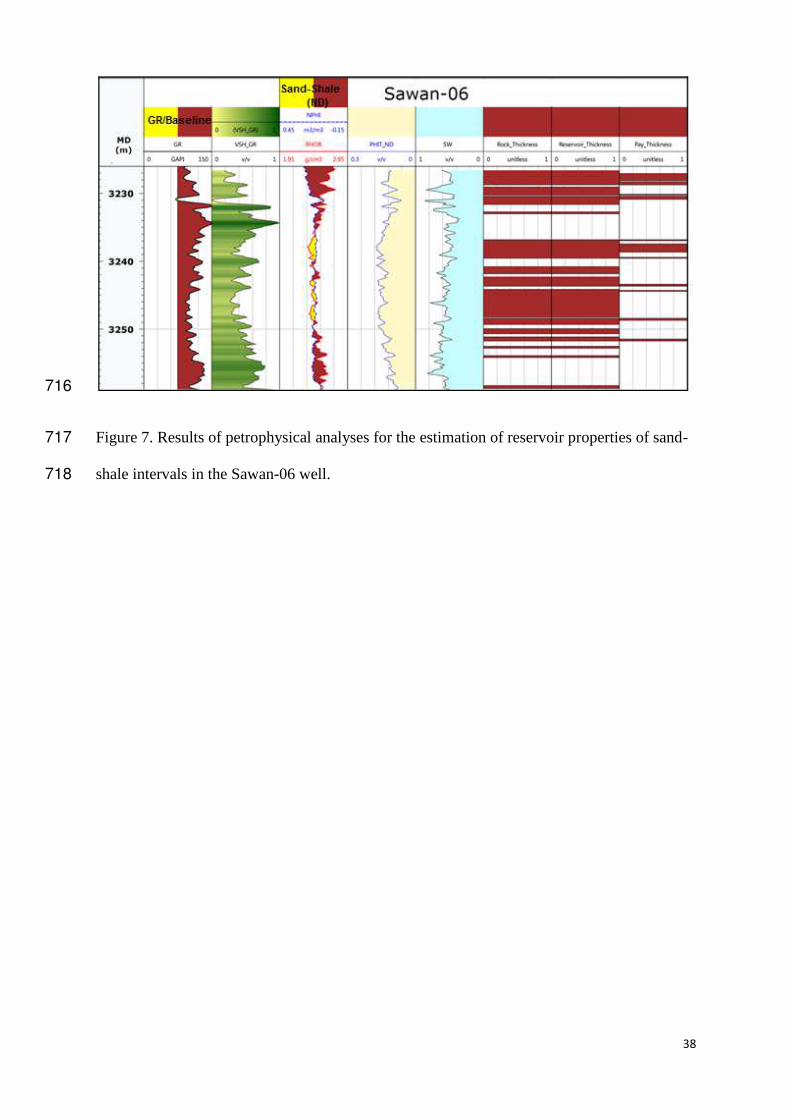
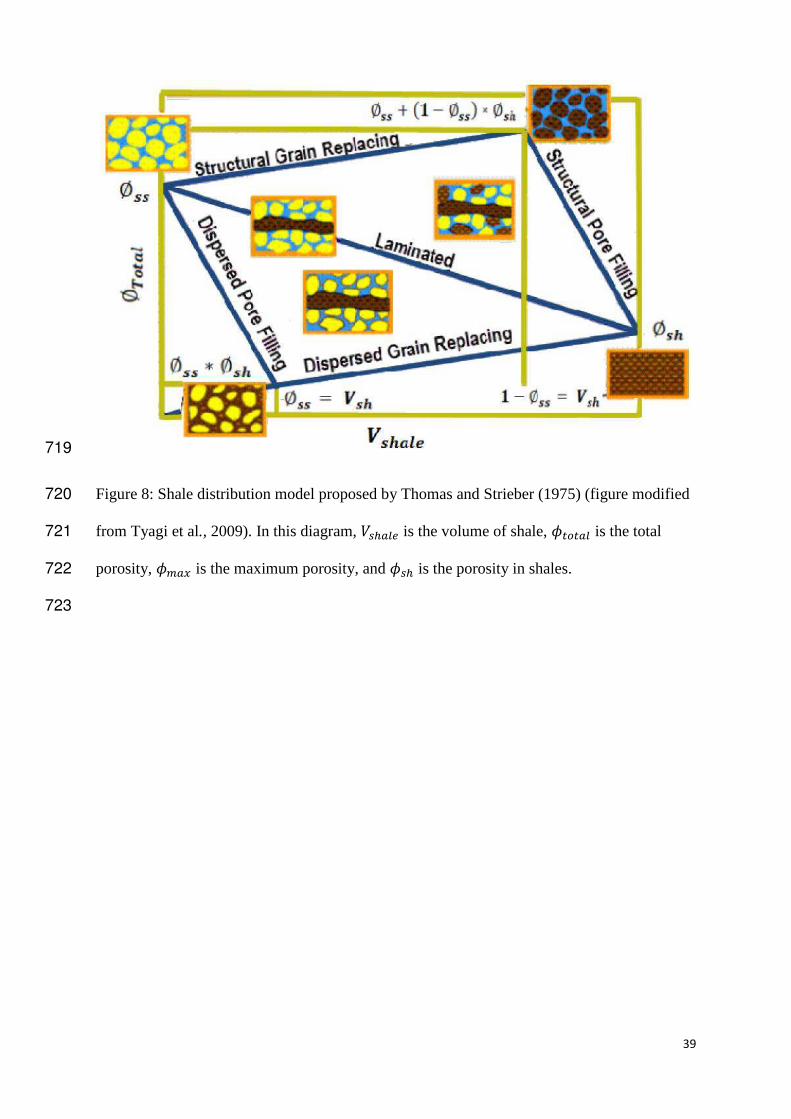
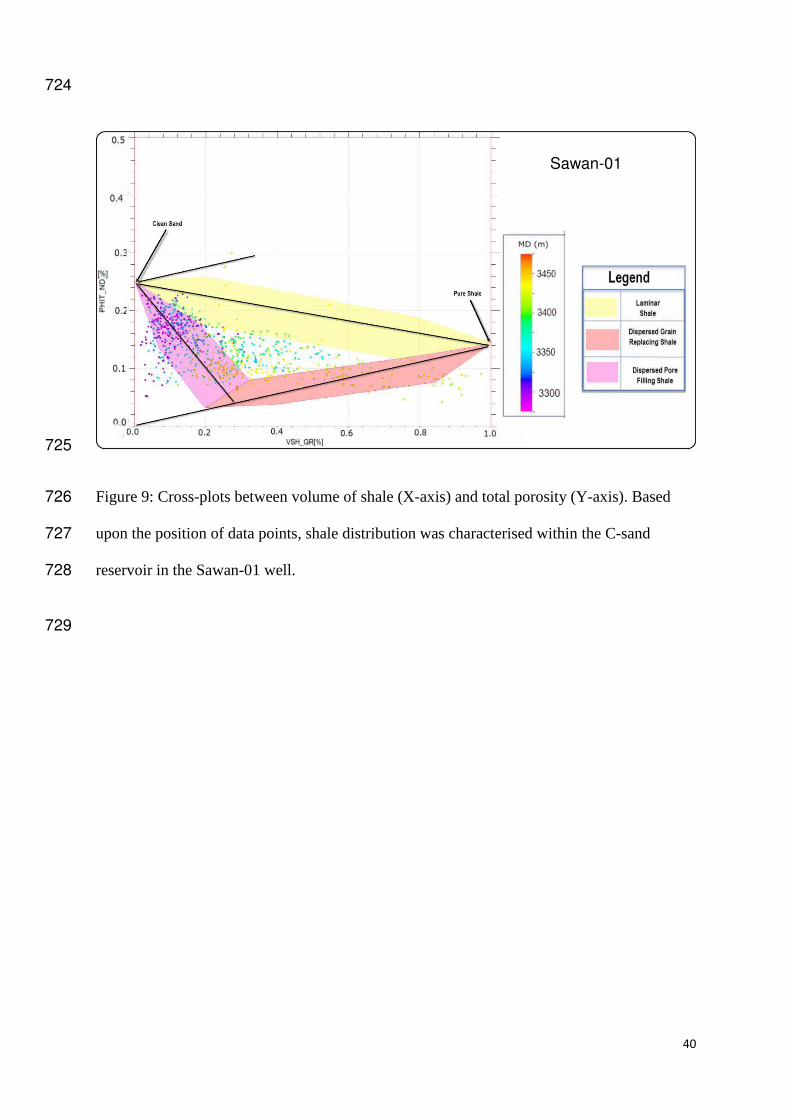
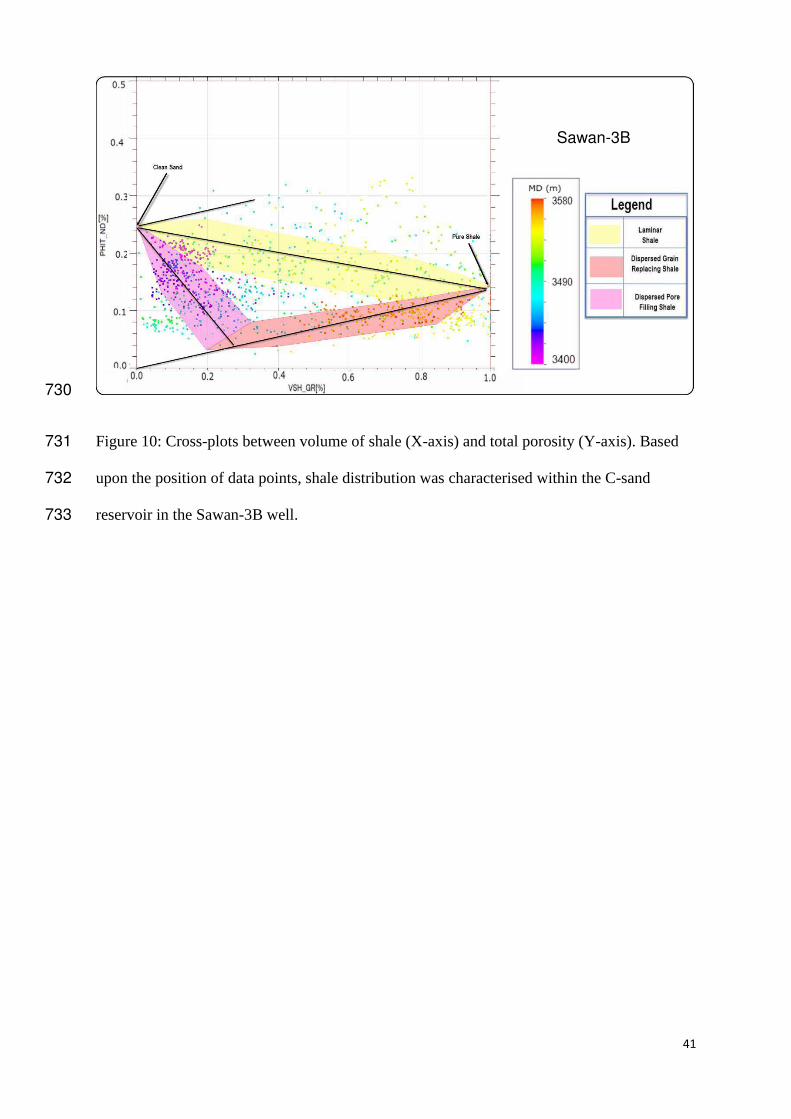
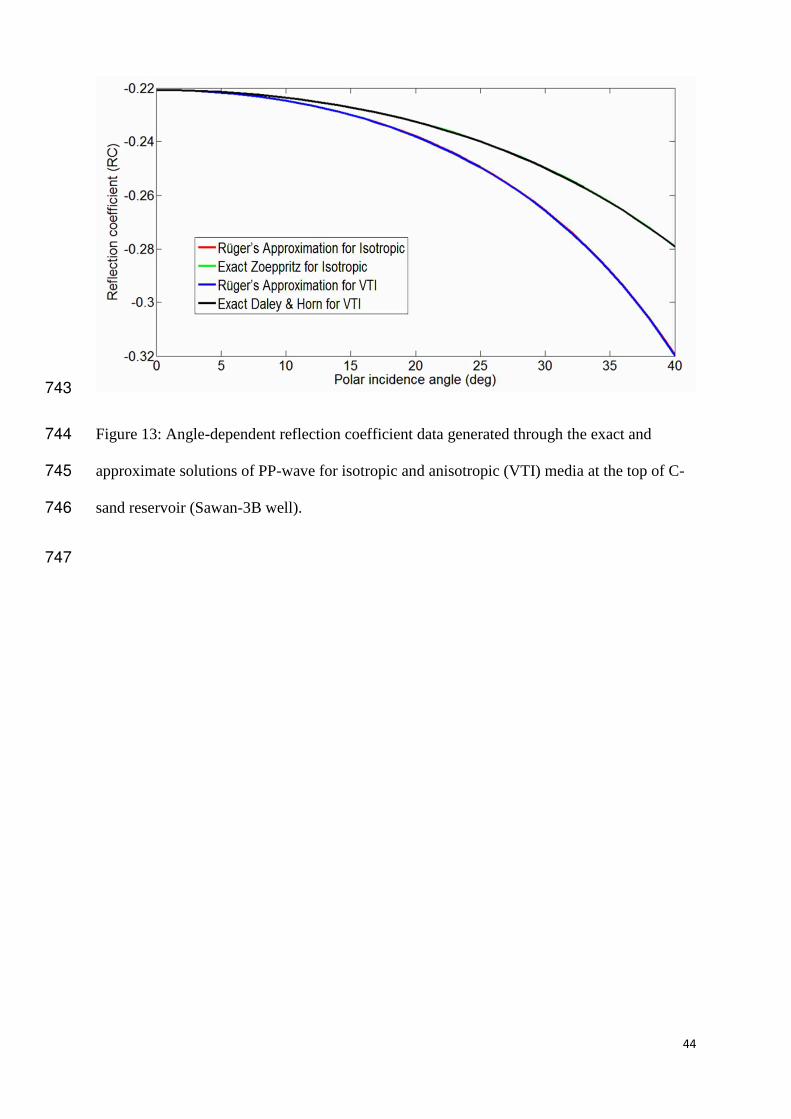
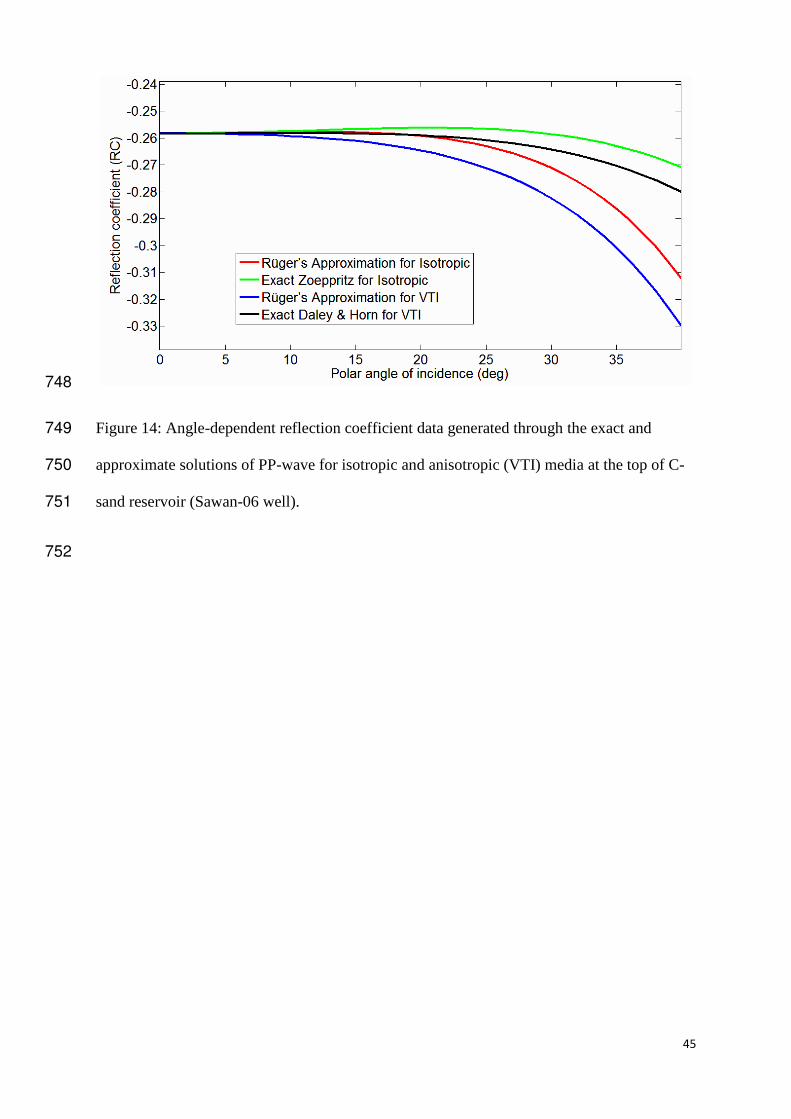
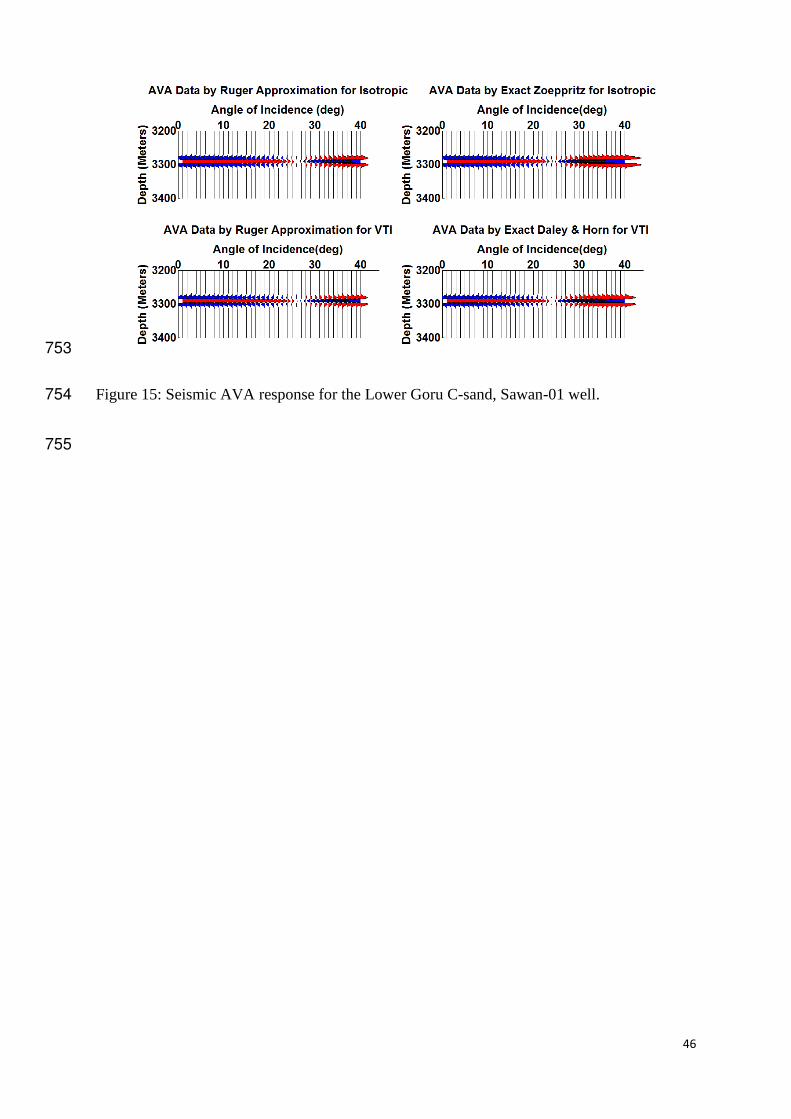
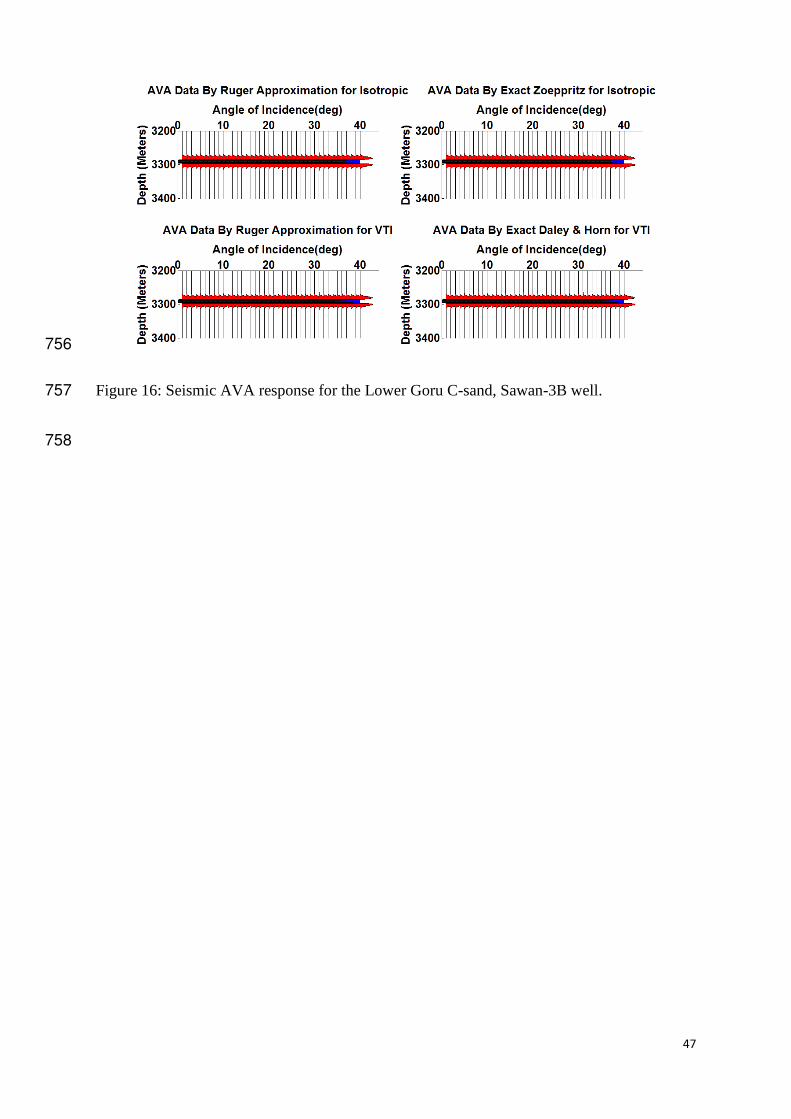
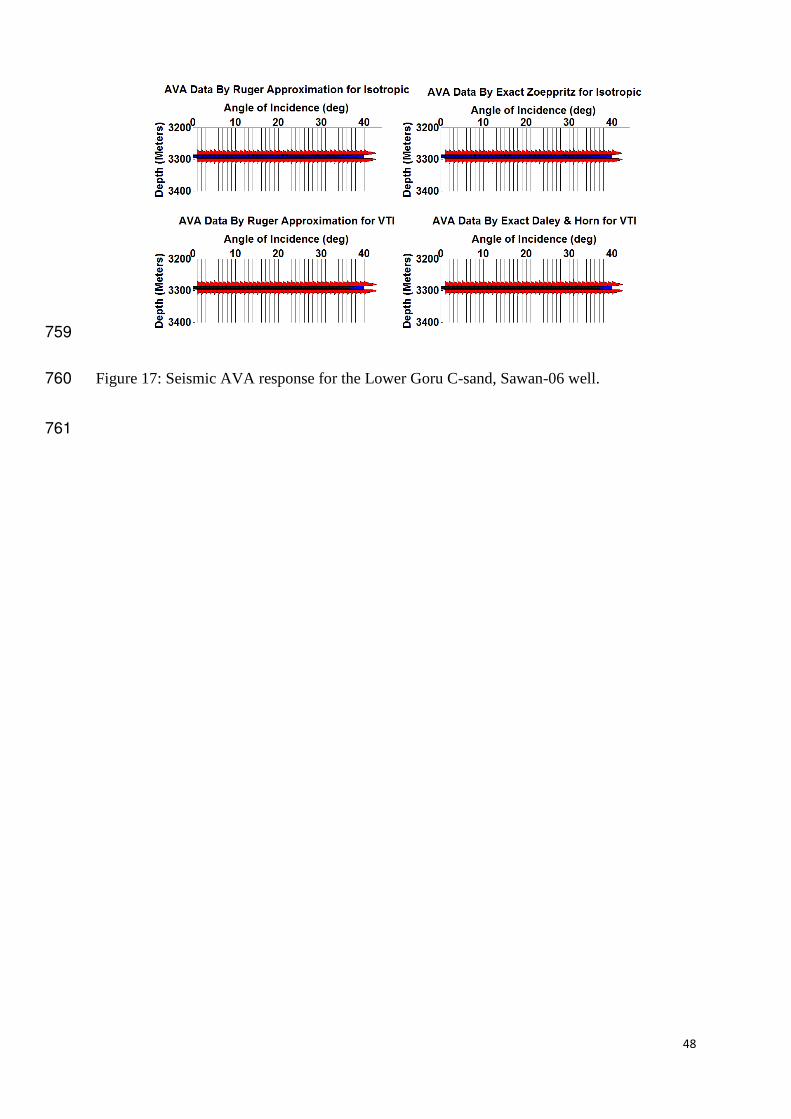
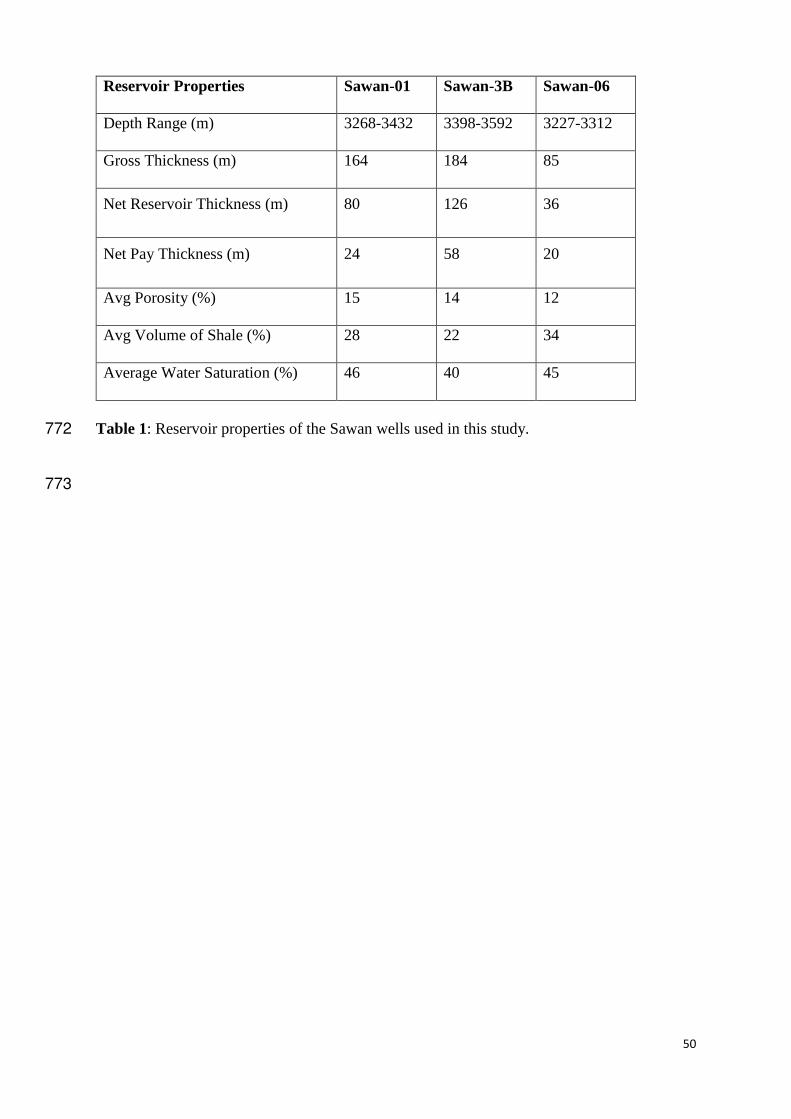
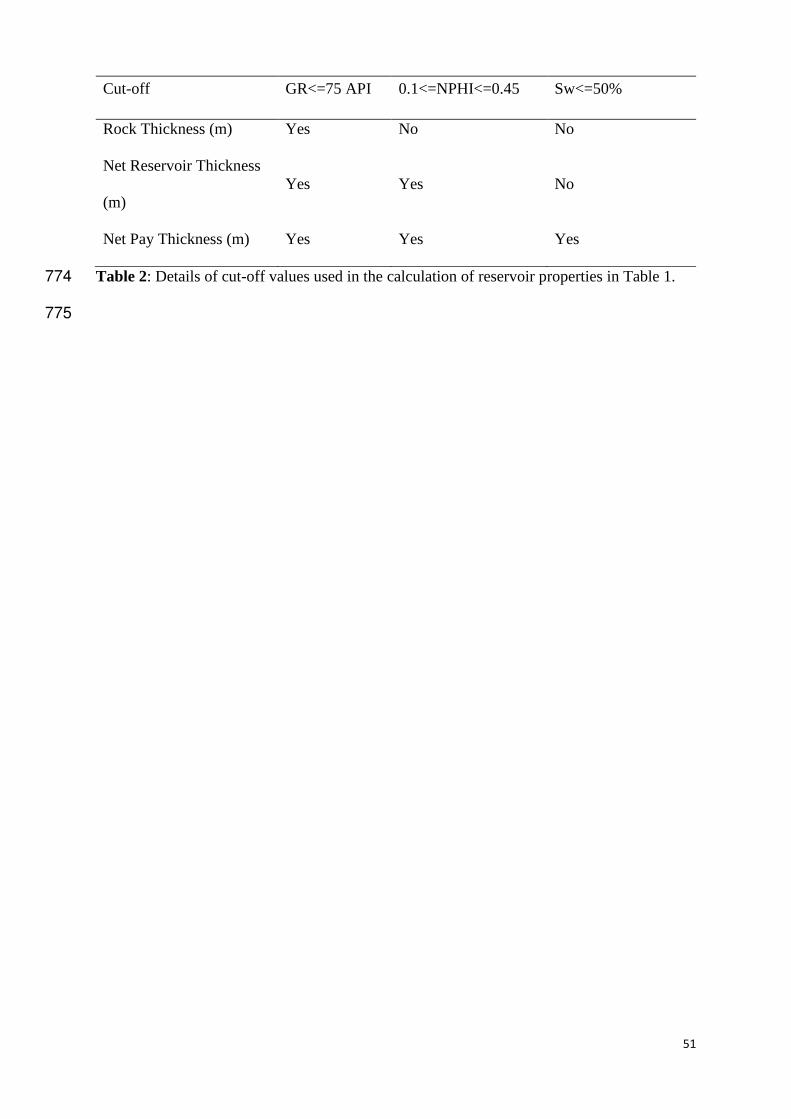
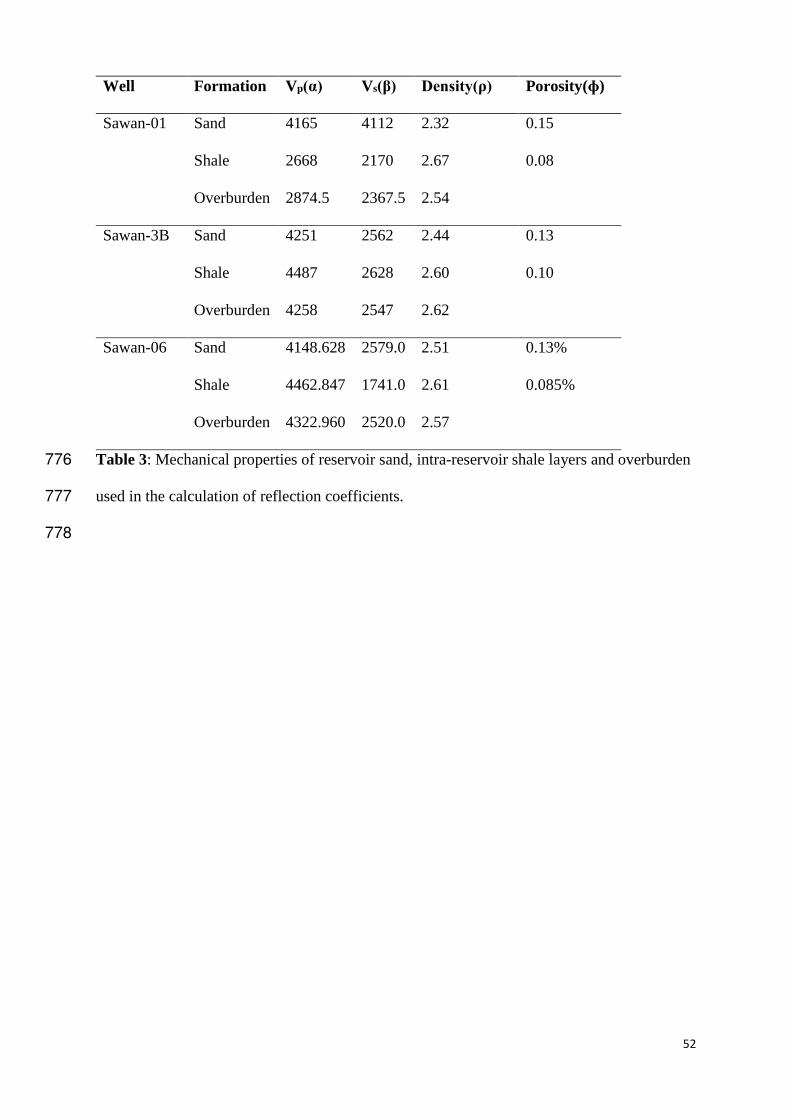
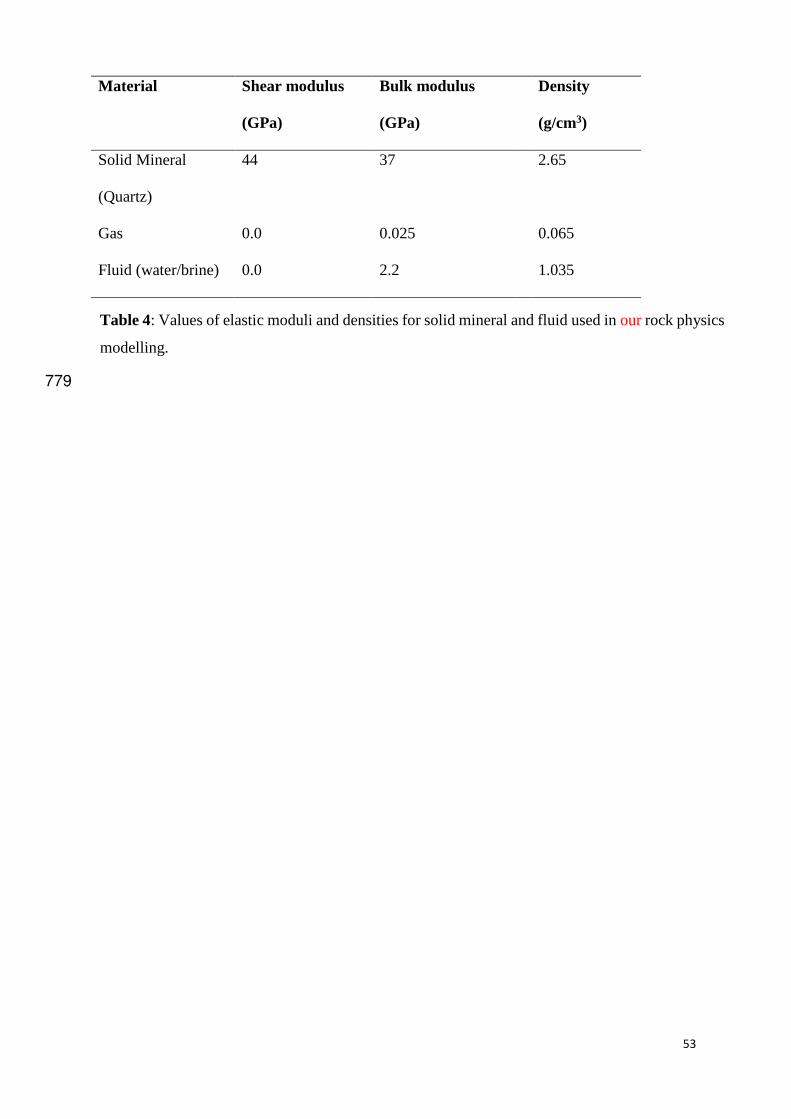
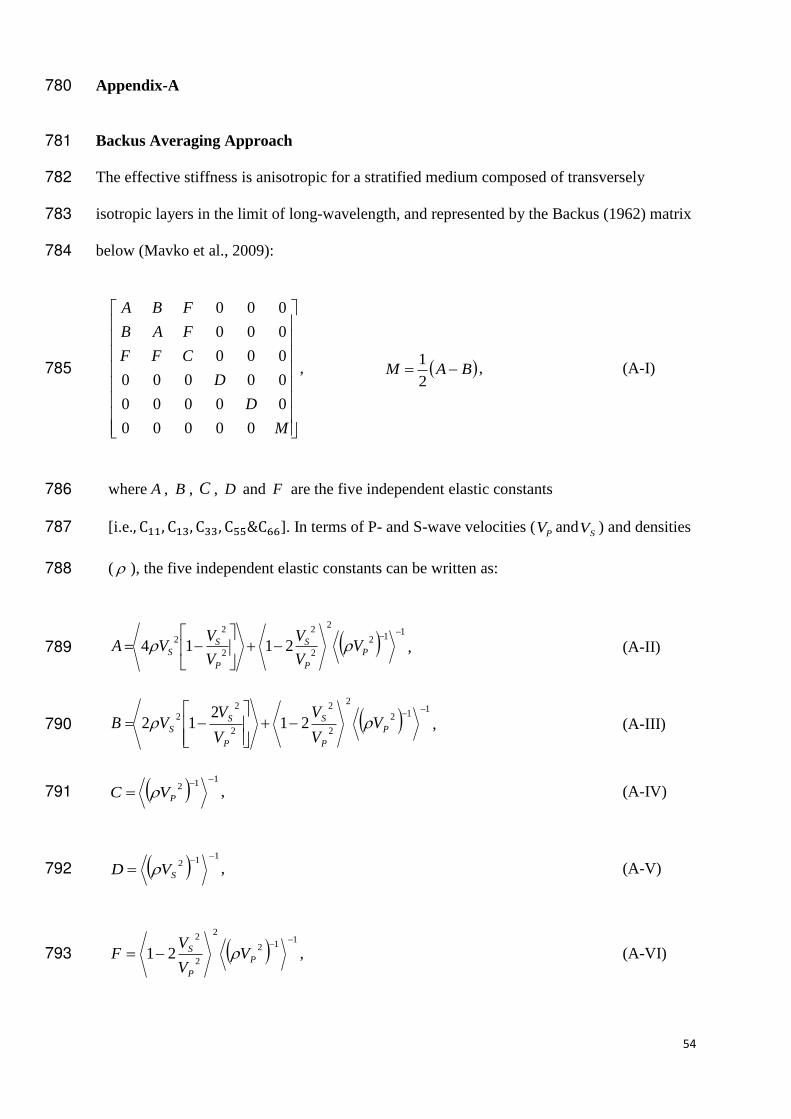
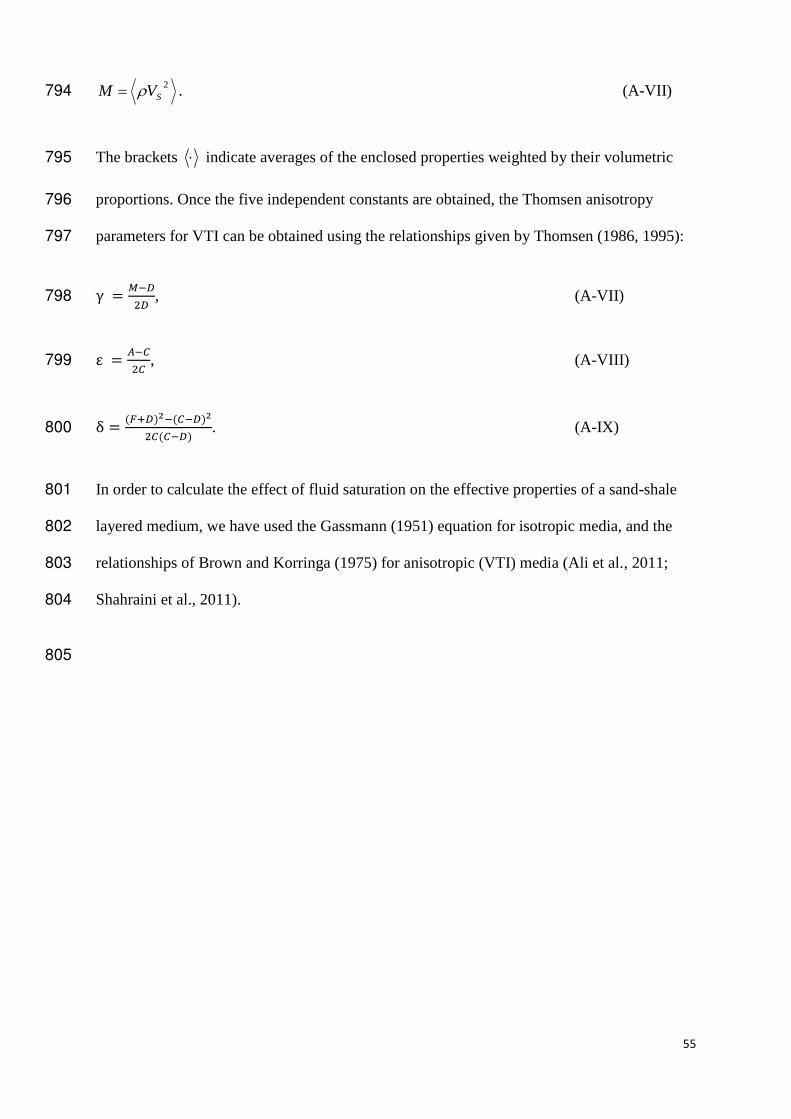
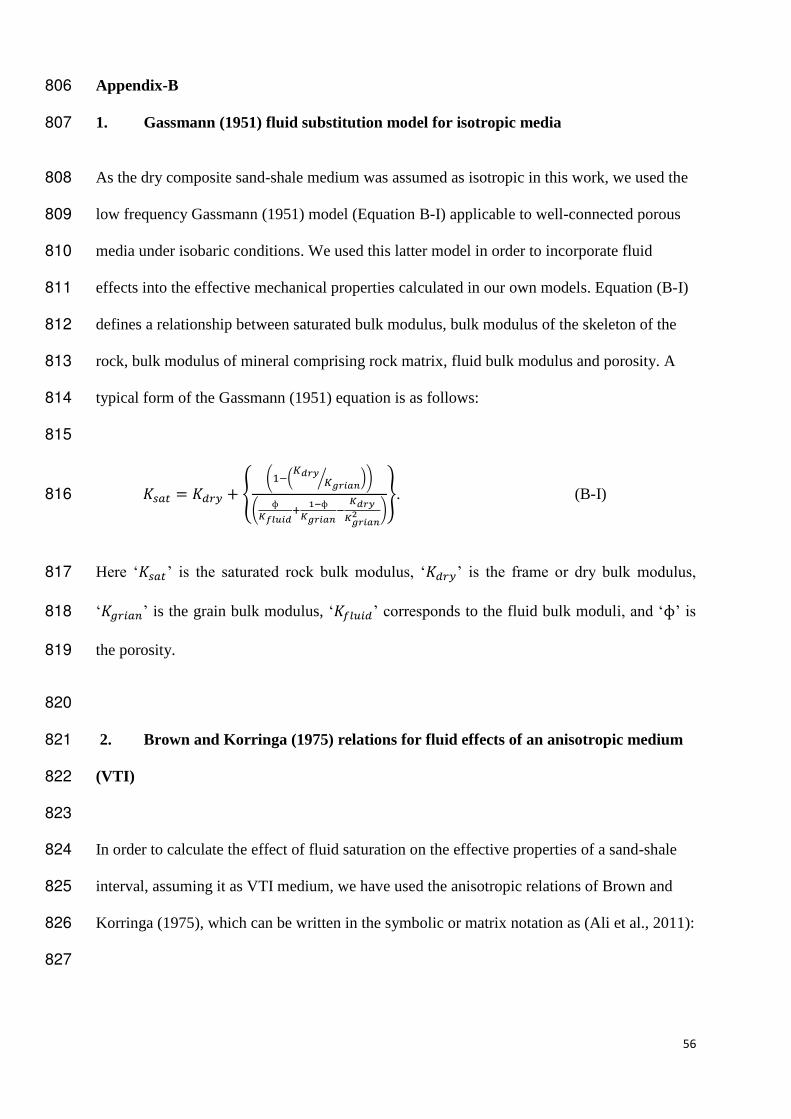
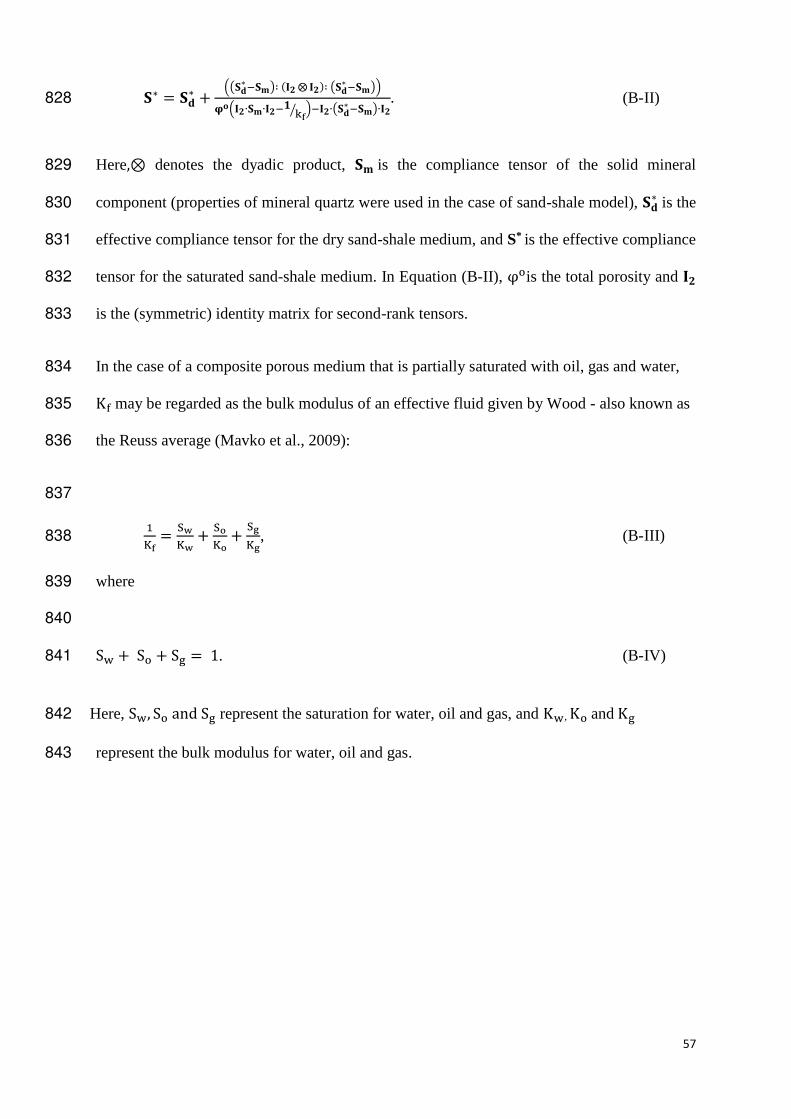