Digital content marketing as a viable online brand equity ...
Upload
khangminh22Category
view
1download
0
The roles of identity and brand equity in organic consumption behavior: Private label brands versus national brands
Reinders, M. J., & Bartels, J.
This is a "Post-Print" accepted manuscript, which has been published in "Journal of Brand Management"
This version is distributed under a non-commercial no derivatives Creative Commons
(CC-BY-NC-ND) user license, which permits use, distribution, and reproduction in any medium, provided the original work is properly cited and not used for commercial purposes. Further, the restriction applies that if you remix, transform, or build upon the material, you may not distribute the modified material.
Please cite this publication as follows:
Reinders, M. J., & Bartels, J. (2017). The roles of identity and brand equity in organic consumption behavior: Private label brands versus national brands. Journal of Brand Management, 24(1), 68-85. DOI: 10.1057/s41262-016-0019-z
You can download the published version at:
https://doi.org/10.1057/s41262-016-0019-z

Journal of Brand Management
The roles of identity and brand equity in organic consumption behavior: Private labelbrands versus national brands
--Manuscript Draft--
Manuscript Number:
Full Title: The roles of identity and brand equity in organic consumption behavior: Private labelbrands versus national brands
Article Type: Original Article
Funding Information:
Abstract: Organic brands have become increasingly important as an offering by which retailerscan differentiate themselves. The current study examines the role of two key drivers(i.e., brand equity and social identification) in the consumption of organic private labelbrands (PLBs) and the extent to which this role differs compared to organic nationalbrands (NBs). Using a longitudinal panel study among consumers in Australia,Canada, Germany, the Netherlands, and the U.S., we tested both mediating andmoderating effects of brand equity, brand identification, and organic consumeridentification on organic brand consumption and on organic consumption behavior ingeneral. The results show that for both PLBs and NBs brand equity positivelyinfluences organic brand consumption and organic consumption behavior. For PLBs,brand identification is related to organic brand consumption as well as organicconsumption behavior. In contrast, for NBs, organic consumer identification influencesorganic brand consumption and organic consumption behavior, which suggests adifference in identity salience for both types of brands. In addition, we found that therelationship between brand equity and organic brand consumption is partially mediatedby brand identification, which implies that consumers are more likely to identify withbrands that have higher brand equity. Marketing implications are discussed.
Corresponding Author: Machiel ReindersWageningen Universiteit en ResearchcentrumNETHERLANDS
Corresponding Author SecondaryInformation:
Corresponding Author's Institution: Wageningen Universiteit en Researchcentrum
Corresponding Author's SecondaryInstitution:
First Author: Machiel Reinders
First Author Secondary Information:
Order of Authors: Machiel Reinders
Jos Bartels
Order of Authors Secondary Information:
Author Comments: Note that the submitted manuscript is a revision that is submitted as a new submissionbecause of the transition to a new submission system.
The tracking number is BM15-174OAR: article title "The roles of identity and brandequity in organic consumption behavior: Private label brands versus national brands"
Please see the Cover Letter below:
Dear Editor,
Thank you very much for the positive review of our manuscript "The roles of identityand brand equity in organic consumption behavior: Private label brands versus nationalbrands" (BM15-174OAR). We are pleased that you have recommended the article bepublished subject to you making certain changes.
Powered by Editorial Manager® and ProduXion Manager® from Aries Systems Corporation

We hereby resubmit the revised manuscript. Since we did not have permission to usethe images displayed in Figure 1, we decided to remove this Figure 1 from the paper.Notice that this has no further consequences for the rest of the paper, since Figure 1was only incorporated for illustrative reasons.
Note that the contact details of one of the authors, Jos Bartels, have changed. Wetherefore also revised the author details and uploaded the correct ones.
We would like to thank the reviewers again for their interest in the paper and we hopethat the paper in its current form lives up to the standards that are expected for theJournal of Brand Management, and we look forward to your reply. Please contact us bye-mail if you have any questions or comments.
Kind regards,Machiel ReindersJos Bartels
Powered by Editorial Manager® and ProduXion Manager® from Aries Systems Corporation

Title: The roles of identity and brand equity in organic consumption behavior: Private
label brands versus national brands
Running title: Drivers of organic brand consumption
Machiel J. Reindersa*, Jos Bartelsb
a Machiel Reinders ([email protected], 0031703358104), LEI Wageningen University
and Research Centre, P.O. Box 29703, 2502 LS, The Hague, The Netherlands
bJos Bartels ([email protected]), Tilburg University, Warandelaan 2, 5037 AB Tilburg, The
Netherlands
*Corresponding author.
Machiel Reinders (PhD) is a Senior Researcher Marketing and Consumer behaviour at LEI-
Wageningen University and Research Centre. He coordinates and conducts research projects,
most of which related to sustainable marketing strategies, consumer behavior with regard to
sustainable and healthy food and consumer response to new products and technologies. His
work has been published in several academic journals, among which Journal of Business
Research, Journal of Service Research, European Journal of Marketing, and Food Quality and
Preference.
Jos Bartels (PhD), is an Assistant Professor in the Department of Communication and
Information Sciences at Tilburg University, the Netherlands. His research focuses on internal
and external communication, social identification processes and sustainability behavior of
multiple stakeholders in organizations. He has published in several academic journals
Author(s)

including Journal of Organizational Behavior, British Journal of Management, Journal of
Occupational and Organizational Psychology, and Journal of Business Research.
1
The roles of identity and brand equity in organic consumption behavior: Private label 1
brands versus national brands 2
3
Abstract 4
Organic brands have become increasingly important as an offering by which retailers can 5
differentiate themselves. The current study examines the role of two key drivers (i.e., brand 6
equity and social identification) in the consumption of organic private label brands (PLBs) 7
and the extent to which this role differs compared to organic national brands (NBs). Using a 8
longitudinal panel study among consumers in Australia, Canada, Germany, the Netherlands, 9
and the U.S., we tested both mediating and moderating effects of brand equity, brand 10
identification, and organic consumer identification on organic brand consumption and on 11
organic consumption behavior in general. The results show that for both PLBs and NBs brand 12
equity positively influences organic brand consumption and organic consumption behavior. 13
For PLBs, brand identification is related to organic brand consumption as well as organic 14
consumption behavior. In contrast, for NBs, organic consumer identification influences 15
organic brand consumption and organic consumption behavior, which suggests a difference in 16
identity salience for both types of brands. In addition, we found that the relationship between 17
brand equity and organic brand consumption is partially mediated by brand identification, 18
which implies that consumers are more likely to identify with brands that have higher brand 19
equity. Marketing implications are discussed. 20
21
Key words: Organic; Private label brand; National brand; Brand equity; Brand identification; 22
Organic consumer identification; Brand consumption 23
24
Blinded Manuscript Click here to download Blinded Manuscript BM15-174ORA_Article file_161007.docx
Click here to view linked References
1 2 3 4 5 6 7 8 9 10 11 12 13 14 15 16 17 18 19 20 21 22 23 24 25 26 27 28 29 30 31 32 33 34 35 36 37 38 39 40 41 42 43 44 45 46 47 48 49 50 51 52 53 54 55 56 57 58 59 60 61 62 63 64 65

2
Introduction 25
Retailers increasingly use their own brands (i.e., private label brands) as a way to 26
differentiate themselves from their competitors (Cuneo et al, 2015; González-Benito and 27
Martos-Partal, 2012; Sethuraman and Gielens, 2014). As a consequence, the market shares of 28
private label brands (PLBs) are growing in almost all European and U.S. markets. For 29
example, the market shares of PLBs in the food and beverage industry in 2013 ranged from 18 30
percent in the U.S. to 42 percent in Germany (Statista, 2014). Consumers indicate that they 31
prefer PLBs over national brands (NBs) and that many PLBs are equally as good as—or better 32
than—their favorite NBs (Deloitte, 2015). This preference is reflected in the fact that PLBs 33
have moved from low priced “me-too” products to high-quality brands (Grewal and Levy, 34
2009). At the end of the 1990s, strong national retailers such as Wal-Mart began to put 35
innovative, good quality private brands on the market. In recent years, we have observed 36
many retailers following this initiative. By increasing the quality of PLBs, retailers can 37
increase profit margins by charging higher prices (Steenkamp et al, 2010). 38
This trend is also reflected in the fact that retailers are now increasingly incorporating 39
environmental and social issues in their PLBs (Aouina Mejri and Bhatli, 2014; Chkanikova 40
and Lehner, 2015; Gleim et al, 2013). One of the ways to accomplish this is by adding an 41
organic label to a PLB. Organic (food) products carry an organic certification that is issued by 42
an independent accredited institution for organic product testing (Bauer et al, 2013). The 43
market for organic products has increased substantially over the last years (Willer and 44
Kilcher, 2010). For example, sales of organic food and non-food products in the U.S. reached 45
a record of $39.1 billion in 2014 (Organic Trade Association, 2015). Moreover, in 2012, 81% 46
of U.S. families reported that they purchase organic products at least occasionally (Organic 47
Trade Association, 2013). Organic PLBs have become increasingly important as an offering 48
by which retailers differentiate themselves (Jonas and Roossen, 2005). Retailers can use 49
1 2 3 4 5 6 7 8 9 10 11 12 13 14 15 16 17 18 19 20 21 22 23 24 25 26 27 28 29 30 31 32 33 34 35 36 37 38 39 40 41 42 43 44 45 46 47 48 49 50 51 52 53 54 55 56 57 58 59 60 61 62 63 64 65

3
brands that are labelled with the organic logo to boost perceived product quality (Larceneux et 50
al, 2012). Ngobo (2011) showed that households are more likely to buy organic PLBs than 51
their national counterparts. In addition, a recent study by Bauer et al (2013) investigated the 52
effect of organic labels on brands and found that private labels benefit more from the use of 53
organic labels than global brands. It is therefore not surprising that many retailers have 54
developed their own organic PLBs. For example, in the U.S., Whole Foods Market launched 55
its own organic products under the label ‘365 Everyday Value’ and the German retail chain 56
Edeka uses ‘Edeka Bio’ as its private label. 57
Despite the strong position that an organic label can provide to PLBs, organic labels 58
have also proven to be an effective instrument for NBs in distinguishing their own brand from 59
that of their competitors (Bauer et al, 2013). Given the increasing importance of organic 60
brands for both brand manufacturers and retailers, the current study examines the role of a 61
number of key constructs in the consumption of organic PLBs and organic NBs. First, we will 62
explore whether brand equity also affects brand consumption in an organic context. In an 63
organic (food) context, we define brand consumption as the number of times a brand is eaten 64
or drunk. Brand equity can be defined as “the incremental utility or value added to a product 65
by its brand name” (Yoo et al, 2000, p. 195). Previous studies have shown that brand equity is 66
an important predictor of the purchase (intention) of brands (Cobb-Walgren et al., 1995; 67
Keller, 1993). These effects are also found in a ‘green’ context (Bekk et al, 2016; Konuk et al, 68
2015). We extend these studies by examining whether brand equity also predicts consumption 69
of brands in an organic context. Next, we try to further elaborate on how brand equity may 70
relate to brand consumption in an organic context by stuyding the roles of brand identification 71
and identification with the group of organic consumers. Brand identification refers to the 72
degree of a brand's ability to integrate the brand into the consumer's self-concept (Escalas & 73
Bettman, 2003), thus helping consumers to define themselves. In the organic context, we 74
1 2 3 4 5 6 7 8 9 10 11 12 13 14 15 16 17 18 19 20 21 22 23 24 25 26 27 28 29 30 31 32 33 34 35 36 37 38 39 40 41 42 43 44 45 46 47 48 49 50 51 52 53 54 55 56 57 58 59 60 61 62 63 64 65

4
expect that in addition to identification with a brand identification with the group of 75
consumers also plays a role in stimulating the consumption of a brand. In this respect, we 76
define organic consumer identification as consumer’s perception of oneness or belongingness 77
to the group of organic consumers (Bergami and Bagozzi, 2000). Due to the distinctive 78
features that are associated with organic products relative to conventional products (e.g., they 79
are environmentally friendly and chemical free), organic consumption is an attractive target 80
for consumers to express their self-definition (i.e., who am I?) and to enact their identity 81
(Ashforth and Mael 1989). In particular, the identity of organic consumers as a group is 82
growing in popularity and carries rich and positive connotations (Hughner et al 2007). In this 83
respect, Schifferstein and Oude Ophuis (1998) state that organic consumption is part of a way 84
of life. Indeed, recent studies suggest that consumers’ identity-related beliefs exert a 85
significant positive impact on their decision to purchase organic products (Bartels and 86
Reinders 2010; Dean et al 2012). 87
Furthermore, we investigate whether in an organic context positive brand equity and 88
identification spill over to the consumption of other organic products. In this respect, Bartels 89
and Hoogendam (2011) found that positive evaluations of a specific brand led to more 90
positive buying behavior for organic foods in general. 91
Finally, we will investigate whether the proposed mechanism between brand equity, 92
brand identification, organic consumer identification, organic brand consumption and general 93
organic consumption differs between organic PLBs and organic NBs. Although many studies 94
are devoted to comparing PLBs and NBs (Ailawadi et al, 2001; De Wulf et al, 2005; 95
Steenkamp et al, 2010), research that compares these two types of brands in an organic 96
context has been limited. More specifically, most studies in a regular context focus on the 97
difference in price perceptions between NBs and PLBs (e.g., Olbrich and Jansen, 2014; 98
Steenkamp et al, 2010), while in an organic context this discussion does not seem to focus on 99
1 2 3 4 5 6 7 8 9 10 11 12 13 14 15 16 17 18 19 20 21 22 23 24 25 26 27 28 29 30 31 32 33 34 35 36 37 38 39 40 41 42 43 44 45 46 47 48 49 50 51 52 53 54 55 56 57 58 59 60 61 62 63 64 65
5
price differences between NBs and PLBs but rather on price differences between regular and 100
organic products (e.g., Aschemann-Witzel and Zielke, 2015; Rödiger and Hamm, 2015). 101
Similarly, several studies in a regular context focus on quality variations between PLBs and 102
NBs (e.g., De Wulf et al, 2005; Mieres et al, 2006), while in an organic context this 103
discussion seems to focus more on quality comparisons between regular and organic products 104
(e.g., Larceneux et al., 2012). In sum, most studies in an organic context focused on 105
comparing organic with regular products and not on comparing organic PLBs with organic 106
NBs. As a result, no studies have examined whether drivers of the consumption of PLBs and 107
NBs may systematically differ in an organic context. 108
In sum, the current study aims to empirically explore the following research questions: 109
How is brand equity related to brand consumption in an organic branding context? What is 110
the role of social identification in this relationship? Do these effects spill over to organic 111
consumption in general? and To what extent do these relationships differ for PLBs and NBs? 112
To answer these questions, we used a cross-country research design and tested both 113
the direct and indirect (i.e., mediating and moderating) effects of brand equity, brand 114
identification, and organic consumer identification on organic brand consumption and on 115
organic consumption in general. Before introducing the method and results of this study, we 116
first briefly review the literature concerning the key constructs of our study. 117
118
Literature Review 119
120
Brand equity and organic branding 121
To increase the perceived value of organic products, branding has become an 122
important marketing strategy. A key construct that is often mentioned with regard to branding 123
is brand equity (Esch et al 2006; Netemeyer et al, 2004). According to Yoo et al (2000, p. 124
1 2 3 4 5 6 7 8 9 10 11 12 13 14 15 16 17 18 19 20 21 22 23 24 25 26 27 28 29 30 31 32 33 34 35 36 37 38 39 40 41 42 43 44 45 46 47 48 49 50 51 52 53 54 55 56 57 58 59 60 61 62 63 64 65

6
195), brand equity is the “incremental utility or value added to a product by its brand name.” 125
Aaker (1991) defined brand equity as “a set of brand assets and liabilities linked to a brand, its 126
name and symbol that add to or subtract from the value provided by a product or service to a 127
firm and to the firm’s customers.” In addition, Keller (1993) posited that brand equity can 128
create the differential effect of a brand relative to other brands. The existing literature has also 129
measured brand equity in the context of PLBs. For example, Erdem et al (2004) found that 130
brand equity plays an important role in consumers' private label brand choices and seems to 131
have a variety of impacts on PLBs. In addition, Cuneo et al (2012) found that private label 132
brand equity varies across different products and markets. More recently, Calvo-Porral et al 133
(2015) found that brand equity dimensions (i.e., awareness, perceived quality and loyalty) 134
were positively related to purchase intention for PLBs. From these studies we can conclude 135
that brand equity plays an important role in the evaluation and purchase of both NBs as well 136
as PLBs. 137
Within the academic literature, an increasing number of studies have focused on the 138
topic of green branding (e.g., Gupta and Kumar, 2013; Hartmann et al, 2005; Pickett-Baker 139
and Ozaki, 2008). For example, a number of studies have investigated the factors that 140
influence the consumer purchasing behavior of green brands (Papista and Krystallis, 2013) 141
and the roles of brand knowledge and attitudes (Bartels and Hoogendam, 2011). As a result, 142
recent studies have also extended the brand equity research into the environmental context by 143
introducing the concept of “green brand equity” (Bekk et al, 2016; Chen, 2010; Kang and 144
Hur, 2011; Ng et al, 2013). This concept can be defined as “a set of brand assets and liabilities 145
about green commitments and environmental concerns linked to a brand, its name and symbol 146
that add to or subtract from the value provided by a product or service.” (Chen, 2010, p. 310). 147
These studies have especially focused on the antecedents of green brand equity, i.e., the 148
aspects that drive brand equity for ‘green’ or eco-friendly brands. For example, Chen (2010) 149
1 2 3 4 5 6 7 8 9 10 11 12 13 14 15 16 17 18 19 20 21 22 23 24 25 26 27 28 29 30 31 32 33 34 35 36 37 38 39 40 41 42 43 44 45 46 47 48 49 50 51 52 53 54 55 56 57 58 59 60 61 62 63 64 65

7
demonstrated that green brand image, green satisfaction, and green trust are positively related 150
to green brand equity. Additionally, Kang and Hur (2011) investigated green affect and green 151
loyalty, and Chang and Chen (2013) explored the relationship between green perceived 152
quality, green brand awareness, and green perceived risk in the building of green brand 153
equity. Recently, Bekk et al (2016) and Konuk et al (2015) presented the first empirical 154
evidence that green brand equity also influences brand outcomes (i.e., purchase intentions and 155
positive word-of-mouth communication). 156
While the previous research has cautiously begun to focus on brand equity in a green 157
context, to the best of our knowledge there are no studies that pay attention to how the sbrand 158
equity of organic brands affects their consumption. For organic products, brand equity could 159
both reflect the equity of the brand itself as well as the equity that is obtained by the organic 160
labels that are carried by these products (Larceneux et al, 2012). Although organic products 161
are a type of product that is sold under many brand names, the concept itself also offers a 162
strong and differentiated advantage as compared with products that do not carry an organic 163
label. In this respect, Stanton and Guion (2015) posit that the organic concept could be 164
regarded as being akin to a brand. Consequently, it is useful to explore how consumers might 165
affiliate with this overall concept of organic, apart from brand equity. More specifically, this 166
relationship between an individual and the organic concept could be best explained by 167
investigating how individuals perceive other individuals or groups that consume organic 168
products. 169
170
Social identification 171
A concept for explaining a relationship between an individual and a group is social 172
identification (Tajfel, 1978; Tajfel and Turner, 1979). Social identification refers to “the 173
perception of oneness with or belongingness to a group, where the individual defines him or 174
1 2 3 4 5 6 7 8 9 10 11 12 13 14 15 16 17 18 19 20 21 22 23 24 25 26 27 28 29 30 31 32 33 34 35 36 37 38 39 40 41 42 43 44 45 46 47 48 49 50 51 52 53 54 55 56 57 58 59 60 61 62 63 64 65
8
herself in terms of the group of which he or she is a member” (Mael and Ashforth, 1992, p. 175
104). Many studies have confirmed the relevance of strong identification in an organizational 176
context (Mael andAshforth, 1992; Van Dick et al, 2004), marketing context (Bhattacharya et 177
al, 1995; Bhattacharya and Sen, 2003; Homburg et al, 2009), brand community context 178
(Algesheimer et al, 2005; Bagozzi and Dholakia, 2006; Dholakia et al, 2004) and, more 179
recently, in a sustainable consumption context (Bartels and Hoogendam, 2011; Bartels and 180
Reinders, 2010). For example, Bartels and Reinders (2010) found that social identification 181
was strongly related to organic food consumption. In addition, Bartels and Hoogendam (2011) 182
showed that in addition to brand knowledge and brand attitude, social identification with 183
green consumer groups had distinct indirect and direct effects on buying behaviors with 184
respect to organic foods. Consequently, we expect that identification with organic consumer 185
groups plays an important stimulating role in the consumption behavior of organic brands. 186
Based on insights from social identity theory, a growing body of research has also 187
focused on what it means for consumers to identify with brands as a consumer-brand 188
relationship construct (Escalas and Bettman, 2003; Stokburger-Sauer et al, 2012). Because 189
consumer-brand identification involves affective attachment with a brand, consumers with 190
stronger brand identification are more likely to evaluate the value of a brand more favorably 191
(He et al, 2012). Brand identification positively affects brand commitment (Tuškej et al, 192
2013), brand passion (Albert et al, 2013) and brand loyalty (Lam et al, 2010). In turn, brand 193
passion was also found to have a direct effect on word-of-mouth and an indirect effect on the 194
willingness to pay a higher price. Because recent research shows that consumers’ 195
identification with a brand plays an important role in the evaluation of the brand, in the 196
current study, we investigate the role of brand identification in the relationship between brand 197
equity and organic brand consumption. 198
1 2 3 4 5 6 7 8 9 10 11 12 13 14 15 16 17 18 19 20 21 22 23 24 25 26 27 28 29 30 31 32 33 34 35 36 37 38 39 40 41 42 43 44 45 46 47 48 49 50 51 52 53 54 55 56 57 58 59 60 61 62 63 64 65

9
In sum, we aim to empirically clarify how brand equity, organic consumer 199
identification and brand identification are related to brand consumption for PLBs and NBs. 200
By doing so, we distinguish between identification with organic consumer groups (i.e., 201
organic consumer identification) and consumer-brand identification with organic brands (i.e., 202
brand identification). Accordingly, we test different models in which we incorporate both the 203
direct and indirect (i.e., mediating and moderating) effects of organic consumer identification 204
and brand identification on organic consumption. 205
206
Method 207
Procedure 208
We conducted a longitudinal online panel study among consumers in five globally 209
dispersed countries (i.e., Australia, Canada, Germany, the Netherlands, and the U.S.). 210
Participants were approached by email to fill out an online self-administered questionnaire. 211
The data were collected by a market research agency (MSI-ACI Europe BV). The respondents 212
completed questions on brand equity, brand identification, identification with organic 213
consumers, brand consumption and organic consumption in general. The market research 214
agency translated the original English items of the questionnaire into the relevant national 215
languages. We collected data on brand consumption and organic consumption in general more 216
than a year later to reduce common method variance and increase the validity of the 217
dependent variables (Podsakoff et al, 2003). The data were collected in December 2010 (T1) 218
and in February 2012 (T2). In total, 1,584 respondents completed the questionnaire at T1, and 219
706 of these respondents also completed the questionnaire at T2. Only the respondents who 220
completed questionnaires at both T1 and T2 (within-subjects design) were included in the 221
analyses. Furthermore, for each country, the respondents received questionnaires that featured 222
either a PLB or NB. For each country, we used one NB and one or two PLBs. We selected the 223
1 2 3 4 5 6 7 8 9 10 11 12 13 14 15 16 17 18 19 20 21 22 23 24 25 26 27 28 29 30 31 32 33 34 35 36 37 38 39 40 41 42 43 44 45 46 47 48 49 50 51 52 53 54 55 56 57 58 59 60 61 62 63 64 65
10
PLBs from retailers that are most well-known in every country. The respondents randomly 224
received one of these brands to evaluate. This process resulted in 404 respondents for PLBs 225
and 302 respondents for NBs. 226
227
Sample 228
We instructed the market research agency that our study samples should be 229
representative of the specific country in terms of age, gender, education and income 230
distribution at T1. The total sample was composed of 354 males and 352 females with a mean 231
age of 49.5 years (SD=14.8). Overall, 18.6% of the respondents had a low educational level, 232
47.5% had a moderate educational level, and 34.0% had a high educational level. With regard 233
to income, 25.6% of the respondents reported a low income level, 32.0% reported a medium 234
income level, and 30.6% reported a high income level. A percentage of 11.8% of the 235
respondents did not want to report their income. Table 1 provides a description of the sample 236
in each of the countries. As shown in the table, organic consumption behavior differs between 237
the countries. Organic consumption is highest in Germany and lowest in Australia and the 238
U.S. Consumption of the specific organic brands that the respondents received (depending on 239
the country and the condition of the questionnaire) also differed per country. Overall, brand 240
consumption is found to be highest in Canada and lowest in the U.S. and Australia. In 241
addition, differences are observed between the consumption of PLBs and NBs, whereby in 242
most cases consumption of PLBs seems to be higher. 243
244
-- INSERT TABLE 1 HERE-- 245
246
1 2 3 4 5 6 7 8 9 10 11 12 13 14 15 16 17 18 19 20 21 22 23 24 25 26 27 28 29 30 31 32 33 34 35 36 37 38 39 40 41 42 43 44 45 46 47 48 49 50 51 52 53 54 55 56 57 58 59 60 61 62 63 64 65

11
Measures 247
The questionnaire covered a number of topics at T1 and T2. Brand equity, brand 248
identification, identification with the organic consumer and organic product familiarity were 249
measured at T1. Organic brand consumption and organic consumption behavior were 250
measured at T2. Brand equity at T1 was operationalized as constituting the dimensions brand 251
awareness, perceived quality and brand loyalty (cf. Yoo and Donthu, 2001) and was measured 252
for the PLBs and NBs, depending on the condition of the questionnaire. We measured the 253
construct on a 5-point Likert scale using three items. An example item is, “The likely quality 254
of this brand is very high.” The reliability of the scale was adequate for both PLBs and NBs 255
(Cronbach’s α = .79 and .83, respectively). Brand identification at T1 was operationalized as 256
the degree of overlap between the self-definition and the identity of the brand as measured by 257
Bergami and Bagozzi’s (2000) visual scale to assess identification. The respondents choose 258
the number that corresponded to the pair of circles (1=”far apart,” 2= “small overlap,” 3= 259
“moderate overlap,” 4= “large overlap,” 5= “complete overlap”) that best reflect the degree of 260
overlap they perceive between their own identity and that of the brand. Likewise, organic 261
consumer identification describes the degree of overlap between the self and the group of 262
organic consumers and was also measured with Bergami and Bagozzi’s (2000) visual scale. 263
The respondents choose the number that corresponded to the pair of circles (1=”far apart,” 2= 264
“small overlap,” 3= “moderate overlap,” 4= “large overlap,” 5= “complete overlap”) that best 265
reflect the degree of overlap that they perceive between their own identity and the identity of 266
the organic consumer. Because organic brands are not well-known to the general public 267
(compared to regular food and beverage brands, e.g., Coca-Cola) and familiarity with a 268
product seems to be important in predicting consumption behavior (Alba and Hutchinson, 269
1987; Biswas, 1992), we incorporated organic product familiarity as a control variable. We 270
used 4 items based on Yoo et al (2000) and adapted them to the organic product domain, with 271
1 2 3 4 5 6 7 8 9 10 11 12 13 14 15 16 17 18 19 20 21 22 23 24 25 26 27 28 29 30 31 32 33 34 35 36 37 38 39 40 41 42 43 44 45 46 47 48 49 50 51 52 53 54 55 56 57 58 59 60 61 62 63 64 65

12
sample items such as, “I can recognize organic products among other regular brands” and 272
“Some characteristics of organic products come to my mind quickly” (Cronbach’s α = .72 for 273
PLBs and .72 for NBs). Organic brand consumption at T2 was measured with the following 274
single item: “How often did you eat or drink Brand X in the last month?” The scale ranged 275
from 1 (never) to 5 (five times a week or more). What was exactly mentioned under “Brand 276
X” was dependent on the version of the questionnaire that the respondent received (i.e., PLB 277
or NB) as well as on the country of the respondent. Organic consumption behavior was 278
measured by asking the respondents to indicate how often they ate organic meat, vegetables, 279
fruit, and dairy products following Onwezen et al (2014) on a five-point scale (ranging from 280
1=‘never’ to 5 = ‘five times a week or more’). Note that, compared to organic brand 281
consumption, this question was the same for all of the respondents that participated in the 282
study, regardless of the version of the questionnaire (i.e., PLB or NB) or country. The 283
Cronbach’s alphas were .90 for PLBs and .91 for NBs. Finally, demographic variables (i.e., 284
age, gender, income and education) were included as control variables in the analyses. Multi-285
item scales were averaged across their scale items to create composite construct scores. 286
287
Results 288
The respondents who completed the questionnaire for PLBs (N = 404) awarded the highest 289
average scores to organic product familiarity (M = 3.06; SD = .82) and the lowest to organic 290
brand consumption (M = 1.73; SD = .98). In addition, all of the independent and dependent 291
variables were positively correlated (p < .01). The respondents who completed the 292
questionnaire for NBs (N = 302) also gave the highest average scores to organic product 293
familiarity (M = 3.05; SD = .82) and the lowest to organic brand consumption (M = 1.62; SD 294
= .95). Again, all of the independent and dependent variables were positively correlated (p < 295
.01). We compared the means for both samples and found that the mean for brand equity was 296
1 2 3 4 5 6 7 8 9 10 11 12 13 14 15 16 17 18 19 20 21 22 23 24 25 26 27 28 29 30 31 32 33 34 35 36 37 38 39 40 41 42 43 44 45 46 47 48 49 50 51 52 53 54 55 56 57 58 59 60 61 62 63 64 65

13
significantly higher for PLBs (M = 2.74) than it was for NBs (M = 2.58; t = 1.99, df = 704, p 297
< .05). The Fisher’s Z-tests revealed significant differences between PLBs and NBs for the 298
correlations of organic consumption behavior with organic brand consumption (z = -3.07, p < 299
.01), the correlations of organic consumer identification with organic brand consumption (z = 300
-2.15, p < .05) and the correlations of organic product familiarity with organic brand 301
consumption (z = -2.22, p < .05). In all of the cases, correlations are stronger for NBs 302
compared to PLBs. Table 2 displays the means, standard deviations and correlations for both 303
samples. 304
305
-- INSERT TABLE 2 HERE-- 306
307
Model testing 308
We conducted multiple regression analyses to answer the research questions. First, we 309
tested the direct effects of brand equity on organic brand consumption (Model 1). Then, we 310
estimated the simultaneous effects of brand equity, brand identification and organic consumer 311
identification on organic brand consumption (Models 2 and 3). In Model 4, we tested whether 312
brand identification and organic consumer identification moderate the relationship between 313
brand equity and organic brand consumption. Finally, we tested whether these effects also 314
hold for general organic consumption behavior as a dependent variable (Models 5 to 8). We 315
also included organic product familiarity in all of the models as a control variable. 316
Additionally, we performed a mediation analysis by conducting Preacher and Hayes’s (2008) 317
bootstrap analysis of indirect effects to test whether the relationships between brand equity 318
and organic brand consumption, on the one hand, and brand equity and organic consumption 319
behavior, on the other hand, were mediated by brand identification and identification with the 320
organic consumer. Before conducting the analyses, we first centered the means of all of the 321
1 2 3 4 5 6 7 8 9 10 11 12 13 14 15 16 17 18 19 20 21 22 23 24 25 26 27 28 29 30 31 32 33 34 35 36 37 38 39 40 41 42 43 44 45 46 47 48 49 50 51 52 53 54 55 56 57 58 59 60 61 62 63 64 65

14
variables for both private label and NBs. Tables 3 and 4 list the estimation results of the 322
models for both PLBs and NBs. The various countries were incorporated as dummy variables 323
in the analyses. 324
325
Private label brands 326
Table 3 displays the results of the regression analyses for PLBs. Brand equity showed 327
a positive direct effect on organic PLB consumption (Model 1: β = .43; p < .01). None of the 328
control variables (i.e., demographics and countries) were significant. When brand equity and 329
brand identification were simultaneously regressed on organic brand consumption in Model 2, 330
the coefficient of brand equity decreased somewhat (β = .29; p < .01), while the coefficient of 331
brand identification was found to be significant (β = .24; p < .05). These results are indicative 332
of a partial mediating role of brand identification in the relationship between brand equity and 333
brand consumption for organic PLBs. To test this more formally, we performed a mediation 334
analysis following the procedure of Preacher and Hayes’s (2008) bootstrap analysis of 335
indirect effect, using 5,000 bootstrap samples. Our bootstrap analysis showed that the indirect 336
effect of brand equity on organic brand consumption through brand identification is positive 337
and significant (estimated effect = .14), with a 95% bias-corrected bootstrap confidence 338
interval excluding zero (.07 to .24). In addition, Model 3 shows that adding organic consumer 339
identification to the model did not lead to a significant improvement of the model. Finally, 340
Model 4 shows that the moderating effects between brand equity and brand identification and 341
between brand equity and organic consumer identification on organic brand consumption 342
were insignificant. 343
Model 5 shows that for NBs, brand equity had a positive direct effect on generic 344
organic consumption behavior (β = .31; p < .01). In contrast to the previous models, organic 345
product familiarity also had a significant effect on generic consumption (β = .30; p < .01). 346
1 2 3 4 5 6 7 8 9 10 11 12 13 14 15 16 17 18 19 20 21 22 23 24 25 26 27 28 29 30 31 32 33 34 35 36 37 38 39 40 41 42 43 44 45 46 47 48 49 50 51 52 53 54 55 56 57 58 59 60 61 62 63 64 65

15
When brand equity and brand identification were simultaneously regressed on generic organic 347
consumption behavior in Model 6, the coefficient of brand equity decreased somewhat (β = 348
.16; p < .01), while the coefficient of brand identification was also found to be significant (β = 349
.26; p < .01). These results are indicative of a partial mediating role of brand identification in 350
the relationship between brand equity and generic organic consumption behavior. A bootstrap 351
analysis using 5,000 bootstrap samples (Preacher and Hayes, 2008) showed that the indirect 352
effect of brand equity on generic organic consumption behavior through brand identification 353
is positive and significant (estimated effect = .16), with a 95% bias-corrected bootstrap 354
confidence interval excluding zero (.08 to .25). When adding organic consumer identification 355
to the model (Model 7), we see that brand equity remained a significant predictor (β = .16; p < 356
.01), while the significance of brand identification decreased somewhat (β = .16; p < .05) at 357
the expense of organic consumer identification (β = .19; p < .01). This could imply a partial 358
mediating role of organic consumer identification in the relationship between brand 359
identification and generic organic consumption behavior. We again performed a bootstrap 360
analysis of indirect effect, using 5,000 bootstrap samples, which showed that the indirect 361
effect of brand identification on generic organic consumption behavior through organic 362
consumer identification is positive and significant (estimated effect = .10), with a 95% bias-363
corrected bootstrap confidence interval excluding zero (.03 to .19). Finally, in Model 8, we 364
found that the moderating effects between brand equity and brand identification and between 365
brand equity and organic consumer identification were also insignificant for generic organic 366
consumption behavior. 367
368
-- INSERT TABLE 3 HERE-- 369
370
National brands 371
1 2 3 4 5 6 7 8 9 10 11 12 13 14 15 16 17 18 19 20 21 22 23 24 25 26 27 28 29 30 31 32 33 34 35 36 37 38 39 40 41 42 43 44 45 46 47 48 49 50 51 52 53 54 55 56 57 58 59 60 61 62 63 64 65

16
Table 4 displays the results of the regression analyses for NBs. Brand equity showed a 372
positive direct effect on organic brand consumption (Model 1: β = .40; p < .01). Interestingly, 373
organic product familiarity also had a positive significant effect on organic brand 374
consumption (β = .23 p < .01) in the NB condition. When brand equity and brand 375
identification were simultaneously regressed on organic brand consumption (Model 2), the 376
coefficient of brand equity decreased somewhat (β = .27; p < .01), while the coefficient of 377
brand identification was found to be significant (β = .22; p < .01). Again, these results could 378
be indicative of a partial mediating role of brand identification in the relationship between 379
brand equity and brand consumption for organic NBs. To test this outcome more formally, we 380
again conducted a mediation analysis using 5,000 bootstrap samples. The results of this 381
bootstrap analysis showed that the indirect effect of brand equity on organic brand 382
consumption through brand identification is positive and significant (estimated effect = .12), 383
with a 95% bias-corrected bootstrap confidence interval excluding zero (.02 to .21). Model 3 384
shows that when adding organic consumer identification to the model, brand equity remained 385
a significant predictor (β = .27; p < .01), while brand identification became insignificant at the 386
expense of organic consumer identification (β = .16; p < .05). This could imply a full 387
mediating role of organic consumer identification in the relationship between brand 388
identification and organic brand consumption. However, a bootstrap analysis with 5,000 389
bootstrap samples showed that for the indirect effect of brand identification on organic brand 390
consumption through organic consumer identification, the 95% bias-corrected bootstrap 391
confidence interval straddles zero. This implies that there is no mediation. Finally, Model 4 392
shows that the moderating effects between brand equity and brand identification and between 393
brand equity and organic consumer identification on organic brand consumption were 394
insignificant. 395
1 2 3 4 5 6 7 8 9 10 11 12 13 14 15 16 17 18 19 20 21 22 23 24 25 26 27 28 29 30 31 32 33 34 35 36 37 38 39 40 41 42 43 44 45 46 47 48 49 50 51 52 53 54 55 56 57 58 59 60 61 62 63 64 65

17
Model 5 shows that both brand equity (β = .33; p < .01) and product familiarity (β = 396
.34; p < .01) were significant predictors of generic organic consumption behavior. When 397
brand equity and brand identification were simultaneously regressed on generic organic 398
consumption behavior in Model 6, the coefficient of brand equity decreased somewhat (β = 399
.20; p < .01), while the coefficient of brand identification was also found to be significant (β = 400
.21; p < .01). These results are indicative of a partial mediating role of brand identification in 401
the relationship between brand equity and brand consumption for generic organic 402
consumption behavior. A bootstrap analysis using 5,000 bootstrap samples showed that the 403
indirect effect of brand equity on generic organic consumption behavior through brand 404
identification is positive and significant (estimated effect = .12), with a 95% bias-corrected 405
bootstrap confidence interval excluding zero (.04 to .20). When adding organic consumer 406
identification to the model (Model 7), we see that brand equity remained a significant 407
predictor (β = .20; p < .01), while brand identification became insignificant, and organic 408
consumer identification became a significant predictor (β = .31; p < .01). This could imply a 409
full mediating role of organic consumer identification in the relationship between brand 410
identification and generic organic consumption behavior. Indeed, a bootstrap analysis of 411
indirect effect, using 5,000 bootstrap samples, showed that the indirect effect of brand 412
identification on generic organic consumption through organic consumer identification is 413
positive and significant (estimated effect = .17), with a 95% bias-corrected bootstrap 414
confidence interval excluding zero (.09 to .27). Finally, in Model 8, we found that the 415
moderating effects between brand equity and brand identification and between brand equity 416
and organic consumer identification were also insignificant for generic organic consumption 417
behavior. 418
419
-- INSERT TABLE 4 HERE -- 420
1 2 3 4 5 6 7 8 9 10 11 12 13 14 15 16 17 18 19 20 21 22 23 24 25 26 27 28 29 30 31 32 33 34 35 36 37 38 39 40 41 42 43 44 45 46 47 48 49 50 51 52 53 54 55 56 57 58 59 60 61 62 63 64 65

18
421
Discussion 422
Organic brands have been gaining significant momentum over the past several years. 423
This study was one of the first studies that investigated the role of brand equity and social 424
identification in the context of organic branding. By doing so, we compared organic PLBs 425
with organic NBs. This study yields several key findings, which will be discussed below. 426
First, as expected, brand equity positively influences organic brand consumption for 427
both PLBs and NBs. This is in line with a vast amount of studies that found that brand equity 428
plays an important role in brand consumption behavior (e.g., Cobb-Walgren et al., 1995; 429
Keller, 1993). The results of this study extend the previous research by showing that in an 430
organic context, the brand equity of a specific organic brand also enhances generic organic 431
consumption. These findings seem to be in contrast with a non-organic, regular context. For 432
example, in a regular context, a positive evaluation of a brand such as Coca-Cola does not 433
necessarily lead to more consumption of other cola or soda brands in general. This 434
relationship between brand equity and general organic consumption behavior could be 435
explained by possible spillover effects. In this context, Bartels and Hoogendam (2011) found 436
moderate to strong positive relationships between attitude towards a specific organic brand 437
and buying behavior for organic food. 438
Second, the current study confirms the importance of multiple identities in explaining 439
behavior (Ashforth and Johnson, 2001; Pratt and Foreman, 2000). Previous studies in a green 440
context have already found that multiple social identities play a role in explaining different 441
environmentally friendly behaviors (Bartels and Reinders, 2016; Murtagh et al, 2012). In 442
addition to these studies, the current study showed that the role of multiple identities on 443
adjacent behaviors also depend on the type of product or brand that is at stake. More 444
precisely, the role of brand identification and organic consumer identification in predicting 445
1 2 3 4 5 6 7 8 9 10 11 12 13 14 15 16 17 18 19 20 21 22 23 24 25 26 27 28 29 30 31 32 33 34 35 36 37 38 39 40 41 42 43 44 45 46 47 48 49 50 51 52 53 54 55 56 57 58 59 60 61 62 63 64 65

19
both organic brand consumption and general organic consumption behavior differs for PLBs 446
compared to NBs. For PLBs, brand identification is related to organic brand consumption as 447
well as organic consumption behavior in general. In contrast, for NBs, brand identification is 448
no longer related to organic brand consumption and general organic consumption behavior 449
when controlling for organic consumer identification. Further, the role of organic consumer 450
identification seems to differ for PLBs compared to NBs. For PLBs, identification with 451
organic consumers does have a positive impact on organic consumption behavior in general, 452
but it does not influence the consumption behavior for that particular brand. In contrast, 453
concerning NBs, identification with organic consumers also leads to an increase in 454
consumption of the brand. Tapping the concept of identity salience1 (Arnett et al, 2003; 455
Stryker and Burke, 2000), consumers’ identity salience could differ between organic PLBs 456
and organic NBs. Under the PLB condition, the identity of the brand could be more salient, 457
while under the NB condition, the identity of the green or sustainable consumer (i.e., the 458
greenness of the concept) could be more salient. This difference in identity salience could 459
explain why brand identification and organic consumer identification seems to have different 460
roles for PLBs and NBs. 461
Third, based on the results from the current study, we can conclude that identification 462
also plays a role in explaining the relationship between brand equity and consumption 463
behavior. On the one hand, for both PLBs and NBs, this relationship was not strengthened or 464
weakened by brand identification or organic consumer identification (i.e., moderation). On the 465
other hand, the relationship between brand equity and consumption behavior of that brand is 466
partially determined by identification with the brand or organic consumer group (i.e., 467
mediation). Social identity theory states that consumers want to identify with groups or brands 468
that have high status and positive publicity (Kuenzel and Halliday, 2008). Because brand 469
1 Identity salience can be defined as the probability that an identity will be invoked across a variety of situations,
or alternatively across persons in a given situation (Stryker and Burke, 2000, p. 286).
1 2 3 4 5 6 7 8 9 10 11 12 13 14 15 16 17 18 19 20 21 22 23 24 25 26 27 28 29 30 31 32 33 34 35 36 37 38 39 40 41 42 43 44 45 46 47 48 49 50 51 52 53 54 55 56 57 58 59 60 61 62 63 64 65

20
equity is related to the quality and status of a brand, it logically follows that consumers are 470
more likely to identify with brands that have higher brand equity, and they are subsequently 471
more likely to buy these brands. Moreover, brand identification seems to lead to stronger 472
organic consumer identification. This could imply that in the case of a specific concept such 473
as organic products, attractive features of a brand could positively reflect on the group of 474
organic consumers. As a result, positive identification with the brand also leads to stronger 475
identification with the group that adheres to this concept (i.e., organic consumers), which 476
indicates so-called ‘nested identities’ (Ashforth and Johnson, 2001). 477
Fourth, we found a distinguishing role of organic product familiarity between organic 478
PLBs and organic NBs. For PLBs, organic product familiarity does not affect the 479
consumption of the brand. A possible explanation for this effect is that the purchase and 480
consumption behavior of organic PLBs is more likely to be related to familiarity with the 481
retailer and its brands than to familiarity with organic products in general. In contrast, for 482
NBs, there is a clear relationship between organic product familiarity and brand consumption. 483
Organic product familiarity could then be one of the drivers of brand consumption. 484
Finally, the results of this study are robust, given that the effects were tested in a 485
variety of countries with different levels of consumption of organic brands and organic 486
products in general. This study therefore meets the requirement of cross-validation for a better 487
understanding of consumer behavior (Steenkamp and Baumgartner, 1998). Moreover, 488
temporarily separating the measurement of the independent variables and dependent variables 489
allows us to reduce biases in consumers’ self-reported responses by making prior responses 490
less salient (Podsakoff et al, 2003). 491
492
Marketing implications 493
1 2 3 4 5 6 7 8 9 10 11 12 13 14 15 16 17 18 19 20 21 22 23 24 25 26 27 28 29 30 31 32 33 34 35 36 37 38 39 40 41 42 43 44 45 46 47 48 49 50 51 52 53 54 55 56 57 58 59 60 61 62 63 64 65

21
The results of the current study offer some interesting marketing implications. The 494
current study shows that building successful organic brands could pay off for retailers as well 495
as brand manufacturers. Building brand equity for organic brands seems to stimulate brand 496
purchases for both PLBs and NBs. This recommendation is relevant given that organic brands 497
are gaining in importance (Organic Trade Association, 2015). The sale of specific organic 498
brands expectedly has spillover effects to other organic products. Thus, creating good quality 499
brands and selling them in attractive stores could help to enhance the market for organic 500
products in general. Although in the short term this seems not to be in the interests of brand 501
managers, they could potentially benefit from a more developed organic market because 502
higher market shares for organic products in general could also stimulate sales of their own 503
organic brands. 504
In addition, for both organic PLBs and NBs, brand identification plays a crucial role in 505
enhancing consumer demand for brands. For both retailers and brand manufacturers, brand 506
identification can be used as a catalyst to improve the sales of organic brands. More 507
specifically, the results of the current study imply that brand managers can use the principles 508
of ‘basking in reflected glory’ to boost the sales of their brands (Cialdini et al, 1976). For 509
example, brand managers may activate consumers’ status motives by linking their organic 510
brands with visible status (e.g., prestigious events) (Griskevicius et al, 2010). 511
Apart from these similarities between organic PLBs and organic NBs, there are also 512
differences to which brand managers should pay attention. For NBs, managers should focus 513
more on organic consumer identification in general. For example, communicating that it is 514
‘cool’ to be part of a green consumer group. For PLBs, managers should focus more on brand 515
identification. For example, managers can try to enhance consumers’ sense that the brand 516
boosts their status and therefore their self-esteem. 517
518
1 2 3 4 5 6 7 8 9 10 11 12 13 14 15 16 17 18 19 20 21 22 23 24 25 26 27 28 29 30 31 32 33 34 35 36 37 38 39 40 41 42 43 44 45 46 47 48 49 50 51 52 53 54 55 56 57 58 59 60 61 62 63 64 65

22
Limitations and directions for future research 519
This study has several limitations that could be addressed in future research. First, this study 520
does not make a distinction between different types of PLBs based on the underlying 521
characteristics of the retailer that is offering the brand. As the retail landscape is rather 522
diverse, ranging from hard-discount to luxury stores, and a retailer’s price positioning has 523
been shown to influence private label brand consumption (González-Benito and Martos-524
Partal, 2012), future research could further elaborate on the evaluation of organic private label 525
brands based on these retailer differences. Similarly, there are a number of differences in how 526
private label brands are labelled. For example, some private label brands bear the name of the 527
retailer (e.g., ‘Edeka Bio’ from Edeka), whereas other private label brands bear their own 528
name (e.g., ‘365 Everyday Value’ from Whole Foods Market). The type of labelling could 529
also influence how organic private label brands are evaluated and, therefore, represents 530
another research opportunity. 531
Second, we focused on organic food. Although food products constitute an important 532
product category in the context of retailing, future research could focus on non-food 533
categories such as organic apparel or personal care products. For example, organic apparel has 534
not only proven to be a promising growth market (Textile Exchange, 2014), but also could be 535
a consequence of potential spill-over effects. In this respect, a recent study by Ellis et al 536
(2012) showed that consumers who had previously purchased organic foods were willing to 537
pay more for organic apparel, thus suggesting the presence of spill-over effects. 538
Third, the findings for organic NBs seem to be somewhat in contrast to a regular 539
context. For example, in a regular context, a positive evaluation of the Coca-Cola brand does 540
not necessarily lead to more consumption of other cola brands in general. Future research 541
could elucidate to what extent it will be more difficult for organic brands to compete with 542
each other compared to how brands in a regular context compete (e.g., Coca-Cola versus 543
1 2 3 4 5 6 7 8 9 10 11 12 13 14 15 16 17 18 19 20 21 22 23 24 25 26 27 28 29 30 31 32 33 34 35 36 37 38 39 40 41 42 43 44 45 46 47 48 49 50 51 52 53 54 55 56 57 58 59 60 61 62 63 64 65
23
Pepsi Cola) and the consequences for future organic brand marketing strategies. In addition, 544
little is known about the way in which the consumption of PLBs and NBs may complement 545
rather than substitute each other (Sethuraman and Gielens, 2014). A recent a study by 546
Krystallis (2015) found that in certain situations, consumer motivation could be equal for both 547
PLBs and NBs, thus suggesting some degree of complementarity. Future research endeavors 548
could focus on this complementarity for organic and other green brands. 549
550
1 2 3 4 5 6 7 8 9 10 11 12 13 14 15 16 17 18 19 20 21 22 23 24 25 26 27 28 29 30 31 32 33 34 35 36 37 38 39 40 41 42 43 44 45 46 47 48 49 50 51 52 53 54 55 56 57 58 59 60 61 62 63 64 65

24
References 551
Aaker, D. (1991). Managing Brand Equity: Capitalizing on the Value of a Brand Name. Free 552
Press, New York, NY. 553
Ailawadi, K.L., Neslin, S.A., and Gedenk, K. (2001). Pursuing the value-conscious consumer: 554
Store brands versus national brand promotions. Journal of Marketing, 65, 71–89. 555
Alba, J.W., and Hutchinson, J.W. (1987). Dimensions of consumer expertise. Journal of 556
consumer research, 411-454. 557
Albert, N., Merunka, D., and Valette-Florence, P. (2013). Brand passion: antecedents and 558
consequences. Journal of Business Research, 66(7), 904-909. 559
Algesheimer, R., Dholakia, U.M., and Herrmann, A. (2005). The social influence of brand 560
community: Evidence from European car clubs. Journal of Marketing, 69(3), 19-34. 561
Aouina Mejri, C., and Bhatli, D. (2014). CSR: Consumer responses to the social quality of 562
private labels. Journal of Retailing and Consumer Services, 21(3), 357-363. 563
Arnett, D.B., German, S.D., and Hunt, S.D. (2003). The identity salience model of 564
relationship marketing success: The case of non-profit marketing . Journal of Marketing, 565
67(2), 89-105. 566
Aschemann-Witzel, J., and Zielke, S. (in press). Can't Buy Me Green? A Review of 567
Consumer Perceptions of and Behavior Toward the Price of Organic Food. Journal of 568
Consumer Affairs. Article in Press 569
Ashforth, B.E., and Mael, F. (1989). Social Identity Theory and the Organization. Academy of 570
Management Review, 14(1), 20-39. 571
Ashforth, B.E., and Johnson, S.A. (2001). Which hat to wear? The relative salience of 572
multiple identities in organizational contexts. In M.A.T. Hogg and D.J. Terry (Eds.), 573
Social Identity Processes in Organizational Contexts. Philadelpia (pp. 31-48). 574
Psychology Press. 575
1 2 3 4 5 6 7 8 9 10 11 12 13 14 15 16 17 18 19 20 21 22 23 24 25 26 27 28 29 30 31 32 33 34 35 36 37 38 39 40 41 42 43 44 45 46 47 48 49 50 51 52 53 54 55 56 57 58 59 60 61 62 63 64 65
25
Bagozzi, R.P., and Dholakia, U.M. (2006). Antecedents and purchase consequences of 576
customer participation in small group brand communities. International Journal of 577
Research in Marketing, 23(1), 45-61. 578
Bartels, J., and Hoogendam, K. (2011). The role of social identity and attitudes toward 579
sustainability brands in buying behavior for organic products. Journal of Brand 580
Management, 18, 697-708. 581
Bartels J., and Reinders, M. (2010). Social identification, social representations, and 582
consumer innovativeness in an organic food context: A cross-national comparison. Food 583
Quality and Preference, 21, 347-352. 584
Bartels, J., and Reinders, M.J. (2016). Consuming apart, together: the role of multiple 585
identities in sustainable behaviour. International Journal of Consumer Studies, 40, 444-586
452. 587
Bauer, H. H., Heinrich, D., and Schäfer, D. B. (2013). The effects of organic labels on global, 588
local, and private brands. More hype than substance? Journal of Business Research, 589
66(8), 1035–1043. 590
Bekk, M., Spörrle, M., Hedjasie, R., and Kerschreiter, R. (2016). Greening the competitive 591
advantage: antecedents and consequences of green brand equity. Quality & Quantity, 592
50(4), 1727-1746. 593
Bergami, M., and Bagozzi, R.P. (2000). Self-categorization, affective commitment and group 594
self-esteem as distinct aspects of social identity in the organization. British Journal of 595
Social Psychology, 39, 555-577. 596
Bhattacharya, C.B., Rao, H., and Glynn, M.A. (1995). Understanding the bond of 597
identification: An investigation of its correlates among art museum members. Journal of 598
Marketing, 59, 46-57. 599
1 2 3 4 5 6 7 8 9 10 11 12 13 14 15 16 17 18 19 20 21 22 23 24 25 26 27 28 29 30 31 32 33 34 35 36 37 38 39 40 41 42 43 44 45 46 47 48 49 50 51 52 53 54 55 56 57 58 59 60 61 62 63 64 65
26
Bhattacharya, C.B., and Sen, S. (2003). Consumer-company identification: A framework for 600
understanding consumers' relationships with companies. Journal of Marketing, 67, 76-88. 601
Biswas, A. (1992). The moderating role of brand familiarity in reference price perceptions. 602
Journal of Business Research, 25(3), 251-262. 603
Calvo-Porral, C. and Lang, M. (2015). Private Labels: The role of manufacturer identification, 604
brand loyalty and image on purchase intention. British Food Journal, 17(2), 506-522. 605
Chang, C.-H., and Chen, Y.-S. (2013). Managing green brand equity: the perspective of 606
perceived risk theory. Quality & Quantity, 48, 1753-1768. 607
Chen, Y.-S. (2010). The drivers of green brand equity: Green brand image, green satisfaction, 608
and green trust. Journal of Business Ethics, 93, 307–319. 609
Chkanikova, O., and Lehner, M. (2015). Private eco-brands and green market development: 610
towards new forms of sustainability in food retailing. Journal of Cleaner Production, 611
107, 74–84. 612
Cialdini, R.B., Borden, R.J., Thorne, A., Walker, M.R., Freeman, S., and Sloan, L.R. (1976). 613
Basking in reflected glory: Three (football) field studies. Journal of Personality and 614
Social Psychology, 34, 366-375. 615
Cobb-Walgren, C.J., Ruble, C.A., and Donthu, N. (1995). Brand equity, brand preference, and 616
purchase intent. Journal of Advertising, 24(3), 25–40. 617
Cuneo, A., Lopez, P., and Yague, M. J. (2012). Private label brands: measuring equity across 618
consumer segments. Journal of Product & Brand Management, 21(6), 428–438. 619
Cuneo, A., Milberg, S. J., Benavente, J. M., and Palacios-Fenech, J. (2015). The growth of 620
private label brands: A worldwide phenomenon. Journal of International Marketing, 23 621
(1), 73-90. 622
1 2 3 4 5 6 7 8 9 10 11 12 13 14 15 16 17 18 19 20 21 22 23 24 25 26 27 28 29 30 31 32 33 34 35 36 37 38 39 40 41 42 43 44 45 46 47 48 49 50 51 52 53 54 55 56 57 58 59 60 61 62 63 64 65

27
Dean, M., Raats, M.M., and Shepherd, R. (2012). The role of self‐identity, past behavior, and 623
their interaction in predicting intention to purchase fresh and processed organic food. 624
Journal of Applied Social Psychology, 42(3), 669-688. 625
Deloitte (2015). The 2015 American Pantry Study The call to re-connect with consumers. 626
http://www2.deloitte.com/content/dam/Deloitte/us/Documents/consumer-business/us-cb-627
2015-american-pantry-study.pdf 628
De Wulf, K., Odekerken-Schröder, G., Goedertier, F., and Van Ossel, G. (2005). Consumer 629
perceptions of store brands versus national brands. Journal of Consumer Marketing, 630
22(4), 223-232. 631
Dholakia, U.M., Bagozzi, R.P., and Pearo, L.K. (2004). A social influence model of consumer 632
participation in network- and small-group-based virtual communities. International 633
Journal of Research in Marketing, 21(3), 241-263. 634
Ellis, J. L., McCracken, V. A., and Skuza, N. (2012). Insights into willingness to pay for 635
organic cotton apparel. Journal of Fashion Marketing and Management, 16 (3), 290-305. 636
Erdem, T., Zhao, Y., and Valenzuela, A. (2004). Performance of store brands: A cross-637
country analysis of consumer store-brand preferences, perceptions, and risk. Journal of 638
Marketing Research, 41 (1), pp. 86-100. 639
Escalas, J.E., and Bettman, J.R. (2003). You are what they eat: The influence of reference 640
groups on consumers’ connections to brands. Journal of Consumer Psychology, 13(3), 641
339-348. 642
Esch, F.-R., Langner, T., Schmitt, B. H., and Geus, P. (2006). Are brands forever? How brand 643
knowledge and relationships affect current and future purchases. Journal of Product & 644
Brand Management, 15(2), 98–105 645
1 2 3 4 5 6 7 8 9 10 11 12 13 14 15 16 17 18 19 20 21 22 23 24 25 26 27 28 29 30 31 32 33 34 35 36 37 38 39 40 41 42 43 44 45 46 47 48 49 50 51 52 53 54 55 56 57 58 59 60 61 62 63 64 65
28
Gleim, M.R., Smith, J.S., Andrews, D., and Cronin Jr., J.J. (2013). Against the green: A 646
multi-method examination of the barriers to green consumption Journal of Retailing, 647
89(1), 44–61. 648
González-Benito, O., and Martos-Partal, M. (2012). Role of retailer positioning and product 649
category on the relationship between store brand consumption and store loyalty. Journal 650
of Retailing, 88 (2), 236-249. 651
Grewal, D., and Levy, M.(2009). Emerging issues in retailing research. Journal of Retailing, 652
85(4), 522-526. 653
Griskevicius, V., Tybur, J.M., and Van den Bergh, B. (2010). Going Green to Be Seen: 654
Status, Reputation, and Conspicuous Conservation. Journal of Personality and Social 655
Psychology, 98(3), 392-404. 656
Gupta, S., and Kumar, V. (2013). Sustainability as a corporate culture of a brand for superior 657
performance. Journal of World Business, 8 (3), 311-320. 658
Hartmann, P., Apaolaza Ibáñez, V., and Forcada Sainz, F.J. (2005). Green branding effects on 659
attitude: functional versus emotional positioning strategies. Marketing Intelligence & 660
Planning, 23 (1), pp. 9-29. 661
He, H., Li, Y., and Harris, L. (2012). Social identity perspective on brand loyalty. Journal of 662
Business Research, 65, 648-657. 663
Homburg, C., Wieseke, J., and Bornemann, T. (2009). Implementing the marketing concept at 664
the employee-customer interface: The role of customer need knowledge. Journal of 665
Marketing, 73, 64-81. 666
Hughner, R.S., McDonagh, P., Prothero, A., Shultz II, C.J., and Stanton, J. (2007). Who are 667
organic food consumers? A compilation and review of why people purchase organic 668
food. Journal of Consumer Behavior, 6, 1-17. 669
1 2 3 4 5 6 7 8 9 10 11 12 13 14 15 16 17 18 19 20 21 22 23 24 25 26 27 28 29 30 31 32 33 34 35 36 37 38 39 40 41 42 43 44 45 46 47 48 49 50 51 52 53 54 55 56 57 58 59 60 61 62 63 64 65

29
Jonas, A., and Roossen, J. (2005). Private labels for premium products – the example of 670
organic food. International Journal of Retail & Distribution Management, 33 (8), pp. 671
636-653. 672
Kang, S., and Hur, W.-M. (2012). Investigating the antecedents of green brand equity: A 673
sustainable development perspective. Corporate Social Responsibility and Environmental 674
Management, 19, 306–316. 675
Keller, K. L. (1993). Conceptualizing, Measuring, and Managing Customer-Based Brand 676
Equity. Journal of Marketing, 57(1), 1–22. 677
Konuk, F. A., Rahman, S. U., and Salo, J. (2015). Antecedents of green behavioral intentions: 678
a cross-country study of Turkey, Finland and Pakistan. International Journal of 679
Consumer Studies, 39, 586-596. 680
Krystallis, A. (2015). Motivation and cognitive structures of store versus manufacturer brand 681
consumers. Journal of Consumer Behavior, 14 (4), 270-284. 682
Kuenzel, S., and Halliday, S.V. (2008). Investigating antecedents and consequences of brand 683
identification. Journal of Product & Brand Management, 17(5), 293 – 304. 684
Lam, S.K., Ahearne, M., Hu, Y., and Schillewaert, N. (2010). Resistance to brand switching 685
when a radically new brand is introduced: A social identity theory perspective. Journal of 686
Marketing, 74(6), 128-146. 687
Larceneux, F., Benoit-Moreau, F., and Renaudin, V. (2012). Why might organic labels fail to 688
influence consumer choices? Marginal labelling and brand equity effects. Journal of 689
Consumer Policy, 35, 85-104. 690
Mael, F.A., and Ashforth, B.E. (1992). Alumni and their alma mater: A partial test of the 691
reformulated model of organization identification. Journal of Organizational Behavior, 692
13(2), 103-123. 693
1 2 3 4 5 6 7 8 9 10 11 12 13 14 15 16 17 18 19 20 21 22 23 24 25 26 27 28 29 30 31 32 33 34 35 36 37 38 39 40 41 42 43 44 45 46 47 48 49 50 51 52 53 54 55 56 57 58 59 60 61 62 63 64 65

30
Mieres, C.G., Martín, A.M.D., and Gutiérrez, J.A.T. (2006). Antecedents of the difference in 694
perceived risk between store brands and national brands. European Journal of Marketing, 695
40(1/2), 61-82. 696
Murtagh, N., Gatersleben, B., and Uzzell, D. (2012). Multiple identities and travel mode 697
choice for regular journeys. Transportation Research Part F, 15, 514–524. 698
Netemeyer, R. G., Krishnan, B., Pullig, C., Wang, G., Yagci, M., Dean, D., Ricks, J., and 699
Wirth, F. (2004). Developing and validating measures of facets of customer-based brand 700
equity. Journal of Business Research, 57(2), 209–224. 701
Ng, P. F., Butt, M. M., Khong, K. W., and Ong, F. S. (2013). Antecedents of green brand 702
equity: an integrated approach. Journal of Business Ethics, 1–13 703
Ngobo, P.-V. (2011). What drives household choice of organic products in grocery stores? 704
Journal of Retailing, 87(1), 90-100. 705
Olbrich, R., and Jansen, H.C. (2014). Price-quality relationship in pricing strategies for 706
private labels. Journal of Product and Brand Management, 23(6), 429-438. 707
Onwezen, M.C., Bartels, J., and Antonides G. (2014). The self-regulatory function of 708
anticipated pride and guilt in a sustainable and healthy consumption context. European 709
Journal of Social Psychology, 44,53–68. 710
Organic Trade Association (2013). Eight in Ten U.S. Parents Report They Purchase Organic 711
Products. Available at https://www.ota.com/news/press-releases/17124, accessed July 712
2015. 713
Organic Trade Association (2015). U.S. Organic Industry Survey 2015. Available at 714
https://ota.com/what-ota-does/market-analysis, accessed July 2015. 715
Papista, E., and Krystallis, A. (2013). Investigating the types of value and cost of green 716
brands: Proposition of a conceptual framework. Journal of Business Ethics, 115 (1), 75-717
92. 718
1 2 3 4 5 6 7 8 9 10 11 12 13 14 15 16 17 18 19 20 21 22 23 24 25 26 27 28 29 30 31 32 33 34 35 36 37 38 39 40 41 42 43 44 45 46 47 48 49 50 51 52 53 54 55 56 57 58 59 60 61 62 63 64 65

31
Pickett-Baker, J., and Ozaki, R. (2008). Pro-environmental products: marketing influence on 719
consumer purchase decision. Journal of Consumer Marketing, 25 (5), 281 – 293. 720
Podsakoff P. M., MacKenzie S. B., Lee J. Y, and Podsakoff, N. P. (2003). Common method 721
biases in behavioral research: a critical review of the literature and recommended 722
remedies. Journal of Applied Psychology, 88(5), 879-903. 723
Pratt, M.G., and Foreman, P.O. (2000). Classifying managerial responses to multiple 724
organizational identities. The Academy of Management Review, 25(1), 18-42. 725
Preacher, K. J., and Hayes, A. F. (2008). Asymptotic and resampling strategies for assessing 726
and comparing indirect effects in multiple mediator models. Behavior research methods, 727
40(3), 879-891. 728
Rödiger, M., and Hamm, U. (2015). How are organic food prices affecting consumer 729
behaviour? A review. Food Quality and Preference, 43, 10-20. 730
Schifferstein, H.N. J., and Oude Ophuis, P.A.M. (1998). Health-related determinants of 731
organic food consumption in the Netherlands. Food Quality and Preference, 9(3), 119-732
133. 733
Sethuraman, R., and Gielens, K. (2014). Determinants of store brand share. Journal of 734
Retailing, 90(2), 141–153. 735
Stanton, J.V., and Guion, D.T. (2015). Perceptions of “organic” food: A view through brand 736
theory. Journal of International Food & Agribusiness Marketing, 27(2), 120-141. 737
Statista (2014). Market share of private label brands worldwide in 2013, by selected country. 738
Available at http://www.statista.com/statistics/244903/market-share-of-private-label-739
brands-worldwide-by-selected-country, accessed July 2015. 740
Steenkamp, J. B. E. M., and Baumgartner, H. (1998). Assessing measurement invariance in 741
cross-national consumer research. Journal of Consumer Research, 25(1), 78–90. 742
1 2 3 4 5 6 7 8 9 10 11 12 13 14 15 16 17 18 19 20 21 22 23 24 25 26 27 28 29 30 31 32 33 34 35 36 37 38 39 40 41 42 43 44 45 46 47 48 49 50 51 52 53 54 55 56 57 58 59 60 61 62 63 64 65

32
Steenkamp, J. B. E. M., van Heerde, H.J., and Geyskens, I. (2010). What makes consumers 743
willing to pay a price premium for national brands over private labels? Journal of 744
Marketing Research, 47, 1011 –1024. 745
Stokburger-Sauer, N., Ratneshwar, S., and Sen, S. (2012). Drivers of consumer–brand 746
identification. International Journal of Research in Marketing, 29, 406-418. 747
Stryker, S., and Burke, P. J. (2000). The past, present, and future of an identity theory. Social 748
Psychology Quarterly, 63(4), 284-297. 749
Tajfel, H. (1978). Social categorisation, social identity and social comparison. In H. Tajfel 750
(Ed.), Differentiation Between Social Groups: Studies in the Social Psychology of Inter-751
Group Relations (pp. 61–76). London: Academic Press. 752
Tajfel, H., and Turner, J. C. (1979). An integrative theory of intergroup conflict. In W. G. 753
Austin and S. Worchel (Eds.), The social psychology of intergroup relations (pp. 33–47). 754
Monterey, CA: Brooks/Cole. 755
Textile Exchange (2014). Organic Cotton Market Report 2014. Available at 756
http://textileexchange.org/resource-center/media-room/2014-organic-cotton-report, 757
accessed July 2015. 758
Tuškej, U., Golob, U., and Podnar, K. (2013). The role of consumer–brand identification in 759
building brand relationships. Journal of Business Research, 66(1), 53-59. 760
van Dick, R., Christ, O., Stellmacher, J., Wagner, U., Ahlswede, O., Grubba, C., Hauptmeier, 761
M., Höhfeld, C., Moltzen, K., and Tissington, P. A. (2004). Should I stay or should I go? 762
Explaining turnover intentions with organizational identification and job satisfaction. 763
British Journal of Management, 15(4), 351-360. 764
Willer, H. and Kilcher, L. (2010), The World of Agriculture. Statistics and Emerging Trends, 765
IFOAM, FiBL, Frick, Bonn. 766
1 2 3 4 5 6 7 8 9 10 11 12 13 14 15 16 17 18 19 20 21 22 23 24 25 26 27 28 29 30 31 32 33 34 35 36 37 38 39 40 41 42 43 44 45 46 47 48 49 50 51 52 53 54 55 56 57 58 59 60 61 62 63 64 65

33
Yoo, B., Donthu, N., and Lee, S. (2000). An examination of selected marketing mix elements 767
and brand equity. Journal of the Academy of Marketing Science 28(2): 195-211. 768
Yoo, B., and Donthu, N. (2001). Developing and validating a multidimensional consumer-769
based brand equity scale. Journal of Business Research, 52, 1-14. 770
1 2 3 4 5 6 7 8 9 10 11 12 13 14 15 16 17 18 19 20 21 22 23 24 25 26 27 28 29 30 31 32 33 34 35 36 37 38 39 40 41 42 43 44 45 46 47 48 49 50 51 52 53 54 55 56 57 58 59 60 61 62 63 64 65
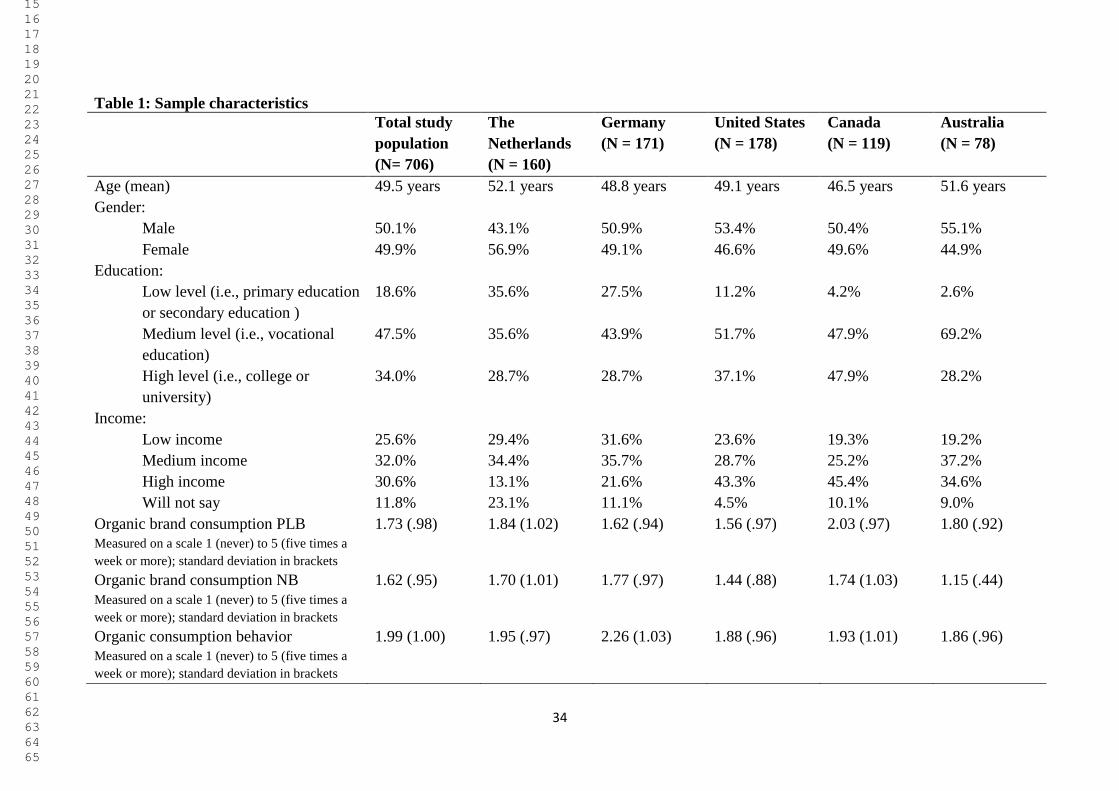
34
Table 1: Sample characteristics
Total study
population
(N= 706)
The
Netherlands
(N = 160)
Germany
(N = 171)
United States
(N = 178)
Canada
(N = 119)
Australia
(N = 78)
Age (mean) 49.5 years 52.1 years 48.8 years 49.1 years 46.5 years 51.6 years
Gender:
Male
Female
50.1%
49.9%
43.1%
56.9%
50.9%
49.1%
53.4%
46.6%
50.4%
49.6%
55.1%
44.9%
Education:
Low level (i.e., primary education
or secondary education )
Medium level (i.e., vocational
education)
High level (i.e., college or
university)
18.6%
47.5%
34.0%
35.6%
35.6%
28.7%
27.5%
43.9%
28.7%
11.2%
51.7%
37.1%
4.2%
47.9%
47.9%
2.6%
69.2%
28.2%
Income:
Low income
Medium income
High income
Will not say
25.6%
32.0%
30.6%
11.8%
29.4%
34.4%
13.1%
23.1%
31.6%
35.7%
21.6%
11.1%
23.6%
28.7%
43.3%
4.5%
19.3%
25.2%
45.4%
10.1%
19.2%
37.2%
34.6%
9.0%
Organic brand consumption PLB
Measured on a scale 1 (never) to 5 (five times a
week or more); standard deviation in brackets
1.73 (.98)
1.84 (1.02)
1.62 (.94)
1.56 (.97)
2.03 (.97)
1.80 (.92)
Organic brand consumption NB
Measured on a scale 1 (never) to 5 (five times a
week or more); standard deviation in brackets
1.62 (.95) 1.70 (1.01) 1.77 (.97) 1.44 (.88) 1.74 (1.03) 1.15 (.44)
Organic consumption behavior
Measured on a scale 1 (never) to 5 (five times a
week or more); standard deviation in brackets
1.99 (1.00) 1.95 (.97) 2.26 (1.03) 1.88 (.96) 1.93 (1.01) 1.86 (.96)
1 2 3 4 5 6 7 8 9 10 11 12 13 14 15 16 17 18 19 20 21 22 23 24 25 26 27 28 29 30 31 32 33 34 35 36 37 38 39 40 41 42 43 44 45 46 47 48 49 50 51 52 53 54 55 56 57 58 59 60 61 62 63 64 65
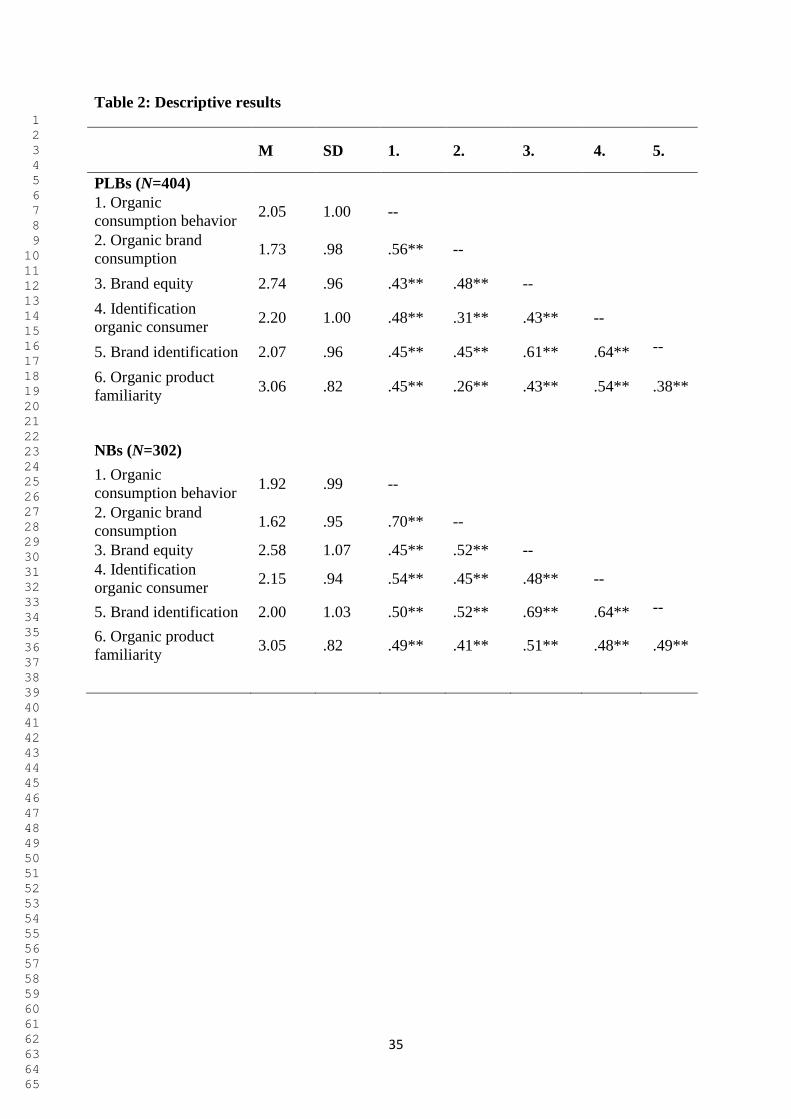
35
Table 2: Descriptive results
M SD 1. 2. 3. 4. 5.
PLBs (N=404)
1. Organic
consumption behavior 2.05 1.00 --
2. Organic brand
consumption 1.73 .98 .56** --
3. Brand equity 2.74 .96 .43** .48** --
4. Identification
organic consumer 2.20 1.00 .48** .31** .43** --
5. Brand identification 2.07 .96 .45** .45** .61** .64** --
6. Organic product
familiarity 3.06 .82 .45** .26** .43** .54** .38**
NBs (N=302)
1. Organic
consumption behavior 1.92 .99 --
2. Organic brand
consumption 1.62 .95 .70** --
3. Brand equity 2.58 1.07 .45** .52** --
4. Identification
organic consumer 2.15 .94 .54** .45** .48** --
5. Brand identification 2.00 1.03 .50** .52** .69** .64** --
6. Organic product
familiarity 3.05 .82 .49** .41** .51** .48** .49**
1 2 3 4 5 6 7 8 9 10 11 12 13 14 15 16 17 18 19 20 21 22 23 24 25 26 27 28 29 30 31 32 33 34 35 36 37 38 39 40 41 42 43 44 45 46 47 48 49 50 51 52 53 54 55 56 57 58 59 60 61 62 63 64 65

36
Table 3: Drivers of organic brand consumption for PLBs
Organic brand consumption (T2)
Organic consumption behavior (T2)
Model 1 Model 2 Model 3 Model 4 Model 5 Model 6 Model 7 Model 8
Brand equity .43** .29** .29** .29** .31** .16* .16** .16**
Brand identification -- .24** .27** .26** -- .26** .16* .16*
Organic consumer identification -- -- -.05 -.06 -- -- .19** .19**
Organic product familiarity .10 .07 .08 .07 .30** .26** .20** .20**
Brand equity X Brand identification -- -- -- .01 -- -- -- .02
Brand equity X Organic consumer identification -- -- -- .10 -- -- -- -.04
Income .04 .04 .04 .03 .07 .07 .07 .08
Education -.01 -.02 -.02 -.02 .06 .05 .04 .03
Age .01 .01 .02 .01 .02 .02 .02 .02
Gender -.01 -.02 -.02 -.03 .06 .05 .05 .05
Country Netherlands .05 .05 .05 .05 .05 .05 .05 .05
Country Germany -.06 -.07 -.08 -.07 .07 .06 .07 .07
Country Australia .06 .06 .06 .06 .03 .04 .04 .04
Country Canada .04 .07 .07 .08 -.02 .00 .01 .01
N 404 404 404 404 404 404 404 404
R2 .25 .28 .28 .29 .29 .33 .34 .35
F Value 11.40** 12.34** 11.35** 10.16** 14.05** 15.33** 15.13** 12.96** Note: *p <.05, **p <.01. Country variables are dummy variables, with the U.S. as the benchmark.
1 2 3 4 5 6 7 8 9 10 11 12 13 14 15 16 17 18 19 20 21 22 23 24 25 26 27 28 29 30 31 32 33 34 35 36 37 38 39 40 41 42 43 44 45 46 47 48 49 50 51 52 53 54 55 56 57 58 59 60 61 62 63 64 65

37
Table 4: Drivers of organic brand consumption for NBs
Organic brand consumption (T2)
Organic consumption behavior (T2)
Model 1 Model 2 Model 3 Model 4 Model 5 Model 6 Model 7 Model 8
Brand equity .40** .27** .27** .28** .33** .20** .20** .20**
Brand identification -- .22** .14 .12 -- .21** .04 .03
Organic consumer identification -- -- .16* .17* -- -- .31** .32**
Organic product familiarity .23** .19** .15* .16* .34** .31** .23** .24**
Brand equity X Brand identification -- -- -- -.07 -- -- -- -.03
Brand equity X Organic consumer identification -- -- -- .13 -- -- -- .08
Income -.09 -.09 -.09 -.09 .05 .05 .05 .05
Education .09 .08 .08 .08 .04 .03 .03 .03
Age .10 .09 .09 .10 .03 .02 .03 .03
Gender .05 .05 .04 .05 .05 .04 .03 .03
Country Netherlands -.01 .00 .01 .01 -.15* -.14* -.13* -.12*
Country U.S. .02 .02 .02 .02 .00 .00 -.01 -.01
Country Australia -.02 .01 .00 .01 -.02 -.01 -.03 -.02
Country Canada .03 .06 .06 .06 -.16* -.14* -.13* -.13*
N 302 302 302 302 302 302 302 302
R2 .33 .35 .37 .38 .36 .38 .43 .43
F Value 12.44** 12.47** 12.03** 10.67** 14.09** 13.99** 15.81** 13.65** Note: *p <.05, **p <.01. Country variables are dummy variables, with Germany as the benchmark.
1 2 3 4 5 6 7 8 9 10 11 12 13 14 15 16 17 18 19 20 21 22 23 24 25 26 27 28 29 30 31 32 33 34 35 36 37 38 39 40 41 42 43 44 45 46 47 48 49 50 51 52 53 54 55 56 57 58 59 60 61 62 63 64 65
Copyright © 2022 FDOKUMEN