Multinational Corporations, International Unionism, and NGOs

Doc. INFRASTRUCTURE.ZZ
THE ROLE OF TRANSNATIONAL
CORPORATIONS IN INFRASTRUCTURE IN
DEVELOPING COUNTRIES
BACKGROUND PAPER AND LITERATURE REVIEW
Prepared for UNCTAD1
Zbigniew Zimny
Geneva, October 2007
1 The paper has served as a background study for World Investment Report 2008. Transnational
Corporations and the Infrastructure Challenge (New York and Geneva: United Nations, 2008).
2
Table of contents
Introduction
I. FORMS OF TNC INVOLVEMENT IN INFRASTRUCTURE
A. Private greenfield investment
B. Public-private partnerships
C. Mergers and acquisitions
D. Forms of investment and FDI data
II. TRENDS IN FDI IN INFRASTRUCTURE
A. A shift from public to private provision of infrastructure services
B. Trends in private investment in infrastructure
1. Growth and decline
2. Regions
3. Sectors
4. Forms
C. The role of FDI
D. TNC players and home countries
III. IMPACT
A. What infrastructure TNCs offer to developing countries?
B. Impact in individual infrastructure sectors
1. Telecommunications
2. Electricity
3. Transportation
a. Rail
b. Ports
4. Water
C. Impact by areas
1. Supply and coverage
2. Efficiency
3. Quality of services
4. Fiscal impact
5. Employment
6. Prices
7. Impact on the poor
8. Conclusion
D. The sources of discontent
IV. POLICY ISSUES
A. Policy reforms
B. FDI policy: to what extent countries allow FDI and TNCs in
infrastructure?
C. Policies to benefit and address concerns
D. The role of international agreements
3
Boxes
1. Infrastructure needs of developing countries
Figures
1. PPI in developing and transition economies, 1990-2005
2. Private investment in infrastructure by region, 1990-2005
3. Private investment in infrastructure in developing countries by sector, 1990-2005
4. Forms of private investment in infrastructure in developing countries, 1990-2005
4. Restrictiveness of FDI policy in 50 developing countries in service industries, 2004
5. Restrictiveness of FDI policy in infrastructure by regions and industry, 2004
6. Restrictiveness of FDI policy in infrastructure in developing and transition economies,
2004
Tables
1. The top 10 TNCs in private infrastructure projects in developing countries, 1990-2001
2. The share of FDI in total investment in infrastructure in developing countries
3. Annual growth rate of telecommunications lines in reforming and non-reforming
countries of Latin America
4. Competitive and non-competitive segments of infrastructure industries
REFERENCES
4
Introduction
Physical infrastructure – transportation infrastructure (roads, ports, airports, etc.)
telecommunication, electricity, water, sewage and waste treatment – is a backbone of any
economy. Good infrastructure facilitates economic activities. Bad infrastructure hampers
these activities, making them costly and uncompetitive. Missing infrastructure (e.g.,
roads or power) makes it impossible to undertake production or trade, thus making it
impossible to exploit potential for larger output (e.g., in mining or tourism). Infrastructure
produces also basic services for households and consumers, determining their well-being.
It also determines living standards of high-income consumers. For example, tourism
relies heavily on all components of physical infrastructure. On the other hand, access to
water and electricity is among chief concerns in the fight against poverty. As regards
FDI, the quality and prices of infrastructure have always stood high in rankings of the
determinants of inward FDI. Excellent infrastructure has been credited, among others, for
spectacular success of such countries as Singapore or Ireland in attracting FDI and using
it to promote development. Poor infrastructure reduces potential to attract FDI in many
African countries.
Markets for infrastructure services are prone to market failures (because of natural
monopoly element, externalities, very high capital intensity or uncertain returns). Some
are public goods while the provision of others is strongly affected by social
considerations such as universal access to basic services by remote areas and
disadvantaged segments of population. It was, therefore, long thought that the best way to
provide these services is through government controlled or owned companies. Such was,
indeed, the infrastructure paradigm after world war two in developing and developed
countries. Given increasingly disappointing performance of many state-owned
monopolies, during the 1980s and 1990s of the past century, however, an old paradigm,
has been replaced by a new one, that is, the private provision of infrastructure services,
manifested by the deregulation of service markets and massive privatization in developed
and most developing and transition countries.
In privatizing infrastructure, many countries turned to foreign investors for participation
in sales of state-owned enterprises (SOEs) (especially countries in Latin America and
Africa as well as transition countries) or for undertaking greenfield investment (East
Asia). FDI in infrastructure, especially in telecommunication and electricity, surged
during the 1990s, fuelling FDI in general and an increasing role of services in inward FDI
of developing countries. According to the Private Participation in Infrastructure (PPI)
data base of the World Bank, during 1990-2005 developing and transition countries
received $962 billion of investment commitments into some 3360 infrastructure projects
with private participation. TNCs participated in 83-85% of these projects. Private
investment and FDI in infrastructure peaked in the second half of the 1990s (1997-1998),
and have fallen ever since.
The decline was partly due to the fact that many developing countries (including large
ones such as Brazil, Mexico or Argentina) which decided to turn to FDI for the private
provision of infrastructure services completed their privatization programmes. Further

5
FDI in such countries has taken the form of re-investment to expand supply capacity
(such investment is typically much smaller than original huge sale transactions). The
giants of Asia, China and India, have not joint in with privatization programmes,
although they allowed some private participation in the form of greenfield investment and
concessions. Partly, foreign involvement in some infrastructure industries (roads, airports
and airport management, water and waste management) takes the form of non-equity
arrangements (such as concessions, leases or BOT arrangements) that go unrecorded by
FDI statistics.
But there have also been reports on disillusionment and disappointment with many
projects on the part of foreign investors and the governments and the public in developing
countries. Some of high-profile have been cancelled or renegotiated. Around 2000 FIAS
wrote that “nightmare stories abound of investors experiencing lengthy delays or project
cancellations because of political, administrative and legal impediments”.2 In some parts
of the world public opinion has become disappointed with the private provision of
infrastructure services, although there have been, so far, few attempts to revert to the
public provision of these services
So, the situation is as follows. After enthusiasm of the 1990s concerning the participation
of TNCs in infrastructure, reflected in huge FDI and many non-equity agreements, the
period of cooling of and perhaps reflection has followed, and FDI has subsided. Investors
(both TNCs and financiers – large projects are often financed by consortia) have lost
some appetite for this investment. Governments are caught between huge, virtually
unlimited, investment needs, far exceeding the capacity of the public purse, and
disappointment of parts of populations with expensive and often unaffordable (though in
most cases better than before) services.
Thus, the challenge to the WIR is to find out what went well and what went wrong and to
propose realistic policy options. The time perspective – ten years after the infrastructure
FDI peak – should provide enough material for cool and reasonable analysis. There have
been also some new developments and issues which require attention. One is, for
example, the growing public private partnerships (PPPs) legislation. PPPs are seen by
some as a new avenue for infrastructure investment. Another is the emergence of
infrastructure TNCs from developing countries. There is also a growing interest in how to
link better FDI and ODA in infrastructure. And after a period of heavy criticism,
governments, international organizations and TNCs are finally seriously considering how
private provision of infrastructure services can benefit more the poor.
I. FORMS OF TNC INVOLVEMENT IN INFRASTRUCTURE
As in other sectors, FDI is not the only form of TNC participation in host countries’
infrastructure. In fact, in some infrastructure industries it is rather an exception than a
rule. Consequently FDI data do not adequately reflect trends in, and scope of, TNC
2 FIAS (2000). Attracting FDI Into Infrastructure. Why Is It So Difficult?, The IFC and the World Bank,
Washington D.C., p. xvii.
6
operations in the sector. What follows is a discussion of these forms and their incidence
in individual infrastructure industries and developing regions.
A. Private greenfield investment
The problem with identifying FDI in infrastructure starts with greenfield investment.
There has been a lot of greenfield investments in infrastructure in developing and
transition countries, with foreign companies building, or participating in building, roads,
tunnels, bridges, power plants, ports, airports, telecom mobile networks etc. But at the
end of construction, facilities are rarely, if at all, owned by the builders (a requirement to
qualify as equity FDI). The ownership of assets is transferred to governments (or SOEs
acting on their behalf), immediately, or after a certain period, during which a foreign
company operates the facility under lease, concession or operation and management
contract.3 Under such contracts, during their duration, the foreign company recovers
investment and operating costs as well as return from revenues generated by the project
from fees charged to service users, without any recourse to the balance sheets of sponsors
of the project or the host government. Given huge amounts of capital involved in
infrastructure projects, long-periods of construction and many non-typical risks involved,
it is rare that such projects are undertaken by a single private company – domestic or
foreign. Typically a consortium is formed, including not only several private investors
but also lenders, which establish a project company in a host country (thus separating its
activities from their own balance sheets). Therefore, for example, the World Bank, while
listing TNCs involved in infrastructure projects, describes them as “sponsors”, suggesting
that they play a key role on the projects, but are not the only parties involved.
Initially such projects commonly took the form of BOT projects, where “B” always
stands for “build”, “O” for “operate” (but sometimes for “own”) and “T” always for
“transfer”. With time, other combinations have emerged, adding to a complexity of forms
under which greenfield infrastructure projects are undertaken. Here are typical ones
where the initial phase always start with building a facility:
BOOT build-operate-own-transfer
BOO build-operate-own
BTO build-transfer-operate
BLT build-lease-transfer
BLO build-lease-operate
DBOM design-build-operate-maintain (similar to a BOT or BOO, but in
addition the project company is responsible for the design of the project.
The purpose of investment can also be not to build a new facility from scratch but to
undertake investment in rehabilitating an existing facility. Then “R” replaces “B”:
ROT rehabilitate-operate-transfer
3 Such contracts give rise to what is known as non-equity forms of FDI (see below). Some of them
(concessions) may be accompanied by an equity participation in the project. If the equity exceeds 10% of
the capital, then the project is qualified as FDI and should be reflected in FDI data.
7
ROO rehabilitate-operate-own
ROL rehabilitate-operate-lease
There are also hybrid arrangements such as DOT (develop-operate-transfer) under which,
in addition to BOT arrangement, the company receives development rights to adjoining
property. None of these forms (except for BOO, build-operate-own) is a classic FDI and,
as such, will not be reflected in FDI data.4 Exceptions can be found in mobile telephony,
where projects typically take the form of equity FDI, that is, foreign investor, after having
received a mobile telephony license, establishes a foreign equity affiliate, which builds,
owns and operates a network, as in “classic” FDI.
B. Public-private partnerships
Then there is a question, what are public-private-partnerships (PPPs), an increasingly
popular form of investing in infrastructure, and how do they relate to grienfield
investment and cross-border M&As. PPPs can be any of the above arrangements (and, in
addition, a joint venture), if the host government participates in financing the project,
typically in exchange for equity (proportional to capital contribution), to support
commercial viability of the project.
There are several explanations of the recent resurgence of PPPs,5 but a plausible one is as
follows. Initially private projects in infrastructure were based on the belief, that it is
possible to provide infrastructure services at no cost to the public. But many projects ran
into problems and were either canceled or required difficult renegotiations. The East
Asian and Argentinean financial crises undermined economic viability of many
infrastructure projects and revealed their high-risk nature. As a result, private investment
in infrastructure fell drastically during the late 1990s and at the beginning of 21st century,
as investors and lenders were put off by the risks involved and unaccounted for in the
original contracts. On the other hand it turned out that in successful private projects in
developed countries (and most likely in developing ones) in the early 1990s the cost of
private provision of services was often much higher “than could have been achieved
under the standard model of public procurement” (http:/en.wikipedia.org/wiki/Public-
private_partnership; and FIAS, 2000). In addition, private investors received a rate of
4 They should find their way to other items of the balance of payments such international loans, trade in
services (construction or engineering services) or transactions related to labour movement (if foreign
workers were involved in construction). 5 Authors of studies and papers on PPPs take it for granted that there has been a recent growing interest in
PPPs and, as a result the number of PPPs has grown, but, surprisingly, none of the papers on PPPs reviewed
for this study has provided evidence for this growth. Hodge and Greve state that “PPPs are enjoying a
global resurgence in popularity” (2007, p. 545). The IMF study describes the situation as follows: “It was
at this time [late 1990s] that PPPs began to emerge significantly as a means of obtaining private sector
capital and management expertise for infrastructure investment, both to carry on where privatization had
left off and as an alternative where there had been obstacles to privatization. After a modest start, a wave of
PPPs is now beginning to sweep the world” (IMF, 2004, p. 4). A UN ECE expert on PPPs G. Hamilton
refers to “thousands of PPPs transactions completed” but does not give any details (Hamilton, 2007). My
explanation is, as argued in the text, that PPPs are, in spite of some claims to the contrary, nothing else than
versions of the forms of PPI with some participation of the public sector. Another IMF study uses PPI data
as a proxy for PPPs (Hammami et.al., 2006, pp. 11-12).
8
return that was higher that government’s bond rate. So, one can say that PPPs have
emerged in reaction to failures of infrastructure projects in developing countries and their
successes (excessive profitability) in developed ones.
Initially, most PPPs were negotiated individually, as one off-deals. But after a number of
studies in Australia and the United Kingdom concluded that private schemes were often
inferior to public procurement (see, for example, EPAC, 1995, a and b), based on
competitive tender, countries started introducing PPP legislation to provide a framework
for financing, risk sharing, mutual responsibilities and, more importantly, for introducing
a systematic framework for assessment procedures. While the initial approach aimed at
avoiding public expenses, a new one involved an appropriate allocation of risks so that
governments could obtain “value for money”. So the idea of purely private financing of
infrastructure projects has given way to the recognition that that public money should be
involved, in exchange, however, for a redefined sharing of risks and responsibilities. The
1992 Private Finance Initiative of the United Kingdom was the first systematic
programme aimed at facilitating PPPs under the new approach. Australia and many other
countries, including developing ones, have followed, introducing legislation guiding
PPPs. As it is easier to say than to implement the rule that governments should seek
“value for money” in PPPs, the debate on how to do it continues (Hodge and Greve,
2007; Spackman, 2002; and Monbiot, 2000). But PPP legislation is spreading to an
increasing number of both developed and developing countries.
C. Mergers and acquisitions (M&As)
M&As as a form of FDI in infrastructure result, as in other sectors, from the sale of state-
owned or private assets to foreign investors. In developing and transition economies,
before they embarked on the path towards the private provision of infrastructure services,
these services were typically provided by SOEs. Therefore this type of FDI initially
involved almost exclusively the sale of SOEs to foreign investors, of course in countries,
which decided to allow FDI in privatizations. Although listed under “M&As”, such
transactions have been acquisitions. They are often called, in an alternative to
“privatizations”, “divestitures”. Infrastructure-related cross-border M&As were the
driving force of FDI in general in a number of countries, when they implemented mass
privatization programmes. Notable examples include Brazil and Argentina as well as a
number of transition economies (UNCTAD, 2004).
A number of SOEs had been privatized to domestic investors, which after some time of
(often successful) operations were purchased by foreign investors. A case of a Chilean
power company, Enersis, is illustrative in this respect. Having emerged from
privatizations, during the 1990s it became a leading regional TNC, acquiring assets in
Argentina, Brazil, Colombia in Peru. In 1997, Enersis sold some 30% of its equity to a
Spanish TNC, Endesa, which, by acquiring further 32% in 1999, took over control and
management of Enersis (ECLAC, 2006, pp. 144-145). With more and more private
companies – domestic and foreign – operating in infrastructure of developing and
transition economies, cross-border M&As more often take the form of acquisitions of
private companies, while privatization-related M&As have subsided.

9
D. Forms of investment and FDI data
To summarize, private participation in infrastructure, including that by TNCs, can take
various forms, which, in the case of TNCs involvement can lead to either equity and non-
equity forms of FDI, or both. For conceptual clarity and statistical purposes (for example,
in the World Bank’s data base on Private Participation in Infrastructure, PPI, World
Bank, 2003) four principal forms of private involvement are typically distinguished:
Management and lease contracts. For the duration of a contract a TNC manages
an SOE, which is owned by the government. The public sector takes investment
decisions and assumes financial responsibilities.
Concessions. A TNC manages an SOE. The difference from the management
contract is that the TNC contributes also capital and thus assumes an investment
risk during the contract.
Greenfield projects. A TNC or a public-TNC joint venture builds and operates
an infrastructure facility during the duration of the contract. But as it is clear from
the earlier discussion of BOT agreements, the final phase of the contract may
involve the return of the facility to the public sector, ownership of the facility by
the TNC or operation of the facility under a non-equity form such as a
management or lease contract.
Privatizations/divestitures. A TNC buys an equity stake or the entire equity in a
SOE and, as a result, owns or controls it (in line with FDI definitions a stake of
10% qualifies as a controlling stake).
FDI data include only projects with at least 10% of foreign equity. So called non-
equity forms, giving a TNC control of a foreign affiliate on the basis of an agreement
without an equity stake are not recorded in FDI data. But they are commonly called
non-equity FDI, because the control is strong enough to manage the affiliate. In
addition, except for capital,6 various components of the FDI package, such as
technology, knowledge and better management are typically transferred to the host
country.
Of the four forms listed above, only the case of privatizations is straightforward as
regards FDI. The acquisition of equity by foreign investors is normally reported in
FDI flows and stocks. Management and lease contracts, not involving equity, are not
included in FDI data. The situation with concessions is unclear. They might meet FDI
criteria, if a TNC provides an equity above 10%. In addition, debt financing by the
parent should be added to FDI flows. But since concessions are limited in time, it is
uncertain if they meet the criterion of “the long-term interest and commitment” by the
parent company.
The situation with greenfield investment is unclear, too. A TNC contributes capital
for the construction of the facility, but the project goes through several phases and it
6 Even though under non-equity forms a TNC does not contribute capital directly, a contract with a TNC
may greatly facilitate obtaining financing from foreign sources.
10
may end up being owned (and operated) by the public sector, a TNC or owned by the
public sector and operated by the TNC under a contract involving or not involving
equity. Wherever the TNC provided enough equity this should qualify as an FDI
project. Debt, if it is provided by the (foreign) equity investor, should also qualify as
FDI. Typically in BOT-type projects and concessions equity tends to be significantly
smaller than debt flows. But on the other hand TNC sponsors of the project tend to
rely on commercial lenders for debt financing (FIAS, 2000, p. 149). In general
information on the financing of such transactions is difficult to obtain.
Further complications arise, because the boundaries between the four categories are
not always clear, and some projects have features of more than one category (World
Bank, 2003, p. 7; in the World Bank PPI data base, which will be used later on,
projects are included in the category which better reflects the risk borne by private
investor).
II. TRENDS IN FDI IN INFRASTRUCTURE
A. A shift from public to private provision of infrastructure services
Until the early 1990s, most developing countries and all transition economies relied on
state-owned enterprises (SOEs) for the provision of infrastructure services. In the 1980s a
few developing countries started liberalizing and privatizing infrastructure (for example,
Chile). In the 1990s, this trend gained strength and turned into a wave, which included
well over 100 of developing countries.
A common reason for this shift was an increasing dissatisfaction with the quality and
insufficient supply of infrastructure services. But disappointment had many roots. In
some countries (notably of Latin America and Africa), SOEs were badly managed and, as
state monopolies, had no incentives and funds for investment and improvement.7 Subject
to political interference, they were depleted of funds by always hungry governments,
which on the other hand subsidized services and were hostile to increasing prices to
reflect inflated costs of inefficient operations. In addition, SOEs were treated as
reservoirs of employment for politically connected. The debt crisis in the 1980s imposed
very tight budgetary constraints in these countries, excluding any possibility of large
public financing of infrastructure investment. In other countries, mostly Asian ones,
SOEs, at least in some countries, were not doing badly and governments were not
indebted. But rapid economic growth led also to a rapidly growing demand for all types
of infrastructure services, which, to satisfy the demand, required amounts of investment
beyond the means of both SOEs and governments. So in the late 1980s and early 1990s,
some 1-1.2 billion people in developing countries had no access to electricity, clean water
and adequate sanitation (World Bank, 1994, p. 1). Telecommunication in a world relying
increasingly on IT technologies was in many countries a costly (but often unreliable)
luxury. The cost of losses caused by inefficient operations of roads, railways, power and
water systems was estimated by the World Bank at $55 billion a year in the early 1990s,
or “an equivalent to 1% of the GDP of all developing countries, a quarter of their annual
7 See, for example, Panayotou (????, pp. 49-51), Kessides (2004, pp. 34-35) and Nellis (2006, pp. 5-6).
11
investment in infrastructure, and twice the annual development finance for infrastructure
in the developing world” (ibid., p. 11).
The shift towards the private provision of infrastructure has spread to former centrally
planned economies, when they started the transition towards market economy in the early
1990s. Infrastructure industries have been, however, included to a various extent in this
undertaking. Privatization has been common in telecommunications and electricity and
less common in other industries, especially in water and sanitation. Countries of Central
and Eastern Europe, which became members of the European Union in 2004, have been
obliged to implement the rules of the internal markets, which emphasized deregulation of
infrastructure industries, while leaving decisions concerning ownership matters to
individual countries.
Whatever the reasons for this shift, it was so strong that during the 1990s hundreds of
billions of private dollars were invested and, at the beginning of the 21st century, almost
all developing countries and transition economies had some private operations in
infrastructure, a huge change from the 1980 when most or almost all of them relied on the
public provision. FIAS estimates, that, among private investors, during 1990-1998, when
most of the private investment took place (71% out of almost 1 trillion dollars committed
during 1990-2005), foreign investors were involved in 83% of private projects or projects
with private participation, measured by both their number and value, in developing and
transition economies (FIAS, 2000, p. vii). During 1998-2003, the involvement of foreign
investors has further increased, to 86% of the projects measured by investment value
(Ettinger et. al, 2005, p. 15). Therefore, it is justified, in the following overview of the
investment trends to begin with a review based on the World Bank’s data base on the
private participation in infrastructure (PPI), even though in its aggregated data part the
data base does not distinguish projects with and without foreign involvement.8 But
knowing that well over 80% of the projects came with foreign involvement, the data base
reflects also well trends in TNC participation in equity and non-equity forms. On the
other hand, as it is widely known, FDI data are very imperfect and, using only these data
it would be impossible to get a picture of investment in infrastructure by regions of
developing countries, by infrastructure sectors and by forms of investment, not saying
about region/sector/forms composition. Nevertheless, available FDI/TNC data will be
used at the end of this chapter. In between, we will also review trends in FDI in
infrastructure, based on FIAS estimates for 1990-1998. They are closely correlated with
overall trends, because, as mentioned earlier, foreign investors participated in 84% of all
projects during 1990-2003.
B. Trends in private investment in infrastructure
1. Growth and decline
8 Information on foreign participants of the projects (including their financial contribution and forms of
investment) is included in the part of the data base providing descriptive profiles of individual projects.
But the data base does not distill this information and although it is publicly available, it would be very
cumbersome to do so, as by 2007 the base included 3,413 profiles. FIAS made an estimate of FDI
participation for the period 1990-1998, retrieving necessary information from 542 projects and then
extrapolating it to 1,707 projects, which took place during this period (FIAS, 2000, pp. 147-153). See
below the discussion of FDI trends, based on FIAS data.
12
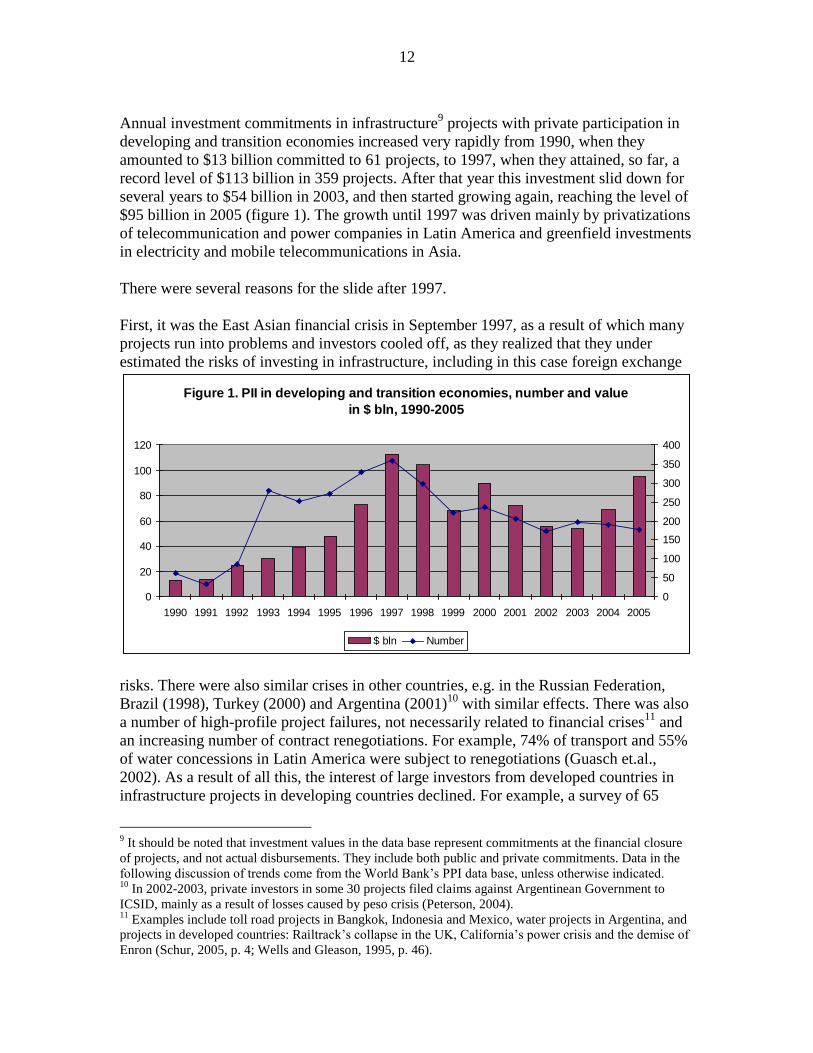
Annual investment commitments in infrastructure9 projects with private participation in
developing and transition economies increased very rapidly from 1990, when they
amounted to $13 billion committed to 61 projects, to 1997, when they attained, so far, a
record level of $113 billion in 359 projects. After that year this investment slid down for
several years to $54 billion in 2003, and then started growing again, reaching the level of
$95 billion in 2005 (figure 1). The growth until 1997 was driven mainly by privatizations
of telecommunication and power companies in Latin America and greenfield investments
in electricity and mobile telecommunications in Asia.
There were several reasons for the slide after 1997.
First, it was the East Asian financial crisis in September 1997, as a result of which many
projects run into problems and investors cooled off, as they realized that they under
estimated the risks of investing in infrastructure, including in this case foreign exchange
Figure 1. PII in developing and transition economies, number and value
in $ bln, 1990-2005
0
20
40
60
80
100
120
1990 1991 1992 1993 1994 1995 1996 1997 1998 1999 2000 2001 2002 2003 2004 2005
0
50
100
150
200
250
300
350
400
$ bln Number
risks. There were also similar crises in other countries, e.g. in the Russian Federation,
Brazil (1998), Turkey (2000) and Argentina (2001)10
with similar effects. There was also
a number of high-profile project failures, not necessarily related to financial crises11
and
an increasing number of contract renegotiations. For example, 74% of transport and 55%
of water concessions in Latin America were subject to renegotiations (Guasch et.al.,
2002). As a result of all this, the interest of large investors from developed countries in
infrastructure projects in developing countries declined. For example, a survey of 65
9 It should be noted that investment values in the data base represent commitments at the financial closure
of projects, and not actual disbursements. They include both public and private commitments. Data in the
following discussion of trends come from the World Bank’s PPI data base, unless otherwise indicated. 10
In 2002-2003, private investors in some 30 projects filed claims against Argentinean Government to
ICSID, mainly as a result of losses caused by peso crisis (Peterson, 2004). 11
Examples include toll road projects in Bangkok, Indonesia and Mexico, water projects in Argentina, and
projects in developed countries: Railtrack’s collapse in the UK, California’s power crisis and the demise of
Enron (Schur, 2005, p. 4; Wells and Gleason, 1995, p. 46).
13
foreign investors in the electricity sector, published in 2003, revealed that 52% of them
were either less interested in, or retreating from, projects in developing countries, while
only 6% responded that they were more interested (Lamech and Saeed, 2003). There has
also been an increase in popular discontent throughout developing world with the private
provision of infrastructure services, including violent incidents and street riots in some
cases (Kikeri and Kolo, 2005, p. 22-24).
Secondly, big infrastructure privatizations in Latin America and Central and Eastern
Europe came to an end. There was not much more to sell to fuel further increases in
investment and significant new countries did not join the club of “privatizers”. Most
notably, Brazil’s privatization programme, the biggest in the world, was largely
completed by 1998, which was a peak year in Brazil (UNCTAD, 2005, p.12). In 1998
Brazil privatized its largest telecommunications company, the Telebras, and several
power distribution firms. These transactions accounted for 46% of developing country
private infrastructure investment in that year, and prevented it from a deeper decline.
After 1998, Brazil’s share fell, but was still significant (20%). Overall, between 1997 and
2001, privatization-related investment declined by 80%, while those related to expansion
by only 40% (World Bank, 2003, p. 13).
Thirdly, as regards other types of projects, that are not privatization-related projects,
opportunities also diminished. Much of investment prior to 1998 took place in more
developed middle-income countries. Opportunities, which remained thereafter tended to
be in more risky and politically sensitive countries and sectors, such as roads and water
(Schur, 2005, p. 2).
Fourthly, one should not forget an economic downturn of 2001-2003 in developed
countries, which resulted in a drastic reduction of their outward FDI. TNCs, as all firms,
typically invest much less, including abroad, during recession than before or after it. As
they dominate investment in infrastructure in developing countries, as indicated above,
the downturn must also have affected this investment. As in 2004 and 2005 FDI started
rising again, so did private infrastructure investment in developing countries.
How to assess the rise and decline in private infrastructure investment? Is it a demise
after the initial euphoria of the 1990s or was it mostly caused by cyclical factors? Initially
the fall caused concern. Infrastructure needs of developing countries have continued to be
vast (box 1) and the problems many projects encountered and withdrawal or more
cautious attitudes of many large investors were indeed often interpreted as a demise.
Investors did not properly assess risks and many developing country governments did not
really understand what meant to hand over the provision of infrastructure services to the
market or, even worse, to a private monopoly. Privatization was portrayed in
oversimplified terms, oversold and consequently raised unrealistic expectations.
Disappointment was great, when delivery did not meet promises (Kessides, 2005). In
2000, FIAS published a study under a symptomatic title: why is it so difficult to attract
FDI into infrastructure? Earlier, when private investment in infrastructure started
booming Louis Wells published an article warning foreign investors about many risks
associated with this investment, saying “the theory starts with a simple principle: most
14
countries would strongly prefer local ownership to foreign ownership” (Wells and
Gleason, 1995, str. 47). This type of investment is considered very risky, prone to
“obsolescence bargaining” and from time to time such and other concerns are expressed
in the literature (see for example, Ramamurti and Doh, 2004).
Box 1. Infrastructure needs of developing countries
It is easier to say that infrastructure needs of developing countries are vast than to put realistic investment
figures on these needs. Everybody agrees that infrastructure financing needs in developing countries are
considerable or vast, “but no one really knows how much is needed” (Estache, 2004, p. 6). Yet estimating
investment needs, even very broadly, is important for this study, given many question marks and doubts
surrounding the experience with the private participation, including foreign participation, in the provision
of infrastructure services. If needs exceed the financing capacity of the public sector, they will remain
unsatisfied or the private sector has to continue investing in infrastructure. If private investors in
developing countries will not be able to finance the balance (as has been the case so far in many developing
countries), foreign investors would have to continue investing in infrastructure to fill the gap.
Economics is about satisfying unlimited people’s needs with scarce resources. So when we talk about
infrastructure needs, we have to make assumptions, what needs do we have in mind. (We would also have
to decide whether these needs will be satisfied through the market mechanism or otherwise).
Needs for water and sanitation have been estimated within the Millennium Development Goals (MDG),
considering access to safe water a fundamental human need and a basic human right (UNDP, 2006, p. 78).
At present, some one billion people in the world do not have access to clean water and 2.6 billion do not
have access to proper sanitation. Nearly 2 million children die every year of illnesses related to unclean
water and poor sanitation. MDG has thus set a modest goal of ensuring, by 2015, access to water for 900
million people and to sanitation for 1.3 billion (ibid., p. 55). Satisfying these needs with basic technologies
available today would require $10 billion of additional financing annually. (Current spending on water and
sanitation in developing countries is estimated at $14-16 billion annually without waste-water treatment).
“Providing a higher level of service while maintaining provision at current levels to people who are already
supplied would add another $15-20 billion a year. Much larger sums would be involved if the target
included costs for collecting and treating household water” (ibid., p. 58).
These are relatively precise estimates. There are many “back of the envelope” estimates for different
sectors, but there is not yet credible assessment of global infrastructure needs from a single source.
International organizations (WHO, ITU, IEA) provide estimates of financing needs in their areas of
responsibility, but these estimates are typically questioned by specialists. For example, WHO estimates for
water, $50 per year (much higher than MDG goals for water and sanitation) have been criticized by the
academic community for unrealistic assumptions: access rates unadjusted for differences in quality
(Estache, 2004, p. 6).
But estimates are needed to inform national debates on resource allocations and both the World Bank and
the United Nations have been working on this, producing some overall preliminary estimates. A UN team
led by J. Sachs has produced infrastructure investment, operations and maintenance needs for Sub-Saharan
Africa. They amount to 12 cents per person, per day (or $44 a year) in the region where more than half of
the population lives on less than $1 per day (ibid.).
The World Bank has produced detailed estimates of infrastructure investment needs for developing
countries (by regions, sectors and income groups) for 2005-2010, based on the investment12
necessary to
satisfy consumer and producer demand based on predicted GDP growth (Fay and Yepes, 2003, p. 1). The
12
Investment includes resources for maintenance (the minimum expenditure needed to maintain the
integrity of infrastructure systems) and investment needed to satisfy new demand. The study covers most
infrastructure industries except for ports, airports and canals.
15
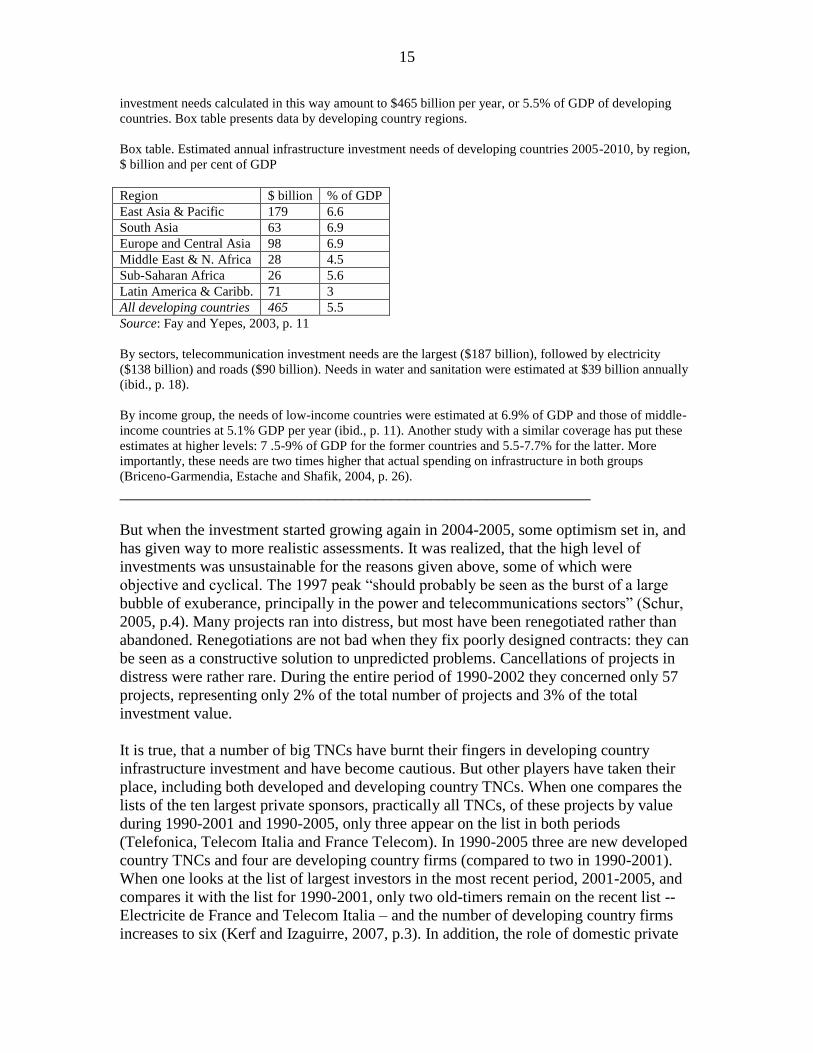
investment needs calculated in this way amount to $465 billion per year, or 5.5% of GDP of developing
countries. Box table presents data by developing country regions.
Box table. Estimated annual infrastructure investment needs of developing countries 2005-2010, by region,
$ billion and per cent of GDP
Region $ billion % of GDP
East Asia & Pacific 179 6.6
South Asia 63 6.9
Europe and Central Asia 98 6.9
Middle East & N. Africa 28 4.5
Sub-Saharan Africa 26 5.6
Latin America & Caribb. 71 3
All developing countries 465 5.5
Source: Fay and Yepes, 2003, p. 11
By sectors, telecommunication investment needs are the largest ($187 billion), followed by electricity
($138 billion) and roads ($90 billion). Needs in water and sanitation were estimated at $39 billion annually
(ibid., p. 18).
By income group, the needs of low-income countries were estimated at 6.9% of GDP and those of middle-
income countries at 5.1% GDP per year (ibid., p. 11). Another study with a similar coverage has put these
estimates at higher levels: 7 .5-9% of GDP for the former countries and 5.5-7.7% for the latter. More
importantly, these needs are two times higher that actual spending on infrastructure in both groups
(Briceno-Garmendia, Estache and Shafik, 2004, p. 26). ___________________________________________________________
But when the investment started growing again in 2004-2005, some optimism set in, and
has given way to more realistic assessments. It was realized, that the high level of
investments was unsustainable for the reasons given above, some of which were
objective and cyclical. The 1997 peak “should probably be seen as the burst of a large
bubble of exuberance, principally in the power and telecommunications sectors” (Schur,
2005, p.4). Many projects ran into distress, but most have been renegotiated rather than
abandoned. Renegotiations are not bad when they fix poorly designed contracts: they can
be seen as a constructive solution to unpredicted problems. Cancellations of projects in
distress were rather rare. During the entire period of 1990-2002 they concerned only 57
projects, representing only 2% of the total number of projects and 3% of the total
investment value.
It is true, that a number of big TNCs have burnt their fingers in developing country
infrastructure investment and have become cautious. But other players have taken their
place, including both developed and developing country TNCs. When one compares the
lists of the ten largest private sponsors, practically all TNCs, of these projects by value
during 1990-2001 and 1990-2005, only three appear on the list in both periods
(Telefonica, Telecom Italia and France Telecom). In 1990-2005 three are new developed
country TNCs and four are developing country firms (compared to two in 1990-2001).
When one looks at the list of largest investors in the most recent period, 2001-2005, and
compares it with the list for 1990-2001, only two old-timers remain on the recent list --
Electricite de France and Telecom Italia – and the number of developing country firms
increases to six (Kerf and Izaguirre, 2007, p.3). In addition, the role of domestic private
16
investors from developing countries, often former minority partners in projects with
TNCs, has also increased during 2001-2005 (Schur, von Klaudy and Dellacha, 2006, pp.
1-3).
But more importantly, both firms and governments have learnt from past mistakes and
recently designed and renegotiated contracts are more realistic than before. As mentioned
in the previous chapter, there is more emphasis on improved risk mitigation and more
realistic risk sharing between private and public partners. Private investors are no longer
ready to take excessive risks, in particular financing and payment risks. On the other hand
governments realize that it is very difficult to develop infrastructure expecting that user
charges will cover all the costs and increasingly recognize the need to complement
revenues with public funds. Hence the growing popularity of PPPs, discussed in the
previous chapter.
* * *
There were no exceptions from the decline after 1997 or 1998, as regards regions and
sectors (figures 2 and 3), but in some regions investment quickly recovered, while in
others it remained at much lower levels than in the peak years of the boom.
Latin America and East Asia, which accounted for most of the boom and the highest
shares in the first half of the 1990s, experienced most of the decline. In Sub-Saharan
Africa and Europe and Central Asia the decline was relatively modest and investment
levels quickly recovered: in the former region in 2001 and in the latter in 2000,
fluctuating, however in the following years. By 2005 the value of private investment
commitments in Sub-Saharan Africa was two times higher ($6 billion) and in Europe and
Central Asia 2.4 times higher than in 1997. Private investment recovered also
significantly in South Asia (2.2 times higher) and to a much smaller degree in West Asia
and North Africa (by 40%). In 2005, in LAC countries and East Asia it was at much
lower levels than in peak years of the boom, respectively, at 37% and 28%. Consequently
the latest regional picture differs from that of the 1990s. In 2004-2005, the largest
investment took place in the transition economies ($50 billion), followed by LAC ($38
billion) and East Asia ($27 billion), with other regions not that far behind as during the
first half of the 1990s: South Asia ($25 billion), West Asia and North Africa ($15) and
Sub-Saharan Africa ($10 billion).
The decline affected also all sectors, including both telecommunications and electricity,
which experienced initially the fastest growth and accounted for the dominant share of
this investment. Decreases were largest in water and electricity and much smaller in the
other two sectors. By 2005, investment recovered only in telecommunications, compared
to a peak year ($60 billion vs. $ 51 billion) and nearly recovered in transportation ($16
billion compared to $18 billion). In electricity it amounted to $17 billion, or 38% of the
1997 level and in water to $1.6 billion, or only 15% of investments in 1997 (figure 3).

17
Figure 2. Private investment in infrastructure by region, 1990-2005, $ mln
0
10000
20000
30000
40000
50000
60000
70000
80000
1990
1991
1992
1993
1994
1995
1996
1997
1998
1999
2000
2001
2002
2003
2004
2005
East Asia&P.
South Asia
West Asia & NA
S-S Africa
LA & Car.
Europe&CA
Figure 3. Private investment in infrastructure in developing countries,
by sector, $ mln, 1990-2005
0
10000
20000
30000
40000
50000
60000
70000
1990
1991
1992
1993
1994
1995
1996
1997
1998
1999
2000
2001
2002
2003
2004
2005
Energy
Telecom
Transport
Water
What follows is an overview of trends during 1990-2005 from three different angles:
developing country regions, sectors and forms of investment.
2. Regions
18
Among developing regions Latin America received by far the largest amounts of
investment in infrastructure during 1990-2005: 42% of the developing country total.
Telecommunications was by far the largest sector, followed by electricity. This pattern is
characteristic for all regions. But Latin America received also significant investments in
transportation and water and sewage in distinction from other regions, where private
investments in these two sectors were low or non-existent. Privatizations and concessions
of the existing assets were the dominant form of investment, accounting for three quarters
of it during 1990-2001. In most countries of the region, opening to private investment has
been part of broader sectoral reforms, including the introduction of competition, the
establishment of regulatory agencies and tariff adjustments aimed at generating resources
to improve the coverage and quality of services. As Latin America was the first region to
allow private investment and implement reforms, initially (during 1990-1992), it
accounted for almost three quarters of developing country total. When the sales of large
SOEs were completed and other countries allowed private investment, the share of Latin
America fell to one quarter in 2003-2005.
East Asia turned to private investment mainly because of the strain on its infrastructure
caused by the rapid economic growth. Therefore letting private investment in the
countries of the region was not, in distinction from Latin America, part of broader
reforms, but rather a measure to increase the supply of services, by complementing public
sector investment. Still, the sub-region received enough investment to be behind Latin
America as a second most important destination of this investment, accounting for 23%
of it during 1990-2005. Privatizations were rather rare, and greenfield projects attracted
over 60% of this investment (during 1990-2001). The share of East Asian countries
increased from 23% in 1990-1992 to 34% in 1996-1997 and fell as a result of the 1997
financial crisis to 10% in 1998, to recover to 23% in 2003-2005. In distinction from all
other regions, where telecommunications was the leading sector, energy attracted the
largest amounts of investment in East Asia. Similarly to Latin America, East Asia also
attracted sizeable investments to transport and water sectors.
In both regions investments never recovered from the fall after the record levels attained
in 1997-1998. In East Asia they were in 2005 only at 39% of the 1997 level and in Latin
America at 28% of the 1998 level. In other regions and sub-regions investments also fell
after 1997, but they recovered: in South Asia and West Asia and North Africa by 2003
and in Sub-Saharan Africa and CEE and Central Asia by 2000-2001. Consequently in
2003-2005 annual flows of investment were more evenly distributed among developing
country regions than in the early 1990s.
CEE and Central Asia was the third region by the size of investment with a share of
19% during 1990-2005. In most countries of the European sub-region, as in Latin
America, private investment was part of broader reforms aimed at reducing the role of the
state and putting infrastructure operations on a more commercial footing. Countries,
which became members of the European Union in 2004, had to comply with the
accession requirements. Privatizations and concessions of existing assets accounted for
55% of investments in the entire region. Apart from telecom (the largest investment
19
sector) and energy, the region received also fair amounts of investments in transport and
water.
Investments in, and shares of, other sub-regions were much smaller than in the above
regions. The shares for the entire period of 1990-2005 were 7% for South Asia, 5% for
Sub-Saharan Africa and 4% for West Asia and North Africa. South Asia and West
Asia and North Africa followed a similar approach to that in East Asia: they invited
private investment to an un-reformed infrastructure system. Thus, SOEs remained largely
in place, and private investment took mainly the form of greenfield investment, which
accounted for 90% of the total in the former region and 50% in the latter. In both regions
telecommunications was the largest sector for private investment, followed by electricity.
In South Asia there was no private investment in water and sewage and in West Asia and
North Africa it began to take place on a visible scale only in 2004-2005.
In Sub-Saharan Africa telecommunications dominated investment to a greater extent than
in other regions, accounting for 70% of the total during 1990-2005. Telecom investment
took both the form of privatizations and greenfield investment in mobile telephony. There
was also some investment in energy and transport and no investment in water and
sewage.
Although, as mentioned earlier, private participation in infrastructure has spread to
almost all developing and transition economies, as with other types of investment, and
notably with FDI, 10 countries have dominated private infrastructure investment. They
were three large Latin American countries (Brazil, Mexico and Argentina leading the list
by the value of projects) and the balance Asian economies: China, Malaysia, the Republic
of Korea, the Philippines, Indonesia, India and Thailand, in that order. Top ten accounted
during 1990-2001 for 47% of the projects and 68% of the value of investment (World
Bank, 2003, p. 20). By 2005 the Republic of Korea and Thailand were replaced on the list
by the value of investment by the Russian Federation and Turkey. China advanced to the
third position before Mexico (World Bank PPI data base). The share of top ten in the
number of projects increased to 60% but decreased by value to 64%.
But when this investment is related to the size of the population or the economy a
different ranking emerges for 1990-2001. Hungary, Panama, Chile, Estonia and Belize
lead the list of top ten, based on the value of investment per head of population, while
Bolivia, Panama, the Lao People’s Democratic Republic and Cape Verde are top
countries as regards the share of private infrastructure investment in GDP. Argentina and
Malaysia are on the three lists (ibid., pp. 20-21).
2. Sectors
Telecommunications was by far the largest sector for private investment in developing
countries, accounting for nearly half of the total during 1990-2005. It was also the only
sector where investment levels in 2005 exceeded the levels attained in the peak year of
20
1998, while in three other sectors, and particularly in energy and water, they remained
after 1997 at much lower annual levels than in the peak year. In all developing regions
investment was driven by greenfield investment in the mobile telephony. In Latin
America and CEE, in addition, it has also been fuelled by privatizations of state-owned
operators of fixed-line services. Technological changes in the sector have stimulated
private investment by reducing the costs of entry and spurring competition by rapid
advances of the mobile telephony: both led to major changes in the market structure.
During the entire period (1990-2005) 41% of this investment went to Latin America, 27%
to CEE and Central Asia and 14% to East Asia.
Energy, including in the World Bank PPI data base electricity and the transmission and
distribution of natural gas, attracted during 1990-2005 31% of the total investment, with
most of this share accounted for by electricity. Private investment in electricity was
facilitated by new technologies, which reduced the minimum size of efficient power
plants. Half of electricity investments took place during 1993-1998, fuelled by the boom
in greenfield projects in Asia, based on BOO and BOT contracts, and by privatizations in
Latin America and CEE. The share of electricity in total investment fell from 41% in the
1997 peak year to 18% in 2005 on the account of falling investment levels. During the
entire period (1990-2005) 41% of this investment went to Latin America, 29% to East
Asia and 13% to CEE and Central Asia.
In transport and water and sewage private investment was much smaller than in two
other sectors. There has not been much technological change in these sectors, political
and popular opposition to reforms has been much stronger than in other sectors and sub-
national governments have often played major roles. Investments in transport, which
accounted for 15% of the total during 1990-2005, focused on toll roads, which have also
received much of the public investment. In countries which decided to go for private
investment, this investment took both the form of transferring the existing assets through
concessions and building toll roads through greenfield projects. In water, almost all
private investments occurred in East Asia, Latin America and CEE and Central Asia and
took the form of concessioning of existing utilities to private investors. There was also
some small investment activity in expanding new capacity for water treatment, based on
BOO and BOT contracts. During the entire period (1990-2005) 47% of transport
investment went to Latin America, 36% to East Asia and 10% to CEE and Central Asia.
In the case of water investment the shares of these regions were much higher because of
very small or no investment in water in other regions. East Asia took the lead with 47%
share, Latin America was second (41%), followed by CEE and Central Asia (8%).
3. Forms
Greenfield projects were the most common form of private investment in infrastructure
in developing countries, accounting for the value share of 47% during the period of 1990-
2005 (figure 4). They reached the peak of $40 billion in 1997, fell, recovered in 2001 and
increased to $53 billion in 2005. This investment was driven mainly by projects in
electricity and mobile telecommunications and among regions by projects on East Asia,
which accounted for 31% of the total.

21
Privatizations followed, accounting for the share only slightly slower than that held by
greenfield projects, 39% (figure 4). Privatization-related investment took place mainly in
telecommunications and electricity in Latina America. After reaching a peak of $48
billion in 1998, investments fell (to a low of $15 billion in 2003) and never recovered,
amounting to $32 billion in 2005. As mentioned earlier, privatizations transactions of
developing countries in 1997-1998 were significantly increased by huge privatizations in
one country – Brazil. Leaving Brazil out, there would be no decrease after 1997-1998,
but rather annual fluctuations at quite elevated level.
In distinction from greenfield investment, the potential for investments related to
privatizations is limited by the pool of countries, which decided to engage in
privatizations in a given period and, within these countries, by the pool of state-owned
companies to be sold to private investors. Once major companies are sold, it is all natural
that potential for further investment is reduced. (But, of course, new private owners can
invest in expanding capacity, which is indeed the case in most privatized companies).
This is what has happened, when countries in Latin America and CEE completed major
privatizations in electricity and telecommunications. In addition, privatizations, which
take the form of sales of assets, do not take place in all infrastructure sectors. As regards
greenfield investments, given the vast number of developing countries and their
infrastructure needs far from being satisfied, the potential for new building projects is
virtually unlimited. So when these projects fall, it may be worrying, unless the gap is
filled by the public investment, which typically is not the case.
Figure 4. Forms of private investment in infrastructure in developing
countries, %, 1990-2005
39%
47%
14%0%
Privatizations
Greenfield
Concessions
Mngmnt. & leases
Concessions were used mainly in transport and water and sewerage and, to some extent,
in electricity. The leading regions, which have granted concessions have been Latin
America and East Asia. Concessions can be alternatives to privatizations of existing
assets. As mentioned above, greenfield projects can be turned into concessions after the
construction of a utility is completed. It seems that, the former dominated concessions,
which peaked in 1997, when large concessions in a number of countries were granted,
22
such as concessions for the electricity and water utility in Casablanca (Morocco), for the
water utility in Manila (Philippines) and for transport in Brazil (World Bank, 2003, p. 5).
Management and lease contracts were used in sectors, which were not reformed, and
countries wished only to improve management, without private investors assuming
investment risks. They were not too many, only around 100 during 1990-2001. Water and
sewerage sector had 41 projects and transportation 44. Among regions, CEE and Central
Asia granted 30 concessions and Sub-Saharan Africa 25.
C. The role of FDI
As was mentioned earlier, foreign investors were involved during 1990-2005 in over 83%
of private projects in infrastructure, measured by the number of projects or total
investment value, in developing and transition economies. “The primary engine behind
this rapid expansion [of private infrastructure investment] during the 1990s clearly has
been foreign direct investment” (FIAS, 2000, p. 8). Therefore, one can be confident, that
the preceding analysis, although dealing with all private projects, reflects quite correctly
FDI trends, although there are some differences related to the use of non-equity form in
some sectors and regions. The following overview of trends in FDI for 1990-1998 is
based on FIAS estimates.
The average 83% share of FDI in all private infrastructure investment in all developing
countries during 1990-1998 masks sectoral differences, but these differences are not big.
In all sectors and transport subsectors, except for two – roads and seaports – these shares
are higher than 86%, with the highest shares in airports (100%), water (98%) and
telecommunications (98%). Very high shares of FDI reflect the lack of not only capital
but also local expertise to undertake such projects. Where the local expertise existed, as
in road construction, governments tended to rely on domestic investors, often excluding
foreign participation. Therefore the share of FDI in roads was the lowest, 37%. In
seaports it was much higher, 62% (ibid., p. 9).
As with all projects, FDI related projects and associated FDI inflows grew very fast from
1990 to 1997, from $2 billion to $36 billion per year, and fell after the East Asian crisis to
$33 billion in 1998. Only Latin America escaped this contraction, owing to large FDI-
related privatizations in Brazil. Excluding Latin America, flows inflows dropped by
44%. Overall, private infrastructure projects attracted estimated $138 billion of FDI
inflows into developing and transition economies during 1990-1998, representing the
share of over 17% in total FDI inflows into these economies.
In terms of FDI inflows, telecommunications and electricity accounted for 95% of the
total. In terms of the number of transactions, however, transportation and water
represented 1/3rd
of all projects, reflecting differences in the size of projects among
sectors. As water and transportation projects are based mainly on concessions and BOT-
type of projects, while privatizations and greenfield investment dominate in electricity
and telecommunications, similar differences occurred, as regards forms of investment.
Thus privatizations (most popular in telecom and electricity) generated 2/3rd
of FDI

23
inflows, but accounted for only 22% of the total number of transactions. On the other
hand BOTs and concessions were responsible for 30% of inflows, while accounting for
three quarters of the number of transactions (ibid., p.12).
As with all projects, Latin America attracted the largest share of FDI inflows among
developing countries, 57%, with 85% of these inflows generated by prvatizations. But by
the number of FDI-related projects, the composition was more balanced: ¼ were
privatizations, 42% concessions and 30% greenfield investments. East and South Asia
received each $18-19 billion of infrastructure-related FDI inflows during 1990-1998.
Almost all of these inflows came through BOT-type contracts. CEE and Central Asia as
well as Sub-Saharan Africa attracted FDI inflows mainly to privatizations.
D. TNC players and home countries
The top ten TNCs involved in infrastructure projects (that is in projects in which they
hold at least 15% of equity, and ranked by the total value of these projects) in developing
and transition economies accounted for 12% of the projects during 1999-2001 but for
nearly 30% of the investment value. Five TNCs originate from the European Union and
only two from the United States. Five of them, in line with the dominant role of the
sector, were telecommunication TNCs, three TNCs in electricity, one TNC in the water
industry and one a multisector TNC (table 1). The investment of three of them
(Telefonica, Carso Global Telecom and Andrade Gutierrez) was located entirely in Latin
America. Telecom Italia also “specialized” in Latin America, with some projects in the
CEE, while Deutsche Telekom in the CEE, with some projects in East Asia. The
investment of remaining top ten was spread among a couple of regions, but only three
TNCs had a presence in all regions (AES Corporation, Enron Corporation and SUEZ).
Home country data, that is data concerning all TNCs, estimated by FIAS for the period
1990-1998 (FIAS, 2000, pp. 14-15), when most of the considered investment took place,
reveal a picture in some respects similar and in others different from that, based on the
top ten TNCs. The United States, which has only two TNCs on the list of top ten is by far
the largest home country, accounting for 30% of the total of home countries responsible
for infrastructure-related FDI flows. Spain is next with the share of 15%, followed by
Germany and France (7% each), Italy (7%) and the UK (2.5%). TNCs from developing
countries account for 8% of infrastructure FDI in other developing countries.
Table 1. The top 10 TNCs in private infrastructure projects in developing countries,
1990-2001 (ranked by total value of investments in which they participated)
TNC Home country Total project investment
2001 $, billions
Number
of
projects
Telefonica Spain 35 12
Carso Global Telecom Mexico 35 5
SUEZ France 33 79
Telecom Italia Italy 31 16
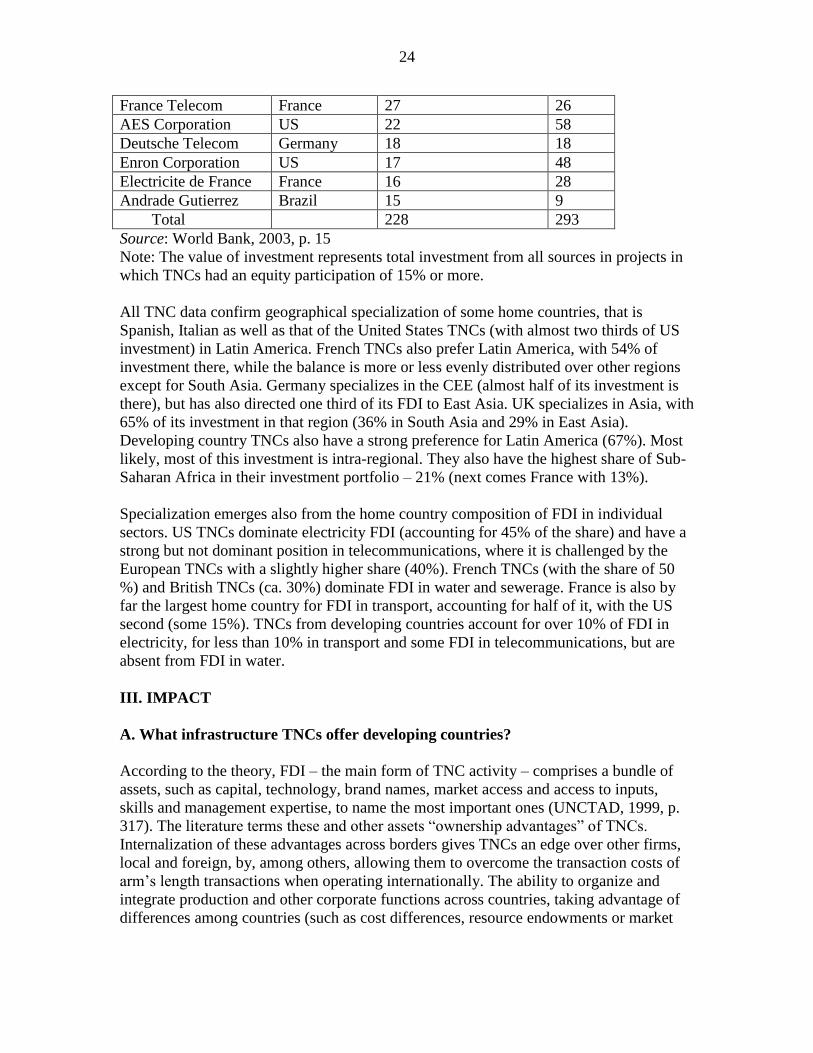
24
France Telecom France 27 26
AES Corporation US 22 58
Deutsche Telecom Germany 18 18
Enron Corporation US 17 48
Electricite de France France 16 28
Andrade Gutierrez Brazil 15 9
Total 228 293
Source: World Bank, 2003, p. 15
Note: The value of investment represents total investment from all sources in projects in
which TNCs had an equity participation of 15% or more.
All TNC data confirm geographical specialization of some home countries, that is
Spanish, Italian as well as that of the United States TNCs (with almost two thirds of US
investment) in Latin America. French TNCs also prefer Latin America, with 54% of
investment there, while the balance is more or less evenly distributed over other regions
except for South Asia. Germany specializes in the CEE (almost half of its investment is
there), but has also directed one third of its FDI to East Asia. UK specializes in Asia, with
65% of its investment in that region (36% in South Asia and 29% in East Asia).
Developing country TNCs also have a strong preference for Latin America (67%). Most
likely, most of this investment is intra-regional. They also have the highest share of Sub-
Saharan Africa in their investment portfolio – 21% (next comes France with 13%).
Specialization emerges also from the home country composition of FDI in individual
sectors. US TNCs dominate electricity FDI (accounting for 45% of the share) and have a
strong but not dominant position in telecommunications, where it is challenged by the
European TNCs with a slightly higher share (40%). French TNCs (with the share of 50
%) and British TNCs (ca. 30%) dominate FDI in water and sewerage. France is also by
far the largest home country for FDI in transport, accounting for half of it, with the US
second (some 15%). TNCs from developing countries account for over 10% of FDI in
electricity, for less than 10% in transport and some FDI in telecommunications, but are
absent from FDI in water.
III. IMPACT
A. What infrastructure TNCs offer developing countries?
According to the theory, FDI – the main form of TNC activity – comprises a bundle of
assets, such as capital, technology, brand names, market access and access to inputs,
skills and management expertise, to name the most important ones (UNCTAD, 1999, p.
317). The literature terms these and other assets “ownership advantages” of TNCs.
Internalization of these advantages across borders gives TNCs an edge over other firms,
local and foreign, by, among others, allowing them to overcome the transaction costs of
arm’s length transactions when operating internationally. The ability to organize and
integrate production and other corporate functions across countries, taking advantage of
differences among countries (such as cost differences, resource endowments or market
25
size and growth) is, itself, a source of additional advantages, termed the advantages of
“multinationality”.
Some of TNC assets are proprietary assets and others are not. Proprietary assets can be
obtained only from firms that create them. Of these assets, the most prized is probably
technology. Proprietary assets can be, theoretically, copied or reproduced by others, if
they have the ability to do so. But the costs can be very high, particularly in developing
countries and where advanced technologies are involved. In addition, TNCs are reluctant
to sell their most valuable assets to unrelated firms that can become competitors or could
leak them to others who have not paid for them. Non-proprietary assets – finance, capital
goods, intermediate inputs and the like – can be obtained from the market, at least in part.
But TNCs can have and, in fact often do have, privileged access to markets for non-
proprietary assets: the may be able to raise capital, or purchase equipment, on better
terms than smaller firms or firms from developing countries. Taken together, these
advantages mean that TNCs can contribute significantly to host developing countries – if
the host country can induce them to transfer these advantages in appropriate forms and
has the capacity to make good use of them.
How does this theory work in infrastructure industries? It does, but given different nature
and economics of infrastructure industries, there are significant differences compared to
other industries, e.g., manufacturing industries.
First, all infrastructure services are not tradable across borders.13
Therefore access to
international markets and contribution to exports, valued very much in manufacturing, do
not matter as a contribution in infrastructure. In addition, this creates dangers when
countries move to the private provision of services. Infrastructure services are natural
monopolies, or at least in part natural monopolies. There is no alternative of competitive
pressure from the imports of services. If privatization transfers natural monopoly from
public to private hands, this also transfers monopoly profits to private firms14
and
deprives the country of many (though not all – the supply and quality of services may still
improve) expected benefits of private provision. Transfer of monopoly to domestic or
foreign firms is, economically, equally damaging. But if private hands are foreign hands,
the backlash is typically stronger than in the case of domestic, public or private,
companies and does not augur well for future privatizations.
Second, infrastructure industries are not, with the exception of telecommunications, high-
tech industries and hard technology is not a strong ownership advantage of TNCs. But
even in telecommunications, technology is not a proprietary asset and can be purchased
in open markets. Leading TNCs, such as Deutsche Telecom, or France Telecom, do
produce technologies, they install in fixed-line or mobile networks. It is rather the ability
13
There are some cases of cross-border trade in electricity and water among neighboring countries (e.g.,
USA-Canada in electricity or Lesotho’s export of water to South Africa), but they are so limited that trade
is practically not a delivery option for infrastructure services. 14
In practice, in many cases, this transfer is illusory, as many SOEs did not make profits before they were
privatized. Even in cases where they were relatively well managed, they operated in systems, where prices
were subsidized, so even if they showed profits, it is difficult to say if they would be able to cover costs in
competitive markets.

26
to know how to use technologies (to, for example, combine the provision of telephony,
internet and media in one service package), marketing know-how and the knowledge of
markets (what will consumers accept) and managerial expertise (including how to assess
risks in private infrastructure markets) which constitute a competitive edge of TNCs. In
the initial phase of privatization, competitive advantages of TNCs vis-à-vis many
developing country public providers were contextual. Both developing and transition
economies did not have firms and investors with the knowledge, how to operate a private
infrastructure entity. So during the transition to market-based delivery, most of these
countries did not have an alternative to turning to TNCs. But with time TNCs may lose
and in fact are losing this advantage, as domestic firms, often minority partners in TNC-
led projects, acquire such knowledge. Witness an increasing role of domestic firms in
infrastructure investment, mentioned earlier.
Third, many projects (though not all) in infrastructure are very large and are characterized
by large economies of scale. They require huge initial capital outlays, while the stream of
revenues to cover the cost of, and return on, capital spreads over many years. Therefore
risks are typically much higher than in, for example, manufacturing projects. There are
also many additional risks that are lower or not existing in other industries, such as
political risks (related to, for example obsolescence bargaining) or regulatory risks. Even
if countries decide to introduce as much competition as possible, in industries relying on
fixed-networks (such as fixed telecommunication lines, electricity distribution or water
pipes), elements of natural monopoly will always remain. They should be managed by a
national regulatory agency, which will determine conditions of access and set prices,
thus, de facto, determining the stream of revenues. For these reasons, although capital
typically is not a proprietary asset of TNCs, in infrastructure projects it practically is.
Huge amounts of capital necessary to invest in infrastructure are beyond the financing
capacity of capital markets in many developing countries. Even if they are not, given
risks involved and doubts about the ability of local investors to manage such projects,
lenders are in most cases hesitant about extending credit to local inexperienced investors.
Teaming up with TNCs may change this situation. Therefore it is quite common that
many projects are financed by consortia of TNCs and domestic investors.
To sum up, key contributions host countries can expect from an FDI package brought by
infrastructure TNCs include capital and the ability to undertake efficient investment (with
associated risks) which would be impossible or difficult to undertake by domestic
investors either because of the lack of capital or expertise how to build and/or run an
infrastructure facility as a private entity, or both. TNCs generally improve corporate
governance.
If countries decide in favour of indigenous ownership, excluding TNCs, in the absence of
well developed financial markets it often means that large “domestic privatizations may
only be feasible to certain high income groups or families, probably the same elite that
controls government” (Saha and Parker, 2002). A number of privatizations in Uganda,
Zambia, Burkina Faso and Cote d’Ivoire have involved the transfer of assets to
politicians, their families and associates on preferential terms. Such privatization may
lead to rent extraction (Parker and Kirkpatrick, 2003, pp. 20-21). On the other hand,
27
privatizations to foreigners risk the tag of “re-colonization and weakening domestic
enterprise development” (Makonnen, 1999).
Before proceeding to the discussion of impacts, based on the literature, a few caveats
need to be made.
The contents of the package and the resulting TNC contributions depend on the form
investment takes. As discussed in the first chapter infrastructure projects can take either
equity or non-equity forms, associated with different contributions. Privatizations and
greenfield projects always involve capital contributions (in the form of equity and/or
debt). While privatization-related FDI includes typically the full package content, in the
case of greenfield investment the content depends on how the project ends. If the facility
is only constructed by a TNC and at the end transferred to the government, then the
expertise how to run the facility is not part of the package. Conversely, a host country
may decide to attract only managerial expertise without a capital and risk-taking or risk-
sharing component, if it prefers a management contract or a lease type of the agreement.
Typically, governments have a choice of the type of investment (within standards
prevailing in each infrastructure industry) and therefore the contributions they expect
from TNCs. For example, countries which decided not to reform their infrastructure
system (that is not to rely on markets and private providers) have gone in
telecommunications and electricity only for greenfield investments. This means that they
expected TNCs mainly to supplement the supply of services to that from existing SOEs,
maintaining their central role in the system. In other words, their expectations concern
increased production within the system of public provision. This is the case of most
countries in Asia.
Countries, which desired to reform the system, that is to introduce market forces (to the
extent possible, given natural monopoly elements) have relied on privatizations of SOEs
and, if need be, on greenfield investment. This is the case of most countries of Latin
America and Central and Eastern Europe and some in Africa. They expected TNC
contributions to do more than to increase the supply of services. They expected private
firms to be efficient and productive enterprises not needing government support and
putting an end to subsidizing infrastructure and thus permitting governments to direct
budgetary resources to other ends. Expectations included also considerable new
investments resulting not only in considerable increase in the availability of services to
all segments of the population but also in considerable quality improvements. They
expected competitive prices covering costs or at least, most likely, did not expect price
increases in spite of discontinuing subsidies. And finally, it is expected that in
environmentally sensitive industries, such as electricity, private investors will be able to
contribute more than pre-existing SOEs. As will be seen below not all expectations have
materialized, for different reasons, not necessarily related to TNCs.
28
But what is important now, is that the division of countries into non-reforming and
reforming groups has implications for the impact discussion. There is really not much to
consider as regards impact in non-reforming countries (which does not mean that there
are no problems with the private production being part of the system relying on public
provision). Therefore, literature dealing with the impact almost entirely focuses on the
latter group of countries, focusing on comparing industry performance after reforms with
that before reforms. Sometimes comparisons concern reforming and non-reforming
countries. Unfortunately, the literature does not pay attention to the impact of foreign
versus domestic private firms. Perhaps it is so, because the ownership of infrastructure
companies is not a decisive factor, determining the industry performance after reforms.
Nevertheless, reforming countries are those which opened widely to TNCs and FDI,
which in many cases play significant or dominant roles in infrastructure industries.
Therefore the impact analysis, even if it does not distinguish ownership, deals practically
with the impact of TNCs.
As indicated above, the ownership matters, and it does so in both groups of countries, as
regards the supply of the necessary capital and the ability to undertake investment. As
mentioned below, here the role of TNCs is very substantial, as they have participated
during 1990-1998 in 83% of the projects, measured both by their number and value.
During 1998-2003 their role has further increased to 86%, measured by investment value
(Ettinger et. al, 2005, p. 15). It does not mean that over 80% of investment capital in both
periods has been contributed by TNCs. It means that TNCs participated in projects, the
total value of which accounted for 83% in 1990-1998 and 86% in 1998-2003 of the total
value of all projects.
FIAS has estimated the capital contribution of TNCs in the form of equity FDI flows
during 1990-1998. The average for all developing countries and transition economies
was 26% of the total value of the projects. The highest contribution was in Sub-Saharan
Africa (63%) and Latin America (36%) and the lowest East Asia (12%). As regards
sectors, telecommunications attracted the greatest share of FDI (44%), followed by
electricity (28%) and roads the lowest (4%) (table 2). Thus, the highest shares of equity
FDI were attracted to both sectors and regions, which relied more on privatization
transactions (this is what explains the highest share in Africa, where most private
investment went to telecommunications in the form privatization-related FDI). But FDI
inflows underestimate capital contributions by TNCs. FIAS excluded from FDI estimates
debt flows, which normally are part of FDI if debt is provided to foreign affiliates by
parents. Underestimation may be serious, as especially in greenfield transactions through
BOTs or concessions equity tends to be significantly smaller than debt flows. As a result,
debt/equity ratios in electricity, transportation and water where these transactions were
important range from 78/22 in the case of roads to 67/33 in the case of seaports (FIAS,
2000, p. 151). In telecommunications where large-scale privatizations of fixed-line
networks were a large component of transactions and investment in cellular telephony
was also based on equity FDI these ratios are 46/56 for fixed lines and 42/58 for the
cellular telephony. The implication is that TNC contribution was higher than the
estimated share of equity FDI, 26%, although it is not possible to establish how much

29
higher. In addition TNC participation in projects helps mobilize financing through debt
indirectly, as it enhances credibility of projects.
Table 2. The share of FDI financing in total investment in infrastructure in developing countries
(1990-1998, by region and infrastructure industry, in %)
Power Airports Seaports Rail Roads Telecoms Water Total
Latin America 41 5 19 14 3 51 14 36
East Asia 16 8 2 9 3 18 4 12
South Asia 16 33 34 17
Europe & Central Asia 40 13 5 38 4 32
Sub-Saharan Africa 19 57 7 3 83 12 63
West Asia & North Africa 38 33 83 11 24
Total 28 9 14 11 4 44 8 26
Source: FIAS, 2000, p. 152
B. Impact in individual infrastructure sectors
1. Telecommunications
In telecommunications reforms in both developing countries and transition countries have
been quite widespread and advanced among infrastructure industries. Typically, after
privatization the supply and density of services and productivity have increased
considerably. At the same time there have been differences among privatizing countries,
as regards (improved) industry performance, depending on the depth and scope of
reforms.
In both Argentina and Jamaica investment increased three to four times four years after
privatization, leading to accelerated capacity expansion, compared to 11 years before
privatization. In Jamaica, an annual network expansion accelerated to 18% compared to
4.5% and in Argentina, respectively, to more than 14%, compared to 6%. Also in Mexico
the supply of services accelerated (Ramamurti, 1996 and Ros, 1999).
Among countries with income per head lower than $10,000, those that permitted private
majority ownership of formerly state-owned telecom companies experienced 130%
higher growth in fixed lines per head than the remaining countries. They also had 1/3
more lines per head (Ros, 1999).
In another comparison, three LAC countries that privatized in 1990-1991 (Argentina,
Mexico and Venezuela), achieved much faster capacity expansion (even though they
granted 6-10 years of monopoly rights to private operators), measured by
telecommunications lines, than countries with state-owned companies (at that time Brazil,
Colombia, Ecuador, Peru and Uruguay). But all fell far behind Chile, whose government
introduced competition and did not give up the right to issue telecommunications licenses
at any time (table 3).
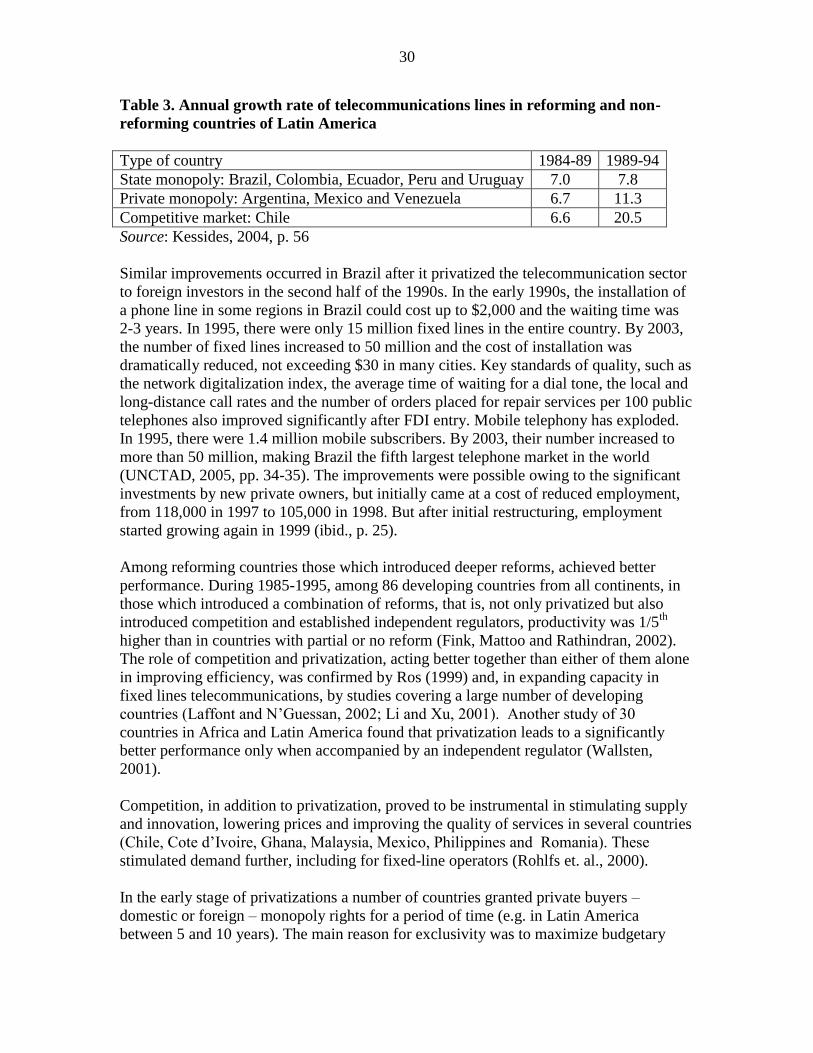
30
Table 3. Annual growth rate of telecommunications lines in reforming and non-
reforming countries of Latin America
Type of country 1984-89 1989-94
State monopoly: Brazil, Colombia, Ecuador, Peru and Uruguay 7.0 7.8
Private monopoly: Argentina, Mexico and Venezuela 6.7 11.3
Competitive market: Chile 6.6 20.5
Source: Kessides, 2004, p. 56
Similar improvements occurred in Brazil after it privatized the telecommunication sector
to foreign investors in the second half of the 1990s. In the early 1990s, the installation of
a phone line in some regions in Brazil could cost up to $2,000 and the waiting time was
2-3 years. In 1995, there were only 15 million fixed lines in the entire country. By 2003,
the number of fixed lines increased to 50 million and the cost of installation was
dramatically reduced, not exceeding $30 in many cities. Key standards of quality, such as
the network digitalization index, the average time of waiting for a dial tone, the local and
long-distance call rates and the number of orders placed for repair services per 100 public
telephones also improved significantly after FDI entry. Mobile telephony has exploded.
In 1995, there were 1.4 million mobile subscribers. By 2003, their number increased to
more than 50 million, making Brazil the fifth largest telephone market in the world
(UNCTAD, 2005, pp. 34-35). The improvements were possible owing to the significant
investments by new private owners, but initially came at a cost of reduced employment,
from 118,000 in 1997 to 105,000 in 1998. But after initial restructuring, employment
started growing again in 1999 (ibid., p. 25).
Among reforming countries those which introduced deeper reforms, achieved better
performance. During 1985-1995, among 86 developing countries from all continents, in
those which introduced a combination of reforms, that is, not only privatized but also
introduced competition and established independent regulators, productivity was 1/5th
higher than in countries with partial or no reform (Fink, Mattoo and Rathindran, 2002).
The role of competition and privatization, acting better together than either of them alone
in improving efficiency, was confirmed by Ros (1999) and, in expanding capacity in
fixed lines telecommunications, by studies covering a large number of developing
countries (Laffont and N’Guessan, 2002; Li and Xu, 2001). Another study of 30
countries in Africa and Latin America found that privatization leads to a significantly
better performance only when accompanied by an independent regulator (Wallsten,
2001).
Competition, in addition to privatization, proved to be instrumental in stimulating supply
and innovation, lowering prices and improving the quality of services in several countries
(Chile, Cote d’Ivoire, Ghana, Malaysia, Mexico, Philippines and Romania). These
stimulated demand further, including for fixed-line operators (Rohlfs et. al., 2000).
In the early stage of privatizations a number of countries granted private buyers –
domestic or foreign – monopoly rights for a period of time (e.g. in Latin America
between 5 and 10 years). The main reason for exclusivity was to maximize budgetary
31
revenues in exchange for benefits of monopoly accruing to private operators. But, as it
was thought at that time, there were also economic arguments. First, high monopoly
profits would facilitate much needed new investment to increase supply and improve
services. Second, competition would undermine the universal provision of services,
forcing privatized operators to focus on better off customers and undermining subsidies
used as part of universal provision policy. And finally, it was thought that incentives (in
the form of monopoly positions) were needed to attract foreign investors (Laffont and
N’Gbo, 2000). Exclusivity typically limited gains from privatization, although not
entirely deprived of them countries using it, compared to countries, which continued to
rely on state monopolies (table 1). Prices were high (though lower than in countries with
state monopolies), reducing demand for services (and subsequently investment) and the
growth of capacity lower (Wallsten, 2000). The literature seems to agree that market
liberalization stimulates network growth and innovation while exclusivity rights delay
them.
Consequently, with time, exclusivity periods became shorter and countries, even small
ones, were able to sell telecommunications companies without exclusivity rights,
attracting several service providers (e.g., El Salvador and Guatemala by 1998, Kessides,
2004, p. 61). On the other hand, countries which initially provided very long monopoly
rights were stuck with them, hampering the industry development. A case in point is
Latvia, which granted in 1994 a 20-year exclusivity for fixed lines to a joint venture
between the government and a foreign investor. Attempts to cut down exclusivity by ten
years resulted in a legal battle between the government and the investor, demanding very
high compensation (ibid., p. 78).
2. Electricity
It was in Latin America where privatization and liberalization of electricity provision and
distribution started among developing countries. Chile was a pioneer in this regard
(1982), followed by Argentina (1992) and several other countries during the 1990s
(Kessides, 2004, p. 172). Examples of Chile and Argentina are illustrative of the impact
of reforms:
Productivity. In Chile labour productivity, measured by generated gigawatt-hours
per employee in the largest supplier, Endesa, increased more than five times
between 1991 and 2002. In distribution, productivity increased more than ten
times (in Chilectra) between 1987 and 2002 (Fischer, Gutierrez and Serra, 2003;
and Pollit, 2003). Labour productivity accelerated after the takeover of domestic
companies by foreign investors. Between 1999 and 2002 the number of
employees in Chile’s electricity industry fell from 8,264 to 5,706 (Kessides, p.
182). In Argentina, thermal plant unavailability fell from 52% in 1992 to 26% in
2000 (Rudnick and Zolezzi, 2001). In Brazil, productivity increased by nearly
150% between 1994 and 2000, while the number of employees fell by half (Mota,
2003).

32
Quality of services. In Chile the time for emergency repair service fell from 5
hours in 1988 to 2 hours in 1994. Power outages caused by transmission failures
fell steadily as well as energy losses, including those caused by theft (from 21%
in 1986 to 9% in 1996). Losses fell also in Argentina (from 26% in 1993 to 10%
in 2000 at Edenor). In Buenos Aires hours of outages per year declined from 17 in
1994 to 5 in 2001.
Supply capacity. Capacity is measured by megawatts and the length of
transmission lines. In Chile the former increased between 1982 and 2002 2.5
times and the latter two times. In Argentina increases amounted, respectively,
between 1992 and 2002, 1.7 times and 1.3 times.
Prices. Before reforms prices did not reflect costs and were often subsidized.
Aligning of prices with costs as a result of relying on private suppliers and market
forces has led in many countries to higher prices. But in some countries prices fell
as a result of introducing new technologies and greater reliance on natural gas. In
Argentina, the average monthly price per megawatt hour in wholesale market fell
from $45 (and $70 in peak times) in 1992 to $15 in 2002. In Chile, wholesale
prices fell 37% and final prices 17%.
Company performance. In both Chile and Argentina, in spite of increased
investment and lower prices in the aftermath of reforms, companies’ financial
performance was strong, as the following examples, using return on equity,
indicate (Kessides, p. 177):
Chilectra – 32% (nominal return), 1996-1998
Endesa – 16% in 1994 (peak year)
Argentina, generation, Buenos Aires, 5.6% average during 1994-99
Transener, transmission, 5.1 in 1998
Distribution, 1994-2000, Edenor and Edesur, respectively 8.3% and 7.2%
pretax returns on net assets.
In Argentina, the industry situation gravely deteriorated as a result of the peso
crisis in 2002. Prices in most contracts were set in dollars, which until 2002 was
pegged to peso one-to-one. Un-pegging in that year, resulting in devaluation of
peso, redefined the economics of contracts. While regulated prices in pesos
remained frozen, inflation set in, resulting in plummeting revenues of electricity
companies and soaring debt (mostly in dollars) and production costs. As a result,
the companies experienced big losses, and, for example, Transener, suspended
payments on its debt. While negotiations with the government went very slowly,
the companies issued in October 2003 a warning about power crisis (Casey,
2003).
Poor. In Chile, the share of households without electricity (among the poorest
10% of households), fell from 29% in 1988 to 7% in 1998. Among the second
10% poorest the share fell from 20% to 4% (Estache, Foster and Wodon, 2002).
33
As a result of a rural electrification programme, the coverage in rural areas
increased from 53% in 1992 to 76% in 1999, exceeding the target of 75% set for
2000.
While in Latin America debt problem of the 1980s influenced the choice of methods of
privatization (sales of existing SOEs was a dominant form) as well as depth and scope of
reforms (they went farthest among developing countries), the situation in Asia, and
especially in East Asia was different. These countries were not indebted (at least not so
heavily as Latin American countries) and SOEs in electricity seemed to have been doing
better than in Latin America. But neither these companies nor governments were able to
finance investment needed to satisfy rapidly growing demand for electricity caused by
rapid economic growth. Consequently the region suffered from power shortages in the
late 1980s and early 1990s, which were particularly severe in Indonesia, Malaysia, the
Philippines and Thailand (Kessides, 2004, p. 178). To deal with the crisis, countries of
the region decided to allow greenfield private investment, but only in power generation,
without reforming the rest of the system. Consequently, private companies were selling
electricity to state-owned utility companies under long-term purchase agreements (the so
called single buyer model). The agreements typically were based on payments in dollars
(to mitigate foreign exchange risk of investors, whose debt and many purchases were in
dollars) and involved government guarantees (because default procedures against public
utilities were usually not allowed). Thus SOEs were placed between private producers of
electricity and final consumers. Tariffs remained unreformed, not reflecting the cost of
production. Initially, this model worked well. During 1990-1997, East Asia attracted $55
billion of mostly private greenfield investment in power generation, or 40% of total
private investment of developing and transition economies. But the financial crisis, which
started in 1997, undermined the rationale of this model. Devaluations of national
currencies and economic slowdown undermined or destroyed economic fundamentals of
agreements, doubling the cost of electricity (which SOEs were reluctant to pass on to end
users, as this was politically unacceptable) and changing demand projections and
associated revenue stream. This resulted in massive increase in debt of state owned
providers, typically guaranteed by governments. For example, in the Philippines, the
foreign debt of the national provider reached 20% of national debt. Some governments
tried to repudiate debt, often claiming that deals made by previous governments were
corrupt, while others rescheduled loans to avoid default. As a result, the private electricity
generation market (as well as other infrastructure projects in transportation and
telecommunications) fell into severe crisis, with projects canceled, delayed or brought to
the brink of bankruptcy (FIAS, 2000, p. 133).
3. Transportation
a. Rail
Deteriorating physical condition of railways and performance of state-owned companies
on the one hand and fiscal constraints of governments on the other have prompted a
number of developing and transition economies to restructure the industry and increase
private participation. During the 1990s more than 40 railways in 16 countries were

34
concessioned or privatized. At the beginning of 21st century railways in 7 countries were
under the process of concessioning (Thompson, 2003). During 1990-2001 more than 70
rail projects with private participation attracted some $30 billion of investment (Harris et.
al., 2003). Only few countries have fully privatized railways. In other cases, the dominant
form of private participation has taken the form of concession to operate and manage the
existing railways. Under concession, the ownership of infrastructure and assets remains
with SOEs. The concessionaire takes obligations for investment to upgrade assets by
making payments to special investment and renewal funds and is obliged to service debt
on any investment undertaken within the concession. Seven countries of Latin America
have led the way, awarding during 1990-1997 26 contracts totaling $6.5 billions. East
Asia and the Pacific issued fewer contracts, but total investment was higher than in Latin
America -- $8 billion – due to the different nature of the projects: large greenfield
investment in metropolitan areas based on BOT contracts (Kessides, p. 200).
Deregulation and privatization led to the reduction of excessive employment (an option
which did not exist before reforms), ranging from 8% in Burkina Faso and Cote d’Ivoire,
to 42% in Estonia, 66% in Mexico and 92% in Argentina. As reported in the literature,
reductions have not been associated with cuts in services. This, combined with traffic
increase, has led to dramatic increases in productivity (except for two African countries),
measured by the sum of ton-and passenger-kilometers per employee, which at least
doubled, but in most cases tripled or even quadrupled (Thompson, Budin and Estache,
2001; Thompson, 2003). In most concessions better service, flexible pricing and lower
freight rates have significantly increased the freight traffic, reversing the trend of
declining share of railroads in this traffic (e.g., in Argentina).
Among 16 privatized railroads, mostly in Latin America, 14 were able to lower freight
tariffs, compared to the pre-privatization period. Rates in LA declined between 8% and
54%, and in Cote d’Ivoire 14%. It is estimated that in six countries, which were studied,
these reductions saved about $1 billion in transport costs per year. Lower railway rates
led also to tariff reductions in other types of freight transportation (Kessides, p. 202).
In Brazil, during most of its history railway operations were unprofitable. In 1995, Rede
Ferroviara Federal (RFFSA) lost more than $300 million and its debt reached $4 billion
(Estache, Goldstein and Pittman, 2001). In 1995, Brazil cut workforce in railways,15
split
RFFSA into six private freight concessions, eliminated subsidies and gave new operators
considerable price flexibility (depending on demand and conditions of contracts). As a
result losses turned quickly into profits and rails declining share in freight traffic was
reversed. However, most operators did not reach investment levels as planned (Campos
and Jimenez, 2003).
b. Ports
During 1990-2001, $18 billion was invested in 177 private port projects, mainly in Latin
America and East Asia, with five countries accounting for 2/3 of the investment. It is
15
Employment fell to 42,000 in 1995 (from 110,000 in 1975) as a result of early retirement, voluntary
separation incentives, training assistance for outplacement and severance packages for dismissed workers.
35
expected that private operators are able to control costs, are faster than public ones to
adopt new technologies and modern managerial practices and are more responsive to the
needs of customers.
These expectations materialized in a pioneering divestiture of container operations in port
Kelang, the largest port in Malaysia, undertaken in 1985:
Crane handling increased from some 19 containers per hour in 1985 to 27 in
1987, almost matching port performance in Singapore.
An annual return on fixed assets increased from 2% during 1981-1986 to nearly
12% during 1986-1990, due to improvements in productivity, not higher prices.
Output per worker increased by 76%.
Real wages increased by 1990 by 60%.
Similar improvements took place as a result of deregulation of ports in several countries
during the 1990s:
In Colombia (between 1993 when reforms in four ports were implemented and
1996), ships’ waiting time fell from ten days to “no wait” or only hours of
waiting, depending on the port. The loaded cargo per vessel per day increased
from 500 tones to 2,500 (for bulk) and from 750 to 1,700 for general cargo and
the number of containers per vessel per hour increased from 16 to 25.
In the port of Buenos Aires (between 1991 and 1999), annual container traffic
increased from 300,000 TEUs to over 1 million, the number of cranes increased
from 3 to 13, labour productivity increased almost four times, and the average
waiting time was reduced from 2.5 to 1.3 days. As a result the port of Buenos
Aires regained its position in competition with other regional ports, surpassing by
1997 Santos, the largest port in South America, in terms of cargo handling.
Mexico’s concessioning of ports to private operators in the mid-1990s led to
much lower tariffs, significant improvements in efficiency, productivity and
profitability. This resulted in substantial investments in ports expansion and
modernization and in considerable tax revenues for the government (while before
deregulation ports depended on public support).
4. Water
Reforms in the water and sanitation sector has been slower and private participation
much more limited than in other infrastructure industries.16
During 1990-2001, the sector
accounted for 5% of global private investment in infrastructure in developing and
transition economies. Private investment in the sector in these countries peaked in 1997,
16
It is also the case in developed countries. For example, in the United States 94% of municipal water
systems, including some 5,000 separate utilities, are under public control. As most required extensive
rehabilitation and repair, at the beginning of the 21st century more than 1,000 units were operated under
private long-term concessions. Some of them ended, however, in failure. For example, a contract signed in
1999 between Atlanta and United Water, a subsidiary of Suez, was terminated in 2003 by mutual consent,
due to disagreements (Kessides, 2004, p. 241).

36
to reach $9.3 billion, and then fell to an annual average of $4.6 billion in 1999-2001.
Latin America leads the developing world in the number of projects, while East Asia in
the value of investment. But three quarters of investment was undertaken in only six
developing countries, led by Argentina and Brazil. The dominant form of private
participation are concessions, accounting for more than 80% of investment value during
the 1990s.
As reforms and private participation in water industry are not very common and most
large public-private partnerships are less than ten years old, studies on the effects of
reforms are rare. One such study (Shirley and Menard, 2002, as reported in Kessides,
2004, pp. 252-256) assesses the results of reforms in 1996 undertaken in six cities during
1989-1993. They are Buenos Aires (concession), Mexico City (service contracts), Lima
(where the concession was not implemented and the system remained under state
ownership and operation), Santiago (contracting) and Abidjan and Conakry (leases).
Although regulatory systems differed greatly in these cities, reforms brought
improvements in productivity (employees per connection). Operating costs fell below
revenues in all cities except Mexico. Water and sewerage coverage increased everywhere
except Lima. Un-accounted for water (that is, physical and commercial losses due to poor
maintenance, financial management and illegal use) fell significantly in Buenos Aires,
Lima and Santiago, with little change in other cities.
Other studies on water cited in the Word Bank report (Kessides, 2004, pp. 255-256)
found that:
In water provision, institutional capacity and the quality of governance are more
important in determining efficiency than private participation (21 African
utilities)
Private operation of water utilities is correlated with greater efficiency (50 Asian
utilities)
There was no evidence from cross-country analysis in Africa that reforms in water
and other infrastructure hurt low-income consumers. On the contrary, poor people
“seem to benefit in terms of having better chances of becoming connected to
network services” (ibid., p. 256).
C. Impact by areas
1. Supply and coverage
There is consensus in the literature on infrastructure privatization that the largest gains
have come through increased investment and supply of services and extended coverage to
previously unattended or unconnected consumers.
The results have been particularly impressive in telecommunications, especially where
competitive regimes have been established. In Latin America, the expansion of networks
has been slower in countries, which have privatized but not introduced competitive
regimes. But it has been faster than in countries, which continued to rely on public
monopolies. The improvements can be spectacular in countries with underdeveloped
37
networks, e.g., in Uganda, where the entry of mobile companies led to a big increase in
the number of connections, as these companies soon after entry dwarfed the fixed-line
incumbent.
Well designed private schemes in water and electricity have also led to significant service
expansion during the years following privatization, after many years of stagnation and
deteriorating service under public provision (Harris, 2003, pp. 18-20):
Increased access to water in nine cities in countries from Latin America, Africa
and Asia amounted to between 10% and 33% (in Manila). Only in one,
Barranquilla, it increased by 5%.
In sanitation, the increases in six cities ranged from 5-7% in Barranquilla, Tunja
and Buenos Aires to 32% in La-Paz-El-Alto.
In electricity, increases in four cities or private providers were much bigger,
ranging from almost 15% in SEEG in Gabon to over 30% in Luz del Sul and
Edelnor (Peru) and 37% in Union Fenosa (Guatemala). The privatization in Lima
has resulted in nearly universal coverage for two private companies. Coverage of
electricity increased also in Chile, with biggest increases for low-income
consumers (Estache, et al., 2000).
Expanded access to utilities can be seen in Argentina, Bolivia, Mexico, Nicaragua
and other Latin American countries. “Increased access is often large; the rate of
increase typically far exceeds that of the predivestiture period, and the Latin
American studies mostly conclude that poorer segments of the population have
benefited disproportionately from these increases” (Nellis and Bridsall, 2007, p.
22).
2. Efficiency
Another visible and rarely contested result of privatization has been improved efficiency
through reducing wasteful costs, including over-staffing, collecting fees and reducing
leakages resulting from theft, payment arrears and corruption in meter reading and billing
(in electricity and water).
Largest gains have been again in telecommunications and competition has enhanced
these gains. One study of 31 privatized companied in 25 developing and developed
countries found significant improvements in operating efficiency (Bortolotti et al, 2001).
In electricity, in Chile losses were cut by more than half after privatization (Estache and
Rodrigues-Pardina, 1998). Similar was the situation in 9 cases of private providers in
Argentina (7) and Chile and Peru (1 provider in each), though in some cases cuts were
smaller, but in others larger than 50% (Feler, 1999).
3. Quality of services
The previous section on the impact in individual industries has provided a number of
examples of the improved quality of services such as drastic reductions of waiting time
38
for phone installations and for dial tone, reductions of breaks in electricity or better
service in ports. In water, connections to networks results in health benefits. E.g., in
Argentina where during the 1990s 30% of municipalities privatized water services,
investments expanded not only access but also increased pressure, the time of supply and
reduced leakages. One study found a reduction of child mortality in the poorest areas by
25% and 5-9% on average (Galiani et al., 2002).
Another side of private provision is, that by separating oversight of utilities from
ownership, it is much easier (if regulatory frameworks are well designed) not only to
reward compliance with safety and security of supply standards but also to punish for
non-compliance in case a private provider cuts expenditures to boost profit margins. A
case in point is a $51 million fine imposed on Edesur company in Buenos Aires for a
major outage in 1995 (Feler, 2001). Such a response would have been difficult to imagine
under a public ownership.
4. Fiscal impact
Privatization has in many cases improved the fiscal position of governments through
eliminating or lowering subsidies, revenues from the sale of state-owned assets,
concession fees and taxes. Here are some examples:
Ferrocalires Argentinos, a railway company, received $1.5 billion of annual
subsidy. After private concession government expenses (related to investment)
fell to $100 million. Concessionaires started also paying $10 million in taxes
annually.
Argentina’s largest power company, SEGBA, lost $1.7 billion during the last
four years of public control. Government revenues from its sale amounted to
$110 million. In addition, after privatization SEGBA started paying taxes.
Owing to increased revenues from privatizations, many governments in Latin America
have been able to increase spending on health and education (Estache, Gomez-Lobo and
Leipziger, 2000). But some argue that public expenditure on infrastructure fell too much,
thus “taxing” infrastructure and reducing the amount left for investing and improving
services or resolving post-privatization problems. There are, however, cases when
revenues from fees from consumers were not sufficient and there were affordability
concerns, and some governments decided to continue re-oriented subsidy schemes to
supplement user fees and extend infrastructure services to rural areas and to ensure that
the poor can afford essential services (Wellenius, 1997; Cannock, 2001; and Gomez-
Lobo, 2001).
There has also been fear that increased revenues would postpone in many countries
desired fiscal adjustment and relax fiscal discipline. These fears by and large turned out
not to be justified: on the whole privatization in a sample of developing countries did
not have a negative effect on fiscal discipline (Barnett, 2000). But some countries,
notably Argentina and Brazil seem to have used revenues from privatizations to
continue unsustainable fiscal position (Nellis and Birdsall, 2007, p. 24).

39
5. Employment
Many public utilities were overstaffed and the shift to private provision has often resulted
in employment reductions to achieve more efficient levels of labour. Private participation
in railways led to reductions of 80,000 employees in Argentina and 18,000 in Brazil
(Kikeri, 1998).
Some private companies in telecommunications have, however, increased employment
where competition and falling prices stimulated increasing demand for services
(Petrazzini, 1996). In general, employment losses were short-term, with employment
increasing in medium term, with competitive restructuring completed and increasing
demand. But new job opportunities have not necessarily been exploited by those,who
have been laid off.
A suggested policy response to job reductions is to introduce schemes to compensate
workers who lose jobs and/or retraining programmes helping laid-off employees to start
their own businesses. But given weaknesses of welfare programmes in developing
countries, such schemes have rather been exception than a rule.
In some cases, employees benefited through higher wages resulting from increased
productivity and from participation in share schemes of privatized companies (Galal et
al., 1994, provides evidence for electricity, telecommunications and ports and Shirley,
2002, for Buenos Aires water concession).
6. Prices
The impact of infrastructure privatization depends on a number of factors. First, on what
was the pre-privatization level of prices compared to costs (as noted elsewhere in water
the price/cost ratio in developing countries was 30%). Second, what are post-privatization
efficiency improvements.17
Third, whether a post-privatization pricing regime includes
provisions for passing on (sufficient) cost reductions to consumers. Fourth, whether
governments eliminate subsidies or decide to continue them to compensate for
insufficient private revenues to compensate costs. And five, as some argue that private
finance involves higher costs that previous public one, this will act in the direction of
price increases.18
Opponents of private provision of infrastructure argue that privatization will inevitably
result in price increases. But, as evidence shows, this does not always have to be the case.
Here are some positive examples:
17
One study found that efficiency improvements in terms of reduced costs amounted on average to 10-30%
(Hodge, 2000). 18
The nominal cost of capital for private firms is higher than that for governments, because the latter have
recourse to taxpayers who provide an open-ended credit insurance to governments, in spite of the fact that
governments do not have superior to private firms capabilities to choose or manage infrastructure projects.
Therefore there is no reason to expect that the social cost of private finance to be higher than the social cost
of public finance (Klein, 1996).
40
In five of ten cases in Latin America, prices decreased following private
participation (McKenzie and Mookherje, 2002).
In electricity in Argentina prices were reduced by 40% post-privatization and in
Chile by 20% between 1988 and 1998 (Estache, Gomez-Lobo and Leipziger,
2000).
In spite of renegotiation of water concession in Buenos Aires, prices were still
14% lower than under public provision (Shirley, 2002).
In Cote d’Ivoire productivity gains in water and electricity were passed on to
consumers (Plane, 1999).
In Manila, initially water prices fell after the private concession in 1997, but by
2001 it exceeded the “public” level of prices.
A study, cited above, which found quite common increased access to utilities in Latin
America, also noted that “often, increased access is accompanied by higher prices (Nellis
and Birdsall, 2007, p. 23). In some cases, inexperienced regulators have found it difficult
to hold down or reduce tariffs in privatized infrastructure firms (ibid.). In other cases,
where pre-privatization cost-price discrepancy was large, efficiency improvements not
sufficient and governments not willing to continue subsidies, prices increased towards
cost-covering levels. Also, where average prices fell benefits were not necessarily
distributed among all consumers. For example, as a result of the elimination of cross-
subsidies, prices for subsidized consumers (such as residential consumers in water and
electricity and local-calls users in telecommunications) have often increased, while those
for carrying the burden of pre-privatization subsidies fell. In addition, if prices embodied
in regulatory frameworks do not reflect the cost of serving incremental consumers, price
reductions may turn out to be temporary. But as stated elsewhere, the need to raise
revenues from user fees to cover costs, in the absence of subsidies, is there, regardless of
whether provision is private or public, and many of the “private” price increases
reflected this need.
7. Impact on the poor
There is no evidence that, as some argue, the public provision of infrastructure services is
better for the poor than the private one. But this does not mean that the private provision
has improved the situation of the poor, either. This is only to say, that there is potential
for such improvement, but whether it is exploited or not, depends on post-privatization
government policy paying attention to the needs of the poor. In most cases, particularly in
the initial phase of infrastructure privatizations, governments did not pursue such policy
and attention to the situation of the poor is a recent development. In cases, where
governments wanted to help the poor with targeted subsidies, often only a small part of
these subsidies reached the poor, while most benefited better-off consumers.
There is much evidence that prior to privatization public utilities did not do a good job in
reaching the poorest consumers. In the early 1990s, in Ghana, Mexico and Peru, access to
water and electricity for the poorest 20% of the population was much lower, and in cases
of Ghana and Peru several times lower than in 20% of the richest (World Bank, 2004).

41
Furthermore a comparison of post-privatization experience in Africa found a higher
coverage of the poor by private utilities than that by public ones (Clarke and Wallsten,
2002).
In some post-privatization cases, the situation of the poor has improved:
In Chile in the case of power services access of the poor increased greatly for
low income groups during the first ten years of private provision (Estache, et
al. 2000).
In La Paz for all utilities access of the poorest 20% increased, after no change
during five years prior to privatization. In El Alto, gains were larger than in La
Paz in water and sanitation services (Foster and Irusta, 2001).
A study of ten utility privatization cases in Latin America, mentioned earlier,
than in nine cases poverty was reduced or did not change compared to pre-
privatization situation (McKenzie and Mookherje, 2002).
Improvements in the situation of the poor were also reported in three cities in
Colombia (Cartagena, Barranquilla and Tunja), and in Dakar, Senegal, in
comparison to eight publicly managed utilities in Africa (Harris, 2003, pp. 26-
27).
As mentioned elsewhere, connections of the poor to networks, where they
took place, represented also typically reduction of prices, as other sources
used by the poor before connection are more expensive (such as buying water
from informal vendors or relying on candles for lighting or batteries for
energy).
To repeat, these examples only serve to say, that private provision does not, by
definition, deteriorate the situation of the poor in distinction from public provision
which is, by definition, better for the poor. In many cases, perhaps in most, post-
privatization situation of the poor did not improve or deteriorated. Price increases,
wherever they took place, hit poor more than better-off, since poor spend much
higher share of their income on such necessities as water, local transport and
electricity. It is poor that have in most cases been victims of the reduction of leakages
of water and electricity and improved revenue collection.19
Governments have possibilities to mitigate this negative impact by subsidizing or
defraying connection costs, providing consumption subsidies such as lifeline tariffs,
which subsidize low levels of consumption. But subsidy schemes have to be designed
in a way targeting not well-off consumers but the poor ones, which is more often than
not the case with the existing subsidy schemes (Harris, 2003, p. 29).
8. Conclusion
19
In Argentina, 436,000 of the first 481,000 additional subscribers to the privatized electricity system were
those who formerly had illegal connections (Delfino and Casarin, 2001, p. 23).
42
There is consensus in the literature that in general privatization of infrastructure has
resulted in positive economic and sometimes social results. Moreover, on two counts
most often raised by the critics of privatization – unemployment and the impact on
the poor -- recent and rigorous studies have concluded that overall, privatization has
contributed only slightly to rising unemployment and inequality and that it either
reduced poverty or had no effect on it (Nellis, J., R. Menzenes and S. Lucas, 2004).
Here are conclusions from two comprehensive reviews of the literature on
privatization, dealing largely with the privatization of infrastructure:
“The vast majority of economic studies praise privatization’s positive impact at
the level of the firm, as well as positive macroeconomic and welfare
contributions. Moreover, contrary to popular perceptions, privatization has not
contributed to maldistribution of income or increased poverty – at least in the best
studied Latin American cases” (Nellis, 2006, p. 1). Furthermore in infrastructure
industries “privatization has also produced improvements in infrastructure
industries, most often and obviously in telecommunications (where technological
change has made competition relatively easy to introduce and maintain, and
private provision has become the norm) and transport, less sweeping but steadily
in electricity and more problematically in water. What is often overlooked is that,
even in the more difficult sectors and settings, private involvement in
infrastructure generally produces results superior to those previously attained by
the public provider” (ibid., p. 23).
In the extensive literature review Megginson and Netter (2001, p. 380) conclude that
“privately-owned firms are more efficient and more profitable than otherwise
comparable, state-owned firms”. After examining 204 privatizations in 41 countries
(in all sectors, but much of it in infrastructure) they put also some perspective on the
success (and failure) rate by finding that in 20% to 33% of privatized firms there was
only slight or no improvement and in some cases, performance deteriorated (ibid., pp.
355-356).
D. The sources of discontent
In spite of this generally positive assessment by the literature, privatization, including
infrastructure privatization, has not been a popular reform. An initial support to
privatization has turned into almost general rejection of it, not only in Latin America,
a leader in privatization, but also across other developing and transition countries.
Joseph Stiglitz has campaigned for slower and more deliberate privatization and
many critics have concluded that privatization should be entirely opposed (Nellis and
Birdsall, 2007, p. 1).
Thus, the question is, why there is so much discontent with infrastructure
privatization?
Popular perceptions about privatization are not shaped by academic and other studies
or by economists and other experts making balanced judgments on the basis of the
43
“majority” or “great number” of studies or “overwhelming evidence”. They are
shaped by general public and media on the basis of negative experiences of some
groups of populations or failures of individual projects, which are picked up by media
and opponents of globalization. As is clear from the previous section, that although in
minority, there has been enough negative experiences with massive lay-offs, rising
prices and deteriorations of individual situations. In addition, privatization not
undertaken in a transparent manner has been often associated with corruption, not
only in popular mind, but also in well documented cases.
Thus a picture of privatization, which has been accepted by many is that
“privatization ….. throws masses of people out of work or forces them to accept jobs
with lower pay, less security and fewer benefits; raises, too far and too fast the prices
of …….. services sold; provides opportunities to enrich the agile and corrupt; and
generally makes the richer rich and the poor poorer” (Nellis and Birdsall, 2007, p. 1).
Governments in many countries, including those which benefited from privatization
(at least according to economic and social analyses), facing popular discontent have
done little or nothing, to try to change or balance this picture. When private investors
were foreign, they turned out to be convenient scapegoats not only for media but also
for some governments. The more so that privatization redefines the balance of power
and among losers are bureaucrats in sectoral ministries, who lose their authority perks
and perhaps even raison d’etre and managers and board members of public
enterprises, to be removed, but typically well connected to the Government.
But privatization of infrastructure in many cases benefited large segments of
populations, providing them with more, better and cheaper services. How come these
improvements seem to have gone unnoticed (again, except in economic and social
studies)? As with trade and many other economic issues, explanation is that benefits
are widely dispersed while costs are concentrated and more visible. As noted in one
study “modest average price declines thrill economists but not the broader public”
(Nellis, 2006, p. 20). For example, in several Latin American countries post-
privatization real electricity prices fell by 5-10% and in telecommunications even
more. While bringing welfare gains and welcomed by masses of consumers, such
changes typically do not mobilize beneficiaries in favour of the policy or the
reforming government.
By contrast, negative effects, especially dismissals, are concentrated and thus visible,
and typically strongly opposed by powerful public sector unions. Well-off consumers
about to lose subsidies also represent a strong opposition to unwelcome changes and
often press governments not to change policy to their detriment. Thus “losses of
comparatively large magnitude, among stakeholders of this nature, typically result in
protest, direct political action, or equally (if not more) effective bureaucratic delay
and misdirection. It is easier to mobilize protest against losses, and generate sympathy
for the losers than to engender gratitude for gains” (ibid., p. 20).
In addition, at the beginning of privatizations, to gain popular support, governments
often oversold privatization as a key to rapid and sustained growth and social
44
progress. The result was unrealistic expectations and broken promises and when they
were not fulfilled, the backlash was strong. Governments typically overestimated
their capacity to manage high expectations of consumers and the electorate and have
often chosen to behave opportunistically. Many governments, which initiated and
implemented privatization, lost power and were replaced by new ones, winning,
among others on anti-privatization banners. But few of the latter, if any, have tried to
turn the privatization-clock and return to public provision.
In a dense atmosphere around privatizations, the nationality of private investors, most
of them foreign, in infrastructure and other services, notably banking, has become an
issue, not only in developing but also in developed countries. Any real or perceived
misbehavior of foreign investors catches the public’s eye and memory easier than
domestic ones and becomes often an election issue, reducing the pool of future
potential investors in infrastructure in the absence of domestic alternatives.
This is of course not to say that the criticism of infrastructure privatization is not
justified. It is. There were many negative economic and social effects of privatization,
but not the majority and not across the board as it is sometimes asserted. Mistakes
have also often been made and promises have been broken but, again, in minority of
cases. Also generalizations about privatization have proven unfounded: that it leads to
(permanent) losses in employment and it is always at the cost of the poor. Overblown
criticism makes it more difficult for experienced privatizers to correct mistakes of the
past and for newcomers to learn from bad experiences of their predecessors, which
remain in most cases the only practical way ahead.
IV. POLICY ISSUES
A. Policy reforms
Since the mid-1980s, developing countries and transition economies have begun to
permit private investment in infrastructure. Today most of them have at least some
private provision of infrastructure services, which in most cases involves foreign
provision in the form of FDI or non-equity FDI.
Most countries in Asia and many in Africa have attracted private investment to
unreformed infrastructure systems. In these countries public monopolies have maintained
their central role and private providers have been expected to increase the supply of
services, which have been sold to SOEs and not to final consumers. The system has been
based, as before, on vertically integrated public monopolies, and managed by
governments which, among others, have set the tariffs and subsidized certain types of
consumers through either differentiated tariffs (called cross-subsidies) or direct payments
financed from taxes.
Conversely, many countries of Latin America and Central and Eastern Europe have
undertaken deep reforms of infrastructure industries, aimed at their rehabilitation and
expansion through increasing efficiency, while at the same time maintaining social
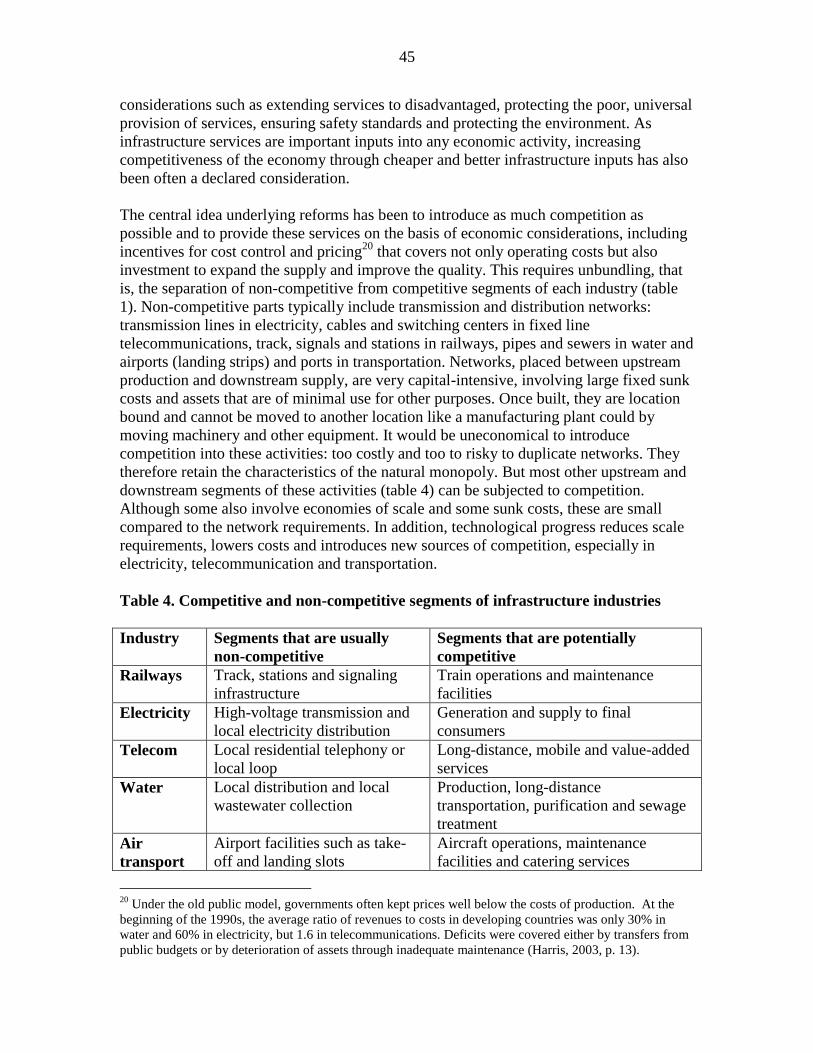
45
considerations such as extending services to disadvantaged, protecting the poor, universal
provision of services, ensuring safety standards and protecting the environment. As
infrastructure services are important inputs into any economic activity, increasing
competitiveness of the economy through cheaper and better infrastructure inputs has also
been often a declared consideration.
The central idea underlying reforms has been to introduce as much competition as
possible and to provide these services on the basis of economic considerations, including
incentives for cost control and pricing20
that covers not only operating costs but also
investment to expand the supply and improve the quality. This requires unbundling, that
is, the separation of non-competitive from competitive segments of each industry (table
1). Non-competitive parts typically include transmission and distribution networks:
transmission lines in electricity, cables and switching centers in fixed line
telecommunications, track, signals and stations in railways, pipes and sewers in water and
airports (landing strips) and ports in transportation. Networks, placed between upstream
production and downstream supply, are very capital-intensive, involving large fixed sunk
costs and assets that are of minimal use for other purposes. Once built, they are location
bound and cannot be moved to another location like a manufacturing plant could by
moving machinery and other equipment. It would be uneconomical to introduce
competition into these activities: too costly and too to risky to duplicate networks. They
therefore retain the characteristics of the natural monopoly. But most other upstream and
downstream segments of these activities (table 4) can be subjected to competition.
Although some also involve economies of scale and some sunk costs, these are small
compared to the network requirements. In addition, technological progress reduces scale
requirements, lowers costs and introduces new sources of competition, especially in
electricity, telecommunication and transportation.
Table 4. Competitive and non-competitive segments of infrastructure industries
Industry Segments that are usually
non-competitive
Segments that are potentially
competitive
Railways Track, stations and signaling
infrastructure
Train operations and maintenance
facilities
Electricity High-voltage transmission and
local electricity distribution
Generation and supply to final
consumers
Telecom Local residential telephony or
local loop
Long-distance, mobile and value-added
services
Water Local distribution and local
wastewater collection
Production, long-distance
transportation, purification and sewage
treatment
Air
transport
Airport facilities such as take-
off and landing slots
Aircraft operations, maintenance
facilities and catering services
20
Under the old public model, governments often kept prices well below the costs of production. At the
beginning of the 1990s, the average ratio of revenues to costs in developing countries was only 30% in
water and 60% in electricity, but 1.6 in telecommunications. Deficits were covered either by transfers from
public budgets or by deterioration of assets through inadequate maintenance (Harris, 2003, p. 13).
46
Source: Gonenc, Maher and Nicoletti, 2000, p. 65 and Kessides, 2004, p. 37.
Thus unbundling is a key component of market-based reforms in infrastructure. It should
involve not only vertical unbundling of competitive and monopoly components of each
industry, but also horizontal one (e.g. splitting a national network into regional ones
and/or permitting several producers to supply one network and sell services leaving the
network, if economies of scale can support several producers)21
to fully exploit potential
for competition. Unbundled parts and firms should be operated by different owners,
competing with one another in competitive segments. Restrictions on ownership
(including discrimination between foreign and local investors) and entry of new firms
should be relaxed or altogether abolished. Network segments involving natural monopoly
– regardless of whether publicly or privately owned – and interactions between
competitive and non-competitive segments should be regulated by special legislation,
implemented by independent regulatory agencies. And finally the provisions to meet
social objectives should be part of regulations.
Note that privatization of services delivery through divestitures or greenfield investment,
the most visible manifestation of reforms, is but one component of reforms, not
necessarily the most important one. It is unbundling, competition and effective regulation
that are the key components of successful infrastructure reforms. Witness, for example,
attempts to deregulate and liberalize services within the internal market programme of the
European Union. While doing this through dismantling monopolies, regulatory reform
and introducing more competition, the EU does not have competence on ownership
matters. As a result many infrastructure companies in Europe remain publicly or partly
publicly owned, increasingly competing with one another and with private firms. Many
of them turned into leading TNCs in infrastructure industries worldwide. It is possible,
because the reform involves the entire huge market of the European Union, which can
accommodate many companies in a single industry. There is also a little chance of
regulatory capture of a regulator – the European Commission – at the level of the EU by
companies or governments (although there are such attempts within individual countries
– witness government supported delays in opening up national markets to competition in
telecommunications in Germany and France).
But in national markets privatization of delivery is generally a natural complement to
reforms. Private companies are considered superior to public ones in efficient
performance. In a number of countries it has been hard to improve the performance of
SOEs, especially to turn round highly inefficient ones. Furthermore, it would not make
sense to unbundle a monopoly into several companies supposed to compete with one
another and to leave them under one (public) ownership. When government is no longer a
provider of services it can more easily allow genuine competition and perform regulatory
function via independent agencies. Combining ownership with regulatory function does
not work. In many countries, privatization has often preceded unbundling, regulation and
the establishment of regulatory agencies. This may be understandable, given that utilities
were worn out, SOEs were on the verge of collapse and indebted governments lost the
financial capacity to continue to support them. But unprepared and partial reforms
21
In small countries this is not always possible, given small size of national markets.

47
resulted in replacing a public monopoly with a private one. Although, as indicated in
chapter I, such a change resulted in some improvements, it also brought lasting economic
and social cost and stalled or delayed further reforms.
Introducing competition-based infrastructure reforms is a tall order, not only in
developing countries lacking institutional and regulatory capabilities but also in
developed countries, as the examples of the failure of railway privatization in the United
Kingdome and electricity shortages in California indicate. Many things, in addition to
improper sequencing of reforms, mentioned in the preceding paragraph, can and have
gone wrong, limiting and/or delaying expected positive results of reforms, reducing
public support for private provision of infrastructure services and enthusiasm of both
governments and investors. There is a large literature analyzing infrastructure reform
experiences and proposing further course of action. What follows is a brief discussion of
some key problems.
The inability or unwillingness to overcome the legacy of the past lies at the heart of many
recent problems with reforms. Prices of services, especially those of water and electricity,
have always been politically sensitive. Therefore, under the old public model,
governments kept prices well below the costs of production. At the beginning of the
1990s, the average ratio of revenues to costs in developing countries was only 30% in
water and 60% in electricity, but 1.6 in telecommunications. Deficits were covered either
by transfers from public budgets or by deterioration of assets through inadequate
maintenance (Harris, 2003, p. 13).
When subsidies proved no longer to be sustainable, governments turned to private sector
provision. Some of them, relieved from the burden of subsidies and uplifted by revenues
from the sale of infrastructure assets, have, however, overlooked the key issue of the past,
namely that services have to paid for either by users or taxpayers, regardless of whether
provision is public or private. In many cases, private operators have been able to reduce
costs so that prices that were not sustainable under public provision could not only cover
costs, but as shown in chapter II, they could even be lowered. But in other situations were
prices were much lower than costs, efficiency improvements alone could not help and, in
the absence of subsidies, tariffs had to be raised, provoking often outrage by consumers
and NGOs. Even if governments understood the need for price increases and agreed to
economically justified tariffs, they often overestimated their ability to manage the politics
of reform. In still other cases governments “behaved opportunistically, promising rational
tariffs and other policies to attract investors but then hoped to renege on these
commitments once investments were made” (Harris, 2003, p. 13), a classic case of
obsolescence bargaining.
Problems related to implementing and sustaining the reform process have been more
acute in electricity and water than in telecommunications, ports, airports and rail freight.
The latter sectors do not serve or serve less the general public than the former ones. In
addition, as shown above, electricity and water services were under-priced much more
than other services, thus requiring much larger price adjustments, and attracting the
largest amount of criticism, including from NGOs.

48
In many cases of problematic investments, investors have not been blameless, either,
overestimating the ability of governments to manage reforms, to honor their
commitments and to sustain stable macro-economic policies, excluding the risk of
devaluations, damaging business plans of projects involving foreign investors.
Miscalculation of risks and neglecting sound project fundamentals might have been
caused by the belief of some investors that, given the importance of infrastructure, should
a project go wrong, government would step in bail them out. There were also cases of
over-bidding by investors in telecommunications (for radio spectrum in developed and
developing countries) and in electricity in larger countries, caused by a perceived
pressure to take a strategic position in important markets.
Problems with a number of infrastructure projects, public disappointment with
privatization and declining levels of private investment in infrastructure have brought
back the issue of private vs. public provision of infrastructure. Governments have
sometimes made private (foreign) investors scapegoats for price increases, reinforcing
sentiment against privatization. Among many opinions evaluating the experiences with
reforms of infrastructure, a credible one seems to be that private participation in
infrastructure is neither a panacea nor the root cause of problems experienced during the
past decade. “With the new institutional arrangements brought in by private provision, it
became much more difficult to sweep difficulties such as unsustainable pricing policies
under the carpet. Legally binding contracts and hard budget constraints replaced the lack
of accountability and financial discipline by public enterprises. This flashed into the open
the problems that had been left unattended during the era of public sector provision”
(Harris, ibid. p. 15). This explains the reluctance of many governments, often critical of
private providers, to go back to the public model: governments realize that the public
provision will not solve the problem of rational pricing of utilities, as it did not in the
past. Hence the small number of cancellations, attempts to re-privatize rather than
nationalize failed projects and continued desire to attract new private investors even in
countries showing strong disappointments and policy reversals vis a vis earlier private
projects. This indicates that the only feasible solution for the future is to learn from past
experiences to improve regulatory frameworks, to strengthen institutions and wherever
needed to put projects on more realistic basis through renegotiations.
B. FDI policy: to what extent countries allow FDI and TNCs in infrastructure?
By the mid-1980s, when the process of FDI liberalization accelerated, mainly in
manufacturing, and became the norm worldwide, infrastructure services were closed to
FDI in most countries of the world. The rapid growth of FDI in infrastructure services
during the 1990s, in particular in telecommunications, electricity and water, worldwide
and in developed and developing countries, is testimony to progressing liberalization of
FDI in these services. Between 1990 and 2002, the dollar value of total inward stock in
electricity jumped by 14 times and that in telecommunications and storage and transport
rose by nearly 14 times, resulting in significant increases of the share of these industries
in world stock of FDI (UNCTAD, 2004, pp. 98-99). In spite of that, by 2004, both in
developed and developing countries, telecommunications and electricity have remained

49
the most heavily restricted industries, as regards FDI (UNCTAD, 2006, p. 19). One could
add to that list water and transport infrastructure (airports, ports and railways), which are
typically overlooked in this type of analysis. Moreover, based on data in chapter I, one
can reasonably assume that these industries are even more restrictive to FDI than
telecommunications and electricity. They are, however, more open than is the case of FDI
to TNC activities in the form of non-equity agreements.
During the initial phase of FDI liberalization in infrastructure services, there has been a
strong correlation between liberalization and FDI inflows. This is in clear distinction
from manufacturing and many other service industries. In manufacturing, all countries
are not only open to FDI but are competing with one another for certain types of this FDI,
but only a few receive it in satisfactory quantities. In infrastructure services, it seems,
most countries, which initially wanted FDI, received it. One explanation is, that the
process of FDI liberalization in infrastructure services started practically almost from
zero level some 15-20 years ago. Another is that with few exceptions, such as mobile
telephony, entry into a host country, regardless of its form (greenfield, privatization or
non-equity forms) gave a TNC or other investors a guaranteed, already existing market,
with significant potential for long-term growth, given huge unsatisfied demand for
infrastructure services. In addition, as mentioned above, in many cases entry was often
associated with a monopoly position, sometimes guaranteed in contracts for many years.
Few TNCs could have resisted such opportunity, and initially infrastructure projects
typically had several bidders, on average four in developing countries [source]. The
relationship between liberalization and FDI weakened significantly around 1997-1998,
when cracks occurred in many projects (see chapter I) and cancellations, renegotiations
and disputes multiplied.
Liberalization of FDI in infrastructure services is in some ways distinct from that in
manufacturing and many (not all) other services. FDI in manufacturing is more often than
not based on the rules -- rules of entry, treatment and operations of investors – which are
often, especially in developing countries, clearly spelled out, and legally binding in
investment codes and some international agreements (e.g. TRIMS). Even if codes or
agreements cover all industries, infrastructure industries are the most frequent exceptions,
sometimes included in constitutions. In infrastructure services, FDI liberalization has
been associated with the shift from public to private provision of services through
divestitures, greenfield projects or concessions and other types of contracts. Therefore,
allowing FDI has involved case-by-case (or rather project-by-project) unilateral decisions
of countries. Case-by-case opening is normal, given that opening to FDI has been
associated with the sale of already existing public monopolies, with state as a sole owner,
to private investors. Also in the case of greenfield infrastructure investment there has not
been a wholesale opening up to FDI, as infrastructure projects are localized and
associated with the existing market, national or regional wihin countries. Thus decisions
concerning the choice of investors are typically done through the process of bidding for
each project pre-approved by a central or local government. This resembles and old, long
abolished, FDI screening process for large projects in manufacturing industries. Even in
competitive activities, such as mobile telephony, governments can control entry through
licensing of new operators. In addition, infrastructure projects, including privatizations,
50
are typically based on agreements, with a government as a party, influencing terms and
conditions of each project and being able to impose obligations on investors – an
equivalent of performance requirements in manufacturing industries.
But still, at the beginning of the 21st century, all groups of countries are much more open
to FDI and TNC activities in infrastructure services than they had been some 20 years
ago. At the same time, FDI policy in these services is still much more restrictive than in
the manufacturing sector and many other services (such as business services or tourism).
In manufacturing, FDI policies of countries have largely converged towards liberalization
As regards infrastructure services, as hinted in chapter I, there are still huge differences
among countries and across industries as regards a degree of openness to FDI and TNC
activities.
Measuring a degree of restrictiveness or liberalization of FDI policies is difficult and
there are not too many studies dealing with this issue. Few studies which do, are based on
descriptive analyses. One study has, however, attempted to quantify a degree of
restrictiveness of FDI policy in 11 service industries, 18 sub-industries and 50 developing
and transition economies,22
including in telecommunications, electricity and
transportation (UNCTAD, 2006). Transportation includes all types of transportation, but
does not distinguish transportation infrastructure, of interest here (operation of ports,
airports, toll roads, tunnels or bridges) from other operations such as coastal
transportation, airlines or railway companies. The study covers entry restrictions,
screening and approval procedures and operational restrictions on foreign management,
expatriates and labour market or other restrictions. Every restriction is given a score,
which are then summed up for every country and or industry to determine a degree of
restrictiveness on a 0-1 scale, with 0 representing full openness and 1 a prohibition of
FDI.
In spite of the shift to private delivery and FDI liberalization, infrastructure services are
the most restrictive among services industries in developing and transition economies,
with electricity and fixed line telecommunications leading the list, with a degree of
restrictiveness, respectively, 0.6 and 0.48 (figure 2). The least restrictive service industry,
constructions, scores 0.18 in 50 countries.
22
14 countries from Africa, 13 from Asia 17 from Latin America and the Caribbean and 6 transition
economies.

51
Figure 2. Restrictiveness of FDI policy of 50 developing countries in
service industries, 2004
0 0.1 0.2 0.3 0.4 0.5 0.6
ElectricityTelecom fixed
RailDomestic air
International airTelecom mobile
FinanceTrans. Dom.
Trans. Int. maritimeRoads
BusinessTourist agency
DistributionEducation
Hotels & Rest.Construction
Source: UNCTAD, 2006, p. 36
As regards regions, Asia is the most restrictive region for FDI in infrastructure industries
among developing and transition economies regions and transition economies of Central
and Eastern Europe the least restrictive, followed by Latin America and Africa (figure 3).
As regards individual industries – power, telecommunications and transport – the pattern
of regional restrictiveness is similar to the average with, however, few exceptions. Asia is
the most restrictive region in all three industries. In telecom Africa is slightly less
restrictive than Latin America. In transport, transition economies are more restrictive than
both Africa and Latin America and in power more restrictive than Latin America, which
is thus in this industry the least restrictive region. As rankings are based on average
country and industry scores for each region, transition economies owe the best average
score to much lower degree of restrictiveness level in telecommunications than that in
other regions (figure 2). Within some regions, notably Latin America, there are big
differences among individual countries as regards an average level of restrictiveness in
the three industries. Five Latin American countries are among the ten least restrictive
developing and transition economies, but three are also among the top ten most restrictive
(seven are Asian countries). Three African countries are among the least restrictive along
with two transition economies (figure 4).
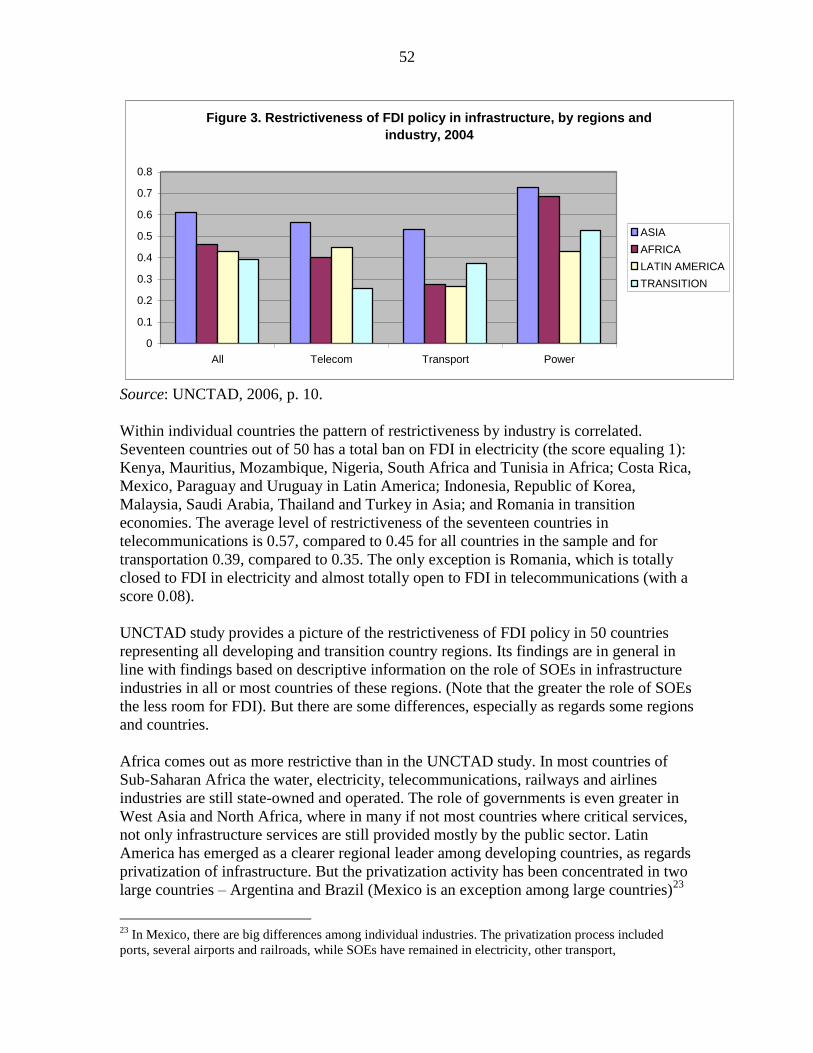
52
Figure 3. Restrictiveness of FDI policy in infrastructure, by regions and
industry, 2004
0
0.1
0.2
0.3
0.4
0.5
0.6
0.7
0.8
All Telecom Transport Power
ASIA
AFRICA
LATIN AMERICA
TRANSITION
Source: UNCTAD, 2006, p. 10.
Within individual countries the pattern of restrictiveness by industry is correlated.
Seventeen countries out of 50 has a total ban on FDI in electricity (the score equaling 1):
Kenya, Mauritius, Mozambique, Nigeria, South Africa and Tunisia in Africa; Costa Rica,
Mexico, Paraguay and Uruguay in Latin America; Indonesia, Republic of Korea,
Malaysia, Saudi Arabia, Thailand and Turkey in Asia; and Romania in transition
economies. The average level of restrictiveness of the seventeen countries in
telecommunications is 0.57, compared to 0.45 for all countries in the sample and for
transportation 0.39, compared to 0.35. The only exception is Romania, which is totally
closed to FDI in electricity and almost totally open to FDI in telecommunications (with a
score 0.08).
UNCTAD study provides a picture of the restrictiveness of FDI policy in 50 countries
representing all developing and transition country regions. Its findings are in general in
line with findings based on descriptive information on the role of SOEs in infrastructure
industries in all or most countries of these regions. (Note that the greater the role of SOEs
the less room for FDI). But there are some differences, especially as regards some regions
and countries.
Africa comes out as more restrictive than in the UNCTAD study. In most countries of
Sub-Saharan Africa the water, electricity, telecommunications, railways and airlines
industries are still state-owned and operated. The role of governments is even greater in
West Asia and North Africa, where in many if not most countries where critical services,
not only infrastructure services are still provided mostly by the public sector. Latin
America has emerged as a clearer regional leader among developing countries, as regards
privatization of infrastructure. But the privatization activity has been concentrated in two
large countries – Argentina and Brazil (Mexico is an exception among large countries)23
23
In Mexico, there are big differences among individual industries. The privatization process included
ports, several airports and railroads, while SOEs have remained in electricity, other transport,
53
– and a few smaller ones, such as Jamaica, Bolivia, Chile and Peru. In a number of other
countries of the region, state enterprises are still in operation. In Europe and Central Asia,
in spite of recent advances in privatizing telecommunications, there is still a large stock
of utilities (especially in electricity and water industries) that are state-owned. Most of
Asia (other than West Asia) has lagged behind other regions and especially Latin
America and transition economies of Europe in privatization activities, permitting private
investment, in most cases foreign, in the form of greenfield projects. In China and India,
SOEs dominate key infrastructure activities (Kikeri and Kolo, 2005, pp. 15-19).
As regards infrastructure industries, in descriptive analyses of countries included in the
World Bank PPI data base, telecommunications and electricity emerge as more open to
private activities than water and transport. Restrictiveness of transport comes as a
surprise, when compared to the UNCTAD study. But it is probably so, because the data
base covers only transport infrastructure while the UNCTAD study focuses more on
operations of transport firms. In addition the data base covers all types of private
participation, including non-equity forms. Thus in transport infrastructure nearly 60% of
all developing countries do not have any form of private infrastructure, thus excluding
FDI and TNC activities. Transport concession have been concentrated in Latin America
and East Asia, with minimal or no activity in other regions. In water, in 70% of all
developing countries there is no private participation (ibid., p. 20).
In electricity and power, the number of countries with SOEs is also relatively high, but it
is not representative of FDI or TNC restrictions, because as mentioned before, in both
industries SOEs can coexist with private (including foreign) operators. For example,
countries in Asia have retained SOEs in electricity, but a number of them has permitted
foreign investors in Greenfield projects. In telecom SOEs in fixed telephony can coexist
with private investors in mobile service.
Electricity utilities are still owned and operated by the state in 85, or 55%, of all
developing countries in the PPI data base. But a more detailed survey of 52 developing
countries shows that in many of them private independent power providers (many of
them presumably foreign) operate along with SOEs. Thus almost 70% of these countries
had not started or completed the process of bringing private participation into electricity,
while 18% had begun the process at the beginning of the 21st century. But independent
providers had been established in 67% of these countries and another 21% planned to
open electricity markets to these providers (ibid., pp. 19-20). Full state ownership of
power utilities is prevalent in low-income countries. It is so in 32 out of 47 countries of
Sub-Saharan Africa, while only eight countries have had concession contracts and seven
management or lease contracts (Gokgur, 2004).
In telecommunications, in line with previous findings, the greatest room for private
participation and TNC activities exists in transition economies of Europe and Central
telecommunications and postal services (Source: OECD, Regulating Market Activities by Public Sector, 1
February 2005).

54
Figure 4. Restrictiveness of FDI policy in infrastructure in developing
and transition economies, 2004
0.00 0.10 0.20 0.30 0.40 0.50 0.60 0.70 0.80 0.90 1.00
UgandaCzech Rep.
ArgentinaSenagalJamaica
BoliviaTanzaniaHungary
GuatemalaChilePeru
El SalvadorGhana
Trinidad &Mongolia
DominicanColombia
IndiaVenezuela
PolandPakistanEcuador
AlgeriaNigeria
RomaniaQuatar
SloveniaMorocco
EgypParaguay
BrazilRussian Fed.
Sri LankaChina
MozambiqueKenya
TunisiaSouth Africa
MauritiusEthiopia
Korea Rep. ofMalaysiaThailand
TurkeyUruguay
MexicoPhilippines
IndonesiaCosta Rica
Saudi Arabia
Asia where, respectively, in only 40% and 30% of countries telecom operators were fully
state-owned and operated at the beginning of the 21st century. In West and South Asia,
respective shares were 65% and 60% (ITU, 2003). In Sub-Saharan Africa, the picture is
varied. The main operator has been fully state-owned in 27 countries. In 17 of these

55
reforms have not started, while in the remaining 10 they have been initiated but stalled or
delayed for political and/or market reasons. The remaining 20 countries have had varying
levels of private participation, mostly foreign [CHECK], but only Somalia is fully
private. 13 countries have majority private participation, while six sold minority shares to
private investors (World Bank, 2005).
In developed countries, FDI in infrastructure takes mainly the form of cross-border
M&As: foreign investors have acquired infrastructure networks that had already been
privatized, participated in privatizations of networks and in PPPs. For example, in OECD
member countries FDI inflows into transportation and telecommunications, typically
reported together in FDI data, increased as a share of total inflows into the services sector
from 0.5% in 1990 to 16% in 2002, largely as a result of privatizations and investments in
mobile telephony and multimedia companies (OECD, 2004). During 1993-2002, the
average share of infrastructure industries in total FDI inflows of selected OECD countries
with data was 9%. For individual countries proportions varied from 6-7% in Italy and
Spain (known for the protective attitude towards infrastructure) and 16% in Sweden and
20% in the United Kingdom (Davies, 2004, p. 31), which are among the most liberal
countries for infrastructure services. Protective attitudes of some developed countries vis
a vis own infrastructure enterprises, such as France, Italy and Spain, do not prevent and
most likely help these enterprises to expand abroad in both developed and developing
countries. As a result the share of infrastructure services in outward FDI is much higher
than in inward FDI, e.g., in Spain 23% vs. 7%.
Increased role of FDI in infrastructure services of developed countries has taken place in
the context of infrastructure reforms which started in the United States in the late 1970s
and accelerated during the 1980s. These reforms in air transportation, rail, road transport,
telecommunications, gas and electricity took the form of deregulation of markets and
dismantling of private monopolies, as the United States did not have state-owned
companies. The United Kingdom, which had SOEs, followed during the 1980s and 1990s
with privatizations and deregulation. In the 1990s, the European Union joint the
reformers with a single market programme, issuing directives, which liberalized and
created a common regulatory framework in telecommunications, railways, electricity and
natural gas markets. The emphasis of the EU reforms is, as mentioned earlier, not on
ownership, but on unbundling, introducing competition and regulating remaining natural
monopoly elements.
The liberalization of FDI policy in infrastructure followed, but as with developing and
transition economies, it has been uneven across countries and sectors. Consequently,
OECD countries still have a relatively restrictive FDI environment in electricity,
transport, telecommunications and water by comparison with other industries, often
taking the form of explicit limits on foreign ownership of domestic firms (Davies, 2004,
p. 5). As regards post-entry restrictions, as measured by exceptions from national
treatment, they are also most common in infrastructure industries. On the matrix of
exceptions from national treatment, organized by OECD member countries and
individual industries, 45% of the entries fall within the category of infrastructure services,
especially air and maritime transport, postal services and telecommunications and
56
electricity (Davies, 2004, pp. 9-11). Remaining restrictions are motivated by various
reasons in different countries, ranging from national security and protectionism to
competition and consumer protection. A number of European countries pursues a policy
of promoting national champions – witness defensive actions of a number of
governments in recent years preventing national champions from foreign takeovers. With
the emergence of infrastructure TNCs from developing countries, more and more
frequent are the cases of government intervention in developed countries, directed
specifically against foreign takeovers by developing country TNCs.
C. Policies to benefit and address concerns
Given the pressing need of developing countries to improve and expand infrastructure,
very high capital intensity of infrastructure projects, low savings rates and
underdeveloped local capital markets in developing countries, FDI is likely to continue to
play a major role in infrastructure of these countries. The scale of infrastructure needs
and associated necessary financing are so vast that no viable alternative exists to satisfy
all these needs. In addition in many countries, where finance could be available, at least
partly, there will be no local investors ready to undertake risky projects at the sufficient
level of efficiency. This is not to say, of course, that all developing countries in all
infrastructure industries will have to rely on FDI or TNCs. But many of them, especially
low-income countries, will.
However, attracting FDI into infrastructure may no longer be so easy as it was in the first
half of the 1990s. Not only the internal opposition to the privatization of infrastructure
(and to infrastructure TNCs) has grown in many countries but also many investors have
been put off by failures of projects due to governments reneging on their promises,
regulatory takings or obsolescence bargaining. A number of investors withdraw from
developing countries and many are in the middle of disputes or renegotiations of the
terms of agreements with host governments. This makes investors realize that they
wrongly calculated risks of investing in developing countries and substantially weakens
their appetite for further investments. Therefore developing country governments wishing
to attract FDI will need to pay greater attention than before to reducing their countries’
risks as far as they are related to their policy, legal and regulatory environment and
handling of infrastructure FDI so far.
The key message from chapter III on the impact is that countries which went further in
reforming infrastructure services, and did it well, benefited more. Thus improving
policy, legal and regulatory frameworks and strengthening institutions and capabilities
will not only make it easier to attract FDI but also to increase benefits from FDI, or any
type of private provision of services. Reforming infrastructure is not an FDI issue. But
attracting FDI into it is, in the absence of many other investment alternatives. The fact
that TNCs have participated so far in over 85% of private infrastructure projects in the
developing world makes de facto all issues, including issues related to impact and policy
issues, TNC-related issues.

57
As is clear from preceding discussions, broadly speaking, there are two groups of
countries in the world as regards the participation of TNCs in infrastructure. One group
includes countries, which attracted FDI into a traditional public model of infrastructure
provision, relying on SOEs with heavily subsidized infrastructure services. The main
objective of these countries as regards FDI has been to increase the production of
services. Another, growing group of countries have attracted FDI into a new, still largely
experimental system, relying on the private provision of services. The (implied)
expectations of these countries vis a vis TNCs have been that TNCs will contribute to
achieving the objectives of reforms, that is, will not only increase the production of
services, but also expand coverage to all segments of population, improve the quality of
services, make them cheaper and more efficient, and provide revenues to the government
and let it get away from costly subsidies. Now, some two decades later reforming
countries are in different situations. In some, reforms are quite advanced while in others
reforms are partial. Some countries, including many LDCs have not yet started
reforming. The implication is that the needs of these countries as regards policy
improvements vary greatly. Countries with advanced and relatively successful reforms
debate how to fine tune the details, e.g., what types of tariffs are best for each industry,
what types of subsidies or policy measures best reach the poor, how to introduce more
competition and reduce the need for regulation. Others, which gave private investors
monopoly rights struggle with how to force them to share benefits with broader
population and business. Those which are about to start privatizations focus on how to
avoid mistakes made by pioneering privatizers.
As already noted, infrastructure reforms are objectively very difficult and pose one of the
greatest policy challenges to developing countries. Even pioneering developed countries
such as the United States and the United Kingdom, which had enough time to un-bundle
monopolies, prepare institutions and regulatory frameworks did not avoid some serious
mistakes. It is worth to remember that many developing countries initiated infrastructure
reforms under the pressure of the situation, with infrastructure or parts of it crumbling,
SOEs in bankruptcy and government coffers empty in the middle of the debt crisis. Many
were preparing the necessary regulatory and institutional components of reforms while at
the same time pursuing privatization and opening up to FDI (for the first time ever in
these services) in the absence of domestic investors (though in some large countries
domestic investors competed with foreign ones for the purchase of state-owned assets).
Mistakes have, therefore, been unavoidable, reducing benefits from private participation
and FDI. In many cases less than optimal choices were deliberate, given the difficult
political economy of privatization in general and infrastructure reforms in particular.
What follows is a brief discussion of key policy areas, which are important for successful
reforms, and by extension increase countries’ chances to benefit more from FDI at the
same time reducing concerns related to FDI. Privatization-related issues are omitted in
this discussion, as they have been extensively examined in UNCTAD, 2004, pp. 187-194
(see, for example, box V.2 Check-list for privatizing services through FDI, p. 190).
It is trivial to note, that for reforms or any policy to have a chance to be successful,
governments need first to establish clear objectives, to build consensus around these
58
objectives through public education and consultative mechanisms and to ensure
cooperation of government agencies in meeting these objectives. But the short history of
infrastructure reforms or rather privatization is testimony to how difficult it is to
formulate clear, realistic and consistent objectives, without misleading the public and
raising unrealistic expectations. Many countries limited their actions to selling public
monopolies to private firms and eventually introducing some monopoly regulations while
selling these actions as “reforms” supposed to achieve objectives mentioned above such
as increased production and coverage, better quality, lower prices for all, increased
government revenues and avoiding negative social consequences. However, to have a
chance to achieve most of these objectives, real comprehensive reforms are needed, in
which privatization is but one component, not necessarily the most important one. As
outlined above the idea of reforms in infrastructure is not centered around the change of
ownership, but around the possibility of introducing as much competition as possible
(through un-bundling and restructuring), regulating the remaining elements of monopoly
and addressing the issue of how services will be paid for under private provision.
Privatization alone can help achieve only some of these objectives.
Important is not only to include all these elements in the programme of reforms24
but also
their proper sequencing. Thus competitive restructuring, introducing regulation and the
establishment of an independent regulatory agency should take place prior to
privatization. Such sequence establishes clear rules of the game for future new players in
the industry. In addition it assures potential investors of both competitive and monopoly
elements. It also reduces the risk of regulatory capture and frustrating the efforts to
introduce competition by established companies.
Evidence suggests that the introduction of competition, wherever it is possible to do so,
will deliver best results and greatest benefits. But introducing competition is not equally
easy in all infrastructure industries. It has been easiest in telecommunications, due among
others to mobile telephony. In this industry competition has driven costs and price
reductions, innovation and expanded services. In a number of cases it permitted the
withdrawal of government from the regulation of tariffs. In electricity or natural gas,
competition is more difficult, but possible. Many markets are too small to accommodate
more than one supplier, making it impossible to dismantle a natural monopoly. Others
can accommodate too few to make competition feasible. In these cases it is possible to
introduce some form of regulated competition, as has been the case in Argentina, Chile
and Peru (Harris, 2003, p. 33).25
24
New Zealand introduced only competition, without regulation, in its power industry by mandating
separation of generation, transmission and distribution. But competition alone proved to be insufficient to
control pricing in natural monopolies and price control over power suppliers had to be imposed (Patterson
and Cornwall, 2001). 25
But even in large countries privatization and competition in electricity might not always be advisable. In
Brazil, for example, hydropower accounts for 95% of electricity. It is generated by large multiyear storage
dams, which are also used for irrigation and other purposes, requiring close coordination between water
authorities and power dispatchers. These conditions provide a strong argument for public ownership and
operation of the dams (Kessides, 2004, p. 43).
59
The scope for introducing competition in water and sewerage services is even more
limited than in other utilities. Local networks of pipes and sewers remain quintessential
natural monopolies. Unbundling is not especially attractive, because costs of producing
water are low relative to the value added at the transportation stage, although this may
vary across countries. Opportunities for competition are greater in sewage treatment.
Franchising is considered the best way of increasing competition (Kessides, 2004, p. 46).
Where competition can be introduced, to develop and maintain it is not sufficient to un-
bundle and ease the rules on market entry, by, for example, facilitating access to network
facilities and other infrastructure. Competition law and competition agency are necessary
supplements of a competitive environment in infrastructure services (Kessides, 2004, p.
69, after Willig, 1992 and Newbury, 2003). Competition policy can also serve as a useful
device protecting against regulatory capture and to counterbalance the power of a
regulatory agency. Competition agency should thus have the mandate to review
regulatory decisions, assess their impact on competition and take action against firms that
use the regulatory process for anticompetitive purposes. Where competition can not be
introduced, regulation serves as an alternative to competition.
Competition, while leading to welfare gains at the macro-level, will, however, typically
erode cross-subsidies26
, leading to negative distributive consequences for some groups of
consumers, including elderly and low income consumers. This might be difficult
politically, especially in electricity and water, and therefore governments night need to
consider the gradual phasing out of subsidies, addressing the problem within the welfare
system or replacing indirect subsidies with direct ones in the form of grants. In addition,
introducing competition in the markets where it has not existed, may require a support to
consumers, if they are to benefit from a change. For example, in the United Kingdom, a
consumer agency, called Energywatch, separated from the regulator, provides
information to consumers and acts as their advocate vis a vis companies, the regulator
and the government (Davies, L. et al, 2005, p. 13).
A second indispensable element of reforms is regulation and the establishment of an
agency to implement regulation. Evidence suggests that a regulatory agency that is
independent, that is, is separate from the executive branch of the government and
immune to political interference is likely to maximize benefits from reforms, balancing
the interests of consumers and services providers and sending the right signals to foreign
investors. Regulator’s independence provides the private investor with a degree of
comfort (but not guarantee) that investment will not be subjected to political intervention
or regulatory takings. An independent regulator might also act in the interest of
consumers, making sure that productivity gains are shared with them rather than taxed
away by the government.
It is not only the independence of the regulator but also the quality of regulations what
matters – the regulator will not be able to achieve much if regulation is bad. From the
26
Cross-subsidies occur when lower prices for some groups of consumers or services are subsidized by
higher prices for others. Examples include higher rates for international calls than local calls in
telecommunications and higher electricity rates for industrial consumers than for households.

60
perspective on investors regulation should provide for issuing licenses with legally
enshrined rights (including property rights where relevant) and obligations to the utilities,
include procedures for dispute resolution and provide for the possibility of adequate tariff
levels. From the perspective of consumers it may include a priori intentions that
efficiency gains should be shared with consumers. The task of regulation is also to
minimize the room for the conflict of interest between participants in the infrastructure
market: competing firms, remaining monopolies and consumers.
A key issue in any infrastructure regulations is how tariffs are set and as a result, how
regulation allocates benefits and risks among companies, consumers and government.
While choosing price regulations, countries should be aware of what they want to achieve
and what signals they sends to the industry players. These signals can lead to different
outcomes as regards the impact on the efficiency of production, efficient (not wasteful)
consumption of services, rent sharing between investors and consumers or so called
revenue adequacy of firms (which need to earn sufficiently enough to attract capital
needed for further investment) (Kessides, 2004, pp. 112-113). Basically there are two
systems of tariff-regulation: cost-plus (or cost-of-service) and price cap. Pure cost-plus
mechanism involves setting by a regulator the price covering operating expenses and
capital costs (depreciation plus an after-tax return that equals or exceeds the cost of
capital) on the basis of the bill submitted by a firm. Prices are tied to accounting costs.
Another edition of this mechanism, rate of return, involves the evaluation of capital and
operating costs, using a specific accounting system. Prices are set at the level of audited
cost plus a reasonable return. Prices remain fixed until the next regulatory review. While
the cost plus system aims at controlling earnings, the price cap system aims at controlling
prices. Under the price cap the regulator sets maximum prices that the firm is allowed to
charge. Cost-plus formula provides investors with more certainty over key variables, but
also with lower incentives for efficiency than price cap regulation. The former shifts also
more risks to consumers than the latter.27
It is probably for this reason that in Latin
America, projects based on cost-plus formula are less likely to be renegotiated than those
with price caps. In practice, most price systems have tended to be hybrid aiming at
rewarding or penalizing the regulated company for actions and factors under its control
and, consequently, not doing so in case of circumstances which are beyond its control
(Harris, 2003, p. 35).
Regulators face also a difficult task of dealing with opportunistic investors, which may
try to shift risks to consumers or taxpayers by renegotiating, without a good reason, key
elements of the regulatory framework. They may threaten withdrawal from the project,
calculating that the government, concerned with the disruption of service will give in to
the demands of investors. It may also happen that companies offer during the bidding low
tariff or high annual concession fee to win the bidding and, once established, demand
renegotiations. The decision what to do requires expertise and good judgment on the part
of regulators. If regulators are confident that they face opportunistic behaviour, some
argue that they should “stick to their guns”, that is not to give in, as happened in
Argentina, where two provincial governments refused to renegotiate the terms of
contracts in case of Rosario Port and Buenos Aires province water concession. A review
27
For an extensive discussion of pros and cons of various price systems, see Kessides, 2004, pp. 112-123.
61
of cancelled projects suggests that concerns about the disruption of services are
exaggerated. Performance bonds can help ensure that the operator remains in service long
enough for alternative management solutions to be put in place, minimizing the risk of
disruption (ibid. p. 35).
D. The role of international agreements
As noted above the liberalization of FDI policies in infrastructure services in developing
countries has proceeded mainly on a unilateral project-by-project basis. In OECD
countries, it has been based on international agreements, notably on the Code of
Liberalization of Capital Movements and on the (voluntary) National Treatment
Instrument accompanying the OECD Declaration on International Investment and
Multilateral Enterprises. Although both instruments have been fully implemented by
member countries in the manufacturing sector, it is in infrastructure services, where the
number of exceptions has been the most frequent. The internal market programme of the
European Union does neither deals with ownership issues nor with privatizations, leaving
both to the decisions of member countries. This indicates that, in both developed and
developing countries, ownership issues in infrastructure industries – and by consequence
FDI policy -- remain almost exclusively a matter of national policy, not subjected to
international agreements. Even if they are, as in the case of OECD instruments, countries
can and do easily exclude infrastructure services. But some international agreements are
relevant to FDI in infrastructure services.
Potentially, the WTO General Agreement on Trade in Services (GATS) might have had
the greatest relevance to FDI in infrastructure services. It covers all services, including
infrastructure and FDI under so called “commercial presence”. But GATS works through
voluntary commitments of countries to liberalization of the four modes of cross-border
services delivery, including FDI (along with reservations to those commitments).
Commitments can be made mode-by-mode for each industry. If a commitment to GATS
is not made, the industry is assumed (by GATS) to be closed to FDI. Once a national
commitment is made, it falls within the WTO system, including its dispute resolution
mechanism. But developing countries (as well as many developed ones) are cautious with
making international FDI commitments in services in general and in infrastructure
services in particular, preferring a unilateral route, permitting them to preserve a policy
space. As a result, very few commitments have been made by countries which have
pursued unilaterally services FDI liberalization. As a result, in 46 developing countries,
which were subject to UNCTAD restrictiveness study, the national score for FDI
restrictiveness in all services is much lower, 0.27, than that based on GATS commitments
– 0.64 (UNCTAD, 2006, p. 16). As the restrictiveness of infrastructure services is much
higher than that of other service industries and sensitivity about their liberalization much
greater, the difference in these services between the national level of liberalization and
that resulting from GATS commitments is also, most likely, much higher.
There is also some ambiguity within the GATS, which some countries have used to limit
their offers in infrastructure services to ensure policy space in the future. The ambiguity
refers to “services supplied in the exercise of government authority” that are excluded
from the scope of application of the GATS. Under one of the GATS articles such services
62
are defined as services that are neither supplied on commercial basis nor in competition
with other services. While academics debate which services these are, the European
Union, for example, interpreted them as public utilities, making them subject to exclusive
rights in its commitment schedule, such as subsidies, continued public ownership or
regulating them in any way needed to meet national policy objectives (UNCTAD, 2004,
pp. 233-234). The reservation of Brazil has gone in a similar direction. Such
interpretations will, most likely, not be helpful for increasing, in the future, the role of
GATS in infrastructure services, especially socially sensitive ones, such as water and
electricity.
But where sensitivities are lower and reforms in individual countries more advanced, in
industries such as telecommunications, GATS members have made some further
progress, by concluding in 1997 Basic Telecommunications Agreement, including
initially 69 countries, among them several developing ones. The agreement accelerated
commitments in telecommunications. By June 2005, such commitments were made by
104 of 148 WTO member countries, including commitments on basic
telecommunications by 96 governments, who control SOEs accounting for over 95% of
world telecommunications revenues. By accessing the agreement and making
commitments, these countries have also committed to overall GATS disciplines on
regulation and transparency, ensuring minimum standards of good regulatory practices.
As regards investment, according to one study,
“These commitments lay the foundation for improved market access and the
liberalization of investment, both foreign and domestic. They strengthen investors
confidence by demonstrating that a country intends to reform its
telecommunications sector in a nonreversible way. They also provide recourse to
foreign investors (through their governments) to settle disputes under the WTO
dispute resolution system.28
GATS commitments, in this way, enhance and
underpin the domestic sector reform agenda of developing countries, providing
investors with greater predictability” (Guislain and Zhen-Wei Qiang, 2006, p. 33).
Bilateral investment treaties (BITs) are relevant to infrastructure investment as they
typically include provisions protecting investors against expropriation (by defining
criteria and the rules of compensation), referring disputes to international arbitration and
more and more often allowing investors to challenge governments.29
These rules are very
important for infrastructure FDI, given the growing number of disputes and cancellations
of infrastructure projects involving foreign investors (see chapter I), requiring settlement
or renegotiations. But they are relevant, of course, only if a home and a host country have
concluded a BIT, which is not always the case. For example, problems in one of the
largest FDI power projects in India – Dabhol project valued at $2 billion – involving
three United States investors, among them Enron, could not be resolved under a BIT,
because India and the United States did not have one (Ramamurti and Doh, 2004, p. 163).
28
The first telecommunications dispute settlement case was filled in 2002 by the United States against
Mexico and ended by a ruling in 2004. But the case concerned commercial rather than FDI issues. 29
Since infrastructure projects are based on agreements between states or local governments and investors
they, most likely, contain similar provisions, perhaps even stronger than BITs.
63
BITs rules on expropriation (and those of other investment agreements) have been for a
long time dormant, as developing countries, which resorted to expropriations several
decades ago, have adopted increasingly welcoming attitudes towards foreign investors.
But growing problems with several infrastructure investments and following disputes
have brought back, in some quarters, questions about the possibility of renationalizations.
So far none has happened, but one should not entirely exclude such a possibility in
isolated cases.
But there has been an increasing interest in indirect takings, including so called “creeping
expropriations” and “regulatory takings”, common in infrastructure projects (see
UNCTAD, 2003, pp. 111-114, for extensive discussion of these issues). In many cases
governments of host countries did renege on commitments made to foreign investors,
often by changing regulations, eroding investors’ profits. As noted by one author, “thus,
even though legal expropriations of foreigners’ assets was rare as expected,
,administrative expropriations’ that eroded foreign investors’ profits was more common
than might have been expected” (Ramamurti and Doh, 2004, p. 164). The issue of
compensation for regulatory takings may, and probably will, attract renewed interest in
light of the recent intensity of regulatory takings in cross-border infrastructure projects.
As often noted in UNCTAD’s WIRs, bilateral or regional trade agreements have become
trade and investment agreements. Some of those include investment provisions on
infrastructure services, notably telecommunications. One example is the bilateral trade
agreement between the United States and Vietnam, which gives the US TNCs the right to
invest in certain telecommunications services. Another involves the provisions of the
Central American Free Trade Agreement (CAFTA), which call for the liberalization of
telecommunications in member countries and opening up to FDI. As has been reported,
CAFTA has provided impetus to telecommunications reforms in Costa Rica and other
countries (Guislain and Zhen-Wei Qiang, 2006, p. 35).
REFERENCES
Barnett, S. (2000). “Evidence on fiscal and macroeconomic impact of privatization”,
Working Paper no.130 (Washington D.C., IMF).
Bortolotti, B., J. D’Souza, M. Fantini and W. Megginson (2001). Sources of Performance
Improvements in Privatized Firms : A Clinical Study of the Global Telecommunications
Industry (University of Oklahoma, The Department of Finance), Working Paper no. 26.
Briceno-Garmendia, C., A. Estache and N. Shafik (2004). Infrastructure Services in
Developing Countries: Access, Quality, Costs and Price Reforms, World Bank Policy
Research Working Paper 3468.
Campos, J. and J. Jimenez (2003). “Evaluating Rail Reform in Latin America:
Competition and Investment Effects”, 1st Conference on Railroad Industry Structure,
Competition and Investment, 7-8 November (Toulouse).
64
Cannock, G. (2001). “Telecom subsidies-output-based contracts for rural services in
Peru”, World Bank Viewpoint Note, no. 105 (Washington, D.C., The World Bank).
Clifton J., Comin F. and Diaz-Fuentes D, editors (2007). Transforming Public Enterprise
in Europe and North America. Networks, Integration and Transnationalisation (Palgrave
Macmillan).
Clarke, G.R.G. and S. J. Wallsten (2002). “Universal(ly Bad) Service: Providing
Infrastructure Services to Rural and Poor Urban Consumers” (Washington, D.C., The
World Bank).
Davies, K. (2004). “Regulatory treatment of foreign direct investment in infrastructure
and public utilities and recent trends: the OECD experience”, OECD-India Investment
Roundtable, 19 October 2004, New Delhi.
Davies, K., K. Wright and C. Waddams Price (2005). Experience of Privatisation,
Regulation and Competition: Lessons for Governments, CCP Working Paper 05-5 (ESCR
Centre for Competition Policy, University of East Anglia, Norwich).
Delfino, J.A. and A. A. Casarin (2001). The reform of the utilities sector in Argentina,
WIDER Discussion Paper No. 74 (Helsinki, United Nations University).
ECLAC (2006). Foreign Investment in Latin America and the Caribbean (Santiago,
United Nations).
Economic Planning Advisory Commission (EPAC) (1995a). “Interim Report of the
Private Infrastructure Task Force” (Canberra, Australian Government Publishing
Service).
Economic Planning Advisory Commission (EPAC) (1995b). “Final Report of the Private
Infrastructure Task Force” (Canberra, Australian Government Publishing Service).
Estache, A. and M. Rodrigues Padrina (1998). Light and Lighting at the End of the Public
Tunel: Reform of the Electricity Sector in the Southern Cone (Washington, D.C., World
Bank Institute, The World Bank).
Estache, A., A. Gomez-Lobo and D. Leipziger (2000). Utility Privatization and the Needs
of the Poor in Latin America. Have We Learned Enough to Get It Right?, Policy
Research Working Paper 2407, (Washington, D.C., The World Bank).
Estache, A., V. Foster and Q. Wodon (2002). Accounting for Poverty in Infrastructure
Reform: Learning from Latin America’s Experience (Washington, D.C., World Bank
Institute).
Ettinger, S. et al. (2005). Developing country investors and opening in infrastructure,
Trends and Policy Options, No. 3, May 2005, PPIAF.
65
Fay, M. and T. Yepes (2003). Investing in Infrastructure. What is needed from 2000 to
2010?, Policy Research Working Paper 3102 (The World Bank, Washington, D.C.).
Feler, L., (2001). “Electricity privatization in Argentina”, mimeo. (The World Bank,
Washington, D.C.).
FIAS (2000). Attracting Foreign Direct Investment Into Infrastructure. Why Is It So
Difficult? (Washington, D.C., The World Bank).
Fink C., A. Mattoo and R. Rathindran (2002). “An Assessment of Telecommunications
Reform in Developing Countries”, Policy Research Working Paper 2909 (Washington,
D.C., World Bank).
Fischer R, R. Gutierrez and P. Serra (2003). “The Effects of Privatization on Firms and
on Social Welfare: The Chilean Case”, Research Network Paper R-456 (Washington,
D.C., Inter-American Development Bank).
Foster, V. and O. Irusta (2001). “A Tale of Two Cities: Evaluating an Impact of
Capitalization Reforms on Poor Households in La Paz and El Alto”, Public Private
Infrastructure Advisory Facility (Washington, D.C., The World Bank).
Galal, A., L. Jones, P. Tandon and I. Vogelsang (1994). Welfare Consequences of Selling
Public Enterprises (Oxford, Oxford University Press).
Galiani, S., P. Gertler and E. Schargodsky (2002). “Water for life: the impact of the
privatization of water services on child mortality, draft report, mimeo. (Washington,
D.C., The World Bank).
Gokgur, N., (2004). Assessing Trends and Outcomes of Private Participation in
Infrastructure in Sub-Saharan Africa
Gomez-Lobo, A. (2001). “Incentive-based subsidies: designing output-based subsidies
for water consumption”, World Bank Viewpoint Note, no. 232 (Washington, D.C., The
World Bank).
Gonenc R., M. Maher and G. Nicoletti (2000). The Implementation and The Effects of
Regulatory Reform: Past Experience and Current Issues, Economics Department
Working Paper No. 251 (Paris, OECD).
Guasch, J.L., J.J. Laffont and S. Straub (2002). “Renegotiation of Concession Contracts
in Latin America”, mimeo., Preliminary version.
Guislang, P. and Ch. Zhen-Wei Qiang (2006). “Foreign Direct Investment in
Telecommunications in Developing Countries”, in Information and Telecommunication
for Development.
66
Hamilton, G. (2007). “Good Governance in Public-Private Partnerships”, presentation at
UNCTAD expert meeting on WIR 2008.
Hammami, M., J-F. Ruhashyankiko and E.B., Yehoue (2006). Determinants of Public-
Private Partnerships in Infrastructure, IMF Working Paper 06/99 (Washington, D.C.,
IMF).
Harris, A.C. (1996). “Financing infrastructure: private profits from public losses”,
conference on Public/Private infrastructure financing: still feasible?, Audit Office of
NSW, Public Accounts Committee, Parliament of NSW, Sydney, September.
Harris, C. (2003). Private Participation in Infrastructure in Developing Countries.
Trends, Impact and Policy Lessons, World Bank Working Paper No.5 (Washington,
D.C., The World Bank).
Hodge, G., (2000). Privatization: An International Review of Performance, Theoretical
Lenses on Public Policy (Westview Press).
Hodge, G. A. and C. Greve (2007). “Public-Private Partnerships: An International
Performance Review”, in Public Administration Review, May/June, 67, 3, Research
Library Core, pp. 545-558.
IMF (2004). “Public-Private Partnerships”, prepared by Fiscal Affairs Department,
March 12, 2004 (Washington, D.C., IMF).
ITU (2003). [ADD]
Kerf, M. and A. K. Izaguirre (2007). Revival of private participation in developing
country infrastructure, GRIDELINES, Note no. 16, Jan. 2007, PPIAF.
Kessides, I. N. (2004). Reforming Infrastructure. Privatization, Regulation and
Competition (Washington, D.C., World Bank and Oxford University Press).
Kessides, I. N. (2005). The Challenge of Infrastructure Privatisation, CESifo DICE
Report, 1/2005.
Kikeri, S., (1998). “Privatization and labour: what happens to workers when governments
divest?”, World Bank Technical Paper No. 396 (Washington, D.C., The World Bank).
Kikeri, S. and Kolo, A.F. (2005). Privatization: Trends and Recent Developments, World
Bank Policy Research Working Paper 3765, November 2005.
Klein, M. (1996). “Risk, Taxpayers and the Role of Government in Project Finance”,
Policy Research Working Paper no. 1688 (Washington, D.C., The World Bank).
67
Laffont, J-J and A. N’Gbo (2000). “Cross-subsidies and network expansion in developing
countries”, European Economic Review, 44, 4-6, pp. 797-805.
Laffont, J-J. and T. N’Guessan (2002). “Telecommunications Reform in Cote d’Ivoire”,
Policy Research Working Paper 2895 (Washington, D.C., World Bank).
Lamech, R. and Saeed K. (2003). “What International Investors Look For When
Investing In Developing Countries? Results From a Survey of International Investors in
the Power Sector”, Discussion Paper, World Bank.
Li, W. and L. Xu (2001). “Liberalization and Performance in the Telecommunications
Sector around the World” (Washington, D.C., World Bank).
Makonnen, D. (1999). Broadening Local Participation in Privatization of Public Assets
in Africa ((Addis Ababa, UN Economic Commission for Africa).
McKenzie, D. and D. Mookherjee (2002). “Distributive impact of privatization in Latin
America: an overview of evidence from four countries”, mimeo.
Megginson, W.L. and J. M. Netter (2001). “From State to Market: A Survey of Empirical
Studies on Privatization”, Journal of Economic Literature, Vol. XXXIX, pp. 321-389.
Monbiot, G. (2000). Captive State. The Corporate Takeover of Britain (Macmillan).
Mota, R. (2003). The Privatization and Restructuring of Electricity Distribution and
Supply Business in Brazil: A Social Cost-Benefit Analysis”, DAE Working Paper 0309
(Cambridge, UK, University of Cambridge).
Nellis, J. (2003). Privatization in Africa: What has happened? What is to be done?
Working Paper No. 25 (Center for Global Development, Washington, D.C.).
Nellis, J., R. Menzenes and S. Lucas (2004). “Privatization in Latin America. The rapid
rise, recent fall and continuing puzzle of a contentious economic policy” Center for
Global Development, Policy Brief, January 2004, Vol. 3, Issue 1.
Nellis, J. (2006). Privatization. A Summary Assessment, Working Paper No. 87 (Center
for Global Development, Washington, D.C.).
Nellis, J. and N. Birdsall, eds. (2007). Reality Check: The Distributional Impact of
Privatization in Developing Countries (Washington, D.C., Center for Global
Development).
OECD (2004). Trends and Recent Developments in Foreign Direct Investment.
International Investment Perspectives (Paris, OECD).

68
Panayotou, T. (????). “The Role of the Private Sector in Sustainable Infrastructure
Development”, Yale F&ES Bulletin (Yale, the University of Yale).
Parker, D. and C. Kirkpatrick (2003). Privatization in Developing Countries: A Review of
the Evidence and Policy Lessons, Centre on Regulation and Competition, Working Paper
no. 55 (University of Manchester, Manchester).
Patterson and Cornwall (2001). In Bacon, R.W. and Besant-Jones, J., “Global Electric
Power Reform. Privatization and Liberalization of the Electric Power Industry in
Developing Countries”, 26 Annual Reviews of Energy and the Environment, 331.
Peterson, L.E. (2004). “Investors Looking beyond ICSID in Investment Treaty Telecom
Cases”, http://www.iisd.org.
Petrazzini, B., (1996). “Competition in telecommunications: implications for universal
service and employment”, FPD Note no.93, Finance and Private Sector Development
(Washington, D.C., The World Bank).
Pollit, M. (1995). “Ownership and performance in electric utilities: the international
evidence on privatization and efficiency” (Oxford Institute of Energy Studies).
Pollit, M., (2003). “Electricity Reform in Argentina – Lessons for Developing Countries”
(Washington, D.C., World Bank).
Ramamurti, P. (1996). « The New Frontier of Privatization » , in R. Ramamurti, ed.,
Privatizing Monopolies: Lessons from the Telecommunications and Transport Sectors in
Latin America (Baltimore, Md., The Johns Hopkins University Press).
Ramamurti R., and J. P. Doh (2004). “Rethinking foreign infrastructure investment in
developing countries”, Journal of World Business, Greenwich, May, Vol. 39, Issue 2, pp.
151-167.
Rohlfs, J., K. Pehrsson, C-M., Rossoto and M. Kerf (2000). “Effects of the Entrance of a
Second GSM Operatoron the Cellular Telecommunications Market and on the Incumbent
Operator”, paper, 28th
Annual Telecommunications Policy Research Conference, 24
September (Alexandria, V.A.).
Ros, A. (1999). “Does Ownership or Competition Matter? The Effects of
Telecommunications Reform on Network Expansion and Efficiency” in Journal of
Regulatory Economics, 15 (1), pp. 65-92.
Rudnick, H. and J. Zolezzi (2001). “Electric Sector Deregulation and Restructuring in
Latin America: Lessons to be Learnt and Possible Ways Forward”, in IEEE,
Proceedings: Generation, Transmission and Distribution, 148, pp. 180-184.
69
Saha, S. and D. Parker, eds. (2002). Globalization and Sustainable Development in Latin
America: Perspectives on the New Economic Order (Edward Elgar, Cheltenham).
M. Shirley, ed. (2002). Thirsting for Efficiency: The Economics and Politics of Urban
Water Systems Reform (Oxford, Elsevier Press).
Shirley, M. and C. Menard (2002). “Cities Awash: Reforming Water Urban Systems in
Developing Countries”, in M. Shirley, ed., Thirsting for Efficiency: The Economics and
Politics of Urban Water Systems Reform (Oxford, Elsevier Press).
Spackman, M. (2002). “Public-private partnerships: lessons from British approach”, in
Economic Systems, 26, 3, pp. 283-301.
Schur, M., von Klaudy, S. and G. Dellacha (2006). “The role of developing country firms
in infrastructure”, GRIDELINES, Note no.3, April 2006, PPIAF.
Schur, M. (2005). “Developing country investors and operators in infrastructure projects.
Prevalence, emerging trends and possible policy implications for the African region”,
Public Private Infrastructure Advisory Facility, May 2005, mimeo..
Thompson, L., K-J., Budin and A. Estache (2001). “Private Investment in Railways:
Experience from South an North America, Africa and New Zealand”, paper, Association
for European Transport Conference, 12-13 September (Cambridge, UK).
Thompson, L. (2003). “Changing Railway Structure and Ownership: Is Anything
Working?”, Transport Review, 23, 3, pp. 311-356.
UNCTAD (1999). World Investment Report. Foreign Direct Investment and the
Challenge of Development. (New York and Geneva, United Nations).
UNCTAD (2003). World Investment Report 2003.FDI Policies for Development:
National and International Perspectives (New York and Geneva, United Nations).
UNCTAD (2004). World Investment Report 2004. The Shift Towards Services (New
York and Geneva, United Nations).
UNCTAD (2005). Investment Policy Review. Brazil, (Geneva: United Nations), Unedited
advance copy.
UNCTAD (2006). Measuring Restrictions on FDI in Services in Developing Countries
and Transition Economies, UNCTAD Current Studies on FDI and Development, No. 2
(New York and Geneva, United Nations).
UNDP (2006). Human Development Report 2006. Beyond scarcity: Power, poverty and
the global water crisis (published for the UNDP by Palgrave Macmillan, New York).

70
Wallsten, B. (2001). “An Econometric Analysis of Telecom Competition, Privatization
and Regulation in Africa and Latin America”, The Journal of Industrial Economics, 49,
1, pp. 1-19.
Wellenius, B., (1997). “Extending telecommunications service to rural areas: the Chilean
experience”, World Bank Viewpoint Note, no. 105 (Washington, D.C., The World Bank).
Wells, L.T., and E.S. Gleason (1995). “Is foreign infrastructure investment still risky?”,
Harvard Business Review, September-October, pp. 44-55.
World Bank (1994). World Development Report 1994 (New York, Oxford University
Press).
World Bank (2003). Private Participation in Infrastructure: Trends in Developing
Countries in 1990-2001 (Washington, D.C., The World Bank).
World Bank (2004). World Development Report 2005. A Better Investment Climate for
Everyone (Washington, D.C., The World Bank and Oxford University Press).
World Bank (2005). Connecting Sub-Saharan Africa: A World Bank Group Strategy for
Information and Communication Technology Development, World Bank/GICT Paper
(Washington, D.C., The World Bank).
Copyright © 2022 FDOKUMEN